Logstash Quick Guide
User Manual:
Open the PDF directly: View PDF ![]() .
.
Page Count: 56
Previous Page Next Page
Logstash - Quick GuideLogstash - Quick Guide
Logstash - Quick Guide
Advertisements
Logstash - IntroductionLogstash - Introduction
Logstash - Introduction
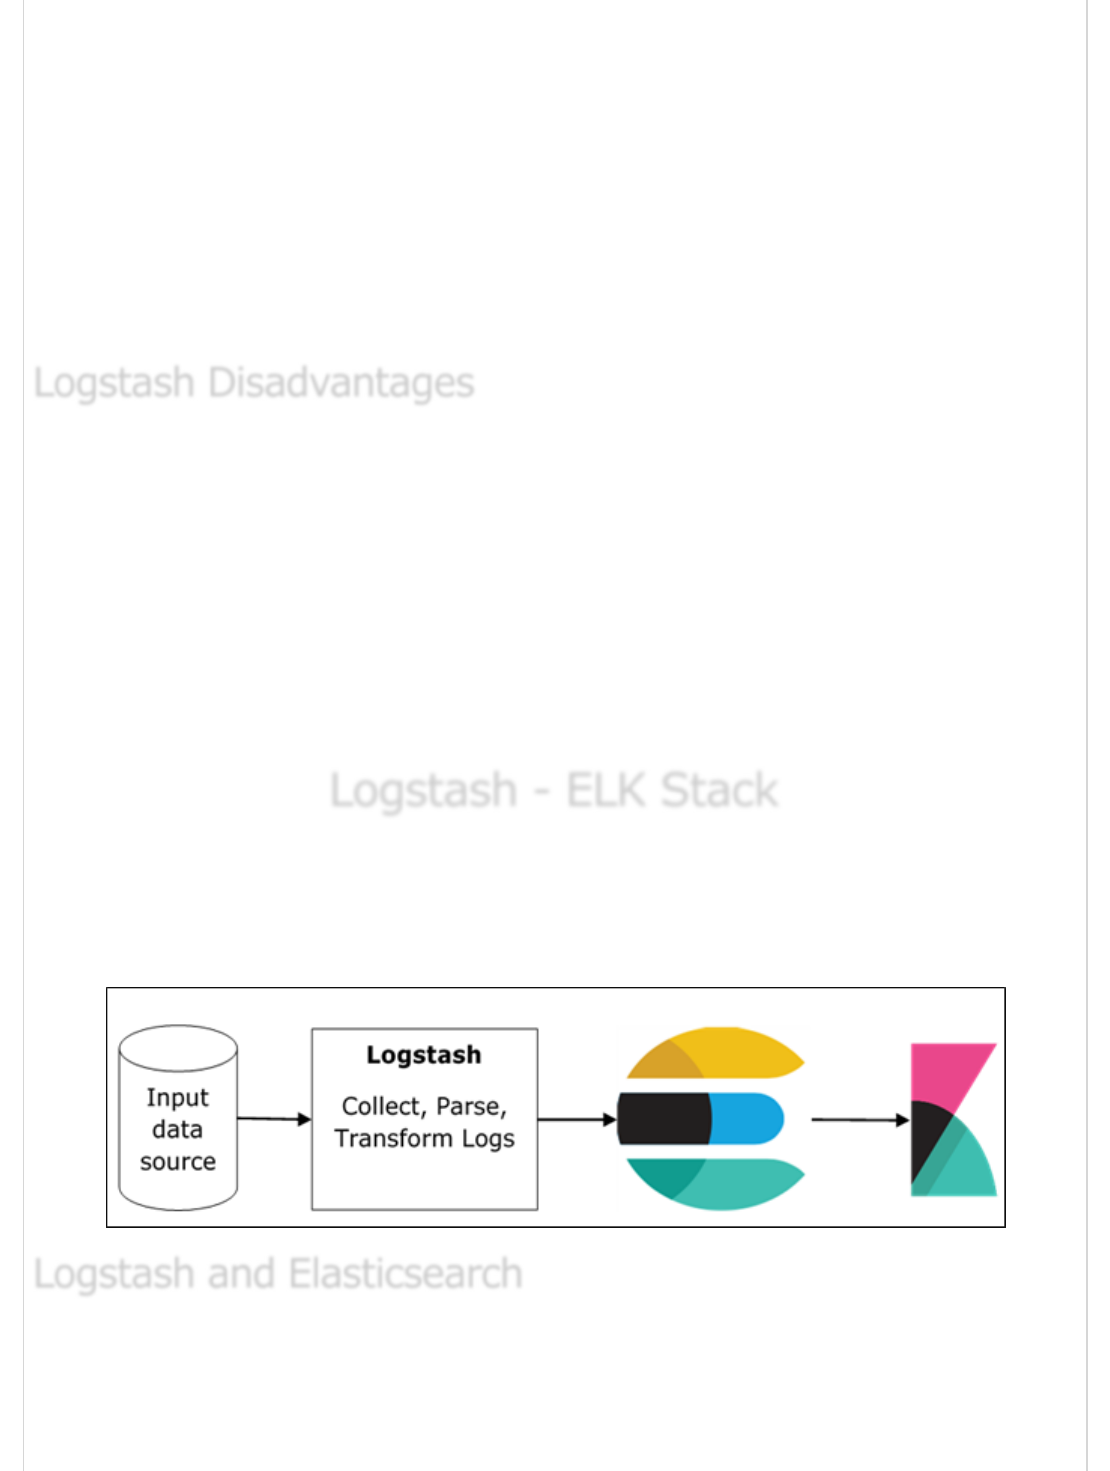
Logstash is a tool based on the filter/pipes patterns for gathering, processing and
generating the logs or events. It helps in centralizing and making real time analysis of logs
and events from different sources.
Logstash is written on JRuby programming language that runs on the JVM, hence you can
run Logstash on different platforms. It collects different types of data like Logs, Packets,
Events, Transactions, Timestamp Data, etc., from almost every type of source. The data
source can be Social data, E-commerce, News articles, CRM, Game data, Web trends,
Financial data, Internet of Things, Mobile devices, etc.
The general features of Logstash are as follows −
Logstash can collect data from different sources and send to multiple destinations.
Logstash can handle all types of logging data like Apache Logs, Windows Event
Logs, Data over Network Protocols, Data from Standard Input and many more.
Logstash can also handle http requests and response data.
Logstash provides a variety of filters, which helps the user to find more meaning in
the data by parsing and transforming it.
Logstash can also be used for handling sensors data in internet of things.
Logstash is open source and available under the Apache license version 2.0.
Logstash General FeaturesLogstash General Features
Logstash General Features
Logstash Key ConceptsLogstash Key Concepts
Logstash Key Concepts
The key concepts of Logstash are as follows −
It is the main object in Logstash, which encapsulates the data flow in the Logstash
pipeline. Logstash uses this object to store the input data and add extra fields created
during the filter stage.
Logstash offers an Event API to developers to manipulate events. In this tutorial, this
event is referred with various names like Logging Data Event, Log Event, Log Data, Input
Log Data, Output Log Data, etc.
It comprises of data flow stages in Logstash from input to output. The input data is
entered in the pipeline and is processed in the form of an event. Then sends to an output
destination in the user or end system’s desirable format.
This is the first stage in the Logstash pipeline, which is used to get the data in Logstash for
further processing. Logstash offers various plugins to get data from different platforms.
Some of the most commonly used plugins are – File, Syslog, Redis and Beats.
This is the middle stage of Logstash, where the actual processing of events take place. A
developer can use pre-defined Regex Patterns by Logstash to create sequences for
differentiating between the fields in the events and criteria for accepted input events.
Logstash offers various plugins to help the developer to parse and transform the events
into a desirable structure. Some of the most commonly used filter plugins are – Grok,
Mutate, Drop, Clone and Geoip.
This is the last stage in the Logstash pipeline, where the output events can be formatted
into the structure required by the destination systems. Lastly, it sends the output event
after complete processing to the destination by using plugins. Some of the most commonly
used plugins are – Elasticsearch, File, Graphite, Statsd, etc.
The following points explain the various advantages of Logstash.
Logstash offers regex pattern sequences to identify and parse the various fields in
any input event.
Logstash supports a variety of web servers and data sources for extracting logging
data.
Event ObjectEvent Object
Event Object
PipelinePipeline
Pipeline
InputInput
Input
FilterFilter
Filter
OutputOutput
Output
Logstash AdvantagesLogstash Advantages
Logstash Advantages
Logstash provides multiple plugins to parse and transform the logging data into
any user desirable format.
Logstash is centralized, which makes it easy to process and collect data from
different servers.
Logstash supports many databases, network protocols and other services as a
destination source for the logging events.
Logstash uses the HTTP protocol, which enables the user to upgrade Elasticsearch
versions without having to upgrade Logstash in a lock step.
The following points explain the various disadvantages of Logstash.
Logstash uses http, which negatively affects the processing of the logging data.
Working with Logstash can sometimes be a little complex, as it needs a good
understanding and analysis of the input logging data.
Filter plugins are not generic, so, the user may need to find the correct sequence
of patterns to avoid error in parsing.
In the next chapter, we will understand what the ELK Stack is and how it helps Logstash.
Logstash - ELK StackLogstash - ELK Stack
Logstash - ELK Stack
ELK stands for Elasticsearch, Logstash, and Kibana. In the ELK stack, Logstash extracts
the logging data or other events from different input sources. It processes the events and
later stores it in Elasticsearch. Kibana is a web interface, which accesses the logging data
form Elasticsearch and visualizes it.
Logstash provides input and output Elasticsearch plugin to read and write log events to
Elasticsearch. Elasticsearch as an output destination is also recommended by Elasticsearch
Company because of its compatibility with Kibana. Logstash sends the data to
Elasticsearch over the http protocol.
Logstash DisadvantagesLogstash Disadvantages
Logstash Disadvantages
Logstash and ElasticsearchLogstash and Elasticsearch
Logstash and Elasticsearch
Elasticsearch provides bulk upload facility, which helps to upload the data from different
sources or Logstash instances to a centralized Elasticsearch engine. ELK has the following
advantages over other DevOps Solutions −
ELK stack is easier to manage and can be scaled for handling petabytes of events.
ELK stack architecture is very flexible and it provides integration with Hadoop.
Hadoop is mainly used for archive purposes. Logstash can be directly connected to
Hadoop by using flume and Elasticsearch provides a connector named es-hadoop
to connect with Hadoop.
ELK ownership total cost is much lesser than its alternatives.
Kibana does not interact with Logstash directly but through a data source, which is
Elasticsearch in the ELK stack. Logstash collects the data from every source and
Elasticsearch analyzes it at a very fast speed, then Kibana provides the actionable insights
on that data.
Kibana is a web based visualization tool, which helps developers and others to analyze the
variations in large amounts of events collected by Logstash in Elasticsearch engine. This
visualization makes it easy to predict or to see the changes in trends of errors or other
significant events of the input source.
Logstash - InstallationLogstash - Installation
Logstash - Installation
To install Logstash on the system, we should follow the steps given below −
Step 1 − Check the version of your Java installed in your computer; it should be Java 8
because it is not compatible with Java 9. You can check this by −
In a Windows Operating System (OS) (using command prompt) −
> java -version
In UNIX OS (Using Terminal) −
$ echo $JAVA_HOME
Step 2 − Download Logstash from −
https://www.elastic.co/downloads/logstash .
For Windows OS, download the ZIP file.
For UNIX OS, download the TAR file.
For Debian OS download the DEB file.
Logstash and KibanaLogstash and Kibana
Logstash and Kibana

For Red Hat and other Linux distributions, download the RPN file.
APT and Yum utilities can also be used to install Logstash in many Linux
distributions.
Step 3 − The installation process for Logstash is very easy. Let’s see how you can install
Logstash on different platforms.
Note − Do not put any whitespace or colon in the installation folder.
Windows OS − Unzip the zip package and the Logstash is installed.
UNIX OS − Extract the tar file in any location and the Logstash is installed.
$tar –xvf logstash-5.0.2.tar.gz
Using APT utility for Linux OS −
Download and install the Public Signing Key −
$ wget -qO - https://artifacts.elastic.co/GPG-KEY-elasticsearch | sudo apt-key add -
Save the repository definition −
$ echo "deb https://artifacts.elastic.co/packages/5.x/apt stable main" | sudo
tee -a /etc/apt/sources.list.d/elastic-5.x.list
Run update −
$ sudo apt-get update
Now you can install by using the following command −
$ sudo apt-get install logstash
Using YUM utility for Debian Linux OS −
Download and install the Public Signing Key −
$ rpm --import https://artifacts.elastic.co/GPG-KEY-elasticsearch
Add the following text in the file with the .repo suffix in your o “/etc/yum.repos.d/”
directory. For example, logstash.repo
[logstash-5.x]
name = Elastic repository for 5.x packages
baseurl = https://artifacts.elastic.co/packages/5.x/yum
gpgcheck = 1
gpgkey = https://artifacts.elastic.co/GPG-KEY-elasticsearch
enabled = 1

autorefresh = 1
type = rpm-md
You can now install Logstash by using the following command −
$ sudo yum install logstash
Step 4 − Go to the Logstash home directory. Inside the bin folder, run the
elasticsearch.bat file in case of windows or you can do the same using the command
prompt and through the terminal. In UNIX, run the Logstash file.
We need to specify the input source, output source and optional filters. For verifying the
installation, you can run it with the basic configuration by using a standard input stream
(stdin) as the input source and a standard output stream (stdout) as the output source.
You can specify the configuration in the command line also by using –e option.
In Windows −
> cd logstash-5.0.1/bin
> Logstash -e 'input { stdin { } } output { stdout {} }'
In Linux −
$ cd logstash-5.0.1/bin
$ ./logstash -e 'input { stdin { } } output { stdout {} }'
Note − in case of windows, you might get an error stating JAVA_HOME is not set. For this,
please set it in environment variables to “C:\Program Files\Java\jre1.8.0_111” or the
location where you installed java.
Step 5 − Default ports for Logstash web interface are 9600 to 9700 are defined in the
logstash-5.0.1\config\logstash.yml as the http.port and it will pick up the first
available port in the given range.
We can check if the Logstash server is up and running by browsing
http://localhost:9600 or if the port is different and then please check the command
prompt or terminal. We can see the assigned port as “Successfully started Logstash API
endpoint {:port ⇒ 9600}. It will return a JSON object, which contains the information
about the installed Logstash in the following way −
{
"host":"manu-PC",
"version":"5.0.1",
"http_address":"127.0.0.1:9600",
"build_date":"2016-11-11T22:28:04+00:00",
"build_sha":"2d8d6263dd09417793f2a0c6d5ee702063b5fada",
"build_snapshot":false
}
Logstash - Internal ArchitectureLogstash - Internal Architecture
Logstash - Internal Architecture
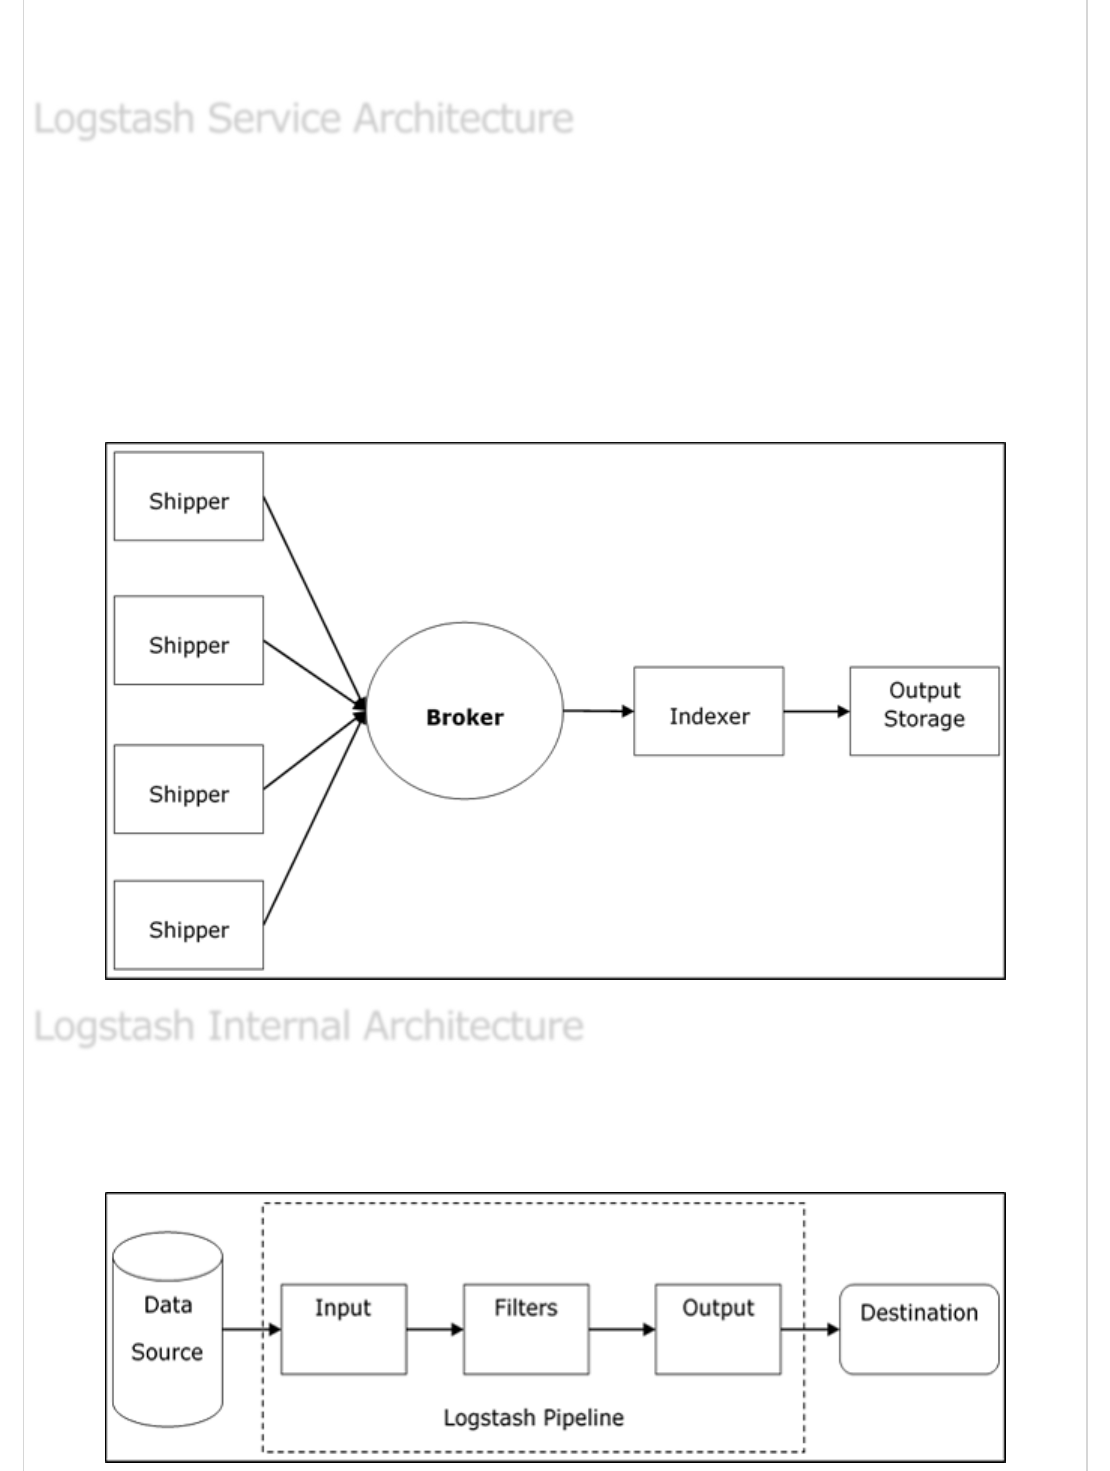
In this chapter, we will discuss regarding the internal architecture and the different
components of Logstash.
Logstash processes logs from different servers and data sources and it behaves as the
shipper. The shippers are used to collect the logs and these are installed in every input
source. Brokers like Redis, Kafka or RabbitMQ are buffers to hold the data for indexers,
there may be more than one brokers as failed over instances.
Indexers like Lucene are used to index the logs for better search performance and then
the output is stored in Elasticsearch or other output destination. The data in output storage
is available for Kibana and other visualization software.
The Logstash pipeline consists of three components Input, Filters and Output. The input
part is responsible to specify and access the input data source such as the log folder of the
Apache Tomcat Server.
Logstash Service ArchitectureLogstash Service Architecture
Logstash Service Architecture
Logstash Internal ArchitectureLogstash Internal Architecture
Logstash Internal Architecture
The Logstash configuration file contains the details about the three components of
Logstash. In this case, we are creating a file name called Logstash.conf.
The following configuration captures data from an input log “inlog.log” and writes it to an
output log “outlog.log” without any filters.
The Logstash configuration file just copies the data from the inlog.log file using the input
plugin and flushes the log data to outlog.log file using the output plugin.
input {
file {
path => "C:/tpwork/logstash/bin/log/inlog.log"
}
}
output {
file {
path => "C:/tpwork/logstash/bin/log/outlog.log"
}
}
Logstash uses –f option to specify the config file.
C:\logstash\bin> logstash –f logstash.conf
The following code block shows the input log data.
Hello tutorialspoint.com
The Logstash output contains the input data in message field. Logstash also adds other
fields to the output like Timestamp, Path of the Input Source, Version, Host and Tags.
{
"path":"C:/tpwork/logstash/bin/log/inlog1.log",
"@timestamp":"2016-12-13T02:28:38.763Z",
"@version":"1", "host":"Dell-PC",
"message":" Hello tutorialspoint.com", "tags":[]
}
As you can, the output of Logstash contains more than the data supplied through the input
log. The output contains the Source Path, Timestamp, Version, Hostname and Tag, which
are used to represent the extra messages like errors.
Example to Explain the Logstash PipelineExample to Explain the Logstash Pipeline
Example to Explain the Logstash Pipeline
Logstash.confLogstash.conf
Logstash.conf
Run LogstashRun Logstash
Run Logstash
inlog.loginlog.log
inlog.log
outlog.logoutlog.log
outlog.log
We can use filters to process the data and make its useful for our needs. In the next
example, we are using filter to get the data, which restricts the output to only data with a
verb like GET or POST followed by a Unique Resource Identifier.
In this Logstash configuration, we add a filter named grok to filter out the input data. The
input log event, which matches the pattern sequence input log, only get to the output
destination with error. Logstash adds a tag named "_grokparsefailure" in the output
events, which does not match the grok filter pattern sequence.
Logstash offers many inbuilt regex patterns for parsing popular server logs like Apache.
The pattern used here expects a verb like get, post, etc., followed by a uniform resource
identifier.
input {
file {
path => "C:/tpwork/logstash/bin/log/inlog2.log"
}
}
filter {
grok {
match => {"message" => "%{WORD:verb} %{URIPATHPARAM:uri}"}
}
}
output {
file {
path => "C:/tpwork/logstash/bin/log/outlog2.log"
}
}
We can run Logstash by using the following command.
C:\logstash\bin> logstash –f Logstash.conf
Our input file contains two events separated by default delimiter, i.e., new line delimiter.
The first event matches the pattern specified in GROk and the second one does not.
GET /tutorialspoint/Logstash
Input 1234
We can see that the second output event contains "_grokparsefailure" tag, because it does
not match the grok filter pattern. The user can also remove these unmatched events in
output by using the ‘if’ condition in the output plugin.
Logstash.confLogstash.conf
Logstash.conf
Run LogstashRun Logstash
Run Logstash
inlog2.loginlog2.log
inlog2.log
outlog2.logoutlog2.log
outlog2.log
{
"path":"C:/tpwork/logstash/bin/log/inlog2.log",
"@timestamp":"2016-12-13T02:47:10.352Z","@version":"1","host":"Dell-PC","verb":"GET",
"message":"GET /tutorialspoint/logstash", "uri":"/tutorialspoint/logstash", "tags":[]
}
{
"path":"C:/tpwork/logstash/bin/log/inlog2.log",
"@timestamp":"2016-12-13T02:48:12.418Z", "@version":"1", "host":"Dell-PC",
"message":"t 1234\r", "tags":["_grokparsefailure"]
}
Logstash - Collecting LogsLogstash - Collecting Logs
Logstash - Collecting Logs
Logs from different servers or data sources are collected using shippers. A shipper is an
instance of Logstash installed in the server, which accesses the server logs and sends to
specific output location.
It mainly sends the output to the Elasticsearch for storage. Logstash takes input from the
following sources −
STDIN
Syslog
Files
TCP/UDP
Microsoft windows Eventlogs
Websocket
Zeromq
Customized extensions
In this example, we are collecting logs of Apache Tomcat 7 Server installed in windows
using the file input plugin and sending them to the other log.
Here, Logstash is configured to access the access log of Apache Tomcat 7 installed locally.
A regex pattern is used in path setting of the file plugin to get the data from the log file.
This contains “access” in its name and it adds an apache type, which helps in
differentiating the apache events from the other in a centralized destination source. Finally,
the output events will be shown in the output.log.
input {
file {
path => "C:/Program Files/Apache Software Foundation/Tomcat 7.0/logs/*access*"
type => "apache"
}
Collecting Logs Using Apache Tomcat 7 ServerCollecting Logs Using Apache Tomcat 7 Server
Collecting Logs Using Apache Tomcat 7 Server
logstash.conflogstash.conf
logstash.conf
}
output {
file {
path => "C:/tpwork/logstash/bin/log/output.log"
}
}
We can run Logstash by using the following command.
C:\logstash\bin> logstash –f Logstash.conf
Access the Apache Tomcat Server and its web apps (http://localhost:8080) to generate
logs. The updated data in the logs are read by Logstash in real time and stashed in
output.log as specified in configuration file.
Apache Tomcat generates a new access log file according to date and logs the access
events there. In our case, it was localhost_access_log.2016-12-24.txt in the logs directory
of Apache Tomcat.
0:0:0:0:0:0:0:1 - - [
25/Dec/2016:18:37:00 +0800] "GET / HTTP/1.1" 200 11418
0:0:0:0:0:0:0:1 - munish [
25/Dec/2016:18:37:02 +0800] "GET /manager/html HTTP/1.1" 200 17472
0:0:0:0:0:0:0:1 - - [
25/Dec/2016:18:37:08 +0800] "GET /docs/ HTTP/1.1" 200 19373
0:0:0:0:0:0:0:1 - - [
25/Dec/2016:18:37:10 +0800] "GET /docs/introduction.html HTTP/1.1" 200 15399
You can see in the output events, a type field is added and the event is present in the
message field.
{
"path":"C:/Program Files/Apache Software Foundation/Tomcat 7.0/logs/
localhost_access_log.2016-12-25.txt",
"@timestamp":"2016-12-25T10:37:00.363Z","@version":"1","host":"Dell-PC",
"message":"0:0:0:0:0:0:0:1 - - [25/Dec/2016:18:37:00 +0800] \"GET /
HTTP/1.1\" 200 11418\r","type":"apache","tags":[]
}
{
"path":"C:/Program Files/Apache Software Foundation/Tomcat 7.0/logs/
localhost_access_log.2016-12-25.txt","@timestamp":"2016-12-25T10:37:10.407Z",
"@version":"1","host":"Dell-PC",
"message":"0:0:0:0:0:0:0:1 - munish [25/Dec/2016:18:37:02 +0800] \"GET /
manager/html HTTP/1.1\" 200 17472\r","type":"apache","tags":[]
}
{
Run LogstashRun Logstash
Run Logstash
Apache Tomcat LogApache Tomcat Log
Apache Tomcat Log
output.logoutput.log
output.log
"path":"C:/Program Files/Apache Software Foundation/Tomcat 7.0/logs/
localhost_access_log.2016-12-25.txt","@timestamp":"2016-12-25T10:37:10.407Z",
"@version":"1","host":"Dell-PC",
"message":"0:0:0:0:0:0:0:1 - - [25/Dec/2016:18:37:08 +0800] \"GET /docs/
HTTP/1.1\" 200 19373\r","type":"apache","tags":[]
}
{
"path":"C:/Program Files/Apache Software Foundation/Tomcat 7.0/logs/
localhost_access_log.2016-12-25.txt","@timestamp":"2016-12-25T10:37:20.436Z",
"@version":"1","host":"Dell-PC",
"message":"0:0:0:0:0:0:0:1 - - [25/Dec/2016:18:37:10 +0800] \"GET /docs/
introduction.html HTTP/1.1\" 200 15399\r","type":"apache","tags":[]
}
In this section, we will discuss another example of collecting logs using the STDIN Plugin.
It is a very simple example, where Logstash is reading the events entered by the user in a
standard input. In our case, it is the command prompt, which stores the events in the
output.log file.
input {
stdin{}
}
output {
file {
path => "C:/tpwork/logstash/bin/log/output.log"
}
}
We can run Logstash by using the following command.
C:\logstash\bin> logstash –f Logstash.conf
Write the following text in the command prompt −
The user entered the following two lines. Logstash separates the events by the delimiter
setting and its value by default is ‘\n’. The user can change by changing the value of the
delimiter in the file plugin.
Tutorialspoint.com welcomes you
Simply easy learning
The following code block shows the output log data.
{
"@timestamp":"2016-12-25T11:41:16.518Z","@version":"1","host":"Dell-PC",
Collecting Logs Using STDIN PluginCollecting Logs Using STDIN Plugin
Collecting Logs Using STDIN Plugin
logstash.conflogstash.conf
logstash.conf
Run LogstashRun Logstash
Run Logstash
output.logoutput.log
output.log
"message":"tutrialspoint.com welcomes you\r","tags":[]
}
{
"@timestamp":"2016-12-25T11:41:53.396Z","@version":"1","host":"Dell-PC",
"message":"simply easy learning\r","tags":[]
}
Logstash - Supported InputsLogstash - Supported Inputs
Logstash - Supported Inputs
Logstash supports a huge range of logs from different sources. It is working with famous
sources as explained below.
System events and other time activities are recorded in metrics. Logstash can access the
log from system metrics and process them using filters. This helps to show the user the
live feed of the events in a customized manner. Metrics are flushed according to the
flush_interval setting of metrics filter and by default; it is set to 5 seconds.
We are tracking the test metrics generated by Logstash, by gathering and analyzing the
events running through Logstash and showing the live feed on the command prompt.
This configuration contains a generator plugin, which is offered by Logstash for test
metrics and set the type setting to “generated” for parsing. In the filtering phase, we are
only processing the lines with a generated type by using the ‘if’ statement. Then, the
metrics plugin counts the field specified in meter settings. The metrics plugin flushes the
count after every 5 seconds specified in the flush_interval.
Lastly, output the filter events to a standard output like command prompt using the codec
plugin for formatting. The Codec plugin is using [events][rate_1m] value to output the
per second events in a 1-minute sliding window.
input {
generator {
type => "generated"
}
}
filter {
if [type] == "generated" {
metrics {
meter => "events"
add_tag => "metric"
}
}
}
output {
# only emit events with the 'metric' tag
if "metric" in [tags] {
stdout {
codec => line { format => "rate: %{[events][rate_1m]}"
Collect Logs from MetricsCollect Logs from Metrics
Collect Logs from Metrics
logstash.conflogstash.conf
logstash.conf
}
}
}
We can run Logstash by using the following command.
>logsaths –f logstash.conf
rate: 1308.4
rate: 1308.4
rate: 1368.654529135342
rate: 1416.4796003951449
rate: 1464.974293984808
rate: 1523.3119444107458
rate: 1564.1602979542715
rate: 1610.6496496890895
rate: 1645.2184750334154
rate: 1688.7768007612485
rate: 1714.652283095914
rate: 1752.5150680019278
rate: 1785.9432934744932
rate: 1806.912181962126
rate: 1836.0070454626025
rate: 1849.5669494173826
rate: 1871.3814756851832
rate: 1883.3443123790712
rate: 1906.4879113216743
rate: 1925.9420717997118
rate: 1934.166137658981
rate: 1954.3176526556897
rate: 1957.0107444542625
Web servers generate a large number of logs regarding user access and errors. Logstash
helps to extract the logs from different servers using input plugins and stash them in a
centralized location.
We are extracting the data from the stderr logs of the local Apache Tomcat Server and
stashing it in the output.log.
Run LogstashRun Logstash
Run Logstash
stdout (command prompt)stdout (command prompt)
stdout (command prompt)
Collect Logs from the Web ServerCollect Logs from the Web Server
Collect Logs from the Web Server
logstash.conflogstash.conf
logstash.conf
This Logstash configuration file directs Logstash to read apache error logs and add a tag
named “apache-error”. We can simply send it to the output.log using the file output plugin.
input {
file {
path => "C:/Program Files/Apache Software Foundation/Tomcat 7.0 /logs/*stderr*"
type => "apache-error"
}
}
output {
file {
path => "C:/tpwork/logstash/bin/log/output.log"
}
}
We can run Logstash by using the following command.
>Logstash –f Logstash.conf
This is the sample stderr log, which generates when the server events occur in Apache
Tomcat.
C:\Program Files\Apache Software Foundation\Tomcat 7.0\logs\ tomcat7-stderr.2016-12-
25.log
Dec 25, 2016 7:05:14 PM org.apache.coyote.AbstractProtocol start
INFO: Starting ProtocolHandler ["http-bio-9999"]
Dec 25, 2016 7:05:14 PM org.apache.coyote.AbstractProtocol start
INFO: Starting ProtocolHandler ["ajp-bio-8009"]
Dec 25, 2016 7:05:14 PM org.apache.catalina.startup.Catalina start
INFO: Server startup in 823 ms
{
"path":"C:/Program Files/Apache Software Foundation/Tomcat 7.0/logs/
tomcat7-stderr.2016-12-25.log","@timestamp":"2016-12-25T11:05:27.045Z",
"@version":"1","host":"Dell-PC",
"message":"Dec 25, 2016 7:05:14 PM org.apache.coyote.AbstractProtocol start\r",
"type":"apache-error","tags":[]
}
{
"path":"C:/Program Files/Apache Software Foundation/Tomcat 7.0/logs/
tomcat7-stderr.2016-12-25.log","@timestamp":"2016-12-25T11:05:27.045Z",
"@version":"1","host":"Dell-PC",
"message":"INFO: Starting ProtocolHandler [
\"ajp-bio-8009\"]\r","type":"apache-error","tags":[]
}
{
Run LogstashRun Logstash
Run Logstash
Sample of Input logSample of Input log
Sample of Input log
output.logoutput.log
output.log
"path":"C:/Program Files/Apache Software Foundation/Tomcat 7.0/logs/
tomcat7-stderr.2016-12-25.log","@timestamp":"2016-12-25T11:05:27.045Z",
"@version":"1","host":"Dell-PC",
"message":"Dec 25, 2016 7:05:14 PM org.apache.catalina.startup.Catalina start\r",
"type":"apache-error","tags":[]
}
{
"path":"C:/Program Files/Apache Software Foundation/Tomcat 7.0/logs/
tomcat7-stderr.2016-12-25.log","@timestamp":"2016-12-25T11:05:27.045Z",
"@version":"1","host":"Dell-PC",
"message":"INFO: Server startup in 823 ms\r","type":"apache-error","tags":[]
}
To start with, let us understand how to Configure MySQL for logging. Add the following
lines in my.ini file of the MySQL database server under [mysqld].
In windows, it is present inside the installation directory of MySQL, which is in −
C:\wamp\bin\mysql\mysql5.7.11
In UNIX, you can find it in – /etc/mysql/my.cnf
general_log_file = "C:/wamp/logs/queries.log"
general_log = 1
In this config file, file plugin is used to read the MySQL log and write it to the ouput.log.
input {
file {
path => "C:/wamp/logs/queries.log"
}
}
output {
file {
path => "C:/tpwork/logstash/bin/log/output.log"
}
}
This is the log generated by queries executed in the MySQL database.
2016-12-25T13:05:36.854619Z 2 Query select * from test1_users
2016-12-25T13:05:51.822475Z 2 Query select count(*) from users
2016-12-25T13:05:59.998942Z 2 Query select count(*) from test1_users
Collect Logs from Data sourcesCollect Logs from Data sources
Collect Logs from Data sources
logstash.conflogstash.conf
logstash.conf
queries.logqueries.log
queries.log
output.logoutput.log
output.log
{
"path":"C:/wamp/logs/queries.log","@timestamp":"2016-12-25T13:05:37.905Z",
"@version":"1","host":"Dell-PC",
"message":"2016-12-25T13:05:36.854619Z 2 Query\tselect * from test1_users",
"tags":[]
}
{
"path":"C:/wamp/logs/queries.log","@timestamp":"2016-12-25T13:05:51.938Z",
"@version":"1","host":"Dell-PC",
"message":"2016-12-25T13:05:51.822475Z 2 Query\tselect count(*) from users",
"tags":[]
}
{
"path":"C:/wamp/logs/queries.log","@timestamp":"2016-12-25T13:06:00.950Z",
"@version":"1","host":"Dell-PC",
"message":"2016-12-25T13:05:59.998942Z 2 Query\tselect count(*) from test1_users",
"tags":[]
}
Logstash - Parsing the LogsLogstash - Parsing the Logs
Logstash - Parsing the Logs
Logstash receives the logs using input plugins and then uses the filter plugins to parse and
transform the data. The parsing and transformation of logs are performed according to the
systems present in the output destination. Logstash parses the logging data and forwards
only the required fields. Later, these fields are transformed into the destination system’s
compatible and understandable form.
Parsing of the logs is performed my using the GROK (Graphical Representation of
Knowledge) patterns and you can find them in Github −
https://github.com/elastic/logstash/tree/v1.4.2/patterns .
Logstash matches the data of logs with a specified GROK Pattern or a pattern sequence for
parsing the logs like "%{COMBINEDAPACHELOG}", which is commonly used for apache
logs.
The parsed data is more structured and easy to search and for performing queries.
Logstash searches for the specified GROK patterns in the input logs and extracts the
matching lines from the logs. You can use GROK debugger to test your GROK patterns.
The syntax for a GROK pattern is %{SYNTAX:SEMANTIC}. Logstash GROK filter is written
in the following form −
%{PATTERN:FieldName}
Here, PATTERN represents the GROK pattern and the fieldname is the name of the field,
which represents the parsed data in the output.
For example, using online GROK debugger https://grokdebug.herokuapp.com/
How to Parse the Logs?How to Parse the Logs?
How to Parse the Logs?
A sample error line in a log −
[Wed Dec 07 21:54:54.048805 2016] [:error] [pid 1234:tid 3456829102]
[client 192.168.1.1:25007] JSP Notice: Undefined index: abc in
/home/manu/tpworks/tutorialspoint.com/index.jsp on line 11
This GROK pattern sequence matches to the log event, which comprises of a timestamp
followed by Log Level, Process Id, Transaction Id and an Error Message.
\[(%{DAY:day} %{MONTH:month} %{MONTHDAY} %{TIME} %{YEAR})\] \[.*:%{LOGLEVEL:loglevel}\]
\[pid %{NUMBER:pid}:tid %{NUMBER:tid}\] \[client %{IP:clientip}:.*\]
%{GREEDYDATA:errormsg}
The output is in JSON format.
{
"day": [
"Wed"
],
"month": [
"Dec"
],
"loglevel": [
"error"
],
"pid": [
"1234"
],
"tid": [
"3456829102"
],
"clientip": [
"192.168.1.1"
],
"errormsg": [
"JSP Notice: Undefined index: abc in
/home/manu/tpworks/tutorialspoint.com/index.jsp on line 11"
]
}
Logstash - FiltersLogstash - Filters
Logstash - Filters
InputInput
Input
GROK Pattern SequenceGROK Pattern Sequence
GROK Pattern Sequence
outputoutput
output
Logstash uses filters in the middle of the pipeline between input and output. The filters of
Logstash measures manipulate and create events like Apache-Access. Many filter plugins
used to manage the events in Logstash. Here, in an example of the Logstash Aggregate
Filter, we are filtering the duration every SQL transaction in a database and computing
the total time.
Installing the Aggregate Filter Plugin using the Logstash-plugin utility. The Logstash-plugin
is a batch file for windows in bin folder in Logstash.
>logstash-plugin install logstash-filter-aggregate
In this configuration, you can see three ‘if’ statements for Initializing, Incrementing,
and generating the total duration of transaction, i.e., the sql_duration. The aggregate
plugin is used to add the sql_duration, present in every event of the input log.
input {
file {
path => "C:/tpwork/logstash/bin/log/input.log"
}
}
filter {
grok {
match => [
"message", "%{LOGLEVEL:loglevel} -
%{NOTSPACE:taskid} - %{NOTSPACE:logger} -
%{WORD:label}( - %{INT:duration:int})?"
]
}
if [logger] == "TRANSACTION_START" {
aggregate {
task_id => "%{taskid}"
code => "map['sql_duration'] = 0"
map_action => "create"
}
}
if [logger] == "SQL" {
aggregate {
task_id => "%{taskid}"
code => "map['sql_duration'] ||= 0 ;
map['sql_duration'] += event.get('duration')"
}
}
if [logger] == "TRANSACTION_END" {
aggregate {
task_id => "%{taskid}"
code => "event.set('sql_duration', map['sql_duration'])"
end_of_task => true
timeout => 120
}
}
Installing the Aggregate Filter PluginInstalling the Aggregate Filter Plugin
Installing the Aggregate Filter Plugin
logstash.conflogstash.conf
logstash.conf
}
output {
file {
path => "C:/tpwork/logstash/bin/log/output.log"
}
}
We can run Logstash by using the following command.
>logstash –f logstash.conf
The following code block shows the input log data.
INFO - 48566 - TRANSACTION_START - start
INFO - 48566 - SQL - transaction1 - 320
INFO - 48566 - SQL - transaction1 - 200
INFO - 48566 - TRANSACTION_END - end
As specified in the configuration file, the last ‘if’ statement where the logger is –
TRANSACTION_END, which prints the total transaction time or sql_duration. This has been
highlighted in yellow color in the output.log.
{
"path":"C:/tpwork/logstash/bin/log/input.log","@timestamp": "2016-12-22T19:04:37.214Z",
"loglevel":"INFO","logger":"TRANSACTION_START","@version": "1","host":"wcnlab-PC",
"message":"8566 - TRANSACTION_START - start\r","tags":[]
}
{
"duration":320,"path":"C:/tpwork/logstash/bin/log/input.log",
"@timestamp":"2016-12-22T19:04:38.366Z","loglevel":"INFO","logger":"SQL",
"@version":"1","host":"wcnlab-PC","label":"transaction1",
"message":" INFO - 48566 - SQL - transaction1 - 320\r","taskid":"48566","tags":[]
}
{
"duration":200,"path":"C:/tpwork/logstash/bin/log/input.log",
"@timestamp":"2016-12-22T19:04:38.373Z","loglevel":"INFO","logger":"SQL",
"@version":"1","host":"wcnlab-PC","label":"transaction1",
"message":" INFO - 48566 - SQL - transaction1 - 200\r","taskid":"48566","tags":[]
}
{
"sql_duration":520,"path":"C:/tpwork/logstash/bin/log/input.log",
"@timestamp":"2016-12-22T19:04:38.380Z","loglevel":"INFO","logger":"TRANSACTION_END",
"@version":"1","host":"wcnlab-PC","label":"end",
"message":" INFO - 48566 - TRANSACTION_END - end\r","taskid":"48566","tags":[]
}
Logstash - Transforming the LogsLogstash - Transforming the Logs
Logstash - Transforming the Logs
Run LogstashRun Logstash
Run Logstash
input.loginput.log
input.log
output.logoutput.log
output.log
Logstash offers various plugins to transform the parsed log. These plugins can Add,
Delete, and Update fields in the logs for better understanding and querying in the output
systems.
We are using the Mutate Plugin to add a field name user in every line of the input log.
To install the mutate filter plugin; we can use the following command.
>Logstash-plugin install Logstash-filter-mutate
In this config file, the Mutate Plugin is added after the Aggregate Plugin to add a new field.
input {
file {
path => "C:/tpwork/logstash/bin/log/input.log"
}
}
filter {
grok {
match => [ "message", "%{LOGLEVEL:loglevel} -
%{NOTSPACE:taskid} - %{NOTSPACE:logger} -
%{WORD:label}( - %{INT:duration:int})?" ]
}
if [logger] == "TRANSACTION_START" {
aggregate {
task_id => "%{taskid}"
code => "map['sql_duration'] = 0"
map_action => "create"
}
}
if [logger] == "SQL" {
aggregate {
task_id => "%{taskid}"
code => "map['sql_duration'] ||= 0 ;
map['sql_duration'] += event.get('duration')"
}
}
if [logger] == "TRANSACTION_END" {
aggregate {
task_id => "%{taskid}"
code => "event.set('sql_duration', map['sql_duration'])"
end_of_task => true
timeout => 120
}
}
mutate {
add_field => {"user" => "tutorialspoint.com"}
}
}
output {
file {
path => "C:/tpwork/logstash/bin/log/output.log"
Install the Mutate Filter PluginInstall the Mutate Filter Plugin
Install the Mutate Filter Plugin
logstash.conflogstash.conf
logstash.conf
}
}
We can run Logstash by using the following command.
>logstash –f logstash.conf
The following code block shows the input log data.
INFO - 48566 - TRANSACTION_START - start
INFO - 48566 - SQL - transaction1 - 320
INFO - 48566 - SQL - transaction1 - 200
INFO - 48566 - TRANSACTION_END - end
You can see that there is a new field named “user” in the output events.
{
"path":"C:/tpwork/logstash/bin/log/input.log",
"@timestamp":"2016-12-25T19:55:37.383Z",
"@version":"1",
"host":"wcnlab-PC",
"message":"NFO - 48566 - TRANSACTION_START - start\r",
"user":"tutorialspoint.com","tags":["_grokparsefailure"]
}
{
"duration":320,"path":"C:/tpwork/logstash/bin/log/input.log",
"@timestamp":"2016-12-25T19:55:37.383Z","loglevel":"INFO","logger":"SQL",
"@version":"1","host":"wcnlab-PC","label":"transaction1",
"message":" INFO - 48566 - SQL - transaction1 - 320\r",
"user":"tutorialspoint.com","taskid":"48566","tags":[]
}
{
"duration":200,"path":"C:/tpwork/logstash/bin/log/input.log",
"@timestamp":"2016-12-25T19:55:37.399Z","loglevel":"INFO",
"logger":"SQL","@version":"1","host":"wcnlab-PC","label":"transaction1",
"message":" INFO - 48566 - SQL - transaction1 - 200\r",
"user":"tutorialspoint.com","taskid":"48566","tags":[]
}
{
"sql_duration":520,"path":"C:/tpwork/logstash/bin/log/input.log",
"@timestamp":"2016-12-25T19:55:37.399Z","loglevel":"INFO",
"logger":"TRANSACTION_END","@version":"1","host":"wcnlab-PC","label":"end",
"message":" INFO - 48566 - TRANSACTION_END - end\r",
"user":"tutorialspoint.com","taskid":"48566","tags":[]
}
Logstash - Output StageLogstash - Output Stage
Logstash - Output Stage
Run LogstashRun Logstash
Run Logstash
input.loginput.log
input.log
output.logoutput.log
output.log

Output is the last stage in Logstash pipeline, which send the filter data from input logs to a
specified destination. Logstash offers multiple output plugins to stash the filtered log
events to various different storage and searching engines.
Logstash can store the filtered logs in a File, Elasticsearch Engine, stdout, AWS
CloudWatch, etc. Network protocols like TCP, UDP, Websocket can also be used in
Logstash for transferring the log events to remote storage systems.
In ELK stack, users use the Elasticsearch engine to store the log events. Here, in the
following example, we will generate log events for a local Elasticsearch engine.
We can install the Elasticsearch output plugin with the following command.
>logstash-plugin install Logstash-output-elasticsearch
This config file contains an Elasticsearch plugin, which stores the output event in
Elasticsearch installed locally.
input {
file {
path => "C:/tpwork/logstash/bin/log/input.log"
}
}
filter {
grok {
match => [ "message", "%{LOGLEVEL:loglevel} -
%{NOTSPACE:taskid} - %{NOTSPACE:logger} -
%{WORD:label}( - %{INT:duration:int})?" ]
}
if [logger] == "TRANSACTION_START" {
aggregate {
task_id => "%{taskid}"
code => "map['sql_duration'] = 0"
map_action => "create"
}
}
if [logger] == "SQL" {
aggregate {
task_id => "%{taskid}"
code => "map['sql_duration'] ||= 0 ;
map['sql_duration'] += event.get('duration')"
}
}
if [logger] == "TRANSACTION_END" {
aggregate {
task_id => "%{taskid}"
code => "event.set('sql_duration', map['sql_duration'])"
Storing LogsStoring Logs
Storing Logs
Installing the Elasticsearch Output PluginInstalling the Elasticsearch Output Plugin
Installing the Elasticsearch Output Plugin
logstash.conflogstash.conf
logstash.conf
end_of_task => true
timeout => 120
}
}
mutate {
add_field => {"user" => "tutorialspoint.com"}
}
}
output {
elasticsearch {
hosts => ["127.0.0.1:9200"]
}
}
The following code block shows the input log data.
INFO - 48566 - TRANSACTION_START - start
INFO - 48566 - SQL - transaction1 - 320
INFO - 48566 - SQL - transaction1 - 200
INFO - 48566 - TRANSACTION_END - end
To start Elasticsearch at the localhost, you should use the following command.
C:\elasticsearch\bin> elasticsearch
Once Elasticsearch is ready, you can check it by typing the following URL in your browser.
http://localhost:9200/
The following code block shows the response of Elasticsearch at localhost.
{
"name" : "Doctor Dorcas",
"cluster_name" : "elasticsearch",
"version" : {
"number" : "2.1.1",
"build_hash" : "40e2c53a6b6c2972b3d13846e450e66f4375bd71",
"build_timestamp" : "2015-12-15T13:05:55Z",
"build_snapshot" : false,
"lucene_version" : "5.3.1"
},
"tagline" : "You Know, for Search"
}
Note − For more information about Elasticsearch, you can click on the following link.
https://www.tutorialspoint.com/elasticsearch/index.html
Input.logInput.log
Input.log
Start Elasticsearch at LocalhostStart Elasticsearch at Localhost
Start Elasticsearch at Localhost
ResponseResponse
Response
Now, run Logstash with the above-mentioned Logstash.conf
>Logstash –f Logstash.conf
After pasting the above-mentioned text in the output log, that text will be stored in
Elasticsearch by Logstash. You can check the stored data by typing the following URL in
the browser.
http://localhost:9200/logstash-2017.01.01/_search?pretty
It is the data in JSON format stored in index Logstash-2017.01.01.
{
"took" : 20,
"timed_out" : false,
"_shards" : {
"total" : 5,
"successful" : 5,
"failed" : 0
},
"hits" : {
"total" : 10,
"max_score" : 1.0,
"hits" : [ {
"_index" : "logstash-2017.01.01",
"_type" : "logs",
"_id" : "AVlZ9vF8hshdrGm02KOs",
"_score" : 1.0,
"_source":{
"duration":200,"path":"C:/tpwork/logstash/bin/log/input.log",
"@timestamp":"2017-01-01T12:17:49.140Z","loglevel":"INFO",
"logger":"SQL","@version":"1","host":"wcnlab-PC",
"label":"transaction1",
"message":" INFO - 48566 - SQL - transaction1 - 200\r",
"user":"tutorialspoint.com","taskid":"48566","tags":[]
}
},
{
"_index" : "logstash-2017.01.01",
"_type" : "logs",
"_id" : "AVlZ9vF8hshdrGm02KOt",
"_score" : 1.0,
"_source":{
"sql_duration":520,"path":"C:/tpwork/logstash/bin/log/input.log",
"@timestamp":"2017-01-01T12:17:49.145Z","loglevel":"INFO",
"logger":"TRANSACTION_END","@version":"1","host":"wcnlab-PC",
"label":"end",
"message":" INFO - 48566 - TRANSACTION_END - end\r",
"user":"tutorialspoint.com","taskid":"48566","tags":[]
}
}
}
}
Logstash - Supported OutputsLogstash - Supported Outputs
Logstash - Supported Outputs
ResponseResponse
Response

Logstash provides multiple Plugins to support various data stores or search engines. The
output events of logs can be sent to an output file, standard output or a search engine like
Elasticsearch. There are three types of supported outputs in Logstash, which are −
Standard Output
File Output
Null Output
Let us now discuss each of these in detail.
It is used for generating the filtered log events as a data stream to the command line
interface. Here is an example of generating the total duration of a database transaction to
stdout.
This config file contains a stdout output plugin to write the total sql_duration to a standard
output.
input {
file {
path => "C:/tpwork/logstash/bin/log/input.log"
}
}
filter {
grok {
match => [
"message", "%{LOGLEVEL:loglevel} - %{NOTSPACE:taskid}
- %{NOTSPACE:logger} - %{WORD:label}( - %{INT:duration:int})?"
]
}
if [logger] == "TRANSACTION_START" {
aggregate {
task_id => "%{taskid}"
code => "map['sql_duration'] = 0"
map_action => "create"
}
}
if [logger] == "SQL" {
aggregate {
task_id => "%{taskid}"
code => "map['sql_duration'] ||= 0 ;
map['sql_duration'] += event.get('duration')"
}
}
if [logger] == "TRANSACTION_END" {
aggregate {
task_id => "%{taskid}"
code => "event.set('sql_duration', map['sql_duration'])"
end_of_task => true
timeout => 120
}
Standard Output (stdout)Standard Output (stdout)
Standard Output (stdout)
logstash.conflogstash.conf
logstash.conf
}
}
output {
if [logger] == "TRANSACTION_END" {
stdout {
codec => line{format => "%{sql_duration}"}
}
}
}
Note − Please install the aggregate filter, if not installed already.
>logstash-plugin install Logstash-filter-aggregate
We can run Logstash by using the following command.
>logstash –f logsatsh.conf
The following code block shows the input log data.
INFO - 48566 - TRANSACTION_START - start
INFO - 48566 - SQL - transaction1 - 320
INFO - 48566 - SQL - transaction1 - 200
INFO - 48566 - TRANSACTION_END – end
stdout (it will be command prompt in windows or terminal in UNIX)
This is the total sql_duration 320 + 200 = 520.
520
Logstash can also store the filter log events to an output file. We will use the above-
mentioned example and store the output in a file instead of STDOUT.
This Logstash config file direct Logstash to store the total sql_duration to an output log file.
input {
file {
path => "C:/tpwork/logstash/bin/log/input1.log"
}
}
filter {
grok {
match => [
"message", "%{LOGLEVEL:loglevel} - %{NOTSPACE:taskid} -
%{NOTSPACE:logger} - %{WORD:label}( - %{INT:duration:int})?"
Run LogstashRun Logstash
Run Logstash
Input.logInput.log
Input.log
File OutputFile Output
File Output
logstash.conflogstash.conf
logstash.conf
]
}
if [logger] == "TRANSACTION_START" {
aggregate {
task_id => "%{taskid}"
code => "map['sql_duration'] = 0"
map_action => "create"
}
}
if [logger] == "SQL" {
aggregate {
task_id => "%{taskid}"
code => "map['sql_duration'] ||= 0 ;
map['sql_duration'] += event.get('duration')"
}
}
if [logger] == "TRANSACTION_END" {
aggregate {
task_id => "%{taskid}"
code => "event.set('sql_duration', map['sql_duration'])"
end_of_task => true
timeout => 120
}
}
}
output {
if [logger] == "TRANSACTION_END" {
file {
path => "C:/tpwork/logstash/bin/log/output.log"
codec => line{format => "%{sql_duration}"}
}
}
}
We can run Logstash by using the following command.
>logstash –f logsatsh.conf
The following code block shows the input log data.
INFO - 48566 - TRANSACTION_START - start
INFO - 48566 - SQL - transaction1 - 320
INFO - 48566 - SQL - transaction1 - 200
INFO - 48566 - TRANSACTION_END – end
The following code block shows the output log data.
520
Run logstashRun logstash
Run logstash
input.loginput.log
input.log
output.logoutput.log
output.log
This is a special output plugin, which is used for analyzing the performance of input and
filter Plugins.
Logstash - PluginsLogstash - Plugins
Logstash - Plugins
Logstash offers various plugins for all three stages of its pipeline (Input, Filter and Output).
These plugins help the user to capture logs from various sources like Web Servers,
Databases, Over Network Protocols, etc.
After capturing, Logstash can parse and transform the data into meaningful information as
required by the user. Lastly, Logstash can send or store that meaningful information to
various destination sources like Elasticsearch, AWS Cloudwatch, etc.
Input plugins in Logstash helps the user to extract and receive logs from various sources.
The syntax for using the input plugin is as follows −
Input {
Plugin name {
Setting 1……
Setting 2……..
}
}
You can download input plugin by using the following command −
>Logstash-plugin install Logstash-input-<plugin name>
The Logstash-plugin utility is present in the bin folder of the Logstash installation
directory. The following table has a list of the input plugins offered by Logstash.
Sr.No. Plugin name & Description
1
beats
To get the logging data or events from elastic beats framework.
2
cloudwatch
To extract events from CloudWatch, an API offer by Amazon Web Services.
3
couchdb_changes
Events from _chages URI of couchdb shipped using this plugin.
Null OutputNull Output
Null Output
Input PluginsInput Plugins
Input Plugins

4drupal_dblog
To extract drupal’s watchdog logging data with enabled DBLog.
5
Elasticsearch
To retrieve the results of queries performed in Elasticsearch cluster.
6
eventlog
To get the events from windows event log.
7
exec
To get shell command output as an input in Logstash.
8
file
To get the events from an input file. This is useful, when the Logstash is locally
installed with the input source and have access to input source logs.
9
generator
It is used for testing purposes, which creates random events.
10
github
Captures events from GitHub webhook.
11
graphite
To get metrics data from graphite monitoring tool.
12
heartbeat
It is also used for testing and it produces heartbeat like events
13
http
To collect log events over two network protocols and those are http and https.
14
http_poller
It is used to decode the HTTP API output to an event.
15 jdbc
It converts the JDBC transactions to an event in Logstash.
16
jmx
To extract the metrics from remote java applications using JMX.
17
log4j
Capture events from socketAppender object of Log4j over TCP socket.
18
rss
To the output of command line tools as an input event in Logstash.
19
tcp
Captures events over TCP socket.
20
twitter
Collect events from twitter streaming API.
21
unix
Collect events over UNIX socket.
22
websocket
Capture events over websocket protocol.
23
xmpp
Reads events over Jabber/xmpp protocols.
All the plugins have their specific settings, which helps to specify the important fields like
Port, Path, etc., in a plugin. We will discuss the settings of some of the input plugins.
This input plugin is used to extract events directly from log or text files present in the input
source. It works similar to the tail command in UNIX and save the last read cursor and
read only the new appended data from the input file, but it can be changed by using
star_position setting. Following are the settings of this input plugin.
Plugin SettingsPlugin Settings
Plugin Settings
FileFile
File

Setting Name Default
Value
Description
add_field {} Append a new field to the input event.
close_older 3600 The files having last read time (in seconds) more than the
specified in this plugin is closed.
codec “plain” It is used to decode the data before entering into the Logstash
pipeline.
delimiter “\n” It is used to specify a new line delimiter.
discover_interval 15 It is the time interval (in seconds) between discovering new files
in the specified path.
enable_metric true It is used to enable or disable the reporting and collection of
metric for the specified plugin.
exclude It is used to specify the filename or patterns, which should be
excluded from input plugin.
Id To specify a unique identity for that plugin instance.
max_open_files It specifies the maximum number of input files by Logstash at
any time.
path Specify the path of the files and it can contain the patterns for
filename.
start_position “end”
You can change to “beginning”, if you want that; initially Logstash
should start reading the files from the starting and not only the
new log event.
start_interval 1 It specifies the time interval in seconds, after which Logstash
checks for the modified files.
tags
To add any additional information, like Logstash, it adds
"_grokparsefailure" in tags, when any log event failed to comply
with the specified grok filter.
type This is a special field, which you can add to an input event and it
is useful in filters and kibana.
This particular plugin is used to read the search queries results in an Elasticsearch cluster.
The following has the settings used in this plugin −
Setting Default Value Description
ElasticsearchElasticsearch
Elasticsearch

Name
add_field {} Same as in file plugin, it is used to append a
field in input event.
ca_file It is used to specify the path of SSL
certificate Authority file.
codec “plain”
It is used to decode the input events from
Elasticsearch before entering in the Logstash
pipeline.
docinfo “false”
You can change it to true, if you want to
extract the additional information like index,
type and id from Elasticsearch engine.
docinfo_fields ["_index", "_type", "_id"] You can eliminate any field, which you do not
want in your Logstash input.
enable_metric true
It is used to enable or disable the reporting
and collection of metric for that plugin
instance.
hosts
It is used to specify the addresses of all
elasticsearch engines, which will be the input
source of that Logstash instance. The syntax
is host:port or IP:port.
Id It is used to give a unique identity number
to that specific input plugin instance.
index "logstash-*"
It is used to specify the index name or a
pattern, which Logstash will monitor by
Logstash for input.
password For authentication purposes.
query "{ \"sort\": [ \"_doc\" ] }" Query for the execution.
ssl false Enable or disable secure socket layer.
tags To add any additional information in input
events.
type
It is used to classify the input forms so that
it will be easy to search all the input events
at later stages.
user For authentic purposes.

This input plugin reads data from win32 API of windows servers. Followings are the
settings of this plugin −
Setting
Name Default Value Description
add_field {} Same as in file plugin, it is used to append a field
in input event
codec “plain” It is used to decode the input events from
windows; before entering in the Logstash pipeline
logfile ["Application", "Security",
"System"]
Events required in the input log file
interval 1000
It is in milliseconds and defines the interval
between two consecutive checks of new event
logs
tags To add any additional information in input events
type
It is used to classify the input form a specific
plugins to given type, so that it will be easy to
search all the input events in later stages
This input plugin is used to collect the feed of twitter from its Streaming API. The following
table describes the settings of this plugin.
Setting Name Default
Value Description
add_field {} Same as in file plugin, it is used to append a field in input
event
codec “plain” It is used to decode the input events from windows; before
entering in the Logstash pipeline
consumer_key It contains the twitter app’s consumer key. For more info, visit
https://dev.twitter.com/apps/new
consumer_secret It contains the twitter app’s consumer secret key. For more
info, visit https://dev.twitter.com/apps/new
enable_metric true It is used to enable or disable the reporting and collection of
metric for that plugin instance
eventlogeventlog
eventlog
TwitterTwitter
Twitter

follows It specifies the user ids separated by commas and
LogStash checks these users’ status in Twitter.
For more info, visit
https://dev.twitter.com
full_tweet false You can change it to true, if you want Logstash to read the full
object return from twitter API
id It is used to give a unique identity number to that specific
input plugin instance
ignore_retweets False You can change set it true to ignore the retweets in the input
twitter feed
keywords It’s an array of keywords, which need to be tracked in the
twitters input feed
language
It defines the language of the tweets needed by LogStash from
input twitter feed. This is an array of identifier, which defines a
specific language in twitter
locations
To filter out the tweets from input feed according to the
location specified. This is an array, which contains longitude
and latitude of the location
oauth_token
It is a required filed, which contains user oauth token. For
more information please visit the following link
https://dev.twitter.com/apps
oauth_token_secret
It is a required filed, which contains user oauth secret token.
For more information please visit the following link
https://dev.twitter.com/apps
tags To add any additional information in input events
type
It is used to classify the input form a specific plugins to given
type, so that it will be easy to search all the input events in
later stages
TCP is used to get the events over the TCP socket; it can read from the user connections
or server, which is specified in mode setting. The following table describes the settings of
this plugin −
Setting
Name
Default
Value
Description
TCPTCP
TCP

add_field {} Same as in file plugin, it is used to append a field in input event
codec “plain” It is used to decode the input events from windows; before entering
in the Logstash pipeline
enable_metric true It is used to enable or disable the reporting and collection of metric
for that plugin instance
host “0.0.0.0” The address of the server OS the client depends upon
id It contains the twitter app’s consumer key
mode “server” It is used to specify the input source is server or client.
port It defines the port number
ssl_cert It is used to specify the path of SSL certificate
ssl_enable false Enable or disable SSL
ssl_key To specify the path of SSL key file
tags To add any additional information in input events
type It is used to classify the input form a specific plugins to given type,
so that it will be easy to search all the input events in later stages
Logstash supports various output sources and in different technologies like Database, File,
Email, Standard Output, etc.
The syntax for using the output plugin is as follows −
output {
Plugin name {
Setting 1……
Setting 2……..
}
}
You can download the output plugin by using the following command −
>logstash-plugin install logstash-output-<plugin name>
The Logstash-plugin utility is present in the bin folder of Logstash installation directory.
The following table describes the output plugins offered by Logstash.
Sr.No. Plugin Name & Description
Logstash – Output PluginsLogstash – Output Plugins
Logstash – Output Plugins

1CloudWatch
This plugin is used to send aggregated metric data to CloudWatch of amazon
web services.
2
csv
It is used to write the output events in a comma-separated manner.
3
Elasticsearch
It is used to store the output logs in Elasticsearch index.
4
email
It is used to send a notification email, when the output is generated. User can
add information about the output in email.
5
exec
It is used to a run a command, which match the output event.
6
ganglia
It writhe the metrics to gmond of Gangila.
7
gelf
It is used to produce output for Graylog2 in GELF format.
8
google_bigquery
It outputs the events to Google BigQuery.
9
google_cloud_storage
It store the output events to Google Cloud Storage.
10
graphite
It is used to store the output events to Graphite.
11
graphtastic
It is used to write the output metrics on Windows.

12 hipchat
It is used to store the output log events to HipChat.
13
http
It is used to send the output log events to http or https endpoints.
14
influxdb
It is used to store the output event in InfluxDB.
15
irc
It is used to write the output events to irc.
16
mongodb
It stores the output data in MongoDB.
17
nagios
It is used to notify Nagios with the passive check results.
18
nagios_nsca
It is used to notify Nagios with the passive check results over NSCA protocol.
19
opentsdb
It store the Logstash output events to OpenTSDB.
20
pipe
It streams the output events to the standard input of another program.
21
rackspace
It is used to send the output log events to Queue service of Rackspace Cloud.
22
redis
It uses rpush command to send the output logging data to Redis queue.
23 riak
It is used to store the output events to the Riak distributed key/value pair.

24
s3
It store the output logging data to Amazon Simple Storage Service.
25
sns
It is used to send the output events to Amazon’s Simple Notification Service.
26
solr_http
It indexes and stores the output logging data in Solr.
27
sps
It is used to ship the events to Simple Queue Service of AWS.
28
statsd
It is used to ship the metrics data to statsd network daemon.
29
stdout
It is used to show the output events on standard output of CLI like command
prompt.
30
syslog
It is used to ships the output events to syslog server.
31
tcp
It is used to send the output events to TCP socket.
32
udp
It is used to push the output events over UDP.
33
websocket
It is used to push the output events over WebSocket protocol.
34
xmpp
It is used to push the output events over XMPP protocol.

All the plugins have their specific settings, which helps to specify the important fields like
Port, Path, etc., in a plugin. We will discuss the settings of some of the output plugins.
Elasticsearch output plugin enables Logstash to store the output in the specific clusters of
Elasticsearch engine. This is one of the famous choices of users because it comes in the
package of ELK Stack and therefore, provides end-to-end solutions for Devops. The
following table describes the settings of this output plugin.
Setting Name Default Value Description
action index
It is used to define the action performed in
Elasticsearch engine. Other values for this settings
are delete, create, update, etc.
cacert It contains the path of file with .cer or .pem for
server’s certificate validation.
codec “plain” It is used to encode the output logging data before
sending it to the destination source.
doc_as_upset false
This setting is used in case of update action. It
creates a document in Elasticsearch engine, if the
document id is not specified in output plugin.
document_type
It is used to store the same type of events in the
same document type. If it is not specified, then the
event type is used for the same.
flush_size 500 This is used for improving the performance of bulk
upload in Elasticsearch
hosts [“127.0.0.1”] It is an array of destination addresses for output
logging data
idle_flush_time 1
It defines the time limit (second) between the two
flushes, Logstash forces flush after the specified time
limit in this setting
index "logstash-%
{+YYYY.MM.dd}"
It is used to specify the index of Elasticsearch engine
manage_temlpate true It is used to apply the default template in
Elasticsearch
parent nil It is used to specify the id of parent document in
Elasticsearch
password It is used to authenticate the request to a secure
ElasticsearchElasticsearch
Elasticsearch

cluster in Elasticsearch
path It is used to specify the HTTP path of Elasticsearch.
pipeline nil It is used to set the ingest pipeline, user wish to
execute for an event
proxy It is used to specify HTTP proxy
retry_initial_interval 2
It is used to set the initial time interval (seconds)
between bulk retries. It get double after each retry
until it reach to retry_max_interval
retry_max_interval 64 It is used to set the maximum time interval for
retry_initial_interval
retry_on_conflict 1 It is the number of retries by Elasticsearch to update
a document
ssl To enable or disable SSL/TLS secured to Elasticsearch
template It contains the path of the customized template in
Elasticsearch
template_name "logstash" This is used to name the template in Elasticsearch
timeout 60 It is the timeout for network requests to Elasticsearch
upsert “” It update the document or if the document_id does
not exist, it creates a new document in Elasticsearch
user It contains the user to authenticate the Logstash
request in secure Elasticsearch cluster
The email output plugin is used to notify the user, when Logstash generates output. The
following table describes the settings for this plugin.
Setting
Name Default Value Description
address “localhost” It is the address of mail server
attachments [] It contains the names and locations of the
attached files
body “” It contains the body of email and should be
plain text
cc It contains the email addresses in comma
EmailEmail
Email

separated manner for the cc of email
codec “plain” It is used to encode the output logging data
before sending it to the destination source.
contenttype "text/html; charset = UTF-8" It is used to content-type of the email
debug false It is used to execute the mail relay in debug
mode
domain "localhost" It is used to set the domain to send the email
messages
from "logstash.alert@nowhere.com" It is used to specify the email address of the
sender
htmlbody “” It is used to specify the body of email in html
format
password It is used to authenticate with the mail server
port 25 It is used to define the port to communicate
with the mail server
replyto It is used to specify the email id for reply-to
field of email
subject “” It contains the subject line of the email
use_tls false Enable or disable TSL for the communication
with the mail server
username Is contains the username for the authentication
with the server
via “smtp” It defines the methods of sending email by
Logstash
This setting is used to send the output events over http to the destination. This plugin has
following settings −
Setting Name Default
Value Description
automatic_retries 1 It is used to set the number of http request retries by logstash
cacert It contains the path of file for server’s certificate validation
codec “plain” It is used to encode the output logging data before sending it to
HttpHttp
Http

the destination source.
content_type I specifies the content type of http request to the destination
server
cookies true It is used to enable or disable cookies
format "json" It is used to set the format of http request body
headers It contains the information of http header
http_method “”
It is used to specify the http method used in the request by
logstash and the values can be "put", "post", "patch", "delete",
"get", "head"
request_timeout 60 It is used to authenticate with the mail server
url It is a required setting for this plugin to specify the http or https
endpoint
The stdout output plugin is used to write the output events on the standard output of the
command line interface. It is command prompt in windows and terminal in UNIX. This
plugin has the following settings −
Setting
Name
Default
Value Description
codec “plain” It is used to encode the output logging data before sending it to the
destination source.
workers 1 It is used to specify number of workers for the output
It is a network daemon used to send the matrices data over UDP to the destination
backend services. It is command prompt in windows and terminal in UNIX. This plugin has
following settings −
Setting
Name
Default
Value Description
codec “plain” It is used to encode the output logging data before sending it to
the destination source.
count {} It is used to define the count to be used in metrics
decrement [] It is used to specify the decrement metric names
stdoutstdout
stdout
statsdstatsd
statsd

host “localhost” It contains the address of statsd server
increment [] It is used to specify the increment metric names
port 8125 It contains the port of statsd server
sample_rate 1 It is used specify the sample rate of metric
sender “%{host}” It specifies the name of the sender
set {} It is used to specify a set metric
timing {} It is used to specify a timing metric
workers 1 It is used to specify number of workers for the output
Logstash supports various filter plugins to parse and transform input logs to a more
structured and easy to query format.
The syntax for using the filter plugin is as follows −
filter {
Plugin name {
Setting 1……
Setting 2……..
}
}
You can download the filter plugin by using the following command −
>logstash-plugin install logstash-filter-<plugin name>
The Logstash-plugin utility is present in the bin folder of Logstash installation directory.
The following table describes the output plugins offered by Logstash.
Sr.No. Plugin Name & Description
1
aggregate
This plugin collects or aggregate the data from various event of same type and
process them in the final event
2
alter
It allows user to alter the field of log events, which mutate filter do not handle
3anonymize
Filter PluginsFilter Plugins
Filter Plugins

It is used replace the values of fields with a consistent hash
4
cipher
It is used to encrypt the output events before storing them in destination
source
5
clone
It is used to create duplicate of the output events in Logstash
6
collate
It merges the events from different logs by their time or count
7
csv
This plugin parse data from input logs according to the separator
8
date
It parse the dates from the fields in the event and set that as a timestamp for
the event
9
dissect
This plugin helps user to extract fields from unstructured data and makes it
easy for grok filter to parse them correctly
10
drop
It is used to drop all the events of same type or any other similarity
11
elapsed
It is used to compute the time between the start and end events
12
Elasticsearch
It is used to copy the fields of previous log events present in Elasticsearch to
the current one in Logstash
13
extractnumbers
It is used to extract the number from strings in the log events

14 geoip
It adds a field in the event, which contains the latitude and longitude of the
location of the IP present in the log event
15
grok
It is the commonly used filter plugin to parse the event to get the fields
16
i18n
It deletes the special characters from a filed in the log event
17
json
It is used to create a structured Json object in event or in a specific field of an
event
18
kv
This plugin is useful in paring key value pairs in the logging data
19
metrics
It is used to aggregate metrics like counting time duration in each event
20
multiline
It is also one of the commonly use filter plugin, which helps user in case of
converting a multiline logging data to a single event.
21
mutate
This plugin is used to rename, remove, replace, and modify fields in your
events
22
range
It used to check the numerical values of fields in events against an expected
range and string’s length within a range.
23
ruby
It is used to run arbitrary Ruby code
24 sleep
This makes Logstash sleeps for a specified amount of time
25
split
It is used to split a field of an event and placing all the split values in the clones
of that event
26
xml
It is used to create event by paring the XML data present in the logs
Codec Plugins can be a part of input or output plugins. These Plugins are used to change
or format the logging data presentation. Logstash offers multiple codec Plugins and those
are as follows −
Sr.No. Plugin Name & Description
1
avro
This plugin encode serialize Logstash events to avro datums or decode avro
records to Logstash events
2
cloudfront
This plugin reads the encoded data from AWS cloudfront
3
cloudtrail
This plugin is used to read the data from AWS cloudtrail
4
collectd
This reads data from the binary protocol called collected over UDP
5
compress_spooler
It is used to compress the log events in Logstash to spooled batches
6
dots
This is used performance tracking by setting a dot for every event to stdout
7es_bulk
Codec pluginsCodec plugins
Codec plugins

This is used to convert the bulk data from Elasticsearch into Logstash events
including Elasticsearch metadata
8
graphite
This codec read data from graphite into events and change the event into
graphite formatted records
9
gzip_lines
This plugin is used to handle gzip encoded data
10
json
This is used to convert a single element in Json array to a single Logstash event
11
json_lines
It is used to handle Json data with newline delimiter
12
line
It plugin will read and write event in a single live, that means after newline
delimiter there will be a new event
13
multiline
It is used to convert multiline logging data into a single event
14
netflow
This plugin is used to convert nertflow v5/v9 data to logstash events
15
nmap
It parses the nmap result data into an XML format
16
plain
This reads text without delimiters
17
rubydebug
This plugin will write the output Logstash events using Ruby awesome print
library

You can also create your own Plugins in Logstash, which suites your requirements. The
Logstash-plugin utility is used to create custom Plugins. Here, we will create a filter plugin,
which will add a custom message in the events.
A user can generate the necessary files by using the generate option of the logstash-plugin
utility or it is also available on the GitHub.
>logstash-plugin generate --type filter --name myfilter --path c:/tpwork/logstash/lib
Here, type option is used to specify the plugin is either Input, Output or Filter. In this
example, we are creating a filter plugin named myfilter. The path option is used to specify
the path, where you want your plugin directory to be created. After executing the above
mentioned command, you will see that a directory structure is created.
You can find the code file of the plugin in the \lib\logstash\filters folder in the plugin
directory. The file extension will be .rb.
In our case, the code file was located inside the following path −
C:\tpwork\logstash\lib\logstash-filter-myfilter\lib\logstash\filters\myfilter.rb
We change the message to − default ⇒ "Hi, You are learning this on tutorialspoint.com"
and save the file.
To install this plugin, the Gemfile of Logstash need to be modified. You can find this file in
the installation directory of Logstash. In our case, it will be in C:\tpwork\logstash. Edit
this file using any text editor and add the following text in it.
gem "logstash-filter-myfilter",:path => "C:/tpwork/logstash/lib/logstash-filter-myfilter"
In the above command, we specify the name of the plugin along with where we can find it
for installation. Then, run the Logstash-plugin utility to install this plugin.
>logstash-plugin install --no-verify
Here, we are adding myfilter in one of the previous examples −
logstash.conf
This Logstash config file contains myfilter in the filter section after the grok filter plugin.
Build Your Own PluginBuild Your Own Plugin
Build Your Own Plugin
Generate the Base StructureGenerate the Base Structure
Generate the Base Structure
Develop the PluginDevelop the Plugin
Develop the Plugin
Install the PluginInstall the Plugin
Install the Plugin
TestingTesting
Testing

input {
file {
path => "C:/tpwork/logstash/bin/log/input1.log"
}
}
filter {
grok {
match => [
"message", "%{LOGLEVEL:loglevel} - %{NOTSPACE:taskid} -
%{NOTSPACE:logger} - %{WORD:label}( - %{INT:duration:int})?" ]
}
myfilter{}
}
output {
file {
path => "C:/tpwork/logstash/bin/log/output1.log"
codec => rubydebug
}
}
Run logstash
We can run Logstash by using the following command.
>logstash –f logsatsh.conf
input.log
The following code block shows the input log data.
INFO - 48566 - TRANSACTION_START - start
output.log
The following code block shows the output log data.
{
"path" => "C:/tpwork/logstash/bin/log/input.log",
"@timestamp" => 2017-01-07T06:25:25.484Z,
"loglevel" => "INFO",
"logger" => "TRANSACTION_END",
"@version" => "1",
"host" => "Dell-PC",
"label" => "end",
"message" => "Hi, You are learning this on tutorialspoint.com",
"taskid" => "48566",
"tags" => []
}
A developer can also publish his/her custom plugin to Logstash by uploading it on the
github and following the standardized steps defined by the Elasticsearch Company.
Please refer the following URL for more information on publishing −
https://www.elastic.co/guide/en/logstash/current/contributing-to-logstash.html
Publish it on LogstashPublish it on Logstash
Publish it on Logstash
Logstash - Monitoring APIsLogstash - Monitoring APIs
Logstash - Monitoring APIs
Logstash offers APIs to monitor its performance. These monitoring APIs extract runtime
metrics about Logstash.
This API is used to get the information about the nodes of Logstash. It returns the
information of the OS, Logstash pipeline and JVM in JSON format.
You can extract the information by sending a get request to Logstash using the following
URL −
GET http://localhost:9600/_node?pretty
Following would be the response of the Node Info API.
{
"host" : "Dell-PC",
"version" : "5.0.1",
"http_address" : "127.0.0.1:9600",
"pipeline" : {
"workers" : 4,
"batch_size" : 125,
"batch_delay" : 5,
"config_reload_automatic" : false,
"config_reload_interval" : 3
},
"os" : {
"name" : "Windows 7",
"arch" : "x86",
"version" : "6.1",
"available_processors" : 4
},
"jvm" : {
"pid" : 312,
"version" : "1.8.0_111",
"vm_name" : "Java HotSpot(TM) Client VM",
"vm_version" : "1.8.0_111",
"vm_vendor" : "Oracle Corporation",
"start_time_in_millis" : 1483770315412,
"mem" : {
Node Info APINode Info API
Node Info API
ResponseResponse
Response
"heap_init_in_bytes" : 16777216,
"heap_max_in_bytes" : 1046937600,
"non_heap_init_in_bytes" : 163840,
"non_heap_max_in_bytes" : 0
},
"gc_collectors" : [ "ParNew", "ConcurrentMarkSweep" ]
}
}
You can also get the specific information of Pipeline, OS and JVM, by just adding their
names in the URL.
GET http://localhost:9600/_node/os?pretty
GET http://localhost:9600/_node/pipeline?pretty
GET http://localhost:9600/_node/jvm?pretty
This API is used to get the information about the installed plugins in the Logstash. You can
retrieve this information by sending a get request to the URL mentioned below −
GET http://localhost:9600/_node/plugins?pretty
Following would be the response of the Plugins Info API.
{
"host" : "Dell-PC",
"version" : "5.0.1",
"http_address" : "127.0.0.1:9600",
"total" : 95,
"plugins" : [ {
"name" : "logstash-codec-collectd",
"version" : "3.0.2"
},
{
"name" : "logstash-codec-dots",
"version" : "3.0.2"
},
{
"name" : "logstash-codec-edn",
"version" : "3.0.2"
},
{
"name" : "logstash-codec-edn_lines",
"version" : "3.0.2"
},
............
}
Plugins Info APIPlugins Info API
Plugins Info API
ResponseResponse
Response
Node Stats APINode Stats API
Node Stats API
This API is used to extract the statistics of the Logstash (Memory, Process, JVM, Pipeline)
in JSON objects. You can retrieve this information by sending a get request to the URLS
mentioned below −
GET http://localhost:9600/_node/stats/?pretty
GET http://localhost:9600/_node/stats/process?pretty
GET http://localhost:9600/_node/stats/jvm?pretty
GET http://localhost:9600/_node/stats/pipeline?pretty
This API retrieves the information about the hot threads in Logstash. Hot threads are the
java threads, which has high CPU usage and run longer than then normal execution time.
You can retrieve this information by sending a get request to the URL mentioned below −
GET http://localhost:9600/_node/hot_threads?pretty
A user can use the following URL to get the response in a form that is more readable.
GET http://localhost:9600/_node/hot_threads?human = true
Logstash - Security and MonitoringLogstash - Security and Monitoring
Logstash - Security and Monitoring
In this chapter, we will discuss the security and monitoring aspects of Logstash.
Logstash is a very good tool to monitor the servers and services in production
environments. Applications in production environment produces different kinds of log data
like access Logs, Error Logs, etc. Logstash can count or analyze the number of errors,
accesses or other events using filter plugins. This analysis and counting can be used for
monitoring different servers and their services.
Logstash offers plugins like HTTP Poller to monitor the website status monitoring. Here,
we are monitoring a website named mysite hosted on a local Apache Tomcat Server.
In this config file, the http_poller plugin is used to hit the site specified in the plugin after a
time interval specified in interval setting. Finally, it writes the status of the site to a
standard output.
input {
http_poller {
urls => {
site => "http://localhost:8080/mysite"
}
request_timeout => 20
interval => 30
Hot Threads APIHot Threads API
Hot Threads API
MonitoringMonitoring
Monitoring
logstash.conflogstash.conf
logstash.conf

metadata_target => "http_poller_metadata"
}
}
output {
if [http_poller_metadata][code] == 200 {
stdout {
codec => line{format => "%{http_poller_metadata[response_message]}"}
}
}
if [http_poller_metadata][code] != 200 {
stdout {
codec => line{format => "down"}
}
}
}
We can run Logstash with the following command.
>logstash –f logstash.conf
If the site is up, then the output will be −
Ok
If we stop the site by using the Manager App of Tomcat, the output will change to −
down
Logstash provides plenty of features for secure communication with external systems and
supports authentication mechanism. All Logstash plugins support authentication and
encryption over HTTP connections.
There are settings like user and password for authentication purposes in various plugins
offered by Logstash like in the Elasticsearch plugin.
elasticsearch {
user => <username>
password => <password>
}
The other authentication is PKI (public key infrastructure) for Elasticsearch. The
developer needs to define two settings in the Elasticsearch output plugin to enable the PKI
authentication.
Run logstashRun logstash
Run logstash
stdoutstdout
stdout
SecuritySecurity
Security
Security with HTTP protocolSecurity with HTTP protocol
Security with HTTP protocol
elasticsearch {
keystore => <string_value>
keystore_password => <password>
}
In the HTTPS protocol, a developer can use the authority’s certificate for SSL/TLS.
elasticsearch {
ssl => true
cacert => <path to .pem file>
}
To use the transport protocol with Elasticsearch, users need to set protocol setting to
transport. This avoids un-marshalling of JSON objects and leads to more efficiency.
The basic authentication is same as performed in http protocol in Elasticsearch output
protocol.
elasticsearch {
protocol => “transport”
user => <username>
password => <password>
}
The PKI authentication also needs the SSL sets to be true with other settings in the
Elasticsearch output protocol −
elasticsearch {
protocol => “transport”
ssl => true
keystore => <string_value>
keystore_password => <password>
}
Finally, the SSL security requires a little with more settings than other security methods in
communication.
elasticsearch {
ssl => true
ssl => true
keystore => <string_value>
keystore_password => <password>
truststore =>
truststore_password => <password>
}
Security with Transport ProtocolSecurity with Transport Protocol
Security with Transport Protocol
Other Security Benefits from LogstashOther Security Benefits from Logstash
Other Security Benefits from Logstash

Previous Page Next Page
Logstash can help input system sources to prevent against attacks like denial of service
attacks. The monitoring of logs and analyzing the different events in those logs can help
system administrators to check the variation in the incoming connections and errors. These
analyses can help to see if the attack is happening or going to happen on the servers.
Other products of the Elasticsearch Company such as x-pack and filebeat provides some
functionality to communicate securely with Logstash.
Advertisements
FAQ's Cookies Policy Contact
© Copyright 2018. All Rights Reserved.
Enter email for newsletter
go
