M4 Competitors Guide
User Manual:
Open the PDF directly: View PDF ![]() .
.
Page Count: 7

1
Competitor’s Guide: Prizes and Rules
Contents
The Prizes ...................................................................................................................................................... 2
1. Three Major Prizes ............................................................................................................................ 2
2. Student Prize ..................................................................................................................................... 3
3. Full Reproducibility Prize................................................................................................................... 4
4. Prediction Intervals Prize .................................................................................................................. 4
Forecasting Horizons ..................................................................................................................................... 5
The dataset ................................................................................................................................................... 5
The Benchmarks ............................................................................................................................................ 6
Factors Affecting Forecasting Accuracy ........................................................................................................ 7

2
The Prizes
There will be six Prizes awarded to the winners of the M4 Competition. The exact cash amounts to be
granted (at present standing at 27,000€) will depend on securing additional sponsors, announced later.
Proportionally, the total amount of 20,000€ generously provided by the University of Nicosia will be
distributed as follows:
Prize
Description
Percentage (%)
1st Prize
Best performing method according to OWA
45
2nd Prize
Second-best performing method according to OWA
20
3rd Prize
Third-best performing method according to OWA
10
Prediction Intervals Prize
Best performing method according to MSIS
25
The UBER Student Prize
Best performing method among student
competitors according to OWA
5,000€
The Amazon Prize
The best reproducible forecasting method
according to OWA
2,000€
Additionally, the global taxi technology company UBER will generously award a special Student Prize of
5,000€ to the student with the most accurate forecasting method according to OWA and Amazon will
generously award 2,000€ for the best Reproducible forecasting method.
There are no restrictions in collecting more than one prize.
1. Three Major Prizes
There will be three major Prizes for the First, Second and Third winner of the competition who will be
selected based on the performance of the participating methods according to the Overall Weighted
Average (OWA) of two accuracy measures: the Mean Absolute Scaled Error (MASE
1
) and the symmetric
Mean Absolute Percentage Error (sMAPE
2
). The individual measures are calculated as follows:
Where is the post sample value of the time series at point t,
the estimated forecast, h the
forecasting horizon and m the frequency of the data (i.e., 12 for monthly series).
An example for computing the OWA is presented below using the MASE and sMAPE of the M3
Competition methods:
Divide all Errors by that of Naïve 2 to obtain the Relative MASE and the Relative sMAPE
1
R. J. Hyndman, A. B. Koehler (2006). Another look at measures of forecast accuracy. International Journal of
Forecasting 22(4), 679-688
2
S. Makridakis, M. Hibon (2000). The M3-Competition: results, conclusions and implications. International Journal
of Forecasting, 16 (4), 451-476

3
Compute the OWA by averaging the Relative MASE and the Relative sMAPE as it is shown in the
table below
Forecasting
Method
MASE
Rank
(MASE)
Relative
MASE
sMAPE
Rank
(sMAPE)
Relative
sMAPE
OWA
Rank
(OWA)
THETA
1.395
1
0.827
12.762
1
0.840
0.834
1
ForecastPro
1.422
2
0.844
13.088
3
0.861
0.852
2
ForcX
1.441
3
0.855
13.130
4
0.864
0.859
3
Comb S-H-D
1.467
6
0.870
13.056
2
0.859
0.865
4
DAMPEN
1.466
5
0.870
13.279
5
0.874
0.872
5
AutoBox2
1.484
7
0.881
13.284
6
0.874
0.877
6
PP-Autocast
1.523
10
0.904
13.600
7
0.895
0.899
7
HOLT
1.507
8
0.894
13.777
9
0.906
0.900
8
B-J auto
1.512
9
0.897
13.819
10
0.909
0.903
9
WINTER
1.544
15
0.916
13.719
8
0.903
0.909
10
Auto-ANN
1.530
11
0.908
13.921
12
0.916
0.912
11
ARARMA
1.531
12
0.909
13.981
14
0.920
0.914
12
Flors-Pearc1
1.549
16
0.919
13.963
13
0.919
0.919
13
ROBUST-
Trend
1.537
13
0.912
14.098
15
0.927
0.920
14
SMARTFCS
1.457
4
0.864
15.390
21
1.012
0.938
15
AutoBox3
1.633
19
0.969
13.913
11
0.915
0.942
16
THETAsm
1.594
18
0.946
14.286
16
0.940
0.943
17
AutoBox1
1.540
14
0.914
14.843
18
0.976
0.945
18
RBF
1.574
17
0.934
15.464
22
1.017
0.976
19
Flors-Pearc2
1.665
21
0.988
14.742
17
0.970
0.979
20
Single
1.659
20
0.985
14.881
19
0.979
0.982
21
Naïve 2
1.685
22
1.000
15.201
20
1.000
1.000
22
Naïve 1
1.787
23
1.060
15.701
23
1.033
1.047
23
Note that MASE and sMAPE are first estimated per series by averaging the error computed per forecasting
horizon and then averaged again across the 3003 time series to compute their value for the whole dataset.
On the other hand, OWA is computed only once at the end for the whole sample, as shown in the Table
above.
In the above example, the most accurate method with the smallest OWA, that would have won the first
prize, is Theta; the second most accurate one is ForecastPro, that would have won the second prize, while
the third most accurate one is ForcX, that would have won the third prize.
The code for computing the OWA is available on GitHub.
2. Student Prize
A prize will be awarded to the student of the best performing method according to OWA.
4
3. Full Reproducibility Prize
The prerequisite for the Full Reproducibility Prize will be that the code used for generating the forecasts,
with the exception of companies providing forecasting services and those claiming proprietary software,
will be put on GitHub, not later than 10 days after the end of the competition (i.e., the 10th of June, 2018).
In addition, there must be instructions on how to exactly reproduce the M4 submitted forecasts. In this
regard, individuals and companies will be able to use the code and the instructions provided, crediting the
person/group that has developed them, to improve their organizational forecasts.
Companies providing forecasting services and those claiming proprietary software will have to provide
the organizers with a detailed description of how their forecasts were made and a source, or execution
file for reproducing their forecasts for 100 randomly selected series. Given the critical importance of
objectivity and replicability, such description and file will be mandatory for participating in the Competition.
An execution file can be submitted in case that the source program needs to be kept confidential, or,
alternatively, a source program with a termination date for running it.
The code for reproducing the results of the 4Theta method, submitted by the Forecasting & Strategy Unit,
was put on GitHub on 21-12-2017. This method will not be considered for any of the Prizes.
4. Prediction Intervals Prize
The M4 Competition adopts a 95% Prediction Interval (PI) for estimating the uncertainty around the point
forecasts. The performance of the generated PI will be evaluated using the Mean Scaled Interval Score
(MSIS
3
) as follows:
Where L and U are the Lower and Upper bounds of the prediction intervals, are the future observations
of the series, is the significance level and 1 is the indicator function (being 1 if Y is within the postulated
interval and 0 otherwise). Given that forecasters will be asked to generate 95% prediction intervals, is
set to 0.05.
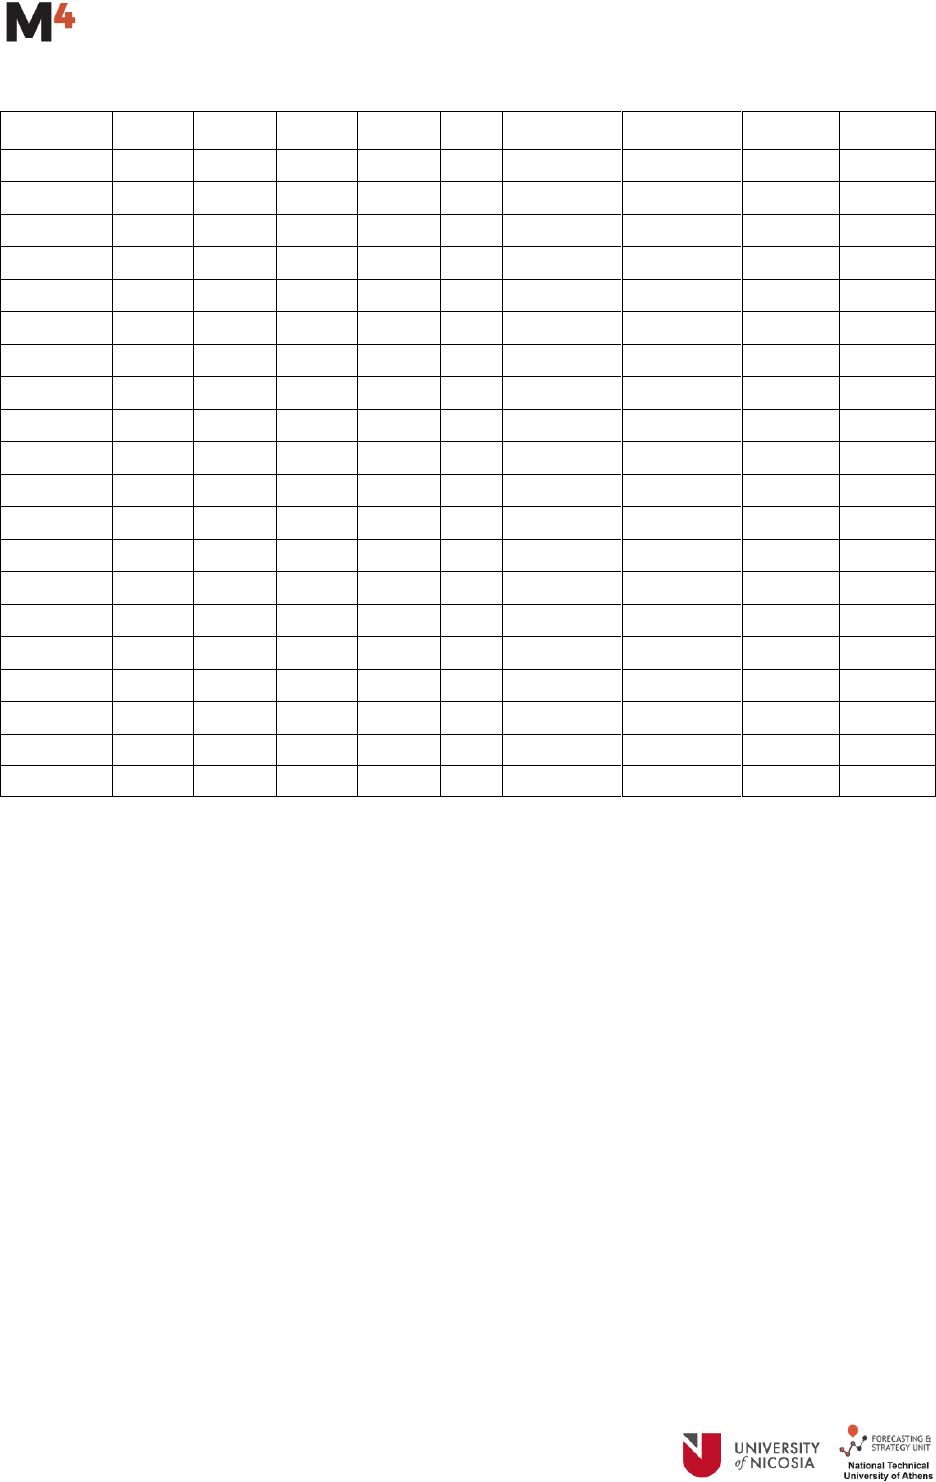
An example for computing the MSIS is presented below using the prediction intervals generated by two
different methods for 18-step-ahead forecasts:
A penalty is calculated for each method at the points where the future values are outside the
specified bounds
The width of the prediction interval adds up to the penalty, if any, to get the IS.
The IS estimated at the individual points are averaged to get the MIS value.
MIS is scaled by dividing its value with the mean absolute seasonal difference of the series (here
200).
After estimating MSIS for all the M4 Competition series, its average value is computed to evaluate
the total performance of the method.
3
T. Gneiting, A. E. Raftery (2007). Strictly Proper Scoring Rules, Prediction, and Estimation. Journal of the American
Statistical Association, 102 (477), 359-378.
5
Forecasting
Horizon
L1
U1
L2
U2
Y
Penalty1
Penalty2
IS1
IS2
1
289
938
297
865
654
0
0
649
568
2
266
923
304
873
492
0
0
657
569
3
313
992
312
880
171
5680
5640
6359
6208
4
238
949
319
888
342
0
0
711
569
5
224
1008
327
895
591
0
0
784
568
6
209
1014
334
903
672
0
0
805
569
7
206
1040
342
910
465
0
0
834
568
8
175
1041
349
918
255
0
3760
866
4329
9
164
1067
357
926
864
0
0
903
569
10
150
1078
364
933
768
0
0
928
569
11
138
1094
372
941
672
0
0
956
569
12
120
1104
379
948
519
0
0
984
569
13
109
1121
387
956
519
0
0
1012
569
14
96
1133
395
963
591
0
0
1037
568
15
83
1146
402
971
480
0
0
1063
569
16
70
1157
410
978
564
0
0
1087
568
17
58
1170
417
986
579
0
0
1112
569
18
46
1182
425
993
423
0
80
1136
648
MIS
1216
1095
MSIS
6.08
5.48
Forecasting Horizons
The number of forecasts required by each method is 6 for yearly data, 8 for quarterly, 18 for monthly, 13
for weekly, 14 for daily and 48 for hourly. The accuracy measures are computed for each horizon
separately and then combined to cover, in a weighted fashion, all horizons together for each of the two
accuracy measures (MASE and sMAPE).
The dataset
The M4 consists of 100,000 time series of Yearly, Quarterly, Monthly and Other (Weekly, Daily and Hourly)
data. The minimum number of observations is 13 for yearly, 16 for quarterly, 42 for monthly, 80 for
weekly, 93 for daily and 700 for hourly series.
The 100,000 time series of the dataset come mainly from the Economic, Finance, Demographics and
Industry areas, while also including data from Tourism, Trade, Labor and Wage, Real Estate,
Transportation, Natural Resources and the Environment.
The M4 Competition series, as those of the M-1 and M-3, aim at representing the real world as much as
possible. The series were selected randomly from a database of 900,000 ones on December 28, 2017.

6
Professor Makridakis chose the seed number for generating the random sample that determined the M4
Competition data. Some pre-defined filters were applied beforehand to achieve some desired
characteristics, such as the length of the series, the percentage of Yearly, Quarterly, Monthly, Weekly,
Daily, and Hourly data, as well as their type (Micro, Macro, Finance, Industry, Demographic, Other).
Below is the number of time series based on their frequency and type:
Frequency
Demographic
Finance
Industry
Macro
Micro
Other
Total
Yearly
1,088
6,519
3,716
3,903
6,538
1,236
23,000
Quarterly
1,858
5,305
4,637
5,315
6,020
865
24,000
Monthly
5,728
10,987
10,017
10,016
10,975
277
48,000
Weekly
24
164
6
41
112
12
359
Daily
10
1,559
422
127
1,476
633
4,227
Hourly
0
0
0
0
0
414
414
Total
8,708
24,534
18,798
19,402
25,121
3,437
100,000
You can download the dataset here. There you may also find additional information regarding the type,
the frequency and the number of forecasts required per series.
In brief, the M4-Info.csv file provides the following information:
M4id: The id of the time series. This is used as a reference. For instance, “Y100” corresponds to the
100th series of the Yearly data.
Category: The type of the time series (e.g. Macro, Micro, Financial etc.)
Frequency: The frequency of the time series considered. This corresponds to the m value used for
estimating MASE. Note that this does not mean that different or multiple seasonality cannot be
considered by the competitors.
Horizon: The forecasting horizon, i.e., the number of periods ahead for which the competitors need to
generate forecasts.
SP: The Seasonal Period (e.g. Yearly, Monthly, Weekly etc.)
The M4DataSet.rar file contains the historical data for training a forecasting model. A separate file is given
per data frequency. The first row displays the M4id, while the rest contain the historical data. No time-
stamp is provided.
The Benchmarks
There will be ten benchmark methods, eight used in the M3 Competition and two extra ones based on ML
concepts. As these methods are well known, readily available and straightforward to apply, the accuracy
of the new ones proposed in the M4 Competition must provide superior accuracy in order to be adopted
and used in practice (taking also into account the computational time it would be required to utilize a
more accurate method versus the benchmarks whose computational requirements are minimal).
1. Naïve 1 Ft+I = Yt i = 1, 2, 3, … , m
2. Seasonal Naïve Forecasts are equal to the last known observation of the same period.
3. Naïve 2 like Naïve 1 but the data is seasonally adjusted, if needed, by applying classical
multiplicative decomposition (R stats package). A 90% autocorrelation test is performed,
when using the R package, to decide whether the data is seasonal.
4. Simple Exponential Smoothing (S) (ses() function from v8.2 of the forecast package for R ).
Seasonality is considered like in Naïve 2.

7
5. Holt’s Exponential Smoothing (H) (holt() function from v8.2 of the forecast package for R ).
Seasonality is considered like in Naïve 2.
6. Dampen Exponential Smoothing (D) (holt() function from v8.2 of the forecast package for R ).
Seasonality is considered like in Naïve 2.
7. Combining S-H-D The arithmetic average of methods 4, 5 and 6.
8. Theta As applied to the M3 competition data. (θ=2, seasonal adjustments like in Naïve 2, and SES
applied using the ses() function from v8.2 of the forecast package for R).
9. MLP A perceptron of a very basic architecture and parameterization (developed in Python using
the Scikit library v0.19.1 - available on GitHub)
10. RNN A recurrent network of a very basic architecture and parameterization (developed in
Python using the Keras v2.0.9 and TensorFlow v1.4.0 libraries - available on GitHub)
The code for generating the forecasts of the benchmarks mentioned above is available on GitHub.
Note that the benchmarks are not eligible for a prize, meaning that the total amount of prizes will be
distributed among the competing participants even if some benchmark could perform better than the
forecasts submitted by the participants.
Factors Affecting Forecasting Accuracy
The M4 would provide a unique opportunity to identify the factors affecting forecasting accuracy. Having
100,000 series, with an average of 12 forecasts for each, more than 100 forecasting methods and 2 accuracy
measures would result in about a quarter of a billion data points. Data analytics will be applied to discover
patterns and relationships, exploiting the findings to enrich our understanding of forecasting accuracy and the
factors that affect it.
