DocGen User's Guide MDK Doc Gen User
User Manual:
Open the PDF directly: View PDF ![]() .
.
Page Count: 92
- DocGen User's Guide
- 1 DocGen
- 1.1 DocGen Overview
- 1.2 Create Offline Content Using DocGen
- 1.3 Create Viewpoint Methods
- 1.3.1 Collect/Sort/Filter Model Elements
- 1.3.1.1 Collect
- 1.3.1.1.1 CollectOwnedElements
- 1.3.1.1.2 CollectOwners
- 1.3.1.1.3 CollectThingsOnDiagram
- 1.3.1.1.4 CollectByStereotypeProperties
- 1.3.1.1.5 CollectByDirectedRelationshipMetaclasses
- 1.3.1.1.6 CollectByDirectedRelationshipStereotypes
- 1.3.1.1.7 CollectByAssociation
- 1.3.1.1.8 CollectTypes
- 1.3.1.1.9 CollectClassifierAttributes
- 1.3.1.1.10 CollectByExpression
- 1.3.1.2 Filter
- 1.3.1.3 Sort
- 1.3.1.1 Collect
- 1.3.2 Present Model Data
- 1.3.3 Other
- 1.3.1 Collect/Sort/Filter Model Elements
- 1.4 Create and Evaluate OCL Constraints
- 1.4.1 What Is OCL and Why Do I Use It?
- 1.4.2 What are the OCL Black Box Expressions?
- 1.4.3 How Do I Use OCL Expressions in a Viewpoint?
- 1.4.4 What is the OCL Evaluator and Why Do I Use It?
- 1.4.5 How Do I Use OCL Viewpoint Constraints?
- 1.4.6 How Do I Create OCL Rules?
- 1.4.7 How Do I Create Expression Libraries?
- 1.4.8 How Do I Use RegEx In my Queries?
- 1.4.9 How Do I Create Transclusions with OCL Queries?
DocGen User's Guide
This document references the DocGen User's Guide as created and maintained in a separate project.
Table of Contents
1 DocGen ...........................................................................................................................................................................................................................10
1.1 DocGen Overview......................................................................................................................................................................................10
1.2 Create Offline Content Using DocGen ......................................................................................................................................................10
1.2.1 Generate Documents .............................................................................................................................................................10
1.2.2 Use the DocGen Stylesheet ...................................................................................................................................................13
1.3 Create Viewpoint Methods ........................................................................................................................................................................13
1.3.1 Collect/Sort/Filter Model Elements.......................................................................................................................................13
1.3.1.1 Collect...............................................................................................................................................................15
1.3.1.1.1 CollectOwnedElements ...............................................................................................................15
1.3.1.1.1.1 Single Depth Example ............................................................................................18
1.3.1.1.1.2 Infinite Depth Example...........................................................................................18
1.3.1.1.2 CollectOwners .............................................................................................................................19
1.3.1.1.2.1 CollectOwners Example View................................................................................21
1.3.1.1.3 CollectThingsOnDiagram............................................................................................................21
1.3.1.1.3.1 CollectThingsOnDiagram Example View ..............................................................23
1.3.1.1.4 CollectByStereotypeProperties....................................................................................................23
1.3.1.1.4.1 Bulleted List Example.............................................................................................27
1.3.1.1.4.2 Table Structure Example.........................................................................................27
1.3.1.1.5 CollectByDirectedRelationshipMetaclasses................................................................................28
1.3.1.1.5.1 Direction Out Example ...........................................................................................30
1.3.1.1.5.2 Direction In Example ..............................................................................................31
1.3.1.1.5.3 Direction Out...........................................................................................................31
1.3.1.1.6 CollectByDirectedRelationshipStereotypes.................................................................................31
1.3.1.1.6.1 Example View.........................................................................................................33
1.3.1.1.7 CollectByAssociation ..................................................................................................................33
1.3.1.1.7.1 Example View.........................................................................................................36
1.3.1.1.8 CollectTypes ................................................................................................................................36
1.3.1.1.8.1 Example View.........................................................................................................38
1.3.1.1.9 CollectClassifierAttributes...........................................................................................................38
1.3.1.1.9.1 Example View.........................................................................................................40
1.3.1.1.10 CollectByExpression .................................................................................................................40
1.3.1.1.10.1 Example View.......................................................................................................41
1.3.1.2 Filter..................................................................................................................................................................41
1.3.1.2.1 FilterByDiagramType..................................................................................................................42
1.3.1.2.1.1 Image Example .......................................................................................................42
1.3.1.2.2 FilterByNames .............................................................................................................................42
1.3.1.2.2.1 Example View.........................................................................................................42
1.3.1.2.3 FilterByMetaclasses.....................................................................................................................42
1.3.1.2.3.1 Example View.........................................................................................................43
1.3.1.2.4 FilterByStereotypes .....................................................................................................................43
1.3.1.2.4.1 Example View.........................................................................................................43
1.3.1.2.5 FilterByExpression ......................................................................................................................43
1.3.1.2.5.1 Example View.........................................................................................................44
1.3.1.3 Sort ...................................................................................................................................................................44
1.3.1.3.1 SortByAttribute............................................................................................................................44
1.3.1.3.1.1 Example View.........................................................................................................44
1.3.1.3.2 SortByProperty ............................................................................................................................44
1.3.1.3.2.1 Example View.........................................................................................................44
1.3.1.3.3 SortByExpression ........................................................................................................................44
1.3.1.3.3.1 Example View.........................................................................................................45
1.3.2 Present Model Data ...............................................................................................................................................................45
1.3.2.1 Table .................................................................................................................................................................46
1.3.2.1.1 Simple Table ................................................................................................................................48
1.3.2.1.2 Complex Table.............................................................................................................................49
1.3.2.2 Paragraph..........................................................................................................................................................49
1.3.2.2.1 Paragraph Action with Targets ....................................................................................................49
1.3.2.2.1.1 Generic Paragraph Example....................................................................................52
2
1.3.2.2.1.2 Paragraph Name Example.......................................................................................52
1.3.2.2.1.3 Paragraph Documentation Example........................................................................52
1.3.2.2.1.4 Paragraph Value Example.......................................................................................52
1.3.2.2.2 Paragraph Action with Body........................................................................................................53
1.3.2.2.2.1 Paragraph Body Example........................................................................................54
1.3.2.2.3 Paragraph Action Evaluate OCL .................................................................................................54
1.3.2.2.3.1 Paragraph With Body..............................................................................................56
1.3.2.2.3.2 Paragraph With Targets ..........................................................................................56
1.3.2.2.3.3 Paragraph With Body And Targets.........................................................................56
1.3.2.3 List....................................................................................................................................................................56
1.3.2.3.1 Example List ................................................................................................................................57
1.3.2.4 Image ................................................................................................................................................................58
1.3.2.4.1 Image Example View...................................................................................................................59
1.3.2.5 Dynamic Sectioning .........................................................................................................................................59
1.3.2.5.1 Example Single Section ...............................................................................................................61
1.3.2.5.1.1 Zoo Animals............................................................................................................61
1.3.2.5.2 Example Multiple Sections..........................................................................................................62
1.3.2.5.2.1 Ostrich.....................................................................................................................62
1.3.2.5.2.2 Crocodile.................................................................................................................62
1.3.2.5.2.3 Zebra .......................................................................................................................62
1.3.2.5.2.4 Seal..........................................................................................................................62
1.3.2.5.2.5 Arctic Tern ..............................................................................................................62
1.3.2.6 Tom Sawyer Diagram.......................................................................................................................................62
1.3.2.6.1 Creating a Tom Sawyer Diagram ................................................................................................62
1.3.2.6.1.1 myView...................................................................................................................64
1.3.2.6.2 A Common Mistake.....................................................................................................................64
1.3.2.6.3 Internal Block Diagram ...............................................................................................................65
1.3.2.6.4 Generating from Previous Diagram.............................................................................................66
1.3.2.7 Plot....................................................................................................................................................................67
1.3.2.7.1 Creating Plots...............................................................................................................................69
1.3.2.7.1.1 Example Line Plot...................................................................................................71
1.3.2.7.1.2 Example Radar Plot ................................................................................................71
1.3.2.7.1.3 Example Parallel Axis Plot .....................................................................................72
1.3.2.7.2 Customizing Plots ........................................................................................................................73
1.3.2.7.3 Common Issues............................................................................................................................75
1.3.3 Other......................................................................................................................................................................................75
1.3.3.1 Simulate............................................................................................................................................................75
1.3.3.1.1 Simulate Config ...........................................................................................................................76
1.3.3.1.2 Simulate Data...............................................................................................................................79
1.3.3.2 OpaqueBehavior ...............................................................................................................................................79
1.4 Create and Evaluate OCL Constraints .......................................................................................................................................................81
1.4.1 What Is OCL and Why Do I Use It? .....................................................................................................................................81
1.4.2 What are the OCL Black Box Expressions? .........................................................................................................................82
1.4.2.1 value()...............................................................................................................................................................83
1.4.2.1.1 Example View..............................................................................................................................83
1.4.2.2 Relationships "r()" ............................................................................................................................................83
1.4.2.2.1 Example View..............................................................................................................................84
1.4.2.3 Names "n()" ......................................................................................................................................................84
1.4.2.3.1 Example View..............................................................................................................................84
1.4.2.4 Stereotypes "s()" ...............................................................................................................................................84
1.4.2.4.1 Example View..............................................................................................................................84
1.4.2.5 Members "m()" .................................................................................................................................................84
1.4.2.5.1 Example View..............................................................................................................................85
1.4.2.6 Evaluate "eval()"...............................................................................................................................................85
1.4.2.6.1 Example View..............................................................................................................................86
1.4.2.7 Types "t()" ........................................................................................................................................................86
1.4.2.7.1 Example View..............................................................................................................................87
1.4.2.8 Owners "owners()" ...........................................................................................................................................87
1.4.2.8.1 Example View..............................................................................................................................87
1.4.2.9 log() ..................................................................................................................................................................87
3
1.4.2.9.1 Example View..............................................................................................................................87
1.4.2.10 run(View/Viewpoint)......................................................................................................................................87
1.4.2.10.1 Example View............................................................................................................................88
1.4.3 How Do I Use OCL Expressions in a Viewpoint?................................................................................................................88
1.4.3.1 Using Collect/Filter/Sort by Expression...........................................................................................................88
1.4.3.2 Advanced Topics ..............................................................................................................................................88
1.4.3.2.1 Use of the Iterate Flag..................................................................................................................88
1.4.4 What is the OCL Evaluator and Why Do I Use It? ...............................................................................................................88
1.4.5 How Do I Use OCL Viewpoint Constraints?........................................................................................................................91
1.4.6 How Do I Create OCL Rules?...............................................................................................................................................91
1.4.6.1 How Do I Create Rules on Specific Model Elements? (Constraint Evaluator)................................................91
1.4.6.2 How Do I Create Rules Within Viewpoints? ...................................................................................................92
1.4.6.3 How Do I Validate OCL Rules in my Model? .................................................................................................92
1.4.7 How Do I Create Expression Libraries?................................................................................................................................92
1.4.8 How Do I Use RegEx In my Queries? ..................................................................................................................................92
1.4.9 How Do I Create Transclusions with OCL Queries? ............................................................................................................92
4
List of Tables
1. DocGen Methods ...........................................................................................................................................................................................................14
2. Example Table ...............................................................................................................................................................................................................27
3. Example Table ...............................................................................................................................................................................................................36
4. Classifiers.......................................................................................................................................................................................................................38
5. Owned Items ..................................................................................................................................................................................................................40
6. DocGen Methods ...........................................................................................................................................................................................................45
7. Simple Table Example...................................................................................................................................................................................................48
8. <> ...................................................................................................................................................................................................................................49
9. Table with headers .........................................................................................................................................................................................................68
10. Table without headers ..................................................................................................................................................................................................68
11. Apples and Oranges Data.............................................................................................................................................................................................73
12. DocGen Methods .........................................................................................................................................................................................................75
13. Instance Table ..............................................................................................................................................................................................................79
14. Opaque Behavior Data.................................................................................................................................................................................................81
15. <> .................................................................................................................................................................................................................................83
16. Relationships................................................................................................................................................................................................................84
17. <> .................................................................................................................................................................................................................................84
18. Stereotypes...................................................................................................................................................................................................................84
19. Members ......................................................................................................................................................................................................................85
20. <> .................................................................................................................................................................................................................................86
21. Types............................................................................................................................................................................................................................87
22. <> .................................................................................................................................................................................................................................87
23. <> .................................................................................................................................................................................................................................88
24. <> .................................................................................................................................................................................................................................91
25. <> .................................................................................................................................................................................................................................92
26. <> .................................................................................................................................................................................................................................92
27. <> .................................................................................................................................................................................................................................92
5
List of Figures
1. Example View Diagram.................................................................................................................................................................................................16
2. Example Diagram ..........................................................................................................................................................................................................17
3. CollectOwnedElements Single Depth............................................................................................................................................................................17
4. CollectOwnedElements Infinite Depth ..........................................................................................................................................................................18
5. Example View Diagram.................................................................................................................................................................................................19
6. CollectOwners................................................................................................................................................................................................................20
7. Example BDD................................................................................................................................................................................................................21
8. Example View Diagram.................................................................................................................................................................................................22
9. CollectThingsOnDiagram ..............................................................................................................................................................................................22
10. Example BDD..............................................................................................................................................................................................................23
11. Example View Diagram...............................................................................................................................................................................................24
12. CollectByStereotypeProperties List.............................................................................................................................................................................25
13. Example BDD..............................................................................................................................................................................................................26
14. CollectByStereotypeProperties Table..........................................................................................................................................................................27
15. Example View Diagram...............................................................................................................................................................................................28
16. CollectByDirectedRelationshipMetaclasses Direction Out .........................................................................................................................................29
17. Example BDD..............................................................................................................................................................................................................30
18. CollectByDirectedRelationshipMetaclasses Direction In............................................................................................................................................30
19. CollectByDirectedRelationshipMetaclasses Viewpoint Method Two ........................................................................................................................31
20. Example View Diagram...............................................................................................................................................................................................32
21. Example BDD..............................................................................................................................................................................................................32
22. CollectByDirectedRelationshipStereotypes.................................................................................................................................................................33
23. Example View Diagram...............................................................................................................................................................................................34
24. CollectByAssociation ..................................................................................................................................................................................................35
25. Example Elements .......................................................................................................................................................................................................36
26. Example View Diagram...............................................................................................................................................................................................36
27. CollectTypes ................................................................................................................................................................................................................37
28. Example BDD..............................................................................................................................................................................................................37
29. Example View Diagram...............................................................................................................................................................................................38
30. CollectClassifierAttributes...........................................................................................................................................................................................39
31. Example BDD..............................................................................................................................................................................................................40
32. Example View Diagram...............................................................................................................................................................................................40
33. CollectByExpression....................................................................................................................................................................................................41
34. Example BDD..............................................................................................................................................................................................................41
35. Example View Diagram...............................................................................................................................................................................................42
36. Diagrams......................................................................................................................................................................................................................42
37. FilterByDiagramType Image .......................................................................................................................................................................................42
38. Diagrams......................................................................................................................................................................................................................42
39. Some Block..................................................................................................................................................................................................................42
40. Example View Diagram...............................................................................................................................................................................................42
41. Example BDD..............................................................................................................................................................................................................42
42. FilterByNames .............................................................................................................................................................................................................42
43. Example View Diagram...............................................................................................................................................................................................43
44. FilterByMetaclasses.....................................................................................................................................................................................................43
45. Example BDD..............................................................................................................................................................................................................43
46. Example View Diagram...............................................................................................................................................................................................43
47. FilterByStereotypes......................................................................................................................................................................................................43
48. Example BDD..............................................................................................................................................................................................................43
49. Example View Diagram...............................................................................................................................................................................................43
50. FilterByExpression ......................................................................................................................................................................................................43
51. Example BDD..............................................................................................................................................................................................................43
52. Example View Diagram...............................................................................................................................................................................................44
53. SortByAttribute............................................................................................................................................................................................................44
54. Example BDD..............................................................................................................................................................................................................44
55. Example View Diagram...............................................................................................................................................................................................44
56. Example BDD..............................................................................................................................................................................................................44
57. SortByProperty ............................................................................................................................................................................................................44
6
58. Example View Diagram...............................................................................................................................................................................................44
59. SortByExpression ........................................................................................................................................................................................................45
60. Example BDD..............................................................................................................................................................................................................45
61. Example View Diagram...............................................................................................................................................................................................47
62. SimpleTable .................................................................................................................................................................................................................47
63. ComplexTable..............................................................................................................................................................................................................48
64. Generic Paragraph View Diagram ...............................................................................................................................................................................50
65. Generic Paragraph........................................................................................................................................................................................................50
66. Paragraph of Name ......................................................................................................................................................................................................51
67. Paragraph of Documentation .......................................................................................................................................................................................51
68. Paragraph of Default Value .........................................................................................................................................................................................52
69. Example View Diagram...............................................................................................................................................................................................53
70. Paragraph Body............................................................................................................................................................................................................53
71. Example View Diagram...............................................................................................................................................................................................54
72. Paragraph OCL With Targets ......................................................................................................................................................................................55
73. Paragraph OCL Without Targets .................................................................................................................................................................................55
74. Paragraph OCL For Targets.........................................................................................................................................................................................56
75. Example List View Diagram .......................................................................................................................................................................................57
76. Bulleted List.................................................................................................................................................................................................................57
77. Example View Diagram...............................................................................................................................................................................................58
78. Image............................................................................................................................................................................................................................58
79. Zoo ...............................................................................................................................................................................................................................59
80. Zoo Animals.................................................................................................................................................................................................................59
81. Example View Diagram...............................................................................................................................................................................................60
82. Dynamic Section..........................................................................................................................................................................................................60
83. Multiple Sections .........................................................................................................................................................................................................61
84. Tom Sawyer BDD View Diagram...............................................................................................................................................................................63
85. Tom Sawyer.................................................................................................................................................................................................................63
86. tomSawyerDiagram .....................................................................................................................................................................................................64
87. Common Mistake View Diagram ................................................................................................................................................................................65
88. Tom Sawyer.................................................................................................................................................................................................................65
89. Tom Sawyer IBD View Diagram ................................................................................................................................................................................66
90. Tom Sawyer.................................................................................................................................................................................................................66
91. Previous Diagram View Diagram................................................................................................................................................................................67
92. Tom Sawyer.................................................................................................................................................................................................................67
93. Demo Plot with Headers ..............................................................................................................................................................................................68
94. Demo Plot without Headers .........................................................................................................................................................................................68
95. Line Plot Blocks...........................................................................................................................................................................................................69
96. Line Plot View Diagram ..............................................................................................................................................................................................69
97. Line Plot.......................................................................................................................................................................................................................70
98. Apples and Oranges .....................................................................................................................................................................................................71
99. Apples and Oranges .....................................................................................................................................................................................................72
100. Apples and Oranges ...................................................................................................................................................................................................73
101. Apples and Oranges ...................................................................................................................................................................................................74
102. Apples and Oranges ...................................................................................................................................................................................................75
103. Force Simulation........................................................................................................................................................................................................76
104. Point Mass..................................................................................................................................................................................................................76
105. System Context ..........................................................................................................................................................................................................77
106. Force Simulation........................................................................................................................................................................................................77
107. Simulate View Diagram.............................................................................................................................................................................................77
108. Simulate .....................................................................................................................................................................................................................78
109. OpaqueBehavior View Diagram................................................................................................................................................................................79
110. OpaqueBehavior Viewpoint.......................................................................................................................................................................................80
111. Animals......................................................................................................................................................................................................................83
112. value() View Diagram................................................................................................................................................................................................83
113. Value Black Box Demo .............................................................................................................................................................................................83
114. relationships() View Diagram....................................................................................................................................................................................84
115. Relationships Black Box Demo .................................................................................................................................................................................84
116. Names View Diagram................................................................................................................................................................................................84
117. Names Black Box Demo............................................................................................................................................................................................84
7
118. Stereotypes View Diagram ........................................................................................................................................................................................84
119. Stereotypes Black Box Demo ....................................................................................................................................................................................84
120. Members View Diagram............................................................................................................................................................................................85
121. Members Black Box Demo........................................................................................................................................................................................85
122. Evaluate View Diagram.............................................................................................................................................................................................86
123. Evaluate Black Box Demo.........................................................................................................................................................................................86
124. Transclusion Test Model............................................................................................................................................................................................86
125. Types View Diagram .................................................................................................................................................................................................86
126. Types Black Box Demo .............................................................................................................................................................................................87
127. Owners View DIagram ..............................................................................................................................................................................................87
128. Owners Black Box Demo ..........................................................................................................................................................................................87
129. Log View Diagram ....................................................................................................................................................................................................87
130. Log Black Box Demo ................................................................................................................................................................................................87
131. RunViewViewpoint View Diagram...........................................................................................................................................................................88
132. Run Black Box Demo ................................................................................................................................................................................................88
133. How Do I Create Rules on Specific Model Elements?..............................................................................................................................................92
8
List of Equations
9

1 DocGen
The DocGen is a more in depth guide to the purpose and function of DocGen.
For specific information about the different DocGen methods and expression libraries, see Create Viewpoint Methods.
Table of Contents
DocGen Overview
Install DocGen
Create Offline Content Using DocGen
Create Viewpoint Methods
DocGen UserScripts
1.1 DocGen Overview
The Document Generator (DocGen) is a module of MDK plug-in in MagicDraw. It provides the capability to generate formal
documents from UML/SysML models in MagicDraw. A "document" is a view into a model, or a representation of model data, which
may be structured in a hierarchical way. A document is a collection of paragraphs, sections, and analysis, and the order and layout of
the content is important. DocGen operates within MagicDraw, traversing document's "outline", collecting information, performing
analysis, and writing the output to a file. DocGen produces a DocBook XML file, which may be fed into transformation tools to
produce the document in PDF, HTML, or other formats.
DocGen consists of:
• a UML profile with elements for creating a document framework
• a set of scripts for traversing document frameworks, conducting analysis, and producing the output
• a set of tools to help users validate the correctness and completeness of their documents.
Users need to invest the time to define the document content and format; however, once this is done the document can be produced
with a button click whenever the model data is updated. The user never has to waste time numbering sections or fighting with
reluctant formatting, as this is all performed automatically during the transformation to PDF, HTML, etc. DocGen can also be
extended and queries may be added in a form of reusable analysis functions. Check with your project to see if they have a document
framework to use.
1.2 Create Offline Content Using DocGen
If a model is not available in EMS server, an offline document can be created using the DocGen module in MDK plug-in. This section
describes how to produce offline, read-only documents in MagicDraw. Note that these documents are not editable like those published
in EMS. All changes must be made directly in the MagicDraw model.
1.2.1 Generate Documents
DocGen allow generating a local version of your document without access to EMS server. Select a document, and use a right click
menu "DocGen>Generate DocGen3 Document". It will generate a DocBook XML file. Check with your project to see if there is a
preferred method of generation. Most practitioners use a .xml viewer such as oXygen to convert the .xml file to a PDF file (or other
types of files if they prefer). You can install oXygen from the SSCAE. Note that the document is static. If you want to change the
document, changes need to made to the MagicDraw model and document needs to be regenerated.
To open your .xml output with oXygen, first obtain a copy of the mgss.xsl stylesheet from MBEE (if you downloaded the bundled
installation of Crushinator from MBEE, you can find mgss.xsl in the install folder under DocGenUserScripts -> DocGenStyleSheet).
Open your oXygen install directory, navigate to <oxygen_dir>/frameworks/docbook/xsl/fo, and save mgss.xsl to that directory. This
stylesheet will allow the front matter inputs from MagicDraw to be visible on the PDF.
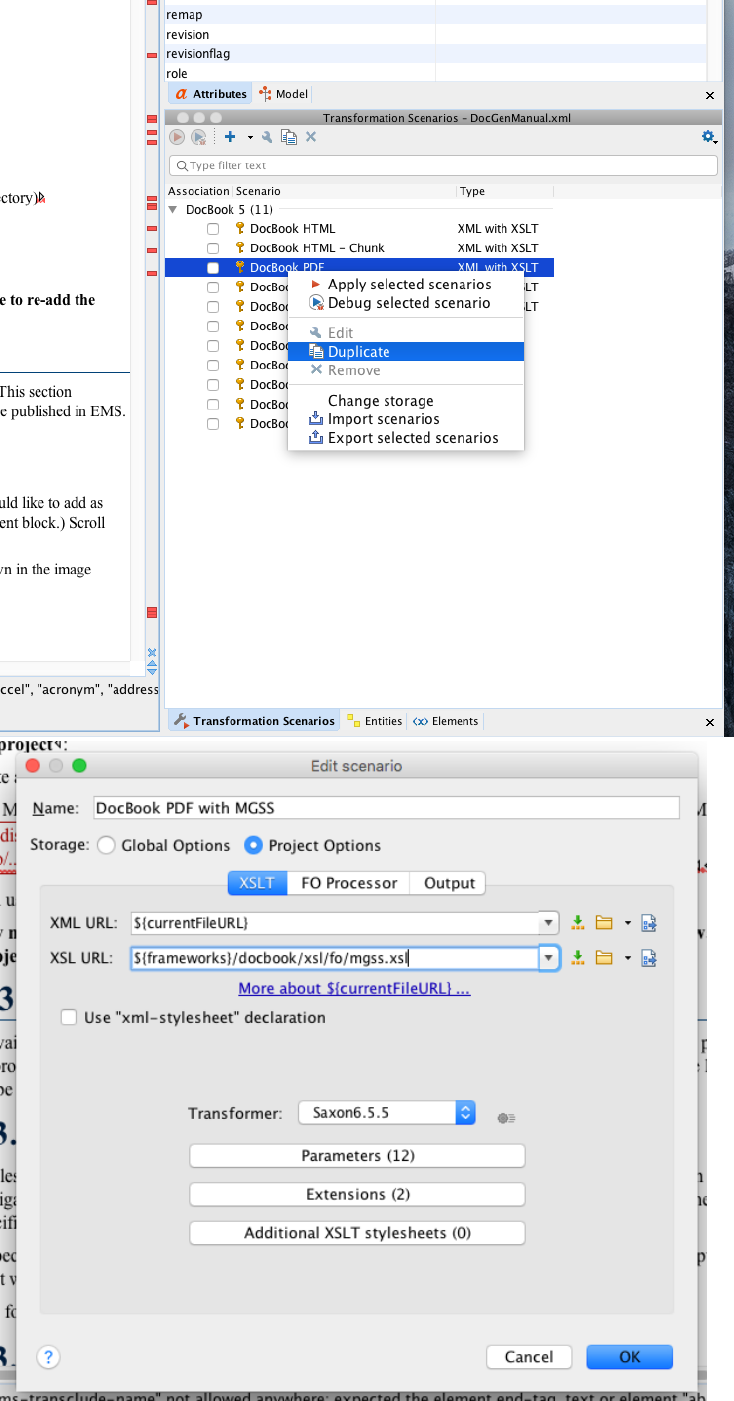
Now you can open your saved .xml output file with oXgen. After opening your file, right click the "DocBook PDF" option within
transformation scenarios, as pictured below. In the menu that appears, select "Duplicate." Rename your new scenario as desired. Select
10
the XSL URL text box and replace "${frameworks}/docbook/xsl/fo/docbook_custom.xsl" with ${frameworks}/docbook/xsl/fo/
mgss.xsl," as pictured below, and then click "OK."
11
12
To generate a new PDF, double-click on your newly created transformation in the Transformation Scenarios window. You can also
click the red "play" button if your DocBook PDF is selected as shown below to generate a PDF.
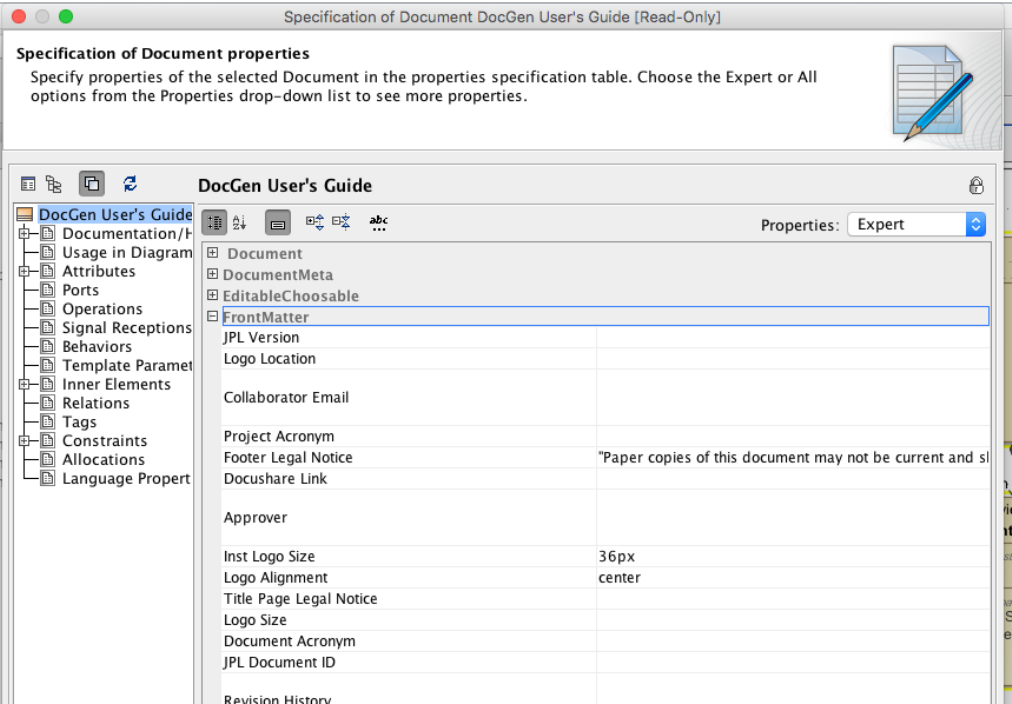
1.2.2 Use the DocGen Stylesheet
The DocGen stylesheet allows the user to input front matter information to a document. To input the information you would like to
add as front matter, navigate to the specification window of a document block. (The easiest way is to double click on the document
block.) Scroll down in the specification window to the "FrontMatter" section, as shown below.
Here, you can specify a variety of fields such as logo size and location, approvers, legal footers, etc. A reference card for the tags is
shown below.
1.3 Create Viewpoint Methods
Creating a viewpoint involves two steps. First, create a viewpoint element. Second, define a viewpoint method diagram for the
viewpoint.
After both are created and defined, the viewpoint can be applied to a view. The following subsections explain each step in more
details, including the DocGen and expression methods offered by the Cookbook library.
1.3.1 Collect/Sort/Filter Model Elements
Once exposed to a view, elements can can be operated on by three types of viewpoint operators (Collect, Sort, and Filter). These
operations can be used to expand or narrow the collection of elements that are used in the viewpoint method.
The following views reveal the View Diagrams, Viewpoint Method Diagrams, and Block Definition Diagrams that - when generated -
result in the contained subviews.
13
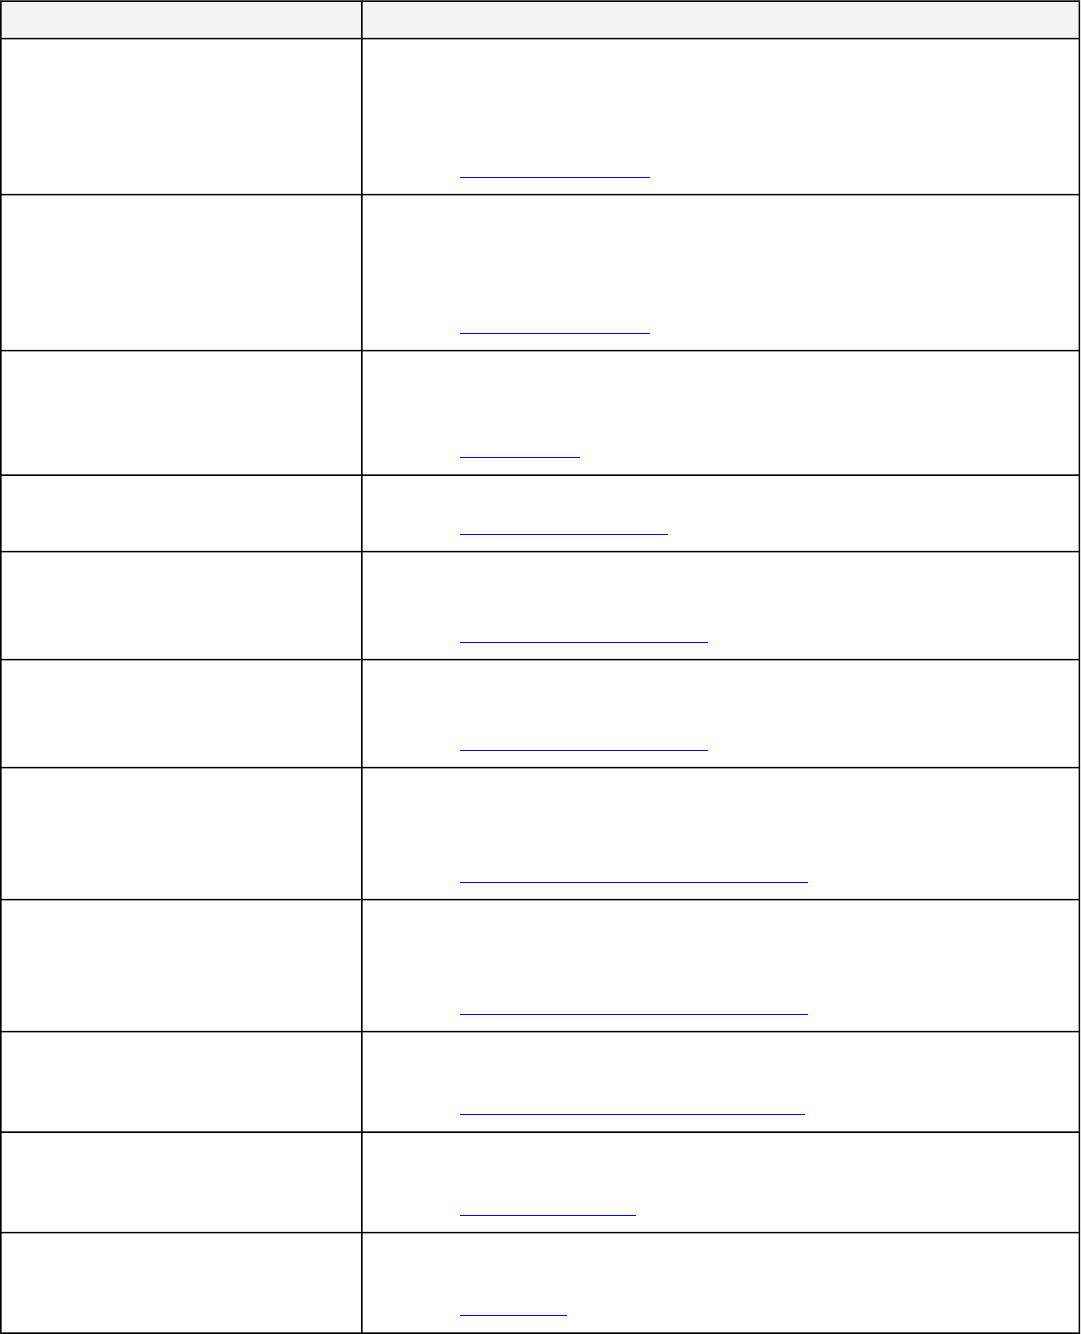
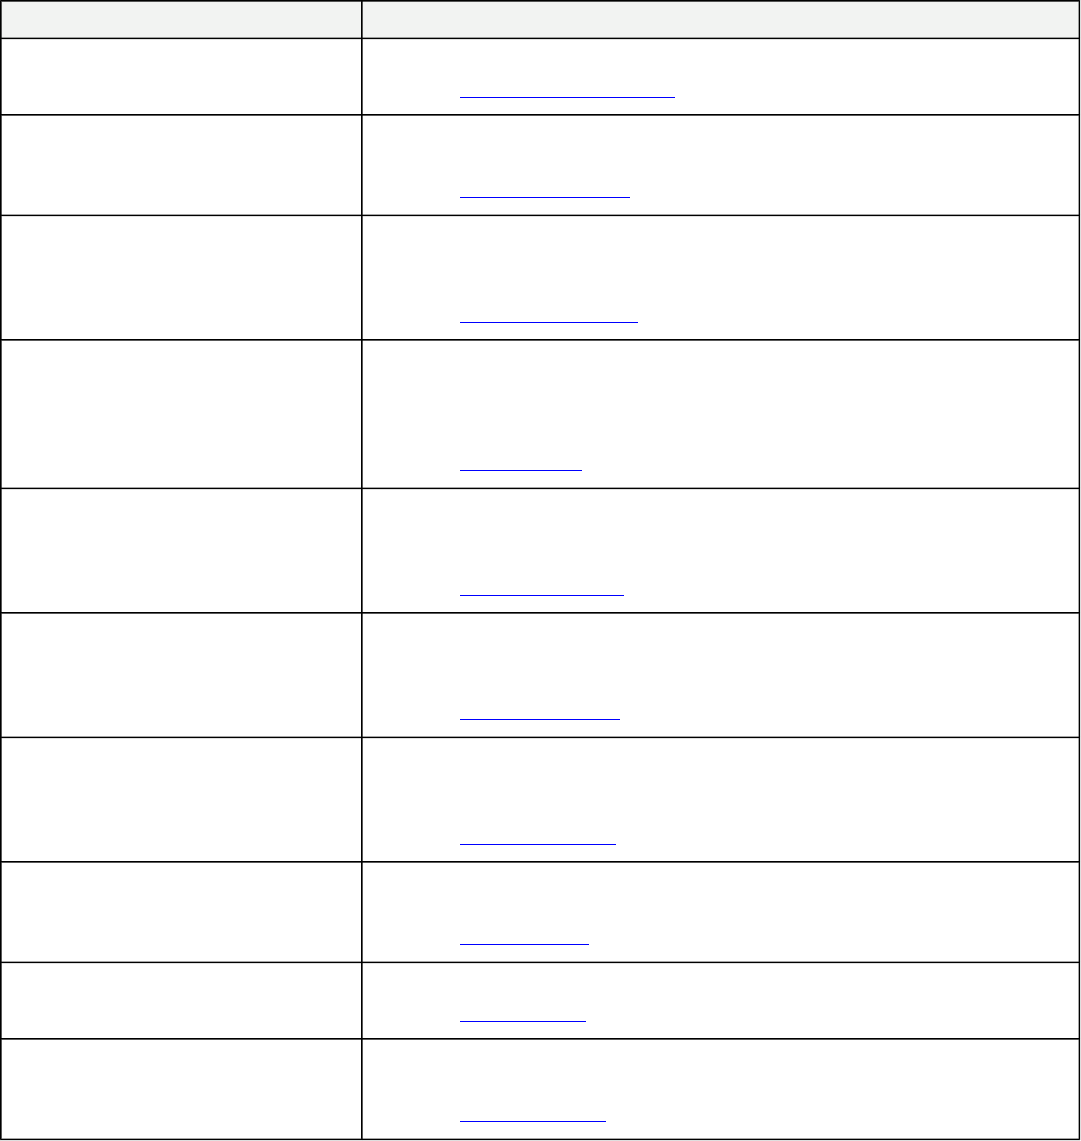
Below is an overview table of the DocGen Methods (specifically Collect/Sort/Filter Methods) discussed.
Table 1. DocGen Methods
Method Name Method Description
CollectOwnedElements Infinite Depth
"CollectOwnedElements" gathers anything owned by the exposed element(s) in the
model to be used in the viewpoint method.
This specific method deals with infinite depth, which means it collects all owned
elements, as opposed to those just on a specified depth (such as level 1 children).
Reference: CollectOwnedElements
CollectOwnedElements Single Depth
"CollectOwnedElements" gathers anything owned by the exposed element(s) in the
model to be used in the viewpoint method.
This specific method deals with a single depth, which means it collects the children of a
specified depth, as opposed to all children.
Reference: CollectOwnedElements
CollectOwners
"CollectOwners" is essentially the opposite of "CollectOwnedElements". It gathers all
of the owners (from the containment tree) of the exposed element(s) for use in the
viewpoint method.
Reference: CollectOwners
CollectThingsOnDiagram
"CollectThingsOnDiagram" will collect all the elements depicted on a diagram.
Reference: CollectThingsOnDiagram
CollectByStereotypeProperties List
"CollectByStereotypeProperties" collects the properties of the stereotypes.
This specific method collects the properties of the stereotype "List".
Reference: CollectByStereotypeProperties
CollectByStereotypeProperties Table
"CollectByStereotypeProperties" collects the properties of the stereotypes.
This specific method collects the properties of the stereotype "Table".
Reference: CollectByStereotypeProperties
CollectByDirectedRelationshipMetaclasses
Direction Out
CollectByDirectedRelationshipMetaclasses action collects elements based on the
relationships that other elements use to connect to them.
This specific method collects elements based on their "Direction Out" relationships.
Reference: CollectByDirectedRelationshipMetaclasses
CollectByDirectedRelationshipMetaclasses
Direction In
CollectByDirectedRelationshipMetaclasses action collects elements based on the
relationships that other elements use to connect to them.
This specific method collects elements based on their "Direction In" relationships.
Reference: CollectByDirectedRelationshipMetaclasses
CollectByDirectedRelationshipStereotypes
"CollectByDirectedRelationshipStereotypes" also collects elements based on the
stereotypeof the relationships that connect them to other elements.
Reference: CollectByDirectedRelationshipStereotypes
CollectByAssociation
"CollectByAssociation" collects the blocks with aggregation of either composite,
shared, or none.
Reference: CollectByAssociation
CollectTypes
CollectTypes collects the types of already collected elements. Most times,
CollectOwned Elements or CollectOwners are used to collect said elements.
Reference: CollectTypes
14
Method Name Method Description
CollectClassifierAttributes
"CollectClassifierAttributes" collects attributes of a class.
Reference: CollectClassifierAttributes
CollectByExpression
"CollectByExpression" is a more customized approach to querying a model using
Object Constraint Language (OCL) .
Reference: CollectByExpression
FilterByDiagramType Image
The "FilterByDiagramType" activity goes through a data set and looks at the elements
which are diagrams. A Collect operation must be used first to collect elements desired
to be filtered.
Reference: FilterByDiagramType
FilterByNames
"FilterByNames" activity goes through a data set and finds all the elements within the
data set with a particular name or the elements connected to the element with the
particular name. A Collect operation must be used first to collect elements desired to be
filtered.
Reference: FilterByNames
FilterByMetaclasses
"FilterByMetaclasses" activity goes through a data set and finds all the elements that
has are defined by a specified metaclass. A Collect operation must be used first to
collect elements desired to be filtered.
Reference: FilterByMetaclasses
FilterByStereotypes
"FilterByStereotypes" activity goes through a data set and finds all the elements that
has are defined by a specified Stereotype. A Collect operation must be used first to
collect elements desired to be filtered.
Reference: FilterByStereotypes
FilterByExpression
"FilterByExpression" activity goes through a data set and finds all the elements that
satisfy (boolean) a Object constraint Language (OCL) expression. A Collect operation
must be used first to collect elements desired to be filtered.
Reference: FilterByExpression
SortByAttribute
"SortByAttribute" allows the user to sort a data set by the chosen attribute: name,
documentation, value.
Reference: SortByAttribute
SortByProperty
"SortByProperty" allows the user to sort a data set by a specified property.
Reference: SortByProperty
SortByExpression
"SortByExpression" a data set as specified by the Object constraint Language (OCL)
expression.
Reference: SortByExpression
1.3.1.1 Collect
"Collect..." is a viewpoint operator that separates the elements in an exposed package into ones that will continue to be used and ones
that will be ignored. There are a number of collection methods, each of which have their own call behavior action in the side bar of the
viewpoint method diagram.
1.3.1.1.1 CollectOwnedElements
CollectOwnedElements gathers anything owned by the exposed element(s) in the model to be used in the viewpoint method. A
common use case would be when a group of elements contained within a package need to be exposed to a view. Instead of
15
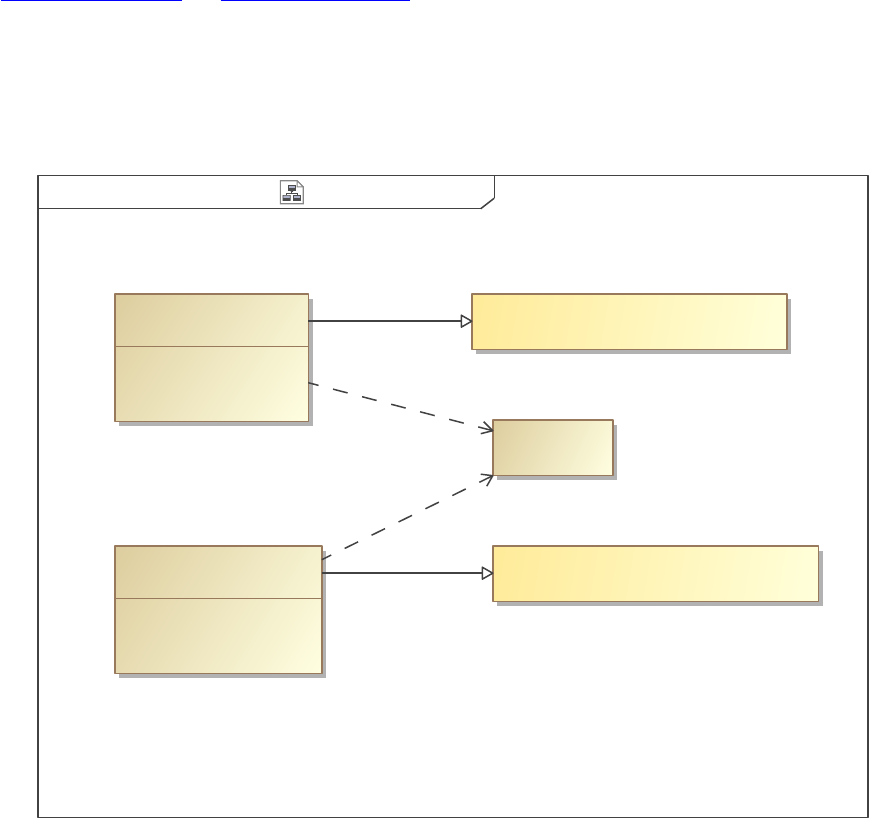
individually exposing each element, a user can employ "CollectOwnedElements" within a viewpoint and then expose only the
package. The collection method will look at the exposed element and return all the elements that it owns.
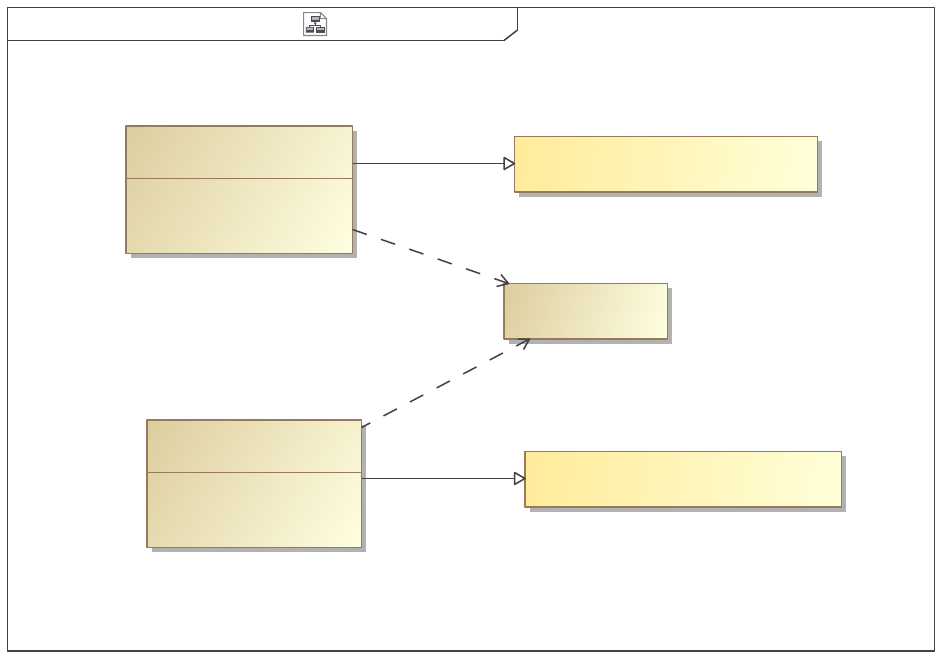
The views Single Depth Example and Infinite Depth Example show the output of the Example View Diagram as shown below. Both
of these views expose the same Lunchbox, but they conform to different viewpoints. The only difference between the viewpoints is
the "DepthChoosable" property: CollectOwnedElements Single Depth has a DepthChoosable of 1, CollectOwnedElements Infinite
Depth has a DepthChoosable of 0.
Note that CollectOwnedElements collects part properties as well. For this example we use FilterByStereotypes to only display Block
elements in the output.
CollectOwnedElements Example View Diagramclass [ ]
«viewpoint»
CollectOwnedElements Infinite Depth
CollectOwnedElements Single Depth
«viewpoint»
{(,)}
{(paragraph,list)}
constraints
Infinite Depth Example
«view»
constraints
{(list)}
{()}
Single Depth Example
«view»
«block»
Lunchbox
«Expose»
«Expose»
«Conforms»
«Conforms»
Figure 1. Example View Diagram
16
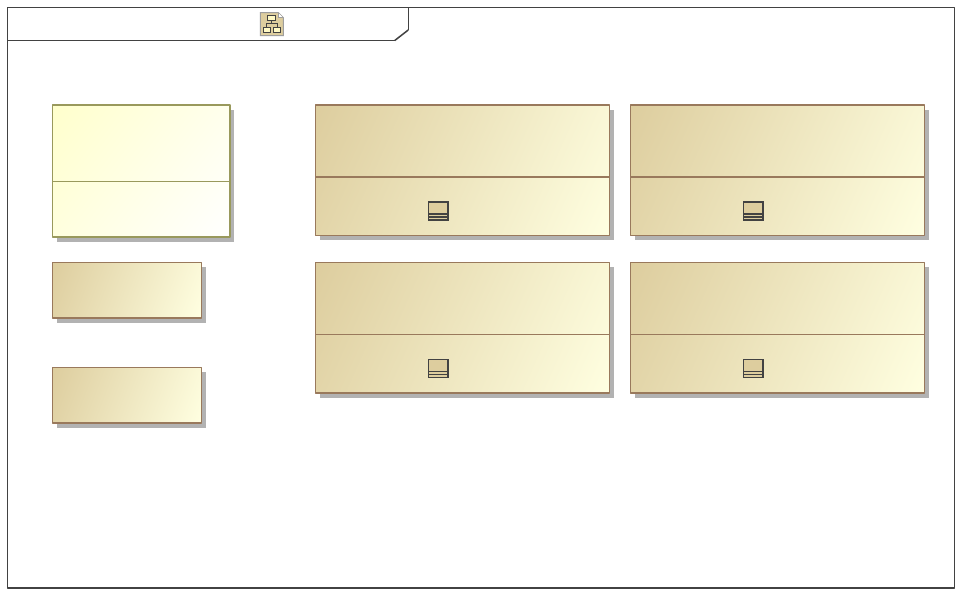
Example DiagramJail Bake[Block]bdd [ ]
«block»
Sandwich Bag Cake
«block»
Lunchbox
«block»
«block»
Nail File
«block»
Bag of ChipsThermos
«block»
Sandwich
«block»
Figure 2. Example Diagram
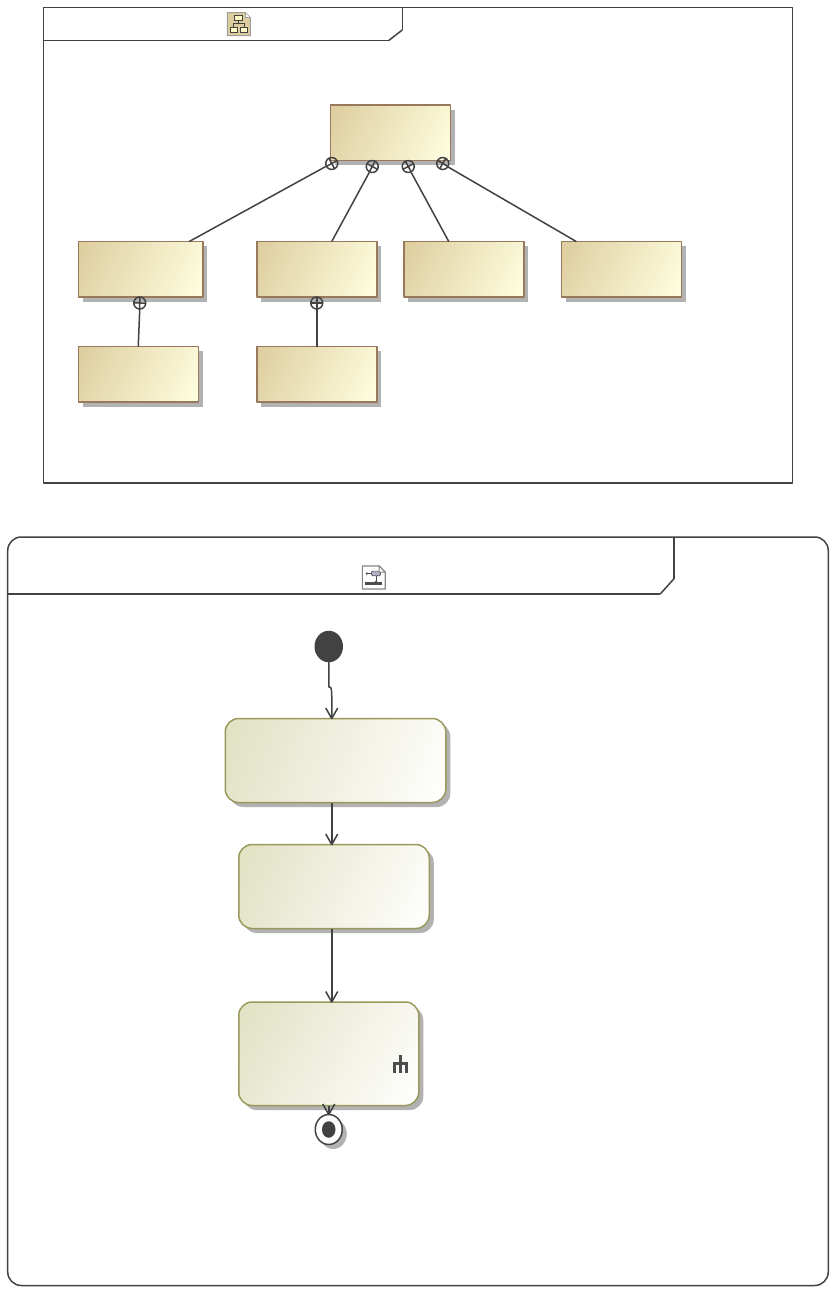
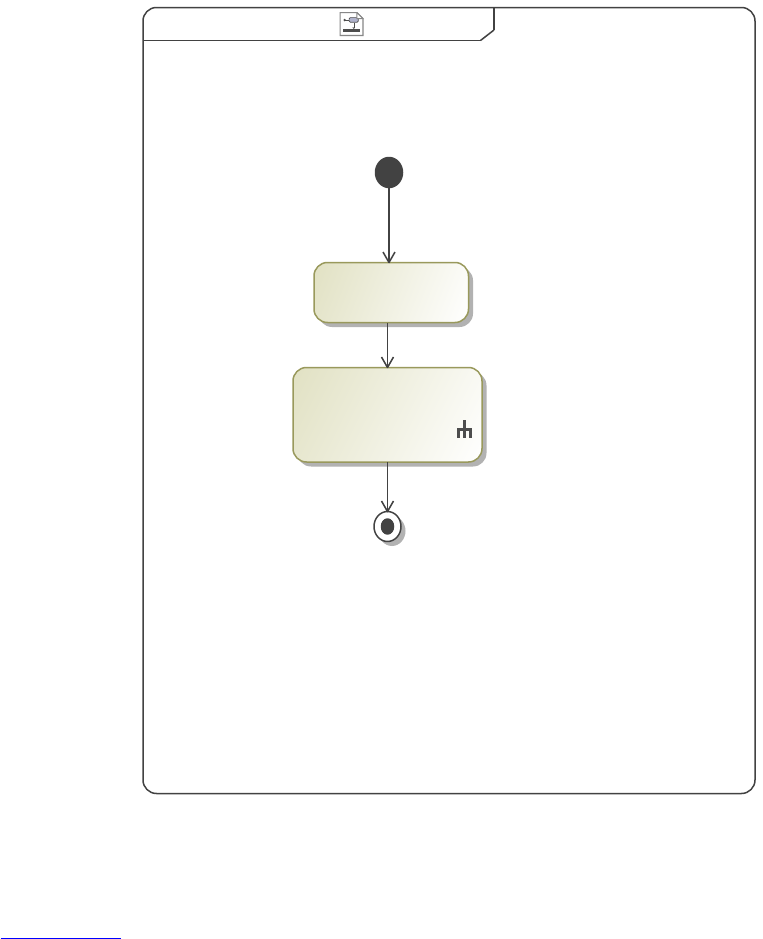
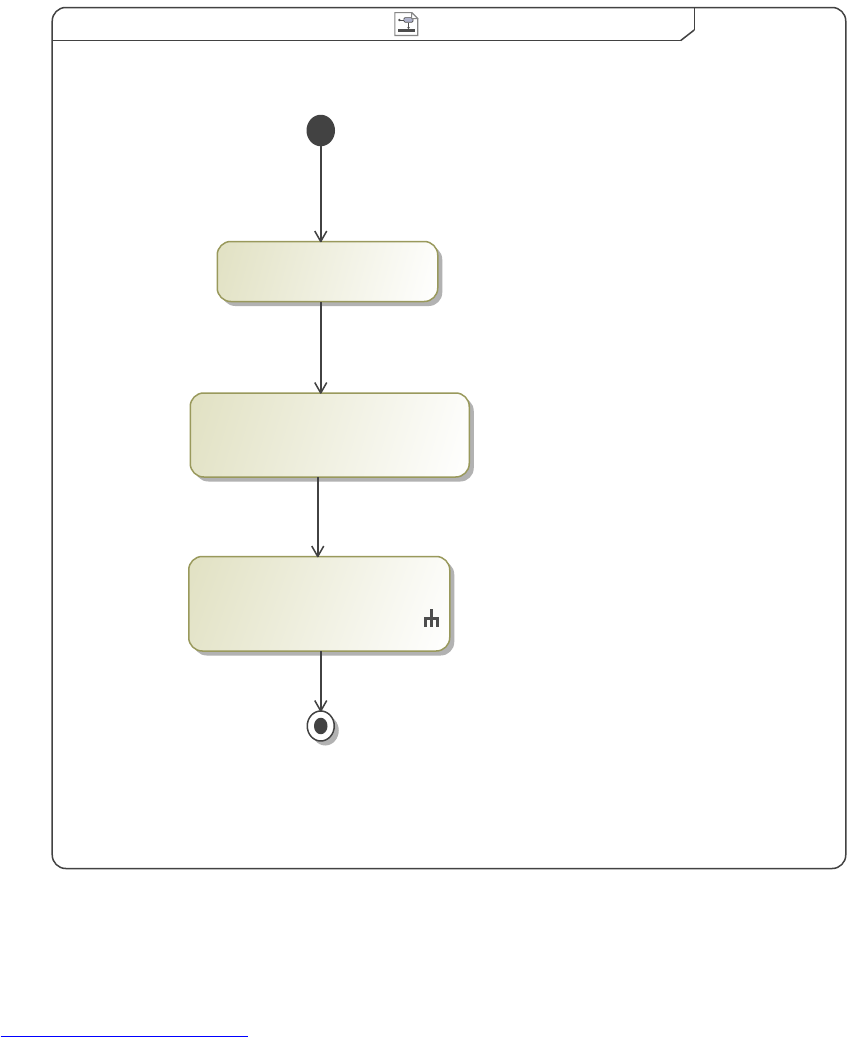
CollectOwnedElements Single Depth CollectOwnedElements Single Depthactivity [ ]
«DiagramOrder»
«CollectOwnedElements»
{depth = 1}
«FilterByStereotypes»
{stereotypes = Block}
«BulletedList»
: BulletedListPreset
Figure 3. CollectOwnedElements Single Depth
"CollectOwnedElements" gathers anything owned by the exposed element(s) in the model to be used in the viewpoint method.
This specific method deals with a single depth, which means it collects the children of a specified depth, as opposed to all children.
17
Reference: CollectOwnedElements
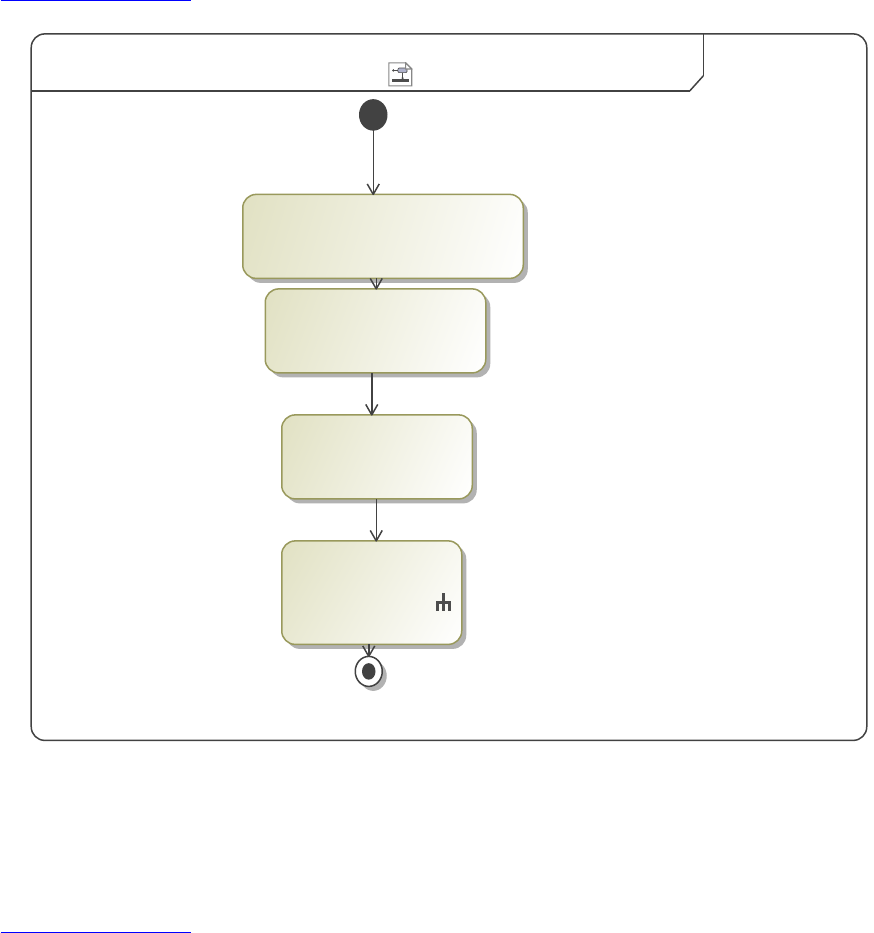
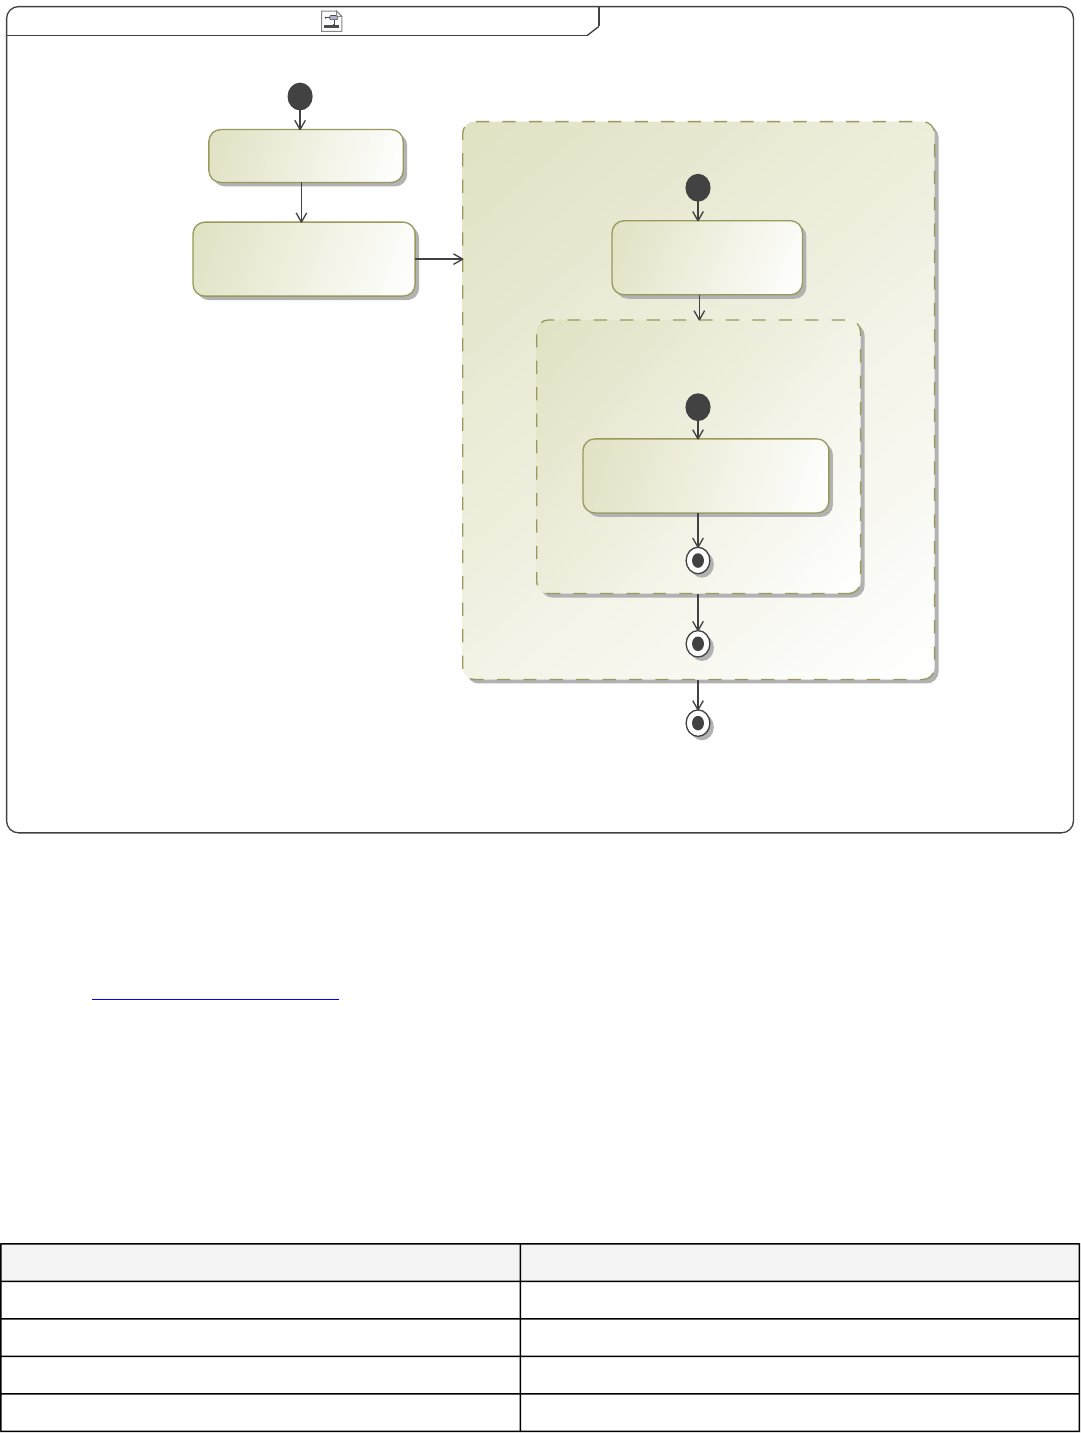
CollectOwnedElements Infinite DepthCollectOwnedElements Infinite Depthactivity ][
«DiagramOrder»
«Paragraph»
{desiredAttribute = Documentation}
«CollectOwnedElements»
{depth = 0}
«FilterByStereotypes»
{stereotypes = Block}
: BulletedListPreset
«BulletedList»
Figure 4. CollectOwnedElements Infinite Depth
"CollectOwnedElements" gathers anything owned by the exposed element(s) in the model to be used in the viewpoint method.
This specific method deals with infinite depth, which means it collects all owned elements, as opposed to those just on a specified
depth (such as level 1 children).
Reference: CollectOwnedElements
1.3.1.1.1.1 Single Depth Example
1. Sandwich Bag
2. Thermos
3. Bag of Chips
4. Cake
1.3.1.1.1.2 Infinite Depth Example
1. Sandwich Bag
2. Sandwich
3. Thermos
4. Bag of Chips
5. Cake
6. Nail File
18
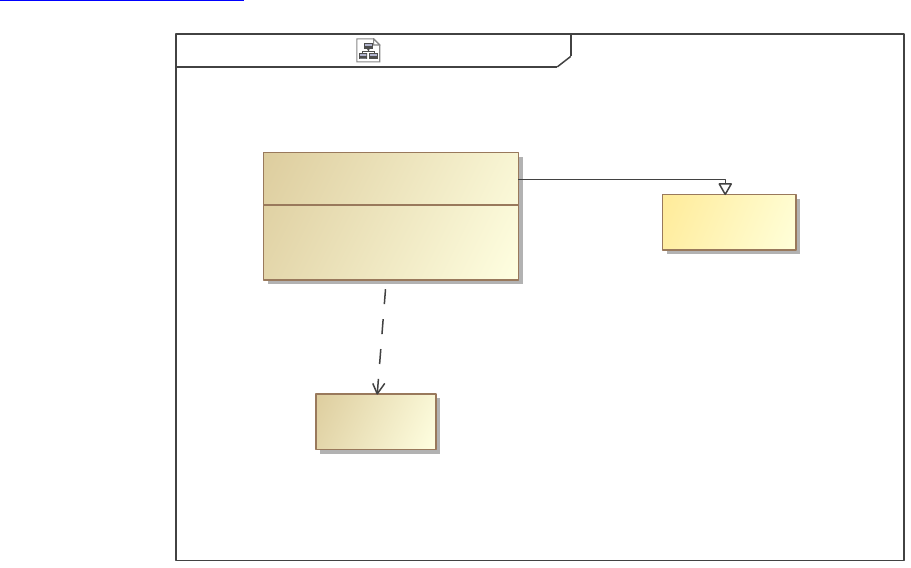
1.3.1.1.2 CollectOwners
"CollectOwners" is essentially the opposite of "CollectOwnedElements". It gathers all of the owners (from the containment tree) of the
exposed element(s) for use in the viewpoint method. Using a different block "Target", this returns the path of ownership in the
containment tree. It starts with the direct ownership package (Example Elements) and progresses back to the entire model (Data)
because the "DepthChoosable" was set at 0 (infinite).
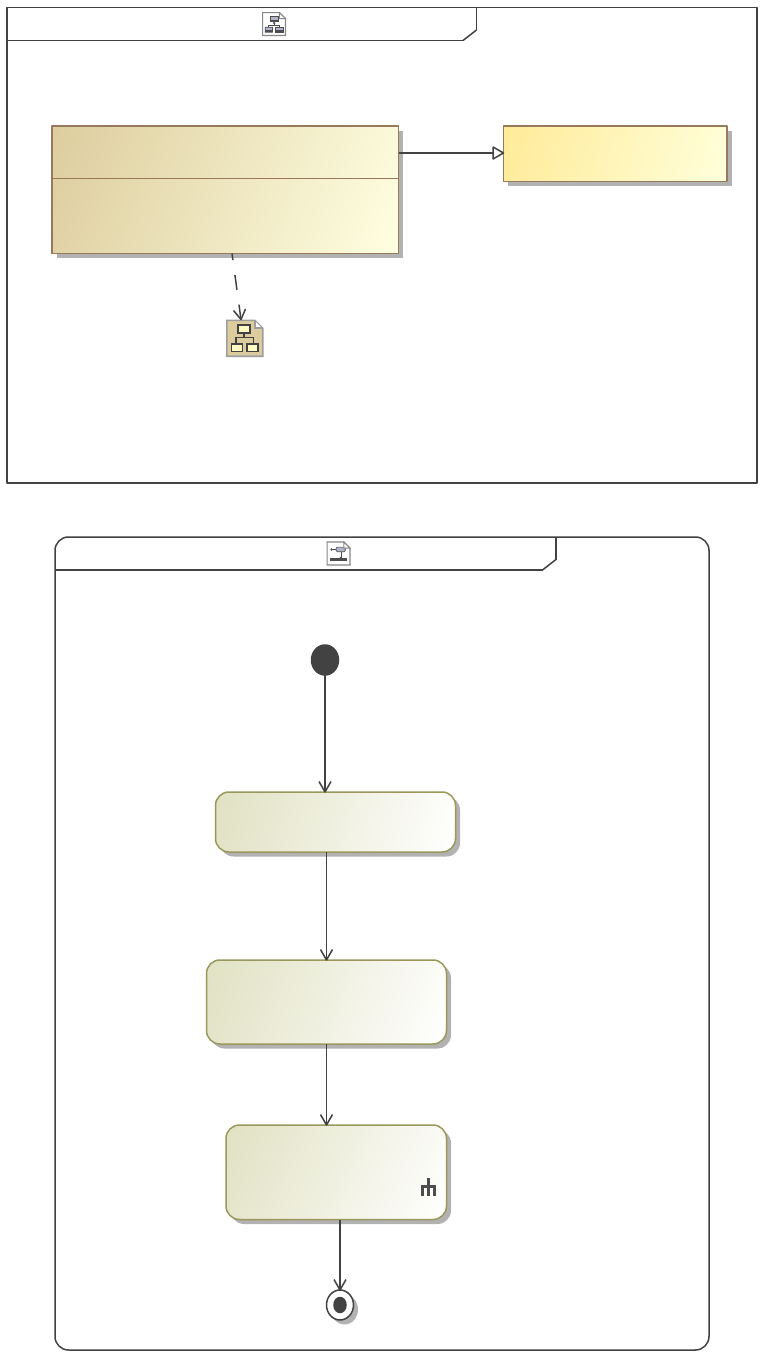
CollectOwners Example View shows the output of the following diagrams.
Example View DiagramCollectOwnersclass [ ]
{(,)}
{(View Documentation,list)}
constraints
«view»
CollectOwners Example View
CollectOwners
«viewpoint»
Target
«block»
«Conforms»
«Expose»
Figure 5. Example View Diagram
19
CollectOwners CollectOwnersactivity [ ]
«BulletedList»
: BulletedListPreset
«CollectOwners»
Figure 6. CollectOwners
"CollectOwners" is essentially the opposite of "CollectOwnedElements". It gathers all of the owners (from the containment tree) of the
exposed element(s) for use in the viewpoint method.
Reference: CollectOwners
20
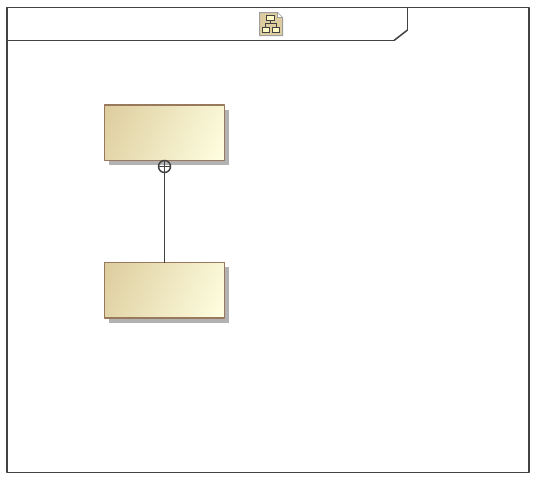
Example Elements Example BDD[Block]bdd [ ]
«block»
Target
Owner
«block»
Figure 7. Example BDD
1.3.1.1.2.1 CollectOwners Example View
1. Owner
2. Example Elements
3. CollectOwners
4. Collect
5. Create Viewpoint Methods Examples
6. Models
7. Docgen
8. Data
1.3.1.1.3 CollectThingsOnDiagram
CollectThingsOnDiagram will collect all the elements depicted on a diagram. To demonstrate this, the Example BDD was exposed.
Note that the name of each element as well as the viewpoint method itself is listed below. Names are often not automatically created
with an element, so these must be inserted in the model. Otherwise a "no content for..." message will appear in the name's spot.
21
CollectThingsOnDiagram Example View Diagramclass [ ]
constraints
{(,)}
{(View Documentation,list)}
«view»
CollectThingsOnDiagram Example View CollectThingsOnDiagram
«viewpoint»
Example BDD
«Conforms»
«Expose»
Figure 8. Example View Diagram
CollectThingsOnDiagramCollectThingsOnDiagramactivity ][
«SortByAttribute»
{desiredAttribute = Name}
«CollectThingsOnDiagram»
: BulletedListPreset
«BulletedList»
Figure 9. CollectThingsOnDiagram
"CollectThingsOnDiagram" will collect all the elements depicted on a diagram.
22
Reference: CollectThingsOnDiagram
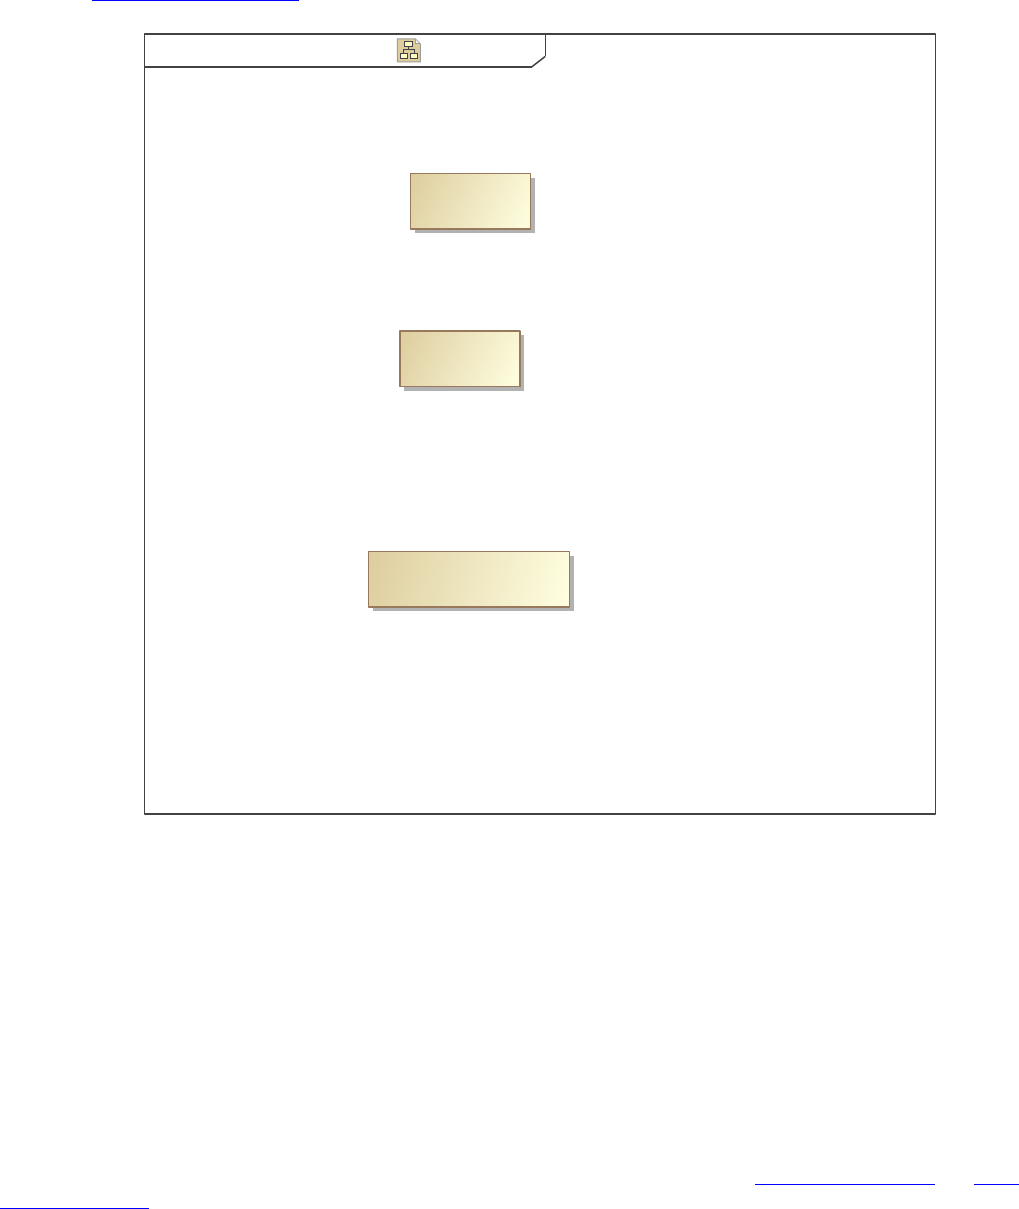
Example Elements Example BDD[Block]bdd [ ]
«block»
This is in the Diagram
Other
«block»
Item
«block»
Figure 10. Example BDD
Another element not shown on this diagram will not be picked up by this method.
1.3.1.1.3.1 CollectThingsOnDiagram Example View
1. Example BDD
2. Item
3. Other
4. This is in the Diagram
1.3.1.1.4 CollectByStereotypeProperties
CollectByStereotypeProperties collects the properties of the stereotypes. The following views Bulleted List Example and Table
Structure Example show the output of the view structure described in the Example View Diagram below.
23
CollectByStereotypeProperties Example View Diagramclass [ ]
«viewpoint»
CollectByStereotypeProperties Table
«viewpoint»
CollectByStereotypeProperties List
{(View Documentation,list)}
{(,)}
constraints
Bulleted List Example
«view»
{(Example Table)}
{()}
constraints
Table Structure Example
«view»
Example Elements
«block»
«Expose»
«Conforms»
«Conforms»
«Expose»
Figure 11. Example View Diagram
24
CollectByStereotypeProperties ListCollectByStereotypeProperties Listactivity ][
«CollectByStereotypeProperties»
{stereotypeProperties = someElem}
: BulletedListPreset
«BulletedList»
«CollectOwnedElements»
Figure 12. CollectByStereotypeProperties List
"CollectByStereotypeProperties" collects the properties of the stereotypes.
This specific method collects the properties of the stereotype "List".
Reference: CollectByStereotypeProperties
25
Example Elements Example BDD[Block]bdd ][
someElem = SampleElement2
«SomeStereotype»
«block»
«SomeStereotype»
Block4
someElem = SampleElement2
«SomeStereotype»
«block»
«SomeStereotype»
Block3
«SomeStereotype»
someElem = SampleElement2
«block»
«SomeStereotype»
Block2
someElem = SampleElement2
«SomeStereotype»
«block»
«SomeStereotype»
Block1
-someElem : Element
attributes
SomeStereotype
[Element]
«stereotype»
SampleElement2
«block»
«block»
SampleElement2
Figure 13. Example BDD
26
CollectByStereotypeProperties Table CollectByStereotypeProperties Tableactivity ][
Example Table
«TableStructure»
someElem
«TableAttributeColumn»
{desiredAttribute = Name}
«CollectByStereotypeProperties»
{stereotypeProperties = someElem}
«TableAttributeColumn»
Element Name
{desiredAttribute = Name}
«FilterByStereotypes»
{stereotypes = SomeStereotype}
«CollectOwnedElements»
Figure 14. CollectByStereotypeProperties Table
"CollectByStereotypeProperties" collects the properties of the stereotypes.
This specific method collects the properties of the stereotype "Table".
Reference: CollectByStereotypeProperties
1.3.1.1.4.1 Bulleted List Example
1. SampleElement2
2. SampleElement2
1.3.1.1.4.2 Table Structure Example
Table 2. Example Table
Element Name someElem
Block1 SampleElement2
Block2 SampleElement2
Block3 SampleElement2
Block4 SampleElement2
27
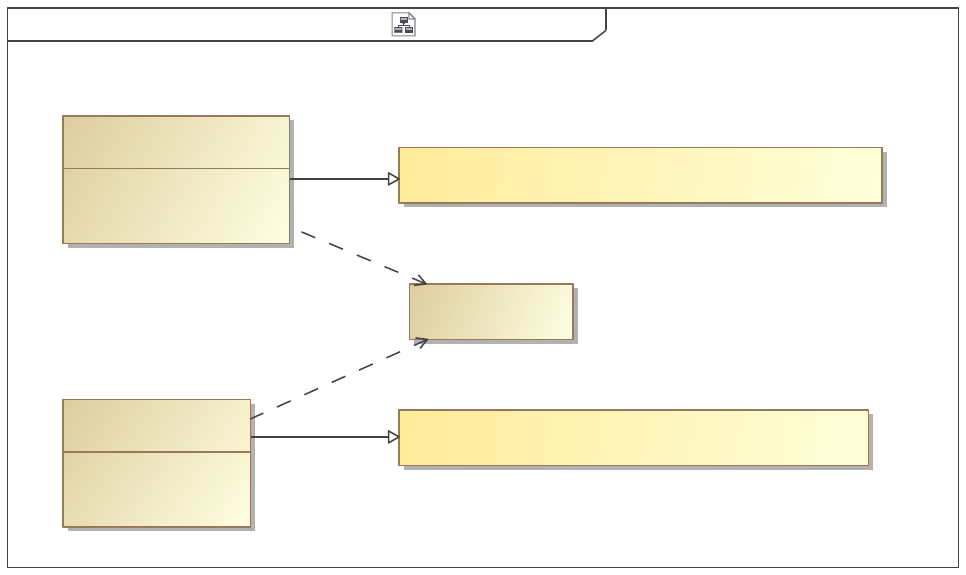
1.3.1.1.5 CollectByDirectedRelationshipMetaclasses
CollectByDirectedRelationshipMetaclasses action collects elements based on the relationships that other elements use to connect to
them. Note that in the example, Helo and Athena are connected to Hera with a "Dependency" (the dashed arrowed line). In other
words, Hera depends on Helo and Athena. These are the only dependencies in the example, so if I expose the Example Elements
package, collect the owned elements, and then use this operator with the metaclass "Dependency", only Helo and Athena will be
collected. Note the origin of the dependency - Hera - is NOT collected with this operator.
Selecting [...] under MetaclassChoosable in the specification will open the element selector, allowing the selection of the desired
metaclass. Make sure the metaclass option is selected in the lower left corner or else metaclasses will not show in the search. Also
keep in mind that depending on the extensions, plug-ins, etc. that you are using in Magic Draw, there might be multiple metaclasses
with the same name (i.e. the built-in one and additional custom ones). Be careful to select the metaclass you are using in the model.
The final results of this operator are shown in the following views.
CollectByDirectedRelationshipMetaclasses Example View Diagramclass [ ]
«viewpoint»
CollectByDirectedRelationshipMetaclasses Direction Out
«viewpoint»
CollectByDirectedRelationshipMetaclasses Direction In
{(View Documentation,list)}
constraints
{(,)}
Direction Out Example
«view»
constraints
{()}
{(list)}
«view»
Direction In Example
Example Elements
«block»
«Expose»
«Conforms»
«Expose»
«Conforms»
Figure 15. Example View Diagram
28
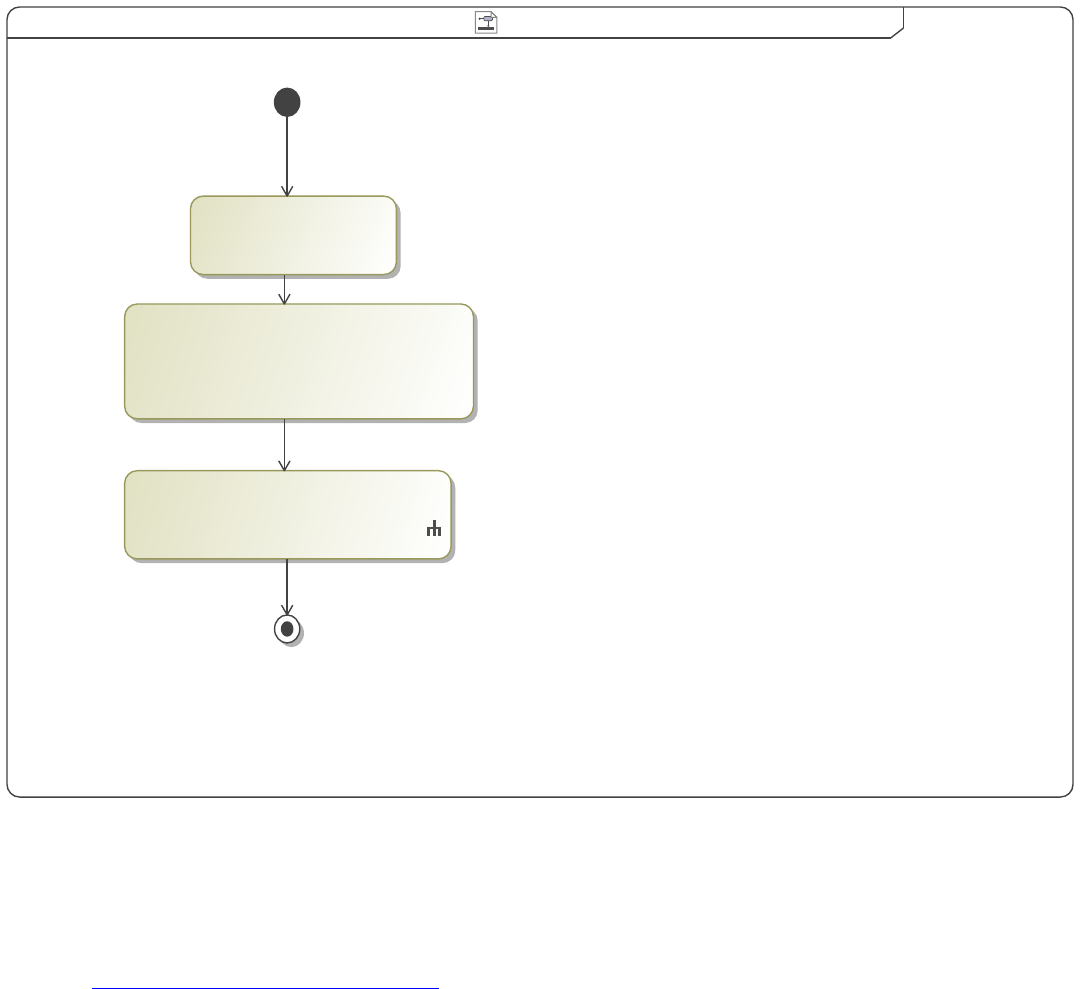
CollectByDirectedRelationshipMetaclasses Direction Out CollectByDirectedRelationshipMetaclasses Direction Outactivity [ ]
«CollectByDirectedRelationshipMetaclasses»
{depth = 0,
directionOut,
metaclasses = Dependency}
: BulletedListPreset
«BulletedList»
«CollectOwnedElements»
{depth = 1}
Figure 16. CollectByDirectedRelationshipMetaclasses Direction Out
CollectByDirectedRelationshipMetaclasses action collects elements based on the relationships that other elements use to connect to
them.
This specific method collects elements based on their "Direction Out" relationships.
Reference: CollectByDirectedRelationshipMetaclasses
29
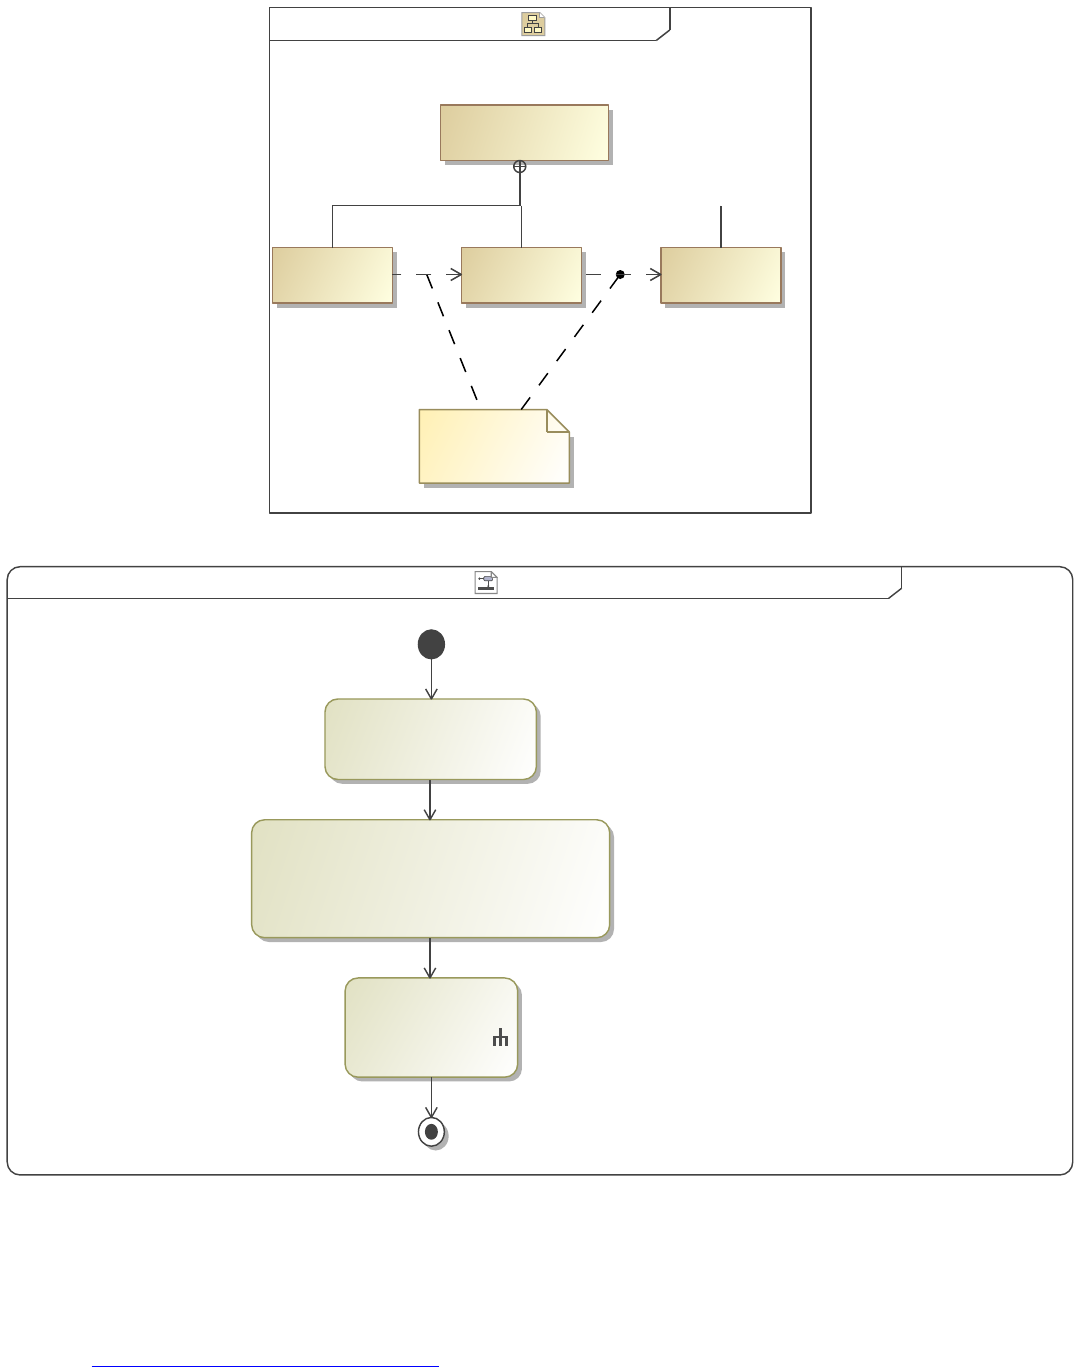
Example Elements Example BDD[Block]bdd ][
«block»
Example Elements
«block»
HeloAthena
«block»
Hera
«block»
These are
Dependencies
Figure 17. Example BDD
CollectByDirectedRelationshipMetaclasses Direction In CollectByDirectedRelationshipMetaclasses Direction Inactivity ][
«CollectByDirectedRelationshipMetaclasses»
{depth = 0,
directionOut = false,
metaclasses = Dependency}
«CollectOwnedElements»
{depth = 1}
«BulletedList»
: BulletedListPreset
Figure 18. CollectByDirectedRelationshipMetaclasses Direction In
CollectByDirectedRelationshipMetaclasses action collects elements based on the relationships that other elements use to connect to
them.
This specific method collects elements based on their "Direction In" relationships.
Reference: CollectByDirectedRelationshipMetaclasses
1.3.1.1.5.1 Direction Out Example
30
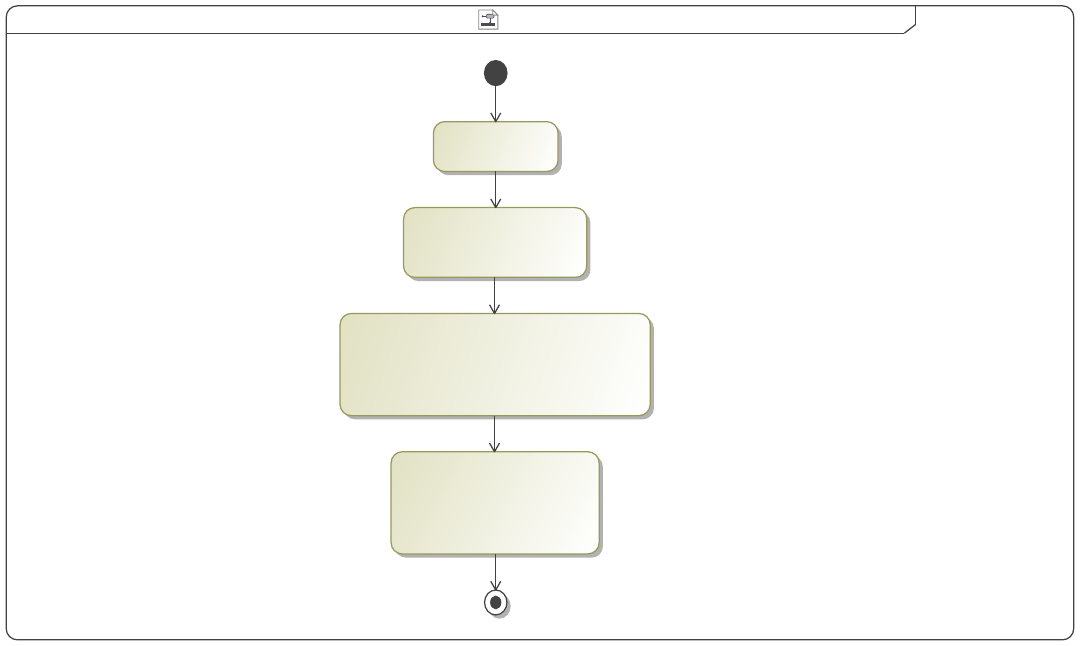
1. Athena
2. Helo
1.3.1.1.5.2 Direction In Example
1. Hera
2. Athena
1.3.1.1.5.3 Direction Out
CollectByDirectedRelationshipMetaclasses Viewpoint Method Two CollectByDirectedRelationshipMetaclasses Viewpoint Method Twoactivity [ ]
«CollectByDirectedRelationshipMetaclasses»
{depth = 1,
directionOut = false,
metaclasses = Dependency}
«BulletedList»
{orderedList,
showStereotypePropertyNames,
showTargets}
«CollectOwnedElements»
{depth = 1}
«Image»
Figure 19. CollectByDirectedRelationshipMetaclasses Viewpoint Method Two
1.3.1.1.6 CollectByDirectedRelationshipStereotypes
CollectByDirectedRelationshipStereotypes also collects elements based on the relationships that connect them to other elements.
However, here the collection is by the stereotype of the relationship instead of the metaclass (as in the previous section).
31
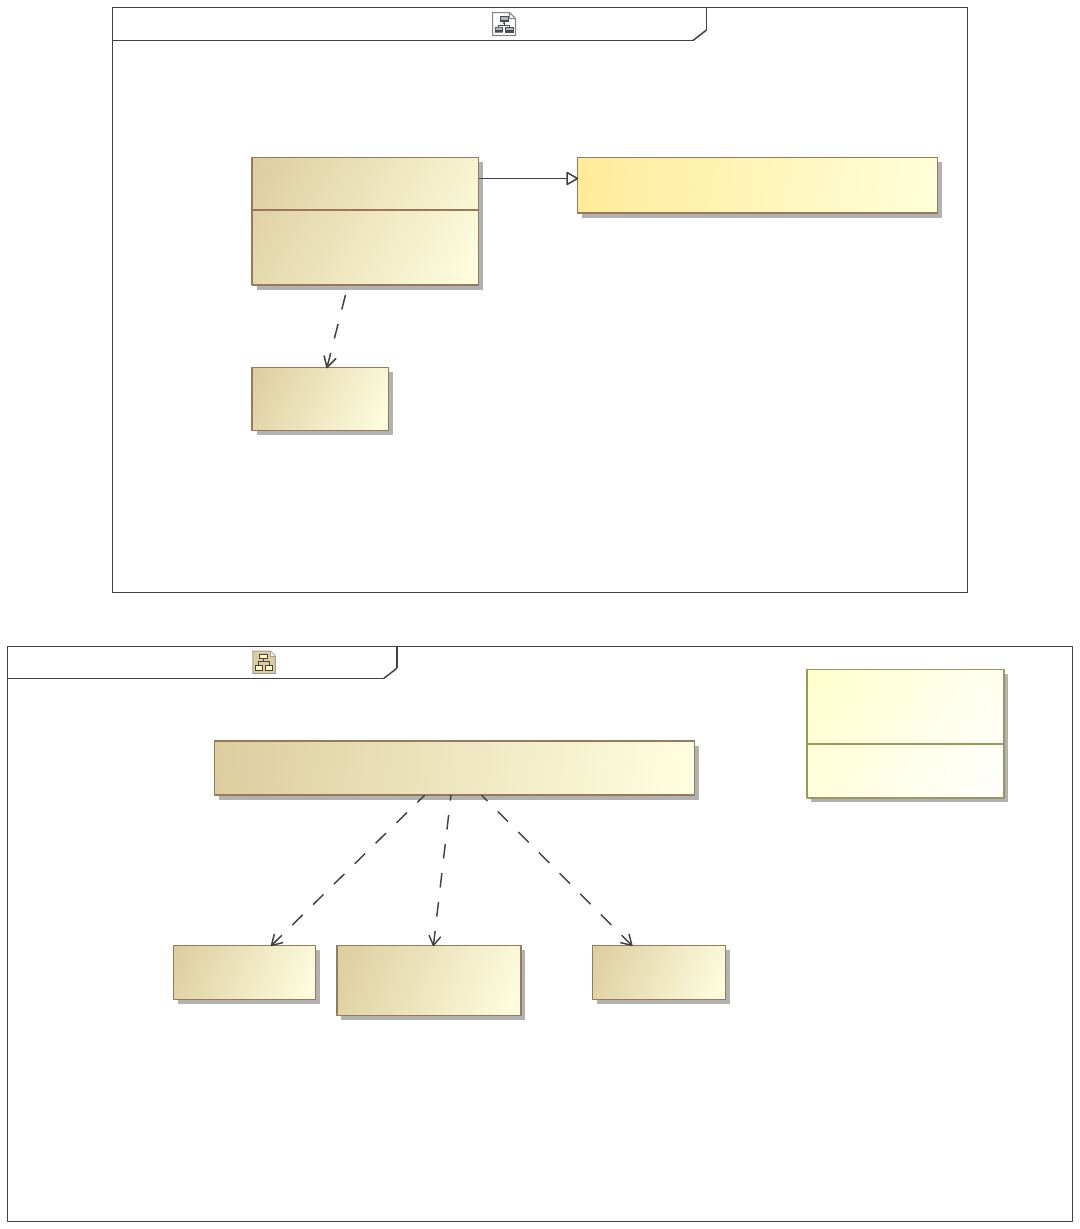
CollectByDirectedRelationshipStereotypes Example View Diagramclass ][
CollectByDirectedRelationshipStereotypes
«viewpoint»
{(,)}
{(View Documentation,list)}
constraints
Example View
«view»
«block»
Target
«Conforms»
«Expose»
Figure 20. Example View Diagram
Example Elements Example BDD[Block]bdd [ ]
«block»
Target
attributes
-name : String = special
SpecialAssoc
«stereotype»
[Dependency]
This Also Wont Show
«block»
This Wont show
«block» «block»
This Will Show
«SpecialAssoc»
Figure 21. Example BDD
32
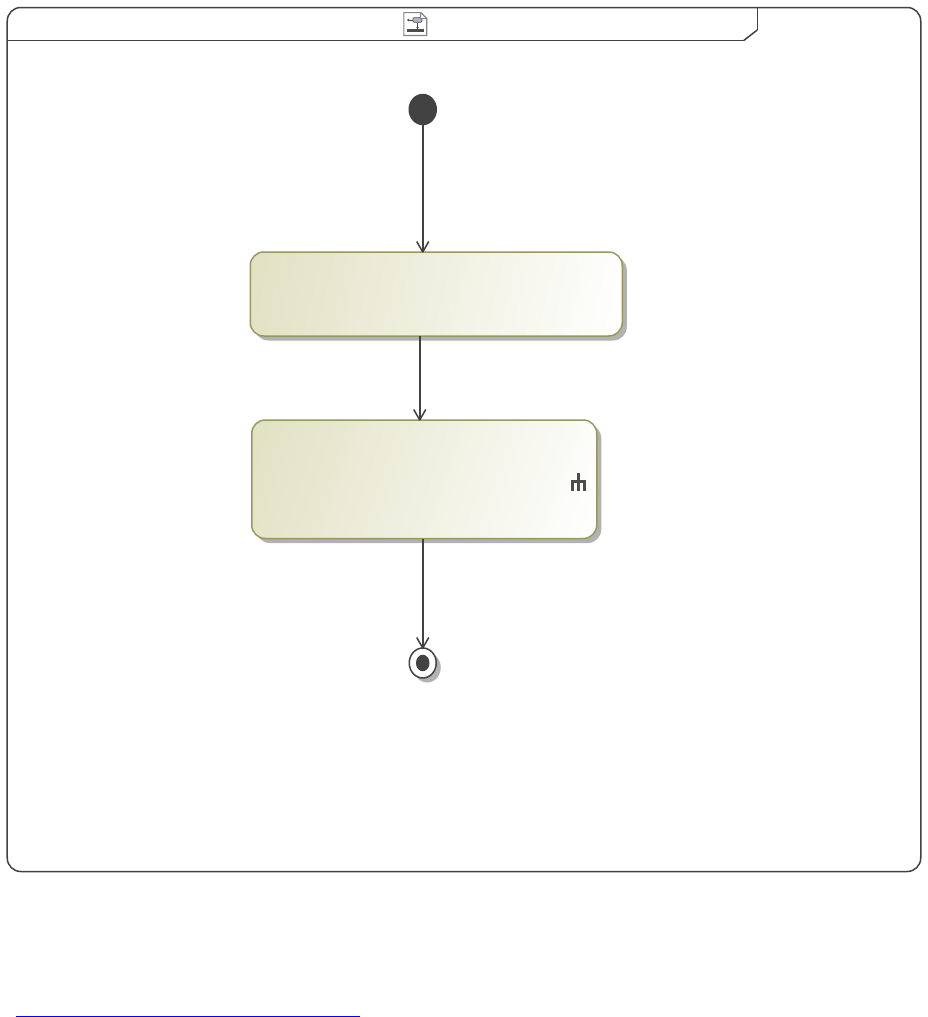
CollectByDirectedRelationshipStereotypes CollectByDirectedRelationshipStereotypesactivity [ ]
«CollectByDirectedRelationshipStereotypes»
{stereotypes = SpecialAssoc}
: BulletedListPreset
«BulletedList»
Figure 22. CollectByDirectedRelationshipStereotypes
"CollectByDirectedRelationshipStereotypes" also collects elements based on the stereotypeof the relationships that connect them to
other elements.
Reference: CollectByDirectedRelationshipStereotypes
1.3.1.1.6.1 Example View
1. This Will Show
1.3.1.1.7 CollectByAssociation
CollectByAssociation collects the blocks with aggregation of either composite, shared, or none. In other words, both white diamond
associations (shared) and black diamond associations (composite) can be collected by this action. The CollectByAssociation action
will then collect only those blocks that have the aggregation type as noted in the specification for CollectByAssociation block.
In the view diagram, this view exposes the Sample Element and conforms to the CollectByAssociation viewpoint method. The result
of this viewpoint method is shown in the following view.
33
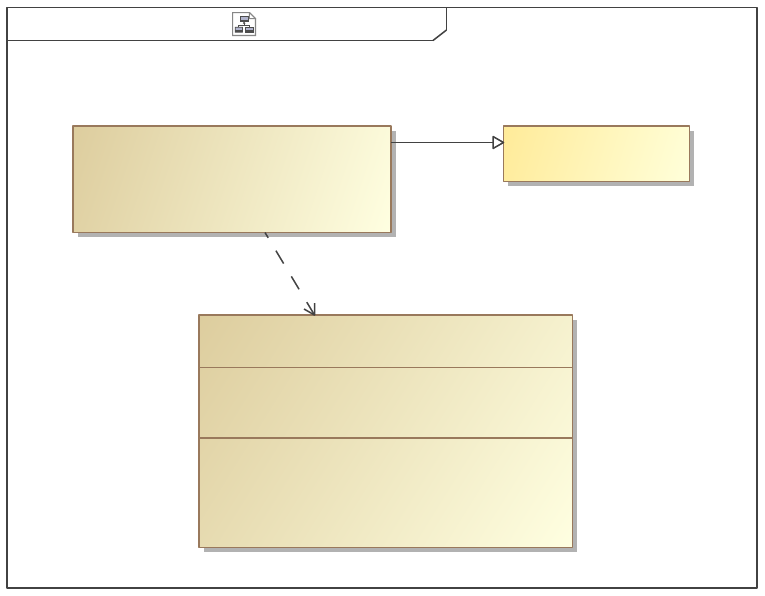
Example View DiagramCollectByAssociationclass [ ]
directed Composition : Directed Composition
composition : Composition
parts
directed Association : Directed Association
directed Aggregation : Directed Aggregation
aggregation : Aggregation
references
Sample Element
«block»
«view»
Example View
«viewpoint»
CollectByAssociation
«Conforms»
«Expose»
Figure 23. Example View Diagram
34
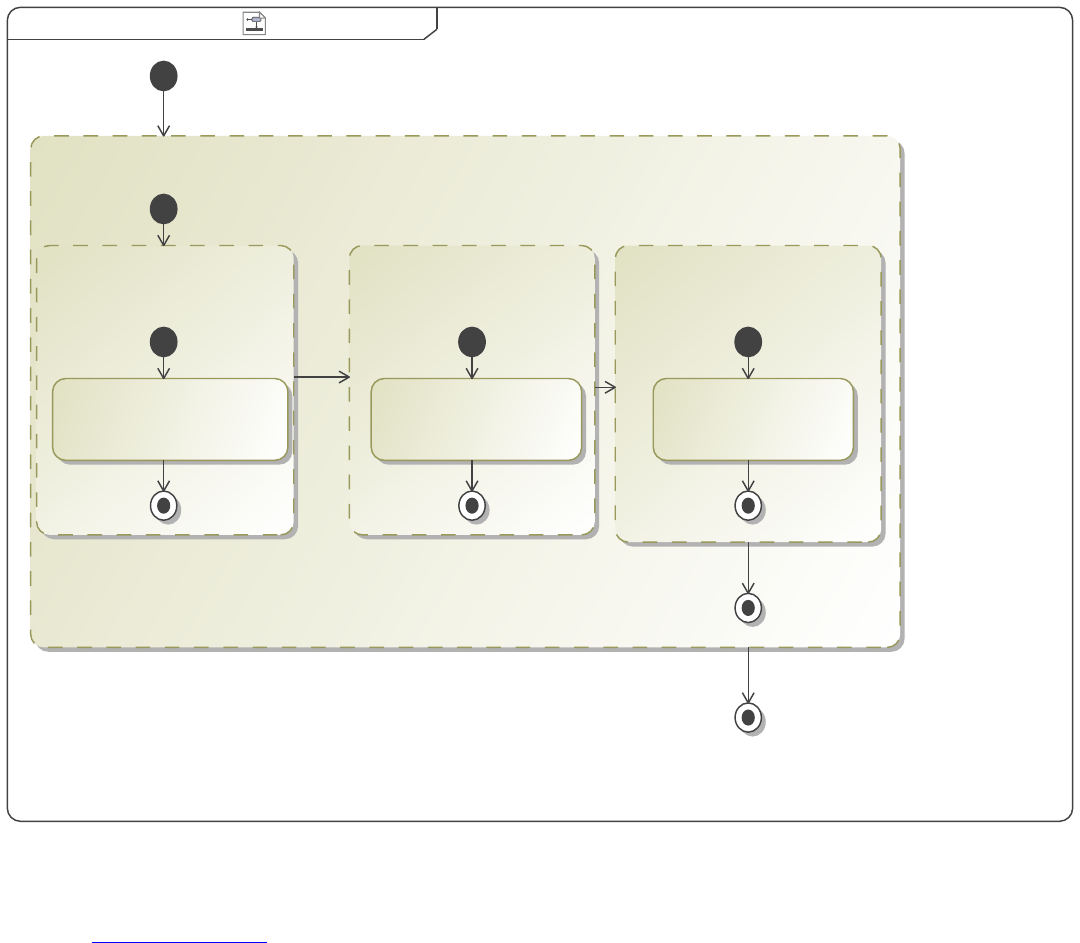
CollectByAssociationCollectByAssociationactivity ][
Example Table
«TableStructure»
«TableAttributeColumn»
None
{desiredAttribute = Name}
«CollectByAssociation»
{associationType = none}
Composite
«TableAttributeColumn»
{desiredAttribute = Name}
«CollectByAssociation»
{associationType = composite}
Shared
«TableAttributeColumn»
{desiredAttribute = Name}
«CollectByAssociation»
{associationType = shared}
Figure 24. CollectByAssociation
"CollectByAssociation" collects the blocks with aggregation of either composite, shared, or none.
Reference: CollectByAssociation
35
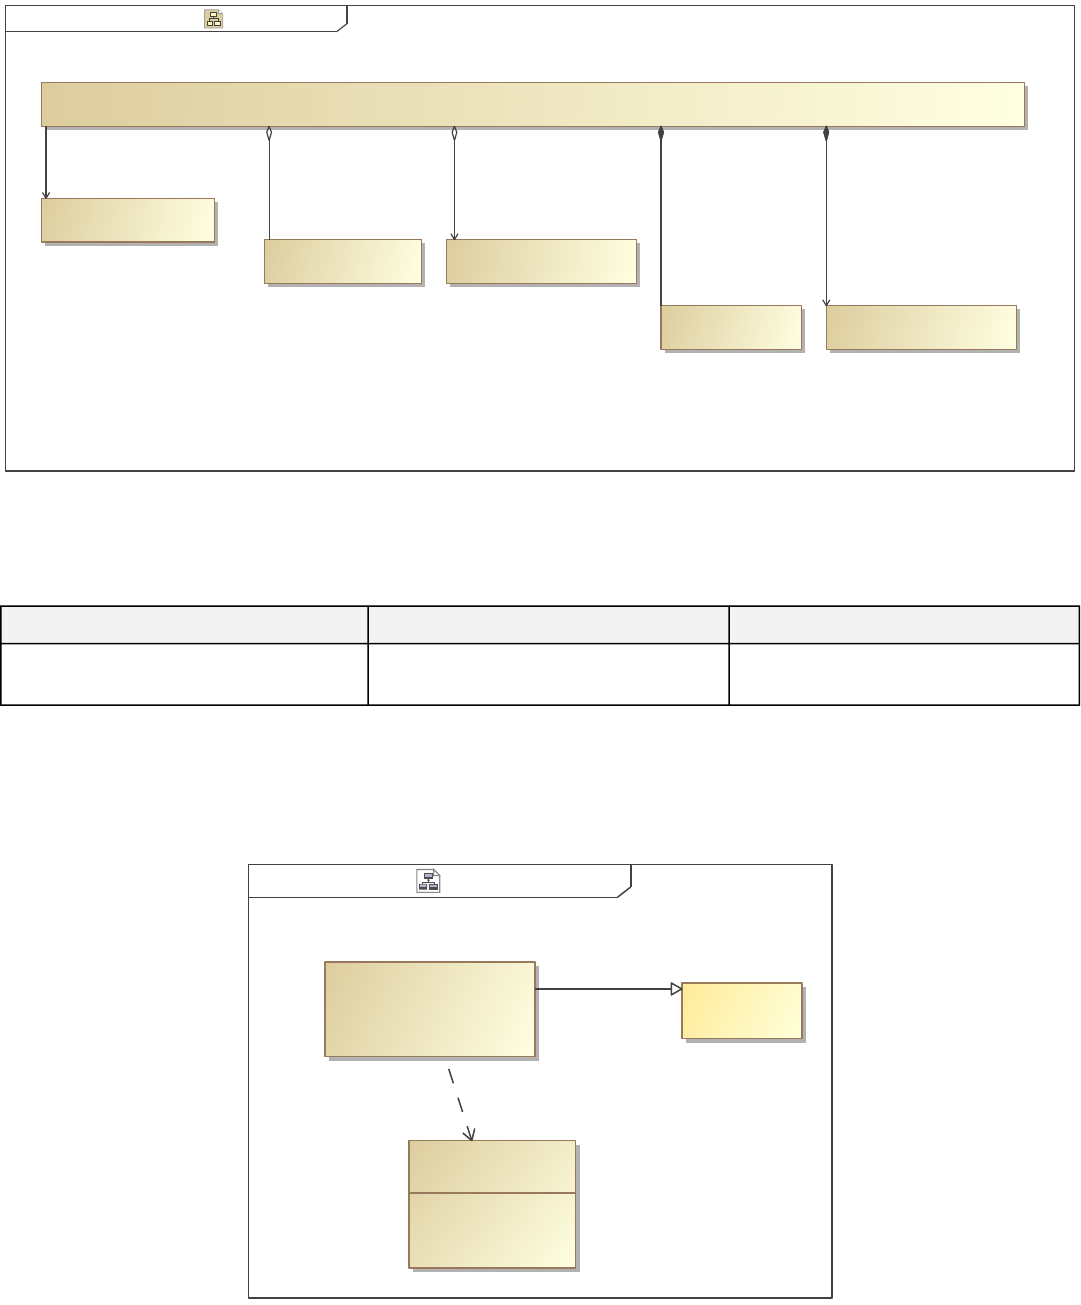
Example ElementsExample Elements[Block]bdd [ ]
«block»
Sample Element
Directed Composition
«block»
«block»
Directed Aggregation
«block»
Directed Association
«block»
Aggregation
Composition
«block»
composition
sample Element
directed Composition
aggregation
sample Element
directed Aggregation
directed Association
Figure 25. Example Elements
1.3.1.1.7.1 Example View
Table 3. Example Table
Composite Shared None
Directed Composition
Composition
Directed Aggregation
Aggregation Directed Association
1.3.1.1.8 CollectTypes
CollectTypes collects types. In this case, the CollectOwnedElements or CollectOwners needs to be used to collect elements before
CollectTypes. Then, CollectTypes will collect the type associated with each element. The viewpoint method diagram is shown below.
Example View DiagramCollectTypesclass [ ]
Example View
«view»
c : Chassis
parts
b : Braking System
Vehicle
«block»
CollectTypes
«viewpoint»
«Conforms»
«Expose»
Figure 26. Example View Diagram
36
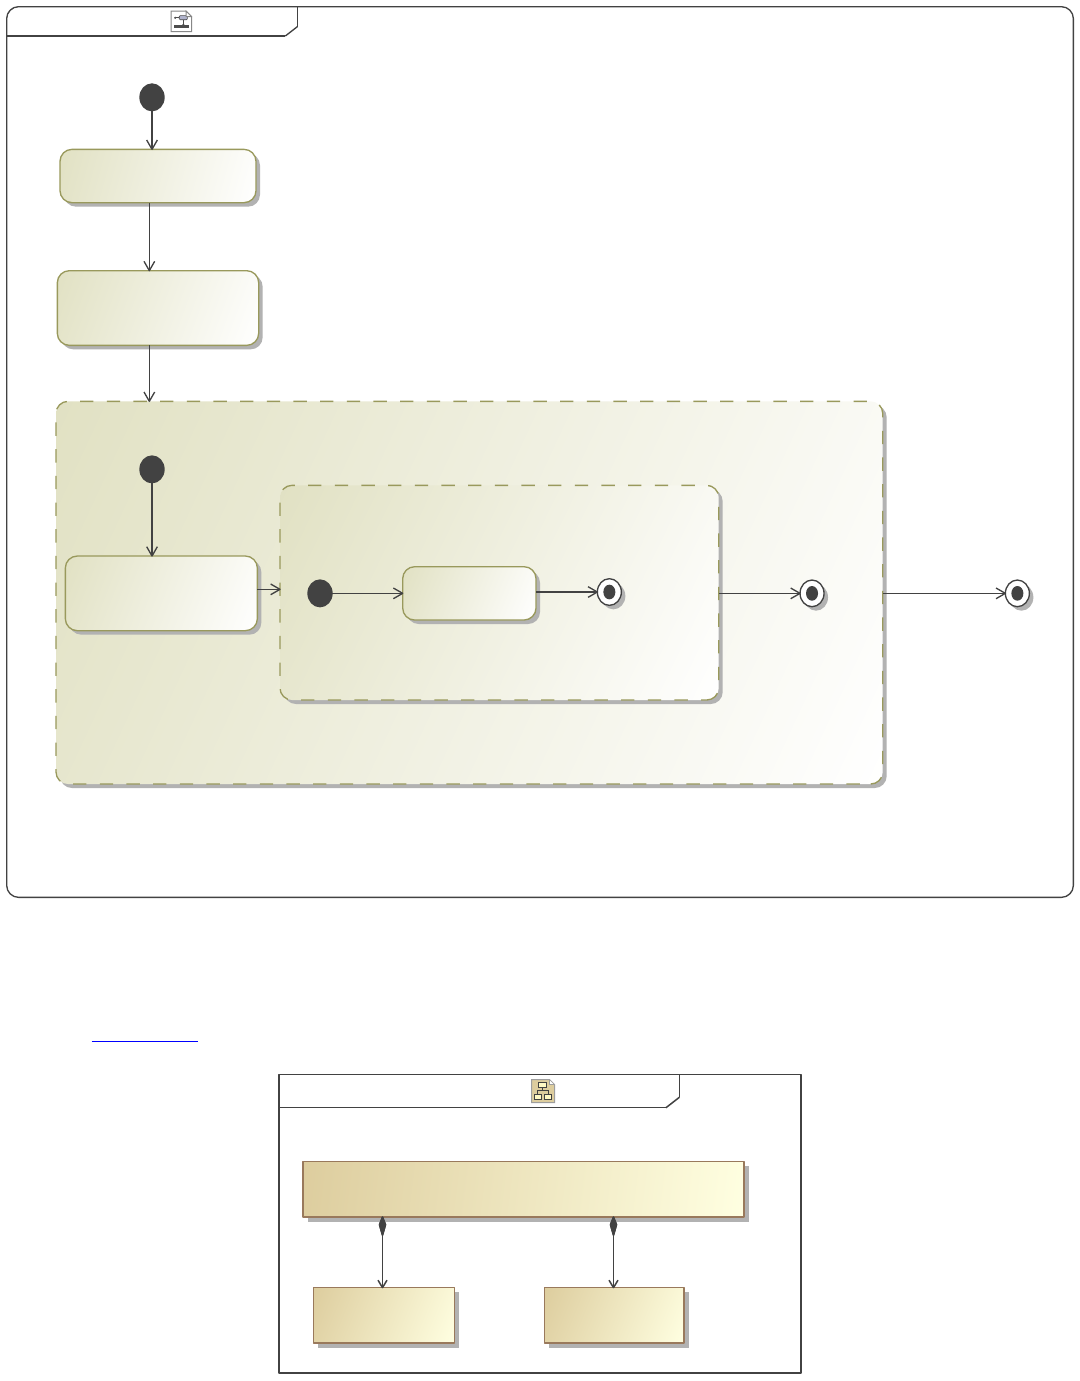
CollectTypes CollectTypesactivity ][
«TableStructure»
Classifiers
«TableAttributeColumn»
Type
{desiredAttribute = Name}
«CollectTypes»
Name
«TableAttributeColumn»
{desiredAttribute = Name}
«FilterByStereotypes»
{stereotypes = PartProperty}
«CollectOwnedElements»
Figure 27. CollectTypes
CollectTypes collects the types of already collected elements. Most times, CollectOwned Elements or CollectOwners are used to
collect said elements.
Reference: CollectTypes
Example Elements Example BDD[Block]bdd ][
«block»
Vehicle
«block»
Braking System Chassis
«block»
cb
Figure 28. Example BDD
37
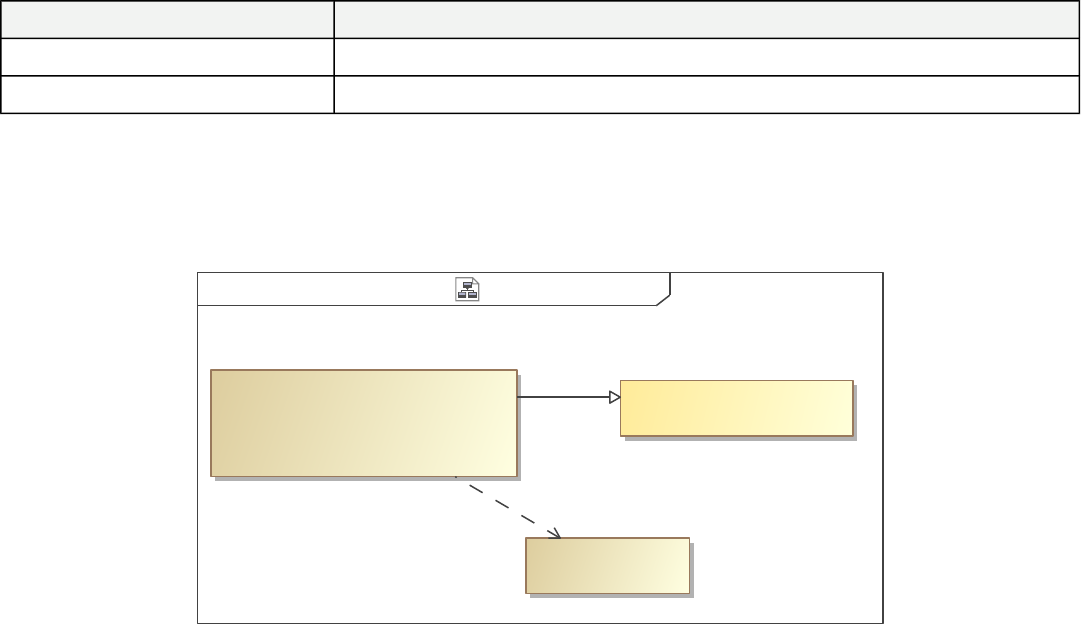
1.3.1.1.8.1 Example View
Table 4. Classifiers
Name Type
b Braking System
c Chassis
1.3.1.1.9 CollectClassifierAttributes
CollectClassifierAttributes collects attributes of a class. To use this operation, we do not need to use CollectOwnedElements or
CollectOwners, unlike in previous sections. The results are displayed in the following Example View table.
CollectClassifierAttributes Example View Diagramclass [ ]
Example View
«view»
CollectClassifierAttributes
«viewpoint»
«block»
Example Elements
«Expose»
«Conforms»
Figure 29. Example View Diagram
38
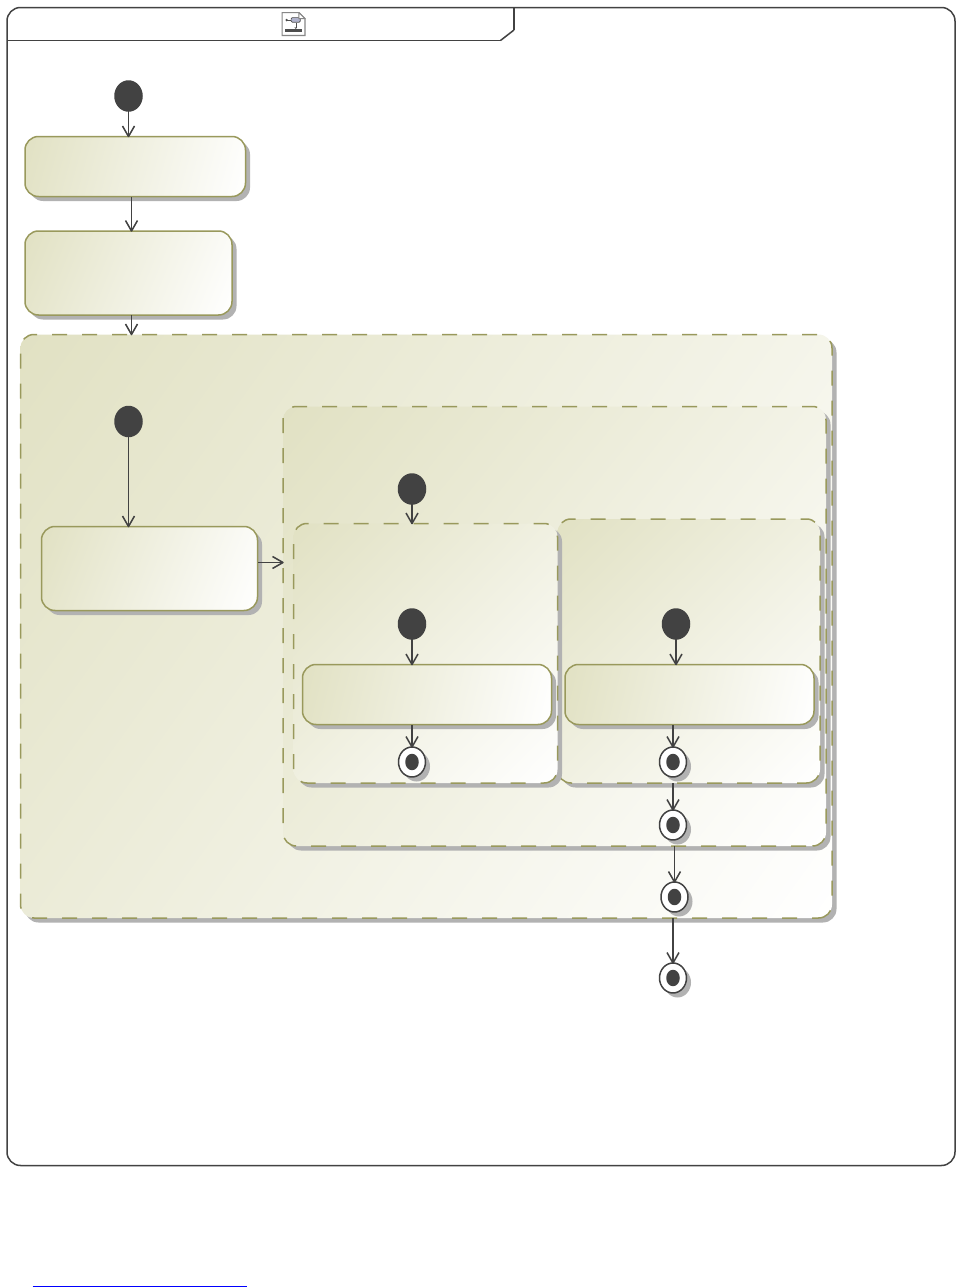
CollectClassifierAttributes CollectClassifierAttributesactivity [ ]
Owned Items
«TableStructure»
Classifier Attributes
«TableColumnGroup»
«TableAttributeColumn»
Attribute Value
{desiredAttribute = Value}
«CollectClassifierAttributes»
«TableAttributeColumn»
Attribute Name
{desiredAttribute = Name}
«CollectClassifierAttributes»
«TableAttributeColumn»
Item Name
{desiredAttribute = Name}
«CollectOwnedElements»
«FilterByStereotypes»
{stereotypes = Block}
Figure 30. CollectClassifierAttributes
"CollectClassifierAttributes" collects attributes of a class.
Reference: CollectClassifierAttributes
39
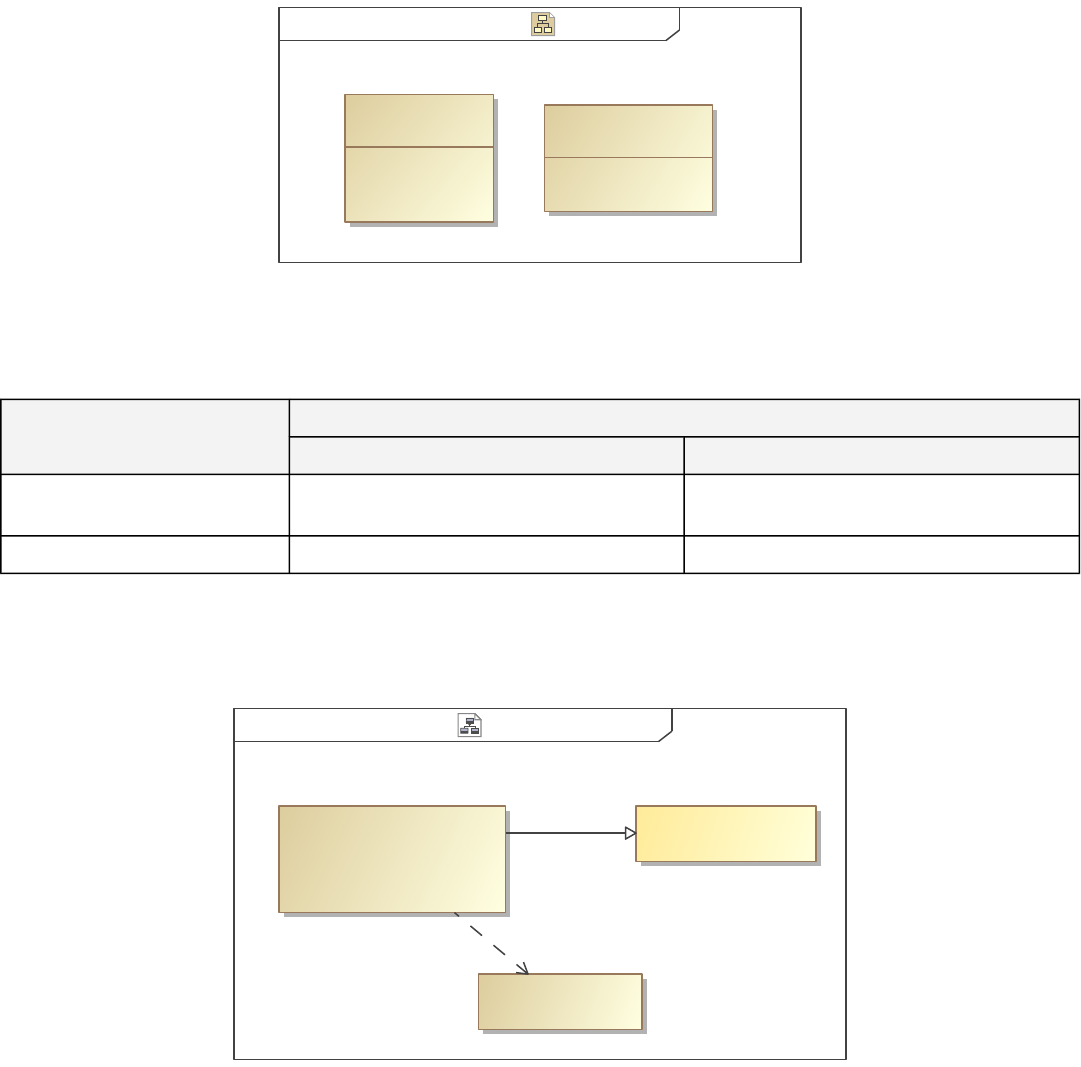
Example Elements Example BDD[Block]bdd ][
values
text : String = "this"
Other
«block»
num : Real = 4.0
values
other : Real = 5.0
«block»
Item
Figure 31. Example BDD
1.3.1.1.9.1 Example View
Table 5. Owned Items
Classifier Attributes
Item Name
Attribute Name Attribute Value
Item num
other
4
5
Other text "this"
1.3.1.1.10 CollectByExpression
CollectByExpression is a more customized approach to querying a model using Object Constraint Language (OCL) .
Example View DiagramCollectByExpressionclass ][
Example View
«view»
CollectByExpression
«viewpoint»
Example Elements
«block»
«Conforms»
«Expose»
Figure 32. Example View Diagram
40
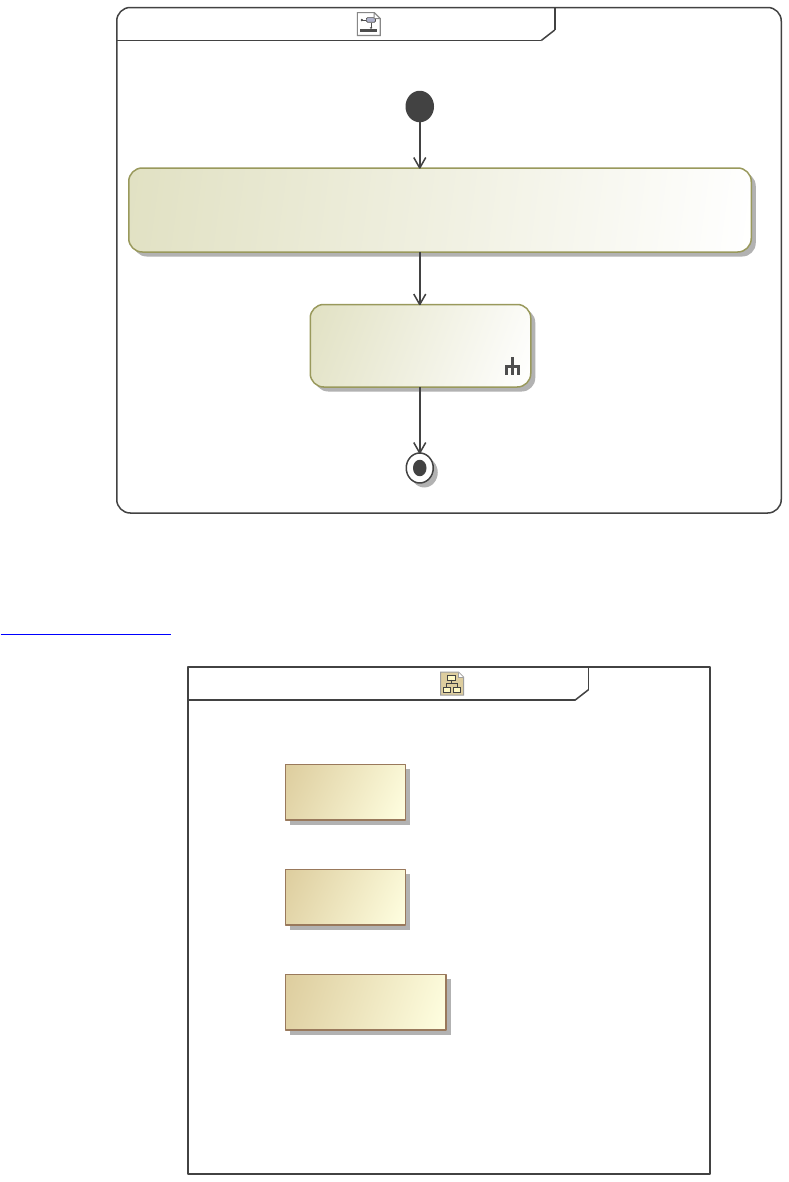
CollectByExpression CollectByExpressionactivity [ ]
«CollectByExpression»
{expression = "members()->select(x|x.oclAsType(NamedElement).name='Target')"}
«BulletedList»
: BulletedListPreset
Figure 33. CollectByExpression
"CollectByExpression" is a more customized approach to querying a model using Object Constraint Language (OCL) .
Reference: CollectByExpression
Example Elements Example BDD[Block]bdd ][
Also Not A Target
«block»
Target
«block»
«block»
Not A Target
Figure 34. Example BDD
1.3.1.1.10.1 Example View
1. Target
1.3.1.2 Filter
41

The Filter operations allow the user to narrow fields of data to the data of interest according to one or multiple filter criteria of various
types (such as stereotype, name, metaclasses, etc). For most applications, the "FilterBy..." operation needs to have a "CollectBy..."
operation preceding it so the filter operation has a data set to look through and filter.
The following sections will take a look at the various Filter operations, what they do, how to set up the operation, and what the output
could look like. The examples to follow are simpler than you would likely use with a real project, and they are meant to be simple to
explain the basic principles that can be used to create the more complicated outputs you may require.
1.3.1.2.1 FilterByDiagramType
The FilterByDiagramType activity goes through a data set and looks at the elements which are diagrams. The user can decide which
type of diagram is of interest to them, and display the names of only those diagrams in their document.
Figure 35. Example View Diagram
Figure 36. Diagrams
Figure 37. FilterByDiagramType Image
The "FilterByDiagramType" activity goes through a data set and looks at the elements which are diagrams. A Collect operation must
be used first to collect elements desired to be filtered.
Reference: FilterByDiagramType
1.3.1.2.1.1 Image Example
Figure 38. Diagrams
Figure 39. Some Block
1.3.1.2.2 FilterByNames
We will now illustrate the use of the "FilterByNames" operation, which allows the user to find all the elements within the data set with
a particular name or the elements connected to the element with the particular name. In this case, we will use the regular expression
"Bat.*" to gather all elements whose names start with "Bat"
Figure 40. Example View Diagram
Figure 41. Example BDD
Figure 42. FilterByNames
"FilterByNames" activity goes through a data set and finds all the elements within the data set with a particular name or the elements
connected to the element with the particular name. A Collect operation must be used first to collect elements desired to be filtered.
Reference: FilterByNames
1.3.1.2.2.1 Example View
1. Batman
2. Batgirl
1.3.1.2.3 FilterByMetaclasses
FilterByMetaclasses allows filtering of elements by metaclasses. As with the previous Filter operations, a Collect operation must be
used first to collect elements desired to be filtered. In the example below, the CollectOwnedElements will be used again; this time, we
will collect the elements owned by the block "Example Elements." The FilterByMetaclasses operation is then used to show the actors
in this subset of elements.
42

After dragging a "FilterByMetaclasses" block onto the diagram, go to the specification window for the "FilterByMetaclasses" block.
In this window, check the "true" box under "IncludeChoosable." As with the previous examples, checking this box means we want to
include the metaclasses we are going to choose to filter. Next, we go to the "MetaclassesChoosable" section in the specification
window, and click the "..." button . A "Select Class" window will appear. In this window, make sure the small box in the bottom left
hand corner is selected to allow metaclasses to be shown in the selection box. Now, we can navigate to "UML Standard Profile" ->
"UML2 Metamodel" -> select "Actor" -> and click the "+" button. We could also have chosen the "Stereotype" metaclass, for
example, or a number of other metaclasses.
Figure 43. Example View Diagram
Figure 44. FilterByMetaclasses
"FilterByMetaclasses" activity goes through a data set and finds all the elements that has are defined by a specified metaclass. A
Collect operation must be used first to collect elements desired to be filtered.
Reference: FilterByMetaclasses
Figure 45. Example BDD
1.3.1.2.3.1 Example View
1. Some Actor
2. Another Actor
1.3.1.2.4 FilterByStereotypes
FilterByStereotypes allows filtering of elements by the stereotype(s) applied to them.
Figure 46. Example View Diagram
Figure 47. FilterByStereotypes
"FilterByStereotypes" activity goes through a data set and finds all the elements that has are defined by a specified Stereotype. A
Collect operation must be used first to collect elements desired to be filtered.
Reference: FilterByStereotypes
Figure 48. Example BDD
1.3.1.2.4.1 Example View
1. Item
1.3.1.2.5 FilterByExpression
FilterByExpression is a more customized approach to querying a model using Object Constraint Language (OCL). The expression
value is simply a boolean written in OCL.
Figure 49. Example View Diagram
Figure 50. FilterByExpression
"FilterByExpression" activity goes through a data set and finds all the elements that satisfy (boolean) a Object constraint Language
(OCL) expression. A Collect operation must be used first to collect elements desired to be filtered.
Reference: FilterByExpression
Figure 51. Example BDD
43

1.3.1.2.5.1 Example View
1. Not Named Block
2. This Also Isn't Named Block
1.3.1.3 Sort
The Sort operations allow a data set to be sorted according to a desired parameter. Data can be sorted either by attribute, property, or
expression. These Sort operations are illustrated below. As with the Filter operations, it is necessary for us to Collect elements in some
way in order to have a data set to sort.
1.3.1.3.1 SortByAttribute
"SortByAttribute" allows the user to sort a data set by the chosen attribute. The list of attributes that can be sorted include name,
documentation, or value. With this operation, only one attribute is choosable at a time for sort. In the "FilterByStereotypes" example,
it was highlighted that a Sort operation was necessary if a user would like to alphabetize the output of a viewpoint method.
In the specification window for "SortByAttribute," we choose the "Name" option from the drop-down menu under the
"AttributeChoosable" section. Ensure "Reverse" is false.
Figure 52. Example View Diagram
Figure 53. SortByAttribute
"SortByAttribute" allows the user to sort a data set by the chosen attribute: name, documentation, value.
Reference: SortByAttribute
Figure 54. Example BDD
1.3.1.3.1.1 Example View
1. Alpha
2. Beta
3. Gamma
1.3.1.3.2 SortByProperty
Figure 55. Example View Diagram
Figure 56. Example BDD
Figure 57. SortByProperty
"SortByProperty" allows the user to sort a data set by a specified property.
Reference: SortByProperty
1.3.1.3.2.1 Example View
1. Should Be First
2. Should Be Third
3. Should Be Second
1.3.1.3.3 SortByExpression
SortByExpression is a more customized approach to querying a model using Object Constraint Language (OCL).
44
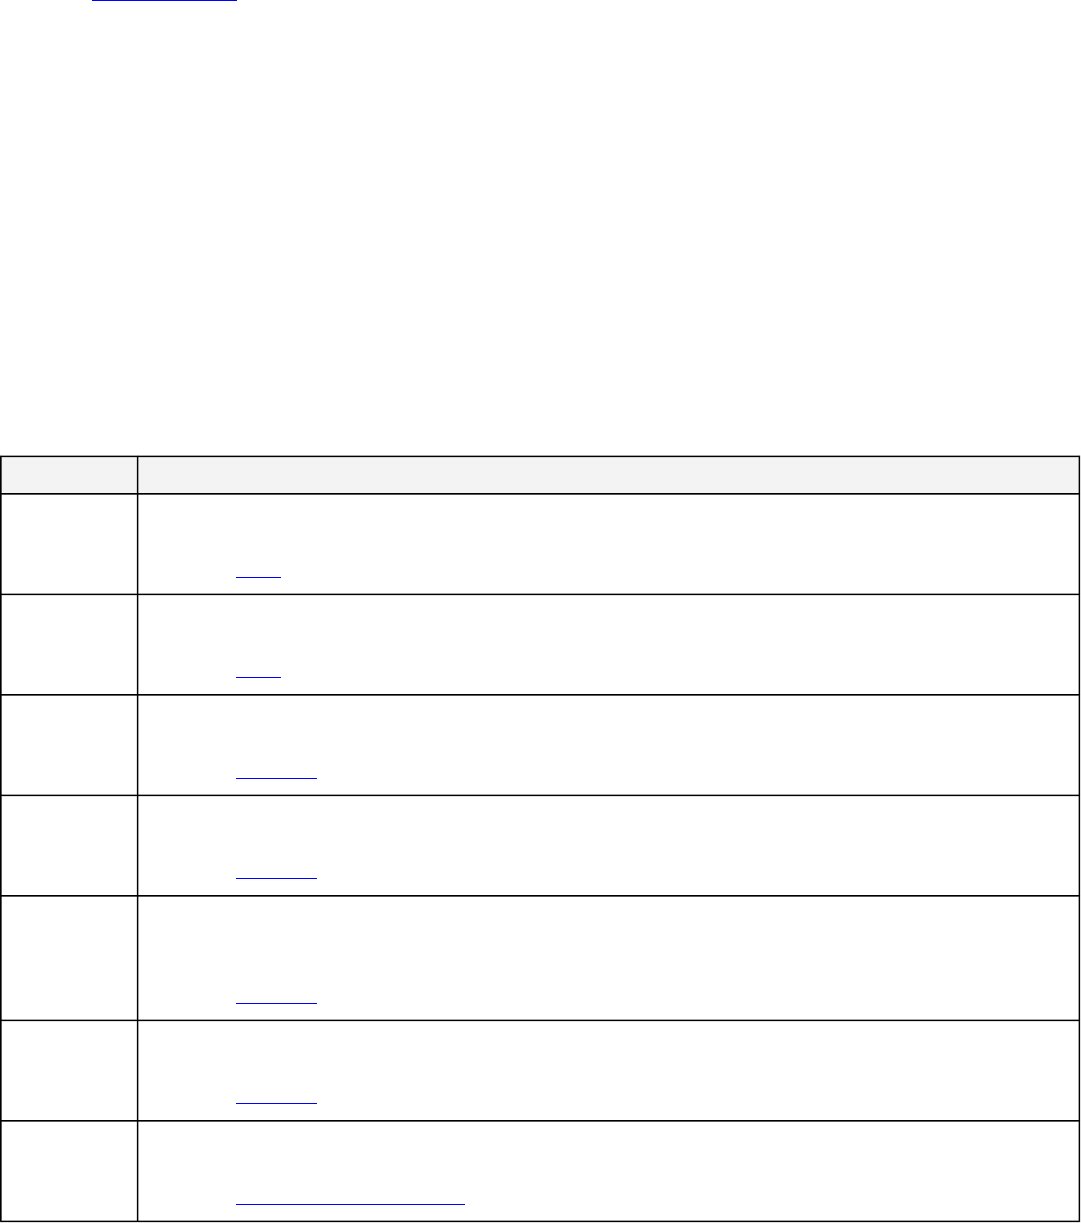
Figure 58. Example View Diagram
Figure 59. SortByExpression
"SortByExpression" a data set as specified by the Object constraint Language (OCL) expression.
Reference: SortByExpression
Figure 60. Example BDD
1.3.1.3.3.1 Example View
1. Super
2. Not Super
1.3.2 Present Model Data
After the data is collected, filtered, and/or sorted, several operators can be used to adjust how the data will be displayed. The
presentation element operators are table, image, paragraph, list, and sections. These are used in the viewpoint method diagram and
determine the formatting that will be displayed in the document views.
The following examples all use a common Zoo package, that has an assortment of elements to serve as samples. The examples that
deal with OCL use a Robot Zoo package in order to demonstrate different behavior.
Table 6. DocGen Methods
Method Name Method Description
SimpleTable
The manual demonstrates constructing a "simple" table made of attribute columns is created using the given
DocGen Table methods.
Reference: Table
ComplexTable
The manual demonstrates constructing a "complex" table made of an attribute column and a table column group
using the given DocGEn Table methods.
Reference: Table
Generic
Paragraph
Paragraph is a presentation element designed to display text. By default (aka the Generic Paragraph), displays the
documentation of the exposed elements or of the view itself.
Reference: Paragraph
Paragraph of
Name
Paragraph is a presentation element designed to display text. The "Paragraph of Name" displays the name attribute
of the exposed elements or of the view itself.
Reference: Paragraph
Paragraph of
Documentation
Paragraph is a presentation element designed to display text. The "Paragraph of Documentation" displays the
documentation attribute of the exposed elements or of the view itself. It will produce the same result of the Generic
Paragraph, but is simply another way to specify it.
Reference: Paragraph
Paragraph of
Default Value
Paragraph is a presentation element designed to display text. The "Paragraph of Default Value" displays the value
attribute of the exposed elements or of the view itself.
Reference: Paragraph
Paragraph
Body
Paragraph is a presentation element designed to display text. The body is text (can be HTML) that isspecified in the
Paragraph specification and then the "Paragraph Body" displays that body.
Reference: Paragraph Action with Body
45
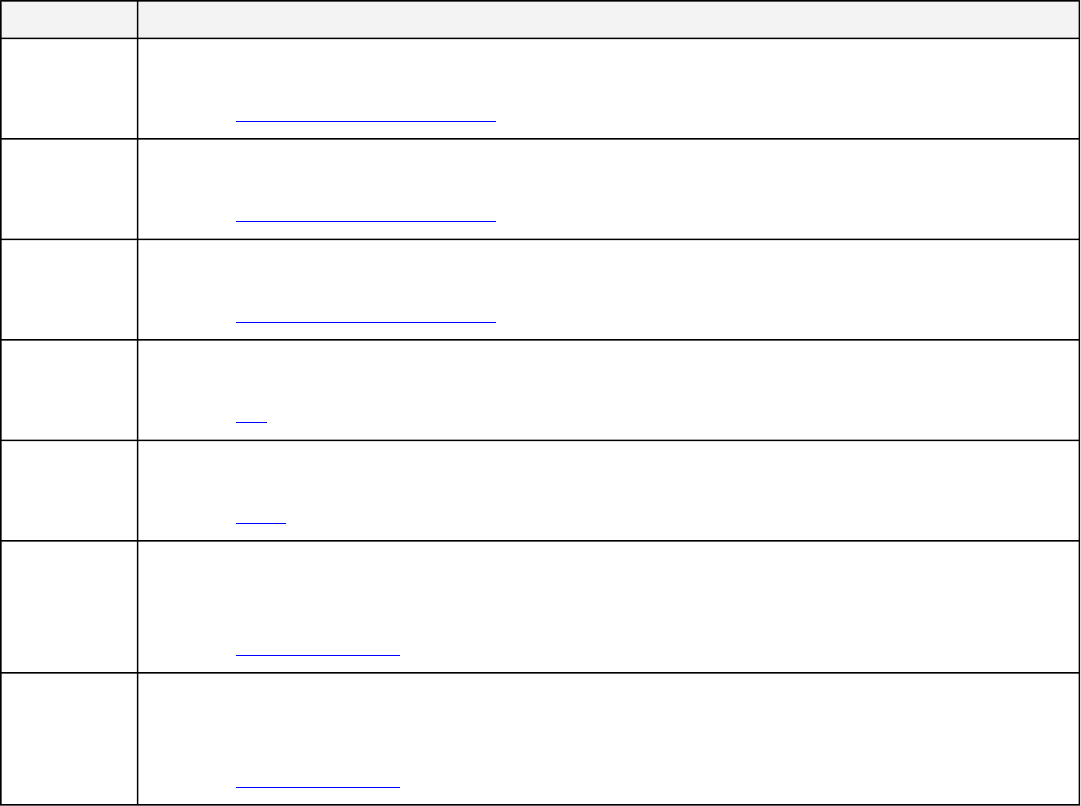
Method Name Method Description
Paragraph
OCL With
Targets
Paragraph is a presentation element designed to display text. By using Object Constraint Language (OCL) and
establishing targets, a more specified paragraph can be created according to said expression.
Reference: Paragraph Action Evaluate OCL
Paragraph
OCL Without
Targets
Paragraph is a presentation element designed to display text. By using Object Constraint Language (OCL) a more
specified paragraph can be created according to said expression, even without targets.
Reference: Paragraph Action Evaluate OCL
Paragraph
OCL For
Targets
Paragraph is a presentation element designed to display text. By using Object Constraint Language (OCL), a more
specified paragraph can be created according to said expression.
Reference: Paragraph Action Evaluate OCL
Bulleted List
"BulletedList" creates lists based on the model elements exposed to the behavior. What information is displayed
depends on the options selected in the behavior's specification and the filters applied to the collected data.
Reference: List
Image
Image Elements can be displayed in view editor by the use of the "Image" action. An example of an Image Element
is a Diagram.
Reference: Image
Dynamic
Section
"Dynamic sectioning" is the creation of viewpoint method defined sections. They are created using the "Structured
Query" activity in the viewpoint method diagram.
This specific example shows the creation of a single section.
Reference: Dynamic Sectioning
Multiple
Sections
"Dynamic sectioning" is the creation of viewpoint method defined sections. They are created using the "Structured
Query" activity in the viewpoint method diagram.
This specific example shows the creation of multiple sections.
Reference: Dynamic Sectioning
1.3.2.1 Table
The sections below go over how to create tables. Tables of varying complexity can be created in MagicDraw, but these tables share
some common base components. The left sidebar gives various components for use under "Table Structure."
The first option, TableStructure, is used in all cases to create the table base. The last three options shown under "Table Structure" in
the sidebar allow the user to select a type of column based on the information they need to display in each column.
TableExpressionColumn uses an OCL expression. TablePropertyColumn allows stereotype properties or value properties of a class to
be displayed, depending on the what the user chooses. The TableAttributeColumn allows the user to display the name, documentation,
or value of an element. Clicking the small black arrow on the right of these options on the sidebar opens a set of selections where the
second one has a dotted outside line on the icon. This dotted outside line selection exists for each of the three column types and allows
the user to configure a flow within the column. The TableColumnGroup allows creating a column group with a merged header, as will
be illustrated in the Complex Table selection.
46
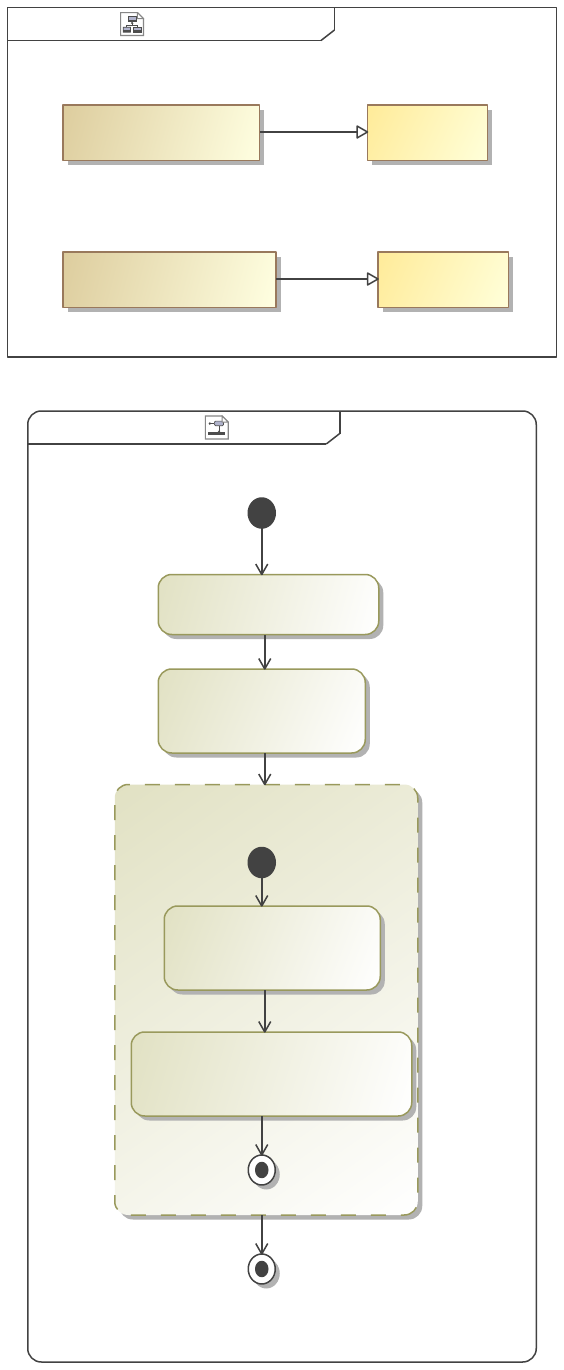
Example View Diagramclass Table ][
«view»
Complex Table Example
«view»
Simple Table Example
«viewpoint»
ComplexTable
«viewpoint»
SimpleTable
«Conforms»
«Conforms»
Figure 61. Example View Diagram
SimpleTable SimpleTableactivity ][
«TableStructure»
Simple Table Example
Description
«TableAttributeColumn»
{desiredAttribute = Documentation}
«TableAttributeColumn»
Animal Name
{desiredAttribute = Name}
«CollectOwnedElements»
«FilterByStereotypes»
{stereotypes = Animal}
Figure 62. SimpleTable
The manual demonstrates constructing a "simple" table made of attribute columns is created using the given DocGen Table methods.
47
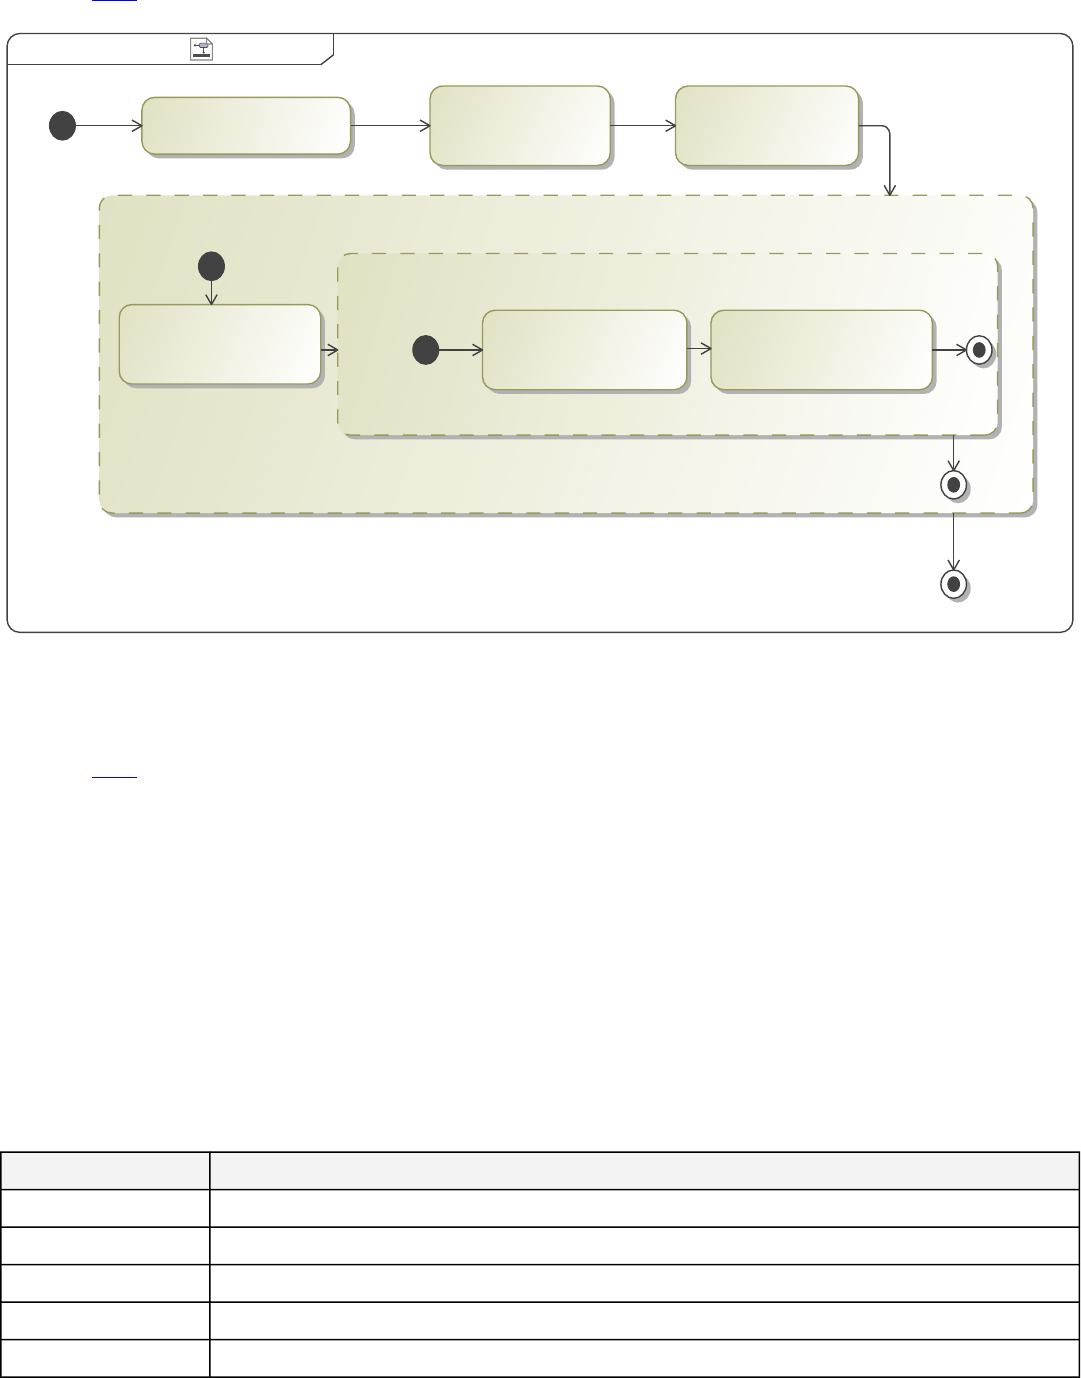
Reference: Table
ComplexTableComplexTableactivity ][
«TableStructure»
«TableColumnGroup»
«TableExpressionColumn»
Exhibit
{expression = "owner"}
«TableAttributeColumn»
Animal
{desiredAttribute = Name}
«TablePropertyColumn»
Diet
{desiredProperty = diet}
«CollectOwnedElements» «SortByProperty»
{desiredProperty = diet}
«FilterByStereotypes»
{stereotypes = Animal}
Figure 63. ComplexTable
The manual demonstrates constructing a "complex" table made of an attribute column and a table column group using the given
DocGEn Table methods.
Reference: Table
1.3.2.1.1 Simple Table
This viewpoint method is used to create a simple table that shows the name and documentation of all the Animals in the Zoo package.
First we collect all elements owned by the Zoo package. Then we filter out all elements that are not <<Animal>>. This leaves the five
animal elements, which we pass into a TableStructure.
The first column we create shows the Name attribute of the animal elements. We call this column "Animal Name" which will become
the header of the column when we generate the document or reveal on ViewEditor. We select "Name" as the desiredAttribute in the
TableAttributeColumn Action.
We do the same thing for the next column "Description" except that we set desiredAttribute to "Documentation" to target a different
attribute of the Animal element.
Table 7. Simple Table Example
Animal Name Description
Ostrich Ostriches can run up to 70 km/h, the fastest land speed of any bird.
Crocodile Basically a dinosaur.
Zebra Zebras feed almost entirely on grasses.
Seal Mostly blubber.
Arctic Tern What sound does an arctic tern make?
48
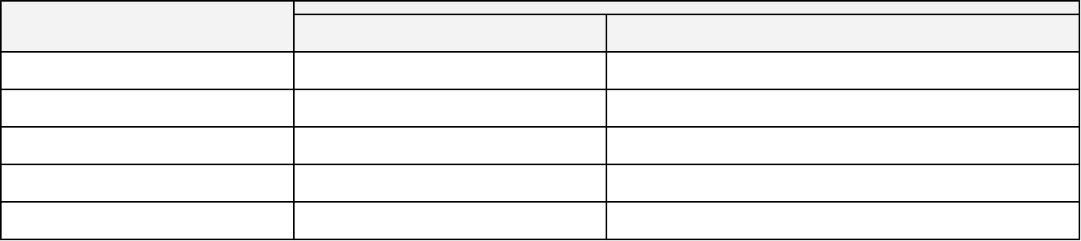
1.3.2.1.2 Complex Table
Table 8. <>
Diet Animal Exhibit
Carnivore Crocodile Africa Exhibit
Carnivore Seal Antarctica Exhibit
Carnivore Arctic Tern Antarctica Exhibit
Herbivore Zebra Africa Exhibit
Omnivore Ostrich Africa Exhibit
1.3.2.2 Paragraph
Paragraph is a presentation element designed to display text. Every view requires a viewpoint method, if one is not specified the
default method is a single paragraph action targeting the documentation of the view element. This is added automatically without
being visible to the user.
This section describes advanced ways you can: create paragraphs, combine paragraphs with other viewpoint method actions, and
generate paragraphs using OCL.
Paragraph is a combination of the features of Image and Table. It is similar to an image in that it will display the documentation of any
element that is exposed by the view. It also has some advanced expression features that allow it to additionally display the attributes of
an element exposed by a view (similar to TableAttributeColumn) or result of an expression (similar to TableExpressionColumn).
In general the results of a paragraph allow greater flexibility to display view editor editable content from that model than information
displayed within the rigid constraints of an Image or Table.
The following sections describe various ways a paragraph can be used.
1.3.2.2.1 Paragraph Action with Targets
49
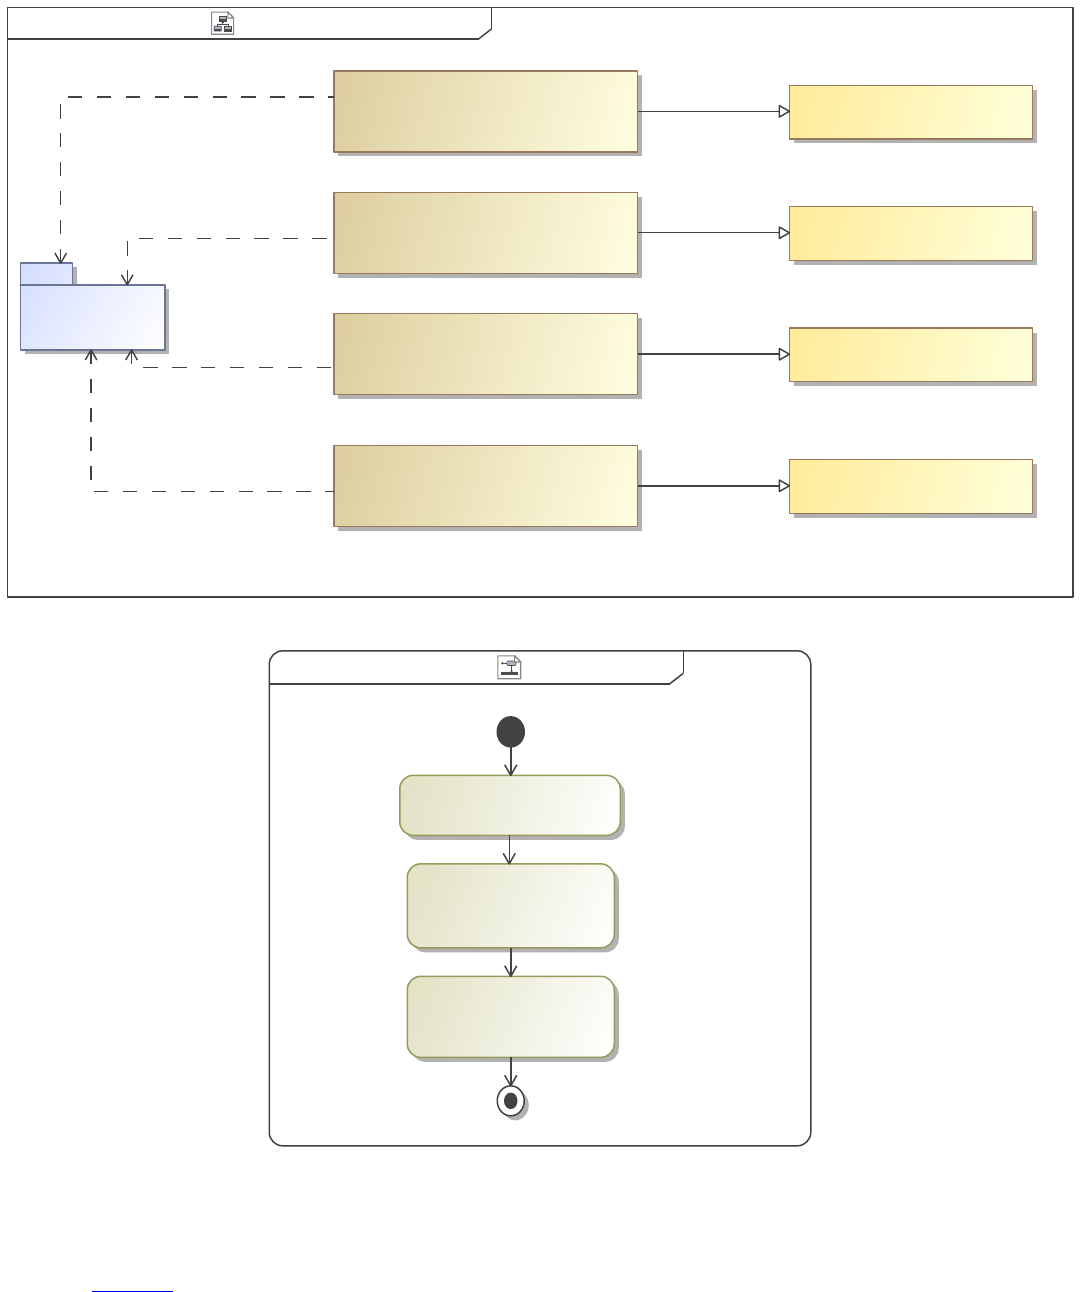
Generic Paragraph View DiagramGeneric Paragraphclass [ ]
Paragraph Value Example
«view»
Paragraph Documentation Example
«view»
Paragraph Name Example
«view»
Generic Paragraph Example
«view»
«viewpoint»
Paragraph of Default Value
«viewpoint»
Paragraph of Documentation
«viewpoint»
Paragraph of Name
Generic Paragraph
«viewpoint»
Zoo
«Expose»
«Expose»
«Expose»
«Expose»
«Conforms»
«Conforms»
«Conforms»
«Conforms»
Figure 64. Generic Paragraph View Diagram
Generic Paragraph Generic Paragraphactivity ][
«CollectOwnedElements»
«Paragraph»
«FilterByStereotypes»
{stereotypes = Animal}
Figure 65. Generic Paragraph
Paragraph is a presentation element designed to display text. By default (aka the Generic Paragraph), displays the documentation of
the exposed elements or of the view itself.
Reference: Paragraph
50
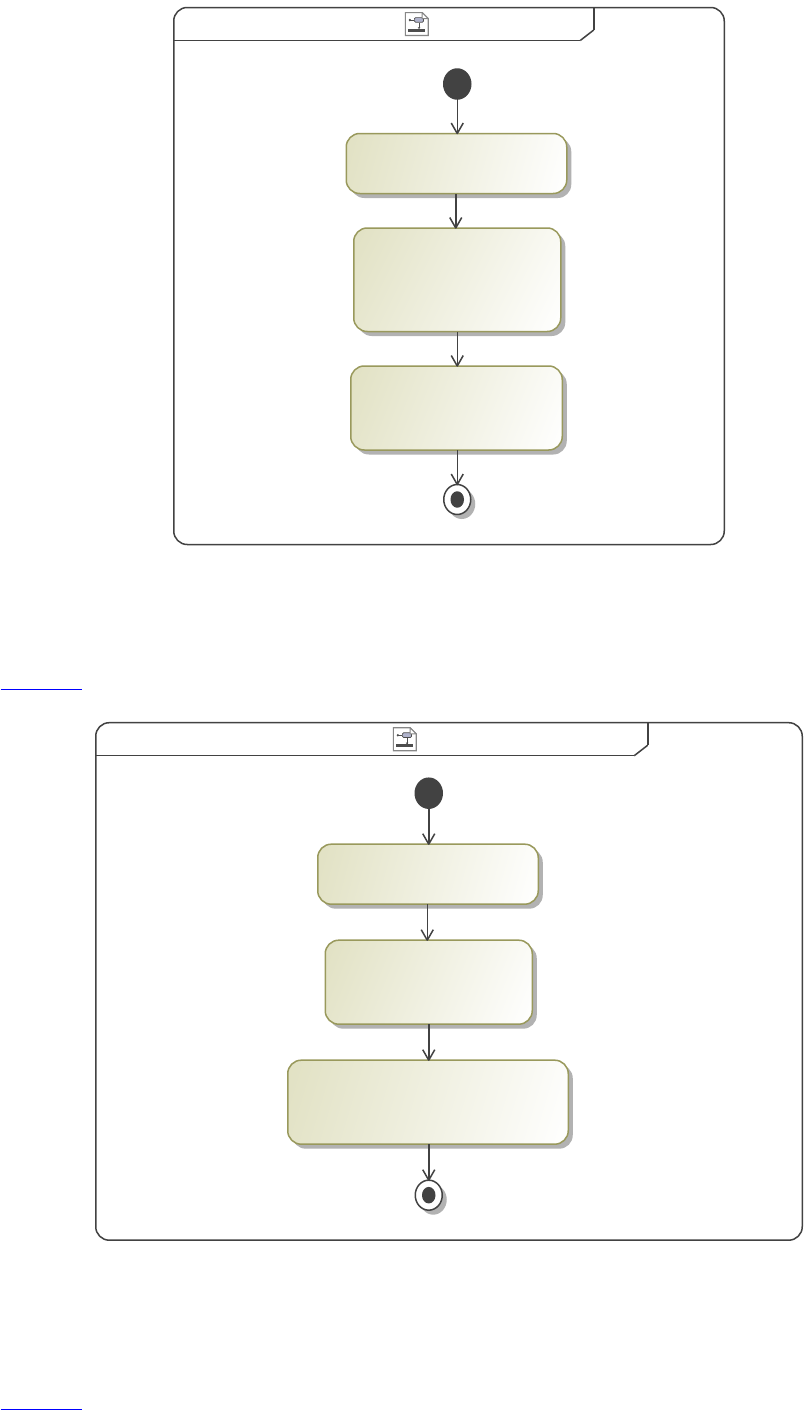
Paragraph of NameParagraph of Nameactivity [ ]
«CollectOwnedElements»
«Paragraph»
{desiredAttribute = Name}
«FilterByStereotypes»
{stereotypes = Block,
Animal}
Figure 66. Paragraph of Name
Paragraph is a presentation element designed to display text. The "Paragraph of Name" displays the name attribute of the exposed
elements or of the view itself.
Reference: Paragraph
Paragraph of DocumentationParagraph of Documentationactivity [ ]
«Paragraph»
{desiredAttribute = Documentation}
«CollectOwnedElements»
«FilterByStereotypes»
{stereotypes = Animal}
Figure 67. Paragraph of Documentation
Paragraph is a presentation element designed to display text. The "Paragraph of Documentation" displays the documentation attribute
of the exposed elements or of the view itself. It will produce the same result of the Generic Paragraph, but is simply another way to
specify it.
Reference: Paragraph
51
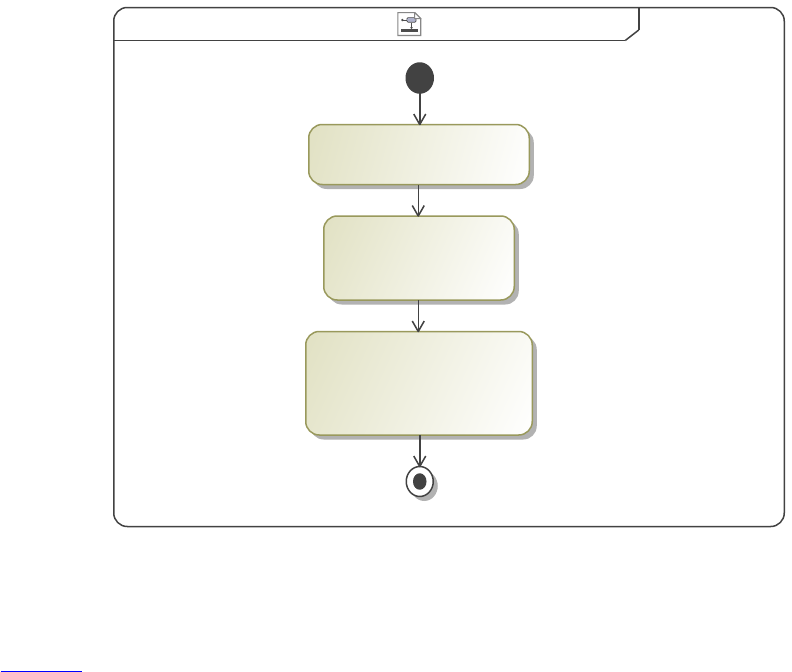
Paragraph of Default ValueParagraph of Default Valueactivity ][
«Paragraph»
{desiredAttribute = Value,
stereotypeProperties = diet}
«CollectOwnedElements»
«FilterByStereotypes»
{stereotypes = Animal}
Figure 68. Paragraph of Default Value
Paragraph is a presentation element designed to display text. The "Paragraph of Default Value" displays the value attribute of the
exposed elements or of the view itself.
Reference: Paragraph
1.3.2.2.1.1 Generic Paragraph Example
Ostriches can run up to 70 km/h, the fastest land speed of any bird.
Basically a dinosaur.
Zebras feed almost entirely on grasses.
Mostly blubber.
What sound does an arctic tern make?
1.3.2.2.1.2 Paragraph Name Example
Africa Exhibit
Ostrich
Crocodile
Zebra
Antarctica Exhibit
Seal
Arctic Tern
hasTitleBlock
1.3.2.2.1.3 Paragraph Documentation Example
Ostriches can run up to 70 km/h, the fastest land speed of any bird.
Basically a dinosaur.
Zebras feed almost entirely on grasses.
Mostly blubber.
What sound does an arctic tern make?
1.3.2.2.1.4 Paragraph Value Example
Omnivore
52
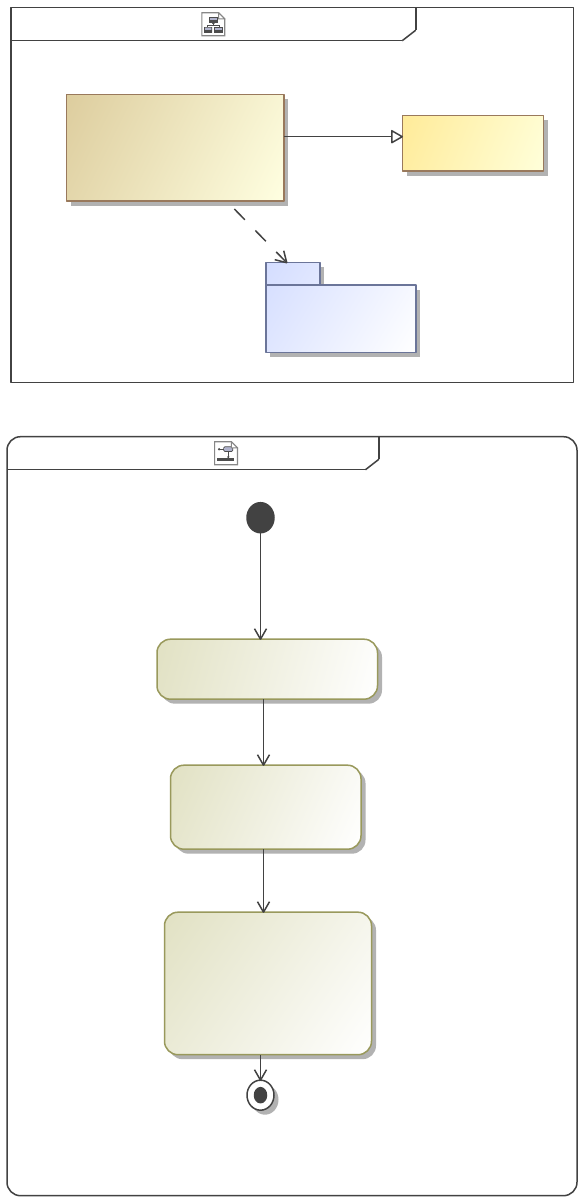
Carnivore
Herbivore
Carnivore
Carnivore
1.3.2.2.2 Paragraph Action with Body
Example View DiagramParagraph Bodyclass [ ]
«view»
Paragraph Body Example
Zoo
Paragraph Body
«viewpoint»
«Conforms»
«Expose»
Figure 69. Example View Diagram
Paragraph Body Paragraph Bodyactivity [ ]
«CollectOwnedElements»
{body = "We should put
more animals in the zoo.",
desiredAttribute = Name}
«Paragraph»
«FilterByStereotypes»
{stereotypes = Block}
Figure 70. Paragraph Body
53
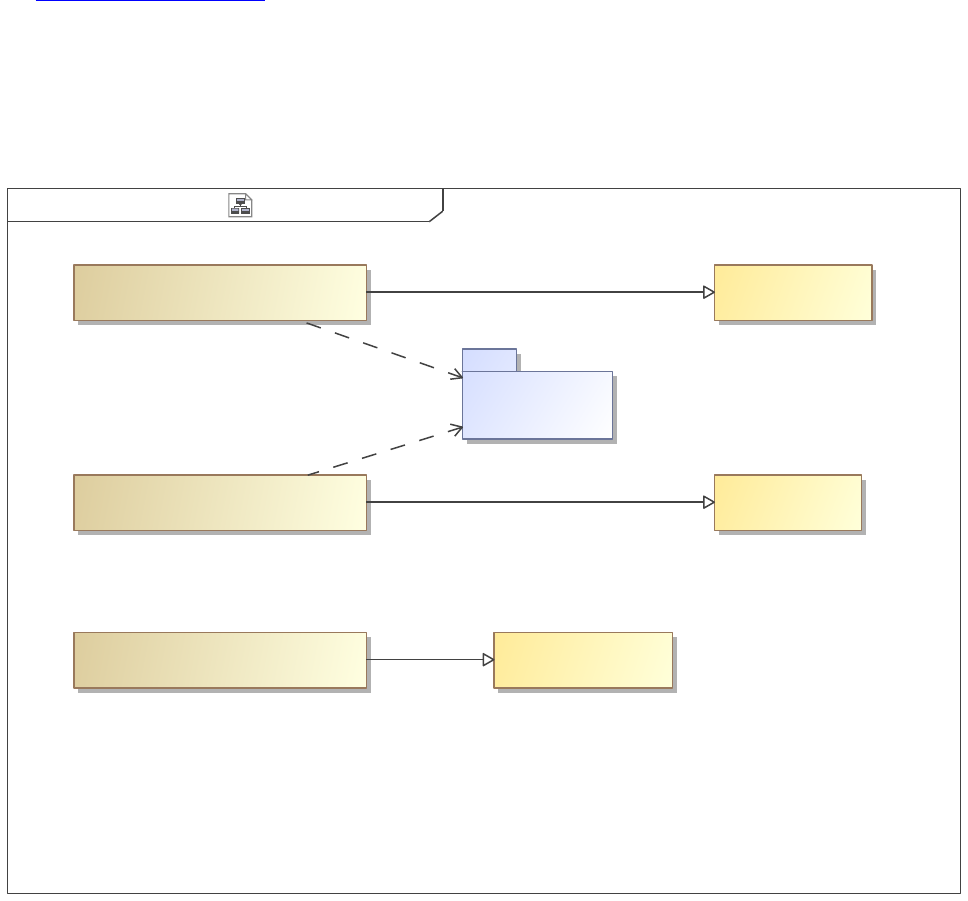
Paragraph is a presentation element designed to display text. The body is text (can be HTML) that isspecified in the Paragraph
specification and then the "Paragraph Body" displays that body.
Reference: Paragraph Action with Body
1.3.2.2.2.1 Paragraph Body Example
We should put more animals in the zoo.
1.3.2.2.3 Paragraph Action Evaluate OCL
Example View DiagramParagraph with OCLclass ][
Paragraph With Body
«view»
«view»
Paragraph With Body And Targets
Paragraph With Targets
«view»
OCL With Body
«viewpoint»
«viewpoint»
OCL With Targets
Robot Zoo
OCL For Targets
«viewpoint»
«Conforms»
«Conforms»
«Expose»
«Expose»
«Conforms»
Figure 71. Example View Diagram
54
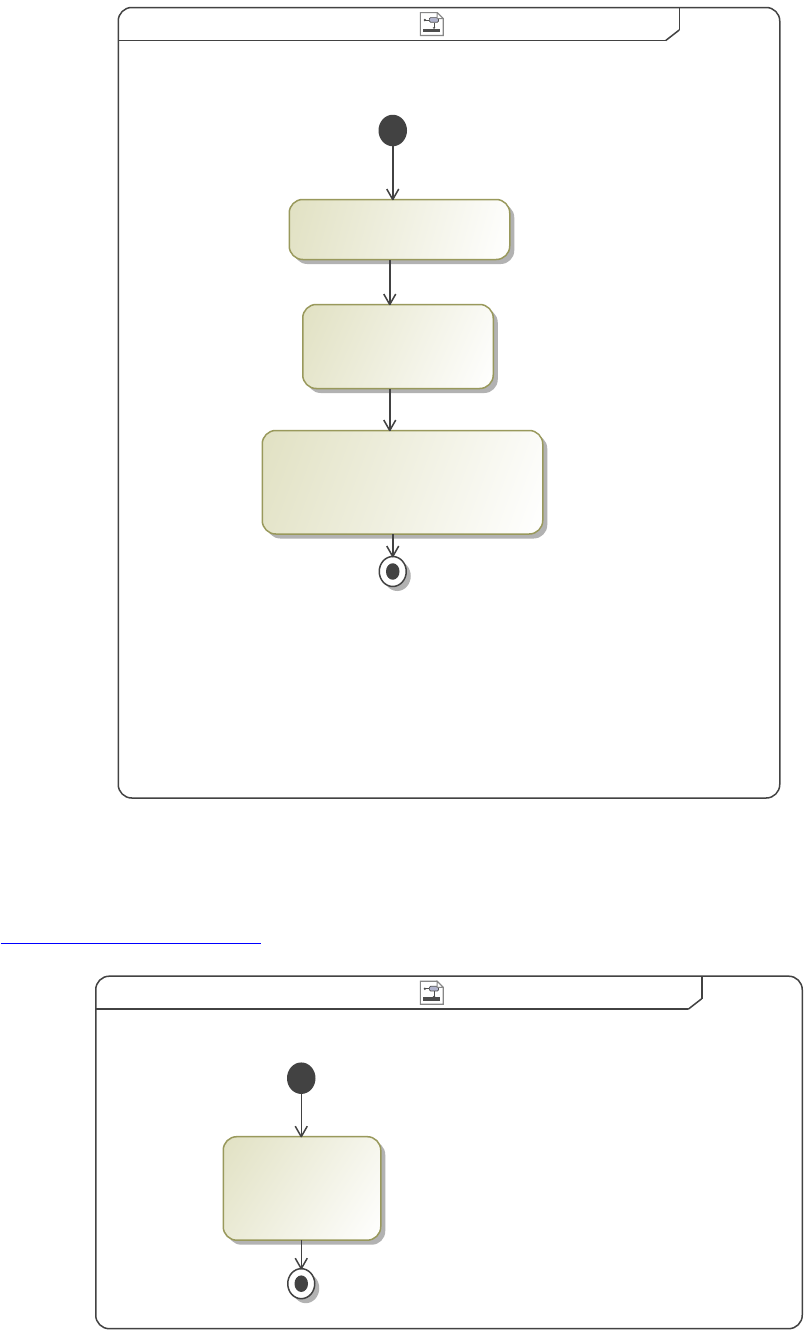
Paragraph OCL With TargetsParagraph OCL With Targetsactivity [ ]
«Paragraph»
{desiredAttribute = Documentation,
evaluateOcl}
«CollectOwnedElements»
«FilterByStereotypes»
{stereotypes = Block}
Figure 72. Paragraph OCL With Targets
Paragraph is a presentation element designed to display text. By using Object Constraint Language (OCL) and establishing targets, a
more specified paragraph can be created according to said expression.
Reference: Paragraph Action Evaluate OCL
Paragraph OCL Without Targets Paragraph OCL Without Targetsactivity [ ]
«Paragraph»
{body = "n()",
evaluateOcl}
Figure 73. Paragraph OCL Without Targets
Paragraph is a presentation element designed to display text. By using Object Constraint Language (OCL) a more specified paragraph
can be created according to said expression, even without targets.
55
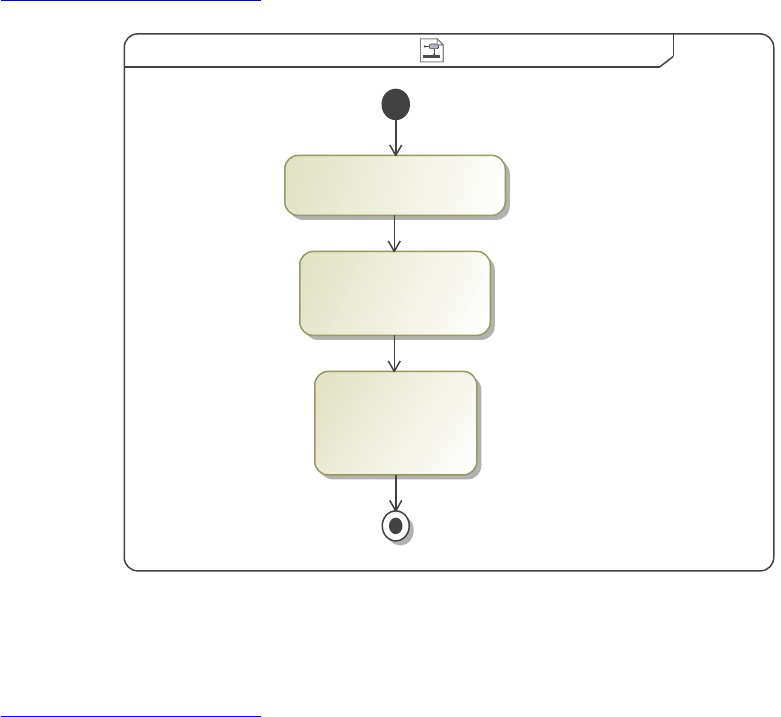
Reference: Paragraph Action Evaluate OCL
Paragraph OCL For Targets Paragraph OCL For Targetsactivity [ ]
«CollectOwnedElements»
«FilterByStereotypes»
{stereotypes = Block}
«Paragraph»
{body = "n()",
evaluateOcl}
Figure 74. Paragraph OCL For Targets
Paragraph is a presentation element designed to display text. By using Object Constraint Language (OCL), a more specified paragraph
can be created according to said expression.
Reference: Paragraph Action Evaluate OCL
1.3.2.2.3.1 Paragraph With Body
Paragraph With Body
1.3.2.2.3.2 Paragraph With Targets
true
false
1.3.2.2.3.3 Paragraph With Body And Targets
Robot Moose
Robot Squirrel
1.3.2.3 List
"BulletedList" creates lists based on the model elements exposed to the behavior. This one presentation element can create either an
ordered (numbered) list, like the one shown below, or a bulleted list like those that have been displayed in previous examples. What
information is displayed (names, documentation, stereotype property values) depends on the options selected in the behavior's
specification and the filters applied to the collected data. For example, when "Show Targets" is "true", the name of the element is
listed.
56
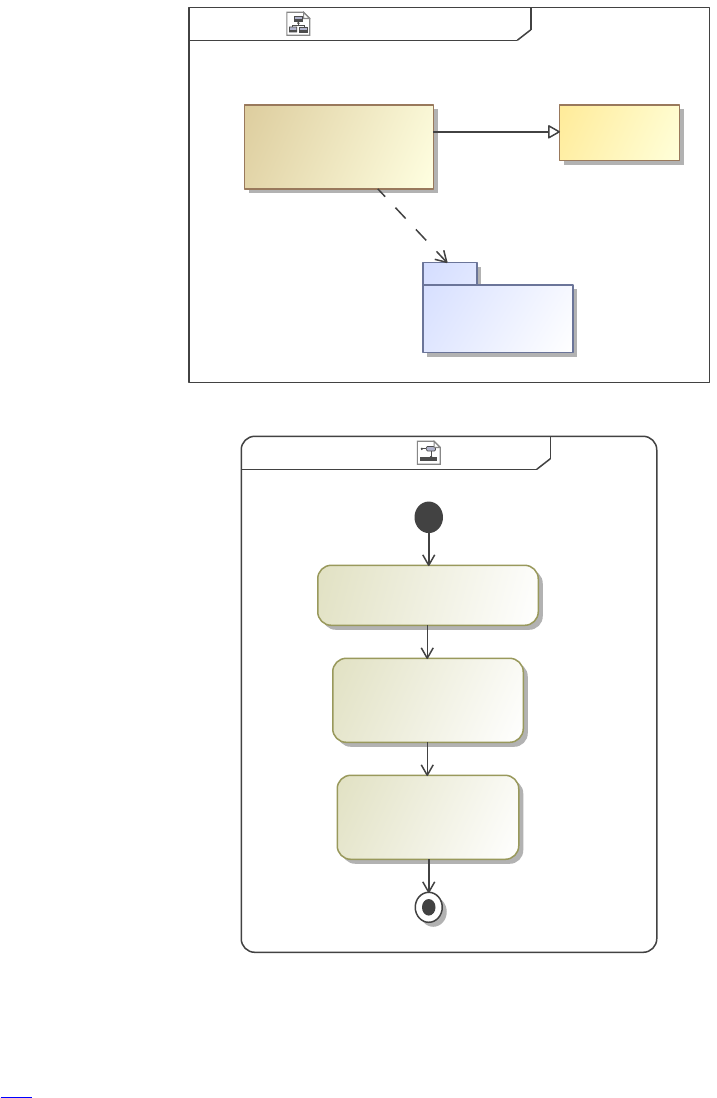
The viewpoint method diagram below shows the diagram that was used to create the below example list. The exposed package was
"Zoo" from previous examples and a filter was applied to only identify the <<Animal>> stereotypes. To create this example,
"Ordered List" was selected to be "true" in order to create a numbered list. If that option had been false, then the list would be
bulleted instead. Inside the bulleted list specification, there are a number of other options. If you click on an option, an explanation
appears in the bottom box.
NOTE: "Show Stereotype Property Names" currently doesn't work. It theoretically prints out the stereotype property name before
listing its values.
Example List View Diagramclass List [ ]
Example List
«view»
Zoo
«viewpoint»
Simple List
«Conforms»
«Expose»
Figure 75. Example List View Diagram
Bulleted ListBulleted Listactivity ][
«CollectOwnedElements»
«FilterByStereotypes»
{stereotypes = Animal}
«BulletedList»
{showTargets}
Figure 76. Bulleted List
"BulletedList" creates lists based on the model elements exposed to the behavior. What information is displayed depends on the
options selected in the behavior's specification and the filters applied to the collected data.
Reference: List
1.3.2.3.1 Example List
• Ostrich
57
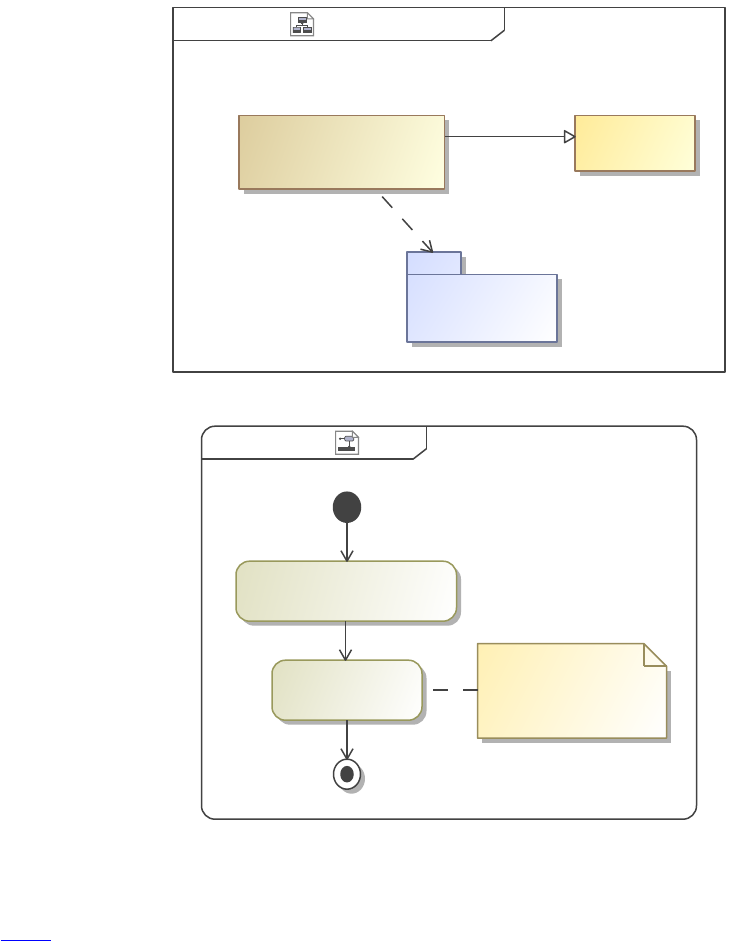
• Crocodile
• Zebra
• Seal
• Arctic Tern
1.3.2.4 Image
Image Elements can be displayed in view editor by the use of the <<Image>> action. An example of an Image Element is a Diagram.
This action will display the image associated with any Image Element followed by its documentation. If multiple diagrams are
exposed or collected, a single <<Image>> action will iteratively display them all.
This image will then be updated when the model is updated without need for a new image to be put into the document to reflect
changes. It is also possible to add captions and titles to the image, however, these functionalities are not currently working.
The View Diagram and Viewpoint Method Diagram for this operation are shown below.
Example View DiagramImageclass ][
Image Example View
«view»
Zoo
Image
«viewpoint»
«Conforms»
«Expose»
Figure 77. Example View Diagram
activity Image Image][
«CollectOwnedElements»
«Image» automatically filters out
non-diagrams
Figure 78. Image
Image Elements can be displayed in view editor by the use of the "Image" action. An example of an Image Element is a Diagram.
Reference: Image
58
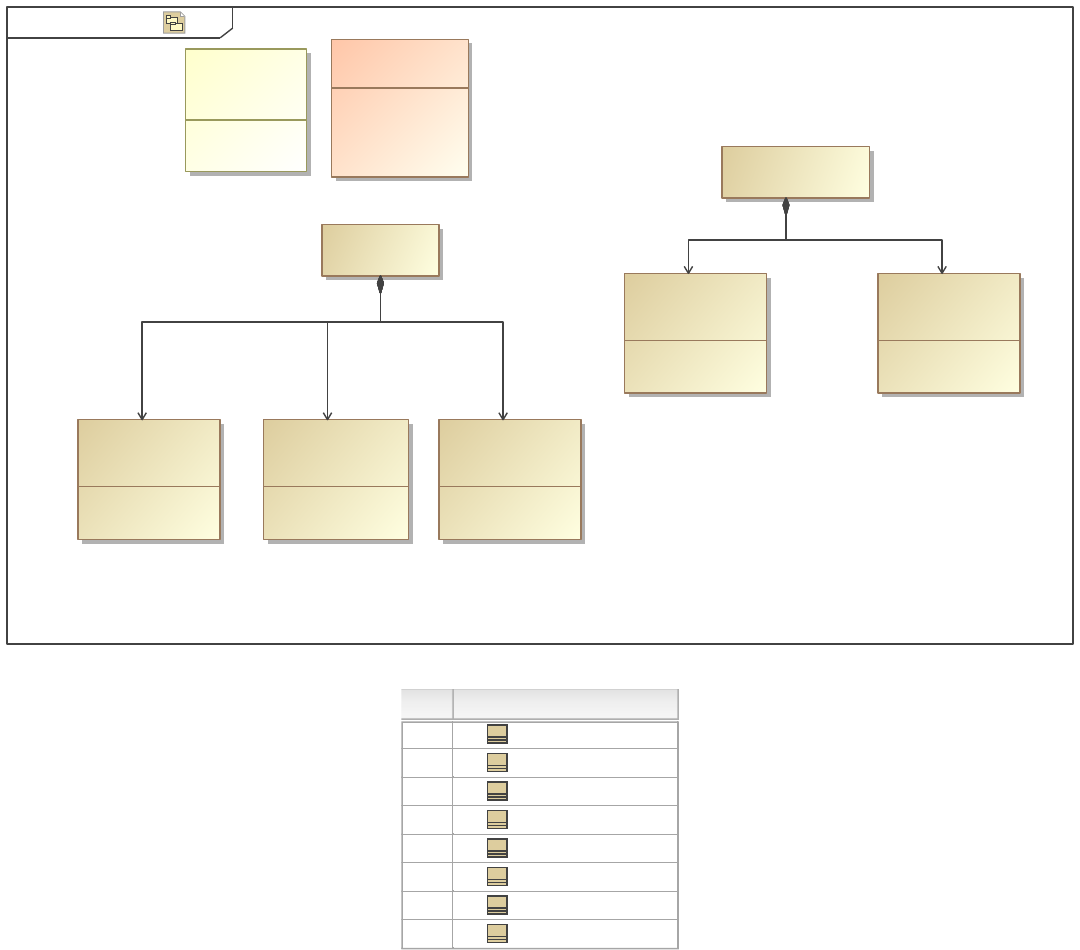
1.3.2.4.1 Image Example View
[Package]pkg ZooZoo ][
«block»
Antarctica Exhibit
«Animal»
diet = Herbivore
«Animal»
«block»
Zebra
diet = Carnivore
«Animal»
«block»
«Animal»
Arctic Tern
diet = Omnivore
«Animal»
Ostrich
«Animal»
«block»
«Animal»
diet = Carnivore
«Animal»
«block»
Crocodile
diet = Carnivore
«Animal»
Seal
«Animal»
«block»
Carnivore
Omnivore
Herbivore
«valueType»
DietKind
attributes
-diet : DietKind
«stereotype»
Animal
[Element]
Africa Exhibit
«block»
ostrich
arctic Tern
crocodilezebra
seal
Figure 79. Zoo
#
#
Name
Name
1
Arctic Tern
2
Crocodile
3
Ostrich
4
Seal
5
Zebra
6
Africa Exhibit
7
Antarctica Exhibit
8
hasTitleBlock
Figure 80. Zoo Animals
1.3.2.5 Dynamic Sectioning
Dynamic sectioning is the creation of viewpoint method defined sections. They are created using the "Structured Query" activity in
the viewpoint method diagram.
This section describes two main types of dynamic sectioning: the creation of a single section and the creation of multiple sections.
The new dynamic section(s) can be distinguished from a standard <<view>> in the table of contents by a small page symbol, §. Notice
that the dynamic section(s) also load into the view at the same time as the parent view.
For these examples, the package "Animals", first introduced in the paragraph examples, was exposed. Each of the five animal
elements consists of an element title and some documentation text.
These sections have two main uses, basic organization allowing sections to be broken up. Formally, dynamic sections allow further
organization of views while preserving the canonical view hierarchy.
59
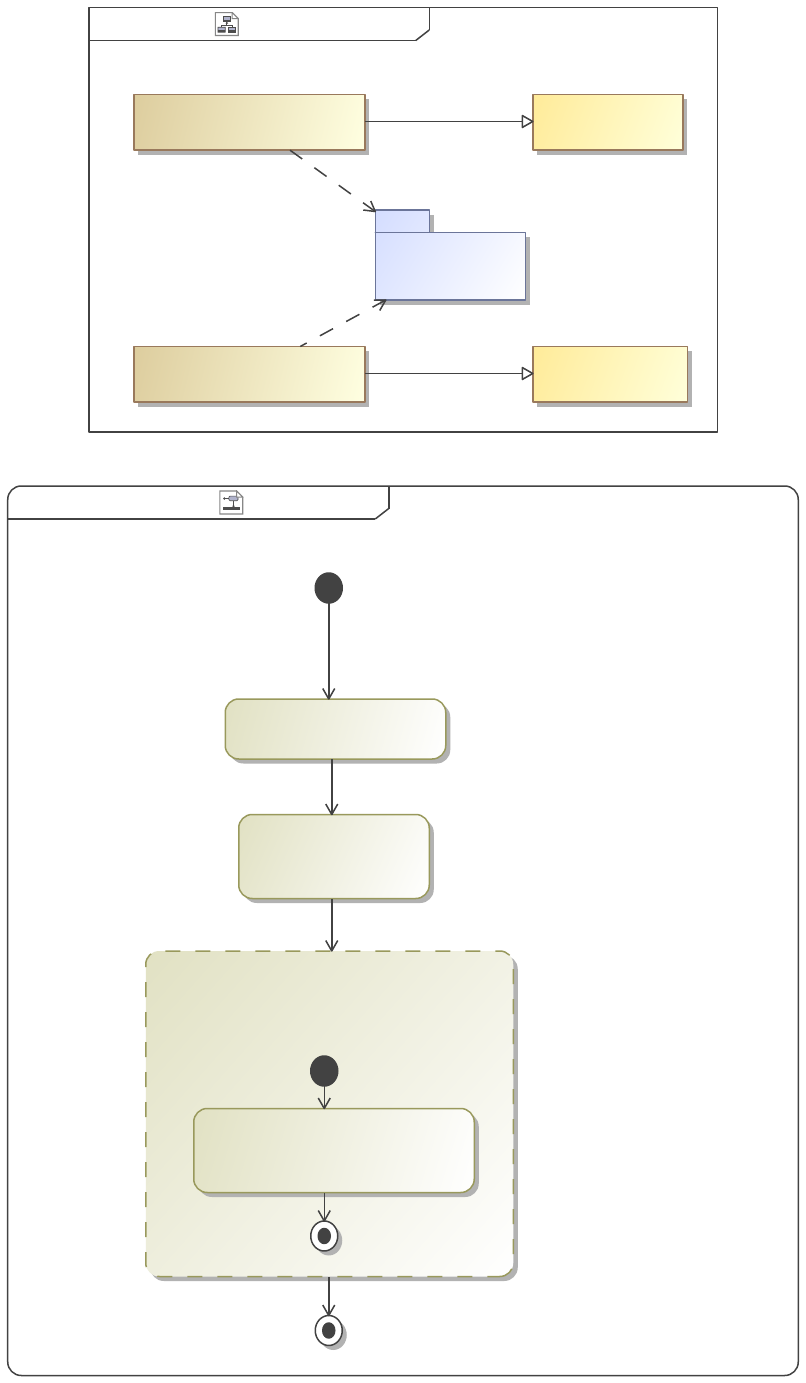
Example View DiagramSectionclass [ ]
«view»
Example Multiple Sections
«view»
Example Single Section
«viewpoint»
Multiple Sections
Zoo
Dynamic Section
«viewpoint»
«Conforms»
«Conforms»
«Expose»
«Expose»
Figure 81. Example View Diagram
Dynamic SectionDynamic Sectionactivity [ ]
Zoo Animals
«StructuredQuery»
{createSections,
loop = false}
«Paragraph»
{desiredAttribute = Documentation}
«CollectOwnedElements»
«FilterByStereotypes»
{stereotypes = Animal}
Figure 82. Dynamic Section
60
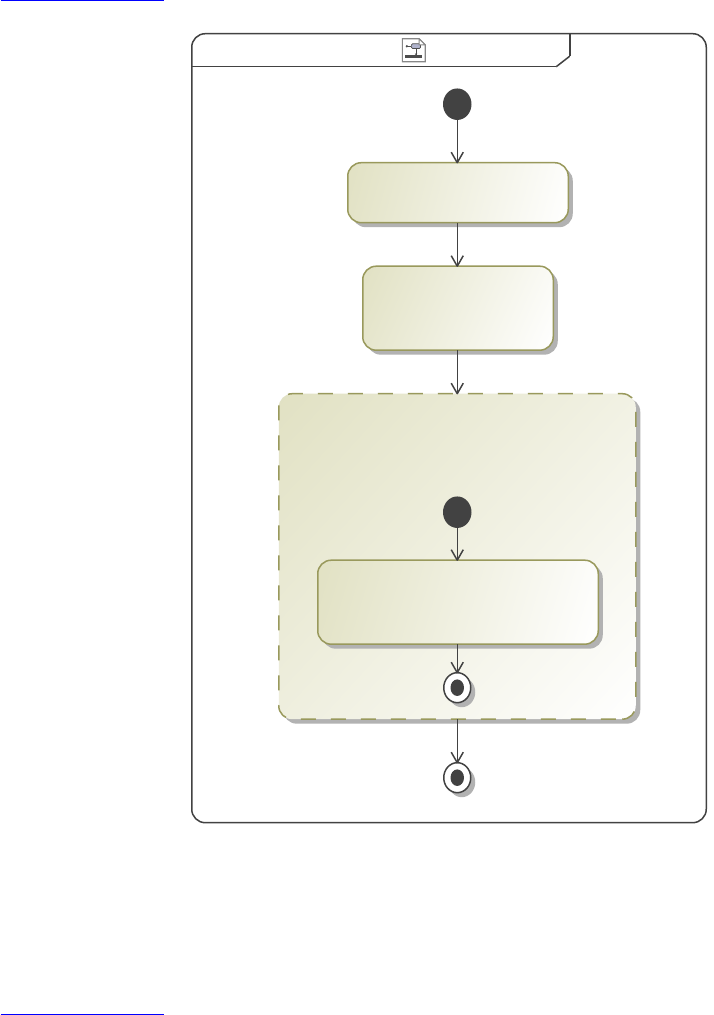
"Dynamic sectioning" is the creation of viewpoint method defined sections. They are created using the "Structured Query" activity in
the viewpoint method diagram.
This specific example shows the creation of a single section.
Reference: Dynamic Sectioning
Multiple SectionsMultiple Sectionsactivity ][
«StructuredQuery»
{createSections,
loop}
«Paragraph»
{desiredAttribute = Documentation}
«CollectOwnedElements»
«FilterByStereotypes»
{stereotypes = Animal}
Figure 83. Multiple Sections
"Dynamic sectioning" is the creation of viewpoint method defined sections. They are created using the "Structured Query" activity in
the viewpoint method diagram.
This specific example shows the creation of multiple sections.
Reference: Dynamic Sectioning
1.3.2.5.1 Example Single Section
1.3.2.5.1.1 Zoo Animals
Ostriches can run up to 70 km/h, the fastest land speed of any bird.
Basically a dinosaur.
Zebras feed almost entirely on grasses.
Mostly blubber.
What sound does an arctic tern make?
61
1.3.2.5.2 Example Multiple Sections
1.3.2.5.2.1 Ostrich
Ostriches can run up to 70 km/h, the fastest land speed of any bird.
1.3.2.5.2.2 Crocodile
Basically a dinosaur.
1.3.2.5.2.3 Zebra
Zebras feed almost entirely on grasses.
1.3.2.5.2.4 Seal
Mostly blubber.
1.3.2.5.2.5 Arctic Tern
What sound does an arctic tern make?
1.3.2.6 Tom Sawyer Diagram
DocGen integrates with Tom Sawyer Perspectives to dynamically generate diagrams and present them in Views.
Note: This feature only works in conjunction with View Editor. It is not supported in local document generation.
1.3.2.6.1 Creating a Tom Sawyer Diagram
Tom Sawyer diagrams are implemented in a model by adding the TomSawyerDiagram action to a DocGen activity.
The goal of the following is to generate a Tom Sawyer diagram from the model elements in a Package. In this example the Tom
Sawyer diagram created is a Block Definition Diagram, but the following diagram types are also supported:
• Internal Block Diagram
• Package Diagram
• Parametric Diagram
• Requirement Diagram
• Sequence Diagram
• State Machine Diagram
• Use Case Diagram
62
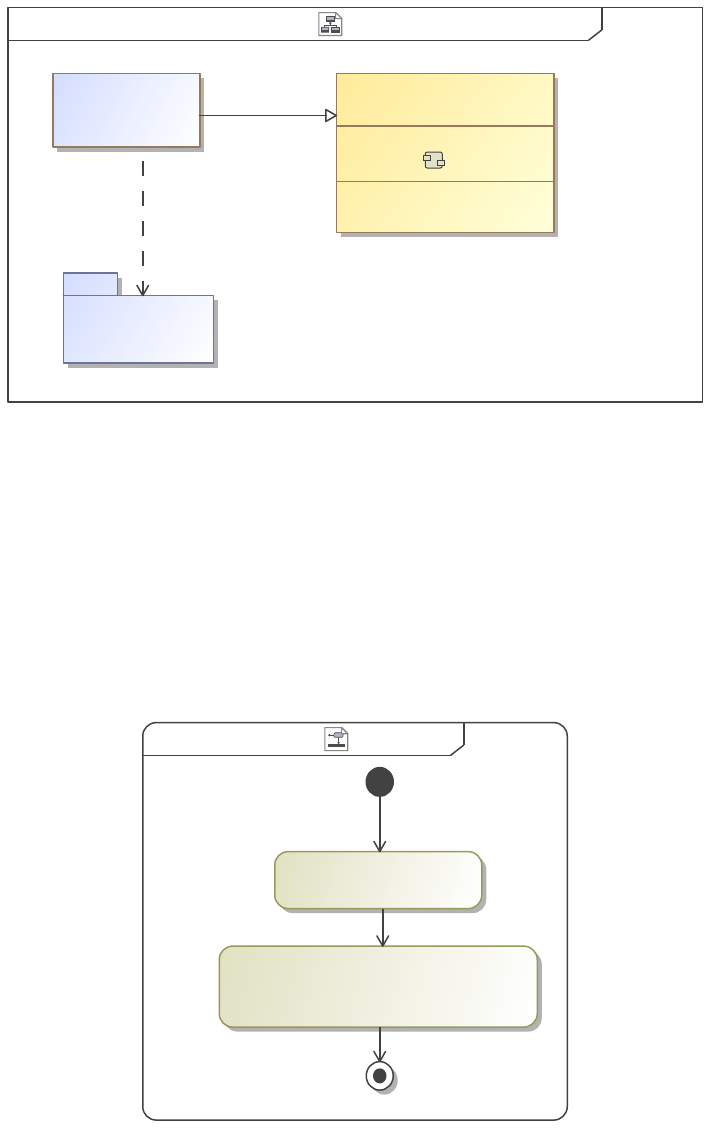
Creating a Tom Sawyer Diagram Tom Sawyer BDD View Diagramclass [ ]
operations
«Create»View()
«viewpoint»
method = Tom Sawyer
Tom Sawyer
«viewpoint»
myBlocks
myView
«view»
«expose»
«conform»
Figure 84. Tom Sawyer BDD View Diagram
As shown above, there is a view named myView where the Tom Sawyer diagram will be created. To accomplish this, myView must
be told what elements to include and how to generate a Tom Sawyer diagram.
There are multiple ways to tell myView which elements we are interested in and it depends on both the construction of the Viewpoint
method and the type of diagram desired. In this case the package myBlocks is a package that contains four blocks, one being
composed of the other three (by way of Directed Composition). Since in this case all the blocks of interest are in the same package and
there are no elements in myBlocks which are not desired on the diagram, we simply expose the package (myBlocks) from the view
(myView), as shown above.
Next we must construct the viewpoint method for the viewpoint Tom Sawyer.
Tom SawyerTom Sawyeractivity ][
«TomSawyerDiagram»
{diagramType = Block Definition Diagram}
«CollectOwnedElements»
Figure 85. Tom Sawyer
First things first once the viewpoint is created it must be given a viewpoint method. To do this right click on the View() operation on
the viewpoint >> Create Method >> Diagram >>Viewpoint Method Diagram.
In this simple example only two actions are needed to generate the Tom Sawyer diagram. First we add the action
CollectOwnedElements, this gathers all elements which are owned by the element which has been exposed by the view (the package
myBlocks is exposed by myView in this example). See the Collect section of the user guide for more details.
Next we add the action TomSawyerDiagram, as the name suggests this action generates the Tom Sawyer diagram. However,
one option must be defined first. In the specification of the TomSawyerDiagram action, set the diagram type to whatever diagram is
desired, in this case we set it to Block Definition Diagram.
63
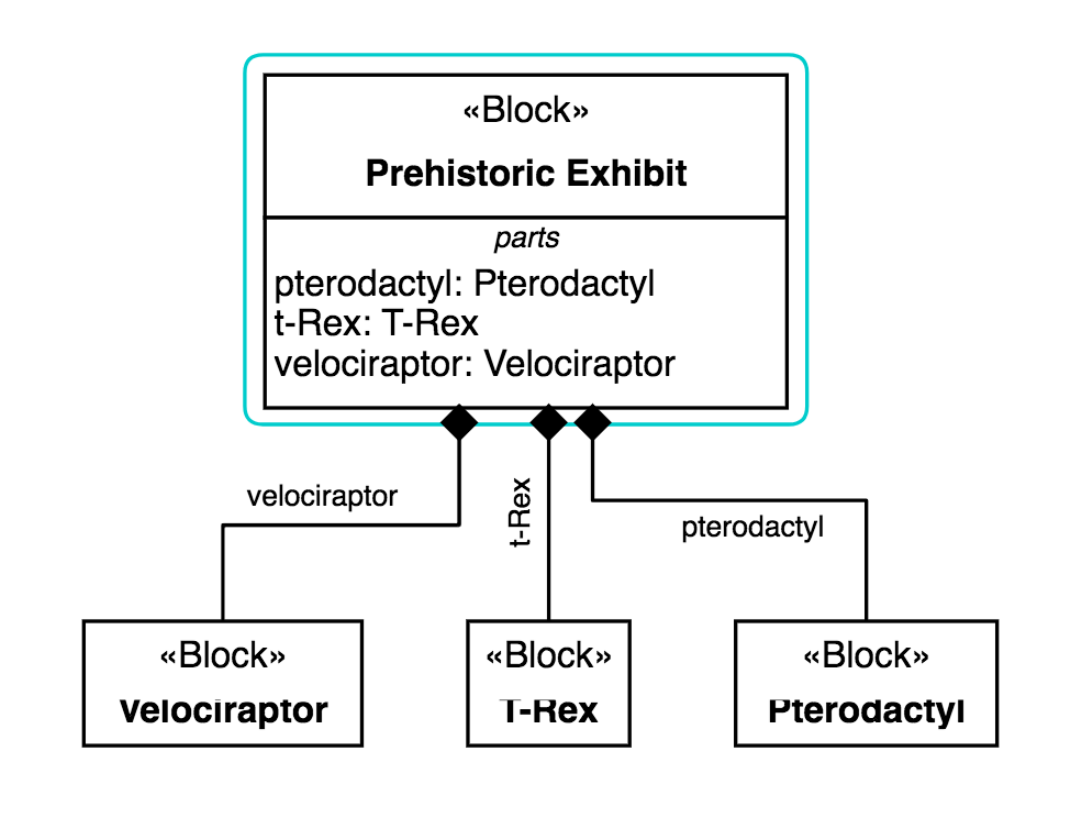
After this the view can be generated and a Tom Sawyer Block Definition Diagram will be displayed on View Editor. This diagram can
then be manipulated through the interface in View Editor.
1.3.2.6.1.1 myView
Figure 86. tomSawyerDiagram
1.3.2.6.2 A Common Mistake
As mentioned in the previous section, a view which exposes a package and conforms to a viewpoint whose method only uses a
CollectOwnedElements and TomSawyerDiagram action is not the only way to generate these diagrams. More complex collect/filter/
sort operations can be added to the activity diagram to generate Tom Sawyer diagrams with the desired elements on it. The following
is an example of a common mistake to watch out for when using Tom Sawyer diagrams.
64
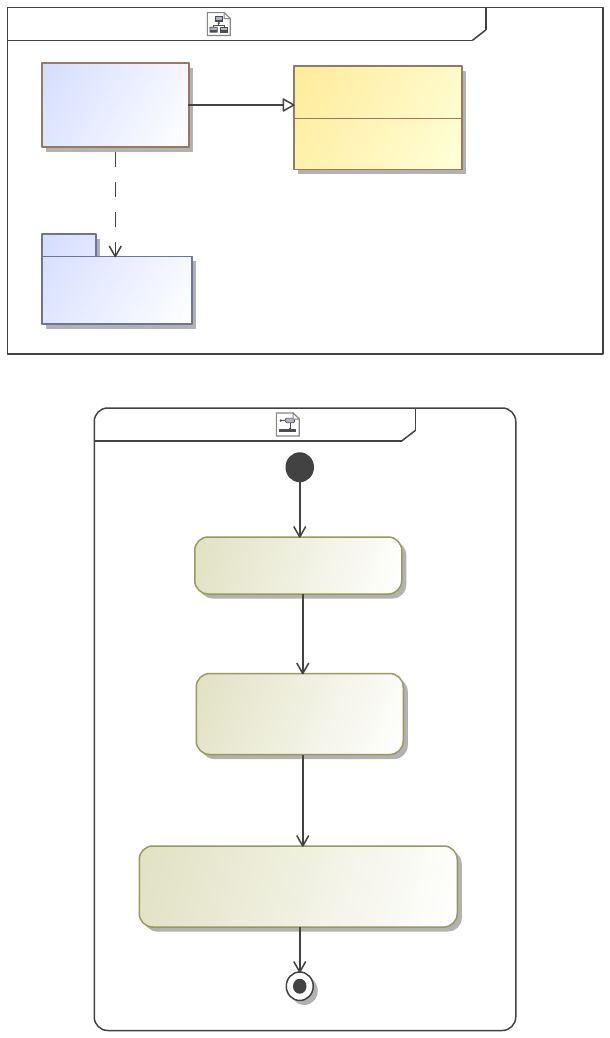
Common Mistake View DiagramCommon Mistakeclass ][
operations
«Create»View()
«viewpoint»
Tom Sawyer
myBlocks
myView
«view»
«expose»
«conform»
Figure 87. Common Mistake View Diagram
Tom Sawyer Tom Sawyeractivity [ ]
«TomSawyerDiagram»
{diagramType = Block Definition Diagram}
«FilterByStereotypes»
{stereotypes = Block}
«CollectOwnedElements»
Figure 88. Tom Sawyer
When trying to generate Tom Sawyer Diagrams by exposing a package then collecting, sorting or filtering the contents there are a few
things to watch out for. Consider a package, like myBlocks above, that containes a few blocks with relationships between them but
also has other elements that are not desired in the Tom Sawyer diagram. It is tempting to simply expose the package from the view
then, in the Viewpoint Method Diagram, do CollectOwnedElements then FilterByStereotype then generate the Tom Sawyer diagram,
as shown above. This is a mistake since by filtering out everything but blocks the modeler will not pass the relationships between
those blocks to the TomSawyerDiagram action and the resulting Tom Sawyer diagram will contain only blocks and no associations.
1.3.2.6.3 Internal Block Diagram
The following is an example of how to generate a Tom Sawyer Internal Block Diagram.
65
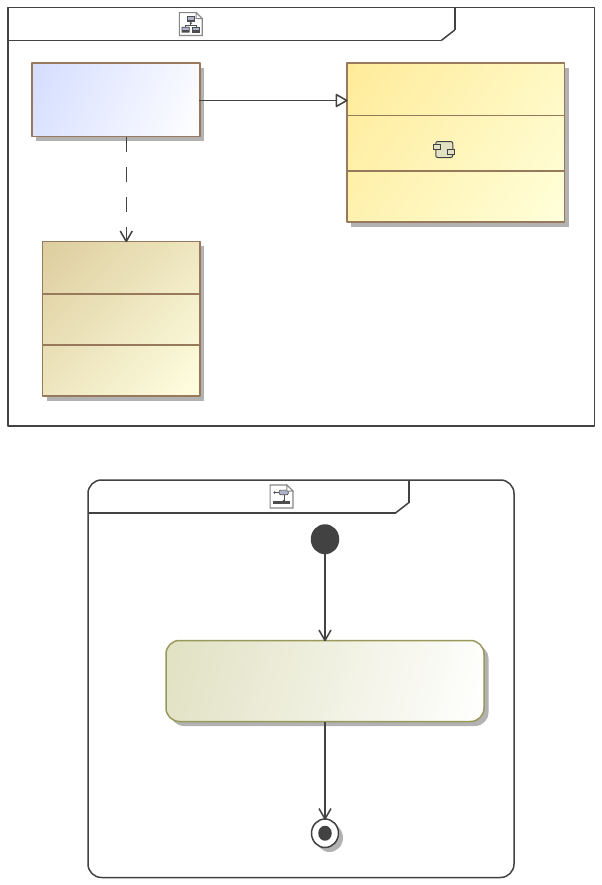
Tom Sawyer IBD View DiagramInternal Blockclass [ ]
operations
«Create»View()
«viewpoint»
method = Tom Sawyer
Tom Sawyer
«viewpoint»
myView
«view»
parts
name = myName
values
value = myValue
«block»
top1
«conform»
«expose»
Figure 89. Tom Sawyer IBD View Diagram
Tom Sawyer Tom Sawyeractivity ][
«TomSawyerDiagram»
{diagramType = Internal Block Diagram}
Figure 90. Tom Sawyer
The process of creating a Tom Sawyer Internal Block Diagram is slightly different from that of a Block Definition Diagram. The
simplest way to generate a Tom Sawyer Internal Block Diagram is to first expose the desired block from the view in which the
diagram will be created. In the example above the block named top1 is exposed by the view named myView and thus the Internal
Block Diagram for top1 will be created on myView.
The next step is to create the Viewpoint Method Diagram for the viewpoint to which myView conforms, in this case the viewpoint is
named Tom Sawyer. In the Viewpoint Method Diagram the only action needed is TomSawyerDiagram. Note that in the specification
of the TomSawyerDiagram action the Diagram Type must be set to Internal Block Diagram AND Collect Related Elements* must be
set to True.
*It should be noted that Collect Related Elements must be on for Internal Block Diagrams. Trying to use a Viewpoint Method
Diagram in which a CollectOwnedElements is connected to a TomSawyerDiagram when the element exposed by the view is a
block will result in an empty diagram regardless of whether Collect Related Elements is True or False. Because of this, it is
recommended that modelers generate Internal Block Diagrams using the methodology mentioned in the previous paragraphs.
1.3.2.6.4 Generating from Previous Diagram
An alternative way of generating Tom Sawyer diagrams is to first create the diagram in the model then generate a Tom Sawyer
diagram from it. The following is a simple example.
66
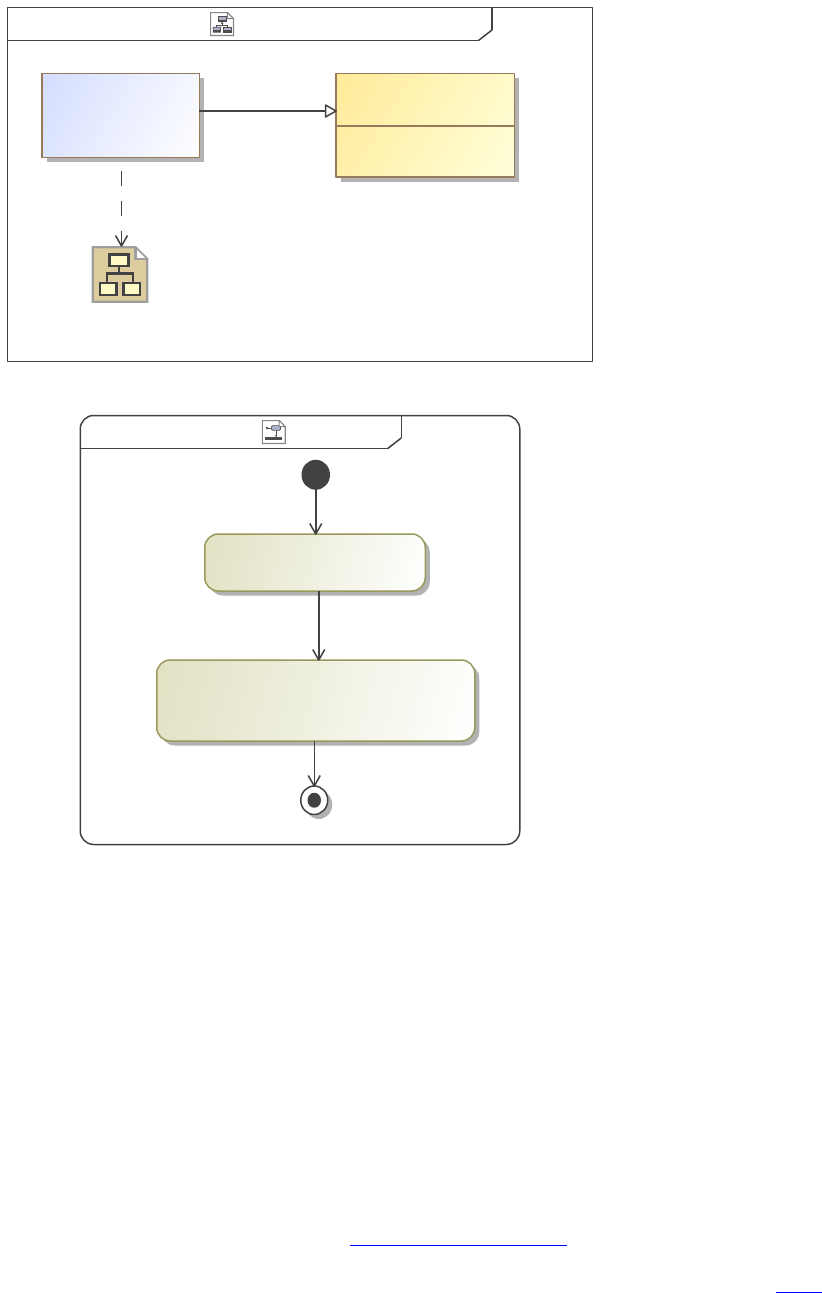
Previous Diagram View DiagramPrevious Diagramclass [ ]
operations
«Create»View()
Tom Sawyer
«viewpoint»«view»
myView
myBlocks
«conform»
«expose»
Figure 91. Previous Diagram View Diagram
Tom SawyerTom Sawyeractivity ][
«TomSawyerDiagram»
{diagramType = Block Definition Diagram}
«CollectThingsOnDiagram»
Figure 92. Tom Sawyer
To generate a Tom Sawyer diagram from a previously made diagram, first expose the desired diagram from the view in which the
Tom Sawyer diagram will be generated. In the image above, the view, named myView, exposes the diagram myBlocks. The diagram
myBlocks is a Block Definition Diagram which was created in the model previously.
Next the Viewpoint Method Diagram of the viewpoint to which the view conforms must be made. In this case the view, myView,
conforms to the viewpoint named Tom Sawyer. On the Viewpoint Method Diagram only two actions are needed, first
CollectThingsOnDiagram collects all elements which are on the exposed diagram, myBlocks. Next TomSawyerDiagram generates the
specified type of diagram. Make sure that the option Diagram Type in the specification of the TomSawyerDiagram action is set to
whatever diagram is desired.
1.3.2.7 Plot
Plots can be generated from a SysML model in MagicDraw via the Plot action. The Plot action can be used on a Viewpoint Method
Diagram. For more info on Viewpoint Methods and setting up views see, Create Viewpoint Methods.
Plots use a table structure to interpret the data to be used on the generated chart. For more info on creating table structures see, Table.
The Plot action interprets table data as follows:
• The first row in the table (Column Headers) is used as the markings on the x-axis of the chart. If the option Hide Headers is
set to True in the table structure, then the markings on the x-axis will be the numbers 0, 1, 2, 3, .... Note: the first cell of the
first row is NOT used.
• The first column in the table serves as the name of each line to be plotted.
67
• Each row (other than the Header row) corresponds to a line to be plotted where the name of the line is in the first cell of that
row and all following cells contain the y-values of that line. See example below.
Example
Table 9. Table with headers
x-value 1 x-value 2 x-value 3 x-value 4
Line 1 2 1 3 4
Figure 93. Demo Plot with Headers
When the table headers are included, as shown above, the column headers are used as the points on the x-axis. It should be noted that
the table is displayed along with the plot here to show the table structure that the plot is generated from, however, the table does not
need to be displayed along with the plot (more on this in the examples).
Table 10. Table without headers
Line 1 2 1 3 4
Figure 94. Demo Plot without Headers
x-value 1 x-value 2 x-value 3
1
1.5
2
2.5
3
3.5
4
Line 1
012
1
1.5
2
2.5
3
3.5
4
Line 1
68
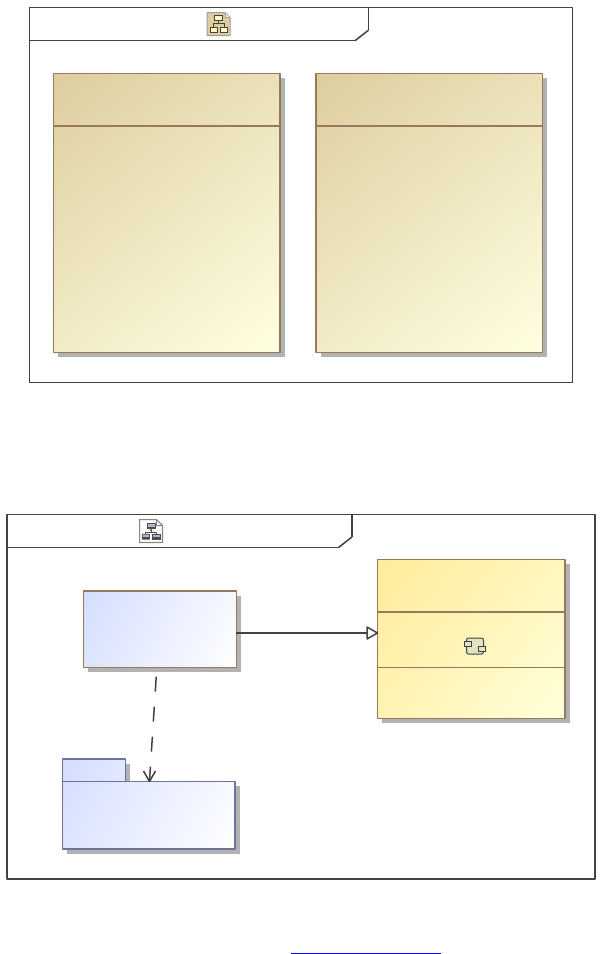
When the table headers are not included the default x-axis labels are the numbers 0, 1, 2, 3,... as shown above. It should be noted that
the table is displayed along with the plot here to show the table structure that the plot is generated from, however, the table does not
need to be displayed along with the plot (more on this in the examples).
1.3.2.7.1 Creating Plots
In this example we will create a line chart using the Plot action in a viewpoint method. We will use a block with value properties to
create the table structure for the plot, however, there are many ways to make a table structure any of which can be used to make a plot.
Viewpoint Method Diagram
In this example we will create a line chart using the Plot action in a viewpoint method. We will use a block with value properties to
create the table structure for the plot, however, there are many ways to make a table structure any of which can be used to make a plot.
Line Plot BlocksLine plot[Block]bdd ][
Day2 = 2
values
Day7 = 7
Day3 = 3
Day6 = 6
Day9 = 9
Day1 = 1
Day4 = 4
Day5 = 5
Day10 = 10
Day8 = 8
Apples
«block»
Day3 = 1
Day4 = 2
Day6 = 6
Day7 = 4
Day10 = 10
Day5 = 9
Day9 = 7
Day2 = 3
Day8 = 9
values
Day1 = 5
Oranges
«block»
Figure 95. Line Plot Blocks
The above two blocks, Apples and Oranges, are the two blocks in the Line Plot Blocks package. Each block has ten value properties
with values that will be used to make a plot. For example these values could be the number of that fruit sold on each day.
Line Plot View DiagramLine plotclass ][
«viewpoint»
method = Line Plot
operations
«Create»View()
«viewpoint»
Line Plot
Line Plot Blocks
Example Line Plot
«view» «conform»
«expose»
Figure 96. Line Plot View Diagram
To setup our view in which the plot will be displayed, in this case Example Line Plot, we expose the Line Plot Blocks package and
conform to a viewpoint.
69
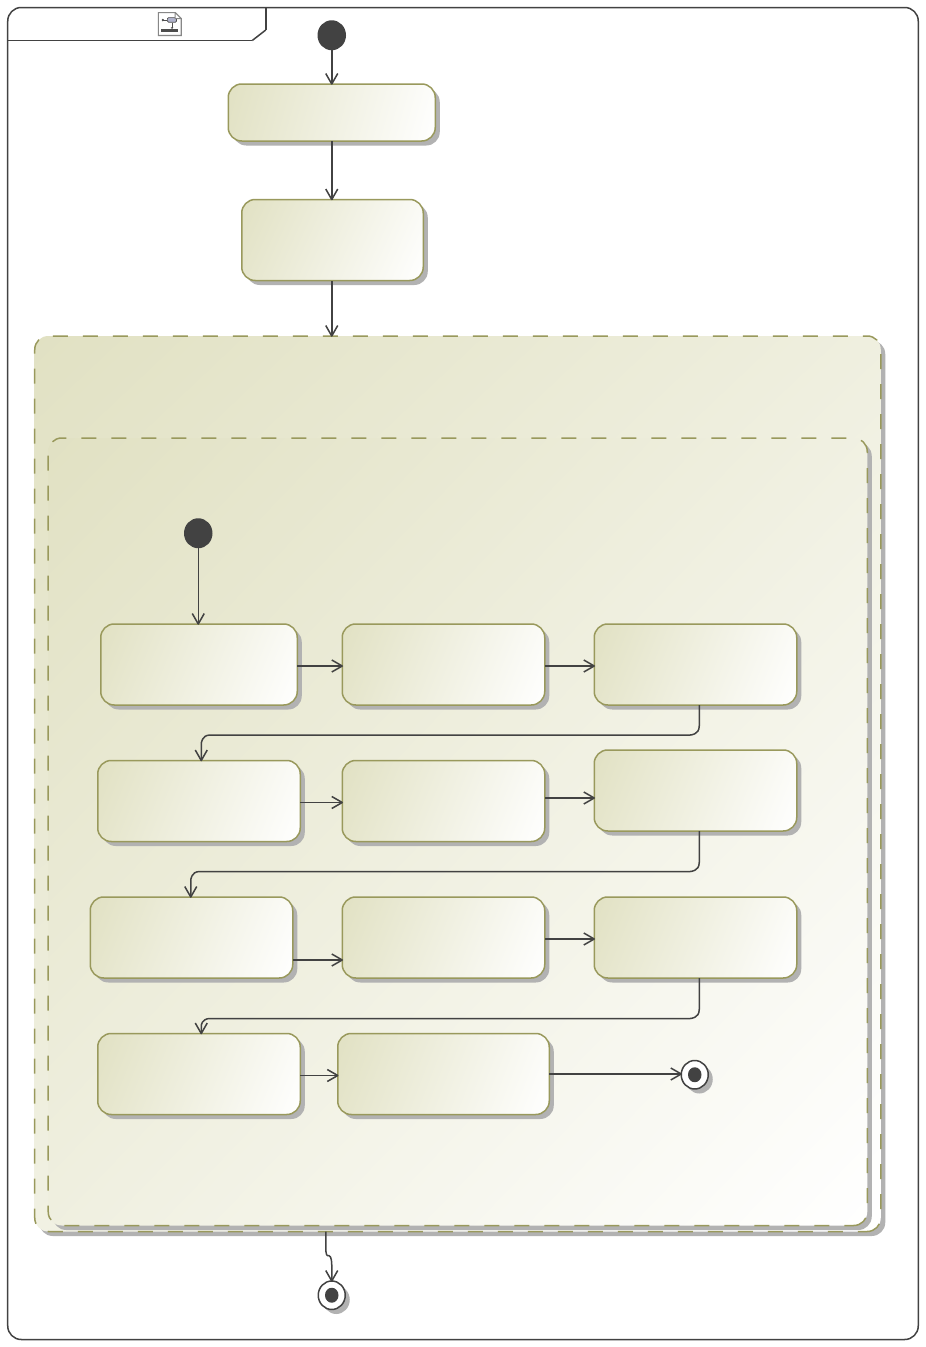
Line Plot Line Plotactivity [ ]
«Plot»
My Plot
{plotTitle = "Apples and Oranges",
plotType = c3}
«TableStructure»
{hideHeaders = false}
«TablePropertyColumn»
Day 10
{desiredProperty = Day10}
Day 5
«TablePropertyColumn»
{desiredProperty = Day5}
Day 6
«TablePropertyColumn»
{desiredProperty = Day6}
«TablePropertyColumn»
Day 2
{desiredProperty = Day2}
«TablePropertyColumn»
Day 9
{desiredProperty = Day9}
Day 4
«TablePropertyColumn»
{desiredProperty = Day3}
Day 8
«TablePropertyColumn»
{desiredProperty = Day8}
Day 7
«TablePropertyColumn»
{desiredProperty = Day7}
«TablePropertyColumn»
Day 3
{desiredProperty = Day3}
Day 1
«TablePropertyColumn»
{desiredProperty = Day1}
«TableAttributeColumn»
{desiredAttribute = Name}
«CollectOwnedElements»
«FilterByStereotypes»
{stereotypes = Block}
Figure 97. Line Plot
70
Next we define the method for the Line Plot viewpoint with the above Viewpoint Method Diagram. First we collect the blocks from
the Line Plot Blocks package with a CollectOwnedElements and FilterByStereotype (block). Then we create a Plot structure and in its
specification, define Plot Title and Plot Type (for line plot set Plot Type to c3). Inside that Plot structure we create a Table structure,
this table will be used to create the plot and will NOT be displayed as a table.
In the table structure we set the first column to be the name of the blocks since entries in the first column serve as the names of the line
to be plotted. Next we make ten columns with headers (Day 1, Day 2,...) since want our x-axis to be labeled by day. Remember that
the headers are the names of the TablePropertyColumn actions. Lastly we set the values of the columns to the value of the properties
named Day1, Day2,... on the blocks in the Line Plot Blocks package. See Table for more information on table structures.
See the Example Line Plot for what yields from generating with the above model. Further, see Example Radar Plot for an example of
a radar plot using the same data and Example Parallel Axis Plot for an example of a parallel axis plot.
1.3.2.7.1.1 Example Line Plot
The following is the line plot generated from the model in Creating Plots.
Figure 98. Apples and Oranges
1.3.2.7.1.2 Example Radar Plot
The following radar plot was generated in the exact same way as the Line Chart in Creating Plots, the only difference being that the
Plot Type was set to d3-radar in the specification of the Plot structure. The same package of blocks was used.
Day 1 Day 2 Day 3 Day 4 Day 5 Day 6 Day 7 Day 8
1
2
3
4
5
6
7
8
9
10
Apples Oranges
71
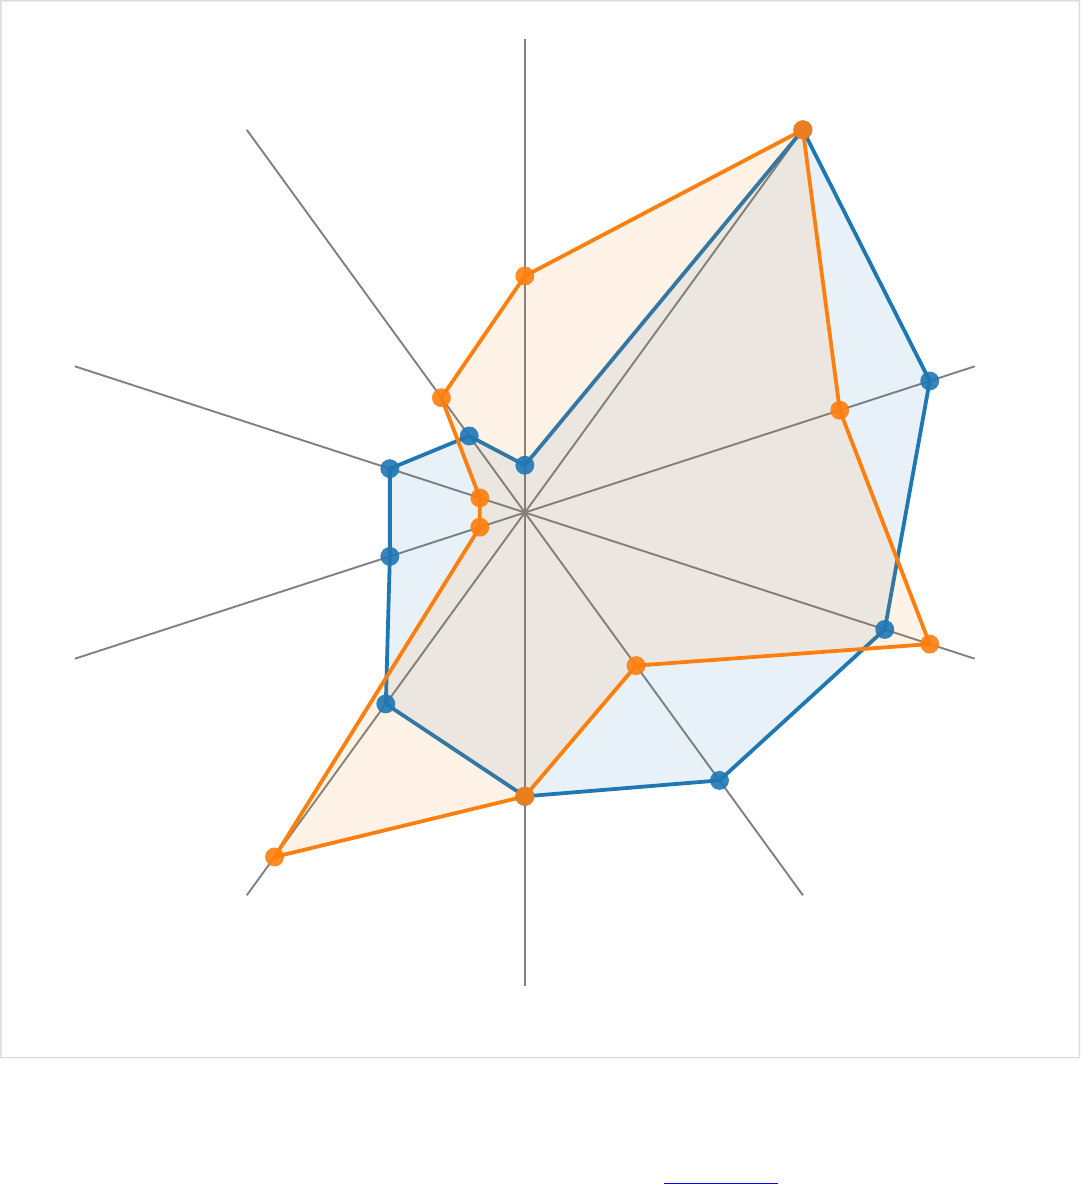
3.33
6.67
10.0
Day 1
Day 2
Day 3
Day 4
Day 5
Day 6
Day 7
Day 8
Day 9
Day 10
Figure 99. Apples and Oranges
1.3.2.7.1.3 Example Parallel Axis Plot
The following radar plot was generated in the exact same way as the Line Chart in Creating Plots, the only difference being that the
Plot Type was set to d3-parallel-axis in the specification of the Plot structure. The same package of blocks was used.
72
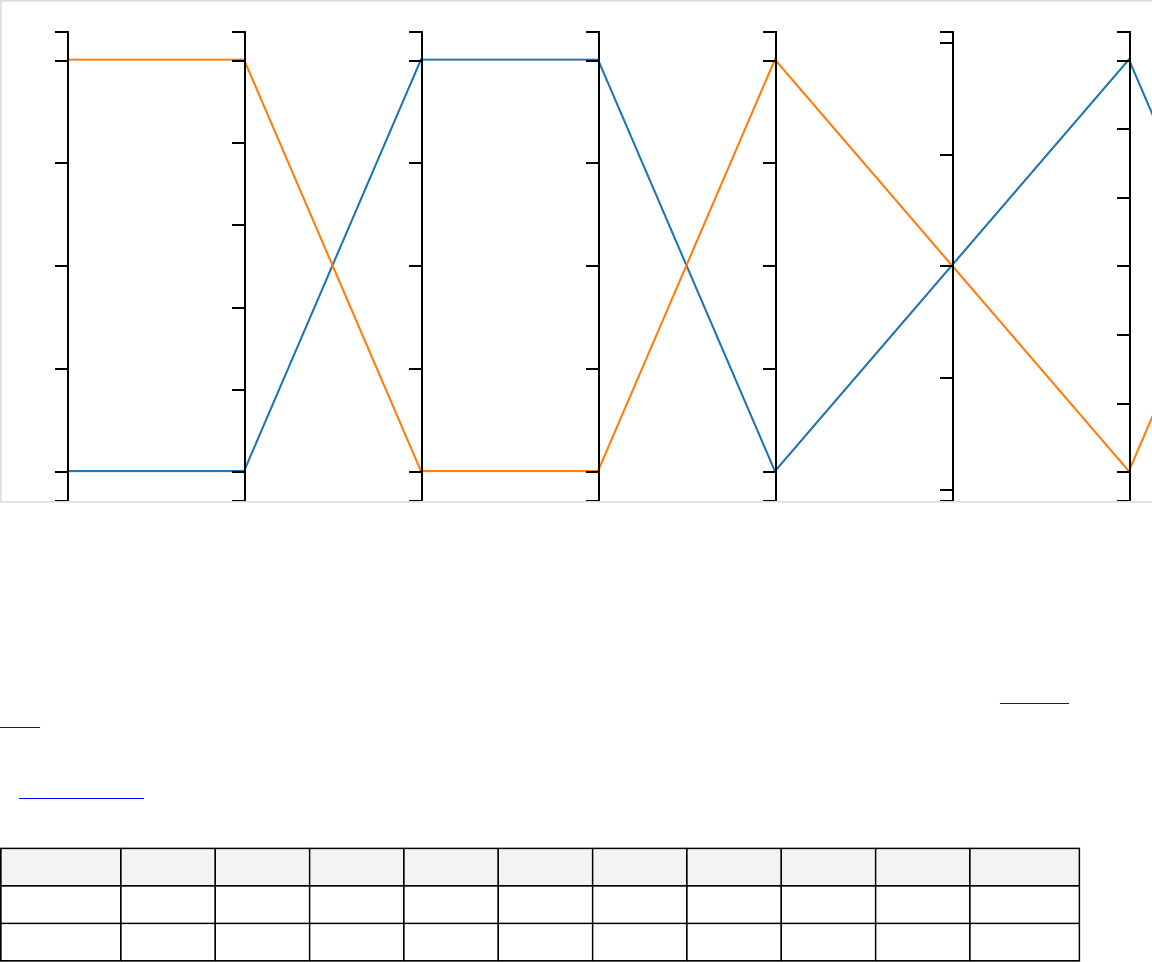
1
2
3
4
5
Day 1
2.0
2.2
2.4
2.6
2.8
3.0
Day 2
1.0
1.5
2.0
2.5
3.0
Day 3
1.0
1.5
2.0
2.5
3.0
Day 4
5
6
7
8
9
Day 5
5.6
5.8
6.0
6.2
6.4
Day 6
4.0
4.5
5.0
5.5
6.0
6.5
7.0
Day 7
Figure 100. Apples and Oranges
1.3.2.7.2 Customizing Plots
Plots can be customized in many ways such as other plots types, colors, labels, etc. To generate a plot with custom properties the Plot
Configuration field in the specification of the Plot structure must be filled with JSON containing the custom options.
A few examples are shown below. These examples were made using the same method and elements as the ones presented in Creating
Plots with a few minor changes discussed below.
Note that these plots are created with the C3.js javascript library which has many options. See the full documentation
at https://c3js.org/.
Table 11. Apples and Oranges Data
Day 1 Day 2 Day 3 Day 4 Day 5 Day 6 Day 7 Day 8 Day 9 Day 10
Apples 1 2 3 3 5 6 7 8 9 10
Oranges 5 3 1 1 9 6 4 9 7 10
For reference this table is the data being used to create the following plots. Again, it is not necessary that the table be generated with
the plot, it is used here for clarity.
Donut Chart
To create a donut chart set the Plot Type as c3 in the specification of the Plot structure, then use the following JSON in the Plot
Configuration field (also in the specification),
{
"options": {
"data": {
"type": "donut"
},
"donut": {
"title": "Apples vs. Oranges"
}
}
}
73

Note: in the above JSON the "title" indicates the text to be put inside the donut circle, whereas the Plot Title defined in the
specification of the Plot structure will create the bold text beneath the donut.
There is an option in the specification of the Table structure nested in the Plot structure called Hide Headers, in this example that
option is set to True. Setting Hide Headers to False in this example yields an extra legend entry, see Common Issues for more detail.
Figure 101. Apples and Oranges
The above plot is the result of using the above JSON in the Plot Configuration field.
Scatter Plot
Creating a scatter plot is similar to creating a donut. Set the Plot Type to c3 then use the following JSON in the Plot Configuration,
{
"options": {
"data": {
"type": "scatter"
},
"axis": {
"x": {
"label": "Days"
},
"y": {
"label": "Number sold"
}
}
}
}
In the above JSON multiple custom features are displayed. Setting "type" to "scatter" is the only piece required to create a scatterplot,
the other two entries under "axis" set the labels of the x and y axes.
There is an option in the specification of the Table structure nested in the Plot structure called Hide Headers, in this example that
option is set to True. Setting Hide Headers to False in this example yields an extra legend entry, see Common Issues for more detail.
Apples vs. Oranges
49.5% 50.5%
0 2 4 6
1
2
3
4
5
6
7
8
9
10
Apples Oranges
74
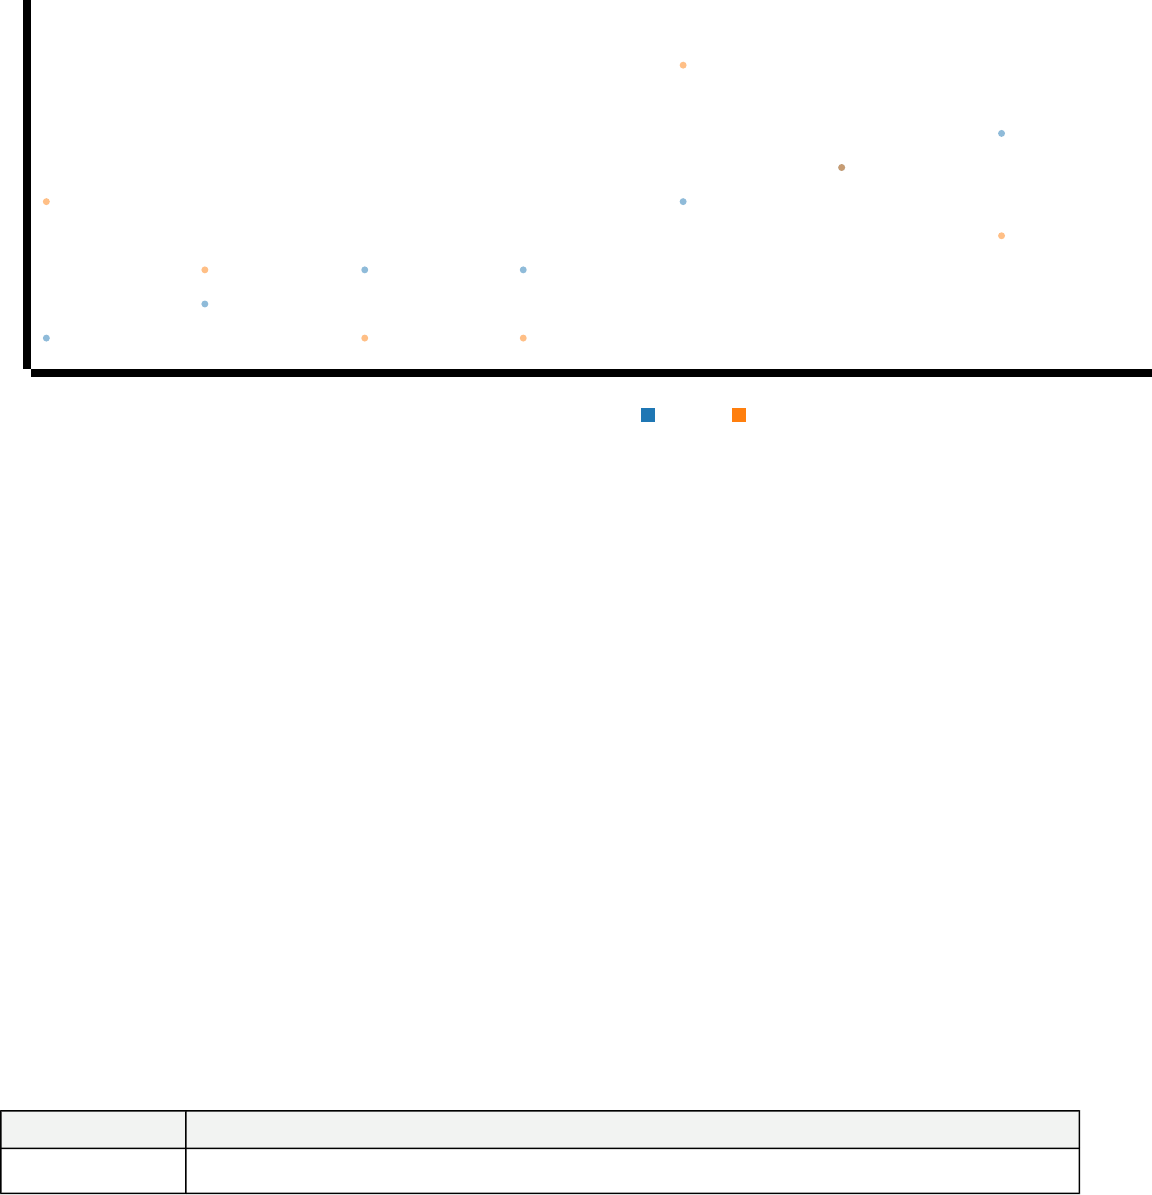
Figure 102. Apples and Oranges
The above plot is the result of using the above JSON in the Plot Configuration field.
1.3.2.7.3 Common Issues
Below are some issues that come up often when dealing with plots.
Headers
There are many reasons a plot does not show up, however, if the title of the plot (as defined in the specification of the Plot structure)
generates but the plot itself does not that is often an issue with the headers setting. The two most common headers issues are as
follows.
1. Plot not generating: In the Viewpoint Method Diagram used to generate the plot, the "x coordinates" are taken as the names
of the Table columns however if the actions that create the columns (i.e. TablePropertyColumn, etc.) are unnamed this can
lead to strange behavior such as the plot being empty or all the y-values having the same x-value. To avoid this, make sure
all column actions are named then use the Hide Headers option in the specification of the Table structure to select whether
to use the header names or numbers on the x-axis. Note Hide Headers set to True will result in numbers on the x-axis,
whereas False will use the names of the columns on the x-axis.
2. Extra legend entry: On certain types of plots, especially custom ones it is possible to have the x-values show up as a data
set in the legend. To fix this, set Hide Headers to True.
1.3.3 Other
Table 12. DocGen Methods
Method Name Method Description
Simulate Execute Cameo Simulation Toolkit simulation(s) and present results as table(s).
1.3.3.1 Simulate
DocGen has the ability to run Cameo Simulation Tool Kit simulations when generating documents. This may be useful when trying to
execute the simulations based on the most recent values and instances in line with generating documents that reference these values.
0 2 4 6
Number sold
1
2
3
4
5
6
7
8
9
10
Apples Oranges
75
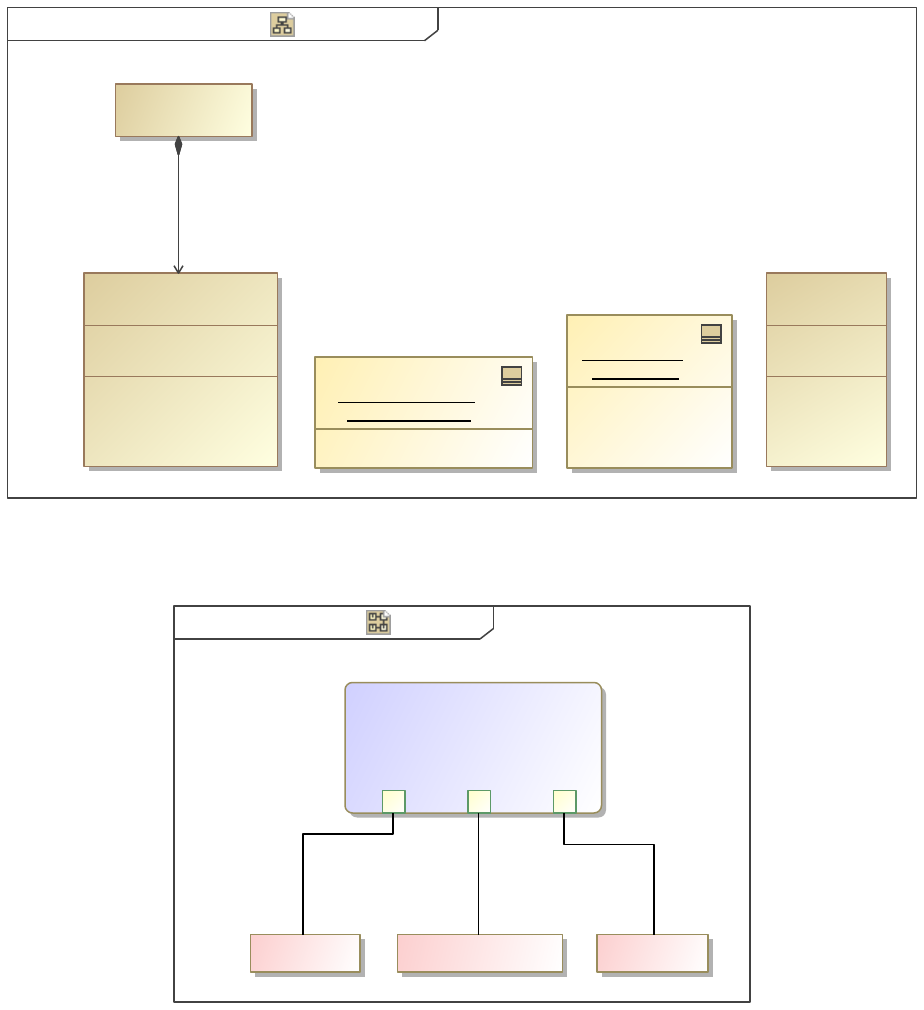
1.3.3.1.1 Simulate Config
Force Simulation Force Simulation[Package]bdd ][
pointMass = pointMass1
systemContext1 :
System Context
«block» {c = a * b}
constraints
c : Real
b : Real
a : Real
parameters
«constraint»
Product
forceConstraint : Product
constraints
force : Real
acceleration : Real
mass : Real
values
Point Mass
«block»
mass = 10.0
force = 40.0
acceleration = 4.0
«block»
pointMass1 :
Point Mass
System Context
«block»
pointMass
Figure 103. Force Simulation
This example simulation calculates the force applied on a point mass given its mass and acceleration.
Point MassPoint Mass[Block]par [ ]
«constraint»
{c = a * b}
forceConstraint : Product
c b a
acceleration : Real mass : Realforce : Real
«equal» «equal» «equal»
Figure 104. Point Mass
This constraint applies Newton's Second Law of Motion to a point mass.
76
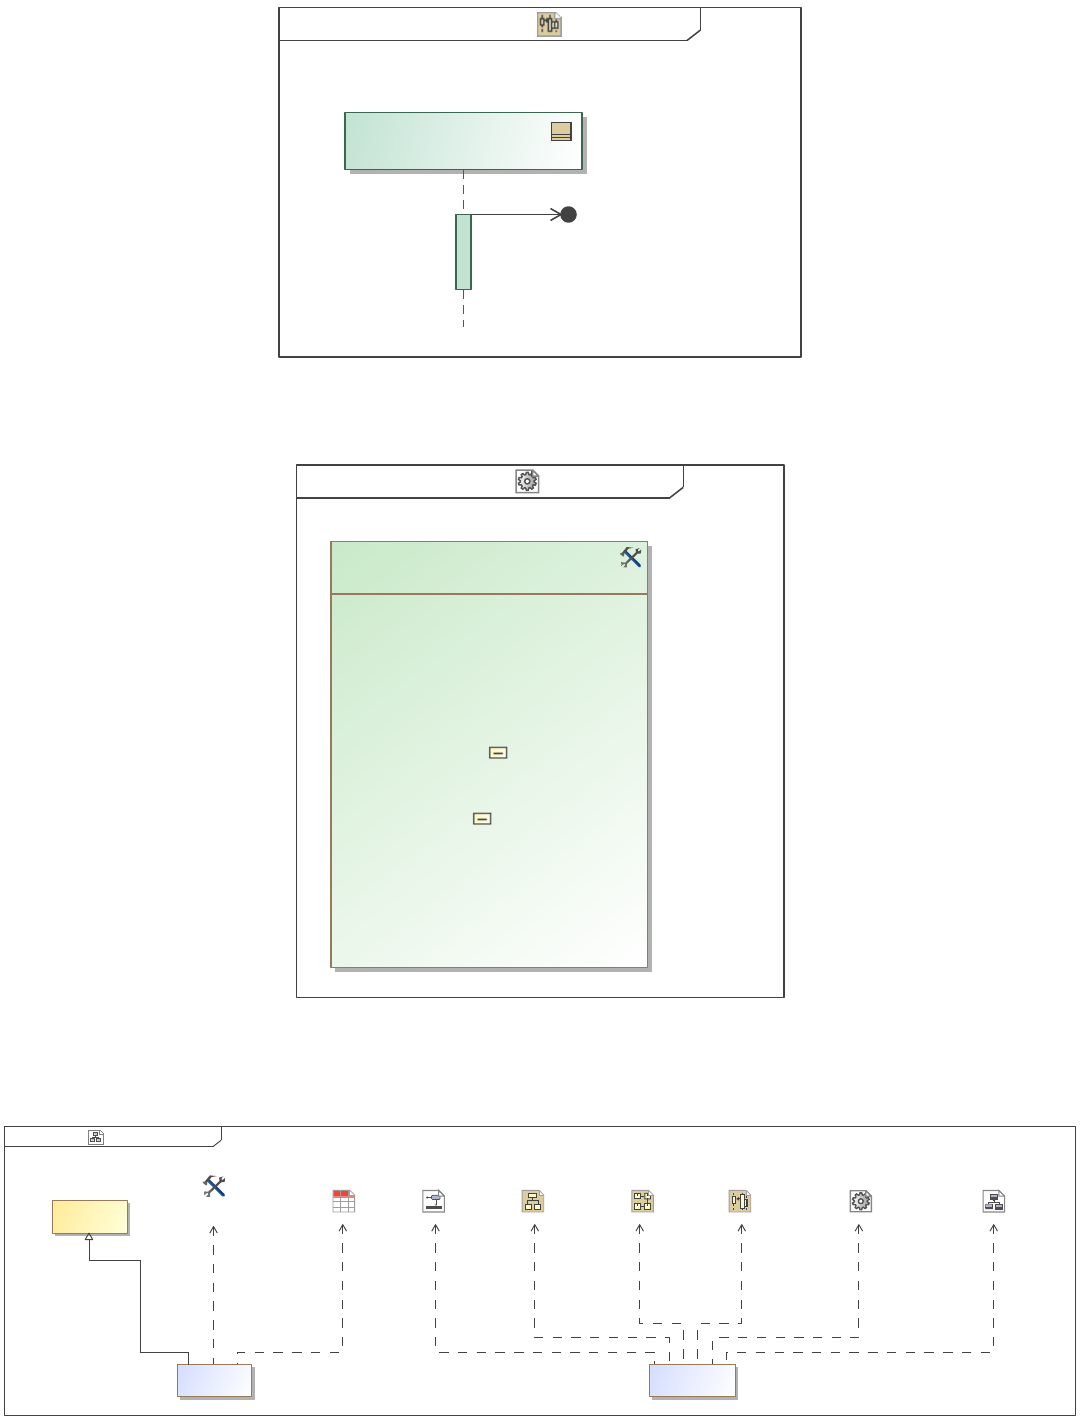
System ContextSystem Context[Interaction]sd ][
«block»
pointMass : Point Mass
1:
Figure 105. System Context
This sequence diagram specifies how the point mass system should be executed.
Force SimulationForce Simulationpackage ][
«SimulationConfig»
resultLocation = systemContext1
executionTarget = systemContext1
treatAllClassifiersAsActive = true
timeVariableName = "simtime"
startWebServer = false
solveAfterInitialization = true
silent = false
runForksInParallel = true
initializeReferences = false
fireValueChangeEvent = true
constraintFailureAsBreakpoint = false
cloneReferences = false
autostartActiveObjects = true
autoStart = true
animationSpeed = 95
addControlPanel = false
«SimulationConfig»
Force Simulation Config
Figure 106. Force Simulation
The SimulationConfig defines the execution target and result location such that it solves the constraint and the solved system is saved
in InstanceSpecifications.
Simulate View DiagramSimulateclass ][
Force Simulation Config
«SimulationConfig»
Simulate View DiagramForce Simulation Force SimulationSystem Context
Simulate Config
«view»
Instance Table
Simulate
«viewpoint»
«view»
Simulate Data
Point MassSimulate
«expose»
«expose» «expose»«expose»«expose»«expose»«expose»«expose»«conform»
77
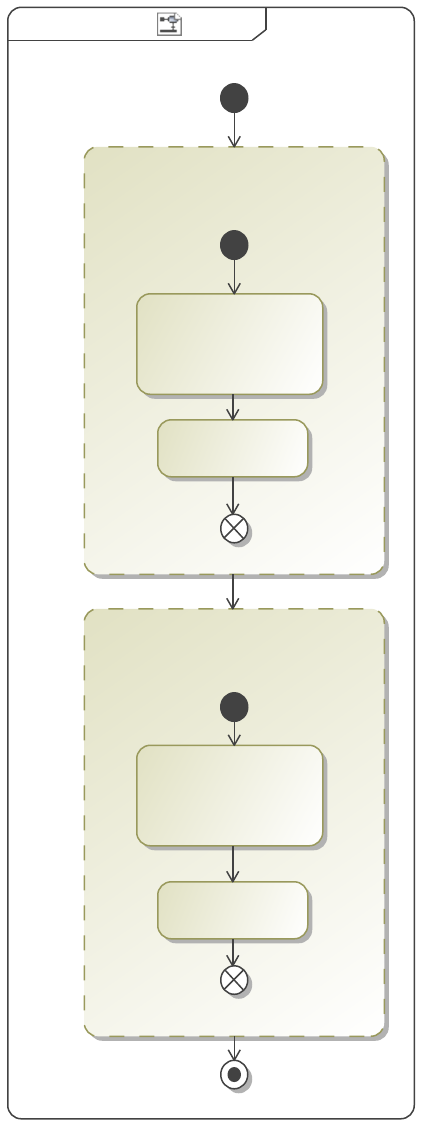
Figure 107. Simulate View Diagram
The view that executes the simulation exposes the simulation target(s), which in this case is a SimulationConfig. The Instance Table is
exposed in order to present the results of the simulation. The viewpoint filters out Diagrams inside a StructuredQuery and simulates
the filtered set, which is just the SimulationConfig in the case of the example simulation. The viewpoint then filters for only Diagrams
inside a StructuredQuery and presents the filtered set as tables, which is just the Instance Table in the case of the example simulation.
Simulateactivity Simulate ][
«StructuredQuery»
«FilterByMetaclasses»
{include,
metaclasses = Diagram}
«GenericTable»
«StructuredQuery»
«FilterByMetaclasses»
{include = false,
metaclasses = Diagram}
«Simulate»
Figure 108. Simulate
Execute Cameo Simulation Toolkit simulation(s) and present results as table(s).
78
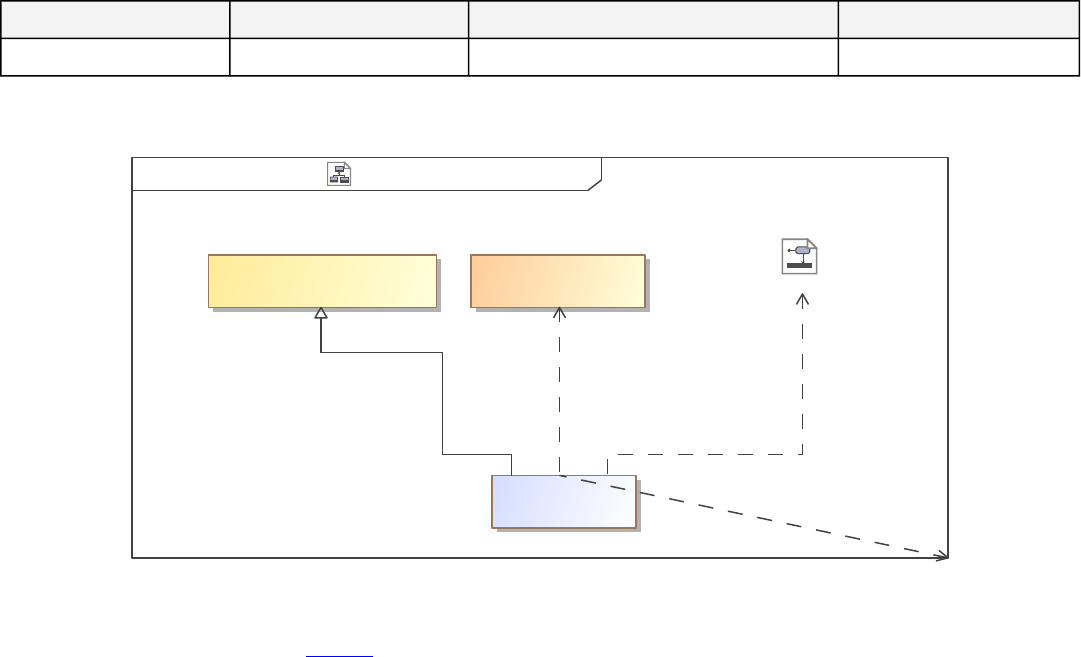
1.3.3.1.2 Simulate Data
Table 13. Instance Table
Name mass : Real acceleration : Real force : Real
pointMass1 10.0 4.0 40.0
1.3.3.2 OpaqueBehavior
OpaqueBehavior View DiagramOpaqueBehaviorclass [ ]
OpaqueBehavior Viewpoint
OpaqueBehavior Viewpoint
«viewpoint» «opaque»
createTestParagraph
OpaqueBehavior
«view» «expose»
«expose»«conform» «expose»
Figure 109. OpaqueBehavior View Diagram
This example View is used to demonstrate how OpaqueBehaviors can be used in DocGen to execute arbitrary code and optionally
generate presentation elements in any JSR 223 compliant scripting language, such as Groovy, Scala, Python, etc. These
OpaqueBehaviors include the code inside a model element, so they are versioned and transported with the model thus removing the
need to have external dependencies to generate views (like plugins, UserScripts, etc.).
79
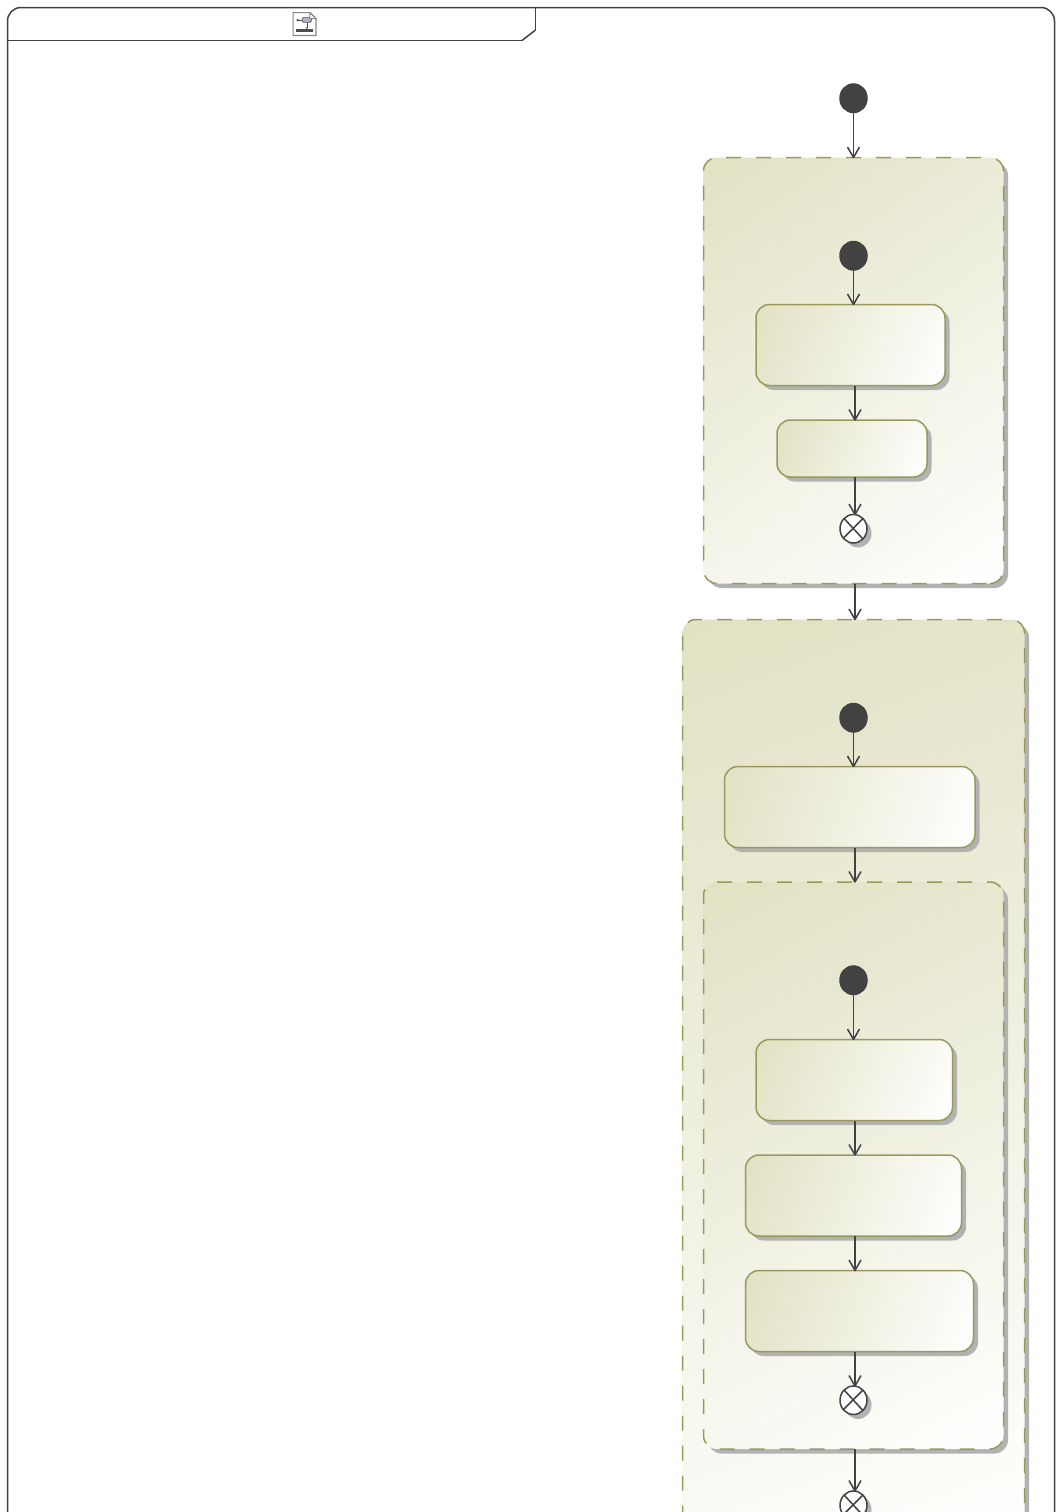
OpaqueBehavior ViewpointOpaqueBehavior Viewpointactivity ][
«StructuredQuery»
«TableStructure»
Opaque Behavior Data
«TableExpressionColumn»
Language
{expression = "self.language"}
«TableExpressionColumn»
Body
{expression = "self._body"}
{desiredAttribute = Name}
«TableAttributeColumn»
Name
«FilterByMetaclasses»
{metaclasses = OpaqueBehavior}
«StructuredQuery»
{metaclasses = Diagram}
«FilterByMetaclasses»
«Image»
80
Figure 110. OpaqueBehavior Viewpoint
This Viewpoint demonstrates the usage pattern for an example OpaqueBehavior named createTestParagraph. All OpaqueBehaviors
used in DocGen are provided four inputs at runtime:
•exposedElements: The list of elements that are exposed to the Behavior as a result of the view generation.
•forViewEditor: A boolean value that is true when the target for generation is View Editor, i.e. when it is not a local
generation.
•outputDirectory: A string with the path to the output directory when using local generation.
•context: The gov.nasa.jpl.mbee.mdk.model.BehaviorQuery object that is executing the code. This input is exposed for
advanced users, but most use cases do not need it.
In this example, the OpaqueBehavior will create a Paragraph that prints all the values of the variables using Groovy. OpaqueBehaviors
can return a single gov.nasa.jpl.mbee.mdk.docgen.docbook.DocumentElement or a collection of them. Any other output will be
ignored and the user will be warned in the notification window. Errors in the code will also be presented in the notification window
and a full stack trace will be printed to the log file.
See MagicDraw documentation for OpaqueBehaviors for implementation details.
Table 14. Opaque Behavior Data
Name Body Language
createTestParagraph
return new gov.nasa.jpl.mbee.mdk.docgen.docbook.DBParagraph('context is "' + context + '".
exposedElements are "' + exposedElements + '".
forViewEditor is "' + forViewEditor + '".
outputDirectory is "'+ outputDirectory + '".')
Groovy
context is
"BehaviorQuery(,callBehaviorAction=com.nomagic.uml2.ext.magicdraw.actions.mdbasicactions.impl.CallBehaviorActionImpl@aa1951dd)".
exposedElements are
"[com.nomagic.uml2.ext.magicdraw.commonbehaviors.mdbasicbehaviors.impl.OpaqueBehaviorImpl@ca48b6ad,
com.nomagic.uml2.ext.magicdraw.classes.mdkernel.impl.DiagramImpl@45bdb0c2,
com.nomagic.uml2.ext.magicdraw.classes.mdkernel.impl.DiagramImpl@74dfc5b7]".
forViewEditor is "true".
outputDirectory is "null".
1.4 Create and Evaluate OCL Constraints
This section is a brief introduction to Object Constraint Language (OCL) and how it is used within the MDK. It is important to note
that this is not a comprehensive explanation of OCL and at any point during this tutorial if you find yourself wanting a more in-depth
explanation of the language, (i.e. specific syntax rules), there are plenty of resources to be found and several are offered in the next
section.
1.4.1 What Is OCL and Why Do I Use It?
OCL Primer By Bradley Clement
What Is OCL?
The Object Constraint Language (OCL) is a text language (a subset of QVT) that can be used to customize views and viewpoints in
various ways that otherwise may require writing external code in Jython, QVT, Java, etc. OCL is used to define invariants of objects
and pre-and post conditions of specified operations. This allows for more advanced querying of model elements and their properties.
Throughout this entire section the words "expression" and "operations" will be used extensively. An OCL "expression" is a
statement of OCL "operations" that can be pieced together to get what you want. These expressions can be quite simple or
complex depending on the need.
For example:
1. n()
81

2. r('analysis:characterizes').oclAsType(Dependency).source.m('mass').oclAsType(Property).defaultValue.oclAsType(LiteralString)
.value.toInteger()=eval(self._constraintOfConstrainedElement->asSequence()->at(1).oclAsType(Constraint)
.specification.oclAsType(OpaqueExpression)._body->at(1))
Both 1 and 2 are OCL expressions, however, it is obvious to see that number 2 is quite a bit more complex. Number 1 is a single
operation that stands alone as an expression. It is important to note that these expressions are built by stringing along carefully
selected operations and separating them with the proper syntax. In the complex example above you will notice a lot of periods (.) and
arrows (->). Both of these symbols separate one piece of the expression from the next (there are more than just these two). It will take
some practice to understand which to use and when to use it. For a more extensive/advanced explanation of OCL syntax check out this
link.
Why Do I Use OCL?
You can use OCL to specify how to collect, filter, sort, constrain, and present model data. Constraints on model elements are the
driving force behind MDK and the inter-workings of certain elements presented earlier in this document will be explained via OCL.
Several new elements that were created specifically for dealing with OCL expressions within a viewpoint will be introduced as well.
For your everyday collect and filters of model elements OCL probably isn't the best choice, however, for more advanced queries of the
model it can be your golden ticket. Examples outlining this idea will follow.
OCL syntax can be tricky since it accesses model information through the UML metamodel (see the UML metamodel manual in your
Magicdraw installation directory, under manual). Here we try to give some tips on how to write OCL expressions to more easily
customize views without having to write external scripts in Jython, Java, QVT, etc. Keep in mind, this topic is more advanced than
previous ones discussed earlier in this document. At this point it is assumed that you understand how a viewpoint method diagram
works and can walk step by step from one action to the next and comprehend what elements should be expected in the final result.
This is important because OCL expressions work the same way.
OCL Resources
For help with OCL, you can try the OCL Cheat Sheet or search the web for example OCL. Some examples will also be given in the
sections below. The OCL Cheat Sheet is very helpful once you get a basic understanding of how OCL works, however, until you have
gained some understanding it might be confusing. In the following sections some references to this resource will be made with
explanations of how it can be useful.
NoMagic's UML metamodel specifies what objects can be referenced in an OCL expression for the different UML types. A pdf
manual of the metamodel can be found in your MagicDraw installation in the manual folder. If you use Eclipse, try opening the
Metamodel Explorer view from the menu: Window -> Show View -> Other. There may be many metamodels, but look for the
com.nomagic.uml2 metamodel. There is a button on the view where you can search for a type, but be careful since there may be more
than one UML metamodel. You want MagicDraw's UML metamodel. There is also a button for showing inherited members that can
be referenced in OCL.
1.4.2 What are the OCL Black Box Expressions?
Black box operations are often used to simplify expression structure. The following section will cover several of these so that you will
recognize them. However, before discussing the black box operations it is important to talk about the viewpoint method action
<<TableExpressionColumn>> since it will be used in the following example viewpoint methods.
<<TableExpressionColumn>> Applies an OCL expression to the target elements in a <<TableStructure>> that will populate a
column of the table displayed in View Editor. This can be used to chain operations on elements and relationships that would
otherwise be difficult or impossible.
Make sure to focus directly on this action in the examples. Understanding how they handle OCL expressions is important.
Another critical topic before moving on is the idea of "casting" in your OCL expressions. Many times when a result is returned from
an OCL operation it will need to be cast as the element expected from the query in order for further operations to be carried out. This
is the nature of OCL and just takes getting used to. Often times errors can be fixed by remembering to cast the returned elements. The
cheat sheet discussed earlier gives the operations needed for casting. They are shown below and will be implemented and explained in
the following examples. Remember to come back and reference these operations while working through the examples.
82
Below are the OCL black box operations used as shorthand in expressions. They will be demonstrated in the following sections.
•m(), member(), or members() returns the owned elements
•r(), relationship(), or relationships() returns all relationships owned or for which the element is a target
•n(), name(), or names() return the name
•t(), types() return all types (Stereotypes, metaclass, and Java classes and interfaces).
•type() returns just the type of the element selected.
•s(), stereotype(), or stereotypes() returns the Stereotypes. This is basically short for appliedStereotypeInstance.classifier.
s() and stereotypes() should return all stereotypes, and stereotype() should just return one.
•e(), evaluate(), or eval() evaluates an ocl expression retrieved from an element
•value() returns the value of a property or slot
•owners() returns owner and owner's owners, recursively
•log() prints to Notification Window
•run(View/Viewpoint) runs DocGen on a single View or Viewpoint with specified inputs and gets the result
Many of these views reference results of the example viewpoints. These results are similar to those found in the Present Model
Data view.
Figure 111. Animals
1.4.2.1 value()
The expression value() is a useful tool to get at the value of a property. In the example below the Animals package was exposed to the
viewpoint method diagram shown. Inspecting the expression [ self.get('noise').v().v() ] shows get() collecting the elements named
"noise," in this case all the properties. v() is then used twice, once to get the property default value, literal string. It is then used again
to get the text of the literal string.
Figure 112. value() View Diagram
Figure 113. Value Black Box Demo
1.4.2.1.1 Example View
Table 15. <>
Animal Noises
meow
quack
moo
ribbit
bark
1.4.2.2 Relationships "r()"
The following is an outline of the operation r(). The viewpoint method below is designed in such a way that it will use r() by itself and
also part of a more complex expression. The bullet list below will run through the explanations of the OCL expressions used in the
<<TableExpressionColumn>> below.
•r(), relationship(), or relationships() returns all relationships owned.
◦r('likes') in the first <<TableExpressionColumn>> gets all of the relationships of name or type 'likes'
◦r('likes').oclAsType(Dependency).target in the second <<TableExpressionColumn>> gets the 'likes'
relationship, casts it as Dependency then collects the target of the relationship (Cat). Keep in mind, when r()
returns the relationship 'likes,' in order to keep performing operations we have to cast what was returned. This is
done by oclAsType(). Look over the cheat sheet discussed earlier to become more familiar with these operations.
◦ Note: ignore the filters in the viewpoint method diagram, they are unimportant to the concept covered in this
section.
83
◦ Notice the <<TableExpressionColumn>> activities are where the OCL expressions are defined in the viewpoint
method diagram.
Figure 114. relationships() View Diagram
Figure 115. Relationships Black Box Demo
1.4.2.2.1 Example View
Table 16. Relationships
Name of element Likes Relationships Likes Target
Dog likes Cat
1.4.2.3 Names "n()"
•n(), name(), or names() returns the name
For this example, expression "n()" returns the name of the element passed to the action. In this case "Dog."
Figure 116. Names View Diagram
Figure 117. Names Black Box Demo
1.4.2.3.1 Example View
Table 17. <>
Name of Element
Dog
1.4.2.4 Stereotypes "s()"
•s(), stereotype(), or stereotypes() returns the Stereotypes. This is basically short for appliedStereotypeInstance.classifier.
s() and stereotypes() should return all stereotypes, and stereotype() should just return one.
For this example, Dog is exposed and it's stereotypes populated into a table.
Figure 118. Stereotypes View Diagram
Figure 119. Stereotypes Black Box Demo
1.4.2.4.1 Example View
Table 18. Stereotypes
Name of element Stereotype of Element
Dog Block
1.4.2.5 Members "m()"
•m(), member(), or members() returns the owned elements
◦ m('text') gets the member whose name or type is 'text'
Example:
• Since the element Dog is again exposed, m('noise') will get the member whose name is 'noise' and post that name to the
Attributes column of some particular table.
84
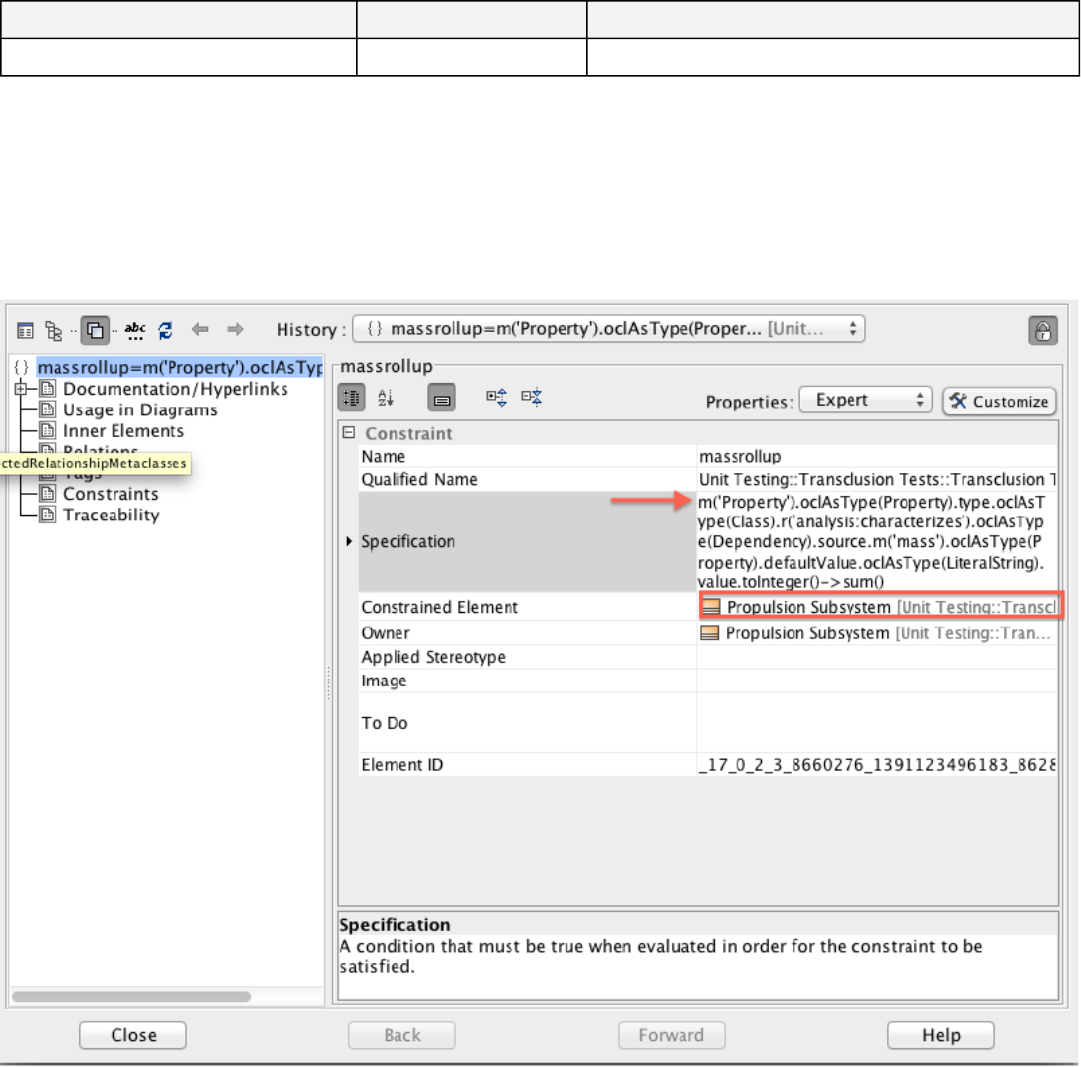
• Notice in the <<TableExpressionColumn>> actions of the viewpoint method are using different OCL expressions. The
"Attributes" column is returning any member who's name is 'noise'. The expression in the "Attribute Default Value" action is
collecting the same property, casting it as a Property and then returning the default value. This is done by:
m('noise').oclAsType(Property).defaultValue.
Figure 120. Members View Diagram
Figure 121. Members Black Box Demo
1.4.2.5.1 Example View
Table 19. Members
Name of element Attributes Attribute Default Value
Dog noise bark
1.4.2.6 Evaluate "eval()"
eval() or e() evaluates an OCL expression retrieved from an element. This example may seem overwhelmingly complex, however, the
main point is to demonstrate the use of the black box expression. The image below shows an element (Propulsion Subsystem) which
has a set constraint (red arrow).
This is a constrained element with the constraint specification:
The example expression is long but take the time to try and piece it together to help your understanding. A useful hint is to start with
the oclAsType() operations since these will give you a clue as to what was returned by the previous operation.
85

This is eval() taking in the constrained element and evaluating the constraint:
This is the complete viewpoint method diagram:
Figure 122. Evaluate View Diagram
Figure 123. Evaluate Black Box Demo
Figure 124. Transclusion Test Model
1.4.2.6.1 Example View
Table 20. <>
Component Name CBE Mass Rollup Number
Propulsion Subsystem 0
Launch Mass
Steady-State Power
On
Off
Standby
Hydrazine Tank
Launch Mass
Steady-State Power
On
Off
Standby
Thruster
Launch Mass
Steady-State Power
On
Off
Standby
Transclusion Test Model
1.4.2.7 Types "t()"
t() returns the type(s) of the element selected where as, type() only returns the type of the element exposed re. Element "Dog" is of
type Class and has other types associated with it. We would like to return just the type of element Dog, therefore, we use type() in the
<<TableExpressionColumn>>.
Note: the other information returned with Class is an artifact of MagicDraw.
86
Figure 125. Types View Diagram
Figure 126. Types Black Box Demo
1.4.2.7.1 Example View
Table 21. Types
Name of element Type of Element
Dog interface com.nomagic.uml2.ext.magicdraw.classes.mdkernel.Class
1.4.2.8 Owners "owners()"
Returns owner and owner's owners, recursively. In the example below, the OCL evaluation tool is used to collect the owners of the
element "Dog" In the results of the evaluation box, the owning packages and model are shown. Note: the fist part of the expression
(self.) is specifying the target element. The operation would work without it since it is just one element being exposed.
The red arrows below show the package hierarchy collected.
Figure 127. Owners View DIagram
Figure 128. Owners Black Box Demo
1.4.2.8.1 Example View
Table 22. <>
Owners
Animals
Present Model Data
Create Viewpoint Methods Examples
Models
Docgen
Data
1.4.2.9 log()
UNDER CONSTRUCTION
The log() black box expression takes the elements collected at any point in an OCL expression and prints them in the notification
window in Magic Draw. In this example, the OCL query shown in the OCL Evaluator (discussed later) was run on the "Animals"
package. This expression collects the owned elements of the package. Notice, in the comparison of the OCL Evaluation (top) window
and the Notification Window (bottom), the elements displayed are the same. The red and blue arrows correspond to the same
elements.
Figure 129. Log View Diagram
Figure 130. Log Black Box Demo
1.4.2.9.1 Example View
1.4.2.10 run(View/Viewpoint)
One way to use run() is to first collect a viewpoint and then run it on the element selected. The first viewpoint method below has an
OCL expression in the <<TableExpressionColumn>> activity: self.get('testforrun').run(self). Dissecting the expression shows the
viewpoint titled "testforrun" was collected using get(). (NOTE: get() is a very useful expression when selecting a specific element).
Next, the operation run() took the viewpoint and ran it against all elements that were not filtered out earlier. At this point in the
87

method, these elements would be classified as "self." The second viewpoint method diagram shown below is "testforrun." As each
element (self) is passed to the viewpoint via run(), their name is collected and returned to the <<TableExpressionColumn>> action.
Figure 131. RunViewViewpoint View Diagram
Figure 132. Run Black Box Demo
1.4.2.10.1 Example View
Table 23. <>
Animals
1.4.3 How Do I Use OCL Expressions in a Viewpoint?
OCL expressions can be used in viewpoint methods in various ways to do various things. The following sections will outline some of
these functions.
1.4.3.1 Using Collect/Filter/Sort by Expression
To more easily introduce OCL Expressions into viewpoint methods, several custom actions have been provided and can be found in
the tool bar of viewpoint method diagrams along with the other collect and filter actions discussed in previous sections. A brief
description of each follows below. Each action's specification window has a designated tag to enter the desired OCL expression.
Viewpoint Elements
<<CollectByExpression>> Collect elements using an OCL expression. This works like other collect stereotypes.
<<FilterByExpression>> Filter a collection using an OCL expression. This works like other filter stereotypes.
<<SortByExpression>> Sort a collection using an OCL expression. This works like other sort stereotypes.
<<Constraint>> You can add this stereotype to a comment or an action in an activity diagram to evaluate an OCL expression on the
action's results. The expression should return true or false. If false, the constraint is violated, and the violation will be added to the
validation results panel. A constraint comment can be anchored to multiple actions to apply to all of the actions' results separately.
<<TableExpressionColumn>> Apply an OCL expression to the target elements. This can be used to chain operations on elements
and relatonships that would be otherwise be difficult or impossible.
<<ViewpointConstraint>> Allows a constraint to be evaluated at any point in a viewpoint method diagram on any elements passed
to the action.
zz<<CustomTable>> A CustomTable allows columns to all be specified as OCL expressions in one viewpoint element. Target
elements each have a row in the table. Title, headings, and captions are specified as with other tables.
1.4.3.2 Advanced Topics
View Currently Under Construction
1.4.3.2.1 Use of the Iterate Flag
1.4.4 What is the OCL Evaluator and Why Do I Use It?
This tool is EXTREMELY helpful since many times your OCL query needs to be pieced together in order to get the results you want.
All of the OCL expressions discussed in the above sections can be reproduced in the the OCL Evaluator directly in Magic Draw. For
88
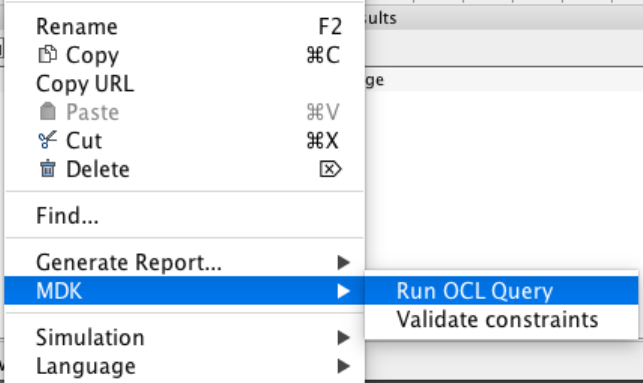
example, the image below demonstrates how the expression used in section "8.2.10 value()" would operate in the OCL Evaluator tool.
Notice .ownedElement was added to collect the elements of the package. This was not needed in the viewpoint method of 8.2.10
because the elements were already collected and filtered.
As you can see, this feature allows you to see what results your expression will return without needing to export your view to View
Editor. This can save you a lot of time.
To try it for yourself, follow these steps:
1. selecting some model element(s) in a diagram or the containment tree,
2. finding the MDK menu, and
3. selecting "Run OCL Query."
4. You may need to resize the popup window to see the entry fields.
5. Enter an expression in OCL, hit Evaluate, and see the result (or error).
Note: "self.n()" in the below examples is setting the target of the OCL expression.
89
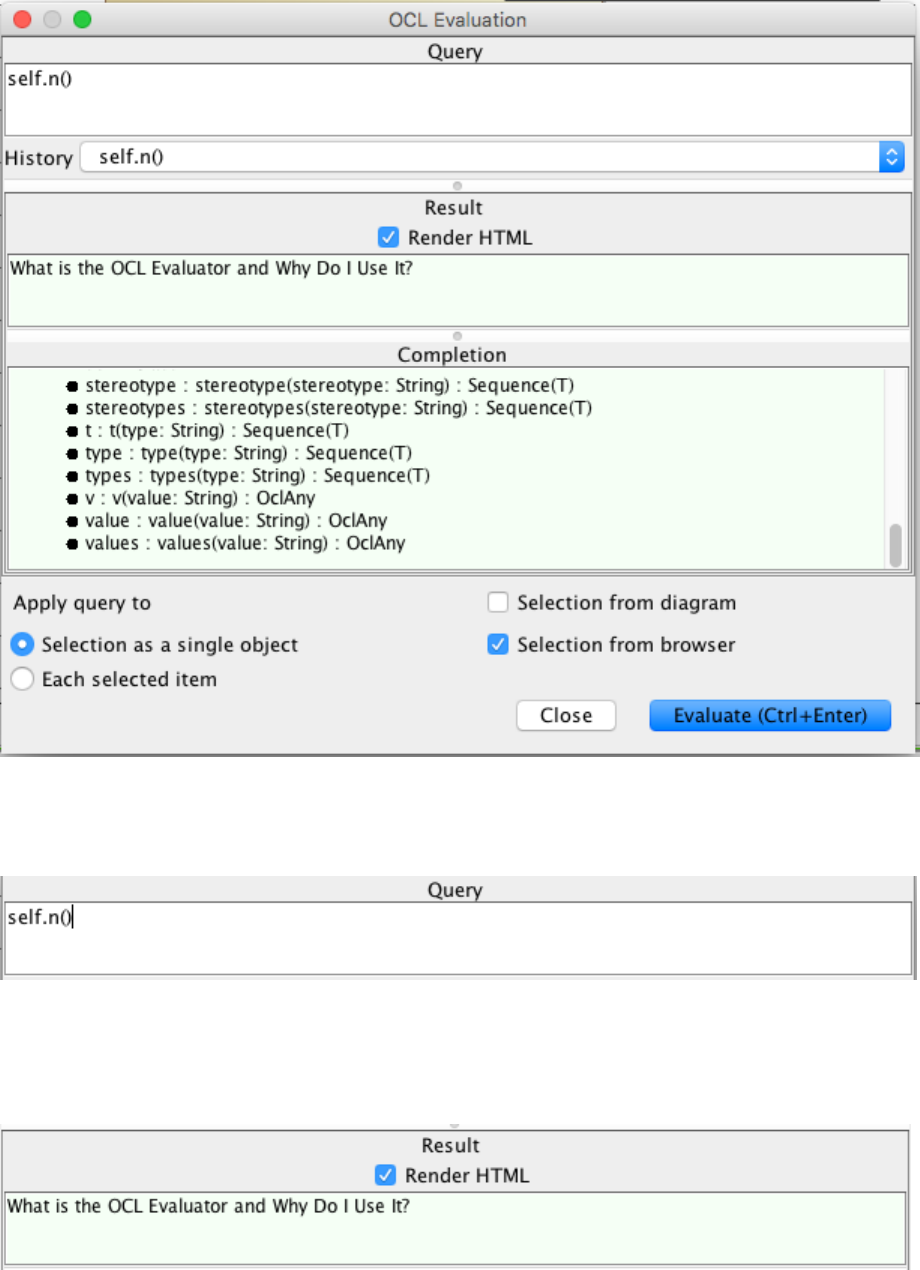
There are four parts to the OCL Evaluator:
1. Expression entry
In this area you can enter an OCL query and recall previously evaluated queries by clicking on the arrow on the right hand side of the
field.
2. Results
This is where the results of the query are displayed.
3. Query completion suggestions
90
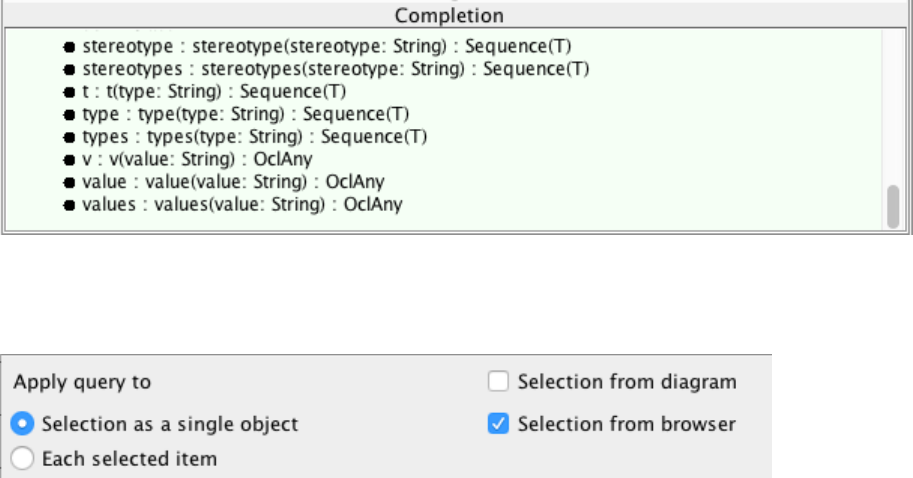
This field suggests potential options for the current result of your query.
4. Selection location
This allows you to select from which location "self.n()" or the target of the query should be taken from.
1.4.5 How Do I Use OCL Viewpoint Constraints?
In this example the package OCL Viewpoint Contraints contains a <<requirement>> that has two dependency relationships
stereotyped <<mission:specifies>>. One of these relationships violates a set pattern for what a requirement can specify. The viewpoint
method shown below contains a <<ViewpointConstraint>> action which will validate elements passed in with a specified OCL
expression. This is the expression used :
r('mission:specifies').oclAsType(Dependency).target.oclIsKindOf(Relationship).validationReport
A breakdown of the expression:
- starts with selecting the mission:specifies relationship using r()
- then casts the values returned as dependencies using .oclAsType(Dependency)
- then selects the targets of the dependencies with .target
- then casts the returned values as relationships using .oclIsKindOf(Relationship)
- finally, signals return of a validation report (first two tables show below) with .validationReport
The validation reports are automatically generated and populated with error data. One being a summary and one detailed.
Since the requirement in the OCL Viewpoint Constraints package has a dependency with another type of relationship as the target an
error will be thrown.The element which violates this constraint is then sent to table structure and populated into the last table shown
below. In this case, "Requirement Name!!" is expected to be the final result.
1.4.6 How Do I Create OCL Rules?
1.4.6.1 How Do I Create Rules on Specific Model Elements?
(Constraint Evaluator)
The diagram below contains a <<block>> named "Commented Block." Attached to this element are two constraints...
91
1. oclIsKindOf(Comment)
2. oclIsKindOf(Class)
Figure 133. How Do I Create Rules on Specific Model Elements?
To validate these constraints directly in the model, select the element and right click, navigate to MDK, Validate constraints. See
image below. Obviously, one of these constraints is true and one is false, so only one warning should be thrown. This is shown in the
image below. The red arrow points out the failed constraint in the Magic Draw Notification window.
Obviously, one of these constraints is true and one is false, so only one warning should be thrown. This is shown in the image below.
The red arrow points out the failed constraint in the Magic Draw Notification window.
1.4.6.2 How Do I Create Rules Within Viewpoints?
1.4.6.3 How Do I Validate OCL Rules in my Model?
There are two methods for validating OCL queries in a model, via a right click and via the MD Validation Window.
To validate OCL rules using the right click menu, select the package containing the elements to be validated and select MDK ->
Validate Constraints
1.4.7 How Do I Create Expression Libraries?
1.4.8 How Do I Use RegEx In my Queries?
http://www.vogella.com/tutorials/JavaRegularExpressions/article.html http://docs.oracle.com/javase/7/docs/api/java/util/regex/
Pattern.html
1.4.9 How Do I Create Transclusions with OCL Queries?
Table 26. <>
Name Documentation
How Do I Create Transclusions with OCL Queries?
Table 27. <>
Name (from constructed Transclusion) Documentation (from constructed Transclusion)
92
