Manual Atto AFMI MFM KPFM P5788
User Manual:
Open the PDF directly: View PDF ![]() .
.
Page Count: 50

Version:
1.0
Modified:
February 2015
Products:
Atomic Force Microscope attoAFM I
User Manuals
Atomic Force Microscope
attoAFM I/MFM/KPFM
P5788
attocube systems AG, Königinstrasse 11 A, D - 80539 München Germany
Phone: +49 89-24208888 Fax: +49 89-24208890
E-Mail: info@attocube.com www.attocube.com
For technical queries, contact:
support@attocube.com
attocube systems office Munich:
Phone +49 89 2877 80915
Fax +49 89 2877 80919

Disclaimer of Responsibility
attocube systems does not assume any responsibility for the use of
any circuitry described in this manual. attocube systems reserves
the right to change the product specifications and the
functionality, or the manual itself, at any time without prior
notice. Furthermore, attocube systems assumes no responsibility
or liability for any misinformation, errors, or general inaccuracies
that may appear in this manual.
Copyright © 2006-2015 attocube systems AG. All rights reserved.
Product and company names listed are trademarks or trade names of
their respective companies. Any rights not expressly granted herein
are reserved.

Page 3
© 2001-2015 attocube systems AG. Product and company names listed are trademarks or trade names of their respective
companies. Any rights not expressly granted herein are reserved. ATTENTION: Specifications and technical data are subject
to change without notice.
Table of Contents
I. Introduction .............................................................................................. 4
I.1. System Overview ..................................................................................... 5
I.1. Safety Information .................................................................................. 6
I.1.a. Warnings ............................................................................................ 7
II. Mode of Operation and Force Detection Scheme ................................................. 9
III. Components of the Microscope and Technical Specifications ................................ 12
III.1. Microscope Setup ................................................................................... 12
III.2. Electronics ............................................................................................ 14
III.2.a. ANC300: High voltage amplifier ............................................................. 14
III.2.b. ACC100: LDM1300 Laser Detector module and Break-Out Panels .................... 14
III.2.c. ANC350 Piezo controller for positioners ................................................... 15
III.2.d. Laser detector module: LDM1300 ........................................................... 16
III.2.e. ASC500 SPM Controller ........................................................................ 16
III.3. (Dis-)Assembling the attoAFM I Module ....................................................... 17
III.3.a. Inserting (removing) the stack into (from) the microscope housing ............... 17
III.3.b. Mounting the Scanner-Positioner Stack ................................................... 19
III.4. Sample Exchange and Thermal Contact ........................................................ 19
III.5. Changing the AFM Cantilever ..................................................................... 20
III.5.a. The cantilever mounting platform .......................................................... 23
III.5.b. Cantilever exchange ............................................................................ 23
III.5.c. Mounting the attoAFM I sensor head into the housing ................................ 26
IV. Connecting the attoAFM I Module .................................................................. 27
IV.1. Electrical Connections ............................................................................. 27
IV.1.a. ASC500 Controller Connections .............................................................. 27
IV.1.b. Break-Out Panel Connections ................................................................ 28
IV.1.c. Pin Connections ................................................................................. 29
IV.1.d. Vacuum Feedthroughs ......................................................................... 31
IV.2. Fiber Connection .................................................................................... 31
V. Measurement Procedure .............................................................................. 32
V.1. Operation Modes .................................................................................... 32
V.1.a. Contact Mode without Feedback (constant height) ..................................... 32
V.1.b. Contact Mode with Feedback on (constant force) ....................................... 33
V.1.c. Non-Contact Mode .............................................................................. 33
V.1.d. MFM and EFM measurements ................................................................. 35
V.1.e. KPFM measurements............................................................................ 35
V.2. Performing a Scan .................................................................................. 36
V.2.a. Set the Actor Scaling ........................................................................... 36
V.2.b. Non-Contact Mode .............................................................................. 37
V.2.c. Contact Mode ..................................................................................... 43
V.2.d. Starting a scan ................................................................................... 48
Page 4
I. Introduction
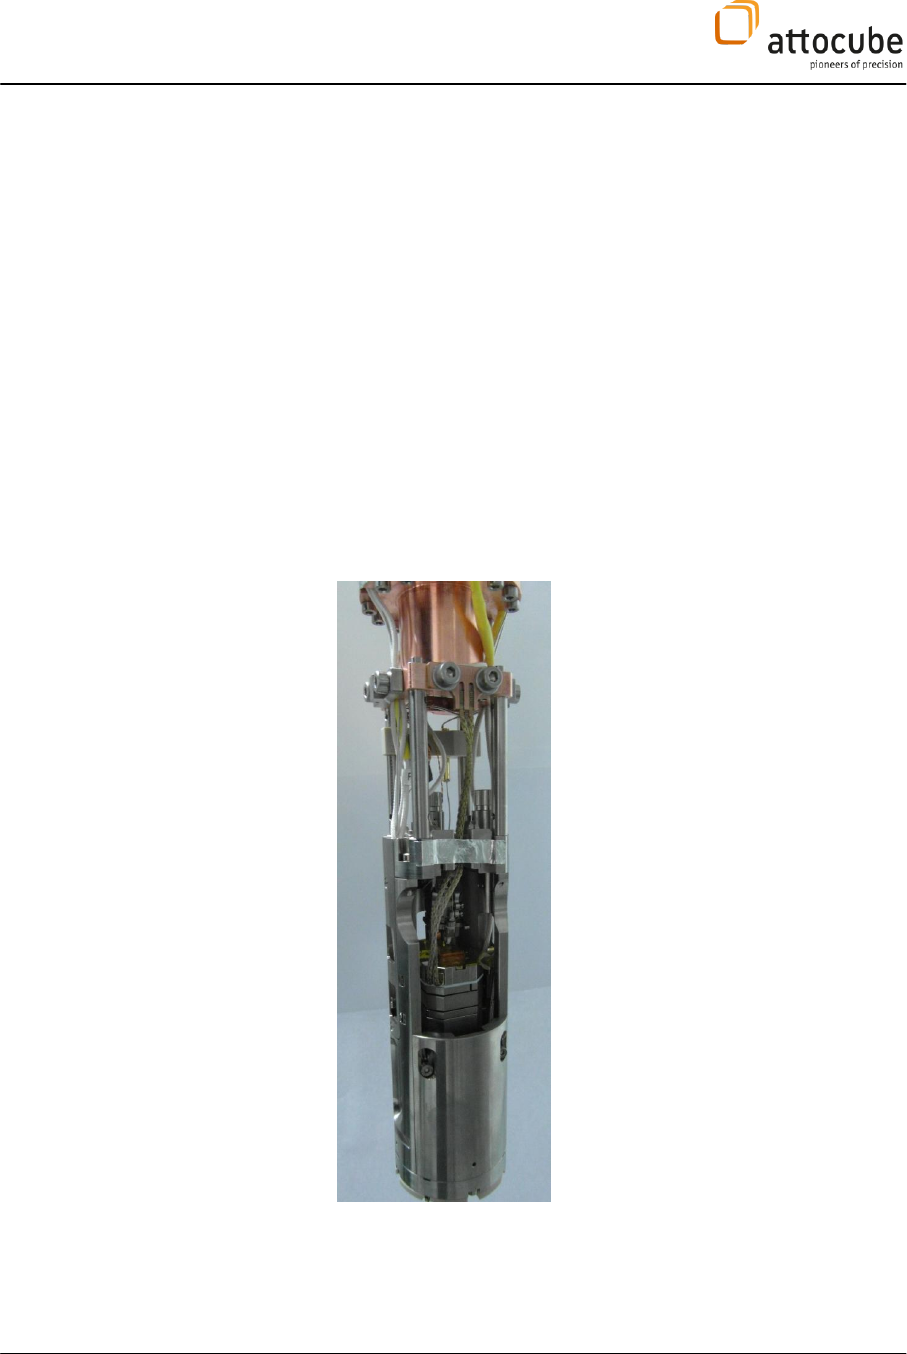
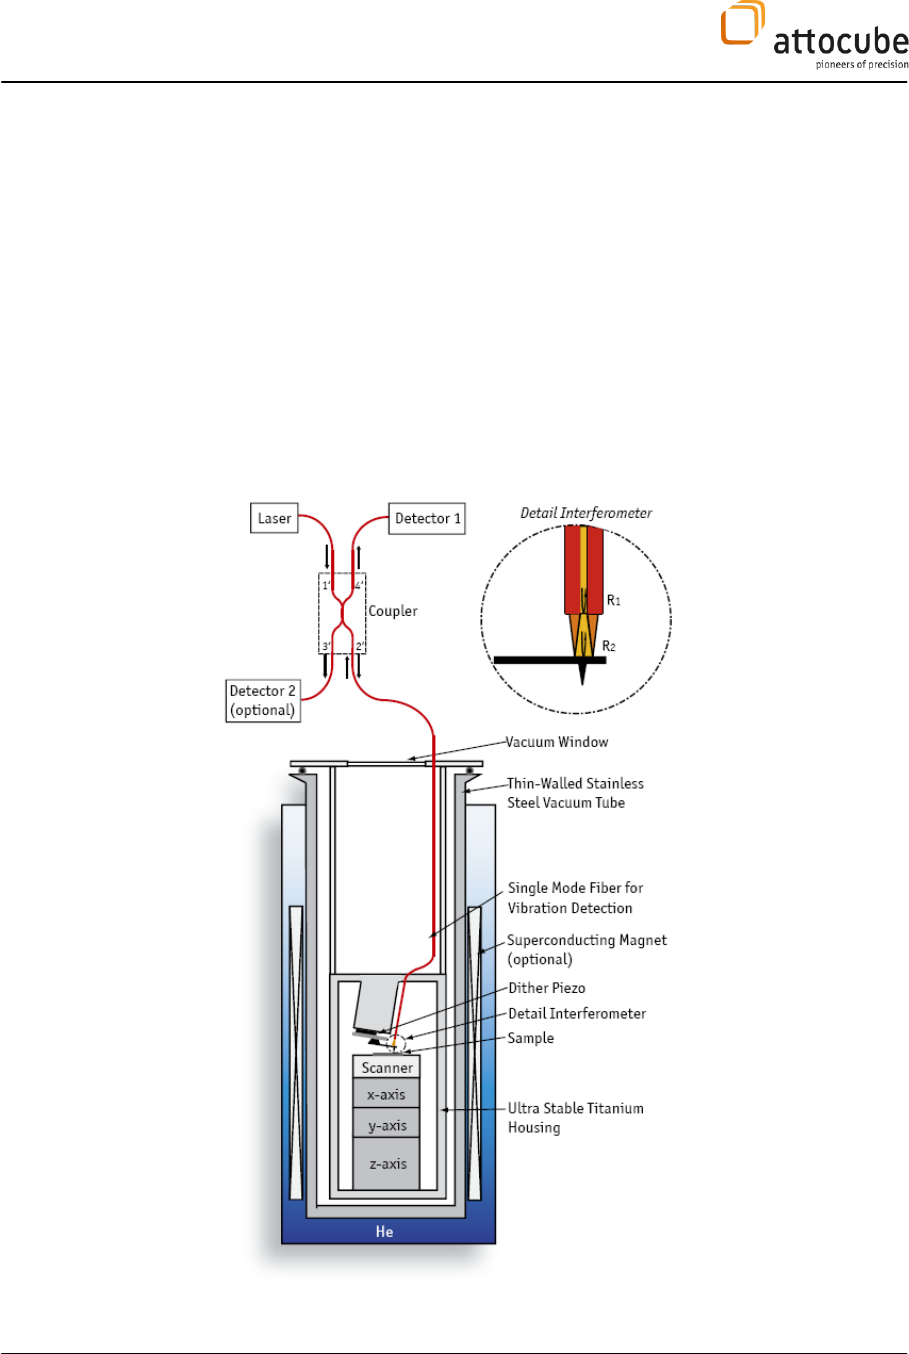
The attoAFM I is designed particularly for the use at extreme
environmental conditions such as ultra-low temperature, high magnetic
fields and high vacuum. Reliable functionality at these extreme conditions
is provided by implementing the outstanding attocube systems
nanopositioning modules as well as a force detection scheme based on an
all fiber low-coherence interferometer (explained in detail in the next
section).
To perform low temperature microscopy, the attoAFM I is cooled by a
controlled exchange gas atmosphere in a liquid Helium bath cryostat or a
variable temperature insert or a closed cycle cooling system.
The instruments may be surrounded by both liquid helium and liquid
nitrogen radiation shields, separated by vacuum insulation.
Figure 1
: The attoAFM I standard setup

Page 5
© 2001-2015 attocube systems AG. Product and company names listed are trademarks or trade names of their respective
companies. Any rights not expressly granted herein are reserved. ATTENTION: Specifications and technical data are subject
to change without notice.
I.1. System Overview
The attoAFM I microscope is a tool to image, characterize, analyze, and
manipulate materials surfaces on a nanometer scale in low temperatures
as well as high magnetic fields. This short chapter wants to give a rough
overview on the concepts of the system.
The attoAFM I consists of the measurement head which is inside a housing
suspended on the lower end of the microscope stick, which itself is placed
in a vacuum tube. Before cooling down the system, this vacuum tube is
evacuated and backfilled with some He exchange gas for coupling to the
temperature outside of the vacuum tube. Typically, this vacuum tube is
then cooled by insertion into a He bath cryostat, a Variable Temperature
Insert (VTI), a pulse tube cooler, or by other means.
The main part of the attoAFM I measurement head is the AFM cantilever, a
thin bar typically made from silicon and possibly functionalized with
different coatings, which is placed before the end of an optical fiber,
hence forming an optical cavity, the length of which can be measured by
a laser/detector system.
The sample to be examined is placed (in standard setups) on an
ANPxyz101 positioner stack for coarse motion (5 x 5 x 5 mm³) and an
ANSxyz100 scanner (typ. 30 x 30 x 15 µm³ at 4 K, for details see the
specifications page at the end of the manual). Just underneath there is
typically also a temperature sensor and a small heater, which allows
controlling the temperature of the sample precisely.
When the sample is brought into contact with the cantilever, the
interaction forces can be measured by recording the length of the cavity.
While the sample is scanned, typically the distance between -tip and
sample is kept constant by the use of a feedback loop. For these purposes,
one uses the electronic scan controller ASC500, which generates all
required voltages and records all relevant signals. Additionally, a high
voltage amplifier ANC300 is part of the system, amplifying the unipolar,
0 – 10 V signals to 0 – 150 V, as well as generating the signals required to
move the stepper positioners.
Regarding the optics, laser light is guided to the fiber-cantilever cavity,
and the back-reflection is then detected by a photo-receiver. The signal
generated by the photo-receiver is analyzed and recorded with the
ASC500 controller.
Page 6
I.1. Safety Information
For the continuing safety of the operators of this equipment and the
protection of the equipment itself, the operator should take note of the
Warnings, Cautions, and Notes throughout this handbook and, where
visible, on the product itself.
The following safety symbols may be used on the equipment:
Laser safety warning. Class 1M laser product.
Warning. Risk of electric shock. High voltages present.
Warning. Risk of danger. Refer to the handbook for details on this hazard.
Functional (EMC) earth/ground terminal.
The following safety symbols may be used throughout the handbook:
Warning. An instruction, which draws attention to the risk of injury or
death.
Caution. An instruction, which draws attention to the risks of damage to
the product, process, or surroundings.
Note. Clarification of an instruction or additional information.
Page 7
© 2001-2015 attocube systems AG. Product and company names listed are trademarks or trade names of their respective
companies. Any rights not expressly granted herein are reserved. ATTENTION: Specifications and technical data are subject
to change without notice.
I.1.a. Warnings
Note: Please read the manual for the positioners, scanners, and the
controllers prior to initial operation! Mind the warnings mentioned in
there!
Warning. To prevent electrical shocks do not remove the cover of the
control unit. Unplug the power cord and all other electrical connections
and consult qualified service personnel before servicing or cleaning.
Operate only under dry conditions and at room temperature.
Warning. If this equipment is used in a manner not specified by the
manufacturer, the protection provided by the equipment may be impaired.
Do not operate the instrument outside its rated supply voltages or
environmental range. In particular, excessive moisture may impair safety.
Warning. Any individual vacuum space must be equipped with a security
overpressure valve! In case of hidden leaks air may enter into vacuum
spaces and build up large amounts of condensate at cold walls and
interfaces. In case such system is warmed up again such ice may evaporate
quickly and easily build up extremely dangerous overpressures! If no
overpressure valve is mounted on such vacuum space or the valve is
blocked e.g. due to mounting to a recovery line, this overpressure may
cause sudden breakdowns of the container, i.e. explosions. If in doubt,
please contact attocube systems.
Laser Safety Warning. Class 1M Laser product. This device utilizes a laser
which emits invisible light. There is potential for eye damage if proper
caution is not taken. The laser assembly should not be modified in any
way. The fiber cable should never be disconnected from the laser device
for any reason. The laser's wavelength is specified at 1330 nm with a
maximum power output of 1.5 mW. Please wear protective eyewear when
the laser source is turned on and never look directly into to the laser port
or fiber.
Warning. Plugging or unplugging modules of the electronic while
connected to power line will cause damages to the electronic. For
replacing modules disconnect the electronics from power and wait at least
5 minutes. Internal components need to be discharged.
Page 8
Caution. Never connect any cabling to the electronics when contacts are
exposed! Never connect any cabling to the electronics when the
electronics is not in GND mode! The scan piezos at the heart of a positioner
unit are high voltage components and can cause serious injuries. Be
careful not to cause a short-cut between the contacts in the BNC or any
other connectors.
Caution. For laboratory use only. This unit is intended for operation from a
normal, single phase supply, in the temperature range 5° to 40°C, 20% to
80% RH. The unit must be connected only to an earthed fused supply of
100, 115 or 230 V, 50/60 Hz.
Caution. In case of failure refer to your local dealer or attocube systems.
Users are cautioned not to attempt to access, open, modify, or service any
part of the setup unless outlined herein or otherwise directed by the
technical support staff from attocube systems. Take special care if
connecting products from other manufacturers. Clean only with a dry
cloth.
Caution. Because of the inherent fragility of the positioners and scanners
and the extreme conditions they are operated in, no responsibility can be
taken by the manufacturer for breakdowns of the ceramic piezo stacks. In
case of breakage, please contact the manufacturer for details of the repair
service.
Page 9
© 2001-2015 attocube systems AG. Product and company names listed are trademarks or trade names of their respective
companies. Any rights not expressly granted herein are reserved. ATTENTION: Specifications and technical data are subject
to change without notice.
II. Mode of Operation and Force Detection Scheme
The attoAFM I is an atomic force microscope built around an optical
fiber based interferometer. The sensor is compatible with any
commercial cantilever and measures the vertical deflection of the
cantilever with picometer resolution. The microscope is designed to
work both in contact and in non-contact mode.
This highly compact microscope guarantees highest resolution tip-
sample positioning and an optimized sensor adjustment suitable for
any environment: room or low temperature, high magnetic field or
high vacuum conditions.
Figure 2
: Schematic drawing of the attoAFM I system.
Page 10
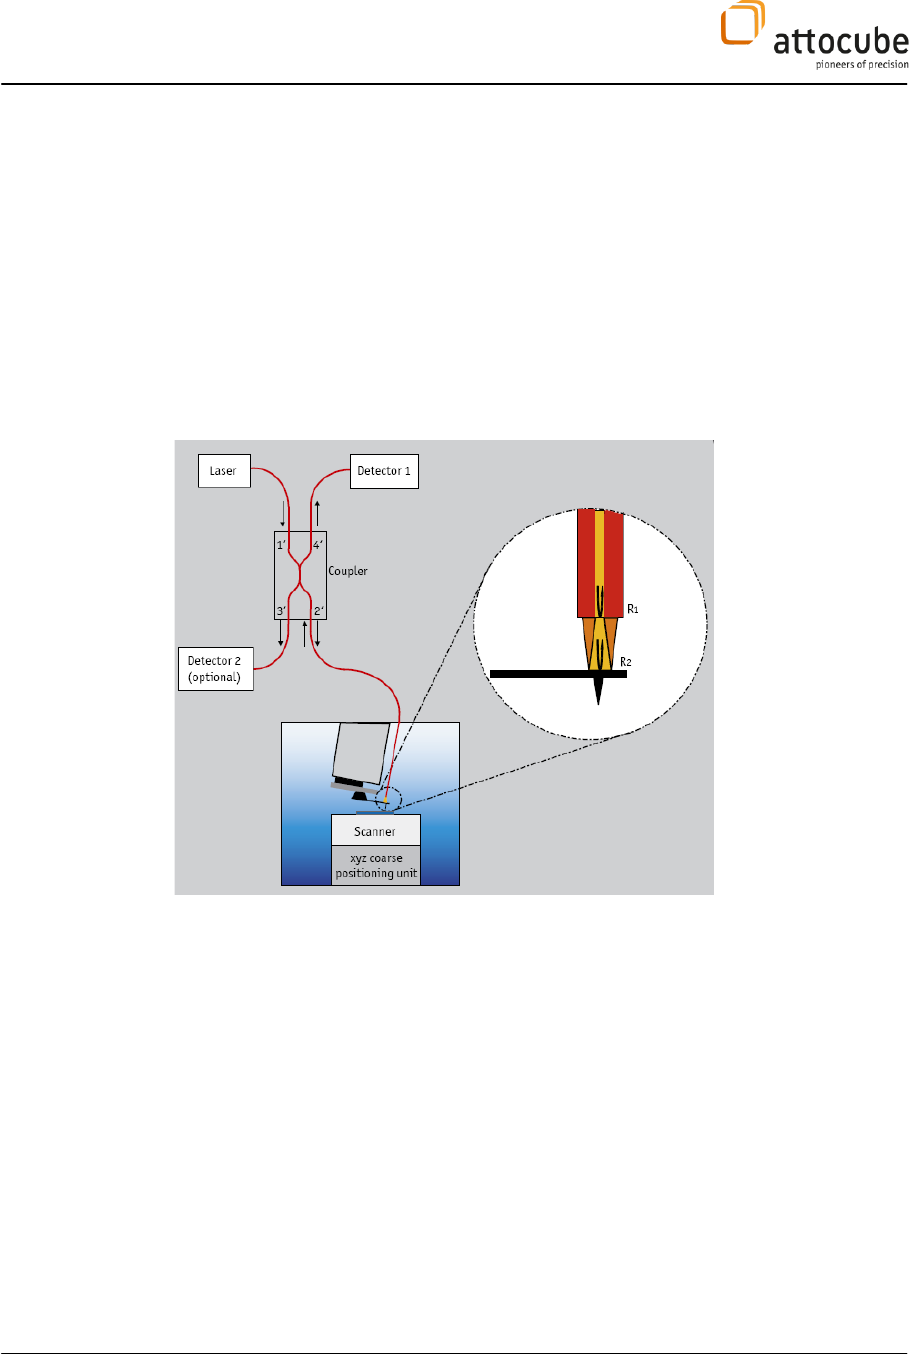
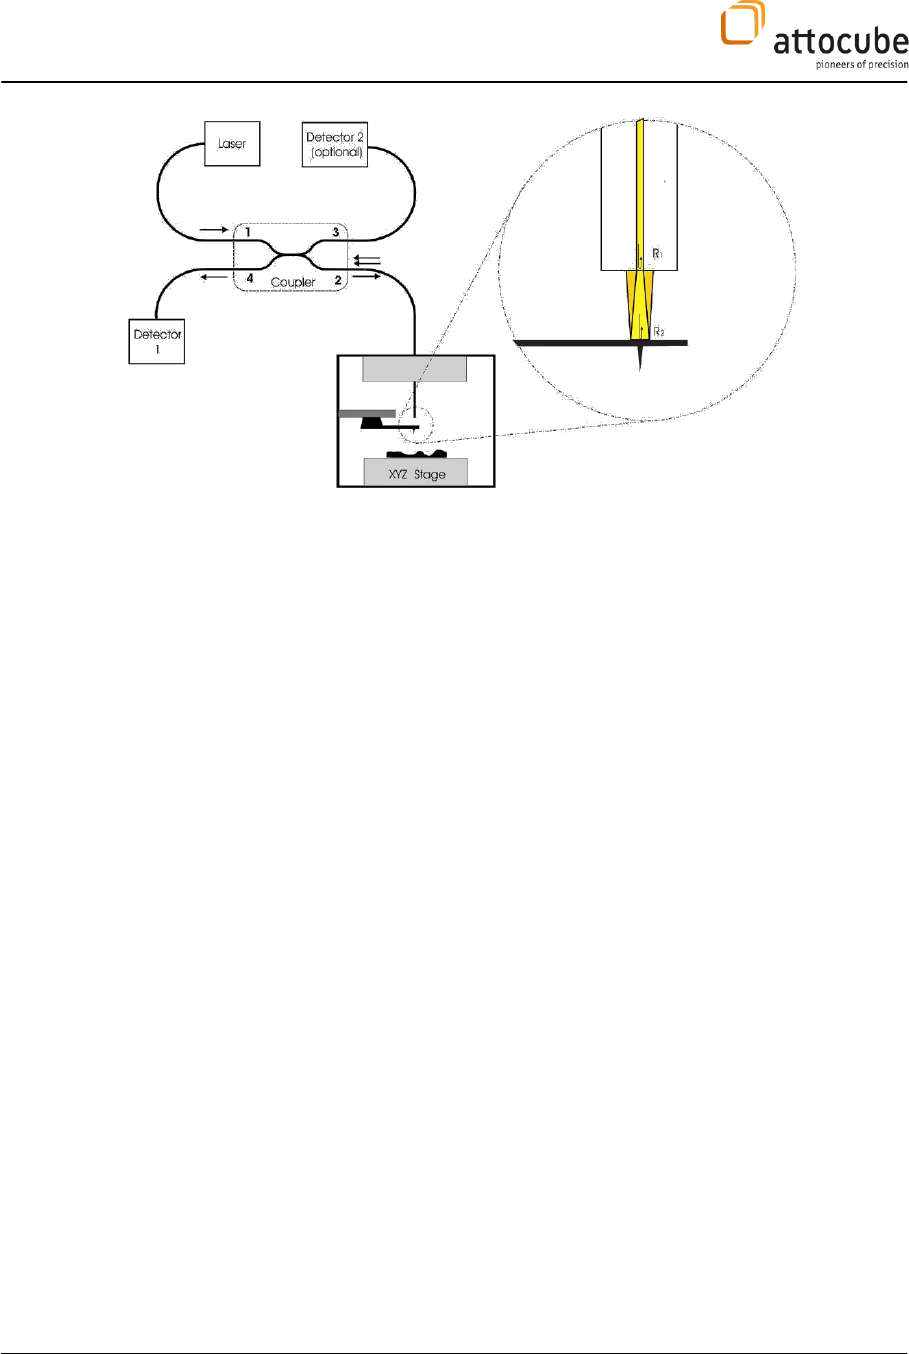
The force detection scheme for the attoAFM I microscope system is
based on an all fiber low-coherence interferometer (seeFigure 3).
Via a 50/50 fiber coupler, a laser beam illuminates a cavity built up
from the end-face of the fiber and the back-face of the cantilever. The
light reflected back from these surfaces gives rise to interferences that
can be seen by a detector. Due to the low reflectivity constants these
surfaces form a low-finesse Fabry-Perot cavity.
Monitoring the intensity of the interference fringes allows measuring
the tip deflection. The low coherence of the laser source has the
advantage of eliminating spurious interference signals resulting from
other reflections in the setup (e.g. the coupler), thus leading to an
increase of the signal-to-noise ratio of about 30 dB.
Figure 3
: Schematic drawing of the AFM I setup.
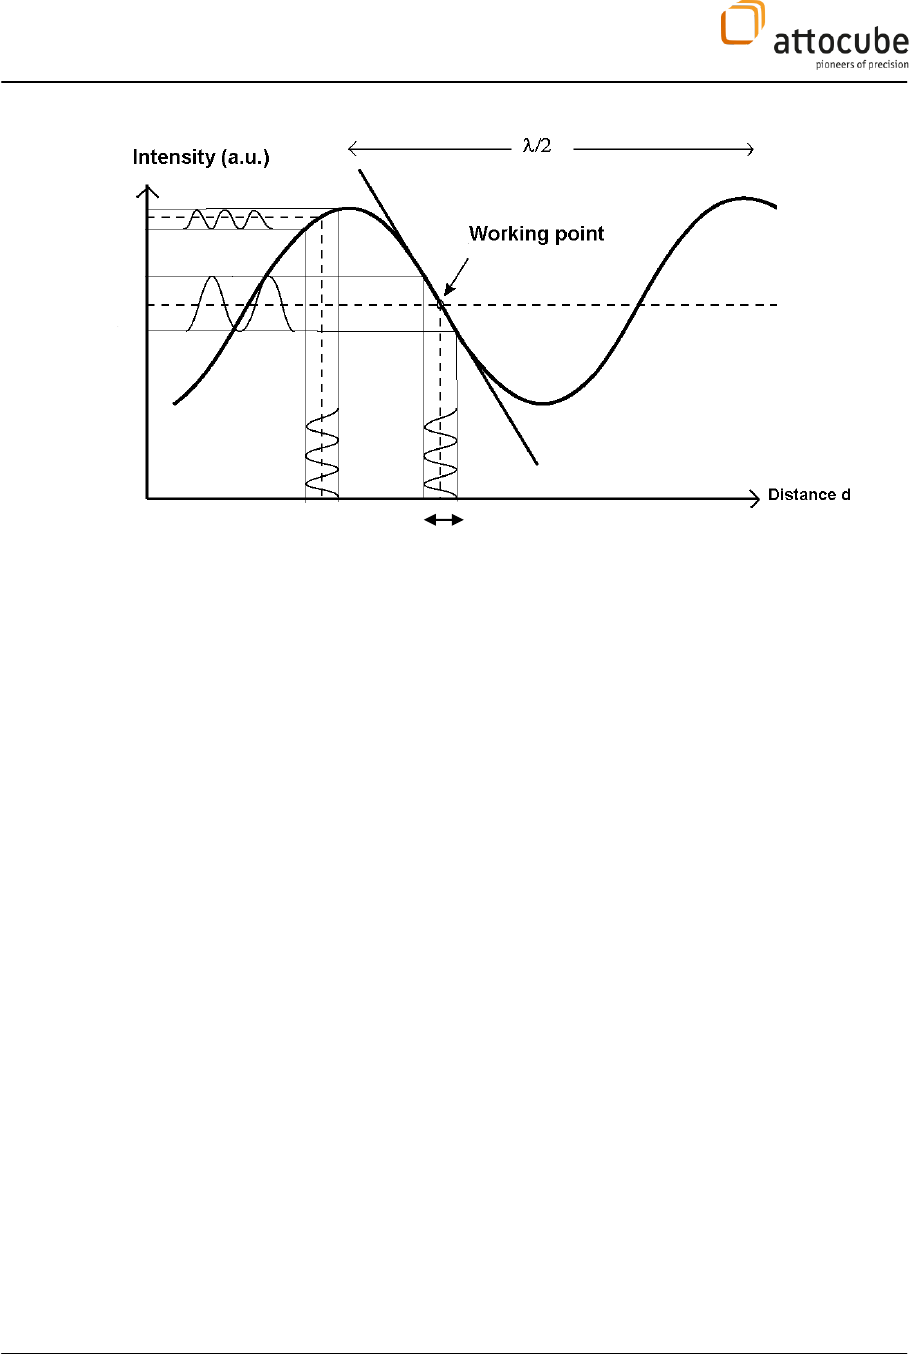
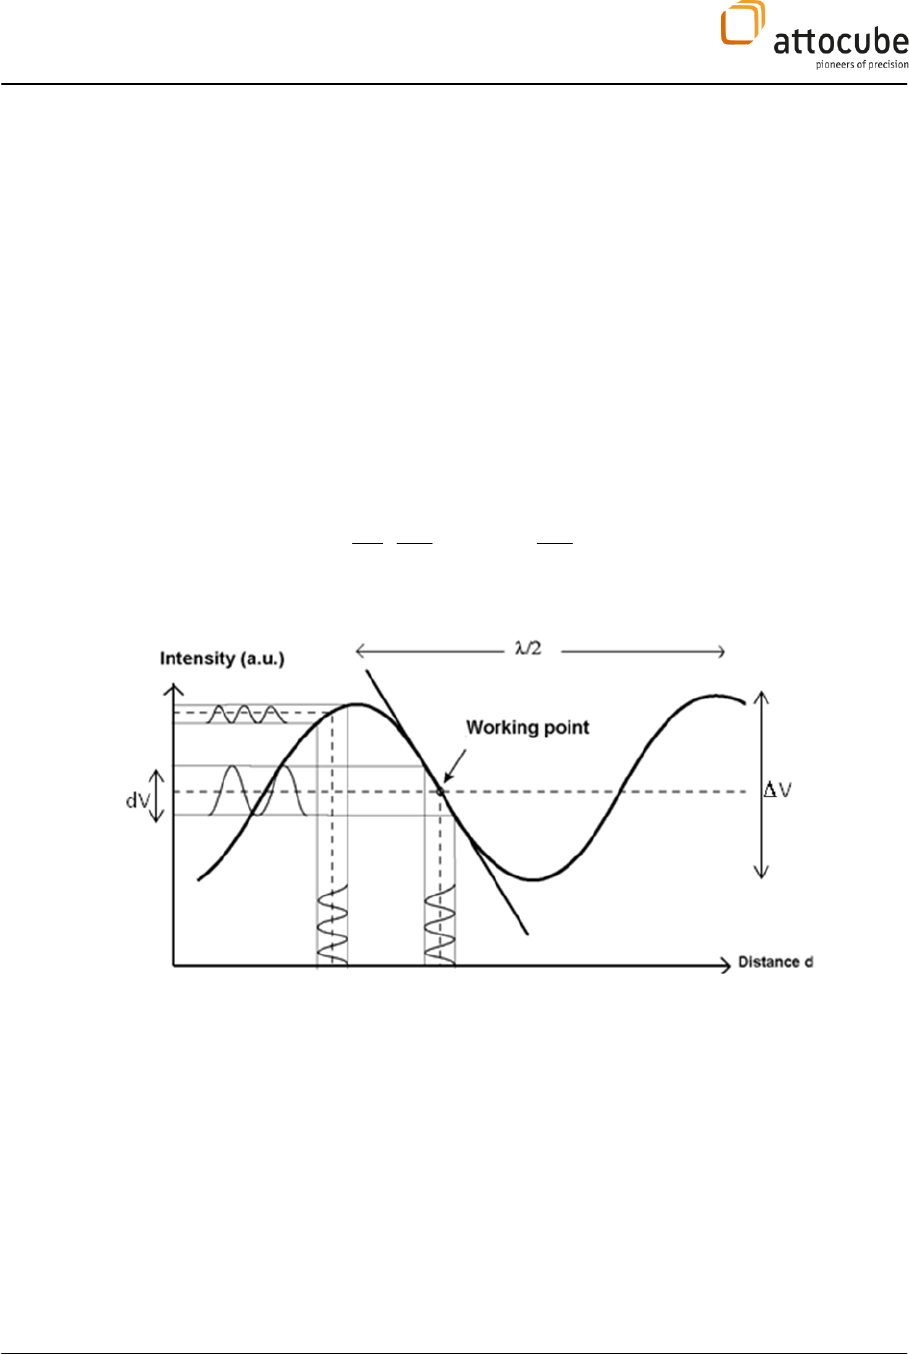
The periodicity of the signal corresponds to half the wavelength -of the
laser source. Hence, the system can be easily calibrated and a measured
voltage difference can be translated into a height difference.
The control fiber has to be adjusted with respect to the cantilever in such a
way that the interference signal is at the quadrature point, i.e. in the
middle between two extrema values. In this case, the sensitivity of the
sensor is highest.
There are different ways to perform topographic images. Common modes
are the so-called contact- and non-contact modes.
Page 11
© 2001-2015 attocube systems AG. Product and company names listed are trademarks or trade names of their respective
companies. Any rights not expressly granted herein are reserved. ATTENTION: Specifications and technical data are subject
to change without notice.
Figure 4
: Schematic drawing of the interference signal.
Contact mode:
The tip is in direct contact with the sample, while the intensity is in the
middle of the intensity range. The cantilever is not oscillating. Due to a de-
tuning of the cantilever position before contacting the surface, a
compressive force is applied onto the sample. The strength of the force
corresponds to the amount of detuning times the force constant of the
cantilever.
For example, the cantilever position can be adjusted off contact such that
the intensity is in a minimum. Now, by engaging the feedback loop, the
sample is lifted up until the tip engages with the sample surface. While still
increasing the sample height, the smaple pushes the cantilever up until
the intensity reaches the middle intensity value. The amount of bending
corresponds in this case to a cavity length difference of -/8, and hence the
force on the tip is F =
-
/8*k, with k being the force constant of the
cantilever. As the feed-back loop keeps the intensity constant, the amount
of bending is kept. Hence, the force on the tip is kept constant.
Non-contact mode:
For non-contact mode, no detuning is applied; the cavity length is such
that the signal is in the middle between the extrema. Then, the cantilever
is excited by the dither piezo at its resonance frequency. The input of the
lock-in measures the AC component of the photo-detected signal, which
reflects the oscillation amplitude of the cantilever. As the cantilever
approaches the sample, the oscillation amplitude drops rapidly with
decreasing tip-sample distance. This signal serves as the input to a feed-
back loop which maintains the cantilever oscillation amplitude at a so
called ‘set level’, which corresponds to a given force between the sample
and the cantilever. During the scan, the output signal of the feedback loop
is recorded (z-scanner piezo voltage), providing a topographic image.
d
Page 12
III. Components of the Microscope and Technical Specifications
III.1. Microscope Setup
The sample is mounted onto a stack consisting of an ANPxyz101 coarse
positioning unit, an ANSxyz100 scanner and a copper sample plate that
carries heater and temperature sensor. The attoAFM I module, consisting
of the cantilever holder and the attoAFM I head together with the fiber
based deflection detection system, is fixed onto a slide which is mounted
in the microscope housing.
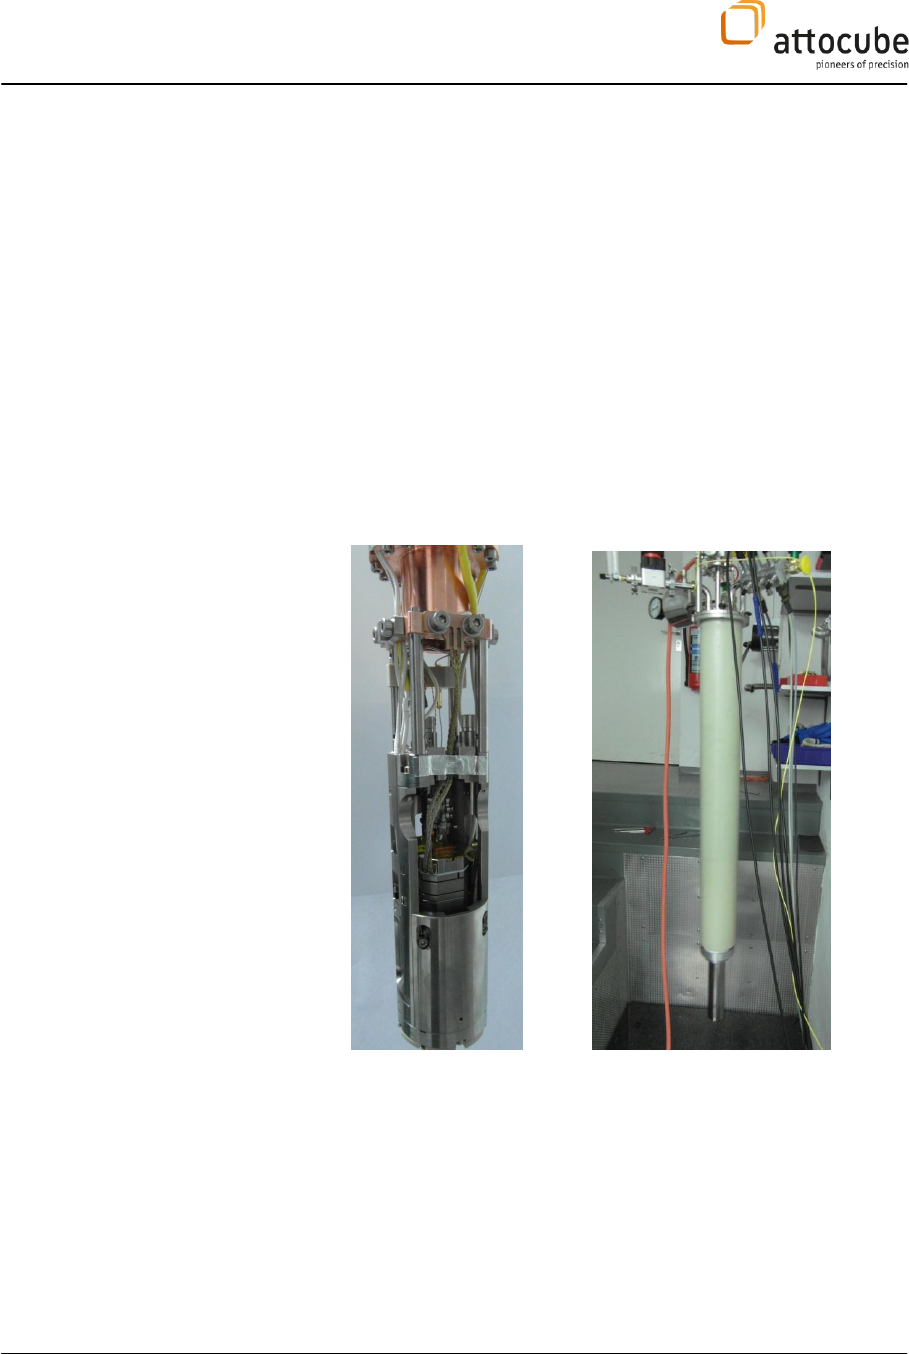
The microscope module is mounted below the 3He pot . The top of the 3He
insert contains all electrical connectors and feedthroughs, the vacuum
window, and the fiber feedthrough. The AFM module including the fiber-
and sample positioning units is attached to the bottom of the insert, see
Figure 5. The microscope housing is inserted into a inner vacuum chamber
(IVC) and subsequently sled into the cryostat utilizing a log G10 tube .
Figure 5:
Image of the attoAFM I housing
The positioning stage ANPxyz101 is built from three individual positioners
mounted on top of each other (please find the specifications in the
respective manual). The ANSxyz100 scanners will be mounted on top of the
positioner stack, followed by a plate with integrated heater and
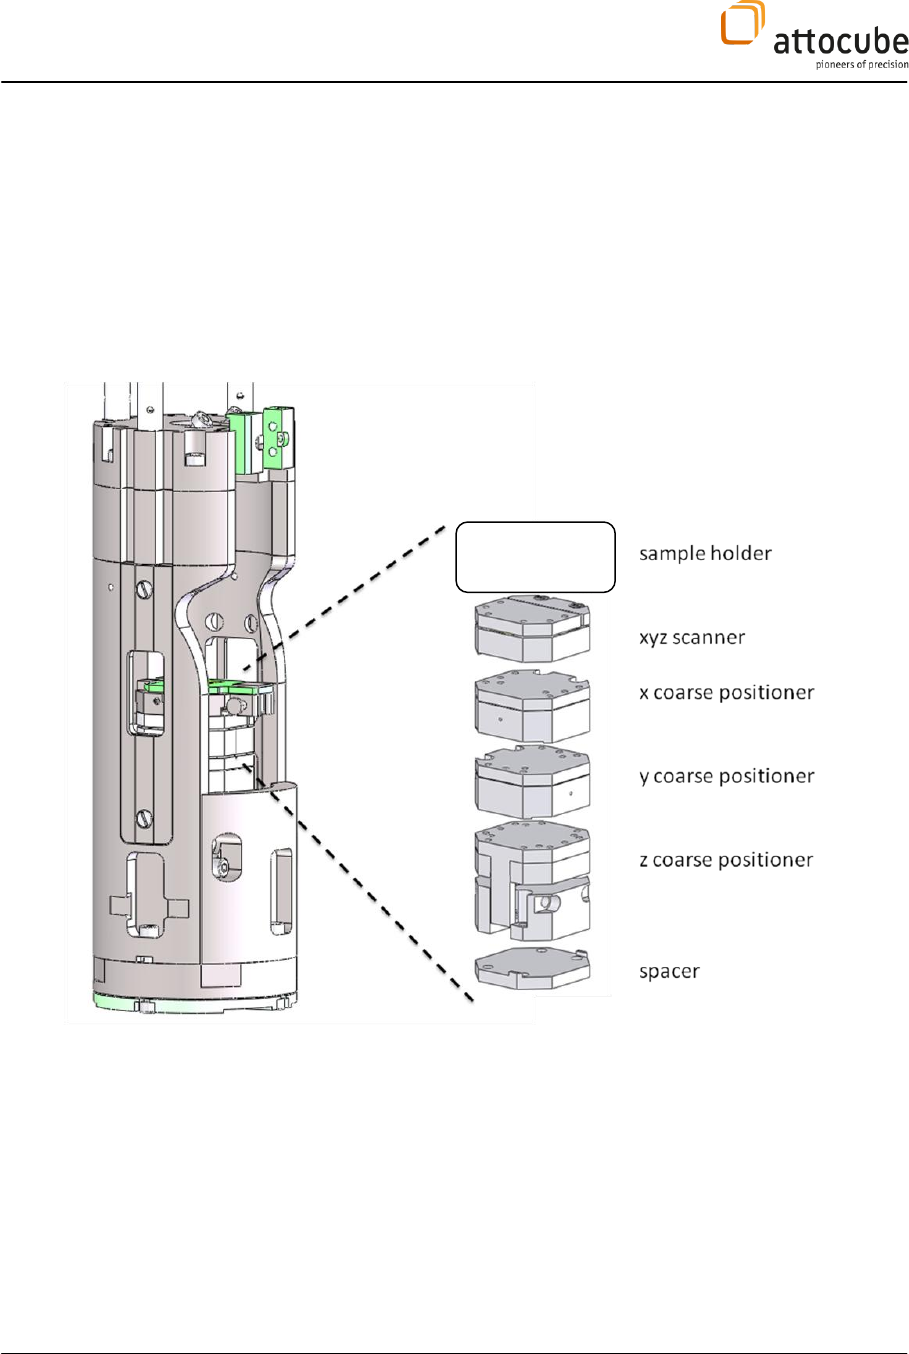
Page 13
© 2001-2015 attocube systems AG. Product and company names listed are trademarks or trade names of their respective
companies. Any rights not expressly granted herein are reserved. ATTENTION: Specifications and technical data are subject
to change without notice.
temperature sensor. Finally, the quik exchange sample holder is mounted
to the very top of the assembly.
The stack will be delivered completely mounted. If you ever need to
disassemble and consequently reassemble it, please recheck the correct
orientation (which is given in the system specs) and the correct order of
the different parts and screws. Wrong screws may cause severe damages to
the scanners and positioners.
Figure 6:
Standard assembly of the stack with a lower coarse-positioning unit and an upper scanner unit. The
sample holder is specially designed for the 3He system.
Page 14
III.2. Electronics
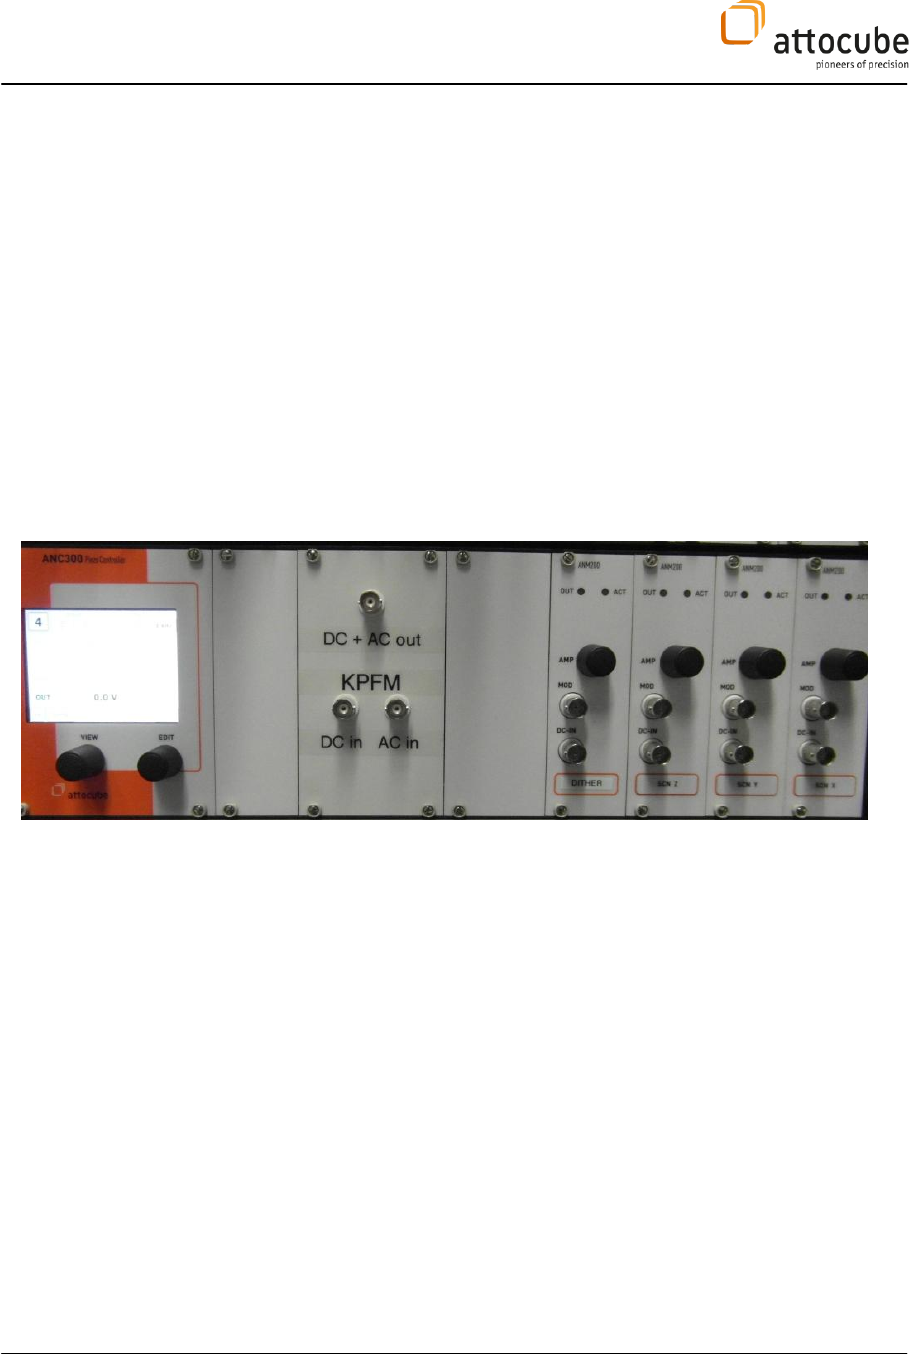
III.2.a. ANC300: High voltage amplifier
The ANC300 can be used either as ‘piezo positioning controller’ or as ‘high
voltage amplifier’.
Four axes of the ANC300 controller provide the high voltages for driving
the attocube scanners for fine positioning (voltage amplifier with an
amplification factor 15).The fourth axis is another high-voltage amplifier
that drives the dither piezo of the attoAFM I.
For technical specifications please refer to the respective manual.
The axis number is counted from the right to the left.
For technical specifications please refer to the respective manual.
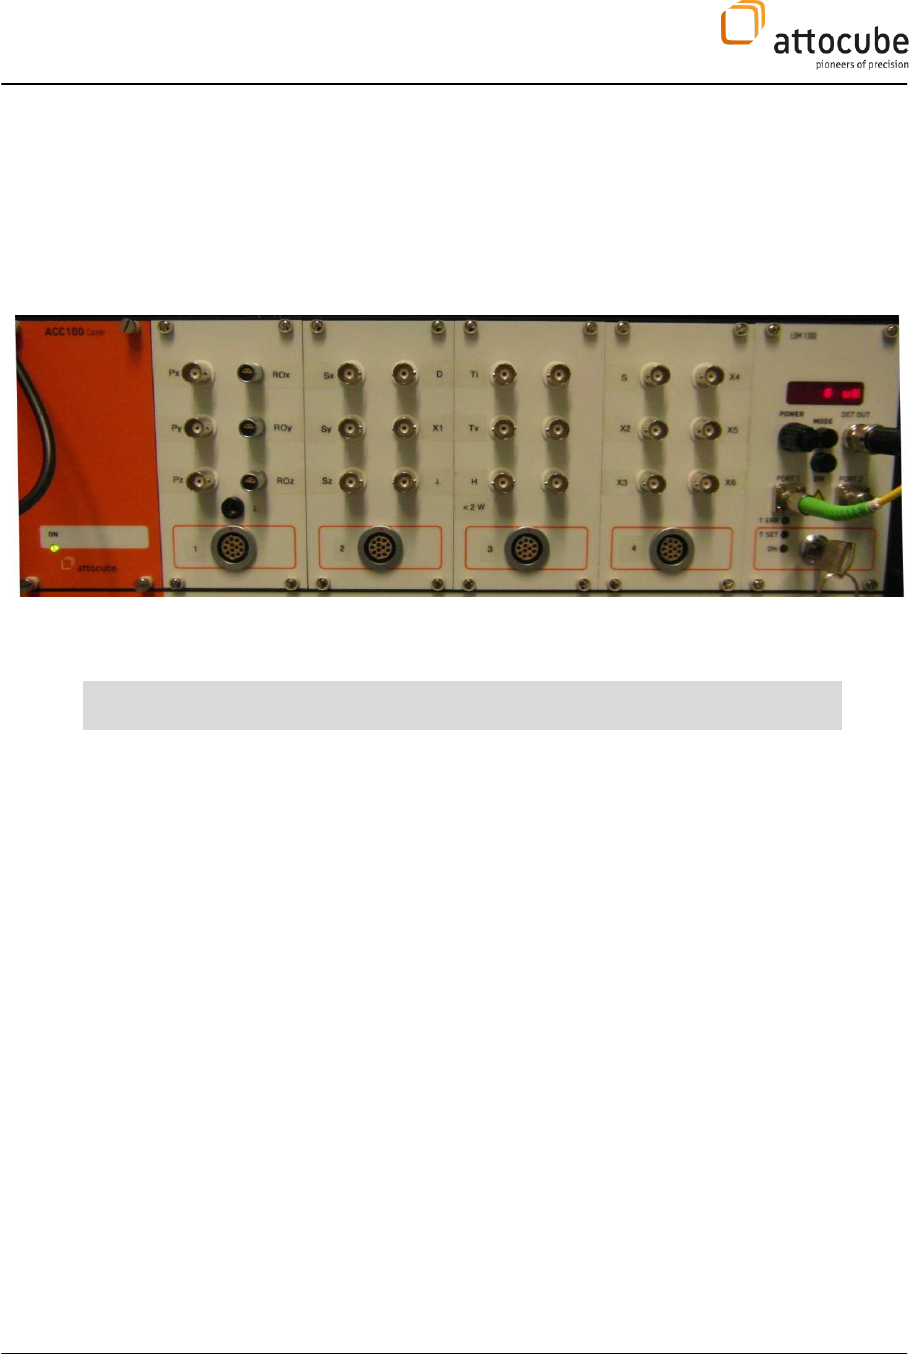
Figure 7
: ANC300 used as high voltage amplifier on the axes 1-4, and as a AC-DC coupler for the tip voltage.
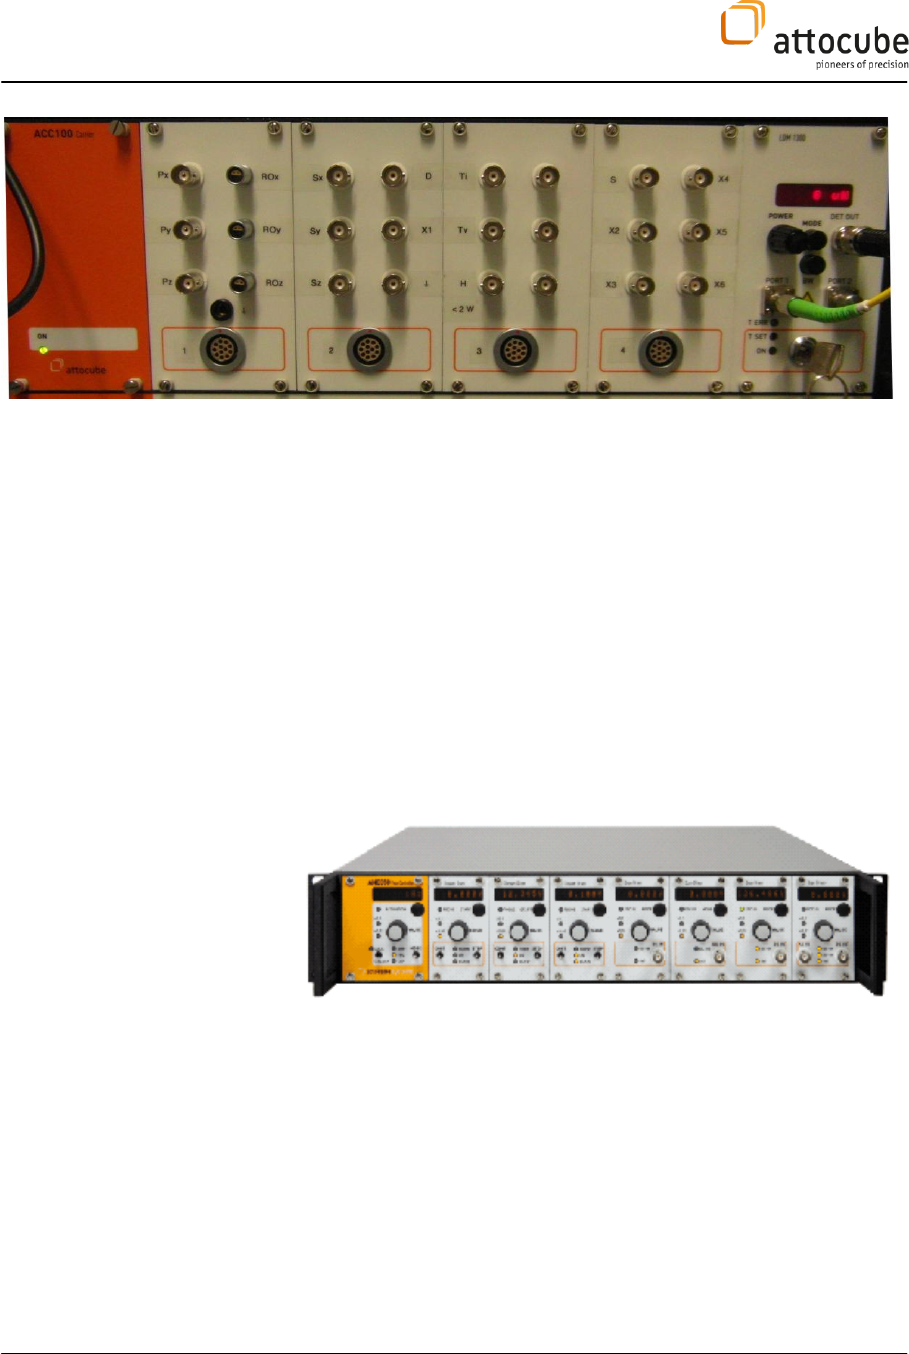
III.2.b. ACC100: LDM1300 Laser Detector module and Break-Out Panels
The ACC100 is a 19”housing that allows to attach electrical break-out
panels as well as additional electronic modules, e.g. the LDM1300 laser
detector module.
The electrical break-out panels convert the 12- and 8-pin Fischer
connectors to easy accessible BNC connectors.
Page 15
© 2001-2015 attocube systems AG. Product and company names listed are trademarks or trade names of their respective
companies. Any rights not expressly granted herein are reserved. ATTENTION: Specifications and technical data are subject
to change without notice.
Figure 8
: The ACC100 with the Break-Out-Panels and the LDM1300.
Four break-out panels serve as connector panels between the controllers
with BNC outputs and the microscope with multi-pin Fischer cables.
For details about the labelling and electrical connections see section IV.1.
III.2.c. ANC350 Piezo controller for positioners
Piezo controller driving /RES encoded attocube positioners in coarse and
fine positioning mode. Please note that for the He-3-system highly
resistive wires are taken for the resistive encoding. This is why you need to
upload a modified RESencoder-file with the extension ‘_mod’. The original
files may be taken without highly resistive wires.
For technical specifications please refer to the respective manual.
Figure 9
: The ANC350 piezo controller.
Page 16
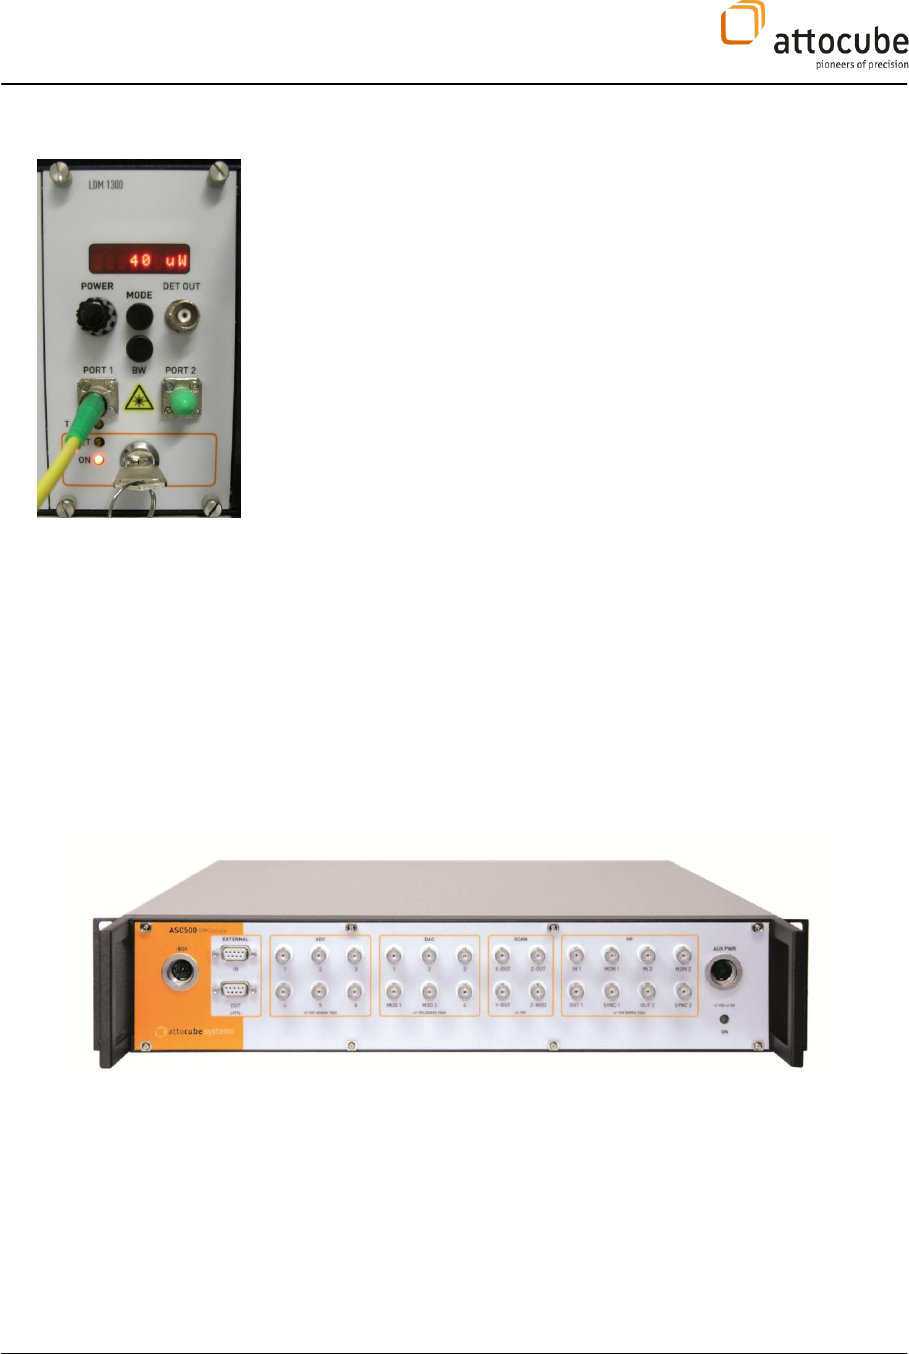
III.2.d. Laser detector module: LDM1300
The attoAFM I system includes a temperature-stabilised laser-detector
module, the LDM1300.
The wavelength of the laser diode is 1310 nm. The built-in photodetector
may be read out via the ‘DET OUT’ BNC connector.
For technical specifications please refer to the respective manual.
Figure 9
: LDM1300.
III.2.e. ASC500 SPM Controller
The modular and flexible digital SPM controller ASC500 combines state of
the art hardware with innovative software concepts to offer an unmatched
diversity of scanning-probe microscopy applications to the customer. All
desirable functions and high-end specifications for controlling the
experiment of your choice in AFM, CFM, SNOM, and STM are available. The
flexible, FPGA-based architecture allows the implementation of your
particular requirements to the system.
Figure 10
: The ASC500 SPM controller
Page 17
© 2001-2015 attocube systems AG. Product and company names listed are trademarks or trade names of their respective
companies. Any rights not expressly granted herein are reserved. ATTENTION: Specifications and technical data are subject
to change without notice.
III.3. (Dis-)Assembling the attoAFM I Module
This section will describe how to assemble and align the AFM module.
Figure 11:
The assembled attoAFM I module.
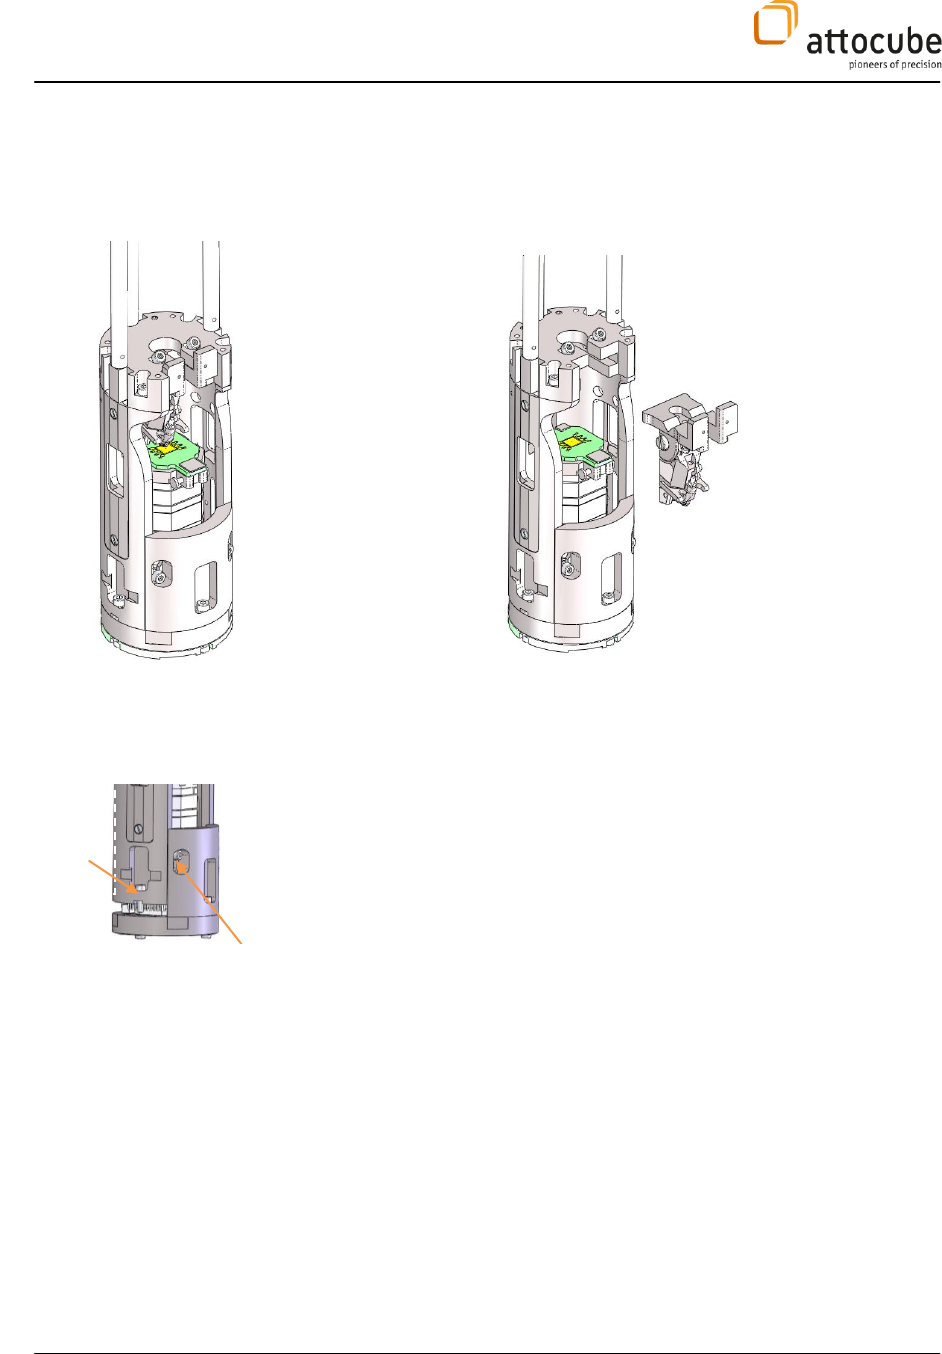
III.3.a. Inserting (removing) the stack into (from) the microscope housing
The microscope stack is fixed to the housing bottom. By loosening
the two screws in the front and opening the three screws on the
left, right and back side the whole bottom part including the
positioner stack may be pushed down and electrically disconnected
from the stick.
The stack and bottom plate may then be taken off towards the front
of the housing.
Open
bottom
screws
Loosen front
screws
Page 18
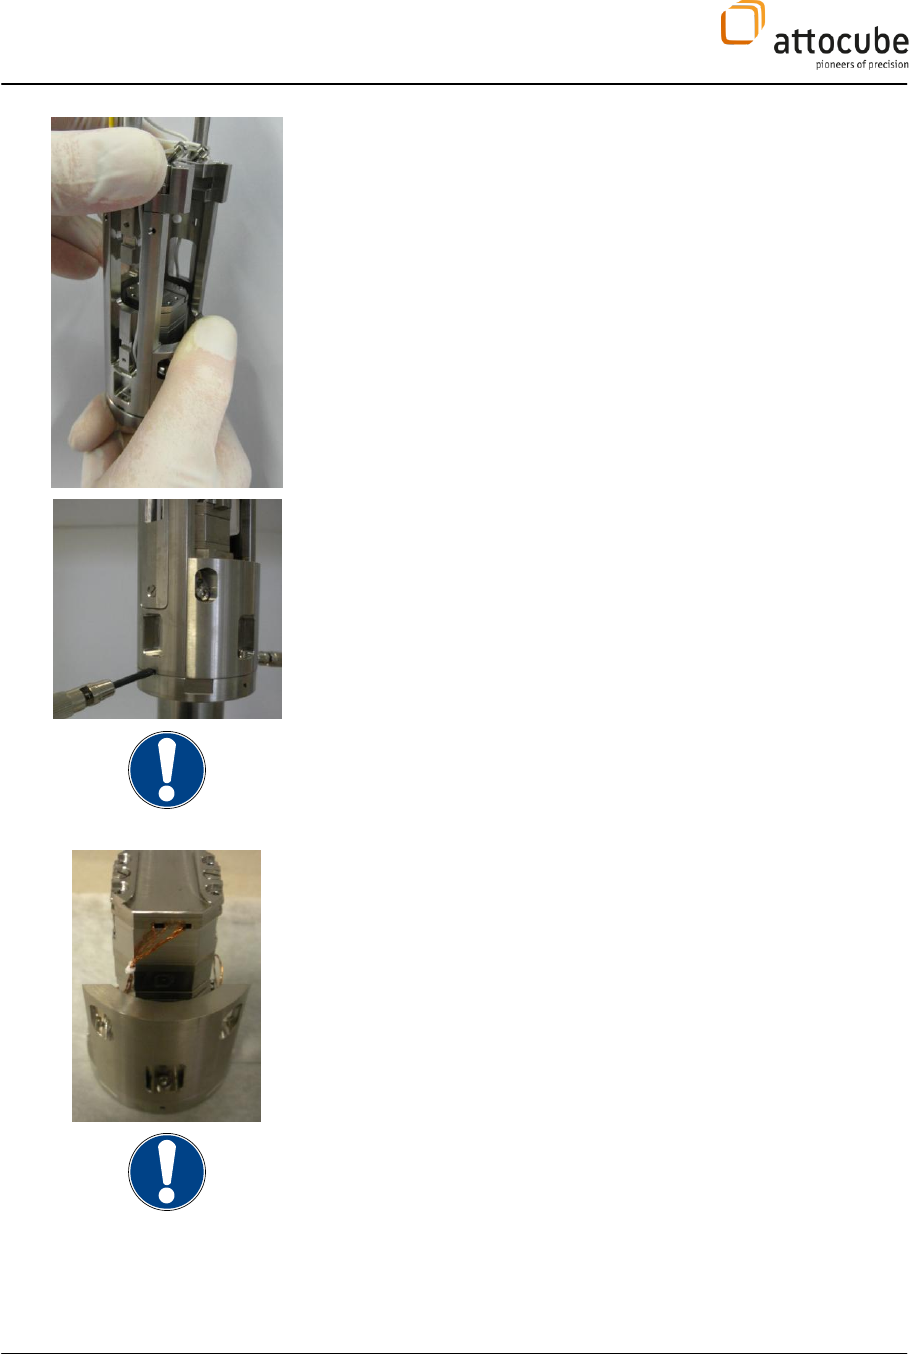
As there might be some force needed to disconnect the bottom
plate, we recommend keeping the housing with one hand and using
the thumb of the other hand to push the front plate down.
Noteworthy, two slits on the sides of the bottom plate may be used
to smoothly lever off the plate using a screw driver.
Before mounting the stack back into the housing, inspect the
cabling before pushing the bottom plate upwards. Make sure not to
squeeze any wire!
‘Bottom part’, including the housing bottom plate and positioner
stack.
You must not disassemble the stack. If there is any problem with
the stack please contact attocube AG for support.
Page 19
© 2001-2015 attocube systems AG. Product and company names listed are trademarks or trade names of their respective
companies. Any rights not expressly granted herein are reserved. ATTENTION: Specifications and technical data are subject
to change without notice.
III.3.b. Mounting the Scanner-Positioner Stack
Carefully place the stack onto the spacer plate on the bottom plate. Make
sure that the stack cannot fall down. Move the stack backwards until the
outer shape matches with the spacer plates.
Introduce two screws (M2.5 x 8) in the bottom plate in order to fix the
stack, see picture. Once the screws are tightened a little by hand, you can
use a screwdriver to tighten them further.
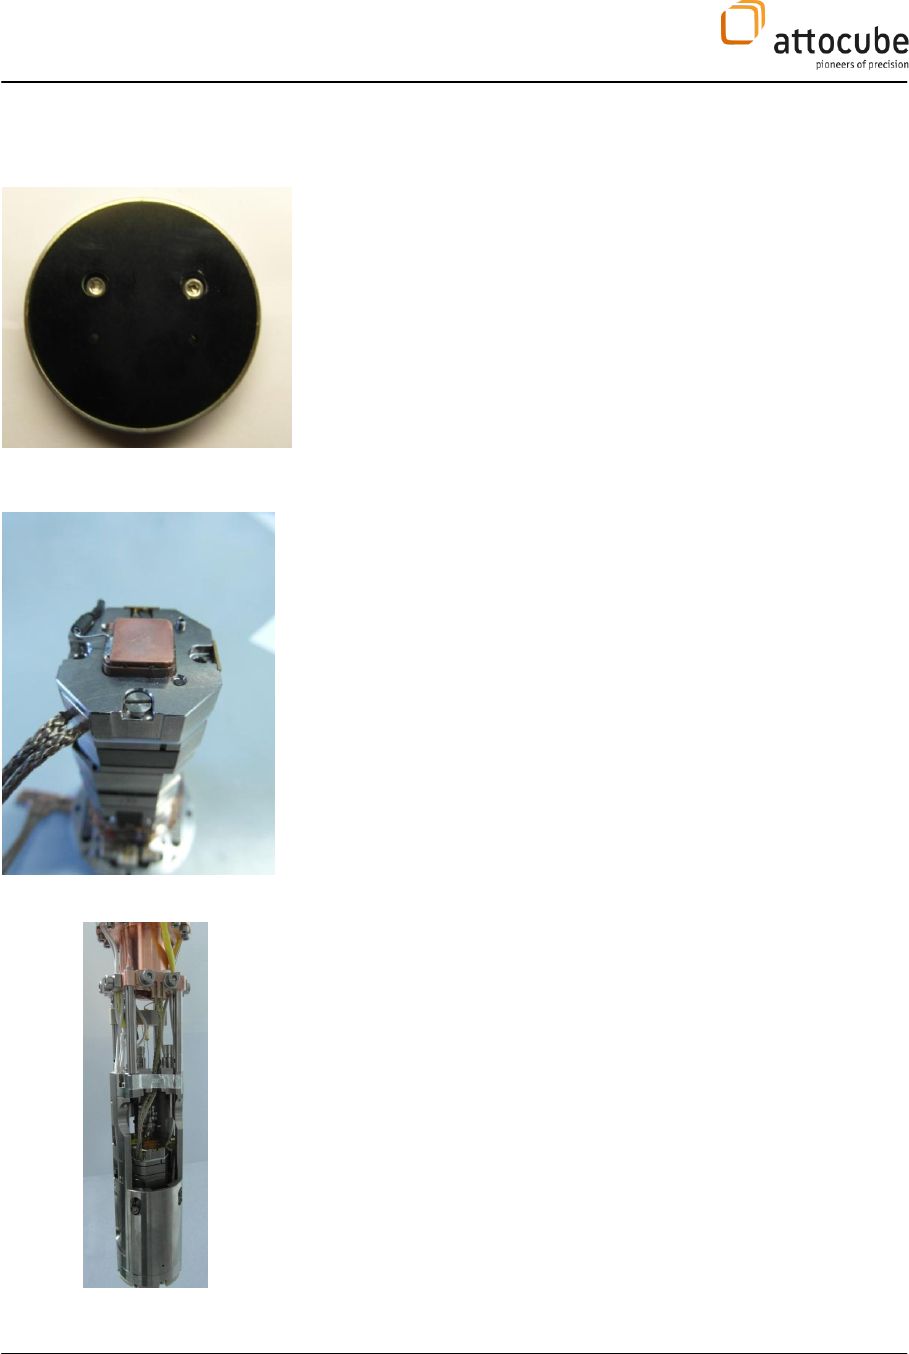
III.4. Sample Exchange and Thermal Contact
In order to change samples you need to take of the stack, as described
above.
A copper plate is fixed on top of the stack, electrically isolated but
thermally coupled, to the copper body that is directly connected/coupled
to the 3He-pot with copper braids.
For cleaning the sample holder acetone as well as alcohol may be used
(please take care that no conductive paste gets between the sample
plate and the lower copper body).
The sample holder may be electrically connected with a single pin
connector to set the sample potential. In the present setup the pin ‘S’ is
supposed to be connected to the sample holder (with a manganin wire) .
In order to fix the sample Apiezon N (available in the tool box) and/or
silver paste (available in the tool box) should be used.
The temperature sensor may be fixed with a headless set screw. Note that
this screw should only be fixed gently, in order to protect the sensor.
Attocube also recommends to cover the smaller top plate of the sensor
with Kapton tape (that can be found in the tool box).
For additional electrical connections, the pins X2…X6 on the housing
bottom may be accessed on the break-out panel ‘4’ of the electronic rack,
delivered with the microscope.
After the sample has been changed, the housing can be assembled again
and at last the copper rods need to be attached to the upper copper body
as shown in the picture to the left with two screws. These screws should
be tighly closed in order to give as good thermal conduction as possible.
Attocube also recommends to polish the inner surfaces of this contact
from time to time and to add a little bit of Apiezon grease (that can be
found in the tool box) before closing it.
Page 20
III.5. Changing the AFM Cantilever
Page 21
© 2001-2015 attocube systems AG. Product and company names listed are trademarks or trade names of their respective
companies. Any rights not expressly granted herein are reserved. ATTENTION: Specifications and technical data are subject
to change without notice.
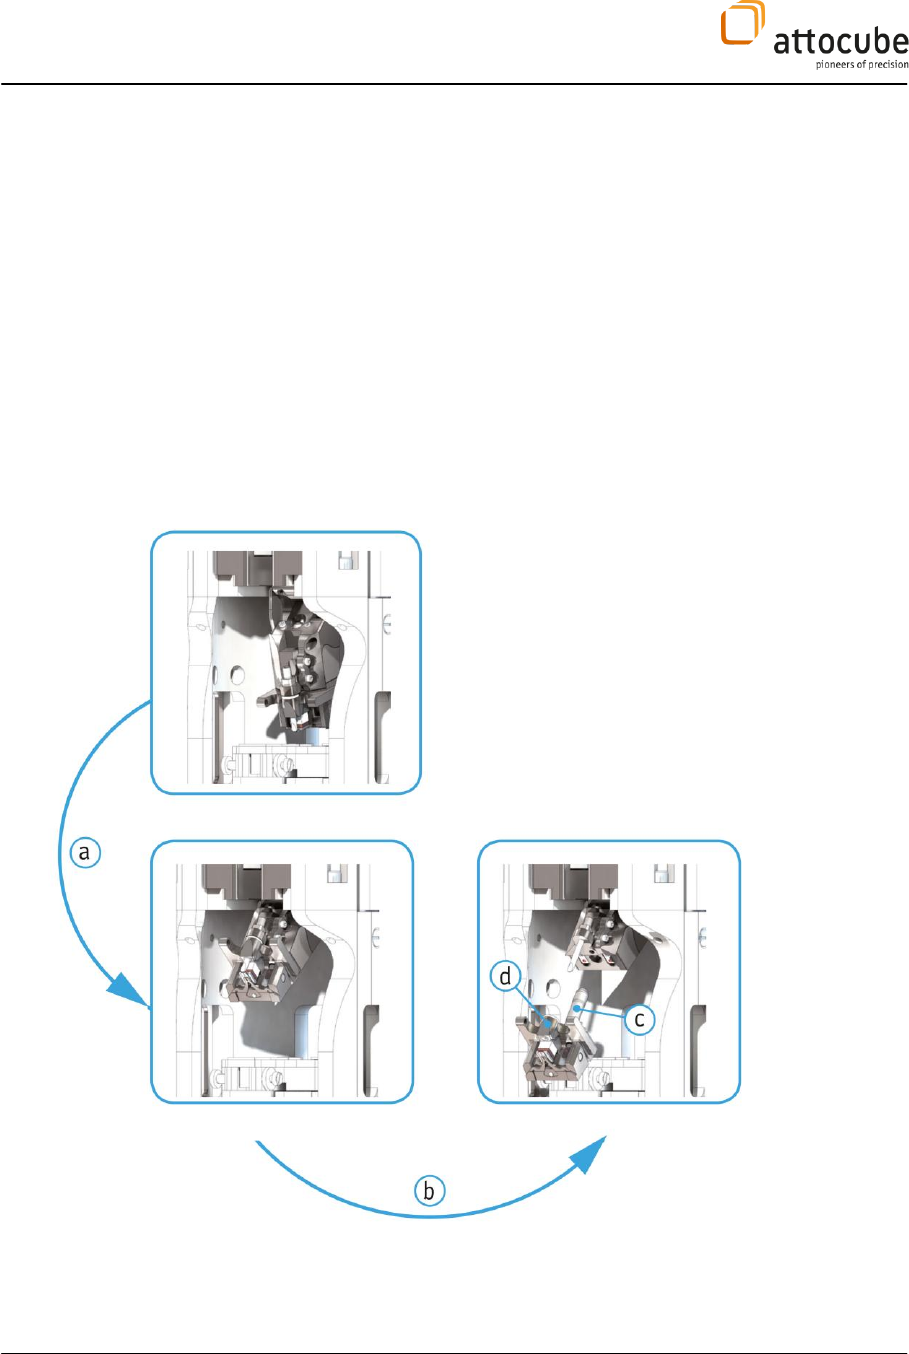
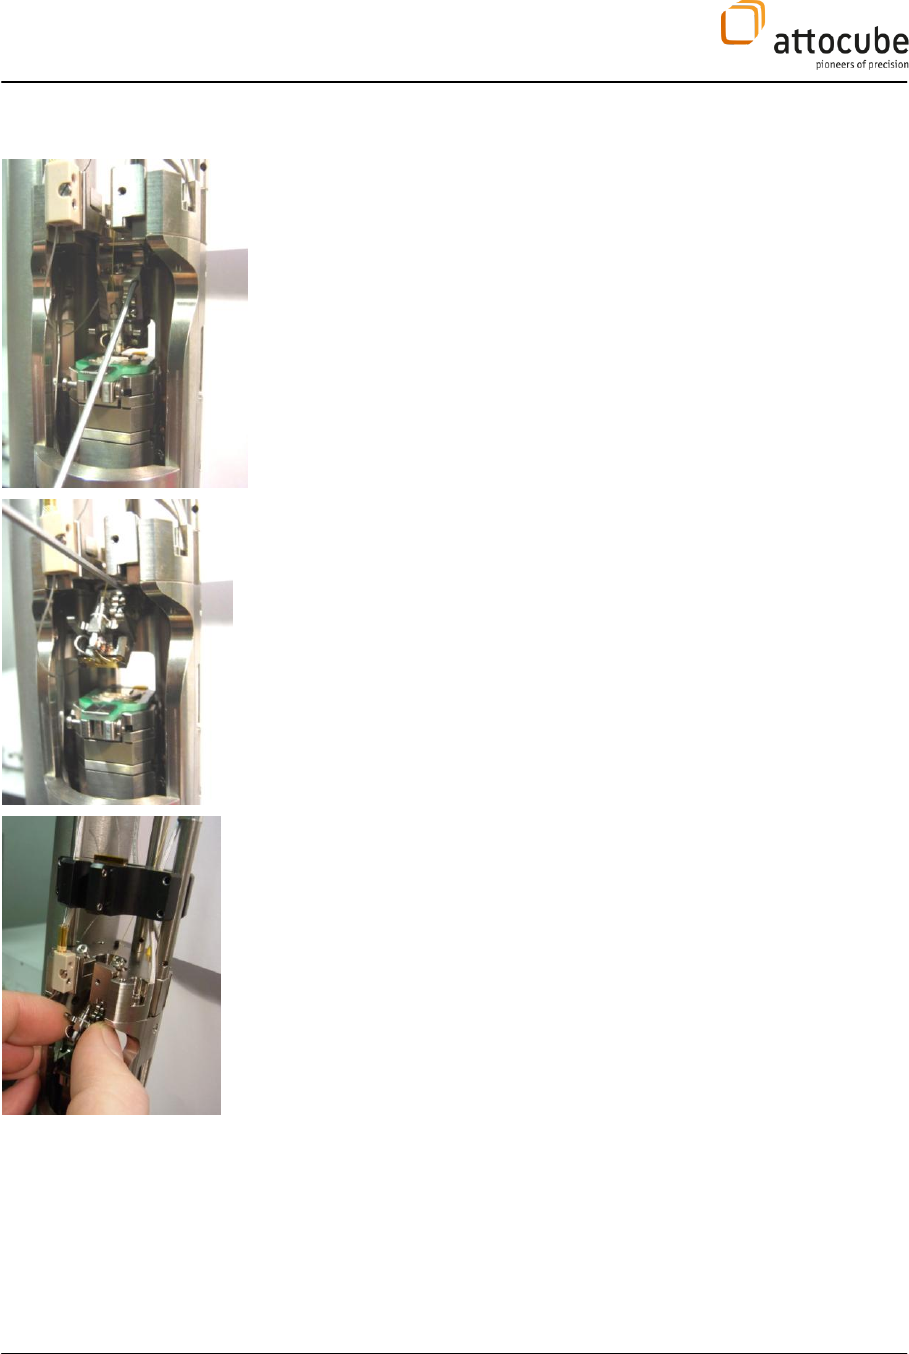
The attoAFM I (+) head includes an alignment-free
cantilever holder that is compatible with all
commercially available XY-auto alignment AFM tips.
In order to change the tip the attoAFM I (+) head
needs to be handled as follows::
1. Turn the AFM head upwards. Insert an Allen key
in the provided hole as shown in the picture to the
left (a)
2. Grab the cantilever holder on its arms and
smoothly strip it off, see picture to the left. (b)
Page 22
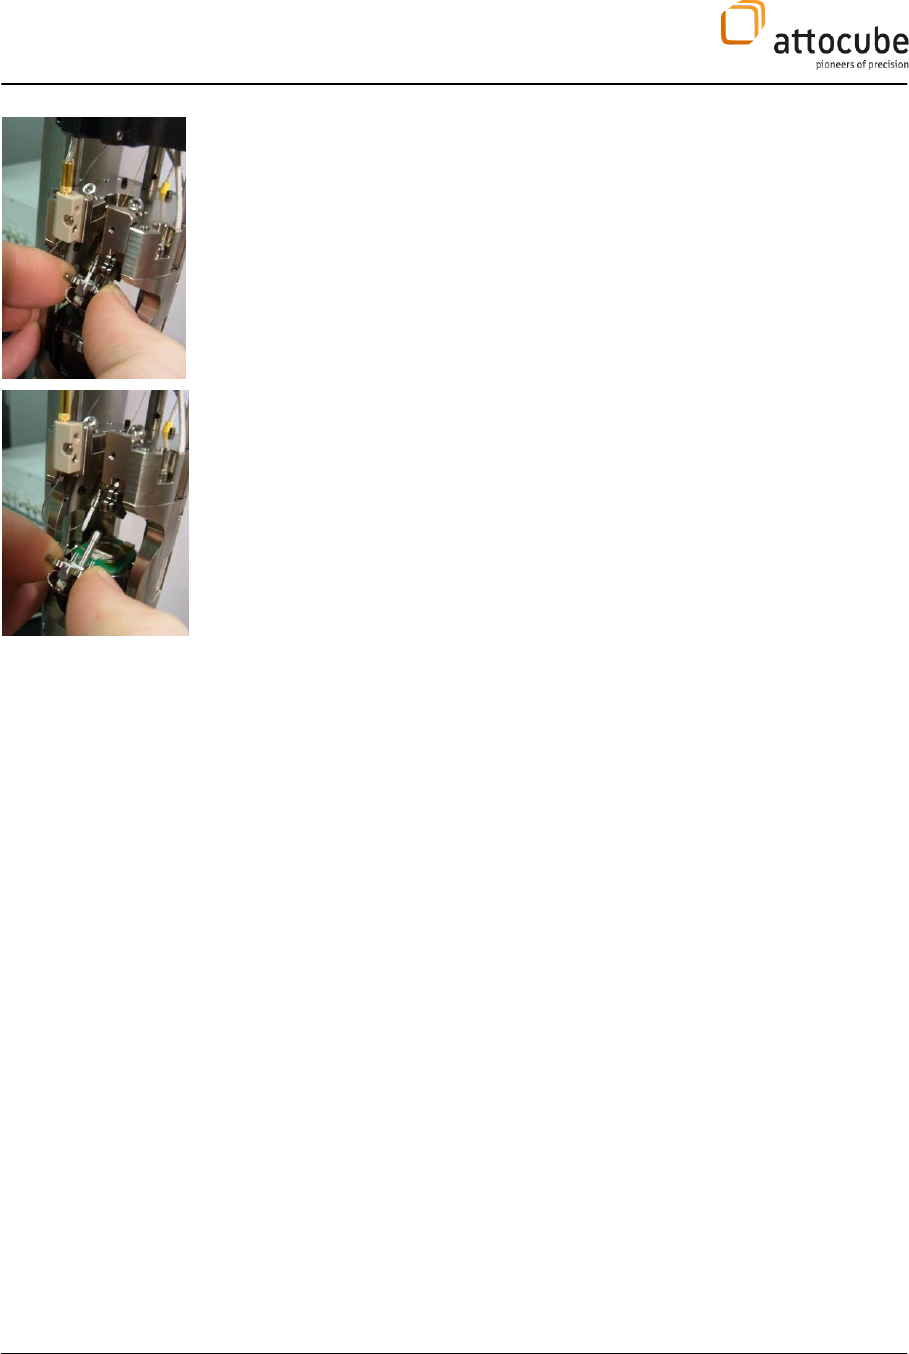
3. Perform the AFM tip exchange (for details, see
description below)
4. Once a new tip is mounted, reattach the
cantilever holder:
A guiding rod (c) automatically centers the
cantilever holder, while the fiber ferrule is still far
away from any potentially harmful obstacle.
5. Feed the ferrule into the cantilever holder
through another guiding sleeve (d). The ferrule
is protected by an additional soft Teflon cap.
6. Tilt the head back into the housing – it flips
conveniently and firmly into its dedicated parking
position.
No further mechanical alignment is necessary.
Page 23
© 2001-2015 attocube systems AG. Product and company names listed are trademarks or trade names of their respective
companies. Any rights not expressly granted herein are reserved. ATTENTION: Specifications and technical data are subject
to change without notice.
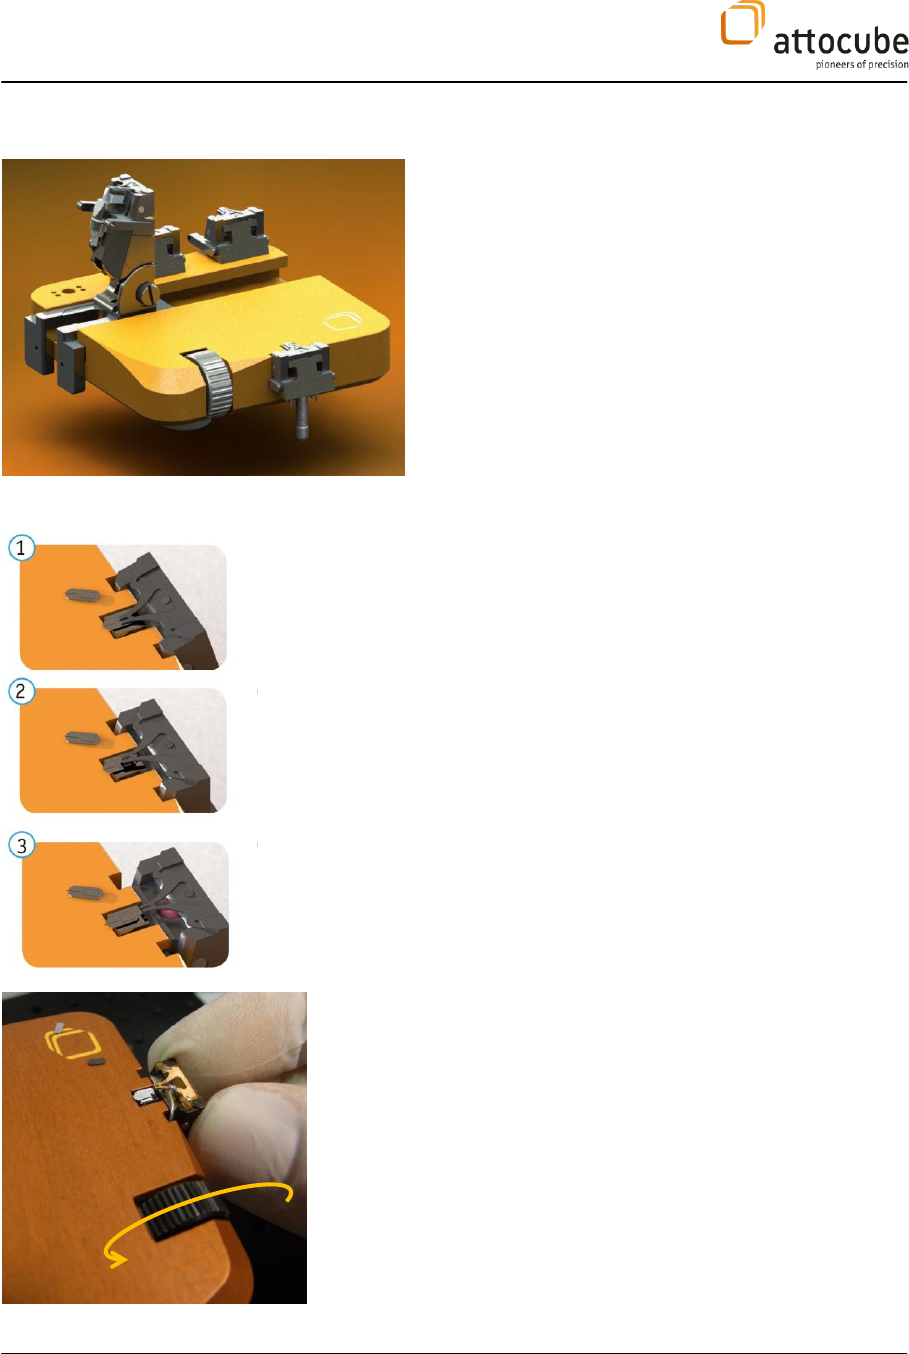
III.5.a. The cantilever mounting platform
The mounting platform provides three stages for
the alignment and adjustment procedures of the
cantilever on the AFMI head, namely:
I – cantilever exchange stage
II – AFM head parking site
III – slider module parking site
III.5.b. Cantilever exchange
In order to change the cantilever you need to:
Put the cantilever holder into the cantilever
exchange stage (1).
Slide back the spring blade, first push the back
part down (spring opens) (2) then pull the
slider towards the back(3).
In order to fix the AFM head into cantilever
exchange stage, you need to turn the black
knurled wheel sitting left to it.
II
I
III
Fix
Page 24
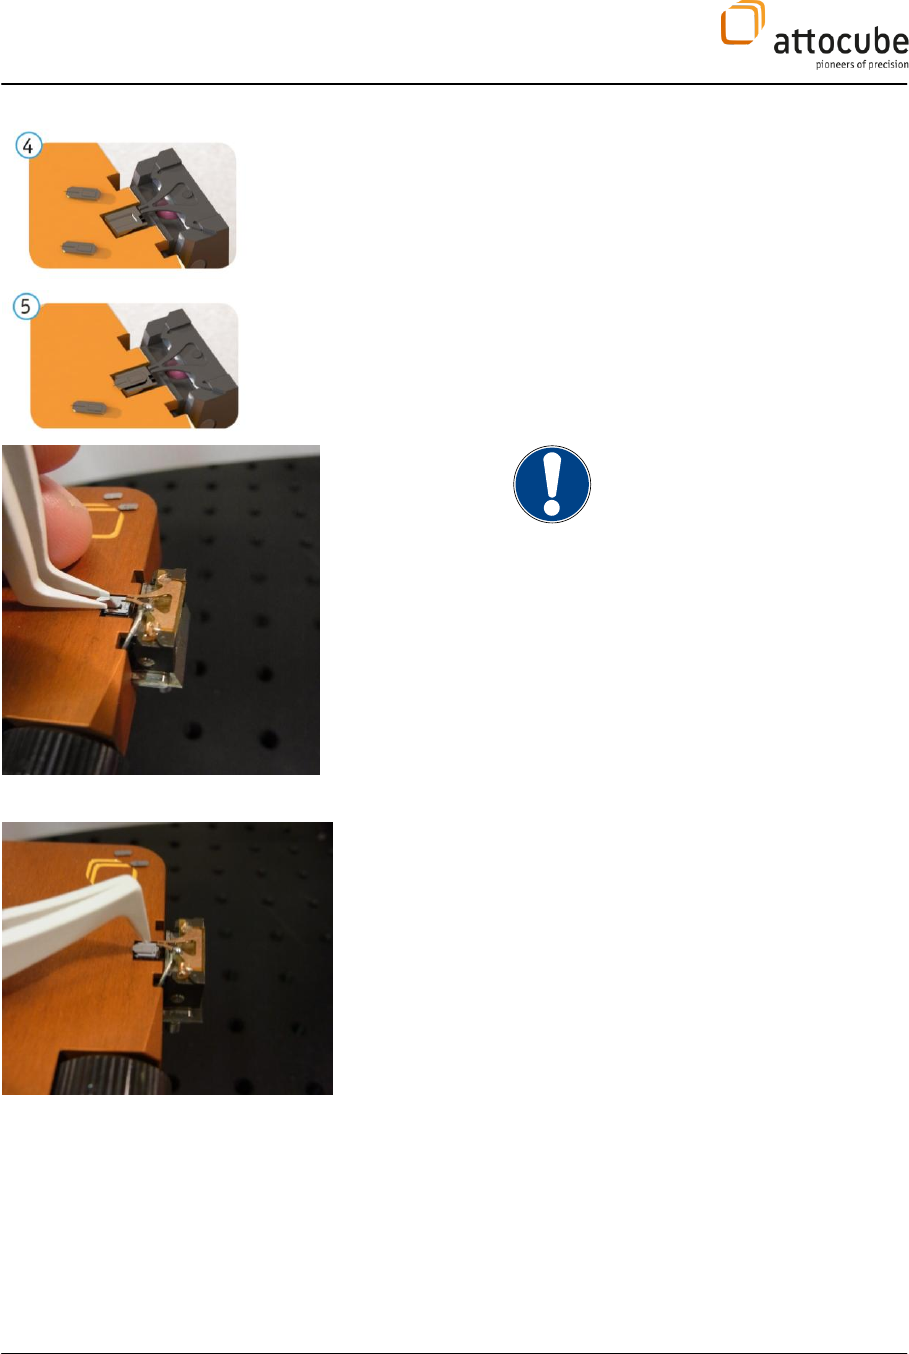
Perform cantilever exchange 4.-5.;
Do only use the plastic tweezers for handling
the cantilevers near the alignment chip.
Metallic parts may easily destroy this silicon
chip.
If the cantilever is not sitting correctly within
the chip you may gently push it with the end of
the plastic tweezers until it gets into the right
place.
Page 25
© 2001-2015 attocube systems AG. Product and company names listed are trademarks or trade names of their respective
companies. Any rights not expressly granted herein are reserved. ATTENTION: Specifications and technical data are subject
to change without notice.
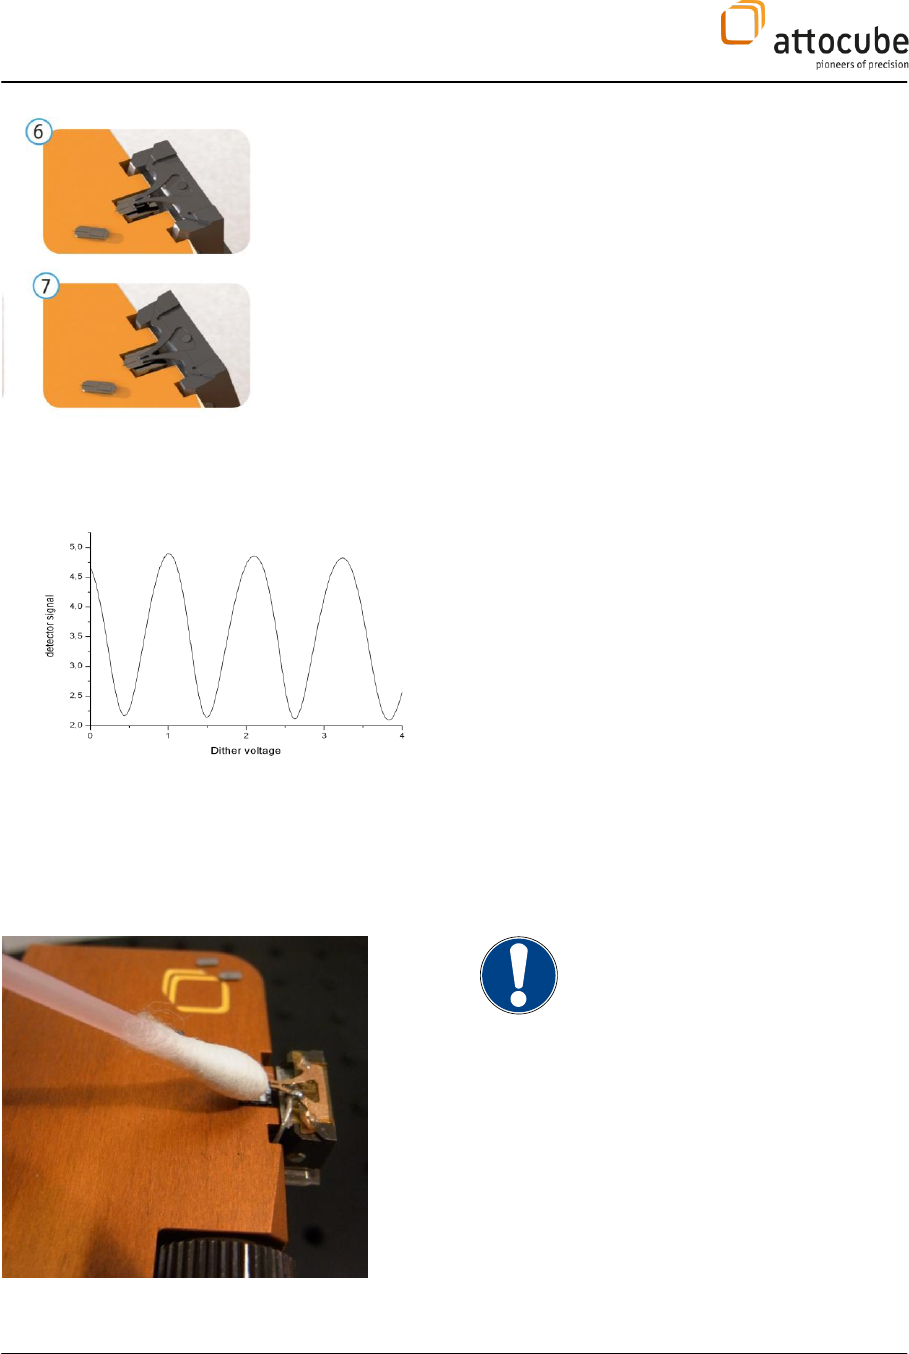
Close the holder. 6.-7.
Remove holder from the exchange
basis, and insert it back, see above,
into the AFM head.
Finally, run a spectroscopy on the dither piezo
(interference signal ADC1 vs. DAC1 dither voltage)
in order to see whether you get a decent
interferogram (in this context, “decent” is defined
by the intensity of the interferometric signal and
its symmetric shape)..
If the interferogram becomes comparable to the
one depicted in Figure 12 with a contrast of ≈ 1 V a
good measuring condition is met.
Figure 12
: Interference fringes seen in the cavity signal
on changing its length (spectroscopy ADC1 vs. DAC1).
Typically, the cavity gap amounts to 10-50 µm. Be
aware that the cavity will decrease when cooling
the microscope to liquid Helium temperature (up to
10 µm depending on the lever in use).
Note that the silicon cantilever-alignment chip
needs to be kept very clean. Hence, from time to
time it needs to be gently brushed with a alcohol-
soaked Q-tip.
Page 26
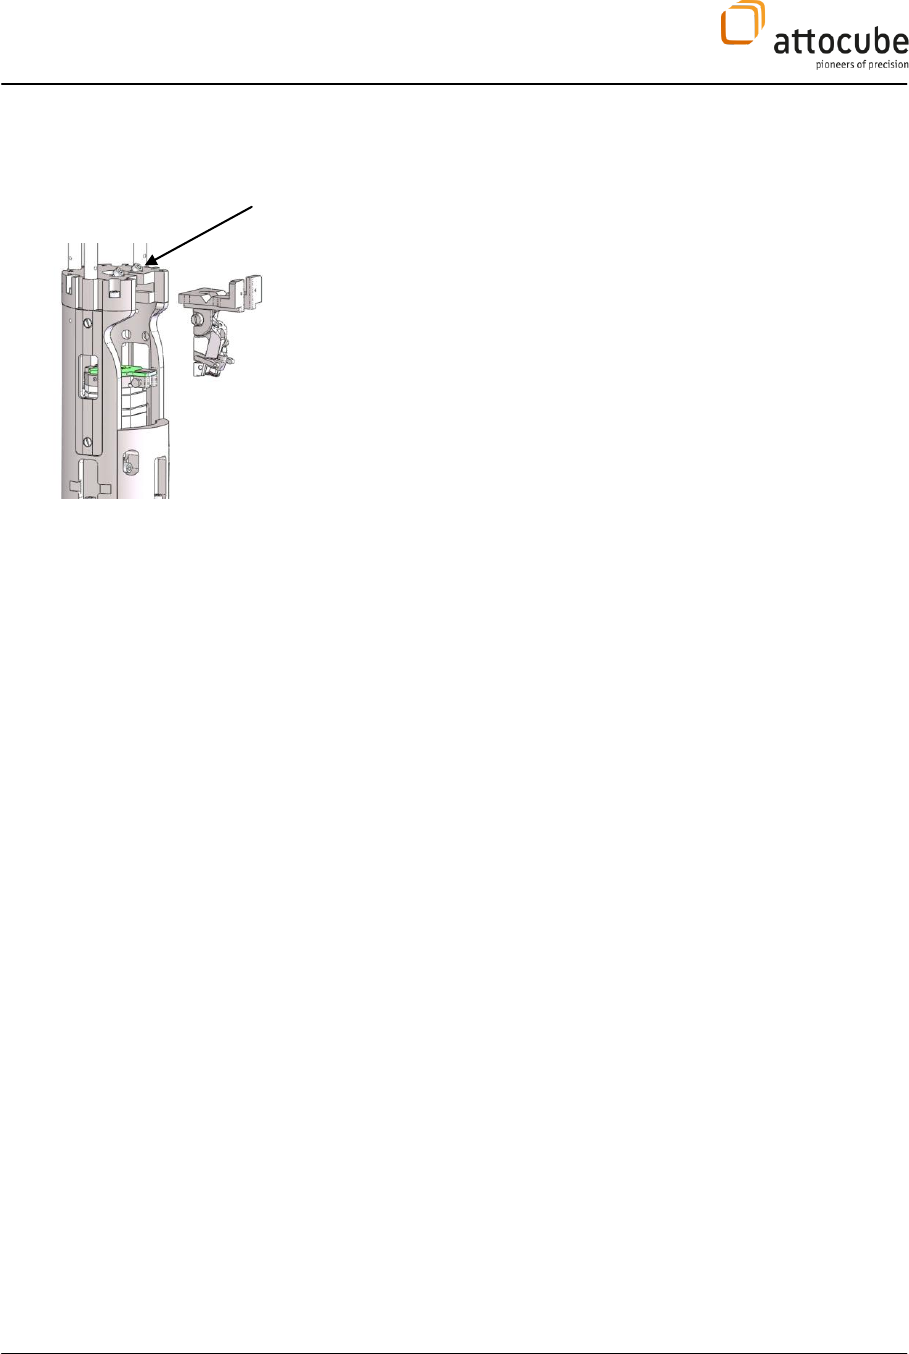
III.5.c. Mounting the attoAFM I sensor head into the housing
Before mounting the attoAFM I head into the housing make sure that
the z-positioning stage is fully retracted and that the cantilever
cannot touch the sample, i.e. sits clearly above the later.
Now slide the aligned attoAFM I head into the microscope housing
and tighten the two screws on top of the housing (see arrow).
This will fix the slider with the microscope head in place that also
makes an electrical contact to the microscope stick (e.g. the dither
piezo connection).
o

Page 27
© 2001-2015 attocube systems AG. Product and company names listed are trademarks or trade names of their respective
companies. Any rights not expressly granted herein are reserved. ATTENTION: Specifications and technical data are subject
to change without notice.
IV. Connecting the attoAFM I Module
IV.1. Electrical Connections
IV.1.a. ASC500 Controller Connections
Table 1 gives an overview of all the electrical connections of the ASC500
controller.
Controller
Port
Controller
Port
Usage
ASC500
X-Out
ANC300 (SCAN)
DC in x (1)
X scanner
Y-Out
ANC300 (SCAN)
DC in y (2)
Y scanner
Z-Out
ANC300 (SCAN)
DC in z (3)
Z scanner
DAC1
ANC300 (SCAN)
DC in D (4)
dither offset (DC)
DAC2
AC/DC coupler
for KPFM
DCin
tip voltage
DAC3
Sample S1
S
sample voltage
ADC1
photo detector
DET out(T-piece)
interferometer signal (DC)
HF1 in
photo detector
DET out (T-piece)
interferometer signal (AC), AFM
HF1 OUT
ANC300 (SCAN)
Mod in D (4)
dither excitation
HF2 in
photo detector
DET out (T-piece)
interferometer signal (AC), KPFM
HF2 OUT
AC/DC coupler
for KPFM)
ACin
KPFM excitation
Ground
(rear side)
break-out panel
╧
grounding of the stack
USB port
PC
USB
PC - ASC500 communication
NSL port
ANC350 (Step)
NSL
ANC350 (STEP) communication
Table 1
: Overview of controller connections.
Page 28
IV.1.b. Break-Out Panel Connections
The break-out panels are connected to the different controllers via BNC
cables. These cables are labelled for your convenience. See Table 2 for a
complete list.
Figure 13
: Break-Out Panels.
Label break-out
panel
Controller connection
Usage
Px
ANC350 Axis 1 (OUTPUT)
X Positioner: Px
Py
ANC350 Axis 2 (OUTPUT)
Y Positioner: Py
Pz
ANC350 Axis 3 (OUTPUT)
Z Positioner: Pz
Sx
ANC300 Axis 1 (OUTPUT)
X Scanner: Sx
Sy
ANC300 Axis 2 (OUTPUT)
Y Scanner: Sy
Sz
ANC300 Axis 3 (OUTPUT)
Z Scanner: Sz
T-I
temperature monitor Ch A
temperature sensor current
T-V
temperature sensor voltage
H
temperature monitor (optional)
╧
ASC500 ground (rear side)
grounding of the stack
X1
---
optional user contact (above
housing)
X2
---
optional user contact
X3
---
optional user contact
X4
---
optional sample contact
X5
---
optional sample contact
X6
---
optional sample contact
D
ANC300 Axis 4 (OUTPUT)
Dither DC voltage/ AC
excitation
╧
ASC500 Ground (rear side)
grounding of the stack

Page 29
© 2001-2015 attocube systems AG. Product and company names listed are trademarks or trade names of their respective
companies. Any rights not expressly granted herein are reserved. ATTENTION: Specifications and technical data are subject
to change without notice.
Table 2
: Overview of Break-Out panel connections.
IV.1.c. Pin Connections
All electrical pin connections to and from the attoAFM I module are low
temperature compatible pin. Most electrical connections are twisted pairs
of copper wires adjusted to the correct lengths. Wires carrying positive
voltages are labelled red, GND wires are marked black. All wiring from the
positioner stack has to be connected to the front- and back-row pin
connectors in the bottom plate of the housing. All connectors are labelled
with short codes. The port numbers are counted from the left to the right
(1,2,3..., see pictures below).
Table 3 describes these codes and provides details about the connections.
Port
number
Usage
Connector code
Leads to Fischer/BNC
connector
1 front
X Positioner
Px
1
2 front
Y Positioner
Py
1
3 front
Z Positioner
Pz
1
4 front
X Scanner
RESx
1
5 front
Y Scanner
RESy
1
6 front
Z Scanner
RESz
1
7 front
--
--
-
8 front
X Scanner
Sx
2
9front
Y Scanner
Sy
2
10 front
Z Scanner
Sz
2
1 back
temperature sensor
T-I
3
2 back
temperature sensor
T-V
3
3 back
sample heater
H
3
4 back
sample
S
4
5 back
user contact
X2
4
6 back
user contact
X3
4
7 back
user contact
X4
4
8 back
user contact
X5
4
9 back
user contact
X6
4
10 back
User contact
BNC1
BNC1
AFM head 1
Dither
D
2
AFM head 2
user contact
X1
2
Housing top
ground
╧
2
Table 3: Overview of pin connections.
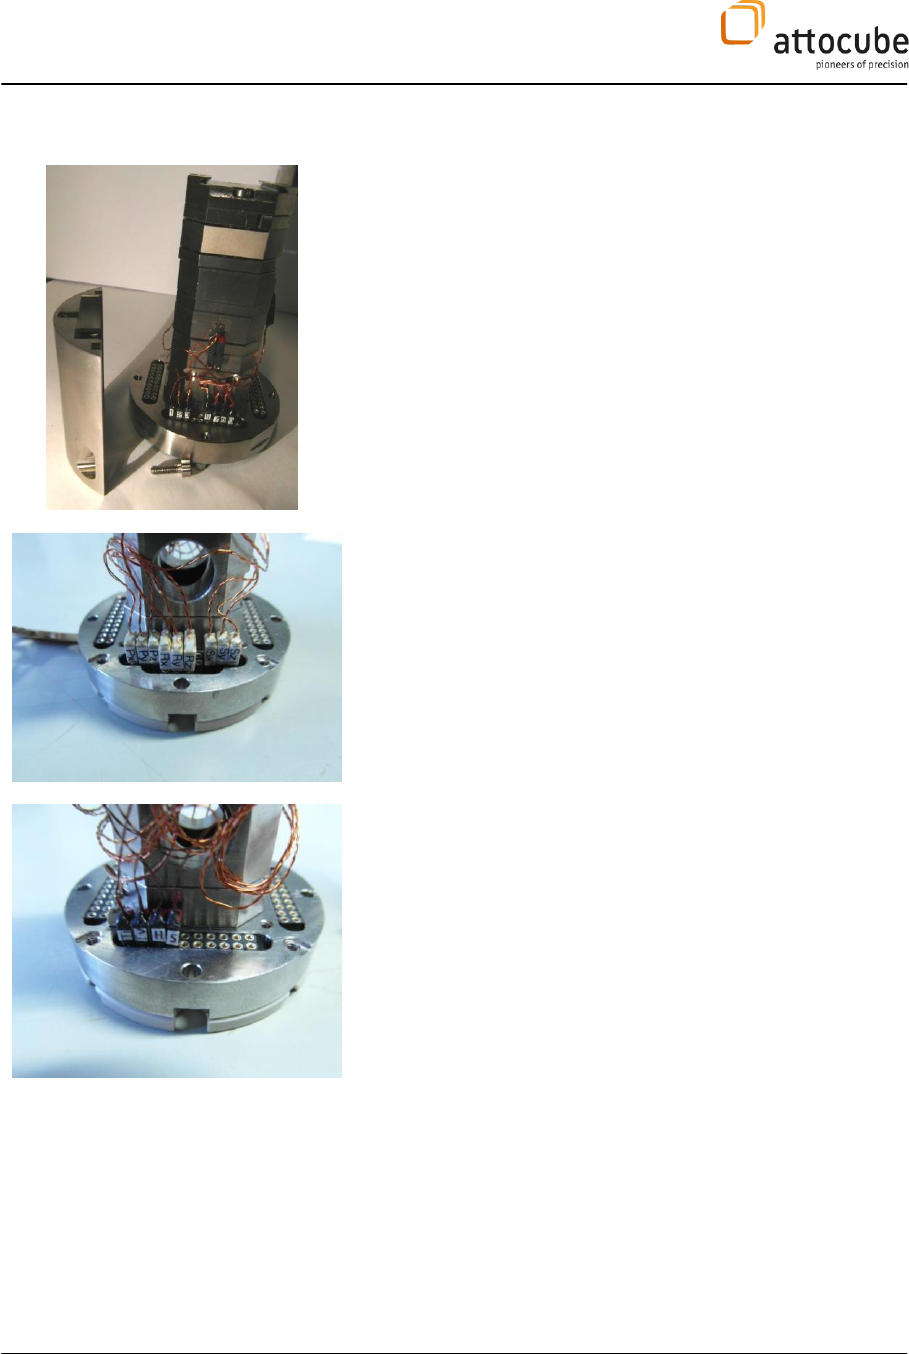
Page 30
In order to get access to the front-row-pin connections the front side
needs to be taken off by opening one screw.
Front view of the present housing pin connections.
Back view of the present housing pin connections.
Page 31
© 2001-2015 attocube systems AG. Product and company names listed are trademarks or trade names of their respective
companies. Any rights not expressly granted herein are reserved. ATTENTION: Specifications and technical data are subject
to change without notice.
IV.1.d. Vacuum Feedthroughs
There are multi-pin cables used to connect the microscope to the
electronics rack. The black cables are labelled ‘1’ ,‘2’,’3’,’4’.
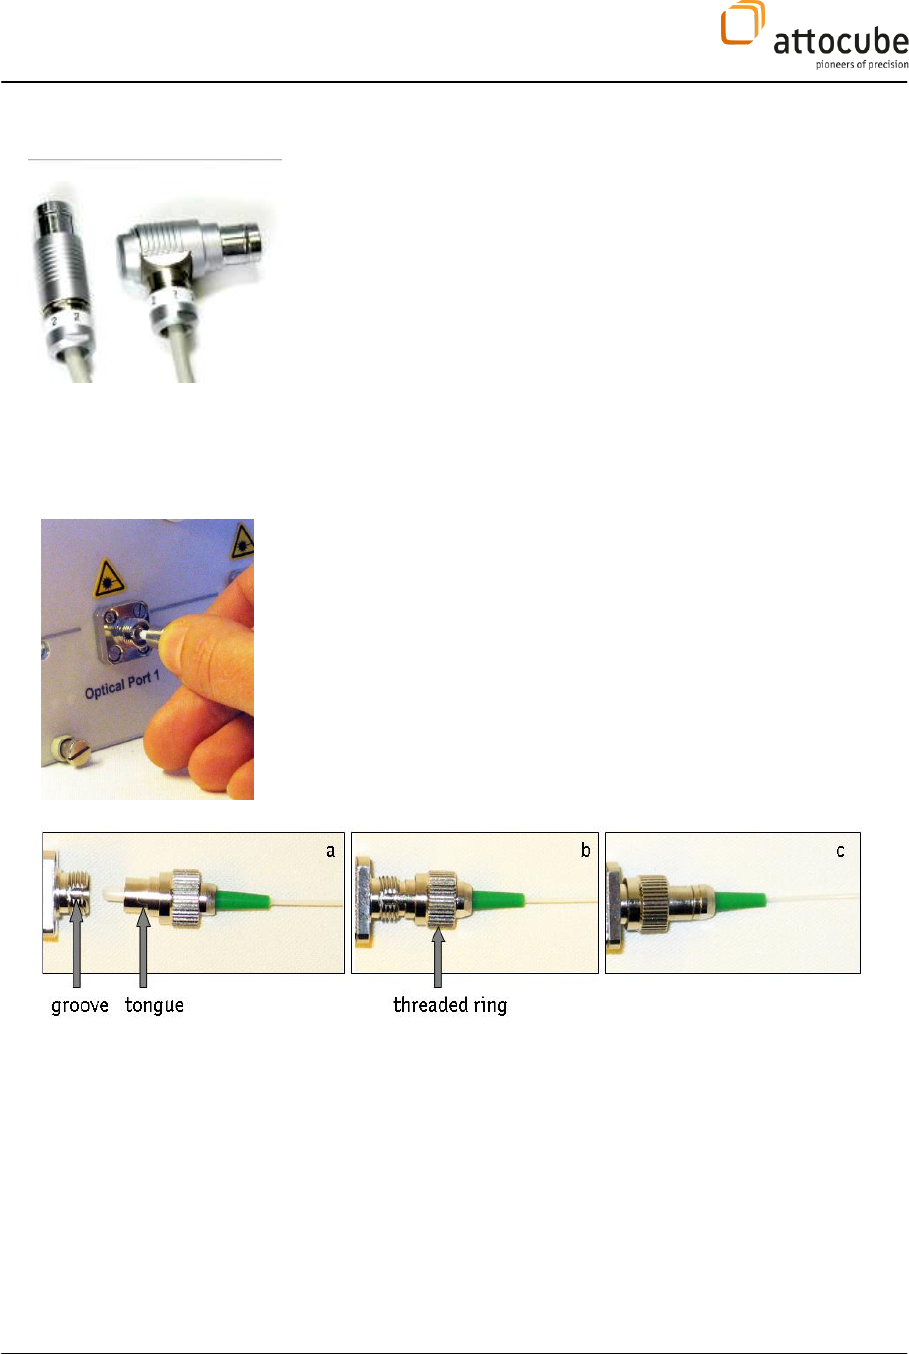
IV.2. Fiber Connection
The optical read out system of the cantilever of the attoAFM I system requires
only one optical connection which will be described in this section.
For the optical connection plug the attoAFMI fiber into the laser port1 (or
port2) of the LDM1300. Please make sure to have the right orientation of the
fiber groove and tongue system (see Figure 14). Do not tighten too hard as
this might damage the optical connector.
Figure 14:
Connecting the FC/APC pigtail to a connector port. Be careful to obey the correct orientation of the
groove and the tongue.

Page 32
V. Measurement Procedure
This chapter will lead you through your first measurement in the different
AFM modes available.
V.1. Operation Modes
Different operation modes are possible. The two fundamental ones are the
Contact Mode - with and without feedback - and the Non-Contact Mode (also
intermittent or modulation mode).
V.1.a. Contact Mode without Feedback (constant height)
In contact mode, the tip is brought in contact with the sample. The sample
is scanned without any feedback control of the z scanner, i.e. topographic
variations are directly translated into a deflection of the cantilever. The
photo detector signal is acquired during scanning, which can be directly
converted into a height signal by using the formula:
V
dV
nm
V
dV
dz
246
2
-
Here, V is the peak-to-peak amplitude of the interferogram; dz is the
change in height corresponding to a change dV in detector voltage.
Important note: This mode is only suitable for samples with a maximum
height corrugation of -/4! Otherwise, the contrast may be inverted.
The contact mode without feedback, also called const.-height mode, is the
easiest and fastest way to record an AFM image, because it is not depending
on z feedback. Please note that the image topography is inverted if the
working point within the interference signal is set to a negative slope.
For contact mode scans, cantilevers with a small stiffness (< 5 N/m) are used
in order to keep the forces between tip and sample small.
Page 33
© 2001-2015 attocube systems AG. Product and company names listed are trademarks or trade names of their respective
companies. Any rights not expressly granted herein are reserved. ATTENTION: Specifications and technical data are subject
to change without notice.
Figure 15
: Schematic drawing of the attoAFM I operated in contact mode without feedback.
V.1.b. Contact Mode with Feedback on (constant force)
The tip is first brought into real contact with the sample surface. In this
mode, however, a feedback mechanism is employed to keep the deflection
signal at a constant value by varying the voltage of the z-scanner. This will
maintain a constant force between tip and sample. The feedback setpoint
should be set to the point of maximum slope in the interference signal
(working point), i.e. to the middle between two interference extrema. The
main measurement signal in this mode is the voltage applied to the z
scanner, which can be translated into height data by using the z piezo
calibration value (usually this is automatically done by the controller
software). The error signal is the detector signal.
This mode is suggested for samples with height corrugations >-/4!
Since a feedback always causes low pass filtering, the measurements in
constant force mode are usually slower but less noisy than constant height
images.
V.1.c. Non-Contact Mode
In this mode, the cantilever is excited at its resonance frequency by an AC
voltage applied to the dither piezo. Correspondingly, the photo-detected AC
signal at the resonance frequency reflects the oscillation amplitude of the
cantilever. As the cantilever approaches the sample, this vibration amplitude
decreases rapidly with diminishing tip-sample distance. Note that the
oscillation amplitude is already reduced due to long-range forces (such as
van der Waals- or electrostatic/magnetic forces), i.e. the tip is not
necessarily physically touching the sample.
At this point, a oscillation amplitude called ‘set level’ is defined,
corresponding to a given force between sample and cantilever. The vibration
amplitude of the cantilever serves as the input to a feedback loop which
maintains the cantilever oscillation at the set level by adjusting the voltage
on the z-scanner (amplitude feedback). Alternatively, the amplitude and the
Page 34
phase of the oscillation resonance can be kept constant (phase feedback).
During the scan, the output signal of the feedback loop is recorded (z-piezo
voltage), providing the topographic information. The error signal is the
oscillation amplitude of the cantilever.
For non-contact mode scans, cantilevers with a high stiffness (k > 2 N/m) are
used to avoid the problem of unwanted jump-to-contact (stop of the
oscillation).
Figure 16 illustrates the interference signal measured by an interferometric
deflection detection system in non-contact mode. The output signal is largest
if the cantilever vibrates around the point of maximum slope of the
interference signal (working point). The working point is set by applying an
offset DC voltage to the dither piezo.
The AC voltage detected (peak to peak) by the Lock-In amplifier can be
translated into the real oscillation amplitude,
V
dV
nm
V
dV
dz
246
2
-
Figure 16:
Schematic drawing of the interference signal.
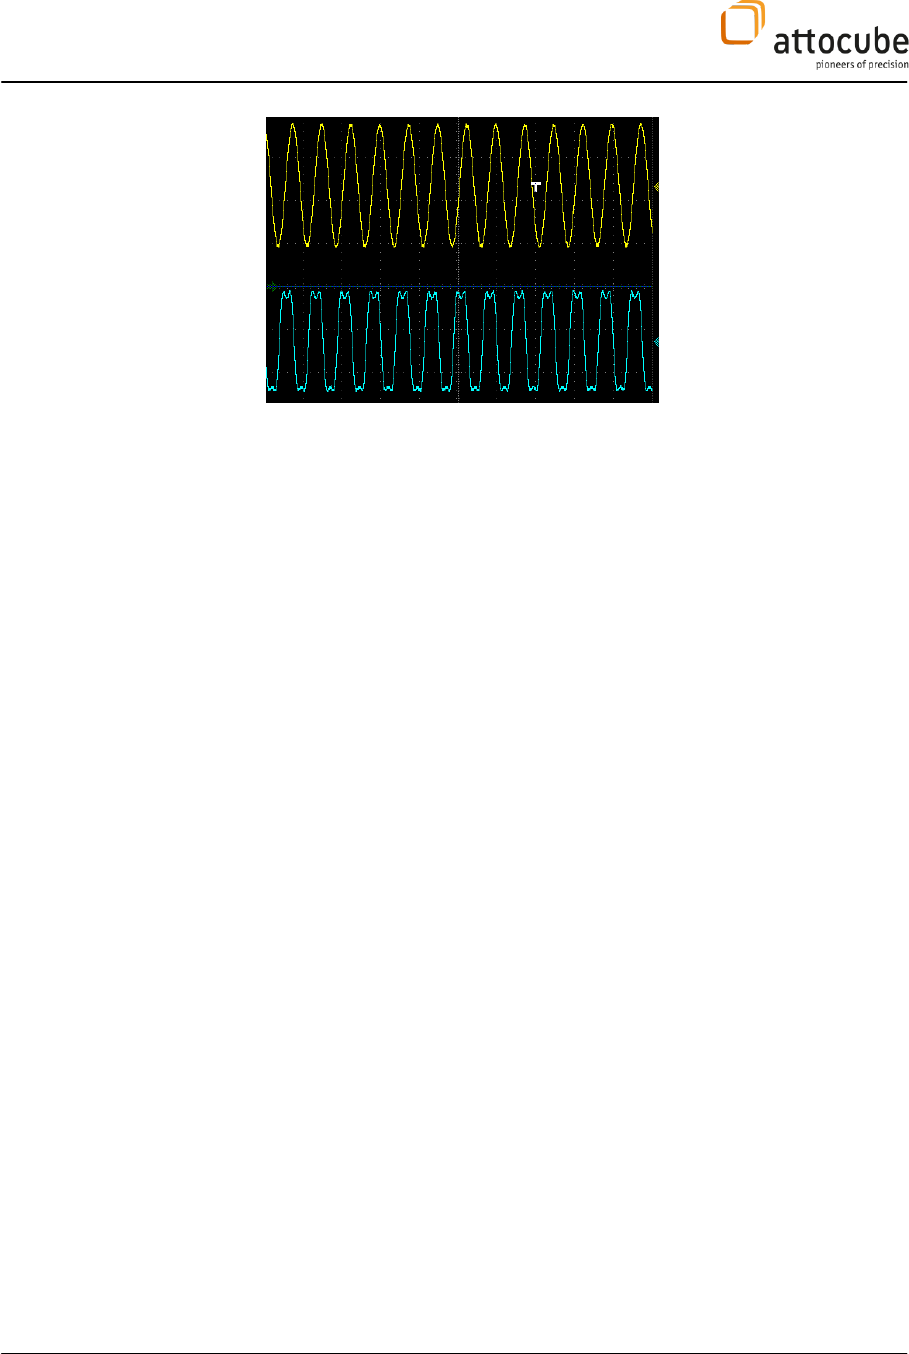
Note that if the vibration amplitude of the cantilever is slightly higher than a
quarter of the wavelength, the optical signal gets distorted at its extrema.
This is shown in Figure 17, which illustrates the electrical signals
corresponding to the dither excitation (top) and the interference signal
(bottom). Sweeping the (DC) dither voltage and measuring the interference
signal provides a quick calibration of the vibration amplitude of the
cantilever.
Page 35
© 2001-2015 attocube systems AG. Product and company names listed are trademarks or trade names of their respective
companies. Any rights not expressly granted herein are reserved. ATTENTION: Specifications and technical data are subject
to change without notice.
Figure 17
: Electrical signals corresponding to the dither excitation (top) and interference signal (bottom).
V.1.d. MFM and EFM measurements
MFM (EFM) is performed in non-contact mode utilizing a magnetic
(conducting) tip, i.e. the tip of the cantilever is covered with hard-magnetic
or conductive material. The tip-sample interaction leads to a shift f of the
lever mechanical resonance frequency f0. This interaction is directly related
to the gradient F of the magnetic force acting on the tip along the lever
bending direction. For a given lever of spring constant K (>> F), the
relation between the force gradient and the frequency shift f (<< f0) is
given by the approximation
F -2 (f/ f0) K.
Thus, the magnetic (electric) information can be either extracted from the
detected phase shift while measuring at a const. frequency or
correspondingly from the measured frequency shift in a phase-lock loop.
In order to avoid mixing of topographic and magnetic (electric)
information, the magnetic signal is usually recorded at bigger tip-sample
distances.
V.1.e. KPFM measurements
KPFM is performed in non-contact mode utilizing a conductive tip, i.e. the
tip of the cantilever is covered with a contactable conductive material. In
contrast to the MFM or EFM modes the cantilever is not mechanically excited
at its resonance frequency by using the dither piezo but by using an
oscillating electrical tip AC potential. The oscillation amplitude thereby
depends on the tip to sample DC voltage difference. Hence, by keeping the
oscillation amplitude at its minimum (i.e. HFx=0) with means of tuning the

Page 36
tip DC voltage a direct mapping of the sample potential is possible. The
KPFM mode is performed in a constant sample to tip distance using the dual
pass technique. In the first line the sample topography is recorded and in
the second line the topography is retraced at a certain tip-sample distance
while the KPFM signal is recorded.
V.2. Performing a Scan
The following sections describe the most important steps to be performed
before a scan is started. The AFM system must be in the following state
before you can go on:
- all electrical and optical connections are correct (see chapter IV).
- The tip-fiber system is well aligned.
- The step function for the positioner axes of the ANC300 axes should be
activated in the hardware but disabled in the coarse menu of the
software.
- For the non-contact mode, the BNC labeled HF out of the Lock-In
amplifier (on the ASC500) should be connected to the AC IN of the
AC/DC-coupler breakout panel and both the HF in input of the Lock-In
amplifier and ADC1 are connected in series to the output of the photo
detector.
With an open system at ambient conditions, start to manually approach the
sample to the tip using the z coarse positioner. This should be done under
eye inspection to a distance close enough for reasonable auto-approach
duration but still far enough away to avoid any crash of the tip. If the system
is going to be cooled down, the sample surface should be moved down 250-
500 steps from the contact position to (i) avoid the tip crashing into the
sample on cooling due to thermal contractions and (ii) assure a reasonable
approach time at low temperatures.
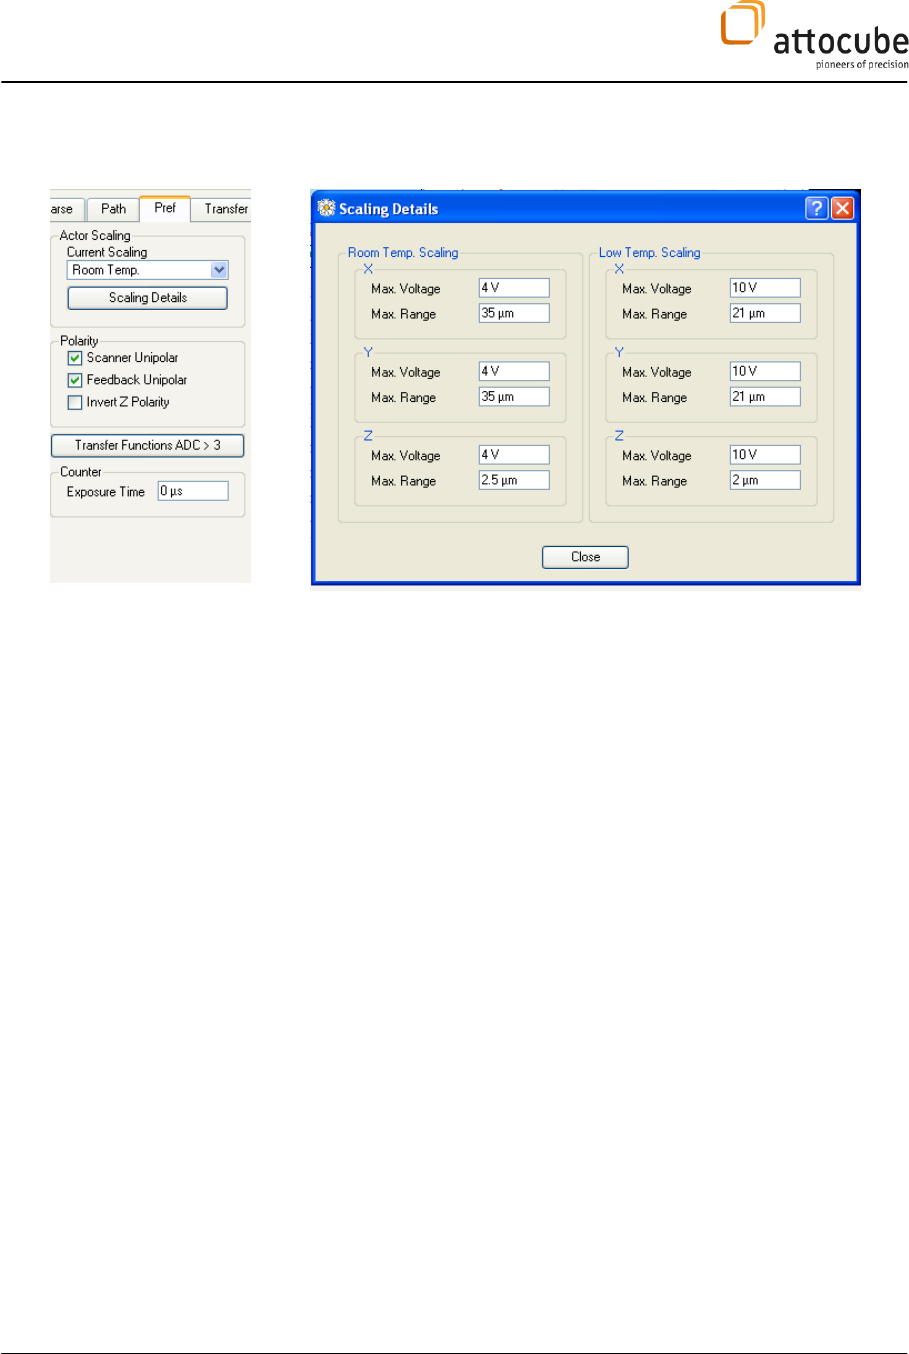
V.2.a. Set the Actor Scaling
The voltage outputs of the ASC500 must be activated (check the ‘output
active’-button within the DAISY software)
However, before you start activating the outputs, check that the correct
temperature and the according scaling details are set correctly in the ‘Actor
Scaling’ box of the ‘Pref’ window.
Two sets of parameters for room temperature and low temperature may be
saved. The parameters for the low temperature scaling entered here by
attocube systems are the calibrated 4 K values.
Note that at room temperature 4 V is the upper limit for the ASC500 scanner
outputs and at 4 K this limit increases to 10 V (this limits are valid for an
amplifier with amplification factor 15, namely the ANC300). If the customer
wants to measure at temperatures in between he should not exceed the
Page 37
© 2001-2015 attocube systems AG. Product and company names listed are trademarks or trade names of their respective
companies. Any rights not expressly granted herein are reserved. ATTENTION: Specifications and technical data are subject
to change without notice.
linearly extrapolated voltages.
V.2.b. Non-Contact Mode
In non-contact mode the tip-fiber cavity has to be adjusted to the point of
highest interference sensitivity, i.e. at which the change in the tip-fiber
distance gives the biggest (linear) change in the interferometric signal.
After the cavity has been adjusted to this point, the cantilever must be
excited at its resonance frequency and the photo-detected AC voltage
AFM Aosc will be used as measuring signal for the feedback loop. The basic
steps for this procedure are sketched below.
1. Adjustment of the fiber-cantilever cavity:
Run a so-called ‘dither spectroscopy’ (spectroscopy of ADC1 vs.DAC1) to
check the interferogram. To do so, choose one of the 'Spec' windows and
enter the following settings:
DAC: DAC1
Start: 0V
End : max. 4V (@RT); max. 10V (@LT)
Data Points: >1000
Data Point Avg. Time: 2-5 ms
Delay per Data Point: 0-5 ms
Choose ADC1 as the signal to be monitored.
Start the spectroscopy.
The Spectroscopy View should look similar to the figure below. The working
point WP (point of highest sensitivity where signal depends linearly on the
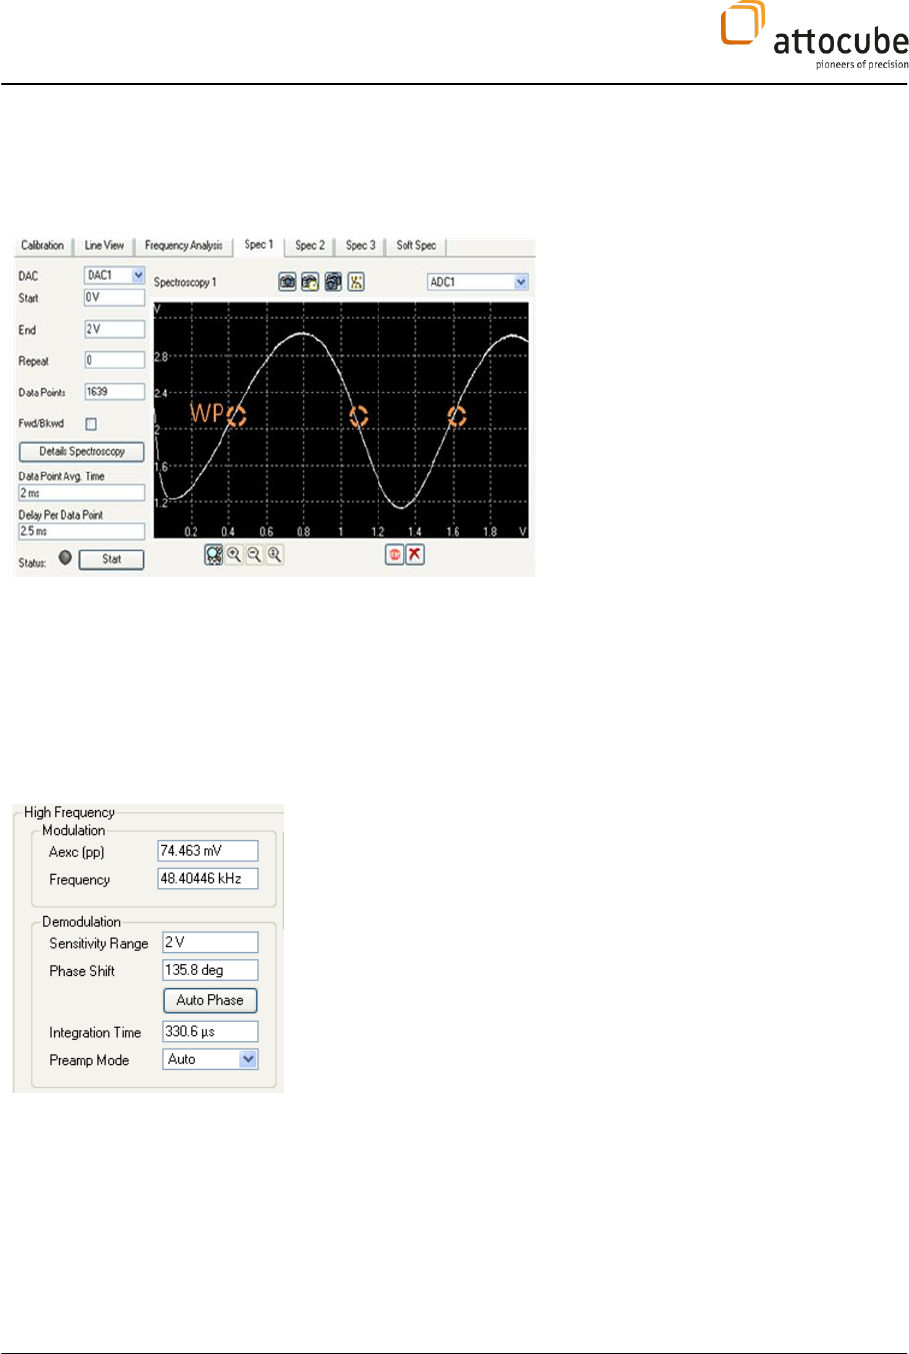
Page 38
cavity length between fiber end and cantilever) is located at the midpoint
between minimum and maximum of the interference signal.
Adjust ADC1 to the WP by tuning the dither piezo voltage, i.e. DAC1, in the
‘DACs’ window.
2. Finding the resonance frequency fres of the cantilever:
In non-contact mode, the cantilever is excited at its resonance frequency fres
with the an AC voltage Aexc. To deduce fres , the excitation frequency is swept
while measuring the oscillation amplitude (and the phase) of the cantilever.
The excitation amplitude and all demodulation settings are made in the
‘Lock In’ widow. The frequency sweep is done in the ‘Calibration’ window.
High Frequency box:
Amplitude (pp): 10-200 mV (@RT); 1-20 mV (@LT)
This sets the excitation amplitude
Frequency: This frequency will be deduced from the
calibration
For ‘Demodulation’ parameters, choose:
Sensitivity Range: 1-2 V (maximum oscillation
amplitude Aosc)
Phase Shift: leave 0 or set an offset phase so that the
phase signal is 0 at resonance.
Integration time: set to 100 µs – 1 ms
Leave the Preferences value set to 1.
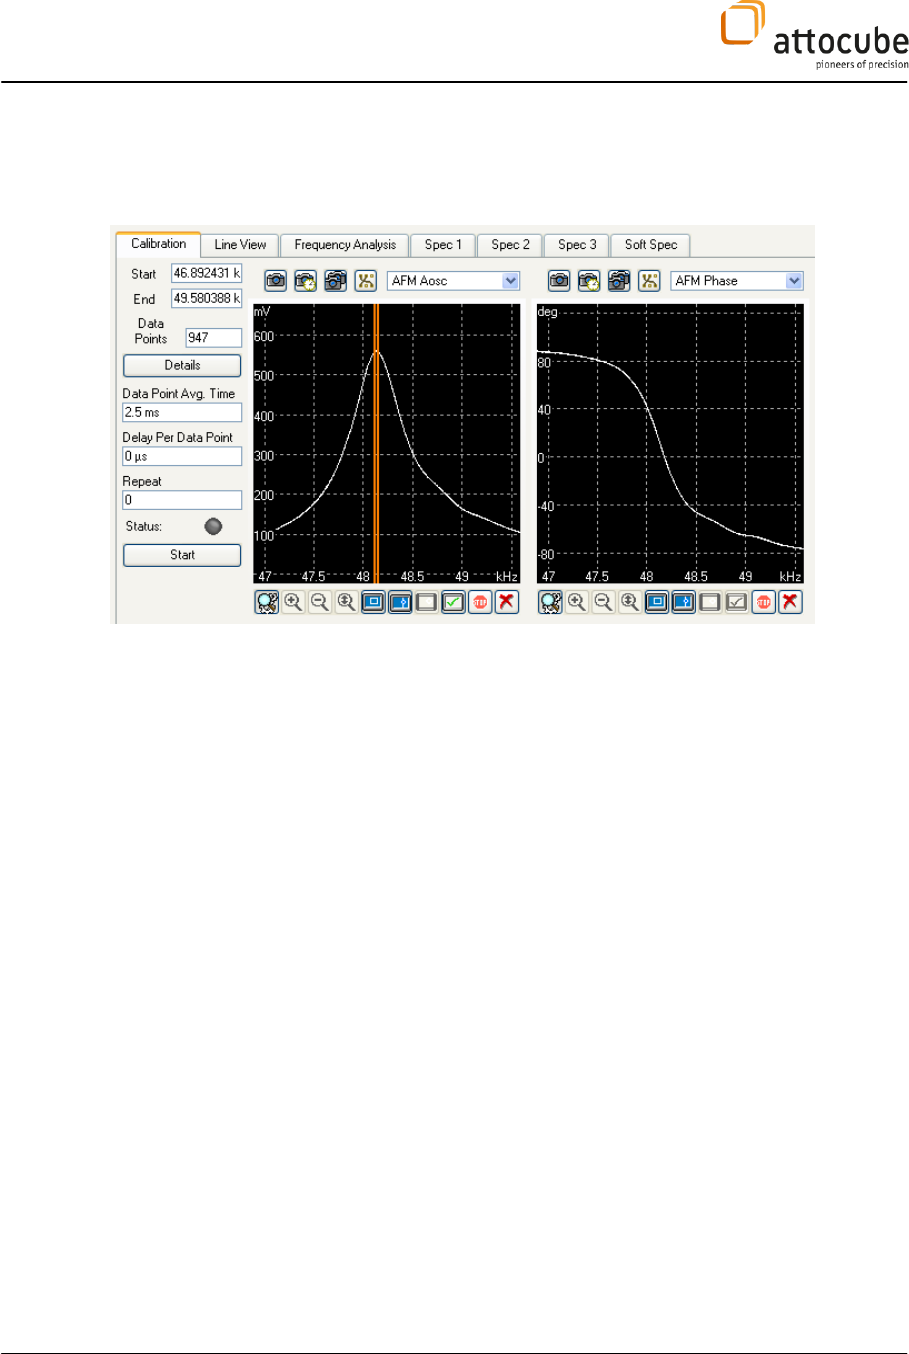
Calibration:
Frequency range (Start - End): 45 kHz – 95 kHz
(depending on the cantilever)
Data Points: 500-5000
Data Point. Avg. Time: 2.5ms
Page 39
© 2001-2015 attocube systems AG. Product and company names listed are trademarks or trade names of their respective
companies. Any rights not expressly granted herein are reserved. ATTENTION: Specifications and technical data are subject
to change without notice.
Delay Per Data Point: 0s
Start the calibration.
The upper figure shows the calibration window and the oscillation amplitude
(AFM Aosc) of the cantilever as a function of the excitation frequency. From
this resonance curve, fres can be selected with the help of the frequency
selection tool. Press the ok button (green checkmark) to set the chosen
frequency as the excitation frequency. It is also possible to zoom in by using
the frequency range selection tool.
It is possible to extract the oscillation amplitude A of the cantilever from the
resonance curve with help of the calibration of the interference signal:
A = -/2*V/V with V being the photo detector signal at resonance and
V being the peak-peak amplitude of the interference
signal.
The amplitude A is typically chosen to be within 20 nm to 100 nm.
Besides the the oscillation frequency of the resonance, the Full Width at Half
Maximum (FWHM) can also be deduced from the resonance curve which
allows calculating the cantilever’s Q factor, Q = fres/FWHM.
Page 40
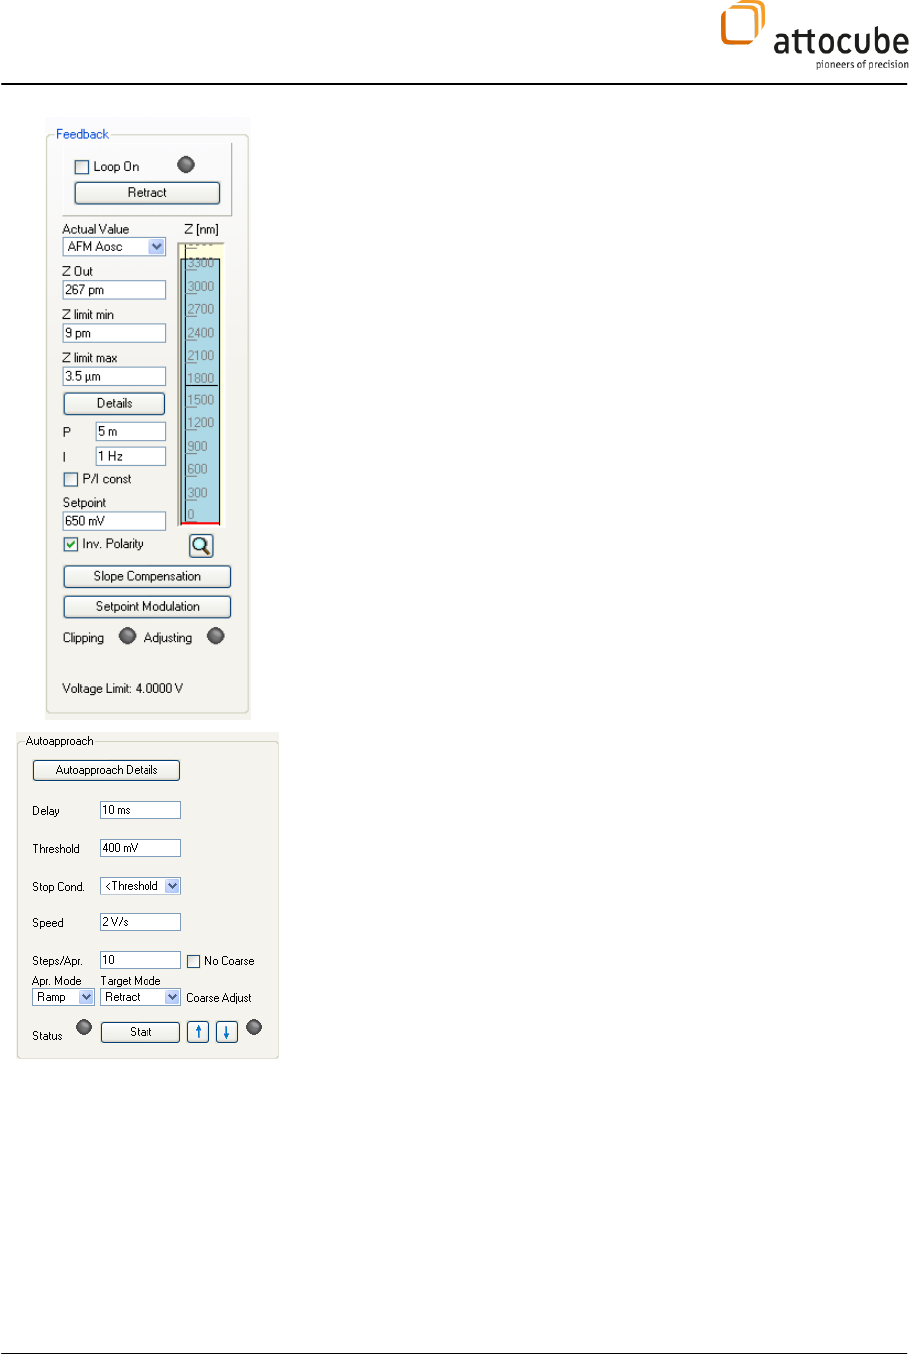
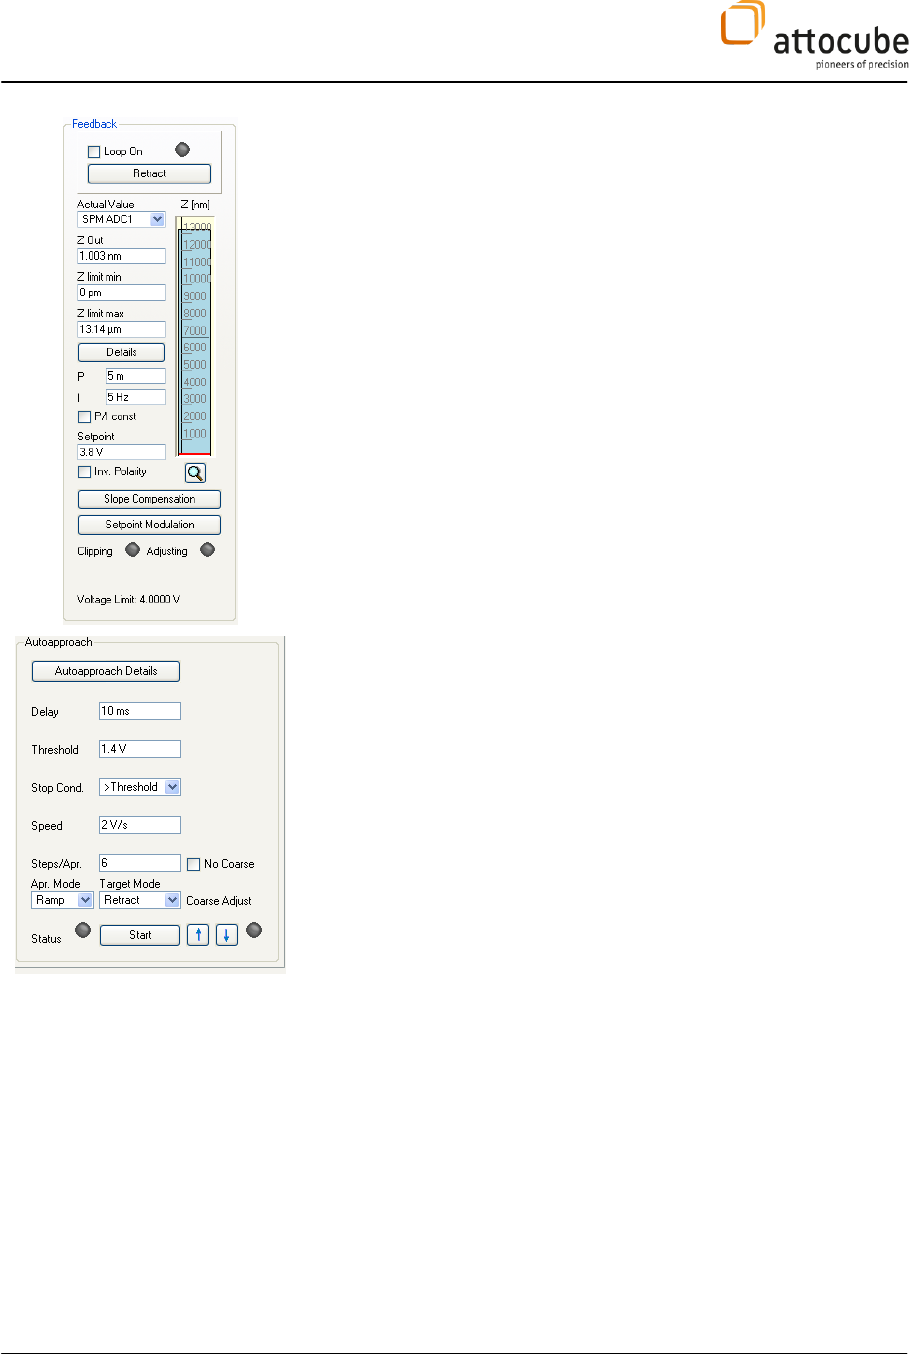
3. Starting the Auto Approach:
The auto approach procedure will expand the z-scanner while constantly
checking the photo-detected Ac signal AFM_Aosc. If a certain threshold (stop
condition) is not detected within one stroke, the z piezo will be retracted and
a predefined number of coarse steps in z direction will be executed.
Afterwards, ramping of the z-scanner will be restarted. Please note that you
can affect the range of the z-piezo stroke by adjusting 'Z limit min' and 'Z
limit max' within the 'Feedback' tap.
Before starting the auto approach, select the AFM_Aosc as ‘Actual Value’ in
the 'Feedback' tab. Furthermore, choose the following parameters:
Z out: 0nm
Z limit min: 0nm
Z limit max: maximum z piezo stroke. See data sheet at
the end of this manual.
P: 1-5 m
I: 1-20 Hz
Inv. Polarity: checked (signal AFM Aosc is expected to decrease with
increasing Z)
In the 'Coarse' tab, one can find the 'Auto Approach' box where the
following parameters should be entered:
Delay: 10 ms
Threshold: ~2/3 * of AFM_Aosc
Stop Cond.: < Threshold
Speed: 2V/s (@RT), 3V/s (@LT)
Steps/Apr.: see data sheet (part of this manual)
Apr. Mode: Ramp
Target Mode: Retract
Page 41
© 2001-2015 attocube systems AG. Product and company names listed are trademarks or trade names of their respective
companies. Any rights not expressly granted herein are reserved. ATTENTION: Specifications and technical data are subject
to change without notice.
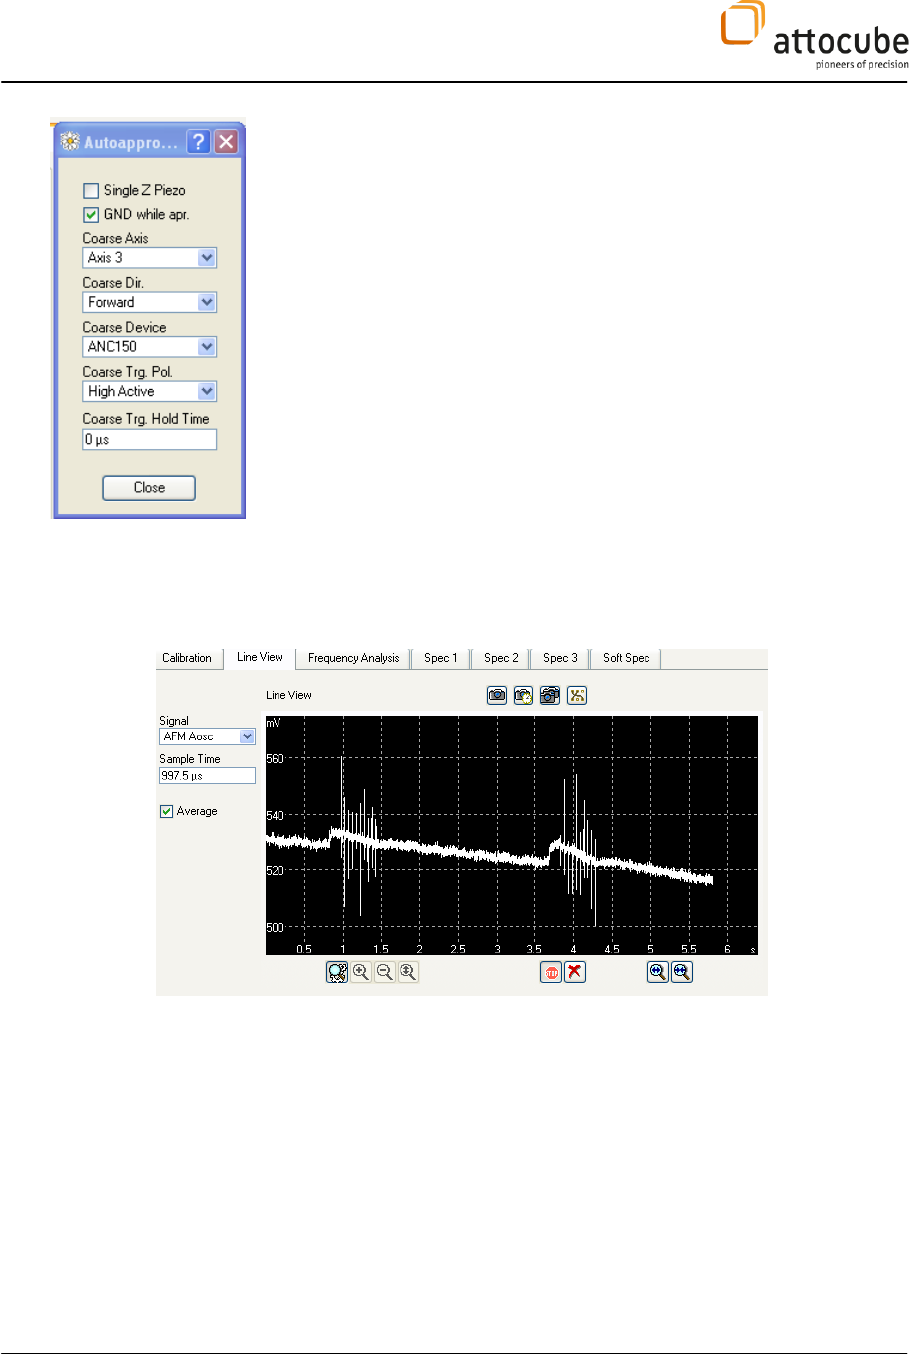
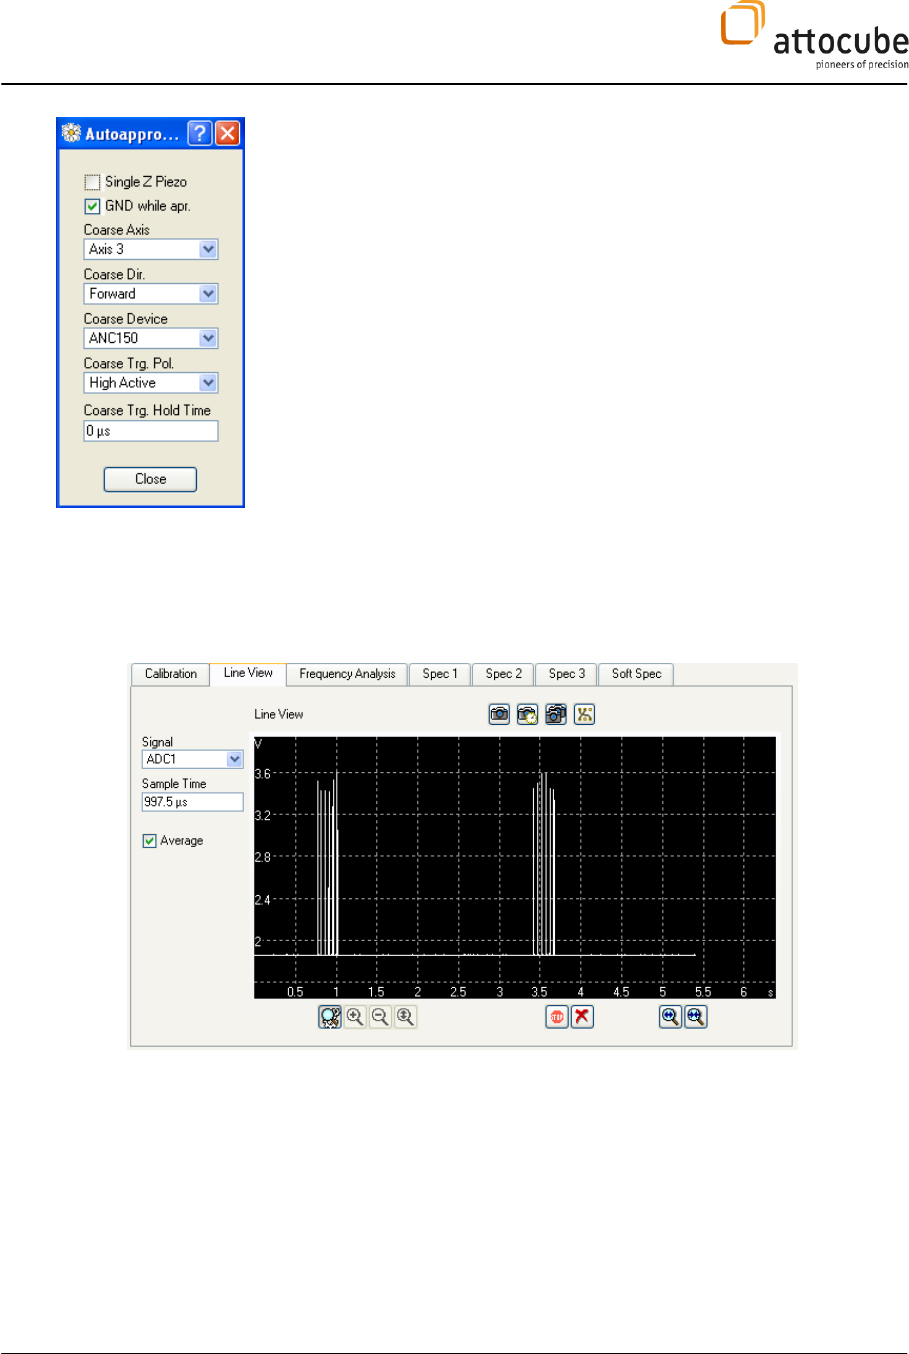
Check the ‘Autoapproach Details’ where the following parameters should be
entered:
Coarse Axis: Axis 3
Coarse Dir.: Forward
Coarse Device: ANC150
Coarse Trig. Pol.: High Active
Coarse Trig. Hold Time: 0 µs
The auto approach should last between a few minutes and half an hour,
depending on approach parameters and initial tip-sample distance. After the
auto approach is finished, the sample surface is within reach of the z
scanner.
The figure below shows how the auto-approach signal is typically reflected
in the photo-detected AC signal AFM Aosc (at an already quite small tip-
sample distance)
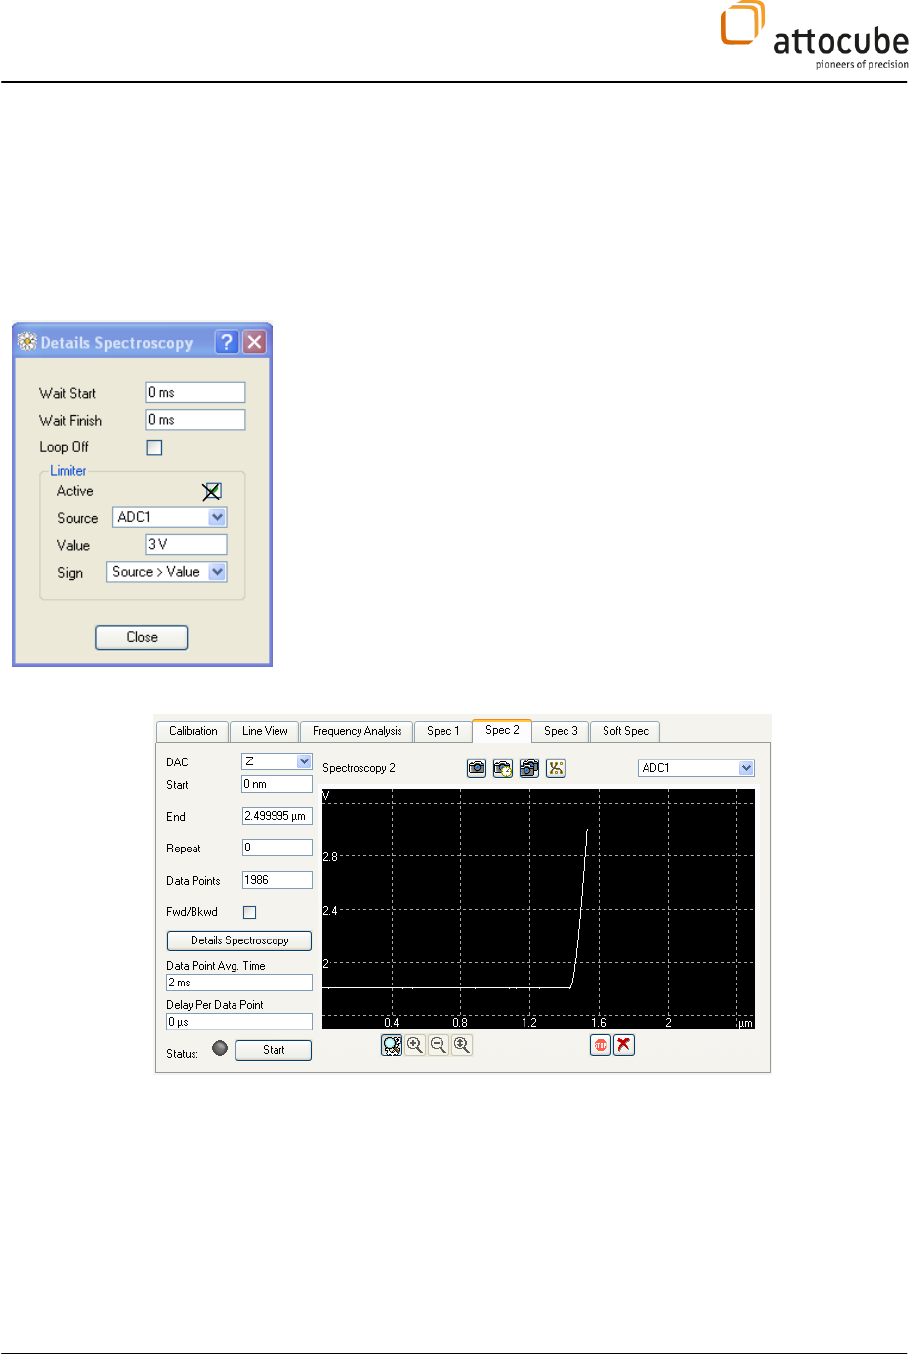
4. Finding a good setpoint:
During the measurement, the distance (force) between tip and sample will
be held constant by the P/I-feedback loop that tries to keep the oscillation
amplitude at a given setpoint by varying the voltage applied to the z
scanner. It will now be described how a reasonable setpoint for the feedback
loop can be found with help of a z-spectroscopy:
In order to perform a ‘z-spectroscopy’, choose on of the ‘spec’ windows and
enter with the following parameters/values:
Page 42
DAC: Z
monitored signal: AFM Aosc
Start: 0pm
End: maximum z piezo stroke. See data sheet at
the end of this manual
Data Points: 1000
Fwd/Bkwd: not checked
Data Point Avg. Time: 2-5ms
Delay Per Data Point: 0ms
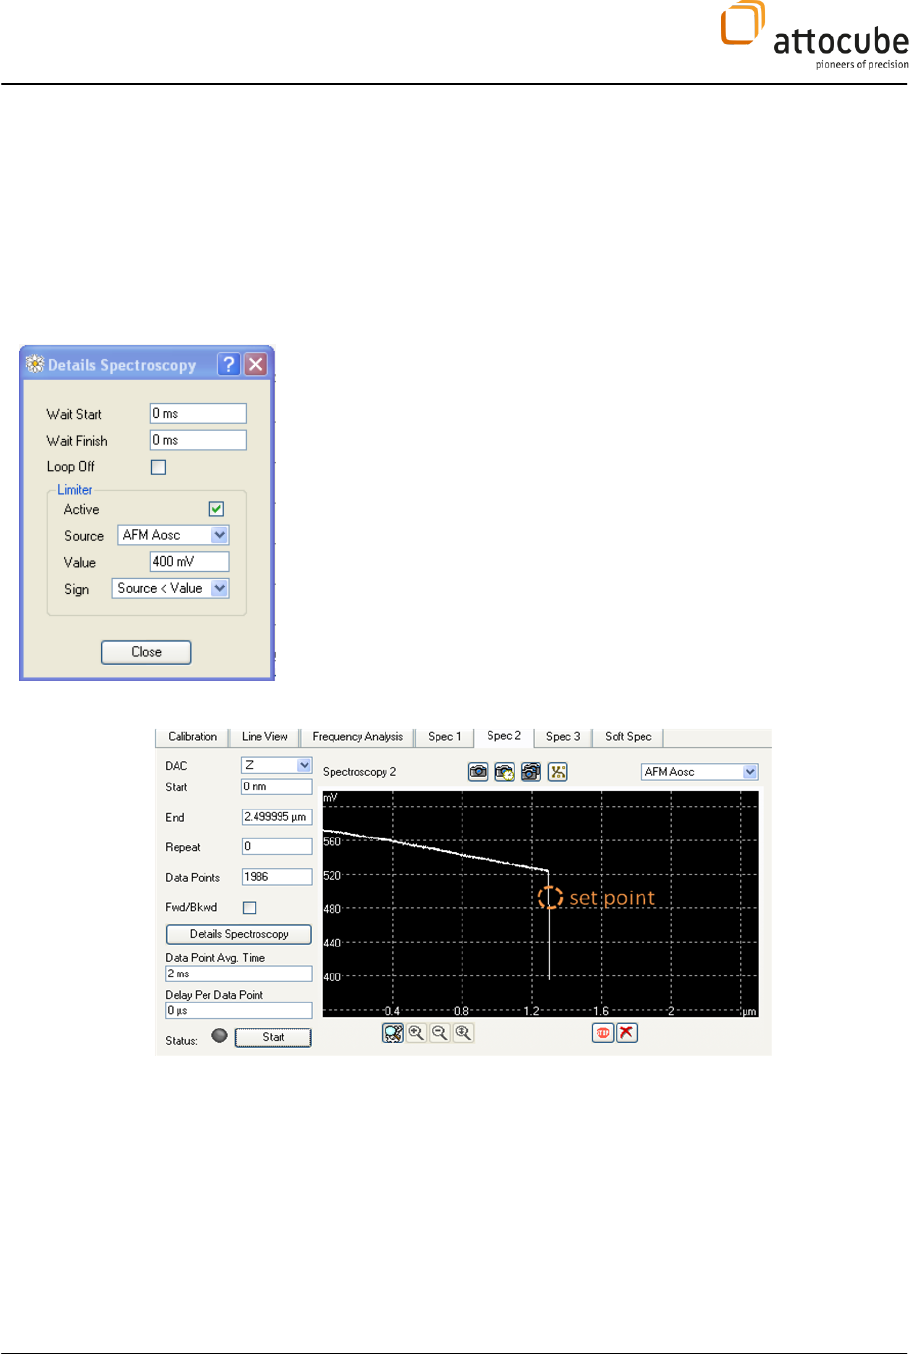
Now open the 'Details Spectroscopy' sub menu and enter the following
parameters:
Limiter: (Stops the z spectroscopy before the tip crashes into the sample)
Active: checked
Source: AFM Aosc
Value: 0.5 * A
Limit: Source<Value
The contact point where the signal is dropping sharply should be in the
middle of the z scanner range. Move manually upwards with the z positioner
in a step by step fashion to adjust this position.
The set point for the AFM Aosc signal should be chosen in such a way as
shown in the picture (typically, the set point value corresponds to 75% -
95% of the free oscillation amplitude).
Page 43
© 2001-2015 attocube systems AG. Product and company names listed are trademarks or trade names of their respective
companies. Any rights not expressly granted herein are reserved. ATTENTION: Specifications and technical data are subject
to change without notice.
V.2.c. Contact Mode
In Contact Mode the cantilever is not excited at its resonance frequency.
Only a DC voltage is applied to the dither piezo (normally on DAC1) and
correspondingly the DC voltage of the photo-detected signal (normally on
ADC1) is used to detect the topography.
Contrary to the non-contact mode the tip-fiber cavity is not set to the WP by
tuning DAC1 manually but by using ADC1 as the feedback input and defining
the working point WP as the setpoint.
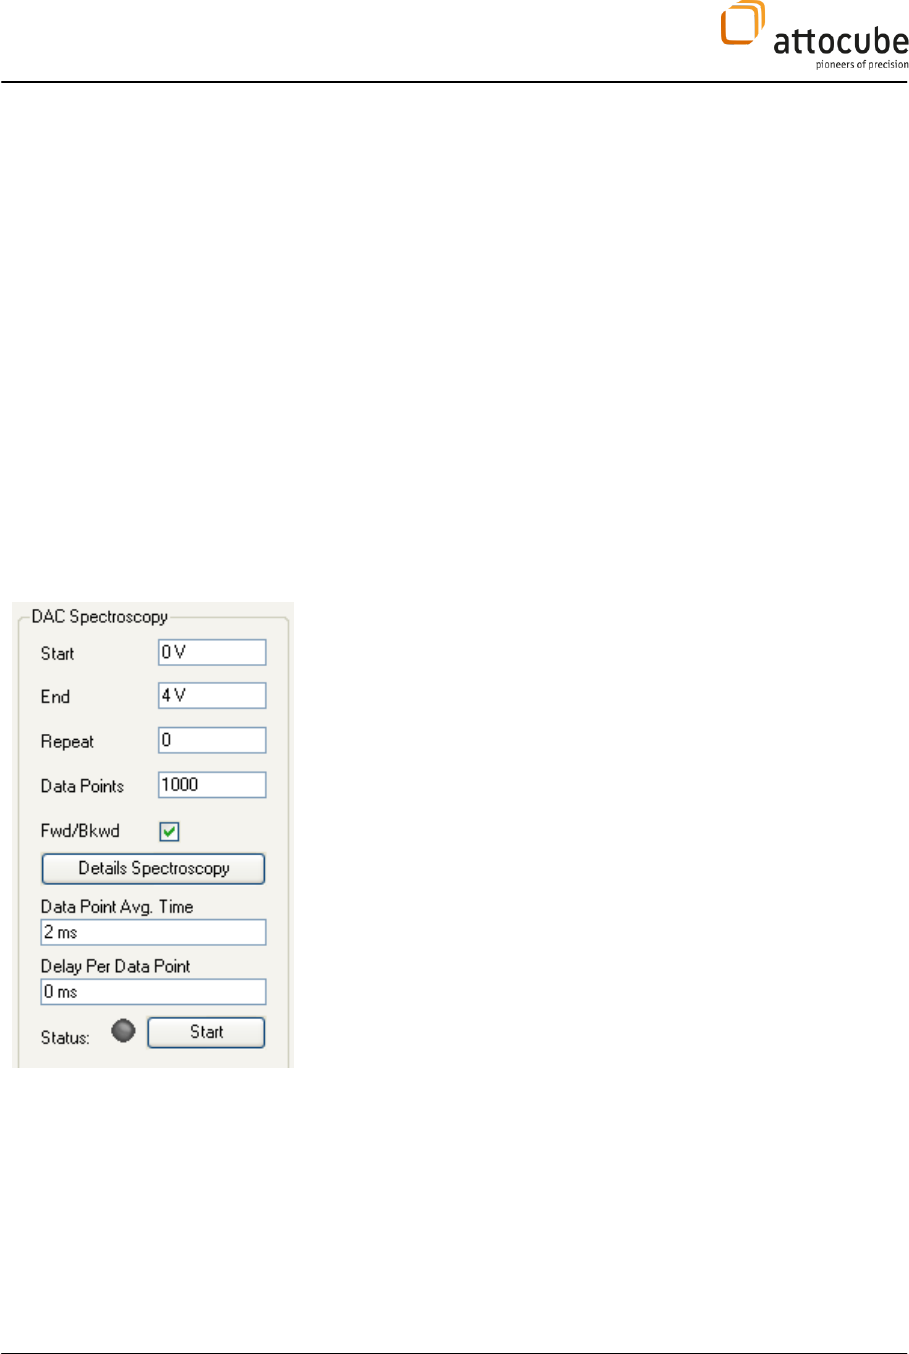
1. Adjustment of the fiber-cantilever cavity length:
Execute a dither spectroscopy (photo-detector signal (normally on ADC1)
vs. DC dither voltage (normally on DAC1)) to check the interferometric
signal. To do so, choose the 'Spectroscopy' and the 'Spectroscopy View' tab
with the following settings:
Start: 0V
End : 4V (@RT); 10V (@LT)
Data Points: 1000
Data Point Avg. Time: 2ms
Delay per Data Point: 0ms
Start the spectroscopy.
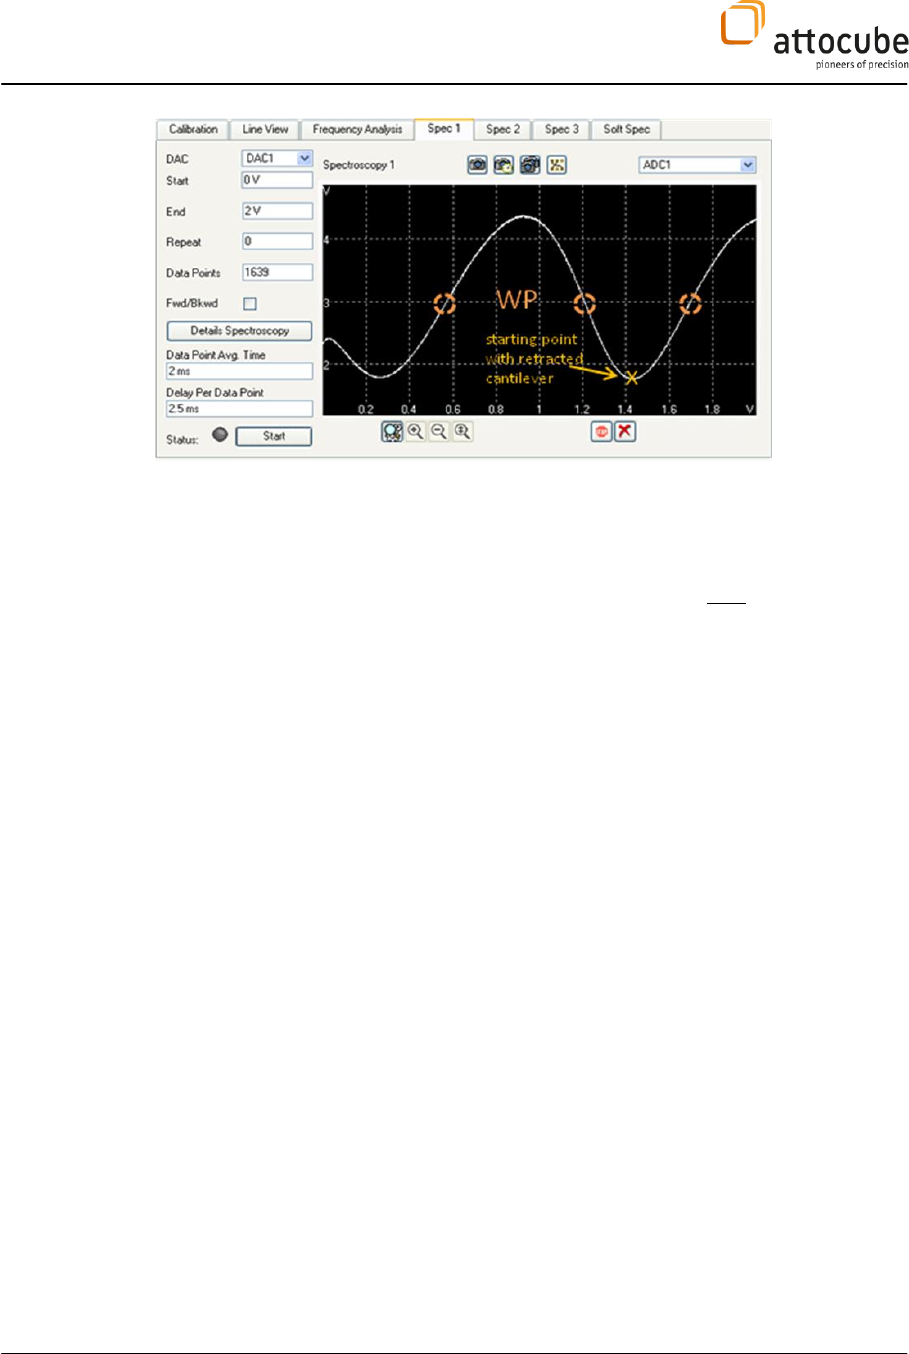
The ‘Spectroscopy View’ should look similar to the Figure 18 below.
The working point WP (point of highest sensitivity where signal depends
linearly on the cavity length between fiber end and cantilever) is located at
the midpoint between minimum and maximum of the interference signal.
Page 44
Figure 18:
Working point WP.
The fiber-tip cavity now must be adjusted to a minimum (ADC1min ) of the
interferogram by tuning the DC voltage of the dither piezo (normally on
DAC1). Hence, as soon as the sample starts pushing against the tip the
cavity will decrease and the interferometric signal must increase.
2. Starting the auto approach:
The auto approach settings must be set accordingly, i.e. the voltage of the
limiter must be set slightly higher than the minimum of the interferometric
signal and the stop condition must be set to “ > threshold”. Remember that
the autoapproach monitors the parameter set kin the feedback window. This
parameter must be set to the DC signal of the photo-detector (ADC1).
Examples for correct autoapproach settings are given in the 3 figures below.
The auto approach will stop when the tip touches the sample. The cantilever
will be bent and the interference signal will sharply increase, see figure to
the left
Page 45
© 2001-2015 attocube systems AG. Product and company names listed are trademarks or trade names of their respective
companies. Any rights not expressly granted herein are reserved. ATTENTION: Specifications and technical data are subject
to change without notice.
Before starting the auto approach select the ADC1 as ‘Actual Value’ in the
'Feedback' box. Furthermore choose the following parameters :
Actual Value: SPM ADC1
Z out: 0nm
Z limit min: 0nm
Z limit max: maximum z scanner stroke (see data sheet at the end
of the manual).
P: 1-5 m
I: 10-50 Hz
Setpoint: Working point WP as indicated in Figure 18.
Inv. Polarity: not checked (signal ADC1 is expected to increase with
increasing Z)
In the 'Coarse' tab one can find the 'Auto Approach' box where the
following parameters should be entered:
Delay: 10ms
Threshold: a value bigger than ADC1min
Stop Cond.: > Threshold
Speed: 2V/s (@RT), 3V/s (@LT)
Steps/Apr.: See Data Sheet at the end of this section
Apr. Mode.: When the stop condition is met, you can either
tell the ASC 500 to remain within the feedback
mode or to immediately retract. To choose
'Retract' is of course the safer procedure.
Target Mode: Retract
Page 46
Press the ‘Autoapproach Details’ where the following parameters should be
entered:
Coarse Axis: Axis 3
Coarse Dir.: Forward
Coarse Device: ANC150
Coarse Trig. Pol.: High Active
Coarse Trig. Hold Time: 1ms
Check the ‘Axis 3’ settings to have reasonable values for the coarse
positioning, for example:
Frequency: 200-1000Hz
Amplitude: 30V (@RT), 50V(@LT)
3. Z Spectroscopy:
After the ‘Auto Approach’, run a so-called ‘z Spectroscopy’. This is a
spectroscopy where the feedback parameter is monitored while the z
scanner moves the sample surface towards the tip until some breakdown
condition is reached. To perform this spectroscopy, we recommend to enter
the following values/ranges into one of the three ‘Spec’ windows
(Spec1,Spec2 or Spec3):
Page 47
© 2001-2015 attocube systems AG. Product and company names listed are trademarks or trade names of their respective
companies. Any rights not expressly granted herein are reserved. ATTENTION: Specifications and technical data are subject
to change without notice.
Start: 0pm
End: maximum z scanner stroke. See data
sheet at the end of this section.
Data Points: 1000
Fwd/Bkwd: not checked
Data Point Avg. Time: 2-10 ms
Delay Per Data Point: 0 s
Now open the ‘Details Spectroscopy’ sub menu and enter the following
parameters:
Limiter: (Stops the z spectroscopy before the a certain force onto the tip is
exceeded)
Active: checked
Source: ADC1
Value: higher than the interference minimum
Sign: Source > Value
Start the z Spectroscopy
The ‘jump-to-contact (JTC)’, will now be seen in a rather sharp ‘jump-like’
increase of the interference signal (ADC1).
Note, that it is suggestive (for the validity of the scale calibration) to keep
the feedback in the middle of the z scanner range. Move manually upwards
(or downwards) with the z positioner step by step to adjust this position.
During the contact-mode measurement, the fiber-tip distance is tried to be
kept constant. This means that the deflection of the cantilever and therefore
the force between tip and sample is kept constant by the P/I-feedback loop.
Page 48
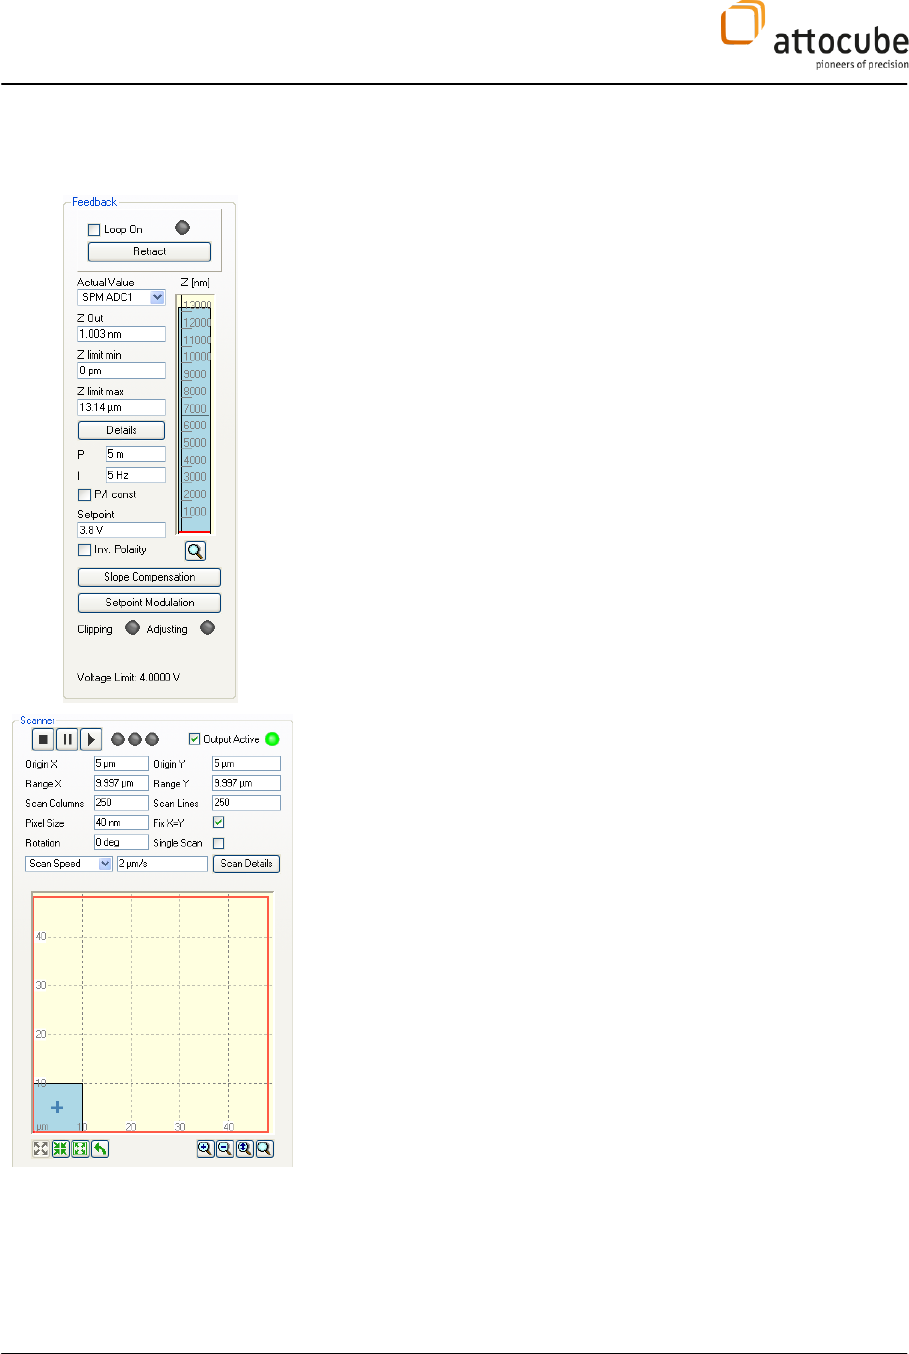
V.2.d. Starting a scan
To finally start the scan check the following parameters in the feedback box
as already shown before:
Actual Value: SPM ADC1
Z limit min: 0nm
Z limit max: maximum z scanner stroke (see data sheet
at the end of the manual).
P: 1-5 m
I: 10-50 Hz
Setpoint: Working point WP as described in the two
subsections above
Inv. Polarity: not checked for contact mode(signal ADC1
is expected to increase with increasing Z)
checked for non-contact mode(signal ADC1
is expected to decrease with increasing Z)
In the ‘Scanner’ box select the scan area (blue shaded area) of interest and
choose a slow ‘Scan Speed’ (< 3 µm/s) to start the scan.
Now the feedback can be activated by checking the ‘Loop On’ box. The z
piezo will expand and the tip will go into contact.
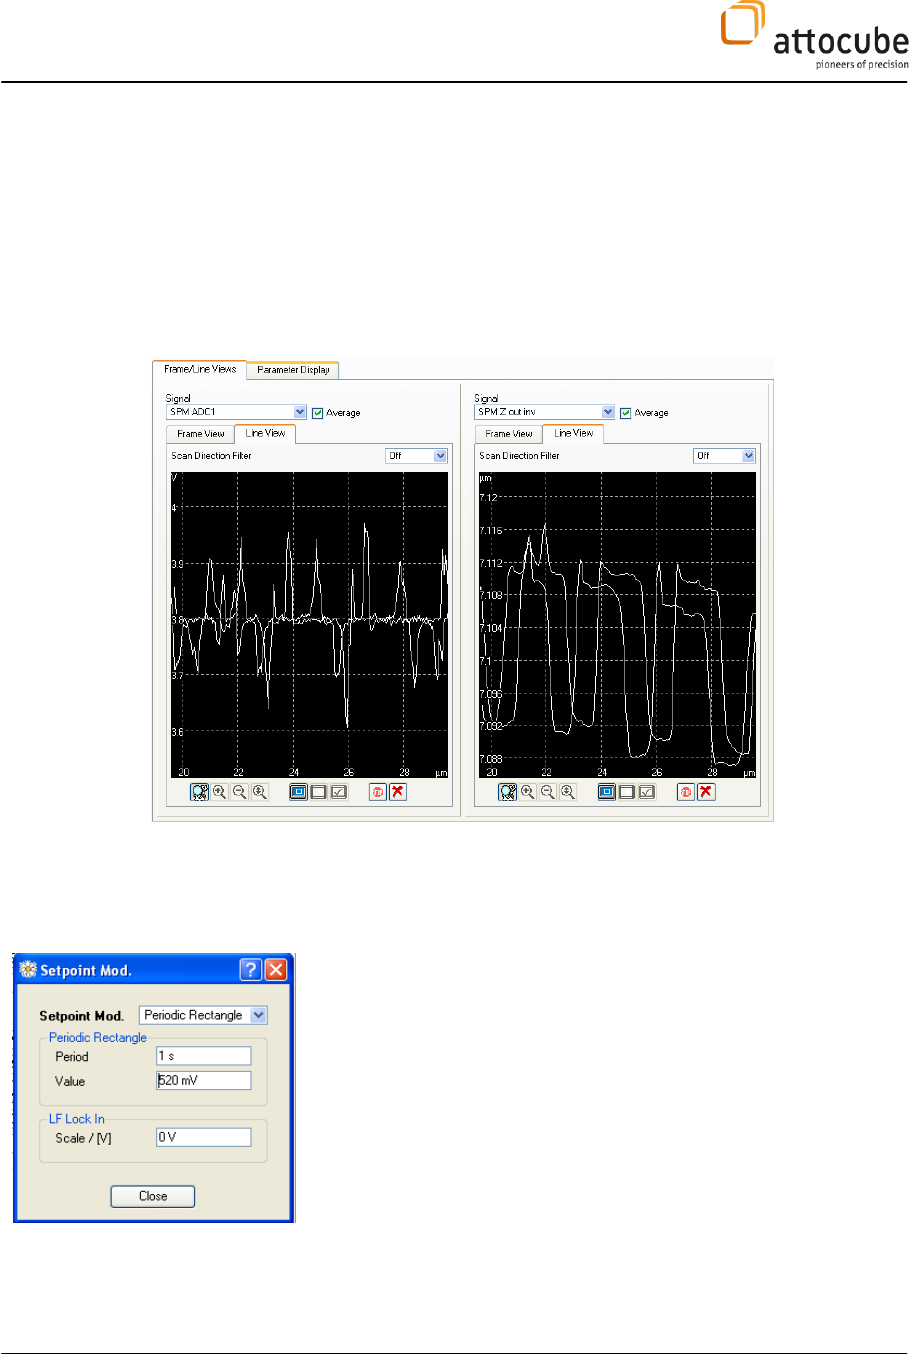
Before you start the scan, select the appropriate signals in the ‘Frame/Line
View’ tab:
Page 49
© 2001-2015 attocube systems AG. Product and company names listed are trademarks or trade names of their respective
companies. Any rights not expressly granted herein are reserved. ATTENTION: Specifications and technical data are subject
to change without notice.
Normally, in contact mode ‘ADC1’ (error signal) and the ‘SPM Z out inv’
(topography signal) is recorded.
In non-contact mode ‘AFM Aosc’ (error signal) and the ‘SPM Z out inv’
(topography signal) is recorded.
During scanning, the P and I parameters of the feedback loop have to be
adjusted according to the chosen scan speed and the surface roughness. At
the same scan speed, for example, a rougher surface will need a faster
feedback loop compared to a smooth surface.
In addition, the sample tilt can be compensated by setting a proper slope
compensation value for x and y. This feature can also be found in the
‘Feedback’ box.
Choosing P, I parameters:
To find reasonable start values for the P, I parameters, a 'Setpoint
Modulation' can be used. This feature is found in the 'Feedback’ box. As
parameters choose:
Setpoint Mod.: Periodic Rectangle
Period: 1s
Value: 95% or 105% of current setpoint
Start the feedback. The setpoint modulation will simulate a step-like pattern
on the sample surface. You can choose P and I for minimum response time
without overshoot (increase P and/or I) or lower noise.
Now, a scan may be started.

Page 50
attocube systems AG
Königinstrasse 11a (Rgb)
D-80539 München
Germany
Phone +49 89 2877 809 0
Fax +49 89 2877 809 19
