Manual App Meta Plot
User Manual:
Open the PDF directly: View PDF ![]() .
.
Page Count: 2

Manual for web application meta-plot
https://rvanaert.shinyapps.io/meta-plot
Author: Robbie C.M. van Aert, R.C.M.vanAert@tilburguniversity.edu
Meta-plots as proposed in van Assen et al. (2019) can be created with this web application.
1
The meta-
plot is a descriptive tool for meta-analysis that (i) provides information on the effect size estimate and
its precision, (ii) robustness of the effect size estimate with respect to primary study’s precision, (iii)
evidence of publication bias and its effect on the effect size estimate, (iv) information on the evidential
value of primary studies in the meta-analysis.
The web application can currently be used for creating meta-plots for three different effect size
measures: two-independent means, and one raw correlation coefficients, and odds ratio.
Step-by-step guide for using the web application:
1) Select the effect size measure in the meta-analysis (two-independent means, one raw
correlation, or odds ratio).
2) Select the alpha level which is used in the primary studies. The default alpha level is .05. Note
that it is assumed that two-tailed tests were conducted in the primary studies. If one-tailed
hypothesis tests were used in the primary studies, the alpha level has to be multiplied by two.
3) Two options are available for entering data in the web application. Data can be entered via a
CSV file or manually in a table in the web browser.
Manually in table:
Data can be entered in the web browser if “Manually in table” is selected. Note that extra rows
can be added to the table by clicking the “plus” sign above the table. The following information
has to be entered:
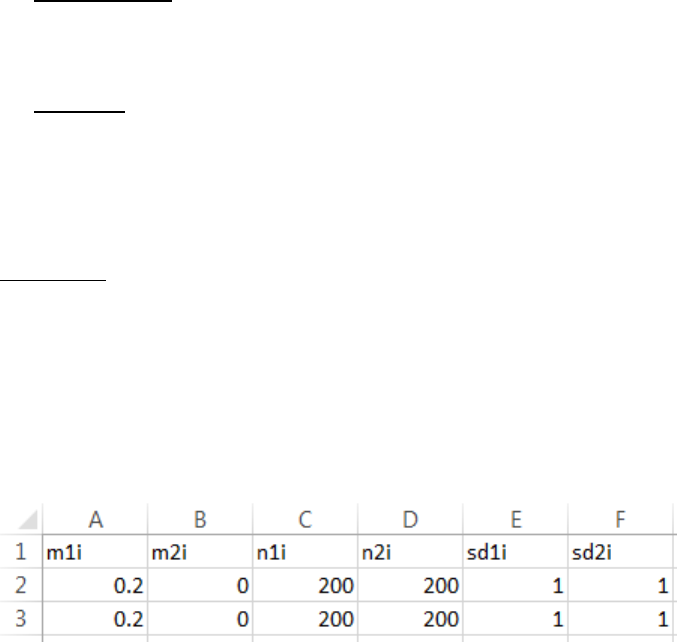
For two-independent means:
- m1i mean in group 1 for each primary study
- m2i mean in group 2 for each primary study
- n1i sample size in group 1 for each primary study
- n2i sample size in group 2 for each primary study
- sd1i standard deviation in group 1 for each primary study
- sd2i standard deviation in group 2 for each primary study
1
This web application is based on the R package puniform which can be downloaded from CRAN by running the
following line of code install.packages(“puniform”); library(puniform). The function meta_plot()
in the package can be used to obtain the plots in R.
For one correlation:
- ri raw correlation coefficient for each primary study
- ni sample size for each primary study
For odds ratio:
- ai frequencies in the upper left cell of 2x2 frequency table for each primary study
- bi frequencies in the upper right cell of 2x2 frequency table for each primary study
- ci frequencies in the lower left cell of 2x2 frequency table for each primary study
- di frequencies in the lower right cell of 2x2 frequency table for each primary study
Via CSV file:
If “via CSV file” is selected, a comma separated file has to be uploaded with a comma as
separator and a period indicating the decimal point. The first row should exactly match the
names of the variables as described above for supplying the data manually in the table. To give
an example, the CSV file for two-independent means has to be structured as follows
For descriptive statistics:
4) By clicking the “Create plots” button two meta-plots are created. One based on all primary
studies included in the meta-analysis and one summary meta-plot.
5) Optional is to save the meta-plots in a .pdf file by clicking the button “Download plots”.
References
van Assen, M. A. L. M., …, & van Aert (2019). The meta-plot. Manuscript in preparation.
