Met Reader Manual
User Manual:
Open the PDF directly: View PDF ![]() .
.
Page Count: 42
MetReader: Documentation and User’s Guide
Hans F. Schwaiger
June 26, 2018
1 Introduction
MetReader is a library written in fortran 90 that provides an interface to numerical weather
prediction (NWP) data, or other forms of meteorological data, such as radiosonde or other
1-D data.
This library was originally written as a component of the USGS volcanic ash transport
and dispersion model, Ash3d. However, since it is useful for programs other than Ash3d, this
interface to NWP files is provided as a separate repository that can either be compiled as a
library or simply compiled directly with other source code.
NWP data are generally made available by agencies (NCEP, NOAA, NASA, etc.) in
a variety of formats (NetCDF, GRIB1, GRIB2, ASCII); each product having its own data
structure, naming convention, units, etc. This library isolates the calling program from the
peculiarities of interfacing with a particular NWP product. Data can be returned to the
calling program on the native grid of the NWP product, or on any grid needed by the calling
program. Projection and interpolation of NWP data to the required grid, along with any
rotation of velocity vectors to grid-relative, is calculated internally by MetReader.
2 Installation
This library requires two additional libraries made available on GitHub and USGS GitLab:
•HoursSince
This is a library that takes a date and time, and calculates the number of hours since
January 1, 1900 (or any artibrary base year).
(https://github.com/hschwaiger-usgs/HoursSince)
•projection
This is a library that calculates commonly-used projected coordinates.
(https://github.com/hschwaiger-usgs/projection)
These libraries are installed by default into /opt/USGS. If they are installed elsewhere,
then you will need to edit the makefile to point to your installation. Additionally, the default
makefile will build MetReader with both NetCDF and GRIB2 enabled. If either of these
libraries are unavailable on your system, you can deactivate those options by setting the
1

corresponding flags to Fin the makefile. On a RHEL/CentOS system, you can install the
data format libraries by typing
sudo yum install netcdf netcdf-devel grib_api grib_api-devel
or for Ubuntu
sudo apt-get install libnetcdf* libgrib-api*
To compile MetReader as a library, simple type:
make all
This will build the requested components of the library. If GRIB2 is enabled, this will also
build the GRIB2 indexer, gen GRIB2 index. This is a tool that generates an index file of the
GRIB records which speeds access time to individual records substantially.
To install the library, module files and tools, edit the INSTALLDIR variable of the makefile
(the default is /opt/USGS) and type:
make install
This will also install scripts that can be used to download the 0.5 degree GFS forecast files
and the NCEP 2.5-degree Reannalysis files.
You will need to have write permission in ${INSTALLDIR}or install as root. Assuming
the libraries projection and hourssince are installed in the default location, installation
will result in the following directory structure:
/opt/USGS
|-- bin
| |-- autorun_scripts
| | |-- autorun_gfs0.5deg.sh
| | |-- autorun_NCEP_50YearReanalysis.sh
| | |-- convert_gfs0.5deg.sh
| | |-- get_gfs0.5deg.sh
| | |-- get_NCEP_50YearReanalysis.sh
| | ‘-- grib2nc.sh
| |-- gen_GRIB2_index
| |-- HoursSince1900
| |-- ncMet_check
| |-- ncMetSonde
| |-- ncMetTraj_B
| |-- ncMetTraj_F
| ‘-- yyyymmddhh_since_1900
|-- include
| |-- metreader.mod
| ‘-- projection.mod
‘-- lib
|-- libhourssince.a
|-- libMetReader.a
‘-- libprojection.a
2

3 Usage
MetReader can read a variety of input data formats (1-D, 3-D, ASCII, NetCDF, GRIB2)
and provide access to the meteorological data on either the native grid of the NWP data, or
interpolated onto a finer regular grid. Before the meterological data can be accessible, several
preliminary steps must first be completed.
3.1 Preliminary meta-data
The calling program needs to prepare several parameters that define the type of meteorological
data to be read.
•iw :: windfile class (the distinction between 3 adn 4 will be obselete soon)
–1 : 1-D wind sounding
–2 : 3-D grid is read from a ASCII file
–3 : single, multistep 3-D datafile
–4 : multiple 3-D datafiles
–5 : special case for NCEP 50-year reanalysis and NOAA reanalysis
•iwf :: windfile format number (linked to specific product in Table 8.2 of Appendix 8.2)
•igrid :: NCEP Grid ID
•idf :: Data file format code (ASCII, NetCDF, GRIB, etc)
–1 : ASCII
–2 : NetCDF
–3 : GRIB Edition 2
–4 : GRIB Edition 1 (Not yet implemented; used by NARR and NOAA-CIRES)
•iwfiles :: number of windfiles to be read
•SimStartHour :: The starting time needed given as hours since 1900-01-01 00:00Z
This can alternatively be given as hours since a different base year as described below.
•SimDuration :: duration needed in hours
Additionally, there are several other parameters that could be set, if needed.
•MR BaseYear :: The default value for this is 1900, but must be reassigned by the calling
program if the NWP files to be read contain data prior to 1900.
•MR useLeap :: The default is .true. but can be set to .false. if the NWP files use a
calendar without leap years (e.g. some paleoclimate CAM files)
•MR iHeightHandler :: This code defines how MetReader behaves when values at alti-
tudes above those available in the NWP files are requested. Default value is 2.
3

–1 : Stop the program
–2 : Return wind values equal to the value at the highest available node; tempera-
ture values remain constant from 11-20 km, then increase by 2◦C/km.
•MR iwf template :: This is the file name of the template for the custom NetCDF files
described in section 5. This is only required to be set if iwf=0. Currently, the custom
windfile specification is only implemented for idf=2 (NetCDF).
•call MR Reset Memory :: If MetReader had been initialized and used for one set of
NWP files, but later during the execution of the calling program, a subsequent set of
NWP files is needed, this subroutine can be called to free all allocated memory.
Step 1: The space needed for storing the NWP file meta-data must be allocated.
call MR_Allocate_FullMetFileList(iw,iwf,igrid,idf,iwfiles)
This allocates the variable MR windfiles(1:MR iwindfiles).
Step 2: The calling program must now fill the list of file names MR windfiles() with each
name not exceeding 130 characters in length. For the special cases for the NCEP/NCAR
Reanalysis 1 or the NOAA-CIRES 20th Century Reanalysis (iwf=25 or 27), MetReader
expects a specific structure to the directory holding the NWP files. For these reanalysis
product, the list of files is only one string (iwfiles=1) with the ‘file’ given as the root
directory to the NWP files. For example, for the NCEP/NCAR Reanalysis 1:
iwfiles = 1
MR_windfiles(1) = ‘/data/WindFiles/NCEP’
where the files are stored as follows:
/data/WindFiles/NCEP
|-- 2016
| |-- air.2016.nc
| |-- hgt.2016.nc
| |-- omega.2016.nc
| |-- shum.2016.nc
| |-- uwnd.2016.nc
| ‘-- vwnd.2016.nc
|-- 2017
|-- air.2017.nc
|-- hgt.2017.nc
|-- omega.2017.nc
|-- shum.2017.nc
|-- uwnd.2017.nc
‘-- vwnd.2017.nc
Similarly, for the NOAA-CIRES 20th Century Reanalysis product:
4

iwfiles = 1
MR_windfiles(1) = ‘/data/WindFiles/NOAA’
where the files are stored as follows:
/data/WindFiles/NOAA
|-- 2008
| |-- GRIB
| | |-- pgrbanl_mean_2008_HGT_pres.grib
| | |-- pgrbanl_mean_2008_RH_pres.grib
| | |-- pgrbanl_mean_2008_TMP_pres.grib
| | |-- pgrbanl_mean_2008_UGRD_pres.grib
| | |-- pgrbanl_mean_2008_VGRD_pres.grib
| | ‘-- pgrbanl_mean_2008_VVEL_pres.grib
| |-- pgrbanl_mean_2008_HGT_pres.nc
| |-- pgrbanl_mean_2008_RH_pres.nc
| |-- pgrbanl_mean_2008_TMP_pres.nc
| |-- pgrbanl_mean_2008_UGRD_pres.nc
| |-- pgrbanl_mean_2008_VGRD_pres.nc
| ‘-- pgrbanl_mean_2008_VVEL_pres.nc
|-- 2009
| -- ...
Note that the GRIB files are in version 1 format and cannot yet be directly read by MetReader.
They must first be converted to NetCDF and placed as described above.
Step 3: Once the names of the NWP files are specified, the files must be queried to deter-
mine the scope of the available data.
call MR_Read_Met_DimVars([iyear])
The iyear argument is optional, but is expected for iwf=25 or 27 since MetReader needs to
know whether to allocate space for 365 or 366 days. Once the subroutine is called, each of
the NWP files is checked for existence, then the following public variables are set:
•All the projection parameters for the NWP grid.
•Met dim names() :: The names of the dimensions in the file in the order of: time,
pressure1, y, x, pressure2 (for Vz), pressure3 (for RH)
•Met var names() :: The names of the variables in the file according to the Table 8.1 of
Appendix 8.1:
•Met var conversion factor() :: For each of the variables, if the units is not as listed
above, then the correpsonding factor is set that converts to the expected units. For
example, if precipitation rate is given in mm/hr, then the conversion factor to the
expected units (kg/m2s) is 1/3600 or 2.778 ×10⁻⁴.
5

•Met var IsAvailable() :: set to .true. if the NWP file provides this variable.
•nx fullmet,ny fullmet,np fullmet :: lengths of grid for x (lon), y (lat) and p
•x fullmet sp,y fullmet sp,p fullmet sp :: values of the grid in km (degrees) and
hPa
•IsLatLon MetGrid :: .true. if the grid is specified in longitude and latitude
•IsGlobal MetGrid :: .true. if the grid is periodic in longitude. (Note: mapping
across the poles is not yet implemented).
•IsRegular MetGrid :: .true. if dx,dy (dlon,dlat) is constant
Step 4: Next, the calling program needs to define the type of grid onto which MetReader
will interpolate values. Namely, whether or not the computational grid is projectected, and
if so, which projection and associated values. This grid used by the calling program can be
independent of the grid used by the NWP files. The parameters in the list for the subroutine
below are the values needed by the libprojection.a library. Below is an example call from
Ash3d.
call MR_Set_CompProjection(IsLatLon,A3d_iprojflag,A3d_lam0, &
A3d_phi0,A3d_phi1,A3d_phi2, &
A3d_k0_scale,A3d_radius_earth)
If IsLatLon=.true. then all other projection parameters are ignored. Similarly, some of
the parameters are required and others not, depending on the projection used. Currently,
libprojection.a has implemented Polar stereographic (iprojflag=1), Albers Equal Area
(iprojflag=2), UTM (iprojflag=3), Lambert conformal conic (iprojflag=4), and Merca-
tor (iprojflag=5).
Step 5: The final prepatory step is to evaluate the windfiles provided with the spatial and
temporal requirements of the calling program.
call MR_Initialize_Met_Grids(nxmax,nymax,nzmax, &
x(1:nxmax),y(1:nymax),z(1:nzmax), &
IsPeriodic)
nxmax,nymax,nzmax are the sizes of the computational grid. x,y,z are the single-precision
grid values in km (or degrees). IsPeriodic indicates whether or not the computational grid
is periodic in x. This subroutine also determines the size of the sub-grid of the full NWP
data that is needed by the calling program.
call MR_Set_Met_Times(SimStartHour, SimDuration)
Here SimStartHour and SimDuration give the initial time (in hours since 1900 (or other base
year)) and the length of time needed in hours. This subroutine opens all the files listed in
MR windfiles() and verifies that the files provided cover the requested time span. Then a
6

list is prepared of all the time steps and files needed to fully cover the requested time with the
step index (istep=1) corresponding to the step at or just prior to SimStartHour. The hours
between time steps is saved in MR MetStep Interval() and does not need to be constant.
3.2 Reading meteorological data
When handling data from the NWP files, there are three grids that MetReader uses:
•metP :: the native grid of the NWP file clipped to span the computational needs (pos-
sible re-ordered)
•metH :: the horizontal grid of the NWP file, but with the vertical coordinate mapped
from the pressure grid of the NWP file to the altitude grid of the computational grid.
•compH :: the full x,y,z of the computational grid.
Once the computational grid is specified and the sub-grid of the NWP is determined in step
5 above, the following public work spaces are allocated.
MR_dum2d_met_int(nx_submet,ny_submet) :: integer
MR_dum2d_met(nx_submet,ny_submet) :: float
MR_dum3d_metP(nx_submet,ny_submet,np_fullmet) :: float
MR_dum3d2_metP(nx_submet,ny_submet,np_fullmet) :: float
MR_dum3d_metH(nx_submet,ny_submet,nz_comp) :: float
MR_dum2d_comp_int(nx_comp,ny_comp) :: integer
MR_dum2d_comp(nx_comp,ny_comp) :: float
MR_dum3d_compH(nx_comp,ny_comp,nz_comp) :: float
nx comp,ny comp,np comp are the number of nodes in the computational grid and nx submet,
ny submet,np submet are the number of nodes of the NWP grid that is needed to span the
required computational grid.
To read data from the meteorological files, the fundamental subroutine is
call MR_Read_3d_MetP_Variable(ivar,istep)
where ivar is the code for the variable of interests (see Table 8.1) and istep is the index
of the sequence of time steps set up based on SimStartHour and SimDuration in Step 5
above. This subroutine provides a common interface regardless of the data format (ASCII,
NetCDF, GRIB2, etc.), data structure (latitude might be top-to-bottom or bottom-to-top,
pressure might be surface-to-top or top-down, grid might be staggered, longitude might be
−180 →180 or 0 →360). In all cases for 3-D variables, what is returned is the public work
array MR dum3d metP. This array is consistantly ordered such that xand y(or lon and lat)
increase with index (North to South NWP grids are flipped) and with pordered from the
surface to top (pressure is high to low).
If 3-D data is needed on the metH grid,
call MR_Read_3d_MetH_Variable(ivar,istep)
7

can be used which first populates MR dum3d metP, then interpolates onto MR dum3d metH.
For simply reading meteorological data onto the computational grid, use
call MR_Read_3d_Met_Variable_to_CompGrid(ivar,istep,[IsNext])
This subroutine reads the variable ivar from the NWP file into MR dum3d metP, then in-
terpolates these values onto MR dum3d metH, finally interpolating onto MR dum3d compH. The
optional argument IsNext is used when velocities are used at different points in the program
and need to be saved. IsNext indicates that the velocity values MR v[x,y] metP next should
be copied to MR v[x,y] metP last.
To interpolate 3-D data onto the altitude levels of the computational grid, first the geopo-
tential height data must be read. This could be achieved by the subroutine MR Read 3d MetP Variable
described above, but as a simulation advances, we typically need to have the geopotential
height data for the previous and the next time steps so that values can be interpolated
between steps. The subroutine
call MR_Read_HGT_arrays(istep,[reset_first_time])
is a specialized reader for ivar=1. The first time this is called, both istep and istep+1
are called, populating the two public variables MR geoH metP last and MR geoH metP next.
Subsequent calls copy MR geoH metP next to MR geoH metP last and reads the next values
from istep+1. If the optional argument reset first time is given, both istep and istep+1
are directly read.
Similar read subroutines are available for 2-D variables.
call MR_Read_2d_Met_Variable(ivar,istep)
Given a 2-D variable identified with ivar, this populates the public work array MR dum2d met,
where again, 1:nx submet,1:ny submet corresponds to the subset of nodes of the NWP file
that is needed to span the computational grid.
call MR_Read_2d_Met_Variable_to_CompGrid(ivar,istep)
can be called similar to MR Read 2d Met Variable which directly reads the variable needed
and returns the values interpolated onto the public work space MR dum2d comp.
3.2.1 Regridding meteorological data
Internal to MetReader are a variety of regridding subroutines to interpolate from the metP
grid onto metH or compH. In some circumstances, data is initially needed just on the native
NWP grid, but then derived values might be required on the full computational grid. For
example, if air viscosity is needed for a particle fall model, temperature and pressure values on
the NWP grid can be read. Then viscosities can be calculated for each of the corresponding
nodes of the NWP grid. To interpolate these values from the metP grid to the compH grid,
the subroutine
call MR_Regrid_MetP_to_CompGrid(istep)
8

can be used. This takes the variable MR dum3d metP and interpolates it onto MR dum3d compH.
Similarly,
call MR_Regrid_MetP_to_MetH(istep)
interpolates MR dum3d metP to MR dum3d metH and
call MR_Regrid_Met2d_to_Comp2d
interpolates MR dum2d met to MR dum2d comp.
3.2.2 Wind velocity vectors
In some cases, the wind velocity vectors need to be mapped from the coordinate system of
the NWP files to the computational grid. Velocity components on the computational grid are
always provided as grid-relative. For some NWP files, such as the North American Regional
Reanalysis (NARR), the NWP grid is projected, yet the wind components are provided as
Earth-relative. In other cases, if the NWP data are provided on a projected grid, but the
computational grid is either lon/lat or on a different projection, the grid-relative, projected
velocity components must be converted to that needed for the computational grid.
If the wind data are provided as grid-relative on a projected grid and something else is
needed, the subroutine
call MR_Rotate_UV_GR2ER_Met(MR_iMetStep_Now)
will read both U and V components and decompose the vector into earth-relative Easterly and
Northerly wind components with values at the metP grid nodes. These components are put in
the variables MR u ER metP and MR v ER metP. Once we have Earth-relative velocity compo-
nents (either from direct read of lon/lat data, from the subrouting MR Rotate UV GR2ER Met
or fron direct read of NARR data), if the computational grid is not Earth-relative, then these
Earth-relative components can be subsequently decomposed into grid-relative components on
the computational grid with
call MR_Rotate_UV_ER2GR_Comp(MR_iMetStep_Now)
This subroutine returns the U and V components on the compH grid through the two dummy
work space variables MR dum3d compH and MR dum3d compH 2
3.3 Additional Functions
Horizontal derivatives MetReader has subroutines for calculating horizontal derivatives
of variables on the metP grid. This is used for calculating velocity gradients for diffusivity
calculations, but could be applied to any variable. The two subroutines are MR DelMetP Dx
and MR DelMetP Dy. Both read the values from MR dum3d metP and return derivative values
on MR dum3d2 metP.
9

U.S. Standard Atmosphere MetReader also has several functions for calculating values
from the U.S. Standard Atmosphere.
•MR Temp US StdAtm(zin) :: Returns a temperature in K given a height in km.
•MR Z US StdAtm(pin) :: Returns a height in km given a pressure in hPa.
•MR Pres US StdAtm(zin) :: Returns a pressure in hPa given a height in km.
4 Supported types of meteorological data
MetReader can read meteorological data in a variety of different formats.
4.1 1-D ASCII data
The simplest format for meteorological data is just a 1-D wind profile in ASCII format.
To read this type, set iw = 1. The particular format of the 1-D data can be specified by
the iwf, where 1 indicates a user-specified column of values and 2 indicates that the files
are from the global radiosonde data available from https://ruc.noaa.gov/raobs/ or from
http://weather.uwyo.edu. In both these cases, there is no NCEP grid ID associated with
the sonde points so MR iGridCode is interpreted as the number of profile points. Each point
at each time must have its own file containing the profile data. MR idataFormat is not needed
(ASCII is assumed from iw = 1). Profiles at multiple times can be included by repeating the
sequence of profile locations at the later times. All points must have profiles for all times and
files for subsequent time steps must be given in the same order. Also, all profile files must be
in the same format (projection, columns of data). For example:
iw = 1
iwf = 2
igrid = 3
MR_iwindfiles = 6 # This must be an even multiple of MR_iGrid
PADQ_2018060100.dat # 00Z radio sonde at Kodiak, AK
PAKN_2018060100.dat # 00Z radio sonde at King Salmon, AK
PANC_2018060100.dat # 00Z radio sonde at Anchorage, AK
PADQ_2018060112.dat # 12Z radio sonde at Kodiak, AK
PAKN_2018060112.dat # 12Z radio sonde at King Salmon, AK
PANC_2018060112.dat # 12Z radio sonde at Anchorage,
4.1.1 User-specified profiles
User-specified profiles describe minimally, the horizontal velocity as a function of height at
a point (or points) in the domain. Beyond this constraint, the format is fairly general. The
format is as follows.
L01 string header line
L02 time(hr) nlev [ncol] [ivar(ncol)]
L03 x/lon y/lat [LLflag] [projection parameters]
L04 data
10
:
Ln EOF
Line 1 is a header line that is ignored
Line 2 contains at least the time of the profiles and the number of lines of data to read.
Optionally, the number of columns of data can be specified followed by a sequence of integers
specifiying the variable ID’s (see Table 8.1) for the corresponding columns. If neither of these
optional arguments ncol ivar(ncol) are given, then MetReader tests for the number of
columns present. If there are 3, then the data are read in as altitude (in m), wind speed (in
m/s), and wind direction (in degrees E of N, with the convention of where the wind is coming
from). If 5 columns are present, the fourth and fifth columns correspond to pressure (in hPa)
and temperature (in ◦C), respectively. If the optional parameters on line 2 are given with
the number of columns of data and corresponding variables, then the variables can be read
in any order, but must include some measure of height and some measure of the wind vector.
Height can include either altitude (in m), or pressure (in hPa), or both. If only one of these
two is given, the other is filled according the the U.S. Standard Atmosphere. The measure of
the wind vector can be given either in U and V, or speed and direction. If temperature is not
provided, it is calculated from the pressure or altitude using the U.S. Standard atmosphere.
Line 3 contains the coordinate of the 1-D profile. If two values are given, the coordinate
system is assumed to be that of the computational grid (either in projected or lon/lat grids).
If more that two parameters are given, then the parameters beyond 2 are interpreted to be the
list of parameters required by libprojection.a. If the LLflag is given as a third parameter
with a value of 1, then the coordinate is interpreted to be in longitude and latitude. If the
value is 0, then the coordinate system is projected with specification defined by subsequent
values on line 3.
Line 4 contains the start of nlev rows of data
Here is an example of the 3-column format.
Hanford
2 5 #wind time, number of levels
-120.0 46.20 #Longitude, latitude
0 10.000 90.00
5000 10.000 90.00
10000 10.000 90.00
15000 10.000 90.00
20000 10.000 90.00
Here is an example of a user-specified number of columns with data on a projected grid.
Hanford
0 5 5 1 2 3 0 5 #wind time, number of levels, nvar ivars(1:nvar)
-2062.26 2606.69 0 4 265.0 25.0 25.0 25.0 6371.229 # (-120.0 46.20) in LCC grid 212 coords
0 -10.000 0.00 1000.0 10.0
5000 -10.000 0.00 560.0 -5.5
10000 -10.000 0.00 262.0 -47.3
15000 -10.000 0.00 126.0 -58.1
20000 -10.000 0.00 58.0 -54.9
11
4.1.2 1-D radiosonde profiles (single or multiple times)
Instead of user-specified profiles, MetReader can also read radiosonde data. Both the global
archive as well as the 00Z and 12Z radiosonde data are available from the NOAA Earth System
Research Laboratory Rapid Update Cycle Radiosonde Database (https://ruc.noaa.gov/raobs/).
These data are also archived at the University of Wyoming
(http://weather.uwyo.edu/upperair/sounding.html). To use data in this format, set iwf
= 2. From both these sites, radiosonde data are availalbe in a variety of formats. The default
format for the UW site is ”Text: List“
72694 SLE Salem Observations at 00Z 20 Jun 2018
-----------------------------------------------------------------------------
PRES HGHT TEMP DWPT RELH MIXR DRCT SKNT THTA THTE THTV
hPa m C C % g/kg deg knot K K K
-----------------------------------------------------------------------------
1007.0 61 30.6 8.6 25 7.01 345 7 303.1 324.5 304.4
1002.0 110 29.4 9.4 29 7.44 349 8 302.4 324.9 303.7
1000.0 129 29.2 9.2 29 7.35 350 8 302.4 324.6 303.7
980.2 305 27.5 8.5 30 7.17 355 9 302.4 324.1 303.7
946.7 610 24.6 7.4 33 6.85 0 7 302.4 323.2 303.7
925.0 814 22.6 6.6 36 6.65 350 6 302.4 322.6 303.6
914.4 914 21.7 5.7 35 6.33 345 7 302.5 321.8 303.7
908.0 975 21.2 5.2 35 6.14 352 7 302.6 321.3 303.7
:
:
:
13.3 29602 -39.7 -76.7 1 0.08 66 18 802.1 803.1 802.2
11.7 30480 -39.0 -76.4 1 0.10 90 30 834.6 835.8 834.6
10.2 31394 -38.2 -76.2 1 0.12 80 19 869.7 871.2 869.8
10.0 31557 -38.1 -76.1 1 0.12 876.2 877.8 876.2
Station information and sounding indices
Station identifier: SLE
Station number: 72694
Observation time: 180620/0000
Station latitude: 44.91
Station longitude: -123.00
Station elevation: 61.0
Showalter index: 6.44
:
:
:
This file contains many pressure levels, but the radiosonde standard include a limited set of
”required“ pressure levels (1000, 925, 850, 700, 500, 400, 300, 250, 200, 150, and 100 mbar; and
supplementally 70, 50, 30, 20, 10 if the probe reaches those heights.). When MetReader reads
a file of this format, only these mandatory pressure levels are read. Only the pressure, height,
12

temperature, wind direction and wind speed are read. After the columnar data are read,
the Station number is read. From this number (72694 in the above example), the station
longitude, latitude and elevation are automatically populated from internally stored station
metadata available from https://ruc.noaa.gov/raobs/General Information.html. The
station list is truncated to just what is currently operational and to just current coordinates
(some stations have been moved or deactivated). Next the Observation time is read.
An alternative format is the FAA604 WMO/GTS format from https://ruc.noaa.gov/raobs/
or the nearly identical ”Text:Raw“ format from the University of Wyoming.
TTAA 70001 72694 99007 30672 34507 00129 29270 35008 92814 22666 35006 85542
17466 03511 70163 04859 09008 50582 10178 20015 40750 22974 23023 30953 39945
24033 25075 49164 24541 20220 52974 25050 15405 55180 26035 10660 60376 23011
88188 54573 25052 77999 31313 58208 82346 51515 10164 00006 10194 00508 09506
TTBB 70008 72694 00007 30672 11002 29470 22908 21266 33890 20469 44814 15067
55762 10261 66693 04259 77655 00456 88615 02757 99592 05350 11580 05756 22573
05764 33566 06368 44551 07765 55547 07762 66536 08563 77526 08166 88518 08766
99509 09378 11494 10782 22468 14374 33440 16981 44381 25773 55346 31962 66330
34346 77323 35738 88302 39743 99278 44357 11261 47757 22245 49568 33240 49977
44231 49578 55220 51375 66194 53373 77188 54573 88175 54774 99172 53376 11170
52777 22160 54379 33153 54180 44143 56979 55134 56379 66129 57578 77120 57778
88110 60177 99106 59977 11104 60976 22102 59977 31313 58208 82346 41414 12761
PPBB 70008 72694 90012 34507 35509 36007 90346 34507 02009 03008 90789 07002
16003 12508 91246 12505 12011 20008 9179/ 19506 19015 92025 21516 23018 23523
93046 23537 24524 25049 940// 25053 950// 26022
TTCC 70002 72694 70883 60377 11004 50095 57778 11020 30421 52181 07020 20686
45783 08022 88999 77999 31313 58208 82346
This format contains nearly the same information as the previous example, but requires
a bit of translation. Appendix F of
https://www.ofcm.gov/publications/fmh/FMH3/00-entire-FMH3.pdf gives the full spec-
ification. If the string ”TTAA“ is found in the ASCII file, this format is attemped first,
otherwise the ”Text:List” is assumed. This WMO/GTS format is intended for the Rapid
Update Cycle data and does not contain the year or month (only the day-of-month and
hour) of the data. If this format is detected, the year and month of the at execution time is
assumed unless otherwise specified by the calling program.
4.2 Network of 1-D radiosonde profiles
In most of the world, the radiosonde launch sites are too dispers to form a meaningful network
across which we can interpolate values. The radiosonde data is most useful for the regions
of interest proximal to launch sites. Currently, the use of multiple sonde locations is not
implemented, but simple interpolation using a small number of sonde points is planned for
future versions of this library.
4.3 3-D forecast or reanalysis data
MetReader’s preferred format for 3-D forecast and reanalysis files is NetCDF. Many prod-
ucts are available directly in NetCDF. format such as NCEP/NCAR Reanalysis 1 or NASA
13

GEOS-5. These products generally require NetCDF version 4. Most of the NCEP forecast
products are provided in GRIB2 format. To convert these forecast products to NetCDF for-
mat, MetReader relies on the NetCDF. java package
(https://www.unidata.ucar.edu/software/thredds/current/netcdf-java/). The con-
version script in the autorun scripts folder are linked to netcdfAll-4.5 however any recent
version should work. Older versions create NetCDF files with different variable names.
Many of the forecast and reanalysis products are built in to MetReader where the grid
geometry, variable list, and pressure levels are preset. These include all the iwf numbers
listed in section 3.1. If the products change such that the pressure levels differ or if variable
names change, then the source code will need to be modified to account for the changes.
Alternatively, a template file could be used as described in section 5 below.
MetReader can also read GRIB2 files directly for certain forecast products, including
the NAM 196 grid over HI (iwf=11), the NAM 91 grid over AK (iwf=13) and the GFS
0.25 ◦and 0.5◦products (iwf=22,20). To read these GRIB2 files, an index file containing
the locations of all the records must be created. This index file can be created by the
utility gen GRIB2 index, or if the file does not exist at run-time, can be generated through
the subroutine call MR Set Gen Index GRIB(filename). In practice, if windfiles will be used
more than a few times, it is generally worthwhile to convert them to NetCDF prior to usage by
MetReader. The current implementation of the GRIB2 reader will read each of the required
GRIB2 records into memory, decompress the full gridded data, then extract the needed sub-
grid; whereas the NetCDF interface allows a more natural direct access to sub-grids. For
high resolution, global grids where only a small sub-grid is needed, the impact of reading and
uncompressing full grids will be noticable.
5 Custom meteorological file specification
As an alternative to using a particular forecast or reanalysis product with hard-coded file
structure, a template file can be used the allows a custom specification of a NetCDF file.
The custom template is indicated by iwf=0 and setting MR iwf template to the name of the
template file. The template file has the following format.
Line 1: The line of projection parameters as expected by libprojection.a. e.g.
Polar-stereographic Grid 91 0 1 -150.0 90.0 0.933 6371.229
Polar-stereographic Grid 216 0 1 -135.0 90.0 0.933 6371.229
Mercator Grid 196 0 5 198.475 20.0 0.933 6371.229
Lambert Conformal Grid 212 0 4 265.0 25.0 25.0 25.0 6371.229
Lambert Conformal Grid 221 0 4 -107.0 50.0 50.0 50.0 6371.229
Line 2: StepInterval [T/F] :: time interval in hours, and flag indicating whether or
not to use leap years (Assumed Tif not provided)
Line 3: ndims nvars :: number of dimensions and variable that will be listed
Line 4-: list of dimensions where each row specifies the information about the dimension.
For example
d 1 1.6667e-2 time hours since
d 2 100.0 lev Pa
14

In this example, the dsignifies that the row describes a dimension, 1is the dimension number,
1.6667e-2 is a scaling factor, and time is the name of the dimension. The dimensions should
be listed in the following order: time, pressure used for primary state variables (velocity,
temperature), y (or longitude), x (or latitude), pressure used for vertical velocities, and
pressure used for moisture variables. Additional dimensions can be listed to support other
specific variables. The scaling factor is the factor needed to convert the dimension from the
units provided to the units required. In this example, the time values are supplied in minutes,
and must be multiplied by 1.6667e-2 to be in the expected units of hours. Similarly, pressure
is supplied in hPa but is expected in Pa.
Line 4+ndims- : list of variables where each row specifies the information about the
variable.
v 4 2 1 1.0 HGT H gpm
v 4 2 2 1.0 UGRD U m/s
v 4 2 3 1.0 VGRD V m/s
v 4 5 4 1.0 VVEL OMEGA Pa/s
v 4 2 5 1.0 TMP T K
v 4 6 30 1.0 RH RH %
v 4 6 31 1.0 SPFH SH kg/kg
In this example, the first character, v, signifies that the row describes a variable. The next
integer is the dimensionality of the variable (3or 4). It is assumed that the variable is a
function of x, y, and t, but if also a function of pressure, the vertical dimension needs to be
specified. The next integer indicated which of the vertical dimensions listed earlier in the
file are used for this variable. The fourth item on the line (third integer) is the variable ID
according to Table 8.1. Next is the scaling factor to convert the provided values to the units
expected for the variable. The next two fields are the WMO variable name and the variable
name given in the NetCDF file.
There are several limitations of the template for the custom NWP reader. Firstly, only the
NetCDF reader is currently implemented. Secondly, currently all variables are assumed to be
transient; so land-use or topography cannot be read with this scheme. Variables that cannot
be simply scaled to the expected units cannot be described in this template. For example,
WRF files (iwf=50) uses a staggered grid with pressure and geopotential given both as a base
value plus a perturbation. Lastly, to determine the start time of the data, a reference time
must be read. First the time variable is checked for the GRIB orgReferenceTime attribute.
If this is not found, then the variable reftime is checked, if it exists.
Several examples of these template files used with NAM and GFS forecast products are
shown in Apendix 8.3.
6 Additional tools/Examples
In the tools folder, three programs are included the illustrate the use of the library.
15

6.1 MetCheck
This utility is used for checking the validity of the NWP files. In some cases, the downloading
of files might be interupted or the files on the NCEP server might be incomplete or corrupt.
This utility opens each of the files and reads the full grid for the variables: geopotential
height, Vx, Vy, Vz, and temperature. If any values are outside of expected ranges, then the
program stops returning a non-zero stop-code (stop 1). Usage:
MetCheck iwf idf filename [year]
6.2 MetSonde
This utility is used for probing the NWP files and returing the temperature as a function of
height. Usage:
MetSonde lon lat YYYY MM DD HH [WIND_ROOT]
The program assumes that the GFS and NCEP files are placed in the default directory, or
at least in default subdirectories off of WIND ROOT. Values are interpolated onto the requested
point and time and are writen to a file (GFS prof.dat) in the current working directory. This
3-column file contains the height (in km), pressure (in Pa) and temperature (in ◦C).
6.3 MetTraj
This utility takes a similar argument list as MetSonde, but instead of probing a single point
and time, this utility calculates trajectories within either a GFS forecast package or the NCEP
reanalysis files. This utility must be compiled with either a -DFORWARD or -DBACKWARD pre-
processor flag to generate separate executables for forward or backward trajectories. The
location of the windfiles is assumed to be the default for GFS and NCEP. For forward tra-
jectories, forecast package beginning most closely prior to the requested start time is used
unless the start time is greater than two weeks from present. If so, the NCEP files are used.
For the backward trajectories, the forecast package chosen is that which can accommodate
the default 24-hours of backward integration.
For each of the trajectory calculations, files are writen to the current working directory
with the longitude and latitude of the trajectory in 1-hour increments at various elevations.
The default elevations are 5000, 10000, 20000, 30000, 40000, and 50000 ft. Files for forward
trajectories are named ftraj[1-6].dat while the backward trajectories are btraj[1-6].dat.
Optionally, the length of time to integrate and a user-specified list of output elevations
can be given. Elevations are given on the command line must be in km. Usage:
MetTraj_F lon lat YYYY MM DD HH [FC_hours nlev lev1 lev2 ...]
7 Windfile managment scripts
Scripts used to manage GFS and NCEP Reanalysis files are provided in the folder autorun scripts.
The script autorun gfs0.5deg 00 (and the dependent scripts get gfs0.5deg.sh and
convert gfs0.5deg.sh) is used for downloading and converting the 0.5◦GFS files from
NCEP. This script is intended to be run from a cron job and take as a parameter, the hour of
the forecast package. For example autorun gfs0.5deg.sh 0 will download for 00Z for the
16

current date. These scripts use a default root download directory of /data/WindFiles, but
this can be modified within the scripts. The GFS files will be downloaded to
/data/WindFiles/gfs/gfs.YYYYMMDDHH where HH is the forecast hour (00, 06, 12, or 18).
The forecast files from hours 0-99 are downloaded then converted using netcdf-java 4.5. The
path this package is set to /ncj/netcdfAll-4.5.jar but can be modified in convert gfs0.5deg.sh.
Similarly, the script get NCEP 50YearReanalysis.sh manages the downloading of the
NCEP reanalysis files. These are placed in /data/WindFiles/NCEP/YYYY/
These scripts are intended to be run as cron jobs. The following line can be added to the
crontab to download the files once they are available.
01 22 * * * /opt/USGS/Ash3d/bin/autorun_scripts/autorun_gfs0.5deg.sh 0 > gfs00_log 2>&1
01 11 * * * /opt/USGS/Ash3d/bin/autorun_scripts/autorun_gfs0.5deg.sh 12 > gfs12_log 2>&1
01 01 * * Sun /opt/USGS/Ash3d/bin/autorun_scripts/autorun_NCEP_50YearReanalysis.sh > NCEP_50yr_log 2>&1
Also included in autorun scripts is a simple stand-alone script (grib2nc.sh) for con-
verting GRIB2 files to NetCDF using netcdf-java.
17

8 Appendix
8.1 Variable codes
Table 1: Variable codes
Variable type ID Name dimensions
3d Mechanical
1 Geopotential Height gmp or m2/s2
2 Vx m/s
3 Vy m/s
4 Vz Pa/s
5 Temperature K
6 Wind speed m/s
7 Wind direction deg East of North
Surface
10 Planetary Boundary Layer Height m
11 U @ 10m m/s
12 V @ 10m m/s
13 Friction velocity m/s
14 Displacement Height m
15 Snow cover %
16 Soil moisture kg/m2
17 Surface Roughness m
18 Wind gust speed m/s
19 surface temperature K
Atmospheric Structure
20 pressure at lower cloud base Pa
21 pressure at lower cloud top Pa
22 temperature at lower cloud top K
23 Total Cloud cover %
24 Cloud cover (low) %
25 Cloud cover (convective) %
Moisture
30 Rel. Hum %
31 QV (specific humidity) kg/kg
32 QL (liquid) kg/kg
33 QI (ice) kg/kg
Precipitation
40 Categorical rain 0 or 1
41 Categorical snow 0 or 1
42 Categorical frozen rain 0 or 1
43 Categorical ice 0 or 1
44 Precipitation rate large-scale (liquid) kg/m2s
45 Precipitation rate convective (liquid) kg/m2s
46 Precipitation rate large-scale (ice) kg/m2s
47 Precipitation rate convective (ice) kg/m2s
18

8.2 NWP product ID (iwf)
Several NWP product (both reanalysis and forecast) are recognized and do not need template
files. These are listed in the table below by the format code. iwf=1,2 are ASCII files.
iwf=3-19 are reserved for products with projected grids. iwf=20-49 are reserved for global
(lon/lat) grids. iwf=50 is for NetCDF output from Weather Research and Forecasting (WRF)
simulations.
Table 2: NWP product ID
iwf Product NCEP Grid resolution
0 Custom format based on template
1 ASCII profile
2 Radiosonde data
3 North American Regional Reanalysis NARR-A 221 32 km
4 North American Regional Reanalysis NARR-A+B 221 32 km
5 NAM Regional Alaska 216 45 km
6 NAM N. Hemisphere 104 90 km
7 NAM Regional CONUS 212 40 km
8 NAM Regional CONUS 218 12 km
10 NAM Regional Alaska 242 11.25 km
11 NAM Regional Hawaii 196 2.5 km
12 NAM Regional Alaska 198 5.953 km
13 NAM Regional Alaska 91 2.976 km
20 GFS 4 0.5◦
21 GFS 3 1.0◦
22 GFS 193 0.25 ◦
23 NCEP-DOE Reanalysis 2 2 2.5◦
24 NASA-MERRA-2 Reanalysis None 0.625 ×0.5◦
25 NCEP/NCAR Reanalysis 1 2 2.5◦
27 NOAA-CIRES 20th Century Reanalysis 2 2.5◦
28 ECMWF ERA-Interim Reanalysis 170 ∼0.7◦-Gaussian
32 Air Force Weather Agency subcenter = 0 None 0.25◦
33 CCSM3.0 Community Atmosphere Model None 3.75 ×3.7◦
40 NASA GEOS-5 Cp None 0.625 ×0.5◦
41 NASA GEOS-5 Np None 0.3125 ×0.25◦
50 WRF - output None
19
8.3 Example Template files
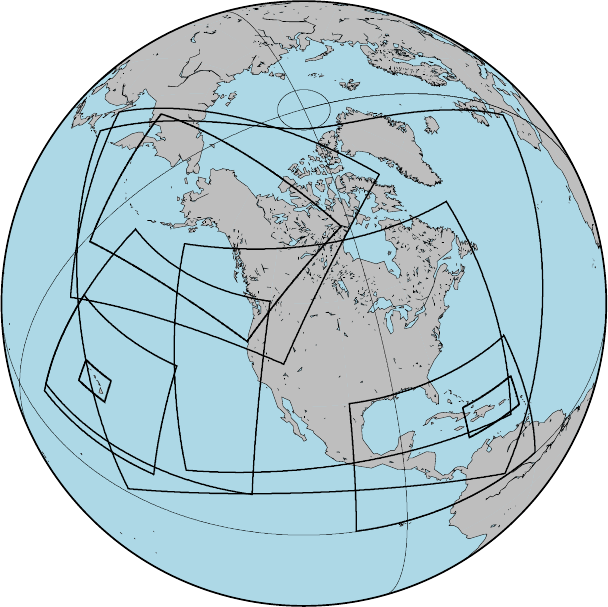
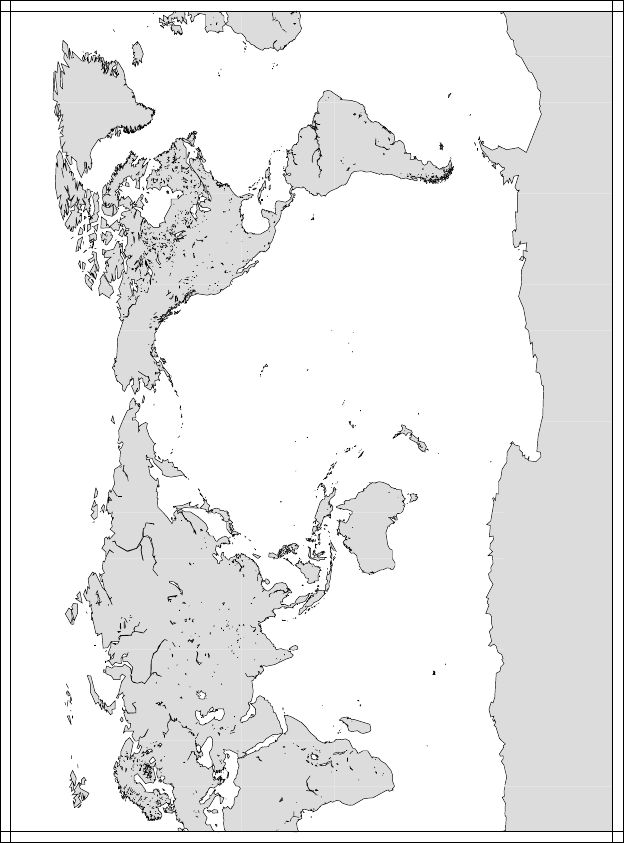
NCEP−Grids
Figure 1: Outlines of North America Mesoscale (NAM) and Global Forecast System (GFS)
models from NCEP that are compatible with MetReader template files.
20
8.4 NAM 221 Regional N.America (32.5 km)
nam.t00z.awip3200.tm00
Available from:
ftp://ftp.ncep.noaa.gov/pub/data/nccf/com/nam/prod/nam.YYYYMDD/
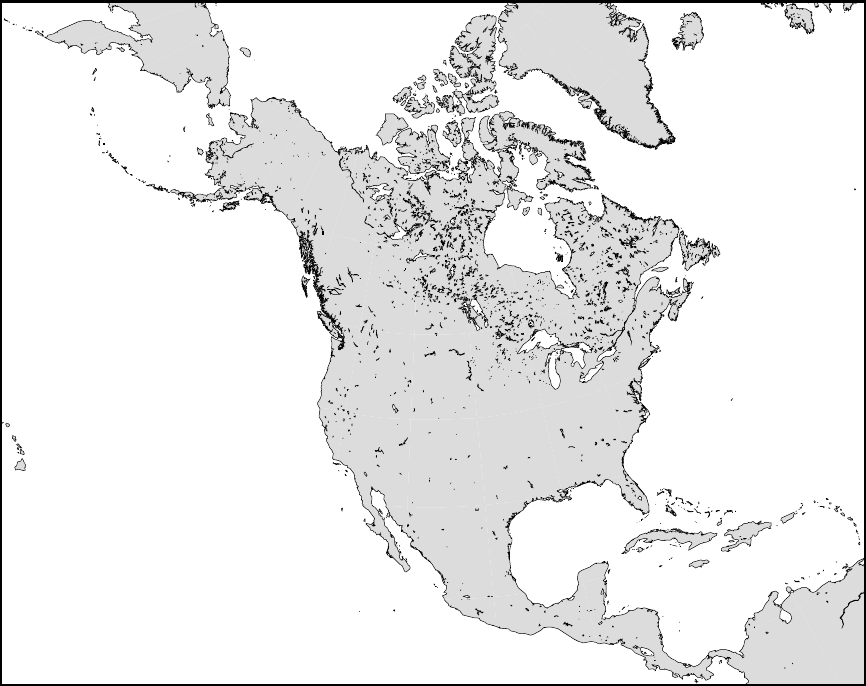
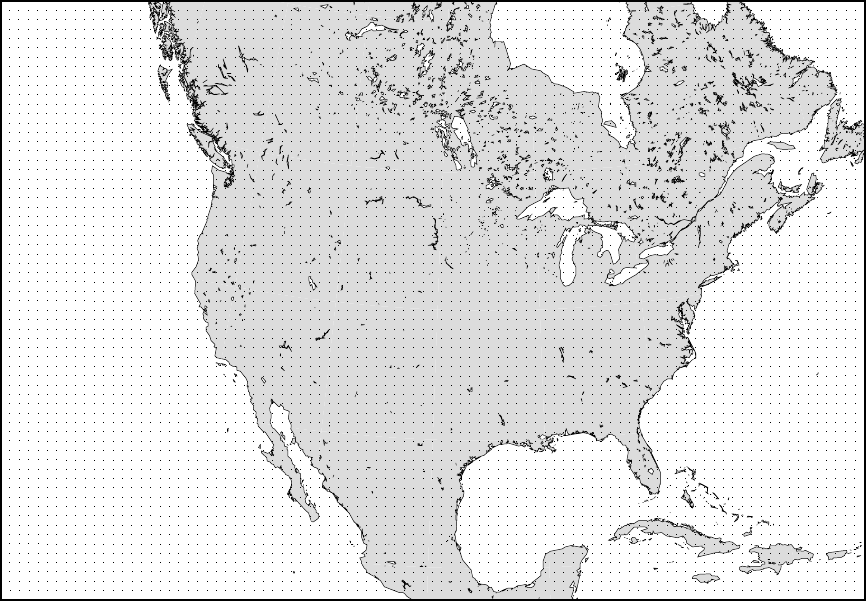
Figure 2: NAM 221, Regional N. America 32.5 km Lambert Conformal Conical
21
n221_template.txt
0 4 -107.0 50.0 50.0 50.0 6371.229 Projection params line
3.0 Time interval
9 29 ndims, nvars
d 1 1.0 time hours since
d 2 1.0 isobaric1 Pa
d 3 1.0 y km or deg
d 4 1.0 x km or deg
d 5 1.0 isobaric1 Pa
d 6 1.0 isobaric1 Pa
d 7 1.0 height_above_ground3 m
d 8 1.0 depth_below_surface_layer m
d 9 1.0 isobaric4 Pa
v 4 2 1 1.0 HGT Geopotential_height_isobaric gpm
v 4 2 2 1.0 UGRD u-component_of_wind_isobaric m/s
v 4 2 3 1.0 VGRD v-component_of_wind_isobaric m/s
v 4 5 4 1.0 VVEL Vertical_velocity_pressure_isobaric Pa/s
v 4 2 5 1.0 TMP Temperature_isobaric K
v 3 0 10 1.0 HPBL Planetary_Boundary_Layer_Height_surface m
v 4 7 11 1.0 UGRD u-component_of_wind_height_above_ground m/s
v 4 7 12 1.0 VGRD v-component_of_wind_height_above_ground m/s
v 3 0 13 1.0 FRICV Frictional_Velocity_surface m.s-1
v 3 0 15 1.0 SNOD Snow_depth_surface m
v 4 2 16 1.0 SOILW Volumetric_Soil_Moisture_Content_depth_below_surface_layer Fraction
v 3 0 17 1.0 SFCR Surface_roughness_surface m
v 3 0 18 1.0 GUST Wind_speed_gust_surface m/s
v 3 0 20 1.0 PRES Pressure_cloud_base Pa
v 3 0 21 1.0 PRES Pressure_cloud_tops Pa
v 3 0 23 1.0 TCDC Total_cloud_cover_entire_atmosphere %
v 4 6 30 1.0 RH Relative_humidity_isobaric %
v 4 6 31 1.0 SPFH Specific_humidity_isobaric kg/kg
v 4 9 32 1.0 CLWMR Cloud_mixing_ratio_isobaric kg/kg
v 4 9 33 1.0 SNMR Snow_mixing_ratio_isobaric kg/kg
v 3 0 40 1.0 CRAIN Categorical_Rain_surface 0 or 1
v 3 0 41 1.0 CSNOW Categorical_Snow_surface 0 or 1
v 3 0 42 1.0 CFRZR Categorical_Freezing_Rain_surface 0 or 1
v 3 0 43 1.0 CICEP Categorical_Ice_Pellets_surface 0 or 1
v 3 0 44 1.0 PRATE Precipitation_rate_surface kg.m-2.s-1
v 3 0 45 1.0 CPRAT Convective_Precipitation_Rate_surface kg.m-2.s-1
v 3 0 45 1.0 APCP Total_precipitation_surface_0_Hour_Accumulation kg.m-2
v 3 0 46 1.0 ACPCP Convective_precipitation_surface_0_Hour_Accumulation kg.m-2
v 3 0 47 1.0 NCPCP Large-scale_precipitation_non-convective_surface_0_Hour_Accumulation kg.m-2
22
8.5 NAM 216 AK (45.0 km); NAM 242 AK (11.25 km)
nam.t00z.awipak00.tm00
Available from:
ftp://ftp.ncep.noaa.gov/pub/data/nccf/com/nam/prod/nam.YYYYMDD/
http://motherlode.ucar.edu/native/conduit/data/nccf/com/nam/prod/nam.YYYYMMDD/
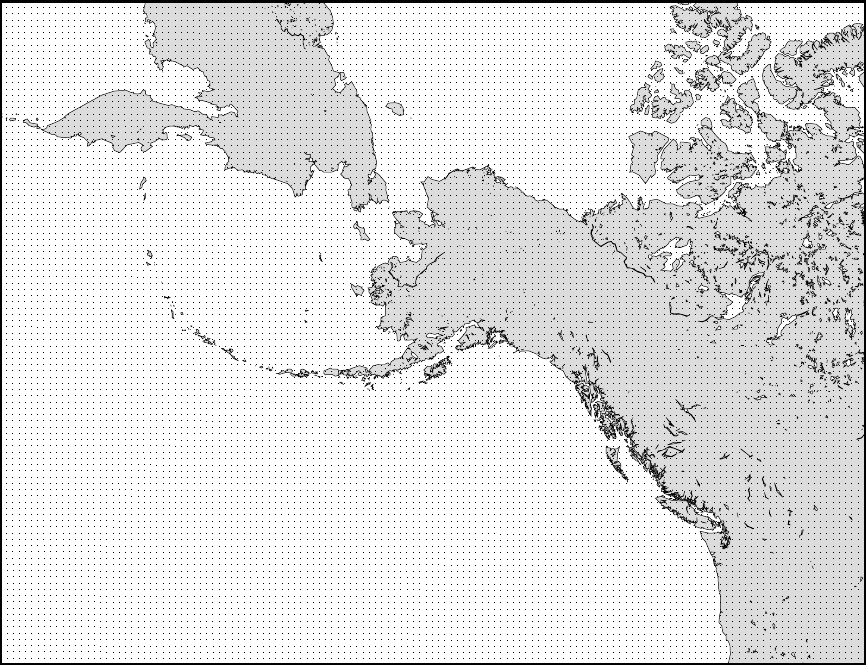
Figure 3: NAM 216, AK 45.0 km Polar Stereographic
23
n216_template.txt
0 1 -135.0 90.0 0.933 6371.229 Projection params line
3.0 Time interval
9 27 ndims, nvars
d 1 1.0 time hours since
d 2 1.0 isobaric1 Pa
d 3 1.0 y km or deg
d 4 1.0 x km or deg
d 5 1.0 isobaric1 Pa
d 6 1.0 isobaric1 Pa
d 7 1.0 height_above_ground3 m
d 8 1.0 depth_below_surface_layer m
d 9 1.0 isobaric4 Pa
v 4 2 1 1.0 HGT Geopotential_height_isobaric gpm
v 4 2 2 1.0 UGRD u-component_of_wind_isobaric m/s
v 4 2 3 1.0 VGRD v-component_of_wind_isobaric m/s
v 4 5 4 1.0 VVEL Vertical_velocity_pressure_isobaric Pa/s
v 4 2 5 1.0 TMP Temperature_isobaric K
v 3 0 10 1.0 HPBL Planetary_Boundary_Layer_Height_surface m
v 4 7 11 1.0 UGRD u-component_of_wind_height_above_ground m/s
v 4 7 12 1.0 VGRD v-component_of_wind_height_above_ground m/s
v 3 0 13 1.0 FRICV Frictional_Velocity_surface m.s-1
v 3 0 15 1.0 SNOD Snow_depth_surface m
v 4 2 16 1.0 SOILW Volumetric_Soil_Moisture_Content_depth_below_surface_layer Fraction
v 3 0 17 1.0 SFCR Surface_roughness_surface m
v 3 0 18 1.0 GUST Wind_speed_gust_surface m/s
v 3 0 20 1.0 PRES Pressure_cloud_base Pa
v 3 0 21 1.0 PRES Pressure_cloud_tops Pa
v 3 0 23 1.0 TCDC Total_cloud_cover_entire_atmosphere %
v 4 6 30 1.0 RH Relative_humidity_isobaric %
v 4 9 32 1.0 CLWMR Cloud_mixing_ratio_isobaric kg/kg
v 3 0 40 1.0 CRAIN Categorical_Rain_surface 0 or 1
v 3 0 41 1.0 CSNOW Categorical_Snow_surface 0 or 1
v 3 0 42 1.0 CFRZR Categorical_Freezing_Rain_surface 0 or 1
v 3 0 43 1.0 CICEP Categorical_Ice_Pellets_surface 0 or 1
v 3 0 44 1.0 PRATE Precipitation_rate_surface kg.m-2.s-1
v 3 0 45 1.0 CPRAT Convective_Precipitation_Rate_surface kg.m-2.s-1
v 3 0 45 1.0 APCP Total_precipitation_surface_0_Hour_Accumulation kg.m-2
v 3 0 46 1.0 ACPCP Convective_precipitation_surface_0_Hour_Accumulation kg.m-2
v 3 0 47 1.0 NCPCP Large-scale_precipitation_non-convective_surface_0_Hour_Accumulation kg.m-2
24
Grid 242 uses the same projection and domain as Grid 216, but with 11.25 km grid
spacing.
nam.t00z.awak3d00.grb2.tm00
Available from:
ftp://ftp.ncep.noaa.gov/pub/data/nccf/com/nam/prod/nam.YYYYMDD/
n242_template.txt
0 1 -135.0 90.0 0.933 6371.229 Projection params line
3.0 Time interval
9 27 ndims, nvars
d 1 1.0 time hours since
d 2 1.0 isobaric2 Pa
d 3 1.0 y km or deg
d 4 1.0 x km or deg
d 5 1.0 isobaric Pa
d 6 1.0 isobaric2 Pa
d 7 1.0 height_above_ground3 m
d 8 1.0 depth_below_surface_layer m
d 9 1.0 isobaric6 Pa
v 4 2 1 1.0 HGT Geopotential_height_isobaric gpm
v 4 2 2 1.0 UGRD u-component_of_wind_isobaric m/s
v 4 2 3 1.0 VGRD v-component_of_wind_isobaric m/s
v 4 5 4 1.0 VVEL Vertical_velocity_pressure_isobaric Pa/s
v 4 2 5 1.0 TMP Temperature_isobaric K
v 3 0 10 1.0 HPBL Planetary_Boundary_Layer_Height_surface m
v 4 7 11 1.0 UGRD u-component_of_wind_height_above_ground m/s
v 4 7 12 1.0 VGRD v-component_of_wind_height_above_ground m/s
v 3 0 13 1.0 FRICV Frictional_Velocity_surface m.s-1
v 3 0 15 1.0 SNOD Snow_depth_surface m
v 4 2 16 1.0 SOILW Volumetric_Soil_Moisture_Content_depth_below_surface_layer Fraction
v 3 0 17 1.0 SFCR Surface_roughness_surface m
v 3 0 18 1.0 GUST Wind_speed_gust_surface m/s
v 3 0 20 1.0 PRES Pressure_cloud_base Pa
v 3 0 21 1.0 PRES Pressure_cloud_tops Pa
v 3 0 23 1.0 TCDC Total_cloud_cover_entire_atmosphere %
v 4 6 30 1.0 RH Relative_humidity_isobaric %
v 4 9 32 1.0 CLWMR Cloud_mixing_ratio_isobaric kg/kg
v 3 0 40 1.0 CRAIN Categorical_Rain_surface 0 or 1
v 3 0 41 1.0 CSNOW Categorical_Snow_surface 0 or 1
v 3 0 42 1.0 CFRZR Categorical_Freezing_Rain_surface 0 or 1
v 3 0 43 1.0 CICEP Categorical_Ice_Pellets_surface 0 or 1
v 3 0 44 1.0 PRATE Precipitation_rate_surface kg.m-2.s-1
v 3 0 45 1.0 CPRAT Convective_Precipitation_Rate_surface kg.m-2.s-1
v 3 0 45 1.0 APCP Total_precipitation_surface_0_Hour_Accumulation kg.m-2
v 3 0 46 1.0 ACPCP Convective_precipitation_surface_0_Hour_Accumulation kg.m-2
v 3 0 47 1.0 NCPCP Large-scale_precipitation_non-convective_surface_0_Hour_Accumulation kg.m-2
25
8.6 NAM 91 AK (2.95 km); NAM 198 AK (5.9 km)
nam.t00z.alaskanest.hiresf00.tm00
Available from:
ftp://ftp.ncep.noaa.gov/pub/data/nccf/com/nam/prod/nam.YYYYMDD/
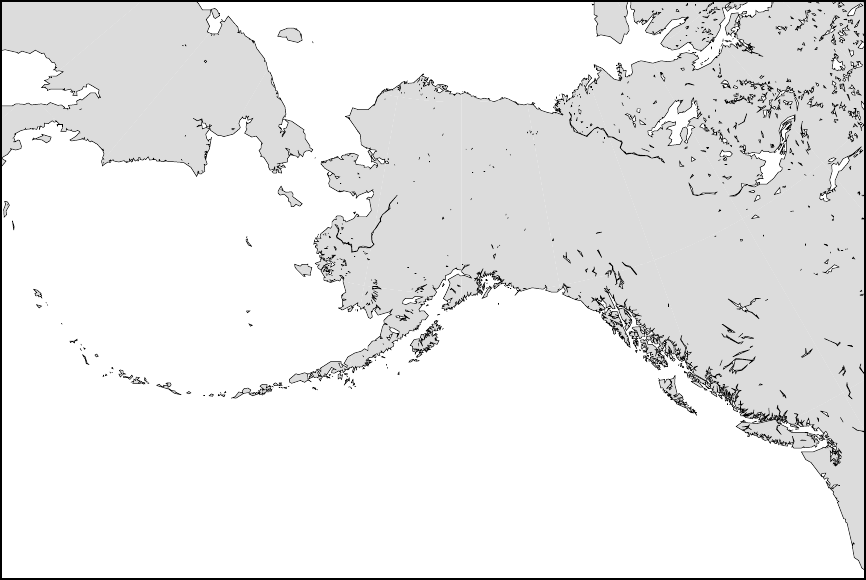
Figure 4: NAM 91, AK 2.95 km Polar Stereographic (previously NAM 198, AK 5.9 km)
26
n091_template.txt
0 1 -150.0 90.0 0.933 6371.229 Projection params line
1.0 Time interval
9 29 ndims, nvars
d 1 1.0 time hours since
d 2 1.0 isobaric2 Pa
d 3 1.0 y km or deg
d 4 1.0 x km or deg
d 5 1.0 isobaric2 Pa
d 6 1.0 isobaric2 Pa
d 7 1.0 height_above_ground3 m
d 8 1.0 depth_below_surface_layer m
d 9 1.0 isobaric3 Pa
v 4 2 1 1.0 HGT Geopotential_height_isobaric gpm
v 4 2 2 1.0 UGRD u-component_of_wind_isobaric m/s
v 4 2 3 1.0 VGRD v-component_of_wind_isobaric m/s
v 4 5 4 1.0 VVEL Vertical_velocity_pressure_isobaric Pa/s
v 4 2 5 1.0 TMP Temperature_isobaric K
v 3 0 10 1.0 HPBL Planetary_Boundary_Layer_Height_surface m
v 4 7 11 1.0 UGRD u-component_of_wind_height_above_ground m/s
v 4 7 12 1.0 VGRD v-component_of_wind_height_above_ground m/s
v 3 0 13 1.0 FRICV Frictional_Velocity_surface m.s-1
v 3 0 15 1.0 SNOD Snow_depth_surface m
v 4 2 16 1.0 SOILW Volumetric_Soil_Moisture_Content_depth_below_surface_layer Fraction
v 3 0 17 1.0 SFCR Surface_roughness_surface m
v 3 0 18 1.0 GUST Wind_speed_gust_surface m/s
v 3 0 20 1.0 PRES Pressure_cloud_base Pa
v 3 0 21 1.0 PRES Pressure_cloud_tops Pa
v 3 0 23 1.0 TCDC Total_cloud_cover_entire_atmosphere %
v 4 6 30 1.0 RH Relative_humidity_isobaric %
v 4 6 31 1.0 SPFH Specific_humidity_isobaric kg/kg
v 4 9 32 1.0 CLWMR Cloud_mixing_ratio_isobaric kg/kg
v 4 9 33 1.0 SNMR Snow_mixing_ratio_isobaric kg/kg
v 3 0 40 1.0 CRAIN Categorical_Rain_surface 0 or 1
v 3 0 41 1.0 CSNOW Categorical_Snow_surface 0 or 1
v 3 0 42 1.0 CFRZR Categorical_Freezing_Rain_surface 0 or 1
v 3 0 43 1.0 CICEP Categorical_Ice_Pellets_surface 0 or 1
v 3 0 44 1.0 PRATE Precipitation_rate_surface kg.m-2.s-1
v 3 0 45 1.0 CPRAT Convective_Precipitation_Rate_surface kg.m-2.s-1
v 3 0 45 1.0 APCP Total_precipitation_surface_0_Hour_Accumulation kg.m-2
v 3 0 46 1.0 ACPCP Convective_precipitation_surface_0_Hour_Accumulation kg.m-2
v 3 0 47 1.0 NCPCP Large-scale_precipitation_non-convective_surface_0_Hour_Accumulation kg.m-2
27
8.7 NAM 243 Eastern N. Pac./HI (0.40 ◦)
nam.t00z.awiphi00.tm00
Available from:
ftp://ftp.ncep.noaa.gov/pub/data/nccf/com/nam/prod/nam.YYYYMDD/
Figure 5: NAM 243, Eastern N. Pac./HI 0.4◦
28
n243_template.txt
1 1 -150.0 90.0 0.933 6371.229 Projection params line
3.0 Time interval
9 24 ndims, nvars
d 1 1.0 time hours since
d 2 1.0 isobaric2 Pa
d 3 1.0 lat km or deg
d 4 1.0 lon km or deg
d 5 1.0 isobaric1 Pa
d 6 1.0 isobaric2 Pa
d 7 1.0 height_above_ground m
d 8 1.0 depth_below_surface_layer m
d 9 1.0 isobaric4 Pa
v 4 2 1 1.0 HGT Geopotential_height_isobaric gpm
v 4 2 2 1.0 UGRD u-component_of_wind_isobaric m/s
v 4 2 3 1.0 VGRD v-component_of_wind_isobaric m/s
v 4 5 4 1.0 VVEL Vertical_velocity_pressure_isobaric Pa/s
v 4 2 5 1.0 TMP Temperature_isobaric K
v 4 7 11 1.0 UGRD u-component_of_wind_height_above_ground m/s
v 4 7 12 1.0 VGRD v-component_of_wind_height_above_ground m/s
v 3 0 13 1.0 FRICV Frictional_Velocity_surface m.s-1
v 3 0 17 1.0 SFCR Surface_roughness_surface m
v 3 0 20 1.0 PRES Pressure_cloud_base Pa
v 3 0 21 1.0 PRES Pressure_cloud_tops Pa
v 3 0 23 1.0 TCDC Total_cloud_cover_entire_atmosphere %
v 4 6 30 1.0 RH Relative_humidity_isobaric %
v 4 6 31 1.0 SPFH Specific_humidity_isobaric kg/kg
v 4 9 32 1.0 CLWMR Cloud_mixing_ratio_isobaric kg/kg
v 4 9 33 1.0 SNMR Snow_mixing_ratio_isobaric kg/kg
v 3 0 40 1.0 CRAIN Categorical_Rain_surface 0 or 1
v 3 0 41 1.0 CSNOW Categorical_Snow_surface 0 or 1
v 3 0 42 1.0 CFRZR Categorical_Freezing_Rain_surface 0 or 1
v 3 0 43 1.0 CICEP Categorical_Ice_Pellets_surface 0 or 1
v 3 0 44 1.0 PRATE Precipitation_rate_surface kg.m-2.s-1
v 3 0 45 1.0 APCP Total_precipitation_surface_0_Hour_Accumulation kg.m-2
v 3 0 46 1.0 ACPCP Convective_precipitation_surface_0_Hour_Accumulation kg.m-2
v 3 0 47 1.0 NCPCP Large-scale_precipitation_non-convective_surface_0_Hour_Accumulation kg.m-2
29

8.8 NAM 182 HI (0.108 ◦)
nam.t00z.afwahi00.grb2.tm00
Available from:
ftp://ftp.ncep.noaa.gov/pub/data/nccf/com/nam/prod/nam.YYYYMDD/
Figure 6: NAM 182, HI 0.108 ◦
30
n182_template.txt
1 1 -150.0 90.0 0.933 6371.229 Projection params line
3.0 Time interval
8 22 ndims, nvars
d 1 1.0 time1 hours since
d 2 1.0 isobaric Pa
d 3 1.0 lat km or deg
d 4 1.0 lon km or deg
d 5 1.0 isobaric Pa
d 6 1.0 isobaric Pa
d 7 1.0 height_above_ground2 m
d 8 1.0 depth_below_surface_layer m
v 4 2 1 1.0 HGT Geopotential_height_isobaric gpm
v 4 2 2 1.0 UGRD u-component_of_wind_isobaric m/s
v 4 2 3 1.0 VGRD v-component_of_wind_isobaric m/s
v 4 5 4 1.0 VVEL Vertical_velocity_pressure_isobaric Pa/s
v 4 2 5 1.0 TMP Temperature_isobaric K
v 3 0 10 1.0 HPBL Planetary_Boundary_Layer_Height_surface m
v 4 7 11 1.0 UGRD u-component_of_wind_height_above_ground m/s
v 4 7 12 1.0 VGRD v-component_of_wind_height_above_ground m/s
v 3 0 13 1.0 FRICV Frictional_Velocity_surface m.s-1
v 3 0 15 1.0 SNOD Snow_depth_surface m
v 4 2 16 1.0 SOILW Volumetric_Soil_Moisture_Content_depth_below_surface_layer Fraction
v 3 0 23 1.0 TCDC Total_cloud_cover_entire_atmosphere %
v 4 6 30 1.0 RH Relative_humidity_isobaric %
v 4 6 31 1.0 SPFH Specific_humidity_isobaric kg/kg
v 4 9 32 1.0 CLWMR Cloud_mixing_ratio_isobaric kg/kg
v 4 9 33 1.0 SNMR Snow_mixing_ratio_isobaric kg/kg
v 3 0 40 1.0 CRAIN Categorical_Rain_surface 0 or 1
v 3 0 41 1.0 CSNOW Categorical_Snow_surface 0 or 1
v 3 0 42 1.0 CFRZR Categorical_Freezing_Rain_surface 0 or 1
v 3 0 43 1.0 CICEP Categorical_Ice_Pellets_surface 0 or 1
v 3 0 45 1.0 APCP Total_precipitation_surface_0_Hour_Accumulation kg.m-2
v 3 0 46 1.0 ACPCP Convective_precipitation_surface_0_Hour_Accumulation kg.m-2
31

8.9 NAM 196 HI (2.5 km)
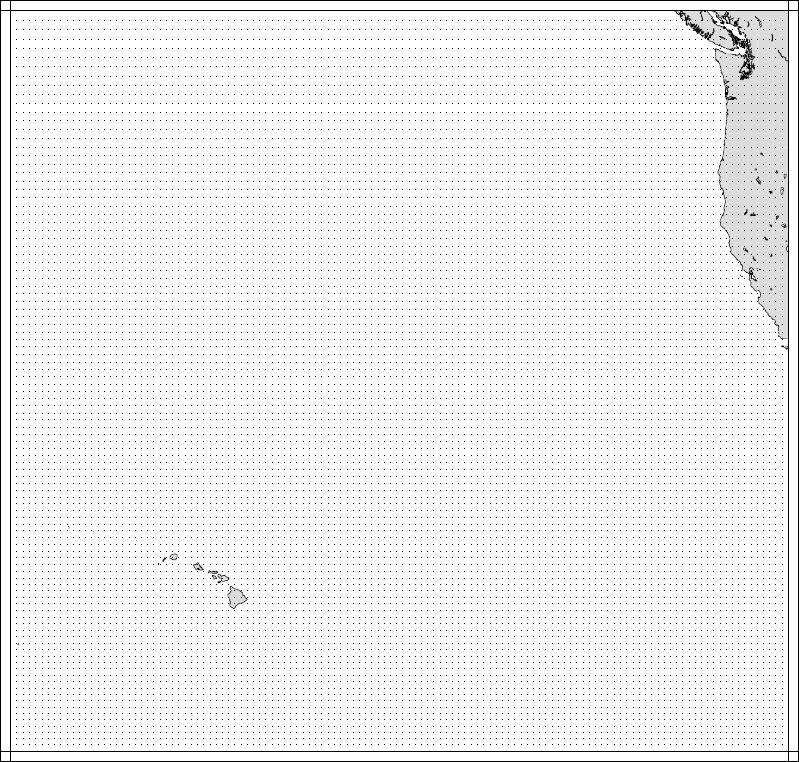
nam.t00z.hawaiinest.hiresf00.tm0
Available from:
ftp://ftp.ncep.noaa.gov/pub/data/nccf/com/nam/prod/nam.YYYYMDD/
Figure 7: NAM 196, AK 2.5 km Mercator
32
n196_template.txt
0 5 198.475 20.0 6371.229 Projection params line
1.0 Time interval
9 27 ndims, nvars
d 1 1.0 time hours since
d 2 1.0 isobaric2 Pa
d 3 1.0 y km or deg
d 4 1.0 x km or deg
d 5 1.0 isobaric2 Pa
d 6 1.0 isobaric2 Pa
d 7 1.0 height_above_ground3 m
d 8 1.0 depth_below_surface_layer m
d 9 1.0 isobaric4 Pa
v 4 2 1 1.0 HGT Geopotential_height_isobaric gpm
v 4 2 2 1.0 UGRD u-component_of_wind_isobaric m/s
v 4 2 3 1.0 VGRD v-component_of_wind_isobaric m/s
v 4 5 4 1.0 VVEL Vertical_velocity_pressure_isobaric Pa/s
v 4 2 5 1.0 TMP Temperature_isobaric K
v 3 0 10 1.0 HPBL Planetary_Boundary_Layer_Height_surface m
v 4 7 11 1.0 UGRD u-component_of_wind_height_above_ground m/s
v 4 7 12 1.0 VGRD v-component_of_wind_height_above_ground m/s
v 3 0 13 1.0 FRICV Frictional_Velocity_surface m.s-1
v 3 0 15 1.0 SNOD Snow_depth_surface m
v 4 2 16 1.0 SOILW Volumetric_Soil_Moisture_Content_depth_below_surface_layer Fraction
v 3 0 17 1.0 SFCR Surface_roughness_surface m
v 3 0 18 1.0 GUST Wind_speed_gust_surface m/s
v 3 0 20 1.0 PRES Pressure_cloud_base Pa
v 3 0 21 1.0 PRES Pressure_cloud_tops Pa
v 3 0 23 1.0 TCDC Total_cloud_cover_entire_atmosphere %
v 4 6 30 1.0 RH Relative_humidity_isobaric %
v 4 6 31 1.0 SPFH Specific_humidity_isobaric kg/kg
v 4 9 32 1.0 CLWMR Cloud_mixing_ratio_isobaric kg/kg
v 4 9 33 1.0 SNMR Snow_mixing_ratio_isobaric kg/kg
v 3 0 40 1.0 CRAIN Categorical_Rain_surface 0 or 1
v 3 0 41 1.0 CSNOW Categorical_Snow_surface 0 or 1
v 3 0 42 1.0 CFRZR Categorical_Freezing_Rain_surface 0 or 1
v 3 0 43 1.0 CICEP Categorical_Ice_Pellets_surface 0 or 1
v 3 0 44 1.0 PRATE Precipitation_rate_surface kg.m-2.s-1
v 3 0 45 1.0 APCP Total_precipitation_surface_0_Hour_Accumulation kg.m-2
v 3 0 47 1.0 NCPCP Large-scale_precipitation_non-convective_surface_0_Hour_Accumulation kg.m-2
33
8.10 NAM 211/212/218/227 CONUS
Figure 8: NAM 211/212/218/227 CONUS Lambert Conformal Conical (dots correspond
to the 81.3 km 211 grid)
34
Available from:
ftp://ftp.ncep.noaa.gov/pub/data/nccf/com/nam/prod/nam.YYYYMDD/
NAM 211 CONUS (81.3 km) :: nam.t00z.awp21100.tm00
n211_template.txt
0 4 265.0 25.0 25.0 25.0 6371.229 Projection params line
6.0 Time interval
9 18 ndims, nvars
d 1 1.0 time hours since
d 2 1.0 isobaric Pa
d 3 1.0 y km or deg
d 4 1.0 x km or deg
d 5 1.0 isobaric Pa
d 6 1.0 isobaric Pa
d 7 1.0 height_above_ground1 m
d 8 1.0 depth_below_surface_layer m
d 9 1.0 isobaric Pa
v 4 2 1 1.0 HGT Geopotential_height_isobaric gpm
v 4 2 2 1.0 UGRD u-component_of_wind_isobaric m/s
v 4 2 3 1.0 VGRD v-component_of_wind_isobaric m/s
v 4 5 4 1.0 VVEL Vertical_velocity_pressure_isobaric Pa/s
v 4 2 5 1.0 TMP Temperature_isobaric K
v 3 0 10 1.0 HPBL Planetary_Boundary_Layer_Height_surface m
v 4 7 11 1.0 UGRD u-component_of_wind_height_above_ground m/s
v 4 7 12 1.0 VGRD v-component_of_wind_height_above_ground m/s
v 3 0 18 1.0 GUST Wind_speed_gust_surface m/s
v 3 0 20 1.0 PRES Pressure_cloud_base Pa
v 3 0 21 1.0 PRES Pressure_cloud_tops Pa
v 4 6 30 1.0 RH Relative_humidity_isobaric %
v 3 0 40 1.0 CRAIN Categorical_Rain_surface 0 or 1
v 3 0 41 1.0 CSNOW Categorical_Snow_surface 0 or 1
v 3 0 42 1.0 CFRZR Categorical_Freezing_Rain_surface 0 or 1
v 3 0 43 1.0 CICEP Categorical_Ice_Pellets_surface 0 or 1
v 3 0 45 1.0 APCP Total_precipitation_surface_0_Hour_Accumulation kg.m-2
v 3 0 46 1.0 ACPCP Convective_precipitation_surface_0_Hour_Accumulation kg.m-2
NAM 212 CONUS (40.6 km) :: nam.t00z.awip3d00.tm00
n212_template.txt
0 4 265.0 25.0 25.0 25.0 6371.229 Projection params line
3.0 Time interval
9 29 ndims, nvars
d 1 1.0 time hours since
d 2 1.0 isobaric1 Pa
d 3 1.0 y km or deg
d 4 1.0 x km or deg
d 5 1.0 isobaric1 Pa
d 6 1.0 isobaric1 Pa
d 7 1.0 height_above_ground2 m
d 8 1.0 depth_below_surface_layer m
d 9 1.0 isobaric1 Pa
v 4 2 1 1.0 HGT Geopotential_height_isobaric gpm
v 4 2 2 1.0 UGRD u-component_of_wind_isobaric m/s
v 4 2 3 1.0 VGRD v-component_of_wind_isobaric m/s
v 4 5 4 1.0 VVEL Vertical_velocity_pressure_isobaric Pa/s
v 4 2 5 1.0 TMP Temperature_isobaric K
v 3 0 10 1.0 HPBL Planetary_Boundary_Layer_Height_surface m
v 4 7 11 1.0 UGRD u-component_of_wind_height_above_ground m/s
v 4 7 12 1.0 VGRD v-component_of_wind_height_above_ground m/s
v 3 0 13 1.0 FRICV Frictional_Velocity_surface m.s-1
v 3 0 15 1.0 SNOD Snow_depth_surface m
v 4 2 16 1.0 SOILW Volumetric_Soil_Moisture_Content_depth_below_surface_layer Fraction
v 3 0 17 1.0 SFCR Surface_roughness_surface m
v 3 0 18 1.0 GUST Wind_speed_gust_surface m/s
v 3 0 20 1.0 PRES Pressure_cloud_base Pa
v 3 0 21 1.0 PRES Pressure_cloud_tops Pa
v 3 0 23 1.0 TCDC Total_cloud_cover_entire_atmosphere %
v 4 6 30 1.0 RH Relative_humidity_isobaric %
v 4 6 31 1.0 SPFH Specific_humidity_isobaric kg/kg
v 4 9 32 1.0 CLWMR Cloud_mixing_ratio_isobaric kg/kg
v 4 9 33 1.0 SNMR Snow_mixing_ratio_isobaric kg/kg
v 3 0 40 1.0 CRAIN Categorical_Rain_surface 0 or 1
v 3 0 41 1.0 CSNOW Categorical_Snow_surface 0 or 1
v 3 0 42 1.0 CFRZR Categorical_Freezing_Rain_surface 0 or 1
v 3 0 43 1.0 CICEP Categorical_Ice_Pellets_surface 0 or 1
v 3 0 44 1.0 PRATE Precipitation_rate_surface kg.m-2.s-1
v 3 0 45 1.0 CPRAT Convective_Precipitation_Rate_surface kg.m-2.s-1
v 3 0 45 1.0 APCP Total_precipitation_surface_0_Hour_Accumulation kg.m-2
v 3 0 46 1.0 ACPCP Convective_precipitation_surface_0_Hour_Accumulation kg.m-2
v 3 0 47 1.0 NCPCP Large-scale_precipitation_non-convective_surface_0_Hour_Accumulation kg.m-2
35
NAM 218 CONUS (12.2 km) :: nam.t00z.awphys00.grb2.tm00
n218_template.txt
0 4 265.0 25.0 25.0 25.0 6371.229 Projection params line
1.0 Time interval
9 21 ndims, nvars
d 1 1.0 time hours since
d 2 1.0 isobaric1 Pa
d 3 1.0 y km or deg
d 4 1.0 x km or deg
d 5 1.0 isobaric1 Pa
d 6 1.0 isobaric Pa
d 7 1.0 height_above_ground4 m
d 8 1.0 depth_below_surface_layer m
d 9 1.0 isobaric4 Pa
v 4 2 1 1.0 HGT Geopotential_height_isobaric gpm
v 4 2 2 1.0 UGRD u-component_of_wind_isobaric m/s
v 4 2 3 1.0 VGRD v-component_of_wind_isobaric m/s
v 4 5 4 1.0 VVEL Vertical_velocity_pressure_isobaric Pa/s
v 4 2 5 1.0 TMP Temperature_isobaric K
v 3 0 10 1.0 HPBL Planetary_Boundary_Layer_Height_surface m
v 4 7 11 1.0 UGRD u-component_of_wind_height_above_ground m/s
v 4 7 12 1.0 VGRD v-component_of_wind_height_above_ground m/s
v 3 0 13 1.0 FRICV Frictional_Velocity_surface m.s-1
v 3 0 15 1.0 SNOD Snow_depth_surface m
v 4 2 16 1.0 SOILW Volumetric_Soil_Moisture_Content_depth_below_surface_layer Fraction
v 3 0 17 1.0 SFCR Surface_roughness_surface m
v 3 0 18 1.0 GUST Wind_speed_gust_surface m/s
v 3 0 23 1.0 TCDC Total_cloud_cover_entire_atmosphere %
v 4 6 30 1.0 RH Relative_humidity_isobaric %
v 3 0 40 1.0 CRAIN Categorical_Rain_surface 0 or 1
v 3 0 41 1.0 CSNOW Categorical_Snow_surface 0 or 1
v 3 0 42 1.0 CFRZR Categorical_Freezing_Rain_surface 0 or 1
v 3 0 43 1.0 CICEP Categorical_Ice_Pellets_surface 0 or 1
v 3 0 45 1.0 APCP Total_precipitation_surface_0_Hour_Accumulation kg.m-2
v 3 0 46 1.0 ACPCP Convective_precipitation_surface_0_Hour_Accumulation kg.m-2
NAM 227 CONUS (5.1 km) :: nam.t00z.conusnest.hiresf00.tm00
n227_template.txt
0 4 265.0 25.0 25.0 25.0 6371.229 Projection params line
1.0 Time interval
9 27 ndims, nvars
d 1 1.0 time hours since
d 2 1.0 isobaric2 Pa
d 3 1.0 y km or deg
d 4 1.0 x km or deg
d 5 1.0 isobaric2 Pa
d 6 1.0 isobaric2 Pa
d 7 1.0 height_above_ground3 m
d 8 1.0 depth_below_surface_layer m
d 9 1.0 isobaric4 Pa
v 4 2 1 1.0 HGT Geopotential_height_isobaric gpm
v 4 2 2 1.0 UGRD u-component_of_wind_isobaric m/s
v 4 2 3 1.0 VGRD v-component_of_wind_isobaric m/s
v 4 5 4 1.0 VVEL Vertical_velocity_pressure_isobaric Pa/s
v 4 2 5 1.0 TMP Temperature_isobaric K
v 3 0 10 1.0 HPBL Planetary_Boundary_Layer_Height_surface m
v 4 7 11 1.0 UGRD u-component_of_wind_height_above_ground m/s
v 4 7 12 1.0 VGRD v-component_of_wind_height_above_ground m/s
v 3 0 13 1.0 FRICV Frictional_Velocity_surface m.s-1
v 3 0 15 1.0 SNOD Snow_depth_surface m
v 4 2 16 1.0 SOILW Volumetric_Soil_Moisture_Content_depth_below_surface_layer Fraction
v 3 0 17 1.0 SFCR Surface_roughness_surface m
v 3 0 18 1.0 GUST Wind_speed_gust_surface m/s
v 3 0 20 1.0 PRES Pressure_cloud_base Pa
v 3 0 21 1.0 PRES Pressure_cloud_tops Pa
v 3 0 23 1.0 TCDC Total_cloud_cover_entire_atmosphere %
v 4 6 30 1.0 RH Relative_humidity_isobaric %
v 4 6 31 1.0 SPFH Specific_humidity_isobaric kg/kg
v 4 9 32 1.0 CLWMR Cloud_mixing_ratio_isobaric kg/kg
v 4 9 33 1.0 SNMR Snow_mixing_ratio_isobaric kg/kg
v 3 0 40 1.0 CRAIN Categorical_Rain_surface 0 or 1
v 3 0 41 1.0 CSNOW Categorical_Snow_surface 0 or 1
v 3 0 42 1.0 CFRZR Categorical_Freezing_Rain_surface 0 or 1
v 3 0 43 1.0 CICEP Categorical_Ice_Pellets_surface 0 or 1
v 3 0 44 1.0 PRATE Precipitation_rate_surface kg.m-2.s-1
v 3 0 45 1.0 APCP Total_precipitation_surface_0_Hour_Accumulation kg.m-2
v 3 0 47 1.0 NCPCP Large-scale_precipitation_non-convective_surface_0_Hour_Accumulation kg.m-2
36
8.11 NAM 181 Caribbean (0.108 ◦)
nam.t00z.afwaca00.grb2.tm00
Available from:
ftp://ftp.ncep.noaa.gov/pub/data/nccf/com/nam/prod/nam.YYYYMDD/
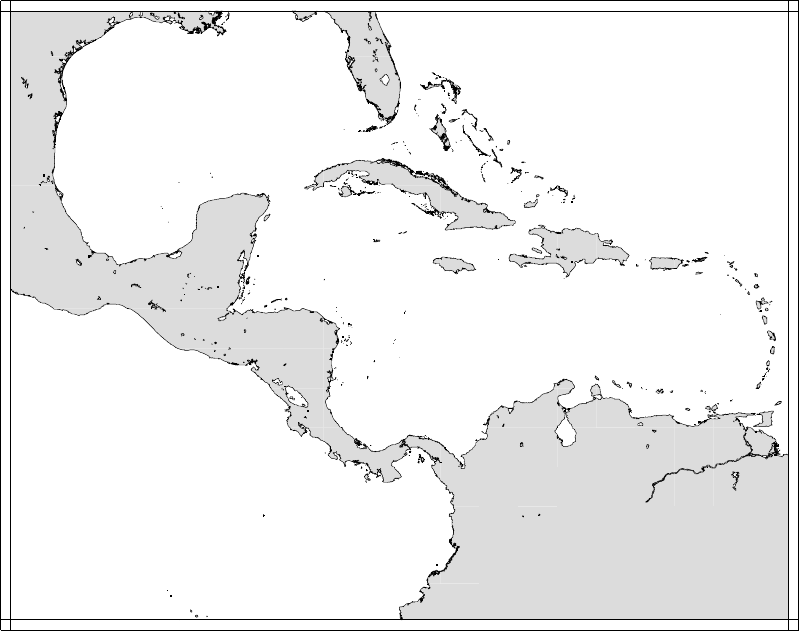
Figure 9: NAM 181, Caribbean 0.108 ◦
37
n181_template.txt
1 1 -150.0 90.0 0.933 6371.229 Projection params line
3.0 Time interval
8 22 ndims, nvars
d 1 1.0 time1 hours since
d 2 1.0 isobaric Pa
d 3 1.0 lat km or deg
d 4 1.0 lon km or deg
d 5 1.0 isobaric Pa
d 6 1.0 isobaric Pa
d 7 1.0 height_above_ground2 m
d 8 1.0 depth_below_surface_layer m
v 4 2 1 1.0 HGT Geopotential_height_isobaric gpm
v 4 2 2 1.0 UGRD u-component_of_wind_isobaric m/s
v 4 2 3 1.0 VGRD v-component_of_wind_isobaric m/s
v 4 5 4 1.0 VVEL Vertical_velocity_pressure_isobaric Pa/s
v 4 2 5 1.0 TMP Temperature_isobaric K
v 3 0 10 1.0 HPBL Planetary_Boundary_Layer_Height_surface m
v 4 7 11 1.0 UGRD u-component_of_wind_height_above_ground m/s
v 4 7 12 1.0 VGRD v-component_of_wind_height_above_ground m/s
v 3 0 13 1.0 FRICV Frictional_Velocity_surface m.s-1
v 3 0 15 1.0 SNOD Snow_depth_surface m
v 4 2 16 1.0 SOILW Volumetric_Soil_Moisture_Content_depth_below_surface_layer Fraction
v 3 0 23 1.0 TCDC Total_cloud_cover_entire_atmosphere %
v 4 6 30 1.0 RH Relative_humidity_isobaric %
v 4 6 31 1.0 SPFH Specific_humidity_isobaric kg/kg
v 4 9 32 1.0 CLWMR Cloud_mixing_ratio_isobaric kg/kg
v 4 9 33 1.0 SNMR Snow_mixing_ratio_isobaric kg/kg
v 3 0 40 1.0 CRAIN Categorical_Rain_surface 0 or 1
v 3 0 41 1.0 CSNOW Categorical_Snow_surface 0 or 1
v 3 0 42 1.0 CFRZR Categorical_Freezing_Rain_surface 0 or 1
v 3 0 43 1.0 CICEP Categorical_Ice_Pellets_surface 0 or 1
v 3 0 45 1.0 APCP Total_precipitation_surface_0_Hour_Accumulation kg.m-2
v 3 0 46 1.0 ACPCP Convective_precipitation_surface_0_Hour_Accumulation kg.m-2
38
8.12 GFS 3/4/193
Figure 10: GFS 3,4,193, (dots correspond to the 1.0◦NAM 3 grid)
39
Available from:
ftp://ftp.ncep.noaa.gov/pub/data/nccf/com/gfs/prod/gfs.YYYYMDD/
GFS NCEP Grid 3 (1.0◦) :: gfs.t00z.pgrb2.1p00.f000.nc
n003_template.txt
GFS NCEP grid 4 (0.5◦) :: n004_template.txt
1 1 -150.0 90.0 0.933 6371.229 Projection params line
3.0 Time interval
9 13 ndims, nvars
d 1 1.0 time hours since
d 2 1.0 isobaric3 Pa
d 3 1.0 lat km or deg
d 4 1.0 lon km or deg
d 5 1.0 isobaric2 Pa
d 6 1.0 isobaric3 Pa
d 7 1.0 height_above_ground3 m
d 8 1.0 depth_below_surface_layer m
d 9 1.0 isobaric4 Pa
v 4 2 1 1.0 HGT Geopotential_height_isobaric gpm
v 4 2 2 1.0 UGRD u-component_of_wind_isobaric m/s
v 4 2 3 1.0 VGRD v-component_of_wind_isobaric m/s
v 4 5 4 1.0 VVEL Vertical_velocity_pressure_isobaric Pa/s
v 4 2 5 1.0 TMP Temperature_isobaric K
v 3 0 10 1.0 HPBL Planetary_Boundary_Layer_Height_surface m
v 4 7 11 1.0 UGRD u-component_of_wind_height_above_ground m/s
v 4 7 12 1.0 VGRD v-component_of_wind_height_above_ground m/s
v 3 0 15 1.0 SNOD Snow_depth_surface m
v 4 2 16 1.0 SOILW Volumetric_Soil_Moisture_Content_depth_below_surface_layer Fraction
v 3 0 18 1.0 GUST Wind_speed_gust_surface m/s
v 4 6 30 1.0 RH Relative_humidity_isobaric %
v 4 5 32 1.0 CLWMR Cloud_mixing_ratio_isobaric kg/kg
GFS NCEP grid 193 (0.25 ◦) :: n193_template.txt
1 1 -150.0 90.0 0.933 6371.229 Projection params line
3.0 Time interval
9 13 ndims, nvars
d 1 1.0 time hours since
d 2 1.0 isobaric3 Pa
d 3 1.0 lat km or deg
d 4 1.0 lon km or deg
d 5 1.0 isobaric2 Pa
d 6 1.0 isobaric3 Pa
d 7 1.0 height_above_ground3 m
d 8 1.0 depth_below_surface_layer m
d 9 1.0 isobaric4 Pa
v 4 2 1 1.0 HGT Geopotential_height_isobaric gpm
v 4 2 2 1.0 UGRD u-component_of_wind_isobaric m/s
v 4 2 3 1.0 VGRD v-component_of_wind_isobaric m/s
v 4 5 4 1.0 VVEL Vertical_velocity_pressure_isobaric Pa/s
v 4 2 5 1.0 TMP Temperature_isobaric K
v 3 0 10 1.0 HPBL Planetary_Boundary_Layer_Height_surface m
v 4 7 11 1.0 UGRD u-component_of_wind_height_above_ground m/s
v 4 7 12 1.0 VGRD v-component_of_wind_height_above_ground m/s
v 3 0 15 1.0 SNOD Snow_depth_surface m
v 4 2 16 1.0 SOILW Volumetric_Soil_Moisture_Content_depth_below_surface_layer Fraction
v 3 0 18 1.0 GUST Wind_speed_gust_surface m/s
v 4 6 30 1.0 RH Relative_humidity_isobaric %
v 4 5 32 1.0 CLWMR Cloud_mixing_ratio_isobaric kg/kg
40
8.13 NASA GEOS-5
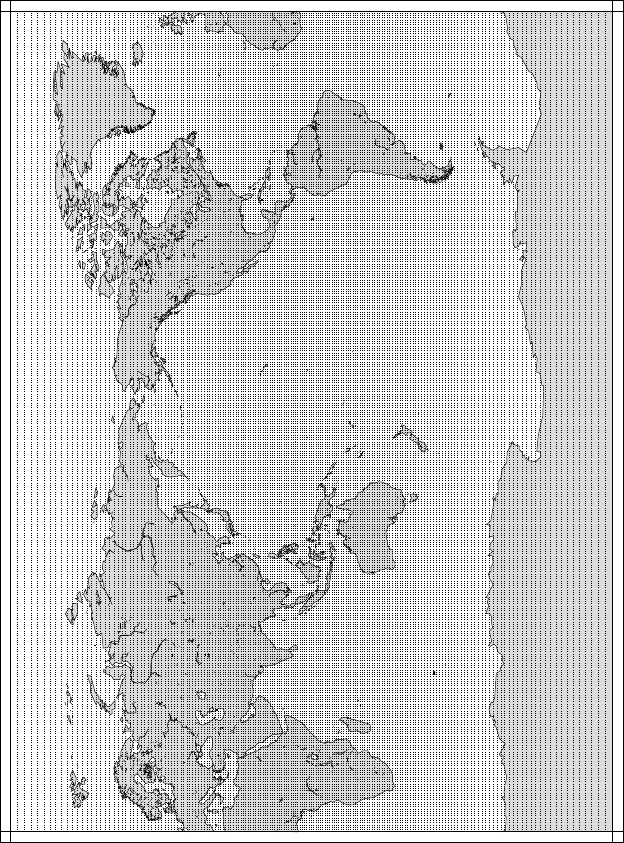
Figure 11: NASA GEOS-5, 0.625/0.5◦
41
Available from:
ftp://gmao_ops@ftp.nccs.nasa.gov/fp/forecast//
NASA GEOS-5 Cp (0.625/0.5◦) ::
GEOS.fp.fcst.inst3_3d_asm_Cp.YYYYMMDD_00+YYYYMMDD_mmmm.V01.nc4
nGCp_template.txt
1 1 -150.0 90.0 0.933 6371.229 Projection params line
3.0 Time interval
6 7 ndims, nvars
d 1 1.6667e-2 time hours since
d 2 100.0 lev Pa
d 3 1.0 lat km or deg
d 4 1.0 lon km or deg
d 5 100.0 lev Pa
d 6 100.0 lev Pa
v 4 2 1 1.0 HGT H gpm
v 4 2 2 1.0 UGRD U m/s
v 4 2 3 1.0 VGRD V m/s
v 4 5 4 1.0 VVEL OMEGA Pa/s
v 4 2 5 1.0 TMP T K
v 4 6 30 1.0 RH RH %
v 4 6 31 1.0 SPFH SH kg/kg
NASA GEOS-5 Np (0.25/0.3125 ◦) ::
GEOS.fp.fcst.inst3_3d_asm_Np.YYYYMMDD_00+YYYYMMDD_mmmm.V01.nc4
nGNp_template.txt
1 1 -150.0 90.0 0.933 6371.229 Projection params line
3.0 Time interval
6 7 ndims, nvars
d 1 1.6667e-2 time hours since
d 2 100.0 lev Pa
d 3 1.0 lat km or deg
d 4 1.0 lon km or deg
d 5 100.0 lev Pa
d 6 100.0 lev Pa
v 4 2 1 1.0 HGT H gpm
v 4 2 2 1.0 UGRD U m/s
v 4 2 3 1.0 VGRD V m/s
v 4 5 4 1.0 VVEL OMEGA Pa/s
v 4 2 5 1.0 TMP T K
v 4 6 30 1.0 RH RH %
v 4 6 31 1.0 SPFH SH kg/kg
42
