Database Design For Mere Mortals®: A Hands On Guide To Relational Michael J. Hernandez Mortals D
User Manual:
Open the PDF directly: View PDF ![]() .
.
Page Count: 660 [warning: Documents this large are best viewed by clicking the View PDF Link!]
- Contents
- Foreword
- Preface
- Acknowledgments
- Introduction
- PART I: RELATIONAL DATABASE DESIGN
- PART II: THE DESIGN PROCESS
- Chapter 4: Conceptual Overview
- Topics Covered in This Chapter
- The Importance of Completing the Design Process
- Defining a Mission Statement and Mission Objectives
- Analyzing the Current Database
- Creating the Data Structures
- Determining and Establishing Table Relationships
- Determining and Defining Business Rules
- Determining and Defining Views
- Reviewing Data Integrity
- Summary
- Review Questions
- Chapter 5: Starting the Process
- Chapter 6: Analyzing the Current Database
- Chapter 7: Establishing Table Structures
- Chapter 8: Keys
- Chapter 9: Field Specifications
- Chapter 10: Table Relationships
- Chapter 11: Business Rules
- Chapter 12: Views
- Chapter 13: Reviewing Data Integrity
- Chapter 4: Conceptual Overview
- PART III: OTHER DATABASE DESIGN ISSUES
- PART IV: APPENDIXES
- Appendix A: Answers to Review Questions
- Appendix B: Diagram of the Database Design Process
- Appendix C: Design Guidelines
- Defining and Establishing Field-Specific Business Rules
- Defining and Establishing Relationship-Specific Business Rules
- Elements of a Candidate Key
- Elements of a Foreign Key
- Elements of a Primary Key
- Elements of the Ideal Field
- Elements of the Ideal Table
- Field-Level Integrity
- Guidelines for Composing a Field Description
- Guidelines for Composing a Table Description
- Guidelines for Creating Field Names
- Guidelines for Creating Table Names
- Identifying Relationships
- Identifying View Requirements
- Interview Guidelines
- Mission Statements
- Mission Objectives
- Relationship-Level Integrity
- Resolving a Multivalued Field
- Table-Level Integrity
- Appendix D: Documentation Forms
- Appendix E: Database Design Diagram Symbols
- Appendix F: Sample Designs
- Appendix G: On Normalization
- Appendix H: Recommended Reading
- Glossary
- References
- Index
ptg14955309

ptg14955309
Database Design
for Mere
Mortals®
Third Edition

ptg14955309
This page intentionally left blank

ptg14955309
Database Design
for Mere
Mortals®
A Hands-on Guide to Relational
Database Design
Third Edition
Michael J. Hernandez
Upper Saddle River, NJ • Boston • Indianapolis • San Francisco
New York • Toronto • Montreal • London • Munich • Paris • Madrid
Capetown • Sydney • Tokyo • Singapore • Mexico City

ptg14955309
Many of the designations used by manufacturers and sellers to distinguish their
products are claimed as trademarks. Where those designations appear in this
book, and the publisher was aware of a trademark claim, the designations have
been printed with initial capital letters or in all capitals.
The author and publisher have taken care in the preparation of this book, but
make no expressed or implied warranty of any kind and assume no responsibil-
ity for errors or omissions. No liability is assumed for incidental or consequential
damages in connection with or arising out of the use of the information or pro-
grams contained herein.
For information about buying this title in bulk quantities, or for special sales
opportunities (which may include electronic versions; custom cover designs; and
content particular to your business, training goals, marketing focus, or branding
interests), please contact our corporate sales department at corpsales@pearsoned.
com or (800) 382-3419.
For government sales inquiries, please contact governmentsales@pearsoned.com.
For questions about sales outside the U.S., please contact international@
pearsoned.com.
Visit us on the Web: informit.com/aw
Cataloging-in-Publication Data is on file with the Library of Congress.
Copyright © 2013 by Michael J. Hernandez
All rights reserved. Printed in the United States of America. This publication is
protected by copyright, and permission must be obtained from the publisher prior
to any prohibited reproduction, storage in a retrieval system, or transmission in
any form or by any means, electronic, mechanical, photocopying, recording, or
likewise. To obtain permission to use material from this work, please submit a
written request to Pearson Education, Inc., Permissions Department, One Lake
Street, Upper Saddle River, New Jersey 07458, or you may fax your request to
(201) 236-3290.
ISBN-13: 978-0-321-88449-7
ISBN-10: 0-321-88449-3
Text printed in the United States on recycled paper at Edwards Brothers Malloy in
Ann Arbor, Michigan.
Third printing, October 2014

ptg14955309
For my wife, who has always believed in me and continues
to do so.
To those who have helped me along my journey—teachers,
mentors, friends, and colleagues.
Dedicated to anyone who has unsuccessfully attempted
to design a relational database.

ptg14955309
This page intentionally left blank

ptg14955309
vii
About the Author
Michael J. Hernandez has been an indepen-
dent relational database consultant specializ-
ing in relational database design. He has more
than twenty years of experience in the tech-
nology industry, developing database applica-
tions for a broad range of clients. He’s been a
contributing author to a wide variety of
magazine columns, white papers, books, and
periodicals, and is coauthor of the best-selling
SQL Queries for Mere Mortals® (Addison-Wesley, 2007). Mike has been a
top-rated and noted technical trainer for the government, the military,
the private sector, and companies throughout the United States. He
has spoken at numerous national and international conferences, and
has consistently been a top-rated speaker and presenter.
Aside from his technical background, Mike has a diverse set of skills
and interests that he also pursues, ranging from the artistic to the
metaphysical. His greatest interest is still the guitar, as he’s been a
practicing guitarist for more than forty years and played profession-
ally for fifteen years. He is a great cook, loves to teach (writing, public
speaking, music), has a gift for bad puns, and even reads tarot cards.
He says he’s never going to retire, per se, but rather just change what-
ever it is he’s doing whenever he finally gets tired of it and move on to
something else that interests him.

ptg14955309
This page intentionally left blank

ptg14955309
ix
Contents
Foreword xxi
Preface xxv
Acknowledgments xxvii
Introduction xxix
What’s New in the Third Edition xxxii
Who Should Read This Book xxxii
The Purpose of This Book xxxiv
How to Read This Book xxxvi
How This Book Is Organized xxxvii
Part I: Relational Database Design xxxvii
Part II: The Design Process xxxvii
Part III: Other Database Design Issues xxxix
Part IV: Appendixes xxxix
A Word About the Examples and Techniques in This Book xl
A New Approach to Learning xli
PART I: RELATIONAL DATABASE DESIGN 1
Chapter 1: The Relational Database 3
Topics Covered in This Chapter 3
Types of Databases 4
Early Database Models 5
The Hierarchical Database Model 5
The Network Database Model 9

ptg14955309
xContents
The Relational Database Model 12
Retrieving Data 15
Advantages of a Relational Database 16
Relational Database Management Systems 18
Beyond the Relational Model 19
What the Future Holds 21
A Final Note 22
Summary 22
Review Questions 24
Chapter 2: Design Objectives 25
Topics Covered in This Chapter 25
Why Should You Be Concerned with Database Design? 25
The Importance of Theory 27
The Advantage of Learning a Good Design Methodology 29
Objectives of Good Design 30
Benefits of Good Design 31
Database Design Methods 32
Traditional Design Methods 32
The Design Method Presented in This Book 34
Normalization 35
Summary 38
Review Questions 39
Chapter 3: Terminology 41
Topics Covered in This Chapter 41
Why This Terminology Is Important 41
Value-Related Terms 43
Data 43
Information 43
Null 45
The Value of Nulls 46
The Problem with Nulls 47

ptg14955309
Contents xi
Structure-Related Terms 49
Table 49
Field 52
Record 53
View 54
Keys 56
Index 58
Relationship-Related Terms 59
Relationships 59
Types of Relationships 60
Types of Participation 65
Degree of Participation 66
Integrity-Related Terms 67
Field Specification 67
Data Integrity 68
Summary 69
Review Questions 70
PART II: THE DESIGN PROCESS 73
Chapter 4: Conceptual Overview 75
Topics Covered in This Chapter 75
The Importance of Completing the Design Process 76
Defining a Mission Statement and Mission Objectives 77
Analyzing the Current Database 78
Creating the Data Structures 80
Determining and Establishing Table Relationships 81
Determining and Defining Business Rules 81
Determining and Defining Views 83
Reviewing Data Integrity 83
Summary 84
Review Questions 86

ptg14955309
xii Contents
Chapter 5: Starting the Process 89
Topics Covered in This Chapter 89
Conducting Interviews 89
Participant Guidelines 91
Interviewer Guidelines (These Are for You) 93
The Case Study: Mike’s Bikes 98
Defining the Mission Statement 100
The Well-Written Mission Statement 100
Composing a Mission Statement 102
Defining the Mission Objectives 105
Well-Written Mission Objectives 106
Composing Mission Objectives 108
Summary 112
Review Questions 113
Chapter 6: Analyzing the Current Database 115
Topics Covered in This Chapter 115
Getting to Know the Current Database 115
Paper-Based Databases 118
Legacy Databases 119
Conducting the Analysis 121
Looking at How Data Is Collected 121
Looking at How Information Is Presented 125
Conducting Interviews 129
Basic Interview Techniques 130
Before You Begin the Interview Process . . . 137
Interviewing Users 137
Reviewing Data Type and Usage 138
Reviewing the Samples 140
Reviewing Information Requirements 144
Interviewing Management 152
Reviewing Current Information Requirements 153
Reviewing Additional Information Requirements 154

ptg14955309
Contents xiii
Reviewing Future Information Requirements 155
Reviewing Overall Information Requirements 155
Compiling a Complete List of Fields 157
The Preliminary Field List 157
The Calculated Field List 164
Reviewing Both Lists with Users and Management 165
Case Study 166
Summary 171
Review Questions 172
Chapter 7: Establishing Table Structures 175
Topics Covered in This Chapter 175
Defining the Preliminary Table List 176
Identifying Implied Subjects 176
Using the List of Subjects 178
Using the Mission Objectives 182
Defining the Final Table List 184
Refining the Table Names 186
Indicating the Table Types 192
Composing the Table Descriptions 192
Associating Fields with Each Table 199
Refining the Fields 202
Improving the Field Names 202
Using an Ideal Field to Resolve Anomalies 206
Resolving Multipart Fields 210
Resolving Multivalued Fields 212
Refining the Table Structures 219
A Word about Redundant Data and Duplicate Fields 219
Using an Ideal Table to Refine Table Structures 220
Establishing Subset Tables 228
Case Study 233
Summary 240
Review Questions 242

ptg14955309
xiv Contents
Chapter 8: Keys 243
Topics Covered in This Chapter 243
Why Keys Are Important 244
Establishing Keys for Each Table 244
Candidate Keys 245
Primary Keys 253
Alternate Keys 260
Non-keys 261
Table-Level Integrity 261
Reviewing the Initial Table Structures 261
Case Study 263
Summary 269
Review Questions 270
Chapter 9: Field Specifications 273
Topics Covered in This Chapter 273
Why Field Specifications Are Important 274
Field-Level Integrity 275
Anatomy of a Field Specification 277
General Elements 277
Physical Elements 285
Logical Elements 292
Using Unique, Generic, and Replica Field Specifications 300
Defining Field Specifications for Each Field in the Database 306
Case Study 308
Summary 310
Review Questions 311
Chapter 10: Table Relationships 313
Topics Covered in This Chapter 313
Why Relationships Are Important 314
Types of Relationships 315
One-to-One Relationships 316
One-to-Many Relationships 319

ptg14955309
Contents xv
Many-to-Many Relationships 321
Self-Referencing Relationships 329
Identifying Existing Relationships 333
Establishing Each Relationship 344
One-to-One and One-to-Many Relationships 345
The Many-to-Many Relationship 352
Self-Referencing Relationships 358
Reviewing the Structure of Each Table 364
Refining All Foreign Keys 365
Elements of a Foreign Key 365
Establishing Relationship Characteristics 372
Defining a Deletion Rule for Each Relationship 372
Identifying the Type of Participation for Each Table 377
Identifying the Degree of Participation for Each Table 380
Verifying Table Relationships with Users and Management 383
A Final Note 383
Relationship-Level Integrity 384
Case Study 384
Summary 389
Review Questions 391
Chapter 11: Business Rules 393
Topics Covered in This Chapter 393
What Are Business Rules? 393
Types of Business Rules 397
Categories of Business Rules 399
Field-Specific Business Rules 399
Relationship-Specific Business Rules 401
Defining and Establishing Business Rules 402
Working with Users and Management 402
Defining and Establishing Field-Specific Business Rules 403
Defining and Establishing Relationship-Specific Business
Rules 412

ptg14955309
xvi Contents
Validation Tables 417
What Are Validation Tables? 419
Using Validation Tables to Support Business Rules 420
Reviewing the Business Rule Specifications Sheets 425
Case Study 426
Summary 431
Review Questions 434
Chapter 12: Views 435
Topics Covered in This Chapter 435
What Are Views? 435
Anatomy of a View 437
Data View 437
Aggregate View 442
Validation View 446
Determining and Defining Views 448
Working with Users and Management 449
Defining Views 450
Reviewing the Documentation for Each View 458
Case Study 460
Summary 465
Review Questions 466
Chapter 13: Reviewing Data Integrity 469
Topics Covered in This Chapter 469
Why You Should Review Data Integrity 470
Reviewing and Refining Data Integrity 470
Table-Level Integrity 471
Field-Level Integrity 471
Relationship-Level Integrity 472
Business Rules 472
Views 473
Assembling the Database Documentation 473
Done at Last! 475

ptg14955309
Contents xvii
Case Study—Wrap-Up 475
Summary 476
PART III: OTHER DATABASE DESIGN ISSUES 477
Chapter 14: Bad Design—What Not to Do 479
Topics Covered in This Chapter 479
Flat-File Design 480
Spreadsheet Design 481
Dealing with the Spreadsheet View Mind-set 483
Database Design Based on the Database Software 485
A Final Thought 486
Summary 487
Chapter 15: Bending or Breaking the Rules 489
Topics Covered in This Chapter 489
When May You Bend or Break the Rules? 489
Designing an Analytical Database 489
Improving Processing Performance 490
Documenting Your Actions 493
Summary 495
In Closing 497
PART IV: APPENDIXES 499
Appendix A: Answers to Review Questions 501
Chapter 1 501
Chapter 2 502
Chapter 3 504
Chapter 4 505
Chapter 5 506
Chapter 6 508
Chapter 7 510

ptg14955309
xviii Contents
Chapter 8 513
Chapter 9 516
Chapter 10 518
Chapter 11 520
Chapter 12 521
Appendix B: Diagram of the Database Design Process 525
Appendix C: Design Guidelines 543
Defining and Establishing Field-Specific Business Rules 543
Defining and Establishing Relationship-Specific Business
Rules 543
Elements of a Candidate Key 544
Elements of a Foreign Key 544
Elements of a Primary Key 545
Rules for Establishing a Primary Key 545
Elements of the Ideal Field 545
Elements of the Ideal Table 546
Field-Level Integrity 546
Guidelines for Composing a Field Description 547
Guidelines for Composing a Table Description 547
Guidelines for Creating Field Names 548
Guidelines for Creating Table Names 548
Identifying Relationships 549
Identifying View Requirements 549
Interview Guidelines 550
Participant Guidelines 550
Interviewer Guidelines 550
Mission Statements 551
Mission Objectives 551
Relationship-Level Integrity 551
Resolving a Multivalued Field 552
Table-Level Integrity 552
Appendix D: Documentation Forms 553

ptg14955309
Contents xix
Appendix E: Database Design Diagram Symbols 557
Appendix F: Sample Designs 559
Appendix G: On Normalization 567
Please Note . . . 568
A Brief Recap 569
How Normalization Is Integrated into My Design Methodology 572
Logical Design versus Physical Design and Implementation 575
Appendix H: Recommended Reading 577
Glossary 579
References 595
Index 597

ptg14955309
This page intentionally left blank

ptg14955309
xxi
Foreword
To the Third Edition
Here it is, ten years later, and Mike and I cross paths even less than
we used to. For those who were unaware, we share the same birth-
day (although he’s much older than me, at least one full year), and we
meet up at least once each year and congratulate ourselves for making
it another year. It’s also funny how Microsoft “reboots” its technology
every ten years or so, and now, revisiting the foreword I wrote ten years
ago, nothing much has changed—I’m still hip-deep in a new Microsoft
technology, but this time it’s all about WinRT and Windows 8, rather
than .NET. One thing that hasn’t changed, however, is the need for
carefully planned and executed database design. Nothing Mike wrote
in his original volume has changed very much, and although this
new edition modifies some details, the basics of good database design
haven’t changed in the ensuing ten years. I must confess a little jeal-
ousy that Mike has written a book with such enduring shelf life, but, if
he’s going to have a book that succeeds for this many years, at least it’s
a good one. Whether this is your first visit to Mike’s detailed explana-
tion of database design, or your second or third, be assured that you’ll
find a carefully considered, helpful path through the vagaries of data-
base design here. But let’s get past the intro, and get to work!
—Ken Getz, November 14, 2012
From the Second Edition . . .
I don’t see Mike Hernandez as much as I used to. Both our profes-
sional lives have changed a great deal since I first wrote the foreword
to his original edition. If nothing else, we travel less, and our paths
cross less often than they did. If you’ll indulge me, I might try to add
that the entire world has changed since that first edition. On the most

ptg14955309
xxii Foreword
mundane level, my whole development life has changed, since I’ve
bought into this Microsoft .NET thing whole-heartedly and full-time.
One thing that hasn’t changed, however, is the constant need for data,
and well-designed data. Slapping together sophisticated applications
with poorly designed data will hurt you just as much now as when
Mike wrote his first edition—perhaps even more. Whether you’re just
getting started developing with data, or are a seasoned pro; whether
you’ve read Mike’s previous book, or this is your first time; whether
you’re happier letting someone else design your data, or you love doing
it yourself—this is the book for you. Mike’s ability to explain these con-
cepts in a way that’s not only clear, but fun, continues to amaze me.
—Ken Getz, October 10, 2002
From the First Edition . . .
Perhaps you’re wondering why the world needs another book on data-
base design. When Mike Hernandez first discussed this book with me,
I wondered. But the fact is—as you may have discovered from leafing
through pages before landing here in the foreword—the world does
need a book like this one. You can certainly find many books detailing
the theories and concepts behind the science of database design, but
you won’t find many (if any) written from Mike’s particular perspec-
tive. He has made it his goal to provide a book that is clearly based
on the sturdy principles of mathematical study, but has geared it
toward practical use instead of theoretical possibilities. No matter what
specific database package you’re using, the concepts in this book will
make sense and will apply to your database-design projects.
I knew this was the book for me when I turned to the beginning of
Chapter 6 and saw this suggestion:
Do not adopt the current database structure as the basis for the new
database structure.

ptg14955309
Foreword xxiii
If I’d had someone tell me this when I was starting out on this data-
base developer path years ago I could have saved a ton of time! And
that’s my point here: Mike has spent many years designing databases
for clients; he has spent lots of time thinking, reading, and studying
about the right way to create database applications; and he has put it
all here, on paper, for the rest of us.
This book is full of the right stuff, illustrated with easy-to-understand
examples. That’s not to say that it doesn’t contain the hardcore infor-
mation you need to do databases right—it does, of course. But it’s
geared toward real developers, not theoreticians.
I’ve spent some time talking with Mike about database design. Over
coffee, in meetings, writing courseware, it’s always the same: Mike is
passionate about this material. Just as the operating system designer
seeks the perfect, elegant algorithm, Mike spends his time looking for
just the right way to solve a design puzzle and—as you will read in
this book—how best to explain it to others. I’ve learned much of what
I know about database design from Mike over the years and feel sure
that I have a lot more to learn from this book. After reading through
this concise, detailed presentation of the information you need to know
in order to create professional databases, I’m sure you’ll feel the same
way.
—Ken Getz, MCW Technologies (KenG@mcwtech.com)

ptg14955309
This page intentionally left blank

ptg14955309
xxv
Preface
Life, as the most ancient
of all metaphors insists, is a journey . . .
—JONATHAN RABAN,
FOR LOVE AND MONEY
Paths may change and
the course may need adjustment,
but the journey continues . . .
—MICHAEL J. HERNANDEZ
DATABASE DESIGN FOR MERE MORTALS®
, S ECOND EDTION
To say that the technology field, and database management in par-
ticular, has changed significantly in the nine years since the second
edition of this book was published would be an understatement, to be
sure. Small, handheld devices containing storage capacity and pro-
cessing power that once would have required several room-sized main-
frame computers are now so ubiquitous that many people take them
for granted, especially the more recent generations. (My young nephew
would likely never understand the excitement I experienced when I
purchased my first 40MB storage expansion card for my IBM PC. But
that’s another story.) Database management systems can now handle
terabytes of data, and there’s recently been a considerable amount of
emphasis on storing, managing, and accessing data “in the cloud.”
Is there still a need, then, for a book such as the one you hold in your
hands? Absolutely! Regardless of how complex or complicated database
management becomes, there will always be a need for a book on the
basics of database design. You must learn the fundamentals in order
to know how and why things work the way they do. This is true of
many other areas of expertise, whether they are technical disciplines
such as architectural design and engineering or artistic disciplines
such as music and cooking.

ptg14955309
xxvi Preface
My journey has taken me along new and different paths in recent
years, and I’m really enjoying what I do. I’ve been doing a lot more
writing lately, which is why I thought it was time to do this new edi-
tion. I thought I’d share some new nuggets of information I’ve learned
along the way and perhaps clarify my perspectives on this subject a
little more. Now that I’ve completed this work, I can’t wait to see where
my journey takes me next.
An important note to readers:
Visit Informit.com/titles/0321884493 to access additional
content referenced in the book.

ptg14955309
xxvii
Acknowledgments
Writing is truly a cooperative effort, despite what you may have heard
about it. I’m so grateful for the editors, colleagues, friends, and family
who continue to be ready and willing to lend their help. These are the
people who provided encouragement and kept me focused on the task
at hand, and it is to them that I extend my most heartfelt appreciation.
First and foremost, I want to thank my wonderful editor, Joan Mur-
ray, for the opportunity to write yet another edition of my book. We
had been talking about this project for a couple of years, and it was
her perseverance, patience, kindness, and leadership that helped me
decide to take on this work and bring it to successful completion. I also
want to thank production editor Caroline Senay for guiding the author
review process with such a deft hand and copy editor Audrey Doyle for
her precise and detailed review of the content. And a special thanks
to John Fuller and his production staff—they did great work, as they
always do! I’ve always had a wonderful relationship with the Addison-
Wesley team, and I just can’t imagine why I’d ever want to write techni-
cal books for anyone else.
Next, I’d like to acknowledge my distinguished technical review team:
Tracy Thornton, Tony Wiggins, and Theodor Richardson. These folks
graciously and generously gave their time, effort, and expertise to pro-
vide me with a wealth of valuable feedback and suggestions. This book
definitely benefitted from their contributions. My thanks once again to
each of you for your time and input and for helping to make this edi-
tion even better than I first envisioned.

ptg14955309
xxviii Acknowledgments
I want to extend a very special thanks to Ken Getz for once again
providing the foreword for my book. Ken is a well-respected expert, a
colleague, and a good friend. I’m so pleased to have his thoughts and
comments at the beginning of the book.
A special thanks also goes to all of those readers who took the time to
send me their thoughts and comments. I am humbled by their praise
and support and particularly appreciative of the good, constructive
criticism that eventually helped me to improve the material in this
edition. I also wish to thank all the academic institutions, government
agencies, and commercial organizations that have adopted my book
and made it “standard reading” for those just beginning their database
careers. I am honored by their support of my work.
Finally, I want to thank my wife for her unending patience while I was
enmeshed in my writing. Her help and support have been invaluable,
and once again, I owe her a great debt. I would tell you exactly how I
feel about her, but she abhors any sort of PDA (public display of affec-
tion). Instead, I’ll just extend her a laurel and hardy handshake.

ptg14955309
xxix
Introduction
Plain cooking cannot be entrusted to plain cooks.
—COUNTESS MORPHY
In the past, the process of designing a database has been a task
performed by people in information technology (IT) departments and
professional database developers. These people usually had mathemat-
ical, computer science, or systems design backgrounds and typically
worked with large mainframe databases. Many of them were experi-
enced programmers and had coded a number of database application
programs consisting of thousands of lines of code. (And these people
were usually very overworked due to the nature and importance of
their work!)
People designing database systems at that time needed to have a solid
educational background because most of the systems they created
were meant to be used companywide. Even when creating databases
for single departments within a company or for small businesses, data-
base designers still required extensive formal training because of the
complexity of the programming languages and database application
programs they were using. As technology advanced, however, those
educational requirements evolved.
Database software programs have evolved quite a bit since the 1980s,
too. Many vendors developed software that ran on desktop computers
and could be more easily programmed to collect, store, and manage
data than their mainframe counterparts. As computing power and
demand for complexity grew, vendors produced software that allowed
groups of people to access and share centralized data within a variety

ptg14955309
xxx Introduction
of environments, such as client/server architectures on computers
connected within local area networks (LANs) and wide area networks
(WANs). People within a company or organization were no longer
strictly dependent on mainframe databases or on having their infor-
mation needs met by centralized IT departments.
The emergence and wide use of the laptop computer and the evolu-
tion and greater acceptance of the Internet have also played a part in
database software development. Laptops have become quite powerful,
with gigabytes of memory and storage, and extremely fast processing
power. They’ve become so ubiquitous that they’ve all but replaced the
desktop computer in many environments. They’ve also allowed people
to be connected to the Internet even in such mundane places as coffee
shops, restaurants, and airports. (And I won’t even mention the pleth-
ora of other devices that now allow the same type of access—that’s for
another book and another discussion.) As such, there’s been a greater
push by both software vendors and businesses to run database soft-
ware and manage databases from the Internet, thus allowing people
to access their applications and data from anywhere at any time. It
will be interesting to see how this whole idea progresses over the next
several years.
Vendors continue to add new features and enhance the tool sets in
their database software, enabling database developers to create more
powerful and flexible database applications. They’re also constantly
improving the ease with which the software can be used, enabling
many people to create their own database applications. Today’s data-
base software greatly simplifies the process of creating efficient data-
base structures and intuitive user interfaces.
Most programs provide sample database structures that you can copy
and alter to suit your specific needs. Although you might initially
think that it would be quite advantageous for you to use these sam-
ple structures as the basis for a new database, you should stop and

ptg14955309
Introduction xxxi
reconsider that move for a moment. Why? Because you could easily
and unwittingly create an improper, inefficient, and incomplete design.
Then you would eventually encounter problems in what you believed to
be a dependable database design. This, of course, raises the question,
“What types of problems would I encounter?”
Most problems that surface in a database fall into two categories:
application problems and data problems. Application problems include
such things as problematic data entry/edit forms, confusing menus
and toolbars, confusing dialog boxes, and tedious task sequences.
These problems typically arise when the database developer is inexpe-
rienced, is unfamiliar with a good application design methodology, or
knows too little about the software he’s using to implement the data-
base. Problems of this nature are common and important to address,
but they are beyond the scope of this work.
❖Note One good way to solve many of your application prob-
lems is to purchase and study third-party “developer” books that
cover the software you’re using. Such books discuss application
design issues, advanced programming techniques, and various
tips and tricks that you can use to improve and enhance an
application. Armed with these new skills, you can revamp and
fine-tune the database application so that it works correctly,
smoothly, and efficiently.
Data problems, on the other hand, include such things as missing
data, incorrect data, mismatched data, and inaccurate information.
Poor database design is typically the root cause of these types of prob-
lems. A database will not fulfill an organization’s information require-
ments if it is not structured properly. Although poor design is typically
generated by a database developer who lacks knowledge of good data-
base design principles, it shouldn’t necessarily reflect negatively on

ptg14955309
xxxii Introduction
the developer. Many people, including experienced programmers and
database developers, have had little or no instruction in any form of
database design methodology. Many are unaware that design method-
ologies even exist. Data problems and poor design are the issues that
this work will address.
What’s New in the Third Edition
I revised this edition to improve readability, update or extend existing
topics, add new content, and enhance its educational value. Here is a
list of the changes you’ll find in this edition.
• Portions of the text have been rewritten to improve clarity and
reader comprehension.
• Figures have been updated for improved relevance as
appropriate.
• The discussion on data types has been updated.
• The Recommended Reading section includes the latest editions of
the books and now includes each book’s ISBN.
• A new appendix on Normalization very briefly explains the con-
cept and then explains in detail how it is incorporated into the
design process presented in this book.
Visit Informit.com/titles/0321884493 to access additional content ref-
erenced in the book.
Who Should Read This Book
No previous background in database design is necessary to read this
book. The reason you have this book in your hands is to learn how
to design a database properly. If you’re just getting into database

ptg14955309
Who Should Read This Book xxxiii
management and you’re thinking about developing your own data-
bases, this book will be very valuable to you. It’s better that you learn
how to create a database properly from the beginning than that you
learn by trial and error. Believe me, the latter method takes much
longer.
If you fall into the category of those people who have been working
with database programs for a while and are ready to begin developing
new databases for your company or business, you should read this
book. You probably have a good feel for what a good database structure
should look like, but aren’t quite sure how database developers arrive
at an effective design. Maybe you’re a programmer who has created a
number of databases following a few basic guidelines, but you have
always ended up writing a lot of code to get the database to work prop-
erly. If this is the case, this book is also for you.
It would be a good idea for you to read this book even if you already
have some background in database design. Perhaps you learned a
design methodology back in college or attended a database class that
discussed design, but your memory is vague about some details, or
there were parts of the design process that you just did not completely
understand. Those points with which you had difficulty will finally
become clear once you learn and understand the design process pre-
sented in this book.
This book is also appropriate for those of you who are experienced
database developers and programmers. Although you may already
know many of the aspects of the design process presented here, you’ll
probably find that there are some elements that you’ve never before
encountered or considered. You may even come up with fresh ideas
about how to design your databases by reviewing the material in this
book because many of the design processes familiar to you are pre-
sented here from a different viewpoint. At the very least, this book can
serve as a great refresher course in database design.

ptg14955309
xxxiv Introduction
The Purpose of This Book
In general terms, there are three phases to the overall database devel-
opment process.
1. Logical design: The first phase involves determining and defin-
ing tables and their fields, establishing primary and foreign
keys, establishing table relationships, and determining and
establishing the various levels of data integrity.
2. Physical implementation: The second phase entails creating the
tables, establishing key fields and table relationships, and using
the proper tools to implement the various levels of data integrity.
3. Application development: The third phase involves creating an
application that allows a single user or group of users to interact
with the data stored in the database. The application develop-
ment phase itself can be divided into separate processes, such
as determining end-user tasks and their appropriate sequences,
determining information requirements for report output, and
creating a menu system for navigating the application.
You should always go through the logical design first and execute it as
completely as possible. After you’ve created a sound structure, you can
then implement it within any database software you choose. As you
begin the implementation phase, you may find that you need to modify
the database structure based on the pros and cons or strengths and
weaknesses of the database software you’ve chosen. You may even
decide to make structural modifications to enhance data processing
performance. Performing the logical design first ensures that you
make conscious, methodical, clear, and informed decisions concern-
ing the structure of your database. As a result, you help minimize the
potential number of further structural modifications you might need to
make during the physical implementation and application development
phases.

ptg14955309
The Purpose of This Book xxxv
This book deals with only the logical design phase of the overall devel-
opment process, and the book’s main purpose is to explain the process
of relational database design without using the advanced, orthodox
methodologies found in an overwhelming majority of database design
books. I’ve taken care to avoid the complexities of these methodologies
by presenting a relatively straightforward, commonsense approach to
the design process. I also use a simple and straightforward data mod-
eling method as a supplement to this approach, and present the entire
process as clearly as possible and with a minimum of technical jargon.
There are many database design books out on the market that include
chapters on implementing the database within a specific database
product, and some books even seem to meld the design and implemen-
tation phases together. (I’ve never particularly agreed with the idea
of combining these phases, and I’ve always maintained that a data-
base developer should perform the logical design and implementation
phases separately to ensure maximum focus, effectiveness, and effi-
ciency.) The main drawback that I’ve encountered with these types of
books is that it can be difficult for a reader to obtain any useful or rele-
vant information from the implementation chapters if he or she doesn’t
work with the particular database software or programming language
that the book incorporates. It is for this reason that I decided to write a
book that focuses strictly on the logical design of the database.
This book should be easier to read than other books you may have
encountered on the subject. Many of the database design books on the
market are highly technical and can be difficult to assimilate. I think
most of these books can be confusing and overwhelming if you are not
a computer science major, database theorist, or experienced database
developer. The design principles you’ll learn within these pages are
easy to understand and remember, and the examples are common and
generic enough to be relevant to a wide variety of situations.
Most people I’ve met in my travels around the country have told me
that they just want to learn how to create a sound database structure

ptg14955309
xxxvi Introduction
without having to learn about normal forms or advanced mathematical
theories. Many people are not as worried about implementing a struc-
ture within a specific database software program as they are about
learning how to optimize their data structures and how to impose data
integrity. In this book, you’ll learn how to create efficient database
structures, how to impose several levels of data integrity, as well as
how to relate tables together to obtain information in an almost infinite
number of ways. Don’t worry; this isn’t as difficult a task as you might
think. You’ll be able to accomplish all of this by understanding a few
key terms and by learning and using a specific set of commonsense
techniques and concepts.
You’ll also learn how to analyze and leverage an existing database,
determine information requirements, and determine and implement
business rules. These are important topics because many of you will
probably inherit old databases that you’ll need to revamp using what
you’ll learn by reading this book. They’ll also be just as important
when you create a new database from scratch.
When you finish reading this book, you’ll have the knowledge and tools
necessary to create a good relational database structure. I’m confident
that this entire approach will work for a majority of developers and the
databases they need to create.
How to Read This Book
I strongly recommend that you read this book in sequence from begin-
ning to end, regardless of whether you are a novice or a professional.
You’ll keep everything in context this way and avoid the confusion
that generally comes from being unable to see the “big picture” first.
It’s also a good idea to learn the process as a whole before you begin to
focus on any one part.

ptg14955309
How This Book Is Organized xxxvii
If you are reading this book to refresh your design skills, you could
read just those sections that are of interest to you. As much as pos-
sible, I’ve tried to write each chapter so that it can stand on its own;
nonetheless, I still recommend that you glance through each chapter
to make sure you’re not missing any new ideas or points on design that
you may not have considered up to now.
How This Book Is Organized
Here’s a brief overview of what you’ll find in each part and each
chapter.
Part I: Relational Database Design
This section provides an introduction to databases, the idea of data-
base design, and some of the terminology you’ll need to be familiar
with in order to learn and understand the design process presented in
this book.
Chapter 1, “The Relational Database,” provides a brief discussion of
the types of databases you’ll encounter, common database models, and
a brief history of the relational database.
Chapter 2, “Design Objectives,” explores why you should be concerned
with design, points out the objectives and advantages of good design,
and provides a brief introduction to Normalization and normal forms.
Chapter 3, “Terminology,” covers the terms you need to know in order
to learn and understand the design methodology presented in this book.
Part II: The Design Process
Each aspect of the database design process is discussed in detail in
Part II, including establishing table structures, assigning primary

ptg14955309
xxxviii Introduction
keys, setting field specifications, establishing table relationships, set-
ting up views, and establishing various levels of data integrity.
Chapter 4, “Conceptual Overview,” provides an overview of the design
process, showing you how the different components of the process fit
together.
Chapter 5, “Starting the Process,” covers how to define a mission
statement and mission objectives for the database, both of which pro-
vide you with an initial focus for creating your database.
Chapter 6, “Analyzing the Current Database,” covers issues concern-
ing the existing database. We look at reasons for analyzing the current
database, how to look at current methods of collecting and presenting
data, why and how to conduct interviews with users and management,
and how to compile initial field lists.
Chapter 7, “Establishing Table Structures,” covers topics such as
determining and defining what subjects the database should track,
associating fields with tables, and refining table structures.
Chapter 8, “Keys,” covers the concept of keys and their importance to
the design process, as well as how to define candidate and primary
keys for each table.
Chapter 9, “Field Specifications,” covers a topic that a number of data-
base developers tend to minimize. Besides indicating how each field
is created, field specifications determine the very nature of the values
a field contains. Topics in this chapter include the importance of field
specifications, types of specification characteristics, and how to define
specifications for each field in the database.
Chapter 10, “Table Relationships,” explains the importance of table
relationships, types of relationships, setting up relationships, and
establishing relationship characteristics.

ptg14955309
How This Book Is Organized xxxix
Chapter 11, “Business Rules,” covers types of business rules, deter-
mining and establishing business rules, and using validation tables.
Business rules are very important in any database because they pro-
vide a distinct level of data integrity.
Chapter 12, “Views,” looks into the concept of views and why they are
important, types of views, and how to determine and set up views.
Chapter 13, “Reviewing Data Integrity,” reviews each level of integrity
that has been defined and discussed in previous chapters. Here you
learn that it’s a good idea to review the final design of the database
structure to ensure that you’ve imposed data integrity as completely as
you can.
Part III: Other Database Design Issues
This section deals with topics such as avoiding bad design and bend-
ing the rules set forth in the design process.
Chapter 14, “Bad Design—What Not to Do,” covers the types of designs
you should avoid, such as a flat-file design and a spreadsheet design.
Chapter 15, “Bending or Breaking the Rules,” discusses those rare
instances in which it may be necessary to stray from the techniques
and concepts of the design process. This chapter tells you when you
should consider bending the rules, as well as how it should be done.
Part IV: Appendixes
These appendices provide information that I thought would be valuable
to you as you’re learning about the database design process and when
you’re working on developing your database.
Appendix A, “Answers to Review Questions,” contains the answers to
all of the review questions in Chapters 1 through 12.

ptg14955309
xl Introduction
Appendix B, “Diagram of the Database Design Process,” provides a
diagram that maps the entire database design process.
Appendix C, “Design Guidelines,” provides an easy reference to the
various sets of design guidelines that appear throughout the book.
Appendix D, “Documentation Forms,” provides blank copies of the
Field Specifications, Business Rule Specifications, and View Specifica-
tions sheets, which you can copy and use on your database projects.
Appendix E, “Database Design Diagram Symbols,” contains a quick
and easy reference to the diagram symbols used throughout the book.
Appendix F, “Sample Designs,” contains sample database designs that
can serve as the basis for ideas for databases you may want or need to
create.
Appendix G, “On Normalization,” provides a discussion on how I incor-
porated Normalization into my design methodology.
Appendix H, “Recommended Reading,” provides a list of books that
you should read if you are inte rested in pursuing an in-depth study of
database technology.
Glossary contains concise definitions of various words and phrases
used throughout the book.
IMPORTANT: READ THIS SECTION!
A Word About the Examples and
Techniques in This Book
You’ll notice that there are a wide variety of examples in this book.
I’ve made sure that they are as generic and relevant as possible. How-
ever, you may notice that several of the examples are rather simplified,

ptg14955309
A Word About the Examples and Techniques in This Book xli
incomplete, or occasionally even incorrect. Believe it or not, I created
them that way on purpose.
I’ve created some examples with errors so that I could illustrate spe-
cific concepts and techniques. Without these examples, you wouldn’t
see how the concepts or techniques are put to use, as well as the
results you should expect from using them. Other examples are simple
because, once again, the focus is on the technique or concept and not
on the example itself. For instance, there are many ways that you can
design an order-tracking database. However, the structure of the sam-
ple order-tracking database I use in this book is simple because the
focus is specifically on the design process, not on creating an elaborate
order-tracking database system.
So what I’m really trying to emphasize here is this:
Focus on the concept or technique and its intended results, not
on the example used to illustrate it.
A New Approach to Learning
Here’s an approach to learning the design process (or pretty much any-
thing else, for that matter) that I’ve found very useful in my database
design classes.
Think of all the techniques used in the design process as a set of tools;
each tool (or technique) is used for a specific purpose. The idea here
is that once you learn how a tool is used generically, you can then use
that tool in any number of situations. The reason you can do this is
because you use the tool the same way in each situation.
Take a Crescent wrench, for example. Generically speaking, you use
a Crescent wrench to fasten and unfasten a nut to a bolt. You open or
close the jaw of the wrench to fit a given bolt by using the adjusting
screw located on the head of the wrench. Now that you’re clear about its
use, try using it on a few bolts. Try it on the legs of an outdoor chair, or

ptg14955309
xlii Introduction
the fan belt cover on an engine, or the side panel of an outdoor cooling
unit, or the hinge plates of an iron gate. Do you notice that regard-
less of where you encounter a nut and bolt, you can always fasten and
unfasten the nut by using the Crescent wrench in the same manner?
The tools used to design a database work in exactly the same way.
Once you understand how a tool is used generically, it will work the
same way regardless of the circumstances under which it is used. For
instance, consider the tool (or technique) for decomposing a field value.
Say you have a single ADDRESS field in a CUSTOMERS table that con-
tains the street address, city, state, and zip code for a given customer.
You’ll find it difficult to use this field in your database because it
contains more than one item of data; you’ll certainly have a hard time
retrieving information for a particular city or sorting the information
by a specific zip code.
The solution to this apparent dilemma is to decompose the ADDRESS
field into smaller fields. You do this by identifying the distinct items
that make up the value of the field, and then treating each item as its
own separate field. That’s all there is to it! This process constitutes a
“tool” that you can now use on any field containing a value composed
of two or more distinct data items, such as these sample fields. The
following table shows the results of the decomposition process.
Current Field Name Sample Value New Field Names
Address 7402 Kingman Dr., Seattle,
WA 98012
Street Address, City,
State, Zip Code
Phone (206) 555-5555 Area Code, Phone
Number
Name Michael J. Hernandez First Name, Middle
Initial, Last Name
EmployeeCode ITDEV0516 Department, Category,
ID Number

ptg14955309
A Word About the Examples and Techniques in This Book xliii
❖Note You’ll learn more about decomposing field values in
Chapter 7, “Establishing Table Structures.”
You can use all of the techniques (“tools”) that are part of the design
process presented in this book in the same manner. You’ll be able to
design a sound database structure using these techniques regardless
of the type of database you need to create. Just be sure to remember
this:
Focus on the concept or technique being presented and its
intended results, not on the example used to illustrate it.

ptg14955309
This page intentionally left blank


ptg14955309
This page intentionally left blank

ptg14955309
3
1
The Relational Database
A fish must swim three times—
in water, in butter, and in wine.
—POLISH PROVERB
Topics Covered in This Chapter
Types of Databases
Early Database Models
The Relational Database Model
Relational Database Management Systems
Beyond the Relational Model
What the Future Holds
Summary
Review Questions
The relational database has been in existence for more than 40 years.
It spawned a multibillion-dollar industry, is the most widely used type
of database in the world today, and is an essential part of our everyday
lives. It is very likely that you are using a relational database every
time you purchase goods online or at a local store, make travel plans
with your travel agent, check out books at the library, or make a pur-
chase on the Internet.
Before we delve into the design process, let’s take a look at a brief his-
tory of the relational database—where it came from, where it is now,
and where it’s likely to go in the future.

ptg14955309
4 Chapter 1 The Relational Database
Types of Databases
What is a database? As you probably know, a database is an organized
collection of data used for the purpose of modeling some type of orga-
nization or organizational process. It really doesn’t matter whether
you’re using paper or a computer application program to collect and
store the data. As long as you’re gathering data in some organized
manner for a specific purpose, you’ve got a database. Throughout the
remainder of this discussion, we’ll assume that you’re using an appli-
cation program to collect and maintain your data.
There are two types of databases in database management, opera-
tional databases and analytical databases.
Operational databases are the backbone of many companies, organiza-
tions, and institutions throughout the world. This type of database is
primarily used in online transaction processing (OLTP) scenarios, that
is, in situations where there is a need to collect, modify, and main-
tain data on a daily basis. The type of data stored in an operational
database is dynamic, meaning that it changes constantly and always
reflects up-to-the-minute information. Organizations such as retail
stores, manufacturing companies, hospitals and clinics, and publish-
ing houses use operational databases because their data is in a con-
stant state of flux.
In contrast, analytical databases are primarily used in online analyt-
ical processing (OLAP) scenarios, where there is a need to store and
track historical and time-dependent data. An analytical database is
a valuable asset when there is a need to track trends, view statistical
data over a long period of time, and make tactical or strategic business
projections. This type of database stores static data, meaning that the
data is never (or very rarely) modified. The information gleaned from
an analytical database reflects a point-in-time snapshot of the data.
Chemical labs, geological companies, and marketing analysis firms are
examples of organizations that use analytical databases.

ptg14955309
Early Database Models 5
Analytical databases often use data from operational databases as
their main data source, so there can be some amount of association
between them; nevertheless, operational and analytical databases
fulfill very specific types of data processing needs and creating their
structures requires radically different design methodologies. This book
focuses on designing an operational database because it is still the
most commonly used type of database in the world today.
Early Database Models
In the days before the relational database model, two data models were
commonly used to maintain and manipulate data—the hierarchical
database model and the network database model.
❖Note I’ve provided a brief overview of each of these models for
historical purposes only. In an overall sense, I believe it is use-
ful for you to know what preceded the relational model so that
you have a basic understanding of what led to its creation and
evolution.
In the following overview I briefly describe how the data in each
model is structured and accessed, how the relationship between
a pair of tables is represented, and one or two of the advantages
or disadvantages of each model.
Some of the terms you’ll encounter in this section are explained in
more detail in Chapter 3, “Terminology.”
The Hierarchical Database Model
Data in this type of database is structured hierarchically and is
typically diagrammed as an inverted tree. A single table in the data-
base acts as the “root” of the inverted tree and other tables act as the
ptg14955309
6 Chapter 1 The Relational Database
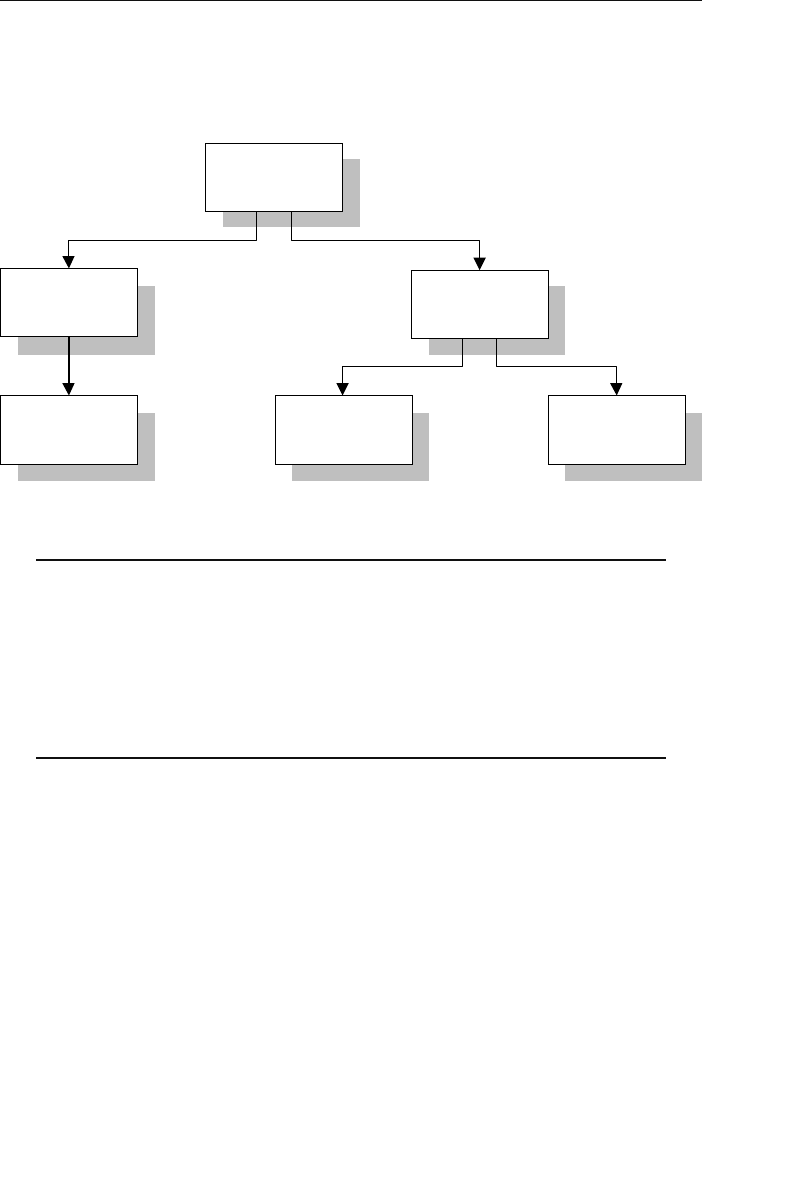
branches flowing from the root. Figure 1.1 shows a diagram of a typi-
cal hierarchical database structure.
Payments
Clients
Agents
Entertainers
Schedule Engagements
Figure 1.1 Diagram of a typical hierarchical database
Agents Database
In the example shown in Figure 1.1, an agent books several
entertainers, and each entertainer has his own schedule. An
agent also maintains a number of clients whose entertain-
ment needs are met by the agent. A client books engagements
through the agent and makes payments to him for his services.
A relationship in a hierarchical database is represented by the term
parent/child. In this type of relationship, a parent table can be associ-
ated with one or more child tables, but a single child table can be asso-
ciated with only one parent table. These tables are explicitly linked
via a pointer or by the physical arrangement of the records within
the tables. A user accesses data within this model by starting at the
root table and working down through the tree to the target data. This
access method requires the user to be very familiar with the structure
of the database.

ptg14955309
Early Database Models 7
One advantage to using a hierarchical database is that a user can
retrieve data very quickly because there are explicit links between the
table structures. Another advantage is that referential integrity is built
in and automatically enforced. This ensures that a record in a child
table must be linked to an existing record in a parent table, and that
a record deleted in the parent table will cause all associated records in
the child table to be deleted as well.
❖Note In the following examples, table names within the text
appear in all capital letters (such as VENDORS) and field names
within the text appear in small capital letters (such as VENDOR ID
NUMBER).
A problem occurs in a hierarchical database when a user needs to
store a record in a child table that is currently unrelated to any record
in a parent table. Consider an example using the Agents database
shown in Figure 1.1. A user cannot enter a new entertainer in the
ENTERTAINERS table until the entertainer is assigned to an agent
in the AGENTS table. Recall that a record in a child table (in this
case, ENTERTAINERS) must be related to a record in the parent table
(AGENTS). Yet in real life, entertainers commonly sign up with the
agency well before they are assigned to specific agents. This scenario
is difficult to model in a hierarchical database. The rules can be bent
without breaking them if a dummy agent record is inserted in the
AGENTS table; however, this option is not really optimal.
This type of database cannot support complex relationships, and there
is often a problem with redundant data. For example, there is a many-
to-many relationship between clients and entertainers—an entertainer
will perform for many clients, and a client will hire many entertain-
ers. You can’t directly model this type of relationship in a hierarchical
database, so you’ll have to introduce redundant data into both the
SCHEDULE and ENGAGEMENTS tables.

ptg14955309
8 Chapter 1 The Relational Database
• The SCHEDULE table will now have client data (such as client
name, address, and phone number) to show for whom and where
each entertainer is performing. This particular data is redundant
because it is currently stored in the CLIENTS table.
• The ENGAGEMENTS table will now contain data on entertainers
(such as entertainer name, phone number, and type of enter-
tainer) to indicate which entertainers are performing for a given
client. This data is redundant as well because it is currently
stored in the ENTERTAINERS table.
The problem with this redundancy is that it opens up the possibility of
allowing a user to enter a single piece of data inconsistently. This, in
turn, can result in producing inaccurate information.
A user can solve this problem in a roundabout manner by creating
one hierarchical database specifically for entertainers and another
specifically for agents. The new Entertainers database will contain
only the ENTERTAINERS table, and the revised Agents database will
contain the AGENTS, CLIENTS, PAYMENTS, and ENGAGEMENTS
tables. The SCHEDULE table is no longer needed in the Entertainers
database because you can define a logical child relationship between
the ENGAGEMENTS table in the Agents database and the ENTER-
TAINERS table in the Entertainers database. With this relationship in
place, you can retrieve a variety of information, such as a list of booked
entertainers for a given client or a performance schedule for a given
entertainer. Figure 1.2 shows a diagram of the new model.
As you can see, a person designing a hierarchical database must be
able to recognize the need to use this technique for a many-to-many
relationship. Here the need is relatively obvious, but many relation-
ships are more obscure and may not be discovered until very late in
the design process or, more disturbingly, well after the database has
been put into operation.

ptg14955309
Early Database Models 9
The hierarchical database lent itself well to the tape storage systems
used by mainframes in the 1970s and was very popular in companies
that used those systems. But, despite the fact that the hierarchical
database provided fast and direct access to data and was useful in a
number of circumstances, it was clear that a new database model was
needed to address the growing problems of data redundancy and com-
plex relationships among data.
The Network Database Model
The network database was, for the most part, developed as an attempt
to address some of the problems of the hierarchical database. The
structure of a network database is represented in terms of nodes and set
structures. Figure 1.3 shows a diagram of a typical network database.
A node represents a collection of records, and a set structure estab-
lishes and represents a relationship in a network database. It is a
Agents
Clients
Entertainers
Engagements Payments
Entertainers Database
Agents Database
Logical Child
Relationship
Figure 1.2 Using two hierarchical databases to resolve a many-to-many
relationship
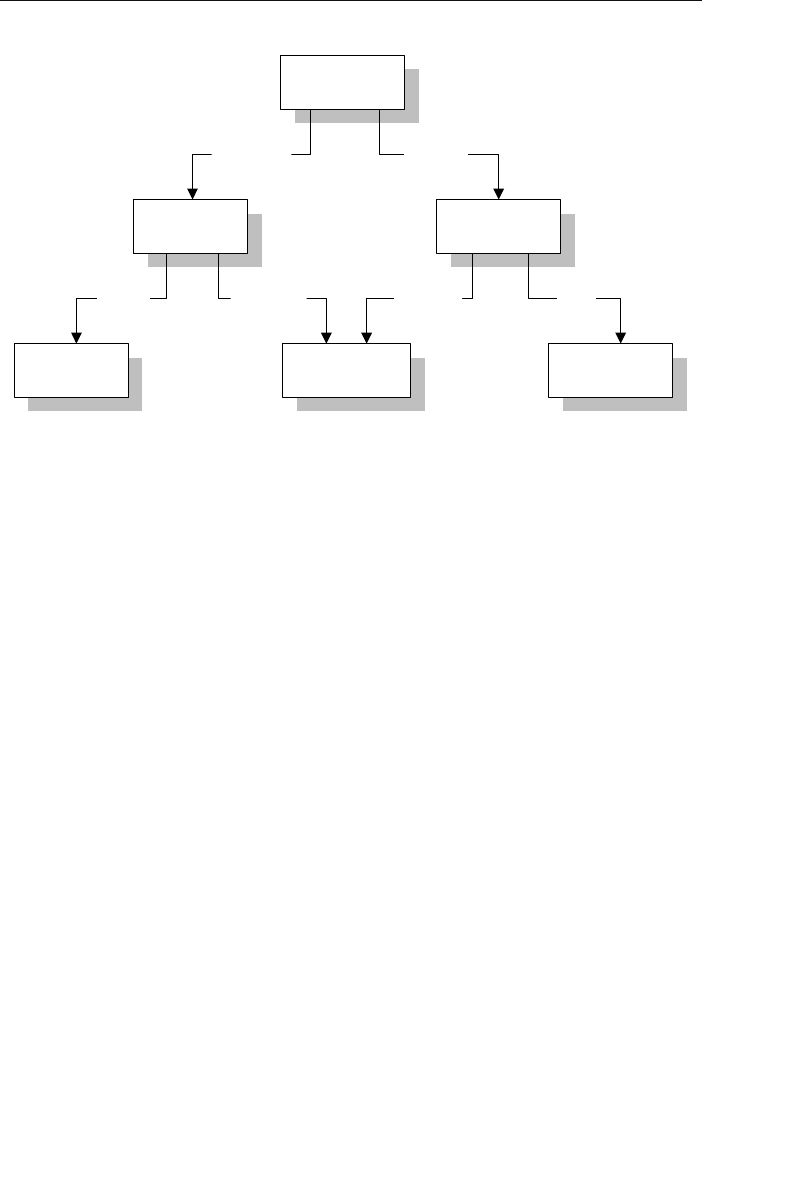
ptg14955309
10 Chapter 1 The Relational Database
transparent construction that relates a pair of nodes together by using
one node as an owner and the other node as a member. (This is a valu-
able improvement on the parent/child relationship.) A set structure
supports a one-to-many relationship, which means that a record in the
owner node can be related to one or more records in the member node,
but a single record in the member node is related to only one record
in the owner node. Additionally, a record in the member node cannot
exist without being related to an existing record in the owner node. For
example, a client must be assigned to an agent, but an agent with no
clients can still be listed in the database. Figure 1.4 shows a diagram
of a basic set structure.
One or more sets (connections) can be defined between a specific
pair of nodes, and a single node can also be involved in other sets
with other nodes in the database. In Figure 1.3, for instance, the
CLIENTS node is related to the PAYMENTS node via the Make set
structure. It is also related to the ENGAGEMENTS node via the Sched-
ule set structure. Along with being related to the CLIENTS node, the
Agents
Clients
Engagements
Entertainers
Musical StylesPayments
Represent Manage
Make Schedule PlayPerform
Figure 1.3 Diagram of a typical network database

ptg14955309
Early Database Models 11
ENGAGEMENTS node is related to the ENTERTAINERS node via the
Perform set structure.
A user can access data within a network database by working through
the appropriate set structures. Unlike the hierarchical database, where
access must begin from a root table, a user can access data from
within the network database, starting from any node and working
backward or forward through related sets. Consider the Agents data-
base in Figure 1.3 once again. Say a user wants to find the agent who
booked a specific engagement. She begins by locating the appropriate
engagement record in the ENGAGEMENTS node, and then determines
which client “owns” that engagement record via the Schedule set
structure. Finally, she identifies the agent that “owns” the client record
via the Represent set structure. The user can answer a wide variety of
questions as long as she navigates properly through the appropriate
set structures.
One advantage the network database provides is fast data access. It
also allows users to create queries that are more complex than those
they created using a hierarchical database. A network database’s main
disadvantage is that a user has to be very familiar with the structure
Agents
Clients
Represent
Owner Node
Set Structure
Member Node
1
M
Figure 1.4 A basic set structure

ptg14955309
12 Chapter 1 The Relational Database
of the database in order to work through the set structures. Consider
the Agents database in Figure 1.3 once again. It is incumbent on the
user to be familiar with the appropriate set structures if she is to
determine whether a particular engagement has been paid. Another
disadvantage is that it is not easy to change the database structure
without affecting the application programs that interact with it. Recall
that a relationship is explicitly defined as a set structure in a network
database. You cannot change a set structure without affecting the
application programs that use this structure to navigate through the
data. If you change a set structure, you must also modify all references
made from within the application program to that structure.
Although the network database was clearly a step up from the hierar-
chical database, a few people in the database community believed that
there must be a better way to manage and maintain large amounts of
data. As each data model emerged, users found that they could ask
more complex questions, thereby increasing the demands made upon
the database. And so we come to the relational database model.
The Relational Database Model
The relational database was first conceived in 1969 and is still one
of the most widely used database models in database management
today. The father of the relational model, Dr. Edgar F. Codd, was an
IBM research scientist in the late 1960s and was at that time looking
into new ways to handle large amounts of data. His dissatisfaction
with the database models and database products of the time led him
to begin thinking of ways to apply the disciplines and structures of
mathematics to solve the myriad problems he had been encountering.
Being a mathematician by profession, he strongly believed that he
could apply specific branches of mathematics to solve problems such
as data redundancy, weak data integrity, and a database structure’s
over dependence on its physical implementation.

ptg14955309
The Relational Database Model 13
Dr. Codd formally presented his new relational model in a landmark
work entitled “A Relational Model of Data for Large Shared Data-
banks”1 in June 1970. He based his new model on two branches of
mathematics—set theory and first-order predicate logic. Indeed, the
name of the model itself is derived from the term relation, which is part
of set theory. (A widely held misconception is that the relational model
derives its name from the fact that tables within a relational database
can be related to one another.)
A relational database stores data in relations, which the user perceives
as tables. Each relation is composed of tuples, or records, and attri-
butes, or fields. (I’ll use the terms tables, records, and fields through-
out the remainder of the book.) The physical order of the records or
fields in a table is completely immaterial, and each record in the table
is identified by a field that contains a unique value. These are the two
characteristics of a relational database that allow the data to exist
independent of the way it is physically stored in the computer. As such,
a user isn’t required to know the physical location of a record in order
to retrieve its data. This is unlike the hierarchical and network data-
base models in which knowing the layout of the structures is crucial to
retrieving data.
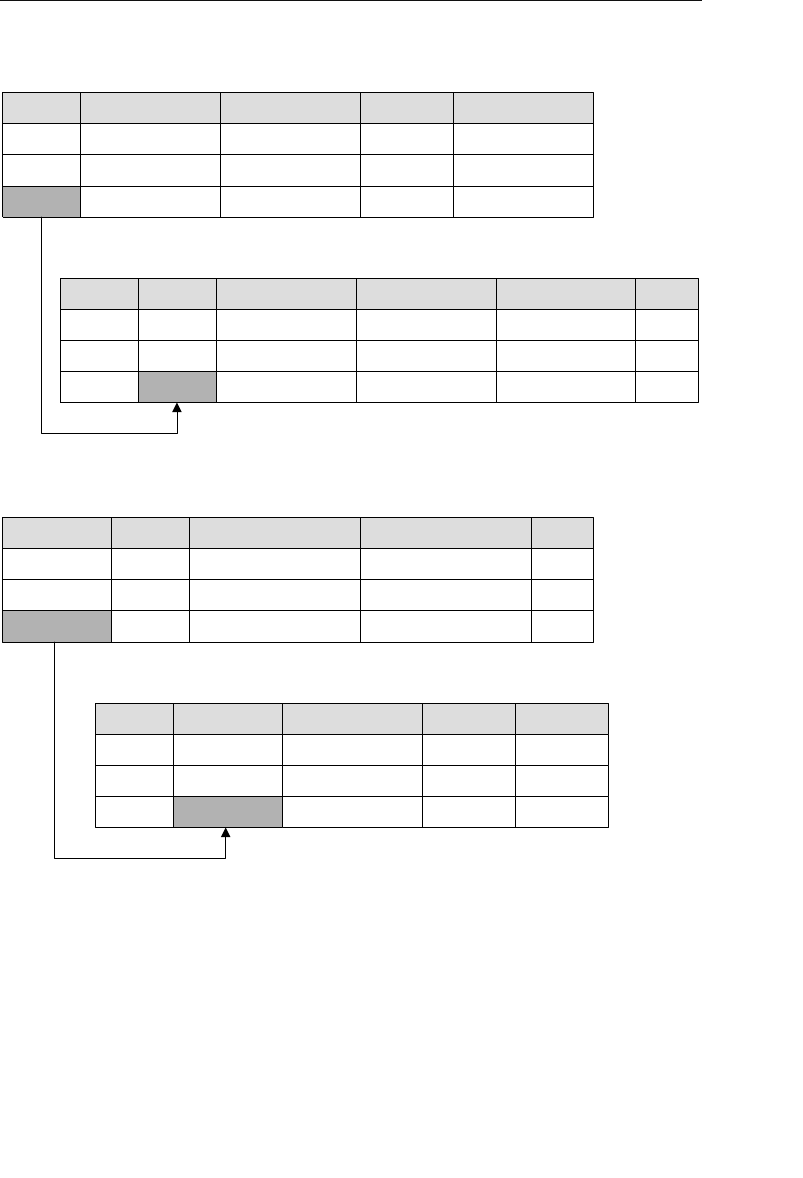
The relational model categorizes relationships as one-to-one, one-to-
many, and many-to-many. (These relationships are covered in detail
in Chapter 10, “Table Relationships.”) A relationship between a pair of
tables is established implicitly through matching values of a shared
field. In Figure 1.5, for example, the CLIENTS and AGENTS tables are
related via an Agent ID field; a specific client is associated with an
agent through a matching Agent ID. Likewise, the ENTERTAINERS
and ENGAGEMENTS tables are related via an Entertainer ID; a record
in the ENTERTAINERS table can be associated with a record in the
ENGAGEMENTS table through matching Entertainer IDs.
1. Edgar F. Codd, “A Relational Model of Data for Large Shared Databanks,” Communi-
cations of the ACM, June 1970, 377–87.
ptg14955309
14 Chapter 1 The Relational Database
Agent ID
100
101
102
Agent First Name
Mike
Greg
Katherine
Agent Home Phone
553-3992
790-3992
551-4993
Date of Hire
05/16/11
10/15/11
03/01/12
Agent Last Name
Hernandez
Johnson
Ehrlich
Client ID
9001
9002
9003
Client First Name
Stewart
Susan
Estela
Client Home Phone
553-3992
790-3992
551-4993
Client Last Name
Jameson
Black
Rosales
Agent ID
100
101
102
......
......
......
......
Client ID
9003
9009
9001
Entertainer ID
3001
3000
3002
Start Time
1:00 PM
9:00 PM
3:00 PM
Engagement Date
04/01/12
04/13/12
05/02/12
Stop Time
3:30 PM
1:30 AM
6:00 PM
Entertainer ID
3000
3001
3002
Entertainer First Name
John
Mark
Teresa
Entertainer Last Name
Slade
Jebavy
Weiss
......
......
......
......
Agent ID
100
101
102
Agents
Clients
Entertainers
Engagements
Figure 1.5 Examples of related tables in a relational database
As long as a user is familiar with the relationships among the tables
in the database, he can access data in an almost unlimited number
of ways. He can access data from tables that are directly related and
from tables that are indirectly related. Consider the Agents database

ptg14955309
The Relational Database Model 15
in Figure 1.5. Although the CLIENTS table is indirectly related to
the ENGAGEMENTS table, the user can produce a list of clients and
the entertainers who have performed for them. (Of course, it really
depends on how the tables are actually structured, but I digress. This
example serves our purpose for now.) He can do this easily because
CLIENTS is directly related to ENGAGEMENTS and ENGAGEMENTS is
directly related to ENTERTAINERS.
Retrieving Data
You retrieve data in a relational database by using Structured Query
Language (SQL). SQL is the standard language used to create, mod-
ify, maintain, and query relational databases. The following shows a
sample SQL query statement you can use to produce a list of all clients
in the city of El Paso:
SELECT ClientLastName, ClientFirstName, ClientPhoneNumber
FROM Clients
WHERE City = "El Paso"
ORDER BY ClientLastName, ClientFirstName
The three components of a basic SQL query are the SELECT…FROM
statement, the WHERE clause, and the ORDER BY clause. You use the
SELECT clause to indicate the fields you want to use in the query and
the FROM clause to indicate the table(s) to which the fields belong. You
can filter the records the query returns by imposing criteria against
one or more fields with the WHERE clause, and then sort the results in
ascending or descending order with the ORDER BY clause.
Most of today’s major relational database software programs incor-
porate various forms of SQL implementations, ranging from windows
in which users can manually enter “raw” SQL statements to tools
that allow users to build queries using various graphic elements. For
example, a user working with R:BASE Technologies’ R:BASE can opt
to build and execute SQL query statements directly from a command
prompt, while someone using Microsoft SQL Server may find it easier

ptg14955309
16 Chapter 1 The Relational Database
to build queries using SQL Server’s graphical query builder. Regardless
of how the queries are built, the user can save them for future use.
It’s not always necessary for you to know SQL in order to work with a
database. If your database software provides a graphical query builder
or you’re using a custom-built application to work with the data in
your database, you’ll never need to write a single SQL statement. It’s
a good idea, however, for you to gain a basic understanding of SQL. It
will help those of you using query-building tools to understand and
troubleshoot the queries you create with these tools, and it will defi-
nitely be to your advantage should you need to work with high-end
database software programs, such as Oracle and Microsoft SQL Server.
❖Note Although a detailed discussion of SQL is beyond the
scope of this book, you should understand that SQL is a lan-
guage directly related to the relational database model. If you
have a desire or need to study SQL, you could start by reading
my second book, SQL Queries for Mere Mortals®
, Second Edition,
and then move on to any of the other SQL books that I have
listed in Appendix H, “Recommended Reading.”
Advantages of a Relational Database
The relational database provides a number of advantages over previous
models, such as the following.
•Built-in multilevel integrity: Data integrity is built into the model
at the field level to ensure the accuracy of the data; at the table
level to ensure that records are not duplicated and to detect
missing primary key values; at the relationship level to ensure
that the relationship between a pair of tables is valid; and at the
business level to ensure that the data is accurate in terms of

ptg14955309
The Relational Database Model 17
the business itself. (Integrity is discussed in detail as the design
process unfolds.)
•Logical and physical data independence from database applica-
tions: Neither changes a user makes to the logical design of the
database, nor changes a database software vendor makes to the
physical implementation of the database, will adversely affect the
applications built upon it.
•Guaranteed data consistency and accuracy: Data is consis-
tent and accurate due to the various levels of integrity you can
impose within the database. (This will become quite clear as you
work through the design process.)
•Easy data retrieval: At the user’s command, data can be retrieved
either from a particular table or from any number of related
tables within the database. This enables a user to view informa-
tion in an almost unlimited number of ways.
These and other advantages have proved beneficial to the business
community and to all those who need to collect and manage data.
Indeed, the relational database has become the database of choice in
many circumstances.
One commonly perceived disadvantage of the relational database
was that software programs based on it ran very slowly. This was not
a fault of the relational model itself, but of the ancillary technology
available at the time of the model’s introduction. Processing speed,
memory, and storage were simply insufficient to provide database soft-
ware vendors with a platform on which to build a full implementation
of the relational database, so the initial relational database software
programs fell woefully short of their full potential. Advances in both
hardware technology and software engineering over the past 20 years
have made processing speed an insignificant issue and have allowed
vendors to make significant gains in their efforts to support the model
more fully.

ptg14955309
18 Chapter 1 The Relational Database
You’ll learn more about the relational database model as you work
through the design process presented in this book. Some of the topics
you’ll encounter include creating tables, establishing data integrity,
working with relationships, and establishing business rules.
Relational Database Management
Systems
A relational database management system (RDBMS) is a software appli-
cation program you use to create, maintain, modify, and manipulate a
relational database. Many RDBMS programs also provide the tools you
need to create end-user applications that interact with the data stored
in the database. Of course, the quality of an RDBMS is a direct func-
tion of the extent to which it supports the relational database model.
Even among “true” RDBMSs, support for the relational database varies
among vendors, and there is yet to be a full implementation of the rela-
tional model’s potential. Despite this, all RDBMS programs continue to
evolve and become more full-featured and powerful than ever before.
In the earliest days of the relational database, RDBMSs were writ-
ten for use on mainframe computers. (Didn’t everything start on a
mainframe?) Two RDBMS programs prevalent in the early 1970s were
System R, developed by IBM at its San Jose Research Laboratory in
California, and Interactive Graphics Retrieval System (INGRES), devel-
oped at the University of California at Berkeley. These two programs
contributed greatly to the general appreciation of the relational model.
As the benefits of the relational database became more widely known,
many companies decided to make a slow move from hierarchical and
network database models to the relational database model, thus cre-
ating a need for more and better mainframe RDBMS programs. The
1980s saw the development of various commercial RDBMSs for main-
frame computers by companies such as Oracle and IBM.

ptg14955309
Beyond the Relational Model 19
The early to mid-1980s saw the rise of the personal computer, and
with it the development of PC-based RDBMS programs. Some of the
early entries in this category, from companies such as Ashton-Tate and
Fox Software, were nothing more than elementary file-based database
management systems. True PC-based RDBMS programs began to
emerge with products developed by companies such as Microrim and
Ansa Software. These companies helped to spread the idea and poten-
tial of database management from the mainframe-dominated domain
of information systems departments to the desktop of the common end
user.
The need to share data became apparent as more and more users
worked with databases throughout the late 1980s and early 1990s.
The concept of a centrally located database that could be made avail-
able to multiple users seemed a very promising idea. This would cer-
tainly make data management and database security much easier to
implement. Database vendors such as Microsoft and Oracle responded
to this need by developing client/server RDBMS programs.
In a client/server environment, the data resides on a computer acting
as a database server, and users interact with the data through appli-
cations residing on their own computers, or database client. The data-
base developer uses the client/server RDBMS program to create and
maintain the database and attendant end-user application programs.
She implements data integrity and data security on the database
server, giving her the ability to base a variety of user applications on
the same set of data without affecting the data’s integrity or security.
Beyond the Relational Model
Although RDBMSs have been widely accepted for use in typical busi-
ness applications such as inventory control, patient management,
banking, order processing, and event scheduling, they proved to be

ptg14955309
20 Chapter 1 The Relational Database
somewhat lacking for such applications as computer-aided design
(CAD), geographic information systems (GIS), and multimedia storage
systems. Two new database models eventually emerged in response
to this problem: the object-oriented database and the object-relational
database.
The object-oriented model incorporates all of the characteristics of an
object-oriented programming language and essentially relegates the
relational database to the status of a data store. The fundamental
idea here is that the database developer handles every aspect of the
database, including the sets of operations that manipulate the data in
the database from within the object-oriented database programming
software. No longer is there a clear separation between the database
software and the application programming software. (As with any
other model, there are pros and cons to this approach.) Versant Corpo-
ration and IBM are two vendors that produce object-oriented database
software.
Unlike the relational model, which has a solid theoretical basis in two
distinct branches of mathematics, the object-oriented database model
has no specific theoretical foundation. As such, there is no singular,
cohesive consensus as to its definition. There is, however, a version
of the model defined by the Object Management Group (OMG) that is
somewhat of a de facto standard for object-oriented database manage-
ment systems.
❖Note The OMG is a nonprofit international group that
addresses the issues of object standards. It was founded in
1989 and comprises more than 800 member organizations. It is
important to note that the OMG is not a standards body, such as
the American National Standards Institute (ANSI), but merely an
advisory and certification group.

ptg14955309
What the Future Holds 21
The object-relational model (formerly known as the extended relational
data model), on the other hand, extended the relational database model
by incorporating various object-oriented elements and characteristics,
such as classes, encapsulation, and inheritance. The idea was that
these extensions would allow a relational database to manage and
manipulate more complex types of data, such as audio streams, video
clips, and architectural drawings. Vendors that have produced appli-
cation programs based on this model include companies such as IBM,
Oracle, Microsoft, and the PostgreSQL Global Development Group.
What the Future Holds
The manner in which databases are used has evolved immensely in
the past several years. There came a time when many organizations
began to realize that there was a lot of useful information that could
be gathered from data they stored in various relational and nonrela-
tional databases. This prompted them to question whether there was a
way to mine the data for useful analytical information that they could
then use to make critical business decisions. Furthermore, they won-
dered if they could consolidate and integrate their data into a viable
knowledgebase for their organizations. Indeed, these would be difficult
questions to answer.
IBM proposed the idea of a data warehouse, which, as originally
conceived, would allow organizations to access data stored in any
number of nonrelational databases. They were unsuccessful in their
first attempts at implementing data warehouses, primarily because
of the complexities and performance problems associated with such a
task. It has been only since the 1990s that the implementation of data
warehouses has become more viable and practical. Bill Inmon, widely
regarded as the father of the data warehouse, is a strong and vocal
advocate of the technology and has been instrumental in its evolution.
Data warehouses are now more commonplace as companies move to

ptg14955309
22 Chapter 1 The Relational Database
leverage the vast amounts of data they’ve stored in their databases
over the years.
The Internet has had a significant impact on the way organizations use
databases. Many companies and businesses use the Web to expand
their consumer base, and much of the data they share with and gather
from these consumers is stored in a database. Developers commonly
use eXtensible Markup Language (XML) to assemble and consolidate
data from various relational and nonrelational systems. There has
been a considerable effort by various vendors to get their clients to
create databases and store data in the “cloud,” that is, a location that
is completely apart from the client’s location. The idea is that the client
can access data from the “cloud” database via the Internet from any-
where at any time. Given the broad emergence and use of connected
devices within the past few years (as of this writing), it will be interest-
ing to see how database management systems evolve within this type
of environment.
A Final Note
RDBMSs now have a long history, and they continue to play a huge
role in the way people, businesses, and organizations interact with
their data. Their role is constantly expanding and evolving as data
becomes more accessible via the Internet and businesses move at an
ever-increasing pace to expand their presence on the Web. Numerous
organizations are heavily invested in their relational database systems,
and they are not likely to disappear anytime soon.
Summary
We opened this chapter by defining the two types of databases cur-
rently used in database management: operational databases and ana-
lytical databases.

ptg14955309
Summary 23
We then briefly discussed the hierarchical database model and the
network database model. Our discussion covered the data structures,
relationships, and data access methods used in both models, as well as
their chief disadvantages. You learned that these models were widely
used in the early days of database management and led to the eventual
development and introduction of the relational database model.
Next, we provided a detailed discussion of the relational database
model, its history, and its features. We noted that it is based on specific
branches of mathematics and that this mathematical foundation is what
makes the model so structurally sound. Then we explored the model’s
data structures and relationships, and the role SQL plays in accessing
data within the model. You’ll remember, no doubt, that SQL is the stan-
dard language used to work with relational databases. We ended this
section by reviewing the advantages of the relational database model.
We then took a look at a brief history of relational database manage-
ment systems, beginning with the mainframe systems of the early
1970s and progressing through the PC-based systems of the 1980s to
the client/server systems of the 1990s. At this point you should have a
sense of the progression of circumstances that have led to the develop-
ment of the database systems we use today.
The chapter continued with a brief discussion of the object-relational
and object-oriented database models. Here you learned that these
models emerged ostensibly as a means to deal with advanced database
applications, and that they each incorporate various object-oriented
elements and characteristics.
Finally, we closed the chapter with a brief discussion of data ware-
houses and accessing data via the Internet. You learned that data
warehouses are used to consolidate and integrate data from hetero-
geneous sources and that the possibility of truly using them has
only recently become more viable and practical. Next, you learned
that XML is a common tool for assembling data across relational and

ptg14955309
24 Chapter 1 The Relational Database
nonrelational data sources and that there is an ever-growing move-
ment to store and manage data “in the cloud.” You should now under-
stand that relational databases are likely to be used for quite some
time, despite the great impact the Internet has had on the way organi-
zations use databases.
In the next chapter, we’ll discuss why you should be concerned with
database design and why theory is important. We’ll also cover the
objectives and advantages of good design.
Review Questions
1. Name the two main types of databases in use today.
2. What type of data does an analytical database store?
3. True or False: An operational database is used primarily in online
transaction processing (OLTP) scenarios.
4. What two data models were commonly used in the days before the
relational database model?
5. Describe a parent/child relationship.
6. What is a set structure?
7. Name one of the branches of mathematics on which the relational
model is based.
8. How does a relational database store data?
9. Name the three types of relationships in a relational database.
10. How do you retrieve data in a relational database?
11. State two advantages of a relational database.
12. What is a relational database management system?
13. What is the premise behind the object-relational model?
14. What is the purpose of a data warehouse?

ptg14955309
25
2
Design Objectives
Everything factual is, in a sense, theory.
The blue of the sky exhibits the basic laws of chromatics.
There is no sense in looking for something behind phenomena;
they are theory.
—GOETHE
Topics Covered in This Chapter
Why Should You Be Concerned with Database Design?
The Importance of Theory
The Advantage of Learning a Good Design Methodology
Objectives of Good Design
Benefits of Good Design
Database Design Methods
Normalization
Summary
Review Questions
Why Should You Be Concerned with
Database Design?
Some of you who work with relational database management sys-
tem (RDBMS) application programs may wonder why you should be
concerned with database design. After all, most programs come with
sample databases that you can copy and modify to suit your own

ptg14955309
26 Chapter 2 Design Objectives
needs, and you can even borrow tables from the sample databases and
use them in other databases that you’ve created. Some programs also
provide tools that will guide you through the process of defining and
creating tables. However, these tools don’t actually help you design a
database—they merely help you create the physical tables that you will
include in the database.
What you must understand is that it’s better for you to use these tools
after you’ve created the logical database structure. RDBMS programs
provide the design tools and the sample databases to help minimize
the time it takes you to implement the database structure physically.
Theoretically, reducing implementation time gives you more time to
focus on creating and building end-user applications.
Yet the primary reason you should be concerned with database design
is that it is crucial to the consistency, integrity, and accuracy of the
data in a database. If you design a database improperly, it will be diffi-
cult for you to retrieve certain types of information, and you’ll run the
risk that your searches will produce inaccurate information. Inaccurate
information is probably the most detrimental result of improper database
design—it can adversely affect your organization’s bottom line. In fact, if
your database affects the manner in which your business performs its
daily operations or if it’s going to influence the future direction of your
business, you must be concerned with database design.
Let’s look at this from a different perspective for a moment: Think
about how you would go about having a custom home built. What’s the
first thing you’re going to do? Certainly you’re not going to hire a con-
tractor immediately and let him build your home however he wishes.
Surely you will first engage an architect to design your new home and
then hire a contractor to build it. The architect will explore your needs
and express them as a set of blueprints, recording decisions about
size and shape and requirements for various systems (structural,
mechanical, electrical). Next, the contractor will procure the labor

ptg14955309
The Importance of Theory 27
and materials, including the listed systems, and then assemble them
according to the drawings and specifications.
Now let’s return to our database perspective and think of the logi-
cal database design as the architectural blueprints and the physical
database implementation as the completed home. The logical data-
base design describes the size, shape, and necessary systems for your
database and it addresses the informational and operational needs of
your business. You then build the physical implementation of the logi-
cal database design using your RDBMS program. Once you’ve created
your tables, set up table relationships, and established the appropriate
levels of data integrity, your database is complete. Now you’re ready to
design and create applications that allow you and your users to inter-
act easily with the data stored in the database, and you can be con-
fident that these applications will provide you with timely and, above
all, accurate information.
Although you can implement a poor design in an RDBMS, implement-
ing a good design is far more to your advantage because it will yield
accurate information, store data more efficiently and effectively, and be
easier for you to manage and maintain.
The Importance of Theory
❖Note In this chapter, I use the term theory to represent “gen-
eral propositions used as principles” and not “conjectures or
proposals.”
A number of major disciplines (and their associated design methodolo-
gies) have some type of theoretical basis. Structural engineers design
an unlimited variety of structures using the theories of physics. Com-
posers create beautiful symphonies and orchestral pieces using the

ptg14955309
28 Chapter 2 Design Objectives
concepts found in music theory. The automobile industry uses aerody-
namics theories to design more fuel-efficient vehicles. The aerospace
industry uses the same theories to design airplane wings that reduce
wind drag.
These examples demonstrate that theory is relevant and very import-
ant. The chief advantage of theory is that it helps you predict out-
comes; it allows you to predict what will happen if you perform a
certain action or series of actions. You know if you drop a stone, it will
fall to the ground. If you are agile, you can get your toes out of the way
of Newton’s theory of gravity. The point is that it works every time. If
you chisel a stone flat and place it on another flat stone, you can pre-
dict that it will stay where you put it. This theory allows you to design
pyramids and cathedrals and brick outhouses. Now consider a data-
base example. Let’s assume you have a pair of tables that are related to
each other. You know that you can draw data from both tables simul-
taneously simply because of the way relational database theory works.
The data you draw from both tables is based on matching values of a
shared field between the tables themselves. Again, your actions have a
predictable result.
The relational database is based on two branches of mathematics
known as set theory and first-order predicate logic. This very fact is
what allows the relational database to guarantee accurate information.
These branches of mathematics also provide the basis for formulating
good design methodologies and the building blocks necessary to create
good relational database structures.
You might harbor an understandable reluctance to study complicated
mathematical concepts simply to carry out what seems to be a rather
limited task. You’re still sure to hear claims that the mathematical
theories on which the relational database and its associated design
methodologies are based don’t have any relevance to the real world, or
that they are somehow impractical. This is not true: Math is central

ptg14955309
The Advantage of Learning a Good Design Methodology 29
to the relational model and is what guarantees the model’s viability.
But cheer up—it isn’t really necessary for you to know anything about
set theory or first-order predicate logic in order to use a relational
database! You certainly don’t have to know all the details of aerody-
namics just to drive an automobile. Aerodynamics theories may help
you understand and appreciate how an automobile can get better gas
mileage, but they won’t help you learn how to parallel park.
Mathematical theory provides the foundation for the relational data-
base model, and thus makes the model predictable, reliable, and
sound. Theory describes the basic building blocks used to create
a relational database and provides guidelines for how it should be
arranged. Arranging building blocks to achieve a desired result is
defined as “design.”
The Advantage of Learning a Good
Design Methodology
You could learn how to design a database properly by trial and error,
but it would take you a very long time and you would probably have to
repair many mistakes along the way. The best approach is to learn a
good database design methodology, such as the one in this book, and
then embark on designing your database.
You’ll gain several advantages from learning and using a good design
methodology.
•It gives you the skills you need to design a sound database
structure. A large number of data processing problems can be
attributed to the presence of redundant data, duplicate data, and
invalid data, or the absence of required data. All of these prob-
lems produce erroneous information and make certain queries
and reports difficult to run. You can avoid almost all of these
problems by employing a good design methodology.

ptg14955309
30 Chapter 2 Design Objectives
•It provides you with an organized set of techniques that will guide
you step-by-step through the design process. The organization of
the techniques enables you to make informed decisions on every
aspect of your design.
•It helps you keep your missteps and design reiterations to a min-
imum. Of course, you will naturally make some mistakes when
you’re designing a database, but a good methodology helps you
recognize errors in your design and gives you the tools to correct
them. Additionally, the organization of the techniques within the
methodology keeps you from unnecessarily repeating a given
design process.
•It makes the design process easier and reduces the amount of time
you spend designing the database. You will inevitably waste valu-
able time taking an arbitrary trial-and-error approach to design
because it lacks the logic and organization that a good methodol-
ogy provides.
•It will help you understand and use your RDBMS application
program more fully and effectively. As your knowledge of proper
design expands and grows, you’ll actually begin to understand
why a given RDBMS provides certain tools and how you can use
them to implement the structure within the RDBMS program.
Regardless of whether you use the design methodology presented in
this book or some other established methodology, you should choose a
design methodology, learn it as well as you can, and use it faithfully to
design your databases.
Objectives of Good Design
There are distinct objectives you must achieve in order to design a
good, sound database structure. You can avoid many of the problems

ptg14955309
Benefits of Good Design 31
mentioned in the previous section if you keep these objectives in mind
and constantly focus on them while you’re designing your database.
•The database supports both required and ad hoc information
retrieval. The database must store the data necessary to support
information requirements defined during the design process and
any possible ad hoc queries that may be posed by a user.
•The tables are constructed properly and efficiently. Each table in
the database represents a single subject, is composed of relatively
distinct fields, keeps redundant data to an absolute minimum,
and is identified throughout the database by a field with unique
values.
•Data integrity is imposed at the field, table, and relationship levels.
These levels of integrity help guarantee that the data structures
and their values will be valid and accurate at all times.
•The database supports business rules relevant to the organization.
The data must provide valid and accurate information that is
always meaningful to the business.
•The database lends itself to future growth. The database structure
should be easy to modify or expand as the information require-
ments of the business change and grow.
You might find it difficult at times to fulfill these objectives, but you’ll
certainly be pleased with your final database structure once you’ve
met them.
Benefits of Good Design
The time you invest in designing a sound database structure is time
well spent. Good design saves you time in the long run because you
do not constantly have to revamp a quickly and poorly designed

ptg14955309
32 Chapter 2 Design Objectives
structure. You gain the following benefits when you apply good design
techniques.
•The database structure is easy to modify and maintain. Modifica-
tions you make to a field or table will not adversely affect other
fields or tables in the database.
•The data is easy to modify. Changes you make to the value of a
given field in a table will not adversely affect the values of other
fields within the table. Furthermore, a well-designed database
keeps duplicate fields to an absolute minimum, so you typically
modify a particular data value in one field only.
•Information is easy to retrieve. You’ll be able to create queries eas-
ily because the tables are well constructed and the relationships
between them are properly established.
•End-user applications are easy to develop and build. You can
spend more time on programming and addressing the data
manipulation tasks at hand, instead of working around the inev-
itable problems that arise when you work with a poorly designed
database.
Database Design Methods
Traditional Design Methods
In general, traditional methods of database design incorporate three
phases: requirements analysis, data modeling, and Normalization.
The requirements analysis phase involves an examination of the busi-
ness being modeled, interviews with users and management to assess
the current system and to analyze future needs, and an assessment of
information requirements for the business as a whole. This process is
relatively straightforward, and, indeed, the design process presented in
this book follows the same line of thinking.
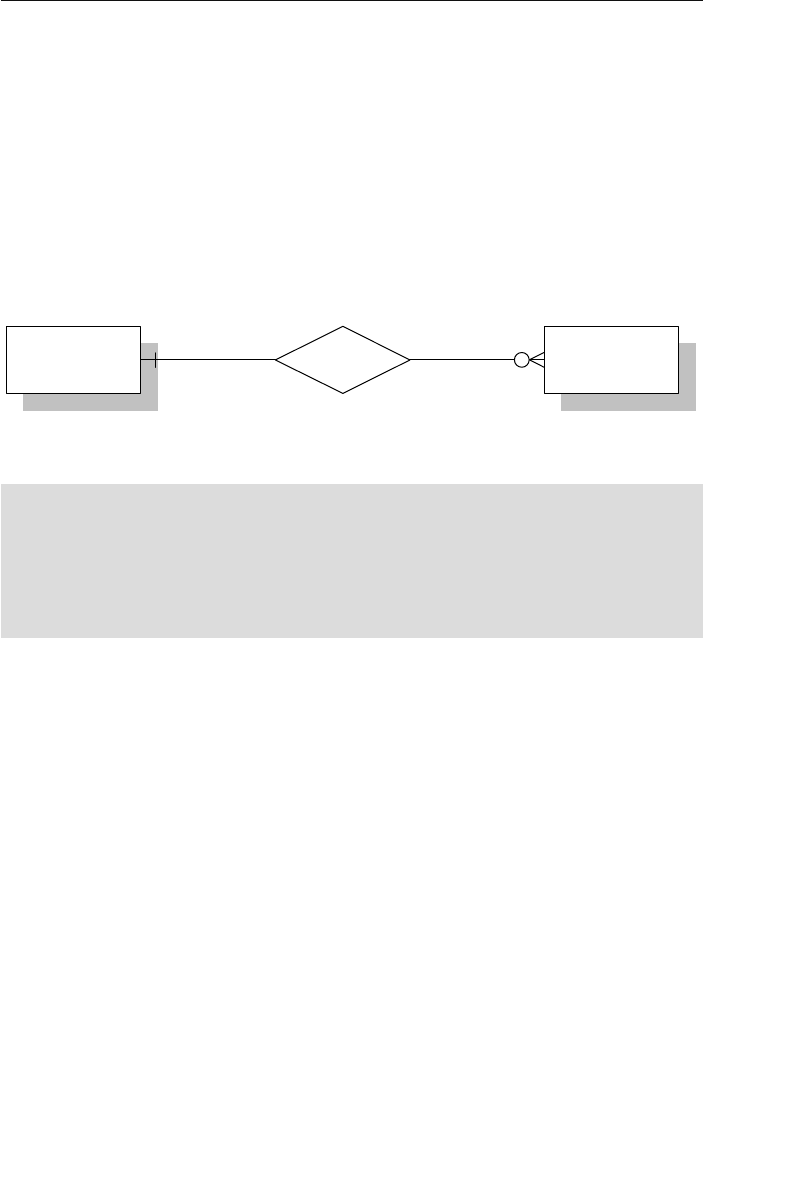
ptg14955309
Database Design Methods 33
The data modeling phase involves modeling the database structure
using a data modeling method, such as entity-relationship (ER) dia-
gramming, semantic-object modeling, object-role modeling, or UML
modeling. Each of these modeling methods provides a means of visu-
ally representing various aspects of the database structure, such as
the tables, table relationships, and relationship characteristics. In fact,
the modeling method used in this book is a basic version of ER dia-
gramming. Figure 2.1 shows an example of a basic ER diagram.
Agents 1:N Clients
Figure 2.1 An example of a basic ER diagram
❖Note I’ve incorporated the data modeling method I use in this
book into the design process itself rather than treating it sep-
arately. I’ll introduce and explain each modeling technique as
appropriate throughout the process.
Each data modeling method incorporates a set of diagramming sym-
bols used to represent a database’s structure and characteristics. For
example, the diagram in Figure 2.1 provides information on several
aspects of the database.
• The rectangles represent two tables called AGENTS and
CLIENTS.
• The diamond represents a relationship between these two tables,
and the “1:N” within the diamond indicates that it is a one-to-
many relationship.
• The vertical line next to the AGENTS table indicates that a client
must be associated with an agent, and the circle next to the

ptg14955309
34 Chapter 2 Design Objectives
CLIENTS table indicates that an agent doesn’t necessarily have
to be associated with a client.
Fields are also defined and associated with the appropriate tables
during the data modeling phase. Each table is assigned a primary key,
various levels of data integrity are identified and implemented, and
relationships are established via foreign keys. Once the initial table
structures are complete and the relationships have been established
according to the data model, the database is ready to go through the
Normalization phase.
Normalization is the process of decomposing large tables into smaller
ones in order to eliminate redundant data and duplicate data, and
to avoid problems with inserting, updating, or deleting data. During
the Normalization process, table structures are tested against nor-
mal forms and then modified if any of the aforementioned problems
are found. A normal form is a specific set of rules that can be used to
test a table structure to ensure that it is sound and free of problems.
There are a number of normal forms, and each one is used to test for
a particular set of problems. The normal forms currently in use are
First Normal Form, Second Normal Form, Third Normal Form, Fourth
Normal Form, Fifth Normal Form, Sixth Normal Form, Boyce-Codd
Normal Form, and Domain/Key Normal Form.
The Design Method Presented in This Book
The design method that I use in this book is one that I’ve developed
over the years. It incorporates a requirements analysis and a simple
ER diagramming method to diagram the database structure. However,
it does not incorporate the traditional Normalization process or involve
the use of normal forms. The reason is simple: Normal forms can be
confusing to anyone who has not taken the time to study formal rela-
tional database theory. For example, examine the following definition
of Third Normal Form:

ptg14955309
Normalization 35
A relvar is in 3NF if and only if it is in 2NF and every non-key attri-
bute is nontransitively dependent on the primary key.1
This description is relatively meaningless to a reader who is unfamiliar
with the terms relvar, 3NF, 2NF, non-key attribute, transitively depen-
dent, and primary key.
The process of designing a database is not and should not be hard to
understand. As long as the process is presented in a straightforward
manner and each concept or technique is clearly explained, anyone
should be able to design a database properly. For example, the follow-
ing definition is derived from the results of using Third Normal Form
against a table structure, and I believe most people will find it clear
and easy to understand:
A table should have a field that uniquely identifies each of its records,
and each field in the table should describe the subject that the table
represents.
The process I used to formulate this definition is the same one I used
to develop my entire design methodology.
Normalization
Back in the late 1980s, it occurred to me that the relational model
had been in existence for almost 20 years and that people had been
designing databases using the same basic methodology for about
twelve years. (And I’m still surprised we’re using it some 20+ years
later.) I was using the traditional design methodology at that time, but
I occasionally found it difficult to employ. The two things that bothered
me the most abou t it were the Normalization process (as a whole) and
the seemingly endless iterations it took to arrive at a proper design. Of
course, these seemed to be sore points with most of the other database
1. C. J. Date, An Introduction to Database Systems, 7th ed. (Boston: Addison-Wesley,
2000), 362; emphasis added.
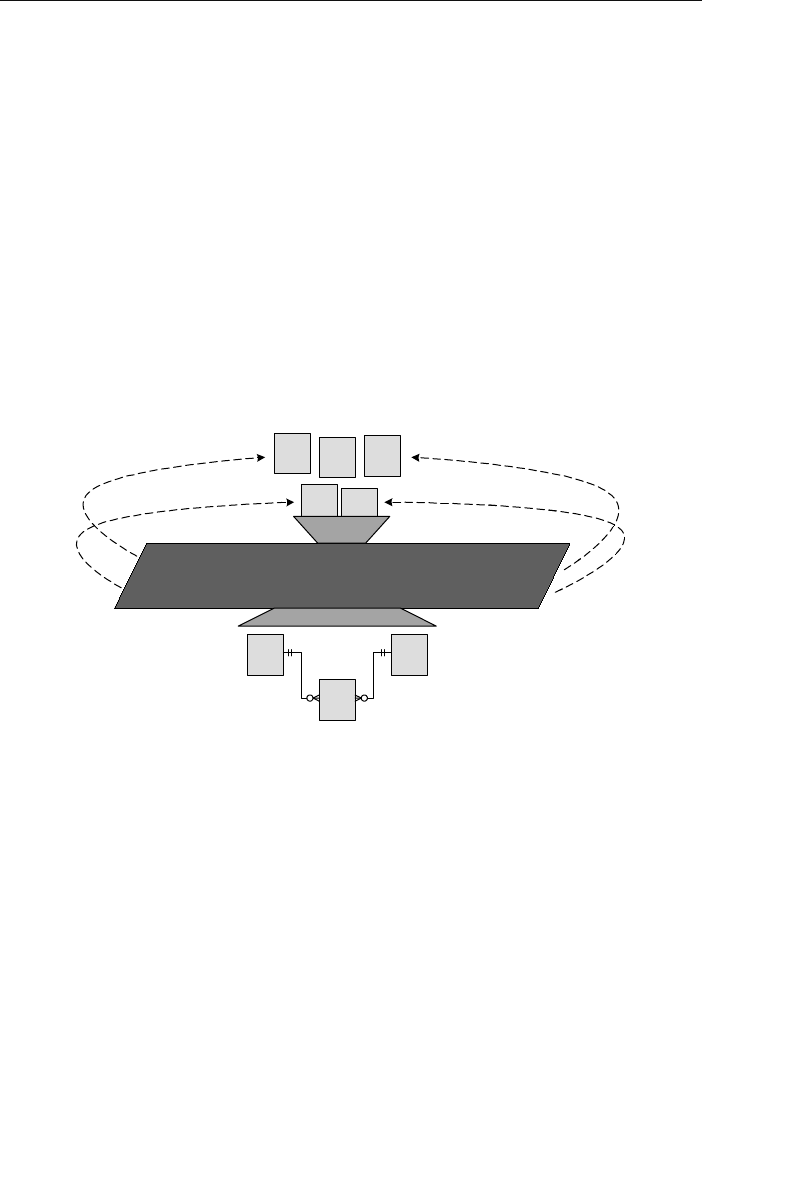
ptg14955309
36 Chapter 2 Design Objectives
developers that I knew, so I certainly wasn’t alone in my frustrations. I
thought about these problems for quite some time, and then I came up
with a solution.
I already knew that the purpose of Normalization is to take an improp-
erly or poorly designed table and transform it into a table with a sound
structure. I also understood the process: Take a given table and test it
against the normal forms to determine whether it is properly designed.
If it isn’t designed properly, make the appropriate modifications, retest
it, and repeat the entire process until the table structure is sound. Fig-
ure 2.2 shows how I visualized the process at this point.
Normalization Process
Non-normalized Tables
Normalized Tables
Figure 2.2 How I viewed the general Normalization process
I kept these facts in mind and then posed the following questions.
1. If we assume that a thoroughly normalized table is properly and
efficiently designed, couldn’t we identify the specific character-
istics of such a table and state these to be the attributes of an
ideal table structure?
2. Couldn’t we then use that ideal table as a model for all tables we
create for the database throughout the design process?

ptg14955309
Normalization 37
The answer to both questions, of course, is yes, so I began in earnest
to develop the basis for my “new” design methodology. I first compiled
distinct sets of guidelines for creating sound structures by identifying
the final characteristics of a well-defined database that successfully
passed the tests of each normal form. I then conducted a few tests,
using the new guidelines to create table structures for a new database
and to correct flaws in the table structures of an existing database.
These tests went very well, so I decided to apply this technique to
the entire traditional design methodology. I formulated guidelines to
address other issues associated with the traditional design method,
such as domains, subtypes, relationships, data integrity, and referen-
tial integrity. After I completed the new guidelines, I performed more
tests and found that my methodology worked quite well.
The main advantage of my design methodology is that it removes many
aspects of the traditional design methodology that new database devel-
opers find intimidating. For example, Normalization, in the traditional
sense, is now transparent to the developer because it is incorporated
(via the new guidelines) throughout the design process. Another major
advantage is that the methodology is clear and easy to implement. I
believe much of this is due to the fact that I’ve written all the guidelines
in plain English, making them easy for most anyone to understand.
It’s important for you to understand that this design methodology will
yield a fully normalized database structure only if you follow it as faith-
fully as you would any other design methodology. You cannot shortcut,
circumvent, de-emphasize, or omit any part of this methodology (or
any design methodology, for that matter) and expect to develop a sound
structure. You must go through the process diligently, methodically,
and completely in order to reap the expected rewards.
❖Note I’ve provided a more detailed explanation of how I incor-
porated Normalization into my design methodology in Appendix G,
“On Normalization.”

ptg14955309
38 Chapter 2 Design Objectives
There are a few basic terms you’ll have to learn before you delve into
the design process, and we’ll cover them in the next chapter.
Summary
At the beginning of this chapter we looked at the importance of being
concerned with database design. You now understand that database
design is crucial to the integrity and consistency of the data contained
in a database. We have seen that the chief problem resulting from
improper or poor design is inaccurate information. Proper design is of
paramount concern because bad design can adversely affect the infor-
mation used by an organization.
Next, we entered into a discussion of the importance of theory, as well
as its relevance to the relational database model. You learned that the
model’s foundation in mathematical theory makes it a very sound and
reliable structure.
Following this discussion, we looked at the advantages gained by
learning a design methodology. Among other things, using a good
methodology yields an efficient and reliable database structure,
reduces the time it takes to design a database, and allows you to avoid
the typical problems caused by poor design.
Next, we listed the objectives of good design. Meeting these objectives
is crucial to the success of the database design process because they
help you ensure that the database structure is sound. We then enu-
merated the advantages of good design, and you learned that the time
you invest in designing a sound database structure is time well spent.
We closed this chapter with a short discussion of traditional database
design methods, an explanation of the premise behind the design
method presented in this book, and Normalization. By now, you under-
stand that traditional design methods are complex and can take some

ptg14955309
Review Questions 39
time to learn and comprehend. On the other hand, the design method
used in this book is presented in a clear and straightforward manner,
is easy to implement, and will yield the same results as the traditional
design methodology.
Review Questions
1. When is the best time to use an RDBMS program’s design tools?
2. True or False: Design is crucial to the consistency, integrity, and
accuracy of data.
3. What is the most detrimental result of improper database design?
4. What fact makes the relational database structurally sound and
able to guarantee accurate information?
5. State two advantages of learning a design methodology.
6. True or False: You will use your RDBMS program more effectively
if you understand database design.
7. State two objectives of good design.
8. What helps to guarantee that data structures and their values are
valid and accurate at all times?
9. State two benefits of applying good design techniques.
10. True or False: You can take shortcuts through some of the design
processes and still arrive at a good, sound design.

ptg14955309
This page intentionally left blank

ptg14955309
41
3
Terminology
“When I use a word,” Humpty Dumpty said in rather a scornful tone,
“it means just what I choose it to mean—neither more nor less.”
—LEWIS CARROLL
THROUGH THE LOOKING GLASS
Topics Covered in This Chapter
Why This Terminology Is Important
Value-Related Terms
Structure-Related Terms
Relationship-Related Terms
Integrity-Related Terms
Summary
Review Questions
The terms in this chapter are important for you to understand before
you embark upon learning the design process. Indeed, there are
other terms that you’ll need to learn, and I’ll cover them as you work
through the process. There’s also a glossary in the back of the book
that you can use to refresh your memory on any term you learn here
or in the following chapters.
Why This Terminology Is Important
Relational database design has its own unique set of terms, just as any
other profession, trade, or discipline. Here are three good reasons why
it’s important for you to learn these terms.

ptg14955309
42 Chapter 3 Terminology
1. They are used to express and define the special ideas and con-
cepts of the relational database model. Much of the terminology
is derived from the mathematical branches of set theory and
first-order predicate logic, which form the basis of the relational
database model.
2. They are used to express and define the database design process
itself. The design process becomes clearer and much easier to
understand once you know these terms.
3, They are used anywhere a relational database or RDBMS is
discussed. You’ll see these terms in publications such as trade
magazines, software manuals, educational course materials,
commercial database software books, and database-related
web sites.
This chapter covers a majority of the terms that define the ideas and
concepts of the design process, including definitions and somewhat
detailed discussions for each term. (I provide pertinent details or nec-
essary further discussion for a given term at the point where the term
is expressly used within a specific technique in the design process.)
There are several other terms that I introduce and discuss later in the
book because I think you’ll more easily understand them within the
context of the specific idea or concept to which they relate.
❖Note The glossary contains concise definitions for all of the
terms in this chapter and throughout the book.
There are four categories of terms defined in this chapter: value-
related, structure-related, relationship-related, and integrity-related.

ptg14955309
Value-Related Terms 43
Value-Related Terms
Data
The values you store in the database are data. Data is static in the
sense that it remains in the same state until you modify it by some
manual or automated process. Figure 3.1 shows some sample data.
George Edleman 92883 05/16/96 95.00
Figure 3.1 An example of basic data
This data is meaningless at this point. For example, there is no easy
way for you to determine what “92883” represents. Is it a zip code? Is it
a part number? Even if you know it represents a customer identifica-
tion number, is it one that is associated with George Edleman? There’s
just no way of knowing until you process the data.
Information
Information is data that you process in a manner that makes it mean-
ingful and useful to you when you work with it or view it. It is dynamic
in the sense that it constantly changes relative to the data stored in
the database, and also in the sense that you can process it and pres-
ent it in an unlimited number of ways. You can show information as
the result of a SQL SELECT statement, display it in a form on your
computer screen, or print it as a report. The point to remember is that
you must process your data in some manner so that you can turn it into
meaningful information.
Figure 3.2 demonstrates how you might process and transform the
data from the previous example into meaningful information. It has
been manipulated in such a way—in this case as part of a patient
invoice report— that it is now meaningful to anyone who views it.
It is very important that you understand the difference between
data and information. You design a database to provide meaningful

ptg14955309
44 Chapter 3 Terminology
information to someone within a business or organization. This infor-
mation is available only if the appropriate data exists in the database
and the database is structured in such a way as to support that infor-
mation. If you ever forget the difference between data and information,
just remember this little axiom:
Data is what you store; information is what you retrieve.
When you fully understand this single, simple concept, the logic
behind the database design process will become crystal clear.
❖Note Unfortunately, data and information are two terms that
are still frequently used interchangeably (and, therefore, errone-
ously) throughout the database industry. You’ll encounter this
error in numerous trade magazines, commercial database books,
and web sites, and you’ll even see the terms misused by authors
who should know better.
Eastside Medical Clinic
7743 Kingman Dr.
Seattle, WA 98032
(206) 555-9982
Patient Name: George Edelman
Patient ID: 10884
Visit Date: 02/16/12
Physician: Daniel Chavez
Doctors Services Service Code Fee
X
X
Consultation
EKG
Physical
Ultrasound
92883
92773
98377
97399
119.00
95.00
Nursing Services Service Code Fee
R.N. Exam
Supplies
Nurse Instruction
Insurance Report
89327
82372
88332
81368
Figure 3.2 An example of data transformed into information

ptg14955309
Value-Related Terms 45
Null
A null represents a missing or unknown value. You must understand
from the outset that a null does not represent a zero or a text string of
one or more blank spaces. The reasons are quite simple.
• A zero can have a very wide variety of meanings. It can represent
the state of an account balance, the current number of available
first-class ticket upgrades, or the current stock level of a particu-
lar product.
• Although a text string of one or more blank spaces is guaran-
teed to be meaningless to most of us, it is definitely meaningful
to a query language like SQL. A blank space is a valid character
as far as SQL is concerned, and a character string composed of
three blank spaces (' ') is just as legitimate as a character
string composed of three letters ('a b c' ). In Figure 3.3, a blank
represents the fact that Washington, D.C., is not located in any
county whatsoever.
• A zero-length string—two consecutive single quotes with no space
in between ('' )—is also an acceptable value to languages such as
SQL, and can be meaningful under certain circumstances. In an
EMPLOYEES table, for example, a zero-length string value in a
Client ID
9001
9002
9003
Client First Name
Stewart
Susan
Estela
Client City
Seattle
Poulsbo
Fremont
Client Last Name
Jameson
Black
Rosales
Client County
King
Alameda
Clients
9004
9005
9006
Timothy
Marvin
Kira
Bellevue
Washington
Portland
Ennis
Russo
Bently
King
State
WA
WA
CA
WA
DC
OR
<< other fields >>
......
......
......
......
......
......
Figure 3.3 An example of a table containing null values

ptg14955309
46 Chapter 3 Terminology
field called MIDDLE INITIAL may represent the fact that a particular
employee does not have a middle initial in his name.
❖Note Due to space restrictions, I cannot always show all of
the fields for a given sample table. I will, however, show the fields
that are most relevant to the discussion at hand and use <<other
fields>> to represent fields that are unessential to the example.
You’ll see this convention in many examples throughout the
remainder of the book.
The Value of Nulls
A null is quite useful when you use it for its stated purpose, and the
CLIENTS table in Figure 3.3 clearly illustrates this. Each null in the
CLIENT COUNTY field represents a missing or unknown county name for
the record in which it appears. In order for you to use nulls correctly,
you must first understand why they occur at all.
Missing values are commonly the result of human error. For example,
consider the record for Shannon Black. If you’re entering the data for
Ms. Black and you fail to ask her for the name of the county she lives
in, that data is considered missing and is represented in the record
as a null. Once you recognize the error, however, you can correct it by
calling Ms. Black and asking her for the county name.
Unknown values appear in a table for a variety of reasons. One reason
may be that a specific value you need for a field is as yet undefined.
For instance, you could have a CATEGORIES table in a School Sched-
uling database that doesn’t currently contain a category for a new set
of classes that you want to offer beginning in the fall session. Another
reason a table might contain unknown values is that they are truly
unknown. Refer to the CLIENTS table in Figure 3.3 once again and
consider the record for Marvin Russo. Say that you’re entering the data

ptg14955309
Value-Related Terms 47
for Mr. Russo and you ask him for the name of the county he lives in.
If he doesn’t know the county name and you don’t happen to know the
county that includes the city in which he lives, then the value for the
county field in his record is truly unknown and is represented within
the record as a null. Obviously, you can correct the problem once
either of you determines the correct county name.
A field value may also be null if none of its values applies to a particular
record. Assume for a moment that you’re working with an EMPLOYEES
table that contains a SALARY field and an HOURLY RATE field. The value
for one of these two columns is always going to be null because an
employee cannot be paid both a fixed salary and an hourly rate.
It’s important to note that there is a very slim difference between “does
not apply” and “is not applicable.” In the previous example, the value of
one of the two fields literally does not apply. Now assume you’re work-
ing with a PATIENTS table that contains a field called HAIR COLOR and
you’re currently updating a record for an existing male patient. If that
patient recently became bald, then the value for that field is definitely
“not applicable.” Although you could just use a null to represent a
value that is not applicable, I always recommend that you use a true
value such as “N/A” or “Not Applicable.” This will make the information
clearer in the long run.
As you can see, whether you allow nulls in a table depends on the
manner in which you’re using the data. Now that you’ve seen the pos-
itive side of using nulls, let’s take a look at the negative implication of
using them.
The Problem with Nulls
The major disadvantage of nulls is that they have an adverse effect on
mathematical operations. An operation involving a null evaluates to
null. This is logically reasonable—if a number is unknown then the
ptg14955309
48 Chapter 3 Terminology
result of the operation is necessarily unknown. Note how a null alters
the outcome of the operation in the following example:
(25 × 3) + 4 = 79
(Null × 3) + 4 = Null
(25 × Null) + 4 = Null
(25 × 3) + Null = Null
The PRODUCTS table in Figure 3.4 helps to illustrate the effects
nulls have on mathematical expressions that incorporate fields from
a table. In this case, the value for the TOTAL VALUE field is derived from
the mathematical expression “[SRP] × [QTY ON HAND].” As you inspect
the records in this table, note that the value for the TOTAL VALUE field is
missing where the QTY ON HAND value is null, resulting in a null value
for the TOTAL VALUE field as well. This leads to a serious undetected
error that occurs when all the values in the TOTAL VALUE field are added
together: an inaccurate total. This error is “undetected” because an
RDBMS program will not inherently alert you of the error. The only
way to avoid this problem is to ensure that the values for the QTY ON
HAND field cannot be null.
Products
Category
Accessories
Accessories
Components
Bikes
SRP
75.00
65.00
36.00
23.50
1,200.00
7.45
Qty On Hand
20
33
16
10
Total Value
1,300.00
1,118.00
376.00
74.50
Product ID
70001
70002
70003
70004
70005
70006
Product Description
Shur-Lok U-Lock
SpeedRite Cyclecomputer
SteelHead Microshell Helmet
SureStop 133-MB Brakes
Diablo ATM Mountain Bike
UltraVision Helmet Mount Mirrors
Figure 3.4 The nulls in this table will have an effect on mathematical operations
involving the table’s fields.

ptg14955309
Structure-Related Terms 49
Figure 3.5 helps to illustrate the effect nulls have on aggregate func-
tions that incorporate the values of a given field in a table. The result
of an aggregate function, such as COUNT(<fieldname>), will be null if it
is based on a field that contains null values. The table in Figure 3.5
shows the results of a summary query that counts the total number
of occurrences of each category in the PRODUCTS table in Figure 3.4.
The value of the TOTAL OCCURRENCES field is the result of the function
expression COUNT([CATEGORY]). Notice that the summary query shows
“0” occurrences of an unspecified category, implying that each product
has been assigned a category. This information is clearly inaccurate
because there are two products in the PRODUCTS table that have not
been assigned a category.
Total Occurrences
0
2
1
1
Category
Accessories
Bikes
Components
Category Summary
Figure 3.5 Nulls affect the results of an aggregate function.
The issues of missing values, unknown values, and whether a value
will be used in a mathematical expression or aggregate function are all
taken into consideration in the database design process, and we will
revisit and discuss these issues further in later chapters.
Structure-Related Terms
Table
According to the relational model, data in a relational database is
stored in relations, which are perceived by the user as tables. Each
relation is composed of tuples (records) and attributes (fields). Fig-
ure 3.6 shows a typical table structure.

ptg14955309
50 Chapter 3 Terminology
Tables are the chief structures in the database and each table always
represents a single, specific subject. The logical order of records and
fields within a table is of absolutely no importance, and every table
contains at least one field—known as a primary key—that uniquely
identifies each of its records. (In Figure 3.6, for example, CLIENT ID is
the primary key of the CLIENTS table.) In fact, data in a relational
database can exist independently of the way it is physically stored in
the computer because of these last two table characteristics. This is
great news for the user because he or she isn’t required to know the
physical location of a record in order to retrieve its data.
The subject that a given table represents can either be an object or an
event. When the subject is an object, it means that the table represents
something that is tangible, such as a person, place, or thing. Regard-
less of its type, every object has characteristics that you can store as
data and then process as information in an almost infinite number of
ways. Pilots, products, machines, students, buildings, and equipment
are all examples of objects that a table can represent, and Figure 3.6
illustrates one of the most common examples of this type of table.
Client ID
9001
9002
9003
Client First Name
Stewart
Susan
Estela
Client City
Seattle
Poulsbo
Tacoma
Client Last Name
Jameson
Black
Rosales
Clients
9004
9005
9006
Timothy
Marvin
Kira
Seattle
Bellingham
Tacoma
Ennis
Russo
Bently
Record
s
Fields
<< other fields >>
......
......
......
......
......
......
Figure 3.6 A typical table structure
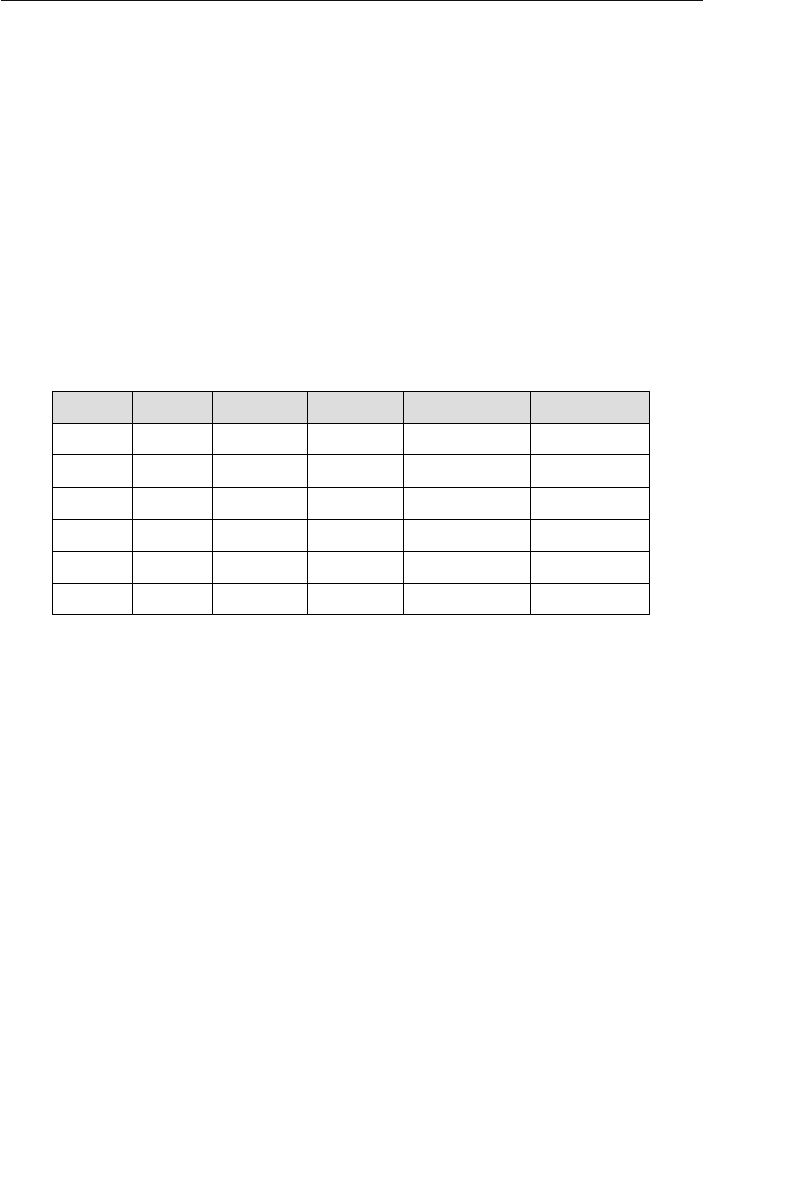
ptg14955309
Structure-Related Terms 51
When the subject of a table is an event, it means that the table rep-
resents something that occurs at a given point in time having charac-
teristics you wish to record. You can store these characteristics as data
and then process the data as information in exactly the same manner
as a table that represents some specific object. Examples of events you
may need to record include judicial hearings, distributions of funds,
lab test results, and geological surveys. Figure 3.7 shows an example
of a table representing an event that we all have experienced at one
time or another—a doctor’s appointment.
Patient Visit
Visit Date
02/14/12
02/14/12
02/15/12
02/15/12
02/15/12
02/16/12
Blood Pressure
120/80
112/74
120/80
160/90
110/75
120/80
Visit Time
10:30
13:00
09:30
11:00
14:00
09:30
Patient ID
92001
97002
99014
96105
96203
98003
Physician
Hernandez
Black
Rolson
Hernandez
Hernandez
Rolson
<< other fields >>
......
......
......
......
......
......
Figure 3.7 A table representing an event
A table that stores data used to supply information is called a data
table, and it is the most common type of table in a relational database.
Data in this type of table is dynamic because you can manipulate it
(modify, delete, and so forth) and process it into information in some
form or fashion. You’ll constantly interact with these types of tables as
you work with your database.
A validation table (also known as a lookup table), on the other hand,
stores data that you specifically use to implement data integrity. A val-
idation table usually represents subjects, such as city names, skill cat-
egories, product codes, and project identification numbers. Data in this
type of table is static because it will very rarely change at all. Although

ptg14955309
52 Chapter 3 Terminology
you have very little direct interaction with these tables, you’ll frequently
use them indirectly to validate values that you enter into a data table.
Figure 3.8 shows an example of a validation table.
Category Name
Accessories
Bikes
Clothing
Components
Category ID
10000
20000
30000
40000
Categories
Figure 3.8 An example of a validation table
I’ll discuss validation tables in more detail in Chapter 11, “Business
Rules.”
Field
A field (known as an attribute in relational database theory) is the
smallest structure in the database and it represents a characteristic
of the subject of the table to which it belongs. Fields are the structures
that actually store data. The data in these fields can then be retrieved
and presented as information in almost any configuration that you
can imagine. The quality of the information you get from your data is
in direct proportion to the amount of time you’ve dedicated to ensur-
ing the structural integrity and data integrity of the fields themselves.
There is just no way to underestimate the importance of fields.
Every field in a properly designed database contains one and only one
value, and its name will identify the type of value it holds. This makes
entering data into a field very intuitive. If you see fields with names
such as FIRSTNAME, LASTNAME, CITY, STATE, and ZIPCODE, you know
exactly what type of values go into each field. You’ll also find it very
easy to sort the data by state or look for everyone whose last name is
“Hernandez.”
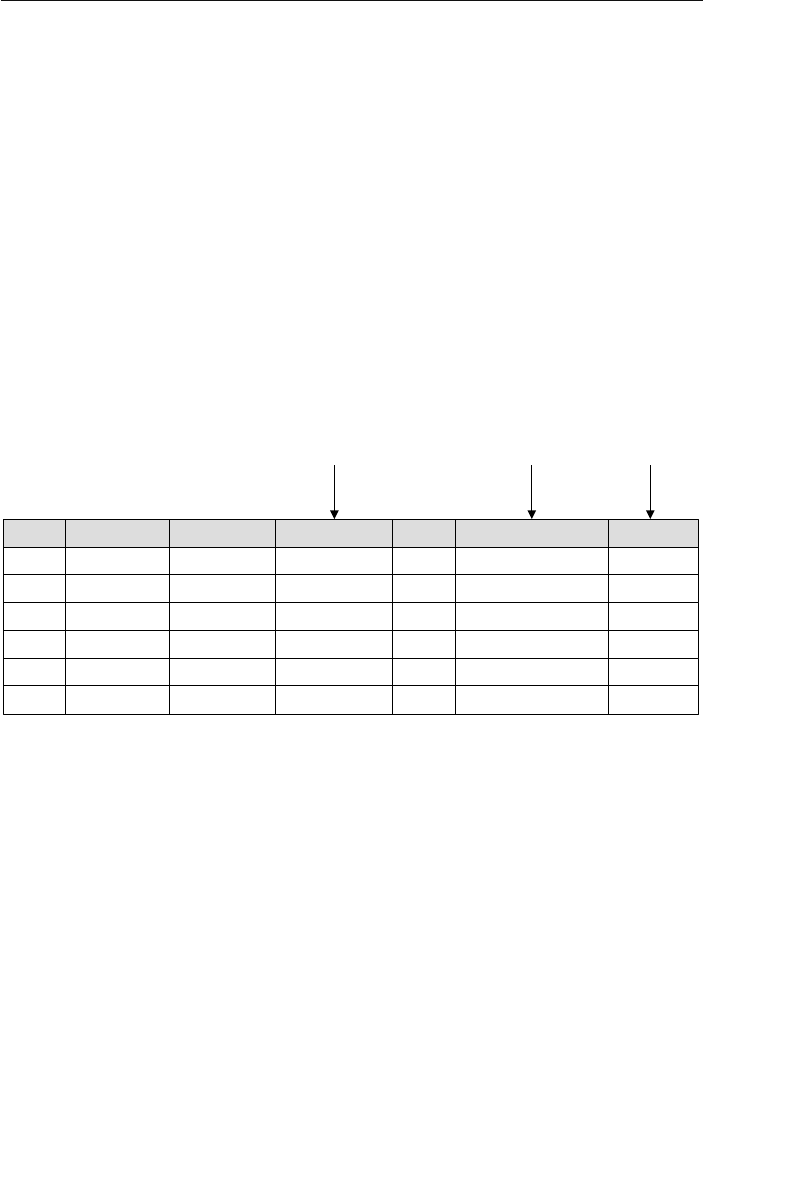
ptg14955309
Structure-Related Terms 53
You’ll typically encounter three other types of fields in an improperly or
poorly designed database:
1. A multipart field (also known as a composite field), which con-
tains two or more distinct items within its value
2. A multivalued field, which contains multiple instances of the
same type of value
3. And a calculated field, which contains a concatenated text value
or the result of a mathematical expression
Figure 3.9 shows a table with an example of each of these types of
fields.
Clients
Calculated Field Multipart Field Multivalued Field
Client ID
9001
9002
9003
9004
9005
9006
Client First Name
Stewart
Susan
Estela
Timothy
Marvin
Kira
Client Last Name
Jameson
Black
Rosales
Ennis
Russo
Bently
Client City, State, Zip
Seattle, WA 98125
Poulsbo, WA 98370
Bellevue, WA 98005
Seattle, WA 98115
Bellingham, WA 98225
Olympia, WA 98504
Client Full Name
Stewart Jameson
Susan Black
Estela Rosales
Timothy Ennis
Marvin Russo
Kira Bently
Address
......
......
......
......
......
......
Account Rep
John, Sandi
Frits
John
Frits, Sandi
Frits, John
Sandi
Figure 3.9 A table containing regular, calculated, multipart, and multivalued
fields
I’ll cover calculated, multipart, and multivalued fields in greater detail
in Chapter 7, “Establishing Table Structures.”
Record
A record (known as a tuple in relational database theory) represents a
unique instance of the subject of a table. It is composed of the entire
set of fields in a table, regardless of whether the fields contain values.

ptg14955309
54 Chapter 3 Terminology
Because of the manner in which a table is defined, each record is iden-
tified throughout the database by a unique value in the primary key
field of that record.
In Figure 3.9, each record represents a unique client within the table,
and the CLIENT ID field will identify a given client throughout the data-
base. In turn, each record includes all of the fields within the table,
and each field describes some aspect of the client represented by the
record. Consider the record for Timothy Ennis, for example. His record
represents a unique instance of the table’s subject (“Clients”) and
includes the total collection of fields in the table, treated as a unit. The
values of those fields represent relevant facts about Mr. Ennis that are
important to someone in the organization.
Records are a key factor in understanding table relationships because
you’ll need to know how a record in one table relates to other records
in another table.
View
A view is a “virtual” table composed of fields from one or more tables
in the database; the tables that comprise the view are known as base
tables. The relational model refers to a view as being “virtual” because
it draws data from base tables rather than storing data on its own. In
fact, the only information about a view that is stored in the database is
its structure. Many major RDBMS programs support views, but some
(such as Microsoft Access) refer to them as saved queries. Your specific
RDBMS program will determine whether you refer to this object as a
query or a view.
Views enable you to see the information in your database from many
different aspects, providing you with a great amount of flexibility when
you work with your data. You can create views in a variety of ways
and they are especially useful when you base them on multiple related
tables. In a school scheduling database, for example, you could create
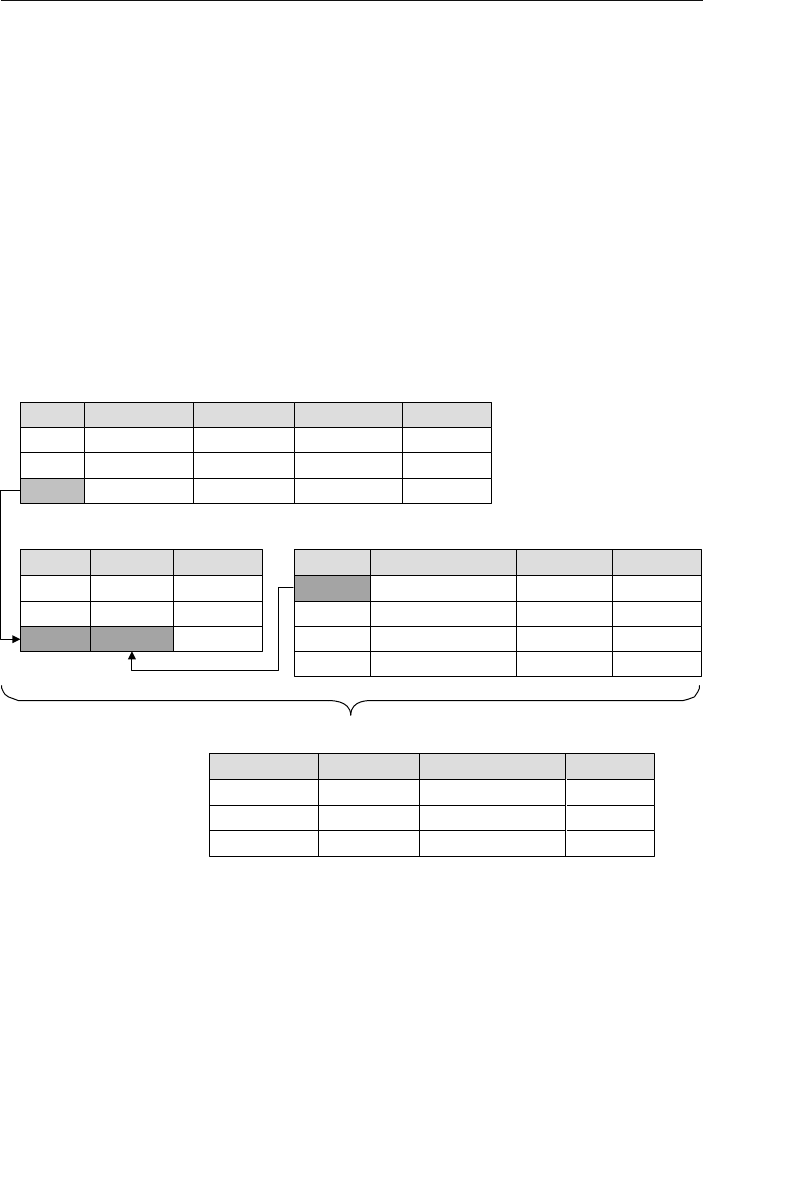
ptg14955309
Structure-Related Terms 55
a view that consolidates data from the STUDENTS, CLASSES, and
CLASS SCHEDULES tables.
Figure 3.10 shows a view called INSTRUMENT ASSIGNMENTS that
is composed of fields taken from the STUDENTS, INSTRUMENTS,
and STUDENT INSTRUMENTS tables. The view displays data that
it draws from all of these tables simultaneously, based on matching
values between the STUDENT ID fields in the STUDENTS and STUDENT
INSTRUMENTS tables, and the INSTRUMENT ID fields in the INSTRU-
MENTS and STUDENT INSTRUMENTS tables.
Student Instruments
Student ID
60002
60003
60001
Checkout Date
02/02/12
02/06/12
02/06/12
Instrument ID
1003
1002
1000
Instruments
Instrument ID Instrument Description Category << other fields >>
......
......
......
1000 Stratocaster Guitar
1002 JCM 2000 Tube Super Lead Amplifier
1003 Twin Reverb Reissue Amplifier
1001 Player 2100 Multieffects Multieffect Unit
......
Student Phone
553-3992
790-3992
551-4993
Student Last Name
Erlich
Black
Rosales
Student First Name
Zachary
Susan
Joe
Student ID
60001
60002
60003
Students
<< other fields >>
......
......
......
Instrument Assignments (View )
Student Last Name
Erlich
Black
Rosales
Student First Name
Zachary
Susan
Joe
Checkout Date
02/06/12
02/03/12
02/06/12
Instrument Description
Stratocaster
JCM 2000 Tube Super Lead
Twin Reverb Reissue
Figure 3.10 An example of a typical view
There are three major reasons that views are important.
1. They enable you to work with data from multiple tables simul-
taneously. (In order for a view to do this, the tables must have
connections, or relationships, to one another.)

ptg14955309
56 Chapter 3 Terminology
2. They enable you to prevent certain users from viewing or
manipulating specific fields within a table or group of tables.
This capability can be very advantageous in terms of security.
3. You can use them to implement data integrity. A view you use
for this purpose is known as a validation view.
You’ll learn more about designing and using views in Chapter 12,
“Views.”
❖Note Although every major database vendor supports the
type of view I’ve described in this section, several vendors are
now supporting what is known as an indexed (or materialized)
view. An indexed view is different from a “regular” view in that it
does store data, and you can index its fields in order to improve
the speed at which the RDBMS processes the view’s data. A full
discussion of indexed views is beyond the scope of this book
because it is a vendor-specific implementation issue. However,
you should research this topic further if you are working with
RDBMS software such as Oracle, Microsoft SQL Server, IBM
DB2, or Sybase SQL, or if you are working within a data ware-
house scenario.
Keys
Keys are special fields that play very specific roles within a table, and
the type of key determines its purpose within the table. There are
several types of keys a table may contain, but the two most significant
ones are the primary key and the foreign key.
A primary key is a field or group of fields that uniquely identifies each
record within a table; a primary key composed of two or more fields is
known as a composite primary key. The primary key is absolutely the
most important key in the entire table.
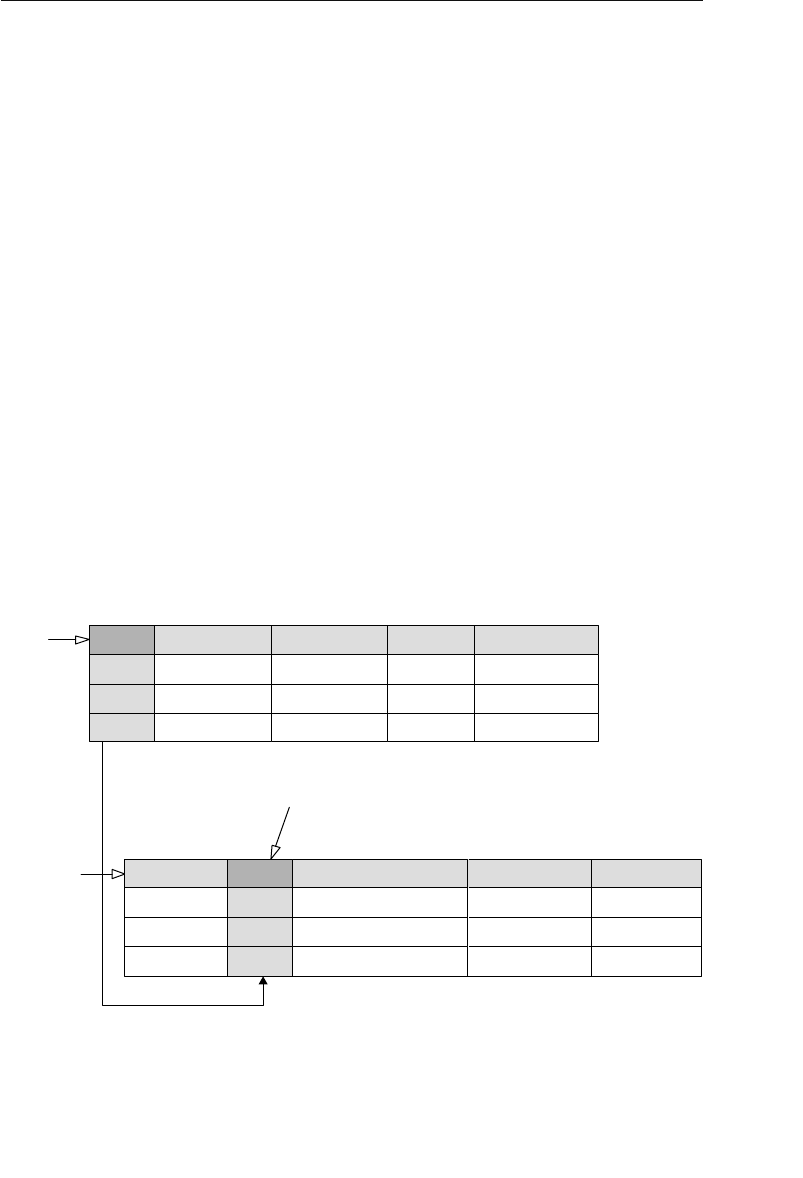
ptg14955309
Structure-Related Terms 57
• A primary key value identifies a specific record throughout the
entire database.
• The primary key field identifies a given table throughout the
entire database.
• The primary key enforces table-level integrity and helps establish
relationships with other tables in the database. (You’ll learn more
about relationships in the next section.)
Every table in your database should have a primary key!
The AGENT ID field in Figure 3.11 is a good example of a primary key.
It uniquely identifies each agent within the AGENTS table and helps
to guarantee table-level integrity by ensuring nonduplicate records. It
also establishes relationships between the AGENTS table and other
tables in the database, as in the case with the ENTERTAINERS table
shown in the example.
Agents
Agent ID
100
101
102
Agent First Name
Stella
Steve
Samantha
Agent Last Name
Rosales
Horst
Nathanson
Date of Hire
05/16/09
10/15/09
03/01/11
Agent Home Phone
553-3992
790-3992
551-4993
Primary
Key
Primary
Key
Foreign Key
Entertainers
Entertainer Phone
555-9928
099-8837
709-3542
Entertainer Name
Jazz Time
The Mike Hernandez Trio
The Country Squires
Agent ID
100
101
100
Entertainer ID
9001
9002
9003
<< other fields >>
......
......
......
Figure 3.11 An example of primary and foreign key fields

ptg14955309
58 Chapter 3 Terminology
When you determine that two tables bear a relationship to each other,
you typically establish the relationship by taking a copy of the primary
key from the first table and incorporating it into the structure of the
second table, where it becomes a foreign key. The name “foreign key” is
derived from the fact that the second table already has a primary key
of its own, and the primary key you are introducing from the first table
is “foreign” to the second table.
Figure 3.11 also shows a good example of a foreign key. Note that
AGENT ID is the primary key of the AGENTS table and a foreign key in
the ENTERTAINERS table. AGENT ID assumes this role because the
ENTERTAINERS table already has a primary key—ENTERTAINER ID. As
such, AGENT ID establishes the relationship between both of the tables.
Besides helping to establish relationships between pairs of tables,
foreign keys also help implement and ensure relationship-level integ-
rity. This means that the records in both tables will always be properly
related because the values of a foreign key must match existing values
of the primary key to which it refers. Relationship-level integrity also
helps you avoid the dreaded “orphaned” record, a classic example of
which is an order record without an associated customer. If you don’t
know who made the order, you can’t process it, and you obviously can’t
invoice it. That’ll throw your quarterly sales off!
Key fields play an important part in a relational database, and you
must learn how to create and use them. You’ll learn more about pri-
mary keys in Chapter 8, “Keys,” and Chapter 10, “Table Relationships.”
Index
An index is a structure that an RDBMS provides to improve data pro-
cessing. Your particular RDBMS program will determine how the index
works and how you use it. However, an index has absolutely nothing to
do with the logical database structure! The only reason I include the term
index in this chapter is that people often confuse it with the term key.

ptg14955309
Relationship-Related Terms 59
Index and key are just two more terms that are widely and frequently
misused throughout the database industry and in numerous data-
base-related publications and web sites. (Remember my comments on
data and information?) You’ll always know the difference between the
two if you remember that keys are logical structures you use to identify
records within a table, and indexes are physical structures you use to
optimize data processing.
Relationship-Related Terms
Relationships
A relationship exists between two tables when you can in some way
associate the records of the first table with those of the second. You
can establish the relationship via a set of primary and foreign keys (as
you learned in the previous section) or through a third table known
as a linking table (also known as an associative table). The manner in
which you establish the relationship really depends on the type of rela-
tionship that exists between the tables. (You’ll learn more about that in
a moment.) While Figure 3.11 illustrated a relationship established via
primary/foreign keys, Figure 3.12 illustrates a relationship established
with a linking table.
A relationship is an important component of a relational database.
• It enables you to create multitable views.
• It is crucial to data integrity because it helps reduce redundant
data and eliminate duplicate data.
You can characterize every relationship in three ways: by the type of
relationship that exists between the tables, the manner in which each
table participates, and the degree to which each table participates.
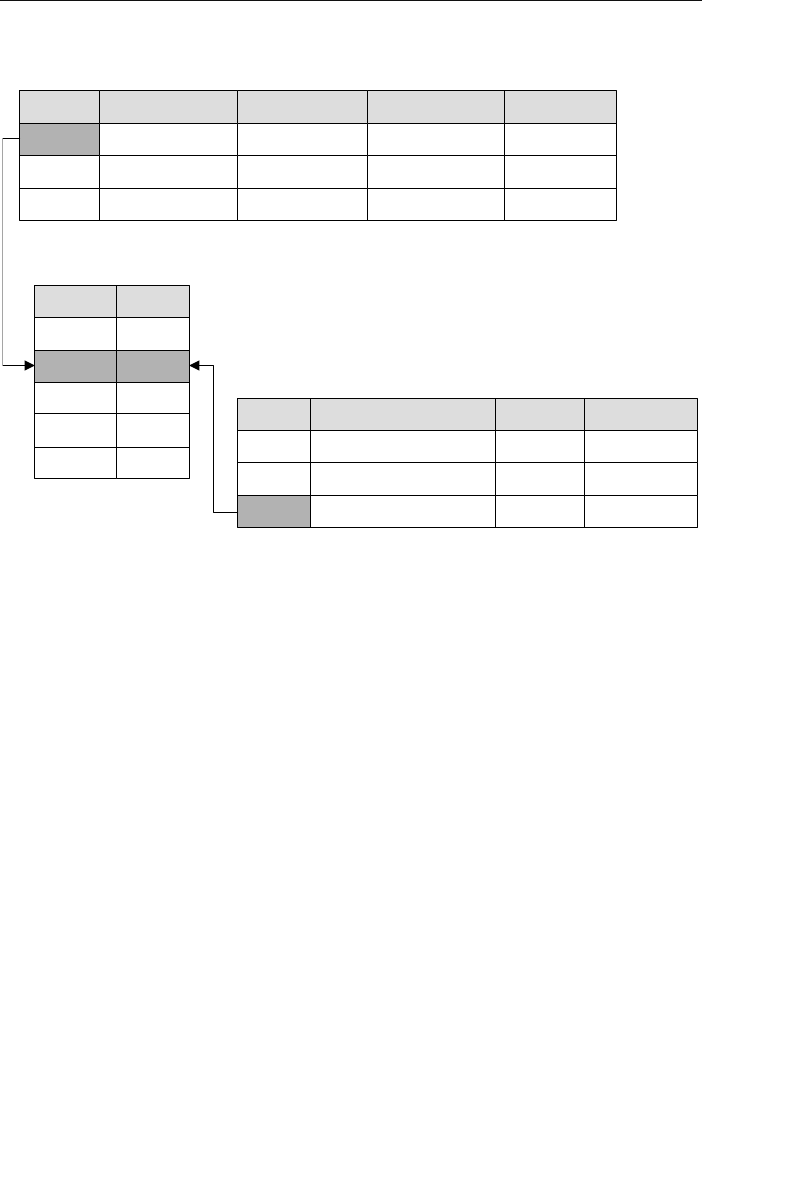
ptg14955309
60 Chapter 3 Terminology
Types of Relationships
There are three specific types of relationship (traditionally known as a
cardinality) that can exist between a pair of tables: one-to-one, one-to-
many, and many-to-many.
One-to-One Relationships
A pair of tables bears a one-to-one relationship when a single record
in the first table is related to only one record in the second table,
and a single record in the second table is related to only one record
in the first table. In this type of relationship, one table serves as a
“parent” table and the other serves as a “child” table. You establish
the relationship by taking a copy of the parent table’s primary key
Student Phone
553-3992
790-3992
551-4993
Student Last Name
Erlich
Black
Rosales
Student First Name
Zachary
Susan
Joe
Student ID
60001
60002
60003
Students
Class Name
Intro. to Political Science
Adv. Music Theory
American History
Class ID
900001
900002
900003
Instructor ID
220087
220039
220148
Classes
Student Schedule (Linking Table )
Student ID
60003
60001
60003
60002
60001
Class ID
900001
900003
900003
900002
900001
<< other fields >>
......
......
......
<< other fields >>
......
......
......
Figure 3.12 A relationship established between two tables with the help of a
linking table
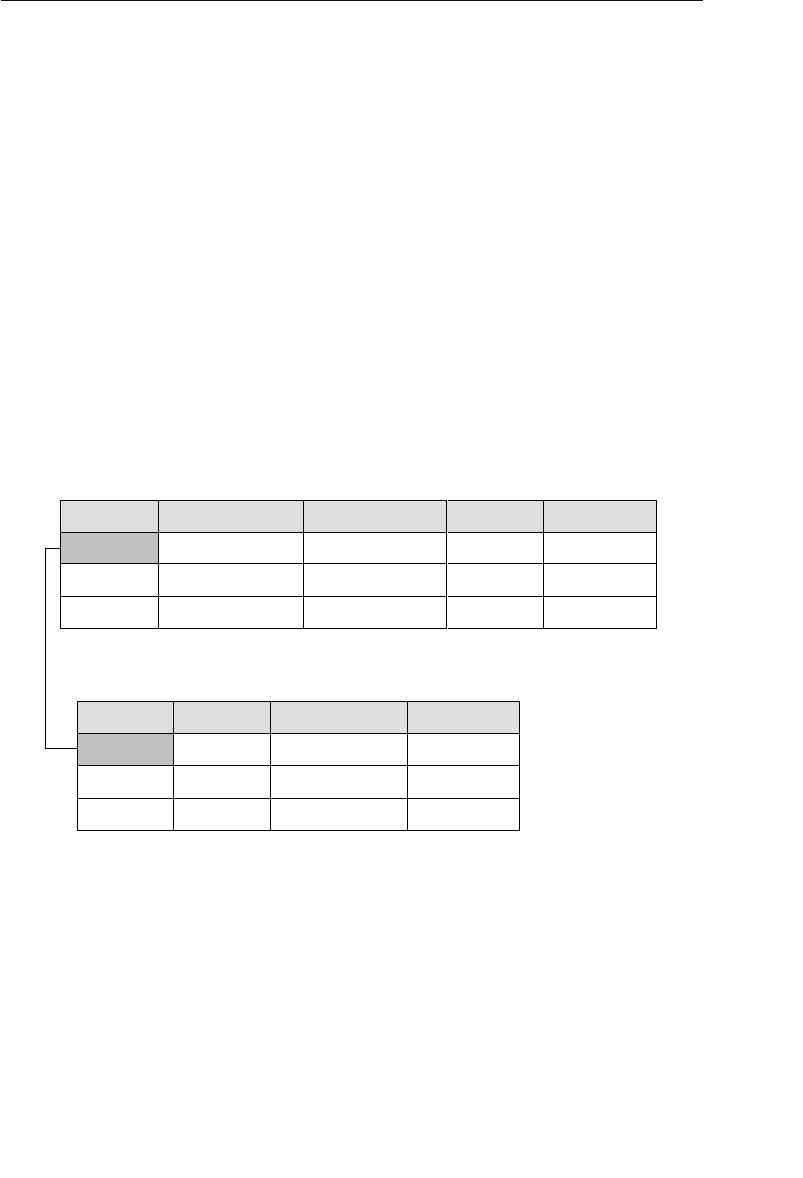
ptg14955309
Relationship-Related Terms 61
and incorporating it within the structure of the child table, where it
becomes a foreign key. This is a special type of relationship because
it is the only one in which both tables may actually share the same
primary key.
Figure 3.13 shows an example of a typical one-to-one relationship. In
this case, EMPLOYEES is the parent table and COMPENSATION is the
child table. The relationship between these tables is such that a single
record in the EMPLOYEES table can be related to only one record in
the COMPENSATION table, and a single record in the COMPENSATION
table can be related to only one record in the EMPLOYEES table. Note
that EMPLOYEE ID is indeed the primary key in both tables. However, it
will also serve the role of a foreign key in the child table.
Employees
Compensation
Home Phone
553-3992
790-3992
551-4993
Employee Last Name
Erlich
Black
Rosales
Employee First Name
Zachary
Susan
Joe
Employee ID
100
101
102
<< other fields >>
......
......
......
Employee ID
100
Commission Rate
3.5%
Hourly Rate
19.75
<< other fields >>
......
101 5.0%25.00 ......
102 5.0%22.50 ......
Figure 3.13 An example of a one-to-one relationship
One-to-Many Relationships
A one-to-many relationship exists between a pair of tables when a sin-
gle record in the first table can be related to many records in the sec-
ond table, but a single record in the second table can be related to only
one record in the first table. (The parent/child model I used to describe
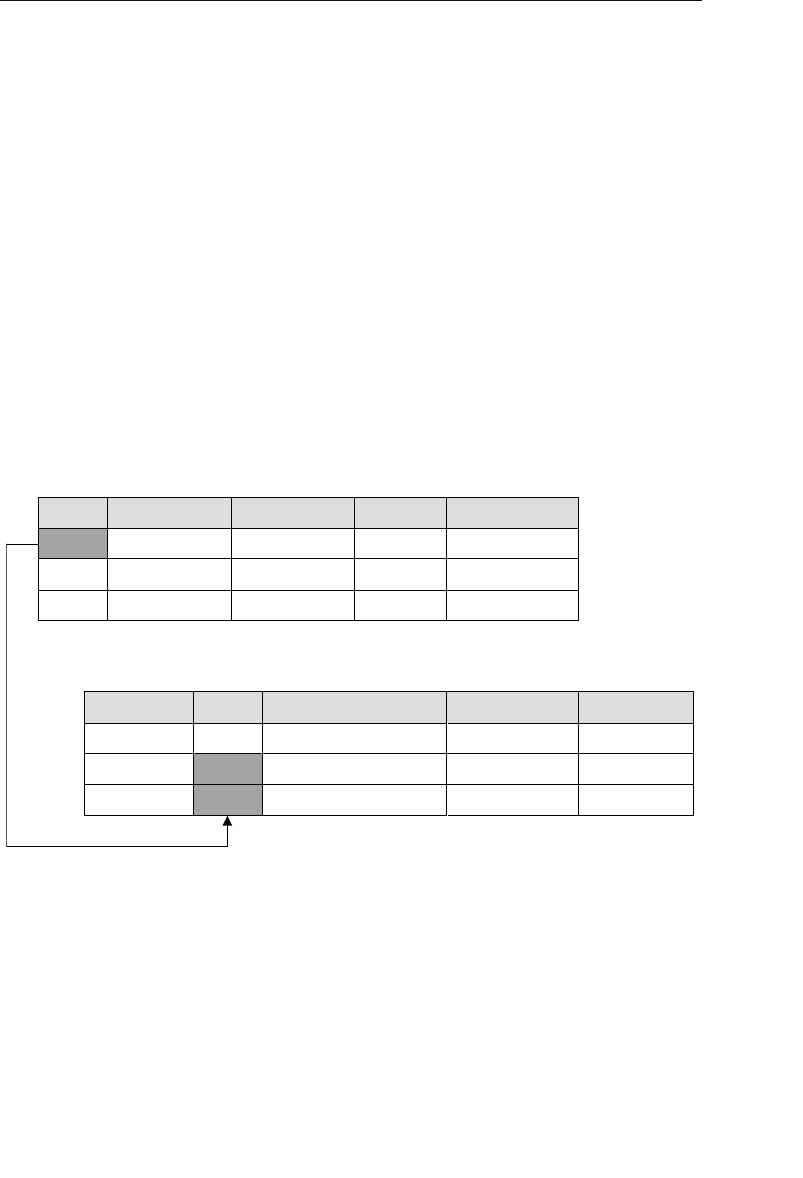
ptg14955309
62 Chapter 3 Terminology
a one-to-one relationship works here as well. In this case, the table on
the “one” side of the relationship is the parent table, and the table on
the “many” side is the child table.) You establish a one-to-many rela-
tionship by taking a copy of the parent table’s primary key and incor-
porating it within the structure of the child table, where it becomes a
foreign key.
The example in Figure 3.14 illustrates a typical one-to-many relation-
ship. A single record in the AGENTS table can be related to one or
more records in the ENTERTAINERS table, but a single record in the
ENTERTAINERS table is related to only one record in the AGENTS
table. As you probably have already guessed, AGENT ID is a foreign key
in the ENTERTAINERS table.
Entertainers
Entertainer Phone
709-3542
Entertainer Name
The Country Squires
Agent ID
100
Entertainer ID
9003
<< other fields >>
......
......
......
555-9928Jazz Time1019001
959-8837The Mike Hernandez Trio1009002
Agents
Agent ID
100
101
102
Agent First Name
Stella
Steve
Samantha
Agent Last Name
Rosales
Horst
Nathanson
Date of Hire
05/16/09
10/15/09
03/01/11
Agent Home Phone
553-3992
790-3992
551-4993
Figure 3.14 An example of a one-to-many relationship
This is by far the most common relationship that exists between a pair
of tables in a database. It is crucial from a data-integrity standpoint
because it helps to eliminate duplicate data and to keep redundant
data to an absolute minimum.
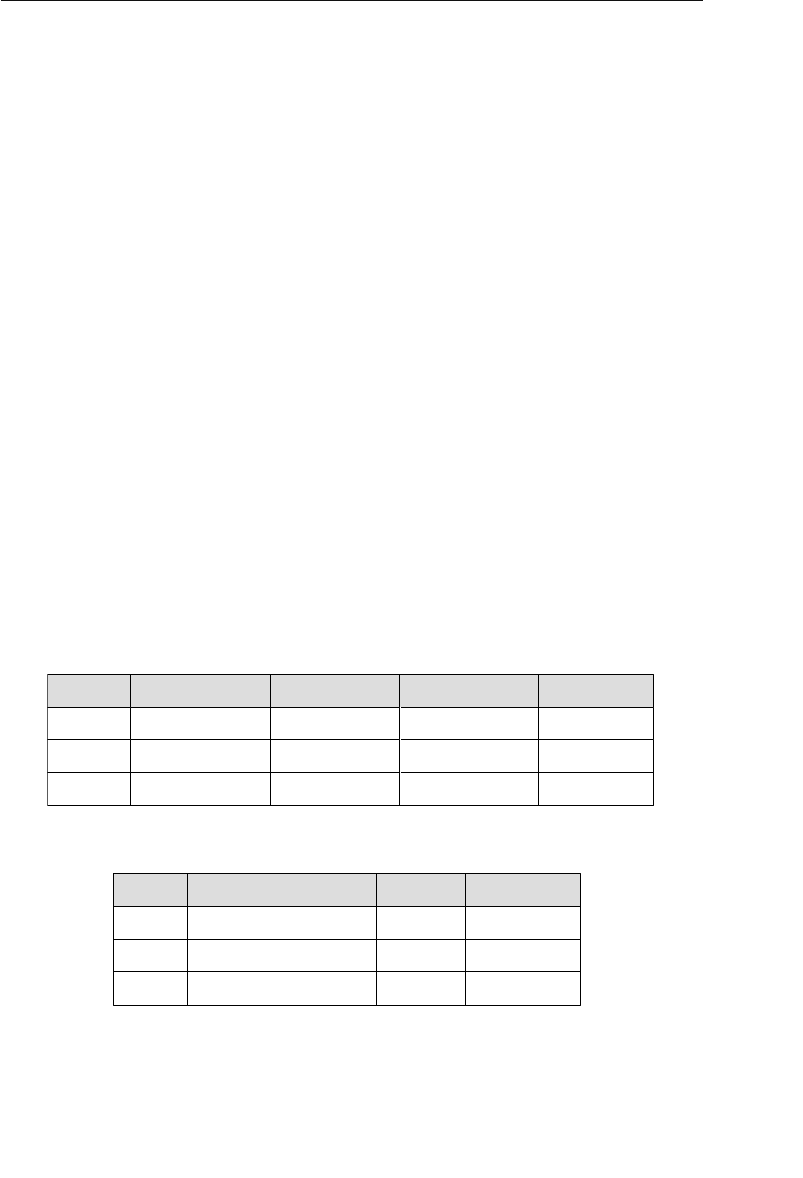
ptg14955309
Relationship-Related Terms 63
Many-to-Many Relationships
A pair of tables bears a many-to-many relationship when a single
record in the first table can be related to many records in the second
table and a single record in the second table can be related to many
records in the first table. You establish this relationship with a linking
table. (You learned a little bit about this type of table at the begin-
ning of this section.) A linking table makes it easy for you to associate
records from one table with those of the other and will help to ensure
you have no problems adding, deleting, or modifying related data. You
define a linking table by taking copies of the primary key of each table
in the relationship and using them to form the structure of the new
table. These fields actually serve two distinct roles: Together, they form
the composite primary key of the linking table; separately, they each
serve as a foreign key.
A many-to-many relationship that is not properly established is “unre-
solved.” Figure 3.15 shows a classic and clear example of an unresolved
many-to-many relationship. In this instance, a single record in the
Student Phone
553-3992
790-3992
551-4993
Student Last Name
Erlich
Black
Rosales
Student First Name
Zachary
Susan
Joe
Student ID
60001
60002
60003
Students
<< other fields >>
......
......
......
Class Name
Intro. to Political Science
Adv. Music Theory
American History
Class ID
900001
900002
900003
Instructor ID
220087
220039
220148
Classes
<< other fields >>
......
......
......
Figure 3.15 An example of an unresolved many-to-many relationship
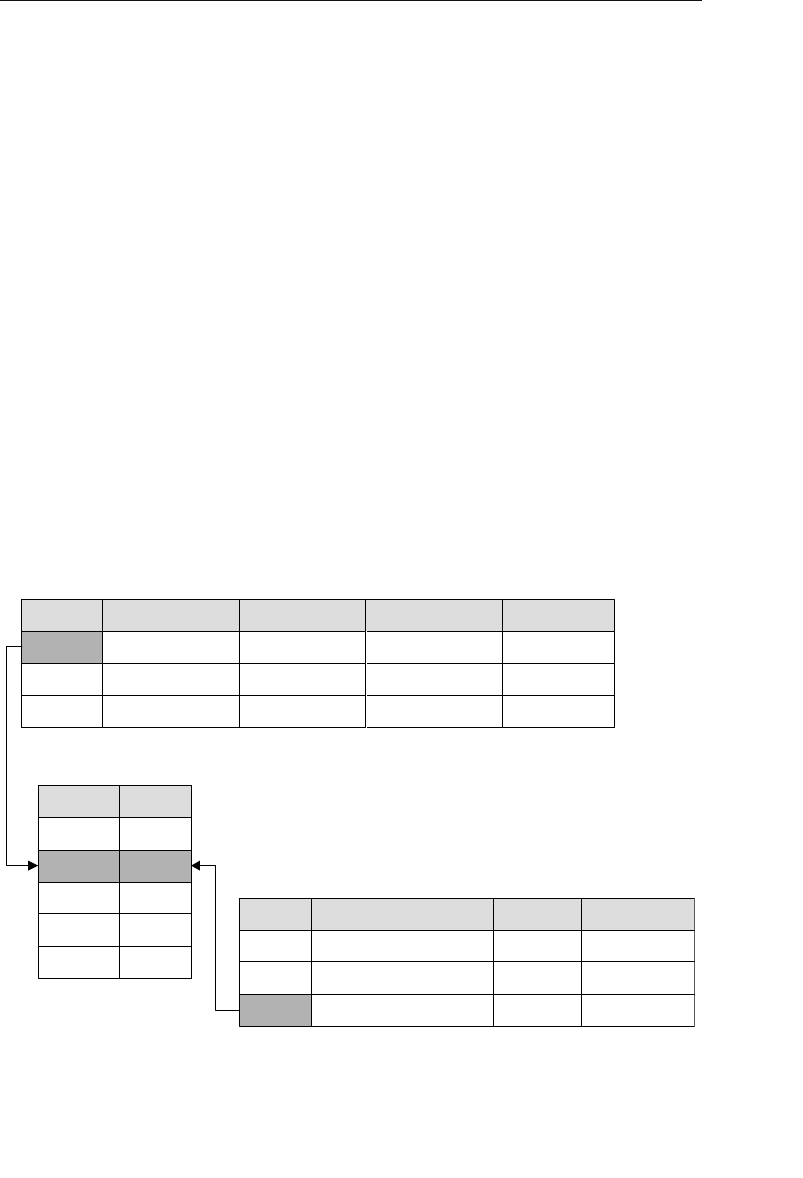
ptg14955309
64 Chapter 3 Terminology
STUDENTS table can be related to many records in the CLASSES
table and a single record in the CLASSES table can be related to many
records in the STUDENTS table.
This relationship is unresolved due to the inherent peculiarity of the
many-to-many relationship. The main issue is this: How do you easily
associate records from the first table with records in the second table?
To reframe the question in terms of the tables shown in Figure 3.15,
how do you associate a single student with several classes or a specific
class with several students? Do you insert a few STUDENT fields into the
CLASSES table? Or do you add several CLASS fields to the STUDENTS
table? Either of these approaches will make it difficult for you to work
with the data in those tables and will affect data integrity adversely.
The best approach for you to take is to create and use a linking table,
which will resolve the many-to-many relationship in the most appropri-
ate and effective manner. Figure 3.16 shows this solution in practice.
Student Phone
553-3992
790-3992
551-4993
Student Last Name
Erlich
Black
Rosales
Student First Name
Zachary
Susan
Joe
Student ID
60001
60002
60003
Students
Class Name
Intro. to Political Science
Adv. Music Theory
American History
Class ID
900001
900002
900003
Instructor ID
220087
220039
220148
Classes
Student Schedule (Linking Table )
Student ID
60003
60001
60003
60002
60001
Class ID
900001
900003
900003
900002
900001
<< other fields >>
......
......
......
<< other fields >>
......
......
......
Figure 3.16 Resolving the many-to-many relationship with a linking table

ptg14955309
Relationship-Related Terms 65
It’s important for you to know the type of relationship that exists
between a pair of tables because it determines how the tables are
related, whether or not records between the tables are interdependent,
and the minimum and maximum number of related records that can
exist within the relationship. You’ll learn much more about relation-
ships in Chapter 10, “Table Relationships.”
Types of Participation
A table’s participation within a relationship can be either manda-
tory or optional. Say there is a relationship between two tables called
TABLE_A and TABLE_B.
• TABLE_A’s participation is mandatory if you must enter at least
one record into TABLE_A before you can enter records into
TABLE_B.
• TABLE_A’s participation is optional if you are not required to
enter any records into TABLE_A before you can enter records
into TABLE_B.
Let’s take a look at an example using the AGENTS and CLIENTS
tables in Figure 3.17. The AGENTS table has a mandatory participa-
tion within the relationship if an agent must exist before you can enter
a new client into the CLIENTS table. However, the AGENTS table’s
participation is optional if there is no requirement for an agent to exist in
the table before you enter a new client into the CLIENTS table. You can
identify the appropriate type of participation for the AGENTS table by
determining how you’re going to use its data in relation to the data in
the CLIENTS table. For example, when you want to ensure that each
client is assigned to an available agent, you make the AGENTS table’s
participation within the relationship mandatory.
ptg14955309
66 Chapter 3 Terminology
Degree of Participation
The degree of participation determines the minimum number of records
that a given table must have associated with a single record in the
related table and the maximum number of records that a given table is
allowed to have associated with a single record in the related table.
Consider, once again, a relationship between two tables called
TABLE_A and TABLE_B. You establish the degree of participation for
TABLE_B by indicating a minimum and maximum number of records
in TABLE_B that can be related to a single record in TABLE_A. If a
single record in TABLE_A can be related to no less than one but no
more than ten records in TABLE_B, then the degree of participation for
TABLE_B is 1,10. (The notation for the degree of participation shows
the minimum number on the left and the maximum number on the
right, separated by a comma.) You can establish the degree of partic-
ipation for TABLE_A in the same manner. You can identify the degree
Agents
Clients
Agent ID
100
101
102
Agent First Name
Stella
Steve
Samantha
Agent Last Name
Rosales
Horst
Nathanson
Date of Hire
05/16/09
10/15/09
03/01/11
Agent Home Phone
553-3992
790-3992
551-4993
Client Home Phone
553-3992
790-3992
551-4993
Client Last Name
Jameson
Black
Baker
Client First Name
Stewart
Susan
Scott
Agent ID
100
101
102
Client ID
9001
9002
9003
Figure 3.17 The AGENTS and CLIENTS tables

ptg14955309
Integrity-Related Terms 67
of participation for each table in a relationship by determining the way
the data in each table is related and how you’re using the data.
Consider the AGENTS and CLIENTS tables in Figure 3.17 once more.
If you require an agent to handle at least one client, but certainly no
more than eight, then the degree of participation for the CLIENTS table
is 1,8. When you want to ensure that a client can only be assigned
to one agent, then you indicate the degree of participation for the
AGENTS table as 1,1. You’ll learn how to indicate the degree of partici-
pation for a given relationship in Chapter 10.
Integrity-Related Terms
Field Specification
A field specification (traditionally known as a domain) represents all
the elements of a field. Each field specification incorporates three types
of elements: general, physical, and logical.
•General elements constitute the most fundamental information
about the field and include items such as Field Name, Descrip-
tion, and Parent Table.
•Physical elements determine how a field is built and how it is
represented to the person using it. This category includes items
such as Data Type, Length, and Display Format.
•Logical elements describe the values stored in a field and include
items such as Required Value, Range of Values, and Default
Value.
You’ll learn all of the elements associated with a field specification,
including those mentioned here, in Chapter 9, “Field Specifications.”

ptg14955309
68 Chapter 3 Terminology
Data Integrity
Data integrity refers to the validity, consistency, and accuracy of the
data in a database. I cannot overstate the fact that the level of accu-
racy of the information you retrieve from the database is in direct
proportion to the level of data integrity you impose upon the database.
Data integrity is one of the most important aspects of the database
design process, and you cannot underestimate, overlook, or even
partially neglect it. To do so would put you at risk of being plagued by
errors that are very hard to detect or identify. As a result, you would be
making important decisions on information that is inaccurate at best,
or totally invalid at worst.
There are four types of data integrity that you’ll implement during the
database design process. Three types of data integrity are based on
various aspects of the database structure and are labeled according to
the area (level) in which they operate. The fourth type of data integrity
is based on the way an organization perceives and uses its data. The
following is a brief description of each.
1. Table-level integrity (traditionally known as entity integrity)
ensures that there are no duplicate records within the table
and that the field that identifies each record within the table is
unique and never null.
2. Field-level integrity (traditionally known as domain integrity)
ensures that the structure of every field is sound; that the
values in each field are valid, consistent, and accurate; and
that fields of the same type (such as CITY fields) are consistently
defined throughout the database.
3. Relationship-level integrity (traditionally known as referential
integrity) ensures that the relationship between a pair of tables
is sound and that the records in the tables are synchronized
whenever data is entered into, updated in, or deleted from either
table.

ptg14955309
Summary 69
4. Business rules impose restrictions or limitations on certain
aspects of a database based on the ways an organization per-
ceives and uses its data. These restrictions can affect aspects of
database design, such as the range and types of values stored
in a field, the type of participation and the degree of partic-
ipation of each table within a relationship, and the type of
synchronization used for relationship-level integrity in certain
relationships. All of these restrictions are discussed in more
detail in Chapter 11. Because business rules affect integrity,
they must be considered along with the other three types of
data integrity during the design process.
Summary
This chapter began with an explanation of why terminology is import-
ant for defining, discussing, or reading about the relational database
model and the database design process.
The section on value-related terms showed you that there is a distinct
difference between data and information, and that understanding this
difference is crucial to understanding the database design process.
You now know quite a bit about nulls and how they affect information
you retrieve from the database.
Structure-related terms were covered next, and you learned that the
core structures of every relational database are fields, records, and
tables. You now know that views are virtual tables that are used, in
part, to work with data from two or more tables simultaneously. We
then looked at key fields, which are used to identify records uniquely
within a table and to establish a relationship between a pair of tables.
Finally, you learned the difference between a key field and an index.
Now you know that an index is strictly a software device used to opti-
mize data processing.

ptg14955309
70 Chapter 3 Terminology
In the section on relationship-related terms, you learned that a connec-
tion between a pair of tables is known as a relationship. A relationship
is used to help ensure various aspects of data integrity, and it is the
mechanism used by a view to draw data from multiple tables. You then
learned about the three characteristics of table relationships: the type
of relationship (one-to-one, one-to-many, many-to-many), the type of
participation (optional or mandatory), and the degree of participation
(minimum/maximum number of related records).
The chapter ended with a discussion of integrity-related terms. Here you
learned that a field specification establishes the general, physical, and
logical characteristics of a field—characteristics that are an integral
part of every field in the database. You then learned that data integrity
is one of the most important aspects of the database design process
because of its positive effect on the data in the database. Also, you now
know that there are four types of data integrity—three based on data-
base structure and one based on the way the organization interprets
and uses its data. These levels of integrity ensure the quality of your
database’s design and the accuracy of the information you retrieve
from it.
Review Questions
1. Why is terminology important?
2. Name the four categories of terms.
3. What is the difference between data and information?
4. What does a null represent?
5. What is a null’s major disadvantage?
6. What are the chief structures in the database?
7. Name the three types of tables.

ptg14955309
Review Questions 71
8. What is a view?
9. State the difference between a key and an index.
10. What are the three types of relationships that can exist between a
pair of tables?
11. What are the three ways in which you can characterize a
relationship?
12. What is a field specification?
13. What three types of elements does a field specification
incorporate?
14. What is data integrity?
15. Name the four types of data integrity.

ptg14955309
This page intentionally left blank


ptg14955309
This page intentionally left blank

ptg14955309
75
4
Conceptual Overview
I don’t pretend to understand the
Universe—it’s a great deal bigger than I am.
—THOMAS CARLYLE
Topics Covered in This Chapter
The Importance of Completing the Design Process
Defining a Mission Statement and Mission Objectives
Analyzing the Current Database
Creating the Data Structures
Determining and Establishing Table Relationships
Determining and Defining Business Rules
Determining and Defining Views
Reviewing Data Integrity
Summary
Review Questions
Understanding how to design a relational database isn’t quite as hard
as understanding the universe; in fact, it’s much easier. It is import-
ant, however, for you to have an overall idea of the way the database
design process works and a general idea of the steps involved within
the process. The purpose of this chapter is to provide an overview of
the database design process.
For the purpose of this overview, I’ve consolidated all of the techniques
in the design process into seven phases and I discuss each phase in
general terms. This discussion provides a good overall picture of the

ptg14955309
76 Chapter 4 Conceptual Overview
database design process and I hope it will give you a much clearer
understanding of each design technique covered in this part of the book.
You can use the design methodology in this book to design a new data-
base completely from scratch, refine an existing database, or help you
analyze an existing database so that you can design a new database
based on the results of your analysis.
❖Note A database can be designed by a single individual or a
design team composed of two or more individuals. Throughout
the remainder of the book, I use the phrase database developer
and the word developer to refer to the person or group designing
the database.
The Importance of Completing the
Design Process
One thing I want to make perfectly clear from the very beginning is
the importance of completing the design process. I’m often asked if it’s
truly necessary to go through the entire design process. My answer is
always a resounding “Yes!” I’m then asked whether it’s still necessary
if someone is only going to create a “simple” database. (Simple is one
of the most dangerous words known to database developers. Nothing
is ever “simple.”) Again, my answer is yes, it’s still necessary. The type,
size, or purpose of the database is totally irrelevant to the value of
undertaking a fully developed design. You should implement and follow
the database design process from beginning to end.
It is a well-known and proven fact that it is a bad idea to attempt to
design a database without employing a thorough database design
process. Many database problems are caused by poor database design,
and partially following the design process is just about as bad as not
using it at all. An incomplete design is a poor design. Only if you follow

ptg14955309
Defining a Mission Statement and Mission Objectives 77
through with a whole, unabbreviated design process are you assured a
sound structure and data integrity.
An important point to keep in mind is that the level of structural integ-
rity and data integrity in your database is directly proportional to how
thoroughly you follow the design process. The less time you spend on
the design process, the greater the risk you run of encountering prob-
lems with the database. Thoroughly following the database design pro-
cess may not eliminate all of the problems you might encounter when
designing a database, but it will greatly help to minimize them. As you
work with your RDBMS software, you’ll find that a well-designed data-
base is easier to implement than a poorly designed one.
Databases are not hard to design; it just takes a little time to design
them properly. Don’t allow yourself to take shortcuts when it seems as
if the design process is taking too long—just be patient and remember
what a wise old sage once said:
There’s never time to do it right, but there’s always time to do
it over!
Defining a Mission Statement
and Mission Objectives
The first phase in the database design process involves defining a
mission statement and mission objectives for the database. The mission
statement establishes the purpose of the database and provides you
with a distinct focus for your design work.
Every database is created for a specific purpose, whether it’s to solve
a particular business problem, to manage the daily transactions
of a business or organization, or to be used as part of an informa-
tion system. You identify the purpose of your database and define it
within a mission statement. This will help ensure that you develop an

ptg14955309
78 Chapter 4 Conceptual Overview
appropriate database structure and that you collect the data necessary
to support the intended purpose of the database.
You’ll also define mission objectives in this phase. These are statements
that represent the general tasks your users can perform against the
data in the database. You use these objectives to support your mission
statement and to help you determine various aspects of the database
structure.
There are two separate groups of people who will be involved in defin-
ing the mission statement and the mission objectives. The first group
includes the database developer (you), the owner or head of the orga-
nization, and management personnel, and it is responsible for defining
the mission statement. The second group includes the database devel-
oper (you again), management personnel, and end users, and it will be
responsible for defining the mission objectives.
Analyzing the Current Database
The second phase in the database design process involves analyzing
the current database, if one exists. Depending on your organization,
the database will typically be a legacy database or a paper-based data-
base. A legacy database (also known as an inherited database) is one
that has been in existence and in use for several years. A paper-based
database, as you may already know, is a loose collection of forms,
index cards, manila folders, and the like. Whatever the database type
or condition, analyzing it will yield valuable information about the
way your organization is currently using and managing its data. The
analysis also involves reviewing the way your organization is currently
collecting and presenting the data. You look at how your organization
uses paper to collect data (via forms) and present data (via reports). If
your organization uses some software application program to manage
and manipulate the data in the database, you study the way it collects

ptg14955309
Analyzing the Current Database 79
and presents the data on-screen. Finally, you take into account how (if
at all) your organization is using its data on the Web, and you review
any browser-based applications that work with the database.
Another part of the analysis involves conducting interviews with users
and management to identify how they interact with the database on a
daily basis. As the database developer, you ask users how they work
with the database and what their information requirements are at
the current time. You then interview management personnel and ask
them about the information they currently receive and their perception
of the overall information requirements for the organization. These
interviews are an important component of your analysis because the
questions you ask (or don’t ask) will have a great impact on your final
database structure. You must conduct full and complete interviews if
you are to design a database that truly meets your organization’s infor-
mation needs.
Next, you use the information you’ve gathered from the analysis and
the interviews to compile an initial list of fields. You then refine this
list by removing all calculated fields and placing them on their own
list—you’ll use these calculated fields later in the design process. The
refined list constitutes your organization’s fundamental data require-
ments and provides a starting point for the design of a new database.
(As you know, nothing is ever truly final. Rest assured that you’ll
extend and refine this field list further as you develop your design.)
Once your initial field list is complete, you send it to your users and
management for a brief review and possible refinement. You encourage
feedback and take their suggestions for modifications into consider-
ation. If you think the suggestions are reasonable and well supported,
you make the appropriate modifications, record the list in its current
state, and move on to the next phase.

ptg14955309
80 Chapter 4 Conceptual Overview
Creating the Data Structures
Creating the data structures for the database is the third phase in the
database design process. You define tables and fields, establish keys,
and define field specifications for every field.
Tables are the first structures you define in the database. You deter-
mine the various subjects that the tables will represent from the mis-
sion objectives you wrote during the first phase of the design process
and the data requirements you gathered during the second phase.
Then you establish these subjects as tables and associate them with
fields from the field list you compiled during the second phase of the
design process. After you’ve completed this task, you review each table
to ensure that it represents only one subject and that it does not con-
tain duplicate fields.
Now you go on to review the fields within each table. You refine all
multipart or multivalued fields in the table so that they each store
only a single value, and you move or delete fields that do not represent
distinct characteristics of the subject the table represents. When you
complete this review, you then review and refine the table structures.
This involves checking the work you performed on the fields to ensure
that you didn’t accidentally miss anything, and ensuring that each
table structure is properly defined. Next, you establish the appropriate
keys for each table. Your main task is to ensure that each table has a
properly defined primary key; this particular key uniquely identifies
each record within a table.
The final step in this phase is to establish field specifications for each
field in the database. Here you conduct interviews with users and
management to help you identify the specific field characteristics that
are important to them and review and discuss any characteristics with
which they may be unfamiliar. After you’ve completed these interviews,
you define and document field specifications for each field. You then

ptg14955309
Determining and Defining Business Rules 81
review the table structures and field specifications with users and
management once more for possible refinements. The table structures
are ready for the next phase once you complete the refinements (if any)
that you identified during the review.
Determining and Establishing Table
Relationships
The fourth phase of the database design process involves establishing
table relationships. You conduct interviews with users and manage-
ment once again, identify relationships, identify relationship character-
istics, and establish relationship-level integrity.
Working with users and management is a prudent exercise because
they can assist you in identifying relationships among the data. You
cannot possibly be familiar with every aspect of the data your orga-
nization uses, so leveraging whatever knowledge they have about the
data they use will be very beneficial to you.
After you’ve identified the relationships, you establish a logical con-
nection between the tables in each relationship with a primary key or
with a linking table. What you actually use depends upon the type of
relationship you’re establishing between the tables. Next, you deter-
mine the type of participation and degree of participation for the tables
in each relationship. In some cases, these participation characteris-
tics will be obvious to you due to the nature of the data stored in the
tables. In other cases, you’ll base the participation characteristics on
specific business rules.
Determining and Defining Business Rules
Determining and defining business rules is the fifth phase of the data-
base design process. During this phase, you’ll hold interviews, identify

ptg14955309
82 Chapter 4 Conceptual Overview
limitations on various aspects of the database, establish business
rules, and define and implement validation tables.
The manner in which your organization views and uses its data will
determine a set of limitations and requirements that you must build
into the database. Your interviews with users and management will
help you identify the specific constraints you will impose on the data,
data structures, or relationships. You then establish and document
these specifications as business rules.
The interviews you conduct with users will reveal specific limitations
on various aspects of the database. For example, a user working with
an order processing database is very aware of specific details, such
as the fact that a ship date must occur later than an order date; that
there must always be a daytime phone number; and that a shipping
method should always be indicated. Your interviews with management,
on the other hand, reveal general limitations on various aspects of the
database. For example, the office manager for an entertainment agency
is familiar with general issues such as the fact that an agent can rep-
resent no more than 20 entertainers and that promotional information
for each entertainer must be updated every year.
Next, you define and implement validation tables as necessary to sup-
port certain business rules. Suppose you find that certain fields have
a finite range of values because of the manner in which your organi-
zation uses them. You can use validation tables to ensure the consis-
tency and validity of the values stored in those fields.
The level of integrity that business rules establish at this point is
significant because it relates directly to the way your organization
views and uses its data. The organization’s perspective on the data
will change as the organization grows, which means that the business
rules must change as well. Determining and establishing business
rules is an ongoing, iterative process, and you must be constantly dili-
gent if you are going to maintain this level of integrity properly.

ptg14955309
Reviewing Data Integrity 83
Determining and Defining Views
The sixth phase of the design process involves determining and defin-
ing views. Here you’ll conduct interviews (once again), identify various
ways of working with the data, and establish the views.
You identify the types of views you need to build in the database by
interviewing users and management and determining how they work
with their respective data. You may find, for example, that many users
require detailed information to perform their work, while others need
only summary information to help them make strategic decisions for
the organization. Each group of users must access information in very
specific ways, and you can use views to accommodate these situations.
Next, you define the views you’ve identified during the interview pro-
cess using the appropriate tables and fields, and establish criteria
for those views that are required to retrieve specific information. For
instance, you would establish criteria for a view that must list all cus-
tomers located in Texas or a view that must display the total number of
authorized vendors (by city) in Washington.
Reviewing Data Integrity
The seventh and final phase in the database design process involves
reviewing the final database structure for data integrity.
First, you review each table to ensure that it meets the criteria of a
properly designed table and you check the fields within each table for
proper structure. You then resolve any inconsistencies or problems you
encounter and review the structures once more. After you’ve made the
appropriate refinements, you check table-level integrity.
Second, you review and check the field specifications for each field. You
make necessary refinements to the fields and then check field-level

ptg14955309
84 Chapter 4 Conceptual Overview
integrity. This review reaffirms the field-level integrity you identified
and established earlier in the database design process.
Third, you review the validity of each relationship, confirm the rela-
tionship type, and confirm the participation characteristics for each
table within the relationship. You then review relationship integrity to
ensure that there are matching values between shared fields and that
there are no problems inserting, updating, or deleting data in either of
the tables within the relationship.
Finally, you review the business rules that you identified earlier in the
database design process and confirm the constraints you’ve placed on
various aspects of the database. If there are any other limitations that
have come to your attention since the last set of personnel interviews,
you establish them as new business rules and add them to the existing
set of business rules.
You’re ready to implement your logical database structure in an
RDBMS program once you’ve completed the entire database design
process. However, the process is never really complete because the
database structure will always need refinement as your organization
evolves.
Summary
We began this chapter with a discussion of the importance of com-
pleting the design process, and you learned that designing a database
without the benefit of a good design method leads to poor and improper
design. We also discussed the fact that the level of structural and
data integrity is in direct proportion to how thoroughly you follow the
design process. You then learned that inconsistent data and inaccurate
information are two problems typically associated with poorly designed
databases.

ptg14955309
Summary 85
Next we looked at an overview of the entire database design process.
The process was consolidated into the following phases in order to pro-
vide you with a clear picture of the general steps involved in designing
a database.
1. Define a mission statement and mission objectives for the data-
base. The mission statement defines the purpose of the data-
base, and the mission objectives define the tasks that are to be
performed by users against the data in the database.
2. Analyze the current database. You identify your organization’s
data requirements by reviewing the way your organization cur-
rently collects and presents its data and by conducting inter-
views with users and management to determine how they use
the database on a daily basis.
3. Create the data structures. You establish tables by identifying
the subjects that the database will track. Next, you associate
each table with fields that represent distinct characteristics of
the table’s subject, and you designate a particular field (or group
of fields) as the primary key. You then establish field specifica-
tions for every field in the table.
4. Determine and establish table relationships. You identify relation-
ships that exist between the tables in the database and estab-
lish the logical connection for each relationship using primary
keys and foreign keys or by using linking tables. Then you set
the appropriate characteristics for each relationship.
5. Determine and define business rules. You conduct interviews
with users and management to identify constraints that must
be imposed upon the data in the database. The manner in
which your organization views and uses its data typically deter-
mines the types of constraints you must impose on the data-
base. You then declare these constraints as business rules, and
they will serve to establish various levels of data integrity.

ptg14955309
86 Chapter 4 Conceptual Overview
6. Determine and establish views. You interview users and man-
agement to identify the various ways they work with the data in
the database. When your interviews are complete, you establish
views as appropriate. You define each view using the appropriate
tables and fields, and you establish criteria for those views that
must display a limited or finite set of records.
7. Review data integrity. This phase involves four steps. First, you
review each table to ensure that it meets proper design criteria.
Second, you review and check all field specifications. Third, you
test the validity of each relationship. Fourth, you review and
confirm the business rules.
Review Questions
1. Why is it important to complete the design process thoroughly?
2. True or False: The level of structural integrity is in direct propor-
tion to how thoroughly you follow the design process.
3. What is the purpose of a mission statement?
4. What are mission objectives?
5. What constitutes your organization’s fundamental data
requirements?
6. How do you determine the various subjects that the tables will
represent?
7. True or False: You establish field specifications for each field in the
database during the second phase of the database design process.
8. How do you establish a logical connection between the tables in a
relationship?
9. What determines a set of limitations and requirements that you
must build into the database?

ptg14955309
Review Questions 87
10. What can you design and implement to support certain business
rules?
11. How do you determine the types of views you need to build in the
database?
12. When can you implement your logical structure in an RDBMS
program?

ptg14955309
This page intentionally left blank

ptg14955309
89
5
Starting the Process
“Where shall I begin, please your Majesty?” he asked.
“Begin at the beginning,” the King said gravely,
“and go on till you come to the end: then stop.”
—LEWIS CARROLL
ALICE’S ADVENTURES IN WONDERLAND
Topics Covered in This Chapter
Conducting Interviews
The Case Study: Mike’s Bikes
Defining the Mission Statement
Defining the Mission Objectives
Summary
Review Questions
Everything has a beginning, and the database design process is no
different. Interestingly enough, you start the process by defining the
end result. It is in the very first step of the database design process that
you identify and declare the purpose of the database. You also define
and declare a list of the tasks that your users can perform against the
data in the database. Both of these items provide you with a focus and
direction for developing a database, and they help ensure that your
final database structure supports the stated purpose and tasks.
Conducting Interviews
Interviews are an integral part of database design and they play a
key role during certain phases of the design process. Assuming that

ptg14955309
90 Chapter 5 Starting the Process
you work within some organization and need to design a database to
support the work that you and your fellow employees perform, you
should make certain that you conduct your interviews in the manner
described in this book. This means that you’ll interact with some of
your fellow employees, management personnel, and the owner (depend-
ing on the size of the organization) throughout the design process.
If you work for a small organization that employs only a handful of
people or if you are only creating a database for yourself, you’ll conduct
“self-interviews”; you’ll still conduct the interviews described in this
book, but you will act as the interviewer and the interviewee. You will
be the one who provides the answers to the questions.
❖Note Interviewing is a skill that you can learn with some
amount of patience, diligence, and practice. There are a vari-
ety of approaches and techniques you can use to conduct an
interview, and there are numerous academic papers, articles,
and books that have been written on the subject. An in-depth
discussion of this topic is beyond the scope of this book, but I’ve
included several techniques and guidelines in this chapter that
will help you conduct your interviews efficiently and effectively.
Interviews are important because they provide a valuable communica-
tion link between you (the developer) and the people for whom you’re
designing the database, help ensure the success of your design efforts,
and provide critical information that can affect the design of the data-
base structure. As you’re working with table relationships, for exam-
ple, you might find it difficult to determine the type of participation
and degree of participation for a specific relationship. The only way for
you to determine the proper values for these relationship character-
istics is to conduct an interview with the appropriate people in your
organization. You can then use the information you gathered during
the interview to set the relationship characteristics. You can use an

ptg14955309
Conducting Interviews 91
interview as an information-gathering tool to gain new insights from
participants regarding part of the database or to clarify facts that you
don’t understand. Note that you must always conduct each of the inter-
views incorporated within this design process, regardless of the type
of database you’re designing or the number of people involved. You will
inevitably miss some piece of important information when you neglect
or omit any of the interviews, and this could adversely affect the final
structure of your database.
❖Note Throughout the remaining chapters, I use open-ended
questions for all interviews that are part of the concept or tech-
nique under discussion. You can use these questions as a guide
for formulating your own questions for a given interview.
Always establish guidelines for your interviews before you conduct them.
This will help ensure that you conduct your interviews in a consistent
manner and that they are always (or usually) successful. Here are
some guidelines you can establish for the participants and for yourself.
Participant Guidelines
•Make the participants aware of your intentions. Many people are
wary of interviews. They don’t like to be “put on the spot” and
they don’t want to be asked “trick” questions. Let each person
know the subject you wish to discuss, the names of the other
participants, the time you want to start the session, and whether
this interview is part of an ongoing series of interviews. Every-
one in a given interview session is more likely to engage in the
conversation at hand and be quite responsive to your questions if
they know how you’re going to conduct the session and what you
expect of them. Above all, reassure them that the interview is not
a disguised assessment of their performance; you want to make

ptg14955309
92 Chapter 5 Starting the Process
certain they feel comfortable talking to you openly and without
reservation. This will go a long way toward building a foundation
of trust between you and the participants.
•Let the participants know that you appreciate their participation in
the interview and that their responses to the interview questions
are valuable to the overall design project. Earlier experiences are
likely to make some people believe that whatever input they pro-
vide at work goes unnoticed and unappreciated. Even when their
input did make a significant impact on a specific project, rarely
did they get so much as a “Thank you.” In light of this, there’s no
real motivation for them to participate in your interview. Many,
if not all, of your participants are likely to start out with this atti-
tude, but you can really increase their motivation by letting them
know that you sincerely and honestly appreciate their participa-
tion and are very interested in their responses. Assure them that
their feedback is truly valuable to the design process and that in
many cases their responses can substantiate and validate deci-
sions made throughout the design process. The participants will
be more apt to help you in any way they can if you make yourself
credible by being genuinely sincere; your job will be much easier
and everyone will participate voluntarily and enthusiastically. It’s
also very effective to show, on a second interview, how you have
already used participants’ earlier contributions.
•Make sure everyone understands that you are the official arbitra-
tor if and when a dispute arises. It’s inevitable that minor dis-
putes will arise during an interview and that there will be some
amount of tension until such disputes are resolved. You can
avoid this situation by arbitrating these disputes yourself. As the
database developer, you’re in the best position to do this because
you have an objective viewpoint and can see both sides of an
issue. Additionally, the decision you make will always be in the
best interests of the database structure. Always remember that

ptg14955309
Conducting Interviews 93
disputes dealing with something other than the database struc-
ture can and should be referred to a more appropriate authority,
if one exists.
Interviewer Guidelines (These Are for You)
•Conduct the interview in a well-lit room, separated from distract-
ing noise, with a large table and comfortable chairs. You’ll greatly
enhance your chances of carrying out a successful interview
when you pay attention to atmosphere—you’ll be surprised how
much of a difference this makes to the tone and energy of the
meeting. Use a well-lit room because it allows the participants to
read your interview materials very easily. A large table ensures
that everyone has space to work, and comfortable chairs keep
them relaxed enough to concentrate on the conversation at hand.
The business climate has changed considerably since I first
wrote this book and the subsequent second edition. Many people
are now conducting interviews and meetings remotely via the
computer and in more public places, such as restaurants or the
local Starbucks; these are all great options if you can’t devise
an appropriate setting for your interviews. Many companies are
more frequently moving certain meetings off-site and into hotel
conference rooms, after finding that it can be quite advanta-
geous and beneficial to get people away from their daily work
environments.
•Set a limit of ten people for each interview. Limiting the number
of participants promotes a more relaxed atmosphere and makes
it easier for you to encourage everyone to participate. One prob-
lem you’ll find in conducting an interview with a large number of
people is that the intimidation level of some of the participants
will rise in direct proportion to the number of participants taking
part in the interview as a whole. Some people are just afraid
of looking ignorant or incompetent in front of their colleagues,

ptg14955309
94 Chapter 5 Starting the Process
regardless of whether there’s truly any justification for such
feelings. As such, you do have a very good reason to restrict the
number of participants in an interview.
•Conduct separate interviews for users and management. Separat-
ing the two groups is a good idea for a variety of reasons, includ-
ing the “fear factor” noted in the preceding item. Primarily, you
want to separate them because each group has a different per-
spective on the organization as a whole and how the organization
uses its data on a daily basis. Conducting separate interviews for
each group allows you to leverage their unique perspectives to
your advantage as you work through the database design pro-
cess. Another reason for keeping the interviews separate is to
eliminate the conflicts that can arise when these groups disagree
about certain aspects of the organization. It’s quite common for
there to be a lack of communication between them and the odds
are 50/50 that the interview will bring this problem to the sur-
face. This may impel them to establish better lines of communi-
cation or it may exacerbate the problem further. In any case, this
communication problem can complicate and extend your inter-
view and diffuse its results. Use your knowledge of the organiza-
tion to help you judge whether to keep the interviews separate. If
you need to conduct an interview with both groups at the same
time, do so intentionally, with a specific purpose in mind, and be
prepared for distractions.
•When you have to interview several groups of people, designate a
group leader for each group. The group leader will help you ensure
that the interview runs smoothly. She will be responsible for
preparing each member of her group for the interview and for
providing you with any new information she obtained from the
group outside of the interview. During the interview, the group
leader can direct your questions to the member best equipped to
answer them.

ptg14955309
Conducting Interviews 95
You’ll occasionally encounter a group leader who may want to
dominate the interview and answer every one of your questions.
When this happens, diplomatically and politely inform him that
it is your job (and duty) to obtain feedback from all of the partic-
ipants so that you can make a complete assessment of the orga-
nization’s overall information requirements. If this doesn’t rectify
the problem, you have the option of refraining from including
him in future interviews or designating someone else as the
group leader.
•Prepare your questions prior to the interview. You can conduct an
interview rather easily if you have a set of prepared questions.
(Coming up with questions off the top of your head is rarely a
good idea, even if you’re an experienced interviewer and are
highly skilled at producing ad hoc questions.) Having a prepared
list of questions allows you to provide a focus and direction for
the interview, and it provides the participant with a continuity of
thought. Your interview will flow more smoothly and will be more
productive when your questions move easily from topic to topic.
As you prepare your list of interview questions, make sure you
use open-ended questions. For example, “Did you feel our ser-
vice was (a) poor, (b) average, or (c) good?” is a closed question.
A closed question isn’t particularly useful because it supplies its
own set of responses and does not allow an interviewee to pro-
vide an objective opinion or elaborate answer. On the other hand,
an open-ended question such as “How do you feel about our
service?” is far more useful because it allows the interviewee to
answer the question in a variety of ways. There are times when
you may need to use closed questions, but it’s better to use them
intentionally, sparingly, and with a specific purpose in mind.
•If you’re not very good at taking notes, either assign that task to a
dependable transcriber for each interview or get the group’s permis-
sion to use a digital (or voice) recorder to record the interview. You

ptg14955309
96 Chapter 5 Starting the Process
conduct interviews to gather specific information about the orga-
nization, so it’s important that you establish a detailed record
of each interview. If you find it difficult to conduct an interview
and take notes at the same time, you should enlist one of the
participants as your assistant and have him take notes for you.
(This is one good way to encourage participation from people who
are normally quiet or reserved.) Choose your assistant carefully
because the notes may suffer if he is at all distracted by the
proceedings. Another option you have available is to use a digital
recorder to record the interview. This might prove to be a better
way to handle your notes because the digital recorder will cap-
ture the interview more accurately, and you’ll be able to deter-
mine exactly who provided you with a given piece of information.
(Be sure you first obtain permission from each participant if you
do decide to record the interview. There may be privacy or confi-
dentiality issues at stake and you don’t want to get yourself into
any kind of trouble.)
•Give everyone your equal and undivided attention. This is a cru-
cial point for you to remember—you must pay complete attention
to the person who is speaking, and do so sincerely. If you give
a participant the impression that you’re bored, uninterested, or
preoccupied, he will immediately reduce his level of participation
within the interview. On the other hand, he will probably partic-
ipate quite enthusiastically if he sees that you are interested in
what he’s saying and has your undivided attention.
I’m sure you know that there will be times when a participant
responds to your questions with vague or incomplete answers.
He may respond this way for several reasons. It may be that he
doesn’t quite know how to express the ideas he wants to convey
or that he’s not at liberty to divulge certain information. It could
also be that he’s just not comfortable talking about himself and
what he does or that he is suspicious of you for some reason.

ptg14955309
Conducting Interviews 97
You’ll just have to be patient and make him feel at ease so that he
will provide you with the information you need. For example, you
could try to state your best approximation of what he’s said thus
far and ask if it is what he meant to say.
•Keep the pace of the interview moving. You’ve probably attended
meetings during which a particular point was belabored or much
time was spent trying to extract information from a reluctant
participant. You can prevent this from happening during your
interviews by setting personal limits on the time you’ll allow for
a question to be answered and the time you’ll spend on a specific
topic. Don’t inform the participants about this limit; instead,
indicate that you’ll table the point for now so that the meeting
can proceed. Be sure you get in touch with the owner of the
database soon after the meeting so that you can come to a final
conclusion and resolution to the issue.
•Always maintain control of the interview. This is the single most
important guideline for every interview you conduct. Inevita-
bly, something goes wrong the moment you lose control of the
interview. For instance, say you have a situation where one of
the participants begins to change the focus of the interview by
discussing issues that have little or no relevance to the topics on
your agenda. You’ll certainly lose control of the interview unless
you do something to redirect the discussion. Regaining control of
the interview will be easy for you to do in some cases, but in oth-
ers you’ll just have to declare your portion of the interview “com-
plete” and let the participants carry on with their discussion. You
can avoid situations like this so long as you maintain control of
the interview.
Interviews are an integral part of the design process and I provide
examples of them throughout the next several chapters. You’ll find
sample dialogue that illustrates typical interview scenarios and
examples of questions you might use during a given interview. (The

ptg14955309
98 Chapter 5 Starting the Process
sample questions always relate to the type of interview you’re currently
conducting.)
❖Note The purpose of an interview example is to illustrate the
techniques you use to conduct a specific type of interview, and
I’ve kept the dialogue relatively simple for this reason. Use the
dialogue as a means of coming up with good ideas for the types
of conversations you conduct in the interview.
One final point: Keep in mind that the guidelines I’ve presented in this
section are merely recommendations. I suspect that you won’t be able
to apply all of these guidelines to every interview you conduct or even
apply them to the extent to which I’ve described. I would, however,
expect you to apply them fully in an ideal situation. Yes, I know—you
don’t come across ideal situations all the time. Neither do I. But you
can still make it your goal to meet as many of these guidelines as pos-
sible. In the end, the person who stands to gain the most is you.
THE CASE STUDY: MIKE’S BIKES
There are numerous examples throughout the book that illustrate the
concepts and techniques used in the database design process. I’ve
drawn these examples from a variety of databases and used them in
an arbitrary fashion. Using them in this manner allows me to demon-
strate that once you learn how to apply a particular concept or tech-
nique generically, you can then apply it to any other database you’re
designing. Your focus, then, should always be on the concept or tech-
nique being presented, not on the example itself.
Nevertheless, I use a single database example as a case study to illus-
trate the steps involved in the design process. This enables me to pres-
ent the process with some degree of continuity. As the database design

ptg14955309
Conducting Interviews 99
process unfolds, I apply each technique to designing the database for
the fictitious company in the case study. I provide only a few details
about the company in this chapter, but I’ll supply more as I present
each new concept or technique.
Mike’s Bikes, our case-study business, is a new bike shop located in
a small suburb called Greenlake, not far from downtown Seattle. It
has been open for only two months, and business is growing steadily.
Mike, the shop’s owner, has been conducting his daily business on
paper. He records sales on preprinted forms, maintains employee and
vendor information on sheets of paper (storing them in folders), and
writes information about his regular customers on index cards. As a
result, Mike spends a lot of time maintaining all of this data. He owns
a computer but uses it mainly to play games, watch videos on YouTube,
write email, keep in touch with friends on Facebook, and visit various
golf sites. The only business-related task he performs on the com-
puter is keeping track of the bike shop’s inventory using a spreadsheet
program.
Recently, Mike learned that using a database would be a good way
to store and work with data related to his business. Using a data-
base would greatly diminish the amount of time he currently spends
maintaining his data, and he could always ensure that the data is
up-to-date and that the information is accurate. Although he thinks a
database is a good idea, he’s aware of the fact that he doesn’t know the
first thing about properly designing one. Undaunted, Mike has decided
to hire a database consultant to design the database for him.
You are, in this fable, the consultant he has hired for the project.
As the database design process unfolds throughout the next several
chapters, you’ll apply each technique to design the database for Mike’s
Bikes. As you learn new concepts or techniques, Mike will supply you
with the information you need to complete the design of his database.

ptg14955309
100 Chapter 5 Starting the Process
Defining the Mission Statement
In the previous chapter, you learned that the mission statement
declares the specific purpose of the database in general terms and that
you define it at the beginning of the database design process. Further-
more, it provides you with a focus for your design efforts and keeps you
from getting diverted and making the database structure unnecessar-
ily large or complex.
The Well-Written Mission Statement
A good mission statement is succinct and to the point. Verbose state-
ments have a tendency to be confusing, ambiguous, or vague; they do
more to obscure the purpose of the database than to clarify it. Here is
an example of a typical mission statement:
The purpose of the New Starz Talent Agency database is to maintain
the data we generate, and to supply information that supports the
engagement services we provide to our clients and the management
services we provide to our entertainers.
This mission statement is well defined and uncluttered by unnecessary
statements or details. It is a very general statement, just as it should
be. Think of a mission statement as the flame of a candle located
at the end of a dark tunnel. The light produced by the flame guides
you to the end of the tunnel, so long as you focus on it. In the same
manner, the mission statement guides you to the end of the database
design process. Guided by your mission statement, you can focus on
designing a database structure that will support the declared purpose
of the database.
A well-written mission statement is free of phrases or sentences that
explicitly describe specific tasks. If your mission statement contains
these types of phrases or sentences, remove them and rewrite the
statement. Be sure to keep the discarded phrases handy, though,
because you may be able to use them to formulate mission objectives.

ptg14955309
Defining the Mission Statement 101
(You’ll learn about mission objectives in the next section.) Here’s an
example of a poorly worded mission statement:
The purpose of the Whatcom County Hearing Examiner’s database
is to keep track of applications for land use, maintain data on appli-
cants, keep a record of all hearings, keep a record of all decisions,
keep a record of all appeals, maintain data on department employees,
and maintain data for general office use.
It should be immediately apparent that there are a few things wrong
with this mission statement.
•It’s slightly verbose. Remember that the ideal mission statement
should be succinct and to the point.
•The specific purpose of the database is unclear. This mission
statement is written in such a way that it is difficult for you to
ascertain the specific purpose of the database.
•It describes several specific tasks. Two issues arise when a mis-
sion statement is written in this manner. First, the description
of the tasks does nothing to define the specific purpose of the
database. Second, the statement somehow appears to be incom-
plete. It raises the question, “Are there any tasks we’ve forgotten
to include in the mission statement?”
You can fix this mission statement by removing the references to spe-
cific tasks (be sure to save them for the next step) and rewriting the
statement. Here is an example of one of the possible ways you could
rewrite this mission statement:
The purpose of the Whatcom County Hearing Examiner’s database is
to maintain the data the examiner’s office uses to make decisions on
land-use requests submitted by citizens of Whatcom County.
Notice how the purpose of the database has become much clearer in
this version. Also note that the statement is more succinct and doesn’t
give the impression of being incomplete. You’ll always have a clear

ptg14955309
102 Chapter 5 Starting the Process
focus during the database design process when you formulate your
mission statements in this manner.
Composing a Mission Statement
The process of creating a mission statement involves conducting
an interview with the owner or manager of the organization, learn-
ing about the organization, and determining the purpose of the new
database.
You conduct the interview for this step with the owner of the organi-
zation or, if he directs, the appropriate staff. Either will be able to help
you define the statement because each has an overall understanding of
the organization and a general comprehension of why the database is
necessary in the first place. Besides helping you to define the mission
statement, this interview will also provide a great deal of information
about the organization itself. This information is valuable because you
can use it later in the design process.
Encourage the interview participant to discuss as many facets of the
organization as she can, even if the discussion relates to issues that
aren’t directly relevant to the database. The idea here is for you to
understand what the organization does and how it functions; the more
you understand an organization, the better prepared you will be to
design a database that will fulfill its needs. The organization’s general
need for a database will become clear to you once you have a better
understanding of the organization itself. You can then translate this
need into a mission statement.
Be sure to ask open-ended questions during the interview. In some
cases, a good question can prompt the participant to state the purpose
of the database without much effort. For example, say you posed the
following question:
“How would you describe the purpose of your organization to a new
client?”

ptg14955309
Defining the Mission Statement 103
This is a good open-ended question because it focuses on the issue
yet gives the participant the freedom to respond with what she feels is
a complete answer. Furthermore, this type of question will typically
generate a response that you can translate directly into a mission
statement.
Now assume you received the following reply:
“We supply entertainment services to our clientele for any and all
occasions. We take care of all the details for the engagement so that it
is as worry-free for the client as possible.”
You can easily rewrite this type of response and turn it into a mission
statement. When a response such as this one consists of two or more
sentences or phrases, one of the sentences or phrases typically indi-
cates the purpose of the database. For example, you can use the first
sentence from the preceding reply to construct the mission statement.
Here is one of several ways you could rewrite the reply:
The purpose of the All-Star Talent database is to maintain the data
we use in support of the entertainment services we provide to our
clientele.
The most important point to remember is that the mission statement
should make sense to you (the database developer) and to those for
whom you are designing the database. Different groups of people have
different ways of phrasing statements, and the specific wording of
the statement can depend greatly on industry-specific terminology.
Your mission statement is complete when you have a sentence that
describes the specific purpose of the database and that is understood
and agreed upon by everyone concerned.
Here are a few sample questions that you can use to arrive at your
mission statement:
How would you describe the purpose of your organization to a new
client?

ptg14955309
104 Chapter 5 Starting the Process
What would you say is the purpose of your organization?
What is the major function of your organization?
How would you describe what your organization does?
How would you define the single most important reason for the exis-
tence of your organization?
What is the main focus of your organization?
You may have noticed that some of these questions seem to be the
same question rewritten in a different manner. Keep in mind that the
observation regarding the phrasing of mission statements also applies
to the interview questions you’ll use throughout the database design
process. You can pose the same question to several people and receive
different responses because each person may interpret the meaning of
the question a little differently. In some cases, you may just get a long
“I haven’t had my first espresso yet” type of stare. Experiment with dif-
ferent types of phrasing and determine which type works best for you.
Your method of constructing and posing questions may be different
from someone else’s, but it doesn’t matter so long as you have a method
that suits you.
CASE STUDY: DEFINING A MISSION
STATEMENT FOR MIKE’S BIKES
Now you need to define a mission statement for Mike’s Bikes. Before
you can define the mission statement, you must conduct an interview
with the owner to gather information about his business. Assume you
have an assistant named Zachary who is conducting the interview for
you. The interview may go something like this:
ZACHARY: “Can you tell me why you believe you need a database?”
MIKE: “I think we need a database just to keep track of all our
inventory. I’d also like to keep track of all our sales as well.”

ptg14955309
Defining the Mission Objectives 105
ZACHARY: “I’m sure the database will address those issues. Now,
what would you say is the single most important func-
tion of your business?”
MIKE: “To provide a wide array of bicycle products and bicy-
cle-related services to our customers. We have a lot of
great customers. And regular ones too! They’re our big-
gest asset.”
(The interview continues until Zachary has finished asking all the
questions on his list.)
After the interview, review the information you’ve gathered and define
the mission statement. You can ascertain a few points from the previ-
ous dialogue with Mike, such as the fact that he’ll need to be able to
track products, customers, and customer sales. But the most valuable
point is provided by his reply to the second question. You can use the
first sentence in that reply to formulate the mission statement. Taking
into account some of the other points you’ve identified in the interview,
you can rewrite Mike’s reply to create the following mission statement:
The purpose of the Mike’s Bikes database is to maintain the data we
need to support our retail sales business and our customer service
operations.
When you believe you have a good mission statement, review it with
Mike and make sure that he understands and agrees with the declared
purpose of the database. When you and Mike are satisfied with the
mission statement, you can go on to the next step, which is to define
the mission objectives.
Defining the Mission Objectives
To expand upon the overview in the previous chapter, mission objec-
tives are statements that represent the general tasks supported by the
data maintained in the database. Each mission objective represents

ptg14955309
106 Chapter 5 Starting the Process
a single task. These mission objectives provide information that you’ll
use throughout the database design process. For example, mission
objectives help you define table structures, field specifications, rela-
tionship characteristics, and views. They also help you establish data
integrity and define business rules. Finally, mission objectives guide
your development efforts and ensure that your final database structure
supports the mission statement.
Well-Written Mission Objectives
A well-written mission objective is a declarative sentence that clearly
defines a general task and is free from unnecessary details. It is
expressed in general terms, succinct and to the point, and unambigu-
ous. Here are some examples of typical mission objectives:
Maintain complete patient address information.
Keep track of all customer sales.
Make sure an account representative is responsible for no more than
20 accounts at any given time.
Keep track of vehicle maintenance.
Produce employee phone directories.
These mission objectives are well defined and easy to understand.
Each mission objective represents a single general task and defines
the task clearly without unnecessary details. For example, the last
mission objective in the list states that employee directories need to be
produced, but it doesn’t indicate how they are to be produced. It is not
necessary to indicate how the employee directories will be produced
because that issue is part of the application development process.
Remember that the purpose of a mission objective is to help define
various structures within the database and to help guide the overall
direction of the database’s development.

ptg14955309
Defining the Mission Objectives 107
If a mission objective represents more than one general task, you
should decompose it into two or more mission objectives. Here is an
example of a poorly written mission objective:
We need to keep track of the entertainers we represent and the type of
entertainment they provide, as well as the engagements that we book
for them.
There are two problems with this mission objective.
1. It defines more than a single general task. It is clear that there
are two tasks represented in this statement—keeping track of
entertainers and keeping track of engagements.
2. It contains unnecessary detail. It’s unnecessary to refer to the
entertainer’s “type of entertainment” in this mission objective.
The phrase type of entertainment either refers to a distinct char-
acteristic of an entertainer, or represents a new task that should
be declared as a mission objective. If it refers to a distinct
characteristic of an entertainer, it should be removed from the
statement; otherwise, it should be used as the basis for a new
mission objective.
You can fix this mission objective by removing the unnecessary detail
and rewriting it as two mission objectives. (Keep the details you dis-
card on a separate list; they may be useful later in the design process.)
Here is an example of one possible revision:
Maintain complete entertainer information.
Keep track of all the engagements we book.
Notice that each mission objective now clearly defines a single general
task and is easy to understand as well. Mission objectives such as
these are easy to use as you design the database.

ptg14955309
108 Chapter 5 Starting the Process
Composing Mission Objectives
Defining mission objectives is a process that involves conducting inter-
views with users and management and then writing appropriate mis-
sion objectives based on the information gathered from the interviews.
The purpose of the interview is to determine what types of general
tasks need to be supported by the data in the database. You accom-
plish this by asking the participants open-ended questions and
allowing them to elaborate on their replies as necessary. The mission
statement and mission objectives interviews are the easiest ones you’ll
conduct during the design process because everyone is usually enthu-
siastic about participating. (In my experience, at least.) It’s fairly easy
to get people to discuss what they do on a daily basis and to give their
perspective on the function of the organization. This is also one of the
few interviews you’ll conduct with both users and management; there
should be a lot of common ground between the two groups due to the
general nature of the interview.
One very important point to remember is that the interviews you con-
duct here involve very general discussions. The discussions are more
conceptual than analytical; your intent here is not to analyze the cur-
rent database or database application, but to get an overall idea of the
general tasks the database should support. Keep in mind that one of
the purposes of the mission objectives is to help guide the development
of the database structure.
As you conduct the interview, be sure, once again, to ask open-ended
questions. Remember that open-ended questions are apt to elicit
better responses from your participants. Ask the participants ques-
tions regarding their daily work, how the organization functions, and
what type of issues they believe need to be addressed by the data-
base. Encourage them to discuss as many facets of their work and the
organization as they possibly can. As they reply, try to record each
response as a declarative sentence. You’ll find it is much easier to

ptg14955309
Defining the Mission Objectives 109
transform a sentence into a mission objective if you can do this. Here
are just a few examples of the types of questions you could pose during
the interview:
What kind of work do you perform on a daily basis?
How would you define your job description?
What kind of data do you work with?
What types of reports do you generate?
What types of things do you keep track of?
What types of services does your organization provide?
How would you describe the type of work you do?
All of these questions are likely to evoke a good, lengthy response from
the participant. One of the advantages of questions like these is that
they provide the opportunity for you to ask follow-up questions. For
example, say you received the following response to the last question in
the list:
“First, I try to determine the general problem with the vehicle. Then I
fill out a work order and note my assessment of the problem. Finally, I
send the vehicle to the next available service team.”
You’ll immediately notice that it’s a lengthy response, which is fine. You
should also note that you could easily ask a follow-up question, such
as the following:
“Is there any type of customer information incorporated within the
procedure you just described?”
Even if the reply is “No,” the question is still open-ended enough for the
participant to elaborate further on his original response. This type of
follow-up question could also jar his memory and cause him to relay
other information, which may be related to the subject of the original
response.

ptg14955309
110 Chapter 5 Starting the Process
Here is a set of mission objectives that you could derive from the par-
ticipant’s original response:
Maintain information on customer vehicles.
Keep track of work orders.
Maintain information on our service teams.
Maintain information on our mechanics.
Maintain information on our customers.
Three of these objectives are derived directly from the response.
They’re easy for you to determine because their subjects are explic-
itly stated in the response itself. The last two mission objectives are
derived from assumptions based on the response. This is a technique
(which you can think of as “reading between the lines”) that experi-
enced database designers use quite often, and it is one that you should
use when you’re defining mission objectives. The technique relies on
your ability to determine what information a response conveys implic-
itly, as well as what it conveys explicitly. So pay attention. Listen for
implications. Without good assumptions, your overall set of mission
objectives could be incomplete.
Review the following response and determine whether there is implicit
information hidden within the response itself:
“I book entertainment for our clientele, which consists of commercial
and noncommercial clients. Our noncommercial clients are typically
individuals or small groups who book weddings, birthdays, anniversa-
ries, and the like. Our commercial clients, on the other hand, consist
of businesses such as nightclubs and corporations. The nightclubs
book entertainment in six-week slots; the corporations book things
such as corporate parties, product rollouts, and various types of pro-
motional functions.”
Aside from the explicit information that this response conveys, there
are at least two pieces of implicit information that you can uncover in

ptg14955309
Defining the Mission Objectives 111
this response. The first piece of implicit information concerns the need
to maintain information on the entertainers booked for the engage-
ments. An agent needs to know things such as the entertainer’s name,
phone number, mailing address, availability, and whether he will
travel to out-of-town locations. The second piece of implicit information
concerns the need to maintain information on the engagements them-
selves. An agent must know all the details concerning the engagement
in order to ensure that the engagement runs smoothly.
Now that you know how important it is to look for implicit information,
keep it in mind when you’re defining mission objectives.
Here are the “final words” regarding mission objectives: Make sure that
your mission objectives are both properly defined and well defined,
that each objective makes sense to you and to those for whom you are
designing the database, and that you look for any implicit information
hidden within every participant’s response.
CASE STUDY: DEFINING MISSION
OBJECTIVES FOR MIKE’S BIKES
It’s time now to interview Mike and his staff so that they can help you
define the mission objectives for the Mike’s Bikes database. Here’s a
partial transcript of the interview with Mike. Once again, your assis-
tant, Zachary, is conducting the interview.
ZACHARY: “Can you give me an idea of the things you’d like to track
in the database?”
MIKE: “Oh sure, that’s pretty easy. I want to keep track of our
inventory, our customers, and our sales.”
ZACHARY: “Is there anything else that you can think of that is
related to these subjects?”
MIKE “Well, I guess if we’re going to keep track of our inven-
tory, we should know who our suppliers are.”

ptg14955309
112 Chapter 5 Starting the Process
ZACHARY: “What about the sales reps involved in each sale?”
MIKE: “Oh yeah, we should definitely keep information about
our employees. If nothing else, it’s a good idea to do this
from a human resources point of view. At least, that’s
what my wife tells me!”
(The interview continues until Zachary has finished asking all the
questions on his list.)
When the interviews are complete, review all the information you’ve
gathered and define the appropriate mission objectives. Be sure to keep
the “final words” in mind as you define them. Here are a few possible
mission objectives for the Mike’s Bikes database.
Maintain complete inventory information.
Maintain complete customer information.
Track all customer sales.
Maintain complete supplier information.
Maintain complete employee information.
Once you’ve compiled a list of mission objectives, review them with
Mike and his staff. When they are satisfied that they understand the
mission objectives and that the list is relatively complete, commit the
list to a document in your favorite application program and save it for
later use.
Summary
This chapter opened with a discussion of the interview process. You
learned why interviews are an important part of the database design
process and why it’s important to learn how to conduct an interview
properly. You now know the difference between an open-ended question
and a closed question, as well as when to use each kind of question.

ptg14955309
Review Questions 113
We ended this discussion by reviewing a set of interview guidelines,
and you learned that you should use them to help you ensure that the
interviews are productive and successful.
The mission statement was our next topic of discussion. We expanded
upon the information in Chapter 4, “Conceptual Overview,” by looking
at how the mission statement states the specific purpose of the data-
base. You now know that the process involves conducting interviews
and learning about the organization, then formulating the mission
statement from the information you gathered during these steps.
We defined the characteristics of a good mission statement, and you
learned that a well-defined mission statement establishes a clear focus
for your design efforts.
Next, we discussed mission objectives, and we expanded upon the
Chapter 4 overview once again. As you now know, mission objectives
represent the tasks performed against the data in the database, and
you define them after the mission statement. We then explored how
to define a mission objective. Here, you learned that you conduct
interviews with users and management and that the information you
gather from these interviews provides the basis for each mission objec-
tive. We also discussed the characteristics of a well-written mission
objective, and you learned that a clearly defined mission objective will
help you define various structures within the database.
Review Questions
1. Why are interviews important?
2. What problem can arise when you conduct an interview with a
large number of people?
3. What is the primary reason for conducting separate interviews
with users and management?

ptg14955309
114 Chapter 5 Starting the Process
4. True or False: You’ll commonly use closed questions in your
interviews.
5. What kind of responses should you try to evoke from the interview
participants?
6. What is the single most important guideline for every interview
you conduct?
7. What is a mission statement?
8. State two characteristics of a well-written mission statement.
9. True or False: You need not learn about the organization in order
to compose a mission statement.
10. When is your mission statement complete?
11. What is a mission objective?
12. State two characteristics of a well-written mission objective.
13. True or False: You should interview users and management to help
you define mission objectives.
14. How does the staff’s daily work relate to the mission objectives?
15. True or False: A mission objective can describe more than one
task.
16. State two ways that a mission objective can be derived from a
response.
17. When is a mission objective complete?

ptg14955309
115
6
Analyzing the Current Database
To see what is in front of one’s nose
needs a constant struggle.
—GEORGE ORWELL
IN FRONT OF YOUR NOSE
Topics Covered in This Chapter
Getting to Know the Current Database
Conducting the Analysis
Looking at How Data Is Collected
Looking at How Information Is Presented
Conducting Interviews
Interviewing Users
Interviewing Management
Compiling a Complete List of Fields
Case Study
Summary
Review Questions
Getting to Know the Current Database
To determine where you should go, you must first understand where
you are.
This maxim defines the entire philosophy behind this phase of the
database design process. You must devote some time to gaining a clear
understanding of your organization’s database so that you can

ptg14955309
116 Chapter 6 Analyzing the Current Database
• Determine whether the database supports the organization’s cur-
rent information requirements
• Uncover existing structural deficiencies
• Determine how the database needs to evolve so that it will sup-
port the organization’s future information requirements
You can use the existing database as a resource for developing a new
database. However, you must carefully judge which aspects of the cur-
rent database remain useful and which aspects should be discarded.
You can make these judgments by answering the following questions:
What types of data does the organization use?
How does the organization use that data?
How does the organization manage and maintain that data?
The answers to these questions provide you with vital information that
you can use to design a database that best suits your organization’s
needs.
You can best answer these questions by analyzing your organization’s
existing database. It’s very likely that the organization is using some
type of database, and it can probably be associated with one of the
following categories.
•Paper-based databases—also known as file systems—typically
consist of various forms and handwritten or printed documents
stored in file folders or bound in notebooks. The folders and note-
books are identified by some coding scheme (e.g., unique num-
bers or colored tabs) and stored in file cabinets. These cabinets
are likely to be identified by some coding scheme as well, depend-
ing on the size of the database.
•Legacy databases have been in existence and in use for several
years or more and consist of various types of data structures and
user interfaces that all reside on mainframe computers, network

ptg14955309
Getting to Know the Current Database 117
servers, or personal computers. The capability, functionality, and
effectiveness of the structures and screens are quite dependent
upon the skills and knowledge of the developers, the application
development tools, and the database management software used
to create them.
•Human-knowledge bases (loosely defined) are based on the mem-
ory of one or more employees within an organization. These indi-
viduals have a specific amount of knowledge regarding a given
aspect of the organization (e.g., customer information or product
details), and they are crucial to conducting the organization’s
business.
The goals of your analysis are to determine the types of data the orga-
nization uses, how the organization manages and maintains that data,
and how the organization views and uses the data. You can reduce the
time it takes to define the preliminary field and table structures for the
new database if you conduct this investigation properly.
During the analysis, you review the various ways the organization
collects and presents its data, and you conduct a set of interviews with
users and management. You then use the information you’ve gath-
ered to define a Preliminary Field List and to help you determine the
tables that should be included in the initial database structure. If your
analysis reveals that the current database is poorly designed, you can
take precautions to ensure that you don’t make the same mistakes in
the new database. Despite whatever shortcomings the current data-
base may have, it can still help you identify a number of the fields and
tables that you should include in the new database.
There’s one rule you should keep first and foremost in your mind as
you’re analyzing the current database:
Do not adopt the current database structure as the basis for the new
database structure.

ptg14955309
118 Chapter 6 Analyzing the Current Database
Following this rule will help you avert unnecessary errors and aid in
maximizing your design efforts.
Every so often, there’s a point during the analysis when a novice
database developer (and sometimes an experienced one) will stop and
think, “This database doesn’t look too bad. Let’s just end the analy-
sis here and use this database as the basis for the new one.” This is a
particularly bad idea because every hidden problem within the current
database structure will be transferred into the new database. These
types of problems include awkward table structures, poorly defined
relationships, and inconsistent field specifications; they will invariably
surface later and at the least opportune times. Therefore, you should
do your best to avoid this perilous situation by following the afore-
mentioned rule. Just remember that it’s always better to define a new
database structure explicitly than to copy an existing structure. After
all, if the old database didn’t have problems, you wouldn’t be building a
new one.
You’ll typically analyze paper-based databases and legacy databases
during this part of the design process. Many organizations use both
types of databases to some degree, and you perform the same basic
analysis process on each of them. There are minor differences in the
way you analyze a paper-based database and a legacy database, to be
sure, but the differences have more to do with the databases them-
selves than with the overall analysis process. You needn’t be concerned
with these differences, however, because I’ve seamlessly incorporated
them into the analysis process presented in this book.
Paper-Based Databases
A paper-based database incorporates data that is literally collected,
stored, and maintained on paper, and you’ll find these items in a vari-
ety of shapes, sizes, and configurations. Some of the more common for-
mats include index cards, handwritten or printed reports, and various

ptg14955309
Getting to Know the Current Database 119
types of preprinted forms. Anyone who has ever worked in an office for
a business or organization is very familiar with this type of database.
You’ll find that analyzing a paper-based database can be a daunting
task. One of your most immediate problems is finding someone who
completely understands how the database works so that you can learn
its use and purpose. There are several problems with the database
itself, especially in terms of the way data is collected and managed.
This type of database typically contains inconsistent data, erroneous
data, duplicate data, redundant data, incomplete entries, and old data
that should have been purged from the database long ago. Clearly, the
only reason you’d analyze this type of database is to identify items that
you could incorporate into the new database. For example, you can
extract individual pieces of data from various sections of a form in the
old database and transform them into fields in the new database.
Legacy Databases
A legacy database is a database that has been in existence and in use
for five years or more. Mainframe databases typically fall into this cat-
egory, as do older PC-based databases. There are several reasons that
“legacy” is used as part of the name for this type of database. First, it
suggests that the database has been around for a long time, possibly
longer than anyone can clearly remember. Second, the word legacy
may mean that the individual who originally created the database
either has shifted responsibilities within the organization or is working
for someone else and, thus, the database has become his or her legacy
to the organization. Third, the term implies the disturbing possibility
that no single individual completely understands the database struc-
ture or how it is implemented in the RDBMS application program.
Mainframe legacy databases present some special problems in the
analysis process. One problem stems from the fact that a number
of older mainframe databases are based on hierarchical or network

ptg14955309
120 Chapter 6 Analyzing the Current Database
database models. If neither you nor anyone in the organization has a
firm understanding of these models, it will take you some time to deci-
pher the structure of the database. In this case, you’ll find it very help-
ful to make printouts of the data in each of the database structures.
Even if a legacy database is based on the relational model, there’s no
particular guarantee that the structure is sound. Unfortunately, there
are many instances in which the people who created these databases
didn’t completely understand the concept of a relational database. (After
you have read this book, you won’t fall into that group.) The result is
that many older databases have improper or inefficient structures.
Numerous PC-based legacy databases are improperly or inefficiently
designed, too. Many of them were originally developed and imple-
mented in older nonrelational database management systems, which
means that they could not take advantage of the benefits provided by
the relational model. Two characteristics commonly associated with
these types of databases are duplicate fields and redundant data.
You’ll learn later that this can cause serious problems with data
integrity.
Analyzing a legacy database is somewhat easier than analyzing a
paper-based database because a legacy database is typically more
organized and structured than a paper-based database, the struc-
tures within the database are explicitly defined, and there is usually
an application program that people use to interact with the data in
the database. (The application program is valuable to you during the
analysis process because it can reveal a lot of information about the
data structures and the tasks performed against the data in the legacy
database.) The time it will take you to perform a proper analysis will
depend to some degree on the platform (mainframe or PC), the RDBMS
used to implement the legacy database, and the application program.
The key point to remember when you’re analyzing either a paper-based
or a legacy database is that you should proceed through the process

ptg14955309
Looking at How Data Is Collected 121
patiently and methodically so that you can ensure a thorough and
accurate analysis.
Conducting the Analysis
There are three steps in the analysis process: reviewing the way data
is collected, reviewing the manner in which information is presented,
and conducting interviews with users and management.
It will be necessary for you to speak to various people in the organi-
zation as you conduct the first two steps in this process. Be sure your
conversations relate purely to the reviews at hand. You’ll have the oppor-
tunity to ask them other in-depth questions later. Keep in mind that
these reviews are an integral part of your preparation for the inter-
views that will follow. Indeed, these reviews help you determine the
types of questions you’ll need to ask in subsequent interviews.
Looking at How Data Is Collected
The first step in the analysis process involves reviewing the ways in
which data is collected. This includes everything from index cards
and handwritten or printed lists to preprinted forms and data entry
screens (such as those used in a database program or web browser).
Begin this step by reviewing all paper-based items. Find out what
types of documents the organization is using to record data and then
gather a single sample of each. Assemble these samples and store them
in a folder for use later in the design process. For example, assume
that the organization is collecting supplier data on index cards. Go
through each of the index cards until you find one with an entry that
is as complete as possible. When you’ve found an appropriate sample,
make a copy of it and save it in the folder. Proceed through this pro-
cess for each type of item being used. Figure 6.1 shows two examples
of how the organization might use paper-based items to collect data.
ptg14955309
122 Chapter 6 Analyzing the Current Database
Next, review all of the computer programs that the organization uses
to collect data. The objective here is to gather a set of sample screen-
shots that represent how the organization uses these programs to work
with data. A word of caution: Many people have discovered unique and
ingenious ways to use common programs, such as word processors
and spreadsheets, as a way to collect and manage data. Make sure you
speak with someone who is familiar with the way the computers are
being used within the organization and determine which programs the
organization is using to manage its data.
As you review each program, find a screen that best represents how
the program collects data. You’re looking for screens similar to those in
Figure 6.2.
A1 Office Supplies
Suite 133
7739 Alpine Way SE
Seattle, WA 98115
Susan Black 519-5883
Email susanb@A10S.com
Employee Fact Sheet
Name: George Chavez
Address: 7527 Taxco Drive
SSN: 987-65-0049Date of Birth: 09/22/85
Date Hired: June 30, 2009
City: Seattle State: WA
Phone: 553-0399
Education:
Name of Academic Organization Location Year Graduated
University of Texas at El Paso El Paso, TX 2007
Zip: 98115
Figure 6.1 Examples of paper-based items used to collect data
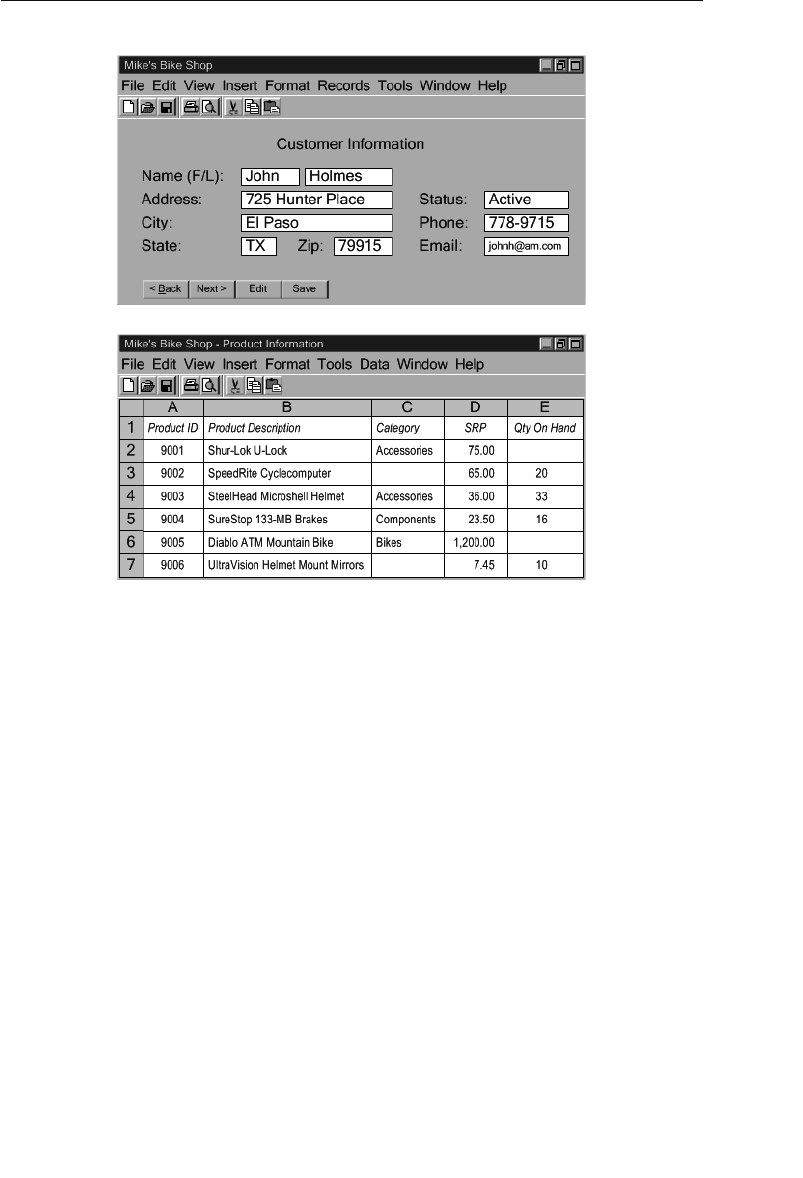
ptg14955309
Looking at How Data Is Collected 123
The first screen is typical of those you would find in a database pro-
gram, and the second screen is typical of those you would find in a
spreadsheet program. When you’ve found an appropriate sample, cre-
ate a screenshot using your favorite screen-capture application, paste
it into a document in your word processing program, indicate the name
of the source program and the date you created the screenshot, and
then print the document. Continue reviewing the program and repeat
this procedure as appropriate. Then repeat the entire process for each
program. Once you’ve printed copies of all the appropriate screenshots,
assemble them together and store them in a folder for use later in the
design process.
Figure 6.2 A typical database screen and a typical spreadsheet screen
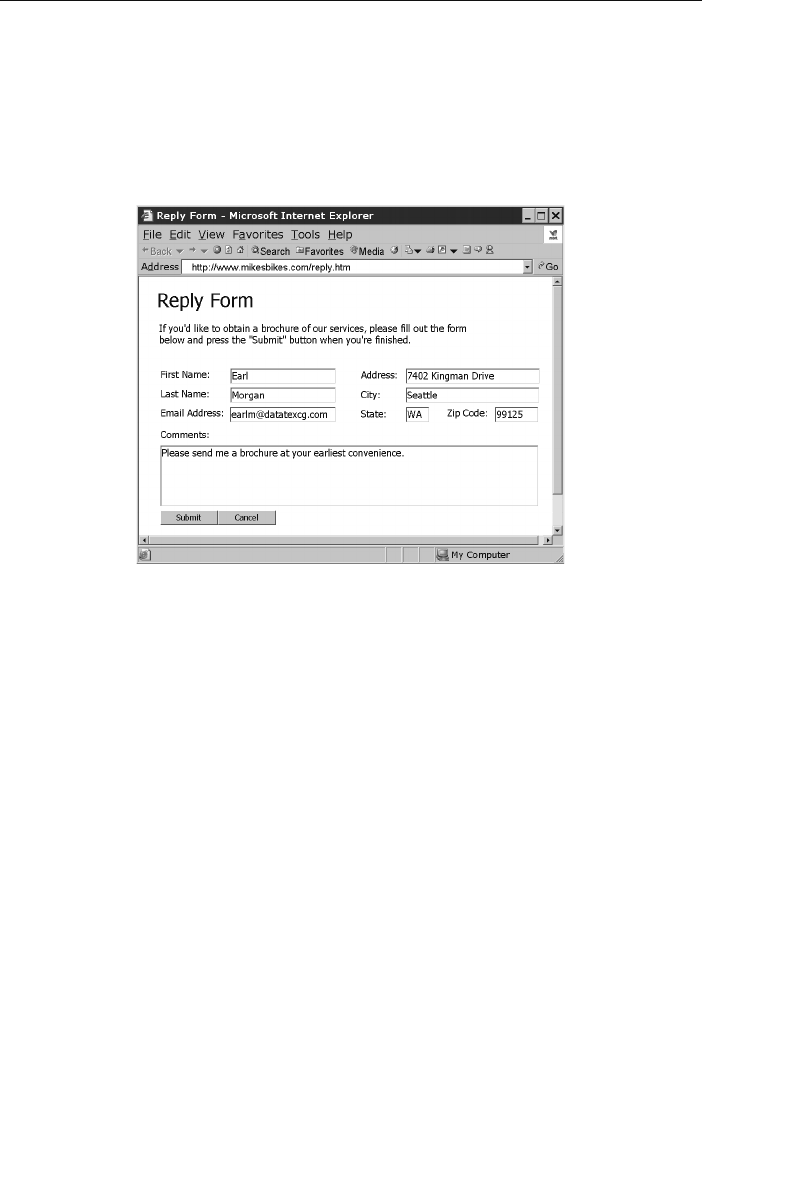
ptg14955309
124 Chapter 6 Analyzing the Current Database
Now examine the web pages that the organization uses to collect data
via the Internet. The pages you’re interested in will look very similar to
the data entry forms you would find in a database application pro-
gram. Figure 6.3 shows an example of such a page.
Figure 6.3 An example of a typical web-based data entry screen
You can follow the same examination procedure here that you used
with the application programs. Take a screenshot of a given web page,
paste it into a word processing document, indicate the program name
and screen capture date, and print it. Continue to review the web
pages and repeat this procedure as appropriate. Once you’ve printed
copies of all the appropriate screenshots, assemble them and store
them in a folder for use later in the design process.
Make sure you clearly mark the folders containing the samples you’ve
gathered during your analysis. The small amounts of time you invest
to organize your materials pay big dividends when you use those mate-
rials during a complex phase of the design process.

ptg14955309
Looking at How Information Is Presented 125
Looking at How Information Is
Presented
The second step in the analysis process involves reviewing the vari-
ous ways in which the organization presents its data as information.
During this process, you’ll review items, such as handwritten docu-
ments, computer printouts, screen presentations, and web pages.
Here are three of the most popular presentation methods that you’ll
encounter during this process.
1. Reports: A report is any document (handwritten, typed, or
computer-generated) used to arrange and present data in such
a way that it is meaningful to the person or people viewing it.
Although using a word processor, spreadsheet, or other software
program is the standard method of generating a report, you’ll
still find some reports written by hand.
2. Screen presentations (a.k.a. slide shows): This type of presen-
tation incorporates a series of screens that discuss various
topics in an organized manner. It is generally created with a
program, such as Microsoft PowerPoint or Corel Presentations,
and executed on a computer, although it can also be composed
of a series of plastic sheets that are displayed on a screen by an
overhead projector. (For our purposes, we’ll assume that you’re
reviewing a computer-based screen presentation.)
3. Web pages: Many organizations have vast amounts of informa-
tion available via pages on their web sites. A web page is used
in much the same manner as a report, and, indeed, it is really
nothing more than a different type of report.
Begin this step by identifying and reviewing each report the organi-
zation generates from the database, regardless of whether the organi-
zation produces the report by hand or with an application program.

ptg14955309
126 Chapter 6 Analyzing the Current Database
Gather samples of the reports and assemble them in a folder as you
did with the items in the previous step. Overall, this task is easier to
perform in this step than it was in the previous step because people in
the organization are typically familiar with the reports they use. Copies
of the reports are usually readily available, and most reports can be
reprinted if necessary. Figure 6.4 shows an example of a report written
by hand and a report generated from a word processing program.
Employee Phone List
as of 05/16/11
John Alcot 554-3002
Regina Allen 752-5593
George Chavez 623-3292
Ryan Boyd 554-2991
Product ID
9001
9002
9003
9004
Current Product Inventory
Product Description
Shur-Lok U-Lock
SpeedRite Cyclecomputer
SteelHead Microshell Helmet
SureStop 133-MB Brakes
Category
Accessories
Accessories
Components
SRP
75.00
65.00
36.00
23.50
Quantity
20
33
16
Figure 6.4 A handwritten report and a computer-generated report
Next, review screen presentations that use or incorporate the data in
the database. It’s unnecessary for you to review every presentation, but
you do need to review those that have a direct bearing on the data in
the database. For example, you don’t need to review a presentation on
ptg14955309
Looking at How Information Is Presented 127
the organization’s new product if it doesn’t draw any data from the data-
base. On the other hand, a presentation on sales statistics that does
incorporate data from the database is one that you do need to review.
Once you’ve identified which presentations you need to review, go
through each one carefully and make screenshots of the slides that
use or incorporate data from the database. Copy the screenshots into
a word processing document, print the document, and then store the
document in a folder for later use. (Write the name of the presentation
and the date you captured the screenshots on the folder; you may need
to refer to it again at a later time.) Follow this procedure separately for
each presentation. You want to make sure you don’t accidentally com-
bine two or more presentations together, because this mistake will
inevitably lead to mass confusion and result in one huge mess!
Figure 6.5 shows an example of the type of slides you’ll examine
during this review.
Central
Northeast
Pacific NW
Southern
Western
1st Qtr
235
335
229
315
240
2nd Qtr
277
369
277
345
251
3rd Qtr
289
388
300
365
266
4th Qtr
316
359
315
376
289
2011
Regional Sales
Total Units Sold
per Quarter
Total Orders
Delivered
per Shipper
1234567
expressed in 100s
Aero-Xpress
Global
Postal Express
Figure 6.5 Examples of screen presentation slides
Reviewing a presentation is difficult in some cases, and deciding
whether you should include a given slide as a sample is purely a
discretionary decision. Therefore, work closely with the person most
ptg14955309
128 Chapter 6 Analyzing the Current Database
familiar with the presentation to ensure that you include all appropri-
ate slides in the samples.
Finally, review web pages that draw information directly from the data-
base. Perform this review in the same manner as the review for the
screen presentations. As with the previous review, you need to review
those web pages that have a direct bearing on the data in the data-
base. For example, you don’t need to review a web page that provides a
history of your organization, but you do need to review a web page that
displays regional employee information.
Once you’ve identified which web pages you need to review, take a
screenshot of each page. Copy the screenshots into a word process-
ing document, print the document, and then store the document in a
folder for later use. (Write the URL address and the current date under
each screenshot in the document; you may need to refer to a particular
web page again at a later time.)
Figure 6.6 shows an example of a web page you would examine during
this review.
Figure 6.6 Example of a web page that presents information from a database

ptg14955309
Conducting Interviews 129
Try to work with the person (or persons) who created and developed
the organization’s web site. She can save you a lot of time by directing
you to the exact pages you should examine for this review.
Conducting Interviews
Now that you have a general idea of how the organization collects
and presents its data, it’s time to interview users and management to
determine how the organization uses its data. Interviews are useful in
the analysis phase for these reasons
•They provide details about the samples you assembled during the
previous reviews. The discussions you had with users and man-
agement during the previous reviews were solely meant to iden-
tify (in general terms) how the organization collects and presents
the data it uses. In this phase, however, you’ll ask specific ques-
tions about the samples you assembled during those reviews.
This will enable you to clarify the aspects of a specific sample
that you consider to be vague or ambiguous.
•They provide information on the way the organization uses its
data. These interviews will provide you with information on how
users work with the organization’s data on a daily basis and how
management uses information based on that data to manage the
organization’s affairs.
•They are instrumental in defining preliminary field and table struc-
tures. The responses you receive from users and management
during this round of interviews will help you identify initial field
and table structures for the database.
•They help to define future information requirements. The discus-
sions you’ll have with users and management regarding the
organization’s future growth will often reveal new information
requirements that must be supported by the database.

ptg14955309
130 Chapter 6 Analyzing the Current Database
I cannot overemphasize, and you must not underestimate, the impact
interviews have on the final database structure and how important
they are to your successful completion of the database design process.
Only full and complete interviews will help you ensure that the data-
base you design fulfills your organization’s information requirements.
Basic Interview Techniques
In order for you to conduct successful interviews, you must first learn
a few basic interview techniques. I address this issue here by providing
you with a set of fundamental techniques that you can use to conduct
every interview within the database design process. These techniques
are relatively easy to learn and apply and they’ll enable you to obtain
the information you require for the task at hand.
You’ll probably execute these techniques in a strict, mechanical fash-
ion as you’re just starting to learn them, but you’ll apply them more
instinctively and intuitively as you conduct further interviews and
gain additional experience. Conducting an interview is a skill, and, as
with any other skill, you will achieve various degrees of expertise with
patience and practice.
The Importance of Questions
Learning how to ask a question is a valuable skill that you’ll have to
learn and develop if you’re going to be successful at designing data-
bases. It is what you will use to understand how your (or your client’s)
business works and enable you to gather the information you need to
develop the various structures for the database. And, as you may have
already surmised, it is precisely the skill required to conduct the inter-
views throughout this design process. I know this might seem like I’m
stating the obvious, but I just can’t overstate how important a skill this
truly is.

ptg14955309
Conducting Interviews 131
The Interview Process
You use both open-ended and closed questions throughout an inter-
view, alternating between each type as the interview progresses. Open-
ended questions are more general in nature and enable you to focus on
specific subjects, whereas closed questions are more specific and allow
you to focus on particular details of a certain subject. For instance,
start the interview with a few open-ended questions to establish some
general subjects for discussion and then select a subject and ask more
specific (closed) questions relating to that subject. You could begin by
asking one of the interview participants an open-ended question such
as this:
“How would you define the work that you do on a daily basis?”
Most participants will use three or more sentences to answer this type
of question. It’s perfectly acceptable for a participant to provide you
with a long, descriptive response because you can work with this type
of response more easily than you can with one that is terse. To illus-
trate this point, assume the participant responds to your question in
this manner:
“As an account representative, I’m responsible for ten clients. Each of
my clients makes an appointment to come into the showroom to view
the merchandise we have to offer for the current season. Part of my
job is to answer any questions they have about our merchandise and
make recommendations regarding the most popular items. Once they
make a decision on the merchandise they’d like to purchase, I write
up a sales order for the client. Then I give the sales order to my assis-
tant, who promptly fills the order and sends it to the client.”
This is a very good response. The participant not only answered your
question, but also provided you with the opportunity to begin asking
follow-up questions. His response also suggests several subjects that
you can discuss later in the interview.

ptg14955309
132 Chapter 6 Analyzing the Current Database
❖Note A terse response, such as “I fill out customer sales
orders,” will provide you with little information, so you’ll have to
work a bit harder with the participant to get an idea of what this
process involves. Terse responses commonly indicate that the
participant is just nervous or uncomfortable. In this case, you
could put him at ease by discussing an unrelated topic for a few
moments or by allowing him to select a more familiar or comfort-
able subject as a starting point.
Identifying Subjects
As you ask each open-ended question, identify the subjects suggested
within the response to the question. You can identify subjects by
looking for nouns within the sentences that make up the response.
Subjects are always represented by nouns and identify a person, place,
thing, or event (something that occurs at a given point in time). There
are some nouns, however, that represent a characteristic of a person,
place, thing, or event; you don’t need to concern yourself with these
just yet. Therefore, make sure you only look for nouns that specifically
represent a person, place, thing, or event. (Note that there’s no need
to mark more than one occurrence of a given noun.) You can ensure
that you account for every subject you need to discuss by marking
the nouns with a double-underline as you identify them, as in this
example:
“As an account representative, I’m responsible for ten clients. Each of
my clients makes an appointment to come into the showroom to view
the merchandise we have to offer for the current season. Part of my
job is to answer any questions they have about our merchandise and
make recommendations regarding the most popular items. Once they
make a decision on the merchandise they’d like to purchase, I write
up a sales order for the client. Then I give the sales order to my assis-
tant, who promptly fills the order and sends it to the client.”

ptg14955309
Conducting Interviews 133
After you’ve identified all of the appropriate nouns within the response,
list them on a sheet of paper; this becomes your list of subjects. You’ll
add more subjects to the list as you continue to work through the
design process. Compile this list carefully and methodically because
you’ll use it to generate further discussions as the interview progresses
and to help you define tables later in the design process.
Here are subjects (shown in alphabetical order) that are represented in
the previous response:
Account Representative Job
Appointment Merchandise
Assistant Sales Order
Clients Season
Items Showroom
You can now use this list as the basis of further questions during the
interview.
❖Note I refer to this entire procedure as the Subject-Identifica-
tion Technique throughout the remainder of the book.
Verify that the nouns you’ve underlined are genuine subjects by
reviewing the way they’re used in the response. For example, “account
representative” is a subject suggested by a noun in the first sentence,
and you can assume that the subject identifies an object (person, place,
or thing) by the way the noun is used in the sentence. “Appointment” is
another subject suggested by a noun in the second sentence, and you
can assume this subject represents an event (something that occurs at
a given point in time) by the way it is used in the sentence.

ptg14955309
134 Chapter 6 Analyzing the Current Database
Identifying Characteristics
After you’ve identified the subjects suggested within the response, pick
a particular subject and begin to ask follow-up questions related to that
subject. You use this line of questioning to obtain as much detailed
information as possible about the subject you’ve selected. Make sure
your follow-up questions are more specific as you progress through
this part of the discussion. The nature of your follow-up questions will
depend on the responses you receive from the participant. Based on
our sample response, for example, you could continue the discussion by
asking more specific questions about sales orders or you could begin an
entirely new line of questioning regarding clients. Assume, for now, that
you ask the following question to learn more about sales orders:
“Let’s discuss sales orders for a moment. What does it take to complete
a sales order for a client?”
Note that this question begins with a statement directing the inter-
view participant to focus on a particular subject. This is a technique
you should use to guide your conversation after you’ve selected a
specific subject to discuss. Also note that the question is open-ended;
it prompts the participant for details related to the subject you’ve
selected (sales orders) and allows you to establish the focus of the par-
ticipant’s subsequent responses.
Now, assume that the participant gives the following reply:
“Well, I enter all the client information first, such as the client’s name,
address, phone number, and email address. Then I enter the items
the client wants to purchase. After I’ve entered all the items, I tally up
the totals and I’m done. Oh, I forgot to mention: I enter the client’s fax
number and shipping address—if they have one.”
Analyze this response with the Subject-Identification Technique to
determine whether there are subjects suggested within the response.
Then add the new subjects to your list of subjects. Remember: List only
those nouns that represent person, place, thing, or event.

ptg14955309
Conducting Interviews 135
After you’ve finished identifying new subjects, begin looking for details
regarding the subject under discussion. Your objective here is to obtain
as many facts about the subject as possible. Now you’re interested in
nouns that represent characteristics of a subject—they describe partic-
ular aspects of that subject. You can identify these nouns quite easily
because they are usually in singular form (“phone number,” “address”).
In contrast, nouns that identify subjects are usually in possessive form
(“the client’s phone number,” “the company’s address”).
Try to account for as many characteristics of the subject as possible.
Use a single underline to mark a noun that represents a characteristic,
as in this example:
“Well, I enter all the client information first, such as the client’s name,
address, phone number, and email address. Then I enter the items the
client wants to purchase. After I’ve entered all the items, I tally up the
totals and I’m done. Oh, I forgot to mention that I enter the client’s fax
number and shipping address—if they have one.”
As you identify the appropriate nouns within a response, list them on a
sheet of paper; this becomes your list of characteristics. You’ll add more
characteristics to the list as you work through the design process,
and you’ll use this list later when you’re determining the fields for the
database. Use a separate sheet of paper for the list of characteristics. Do
not list the subjects and characteristics on the same sheet! (The reason
for keeping them on different lists will become clear when you begin
to define tables for the database in Chapter 7, “Establishing Table
Structures.”)
Here are the characteristics (shown in alphabetical order) that are rep-
resented in the previous response:
Address Name Totals
Email Address Phone Number
Fax Number Shipping Address

ptg14955309
136 Chapter 6 Analyzing the Current Database
This constitutes the list of characteristics for the subject under dis-
cussion. These characteristics will eventually become fields in the
database.
❖Note I refer to this entire procedure as the Characteristic-Iden-
tification Technique throughout the remainder of the book.
Verify that the nouns you’ve marked with a single underline are genu-
ine characteristics by reviewing the way they’re used in the response.
For example, “name” is a characteristic suggested by a noun in the
first sentence, and you can assume that it describes some aspect of the
subject “client” by the way the noun is used in the sentence. “Shipping
address” is another characteristic suggested by a noun in the last sen-
tence, and you can assume that this noun also represents some aspect
of the subject “client” by the way the noun is used in the sentence.
After you’ve finished discussing a particular subject, move on to the
next subject on your subjects list and begin the same pattern of ques-
tioning. Start with open-ended questions, identify the subjects sug-
gested in the responses, ask more specific questions as the discussion
progresses, and identify as many of the subject’s characteristics as
possible. Continue this process in a methodical manner until you’ve
discussed every subject on your list.
You should learn the Subject-Identification Technique and the Char-
acteristic-Identification Technique as thoroughly as possible because
you’ll use them during your interviews with users and management
and as you identify fields and tables for the initial database struc-
ture. Note that you won’t have to incorporate the single and double
underlines forever; you’ll eventually execute these techniques in your
mind as you gain experience and as they become more instinctive and
intuitive.

ptg14955309
Interviewing Users 137
Before You Begin the Interview Process . . .
You can use the techniques you’ve just learned in this section for both
user interviews and management interviews. The only differences
between the two sets of interviews lie in the subject matter and the
content of the questions.
The interview process involves two sets of discussions: one with users
and the other with management. You’ll speak to the users first because
they represent the “front lines” of the organization. They have the
clearest picture of the details connected with the organization’s daily
operations. Also, the information you gather from the users should
help you to understand the answers you receive from management.
Interviewing Users
The first part of the interview process involves conducting user inter-
views. The interviews focus on these four issues:
1. The types of data users are currently using
2. How users are currently using their data
3. The collection of samples you assembled during the first two
steps of the analysis
4. And the types of information users require for their daily work
Because these issues are both data-centric and information-centric,
you must be certain that you understand and always keep in mind
the difference between data and information. Recall from Chapter 3,
“Terminology,” that data are the values you store in the database and
information is data that you process in a manner that makes it mean-
ingful and useful to you when you work with it or view it. Keeping
these definitions in mind will help ensure that you focus on each issue
properly and conduct each segment of the interview successfully.

ptg14955309
138 Chapter 6 Analyzing the Current Database
Reviewing Data Type and Usage
You can usually discuss the first two issues at the same time if you
carefully phrase your questions at the beginning of the interview. Your
objective for this part of the interview is to identify the types of data
the users are currently using and how they use that data in support of
the work they do. You’ll use this information later in the design process
to help define field and table structures. Use the data collection and
data representation samples to help you formulate questions about the
user’s data. (However, don’t actually discuss the samples just yet; you
should deal with them separately.) During this discussion, you’ll start
with open-ended questions, identify subjects within the responses, and
then use specific follow-up questions to identify the characteristics of
each subject.
As you begin the interview, ask each participant about the work he or
she performs on a daily basis. After a participant provides an overall
description of the work he does, ask him to explain his job in more
detail. Perhaps he can walk you through the job he performs on a daily
basis.
Here’s an example of a typical conversation that occurs during this
part of the interview:
INTERVIEWER: “What kind of work do you do on a day-to-day basis?”
PARTICIPANT: “I accept land-use applications that are submitted
by various people, log them in, and set a hearing
date with the hearing examiner. I also assist appli-
cants if they have any questions regarding a specific
application.”
INTERVIEWER: “Let’s talk about the applications for a moment. What
types of facts are associated with an application?”
PARTICIPANT: “There’s quite a number, actually. There are facts
concerning the type and name of the application, its
designation and address, and its location.”

ptg14955309
Interviewing Users 139
INTERVIEWER: “Tell me about the facts concerning the application’s
type and name.”
PARTICIPANT: “There are four things we record: the type of applica-
tion, the name of the subdivision, the purpose of the
project, and a description of the project.”
Note how the interviewer starts the discussion with an open-ended
question. After the participant responds, the interviewer uses the
Subject-Identification Technique to identify subjects within the response.
The interviewer then chooses a particular subject and uses another
open-ended question to focus the participant’s attention on that subject.
Because the participant’s next response is general in nature, the inter-
viewer focuses on a particular aspect of the subject and uses a more spe-
cific follow-up question to elicit a detailed response from the participant.
The interviewer can continue to narrow the focus of his questions as
the discussion progresses. As the participant responds to each ques-
tion, the interviewer continues to use the Characteristic-Identification
Technique to identify characteristics of the subject that appear in the
response. After he’s identified all of the subject’s characteristics, the
interviewer then moves on to the next subject and begins the entire
process again. He’ll continue in this manner until he’s covered his
entire list of subjects. You’ll go through the same exact process when
you act as interviewer.
❖Note The dialogue in the previous example and in the exam-
ples throughout the book is simplistic by design; this also
applies to all of the sample questions I provide during my dis-
cussion of the interview process. They are simply the vehicle
through which I am presenting a specific skill or technique.
As such, don’t get too preoccupied with the actual dialogue or
question itself; rather, focus on how it is illustrating the skill or
technique that I’m discussing at the moment. The examples will
be more beneficial to you if you see them from this perspective.
ptg14955309
140 Chapter 6 Analyzing the Current Database
Reviewing the Samples
The next round of discussions centers on all the samples you assem-
bled earlier in the analysis process. Your objectives during these
discussions are to identify how the objects represented by the samples
are used, clarify the aspects of the samples you don’t understand, and
assign a description to each sample.
It should be relatively easy for you to talk to participants about the
samples now that you have an idea of the data the participants use on
a daily basis. Begin the conversation by asking questions about a spe-
cific sample. Figure 6.7 shows an example of a data collection sample
you might use as a starting point.
Figure 6.7 A data collection sample
❖Note The statement I made about the dialogue examples also
applies to this figure and many of the other figures throughout
the book. These figures are simply the vehicle through which
I am presenting a specific skill or technique. Use the same
approach that I suggested for the dialogue examples, as they’ll
be more beneficial to you.
Review your notes from the discussions you held at the beginning of
the interview before you ask your first question. You want to determine

ptg14955309
Interviewing Users 141
whether anything you’ve already discussed is relevant to the sample
you’re about to discuss. In one of the previous discussions, for exam-
ple, a participant indicated that part of his job is to keep track of all
the organization’s customers. Using that statement as a starting point,
you could ask him how he uses this particular data collection sample
to perform that task.
“You mentioned in a previous discussion that you keep track of all the
customers. How does this screen help you to carry out that task?”
This is a well-phrased question. It begins with a statement that focuses
on a particular subject and then continues by bringing the partici-
pant’s attention to the sample. The question is open enough to elicit a
clear and complete response.
Now, assume the participant provides this response:
“This screen allows me to enter new customers, as well as modify and
maintain all the information we have on existing customers.”
If this reply answers the question to your complete satisfaction, use
it as the basis for a description of the sample. On the other hand, if
the reply does not completely answer the question, continue with an
appropriate line of questioning until the participant clearly identifies
the purpose and use of the sample. You must supply descriptions for
all of your samples because you’ll use them again later in the design
process.
A sample’s description should be succinct, yet clear enough to indicate
the sample’s purpose and how it is used. Write the description on a slip
of paper and attach it to the sample. Here’s an example of a description
you might use for the sample in Figure 6.7:
This screen is used to collect and maintain all customer data.
It’s necessary for you to understand the sample as completely as
possible so that you can write a clear and concise description. If there
are aspects of a given sample that you don’t understand, ask the

ptg14955309
142 Chapter 6 Analyzing the Current Database
participant to clarify them for you. For example, assume you’re work-
ing with the report sample shown in Figure 6.8.
If you don’t know what the abbreviation “SRP” represents, make sure
you have the participant clarify it for you—never make assumptions or
suppositions. Doing so can waste valuable time and effort later in the
process if your assumption or supposition proves to be incorrect.
As you compose descriptions for each of the samples, you might find it
difficult to write a description for a complex sample. A sample is com-
plex if it represents more than one subject. The sample in Figure 6.8,
for example, covers only one subject: products. The sample in Fig-
ure 6.9, however, covers at least three subjects: doctor services, nurs-
ing services, and patients. You’ll often have to work a little harder to
determine a complex sample’s purpose and use. In some cases, you’ll
have to use the Subject-Identification Technique to determine what
subjects are represented.
Let’s say you’re working with the report sample shown in Figure 6.9
and you have questions regarding the nursing services. You wonder
whether the organization is using this report as an indirect means of
Product ID
9001
9002
9003
9004
Current Product Inventory
Product Description
Shur-Lok U-Lock
SpeedRite Cyclecomputer
SteelHead Microshell Helmet
SureStop 133-MB Brakes
Category
Accessories
Accessories
Components
SRP
75.00
65.00
36.00
23.50
Quantity
20
33
16
Figure 6.8 A report sample

ptg14955309
Interviewing Users 143
maintaining a current list of nursing services. A question that elicits a
yes or no response from a participant is not going to help you much at
all, so you need to use an open-ended question that will elicit a more
informative response. You could begin your discussion of this sample
with this question:
“What nursing services do you provide besides those listed in this
sample?”
This type of question gives the participant an opportunity to provide
you with a detailed response; furthermore, you’ve given yourself the
opportunity to ask follow-up questions as warranted by the partici-
pant’s reply. To continue the example, say you receive the following
answer:
“We provide various specialized services for the more complex patient.
You see only the general services on this report. However, I can show
you a complete list of our services that Katherine maintains on her
computer.”
Eastside Medical Clinic
7743 Kingman Dr.
Seattle, WA 98032
(206) 555-9982
Patient Name: George Edelman
Patient ID: 10884
Visit Date: 02/16//12
Physician: Daniel Chavez
Doctors Services Service Code Fee
X
X
Consultation
EKG
Physical
Ultrasound
92883
92773
98377
97399
119.00
95.00
Nursing Services Service Code Fee
R.N. Exam
Supplies
Nurse Instruction
Insurance Report
89327
82372
88332
81368
Figure 6.9 An example of a complex report sample

ptg14955309
144 Chapter 6 Analyzing the Current Database
You can continue with the process of writing the sample’s description
if this reply clarifies the point in question and you now understand the
purpose of this report sample; otherwise, continue asking follow-up
questions until everything is explained to your satisfaction.
Reviewing Information Requirements
The final issue you’ll discuss with users concerns their informa-
tion requirements. The objectives of this discussion are to determine
whether individual users receive information based on data they don’t
directly control or maintain, to determine what types of additional
information they need, and to determine what types of information
they can foresee themselves needing in the future. You’ll use the infor-
mation you gather during this discussion later in the design process to
help define and verify field and table structures. You can also use this
information as yet another way of determining whether you acciden-
tally overlooked anything during the previous discussions.
Current Information Requirements
Users typically receive the information they use through a variety of
reports. Therefore, the best way to begin this discussion is by review-
ing the report samples. This time around, though, you’re not so con-
cerned with how the reports are used as you are with the data upon
which they are based. It’s quite common that information on some of
the reports a user receives is based on data he does not personally cre-
ate and maintain. In this situation, you must determine the origin of
that data so that you can identify all the data used by a user, whether
he uses it directly or indirectly.
Select a report from the report samples and work with one of the par-
ticipants to determine what data is used to produce the report. Ask
him if he creates and maintains the data on which the report is based.
You can move on to the next sample if he answers yes, but you’ll need

ptg14955309
Interviewing Users 145
to identify the origin of the data if he answers no. Here’s an example
that illustrates this process.
Say you have an assistant named Kira who is beginning a discussion
with a participant named Joan regarding the report sample shown in
Figure 6.10.
Last Purchase
11/21/11
12/19/11
11/16/11
01/22/12
Customer Type
Preferred
Silver
Preferred
Gold
Customer Name
Alastair Black
Dave Cunningham
Zachary Ehrlich
Bill Champlin
Phone Number
551-0993
533-9182
515-3921
552-3884
Customer Phone List
Figure 6.10 A sample report
As Kira begins the conversation, Joan mentions that she works in the
telemarketing department. When Kira first asks about the sample
report, Joan indicates that she receives it every Monday morning. So
Kira asks her the following question:
“Do you provide the data that’s used to generate this report?”
Her next course of action depends on Joan’s response. Kira can move
on to the next sample if Joan’s answer is yes; however, it would be a
good idea for Kira to ask a follow-up question to make certain that
Joan’s answer is true.
“Do you personally enter and maintain this data on a daily basis?”
If Joan’s answer is still yes, Kira can definitely move on to the next
sample.

ptg14955309
146 Chapter 6 Analyzing the Current Database
On the other hand, if Joan’s answer to the original question is no,
Kira will need to ask a few follow-up questions. First, she’ll ask Joan
whether she contributes any data to the report. If she does, Kira will
then determine what data Joan specifically submits. Then Kira will
ask whether Joan knows the source of the remaining data.
To continue the example, say Joan’s reply to the original question is no
and that the following dialogue takes place after her response:
KIRA: “Can you tell me, then, if there is any data that you con-
tribute to the report at all?”
JOAN: “I do supply the customer’s name and phone number.”
KIRA: “Then you don’t supply the customer type or the last
purchase date. Is that correct?”
JOAN: “Yes.”
KIRA: “Can you tell me who provides this data?”
JOAN: “I’m not really sure, but . . .”
KIRA: “Do you have an idea of where these items come from?”
JOAN: “As a matter of fact, I do. They come from the sales
department.”
KIRA: “That sounds good to me. I’ll make a note of that on this
sample, and then we can move on to the next one.”
Note that as the dialog begins, Kira first tries to determine whether
Joan submits any data at all to the report. When Joan reveals that she
contributes two of the items for the report, Kira then poses a follow-up
question to verify that Joan is not submitting any of the other data.
Finally, Kira tries to identify the source of the remaining data by ask-
ing Joan if she knows from where the data originates. In this case, it
takes only two well-phrased questions to find the answer. If Joan could
not answer the last two questions, Kira would need to continue her
investigation with other participants.
You’re sure to obtain all the information you need about your report
samples if your discussions progress in the same manner as the

ptg14955309
Interviewing Users 147
preceding dialogue. Remember: Follow-up questions are a crucial part
of the conversation. You must phrase your questions properly to elicit
the types of responses you need from the participants.
Additional Information Requirements
The next subject of discussion is additional information requirements.
The objective here is to determine whether users require additional
information that is not being delivered to them currently. If this is the
case, you must identify what additional information they require and
then define new data structures to support this extra information later
in the design process.
Start this conversation by directing the participants to review the
reports they currently receive. Ask them whether there is other infor-
mation they would like to see in their reports. Next, direct them to
discuss the additional information, which reports the information will
affect, and the reason they believe the information is necessary. Then
determine whether the additional information represents new subjects
or new characteristics. If it does, identify each new item and add it to
the appropriate list. Finally, review the participants’ comments and
determine whether there are further issues you need to discuss with
them in regard to the reports. Here’s an example that illustrates the
process.
Say you’re beginning this discussion and you’ve just asked the par-
ticipants to review the report samples they currently use. One of the
participants is reviewing the sample report shown in Figure 6.11.
You now instruct this particular participant to note the additional
information she would like to see on the report and to provide a brief
statement indicating why the information is necessary. It doesn’t
really matter exactly how she makes the notations so long as they are
clear and attached to the report in an obvious manner. In this case,
she decides to use large sticky notes as a means of documenting her

ptg14955309
148 Chapter 6 Analyzing the Current Database
comments. She’s specified two new fields she’d like to add to the report,
along with the reason for their inclusion. She’s also suggested possible
locations for the fields by writing their names on the report itself. Fig-
ure 6.12 shows the sample report with her comments.
Product ID
Current Product Inventory
Product Description Category SRP
9001 Shur-Lok U-Lock Accessories 75.00
Quantity
9002 SpeedRite Cyclecomputer 65.00 20
9003 SteelHead Microshell Helmet Accessories 36.00 33
9004 SureStop 133-MB Brakes Components 23.50 16
Wholesale Cost
If we could see wholesale
cost, it would help us
calculate more accurate
discounts.
Vendor Name
Can we include the Vendor
name? It would make it
easier to identify a specific
product
Figure 6.12 A report sample with a participant’s comments
Next, determine whether there are new subjects or new characteristics
represented in the additional information. Apply the Subject- Identification
Technique and the Characteristic-Identification Technique to the com-
ments attached to the report. Here’s an example of how you apply these
techniques to the first comment in Figure 6.12:
Product ID
Current Product Inventory
Product Description Category SRP
9001 Shur-Lok U-Lock Accessories 75.00
Quantity
9002 SpeedRite Cyclecomputer 65.00 20
9003 SteelHead Microshell Helmet Accessories 36.00 33
9004 SureStop 133-MB Brakes Components 23.50 16
Figure 6.11 The sample report being reviewed by a participant

ptg14955309
Interviewing Users 149
“Can we include the vendor name? It would make it easier to identify a
specific product.”
Here you’ve identified both a subject and a characteristic. (Note that
the subject and characteristic aren’t directly related: “vendor name” is
a characteristic of a vendor, not of a product. There’s no problem here,
but you should be aware that this apparent mismatch of subjects and
characteristics is typical. You’ll address this issue later in the design
process.) Now, check your subjects list and characteristics list to deter-
mine whether you’ve already accounted for these items. If you have,
move on to the next comment and repeat this procedure.
If you do discover a new subject, add it to your list of subjects and
then identify as many of its characteristics as possible. When you’re
finished, add these items to your list of characteristics, move on to the
next comment, and repeat the entire procedure. In many instances,
however, you’ll only identify new characteristics. Don’t be alarmed.
People often want to add items to a report that are characteristics of
subjects that are already represented by the information on the report.
Finally, reexamine each report and determine if you have questions
or concerns about the notes participants have made. For instance,
you may question the rationale behind one participant’s belief that
specific fields are necessary on a given report. Or you might wonder
why another participant wants to exclude certain fields from one of
his reports. You definitely want to make sure that the fields he wants
to exclude are truly unnecessary and that removing them will not
have an adverse effect on the information the report provides to other
people. In either case, the inclusion or exclusion of fields will affect the
final database structure.
If a report has one or more remarks that are cause for concern, review
it with the appropriate participant and settle as many of the issues as
you can. You can usually resolve all your concerns with a few simple
questions, but in some cases the resolution to certain issues will not

ptg14955309
150 Chapter 6 Analyzing the Current Database
become apparent until later in the design process. For example, you
might have noticed that certain fields appear on two or more reports.
It’s difficult to determine if the fields are being unnecessarily dupli-
cated until you begin to define the field and table structures. When
you encounter an issue that is difficult to resolve at the present time,
make a note of it and put the report aside for later review.
Future Information Requirements
The last subject of discussion concerns future information require-
ments. Your objective here is to identify the information that the
participants believe will be necessary for them to receive as the orga-
nization evolves. Once you identify these future information require-
ments, you can ensure that you define the data structures necessary
to support that information.
You first need to make sure that every participant has some idea of
how the organization is evolving. The nature of the organization’s evo-
lution will determine what new information participants will require.
If several people are unacquainted with these issues, you’ll need to
obtain this information from management and then relay it to the par-
ticipants prior to the discussion. Once everyone is familiar with these
matters, you can begin the conversation.
Start the discussion by directing the participants to think about the
future evolution of the organization and how it may affect the work
they do on a daily basis. You’ll often find that some participants are
going to have a difficult time envisioning this scenario. When this hap-
pens, use questions such as these to help them focus their thoughts:
How will the organization’s evolution affect the amount of information
you’ll need to do your job?
Do you think you’ll need additional types of information to carry out
your duties effectively as the organization evolves?

ptg14955309
Interviewing Users 151
How will the evolution of the organization increase the time you spend
on your daily tasks?
Can you predict what types (categories, not specific items) of new
information you’ll need in order to carry out your duties as the organi-
zation evolves?
Do you anticipate a need for new information if your duties are
increased as a result of the organization’s evolution?
Keep in mind that most of the participants’ answers will be based on
speculation. There’s no accurate way for them to predict what types
of information they’ll really need until the organization’s evolution
occurs. However, if you can anticipate their hypothetical information
requirements, you can prepare for them by defining the necessary data
structures in advance.
As the participants respond, use the Subject-Identification Technique
to identify brand-new subjects and then add them to your list of sub-
jects. Then use the Characteristic-Identification Technique to uncover
new details concerning existing or new subjects and add them to your
list of characteristics.
You can sketch ideas for new reports or data entry forms to help
participants visualize the types of information they may need in the
future. These sketches can then help you identify new subjects or
characteristics that the database structure needs to address. If you
create several rough drawings of sample reports, be sure to assemble
them in a separate, clearly marked folder. Then code each revision so
that you can compare it with earlier revisions. Figure 6.13 shows an
example of a preliminary design for a future report.
Continue the conversation with users until you’re satisfied that you’ve
accounted for as many of the participants’ future information require-
ments as possible. When you’ve completed the discussion, you’re ready
to conduct interviews with management.

ptg14955309
152 Chapter 6 Analyzing the Current Database
❖Note You can use all of the techniques you learned in this
section for the management interviews as well. Therefore, the
next section is somewhat shorter and more concise.
Interviewing Management
The second part of the interview process involves interviewing man-
agement personnel. This round of interviews focuses on these issues:
1. The types of information managers currently receive
2. The types of additional information they need to receive
3. The types of information they foresee themselves needing
4. And their perception of the organization’s overall information
requirements
1st Quarter Customer Sales Statistics
Customer ID
9001
9002
9003
9004
Customer Name
Stewart Jameson
Shannon Black
Estela Rosales
Timothy Ennis
Maximum Minimum Average
Sales Amounts
23.00
125.00
35.00
20.00
55.00
70.00
36.00
25.00
265.00
550.00
250.00
325.00
Figure 6.13 An example of a design for a new report

ptg14955309
Interviewing Management 153
❖Note Throughout the remainder of the book, I use the term
management to refer to the person or persons controlling or
directing the organization.
Reviewing Current Information Requirements
Your objectives during the first part of this interview are to identify
the information that management routinely receives and to determine
whether it receives reports that are not represented in your group of
report samples.
As you begin the interview, ask each participant about the work he
performs and the responsibilities associated with his position. A man-
ager typically has a number of issues on his mind, so these questions
will help him focus his attention on the matters at hand. His answers
will give you some idea of how he might use the information on the
reports he receives and will provide you with a perspective on his need
for that information.
Next, ask each participant if he uses any of the reports in your collec-
tion of report samples. Proceed with the next step if he says he doesn’t
use any of the reports; otherwise, examine each report and ask him to
help you identify other subjects that you might have previously over-
looked. Use the Subject-Identification Technique as necessary to aid
you in this process. If the manager identifies a new subject, add it to
your list of subjects and use the Characteristic-Identification Tech-
nique to determine the subject’s characteristics. Then add the new
characteristics to your list of characteristics. Repeat this entire proce-
dure for each sample report.
Continue the discussion by asking each participant whether he
receives reports that are not represented in your report samples. If he
answers yes, obtain a sample of each new report and review it with the

ptg14955309
154 Chapter 6 Analyzing the Current Database
participant. Use the Subject-Identification Technique and the Character-
istic-Identification Technique to identify the subjects (and their associ-
ated characteristics) represented within the report, and then add the
subjects and characteristics to their respective lists. Finally, attach a
description to the report and add it to your collection of report samples.
Repeat this procedure until you’ve accounted for every new report.
Reviewing Additional Information Requirements
The next subject of discussion concerns management’s need for addi-
tional information. Your objective is to determine whether it requires
supplemental information that is currently missing from the reports
it receives. If you conclude that this is the case, you must identify
that additional information. You’ll then define new data structures (as
appropriate) to support this information later in the design process.
However, you can move on to the next part of the interview if manage-
ment doesn’t require additional information.
You use the same techniques for this discussion as those you used for
this segment of the user interviews. Here are the steps you’ll follow.
1. Review the report samples with the participants once again and
ask them if there is additional information they would like to
include in any of the reports.
2. Have the participants note the additional information—
including the reasons that they believe it’s necessary—on the
appropriate reports. Remember that it doesn’t matter how the
participants make the notations so long as they are clear, are
noticeable, and are attached to the appropriate report.
3. Identify new subjects or characteristics within the information
and add them to the appropriate list.
4. Review the reports and discuss any concerns you have about
them with the participants. Once your concerns are resolved,
this process is complete.

ptg14955309
Interviewing Management 155
Reviewing Future Information Requirements
Future information requirements are the next subject of discussion.
Your objective here is to determine what information management
foresees itself needing in the future. Once you’ve identified these
requirements, you can ensure that there are data structures in place
to support this information as the need for it arises.
As you begin the discussion, have the participants consider how the
organization is currently evolving. Then ask them how this evolution
will affect the information they require to make sound decisions and
how it will influence the way they guide or direct the organization.
Remember that their answers are going to be based on speculation,
as was the case with the similar questions you asked users; there’s
no way for management to predict its future needs accurately until
the organization actually begins to evolve. (It’s always a good idea,
however, to plan for the future as much as possible.) Use the Subject-
Identification Technique and Characteristic-Identification Technique
to identify new subjects and characteristics within the participants’
responses and then add the new items (if any) to the appropriate lists.
Next, make sketches of any new reports the participants might have in
mind. Identify new subjects and characteristics within each report and
add them to the appropriate lists. Then assemble these new reports in
a clearly marked folder and add it to your collection of samples.
You’re ready to move on to the last subject when you’ve accounted for
as many of management’s future information requirements as possible.
Reviewing Overall Information Requirements
The last topic of discussion concerns the organization’s overall infor-
mation requirements. In management’s opinion, what generic class
of information does the organization need? Your objective here is to
discover whether there is data that the organization needs to maintain
that has not been previously discussed in either the user interviews or

ptg14955309
156 Chapter 6 Analyzing the Current Database
the management interviews. If you determine that there is such data,
you must account for it in the database structure.
Take all of the reports that you’ve gathered throughout the analy-
sis and interview processes and review them with the participants
once more. Then ask the participants to consider the information the
reports provide and how they might use that information. (Note that
they’ll have to make assumptions about how they might use the infor-
mation from the new reports.) Next, ask participants to determine
whether there is information that would be useful or valuable to the
organization, but that is not currently being received by anyone within
the organization. If they determine that there is indeed some new
information that the organization could use, go through the normal
process of identifying that information and the subjects and charac-
teristics represented within it. Sketch samples of new reports for the
information, as appropriate, and add the samples to your existing
collection of new reports.
For example, assume that one of the participants has identified a need
for demographic information; she believes that it would help the orga-
nization identify a more specific target market for its product. None of
the existing reports furnishes this information, so you identify exactly
what she needs by working with her to create a sketch of a report that
will present this information. (She might actually sketch more than
one report, but this is neither a problem nor a cause for concern.) You
then use the appropriate techniques to identify and note the subjects
and characteristics represented within the report and add it to your
existing collection of new reports. Later in the design process, you’ll
define the data structures necessary to support the new information.
Repeat this procedure until the participants can no longer identify any
further information that the organization might find useful or valu-
able. After you’re reasonably confident that you’ve accounted for all of
the organization’s information requirements, suspend the interview
process and begin the process of compiling the Preliminary Field List.

ptg14955309
Compiling a Complete List of Fields 157
It’s important for you to understand that you may have to revisit this
process, even though you and the participants may believe that you’ve
accounted for all the information the organization could possibly use.
You’ll commonly identify new information as the database design pro-
cess unfolds.
Compiling a Complete List of Fields
The Preliminary Field List
Now that you have completed your analysis of the current database
and the interviews with users and management, you can create a
Preliminary Field List. This list represents the organization’s fundamen-
tal data requirements and constitutes the core set of fields that you’ll
define in the database. You create the Preliminary Field List using a
two-step process.
Step 1: Review and Refine the List of Characteristics
The first step involves reviewing and refining the list of characteristics
you compiled throughout the analysis and interview process. As you
learned in Chapter 3, a field represents a characteristic of a particular
subject; therefore, each item on your list of characteristics will become
a field. Before you transform those characteristics into fields, how-
ever, you first need to review the list to identify and remove duplicate
characteristics.
During the interviews, you identified various characteristics within
each participant’s responses and compiled them into a list as the
interview progressed. There were probably times when you mistak-
enly added the same characteristic to the list more than once, or
unknowingly referred to the same characteristic by two or more dif-
ferent names. As a result, your list of characteristics requires some
refinement.

ptg14955309
158 Chapter 6 Analyzing the Current Database
Refining Items with the Same Name
Begin refining your list of characteristics by looking for items with the
same name. When you find one or more occurrences of a particular
name, determine whether they all represent the same characteristic.
Remove all but one occurrence of the name from the list if they do
represent the same characteristic; otherwise, determine what each
instance of the name represents. You’ll often find that a duplicate
name represents the same type of characteristic as its original coun-
terpart but should be associated with a different subject than its coun-
terpart. In this case, you rename the duplicate to reflect how it relates
to the appropriate subject.
Assume, for example, that the item “Name” appears three times on
your list of characteristics. Your first inclination will probably be to
remove two of the occurrences because your current objective is to
eliminate duplicate characteristics. However, you should determine
whether each instance of “Name” represents a distinct characteristic
before you remove it. You can easily make this determination by exam-
ining your interview notes; this will help you remember when and why
you added the item to the list.
After careful examination, you discover that the first occurrence of
“Name” represents a characteristic of the subject “Clients,” the second,
a characteristic of the subject “Employees,” and the third, a character-
istic of the subject “Contacts.” You resolve this duplication by renaming
each occurrence of “Name” (using the subject as a prefix) to reflect its
true meaning. Now you’ll have three new characteristics called “Client
Name,” “Employee Name,” and “Contact Name.”
Items similar to “Name” commonly appear on a list of characteristics,
and you must address them in the same manner. You’ll commonly see
one or more occurrences of items such as “Address,” “City,” “State,”
“Zip Code,” “Phone Number,” and “Email Address,” and you can refer
to them collectively as generic items. The point here is that you must

ptg14955309
Compiling a Complete List of Fields 159
rename each instance of a generic item to reflect its true relationship
to a particular subject, thus ensuring that you have as accurate a field
list as possible.
Refining Items Representing the Same Characteristic
Now look for items that represent the same characteristic and remove
all but one. The idea here is that a given characteristic should appear
only once in the list of characteristics. For example, assume that
“Product #,” “Product No.,” and “Product Number” appear on your list
of characteristics. It’s evident that these items all represent the same
characteristic and you need only one of them on your list. Choose the
one that conveys the intended meaning clearly, completely, and unam-
biguously and remove the remaining items from the list of character-
istics. (In this case, the best choice is “Product Number” because it
fulfills the previous criteria.)
Ensuring Items Represent Characteristics
Finally, make sure that each item on your list represents a characteris-
tic. It’s easy to place items accidentally on the list that represents sub-
jects. You can test each item by asking yourself questions such as these:
Can this word be used to describe something?
Does this word represent a component, detail, or piece of something in
particular?
Does this word represent a collection of things?
Does this word represent something that can be broken down into
smaller pieces?
Depending on the item you’re working with, some questions are eas-
ier to answer than others. When you find that an item represents a
subject rather than a characteristic, remove it from the list of char-
acteristics and add it to the list of subjects. Be sure to identify the
new subject’s characteristics and add them to the existing list of
characteristics.

ptg14955309
160 Chapter 6 Analyzing the Current Database
For example, say “Item” appears on your list of characteristics and
you’re not quite sure whether it represents a characteristic or a subject.
Use the preceding questions to help you make a determination.
Can “Item” be used to describe something?
Does “Item” represent a component, detail, or piece of something in
particular?
You could make a case that “Item” helps to describe a sale inasmuch
as it identifies what a customer purchased. On the other hand, you
could also say that “Item” isn’t a characteristic because it doesn’t rep-
resent a singular aspect of a sale. “Date Sold,” for example, represents
a singular characteristic of a sale. Leaving the quandary surrounding
these questions unresolved, you go on to the next question:
Does “Item” represent a collection of things?
You can answer this question easily by looking at the plural form of
the word, which in this case is “Items.” If “Items” can be referred to as
a collection, it is a subject. It’s beginning to become clear that “Item”
does represent a collection of some sort, and you can make a final
determination by asking yourself the last question:
Does “Items” represent something that can be broken down into
smaller pieces?
You can answer this question by determining whether you can iden-
tify any characteristics for “Items.” If you can, then “Items” definitely
represents a subject and you should move it to the list of subjects. You
also need to identify its characteristics and add them to your list of
characteristics.
Continue with this procedure until you’ve reviewed and refined
the entire list of characteristics to your satisfaction. When you are
through, you have your first version of the Preliminary Field List. Now
you’ll add new items to it and refine it further during the next step.
ptg14955309
Compiling a Complete List of Fields 161
Step 2: Determine Whether There Are New Characteristics
in Any of Your Samples
This step involves an examination of all the samples you gathered
throughout the analysis process. Your goal is to determine whether
there are characteristics on the samples that need to be added to the
Preliminary Field List.
Begin this step by highlighting every characteristic you find on each
sample. Then, examine each characteristic and determine whether
it’s already on the Preliminary Field List; cross it out on the sample if
it’s already on the list. Next, study the remaining characteristics and
determine whether any of them has the same meaning as an existing
field; if it does, cross it out on the sample. (Use the same procedure
you used in the first step to make this determination.) Finally, add any
highlighted characteristics remaining on the samples to the Prelimi-
nary Field List.
For example, say you’re working with the data collection sample shown
in Figure 6.14.
Figure 6.14 An example of a data collection sample
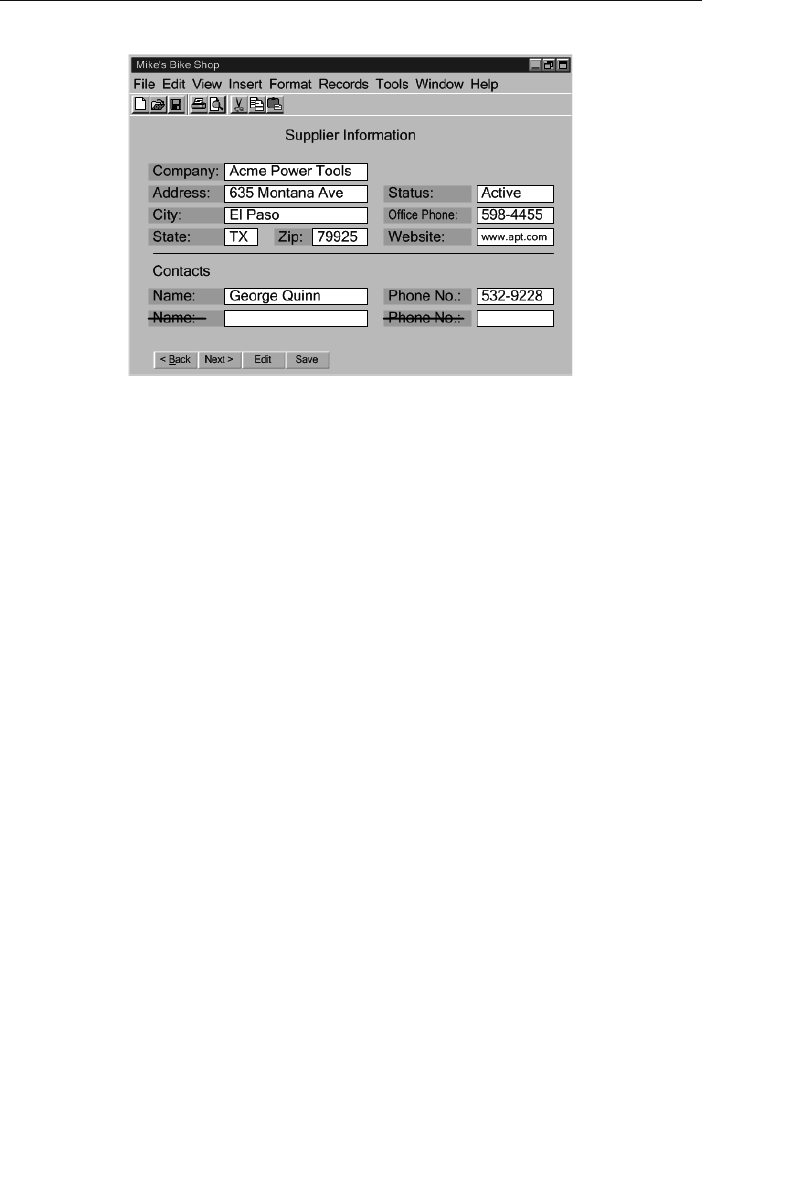
ptg14955309
162 Chapter 6 Analyzing the Current Database
Highlight each characteristic you find on the sample, as shown in Fig-
ure 6.15.
You’re likely to find multiple occurrences of various characteristics in
some of the samples. As you can see, both “Name” and “Phone No.”
appear twice on this particular sample. You can cross out the dupli-
cates in this case because they have the same meaning as the original
instances.
To continue with the example, say you reviewed the Preliminary Field
List and found that every characteristic on the sample is already
on the list with the exception of “Name” and “Phone No.” Cross out
the existing items on the sample to show that you have accounted
for them. Before you add “Name” and “Phone No.” to the Preliminary
Field List, however, make sure that the names of these items prop-
erly describe their relationship to the subject represented within the
sample. In this case, the two remaining items represent characteris-
tics of a group of people known as “Contacts.” Therefore, you rename
these characteristics (using the subject as a prefix) as “Contact Name”
and “Contact Phone Number,” and then add them to the Preliminary
Field List. Repeat this procedure for each sample you’ve gathered until
Figure 6.15 A sample with highlighted characteristics
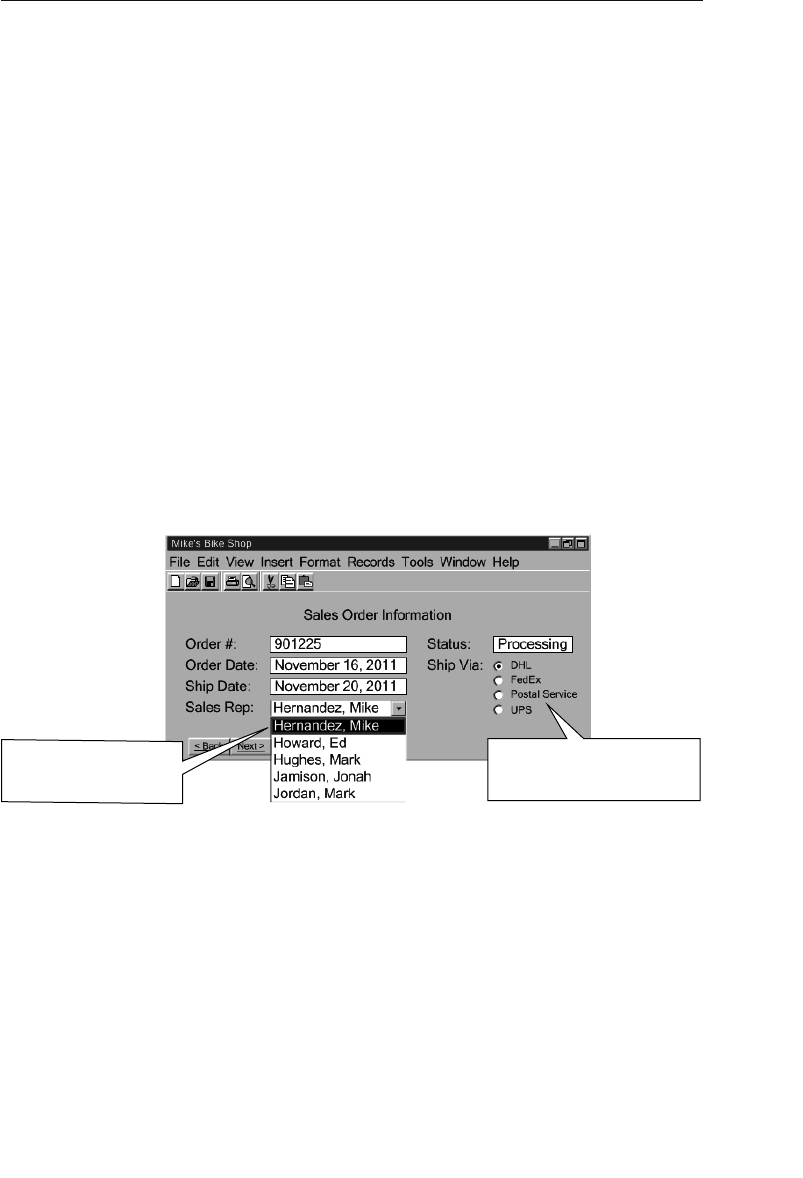
ptg14955309
Compiling a Complete List of Fields 163
you’ve gone through all the samples you’ve collected. When you’re
through, you have the second version of the Preliminary Field List.
A Side Note: Value Lists
As you examine the characteristics on a database, spreadsheet, or web
page sample, record on a sheet of paper the name of each character-
istic that incorporates a value list (also known as an enumerated list).
This list specifies the acceptable range of values for a particular char-
acteristic and often enforces a given business rule. (You’ll learn about
business rules in Chapter 11, “Business Rules.”) For example, say you
work for a manufacturing company that uses four specific vendors to
deliver its goods to customers across the nation. You could use a value
list to ensure that a user selects one of those four vendors to ship a
particular order. Figure 6.16 illustrates this example (note Ship Via)
and also shows two common types of value list.
A value list can appear
as a drop-down list or
scrollable list.
A value list can also appear
as a set of buttons or
checkboxes.
Figure 6.16 A database screen with two value lists
When you record the name of a characteristic that incorporates a value
list, also record the values within the list. If the list contains a large
number of values, write a brief description of the type of values in the
list and (if possible) a minimum and maximum value; otherwise, write
down each of the values. Figure 6.17 shows an example of the record
you’re creating.

ptg14955309
164 Chapter 6 Analyzing the Current Database
You can be discerning about the characteristics you choose to record.
For example, it’s unnecessary for you to record characteristics that
accept simple or obvious sets of values, such as “yes/no,” “true/false,”
or “active/inactive.” Instead, you should record characteristics that
accept distinct, specific sets of values.
Set this sheet (or sheets) aside after you’ve finished recording the
appropriate characteristics. You’ll refer to this sheet when you define
field specifications for the fields in the database and again when you
define business rules.
The Calculated Field List
There’s one final refinement you must make to the Preliminary Field
List before you can consider it complete: You must remove every calcu-
lated field and place it on a separate list. This new list becomes your
Calculated Field List. Recall from Chapter 3 that a calculated field is
Characteristics Incorporating a Value List
Characteristic
Sales Rep The name of every employee within the
organization whose position is that of sales rep
Value List
Ship Via DHL, FedEx, Postal Service, UPS
Category Accessories, Bikes, Clothing, Components,
Maintenance, Racks, Wheels
Department Accessories, Bikes, Clothing, Service,
Figure 6.17 Recording characteristics that incorporate value lists

ptg14955309
Compiling a Complete List of Fields 165
one that stores the result of a string concatenation or mathematical
expression as its value. You list calculated fields separately because
you’ll use them in a specific manner later in the design process.
You build the Calculated Field List using existing fields from the
Preliminary Field List. Examine the list and determine whether there
are fields that fit the description of a calculated field. Fields that have
names containing words such as amount, total, sum, average, mini-
mum, maximum, and count are likely candidates for the Calculated
Field List. Common names for calculated fields include “Subtotal,”
“Average Age,” “Discount Amount,” and “Customer Count.” As you
identify each calculated field, remove it from the Preliminary Field List
and place it in the Calculated Field List. When you’ve completed your
examination of all of the fields in the Preliminary Field List, you’ll have
two completely new lists: a third version of the Preliminary Field List
and a Calculated Field List.
Reviewing Both Lists with Users and Management
Conduct brief interviews with users and management to review the
items that appear on the Preliminary Field List and the Calculated
Field List. Your objective here is to determine whether there are fields
that have been omitted from either list. You can continue with the next
step in the design process when everyone is satisfied that the lists are
complete; otherwise, identify the fields that are missing and add them
to the appropriate list. Once the interviews are complete, you’ll have a
“final” version of each list.
Be sure you conduct these interviews because the participants’ feed-
back provides you with a means of verifying the fields on both lists. Let
me remind you once again to avoid becoming too invested in the idea
that these lists are absolutely complete and final. At this point you
still may not have identified every field that needs to be included in the
database—inadvertently, you’re almost sure to miss a few fields—but

ptg14955309
166 Chapter 6 Analyzing the Current Database
if you strive to make your lists as complete as you can, the inevitable
additions or deletions will be quick and easy to make.
CASE STUDY
You’ve already defined the mission statement and mission objectives
for Mike’s new database. Now it’s time to perform an analysis, conduct
interviews, and compile a Preliminary Field List.
First, analyze Mike’s current database. As you already know, he keeps
most of his data on paper; the only exception is the product inventory
he maintains in a spreadsheet program. Gather samples of the various
papers Mike uses to collect data and a screenshot or printout of the
spreadsheet he uses to maintain the product inventory. Assemble these
samples together in a folder for later use. For example, Figure 6.18
shows a sample of the index cards Mike uses to collect customer infor-
mation, along with a screenshot of his spreadsheet program.
Next, identify the methods Mike uses to present information. He and
his staff currently produce a variety of reports that present the infor-
mation they need to conduct their daily affairs. They generate most of
the reports using a word processing program. Gather samples of all
the reports and place them in a folder for later use. Figure 6.19 shows
a sample report that Mike creates on his computer.
Now you’re ready to interview Mike’s staff. Here are some points to
remember as you’re conducting the interviews.
• Identify the types of data staff members are using and how they
use that data. Be sure to use the Subject-Identification Tech-
nique and the Characteristic-Identification Technique to help you
analyze responses and formulate follow-up questions.
• Review all the samples you gathered during the beginning of
the analysis process. Determine how each sample is used, write
ptg14955309
Compiling a Complete List of Fields 167
Mike's Bike Shop - Product Information
File Edit View Insert Format Tools Data Window Help
Product Description
Shur-Lok U-Lock
SpeedRite Cyclecomputer
SteelHead Microshell Helmet
SureStop 133-MB Brakes
Diablo ATM Mountain Bike
UltraVision Helmet Mount Mirrors
SRP
75.00
65.00
36.00
23.50
1,200.00
7.45
Product ID
9001
9002
9003
9004
9005
9006
1
2
3
4
5
6
7
B
C
D
E
A
Qty On Hand
20
33
16
10
Category
Accessories
Accessories
Components
Bikes
Steven Horst 363-9755
Apartment 2B
2380 Redbird Lane
Seattle, WA 98115
He’s primarily interested in mountain bike stuff.
Keep him abreast of the summer bike tours.
Figure 6.18 A paper-based and a computer-generated sample from Mike’s Bikes
Company Name
ACME Cycle Supplies
B & M Bike Supplies
CycleWorks
Evanstone's Cycle Warehouse
Contact Name
George Chavez
Carol Ortner
Julia Black
Allan Davis
Phone Number
633-9910
527-3817
527-0019
636-9360
Supplier Phone List
Figure 6.19 A report sample from Mike’s Bikes

ptg14955309
168 Chapter 6 Analyzing the Current Database
an appropriate description, and attach the description to the
sample.
• Identify the staff’s information requirements. Determine what
information they’re currently using, what additional information
they need (remember to use the samples), and what kind of infor-
mation they believe they’ll need as the business evolves.
During the interview, one of the employees wonders whether she can
add a new field to the supplier phone list report. How do you respond?
You hand her the report and ask her to attach a note indicating the
name of the new field and a brief explanation of why she believes it’s
necessary. When she’s finished, return the sample to the report sam-
ples folder. Figure 6.20 shows the report sample with the attached note.
Supplier Phone List
Company Name
ACME Cycle Supplies
B & M Bike Supplies
CycleWorks
Evanstone's Cycle Warehouse
Contact Name
George Chavez
Carol Ortner
Julia Black
Allan Davis
Phone Number
633-9910
527-3817
527-0019
636-9360
Can we include fax number?
We can process special
orders more quickly via fax.
Figure 6.20 A report sample with attached note suggesting a new field
You’ll conduct the final interview with Mike. Keep the following points
in mind as you speak with him.
• Identify the reports he currently receives; you need to know what
kind of information he uses to make business decisions. If he
receives reports that are not represented in your group of report

ptg14955309
Compiling a Complete List of Fields 169
samples, obtain a sample of each report and add it to the group,
updating the subject and characteristic lists as needed.
• Review the group of report samples with him and determine
whether he can identify subjects or characteristics that have
been overlooked by his staff. Use the appropriate techniques to
identify these items and then add them to the appropriate list.
• Determine whether there is any additional information Mike
needs to supplement the information he currently receives.
• Determine what types of information Mike will need as the busi-
ness evolves.
As you and Mike discuss his future information needs, he indicates
that there is some new information he’d like to receive once the busi-
ness really gets rolling: He’d like to see total bike sales by manufac-
turer. He believes this information would help him determine which
bikes he should consistently keep in stock. Such a report does not cur-
rently exist, so have Mike sketch it out on a sheet of paper. Next, iden-
tify the subjects and characteristics represented within the report and
add them to the appropriate list. Then add the new report to your group
of report samples. Figure 6.21 shows the sketch of Mike’s new report.
Bike Sales Summary
Company Name
Altair Bicycles
Bandido Bikes
Bike Model
ATB 600-A
Cruiser 500
Baja Delight
Diablo Rojo
Total Units Sold
12
7
16
9
Figure 6.21 The sketch of Mike’s new report

ptg14955309
170 Chapter 6 Analyzing the Current Database
Your analysis is now complete. You’ve interviewed Mike and his staff,
you’ve gathered all the relevant samples, and you’ve created a list of
subjects and a list of characteristics. A partial list of subjects and
characteristics is shown in Figure 6.22. All you need to do now is to
create your Preliminary Field List.
List of Characteristics
as of 02/13/12
Address Home Phone
Birth Date Last Name
Category Name
City Phone
Comments Product No.
First Name State
List of Subjects
as of 02/13/12
Customers Sales
Employees Suppliers
Products
Figure 6.22 Partial lists of subjects and characteristics for Mike’s Bikes
As you already know, you need to refine the list of characteristics
before it can become the first version of the Preliminary Field List.
Remove all duplicate characteristics, delete items that represent the
same characteristic, and refine those items that have generic names.
(Remember the problem with the characteristic called “Name”? If you
find such characteristics, now is the time to resolve them.) Next, review
all your samples and determine whether they contain characteristics
that do not currently appear on the Preliminary Field List. Add to the
list any new characteristics that you find. When you complete these
tasks, you have the first version of your Preliminary Field List.
Now you remove all the calculated fields from the Preliminary Field
List and place them on their own list; this becomes your new Calcu-
lated Field List. Figure 6.23 shows a small portion of your final Prelimi-
nary Field List and Calculated Field List.

ptg14955309
Summary 171
❖Note You may have noticed that each list includes a date in
the title. It’s a good idea to date your lists so that you can main-
tain a clear history of their development.
Summary
This chapter began by discussing why you should analyze the orga-
nization’s current database. You learned that the analysis helps you
identify aspects of the current database that will be useful to you when
you design the new database. Armed with this information, you can
design a database that best suits the organization’s needs. Next, we
briefly looked at the two types of databases organizations commonly
used: paper-based databases and legacy databases. We ended this
discussion by identifying the three steps used in the analysis process:
reviewing the way data is collected, reviewing the way information is
presented, and conducting interviews with the organization’s staff.
Preliminary Field List
as of 02/16/12
Office PhoneBirth Date
Unit PriceEmployee City
CategoryEmployee Address
Product NameEmployee Name
Invoice NumberCustomer Name
Invoice DateCustomer Address
Calculated Field List
as of 02/16/12
Discount Amount
Grand Total
Item Total
Subtotal
Figure 6.23 A partial Preliminary Field List and a Calculated Field List

ptg14955309
172 Chapter 6 Analyzing the Current Database
The chapter continued with a discussion of the review process. You
learned how to review the ways the organization collects its data and
how to assemble a set of data collection samples. Then you learned how
to review the ways the organization presents information and how to
assemble a set of report samples.
Next, we discussed the process you use to conduct interviews, and you
learned why interviews are useful at this stage of the design process.
During this discussion you learned two techniques that are crucial to
the success of interviews: the Subject-Identification Technique and the
Characteristic-Identification Technique.
Conducting user interviews was the next subject of discussion. We
examined the four issues you must address during these interviews,
along with the techniques you use to address them. Next, we dis-
cussed conducting management interviews. Here you learned about the
issues and techniques these interviews incorporate.
Finally, we discussed the process of compiling a list of fields based
on the list of characteristics and the characteristics that appear in
the samples. You learned that you decompose the field list into two
separate lists: a Preliminary Field List and a Calculated Field List.
The Preliminary Field List enumerates the organization’s fundamen-
tal data requirements and establishes the core set of fields you must
define in the database. The Calculated Field List consists of fields that
contain values resulting from string concatenations or mathematical
expressions.
Review Questions
1. State two goals of analyzing the current database.
2. True or False: You can adopt the current database structure as
the basis for the new structure.

ptg14955309
Review Questions 173
3. What is a legacy database?
4. State two steps of the analysis process.
5. Which types of computer software programs should you review
during the analysis?
6. Why should you conduct interviews after you gather data collec-
tion and information presentation samples?
7. How do you use “open-ended” and “closed” questions?
8. What is the Subject-Identification Technique?
9. How do you identify specific attributes for a particular subject?
10. True or False: You should interview users and management at the
same time.
11. What three basic types of information requirements must you
identify?
12. What is the Preliminary Field List?
13. State why each item on the Preliminary Field List should have a
unique name.
14. What is a value list?
15. What are calculated fields? What (if anything) should you do about
them?

ptg14955309
This page intentionally left blank

ptg14955309
175
7
Establishing Table Structures
It is a capital mistake to theorize
before one has data.
—SHERLOCK HOLMES,
THE ADVENTURES OF SHERLOCK HOLMES
Topics Covered in This Chapter
Defining the Preliminary Table List
Defining the Final Table List
Associating Fields with Each Table
Refining the Fields
Refining the Table Structures
Case Study
Summary
Review Questions
Organizations use databases to keep track of various subjects that are
important to them. For example, a medical clinic keeps track of, among
other things, its patients, doctors, and appointments; an equipment
rental business must maintain data on its customers, equipment, and
rental agreements; and a registrar’s office is concerned (at the very least)
with students, teaching staff, and courses. In every case—and in any
other scenario you can imagine—a table within the database represents
each subject. Furthermore, each table is composed of fields, which rep-
resent the characteristics that define or describe the subject of the table.
Tables constitute the very foundation of the database, and they guaran-
tee a solid and sound foundation when they are properly designed.

ptg14955309
176 Chapter 7 Establishing Table Structures
Defining the Preliminary Table List
During this portion of the database design process, you’ll define a Pre-
liminary Table List that you’ll use to identify and establish the tables
for the new database. You’ll use three procedures to develop this list.
The first involves using the Preliminary Field List, the second involves
using the list of subjects you gathered during the interviewing process,
and the third involves using the mission objectives you defined at the
beginning of the database design process. You’ll then move on to build
the structure of each table using fields from the Preliminary Field List.
Identifying Implied Subjects
The process of defining the tables for the database begins with a
review of the Preliminary Field List. Your objective is to identify sub-
jects that are implied by the fields on the list.
You may wonder why you’re reviewing the Preliminary Field List
instead of starting with the list of subjects. The list of subjects does
seem to be a more intuitive place to start. After all, you’ve carefully
built this list during the interview process, and you’ve been influenced
by the conversations you’ve had with the users and management.
Surely, all of this has helped you identify every subject that needs to be
represented in the database. You may be correct, but you could have a
minor problem if you’re wrong: missing tables.
Studying the fields on the primary field list helps you identify subjects
from an unbiased viewpoint—you’re letting the fields “talk” to you. It’s
crucial that you now look at this list as objectively as possible—as
though you’ve never seen it before—without any of the biases you’ve
assimilated during the interview process. This enables you to see how
certain groups of fields suggest specific subjects, some of which may
not have been identified during the interview process. You can also
use the Preliminary Field List to verify many of the subjects on the list

ptg14955309
Defining the Preliminary Table List 177
of subjects. Using the Preliminary Field List in these ways allows you
to cross-check your previous work and helps you ensure that the new
database structure includes all of the necessary subjects.
As you review the Preliminary Field List, ask yourself whether a cer-
tain set of fields defines or describes a particular subject. Move on to
another set of fields if nothing readily comes to mind. When you can
infer a subject from the field in the list, enter that subject on a new
Preliminary Table List. Figure 7.1 shows a partial sample of a Prelimi-
nary Field List and illustrates how a subject can be suggested by a set
of fields.
Preliminary Field List
Phone Extension
Status
Student First Name
Student Last Name
Home Phone
Address
City
State
Course Code
Course Name
Course Description
Lab Fee
Faculty First Name
Faculty Last Name
Date Hired
Phone Extension
These fields
suggest
“Courses.”
These fields
suggest
“Faculty.”
These fields
suggest
“Students.”
Figure 7.1 Using the Preliminary Field List to identify subjects
Continue your review until you’ve scanned all the fields and identified
as many subjects as possible. Be sure to add each subject you identify
to the Preliminary Table List. This list will grow as you work with the
list of subjects and mission objectives. Figure 7.2 shows an example of
the first version of a Preliminary Table List.

ptg14955309
178 Chapter 7 Establishing Table Structures
Using the List of Subjects
Now, create a second version of the Preliminary Table List by merging
the list of subjects (created during the interviews with users and man-
agement) with the first version of the Preliminary Table List (compiled
by studying the Preliminary Field List). This new version contains a
more complete list of tables. Merging the two lists is a three-step pro-
cess, which involves resolving duplicate items, resolving items that rep-
resent the same subject, and combining the remaining items together
into one list.
Step 1: Resolve Duplicate Items
Start this step by reviewing and cross-checking each item on the list of
subjects against the items on the Preliminary Table List. Your objective
here is to identify duplicate items, which are items on the list of sub-
jects that already appear on the Preliminary Table List. You must be
very careful how you resolve the duplicate items that you find. Begin
by determining whether the items represent different subjects, despite
the fact that they share the same name. (Use your interview notes
as necessary to help you make your decision.) If they do represent
Preliminary Table List
Courses
Faculty
Labs
Students
Classrooms
Figure 7.2 The first version of the Preliminary Table List

ptg14955309
Defining the Preliminary Table List 179
different subjects, rename each item so that it accurately identifies
the subject it represents and then add both items to the Preliminary
Table List; otherwise, determine whether they truly represent the same
subject. When you conclude that both items do represent the same
subject, cross out the item on the list of subjects and keep the one that
appears on the Preliminary Table List. Then resume the review until
you’ve examined all of the items on both the list of subjects and the
Preliminary Table List. Let’s take a look at an example of this process.
Assume that you’re developing a database for an equipment rental
business, and you’re working with the list of subjects and the Prelimi-
nary Table List shown in Figure 7.3.
Preliminary Table ListList of Subjects
Clients
Equipment
Rental Agreements
Services
Employees
Customers
Rental Agreements
Sales Reps
Equipment
Figure 7.3 The list of subjects and the Preliminary Table List for an equipment
rental business
As you review these lists, you discover two duplicate items: “Equip-
ment” and “Rental Agreements.” These items warrant further examina-
tion, so you start with “Equipment” and try to determine whether each
occurrence represents a different subject. In reviewing your interview
notes, you find that “Equipment” on the list of subjects represents
items such as tools, appliances, and audiovisual equipment. Then
you remember that “Equipment” on the Preliminary Table List also
includes trucks, vans, and trailers. You review your interview notes
further and discover that vehicle rentals are treated differently from

ptg14955309
180 Chapter 7 Establishing Table Structures
“regular” equipment rentals. Therefore, each occurrence of “Equip-
ment” does represent a different subject. You resolve the duplication by
keeping one occurrence of “Equipment” and renaming the other “Vehi-
cles.” You then list both items on the Preliminary Table List.
Now you go through the same process with “Rental Agreements.”
Fortunately, you discover that both occurrences share exactly the
same meaning. The only thing you have to do in this case is cross out
“Rental Agreements” on the list of subjects. Now you can continue your
review until you’ve inspected each item on the list of subjects. Figure
7.4 shows the revised list of subjects and the Preliminary Table List.
Preliminary Table ListList of Subjects
Clients
Equipment
Rental Agreements
Services
Employees
Customers
Rental Agreements
Sales Reps
Equipment
Vehicles
Figure 7.4 The revised list of subjects and the revised Preliminary Table List
(first view)
Step 2: Resolve Items That Represent the Same Subject
Your objective during this step of the merge process is to determine
whether an item on the list of subjects and an item on the Preliminary
Table List represent the same subject even though they have different
names. When you identify such a set of items, select the name that
best represents the subject and use it as the sole identifier for that
subject. Then deal with the name in this manner.
• If the name you’ve selected already appears on the Preliminary
Table List, cross out its counterpart on the list of subjects.

ptg14955309
Defining the Preliminary Table List 181
• If the name appears on the list of subjects, remove its counter-
part on the Preliminary Table List and replace it with the name
from the list of subjects.
Repeat this process until you’ve covered all the items on the list of
subjects.
Continuing with the equipment rental business example, assume
you’ve discovered that “Clients” and “Employees” on the list of sub-
jects and “Customers” and “Sales Reps” on the Preliminary Table List
represent (respectively) the same subject (see Figure 7.4). Deciding to
deal with “Clients” and “Customers” first, you review your interview
notes and determine that “Customers” is the name that best represents
both the people and the organizations that rent equipment from the
business. You then resolve the duplication by keeping “Customers” and
crossing out “Clients.” Moving on to the next set of duplicate items,
you decide to keep “Employees” and discard “Sales Reps” because you
believe that “Employees” best describes those people who are employed
by the business, regardless of their position. Figure 7.5 shows a
revised version of both lists and the resolution of the duplicate items.
Preliminary Table ListList of Subjects
Clients
Equipment
Rental Agreements
Services
Employees
Customers
Rental Agreements
Vehicles
Equipment
Employees
Figure 7.5 The revised list of subjects and the revised Preliminary Table List
(second view)

ptg14955309
182 Chapter 7 Establishing Table Structures
Step 3: Combine the Items on the List of Subjects and the
Preliminary Field List
The final step of this process is the easiest of the three. All you do is
add the remaining items from the list of subjects to the Preliminary
Table List. Then throw away the list of subjects—you won’t need it any-
more. The list that remains becomes the second version of the Prelim-
inary Table List. That’s all there is to it! Figure 7.6 shows the second
version of the Preliminary Table List, which is the result of merging the
two lists shown in Figure 7.5.
Preliminary Table List
Customers
Rental Agreements
Employees
Equipment
Services
Vehicles
Figure 7.6 The second version of the Preliminary Table List
Using the Mission Objectives
In this third and final procedure, you use the mission objectives to
determine whether you’ve overlooked any subjects during the previous
two procedures. This is your final opportunity to add tables to the Pre-
liminary Table List.
Start with the first mission objective, and use the Subject- Identification
Technique to identify the subjects represented in that statement.
Underline each subject you identify and then cross-check it against the

ptg14955309
Defining the Preliminary Table List 183
items on the Preliminary Table List. Use the same techniques here that
you used in the previous procedure.
1. When an item you underlined in a mission objective statement
matches an item on the Preliminary Table List, determine
whether the items represent different subjects. If they do, assign
an appropriate name to each occurrence and then add each one
to the Preliminary Table List; otherwise, cross out the duplicate
item on the mission objective.
2. When an item you underlined in the mission objective statement
has a name that is synonymous with the name of an item on
the Preliminary Table List and both items represent the same
subject, select the name that best identifies that subject and use
it in the Preliminary Table List.
3. When an item you underlined in the mission objective statement
represents a new subject, add it to the Preliminary Table List.
Repeat these steps until you’ve worked through all the mission objec-
tives. Here’s an example of how you use these techniques to review the
mission objectives.
Assume that you’re designing a database for a flight training school.
You’re just starting this particular process, and you’ve just used the
Subject-Identification Technique on the following statement:
We need to maintain data on our pilots and their certifications.
You now cross-check the subjects you identified in this mission objec-
tive against the items in the Preliminary Table List shown in Figure 7.7.
In this case, you cross out “pilots” in the mission objective statement
because it already exists on the Preliminary Table List and it rep-
resents the same subject. You then decide to examine “certifications”
further, and, after some careful thought, you make these observations.

ptg14955309
184 Chapter 7 Establishing Table Structures
1. It does not appear on the Preliminary Table List.
2. It doesn’t duplicate any item on the Preliminary Table List.
3. Its name is not synonymous with any item on the Preliminary
Table List.
4. It doesn’t represent the same subject as any other item on the
Preliminary Table List.
These findings indicate that “certifications” is a new item and should
be added to the Preliminary Table List. So you add it to the Prelimi-
nary Table List and cross it out on the mission objective statement;
this shows you that you’ve already dealt with this particular item. Fig-
ure 7.8 shows the revised version of the Preliminary Table List.
Defining the Final Table List
Your Preliminary Table List is as complete as it can be at this point,
so you’ll now transform it into a Final Table List. This new list incor-
porates two elements that are not currently on the Preliminary Table
List: table type and table description. Figure 7.9 shows an example of a
Final Table List.
Preliminary Table List
Courses
Employees
Maintenance History
Pilots
Planes
Students
Figure 7.7 The Preliminary Table List for a flight training school

ptg14955309
Defining the Final Table List 185
Preliminary Table List
Courses
Employees
Maintenance History
Pilots
Planes
Students
Certifications
Figure 7.8 The revised Preliminary Table List
Final Table List
Courses
Classrooms
Name
Data
Data
Type
The spaces or areas within a facility
reserved for the purpose of conducting class
proceedings. Information regarding the
physical aspects, on-site resources, and
availability of these areas is useful because
it allows us to assign classes to the facility
that can make the best use of these areas.
Description
The programs of instruction conducted through
courses offered by this institution. Course
information must always reflect the addtion of
new courses, the deletion of old courses, and
the continuing evolution of existing courses.
Figure 7.9 An example of a Final Table List

ptg14955309
186 Chapter 7 Establishing Table Structures
A table type allows you to classify a table by the role it plays within
the database and provides you with a means of identifying tables that
function in a similar manner. The table’s role determines its type, and
there are four table types that you can associate with a given table.
1. A data table represents a subject that is important to the orga-
nization and is the primary foundation of the information that
the database provides. (You’ll learn more about data tables later
in this chapter.)
2. A linking table establishes a link between two tables in a many-
to-many relationship. (Chapter 10, “Table Relationships,” covers
linking tables in more detail.)
3. A subset table contains fields that are related to a particular
data table and further describes the data table’s subject in a
very specific manner. (You’ll learn more about subset tables
later in this chapter.)
4. A validation table contains relatively static data and is a crucial
component of data integrity. (Chapter 11, “Business Rules,” pro-
vides further details on this type of table.)
A table description provides a clear definition of the subject represented
by the table and states why the subject is important to the organiza-
tion. There are certain guidelines that govern how you create a table
description, and you’ll learn about them later in this chapter. There is
a final task you have to perform before you transform your Preliminary
Table List into the Final Table List: refining the table names.
Refining the Table Names
Naming a table is a more complex affair than you may realize at the
moment. As you learned in Chapter 3, “Terminology,” a table represents
a single subject; therefore, its name must clearly identify the subject it
represents. The following guidelines will help you create table names

ptg14955309
Defining the Final Table List 187
that are clear, unambiguous, descriptive, and meaningful. They will
also help ensure that you name your tables in a consistent manner.
Guidelines for Creating Table Names
•Create a unique, descriptive name that is meaningful to the entire
organization. Using unique names helps to ensure that each table
clearly represents a different subject and that everyone in the
organization will understand what the table represents. (If you
encounter duplicate table names at this point, resolve the prob-
lem using the techniques you learned earlier in this chapter.)
Choose names that are descriptive enough to be self-explanatory.
“Vehicle Maintenance” is an example of a good, descriptive name.
Defining a unique and descriptive name does take some work on
your part, but it’s well worth the effort in the long run.
•Create a name that accurately, clearly, and unambiguously iden-
tifies the subject of the table. Vague or ambiguous names usu-
ally indicate that the table represents more than one subject.
When you encounter such a name, identify the subjects the table
truly represents and then treat each subject as a separate table.
“Dates” is a good example of a vague table name. You really don’t
know what the table represents without referring to its descrip-
tion. For example, assume you’re designing a database for an
entertainment agency and this table appears in the Preliminary
Table List. Upon seeing this table name, you decide to review
your interview notes. You discover that one person says “Dates”
represents appointments for client meetings, and another person
says it represents booking dates for the agency’s stable of enter-
tainers. This table clearly represents two subjects, so you remove
“Dates” from the Preliminary Table List and replace it with two
new tables called “Client Meetings” and “Entertainer Schedules.”
Possibly the most vague and ambiguous name you could assign
to a table is “Miscellaneous”—it doesn’t identify a single subject

ptg14955309
188 Chapter 7 Establishing Table Structures
whatsoever. You might occasionally feel compelled to create a
“Miscellaneous” table because you just can’t figure out what to
do with certain fields on your Preliminary Field List. When that
happens, stop, take a break, and then come back and reexamine
those fields. Carefully and methodically apply the design tech-
niques you’ve learned, and you’re sure to determine what to do
with the fields after all.
•Use the minimum number of words necessary to convey the sub-
ject of the table. Everyone in the organization should be able to
identify what the table represents without having to read its
description. Although your objective is to create a short, succinct
table name, avoid using a minimalist approach. “TD_1” is a good
example of a name that is exceedingly short. You won’t have the
slightest idea what this table represents unless you know the
meaning of each character in the name. You should also avoid
going in the opposite direction as well. “Multiuse Vehicle Mainte-
nance Equipment” is much too long and can easily be shortened
to just “Equipment.”
•Do not use words that convey physical characteristics. Avoid using
words such as file, record, and table in the table name because
they add a level of confusion that you don’t need. A table name
that includes this type of word is very likely to represent more
than one subject. Consider the name “Patient Record.” On the
surface, this may appear to be an acceptable name. You’ll realize,
however, that there are potential problems with this name when
you take some time to think about what a “patient record” is sup-
posed to represent. The name contains a word that you’re trying
hard to avoid (record) and it potentially represents three subjects:
“patients,” “doctors,” and “examinations.” With this in mind,
remove “patients” from the Preliminary Table List and replace it
with three new tables, one for each of the three subjects.
•Do not use acronyms and abbreviations. Acronyms are hard to
decipher, abbreviations rarely convey the subject of the table, and

ptg14955309
Defining the Final Table List 189
both violate the first guideline in this list. Take acronyms, for
example. Say you’re helping an organization revise its database
structure and you encounter a table named “SC.” How do you
know what the table represents without knowing the meaning of
the letters themselves? The fact is that you can’t easily identify
the subject of the table. What’s more, you may find that the table
means different things to different departments in the organiza-
tion. So you decide to conduct a brief interview with some of the
staff in order to determine what the letters represent. (Now, this
is the scary part.) To your disbelief, you discover that the folks in
personnel think it stands for “Steering Committees”; the informa-
tion systems staff believes it to be “System Configurations”; and
the people in security insist that it represents “Security Codes.”
This example clearly illustrates why you should make every effort
to avoid using abbreviations and acronyms in a table name.
•Do not use proper names or other words that will unduly restrict
the data that can be entered into the table. This guideline will
keep you from falling into the trap of creating duplicate table
structures. A name such as “Southwest Region Employees,” for
example, severely restricts the data that you can enter into this
table. As the organization grows, how will you deal with employ-
ees from other regions? When the organization begins to hire
employees in Washington, Oregon, and Idaho, you’ll have to
create a “Pacific Northwest Region Employees” table, and you’ll
have to create a “Western Region Employees” table when the
organization begins to hire folks in Arizona, Utah, Nevada, and
California.
Proper database design principles dictate that you should not
create duplicate structures such as these because they can be
quite problematic.
1. Users could have a difficult time retrieving data from all three
tables simultaneously.

ptg14955309
190 Chapter 7 Establishing Table Structures
2. The person maintaining the database would have the added
responsibility of ensuring that the tables are always struc-
turally synchronized. If he adds, modifies, or deletes a field
in one table, he must take the same action on all the other
tables.
3. The person maintaining the database would also have the
added responsibility of ensuring synchronized data integrity
between the tables. He must be able to guarantee that data is
completely and accurately transferred from one table to the
other when an employee relocates from one region to another.
•Do not use a name that implicitly or explicitly identifies more than
one subject. This is one of the most common mistakes you can
make with a table name, and it is relatively easy to identify. This
type of name typically contains the word and or or and charac-
ters such as the slash (\) or ampersand (&); examples include
“Department or Branch” and “Facility\Building.” A table with an
ambiguous name suggests that you may have not identified the
subject clearly or accurately during the analysis and interview
processes. You can rectify this problem by reviewing your notes
and conducting further analysis and interviews as necessary.
Just remember that you must always ensure that each table rep-
resents only one subject.
Another name that falls under this category is “Miscellaneous.”
(Yes, here’s that name again!) A moment ago, I said that this
name didn’t identify a single subject whatsoever; this is a cor-
rect and valid assertion. It is also true, however, that the name
implicitly identifies more than one subject; you can’t specifically
identify the subjects because the name is vague and ambiguous.
Merriam-Webster’s online dictionary defines the word itself as
follows:
Miscellaneous adj. 1. consisting of diverse things or members;
hetero geneous. 2. having various traits.

ptg14955309
Defining the Final Table List 191
You can clearly see the problems that this name creates, so you
should not use it as a table name at all. There are certainly good
reasons not to do so.
•Do use the plural form of the name. As you know, a table rep-
resents a single subject, which can be an object or event. You
can take this definition one step further and state that a table
represents a collection of similar objects or events. For example,
a sales representative wants to maintain data on all of his cus-
tomers, not just a single one; and a car rental business wants to
keep track of all its vehicles, not just the blue BMW. Using the
plural form of the table name is a sound idea because it makes
clear your intention to refer to a collection. Collections, of course,
always take the plural (“Boats,” not “Boat”). In contrast, words
that identify fields are always singular (“Home Phone,” not “Home
Phones”). Following this rule will make it easy for you to differen-
tiate between table names and field names in any documentation
you create for the database. (As you rename your tables, remem-
ber that the plural form of some words does not end in s or es.
For instance, the singular and plural forms of “equipment” are
exactly the same.)
Use these guidelines to refine each table name on the Preliminary Table
List. When you’re finished, this list becomes your Final Table List and
remains so for the duration of the database design process. Note that
the list is “final” only in the sense that you’ve accounted for all the tables
that you identified throughout the entire analysis process. It’s very likely
that you’ll add new tables to this list based on requirements imposed by
relationships, data integrity, or other information that you develop.
❖Note The guideline for using a plural form for a table name
is a particularly good one while you’re working on the logical
design of the database. It makes it very easy to differentiate table

ptg14955309
192 Chapter 7 Establishing Table Structures
names from field names, especially when you’re displaying them
on a projection screen or when you’ve written them all across a
white board in a conference room.
Keep in mind, however, that the table names are likely to change
once you (or the database developer in charge of implementing
the database) begin implementing the database into a specific
RDBMS application. The names will then need to conform to the
naming convention that developers commonly use for the RDBMS.
Indicating the Table Types
As you learned earlier in this chapter, you indicate each table’s type on
the Final Table List. Recall that the four classifications you can use to
identify the table type are data, linking, subset, and validation.
When you first create your Final Table List, every item on the list is
a data table because it represents a subject that is important to the
organization and serves as the primary foundation of the information
that the database provides. There will be no linking tables or valida-
tion tables on the list because you have not yet defined relationships or
imposed data integrity. (You’ll address these issues later in the design
process.) The list will not contain subset tables because you define
them after you assign fields to the data tables.
For the moment, designate each table on the Final Table List as a data
table. You’ll assign other table types later as the database design pro-
cess continues to unfold.
Composing the Table Descriptions
The table description is another aspect of a table that you record on
the Final Table List. A table description is crucial because it helps

ptg14955309
Defining the Final Table List 193
everyone understand why a given table exists and why the organiza-
tion is concerned with collecting the data for that table. In fact, the
description must explicitly define the table and state its importance to
the organization. It doesn’t matter whether the definition comes first
or you use more than one sentence to convey this information—both
the definition and the explanation of the table’s importance must be in
the description. The table description also provides a means of vali-
dating the need for a table—if you are unable to explain why a table is
important to the organization, then you need to determine when and
how the table was identified and whether it really is necessary at all.
Just as you had guidelines to help define table names, you also have
a set of guidelines to help you compose a table description that is
focused, concise, unambiguous, and clear.
Guidelines for Composing a Table Description
•Include a statement that accurately defines the table. Anyone
should easily be able to determine the identity of the table from
its description without any confusion or uncertainty. Here’s an
example of a poor definition for a table named “Suppliers” in a
bakery database. As you can see, it’s not very accurate:
Suppliers—the companies that supply us with ingredients and
equipment
What if the bakery receives some of its ingredients from local
farmers? The farmers certainly don’t qualify as “companies.”
What type of equipment do these suppliers supply? Cooking
utensils? Hand trucks? Delivery racks? Here’s a much better
definition of suppliers:
Suppliers—the people and organizations from which we pur-
chase ingredients and equipment
This statement can be used in the table description as the table
definition.

ptg14955309
194 Chapter 7 Establishing Table Structures
•Include a statement that explains why this table is important to the
organization. A table contains data that is collected, maintained,
manipulated, and retrieved by the organization for a particular
reason. Your statement should explain why the data is important
to the organization. Keeping in mind that this statement becomes
part of your table description, you might be tempted to construct
a statement such as this:
We need the Suppliers table to keep track of the names,
addresses, phone numbers, and contact names of all our
suppliers.
This statement is inadequate because it emphasizes only what
needs to be stored in the Suppliers table instead of amplifying
why the data is important to the business. The next example
conveys a better sense of why the information is important:
Supplier information is vital to the bakery because it allows us
to maintain a constant supply of ingredients and ensure that
our equipment is always in working order.
This is a more effective statement because it conveys the impor-
tance of the data by identifying the services the suppliers pro-
vide to the bakery. It also implies that the bakery could run
out of ingredients or have a hard time keeping its equipment in
top shape without the suppliers’ services. This statement now
reflects why the table is important to the organization.
•Compose a description that is clear and succinct. Avoid the com-
mon mistake of restating or rephrasing the table name in your
table description, as in this example:
Student Schedule—the class schedule of the student
Don’t be too brief or too verbose. You want to make sure that
everyone can identify the table and understand its importance to
the organization, but you also want to avoid furnishing too much

ptg14955309
Defining the Final Table List 195
information. Here’s an example of a description that is quite
lengthy and provides more information than is necessary:
Student Schedule—All the classes that a student will attend
(including the days, the times, and the faculty conducting the
class) during the course of the school year. The data in this
table is important because it will let the student know the
name of the class and when and where he’s supposed to be.
Also, the student will know the duration of the class, as well as
the name of the teacher who is teaching the class.
This can be recast more clearly and succinctly as follows:
Student Schedule—Those classes that the student is scheduled
to attend during this school year. The information provided by
this table helps the student implement effective time manage-
ment and enables the school to figure class loads and student
loads.
The first sentence in this example provides the definition of the
table, and the second sentence states why the table is important
to the academic organization.
•Do not include implementation-specific information in your table
description, such as how or where the table is used. Avoid state-
ments that indicate how you will specifically use this table, or
how you will physically access it. This type of information is
germane to the database implementation process, which is wholly
separate from the database design process you’re learning in this
book. Here is an example of a description containing this type of
inappropriate information:
Student Schedule—Those classes that the student is scheduled
to attend during this school year. This information is used by
the registrar and is accessed from the Student Admissions
menu in the Registration Program.
•Do not make the table description for one table dependent upon
the table description of another table. Each table description

ptg14955309
196 Chapter 7 Establishing Table Structures
should be self-explanatory and independent from every other
table description; it should be absolutely unnecessary for you to
cross-reference one table description against another. This is the
type of statement you’re trying to avoid:
Dependents—the spouse, children, or wards of a given
employee. (See description of Employee table for further
information.)
Here’s a much better description:
Dependents—the spouse, children, or wards of a given
employee. This information allows us to make the appropriate
tax deductions for the employee, and is necessary for the bene-
fits programs in which the employee is enrolled.
•Do not use examples in a table description. An example is a
valuable communication tool that helps you convey a particular
meaning or concept and is very effective when you use it wisely.
But an example depends on supplemental information (and, in
some cases, further examples) to complete the idea it’s supposed
to convey. For instance, just think of the number of examples you
would have to use in order to define fully what a table represents.
A well-defined description is clear, succinct, and self-explanatory;
therefore, it does not require an example to convey its meaning.
Interviewing Users and Management
Now you’ll define table descriptions for the tables on the Final Table
List. You’ll conduct interviews with both users and management, and
enlist their aid in establishing each table’s definition and importance
to the organization. (This is one of the few times that you’ll actually
interview both groups together.) Your main objective is to get a con-
sensus on general descriptions for the tables. When your interviews
are complete, take your notes and compose final table descriptions,
making sure to follow the guidelines outlined earlier in this chapter.
Then confer with both parties once more to make certain that the

ptg14955309
Defining the Final Table List 197
descriptions are acceptable and easily understood by all. The Final
Table List is complete when everyone has agreed on the descriptions.
Consider this example: Assume you’re developing a database for a local
software training organization. Your assistant, John, is conducting an
interview with some of the people from the organization. Specifically,
he’s speaking to Mark from the administration department; Frits, the
instructor coordinator; Sara, the vice president of sales; and Caroline,
the head of the organization. The dialogue that follows is a partial
transcript of John’s interview. John is currently discussing the Stu-
dents table.
Unlike the interviews you conducted during the analysis and
requirements review stages of the design process, you no longer
need to involve everyone in the organization. But you will work
with a representative group of users and management for the
interviews you’ll conduct throughout the remainder of the design
process.
JOHN: “Okay, let’s talk about the Students table. How would you
describe a ‘student’?”
FRITS: “A student is a private individual who comes in for one of
our classes.”
SARA: “That’s only partially true. A student can also be an
individual that an organization sends to our classes. For
example, many of our students come from local banks
and insurance companies, and those organizations pay
for the students’ tuitions.”
MARK: “Yes, you’re quite right. I guess we can simply say that
a student is an individual who comes in for one of our
classes.”
(John makes a note of what Mark just said.)

ptg14955309
198 Chapter 7 Establishing Table Structures
JOHN: “Good—got it. Does everyone agree with Mark?”
(Everyone nods in approval.)
“Great. Now, how would you explain to someone why stu-
dent information is important to this organization?”
CAROLINE: “Without students, we don’t have a business!”
FRITS: “If we can keep track of the students who attend our
classes, we can send them information regarding our
new classes.”
SARA: “Keeping track of this information allows us to keep bill-
ing and contact information current. This is especially
true for organizations that send their employees to our
classes. Training coordinators move on to other posi-
tions, and we have to know the name of the new person
we’ll be dealing with.”
JOHN: “Good point. Does anyone have anything further to add?
No? Okay, does everyone agree with what has been said
so far?”
(Everyone once again nods in approval. Because no additional com-
ments are made, John jots down some final notes and moves on to
the next table.)
As you can see, conducting this type of interview is a fairly straightfor-
ward affair. Notice how John attempts to get a consensus as he recog-
nizes that no one has anything else to say about the topic at hand. He
then makes note of the points that will help him compose the descrip-
tion and moves on to his next topic.
After John has finished conducting the interview, he uses his notes to
develop a table description for each table on the Final Table List. He’ll
have to interpret and study the participants’ responses in order to
develop a suitable table description. Based on his examination, John
writes the following description:

ptg14955309
Associating Fields with Each Table 199
Students—those individuals who attend our classes. The information
provided by the data in the Students table allows our organization
to further promote our classes and supports proper communications
with the students.
John then writes a description for each table on the Final Table List.
When he’s finished, he’ll speak with Mark, Frits, Sara, and Caroline
once more to make sure the descriptions are acceptable and that
everyone understands them without any difficulty.
Associating Fields with Each Table
In Chapter 3 you learned that tables are composed of fields. During this
stage of the database design process, you’ll assign fields to each table
on the Final Table List using fields from your Preliminary Field List.
Assigning fields to a table is a relatively easy process: Determine which
fields best represent characteristics of the table’s subject and assign
them to that table. Repeat this procedure for every table on the Final
Table List. If you think you can use a field or set of fields to represent
characteristics of more than one table, then assign them accordingly.
You’ll discover whether you’ve assigned the appropriate fields to each
table later when you go through the process of refining the table
structures.
❖Note In the following examples, you’ll note that I ask you to
use sheets of paper for specific procedures. Using paper helps
you avoid the temptation of using an RDBMS program to design
your database. I cannot overemphasize or overstate the fact
that you should not use the computer at all until the database
design process is complete unless you’re using some type of data-
base-design-specific software. By heeding this advice, you will
avoid the traps I discuss later in Chapter 14 “Bad Design—What
Not to Do.”

ptg14955309
200 Chapter 7 Establishing Table Structures
Begin this process by taking a sheet of legal paper and laying it in
front of you lengthwise from left to right. Write the name of each table
(from the Final Table List) across the top of the paper, starting at the
left-hand side; leave enough space between the table names to give you
enough room to list lengthy field names underneath them. Repeat this
procedure, using as many sheets as you need to account for every table
on the list. Continuing with the school database example, Figure 7.10
shows the set of table structures currently under development.
Table Structures
Courses Subjects Instructors Students
Figure 7.10 Setting up a sheet for listing table structures
Next, assign fields from the Preliminary Field List to each table. Deter-
mine which fields best describe or define a table’s subject and then list
these fields underneath the table name. After you’ve assigned all of the
fields you believe to be appropriate for the table, move on to the next
table and repeat the process. Continue in this manner until you’ve
assigned fields to all the tables. Figure 7.11 shows a partial set of table
structures.

ptg14955309
Associating Fields with Each Table 201
❖Note Before you work through the remainder of the chap-
ter, now is a good time to recall a principle I presented in the
Introduction:
Focus on the concept or technique and its intended results, not
on the example used to illustrate it.
I bring this to your attention once again because you’ll certainly
wonder why I created an example in a particular manner. Maybe
you’ve thought of a different or better approach to the problem,
and you might have thoroughly valid reasons for using it. But
don’t let the example mislead you. I’ve fashioned each example in
a specific manner for the sole reason of illustrating the concept
or technique at hand. Therefore, study the way that I correct the
problems you see in a particular example so that you can use
those techniques when you encounter similar problems in your
database.
Table Structures
Subjects
Subject Name
Subject Description
Category
Credits
Classes
Class Number
Class Name
Room Number
Instructor Name
Subject Name
Students
Student Name
Student Address
Student Phone
Student SSN
Instructor Name
Instructor Address
Instructor Phone
Instructor SSN
Date Hired
Pay Rate
Instructors
Figure 7.11 Listing tables with their associated fields

ptg14955309
202 Chapter 7 Establishing Table Structures
Refining the Fields
Now that you’ve assigned fields to each table, you’ll refine the fields by
improving the field names and resolving any structural problems that
may exist. Then you’ll refine the tables further by establishing that
you’ve assigned the appropriate fields to each table and that the table
structures are sound.
Improving the Field Names
As you know, a field represents a characteristic of the subject of the
table to which it belongs. You can easily identify the characteristic a
field is supposed to represent when that field has an appropriate name.
A field name that is ambiguous, vague, or unclear is a sure sign of
trouble and suggests that you have not thoroughly identified the pur-
pose of the field.
Earlier in this chapter, you learned a set of guidelines for naming a
table. Now you’ll learn another set of guidelines that you’ll apply to field
names. Fortunately, many of them are similar to the guidelines govern-
ing table names, so you’re already familiar with most of the concepts.
Guidelines for Creating Field Names
•Create a unique, descriptive name that is meaningful to the entire
organization. A given field name should appear only once in the
entire database; the only exception to this rule occurs when the
field serves to establish a relationship between two tables. Make
certain the name is descriptive enough to convey its meaning
accurately to everyone who sees it. (Chapter 10 covers this issue
in greater detail.)
•Create a name that accurately, clearly, and unambiguously identi-
fies the characteristic a field represents. “Phone Number” is a good
example of an inaccurate, ambiguous field name. What kind
of phone number does it represent? A home phone? An office

ptg14955309
Refining the Fields 203
phone? A cellular phone? Learn to be specific. If you need to
record each of these types of phone numbers, then create “Home
Phone,” “Work Phone,” and “Cellular Phone” fields.
In Chapter 6, “Analyzing the Current Database,” you learned
how to resolve generic field names, such as “Address,” “City,” and
“State,” by using the table name as a prefix for the field name.
This produces names such as “Employee Address,” “Customer
Address,” and “Supplier Address.” When you have field names
such as these, you can abbreviate the prefix (for brevity’s sake)
by using the first three or four letters of the table name as the
revised prefix. This allows you to transform the previous field
names into “EmpAddress,” “CustAddress,” and “SuppAddress.”
This technique helps you fulfill not only this guideline, but the
previous one as well.
❖Note The degree to which you use prefixes within a table is a
matter of style. When a table contains generic field names, some
database designers will choose to prefix the generic names only,
while others elect to prefix all of the field names within the table.
Regardless of the prefix method you choose to use, it is very
important that you use it consistently throughout the database
structure.
I personally prefer to prefix the generic field names only, and I’ll
follow this preference throughout the remainder of the book.
•Use the minimum number of words necessary to convey the mean-
ing of the characteristic the field represents. You want to avoid
lengthy field names, but at the same time, you also want to avoid
using a single word as a field name if that word is inappropri-
ate. For example, if you’re trying to record the date a particu-
lar employee joined the organization, “Hired” is too short (and
slightly vague) and “Date That the Employee Was Hired” is too

ptg14955309
204 Chapter 7 Establishing Table Structures
long! “Date Hired,” however, is a more appropriate name and
accurately represents the characteristic the field represents.
•Do not use acronyms, and use abbreviations judiciously. Acronyms
can be hard to decipher and often lead to misunderstanding.
Imagine a field named “CAD_SW.” How would you determine
what the field represents? On the other hand, you can use abbre-
viations so long as you use them sparingly and handle them with
care. Only use an abbreviation if it supplements or enhances the
field name in a positive manner. An abbreviation shouldn’t make
a field name ambiguous or diminish its meaning.
•Do not use words that could confuse the meaning of the field
name. A field name that contains redundant words or synonyms
can make the name’s meaning unclear and subject to misinter-
pretation. For instance, consider the name “Digital Identification
Code Number.” “Digital” and “number” are redundant, so you can
eliminate either one without diminishing the field name’s mean-
ing. Let’s assume that you decide to eliminate “digital.” You can
split the remaining name into two smaller names: “Identification
Code” and “Identification Number.” These names are often synon-
ymous, and you can easily use either as the final field name. In
this situation, just use the name that is most meaningful within
the organization.
•Do not use names that implicitly or explicitly identify more than
one characteristic. These types of names are easy to spot because
they typically use the word and or or. Field names that contain a
slash (\) or an ampersand (&) are dead giveaways as well. When
you encounter a field with a name such as “Area or Location” or
“Phone\Fax,” identify each characteristic that the name implies,
and create a new field for the characteristic. Then test the new
field name against these guidelines to ensure that the name is
sound.

ptg14955309
Refining the Fields 205
•Use the singular form of the name. A field with a plural name,
such as “Skills,” implies that it may contain two or more values
for a given record, which is not a good idea. (You’ll learn more
about this later in the chapter.) A field name is singular because
it represents a single characteristic of the subject of the table
to which it belongs. A table name, on the other hand, is plural
because it represents a collection of similar objects or events. You
can distinguish table names from field names quite easily when
you use this naming convention.
❖Note The specific guideline for using a table name as a pre-
fix for a field name will have the same issue that I brought up
earlier for table names: These particular field names are likely to
change once you (or the database developer in charge of imple-
menting the database) begin implementing the database into a
specific RDBMS application. The names will need to conform to
the naming convention that developers commonly use for the
RDBMS.
With these guidelines in mind, review each table and determine
whether you can make improvements to any of the field names. When
you’re finished, you’re ready to identify and resolve any problems with
the fields. Figure 7.12 shows revisions to the field names of the table
structures in Figure 7.11.
In Figure 7.12, “Classes” is shortened to “Cls,” “Subjects” is shortened
to “Subj,” “Instructors” is shortened to “Inst,” “Student” is shortened to
“Std,” and “Social Security Number” replaces “SSN.” Remember that
abbreviations can be very useful so long as they are meaningful and
understood by everyone in the organization. Using proper and appro-
priate abbreviations will not detract from the meaning of the field
name.

ptg14955309
206 Chapter 7 Establishing Table Structures
❖Note Throughout the remainder of the chapter and the rest of
the book, table names within the text appear in all capital letters
(such as VENDORS) and field names within the text appear in
small capital letters (such as VENDOR ID NUMBER).
Using an Ideal Field to Resolve Anomalies
Although you’ve carefully identified the fields on your Preliminary
Field List, you may have created a few fields that could prove problem-
atic to the table structure. Poorly defined fields can cause duplicate
data and redundant data, and they can be difficult to use. You might
find it difficult to determine whether any of the fields in a table is going
to cause problems unless you know the warning signs. The best way
to identify potentially troublesome fields is to determine whether they
comply with the Elements of the Ideal Field. These elements constitute
a set of guidelines you can use to create sound field structures and to
spot poorly designed fields easily.
Table Structures
InstName
InstAddress
InstPhone
InstSocial Security Number
Date Hired
Pay Rate
Instructors Students
StdName
StdAddress
StdPhone
StdSocial Security Number
Classes
ClsNumber
ClsName
Room Number
InstName
SubjName
Subjects
SubjName
SubjDescription
Category
Credits
Figure 7.12 Revised field names

ptg14955309
Refining the Fields 207
Elements of the Ideal Field
•It represents a distinct characteristic of the subject of the table. As
you know, a table represents a specific subject, which can be an
object or event. The ideal field represents a distinct characteristic
of that object or event.
•It contains only a single value. A field that can potentially store
two or more occurrences of the same value is known as a mul-
tivalued field. A multivalued field causes data redundancy prob-
lems (quite obviously) and is difficult to use when you try to edit,
delete, or sort the data within it. The ideal field is free of these
problems because it contains only a single value.
•It cannot be deconstructed into smaller components. A field that
can potentially store two or more distinct items within a value
is known as a multipart (or composite) field. Like the multival-
ued field, this type of field causes problems when you try to edit,
delete, or sort the data within it. These problems don’t occur with
an ideal field because it represents a single, distinct character-
istic of the subject of the table to which it belongs. (You’ll learn
more about multivalued and multipart fields in just a moment.)
•It does not contain a calculated or concatenated value. The val-
ues of the fields in a table should be mutually independent; a
particular field should not have to depend on the values of other
fields for its own value. A calculated field, however, does depend
on the values of other fields for its own value, and therein lies
the problem. The calculated field’s value is not updated when the
value of any field participating in the calculation changes. It then
becomes the responsibility (and an undesirable burden) of the
user or the database application program to update the calcu-
lated field when this type of change takes place. This is precisely
why you deal with calculated fields separately.
•It is unique within the entire database structure. The only dupli-
cate fields that appear in a properly designed database are those

ptg14955309
208 Chapter 7 Establishing Table Structures
that establish relationships between tables. If duplicate fields
other than these exist in a table, it is very likely that the table
will accumulate unnecessary redundant data and that the data
within the duplicate fields will inevitably become inconsistent.
❖Note Remember that you’re dealing strictly with the logical
database structure at this point. You might have cause to dupli-
cate specific fields when you physically implement the database
in an RDBMS program. During that process, however, you’re
making a conscious decision to duplicate the fields and you’re
prepared to deal with the consequences of that decision.
•It retains a majority of its properties when it appears in more than
one table. A field that establishes a relationship between two
tables is a structural component of each table. A majority of the
field’s properties remain constant in each occurrence of the field.
(Chapter 9, “Field Specifications,” and Chapter 10 cover this mat-
ter in greater detail.)
Although you now know the specific elements of an ideal field, you’ll
still find it difficult in many instances to identify problematic fields
just by looking at their names. Figure 7.13 shows a table structure
that helps to illustrate this point. Take a moment and try to determine
whether each field complies with the Elements of the Ideal Field or
needs to be modified.
Each field on the list seems to conform to the Elements of the Ideal
Field. Examine the list carefully, however, and you’ll see that some
fields don’t really comply with the second and third elements. Three
fields have anomalies that will cause problems unless you resolve them:
INSTNAME, INSTADDRESS, and CATEGORIES TAUGHT. If you doubt this asser-
tion, you can test it by “loading” the table with sample data. This will
quickly reveal anomalies, if any exist, and is the best way to confirm
whether a field complies with all of the Elements of the Ideal Field.

ptg14955309
Refining the Fields 209
You don’t have to create a table physically to perform this test. Take a
sheet of legal paper and lay it in front of you lengthwise from left to right.
Write the name of each field across the top of the paper, starting from the
left-hand side; leave enough space between the field names to allow room
for the values you’re going to place underneath them. Then enter records
into the table by filling in each field with some sample data; be sure the
sample data represents the data you’re actually going to enter into the
database. You need only a few records for the test to work properly. Your
sheet of paper should look similar to the one in Figure 7.14.
Table Structures
Instructors
InstName
InstAddress
InstPhone
InstSocial Security Number
Date Hired
Pay Rate
Categories Taught
Figure 7.13 A table containing fields with questionable structures
Instructors
<< other fields >>
......
......
......
......
InstPhone
363-9948
527-4992
336-5992
322-6992
InstAddress
3131 Mockingbird Lane, Seattle, WA 98157
7402 Kingman Drive, Redmond, WA 98115
4141 Lake City Way, Seattle, WA 98136
970 Phoenix Avenue, Bellevue, WA 98046
Categories Taught
DTP, SS, WP
WP, DB, OS
DB, SS
DTP, WP, PG
InstName
Shannon Black
Estela Rosales
Timothy Ennis
Kira Bently
Figure 7.14 Testing a table with sample data

ptg14955309
210 Chapter 7 Establishing Table Structures
❖Note As I mentioned in Chapter 3, I show only those fields
that are most relevant to the discussion at hand and use <<other
fields>> to represent fields that are inessential to the example.
Now you can easily identify which fields are going to be troublesome
unless they are resolved. As you can see, INSTNAME and INSTADDRESS are
both multipart fields, and CATEGORIES TAUGHT is a multivalued field. You
must resolve these fields before you can refine the table structure.
Resolving Multipart Fields
Working with a multipart field is difficult because its value contains
two or more distinct items. It’s hard to retrieve information from a mul-
tipart field, and it’s hard to sort or group the records in the table by
the field’s value. The INSTADDRESS field in Figure 7.14 illustrates these
difficulties; you’d certainly have problems retrieving information for
the city of Seattle or sorting information by zip code.
You resolve a multipart field by identifying the distinct items within
the field’s value and treating each item as an individual field. Accom-
plish this task by asking yourself a simple question: “What specific
items does this field’s value represent?” Once you’ve answered the
question and identified the items (as best you can), transform each
item into a new field.
In Figure 7.14, the value of the field INSTNAME represents two items: the
first name and the last name of an instructor. You resolve this field
by creating a new INSTFIRST NAME field and a new INSTLAST NAME field.
The value of INSTADDRESS represents four items: the street address,
city, state, and zip code of an instructor. You transform these items
into fields as well; they will appear in the table as INSTSTREET ADDRESS,
INSTCITY, INSTSTATE, and INSTZIPCODE. Figure 7.15 shows the newly revised
INSTRUCTORS table.

ptg14955309
Refining the Fields 211
Some multipart fields are hard to recognize. Take a look at the INSTRU-
MENTS table in Figure 7.16. At first glance, the table doesn’t seem to
contain multipart fields. When you examine the data in the table more
closely, however, you’ll see that INSTRUMENT ID is actually a multipart
field. This field’s value represents two distinct items: the category to
which the instrument belongs—AMP (amplifier), GUIT (guitar), MFX
(multi-effects unit), SFX (single-effect unit)—and the instrument’s
identification number. Clearly, you should deconstruct INSTRUMENT ID
Instructors
InstFirst Name InstLast Name InstStreet Address InstCity InstState InstZipcode InstPhone Categories Taught << other fields >
>
Kira Bently 3131 Mockingbird Lane Seattle WA 98157 363-9948 DTP, SS, WP ......
Timothy Ennis 7402 Kingman Drive Redmond WA 98115 527-4992 WP, DB, OS ......
Shannon Black 4141 Lake City Way Seattle WA 98136 336-5992 DB, SS ......
Estela Rosales 970 Phoenix Avenue Bellevue WA 98046 322-6992 DTP, WP, PG ......
Figure 7.15 Resolving the multipart fields in the INSTRUCTORS table
Instrument ID Manufacturer Instrument Description
Instruments
<< other fields >>
Player 2100 MultieffectsZoomMFX3349 ......
JCM 2000 Tube Super LeadMarshallAMP1001 ......
VC60 Pro Tube AmpCrateAMP5590 ......
Cry Baby Wah-WahDunlopSFX2227 ......
Twin Reverb ReissueFenderAMP2766 ......
GUIT = Category (“Guitar”)
2201 = Identification Number
StratocasterFender ......GUIT2201
Figure 7.16 An example of a “hidden” multipart field

ptg14955309
212 Chapter 7 Establishing Table Structures
into two smaller fields in accordance with the third element of an ideal
field. Imagine how difficult it would be for you to update the field’s
value if the MFX category changed to MFU if you don’t do this. You
would have to write programming code to parse the value, test for the
existence of MFX, and then replace it with MFU if it existed within the
parsed value. It’s not so much that you can’t do this, but you would
definitely be working harder than necessary, and you shouldn’t have to
go through this at all if you have a properly designed database.
Resolving Multivalued Fields
As you know, a multivalued field can potentially store two or more
occurrences of the same value. Fortunately, you’ll recognize a mul-
tivalued field when you see one. The field’s name is often plural and its
value almost invariably contains a number of commas, which serve to
separate the various occurrences that exist within the value itself.
Resolving multipart fields is not very hard at all, but resolving mul-
tivalued fields can be a little more difficult and will take some work.
A multivalued field has the same fundamental set of problems as a
multipart field, as the CATEGORIES TAUGHT field in Figure 7.17 clearly
Instructors
InstStreet Address
3131 Mockingbird Lane
7402 Kingman Drive
4141 Lake City Way
970 Phoenix Avenue
InstCity
Seattle
Redmond
Seattle
Bellevue
InstFirst Name
Shannon
Estela
Timothy
Kira
InstLast Name
Black
Rosales
Ennis
Bently
<< other fields >>
......
......
......
......
Categories Taught
DB, SS
DTP, WP, PG
DTP, SS, WP
WP, DB, OS
Commas separate
the occurrences
within this value.
Figure 7.17 Identifying a multivalued field

ptg14955309
Refining the Fields 213
illustrates. For example, you’ll have difficultly retrieving information
for everyone who teaches a specific category (such as WP), you can’t
sort the data in any meaningful fashion, and, most important, you
don’t have room to enter more than four categories. What happens
when one or more instructors teach five categories? The only option
you’ll have is to make the field larger every time you need to enter more
values than it will currently allow.
So how would you resolve this multivalued field? Your first thought
may be to create a new field for each value, thus “flattening” the mul-
tivalued field into several single-valued fields. Figure 7.18 shows what
will happen if you follow through with this idea.
Unfortunately, this is not much of an improvement at all. There are
three specific problems that arise from this type of structure.
1. Retrieving category information will be tedious at best. A user
attempting to find all instructors who teach the WP category
must be sure to search for this value within each of the category
fields—there is no guarantee that WP is consistently stored in
the same field. Failure to do so means that the user runs the
risk of overlooking a qualified instructor.
2. There is no way for the RDBMS program to sort the category
data in a meaningful fashion.
Instructors
Category Taught 1
DTP
WP
DB
InstFirst Name
Shannon
Timothy
Kira
InstLast Name
Black
Ennis
Bently
InstStreet Address
3131 Mockingbird Lane
7402 Kingman Drive
4141 Lake City Way
InstCity
Seattle
Redmond
Seattle
Category Taught 2
SS
DB
SS
Category Taught 3
WP
OS
<< other fields >>
......
......
......
970 Phoenix Avenue BellevueEstela Rosales ...... DTP WP PG
Figure 7.18 The result of “flattening” the CATEGORIES TAUGHT field

ptg14955309
214 Chapter 7 Establishing Table Structures
3. This structure is inherently volatile. In its current state, the table
unnecessarily restricts the number of categories an instructor
can teach; you must create additional category fields when you
have instructors who teach more than three categories. Adding
more category fields just compounds the first two problems.
Realizing that flattening the CATEGORIES TAUGHT field won’t solve your
problem, your next thought is to bring the field into compliance with
the second element of an ideal field and declare that it will contain
only a single value. Although this is a good impulse and a step in the
right direction, it will not resolve the matter completely because it will
introduce yet another problem: data redundancy. Figure 7.19 illus-
trates what happens when you follow through with this particular
idea. Note that there is now a single value in the CATEGORIES TAUGHT field
for each record in the table.
The values in CATEGORIES TAUGHT cause redundant data because you
must duplicate a given instructor record for each category that the
Instructors
InstPhone
363-9948
527-4992
336-5992
Categories Taught
DTP
DB
DB
InstFirst Name
Shannon
Timothy
Kira
InstLast Name
Black
Ennis
Bently
InstStreet Address
3131 Mockingbird Lane
7402 Kingman Drive
4141 Lake City Way
InstState
WA
WA
WA
InstCity
Seattle
Redmond
Seattle
InstZipcode
98157
98115
98136
363-9948 SSKira Bently 3131 Mockingbird Lane WASeattle 98157
363-9948 WPKira Bently 3131 Mockingbird Lane WASeattle 98157
527-4992 OSTimothy Ennis 7402 Kingman Drive WARedmond 98115
527-4992 WPTimothy Ennis 7402 Kingman Drive WARedmond 98115
322-6992 DTPEstela Rosales 970 Phoenix Avenus WABellevue 98046
336-5992 SSShannon Black 4141 Lake City Way WASeattle 98136
322-6992 WPEstela Rosales 970 Phoenix Avenus WABellevue 98046
322-6992 PGEstela Rosales 970 Phoenix Avenus WABellevue 98046
Figure 7.19 The result of bringing CATEGORIES TAUGHT into compliance with the
second element of an ideal field

ptg14955309
Refining the Fields 215
instructor teaches. This redundancy is obviously unacceptable, so
you’ll have to resolve this problem in some other manner.
You can avoid this situation entirely by using these steps to resolve a
multivalued field.
1. Remove the field from the table and use it as the basis for a new
table. If necessary, rename the field in accordance with the field
name guidelines that you learned earlier in this chapter.
2. Use a field (or set of fields) from the original table to relate the
original table to the new table; try to select fields that represent
the subject of the table as closely as possible. The field(s) you
choose will appear in both tables. (You’ll learn more about relat-
ing tables in Chapter 10.)
3. Assign an appropriate name, type, and description to the new
table and add it to the Final Table List.
These steps form a generic procedure that you can use to resolve any
multivalued field you encounter in a table. Now, apply these steps to
the CATEGORIES TAUGHT field.
1. Remove the field from the INSTRUCTORS table and use it as the
basis of a new table. Because this will now be a single-valued
field, rename the field CATEGORY TAUGHT.
2. Use INSTFIRST NAME and INSTLAST NAME as the connecting fields
that will relate the INSTRUCTORS table to the new table, and
add them to the structure of the new table.
3. Give the new table a proper name, compose a suitable descrip-
tion, and add the table to the Final Table List. (Indicate the
table’s type as “Data.”) Here’s one possible name and description
you might use for the new table:
Instructor Categories—the categories of software programs that
an instructor is qualified to teach. The information this table

ptg14955309
216 Chapter 7 Establishing Table Structures
provides allows us to make certain that there is an adequate
number of instructors for each software category.
Figure 7.20 shows the revised INSTRUCTORS table and the new
INSTRUCTOR CATEGORIES table.
Instructors
InstPhoneInstFirst Name InstLast Name InstStreet Address InstStateInstCity InstZipcode
363-9948Kira Bently 3131 Mockingbird Lane WASeattle 98157
527-4992Timothy Ennis 7402 Kingman Drive WARedmond 98115
336-5992Shannon Black 4141 Lake City Way WASeattle 98136
322-6992Estela Rosales 970 Phoenix Avenue WABellevue 98046
Category Taught
Instructor Categories
InstFirst Name InstLast Name
Kira Bently DTP
Kira Bently SS
Kira Bently WP
Timothy Ennis WP
Timothy Ennis DB
Timothy Ennis OS
Shannon Black DB
Shannon Black SS
Figure 7.20 Resolving the multivalued field in the INSTRUCTORS table
Note that the new INSTRUCTOR CATEGORIES table is free from the
problems typically associated with multivalued fields because CATE-
GORY TAUGHT is a single-value field. You can easily retrieve information
for a particular instructor or category, and you can sort the records in
a meaningful manner. Also note that the INSTFIRST NAME and INSTLAST
NAME fields retain their names in the new table, making them compli-
ant with the fifth element of an ideal field.

ptg14955309
Refining the Fields 217
Although the new table contains redundant data, the redundancy is
acceptable because it is minimal. It’s a fact of life that a relational data-
base will always contain some amount of redundant data. Your goal as
the database architect is to make certain that it has only an absolute
minimum amount of redundant data.
Figure 7.21 shows a version of the INSTRUCTORS table that contains
three multivalued fields.
CATEGORIES TAUGHT—This indicates the categories of classes that an
instructor can teach.
MAXIMUM LEVEL TAUGHT—This indicates the maximum skill level that
the instructor can teach for a given category.
LANGUAGES SPOKEN—This indicates the foreign languages that an
instructor can speak.
Instructors
Campus Phone
363-9948
527-4992
336-5992
322-6992
Categories Taught
DTP, OS, SS, WP
DB, OS, UT, WP
DB, PG, SS
DTP, PG, WP
InstFirst Name
Shannon
Estela
Timothy
Kira
InstLast Name
Black
Rosales
Ennis
Bently
Maximum Level Taught
Intermediate, Basic, Advanced, Basic
Intermediate, Basic, Basic, Advanced
Advanced, Intermediate, Intermediate
Basic, Intermediate, Basic
Languages Spoken
French, Spanish
German, Spanish
French, German
French, Italian, Spanish
Figure 7.21 A version of the INSTRUCTORS table containing three multivalued
fields
Your task here seems relatively clear—you’re going to use the proce-
dure you’ve just learned to resolve these multivalued fields. You then
notice one small, relatively obscure problem: There is a distinct one-to-
one association between values in CATEGORIES TAUGHT and the values in
MAXIMUM LEVEL TAUGHT for any given record. You probably wouldn’t have
noticed this anomaly had you not carefully examined the sample data
within these fields. Don’t worry; you’ll still use the same procedure,
but with one minor modification.

ptg14955309
218 Chapter 7 Establishing Table Structures
You’ll occasionally encounter a situation such as this, where some
given field (whether single- or multivalued) depends on a particular
multivalued field. You can easily fix this problem by including the
dependent field in the structure of the new table you build to resolve
the multivalued field. Figure 7.22 shows the results of consolidating
this technique with the previous one to resolve CATEGORIES TAUGHT. (It
shows the resolution of LANGUAGES SPOKEN as well.)
The redundancy in the new tables is acceptable because, once again,
it is minimal. In Chapter 10, you’ll learn how to reduce this type of
redundancy even further by relating the tables with primary keys and
foreign keys.
Instructors
Campus PhoneInstFirst Name InstLast Name
336-5992Shannon Black
322-6992Estela Rosales
527-4992Timothy Ennis
363-9948Kira Bently
Language Spoken
Instructor Languages
InstFirst Name
Kira
InstLast Name
Bently
Shannon
Kira
Black
Bently
Timothy Ennis
Timothy Ennis
Shannon Black
Estela Rosales
Estela Rosales
French
Spanish
German
Spanish
French
German
French
Italian
Estela Rosales Spanish
Category Taught
Instructor Categories
InstFirst Name
Kira
InstLast Name
Bently
Timothy
Kira
Ennis
Bently
Kira Bently
Kira Bently
Timothy Ennis
Timothy Ennis
Timothy Ennis
DTP
OS
SS
WP
DB
OS
UT
WP
Maximum Level
Intermediate
Advanced
Basic
Advanced
Intermediate
Basic
Basic
Advanced
Figure 7.22 Resolving the multipart fields in the INSTRUCTORS table

ptg14955309
Refining the Table Structures 219
Refining the Table Structures
Now that you’ve refined the fields and made certain that each field
is sound, you can begin the process of refining the table structures.
Your objective in this phase of the design process is to make sure that
you’ve assigned the appropriate fields to each table and that you’ve
properly defined each table’s structure. This process will also reveal
whether the tables have anomalies that you need to resolve.
A Word about Redundant Data and
Duplicate Fields
You’ve seen the term redundant data used quite often in this chapter.
Redundant data was characterized as being unacceptable in many
cases, but appropriate in others. In order for you to better understand
how to determine when redundant data is acceptable, a definition of
the term is in order.
Redundant data is a value that is repeated in a field as a result of the
field’s participation in relating two tables or as a result of some field or
table anomaly. In the first instance, the redundant data is appropriate;
by definition, a field used to relate one table to another will contain
redundant data. (You’ll learn more about this in Chapter 10.) Redun-
dant data is entirely unacceptable in the second instance, however,
because it poses problems with data consistency and data integrity;
therefore, you should always strive to keep redundant data to an abso-
lute minimum.
A duplicate field is a field that appears in two or more tables for any of
these reasons.
• It is used to relate a set of tables together.
• It indicates multiple occurrences of a particular type of value.
• There is a perceived need for supplemental information.

ptg14955309
220 Chapter 7 Establishing Table Structures
The only instance in which a duplicate field is necessary is when it
serves to establish a relationship between two tables; it provides the sole
means of associating records in the first table with records in the sec-
ond table. Duplicate fields are unnecessary in all other cases, and you
should avoid them because they introduce needless, redundant data.
As you refine each table structure, you’ll assess whether to retain a
given duplicate field in the table. If the reason for its existence in the
table is valid, then you’ll keep it; otherwise, you’ll remove it. You’ll
learn how to deal effectively with both redundant data and unneces-
sary duplicate fields in the following sections.
Using an Ideal Table to Refine Table Structures
Despite your efforts to refine the fields in a table, the table structure
itself may contain anomalies that can produce unnecessary redun-
dant data and make it difficult to work with the data in the table. You
can identify a potentially problematic table structure by determining
whether it complies with the Elements of the Ideal Table. These ele-
ments constitute a set of guidelines you can use to create sound table
structures and to spot poorly designed tables easily.
Elements of the Ideal Table
•It represents a single subject, which can be an object or event. Yes,
I know, I’ve said this a number of times already. The fact of the
matter is that I can’t overemphasize this point. As long as you
guarantee that each of your tables represents a single subject,
you greatly reduce the risk of potential data integrity problems.
This element validates the work you’ve done during the analysis
and interview stages of the database design process, as well as
the work you’ve just recently performed.
•It has a primary key. This is important for two reasons: A pri-
mary key uniquely identifies each record within a table, and it

ptg14955309
Refining the Table Structures 221
plays a key role (no pun intended) in establishing table relation-
ships. Additionally, it has specific characteristics that help to
implement and enforce various levels of data integrity. If you fail
to assign a primary key to each table, you will eventually have
data integrity problems. Chapter 8, “Keys,” covers primary keys
in greater detail.
•It does not contain multipart or multivalued fields. Theoretically,
you should have resolved these issues when you refined the field
structures. Nevertheless, it’s still a good idea to review the fields
one last time to ensure that you’ve completely removed each and
every one of them.
•It does not contain calculated fields. Although you might believe
that your current table structures are free of calculated fields,
you may have accidentally overlooked one or two calculated fields
during the field refinement process. This is a good time to review
the table structures once more and make certain you remove
those calculated fields you may have missed.
•It does not contain unnecessary duplicate fields. (Note that this
guideline does not apply to fields used to relate a set of tables
together, such as those used in the example in Figure 7.22.) One
of the hallmarks of a poorly designed table is the inclusion of
duplicate fields from other tables. You might feel compelled to add
duplicate fields to a table for one of two reasons: to provide refer-
ence information or to indicate multiple occurrences of a partic-
ular type of value. Duplicate fields such as these raise various
difficulties when you work with the data or attempt to retrieve
information from the table.
•It contains only an absolute minimum amount of redundant data.
Remember that a relational database will never be completely
free of redundant data. But you can—and should—make certain
that each table contains as little redundant data as possible.

ptg14955309
222 Chapter 7 Establishing Table Structures
Resolving Unnecessary Duplicate Fields
Before you make final modifications to the table structures, you must
first remove all unnecessary duplicate fields from the database. You
can then refine the tables so that they comply with the Elements of the
Ideal Table.
Duplicate fields that serve to provide reference information (also
known as reference fields) are unnecessary and easy to resolve—you
just remove them from the table. Unfortunately, many people believe
that a table must contain every field that will appear in the reports
they generate from it, so they introduce into the table various duplicate
fields they deem are necessary. They assume that the table will then
be able to provide all the requisite information for their reports. But
they are mistaken, and their action is both unwise and undesirable.
Tables containing reference fields exhibit poor design and will have a
number of problems, many of which will become increasingly clear as
the database design process unfolds. Reference fields force the user or
database application program to ensure that the values in all occur-
rences of the field are mutually consistent, a process that carries a
high risk of error. Figure 7.23 shows an example of a table containing
reference fields.
The MANPHONE and WEB SITE fields in the INSTRUMENTS table are
reference fields and, by definition, are actually unnecessary duplicate
fields. You certainly don’t need to include them in this table because
they’re already part of the MANUFACTURERS table structure; there-
fore, you can remove them from the INSTRUMENTS table in order to
resolve the unnecessary duplication problem. (MANUFACTURER is not a
reference field because it currently relates the INSTRUMENTS table to
the MANUFACTURERS table.) You’ll learn in Chapter 12, “Views,” that
you can work with fields from the INSTRUMENTS table and the MAN-
UFACTURERS table at the same time by combining them within a
view (virtual table). You can then use this view as the basis for compil-
ing any reports you require.

ptg14955309
Refining the Table Structures 223
Manufacturers
ManPhone
745-2722
596-9690
778-6565
364-2244
Manufacturer
Mesa/Boogie
Samson Technologies Corp.
Fender Musical Instruments
Dunlop Manufacturing, Inc.
ManStreet Address
PO Box 846
8860 E. Chaparral Road
1317 Ross Street
PO Box 9031
ManState
CA
AZ
CA
NY
ManCity
Benicia
Scottsdale
Petaluma
Syosset
ManZipcode
94510
85250
94954
11791
738-7563St. Louis Music, Inc. 1400 Ferguson Avenue MOSt. Louis 63133
Web Site
www.jimdunlop.com
www.fender.com
www.mesaboogie.com
www.samsontech.com
www.crateamps.com
Instruments
Instrument ID
2201
3349
1001
5590
2227
2766
Instrument Description
Stratocaster
Player 2100 Multi-Effects
JCM 2000 Tube Super Lead
Crate VC60 Pro Tube Amp
Cry Baby Wah-Wah
Twin Reverb Reissue
Amplifier
Amplifier
Single-Effect Unit
Amplifier
Category
Guitar
Multi-Effect Unit
Web Site
www.jimdunlop.com
www.fender.com
www.mesaboogie.com
www.samsontech.com
www.crateamps.com
ManPhone
745-2722
596-9690
778-6565
364-2244
738-7563
www.fender.com596-9690
Manufacturer
Fender Musical Instruments
Samson Technologies Corp.
Mesa/Boogie
St. Louis Music, Inc.
Dunlop Manufacturing, Inc.
Fender Musical Instruments
$ 549.99
$ 399.99
$ 169.99
$ 1,224.99
Price
$ 799.99
$ 174.99
These fields duplicate the MANPHONE and WEB SITE
fields in the MANUFACTURERS table.
Figure 7.23 Example of a table containing reference fields

ptg14955309
224 Chapter 7 Establishing Table Structures
Duplicate fields that serve to indicate multiple occurrences of the same
type of value are unnecessary as well. For example, take a look at the
version of the STUDENTS table presented in Figure 7.24.
Students
Instrument 1 Instrument 2 Instrument 3
These duplicate fields represent three
occurrences of the same type of value.
StdFirst Name StdLast Name StdStreet Address << other fields >>
Guitar Tenor SaxScott Baker 2904 Madison Ave ......
Tenor Sax Clarinet Electric PianoMichael Chow 7410 Taxco Drive ......
Drum Set Bass GuitarDebbie McGuire 332 158th Ave SE ......
Guitar Electric Piano Snare DrumAngie Thomson 970 Pine Blvd ......
Figure 7.24 A simple example of a table containing unnecessary duplicate fields
INSTRUMENT 1, INSTRUMENT 2, and INSTRUMENT 3 are duplicate fields that
represent multiple occurrences of the same type of value. Their pur-
pose in the table is to enable the music department to keep track of the
instruments checked out by a given student. Aside from the difficulties
these fields pose in retrieving information about a particular instru-
ment, the fields also limit the number of instruments a student can
check out. What happens if several students want to check out more
than three instruments?
Does this type of field structure look strangely familiar? It should!
It’s similar to the one back in Figure 7.18. As you’ve probably already
guessed, it’s nothing more than a flattened multivalued field. Mind
you, the person who created this table probably didn’t have a multival-
ued field in mind (and neither do most folks who create fields such as
these), but that is what it truly is.
You already know how to deal with these unnecessary duplicate fields
because you know how to resolve multivalued fields. You can easily fix

ptg14955309
Refining the Table Structures 225
the STUDENTS table by first visualizing the INSTRUMENT 1, INSTRUMENT 2,
and INSTRUMENT 3 fields as a singular multivalued field, and then
resolving it as you would any multivalued field. Figure 7.25 illustrates
this process. The shaded version of the STUDENTS table shows how
you visualize the instrument fields as a singular multivalued field. You
then resolve the multivalued field by applying the three-step process
you learned earlier, which yields the revised STUDENTS table and
the new STUDENT INSTRUMENTS table. When you’re finished, you’ll
be able to enter any number of instruments for a particular student.
It will then be quite easy for you to retrieve information such as the
names of the students who have checked out a guitar, a list of the
instruments that are currently checked out by a particular student,
and the number of students who have checked out an electric piano.
Student Instruments
Instrument
Guitar
Tenor Sax
Clarinet
Electric Piano
Tenor Sax
Drum Set
Bass Guitar
StudLast Name
Baker
Chow
McGuire
Baker
Chow
Chow
McGuire
StudFirst Name
Scott
Michael
Debbie
Scott
Michael
Michael
Debbie
Students
StdFirst Name
Scott
Michael
Debbie
Angie
StdLast Name
Baker
Chow
McGuire
Thomson
StdStreet Address
2904 Madison Ave
7410 Taxco Drive
332 158th Ave SE
970 Pine Blvd
<< other fields >>
......
......
......
......
Students
StdFirst Name StdLast Name StdStreet Address << other fields >> Instruments
Scott Baker 2904 Madison Ave ...... Guitar, Tenor Sax
Michael Chow 7410 Taxco Drive ...... Tenor Sax, Clarinet, Electric Piano
Debbie McGuire 332 158th Ave SE ...... Drum Set, Bass Guitar
Angie Thomson 970 Pine Blvd ...... Guitar, Electric Piano, Snare Drum
Figure 7.25 Resolving a simple set of unnecessary duplicate fields

ptg14955309
226 Chapter 7 Establishing Table Structures
In some instances, a table can contain two or more sets of duplicate
fields that represent multiple occurrences of the same type of value.
Figure 7.26 shows a slightly different version of the STUDENTS table
shown in Figure 7.24; this version contains two sets of duplicate fields.
You may be thinking at this very moment, “Why is he saying there
are two sets of duplicate fields when I clearly see three? ” Contrary to
what you may think, INSTRUMENT 1/CHECKOUT DATE 1, for example, does
not constitute a set of duplicate fields. Quite the opposite—INSTRUMENT
1/INSTRUMENT 2/INSTRUMENT 3 constitute the first set of duplicate fields,
and CHECKOUT DATE 1/CHECKOUT DATE 2/CHECKOUT DATE 3 constitute the
second set of duplicate fields.
You’ve probably realized that these two sets of duplicate fields are
actually two flattened multivalued fields and that you can resolve them
in the same manner as in the previous example. The only other issue
that you must be concerned with is the distinct one-to-one association
between an instrument and a checkout date. This won’t be a problem,
however, because you’ve dealt with this type of scenario before. If you
visualize one multivalued field called INSTRUMENTS and another called
CHECKOUT DATE, you’ll see that the overall table structure is quite simi-
lar to the one in Figure 7.21. (In that figure, there’s a one-to-one asso-
ciation between the CATEGORIES TAUGHT and MAXIMUM LEVEL TAUGHT fields.)
Figure 7.27 illustrates how you can fix this table. As before, the
shaded version of the STUDENTS table shows how you visualize the
Students
StdFirst Name
Scott
Michael
Debbie
Angie
StdLast Name
Baker
Chow
McGuire
Thomson
<< other fields >>
......
......
......
......
Instrument 1
Guitar
Tenor Sax
Drum Set
Guitar
Instrument 2
Tenor Sax
Clarinet
Bass Guitar
Electric Piano
Instrument 3
Electric Piano
Snare Drum
Checkout Date 1
09/26/01
09/26/01
11/14/01
11/14/01
Checkout Date 2
09/28/01
10/03/01
11/20/01
11/14/01
Checkout Date 3
10/16/12
12/05/12
Figure 7.26 Example of a table with multiple sets of duplicate fields

ptg14955309
Refining the Table Structures 227
instrument and checkout date fields as singular multivalued fields.
You then resolve the multivalued fields by applying the three-step pro-
cess you learned earlier, yielding the revised STUDENTS table and the
new STUDENT INSTRUMENTS table.
Now that you’re familiar with the Elements of the Ideal Table, review
your table structures and refine them as necessary. When you’re in
doubt about a particular table, sketch its structure on a piece of paper
and load it with sample data. You’ll then be able to resolve the anoma-
lies revealed by the data.
Students
StdFirst Name
Scott
Michael
Debbie
Angie
StdLast Name
Baker
Chow
McGuire
Thomson
StdStreet Address
2904 Madison Ave
7410 Taxco Drive
332 158th Ave SE
970 Pine Blvd
<< other fields >>
......
......
......
......
Students
StdFirst Name StdLast Name << other fields >> Checkout DatesInstruments
Scott Baker ...... 09/26/12, 09/28/12Guitar, Tenor Sax
Michael Chow ...... 09/28/12, 10/03/12, 10/16/12Tenor Sax, Clarinet, Electric Piano
Debbie McGuire ...... 11/14/12, 11/20/12Drum Set, Bass Guitar
Angie Thomson ...... 11/14/12, 11/14/12, 12/05/12Guitar, Electric Piano, Snare Durm
Student Instruments
Instrument
Guitar
Tenor Sax
Clarinet
Electric Piano
Tenor Sax
Drum Set
Bass Guitar
StudLast Name
Baker
Chow
McGuire
Baker
Chow
Chow
McGuire
StudFirst Name
Scott
Michael
Debbie
Scott
Michael
Michael
Debbie
Checkout Date
09/26/12
10/03/12
09/28/12
09/28/12
10/16/12
11/14/12
11/20/12
Figure 7.27 Resolving the multiple sets of duplicate fields in the STUDENTS table

ptg14955309
228 Chapter 7 Establishing Table Structures
Establishing Subset Tables
As you refine the structures of your tables, you may find that some
of the fields in a particular table do not always contain values. This
situation will not affect your ability to retrieve information from the
table, but it can indicate that the table might need further refinement.
Consider the structure of the INVENTORY table in Figure 7.28.
Table Structures
Inventory
Item Name Model
Item Description Warranty Expiration Date
Current Value Publisher
Insured Value Author
Date Entered ISBN
Manufacturer Category
Figure 7.28 Structure of an office inventory table
In this scenario, the table contains data about various items in a
person’s office, such as office furniture, office equipment (computers,
printers, and so forth), and books. It’s inevitable that the values of
several fields in many of the records will be blank. For example, a book
will not have a MANUFACTURER, MODEL, or WARRANTY EXPIRATION DATE, and
a printer will not have an AUTHOR, PUBLISHER, ISBN, or CATEGORY. This
doesn’t pose a problem from a physical viewpoint (limited hard-disk
space certainly isn’t the critical issue it was in years past), but it can
pose a perceptual problem. Users (and management, for that matter)
get fairly nervous when they see a lot of blank values in a table. Is the
data missing? Did someone forget to make entries into these fields?

ptg14955309
Refining the Table Structures 229
Has someone mistakenly deleted the data? Did the computer acciden-
tally destroy the original values? (Yes, the urban myth, “The computer
did it!” still lives on.) The more important question is this: If you were
adhering to the Elements of the Ideal Table as you were creating this
table, how did you arrive at this particular structure?
Fortunately, this is just another type of structural anomaly that occa-
sionally occurs as you design various tables. Your task now is to learn
how to deal with it in an appropriate manner.
The first step is to determine whether the INVENTORY table truly
complies with the first element of an ideal table (i.e., “It represents a
single subject”). A table that contains a large number of blank values
in its fields usually—but not always—represents more than one sub-
ject. Think about the two sets of fields in question for a moment, and
you’ll soon realize that they represent characteristics of two distinct
aspects of the table’s subject. The first set of fields describes equipment
inventory, and the second set of fields describes books inventory; fur-
thermore, both types of inventory share common characteristics, such
as ITEM NAME, ITEM DESCRIPTION, and CURRENT VALUE. In essence, “Equip-
ment” and “Books” are subjects that are dependent upon the INVEN-
TORY table for their very existence; neither describes a completely
distinct object or event. As a result, they are subordinate subjects, and
you’ll create a subset table for each of them.
Just as a data table represents a distinct subject, a subset table rep-
resents a subordinate subject of a particular data table. The subset
table contains fields that are germane to the subordinate subject it
represents, and it also includes a field (or fields) from the data table
that serves to relate the data table to the subset table. It’s important
to note that a subset table does not contain fields that represent char-
acteristics common to both it and the data table; these fields must
remain in the data table.

ptg14955309
230 Chapter 7 Establishing Table Structures
Now that you’ve determined that the INVENTORY table describes three
subjects (it doesn’t matter that two of them are subordinate subjects),
you must bring it into compliance with the first element of an ideal
table by removing the fields in question. You then use the fields as the
basis for two new subset tables, one for each subordinate subject. Here
are the steps you follow to accomplish these tasks.
1. Use the MANUFACTURER, MODEL, and WARRANTY EXPIRATION DATE
fields to create a new subset table called EQUIPMENT.
2. Use the PUBLISHER, AUTHOR, ISBN, and CATEGORY fields to create a
new subset table called BOOKS.
3. Add ITEM NAME to both tables; this field will relate each subset
table to the data table.
4. Compose a suitable description for both subset tables and
add them to the Final Table List. Indicate each table’s type as
“Subset.”
Figure 7.29 shows the new subset table structures.
Table Structures
Manufacturer
Model
Warranty Expiration Date
Item Name
Equipment
Publisher
Author
ISBN
Category
Item Name
BooksInventory
Item Name
Item Description
Current Value
Insured Value
Date Entered
Figure 7.29 The new subset table structures

ptg14955309
Refining the Table Structures 231
Take a moment to review your table structures once more. You may
discover that you’ve created subset tables without knowing it. Tables
that have almost identical structures are commonly subset tables;
there are usually only a few unique fields that distinguish one table
from the other. For example, consider the two partial table structures
in Figure 7.30. Each table represents a distinct aspect of the same
subject.
Table StructuresTable Structures
FTELast Name
FTEDate Hired
Salary Amount
Position
FTEFirst Name
Full-Time Employees
FTEStreet Address
FTECity
FTEState
PTELast Name
PTEDate Hired
Hourly Rate
PTEFirst Name
Part-Time Employees
Skill Level
PTEStreet Address
PTECity
PTEState
Figure 7.30 Previously unidentified subset tables
Both of these tables represent employees, but each represents a specific
type of employee. Notice, however, that there are generic fields common
to both tables: first name, last name, date hired, street address, city,
and state. These fields are duplicated unnecessarily, so you’ll need to
refine the table structures to resolve this problem.
Refining Previously Unidentified Subset Tables
When you identify subset tables such as these, you can refine them
using these steps.

ptg14955309
232 Chapter 7 Establishing Table Structures
1. Remove all the fields that the subset tables have in common and
use them as the basis for a new data table.
2. Identify what subject the new data table represents, and then
give the table an appropriate name.
3. Make sure that the subset tables represent subordinate sub-
jects of the data table and modify the subset table names as
necessary.
4. Compose a suitable description for the data table and then add
it to the Final Table List. Indicate the table type as “Data.”
Figure 7.31 shows the results of using these steps on the FULL-TIME
EMPLOYEES and PART-TIME EMPLOYEES tables.
Table Structures
EmpLast Name
Date Hired
EmpFirst Name
Employees
EmpStreet Address
EmpCity
EmpState
EmpLast Name
Salary Amount
Position
EmpFirst Name
Full-Time Employees
EmpLast Name
Hourly Rate
EmpFirst Name
Part-Time Employees
Skill Level
Figure 7.31 The results of refining the subset tables
At this point, all of your table structures should be in pretty good
shape. You will need to refine them even further, however, as you learn
about primary keys, foreign keys, relationships, and business rules.

ptg14955309
Refining the Table Structures 233
CASE STUDY
You’re now going to define the Preliminary Table List for Mike’s Bikes.
As you know, the first thing you need to do is review the Preliminary
Field List to determine what subjects you can infer from the fields on
the list. Figure 7.32 shows a partial sample of that list.
Preliminary Field List
as of 02/16/12
Office PhoneBirth Date
Unit PriceEmployee City
CategoryEmployee Address
Product NameEmployee Name
Invoice NumberCustomer Name
Invoice DateCustomer Address
Figure 7.32 The Preliminary Field List for Mike’s Bikes
After carefully reviewing the entire Preliminary Field List, you deter-
mine that the fields on the list suggest these subjects: customers,
employees, invoices, products, and vendors. You then compile these
items into the first version of your Preliminary Table List.
Now you create a second version of the list by merging the current
Preliminary Table List with the list of subjects you created during the
analysis process. Keep the following steps in mind as you merge the
two lists together.
1. Resolve items that are duplicated on both lists. Remember that a
single item can appear on both lists yet represent different sub-
jects. When you identify such items, use the appropriate tech-
niques to resolve this problem.

ptg14955309
234 Chapter 7 Establishing Table Structures
2. Resolve items that represent the same subject but have different
names. You want to ensure that only one table represents a par-
ticular subject.
3. Combine the remaining items together into one list. The combined
list becomes the second version of the Preliminary Table List.
After following these steps, your Preliminary Table List should look
similar to the one shown in Figure 7.33.
Preliminary Table ListList of Subjects
Customers
Products
Sales
Suppliers
Employees
Customers
Products
Employees
Invoices
Vendors
Figure 7.33 The second version of the Preliminary Table List
You cross out “Customers,” “Employees,” and “Products” on the list of
subjects because they represent the same subjects as their counter-
parts on the Preliminary Table List. The SALES table has no coun-
terpart on the Preliminary Table List, but it does represent the same
subject as “Invoices.” “Invoices” is most meaningful to Mike and his
staff, however, so you use it on the Preliminary Table List instead of
“Sales.” A similar situation exists between “Suppliers” and “Vendors”;
Mike selects “Vendors” as the name to appear on the Preliminary Table
List, so you cross out “Suppliers.”
❖Note Selecting a name that best represents the subject of
the table is an arbitrary task. A good rule to follow is to use the
name that is most meaningful to everyone in the organization.

ptg14955309
Refining the Table Structures 235
Now you’ll work toward the final version of the Preliminary Table List.
Use the mission objectives you created at the beginning of the data-
base design process to determine whether there are subjects you may
have overlooked during the previous two procedures. Identify each
subject represented in the mission objectives using the Subject-Identifi-
cation Technique. Once you’ve identified as many subjects as possible,
you can use the steps from the second procedure to cross-check these
subjects against the subjects currently listed on the Preliminary Table
List. When you’ve completed the review and have resolved any dupli-
cate items, your final version of the Preliminary Table List is complete.
As it turns out, all of the subjects you’ve identified from the mission
objectives for Mike’s Bikes already appear on the Preliminary Table
List. This is good news because it allows you to complete your cross-
check quite easily. Satisfied that you’ve completed the task thoroughly,
you now have the final version of the Preliminary Table List.
Now that the Preliminary Table List is complete, you’re ready to trans-
form it into a Final Table List. Keep these steps in mind as you begin
this process.
1. Refine the table names. Use the appropriate guidelines to ensure
that each table name is clear, unambiguous, descriptive, and
meaningful.
2. Compose a suitable description for each table. Make certain that
the table description explicitly defines the table and states its
importance to the organization. Use the pertinent guidelines to
create each table description.
3. Indicate the table’s type. Remember that a table can be classified
in one of four ways—data, linking, subset, or validation. At this
point, all of your tables are data tables.
Figure 7.34 shows a partial example of the Final Table List for Mike’s
Bikes.

ptg14955309
236 Chapter 7 Establishing Table Structures
The next order of business is to associate fields from the Preliminary
Field List with each table in the Final Table List. Make certain you
select the fields that best represent characteristics of each table’s
subject; each field should define or describe a particular aspect of the
subject. Figure 7.35 shows a partial example of the table structures for
Mike’s Bikes.
Now you refine the fields. Remember to follow these steps as you work
with each field.
1. Improve the field name. Use the appropriate guidelines to ensure
that each field name is as clear, unambiguous, and descriptive
as possible.
2. Determine whether the field complies with the Elements of the
Ideal Field. Make certain you check for multipart and multival-
ued fields. As you learned earlier, they can cause a number of
problems within a table.
Final Table List
Employees
Customers
Name
Data
Data
Type
The people who purchase the products we
have to offer. Keeping track of our customers
allows us to promote our business and obtain
valuable feedback in assessing the quality of
our customer service.
Description
The people who work for our company in various
capacities. This information is important for tax
purposes, health benefits, and work-related
issues.
Figure 7.34 A partial listing of the Final Table List for Mike’s Bikes

ptg14955309
Refining the Table Structures 237
As you review the fields, you decide to abbreviate some of the field
names in the CUSTOMERS, EMPLOYEES, and INVOICES tables,
shortening CUSTOMER to CUST and EMPLOYEE to EMP. You also
decide that the field name QUANTITY (in the PRODUCTS table) does not
completely describe the characteristic it represents, so you change it to
QUANTITY ON HAND. The phone fields in the CUSTOMERS and EMPLOY-
EES tables suffer the same problem, so you change them to CUSTHOME
PHONE and EMPHOME PHONE, respectively. Furthermore, you change
SSN to SOCIAL SECURITY NUMBER so that the field name is absolutely
unambiguous.
Further investigation of the fields reveals that almost all of them
comply with the Elements of the Ideal Field. The only exceptions are
the address fields in the CUSTOMERS and EMPLOYEES tables, and
the EMPLOYEE NAME fields in the EMPLOYEES and INVOICES tables.
After ascertaining that you can decompose each address field into
four individual items—street address, city, state, and zip code—you
transform these items into fields and add them to the CUSTOMERS
and EMPLOYEES tables. Similarly, you notice that the EMPLOYEE NAME
Table Structures
EmployeesCustomers Invoices Products
Employee NameCustomer First Name Invoice Number Product Name
Date HiredStatus Customer First Name Retail Price
Employee AddressCustomer Last Name Invoice Date Product Description
Employee PhoneCustomer Phone Employee Name Category
SSNCustomer Address Customer Last Name Wholesale Price
Position Customer Phone Quantity
Figure 7.35 A partial listing of the table structures for Mike’s Bikes

ptg14955309
238 Chapter 7 Establishing Table Structures
field represents two items—first name and last name—and you make
the appropriate adjustments to that field in the EMPLOYEES and
INVOICES tables.
Figure 7.36 shows the result of all the changes you’ve made to the
fields.
Table Structures
ProductsCustomers Employees Invoices
Product NameCustFirst Name EmpFirst Name Invoice Number
Product DescriptionCustLast Name EmpLast Name Invoice Date
CategoryCustHome Phone EmpHome Phone EmpFirst Name
Wholesale PriceCustStreet Address Social Security Number EmpLast Name
Retail PriceCustCity EmpStreet Address CustFirst Name
Quantity On HandCustState EmpCity CustLast Name
CustZipcode EmpState CustHome Phone
Figure 7.36 Refinements to the fields in the table structures
Your final task is to refine the table structures. Make certain that you
have assigned the appropriate fields to each table and that you have
properly defined each table. Remember to follow these steps as you
work with each table.
1. Resolve unnecessary duplicate fields. When you create new
tables as a result of resolving duplicate fields, make sure you
properly identify them and add them to the Final Table List.
2. Determine whether each table complies with the Elements of the
Ideal Table. Make certain you resolve all the anomalies you
identify in the fields or within the table structure as a whole.

ptg14955309
Refining the Table Structures 239
3. Establish subset tables as appropriate. Make certain you prop-
erly identify these tables and add them to the Final Table List
as well.
As you complete your review of the tables, you determine that all of them
conform to the Elements of the Ideal Table with the exception of the
INVOICES table. The only problem with this table is that it contains an
unnecessary duplicate field: CUSTHOME PHONE. You can remove this field
from the table, however, because it provides only reference information.
As you work with the PRODUCTS table, you notice that there are fields
you might be able to remove and then use as the basis for a subset
table. So you review the table once again. Figure 7.37 shows the PROD-
UCTS table structure you’re currently examining. (This is an expanded
version of the table structure shown in Figure 7.36.)
Table Structures
Products
Product Name Service Name
Quantity On Hand Service Charge
Product Description Service Description
Wholesale Price Service Type
Retail Price Materials Charge
Category Service Category
Figure 7.37 The PRODUCTS table structure (expanded version)
Your assumption proves correct. You determine that certain fields
describe a service, and you can construe a service as being a different
type of product. A service is similar to a product in that it has a name,
description, and category, but it is different inasmuch as it has a type,

ptg14955309
240 Chapter 7 Establishing Table Structures
materials charge, service charge, and service date. With this in mind,
you create a new subset table called SERVICES, make the appropriate
modifications to the PRODUCTS table, and use the PRODUCT NAME field
to relate the two tables to each other. You then add the suitable listing
for the SERVICES table to the Final Table List. Figure 7.38 shows the
revised PRODUCTS table and the new SERVICES subset table.
Table Structures
ServicesProducts
Product NameProduct Name
Retail Price
Service TypeProduct Description
Materials ChargeCategory
Service ChargeWholesale Price
Quantity On Hand
Figure 7.38 The new PRODUCTS and SERVICES tables
Summary
We opened the chapter with a discussion of the Preliminary Table List.
This list constitutes the initial table structures for the new database.
You learned how to develop this list using the Preliminary Field List,
the list of subjects, and the mission objectives, all of which you com-
piled during the analysis phase of the database design process.
Next we discussed the procedure for transforming the Preliminary
Table List into a Final Table List, which contains the name, type, and
description of each table in the database. You learned a set of guide-
lines for creating table names, and another set of guidelines for com-
posing table descriptions. We then worked on creating table names

ptg14955309
Summary 241
that are unambiguous, descriptive, and meaningful and descriptions
that explicitly define tables, as well as stating their importance to the
organization. You also learned that enlisting the help of users and
management is crucial to the process of developing well-defined table
descriptions. Table descriptions must be suitable and easily under-
stood by everyone in the organization.
We then discussed the process of associating fields with each table on
the Final Table List. Here you learned how to build a structure for a
given table using fields from the Preliminary Field List that best repre-
sent characteristics of the table’s subject.
Refining fields was the next subject of discussion, and you learned a
set of guidelines for creating field names that will help you ensure that
they are clear, descriptive, and meaningful. You also learned about the
Elements of the Ideal Field. Now you know that you can resolve anom-
alies in a field by determining whether it complies with these elements.
We then discussed how to resolve multipart and multivalued fields. You
learned that decomposing multipart fields yields new fields, whereas
decomposing multivalued fields yields new tables.
The chapter closed with a discussion of refining table structures. You
learned to identify the Elements of the Ideal Table, and you now know
that you can ferret out a problem in table structure by determining
whether a table complies with these elements. We then discussed
unnecessary duplicate fields, and you now know that they appear in a
table for one of two reasons: to supply reference information or to repre-
sent different occurrences of the same type of value. You then learned
how to resolve duplicate fields to eliminate the problems they present.
The final discussion centered on the topic of subset tables. As you now
know, a subset table represents a subordinate subject of a particular
data table, and there is a distinct relationship between the subset table
and the data table. You also know that you can explicitly create sub-
set tables. You then learned that you may have unknowingly created

ptg14955309
242 Chapter 7 Establishing Table Structures
subset tables earlier in the database design process and that you need
to look for subset tables you have not previously identified. When you
identify a subset table, you refine it and add it to the Final Table List.
Review Questions
1. How do you identify and establish tables for a new database?
2. Why do you use the Preliminary Field List to help you define tables
for the database?
3. What action do you take when an item on the list of subjects and
a differently named item on the Preliminary Table List both repre-
sent the same subject?
4. What information does the Final Table List provide?
5. State three guidelines for creating table names.
6. State two guidelines for composing table descriptions.
7. How do you assign fields to a table on the Final Table List?
8. State three guidelines for creating field names.
9. What two problems can poorly designed fields cause?
10. What can you use to resolve field anomalies?
11. State three of the Elements of the Ideal Field.
12. Under what condition is redundant data acceptable?
13. In general terms, what three steps do you follow to resolve a multi-
valued field?
14. When is it necessary to use a duplicate field in a table?
15. How can you refine table structures?
16. State three of the Elements of the Ideal Table.
17. What is a subset table?

ptg14955309
243
8
Keys
A fact in itself is nothing. It is valuable only for the idea
attached to it, or for the proof which it furnishes.
—CLAUDE BERNARD
Topics Covered in This Chapter
Why Keys Are Important
Establishing Keys for Each Table
Table-Level Integrity
Reviewing the Initial Table Structures
Case Study
Summary
Review Questions
By now you’ve identified all the subjects that the database will track
and defined the table structures that will represent those subjects.
Furthermore, you’ve put the structures through a screening process
to control their makeup and quality. In this next stage of the data-
base design process, you’ll begin the task of assigning keys to each
table. You’ll soon learn that there are different types of keys, and each
plays a particular role within the database structure. All but one key
is assigned during this stage; you’ll assign the remaining key later
(in Chapter 10, “Table Relationships”) as you establish relationships
between tables.

ptg14955309
244 Chapter 8 Keys
Why Keys Are Important
Keys are crucial to a table structure for the following reasons.
•They ensure that each record in a table is precisely identified.
As you already know, a table represents a singular collection
of similar objects or events. (For example, a CLASSES table
represents a collection of classes, not just a single class.) The
complete set of records within the table constitutes the collec-
tion, and each record represents a unique instance of the table’s
subject within that collection. You must have some means of
accurately identifying each instance, and a key is the device that
allows you to do so.
•They help establish and enforce various types of integrity. Keys are
a major component of table-level integrity and relationship-level
integrity. For instance, they enable you to ensure that a table has
unique records and that the fields you use to establish a relation-
ship between a pair of tables always contain matching values.
•They serve to establish table relationships. As you’ll learn in
Chapter 10, you’ll use keys to establish a relationship between a
pair of tables.
Always make certain that you define the appropriate keys for each
table. Doing so will help you guarantee that the table structures are
sound, that redundant data within each table is minimal, and that the
relationships between tables are solid.
Establishing Keys for Each Table
Your next task is to establish keys for each table in the database.
There are four main types of keys: candidate, primary, foreign, and non-
keys. A key’s type determines its function within the table.

ptg14955309
Establishing Keys for Each Table 245
Candidate Keys
The first type of key you establish for a table is the candidate key,
which is a field or set of fields that uniquely identifies a single instance
of the table’s subject. Each table must have at least one candidate key.
You’ll eventually examine the table’s pool of available candidate keys
and designate one of them as the official primary key for the table.
Before you can designate a field as a candidate key, you must make cer-
tain it complies with all of the Elements of a Candidate Key. These ele-
ments constitute a set of guidelines you can use to determine whether
the field is fit to serve as a candidate key. You cannot designate a field
as a candidate key if it fails to conform to any of these elements.
Elements of a Candidate Key
•It cannot be a multipart field. You’ve seen the problems with
multipart fields, so you know that using one as an identifier is
a bad idea.
•It must contain unique values. This element helps you guard
against duplicating a given record within the table. Duplicate
records are just as bad as duplicate fields, and you must avoid
them at all costs.
•It cannot contain null values. As you already know, a null value
represents the absence of a value. There’s absolutely no way a
candidate key field can identify a given record if its value is null.
•Its value cannot cause a breach of the organization’s security or
privacy rules. Values such as passwords and Social Security
numbers are not suitable for use as a candidate key.
•Its value is not optional in whole or in part. A value that is optional
implies that it may be null at some point. You can infer, then,
that an optional value automatically violates the previous ele-
ment and is, therefore, unacceptable. (This caveat is especially

ptg14955309
246 Chapter 8 Keys
applicable when you want to use two or more fields as a candi-
date key.)
•It comprises a minimum number of fields necessary to define
uniqueness. You can use a combination of fields (treated as a
single unit) to serve as a candidate key, so long as each field
contributes to defining a unique value. Try to use as few fields
as possible, however, because overly complex candidate keys
can ultimately prove to be difficult to work with and difficult to
understand.
•Its values must uniquely and exclusively identify each record in
the table. This element helps you guard against duplicate records
and ensures that you can accurately reference any of the table’s
records from other tables in the database.
•Its value must exclusively identify the value of each field within a
given record. This element ensures that the table’s candidate keys
provide the only means of identifying each field value within the
record. (You’ll learn more about this particular element in the
section on primary keys.)
•Its value can be modified only in rare or extreme cases. You should
never change the value of a candidate key unless you have an
absolute and compelling reason to do so. A field is likely to have
difficulty conforming to the previous elements if you can change
its value arbitrarily.
Establishing a candidate key for a table is quite simple: Look for a field
or set of fields that conforms to all of the Elements of a Candidate Key.
You’ll probably be able to define more than one candidate key for a
given table. Loading a table with sample data will give you the means
to identify potential candidate keys accurately. (You used this same
technique in the previous chapter.)
See if you can identify any candidate keys for the table in Figure 8.1.

ptg14955309
Establishing Keys for Each Table 247
You probably identified EMPLOYEE ID, SOCIAL SECURITY NUMBER, EMPLAST
NAME, EMPFIRST NAME and EMPLAST NAME, EMPZIPCODE, and EMPHOME PHONE
as potential candidate keys. But you’ll need to examine these fields more
closely to determine which ones are truly eligible to become candidate
keys. Remember that you must automatically disregard any field(s) fail-
ing to conform to even one of the Elements of a Candidate Key.
Upon close examination, you can draw the following conclusions.
•EMPLOYEE ID is eligible. This field conforms to every element of a
candidate key.
•SOCIAL SECURITY NUMBER is ineligible because it could contain null
values and will most likely compromise the organization’s privacy
rules. Contrary to what the sample data shows, this field could
contain a null value. For example, there are many people working
in the United States who do not have Social Security numbers
because they are citizens of other countries.
❖Note Despite its wides pread use in many types of databases, I
strongly recommend that you refrain from using SOCIAL SECURITY
NUMBER as a candidate key (or as a primary key, for that matter)
Employees
EmpFirst Name
Kira
Timothy
Shannon
Estela
Susan
Katherine
Timothy
Social Security Number
987-65-9938
987-65-0039
987-65-1299
987-65-5583
987-65-6529
987-65-6531
987-65-1734
EmpLast Name
Bently
Ennis
Black
Rosales
Black
Erlich
Sherman
EmpStreet Address
1204 Bryant Road
7402 Kingman Drive
4141 Lake City Way
101 C Street, Apt. 32
2100 Mineola Avenue
101 C Street, Apt. 32
66 NE 120th
EmpCity
Seattle
Redmond
Seattle
Bellevue
Seattle
Bellevue
Bothell
EmpState
WA
WA
WA
WA
WA
WA
WA
EmpZipcode
98157
98115
98136
98046
98115
98046
98216
EmpHome Phone
363-9948
527-4992
336-5992
322-6992
572-9948
322-6992
522-3232
Employee ID
1000
1002
1003
1005
1004
1001
1006
Figure 8.1 Are there any candidate keys in this table?
continues

ptg14955309
248 Chapter 8 Keys
in any of your database structures. In many instances, it doesn’t
conform to the Elements of a Candidate Key.
The Philadelphia Region section of the Social Security Online web
site provides some very interesting facts about Social Security
numbers and identify theft, which is yet another good reason why
you should avoid using SSNs as candidate/primary keys. You can
access their site here: www.ssa.gov/phila/ProtectingSSNs.htm.
•EMPLAST NAME is ineligible because it can contain duplicate values.
As you’ve learned, the values of a candidate key must be unique.
In this case there can be more than one occurrence of a particu-
lar last name.
•EMPFIRST NAME and EMPLAST NAME are eligible. The combined values
of both fields will supply a unique identifier for a given record.
Although multiple occurrences of a particular first name or last
name will occur, the combination of a given first name and last
name will always be unique. (Some of you are probably saying,
“This is not necessarily always true.” You’re absolutely right.
Don’t worry; we’ll address this issue shortly.)
•EMPZIPCODE is ineligible because it can contain duplicate values.
Many people live in the same zip code area, so the values in
EMPZIPCODE cannot possibly be unique.
•EMPHOME PHONE is ineligible because it can contain duplicate values
and is subject to change. This field will contain duplicate values
for either of these two reasons.
1. One or more family members work for the organization.
2. One or more people share a residence that contains a single
phone line.

ptg14955309
Establishing Keys for Each Table 249
You can confidently state that the EMPLOYEES table has two can-
didate keys: EMPLOYEE ID and the combination of EMPFIRST NAME and
EMPLAST NAME.
Mark candidate keys in your table structures by writing the letters
“CK” next to the name of each field you designate as a candidate key. A
candidate key composed of two or more fields is known as a composite
candidate key, and you’ll write “CCK” next to the names of the fields
that make up the key. When you have two or more composite candidate
keys, use a number within the mark to distinguish one from another.
If you had two composite candidate keys, for example, you would mark
one as “CCK1” and the other as “CCK2.”
Apply this technique to the candidate keys for the EMPLOYEES table
in Figure 8.1. Figure 8.2 shows how your structure should look when
you’ve completed this task.
Table Structures
Employees
EmpLast Name CCK
EmpStreet Address
EmpCity
EmpZipcode
EmpHome Phone
Employee ID CK
EmpState
EmpFirst Name CCK
Social Security Number
Figure 8.2 Marking candidate keys in the EMPLOYEES table structure

ptg14955309
250 Chapter 8 Keys
Now try to identify as many candidate keys as you can for the PARTS
table in Figure 8.3.
At first glance, you may believe that PART NAME, MODEL NUMBER, the
combination of PART NAME and MODEL NUMBER, and the combination of
MANUFACTURER NAME and PART NAME are potential candidate keys. After
investigating this theory, however, you come up with the following
results.
•PART NAME is ineligible because it can contain duplicate values. A
given part name will be duplicated when the part is manufac-
tured in several models. For example, this is the case with Faust
Brake Levers.
•MODEL NUMBER is ineligible because it can contain null values. A
candidate key value must exist for each record in the table. As
you can see, some parts do not have a model number.
•PART NAME and MODEL NUMBER are ineligible because either field can
contain null values. The simple fact that MODEL NUMBER can con-
tain null values instantly disqualifies this combination of fields.
•MANUFACTURER NAME and PART NAME are ineligible because the values
for these fields seem to be optional. Recall that a candidate key
Parts
Part Name
Shimka XT Cranks
Faust Brake Levers
MiniMite Pump
Hobo Fanny Pack
Diablo Bike Pedals
Shimka Truing Stand
Faust Brake Levers
Model Number
XT-113
BL / 45
Mtn-A26
SP-100
BL / 60
Manufacturer Name
Shimka Incorporated
Faust USA
MiniMite
Hobo Bike Company
Diablo Sports
Faust USA
Retail Price
199.95
53.79
35.00
59.00
129.50
37.95
79.95
Figure 8.3 Can you identify any candidate keys in the PARTS table?

ptg14955309
Establishing Keys for Each Table 251
value cannot be optional in whole or in part. In this instance,
you can infer that entering the manufacturer name is optional
when it appears as a component of the part name; therefore, you
cannot designate this combination of fields as a candidate key.
It’s evident that you don’t have a single field or set of fields that quali-
fies as a candidate key for the PARTS table. This is a problem because
each table must have at least one candidate key. Fortunately, there is a
solution.
Artificial Candidate Keys
When you determine that a table does not contain a candidate key,
you can create and use an artificial (or surrogate) candidate key. (It’s
artificial in the sense that it didn’t occur “naturally” in the table; you
have to manufacture it.) You establish an artificial candidate key by
creating a new field that conforms to all of the Elements of a Candi-
date Key and then adding it to the table; this field becomes the official
candidate key.
You can now solve the problem in the PARTS table. Create an artificial
candidate key called PART NUMBER and assign it to the table. (The new
field will automatically conform to the Elements of a Candidate Key
because you’re creating it from scratch.) Figure 8.4 shows the revised
structure of the PARTS table.
When you’ve established an artificial candidate key for a table, mark
the field name with a “CK” in the table structure, just as you did for
the EMPLOYEES table in the previous example.
You may also choose to create an artificial candidate key when it
would be a stronger (and thus, more appropriate) candidate key than
any of the existing candidate keys. Assume you’re working on an
EMPLOYEES table and you determine that the only available candi-
date key is the combination of the EMPFIRST NAME and EMPLAST NAME

ptg14955309
252 Chapter 8 Keys
fields. Although this may be a valid candidate key, using a single-field
candidate key might prove more efficient and may identify the subject
of the table more easily. Let’s say that everyone in the organization
is accustomed to using a unique identification number rather than a
name as a means of identifying an employee. In this instance, you can
choose to create a new field named EMPLOYEE ID and use it as an arti-
ficial candidate key. This is an absolutely acceptable practice—do this
without hesitation or reservation if you believe it’s appropriate.
❖Note I commonly create an ID field (such as EMPLOYEE ID, VEN-
DOR ID, DEPARTMENT ID, CATEGORY ID, and so on) and use it as an
artificial candidate key. It always conforms to the Elements of a
Candidate Key, makes a great primary key (eventually), and, as
you’ll see in Chapter 10, makes the process of establishing table
relationships much easier.
Review the candidate keys you’ve selected and make absolutely certain
that they thoroughly comply with the Elements of a Candidate Key.
Don’t be surprised if you discover that one of them is not a candidate
key after all—incorrectly identifying a field as a candidate key happens
Parts
Part Number
41000
41001
41002
41003
41004
41005
41006
Part Name
Shimka XT Cranks
Faust Brake Levers
MiniMite Pump
Hobo Fanny Pack
Diablo Bike Pedals
Shimka Truing Stand
Faust Brake Levers
Model Number
XT-113
BL / 45
Mtn-A26
SP-100
BL / 60
Manufacturer Name
Shimka Incorporated
Faust USA
MiniMite
Hobo Bike Company
Diablo Sports
Faust USA
Retail Price
199.95
53.79
35.00
59.00
129.50
37.95
79.95
Figure 8.4 The PARTS table with the artificial candidate key PART NUMBER

ptg14955309
Establishing Keys for Each Table 253
occasionally. When this does occur, just remove the “CK” designator
from the field name in the table structure. Deleting a candidate key
won’t pose a problem so long as the table has more than one candidate
key. If you discover, however, that the only candidate key you identi-
fied for the table is not a candidate key, you must establish an artificial
candidate key for the table. After you’ve defined the new candidate key,
remember to mark its name with a “CK” in the table structure.
Primary Keys
By now, you’ve established all the candidate keys that seem appropri-
ate for every table. Your next task is to establish a primary key for each
table, which is the most important key of all.
• A primary key field exclusively identifies the table throughout the
database structure and helps establish relationships with other
tables. (You’ll learn more about this in Chapter 10.)
• A primary key value uniquely identifies a given record within
a table and exclusively represents that record throughout the
entire database. It also helps to guard against duplicate records.
A primary key must conform to the exact same elements as a candi-
date key. This requirement is easy to fulfill because you select a pri-
mary key from a table’s pool of available candidate keys. The process
of selecting a primary key is somewhat similar to that of a presidential
election. Every four years, several people run for the office of President
of the United States. These individuals are known as “candidates”
and they have all of the qualifications required to become president. A
national election is held, and a single individual from the pool of avail-
able presidential candidates is elected to serve as the country’s official
president. Similarly, you identify each qualified candidate key in the
table, run your own election, and select one of them to become the offi-
cial primary key of the table. You’ve already identified the candidates,
so now it’s election time!

ptg14955309
254 Chapter 8 Keys
Assuming that there is no other marginal preference, here are a couple
of guidelines you can use to select an appropriate primary key.
1. If you have a simple (single-field) candidate key and a composite
candidate key, choose the simple candidate key. It’s always best
to use a candidate key that contains the least number of fields.
2. Choose a candidate key that incorporates part of the table name
within its own name. For example, a candidate key with a name
such as SALES INVOICE NUMBER is a good choice for the SALES
INVOICES table.
Examine the candidate keys and choose one to serve as the primary
key for the table. The choice is largely arbitrary—you can choose the
one that you believe most accurately identifies the table’s subject or the
one that is the most meaningful to everyone in the organization. For
example, consider the EMPLOYEES table again in Figure 8.5.
Table Structures
Employees
EmpLast Name CCK
EmpStreet Address
EmpCity
EmpZipcode
EmpHome Phone
Employee ID CK
EmpState
EmpFirst Name CCK
Social Security Number
Figure 8.5 Which candidate key should become the primary key of the
EMPLOYEES table?

ptg14955309
Establishing Keys for Each Table 255
Either of the candidate keys you identified within the table could serve
as the primary key. You might decide to choose EMPLOYEE ID if everyone
in the organization is accustomed to using this number as a means of
identifying employees in items such as tax forms and employee bene-
fits programs. The candidate key you ultimately choose becomes the
primary key of the table and is governed by the Elements of a Primary
Key. These elements are exactly the same as those for the candidate
key, and you should enforce them to the letter. For the sake of clarity,
here are the Elements of a Primary Key:
Elements of a Primary Key
• It cannot be a multipart field.
• It must contain unique values.
• It cannot contain null values.
• Its value cannot cause a breach of the organization’s security or
privacy rules.
• Its value is not optional in whole or in part.
• It comprises a minimum number of fields necessary to define
uniqueness.
• Its values must uniquely and exclusively identify each record in
the table.
• Its value must exclusively identify the value of each field within a
given record.
• Its value can be modified only in rare or extreme cases.
Before you finalize your selection of a primary key, it is imperative that
you make absolutely certain that the primary key fully complies with
this particular element:
Its value must exclusively identify the value of each field within a
given record.

ptg14955309
256 Chapter 8 Keys
Each field value in a given record should be unique throughout the
entire database (unless it is participating in establishing a relationship
between a pair of tables) and should have only one exclusive means of
identification—the specific primary key value for that record.
You can determine whether a primary key fully complies with this ele-
ment by following these steps.
1. Load the table with sample data.
2. Select a record for test purposes and note the current primary
key value.
3. Examine the value of the first field (the one immediately after
the primary key) and ask yourself this question:
Does this primary key value exclusively identify the current
value of <fieldname>?
a. If the answer is yes, move to the next field and repeat the
question.
b. If the answer is no, remove the field from the table, move to the
next field, and repeat the question.
4. Continue this procedure until you’ve examined every field value
in the record.
A field value that the primary key does not exclusively identify indi-
cates that the field itself is unnecessary to the table’s structure; there-
fore, you should remove the field and reconfirm that the table complies
with the Elements of the Ideal Table. You can then add the field you
just removed to another table structure, if appropriate, or you can dis-
card it completely because it is truly unnecessary.
Here’s an example of how you might apply this technique to the partial
table structure in Figure 8.6. (Note that INVOICE NUMBER is the primary
key of the table.)

ptg14955309
Establishing Keys for Each Table 257
First, you load the table with sample data. You then select a record for
test purposes—we’ll use the third record for this example—and note
the value of the primary key (13002). Now, pose the following question
for each field value in the record.
Does this primary key value exclusively identify the current
value of . . .
INVOICE DATE? Yes, it does. This invoice number will always
identify the specific date that the invoice was
created.
CUSTFIRST NAME? Yes, it does. This invoice number will always
identify the specific first name of the particular
customer who made this purchase.
CUSTLAST NAME? Yes, it does. This invoice number will always
identify the specific last name of the particular
customer who made this purchase.
EMPFIRST NAME? Yes, it does. This invoice number will always
identify the specific first name of the particular
employee who served the customer for this sale.
Sales Invoices
363-9948
527-4992
336-5992
322-6992
572-9948
322-6992
EmpHome Phone
Rosales
Bently
Bently
Rosales
Black
Erlich
EmpLast Name
Estela
Kira
Kira
Estela
Shannon
Katherine
EmpFirst Name
DeSoto
Aguilar
Cunningham
DeSoto
Aguilar
Mattson
CustLast Name
Frank
Carmen
David
Frank
Carmen
Gregory
CustFirst Name
06/15/02
06/16/02
06/15/02
06/15/02
06/16/02
06/17/02
Invoice Date
13000
13003
13001
13002
13004
13005
Invoice Number
Figure 8.6 Does the primary key exclusively identify the value of each field in
this table?

ptg14955309
258 Chapter 8 Keys
EMPLAST NAME? Yes, it does. This invoice number will always
identify the specific last name of the particular
employee who served the customer for this sale.
EMPHOME PHONE? No, it doesn’t! The invoice number indirectly
identifies the employee’s home phone number
via the employee’s name. In fact, it is the current
value of both EMPFIRST NAME and EMPLAST NAME
that exclusively identifies the value of EMPHOME
PHONE—change the employee’s name and you
must change the phone number as well. You
should now remove EMPHOME PHONE from the
table for two reasons: The primary key does
not exclusively identify its current value and
(as you’ve probably already ascertained) it is an
unnecessary field. As it turns out, you can dis-
card this field completely because it is already
part of the EMPLOYEES table structure.
After you’ve removed the unnecessary fields you identified during this
test, examine the revised table structure and make sure it complies
with the Elements of the Ideal Table.
The primary key should now exclusively identify the values of the
remaining fields in the table. This means that the primary key is truly
sound and you can designate it as the official primary key for the
table. Remove the “CK” next to the field name in the table structure
and replace it with a “PK.” (A primary key composed of two or more
fields is known as a composite primary key, and you mark it with the
letters “CPK.”) Figure 8.7 shows the revised structure of the SALES
INVOICES table with INVOICE NUMBER as its primary key.
As you create a primary key for each table in the database, keep these
two rules in mind:

ptg14955309
Establishing Keys for Each Table 259
Rules for Establishing a Primary Key
1. Each table must have one—and only one—primary key. Because
the primary key must conform to each of the elements that gov-
ern it, only one primary key is necessary for a particular table.
2. Each primary key within the database must be unique—no two
tables should have the same primary key unless one of them is
a subset table. You learned at the beginning of this section that
the primary key exclusively identifies a table throughout the
database structure; therefore, each table must have its own
unique primary key in order to avoid any possible confusion
or ambiguity concerning the table’s identity. A subset table is
excluded from this rule because it represents a more specific
version of a particular data table’s subject—both tables must
share the same primary key.
Later in the database design process, you’ll learn how to use the pri-
mary key to help establish a relationship between a pair of tables.
Table Structures
Sales Invoices
CustLast Name
EmpFirst Name
EmpLast Name
Ship Date
Invoice Date
Shipper Name
CustFirst Name
Invoice Number PK
Figure 8.7 The revised SALES INVOICES table with its new primary key

ptg14955309
260 Chapter 8 Keys
Alternate Keys
Now that you’ve selected a candidate key to serve as the primary key
for a particular table, you’ll designate the remaining candidate keys as
alternate keys. These keys can be useful to you in an RDBMS program
because they provide an alternative means of uniquely identifying a par-
ticular record within the table. If you choose to use an alternate key in
this manner, mark its name with “AK” or “CAK” (composite alternate key)
in the table structure; otherwise, remove its designation as an alternate
key and simply return it to the status of a normal field. You won’t be
concerned with alternate keys for the remainder of the database design
process, but you will work with them once again as you implement the
database in an RDBMS program. (Implementing and using alternate
keys in RDBMS programs is beyond the scope of this work—our only
objective here is to designate them as appropriate. This is in line with the
focus of the book, which is the logical design of a database.)
Figure 8.8 shows the final structure for the EMPLOYEES table with the
proper designation for both the primary key and the alternate keys.
Table Structures
Employees
EmpLast Name CAK
EmpStreet Address
EmpCity
EmpZipcode
EmpHome Phone
Employee ID PK
EmpState
EmpFirst Name CAK
Social Security Number
Figure 8.8 The EMPLOYEES table with designated primary and alternate keys

ptg14955309
Reviewing the Initial Table Structures 261
Non-keys
A non-key is a field that does not serve as a candidate, primary, alter-
nate, or foreign key. Its sole purpose is to represent a characteristic
of the table’s subject, and its value is determined by the primary key.
There is no particular designation for a non-key, so you don’t need to
mark it in the table structure.
Table-Level Integrity
This type of integrity is a major component of overall data integrity,
and it ensures the following.
• There are no duplicate records in a table.
• The primary key exclusively identifies each record in a table.
• Every primary key value is unique.
• Primary key values are not null.
You began establishing table-level integrity when you defined a pri-
mary key for each table and ensured its enforcement by making abso-
lutely certain that each primary key fully complied with the Elements
of a Primary Key. In the next chapter, you’ll enhance the table’s integ-
rity further as you establish field specifications for each field within
the table.
Reviewing the Initial Table Structures
Now that the fundamental table definitions are complete, you need to
conduct interviews with users and management to review the work
you’ve done so far. This set of interviews is fairly straightforward and
should be relatively easy to conduct.

ptg14955309
262 Chapter 8 Keys
During these interviews, you will accomplish these tasks.
•Ensure that the appropriate subjects are represented in the data-
base. Although it’s highly unlikely that an important subject is
missing at this stage of the database design process, it can hap-
pen. When it does happen, identify the subject, use the proper
techniques to transform it into a table, and develop it to the same
degree as the other tables in the database.
•Make certain that the table names and table descriptions are
suitable and meaningful to everyone. When a name or descrip-
tion appears to be confusing or ambiguous to several people in
the organization, work with them to clarify the item as much as
possible. It’s common for some table names and descriptions to
improve during the interview process.
•Make certain that the field names are suitable and meaningful to
everyone. Selecting field names typically generates a great deal
of discussion, especially when there is an existing database in
place. You’ll commonly find people who customarily refer to a
particular field by a certain name because “that’s what it’s called
on my screen.” When you change a field name—you have good
reasons for doing so—you must diplomatically explain to these
folks that you renamed the field so that it conforms to the stan-
dards imposed by the new database. You can also tell them that
the field can appear with the more familiar name once the data-
base is implemented in an RDBMS program. What you’ve said
is true; many RDBMSs allow you to use one name for the field’s
physical definition and another name for display purposes. This
feature, however, does not change, reduce, or negate the need
for you to follow the guidelines for creating field names that you
learned in Chapter 7, “Establishing Table Structures.”
•Verify that all the appropriate fields are assigned to each table.
This is your best opportunity to make certain that all of the nec-
essary characteristics pertaining to the subject of the table are

ptg14955309
Reviewing the Initial Table Structures 263
in place. You’ll commonly discover that you accidentally over-
looked one or two characteristics earlier in the design process.
When this happens, identify the characteristics, use the appro-
priate techniques to transform them into fields, and follow all the
necessary steps to add them to the table.
When you’ve completed the interviews, you’ll move to the next phase of
the database design process and establish field specifications for every
field in the database.
CASE STUDY
It’s now time to establish keys for each table in the Mike’s Bikes
database. As you know, your first order of business is to establish
candidate keys for each table. Let’s say you decide to start with the
CUSTOMERS table in Figure 8.9.
As you review each field, you try to determine whether it conforms to
the Elements of a Candidate Key. You determine that STATUS, CUSTHOME
Table Structures
Customers
CustStreet Address
CustCity
CustState
CustZipcode
Status
CustFirst Name
CustHome Phone
CustLast Name
Figure 8.9 The CUSTOMERS table structure in the Mike’s Bikes database

ptg14955309
264 Chapter 8 Keys
PHONE, and the combination of CUSTFIRST NAME and CUSTLAST NAME are
potential candidate keys, but you’re not quite certain whether any of
them will completely conform to all of the elements. So you decide to
test the keys by loading the table with sample data as shown in
Figure 8.10.
Customers
CustHome Phone
422-4982
363-9360
363-9360
365-7199
441-3987
322-1178
332-0499
Status
Valued
Valued
Preferred
Valued
Preferred
CustZipcode
98004
98225
98225
98115
98001
98126
98026
CustState
WA
WA
WA
WA
WA
WA
WA
CustCity
Bellevue
Redmond
Redmond
Seattle
Bothell
Kent
Seattle
CustStreet Address
2121 NE 35th
7525 Taxco Lane
7525 Taxco Lane
301 N Main
750 Pike Street
101 9th Avenue
115 Pine Place
CustLast Name
Berlin
Brigan
Carmichael
Chavez
Chavez
Bradley
Cooper
CustFirst Name
Bridget
Kel
Barbara
Daniel
Daniel
Phillip
Sandi
Figure 8.10 Testing candidate keys in the CUSTOMERS table
Always remember that a field must comply with all of the Elements of a
Candidate Key in order to qualify as a candidate key. You must imme-
diately disqualify the field if it does not fulfill this requirement.
As you examine the table, you draw these conclusions.
•STATUS is ineligible because it will probably contain duplicate val-
ues. As business grows, Mike is going to have many “Valued”
customers.
•CUSTHOME PHONE is ineligible because it will probably contain dupli-
cate values. The sample data reveals that two customers can live
in the same residence and have the same phone number.
•CUSTFIRST NAME and CUSTLAST NAME are ineligible because they will
probably contain duplicate values. The sample data reveals that
the combination of first name and last name can represent more
than one distinct customer.

ptg14955309
Reviewing the Initial Table Structures 265
These findings convince you to establish an artificial candidate key for
this table. You then create a field called CUSTOMER ID, confirm that it
complies with the requirements for a candidate key, and add the new
field to the table structure with the appropriate designation.
Figure 8.11 shows the revised structure of the CUSTOMERS table.
Table Structures
Customers
CustStreet Address
CustCity
CustState
CustZipcode
Status
CustFirst Name
CustHome Phone
CustLast Name
Customer ID CK
Figure 8.11 The CUSTOMERS table with the new artificial candidate key,
CUSTOMER ID
Now you’ll repeat this procedure for each table in the database.
Remember to make certain that every table has at least one candidate
key.
The next order of business is to establish a primary key for each table.
As you know, you select the primary key for a particular table from the
table’s pool of available candidate keys. Here are a few points to keep
in mind when you’re choosing a primary key for a table with more than
one candidate key.
• Choose a simple (single-field) candidate key over a composite
candidate key.

ptg14955309
266 Chapter 8 Keys
• If possible, pick a candidate key that has the table name incorpo-
rated into its own name.
• Select the candidate key that best identifies the subject of the
table or is most meaningful to everyone in the organization.
You begin by working with the EMPLOYEES table in Figure 8.12. As
you review the candidate keys, you decide that EMPLOYEE NUMBER is a
much better choice for a primary key than the combination of EMPFIRST
NAME and EMPLAST NAME because Mike’s employees are already accus-
tomed to identifying themselves by their assigned numbers. Using
EMPLOYEE NUMBER makes perfect sense, so you select it as the primary
key for the table.
Table Structures
Employees
EmpLast Name CCK
EmpStreet Address
EmpCity
EmpZipcode
EmpHome Phone
Employee Number CK
EmpState
EmpFirst Name CCK
Social Security Number
Figure 8.12 The EMPLOYEES table structure in the Mike’s Bikes database
Now you perform one final task before you designate EMPLOYEE NUM-
BER as the official primary key of the table: You make absolutely cer-
tain that it exclusively identifies the value of each field within a given
record. So you test EMPLOYEE NUMBER by following these steps.

ptg14955309
Reviewing the Initial Table Structures 267
1. Load the EMPLOYEES table with sample data.
2. Select a record for test purposes and note the current value of
EMPLOYEE NUMBER.
3. Examine the value of the first field (the one immediately after
EMPLOYEE NUMBER) and ask yourself this question:
Does this primary key value exclusively identify the current
value of <fieldname>?
a. If the answer is yes, move to the next field and repeat the
question.
b. If the answer is no, remove the field from the table, move to
the next field, and repeat the question. (Be sure to determine
whether you can add the field you just removed to another
table structure, if appropriate, or discard it completely
because it is truly unnecessary.)
4. Continue this procedure until you’ve examined every field value
in the record.
You know that you’ll have to remove any field containing a value that
EMPLOYEE NUMBER does not exclusively identify. EMPLOYEE NUMBER does
exclusively identify the value of each field in the test record, however,
so you use it as the official primary key for the EMPLOYEES table and
mark its name with the letters “PK” in the table structure. You then
repeat this process with the rest of the tables in Mike’s new database
until every table has a primary key.
Remember to keep these rules in mind as you establish primary keys
for each table.
• Each table must have one—and only one—primary key.
• Each primary key within the database should be unique—no two
tables should have the same primary key (unless one of them is a
subset table).

ptg14955309
268 Chapter 8 Keys
As you work through the tables in Mike’s database, you remember that
the SERVICES table is a subset table. You created it during the previ-
ous stage of the design process (in Chapter 7), and it represents a more
specific version of the subject represented by the PRODUCTS table. The
PRODUCT NAME field is what currently relates the PRODUCTS table to the
SERVICES subset table. You now know, however, that a subset table
must have the same primary key as the table to which it is related, so
you’ll use PRODUCT NUMBER (the primary key of the PRODUCTS table)
as the primary key of the SERVICES table. Figure 8.13 shows the
PRODUCTS and SERVICES tables with their primary keys.
Table Structures
ServicesProducts
Service TypeProduct Name
Retail Price
Materials ChargeProduct Description
Service Charge
Service Date
Category
Wholesale Price
Quantity On Hand
Product Number PKProduct Number PK
Figure 8.13 Establishing the primary key for the SERVICES subset table
The last order of business is to conduct interviews with Mike and his
staff and review all the work you’ve performed on the tables in the
database. As you conduct these interviews, make certain you check
the following.
• The appropriate subjects are represented in the database.
• The table names and descriptions are suitable and meaningful to
everyone.

ptg14955309
Summary 269
• The field names are suitable and meaningful to everyone.
• All the appropriate fields are assigned to each table.
By the end of the interview, everyone agrees that the tables are in
good form and that all the subjects with which they are concerned are
represented in the database. Only one minor point came up during the
discussions: Mike wants to add a CALL PRIORITY field to the VENDORS
table. There are instances in which more than one vendor supplies a
particular product, and Mike wants to create a way to indicate which
vendor he should call first if that product is unexpectedly out of stock.
So you add the new field to the VENDORS table and bring the inter-
view to a close.
Summary
The chapter opened with a discussion of the importance of keys. You
learned that there are different types of keys, and each type plays a
different role within the database. Each key performs a particular
function, such as uniquely identifying records, establishing various
types of integrity, and establishing relationships between tables. You
now know that you can guarantee sound table structure by making
certain that the appropriate keys are established for each table.
We then discussed the process of establishing keys for each table. We
began by identifying the four main types of keys: candidate, primary,
foreign, and non-keys. First, we looked at the process of establishing
candidate keys for each table. You learned about the Elements of a
Candidate Key and how to make certain that a field (or set of fields)
complies with these elements. Then you learned that you can create
and use an artificial candidate key when none of the fields in a table
can serve as a candidate key or when a new field would make a stron-
ger candidate key than any of the existing candidate key fields.

ptg14955309
270 Chapter 8 Keys
The chapter continued with a discussion of primary keys. You learned
that you select a primary key from a table’s pool of candidate keys and
that the primary key is governed by a set of specific elements. We then
covered a set of guidelines that help you determine which candidate
key to use as a primary key. Next, you learned how to ensure that the
chosen primary key exclusively identifies a given record and its set of
field values. When the primary key does not exclusively identify a par-
ticular field value, you know that you must remove the field from the
table in order to ensure the table’s structural integrity. You also know
that each table must have a single, unique primary key.
You then learned that you designate any remaining candidate keys
as alternate keys. These keys will be most useful to you when you
implement the database in an RDBMS program because they provide
an alternate means of identifying a given record. We then discussed
the non-key field, which is any field not designated as a candidate,
primary, alternate, or foreign key. You now know that a non-key field
represents a characteristic of the table’s subject and that the primary
key exclusively identifies its value.
Table-level integrity was the next subject of discussion, and you learned
that it is established through the use of primary keys and enforced by
the Elements of a Primary Key.
The chapter closed with some guidance on conducting further inter-
views with users and management. You now know that these inter-
views provide you with a means of reviewing the work you have
performed on the tables and help you to verify and validate the current
database structure.
Review Questions
1. State the three reasons why keys are important.
2. What are the four main types of keys?

ptg14955309
Review Questions 271
3. What is the purpose of a candidate key?
4. State four items of the Elements of a Candidate Key.
5. True or False: A candidate key can be composed of more than one
field.
6. Can a table have more than one candidate key?
7. What is an artificial candidate key?
8. What is the most important key you assign to a table?
9. Why is this key important?
10. How do you establish a primary key?
11. State four items of the Elements of a Primary Key.
12. What must you do before you finalize your selection of a primary
key?
13. What is an alternate key?
14. What do you ensure by establishing table-level integrity?
15. Why should you review the initial table structures?

ptg14955309
This page intentionally left blank

ptg14955309
273
9
Field Specifications
It has long been an axiom of mine that the
little things are infinitely the most important.
—SHERLOCK HOLMES,
THE ADVENTURES OF SHERLOCK HOLMES
Topics Covered in This Chapter
Why Field Specifications Are Important
Field-Level Integrity
Anatomy of a Field Specification
Using Unique, Generic, and Replica Field Specifications
Defining Field Specifications for Each Field in the Database
Case Study
Summary
Review Questions
Fields are the bedrock of the database. They represent characteristics
of the subjects that are important to an organization. Fields store the
data that the organization uses as the basis of information—informa-
tion that is vital to its daily operations, success, and future growth.
Despite their inherent value, fields are still the most overlooked,
underutilized, and neglected assets of the organization! Frequently,
little or no time is spent ensuring the structural and logical integrity of
the fields in the database.
Much is said and written about data integrity, but little is done
about it. Many people believe that keeping an eye on their data entry

ptg14955309
274 Chapter 9 Field Specifications
personnel and having a “foolproof” user interface for the database
will greatly minimize potential data-related problems. This superficial
approach to data integrity commonly stems from an incorrect belief
that proper data integrity takes too much time to establish. It’s import-
ant to note, however, that the people who don’t have time to estab-
lish data integrity usually spend a large amount of time fixing their
improperly designed databases—typically spending up to three times
as long as it would have taken them to design the database properly in
the first place!
In this chapter, you’ll learn how to establish data integrity by defin-
ing field specifications for each field in the database. First, you’ll learn
about the three sets of elements that compose a field specification;
then you’ll learn how to conduct interviews with users and manage-
ment to enlist their help in defining the specifications for the fields.
Why Field Specifications Are Important
Despite what you may have heard, the time it takes to establish field
specifications for each field in the database is an investment toward
building consistent data and quality information—you are not wasting
time whatsoever by performing this process. In fact, you’ll waste more
time in the end if you only partially perform this process or neglect it
entirely. Shirking this duty means you’re bound to encounter (and suf-
fer from) inconsistent and erroneous data and inaccurate information.
There are several reasons why field specifications are crucial.
•Field specifications help establish and enforce field-level integrity.
Implementing these specifications enables you to guarantee that
the data in each field is consistent and valid.
•Defining field specifications for each field enhances overall
data integrity. Remember that field-level integrity is one of the
four components of overall data integrity. Field-level integrity

ptg14955309
Field-Level Integrity 275
enhances (to some extent) the table-level integrity you estab-
lished in the previous stage of the design process. (This will
become apparent when you work with the logical elements of the
field specification.)
•Defining field specifications compels you to acquire a complete
understanding of the nature and purpose of the data in the data-
base. Understanding the data means that you can judge whether
the data is truly necessary and important to the organization,
and you can learn how to use it to your best advantage.
•Field specifications constitute the “data dictionary” of the data-
base. Each field specification stores data on the characteristics
of a particular field within the database. The complete set of
specifications you establish for all of the fields in the database
composes a literal dictionary of the database’s structure. This
data dictionary is particularly useful when you implement your
database in an RDBMS—you can use it as a guide for creating
the fields and setting their fundamental properties. These spec-
ifications will also help you determine what type of data entry
and data validation procedures you need to implement within
any user interface application you create for the database.
Keep in mind that the levels of consistency, quality, and accuracy of
the data in the database (and information retrieved from that data) are
in direct proportion to the degree to which you complete these spec-
ifications. It is paramount that you establish each field specification
completely if your organization depends heavily on the information you
retrieve from the database.
Field-Level Integrity
A field attains field-level integrity after you’ve defined a complete set
of field specifications for the field. Field-level integrity warrants the
following.

ptg14955309
276 Chapter 9 Field Specifications
• The identity and purpose of a field is clear, and all of the tables
in which it appears are properly identified.
• Field definitions are consistent throughout the database.
• The values of a field are consistent and valid.
• The types of modifications, comparisons, and operations that
can be applied to the values in the field are clearly identified.
You can guarantee that a field structure is sound and optimally
designed when it has a complete set of field specifications and fully
conforms to the Elements of the Ideal Field. In fact, ensuring that the
field complies with the Elements of the Ideal Field makes defining a set
of specifications a relatively easy task.
If you’ve had any lingering doubt about a particular field’s confor-
mance to the Elements of the Ideal Field, now is a good time to review
that field once more. If you determine that it is not in conformance,
use the appropriate techniques to resolve the problem and make the
proper adjustments to the table; otherwise, you can begin the process
of defining field specifications for each field in the database. Here are
the Elements of the Ideal Field once again for your convenience.
• It represents a distinct characteristic of the subject of the table.
• It contains only a single value.
• It cannot be deconstructed into smaller components.
• It does not contain a calculated or concatenated value.
• It is unique within the entire database structure.
• It retains a majority of its characteristics when it appears in
more than one table.

ptg14955309
Anatomy of a Field Specification 277
Anatomy of a Field Specification
A field specification incorporates various elements that define every
attribute of a field. All of the elements within the specification are
categorized as general elements, physical elements, or logical elements.
These element categories enable you to focus on a distinct aspect of
the field as you’re defining the specification, and they provide a way for
you to find a particular element quite easily.
Here are the elements within each category.
•General Elements: Field Name, Parent Table, Label, Specification
Type, Source Specification, Shared By, Alias(es), Description
•Physical Elements: Data Type, Length, Decimal Places, Character
Support, Input Mask, Display Format
•Logical Elements: Key Type, Key Structure, Uniqueness, Null Sup-
port, Values Entered By, Required Value, Default Value, Range of
Values, Edit Rule, Comparisons Allowed, Operations Allowed
Figure 9.1 shows an example of a Field Specifications sheet. We’ll use
this sheet (or various portions of it) as we work on field specification
examples throughout the remainder of the book.
General Elements
Items under the General Elements category represent the most funda-
mental attributes of the field. They provide information on the field’s
purpose, the name of the table(s) in which the field appears, and the
pseudonyms the field assumes under certain circumstances.
Field Name
This is the set of absolute minimal words that uniquely identifies a
particular field throughout the database. You created and refined
field names earlier in the database design process (see Chapter 7,

ptg14955309
278 Chapter 9 Field Specifications
Field Name:
Label:
Parent Table:
Shared By:
Alias(es):
Description:
Specification Type:
Source Specification:
ReplicaUnique Generic
Length:
Decimal Places:
Input Mask:
Display Format:
Data Type: Character Support:
Letters (A–Z)
Numbers (0–9)
.Keyboard ( , / $ # %)
Special ( © ® ™ ∑ π)
Key Structure:
Non
Not Determined At This Time
Edit Rule:
Null Support: Nulls Allowed
Enter Now, Edits Allowed
Enter Now, Edits Not Allowed
Enter Later, Edits Allowed
Primary
AlternateForeign
No Nulls
Uniqueness: Non-unique Unique
Required Value: No Yes
Comparisons Allowed:
Range of Values:
Default Value:
Values Entered By: User
Operations Allowed:
System
Key Type:
CompositeSimple
Enter Later, Edits Not Allowed
<> ≠<=>=
Other Fields
Same Field =
Value Expression
<> ≠<=>==
<> ≠<=>==
All
All
All
÷Same Field
Other Fields Concatenation
÷
All
All
+
+
x
x
Value Expression All Concatenation÷+x
Concatenation
General Elements
Physical Elements
Logical Elements
FIELD SPECIFICATIONS
–
–
–
Figure 9.1 Field Specifications sheet

ptg14955309
Anatomy of a Field Specification 279
“Establishing Table Structures”), so you’ll just take each name and use
it as the setting for this element.
Parent Table
The table that incorporates a given field within its structure is known
as the field’s parent table. This is the only table in which the field will
appear unless the field is participating in establishing a relationship.
(You’ll learn more about this exception in Chapter 10, “Table Relation-
ships.”) For example, STUDENTS is the parent table of the STUDFIRST
NAME field.
Label
This is an alternate name (typically a shorter form of the field name)
by which you can identify the field within an end-user application
interface that you create for the database. For example, you might use
QTY ON HAND as a label for a field named QUANTITY ON HAND because
many people in the organization are already accustomed to this par-
ticular name. Labels can be particularly useful when you want to
conserve space on a data entry screen or squeeze more fields into a
particular report.
Avoid the temptation of using the label as the official field name within
the table structure; otherwise, you make it possible for someone to
misinterpret or incorrectly identify the field. Always use the most
precise and accurate name as the official field name and then use the
label (judiciously, of course) within your end-user interface applica-
tions. This will enable you to make a distinction between the two at all
times.
Specification Type
The elements you set for a given field depend upon the type of specifi-
cation you define for the field. You can define a specification in three
ways.

ptg14955309
280 Chapter 9 Field Specifications
1. Unique: This is the default specification for all fields except those
that serve as a template for other fields or those that participate
within a table relationship as foreign keys. You can incorporate
all but the Source Specification element for this type of specifi-
cation, and the element settings you establish will apply only to
the field indicated in the Field Name element.
2. Generic: This specification serves as a template for other field
specifications and helps you ensure consistent definitions for
fields that have the same general meaning. For example, you
could create this type of specification for a generic STATE field
and then use it as the basis for every other STATE field in the
database. Fields such as CUSTSTATE, EMPSTATE, and VENDSTATE
all have the same meaning (they represent a state within the
United States), but there is enough of an obvious distinction
between them to require that they remain separate fields. (If you
recall, you learned about generic fields in Chapter 6, “Analyzing
the Current Database,” when you were developing the Prelim-
inary Field List and in Chapter 7 when you were working with
the Elements of the Ideal Field.)
A generic specification requires you to use a nonspecific field
name and element settings that are as broad and general as
possible. You can, however, incorporate any element except Par-
ent Table, Label, Shared By, Alias(es), and Source Specification.
3. Replica: This is the default specification for a field based on a
generic field or a field that serves as a foreign key within a table
relationship, and it draws a majority of its element settings from
an existing specification. You can incorporate elements that were
not already incorporated by the source specification, and you can
alter any element settings drawn from the source specification.
You’ll learn how to define each type of specification in the section
“Using Unique, Generic, and Replica Field Specifications” later in this
chapter.

ptg14955309
Anatomy of a Field Specification 281
Source Specification
This element is set only on a Replica specification and indicates the
name of the specific field specification upon which the current specifi-
cation is based. (You’ll see a good example of this element in the next
section.)
Shared By
This element indicates the names of other tables that share this field.
The only table names that should appear here are those that have an
explicit relationship to the field’s parent table. For example, assume
you have a data table called EMPLOYEES that is related to two subset
tables called PART-TIME EMPLOYEES and FULL-TIME EMPLOYEES
via a field called EMPLOYEE ID NUMBER. As you create a field specifica-
tion for EMPLOYEE ID NUMBER, you would use “PART-TIME EMPLOYEES,
FULL-TIME EMPLOYEES” as the setting for this element.
Alias(es)
This is a name (or set of names) that you use for the field in very rare
circumstances. One instance in which you would use an alias is when
there must be two occurrences of the field in the same table. Let’s
assume that an organization is accustomed to identifying its employ-
ees by unique values within an EMPLOYEE ID NUMBER field. Now, con-
sider the SUBSIDIARIES table structure in Figure 9.2 (this is a partial
structure only).
In this instance, each subsidiary has a president and a vice president.
Both of these individuals must be represented in the table because of
their positions within the subsidiary organization, so there are two
EMPLOYEE ID NUMBER fields in the table structure. Proper database design,
however, dictates that there can only be one occurrence of this field
within the table; there is an obvious problem here. The only solution is
to use an alias for one or both occurrences of the EMPLOYEE ID NUMBER
field. For instance, you could (for sake of clarity) use PRESIDENT ID as an

ptg14955309
282 Chapter 9 Field Specifications
alias for the first occurrence of EMPLOYEE ID NUMBER and VICE PRESIDENT
ID as an alias for the second occurrence of EMPLOYEE ID NUMBER. With
the aliases in place, both employees are properly represented within the
table. Figure 9.3 shows the revised table structure.
Although using an alias is acceptable under these circumstances, you
should use them very judiciously; otherwise, they can become difficult
Table Structures
Subsidiaries
Employee ID Number
Subsidiary ID Number
Subsidiary Name
Employee ID Number
SubsStreet Address
SubsCity
Figure 9.2 A table requiring two occurrences of the same field
Table Structures
Subsidiaries
President ID Number
Subsidiary ID Number
Subsidiary Name
Vice President ID Number
SubsStreet Address
SubsCity
Figure 9.3 Using aliases in place of the EMPLOYEE ID NUMBER fields

ptg14955309
Anatomy of a Field Specification 283
to manage and maintain, eventually conceal or disguise the true
meaning of the original fields, and cause you to misunderstand what
the data actually represents. This issue will become even clearer when
you begin to establish table relationships.
Description
This is a complete interpretation of the field. Composing a field descrip-
tion is extremely beneficial because it forces you (and everyone in
the organization) to think carefully about the nature of the data that
will be stored in the field. You can be relatively sure that the field
requires further refinement if you have difficultly composing a suitable
description.
Earlier in the database design process you learned a set of guidelines
for composing a table description. Similarly, there is a set of guidelines
that governs how you compose a proper field description.
Guidelines for Composing a Field Description
•Use a statement that accurately identifies the field and clearly
states its purpose. The description should supplement the field
name in terms of defining what the field represents. It should
also state the field’s role within the table or its relationship to the
table’s subject. Here’s an example of such a description:
CustCity—the metropolitan area in which a customer resides or
conducts business. This is an integral component of a custom-
er’s complete address.
•Write a clear and succinct statement. The description should be
free of confusing sentences or ambiguous phrases. Although the
description should be as complete as possible, use the minimum
number of words necessary to convey the required information.
As you’ve seen with table descriptions, verbose statements are
difficult to read and understand.

ptg14955309
284 Chapter 9 Field Specifications
•Refrain from restating or rephrasing the field name. Neither of
these practices does anything to illuminate the identity or pur-
pose of the field. Remember that the purpose of a description is
to provide a complete interpretation of the field. Here’s an exam-
ple of a poor description:
CustLast Name—the last name of a customer.
A description is far more useful when you write it in this manner:
CustLast Name—the surname of a customer, whether original
or by marriage, that we use in all formal communications and
correspondence with that customer.
•Avoid using technical jargon, acronyms, or abbreviations. Although
some people within the organization will understand these types
of idioms, it’s better for you to use terminology that everyone
understands. Remember that a description must be as clear as
possible to anyone who reads it. For example, you should avoid
this type of statement:
Employee ID Number—a unique number used to identify an
employee within the organization. It is a component of the SSP.
The problem with this description is that there is no inherent
way to determine the meaning of the acronym SSP. You could
resolve this problem by spelling out the complete term, but it
would be better for you to restate the purpose of the field.
•Do not include implementation-specific information. There’s no
reason to include the fact that a given field appears on a partic-
ular data entry screen or is used within a specific piece of pro-
gramming code. This type of information is more appropriate for
the implementation phase of the overall database development
process.
•Do not make this description dependent upon the description of
another field. Each description should be as complete as possi-
ble and independent of every other description in the database.
ptg14955309
Anatomy of a Field Specification 285
Interdependent descriptions introduce unnecessary confusion
and can inadvertently obscure the field’s true identity and pur-
pose. Avoid using a description such as this:
Item Reorder Level—minimum number of items that must exist
for a particular product. (See description for Quantity On Hand.)
•Do not use examples. As you learned in Chapter 7, using exam-
ples in a description is a bad idea because they depend on sup-
plemental information to convey their full meaning. You can
ensure that a description is clear and succinct by keeping it
absolutely free of examples.
Figure 9.4 shows the General Elements section of a Field Specifications
sheet for an EMPLOYEE ID NUMBER field.
A unique number used to identify each employee within our organization. It is assigned
during the first day of Employee Orientation and remains with the employee throughout
the duration of his or her employment.
Full-Time Employees, Part-Time Employees, Customers
Employee #
Employees
Employee ID Number
General Elements
Field Name:
Label:
Parent Table:
Shared By:
Alias(es):
Description:
Source
Specification Type:
Specification:
xGenericUnique Replica
Figure 9.4 The General Elements category for an EMPLOYEE ID NUMBER field
Physical Elements
This category pertains to the structure of a field. Its elements are
expressed in general terms because each RDBMS program imple-
ments them in a slightly different manner. Establishing these elements
during this phase of the design process helps you ensure consistent
field definitions throughout the database and reduces the time it will
take you to implement the field structures in an RDBMS program.

ptg14955309
286 Chapter 9 Field Specifications
Data Type
This element indicates the nature of the data that the field stores.
In Chapter 1, “Relational Databases,” you learned that Structured
Query Language, or SQL, is the standard language used to create,
modify, maintain, and query relational databases. SQL is actually a
fully documented standard set forth jointly by the American National
Standards Institute (ANSI) and the International Organization for
Standardization (ISO). Although the current version of the standard
(as of this writing) is SQL 2011, most major RDBMS programs still
seem to be supporting earlier versions of SQL, such as SQL/92 and
SQL 2008.
The SQL standard defines eight major data types, and each data type
has one or more uniquely named variations. Here’s a brief definition of
each data type.
1. Character: This data type stores a fixed- or varying-length char-
acter string of one or more printable characters. A fixed-length
Character data type is known as CHARACTER or CHAR, and a
varying-length Character data type is known as CHARACTER
VA RY ING, CH AR VA RY ING, or VA RCH A R.
2. National Character: This data type is the same as the Character
data type, but it can also store characters from foreign-language
character sets. A fixed-length National Character data type
is known as NATIONAL CHARACTER, NATIONAL CHAR, or
NCHAR, and a varying-length National Character data type is
known as NATIONAL CHARACTER VARYING, NATIONAL CHAR
VARYING, or NCHAR VARYING.
3. Binary: This data type stores binary data such as images,
sounds, videos, or complex embedded documents such as word
processing files or spreadsheets. This data type is often referred
to as BIT or BIT VARYING.

ptg14955309
Anatomy of a Field Specification 287
4. Exact Numeric: This data type stores whole numbers and num-
bers with decimal places. Most RDBMS programs implement an
Exact Numeric as NUMERIC, DECIMAL (DEC), INTEGER (INT),
BIGINT, or SMALLINT, and each variation determines the range
of values that the field will accept.
5. Approximate Numeric: This data type stores numbers with decimal
places and exponential numbers. Most RDBMS programs imple-
ment an Approximate Numeric as FLOAT, REAL, or DOUBLE
PRECISION, and each variation determines the range of values
that the field will accept.
6. Boolean: This data type stores true and false values, usually
in a single binary bit. Some RDBMS programs use BIT, INT, or
TINYINT to store this data type.
7. DateTime: This data type is commonly known as DATE, TIME,
or TIMESTAMP in most RDBMS programs, and it stores dates,
times, and combinations of both. Note that the implementation
of this data type varies widely among RDBMS programs, so you
must make absolutely certain that you refer to the RDBMS’s
documentation to determine how the RDBMS handles dates and
times.
8. Interval: This data type stores the quantity of time between two
DateTime values, expressed either as year, month, year/month
day, time, or day/time. Not all major database systems support
this data type, so check your RDBMS’s documentation for fur-
ther information.
Many RDBMS programs provide additional data types beyond those
specified by the standard, which are known as extended data types.
Examples of extended data types include MONEY/CURRENCY and
SERIAL/ROWID (for unique row identifiers).
I’ve presented the SQL standard data types because you will encoun-
ter them (or variations thereof) in practically every RDBMS program. I

ptg14955309
288 Chapter 9 Field Specifications
have not provided much detail on these data types, however, because
they are not implemented consistently across all RDBMS programs;
you must consult your RDBMS’s documentation to determine which
data types the RDBMS supports and how it implements them.
You can use any of the SQL data types (except Boolean and Interval) as
the setting for the Data Type element of a given specification. Due to
data type implementation inconsistencies, however, I recommend that
you use one of the following three general data types as the setting for
this element instead.
1. Alphanumeric: This data type stores any combination of letters,
numbers, keyboard characters, or special characters. Keyboard
characters include the comma, dollar sign, exclamation mark,
percent sign, and period. Special characters include the copy-
right symbol, the trademark symbol, and the symbol for pi.
2. Numeric: This data type stores only whole numbers and real
numbers. It will not accept numbers with leading zeroes (e.g.,
0000234) because they are not genuine numbers.
3. DateTime: This data type stores dates, times, or a combination
of both.
These data types are quite suitable for indicating the nature of the
data that the field stores, and they are certainly much easier for users
and management to understand. Using general data types will help
you avoid unnecessary confusion, especially when you’re reviewing the
specification with users and management.
❖Note I use these general data types as the basis for all further
data type references and examples throughout the remainder of
the book. You’ll certainly adjust these as necessary when you
implement your database in a particular RDBMS program.

ptg14955309
Anatomy of a Field Specification 289
Length
This element specifies the total number of characters that a user can
enter for any given field value. The RDBMS program you use to imple-
ment the database will determine the maximum number of charac-
ters you can set for this element. Although you can theoretically set
the Length element for any data type, you should be aware that some
RDBMS programs do not allow you to specify a length for a numeric
field. Instead, the RDBMS program sets the length of a numeric field
based on the type of number the field stores, such as an integer, a long
integer, or a real number.
Decimal Places
This denotes the number of digits to the right of the decimal point in a
real number. The number of digits determines the real number’s pre-
cision. For example, many businesses require that all currency values
have four digits of precision to the right of the decimal point.
Character Support
This element indicates the type of characters that a user can enter into
a given field value. Setting and enforcing this element helps you ensure
that the user cannot introduce meaningless data into the field, thus
enhancing field-level integrity.
Let’s say you’re working with a CUSTSTATE field and its data type is
alphanumeric. This data type is appropriate for the field because it
allows a user to incorporate letters as part of a given field value. But it
also allows him to use numbers, keyboard characters, and extended
characters, which means that he can enter a meaningless value into
the field—there are no state names or state abbreviations that con-
tain characters other than letters. You solve this problem by using the
Character Support element to define the characters that the user can
incorporate within a field value. (I address the issue of a valid combi-
nation of letters in the “Logical Elements” section.)

ptg14955309
290 Chapter 9 Field Specifications
You can choose to include or exclude any of the following types of
characters.
•Letters: All letters of the alphabet including foreign language let-
ters such as é and ñ.
•Numbers: 0 through 9.
•Keyboard characters: Any standard character other than
letters and numbers, such as asterisk, ampersand, bracket,
caret, comma, equals sign, exclamation point, parenthesis, per-
cent sign, period, pound sign, question mark, quote, semicolon,
slash, or vertical bar. Note that the Field Specifications sheet
includes examples of the characters that belong to this category.
•Special characters: Any character that you can produce only
through specific combinations of standard keys and the CTRL,
ALT, and/or S HIFT keys, or with the aid of a special software
program. Characters in this category include complex mathe-
matical symbols, the copyright symbol, fractions, the symbol
for pi, and the trademark symbol. The Field Specifications sheet
includes examples of these characters as well.
Input Mask
This element specifies the manner in which a user should enter data
into the field. For example, there are many ways to enter a date, such
as “01/01/12,” “01-01-12,” and “01-Jan-2012.” Using an input mask
helps you ensure that a user enters values into the field consistently
and (in this case) prevents confusion over the meaning of the date
sequence.
RDBMS programs implement input masks in various ways, so you
should use a relatively generic setting for this element. (You can assign
multiple input masks, if appropriate.) For example, you could use
“mm/dd/yy” as the input mask for a date field. This mask indicates

ptg14955309
Anatomy of a Field Specification 291
the sequence of the date components (month, day, year), the structure
of the date (two numbers per component, e.g., 05/16/12), and the date
component separator (the slash).
Display Format
This element governs the appearance of a field’s value when it is dis-
played on a screen or printed within a document. A display format
enables you to present the field value in a more meaningful or read-
able fashion than the manner in which it was entered. For example,
“03/13/2012” might be the way you enter a given date, but “March 13,
2012” is much easier to read and comprehend.
Use a generic setting for this element, just as you did with the Input
Mask; RDBMS programs implement display formats in various ways as
well. For example, you can use “Month Day, Year” as a display format
for a DATE HIRED field. You can also use a complete sentence to indicate
a display format, such as the one in this example of a display format
setting for a COMPANY NAME field:
Each word should start with a capital letter.
Figure 9.5 shows the Physical Elements section of a Field Specifica-
tions sheet for an EMPLOYEE ID NUMBER field.
Physical Elements
Length:
Decimal Places:
Input Mask:
Display Format:
Data Type: Character Support:
Special ( © ® ™ ∑ π)
Keyboard ( . , / $ # %)
Letters (A–Z)
Numbers (0–9)
x
Numeric
4
0
####
0000
Figure 9.5 The Physical Elements category for an EMPLOYEE ID NUMBER field

ptg14955309
292 Chapter 9 Field Specifications
Logical Elements
This category pertains mainly to the values within a field. Its elements
govern matters such as whether each value should be unique, when a
value should be entered, whether a value can be edited, and the types
of comparisons and operations that can be performed on each value.
Setting these elements helps you establish and enforce a large part of
field-level integrity.
Key Type
This element designates a field’s role within a table, which you iden-
tified as you were establishing a primary key for the table. As you
already know, a field can serve as a non-key, a primary key, or an alter-
nate key. In Chapter 10, you’ll learn all about foreign keys and when to
designate a field as a foreign key on the Field Specifications sheet.
Key Structure
This element denotes whether a field designated as a primary key is
acting as a simple (single-field) primary key or as part of a composite
(multifield) primary key.
Uniqueness
This element indicates whether a field’s values are unique. You set it
as “Unique” when the Key Type element is set to “Primary”; otherwise,
you’ll typically set this element as “Non-unique.”
When you work with a non-key field, think about how its values are
going to be used so that you can determine whether they should be
unique. Consider the DEPARTMENTS table structure in Figure 9.6.
In this example, the EMPLOYEE ID NUMBER field identifies the person who
manages a particular department. Assuming that a person is allowed
to manage only one department at any given time, the values in this
field should be unique; therefore, you should set the Uniqueness ele-
ment for this field as “Unique.”

ptg14955309
Anatomy of a Field Specification 293
Null Support
This specifies whether a field accepts null values. “No Nulls” is the set-
ting you’ll commonly use for this element, especially when a field serves
as a primary key or an alternate key, or when the field’s Required Value
element is set to “Yes.” You can set this element to “Nulls Allowed,”
however, when there is a valid reason for a field to accept null values.
A CUSTCOUNTY field, for example, must accept nulls because a customer
may not know the name of the county in which she lives. (Of course, it
will no longer be null once she supplies the county name.)
Remember that a null does not represent a blank—it represents a miss-
ing or unknown value. Users commonly make the mistake of using a
blank to represent a meaningful value, such as “None,” “Not Applicable,”
“No Response,” and “Not Wanted.” If these values are valid for a partic-
ular field, then make sure you include them in the Range of Values ele-
ment for the field. Above all, use nulls judiciously and do not use blanks!
Values Entered By
This element indicates the source of a field’s values. Either a user will
enter values into the field manually or a database application program
will enter them automatically; the application program can provide val-
ues for the field only if the person who developed the program provided
a means for it to generate the values. Note that the setting that rep-
resents the database application program is “System.”
Table Structures
Departments
Employee ID Number
Department ID Number
Department Name
Figure 9.6 Should the values of EMPLOYEE ID NUMBER be unique?

ptg14955309
294 Chapter 9 Field Specifications
Required Value
This denotes whether a user is required to enter a value for a field.
Although you’ll typically set this element to “No” for most of the fields
in a table, you must set it to “Yes” when the field serves as the primary
key. You may also need to set Required Value to “Yes” for a field such
as CUSTZIPCODE—a letter or package you send to a given customer must
include a zip code in order for the Postal Service to handle it properly
and accurately.
Default Value
This is a value that a user can enter into a field when a more appro-
priate value is not yet available and nulls are disallowed. Use a default
value very judiciously, and only if it is meaningful. For example, “WA” is
a meaningful default value for a CUSTSTATE field when the vast majority
of your customers live in Washington. Conversely, “01/01/12” is not a
good default value for a DATE HIRED field because it is a completely arbi-
trary value that has no real meaning.
Range of Values
This element specifies every possible valid value for a field. You can
set this element in various ways, such as with a lower and upper limit
(1,000 to 9,999) or with a specific list of values (“WA,” “OR,” “ID,” “MT”).
There are three categories under which you can establish a range of
values.
1. General—a complete collection of every possible value for this
field. For example, the general range of values for a CUSTSTATE
field might include all valid abbreviations for every state in the
United States.
2. Integrity-specific—a collection of values based on the field’s role
within a table relationship. (You’ll learn all about this category in
Chapter 10.)

ptg14955309
Anatomy of a Field Specification 295
3. Business-specific—a collection of values generated by a particular
business requirement. Organizations commonly have various
requirements that limit the range of values for a field. In an
organization that conducts its business strictly in the Pacific
Northwest, for example, the valid range of values for a CUSTSTATE
field are “WA,” “OR,” “ID,” and “MT.” (You’ll learn more about this
category in Chapter 11, “Business Rules.”)
You’re concerned only with the general range of values during this
stage of the database design process, and you’ll revisit the Range of
Values element later when you establish table relationships and busi-
ness rules.
It’s important to note that “Other” and “Miscellaneous” are two values
that you do not want to set within any category of the Range of Val-
ues element. Both values are nonspecific and absolutely meaningless
within this context and are a sign of mental laziness in that their
very presence indicates a need to review the field for possible refine-
ment. You can avoid unnecessary confusion and potential problems by
refraining from using these values.
Edit Rule
This element designates at what point a user can enter a value into a
field and whether he can modify that value. You set this element to one
of these four options.
1. Enter Now, Edits Allowed: A user must enter a value for this field
when she creates a new record in the field’s parent table. She
can then edit the value at any time.
2. Enter Later, Edits Allowed: A user has the option of entering a
value for this field when he creates a new record in the field’s
parent table. This does not imply in any way that the field’s
value can be null for all time; the user must enter a value for

ptg14955309
296 Chapter 9 Field Specifications
this field at some point in the near future. After he’s entered the
value, he can then edit it at any time.
3. Enter Now, Edits Not Allowed: A user must enter a value for this
field when she creates a new record in the field’s parent table,
but she cannot edit it at any time whatsoever.
4. Enter Later, Edits Not Allowed: A user has the option of entering
a value for this field when he creates a new record in the field’s
parent table. This does not imply in any way that the field’s
value can be null for all time; the user must enter a value for
this field at some point in the near future. After he’s entered the
value, he cannot edit it at any time whatsoever.
You should use a default value when you set the Edit Rule element to
the second or fourth option; this will keep the field’s value from being
null until such time that the user enters an appropriate value.
Comparisons Allowed
This indicates the types of comparisons a user can apply to a given
field value when he’s retrieving information from the field. There are
six types of comparisons: equal to (=), not equal to (≠), greater than (>),
less than (<), greater than or equal to (>=), and less than or equal to
(<=). This element also indicates whether a user can compare a given
field value to any of the following.
• Another value within the same field. When a field serves as a pri-
mary key, this option applies to the values of related foreign key
fields. (You’ll learn more about this in the next chapter.)
• A value of another field within the parent table or from some
other table in the database.
• A value expression, which is some form of operation involving
field values, literal values, or a combination of both. It returns

ptg14955309
Anatomy of a Field Specification 297
a single value that you can then use for the comparison: (RETAIL
PRICE – 2.50) is an example of a value expression.
Controlling the types of comparisons a user can apply to the field’s val-
ues enables you to keep him from making meaningless comparisons.
Let’s say that he’s working with an EMPLOYEE ID NUMBER field based on
a numeric data type. Unless you indicate otherwise, he can make a
comparison such as this one:
Is an Employee ID Number in the Employees table greater than or
equal to an Employee ID Number in the Part-Time Employees table?
Although a “greater than or equal to” comparison is generally accept-
able in a numeric field, it is not appropriate in this instance; there is
no valid reason for him to make this type of comparison.
Similarly, it would be pointless for him to make a comparison between
a given EMPLOYEE ID NUMBER value and the value of another numeric
field within the EMPLOYEES table or some other table within the data-
base; therefore, a comparison such as this is invalid:
Is an Employee ID Number in the Employees table greater than or
equal to a Quantity On Hand in the Products table?
It is both suitable and reasonable, however, for him to make a compari-
son between a given EMPLOYEE ID NUMBER value within the EMPLOYEES
table and another EMPLOYEE ID NUMBER value within a related data table
or related subset table. This comparison, then, is a valid one:
Is an Employee ID Number in the Employees table equal to an
Employee ID Number in the Part-Time Employees table?
There are instances when it is perfectly suitable for the user to com-
pare a particular value of one field to the value of a completely different
field. For example, it is totally logical for him to make the following
comparison between a DATE SHIPPED field and a DATE ORDERED field:

ptg14955309
298 Chapter 9 Field Specifications
Is the current value of Date Shipped greater than or equal to the cur-
rent value of Date Ordered?
It’s fortunate that he can make this type of comparison—he certainly
doesn’t want the value of DATE SHIPPED to be earlier than the value of
DATE ORDERED!
As you set the Comparisons Allowed element for a given field, think
about how you’re going to use the field’s values so that you can desig-
nate the appropriate comparisons. It’s very likely that you’ll review this
element later in the design process when you establish table relation-
ships and define business rules.
Operations Allowed
This element specifies the types of operations that a user can per-
form on the field’s values. There are five types of operations: addition
(+), subtraction (–), multiplication (×), division (÷), and concatenation.
(Obviously, any combination of these operations is valid as well.) This
element also indicates whether an operation can incorporate
• Another value within the same field
• A value from another field within the parent table or from some
other table in the database
• The result of a value expression (which, as you recall, is itself
some form of operation involving field values, literal values, or a
combination of both, that returns a single value)
You can prevent the user from defining meaningless operations by lim-
iting the types of operations that he can perform on the field’s values.
Let’s consider the EMPLOYEE ID NUMBER , DATE SHIPPED, and DATE ORDERED
fields once again. There is no reason for the user to perform mathe-
matical operations on a pair of EMPLOYEE ID NUMBER values within the
EMPLOYEES table, nor is there any reason for him to perform such
operations using a given EMPLOYEE ID NUMBER value and some other
ptg14955309
Anatomy of a Field Specification 299
numeric field’s value. In the case of the DATE SHIPPED field, however, it is
suitable to perform some of these operations using a given DATE SHIPPED
value and the value of some other appropriate date field within the
database. For example, the user might need to subtract DATE ORDERED
from DATE SHIPPED to determine the time that elapsed between the date
that the customer placed the order and the date that the items within
the order were shipped to the customer.
As you set the Operations Allowed element for a given field, think
about how you’re going to use the field’s values so that you can desig-
nate the appropriate operations. It’s very likely that you’ll review this
element later in the design process as you define business rules.
Figure 9.7 shows the Logical Elements section of a Field Specifications
sheet for an EMPLOYEE ID NUMBER field.
Logical Elements
Key Structure:
Non
Not Determined At This Time
Edit Rule:
Null Support: Nulls Allowed
Enter Now, Edits Allowed
Enter Now, Edits Not Allowed
Enter Later, Edits Allowed
Primary
AlternateForeign
No Nulls
Uniqueness: Non-unique Unique
Required Value: No Yes
Comparisons Allowed:
x
x
x
x
x
Range of Values:
Default Value:
Values Entered By: User
Operations Allowed:
System
x
Key Type:
CompositeSimple
x
Enter Later, Edits Not Allowed
<> <=>=
Other Fields
Same Field
x=
x
Value Expression
x
<> <=>==
<> <=>==
x
All
All
All
Same Field
Other Fields Concatenation
All
All
+
+
x
x
Value Expression All Concatenation+ x
Concatenation
1000–9999
≠
≠
≠
÷
÷
÷
–
–
–
Figure 9.7 The Logical Elements category for an EMPLOYEE ID NUMBER field

ptg14955309
300 Chapter 9 Field Specifications
Using Unique, Generic, and Replica
Field Specifications
Earlier in this chapter, you learned that you could define a specifica-
tion as Unique, Generic, or Replica. You can ensure that you define the
appropriate type of specification for a given field by following these
simple guidelines.
• Use a Unique specification for any field that will appear only once
within the entire database or for a field that serves as a primary
key.
• Use a Generic specification for a field that serves as a template for
other fields within the database. Remember to use a nonspecific
field name and element settings that are as broad and general as
possible.
• Use a Replica specification for a field that you base on a given
generic field or for a field that serves as a foreign key within a
table relationship.
Figure 9.8 shows the complete Unique field specification for a VENDOR
ID NUMBER field.
Here are a few things to note about this specification.
1. This field also appears in the PRODUCTS table, as indicated
by the Shared By general element. This is both reasonable and
necessary because each product must be associated with a
specific vendor. (You’ll learn more about this type of issue in the
next chapter.)
2. Examine the settings for the Uniqueness, Null Support,
Required Value, and Edit Rule logical elements. They are set in
this manner because the Key Type element is set to “Primary.”
ptg14955309
Using Unique, Generic, and Replica Field Specifications 301
General Elements
Field Name:
Label:
Parent Table:
Shared By:
Alias(es):
Description:
Specification Type:
Source Specification:
ReplicaUnique Generic
Physical Elements
Length:
Decimal Places:
Input Mask:
Display Format:
Data Type: Character Support:
Letters (A–Z)
Numbers (0–9)
Logical Elements
Key Structure:
Non
Not Determined At This Time
Edit Rule:
Null Support: Nulls Allowed
Enter Now, Edits Allowed
Enter Now, Edits Not Allowed
Enter Later, Edits Allowed
Primary
AlternateForeign
No Nulls
Uniqueness: Non-unique Unique
Required Value: No Yes
Comparisons Allowed:
Range of Values:
Default Value:
Values Entered By: User
Operations Allowed:
System
Key Type:
CompositeSimple
Enter Later, Edits Not Allowed
<> ≠<=>=
Other Fields
Same Field =
Value Expression
<> ≠<=>==
<> ≠<=>==
All
All
All
÷Same Field
Other Fields Concatenation
÷
All
All
+
+
x
x
Value Expression All Concatenation÷+x
Concatenation
100000–200000
x
x
x
x
x
x
x
x
x
x
A unique number used to identify each Vendor that supplies our organization with goods or
services. It is assigned when we place the first order for such goods or services with the
Vendor.
x
Numeric
6
0
######
000000
Products
Vendor #
Vendors
Vendor ID Number
.Keyboard ( , / $ # %)
–
–
–
FIELD SPECIFICATIONS
x
x
Figure 9.8 Unique field specification for the VENDOR ID NUMBER field

ptg14955309
302 Chapter 9 Field Specifications
You should, in fact, use these element settings for any field that
serves as a primary key.
3. The Comparisons Allowed logical element is set to “Same Field—
Equals” so that a user can compare VENDOR ID NUMBER values in
the VENDORS table to VENDOR ID NUMBER values in the PROD-
UCTS table.
4. The Comparisons Allowed logical element is also set to “Value
Expression—Equals” so that a user can compare VENDOR ID
NUMBER values to some arbitrary numeric value.
Figure 9.9 shows the complete Generic field specification for a generic
STATE field.
Take note of these particular items.
1. The description is very general, as it should be for this type of
specification.
2. The setting of the Display Format physical element is in the
form of an instruction. This demonstrates that you have a great
deal of flexibility in the way you set this element.
3. The Range of Values logical element is appropriately broad.
4. The Comparisons Allowed logical element is set to “Value
Expression—Equals” so that a user can compare STATE values to
some arbitrary two-character alphanumeric value.
5. The Operations Allowed logical element is set to “Other Fields—
Concatenation” so that a user can concatenate a given STATE
value to the value of some other alphanumeric field.
6. The Operations Allowed logical element is also set to “Value
Expression—Concatenation” so that a user can concatenate a
given STATE value to some arbitrary alphanumeric value.

ptg14955309
Using Unique, Generic, and Replica Field Specifications 303
General Elements
Field Name:
Label:
Parent Table:
Shared By:
Alias(es):
Description:
Specification Type:
Source Specification:
ReplicaUnique Generic
Physical Elements
Length:
Decimal Places:
Input Mask:
Display Format:
Data Type: Character Support:
Letters (A–Z)
Numbers (0–9) Special ( © ® ™ Σ π)
Logical Elements
Key Structure:
Non
Not Determined At This Time
Edit Rule:
Null Support: Nulls Allowed
Enter Now, Edits Allowed
Enter Now, Edits Not Allowed
Enter Later, Edits Allowed
Primary
AlternateForeign
No Nulls
Uniqueness: Non-unique Unique
Required Value: No Yes
Comparisons Allowed:
Range of Values:
Default Value:
Values Entered By: User
Operations Allowed:
System
Key Type:
CompositeSimple
Enter Later, Edits Not Allowed
<> <=>=
Other Fields
Same Field =
Value Expression
<> <=>==
<> <=>==
All
All
All
Same Field
Other Fields Concatenation
All
All
+
+
x
x
Value Expression All Concatenation+ x
Concatenation
x
x
x
x
x
x
x
x
xx
State
A state or territory within the United States in which a person, organization, or institution
resides or conducts business.
Alphanumeric
2
None
AA
Both letters should be capitalized.
All state abbreviations recognized by the United States Postal Service.
x
x
x
x
≠
≠
≠
÷
÷
÷
.Keyboard ( , / $ # %)
FIELD SPECIFICATIONS
–
–
–
Figure 9.9 Generic field specification for a generic STATE field

ptg14955309
304 Chapter 9 Field Specifications
This field (and its specification) now serves as a template for all other
state fields you create in the database. For example, you can create a
VENDSTATE field based on the generic STATE field. You’ll define a Replica
specification for the VENDSTATE field that is based on the STATE field’s
Generic specification. Although the VENDSTATE field’s Replica specifi-
cation draws its initial element settings from the STATE field’s Generic
specification, you can modify any of the Replica specification’s element
settings so that you can completely customize them for the VENDSTATE
field. Figure 9.10 shows the customized Replica field specifications for
the VENDSTATE field.
Here are a few things to note about this specification.
1. The field name (VENDSTATE) accurately denotes what the field
represents.
2. The label (“State”) is what the user will see on visual displays
and printed documents.
3. The Source Specification general element properly references the
generic STATE field’s specification.
4. The Description element is now specific to this field. Recall that
the description is more general in the source specification.
5. A default value has been set for this field; there is no such value
in the source specification.
6. The Range of Values element is now specific to this field; it was
much broader in the source specification.
In the next chapter, you’ll learn how to define a Replica field specifica-
tion for a field that serves as a foreign key.

ptg14955309
Using Unique, Generic, and Replica Field Specifications 305
General Elements
Field Name:
Label:
Parent Table:
Shared By:
Alias(es):
Description:
Specification Type:
Source Specification:
ReplicaUnique Generic
Physical Elements
Length:
Decimal Places:
Input Mask:
Display Format:
Data Type: Character Support:
Letters (A–Z)
Numbers (0–9) Special ( © ® ™ ∑ π)
Logical Elements
Key Structure:
Non
Not Determined At This Time
Edit Rule:
Null Support: Nulls Allowed
Enter Now, Edits Allowed
Enter Now, Edits Not Allowed
Enter Later, Edits Allowed
Primary
AlternateForeign
No Nulls
Uniqueness: Non-unique Unique
Required Value: No Yes
Comparisons Allowed:
Range of Values:
Default Value:
Values Entered By: User
Operations Allowed:
System
Key Type:
CompositeSimple
Enter Later, Edits Not Allowed
<> <=>=
Other Fields
Same Field =
Value Expression
<> <=>==
<> <=>==
All
All
All
Same Field
Other Fields Concatenation
All
All
+
+
x
x
Value Expression All Concatenation+ x
Concatenation
x
x
x
x
x
x
x
x
xx
x
x
x
x
≠
≠
≠
÷
÷
÷
VendState
Vendors
The state in which the vendor's headquarters are located. This data is a component of the
vendor's overall mailing address.
Alphanumeric
2
Both letters should be capitalized.
None
AA
WA
CA, ID, MT, OR, WA
State
.Keyboard ( , / $ # %)
–
–
–
State
FIELD SPECIFICATIONS
Figure 9.10 Customized Replica field specifications for the VENDSTATE field

ptg14955309
306 Chapter 9 Field Specifications
Defining Field Specifications for Each
Field in the Database
Now that you have all the necessary fields assigned to each table and
you understand the various elements within a field specification, you
can begin the process of defining a field specification for each field in
the database. It will take you a considerable amount of time to com-
plete this process, but remember that you’re working diligently to
establish field-level integrity by ensuring that the data is consistent,
valid, and as free from errors as possible. All your hard work will pay
great dividends because the information you retrieve from the data-
base will always be timely and accurate, and you will have a reliable
set of structural blueprints you can use when you implement the data-
base in an RDBMS program.
You can ensure that the specifications are as complete and accurate as
possible by working with both users and management to define them.
They can provide insights into the data and can be of special assistance
in refining the specification’s logical elements. You don’t have to speak
with everyone in the organization, but you do want to assemble and
meet with a representative number of people who are very familiar with
the data and how it is used. Schedule as many meetings as are neces-
sary (or possible) to complete the interview process, and take the time
you need to be as thorough as you can. Above all, do not rush through
this phase! Doing so just diminishes the benefits of your overall efforts
and increases your chances of making unnecessary mistakes.
The best strategy for this task is to define as many of the specifications
as you can (as completely as possible) and then work with the partic-
ipants to complete the rest. As you work with a field’s specifications,
use your best judgment to define the settings for each element. Don’t
worry if your settings seem slightly incorrect or if you have difficulty

ptg14955309
Defining Field Specifications for Each Field in the Database 307
providing settings for some of the elements—you’re going to review
them with the participants anyway. After you’ve defined specifications
for all of the fields that are familiar to you, begin meeting with the par-
ticipants to work on specifications for the remaining fields.
Your first order of business during the initial meeting is to explain the
various elements within a field specification and make sure that every-
one understands them as much as possible. Providing the participants
with a brief and succinct education on the specification’s elements
gives them the knowledge they need to help you define a specification
properly. (In subsequent meetings, just review the elements to make
certain that everyone remembers what they represent.)
Next, review all of the specifications you’ve defined and ask the partici-
pants whether the settings for the elements are suitable and correct. In
some cases, the participants will reveal new information about a field
that will affect that field’s specification. For example, a participant may
remember (prompted by some topic in the discussion) that there is a
specific set of values that has always been used for a particular field;
therefore, you set the field’s Range of Values element to reflect this new
information. Make sure that you examine each part of the specification
and then move on to the next specification when the participants have
no further suggestions for refinement. Repeat this process for each
specification.
Now, work with the participants on the specifications you were unable
to define or complete. Try to work with the people who are most famil-
iar with the fields under discussion because they are likely to know
what settings should be used for the Logical Elements category. Iden-
tify the appropriate element settings for each field and mark them on
the Field Specifications sheet. After you’ve defined specifications for
every field in the database, the entire process is complete.

ptg14955309
308 Chapter 9 Field Specifications
The design of the new database is now close to completion. In the next
chapter, you’ll learn how to establish relationships between the tables
in the database. Relationships are important because they allow a view
to draw data from multiple tables simultaneously.
CASE STUDY
Now that you have all the appropriate fields assigned to the tables in
the Mike’s Bikes database, it’s time to define field specifications for
each field. Before you meet with Mike and his staff, you define as many
field specifications as you can. None of the tables are unusual in any
way, and the fields are pretty straightforward, so you have little diffi-
culty in defining the specifications. Figure 9.11 shows the specifica-
tions for the PRODUCT DESCRIPTION field in the PRODUCTS table.
Now you meet with Mike and his staff to discuss the field specifica-
tions you’ve defined. No one seems to have problems with any of the
specifications; everyone confirms that all of the element settings seem
suitable and correct. You do have a question, however, regarding the
CATEGORY field in the PRODUCTS table: You want to know the appro-
priate setting for the Range of Values element. The response to your
question is mixed—no one seems to know the complete list of catego-
ries that are valid for the field, so you decide to specify a general range
of values for now. Figure 9.12 shows the revised logical elements for the
CATEGORY field.
You’ll revisit this field (and its elements) again when you establish
business rules for the database. With this problem solved, your meet-
ing—as well as the process of establishing field specifications—is
complete.
ptg14955309
Defining Field Specifications for Each Field in the Database 309
General Elements
Field Name:
Label:
Parent Table:
Shared By:
Alias(es):
Description:
Specification Type:
Source Specification:
ReplicaUnique Generic
Physical Elements
Length:
Decimal Places:
Input Mask:
Display Format:
Data Type: Character Support:
Letters (A–Z)
Numbers (0–9) Special ( © ® ™ ∑ π)
Logical Elements
Key Structure:
Non
Not Determined At This Time
Edit Rule:
Null Support: Nulls Allowed
Enter Now, Edits Allowed
Enter Now, Edits Not Allowed
Enter Later, Edits Allowed
Primary
AlternateForeign
No Nulls
Uniqueness: Non-unique Unique
Required Value: No Yes
Comparisons Allowed:
Range of Values:
Default Value:
Values Entered By: User
Operations Allowed:
System
Key Type:
CompositeSimple
Enter Later, Edits Not Allowed
<> <=>=
Other Fields
Same Field =
Value Expression
<> <=>==
<> <=>==
All
All
All
Same Field
Other Fields Concatenation
All
All
+
+
x
x
Value Expression All Concatenation+ x
Concatenation
x
x
x
x
x
x
x
x
≠
≠
≠
÷
÷
÷
Product Description
Description
Products
A statement that provides pertinent details about the product. This information is useful to
our sales and promotion efforts and is provided to our customers by means of various
promotional materials.
Alphanumeric
180
None x
x
x
.Keyboard ( , / $ # %)
FIELD SPECIFICATIONS
–
–
–
Figure 9.11 Field specifications for the PRODUCT DESCRIPTION field
ptg14955309
310 Chapter 9 Field Specifications
Logical Elements
Key Structure:
Non
Not Determined At This Time
Edit Rule:
Null Support: Nulls Allowed
Enter Now, Edits Allowed
Enter Now, Edits Not Allowed
Enter Later, Edits Allowed
Primary
AlternateForeign
No Nulls
Uniqueness: Non-unique Unique
Required Value: No Yes
Comparisons Allowed:
x
x
x
Range of Values:
Default Value:
Values Entered By: User
Operations Allowed:
System
Key Type:
CompositeSimple
x
Enter Later, Edits Not Allowed
<> <=>=
Other Fields
Same Field =
Value Expression
x
<> <=>==
<> <=>==
x
All
All
All
Same Field
Other Fields Concatenation
All
All
+
+
x
x
Value Expression All Concatenation+ x
Concatenation
Any valid internal or external product category.
≠
≠
≠
÷
÷
÷
x
x
x
xx
x
–
–
–
Figure 9.12 The logical elements for the CATEGORY field in the PRODUCTS table
Summary
The chapter opened with an explanation of why field specifications are
important and the benefits you derive from defining them. You learned
that defining specifications helps you establish and enforce field-level
integrity, enhances overall data integrity, and compels you to acquire a
complete understanding of the nature and purpose of the data in the
database. This level of understanding enables you to leverage the data
to your best advantage.
Next, we discussed the anatomy of a field specification. You’re now
familiar with the three categories of elements within the specifica-
tion and the sheet you use to record them. We then discussed each

ptg14955309
Review Questions 311
category and its elements in detail. As you now know, the General Ele-
ments category represents the most basic attributes of the field. During
this discussion, you learned a set of guidelines that will help you com-
pose a good field description. You also learned that you could define
three types of specifications, thus enabling you to establish and main-
tain consistent field definitions. We examined the Physical Elements
category next, and you learned that it pertains to the structure of the
field. The Logical Elements category was the last topic of discussion in
this section. You now know that it mainly pertains to a field’s values
and that it includes elements such as Key Type, Null Support, Range of
Values, Edit Rule, Comparisons Allowed, and Operations Allowed.
We then discussed how to use each type of specification, and you
learned a set of guidelines that will help you determine which one to
define for a given field. You also examined samples of the specifica-
tions, and you know how they differ.
The chapter ended with a discussion of defining field specifications
for each field. Here you learned that the best way to ensure complete
and accurate specifications is to work with users and management to
define them. You should first define as many specifications as you can
and then work with the staff to define specifications for the remaining
fields. You also learned that you could work with staff to refine the
specifications you initially defined.
Review Questions
1. State two major reasons why field specifications are important.
2. What do you gain by establishing field-level integrity?
3. What are the three categories of elements in a field specification?
4. Name the three types of specifications.
5. Why is it beneficial for you to compose a proper field description?

ptg14955309
312 Chapter 9 Field Specifications
6. What does the Data Type element indicate?
7. What does the Character Support element indicate?
8. What is the purpose of the Display Format element?
9. What types of keys are indicated on a field specification?
10. True or False: A null represents a blank value.
11. What is the significance of the Range of Values element?
12. What is the purpose of an Edit Rule?
13. What is the purpose of the Comparisons Allowed element?
14. What is a value expression?
15. When do you use a generic specification?

ptg14955309
313
10
Table Relationships
There is no substitute for the comfort supplied by the utterly taken-for-
granted relationship.
—IRIS MURDOCH
Topics Covered in This Chapter
Why Relationships Are Important
Types of Relationships
Identifying Existing Relationships
Establishing Each Relationship
Refining All Foreign Keys
Establishing Relationship Characteristics
Relationship-Level Integrity
Case Study
Summary
Review Questions
You learned in Chapter 3, “Terminology,” that a relationship exists
between two tables when you can in some way associate the records
of the first table with those of the second. You also learned that each
relationship has three distinct characteristics: the type of relationship
that exists between the tables, the manner in which each participates,
and the degree to which each table participates.
In this chapter, I’ll discuss these topics in more detail. You’ll first learn
how to identify and establish the relationships between the tables in a
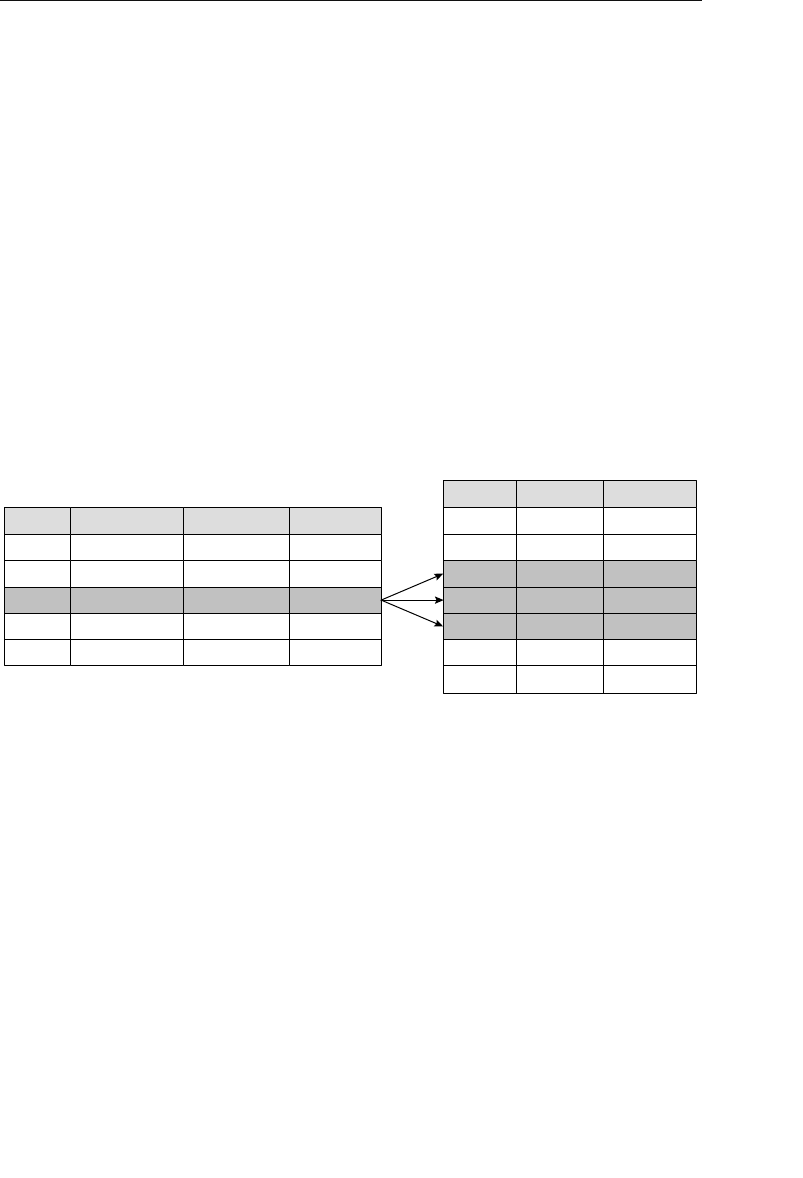
ptg14955309
314 Chapter 10 Table Relationships
database and then how to set each relationship’s characteristics. You’ll
also learn how to diagram tables and relationships, which will enable
you to create a graphic representation of the entire database structure.
Why Relationships Are Important
A relationship is an important component of a relational database.
•It establishes a connection between a pair of tables that are log-
ically related to each other. A pair of tables is logically related
via the data each contains. For example, consider the tables in
Figure 10.1.
StudLast Name
Ehrlich
Black
Rosales
StudFirst Name
Zachary
Susan
Joe
Student ID
60001
60002
60003
Students
<< other fields >>
......
......
......
ChowMichael60004 ......
ThompsonAngie60005 ......
Student Instruments
Student ID
60002
60003
60001
Checkout Date
09/26/11
09/28/11
09/28/11
Instrument ID
1000
1002
1010
60003 09/28/111013
60003 09/28/111011
60001
60001
10/02/11
10/02/11
1022
1021
Figure 10.1 A pair of logically related tables
A logical relationship exists between the data in the STUDENTS
table and the data in the STUDENT INSTRUMENTS table. A stu-
dent can check out one or more instruments during the course
of a school year, so a record in the STUDENTS table (represent-
ing the student) can be related to one or more records in the
STUDENT INSTRUMENTS table (representing the particular
instruments the student checks out).
•It helps to further refine table structures and minimize redundant
data. As you establish a relationship between a pair of tables,

ptg14955309
Types of Relationships 315
you will inevitably make minor modifications to the table struc-
tures. These refinements will make the structures more efficient
and minimize any redundant data that the tables may contain.
•It is the mechanism that enables you to draw data from multiple
tables simultaneously. In Chapter 12, “Views,” you’ll learn how a
relationship enables you to construct a view using fields from two
or more related tables.
A properly defined relationship ensures relationship-level integrity,
which guarantees that the relationship itself is reliable and sound.
(Recall that relationship-level integrity is a component of overall data
integrity.) You can take advantage of the many benefits a relational
database provides only when you establish each relationship care-
fully and properly. Failure to do so means that you’ll have a hard and
tedious time working with data from multiple tables, and you’ll cer-
tainly encounter problems when you try to insert, update, or delete
records in related tables. You’ll learn more about these types of prob-
lems later as the design process unfolds.
Types of Relationships
Before you begin to establish relationships between tables in the data-
base, you must know what types of relationships can exist between
a given pair of tables. Knowing how to identify them properly is an
invaluable skill for designing a database successfully.
There are three specific types of relationships that can exist between
a pair of tables: one-to-one, one-to-many, and many-to-many. The tables
participate in only one type of relationship at any given time. (You’ll
rarely need to change the type of relationship between a pair of tables.
Only major changes in either of the table’s structures could cause you
to change the relationship.)

ptg14955309
316 Chapter 10 Table Relationships
❖Note The discussion for each type of relationship begins with
a generic example of the relationship. Learning how to visualize
a relationship generically enables you to understand the princi-
ple behind the relationship itself. Once you understand how and
why the relationship works, you’ll be able to determine whether it
exists between a given pair of tables quite easily.
Each discussion also includes an example of how to diagram
the relationship. I provide special instructions pertaining to the
diagramming process where appropriate and explain the sym-
bols incorporated within the diagram as necessary. This allows
you to learn the diagramming method at a reasonable pace and
keeps you from having to memorize the entire set of diagram
symbols all at once.
Figure 10.2 shows the first symbols you will use to diagram a table
relationship.
Table Name
Subset TableData Table
Table Name
Figure 10.2 Diagramming symbols for a data table and a subset table
One-to-One Relationships
A pair of tables bears a one-to-one relationship when a single record
in the first table is related to only one record in the second table, and
a single record in the second table is related to only one record in
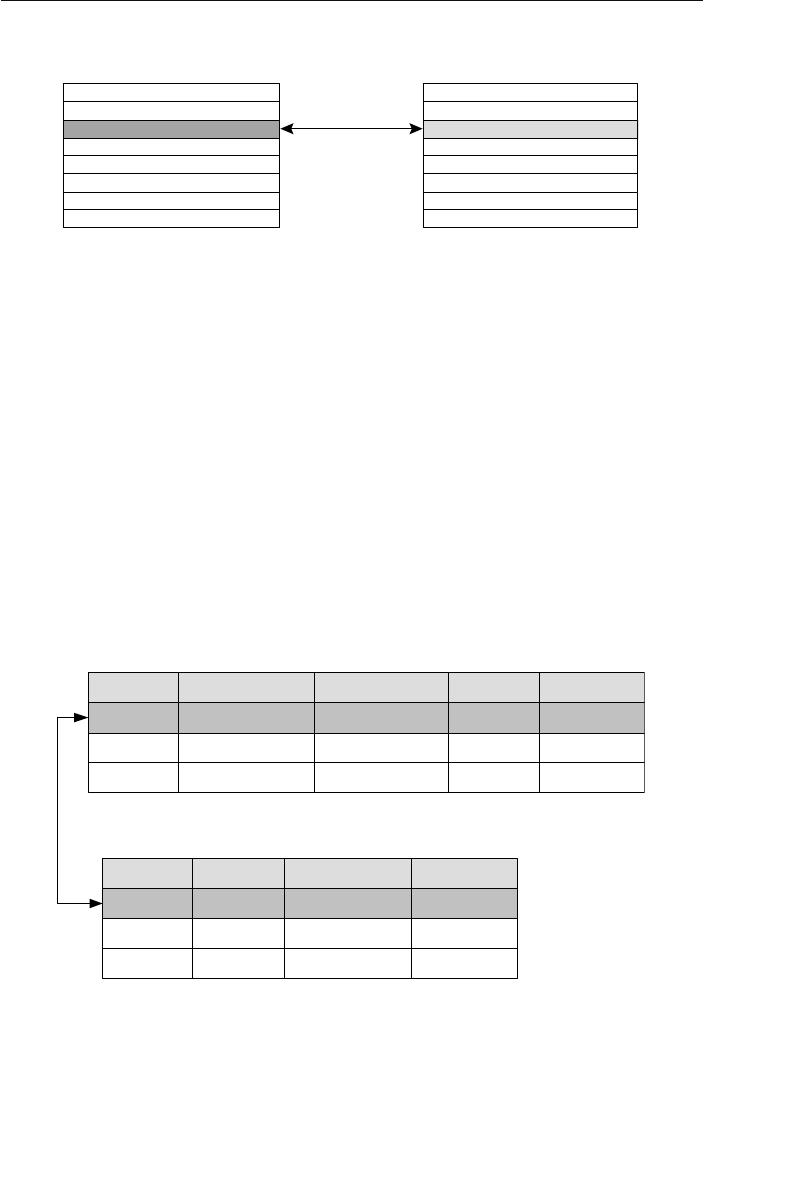
ptg14955309
Types of Relationships 317
the first table. Figure 10.3 shows a generic example of a one-to-one
relationship.
As you can see, a single record in TABLE A is related to only one
record in TABLE B, and a single record in TABLE B is related to only
one record in TABLE A. A one-to-one relationship usually (but not
always) involves a subset table. Figure 10.4 shows an example of a
typical one-to-one relationship that you might find in a database for an
organization’s human resources department. This example also illus-
trates a situation where neither of the tables is a subset table.
Employees
Compensation
Home Phone
553-3992
790-3992
551-4993
EmpLast Name
Erlich
Black
Rosales
EmpFirst Name
Zachary
Susan
Joe
EmpID
100
101
102
<< other fields >>
......
......
......
EmpID
100
101
102
Commission Rate
5.0%
3.5%
5.0%
Hourly Rate
25.00
19.75
22.50
<< other fields >>
......
......
......
Figure 10.4 A typical example of a one-to-one relationship
Table A Table B
Figure 10.3 A generic example of a one-to-one relationship
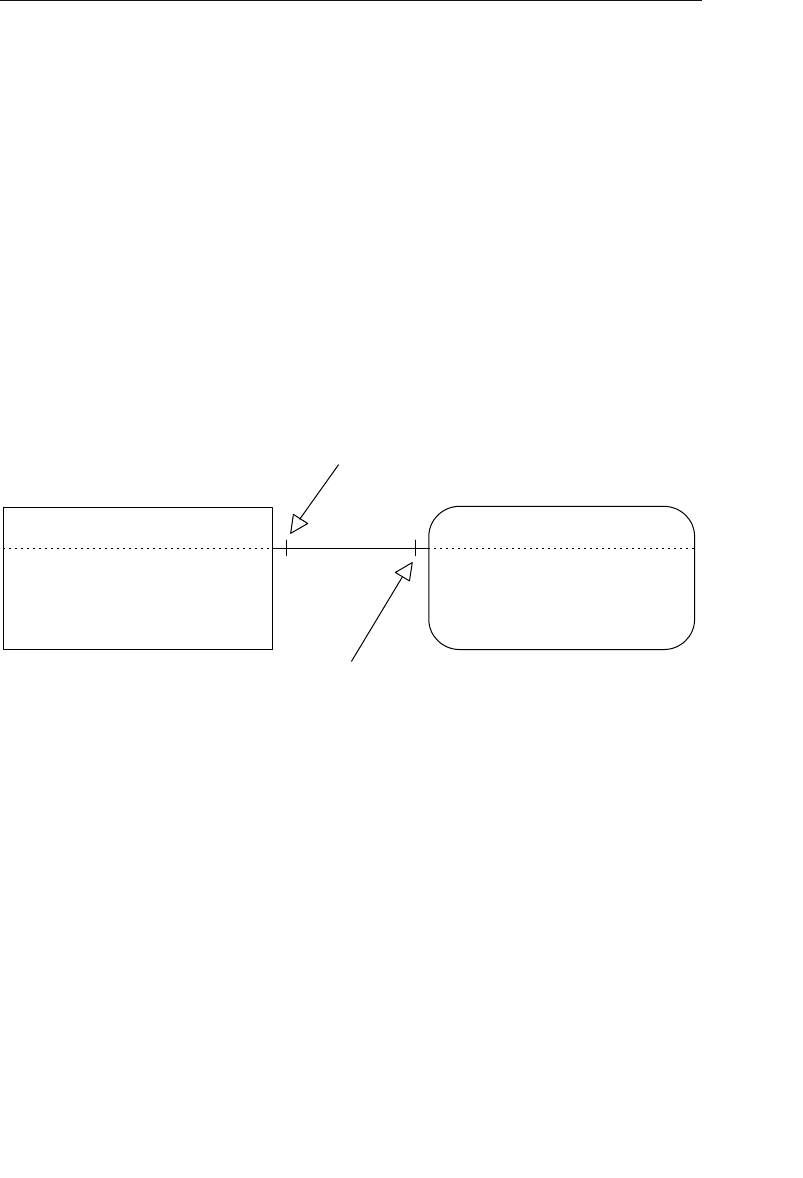
ptg14955309
318 Chapter 10 Table Relationships
Although the fields in these tables could be combined into a sin-
gle table, the database designer chose to place the fields that can be
viewed by anyone in the organization in the EMPLOYEES table and
the fields that can be viewed only by authorized personnel in the
COMPENSATION table. Only one record is required to store the com-
pensation data for a given employee, so there is a distinct one-to-one
relationship between a record in the EMPLOYEES table and a record
in the COMPENSATION table.
Figure 10.5 shows a generic example of how you create a relationship
diagram for a one-to-one relationship.
Table NameTable Name
This line indicates that a single
record in TABLE B is related to
only one record in TABLE A.
This line indicates that a single
record in TABLE A is related to
only one record in TABLE B,
Figure 10.5 Diagramming a one-to-one relationship
The line that appears between the tables in the diagram indicates the
type of relationship, and there is a particular line that you use for each
type. Later in this chapter, you’ll learn how to modify the line so that
it also shows the characteristics of the relationship. Figure 10.6 shows
the relationship diagram for the EMPLOYEES and COMPENSATION
tables in Figure 10.4. (Note that a Data Table symbol represents each
table.)
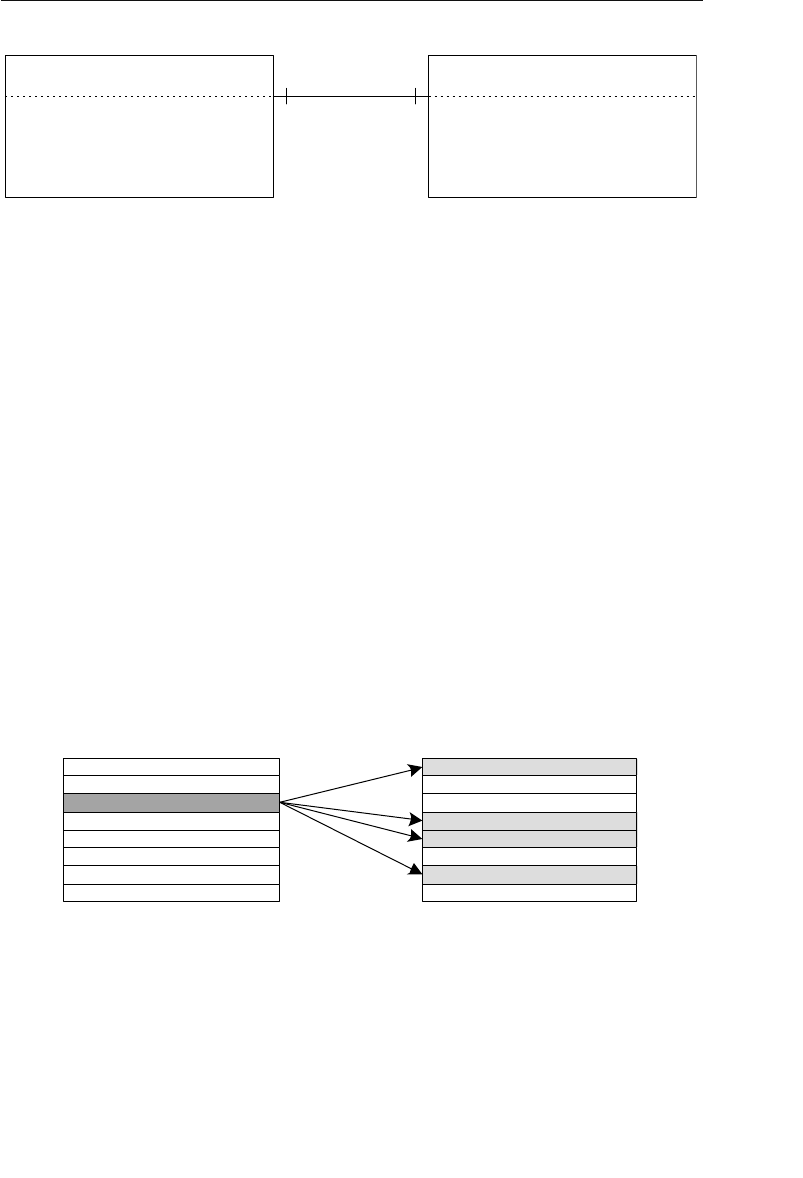
ptg14955309
Types of Relationships 319
One-to-Many Relationships
A one-to-many relationship exists between a pair of tables when a sin-
gle record in the first table can be related to one or more records in the
second table, but a single record in the second table can be related to
only one record in the first table. Let’s look at a generic example of this
type of relationship.
Say you’re working with two tables, TABLE A and TABLE B, that have
a one-to-many relationship between them. Because of the relationship,
a single record in TABLE A can be related to one or more records in
TABLE B. Figure 10.7 shows the relationship from the perspective of
TABLE A.
Table A Table B
Figure 10.7 A one-to-many relationship from the perspective of TABLE A
Conversely, a single record in TABLE B can be related to only one
record in TABLE A. Figure 10.8 shows the relationship from the per-
spective of TABLE B.
Employees Compensation
Figure 10.6 The relationship diagram for the EMPLOYEES and COMPENSATION
tables
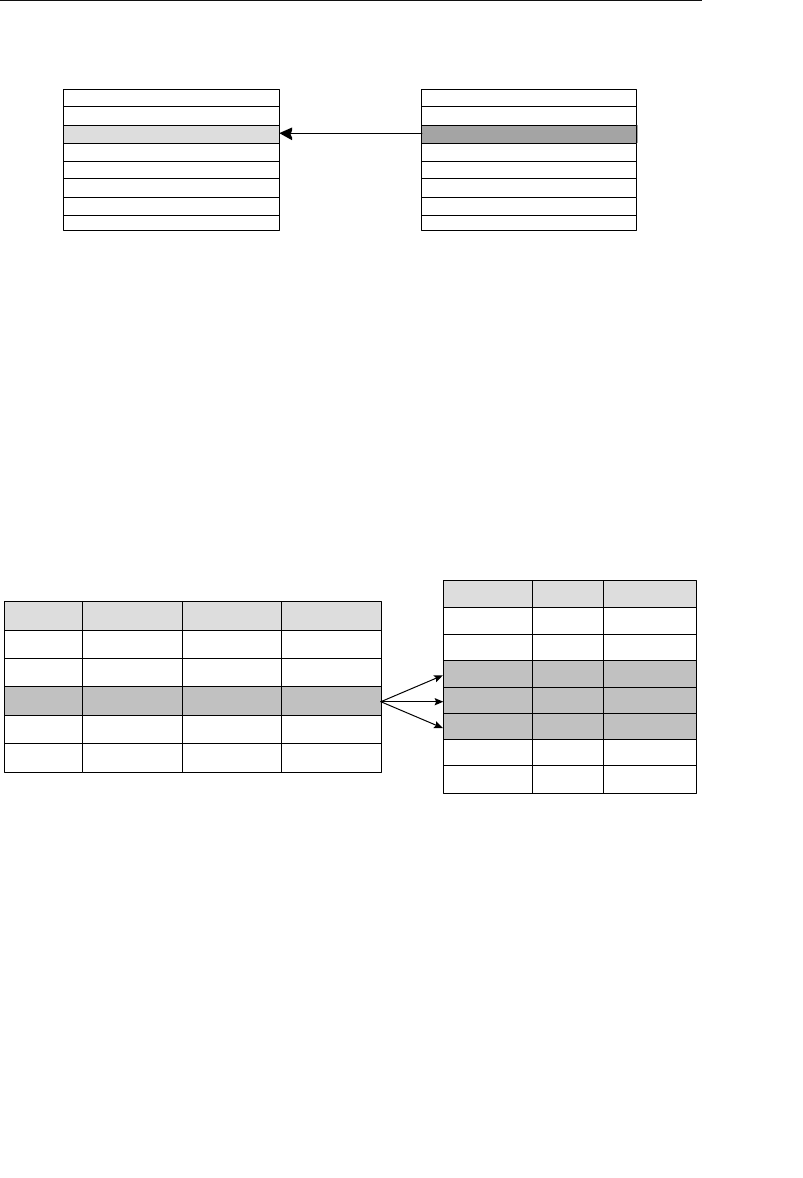
ptg14955309
320 Chapter 10 Table Relationships
This is by far the most common relationship that exists between a pair
of tables in a database, and it is the easiest to identify. It is crucial
from a data integrity standpoint because it helps to eliminate duplicate
data and to keep redundant data to an absolute minimum. Figure 10.9
shows a common example of a one-to-many relationship that you might
find in a database for an equipment rental store.
CustLast Name
Litwin
Balter
Baron
CustFirst Name
Paul
Alison
Andy
Customer ID
9001
9002
9003
Customers
......
......
......
KunickiChris9004 ......
ChipmanMary9005 ......
Customer Rentals
Customer ID
9002
9003
9001
Checkout Date
09/26/11
09/28/11
09/28/11
Item ID
80115
64558
10202
9003 09/28/1111354
9003 10/02/1178422
9005
9004
09/26/11
10/05/11
30556
20655
<< other fields >>
Figure 10.9 A typical example of a one-to-many relationship
A customer can check out any number of items, so a single record
in the CUSTOMERS table can be related to one or more records in
the CUSTOMER RENTALS table. A single item, however, is associ-
ated with only one customer at any given time, so a single record in
the CUSTOMER RENTALS table is related to only one record in the
CUSTOMERS table.
Table A Table B
Figure 10.8 A one-to-many relationship from the perspective of TABLE B
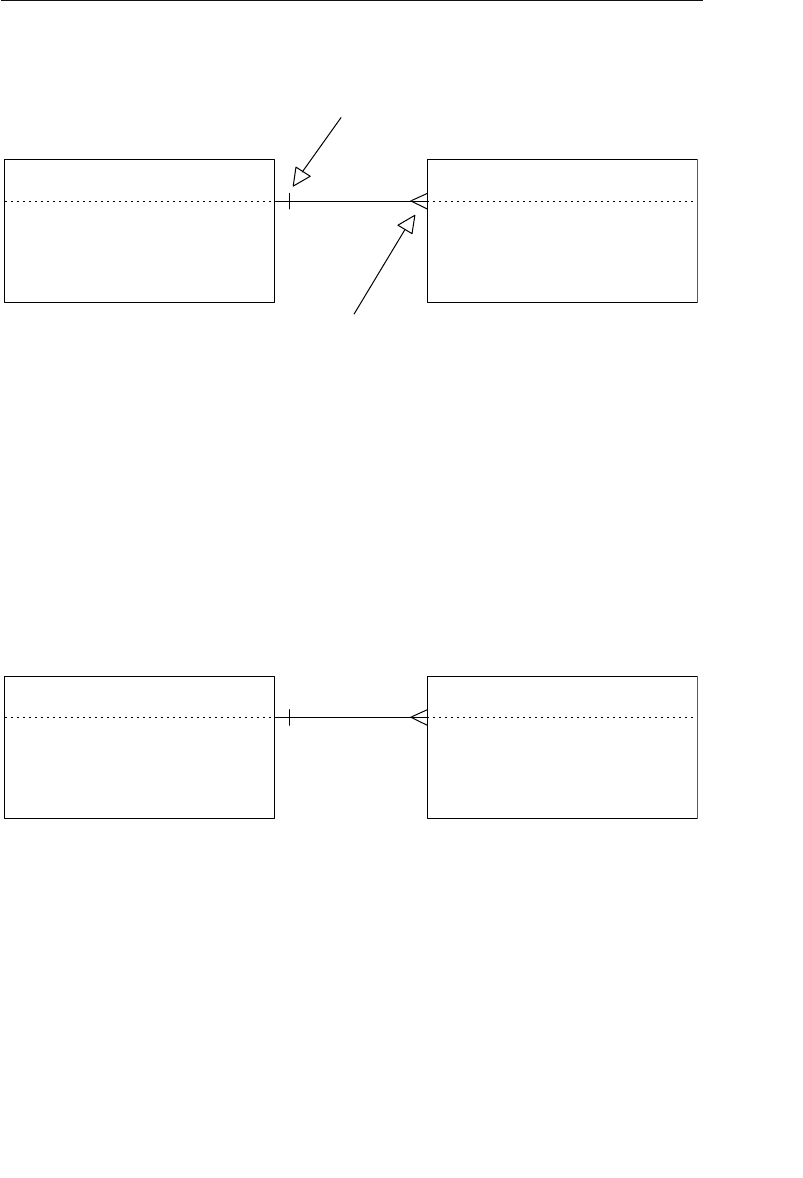
ptg14955309
Types of Relationships 321
Figure 10.10 shows a generic example of how you create a relationship
diagram for a one-to-many relationship.
Note that the crow’s foot symbol is always located next to the table on
the “many” side of the relationship. Figure 10.11 shows the relationship
diagram for the CUSTOMERS and CUSTOMER RENTALS tables in
Figure 10.9.
Customers Customer Rentals
Figure 10.11 The relationship diagram for the CUSTOMERS and CUSTOMER
RENTALS tables
Many-to-Many Relationships
A pair of tables bears a many-to-many relationship when a single
record in the first table can be related to one or more records in the
Table A
This line indicates that a single
record in TABLE B is related to
only one record in TABLE A.
This “crow’s foot” indicates that a
single record in TABLE A is related
to many records in TABLE B.
Table B
Figure 10.10 Diagramming a one-to-many relationship
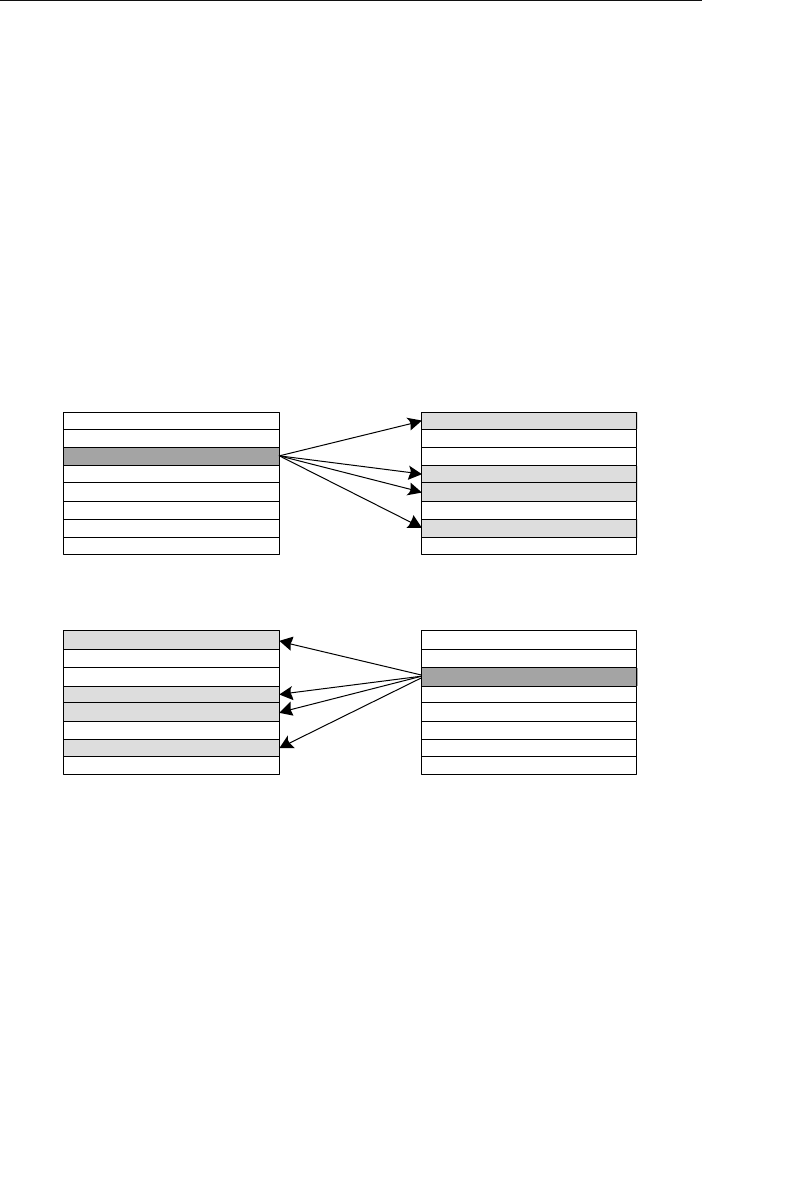
ptg14955309
322 Chapter 10 Table Relationships
second table and a single record in the second table can be related to
one or more records in the first table.
Assume once again that you’re working with TABLE A and TABLE B
and that there is a many-to-many relationship between them. Because
of the relationship, a single record in TABLE A can be related to one or
more records (but not necessarily all) in TABLE B. Conversely, a single
record in TABLE B can be related to one or more records (but not nec-
essarily all) in TABLE A. Figure 10.12 shows the relationship from the
perspective of each table.
Table A Table B
Table A Table B
Figure 10.12 A many-to-many relationship from the perspective of both TABLE A
and TABLE B
This is the second most common relationship that exists between a pair
of tables in a database. It can be a little more difficult to identify than
a one-to-many relationship, so you must be sure to examine the tables
carefully. Figure 10.13 shows a typical example of a many-to-many rela-
tionship that you might find in a school database, which happens to be
a classic example of this type of relationship (no pun intended!).
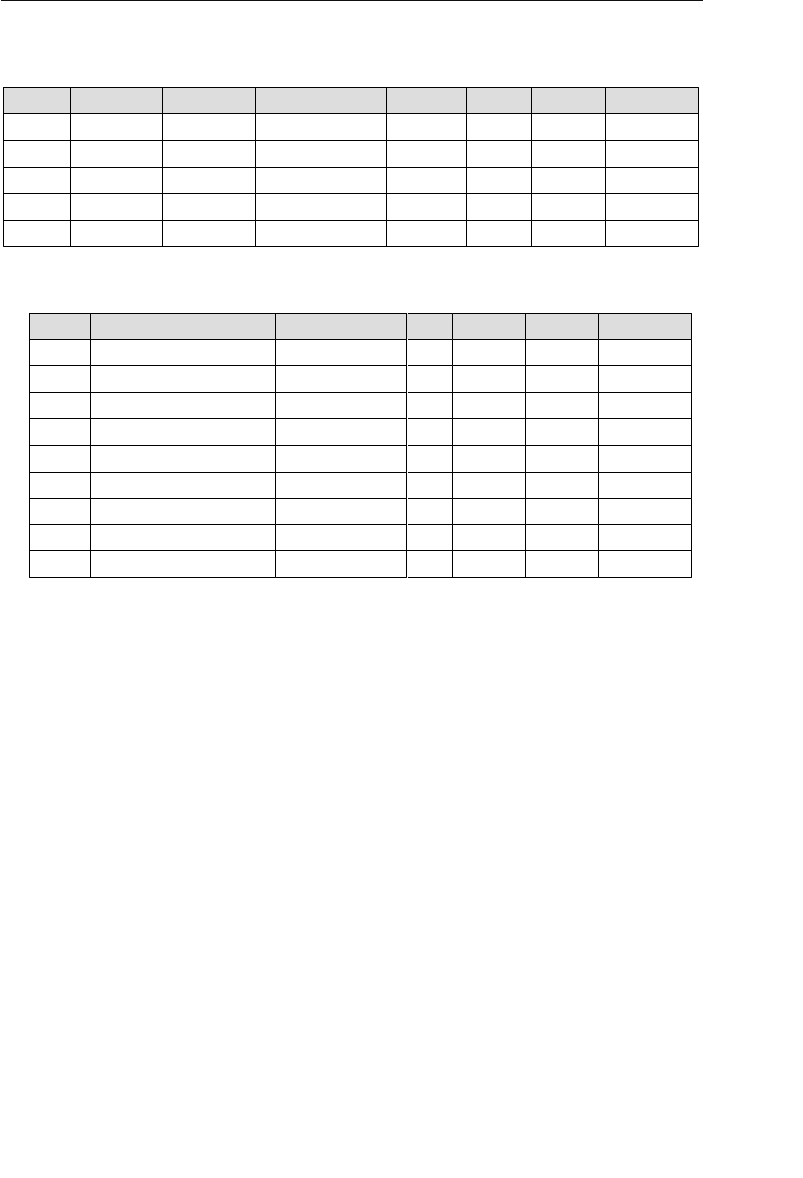
ptg14955309
Types of Relationships 323
A student can attend one or more classes during a school year, so a
single record in the STUDENTS table can be related to one or more
records in the CLASSES table. Conversely, one or more students will
attend a given class, so a single record in the CLASSES table can be
related to one or more records in the STUDENTS table.
Figure 10.14 shows a generic example of how you create a relationship
diagram for a many-to-many relationship.
In this case, there is a crow’s foot symbol located next to each table.
Figure 10.15 shows the relationship diagram for the STUDENTS and
CLASSES tables in Figure 10.13.
Introduction to Political Science 5900009 Political Science 220337 ......
3308
Class NameClass ID
900001
900002
900003
Instructor ID
220087
220039
220148
Classes
<< other fields >>
......
......
......
Credits
3
5
2
Classroom
2201
7012
3305
Advanced Music Theory
Computers in Business
American History
Computers in Society
Introduction to Database Design
Advanced Calculus
Introduction to Biology
Introduction to Physics
2
4
5
5
5
900004
900005
900006
900007
900008
Computer Science
Math
Music
History
Physics
Computer Science
Biology
Computer Science
Class Category
220387
220387
220498
......
......
......
5115
5117
3112
220516
220087
......
......
5105
2205
<< other fields >>
......
......
......
StudState
WA
WA
WA
WA
WA
StudStreet Address
1204 Bryant Road
201 Cherry Lane SE
4141 Lake City Way
2100 Mineola Avenue
101 C Street, Apt. 32
StudCity
Seattle
Redmond
Woodinville
Bellevue
Redmond
StudZipcode
98125
98052
98073
StudLast Name
Erlich
Black
Rosales
StudFirst Name
Zachary
Susan
Joe
Student ID
60001
60002
60003
Students
PriceDiana60004
WickerathTom60005
98072
98006
......
......
Figure 10.13 A typical example of a many-to-many relationship
ptg14955309
324 Chapter 10 Table Relationships
Problems with Many-to-Many Relationships
A many-to-many relationship has an inherent peculiarity that you
must address before you can effectively use the data from the tables
involved in the relationship. The issue is this: How do you easily
associate records from the first table with records in the second table
in order to establish the relationship? This is an important question
because you’ll encounter problems such as these if you do not estab-
lish the relationship properly.
• It will be tedious and somewhat difficult to retrieve information
from one of the tables.
• One of the tables will contain a large amount of redundant data.
Table A
This “crow’s foot” indicates that a
single record in TABLE B is related to
many records in TABLE A.
This “crow’s foot” indicates that a
single record in TABLE A is related to
many records in TABLE B.
Table B
Figure 10.14 Diagramming a many-to-many relationship
Students Classes
Figure 10.15 The relationship diagram for the STUDENTS and CLASSES tables

ptg14955309
Types of Relationships 325
• Duplicate data will exist within both tables.
• It will be difficult for you to insert, update, and delete data.
There are two common methods that novice and inexperienced devel-
opers use in a futile attempt to address this situation. I’ll demon-
strate how you might apply these methods using the STUDENTS and
CLASSES tables in Figure 10.16 as examples.
❖Note As this example unfolds, keep in mind that every many-
to-many relationship you encounter will exhibit these same
issues.
Table Structures
ClassesStudents
Class NameStudFirst Name
ClassroomStudState
Class CategoryStudLast Name
CreditsStudStreet Address
Instructor IDStudCity
Class DescriptionStudZipcode
Class ID PKStudent ID PK
Catalog CodeStudHome Phone
Social Security Number
StudEmail Address
Figure 10.16 Structures of the STUDENTS and CLASSES tables
As you can see, there is no actual connection between the two tables,
so you have no way of associating records in one table with records in
the other table. The first method you might use to attempt to establish

ptg14955309
326 Chapter 10 Table Relationships
a connection involves taking a field from one table and incorporating it
a given number of times within the other table. (This approach usually
appeals to people who are accustomed to working with spreadsheets.)
For example, you could take the STUDENT ID field from the STUDENTS
table and incorporate it within the CLASSES table structure, creat-
ing as many copies of the field as you need to represent the maximum
number of students that could attend any class. Figure 10.17 shows
the revised version of the CLASSES table structure.
Table Structures
Student ID 22Student ID 14Student ID 6
Student ID 17Student ID 9Student ID 1Class ID PK
Student ID 21Student ID 13Student ID 5Instructor ID
Student ID 18Student ID 10Student ID 2Class Name
Student ID 23Student ID 15Student ID 7Class Description
Classes
Student ID 19Student ID 11Student ID 3Class Category
Student ID 20Student ID 12Student ID 4Credits
Classroom
Student ID 24Student ID 16Student ID 8Catalog Code
Figure 10.17 Incorporating STUDENT ID fields within the CLASSES table structure
This structure is likely to be problematic, so you might try taking the
CLASS ID field from the CLASSES table and incorporating it within the
STUDENTS table structure instead. Figure 10.18 shows the revised
version of the STUDENTS table structure.
Do these structures look (vaguely) familiar? They should. By using
this method, all you’ve done is to introduce a “flattened” multivalued
field into the table structure. In doing so, you’ve also introduced the

ptg14955309
Types of Relationships 327
problems associated with a multivalued field. (If necessary, review
Chapter 7, “Establishing Table Structures.”) Although you know how to
resolve a multivalued field, this is not a good or proper way to establish
the relationship.
The second method you might attempt to use is simply a variation of
the first method. In this case, you take one or more fields from one
table and incorporate a single instance of each field within the other
table. For example, you could take the CLASS ID, CLASS NAME, and
INSTRUCTOR ID fields from the CLASSES table and incorporate them into
the STUDENTS table in order to identify the classes in which a student
is currently enrolled. This may seem to be a distinct improvement over
the first method, but you’ll see that there are problems that arise from
such modifications when you load the revised STUDENTS table with
sample data.
Table Structures
Students
Social Security Number
StudEmail Address
Student ID PK Class ID 1
StudFirst Name Class ID 2
StudLast Name Class ID 3
StudStreet Address Class ID 4
StudCity Class ID 5
StudState Class ID 6
StudZipcode Class ID 7
StudHome Phone Class ID 8
Figure 10.18 Incorporating CLASS ID fields within the STUDENTS table structure
ptg14955309
328 Chapter 10 Table Relationships
Figure 10.19 clearly illustrates the problems you’ll encounter using this
method.
•The table contains unnecessary duplicate fields. You learned all
about unnecessary duplicate fields and the problems they pose
back in Chapter 7, so you know that using them here is not
a good idea. Besides, it is very likely that the CLASS NAME and
INSTRUCTOR ID fields are not appropriate in the STUDENTS table—
the CLASS ID field identifies the class sufficiently, and it is really
all you need to identify the classes a student is taking.
•There is a large amount of redundant data. Even if you remove the
CLASS NAME and INSTRUCTOR ID fields from the STUDENTS table,
the CLASS ID field will still produce a lot of redundant data.
•It is difficult to insert a new record. If you enter a record in the
STUDENTS table for a new class (instead of entering it in the
CLASSES table) without also entering student data, the fields
pertaining to the student will be null—including the primary key
Student Last NameStudent First NameStudent ID
Students
Class Name
Class ID Instructor ID << other fields >>
ErlichZachary60001
ErlichZachary60001
ErlichZachary60001
ErlichZachary60001
Introduction to Political Science900009 220087 ......
Advanced Music Theory
Computers in Business
900002
900004
220039
220121
......
......
American History900003 220148 ......
BlackSusan60002
BlackSusan60002
BlackSusan60002
Advanced Music Theory900002 220039 ......
Introduction to Political Science900009 220087 ......
Introduction to Biology900006 220117 ......
RosalesJoe60003 Computers in Business900004 220121 ......
RosalesJoe60003 Advanced Calculus900001 220101 ......
RosalesJoe60003 Introduction to Physics900008 220075 ......
PriceDiana60004 Introduction to Database Design900007 220120 ......
Figure 10.19 The revised STUDENTS table with sample data

ptg14955309
Types of Relationships 329
of the STUDENTS table (STUDENT ID). This will automatically trig-
ger a violation of the Elements of a Primary Key because the pri-
mary key cannot be null; therefore, you cannot insert the record
into the table until you can provide a proper primary key value.
•It is difficult to delete a record. This is especially true if the only
data about a new class has been recorded in the particular
student record you want to delete. Note the record for Diana
Barlet, for example. If Diana decides not to attend any classes
this year and you delete her record, you will lose the data for the
“Introduction to Database Design” class. That might not create
a serious problem—unless someone neglected to enter the data
about this class into the CLASSES table as well. Once you delete
Diana’s record, you’ll have to reenter all of the data for the class
in the CLASSES table.
Fortunately, you will not have to worry about any of these problems
because you’re going to learn the proper way to establish a many-to-
many relationship.
Self-Referencing Relationships
This particular type of relationship does not exist between a pair of
tables, which is why it isn’t mentioned at the beginning of this section.
It is instead a relationship that exists between the records within a
table. Ironically, you’ll still regard this throughout the design process
as a table relationship.
A table bears a self-referencing relationship (also known as a recursive
relationship) to itself when a given record in the table is related to
other records within the table. Similar to its dual-table counterpart,
a self-referencing relationship can be one-to-one, one-to-many, or
many-to-many.
ptg14955309
330 Chapter 10 Table Relationships
One-to-One
A self-referencing one-to-one relationship exists when a given record in
the table can be related to only one other record within the table. The
MEMBERS table in Figure 10.20 is an example of a table with this
type of relationship. In this case, a given member can sponsor only one
other member within the organization; the SPONSOR ID field stores the
member identification number of the member acting as a sponsor. Note
that Susan Black is Tom Wickerath’s sponsor.
<< other fields >>
......
......
......
MbrLast Name
Erlich
Black
Rosales
MbrFirst Name
Zachary
Susan
Joe
Member ID
1001
1002
1003
Members
PriceDiana1004
WickerathTom1005
......
......
Sponsor ID
1001
1003
1002
Figure 10.20 Example of a self-referencing one-to-one relationship
Figure 10.21 shows how you diagram this type of relationship.
The line on the side of the table shows the self-
referencing (or “recursive”) nature of the relationship
and also indicates the relationship type.
Members
Figure 10.21 Diagramming a self-referencing one-to-one relationship
One-to-Many
A table bears a self-referencing one-to-many relationship to itself when
a given record in the table can be related to one or more other records
within the table. Figure 10.22 shows an example in which a given
ptg14955309
Types of Relationships 331
customer can refer other customers to the organization. The REFERRED
BY field stores the customer identification number of the customer
making the referral. Note that Paul Litwin referred both Andy Baron
and Mary Chipman.
CustLast Name
Litwin
Balter
Baron
CustFirst Name
Paul
Alison
Andy
Customer ID
9001
9002
9003
Customers
<< other fields >>
......
......
......
KunickiChris9004 ......
ChipmanMary9005 ......
Referred By
9001
9003
9001
Figure 10.22 Example of a self-referencing one-to-many relationship
Figure 10.23 shows how you diagram a self-referencing one-to-many
relationship.
Customers
Figure 10.23 Diagramming a self-referencing one-to-many relationship
Many-to-Many
A self-referencing many-to-many relationship exists when a given record
in the table can be related to one or more other records within the
table and one or more records can themselves be related to the given
record. This may sound somewhat confusing at first, but the example
in Figure 10.24 should help clarify the matter.
In this case, a particular part can comprise several different com-
ponent parts, and it can itself be a component of other parts. For
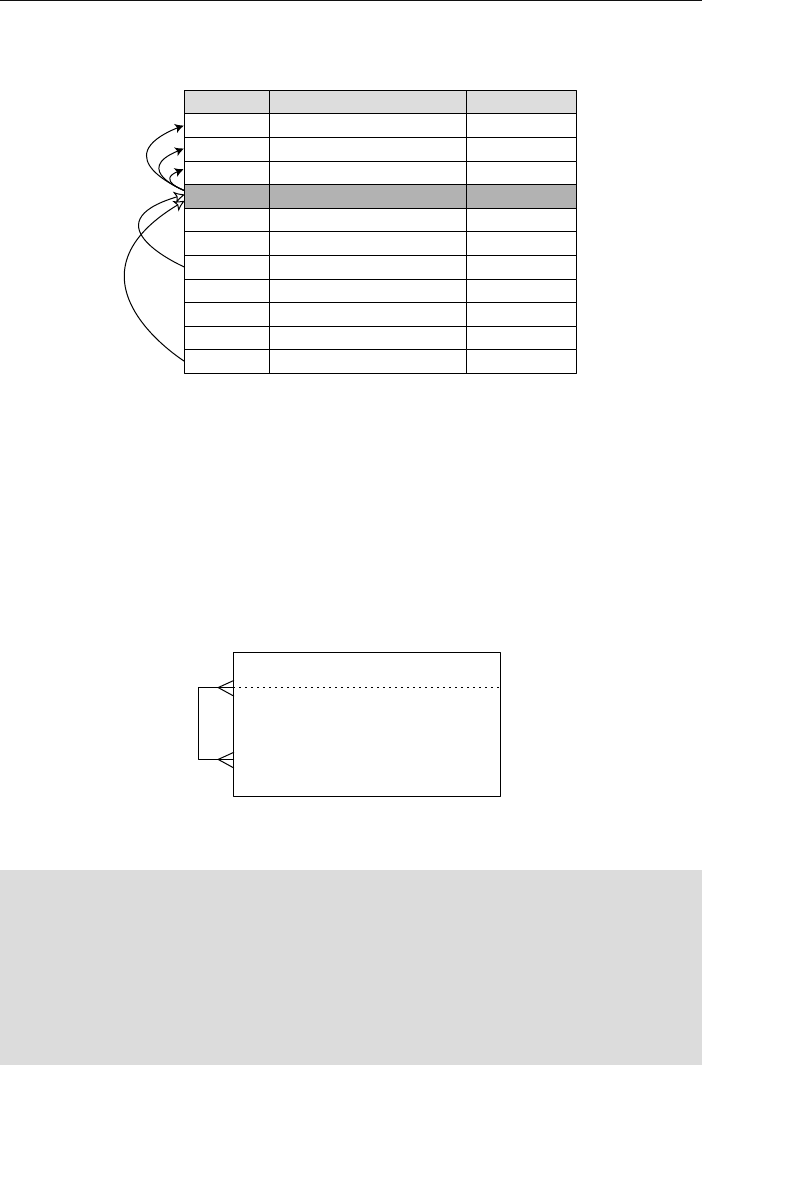
ptg14955309
332 Chapter 10 Table Relationships
example, a clamp assembly (Part ID 704) is composed of a fastening
bolt (Part ID 703), a bottom clamp (Part ID 702), and a top clamp (Part
ID 701). Additionally, the clamp assembly is itself a component of a
seat assembly (Part ID 707) and a frame assembly (Part ID 711). Fig-
ure 10.25 shows how you diagram this type of relationship.
Parts
Figure 10.25 Diagramming a self-referencing many-to-many relationship
❖Note Before you begin to work through the examples in the
remainder of the chapter, now is a good time to remember a prin-
ciple I presented in the introduction:
Focus on the concept or technique and its intended results, not
on the example used to illustrate it.
Part NamePart ID
Parts
<< other fields >>
701 Top Clamp
702
......
Bottom Clamp
703
......
Fastening Bolt
704
......
Seat Assembly
705
......
Saddle
706
......
Seatpost
707
......
Frame Assembly
708
......
Body Tube
709
......
Front Fork Tube
710
......
Rear Stay Tube ......
711
Clamp Assembly ......
Figure 10.24 Example of a self-referencing many-to-many relationship

ptg14955309
Identifying Existing Relationships 333
There are, without a doubt, any number of ways in which you can relate
the tables in these examples (and also in the case studies), depend-
ing on each table’s role within a given database. The manner in which
I use the examples here is not important; what is important are the
techniques I use to identify and establish relationships between tables.
Once you learn these techniques, you can identify and establish rela-
tionships for any pair of tables within any context you may encounter.
Now that you’ve learned about the various types of table relationships,
your next task is to identify the relationships that currently exist
among the tables in the database.
Identifying Existing Relationships
When you were composing the table descriptions earlier in the data-
base design process (back in Chapter 7, to be exact), you assembled
a representative group of users and management to help you with
that task. These people were also designated as representatives of the
organization and granted the authority to aid in the decision-making
process throughout the remainder of the database design process. (At
least, this is the current assumption for the sake of discussion and
example.) Now you’ll arrange meetings with this group once again so
that they can help you identify existing table relationships. These folks
can provide valuable input because they are likely to have a good per-
spective on how various subjects (or tables) are related. Although their
perceptions of the manner in which these subjects are related may not
always be complete or accurate, their contributions will still be useful
in identifying most of the relationships.
Begin the process of identifying relationships by creating a matrix of
all the tables in your database. (You can do this on a sheet of paper, a
white board, or a spreadsheet program.) For example, assume you’re
working with these tables:
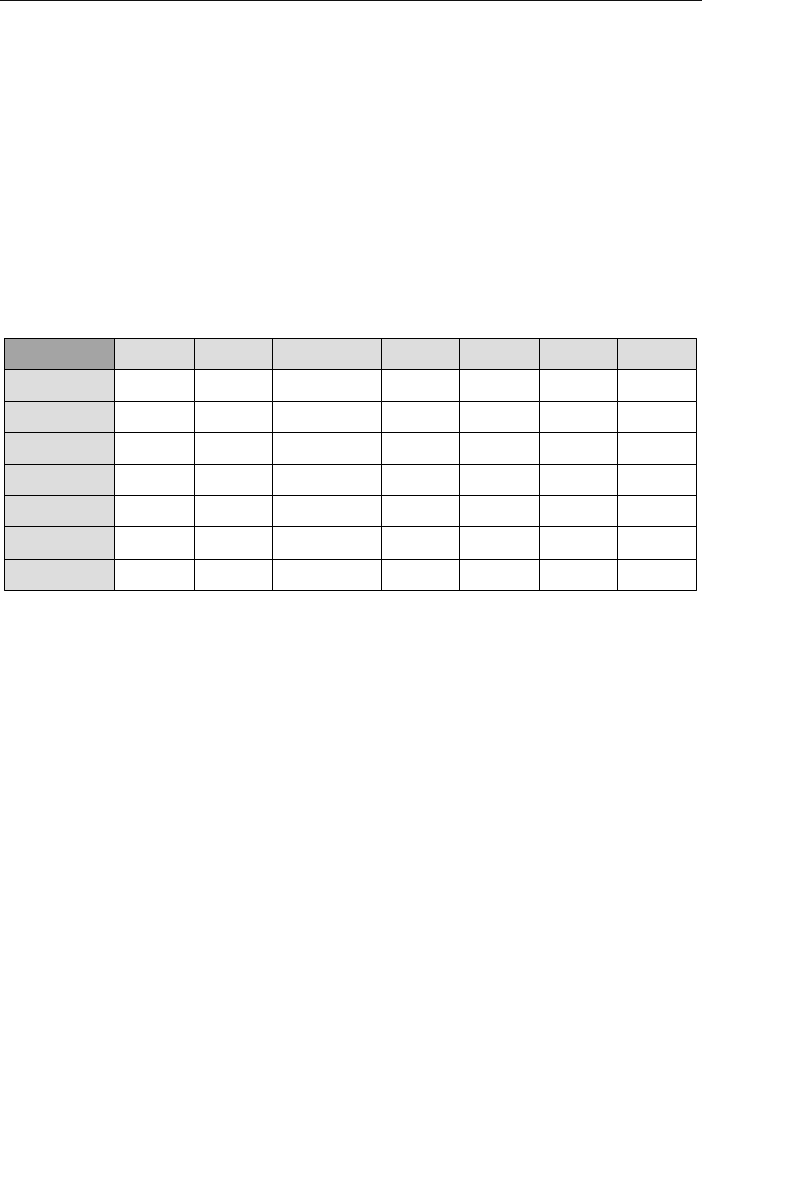
ptg14955309
334 Chapter 10 Table Relationships
BUILDINGS FACULTY STUDENTS
CLASSES ROOMS
COMPENSATION STAFF
List each of the tables across the top of the matrix, and then again
down the left-hand side of the matrix; make certain the table names
are in the same order. Figure 10.26 illustrates how the matrix should
appear.
Buildings
Classes
Compensation
Faculty
Rooms
Staff
Students
Buildings Classes Compensation Faculty Rooms Staff Students
Figure 10.26 Setting up a table matrix to help identify existing relationships
Select a table on the left as a starting point and determine whether it
has a relationship with any of the tables listed across the top, working
your way through the matrix as you do so. (It doesn’t matter whether
you work your way across the top or down the side. Just make sure
you work consistently, as it will make the task much easier.)
Keep in mind that you’re looking for direct relationships only—there
must be a specific connection between tables participating in the rela-
tionship. For example, the CLASSES table has a direct relationship to
the STUDENTS table because one or more students can attend a given
class. Conversely, the CLASSES table has an indirect relationship to
the STAFF table via the FACULTY table; it is a faculty member that
teaches a class, not a staff member. (You don’t have to worry about
indirect relationships just yet.)

ptg14955309
Identifying Existing Relationships 335
As you work with a pair of tables, ask the participants questions about
the records in each table. Your goal is to determine the relationship
between a single record in one table to one or more records in the
other table, and vice versa. (Remember that each record represents a
single instance of the subject represented by the table.) When you get
to a point where you’re examining the same table on both sides of the
matrix, try to determine the relationship between a given record in the
table to one or more other records within the table itself.
There are two types of questions you can ask.
1. Associative: This is a simple and straightforward type of ques-
tion that you can generically phrase as follows: Can a single
record in (name of first table) be associated with one or more
records in (name of second table)? Considering the matrix in
Figure 10.26, you might ask an associative question such as
this:
Can a single record in CLASSES be associated with one or
more records in BUILDINGS?
You can use this type of question to determine whether a table
has a self-referencing relationship by making two minor modi-
fications to the question itself: Can a single (singular form of the
table name) be associated with one or more (plural form of the
table name)? For example, here’s a question you might pose for
the STAFF table:
Can a single staff member be associated with one or more other
staff members?
2. Contextual: This type of question contrasts a single instance
of the subject represented by the first table against multiple
instances of the subject represented by the second table. There
are two categories within this type of question: ownership-
oriented and action-oriented.

ptg14955309
336 Chapter 10 Table Relationships
a. Ownership-oriented questions include words or phrases such
as own, has, is part of, and contain. Here’s an example of this
type of question:
Can a single order contain one or more products?
You can use this question to test for a self-referencing relation-
ship by making the same modifications you made to the asso-
ciative question. Here’s an example of a question you might pose
for a PARTS table:
Can a single part contain one or more other parts?
b. Action-oriented questions incorporate action verbs such as
make, visit, place, teach, and attend. Here’s an example of this
type of question:
Does a single flight instructor teach one or more types of
classes?
As you may have already guessed, you can use this question
to test for a self-referencing relationship as well by making the
same modifications:
Does a single staff member manage one or more other staff
members?
Use the type of question you believe to be the most appropriate for the
pair of tables you’re working with. As you work down the list of tables
in the matrix, you’ll eventually realize that you’re asking questions
about a given pair of tables twice—once from the perspective of the
first table and then again from the perspective of the second table. The
answers to both of these questions will identify the type of relationship
that exists between the tables.
Continuing with the example, assume that you’ve decided to start with
the CLASSES table and this is your first question:
Is a single class held in one or more buildings?

ptg14955309
Identifying Existing Relationships 337
The answer to this question will reveal the type of relationship that
exists between these tables from the perspective of the CLASSES table.
If you receive the following answer, then a one-to-one relationship
exists between these tables:
A single class is held in only one building.
If you receive this answer, however, then a one-to-many relationship
exists between the two tables:
A single class may be held in more than one building.
Once you’ve identified the relationship, indicate the relationship type
in the box located at the junction of the CLASSES table row (on the
left) and the BUILDINGS table column (on the top). You can use the
following shorthand symbols for the relationship types:
1:1—one-to-one
1:N—one-to-many
M:N—many-to-many
❖Note You won’t need the many-to-many shorthand symbol at
this point, but I’ve included it here for completeness.
Figure 10.27 shows how the table matrix looks after you’ve finished
identifying relationships for the CLASSES table. Remember that the
relationships indicated here are from the perspective of the CLASSES
table.
You’ve probably noticed that some of the junction boxes are empty; this
is perfectly acceptable. It’s unnecessary for you to enter anything into
the junction box if there is no relationship between the tables at either
end of the junction.

ptg14955309
338 Chapter 10 Table Relationships
Now you repeat this process for each table on the left-hand side of the
matrix. Remember that you can start with any table. Let’s assume that
you decide to continue with the BUILDINGS table, and you’re attempt-
ing to identify the relationship between it and the CLASSES table. Yes,
I know you’ve covered this once already, but in this case you’re iden-
tifying the relationship from the perspective of the BUILDINGS table.
Let’s now assume that you ask this question:
Does a single building provide space for more than one class?
If the answer is yes, then a one-to-many relationship exists between
these tables; otherwise, it’s a one-to-one relationship. Once you’ve iden-
tified the relationship, indicate the relationship type in the box located
at the junction of the BUILDINGS table row (on the left) and the
CLASSES table column (on the top). Figure 10.28 shows the revised
table matrix with your entries for the BUILDINGS table.
You’ve just seen two examples of how to identify a relationship between
a distinct pair of tables, so let’s take a look at how you identify a
self-referencing relationship for a single table. Assume you’re work-
ing with the STAFF table, and you’re now at the junction between the
STAFF table on the left and the STAFF table on the top. Using the
Buildings
Classes
Compensation
Faculty
Rooms
Staff
Students
Buildings Classes Compensation Faculty Rooms Staff Students
1:1 1:N 1:1 1:N
Figure 10.27 Completed table-matrix entries for the CLASSES table

ptg14955309
Identifying Existing Relationships 339
techniques you learned earlier in this section, you might pose a ques-
tion such as this:
Can a single staff member be associated with one or more other staff
members?
As with the earlier examples, the answer will indicate the type of rela-
tionship. Say you received this answer:
Yes, a given staff member can be the spouse of another staff member.
This indicates (rather obviously) that a self-referencing one-to-one
relationship exists for the STAFF table. But assume you received this
answer instead:
Yes, a single staff member can manage several other staff members.
You probably quickly realized that this answer indicates that a self-
referencing one-to-many relationship exists for the STAFF table.
Identifying these two types of relationships is a relatively easy task;
identifying a self-referencing many-to-many relationship can be
slightly more difficult.
This is the type of question you must ask in order to determine
whether a table has a self-referencing many-to-many relationship: Can
Buildings
Classes
Compensation
Faculty
Rooms
Staff
Students
Buildings Classes Compensation Faculty Rooms Staff Students
1:1 1:N 1:1 1:N
1:N 1:N
Figure 10.28 Completed table-matrix entries for the BUILDINGS table

ptg14955309
340 Chapter 10 Table Relationships
a single (singular form of the table name) be associated with one or
more other (plural form of the table name), and can any of those (plural
form of the table name) then be associated with yet one or more other
(plural form of the table name)? For example, here’s a question you
might pose for the STAFF table:
Can a single staff member be associated with one or more other staff
members, and can any one of those staff members then be associated
with one or more other staff members?
An answer such as the following (or one very similar to it) indi-
cates that the STAFF table has a self-referencing many-to-many
relationship:
Yes, a given staff member can manage several other staff members,
and any one of those folks can then supervise one or more other staff
members.
Once you’ve identified the type of self-referencing relationship that
exists for the table, you indicate it in the table matrix as you would
any other relationship.
Relationships will often differ from one perspective to the other, and
you must know how to determine what type of relationship officially
exists between each pair of tables on the matrix. You make this deter-
mination using the following set of formulas; each formula corre-
sponds to a particular relationship type definition. (I’ve provided the
definitions as a point of reference.)
1:1 + 1:1 = 1:1 A pair of tables bears a one-to-one relationship
when a single record in the first table is related
to only one record in the second table, and a sin-
gle record in the second table is related to only
one record in the first table.
1:N + 1:1 = 1:N A one-to-many relationship exists between a pair
of tables when a single record in the first table

ptg14955309
Identifying Existing Relationships 341
can be related to one or more records in the sec-
ond table, but a single record in the second table
can be related to only one record in the first table.
1:N + 1:N = M:N A pair of tables bears a many-to-many relation-
ship when a single record in the first table can
be related to one or more records in the second
table and a single record in the second table can
be related to one or more records in the
first table.
Here is the specific procedure you’ll use to identify the official rela-
tionship between a pair of tables in the matrix. (It incorporates the
relationship formulas in the preceding list.) Let’s first look at a generic
version of the procedure.
1. Select a pair of tables and note the entry at the junction
between the first table and the second table.
2. Locate the second table on the same side of the matrix you’re
working on and note the entry at the junction between it and
the first table on the opposite side of the matrix.
3. Apply the appropriate formula to the two entries and identify
the official relationship between the tables.
4. Diagram the relationship in the appropriate manner.
5. Cross out both entries on the matrix.
Now, let’s take a look at how you apply this procedure to a pair of
tables in the matrix. (In this example, you’re working down the left-
hand side of the matrix.)
1. Assume you’ve selected the BUILDINGS and CLASSES tables.
You note that the entry at the junction between BUILDINGS and
CLASSES is 1:N.
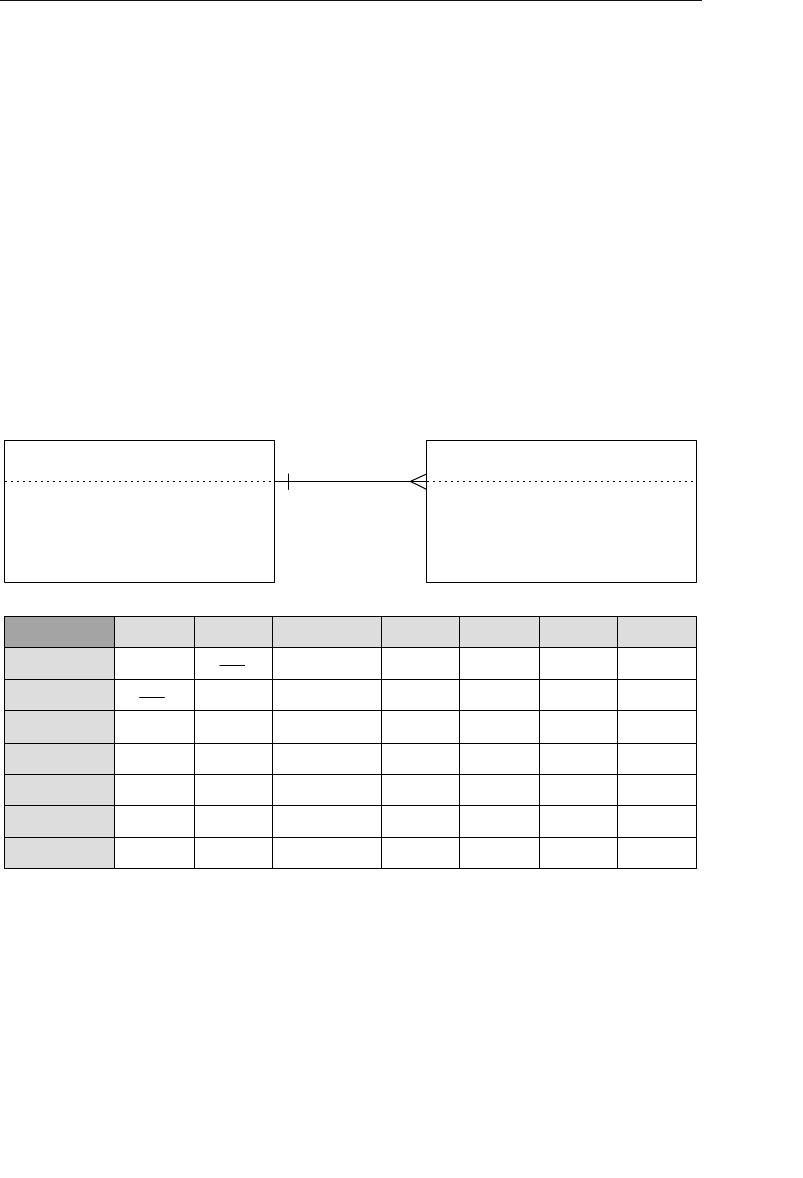
ptg14955309
342 Chapter 10 Table Relationships
2. Now you proceed down the left-hand side of the matrix until you
locate the CLASSES table and then note that the entry at the
junction between the CLASSES and BUILDINGS table is 1:1.
3. Using these entries with the appropriate formula, you deter-
mine that the official relationship between the BUILDINGS and
CLASSES tables is 1:N. (1:N + 1:1 = 1:N)
4. You create a one-to-many relationship diagram for the BUILD-
INGS and CLASSES tables.
5. You cross out the entries on the matrix.
Figure 10.29 shows the results of your work.
Buildings
Classes
Compensation
Faculty
Rooms
Staff
Students
Buildings Classes Compensation Faculty Rooms Staff Students
1:1 1:N 1:1 1:N
1:N 1:N
1:1
1:N
1:N
1:N
1:1 1:1
1:1
1:1
1:N
Buildings Classes
Building Number PK Class ID PK
Figure 10.29 Identifying the official relationship between the BUILDINGS and
CLASSES tables
Note that the relationship diagram is built from the perspective of the
BUILDINGS table. This is due to the fact that the BUILDINGS table is
on the “one” side of the relationship. When you create a simple diagram
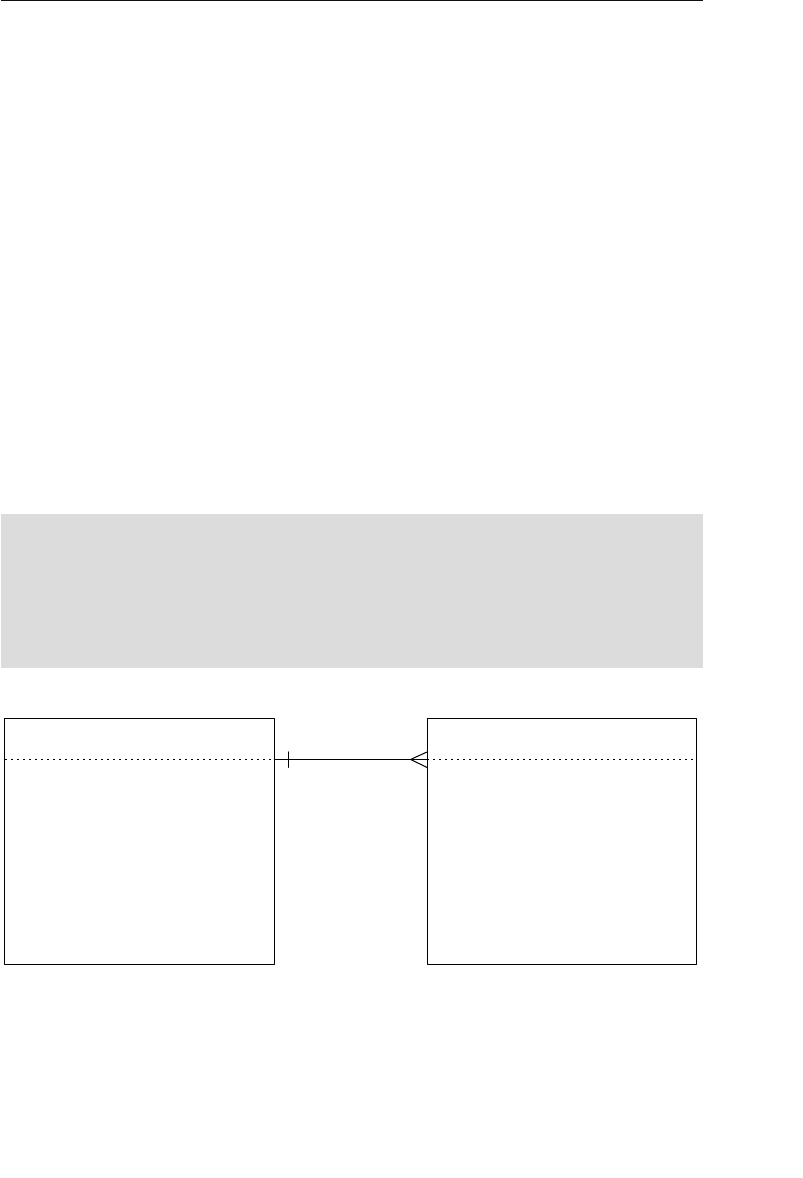
ptg14955309
Identifying Existing Relationships 343
such as this, I recommend that you always show the “one” side of the
relationship on the left and the “many” side on the right. Following this
practice will make your diagrams easy to read and help ensure that
you create them in a consistent manner. (This practice is unnecessary,
however, when you create a complex diagram showing the relation-
ships between several tables.)
At the very least, you should include each table’s primary key in the
diagram. Doing so will prove to be a valuable visual aid when you
begin to establish the relationships. You could go so far as to display
each table’s complete structure (as you see in Figure 10.30), assum-
ing you have space on the diagram. Displaying the structures in this
manner often helps to reinforce the decision you’ve made regarding the
type of relationship that exists between the tables. (I use both types of
diagrams throughout the remainder of the book.)
❖Note You’ll occasionally find it difficult to identify the exact
relationship between a given pair of tables. When this happens,
just load the tables with some sample data. This usually helps to
reveal the type of relationship that exists between the tables.
Buildings Classes
Building Number PK
Number of Floors
Elevator Access
Site Parking Available
Class ID PK
Instructor ID
Class Name
Class Description
Class Category
Credits
Classroom
Catalog Code
Figure 10.30 Displaying each table’s structure in a relationship diagram
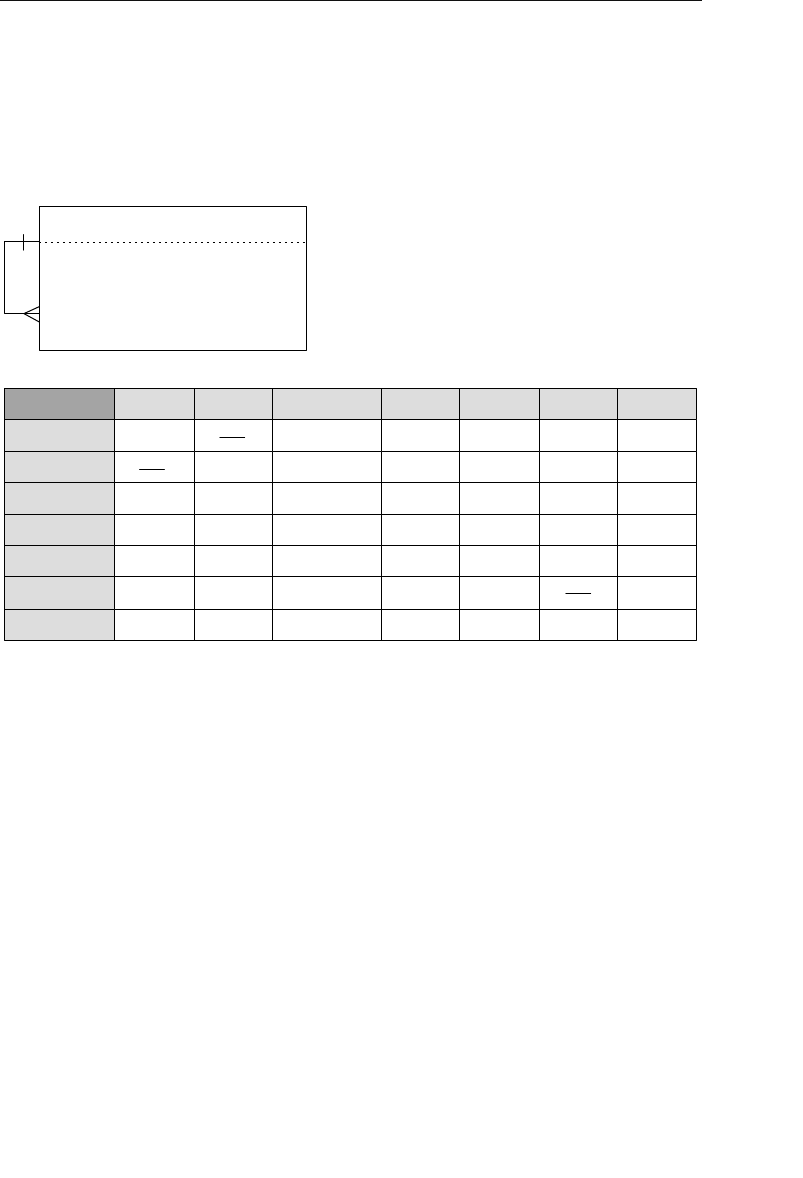
ptg14955309
344 Chapter 10 Table Relationships
It’s worth mentioning that this procedure is much easier and shorter
when you work with a table that has a self-referencing relationship,
such as the STAFF table. As Figure 10.31 illustrates, all you have to do
here is diagram the relationship and cross out the entry on the matrix.
Staff
Buildings
Classes
Compensation
Faculty
Rooms
Staff
Students
Buildings Classes Compensation Faculty Rooms Staff Students
1:1 1:N 1:1 1:N
1:N 1:N
1:1
1:N
1:N
1:N
1:1 1:1
1:1
1:1
1:N
Figure 10.31 Working with a self-referencing relationship
Continue this procedure until you’ve eliminated all of the entries on
the matrix. When you’ve finished identifying the official relationships
among the tables in the database, you can then go through the pro-
cess of establishing each relationship in the appropriate manner.
Establishing Each Relationship
This process involves defining an explicit logical connection between a
pair of related tables. The type of relationship that exists between the
tables determines the manner in which you define the connection.

ptg14955309
Establishing Each Relationship 345
One-to-One and One-to-Many Relationships
You use a primary key and a foreign key to establish the connection
between tables participating in a one-to-one or one-to-many relation-
ship. (You’ll learn the definition of a foreign key in just a moment.)
The One-to-One Relationship
In this type of relationship, one table serves as a parent table and
the other serves as a child table. A record must exist in the parent
table before you can enter a related record in the child table; stated
another way, a record in the child table must have a related record in
the parent table. The roles you assign to the tables usually depend on
the subjects they represent, although there will be instances when
you can assign the roles rather arbitrarily. In Figure 10.32, for exam-
ple, you would most likely assign the parent role to the STAFF table
and the child role to the COMPENSATION table. This is a reasonable
assumption because it would be completely illogical to have a record
in the COMPENSATION table that is not related to a record in the
STAFF table.
Staff Compensation
PK Staff ID
Salary Amount
Investment Plan Type
Medical Plan Type
Life Insurance Plan
Staff ID
StaffFirst Name
StaffLast Name
StaffStreet Address
StaffCity
StaffState
StaffZipcode
StaffPhone Number
Position
Date Hired
PK
Figure 10.32 Which table would you pick as the parent table?

ptg14955309
346 Chapter 10 Table Relationships
In the case where one of the tables is a subset table, you will usually
assign the child role to the subset table. There are instances, however,
when you can assign the parent role to the subset table.
You establish a one-to-one relationship by taking a copy of the parent
table’s primary key and incorporating it within the structure of the
child table, where it then becomes a foreign key. (The term foreign key
is derived from the fact that the child table already has a primary key
of its own, and the primary key you are introducing from the parent
table is “foreign” to the child table.) In most one-to-one relationships,
however, the foreign key also serves as the child table’s primary key.
Figure 10.33 illustrates how you would establish the relationship
between the STAFF and FACULTY tables. STAFF is the parent table
in this case because a record in the FACULTY table must be related
to a record in the STAFF table; faculty members are drawn from the
school’s staff. If you were to follow the procedure you just learned, you
would take a copy of the STAFF table’s primary key and incorporate it
as a foreign key in the FACULTY table. This is unnecessary, however,
Staff Faculty
PK Staff IDStaff ID
StaffFirst Name
StaffLast Name
StaffStreet Address
StaffCity
StaffState
StaffZipcode
StaffPhone Number
Position
Date Hired
PK
Title
Status
Tenured
Figure 10.33 Establishing the one-to-one relationship between the STAFF and
FACULTY tables
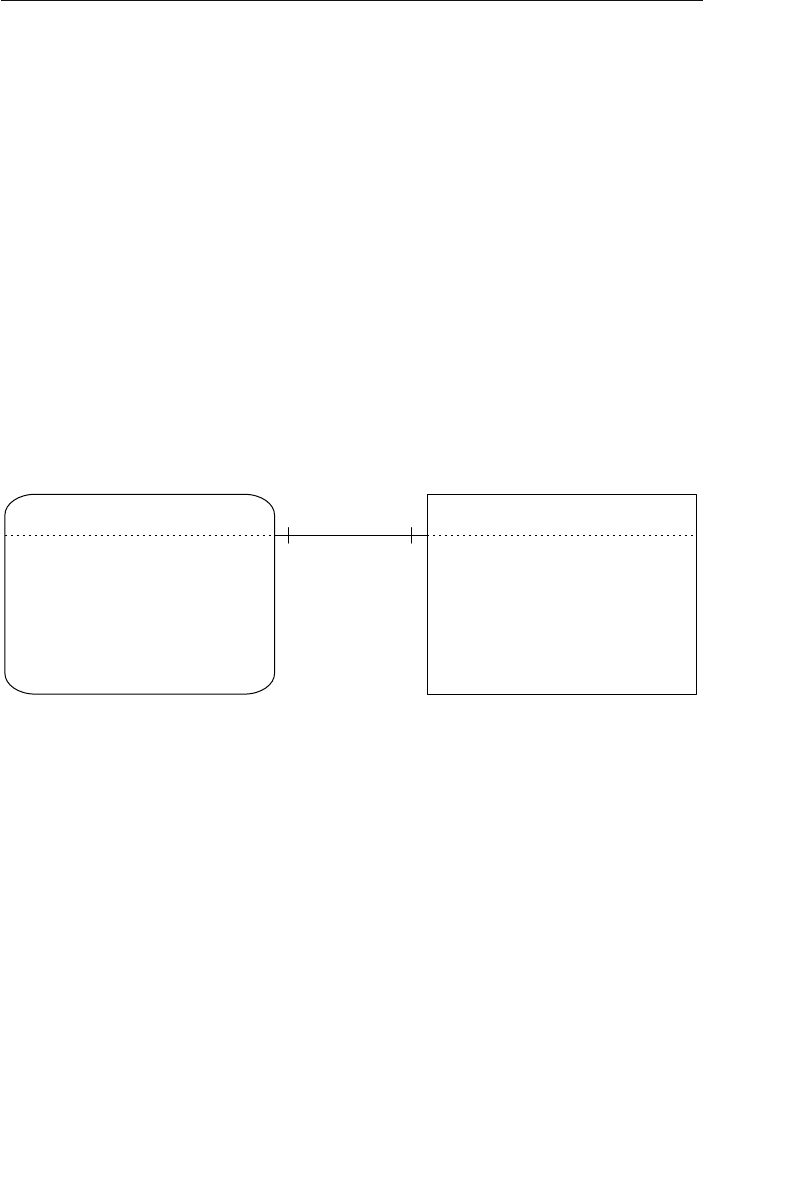
ptg14955309
Establishing Each Relationship 347
because FACULTY is already a properly defined subset table. (Recall
that a subset table and the data table from which it was derived must
share the same primary key. You learned how to define a subset table
in Chapter 7 and how to establish its primary key in Chapter 8, “Keys.”)
Figure 10.34 shows a slightly different example of a one-to-one rela-
tionship. Assume that MANAGERS is a subset table of EMPLOYEES
but has a direct relationship to DEPARTMENTS—a single manager
is associated with only one department and a single department is
associated with only one manager. Further assume that MANAGERS
is the parent table and DEPARTMENTS is the child table. (This is a
good example of a scenario in which you can choose the roles rather
arbitrarily. It’s also an instance of when a subset table plays the parent
role within the relationship.)
Managers Departments
PK
EMail Address
Cellular Phone Number
Department ID
DeptName
Maximum Staff Level
DeptCategory
PKEmployee ID
Figure 10.34 A one-to-one relationship with a subset table in the parent role
Establish the relationship between these tables using the procedure
you’ve just learned, and then identify the DEPARTMENTS table’s new
foreign key (EMPLOYEE ID) by placing the letters “FK” next to its name.
Figure 10.35 shows the revised relationship diagram with the results
of your modifications.
As long as you can visualize this process generically, you’ll be able to
establish any one-to-one relationship you encounter.

ptg14955309
348 Chapter 10 Table Relationships
❖Note Many database designers will use MANAGER ID as the
primary key name in the MANAGERS table and the foreign key
name in the DEPARTMENTS table. I choose to use EMPLOYEE ID
instead for these reasons.
• MANAGERS is a subset of the EMPLOYEES table, so it
shares the same primary key (EMPLOYEE ID).
• It keeps the field in conformance with the Elements of the
Ideal Field. (It retains a majority of its characteristics when it
appears in more than one table.)
• It keeps the field in conformance with the Elements of a For-
eign Key. (You’ll learn about foreign keys later in this chapter.)
• It removes any possible ambiguity or doubt about the true
nature of a foreign key. (I’ll explain this in more detail
during the discussion of the Elements of a Foreign Key.)
There is no absolute right or wrong way to do this—in the end,
the approach you use is simply a matter of style. Once you decide
which approach you want to use, however, make certain you use
it consistently.
Managers Departments
PK
EMail Address
Cellular Phone Number
Department IDPKEmployee ID
DeptName
Maximum Staff Level
DeptCategory
Employee ID FK
Figure 10.35 Establishing the relationship between the MANAGERS and
DEPARTMENTS tables
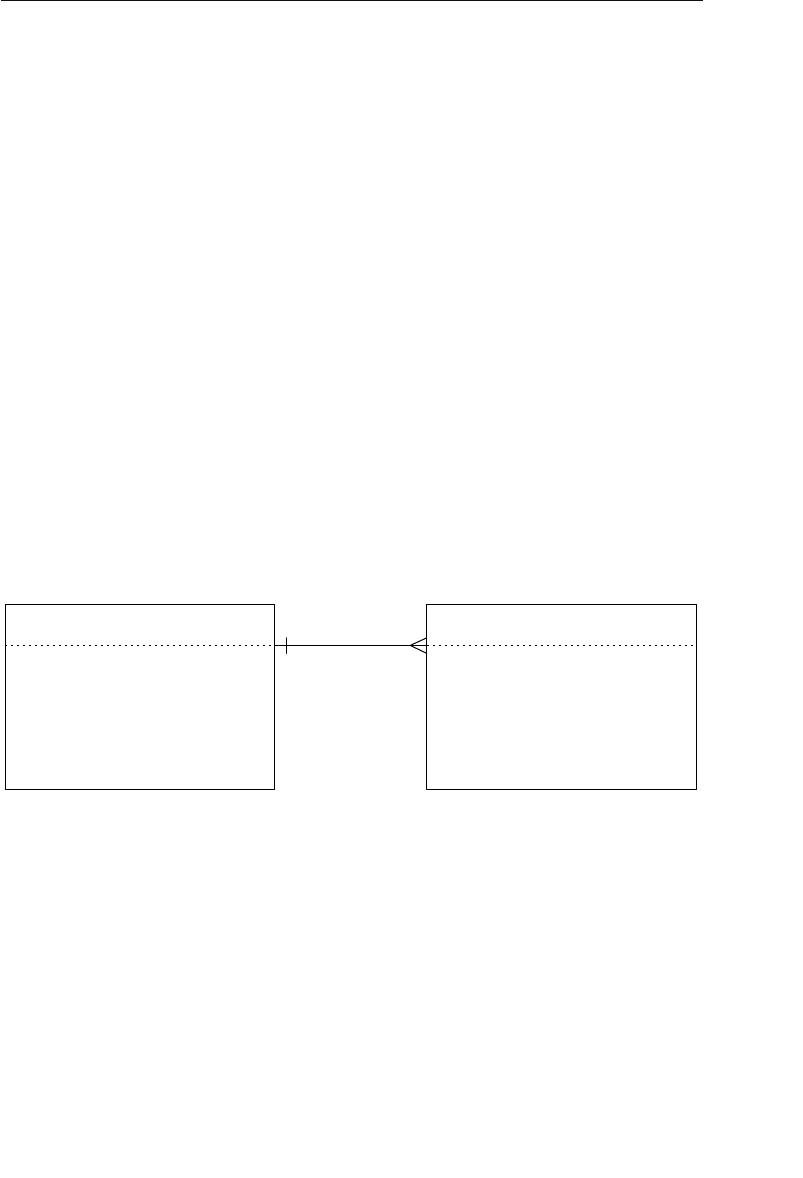
ptg14955309
Establishing Each Relationship 349
There is a small change in the way you’ll diagram the relationships
from this point forward. You should now use the primary key as the
beginning point and the foreign key as the end point of the relation-
ship line. (The only exception will be when you’re diagramming the
relationship between a subset table and its parent data table.) Mak-
ing this minor modification will help you visualize the relationships
more clearly and make it easier to identify the fields that establish the
relationship.
The One-to-Many Relationship
The technique you use to establish a one-to-many relationship is
similar to the one you used to establish a one-to-one relationship.
You simply take a copy of the primary key from the table on the “one”
side of the relationship and incorporate it within the table structure
on the “many” side, where it then becomes a foreign key. For example,
consider the one-to-many relationship between the BUILDINGS and
ROOMS tables shown in Figure 10.36.
Buildings Rooms
PKPKBuilding Number
Number of Floors
Elevator Access
Site Parking Available
Room Number
Square Footage
Type of Room
Phone Available
Figure 10.36 The existing one-to-many relationship between the BUILDINGS
and ROOMS tables
The relationship between these two tables is such that a single
building can contain one or more rooms, but a single room is con-
tained within only one building. Using the procedure outlined earlier,
you establish this relationship by taking a copy of the primary key
( BUILDING NUMBER) from the BUILDINGS table and incorporating it as
a foreign key within the ROOMS table. Now, revise the relationship
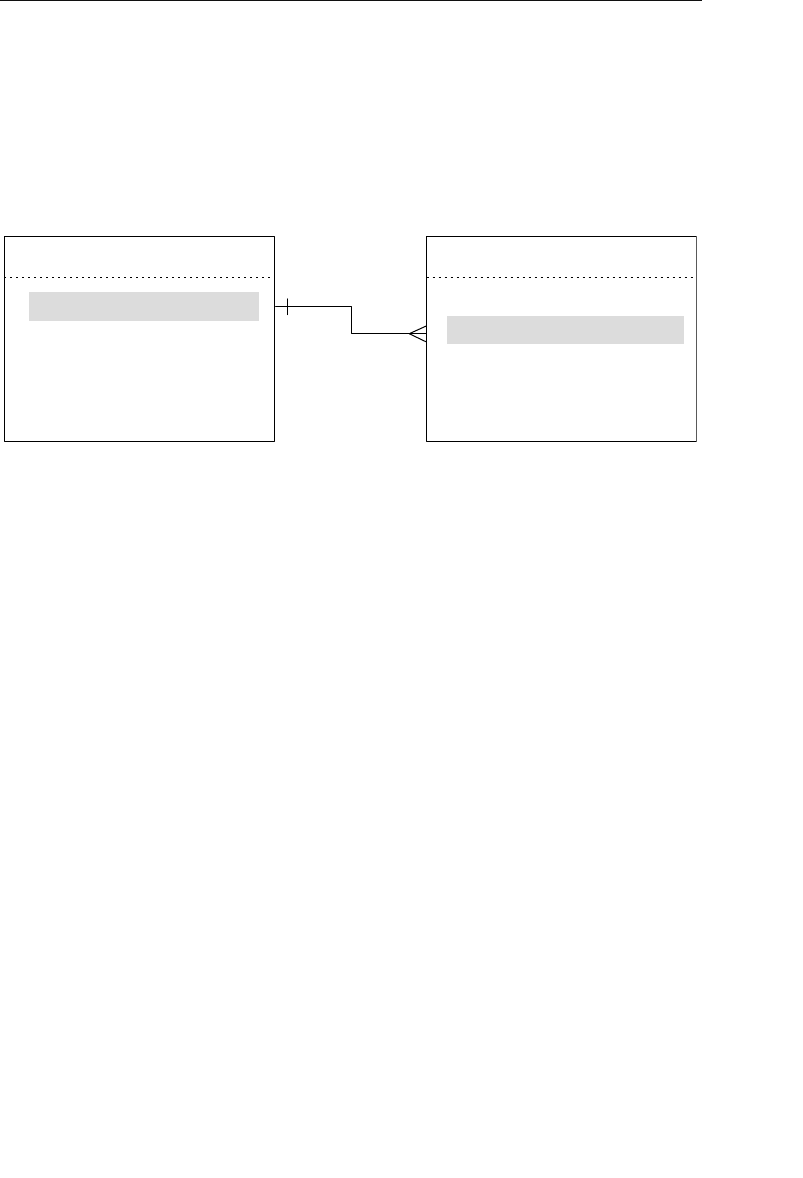
ptg14955309
350 Chapter 10 Table Relationships
diagram and make the same type of adjustments as you did with the
diagram for the one-to-one relationship. Your revised diagram should
look like the one in Figure 10.37. (Note that the middle line of the
crow’s foot symbol is the significant connection point—it should point
directly to the foreign key.)
Buildings Rooms
PKBuilding Number
Number of Floors
Elevator Access
Site Parking Available
PKRoom Number
Square Footage
Type of Room
Phone Available
Building Number FK
Figure 10.37 Establishing the one-to-many relationship between the BUILDINGS
and ROOMS tables
Resolving Multivalued Fields—Revisited
Back in Chapter 7 you learned how to resolve a multivalued field by
using this generic procedure:
1. Remove the field from the table and use it as the basis for a new
table. If necessary, rename the field in accordance with the field
naming guidelines that you learned earlier in this chapter.
2. Use a field (or set of fields) from the original table to relate the
original table to the new table; try to select fields that represent
the subject of the table as closely as possible. The field(s) you
choose will appear in both tables.
3. Assign an appropriate name, type, and description to the new
table and add it to the final table list.
You used this procedure to resolve a multivalued field called CATEGORIES
TAUGHT in an INSTRUCTORS table. Figure 10.38 shows the original
version of the table and the results of applying the procedure.
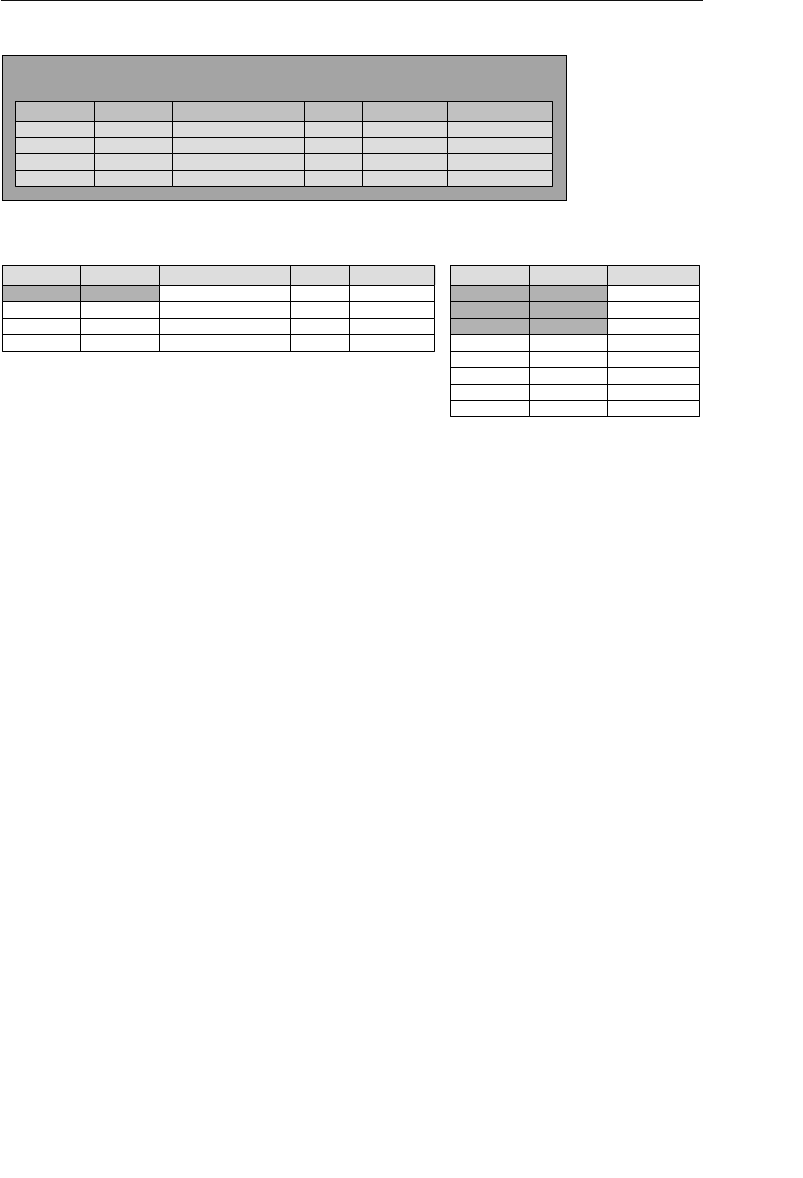
ptg14955309
Establishing Each Relationship 351
There’s one final fact about a multivalued field that you need to learn:
An inherent one-to-many relationship exists between a given set of val-
ues within a multivalued field and the record in which they reside. You’ll
see this when you examine the original INSTRUCTORS table in Figure
10.38. A single instructor (such as Kira Bently) can teach one or more
categories (DTP, SS, WP)—this holds true for every record in the table.
When you properly resolve the multivalued field, the tables produced
by the procedure inherit the relationship. This is clearly the case with
the revised INSTRUCTORS and new INSTRUCTOR CATEGORIES
tables. You can now establish this one-to-many relationship as you
would any other. (Of course, this assumes that you’ve assigned a pri-
mary key to the INSTRUCTORS table.) Figure 10.39 shows the results
of properly establishing this relationship.
The INSTRUCTOR ID field in the INSTRUCTOR CATEGORIES table serves
as a foreign key and helps to establish the one-to-many relation-
ship between the INSTRUCTORS and INSTRUCTOR CATEGORIES
tables. INSTRUCTOR ID is also part of the composite primary key for the
Instructors
InstStreet Address
3131 Mockingbird Lane
7402 Kingman Drive
4141 Lake City Way
970 Phoenix Avenue
InstCity
Seattle
Redmond
Seattle
Bellevue
InstFirst Name
Susan
Estela
Timothy
Kira
InstLast Name
Black
Rosales
Ennis
Bently
<< other fields >>
......
......
......
......
Category Taught
Instructor Categories
InstFirst Name
Kira
InstLast Name
Bently
Timothy
Kira
Ennis
Bently
Kira Bently
Timothy Ennis
Timothy Ennis
Susan Black
DTP
SS
WP
WP
DB
OS
DB
Susan Black SS
Instructors
InstStreet Address
3131 Mockingbird Lane
7402 Kingman Drive
4141 Lake City Way
970 Phoenix Avenue
InstCity
Seattle
Redmond
Seattle
Bellevue
InstFirst Name
Susan
Estela
Timothy
Kira
InstLast Name
Black
Rosales
Ennis
Bently
<< other fields >>
......
......
......
......
Categories Taught
DTP, SS, WP
DB, SS
DTP, WP, PG
WP, DB, OS
Figure 10.38 The original resolution of the CATEGORIES TAUGHT multivalued field

ptg14955309
352 Chapter 10 Table Relationships
INSTRUCTOR CATEGORIES table; a given combination of INSTRUCTOR
ID and CATEGORY TAUGHT values uniquely identifies a specific record in
the table.
The Many-to-Many Relationship
You establish a many-to-many relationship with a linking table. This is
a new table that you’ll create using the following three-step procedure.
1. Define the linking table by taking copies of the primary key
from each table in the relationship and using those keys to form
the structure of the table. These fields will serve two distinct
purposes within the linking table: Together they constitute the
table’s composite primary key, and each is a unique foreign key
that helps to establish a relationship between its parent table
and the linking table.
2. Give the linking table a name that represents the nature of
the relationship between the two tables. For example, if you’re
establishing a many-to-many relationship between a PILOTS
table and a CERTIFICATIONS table, you might choose to call
the linking table PILOT CERTIFICATIONS.
3. Add the linking table to the final table list and make the proper
entries for “Table Type” and “Table Description.”
Instructors Instructor Categories
Category Taught
DTP
SS
WP
WP
DB
OS
DB
SS
Instructor ID
60001
60001
60001
60002
Instructor ID
60001
60002
60003
60004
InstStreet Address
3131 Mockingbird Lane
7402 Kingman Drive
4141 Lake City Way
970 Phoenix Avenue
InstCity
Seattle
Redmond
Seattle
Bellevue
InstFirst Name
Susan
Estela
Timothy
Kira
InstLast Name
Black
Rosales
Ennis
Bently
<< other fields >>
......
......
......
......
60002
60002
60003
60003
Figure 10.39 Establishing the one-to-many relationship between the
INSTRUCTORS and INSTRUCTOR CATEGORIES tables

ptg14955309
Establishing Each Relationship 353
Figure 10.40 shows how you establish the many-to-many relationship
between the STUDENTS and CLASSES tables. (Note the new diagram
symbol used to represent a linking table.)
❖Note You could have used STUDENT SCHEDULES or CLASS
SCHEDULES as the name of the linking table; STUDENT
CLASSES just happens to be my personal preference. The point
to remember is that you should use a name that makes the most
sense to you or the organization.
Creating a linking table produces a few noteworthy results.
•The original many-to-many relationship has been dissolved
because there is no longer a direct relationship between the STU-
DENTS and CLASSES tables. The original relationship has been
replaced by two one-to-many relationships: one between STU-
DENTS and STUDENT CLASSES and another between CLASSES
and STUDENT CLASSES. In the first relationship, a single record
in STUDENTS can be associated with one or more records in
Student Classes
Classes
Class ID
Instructor ID
Class Name
Class Description
Category
PK
Student ID CPK/FK
Class ID CPK/FK
Students
Student ID
StudFirst Name
StudLast Name
StudStreet Address
StudCity
StudState
StudZipcode
StudHome Phone
StudEmail Address
Social Security Number
PK
Figure 10.40 Establishing the many-to-many relationship between the STU-
DENTS and CLASSES tables

ptg14955309
354 Chapter 10 Table Relationships
STUDENT CLASSES, but a single record in STUDENT CLASSES
table can be associated with only one record in STUDENTS.
In the second relationship, a single record in the CLASSES
table can be associated with one or more records in STUDENT
CLASSES, but a single record in STUDENT CLASSES can be
associated with only one record in CLASSES.
•The STUDENT CLASSES linking table contains two foreign keys.
STUDENT ID and CLASS ID are both copies of the primary keys from
the STUDENTS and CLASSES tables, respectively; therefore, each
is a foreign key by definition. As such, they help to establish the
relationship between their parent tables and the linking table.
•The STUDENT CLASSES linking table has a composite primary
key composed of the STUDENT ID and CLASS ID fields. Except in rare
instances, a linking table always contains a composite primary
key. (This rule applies to the database’s logical design only. There
are various reasons why you might break this rule when you
transform the logical design into a physical design, but this is
a discussion that is beyond the scope of this book.) It’s import-
ant to note that you’ll occasionally have to add more fields to the
linking table in order to guarantee a unique primary key value.
For example, assume the school decides to record student sched-
ules for every term of the school year (fall, winter, and spring).
You would have to add a new field, perhaps called TERM, and des-
ignate it as part of the composite primary key. This would enable
you to enter another instance of a given student and class into
the table, but for a different term; a student may need to retake
a class during the spring term because he failed the class in the
fall term.
•The linking table helps to keep redundant data to an absolute
minimum. There is no superfluous data in this table at all. In
fact, the main advantage of this table structure is that it allows
you to enter as few or as many classes for a single student as are
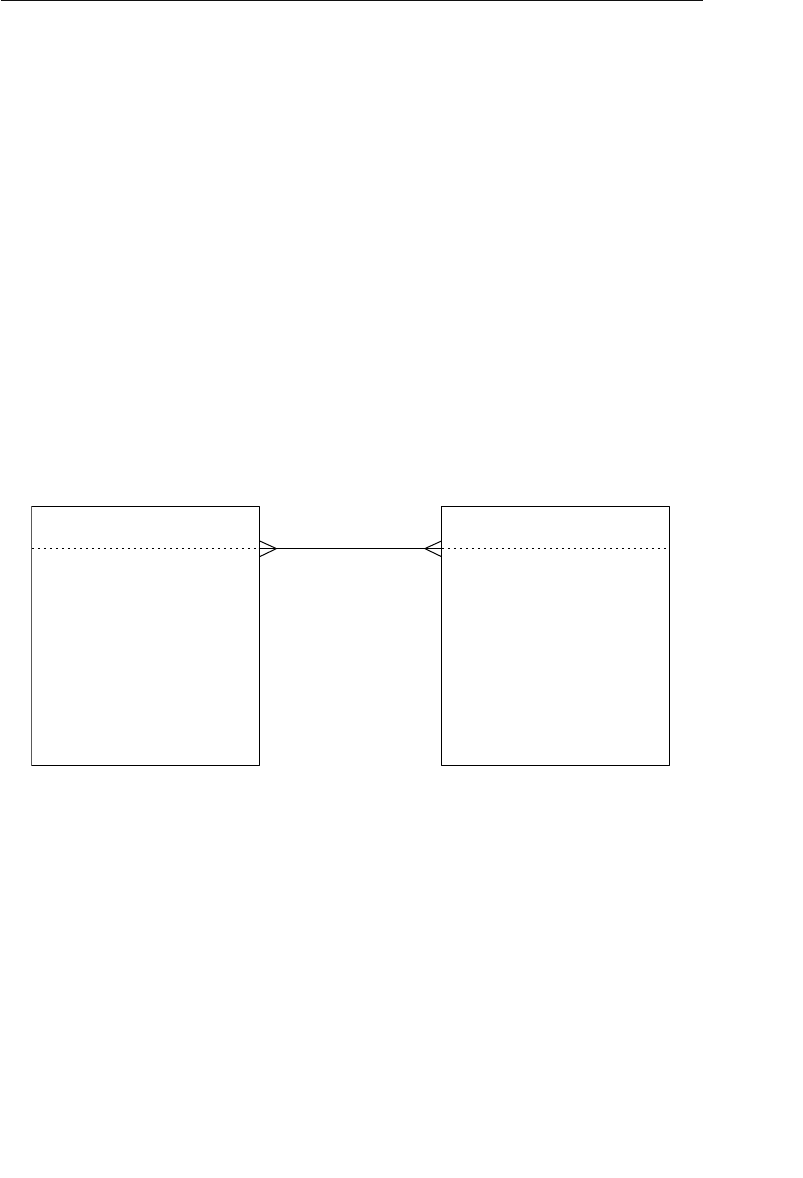
ptg14955309
Establishing Each Relationship 355
necessary. Later in the database design process, you’ll learn how
to create views to draw the data from these tables together in
order to present it as meaningful information.
•The name of the linking table reflects the purpose of the rela-
tionship it helps establish. The data stored in the STUDENT
CLASSES table represents a student and the classes in which he
or she is enrolled.
As you work with many-to-many relationships, there will be instances
in which you will need to add fields to the linking table in order to
reduce data redundancy and further refine structures of the tables
participating in the relationship. For example, assume you’re working
on a new database with a colleague and he’s just brought the ORDERS
and PRODUCTS tables in Figure 10.41 to your attention.
Orders
PK Product Number
ProdDescription
ProdName
Category
Quote Price
Wholesale Price
Customer Number
Order Date
Ship Date
Employee ID
Quote Price
Product Number
Quantity Ordered
Order Number
Products
PK
FK
FK
Figure 10.41 Is there a problem with either of these tables?
You note that there’s a many-to-many relationship between the tables
and then realize that your colleague tried to establish this relationship
by taking a copy of the PRODUCT NUMBER and QUOTE PRICE fields from the
PRODUCTS table and incorporating them into the ORDERS table. He
thought that this was the best way to associate various products with
a particular order. The presence of these fields in the ORDERS table,
however, produces a large amount of redundant data. Figure 10.42
illustrates this problem quite clearly.

ptg14955309
356 Chapter 10 Table Relationships
You can enter only one product number, quantity ordered, and quote
price for any given record; therefore, you’ll have to enter a new record
into the table for each item a customer places on his order. Customer
number 9001, for example, included eight items on an order he made
on May 16, so there are eight records in the table for this order alone.
Based on what you learned earlier in this chapter, you know that this
is an improper way to establish this relationship. You also know that
you can establish the relationship properly by creating and using
a linking table. So you remove the PRODUCT NUMBER field from the
ORDERS table, establish the relationship in the appropriate manner,
and revise the relationship diagram. Figure 10.43 shows the results of
your work.
You’ve eliminated the redundant data in the ORDERS table, but you
still have two minor problems.
1. The QUOTE PRICE and QUANTITY ORDERED fields are no longer
appropriate for the ORDERS table; the ORDERS table’s primary
key does not exclusively identify their values, and they bear no
Orders
Order Number
1000
1000
1000
1000
1000
1000
1000
1000
1001
1001
1001
Customer Number
9001
9001
9001
9001
9001
9001
9001
9001
9012
9012
9012
Order Date
05/16/12
05/16/12
05/16/12
05/16/12
05/16/12
05/16/12
05/16/12
05/16/12
05/16/12
05/16/12
05/16/12
Quote Price
8.95
3.75
6.50
5.99
4.45
6.50
31.50
5.00
6.50
4.00
6.35
Product Number
410001
410004
410007
410005
410015
410011
410021
410029
410011
410015
410022
Quantity Ordered
4
12
5
6
11
5
2
8
5
3
12
<< other fields >>
......
......
......
......
......
......
......
......
......
......
......
Figure 10.42 Redundant data caused by an improperly established many-to-
many relationship

ptg14955309
Establishing Each Relationship 357
relationship to any of the remaining fields in the table. They do,
however, relate to a particular PRODUCT NUMBER that’s part of a
given order within the ORDER DETAILS table.
2. You have duplicate data because there are two copies of the
QUOTE PRICE field: one in the ORDERS table and another in the
PRODUCTS table.
So you resolve the first problem by removing the QUOTE PRICE and
QUANTITY ORDERED fields from the ORDERS table and incorporating
them within the ORDER DETAILS table. You then resolve the second
problem by deleting the QUOTE PRICE field from the PRODUCTS table;
it makes more sense to associate a quote price with a product as it’s
being ordered. Finally, you modify the relationship diagram to reflect
the changes you made to the structures. Figure 10.44 shows your
revised diagram.
When you establish a many-to-many relationship between a pair of
tables, make certain that you check each table and determine whether
there are any fields that you should transfer to the linking table. When
in doubt, load all the tables with sample data; this will usually reveal
any potential problems.
Order Details
Order Number CPK/FK
Product NumberCPK/FK
Product Number
ProdDescription
ProdName
Category
Quote Price
Wholesale Price
Products
PK
Orders
PK
Customer Number
Order Date
Ship Date
Employee ID
Quote Price
Quantity Ordered
Order Number
FK
FK
Figure 10.43 Properly establishing the many-to-many relationship between the
ORDERS and PRODUCTS tables

ptg14955309
358 Chapter 10 Table Relationships
❖Note You won’t encounter this problem very often if you
faithfully follow the design process you’ve learned thus far. It will
typically arise, however, when you’re trying to incorporate a pair
of tables from an existing database or legacy database and you
haven’t taken the time to refine their structures properly. You’ll
also encounter this problem when you work with someone who
has little or no database design experience.
Self-Referencing Relationships
Establishing a self-referencing relationship will be a relatively simple
task now that you know how to establish a relationship between a pair
of tables.
One-to-One and One-to-Many
You use a primary key and a foreign key to establish these self-refer-
encing relationships, just as you do with their dual-table counterparts.
The difference here, however, is that the foreign key will reside in the
same table as the primary key to which it refers. You’ll often find that
the foreign key is already part of the table’s structure. If the foreign key
does not already exist, you’ll simply create one.
Order Details
Order Number CPK/FK
Product NumberCPK/FK
Orders
PK Product Number
ProdDescription
ProdName
Category
Wholesale Price
Customer Number
Order Date
Ship Date
Employee ID
Order Number
Products
PK
FK
FK
Quantity Ordered
Quote Price
Figure 10.44 The revised ORDER DETAILS linking table

ptg14955309
Establishing Each Relationship 359
Let’s revisit the MEMBERS table example from Figure 10.20. Recall
that this table has a self-referencing one-to-one relationship because a
given member can sponsor only one other member within the organi-
zation; the SPONSOR ID field stores the member identification number of
the member acting as a sponsor. Because the SPONSOR ID field draws its
values exclusively from the MEMBER ID field, it acts as the foreign key
for the relationship. You establish the relationship by officially desig-
nating the SPONSOR ID field as the foreign key and notating it as such in
the relationship diagram. Figure 10.45 shows the revised relationship
diagram for the MEMBERS table.
Members
PKMember ID
MbrFirst Name
MbrLast Name
MbrStreet Address
MbrCity
MbrState
MbrZipcode
MbrPhone Number
Status
Date Enrolled
FKSponsor ID
Figure 10.45 Establishing the self-referencing one-to-one relationship for the
MEMBERS table
Now, consider the STAFF table example in Figure 10.46. You may
remember that this table has a self-referencing one-to-many relation-
ship because a single staff member can manage one or more other
staff members.
There is currently no means of associating a given staff member to
other staff members within the table; therefore, you must create a new
field that will act as the foreign key and enable you to establish the

ptg14955309
360 Chapter 10 Table Relationships
relationship. Let’s assume you create a new foreign key field called MAN-
AGER ID that will draw its values exclusively from the STAFF ID field. You
now establish the relationship by officially designating MANAGER ID as
the foreign key and notating it as such in the relationship diagram. Fig-
ure 10.47 shows the revised relationship diagram for the STAFF table.
Staff
PKStaff ID
StaffFirst Name
StaffLast Name
StaffStreet Address
StaffCity
StaffState
StaffZipcode
StaffPhone Number
Position
Date Hired
Figure 10.46 The current structure of the STAFF table
Staff
PKStaff ID
StaffFirst Name
StaffLast Name
StaffStreet Address
StaffCity
StaffState
StaffZipcode
StaffPhone Number
Position
Date Hired
Manager ID FK
Figure 10.47 The revised STAFF table with the new MANAGER ID foreign key

ptg14955309
Establishing Each Relationship 361
You probably noticed that the “one” side of the relationship line points
to the MANAGER ID field and the “many” side of the line points to the
STAFF ID field. This is perfectly acceptable because a manager will
manage one or more staff members, but a given staff member reports
to only one manager. (As you may have intuitively guessed, the “one”
side of the line commonly points to the primary key and the “many”
side to the foreign key.)
As you work with self-referencing one-to-one and one-to-many rela-
tionships, take a moment and examine each table’s structure care-
fully. You’ll occasionally find that you can (or may need to) modify and
improve the existing structure in order to eliminate the relationship. I
know what you’re wondering: “But why would I want to do that?”
Retrieving information from tables with these types of relationships
can be tedious and somewhat difficult. (A discussion of the reasons for
this is, unfortunately, outside the scope of this work.) Additionally, the
very presence of the relationship can indicate the need for new field
and table structures.
Consider the STAFF table once again. Does it occur to you that if there
is a need to track staff members who are managers, there could be a
need to track the departments they manage? If this is true, then there
must be other facets of the departments that you need to track in the
database. You should now conduct a quick interview with the appropri-
ate staff members to answer these questions and then take the appro-
priate action based on their responses.
Let’s assume you were right and the organization does want to track
departmental data. Figure 10.48 shows one possible approach you
might use to accomplish this task.
These new structures and relationships enable you to track the data
efficiently and will provide a wide variety of information about the
departments. (You will, of course, ensure that the new fields and tables
conform to the various design elements that you’ve learned thus far.)
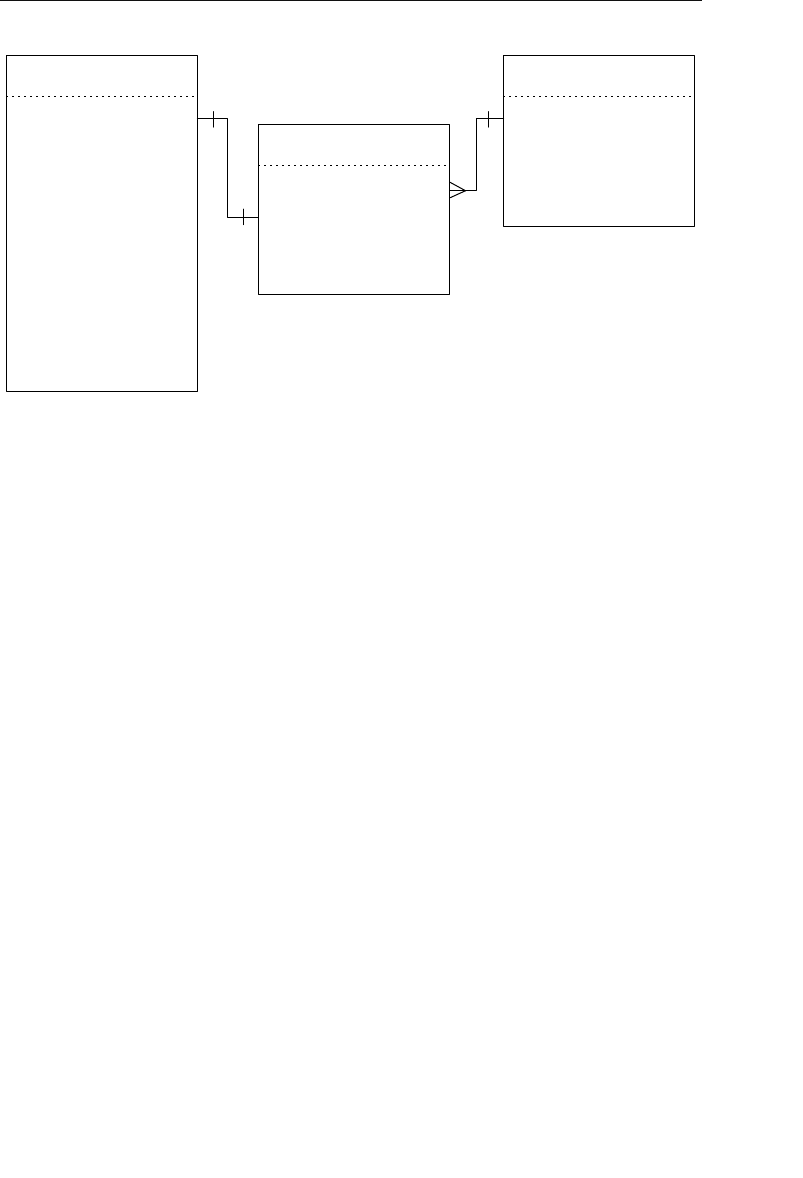
ptg14955309
362 Chapter 10 Table Relationships
It’s important to note that self-referencing relationships do have their
place within a well-designed database. You should be vigilant, however,
and make certain that each self-referencing relationship does indeed
serve a useful purpose.
Many-to-Many
You use a linking table to establish this type of self-referencing rela-
tionship, just as you do with its dual-table counterpart. Establishing
this relationship is slightly different in that the fields you use to build
the linking table come from the same parent table.
Let’s revisit the PARTS table example from Figure 10.24. Recall that
this table has a self-referencing many-to-many relationship because a
particular part can comprise several different component parts, and
that part itself can be a component of other parts. You establish this
relationship as you would any other many-to-many relationship—with
a linking table. There is currently no way to associate a given part to
other parts within the table, so you must create a new field for this
Staff
PKStaff ID
StaffFirst Name
StaffLast Name
StaffStreet Address
StaffCity
StaffState
StaffZipcode
StaffPhone Number
Position
Date Hired
Department ID
DeptCategory
Maximum Staff Level
DeptName
Department Staff
Department ID CPK/FK
Position
Section
Staff ID CPK/FK
Department
PK
Figure 10.48 Results of eliminating the self-referencing relationship and adding
new structures to track departmental data
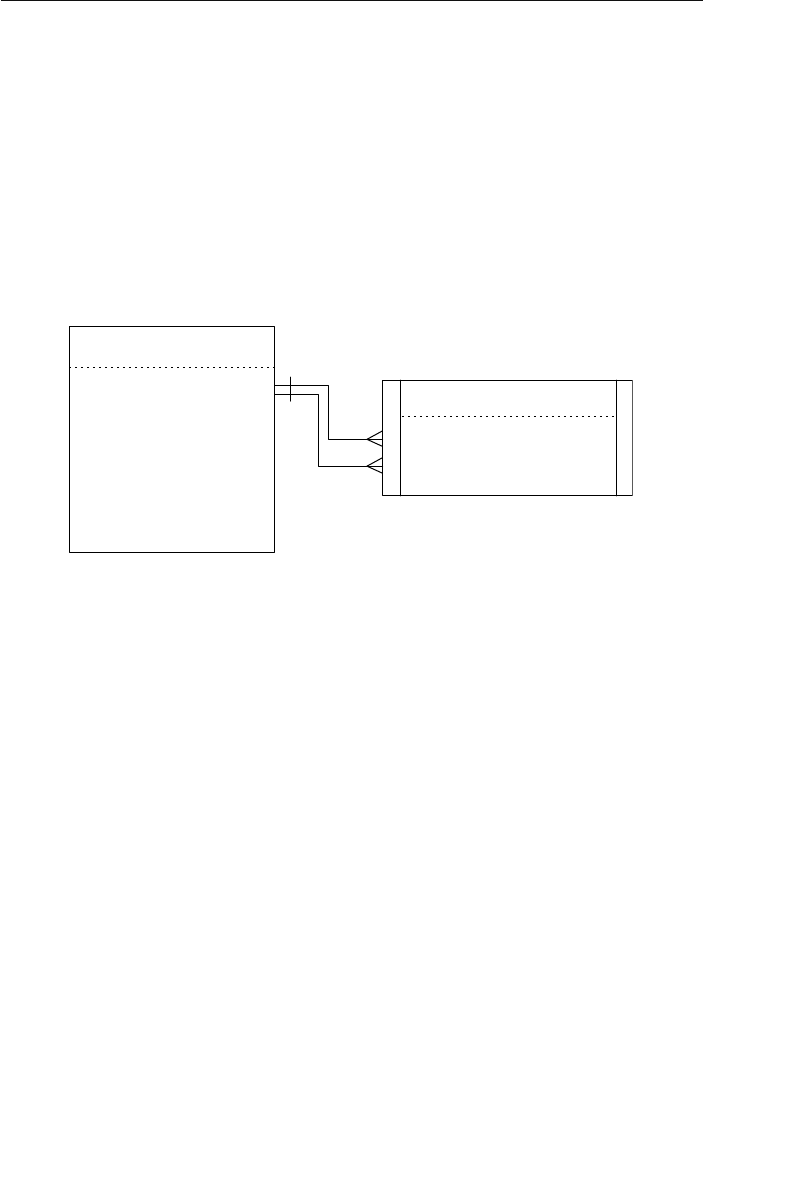
ptg14955309
Establishing Each Relationship 363
purpose. Say, for example, that you create a field called COMPONENT
ID. This field will store the part identification number of a part that
serves as a component of a parent part. You can now use the PART ID
and COMPONENT ID fields as the basis for the linking table. For the sake
of our example, we’ll assume that the name of the new linking table
is PART COMPONENTS. Once you’ve created and named the linking
table, be sure to revise the relationship diagram for the PARTS table.
Figure 10.49 shows the results of your work.
Parts
PK Part Components
CPK/FK
CPK/FK
Part ID
Part Description
Part Name
Category
Retail Price
Wholesale Price
Part ID
Component ID
Figure 10.49 Establishing the self-referencing many-to-many relationship for the
PARTS table
As you can see, the PARTS table now has two distinct one-to-many
relationships with the PART COMPONENTS table. The first relation-
ship is established via the PART ID field and the second relationship
is established via the COMPONENT ID field. Figure 10.50 illustrates how
these relationships work. Note that a clamp assembly (Part ID 704)
contains three components and is itself a component of a seat assem-
bly (Part ID 707) and a frame assembly (Part ID 711).
Now, use the techniques you’ve just learned to establish all of the
relationships you’ve identified among the tables in the database. Make
absolutely certain you create a diagram for each relationship—you’re
going to add new information to these diagrams as the design process
unfolds further.

ptg14955309
364 Chapter 10 Table Relationships
Reviewing the Structure of Each Table
Review all of the table structures after you’ve established the relation-
ships between tables. Remember that you made modifications to the
existing table structures and created several new table structures as
you established the relationships; therefore, you want to make certain
that each table conforms to the Elements of the Ideal Table.
Elements of the Ideal Table
• It represents a single subject, which can be an object or event.
• It has a primary key.
• It does not contain multipart or multivalued fields.
• It does not contain calculated fields.
• It does not contain unnecessary duplicate fields.
• It contains only an absolute minimum amount of redundant
data.
Part NamePart ID
Parts
<< other fields >>
Clamp Assembly
701
......
Top Clamp
702
......
Bottom Clamp
703
......
Fastening Bolt
704
......
Seat Assembly
705
......
Saddle
706
......
Seatpost
707
......
Frame Assembly
708
......
Body Tube
709
......
Front Fork Tube
710
......
Rear Stay Tube
711
......
Part Components
Part ID
704
704
707
707
Component ID
702
703
704
705
707 706
711 708
711 709
704 701
711 710
711 704
Figure 10.50 Data relationships between the PARTS and PART COMPONENTS
tables

ptg14955309
Refining All Foreign Keys 365
When you determine that a table does not comply with the Elements
of the Ideal Table, identify the problem and make the necessary mod-
ifications. Then, take the table through the appropriate stages of the
database design process until you return to this point. You shouldn’t
encounter any problems with the tables if you’ve been following proper
procedures thus far.
Refining All Foreign Keys
You now know that a primary key becomes a foreign key when you use
it to establish a relationship between a pair of tables in a one-to-one
or one-to-many relationship. As with any other key that you’ve worked
with so far, a foreign key must comply with a specific set of elements.
These elements are collectively known as the Elements of a Foreign Key.
Elements of a Foreign Key
•It has the same name as the primary key from which it was cop-
ied. You should adhere to this rule unless there is an absolutely
compelling reason not to do so. (Review the discussion of the
Alias field specification element in Chapter 9, “Field Specifica-
tions.” It provides an example of an occasion when you might
decide to break this rule.) Consider the relationship diagram in
Figure 10.51, and note that the foreign keys have different names
than the primary keys to which they refer.
The fact that the names are different poses a problem because
you can’t be sure that the foreign keys are truly valid and
actually refer to the primary keys. Is EMP # truly equivalent
to EMPLOYEE NUMBER? Is “Emp” really a shortened version of
“Employee,” or does it mean something else? Why did someone
choose to use CLIENT # in the ORDERS table instead of CUSTOMER
ID? Is there any difference between the two? Do they store the
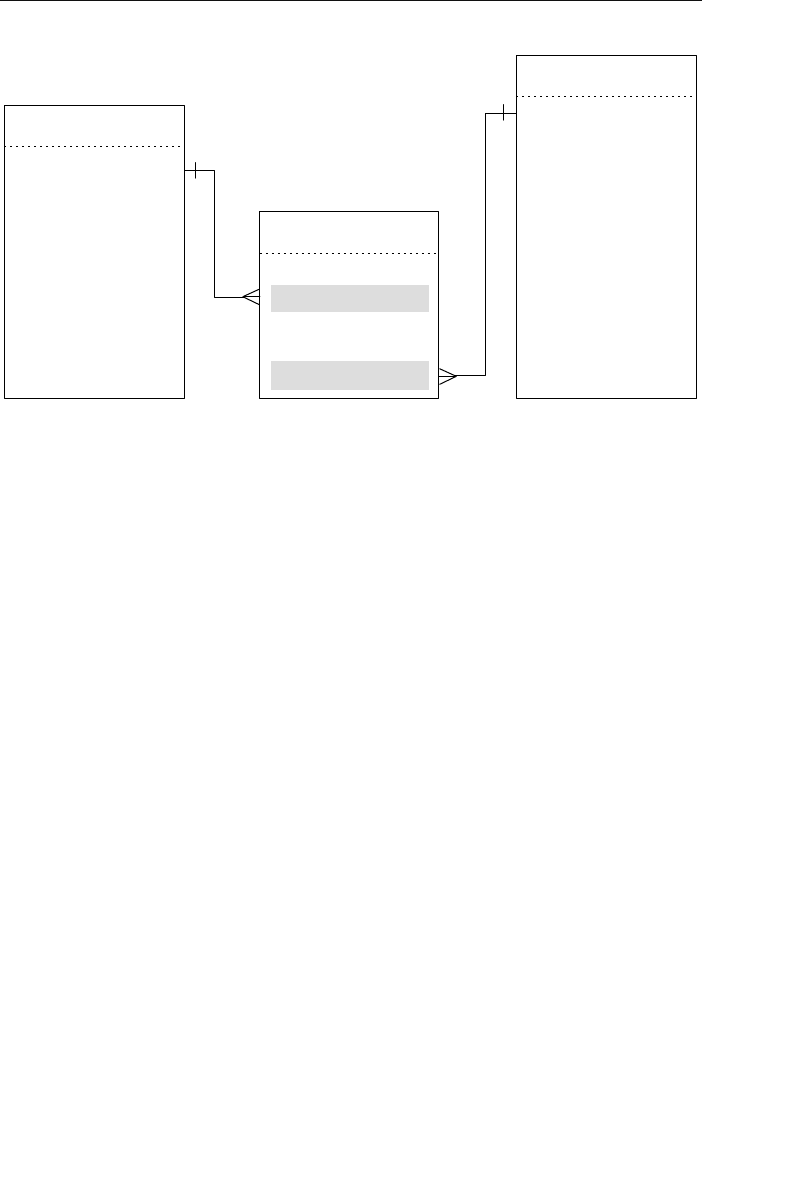
ptg14955309
366 Chapter 10 Table Relationships
same type of data? These are questions you must answer before
you can do anything else with these tables and their respective
relationships.
You could make a relatively reasonable argument that the names
are close enough to assume that the foreign keys are indeed
valid. If there’s any doubt, you could test your assumption by
loading the tables with sample data. You really shouldn’t have to
take the time to do this, however. Imagine having to do this for
15 or 20 relationships; the amount of wasted time adds up.
You won’t have to ask these questions or perform these tests
at all when you adhere to this element. Figure 10.52 shows a
revised version of the diagram that uses the proper foreign key
names. In this case, there is no ambiguity and little doubt that
the foreign keys are appropriate. You can examine this diagram
nine months from now and, with a quick glance, confidently
ascertain the type of relationships between the tables and how
they’re established.
PK
PK
Employee
Employee Number
EmpFirst Name
EmpLast Name
EmpStreet Address
EmpCity
EmpState
EmpZipcode
EmpPhone Number
Position
Hourly Rate
Date Hired
Orders
Client # FK
Order Date
Ship Date
Emp # FK
Order Number PK
Customers
Customer ID
CustFirst Name
CustLast Name
CustStreet Address
CustState
CustZipcode
CustPhone
CustEmail Address
CustCity
Figure 10.51 Primary keys and foreign keys with mismatched names
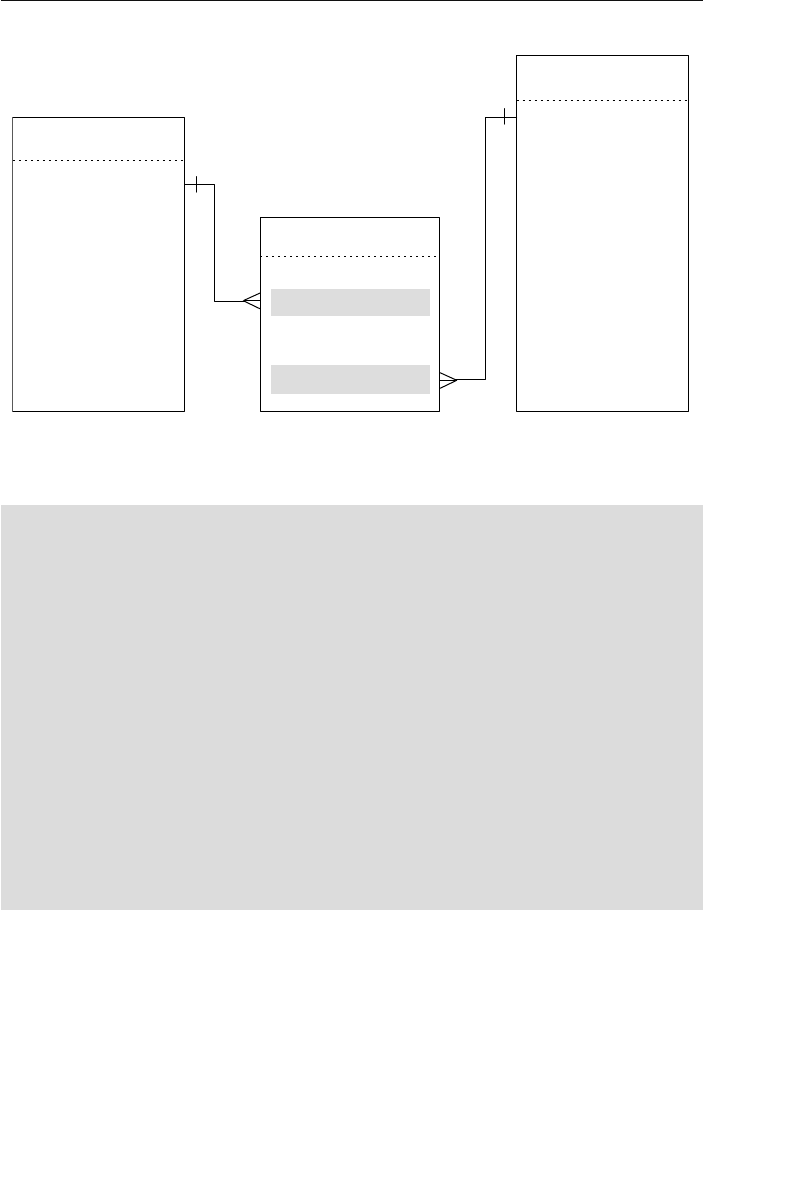
ptg14955309
Refining All Foreign Keys 367
❖Note I encounter this issue quite often when I’m asked to
analyze certain types of database problems. In many cases,
the foreign keys are either completely inappropriate or manifest
serious data-integrity and relationship-integrity problems. Once I
identify the appropriate foreign keys (or revise the existing ones)
and ensure that they comply with this particular element, a
number of problems disappear.
The only time I can justify and approve of using a different name
for the foreign key field is when I establish a self-referencing rela-
tionship for a given table. This is reasonable because the pri-
mary key and foreign key both reside within the table (in most
cases), and each must have a unique name.
• It uses a replica of the field specifications for the primary key from
which it was copied. This supports the sixth element of an ideal
field, which you learned in Chapter 7 (“It retains a majority of its
PK
PK
Employee
Employee Number
EmpFirst Name
EmpLast Name
EmpStreet Address
EmpCity
EmpState
EmpZipcode
EmpPhone Number
Position
Hourly Rate
Date Hired
Orders
Customer ID FK
Order Date
Ship Date
Employee Number FK
Order Number PK
Customers
Customer ID
CustFirst Name
CustLast Name
CustStreet Address
CustState
CustZipcode
CustPhone
CustEmail Address
CustCity
Figure 10.52 Foreign keys that comply with the first element of a foreign key

ptg14955309
368 Chapter 10 Table Relationships
properties when it appears in more than one table”). A foreign
key, however, has a few settings in both the General Elements
and Logical Elements categories that are slightly different from
those of its parent primary key.
There are four elements in the General Elements category that you
will modify when you define a field specification for a foreign key.
a. Specification Type: Because a foreign key is based on an
existing primary key, it inherits a replica of the primary key’s
field specifications; therefore, you designate the foreign key’s
specification type as “Replica.” This designation helps you
ensure that your foreign key specifications are consistent, and
reminds you to keep this specification synchronized with the
primary key’s specification.
b. Parent Table: The name of the foreign key’s parent table goes
here.
c. Source Specification: This is where you indicate the name of
the parent primary key. (Make certain you include the name
of the primary key’s parent table as well; this will make it eas-
ier for you to find the primary key’s specification should you
want to compare it to the foreign key’s specification.)
d. Description: Compose a description that indicates the foreign
key’s purpose within the table. Figure 10.53 shows an exam-
ple of these modifications for an EMPLOYEE ID NUMBER field
serving as a foreign key in an ORDERS table.
You’ll also adjust five elements in the Logical Elements category
for the foreign key field specification.
a. Key Type: Set this element to “Foreign.” This is a rather
obvious change, but one that you can accidentally overlook if
you’re not careful.
b. Uniqueness: You designate this element as “Non-unique”
because you want to be able to associate a single foreign key

ptg14955309
Refining All Foreign Keys 369
value with any number of records in the parent table. In terms
of our example, you want to be able to associate a specific
employee with any number of orders. If you set this to “Unique”
instead, you could associate a given employee with one order
only, which would greatly limit his or her sales potential! (In
the case of a one-to-one relationship, however, you’ll designate
this element as “Unique” because you want to associate a sin-
gle foreign key value in the child table with only one record in
the parent table.)
c. Values Entered By: Unlike the parent primary key, you (or a
user) will enter values into the foreign key; therefore, you set
this element to “User.”
d. Range of Values: You must set this element in such a way that
you (or a user) can enter only existing values from the par-
ent primary key. (You’ll learn more about this and see a good
example in just a moment.)
e. Edit Rule: You normally set this to “Enter Now, Edits Allowed,”
although there might be instances (such as when the foreign
key comes from a validation table) when you can set this to
“Enter Later, Edits Allowed.” Allowing edits of foreign key
Employee #
Employee ID Number
General Elements
Field Name:
Label:
Parent Table:
Shared By:
Alias(es):
Description:
Source Specification:
Specification Type: GenericUnique Replica
The identification number of an employee within our organization. The values in this field
enable us to identify and keep track of the employees who place orders for our customers.
Employee ID Number from the EMPLOYEES table.
Orders
x
Figure 10.53 General Elements for the EMPLOYEE ID NUMBER foreign key field in
the ORDERS table
ptg14955309
370 Chapter 10 Table Relationships
values enables you to fix mistakes. For example, you might
have mistakenly entered employee ID number “100” for a given
order when you meant to enter “110.”
Figure 10.54 shows an example of these modifications for the
EMPLOYEE ID NUMBER foreign key field. (Note the setting for the
Range of Values—this is one good way to set this element.)
Logical Elements
Key Structure:
Non
Not Determined At This Time
Edit Rule:
Null Support: Nulls Allowed
Enter Now, Edits Not Allowed
Enter Later, Edits Allowed
Primary
AlternateForeign
No Nulls
Uniqueness: Unique
Required Value: No Yes
Comparisons Allowed:
x
x
x
x
Range of Values:
Default Value:
Values Entered By:
Operations Allowed:
System
x
Key Type:
CompositeSimple
x
Enter Later, Edits Not Allowed
<> <=>=
Other Fields
Same Field
x=
x
Value Expression
x
<> <=>==
<> <=>==
x
All
All
All
Same Field
Other Fields Concatenation
All
All
+
+
x
x
Value Expression All Concatenation+ x
Concatenation
÷
÷
÷
Any existing Employee ID Number in the EMPLOYEES table.
Enter Now, Edits Allowed
x
User
–
–
–
=/
=/
=/
Non-unique
Figure 10.54 Logical Elements for the EMPLOYEE ID NUMBER foreign key field in the
ORDERS table
In order for you to see the significance of these modifications,
Figure 10.55 shows the Logical Elements category from the
Source Specification. (Recall that this element is in the General
Elements category; see Figure 10.53.)
•It draws its values from the primary key to which it refers. By defi-
nition, a foreign key’s range of values is limited to existing values

ptg14955309
Refining All Foreign Keys 371
of the primary key to which it refers. For example, you cannot
enter an invalid EMPLOYEE ID NUMBER into the ORDERS table.
Any EMPLOYEE ID NUMBER you enter into the ORDERS table must
first exist as an EMPLOYEE ID NUMBER in the EMPLOYEES table.
This ensures consistency among the values of both fields in both
tables and helps to establish relationship-level integrity.
Review the foreign keys in each table to make certain that they con-
form to the Elements of a Foreign Key, and make the appropriate
modifications to those that fail to do so. You really shouldn’t encounter
any problems if you’ve been faithfully following the design process up
to this point.
Logical Elements
Key Structure:
Non
Not Determined At This Time
Edit Rule:
Null Support: Nulls Allowed
Enter Now, Edits Allowed
Enter Now, Edits Not Allowed
Enter Later, Edits Allowed
Primary
AlternateForeign
No Nulls
Uniqueness: Non-unique Unique
Required Value: No Yes
Comparisons Allowed:
x
x
x
x
x
Range of Values:
Default Value:
Values Entered By: User
Operations Allowed:
System
x
Key Type:
CompositeSimple
x
Enter Later, Edits Not Allowed
<> <=>=
Other Fields
Same Field
x=
x
Value Expression
x
<> <=>==
<> <=>==
x
All
All
All
Same Field
Other Fields Concatenation
All
All
+
+
x
x
Value Expression All Concatenation+ x
Concatenation
1000–9999
≠
≠
≠
÷
÷
÷
–
–
–
Figure 10.55 Logical Elements for the EMPLOYEE ID NUMBER primary key field in
the EMPLOYEES table

ptg14955309
372 Chapter 10 Table Relationships
Establishing Relationship Characteristics
Now you’ll establish the characteristics of each relationship. These
characteristics indicate what will occur when you delete a record, the
type of participation each table bears within the relationship, and to
what degree each table participates in the relationship.
Defining a Deletion Rule for Each Relationship
The first characteristic you’ll establish for the relationship is a dele-
tion rule. This rule determines what your RDBMS should do when
you place a request to delete a given record in the parent table of the
relationship. Deletion rules are crucial to relationship-level integrity
because they help guard against orphaned records, which are records
in the child table that have no relationship whatsoever to any records
in the parent table.
These are the five types of deletion rules you can define and the
actions the RDBMS should take when a given rule is in force.
1. Deny: The RDBMS will not delete the record in the parent table,
but will instead keep the record and designate it as “inactive.”
2. Restrict: The RDBMS will not delete the record in the parent
table if related records exist in the child table. You must have
the RDBMS delete all of the related records in the child table
before you can have it delete the record in the parent table.
3. Cascade: The RDBMS will take two specific actions: It will
delete the record in the parent table, and it will also automati-
cally delete all related records in the child table.
4. Nullify: The RDBMS will delete the record in the parent table
and will then update the foreign key values of related records in
the child table to null. If you are going to use this deletion rule,
you must modify the foreign key’s field specifications and set the
Null Support logical element to “Nulls Allowed.”
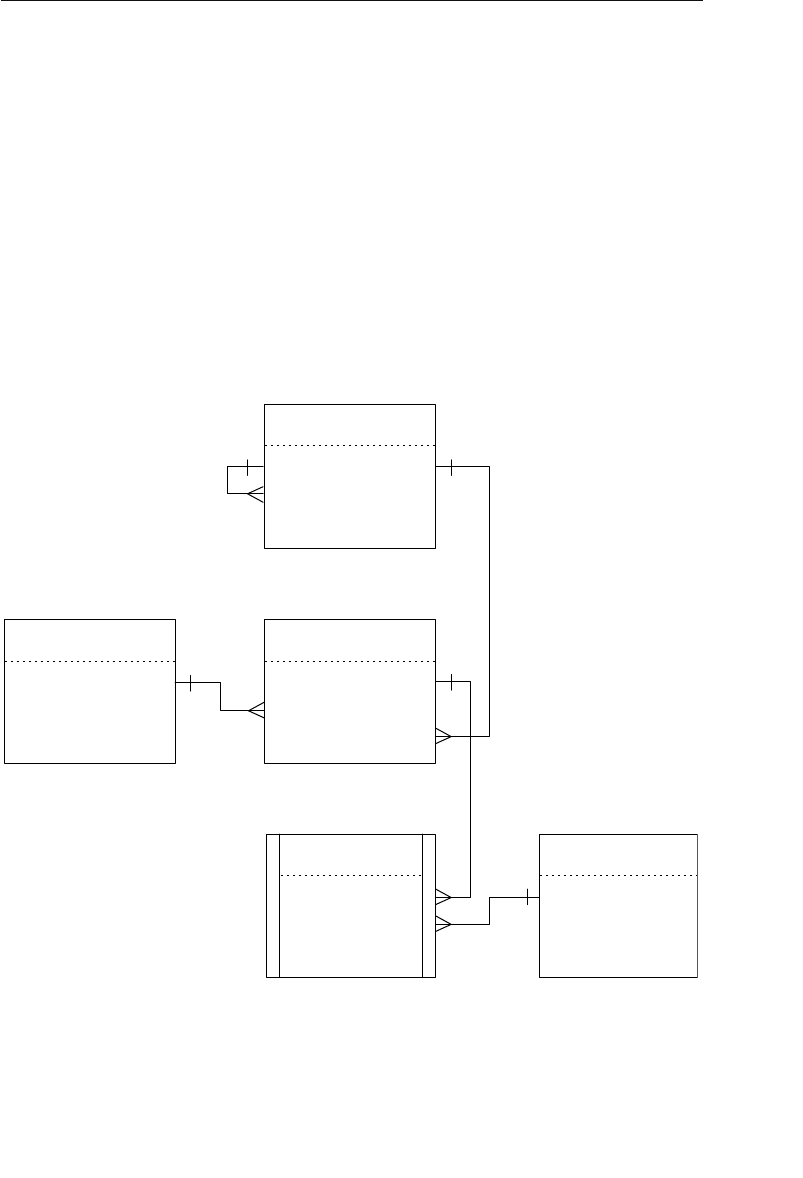
ptg14955309
Establishing Relationship Characteristics 373
5. Set Default: The RDBMS will delete the record in the parent
table and will then update the foreign key values of related
records in the child table to the current Default Value logical
element setting in the foreign key’s field specifications. Obvi-
ously, you must have a setting for the Default Value element in
order to use this rule.
Use a Restrict deletion rule as a matter of course and the other rules
as appropriate. The best way to determine which deletion rule is appro-
priate for a given relationship is to examine the relationship diagram.
Consider the diagram in Figure 10.56.
Product Number
Products
PK
Order Details
Order Number CPK/FK
Product NumberCPK/FK
Orders
PK
Customer ID
Employee Number
Order Number
FK
FK
Customers
PKCustomer ID
Employees
PK
Manager ID
Employee Number
FK
Figure 10.56 What deletion rule is appropriate for a given relationship?

ptg14955309
374 Chapter 10 Table Relationships
Select a relationship, look at the diagram, and pose the following question:
When a record in the (name of parent table) table is deleted, what
should happen to related records in the (name of child table) table?
Here the question is framed in a generic manner so that you can
understand the premise behind it. When you pose this question for
a pair of tables in a particular relationship, substitute the phrases
within the parentheses with the appropriate table names. If you’re
working with the relationship between the EMPLOYEES and ORDERS
table, you could pose the question in this manner:
When a record in the EMPLOYEES table is deleted, what should hap-
pen to related records in the ORDERS table?
The answer you receive depends on how the organization is using the
data within the tables and will usually indicate which deletion rule
you should use for the relationship.
You can’t delete an employee record; you have to designate the
employee as inactive. (Use a Deny rule.)
You can’t delete an employee record if there are related order records.
(Use a Restrict rule.)
You must first delete the orders associated with the employee from the
ORDERS table and then delete the employee from the EMPLOYEES
table. (Use the Restrict rule.)
All orders associated with the employee must be deleted from the
ORDERS table as well. (Use the Cascade rule.)
The employee number for all orders associated with the employee
must be deleted. (Use a Nullify rule.)
The employee number for all orders associated with the employee
must be reset to the lead salesperson’s employee number. (Use a Set
Default rule.)
If you (or the people you’re working with) cannot easily provide an
answer, make note of the relationship and continue with another
relationship. You’ll revisit all of these relationships when you establish
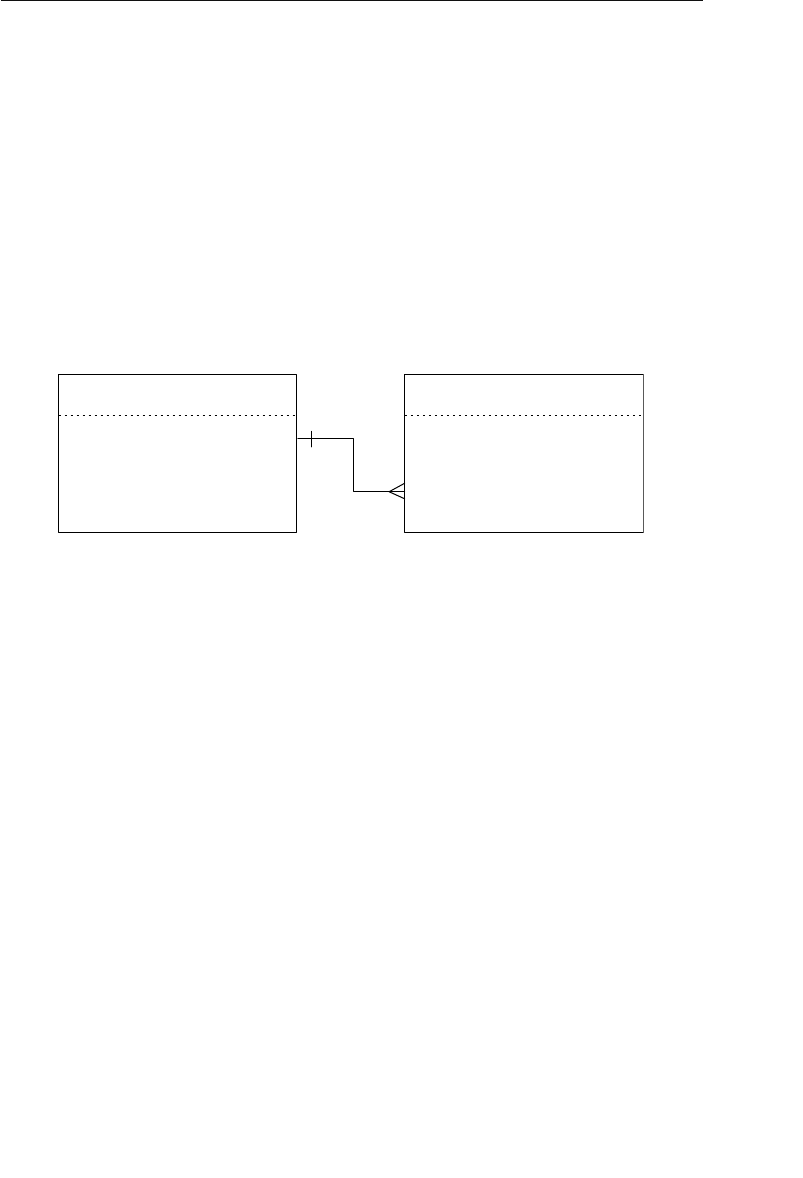
ptg14955309
Establishing Relationship Characteristics 375
business rules for the database in Chapter 11, “Business Rules.” For
now, let’s assume you received the first reply and you’re going to use a
Deny rule for the relationship.
Once you’ve identified the type of deletion rule you want to use for the
relationship, designate the rule on the relationship diagram. Use (D)
for Deny, (R) for Restrict, (C) for Cascade, (N) for Nullify, and (S) for Set
Default. Place the designation under the connection line of the parent
table. Figure 10.57 shows the revised relationship diagram for the
EMPLOYEES and ORDERS tables.
Orders
PK
Customer ID
Employee Number
Order Number
FK
FK
Employees
PK
Manager ID
Employee Number
FK (D)
Figure 10.57 Designating a Deny deletion rule for the relationship between the
EMPLOYEES and ORDERS tables
You always set the deletion rule from the perspective of the parent
table because it is the more important of the two tables within the
relationship. Deleting a record in the parent table will always have
some effect on related records in the child table, but deleting a record
in the child table will have no effect on the related record in the par-
ent table. (There is a specific circumstance in which you might want
to establish a Restrict deletion rule for the child table, and you’ll learn
about it in Chapter 11.)
The question you use to determine the deletion rule for a self-referenc-
ing relationship is just slightly different from the one you just used for
a dual-table relationship:
When a record in the (name of parent table) table is deleted, what
should happen to the foreign key values of the other records that were
related to it?

ptg14955309
376 Chapter 10 Table Relationships
If you’re working with the self-referencing relationship for the
EMPLOYEES table, you could pose the question in this manner:
When a record in the EMPLOYEES table is deleted, what should hap-
pen to the foreign key values of the other records that were related to
it?
Once again, the reply will usually indicate which deletion rule you
should use for the relationship:
You can’t delete a record for an employee who’s currently managing
other employees. (Use a Restrict rule.)
If the employee you want to delete is a manager, you cannot delete his
record until you assign the employees he manages to a different man-
ager. (Use the Restrict rule.)
If the employee whose record you want to delete is a manager, the
MANAGER ID must be deleted from the record of every employee he cur-
rently manages. (Use a Nullify rule.)
If the employee whose record you want to delete is a manager, the
MANAGER ID must be reset to the senior manager’s employee number in
the record of every employee he currently manages. (Use a Set Default
rule.)
❖Note The Cascade rule is notably absent from this exam-
ple because it doesn’t apply to the relationship at all; you don’t
want to fire employees just because their manager is leaving the
organization. This rule is still a viable option in some instances,
so do keep it in mind when you’re establishing deletion rules for
other self-referencing relationships.
Say that you received the last reply in the preceding list and have
determined that you’re going to use a Set Default deletion rule for the
relationship. You now complete the process by designating the rule on
the relationship diagram. Figure 10.58 shows the results of your work.

ptg14955309
Establishing Relationship Characteristics 377
Identifying the Type of Participation for
Each Table
When you establish a relationship between a pair of tables, each table
participates in a particular manner. The type of participation you
assign to a given table determines whether a record must exist in that
table before you can enter records into the related table. There are two
types of participation.
1. Mandatory: There must be at least one record in this table before
you can enter any records into the related table.
2. Optional: There is no requirement for any records to exist in this
table before you can enter records into the related table.
You’ll commonly determine the type of participation for most tables later
when you’re defining business rules, although you can quite often estab-
lish the type of participation for tables in relationships where the type
of participation for each table is obvious, is a result of common sense,
or is in accordance with some particular set of standards. For example,
consider the one-to-many relationship between the EMPLOYEES and
CUSTOMERS tables in Figure 10.59. (These are slightly different ver-
sions of the tables in Figure 10.56.)
Assume that each customer must be assigned to a particular
employee. This employee acts as the customer’s account representative
Employees
PK
Manager ID
Employee Number
FK
(S)
Figure 10.58 Designating a Set Default deletion rule for the EMPLOYEES table
self-referencing relationship

ptg14955309
378 Chapter 10 Table Relationships
Customers
Customer ID
Employee Number FK
PK
Employees
PKEmployee Number
(D)
Figure 10.59 What type of participation should you assign to each table?
and takes care of all transactions and communications between the
organization and that customer. Although each customer must be
associated with a particular employee, a given employee does not have
to be associated with any customer at all. Many employees perform
other functions within the organization that do not require customer
interaction.
This scenario neither implies nor defines any special circumstances,
but does indicate the manner in which the organization conducts this
part of its business. As such, you can infer the following.
•You should designate a Mandatory type of participation for the
EMPLOYEES table. This ensures that there is at least one
employee for you to assign to a given customer.
•You should designate an optional type of participation for the CUS-
TOMERS table. This allows you to enter any person employed by
the organization.
Once you’ve determined the type of participation for each table within
the relationship, designate each table’s participation on the relation-
ship diagram. Use a vertical line to represent a Mandatory type of
participation and a circle to represent an optional type of participation.
Figure 10.60 shows the revised relationship diagram for the EMPLOY-
EES and CUSTOMERS tables and also demonstrates how you indicate
each type of participation. Note that you place the symbol representing
the type of participation outside the symbol that represents the type of
relationship.

ptg14955309
Establishing Relationship Characteristics 379
The type of participation also applies to a self-referencing relationship,
although in a slightly different manner. Because of the nature of a
self-referencing relationship, you designate the type of participation for
the primary key and foreign key fields in the table. Figure 10.61 shows
a revised relationship diagram for the STAFF table you worked with
earlier in this chapter.
Staff
PK
Manager ID
Staff ID
FK
(S)
Figure 10.61 Designating the type of participation for the primary and foreign
keys of the STAFF table
In this case, you must have at least one staff member with a valid staff
identification number (the primary key) who can serve as a manager.
Conversely, you need not provide a manager identification number (the
Customers
Customer ID
Employee Number FK
PK
Employees
PKEmployee Number
(D)
This line symbolizes a mandatory
type of participation for this table.
This circle symbolizes an optional
type of participation for this table.
Figure 10.60 Designating the type of participation for the EMPLOYEES and
CUSTOMERS tables

ptg14955309
380 Chapter 10 Table Relationships
foreign key) for a brand-new staff member; this person may have just
been hired earlier today and has not yet been assigned to a particular
department or project.
Identifying the Degree of Participation for
Each Table
Now that you’ve determined how each table will participate within the
relationship, you must determine the degree to which each table will
participate. The degree of participation indicates the minimum number
of records that a given table must have associated with a single record
in the related table and the maximum number of records that the table
is allowed to have associated with a single record in the related table.
The factors you use to determine the degree of participation—obvious
circumstances, common sense, or conformance to some set of stan-
dards—are the same as those you used to determine the type of par-
ticipation. You’ll commonly identify the degree of participation for some
tables now and revisit the remaining tables when you define business
rules for the database.
You use two numbers separated by a comma and enclosed within
parentheses to represent the degree of participation for a given table.
The first number indicates the required minimum number of related
records and the second number indicates the allowable maximum
number of related records. For example, a degree of participation such
as (2,11) indicates that the table must have at least 2 but no more than
11 of its records related to a single record in the other table.
Consider the EMPLOYEES and CUSTOMERS tables once again. There
is a one-to-many relationship between these tables, which means that
a given customer can be associated with only one employee and a
given employee can be associated with any number of customers. (Yes,
I know; this is the obvious part.) Assume, however, that your organi-
zation has just instituted a new policy that focuses sharply on quality

ptg14955309
Establishing Relationship Characteristics 381
customer service. In order to ensure that each account representative
can deliver the level of service the organization requires, the policy
stipulates that he cannot be assigned to more than 15 customers at
the same time. Based on this scenario, you can infer that the degree of
participation for the EMPLOYEES table is (1,1) and the degree of par-
ticipation for the CUSTOMERS table is (0,15).
Once you’ve identified the degree of participation for a particular table,
add the information to the relationship diagram. Designate the degree
of participation over the connection line of the appropriate table. Fig-
ure 10.62 shows the revised relationship diagram for the EMPLOYEES
and CUSTOMERS tables.
Customers
Customer ID
Employee Number FK
PK
Employees
PKEmployee Number
(D)
This indicates the minimum
and maximum number of
customers to which an
employee can be related.
This indicates the minimum
and maximum number of
employees to which a
customer can be related.
(1,1)
(0,15)
Figure 10.62 Designating the degree of participation for the EMPLOYEES and
CUSTOMERS tables
The degree of participation also applies to a self-referencing relation-
ship, although you designate it for the primary key and foreign key
fields in the table, just as you did with the type of participation. Figure
10.63 shows an updated version of the relationship diagram for the
STAFF table that includes the degree of participation information.
STAFF ID has a degree of participation of (0,12) because a manager can
manage up to 12 staff members; a new manager who hasn’t yet been
assigned to a department or project will have no (or 0) staff members
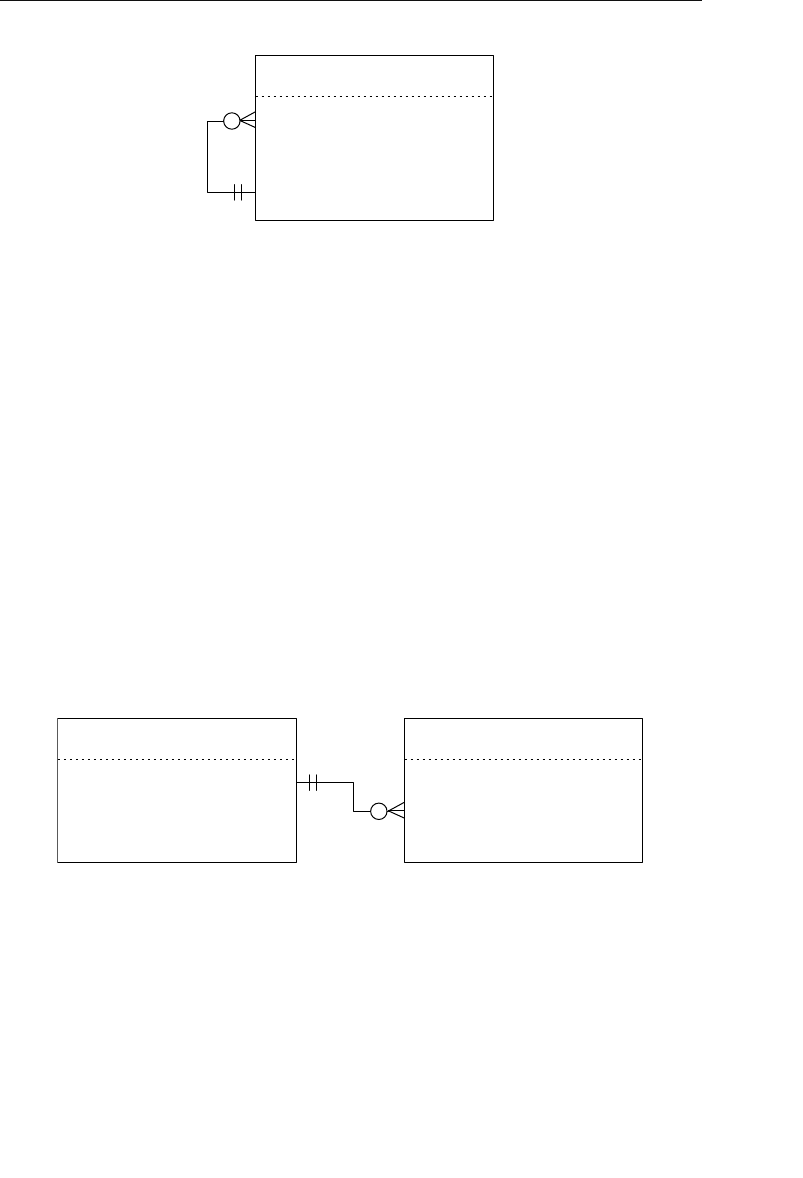
ptg14955309
382 Chapter 10 Table Relationships
to manage. The degree of participation for MANAGER ID is (1,1) because a
given staff member is managed by only one manager.
You can designate an unlimited degree of participation for any table
in a dual-table relationship or key field in a self-referencing relation-
ship by using an “N” in place of the second number. For example, the
ORDERS table in Figure 10.64 has an unlimited degree of partici-
pation. Although a new customer may have not yet placed an order,
you will allow him to place as many orders as he wishes. Imagine the
impact on your organization’s business if you limited each customer to
35 orders! Your organization would soon be out of business, unless it
could continually and consistently acquire new customers.
Customers
Customer ID
Employee Number FK
PK
Orders
PKOrder Number
(R)
(1,1)
(0,N)
Customer ID FK
Figure 10.64 Designating an unlimited degree of participation for the ORDERS
table
Your task now is to set the relationship characteristics for every rela-
tionship you’ve established thus far. As you complete work on a given
relationship, be sure to update the relationship diagram so that it
reflects the results of your work.
Staff
PK
Manager ID
Staff ID
FK
(S)
(1,1)
(0,12)
Figure 10.63 Designating the degree of participation for the primary and foreign
keys of the STAFF table

ptg14955309
Establishing Relationship Characteristics 383
Verifying Table Relationships with Users and
Management
The very last order of business is to verify the relationships. You can
perform this task relatively easily by using the following checklist.
1. Make sure that you’ve properly identified each relationship.
2. Make certain that you’ve properly established each relationship.
3. Make certain that each foreign key complies with the Elements
of a Foreign Key.
4. Make sure that you’ve established an appropriate deletion rule
for each relationship.
5. Make certain that you’ve identified the proper type of participa-
tion for each table within a dual-table relationship and for the
appropriate key fields in a self-referencing relationship.
6. Make certain that you’ve identified the proper degree of partici-
pation for each table within a dual-table relationship and for the
appropriate key fields in a self-referencing relationship.
If all the relationships check out and everyone you’re working with
agrees to this assessment, you can be confident that the relationships
are sound and ready to be incorporated into views.
A Final Note
The degree to which you can easily implement these three relationship
characteristics depends greatly upon your RDBMS. Most RDBMSs do
not fully or inherently support all of the characteristics, but they do
provide some basic support for the deletion rule and type of partici-
pation. In most cases, however, you can use SQL and programming
code to implement these characteristics for any relationship in your
database.

ptg14955309
384 Chapter 10 Table Relationships
Relationship-Level Integrity
A relationship attains relationship-level integrity after you’ve verified
that it is properly established and its characteristics are suitably set.
Relationship-level integrity warrants the following.
•The connection between the two tables (or key fields) in a relation-
ship is sound. You accomplished this by using primary and foreign
key fields to establish a one-to-one or a one-to-many relationship
and a linking table to establish a many-to-many relationship.
•You can insert new records into each table in a meaningful manner.
You ensured this by designating the appropriate type of partici-
pation for each table (or key field) within the relationship.
•You can delete an existing record without producing any adverse
effects. You guaranteed this by assigning an appropriate deletion
rule for the relationship.
•There is a meaningful limit to the number of records that can be
interrelated within the relationship. You implemented this by des-
ignating the appropriate degree of participation for each table (or
key field) within the relationship.
As you know, relationship-level integrity is the third component of
overall data integrity. (The first is table-level integrity and the second is
field-level integrity.) You’ll establish the final component of overall data
integrity in the next chapter when you learn how to establish business
rules for the database.
CASE STUDY
It’s now time to identify the relationships that exist for the tables that
appear on the final table list for Mike’s Bikes. You’ve assigned your
assistant, Zachary, to this part of the design process, and he’s cur-
rently working with these tables:
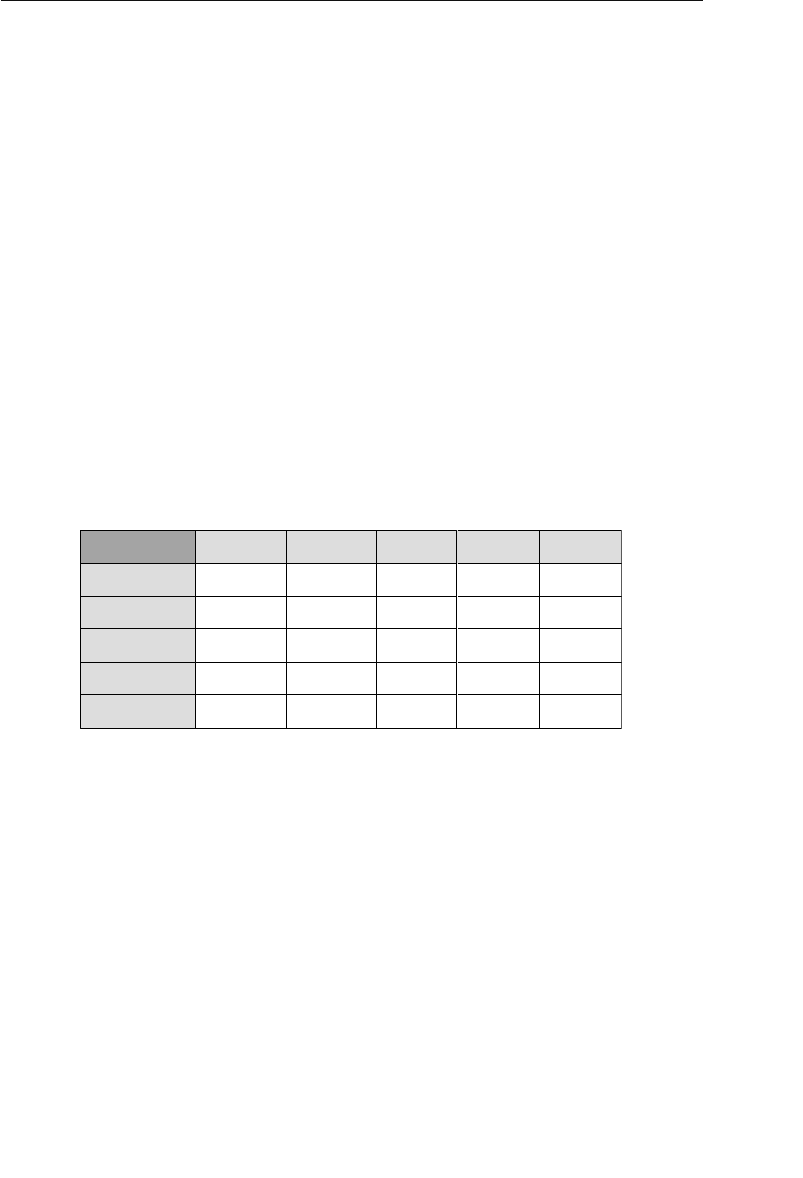
ptg14955309
Relationship-Level Integrity 385
CUSTOMERS
EMPLOYEES
INVOICES
PRODUCTS
VENDORS
Zachary’s first order of business is to identify the relationships that cur-
rently exist between the tables. He decides to meet only with Mike because
there are few tables in this database, and he figures that Mike should be
familiar enough with the tables to help him verify the relationships.
Before Zachary meets with Mike, he creates a table matrix and iden-
tifies as many relationships as possible. Figure 10.65 shows his com-
pleted matrix.
1:1
Customers
Employees
Invoices
Products
Vendors
Customers Employees Products Vendors
1:1 1:N
?
?
Invoices
1:N
1:N
1:N
Figure 10.65 Identifying the relationships among the tables in the Mike’s Bikes
database
Zachary then studies the table matrix closely and uses the appropriate
formula to determine the true relationship between each pair of tables.
Here is what he’s discovered so far.
CUSTOMERS and INVOICES bear a one-to-many relationship.
(1:1 + 1:N = 1:N)
EMPLOYEES and INVOICES bear a one-to-many relationship.
(1:1 + 1:N = 1:N)

ptg14955309
386 Chapter 10 Table Relationships
PRODUCTS and INVOICES bear a many-to-many relationship.
(1:N + 1:N = M:N)
Now he diagrams the relationships, places them in a folder, and heads
to Starbucks for his meeting with Mike.
At the meeting, Mike and Zachary work on verifying the relationships.
They both determine that the three relationships are indeed correct,
and then Zachary brings Mike’s attention to the PRODUCTS and
VENDORS tables. He’s not quite sure about the relationship between
them, so he discusses the matter with Mike.
ZACHARY: “I wanted to ask you about the relationship between the
PRODUCTS and VENDORS tables. Can a single product
be associated with one or more vendors?”
MIKE: “Yes, in a manner of speaking. What I mean is that a
single type of product—such as a bike lock—can be
associated with one or more vendors. But I give each lock
its own product number and treat it as a distinct item,
regardless of the vendor who supplies it. Now, if the true
meaning of your question is whether a single record in
the PRODUCTS table can be associated with one or more
records in the VENDORS table, then the answer is no
because each record in the PRODUCTS table contains a
reference to only one vendor in the VENDORS table.”
ZACHARY: “I thought as much. In that case, there’s a one-to-many
relationship between the VENDORS and PRODUCTS
tables. I automatically figured that a single vendor could be
associated with many products in the PRODUCTS table.”
Zachary now diagrams the one-to-many relationship between the
VENDORS and PRODUCTS tables and continues with the next step.
He establishes each one-to-many relationship by taking a copy of the
primary key from the parent table and incorporating it within the
structure of the child table (where it serves as a foreign key) and then
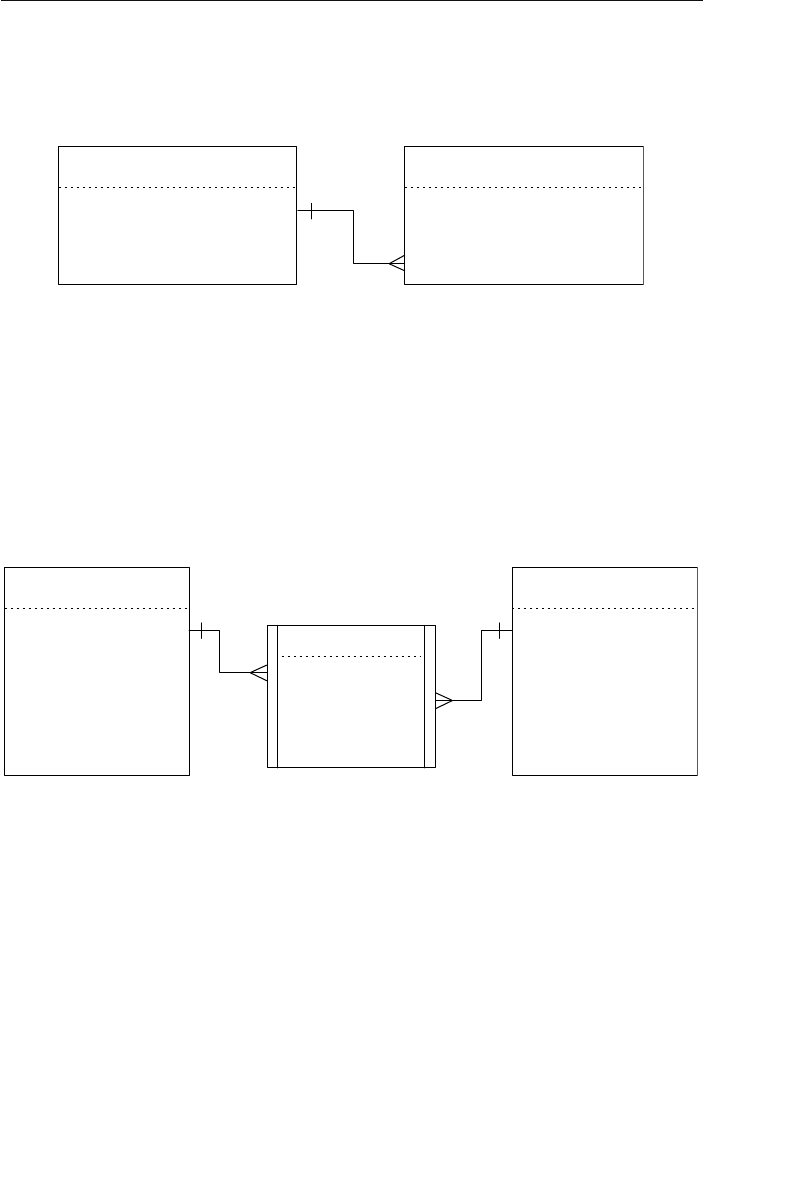
ptg14955309
Relationship-Level Integrity 387
revises the relationship diagram accordingly. Figure 10.66 shows one
of his revised diagrams.
Invoices
PK
Customer Number
Employee Number
Invoice Number
FK
FK
Employees
PKEmployee Number
Figure 10.66 The relationship diagram for the EMPLOYEES and INVOICES tables
Now Zachary establishes the many-to-many relationship between
the INVOICES and PRODUCTS tables by creating a new linking table
called INVOICE PRODUCTS. He bases the new table on the INVOICE
NUMBER field from the INVOICES table and the PRODUCT NUMBER field
from the PRODUCTS table. Figure 10.67 shows the revised relationship
diagram for the INVOICES and PRODUCTS tables.
Invoice Products
Invoice Number CPK/FK
Product NumberCPK/FK
Invoices
PK Product Number
ProdDescription
ProdName
Category
Wholesale Price
Customer Number
Invoice Date
Ship Date
Employee ID
Invoice Number
Products
PK
FK
FK
Quantity Ordered
Quote Price Retail Price
Figure 10.67 Establishing and diagramming the many-to-many relationship
between the INVOICES and PRODUCTS tables
Zachary reviews each table structure to ensure that it conforms to the
Elements of the Ideal Table. Fortunately, he doesn’t have to make any
modifications because all of the table structures are sound. He now
refines the foreign keys in each table by making certain that each one
complies with the Elements of a Foreign Key. Finally, Zachary modifies
the appropriate items in the General Elements and Logical Elements
ptg14955309
388 Chapter 10 Table Relationships
sections of each foreign key’s Field Specifications sheet. Figure 10.68
shows the modifications he’s made for one of the foreign keys. (I’ve
highlighted the changes so that you can recognize them more easily.)
Logical Elements
Key Structure:
Non
Not Determined At This Time
Edit Rule:
Null Support: Nulls Allowed
Enter Now, Edits Not Allowed
Enter Later, Edits Allowed
Primary
Alternate
No Nulls
Uniqueness: Unique
Required Value: No Yes
Comparisons Allowed:
x
x
x
x
Range of Values:
Default Value:
Values Entered By:
Operations Allowed:
System
x
Key Type:
CompositeSimple
x
Enter Later, Edits Not Allowed
<> <=>=
Other Fields
Same Field
x=
x
Value Expression
x
<> <=>==
<> <=>==
x
All
All
All
Same Field
Other Fields Concatenation
All
All
+
+
x
x
Value Expression All Concatenation+ x
Concatenation
Any existing Customer Number in the CUSTOMERS table.
Enter Now, Edits Allowed
x
Non-unique
User
Customer Number
General Elements
Field Name:
Label:
Parent Table:
Shared By:
Alias(es):
Description:
Source Specification:
Specification Type: GenericUnique Replica
Customer Number from the CUSTOMERS table.
Invoices
x
The identification number of a given customer. The values in this field enable us to identify
and keep track of the customers who place orders for the products we provide.
–
–
–
Foreign
Figure 10.68 The General Elements and Logical Elements sections of the Field
Specifications sheet for the CUSTOMER ID foreign key field in the INVOICES table
ptg14955309
Summary 389
Zachary’s next task is to establish the appropriate relationship charac-
teristics for each relationship. He begins by defining a deletion rule for
each relationship and then identifies both the type of participation and
the degree of participation for each table within the relationship. He
completes his task by designating these characteristics on the relation-
ship diagram. Figure 10.69 shows one of the completed diagrams.
Invoices
PK
Customer Number
Employee Number
Invoice Number
FK
FK
Employees
PKEmployee Number
(R)
(1,1)
(0,N)
Figure 10.69 The completed relationship diagram for the EMPLOYEES and
INVOICES tables
Mike and Zachary review and verify all the relationships one last time.
They agree that everything is complete, so they celebrate with a couple
of Mocha Bréves.
Summary
We opened this chapter with a discussion of the three types of relation-
ships that can exist between a particular pair of tables—one-to-one,
one-to-many, and many-to-many. You now know that the one-to-many
relationship is the most common type of dual-table relationship and
that the many-to-many relationship gives rise to problems that must
be resolved. You then learned about a self-referencing relationship,
which is a type of relationship that occurs between the records within
a given table. It is similar to a dual-table relationship in that it can be
one-to-one, one-to-many, or many-to-many.
Next, we discussed how to identify the relationships that exist among
the tables in a database. First you learned how to construct and use

ptg14955309
390 Chapter 10 Table Relationships
a table matrix, and then you learned how to use associative and con-
textual questions to help you identify a given relationship. We then
discussed three formulas you could use to determine the true rela-
tionship that exists between the tables in a dual-table relationship or
between the records in a self-referencing relationship.
The chapter continued with a discussion of how relationships are
established. You learned that one-to-one and one-to-many relation-
ships are established by using primary keys and foreign keys, and that
many-to-many relationships are established using linking tables. We
then briefly revisited multivalued fields, and you learned how to use
a proper one-to-many relationship to resolve a multivalued field more
efficiently. Next, we discussed self-referencing relationships, and you
now know that you establish them in a very similar manner to dual-ta-
ble relationships. You then learned that you must review all of the
table structures and ensure that they still conform to the Elements of
the Ideal Table.
Foreign keys were the next topic of discussion, and you learned that
every foreign key must comply with the Elements of a Foreign Key. You
now know that it can be very important for a foreign key to share the
same name as its parent primary key, that you must modify certain ele-
ments of a field specification for a field that serves as a foreign key, and
that a foreign key must draw its values from the parent primary key.
We then discussed relationship characteristics. You learned how to
define a deletion rule for a relationship and that there are four ways
you can define it. Next, you learned how to identify the type of partic-
ipation and degree of participation for each table within a dual-table
relationship and for each key field in a self-referencing relationship. As
you now know, you can designate the type of participation as Manda-
tory or Optional. You also know that the degree of participation gauges
the minimum and maximum number of interrelated records that can
exist within a given relationship. Finally, you learned that you must

ptg14955309
Review Questions 391
verify the relationships with users and management and that you can
use a checklist to accomplish this task.
The chapter closed with a look at relationship-level integrity. You
learned that a relationship attains this type of integrity after you’ve
verified that it is properly established and its characteristics are suit-
ably set.
Review Questions
1. State two major reasons why a relationship is important.
2. Name the three types of relationships.
3. Which relationship will pose the most problems?
4. State two problems you could possibly encounter with a many-to-
many relationship.
5. What is a self-referencing relationship?
6. How do you begin the process of identifying the relationships
among the tables in the database?
7. What are the two types of questions you can ask to help you iden-
tify existing relationships?
8. What shorthand symbol do you use to designate a one-to-many
relationship in the table matrix?
9. How do you determine what type of relationship officially exists
between each pair of tables in the matrix?
10. How do you establish a one-to-many relationship?
11. True or False: Retrieving information from tables with a self-refer-
encing relationship can be tedious and somewhat difficult.
12. How do you establish a self-referencing many-to-many
relationship?

ptg14955309
392 Chapter 10 Table Relationships
13. How do you refine the foreign keys in the database?
14. What two element categories must you modify for a foreign key’s
field specification?
15. What is the function of a deletion rule?
16. What two types of participation can you designate for a table?
17. What does the degree of participation indicate?
18. When does a relationship attain relationship-level integrity?

ptg14955309
393
11
Business Rules
You are remembered for the rules you break.
—GENERAL DOUGLAS MACARTHUR
Topics Covered in This Chapter
What Are Business Rules?
Categories of Business Rules
Defining and Establishing Business Rules
Validation Tables
Reviewing the Business Rule Specifications Sheets
Case Study
Summary
Review Questions
Throughout the database design process, you’ve performed tasks that
helped to establish various levels of data integrity. You’ve established
table-level integrity, field-level integrity, and relationship-level integrity
thus far. In doing so, you’ve ensured that the table and field structures
are sound, that data entered into the fields will be consistent and basi-
cally valid, and that relationships are meaningful and properly estab-
lished. In this chapter you’ll learn how to establish the final component
of overall data integrity: business rules.
What Are Business Rules?
A business rule is a statement that imposes some form of constraint
on a specific aspect of the database, such as the elements within a

ptg14955309
394 Chapter 11 Business Rules
field specification for a particular field or the characteristics of a given
relationship. You base a business rule on the way the organization
perceives and uses its data, which you determine from the manner in
which the organization functions or conducts its business.
An important aspect of any design process is making choices. In data-
base design, for example, you must choose which data to store in the
database; you would not necessarily want or need to store every last
piece of data the organization might possibly use. The data you finally
choose to store and how you decide to store it will be determined by
the way the organization uses its data. A hospital may wish to store
times of various events to the second, whereas a warehouse requires
only the date for any given event.
To guide these and other choices you’ll be required to make during the
database design process (and later, when you implement the data-
base in an RDBMS), you need a formal statement of the organization’s
business rules. These rules will influence a wide variety of database
issues, such as the data you collect and store, the manner in which
you define and establish relationships, the types of information that
the database can provide, and the very security and confidentiality of
the data itself. It is next to impossible to create a generic set of busi-
ness rules that could apply to two or more organizations. Each organi-
zation has its own data and information requirements and each has its
own unique way of conducting its business; therefore, every organiza-
tion needs its own specific set of business rules.
The following statement is an example of a typical business rule:
A SHIP DATE cannot be prior to an ORDER DATE for any given order.
This particular business rule imposes a constraint on the Range of
Values element of the field specifications for a SHIP DATE field. It will
help ensure that the value of SHIP DATE is meaningful within the con-
text of a sales order. Without this constraint, you could enter any date

ptg14955309
What Are Business Rules? 395
into the field (including one prior to the ORDER DATE), making the SHIP
DATE field’s value absolutely meaningless. The business rule is what
makes the SHIP DATE field’s value contextually meaningful.
Because business rules depend on the manner in which an organiza-
tion perceives and uses its data, it is quite possible that a particular
rule can be used by several organizations, but for completely different
reasons.
For example, say that the music department at Bel Air High School is
known far and wide for the quality of musicianship it develops in its
student musicians. The students are able to attain this level of musi-
cianship because they’re encouraged to focus their musical studies
and restrict themselves to learning to play no more than two instru-
ments. In another part of town, the music department at Lake City
High School (a private school) also imbues its student musicians with
a high quality of musicianship by helping the students focus their
musical studies. The students at this school, however, are restricted to
learning to play no more than two instruments due to school policy;
the school’s inventory of musical instruments is very limited.
Coincidentally, both schools are in the process of designing their own
database. In each case, the school will use the database to support its
daily operations and administrative functions. It so happens that each
database contains the tables shown in Figure 11.1.
Both schools are at the same stage of the database design process and
are currently establishing business rules. As it turns out, each school
is using the following business rule in their respective databases:
A student cannot have more than two instruments checked out at the
same time.
This business rule applies to the degree of participation between
the STUDENTS table and STUDENT INSTRUMENTS table. In this
instance, a single record in the STUDENTS table cannot be associated

ptg14955309
396 Chapter 11 Business Rules
with more than two records in the STUDENT INSTRUMENTS table
where the value of CHECK-IN DATE for each record is null; a null value
in the CHECK-IN DATE field indicates that the instrument is still in the
student’s possession.
The rule does apply to both schools, yet each school requires it for a
different reason. Bel Air High School requires the rule because of the
manner in which its music program has been established, whereas
Lake City High School requires the constraint because of the physi-
cal limitations of its instrument inventory. The fact that both schools
developed an identical rule is pure coincidence. This example illus-
trates that a business rule is, indeed, based on the way an organiza-
tion functions or conducts its business and demonstrates why every
organization must have its own specific set of business rules.
The example also illustrates another issue: You cannot establish
constraints imposed by certain business rules, such as this one,
within the logical design of the database. For instance, there is no
clear way for you to indicate that the CHECK-IN DATE values must be
tested in order to determine whether a student can check out another
Student Instruments
Student ID
Instrument ID
Check-Out Date
Check-In Date
(1,1)
(1,1)
(0,2)
(R)
(R)
Instruments
Instrument ID
Product Line
Category
InstDescription
InstName
Manufacturer ID
Model
Estimated Value
Date Acquired
Students
Student ID
StudFirst Name
StudLast Name
StudStreet Address
StudCity
StudState
StudZipcode
StudHome Phone
StudEmail Address
Social Security Number
CPK/FK
CPK/FK
(0,N)
CPK/FK
FK
PK
PK
Figure 11.1 Tables from the Bel Air High School and Lake City High School
databases

ptg14955309
What Are Business Rules? 397
instrument. You must instead address and establish the constraint
outside of the logical design of the database. How do you determine
whether you can properly represent a given constraint within this pro-
cess? You do so by identifying the type of business rule you’re defining.
Types of Business Rules
There are two major types of business rules: database oriented and
application oriented. Both types of business rules impose some form
of constraint and help enforce and maintain overall data integrity, but
they differ with regard to where and how they are established.
Database-oriented business rules impose constraints that you can
establish within the logical design of the database. You implement a
given constraint by modifying various field specification elements, rela-
tionship characteristics, or a combination of the two. The statement
from which you derive the constraint is a database-oriented business
rule if you can meaningfully and clearly establish the constraint by
either of these means. For example, say you have a VENDORS table
and define the following business rule for the VENDSTATE field in that
table:
We conduct business exclusively with vendors from the Pacific
Northwest.
This business rule limits the values that you can enter into the
VENDSTATE field to WA, OR, ID, and MT. You can establish the business
rule’s constraint in a meaningful manner by modifying the Range of
Values element in the field specifications for the VENDSTATE field.
Figure 11.2 shows the modification.
Application-oriented business rules impose constraints that you cannot
establish within the logical design of the database. You must instead
establish them within the physical design of the database or within the
design of a database application, where they will be more applicable
ptg14955309
398 Chapter 11 Business Rules
and meaningful. (I use the term database application here to refer to
a program written in some RDBMS software that allows people in the
organization to use the database easily and to perform tasks related to
their daily work activities.)
Here is an example of a typical application-oriented business rule:
A customer with a “Preferred” status receives a 15% discount on all
purchases.
This business rule determines the amount of discount applied to a
customer’s purchases, based on a particular status. You cannot estab-
lish this constraint meaningfully in the logical design for two reasons:
There is no field in which to store the discount amount (the amount
Logical Elements
Key Structure:
Non
Not Determined At This Time
Edit Rule:
Null Support: Nulls Allowed
Enter Now, Edits Not Allowed
Enter Later, Edits Allowed
Primary
AlternateForeign
No Nulls
Uniqueness: Unique
Required Value: No Yes
Comparisons Allowed:
x
x
x
x
Range of Values:
Default Value:
Values Entered By:
Operations Allowed:
System
x
Key Type:
CompositeSimple
Enter Later, Edits Not Allowed
<> <=>=
Other Fields
Same Field
x=
x
Value Expression
<> <=>==
<> <=>==
All
All
All
Same Field
Other Fields Concatenation
All
All
+
+
x
x
Value Expression All Concatenation+ x
Concatenation
≠
≠
≠
÷
÷
÷
ID, MT, OR, WA
Enter Now, Edits Allowed
x
Non-unique
User
None
–
–
–
Figure 11.2 Implementing a constraint imposed by a database-oriented business
rule

ptg14955309
Categories of Business Rules 399
is a result of a calculation, and calculated fields are not allowed in a
table), and there is no way to indicate the criterion used—the custom-
er’s status—to determine the discount. This is a rule that you must
establish within the physical design of the database or the design of
the database application.
❖Note The manner in which you actually define and establish
application-oriented business rules is a topic that is beyond the
scope of this book. Some RDBMSs provide tools that allow you to
implement common application-oriented business rules relatively
easily; most RDBMSs will require you to write programming
code to implement and enforce these rules.
Although both types of business rules are important, you’ll focus on
database-oriented business rules during this stage of the database
design process.
❖Note Throughout the remainder of the book, I’ll refer to
database-oriented business rules simply as business rules.
Categories of Business Rules
It will be easier for you to understand and define business rules if you
divide them into two distinct categories: field specific and relationship
specific.
Field-Specific Business Rules
Business rules under this category impose constraints on the elements
of a field specification for a particular field. The number of elements

ptg14955309
400 Chapter 11 Business Rules
a given rule affects depends on the manner in which you define that
rule. For example, this rule only affects one element:
Order dates are to be displayed in long form, such as “January 10,
2012.”
This rule affects the Display Format element of the ORDER DATE field in
an ORDERS table. You establish this rule by modifying the Display
Format element of the field specifications for the ORDER DATE field to
indicate the manner in which the date should be displayed.
Here’s a rule that affects more than one element:
We must be able to store a zip code for our Canadian customers.
This rule affects the Data Type, Character Support, and Display For-
mat elements of the field specifications for the CUSTZIPCODE field in a
CUSTOMERS table. Canadian zip codes include letters, so you must
make the following modifications to these elements in order to impose
the constraints defined by this rule.
1. Change the Data Type setting to “Alphanumeric.”
2. Include “Letters” under the Character Support element.
3. Modify the Display Format element to ensure that the letters in
Canadian zip codes will be capitalized.
Figure 11.3 shows the modified Physical Elements section of
CUSTZIPCODE’s field specifications.
Physical Elements
Length:
Decimal Places:
Input Mask:
Display Format:
Data Type: Character Support:
Numbers (0–9)
.Keyboard ( , / $ # %)
Special ( © ® ™ ∑ π)
x
6
Not Applicable x
Alphanumeric
Letters (A–Z)
Uppercase letters where applicable.
Not Applicable
Figure 11.3 Establishing a field-specific business rule for CUSTZIPCODE
ptg14955309
Categories of Business Rules 401
Relationship-Specific Business Rules
These types of business rules impose constraints that affect the char-
acteristics of a relationship. For instance, assume you’re working with
the tables and relationships in Figure 11.4.
Student Classes
Student ID
Class ID
ClassesStudents
Student ID
StudFirst Name
StudLast Name
StudStreet Address
StudCity
StudState
StudZipcode
StudHome Phone
StudEmail Address
Social Security Number
CPK/FK
CPK/FK
FK
PKPK Class ID
Instructor ID
Class Name
Class Description
Category
(1,1) (1,1)
(0,N)
(R)
(R)
(0,N)
Figure 11.4 Tables and relationships from a school database
Say you determine that there must be a limit to the number of stu-
dents for each class and you define the following business rule:
Each class must have a minimum of five students, but cannot have
more than 20.
This business rule affects the degree of participation between the
CLASSES and STUDENT CLASSES tables. You enforce the constraint
this rule defines by modifying the relationship diagram to show that a
single record in the CLASSES table must be related to at least five—but
no more than 20—records in the STUDENT CLASSES table. (Depend-
ing on your point of view, you could also infer from this business rule
that the type of participation for the STUDENT CLASSES table is now
mandatory. You can enter a new class or keep an existing class in the
CLASSES table if and only if there are at least five students registered
for that class.) Figure 11.5 shows the modification you must make to
the diagram in order to establish the business rule.
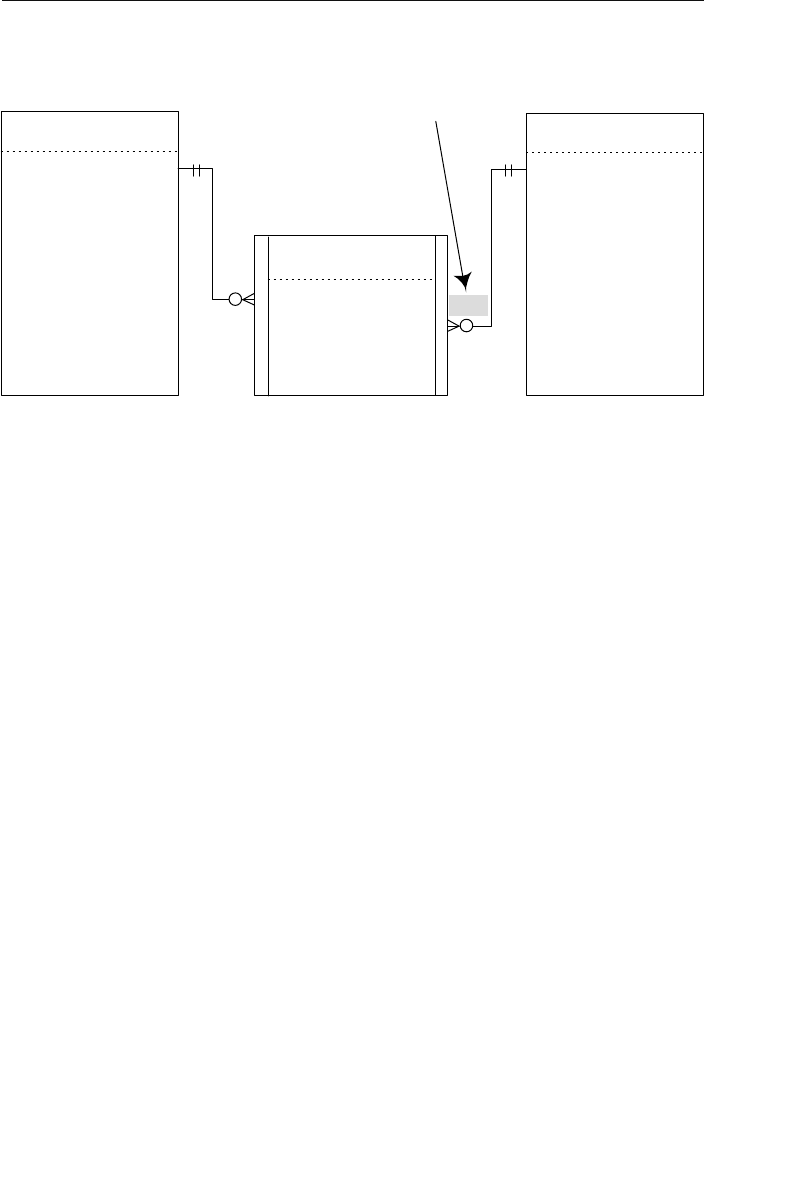
ptg14955309
402 Chapter 11 Business Rules
Defining and Establishing Business
Rules
You’ll define and establish business rules for the database during this
stage of the design process. Remember that you must base these rules
on the manner in which your organization perceives and uses its data,
which (as you well know) will depend on the way the organization
functions or conducts its business. The best approach to this task is
to define and establish the field-specific business rules first, followed
by the relationship-specific business rules. This approach helps you
to remain focused on the type of rule you’re defining. It also keeps you
from jumping back and forth between different types of business rules,
which can often lead to confusion and some amount of frustration.
Working with Users and Management
Once again, you’ll work with the representative group of users and
management. Schedule new meetings with them so that you can work
Student Classes
Student ID
Class ID
ClassesStudents
Student ID
StudFirst Name
StudLast Name
StudStreet Address
StudCity
StudState
StudZipcode
StudHome Phone
StudEmail Address
Social Security Number
CPK/FK
CPK/FK
FK
PKPK Class ID
Instructor ID
Class Name
Class Description
Category
(1,1) (1,1)
(0,N)
(R)
(R)
(5,20)
Modification made to the
Degree of Participation for
the CLASSES table
Figure 11.5 Establishing a relationship-specific business rule

ptg14955309
Defining and Establishing Business Rules 403
together to define and establish the appropriate business rules for
the database. Working as a group enables you to make certain that
the constraints imposed by the business rules you define are mean-
ingful and that there is no confusion or ambiguity as to the necessity
of imposing each constraint. If you or anyone in the group has some
doubt about a constraint, you can discuss the effect it will have on the
field or relationship involved and the advantages and disadvantages of
imposing the constraint. You can then decide whether to keep the rule
or disregard it completely based on the results of your discussion.
Defining and Establishing Field-Specific Business
Rules
Begin the process of establishing business rules for the database by
working on field-specific rules. You define and establish each rule
using these steps.
1. Select a table.
2. Review each field and determine whether it requires any
constraints.
3. Define the necessary business rules for the field.
4. Establish the rules by modifying the appropriate field specifica-
tion elements.
5. Determine what actions test the rule.
6. Record the rule on a Business Rule Specifications sheet.
Let’s now take a look at each step in greater detail.
Step 1: Select a Table
It doesn’t matter which table you select first because you’ll eventually
apply this procedure to every table within the database. If you choose
a table with a familiar structure, however, you can focus a little more

ptg14955309
404 Chapter 11 Business Rules
on learning the steps within the procedure. This extra effort will pay
dividends when you begin to work with tables containing fields that
bear closer attention and examination.
Think about the subject the table represents and then pose these
questions:
How does the organization use information based on or related to this
subject?
What relationships does this table have to itself or to other tables in
the database?
When necessary, consult the final table list and read the description
for this table, and refer to any relationship diagrams that incorporate
this table. The answers to these questions will be useful to you while
you’re defining rules for this table and focusing on the table in this
manner prepares you for the next step.
Step 2: Review Each Field and Determine Whether It
Requires Any Constraints
Examine the Field Specifications sheet for each field and determine
whether you should apply a constraint to any of its elements. Keep
the questions from Step 1 in mind as you review a given specification
sheet, and then pose this question:
Based on how the table is used within the database, is a constraint
necessary for any element within this specification?
If the answer is no, move on to the next field; otherwise, go on to the
next step. For example, assume you’re working with the CUSTCOUNTY
field in a CUSTOMERS table and you have just posed the question
about the need for a constraint. (Figure 11.6 shows the current Logical
Elements category for this field.)
ptg14955309
Defining and Establishing Business Rules 405
You should move on to the next step if you receive an answer such as
this:
“Well, the boss wants to begin tracking our customers by county, so
we must make certain we record a county for every customer. In fact,
we’ve just added Pierce County and Snohomish County to our sales
region, so it’ll be imperative that the county names get recorded.”
This response clearly is a yes, so you will go on to define business
rules for this field in the next step.
Step 3: Define the Necessary Business Rules for the Field
You define the appropriate business rules for the CUSTCOUNTY field by
identifying the constraints implied by the response in Step 2. Then you
transform each constraint into a rule.
Logical Elements
Key Structure:
Non
Not Determined At This Time
Edit Rule:
Null Support: Nulls Allowed
Enter Now, Edits Not Allowed
Enter Later, Edits Allowed
Primary
AlternateForeign
Uniqueness: Unique
Required Value: No
Comparisons Allowed:
xx
Range of Values:
Default Value:
Values Entered By:
Operations Allowed:
System
x
Key Type:
CompositeSimple
Enter Later, Edits Not Allowed
<> <=>=
Other Fields
Same Field =
Value Expression
<> <=>==
<> <=>==
All
All
Same Field
Other Fields Concatenation
All
All
+
+
x
x
Value Expression All Concatenation+ x
Concatenation
≠
≠
≠
÷
÷
÷
Enter Now, Edits Allowed
x
Non-unique
User
None
King, Kitsap
All
xx
x
x
x
x
Yes
No Nulls
x
x
x
–
–
–
Figure 11.6 Current settings for the Logical Elements category of the CUSTCOUNTY
field

ptg14955309
406 Chapter 11 Business Rules
The response in Step 2 suggests two possible constraints that you
should impose upon the CUSTCOUNTY field: A county name is required
for each customer, and the range of values for this field is limited to
four specific counties (the two currently on the field specification and
the two new counties indicated in the response). Here are two state-
ments you might use to begin transforming these constraints into
business rules:
A county must be associated with each customer.
The only counties that can be entered into this field are King, Kitsap,
Pierce, and Snohomish.
Once you’ve defined the appropriate business rules, you can move on
to Step 4.
Step 4: Establish the Rules by Modifying the Appropriate
Field Specification Elements
Establish each business rule you defined in Step 3 by modifying the
appropriate elements on the Field Specifications sheet. (Remember
that some rules may affect more than one element.) First, however, you
must identify which elements of the field specifications the rule affects.
For example, consider the first business rule you defined for the Cust-
County field in Step 3:
A county must be associated with each customer.
You can deduce that the rule affects the Required Value, Null Support,
and Edit Rule elements because it explicitly states that a county “must
be associated” with a customer. Now you can make the appropriate
modifications to these elements. In this particular case, you’ll set
Required Value to “Yes,” Null Support to “No Nulls,” and Edit Rule to
“Enter Now, Edits Allowed.”
As you can see, it’s important for you to examine each business rule
very carefully in order to determine which field specification elements
ptg14955309
Defining and Establishing Business Rules 407
it’s going to affect. When you first begin to define business rules, it’s
best to have a Field Specifications sheet handy so that you can refer to
it as necessary. Many of the elements will come to mind more easily as
you become more experienced at establishing business rules.
Now, consider the next business rule in the example:
The only counties that can be entered into this field are King, Kitsap,
Pierce, and Snohomish.
This business rule affects the Range of Values element, and you’ll now
revise its setting to “King, Kitsap, Pierce, and Snohomish.” Figure 11.7
shows the revised Logical Elements category of the Field Specifications
sheet for the CUSTCOUNTY field.
Logical Elements
Key Structure:
Non
Not Determined At This Time
Edit Rule:
Null Support: Nulls Allowed
Enter Now, Edits Not Allowed
Enter Later, Edits Allowed
Primary
AlternateForeign
Uniqueness: Unique
Required Value: No
Comparisons Allowed:
x
x
x
x
Range of Values:
Default Value:
Values Entered By:
Operations Allowed:
System
x
Key Type:
CompositeSimple
Enter Later, Edits Not Allowed
<> <=>=
Other Fields
Same Field =
Value Expression
<> <=>==
<> <=>==
All
All
Same Field
Other Fields Concatenation
All
All
+
+
x
x
Value Expression All Concatenation+ x
Concatenation
≠
≠
≠
÷
÷
÷
Enter Now, Edits Allowed
x
Non-unique
User
None
King, Kitsap, Pierce, Snohomish
All
xx
x
x
x
x
Yes
No Nulls
–
–
–
Figure 11.7 Revised settings for the Logical Elements category of the CUSTCOUNTY
field

ptg14955309
408 Chapter 11 Business Rules
Step 5: Determine What Actions Test the Rule
The constraint the business rule imposes is tested when you attempt
to perform one of three actions: inserting a record into the table or an
entry into a field, deleting a record from the table or a value within a
field, or updating a field’s value. Now that you’ve established a business
rule and understand the constraint it will impose, determine what
actions test the rule by identifying when a violation of the rule is most
likely to occur. You can make this a relatively easy task by asking
yourself the following questions:
Will this rule be violated if I enter a new record into this table?
Will this rule be violated if I do not enter a new record into this table?
Will this rule be violated if I delete a record from this table?
Will this rule be violated if I enter a value into this field?
Will this rule be violated if I do not enter a value into this field?
Will this rule be violated if I update the value of this field?
Will this rule be violated if I delete the value of this field?
Once you’ve determined which actions will trigger a violation of the
rule, make note of them; you’ll use them in the next step. This infor-
mation will also help you to establish this rule in the most effective
manner possible when you implement the database in your RDBMS.
In this case, the business rule for the CUSTCOUNTY field will be tested
when you try to insert a value into the field because the value must be
within a specific range of values. The rule will also be tested when you
try to delete a value in the field because the value cannot be null.
Step 6: Record the Rule on a Business Rule Specifications
Sheet
You can document a given business rule for future reference by filling
out a Business Rule Specifications sheet. This is something you should

ptg14955309
Defining and Establishing Business Rules 409
do for every rule, regardless of its type or category. The Business Rule
Specifications sheet provides three advantages.
1. It allows you to document every database-oriented business rule.
This helps you ensure that you have appropriately defined and
properly established each rule.
2. It allows you to document every application-oriented business
rule. Although you cannot establish this type of rule within the
logical design of the database, you can at least indicate its basic
elements. The information you document for this type of busi-
ness rule will prove invaluable to you when you implement the
database within your RDBMS or when you create the applica-
tion program that people will use to work with the database.
3. It provides a standard method for recording all business rules.
Business rules are easier to track and maintain if you record
them in a consistent manner. Using a uniform format also
makes it easier for you to troubleshoot business rules; every
aspect of the rule appears on the specification sheet.
The Business Rule Specifications sheet contains the following items.
•Statement: This is the text of the business rule itself. It should be
clear and succinct and should convey the required constraints
without any confusion or ambiguity. Here’s an example of a well-
framed statement:
A booking agent cannot be assigned to more than 25
entertainers.
•Constraint: This is a brief explanation of how the constraint
applies to the tables and fields. For instance, you can use the
following explanation for the constraint imposed by the business
rule in the preceding example:
A single record in the AGENTS table can be associated with no
more than 25 records in the ENTERTAINERS table.

ptg14955309
410 Chapter 11 Business Rules
•Type: Here is where you indicate whether the rule is database
oriented or application oriented.
•Category: This is where you indicate whether the rule is field spe-
cific or relationship specific.
•Test On: Here is where you indicate which actions (insert, delete,
update) will test the constraint the business rule imposes.
•Structures Affected: Depending on the type of business rule, the
constraint will affect either a field or a relationship. This is where
you designate the name of the field(s) the rule will affect or the
name of the table(s) involved in the relationship that the rule
affects.
•Field Elements Affected: A business rule that pertains to a field
can affect one or more elements of that field’s specifications. This
is where you indicate the elements the rule affects.
•Relationship Characteristics Affected: A business rule that per-
tains to a relationship will affect one or more of the relationship’s
characteristics. Here is where you indicate the characteristics
that the rule affects.
•Action Taken: Here you indicate the modifications you’ve made to
the elements of a field specification or to a relationship diagram.
It is very important that the statement you enter here be as clear
and unambiguous as possible. Should a problem occur as a
result of enforcing this business rule, this statement serves as
accurate documentation of the steps you have taken to establish
the rule. You can use this statement to make certain that these
steps were actually carried out and that the rule has been prop-
erly established.
Now, fill out a Business Rule Specifications sheet for the rule you
established in Step 4. Figure 11.8 shows a completed Business Rule
Specifications sheet that documents the business rules you estab-
lished for the CUSTCOUNTY field.

ptg14955309
Defining and Establishing Business Rules 411
Action Taken
Structures Affected
Field Names:
Table Names:
Rule Information
Statement:
Constraint:
Test On: Insert
Delete
x
x
Update
Category: Field Specific
Relationship Specific
x
Type: Database Oriented
Application Oriented
x
Field Elements Affected
Logical Elements
Key Structure
Edit Rule
Null Support
Uniqueness
Required Value
Comparisons Allowed
x
xRange of Values
Default Value
Values Entered By
Operations Allowed
Key Type
x
Physical Elements
Length
Input MaskDecimal Places
Character Support Display Format
Data Type
Relationship Characteristics Affected
Degree of ParticipationType of ParticipationDeletion Rule
CUSTCOUNTY
Required Value was set to “Yes,” Null Support was set to “No Nulls,” and Edit Rule was set to
“Enter Now, Edits Allowed.”
A county must be associated with each customer.
An entry must be made into the CustCounty field; it cannot be Null.
BUSINESS RULE SPECIFICATIONS
Figure 11.8 An example of a Business Rule Specifications sheet

ptg14955309
412 Chapter 11 Business Rules
Defining and Establishing Relationship-Specific
Business Rules
After defining and establishing field-specific business rules, the next
order of business is to tackle relationship-specific business rules. The
procedure for performing this task involves the following steps.
1. Select a relationship.
2. Review the relationship and determine whether it requires any
constraints.
3. Define the necessary business rules for the relationship.
4. Establish the rule by modifying the appropriate relationship
characteristics.
5. Determine what actions will test the rule.
6. Record the rule on a Business Rule Specifications sheet.
As you can see, this procedure is similar to the one you used for field-
specific business rules. Now, let’s take a look at each step in more detail.
❖Note You can apply this entire procedure to both self-refer-
encing and dual-table relationships. I’ve based the remainder of
the discussion on a dual-table relationship, however, because it
is the type of relationship you are likely to work with the major-
ity of the time.
Step 1: Select a Relationship
Which relationship you choose is a relatively trivial matter because
you’ll eventually apply this procedure to every relationship anyway.
Once you select a specific relationship, review its relationship diagram.
Then think about what the tables represent and why they are related
and pose the following questions:

ptg14955309
Defining and Establishing Business Rules 413
What kind of information do these tables provide?
Why is the relationship between these two tables important?
The answer to these questions will help you define any necessary busi-
ness rules for the relationship, and keeping them in mind will prepare
you for the next step.
Step 2: Review the Relationship and Determine Whether It
Requires Any Constraints
Briefly review each relationship characteristic and keep its current
setting in mind. Then examine the relationship as a whole and deter-
mine whether it requires some form of constraint. As you review the
relationship, remember the answers to the questions you posed in
Step 1. You now pose a question such as this to help you determine
whether a constraint is necessary:
Is there a need to impose some type of limitation on this relationship
based on the way the organization functions or conducts its business?
If the answer is yes, then go to the next step; otherwise, review the
next relationship and perform this step once again. For example,
assume you’re designing a database for a small dance studio, and
you’re working with the relationship between the INSTRUCTORS and
INSTRUCTOR CLASSES tables in Figure 11.9.
Now, pose a question to help you determine whether the relationship
requires a constraint:
Is there a need to impose some type of limitation on this relationship
based on the way the dance studio functions or conducts its business?
Move to the next step if you receive an answer such as this:
Yes, there is. We require all instructors to teach at least one class. We
limit them, however, to teaching no more than eight classes.
You’ll use this response as the basis of a business rule in the next step.

ptg14955309
414 Chapter 11 Business Rules
Step 3: Define the Necessary Business Rules for the
Relationship
Next, define an appropriate business rule based on the response you
received in Step 2. Identify the constraint the response implies and
then transform it into a business rule. For example, you can infer two
constraints from the response: The minimum number of classes an
instructor can teach is one, and the maximum number is eight. Trans-
form these constraints into a business rule by composing a statement
such as this one:
An instructor must teach one class, but no more than eight classes.
After you’ve defined the rule, continue with the next step.
Step 4: Establish the Rule by Modifying the Appropriate
Relationship Characteristics
Establish the business rule you just defined by modifying the appro-
priate characteristics in the relationship diagram. Before you make
any modifications, consider the business rule statement once again
and identify which relationship characteristics the rule affects:
An instructor must teach one class, but no more than eight classes.
Instructor Classes
Instructor ID
Class ID
(1,1) (1,1)
(0,N)
(R)
(R)
Instructors
CPK/FK
CPK/FK
(0,N)
PK
Classes
PKClass ID
Class Name
Class Description
Category
Instructor ID
InstFirst Name
InstLast Name
InstStreet Address
InstCity
InstState
InstZipcode
InstHome Phone
InstEmail Address
Date Hired
Figure 11.9 A relationship diagram for tables from a dance studio database
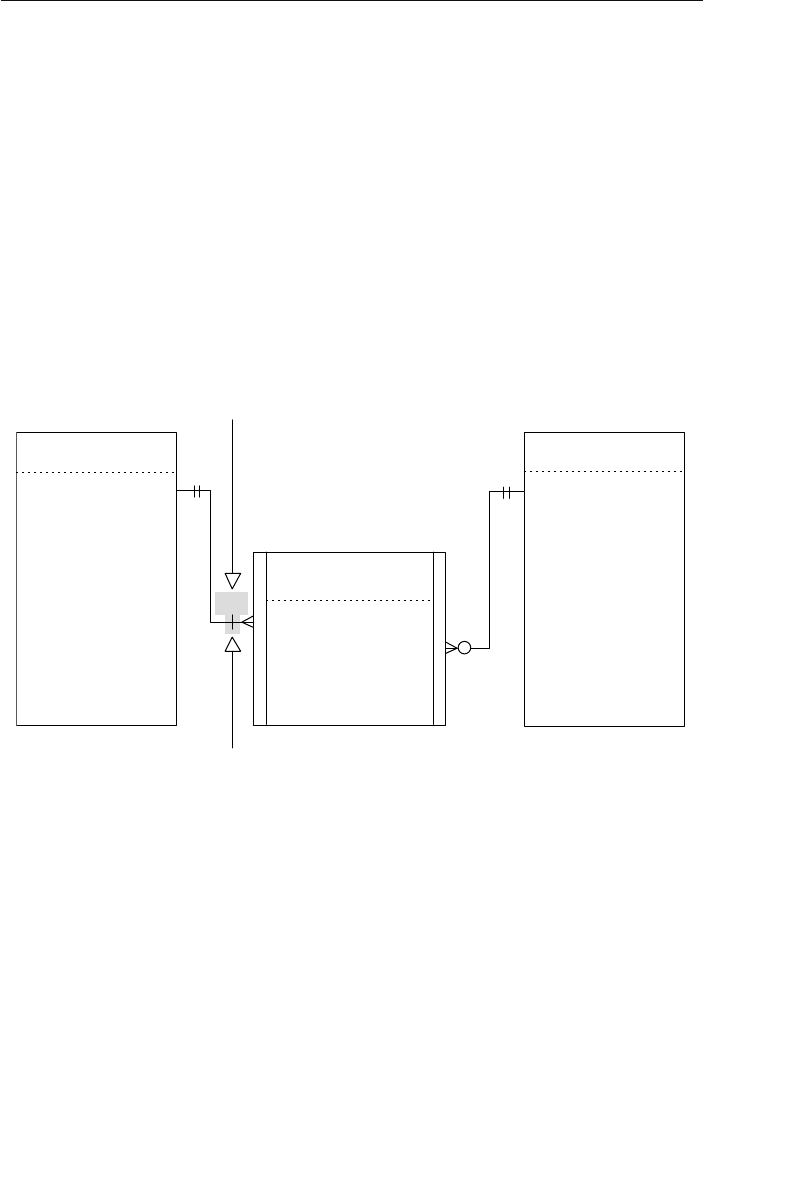
ptg14955309
Defining and Establishing Business Rules 415
The constraint affects the number of classes an instructor can
teach, so you modify the degree of participation characteristic of the
INSTRUCTOR CLASSES table by setting it to “(1,8).” This rule also
affects the type of participation characteristic of the INSTRUCTOR
CLASSES table. You must set the table’s type of participation to “Man-
datory” because a single record in the INSTRUCTORS table must be
associated with at least one record in the INSTRUCTOR CLASSES
table. Figure 11.10 shows the revised relationship diagram with your
modifications.
Instructor Classes
Instructor ID
Class ID
(1,1) (1,1)
(R)
(R)
Instructors
CPK/FK
CPK/FK
(0,N)
PK
Classes
PKClass ID
Class Name
Class Description
Category
Instructor ID
InstFirst Name
InstLast Name
InstStreet Address
InstCity
InstState
InstZipcode
InstHome Phone
InstEmail Address
Date Hired
Modification made to the
Degree of Participation for the
INSTRUCTOR CLASSES table
Modification made to the
Type of Participation for the
INSTRUCTOR CLASSES table
(1,8)
Figure 11.10 The revised relationship diagram that establishes the new busi-
ness rule
Step 5: Determine What Actions Will Test the Rule
As you know, the constraint the business rule imposes is tested when
you attempt to insert, delete, or update a table record or field value.
Now that you’ve established the business rule and understand how it

ptg14955309
416 Chapter 11 Business Rules
affects the relationship, determine what actions test the rule by iden-
tifying when a violation of the rule is most likely to occur. Use the
following questions to help you make your decision:
Are there circumstances under which this rule will be violated if I
enter a new record into this table?
Will this rule be violated if I do not enter a new record into this table?
Will this rule be violated if I delete a record from this table?
Once you’ve determined which actions will trigger a violation of the
rule, make note of them; you’ll use them in the next step. This infor-
mation will also help you to establish this rule in the most effective
manner possible when you implement the database in your RDBMS.
Here’s an important point to note: When you determine that a rule
will be violated when you attempt to delete a record, you must alter
the current deletion rule for the relationship accordingly or add a new
deletion rule to the relationship.
You learned in Chapter 10, “Table Relationships,” that you don’t need
to worry about deleting records in the child table of a relationship
because there can be no adverse effects from doing so. We must now
amend this assertion by stating that an exception occurs when delet-
ing a record in the child table would violate a required business rule.
You handle this exception by establishing a Restrict deletion rule for
the child table. Make absolutely certain that you keep this in mind as
you’re determining when a rule will be tested.
The new business rule for the dance studio database will be tested
when you attempt to insert a record into the INSTRUCTOR CLASSES
table; you can associate a maximum of only eight records with a
particular instructor. The rule will also be tested when you attempt to
delete a record from the INSTRUCTOR CLASSES table; each instruc-
tor must be associated with at least one class. As a result, you must
establish a Restrict deletion rule for this table. Figure 11.11 shows the
modifications you’ve made to this relationship’s diagram.

ptg14955309
Validation Tables 417
Step 6: Record the Rule on a Business Rule Specifications
Sheet
Finally, fill out a Business Rule Specifications sheet for the business
rule you established in Step 4. Figure 11.12 shows the completed Busi-
ness Rule Specifications sheet for your new rule.
Validation Tables
As you define field-specific business rules, there will be instances in
which a rule imposes a constraint that defines a distinct set of valid
values for a given field’s range of values. (This affects the field’s Range
of Values element in its field specification.) This set of values commonly
comprises a relatively fixed number of entries, and the values them-
selves will rarely change. If the number of entries is rather high, how-
ever, you might discover that it’s going to be slightly difficult for you to
implement this rule. For example, you’ll probably run out of room very
quickly when you attempt to enumerate each of the values within the
Instructor Classes
Instructor ID
Class ID
(1,1) (1,1)
(R)
(R)
Instructors
CPK/FK
CPK/FK
(0,N)
PK
Classes
PKClass ID
Class Name
Class Description
Category
Instructor ID
InstFirst Name
InstLast Name
InstStreet Address
InstCity
InstState
InstZipcode
InstHome Phone
InstEmail Address
Date Hired
New Restrict deletion rule added for
the INSTRUCTOR CLASSES table
(1,8)
(R)
Figure 11.11 Establishing a Restrict deletion rule for the INSTRUCTOR CLASSES
table to support the new business rule
ptg14955309
418 Chapter 11 Business Rules
Action Taken
Structures Affected
Field Names:
Table Names:
Rule Information
Statement:
Constraint:
Test On: Insert
Delete
x
x
Update
Category: Field Specific
Relationship Specific
Type: Database Oriented
Application Oriented
x
Field Elements Affected
Logical Elements
Key Structure
Edit Rule
Null Support
Uniqueness
Required Value
Comparisons Allowed
Range of Values
Default Value
Values Entered By
Operations Allowed
Key Type
Physical Elements
Length
Input MaskDecimal Places
Character Support Display Format
Data Type
Relationship Characteristics Affected
Degree of ParticipationType of ParticipationDeletion Rule
The type of participation for the INSTRUCTOR CLASSES table was changed to Mandatory.
The degree of participation for the INSTRUCTOR CLASSES table was changed to (1,8).
A new Restrict deletion rule was added to the relationship for the INSTRUCTOR CLASSES table.
INSTRUCTORS, INSTRUCTOR CLASSES
An instructor must teach one class, but no more than eight (8) classes.
The participation of INSTRUCTORS within the relationship is Mandatory. Also, a single record in
INSTRUCTORS can be related to only eight (8) records in INSTRUCTOR CLASSES.
xx x
x
BUSINESS RULE SPECIFICATIONS
Figure 11.12 The completed Business Rule Specifications sheet for the new busi-
ness rule
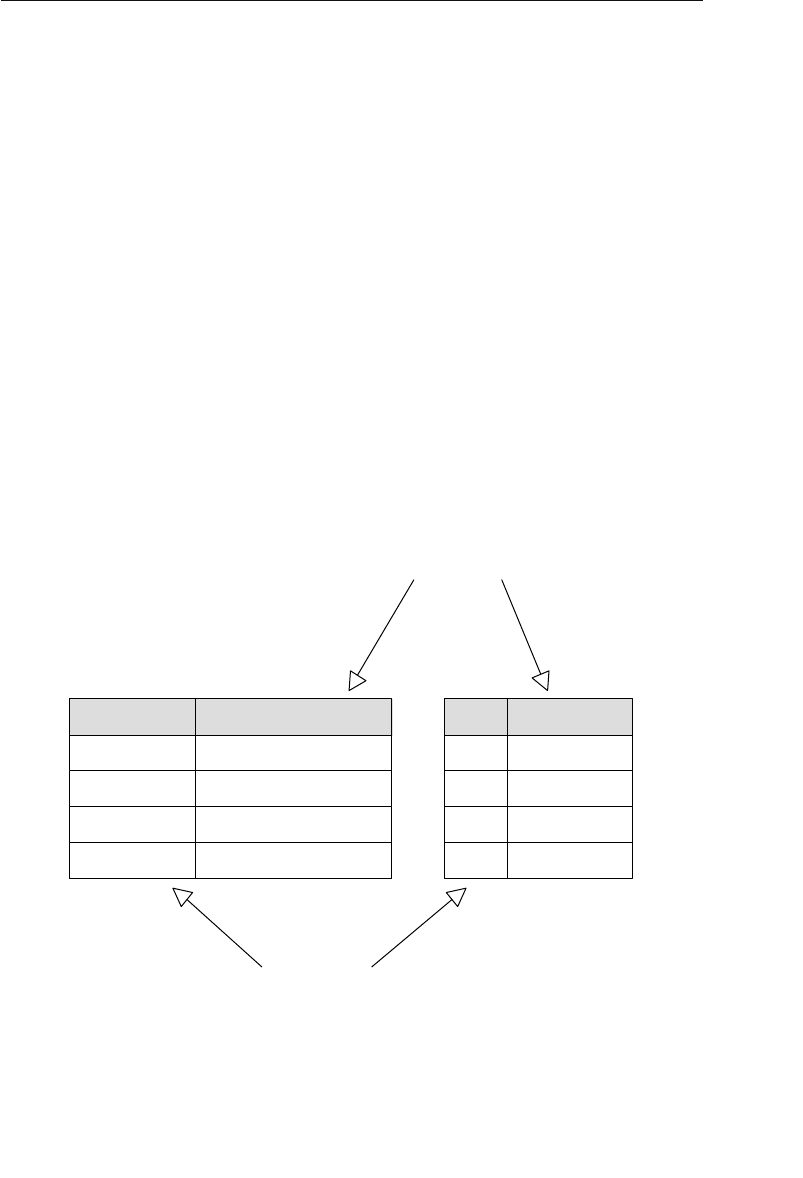
ptg14955309
Validation Tables 419
Range of Values element on the Field Specifications sheet, and imple-
menting the entire set of values within the RDBMS could prove to be
somewhat complicated. You can avoid problems such as these by stor-
ing all of the values in a validation table.
What Are Validation Tables?
As you learned in Chapter 3, “Terminology,” a validation table (also
known as a lookup table) stores data that you specifically use to
implement data integrity. You won’t often insert, update, or delete any
records within the table once you populate the table with the data you
require. Validation tables usually (but not always) comprise two fields:
The first acts as the primary key and is what you’ll use to help you
enforce data integrity, and the second is simply a non-key field that
stores a set of values required by some other field in the database. Fig-
ure 11.13 shows two examples of validation tables.
Category
Architects
General Contractors
Attorneys
Computer Consultants
Category ID
60002
60003
60004
60001
Categories States
State
AL
AK
AR
CA
State Name
Alabama
Alaska
Arkansas
California
Primary Key Field
Non-Key Field
Figure 11.13 Examples of validation tables

ptg14955309
420 Chapter 11 Business Rules
In this section, you’ll learn how to use the primary key field to help
enforce a business rule. You’ll learn how to use the non-key field in
Chapter 12, “Views.”
Using Validation Tables to Support Business Rules
When a business rule limits a field’s range of values, you can enforce
the constraint by using a validation table; the field will then draw its
values from an appropriate field in the validation table. Establishing
this type of rule involves two steps: defining a relationship between the
parent table of the field affected by the rule and the validation table,
and making a modification to the Range of Values element of the field
specifications for the affected field in the parent table.
For example, assume you’re working with the SUPPSTATE field of a
SUPPLIERS table, and you’ve defined the following business rule:
Any supplier we use must be based in one of the 11 contiguous west-
ern states, Alaska, or Hawaii.
You can see that this rule imposes a constraint on the SUPPSTATE field’s
range of values, limiting them to AK, AZ, CA, CO, HI, ID, MT, NM, NV,
OR, UT, WA, and WY. (According to the rule, you can’t use a sup-
plier based in some other state.) The easiest and most efficient way to
establish this rule is to store these values in a validation table called
STATES, and then to use the validation table as the source of the
SUPPSTATE field’s range of values.
Consider the tables in Figure 11.14. (Note the new symbol that is used
to represent a validation table.) The SUPPLIERS table stores all the
requisite data on the SUPPLIERS engaged by the organization, and the
STATES table is a new validation table that will store the names and
abbreviations of the specified states.
Your first order of business (no pun intended) is to establish a rela-
tionship between these tables. As you can see, there is a one-to-many

ptg14955309
Validation Tables 421
relationship between them—a single record in STATES can be asso-
ciated with one or more records in SUPPLIERS, but a single record
in SUPPLIERS will be associated with only one record in STATES.
You already know that you establish a one-to-many relationship by
taking a copy of the parent table’s primary key and incorporating it
within the structure of the child table where it becomes a foreign key.
Although the SUPPLIERS table already has a field named SUPPSTATE,
you’ll replace it with the STATE field from the STATES validation table.
(This is a reasonable modification because it is in accordance with the
Elements of the Ideal Field and is consistent with the manner in which
you establish one-to-many relationships.) Figure 11.15 shows the new
relationship diagram for these two tables.
Now that the STATE field is a foreign key in the SUPPLIERS table, make
certain that it conforms to the Elements of a Foreign Key (as outlined
in Chapter 10) and set its field specification in the appropriate manner.
Then set the relationship’s characteristics in this manner.
•Deletion Rule: Define a Restrict deletion rule for this relationship.
You do not want to delete a state in the STATES table that is
being referenced by records in the SUPPLIERS table.
Suppliers
PKSupplier ID
SuppName
SuppFax Number
SuppAddress
SuppCity
SuppState
SuppZipcode
SuppPhone Number
State
State Name
States
PK
Figure 11.14 The SUPPLIERS table and the STATES validation table

ptg14955309
422 Chapter 11 Business Rules
•Type of Participation: Designate an Optional type of participation
for the SUPPLIERS table and a Mandatory type of participation
for the STATES table. Although it’s unnecessary for the SUP-
PLIERS table to contain any records before you can enter a new
record in the STATES table, there must be at least one record in
the STATES table before you can enter records into the SUPPLI-
ERS table.
•Degree of Participation: Assign a (1,1) degree of participation for
the STATES table; as you already know, there must be at least
one record in the STATES table before you can enter records into
the SUPPLIERS table. Assign a (0,N) degree of participation for
the SUPPLIERS table; any number of records in this table can be
associated with a particular record in the STATES table.
Next, modify the Range of Values element of the field specification for
the STATE field in the SUPPLIERS table using a setting such as this:
Any value within the STATE field of the STATES table.
Figure 11.16 shows the settings you’ve made within the Logical Ele-
ments category of the Field Specifications sheet for this field.
Suppliers
PKSupplier ID
SuppName
SuppFax Number
Supp Address
SuppCity
State
SuppZipcode
SuppPhone Number
State
State Name
States
PK
(1,1)
(0,N)
(R)
FK
Figure 11.15 A relationship diagram for the SUPPLIERS and STATES tables
ptg14955309
Validation Tables 423
Now you must decide which actions test the rule. When you use a val-
idation table to enforce a business rule, you typically want to test the
rule when a user attempts to insert a new value into the field or update
an existing value within the field. In either case, a violation will occur
when the user attempts to enter a value that does not exist in the vali-
dation table.
Finally, fill out a Business Rule Specifications sheet for the business
rule you’ve just established. Be sure to indicate the modifications
you’ve made to both the field and the new relationship. Figure 11.17
shows the completed Business Rule Specifications sheet for your new
rule.
Logical Elements
Key Structure:
Non
Not Determined At This Time
Edit Rule:
Null Support: Nulls Allowed
Enter Now, Edits Not Allowed
Enter Later, Edits Allowed
Primary
Alternate
Uniqueness: Unique
Required Value: No
Comparisons Allowed:
x
x
x
x
Range of Values:
Default Value:
Values Entered By:
Operations Allowed:
System
x
Key Type:
CompositeSimple
Enter Later, Edits Not Allowed
<> <=>=
Other Fields
Same Field =
Value Expression
<> <=>==
<> <=>==
All
All
Same Field
Other Fields Concatenation
All
All
+
+
x
x
Value Expression All Concatenation+ x
Concatenation
=/
=/
=/
÷
÷
÷
Enter Now, Edits Allowed
x
User
None
Any value within the State field of the STATES table
All
xx
Yes
No Nulls
Non-unique
Foreign
xx
–
–
–
x
Figure 11.16 Setting the Logical Elements category for the STATE foreign key field
in the SUPPLIERS table
ptg14955309
424 Chapter 11 Business Rules
Field Names:
Table Names:
Statement:
Constraint:
Test On: Insert
Delete
xUpdate
Category: Field Specific
Relationship Specific
Type: Database Oriented
Application Oriented
x
Logical Elements
Key Structure
Edit Rule
Null Support
Uniqueness
Required Value
Comparisons Allowed
Range of Values
Default Value
Values Entered By
Operations Allowed
Key Type
Physical Elements
Length
Input MaskDecimal Places
Character Support Display Format
Data Type
Degree of ParticipationType of ParticipationDeletion Rule xx x
x
Any supplier we use must be based in one of the 11 contiguous Western states, Alaska, or
Hawaii.
Entries for the State field in the SUPPLIERS table are limited to existing values of the State field
in the STATES table.
SUPPLIERS, STATES
STATE
The Range of Values was set to “Any value within the State field of the STATES table.”
The type of participation for each table was changed: STATES is Mandatory; SUPPLIERS is Optional.
The degree of participation for each table was changed: SUPPLIERS is (0,N); STATES is (1,1).
A Restrict deletion rule was defined for the relationship between SUPPLIERS and STATES.
x
x
BUSINESS RULE SPECIFICATIONS
Action Taken
Structures Affected
Rule Information
Field Elements Affected
Relationship Characteristics Affected
Figure 11.17 A completed Business Rule Specifications sheet for the new
business rule

ptg14955309
Reviewing the Business Rule Specifications Sheets 425
Reviewing the Business Rule
Specifications Sheets
After you’ve established the business rules you believe to be appropri-
ate, review their specification sheets. Carefully examine each speci-
fication sheet and make certain that you’ve properly established the
rule and that you’ve clearly marked all of the appropriate areas on
the sheet. If you find an error, make the necessary modifications and
review it once more. Repeat this process until you’ve reviewed every
business rule.
Business rules are an important component of the database. They
contribute to overall data integrity and impose integrity constraints
that are specific to the organization. As you’ve seen, these rules help
to ensure the validity and consistency of the data according to the
manner in which the organization functions or conducts its business.
Additionally, these rules will eventually influence the manner in which
you implement the database within your RDBMS and how you design
and develop end-user application programs for the database.
It’s important to understand that you will revisit these rules quite
often. As you review the final structure, for example, you may deter-
mine that additional business rules are necessary. You may discover
that some of the rules will not provide the results you had initially
envisioned, so you’ll need to modify them. It’s also possible for you to
determine that some of the rules aren’t necessary after all. (In this
instance, be absolutely sure to examine the rules carefully before you
remove them.)
Keep in mind that the business rules you define now are bound to
require modifications in the future; you will most likely need to add
business rules in due course because of changes in the way the
organization functions or conducts its business. The need to mod-
ify existing business rules or develop new ones is quite normal—the
organization inevitably grows and matures, and so does the manner

ptg14955309
426 Chapter 11 Business Rules
in which it acts upon or reacts to external forces. These forces affect
the manner in which the organization perceives and uses its data,
which, in turn, changes the nature of the organization’s business rule
requirements.
The task of defining and establishing business rules is—as are so
many other tasks within the database design process—ongoing. Don’t
be discouraged if you have to perform this task several times. Your
efforts will pay great dividends in the long run.
CASE STUDY
Now it’s time to establish business rules for Mike’s database. You
schedule a meeting with Mike and his staff to review the tables and
relationships in their database. The first order of business is to define
and establish field-specific business rules.
You start the process by reviewing the PRODUCTS table. As you
examine each field, you determine whether it requires any constraints.
When you come upon the CATEGORY field, you remember that there was
some question regarding its range of values. (Refer to the Case Study
in Chapter 9, “Field Specifications.”) You discuss this issue once again
with Mike and his staff, and you finally come to a consensus on a
distinct list of categories. Mike then decides that the values for the
CATEGORY field should be limited to those on this list to make certain
that the staff does not arbitrarily invent new categories. Based on
Mike’s decision, you define an appropriate business rule to establish
the constraint:
Invalid product categories are not allowed.
There are a number of items in the list of possible categories, so you
decide that the best way to establish this rule is to use a validation
table. You create a new table called CATEGORIES and then establish
a relationship between it and the PRODUCTS table. Next, you diagram

ptg14955309
Reviewing the Business Rule Specifications Sheets 427
the relationship and set the relationship’s characteristics in the appro-
priate manner. Figure 11.18 shows the results of your work.
Products
PK
Categories
PK
(1,1)
(R)
(0,N)
Category ID
CategoryDescription
Product Number
ProdDescription
ProdName
Retail Price
Wholesale Price
Category ID FK
Figure 11.18 The relationship diagram for the PRODUCTS and CATEGORIES
tables
Here are the settings you used for the relationship’s characteristics.
• There is a Restrict deletion rule for the relationship.
• The CATEGORIES table has a mandatory type of participation.
• The PRODUCTS table has an optional type of participation.
• The CATEGORIES table has a (1,1) degree of participation.
• The PRODUCTS table has a (0,N) degree of participation.
Remember that by establishing this relationship, you’ve replaced the
existing CATEGORY field in the PRODUCTS table with a copy of the CAT-
EGORY ID field from the new CATEGORIES table. You must now make
certain that the CATEGORY ID field in the PRODUCTS table conforms to
the Elements of a Foreign Key and then make the appropriate modifi-
cations to its field specification. Finally, set the field’s Range of Values
element to something such as this:
Any value within the CATEGORY ID field in the CATEGORIES table.
Figure 11.19 shows the settings you’ve made to the Logical Elements
category of the field specifications for the CATEGORY ID field in the
PRODUCTS table.
ptg14955309
428 Chapter 11 Business Rules
Logical Elements
Key Structure:
Non
Not Determined At This Time
Edit Rule:
Null Support: Nulls Allowed
Enter Now, Edits Not Allowed
Enter Later, Edits Allowed
Primary
Alternate
Uniqueness: Unique
Required Value: No
Comparisons Allowed:
x
x
x
x
Range of Values:
Default Value:
Values Entered By:
Operations Allowed:
System
x
Key Type:
CompositeSimple
Enter Later, Edits Not Allowed
<> <=>=
Other Fields
Same Field =
Value Expression
<> <=>==
<> <=>==
All
All
Same Field
Other Fields Concatenation
All
All
+
+
x
x
Value Expression All Concatenation+ x
Concatenation
=/
=/
=/
÷
÷
Enter Now, Edits Allowed
x
User
None
Any value within the Category ID field in the CATEGORIES table
All
xx
Yes
No Nulls
Non-unique
Foreign
xx
x
–
–
–
÷
Figure 11.19 Logical Elements settings for the CATEGORY ID foreign key field in the
PRODUCTS table
Now you must decide when the rule should be tested. As you already
know, you typically want to test a rule established with a validation
table if the user attempts to insert a value into the field or update an
existing value within the field.
Finally, you complete a Business Rule Specifications sheet for this new
business rule. This specification sheet will reflect the modifications
you’ve made to the field specifications for the CATEGORY ID field, as well
as the characteristics of the relationship between the CATEGORIES
and PRODUCTS tables. Figure 11.20 shows the completed Business
Rule Specifications sheet.
You repeat this process for the remaining fields in this table and for
the fields in the remaining tables. After you’re finished, you move on to
the next task.
ptg14955309
Reviewing the Business Rule Specifications Sheets 429
Field Names:
Table Names:
Statement:
Constraint:
Test On: Insert
Delete
xUpdate
Category: Field Specific
Relationship Specific
Type: Database Oriented
Application Oriented
x
Logical Elements
Key Structure
Edit Rule
Null Support
Uniqueness
Required Value
Comparisons Allowed
Range of Values
Default Value
Values Entered By
Operations Allowed
Key Type
Physical Elements
Length
Input MaskDecimal Places
Character Support Display Format
Data Type
Degree of ParticipationType of ParticipationDeletion Rule xx x
x
PRODUCTS, CATEGORIES
CATEGORY ID
x
x
The Range of Values was set to “Any value within the Category ID field of the CATEGORIES table.”
The type of participation for each table was changed: PRODUCTS is Optional; CATEGORIES is Mandatory.
The degree of participation for each table was changed: PRODUCTS is (0,N); CATEGORIES is (1,1).
A Restrict deletion rule was defined for the relationship between PRODUCTS and CATEGORIES.
Entries for the Category ID field in the PRODUCTS table are limited to existing values of the
Category ID field in the CATEGORIES table.
Invalid product categories are not allowed.
Action Taken
Structures Affected
Rule Information
Field Elements Affected
Relationship Characteristics Affected
BUSINESS RULE SPECIFICATIONS
Figure 11.20 The completed Business Rule Specifications sheet for the new
business rule

ptg14955309
430 Chapter 11 Business Rules
The next order of business is to establish relationship-specific business
rules. You begin by reviewing the relatio nship between the EMPLOY-
EES and INVOICES tables, and you review the relationship diagram to
determine whether the relationship requires any constraints. Every-
thing seems to be in order, so you move to the relationship between the
VENDORS and PRODUCTS tables. Figure 11.21 shows the relationship
diagram for these tables.
Vendors
PK
(1,1)
(0,N)
(R)
Products
PKProduct Number
ProdDescription
ProdName
Category ID
Retail Price
Wholesale Price
Vendor ID
Vendor ID
VendName
VendFax Number
Vend Address
VendCity
VendState
VendZipcode
VendPhone Number
FK
FK
Figure 11.21 The relationship diagram for the VENDORS and PRODUCTS tables
As you and Mike discuss whether you should impose any constraints
on this relationship, Mike determines that there should be a constraint
on the PRODUCTS table. He wants to make sure that every vendor in
the VENDORS table is associated with at least one product; he figures
that it’s unnecessary to keep data on a vendor who’s not supplying him
with any products. So you define the following business rule for this
constraint:
Every vendor must supply at least one product.
Now you establish the rule by modifying the appropriate relationship
characteristics. You begin by designating a Mandatory type of partici-
pation and assigning a (1,N) degree of participation to the PRODUCTS
table. You then define a Restrict deletion rule for the relationship based

ptg14955309
Summary 431
on the PRODUCTS table; this will keep you from accidentally deleting
the only product associated with a given vendor. Figure 11.22 shows
the results of your modifications.
Vendors
PK
(1,1)
(R)
Products
PKProduct Number
ProdDescription
ProdName
Category ID
Retail Price
Wholesale Price
Vendor ID
Vendor ID
VendName
VendFax Number
Vend Address
VendCity
VendState
VendZipcode
VendPhone Number
FK
FK
(1,N)
(R)
Figure 11.22 The revised relationship diagram for the VENDORS and PROD-
UCTS tables
You already know that this type of business rule will be tested when a
user attempts to insert a record into or delete a record from the PROD-
UCTS table, so you complete this process by filling out a Business Rule
Specifications sheet for this rule. Figure 11.23 shows the completed
specification sheet.
Now you repeat this process for the remaining relationships. When
you’re finished, the process is complete and you’re ready for the next
stage of the database design process.
Summary
This chapter opened with a definition of business rules. You learned
that a business rule is a constraint imposed on a field or a relation-
ship that is based on the way the organization perceives and uses its
data and that it is derived from the manner in which the organization

ptg14955309
432 Chapter 11 Business Rules
Field Names:
Table Names:
Statement:
Constraint:
Test On: Insert
Delete
xUpdate
Category: Field Specific
Relationship Specific
Type: Database Oriented
Application Oriented
x
Logical Elements
Key Structure
Edit Rule
Null Support
Uniqueness
Required Value
Comparisons Allowed
Range of Values
Default Value
Values Entered By
Operations Allowed
Key Type
Physical Elements
Length
Input MaskDecimal Places
Character Support Display Format
Data Type
Degree of ParticipationType of ParticipationDeletion Rule xx x
x
VENDORS, PRODUCTS
x
The type of participation for PRODUCTS was changed to Mandatory.
The degree of participation for PRODUCTS was changed to (1,N).
A Restrict deletion rule was defined for the PRODUCTS table.
A single record in the VENDORS table must be associated with at least one record in the
PRODUCTS table.
Every vendor must supply at least one product.
Action Taken
Structures Affected
Rule Information
Field Elements Affected
Relationship Characteristics Affected
BUSINESS RULE SPECIFICATIONS
Figure 11.23 A completed Business Rule Specifications sheet

ptg14955309
Summary 433
functions or conducts its business. You now know that there are
two major types of business rules: database oriented and application
oriented. Although our focus here is on database-oriented business
rules, you know that you can at least record the basic elements of
application-oriented business rules for use later in the implementation
process.
You then learned that database-oriented business rules are divided into
two categories: field-specific business rules, which affect the elements of
a field specification for a particular field; and relationship- specific busi-
ness rules, which affect the characteristics of a relationship.
The chapter continued with a discussion of defining and establishing
business rules. Here you learned that you work with users and man-
agement to define the business rules required by the organization. You
also learned that it is best to establish the field-specific business rules
first, followed by the relationship-specific business rules.
Next, you learned the steps necessary to define and establish each
type of business rule. You now know that, in general, you work with a
field or relationship, review the field or relationship in light of the rule
to determine whether any constraints are necessary, define the appro-
priate business rule, establish the rule by modifying the appropriate
field specification elements or relationship characteristics, decide
which actions test the rule, and then complete a Business Rule Specifi-
cations sheet for the rule.
The chapter continued with a discussion of the elements of the Busi-
ness Rule Specifications sheet, and how each element on the sheet is
defined. As you now know, using Business Rule Specifications sheets
allows you to document all of your rules and provides you with a stan-
dard method for recording and reviewing them.
We closed the chapter by discussing validation tables. You learned that
you can create and use a validation table to support a business rule

ptg14955309
434 Chapter 11 Business Rules
that limits the range of values for a particular field. In this manner,
the validation table helps to enforce data integrity. You also learned
that you need to establish new relationships when you use validation
tables and that these relationships have the same types of characteris-
tics as any other types of relationships in the database.
Review Questions
1 . What is a business rule?
2. Name the two major types of business rules.
3. Can you establish application-oriented business rules within the
logical design of the database?
4. What are the two categories of database-oriented business rules?
5. What is a field-specific business rule?
6. When is a business rule tested?
7. How do you document a business rule?
8. State two advantages a Business Rule Specifications sheet
provides.
9. What is the purpose of the Action Taken section of a Business Rule
Specifications sheet?
10. What is the purpose of a validation table?
11. What is the typical structure of a validation table?
12. What is the association between a business rule and a validation
table?
13. Why should you review all of your completed Business Rule Speci-
fications sheets?

ptg14955309
435
12
Views
There is no object on earth which cannot be
looked at from a cosmic point of view.
—FYODOR MIKHAYLOVICH DOSTOYEVSKY
Topics Covered in This Chapter
What Are Views?
Anatomy of a View
Determining and Defining Views
Case Study
Summary
Review Questions
What Are Views?
As you learned in Chapter 3, “Terminology,” a view is a virtual table
composed of fields from one or more tables in the database; it can also
include fields from other views. The tables and views that comprise
a given view are known as the view’s base tables. A view is “virtual”
because it draws data from base tables rather than storing data on
its own. In fact, the only information about a view that is stored in
the database is its structure; the RDBMS rebuilds and “repopulates”
the view every time you access the view in some manner. Many major
RDBMS programs support views, but some refer to them as saved que-
ries. Your specific RDBMS program will determine whether you refer to
this object as a query or a view.

ptg14955309
436 Chapter 12 Views
❖Note Although every major database vendor supports the
view I’ve just described, several vendors support what is known
as an indexed (or materialized) view. An indexed view is different
from a regular view in that it does store data, and its fields can
be indexed to improve the speed at which the RDBMS processes
the view’s data. A full discussion of indexed views is beyond the
scope of this book because it is a vendor-specific implementation
issue. However, you should research this topic further if you are
working with a client/server or mainframe RDBMS program.
Views enable you to see the information in your database from many dif-
ferent aspects, providing you with a great amount of flexibility when you
work with your data. You can create views in a variety of ways, and they
are especially useful when you base them on multiple related tables.
There are several reasons why you should define and use views in your
database.
•You can use them to work with data from multiple tables simulta-
neously. During the database design process, you established
relationships between various pairs of tables bearing one-to-
many or many-to-many relationships to each other. (Recall that
you resolved the many-to-many relationships via linking tables.)
A view provides the mechanism that allows you to work with
data from two or more related tables simultaneously.
•They reflect the most current information. Because the RDBMS
rebuilds and repopulates the view every time you access it,
the information displayed by the view exhibits the most recent
changes to the data in its base tables.
•You can customize them to the specific needs of an individual
or group of individuals. You can build a view to suit any set of
requirements, such as providing the data for a particular report

ptg14955309
Anatomy of a View 437
or providing a means of examining specific information that is
common to several departments within an organization.
•You can use them to help enforce data integrity. You can define a
validation view that works in the same manner as a validation
table—its purpose is to provide a valid range of values for a given
field in the database.
•You can use them for security or confidentiality purposes. You can
determine what data is available to a particular user or group
of users by defining a view on select fields from the view’s base
tables.
Define your views carefully and skillfully, and they will become a valu-
able asset after you’ve implemented the database within your RDBMS.
Anatomy of a View
There are three types of views (data, aggregate, and validation) that
you can define as you design the logical structure of the database and
two types of views (materialized and partitioned) that you can define as
you implement your database within an RDBMS. The ability to define
the latter two types of views and the manner in which you do so are
highly dependent upon your RDBMS, so they are beyond the scope
of this book. We will, therefore, focus our attention on the first three
types of views.
Data View
You use this type of view to examine and manipulate data from a sin-
gle base table or multiple base tables.
Single-Table Data View
Although you could use all of the fields from the base table to build
this type of view, you’ll usually just use selected fields. (Building a view

ptg14955309
438 Chapter 12 Views
using all of the base table’s fields would simply produce a virtual copy
of the base table.) For example, say you want to make a list of employee
names and phone numbers available to everyone in the organization.
You can construct an EMPLOYEE PHONE LIST view based on the
EMPLOYEES table using just the EMPLOYEE ID, EMPFIRST NAME, EMPLAST
NAME, and EMPPHONE NUMBER fields. Figure 12.1 shows a diagram of this
particular view. (Note the new symbol used to indicate a view.)
Employees
PKEmployee ID
EmpFirst Name
EmpLast Name
EmpStreet Address
EmpCity
EmpState
EmpZipcode
EmpHome Phone
Employee Phone List
EmpFirst Name
EmpLast Name
EmpPhone Number
Employee ID
Figure 12.1 The EMPLOYEE PHONE LIST view
Your RDBMS will rebuild and repopulate the EMPLOYEE PHONE
LIST view each time you access it, and the view will reflect the latest
changes you’ve made to the data in the EMPLOYEES table. Figure 12.2
shows how an RDBMS will typically display the data within a view.
Note that the view’s appearance is quite similar to that of a table; this
is yet another reason why a view is known as a “virtual table.”

ptg14955309
Anatomy of a View 439
You can modify the data within a single-table data view at any time,
and the modifications you make will flow through the view and into
the base table. Keep in mind, however, that field specifications and
business rules will determine what types of modifications you can
make to the data. For example, you won’t be able to delete a last name
in the EMPLOYEE PHONE LIST view if the Null Support element of the
field specification for the EMPLAST NAME field is set to “No Nulls.”
❖Note View implementation varies to some degree among most
RDBMS software. Make sure you examine your RDBMS’s doc-
umentation to determine how fully the RDBMS supports views
and what types of constraints it imposes (if any) on modifying
the data in a view.
Multitable Data View
As I mentioned at the beginning of this section, you can define a data
view using two or more tables. The only requirement is that the tables
you use to create the view must bear a relationship to each other; this
helps ensure that the information the view presents is both valid and
meaningful. For example, assume you’re designing a database for a
EmpPhone NumberEmpLast Name
Erlich
Black
Rosales
EmpFirst Name
Zachary
Susan
Joe
Employee ID
Employee Phone List
Black
Christian
Price
Alastair
Katie
Diana
553-3992
790-3992
551-4993
227-4992
525-2993
248-4953
100
101
102
103
104
105
Figure 12.2 Information from the EMPLOYEE PHONE LIST view
ptg14955309
440 Chapter 12 Views
local community college and that the tables in Figure 12.3 are part of
the database. You’ve just decided that you need to create a view called
CLASS ROSTER that shows the name of each class and the names of
the students who are currently registered to attend it. This will be an
easy task for you to perform because you can use the three tables as
the basis of the view; they contain the fields that you need to define
the view and they bear a relationship to one another.
Student Classes
Student ID
Class ID
Students
CPK/FK
CPK/FK
PK
Classes
FK
PKClass ID
Class Name
Class Description
Category
Student ID
StudFirst Name
StudLast Name
StudStreet Address
StudCity
StudState
StudZipcode
StudHome Phone
StudEmail Address
Instructor ID
Figure 12.3 Base tables for the CLASS ROSTER view
Now you define the CLASS ROSTER view by using the CLASS NAME field
from the CLASSES table and the STUDFIRST NAME and STUDLAST NAME
fields from the STUDENTS table. The appropriate student names will
appear for each class because CLASSES and STUDENTS are related
(and therefore connected) through the STUDENT CLASSES linking
table. Figure 12.4 shows the diagram for the CLASS ROSTER view.
Note that no changes have been made to any of the base tables.
Every time you access the CLASS ROSTER view, the RDBMS will
rebuild and repopulate it using the most current data from the view’s
base tables. Figure 12.5 shows a sample of the view’s data.
You can modify most of the data within a multitable data view at any
time, and the modifications you make will flow through the view and
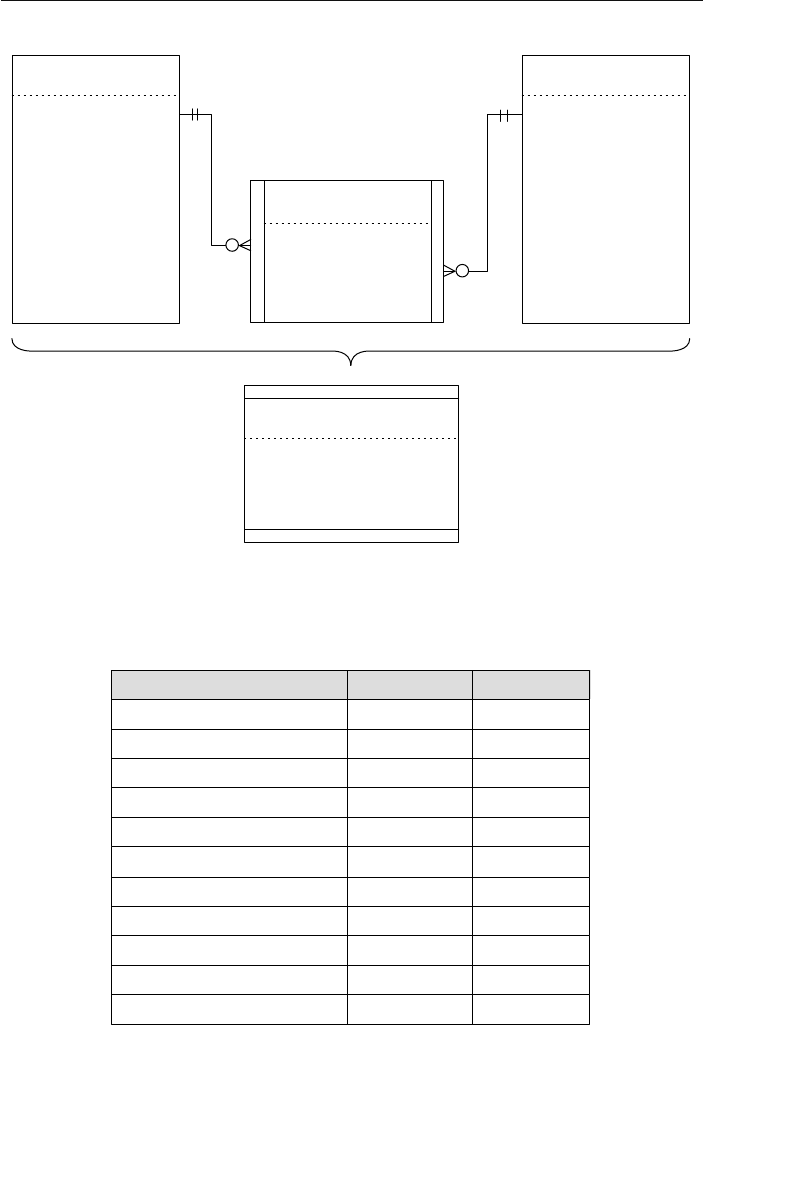
ptg14955309
Anatomy of a View 441
Students Classes
Student ID
Class ID
Students
CPK/FK
CPK/FK
PK
Classes
PKClass ID
Class Name
Class Description
Category
Student ID
StudFirst Name
StudLast Name
StudStreet Address
StudCity
StudState
StudZipcode
StudHome Phone
StudEmail Address
FKInstructor ID
Class Roster
Class Name
StudFirst Name
StudLast Name
Figure 12.4 The diagram for the CLASS ROSTER view
Class Roster
Class Name
Advanced Music Theory
American History
Advanced Calculus
StudLast Name
Carter
StudFirst Name
Gina
ApplebeeMartin
CarterGina
RosalesJoe
UlrichSara
HernandezMike
BlackSusan
TurnerLee
BlackSusan
PriceGeorge
RosalesJoe
Advanced Calculus
Advanced Calculus
Advanced Calculus
Advanced Music Theory
Advanced Music Theory
American History
American History
American History
Figure 12.5 A partial sample of data from the CLASS ROSTER view

ptg14955309
442 Chapter 12 Views
into the base tables. Quite obviously, you can’t modify the value of any
primary keys that you incorporate from the base tables. As in the case
of a single-table view, field specifications and business rules will deter-
mine what types of modifications you can make to the data. (Again, be
sure to check your RDBMS documentation for any further constraints
it may place upon your views.)
The redundant data in the CLASS ROSTER view (which you should
have noticed) is the result of merging a record from the CLASSES
table with two or more records from the STUDENTS table; the number
of times a particular class name appears is equal to the number of
students that are registered to attend that class. This apparent redun-
dancy is acceptable because the data is not physically stored in the
view—rather, it is drawn from the view’s base tables, where it is stored
in accordance with the rules of proper database design. RDBMSs com-
monly display data from multitable views in this fashion.
Another point to note is that a data view does not contain its own pri-
mary key. It lacks a primary key because it is not a table; a true table
stores data and requires a primary key to serve as a unique identifier
for each of its records. You can incorporate a primary key from any (or
all) of the base tables within the view, however, when you determine it
will contribute to the information the view provides.
❖Note In order to avoid any unnecessary ambiguity or confu-
sion, make certain you do not have any primary key indicators
within the view symbol when you diagram a data view.
Aggregate View
You use this type of view to display information produced by aggregat-
ing a particular set of data in a specific manner. As with a data view,
you can define an aggregate view using one or more base tables. You
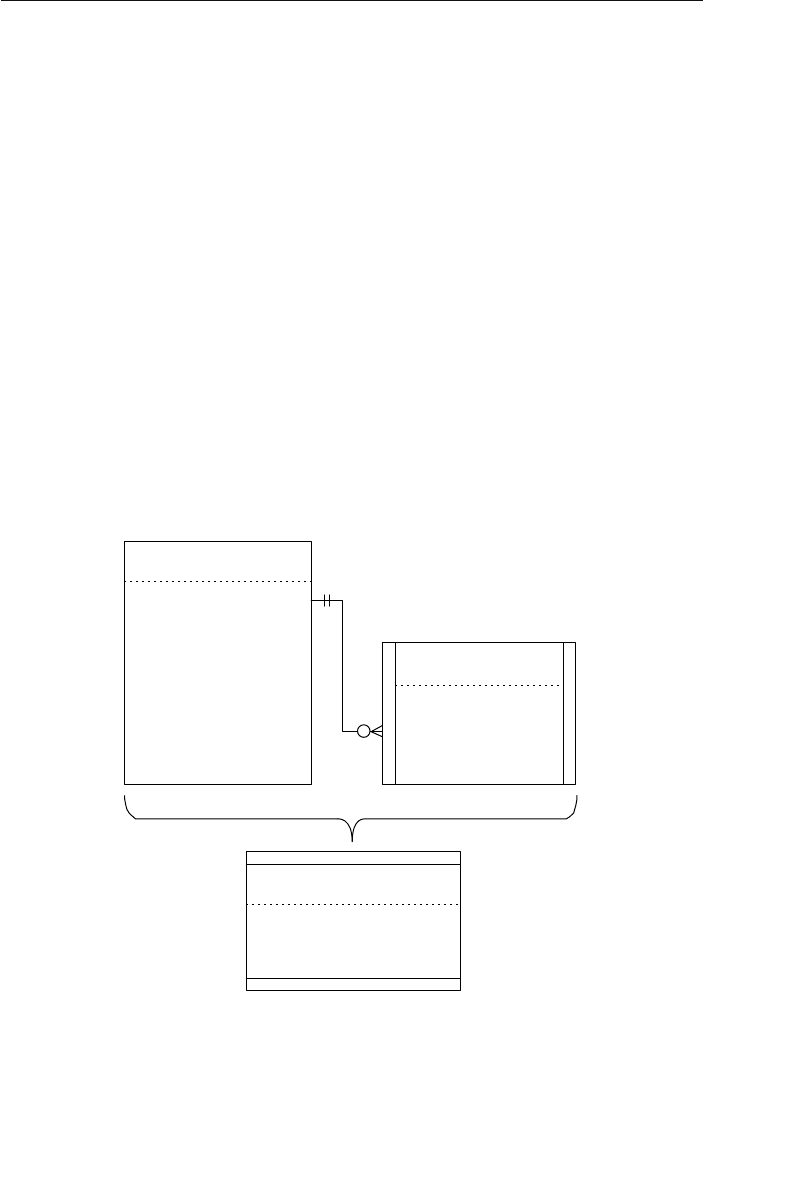
ptg14955309
Anatomy of a View 443
can then include one or more calculated fields that incorporate the
functions that aggregate the data and one or more data fields (drawn
from the view’s base tables) to group the aggregated data. Sum, Aver-
age (arithmetic mean), Minimum, Maximum, and Count are the most
common aggregate functions that you can apply to a set of data, and
every major RDBMS supports them.
Let’s say that you wanted to know how many students are registered
for each class, and you’re using the tables from the school example
shown in Figure 12.3. Your first impulse is to define a data view called
CLASS REGISTRATION that will provide the information you need
to answer your question. So, you use the CLASS NAME field from the
CLASSES table and the STUDENT ID field from the STUDENT CLASSES
table to build the view. Figure 12.6 shows a diagram for the new
CLASS REGISTRATION view.
Students Classes
Student ID
Class ID
CPK/FK
CPK/FK
Classes
PKClass ID
Class Name
Class Description
Category
FKInstructor ID
Class Registration
Class Name
Student ID
Figure 12.6 View diagram for the new CLASS REGISTRATION view
ptg14955309
444 Chapter 12 Views
Now you access the view so that you can answer your question.
Figure 12.7 shows a partial sample of the data in the view.
In order to answer your question, you must now count each instance of
a given class name so that you can determine how many students are
registered for that class. Imagine the work you have ahead of you—this
will not be an easy task! Rather than going through all this tedious
work, you can answer your question quite easily (and more efficiently)
using an aggregate view.
There’s no need to define a new view because you can modify the one
you have just now. Remove the STUDENT ID field from the view and
replace it with a calculated field called TOTAL STUDENTS REGISTERED that
counts the number of students per class. (When you work with a cal-
culated field, make certain that you give it a name that is meaningful
and that will distinguish it from other calculated fields in the view.)
The calculated field will use a Count function to count the number of
STUDENT IDs in the STUDENT CLASSES table that are associated with
Class Registration
Class Name
Advanced Music Theory
Business Administration
Advanced Calculus
Advanced Calculus
Advanced Calculus
Advanced Calculus
Advanced Music Theory
Advanced Music Theory
Business Administration
Business Administration
Business Administration
Student ID
1003
1025
1073
1110
1045
1066
1085
1025
1066
1017
1073
Figure 12.7 A partial sample of data from the CLASS REGISTRATION view
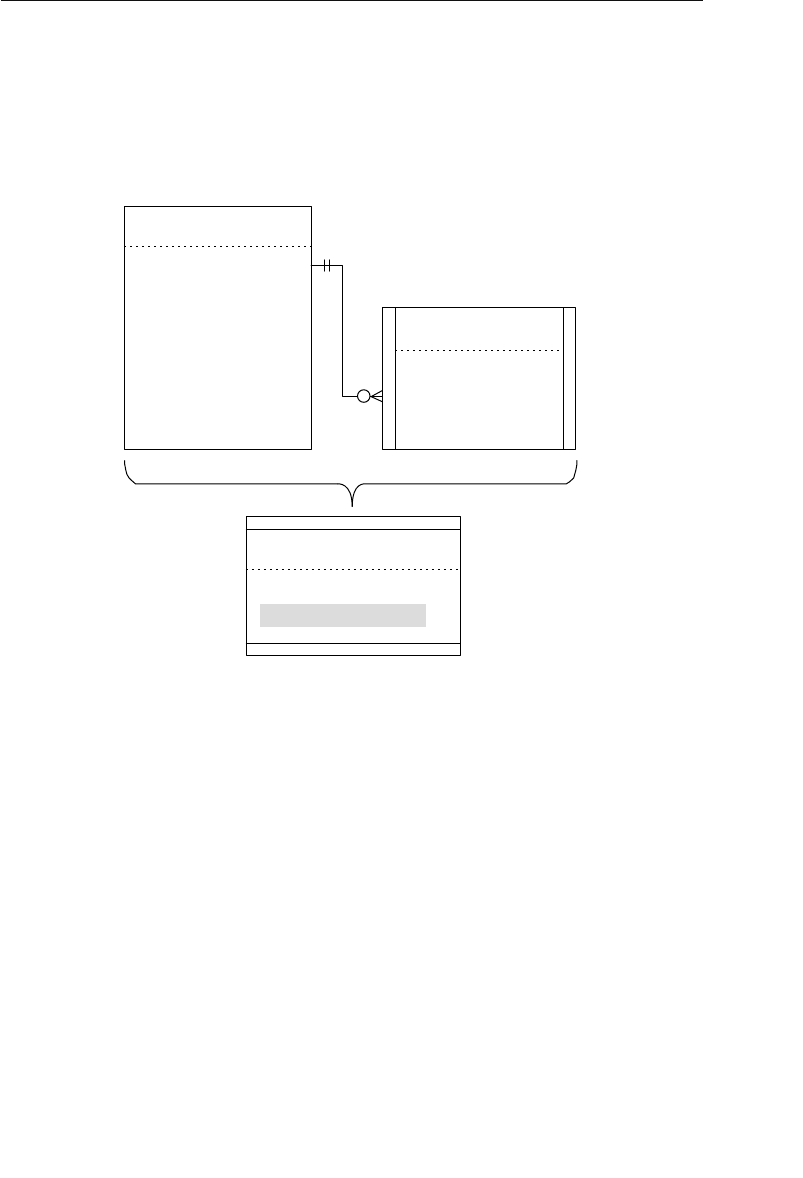
ptg14955309
Anatomy of a View 445
each CLASS ID in the STUDENT CLASSES table. (Later, you’ll learn
how to document a view and record the expression the calculated field
will use.) Figure 12.8 shows the revised diagram for the CLASS
REGISTRATION view.
Students Classes
Student ID
Class ID
CPK/FK
CPK/FK
Classes
PKClass ID
Class Name
Class Description
Category
FKInstructor ID
Class Registration
Class Name
Total Students Registered
Figure 12.8 Revised diagram for the CLASS REGISTRATION view
As was the case with the data view, the RDBMS will rebuild and
repopulate the CLASS REGISTRATION view every time you access it,
using the most current data from the view’s base tables. Figure 12.9
shows a sample of the view’s data.
There are three things to note about this view.
1. The TOTAL STUDENTS REGISTERED field displays a single number for
each class name, which represents the total number of students
registered for that class.
2. The redundancy within the CLASS NAME field has been elimi-
nated; all instances of a given class name have been grouped

ptg14955309
446 Chapter 12 Views
into a single instance. As a result, CLASS NAME is now a grouping
field, and its values cannot be modified in any way.
❖Note All data fields in an aggregate view are grouping fields.
3. Because an aggregate view is composed entirely of grouping
fields and calculated fields, you cannot modify any of its data.
An aggregate view is most useful as the basis of a report or as a means
of providing various types of statistical information. You’ll learn later
that you can apply filtering criteria to this (or any) view in order to
control and restrict the data that the view displays.
Validation View
A validation view is similar to a validation table in that it can help
implement data integrity. When a business rule limits a particular
field’s range of values, you can enforce the constraint just as easily
with a validation view as you can with a validation table. The differ-
ence between the two lies in their construction—a validation table
Class Registration
Class Name
Advanced Calculus
Total Students Registered
80
92
80
84
98
80
60
84
Advanced Music Theory
Business Administration
Introduction to Database Design
Introduction to Biology
English Literature
Pan-American Studies
Computers in Business
Figure 12.9 A sample of data from the revised CLASS REGISTRATION view
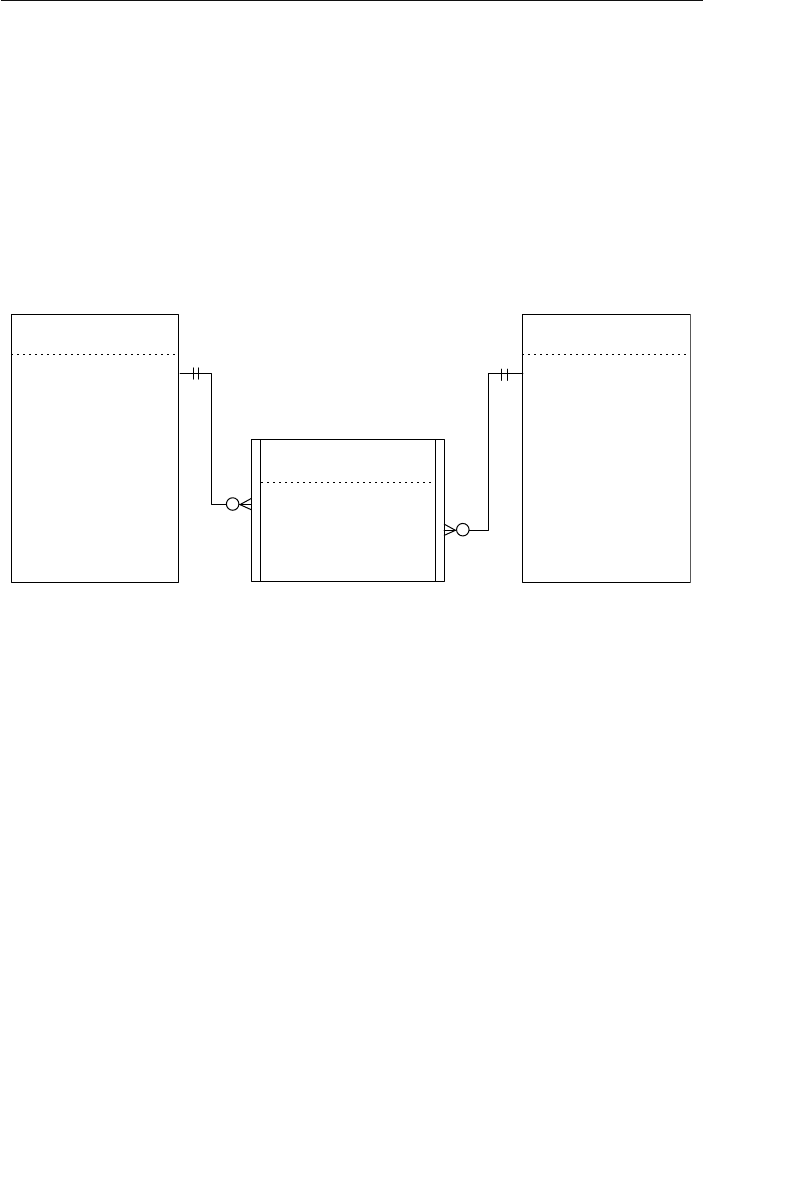
ptg14955309
Anatomy of a View 447
stores its own data, whereas a validation view draws data from its base
tables. Although you can define a validation view using one or more
base tables, you’ll commonly define a validation table using a single
base table and incorporate only two or three of the base table’s fields.
(This structure is quite similar to that of a validation table.)
For example, let’s say you’re designing a database for a small contrac-
tor and you’re working with the tables in Figure 12.10.
Project Subcontractors
Subcontractors
CPK/FK
CPK/FK
PK
Projects
PK
FK
Project ID
Project End Date
Project Name
Project Start Date
Category ID
Subcontractor ID
Project ID
Subcontractor ID
SCName
SCStreet Address
SCCity
SCState
SCZipcode
SCPhone Number
SCEmail
Figure 12.10 Tables from a database for a small contractor
As you can see, the SUBCONTRACTOR ID field in the SUBCONTRACTORS
table provides the range of values for the SUBCONTRACTOR ID field in the
PROJECT SUBCONTRACTORS table. (Recall that a foreign key draws
its values from the primary key to which it refers.) You’ve determined,
however, that you want to restrict the access users currently have to
certain fields in the SUBCONTRACTORS table; you’ve decided that the
only fields users should be able to access are the SUBCONTRACTOR ID,
SCNAME, SCPHONE NUMBER, and SCEMAIL fields. So, you define a valida-
tion view called APPROVED SUBCONTRACTORS that will incorporate
these fields and still provide the range of values for the SUBCONTRAC-
TOR ID field in the PROJECT SUBCONTRACTORS table. Figure 12.11
shows a revised diagram of the tables, including the new view.

ptg14955309
448 Chapter 12 Views
The APPROVED SUBCONTRACTORS view now gives users access only
to those fields that you’ve indicated and provides the appropriate range
of values for the SUBCONTRACTOR ID field in the PROJECT SUBCON-
TRACTORS table. Additionally, the view will still enforce the rela-
tionship characteristics that exist for the SUBCONTRACTORS table
because it (as you will recall) is the view’s base table.
Determining and Defining Views
By now you’ve probably realized that views can be a substantial asset
to the database. During this stage of the database design process,
you’ll define a fundamental set of views for the database. Your defini-
tion of views won’t stop here—you’ll probably define more views when
you implement the database within your RDBMS and as you create
your end-user application programs. In these instances, you’ll use
views as a tool to support particular aspects of the implementation or
application program. The views you define during the database design
process, however, will focus strictly on data access and information
retrieval issues.
Approved Subcontractors
PK
Projects
PK
FK
Project ID
Project End Date
Project Name
Project Start Date
Category ID
Project Subcontractors
CPK/FK
CPK/FK
Subcontractor ID
Project ID
Subcontractor ID
SCName
SCPhone Number
SCEmail
Figure 12.11 Revised table diagram; note the new APPROVED
SUBCONTRACTORS view.

ptg14955309
Determining and Defining Views 449
Working with Users and Management
You’ll work once again with the organization’s representative group of
users and management to identify the types of views the organization
requires. After you identify these views, you’ll establish and document
them, and then you and the group will review the views to make cer-
tain that they are properly defined.
Before you conduct your first meeting with the group, review the notes
you’ve taken throughout the entire design process. Your objective is to
get an idea of the types of views the organization might need. Almost
every organization spends a large amount of time producing and
reading reports, so you should focus on that aspect of your notes. You
should also review the report samples you assembled during the anal-
ysis process.
When you and the group meet, consider the following points to help
you identify view requirements.
•Review your notes with the group. In many instances, talking
about a specific topic will spark an idea for a new or required
view. For example, someone may realize a need for a view during
a discussion of mission objectives.
•Review the data entry, report, and presentation samples you
gathered during the early stages of the design process. Examining
these samples, especially summary-style reports, could easily
illuminate the need for certain types of views.
•Examine the tables and the subjects they represent. Some individ-
uals in the group may identify the need for a view based solely
on a specific subject. If someone mentions a subject, such as
Employees, it may cause someone else to say, “We definitely need
a view that restricts certain employee data for confidentiality
reasons.”

ptg14955309
450 Chapter 12 Views
•Analyze the table relationships. You’ll most likely identify a num-
ber of multitable views that you should create for many of the
relationships. Several of these views will coincide with views you
identified for the report samples.
•Study the business rules. As you already know, you can use a
validation view to enforce a rule that imposes a constraint on a
particular field’s range of values.
You and the group should be able to identify a number of views by
going over the items on this list. After you’ve identified as many of the
required views as possible, your next task is to define them.
Defining Views
You’ll now define each view that you’ve identified using the appropriate
tables and fields. Review the relationship diagrams to identify which
tables and fields you need for the view’s structure. When you’ve deter-
mined what you need, define the view and record it in a view diagram.
For example, say you’ve determined that you can use a view for
the report shown in Figure 12.12; the name of the new view will be
CUSTOMER CALL LIST.
The notes you’ve taken throughout the design process become useful
once again. You reviewed this report during the analysis stage of the
design process, and you’ve noted that this report represents infor-
mation about customers and their orders; it is from the order data
that you can determine when a given customer made his last pur-
chase. Now, review the relationship diagram for the CUSTOMERS and
ORDERS tables; you’ll use fields from these tables to create the CUS-
TOMER CALL LIST view. Figure 12.13 shows the relationship diagram
for these tables.
After examining the relationship diagram, you determine you need
to use five fields to build this view: CUSTFIRST NAME, CUSTLAST NAME,

ptg14955309
Determining and Defining Views 451
Bothell Sara Anderson 542-0039 05/16/02
City Customer Name Phone Number Last Purchase
Jim Booth 367-4495 02/11/02
Larry Currey 445-3394 02/06/02
Bellevue Jim Davis 545-9932 05/10/02
Larry Lang 545-3384 01/22/02
Sandra Wasser 367-2293 06/30/02
Edmonds Julia Black 223-9943 04/12/02
Lynnwood Mary Black 562-1274 02/28/02
Barbara Reeves 445-2094 03/07/02
Customer Call List
Figure 12.12 Report sample requiring a view
Orders
PKOrder Number
Employee ID FK
Customer ID FK
(R)
PK
Customers
Customer ID
CustFirst Name
CustLast Name
CustStreet Address
CustState
CustZipcode
CustPhone Number
Status
CustCIty
Ship Date
(1,1)
(0,N)
Order Date
Figure 12.13 Relationship diagram for the CUSTOMERS and ORDERS tables
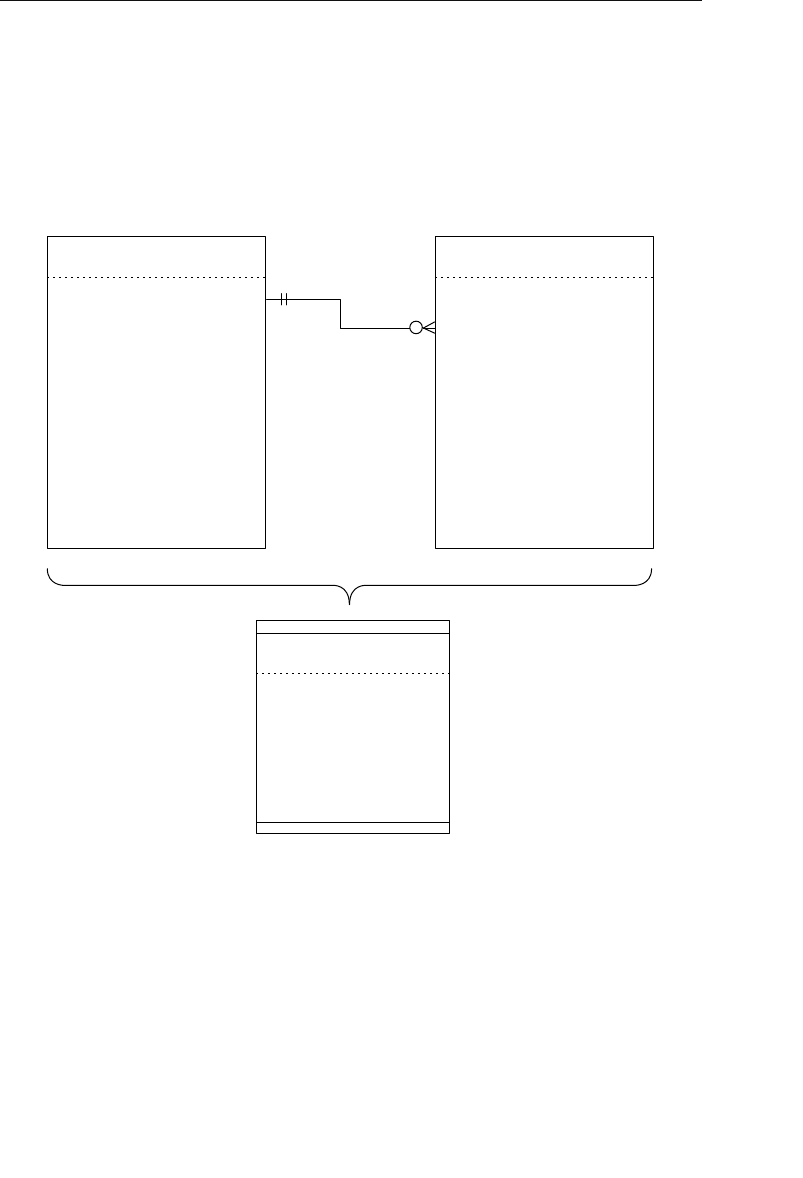
ptg14955309
452 Chapter 12 Views
CUSTPHONE NUMBER, and CUSTCITY from the CUSTOMERS table, and
ORDER DATE from the ORDERS table. You now define the CUSTOMER
CALL LIST view by assigning the fields to the view and then recording
them in a view diagram. When you’re finished, your diagram should
look like the one in Figure 12.14.
Orders
(R)
PK
Customers
Customer ID
CustFirst Name
CustLast Name
CustStreet Address
CustState
CustZipcode
CustPhone Number
Status
CustCIty
(1,1)
(0,N)
Customer Call LIst
CustFirst Name
CustLast Name
CustCity
CustPhone Number
Order Date
PKOrder Number
Employee ID FK
Customer ID FK
Ship Date
Order Date
Figure 12.14 View diagram for the CUSTOMER CALL LIST view
Using Calculated Fields Where Appropriate
Earlier in the database design process, you learned that tables couldn’t
contain calculated fields for a number of good reasons. But one of the
characteristics of a view that makes it so useful is that it can contain

ptg14955309
Determining and Defining Views 453
calculated fields. Recall that calculated fields will display the result of
a concatenation, expression, or aggregate function; this makes them
an extremely flexible structure to include in a view.
For example, consider the new CUSTOMER CALL LIST view. Although
you have the fields you need for the view, you’ll have to make one
minor modification to the view so that it can display the appropriate
data. One of the requirements for this view is that it must display the
date of the last purchase made by each customer. In order to retrieve
and display the proper date, you’ll have to add a calculated field to the
view. This field will use the Maximum function [commonly known as
Max( )] to retrieve the correct date from the ORDER DATE field. Name the
new field LAST PURCHASE DATE and add it to the CUSTOMER CALL LIST
view diagram. (You no longer need the ORDER DATE field in the view, so
you can remove it from the view’s structure.) This is the expression
you’ll use in the calculated field to retrieve the appropriate date:
Max(Order Date)
Later in this section, you’ll learn where and how to record this
expression.
❖Note Be sure to refer to your RDMBS’s documentation to
determine the correct syntax for this function and all of the
other functions used in this chapter.
Another calculated field you might include in this view is one that
displays the complete customer name by concatenating CUSTFIRST NAME
and CUSTLAST NAME. Say, for example, that you want to display the
customer name in this manner: “Hernandez, Michael.” Create a calcu-
lated field called CUSTOMER NAME and use the following concatenation
expression:
CustLast Name & “, “ & CustFirst Name
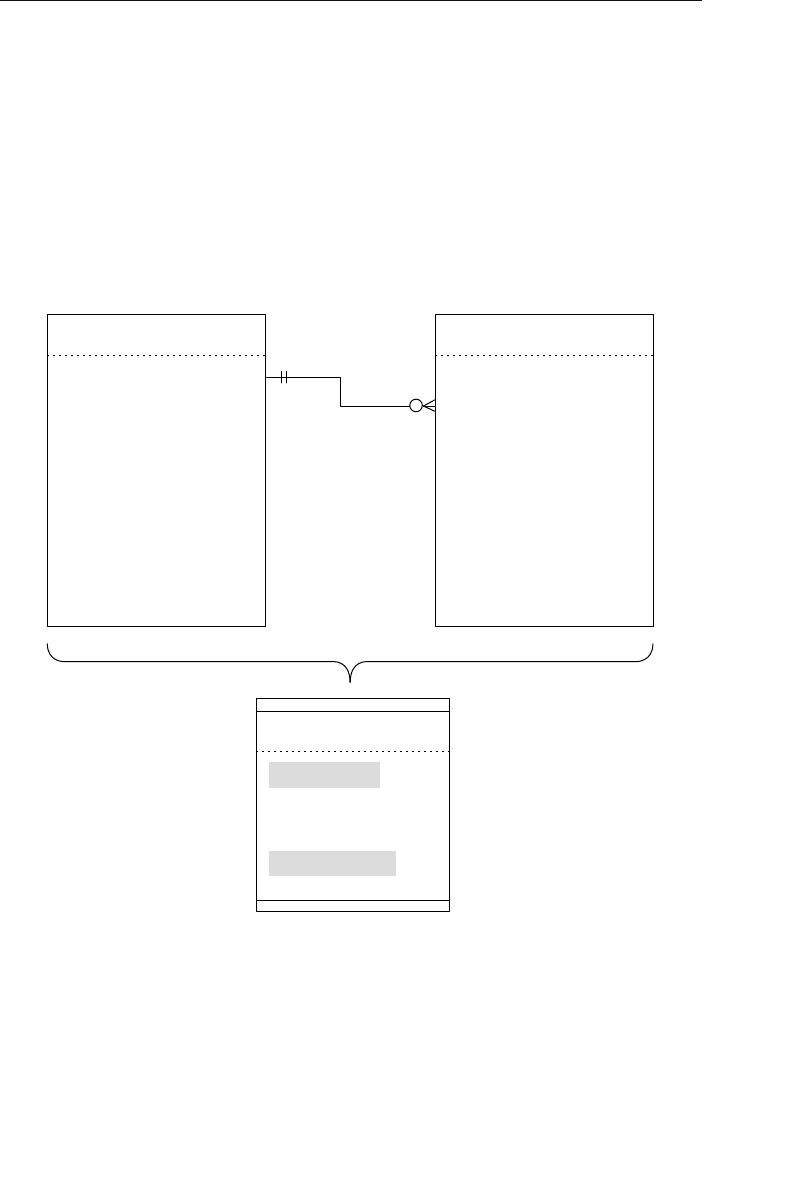
ptg14955309
454 Chapter 12 Views
Add the new calculated field to the CUSTOMER CALL LIST view dia-
gram and remove the CUSTFIRST NAME and CUSTLAST NAME fields from the
view; you don’t need these fields anymore because you’re now using
the CUSTOMER NAME calculated field. (You’ll soon properly record this
expression as well.)
Figure 12.15 shows how your revised view diagram should look after
you’ve completed these modifications.
Orders
(R)
PK
Customers
Customer ID
CustFirst Name
CustLast Name
CustStreet Address
CustState
CustZipcode
CustPhone Number
Status
CustCity
(1,1)
(0,N)
Customer Call LIst
CustCity
Customer Phone Number
PKOrder Number
Employee ID FK
Customer ID FK
Ship Date
Order Date
Customer Name
Last Purchase Date
Figure 12.15 Revised view diagram for the CUSTOMER CALL LIST
As you’ve just learned, a calculated field can be quite an asset because
you can use it to enhance the information a view provides. You also
learned earlier in this chapter that calculated fields are particularly

ptg14955309
Determining and Defining Views 455
crucial in aggregate views. A good rule of thumb to follow when you
think you may need calculated fields is to use them if they will provide
pertinent and meaningful information or if they will enhance the man-
ner in which the view uses its data.
If you recall, you created a calculated field list earlier in the design
process (refer to Chapter 6, “Analyzing the Current Database”). You
can now use this list as a source of calculated fields that you might (or
should) use in your views. Review the list as you define each new view
and determine whether you can use one of the calculated fields on the
list. When you find one that you can use, create it in the same manner
as you did in the preceding examples. (If you create a new calculated
field that does not appear on your list, however, be sure to add it to the
list. This will help you keep your calculated field list current and in
order.)
Imposing Criteria to Filter the Data
Views have another characteristic that makes them extremely useful:
You can impose criteria against one or more fields in the view to filter
the records it displays. For example, say that the CUSTOMER CALL
LIST view included the CUSTSTATE field. Although the view would con-
tinue to display the set of records it did before, you would also see the
state in which each customer lives. Assume, however, that you want
the view to show a particular set of records, such as those for cus-
tomers who live in Washington. You can accomplish this by setting a
specific criterion on the CUSTSTATE field that will filter the data so that
the view displays only those records of customers from Washington.
❖Note In database work, the word criterion refers to an expres-
sion that is tested against the value of a particular field. The
view will include a given record if the value of the field meets the
criterion.

ptg14955309
456 Chapter 12 Views
This is the expression you will use to filter the records for the
CUSTOMER CALL LIST view:
CustState = “WA”
Now the view will display only customers from Washington. If you want
to filter the records further to show only those customers who live in
specific cities, you add a criterion such as this:
CustCit y In ( “Bellevue,” “Oly mpia,” “Redmond,” “Seattle,”
“Spokane,” “Tacoma”)
The view will now display Washington customers who live in the
cities specified in the expression. You may wonder why both criteria
are necessary—the criterion for the CUSTCITY field should retrieve the
appropriate records by itself. The trouble is that many cities are named
for other cities, so cities in two or three different states could have the
same name. For example, there is a Portland, Oregon, and a Portland,
Maine, both named after Portland, England. The point to remember is
that you must use your best judgment when you establish criteria for a
view—use the minimum number of criteria that will cause the view to
display the records you require.
When you use a criterion in a view, you must make certain that the
field you’re testing in the criterion is included in the view’s structure.
If you do not include the field in the view, you have no way of imposing
the criterion. This is an important point to remember because it is a
requirement when you logically define a view and when you implement
the view in your RDBMS.
The one problem with applying a filter to a view is that there is no way
to indicate it on a view diagram; therefore, you must record it on a
View Specifications sheet.

ptg14955309
Determining and Defining Views 457
Using a View Specifications Sheet to Record the View
A View Specifications sheet must accompany each view diagram you
create. It is on this sheet that you will record the characteristics of the
view. The View Specifications sheet contains the following items.
•Name: This is where you indicate the name of the view. Before
you record the name, however, test it against the guidelines for
creating table names you learned in Chapter 7, “Establishing
Table Structures.” These guidelines govern the naming of views
as well, with one exception: The name of a view can implicitly or
explicitly identify more than one subject. This is because you can
define views from two or more base tables, so they do, indeed,
represent more than one subject.
•Type: This is where you indicate whether you’re defining a data,
aggregate, or validation view.
•Base tables: This is where you specify the names of the view’s
base tables. Although the view diagram shows these tables, they
appear here as a matter of convenience. The View Specifications
sheet does not include field names, however, because you can
record and display them more easily and efficiently on the view
diagram.
•Calculated field expressions: This is where you record the expres-
sions for the calculated fields you included in the view. As you
record the name of the calculated field, test it against the guide-
lines for creating field names you learned in Chapter 7. Cal-
culated field names are governed by these guidelines with two
exceptions: You can implicitly or explicitly identify more than one
characteristic in a name, and you can use the plural form of the
name. But it’s still desirable to use the singular form of the name
whenever possible.

ptg14955309
458 Chapter 12 Views
•Filters: This is where you record the criteria that the view will use
to filter the records it displays. You’ll record both the field being
tested and the expression used to test it.
❖Note When you fill out the Calculated Field Expressions and
Filters sections of a View Specifications sheet, use the expres-
sions with which you are most familiar. You’ll modify them as
necessary when you implement the database in an RDBMS.
Fill out a View Specifications sheet for each view that you create, and
attach the sheet to the proper view diagram. Both of these items will
serve to document the view fully. Figure 12.16 shows a completed View
Specifications sheet for the CUSTOMER CALL LIST view. (Keep in
mind that the view has been updated to include the CUSTSTATE field.)
Reviewing the Documentation for Each View
Once you’ve completed the task of defining and documenting each
view, review all of your views once more—ensuring that the quality
of the information each view provides is well worth the effort. As you
review each view, keep the following points in mind.
•Make certain that you’ve defined the view properly. Think about
the information the view should provide. Are you establishing the
correct type of view for the required information? Did you use
the appropriate base tables to define the view? Did you include
all the necessary fields within the view’s structure? Are only the
necessary fields included in the view’s structure?
•Make certain that the calculated fields you’ve created are suitable
for the view. Do they provide pertinent and meaningful informa-
tion? Do they serve to enhance the manner in which the view
displays its data?
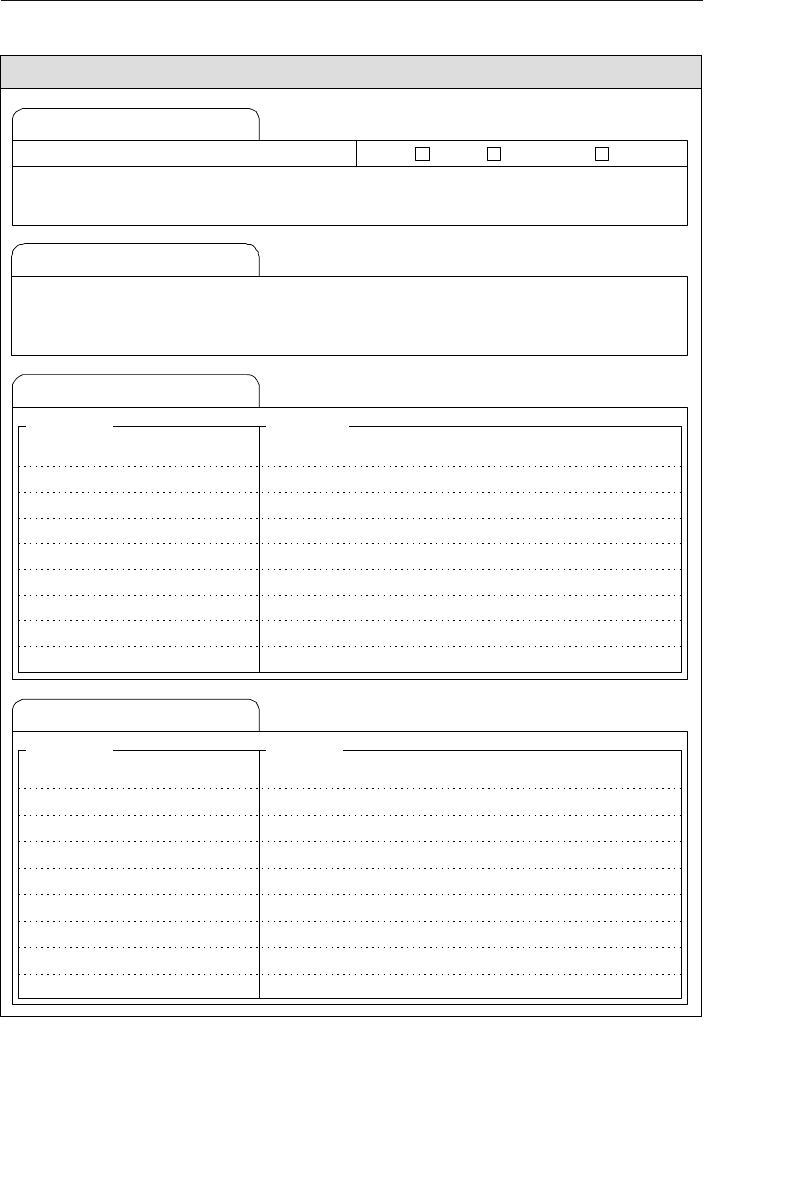
ptg14955309
Determining and Defining Views 459
Description:
Field Name
VIEW SPECIFICATIONS
Base Tables
General Information
Calculated Field Expressions
Filters
Field Name Condition
Expression
This view provides information that allows us to execute follow-up calls to our customers in
Washington. Also indicated is the date of the customer's last purchase.
CUSTOMERS, ORDERS
CUST STATE
CUST CITY
CUSTOMER NAME
LAST PURCHASE DATE Max(ORDER DATE )
="WA"
In ("Bellevue", "Olympia", "Redmond", "Seattle", "Spokane", "Tacoma")
CUSTLAST NAME & ", " & CUSTFIRST NAME
Customer Call ListName: Type: Data ValidationX Aggregate
Figure 12.16 Completed View Specifications sheet for the CUSTOMER CALL
LIST view

ptg14955309
460 Chapter 12 Views
•Make certain that the filters will retrieve the required records. First
of all, do you need a filter for this view? If the answer is yes, do
you know exactly which records you want the view to display? Do
you believe that the filter will work correctly?
•Above all, make certain that you have a view diagram and View
Specifications sheet for each view. This documentation will be very
useful when you finally implement the database in an RDBMS.
CASE STUDY
Your work on Mike’s database is finally nearing an end. You meet
with Mike and his staff to determine whether there is a need to estab-
lish views for the database. The agenda you’ve set up for the meeting
involves the following steps.
1. Review the notes you’ve compiled during the design process.
2. Review each of the various samples you gathered during the
early stages of the design process.
3. Examine the subjects represented by the tables in the database.
4. Analyze the table relationships.
5. Review and study the business rules.
As the meeting progresses, you identify several views that you need
to define, including a PREFERRED CUSTOMERS view and a VEN-
DOR PRODUCT COUNT view. The first view will provide the name and
phone number of each customer who has a “Preferred” status, and the
second view will provide information on the total number of different
products each vendor supplies.
You base the PREFERRED CUSTOMERS view on the CUSTOMERS
table and use the CUSTOMERID, CUSTFIRST NAME, CUSTLAST NAME,
CUSTHOME PHONE, and STATUS fields for the view’s structure. Before

ptg14955309
Determining and Defining Views 461
you construct the view, however, Mike asks if there’s any way to dis-
play the first name and last names together. You respond that it can
be done, so you create a calculated field called CUSTOMER NAME that
concatenates both of the fields together; this field will now replace the
CUSTFIRST NAME and CUSTLAST NAME fields. Figure 12.17 shows the view
diagram for the PREFERRED CUSTOMERS view.
Customer ID
CustFirst Name
CustLast Name
CustStreet Address
CustCity
CustState
CustZipcode
CustPhone Number
Status
Customers
PK
Customer Name
CustHome Phone
Status
Customer ID
Preferred Customers
Figure 12.17 View diagram for the PREFERRED CUSTOMERS view
After you create the view diagram, you make note of the expression
that you’ll use to filter the view’s data:
Status = “Preferred”
Then you complete a View Specifications sheet for the PREFERRED
CUSTOMERS view. Figure 12.18 shows the results of your work.

ptg14955309
462 Chapter 12 Views
Description:
Field Name
Field Name Condition
Expression
Name: Type: Data ValidationX Aggregate
This View provides the names and phone numbers of our Preferred customers. We use this
information in support of the services we provide to these customers.
CUSTOMERS
CUSTFIRST NAME & “ ” & CUSTLAST NAME
Preferred Customers
STATUS
CUSTOMER NAME
=“Preferred”
VIEW SPECIFICATIONS
Base Tables
General Information
Calculated Field Expressions
Filters
Figure 12.18 The View Specifications sheet for the PREFERRED CUSTOMERS
view
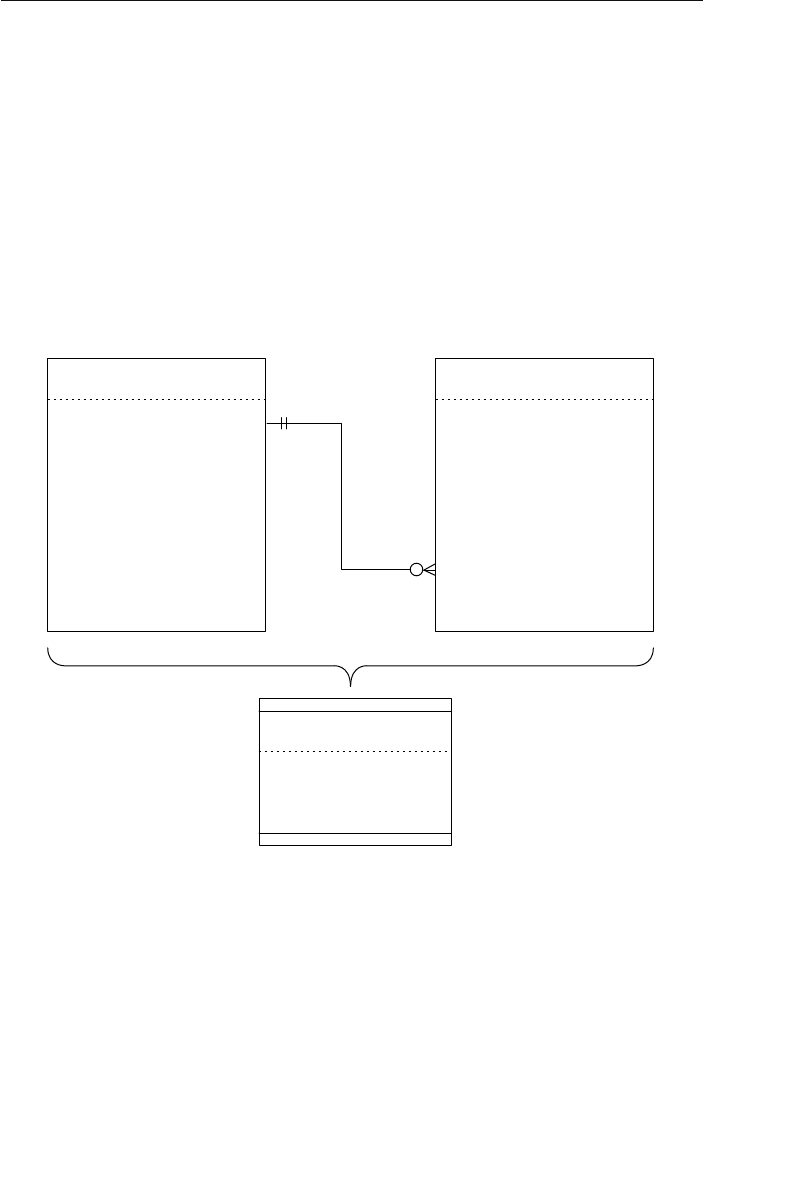
ptg14955309
Determining and Defining Views 463
Now you define the VENDOR PRODUCT COUNT view using the VEN-
DORS and PRODUCTS tables as the view’s base tables. You use the
VENDOR NAME field from the VENDORS table to display the names of
the vendors. Next, you create a calculated field called PRODUCT COUNT to
display the total number of products each vendor supplies. This is the
expression the field uses to calculate the total:
Count(ProdName)
Now you create a diagram for the view, as shown in Figure 12.19.
(R)
PK
(1,1)
(0,N)
Vendor Product Count
Product Count
Vendor Name
Products
Product Number
ProdDescription
ProdName
Category
Retail Price
Wholesale Price
Vendor ID
Vendors
Vendor ID
VendName
VendFax Number
VendStreet Address
VendCity
VendState
VendZipcode
VendPhone Number
FK
PK
FK
Figure 12.19 View diagram for the VENDOR PRODUCT COUNT view
After determining that a filter is unnecessary for this view, you fin-
ish documenting the view by completing the View Specifications sheet
shown in Figure 12.20.
You then repeat this process for every view you’ve identified for Mike’s
database.
ptg14955309
464 Chapter 12 Views
Description:
Field Name
Field Name Condition
Expression
Name: Type: Data ValidationAggregate
This view tells us how many products are supplied by each vendor. This information will help
us determine which vendors we might need to drop.
VENDORS, PRODUCTS
Count(PRODUCT NAME)
Vendor Product Count
PRODUCT COUNT
X
VIEW SPECIFICATIONS
Base Tables
General Information
Calculated Field Expressions
Filters
Figure 12.20 View Specifications sheet for the VENDOR PRODUCT COUNT view

ptg14955309
Summary 465
Summary
We began this chapter with a definition of a view, and you learned that
it is a virtual table that does not contain or store data. Views are use-
ful for several reasons—they provide a means for you to work with data
from multiple tables, they help enforce data integrity, and they help
keep data secure or confidential.
We then discussed the three types of views: data, aggregate, and val-
idation. You learned that each type of view could be based on one or
more tables, other views, or a combination of both. Your RDBMS will
rebuild and repopulate a view every time you access it, using the most
current data from the view’s base tables. As you now know, there must
be relationships between tables in a multitable view (thus making the
view’s information valid and meaningful), and the characteristics of
those relationships are carried forth through the view. Additionally,
you can modify most views, and all the modifications you make to the
data are passed through the view to the base tables. You also learned
that validation views work in the same manner as validation tables
and that they have distinct advantages over validation tables. For
instance, validation views can incorporate data from multiple tables.
The chapter then continued with a discussion of determining and
defining views for the database. Here you learned several specific
points to keep in mind while you work with users and management to
identify the organization’s view requirements. Next, we discussed how
to define a view, and you learned how to create a view diagram to doc-
ument the view. Now you know how to select fields from the base tables
and assign them to the view.
We then discussed how to use calculated fields in a view. You learned
that you could use them to help provide pertinent information and to
enhance how the view displays its data. You also learned that calcu-
lated fields are especially crucial in aggregate views and that each

ptg14955309
466 Chapter 12 Views
calculated field uses an expression to derive the value it displays. Next,
you learned how to apply a filter to a view so that it will retrieve and
display a specific set of records. The view will display a given record
only if it meets the criteria you’ve imposed against one or more fields in
the view. You frame each criterion as an expression and use it to test
the value of a particular field.
The chapter closed with a discussion of the View Specifications sheet.
Here you learned how to document the characteristics of the view,
such as its name and type. You also learned about the items that com-
pose the View Specifications sheet and how you use them to record the
view’s characteristics.
Review Questions
1. Why can you refer to a view as a virtual table?
2. State two reasons why views are valuable.
3. Name the types of views you can define as you design the logical
structure of the database.
4. What does your RDMBS do each time you access a data view (or
any type of view, for that matter)?
5. What determines the type of modifications you can make to a
view’s data?
6. What is the only requirement you must fulfill in order to define a
multitable data view?
7. Why doesn’t a data view contain its own primary key?
8. What is the purpose of an aggregate view?
9. What are the most common aggregate functions that you can apply
to a set of data?

ptg14955309
Review Questions 467
10. What is a grouping field?
11. True or False: You can modify the data in an aggregate view.
12. What is the difference between a validation table and a validation
view?
13. Name two points you would consider when identifying view
requirements.
14. When should you use calculated fields?
15. How do you define a view that displays only science-fiction books?
16. Why must you complete a View Specifications sheet for every view
in the database?

ptg14955309
This page intentionally left blank

ptg14955309
469
13
Reviewing Data Integrity
When you have eliminated the impossible, whatever remains,
however improbable, must be the truth.
—SHERLOCK HOLMES,
THE SIGN OF FOUR
Topics Covered in This Chapter
Why You Should Review Data Integrity
Reviewing and Refining Data Integrity
Assembling the Database Documentation
Done at Last!
Case Study—Wrap-Up
Summary
You are now at the final stage of the database design process. You’ve
accomplished many things since you started the process. Thus far you
have
• Perceived the advantages of the relational database model and
how it compares to other database models
• Created a mission statement for a new database
• Defined mission objectives for the new database
• Performed a complete analysis of an old database
• Identified the organization’s information requirements
• Defined all the appropriate table structures
• Assigned a primary key to each table

ptg14955309
470 Chapter 13 Reviewing Data Integrity
• Established field specifications for each field
• Established table relationships
• Defined and established business rules
• Defined all the appropriate views
• Established overall data integrity
For all intents and purposes, your new database is complete; neverthe-
less, it would be to your advantage to perform one final review of the
overall data integrity of your database.
Why You Should Review Data Integrity
You’re probably wondering why you should review the database struc-
ture one last time, given that you’ve paid attention to every detail and
have focused on data integrity throughout the entire design process.
The answer is simple: You want to make certain that the data integrity
you’ve been so careful to establish is absolutely as sound as possible.
As you well know, a crack in the integrity could result in inconsistent
data or inaccurate information. However improbable, it is possible that
you may have overlooked something. The peace of mind you gain from
knowing that you have a solidly designed database is well worth the
investment of your time and effort of this final review.
❖Note Remember: Garbage in, garbage out!
Reviewing and Refining Data Integrity
Reviewing data integrity is a simple task if you take a modular
approach, that is, if you sequentially review each component of overall
data integrity: table-level, field-level, and relationship-level integrity

ptg14955309
Reviewing and Refining Data Integrity 471
and business rules. You should encounter very few problems here if
you have carefully followed the design method presented in this book.
The following sections briefly outline the points you should keep in
mind as you conduct the review, and they contain references to earlier
chapters in case you encounter any problems.
Table-Level Integrity
In order to ensure that you’ve properly established table-level integrity,
review each table and make certain that the table conforms to all of
the following points.
• There are no duplicate fields in the table.
• There are no calculated fields in the table.
• There are no multivalued fields in the table.
• There are no multipart fields in the table.
• There are no duplicate records in the table.
• Every record in the table is identified by a primary key value.
• Each primary key conforms to the Elements of a Primary Key.
If you believe you have problems with any of these items, resolve them
using the techniques and concepts discussed in Chapter 6, “Analyzing
the Current Database,” Chapter 7, “Establishing Table Structures,” and
Chapter 8, “Keys.”
Field-Level Integrity
You can ensure that you’ve properly established field-level integrity
after you’ve done the following:
• Made sure each field conforms to the Elements of the Ideal Field
• And made certain you’ve defined a set of field specifications for
each field

ptg14955309
472 Chapter 13 Reviewing Data Integrity
You can resolve field-level integrity problems with the techniques dis-
cussed in Chapter 9, “Field Specifications.”
Relationship-Level Integrity
Examine each table relationship to ensure that you’ve properly estab-
lished relationship-level integrity. You’ve achieved this level of integrity
when you’ve completed these tasks:
• Properly established the relationship
• Defined the appropriate deletion rules
• Correctly identified the type of participation for each table
• And established the proper degree of participation for each table
If you identify a problem with a relationship, use the techniques in
Chapter 10, “Table Relationships,” to resolve it.
Business Rules
You can ensure that your business rules are sound by making certain
these tasks are complete.
• You’re sure that each rule imposes a meaningful constraint.
• You’ve determined the proper category for the rule.
• You’ve properly defined and established each rule.
• You’ve modified the appropriate field specification elements or
table relationship characteristics.
• You’ve established the appropriate validation tables.
• You’ve completed a Business Rule Specifications sheet for each rule.
If you encounter problems with any of your business rules, refer to Chap-
ter 11, “Business Rules,” for the techniques necessary to solve them.

ptg14955309
Assembling the Database Documentation 473
Views
Although views are not directly connected to any component of data
integrity, you should nevertheless review all of your view structures. As
you examine each view, make certain you’ve addressed these items.
• Each view contains the base tables necessary to provide the
required information.
• You’ve assigned the appropriate fields to each view.
• Each calculated field provides pertinent information or enhances
the manner in which the view presents its data.
• Each filter returns the appropriate set of records.
• Each view has a view diagram.
• Each view diagram is accompanied by a View Specifications
sheet.
If you encounter problems with any view, resolve them by using the
techniques discussed in Chapter 12, “Views.”
Once you’ve completed this entire review, you can be confident that the
database structure is sound, the data within the database is consis-
tent and valid, and the information you retrieve from the database will
be accurate.
Assembling the Database
Documentation
Throughout the database design process, you’ve generated a number of
lists, specification sheets, and diagrams used to record various aspects
of the database design. You should now assemble them into a central
repository, preferably in a set of binders or in an organized set of fold-
ers and files on a computer. The design repository should consist of the
following sets of documents:

ptg14955309
474 Chapter 13 Reviewing Data Integrity
• Final table list
• Field Specifications sheets
• Calculated field list
• Table structure diagrams
• Relationship diagrams
• Business Rule Specifications sheets
• View diagrams
• And View Specifications sheets
Two additional sets of items you may consider keeping with this docu-
mentation are the notes you compiled during the design process and
the samples you gathered during the analysis stage of the design pro-
cess. You can keep each of these items in a separate appendix at the
end of the documentation.
All of these items constitute the complete set of documentation for the
logical design of the database. This documentation is vital for three
reasons.
1. It provides a complete record of the database structure. You can
find every aspect of the logical structure of the database within
the documentation. Additionally, you can answer almost any
question concerning the database simply by referring to the
documentation.
2. It provides a complete set of specifications and instructions on
how the database should be created during the implementation
process. This documentation is similar to an architect’s blue-
prints: It indicates how the database is to be constructed. It
also identifies the integrity that needs to be established for the
database. Because the database design is not directed to a par-
ticular RDBMS, the individuals implementing the database have

ptg14955309
Done at Last! 475
full latitude concerning the manner in which they physically
implement the database.
3. Should it seem necessary to modify the database structure during
the implementation process, the design documentation can be
used to determine the effects and consequences of any modifica-
tions. Any modifications you make to the database structure
should be the result of an informed decision. You can make cer-
tain that a proposed modification will not have an adverse effect
on the database structure by referencing the documentation
first.
Done at Last!
Now that you’ve completed the integrity review and assembled all of the
documentation for the database, the logical database design process
is complete. You can rest assured that you have a properly designed
database and that its implementation will proceed smoothly. On to the
next client and the next database design!
CASE STUDY—WRAP-UP
This is your last meeting with Mike and his staff. Your objective is to
review his database and its integrity one final time. Although you’re
confident that you will not find any problems, you want to give the
database one final quality-control review.
During the meeting, you review each of the database structures to
ensure that they are in accordance with the various elements that
govern them. Then you review each component of overall data integrity
to make certain that you’ve properly established table-level, field-level,
and relationship-level integrity, as well as business rules. Finally, you
gather all of the documentation you’ve generated throughout the design

ptg14955309
476 Chapter 13 Reviewing Data Integrity
process. After you’ve assembled all of the documentation into a set of
binders, you give the binders to Mike and declare that his database is
now complete. Mike expresses his thanks and gratitude for a job well
done and promises your check will be in the mail by the fifteenth of
the month. You express your thanks to Mike and his staff, say your
good-byes, and depart for new horizons. As you leave, Mike stares in
your direction; one final thought occurs to him:
“Now, if I could just get you to implement my database for me . . .”
Summary
The chapter opened with a list of your accomplishments since you
began the database design process. It then continued with a discus-
sion of why you should review overall data integrity one final time.
This was followed by a brief discussion of the points to keep in mind
as you review each component of overall data integrity. We closed the
chapter by discussing the importance of the documentation you’ve
assembled during the entire design process.


ptg14955309
This page intentionally left blank

ptg14955309
479
14
Bad Design—
What Not to Do
Mistakes are always initial.
—CESARE PAVESE
Topics Covered in This Chapter
Flat-File Design
Spreadsheet Design
Database Design Based on the Database Software
A Final Thought
Summary
You may have wondered why this chapter appears at the end of the
book instead of at the beginning. The reason is simple: You can appre-
ciate the dangers presented by a poorly designed database now that
you’ve learned how to design a database properly. Additionally, you will
be able to determine for yourself why a particular design is bad—you’ll
look at the design and be able to identify the problems with the struc-
ture immediately. You also possess the knowledge required to identify
possible solutions to these problems.
In this chapter, you’ll see the three most common design approaches
that lead to poorly structured databases. The discussions are brief
because they are only meant to illustrate types of design you should
avoid. It should now be obvious that the way to resolve an improperly
designed database is to take it through the complete design process
you’ve just learned.

ptg14955309
480 Chapter 14 Bad Design—What Not to Do
Flat-File Design
This type of design (sometimes known as the “throw-everything-in-
to-one-big-table” design) has been in existence for many years and
is common in databases that have been designed for implementation
in nonrelational database management systems. A flat-file design is
fraught with problems, as you can see by examining the structure in
Figure 14.1.
Customer Orders
Table Structures
Customer Number Item 2
Customer Name Quantity 2
Customer Address Price 2
Order Number Customer Phone Item 2 Extension
Order Date Item 1 Item 3
Ship Date Quantity 1 Quantity 3
Order Amount Price 1 Price 3
Sales Rep Name Item 1 Extension Item 3 Extension
Figure 14.1. An example of a flat-file structure
This diagram represents the structure of a single table. (Imagine how
other tables within the database are structured!) You can readily see
that this structure will inevitably cause problems with redundant data
and inconsistent data and that it suffers from a lack of data integrity.
As you’ve probably already noted, there are a few other problems with
this structure.
•Multipart fields: SALES REP NAME includes the sales rep’s first and
last names, CUSTOMER NAME includes the customer’s first and last

ptg14955309
Spreadsheet Design 481
names, and CUSTOMER ADDRESS includes the customer’s street
address, city, state, and zip code.
•Calculated fields: The ORDER AMOUNT field contains a value that
is most likely manually calculated, especially if the customer is
ordering more than three items. The ITEM # EXTENSION fields are
also all likely to be manually calculated. The value for a given
ITEM # EXTENSION field is the result of multiplying the value of a
related QUANTITY # field by the value of a related PRICE # field. (For
example: ITEM 3 EXTENSION = QUANTITY 3 ∴ PRICE 3)
•Unnecessary duplicate fields: Each of the fields pertaining to a
particular item is a duplicate. For example, the ITEM 1, ITEM 2,
and ITEM 3 fields are unnecessary duplicate fields.
•No true primary key: There is no field or group of fields that can
uniquely identify a single record in this table. The ORDER NUMBER
field is not a primary key in this table; if a customer orders more
than three items, you’ll have to enter another record into the
table using the same order number.
•The table represents more than one subject. This table represents
three subjects: customers, orders, and items. (Depending on your
point of view, it also represents sales reps.)
Now that you know the elements of good database design, you’re sure
to avoid a design such as this.
Spreadsheet Design
A spreadsheet is certainly a good tool if you use it properly and for the
purpose for which it was designed. For example, it is quite suitable for
work that involves complex mathematical calculations and statistical
analysis. Contrary to popular myth, however, a spreadsheet does not
make a good relational database. If your organization has a need to
collect, store, maintain, and manipulate various types of data, then
ptg14955309
482 Chapter 14 Bad Design—What Not to Do
use the proper tool for the job by designing and implementing a real
database. For example, consider the spreadsheet in Figure 14.2.
This spreadsheet is being used to keep track of store managers for a
small chain of retail stores. As you can see, this approach has prob-
lems as well.
•Duplicate fields: Each field on this spreadsheet is a duplicate
field. If you take the fields at face value, there are basically three
fields in each instance: STORE NUMBER, MANAGER NAME, and ASSIS-
TANT MANAGER NAME.
•Multipart fields: Each field holds two values. The first field stores
the store number and phone number, the second field stores the
manager’s first and last names, and the third field stores the
assistant manager’s first and last names.
•Multivalued fields: The ASSISTANT MANAGER field is a multivalued
field because there can be more than one assistant manager
assigned to a particular store.
B C
Store 103 (554-2993)
Manager: Katie Christian
Asst. Mgr: Terri Sharpe
Store 104 (773-1837)
Manager: Gary Wayne
Asst. Mgr: Barbara Clark
and Tim Ennis
Store 105 (344-2883)
Manager: Carmine Aguilar
Asst. Mgr: Lee Sampson
A
Store 100 (344-0029)
Manager: Mike Hernandez
Asst. Mgr: Bob McNeal and
1
2
3
Suzi Thompson4
Store 101 (433-4872)5
6
7
8
9
10
11
Manager: Abe Hernandez
Asst. Mgr: Steve McMahn
Store 102 (433-4872)
Manager: Susan Black
Asst. Mgr: Diana Price
Figure 14.2. An example of a typical spreadsheet “database”

ptg14955309
Spreadsheet Design 483
•Difficult to use: Data-oriented tasks that can be performed with
ease in an RDBMS program are tedious and time-consuming to
carry out in a spreadsheet. For example, it would take you some
time to create a list containing only the name of each store man-
ager and his or her phone number.
After seeing the problems associated with a simple spreadsheet “data-
base” such as this one, you can imagine the types of problems you
would encounter with a more complex database. If you’re currently
using a spreadsheet as a database, you can improve the database’s
quality, speed, and versatility if you remove it from the spreadsheet,
take it through the entire database design process, and implement it in
a suitable RDBMS.
Dealing with the Spreadsheet View Mind-set
When you begin to work with a true database and RDBMS, you must
break away from a spreadsheet view mind-set. This means that you’ll
have to resign yourself to the fact that certain ways of viewing the
data are now unavailable—you can no longer use typical spreadsheet
layouts. For example, consider a typical spreadsheet report shown in
Figure 14.3.
You cannot produce a report with this type of layout using a database.
Whereas a spreadsheet stores the data exactly as you see it on the
report, a database would store it in four separate fields within a table.
Figure 14.4 shows an example of a database report you could generate
for the same data. The database presentation is not the same as the
spreadsheet presentation, but it is just as clear.
The point to remember is that you’ll have to adjust the manner in
which you think about working with the data in your database. In the
end, there are many more advantages to storing and using your data
in an actual database than trying to use a spreadsheet in a similar
manner. A database gives you much more control over data integrity

ptg14955309
484 Chapter 14 Bad Design—What Not to Do
Branch Stores
Bellevue
Store 118 Store 201 Store 211
Manager: Katherine Ehrlich Manager: Kevin Swanson Manager: George Chavez
Redmond
Store 27 Store 75 Store 322
Manager: Mark Rosales Manager: Chris Warren Manager: Steve Horst
Seattle
Store 105 Store 187 Store 200
Manager: Caroline Cole Manager: Julia Black Manager: Alan Jacob
Figure 14.3. An example of a typical spreadsheet report
Branch Stores
Bellevue
Store 118 Manager: Katherine Ehrlich
Store 201 Manager: Kevin Swanson
Store 211 Manager: George Chavez
Redmond
Store 27 Manager: Mark Rosales
Store 75 Manager: Chris Warren
Store 322 Manager: Steve Horst
Seattle
Store 105 Manager: Carmen Aguilar
Store 187 Manager: Julia Black
Store 200 Manager: Alan Jacob
Figure 14.4. An example of a typical database report

ptg14955309
Database Design Based on the Database Software 485
and the consistency and validity of the data. It also provides an almost
unlimited number of ways to retrieve the data, enabling you to obtain
a wide variety of information.
Database Design Based on the Database
Software
An RDBMS does not provide a basis or procedure or even a reason for
designing a database in a particular fashion—it only provides the tools
that you need to implement a design. In contrast, a formal database
design method provides both the principles and rationale necessary to
define a database properly and effectively.
Many people unwittingly fall into the trap of designing a database
based solely on the RDBMS software they will use for its implemen-
tation. In many cases, they do so because they are already somewhat
familiar and skilled with a particular RDBMS or their company or
organization is already using a particular RDMBS. This is an unwise
approach that you should avoid (as much as possible) for several
reasons.
•You’re likely to make design decisions based on your perceptions of
what your RDBMS can or can’t do. For example, you may decide
not to impose a degree of participation for a given relationship
because you believe the RDBMS does not provide you with the
means to do so.
•You’ll inadvertently let the RDBMS dictate the design of the data-
base as opposed to driving the design strictly from the organiza-
tion’s information requirements. This usually occurs when you
discover that your RDBMS provides only limited support for
certain aspects of the database, such as field specifications and
relationship characteristics.

ptg14955309
486 Chapter 14 Bad Design—What Not to Do
•Your design will be constrained by your knowledge of the RDBMS.
For example, you may decide not to implement relationship char-
acteristics simply because you don’t know how to do so.
•Your design will be constrained by how skilled you are with your
RDBMS. Your skill level affects how efficiently and effectively you
can implement various aspects of the database, such as field
specifications and business rules.
•Using this approach to design a database commonly results in
improper structural design, insufficient data integrity, and prob-
lems with inconsistent data and inaccurate information. Defining
a database within an RDBMS can be deceptively easy. You may
create a database that works, but you’re very likely to have a poor
design without knowing it.
•In the end, the RDBMS that you know and love so well may not be
suitable for your organization’s database requirements.
You should always design the logical structure of your database with-
out regard to any RDBMS. By doing so, you’re more likely to design
a sound structure because you’ll be focused on the organization’s
information requirements. Once your design is complete, you can then
clearly determine how you should implement the database (single-user
application, client/server, web-based, and so on) and which RDBMS
you should use to facilitate the implementation.
A Final Thought
Through years of teaching database design and instructing people
in how to use various RDBMS software programs, I’ve observed an
interesting phenomenon: People who are familiar with the fundamen-
tal principles of proper database design have a better comprehension of
their RDBMS and the tools it provides than those who know little at all
about database design. I believe this is due to the fact that the people

ptg14955309
Summary 487
who know database design are able to understand why the RDBMS
provides certain tools and how they can (and should) use them. For
this reason—as well as the many others presented in this book—it
is to your distinct advantage to learn and understand good database
design techniques. This book does not map the only road, but it is, I
believe, the straightest, surest, and most easily traveled.
Summary
This chapter contrasted relational database design with weaker, less
effective design formats. First, we looked at flat-file design. You learned
that there are numerous fatal problems with this approach and that it
should be completely avoided. We then examined spreadsheet design
and you saw how constrained this approach can be. The chapter
closed with a discussion of designing a database using RDBMS soft-
ware. You learned that this type of design is perilously dependent on
your familiarity and skill level with the software. Unlike a good data-
base design method, designing a database around an RDBMS does
not provide you with principles and a rationale for designing a proper
database structure. Superficially, in the short run, the software prod-
uct looks as good—it just doesn’t work as well in the long run as the
design method discussed in this book.

ptg14955309
This page intentionally left blank

ptg14955309
489
15
Bending or Breaking the Rules
Nature never breaks her own laws.
—LEONARDO DA VINCI
Topics Covered in This Chapter
When May You Bend or Break the Rules?
Documenting Your Actions
Summary
I always advocate following proper database design techniques. As
you’ve already learned, there are numerous reasons for doing so. But
first and foremost, you should use a good design method to ensure the
integrity of the database. I cannot overstate how important this is. You
now know the consequences of improperly establishing data integrity,
so following the rules is of paramount importance.
When May You Bend or Break the
Rules?
There are only two specific circumstances under which it is at all per-
missible to bend or break the rules of proper database design. Unless
either of these is an inescapable imperative, you should use proper
database design techniques when designing your database.
Designing an Analytical Database
As you learned in Chapter 1, “Relational Databases,” an analytical
database stores and tracks historical and time-dependent data. This

ptg14955309
490 Chapter 15 Bending or Breaking the Rules
type of database often contains calculated fields within some of its
table structures. The expressions used in many of these fields are
meant to record the state of a particular set of data at a given moment
in time; other fields store the results of aggregate functions.
You may have already surmised from the description that this type of
database violates proper database design because its tables contain
calculated fields (refer to Chapter 7, “Establishing Table Structures”).
In this particular instance, the violation is acceptable because of the
manner in which the data in the database is being used. I recommend
that you properly design the database first and then break the rules
only after judicious consideration—you should make a deliberate deci-
sion to break a rule and understand why doing so is necessary in the
specific instance.
❖Note Designing an analytical database requires a radically
different design methodology than the one you learned in this
book. If you determine that your organization requires an ana-
lytical database, I strongly recommend that you acquire a good
book on the subject and learn how to design such a database
properly.
Improving Processing Performance
This is still the most common reason that people feel compelled to
bend or break the rules. Whenever an RDBMS takes what seems to be
an inordinate amount of time to process multitable queries or complex
reports, many people believe that the solution to the problem is to alter
the underlying table structures. For example, they would have you
modify a table in such a way that it includes every field necessary for
the query or report. While this modification does indeed increase the
speed at which the RDBMS processes the query or report (particularly

ptg14955309
When May You Bend or Break the Rules? 491
in older systems), it also introduces a number of new problems, such
as unnecessary duplicate fields and redundant data. This is clearly not
a desirable solution, because it violates proper database design.
Unfortunately, real life is not as ideal as we would like it to be, so you
will sometimes find that you must decide between improving process-
ing performance and holding to proper design principles.
Is It Worth It?
When you take a moment to really think about this dilemma, you’ll
soon realize that the question really isn’t about performance; it’s about
data integrity. Anytime you break the rules for the sake of performance
(or any other reason, for that matter), you are surely going to introduce
data-integrity problems. The question you must ask yourself, then, is
this: Is the perceived increase in processing performance worth the
price of reduced (and, therefore, weakened) data integrity? As you well
know, the consequences of making imprudent modifications to your
data structures will eventually spread, like ripples in a pond, through-
out your database. Here are just a few of the problems you’ll encounter.
•Inconsistent data: This is a result of introducing unnecessary
duplicate fields into a table. It will be your responsibility (or that
of your application program) to ensure that the data in these
fields is synchronized; if you modify the value in a particular
duplicate field, you’ll have to make certain that the same modifi-
cation is made to the remaining duplicate fields.
•Redundant data: Redundant data is also a result of introducing
unnecessary duplicate fields into a table. When you edit a par-
ticular value in a field that contains redundant data, you must
be sure to make the same modification for each instance of that
value.
•Impaired data integrity: Bending or breaking the rules often vio-
lates one or more components of overall data integrity, such as

ptg14955309
492 Chapter 15 Bending or Breaking the Rules
table-level integrity and relationship-level integrity. It will be your
responsibility (or that of your application program) to compensate
for the lack of integrity—in whatever way it manifests itself—as
best as you can.
•Inaccurate information: You cannot possibly expect the database
to provide accurate information if it has any of the aforemen-
tioned problems.
Improving Performance by Other Means First
If you still think you want to pursue this course of action in order to
improve processing performance, do it only as a last resort. Before you
take these measures, however, try to improve performance by some
other means first. Consider these alternatives.
•Enhance or upgrade the computer hardware. Cost is not quite the
issue it used to be, so this is still the easiest way to increase pro-
cessing performance. Items such as a faster CPU, more memory,
faster and more efficient disk drives, and a printer that better
meets your printing requirements will all help to greatly decrea se
the time it takes the RDBMS to process a complex query or report.
•Fine-tune the operating system software. Make certain that the
computer’s operating system is optimized for peak performance.
This is especially important for networked computers and server
hardware. You can greatly enhance general processing perfor-
mance by working with the configuration options settings. The
types of modifications you make to the operating system in gen-
eral will depend on your operating system, so you’ll have to refer
to your documentation to determine what types of modifications
you can make.
•Review the database structure. Make absolutely certain that
the database is properly designed. It makes quite a difference.
Poorly designed databases actually contribute to poor processing
performance.

ptg14955309
Documenting Your Actions 493
•Review the database’s implementation. Examine how the data-
base is currently implemented within the RDBMS. Make certain
you’ve taken full advantage of the RDBMS’s capabilities and
defined the database as efficiently and completely as possible.
•Review the application program used to work with the database.
Here’s another area you should examine very closely. Is the appli-
cation program well written? Does it make the best use of the
tools the RDBMS provides? Are the application’s components well
defined? In some cases, a report may print more slowly because
it is poorly designed—there may be more effective ways to design
and generate the same report. Queries may run slowly because
they are improperly defined. Make certain that each query is
defined correctly and in the most efficient way possible.
If you believe you must depart from proper database design tech-
niques, carefully examine your situation. As I mentioned earlier, it’s
acceptable to suspend the rules if you are designing an analytical
database. But I still strongly recommend that you design your data-
base properly and thoroughly and relax the rules only for very specific
reasons.
Documenting Your Actions
If you’ve exhausted all other options and still come to the conclusion
that you need to bend or break the rules, then you must document each
rule you break and each action you take! It is important that you doc-
ument your changes because doing so will compel you to think about
the consequences of what you are about to do and it provides a means
of recording the changes you make to the database structure. Should
you decide later that the modifications did not provide significant ben-
efits, you can use the documentation as a guide to reverse the modifi-
cations you initially made.

ptg14955309
494 Chapter 15 Bending or Breaking the Rules
These are the items that you should record.
•The reason you’re breaking the rules: Increasing processing
performance and decreasing the time it takes to print complex
reports are two of the most common reasons for breaking the
rules. Whatever your reason, be sure to state it thoroughly and
clearly.
•The design principle you’re violating: Recording how you’ve altered
the database design will give you the means to reverse these
changes later should you determine that performance did not
significantly improve. You might indicate that you’re altering the
structure of a table, for example.
•The aspect of the database that you’re modifying: Indicate which
particular field, table, relationship, or view you are going to alter.
Once again, this information will be valuable should you decide
to reverse the modifications.
•The specific modifications you are making: Once you determine
which item you need to modify, record the exact modifications
you make to that item. For example, if you need to modify a rela-
tionship, note the exact changes you make to its characteristics.
•The anticipated effects on the database and the application pro-
gram: Any modifications you make to the database are going
to affect all accompanying end-user application programs. For
example, altering the structure of a particular table can affect
data integrity, view structures, data entry forms and reports built
upon the table (either partially or totally), and programming code
that refers to the table. You must be sure to list every effect.
Add this document to the documentation you compiled for the data-
base. Even if you reverse the changes later, this record could prevent
you from yielding to a future impulse to attempt the same types of
changes.

ptg14955309
Summary 495
Summary
The chapter opened by examining the two circumstances under which
you might feel compelled to depart from proper database design tech-
niques. You learned that breaking the rules is acceptable if you are
designing an analytical database; otherwise, you should design the
database properly first and then make deliberate decisions to break or
bend specific rules. You then learned that the most common reason
for departing from proper design techniques is to improve processing
performance. Although this is not a satisfactory reason for breaking
the rules, there are times when circumstances dictate that you must
consider such changes.
We then continued with a discussion of the alternate measures you
can take to improve processing performance, such as enhancing or
upgrading the hardware and reviewing the implementation of the
database. You learned that you should do all you can to improve per-
formance first and depart from proper design techniques only as a last
resort. The chapter then closed with a list of items you should record if
you need to break the rules.

ptg14955309
This page intentionally left blank

ptg14955309
497
In Closing
I’m not a teacher: only a fellow-traveller
of whom you asked the way. I pointed
ahead—ahead of myself as well as you.
—GEORGE BERNARD SHAW
I’ve always believed that you shouldn’t have to be a rocket scien-
tist in order to design a database properly. It should be a relatively
straightforward task that can be performed by anyone possessing a
good amount of common sense. As long as you follow a good database
design method, you should be able to design a sound and reliable data-
base structure.
You now possess the knowledge and skills necessary to design a rela-
tional database. You know how to define the necessary structures,
establish table relationships, and implement various levels of data
integrity. If you encounter improperly or poorly designed structures,
you now know how to improve them.
Learning about database design is an ever-continuing process. You
can learn enough to design the types of databases you require, you
can turn it into a profession, or you can even make it a lifelong study.
Whatever your approach, you’ll encounter one inescapable fact: The
more you learn, the more you realize you don’t know it all. But don’t be
discouraged; this is true of any major subject you endeavor to learn,
such as music, art, philosophy—or rocket science!
I sincerely hope you’ve enjoyed reading this book as much as I’ve
enjoyed writing it. I know that most technical books of this nature can
be a little dry, so I tried to inject a little humor every now and then,

ptg14955309
498 In Closing
particularly in the interview and meeting dialogues. Those of you
who thought the conversations were relatively realistic are quite per-
ceptive—they were very loosely based on a number of interviews and
conversations I’ve had with my clients over the years.
As a parting piece of advice, let me leave you with two words: Always
learn. Never be afraid or intimidated or reluctant to learn something
new. Learning opens the door to fresh ideas, different concepts, and
new perceptions. It encourages participation and communication
between individuals and broadens everyone’s horizons.
Learning is a journey that begins with but one step. You’ve taken the
first step by reading this book. Now you will continue your journey by
learning about other facets of database management.
My book ends here, but your journey is just beginning. . . .


ptg14955309
This page intentionally left blank

ptg14955309
501
A
Answers to Review Questions
Chapter 1
1. The two main types of databases in use today are operational and
analytical.
2. An analytical database stores static data.
3. True. An operational database is used primarily in OLTP
scenarios.
4. The hierarchical and network database models were commonly
used in the days before the relational database model.
5. In a parent/child relationship, a parent table can be associated
with one or more child tables, but a single child table can be asso-
ciated with only one parent table.
6. A set structure is a transparent construction that establishes and
represents a relationship in a network database.
7. The relational model is based on two branches of mathematics—
set theory and first-order predicate logic.
8. A relational database stores data in relations, which the user per-
ceives as tables.
9. These are the types of relationships in a relational database:
a. One-to-one
b. One-to-many
c. Many-to-many

ptg14955309
502 Appendix A Answers to Review Questions
10. You retrieve data in a relational database by using SQL.
11. These are the advantages of a relational database:
a. Built-in multilevel integrity
b. Logical and physical data independence from database
applications
c. Guaranteed data consistency and accuracy
d. Easy data retrieval
12. A relational database management system, or RDBMS, is a soft-
ware program you use to create, maintain, modify, and manipu-
late a relational database.
13. The object-relational model extends the relational database model
by incorporating various object-oriented elements and characteris-
tics, such as classes, encapsulation, and inheritance.
14. A data warehouse allows organizations to access data stored in
any number of relational and nonrelational databases.
Chapter 2
1. The best time to use an RDBMS program’s design tools is after you
design the logical structure of the database.
2. True. Design is crucial to the consistency, integrity, and accuracy
of data.
3. The most detrimental result of improper database design is inac-
curate information.
4. The fact that the relational database model is based on set theory
and first-order predicate logic makes the relational database struc-
turally sound and able to guarantee accurate information.

ptg14955309
Chapter 2 503
5. These are the advantages to learning a design methodology.
a. It gives you the skills you need to design a sound database
structure.
b. It provides you with an organized set of techniques that will
guide you step-by-step through the design process.
c. It helps you keep your missteps and design reiterations to a
minimum.
d. It makes the design process easier and reduces the amount of
time you spend designing the database.
e. It will help you understand and use your RDBMS software
more fully and effectively.
6. True. Understanding database design will help you use your
RDBMS program more effectively.
7. These are the objectives of good design.
a. The database supports required and ad hoc information
retrieval.
b. The tables are constructed properly and efficiently.
c. Data integrity is imposed at the field, table, and relationship
levels.
d. The database supports business rules relevant to the
organization.
e. The database lends itself to future growth.
8. Data integrity helps to guarantee that data structures and their
values are valid and accurate at all times.
9. These are the benefits of applying good design techniques.
a. The database structure is easy to modify and maintain.
b. The data is easy to modify.

ptg14955309
504 Appendix A Answers to Review Questions
c. Information is easy to retrieve.
d. End-user applications are easy to develop and build.
10. False. You cannot take shortcuts through some of the design pro-
cesses and still arrive at a good, sound design.
Chapter 3
1. Terminology is important for the following reasons.
a. It is used to express and define the special ideas and concepts
of the relational database model.
b. It is used to express and define the database design process
itself.
c. It is used anywhere a relational database or RDBMS is
discussed.
2. The four categories of terms are value-related, structure-related,
relationship-related, and integrity-related.
3. The values you store in the database are data. Information is data
that you process in a manner that makes it meaningful and useful
to you when you work with it or view it.
4. A null represents a missing or unknown value.
5. The major disadvantage of nulls is that they have an adverse effect
on mathematical operations.
6. Tables are the chief structures in the database.
7. The three types of tables are data tables, linking tables, and vali-
dation tables.
8. A view is a virtual table composed of fields from one or more base
tables in the database.

ptg14955309
Chapter 4 505
9. A key is a logical structure that you use to identify records within a
table, and an index is a physical structure that you use to optimize
data processing.
10. The three types of relationships that can exist between a pair of
tables are one-to-one, one-to-many, and many-to-many.
11. You can characterize every relationship in three ways: by the
type of relationship that exists between the tables, the manner in
which each table participates, and the degree to which each table
participates.
12. A field specification represents all the elements of a field.
13. A field specification incorporates the following three types of ele-
ments: general, physical, and logical.
14. Data integrity refers to the validity, consistency, and accuracy of
the data in a database.
15. The four types of data integrity are field-level, table-level, relation-
ship-level, and business rules.
Chapter 4
1. It is important to complete the design process thoroughly because
it helps you ensure a sound structure and data integrity.
2. True. The level of structural integrity is in direct proportion to how
thoroughly you follow the design process.
3. The mission statement identifies the purpose of your database.
4. Mission objectives are statements that represent the general tasks
your users can perform against the data in the database.
5. The list of fields and calculations that you compile during the
second phase of the design process constitutes your organization’s
fundamental data requirements.

ptg14955309
506 Appendix A Answers to Review Questions
6. You determine the various subjects that the tables will represent
from the mission objectives you wrote during the first phase of the
design process and the data requirements you gathered during the
second phase.
7. False. You establish field specifications for each field in the data-
base during the third phase of the database design process.
8. You establish a logical connection between the tables in a relation-
ship either with a primary key or with a linking table.
9. The manner in which your organization views and uses its data
will determine a set of limitations and requirements that you must
build into the database.
10. You can define and implement validation tables as necessary to
support certain business rules.
11. You identify the types of views you need to build in the database
by interviewing users and management and determining how they
work with their respective data.
12. You can implement the logical database structure in an RDBMS
program after you’ve completed the entire database design process.
Chapter 5
1. Interviews are important because they provide a valuable commu-
nication link between you (the developer) and the people for whom
you’re designing the database. They help ensure the success of
your design efforts, and they provide critical information that can
affect the design of the database structure.
2. The problem that arises when you conduct an interview with a
large number of people is that the intimidation level of some of the
participants will rise in direct proportion to the number of partici-
pants taking part in the interview as a whole.

ptg14955309
Chapter 5 507
3. The primary reason for conducting separate interviews with users
and management is that each group has a different perspective on
the organization as a whole and on how the organization uses its
data on a daily basis.
4. False. You’ll commonly use open-ended questions in your interviews.
5. You should try to elicit complete, descriptive responses from the
interview participants.
6. The single most important guideline for every interview you con-
duct is to always maintain control of the interview.
7. A mission statement declares the specific purpose of the database
in general terms.
8. A well-written mission statement has the following characteristics.
a. It is unambiguous.
b. It is succinct and to the point.
c. It is free of phrases or sentences that explicitly describe spe-
cific tasks.
9. False. You must learn about the organization in order to compose
a mission statement.
10. Your mission statement is complete when you have a sentence that
describes the specific purpose of the database and is understood
and agreed on by everyone concerned.
11. A mission objective is a statement that represents a single, general
task supported by the data maintained in the database.
12. A well-written mission objective has the following characteristics.
a. It is a declarative sentence that clearly defines a general task
and is free from unnecessary details.
b. It is expressed in general terms.

ptg14955309
508 Appendix A Answers to Review Questions
c. It is succinct and to the point.
d. It is unambiguous.
13. True. You should interview users and management to help you
define mission objectives.
14. The staff’s daily work relates to the mission objectives in that
many of the tasks they perform will become mission objectives.
15. False. A mission objective cannot describe more than one task.
16. A mission objective can be derived from a response either explicitly
or implicitly.
17. A mission objective is complete when it is both properly defined
and well defined, and when it makes sense to you and to those for
whom you are designing the database.
Chapter 6
1. The goals of analyzing the current database are to determine the
following:
a. What types of data the organization uses
b. How the organization uses its data
c. How the organization manages and maintains its data
2. False. You should not adopt the current database structure as the
basis for the new structure.
3. A legacy database is a database that has been in existence and in
use for five years or more.
4. The analysis process incorporates these three steps:
a. Reviewing the way data is collected
b. Reviewing the manner in which information is presented
c. Conducting interviews with users and management

ptg14955309
Chapter 6 509
5. The types of computer software programs you should review
during the analysis include word processors, spreadsheets, data-
bases, and web pages.
6. You should conduct interviews after you gather data collection and
information presentation samples for these reasons.
a. They provide details about the samples you assembled during
the previous reviews.
b. They provide information on the way the organization uses its
data.
c. They are instrumental in defining preliminary field and table
structures.
d. They help to define future information requirements.
7. You use open-ended questions to focus on specific subjects and
closed questions to focus on specific details of a certain subject.
8. The Subject-Identification Technique allows you to identify subjects
within a participant’s response to a given question.
9. You identify specific attributes for a particular subject by using
the Characteristic-Identification Technique.
10. False. You should interview users and management separately.
11. The three basic types of information requirements you must iden-
tify are current, additional, and future.
12. The Preliminary Field List represents the organization’s fundamen-
tal data requirements and constitutes the core set of fields that
you must define in the database.
13. Each item on the Preliminary Field List should have a unique name
to ensure that the characteristic appears only once on the list.
14. A value list specifies the acceptable range of values for a particular
characteristic and often enforces a given business rule.

ptg14955309
510 Appendix A Answers to Review Questions
15. A calculated field stores the result of a string concatenation or
mathematical expression as its value. You should remove calcu-
lated fields from the Preliminary Field List and place them on a
dedicated Calculated Field List.
Chapter 7
1. You identify and establish tables for a new database using the Pre-
liminary Table List.
2. You use the Preliminary Field List to help you define tables for the
database because the fields on the list may imply subjects that the
database needs to track.
3. When an item on the list of subjects and a differently named item
on the Preliminary Table List both represent the same subject, you
select the name that best represents the subject and use it as the
sole identifier for that subject.
4. The Final Table List provides the name, type, and description of
each table in the database.
5. These are the guidelines for creating table names.
a. Create a unique, descriptive name that is meaningful to the
entire organization.
b. Create a name that accurately, clearly, and unambiguously
identifies the subject of the table.
c. Use the minimum number of words necessary to convey the
subject of the table.
d. Do not use words that convey physical characteristics.
e. Do not use acronyms and abbreviations.
f. Do not use proper names or other words that will unduly
restrict the data that can be entered into the table.

ptg14955309
Chapter 7 511
g. Do not use a name that implicitly or explicitly identifies more
than one subject.
h. Use the plural form of the name.
6. These are the guidelines for composing table descriptions.
a. Include a statement that accurately defines the table.
b. Include a statement that explains why this table is important
to the organization.
c. Compose a description that is clear and succinct.
d. Do not include implementation-specific information in your
table description, such as how or where the table is used.
e. Do not make the table description for one table dependent
upon the table description for another table.
f. Do not use examples in a table description.
7. You assign fields to a table on the Final Table List by determin-
ing which fields best represent characteristics of the table’s
subject.
8. These are the guidelines for creating field names.
a. Create a unique, descriptive name that is meaningful to the
entire organization.
b. Create a name that accurately, clearly, and unambiguously
identifies the characteristic a field represents.
c. Use the minimum number of words necessary to convey the
meaning of the characteristic the field represents.
d. Do not use acronyms, and use abbreviations judiciously.
e. Do not use words that could confuse the meaning of the field
name.

ptg14955309
512 Appendix A Answers to Review Questions
f. Do not use names that implicitly or explicitly identify more
than one characteristic.
g. Use the singular form of the name.
9. Poorly designed fields can cause problems with duplicate data and
redundant data.
10. You can resolve field anomalies by ensuring that the field complies
with the Elements of the Ideal Field.
11. These are the Elements of the Ideal Field.
a. It represents a distinct characteristic of the subject of the
table.
b. It contains only a single value.
c. It cannot be deconstructed into smaller components.
d. It does not contain a calculated or concatenated value.
e. It is unique within the entire database structure.
f. It retains a majority of its characteristics when it appears in
more than one table.
12. Redundant data is acceptable when it is the result of resolving a
multivalued field or an unnecessary duplicate field.
13. In general terms, these are the three steps you follow to resolve a
multivalued field.
a. Remove the field from the table and use it as the basis for a
new table.
b. Use a field (or set of fields) from the original table to relate the
original table to the new table.
c. Assign an appropriate name, type, and description to the new
table and add it to the Final Table List.

ptg14955309
Chapter 8 513
14. The only instance in which it is necessary to use a duplicate
field in a table is when the field serves to establish a relationship
between two tables.
15. You can refine table structures by ensuring that each table com-
plies with the Elements of the Ideal Table.
16. These are the Elements of the Ideal Table.
a. It represents a single subject, which can be an object or event.
b. It has a primary key.
c. It does not contain multipart or multivalued fields.
d. It does not contain calculated fields.
e. It does not contain unnecessary duplicate fields.
f. It contains only an absolute minimum amount of redundant
data.
17. A subset table is a table that represents a subordinate subject of a
particular data table.
Chapter 8
1. Keys are important for the following reasons.
a. They ensure that each record in a table is properly identified.
b. They help establish and enforce various types of integrity.
c. They serve to establish table relationships.
2. The four main types of keys are candidate, primary, foreign,
and non.
3. The purpose of a candidate key is to uniquely identify a single
instance of the table’s subject.

ptg14955309
514 Appendix A Answers to Review Questions
4. These are the Elements of a Candidate Key.
a. It cannot be a multipart field.
b. It must contain unique values.
c. It cannot contain null values.
d. Its value is not optional in whole or in part.
e. It comprises a minimum number of fields necessary to define
uniqueness.
f. Its values must uniquely and exclusively identify each record
in the table.
g. Its value must exclusively identify the value of each field
within a given record.
h. Its value can be modified only in rare or extreme cases.
5. True. A candidate key can be composed of more than one field.
6. Yes, a table can have more than one candidate key.
7. A field you create for the sole purpose of serving as a candidate
key is known as an artificial candidate key. You create this type of
key when there are no “naturally occurring” candidate keys in a
table.
8. The primary key is the most important key you assign to a table.
9. The primary key is important for the following reasons.
a. A primary key field exclusively identifies the table throughout
the database structure and helps establish relationships with
other tables.
b. A primary key value uniquely identifies a given record within
a table and exclusively represents that record throughout
the entire database. It also helps to guard against duplicate
records.

ptg14955309
Chapter 8 515
10. You establish a primary key by examining the table’s pool of avail-
able candidate keys and then selecting one as the primary key.
11. These are the Elements of a Primary Key.
a. It cannot be a multipart field.
b. It must contain unique values.
c. It cannot contain null values.
d. Its value is not optional in whole or in part.
e. It comprises a minimum number of fields necessary to define
uniqueness.
f. Its values must uniquely and exclusively identify each record
in the table.
g. Its value must exclusively identify the value of each field
within a given record.
h. Its value can be modified only in rare or extreme cases.
12. Before you finalize your selection of a primary key, you must make
absolutely certain that it exclusively identifies the value of each
field within a given record.
13. An alternate key is a candidate key that was not chosen to serve
as the primary key of the table.
14. By establishing table-level integrity, you ensure the following.
a. There are no duplicate records in a table.
b. The primary key exclusively identifies each record in a table.
c. Every primary key value is unique.
d. Primary key values are not null.

ptg14955309
516 Appendix A Answers to Review Questions
15. You should review the initial table structures for the following
reasons:
a. To ensure that the appropriate subjects are represented in the
database
b. To make certain that the table names and table descriptions
are suitable and meaningful to everyone
c. To make certain that the field names are suitable and mean-
ingful to everyone
d. To verify that all the appropriate fields are assigned to each
table
Chapter 9
1. Field specifications are important for these reasons.
a. They help establish and enforce field-level integrity.
b. They help enhance overall data integrity.
c. They compel you to acquire a complete understanding of the
nature and purpose of the data in the database.
d. They constitute the “data dictionary” of the database.
2. Field-level integrity warrants the following.
a. The identity and purpose of a field is clear, and all of the
tables in which it appears are properly identified.
b. Field definitions are consistent throughout the database.
c. The values of a field are consistent and valid.
d. The types of modifications, comparisons, and operations that
can be applied to the values in the field are clearly identified.

ptg14955309
Chapter 9 517
3. The three categories of elements within a field specification are
general, physical, and logical.
4. The three types of specifications are Unique, Generic, and Replica.
5. Composing a proper field description is extremely beneficial
because it forces you (and everyone in the organization) to think
carefully about the nature of the data that will be stored in the
field.
6. The Data Type element indicates the nature of the data that the
field stores.
7. T he Character Support element indicates the type of characters
that a user can enter into a given field value.
8. The Display Format element governs the appearance of a field’s
value when it is displayed on a screen or printed within a
document.
9. The types of keys indicated on a field specification are non, pri-
mary, alternate, and foreign.
10. False. Null does not represent a blank—it represents a missing or
unknown value.
11. The Range of Values element specifies every possible valid value for
a field.
12. An Edit Rule designates at what point in time a user can enter a
value into a field and whether he can modify that value.
13. The Comparisons Allowed element indicates the types of compar-
isons a user can apply to a given field value when he’s retrieving
information from the field.
14. A value expression is some form of operation involving field values,
literal values, or a combination of both, and it returns a single
value that you can then use for a comparison operation.

ptg14955309
518 Appendix A Answers to Review Questions
15. You use a generic specification for a field that serves as a template
for other fields within the database.
Chapter 10
1. A relationship is important for the following reasons.
a. It establishes a connection between a pair of tables that are
logically related to each other.
b. It helps to refine table structures and minimize redundant
data further.
c. It is the mechanism that enables you to draw data from multi-
ple tables simultaneously.
2. The three types of relationships are one-to-one, one-to-many, and
many-to-many.
3. The many-to-many relationship will pose the most problems.
4. You could possibly encounter problems such as these with a many-
to-many relationship.
a. It will be tedious and somewhat difficult for you to retrieve
information from one of the tables.
b. One of the tables will contain a large amount of redundant
data.
c. Duplicate data will exist within both tables.
d. It will be difficult to insert, update, and delete data.
5. A self-referencing relationship is a relationship that exists between
the records within a given table.
6. You begin the process of identifying the relationships among the
tables in the database by creating a matrix of all the tables.

ptg14955309
Chapter 10 519
7. T he two types of questions you can ask to help you identify exist-
ing relationships are associative and contextual.
8. You use a 1:N shorthand symbol to designate a one-to-many rela-
tionship in the table matrix.
9. You determine what type of relationship officially exists between
each pair of tables in the matrix using formulas that correspond
to the three relationship-type definitions.
10. You establish a one-to-many relationship by taking a copy of the
primary key from the table on the “one” side of the relationship
and incorporating it within the table structure on the “many” side,
where it then becomes a foreign key.
11. True. Retrieving information from tables with a self-referencing
relationship can be tedious and somewhat difficult.
12. You establish a self-referencing many-to-many relationship as you
would a dual-table many-to-many relationship—with a linking
table.
13. You refine the foreign keys in the database by ensuring that each
one complies with the Elements of a Foreign Key.
14. The two element categories you must modify for a foreign key’s
field specification are the General Elements and Logical Elements
categories.
15. A deletion rule determines what your RDBMS should do when you
place a request to delete a given record in the parent table of the
relationship.
16. The two types of participation you can designate for a table are
Mandatory and Optional.
17. The degree of participation indicates the minimum number of
records that a given table must have associated with a single
record in the related table and the maximum number of records

ptg14955309
520 Appendix A Answers to Review Questions
that the table is allowed to have associated with a single record in
the related table.
18. A relationship attains relationship-level integrity after you’ve veri-
fied that it is properly established and its characteristics are suit-
ably set.
Chapter 11
1. A business rule is a statement that imposes some form of con-
straint on a specific aspect of the database, such as the elements
within a field specification for a particular field or the characteris-
tics of a given relationship.
2. The two major types of business rules are database oriented and
application oriented.
3. No. Application-oriented business rules impose constraints that
you cannot establish within the logical design of the database.
4. The two categories of database-oriented business rules are field
specific and relationship specific.
5. A field-specific business rule is one that imposes constraints on the
elements of a field specification for a particular field.
6. The constraint the business rule imposes is tested when you
attempt to perform one of three actions: inserting a record into the
table or an entry into a field, deleting a record from the table or a
value within a field, or updating a field’s value.
7. You document a business rule by filling out a Business Rule Spec-
ifications sheet for the rule.
8. The Business Rule Specifications sheet provides these advantages.
a. It allows you to document every database-oriented business
rule.

ptg14955309
Chapter 12 521
b. It allows you to document every application-oriented business
rule.
c. It provides a standard method for recording all business rules.
9. The Action Taken section of a Business Rule Specifications sheet is
the area where you indicate the modifications you’ve made to the
elements of a field specification or to a relationship diagram.
10. A validation table (also known as a lookup table) stores data that
you specifically use to implement data integrity.
11. Validation tables usually (but not always) comprise two fields:
The first acts as the primary key and is what you’ll use to help
you enforce data integrity, and the second is simply a non-key
field that stores a set of values required by some other field in the
database.
12. You can use a validation table to enforce a constraint that a busi-
ness rule imposes on a given field’s range of values.
13. You should review each Business Rule Specifications sheet to
ensure that you’ve properly established the rule it records and that
you’ve clearly marked all of the appropriate areas on the sheet.
Chapter 12
1. You can refer to a view as a virtual table because it draws data
from base tables rather than storing data on its own.
2. Views are valuable for the following reasons.
a. You can use them to work with data from multiple tables
simultaneously.
b. They reflect the most current information.
c. You can customize them to the specific needs of an individual
or group of individuals.

ptg14955309
522 Appendix A Answers to Review Questions
d. You can use them to help enforce data integrity.
e. You can use them for security or confidentiality purposes.
3. The types of views you can define as you design the logical struc-
ture of the database are data, aggregate, and validation views.
4. Each time you access a view your RDBMS will rebuild and repopu-
late it using the most current data from the view’s base tables.
5. Field specifications and business rules determine the types of
modifications you can make to a view’s data.
6. The only requirement you must fulfill in order to define a multi-
table data view is that the tables you use to create the view must
bear a relationship to each other.
7. A data view does not contain its own primary key because it is
not a table; a true table stores data and requires a primary key to
serve as a unique identifier for each of its records.
8. The purpose of an aggregate view is to display information pro-
duced by aggregating a particular set of data in a specific manner.
9. Sum, Average (arithmetic mean), Minimum, Maximum, and Count
are the most common aggregate functions that you can apply to a
set of data.
10. A grouping field is a data field within an aggregate view that
“groups” multiple instances of a given value into a single instance
of the value.
11. False. You cannot modify the data in an aggregate view because it
is composed entirely of grouping fields and calculated fields.
12. The difference between a validation table and a validation view
lies in their construction—a validation table stores its own data,
whereas a validation view draws data from its base tables.

ptg14955309
Chapter 12 523
13. You would keep the following points in mind as you identify view
requirements.
a. Review your notes with the group.
b. Review the data entry, report, and presentation samples you
gathered during the early stages of the design process.
c. Examine the tables and the subjects they represent.
d. Analyze the table relationships.
e. Study the business rules.
14. You should use calculated fields when they will provide pertinent
and meaningful information or when they will enhance the man-
ner in which the view uses its data.
15. You define a view that displays only science-fiction books by apply-
ing a filter to the appropriate field within the view.
16. You must complete a View Specifications sheet for every view in
the database because it is on this sheet that you will record the
characteristics of the view.

ptg14955309
This page intentionally left blank
ptg14955309
525
B
Diagram of the Database
Design Process
The diagram on the following pages provides you with a map of the
entire database design process. It indicates each design phase, pro-
cedures within the phase, tasks within the procedure, and in some
cases, subtasks within a task.
This legend shows the type of symbols you’ll see in the diagram.
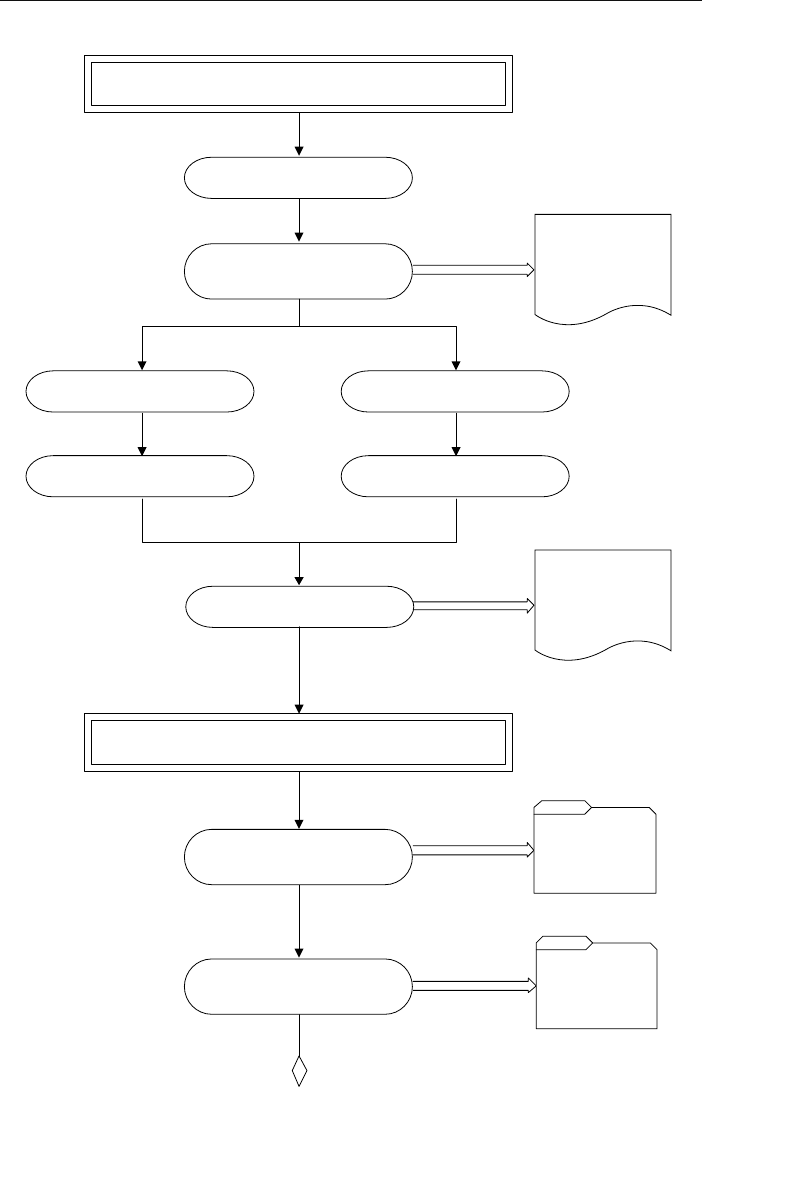
ptg14955309
526 Appendix B Diagram of the Database Design Process
Write the Mission
Statement
Interview the Owner
Interview Users Interview Management
Define Mission Objectives Define Mission Objectives
Write Mission Objectives
Mission Objectives
• ~~ ~~~~ ~ ~~~~~
• ~~ ~~~~ ~~~ ~~~
• ~~~ ~~~ ~~ ~ ~~~
• ~~ ~~~~ ~ ~~~~~
• ~~ ~~~~ ~~~ ~~~
• ~~~ ~~~ ~~ ~ ~~~
Define a Mission Statement and Mission Objectives
Mission Statement
~~ ~~~~ ~~~~~~ ~~
~~~~~~ ~~~~ ~~~ ~~
~ ~~~~~ ~~ ~~~
~~~~~~ ~~~ ~~~ ~~
Analyze the Current Database
Data Collection
Samples
Presentation
Samples
Review How
Data Is Collected
Review How
Information Is Presented
ptg14955309
Diagram of the Database Design Process 527
Interview Users
Initial List
of Subjects
~~ ~~
~~~~~
~~~~~~
~~~~
~~~~~
Additional
Subjects
~~ ~~
~~~~~
~~~~~~
~~~~
~~~~~
Review Information
Requirements
Verify and
Note Data
Sources
Review Data
Type and Usage
Review the Samples
Current Information
Requirements
Additional Information
Requirements
Future Information Requirements
Data Collection
Samples
with Descriptions Presentation
Samples
with Descriptions
New Subjects
~~ ~~
~~~~~
~~~~~~
~~~~
~~~~~
Additional Data
Collection and
Presentation
Samples
Initial List of
Characteristics
~~ ~~ ~~~~
~~~~~ ~~~
~~~~~~ ~~~~~
~~~~ ~~~~
~~~~~ ~~~~~
Additional
Characteristics
~~ ~~ ~~~~
~~~~~ ~~~
~~~~~~ ~~~~~
~~~~ ~~~~
~~~~~ ~~~~~
New
Characteristics
~~ ~~ ~~~~
~~~~~ ~~~
~~~~~~ ~~~~~
~~~~ ~~~~
~~~~~ ~~~~~
ptg14955309
528 Appendix B Diagram of the Database Design Process
Additional Information
Requirements
Additional
Subjects
~~ ~~
~~~~~
~~~~~~
~~~~
~~~~~
Interview Management
Review Information
Requirements
New Subjects
~~ ~~
~~~~~
~~~~~~
~~~~
~~~~~
Current Information
Requirements
New Subjects
~~ ~~
~~~~~
~~~~~~
~~~~
~~~~~
Future Information Requirements
New Subjects
~~ ~~
~~~~~
~~~~~~
~~~~
~~~~~
Overall Information
Requirements
Newly
Discovered
Presentation
Samples
New Data
Collection and
Presentation
Samples
Additional Data
Collection and
Presentation
Samples
New
Characteristics
~~ ~~ ~~~~
~~~~~ ~~~
~~~~~~ ~~~~~
~~~~ ~~~~
~~~~~ ~~~~~
New
Characteristics
~~ ~~ ~~~~
~~~~~ ~~~
~~~~~~ ~~~~~
~~~~ ~~~~
~~~~~ ~~~~~
New
Characteristics
~~ ~~ ~~~~
~~~~~ ~~~
~~~~~~ ~~~~~
~~~~ ~~~~
~~~~~ ~~~~~
Additional
Characteristics
~~ ~~ ~~~~
~~~~~ ~~~
~~~~~~ ~~~~~
~~~~ ~~~~
~~~~~ ~~~~~
ptg14955309
Diagram of the Database Design Process 529
Create the Data Structures
Create a
Preliminary Table List
Preliminary
Table List
1st version
~~ ~~ ~~~~
~~~~~ ~~~
~~~~~~ ~~~~~
~~~~ ~~~~
~~~~~ ~~~~~
Compile a Complete
List of Fields
Create a
Preliminary Field List
Preliminary
Field List
~~ ~~ ~~~~
~~~~~ ~~~
~~~~~~ ~~~~~
~~~~ ~~~~
~~~~~ ~~~~~
Review and Refine
List of Characteristics
Create a
Calculated Field List
Calculated
Field List
~~ ~~ ~~~~
~~~~~ ~~~
~~~~~~ ~~~~~
~~~~ ~~~~
~~~~~ ~~~~~
Review and Refine
Preliminary Field List
Sign Off on
Both Lists
Review Field Lists with
Users and Management
Identify Implied
Subjects from
Preliminary Field List
ptg14955309
530 Appendix B Diagram of the Database Design Process
Merge the
Preliminary Table List
with the
List Of Subjects
Preliminary
Table List
2nd version
~~ ~~ ~~~~
~~~~~ ~~~
~~~~~~ ~~~~~
~~~~ ~~~~
~~~~~ ~~~~~
Incorporate Subjects
from the
Mission Objectives
Preliminary
Table List
3rd version
~~ ~~ ~~~~
~~~~~ ~~~
~~~~~~ ~~~~~
~~~~ ~~~~
~~~~~ ~~~~~
Define the Final Table List
Refine Table Names
Indicate Table Types
Compose Table
Descriptions
Final Table List
~~ ~~ ~~~~
~~~~~ ~~~
~~~~~~ ~~~~~
~~~~ ~~~~
~~~~~ ~~~~~
Interview Users
and Management
Have Everyone Sign Off On The List
ptg14955309
Diagram of the Database Design Process 531
Associate Fields
with Each Table
Associate Fields from the
Preliminary Field List to
Each Table as Appropriate
List of Table
Structures
~~ ~~ ~~~~
~~~~~ ~~~
~~~~~~ ~~~~~
~~~~ ~~~~
~~~~~ ~~~~~
Refine the Fields
Improve Field Names Using
the Appropriate Guidelines
Use the Elements of the
Ideal Field to Resolve Field
Anomalies
Resolve Multipart Fields
Resolve Multivalued Fields
List of Table
Structures
with Revised Fields
~~ ~~ ~~~~
~~~~~ ~~~
~~~~~~ ~~~~~
~~~~ ~~~~
~~~~~ ~~~~~
ptg14955309
532 Appendix B Diagram of the Database Design Process
Refine the Table Structures
Resolve Unnecessary Duplicate Fields
Establish Subset Tables
List of Table
Structures
with Revised Tables
~~ ~~ ~~~~
~~~~~ ~~~
~~~~~~ ~~~~~
~~~~ ~~~~
~~~~~ ~~~~~
List of Table
Structures
with Subset Tables
~~ ~~ ~~~~
~~~~~ ~~~
~~~~~~ ~~~~~
~~~~ ~~~~
~~~~~ ~~~~~
Establish Keys for Each Table
Define Candidate Keys
Based on the Elements
of a Candidate Key
List of Table
Structures
with candidate keys
~~ ~~ ~~~~
~~~~~ ~~~
~~~~~~ ~~~~~
~~~~ ~~~~
~~~~~ ~~~~~
Use the Elements of
the Ideal Table to
Refine Table Structures
Refine Previously
Unidentified Subset Tables
Create Artificial Candidate
Keys as Necessary
ptg14955309
Diagram of the Database Design Process 533
Define Primary Keys
Based on the Elements
Of A Primary Key
List of Table
Structures
with Primary Keys
~~ ~~ ~~~~
~~~~~ ~~~
~~~~~~ ~~~~~
~~~~ ~~~~
~~~~~ ~~~~~
Designate Alternate
Keys From Remaining
Candidate Keys
List of Table
Structures
with Alternate Keys
~~ ~~ ~~~~
~~~~~ ~~~
~~~~~~ ~~~~~
~~~~ ~~~~
~~~~~ ~~~~~
Review Initial
Table Structures
Initial Table
Structures
~~ ~~ ~~~~
~~~~~ ~~~
~~~~~~ ~~~~~
~~~~ ~~~~
~~~~~ ~~~~~
Interview Users
and Management
Have Everyone Sign Off
on the Structures
with All Keys
ptg14955309
534 Appendix B Diagram of the Database Design Process
Ensure the Specifications You
Completed Are Suitable and Correct
Meet with User/management
Representatives and Review
All of the Specifications
Finish the Specifications You
Were Initially Unable to Complete
Define a Field Specification for
Each Field in the Database
Complete as Many
Specifications as You Can
Have Everyone Sign Off
on the Completed Specifications
~~~~~~~
Complete Field
Specifications
~~~~~~~
Partial Field
Specifications
~~~~~~~
Field Specification
Sheets
for All Fields
ptg14955309
Diagram of the Database Design Process 535
Determine and Establish Table Relationships
Identify Existing Relationships
Create and Set Up
a Table Matrix
Review and Refine Table Structures
Table Matrix
Identify the Official
Relationships for the Tables
within the Matrix
Establish Each Relationship
Using Foreign Keys or Linking
Tables as Appropriate
Refine All Foreign Keys Using
the Elements of a Foreign Key
Relationship
Diagrams
Revised
Relationship
Diagrams
Revised
Relationship
Diagrams
ptg14955309
536 Appendix B Diagram of the Database Design Process
Establish Relationship
Characteristics
Define a Deletion Rule
Indicate the Type of
Participation for Each Table
Indicate the Degree of
Participation for Each Table
Have Everyone Sign Off
on the Structures
Verify Relationships with
User/Management
Representatives
Revised
Relationship
Diagrams
Revised
Relationship
Diagrams
Revised
Relationship
Diagrams
ptg14955309
Diagram of the Database Design Process 537
Define and Establish Business Rules
Field Specific Rules
Identify Any Constraints
for Each Field
Define the Necessary Rules
Identify the Actions that Test
Each Rule
Record the Rule on a
Business Rule Specifications
Sheet
Modify the Appropriate Field
Specification Elements
~~~~~~~
Business Rule
Specifications
~~~~~~~
Revised Field
Specifications
ptg14955309
538 Appendix B Diagram of the Database Design Process
Relationship Specific Rules
Identify Any Constraints
for Each Relationship
Define the Necessary Rules
Identify the Actions that Test
Each Rule
Record the Rule on a
Business Rule Specifications
Sheet
Modify the Appropriate
Relationship Characteristics
Review Business Rule
Specifications Sheets
Revise as Necessary
~~~~~~~
Business Rule
Specifications
~~~~~~~
Revised Business
Rule Specifications
Sheets
Relationship
Diagrams
Revised
ptg14955309
Diagram of the Database Design Process 539
Determine and Define Views
Identify the Organization's
View Requirements
Collaborate with the User/
Management Representatives
Review the Materials You've
Gathered and Created
Throughout the Design Process
Review he Tables, Relationships,
and Business Rules
View Requirements
~~ ~~~~ ~~~~~~ ~~
~~~~~~ ~~~~ ~~~ ~~
~ ~~~~~ ~~ ~~~
~~~~~~ ~~~ ~~~ ~~
Define the Views
Review Relationship Diagrams
Identify the Tables You
Need for Each View
Diagram the View
View Diagram
ptg14955309
540 Appendix B Diagram of the Database Design Process
Review Each of the
View Specifications Sheets
Add Calculated
Fields as Necessary
Make Sure the View Is Properly
Defined and Everything Is in Order
Impose Criteria to Filter
the Data as Necessary
Record the View in a
View Specifications Sheet
Have Everyone Sign Off
on the View Structures
Revised
View Diagram
~~~~~~~
View
Specifications
ptg14955309
Diagram of the Database Design Process 541
Review Data Integrity
Review Each Component
of Data Integrity
Field Level
Relationship Level
Business Rules
View Level
Table Level
Assemble Database Documentation
The Design Process Is Complete!
View Diagrams
Final Table List Relationship Diagrams
Field Specifications Sheets Business Rule Specification Sheets
Calculated Field List
Table Structure Diagrams View Specification Sheets

ptg14955309
This page intentionally left blank

ptg14955309
543
C
Design Guidelines
Here, in alphabetical order, are the various sets of design guidelines
that appear throughout the book.
Defining and Establishing Field-Specific
Business Rules
1. Select a table.
2. Review each field and determine whether it requires any
constraints.
3. Define the necessary business rules for the field.
4. Establish the rules by modifying the appropriate field specifica-
tion elements.
5. Determine what actions test the rule.
6. Record the rule on a Business Rule Specifications sheet.
Defining and Establishing Relationship-
Specific Business Rules
1. Select a relationship.
2. Review the relationship and determine whether it requires any
constraints.
3. Define the necessary business rules for the relationship.

ptg14955309
544 Appendix C Design Guidelines
4. Establish the rule by modifying the appropriate relationship
characteristics.
5. Determine what actions will test the rule.
6. Record the rule on a Business Rule Specifications sheet.
Elements of a Candidate Key
• It cannot be a multipart field.
• It must contain unique values.
• It cannot contain null values.
• Its value cannot cause a breach of the organization’s security or
privacy rules.
• Its value is not optional in whole or in part.
• It comprises a minimum number of fields necessary to define
uniqueness.
• Its values must uniquely and exclusively identify each record in
the table.
• Its value must exclusively identify the value of each field within a
given record.
• Its value can be modified only in rare or extreme cases.
Elements of a Foreign Key
• It has the same name as the primary key from which it was
copied.
• It uses a replica of the field specifications for the primary key
from which it was copied.
• It draws its values from the primary key to which it refers.

ptg14955309
Elements of the Ideal Field 545
Elements of a Primary Key
• It cannot be a multipart field.
• It must contain unique values.
• It cannot contain null values.
• Its value cannot cause a breach of the organization’s security or
privacy rules.
• Its value is not optional in whole or in part.
• It comprises a minimum number of fields necessary to define
uniqueness.
• Its values must uniquely and exclusively identify each record in
the table.
• Its value must exclusively identify the value of each field within a
given record.
• Its value can be modified only in rare or extreme cases.
Rules for Establishing a Primary Key
• Each table must have one—and only one—primary key.
• Each primary key within the database must be unique—no two
tables should have the same primary key unless one of them is a
subset table.
Elements of the Ideal Field
• It represents a distinct characteristic of the subject of the table.
• It contains only a single value.
• It cannot be deconstructed into smaller components.

ptg14955309
546 Appendix C Design Guidelines
• It does not contain a calculated or concatenated value.
• It is unique within the entire database structure.
• It retains the majority of its characteristics when it appears in
more than one table.
Elements of the Ideal Table
• It represents a single subject, which can be an object or event.
• It has a primary key.
• It does not contain multipart or multivalued fields.
• It does not contain calculated fields.
• It does not contain unnecessary duplicate fields.
• It contains only an absolute minimum amount of redundant
data.
Field-Level Integrity
This type of integrity ensures the following.
• The identity and purpose of a field is clear, and all of the tables
in which it appears are properly identified.
• Field definitions are consistent throughout the database.
• The values of a field are consistent and valid.
• The types of modifications, comparisons, and operations that
can be applied to the values in the field are clearly identified.

ptg14955309
Guidelines for Composing a Table Description 547
Guidelines for Composing a Field
Description
• Use a statement that accurately identifies the field and clearly
states its purpose.
• Write a clear and succinct statement.
• Refrain from restating or rephrasing the field name.
• Avoid using technical jargon, acronyms, or abbreviations.
• Do not include implementation-specific information.
• Do not make this description dependent upon the description of
another field.
• Do not use examples.
Guidelines for Composing a Table
Description
• Include a statement that accurately defines the table.
• Include a statement that explains why this table is important to
the organization.
• Compose a description that is clear and succinct.
• Do not include implementation-specific information in your table
description, such as how or where the table is used.
• Do not make the table description for one table dependent upon
the table description for another table.
• Do not use examples in a table description.

ptg14955309
548 Appendix C Design Guidelines
Guidelines for Creating Field Names
• Create a unique, descriptive name that is meaningful to the
entire organization.
• Create a name that accurately, clearly, and unambiguously iden-
tifies the characteristic a field represents.
• Use the minimum number of words necessary to convey the
meaning of the characteristic the field represents.
• Do not use acronyms, and use abbreviations judiciously.
• Do not use words that could confuse the meaning of the field
name.
• Do not use names that implicitly or explicitly identify more than
one characteristic.
• Use the singular form of the name.
Guidelines for Creating Table Names
• Create a unique, descriptive name that is meaningful to the
entire organization.
• Create a name that accurately, clearly, and unambiguously iden-
tifies the subject of the table.
• Use the minimum number of words necessary to convey the sub-
ject of the table.
• Do not use words that convey physical characteristics.
• Do not use acronyms and abbreviations.
• Do not use proper names or other words that will unduly restrict
the data that can be entered into the table.

ptg14955309
Identifying View Requirements 549
• Do not use a name that implicitly or explicitly identifies more
than one subject.
• Use the plural form of the name.
Identifying Relationships
Use this procedure to identify the official relationship between a pair of
tables within a table matrix.
1. Select a pair of tables and note the entry at the junction of the
first table and the second table.
2. Locate the second table on the same side of the matrix you’re
working on and note the entry and the junction between it and
the first table on the opposite side of the matrix.
3. Apply the appropriate formula (shown below) to the two entries
and identify the official relationship between the tables.
1:1 + 1:1 = 1:1
1:N + 1:1 = 1:N
1:N + 1:N = M:N
4. Diagram the relationship in the appropriate manner.
5. Cross out both entries on the matrix.
Identifying View Requirements
Use this procedure to identify your organization’s view requirements.
• Review your notes with the group of user/management
representatives.
• Review the data entry, report, and presentation samples you
gathered during the early stages of the design process.

ptg14955309
550 Appendix C Design Guidelines
• Examine the tables and the subjects they represent.
• Analyze the table relationships.
• Study the business rules.
Interview Guidelines
Participant Guidelines
• Make the participants aware of your intentions.
• Let the participants know that you appreciate their taking part
in the interview and that their responses to the interview ques-
tions are valuable to the overall design project.
• Make sure everyone understands that you are the official arbitra-
tor if and when a dispute arises.
Interviewer Guidelines
• Conduct the interview in a well-lit room, separated from distract-
ing noise, with a large table and comfortable chairs.
• Set a limit of ten people or fewer for each interview.
• Conduct separate interviews for users and management.
• When you have to interview several groups of people, designate a
group leader for each group.
• Prepare your questions prior to the interview.
• If you’re not very good at taking notes, either assign that task
to a dependable transcriber for each interview or get the group’s
permission to use a voice recorder or digital recording device to
record the interview.
• Give everyone your equal and undivided attention.

ptg14955309
Relationship-Level Integrity 551
• Keep the pace of the interview moving.
• Always maintain control of the interview.
Mission Statements
A well-written mission statement has the following attributes.
• It expresses its point succinctly and immediately.
• It avoids unnecessary statements or details and is well defined.
• It avoids phrases or sentences that explicitly describe specific
tasks.
• It makes sense to you (the database developer) and to those for
whom you are designing the database.
Mission Objectives
A well-written mission objective has the following attributes.
• It comprises a declarative sentence that clearly defines a general
task and is free from unnecessary details.
• It expresses itself in general terms that are succinct, to the point,
and unambiguous.
• It makes sense to you and to those for whom you are designing
the database.
Relationship-Level Integrity
This type of integrity ensures the following.
• The connection between the two tables (or key fields) in a rela-
tionship is sound.

ptg14955309
552 Appendix C Design Guidelines
• You can insert new records into each table in a meaningful
manner.
• You can delete an existing record without producing any adverse
effects.
• There is a meaningful limit to the number of records that can be
interrelated within the relationship.
Resolving a Multivalued Field
Use this generic procedure to resolve a multivalued field.
1. Remove the field from the table and use it as the basis for a new
table. If necessary, rename the field in accordance with the field
name guidelines that you learned earlier.
2. Take the primary key from the original table and incorporate it
into the new table structure. This field will perform two specific
functions in the new table: It will serve as part of the table’s
composite primary key, and it will serve as a foreign key that
helps to establish the relationship between the new table and
the original table.
3. Assign an appropriate name, type, and description to the new
table and add it to the Final Table List.
Table-Level Integrity
This type of integrity ensures the following.
• There are no duplicate records in a table.
• The primary key exclusively identifies each record in a table.
• Every primary key value is unique.
• Primary key values are not null.

ptg14955309
553
D
Documentation Forms
I’ve provided blank copies of the Field Specifications sheet, Business
Rule Specifications sheet, and View Specifications sheet here for you to
copy and use on your database projects.
There are also Microsoft Word 2010 templates included on the CD that
you can use to create the specifications in Word.

ptg14955309
554 Appendix D Documentation Forms
Field Name:
Label:
Parent Table:
Shared By:
Alias(es):
Description:
Specification Type:
Source Specification:
ReplicaUnique Generic
Length:
Decimal Places:
Input Mask:
Display Format:
Data Type: Character Support:
Letters (A–Z)
Numbers (0–9)
.Keyboard ( , / $ # %)
Special ( © ® ™ ∑ π)
Key Structure:
Non
Not Determined At This Time
Edit Rule:
Null Support: Nulls Allowed
Enter Now, Edits Allowed
Enter Now, Edits Not Allowed
Enter Later, Edits Allowed
Primary
AlternateForeign
No Nulls
Uniqueness: Non-unique Unique
Required Value: No Yes
Comparisons Allowed:
Range of Values:
Default Value:
Values Entered By: User
Operations Allowed:
System
Key Type:
CompositeSimple
Enter Later, Edits Not Allowed
<> ≠<=>=
Other Fields
Same Field =
Value Expression
<> ≠<=>==
<> ≠<=>==
All
All
All
÷Same Field
Other Fields Concatenation
÷
All
All
+
+
x
x
Value Expression All Concatenation÷+x
Concatenation
General Elements
Physical Elements
Logical Elements
FIELD SPECIFICATIONS
–
–
–
ptg14955309
Documentation Forms 555
Field Names:
Table Names:
Statement:
Constraint:
Test On: Insert
Delete
Update
Category: Field Specific
Relationship Specific
Type: Database Oriented
Application Oriented
Logical Elements
Key Structure
Edit Rule
Null Support
Uniqueness
Required Value
Comparisons Allowed
Range of Values
Default Value
Values Entered By
Operations Allowed
Key Type
Physical Elements
Length
Input MaskDecimal Places
Character Support Display Format
Data Type
Degree of ParticipationType of ParticipationDeletion Rule
Action Taken
Structures Affected
Rule Information
Field Elements Affected
Relationship Characteristics Affected
BUSINESS RULE SPECIFICATIONS
ptg14955309
556 Appendix D Documentation Forms
Base Tables
General Information
Description:
Calculated Field Expressions
Field Name
Filters
Field Name Condition
Expression
Name: Type: Data ValidationAggregate
VIEW SPECIFICATIONS

ptg14955309
557
E
Database Design Diagram
Symbols
The symbols I’ve used throughout the book to diagram data struc-
tures, relationships, relationship characteristics, and key designations
are presented here for quick and easy reference.
DATA TABLE
SUBSET TABLE VALIDATION TABLE
LINKING TABLE VIEW
Table and View Structures

ptg14955309
558 Appendix E Database Design Diagram Symbols
Relationship Types
One-to-One
One-to-Many
Many-to-Many
Dual Table Single Table
(C) Cascade
(D) Deny
Deletion Rules
(N) Nullify
(R) Restrict
(S) Set Default
Type of Participation
Mandatory Participation
Optional Participation
Degree of Participation
(1,8)
Minimum number of
related records allowed
Maximum number of
related records allowed
PK Primary Key
CCK Composite Candidate KeyCK Candidate Key
AK Alternate Key
FK Foreign Key
Key Designations
CFK Composite Foreign Key
CAK Composite Alternate Key
CPK Composite Primary Key

ptg14955309
559
F
Sample Designs
I’ve provided these sample designs to serve as ideas for databases you
may want or need to create. I emphasize the word ideas because five
people can look at the same design and come up with five distinct vari-
ations based on their needs, backgrounds, and personal points of view.
Remember that there is no right or wrong way to design a given data-
base, but you do have to ensure that the tables, fields, relationships,
and views all conform to the guidelines you’ve learned from this book.
I intentionally omitted all but the primary and foreign key fields from
each table because I did not want to greatly influence you in any way
as to how the tables should be populated. I also omitted a majority of
the relationship characteristics for the same reason.
Should you see a design that you might be able to use, run it through
the entire database design process and treat it like an existing data-
base. At the end of the process, you should have a database that suits
your needs.
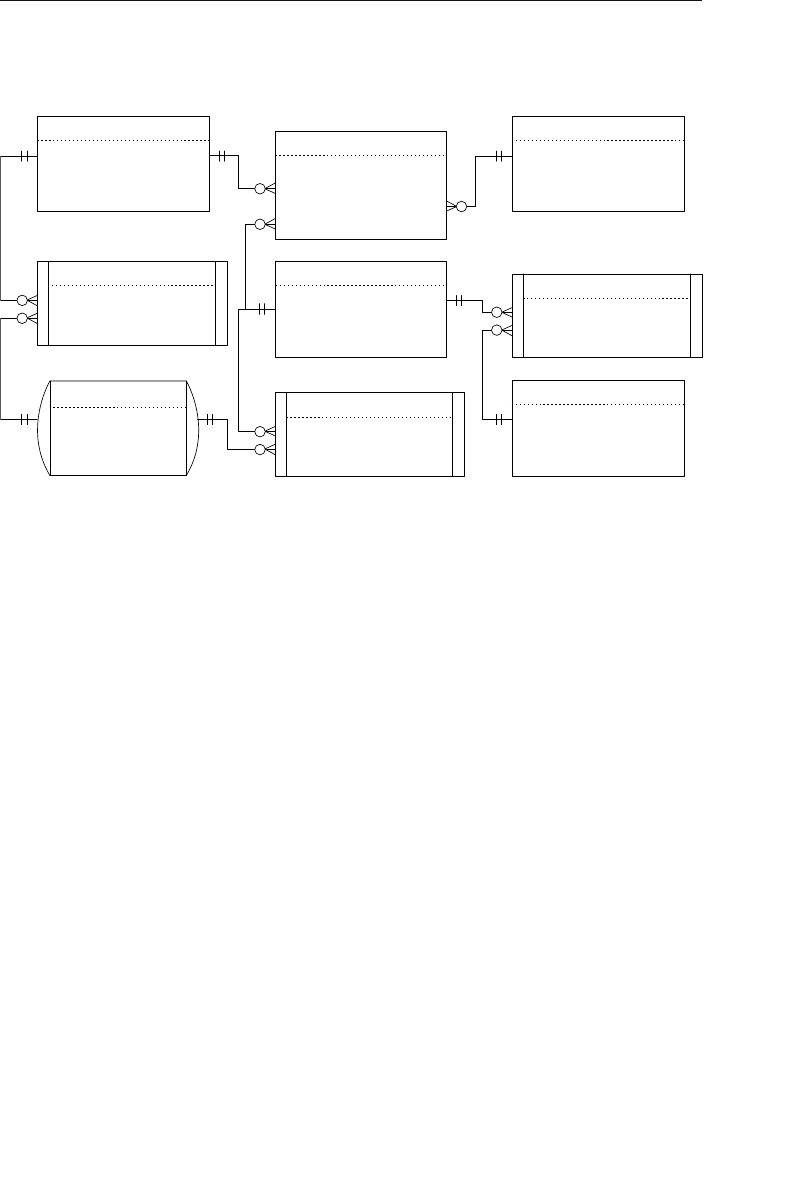
ptg14955309
560 Appendix F Sample Designs
Entertainment Agency Database
Customers
Customer ID PK
Agents
Agent ID PK
Members
Member ID PK
Entertainer Members
Entertainer ID CPK/FK
Member ID CPK/FK
Musical Preferences
Customer ID CPK/FK
Style ID CPK/FK
Musical Styles
Style ID PK
Entertainers
Entertainer ID PK
Entertainer Styles
Customer ID CPK/FK
Style ID CPK/FK
Engagements
Engagement ID PK
Customer ID FK
Agent ID FK
Entertainer ID FK
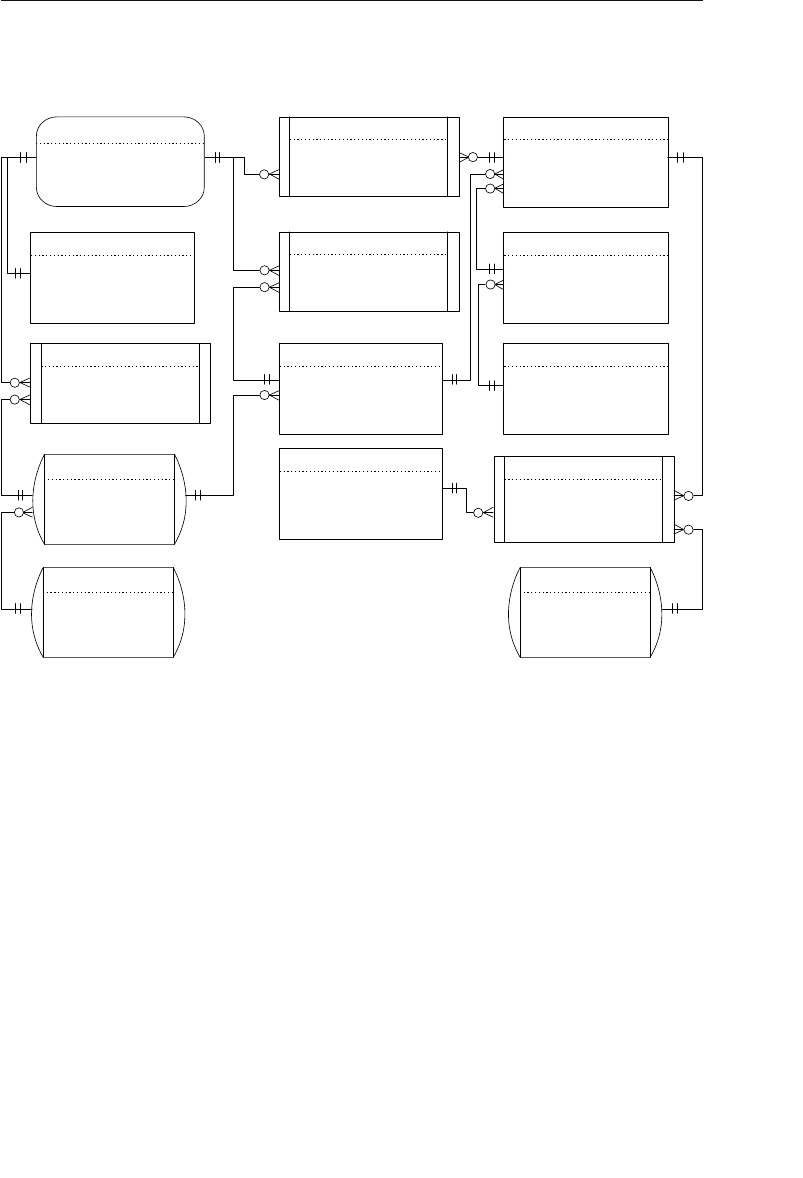
ptg14955309
Sample Designs 561
School Database
Staff
Staff ID PK
Faculty
Staff ID PK
Faculty Categories
Staff ID CPK/FK
Category ID CPK/FK
Faculty Classes
Class ID CPK/FK
Staff ID CPK/FK
Faculty Subjects
Staff ID CPK/FK
Subject ID CPK/FK
Subjects
Subject ID PK
Departments
Department ID PK
Classroomes
ClassRoom ID PK
Buildings
Building Code PK
Students
Student ID PK
Student Class Status
Class Status PK
Building Code FK
Categories
Category ID PK
Department ID FK
Category ID FK
Classes
Class ID PK
Subject ID FK
Classroom ID FK
Student Schedules
Class ID CPK/FK
Student ID CPK/FK
Class Status FK
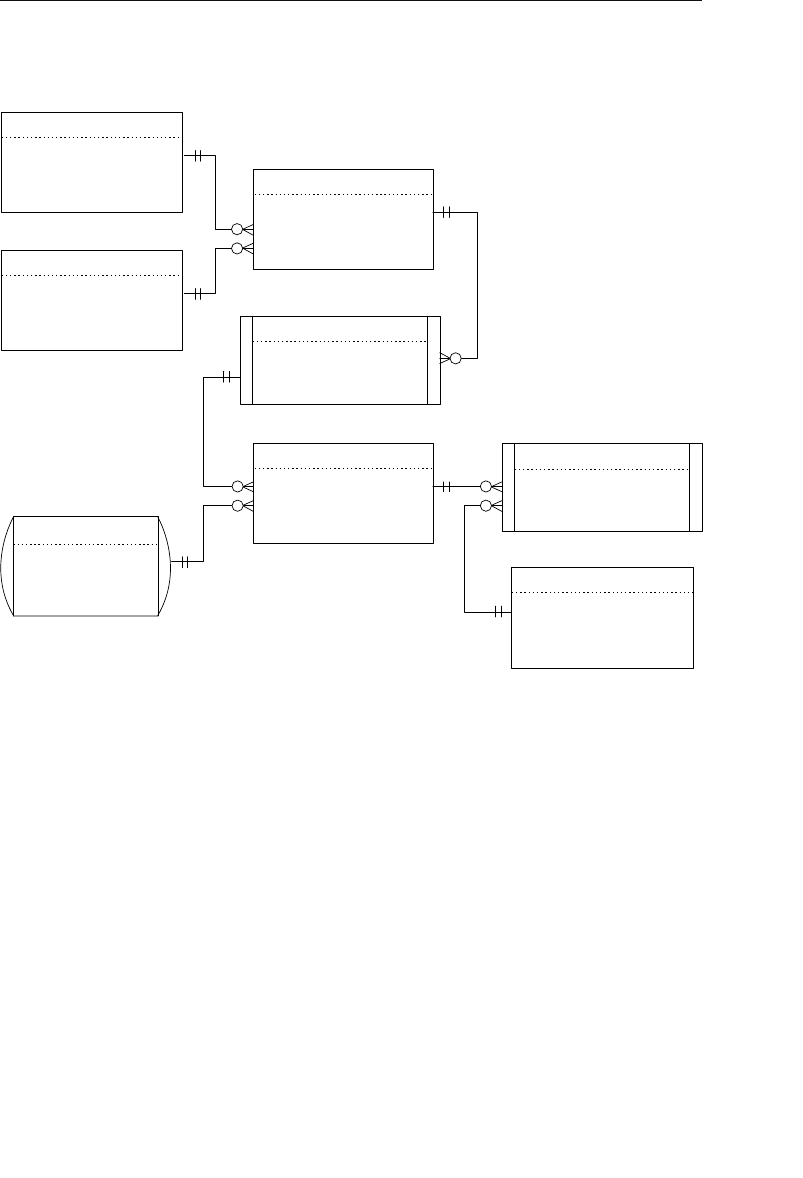
ptg14955309
562 Appendix F Sample Designs
Sales Order Database
Customers
Customer ID PK
Employees
Employee ID PK
Orders
Order ID PK
Customer ID FK
Employee ID FK
Products
Product Number PK
Category ID FK
Order Details
Order ID CPK/FK
Product Number CPK/FK
Categories
Category ID PK
Product Vendors
Product Number CPK/FK
Vendor ID CPK/FK
Vendors
Vendor ID PK
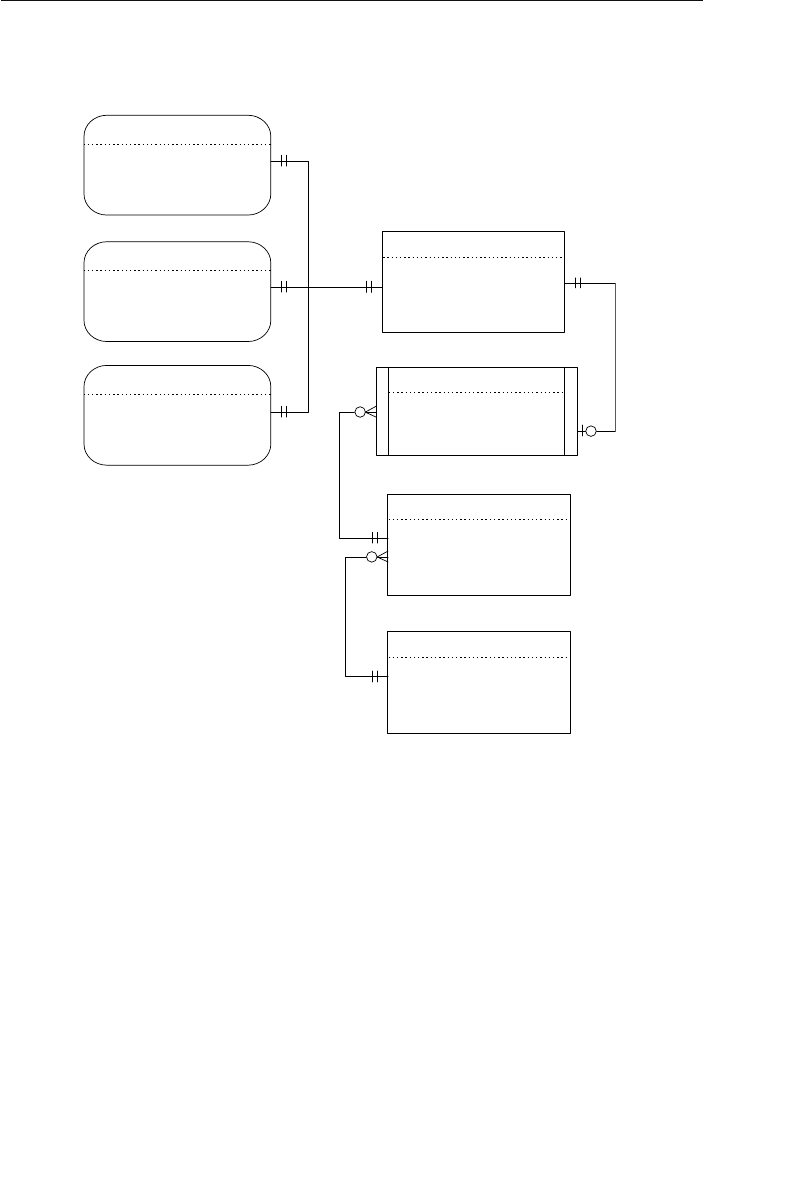
ptg14955309
Sample Designs 563
Office Inventory Database
Software
Item ID PK
Office Furniture
Item ID
Office Equipment
Item ID
Items
Item ID PK
Container Items
Container ID CPK/FK
Item ID CPK/FK
Containers
Container ID PK
Storage Location ID FK
Storage Locations
Storage Location ID PK
PK
PK
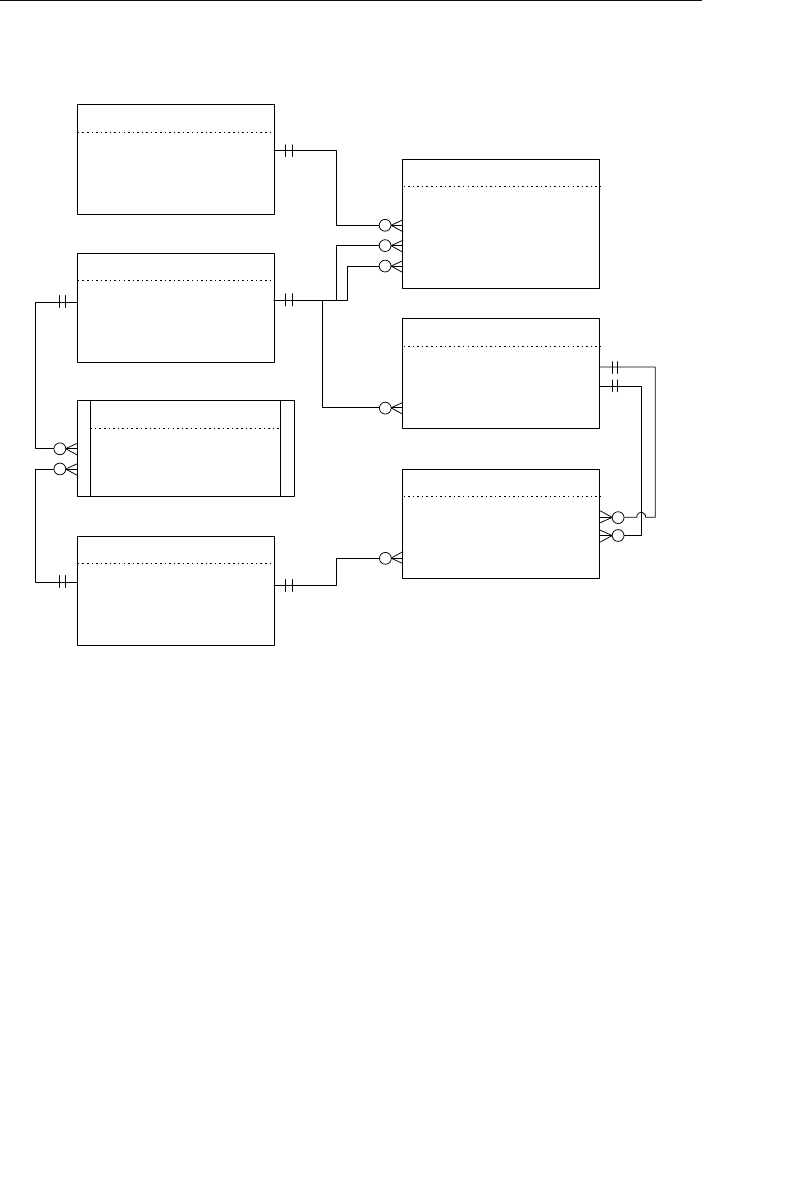
ptg14955309
564 Appendix F Sample Designs
Bowling League Database
Matches
Match ID PK
Tournament ID FK
Odd-lane Team ID FK
Even-lane Team ID FK
Tournaments
Tournament ID PK
Teams
Team ID PK
Bowlers
Bowler ID PK
Team Members
Team ID CPK/FK
Bowler ID CPK/FK
Matches
Match ID CPK
Game Number CPK
Winning Team ID FK
Bowler Scores
Match ID CPK
Game Number CPK
Bowler ID CPK
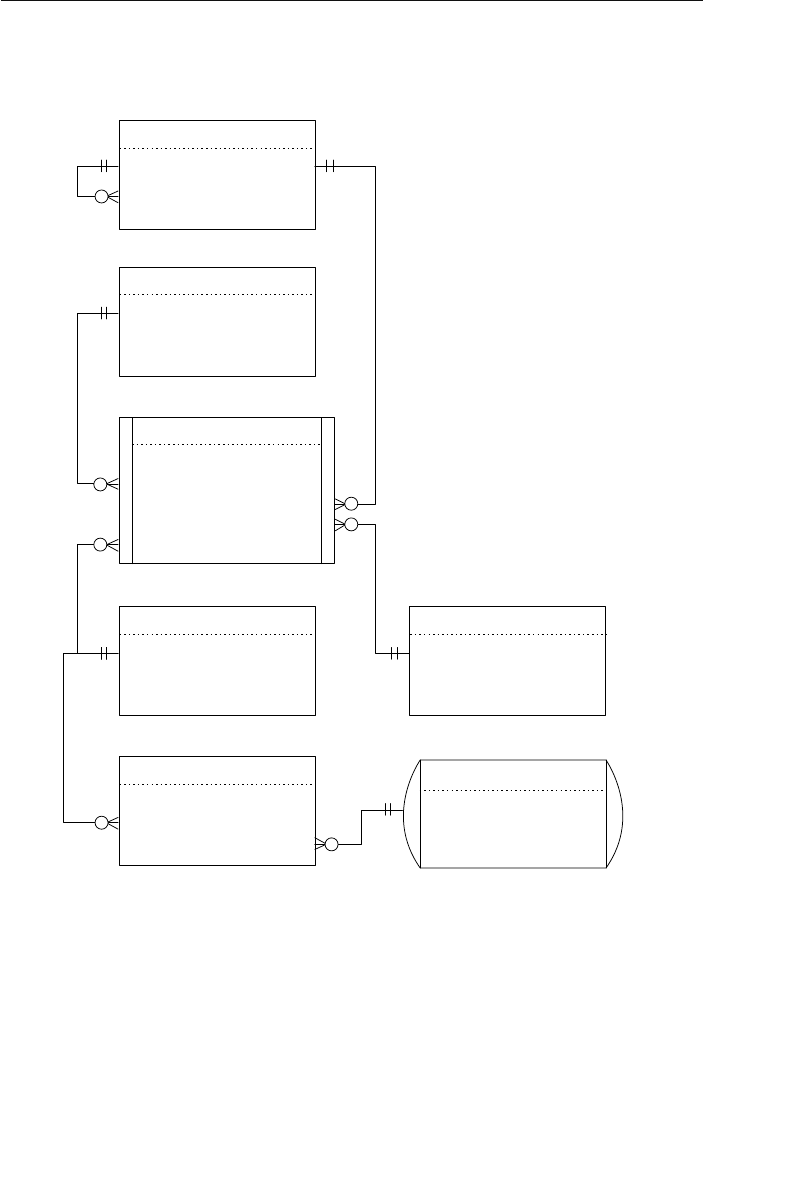
ptg14955309
Sample Designs 565
Car Rental Database
Customers
Customer ID PK
Vehicles
License Number PK
Employees
Employee ID PK
Supervisor ID FK
Locations
Location ID PK
Maintenance Types
Maintenance Type ID PK
Maintenance Workorders
Workorder Number PK
License Number FK
Maintenance Type ID FK
Rentals
Rental ID PK
Customer ID FK
Employee ID FK
Location ID FK
License Number FK

ptg14955309
This page intentionally left blank

ptg14955309
567
G
On Normalization
I will always cherish
the initial misconceptions
I had about you.
—UNKNOWN
People often wonder why I didn’t cover Normalization in the previous
editions of this book, given that it has been part of traditional data-
base design for such a long time. The fact is that it’s unnecessary for
me to discuss it for two reasons.
1. A thorough discussion that would do justice to the subject is
beyond the scope of this work, especially given the nontradi-
tional design methodology I present here and the “for mere mor-
tals” nature of the approach to the material.
2. Normalization is actually incorporated into my design process
anyway. (I’ll explain how in a moment.)
I still get questions about this issue and see comments about it on the
book’s Amazon.com page, so I decided to include a discussion on how
the traditional Normalization process is incorporated into my design
process. Those of you currently studying the traditional design and
Normalization process will most likely understand my design method-
ology more clearly once you’ve read through this material.

ptg14955309
568 Appendix G On Normalization
Please Note . . .
There are a few points I want to make perfectly clear before you con-
tinue reading.
•Please read “The Design Method Presented in This Book” and the
“Normalization” sections toward the end of Chapter 2, “Design Objec-
tives,” before you read anything else in this appendix. These sections
provide an overall explanation of why and how I came up with my
design methodology. They will also provide you with the context
you need for the points I discuss in the sections that follow.
•This is not a formal discussion or tutorial on the traditional Nor-
malization process. There are books I’ve recommended in Appen-
dix H, “Recommended Reading,” that discuss this topic quite well
and very thoroughly.
•I assume that you already understand the traditional Normal-
ization process and its associated concepts and terminology.
Throughout the lifespan of this book, I’ve found that the only
people who are typically interested in this discussion are either
database application programmers, people who already know
Normalization, or students who are studying Normalization. As
such, I assume that you are in one or more of these groups if you
are reading this appendix.
•There is no literal one-to-one mapping between the Normalization
process as a whole and my design methodology. Normalization is
indeed integrated into my methodology, but not in any distinct
sequential manner. Whereas Normalization is a specific step of
the tradition logical design process, it is transparently integrated
throughout the entire design process in my methodology. This will
become clearer as you read through the material.
•My design methodology will yield fully normalized tables. This is
true, however, only if you follow my methodology as faithfully as

ptg14955309
A Brief Recap 569
you would the traditional methodology or any other methodol-
ogy. Taking shortcuts or failing to follow parts of the process will
result in poor table structures and poor integrity. But this is also
true if you do the same in any other methodology, traditional or
otherwise.
Hopefully, you’ve just finished reading the two sections in Chapter 2.
Now I’ll explain how I integrated Normalization into my design
methodology.
A Brief Recap
I’ll start with a short review on how I came up with my methodology,
which you learned when you read those two sections in Chapter 2.
Let’s begin, however, by reviewing the overall steps in the traditional
design method.
• Identify major entities.
• Identify relationship types.
• Determine Primary Keys.
• Determine Foreign Keys.
• Associate attributes with entity or relationship types.
• Determine attribute domains.
• Validate the model using Normalization.
• Define integrity constraints.
The two things that bothered me the most about this methodology
were the Normalization process (as a whole) and the seemingly endless
iterations it took to arrive at a proper design.
ptg14955309
570 Appendix G On Normalization
I already knew that the purpose of Normalization is to transform a set
of improperly or poorly designed tables into tables with sound struc-
tures. I also understood the process: Take a given table and test it
against normal forms to determine whether it is properly designed. If it
isn’t designed properly, make the appropriate modifications, retest it,
and repeat the entire process until the table structure is sound.
Figure G.1 shows how I visualized the process at this point.
Non-Normalized Tables
Normalized Tables
Normalization
Process
Figure G.1 How I viewed the general Normalization process
There are a number of normal forms, and each one is used to test for
a particular set of problems or characteristics, such as modification
anomalies, functional dependencies, transitive dependencies, multival-
ued dependencies, join dependencies, domains, and keys. The problem
with normal forms is that they can be quite confusing to anyone who
has not taken the time to study formal relational database theory.
At one point, I asked myself, “Why do we take the time to create the
database almost three-quarters of the way through, come to a screech-
ing halt, and then determine whether we designed our structures cor-
rectly?” I thought this was a ridiculous way to do things.

ptg14955309
A Brief Recap 571
Keeping the purpose of Normalization in mind, I then posed the follow-
ing questions.
1. If we assume that a thoroughly normalized table is properly and
efficiently designed, shouldn’t we be able to identify the specific
characteristics of such a table and state these to be the attri-
butes of an ideal table structure?
2. Couldn’t we then use that ideal table as a model for all tables we
create for the database throughout the design process?
The answer to both questions, of course, is yes, so I used this premise
as the basis for my “new” design methodology. I first compiled distinct
sets of guidelines for creating sound structures by identifying the final
characteristics of a well-defined database that successfully passed the
tests of each normal form. I then conducted a few tests, using the new
guidelines to create table structures for a new database and to correct
flaws in the table structures of an existing database. These tests went
very well, so I decided to apply this technique to the entire traditional
design methodology. I formulated guidelines to address other issues
associated with the traditional design method, such as domains,
subtypes, relationships, data integrity, and referential integrity. After
Wait a minute!
Do we even have
sound structures?

ptg14955309
572 Appendix G On Normalization
I completed the new guidelines, I performed more tests and found that
my methodology worked quite well.
My design methodology removes many aspects of the traditional design
methodology that new database developers find intimidating. For
example, Normalization, in the traditional sense, is now transparent
to the developer because it is incorporated (via the new guidelines)
throughout the design process. The methodology is also clear and easy
to implement, which I believe is due to the fact that the guidelines are
in plain English, making them easy for most anyone to understand.
I believe that the process of designing a database is not and should
not be hard to understand. As long as the process is presented in
a straightforward manner and each concept or technique is clearly
explained, anyone should be able to design a database properly.
How Normalization Is Integrated into
My Design Methodology
As I mentioned earlier, there is no direct one-to-one mapping between
Normalization and my design methodology. Rather, various elements of
my methodology transparently work together to resolve the issues usu-
ally addressed by the Normalization process. My approach additionally
and transparently addresses and resolves other traditional design
issues such as scalar values, determinates, functional dependencies,
domains, modification anomalies, referential integrity, cardinality, and
optionality.
Let’s first look at the fundamental issues each Normal Form addresses
before I show you how my system specifically deals with them (see
Table G.1).
Keeping this in mind (along with the other issues I referenced earlier), I
originally strove to develop a design methodology that incorporated all

ptg14955309
How Normalization Is Integrated into My Design Methodology 573
this and addressed it in a more efficient and far less repetitive man-
ner. I also wanted my methodology to be clear and easily understood
by anyone deciding to adopt it. That is why I specifically decided to
move away from the traditional jargon and mathematical approach and
instead use plain English to describe the processes I developed.
Table G.2 shows how various components of my design methodology
address traditional Normalization and design issues.
As I’ve said all along, my approach does indeed deal with all of the
issues you would typically address with the Normalization process,
and it will yield fully normalized tables. It will only do so, however, if
you follow my methodology as faithfully as you would the traditional
methodology or any other methodology. Keep in mind that you’re actu-
ally dealing with all of these issues as you develop the database instead
of waiting to deal with them until you’re about two-thirds of the way
through the process in the traditional method. I’ve found this to be a
much better approach to design—there’s less repetitiveness and it cer-
tainly takes less time overall to design the database.
Table G.1 Fundamental Issues Addressed by Each Normal Form
First Normal Form Deals with functional and multivalued
dependencies
Second Normal Form Deals with functional dependencies, transi-
tive dependencies, and calculated fields
Third Normal Form Deals with functional dependencies and
modification anomalies
Fourth Normal Form Deals with multivalued dependencies
Fifth Normal Form Deals with join dependencies
Sixth Normal Form
Primarily used on spatial data
Boyce/Codd Normal Form Deals with determinates and candidate
keys
Domain/Key Normal Form Deals with domains and keys

ptg14955309
574 Appendix G On Normalization
Table G.2 How My Methodology Addresses Traditional Normalization and
Design Issues
Component of My Design
Methodology
Traditional Normalization or Design Issues
It Addresses
Business Rule Specifications Logical domains, validation tables
Elements of a Candidate/
Primary Key
Functional dependencies, multivalued
dependencies, transitive dependencies,
determinates
Elements of a Foreign Key Foreign keys, referential integrity, modifi-
cation anomalies
Elements of the Ideal Field Scalar values, multivalued and multipart
fields, calculated values
Elements of the Ideal Table Functional dependencies, multivalued
dependencies, transitive dependencies,
join dependencies, duplicate fields, dupli-
cate and redundant data, modification
anomalies, subtypes
Field-Level Integrity Scalar values, physical domains, logical
domains, domain integrity
Field Specifications Scalar values, physical domains, logical
domains, domain integrity
Relationship Characteristics Cardinality, optionality, deletion rules
Relationship-Level Integrity Referential integrity, foreign keys
Resolving Multipart Fields Scalar values, logical domains
Resolving Multivalued Fields Scalar values, logical domains
Table-Level Integrity Primary key integrity, duplicate records,
functional dependencies

ptg14955309
Logical Design versus Physical Design and Implementation 575
Logical Design versus Physical Design
and Implementation
I’m occasionally asked why I didn’t include more discussion on SQL
and implementation issues such as indexing, partitioning, and distri-
bution. The answer is quite simple: I’ve always believed that the logical
design process and the physical design and implementation processes
should be kept separate.
I still believe that many people unwittingly fall into the trap of design-
ing a database based solely on the RDBMS software they will use
for its implementation. In many cases, they do so because they are
already somewhat familiar and ski lled with a particular RDBMS or
their company or organization is already using a particular RDBMS.
This is an unwise approach that you should avoid (as much as possi-
ble) for several reasons.
•You’re likely to make design decisions based on your perceptions of
what your RDBMS can or can’t do. For example, you may decide
not to impose a degree of participation for a given relationship
because you believe the RDBMS does not provide you with the
means to do so.
•You’ll inadvertently let the RDBMS dictate the design of the data-
base as opposed to driving the design strictly from the organiza-
tion’s information requirements. This usually occurs when you
discover that your RDBMS provides only limited support for
certain aspects of the database, such as field specifications and
relationship characteristics.
•Your design will be constrained by your knowledge of the RDBMS.
For example, you may decide not to implement relationship char-
acteristics simply because you don’t know how to do so.
•Your design will be constrained by how skilled you are with your
RDBMS. Your skill level affects how efficiently and effectively you

ptg14955309
576 Appendix G On Normalization
can implement various aspects of the database, such as field
specifications and business rules.
•Using this approach to design a database commonly results in
improper structural design, insufficient data integrity, and prob-
lems with inconsistent data and inaccurate information. Defining
a database within an RDBMS can be deceptively easy. You may
create a database that works, but you’re very likely to have a poor
design without knowing it.
•In the end, the RDBMS that you know and love so well may not be
suitable for your organization’s database requirements.
I believe you should always design the logical structure of your data-
base without regard to any RDBMS. By doing so, you’re more likely to
design a sound structure because you’ll be focused on the organiza-
tion’s information requirements. Once your design is complete, you can
then clearly determine how you should implement the database (sin-
gle-user application, client/server, web-based, and so on) and which
RDBMS you should use to facilitate the implementation.
(The preceding content is in the “Database Design Based on the Data-
base Software” section in Chapter 14, “Bad Design—What Not to Do,”
but I thought it bore repeating here.)
I hope this finally clears any confusion and answers any questions
you may have regarding my design methodology and Normalization.
I’ve certainly accomplished my goal if you now at least understand my
approach a little more clearly and see how it does address the same
issues as Normalization.

ptg14955309
577
H
Recommended Reading
Should you be interested in pursuing an in-depth study of database
technology, here are my recommendations for books on this subject.
I’ve chosen these particular books because they have stood the test
of time and have become “standard reading” within the database
industry and academic institutions. (I’m pleased to state that my book
has become part of this notable list.) Keep in mind that most of these
books are going to be challenging to read; the authors presume that
you have a fair amount of background in computers and programming
or are pursuing a degree in computer science.
Codd, E. F. (1990) The Relational Model for Database Management:
Version 2. Reading, MA: Addison-Wesley. ISBN: 0201141922 (Note:
This book is hard to find, but it’s worth having in your library if
you’re going to become a serious database developer. Written by the
“Father of the Relational Database” himself.)
Connolly, Thomas, and Carolyn Begg. (2009) Database Systems—
A Practical Approach to Design, Implementation, and Management,
Fifth Edition. Boston: Addison-Wesley. ISBN: 0321523067
Date, C. J. (2001) The Database Relational Model—A Retrospective
Review and Analysis. Boston: Addison-Wesley. ISBN: 0201612941
——(2003) An Introduction to Database Systems, Eighth Edition.
Boston: Addison-Wesley. ISBN: 0321197844
——(2006) Databases, Types and the Relational Model, Third Edi-
tion. Boston: Addison-Wesley. ISBN: 0321399420

ptg14955309
578 Appendix H Recommended Reading
——(2005) Database In Depth—Relational Theory for Practitioners.
Sebastopol, CA: O’Reilly Media, ISBN: 0596100124
——(2012) Database Design and Relational Theory: Normal
Forms and All That Jazz. Sebastopol, CA: O’Reilly Media. ISBN:
1449328016
Hoffer, Jefferey A., Mary B. Prescott, and Fred R. McFadden. (2010)
Modern Database Management, Tenth Edition. Upper Saddle River,
NJ: Prentice Hall. ISBN: 0136088392
Kroenke, David M. (2011) Database Processing, Twelfth Edition.
Upper Saddle River, NJ: Prentice Hall. ISBN: 0132145375

ptg14955309
579
Glossary
Ad Hoc Information Retrieval The process of using ad hoc queries
to retrieve information that currently does not appear in any existing
reports or data management screens.
Ad Hoc Query A nonpredefined query that you pose to the database
application.
Aggregate Function A snippet of programming code that executes
a particular type of mathematical aggregation on a set of data and
returns a single value.
Aggregate View A view used to display information produced by
aggregating a particular set of data in a specific manner.
Alternate Key A candidate key that has not been designated as a pri-
mary key.
Analytical Database A type of database that stores static data and is
used when there is a need to track trends, view statistical data over a
long period of time, or make tactical or strategic business projections;
it is typically associated with OLAP.
Application A commercial or custom-built software program that is
typically used to provide a user-friendly interface for a database.
Application Development The process of designing and creating an
application that will serve as the user interface for a database.
Application-Oriented Business Rule A rule that imposes constraints
that you must establish within the physical design of the database or
within the design of the database application.

ptg14955309
580 Glossary
Application Program Commercial or custom-built software that
serves as the user interface to a database.
Artificial Candidate Key A field created for the sole purpose of serv-
ing as a candidate key. Its existence is due to an absence of any “natu-
rally occurring” candidate keys within the table.
Associative Table See Linking Table.
Attribute The relational model’s equivalent of a field.
Base Tables Tables that form the basis of a view.
Business Rule Specification Represents all of the characteristics of
a business rule, such as the rule statement, the constraint it imposes,
the structures it affects, and so on.
Business Rules Restrictions or limitations on certain aspects of a
database based on the ways an organization perceives and uses its
data.
Calculated Field A field that contains a concatenated text value or the
result of a mathematical expression.
Calculated Field List A list of fields that can be defined only within
an RDBMS. (Recall that you cannot define calculated fields within a
table structure.)
Cardinality The type of relationship that exists between a pair of
tables in a relational database. See Relationship.
Child Table Within a given relationship, a table containing records
that are explicitly dependent upon the existence of records in the
related table.
Client/Server RDBMS A type of RDBMS in which data resides on a
computer acting as a database server and users interact with the data

ptg14955309
Glossary 581
through applications residing on their own computer, known as the
database client.
Closed Question A question that has a definitive, finite set of answers.
This type of question leaves little opening for further follow-up
questions.
Composite Primary Key A primary key composed of two or more
fields.
Data The values stored in the database.
Data Consistency Every occurrence of a given field value throughout
the entire database is exactly the same.
Data Entry Form A screen within an application program used to
gather and collect data.
Data Integrity A set of rules or guidelines that governs the validity,
consistency, and accuracy of the data in a database. There are four
types of data integrity: table-level, field-level, relationship-level, and
business rules.
Data Structure A particular construct used to store data, such as a
field or table.
Data Table A table that stores data used to supply information; it is
the most common type of table in a relational database.
Data View A view used to examine and manipulate data from one or
more base tables.
Data Warehouse A relational database designed for interrogation and
analysis rather than for transaction processing.
Database Application Program See Application Program.

ptg14955309
582 Glossary
Database Design Process The set of actions required to design the
logical structure of a database.
Database-Oriented Business Rule A rule that imposes constraints
that you can establish within the logical design of the database.
DBMS (Database Management System) A software program that is
used to create, maintain, modify, and manipulate a database.
Degree of Participation Considering a given relationship between a
pair of tables within a relational database, this is the minimum and
maximum number of records that one table can have associated with a
single record in the related table.
Deletion Rule A rule that determines what the RDBMS should do
when a user places a request to delete a given record in the parent
table of a relationship.
Domain See Field Specification.
Domain Integrity See Field-Level Integrity.
Duplicate Data A nonprimary key value that appears in more than
one table within the database.
Duplicate Field A field that appears in two or more tables for any of
these reasons: It is used to relate a set of tables together; it indicates
multiple occurrences of a particular type of value; or there is a per-
ceived need for supplemental information.
Dynamic Data Data that changes constantly and always reflects
up-to-the-minute information.
Elements of a Candidate Key A set of guidelines used to determine
whether a given field is fit to serve as a candidate key.
Elements of a Foreign Key A set of guidelines used to determine
whether a given field is fit to serve as a foreign key.

ptg14955309
Glossary 583
Elements of a Primary Key A set of guidelines used to determine
whether a given candidate key field is fit to serve as a primary key.
Elements of the Ideal Field A set of guidelines used to create sound
field structures and to help identify poorly designed fields.
Elements of the Ideal Table A set of guidelines used to create sound
table structures and to help identify poorly designed tables.
End User A person who uses and works with a database or database
application program.
End-User Application Commercial or custom-built software that
serves as the user interface to a database.
Entity Integrity See Table-Level Integrity.
Event Something that occurs at a given point in time (such as a doc-
tor’s appointment or stock transaction) that can be represented by a
table.
Explicit Information Information that is clearly stated within the
response to a given question.
Extended Data Types Additional data types provided by many
RDBMS programs that go beyond those specified by the SQL Standard.
Field The smallest structure in the database. It represents a charac-
teristic of the subject of the table to which it belongs and is the only
structure that actually stores data within the database.
Field-Level Integrity This type of data integrity warrants the follow-
ing: The identity and purpose of a field is clear and all of the tables in
which it appears are properly identified; field definitions are consistent
throughout the database; the values of a field are consistent and valid;
and the types of modifications, comparisons, and operations that can
be applied to the values in the field are clearly identified.

ptg14955309
584 Glossary
Field Specification Represents all of the general, physical, and logical
elements of a field. (This is traditionally known as a domain.)
Field-Specific Business Rule A rule that imposes constraints on the
elements of a field specification for a given field.
Filter A set of one or more constraints imposed on a view that causes
it to return a specific set of information.
Final Table List This list contains key information (name, type, and
description) on every table in the database.
First-Order Predicate Logic One of the two branches of mathematics
upon which the relational model is based.
Hierarchical Database A database in which data is structured hier-
archically and is typically diagrammed as an inverted tree.
Implementation Process The set of actions required to take a logical
database design and incorporate it within a specific RDBMS.
Implicit Information Information that is not expressly stated within a
response to a given question; you must derive it from your examination
of the response.
Index A structure within an RDBMS program that can be used to
improve data processing.
Information Data that is processed in a manner that makes it mean-
ingful and useful to the person working with it or viewing it.
Information Requirements Information that must be supported by
the data in the database in order for the organization to function prop-
erly, effectively, and efficiently.
Inherited Database See Legacy Database.

ptg14955309
Glossary 585
Keys Special fields that play very specific roles within a table; the type
of key determines its purpose within the table. There are four signifi-
cant types of key: candidate, primary, alternate, and foreign.
LAN See Local Area Network.
Legacy Database A database that has been in existence and in use
for several years or more.
Linking Table A table that helps to establish a many-to-many rela-
tionship between a given pair of tables.
List of Characteristics A collection of nouns that imply various attri-
butes of the items on the List of Subjects.
List of Subjects A collection of nouns that represent subjects that may
be of interest to the organization.
Local Area Network (LAN) A group of computers and peripherals
located within a relatively limited geographical area that share ser-
vices and resources.
Logical Child Relationship A relationship that exists between a given
table in one hierarchical database and another table in a second hier-
archical database.
Logical Data Independence Changes made to the logical design of
the database will not adversely affect the applications built upon the
database.
Lookup Table See Validation Table.
Mainframe Computer A large, high-end, extremely powerful computer
designed to handle literally millions of highly intensive computations
simultaneously.
Many-to-Many Relationship A relationship between a pair of tables in
a relational database in which a single record in the first table can be

ptg14955309
586 Glossary
related to many records in the second table and a single record in the
second table can be related to many records in the first table.
Member The subordinate node in a given relationship within a network
database.
Missing Value A data value that has not been entered into a given field
due to human error.
Mission Objective A statement that represents a general task that a
user will perform against the data in the database.
Mission Statement A statement that establishes the purpose of the
database and provides a distinct focus for your design work.
Multilevel Integrity This incorporates two or more of the following:
field-level integrity, table-level integrity, relationship-level integrity, and
business rules.
Multipart Field A field that contains more than one type of distinct
value.
Multivalued Field A field that contains multiple instances of the same
type of value.
Network Database A database in which data is structured hierar-
chically and is typically diagrammed as an inverted tree. Unlike the
hierarchical database, however, it can contain several inverted trees
that share branches.
Node A given collection of records within a network database.
Non-key A field that does not serve as a candidate, primary, alternate,
or foreign key.
Normal Form A specific set of rules that can be used to test a table
structure to ensure that it is sound and free of problems.

ptg14955309
Glossary 587
Normalization The process of decomposing large tables into smaller
ones in order to eliminate redundant data and duplicate data.
Null This represents a missing or unknown value; it does not repre-
sent a zero or a text string of one or more blank spaces.
Object A tangible item (such as a person, place, or thing) that can be
represented by a table.
OLAP (Online Analytical Processing) A method of presenting data
from an analytical database in which the data is summarized and pre-
sented in the form of a table or cube.
OLTP (Online Transaction Processing) A system for processing trans-
actions as soon as the computer receives them and updating master
files immediately in a database management system.
One-to-Many Relationship A relationship between a pair of tables in
a relational database in which a single record in the first table can be
related to many records in the second table, but a single record in the
second table can be related to only one record in the first table.
One-to-One Relationship A relationship between a pair of tables in a
relational database in which a single record in the first table is related
to only one record in the second table, and a single record in the sec-
ond table is related to only one record in the first table.
Online Analytical Processing See OLAP.
Online Transaction Processing See OLTP.
Open-Ended Question A question that can be answered in a variety of
ways and can lead to further follow-up questions.
Operating System The complete set of software required to manage
and provide services for the computer’s hardware, peripheral equipment
(such as printers and scanners), and all other software programs. The
computer cannot function without the operating system.

ptg14955309
588 Glossary
Operational Database A type of database that stores dynamic data
and is used in situations where there is a need to collect, modify, and
maintain data on a daily basis; it is typically associated with OLTP.
Orphaned Record Given two related tables, this is a record in one
table that is not associated with any record in the other table.
Owner The main node in a given relationship within a network database.
Owner/Member Relationship A type of relationship in a network
database in which an owner table can be associated with one or more
member tables, but a single member table must be associated with a
specific owner table.
Paper-Based Database A loose collection of forms, index cards,
manila folders, and so on, used to collect and maintain data.
Parent/Child Relationship A type of relationship in a hierarchical
database in which a parent table can be associated with one or more
child tables, but a single child table can be associated with only one
parent table.
Parent Table Within a given relationship, a table containing records
that are not dependent upon the existence of records in the related
table.
Parse To decompose a given data value into smaller, distinct parts.
Physical Data Independence Changes the database software ven-
dor makes to the physical implementation of the database will not
adversely affect the applications built upon the database.
Pointer A mechanism that explicitly links a parent table to a child
table in a hierarchical database.
Preliminary Field List A list of fields that represents the organiza-
tion’s fundamental data requirements and constitutes the core set of
fields that must be defined in the database.

ptg14955309
Glossary 589
Preliminary Table List The core set of tables that must be defined in
the database.
Primary Key A field or group of fields that uniquely identifies each
record within a table.
Programming Environment The combination of a given computing
platform (PC, client/server, mainframe, and so on), operating system,
and programming language.
Programming Language A software program that can be used to
define sets of instructions that will ultimately be processed and exe-
cuted by the computer.
Query A request for information posed to the database via a SQL query
statement.
Query Builder A tool within a database software program that allows
a user to build a query via an easy-to-use graphical interface.
RDBMS (Relational Database Management System) A software
program that is used to create, maintain, modify, and manipulate a
relational database.
Record A structure that is composed of a complete set of singular
values (regardless of whether any are null) for every field within a table
and represents a unique instance of the table’s subject.
Recursive Relationship See Self-Referencing Relationship.
Redundant Data A value that is repeated in a field as a result of the
field’s participation in relating two tables or as a result of some field or
table anomaly.
Reference Field See Duplicate Field.
Referential Integrity See Relationship-Level Integrity.

ptg14955309
590 Glossary
Relation The relational model’s equivalent of a table.
Relational Database A type of database that stores data in relations
(perceived by the user as tables). Each relation is composed of tuples
(records) and attributes (fields).
Relational Database Management System See RDBMS.
Relational Model A data model based on set theory and first-order
predicate logic invented by Dr. Edgar F. Codd.
Relationship An interdependence that exists between two tables when
records in the first table can in some way be associated with records in
the second table. There are three types of relationships in a relational
database: one-to-one, one-to-many, and many-to-many.
Relationship Diagram A graphic representation of the relationship
between a given pair of tables or between a given set of records within
a table.
Relationship-Level Integrity A type of data integrity that ensures that
the relationship between a pair of tables is sound and that the records
in the tables are synchronized whenever data is entered into, updated
in, or deleted from either table.
Relationship-Specific Business Rule A rule that imposes constraints
that affect the characteristics of a relationship.
Report Any handwritten, typed, or computer-generated document used
to arrange and present data in such a way that it is meaningful to the
person or people viewing it.
Root Table The topmost table in a hierarchical database structure.
Screen Presentation A series of screens that discuss various topics in
an organized manner.

ptg14955309
Glossary 591
Self-Referencing Many-to-Many Relationship A relationship that
exists when a given record in a table can be related to one or more
other records within the table and one or more records can themselves
be related to the given record.
Self-Referencing One-to-Many Relationship A relationship that exists
when a given record in a table can be related to one or more other
records within the table.
Self-Referencing One-to-One Relationship A relationship that exists
when a given record in a table can be related to only one other record
within the table.
Self-Referencing Relationship A relationship that exists between
the records within a table. Similar to its dual-table counterpart,
a self-referencing relationship can be one-to-one, one-to-many, or
many-to-many.
Set Structure A transparent construction that establishes and rep-
resents a relationship within a network database.
Set Theory One of the two branches of mathematics upon which the
relational model is based.
SQL (Structured Query Language) A standardized language used to
create, maintain, modify, and query relational databases.
Static Data Data that is never (or very rarely) modified.
Structural Integrity A set of rules or guidelines that governs the
manner in which fields, tables, and views are defined.
Structured Query Language See SQL.
Subset Table A table that represents a subordinate subject of a partic-
ular data table.

ptg14955309
592 Glossary
Table The chief structure in a database. It is composed of fields and
records and always represents a single, specific subject.
Table Description A statement that provides a clear definition of the
subject represented by the table and states why the subject is import-
ant to the organization.
Table-Level Integrity This type of data integrity ensures that a table
is free of duplicate records and that the values of the table’s primary
key are unique, are never null, and exclusively identify the table
records.
Tuple The relational model’s equivalent of a record.
Type of Participation The manner in which a table participates
within a given relationship in a relational database. The type of partic-
ipation can be either mandatory or optional.
Type of Relationship The manner in which a given pair of tables can
be related (one-to-one, one-to-many, many-to-many).
Unknown Value A value for a specific field that has yet to be deter-
mined or defined.
URL An acronym for Uniform Resource Locator. It represents an
address for a given resource on the Internet, such as www.ForMereMo-
rtals.com.
Validation Table A table that stores data specifically used to imple-
ment data integrity. (This is also known as a lookup table.)
Validation View A view used specifically to implement data integrity.
View A virtual table composed of fields from one or more base tables in
the database.
View Specification Represents all of the characteristics of a view,
such as the name, type, base tables, and so on.

ptg14955309
Glossary 593
WAN See Wide Area Network.
Web Page A document consisting of a Hypertext Markup Language
(HTML) file and associated support files that can be accessed via the
Internet.
Wide Area Network (WAN) A group of computers and peripherals
located over a widespread geographic area that depends on various
communications devices to share services and resources.
Zero-Length String Two consecutive single quotes with no space in
between them.

ptg14955309
This page intentionally left blank

ptg14955309
595
References
Codd, E. F. (1990) “Relational Philosopher.” DBMS. December 1990,
34–40, 60.
———. (1990) The Relational Model for Database Management Version 2.
Reading, MA: Addison-Wesley.
Connolly, Thomas, and Carolyn Begg. (2002) Database System: A
Practical Approach to Design, Implementation and Management, Third
Edition. Boston: Addison-Wesley.
Date, C. J. (1994) “According to Date: Many Happy Returns!” Database
Programming and Design. September 1994, 19–22.
———. (2000) An Introduction to Database Systems, Seventh Edition.
Boston: Addison-Wesley.
Fleming, Candace C., and Barbara von Halle. (1989) Handbook of
Relational Database Design. Reading, MA: Addison-Wesley.
Hoffer, Jeffrey A., Mary B. Prescott, and Fred R. McFadden. (2002)
Modern Database Management, Sixth Edition. Upper Saddle River, NJ:
Prentice Hall.
Kalman, David. (1994) “Moving Forward with Relational.” DBMS.
October 1994, 62–74, 109.
Kroenke, Dr. David M. (2000) Database Processing Fundamentals,
Design and Implementation, Seventh Edition. Upper Saddle River, NJ:
Prentice Hall.

ptg14955309
596 References
McGoveran, David. (1994) “The Relational Model Turns 25.” DBMS.
October 1994, 46–61.
Pascal, Fabian. (2000) Practical Issues in Database Management:
A Reference for the Thinking Practitioner. Boston: Addison-Wesley.
Stephens, Ryan K., and Ronald R. Plew. (2001) Database Design.
Indianapolis: Sams.
Teorey, Toby J. (1999) Database Modeling & Design, Third Edition.
San Francisco: Morgan Kaufmann.

ptg14955309
597
Index
A
Abbreviations
in field names, 289, 294
in Field Specifications. 284
in table names, 188-189, 204
Accuracy of data, 17, 26
Acronyms
in field names, 511, 548
in Field Specifications, 284,
in table names, 188-189, 204
Action-oriented questions, 335–336
Aggregate functions, effects of nulls,
49
Aggregate views, 442–446
Aliases element, 281–283
Alphanumeric data type, 288
Alternate keys, 260
Analytical databases, 4, 489–490
Analyzing current databases
adopting the current structure,
117–118
case study, 166–171
conducting interviews, 129–137
data collection, 121–124
in the design process, 78–79
goals of analysis, 117
human-knowledge databases, 117
information presentation, 125–129
legacy databases, 116 –117,
119 –121
over v iew, 115 –118
paper-based databases, 116,
118 –119
reports, 125–126
screen presentations, 125, 126–128
slide shows, 125
web pages, 125, 128–129
Anomalies, using ideal field to
resolve, 206-218
Ansa Software, 19
Answers to review questions,
501–523
Application-oriented business rules,
397–399
Approximate Numeric data type, 287
Artificial candidate keys, 251–253
Ashton-Tate, 19
Associative questions, 335
Associative tables. See Linking
tables.
Attributes. See Fields.
B
Bad design
design based on RDBMS
capability, 485–486
flat-file design, 480–481
improper design methodology, 26
spreadsheet design, 481–485
Base tables, 54, 435
Binary data type, 287
Blank values, 228–229
Books and publications
recommended reading, 577–578
SQL Queries for Mere Mortals, 15
Boolean data type, 287

ptg14955309
598 Index
Bowling league, sample database
design, 564
Business Rules
application-oriented, 397–399
case study, 426–431
categories of, 399–402
constraints, 408
data integrity, 472
database-oriented, 397–399
defining and establishing,
402–417
in the design process, 81–82
determining and defining, 81–82
example, 394–397
field-specific, 399–400, 403–411,
543
overview, 393–394
relationship-specific, 401–402,
412–417, 543–544
types of, 397–399
Business Rules Specifications sheet
advantages of, 409
case study, 429
contents of, 409–410
examples, 411, 418, 424, 429, 555
reviewing, 425–426
Business rules, validation tables
description, 419–420
examples, 419
overv iew, 417, 419
sample Business Rule
Specifications sheet, 418
supporting business rules,
420–424
Business-specific range of values,
295
C
Calculated field lists
compiling, 164–165
interviews with management,
165 –166
reviewing with users and
management, 165 –166
Calculated fields
definition, 53
in views, 452–455
Candidate keys
artificial, 251–253
composite candidate keys, 249
elements of, 245–246, 544
establishing, 246–249
identifying, 250–251
overview, 245
Social Security numbers as,
247–248
Car rental, sample database design,
565
Cascade deletion rule, 372–377
Case study (Mike's Bikes)
analyzing current databases,
166 –171
business rules, 426–431
data integrity, 475 –476
field specifications, 308–310
fields, in table structure, 233–240
final table list, 233–240
keys, 263–269
mission objectives, 111–112
mission statement, 104–105
overview, 98–99
preliminary table list, 233–240
table relationships, 384–389
views, 460–464
Character data type, 286
Character Support element, 289–290
Characteristic-Identification
Technique, 136
Characteristics
current, identifying, 134–136
items representing, 159–160
new, identifying, 161–164
review and refine, 157–160
Child tables, 5–9, 60–61
Closed questions, in interviews, 131
Codd, Edgar F., 12
Comparisons Allowed element,
296–298

ptg14955309
Index 599
Composite candidate keys, 249
Composite primary keys, 56, 63, 352
Concatenation, 165, 172, 298, 302
Consistency, data, 17, 26
Contextual questions, 335
Controlling interviews, 97
Criteria, 83, 86, 159, 455
Criterion, 455
Crows foot symbol, 321
Current databases, analyzing
adopting the current structure,
117–118
case study, 166–171
conducting interviews, 129–137
data collection, 121–124
in the design process, 78–79
goals of analysis, 117
human-knowledge databases, 117
information presentation, 125–129
legacy databases, 116 –117,
119 –121
over v iew, 115 –118
paper-based databases, 116,
118 –119
reports, 125–126
screen presentations, 125,
126–128
slide shows, 125
web pages, 125, 128–129
D
Data
accuracy, 17, 26
consistency, 17, 26
definition, 43
inconsistent, 119, 470, 480, 486,
491, 576
redundant, 7, 29, 34, 59-67, 206,
214–217, 219 –221, 242
Data collection, analyzing current
methods, 121–124
Data dictionary, 275
Data independence, advantages of
relational databases, 17
Data integrity
advantages of relational
databases, 16–17
bending or breaking the rules,
491–492
business rules, 472
case study, 475–476
design methodology, 26
field-level, 275–276, 471–472, 546
integrity-specific range of values,
294
objectives of good design, 31
related terminology, 67–69. See
also specific terms.
relationship-level, 384, 472,
551–552
reviewing and refining, 83–84,
469–473
table-level, 261, 471, 552
views, 473
Data modeling phase, 33–34
Data structures in the design
process, 80–81
Data table symbol, 316
Data tables, final table list, 186
Data types
alphanumeric, 288
approximate numeric, 287
binary, 287
Boolean, 287
character, 286
DateTime, 287, 288
exact numeric, 287
extended, 287
general, 288
interval, 287
national character, 286
numeric, 288
SQL standard, 286–288
Data Types element, 286–288
Data views, 437–442
Data warehousing, 21–22
Database-oriented business rules,
397–399

ptg14955309
600 Index
Database design See also Design
methodology.
Database models
hierarchical, 5–9, 584
network, 9 –12, 586
relational, 3, 12-19, 590
Databases
analytical, 4, 489–490
analyzing. See Analyzing current
databases.
data models, 5–12. See also
Relational databases.
designing. See Design methodology;
Design process.
examples of. See Case study
(Mike's Bikes); Sample
designs.
operational, 4
types of, 4
DateTime data type, 287, 288
Decimal Places element, 289
Default Value element, 294
Degree of table participation in
relationships, 66–67
Deletion rules, defining, 372–377
Deny deletion rule, 372–377
Design methodology. See also Design
process; Sample designs.
advantages of, 29–32
bending or breaking the rules,
489–493
data modeling phase, 33–34
importance of, 25–27
improper, results of, 26. See also
Bad design.
objectives of good design, 30–31
requirements analysis phase, 32
theory, importance of, 27–29
traditional methods, 32–34
as used in this book, 34–35
using tools, 26
Design methodology, normalization
definition, 34
description, 35–38
in the design process, 34, 567–576
implementation issues, 575–576
logical design versus physical
design, 575 –576
Design process. See also Design
methodology.
analyzing current databases,
78–79
business rules, 81–82
data structures, 80–81
importance of, 76–77
mission objectives, 77–78
mission statements, 77–78
reviewing data integrity, 83–84
table relationships, 81
validation tables, 82
views, 82
Diagrams
database design process, 525–541
symbols for, 557–558
Diagrams, self-referencing
relationships
many-to-many, 332
one-to-many, 331
one-to-one, 330
Diagrams, table relationships
crows foot symbol, 321
data table symbol, 316
many-to-many, 323–324
one-to-many, 321, 350
one-to-one, 318
self-referencing many-to-many,
332
self-referencing one-to-many, 331
self-referencing one-to-one, 330
subset table symbol, 316
table structure, 343
Direct relationships, 334
Display Format element, 291
Dispute arbitration, interviews, 92
Documentation
of bent or broken rules, 493–494
database, assembling, 473–475
database design process
diagrams, 525–541
importance of, 474

ptg14955309
Index 601
types of, 473–474
view diagrams, 452, 457–458
View Specifications sheet, 457–
458, 556
Documentation, Business Rule
Specifications sheet
advantages of, 409
case study, 429
contents of, 409–410
examples, 411, 418, 424, 429, 555
reviewing, 425–426
Documentation, Field Specifications
sheet
case study, 309–310
example, 554
full sheet, 278
general elements, 285
generic field specifications, 303
logical elements, 299
physical elements, 292
replica field specifications, 305
unique field specifications, 301
Documentation, self-referencing
relationship diagrams
many-to-many, 332
one-to-many, 331
one-to-one, 330
Documentation, table relationship
diagrams
crows foot symbol, 321
data table symbol, 316
many-to-many, 323–324
one-to-many, 321, 350
one-to-one, 318
self-referencing many-to-many,
332
self-referencing one-to-many, 331
self-referencing one-to-one, 330
subset table symbol, 316
table structure, 343
Documentation, View Specifications
sheet
advantages of, 458
case study, 460
contents of, 457 –458
examples, 459, 462, 464
reviewing, 458
Domain integrity, 68, 574, 582
Duplicate fields, 219–220, 222–227
Duplicate items, 178–182
E
Edit Rule element, 296–297,
369–370
Entertainment agency, sample
database design, 560
Entity integrity, 68, 583
Enumerated lists. See Value lists.
Events versus objects, in tables,
50–51
Exact Numeric data type, 287
Examples. See Case study (Mike's
Bikes); Sample designs.
Extended data type, 287
F
Field Description element, 283–285,
368, 547
Field lists, compiling, 157–166. See
also Calculated field lists;
Preliminary field lists.
Field names, 277, 279, 548
Field specifications
case study, 308–310
for each field in the database,
306–308
for foreign keys, 368–371
generic, 280, 300–305
guidelines for, 283–285
importance of, 274–275
overview, 273–274
replica, 280, 300–305
unique, 280, 300–305
Field specifications, general elements
aliases, 281–283
field descriptions, 283–285, 368
field names, 277, 279
label, 279
overview, 277
parent table, 279, 368

ptg14955309
602 Index
Field specifications, general elements
(continued )
shared by, 281
source specification, 281, 368
specification type, 368
Field specifications, logical elements
comparisons allowed, 296–298
default value, 294
edit rule, 296–297, 369–370
key structure, 292
key type, 292, 368
null support, 293
operations allowed, 298–299
range of values, 294–295, 369
required value, 294
specification sheet example, 299
uniqueness, 292–293, 368–369
values entered by, 293, 369
Field specifications, physical
elements
character support, 289–290
data types, 286–288
decimal places, 289
display format, 291
input mask, 290–291
length, 289
overview, 285
Field Specifications sheet, examples
case study, 309–310
full sheet, 278, 554
general elements, 285
generic field specifications, 303
logical elements, 299
physical elements, 292
replica field specifications, 305
unique field specifications, 301
Field-level integrity, 275–276,
471–472, 546
Fields
associating with tables, 199–201
calculated, 53
multipart, 53
multivalued, 53, 350–352
overview, 52–53
types of, 53
Fields, in table structure
anomalies, resolving, 206–210
case study, 233–240
duplicates, 219–220, 222–227
ideal, 206–210
multipa rt, resolving, 210 –212
multivalued, resolving, 212 –218
naming conventions, 202–206
reference, 222
Field-specific business rules, 399–
400, 403–411, 543
File systems. See Paper-based
databases.
Filtering data in views, 455–456
Final table list. See also Preliminary
table list.
case study, 233–240
data tables, 186
definition, 184
example, 185
interviewing users and
management, 196–199
linking tables, 186
subset tables, 186
table descriptions, 186, 192–199
table names, naming conventions,
187–191
table types, 186, 192
validation tables, 186
First-order predicate logic, 13, 28
Flat-file design, 480–481
Foreign keys. See also Primary keys.
elements of, 365–371, 544
example, 57
field specifications, 368–371
one-to-one relationships, 346
overview, 58
refining, 365–371
Fox Software, 19
G
General data type, 288
General elements, field specifications
aliases, 281–283
field descriptions, 283–285, 368

ptg14955309
Index 603
field names, 277, 279
label, 279
overview, 277
parent table, 279, 368
shared by, 281
source specification, 281, 368
specification type, 368
General range of values, 294
Generic field specifications, 280,
300–305
Grouping fields, 446
H
Hierarchical databases, 5–9
Human-knowledge databases, 117
I
IBM
data warehousing, 21–22
object-oriented databases, 20–21
object-relational databases, 21
RDBMS programs, 18
System R, 18
Ideal fields, 206–210, 545–546
Ideal table elements, 364–365, 546
Implicit i nfor mat ion, 110-111
Implied subjects, 176-177, 529
Inconsistent data, 80, 81–84
Indexed views, 56, 436
Indexes, 58–59
Indirect relationships, 334
Information, definition, 43–44
Information presentation, analyzing
current methods, 125–129
Information requirements, reviewing
with
management, 153–157
users, 144–152
INGRES (Interactive Graphics
Retrieval System), 18
Inherited database. See Current
database.
Inmon, Bill, 21
Input Mask element, 290–291
Integrity. See Data integrity.
Interval data type, 287
Interviewer guidelines, 91–93,
550–551
Interviews
about current databases, 129–137
in the analysis phase, 129–137
closed questions, 131
controlling, 97
in the design phase, 89–98
dispute arbitration, 92
group leadership, 94–95
guidelines for, 91–93, 550–551
importance of, 90–91
interviewer guidelines, 91–93
number of participants, 93
open-ended questions, 95, 131
overview, 89–90
pacing, 97
participant guidelines, 91–93
separating users from
management, 94
setting, 93
taking notes, 95–96
Interviews, basic techniques
characteristic-identification
technique, 136
characteristics, identifying,
134–136
closed questions, 131
importance of questions, 130
interview process, 131
open-ended questions, 131
subject-identification technique,
133
subjects, identifying, 132–133
Interviews, with management
business rules, defining and
establishing, 402–417
calculated field lists, reviewing,
165 –166
compiling field lists, 157–166
defining views, 449–450
final table list, 196–199
information requirements,
reviewing, 153–157

ptg14955309
604 Index
Interviews, with management
(continued )
keys, 261–263
main issues, 152
preliminary field lists, reviewing,
165 –166
separating from user interviews, 94
separating from users, 94
verifying table relationships, 383
Interviews, with users
business rules, defining and
establishing, 402–417
calculated field lists, reviewing,
165 –166
data type and usage, 138–139
defining views, 449–450
final table list, 196–199
information requirements,
reviewing, 144–152
keys, 261–263
main issues, 137
preliminary field lists, reviewing,
165 –166
sample conversation, 138–139
sa mples, review ing, 140 –14 4
separating from management, 94
table descriptions, 196–199
verifying table relationships, 383
K
Key structure element, 292
Key Type element, 292, 368
Keyboard characters, field
specifications, 289–290
Keys
alternate, 260
case study, 263–269
importance of, 244
versus indexes, 59
non-key fields, 261
reviewing with users and
management, 261–263
Social Security numbers as,
247–248
table-level integrity, 261
types of, 244. See also specific
types.
Keys, candidate
artificial, 251–253
composite candidate keys, 249
elements of, 245–246, 544
establishing, 246–249
identifying, 250–251
overview, 245
surrogate, 251–253
Keys, foreign. See also Keys, primary.
elements of, 365–371, 544
example, 57
field specifications, 368–371
one-to-one relationships, 346
overview, 58
refining, 365–371
Keys, primary. See also Keys,
foreign.
elements of, 255–256
fields, 253
overview, 253–255
rules for establishing, 259, 545
selecting, 254–259
unnecessary fields, 256
values, 253
L
Label element, 279
Leadership, interviews with, 94–95
L egacy dat abases, 116 –117, 119 –121.
See also Current databases.
Length element, 289
Letters, field specifications, 289–290
Linking tables
definition, 59
final table list, 186
many-to-many relationships, 63,
352–358
Logical elements, field specifications
comparisons allowed, 296–298
default value, 294
edit rule, 296–297, 369–370
key structure, 292
key type, 292, 368

ptg14955309
Index 605
null support, 293
operations allowed, 298–299
range of values, 294–295, 369
required value, 294
specification sheet example, 299
uniqueness, 292–293, 368–369
values entered by, 293, 369
Lookup tables. See Validation tables.
M
Management, interviewing. See
Interviews, with management.
Mandatory participation, 377
Mandatory table participation in
relationships, 65–66
Many-to-many relationships
composite primary keys, 352
diagramming, 323–324
establishing, 352–358
linking tables, 352–358
overview, 63–65, 321–324
problems with, 324–329
redundant data, 355–356
self-referencing, 331–332, 362–364
Materialized views, 56, 436–437
Microrim, 19
Microsoft
object-relational databases, 21
RDBMS programs, 19
Microsoft Access, saved queries, 54
Mike's Bikes. See Case study (Mike's
Bikes).
Missing values, 46
Mission objectives
case st udy, 111–112
characteristics of, 106–107, 551
composi ng, 108 –111
in the design process, 77–78
over view, 105 –106
reviewing for preliminary table
list, 182–184
Mission statements
case study, 104–105
characteristics of, 100–102, 551
completeness, 103
composing, 102–104
in the design process, 77–78
Multipart fields
definition, 53
resolving, 210 –212
Multitable data views, 439–442
Multivalued fields
definition, 53
resolving, 212–218, 350 –352, 552
N
National Character data type, 286
Network databases, 9–12
Non-key fields, 261
Normal forms, 34–36, 570
Normalization
definition, 34
description, 35–38
in the design process, 34, 567–576
implementation issues, 575–576
logical design versus physical
design, 575 –576
Null Support element, 293
Nullify deletion rule, 372–377
Nulls
definition, 45
disadvantages of, 47–49
effects on aggregate functions, 49
missing values, 46
problems with, 47-49
reasons for, 45–46
support for, 46–47
unknown values, 46
value of, 46–47
Numbers, field specifications,
289–290
Numeric data type, 288
O
Object-oriented databases, 20–21
Object-relational databases, 20–21
Objects versus events, in tables,
50–51
Office inventory, sample database
design, 563

ptg14955309
606 Index
OMG (Object Management Group),
20
One-to-many relationships
diagramming, 321, 350
establishing, 349–350
multivalued fields, resolving,
350–352
overview, 61–62, 319–321
self-referencing, 330–331,
358–362
One-to-one relationships
diagramming, 318
establishing, 345–349
foreign keys, 346
over v iew, 60 – 61, 316 –319
parent/child relationships, 60–61
self-referencing, 330, 358–362
subset tables, 317
Open-ended questions, in interviews,
95, 131
Operational databases, 4
Operations Allowed element,
298–299
Optional participation, 377
Optional table participation in
relationships, 65–66
Oracle, RDBMS programs, 18–19
Orphaned records, preventing,
372–377
Ownership-oriented questions,
335–336
P
Paper-based databases, 116,
118 –119. See also Current
databases.
Parent table element, 279, 368
Parent tables, 6
Parent/child relationships, 6, 60–61
Participant guidelines, interviews,
91– 93
Participation degree, identifying,
380–382
Participation type, identifying,
377–380
Performance
improving, 490–493
relational databases, 17
Physical elements, field
specifications
character support, 289–290
data types, 286–288
decimal places, 289
display format, 291
input mask, 290–291
length, 289
overview, 285
Prefixes
in field lists, 157–159
in field names, 202–203, 205
refining items with same name,
158, 162, 202
PostgreSQL Global Development
Group, 21
Preliminary field lists
case study, 166–171
definition, 157
generic items, 158
identifying new characteristics,
161–164
items representing characteristics,
159 –160
items with same name, 158–159
review and refine characteristics,
157–160
reviewing with users and
management, 165 –166
value lists, 163–164
Preliminary table list. See also Final
table list.
case study, 233–240
duplicate items, 178–180
example, 184
implied subjects, identifying,
176 –178
items representing same subject,
180 –181
list of subjects, merging, 178–184
mission objectives, reviewing,
182–184

ptg14955309
Index 607
Primary keys. See also Foreign keys.
composite, 56, 63
in data views, 442
definition, 50
elements of, 255–256, 545
example, 57
fields, 253
overview, 56–57, 253–255
rules for establishing, 259, 545
selecting, 254–259
Social Security numbers as,
247–248
unnecessary fields, 256
values, 253
Publications
recommended reading, 577–578
SQL Queries for Mere Mortals, 15
Q
Questions, in interviews, 95, 130–131
R
Range of Values element, 294–295,
369
Ranges of values
business-specific, 295
general, 294
integrity-specific, 294
RDBMS (relational database
management systems), 18–19.
See also specific RDBMS
programs.
Readings. See Books and
publications.
Records, 53–54
Recursive relationships. See Self-
referencing relationships.
Redundant data, 219–220, 355–356
Reference fields, 222–227
Referential integrity, 7, 37, 68,
571–575
Relational databases
advantages of, 16–18
data storage, 13. See also Fields;
Records; Tables.
disadvantages of, 17
mathematical roots, 12–13, 28
object-oriented model, 20–21
object-relational model, 20–21
performance issues, 17
table relationships, 13. See also
specific relationships.
Relations, definition, 13, 49
Relationship-level data integrity, 472,
551–552
Relationship-related terminology,
59–67. See also specific terms.
Relationships. See Table
relationships.
Relationship-specific business rules,
401–402, 412–417, 543–544
Replica field specifications
defining, 300–305
overview, 280
Reports, analyzing current methods,
125–126
Required Value element, 294
Requirements analysis phase, 32
Restrict deletion rule, 372–377
Retrieving data. See also SQL
(Structured Query Language).
advantages of relational
databases, 17
overview, 15–16
Reviewing table structure, 364–365
Rules
bending or breaking, 489–493
business. See Business rules.
cascade deletion, 372–377
deletion, 372–377
deny deletion, 372–377
edit, 296–297, 369–370
establishing primary keys, 259
nullify deletion, 372–377
restrict deletion, 372–377
set default deletion, 373–377
S
Sales orders, sample database
design, 562

ptg14955309
608 Index
Sample designs
bowling league, 564
car rental, 565
entertainment agency, 560
office inventory, 563
sales orders, 562
school, 561
Saved queries, 54. See also Views.
School, sample database design, 561
Screen presentations, analyzing
current, 125, 126–128
Self-referencing relationships
identifying, 338–340
many-to-many, 331–332, 362–364
one-to-many, 330–331, 358–362
one-to-one, 330, 358–362
overview, 329
Self-referencing relationships,
diagramming
many-to-many, 332
one-to-many, 331
one-to-one, 330
Self-referencing relationships,
establishing
many-to-many, 362–364
one-to-many, 358–362
one-to-one, 358–362
Set default deletion rule, 373–377
Set structures, 9–12
Set theory, 13, 28
Shared By element, 281
Single-table data views, 438–439
Slide shows, analyzing current, 125
Social Security numbers as keys,
247–248
Source Specification element, 281, 368
Special Characters, field
specifications, 289–290
Specification Type element, 368
Spreadsheet design, 481–485
Spreadsheet view mind-set, 483–485
SQL (Structured Query Language),
15–16. See also Retrieving data.
SQL Queries for Mere Mortals, 15
SQL standard data types, 286–288
Structure-related terminology,
49–59. See also specific terms.
Subject-Identification Technique, 133
Subjects, identifying current,
132–133
Subset table symbol, 316
Subset tables
final table list, 186
one-to-one relationships, 317
subordinate subjects, 229–232
table structure, 228–232
Surrogate candidate keys, 251–253
System R, 18
T
Table descriptions
composing, 547
final table list, 186, 192–199
Table names, 187–191, 548–549
Table relationships
case study, 384–389
deletion rules, defining, 372–377
in the design process, 81
ideal table elements, 364–365
identifying, 549
impor ta nce of, 314 –315
linking tables, 59, 63
mandatory participation, 377
most common type, 62
optional participation, 377
participation degree, identifying,
380–382
participation type, identifying,
377–380
between records within a
table. See Self-referencing
relationships.
reviewing table structure,
364–365
types of, 60, 315–316. See also
specific types.
unlimited degree of participation,
382
verifying with users and
management, 383

ptg14955309
Index 609
Table relationships, diagramming
crows foot symbol, 321
data table symbol, 316
many-to-many, 323–324
one-to-many, 321, 350
one-to-one, 318
self-referencing many-to-many,
332
self-referencing one-to-many, 331
self-referencing one-to-one, 330
subset table symbol, 316
table structure, 343
Table relationships, identifying
action-oriented questions,
335–336
associative questions, 335
contextual questions, 335
direct relationships, 334
indirect relationships, 334
overview, 333–334
ownership-oriented questions,
335–336
relationship type, determining,
340–343
relationships between tables,
333–338
relevant questions, 335–338
self-referencing relationships,
338–340
Table relationships, table
participation
degree of, 66–67
mandatory, 65–66
minimum/maximum record
count, 66–67
optional, 65–66
types of, 65–66
Table structure
associating fields with tables,
199–201
blank values, 228–229
case study, 233–240
diagramming, 343
duplicate fields, 219–220, 222–227
final table list, 184–199
ideal tables, 220–227
preliminary table list, 176–184
redundant data, 219–220
reference fields, 222–227
refining, 219–232
refining fields, 202–218
reviewing, 364–365
subset tables, 228–232
types of, 184-199
Table-level data integrity, 471, 552
Tables. See also Foreign keys;
Primary keys.
data, 51
examples of, 14
objects versus events, 50–51
overview, 49–52
typical structure, 50
validation, 51–52
Taking notes, interviews, 95–96
Terminology. See also specific terms.
importance of, 41–42
integrity-related, 67–69
relationship-related, 59–67
structure-related, 49–59
value-related, 43–49
Tuples. See Records.
U
Unique field specifications
defining, 300–305
overview, 280
Uniqueness element, 292–293,
368–369
Unknown values, 46
Unlimited degree of participation,
382
Unresolved many-to-many
relationships, 63–65
Users, interviewing. See Interviews,
with users.
V
Validation tables
in the design process, 82
final table list, 186

ptg14955309
610 Index
Validation tables (continued )
overview, 51–52
versus validation views, 446–447
Validation tables, business rules
description, 419–420
examples, 419
overv iew, 417, 419
sample Business Rule
Specifications sheet, 418
supporting business rules,
420–424
Validation views, 56, 446–448
Value lists, 163 –164
Value-related terminology, 43–49.
See also specific terms.
Values Entered By element, 293, 369
Versant Corporation, 20–21
View diagrams, 452, 457–458
View Specifications sheet, 457–458,
556
Views
aggregate, 442–446
base tables, 54, 435
case study, 460–464
data, 437–442
data integrity, 473
in the design process, 82
documenting, 452, 457–458
grouping fields, 446
importance of, 55–56
indexed, 56, 436
materialized, 56, 436–437
multitable data, 439–442
overview, 54–56, 435–437
primary keys, 442
purpose of, 436–437
reviewing documentation,
458–460
single-table data, 438–439
types of, 437. See also specific
types.
validation, 56, 446–448
Views, creating
calculated fields, 452–455
defining views, 450–452
documentation, 452, 457–458
filtering data, 455–456
interviewing users and
management, 449–450
requirements, identifying, 449–
450, 549–550
view diagrams, 452, 457–458
View Specifications sheet,
457–458
W
Web pages, analyzing current, 125,
128–129
Z
Zero, 45, 288
Zero-length string, 45

ptg14955309
This page intentionally left blank

ptg14955309
Register the Addison-Wesley, Exam
Cram, Prentice Hall, Que, and
Sams products you own to unlock
great benefi ts.
To begin the registration process,
simply go to informit.com/register
to sign in or create an account.
You will then be prompted to enter
the 10- or 13-digit ISBN that appears
on the back cover of your product.
informIT.com
THE TRUSTED TECHNOLOGY LEARNING SOURCE
Addison-Wesley | Cisco Press | Exam Cram
IBM Press
| Que | Prentice Hall
| Sams
SAFARI BOOKS ONLINE
About InformIT — THE TRUSTED TECHNOLOGY LEARNING SOURCE
INFORMIT IS HOME TO THE LEADING TECHNOLOGY PUBLISHING IMPRINTS
Addison-Wesley Professional, Cisco Press, Exam Cram, IBM Press, Prentice Hall
Professional, Que, and Sams. Here you will gain access to quality and trusted content and
resources from the authors, creators, innovators, and leaders of technology. Whether you’re
looking for a book on a new technology, a helpful article, timely newsletters, or access to
the Safari Books Online digital library, InformIT has a solution for you.
Registering your products can unlock
the following benefi ts:
• Access to supplemental content,
including bonus chapters,
source code, or project fi les.
• A coupon to be used on your
next purchase.
Registration benefi ts vary by product.
Benefi ts will be listed on your Account
page under Registered Products.
informit.com/register
THIS PRODUCT

ptg14955309
InformIT is a brand of Pearson and the online presence
for the world’s leading technology publishers. It’s your source
for reliable and qualified content and knowledge, providing
access to the top brands, authors, and contributors from
the tech community.
informIT.com THE TRUSTED TECHNOLOGY LEARNING SOURCE
LearnIT at InformIT
Looking for a book, eBook, or training video on a new technology? Seeking
timely and relevant information and tutorials? Looking for expert opinions,
advice, and tips? InformIT has the solution.
• Learn about new releases and special promotions by
subscribing to a wide variety of newsletters.
Visit informit.com/newsletters.
• Access FREE podcasts from experts at informit.com/podcasts.
• Read the latest author articles and sample chapters at
informit.com/articles.
• Access thousands of books and videos in the Safari Books
Online digital library at safari.informit.com.
• Get tips from expert blogs at informit.com/blogs.
Visit informit.com/learn to discover all the ways you can access the
hottest technology content.
informIT.com THE TRUSTED TECHNOLOGY LEARNING SOURCE
Are You Part of the IT Crowd?
Connect with Pearson authors and editors via RSS feeds, Facebook,
Twitter, YouTube, and more! Visit informit.com/socialconnect.

ptg14955309
* Available to new subscribers only. Discount applies to the Safari Library and is valid for m rst
12 consecutive monthly billing cycles. Safari Library is not available in all countries.
Try Safari Books Online FREE for 15 days
Get online access to Thousands of Books and Videos
FREE 15-DAY TRIAL + 15% OFF*
informit.com/safaritrial
Feed your brain
Gain unlimited access to thousands of books and videos about technology,
digital media and professional development from O’Reilly Media,
Addison-Wesley, Microsoft Press, Cisco Press, McGraw Hill, Wiley, WROX,
Prentice Hall, Que, Sams, Apress, Adobe Press and other top publishers.
See it, believe it
Watch hundreds of expert-led instructional videos on today’s hottest topics.
WAIT, THERE’S MORE!
Gain a competitive edge
Be first to learn about the newest technologies and subjects with Rough Cuts
pre-published manuscripts and new technology overviews in Short Cuts.
Accelerate your project
Copy and paste code, create smart searches that let you know when new
books about your favorite topics are available, and customize your library
with favorites, highlights, tags, notes, mash-ups and more.

ptg14955309
You love our titles and you love to
share them with your colleagues and friends...why
not earn some $$ doing it!
If you have a website, blog, or even a Facebook
page, you can start earning money by putting
InformIT links on your page.
Whenever a visitor clicks on these links and makes
a purchase on informit.com, you earn commissions*
on all sales!
Every sale you bring to our site will earn you a
commission. All you have to do is post the links to
the titles you want, as many as you want, and we’ll
take care of the rest.
APPLY AND GET STARTED!
It’s quick and easy to apply.
To learn more go to:
http://www.informit.com/affiliates/
*Valid for all books, eBooks and video sales at www.informit.com
JOIN THE
InformIt
AFFILIATE TEAM!
