Mitel 6100 User Guide
User Manual: Mitel 6100 User Guide
Open the PDF directly: View PDF ![]() .
.
Page Count: 449 [warning: Documents this large are best viewed by clicking the View PDF Link!]
- Mitel Networks 6110 CCM User Guide
- Chapter 1 The prairieFyre Contact Center Solutions suite
- prairieFyre Contact Center Solutions suite
- Features and benefits
- Licencing
- About the 6110 CCM User Guide
- User guide layout
- Chapter 1: prairieFyre suite
- Chapter 2: Call center concepts
- Chapter 3: Planning and managing your call center
- Chapter 4: Management Console
- Chapter 5: YourSite
- Chapter 6: Real-time Monitors
- Chapter 7: Reporter and Scheduled Reports
- Chapter 8: Data-mining
- Chapter 9: The Enterprise Node (CEN)
- Chapter 10: Network and Collector Monitors
- Chapter 11: WallBoarder
- Chapter 12: 6115 Interactive Contact Center
- Chapter 13: 6120 Contact Center Scheduling
- Chapter 14: 6150 Multimedia Contact Center
- User guide conventions
- The word NOTE: designates essential user information.
- Client downloads from the 6110 CCM Web site
- Navigating 6110 CCM
- User guide layout
- prairieFyre Contact Center Solutions suite
- Chapter 2 Call center concepts
- Chapter 3 Planning and managing
- your call center
- Planning and managing your call center
- Step #1 establish a corporate service level objective
- Quality of service
- Step #2 collect data
- Step #3 forecast the call load
- Step #4 calculate required resources
- Step #5 schedule agents
- Step #6 determine call center costs
- Planning and managing your call center
- Chapter 4 Management Console
- Chapter 5 YourSite
- YourSite
- Configuration
- Determining which call center devices to configure
- Agent tab
- Adding elements to YourSite
- Editing YourSite elements
- Deleting YourSite elements
- Agent Group tab
- Adding groups to YourSite
- Editing YourSite groups
- Deleting YourSite groups
- Adding elements to YourSite groups
- Deleting elements from YourSite groups
- Team tab
- Queue tab
- Queue Group tab
- Extension tab
- Extension Group tab
- Trunk tab
- Trunk Group tab
- Account Code tab
- ANI tab
- DNIS tab
- DNIS Group tab
- Employee tab
- Employee Group tab
- Make Busy Reason Codes tab
- Automatic Synchronization with 6115 ICC
- Security
- Configuration
- YourSite
- Chapter 6 Real-time monitors
- Real-time monitors
- SuperAdvisor
- AgentAdvisor
- 6115 CCM InterActive
- Configuring Make Busy Reason Codes
- CyberTerminal
- Real-time monitors
- Chapter 7 Reporter and Scheduled Reports
- Reporter and Scheduled Reports
- Report Inbox
- Run-on-demand reports
- Scheduled Reports
- licence violations
- Report Distributor
- Report types
- Report parameters
- Queue Reports
- Agent Reports
- Employee Reports
- Team Reports
- Trunk Reports
- Extension Reports
- 4Sight Reports
- DNIS Reports
- Reporter and Scheduled Reports
- Chapter 8 Data-mining tools
- Data-mining tools
- ACD Inspector
- ACD search criteria
- Running searches in ACD Inspector
- Interpreting ACD search results
- Agent Events tab
- Node
- Date
- Function/Event
- Time
- Directory Number
- Agent ID
- Line Number
- Make Busy/DND
- Agent Log In
- Agent Log Out
- Set Do Not Disturb
- Remove Do Not Disturb
- Remove Make Busy
- Answer ACD Call
- Answer Personal Call
- Originate Call
- Agent Idle
- Work Timer Start Event
- Work Timer Expire Event
- Call Hold Event
- Hold Retrieve Event
- Hold Abandon Event
- Queue Events tab
- Option Events tab
- Exception Events tab
- Advanced Search tab
- Examples of ACD records
- Agent Events tab
- SMDR Inspector
- SMDR search criteria
- Running searches in SMDR Inspector
- Interpreting SMDR search results
- SMDR Search Results tab
- Node
- Date (mm/dd)
- Start Time (hh:mmp)
- Duration of Call (hh:mm:ss)
- Calling Party (pppp)
- Attendant (f)
- Time to Answer (ttt)
- Digits Dialed (xx...x)
- Call Completion Status (h)
- Speed Call or Call Forward Flags (S or F)
- Called Party (qqqq)
- Transfer/Conference Call (K)
- Third Party (rrrr)
- Account Code (aa...a)
- Route Optimization Flag (s)
- System Identifier (iii)
- ANI/DNIS (xx........xxxxxxx)
- Advanced Search Results tab
- Agent Shift Results tab
- Exception Records tab
- SMDR record fields
- Examples of external SMDR records
- Example 1. 2-party outgoing call
- Example 2. 2-party outgoing call
- Example 3. 2-party incoming call
- Example 4. 2-party incoming call
- Example 5. Attendant-handled call - outgoing trunk
- Example 6. Attendant-handled call - incoming trunk
- Example 7. Calling station transfer call
- Example 8. Called station transfer call
- Example 9. Attendant-controlled conference (with trunk)
- Example 10. Incoming call/call forward enabled at called station
- Example 11. Internal call/call forward enabled at called station
- SMDR Search Results tab
- Advanced Inspector
- Example 1: Why are the Agent Performance by Period Reports and Agent Event by Period Reports diff...
- Example 2: Do I have SMDR records for internal calls?
- Example 3: Do I have extended record formats in both data streams and the database?
- Switch related questions
- Queue related questions
- Are there any calls that were routed due to Path Unavailable?
- Show all records where the call was requeued
- Show the answering devices and their search order for a specific queue
- Show all AnswerACD call records from the ACD stream where the queue does not take the form Pxxxx
- Show all times the ACD stream indicated there were no agents available for a queue or an agent group
- Agent related questions
- SuperAuditor
- ACD Inspector
- Data-mining tools
- Chapter 9 Enterprise Node (CEN)
- Chapter 10 Network and
- Collector Monitors
- Chapter 11 WallBoarder
- Chapter 12 4Sight Reports
- Chapter 13 Mitel Networks 6150 MCC
- Mitel Networks 6150 MCC
- Configuring 6150 MCC
- Configuring 6110 CCM
- Changing 6150 MCC options
- To change the IP address and port number
- To open Outlook 2000
- To view the 6150 MCC inbox when Outlook starts up
- To display 6150 MCC shortcuts
- To display the log on window when Outlook 2000 opens
- To make Outlook your top window when an e-mail arrives
- To direct e-mail to the 6150 MCC inbox
- To change the 6150 MCC e-mail arrival sound file
- Setting agent actions
- Responding to an e-mail
- Viewing e-mail history
- Creating and using a 6150 MCC template
- Viewing Mini Queue Now Stats
- Appendix A
- 6150 MCC Terminology
- Agent Load
- Answered By
- Answer Percent
- ACD
- ANI
- ASA
- Average Abandon Time
- Average Talk Time
- Blocked Call
- Busy Hour Traffic
- Call Load
- Call Routing
- Call Volume See Calls Offered
- Calls Abandoned
- Calls Abandoned Paramater
- Calls Abandoned (Short)
- Calls Abandoned (Long)
- Calls Answered
- Calls Interflowed
- Short Calls Interflowed
- Long Calls Interflowed
- Calls Offered
- Calls Requeued
- Calls Waiting
- CO
- CTI
- Delayed Call
- Dialable Number
- DNIS
- DND
- Erlang
- Erlang C
- Extension
- Grade of Service
- Inbound
- LAN
- Logged On
- Logged Off
- Longest Waiting
- Make Busy
- MIS
- On ACD
- On Non ACD
- Overflow
- Path Unavailable
- Pooling Principle
- Probability of Delay
- PSTN
- Quality of Service
- Queue Number
- Readerboard see Wall Board
- Real-Time Adherence
- Recorded Announcement Device
- Reporting Number
- Service Level
- Service Level Percent
- Service Level Time
- Silent Monitoring
- SQL
- Support Systems
- Talk Time
- TCP-IP
- Telephone System
- Time Stamp
- Trunk Load
- Unavailable see Path Unavailable
- Wall Board
- WAN
- Workforce Management
- Wrap Up Time
- 6150 MCC Terminology
- Mitel Networks 6150 MCC
- Index
version 3.0
-XQH
&RQWHQWV
Chapter 1 prairieFyre Contact Center Solutions suite
Features and benefits . . . . . . . . . . . . . . . . . . . . . . . . . . . . . . . . . . . . . . . . . . . . 2
Licencing. . . . . . . . . . . . . . . . . . . . . . . . . . . . . . . . . . . . . . . . . . . . . . . . . . . . . . . 2
About the 6110 CCM User Guide. . . . . . . . . . . . . . . . . . . . . . . . . . . . . 2
User guide layout . . . . . . . . . . . . . . . . . . . . . . . . . . . . . . . . . . . . . . . . . . . . . . . . 2
Chapter 1: prairieFyre suite. . . . . . . . . . . . . . . . . . . . . . . . . . . . . . . . . . . . . . . . . . . . . . . . . . . . . . . . 2
Chapter 2: Call center concepts . . . . . . . . . . . . . . . . . . . . . . . . . . . . . . . . . . . . . . . . . . . . . . . . . . . . 2
Chapter 3: Planning and managing your call center . . . . . . . . . . . . . . . . . . . . . . . . . . . . . . . . . . . 3
Chapter 4: Management Console . . . . . . . . . . . . . . . . . . . . . . . . . . . . . . . . . . . . . . . . . . . . . . . . . . . 3
Chapter 5: YourSite . . . . . . . . . . . . . . . . . . . . . . . . . . . . . . . . . . . . . . . . . . . . . . . . . . . . . . . . . . . . . . 3
Chapter 6: Real-time Monitors . . . . . . . . . . . . . . . . . . . . . . . . . . . . . . . . . . . . . . . . . . . . . . . . . . . . . 3
Chapter 7: Reporter and Scheduled Reports . . . . . . . . . . . . . . . . . . . . . . . . . . . . . . . . . . . . . . . . . 4
Chapter 8: Data-mining . . . . . . . . . . . . . . . . . . . . . . . . . . . . . . . . . . . . . . . . . . . . . . . . . . . . . . . . . . . 4
Chapter 9: The Enterprise Node (CEN) . . . . . . . . . . . . . . . . . . . . . . . . . . . . . . . . . . . . . . . . . . . . . . 5
Chapter 10: Network and Collector Monitors . . . . . . . . . . . . . . . . . . . . . . . . . . . . . . . . . . . . . . . . . 5
Chapter 11: WallBoarder . . . . . . . . . . . . . . . . . . . . . . . . . . . . . . . . . . . . . . . . . . . . . . . . . . . . . . . . . . 5
Chapter 12: 6115 Interactive Contact Center. . . . . . . . . . . . . . . . . . . . . . . . . . . . . . . . . . . . . . . . . . 5
Chapter 13: 6120 Contact Center Scheduling . . . . . . . . . . . . . . . . . . . . . . . . . . . . . . . . . . . . . . . . . 5
Chapter 14: 6150 Multimedia Contact Center . . . . . . . . . . . . . . . . . . . . . . . . . . . . . . . . . . . . . . . . . 6
User guide conventions. . . . . . . . . . . . . . . . . . . . . . . . . . . . . . . . . . . . . . . . . . . 6
User Interface (UI) syntax . . . . . . . . . . . . . . . . . . . . . . . . . . . . . . . . . . . . . . . . . . . . . . . . . . . . . . . . . 6
The word NOTE: designates essential user information.. . . . . . . . . . . . . . . . 7
Client downloads from the 6110 CCM Web site . . . . . . . . . . . . . . . . . . . . . . . 7
Client Downloads . . . . . . . . . . . . . . . . . . . . . . . . . . . . . . . . . . . . . . . . . . . . . . . . . . . . . . . . . . . . . . . . 7
Navigating 6110 CCM. . . . . . . . . . . . . . . . . . . . . . . . . . . . . . . . . . . . . . . . . . . . . 8
Viewing multiple sessions of 6110 CCM . . . . . . . . . . . . . . . . . . . . . . . . . . . . . . . . . . . . . . . . . . . . . 8
Chapter 2 Call center concepts
The ACD process . . . . . . . . . . . . . . . . . . . . . . . . . . . . . . . . . . . . . . . . . . . . . . . . 12
ACD call flow . . . . . . . . . . . . . . . . . . . . . . . . . . . . . . . . . . . . . . . . . . . . . . . . . . . . . . . . . . . . . . . . . . . 12
Call routing . . . . . . . . . . . . . . . . . . . . . . . . . . . . . . . . . . . . . . . . . . . . . . . . . . . . . . . . . . . . . . . . . . . . . 13
Understanding the inbound call environment. . . . . . . . . . . . . . . . . . . . . . . . . 15
Random and predicted call arrival . . . . . . . . . . . . . . . . . . . . . . . . . . . . . . . . . . . . . . . . . . . . . . . . . . 15
Caller tolerance . . . . . . . . . . . . . . . . . . . . . . . . . . . . . . . . . . . . . . . . . . . . . . . . . . . . . . . . . . . . . . . . . 15
Chapter 3 Planning and managing your call center
Step #1 establish a corporate service level objective . . . . . . . . . . . . . . . . . . 19
Service defined. . . . . . . . . . . . . . . . . . . . . . . . . . . . . . . . . . . . . . . . . . . . . . . . . . . . . . . . . . . . . . . . . . 19
Why is service level more meaningful than other metrics?. . . . . . . . . . . . . . . . . . . . . . . . . . . . . . 20
Calculating the service level . . . . . . . . . . . . . . . . . . . . . . . . . . . . . . . . . . . . . . . . . . . . . . . . . . . . . . . 21
How do I choose a service level goal?. . . . . . . . . . . . . . . . . . . . . . . . . . . . . . . . . . . . . . . . . . . . . . . 21
Quality of service . . . . . . . . . . . . . . . . . . . . . . . . . . . . . . . . . . . . . . . . . . . . . . . . 22
Silent monitoring . . . . . . . . . . . . . . . . . . . . . . . . . . . . . . . . . . . . . . . . . . . . . . . . . . . . . . . . . . . . . . . . 22
Silent monitoring systems . . . . . . . . . . . . . . . . . . . . . . . . . . . . . . . . . . . . . . . . . . . . . . . . . . . . . . . . . 23
IT support systems . . . . . . . . . . . . . . . . . . . . . . . . . . . . . . . . . . . . . . . . . . . . . . . . . . . . . . . . . . . . . . . 23
Step #2 collect data . . . . . . . . . . . . . . . . . . . . . . . . . . . . . . . . . . . . . . . . . . . . . . 25
Collecting data on call handling. . . . . . . . . . . . . . . . . . . . . . . . . . . . . . . . . . . . . . . . . . . . . . . . . . . . . 25
Step #3 forecast the call load . . . . . . . . . . . . . . . . . . . . . . . . . . . . . . . . . . . . . . 26
The importance of forecasting . . . . . . . . . . . . . . . . . . . . . . . . . . . . . . . . . . . . . . . . . . . . . . . . . . . . . . 26
Conducting a forecast . . . . . . . . . . . . . . . . . . . . . . . . . . . . . . . . . . . . . . . . . . . . . . . . . . . . . . . . . . . . . 26
Step #4 calculate required resources. . . . . . . . . . . . . . . . . . . . . . . . . . . . . . . . 27
Predicting the agent requirement. . . . . . . . . . . . . . . . . . . . . . . . . . . . . . . . . . . . . . . . . . . . . . . . . . . . 27
Erlang C . . . . . . . . . . . . . . . . . . . . . . . . . . . . . . . . . . . . . . . . . . . . . . . . . . . . . . . . . . . . . . . . . . . . . . . . 28
Service Level . . . . . . . . . . . . . . . . . . . . . . . . . . . . . . . . . . . . . . . . . . . . . . . . . . . . . . . . . . . . . . . . . . . . 29
Determining the agent requirement . . . . . . . . . . . . . . . . . . . . . . . . . . . . . . . . . . . . . . . . . . . . . . . . . . 29
Performing what-if scenarios . . . . . . . . . . . . . . . . . . . . . . . . . . . . . . . . . . . . . . . . . . . . . . . . . . . . . . . 29
The relationship between agents and trunks . . . . . . . . . . . . . . . . . . . . . . . . . . . . . . . . . . . . . . . . . . 29
Predicting the trunk requirement . . . . . . . . . . . . . . . . . . . . . . . . . . . . . . . . . . . . . . . . . . . . . . . . . . . . 30
Erlang B . . . . . . . . . . . . . . . . . . . . . . . . . . . . . . . . . . . . . . . . . . . . . . . . . . . . . . . . . . . . . . . . . . . . . . . . 30
Determining trunk requirements . . . . . . . . . . . . . . . . . . . . . . . . . . . . . . . . . . . . . . . . . . . . . . . . . . . . 31
Step #5 schedule agents . . . . . . . . . . . . . . . . . . . . . . . . . . . . . . . . . . . . . . . . . . 32
The shrinkage factor . . . . . . . . . . . . . . . . . . . . . . . . . . . . . . . . . . . . . . . . . . . . . . . . . . . . . . . . . . . . . . 32
Creative scheduling. . . . . . . . . . . . . . . . . . . . . . . . . . . . . . . . . . . . . . . . . . . . . . . . . . . . . . . . . . . . . . . 33
Call routing to optimize coverage . . . . . . . . . . . . . . . . . . . . . . . . . . . . . . . . . . . . . . . . . . . . . . . . . . . 35
Scheduling considerations . . . . . . . . . . . . . . . . . . . . . . . . . . . . . . . . . . . . . . . . . . . . . . . . . . . . . . . . . 35
How accurate is your scheduling?. . . . . . . . . . . . . . . . . . . . . . . . . . . . . . . . . . . . . . . . . . . . . . . . . . . 35
Step #6 determine call center costs . . . . . . . . . . . . . . . . . . . . . . . . . . . . . . . . . 36
A breakdown of expenses. . . . . . . . . . . . . . . . . . . . . . . . . . . . . . . . . . . . . . . . . . . . . . . . . . . . . . . . . . 36
Cost of delay. . . . . . . . . . . . . . . . . . . . . . . . . . . . . . . . . . . . . . . . . . . . . . . . . . . . . . . . . . . . . . . . . . . . . 36
Cost per call . . . . . . . . . . . . . . . . . . . . . . . . . . . . . . . . . . . . . . . . . . . . . . . . . . . . . . . . . . . . . . . . . . . . . 36
Average call value . . . . . . . . . . . . . . . . . . . . . . . . . . . . . . . . . . . . . . . . . . . . . . . . . . . . . . . . . . . . . . . . 37
Anticipating growth . . . . . . . . . . . . . . . . . . . . . . . . . . . . . . . . . . . . . . . . . . . . . . . . . . . . . . . . . . . . . . . 37
Chapter 4 Management Console
Using Management Console . . . . . . . . . . . . . . . . . . . . . . . . . . . . . . . . . . . . . . . 40
Enabling the Real-time Demo Simulation on the 6110 CCM Server . . . . . . . . . . . . . . . . . . . . . . . . 43
Gaining access to database menu options . . . . . . . . . . . . . . . . . . . . . . . . . . . . . . . . . . . . . . . . . . . . 44
System Settings tab . . . . . . . . . . . . . . . . . . . . . . . . . . . . . . . . . . . . . . . . . . . . . . 45
Editing registry settings . . . . . . . . . . . . . . . . . . . . . . . . . . . . . . . . . . . . . . . . . . . . . . . . . . . . . . . . . . . 45
Setting alarms . . . . . . . . . . . . . . . . . . . . . . . . . . . . . . . . . . . . . . . . . . . . . . . . . . . . . . . . . . . . . . . . . . . 46
Database tab . . . . . . . . . . . . . . . . . . . . . . . . . . . . . . . . . . . . . . . . . . . . . . . . . . . . 48
Quick Configuration Tool for the SX-2000. . . . . . . . . . . . . . . . . . . . . . . . . . . . . . . . . . . . . . . . . . . . . 48
Backing up the YourSite Database. . . . . . . . . . . . . . . . . . . . . . . . . . . . . . . . . . . . . . . . . . . . . . . . . . . 51
Restoring the YourSite Database . . . . . . . . . . . . . . . . . . . . . . . . . . . . . . . . . . . . . . . . . . . . . . . . . . . . 51
Backing up the 6110 CCM Database . . . . . . . . . . . . . . . . . . . . . . . . . . . . . . . . . . . . . . . . . . . . . . . . . 52
Restoring the 6110 CCM Database. . . . . . . . . . . . . . . . . . . . . . . . . . . . . . . . . . . . . . . . . . . . . . . . . . . 52
Enterprise tab . . . . . . . . . . . . . . . . . . . . . . . . . . . . . . . . . . . . . . . . . . . . . . . . . . . 52
Chapter 5 YourSite
Configuration . . . . . . . . . . . . . . . . . . . . . . . . . . . . . . . . . . . . . . . . . . . . . 58
Determining which call center devices to configure . . . . . . . . . . . . . . . . . . . . . . . . . . . . . . . . . . . . 59
Agent tab. . . . . . . . . . . . . . . . . . . . . . . . . . . . . . . . . . . . . . . . . . . . . . . . . . . . . . . 61
Adding elements to YourSite . . . . . . . . . . . . . . . . . . . . . . . . . . . . . . . . . . . . . . 64
Editing YourSite elements. . . . . . . . . . . . . . . . . . . . . . . . . . . . . . . . . . . . . . . . . 64
Deleting YourSite elements. . . . . . . . . . . . . . . . . . . . . . . . . . . . . . . . . . . . . . . . 65
Agent Group tab. . . . . . . . . . . . . . . . . . . . . . . . . . . . . . . . . . . . . . . . . . . . . . . . . 65
Dialable Number . . . . . . . . . . . . . . . . . . . . . . . . . . . . . . . . . . . . . . . . . . . . . . . . . . . . . . . . . . . . . . . . . 68
Adding groups to YourSite . . . . . . . . . . . . . . . . . . . . . . . . . . . . . . . . . . . . . . . . 68
Editing YourSite groups . . . . . . . . . . . . . . . . . . . . . . . . . . . . . . . . . . . . . . . . . . 69
Deleting YourSite groups . . . . . . . . . . . . . . . . . . . . . . . . . . . . . . . . . . . . . . . . . 69
Adding elements to YourSite groups . . . . . . . . . . . . . . . . . . . . . . . . . . . . . . . . 69
Deleting elements from YourSite groups. . . . . . . . . . . . . . . . . . . . . . . . . . . . . 70
Team tab . . . . . . . . . . . . . . . . . . . . . . . . . . . . . . . . . . . . . . . . . . . . . . . . . . . . . . . 70
Queue tab . . . . . . . . . . . . . . . . . . . . . . . . . . . . . . . . . . . . . . . . . . . . . . . . . . . . . . 71
Queues . . . . . . . . . . . . . . . . . . . . . . . . . . . . . . . . . . . . . . . . . . . . . . . . . . . . . . . . . . . . . . . . . . . . . . . . 71
AnsBy . . . . . . . . . . . . . . . . . . . . . . . . . . . . . . . . . . . . . . . . . . . . . . . . . . . . . . . . . . . . . . . . . . . . . . . . . 71
Queue Number . . . . . . . . . . . . . . . . . . . . . . . . . . . . . . . . . . . . . . . . . . . . . . . . . . . . . . . . . . . . . . . . . . 72
Dialable Number . . . . . . . . . . . . . . . . . . . . . . . . . . . . . . . . . . . . . . . . . . . . . . . . . . . . . . . . . . . . . . . . . 72
Service Level . . . . . . . . . . . . . . . . . . . . . . . . . . . . . . . . . . . . . . . . . . . . . . . . . . . . . . . . . . . . . . . . . . . 72
Calls Abandoned Parameter . . . . . . . . . . . . . . . . . . . . . . . . . . . . . . . . . . . . . . . . . . . . . . . . . . . . . . . 73
Properties . . . . . . . . . . . . . . . . . . . . . . . . . . . . . . . . . . . . . . . . . . . . . . . . . . . . . . . . . . . . . . . . . . . . . . 73
Queue Group tab . . . . . . . . . . . . . . . . . . . . . . . . . . . . . . . . . . . . . . . . . . . . . . . . 73
Extension tab . . . . . . . . . . . . . . . . . . . . . . . . . . . . . . . . . . . . . . . . . . . . . . . . . . . 74
Extension Group tab . . . . . . . . . . . . . . . . . . . . . . . . . . . . . . . . . . . . . . . . . . . . . 75
Trunk tab. . . . . . . . . . . . . . . . . . . . . . . . . . . . . . . . . . . . . . . . . . . . . . . . . . . . . . . 76
Trunk Group tab . . . . . . . . . . . . . . . . . . . . . . . . . . . . . . . . . . . . . . . . . . . . . . . . . 77
Account Code tab. . . . . . . . . . . . . . . . . . . . . . . . . . . . . . . . . . . . . . . . . . . . . . . . 78
ANI tab. . . . . . . . . . . . . . . . . . . . . . . . . . . . . . . . . . . . . . . . . . . . . . . . . . . . . . . . . 79
DNIS tab . . . . . . . . . . . . . . . . . . . . . . . . . . . . . . . . . . . . . . . . . . . . . . . . . . . . . . . 80
DNIS Group tab. . . . . . . . . . . . . . . . . . . . . . . . . . . . . . . . . . . . . . . . . . . . . . . . . . 81
Employee tab . . . . . . . . . . . . . . . . . . . . . . . . . . . . . . . . . . . . . . . . . . . . . . . . . . . 82
Employee Group tab . . . . . . . . . . . . . . . . . . . . . . . . . . . . . . . . . . . . . . . . . . . . . 83
Make Busy Reason Codes tab . . . . . . . . . . . . . . . . . . . . . . . . . . . . . . . . . . . . . 84
Automatic Synchronization with 6115 ICC. . . . . . . . . . . . . . . . . . . . . 85
The effects of Automatic Synchronization . . . . . . . . . . . . . . . . . . . . . . . . . . . 85
Employee IDs/Agent IDs . . . . . . . . . . . . . . . . . . . . . . . . . . . . . . . . . . . . . . . . . . . . . . . . . . . . . . . . . . 85
Reporting numbers/Dialable numbers . . . . . . . . . . . . . . . . . . . . . . . . . . . . . . . . . . . . . . . . . . . . . . . 85
New Queues . . . . . . . . . . . . . . . . . . . . . . . . . . . . . . . . . . . . . . . . . . . . . . . . . . . . . . . . . . . . . . . . . . . . 85
Changing Device names . . . . . . . . . . . . . . . . . . . . . . . . . . . . . . . . . . . . . . . . . . . . . . . . . . . . . . . . . . 85
Setting the MiTAI Node . . . . . . . . . . . . . . . . . . . . . . . . . . . . . . . . . . . . . . . . . . . 86
Entering the Queue dialable and reporting numbers . . . . . . . . . . . . . . . . . . . 87
Setting the re-synchronization time . . . . . . . . . . . . . . . . . . . . . . . . . . . . . . . . . 90
Security. . . . . . . . . . . . . . . . . . . . . . . . . . . . . . . . . . . . . . . . . . . . . . . . . . 91
Creating a Security Role . . . . . . . . . . . . . . . . . . . . . . . . . . . . . . . . . . . . . . . . . . . . . . . . . . . . . . . . . . . 91
Granting or restricting access to 6110 CCM . . . . . . . . . . . . . . . . . . . . . . . . . . . . . . . . . . . . . . . . . . . 93
Creating lists . . . . . . . . . . . . . . . . . . . . . . . . . . . . . . . . . . . . . . . . . . . . . . . . . . . . . . . . . . . . . . . . . . . . 94
Creating an Advanced Security Role . . . . . . . . . . . . . . . . . . . . . . . . . . . . . . . . . . . . . . . . . . . . . . . . . 98
Viewing My Security Role . . . . . . . . . . . . . . . . . . . . . . . . . . . . . . . . . . . . . . . . . . . . . . . . . . . . . . . . . . 100
Chapter 6 Real-time monitors
SuperAdvisor . . . . . . . . . . . . . . . . . . . . . . . . . . . . . . . . . . . . . . . . . . . . . 103
Grid properties . . . . . . . . . . . . . . . . . . . . . . . . . . . . . . . . . . . . . . . . . . . . . . . . . . 104
SuperAdvisor monitors . . . . . . . . . . . . . . . . . . . . . . . . . . . . . . . . . . . . . . . . . . . 105
Agent State by Position and Employee State by Position grids . . . . . . . . . . . . . . . . . . . . . . . . . . . 105
Agent State by Time and Employee State by Time grids. . . . . . . . . . . . . . . . . . . . . . . . . . . . . . . . . 109
Agent Shift grid . . . . . . . . . . . . . . . . . . . . . . . . . . . . . . . . . . . . . . . . . . . . . . . . . . . . . . . . . . . . . . . . . . 110
Queue by Period grid. . . . . . . . . . . . . . . . . . . . . . . . . . . . . . . . . . . . . . . . . . . . . . . . . . . . . . . . . . . . . . 111
Queue Now and Queue Group Now grids . . . . . . . . . . . . . . . . . . . . . . . . . . . . . . . . . . . . . . . . . . . . . 113
Call Count by Queue chart . . . . . . . . . . . . . . . . . . . . . . . . . . . . . . . . . . . . . . . . . . . . . . . . . . . . . . . . . 115
Queue Service Level Percent chart . . . . . . . . . . . . . . . . . . . . . . . . . . . . . . . . . . . . . . . . . . . . . . . . . . 115
Queue Status chart . . . . . . . . . . . . . . . . . . . . . . . . . . . . . . . . . . . . . . . . . . . . . . . . . . . . . . . . . . . . . . . 116
Viewing real-time statistics . . . . . . . . . . . . . . . . . . . . . . . . . . . . . . . . . . . . . . . . 116
Adding, rearranging, resizing, and sorting devices . . . . . . . . . . . . . . . . . . . . . . . . . . . . . . . . . . . . . 118
Hiding grid fields . . . . . . . . . . . . . . . . . . . . . . . . . . . . . . . . . . . . . . . . . . . . . . . . . . . . . . . . . . . . . . . . . 119
Defining grid styles . . . . . . . . . . . . . . . . . . . . . . . . . . . . . . . . . . . . . . . . . . . . . . . . . . . . . . . . . . . . . . . 119
Defining chart styles . . . . . . . . . . . . . . . . . . . . . . . . . . . . . . . . . . . . . . . . . . . . . . . . . . . . . . . . . . . . . . 120
Defining performance thresholds. . . . . . . . . . . . . . . . . . . . . . . . . . . . . . . . . . . 123
Creating profiles. . . . . . . . . . . . . . . . . . . . . . . . . . . . . . . . . . . . . . . . . . . . . . . . . 126
Loading profiles . . . . . . . . . . . . . . . . . . . . . . . . . . . . . . . . . . . . . . . . . . . . . . . . . 127
Chatting online in SuperAdvisor. . . . . . . . . . . . . . . . . . . . . . . . . . . . . . . . . . . . 128
AgentAdvisor . . . . . . . . . . . . . . . . . . . . . . . . . . . . . . . . . . . . . . . . . . . . . 130
Installing AgentAdvisor . . . . . . . . . . . . . . . . . . . . . . . . . . . . . . . . . . . . . . . . . . . 130
Grid properties . . . . . . . . . . . . . . . . . . . . . . . . . . . . . . . . . . . . . . . . . . . . . . . . . . 131
AgentAdvisor monitors . . . . . . . . . . . . . . . . . . . . . . . . . . . . . . . . . . . . . . . . . . . 132
Agent State by Position and Employee State by Position grids . . . . . . . . . . . . . . . . . . . . . . . . . . . 132
Queue Now grid . . . . . . . . . . . . . . . . . . . . . . . . . . . . . . . . . . . . . . . . . . . . . . . . . . . . . . . . . . . . . . . . . . 134
My Shift grid . . . . . . . . . . . . . . . . . . . . . . . . . . . . . . . . . . . . . . . . . . . . . . . . . . . . . . . . . . . . . . . . . . . . . 135
Viewing real-time statistics . . . . . . . . . . . . . . . . . . . . . . . . . . . . . . . . . . . . . . . . 137
Adding, rearranging, resizing, and sorting devices . . . . . . . . . . . . . . . . . . . . . . . . . . . . . . . . . . . . . 139
Hiding grid fields . . . . . . . . . . . . . . . . . . . . . . . . . . . . . . . . . . . . . . . . . . . . . . . . . . . . . . . . . . . . . . . . . 141
Defining grid styles . . . . . . . . . . . . . . . . . . . . . . . . . . . . . . . . . . . . . . . . . . . . . . . . . . . . . . . . . . . . . . . 141
Defining performance thresholds. . . . . . . . . . . . . . . . . . . . . . . . . . . . . . . . . . . 142
Creating profiles. . . . . . . . . . . . . . . . . . . . . . . . . . . . . . . . . . . . . . . . . . . . . . . . . 144
Loading profiles . . . . . . . . . . . . . . . . . . . . . . . . . . . . . . . . . . . . . . . . . . . . . . . . . 145
Chatting online in AgentAdvisor. . . . . . . . . . . . . . . . . . . . . . . . . . . . . . . . . . . . 145
6115 CCM InterActive . . . . . . . . . . . . . . . . . . . . . . . . . . . . . . . . . . . . . . 147
Configuring Make Busy Reason Codes . . . . . . . . . . . . . . . . . . . . . . . 148
Adding a Make Busy Reason Code . . . . . . . . . . . . . . . . . . . . . . . . . . . . . . . . . 149
Editing a Make Busy Reason Code . . . . . . . . . . . . . . . . . . . . . . . . . . . . . . . . . 150
Deleting a Make Busy Reason Code . . . . . . . . . . . . . . . . . . . . . . . . . . . . . . . . 150
Agent controls . . . . . . . . . . . . . . . . . . . . . . . . . . . . . . . . . . . . . . . . . . . . . . . . . . 151
Logging on . . . . . . . . . . . . . . . . . . . . . . . . . . . . . . . . . . . . . . . . . . . . . . . . . . . . . . . . . . . . . . . . . . . . . 151
Logging off . . . . . . . . . . . . . . . . . . . . . . . . . . . . . . . . . . . . . . . . . . . . . . . . . . . . . . . . . . . . . . . . . . . . . 151
Placing agents or yourself in make busy with reason, or do not disturb. . . . . . . . . . . . . . . . . . . 152
Removing agents or yourself from make busy with reason, or do not disturb . . . . . . . . . . . . . . 152
Agent grid controls . . . . . . . . . . . . . . . . . . . . . . . . . . . . . . . . . . . . . . . . . . . . . . 153
Logging off . . . . . . . . . . . . . . . . . . . . . . . . . . . . . . . . . . . . . . . . . . . . . . . . . . . . . . . . . . . . . . . . . . . . . 154
Placing all agents or yourself in make busy with reason, or do not disturb . . . . . . . . . . . . . . . . 154
Removing all agents or yourself from make busy or do not disturb . . . . . . . . . . . . . . . . . . . . . . 155
Queue controls. . . . . . . . . . . . . . . . . . . . . . . . . . . . . . . . . . . . . . . . . . . . . . . . . . 155
Placing queues in do not disturb . . . . . . . . . . . . . . . . . . . . . . . . . . . . . . . . . . . . . . . . . . . . . . . . . . . 155
Removing queues from do not disturb . . . . . . . . . . . . . . . . . . . . . . . . . . . . . . . . . . . . . . . . . . . . . . 155
Queue grid controls . . . . . . . . . . . . . . . . . . . . . . . . . . . . . . . . . . . . . . . . . . . . . . 156
Placing all queues in do not disturb. . . . . . . . . . . . . . . . . . . . . . . . . . . . . . . . . . . . . . . . . . . . . . . . . 156
Removing all queues from do not disturb . . . . . . . . . . . . . . . . . . . . . . . . . . . . . . . . . . . . . . . . . . . . 156
CyberTerminal. . . . . . . . . . . . . . . . . . . . . . . . . . . . . . . . . . . . . . . . . . . . 157
SX-200 connectivity to the 6110 CCM Server . . . . . . . . . . . . . . . . . . . . . . . . . 157
Data streams and prairieFyre real-time displays . . . . . . . . . . . . . . . . . . . . . . . . . . . . . . . . . . . . . . 157
Viewing real-time SX-200 statistics . . . . . . . . . . . . . . . . . . . . . . . . . . . . . . . . . . . . . . . . . . . . . . . . . 158
ACD Monitor sessions. . . . . . . . . . . . . . . . . . . . . . . . . . . . . . . . . . . . . . . . . . . . 160
System Activity monitor . . . . . . . . . . . . . . . . . . . . . . . . . . . . . . . . . . . . . . . . . . . . . . . . . . . . . . . . . . 160
Path Summary monitors . . . . . . . . . . . . . . . . . . . . . . . . . . . . . . . . . . . . . . . . . . . . . . . . . . . . . . . . . . 162
Agent Group Summary monitors . . . . . . . . . . . . . . . . . . . . . . . . . . . . . . . . . . . . . . . . . . . . . . . . . . . 164
Agent Information monitors . . . . . . . . . . . . . . . . . . . . . . . . . . . . . . . . . . . . . . . . . . . . . . . . . . . . . . . 166
Chapter 7 Reporter and Scheduled Reports
Run-on-demand reports . . . . . . . . . . . . . . . . . . . . . . . . . . . . . . . . . . . . . . . . . . 171
Generating run-on-demand reports . . . . . . . . . . . . . . . . . . . . . . . . . . . . . . . . . . . . . . . . . . . . . . . . . 171
Viewing run-on-demand reports. . . . . . . . . . . . . . . . . . . . . . . . . . . . . . . . . . . . . . . . . . . . . . . . . . . . 173
What to do if data is missing from the reports . . . . . . . . . . . . . . . . . . . . . . . . . . . . . . . . . . . . . . . . 177
Deleting reports . . . . . . . . . . . . . . . . . . . . . . . . . . . . . . . . . . . . . . . . . . . . . . . . . . . . . . . . . . . . . . . . . 178
Scheduled Reports. . . . . . . . . . . . . . . . . . . . . . . . . . . . . . . . . . . . . . . . 179
Generating a schedule. . . . . . . . . . . . . . . . . . . . . . . . . . . . . . . . . . . . . . . . . . . . 180
Associating reports to the schedule . . . . . . . . . . . . . . . . . . . . . . . . . . . . . . . . 181
Generating scheduled reports immediately . . . . . . . . . . . . . . . . . . . . . . . . . . 184
Viewing scheduled reports . . . . . . . . . . . . . . . . . . . . . . . . . . . . . . . . . . . . . . . . 185
What to do if data is missing from the reports . . . . . . . . . . . . . . . . . . . . . . . . 187
Deleting reports . . . . . . . . . . . . . . . . . . . . . . . . . . . . . . . . . . . . . . . . . . . . . . . . . 188
Deleting Scheduled Reports . . . . . . . . . . . . . . . . . . . . . . . . . . . . . . . . . . . . . . . . . . . . . . . . . . . . . . . 189
licence violations . . . . . . . . . . . . . . . . . . . . . . . . . . . . . . . . . . . . . . . . . . 189
Report Distributor . . . . . . . . . . . . . . . . . . . . . . . . . . . . . . . . . . . . . . . . . 190
Report types . . . . . . . . . . . . . . . . . . . . . . . . . . . . . . . . . . . . . . . . . . . . . . 194
Report parameters . . . . . . . . . . . . . . . . . . . . . . . . . . . . . . . . . . . . . . . . . . . . . . . 194
Queue Reports . . . . . . . . . . . . . . . . . . . . . . . . . . . . . . . . . . . . . . . . . . . . . . . . . . 196
Performance Reports. . . . . . . . . . . . . . . . . . . . . . . . . . . . . . . . . . . . . . . . . . . . . . . . . . . . . . . . . . . . . . 197
Internal External Reports . . . . . . . . . . . . . . . . . . . . . . . . . . . . . . . . . . . . . . . . . . . . . . . . . . . . . . . . . . 202
Spectrum by Period Reports. . . . . . . . . . . . . . . . . . . . . . . . . . . . . . . . . . . . . . . . . . . . . . . . . . . . . . . . 203
Spectrum by Day of the Week Reports . . . . . . . . . . . . . . . . . . . . . . . . . . . . . . . . . . . . . . . . . . . . . . . 207
Spectrum by Queue Reports. . . . . . . . . . . . . . . . . . . . . . . . . . . . . . . . . . . . . . . . . . . . . . . . . . . . . . . . 210
ANI Reports . . . . . . . . . . . . . . . . . . . . . . . . . . . . . . . . . . . . . . . . . . . . . . . . . . . . . . . . . . . . . . . . . . . . . 211
Queue Group by Queue with Agent Information. . . . . . . . . . . . . . . . . . . . . . . . . . . . . . . . . . . . . . . . 212
Agent Reports. . . . . . . . . . . . . . . . . . . . . . . . . . . . . . . . . . . . . . . . . . . . . . . . . . . 213
Performance Reports. . . . . . . . . . . . . . . . . . . . . . . . . . . . . . . . . . . . . . . . . . . . . . . . . . . . . . . . . . . . . . 214
Internal/External Reports . . . . . . . . . . . . . . . . . . . . . . . . . . . . . . . . . . . . . . . . . . . . . . . . . . . . . . . . . . 219
Event by Period Reports . . . . . . . . . . . . . . . . . . . . . . . . . . . . . . . . . . . . . . . . . . . . . . . . . . . . . . . . . . . 221
. . . . . . . . . . . . . . . . . . . . . . . . . . . . . . . . . . . . . . . . . . . . . . . . . . . . . . . . . . . . . . . . . . . . . . . . . . . . . . . .In-
bound/Outbound Trace Reports. . . . . . . . . . . . . . . . . . . . . . . . . . . . . . . . . . . . . . . . . . . . . . . . . . . . . 225
Answering Agent Reports. . . . . . . . . . . . . . . . . . . . . . . . . . . . . . . . . . . . . . . . . . . . . . . . . . . . . . . . . . 226
Agent Shift Reports . . . . . . . . . . . . . . . . . . . . . . . . . . . . . . . . . . . . . . . . . . . . . . . . . . . . . . . . . . . . . . . 228
Employee Reports . . . . . . . . . . . . . . . . . . . . . . . . . . . . . . . . . . . . . . . . . . . . . . . 229
Performance Reports. . . . . . . . . . . . . . . . . . . . . . . . . . . . . . . . . . . . . . . . . . . . . . . . . . . . . . . . . . . . . . 230
Internal/External Reports . . . . . . . . . . . . . . . . . . . . . . . . . . . . . . . . . . . . . . . . . . . . . . . . . . . . . . . . . . 234
Event by Period Reports . . . . . . . . . . . . . . . . . . . . . . . . . . . . . . . . . . . . . . . . . . . . . . . . . . . . . . . . . . . 236
Team Reports . . . . . . . . . . . . . . . . . . . . . . . . . . . . . . . . . . . . . . . . . . . . . . . . . . . 237
Performance Reports. . . . . . . . . . . . . . . . . . . . . . . . . . . . . . . . . . . . . . . . . . . . . . . . . . . . . . . . . . . . . . 237
Event by Period Reports . . . . . . . . . . . . . . . . . . . . . . . . . . . . . . . . . . . . . . . . . . . . . . . . . . . . . . . . . . . 239
Trunk Reports. . . . . . . . . . . . . . . . . . . . . . . . . . . . . . . . . . . . . . . . . . . . . . . . . . . 240
Performance Reports. . . . . . . . . . . . . . . . . . . . . . . . . . . . . . . . . . . . . . . . . . . . . . . . . . . . . . . . . . . . . . 240
Busy Minutes Reports . . . . . . . . . . . . . . . . . . . . . . . . . . . . . . . . . . . . . . . . . . . . . . . . . . . . . . . . . . . . . 241
Extension Reports . . . . . . . . . . . . . . . . . . . . . . . . . . . . . . . . . . . . . . . . . . . . . . . 241
Performance Reports. . . . . . . . . . . . . . . . . . . . . . . . . . . . . . . . . . . . . . . . . . . . . . . . . . . . . . . . . . . . . . 241
4Sight Reports . . . . . . . . . . . . . . . . . . . . . . . . . . . . . . . . . . . . . . . . . . . . . . . . . . 242
DNIS Reports . . . . . . . . . . . . . . . . . . . . . . . . . . . . . . . . . . . . . . . . . . . . . . . . . . . 243
Performance Reports. . . . . . . . . . . . . . . . . . . . . . . . . . . . . . . . . . . . . . . . . . . . . . . . . . . . . . . . . . . . . . 243
Chapter 8 Data-mining tools
ACD Inspector . . . . . . . . . . . . . . . . . . . . . . . . . . . . . . . . . . . . . . . . . . . . 248
ACD search criteria . . . . . . . . . . . . . . . . . . . . . . . . . . . . . . . . . . . . . . . . . . . . . . 249
ACD search criteria - agent events. . . . . . . . . . . . . . . . . . . . . . . . . . . . . . . . . . . . . . . . . . . . . . . . . . . 249
ACD search criteria - queue events . . . . . . . . . . . . . . . . . . . . . . . . . . . . . . . . . . . . . . . . . . . . . . . . . . 250
ACD search criteria - option events . . . . . . . . . . . . . . . . . . . . . . . . . . . . . . . . . . . . . . . . . . . . . . . . . . 251
ACD search criteria - download status . . . . . . . . . . . . . . . . . . . . . . . . . . . . . . . . . . . . . . . . . . . . . . . 253
ACD search criteria - advanced . . . . . . . . . . . . . . . . . . . . . . . . . . . . . . . . . . . . . . . . . . . . . . . . . . . . . 254
Running searches in ACD Inspector . . . . . . . . . . . . . . . . . . . . . . . . . . . . . . . . 255
Wildcard Searches . . . . . . . . . . . . . . . . . . . . . . . . . . . . . . . . . . . . . . . . . . . . . . . . . . . . . . . . . . . . . . . 255
Interpreting ACD search results . . . . . . . . . . . . . . . . . . . . . . . . . . . . . . . . . . . . 257
Agent Events tab . . . . . . . . . . . . . . . . . . . . . . . . . . . . . . . . . . . . . . . . . . . . . . . . . . . . . . . . . . . . . . . . 257
Queue Events tab. . . . . . . . . . . . . . . . . . . . . . . . . . . . . . . . . . . . . . . . . . . . . . . . . . . . . . . . . . . . . . . . 261
Option Events tab. . . . . . . . . . . . . . . . . . . . . . . . . . . . . . . . . . . . . . . . . . . . . . . . . . . . . . . . . . . . . . . . 263
Exception Events tab. . . . . . . . . . . . . . . . . . . . . . . . . . . . . . . . . . . . . . . . . . . . . . . . . . . . . . . . . . . . . 264
Advanced Search tab. . . . . . . . . . . . . . . . . . . . . . . . . . . . . . . . . . . . . . . . . . . . . . . . . . . . . . . . . . . . . 265
Examples of ACD records . . . . . . . . . . . . . . . . . . . . . . . . . . . . . . . . . . . . . . . . . . . . . . . . . . . . . . . . . 266
SMDR Inspector . . . . . . . . . . . . . . . . . . . . . . . . . . . . . . . . . . . . . . . . . . 267
SMDR search criteria . . . . . . . . . . . . . . . . . . . . . . . . . . . . . . . . . . . . . . . . . . . . . 267
SMDR search criteria - call parties . . . . . . . . . . . . . . . . . . . . . . . . . . . . . . . . . . . . . . . . . . . . . . . . . . 267
SMDR search criteria - call types . . . . . . . . . . . . . . . . . . . . . . . . . . . . . . . . . . . . . . . . . . . . . . . . . . . 269
SMDR search criteria - options. . . . . . . . . . . . . . . . . . . . . . . . . . . . . . . . . . . . . . . . . . . . . . . . . . . . . 271
SMDR search criteria - advanced . . . . . . . . . . . . . . . . . . . . . . . . . . . . . . . . . . . . . . . . . . . . . . . . . . . 273
SMDR search criteria - agent shift . . . . . . . . . . . . . . . . . . . . . . . . . . . . . . . . . . . . . . . . . . . . . . . . . . 275
SMDR search criteria - download status . . . . . . . . . . . . . . . . . . . . . . . . . . . . . . . . . . . . . . . . . . . . . 276
Running searches in SMDR Inspector . . . . . . . . . . . . . . . . . . . . . . . . . . . . . . . 276
Wildcard Searches . . . . . . . . . . . . . . . . . . . . . . . . . . . . . . . . . . . . . . . . . . . . . . . . . . . . . . . . . . . . . . . 276
Interpreting SMDR search results . . . . . . . . . . . . . . . . . . . . . . . . . . . . . . . . . . 278
SMDR Search Results tab . . . . . . . . . . . . . . . . . . . . . . . . . . . . . . . . . . . . . . . . . . . . . . . . . . . . . . . . . 278
Advanced Search Results tab. . . . . . . . . . . . . . . . . . . . . . . . . . . . . . . . . . . . . . . . . . . . . . . . . . . . . . 282
Agent Shift Results tab . . . . . . . . . . . . . . . . . . . . . . . . . . . . . . . . . . . . . . . . . . . . . . . . . . . . . . . . . . . 283
Exception Records tab . . . . . . . . . . . . . . . . . . . . . . . . . . . . . . . . . . . . . . . . . . . . . . . . . . . . . . . . . . . 285
SMDR record fields . . . . . . . . . . . . . . . . . . . . . . . . . . . . . . . . . . . . . . . . . . . . . . . . . . . . . . . . . . . . . . 286
Examples of external SMDR records . . . . . . . . . . . . . . . . . . . . . . . . . . . . . . . . . . . . . . . . . . . . . . . . 289
Advanced Inspector. . . . . . . . . . . . . . . . . . . . . . . . . . . . . . . . . . . . . . . . . . . . . . 291
Switch related questions . . . . . . . . . . . . . . . . . . . . . . . . . . . . . . . . . . . . . . . . . . . . . . . . . . . . . . . . . . 296
Queue related questions . . . . . . . . . . . . . . . . . . . . . . . . . . . . . . . . . . . . . . . . . . . . . . . . . . . . . . . . . . 296
Agent related questions . . . . . . . . . . . . . . . . . . . . . . . . . . . . . . . . . . . . . . . . . . . . . . . . . . . . . . . . . . 298
SuperAuditor. . . . . . . . . . . . . . . . . . . . . . . . . . . . . . . . . . . . . . . . . . . . . 299
SuperAuditor icons . . . . . . . . . . . . . . . . . . . . . . . . . . . . . . . . . . . . . . . . . . . . . . 300
Viewing historical real-time events . . . . . . . . . . . . . . . . . . . . . . . . . . . . . . . . . 302
Chapter 9 6110 CCM Enterprise Node
Local and remote collectors . . . . . . . . . . . . . . . . . . . . . . . . . . . . . . . . . . . . . . . 307
Enterprise communications . . . . . . . . . . . . . . . . . . . . . . . . . . . . . . . . . . . . . . . 307
Viewing real-time data collection on the 6110 CCM Enterprise Server. . . . . . . . . . . . . . . . . . . . . 307
Viewing data and system alarms . . . . . . . . . . . . . . . . . . . . . . . . . . . . . . . . . . . . . . . . . . . . . . . . . . . 309
Enabling and disabling the alarm beep . . . . . . . . . . . . . . . . . . . . . . . . . . . . . . . . . . . . . . . . . . . . . . 309
Enabling pop-up alerts . . . . . . . . . . . . . . . . . . . . . . . . . . . . . . . . . . . . . . . . . . . . . . . . . . . . . . . . . . . 310
Re-Initializing the Collector Service . . . . . . . . . . . . . . . . . . . . . . . . . . . . . . . . . . . . . . . . . . . . . . . . . 310
Managing call center operations . . . . . . . . . . . . . . . . . . . . . . . . . . . . . . . . . . . . . . . . . . . . . . . . . . . 311
Setting up enterprise services . . . . . . . . . . . . . . . . . . . . . . . . . . . . . . . . . . . . . 312
Configuring 6110 CCM enterprise nodes. . . . . . . . . . . . . . . . . . . . . . . . . . . . . 315
Configuring local and remote collectors on the 6110 CCM Enterprise Server (Los Angeles in this exam-
ple). . . . . . . . . . . . . . . . . . . . . . . . . . . . . . . . . . . . . . . . . . . . . . . . . . . . . . . . . . . . . . . . . . . . . . . . . . . . 315
Installing and configuring CEN software . . . . . . . . . . . . . . . . . . . . . . . . . . . . . . . . . . . . . . . . . . . . . 319
Chapter 10 6110 CCM Network and Collector Monitors
Network Monitor overview. . . . . . . . . . . . . . . . . . . . . . . . . . . . . . . . . . . . . . . . . 322
Menu functions. . . . . . . . . . . . . . . . . . . . . . . . . . . . . . . . . . . . . . . . . . . . . . . . . . . . . . . . . . . . . . . . . . . 322
Setting the data alarms in the Management Console. . . . . . . . . . . . . . . . . . . . . . . . . . . . . . . . . . . . 323
Enabling pop-up alerts . . . . . . . . . . . . . . . . . . . . . . . . . . . . . . . . . . . . . . . . . . . . . . . . . . . . . . . . . . . . 325
What to do if data is not streaming . . . . . . . . . . . . . . . . . . . . . . . . . . . . . . . . . . . . . . . . . . . . . . . . . . 325
Re-Initializing the Collector Service. . . . . . . . . . . . . . . . . . . . . . . . . . . . . . . . . . . . . . . . . . . . . . . . . . 325
Collector Monitor overview . . . . . . . . . . . . . . . . . . . . . . . . . . . . . . . . . . . . . . . . 326
Menu functions. . . . . . . . . . . . . . . . . . . . . . . . . . . . . . . . . . . . . . . . . . . . . . . . . . . . . . . . . . . . . . . . . . . 326
Starting the Collector Monitor . . . . . . . . . . . . . . . . . . . . . . . . . . . . . . . . . . . . . . . . . . . . . . . . . . . . . . 328
Chapter 11 WallBoarder
Spectrum wall sign setup . . . . . . . . . . . . . . . . . . . . . . . . . . . . . . . . . . . . . . . . . 331
Specifying wall sign comport settings. . . . . . . . . . . . . . . . . . . . . . . . . . . . . . . . . . . . . . . . . . . . . . . . 332
Configuring wall sign messages. . . . . . . . . . . . . . . . . . . . . . . . . . . . . . . . . . . . 332
Maintenance screen. . . . . . . . . . . . . . . . . . . . . . . . . . . . . . . . . . . . . . . . . . . . . . . . . . . . . . . . . . . . . . . 332
Resetting wall signs. . . . . . . . . . . . . . . . . . . . . . . . . . . . . . . . . . . . . . . . . . . . . . 333
Variables screen. . . . . . . . . . . . . . . . . . . . . . . . . . . . . . . . . . . . . . . . . . . . . . . . . . . . . . . . . . . . . . . . . . 333
Defining sign variables . . . . . . . . . . . . . . . . . . . . . . . . . . . . . . . . . . . . . . . . . . . 335
Messages screen . . . . . . . . . . . . . . . . . . . . . . . . . . . . . . . . . . . . . . . . . . . . . . . . . . . . . . . . . . . . . . . . . 336
Defining sign messages . . . . . . . . . . . . . . . . . . . . . . . . . . . . . . . . . . . . . . . . . . 338
Groups screen . . . . . . . . . . . . . . . . . . . . . . . . . . . . . . . . . . . . . . . . . . . . . . . . . . . . . . . . . . . . . . . . . . . 338
Defining sign groups . . . . . . . . . . . . . . . . . . . . . . . . . . . . . . . . . . . . . . . . . . . . . 340
Priority Messages screen . . . . . . . . . . . . . . . . . . . . . . . . . . . . . . . . . . . . . . . . . . . . . . . . . . . . . . . . . . 340
Defining priority messages . . . . . . . . . . . . . . . . . . . . . . . . . . . . . . . . . . . . . . . . 342
Chapter 12 4Sight
Forecast parameters . . . . . . . . . . . . . . . . . . . . . . . . . . . . . . . . . . . . . . . . . . . . . 346
Generating forecast reports . . . . . . . . . . . . . . . . . . . . . . . . . . . . . . . . . . . . . . . 347
Viewing forecast reports . . . . . . . . . . . . . . . . . . . . . . . . . . . . . . . . . . . . . . . . . . 348
Performing what-if scenarios . . . . . . . . . . . . . . . . . . . . . . . . . . . . . . . . . . . . . . . . . . . . . . . . . . . . . . . 351
What to do if data is missing from the reports . . . . . . . . . . . . . . . . . . . . . . . . . . . . . . . . . . . . . . . . . 351
Deleting reports . . . . . . . . . . . . . . . . . . . . . . . . . . . . . . . . . . . . . . . . . . . . . . . . . . . . . . . . . . . . . . . . . . 351
licence violations . . . . . . . . . . . . . . . . . . . . . . . . . . . . . . . . . . . . . . . . . . . . . . . . . . . . . . . . . . . . . . . . . 353
Report Distributor . . . . . . . . . . . . . . . . . . . . . . . . . . . . . . . . . . . . . . . . . 354
6120 CCS. . . . . . . . . . . . . . . . . . . . . . . . . . . . . . . . . . . . . . . . . . . . . . . . . 358
Exporting, forecasting, and scheduling agents . . . . . . . . . . . . . . . . . . . . . . . 360
Chapter 13 Mitel Networks 6150 MCC
Configuring 6150 MCC. . . . . . . . . . . . . . . . . . . . . . . . . . . . . . . . . . . . . . 360
To configure employees . . . . . . . . . . . . . . . . . . . . . . . . . . . . . . . . . . . . . . . . . . 361
Adding Employees. . . . . . . . . . . . . . . . . . . . . . . . . . . . . . . . . . . . . . . . . . . . . . . . . . . . . . . . . . . . . . . . 361
Editing Employees . . . . . . . . . . . . . . . . . . . . . . . . . . . . . . . . . . . . . . . . . . . . . . . . . . . . . . . . . . . . . . . 363
Deleting Employees . . . . . . . . . . . . . . . . . . . . . . . . . . . . . . . . . . . . . . . . . . . . . . . . . . . . . . . . . . . . . . 363
To configure agents. . . . . . . . . . . . . . . . . . . . . . . . . . . . . . . . . . . . . . . . . . . . . . 364
Adding Agents . . . . . . . . . . . . . . . . . . . . . . . . . . . . . . . . . . . . . . . . . . . . . . . . . . . . . . . . . . . . . . . . . . 364
Editing Agents . . . . . . . . . . . . . . . . . . . . . . . . . . . . . . . . . . . . . . . . . . . . . . . . . . . . . . . . . . . . . . . . . . 366
Deleting Agents . . . . . . . . . . . . . . . . . . . . . . . . . . . . . . . . . . . . . . . . . . . . . . . . . . . . . . . . . . . . . . . . . 366
To configure agent groups . . . . . . . . . . . . . . . . . . . . . . . . . . . . . . . . . . . . . . . . 367
Adding Agent Groups . . . . . . . . . . . . . . . . . . . . . . . . . . . . . . . . . . . . . . . . . . . . . . . . . . . . . . . . . . . . 367
Editing Agent Groups . . . . . . . . . . . . . . . . . . . . . . . . . . . . . . . . . . . . . . . . . . . . . . . . . . . . . . . . . . . . 368
Deleting Agent Groups . . . . . . . . . . . . . . . . . . . . . . . . . . . . . . . . . . . . . . . . . . . . . . . . . . . . . . . . . . . 369
To configure members of an agent group . . . . . . . . . . . . . . . . . . . . . . . . . . . . 370
Adding an agent to an agent group . . . . . . . . . . . . . . . . . . . . . . . . . . . . . . . . . . . . . . . . . . . . . . . . . 370
Removing an agent from an agent group . . . . . . . . . . . . . . . . . . . . . . . . . . . . . . . . . . . . . . . . . . . . 370
To configure queues . . . . . . . . . . . . . . . . . . . . . . . . . . . . . . . . . . . . . . . . . . . . . 371
Adding Queues. . . . . . . . . . . . . . . . . . . . . . . . . . . . . . . . . . . . . . . . . . . . . . . . . . . . . . . . . . . . . . . . . . 371
Editing Queues. . . . . . . . . . . . . . . . . . . . . . . . . . . . . . . . . . . . . . . . . . . . . . . . . . . . . . . . . . . . . . . . . . 373
Deleting Queues. . . . . . . . . . . . . . . . . . . . . . . . . . . . . . . . . . . . . . . . . . . . . . . . . . . . . . . . . . . . . . . . . 373
To configure responses. . . . . . . . . . . . . . . . . . . . . . . . . . . . . . . . . . . . . . . . . . . 375
Adding Responses. . . . . . . . . . . . . . . . . . . . . . . . . . . . . . . . . . . . . . . . . . . . . . . . . . . . . . . . . . . . . . . 376
Editing Responses . . . . . . . . . . . . . . . . . . . . . . . . . . . . . . . . . . . . . . . . . . . . . . . . . . . . . . . . . . . . . . . 377
Deleting Responses . . . . . . . . . . . . . . . . . . . . . . . . . . . . . . . . . . . . . . . . . . . . . . . . . . . . . . . . . . . . . . 377
Configuring 6110 CCM . . . . . . . . . . . . . . . . . . . . . . . . . . . . . . . . . . . . . 378
To configure Account Codes . . . . . . . . . . . . . . . . . . . . . . . . . . . . . . . . . . . . . . 378
Adding an Account Code . . . . . . . . . . . . . . . . . . . . . . . . . . . . . . . . . . . . . . . . . . . . . . . . . . . . . . . . . 378
Editing an Account Code. . . . . . . . . . . . . . . . . . . . . . . . . . . . . . . . . . . . . . . . . . . . . . . . . . . . . . . . . . 380
Deleting an Account Code. . . . . . . . . . . . . . . . . . . . . . . . . . . . . . . . . . . . . . . . . . . . . . . . . . . . . . . . . 381
To configure Make Busy Reason Codes . . . . . . . . . . . . . . . . . . . . . . . . . . . . . 382
Adding a Make Busy Reason Code . . . . . . . . . . . . . . . . . . . . . . . . . . . . . . . . . . . . . . . . . . . . . . . . . 382
Editing a Make Busy Reason Code . . . . . . . . . . . . . . . . . . . . . . . . . . . . . . . . . . . . . . . . . . . . . . . . . 383
Deleting a Make Busy Reason Code . . . . . . . . . . . . . . . . . . . . . . . . . . . . . . . . . . . . . . . . . . . . . . . . 383
Changing 6150 MCC options. . . . . . . . . . . . . . . . . . . . . . . . . . . . . . . . 384
To change the IP address and port number . . . . . . . . . . . . . . . . . . . . . . . . . . 385
To open Outlook 2000 . . . . . . . . . . . . . . . . . . . . . . . . . . . . . . . . . . . . . . . . . . . . 386
Opening Outlook 2000 . . . . . . . . . . . . . . . . . . . . . . . . . . . . . . . . . . . . . . . . . . . . . . . . . . . . . . . . . . . . 386
Manually loading the 6150 MCC plug-in. . . . . . . . . . . . . . . . . . . . . . . . . . . . . . . . . . . . . . . . . . . . . . 386
To view the 6150 MCC inbox when Outlook starts up . . . . . . . . . . . . . . . . . . 387
To display 6150 MCC shortcuts . . . . . . . . . . . . . . . . . . . . . . . . . . . . . . . . . . . . 390
To display the log on window when Outlook 2000 opens . . . . . . . . . . . . . . . 391
To make Outlook your top window when an e-mail arrives. . . . . . . . . . . . . . 392
To direct e-mail to the 6150 MCC inbox . . . . . . . . . . . . . . . . . . . . . . . . . . . . . . 393
To change the 6150 MCC e-mail arrival sound file . . . . . . . . . . . . . . . . . . . . . 394
Setting agent actions . . . . . . . . . . . . . . . . . . . . . . . . . . . . . . . . . . . . . . 395
To log on to 6150 MCC. . . . . . . . . . . . . . . . . . . . . . . . . . . . . . . . . . . . . . . . . . . . 395
To log off from 6150 MCC . . . . . . . . . . . . . . . . . . . . . . . . . . . . . . . . . . . . . . . . . 396
To set a Make Busy Reason Code . . . . . . . . . . . . . . . . . . . . . . . . . . . . . . . . . . 397
To remove Make Busy . . . . . . . . . . . . . . . . . . . . . . . . . . . . . . . . . . . . . . . . . . . . 398
Responding to an e-mail . . . . . . . . . . . . . . . . . . . . . . . . . . . . . . . . . . . . 399
To set an Account Code . . . . . . . . . . . . . . . . . . . . . . . . . . . . . . . . . . . . . . . . . . 400
To hold an e-mail . . . . . . . . . . . . . . . . . . . . . . . . . . . . . . . . . . . . . . . . . . . . . . . . 401
To transfer an e-mail . . . . . . . . . . . . . . . . . . . . . . . . . . . . . . . . . . . . . . . . . . . . . 402
To set No Reply Needed . . . . . . . . . . . . . . . . . . . . . . . . . . . . . . . . . . . . . . . . . . 403
To send a reply. . . . . . . . . . . . . . . . . . . . . . . . . . . . . . . . . . . . . . . . . . . . . . . . . . 403
Viewing e-mail history . . . . . . . . . . . . . . . . . . . . . . . . . . . . . . . . . . . . . . 404
To view e-mail history . . . . . . . . . . . . . . . . . . . . . . . . . . . . . . . . . . . . . . . . . . . . 404
To view Current Case . . . . . . . . . . . . . . . . . . . . . . . . . . . . . . . . . . . . . . . . . . . . . . . . . . . . . . . . . . . . . 406
To view Entire History . . . . . . . . . . . . . . . . . . . . . . . . . . . . . . . . . . . . . . . . . . . . . . . . . . . . . . . . . . . . . 407
To view a Specific E-mail . . . . . . . . . . . . . . . . . . . . . . . . . . . . . . . . . . . . . . . . . . . . . . . . . . . . . . . . . . 408
To view the Current E-mail . . . . . . . . . . . . . . . . . . . . . . . . . . . . . . . . . . . . . . . . . . . . . . . . . . . . . . . . . 410
Creating and using a 6150 MCC template . . . . . . . . . . . . . . . . . . . . . . 411
To create a template. . . . . . . . . . . . . . . . . . . . . . . . . . . . . . . . . . . . . . . . . . . . . . 411
To use a 6150 MCC template. . . . . . . . . . . . . . . . . . . . . . . . . . . . . . . . . . . . . . . 413
Viewing Mini Queue Now Stats. . . . . . . . . . . . . . . . . . . . . . . . . . . . . . . 414
To view Mini Queue Now Stats . . . . . . . . . . . . . . . . . . . . . . . . . . . . . . . . . . . . . 414
To view the repository . . . . . . . . . . . . . . . . . . . . . . . . . . . . . . . . . . . . . . . . . . . . 415
To view the original e-mails . . . . . . . . . . . . . . . . . . . . . . . . . . . . . . . . . . . . . . . . . . . . . . . . . . . . . . . . 415
To view the e-mail replies . . . . . . . . . . . . . . . . . . . . . . . . . . . . . . . . . . . . . . . . . . . . . . . . . . . . . . . . . . 415
Appendix A . . . . . . . . . . . . . . . . . . . . . . . . . . . . . . . . . . . . . . . . . . . . . . . 416
6150 MCC Terminology . . . . . . . . . . . . . . . . . . . . . . . . . . . . . . . . . . . . . . . . . . . 416
*ORVVDU\

&KDSWHU7KHSUDLULH)\UH&RQWDFW
&HQWHU6ROXWLRQVVXLWH
&KDSWHUSUDLULH)\UH&RQWDFW&HQWHU0DQDJHPHQWVXLWH
SUDLULH)\UH&RQWDFW&HQWHU6ROXWLRQVVXLWH
)HDWXUHVDQGEHQHILWV
The prairieFyre suite provides the following functionality:
• The browser-based user interface works across all 32-bit Windows platforms.
• It operates in conjunction with familiar office productivity tools.
• It is installed on the server only and can be accessed by an unlimited number of users.
• Configuration changes instantly deploy from the server to authorized intranet and Internet-based clients.
• You can remotely manage call center operations and restrict user access to program functions and
individual call center elements — log on to any PC and monitor call center operations and program
system features.
The prairieFyre Contact Center Solutions suite is designed for the SX-2000, SX-200, and SX-200 with real-
time (SX-200 EL/ML LIGHTWARE Release 4.0 and greater) telephone systems. With the prairieFyre suite,
you can manage your call center from anywhere, at any time. The suite provides data collection, analysis and
storage, forecasting, real-time monitoring, online messaging, historical reporting, data mining, and wall sign
messaging.
/LFHQFLQJ
NOTE: An employee is a physical person being tracked in your call center. Employees can have multiple
agent IDs. The number of employees you program in the YourSite Database must be consistent with your
software licence. If you have more employees programmed than your licence permits, “[licence Is In
Violation of Max Agents Allowed]” will appear in place of your company name on the 6110 CCM user
interface (UI) and on any reports you generate.
$ERXWWKH&&08VHU*XLGH
The 6110 Contact Center Manager User Guide provides information on the basics of ACD call center
management and the use of 6110 CCM programs. The topics covered require the user to have a working
knowledge of the Microsoft Windows operating environment and Microsoft Excel 97 or 2000. The tutorials
that accompany Windows and Excel provide the information necessary for basic use.
8VHUJXLGHOD\RXW
&KDSWHUSUDLULH)\UHVXLWH
Chapter 1 describes the features and benefits of the prairieFyre suite, the layout of the document, and basic
information about client downloads from our Web site.
&KDSWHU&DOOFHQWHUFRQFHSWV
Chapter 2 describes the inbound call center environment and how resources interact to process calls.
Call centers process a high volume of calls to meet marketing, sales, customer service, technical support, and
other business objectives. A fine-tuned call center distributes calls efficiently and optimizes the use of agents
and other resources.
&KDSWHU3ODQQLQJDQGPDQDJLQJ\RXUFDOOFHQWHU
Chapter 3 instructs you on how to plan and manage your call center.
&KDSWHU0DQDJHPHQW&RQVROH
Chapter 4 instructs you on how to configure the 6110 CCM server.
Management Console is located on the 6110 CCM Enterprise server. With Management Console, you can
troubleshoot 6110 problems, manage the SQL database, inspect the SQL database object and back up and
restore the database, or critical portions of the database.
&KDSWHU<RXU6LWH
Chapter 5 instructs you on how to configure your database and security. You add elements and groups to the
database in the Configuration module. You program and enforce security in the Security module.
When you configure the YourSite Database, it must reflect the trunks, lines, routing and timing options, and
agent positions in use on the telephone system. You can register account codes in YourSite for individual
departments, projects, and services to generate reports. For example, an agent who receives calls for three
catalog companies enters account code 1 for calls to company X, account code 2 for calls to company Y, and
account code 3 for calls to company Z.
You enter resource information in YourSite so that you can generate reports with 6110 CCM. If you register
the aforementioned catalog companies in YourSite, 6110 CCM generates reports on the number, origin, and
handling of calls to the three companies.
You implement security to restrict the database teams and groups that individual users view when generating
reports and monitoring real-time activities. If you do not implement security, then 6110 CCM users will see all
of the devices, reports, and users listed in YourSite when running reports and monitoring real-time activities.
&KDSWHU5HDOWLPH0RQLWRUV
Chapter 6 instructs you on how to configure and use SuperAdvisor and AgentAdvisor. With SuperAdvisor,
supervisors can view agent states and statistics in real-time. With AgentAdvisor, agents can view their own
states and statistics.
6XSHU$GYLVRU
The SuperAdvisor program provides real-time and cumulative agent statistics, and real-time, by 15-minute
intervals, over-the business-day, queue statistics. You can view real-time statistics across multiple queues or
agents. You can define alarm thresholds for individual queues or across all queues, and customize display
characteristics. SuperAdvisor includes an online chat feature that communicates essential information to one
or more agents or supervisors quickly and securely.
&KDSWHUSUDLULH)\UH&RQWDFW&HQWHU0DQDJHPHQWVXLWH
$JHQW$GYLVRU
The AgentAdvisor program provides real-time agent statistics. It displays the agent state, agent name, agent
number, extension number (or queue number for On ACD and on ACD Hold agents), and time in state for
each agent. AgentAdvisor also provides real-time and over-the-business-day queue statistics. The displays
change color when pre-defined performance thresholds are exceeded to keep agents informed of significant
changes in the service provided to callers. AgentAdvisor includes a chat feature agents use to send online
messages to supervisors.
&KDSWHU5HSRUWHUDQG6FKHGXOHG5HSRUWV
Chapter 7 instructs you on how to create reports and scheduled reports. You use Reporter to produce run-on-
demand reports, and Scheduled Reports to set up timetables for generating reports.
The Reporter and Scheduled Reports programs provide detailed statistics on the performance of your call
center resources. You can generate load activity, resource activity, ACD queue activity, and forecast reports
for 15, 30, or 60-minute intervals across any series of days you specify.
The reporting programs provide presentation quality reports and graphs in a Microsoft Excel spreadsheet.
You can customize the content and style of report grids and graphs directly in your browser.
5HSRUW'LVWULEXWRU
The Report Distributor application prints and e-mails your reports and displays the status of your printing and
mailing jobs. It runs in the system tray on your computer and must be running at all times in order to print and
e-mail reports automatically.
&KDSWHU'DWDPLQLQJ
Chapter 8 instructs you on various data-mining tools: Inspector, Advanced Inspector, and SuperAuditor.
,QVSHFWRU
Inspector finds specific call center events, such as the exact time an agent logs off at lunch, the duration of
time agents spend in Do Not Disturb from 1:00 P.M. to 2:00 P.M. on Monday, or the maximum number of
callers that waited in queue for the day. In a single session you can search through the data from multiple days
to find a specific event. The search follows a wild-card format; your specifications do not have to be exact.
You can make the search as inclusive or exclusive as you wish. Inspector displays the results in an easy-to-
interpret grid that you can print or save to file.
$GYDQFHG,QVSHFWRU
Using Advanced Inspector, you can determine why there are discrepancies between reports, verify the
programming of the telephone system and the YourSite Database, and compare the data output by the ACD
and SMDR data streams. The results are displayed in a table. The search output also provides a written
explanation for the results.
6XSHU$XGLWRU
With SuperAuditor you can view historical real-time events for any date, at your own pace. As you are
viewing the event, you can step forward, jump forward, advance to the end of the day, or rewind to the
beginning of the day. SuperAuditor makes it possible for you to analyze when and why past service problems
occur. With this knowledge, you can easily solve similar problems in the future.
&KDSWHU7KH(QWHUSULVH1RGH&(1
Chapter 9 instructs you on how to configure both local and remote nodes.
The Enterprise Node permits supervisors to access data from remote sites with a PC using Internet Explorer. A
node is also known as a collector.
&KDSWHU1HWZRUNDQG&ROOHFWRU0RQLWRUV
Chapter 10 instructs you on how to use the Network and Collector Monitors.
1HWZRUN0RQLWRU
With the Network Monitor, you can connect to a node (collector), view real-time data collection for all nodes,
enable a popup alarm that notifies you of any data and system alarms, re-initialize the server, and view the
Collector Monitor, which provides detailed node information.
&ROOHFWRU0RQLWRU
The Collector Monitor verifies that the Collector Service is collecting real-time data from your telephone
system. It forwards the real-time data to connected clients and to the Structured Query Language (SQL)
database. With the Collector Monitor, you can view detailed node information.
&KDSWHU:DOO%RDUGHU
Chapter 11 instructs you on how to configure and use WallBoarder.
WallBoarder uses one or more Spectrum Light Emitting Diode (LED) wall signs (reader boards) to provide
real-time ACD statistics to agents and supervisors, such as the number of calls in queue, the wait time of the
longest waiting caller, and the number of available agents. You can customize the size and color of the
displayed statistics and the way they move across the wall sign.
&KDSWHU,QWHUDFWLYH&RQWDFW&HQWHU
6115 CCM is a purchasable option that complements the SX-2000 and 3200 ICP/3300 ICP (Integrated
Communications Platform) telephone systems.
Chapter 12 instructs you on how to configure and use SuperAdvisor and AgentAdvisor when used in
conjunction with 6115 Interactive Contact Center.
With SuperAdvisor and 6115 CCM, supervisors can interact with agent states in real-time. Supervisors can
control the availability of agents and ACD queues. They can log an agent out of one queue and into a busier
queue, or place the agent in make busy or do not disturb. In addition, they can log a queue in and out, or place
the queue in make busy or do not disturb.
With AgentAdvisor and 6115, agents have more control over their own states.
&KDSWHU&RQWDFW&HQWHU6FKHGXOLQJ
Chapter 13 instructs you on how to produce a 4Sight report. The 4Sight report can be imported into 6120 CCS
to predict future workforce scheduling demands. For more information on 6120 CCS, please read the 6120
Contact Center Scheduling User Guide.
&KDSWHUSUDLULH)\UH&RQWDFW&HQWHU0DQDJHPHQWVXLWH
Reporter and Scheduled Reports include a 4Sight report. You can accurately predict resource requirements
using the Erlang C formula. Erlang C uses your historical call load data, average talk time data, service level
percent, service level time, and wrap up time you specify to predict the agent requirement for the time
interval and date range in the forecast.
&KDSWHU0XOWLPHGLD&RQWDFW&HQWHU
Chapter 14 instructs you on how to use 6150 CCM.
8VHUJXLGHFRQYHQWLRQV
This user guide uses the following document conventions.
8VHU,QWHUIDFH8,V\QWD[
The following terms apply to actions you perform on user interface (UI) screens:
• Click precedes items you select with the mouse, such as buttons and items in list boxes.
• Press precedes items you select on the keyboard.
• Select or clear precedes items you turn on or turn off, such as check boxes.
• Select precedes items you select in combo boxes (text boxes with attached list boxes).
• Using a drag-and-drop operation means clicking an object on the screen with the left mouse button,
and pressing the mouse button while you drag the object to a different position on the screen.
For example: click OK; press ENTER; select the PFDatabase check box.
,WDOLF
Italic typeface is used to set off words, letters, and numbers referred to as themselves in the text, and for
characters or words you type in the user interface. For example: overflow is the routing of calls to more than
one queue; the program saves text files as MMDDYYYY.sql.
4XRWDWLRQPDUNV
Quotation marks are used for memorable or well known information. For example: perform “what-if”
scenarios on the resultant data.
%ROG
Bold designates paths you select in your root directory and items you click, press, or select. For example:
Click OK; delete 50 and insert 60; select the Check database integrity check box.
0HQXLWHPV
Menu items you select are separated by an arrow [=>]. For example, File=>Open tells you to select the Open
submenu on the File menu.
1RWH
The word NOTE: designates essential user information.
&OLHQWGRZQORDGVIURPWKH&&0:HEVLWH
&OLHQW'RZQORDGV
Client Downloads consists of the Critical Component Pack, the Client Component Pack, and Optional
Component Pack.
&ULWLFDO&RPSRQHQW3DFN
The following Supervisor Desktop applications are included in the Critical Component Pack: MS Visual
Basic version 6 Runtimes, MS MFC 6.2 version 6 Runtimes, MS MDAC 2.6 Runtimes, MS Standard OCX
and DLL Redistributables, and Third Party licenced Redistributables Required by 6110 CCM/6150 MCC
Programs.
&OLHQW&RPSRQHQW3DFN
The following Supervisor Desktop applications are included in the Client Component Pack:
AgentAdvisor
AgentAdvisor is an Agent Desktop applications for agent computers.
This is a download for 6110 CCM that provides a subset of the functionality of SuperAdvisor. It runs as an
executable program instead of from within the Internet Explorer environment.
Excel Report Templates
These are the templates for all 6110 CCM performance reports. You must install these on your TEMP
directory before you can run any reports. If you change or customize your report templates, please ensure you
back up your files before re-running this installation.
Report Distributor
With this download you can print your scheduled reports from your computer. When installed, the Report
Distributor resides in your system tray.
Network Monitor
The Network Monitor indicates if your ACD and SMRD data streams are running. If the data streams are not
running, you can easily clear the alarms that indicate the data streams are not running and reset the ACD and
SMRD links.
Auto Update
If you upgrade your server the Auto Update download will notify you when you open Outlook that a new
version of the 6150 Mulitmedia Contact Center is available.
6150 MCC Outlook Extensions
With the 6150 Mulitmedia Contact Center Outlook Extensions download you can run 6150 MCC.
&KDSWHUSUDLULH)\UH&RQWDFW&HQWHU0DQDJHPHQWVXLWH
2SWLRQDO&RPSRQHQWV
Microsoft Data Access Components (MDAC) 2.6
This is a Microsoft installation that provides access to your structured data across a network connection. It is
required for all prairieFyre clients.
Adobe Acrobat Reader
This is the Adobe Acrobat Reader installation for version 5.5. You require Acrobat Reader to view the online
user guide and user tutorial.
prairieFyre provides the following additional supporting applications.
Microsoft Internet Explorer 6.0
6110 CCM requires at least IE 6.0 to function.
CyberTerminal
This is an optional installation required if you are running a call center with a Mitel SX-200 Digital PBX, and
you have not purchased the ACD real-time event option from Mitel or your Interconnect. This is the server
component that provides a networked-based VT-100 session for clients on the 6110 CCM network. Please
refer to the online Help or Chapter 7 of this guide for a more detailed description.
CEN
CEN software implements mulit-site call center capabilities with a single server configuration. The CEN
software is designed for geographically dispersed call centers requiring consolidated management reporting
and real-time capabilities. CEN software can be installed on a remote Windows NT/2000 Server or Window
2000 Professional computers. Please do not install CEN on the Enterprise 6110 CCM Server computer.
1DYLJDWLQJ&&0
The following tips will help you navigate efficiently in 6110 CCM.
9LHZLQJPXOWLSOHVHVVLRQVRI&&0
Sometimes you will need to view two or more 6110 CCM programs simultaneously. For example, you open
two or more sessions to perform multiple searches for event records, and to compare report data to SMDR
search results.
To run multiple 6110 CCM sessions:
1. In the browser, type in the 6110 CCM Server IP address http://[your 6110 CCM Server address]/
6110 CCM/. Alternatively, double-click the 6110 CCM desktop icon.
2. If you do not see the 6110 CCM desktop icon, to create a shortcut to 6110 CCM, drag-and-drop the
6110 CCM Web address to your desktop.
3. Click Add to Favorites to add the 6110 CCM Server IP address to your list of favorite addresses and
click OK.
4. Click Favorites, locate the prairieFyre 6110 CCM entry (at the bottom of the list) and move it to the
top of the list using a drag-and-drop operation.
5. Optionally click Make Home Page to set the 6110 CCM Server IP address as your home page.
6. Enter your username and password and click Submit.
7. Click Change Password and change your 6110 CCM password.
You can start additional 6110 CCM sessions by clicking the Internet Explorer icon on the Windows Taskbar
and selecting 6110 CCM from your list of favorites.
Alternatively, you can click Tools=>Internet Options and set your Home Page to the 6110 CCM program
(your 6110 CCM Server IP address) to run multiple sessions. You start the first instance of 6110 CCM by
clicking the 6110 CCM desktop icon, and the second (and subsequent) 6110 CCM sessions by clicking the
Internet Explorer icon on the Windows Taskbar.
You can open multiple browser sessions of the SuperAdvisor, YourSite Configuration, ACD Inspector, SMDR
Inspector, and ACDLink applications from their respective menus.
For example, to open a new session of SMDR Inspector:
1. Click the 6110 CCM desktop icon and log on to 6110 CCM.
2. On the Tools menu, right-click SMDR Inspector.
3. Click Open in New Window to start SMDR Inspector in a new browser session.
6110 CCM displays the new SMDR Inspector session in addition to your original 6110 CCM session.
NOTE: You can switch between 6110 CCM sessions by holding down the Alt key and pressing the Tab key
until you locate the desired session.
&KDSWHUSUDLULH)\UH&RQWDFW&HQWHU0DQDJHPHQWVXLWH

&KDSWHU&DOOFHQWHUFRQFHSWV
$ILQHWXQHGFDOOFHQWHUGLVWULEXWHV
FDOOVHIILFLHQWO\DQGRSWLPL]HVWKH
XVHRIDJHQWVDQGRWKHUUHVRXUFHV

&KDSWHU&DOOFHQWHUFRQFHSWV
&DOOFHQWHUFRQFHSWV
Call centers process a high volume of calls to meet marketing, sales, customer service, technical support, and
other business objectives. A fine-tuned call center distributes calls efficiently and optimizes the use of agents
and other resources. This chapter describes the inbound call center environment and how resources interact to
process calls.
7KH$&'SURFHVV
An Automatic Call Distributor (ACD) is a specialized telephone system program for distributing incoming
calls. The primary goal of an ACD is to ration calls to agents in a cost-effective manner that provides
acceptable service to callers.
To optimize the use of agents, you cross-train them so they can handle a variety of inquiries. Rather than
distributing calls to a number of small, specialized agent or extension groups, the ACD distributes them
efficiently among the entire pool of available agents. When you consolidate resources (use the Pooling
Principle), the same number of call center agents handle more calls while maintaining service levels.
Typically, you program the ACD to ensure the first call to arrive reaches the first available agent or the agent
who has been idle the longest. However, you can vary the order of calls and agents to provide superior service
to preferred customers, and skills-based routing.
$&'FDOOIORZ
Figure 2-1 illustrates how call center resources interact to process calls.
)LJXUH$&'FDOOIORZ
The path of an incoming call is as follows. A caller telephones your call center via the Public Switched
Telephone Network (PSTN). (The PSTN is a global collection of Central Offices (COs) interconnected by
long-distance telephone switching systems.) The local CO directs the call to one of your trunk groups. An
available trunk picks up the call. Typically, calls from the PSTN arrive to the call center over incoming trunks
and calls from the call center to the PSTN travel over outgoing trunks. If no trunks are available, the call does
not get through to the system (is blocked) and the caller receives a busy signal.
When a trunk picks up a call, it forwards it through to a group of agents answering calls, or to some other
answering point. The call arrives at the ACD queue of an agent group. The queue delays the call rather than
blocking the call from entering the system. The length of time the caller waits in queue is the queue time.
While waiting in queue, the caller listens to product features, announcements, or other messages provided by
a Recorded Announcement Device (RAD). The caller can wait patiently in queue for an available agent, leave
a voice mail message, or hang up (abandon) the call.
An agent answers the call. The time the caller spends talking to the agent is the talk time. When the call is
completed, the agent may need to perform additional work associated with the call. The time taken to perform
this work is the wrap up time.
0RQLWRULQJWKHFDOOIORZSURFHVV
Second-by-second (real-time) statistics presented on wall signs and desktop monitors enable you to monitor
the service provided to callers. You can monitor the number of incoming calls, the time it takes to process
them, the queue load, and the availability of agents using a Management Information System (MIS). The term
MIS refers to the processing of data produced by the telephone system. The MIS uses telephone system
records to provide forecasting, real-time monitoring, and reporting functions.
(QVXULQJWUDIILFFDUU\LQJHIILFLHQF\
To optimize traffic-carrying efficiency ensure
• Sufficient trunks are available to carry incoming calls.
• Callers experience a delay in queue.
• There is a random distribution of calls among available agents.
6FKHGXOLQJWRRSWLPL]HFDOOIORZ
You schedule agents so the number of incoming calls at any given time typically exceeds the number of agents
currently available. The intent is that callers experience a slight delay before agents answer their calls. The
expected number of incoming calls forecasted for the time of day, and day of the week influence scheduling
decisions.
&DOOURXWLQJ
Call routing options you program in the telephone system provide a set of instructions that automate the
movement of calls to their intended answering points. You can define options—if the caller dials 1 forward the
call to customer service. You can specify re-routing for calls not answered after a set period of time and parse
incoming Automatic Number Identification (ANI) and Dialed Number Identification Service (DNIS) data to
direct call routing. Figure 2-2 illustrates some common routing options.
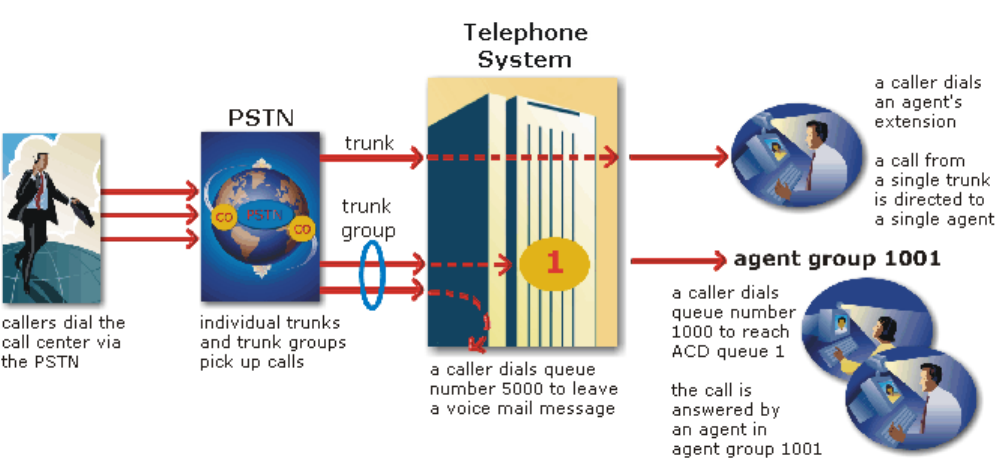
&KDSWHU&DOOFHQWHUFRQFHSWV
)LJXUH&DOOURXWLQJ
'LDOLQJDQDJHQW¶VH[WHQVLRQ
In the simplest call scenario, a single trunk picks up an incoming call to your call center. The telephone system
presents the caller with options to dial various answering points. The caller dials an individual agent at an
extension through a queue number. A queue number is an address mechanism for a queue or other answering
point. The programming associated with the queue number defines the routing and timing features of the call.
The telephone system collects data on the agent and trunk involved in the call. The ACD management
reporting program produces reports on agent and trunk activity.
'LDOLQJDTXHXH
In the next call scenario a trunk group picks up an incoming call to your call center. The system presents the
caller with options to dial various answering points. The caller dials queue number 1 to reach queue 1
(Customer Service). The system forwards the call to the first available agent in the agent or extension group
associated with queue 1. The call is an ACD call because one dialable number represents all agents in the
group. The telephone system collects data records for the call. The ACD management software produces
Queue Reports on queue 1.
&DOORYHUIORZ
An ACD call that is not answered immediately is placed in a queue. If an agent does not pick up the call after
a set amount of time (the overflow time) the system places the call in the queue of another agent group, in
addition to keeping it in the first queue. The first available agent in either group answers the call. The
overflow feature limits the delay faced by callers by queuing calls against two or more agent groups, as
illustrated in Figure 2-3.
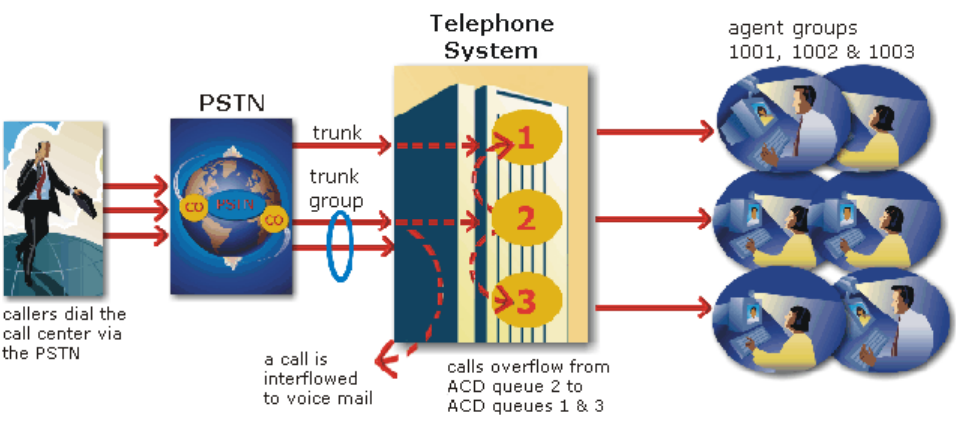
)LJXUH0XOWLSOHTXHXHURXWLQJ
&DOOLQWHUIORZ
You can program the telephone system to direct a queue delayed call to voice mail or to another answering
point. The interflow timer runs independently of the overflow timer. If the interflow timer expires, the system
removes the call from the queue and re-directs it to another answering point, such as a trunk or voice mail.
8QGHUVWDQGLQJWKHLQERXQGFDOOHQYLURQPHQW
The inbound call center environment has unique characteristics that must be considered in effective planning
and management.
5DQGRPDQGSUHGLFWHGFDOODUULYDO
Calls arrive randomly to call centers. You cannot predict the minute-to-minute arrival of calls. This results in
unanticipated increases in workload, and impacts staffing calculations and the load carried by system and
network resources.
You can predict the pattern of call arrivals for 15-minute or longer intervals. For example, you can predict that
next Monday between 1:00 P.M. and 1:30 P.M. you will receive 60 phone calls. However, you cannot predict
how many calls will arrive in the first five minutes, the second five minutes, and so on.
&DOOHUWROHUDQFH
Several factors influence a caller’s tolerance to queue delays:
• The immediacy of the caller’s requirement
• The availability of similar products or services
• The caller’s expectations for service
• The time available to make the call
• Whether or not the caller is paying for the call
&KDSWHU&DOOFHQWHUFRQFHSWV

&KDSWHU3ODQQLQJDQGPDQDJLQJ
\RXUFDOOFHQWHU
(QVXUH\RXKDYHWKHULJKW
UHVRXUFHVLQSODFHDWWKHULJKW
WLPHVWRKDQGOHDQDFFXUDWHO\
IRUHFDVWHGZRUNORDGDWWKHGHVLUHG
OHYHORIVHUYLFH
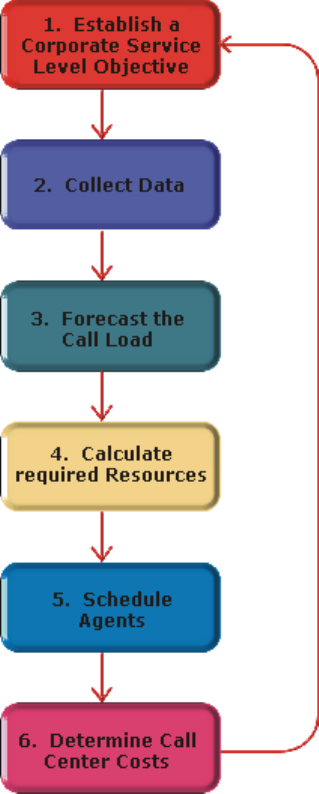
&KDSWHU3ODQQLQJDQGPDQDJLQJ\RXUFDOOFHQWHU
3ODQQLQJDQGPDQDJLQJ\RXUFDOOFHQWHU
Effective call center management involves having the right resources in place at the right times to handle an
accurately forecasted workload at the desired level of service. Commitment to a systematic planning and
management strategy is essential; the strategy is based on corporate objectives that you continually access and
refine.
Whether you are managing a start-up call center or refining the performance of an existing operation, the
process illustrated in Figure 3-1 applies. It is the basic framework for achieving and maintaining your service
objectives.
)LJXUH3ODQQLQJF\FOH
The objective of call center management is to find the right balance between the agents scheduled and the
service provided to customers. This involves assessing and re-assessing trade-offs between the service level,
agents scheduled, and average call duration for a known call load for each 15-minute or half-hour interval of
the day. Collecting, properly interpreting, and applying ACD and other information allows you to accurately
forecast the workload and schedule sufficient agents to meet your service objectives.
6WHSHVWDEOLVKDFRUSRUDWHVHUYLFHOHYHOREMHFWLYH
Defining and adequately funding a service level should be closely tied to your corporate mission. The service
level identifies the average length of time a caller who has obtained a trunk waits for an available agent. It is
the basis for planning and budgeting and links the resources you require to your service objectives. Choosing
a service objective is the first step in a comprehensive planning and management solution. Once you set a
service objective, you should routinely access it to see how consistently you are meeting it, on a 15-minute or
half-hour basis.
Call centers in different industries use different criteria for measuring service. Your service level objective
should reflect the type of service being provided and the expectations of callers seeking the service. For
example, a company that sells magazine subscriptions has less to lose in the outcome of any one call than a car
dealership does. A caller to a credit card “lost or stolen” line might expect different service than a caller to a
customer service department at a bank. Call center metrics across industries are designed to reflect this.
Performance targets must suit the primary function of a call center. In revenue-based call centers where agents
sell products or services, the net revenue per call is considered when defining a service objective. Revenue-
based call centers strive to provide a high level of service with minimal blocking and delays.
In cost-based call centers where agents provide customer service, call handling incurs costs but does not
provide additional revenues. The level of service in cost-based call centers is typically not as high as the level
of service in revenue-based centers. Although the chance of blocking is minimal, an almost certain delay in
the ACD queue is to be expected.
6HUYLFHGHILQHG
Service level is expressed as X percent of calls answered in Y seconds, such as 80 percent of calls answered in
20 seconds. Why is service level the standard measurement of service? The answer is service level provides
the most accurate representation of the callers’ experience; it is ultimately the caller who decides what
constitutes good service, and whether or not to end a call. The service level is sometimes called the telephone
service factor (TSF). It applies to inbound transactions that must be addressed as they arrive.
6HUYLFH/HYHO
The term service level is total number of calls which are answered, abandoned, and interflowed before a
defined threshold time (Service Level Time), compared to the total number of calls answered, abandoned, and
interflowed. It’s the average length of time a caller who has obtained a trunk waits for an available agent. The
service level = (Calls Answered + Long Calls Abandoned + Long Interflow) within the Service Level Time ÷
(Calls Answered + Long Calls Abandoned + Long Interflow).
6HUYLFH/HYHO3HUFHQW
The service level percent is the proportion of calls, expressed as a percentage, which are answered,
abandoned, and interflowed within a defined threshold time compared to the total number of calls answered or
abandoned (after the short abandon time).
6HUYLFH/HYHO7LPH
The service level time is the threshold time used in calculating the service level percentage, such as 90 percent
of calls answered in 20 seconds. The service level percentage and service level time are parameters you define
as your service objective.
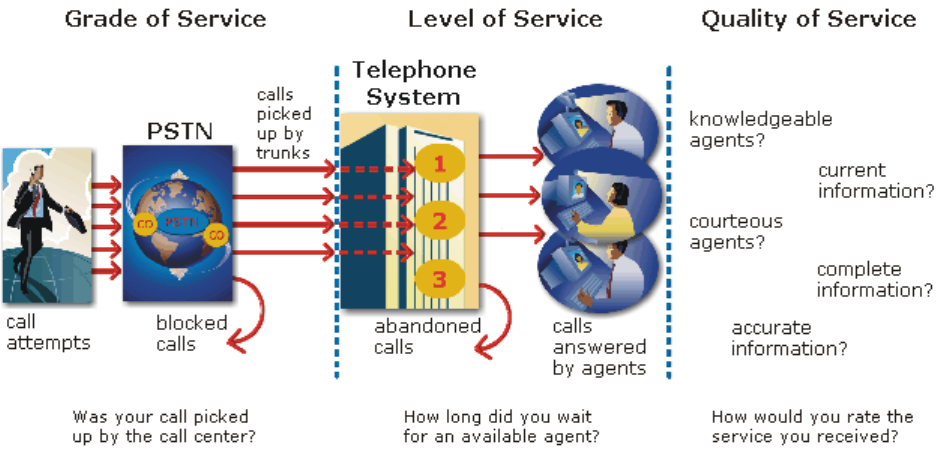
&KDSWHU3ODQQLQJDQGPDQDJLQJ\RXUFDOOFHQWHU
:K\LVVHUYLFHOHYHOPRUHPHDQLQJIXOWKDQRWKHUPHWULFV"
Service level is one of many ACD statistics used to measure performance. Each statistic has its purpose. For
example, the grade of service (GOS) statistic relates the number of trunks to the level of traffic and indicates
the likelihood an attempted call will receive a busy signal. It is expressed as a decimal fraction. For example,
a GOS of P.02 means a caller will have a two percent chance of receiving a busy signal. Since trunk costs are
insignificant compared to agent costs call centers are well advised to schedule sufficient trunks; abandons
should be minimal.
A delayed call is a call placed in the ACD queue because it can not be answered immediately by an agent.
The probability of delay statistic relates the number of agents or extensions to the level of traffic carried by the
trunks and indicates the likelihood and amount of delay experienced. The GOS, probability of delay, and
quality of service rendered by agents provide vital information about the callers’ experience, as illustrated in
Figure 3-2.
)LJXUH6HUYLFHFULWHULD
The GOS and probability of delay contribute to our understanding of what happens to the calls not answered
in Y seconds, and give meaning to service level. Service level is the primary statistic used in planning and
budgeting because it is the most stable measurement of queue activity.
$6$
The average speed of answer (ASA) is an ACD statistic that measures how long the average caller waits on
hold before his or her call is picked up by an agent. ASA is a valuable measure of service quality, but is often
misinterpreted. The average does not represent what is typically experienced by individual callers. Most calls
are answered by agents more quickly than the average, but a small percentage of callers wait several minutes
in queue. ASA is a useful parameter, but service level is a more reliable indicator of what callers experience.
$EDQGRQPHQW
ACDs collect statistics on how long callers wait before abandoning calls, and what percentage of calls are
abandoned. Unfortunately, abandonment is difficult to forecast because it is impossible to predict caller
behavior with any reliability. Sometimes when the service level is high more callers abandon than expected.
There are no industry standards for abandonment; it is a somewhat unreliable measure of call center
performance. However, abandonment statistics assist in planning service levels, and provide valuable
information used to create in-queue and message-on-hold announcements.
&DOOV$EDQGRQHG3DUDPHWHU
The Calls Abandoned Parameter specifies the value which determines whether a call is a Short Abandoned
Call or a Long Abandoned Call. If the abandon time is less than the Call Abandoned Parameter, then it is a
Short Abandoned Call. If the abandon time is more than the Call Abandoned Parameter, then it is a Long
Abandoned Call.
You assign the Calls Abandoned Parameter (called the Queue Short Abandon Time) values to ACD queues in
the YourSite Database.
Callers can abandon after they reach a trunk (before they reach the ACD queue) or while they are in queue
waiting for an available agent (either before or after the short abandon time you specify).
&DOFXODWLQJWKHVHUYLFHOHYHO
The service level is the total number of calls which are answered, abandoned, and interflowed before a defined
threshold time (Service Level Time), compared to the total number of calls answered, abandoned, and
interflowed. It’s the average length of time a caller who has obtained a trunk waits for an available agent. The
service level = (Calls Answered + Long Calls Abandoned + Long Interflow) within the Service Level Time ÷
(Calls Answered + Long Calls Abandoned + Long Interflow).
+RZGR,FKRRVHDVHUYLFHOHYHOJRDO"
Contrary to popular belief, there is no industry standard service level. Some call centers base their service
level goal on the targets of same-industry companies. In doing so, they assume these companies are actually
meeting their intended targets. Companies are setting increasingly rigorous service level targets in sectors
where outstanding customer service is the norm. In a survey of over 100 UK call centers Opta Consulting was
surprised to find an average performance target of 90 percent of calls answered in 15 seconds. They found that
companies setting extremely rigorous targets did not necessarily meet them, and the investment required to
achieve “best in class” targets was difficult to justify.
Setting an appropriate service level goal for your call center is not easy. The motivation and expectations of
your customers, the availability of similar goods or services, the service level targets of same-industry
companies, and the value of calls are things to consider. It may be useful to run some calculations to determine
the trade-offs in service level associated with adding or removing an agent, and implement customer
satisfaction surveys. When defining your corporate service level, consider several factors and rate their
relative importance.
An appropriate service level is one that
• Satisfies callers’ expectations for service
• Keeps abandonment in check (at less than five percent)
• Minimizes expenses and maximizes revenue
• Meets with the approval and support of agents, supervisors, and senior management
&KDSWHU3ODQQLQJDQGPDQDJLQJ\RXUFDOOFHQWHU
Consider this modest objective. For a service level of 80 percent of calls answered in 20 seconds, callers
receive the following service:
• Approximately 30 percent of callers experience a delay in queue.
• The longest wait time is approximately three minutes.
• The average speed of answer is approximately 12 seconds.
Is this acceptable service for you and for your callers?
4XDOLW\RIVHUYLFH
Agent statistics reflect the time agents spend in various states and are used to assess agent performance; the
average time an agent spends in talk time, make busy, unavailable, and wrap up states directly affects his or
her availability and the service level provided to callers.
Service level alone does not ensure customer satisfaction. The quality of the interaction between the caller and
agent leaves a lasting impression. The quality of service reflects an agent’s ability to provide excellent service
to each customer. The knowledge of the agent, the accuracy and completeness of the information provided,
and the courtesy extended to the caller contribute to the caller’s experience.
6LOHQWPRQLWRULQJ
Silent monitoring systems complement ACD statistics by providing a snapshot of quality and productivity in
your call center. You can track call handling techniques and determine where improvements can be made in
individual performance. Advanced systems capture the voice conversations between agents and callers and
record agent data screens for a complete picture of call handling. They provide online evaluation forms so you
can annotate recordings with feedback.
Silent monitoring takes the bias out of performance evaluation; it provides a systematic process for
monitoring and grading agent calls. You can schedule sessions across different times of the day, days of the
week, and evaluators promoting fairness and consistency. Showing agents where improvement is needed is
more effective than just telling them. Silent monitoring can contribute to a reduction in call time, a reduction
in monitoring time and personnel, and increased training efficiency.
You can use pre-recorded conversations between agents and customers to train agents and for ongoing
evaluation. You can use the information to
• Provide recorded examples of exceptional service and unacceptable service to agents in training.
• Record, review, annotate with feedback, and forward call records to agents who then review your
comments within the context of the actual call.
• Calibrate and routinely access the scoring consistency of call monitors.
• Assess the effectiveness of current training programs.
• Assess the efficiency of the monitoring and assessment process.
'HILQLQJVFRULQJSDUDPHWHUV
The parameters used to evaluate how well agents handle calls are based on the purpose of the calls. Goals vary
across calls for inbound and outbound services. For example, in an outbound sales environment quality may
be based on whether or not the agent made the sale, took advantage of cross-sell opportunities, and adhered to
a pre-defined script. In an inbound environment quality may be based on the completeness and accuracy of the
information and whether or not the caller’s questions were answered satisfactorily. Agents are also evaluated
on “soft skills”, such as voice quality, pausing at regular intervals, rate of speech, use of positive language,
and other listening and communication skills.
6HWWLQJSHUIRUPDQFHVWDQGDUGVDQGJRDOV
Once you determine appropriate scoring parameters, you define standards for exceptional and acceptable
levels of performance. Assessment standards are based on consensus and must be clearly defined and
communicated to monitors and agents. Collaborate with agents in setting performance goals and clearly
define exceptional service and interim performance steps. Determine a baseline of current performance and
set performance steps for an agent group. Provide agents in the group who meet or exceed the interim target
with rewards and recognition commensurate with their performance. When systematically used in training
and coaching recorded sessions positively impact productivity. Fair assessment is good for moral and
motivation, and contributes to an environment in which agents can learn and grow.
)UHTXHQF\RIPRQLWRULQJVHVVLRQV
The frequency of monitoring sessions is determined by individual companies and ranges from once a month
to 15 or 20 sessions a month. Implementing five to 10 monitoring sessions per month is common practice.
Trainees and agents with consistently low scores are monitored more frequently than other agents. Resource
limitations typically influence the frequency of monitoring.
6LOHQWPRQLWRULQJV\VWHPV
Silent monitoring systems range from tape recorders to client/server based recording systems. Advanced
systems schedule, record, and store voice files in a compressed digital format using a real-time link to your
telephone system. They capture any data screens accessed by the agent in addition to voice data. Silences are
eliminated to optimize monitoring efficiency. Recording sessions can be played back from any telephone,
anywhere, at anytime. You can customize agent evaluation forms and define parameters for quality with
advanced systems. They provide activity, status, and management reports for evaluating agents and
observation practices.
,7VXSSRUWV\VWHPV
Information Technology (IT) support systems are commonplace in call centers. Call center agents divide their
time between listening to customer requests, entering and updating customer information and other entries,
searching for required information, and providing feedback to customers. In order to provide prompt and
complete information, agents must have immediate online access to information including customer records
and case histories, products and services, and company policies and procedures.
The push to increase agent efficiency and customer service has placed new demands on computer information
systems and information technology. Information products that enhance agent productivity are continually
being developed. Call center systems are designed to incorporate some, or all of the following specialized
support functions.
&KDSWHU3ODQQLQJDQGPDQDJLQJ\RXUFDOOFHQWHU
&7,
Computer telephony integration (CTI) is the merging of computers and telephone systems. Today’s computer-
based telephone systems deliver synchronized voice and data, voice and data conferencing, automatic
information retrieval for calls, caller-based messaging and routing, and desktop productivity tools. You can
use customer databases in call handling to enhance customer service and agent productivity. When databases
are shared between call center departments each agent can access a caller’s contact information, purchasing
records, call history, and preferences by a caller ID number.
$1,
Automatic Number Identification (ANI) identifies the telephone numbers of callers to your call center, so
agents can receive screen pops with calls. You can connect a database to your telephone system to
simultaneously send calls and caller information. The telephone system forwards the caller’s telephone
number to a software program that relays database records on the caller to the agent. Alternately, the caller
enters an ID number that the database associates with a set of records for the caller and the agent is sent the
information.
ANI saves agents time since they do not have to ask for and enter a name for a caller, and wait for the database
to respond. This time savings significantly impacts staffing requirements and telephone service charges. ANI
also identifies telephone numbers of callers who abandon calls so they can be contacted later for potential
business.
Reports can identify the volume of usage and costs of internal line numbers, and help you track the long
distance distribution per line number and maximize long distance efficiency.
'1,6
Dialed Number Identification Service (DNIS) is a feature of toll-free lines that identifies the telephone
number the caller dials. This assists agents who answer calls for more than one business or product line. Each
business or product line has its own toll-free number. When a caller dials a toll-free number, the telephone
system forwards information to the agent so the agent can identify who the caller dialed. For example, a caller
dials a tool-free number for a cruise line. The telephone system sends a script to the agent along with the call.
The agent then knows to answer “Good morning. Thank you for calling Southern Cruises,” instead of the
name of another cruise line serviced by the center.
$XWRPDWHG+HOSGHVNZRUNIORZ
Agents at IT help desks require quick access to customer information and call history, and the ability to
rapidly log all support calls and incidents. Advanced help desk packages offer automated desk help workflow
systems. They assist agents in logging service requests (tickets), dispatching them to prioritized queues or
agents, tracking them, and documenting activities.
External programs, help desk operators, or end users (in Web-based programs) generate tickets. The system
generates them manually, or in some cases automatically, in response to system events. It can correlate
multiple incidents with single tickets, and multiple problems with a single call.
Automated help desk workflow systems track each step taken in the resolution of a call, with automatic time
stamping of all referrals, escalations, reminders, alerts, and email notifications. Calls are prioritized and
referred to other departments without reassignment, reassigned (escalated) to other technicians or specialized
staff, and placed in an alert condition when they are not resolved promptly. Activities are date and time
stamped automatically. Most help desks offer outgoing email notification and paging. Some help desks offer
automated logging of incoming e-mails, and automated call acknowledgment e-mails to clients.
6WHSFROOHFWGDWD
Telephone systems generate an enormous amount of real-time and historical data used in planning and
management. You use real-time data to monitor the current call load and agent availability so minute-to-
minute adjustments can be made. You use historical information in forecasting, staffing, and scheduling.
Other critical management information comes from customer surveys, market studies, employees, external
departments, telephone networks, workforce management systems, competitors, and the media. Data
collection is a continuous process you implement as soon as your telephone system is up and running.
Telephone systems provide detailed report data on every aspect of call transactions. You can program
computer-based telephone systems connected to a Local Area Network (LAN). Users on the LAN can view or
print real-time and historical reports. With Web-enabled telephone systems, you can view and generate reports
in a Web browser. You can monitor call center activities remotely, and distribute reports to people on different
networks.
&ROOHFWLQJGDWDRQFDOOKDQGOLQJ
Call center reporting software displays real-time telephone system data on desktop monitors and wall signs.
With real-time data, you can manage current conditions and ensure agents respond to changing call center
events. The telephone system provides information on call activity, agent activity, and queue activity.
You can use historical data in forecasting and in assessing the performance of your resources. Historical
reports provide vital information on load activity, resource activity, and queue activity. For example, resource
activity reports on trunks can tell you the highest number of trunks used during peak traffic periods, and the
total duration of calls handled by each trunk for the reporting period. You can determine how busy your trunks
are, and whether or not you have the right number of trunks scheduled. You can produce reports categorized
by the requirement for call center resources, the reporting period, and by time interval.
CTI provides in-depth information on call transactions. Detailed information on keystroke sequences,
databases searched on, and on-screen assistance provides a clear picture of agent activities. With ANI data,
you can identify callers by area code and collate information on demographic trends in caller behavior.
Workforce management systems use telephone system data to forecast and schedule agents. Some packages
monitor the real-time adherence of agents to scheduled activities, so you know the number of agents currently
logged on and available to answer calls. Workforce management systems collect and store real-time
adherence data. This data provides a historical account of adherence used in agent assessment.
Customer surveys provide valuable supporting information on callers’ tolerance to delay, and expectations for
service. They address some of the following questions: Was the agent accessible? Was the caller put on hold
for too long? Was the agent courteous and responsive to my request? Was the agent well informed? Did the
agent provide the correct information and keep commitments? Call centers use this information to estimate
the repercussions of poor service: escalated costs, duplication of work, lost customers.
As the economy moves towards individual, personalized services, new ways of handing calls continue to
emerge. These new features add to the complexity of collecting and measuring information. It is vital you
establish an integrated, reliable system for measuring the key indicators of performance: the efficiency of call
handling, the service callers experience, and their perceptions of that service.
&KDSWHU3ODQQLQJDQGPDQDJLQJ\RXUFDOOFHQWHU
6WHSIRUHFDVWWKHFDOOORDG
Finding the right balance between resources and traffic volumes is a critical step in effective call center
management. Estimating resource requirements is particularly challenging as the number of calls and the total
duration of calls expected for a given time interval is difficult to predict. Forecasting involves taking historical
data generated by your telephone system and using it to predict future traffic volumes and patterns.
7KHLPSRUWDQFHRIIRUHFDVWLQJ
The importance of accurate forecasting can not be overstated. Forecasting is the basis for estimating required
resources, such as agents, trunks, and workstations, and impacts call center operations and performance in the
following ways:
• The number of blocked and abandoned calls
• The level of service provided to callers and callers’ perception of service
• Agent workload, call behavior, and retention
• The accuracy and usefulness of schedules
• The success of periodic sales campaigns
Forecasting is an imprecise science. It involves taking a year (or preferably two or three years) of queue traffic
data and performing the following steps:
1. Examine trends in call load patterns.
2. Break the information down into monthly, weekly, daily, half-hour, and 15-minute intervals that reflect
call load patterns.
3. Determine the handling times of calls.
4. Modify the forecast based on current call center activities and other considerations, such as
absenteeism, agent breaks, holidays, and training.
The range of forecast dates you specify depends on the purpose of the forecast. With long-term forecasts, you
can estimate future budgets and expansion opportunities, and establish corporate objectives. With short-term
forecasts (of one to three months) you can determine seasonal staffing requirements, plan for short-term sales
campaigns, and assess upcoming hiring needs. You can use weekly, daily, hourly and half-hour forecasts to
tweak agent schedules and adjust for absenteeism.
&RQGXFWLQJDIRUHFDVW
Conducting a forecast involves accurately estimating the three components of call load: talk time, wrap up
time, and calls offered. The accuracy of your forecast increases markedly with the size of your data sample.
For example, the call load estimate derived from data on 30 agents who receive 950 calls will be more
accurate than the call load estimate on 10 agents who receive 280 calls during the same period. Extraneous
values for talk time and transient changes in agent availability become less significant as the data sample
increases.
Most integrated call center management programs include software that will do the preliminary forecasting
for you. Forecast programs analyze your historical traffic data and display the results in a spreadsheet
program, such as Microsoft Excel. Forecast programs calculate the following parameters based on your
historical data.
&DOOORDG
The call load is the combined effect of the number of calls received by the ACD queue and their
duration, or the calls offered x (average talk time + average wrap up time).
&DOOV2IIHUHG
All calls received by the ACD queue, regardless of how they are handled or routed, are referred to as the calls
offered. This includes Calls Answered, Long Interflowed Calls, and Long Abandoned Calls. Calls Requeued,
Path Unavailable Calls, Short Abandoned Calls and Short Interflowed Calls are not considered. Telephone
system data on the calls offered and average talk time is used by the Erlang C equation in calculating the
agents required.
7DONWLPH
The talk time is the time the caller spends talking to an agent.
$YHUDJHWDONWLPH
The average talk time is the average time the agent spends talking to callers during a given time interval; it is
the total average call duration plus any wrap up time you add.
:UDSXSWLPH
The wrap up time is the time an agent spends completing transactions associated with a call after the agent
hangs up. The wrap up time is a standardized period. If an agent requires additional time to complete
paperwork or online transactions, the agent can leave the ACD queue temporarily for this purpose.
After you run a forecast, it is useful to examine the data and make adjustments based on present call center
conditions. Tweak the forecast by adding or reducing calls based on your intuition and on information
gathered by yourself and others. Devise a system that involves the collaboration of supervisors and managers
from various departments. Meet routinely to discuss factors that may influence the forecast for the year and
adjust it accordingly.
You may need to consider the following issues: hardware or software system changes, expected callers,
advertising and media, changes to your products, services, or pricing, new products, product performance,
competitors actions, and international, national, and company events. It is vital to have a systematic
forecasting process in place that all departments support.
6WHSFDOFXODWHUHTXLUHGUHVRXUFHV
You calculate the agent requirement in conjunction with the trunking requirement. The number of available
agents affects the likelihood and length of delay experienced by callers. The delay affects the load trunks must
carry. Because the number of available agents impacts the number of trunks required, you calculate the agent
requirement first.
3UHGLFWLQJWKHDJHQWUHTXLUHPHQW
Agent costs account for over 60 percent of all call center costs. Accurately predicting the agent requirement,
making the most effective use of agents, and standardizing and monitoring agent activities are paramount to
achieving your service objectives. Agents are your most valuable resource: make team building and team
management a high priority.
You can predict the agent requirement for your service level percentage and service level time targets by
applying the Erlang C equation to the estimated call load and average talk time.
&KDSWHU3ODQQLQJDQGPDQDJLQJ\RXUFDOOFHQWHU
(UODQJ&
Staffing models consider important factors unique to the inbound call center environment:
• Call arrival is random.
• Consolidating resources allows the same number of call center agents to handle more calls while
maintaining service levels.
• Maintaining high service level targets requires staffing a large number of agents that will be idle a
significant portion of the day.
The industry standard Erlang C equation operates on these principals. Most call center reporting packages use
Erlang C.
An Erlang measures telephone traffic, or the flow of calls and call attempts to your call center during a given
period. One Erlang equals one hour or 60 x 60 = 3,600 seconds of telephone conversation. This could be one
call lasting one hour, six calls lasting 10 minutes, or any combination of calls and call durations that equal 60
minutes. The Erlang formulas provide a mathematical basis for making predictions about randomly arriving
workloads.
A.K. Erlang, a Danish engineer who worked for the Copenhagen Telephone Company, developed Erlang C in
1917. Agent and delay calculations use the Erlang C equation. It predicts the resources required to keep delay
times within your service level objective. Three variables influence the delay time: the number of agents, the
number of waiting callers, and the average time it takes to handle each call.
Erlang C has fundamental principles that do not reflect real-world circumstances; it assumes all calls reach the
call center and all callers wait indefinitely to reach agents. Because Erlang C assumes no blocking or
abandons, it may overestimate the agents you need. Erlang C requires accurate information on call flow where
voice messaging and call overflow are employed, assumes your call load prediction is extremely accurate, and
assumes you have the same number of agents answering calls the entire half hour.
Although Erlang C has its limitations, it is the preferred planning tool as it provides reasonable traffic
estimates for call centers that maintain good service-minimal blocking and few abandons. Erlang C provides
theoretical numbers for staffing that you need to assess in light of the following call center realities:
• The call center blocks a certain proportion of calls and some callers abandon their calls.
• Talk time is unpredictable, and although most calls may last two to three minutes, a few calls can last
upwards of an hour.
• Agents in training may require more time to process calls.
• Agents may use wrap up (after-call paperwork) time inconsistently during busy periods.
• Not all agents within an agent group are available at all times to handle calls offered to the agent group.
Erlang C predicts staffing needs fairly accurately. However, call centers that use skills-based routing,
overflow, interflow, and advanced routing options need to use intuition and experience in adjusting the final
numbers.
6HUYLFH/HYHO
The term service level is total number of calls which are answered, abandoned, and interflowed before a
defined threshold time (Service Level Time), compared to the total number of calls answered, abandoned, and
interflowed. It’s the average length of time a caller who has obtained a trunk waits for an available agent. The
service level = (Calls Answered + Long Calls Abandoned + Long Interflow) within the Service Level Time ÷
(Calls Answered + Long Calls Abandoned + Long Interflow).
6HUYLFH/HYHO3HUFHQW
The service level percent is the proportion of calls, expressed as a percentage, which are answered,
abandoned, and interflowed within a defined threshold time compared to the total number of calls answered or
abandoned (after the short abandon time).
6HUYLFH/HYHO7LPH
The service level time is the threshold time used in calculating the service level percentage, such as 90 percent
of calls answered in 20 seconds. The service level percentage and service level time are parameters you define
as your service objective.
'HWHUPLQLQJWKHDJHQWUHTXLUHPHQW
The Erlang C formula uses your historical call load and average talk time data to predict the agent requirement
for the time interval and date range in the forecast. The resultant spreadsheet displays the call load and agents
required across time intervals.
3HUIRUPLQJZKDWLIVFHQDULRV
After you run a forecast, you can perform “what-if” scenarios on the resultant data by changing the value of
forecast parameters and recalculating the results. You can enter values for the calls offered, average talk time,
wrap up time, and service level percentage and time and recalculate the number of agents required. For
example, you can reduce the average talk time and recalculate the agents required and the calls handled across
15-minute time intervals for the shift.
7KHUHODWLRQVKLSEHWZHHQDJHQWVDQGWUXQNV
You are already familiar with the terms GOS (probability of blockage) and service level (average wait time).
The following definitions are essential to understanding the relationship between agents and trunks.
'HOD\
Trunk calculations assume no queueing. For trunk calculations, the delay includes the time from when a trunk
picks up a call until an agent answers it.
$JHQWORDG
The agent load includes the talk time and wrap up time.
7UXQNORDG
The trunk load includes the time from when a trunk picks up a call until the agent finishes speaking to the
caller and disconnects. The trunk load does not include wrap up time.
&KDSWHU3ODQQLQJDQGPDQDJLQJ\RXUFDOOFHQWHU
Callers expect to have a 95 percent or better chance of obtaining a free trunk into your call center, and expect
to connect to an agent within a reasonable amount of time. There must be sufficient trunks available to pick up
calls, and sufficient agents available to handle the level of traffic carried by the trunks. The more agents
handling a given call load, the less delay callers’ experience. Callers experience a delay if there are
insufficient agents available. If the delay is considerable, calls back up and some calls do not reach the call
center.
Traffic engineering involves estimating the number of trunks and amount of communications equipment
needed to service an anticipated number of callers. It revolves around basic questions concerning the
relationships between service parameters and trunk and agent resources. How much traffic can a particular
number of trunks handle for a particular GOS? What is the GOS for a particular number of trunks and traffic
level? How many trunks are required to handle a particular traffic level and GOS? What is the probability of
delay and length of delay experienced for a particular traffic level and number of agents? How many agents
are required to handle a particular traffic level for a given set of delay characteristics?
3UHGLFWLQJWKHWUXQNUHTXLUHPHQW
The number of trunks you require reflects the level of traffic expected during your busiest hour of operation.
The busy hour is the hour during the workday in which a trunk group carries the most traffic. You calculate the
trunk load after you forecast the call load for the busiest hour and determine the number of agents required to
handle the call load for your service level objective.
(UODQJ%
Call centers use the Erlang B equation to estimate the number of trunks required. Erlang B assumes calls are
not queued and that callers who receive a busy signal do not attempt to call again. It can underestimate the
trunks required. Predicting your trunk requirement involves determining your busy hour traffic and deciding
how many blocked calls you can tolerate.
%XV\KRXUWUDIILF
The busy hour traffic, measured in Erlangs, is the number of hours of call traffic (or trunk traffic) you
experience during the busiest hour of operation. It is important that your busy hour Figure represent the
busiest call load your trunks will ever receive, and not just today’s peak traffic. The busy hour traffic is the
(average call duration + average delay) x calls per hour ÷ 3600. This value represents the total trunk load
(occupancy) in hours.
The call center traffic is the average number of trunks busy during the hour in question. One Erlang equals
one hour or 60 x 60 = 3,600 seconds of telephone conversation. If a call center experiences 6.12 erlangs (or
6.12 hours of telephone conversation) during an hour, an average of six trunks were busy.
*26
The Grade of Service (GOS) value is a decimal fraction. A GOS of P.02 means a caller has a two percent
chance of receiving a busy signal. Call centers use GOS in calculating the number of trunks required. It is
important to specify a GOS that is right for you in order for the trunk calculation to be realistic.
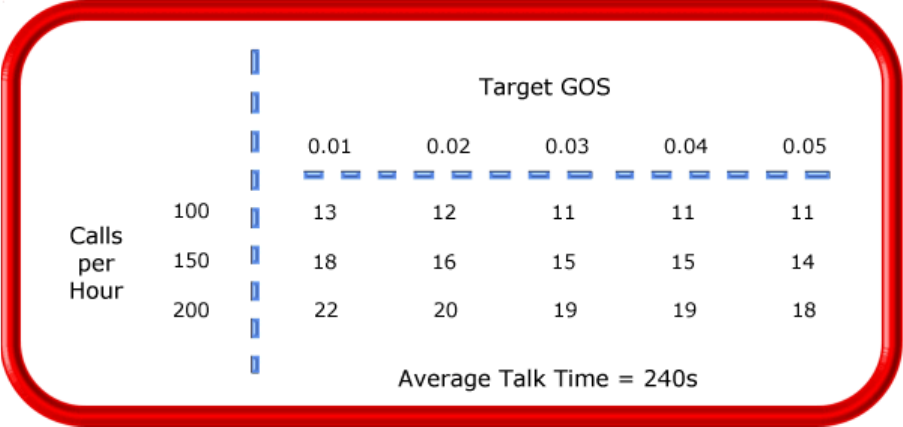
'HWHUPLQLQJWUXQNUHTXLUHPHQWV
Traffic calculators used to predict call center resource requirements are available on the Web from companies
such as Westbay-www.erlang.com. You can obtain basic calculators at no cost. Calculators that display and
print results or calculations made during the previous week are available at a modest cost.
To calculate the trunks required you simply input two of the Figures and calculate the third. For example, if
you know that your busy hour traffic is 10 erlangs and you want to determine how many trunks are required if
only two calls are blocked in every 100 call attempts, you input the busy hour time (10) and your target rate of
blocking (0.02). The calculator displays a value for the trunks required (17).
Figure 3-3 illustrates the trunks required across a spectrum of GOS values. Whether you chose a GOS of 0.01,
0.05, or somewhere in between these values reflects how may calls per 100 call attempts you can afford to
lose. In revenue-based call centers minimal blocking and delay is a priority.
)LJXUH(VWLPDWLQJWKHWUXQNUHTXLUHPHQW
Although some call centers base the trunk requirement on a staff-to-trunk ratio, such as 1.5 trunks per agent,
many use the Erlang B equation. Whatever ratio results will be the right one for you.
It is better to slightly overestimate than slightly underestimate the number of trunks required: trunks are
inexpensive, compared to agent costs. You can always cancel a trunk if periodic trunk load calculations show
low occupancy on the trunk.
No staffing approach is absolute. You need to acknowledge the assumptions implicit in your calculations and
use common sense when estimating your resource requirements. When you schedule resources, they must be
closely monitored to ensure you are making full use of them.
&KDSWHU3ODQQLQJDQGPDQDJLQJ\RXUFDOOFHQWHU
6WHSVFKHGXOHDJHQWV
Scheduling involves accurately forecasting the workload and determining which agents should work which
shifts. This has traditionally been a labor-intensive manual process for call center supervisors. You can
schedule agents for breaks, split shifts, ACD and non-ACD work periods, repeating work patterns, holidays,
and on call work. You can categorize agents by pay level, overtime eligibility, skill level, employment status
(part time or full time), and scheduling preferences. Matching these shift and agent variables to the anticipated
workload, and re-allocating agents in response to employee absenteeism can be a daunting task.
Scheduling is becoming increasingly challenging, as call centers support a wider range of products and
services, and agents require more frequent and specialized training. Advances in technology have automated
many agent tasks and have resulted in more varied and challenging calls and responsibilities.
Accurately forecasting and building schedules that reflect the workload as it changes across intervals for days
of the week, weeks of the month, and seasons of the year is essential in meeting your service objectives. You
need a schedule that accurately matches agents to the anticipated workload and agents who aspire to adhere to
the activities scheduled.
You can track the availability and activities of agents throughout the day and verify agents are performing the
duties for which they are scheduled. Not adhering to the schedule, such as forgetting to log out for a break, or
performing non-ACD work when scheduled to perform ACD work (answer telephones) adversely affects your
service level and the moral of other agents who must compensate for the unavailable agent.
7KHVKULQNDJHIDFWRU
Accurately forecasting the workload and scheduling agents to satisfy your service level objective is a good
start, but does not account for the activities that prevent agents from sitting at their desks and answering
telephones. Agents scheduled for ACD work can be involved in some of the following activities:
• On a bathroom break
• Making or receiving personal calls
• Conferring with the supervisor or another agent
• On the phone with other departments
• Sending emails or faxes
• Involved in a lengthy difficult call
• Prolonged in after-call work
• Absent due to illness or compassionate leave
To account for short-term or daily unscheduled absences, you can calculate the rostered staff factor (shrinkage
factor). The shrinkage factor is a numerical value that defines the percentage of time agents are scheduled to
work but are unavailable to answer calls. It tells you the number of agents you must schedule in addition to the
base number of agents required to meet your service level. You calculate the shrinkage factor for one or more
agent groups as follows:
1. Determine the base staff forecasted by hour or half hour for the day.
2. Make a list of activities that prevent ACD agents from answering calls.
3. Add the base staff to the number of agents who are unavailable to answer calls because they are
absent, on break, at a unanticipated meeting, etcetera.
4. Calculate the shrinkage factor for each time interval by dividing the scheduled staff by the base staff
required to answer telephones.

The result is a set of shrinkage factors that represent the expected shrinkage by half hour, as illustrated in
Figure 3-4.
You multiply shrinkage values against the base staff required on telephones when setting future schedules. If
your agent requirements vary considerably on certain days of the week, you can calculate a separate set of
shrinkage factors for these days. You must use your good judgement in identifying absences that are relevant
to include in your shrinkage factor calculations; anticipating higher absenteeism on Fridays and Mondays is a
safe bet while factoring in daily compassionate leave is not. As with all steps in call center planning, routinely
assess the accuracy of your shrinkage predictions and adjust them as required.
)LJXUH&DOFXODWLQJWKHVKULQNDJHIDFWRU
&UHDWLYHVFKHGXOLQJ
Now that you have adjusted your agent requirement to account for unanticipated absences, the next step is to
design a schedule that makes the most of your resources. The following examples illustrate ways to
adequately staff a call center without having agents sit idle during slower periods.
6FKHGXOLQJVSOLWVKLIWV
Although not everyone likes to take a long break in the middle of a shift, for some agents split shifts fit well
with priorities outside of work. For call centers that experience heavy call traffic in the morning and evening,
split shifts prevent overstaffing during these periods.
6WDJJHULQJVKLIWV
Staggering shifts allows you to maintain staffing levels over busy periods or periods when agents are on
breaks. For example, one set of agents could start at 8:00 A.M., a second group at 9:00 A.M., and a third
group at 10:00 A.M. so the call center is fully staffed when it starts getting busy mid morning. Alternately, you
could schedule morning and afternoon shifts that overlap from noon until 1:00 P.M. to enable the morning
shift to break for lunch while the afternoon shift answers calls.
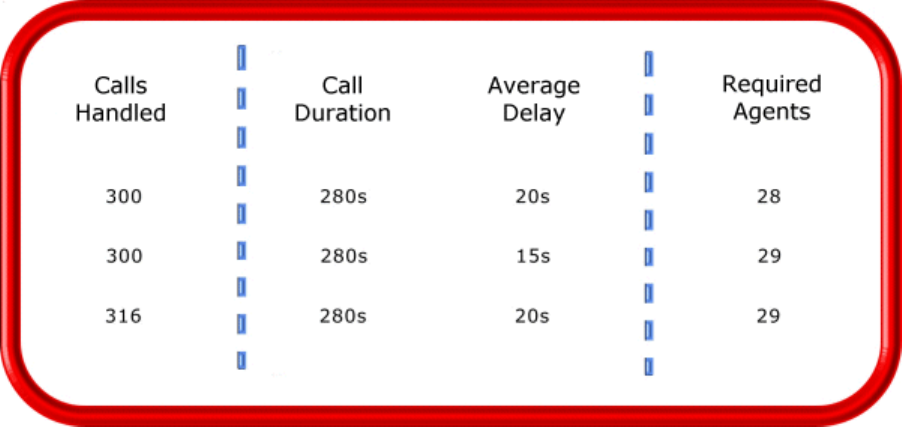
&KDSWHU3ODQQLQJDQGPDQDJLQJ\RXUFDOOFHQWHU
6WDJJHULQJEUHDNV
Making slight adjustments to the timing of morning, lunch, and afternoon breaks has a tremendous effect on
call handling, as illustrated in Figure 3-5. The Erlang C equation predicts 28 agents can handle 300 calls, each
lasting 280 seconds and delayed 20 seconds.
)LJXUH6WDJJHULQJEUHDNVWRRSWLPL]HFDOOKDQGOLQJ
Figure 3-5 illustrates that changing the availability of only one agent decreases the average delay time by five
seconds, and allows the call center to handle 16 additional calls.
)RUHFDVWLQJQRQ$&'ZRUN
Not all non-ACD work must be performed immediately. For example, call-backs to clients, e-mails, and
discussions with staff and supervisors can sometimes wait until less busy periods. Forecast and schedule non-
ACD work for slow times to ensure sufficient agents are available during peak periods. Set availability
priorities and regularly communicate them to agents.
6FKHGXOLQJSDUWWLPHDJHQWVDQGDJHQWVRQFDOO
When practical, scheduling part-time agents and agents on call can be an effective strategy for topping up
your pool of available agents. Scheduling agents on call is particularly useful for days of the week and seasons
when absenteeism is noticeably higher.
&DOOURXWLQJWRRSWLPL]HFRYHUDJH
To optimize service, you can use routing strategies that involve resources outside of the target agent group.
2YHUIORZLQJFDOOVWROHVVEXV\DJHQWJURXSV
You can overflow calls from busy agent groups to less busy agent groups during peak periods. You can route
calls to agents who primarily perform non-ACD work but act as reinforcements during busy periods, and to
supervisors.
(PSOR\LQJFDOOEDFNPHVVDJLQJ
You can program the ACD to forward calls to voice mail so callers can leave messages instead of waiting for
live agents. Call-back messaging helps to balance agent workloads between peak call periods and slow
periods.
&RQWUDFWLQJFDOOVWRFXVWRPHUFDUHEXUHDXV
Contracting calls is a growing industry. During peak periods, you can route simple, routine calls externally to
customer care bureaus. Service bureaus collaborate with call centers to set up scheduling and monitoring
practices, and train agents to handle calls that vary in complexity.
(PSOR\LQJ$&'HQWHUSULVHFDOOURXWLQJ
Call centers that provide extended, or around-the-clock service, can interflow calls to other sites. For example,
you can interflow mid-day calls received by a busy center in San Francisco to agents working the late-
afternoon shift at a center in Philadelphia. This optimizes call handling without scheduling additional agents.
6FKHGXOLQJFRQVLGHUDWLRQV
Scheduling should be a collaborative effort. Agents have schedule preferences, and want to know when they
are working well in advance. Agents are more likely to adhere to schedules if they are involved in defining the
conditions of schedule adherence and non-adherence, and in other areas of the planning process.
Producing long-term schedules is less efficient than producing monthly schedules, as call center conditions
and agent availability are continually changing. Short-term scheduling is more accurate, but less popular with
agents. It is important to find a good balance.
+RZDFFXUDWHLV\RXUVFKHGXOLQJ"
You can measure the effectiveness of your scheduling process. Create a line graph of the service level for each
half-hour interval for each day over the past week. Draw a horizontal line across the graph to indicate your
service objective. Look for inconsistencies in the service provided for different time intervals across days, and
how far you stray from your service objective.
If the service level is erratic, you may have enough resources in place, but they may not be consistently
available to answer calls. If the service level is inconsistent at certain time intervals across the week, or you
are not meeting your service level objective, investigate to see if you are adequately staffed at these times and
are making the best use of resources. Try to assess how consistently the agents are responding to real-time
information displays. Determine if they are restricting non-ACD activities to slow periods and adhering to the
schedule.
&KDSWHU3ODQQLQJDQGPDQDJLQJ\RXUFDOOFHQWHU
:RUNIRUFHPDQDJHPHQWWRROV
Workforce management tools assist you in scheduling agents for work and holiday periods. Many packages
offer an integrated forecasting component that uses historical data to partially automate the scheduling process
for established agents. Scheduling is not entirely automated: you must tweak agent schedules and enter shift
and agent variables for agents manually.
6WHSGHWHUPLQHFDOOFHQWHUFRVWV
An effective budget conveys what is currently happening in the call center, projections for the upcoming year,
and business objectives. It is important to highlight the trade-offs between the service provided to callers and
costs to the organization by developing at least two budgets that reflect different scenarios.
You need to provide a clear indication of how the money is being spent, what you are doing to reduce or curb
spending, and what equipment is required to meet service objectives and expected growth over the next year.
Budgeting is on-going process that needs continuous refinement.
$EUHDNGRZQRIH[SHQVHV
The costs associated with call center operations include
• Loaded labor costs
• Equipment and automation costs
• Transmission costs
Loaded labor costs include wages, fringe benefits, and facilities, and account for over 60 percent of call center
costs. This is a significant cost and underlines the importance of accurate forecasting and scheduling.
Equipment and automation costs include the cost of the telephone system, computer systems, and furniture,
and account for about five percent of total expenses. Transmission costs include costs incurred for voice
(telephone lines) and data (email, fax, and modem) transmission, and account for 25 to 30 percent of call
center costs. Transmission costs have decreased considerably in the past few years and are continuing to drop.
In revenue-based call centers, toll-free lines cost approximately 15 cents per minute, or nine dollars per hour,
per line.
&RVWRIGHOD\
When insufficient agents are available to handle a given call load, the delay increases as does the trunk load.
Calls are queued. For toll-free services each call delayed in queue is a cost to the organization. You are
charged for the toll-free service from the time a trunk picks up a call until an agent completes the call and
hangs up. The expense of queueing callers is known as the cost of delay. Staffing affects toll-free service
costs: if insufficient agents are available and the service level is continually low, network costs will be high.
You need to consider the cost of delay when estimating the agent requirement, and closely monitor it.
&RVWSHUFDOO
You use a cost-per-call analysis to measure call center profitability and performance. The cost per call
measures labor, communication, and equipment costs against the revenue generated. You calculate it by
dividing the total cost by the total calls for a particular period of time.
$YHUDJHFDOOYDOXH
You use the average call value in revenue-based call centers. You calculate it by dividing the total revenue by
the number of calls received for a given period. Sales and reservations environments use the average call
value; the value of each call is balanced against the service provided to customers.
$QWLFLSDWLQJJURZWK
Predicting company growth is a challenging and essential aspect of call center costing. Growth predictions
impact budgeting considerations and must be clearly communicated to senior management. It is useful to map
out your projected costs and time frames for the upcoming year and substantiate them with statistics and
graphs. Determine when and how many resources you require, and lead-time issues.
&KDSWHU3ODQQLQJDQGPDQDJLQJ\RXUFDOOFHQWHU

&KDSWHU0DQDJHPHQW&RQVROH
.HHSRQWRSRIV\VWHPVHWWLQJVZLWK
0DQDJHPHQW&RQVROH(GLWFRPSRUW
YDOXHVDQG,3DGGUHVVHV
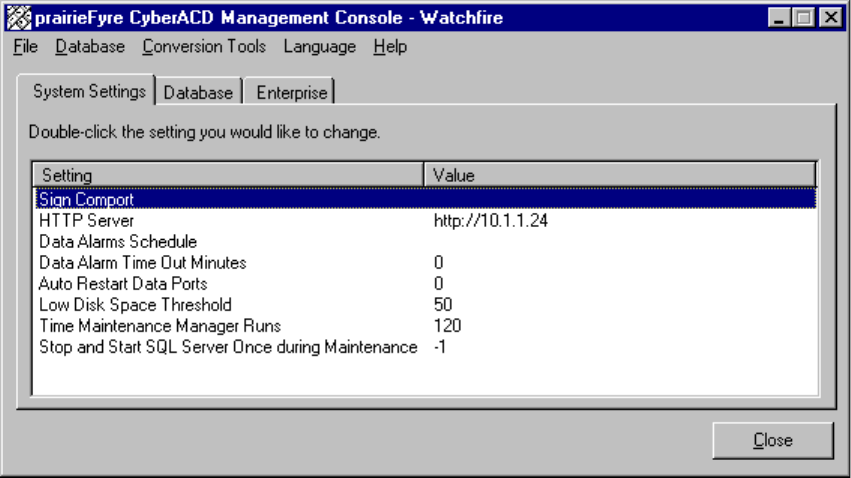
&KDSWHU0DQDJHPHQW&RQVROH
0DQDJHPHQW&RQVROH
There are two versions of the Management Console application: Management Console Enterprise and
Management Console Node. Call centers that have 6110 CCM Server software installed use Management
Console Enterprise. Call centers that do not have 6110 CCM Server software installed use Management
Console Node.
You use the Management Console application for configuring your database if you have the SX-2000 or
3200 ICP/3300 ICP, and for troubleshooting problems, SQL database management, and SQL database
object inspection. You can verify the existence of all critical 6110 CCM Database objects, change your IP
address and comport settings, and back up and restore the 6110 CCM Database or critical portions of the
database. You also use Management Console to configure multi-site monitoring and reporting.
You start the Management Console program on the 6110 CCM Server. Before you start Management
Console you must log on to the Windows NT Server with an account that has administrative privileges.
8VLQJ0DQDJHPHQW&RQVROH
To start Management Console:
/RJRQWRWKH:LQGRZV6HUYHUZLWKDQDFFRXQWWKDWKDVDGPLQLVWUDWLYHSULYLOHJHV
&OLFN6WDUW !3URJUDPV !0LWHO1HWZRUNV !&&00DQDJHPHQW&RQVROHWR
VWDUW0DQDJHPHQW&RQVROH
Figure 4-1 appears. Management Console consists of the System Settings, Enterprise/Nodes, and Database
(Management Console Enterprise version only) tabs. You use the System Settings and Enterprise tabs to
change settings in the registry. You use the Database tab to view 6110 CCM Database records and perform
diagnostics.
)LJXUH0DQDJHPHQW&RQVROH(QWHUSULVH6\VWHP6HWWLQJVWDE
Management Console has the following menus.
)LOHPHQX
You can demonstrate the complete functionality of 6110 CCM using a simulation mode. You must click the
Local Node Simulation Settings command and select the Run in simulation mode check box to run 6110
CCM in simulation mode.
The Reload System Settings command refreshes the values displayed on the System Settings tab.
The 6110 CCM User Manager command specifies 6110 CCM users (managers and supervisors), and which
6110 CCM applications the managers and supervisors are authorized to use.
The Force Collector Settings Reload command forces the main NT Enterprise Service on the 6110 CCM
Enterprise Server to reinitialize the local enterprise nodes.
The Force Node Synchronization command synchronizes the raw data from remote nodes (CENs) with the
data stored on the local hard drive of the 6110 CCM Enterprise Server.
The Exit command quits Management Console.
'DWDEDVHPHQX0DQDJHPHQW&RQVROH(QWHUSULVHYHUVLRQRQO\
The Load SQL Databases command updates the settings displayed on the Database tab.
The Launch prairieFyre Query Tool command starts an advanced diagnostic tool used for examining
database data. It is intended you use this tool on technical support calls with prairieFyre.
The Change 6110 CCM Login Password command edits the default 6110 CCM Web application login
account. This is a single account that validates user logins. Before you click Change 6110 CCM Login
Password, you must click Database=>Load SQL Databases.
The Change SQL System Administrator Password command edits the administrator password.
The Truncate SQL Transaction Log and Shrink Database Files command manually shrinks the transaction
logs and SQL database files on the 6110 CCM Server. This action is performed by the prairieFyre
Maintenance Service during the nightly maintenance routine.
The SQL transaction log is a critical part of the SQL Server. It is used for disaster recovery and up-to-the-
second restorations. If the SQL database transaction log reaches the 100 MB maximum without a backup
being done, then the SQL server will stop working. Therefore, ensure the prairieFyre Maintenance Service
is always enabled.
During the prairieFyre Maintenance Service nightly routine SQL writes a checkpoint into the transaction
log. The log marks a certain amount of space as available to ensure it operates continuously. The Truncate
and Shrink SQL Transaction Log function programmatically causes a checkpoint to be written into the log.
Although this function helps move 6110 CCM towards a zero-maintenance model, it is not a substitute for
implementing and following a regular backup plan.
The Re-Index Database Tables command manually re-indexes the SQL database tables. This action is
performed by the prairieFyre Maintenance Service during the nightly maintenance routine.
&KDSWHU0DQDJHPHQW&RQVROH
The Start SQL Server and Stop SQL Server commands manually stop and restart the SQL Server. These
actions are performed by the prairieFyre Maintenance Service during the nightly maintenance routine.
The Back Up YourSite Configuration command backs up the current programming in the YourSite
Database to a file in your Temp directory. The naming syntax is MMDDYYYY.sql.
The Restore YourSite Configuration command restores the YourSite Database to the time of your last
database backup.
The Back Up 6110 CCM Database command backs up the current 6110 CCM Database configuration to a
file in your Temp directory. The naming syntax is PFDB_BackupMMDDYYYY.bak.
The Restore 6110 CCM Database command restores the 6110 CCM Database to the time of your last
database backup. Call prairieFyre technical support at (613) 599-0045 before you restore the 6110 CCM
Database.
The Summarize Data command uploads historical data from the telephone system to the prairieFyre
Service and SQL database for a particular date range.
If you run a report and notice that data for a particular device is missing from the report output, verify the
device is programmed in the telephone system and in the YourSite Database. If you determine the device is
missing from the database, add it to the database and use the Summarize Data command to update the
prairieFyre Service and the SQL database with the complete raw telephone system data (stored on the local
hard drive). You can then produce reports on the device.
The Notify Realtime Clients command updates the SuperAdvisor, AgentAdvisor, Reporter, and Scheduled
Reports applications with any changes you make to the YourSite Database.
The Delete Data from Database command deletes all data files from the database tables.
&RQYHUVLRQ7RROV0HQX0DQDJHPHQW&RQVROH(QWHUSULVHYHUVLRQRQO\
The Convert V2 6110 CCM Data Files to V2.5 command updates the raw 6110 CCM data files from
version 2 to version 2.5.
To update the raw data files:
&OLFN'DWDEDVH !&RQYHUW9&&0'DWD)LOHVWR9
&OLFN0RYH)LOHVWRPRYHWKHVRXUFHGDWDIURPWKH'DWD'LUHFWRU\GLUHFWRU\WRWKH
1RGHBGHVWLQDWLRQGLUHFWRU\
&OLFN2.
The Convert V5 Toolbox Database command exports your existing database to ACCESS and converts it to
a format 6110 CCM can use.
To convert the database:
&OLFN'DWDEDVH !&RQYHUW97RROER['DWD
&OLFN%URZVHDQGVHOHFWWKHGLUHFWRU\KRXVLQJ\RXUH[LVWLQJGDWDEDVHGDWD
&OLFN&RQYHUWDQGFOLFN&ORVH
The Convert V5 Toolbox Text Files command converts your existing text files to a format 6110 CCM can
use.
To convert the text files:
&OLFN&RQYHUW97RROER[7H[W)LOHV
&OLFN0RYH)LOHVWRPRYHWKHVRXUFHGDWDIURPWKH'HVNWRSGLUHFWRU\WRWKH
&&0'HVNWRSGHVWLQDWLRQGLUHFWRU\
&OLFN2.DQGFOLFN([LW
The Convert V2 6110 CCM Database to V2.5 command updates the version 2 6110 CCM Database to
version 2.5.
To update the database:
&OLFN&RQYHUW9&&0'DWDEDVHWR9
&OLFN&RQYHUWWRFRQYHUWWKHGDWDEDVHDQGXSGDWHDOOXVHUVDQGVFKHGXOHV
&OLFN&ORVH
+HOSPHQX
The Contents and Index option provides access to the current Help file. The About option provides
Management Console licencing information.
(QDEOLQJWKH5HDOWLPH'HPR6LPXODWLRQRQWKH&&0
6HUYHU
To run the simulation, you must perform a complete installation of the 6110 CCM production version
software (preferably your FREE in-house demonstration software).
With a typical installation, prairieFyre automatically provides a sample database, PBX simulation data
files, and a SuperAdvisor real-time profile. To locate these files, click <drive:>\program files\prairiefyre
software\6110 CCM\acd manager\demo.
&UHDWHWKH&&0'DWDEDVH
To restore the demo database:
&OLFN6WDUW !3URJUDPV !SUDLULH)\UH6RIWZDUH,QF !SUDLULH)\UH
0DQDJHPHQW&RQVROH
&OLFN'DWDEDVH !5HVWRUH'DWDEDVHDQGQDYLJDWHWKURXJKWKHUHVWRUHZL]DUG
(QVXUH\RXVHOHFWWKHGLUHFWRU\ZKHUHWKHGHPRGDWDEDVHILOHVUHVLGH
GULYH!?SURJUDPILOHV?SUDLULHI\UHVRIWZDUH?&&0?DFGPDQDJHU?GHPR?GHPRGE
&OLFN)LQLVK
Before you generate example reports, you must summarize the demo data into the recently restored
database.
To summarize the data:
6WDUW0DQDJHPHQW&RQVROHDQGFOLFN'DWDEDVH !6XPPDUL]H'DWD
6HOHFW0DUFKDQGFOLFN2.
&KDSWHU0DQDJHPHQW&RQVROH
To run 6110 CCM in simulation mode:
,Q0DQDJHPHQW&RQVROHFRQILJXUHWKHFRPSRUWVWRUHDGIURPDILOHDQGVHOHFWWKH
$W[WDQG6W[WILOHVLQFOXGHGLQWKH'HPR'DWDIROGHU
&OLFN)LOH !/RFDO1RGH6LPXODWLRQ6HWWLQJV
,QWKH/RFDO1RGH6LPXODWLRQ6HWWLQJVGLDORJER[VHOHFWWKHIROORZLQJVHWWLQJV
• The Run in simulation mode check box enables the 6110 CCM simulation mode.
• The Enable 6110 CCM Interactive simulation mode check box allows you demonstrate the 6115 CCM
functionality without a MiTAI link to the PBX.
The next two settings specify the intervals during the day for which you read data.
• The Run fast from midnight until this time option skips through the file to a point in time where there is
activity in the call center. In this case, select 8 A.M.
• The Run fast from this time to midnight option specifies the point in time you would like to stop reading
data and fast forward to midnight (to the next day).
This function skips through files to midnight. In this case, select 5 P.M.
$GGLWLRQDOVLPXODWLRQRSWLRQV
The Run simulator for this many days option replays the same SMDR and ACD files repeatedly for x
number of days. It dynamically changes the date in the SMDR and ACD files displayed in the real-time and
report applications.
The Run simulator at this time multiplier option varies the speed at which the ACD and SMDR files are
read. For example, if you choose 10, the simulator will run through 10 seconds of the ACD and SMDR files
for each second of time that elapses.
To stop or start the real-time simulation, navigate to the Services window, and stop and start the prairieFyre
Collector Service.
To log on to 6110 CCM, type demo for the username and demo for the password.
*DLQLQJDFFHVVWRGDWDEDVHPHQXRSWLRQV
You logged on to the Windows NT Server to start Management Console. You do not need to log on a
second time if you only want to change system settings, such as the wall sign comport value. You do not
need to log on to the SQL Server to back up or restore the YourSite Database: SQL Server uses your
current credentials.
You must log on to the SQL Server to gain access to all database menu options. To log on, you click
Database=>Load SQL Databases. The first time you log on to the SQL Server, you use the following
credentials: Username: sa
Password:
To change the sa password, click Database=>Change SQL System Administrator Password. Be sure to
record the new password for your records. Do not disclose the password to anyone who does not absolutely
require it.
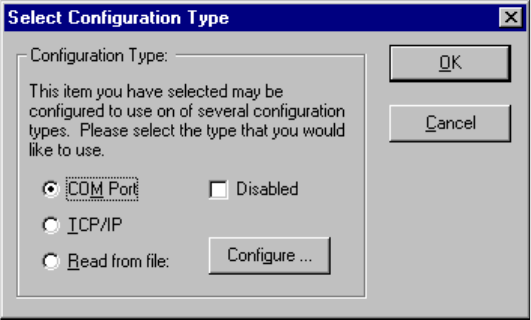
6\VWHP6HWWLQJVWDE
You use the System Settings tab to change settings in the registry. It is illustrated in Figure 4-1.
(GLWLQJUHJLVWU\VHWWLQJV
To edit a registry setting you double-click the setting and enter one or more values.
The following registry settings are available on the System Settings tab:
• Sign Comport
• HTTP Server
• Data Alarms Schedule
• Data Alarm Time Out Minutes
• Auto Restart Data Ports
• Low Disk Space Threshold (MB)
• Time Maintenance Manager (Maintenance Service nightly routine) Runs
• Stop and Start SQL Server Once During Maintenance
• Enable MDR SMDR Buffering
• MiTAI Runtime Version
You click File=>Reload System Settings to refresh the values displayed on the System Settings tab.
6LJQ&RPSRUW
When you double-click Sign Comport Figure 4-2 appears. You configure the comports so the prairieFyre
Service knows where to go to find data.
)LJXUH6HOHFWFRQILJXUDWLRQW\SH
You configure the comport to use one of three configuration types: COM Port, TCP/IP, or Read from file.
+7736HUYHU
The HTTP Server setting specifies the server IP address used by the 6110 CCM Web program. You must
select the This Server uses SSL (Secure Sockets Layer) check box if you have SSL installed on your Web
site. SSL encrypts communications between the client and server.

&KDSWHU0DQDJHPHQW&RQVROH
6HWWLQJDODUPV
You set alarms in Management Console so the system will notify you if the prairieFyre Service is not
receiving data or the server disk space is low.
'DWD$ODUPV6FKHGXOH
The Data Alarms Schedule setting specifies the system raise data alarms when it detects the prairieFyre
Service is not receiving data. You can program alarms across individual days of the week.
'DWD$ODUP7LPH2XW0LQXWHV
The Data Alarm Time Out Minutes setting specifies the number of minutes the system waits (when it
detects the prairieFyre Service is not receiving data) before it raises an alarm.
$XWR5HVWDUW'DWD3RUWV
The Auto Restart Data Ports setting attempts to reopen the data ports when it detects the prairieFyre Service
is not receiving data. Provided alarms are set, the system closes the comports for 30 seconds and then
attempts to reopen them.
/RZ'LVN6SDFH7KUHVKROG
The Low Disk Space Threshold setting detects if the disk space is low on the disk housing the text files and
SQL database. If the disk space is less than the threshold specified, the system sets off an alarm in the
SuperAdvisor program.
When the system raises an alarm, the prairieFyre Network Monitor icon on your desktop flashes. Right-
click it and click Summary of Alarm Status to view any alarms.
On the 6110 CCM Server, you can click Start=>Programs=>Administrative Tools=>Event Viewer to view
additional information on the error.

Figure 4-3 illustrates the time out error details provided by the Event Viewer.
)LJXUH(YHQWGHWDLOV
7LPH0DLQWHQDQFH0DQDJHU5XQV
The Time Maintenance Manger Runs setting specifies the time the nightly maintenance service runs.
6WRSDQG6WDUW64/6HUYHU2QFH'XULQJ0DLQWHQDQFH
The Stop and Start SQL Server Once During Maintenance setting instructs the maintenance manager to
stop and restart the SQL server during the nightly maintenance routine. This ensures the SQL database
makes optimal use of memory.
(QDEOH0'560'5%XIIHULQJ
The Enable MDR SMDR Buffering setting stores SMDR telephone system data in a separate file. The
MDR application uses this data to generate call costing reports.
0L7$,5XQWLPH9HUVLRQ
The MiTAI Runtime Version setting specifies the version of MiTAI software you are using. You configure
this setting if you have installed the 6110 CCM 6115 CCM add-on application.
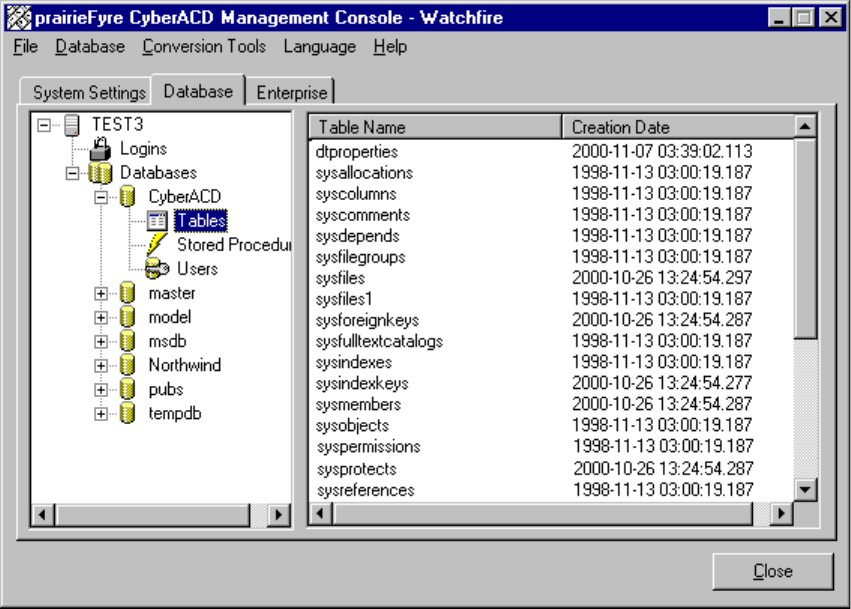
&KDSWHU0DQDJHPHQW&RQVROH
'DWDEDVHWDE
The Database tab is not available on the Management Console Node application.
You use the Database tab to configure your database if you have the SX-2000, or to view 6110 CCM
Database objects and perform diagnostics. All objects are read-only. The objects are comprised of server
logins (user groups for cross-domain resource sharing), tables, stored procedures, and database users.
Figure 4-4 illustrates the Database tab.
)LJXUH0DQDJHPHQW&RQVROH(QWHUSULVH'DWDEDVHWDE
You click Database=>Load SQL Databases to update the settings displayed on the Database tab.
4XLFN&RQILJXUDWLRQ7RROIRUWKH6;
If you have the SX-2000, then you can use the Quick Configuration Tool to configure your database. If you
have the SX-200 or the SX-200 real-time, you must configure the database with YourSite. See “There are
three ways to configure the 6110 CCM system. The first time you configure your database” on page 58.
The Agent Group Assignment Form and the Path Assignment Form are found on the PBX. First you must
convert these files to .txt files. Then you use the Quick Configuration tool to input the information from
these forms into Mitel Networks 6110 Contact Center Management with the Management Console.
Converting Mitel forms to a .txt file:
&OLFN6WDUW !3URJUDPV !$FFHVVRULHV !+\SHUWHUPLQDO !+\SHU7HUPLQDORU
if you have Windows 2000,
click Start=>Programs=>Accessories=>Communications =>HyperTerminal.
The New Connection - HyperTerminal window and Connection Description window appear.
2QWKH&RQQHFWLRQ'HVFULSWLRQZLQGRZXQGHU1DPHW\SHWKHQDPHRIWKLV
FRQQHFWLRQHJ&RQQHFWLRQ
&OLFN2.
The Connect To window appears.
$IWHU&RQQHFWXVLQJVHOHFWWKHFRPSRUWHJ&20
&OLFN2.
The COM1 Properties window appears.
9HULI\WKDWWKHELWVSHUVHFRQGGDWDELWVSDULW\VWRSELWVDQGIORZFRQWURODUH
FRUUHFW
&OLFN2.
The Connection1 HyperTerminal window appears.
&OLFN7UDQVIHU !&DSWXUH7H[W
The Capture Text window appears.
&OLFN%URZVHDQGVHOHFWWKHGHVWLQDWLRQRIWKHWH[WILOH
&OLFN6WDUW
The Mitel forms information will appear in the Connection1 HyperTerminal window.
:KHQDOOWKH0LWHOIRUPVLQIRUPDWLRQLVFRQYHUWHGWRWH[WFORVHWKH&RQQHFWLRQ
+\SHU7HUPLQDOZLQGRZ
On the PBX, you now send all valid Agent Group Assignments and Path Assignment to the file. Save the
text file and proceed to Configuring Agents, Agent Groups, and/or Queues.

&KDSWHU0DQDJHPHQW&RQVROH
Configuring Agents, Agent Groups, and/or Queues:
&OLFN6WDUW !3URJUDPV !SUDLULH)\UHVRIWZDUH,QF !SUDLULH)\UH
0DQDJHPHQW&RQVROH
&OLFN'DWDEDVH !,PSRUW&RQILJXUDWLRQIURP0LWHO$VVLJQPHQW)RUPV
The Interpret Mitel Assignment Forms window appears.
$IWHU6HOHFWD)LOHFOLFN%URZVH
6HOHFWWKHGDWDILOHFUHDWHGE\WKH6;WHOHSKRQHVZLWFK
&OLFN2.
The Interpret Mitel Assignment Forms window reappears.
&OLFN5HDG)LOH
Under Results, the information retrieved from the forms is displayed.
6HOHFW$JHQWV$JHQW*URXSVDQGRU4XHXHV
&OLFN&RPPLWWR'DWDEDVH
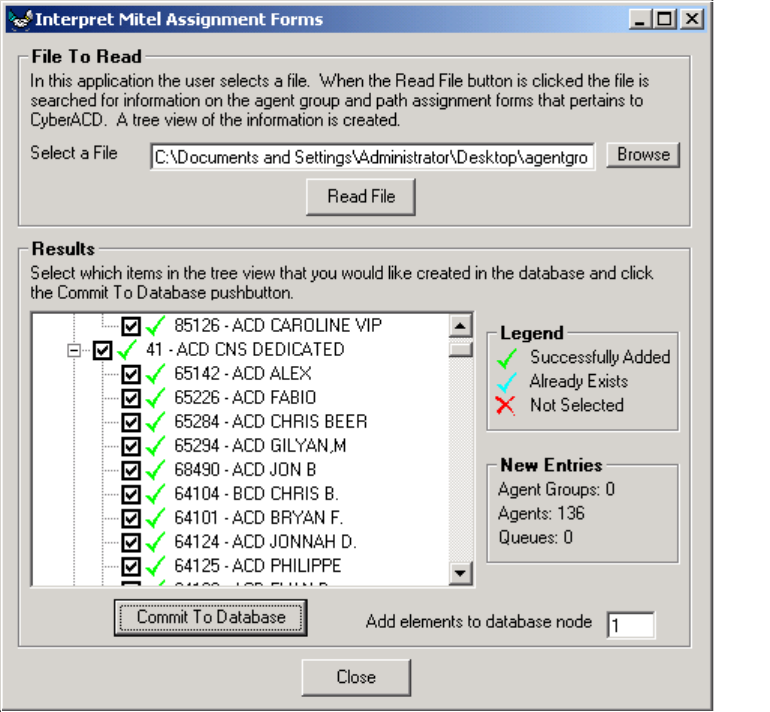
A legend appears that indicates if the data has been successfully added, if it already exists, or
if it was not selected.
9. Click Close.
%DFNLQJXSWKH<RXU6LWH'DWDEDVH
You click Database=>Back Up YourSite Configuration to back up the current programming in the YourSite
Database to a file in your Temp directory. The naming syntax is MMDDYYYY.sql. If required, you can later
recover the YourSite Database data exclusively, rather than restoring the entire SQL database.
This backup offers protection in case you program the database incorrectly, or a careless user reconfigures
it. prairieFyre recommends you perform this backup weekly, in addition to regular database maintenance.
5HVWRULQJWKH<RXU6LWH'DWDEDVH
You click Database=>Restore YourSite Configuration to restore the YourSite Database to the time of your
last database backup.
&KDSWHU0DQDJHPHQW&RQVROH
NOTE: Restoring the YourSite Database deletes all current database table entries and replaces them with
the entries defined at the time of your last database backup. Any changes made to the database in the
interim are lost. Backing up the YourSite Database also deletes all report permissions defined for users in
the Report Permissions component of YourSite.
%DFNLQJXSWKH&&0'DWDEDVH
The 6110 CCM Database stores the YourSite Database, the telephone system call record data, and the
stored procedures used to store and retrieve historical data.
You click Database=>Back Up 6110 CCM Database to back up the current 6110 CCM Database
configuration to a file in your Temp directory. The naming syntax is PFDB_BackupMMDDYYYY.bak. If
required, you can later recover the 6110 CCM Database information exclusively, rather than restoring the
entire SQL database.
You use this backup for disaster recovery. prairieFyre recommends you perform this backup weekly, in
addition to regular database maintenance.
5HVWRULQJWKH&&0'DWDEDVH
Clicking Database=>Restore 6110 CCM Database restores the database to the time of your last database
backup.
NOTE: Call prairieFyre before you restore the 6110 CCM Database! Restoring the 6110 CCM Database
deletes the entire 6110 CCM Database, which is the core of the 6110 CCM program. After you restore the
database you need to take further steps to re-enter the telephone system data in the database.
(QWHUSULVHWDE
You use the Enterprise tab to change settings in the registry and to configure your nodes for multi-site
monitoring and reporting. It is illustrated in Figure 4-9.
/RFDODQG5HPRWH1RGHV
A node is a data collection point for a single telephone system. Local nodes reside in call centers that have
6110 CCM Server software installed. Remote nodes reside in call centers that have 6110 CCM Enterprise
Node (CEN) software installed on computer running NT Workstation or Windows 2000 Professional.
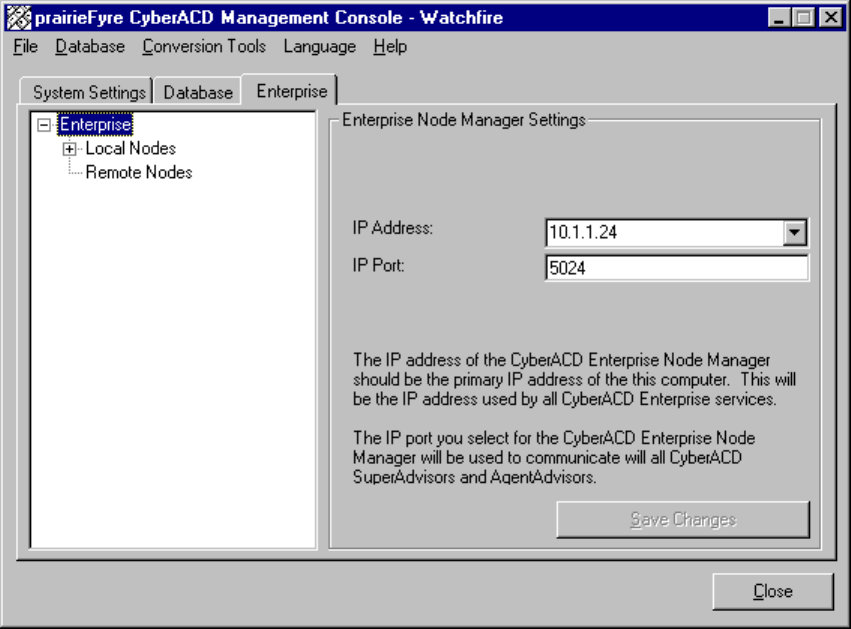
)LJXUH0DQDJHPHQW&RQVROH(QWHUSULVH(QWHUSULVHWDE
When you click Enterprise, the following 6110 CCM Server settings appear.
,3$GGUHVV
The IP Address box specifies the IP address for the 6110 CCM Server Web application.
,33RUW
The IP Port box specifies the port number over which the 6110 CCM Server communicates all with real-
time clients.
When you expand the Enterprise tree in the left pane, the settings illustrated in Figure 4-10 appear.
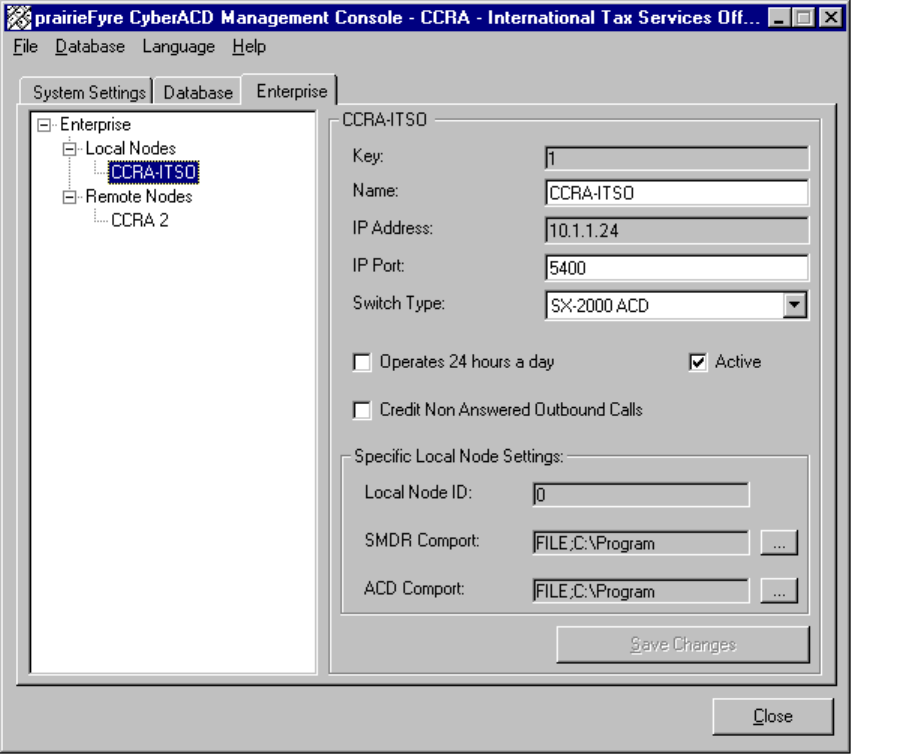
&KDSWHU0DQDJHPHQW&RQVROH
)LJXUH(QWHUSULVHWDE
,3$GGUHVV
The IP Address box specifies the IP address of the local computer where data collection occurs.
,33RUW
The IP Port box specifies the port number over which the 6110 CCM Server service communicates with
local data collection mechanisms. For remote nodes, both parties must use enter the same port number in
order for communication to be successful.
6ZLWFK7\SH
The Switch Type setting specifies the type of telephone system used at the node.
2SHUDWHVKRXUVDGD\
The Operates 24 hours a day option ensures proper reporting for call centers that operate over the midnight
hour.
&UHGLW1RQ$QVZHUHG2XWERXQG&DOOV
The Credit Non Answered Outbound Calls option includes non-answered outbound calls in the data
collected for reporting.
60'5&RPSRUW
The SMDR Comport setting specifies the SMDR comport setting for the local telephone system.
$&'&RPSRUW
The ACD Comport setting specifies the ACD comport setting for the local telephone system.
&&0(QWHUSULVH1RGH
6110 CCM Enterprise Node (CEN) software provides multi-site call center capabilities with a single server
configuration. It provides centralized reporting for geographically dispersed call centers. To learn how to
install CEN software and configure local and remote nodes, see Chapter 11 6110 CCM Enterprise Node.
&KDSWHU0DQDJHPHQW&RQVROH

&KDSWHU<RXU6LWH
3URJUDP\RXUFDOOFHQWHUGDWDEDVH
IURPDQ\ZKHUHDWDQ\WLPHZLWK
<RXU6LWH
&KDSWHU<RXU6LWH
<RXU6LWH
The YourSite application consists of the configuration and the security for 6110 CCM.
There are three ways to configure the 6110 CCM system. The first time you configure your database
• if you have the SX-2000, you use the Quick Configuration Tool. See “Quick Configuration Tool for the
SX-2000” on page 48.
• if you have Mitel Networks 6115 Interactive Contact Center, you use the Automatic Synchronization
Tool. See “Automatic Synchronization with 6115 ICC” on page 85.
• if you have the SX-200 with real-time, or the SX-200, you must configure your system manually.
Starting with version 2.8, 6110 CCM has new security features. The security can now be as basic or as flexible
(advanced) as you need it. You must assign each user a security role. With these security roles, you can restrict
what you want users to have access to. By default the security role is Not Restricted (to the Web site).
&RQILJXUDWLRQ
Call centers that use 6110 CCM (Contact Center Management) have two main databases: the telephone
system database and the prairieFyre YourSite Database. In the Configuration module, you program the
YourSite Database to mirror the lines, routing and timing options, and agent positions in use on the telephone
system. For example, if you enter Deborah Black as Agent ID 5000 in the telephone system database then you
must enter Deborah Black as Agent ID 5000 in the YourSite Database.
For reporting purposes, the trunk, extension, agent, agent group, queue, dialable, and account code numbers
you program in the YourSite Configuration Database must be identical to those of the telephone system.
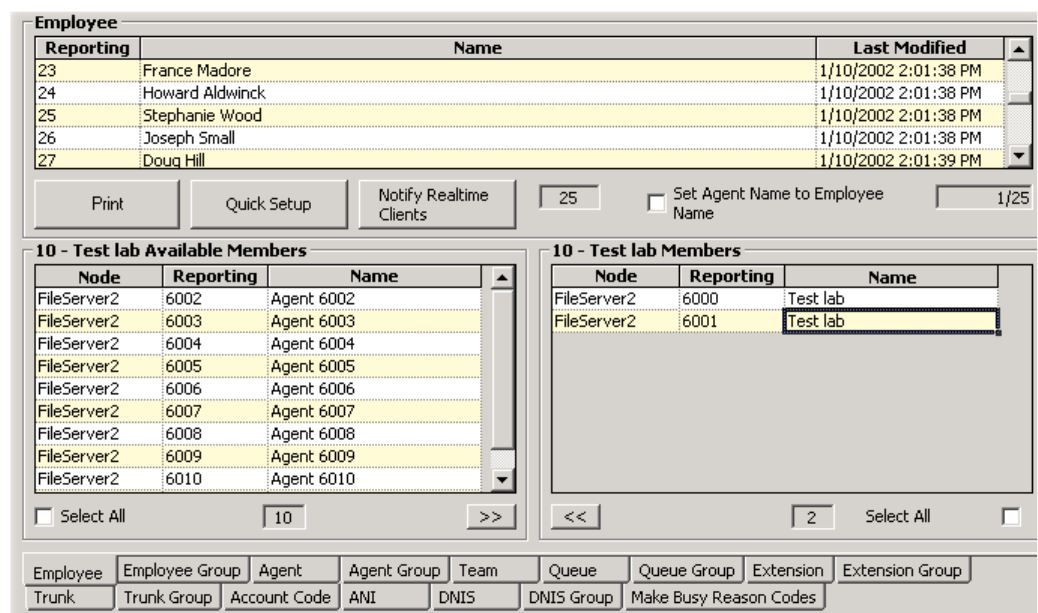
&RQILJXUDWLRQPDLQVFUHHQ
When you click YourSite=>Configuration Figure 5-1 appears featuring the Employee tab.
)LJXUH&RQILJXUDWLRQPDLQVFUHHQ
'HWHUPLQLQJZKLFKFDOOFHQWHUGHYLFHVWRFRQILJXUH
Before you program devices and device groups in the YourSite Database you must consider your needs.
5HSRUWLQJ
• Will you report on all devices and device groups, or only on agents, agent groups, queues, and queue
groups?
5HDOWLPH
• SuperAdvisor and AgentAdvisor display statistics on agents, agent groups, queues, queue groups,
employees, and employee groups. You must configure these devices in the YourSite Database and
associate them to groups in order to view data on them in real-time.
2QOLQHFKDW
• Agents log on to the chat module using employee IDs: you must configure them in the database.
&KDSWHU<RXU6LWH
NOTE: Mitel Networks 6110 CCM permissions are based on database teams and groups. If you have the SX-
2000, you can use the Quick Configuration Tool (see the Management Console). If you have the SX-200 with
real-time or the SX-200, you must programming the YourSite Database in the traditional way. You must create
agent IDs and associate the agents to employees and to agent groups. Then you associate the agent groups to
the queues for which they answer calls. Associate the employees to employee groups and the queues to queue
groups and then create these associations in the database in order to view real-time data and report on these
devices. If you are reporting on extensions, trunks, and employees, you must add these devices to the YourSite
Database and associate the extensions to extension groups, trunks to trunk groups, and DNIS numbers to
DNIS groups.
NOTE: When you upgrade from a Toolbox version 5.0 system to a Mitel Networks 6110 CCM system, 6110
CCM creates an employee ID for each agent ID programmed in the PBX. During the upgrade, if an agent has
three agent IDs, 6110 CCM creates a unique employee ID for each of the three agent IDs. This is a problem.
Agents must have only one employee ID. Following the upgrade, you must go into the YourSite Database and
re-associate the three agent IDs (for the agent) to one employee number.
The Configuration module is comprised of the following tabs: Agent, Agent Group, Team, Queue, Queue
Group, Extension, Extension Group, Trunk, Trunk Group, Account Code, Automatic Number Identification
(ANI), Dialed Number Identification Service (DNIS), DNIS Group, Employee, Employee Group, and Make
Busy Reason Codes. Each of these tabs contains one or more grids with records. A record is a set of entries for
a particular element.
$JHQWWDE
The grid in Figure 5-1 displays the employee and agent IDs in YourSite. You define agent names and IDs by
right-clicking the grid and clicking Add. You can double-click grid headers and sort the data by ascending or
descending order.
1RGH
The Node field lists the call center site to which the agent is currently associated.
(PSOR\HH,'
The employee ID field lists employee reporting numbers for employees defined in YourSite. You add
employee reporting numbers on the Employee tab.
5HSRUWLQJ
The agent Reporting field specifies agent IDs/reporting numbers for agents defined in YourSite.
You assign multiple agent IDs to agents who are cross-trained to answer calls for different departments and
log in and out of various queues. For example, agent Carol Jones answers calls for English, French, and
Spanish queues. In the YourSite Database you assign agent Jones three agent IDs (one for each queue for
which she answers calls) and an employee ID.
1DPH
The Name field lists the names of agents defined in YourSite.
/DVW0RGLILHG
The Last Modified field specifies the date that database information on the device was last edited.
$GG
The Add command adds new agents to YourSite.
(GLW
The Edit command edits reporting numbers, names, and nodes for agents.
'HOHWH
The Delete command deletes one or more agents from the Agents tab and from all corresponding database
groups.
6KRZ'HOHWHG
The Show Deleted command displays devices you have deleted from YourSite.
)LQG
The Find command locates a reporting number, name, or row number.
3ULQW
The Print command prints the grid currently displayed.

&KDSWHU<RXU6LWH
4XLFN6HWXS
The Quick Setup command adds a series of agents to YourSite. It is illustrated in Figure 5-2.
)LJXUH4XLFN6HWXS
NOTE: The YourSite Database programming must mirror that of the telephone system.
The Advanced option specifies advanced numbering features illustrated in Figure 5-3.
On the General tab, you can specify prefixes and postfixes for device names and dialable numbers, for a range
of devices.
On the Reporting tab, you can specify prefixes and postfixes for reporting numbers. You can use algorithms
(+, -, *, /) to specify ranges of device numbers. For example, you can enter an active range of agent reporting
numbers from 700 to 708 and an operator number of + 2. The resulting agent reporting numbers programmed
are 702, 704, 706, 708, and 710.
On the Metrics tab, you can specify service level time, short abandon time, and short talk time values for a
range of queues or agent groups.
On the Answer By tab, you can specify the answering priority for up to four agent groups for a range of
queues.
([DPSOH
You want to add a series of queues to the database with queue dialable numbers from 7900 to 7930 and queue
reporting numbers from 900 to 930.
To add the series of queues to YourSite:
1. Click Quick Setup.
2. Click Advanced.
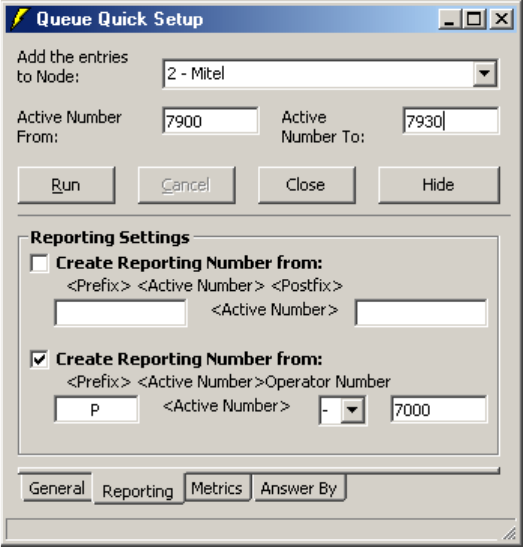
The dialog box illustrated in Figure 5-3 appears.
)LJXUH4XLFN6HWXSDGYDQFHGIHDWXUHV
3. In the Add the Entries to Node box, select a node.
4. In the Active Number From and Active Number To boxes, type 7900 and 7930 respectively.
5. Select the lower Create Reporting Number from check box.
6. Type P for the prefix, select the minus sign [-] for the active number, and type 7000 for the operator
number.
7. Click Run and click Close.
1RWLI\5HDOWLPH&OLHQWV
The Notify Realtime Clients command updates the SuperAdvisor, AgentAdvisor, Reporter, and Scheduled
Reports applications with changes you make to the database.
$JHQWV
The Agents counter displays the number of agents programmed in YourSite. If you click the ACD Queue,
Extension, or Trunk tab, the counter displays the number of ACD queues, extensions, or trunks programmed
in YourSite.
&KDSWHU<RXU6LWH
$GGLQJHOHPHQWVWR<RXU6LWH
To add elements, such as agents, extensions, and account codes to YourSite:
1. Click the Agent, Extension, Trunk, Account Code, ANI, or DNIS tab.
2. Right-click the grid and click Add.
3. Add one or more elements to the database, being sure to select the call center site (node) to which
the element belongs.
4. Click Add All.
5. Click Close to save changes to the database.
To add a series of elements to YourSite:
1. Click the Agent, Extension, Trunk, Account Code, ANI, or DNIS tab.
2. Right-click the grid and click Quick Setup.
3. In the Add the Entries to Node box, select the call center site to which the elements belong.
4. In the Active Number From and Active Number To boxes, enter a range of elements/device
numbers.
5. Click Run and click Close.
NOTE:
• An employee is a physical person being tracked in your call center. Employees can have multiple agent
IDs. The number of employees you program in the YourSite Database must be consistent with your
software licence. If you have more employees programmed than your licence permits, “[licence Is In
Violation of Max Agents Allowed]” will appear in place of your company name on the Mitel Networks
6110 CCM user interface (UI) and on any reports you generate.
• For the SX-200 and the SX-200 with real-time, the dialable number and queue number you define (in
the YourSite Database) for a particular queue must be identical. If you use 5300 as the dialable number
for the primary customer service queue, you must use P5300 for the corresponding queue number. You
define queue numbers on the Queue tab and dialable numbers on the Extension tab.
• If you attempt to add an element to YourSite that is already in the database the system notifies you the
element is already present. When you add a series of elements to YourSite, such as Extensions 5001 to
5005, if the system detects you have already added Extension 5002, then it will not add Extension 5002
or any subsequent extensions in the series (that is, Extensions 5003 to 5005) to the database.
(GLWLQJ<RXU6LWHHOHPHQWV
To edit YourSite elements:
1. Click the Agent, Extension, Trunk, Account Code, ANI, or DNIS tab.
2. Select a device.
3. Right-click the grid and click Edit.
4. Click a grid cell and make the required changes.
5. Click Update and click Close.
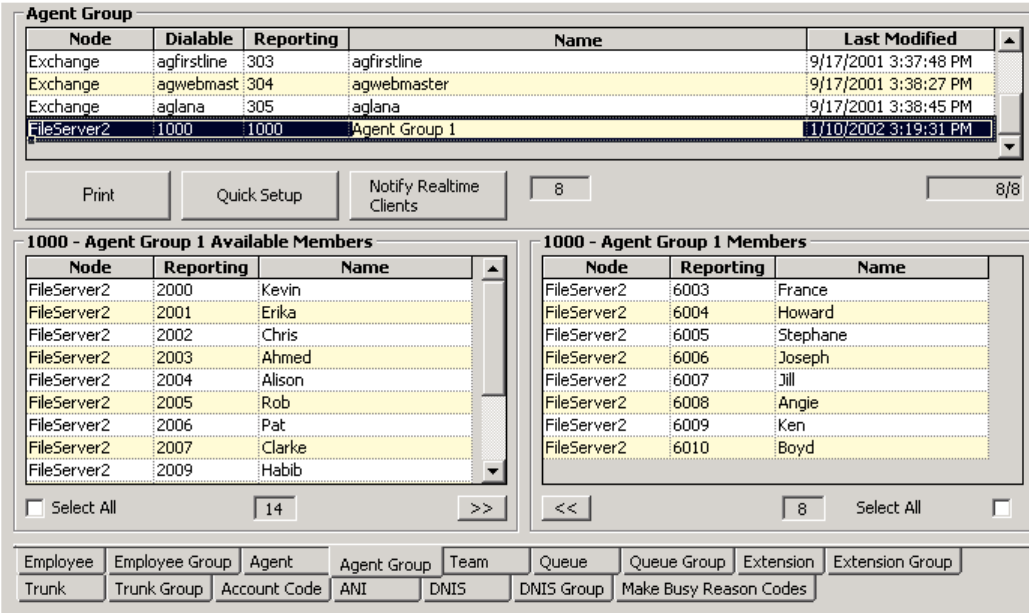
'HOHWLQJ<RXU6LWHHOHPHQWV
To delete YourSite elements:
1. Click the Agent, Extension, Trunk, Account Code, ANI, or DNIS tab.
2. Right-click the grid and click Delete.
3. Select one or more agents or account codes to delete and click Clear All.
4. Click Remove and click Close.
YourSite removes the element from the current table and from all corresponding database groups.
$JHQW*URXSWDE
Figure 5-4 illustrates the Agent Group tab. The Agent Group tab displays agents who belong to the agent
group currently selected. You define agent group numbers, group names, and service level time values on the
Agent Group tab by right-clicking the grid and clicking Add. You associate agents to agent groups on the
Agent Group tab. You can sort the information presented in grid fields by ascending or descending order by
double-clicking grid headers.
)LJXUH$JHQW*URXSWDE
The following functions are available on the Agent Group, Team, Queue, Queue Group, Extension Group,
Trunk Group, DNIS, DNIS Group, Employee, Employee Group tabs, and the Make Busy Reason Codes.
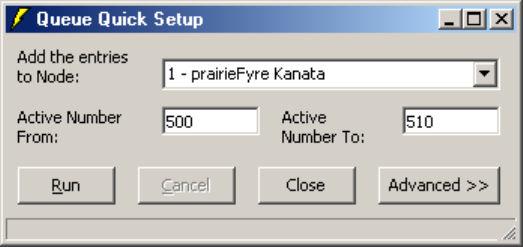
&KDSWHU<RXU6LWH
$GG
The Add command adds agent groups to YourSite.
(GLW
The Edit command edits group names and service level time values for agent groups.
'HOHWH
The Delete command deletes one or more agent groups.
6KRZ'HOHWHG
The Show Deleted command displays devices you have deleted from YourSite.
)LQG
The Find Command locates a reporting number, name, or row number.
3ULQW
The Print command prints a list of all agents programmed in YourSite for the current agent group.
3ULQW0HPEHUV
The Print Members command prints a list of members who belong to the group currently selected.
$GGDV0HPEHU
The Add as Member command adds the device currently selected to the Members grid.
4XLFN6HWXS
The Quick Setup command adds a series of agents to YourSite. It is illustrated in Figure 5-5.
)LJXUH4XLFN6HWXS
NOTE: The YourSite Database programming must mirror that of the telephone system.
The Advanced option specifies advanced numbering features.
On the General tab, you can specify prefixes and postfixes for device names and dialable numbers, for a range
of devices.

On the Reporting tab, you can specify prefixes and postfixes for reporting numbers. You can use algorithms
(+, -, *, /) to specify ranges of device numbers. For example, you can enter an active range of agent reporting
numbers from 700 to 708 and an operator number of + 2. The resulting agent reporting numbers programmed
are 701, 702, 704, 706, and 708.
On the Metrics tab, you can specify service level time, short abandon time, and short talk time values for a
range of queues or agent groups.
On the Answer By tab, you can specify the answering priority for up to four agent groups for a range of
queues.
([DPSOH
You want to add a series of queues to the database with queue dialable numbers from 7900 to 7930 and queue
reporting numbers from 900 to 930.
To add the series of queues to YourSite:
1. Click Quick Setup.
2. Click Advanced.
The dialog box illustrated in Figure 5-6 appears.
)LJXUH4XLFN6HWXSDGYDQFHGIHDWXUHV
1RWLI\5HDOWLPH&OLHQWV
The Notify Realtime Clients command updates the SuperAdvisor, AgentAdvisor, Reporter, and Scheduled
Reports applications with changes you make to the database.
&KDSWHU<RXU6LWH
$JHQW*URXSV
The Agent Groups counter displays the number of agent groups programmed in YourSite.
$YDLODEOH0HPEHUV
The Available Members counter lists the number of agent available to become members of the agent group
currently selected. The Available Members grid lists the agents you can add to the group.
0HPEHUV
The Members counter lists the number of agents that belong to the agent group currently selected. The
Members grid lists the agents that are members of the group.
1RGH
The Node field lists the call center site to which the agent group is currently associated.
5HSRUWLQJ
The Reporting field specifies reporting numbers for agent groups defined in YourSite.
1DPH
The Name field lists the names of agent groups defined in YourSite.
/DVW0RGLILHG
The Last Modified field specifies the date that database information on the device was last edited.
The following four fields appear on the Queue and Agent Group tabs only.
'LDODEOH1XPEHU
The Dialable Number field specifies the number the caller dials to reach a device.
$GGLQJJURXSVWR<RXU6LWH
When you assign numbers to groups in YourSite, use numerical characters only, such as 1 (for Extension
Group 1). Do not insert symbols, such as a star [ * ] or pound sign [ # ], in the number.
To add groups, queues, or teams to YourSite:
1. Click the Agent Group, Team, Queue, Queue Group, Extension Group, Trunk Group, or DNIS
Group tab.
2. Right-click the grid and click Add.
3. Add one or more groups, queues, or teams to the database, being sure to select the call center site
(node) to which the group belongs.
4. Click Add All and click Close.
To add a series of groups, queues, or teams to YourSite:
1. Click the Agent Group, Team, Queue, Queue Group, Extension Group, Trunk Group, or DNIS
Group tab.
2. Right-click the grid and click Quick Setup.
3. In the Add the Entries to Node box, select the call center site to which the groups belong.
4. In the Active Number From and Active Number To boxes, enter a range of group numbers.
5. Click Run and click Close.
NOTE: If you attempt to add a group to YourSite that is already in the database the system notifies you that
the group is already present. When you add a series of groups to YourSite, such as Extension Groups 1 to 5, if
the system detects you have already added Extension Group 3, then it will not add Extension Group 3 or any
subsequent extensions in the series (that is, Extension Group 4 or 5) to the database.
(GLWLQJ<RXU6LWHJURXSV
To edit YourSite groups:
1. Click the Agent Group, Team, Queue, Queue Group, Extension Group, Trunk Group or DNIS
Group tab.
2. Select a group, queue, or team.
3. Right-click the grid and click Edit.
4. Click a grid cell and make the required changes.
5. Click Update.
6. Click Close.
'HOHWLQJ<RXU6LWHJURXSV
To delete YourSite groups:
1. Click the Agent Group, Team, Queue, Queue Group, Extension Group, Trunk Group, or DNIS
Group tab.
2. Right-click the grid and click Delete.
3. Select one or more groups to delete and click Clear All.
4. Click Remove and click Close.
$GGLQJHOHPHQWVWR<RXU6LWHJURXSV
To add elements to YourSite groups:
1. Click the Agent Group, Team, Queue, Queue Group, Extension Group, Trunk Group, or DNIS
Group tab.
2. Select a group, queue, or team.
3. In the Available Members grid, select an element (or select multiple elements by clicking an
element, holding down the left mouse button, and dragging down the list) and click the right [>>]
arrow button to add it to the Members grid.
Alternatively, you can select the Select All check box to add all elements to the Members grid.
The elements are added to the members database instantly.
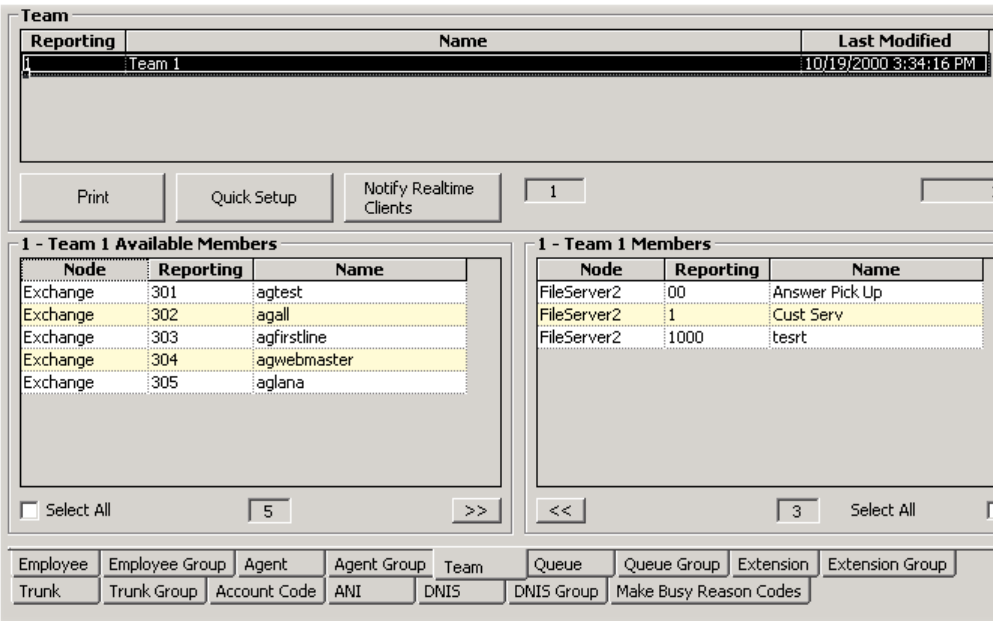
&KDSWHU<RXU6LWH
'HOHWLQJHOHPHQWVIURP<RXU6LWHJURXSV
To delete elements from YourSite groups:
1. Click the Agent Group, Team, Queue, Queue Group, Extension Group, Trunk Group, or DNIS
Group tab.
2. Select a group, queue, or team.
3. In the Members grid, select an element (or select multiple elements by clicking an element, holding
down the left mouse button, and dragging down the list) and click the left [<<] arrow button to add it
to the Available Members grid.
The elements are removed from the members database instantly.
7HDPWDE
Figure 5-7 illustrates the Team tab. The Team tab displays the agent groups that belong to the team currently
selected. The functions on the Team tab are the same as those presented in the section entitled Agent Group
tab. When you build teams, you can run reports for several agent groups simultaneously. You define team
numbers and names on the Team tab by right-clicking the grid and clicking Add.
)LJXUH7HDPWDE
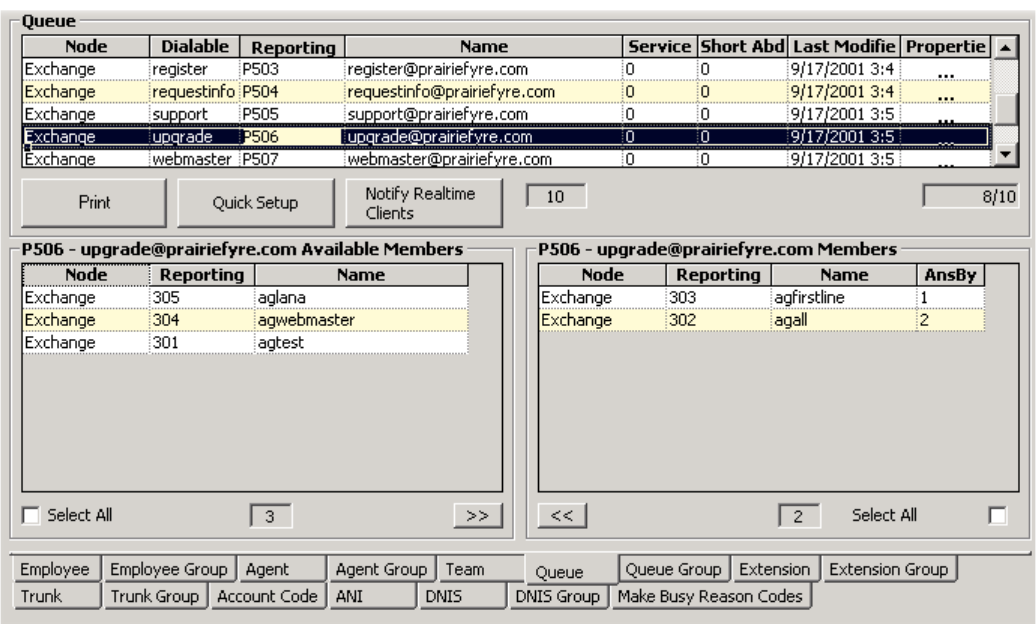
4XHXHWDE
Figure 5-8 illustrates the Queue tab. The Queue tab displays the agent groups that belong to the queue
currently selected. You define queue numbers, dialable numbers, queue names, short abandon time values,
short talk time values, and service level time values for queues by right-clicking the grid and clicking Add.
)LJXUH4XHXHWDE
NOTE: You must associate at least one agent group to a queue in order to produce reports on the queue.
4XHXHV
The Queues counter lists the number of ACD queues programmed in YourSite.
$QV%\
In the Members grid, the AnsBy field specifies the answering priority of up to four agent groups.
To specify which agent groups have answering priority, and in what order:
1. Click the Queue tab.
2. In the Agent Groups Available table, click an agent group.
3. Click the right arrow [>>] to add the agent group to the first answered by position in the Queue
Members table.
4. Repeat steps 1 to 3 to specify the answering priority for up to four agent groups.
This saves the answering priority to the database.
&KDSWHU<RXU6LWH
You define the following queue parameters by right-clicking the grid and clicking Add.
4XHXH1XPEHU
Users often get confused when programming queue numbers. prairieFyre refers to the telephone system path
reporting number as the queue reporting number. When you program the telephone system with a path number
such as six, you enter this number in the YourSite Database as queue reporting number P006 (for the SX-
2000) or P0006 (for the SX-200 and the SX-200 with real-time).
ACD queue numbers are four digits in length: P001 (for the SX-2000), or five or six digits in length: P0001 or
P00001 (for the SX-200 and the SX-200 with real-time).
For the SX-2000, the database expands any dialable number that is less than three digits. For example, if you
enter a queue number comprised of fewer than three numeric characters, such as P1, YourSite adds two zeros
preceding the 1, as does your telephone system. If you enter a queue number of P30, the database expands the
number to P030. For the SX-200 and SX-200 with real-time, the database expands any dialable number that is
less than four digits. For example, if you enter a queue number of P30, the database expands the number to
P0030.
NOTE: For the SX-200 and the SX-200 with real-time, the dialable number and queue number you define (in
the YourSite Database) for a particular queue must be identical. If you use 5300 as the dialable number for the
primary customer service queue, you must use P5300 for the corresponding queue number. You define queue
numbers on the Queue tab and dialable numbers on the Queue tab.
The following four fields appear on the Queue and Agent Group tabs.
'LDODEOH1XPEHU
The Dialable Number field specifies the number the caller dials to reach a device.
6HUYLFH/HYHO
The Service Level field specifies the service level time for the queue. You enter the value in seconds.
NOTE: The 6110 CCM reporting and real-time applications use the service level time in calculating the
service level percentage.
6HUYLFH/HYHO
The service level is the total number of calls which are answered, abandoned, and interflowed before a defined
threshold time (Service Level Time), compared to the total number of calls answered, abandoned, and
interflowed. It’s the average length of time a caller who has obtained a trunk waits for an available agent. The
service level = (Calls Answered + Long Calls Abandoned + Long Interflow) within the Service Level Time ÷
(Calls Answered + Long Calls Abandoned + Long Interflow).
6HUYLFH/HYHO3HUFHQW
The service level percent is the proportion of calls, expressed as a percentage, which are answered,
abandoned, and interflowed within a defined threshold time compared to the total number of calls answered or
abandoned (after the short abandon time).
6HUYLFH/HYHO7LPH
The service level time is the threshold time used in calculating the service level percentage, such as 90 percent
of calls answered in 20 seconds. The service level percentage and service level time are parameters you define
as your service objective.
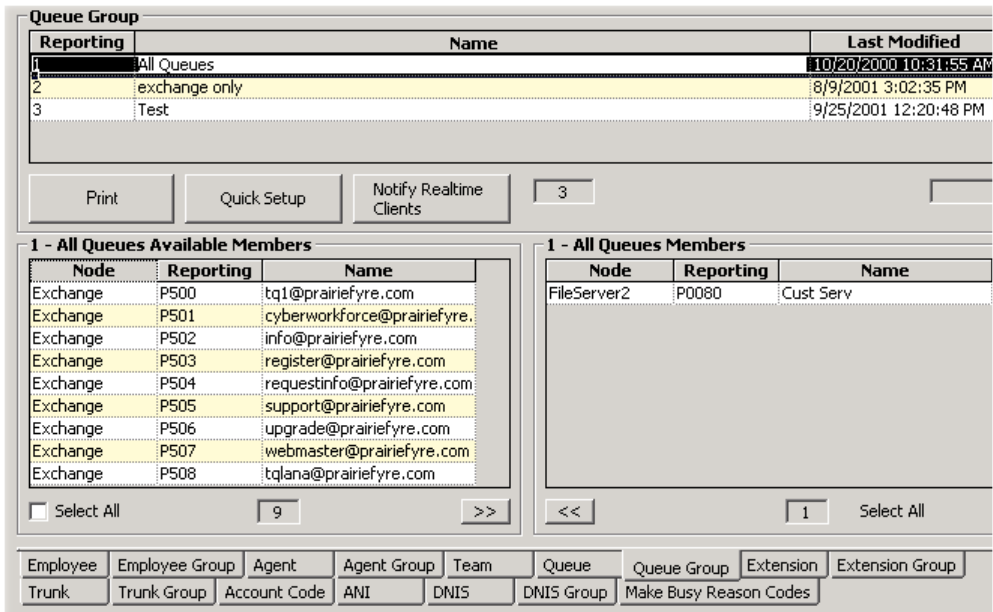
&DOOV$EDQGRQHG3DUDPHWHU
The Calls Abandoned Parameter specifies the value which determines whether a call is a Short Abandoned
Call or a Long Abandoned Call. If the abandon time is less than the Call Abandoned Parameter, then it is a
Short Abandoned Call. If the abandon time is more than the Call Abandoned Parameter, then it is a Long
Abandoned Call.
You assign the Calls Abandoned Parameter (called the Queue Short Abandon Time) values to ACD queues in
the YourSite Database.
Callers can abandon after they reach a trunk (before they reach the ACD queue) or while they are in queue
waiting for an available agent (either before or after the short abandon time you specify).
3URSHUWLHV
With the properties field, under Business Hours, you can enter your business hours of operation so the system
will put you in and out of Do Not Disturb automatically. Under Spectrum Values, you can set the spectrum
threshold that the spectrum reports are based on. The spectrum values are in seconds.
4XHXH*URXSWDE
Figure 5-9 illustrates the Queue Group tab. The Queue Group tab displays queues that belong to the queue
group currently selected. The functions on the Queue Group tab are the same as those presented in the section
entitled Agent Group tab. You define queue group numbers and names on the Queue Group tab by right-
clicking the grid and clicking Add.
)LJXUH4XHXH*URXSWDE
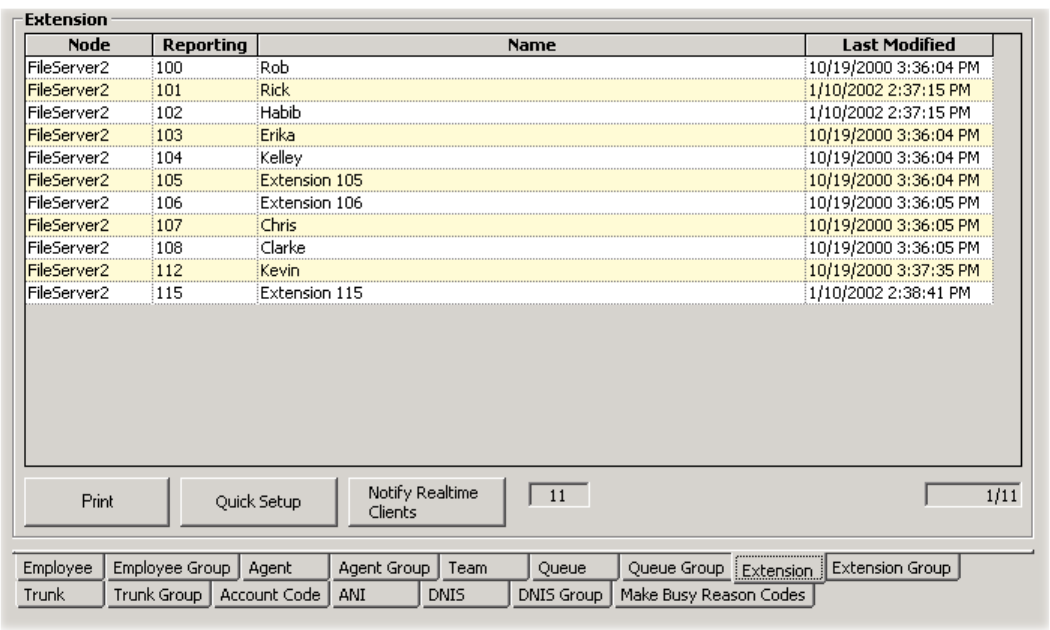
&KDSWHU<RXU6LWH
([WHQVLRQWDE
Figure 5-10 illustrates the Extension tab. The functions on the Extension tab are the same as those presented in
the section entitled Agent tab. You define extension numbers and names on the Extension tab by right-clicking
the grid and clicking Add.
)LJXUH([WHQVLRQWDE
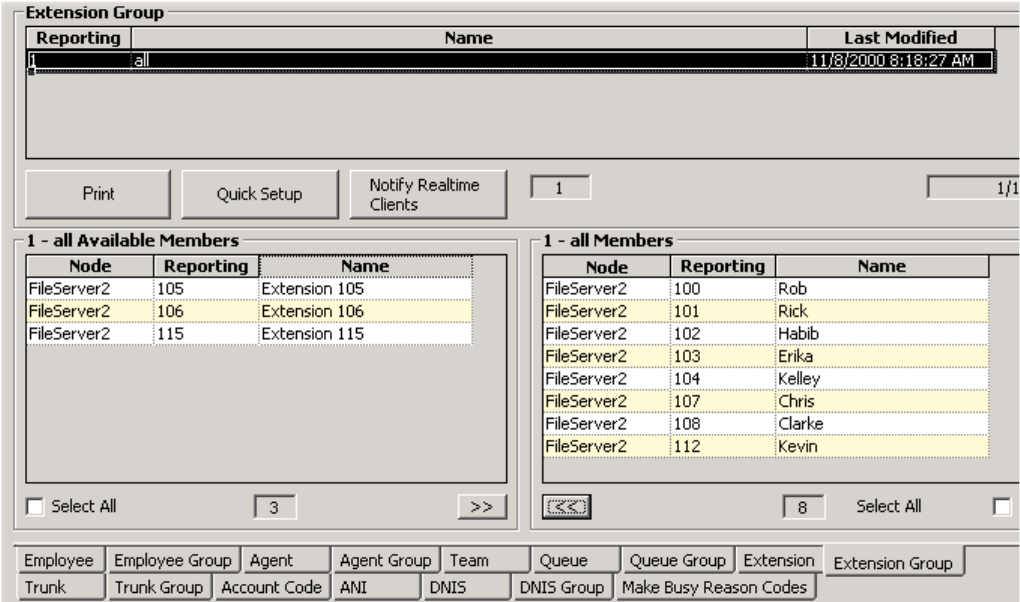
([WHQVLRQ*URXSWDE
Figure 5-11 illustrates the Extension Group tab. The functions on the Extension Group tab are the same as
those presented in the section entitled Agent Group tab. You define extension group numbers and names on
the Extension Group tab by right-clicking the grid and clicking Add.
)LJXUH([WHQVLRQ*URXSWDE
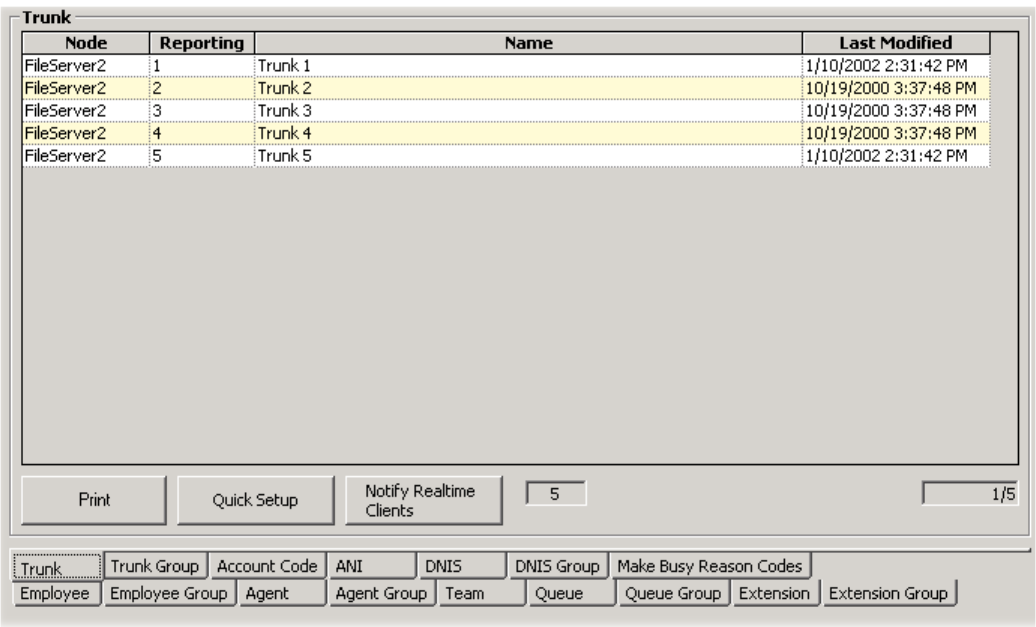
&KDSWHU<RXU6LWH
7UXQNWDE
Figure 5-12 illustrates the Trunk tab. The functions on the Trunk tab are the same as those presented in the
section entitled Agent tab. You define trunk numbers and names on the Trunk tab by right-clicking the grid
and clicking Add.
)LJXUH7UXQNWDE
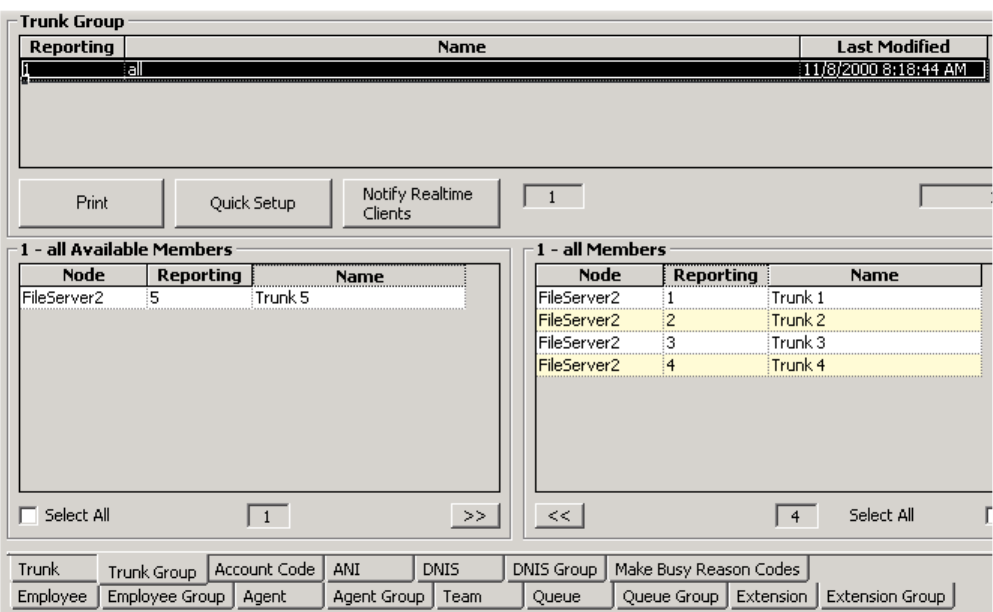
7UXQN*URXSWDE
Figure 5-13 illustrates the Trunk Group tab. The functions on the Trunk Group tab are the same as those
presented in the section entitled Agent Group tab. You define trunk group numbers and names on the Trunk
Group tab by right-clicking the grid and clicking Add.
)LJXUH7UXQN*URXSWDE
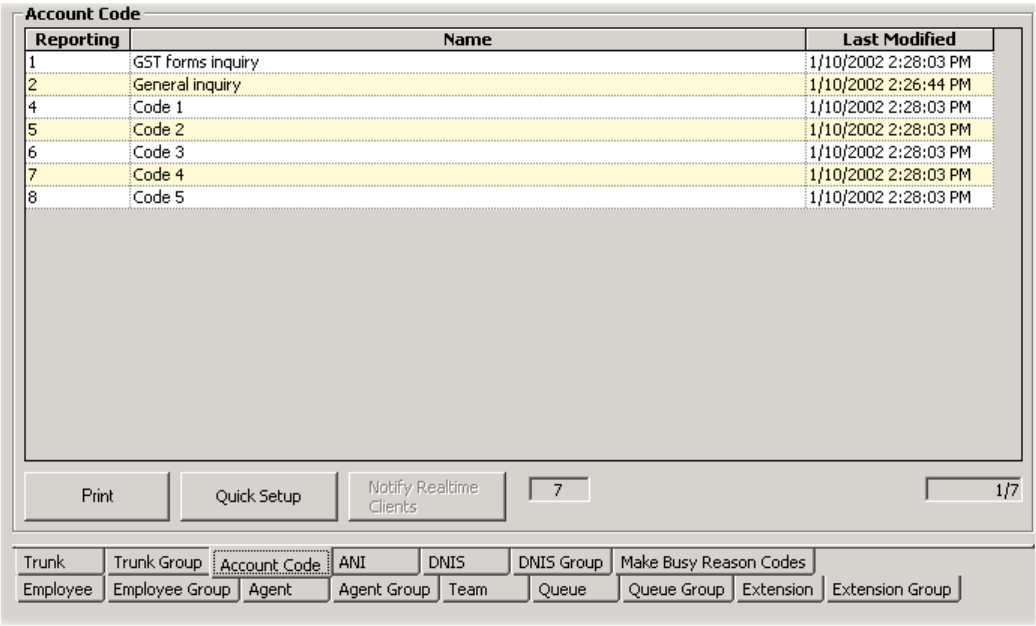
&KDSWHU<RXU6LWH
$FFRXQW&RGHWDE
Figure 5-14 illustrates the Account Code tab. The functions on the Account Code tab are the same as those
presented in the section entitled Agent tab. You define account code numbers and names on the Account Code
tab by right-clicking the grid and clicking Add.
)LJXUH$FFRXQW&RGHWDE
You can register account codes in YourSite for individual departments, projects, and services and generate
reports. For example, an agent who receives calls for three catalog companies enters account code 1 for calls
to company X, account code 2 for calls to company Y, and account code 3 for calls to company Z. If you
register these catalog companies in YourSite, the 6110 system generates reports on the number, origin, and
handling of calls to the three companies.
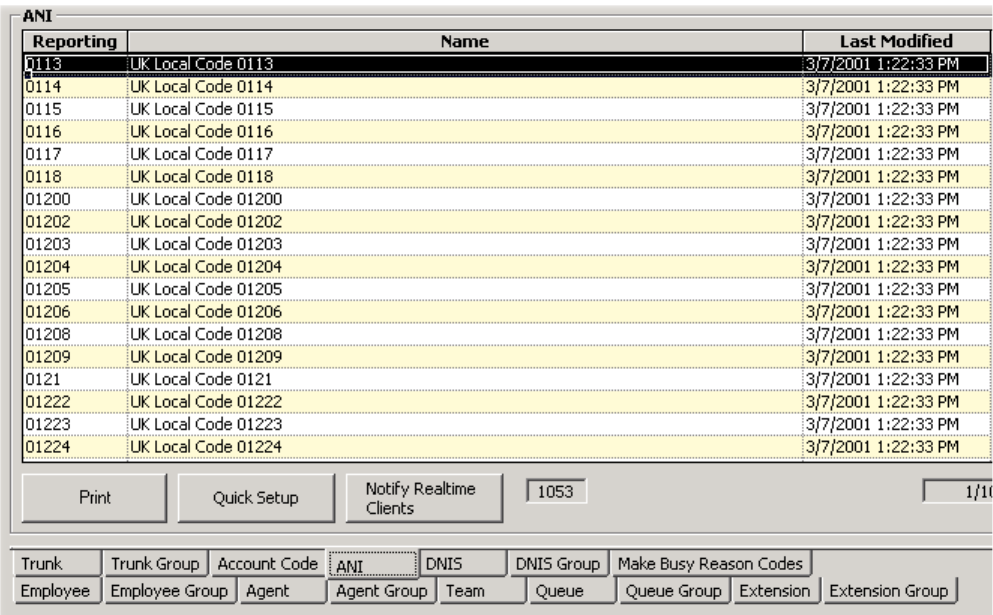
$1,WDE
Figure 5-15 illustrates the ANI tab. The functions on the ANI tab are the same as those presented in the
section entitled Agent tab. The ANI tab provides area codes used to produce reports on the number of calls
originating from various geographical regions. You define area codes and corresponding regions on the ANI
tab by right-clicking the grid and clicking Add.
)LJXUH$1,WDE
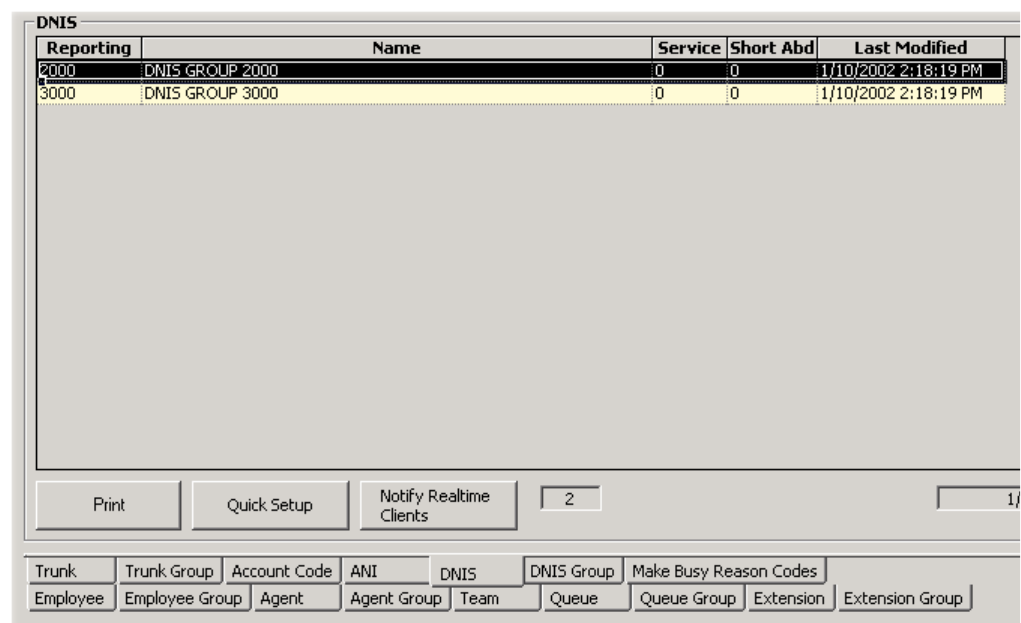
&KDSWHU<RXU6LWH
'1,6WDE
Figure 5-16 illustrates the DNIS tab. The functions on the DNIS tab are the same as those presented in the
section entitled Agent tab.
Dialed Number Identification Service (DNIS) is a feature of toll-free lines that identifies the telephone
number the caller dials. This assists agents who answer calls for more than one business or product line.
Each business or product line has its own toll-free number. When a caller dials a toll-free number, the
telephone system forwards information to the agent allowing the agent to identify who the caller dialed. For
example, a caller dials a tool-free number for a cruise line. The telephone system sends a script to the agent
along with the call. The agent then knows to answer “Good morning. Thank you for calling Southern
Cruises,” instead of the name of another cruise line serviced by the center.
)LJXUH'1,6WDE
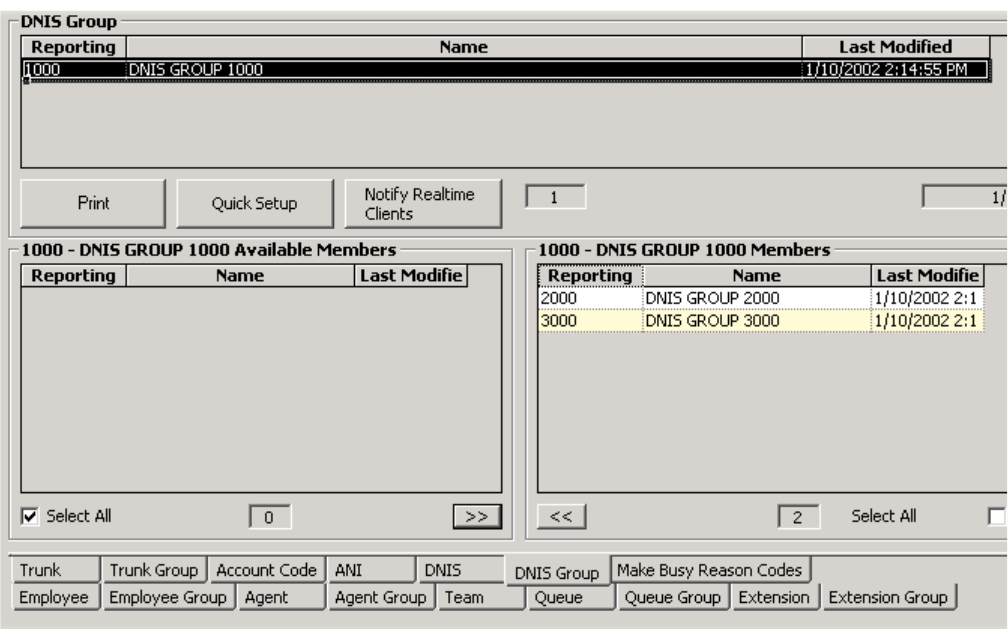
'1,6*URXSWDE
Figure 5-17 illustrates the DNIS Group tab. The functions on the DNIS Group tab are the same as those
presented in the section entitled Agent Group tab.
)LJXUH'1,6*URXSWDE
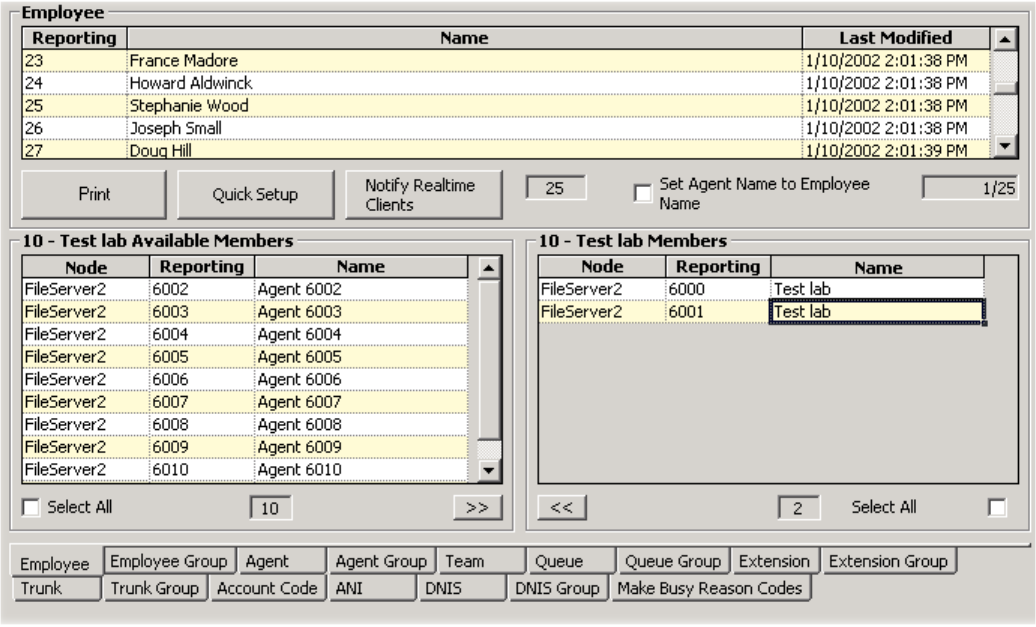
&KDSWHU<RXU6LWH
(PSOR\HHWDE
Figure 5-18 illustrates the Employee tab. On the Employee tab, you must enter an employee ID for each call
center agent and associate the employee ID to the agent ID. You enter employee names and IDs by right-
clicking the grid and clicking Add.
The agent ID and employee ID for an agent can be identical, or different. The choice is yours. It is important
you do not assign the same employee ID to two agents; agents must have unique employee IDs.
)LJXUH(PSOR\HHWDE
NOTE: An employee is a physical person being tracked in your call center. Employees can have multiple
agent IDs. The number of employees you program in the YourSite Database must be consistent with your
software licence. If you have more employees programmed than your licence permits, “[licence Is In
Violation of Max Agents Allowed]” will appear in place of your company name on the 6110 CCM user
interface (UI) and on any reports you generate.
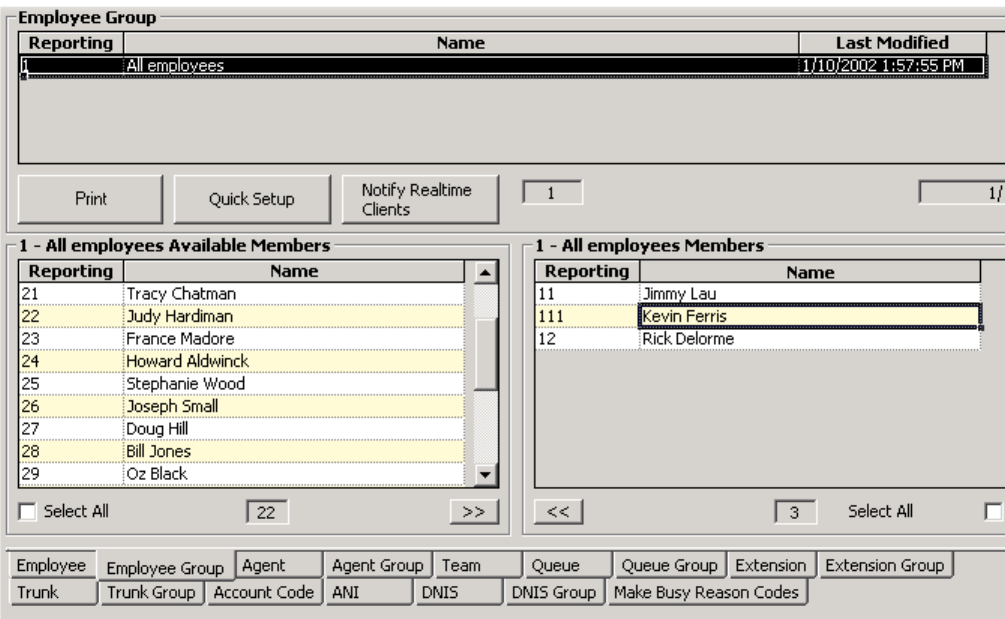
(PSOR\HH*URXSWDE
Figure 5-19 illustrates the Employee Group tab. The functions on the Employee Group tab are the same as
those presented in the section entitled Agent Group tab. You enter employee group numbers and names on the
Employee Group tab by right-clicking the grid and clicking Add Group.
)LJXUH(PSOR\HH*URXSWDE
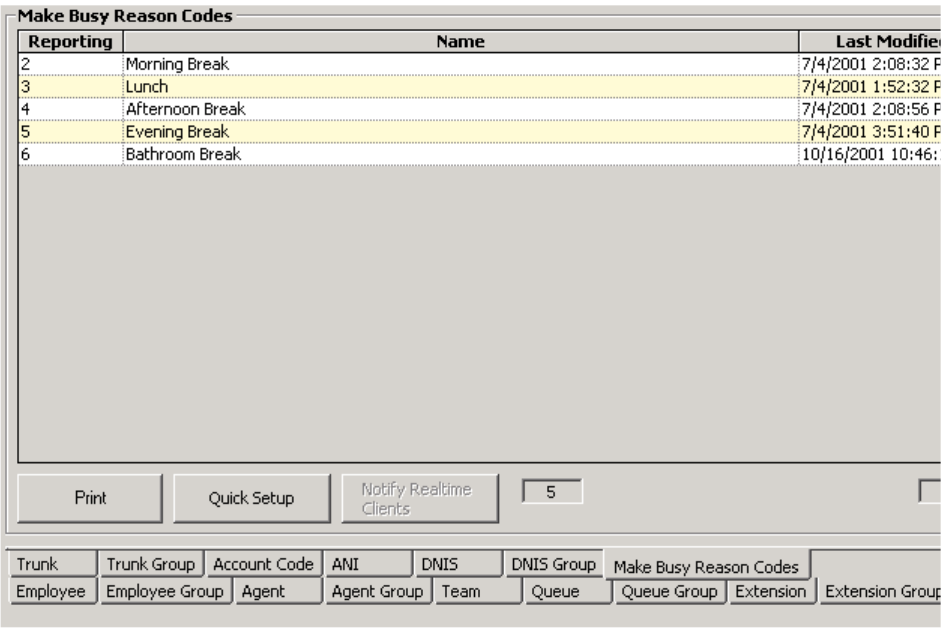
&KDSWHU<RXU6LWH
0DNH%XV\5HDVRQ&RGHVWDE
Figure 5-20 illustrates the Employee Group tab. The functions on the Make Busy Reason Codes tab are the
same as those presented in the section entitled Agent Group tab. You enter Make Busy Reason Codes on the
by right-clicking the grid and clicking Add.
)LJXUH0DNH%XV\5HDVRQ&RGHVWDE
$XWRPDWLF6\QFKURQL]DWLRQZLWK,&&
Automatic Synchronization is only available if you have Mitel Networks 6115 Interactive Contact Center.
Automatic Synchronization reads the PBX Agent ID/Names, Agent groups/Names, and Paths/Names (only if
you have DNIS*), then it dynamically updates the YourSite database.
*If you do not have DNIS, you can enter the Path Dialable and Reporting numbers, and then the Paths/Names
will be automatically synchronized.
NOTE: Ensure you have licences for each employee before you begin. If you have more employees than you
have licences for, the Automatic Synchronization will not add employees to the database. You will have to add
the employees and then associate them to the agents.
To configure your database for the first time, you must
1. Set the MiTAI node.
2. Enter the Queue dialable and reporting numbers, and enable Interactive in the database.
3. Wait approximately five minutes for Automatic Synchronization.
4. Refresh the screen.
5. Set the re-synchronization time.
Your database will be updated.
If you have previously configured your database and just want to update your database daily, you must
1. Set the re-synchronization time.
7KHHIIHFWVRI$XWRPDWLF6\QFKURQL]DWLRQ
(PSOR\HH,'V$JHQW,'V
The Employee name and ID (Identification number) will now be the same as the Agent name and ID.
5HSRUWLQJQXPEHUV'LDODEOHQXPEHUV
Reporting numbers that are known to 6110 CCM will remain unchanged.
Reporting numbers that are unknown to 6110 CCM will appear in the following format: MDialable Number
(M1600). For example, M1600 is the reporting number for the agent group with the dialable number 1600.
1HZ4XHXHV
As new queues are entered into the switch, MiTAI will automatically update the database to include them.
&KDQJLQJ'HYLFHQDPHV
You can change the name of any device and Automatic Synchronization will not attempt to overwrite the
name. That means that a single agent might be referred to as Agent1 on the PBX and referred to as Kevin in
6110 CCM.

&KDSWHU<RXU6LWH
6HWWLQJWKH0L7$,1RGH
1. Click Start=>Programs=>Mitel Networks=>Management Console.
2. Click Enterprise.
3. Expand the Local Nodes and select the MiTAI node. (For example, select Toronto.)
4. After Switch Type, select the MiTAI switch.
5. Type the Node, Name, IP Address, and IP Port.
6. Click Save Changes.
)LJXUH0DQDJHPHQW&RQVROHZLQGRZ
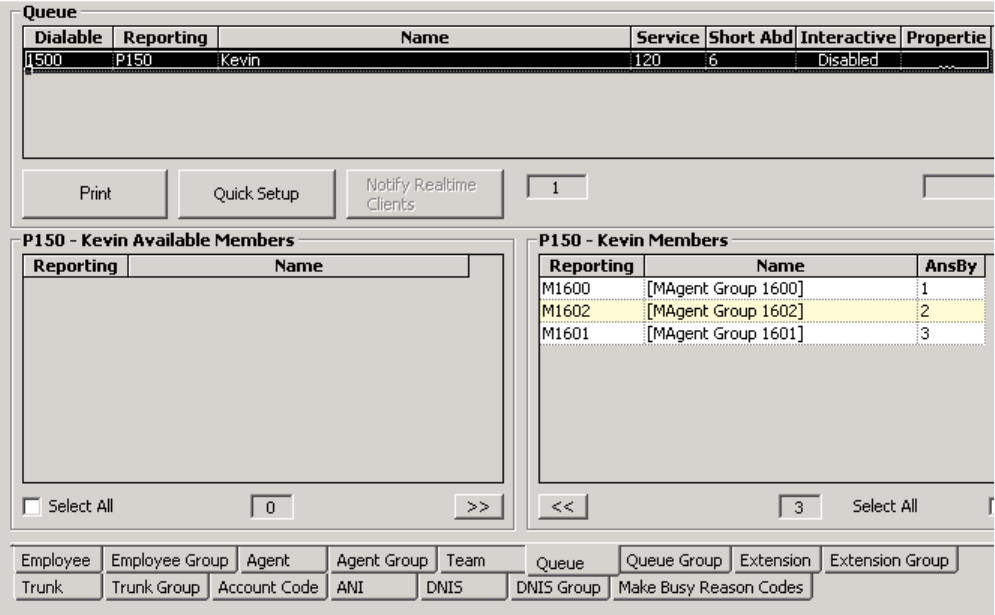
(QWHULQJWKH4XHXHGLDODEOHDQGUHSRUWLQJQXPEHUV
1. Click YourSite=>Configuration.
2. Click the Queue tab.
3. Select a queue.
The Queue window appears. See Figure 5-22.
)LJXUH7KH4XHXHZLQGRZ
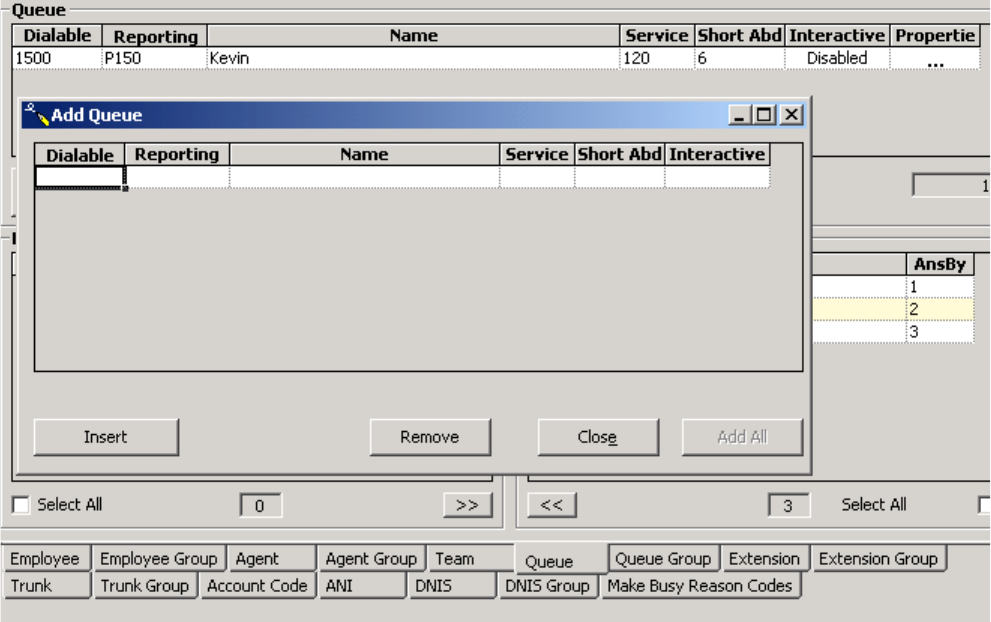
&KDSWHU<RXU6LWH
4. Under Dialable, right-click and select Add.
The Add Queue window appears. See Figure 5-23.
5. Under Dialable, type the dialable number.
6. Under Reporting, type the reporting number.
7. Under Name, type the name.
8. Under Service, type the service.
9. Under Short Abd, type the duration for short abandon.
10. Under Interactive, select Enabled.
11. Click Insert.
12. Repeat steps 5-7 until you have typed all dialable and reporting numbers, and enabled Interactive for
the queue, then click Add All.
)LJXUH$GG4XHXHZLQGRZ
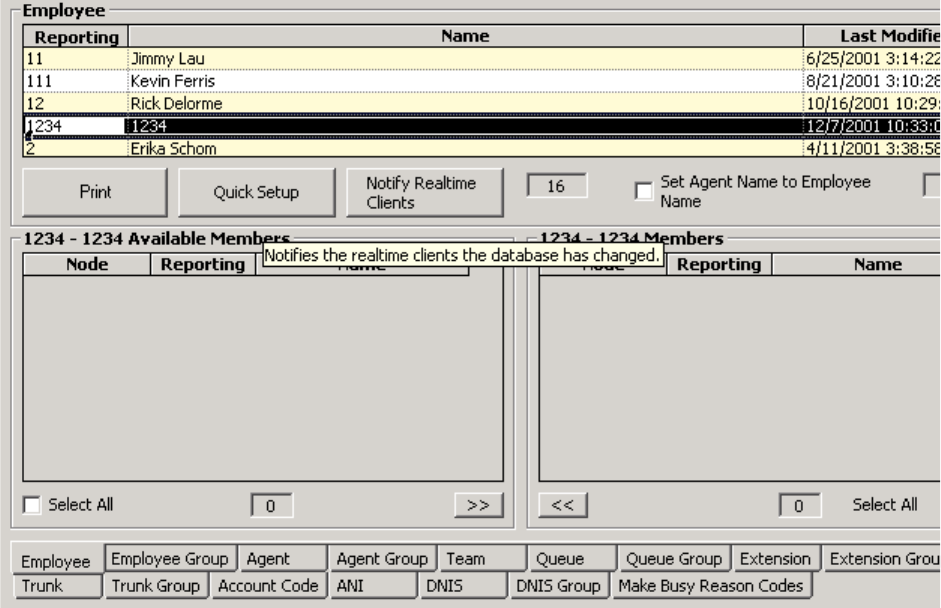
You must update the real-time clients. (See Figure 5-24.)
13. Click Notify Realtime Clients.
)LJXUH1RWLI\UHDOWLPHFOLHQWV
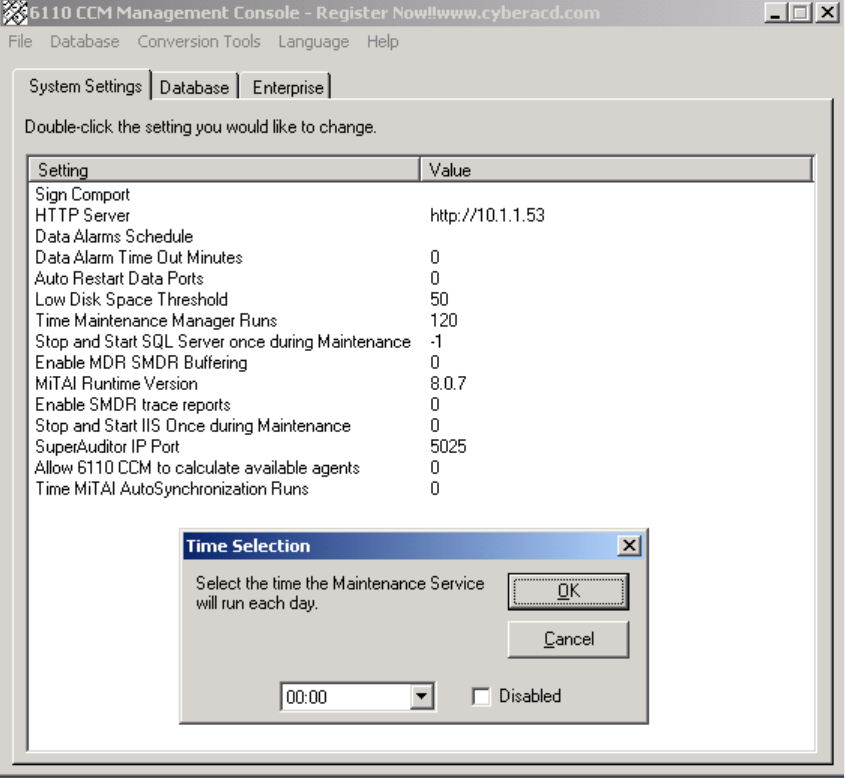
&KDSWHU<RXU6LWH
6HWWLQJWKHUHV\QFKURQL]DWLRQWLPH
1. Click Start=>Programs=>Mitel Networks=>Management Console.
2. Click Time MiTAI AutoSynchronization Runs.
The Time Selection window appears. (See Figure 5-25.)
3. Select the time for the automatic synchronization to occur.
4. Click OK.
5. Close the Management Console.
)LJXUH0DQDJHPHQW&RQVROH
6HFXULW\
After you install 6110 CCM, you must grant users access to the 6110 CCM Web site. When users browse to
the 6110 CCM Enterprise server to start 6110 CCM, security requires they provide a valid user name and
password. 6110 CCM security challenges users a second time if they attempt to run an application to which
they are not permitted access.
Starting with version 2.8, Mitel Networks 6110 CCM has new security features. The security can now be as
basic or as flexible (advanced) as you need it.
With security roles, you can define what you want users to have access to. By default the security role is Not
Restricted (to the Web site). However you have the option of creating a more customized security role and
then assign users to it.
&UHDWLQJD6HFXULW\5ROH
NOTE: Every time the new install is run a default user is created. The default gives both prairieFyre staff and
the installer the assurance that there is at least one account with which to access the Web site.
• Username: _Admin
• Password: _Password
• Security Role: Not Restricted, may do anything
You must change the account password from the default to a unique password after EACH installation of
Mitel Networks 6110 CCM.
There are two categories of Security Role: Basic and Advanced. You can create a Basic Security Role to
restrict user access to specific applications, or you can create an Advanced Security Role to restrict user
access to customized lists: Device Lists, Report Lists, and/or User Lists.
NOTE: For you to assign security roles, your account must be associated to a security role that does not
restrict you from administering security.
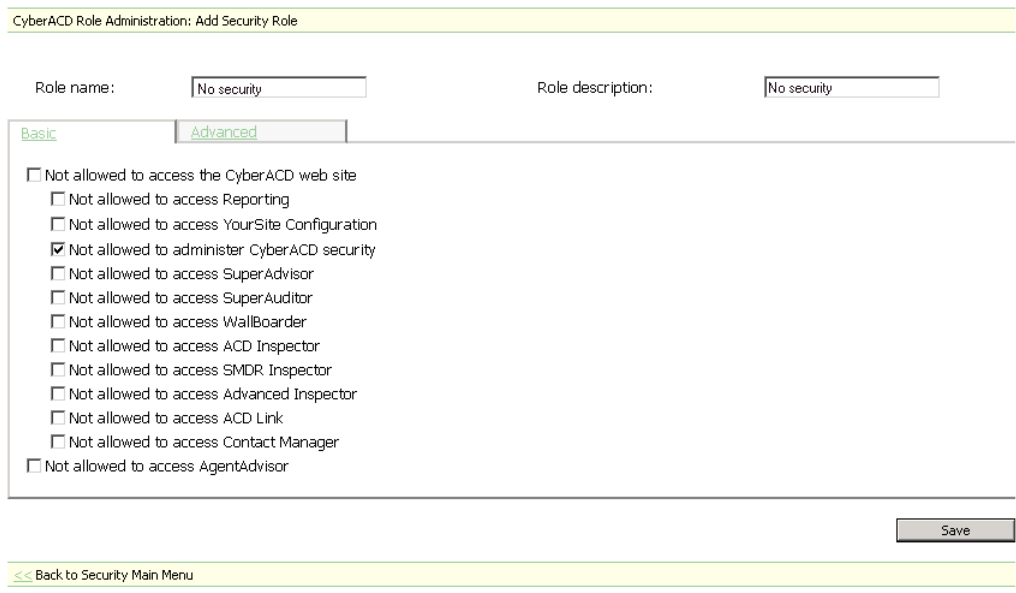
&KDSWHU<RXU6LWH
&UHDWLQJD%DVLF6HFXULW\5ROH
When you first access the prairieFyre Web site, users by default have total access to the Web site. If you want
some users to have access to the Web site, but do not want them to have access to everything (for example,
you do not want them to administer security) then you must create a Security Role with that characteristic.
1. Click YourSite=>Security.
2. Click Security Roles.
3. Click Add.
4. Figure 5-26 appears.
5. After Role name, type the name of this security role.
6. After Role description, type the description of this security role.
7. On the Basic tab, select from the list that which the user is not permitted to access. For example, if
agents are not permitted to administer security, select Not allowed to administer 6110 CCM
security.
8. Click Save.
)LJXUH6HFXULW\5ROHV
9. Log off and log back on to view the changes you just made.
10. Click YourSite=>Security.
11. Click Security Roles.
The name of the security role you just created appears under Name.
There are now two security roles: the original security roles (Not Restricted) and the security role you just
created. You can assign the new security role to new users, or you can edit the current users’ existing security
roles to that of the new security role.
Users who are currently logged on will not be affected by changes made to their associated role until the next
time they log on. If you want the security role changes to take effect immediately, start and stop the 6110
CCM Web site from the Internet Server Manager. All clients will be disconnected and forced to re-log on.
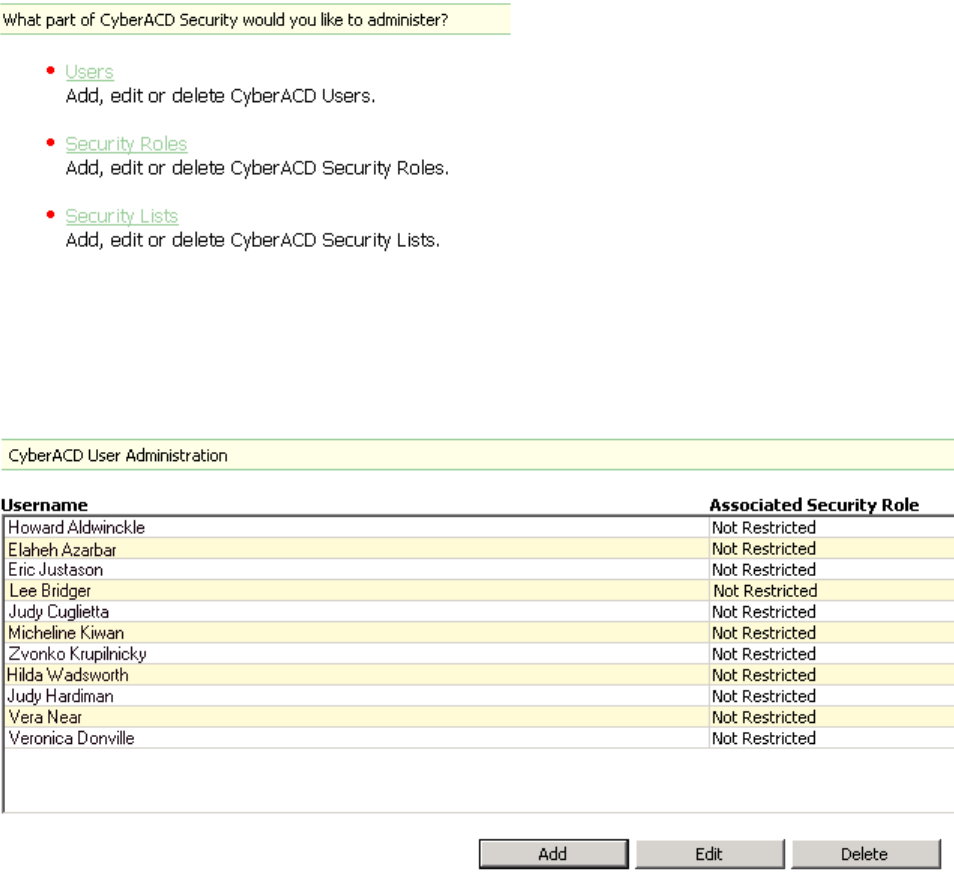
*UDQWLQJRUUHVWULFWLQJDFFHVVWR&&0
By default, security grants total access to the Website.
1. Click YourSite=>Security.
Figure 5-27 appears.
2. Click Users.
)LJXUH6HFXULW\
Figure 5-28 appears. The users and their associated security roles are listed here.
3. Click Add.
)LJXUH8VHU$GPLQLVWUDWLRQ
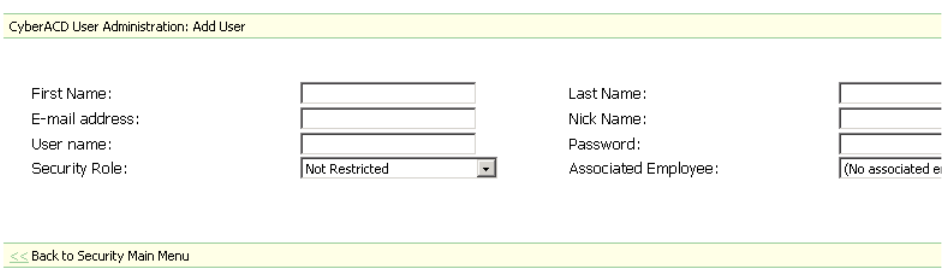
&KDSWHU<RXU6LWH
Figure 5-29 appears.
4. Type the user information into the text boxes.
5. After Security Role, select the appropriate Security Role.
All new Security Roles will be listed here.
6. After Associated Employee, select the employee. The Associated Employee list will include all
configured and licenced 6110 CCM employees. You must associate the user with the employee if
that employee is an agent who answers the telephones. If the employee is not an agent who
answers the telephone, then select No associated employee.
7. Click Save.
)LJXUH
&UHDWLQJOLVWV
You must create a User List, a Report List, and/or a Device List before you create an Advanced Security Role.
With these lists, you can fine-tune a Security Role. The User List restricts access to employees Chat. The
Report List restricts access to report types. The Device List restricts access to historical reporting, real-time,
and 6115 CCM statistics.
&UHDWLQJD8VHU/LVW
You create a User List to restrict access to Chat.
1. Click YourSite=>Security.
2. Click Security Lists.
The Security List Administration window appears.
3. After Select List Type, select User Lists.
4. Click Add.
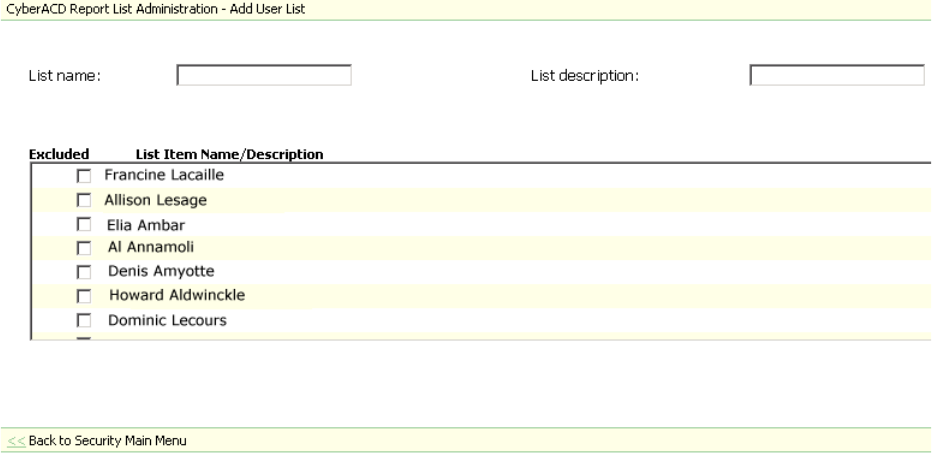
The Report List Administration - User List, Figure 5-30 appears.
5. After List name, type the list name (for example, No Chat).
6. After List description, type the list description, (for example, No Chat).
7. Select all employees who you are restricting access to Chat.
8. Click Save.
)LJXUH5HSRUW/LVW$GPLQLVWUDWLRQ8VHU/LVW
&UHDWLQJD5HSRUW/LVW
You create a Report List to restrict specific report types on specific users. For example, you might want
manager to view only Employee Reports (specific report type) on the employees they manage only (specific
devices). By creating a Report List, you can restrict access to that specific report type only.
1. Click YourSite=>Security.
2. Click Security Lists.
The Security List Administration window appears.
3. After Select List Type, select Report Lists.
4. Click Add.
5. After List name, type the report type (for example, only Employee Reports).
6. After List description, type the report list description, for example, Restrict all but Employee
Reports).
7. Select the first report type (for example, 4Sight Reports).
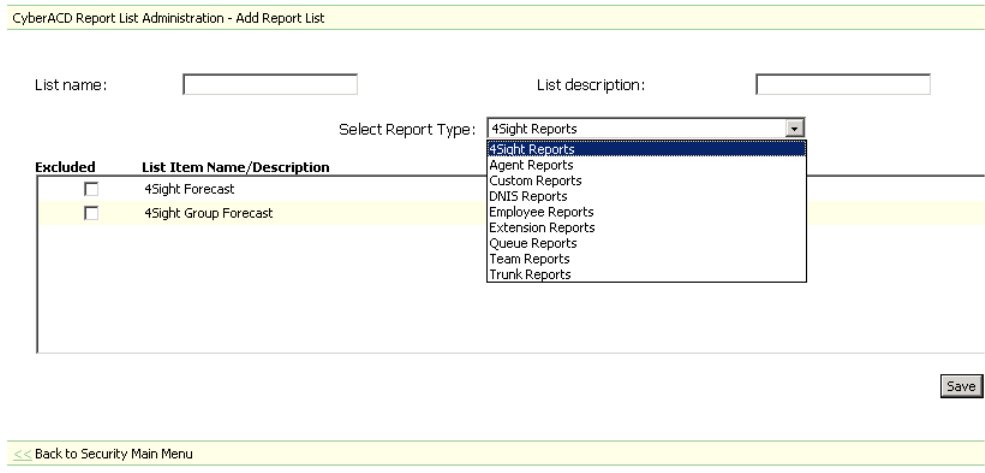
&KDSWHU<RXU6LWH
The Report List Administration - Add Report List window, Figure 5-31 appears.
8. Select all reports listed that you do not want the manager to have access to (for example 4Sight
Forecast and 4Sight Group Forecast).
9. Select the next report type (for example, Agent Reports).
10. Select all reports listed that you do not want the manager to have access to.
11. Repeat steps 9-10 until you have selected every report you do not want the manager to have access
to.
12. Click Save.
)LJXUH5HSRUW/LVW$GPLQLVWUDWLRQ$GG5HSRUW/LVWZLQGRZ
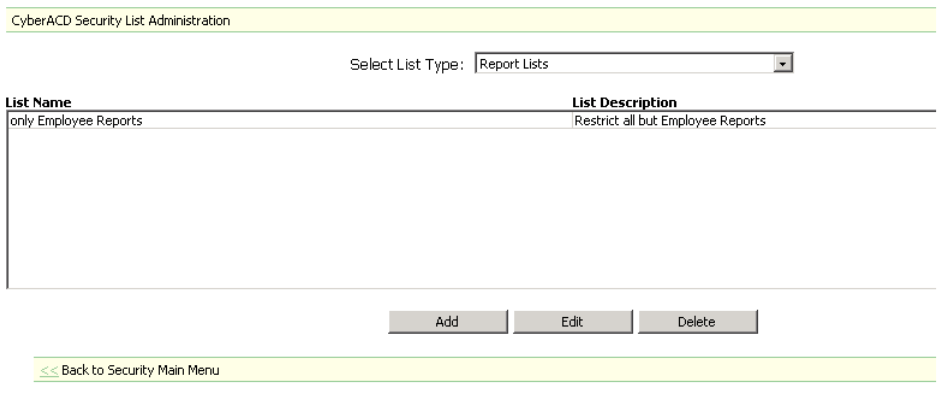
There is now an only Employee Reports Report List. See the Security List Administration window,
Figure 5-32.
)LJXUH6HFXULW\/LVW$GPLQLVWUDWLRQZLQGRZ
&UHDWLQJD'HYLFH/LVW
You create a Device List to restrict access to statistics on specific users. For example, you might want a
manager to view only Employee Reports (specific report type) on the employees he manages only (specific
devices). By creating a Device List, you can restrict access to those specific employees only.
A Device is real-time or 6116 CCM statistics from which you can create a historical report or view real-time
or 6115 CCM statistics: Agents, Agent Groups, Queues, Queue Groups, Extensions, Extension Groups,
Trunks, Trunk Groups, Employees, Employee Groups, Teams, and DNIS.
1. Click YourSite=>Security.
2. Click Security Lists.
The Security List Administration window appears.
3. After Select List Type, select Device Lists.
4. Click Add.
5. After List name, type the device type (for example, only Employee Group 6).
6. After List description, type the report list description, for example, (Dan’s agents).
7. After Select Device Group Type, select the first device group (for example, Employee Groups).
8. Select all the devices you do not want the manager to have access to.
9. After Select Device Group Type, select the next device group.
10. Select all the devices you do not want the manager to have access to.
You can click on the Device Group Type to view the members. This is for reference only.
11. Repeat steps 9-10 until all devices are selected except for the device you want the manager to have
access to.
12. Click Save.

&KDSWHU<RXU6LWH
Figure 5-33 appears.
)LJXUH6HFXULW\/LVWV
&UHDWLQJDQ$GYDQFHG6HFXULW\5ROH
You must create a User List, a Report List, and/or a Device List before you create an Advanced Security Role.
With these lists, you can fine-tune a Security Role. The User List restricts access to employees Chat. The
Report List restricts access to report types. The Device List restricts access to real-time and 6115 CCM
statistics.
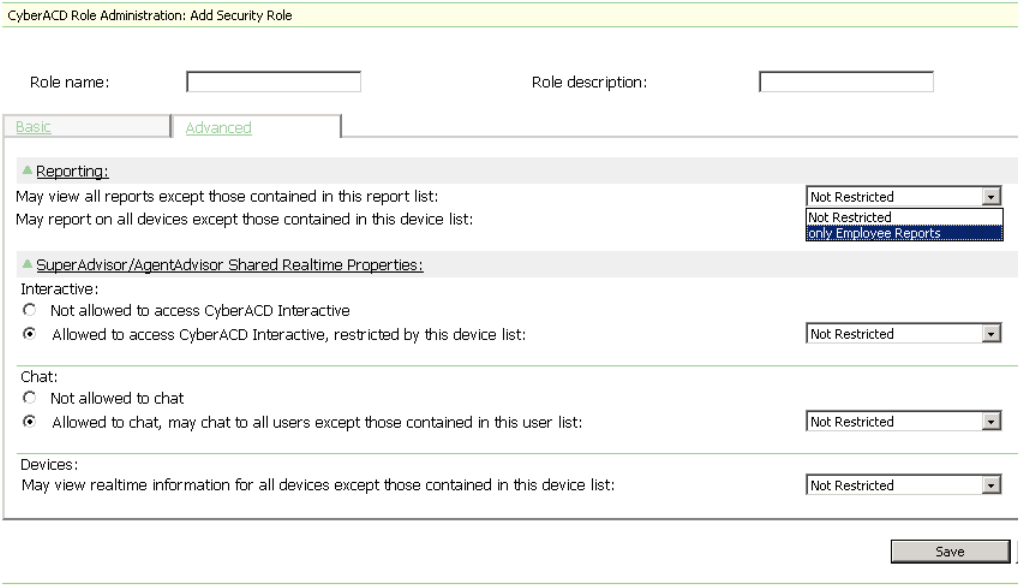
&UHDWLQJDQ$GYDQFHG6HFXULW\5ROHWKDWUHVWULFWVDFFHVVWRUHSRUWV
Once you create a Device List you can create an Advanced Security Role that restricts access to reports, based
on the Report List. See Figure 5-34.
1. Click YourSite=>Security.
2. Click Security Roles.
3. Click Add.
4. Click the Advanced tab.
5. After Role name, type the name of this security role.
6. After Role description, type the description of this security role.
7. Under Reporting, select the Report List that you have created that you want to apply to this
manager. (For example, select only Employee Reports).
8. Click Save.
)LJXUH$GYDQFHG6HFXULW\5ROH
&KDSWHU<RXU6LWH
&UHDWLQJDQ$GYDQFHG6HFXULW\5ROHWKDWUHVWULFWVDFFHVVWRUHDOWLPHDQG
VWDWLVWLFV
Once you create a Device List you can create an Advanced Security Role that restricts access to real-time and
6115 statistics, based on the Device List.
1. Click YourSite=>Security.
2. Click Security Roles.
3. Click Add.
4. Click the Advanced tab.
5. After Role name, type the name of this security role.
6. After Role description, type the description of this security role.
7. Under Devices, select the Device List that you have created that you want to apply to this manager.
(For example, select Employee Group 6).
8. Click Save.
&UHDWLQJDQ$GYDQFHG6HFXULW\5ROHWKDWUHVWULFWVDFFHVVWR&KDW
Once you create a User List you can create an Advanced Security Role that restricts access to Chat, based on
the User List.
1. Click YourSite=>Security.
2. Click Security Roles.
3. Click Add.
4. Click the Advanced tab.
5. After Role name, type the name of this security role.
6. After Role description, type the description of this security role.
7. Under Chat, select the User List that you have created that you want to apply to this manager. (For
example, select No Chat).
8. Click Save.
9LHZLQJ0\6HFXULW\5ROH
You can view what your Security Role permits or restricts.
1. Click My Options=>Security Role.
You can either view the Restricted View (what you cannot do), or you can view the Allowed View (what you
can do).

&KDSWHU5HDOWLPHPRQLWRUV
0RQLWRUUHDOWLPHFDOOFHQWHU
DFWLYLWLHVRYHUWKH:HEZLWK
6XSHU$GYLVRU.HHSDJHQWVXSWR
GDWHZLWK$JHQW$GYLVRU:LWK
,QWHUDFWLYHLQFRQMXQFWLRQZLWK
6XSHU$GYLVRUDQG$JHQW$GYLVRU
WKHPRQLWRULQJSRZHULQFUHDVHV

&KDSWHU5HDOWLPHPRQLWRUV
5HDOWLPHPRQLWRUV
Supervisor monitors, agent monitors, and (reader boards) wall signs display real-time telephone system data.
Supervisors and agents view real-time statistics over the intranet or Internet in SuperAdvisor and
AgentAdvisor respectively. Supervisors display text messages and call center statistics on one or more
Spectrum light emitting diode (LED) wall signs using WallBoarder.
The prairieFyre Service continuously updates the SuperAdvisor, AgentAdvisor, and WallBoarder displays
with telephone system data. It updates the SuperAdvisor for the SX-2000 and the SX-200 with real-time (SX-
200 EL/ML LIGHTWARE Release 4.0 and greater) with SMDR and ACD records.
The prairieFyre Service forwards real-time data to the Structured Query Language (SQL) database and to
connected clients through Transmission Control Protocol-Internet Protocol (TCP-IP). TCP-IP is the basic
communication language (protocol) of the Internet, and a communications protocol used in private networks
(intranets).
Figure 6-1 illustrates the connectivity between the prairieFyre Service and connected clients viewing the 6110
CCM real-time applications.
NOTE: The following information applies to the SX-2000 and the SX-200 with real-time. For information on
viewing real-time data with the SX-200 before EL/ML LIGHTWARE Release 4.0, see CyberTerminal.
)LJXUH5HDOWLPHPRQLWRUV
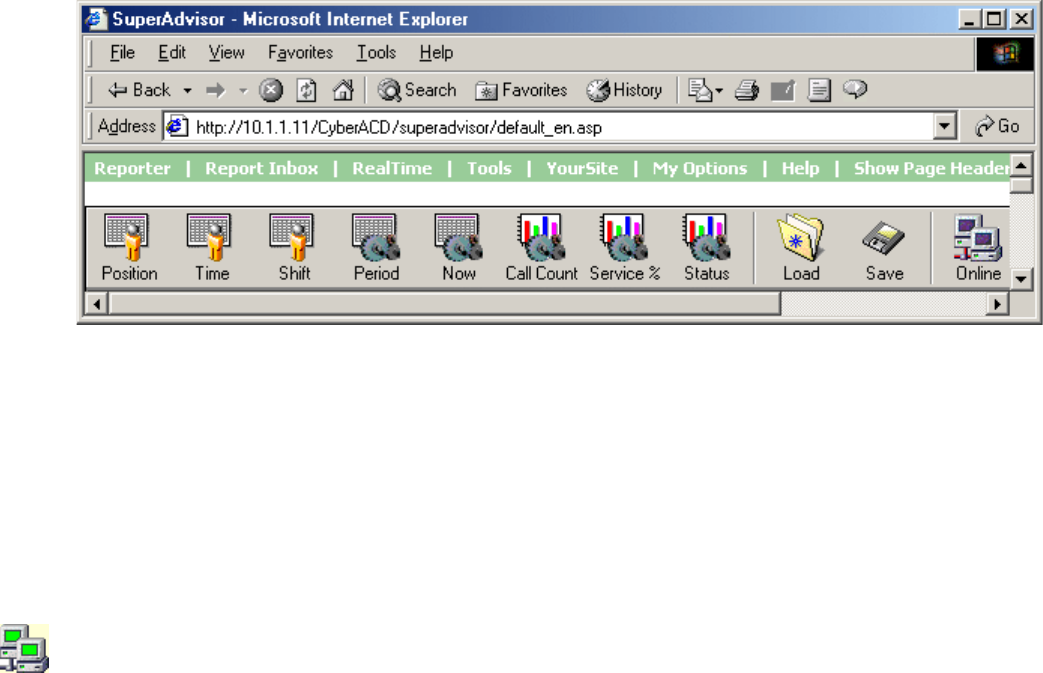
6XSHU$GYLVRU
SuperAdvisor displays statistics on agent and queue activity in color-coded grids. The grid cells change color
when performance changes to keep supervisors informed of the service provided to callers.
6XSHU$GYLVRUPDLQVFUHHQ
For the SX-2000 and the SX-200 with real-time, when you click RealTime=>SuperAdvisor Figure 6-2
appears.
)LJXUH6XSHU$GYLVRUPDLQVFUHHQ
SuperAdvisor consists of 11 monitors. The Agent State by Position, Employee State by Position, Agent State
by Time, Employee State by Time, and Agent Shift monitors provide agent availability statistics. The Queue
by Period, Queue Now, and Queue Group Now monitors provide queue statistics. The Call Count by Queue,
Queue Service Level Percent, and Queue Status monitors provide graphic displays on queues statistics. With
the Load profile, you can load a previously saved profile. With Save profile, you can save your current profile.
On the SuperAdvisor main screen, you can create profiles to save threshold settings and display
characteristics you define for monitors. The Save button saves all open monitors under one profile name. The
Load button loads existing profiles and deletes profiles.
When you open a new monitor, the computer monitor icon turns green to verify you are receiving data. If the
computer icon is marked with a red X, SuperAdvisor is not receiving data.
When you select devices, such as agents or queues, to display on a monitor you can specify the devices be
sorted alphabetically or by device ID, in ascending or descending order. SuperAdvisor displays the devices
across the grid in the order you specify. (See Viewing real-time statistics for more information).
NOTE: 6110 CCM associations are based on database teams and groups. In programming the YourSite
Database, you must create agent IDs and associate the agents to employees and to agent groups. You must
associate the agent groups to the queues for which they answer calls. You must associate the employees to
employee groups and the queues to queue groups. You must create these associations in the database in order
to view real-time data and report on these devices. If you are reporting on extensions, trunks, DNIS numbers,
and account codes, you must add these devices to the YourSite Database and associate the extensions to
extension groups, trunks to trunk groups, and DNIS numbers to DNIS groups.
&KDSWHU5HDOWLPHPRQLWRUV
*ULGSURSHUWLHV
When you open an agent or queue monitor and right-click the grid, the following menu items appear.
&OHDU$ODUPV
The Clear Alarms command clears any current performance threshold alarms in SuperAdvisor.
7LOH+RUL]RQWDOO\9HUWLFDOO\
The Tile Horizontally command distributes active monitors down the SuperAdvisor window. The Tile
Vertically command distributes active monitors across the SuperAdvisor window.
$GG5HPRYH'HYLFH,'V
The Add Device IDs command specifies devices or device groups to monitor. If you add an agent, the agent is
placed in the current cell. If you add multiple agents, they are added to the bottom of the grid. The Remove
Device IDs command removes one or more devices or device groups from the current grid.
*ULG'LPHQVLRQV
On the Agent State by Position grid, the Grid Dimensions command adds or deletes columns or rows. It
deletes them from the lower right side of the grid.
6L]H*ULGWR)UDPH
The Size Grid to Frame command resizes a grid re-distributes the grid cells equally across the grid and auto-
fits the grid to the frame.
6RUW*ULGE\6WDWH
On the Agent State by Position grid, the Sort Grid by State command sorts agents by state and time in state.
SuperAdvisor displays the agents across the grid in the following order:
• On ACD agents
• ACD Hold agents
• Wrap Up agents
• Idle agents
• On Non ACD agents
• Non ACD Hold agents
• Outbnd agents
• Outbnd Hold agents
• Make Busy agents
• Do Not Disturb agents
• Log Off agents
• Unknown agents
7RJJOH7RROEDU
The Toggle Toolbar command hides the toolbar.
&KDW/RJLQ
The Chat Login command logs on users so they can send online messages.
&KDW
The Chat command sends an online message to one or more agents or supervisors.
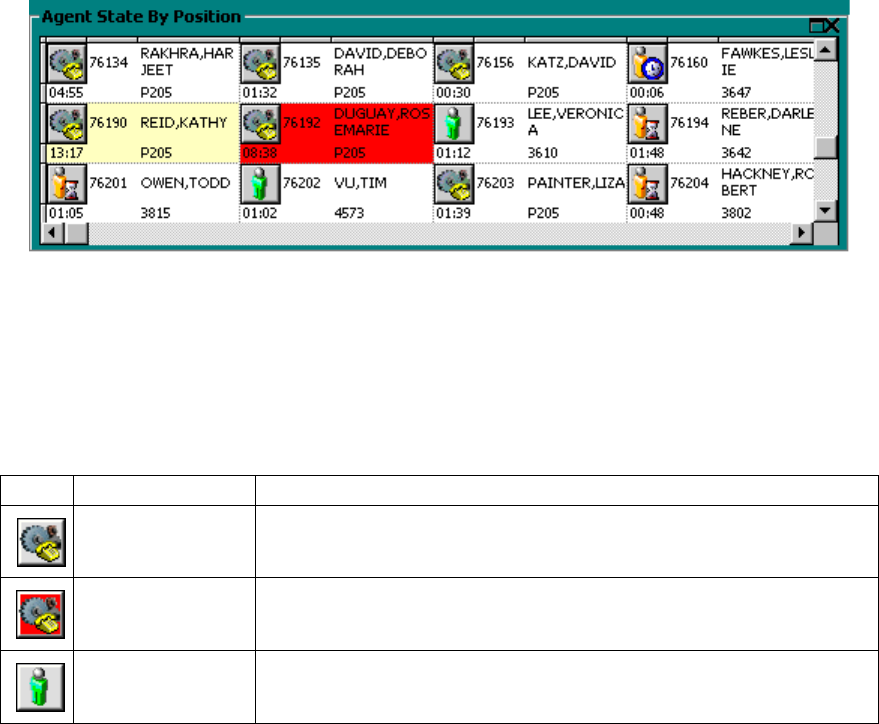
/HJHQG
The Legend command displays a legend of agent state icons and their meanings.
3URSHUWLHV
The Properties menu specifies grid display characteristics and performance thresholds for queues and agents.
(PSOR\HH,QIRUPDWLRQ
For employee monitors, the Employee Information menu displays the Employee Information dialog box.
6XSHU$GYLVRUPRQLWRUV
The following section describes the monitors provided by the SuperAdvisor application.
$JHQW6WDWHE\3RVLWLRQDQG(PSOR\HH6WDWHE\3RVLWLRQJULGV
The Agent State by Position and Employee State by Position grids provide real-time agent information. They
display the state, agent name, agent ID, extension number (or queue number for agents On ACD or on ACD
Hold), and time in state, as illustrated in Figure 6-3.
)LJXUH$JHQW6WDWHE\3RVLWLRQJULG
You can change the height and width of grids and charts in SuperAdvisor by left-clicking the lower right
corner of the display and performing a drag-and-drop operation. You can rearrange grid cells on the Agent/
Employee State by Position grid by left-clicking a cell, and performing a drag-and-drop operation. Table 7-1
lists the agent states provided.
7DEOH$JHQWVWDWHV
7HUP 0HDQLQJ
On ACD an agent on an ACD call
ACD Hold an agent who has placed an ACD call on hold
Idle
(green icon) an agent logged on and waiting to receive a call

&KDSWHU5HDOWLPHPRQLWRUV
If you have agents who are cross trained to answer calls for different departments (and log in and out of
various queues) the telephone system requires you assign the agents multiple IDs. You use the Employee State
by Position grid to view the activities of agents with multiple agent IDs.
For example, agent Kathy Reid answers calls for English, French, and Spanish queues. In the YourSite
Database you assign her three agent IDs (one for each queue for which she answers calls) and an employee
ID. (See Chapter 5 YourSite for more information on employee IDs.)
You click the Agent State by Position icon and select agents (including Kathy Reid) to monitor. The Agent
State by Position grid displays three cells for Kathy Reid, as illustrated in Figure 6-4. The first two cells show
Kathy logged off. The third cell shows Kathy’s current state and agent ID. Each cell displays a different agent
ID for Kathy. Agents can log on using only one agent ID at a time. If your agents have multiple IDs (and
therefore multiple cells) the Agent State by Position grid becomes cluttered.
On Non ACD an agent involved in an incoming non-ACD call or agent originated
call
Non ACD Hold an agent who has placed a non-ACD call on hold
OutBnd an agent on an outgoing call
OutBnd Hold an agent who has placed an outgoing call on hold
Do Not Disturb an agent who has activated Do Not Disturb and is not available to
receive any ACD or non-ACD calls
Make Busy an agent who is not available to receive ACD calls but can receive
calls dialed directly to his or her extension
Wrap Up an agent completing paperwork who is unavailable to receive calls
Unknown an agent who has not generated any activity since 6110 CCM was
started
Log Off
(gray icon) an agent not currently logged on to the ACD system
7DEOH$JHQWVWDWHV

)LJXUH$JHQW6WDWHE\3RVLWLRQJULGYLHZLQJPXOWLSOHDJHQW,'V
Alternatively, you can view the Employee State by Position grid. To view the grid, you click the Position icon
and select employees, rather than agents, to monitor. The grid displays one cell for Kathy, with her current
state and agent ID, as illustrated in Figure 6-5.
)LJXUH(PSOR\HH6WDWHE\3RVLWLRQJULGYLHZLQJDVLQJOHHPSOR\HH,'
Kathy is currently logged on to Queue 206 using Agent ID 76190. Sometime later you notice Kathy logs on to
Queue 205 using Agent ID 76191, as illustrated in Figure 6-6.
)LJXUH(PSOR\HH6WDWHE\3RVLWLRQJULG
If you right-click the Employee State by Position grid and click Employee Information, Figure 6-7 appears.

&KDSWHU5HDOWLPHPRQLWRUV
)LJXUH(PSOR\HHLQIRUPDWLRQ
You use the Employee Information dialog box to verify the agent IDs defined for an agent (in the YourSite
Database). The Employee Information dialog box tags agents as unavailable under the following conditions:
• The agent ID you are trying to view does not belong to any of the agent groups programmed in Your-
Site
• You are restricted from viewing the agent group to which the agent ID is associated in YourSite
Unavailable agents are agents not being tracked in real-time and therefore not available to be displayed in
agent and employee grids. We recommend you periodically check the availability status of your agents on the
Employee Information dialog box.

$JHQW6WDWHE\7LPHDQG(PSOR\HH6WDWHE\7LPHJULGV
The Agent State by Time and Employee State by Time grids provide real-time agent information under ACD,
Idle, On Non ACD, Unavailable, and Log Off column headings. They display the state, agent name, agent ID,
extension number (or queue number for Agents On ACD and agents on ACD Hold), and time in state.
The Agent State by Time and Employee State by Time grids place agents under the column heading that
corresponds to their current state, as illustrated in Figure 6-8. Each column lists the agents in order of time in
state. You can specify which columns of agent statistics are displayed.
)LJXUH$JHQW6WDWHE\7LPHJULG
Table 7-2 lists the column headings and their associated agent states.
If you have agents who are cross trained to answer calls for different departments (and log in and out of
various queues) the telephone system requires you assign the agents multiple IDs. You use the Employee State
by Time grid to view the activities of agents with multiple agent IDs. (See Agent State by Position and
Employee State by Position grids for more information on viewing agents with multiple agent IDs.)
7DEOH$JHQW6WDWH(PSOR\HH6WDWHE\7LPHFDWHJRULHV
&DWHJRU\ $VVRFLDWHG$JHQW6WDWHV
On ACD includes agents On ACD and agents on ACD Hold
Idle includes agents in the Idle state
On Non ACD includes agents On Non ACD, on Non ACD Hold, OutBnd agents, and OutBnd
Hold agents
Unavailable includes agents in Do Not Disturb, Make Busy, Wrap Up, and Unknown
Log Off includes agents in the Log Off state
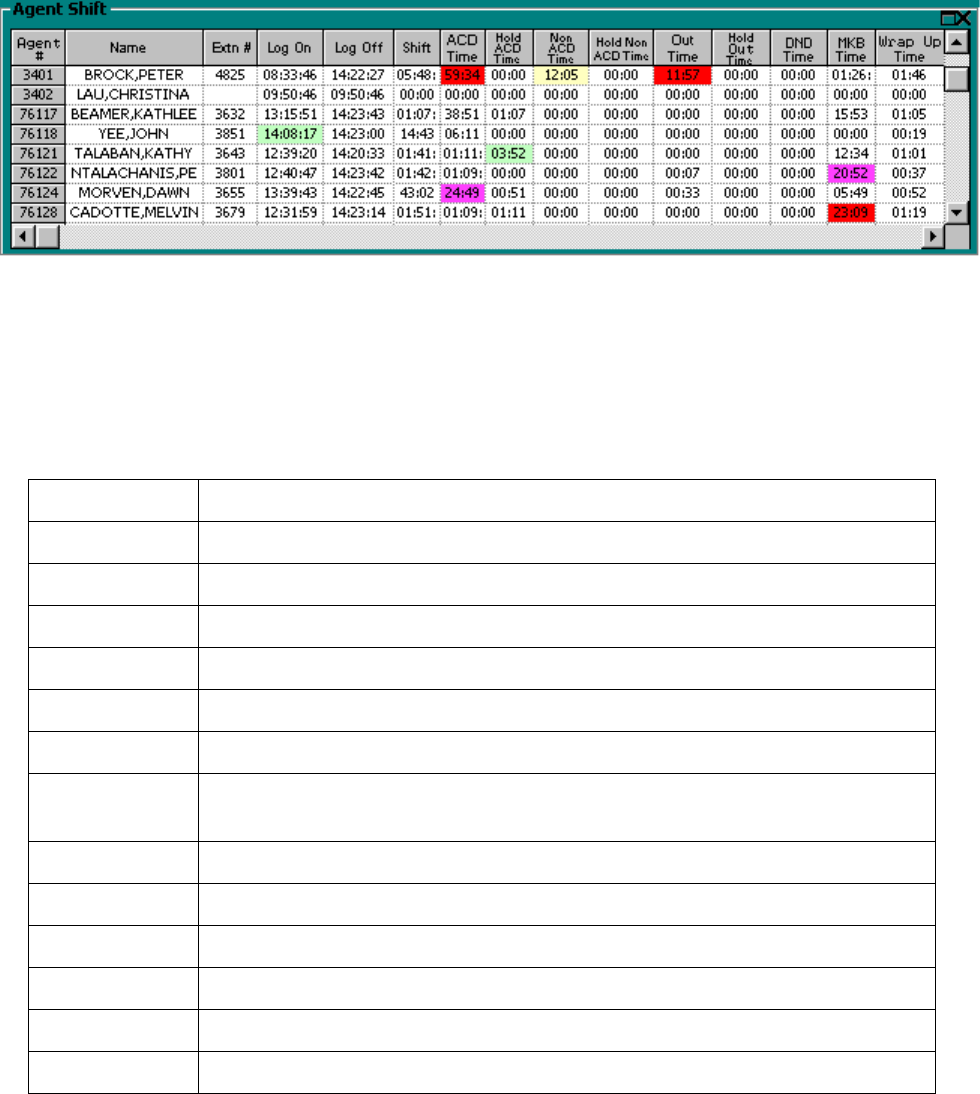
&KDSWHU5HDOWLPHPRQLWRUV
$JHQW6KLIWJULG
The Agent Shift grid provides running totals of statistics on individual agents for the day, as illustrated in
Figure 6-9. You can specify which columns of agent shift statistics are displayed, and sort individual grid
columns in ascending or descending order.
)LJXUH$JHQW6KLIWJULG
NOTE: The number of agents logged on at any time must be consistent with your software licence. If you
have more agents logged on than your licence permits, “[licence Is In Violation of Max Agents Allowed]” will
appear in place of your company name on the 6110 CCM user interface (UI) and on any reports you generate.
Table 7-3 lists the column headings and their associated agent states.
7DEOH$JHQW6KLIWVWDWLVWLFV
7HUP 0HDQLQJ
Log On the time the agent logged on
Log Off the time the agent logged off
Shift the total shift time for the agent
ACD Time the total time the agent spent on ACD calls
Hold ACD Time the total time for ACD calls put on hold
Non ACD Time the total time the agent spent on non-ACD calls
Hold Non ACD
Time the total time for non-ACD calls put on hold
Out Time the total time the agent spent on outbound calls
Hold Out Time the total time for outbound calls put on hold
DND Time the total time the agent spent in the do not disturb state
MKB Time the total time the agent spent in the make busy state
Wrap Up Time the total time the agent spent in the wrap up state
DND Count the number of times the agent entered the do not disturb state
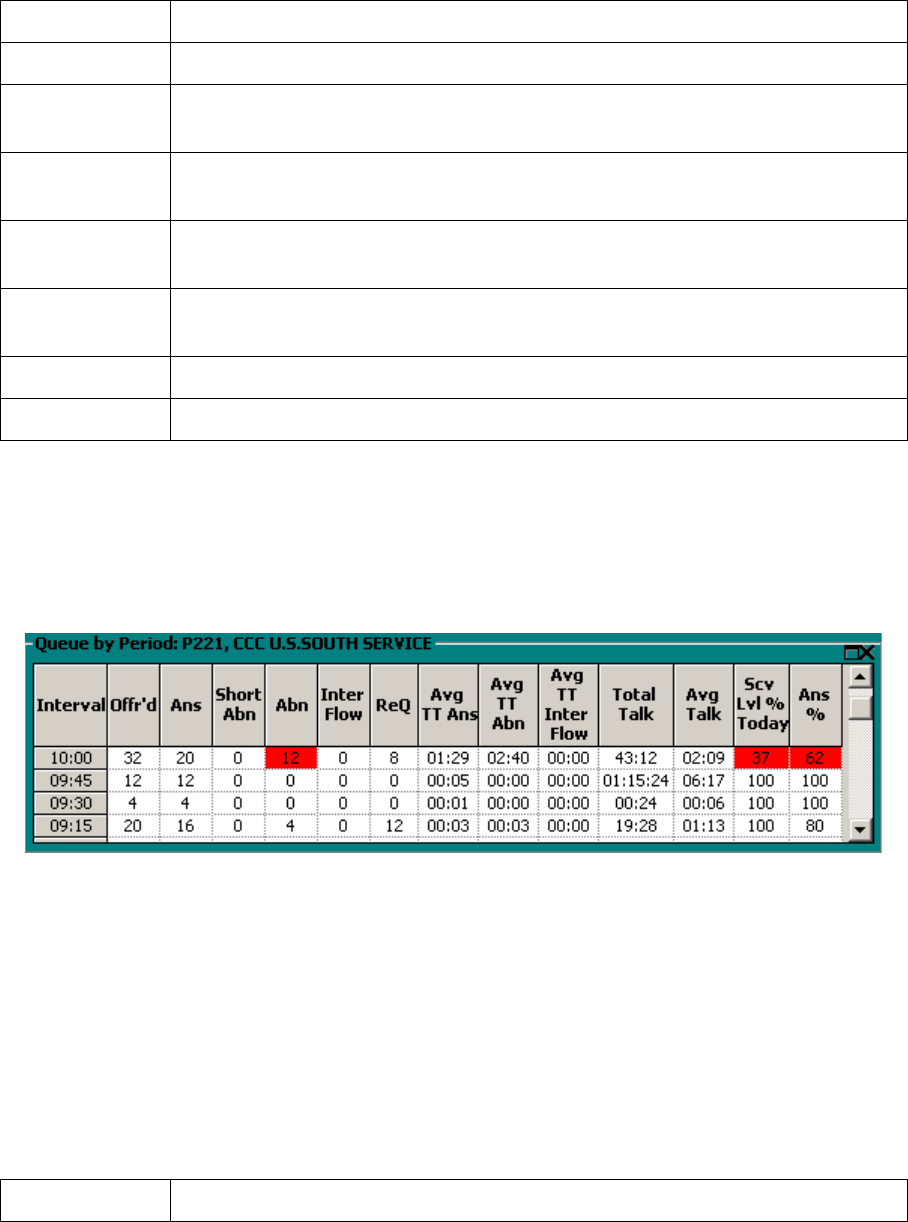
4XHXHE\3HULRGJULG
The Queue by Period grid displays queue statistics collated over 15-minute intervals, as illustrated in Figure
6-10.
)LJXUH4XHXHE\3HULRGJULG
You can rearrange columns on the Queue by Period grid. You click a column header to select a column,
release the mouse button, click the column header again and move the column to another place on the grid
using a drag-and-drop operation. In addition, you can specify which columns of queue statistics are displayed.
NOTE: When an agent receives an ACD call and fails to pick up the call after X seconds or X rings, the
telephone system places the agent in Make Busy. The telephone system requeues the call (places the call back
in the same queue) and offers it to the next available agent.
Table 7-4 lists the queue statistics provided.
MKB Count the number of times the agent entered the make busy state
ACD Count the total number of ACD calls answered by the agent
Short ACD
Count the total number of ACD calls the agent answered that lasted less than 20 seconds
Hold ACD
Count the number of times the agent put ACD calls on hold
Non ACD
Count the total number of non-ACD calls answered by the agent
Hold Non ACD
Count the number of times the agent put non-ACD calls on hold
Out Count the total number of outgoing calls the agent made
Hold Out Count the number of times the agent put outgoing calls on hold
7DEOH4XHXHE\3HULRGVWDWLVWLFV
7HUP 0HDQLQJ
7DEOH$JHQW6KLIWVWDWLVWLFV

&KDSWHU5HDOWLPHPRQLWRUV
Offr’d the total number of calls offered to the queue
Ans the total number of calls answered by agents
Short Abn the total number of calls abandoned before the short abandon time programmed
in YourSite
Abn the total number of calls abandoned before being answered by agents
Interflow the total number of calls interflowed
ReQ the total number of calls requeued
AnsBy1-4 % a count of all calls answered by the first, second, third, and forth answer points
Total Talk the total time agents spent talking to callers
Avg Talk the average time agents spent talking to callers
Avg TT Ans the average number of minutes callers waited before agents answered their calls
Avg TT Abn the average number of minutes callers waited before abandoning calls
Avg TT Inter
Flow the average number of minutes callers waited before being interflowed
Svc Lvl %
Today the percentage of calls answered within your service level time value
Ans % the percentage of calls answered compared to the total number of calls offered to
the ACD queue for the day
7DEOH4XHXHE\3HULRGVWDWLVWLFV
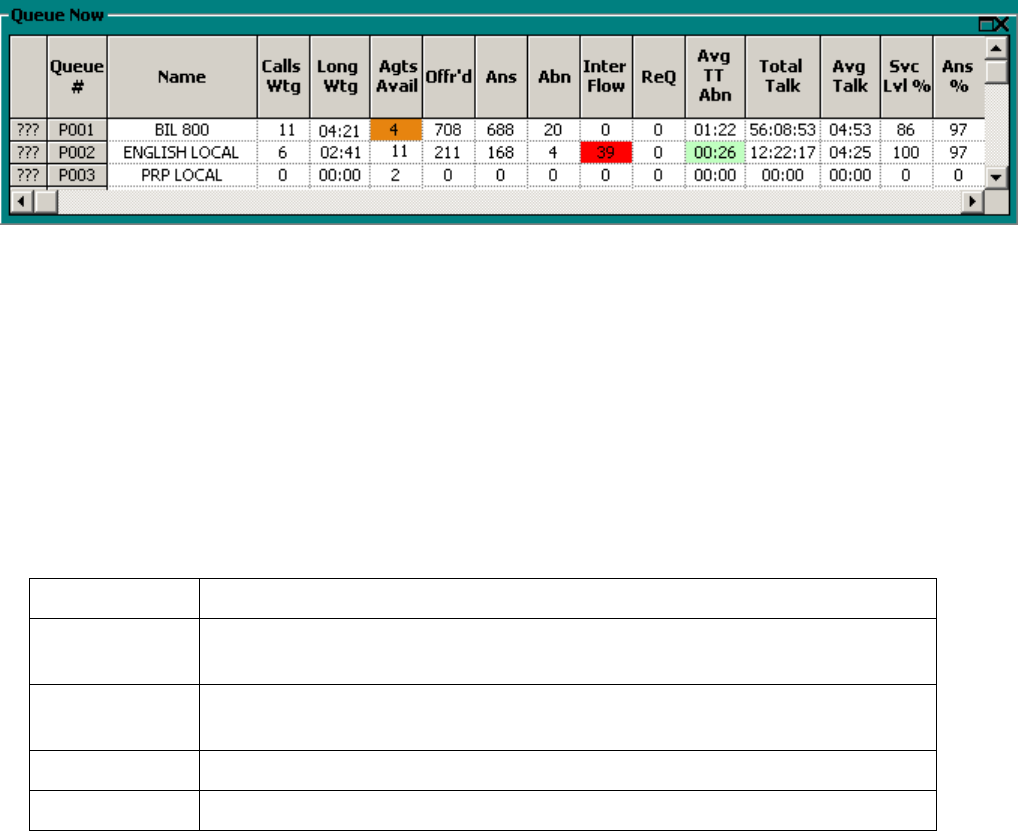
4XHXH1RZDQG4XHXH*URXS1RZJULGV
The Queue Now grid displays the following statistics across queues: Calls Wtg, Long Wtg, Agts Avail, Offr’d
Ans, Abn, Inter Flow, ReQ, AnsBy 1-4 %, Avg TT Ans, Avg TT Abn, Total Talk, Avg Talk, Svc Lvl %, Ans
%, Total Q Unavail, and Current Q Unavail.
The Queue Group Now grid displays the following statistics across queue groups: Max Calls Wtg, Max Long
Wtg, Max Agts Avail, Offr’d, Ans, Abn, Inter Flow, ReQ, AnsBy 1-4 %, Avg TT Ans, Avg TT Abn, Total
Talk, Avg Talk, Svc Lvl %, Ans %, Total Q Unavail, and Current Q Unavail.
NOTE: SuperAdvisor derives the Calls Wtg, Max Calls Wtg, Long Wtg, Max Long Wtg, Agts Avail, and
Max Agts Avail statistics from the ACD stream. If the telephone system has not updated 6110 CCM with
ACD real-time statistics in the last 90 seconds, question marks appear in place of these statistics.
Figure 6-11 illustrates the Queue Now grid.
)LJXUH4XHXH1RZJULG
You can rearrange columns on the Queue Now and Queue Group Now grids. You click a column header to
select a column, release the mouse button, click the column header again and move the column to another
place on the grid using a drag-and-drop operation. In addition, you can specify which columns of queue
statistics are displayed.
NOTE: When an agent receives an ACD call and fails to pick up the call after X seconds or X rings, the
telephone system places the agent in Make Busy. The telephone system requeues the call (places the call back
in the same queue) and offers it to the next available agent.
Table 7-5 lists the real-time and over-the business-day Queue Now statistics.
7DEOH4XHXH1RZVWDWLVWLFV
7HUP 0HDQLQJ
Calls Wtg the current number of callers queued up waiting for an agent to become available,
including those listening to silence, music, or recorded announcements
Long Wtg the current duration, in minutes and seconds, of the call waiting the longest in
queue
Agts Avail the current number of agents on ACD calls
Offr’d the total number of calls offered to the queue

&KDSWHU5HDOWLPHPRQLWRUV
Ans the total number of calls answered by agents for the day
Abn the total number of calls abandoned before being answered by an agent for the
day
Interflow the total number of calls interflowed for the day. Interflow is a mechanism that
directs a queue delayed call to voice mail or to another answering point
ReQ the total number of calls requeued for the day
AnsBy1-4 % a count of all calls answered by the first, second, third, and forth answer points
Avg TT Ans the current average time callers wait before being answered by an agent
Avg TT Abn the current average time callers wait before abandoning calls
Total Talk the total talk time for the day
Avg Talk the average talk time for the day
Svc Lvl % the percentage of calls answered within your service level time value over the
day
Ans % the percentage of calls answered compared to the total number of calls offered to
the ACD queue for the day
Total Q Unavail the total number of times during the day callers dialed the queue and were
rerouted because no agents were logged on to the queue or you set the queue to
Unavailable
See Path Unavailable Calls.
Current Q
Unavail This is the total number of callers that were rerouted after you set the queue to
Unavailable. When you make the queue available again, this value resets to zero.
7DEOH4XHXH1RZVWDWLVWLFV
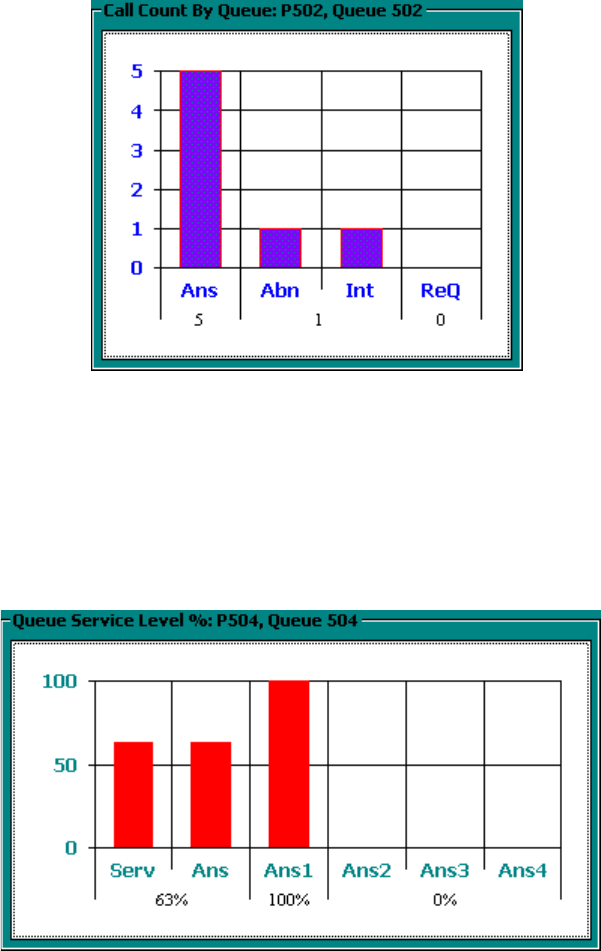
&DOO&RXQWE\4XHXHFKDUW
The Call Count by Queue chart displays over-the business-day queue statistics, as illustrated in Figure 6-12.
It displays the total Calls Answered, Calls Abandoned, Calls Interflowed, and Calls Requeued for Queue 502
for the day.
NOTE: When an agent receives an ACD call and fails to pick up the call after X seconds or X rings, the
telephone system places the agent in Make Busy. The telephone system requeues the call (places the call back
in the same queue) and offers it to the next available agent.
)LJXUH&DOO&RXQWE\4XHXHFKDUW
4XHXH6HUYLFH/HYHO3HUFHQWFKDUW
The Service Level Percent chart displays over-the business-day queue statistics, as illustrated in Figure 6-
13. It displays the average Service Level Percent, Answer Percent, and Calls Answered by the first, second,
and third answering points for Queue 504 for the day.
)LJXUH4XHXH6HUYLFH/HYHO3HUFHQWFKDUW
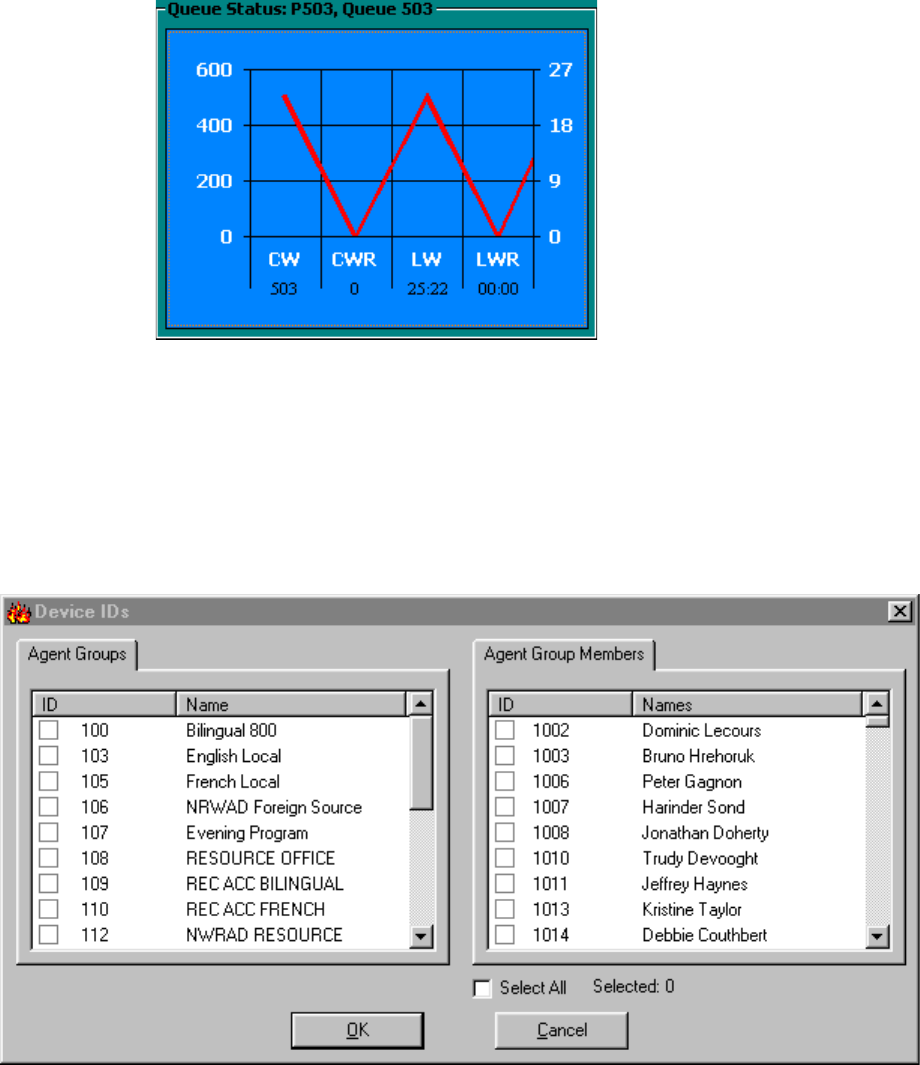
&KDSWHU5HDOWLPHPRQLWRUV
4XHXH6WDWXVFKDUW
The Queue Status chart displays over-the business-day queue statistics, as illustrated in Figure 6-14. It
displays the Calls Waiting, Remote Calls Waiting, Longest Waiting, and Remote Longest Waiting for Queue
503 for the day.
)LJXUH4XHXH6WDWXVFKDUW
9LHZLQJUHDOWLPHVWDWLVWLFV
To view statistics on your desktop in SuperAdvisor:
1. Click the Position icon and click Agent by Position.
Figure 6-15 appears.
)LJXUH'HYLFH,'V
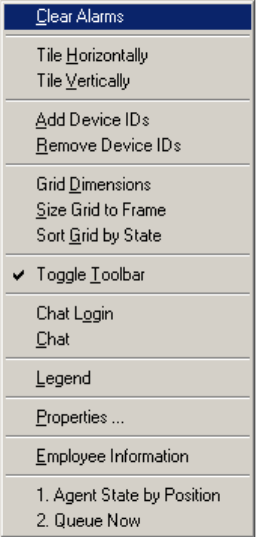
2. Under Agent Groups select agent groups to monitor. Alternatively, under Agent Group Members
select agents to monitor.
On the Device IDs dialog box you can sort devices alphabetically, or by device ID, in ascending or
descending order.
3. Click the ID or Name header for a device or device group list to sort it by ID or name.
4. Click OK.
SuperAdvisor displays the devices across the grid in the order you specified.
5. Repeat steps 1 to 4 to open the Queue Now monitor.
When you open a second monitor, SuperAdvisor places it on top of the first monitor. You can move the
monitor to a new position using a drag-and-drop operation.
You can right-click any monitor to view the following menu options and a list of active monitors.
If your monitors overlap one another, you can switch between monitors by right-clicking a monitor and
selecting a different monitor from the menu. (See Figure 6-16.)
NOTE: You can change the height and width of grids and charts in SuperAdvisor by left-clicking the lower
right corner of the display and using a drag-and-drop operation.
NOTE: 6110 CCM associations are based on database teams and groups. In programming the YourSite
Database, you must create agent IDs and associate the agents to employees and to agent groups. You must
associate the agent groups to the queues for which they answer calls. You must associate the employees to
employee groups and the queues to queue groups. You must create these associations in the database in order
to view real-time data and report on these devices. If you are reporting on extensions, trunks, DNIS numbers,
and account codes, you must add these devices to the YourSite Database and associate the extensions to
extension groups, trunks to trunk groups, and DNIS numbers to DNIS groups.
)LJXUH0RQLWRUPHQX
&KDSWHU5HDOWLPHPRQLWRUV
$GGLQJUHDUUDQJLQJUHVL]LQJDQGVRUWLQJGHYLFHV
You can add, rearrange, resize, and sort devices on grids. For example, to add additional agents to the Agent
State by Position grid:
1. Right-click the Agent State by Position grid and click Add Device IDs.
2. Under Agent Group Members, select additional agents and click OK.
SuperAdvisor adds the agents to the bottom of the Agent State by Position grid.
NOTE: If you right-click a cell and add a single agent to the grid, the new agent replaces the agent
in the current cell.
3. Right-click the grid and click Legend to view agent state icons and their meanings.
To rearrange and resize agent cells on the Agent State by Position grid:Left-click an agent’s cell and
perform a drag-and-drop operation to move it to a different position on the grid.
4. Optionally click the column header above any column of agent state icons and drag the right edge of
the header towards the left to make the column (and agent state icons) proportionately smaller.
This resizes all agent state icons on the grid.
To enlarge the grid frame:
• Left-click the lower right corner of the display and perform a drag-and-drop operation.
To auto-fit the grid to the frame:
• Right-click the grid and click Size Grid to Frame.
The grid cells change size to fit the new grid dimensions.
To sort agents on the Agent State by Position grid:
• Right-click the grid and click Sort Grid by State.
SuperAdvisor sorts the agents by state and time in state. SuperAdvisor displays the agents across the grid in
the following order:
• On ACD agents
• ACD Hold agents
• Wrap Up agents
• Idle agents
• On Non ACD agents
• Non ACD Hold agents
• Outbnd agents
• Outbnd Hold agents
• Make Busy agents
• Do Not Disturb agents
• Log Off agents
• Unknown agents
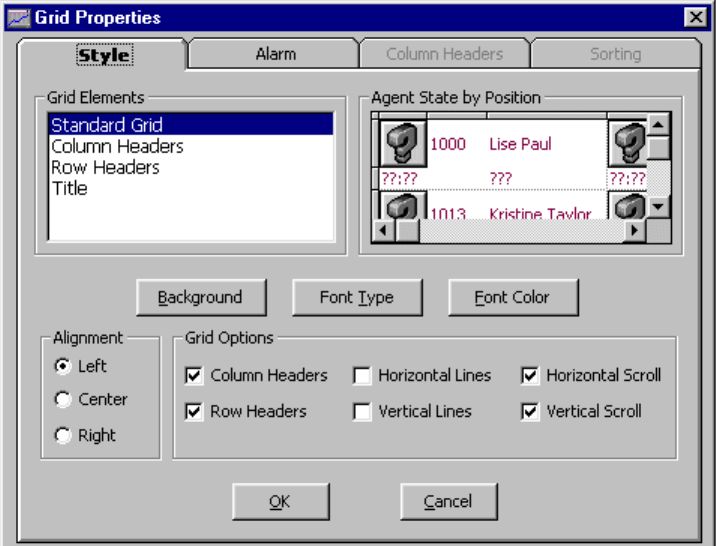
+LGLQJJULGILHOGV
You can hide grid fields (columns) you are not interested in viewing on all grids that display queue
information.
To hide grid columns:
1. Right-click the Queue Now grid and click Properties.
2. Click the Column Headers tab.
3. Under Show/Hide Column Headers, clear the check boxes of statistics you want to hide from view.
4. Click OK.
'HILQLQJJULGVW\OHV
You can customize the appearance of grid elements, such as column and row headers.
NOTE: If you have more than one Agent/Employee State by Position or Agent/Employee State by Time grid
displayed, any changes you make to the ACD variable threshold programming or grid styles effect all open
Agent/Employee State by Position or Agent/Employee State by Time monitors.
1. Right-click an open monitor and click Properties.
2. Click the Style tab.
Figure 6-17 appears.
3. In the Grid Elements list, click a grid element.
4. Click Background, Font Type, and Font Color and specify a background color, font type, and font
color for the grid element.
5. Select alignment and grid options for the grid element.
6. Click OK to save style changes for the grid element.
7. Repeat steps 4 to 7 for other grid elements.
8. Click OK.
NOTE: You can select multiple grid elements by pressing Shift or Control and apply styles across
them.
)LJXUH6W\OHWDE
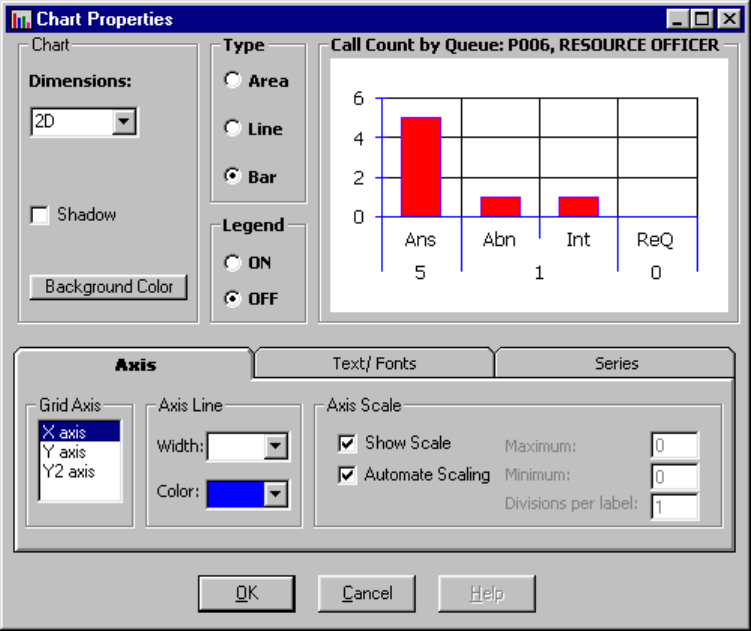
&KDSWHU5HDOWLPHPRQLWRUV
'HILQLQJFKDUWVW\OHV
To define display characteristics for the Call Count by Queue, Queue Service Level Percent, and Queue Status
charts:
1. Click the Call Count icon.
2. Right-click the display and click Properties.
Figure 6-18 appears.
3. Specify chart characteristics (dimensions, drop shadow, background color, chart type and legend).
4. On the Axis tab, specify the width and color of axis lines, and axis scale characteristics.
5. Click the Text/Fonts tab.
)LJXUH$[LVWDE
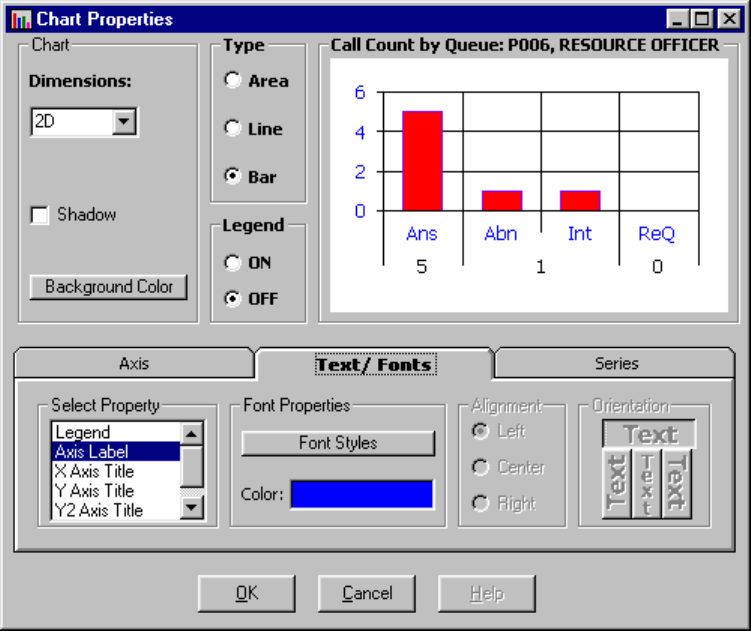
Figure 6-19 appears.
6. Specify axis label color and font properties.
7. Click the Series tab.
)LJXUH7H[W)RQWVWDE
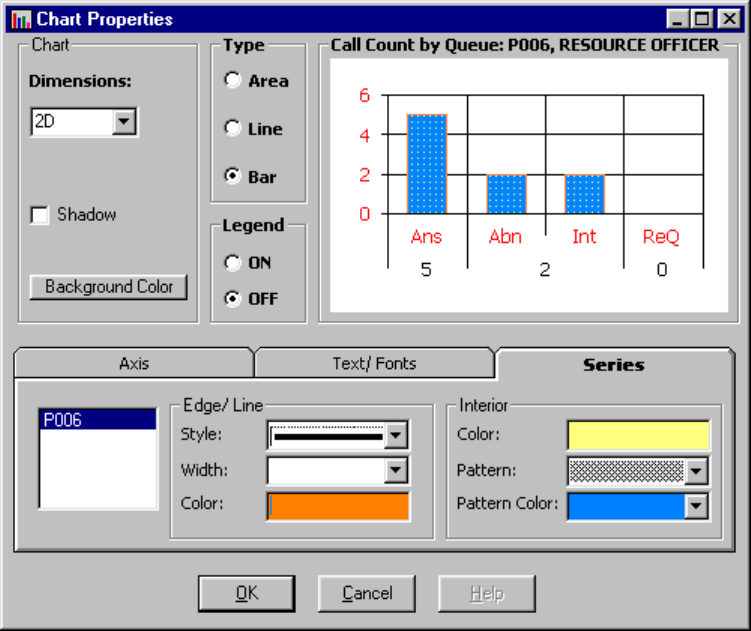
&KDSWHU5HDOWLPHPRQLWRUV
Figure 6-20 appears.
)LJXUH6HULHVWDE
8. Specify the style, width, and color of the border for the area, line, or bar chart selected.
9. Specify the color, pattern, and pattern color of the chart.
10. Click OK to apply the changes to the Call Count by Queue chart for the active queue.
11. Repeat steps 1 to 10 to define display characteristics for the other charts.
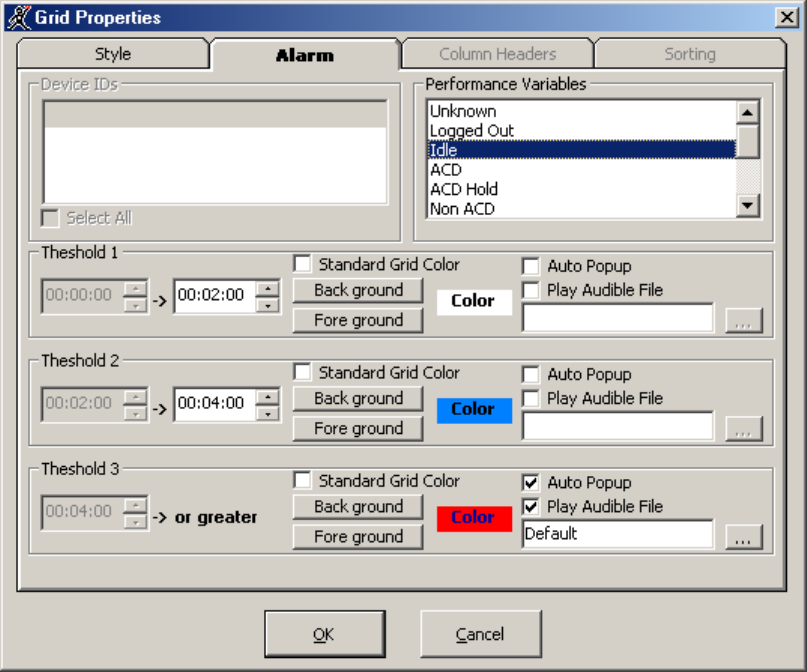
'HILQLQJSHUIRUPDQFHWKUHVKROGV
SuperAdvisor displays statistics in color-coded grid cells on your desktop. The grid cells and statistics change
color when performance changes to keep you informed of the service provided to callers.
NOTE: If you have more than one Agent/Employee State by Position or Agent/Employee State by Time grid
displayed, any changes you make to the ACD variable threshold programming or grid styles effect all open
Agent/Employee State by Position or Agent/Employee State by Time monitors.
When performance thresholds are not being met, SuperAdvisor appears on top of all open desktop
applications and “beeps”. You can optionally select an alternate .wav file to play.
To define performance thresholds and corresponding colors:
1. Select the Agent State by Position, Employee State by Position, Agent State by Time, or
Employee State by Time monitor.
2. Right-click the grid and click Properties.
3. Click the Alarm tab.
See Figure 6-21.
)LJXUH$ODUPWDE
4. In the Performance Variables list, click a variable.
&KDSWHU5HDOWLPHPRQLWRUV
5. Under Threshold 1, select range values for the statistic.
6. Click Background and Foreground and specify alarm threshold colors for Threshold 1.
7. Optionally select the Auto Popup check box to display SuperAdvisor on top of all other applications
when the threshold conditions are satisfied.
8. Optionally select the Play Audible File check box to have SuperAdvisor beep when the threshold
conditions are satisfied.
9. Repeat steps 5 to 8 to define parameters for Threshold 2 and Threshold 3.
10. Repeat steps 4 to 8 to define thresholds for other performance variables.
11. Click OK.
Consider the threshold programming in the preceding figure. When an agent has been in the Idle state for zero
to two minutes the grid cell housing the agent remains white. When an agent has been in the Idle state for two
to four minutes the grid cell turns blue. When an agent has been in the Idle state for more than four minutes
the grid cell turns red and the text in the grid cell turns navy blue. In addition, SuperAdvisor appears on top of
all open desktop applications and beeps.
You can define performance thresholds for individual or multiple queues on the Agent Shift, Queue Now,
Queue Group Now, and Queue by Period monitors.

To define performance thresholds and corresponding colors:
1. Select the Agent Shift, Queue by Period, or Queue Now monitor.
2. Right-click the display and click Properties.
3. Click the Alarm tab.
Figure 6-22 appears.
)LJXUH$ODUPWDE
NOTE: You can select the Select All check box to apply threshold settings for a performance
variable across all available queues. If you select the Standard Grid Color check box the
background color turns white for the active performance variable.
4. In the Device IDs list, select one or more queues/agents or select the Select All check box to select
all queues/agents.
5. In the Performance Variables list, click a variable.
6. Under Threshold 1, select range values for the statistic.
7. Click Background and Foreground and specify alarm threshold colors for Threshold 1.
8. Optionally select the Auto Popup check box to display SuperAdvisor on top of all other applications
when the threshold conditions are satisfied.
9. Optionally select the Play Audible File check box to have SuperAdvisor beep when the threshold
conditions are satisfied.
10. Repeat steps 6 to 9 to define parameters for Threshold 2 and Threshold 3.
11. Repeat steps 4 to 9 to define thresholds for other performance variables.
12. Click OK.
&KDSWHU5HDOWLPHPRQLWRUV
Consider the threshold programming in the preceding Figure. When zero to six callers are waiting in Queue
P501 the grid cell housing the Calls Waiting statistic is yellow. When seven to 12 callers are waiting in Queue
501 the grid cell turns green. When 13 or more callers are waiting in Queue P501 the grid cell turns red. In
addition, SuperAdvisor appears on top of all open desktop applications and plays an audible alarm.
&UHDWLQJSURILOHV
On the SuperAdvisor main screen, you can create profiles to save threshold settings and display
characteristics you define for monitors. The Save button saves all open monitors under one profile name.
You can now save all profiles in one folder so that all agents can access them.
NOTE: You must save your open monitors to a profile before you select a different 6110 CCM application,
such as YourSite, or Report Inbox, or your programming in SuperAdvisor will be lost.
To save monitors currently displayed in SuperAdvisor:
1. Click Save.
2. After Save in, select where to save the profile.
3. Type a profile name and click OK.
SuperAdvisor saves the profile.
To clear monitors currently displayed:
1. On the Internet Explorer menu, click Refresh.
SuperAdvisor closes all monitors.
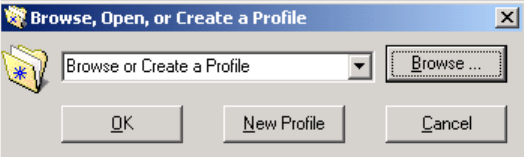
/RDGLQJSURILOHV
The Load button loads existing profiles. You can now browse to locate the profiles you want to load.
1. Click Load.
The Browse, Open, or Create a Profile window appears. (See Figure 6-23.)
2. Click Browse.
3. After Look in, locate your profile. It is an .saf file.
4. Select the profile from the list box and click Open.
)LJXUH%URZVH2SHQRU&UHDWHD3URILOH
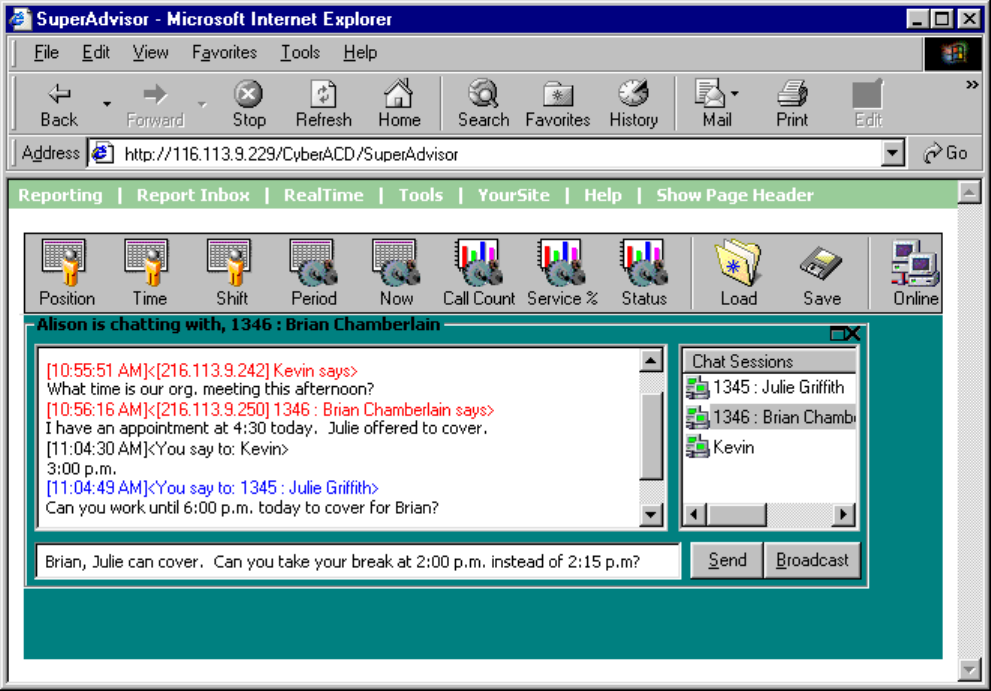
&KDSWHU5HDOWLPHPRQLWRUV
&KDWWLQJRQOLQHLQ6XSHU$GYLVRU
You can communicate essential information to one or more agents or supervisors quickly and securely with
the SuperAdvisor ChatLine. You can broadcast service alerts, coach agents, and send timely messages, such
as asking an agent to delay going on break when it is busy.
NOTE: You must log on to the SuperAdvisor chat module in order to send and receive online messages.
When you receive a message, SuperAdvisor displays it immediately on top of all open windows.
To chat online with agents or supervisors:
1. Right-click the SuperAdvisor main screen (or any open monitor) and click Chat.
Figure 6-24 appears.
2. Type a message in the text window and click Send.
)LJXUH6XSHU$GYLVRU&KDW/LQH

The Device ID list dialog box appears.
3. Select one or more agent groups, agents, or supervisors to send the message to and click OK.
The agents or supervisors you selected appear in the Chat Sessions window. The Chat Sessions window lists
the agent ID and name of each agent you selected. Supervisors are identified by name only.
NOTE: On the agent grids, if you right-click an agent’s cell and click Chat the agent appears in the Chat
Sessions window automatically.
Blue text appears in the chat window to confirm SuperAdvisor sent the message. The recipient’s response to
your message appears in the chat window below a red header.
To send a subsequent message to agents or supervisors:
1. Right-click the Chat Sessions window and click Add Chat Sessions.
2. Select one or more agent groups, agents, or supervisors to send the message to and click OK.
3. Type a message in the text window and click Send.
Alternatively, you can type a message, click Broadcast, select a recipient, and click OK to send a subsequent
message to agents or supervisors.
To reply to a message, type a message and press Enter. ChatLine sends your response to the person who most
recently sent you a message (the person listed at the bottom of your chat window). To reply to a previous
message, select the individual in the Chat Sessions window, type a message, and click Send.
NOTE: If the agent or supervisor is logged out at the time you send the message, ChatLine marks the agent’s
or supervisor’s icon (in the Chat Sessions window) with a red X. If you send a message to an agent who does
not have AgentAdvisor open, ChatLine marks the agent’s icon with a red X.
&KDSWHU5HDOWLPHPRQLWRUV
$JHQW$GYLVRU
Starting with 6110 CCM version 2.8, security now demands a password to access AgentAdvisor. See
“Security” on page 91 for more details.
The AgentAdvisor application provides real-time statistics for the SX-2000 and SX-200 with real-time
systems. It displays statistics in color-coded sections on the agent’s desktop. The display keeps agents
informed of significant changes in the service provided to callers.
NOTE: When you minimize AgentAdvisor a green AgentAdvisor icon appears on your system tray. You
double-click the icon to restore AgentAdvisor.
,QVWDOOLQJ$JHQW$GYLVRU
On agent computers that have Internet Explorer 6.0 installed, to install AgentAdvisor:
1. Start Internet Explorer 6.0 and browse to the 6110 CCM Web application.
2. Log on to the 6110 CCM Enterprise Server using your 6110 CCM user name and password.
3. On the 6110 CCM user interface, click Help=>Client Download and click 6110 CCM Agent
Desktop to run the AgentAdvisor Setup.
Leave the Employee field blank if you do not know the agent’s 6110 CCM employee number.
4. Click Start=>Programs=>prairieFyre Software Inc=>6110 CCM Agent Desktop to open the
AgentAdvisor application.
On agent computers that have a browser other than Internet Explorer 6.0 installed, to install AgentAdvisor:
1. Browse to the 6110 CCM Web application.
2. On the 6110 CCM user interface, click Software Download.
3. Click 6110 CCM Agent Desktop to run the AgentAdvisor Setup.
Leave the Employee field blank if you do not know the agent’s 6110 CCM employee number.
4. Click Start=>Programs=>prairieFyre Software Inc=>6110 CCM Agent Desktop to open the
AgentAdvisor application.
On agent computers that do not have a browser installed, to install AgentAdvisor:
1. In the OtherWebDownloads folder of the 6110 CCM Installation CD, click the 6110
CCMAgentDesktop.exe file or click the 6110 CCMAgentAdvisor.exe file (if you have 6110 CCM
version 2.5 or less) to run the AgentAdvisor Setup.
Leave the Employee field blank if you do not know the agent’s 6110 CCM employee number.
2. Click Start=>Programs=>prairieFyre Software Inc=>6110 CCM Agent Desktop to open the
AgentAdvisor application.
$JHQW$GYLVRUPDLQVFUHHQ
AgentAdvisor consists of the Agent State by Position, Employee State by Position, My Shift, and Queue Now
monitors.
*ULGSURSHUWLHV
When you open a monitor in AgentAdvisor and right-click the grid, the following menu items appear.
$GG'HYLFH,'V
The Add Device IDs command specifies devices or device groups to monitor. If you add one agent, the agent
is placed in the current cell. If you add multiple agents, they are added to the bottom of the grid.
5HPRYH'HYLFH,'V
The Remove Device IDs command removes one or more devices or device groups from the current grid.
*ULG'LPHQVLRQV
On the Agent State by Position grid, the Grid Dimensions command adds or deletes columns or rows. It
deletes them from the lower right side of the grid.
6L]H*ULGWR)UDPH
The Size Grid to Frame command resizes a grid re-distributes the grid cells equally across the grid and auto-
fits the grid to the frame.
6RUW*ULGE\6WDWH
On the Agent State by Position grid, the Sort Grid by State command sorts agents by state and time in state.
SuperAdvisor displays the agents across the grid in the following order:
• On ACD agents
• ACD Hold agents
• Wrap Up agents
• Idle agents
• On Non ACD agents
• Non ACD Hold agents
• Outbnd agents
• Outbnd Hold agents
• Make Busy agents
• Do Not Disturb agents
• Log Off agents
• Unknown agents
3URSHUWLHV
The Properties menu specifies grid display characteristics and performance thresholds for queues and agents.
&DSWLRQ
Clearing the Caption command hides the title bar. If you hide the title bar, you can move the display by
holding down the shift key, clicking the grid, and performing a drag-and-drop operation.
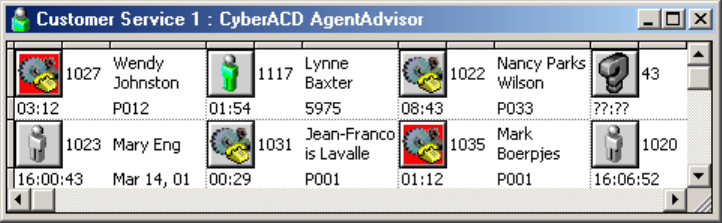
&KDSWHU5HDOWLPHPRQLWRUV
$OZD\VRQ7RS
The Always on Top option displays the active monitor on top of all other applications.
6SHFLI\,3$GGUHVVXSRQ6WDUWXS
The Specify IP Address upon Startup command omits the login verification process.
&RQQHFWLRQ6WDWXV
The Connection Status item lists your server IP address and server port number.
+HOS
The Help menu item provides online Help on the current application.
&KDW
The Chat command sends an online message to one or more supervisors.
6DYH3URILOH
The Save Profile command saves profiles you create in AgentAdvisor for threshold settings and display
characteristics you define for monitors.
([LW
The Exit command closes the application.
NOTE: You can change the height and width of grids and charts in SuperAdvisor by left-clicking the lower
right corner of the display and performing a drag-and-drop operation. You can rearrange grid cells by left-
clicking a cell, and performing a drag-and-drop operation.
$JHQW$GYLVRUPRQLWRUV
The following section describes the monitors provided by the AgentAdvisor application.
$JHQW6WDWHE\3RVLWLRQDQG(PSOR\HH6WDWHE\3RVLWLRQJULGV
The Agent State by Position and Employee State by Position grids provide real-time agent information. They
display the agent state, agent name, agent ID, extension number (or queue number for On ACD and on ACD
Hold agents), and time in state for each agent, as illustrated in Figure 6-25.
You can change the height and width of a grid in AgentAdvisor by left-clicking the lower right corner of the
display and performing a drag-and-drop operation. You can rearrange grid cells on the Agent and Employee
State by Position grids by left-clicking a cell and performing a drag-and-drop operation.
)LJXUH$JHQW6WDWHE\3RVLWLRQJULG

If you have agents who are cross trained to answer calls for different departments (and log in and out of
various queues) the telephone system requires you assign the agents multiple IDs. You use the Employee State
by Time grid to view the activities of agents with multiple agent IDs. (See SuperAdvisor: Agent State by
Position and Employee State by Position grids) for more information on viewing agents with multiple agent
IDs.)
Table 7-6 lists the agent states provided.
7DEOH$JHQWVWDWHV
7HUP 0HDQLQJ
On ACD an agent on an ACD call
ACD Hold an agent who has placed an ACD call on hold
Idle an agent logged on and waiting to receive a call
On Non ACD an agent involved in an incoming non-ACD call or agent originated
call
Non ACD Hold an agent who has placed a non-ACD call on hold
OutBnd an agent on an outgoing call
OutBnd Hold an agent who has placed an outgoing call on hold
Do Not Disturb an agent who has activated Do Not Disturb and is not available to
receive any ACD or non-ACD calls
Make Busy an agent who is not available to receive ACD calls but can receive
calls dialed directly to his or her extension
Wrap Up an agent completing paperwork who is unavailable to receive calls
Unknown an agent who has not generated any activity since 6110 CCM was
started
Log Off an agent not currently logged on to the ACD system
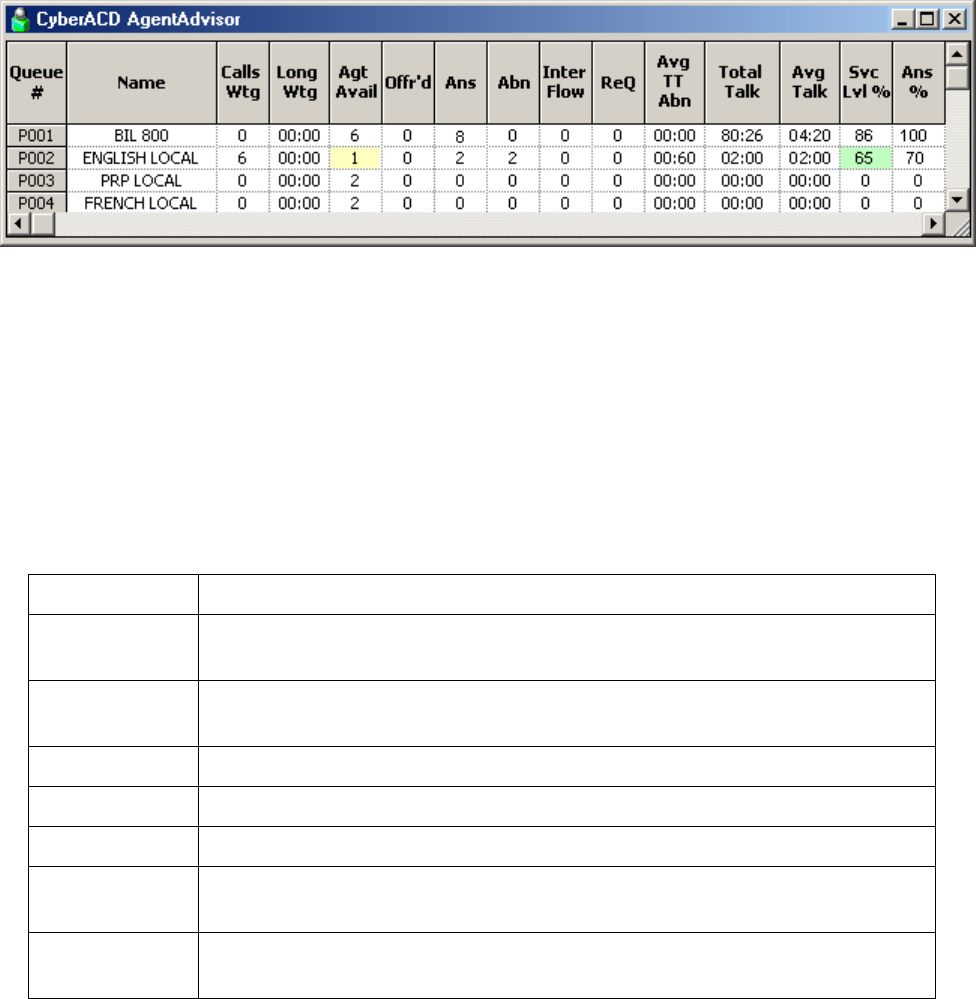
&KDSWHU5HDOWLPHPRQLWRUV
4XHXH1RZJULG
The Queue Now grid displays the following statistics across queues: Calls Wtg, Long Wtg, Agt Avail, Offr’d,
Ans, Abn, Inter Flow, ReQ, AnsBy 1-4 %, Avg TT Ans, Avg TT Abn, Total Talk, Avg Talk, Svc Lvl %, Ans
%, Total Q Unavail, and Current Q Unavail. Figure 6-26 illustrates the Queue Now grid.
NOTE: AgentAdvisor derives the Calls Wtg, Long Wtg, and Agts Avail statistics from the ACD stream. If
the telephone system has not updated 6110 CCM with ACD real-time statistics in the last 90 seconds, question
marks appear in place of these statistics.
)LJXUH4XHXH1RZJULG
You can rearrange columns on the Queue Now grid. You click a column header to select a column, release the
mouse button, click the column header again and move the column to another place on the grid using a drag-
and-drop operation. In addition, you can specify which columns of queue statistics are displayed.
NOTE: When an agent receives an ACD call and fails to pick up the call after X seconds or X rings, the
telephone system places the agent in Make Busy. The telephone system requeues the call (places the call back
in the same queue) and offers it to the next available agent.
Table 7-7 displays the real-time and over-the business-day Queue Now statistics.
7DEOH4XHXH1RZVWDWLVWLFV
7HUP 0HDQLQJ
Calls Wtg the current number of callers queued up waiting for an agent to become available,
including those listening to silence, music, or recorded announcements
Long Wtg the current duration, in minutes and seconds, of the call waiting the longest in
queue
Agt Avail the current number of agents on ACD calls
Offr’d the total number of calls offered to the queue for the day
Ans the total number of calls answered by agents for the day
Abn the total number of calls abandoned before being answered by an agent for the
day
Interflow the total number of calls interflowed for the day. Interflow is a mechanism that
directs a queue delayed call to voice mail or to another answering point
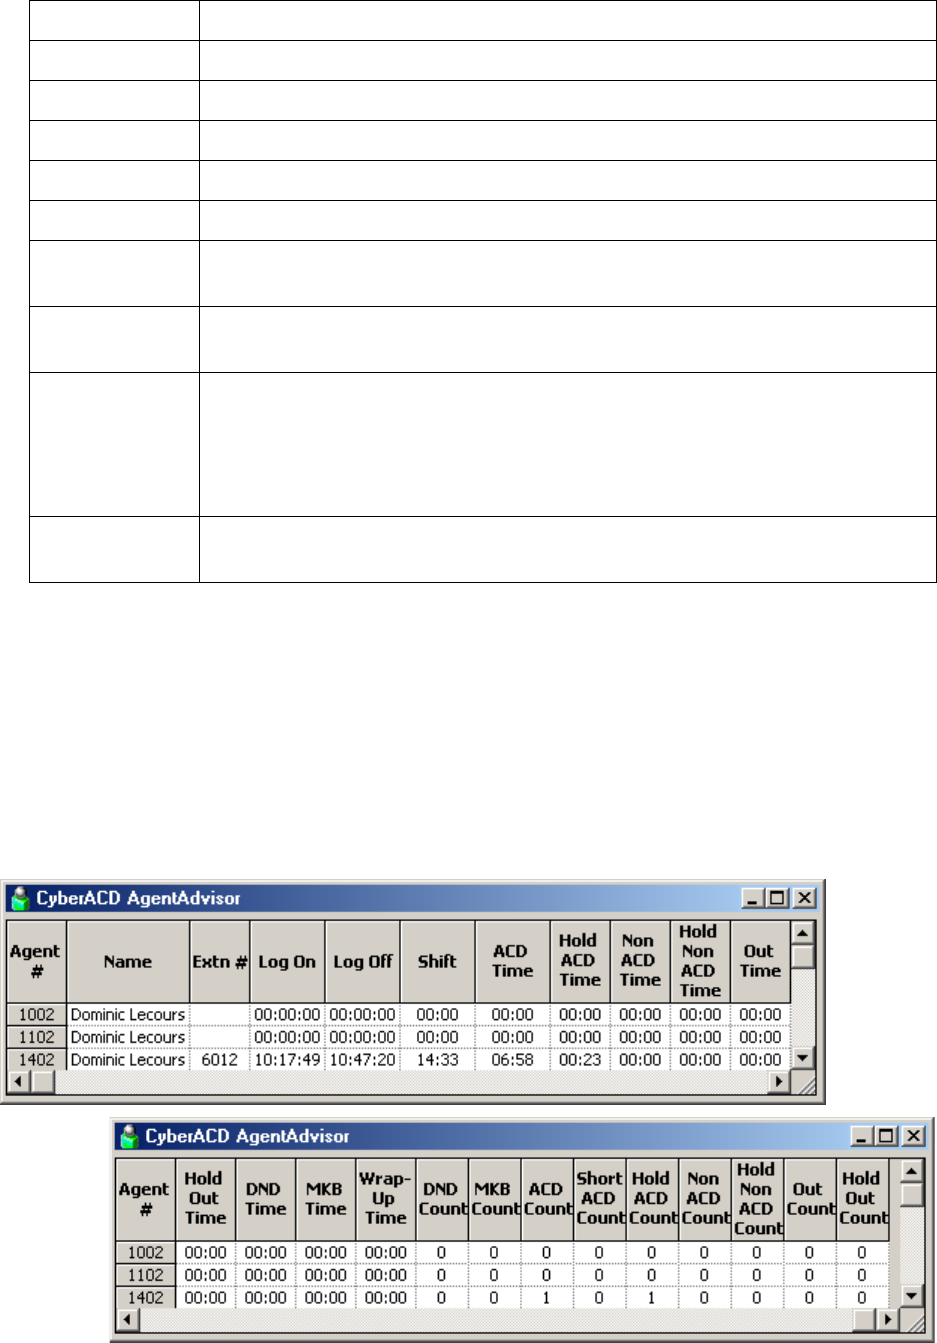
0\6KLIWJULG
The My Shift grid displays the following statistics across queues: Extn #, Log On, Log Off, Shift, ACD Time,
Hold ACD Time, Non ACD Time, Hold Non ACD Time, Out Time, Hold Out Time, DND Time, MKB Time,
Wrap-Up Time, DND Count, MKB Count, ACD Count, Short ACD Count, Hold ACD Count, Non ACD
Count, Hold Non ACD Count, Out Count, Hold Out Count. The My Shift grid provides running totals of
statistics for an agent for the day. It displays real-time shift statistics for the agent across the agent’s IDs, as
illustrated in Figure 6-27.
)LJXUH0\6KLIWJULG
ReQ the total number of calls requeued for the day
AnsBy1-4 % a count of all calls answered by the first, second, third, and forth answer points
Avg TT Ans the current average time callers wait before being answered by an agent
Avg TT Abn the current average time callers wait before abandoning calls
Total Talk the total talk time for the day
Avg Talk the average talk time for the day
Svc Lvl % the percentage of calls answered within your service level time value over the
day
Ans % the percentage of calls answered compared to the total number of calls offered to
the ACD queue for the day
Total Q Unavail the total number of times during the day callers dialed the queue and were
rerouted because no agents were logged on to the queue or the queue was set to
Unavailable
See Path Unavailable Calls.
Current Q
Unavail This is the total number of callers that were rerouted after you set the queue to
Unavailable. When you make the queue available again, this value resets to zero.
7DEOH4XHXH1RZVWDWLVWLFV

&KDSWHU5HDOWLPHPRQLWRUV
You can rearrange columns on the My Shift grid. You click a column header to select a column, release the
mouse button, click the column header again and move the column to another place on the grid using a drag-
and-drop operation. In addition, you can specify which columns of queue statistics are displayed.
Table 7-8 displays My Shift statistics.
7DEOH0\6KLIWVWDWLVWLFV
7HUP 0HDQLQJ
Extn # the extension number of the phone the agent uses
Log On the time the agent logged on
Log Off the time of the agent’s last ACD event on the queue
Shift the total shift time for the agent
ACD Time the total time the agent spent on ACD calls
Hold ACD Time the total time for ACD calls put on hold
Non ACD Time the total time for non-ACD calls put on hold
Hold Non ACD
Time the total time for non-ACD calls put on hold
Out Time the total time the agent spent on outbound calls
Hold Out Time the total time for outbound calls put on hold
DND Time the total time the agent spent in the do not disturb state
MKB Time the total time the agent spent in the make busy state
Wrap-Up Time the total time the agent spent in the wrap up state
DND Count the number of times the agent entered the do not disturb state
MKB Count the number of times the agent entered the make busy state
ACD Count the total number of ACD calls answered by the agent
Short ACD
Count the total number of ACD calls the agent answered that lasted less than 20 seconds
Hold ACD
Count the number of times the agent put ACD calls on hold
Non ACD
Count the total number of non-ACD calls answered by the agent
Hold Non ACD
Count the number of times the agent put non-ACD calls on hold
Out Count the total number of outgoing calls the agent made
Hold Out Count the number of times the agent put outgoing calls on hold

9LHZLQJUHDOWLPHVWDWLVWLFV
NOTE: In the YourSite Database, an agent must be a member of an agent group, and must be associated to an
employee ID in order for you to view the agent in AgentAdvisor. An employee must be a member of an
employee group in order for you to view the employee in AgentAdvisor. A queue must be a member of a
queue group and have at least one agent group associated to it in order for you to view the queue in
AgentAdvisor. This is to support real-time and report permissions: you define permissions for database
groups.
To view real-time statistics:
1. Click Start=>Programs=>prairieFyre Software Inc=>6110 CCM AgentAdvisor.
The Server Connection window appears. (See Figure 6-28.)
2. Verify your Server IP Address and Port and click OK.
)LJXUH6HUYHU&RQQHFWLRQ
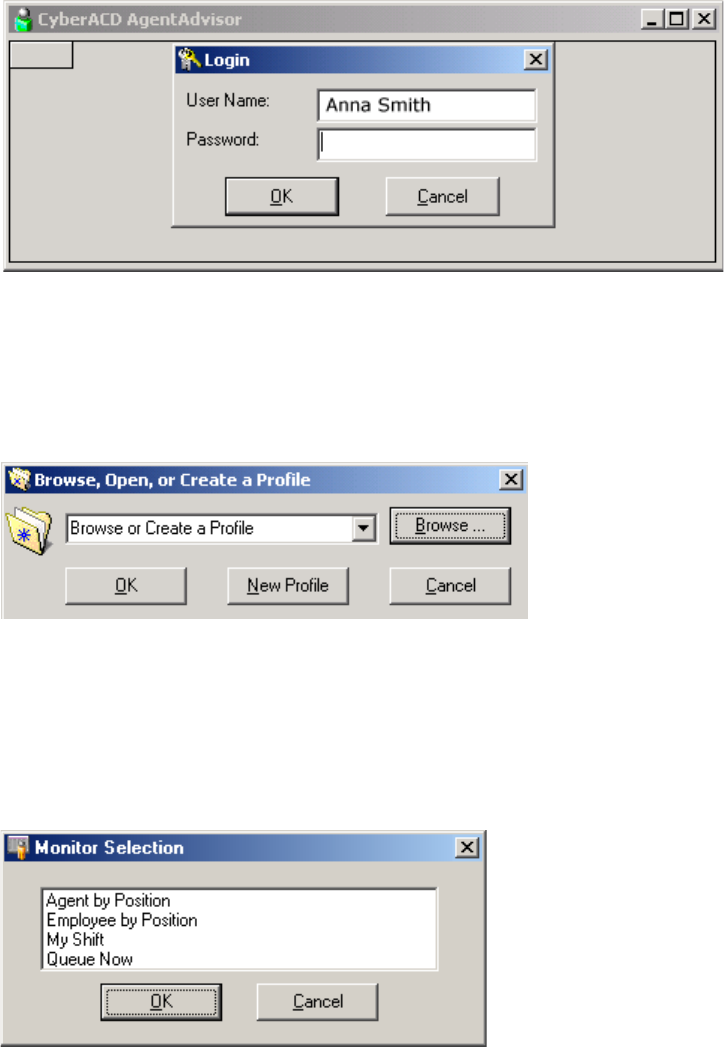
&KDSWHU5HDOWLPHPRQLWRUV
The Login window appears. (See Figure 6-29.)
3. Log on to AgentAdvisor using your employee ID number, and click OK.
)LJXUH/RJLQ
4. Log on to AgentAdvisor using your employee ID number, and click OK.
Figure 6-30 appears. You enter profile names to save display parameters and alarm characteristics
you define for agents and queues. The preceding Figure displays the Customer Service Agents
profile.
)LJXUH3URILOHVGLDORJ
5. Select a profile and click OK, or click New Profile (and enter the profile name later).
Figure 6-31 appears.
6. Select the Agent State by Position monitor and click OK.
)LJXUH0RQLWRUVHOHFWLRQ
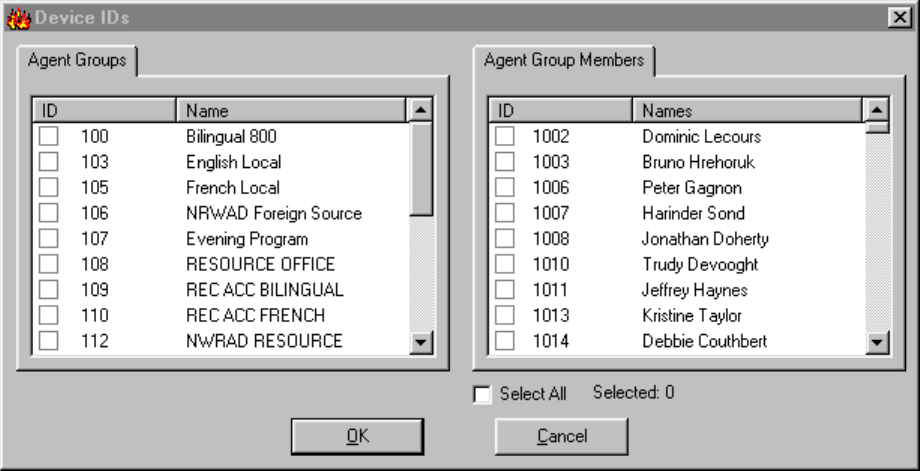
Figure 6-32 appears.
7. Under Agent Groups select agent groups to monitor. Alternatively, under Agent Group Members
select agents to monitor.
)LJXUH'HYLFH,'OLVW
To sorting devices alphabetically
On the Device IDs dialog box you can sort devices alphabetically, or by device ID, in ascending or descending
order.
1. Click the ID or Name header for a device or device group list to sort it by ID or name.
2. Click OK.
AgentAdvisor displays the devices across the grid in the order you specified.
To start a second instance of AgentAdvisor:
1. Log on to AgentAdvisor and start a new session.
2. Select the Queue Now monitor and click OK.
3. Repeat steps 5 to 7 to display the monitor.
$GGLQJUHDUUDQJLQJUHVL]LQJDQGVRUWLQJGHYLFHV
You can add, rearrange, resize, and sort devices on grids.
To add additional agents to the Agent State by Position grid:
1. Right-click the Agent State by Position grid and click Add Device IDs.
2. Under Agent Group Members, select additional agents and click OK.
SuperAdvisor adds the agents to the bottom of the Agent State by Position grid.
NOTE: If you right-click a cell and add a single agent to the grid, the new agent replaces the agent
in the current cell.
&KDSWHU5HDOWLPHPRQLWRUV
To rearrange and resize agent cells on the Agent State by Position grid:
1. Left-click an agent’s cell and perform a drag-and-drop operation to move it to a different position on
the grid.
2. Optionally click the column header above any column of agent state icons and drag the right edge of
the header towards the left to make the column (and agent state icons) proportionately smaller.
This resizes all agent state icons on the grid.
To enlarge the grid frame:
• Left-click the lower right corner of the display and perform a drag-and-drop operation.
To auto-fit the grid to the frame:
• Right-click the grid and click Size Grid to Frame.
The grid cells change size to fit the new grid dimensions.
To sort agents on the Agent State by Position grid:
• Right-click the grid and click Sort Grid by State.
SuperAdvisor sorts the agents by state and time in state. SuperAdvisor displays the agents across the grid in
the following order:
• On ACD agents
• ACD Hold agents
• Wrap Up agents
• Idle agents
• On Non ACD agents
• Non ACD Hold agents
• Outbnd agents
• Outbnd Hold agents
• Make Busy agents
• Do Not Disturb agents
• Log Off agents
• Unknown agents
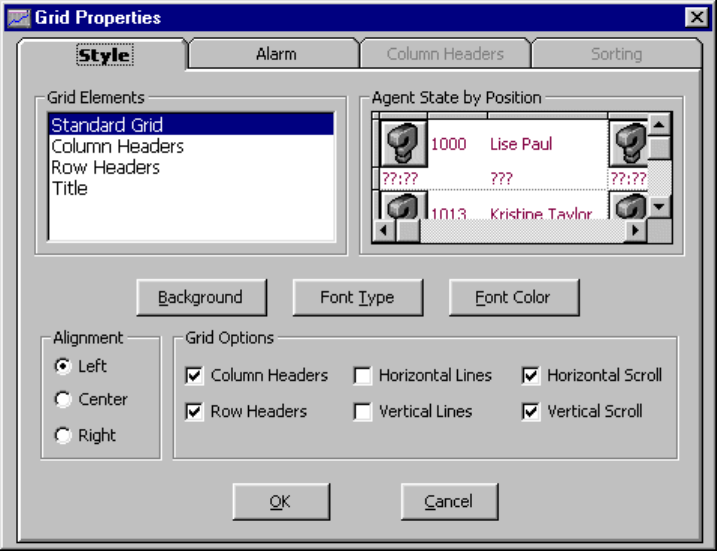
+LGLQJJULGILHOGV
On on all queue grids you can optionally hide the grid fields (columns) you are not interested in viewing.
For example, to hide grid columns on the Queue Now grid:
1. Right-click the Queue Now grid and click Properties.
2. Click the Column Headers tab.
3. Under Show/Hide Column Headers, clear any check boxes that correspond to statistics you want
to hide from view on the grid.
4. Click OK.
AgentAdvisor hides the grid columns.
'HILQLQJJULGVW\OHV
You can customize the appearance of grid elements, such as column and row headers.
1. Select a monitor.
2. Right-click the display and click Properties.
3. Click the Style tab.
Figure 6-33 appears.
4. In the Grid Elements list, click a grid element.
5. Click Background, Font Type, and Font Color and specify a background color, font type, and font
color for the grid element.
6. Select alignment and grid options for the grid element.
7. Click OK to save style changes for the grid element.
8. Repeat steps 4 to 7 for other grid elements.
9. Click OK.
NOTE: You can apply styles across multiple grid elements by pressing Shift or Control.
)LJXUH6W\OHWDE
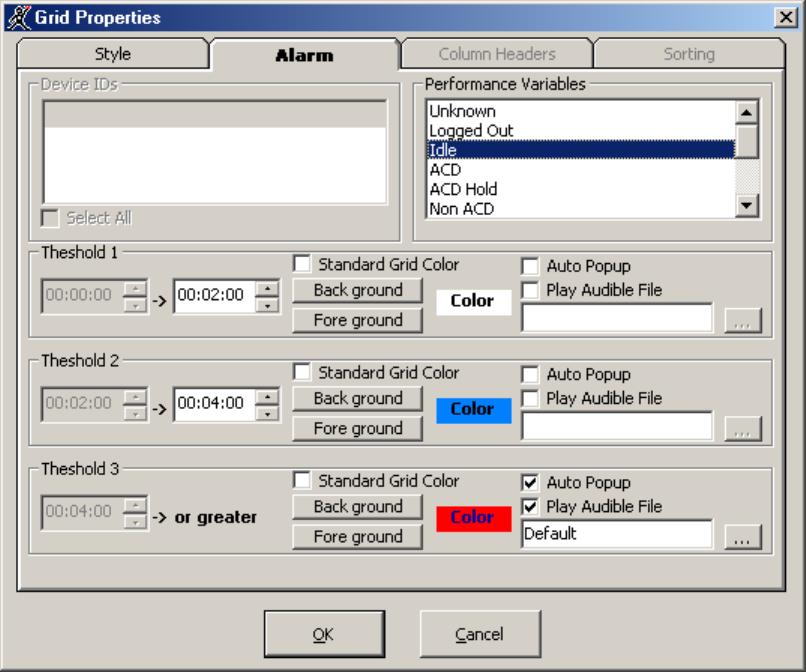
&KDSWHU5HDOWLPHPRQLWRUV
'HILQLQJSHUIRUPDQFHWKUHVKROGV
AgentAdvisor displays queue and agent statistics. The grid cells and statistics change color when performance
changes to keep you informed of the service provided to callers.
To define performance thresholds and corresponding colors:
1. Open the Agent State by Position or Employee State by Position monitor.
2. Right-click the grid and click Properties.
3. Click the Alarm tab.
Figure 6-34 appears.
4. In the Performance Variables list, click a variable.
5. Under Threshold 1, select range values for the statistic.
6. Click Background and Foreground and specify alarm threshold colors for Threshold 1.
7. Optionally select the Auto Popup check box to display AgentAdvisor on top of all other applications
when the threshold conditions are satisfied.
8. Optionally select the Play Audible File check box to have AgentAdvisor beep when the threshold
conditions are satisfied.
9. Repeat steps 5 to 8 to define parameters for Threshold 2 and Threshold 3.
10. Repeat steps 4 to 8 to define thresholds for other performance variables.
11. Click OK.
)LJXUH$ODUPWDE
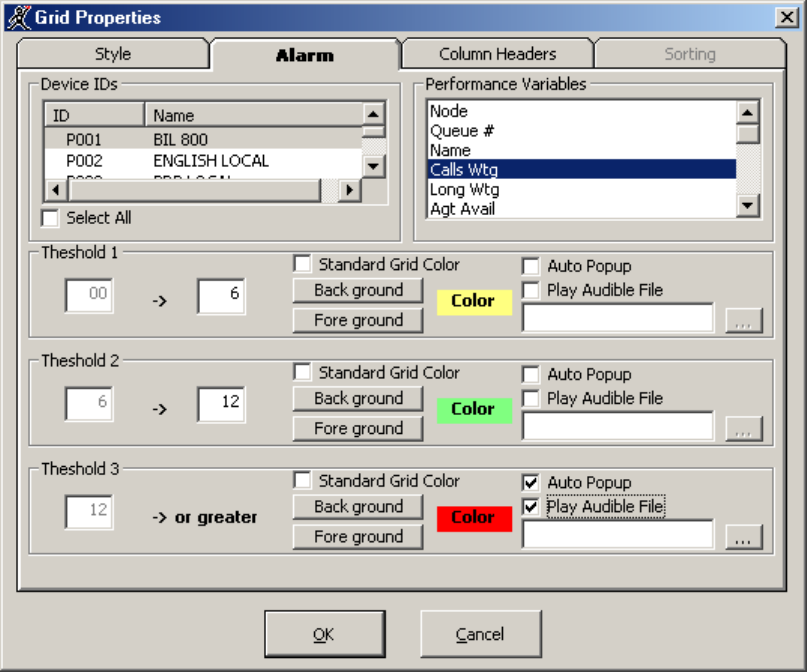
NOTE: If you select the Standard Grid Color check box, the background color turns white.
Consider the threshold programming in the preceding Figure. When an agent has been in the Idle state for zero
to two minutes the grid cell housing the agent remains white. When an agent has been in the Idle state for two
to four minutes the grid cell turns blue. When an agent has been in the Idle state for more than four minutes
the grid cell turns red and the text in the grid cell turns navy blue. In addition, AgentAdvisor appears on top of
all open desktop applications and beeps.
You can define threshold settings for performance variables for individual or multiple queues on the Queue
Now monitor.
To define performance thresholds and corresponding colors:
1. Open the Queue Now monitor.
2. Right-click the grid and click Properties.
3. Click the Alarm tab.
Figure 6-35 appears.
)LJXUH$ODUPWDE
&KDSWHU5HDOWLPHPRQLWRUV
NOTE: You can select Select All, to apply threshold settings for a performance variable across all
available queues. If you select the Standard Grid Color check box, the background color turns white
for the active performance variable.
4. In the Device IDs list, select one or more queues or select the Select All check box to select all
queues.
5. In the Performance Variables list, click a variable.
6. Under Threshold 1, select range values for the statistic.
7. Click Background and Foreground and specify alarm threshold colors for Threshold 1.
8. Optionally select the Auto Popup check box to display AgentAdvisor on top of all other applications
when the threshold conditions are satisfied.
9. Optionally select the Play Audible File check box to have AgentAdvisor beep when the threshold
conditions are satisfied.
10. Repeat steps 6 to 9 to define parameters for Threshold 2 and Threshold 3.
11. Repeat steps 4 to 9 to define thresholds for other performance variables.
12. Click OK.
Consider the threshold programming in the preceding Figure. When zero to six callers are waiting in Queue
P501 the grid cell housing the Calls Waiting statistic is yellow. When seven to 12 callers are waiting in Queue
501 the grid cell turns green. When 13 or more callers are waiting in Queue P501 the grid cell turns red. In
addition, AgentAdvisor appears on top of all open desktop applications and plays an audible alarm.
&UHDWLQJSURILOHV
In AgentAdvisor you can create profiles to save threshold settings and display characteristics you define for
monitors.
You can now save all profiles in one folder so that all agents can access them.
NOTE: You must save your open monitors to a profile before you select a different 6110 CCM application,
such as YourSite, or Report Inbox, or your programming in AgentAdvisor will be lost.
To save monitors currently displayed in AgentAdvisor:
1. Right-click the grid and click Save Profile.
2. After Save in, select where to save the profile.
3. Type a profile name and click OK.
AgentAdvisor saves the profile.

/RDGLQJSURILOHV
The Load button loads existing profiles. You can now browse to locate the profiles you want to load.
1. Click Load.
The Browse, Open, or Create a Profile window appears. (See Figure 6-36.)
2. Click Browse.
3. After Look in, locate your profile. It is an .saf file.
4. Select the profile from the list box and click Open.
)LJXUH%URZVH2SHQRU&UHDWHD3URILOH
&KDWWLQJRQOLQHLQ$JHQW$GYLVRU
Agents can communicate essential information to supervisors quickly and securely with the AgentAdvisor
ChatLine. Agents requiring help on calls can consult with supervisors online and provide immediate feedback
to clients, without having to leave their seats.
NOTE: You must log on to AgentAdvisor in order to send and receive messages. When you receive a
message, AgentAdvisor displays it immediately on top of all open windows.
To chat online with supervisors or agents:
1. Right-click a monitor and click Chat.
Figure 6-37 appears.
2. Type a message and click Send to.
3. Select one or more supervisors or agents to send the message to and click OK.
)LJXUH$JHQW$GYLVRU&KDW/LQH
&KDSWHU5HDOWLPHPRQLWRUV
Blue text appears in the chat window to confirm AgentAdvisor sent the message. The supervisor's or agent’s
response to the message appears in the chat window below a red header. To reply to a message, type a
message and press Enter. ChatLine sends your response to the person who most recently sent you a message,
that is, the person listed at the bottom of your chat window. To reply to a previous message, type in a message,
click Send to, select a supervisor from the list, and click OK.
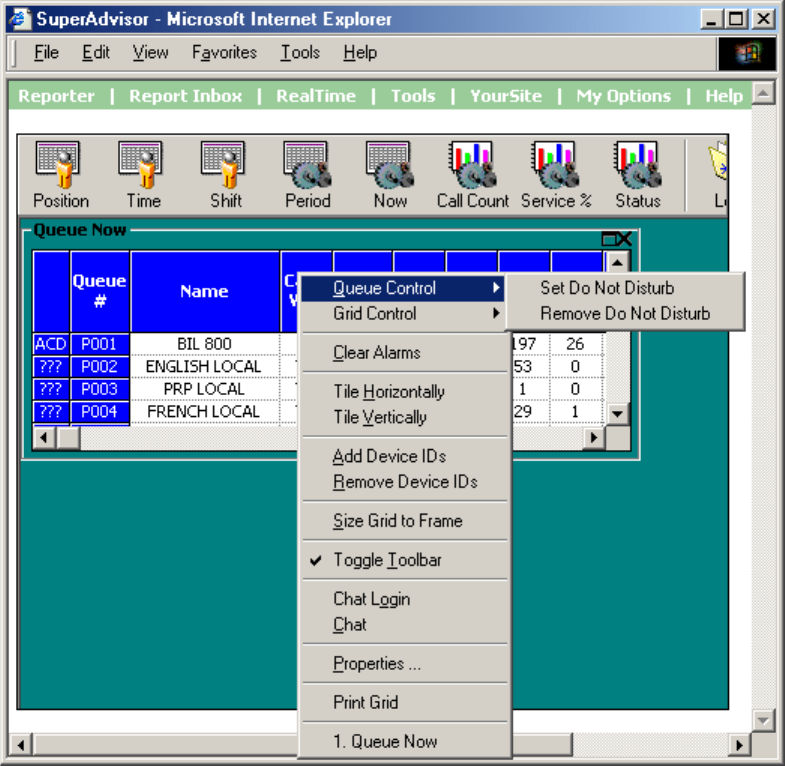
&&0,QWHU$FWLYH
Mitel Network 6115 Contact Center Management is a purchasable option that complements the SX-2000 and
3200/3300 ICP (Integrated Communications Platform) telephone systems. It is used in conjunction with
SuperAdvisor and AgentAdvisor. Using 6115 CCM and SuperAdvisor, supervisors can control the availability
of agents and ACD queues. They can log an agent out of one queue and into a busier queue, or place the agent
in make busy or do not disturb. In addition, they can log a queue in and out, or place the queue in make busy
or do not disturb. Using 6115 CCM and AgentAdvisor, agents can control their own availability by logging on
and logging off and with make busy and do not disturb.
&&0PDLQVFUHHQ
With SuperAdvisor, you can control the availability of agents and ACD queues on the Agent by Position,
Employee by Position, and Queue Now grids. When you open the Queue Now monitor and right-click the
grid, the menu illustrated in Figure 6-38 appears.
With AgentAdvisor, you can control the availability of yourself on the Agent by Position, Employee by
Position, and Queue Now grids.
The Queue Control and Grid Control commands place a single agent, or all agents in do not disturb or make
busy.
)LJXUH&&0PHQX
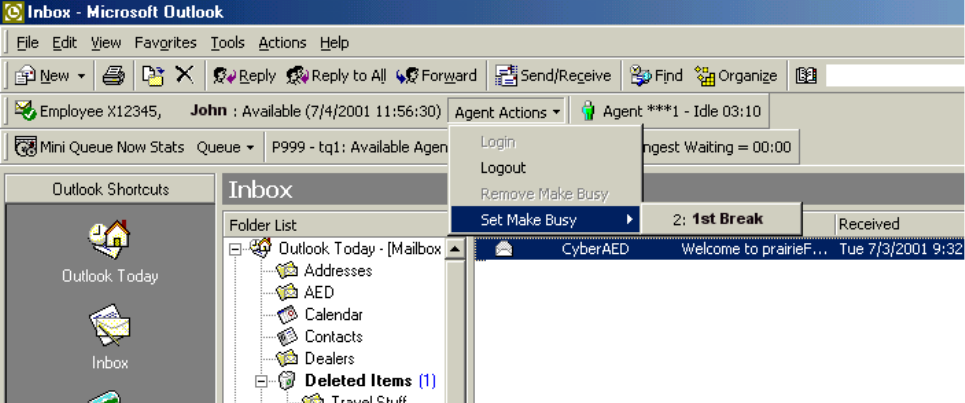
&KDSWHU5HDOWLPHPRQLWRUV
&RQILJXULQJ0DNH%XV\5HDVRQ&RGHV
Every time an agent leaves his desk, he must set Make Busy. There are many reasons why an agent leaves his
desk. Each of these reasons must be assigned a Make Busy Reason Code and added to YourSite before these
reasons can be selected by the agent. For example, when an agent gets a coffee, takes his morning break, or
takes his lunch, he uses the appropriate Make Busy Reason Code. (See Figure 6-39.) When an Agent
Performance by Make Busy Code report is run, the report clearly indicates when the agent went on Make
Busy, and why (which code the agent assigned each time). For example, in the following figure, John is
setting Make Busy Reason Code 2: 1st Break.
)LJXUH0DNH%XV\ZLWK5HDVRQ&RGH
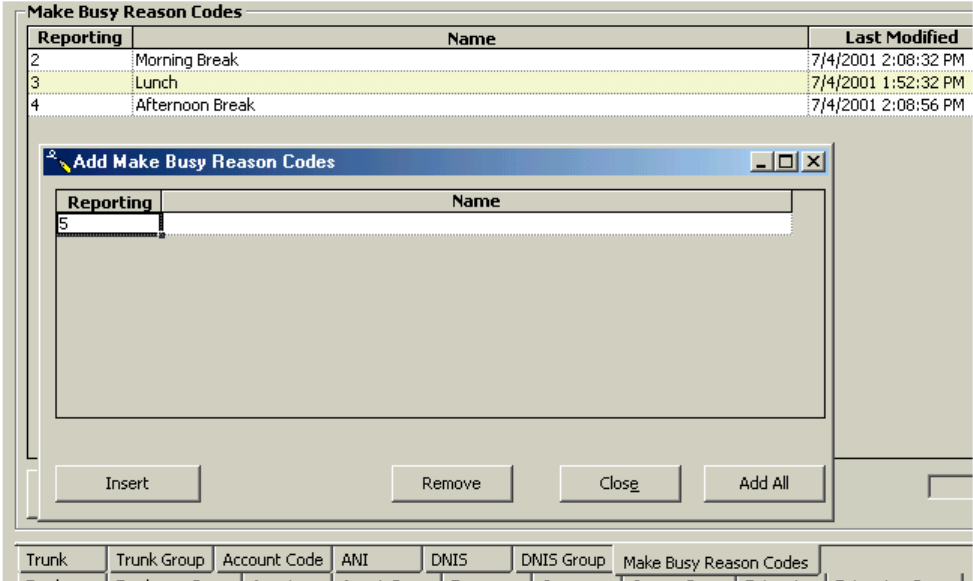
$GGLQJD0DNH%XV\5HDVRQ&RGH
1. Click the Make Busy Reason Codes tab.
2. Right-click the first Make Busy Code, and select Add.
The Make Busy Reason Codes window appears. (See Figure 6-40.)
3. Under Reporting, type the Make Busy Code.
4. Under Name, type the name of the Make Busy Code.
5. Click Add All.
)LJXUH$GG0DNH%XV\5HDVRQ&RGHVZLQGRZ

&KDSWHU5HDOWLPHPRQLWRUV
The Your Site Configuration window appears indicating the success or failure of the addition. (See
Figure 6-41.)
6. Click OK.
)LJXUH<RXU6LWH&RQILJXUDWLRQZLQGRZ
(GLWLQJD0DNH%XV\5HDVRQ&RGH
1. Click the Make Busy Reason Code tab.
2. Right-click the Make Busy Reason Codes, and select Edit.
3. Select the Make Busy Reason Code you want to edit.
4. Under Reporting, type the correct Make Busy Reason Code.
5. Under Name, type the correct name.
6. Press Enter.
7. Click Update.
The Your Site Configuration window appears indicating the success or failure of the edition.
Click OK.
'HOHWLQJD0DNH%XV\5HDVRQ&RGH
1. Click the Make Busy Reason Code tab.
2. Right-click the Make Busy Reason Codes, and select Delete.
3. Select the Make Busy Reason Code you want to delete.
4. Click Remove.
The Your Site Configuration window appears.
5. Click Yes.
The Your Site Configuration window appears indicating the success or failure of the deletion.
6. Click OK.
7. Click Close.
$JHQWFRQWUROV
With SuperAdvisor, using agent controls, you can log on and log off agents, set and remove agents from make
busy with reason, and set and remove agents from do not disturb from the Agent State by Position grid or the
Employee State by Position grid.
With AgentAdvisor, using agent controls, you can log yourself on or off, set or remove yourself from make
busy with reason, and set or remove yourself from do not disturb from the Agent State by Position grid or the
Employee State by Position grid.
/RJJLQJRQ
SuperAdvisor
To log on an agent:
1. Click the Position icon and click Agent by Position or Employee by Position.
2. Select agents or employees to monitor.
3. Click OK.
SuperAdvisor displays the devices across the grid in the order you specified.
4. Right-click the cell of an agent who is logged out and click Agent Control=>Log IN.
5. Select one of the agent’s IDs.
The first time you log in an agent, you must specify the agent’s extension number so 6115 CCM
knows to which phone the agent is logged in.
6. Type the agent’s extension number and click OK.
SuperAdvisor logs in the agent.
AgentAdvisor
To log on:
1. Click the Position icon and click Agent by Position or Employee by Position.
2. Select agents or employees to monitor.
3. Click OK.
AgentAdvisor displays the devices across the grid in the order you specified.
4. Right-click your cell and click Agent Control=>Log IN.
5. If you have multiple IDs, select one.
The first time you log on, you must specify your extension number so 6115 CCM knows to which
phone you are logged on.
6. Type your extension number and click OK.
AgentAdvisor logs you on.
/RJJLQJRII
Agents can have multiple agent IDs. In the YourSite Database agent IDs are associated to agent groups, and
agent groups are associated to queues. When you log in an agent in SuperAdvisor, the agent ID you select for
the agent determines the queue to which the agent logs in.
For example, Jeffrey Haynes has two Agent IDs: 1010 and 1011. They are associated to Queues P007 and
P001 respectively. Figure 6-42 shows agent Haynes logged in to P007 using Agent ID 1010. To log agent
Haynes out of P007 and in to P001, you right-click the grid, click Agent Control=>Log IN, and select 1011:
Jeffrey Haynes from the list of available agent IDs.
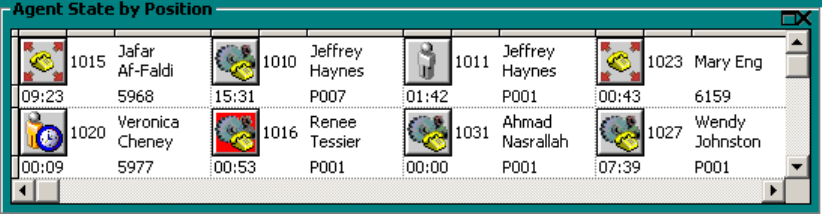
&KDSWHU5HDOWLPHPRQLWRUV
)LJXUH$JHQWVZLWKPXOWLSOHDJHQW,'V
SuperAdvisor
To log off an agent:
• Right-click the cell of the agent and click Agent Control=>Log OUT.
SuperAdvisor logs off the agent.
AgentAdvisor
To log off:
• Right-click your cell and click Agent Control=>Log OUT.
AgentAdvisor logs you off.
3ODFLQJDJHQWVRU\RXUVHOILQPDNHEXV\ZLWKUHDVRQRUGRQRW
GLVWXUE
NOTE: If you configure the Make Busy Reason Codes while you are logged on, you must click Notify
RealTime Clients to update the Make Busy Reasons in SuperAdvisor or AgentAdvisor.
You must configure the Make Busy Reason Codes with YourSite before you can assign the Make Busy
Reason.
SuperAdvisor
To place an agent in make busy or do not disturb:
• Right-click the cell of an agent who is logged in and click Agent Control=>Set Make Busy, then
select the Make Busy reason code, or click Agent Control=>Set Do Not Disturb.
SuperAdvisor places the agent in make busy or do not disturb.
AgentAdvisor
To place yourself in make busy or do not disturb:
• Right-click your cell and click Agent Control=>Set Make Busy, then select the Make Busy reason,
or click Agent Control=>Set Do Not Disturb.
AgentAdvisor places the agent in make busy or do not disturb.
5HPRYLQJDJHQWVRU\RXUVHOIIURPPDNHEXV\ZLWKUHDVRQRUGR
QRWGLVWXUE
SuperAdvisor
To remove an agent from make busy or do not disturb:
• Right-click the cell of an agent who is in make busy or do not disturb and click Agent Con-
trol=>Remove Make Busy or click Agent Control=>Remove Do Not Disturb.
SuperAdvisor removes the agent from make busy or do not disturb.
AgentAdvisor
To remove yourself from make busy or do not disturb:
• Right-click your cell and click Agent Control=>Remove Make Busy or click Agent Con-
trol=>Remove Do Not Disturb.
AgentAdvisor removes the agent from make busy or do not disturb.
$JHQWJULGFRQWUROV
With SuperAdvisor, using grid controls, you can log on or log off all agents on a grid, and set or remove all
agents from make busy with reason, and set or remove agents from do not disturb.
With AgentAdvisor, using grid controls, you can log on or log off, and set or remove yourself from make busy
with reason, and set or remove yourself from do not disturb for the My Shift and Agent by Position grids.
&KDSWHU5HDOWLPHPRQLWRUV
/RJJLQJRII
You can log out agents on the Agent State by Position grid or the Employee State by Position grid.
SuperAdvisor
To log out all of the agents on a grid:
• Right-click the grid and click Grid Control=>Log OUT.
SuperAdvisor logs out all of the agents on the grid.
AgentAdvisor
To log off a grid (My Shift or Agent by Position):
• Right-click the grid and click Grid Control=>Log OUT.
AgentAdvisor logs you off the grid.
3ODFLQJDOODJHQWVRU\RXUVHOILQPDNHEXV\ZLWKUHDVRQRUGRQRW
GLVWXUE
NOTE: If you configure the Make Busy Reason Codes while you are logged on, you must click Notify
RealTime Clients to update the Make Busy Reasons in SuperAdvisor or AgentAdvisor.
You must configure the Make Busy Reason Codes with YourSite before you can assign the Make Busy
Reason.
SuperAdvisor
To place all of the agents on a grid in make busy or do not disturb:
• Right-click the grid and click Grid Control=>Set Make Busy, then select the Make Busy reason, or
click Grid Control=>Set Do Not Disturb.
SuperAdvisor places all of the logged in agents in make busy or do not disturb.
AgentAdvisor
To put yourself in make busy or do not disturb on a grid (My Shift or Agent by Position):
1. Right-click the grid and click Grid Control=>Set Make Busy, then select the Make Busy reason, or
click Grid Control=>Set Do Not Disturb.
AgentAdvisor places you in make busy with reason, or do not disturb.
5HPRYLQJDOODJHQWVRU\RXUVHOIIURPPDNHEXV\RUGRQRWGLVWXUE
SuperAdvisor
To remove all of the agents on a grid from make busy or do not disturb:
• Right-click the grid and click Grid Control=>Remove Make Busy or click Grid Control=>Remove
Do Not Disturb.
SuperAdvisor removes all of the agents from make busy or do not disturb.
AgentAdvisor
To remove yourself from make busy or do not disturb on a grid (My Shift or Agent by Position):
• Right-click the grid and click Grid Control=>Remove Make Busy or click Grid Control=>Remove
Do Not Disturb.
AgentAdvisor removes you from make busy or do not disturb.
4XHXHFRQWUROV
With SuperAdvisor, using queue controls, you can set and remove queues from do not disturb on the Queue
Now grid. Queue controls are not available to AgentAdvisor.
3ODFLQJTXHXHVLQGRQRWGLVWXUE
SuperAdvisor
To place a queue in do not disturb:
• Right-click the cell of an active queue and click Queue Control=>Set Do Not Disturb.
SuperAdvisor places the queue in do not disturb.
5HPRYLQJTXHXHVIURPGRQRWGLVWXUE
SuperAdvisor
To remove a queue from do not disturb:
• Right-click the cell of a queue that is in do not disturb and click Queue Control=>Remove Do Not
Disturb.
SuperAdvisor removes the queue from do not disturb.
&KDSWHU5HDOWLPHPRQLWRUV
4XHXHJULGFRQWUROV
Using grid controls, you can set or remove all queues from do not disturb simultaneously. Queue controls are
not available to AgentAdvisor.
3ODFLQJDOOTXHXHVLQGRQRWGLVWXUE
SuperAdvisor
To place all of the queues on a grid in do not disturb:
• Right-click the grid and click Grid Control=>Set Do Not Disturb.
SuperAdvisor places all of the active queues in do not disturb.
5HPRYLQJDOOTXHXHVIURPGRQRWGLVWXUE
SuperAdvisor
To remove all of the queues on a grid from do not disturb:
• Right-click the grid and click Grid Control=>Remove Do Not Disturb.
SuperAdvisor removes all of the queues from do not disturb.
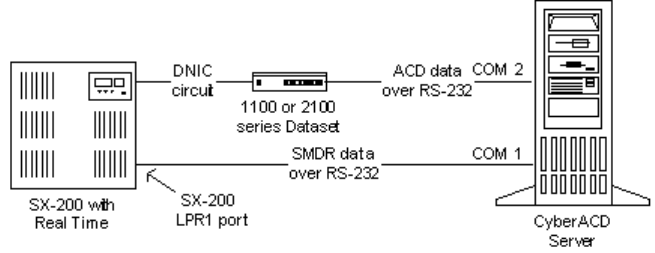
&\EHU7HUPLQDO
The SX-200 displays data in a series of ACD Monitors on a standard VT100™ compatible terminal. The
ACD Monitors act as a “window” to the ACD system providing an event-display that is updated after the
completion of each ACD activity. The VT100 has System Activity, Path Summary, Agent Group Summary,
and Agent Information event-displays (sessions).
prairieFyre uses CyberTerminal to view a VT100 terminal session. If you have Windows 2000, or Windows
2000 Professional, you can optionally view ACD Monitor sessions on the VT100 terminal using the
HyperTerminal application. You click Start=>Programs=>Accessories=>Communications=> HyperTerminal
to start HyperTerminal.
6;FRQQHFWLYLW\WRWKH&&06HUYHU
Typically, the SX-200 telephone system is co-located with the 6110 CCM Server. By default, prairieFyre
configures Comport 2 to accept the ACD data stream generated by the 1103 Datatset, and Comport 1 to accept
the SMDR and Agent Shift data streams. The 1103 Dataset connects to the DNIC port on the SX-200. All
components connect over RS-232 serial cable.
Call centers that have only one 1103 Dataset and one DNIC port on the SX-200 system have a single VT100
terminal session available for viewing real-time System Activity, Path Summary, Agent Group Summary, and
Agent Information ACD Monitor sessions. In order to view more than one session simultaneously, you require
additional 1103 Datasets and DNIC ports.
prairieFyre uses CyberTerminal to view a VT100 terminal session. The terminal session runs on the server in
memory. The server distributes it to connected clients through TCP-IP.
Figure 6-43 illustrates how CyberTerminal distributes real-time information through the VT100 terminal
session for the SX-200 (prior to SX-200® EL/ML LIGHTWARE 17 Release 4.0).
)LJXUH6;FRQQHFWLYLW\WRWKH&&06HUYHU
'DWDVWUHDPVDQGSUDLULH)\UHUHDOWLPHGLVSOD\V
On the 6110 CCM Server, Comport 2 accepts the ACD data stream generated by the 1103 Dataset, and
Comport 1 accepts the SMDR and Agent Shift data streams.
Table 7-9 illustrates which data streams feed the various ACD monitors.

&KDSWHU5HDOWLPHPRQLWRUV
Using CyberTerminal, multiple clients can simultaneously view real-time data displayed on a VT100
terminal. Clients view the session over the LAN or WAN, and can control which session is currently being
viewed. They can connect to an existing VT100 display or create a new one if not all displays are already
open. Clients have the same memory image as the server. All subsequent updates are sent to all connected
clients.
9LHZLQJUHDOWLPH6;VWDWLVWLFV
CyberTerminal displays one or more ACD Monitor sessions on the VT100 terminal. The monitors are
arranged in a hierarchy that provides quick access to the following four areas of the telephone system: the
System Activity Monitor, the Path Summary Monitors, the Agent Group Summary Monitors, and the Agent
Information Monitors. Clients connected to the 6110 CCM Server computer are automatically updated with
real-time statistics.
To install CyberTerminal and view real-time statistics:
1. Start IE and browse to the 6110 CCM Web application.
2. Log on to the 6110 CCM Server using your 6110 CCM user name and password.
3. On the 6110 CCM user interface, click Help=>Client Download and click CyberTerminal to run the
CyberTerminal Setup.
4. Click Start=>Programs=>prairieFyre Software Inc=>6110 CCM CyberTerminal.
5. Click File=>Connect, enter the 6110 CCM Server IP address and port number, and click OK.
6. Press Enter several times to view the System Activity display.
Figure 6-44 appears.
7DEOH'DWDVWUHDPVDQGSUDLULH)\UHUHDOWLPHGLVSOD\V
'DWD6WUHDP 976HVVLRQ
ACD ACD System Screen
ACD Group Summary Screen
ACD Agent Summary Screen
SMDR & ACD Path Summary Screen
SMDR N/A
SMDR N/A
SMDR N/A
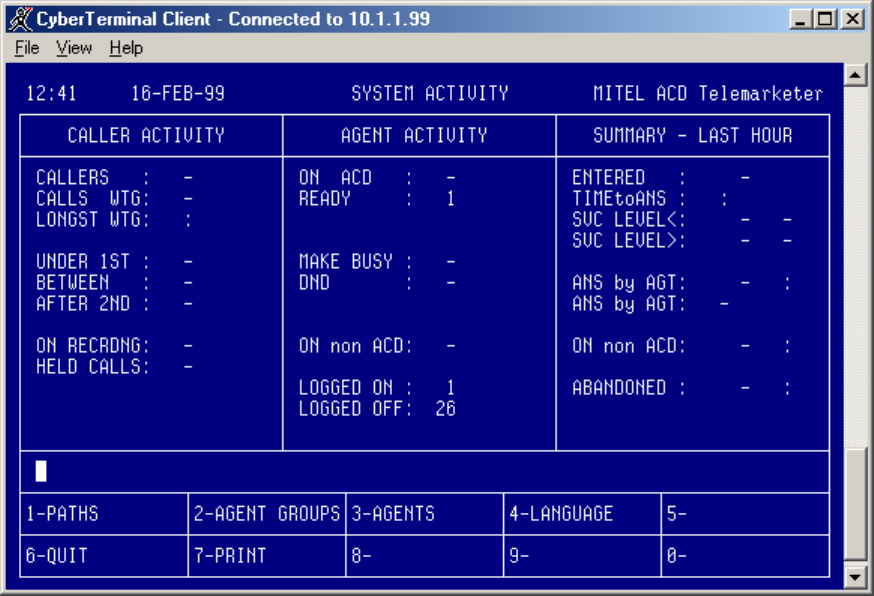
)LJXUH&\EHU7HUPLQDO6\VWHP$FWLYLW\0RQLWRU
The VT100 sessions are arranged in a hierarchy that provides access to the following four areas of the
telephone system: the System Activity Monitor, Path Summary Monitors, Agent Group Summary Monitors,
and Agent Information Monitors.
To view a different display:
1. Type the number on your keyboard that corresponds to the display you want to view.
2. Press Enter.
3. Type 1 to display the Path Summary Monitor.
4. Type 5 to cancel the display and returns you to the previous display.
5. Type Ctrl-W to force the server to refresh all clients.
The server main screen provides the following functions.
)LOH
The File menu consists of the following commands.
• The Connect command connects your computer to the 6110 CCM Server.
• The Disconnect command disconnects your computer from the 6110 CCM Server.
• The Exit command closes the application.

&KDSWHU5HDOWLPHPRQLWRUV
9LHZPHQX
• The View menu consists of the following commands.
• The AutoResize command resizes the CyberTerminal application to its default display size.
• The Options command provides options for changing the background color, and the font color and
size for CyberTerminal.
+HOSPHQX
The Help menu provides the version number of the CyberTerminal application and access to an online Help
file on CyberTerminal.
$&'0RQLWRUVHVVLRQV
The following section describes the VT100 System Activity, Path Summary, Agent Group Summary, and
Agent Information ACD Monitors sessions.
6\VWHP$FWLYLW\PRQLWRU
The System Activity monitor displays agent activity, the current status of the ACD system, and a summary of
system performance over the past hour. Table 7-10 lists the fields of the System Activity display provided by
CyberTerminal.
7DEOH7HUPVXVHGLQ6\VWHP$FWLYLW\GLVSOD\
7HUP 0HDQLQJ
&DOOHUV
Callers This is the number of callers within the ACD system including callers talking to
agents and callers waiting for agents, but not including callers in the delay for
ring back.
Calls Wtg This is the number of callers queued up waiting for an agent to become available,
including those listening to silence, music, alternate music, or a recorded
announcement.
Longst Wtg This is the duration, in minutes and seconds, of the call that has been waiting
longest in queue.
Under 1st This is the percentage of callers in the system that wait less than the first thresh-
old time programmed for the primary group of the path.
Between This is the percentage of callers in the system that wait longer than the first
threshold time but less than the second threshold time programmed for the pri-
mary group of the path.
After 2nd This is the percentage of callers in the system that wait longer than the second
threshold time programmed for the primary group of the path.
On Recrdng This is the number of calls that are listening to a recorded announcement while
waiting in the queues.
Held Calls This indicates the number of ACD callers that have been placed on hold.

$JHQWDFWLYLW\
On ACD This is the number of agents currently on ACD calls.
Ready This is the number of agents currently ready. Those agents are not on any type of
call and are available to receive ACD calls.
Make Busy This is the number of logged in agents that are in Make Busy. These agents do not
receive ACD calls.
DND This is the number of logged in agents that have activated Do Not Disturb. These
agents do not receive ACD or non-ACD calls.
On Non ACD This is the number of agents currently involved in incoming non-ACD calls or
agent originated calls.
Logged On This is the number of agents currently logged into the ACD system.
Logged Off This is the number of agents currently not logged in to the ACD system.
6XPPDU\ODVWKRXU
Entered This is the total number of ACD calls that have entered a queue in the ACD sys-
tem over the past hour.
Time To Ans This is the average time before a call is answered by an agent.
SVC Level This is the summary - from all paths in the system - of the path service level sta-
tistics. The first field shows the number of calls answered within the paths’ ser-
vice time; the second is the percentage of calls answered outside of the service
time.
Ans By Agt This is the number of calls received over the past hour that have been answered
by an agent and the average duration of the calls.
Ans By Agt This is the percentage of all ACD calls that entered over the past hour that were
answered by an agent.
On Non ACD This is the number of calls over the past hour that were either incoming non-ACD
calls answered by an agent or agent originated calls, and the average duration of
these calls.
Abandoned This is the number of callers who abandoned before being answered by an agent
and the average time a caller waited before abandoning.
7DEOH7HUPVXVHGLQ6\VWHP$FWLYLW\GLVSOD\
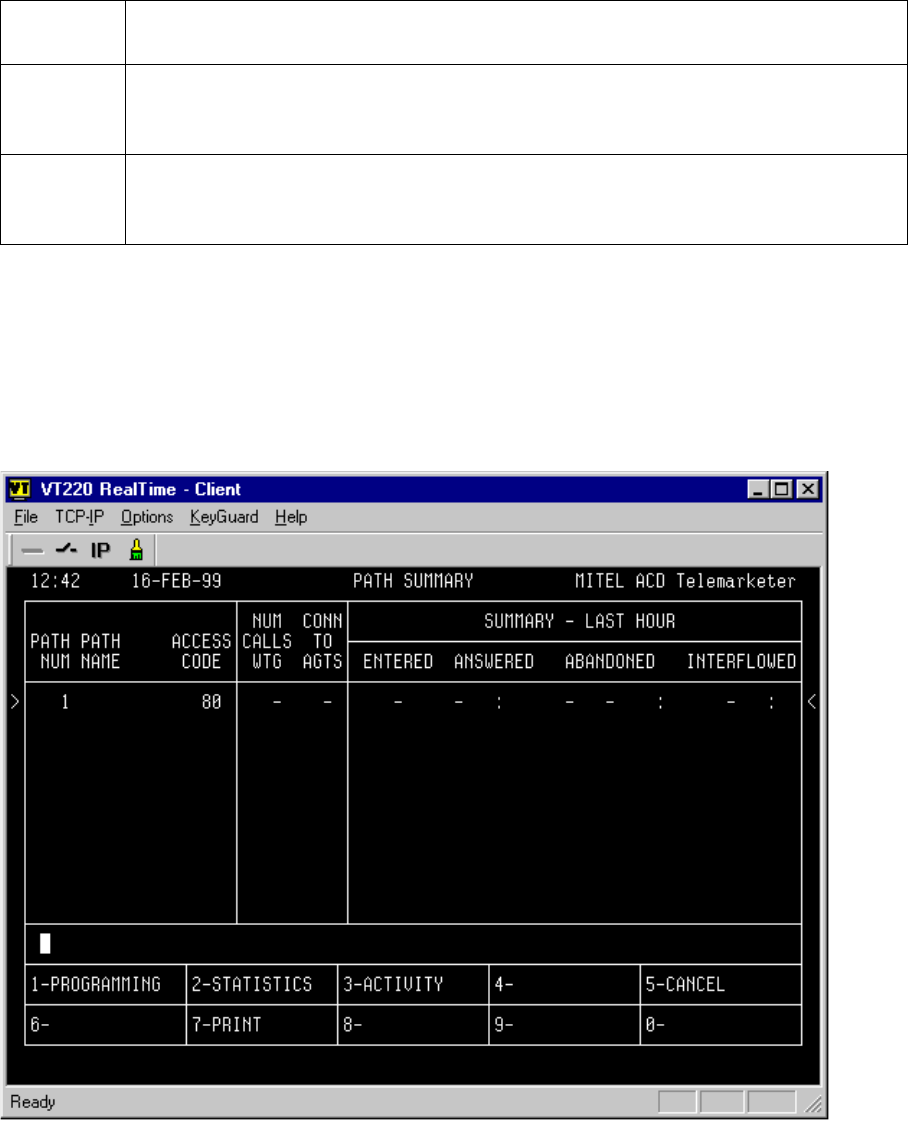
&KDSWHU5HDOWLPHPRQLWRUV
6\VWHP$FWLYLW\PRQLWRU6RIWNH\V
The System Activity monitor display has System Activity monitor Softkeys used to enter the second level in
the monitor hierarchy. The softkeys provide access to detailed displays on the performance of specific paths
(queues), agent groups and agents. Table 7-11 explains the various softkeys and their purpose.
3DWK6XPPDU\PRQLWRUV
Figure 6-45 illustrates the main Path Summary Monitor. The Path Summary monitors provide data on
individual queues, that includes the database defined parameters of the queue, the current activity on the
queue, and a brief statistical analysis for the queue.
)LJXUH3DWK6XPPDU\0RQLWRUV
7DEOH6\VWHP$FWLYLW\0RQLWRU6RIWNH\V
PATHS When you enter 1 (for PATHS) at the prompt you are requested to provide a queue ID.
The Path Summary monitors for the selected queue are displayed.
AGENT
GROUPS When you enter 2 (for AGENT GROUPS) at the prompt you are requested to provide
an Agent group number. The Agent Group Summary monitors for the selected group
are displayed.
AGENTS When you enter 3 (for AGENTS) at the prompt you are requested to provide an Agent
ID number. The Agent Information monitors showing current agent activity and the
last hour’s statistics are displayed.

The system displays path information on four forms. You enter the Path monitor sub-level from the Path
Summary display, which shows activity on the requested path. When you enter 1 for PATHS on the System
Activity Monitor and enter a queue number, Figure 6-45 appears.
Table 6-12 lists the fields of the Path Summary display.
NOTE: The Entered field on the Path Summary monitor shows the number of times a call enters the path. In
cases where a path interflows to itself or to another path, each call that interflows increments the entered
count. Therefore, one call into the system may have “entered” many times.
The Path Summary display has Path Summary Softkeys you use to access detailed information in three
categories: database programmed data, statistics gathered on the path over the past hour, and current path
activity.
Entering 2 for the STATISTICS softkey in the Path Summary window displays the Path Statistics display. This
display provides a statistical overview of the queue’s current performance, as well as a summary of activity
over the past hour.
Entering 3 for the ACTIVITY softkey in the Path Summary window displays the Path Activity display. This
display provides a continuously updated picture of the traffic on a given queue. The information relates to the
callers in line for the queue as well as any ready agents waiting for calls from the queue.
7DEOH7HUPVXVHGLQ3DWK6XPPDU\GLVSOD\
7HUP 0HDQLQJ
&XUUHQWLQIRUPDWLRQ
Path Num This is the path/queue number. Queues are displayed in ascending order by queue
numbers (range = 1 - 50).
Path Name This is the name of the queue as programmed in database.
Access Code This is the access code of the queue (1 - 5 digits).
Num Call Wtg This is the number of ACD calls which originated on this queue that are currently
queued against any of the groups programmed in the queue.
Conn To Agts This is the number of callers from this queue currently talking to agents of any of
the groups programmed in this queue.
6XPPDU\ODVWKRXU
Entered This is the number of calls that entered this path. See NOTE below.
Answered This is the first entry is the number of calls answered by all groups in the path.
The second entry is the average time to answer for those calls.
Abandoned This is the first entry is the number of callers who abandoned while waiting for a
group in this path. The second entry is the percentage of the calls offered that this
represents, and the third is the average time a caller waited before abandoning.
Interflowed This is the first entry is the number of callers who interflowed out of this path.
The second entry is the average time to interflow for those calls.
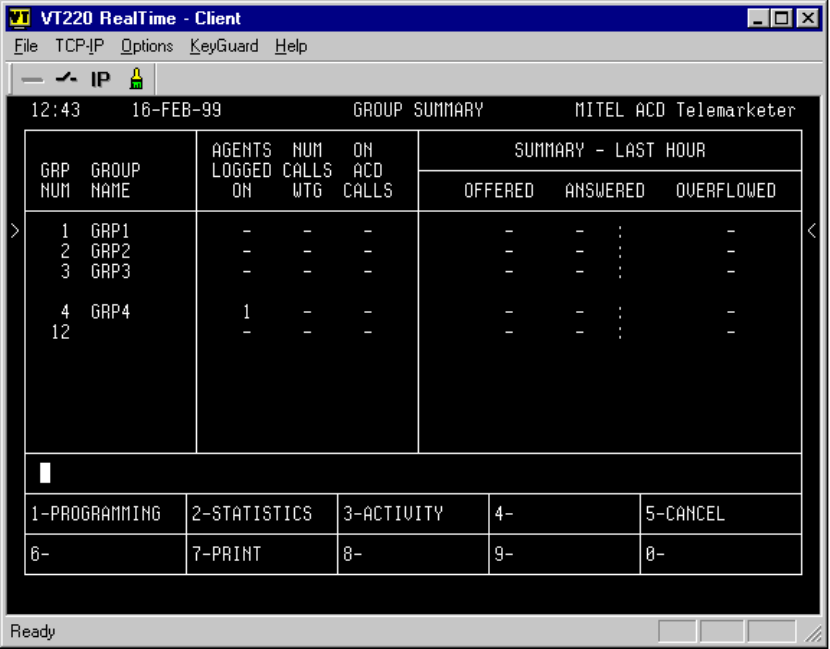
&KDSWHU5HDOWLPHPRQLWRUV
$JHQW*URXS6XPPDU\PRQLWRUV
The Agent Groups Summary monitors display data on individual agent groups. Displays include the database
programmed data for each agent group, the current activity of the group, and a brief current analysis of
statistical data for the group.
The following four forms provide information about the agent groups programmed in the ACD system:
• The Group Summary form displays important information about each agent group.
• The Group Programmed Data form displays the data programmed in database for each agent group.
• The Group Statistics form provides statistics gathered on the agent group over the past hour and
since the beginning of the shift.
• The Group Activity form shows current caller and agent activity for the group.
When you enter 2 for AGENT GROUPS on the System Activity Monitor and enter an agent group number,
Figure 6-46 appears.
)LJXUH$JHQW*URXS6XPPDU\0RQLWRUV

Table 7-13 lists the fields of the Agent Group Summary display.
Agent Group form Softkeys provide access to detailed information on database programmed data, current
queue activity, and statistics gathered on the queue over the past hour.
Entering 2 for the STATISTICS softkey in the Agent Group Monitor window displays the Group Statistics
form. This display provides a summary of statistics collected over the past hour and shift totals for the group.
Entering 3 for the ACTIVITY softkey in the Agent Group Monitor window displays the Group Activity form.
This form provides a continuously updated display of the activity of callers and agents within the group.
7DEOH7HUPVXVHGLQ*URXS6XPPDU\GLVSOD\
7HUP 0HDQLQJ
&XUUHQWLQIRUPDWLRQ
Grp Num This is the agent group’s number.
Group Name This is the agent group’s name as programmed in database.
&XUUHQWVWDWH
AGENTS
LOGGED ON This is the number of agents in this group currently logged on.
NUM CALLS
WTG This is the number of ACD calls queued up, from all paths, for agents in this
group.
ON ACD CALLS This is the number of agents in this group currently active on ACD calls.
6XPPDU\ODVWKRXU
OFFERED This is the number of incoming ACD calls offered to the group from all paths.
ANSWERED This is the number of incoming ACD calls answered by this group and the
average duration of those calls.
OVERFLOWED This is the number of calls that overflowed in any path while queued for this
group as the primary group.
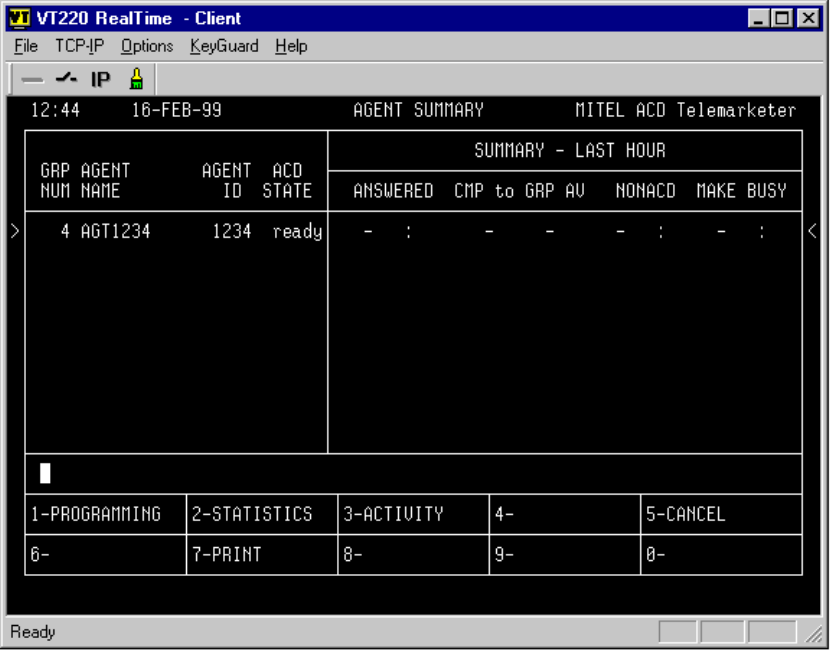
&KDSWHU5HDOWLPHPRQLWRUV
$JHQW,QIRUPDWLRQPRQLWRUV
The Agent Information monitors provide data on individual ACD agents. Displays include the database
programmed data for each agent in the system, the current activity of the agents, and a brief current analysis of
statistical data for the agents.
The following forms provide information about the agents who are currently logged in, and who are
programmed in the ACD system:
• The Agent Programmed Data display shows all information entered during customer data entry that
affects this agent.
• The Agent Statistics display shows details of the agent’s performance over the last hour, and a com-
parison between the performance of this agent and the entire group.
• The Agent Activity display shows the current status of any particular agent.
When you enter 3 for AGENTS on the System Activity Monitor and enter an agent ID, Figure 6-47 appears.
)LJXUH$JHQW,QIRUPDWLRQ0RQLWRUV
The Agent Summary form is the primary form within the agent sub-level. This form provides an overview of
current activity. Table 7-14 lists the fields of the Agent Summary display.

The Agent Summary form display has Agent Summary form softkeys you use to access detailed information.
Agent Summary form softkey labels provide detailed information in three categories: database programmed
data, statistics gathered on the path over the past hour, and current path activity.
Entering 2 for the STATISTICS softkey in the Agent Summary window displays the Group Statistics form.
This form provides a summary of agent performance statistics collected over the past hour. Entering 3 for the
ACTIVITY softkey in the Agent Group Monitor window displays the Group Activity form. This form
provides a continuously updated display of the activity of callers and agents within the group. For more
information on available softkeys and their purpose consult the CyberTerminal online Help file, or the “Mitel
ACD TELEMARKETERS programs Package” on the “SX-200 EL/ML Technical Documentation CD-ROM”
(PN 9109-953-071-NA).
7DEOH7HUPVXVHGLQ$JHQW6XPPDU\GLVSOD\
7HUP 0HDQLQJ
$JHQWQDPHDQGFXUUHQWVWDWH
Grp Num This is the agent group’s number.
Agent Name This is the agent’s name as programmed in database.
Agent ID This is the agent’s ID or access code.
ACD State This is the current state of the agent. The agent can be in one of the following
states:
• The ACD agent in on an ACD call.
• The DND agent has Do Not Disturb activated.
• The hold agent has an ACD caller on hold.
• The make busy agent has entered the make busy state.
• The non-ACD agent is on a non-ACD or outgoing call.
• The ready agent is ready to accept an ACD call.
• The wrap up agent is in an after work timer state.
6XPPDU\ODVWKRXU
Answered This is the number and average duration of incoming ACD calls answered by this
agent.
Cmp To Grp Av This is the first percentage is the ratio of the number of incoming ACD calls
answered by this agent compared to the total number of calls answered by the
group over the same period. Agents logging on and off during the period affect
the numbers.
This is the second percentage is the ratio of the average call duration of incoming
ACD calls answered by this agent compared to the average duration of calls
answered by the group over the same period.
Non ACD This is the number and average duration of non-ACD calls received and placed
by the agent.
Make Busy This is the number and average duration of times the agent was in a Make Busy
state.
&KDSWHU5HDOWLPHPRQLWRUV

&KDSWHU5HSRUWHUDQG
6FKHGXOHG5HSRUWV
9LHZRUJHQHUDWHVWDWXVUHSRUWV
IURPDQ\ZKHUHDWDQ\WLPH
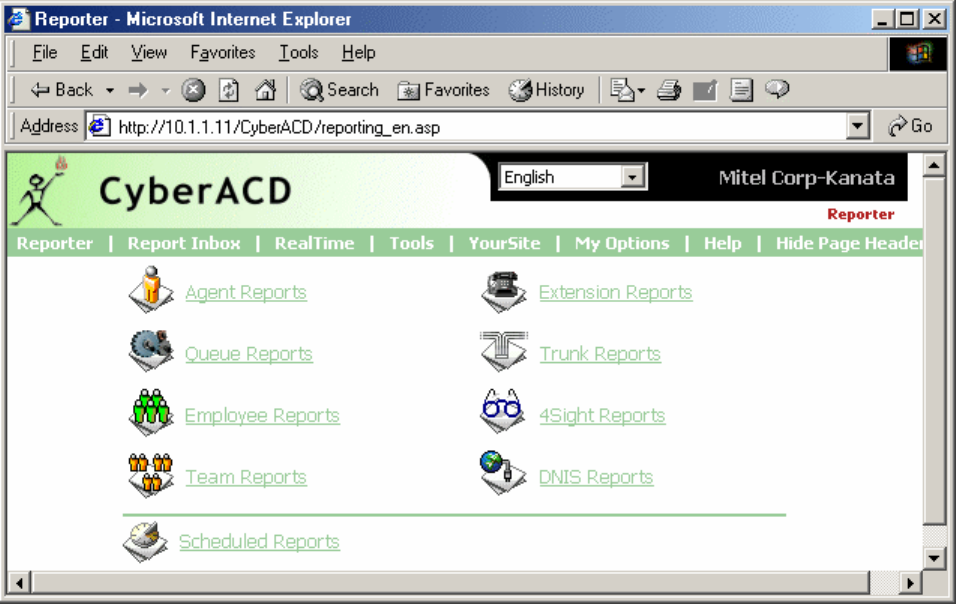
&KDSWHU5HSRUWHUDQG6FKHGXOHG5HSRUWV
5HSRUWHUDQG6FKHGXOHG5HSRUWV
The Reporter and Scheduled Reports programs provide detailed statistics on the performance of your call
center resources in the form of reports.You use Reporter to produce run-on-demand reports. You use
Scheduled Reports to set up timetables for generating reports. All reports can be generated as a run-on-
demand report or as a scheduled report.
You can generate load activity, resource activity, ACD queue activity, and forecast reports for 15, 30, or 60-
minute intervals across any series of days you specify.
NOTE: If you intend to export a 4Sight report to 6120 CCS, the time interval must be 30 minutes.
5HSRUWHUPDLQVFUHHQ
When you click the Reporting menu Figure 7-1 appears. The Reporter and Scheduled Reports programs have
Agent, Queue, Employee, Team, Extension, Trunk, 4Sight, and DNIS Report categories. There is also a
Custom Reports category for users who are licenced for custom reports.
)LJXUH5HSRUWHUPDLQVFUHHQ
5HSRUW,QER[
The Report Inbox program stores all of your reports in your personal report inbox. The reports you generate
are available only to you. You can gain access to your reports by clicking the Report Inbox menu.

5XQRQGHPDQGUHSRUWV
*HQHUDWLQJUXQRQGHPDQGUHSRUWV
Before you generate any reports, ensure you select Help=>Client Download and download the 6110 CCM
Excel report templates from the Client Download page to your computer.
The following example demonstrates how to generate a run-on-demand Queue Group Performance by Queue
Report.
If you intend to e-mail the report to one or more recipients you must add the recipients to a mailing list and
associate the recipients to a group.
To set up groups for e-mailing reports:
1. Click My Options=>Contacts.
2. On the Contacts tab, click Add.
3. Type the fist name, last name, and e-mail address of the person to which you want to e-mail the
report and click OK.
4. Optionally add additional e-mail recipients to the contacts list.
5. Click Contact Groups.
6. Click Add and type a name and description for the contract group, and click OK.
7. On the Groups tab, double-click the group, add members to the group, and click Save.
To run the report:
1. Click Reporting=>Queue Reports.
Figure 7-2 appears.
)LJXUH6HOHFWUHSRUWRSWLRQV
&KDSWHU5HSRUWHUDQG6FKHGXOHG5HSRUWV
2. In the Report Type list, click Queue Group Performance by Queue.
3. In the Queue list, select a device.
4. In the Start Date and End Date lists, click a start date and end date for the report.
5. In the Start Hour and End Hour lists, click a start hour and end hour for the report.
6. In the Output Language list, select English or French.
7. In the Interval list, select the time interval for reporting.
8. Under Days to Include, select days of the week to include in the report.
9. Under Automatic Client Printing Options, select printing options.
10. Under Automatic Client Mailing Options, select the Enable check box and select an e-mail
address.
11. Click Submit.
The following options are available.
5HSRUW7\SH
The Report Type field lists the report name.
4XHXH
The Queue field lists the reporting number for the queue on which you are reporting.
6WDUW'DWH(QG'DWH
The Start Date and End Date lists specify the range of dates used in the report. You can pick any calendar date
as the start date, and any date later in the calendar year as the end date.
6WDUW+RXU(QG+RXU
The Start Hour and End Hour lists specify the hours of the day included in the report.
2XWSXW/DQJXDJH
The Output Language list specifies the language used in the report tables and charts: English or French.
,QWHUYDO
The Interval list specifies the report period: by 15, 30, or 60 minutes.
'D\VWR,QFOXGH
The Days to Include check boxes specify days of the week to include in the report.
$XWRPDWLF&OLHQW3ULQWLQJ
The Automatic Client Printing check boxes print the report spreadsheet and associated graph.
$XWRPDWLF&OLHQW0DLOLQJ
Under Automatic Client Mailing, the Enable check box e-mails the report spreadsheet and associated graph to
the e-mail address selected in the Mail To list. You add contacts and contact groups to the Mail To list under
the My Options menu.
NOTE: Each time you run a report, Reporter retains the Start Hour, End Hour, Interval, and Days to Include
report parameters last selected.
NOTE: You can generate multiple queue reports simultaneously by selecting more than one queue in the
Queue list and clicking Submit. This function applies to all report types.
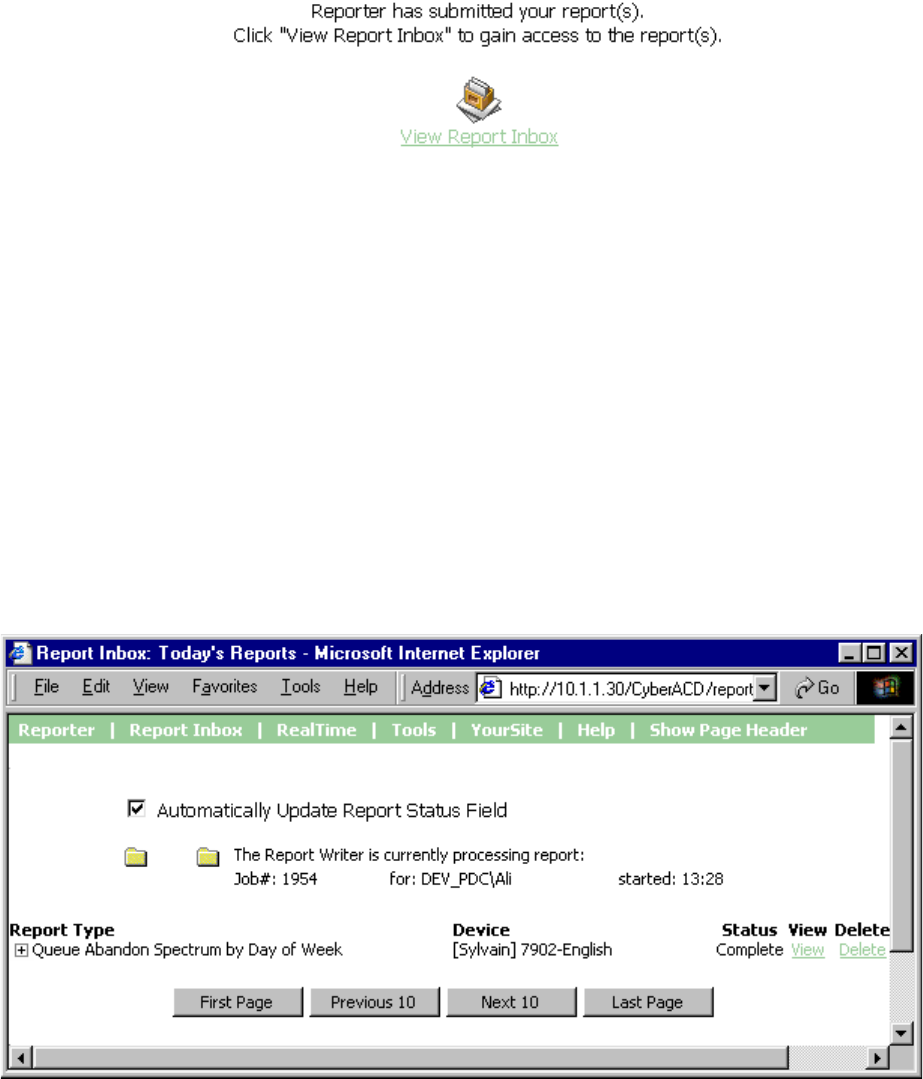
Figure 7-3 appears.
)LJXUH5HSRUWFRQILUPDWLRQ
The Report Writer queries the SQL database for report data and saves the data on the 6110 CCM Server.
9LHZLQJUXQRQGHPDQGUHSRUWV
Report Inbox includes Today’s Reports, Yesterday’s Reports, All of Your Reports, and Inbox Manager links.
Today’s Reports displays all of the reports generated today under your user name. Yesterday’s Reports
displays all of the reports generated yesterday under your user name. All of Your Reports displays all of the
reports generated under your user name over the last 30 days. It provides links to run-on-demand, run-from-
schedule, and all reports, by date. Inbox Manager deletes reports from your inbox by date range.
To view reports:
1. Click View Report Inbox (upon submitting a report) or click Report Inbox=>Today.
When you click the Report Inbox menu Figure 7-4 appears.
)LJXUH6XEPLWWHGUHSRUWV
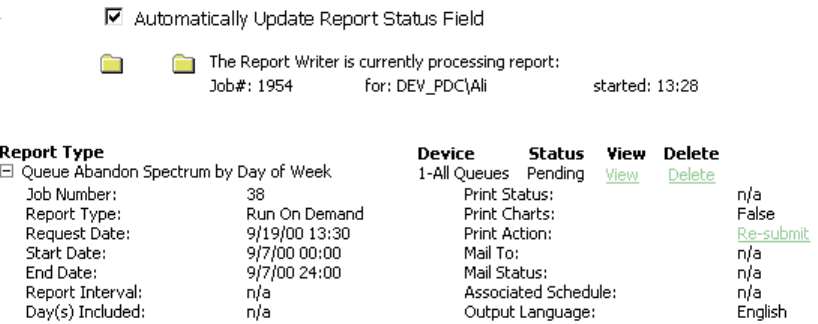
&KDSWHU5HSRUWHUDQG6FKHGXOHG5HSRUWV
Report Writer displays all reports generated under your user name for the time period selected.
2. Select the Automatically Update Report Status Field check box to have the Web page
automatically updated every 10 seconds.
3. Click the expansion box adjacent to a report to review report status details.
Figure 7-5 appears.
4. Click the View entry associated with a report to open the report.
)LJXUH5HSRUWVWDWXV
Report Inbox provides the following information.
5HSRUW7\SH
The Report Type field lists the report name.
'HYLFH
The Device field lists the reporting number for the device on which you are reporting.
6WDWXV
The Status field confirms if your report is ready. When Complete appears in the status field the report is
waiting in your Report Inbox. When Pending appears, the report is not ready. No Data means no records were
available for the parameters you specified. Failed means the report did not generate. If a report fails, the
Report Writer logs errors in the NT event log. Clicking Re-Submit regenerates the report.
9LHZ
The View command displays reports generated in Microsoft Excel.
'HOHWH
The Delete command deletes reports from your report inbox.
3ULQW6WDWXV
The Print Status field confirms if the Report Distributor program has printed a copy of the report. Field entries
include Sent to Client, Pending, and Failed. Sent to Client means the Report Distributor received instructions
to process the print job. Pending means the Report Distributor has not requested the job yet, or is not currently
running on your computer.
3ULQW&KDUWV
The Print Charts field confirms whether or not charts will be printed.
3ULQW$FWLRQ
Under Print Action, the Re-Submit command resubmits the report for printing.
0DLO7R
The Mail To field lists the e-mail address of the person to which you sent the report.
0DLO6WDWXV
The Mail Status field confirms if the Report Distributor has mailed a copy of the report. Field entries include
Sent to Client, Pending, and Failed. Sent to Client means the Report Distributor received instructions to
process the e-mail. Pending means the Report Distributor has not requested the job yet, it is not currently
running on your computer, or there was a problem in distributing the e-mail.
$VVRFLDWHG6FKHGXOH
The Associated Schedule field specifies the associated schedule for scheduled reports.
2XWSXW/DQJXDJH
The Output Language list specifies the language used in the report tables and charts: English or French.
When you click View, the client-side Report Writer (Web page) retrieves the data files from the 6110 CCM
Server and re-creates the data set on your computer. It starts Excel and displays the report spreadsheet and
graph. If you click View to open a second report, Report Writer displays it in the same Excel session
You can graph other results by highlighting one or more columns of data in the spreadsheet and using the
Excel Chart Wizard. You can also use the Excel chart wizard to change the grid style.
While the report is open on your computer, you can save it to your local disc drive and e-mail it to others, or
place it on a shared network drive for others to access.
If you e-mail reports to other users, the users must have Excel installed on their computers to view the reports.
NOTE: 6110 CCM permissions are based on database teams and groups. In programming the YourSite
Database, you must create agent IDs and associate the agents to employees and to agent groups. You must
associate the agent groups to the queues for which they answer calls. You must associate the employees to
employee groups and the queues to queue groups. You must create these associations in the database in order
to view real-time data and report on these devices. If you are reporting on extensions, trunks, DNIS numbers,
and account codes, you must add these devices to the YourSite Database and associate the extensions to
extension groups, trunks to trunk groups, and DNIS numbers to DNIS groups.
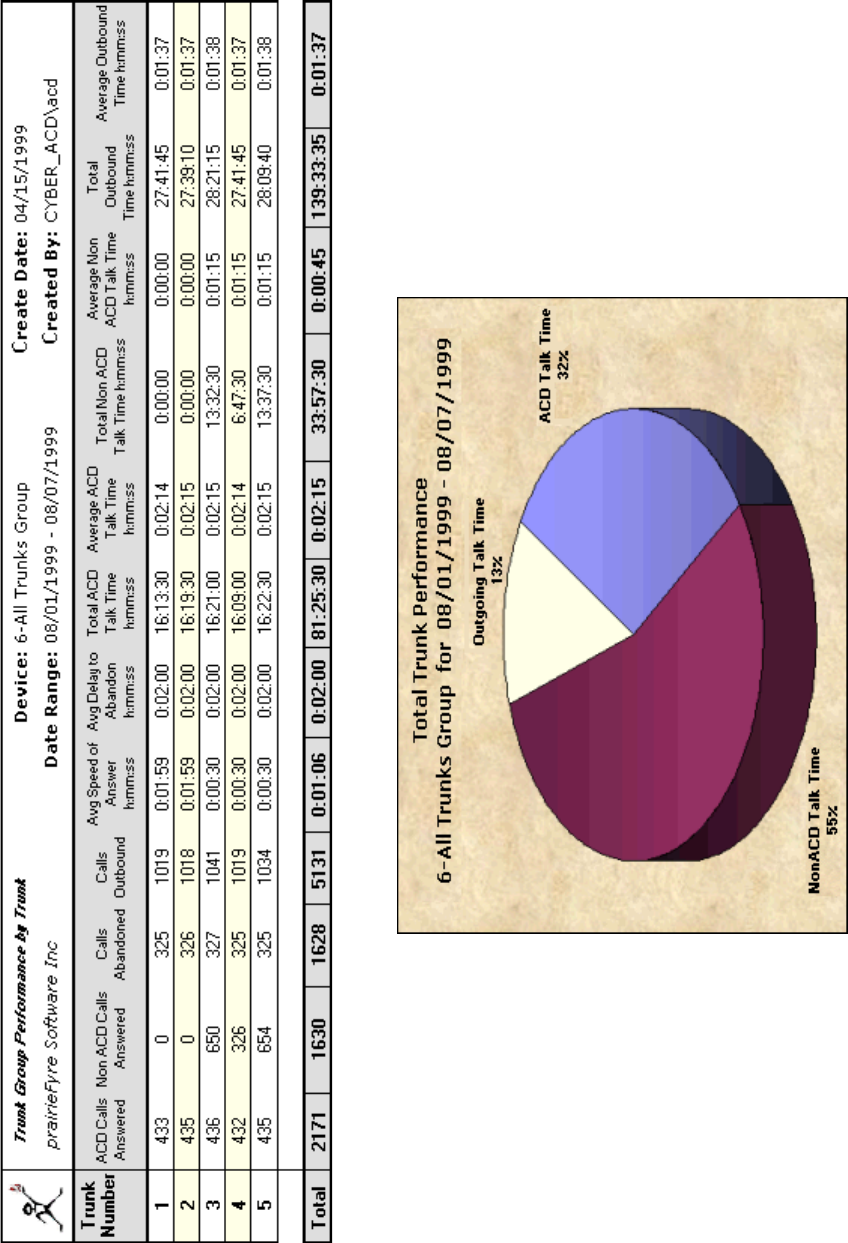
&KDSWHU5HSRUWHUDQG6FKHGXOHG5HSRUWV
Figure 7-6 illustrates the report output for a Trunk Group Performance by Trunk Report.
)LJXUH7UXQN*URXS3HUIRUPDQFHE\7UXQN5HSRUW
:KDWWRGRLIGDWDLVPLVVLQJIURPWKHUHSRUWV
The prairieFyre Service compares the raw telephone system data to the configuration of the YourSite database
and forwards relevant files to the Structured Query Language (SQL) database in real-time. Reports are run
based on the data in the SQL database.
NOTE: 6110 CCM associations are based on database teams and groups. In programming the YourSite
Database, you must create agent IDs and associate the agents to employees and to agent groups. You must
associate the agent groups to the queues for which they answer calls. You must associate the employees to
employee groups and the queues to queue groups. You must create these associations in the database in order
to view real-time data and report on these devices. If you are reporting on extensions, trunks, DNIS numbers,
and account codes, you must add these devices to the YourSite Database and associate the extensions to
extension groups, trunks to trunk groups, and DNIS numbers to DNIS groups.
If you run a report and notice that the data for a particular device is missing from the report output, verify the
device is programmed in the telephone system and in the YourSite Database. If you determine the device is
missing from the database, add it to the database and use the Summarize Data command (on the Management
Console program) to update the prairieFyre Service and the SQL database with the complete telephone system
data stored on the local hard drive. You can then produce reports on the device.
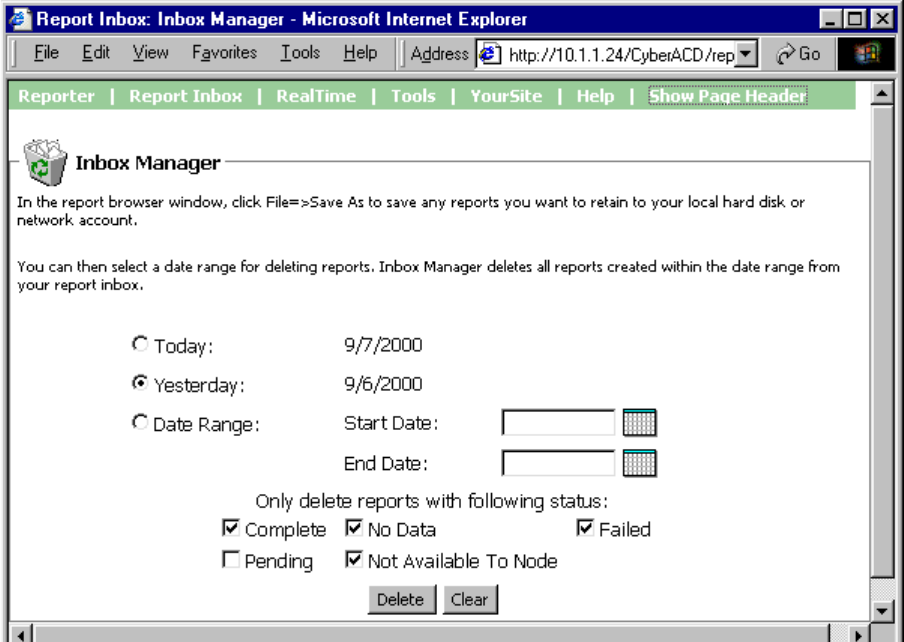
&KDSWHU5HSRUWHUDQG6FKHGXOHG5HSRUWV
'HOHWLQJUHSRUWV
You can delete reports individually in Report Inbox or by date in the Inbox Manager program.
To delete all reports submitted on a given date:
1. Click Report Inbox=>Inbox Manager.
Figure 7-7 appears.
2. Select a date range for deleting reports.
3. Click Delete.
Inbox Manager deletes all reports submitted on the date(s) in question.
NOTE: Report Writer deletes all reports that are 30 days or older from your report inbox. For run-on-demand
reports, the request date governs the reports age. For scheduled reports, the date the system generates the
report governs the reports age. You save any reports you want to retain beyond 30 days to your hard drive or
network home directory.
)LJXUH,QER[0DQDJHUPDLQVFUHHQ
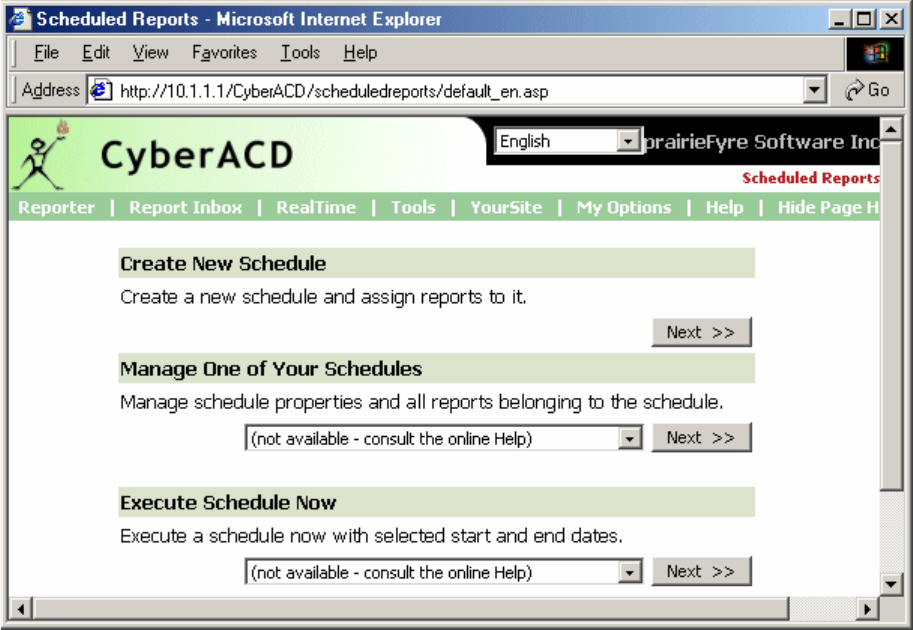
6FKHGXOHG5HSRUWV
Scheduled Reports sets up timetables for generating reports.
Before you generate any reports, ensure you select Help=>Client Download and download the 6110 CCM
Excel report templates from the Client Download page to your computer.
6FKHGXOHG5HSRUWVPDLQVFUHHQ
When you click Reporting=>Scheduled Reports, Figure 7-8 appears. This is where you create and manage
schedules.
)LJXUH6FKHGXOHG5HSRUWVPDLQVFUHHQ
On the Scheduled Reports main screen, under Create New Schedule you can create a new schedule. Under
Manage One of Your Schedules, you can view and edit schedule details. Under Execute Schedule Now, you
can select a schedule and generate the reports associated with the schedule immediately.
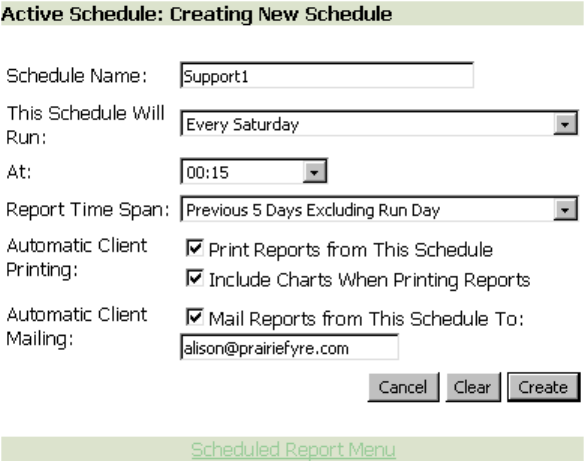
&KDSWHU5HSRUWHUDQG6FKHGXOHG5HSRUWV
*HQHUDWLQJDVFKHGXOH
During the nightly maintenance routine, the entire day’s raw telephone system data is re-summarized from the
local hard drive into the SQL database. In the event the SQL database is stopped and restarted during the day,
re-summarizing the data ensures the SQL database has the entire set of raw data files.
Reports are run based on the data in the SQL database. We recommend you schedule your reports to run after
the nightly maintenance routine runs, that is, after 2:00 A.M., to ensure the reports are based on the entire
day’s raw telephone system data.
If you intend to e-mail the report(s) (associated with your schedule) to one or more recipients you must add
the recipients to a mailing list and associate the recipients to a group.
To set up groups for e-mailing reports:
1. Click My Options=>Contacts.
2. On the Contacts tab, click Add.
3. Type the fist name, last name, and e-mail address of the person to which you want to e-mail the
report and click OK.
4. Optionally add additional e-mail recipients to the contacts list.
5. Click Groups.
6. Click Add and type a name and description for the contract group, and click OK.
7. On the Groups tab, double-click the group, add members to the group, and click Save.
To create a schedule for running reports:
1. On the Scheduled Reports main screen, click Next under Create New Schedule to create a
schedule.
Figure 7-9 appears.
)LJXUH6HOHFWVFKHGXOHSDUDPHWHUV
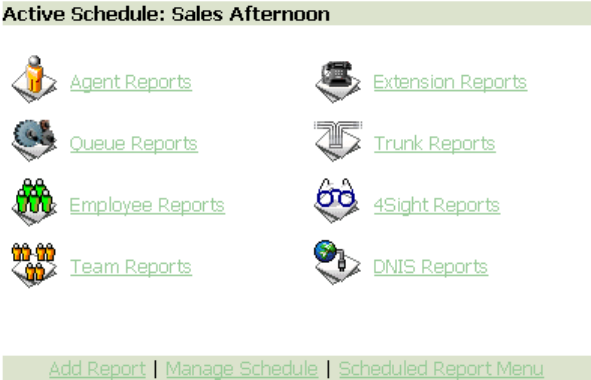
2. In the Schedule Name list, type a schedule name.
3. In the This Schedule Will Run list, click the schedule frequency, such as every day, every
Wednesday, or the start of month.
4. In the At list, click the time of day the schedule will be activated.
5. In the Report Time Span list, specify the dates to be included in the report.
6. Under Automatic Client Printing, select printing options.
7. Under Automatic Client Mailing, select the Mail Reports from This Schedule To check box and
select an e-mail address.
Consider the schedule parameters in Figure 7-9. At 00:15 hours each Saturday, Scheduled Reports will
generate reports associated with the Support1 schedule. It will place them in your inbox, print them in hard
copy, and e-mail them automatically.
Under Report Time Span, if you select Year to Date, the report output includes all days from 1 January to the
present date. You can optionally select the From Given Start Date to Current Date option and produce reports
for your fiscal year.
If you select printing and mailing options, the Report Distributor prints and e-mails all of the reports included
in the schedule (on the date the system runs the reports).
$VVRFLDWLQJUHSRUWVWRWKHVFKHGXOH
1. After creating a schedule for running reports, click Create.
Figure 7-10 appears.
2. Click a report icon, such as Queue Reports.
3. In the Report Type list, click a report type.
4. In the Queue list, click a group.
5. In the Start Hour and End Hour lists, click a start hour and end hour for the report.
6. In the Interval list, select the time interval for reporting.
7. In the Output Language list, select English or French.
8. Under Days to Include, select days of the week to include in the report.
9. Click Submit.
)LJXUH5HSRUWFDWHJRULHV
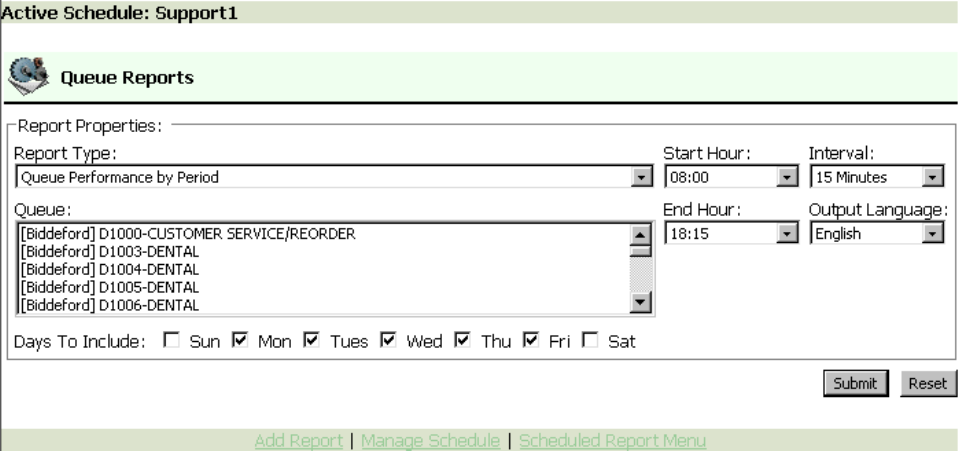
&KDSWHU5HSRUWHUDQG6FKHGXOHG5HSRUWV
Figure 7-11 appears.
)LJXUH4XHXHUHSRUWRSWLRQV
The following options are available.
5HSRUW7\SH
The Report Type field lists the report name.
4XHXH
The Queue field lists the reporting number for the queue on which you are reporting.
6WDUW+RXU(QG+RXU
The Start Hour and End Hour lists specify the hours of the day included in the forecast.
,QWHUYDO
The Interval list specifies the report period: by 15, 30, or 60 minutes.
2XWSXW/DQJXDJH
The Output Language list specifies the language used in the report tables and charts: English or French.
'D\VWR,QFOXGH
The Days to Include check boxes specify the days of the week to include in the report.
NOTE: Each time you run a report, Reporter retains the Start Hour, End Hour, Interval, and Days to Include
report parameters last selected.
NOTE: You can generate multiple queue reports simultaneously by selecting more than one queue in the
Queue list and clicking Submit. This function applies to all report types.
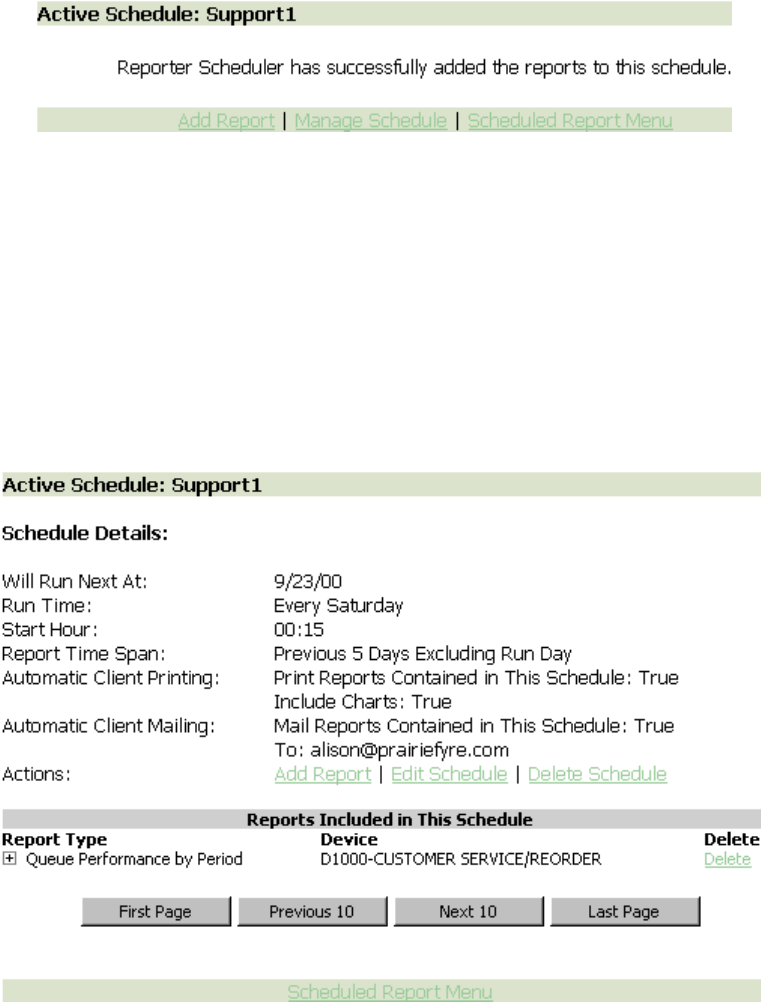
Figure 7-12 appears.
10. Click Manage Schedule to review schedule details for the reports associated with the active
schedule.
)LJXUH6FKHGXOHFRQILUPDWLRQ
Figure 7-13 appears. The Report Writer queries the SQL database for report data and saves the
data on the 6110 CCM Server.
11. Click the expansion box adjacent to a report to review report status details.
You can click Add Report (to add an additional report to the active schedule), Edit Schedule (to edit the active
schedule) or Delete Schedule (to delete the active schedule), Manage Schedule (to review schedule status
details) or Scheduled Report Menu (to create a new schedule).
The Scheduled Reports program renders a grid and chart in Microsoft Excel in your browser. It retains the
report start hour, end hour, interval, and report days last selected.
)LJXUH0DQDJHVFKHGXOH
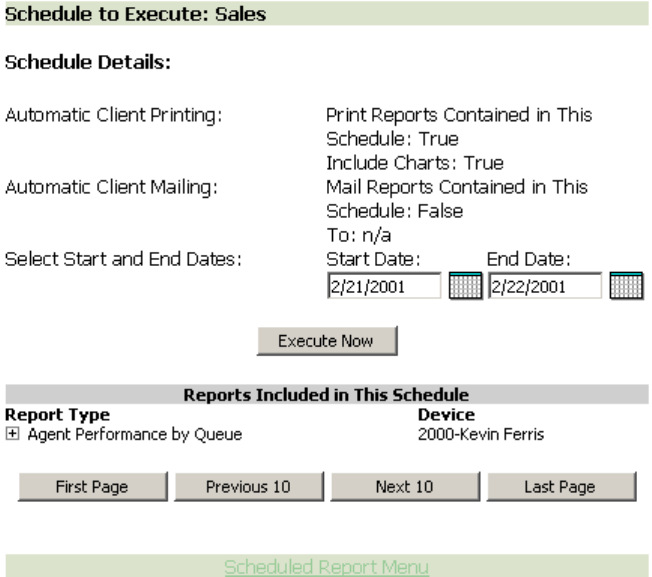
&KDSWHU5HSRUWHUDQG6FKHGXOHG5HSRUWV
*HQHUDWLQJVFKHGXOHGUHSRUWVLPPHGLDWHO\
In Scheduled Reports, typically you create a schedule, associate reports to it, and specify the date and time
you would like the reports to be run. On the Scheduled Reports main screen, under Execute Schedule Now,
you can select a schedule and generate the reports associated with the schedule immediately.
To generate scheduled reports immediately:
1. On the Scheduled Reports main screen, under Execute Schedule select a schedule.
Figure 7-14 appears.
2. Under Select Start and End Dates, specify the dates on which you are reporting.
3. Click Execute Now.
Scheduled Reports generates the reports associated with the schedule and files them to your personal report
inbox immediately.
)LJXUH([HFXWHVFKHGXOH

9LHZLQJVFKHGXOHGUHSRUWV
NOTE: 6110 CCM associations are based on database teams and groups. In programming the YourSite
Database, you must create agent IDs and associate the agents to employees and to agent groups. You must
associate the agent groups to the queues for which they answer calls. You must associate the employees to
employee groups and the queues to queue groups. You must create these associations in the database in order
to view real-time data and report on these devices. If you are reporting on extensions, trunks, DNIS numbers,
and account codes, you must add these devices to the YourSite Database and associate the extensions to
extension groups, trunks to trunk groups, and DNIS numbers to DNIS groups.
Report Inbox includes Today’s Reports, Yesterday’s Reports, All of Your Reports, and Inbox Manager links.
Today’s Reports displays all of the reports generated today under your user name. Yesterday’s Reports
displays all of the reports generated yesterday under your user name. All of Your Reports displays all of the
reports generated under your user name over the last 30 days. It provides links to run-on-demand, run-from-
schedule, and all reports, by date. Inbox Manager deletes reports from your inbox by date range.
To view reports:
1. Click Report Inbox=>Today.
Figure 7-15 appears.
2. Select the Automatically Update Report Status Field check box to have the Web page
automatically updated every 10 seconds.
3. Click the expansion box adjacent to a report to review report status details.
)LJXUH6XEPLWWHGUHSRUWV
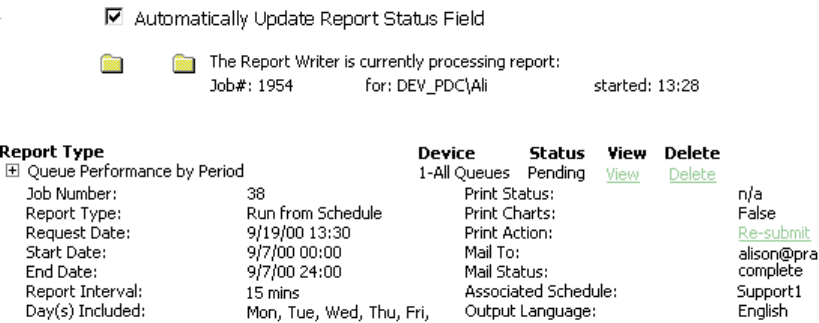
&KDSWHU5HSRUWHUDQG6FKHGXOHG5HSRUWV
Figure 7-16 appears.
4. Click the View entry associated with a report to open the report.
)LJXUH5HSRUWVWDWXV
The following options are available.
5HSRUW7\SH
The Report Type field lists the report name.
'HYLFH
The Device field lists the reporting number for the device on which you are reporting.
6WDWXV
The Status field confirms if your report is ready. When Complete appears in the status field the report is
waiting in your Report Inbox. When Pending appears, the report is not ready. No Data means no records were
available for the parameters you specified. Failed means the report did not generate. If a report fails, the
Report Writer logs errors in the NT event log. Clicking Re-Submit regenerates the report.
9LHZ
The View command displays reports generated in Microsoft Excel.
'HOHWH
The Delete command deletes reports from your report inbox.
3ULQW6WDWXV
The Print Status field confirms if the Report Distributor program has printed a copy of the report. Field entries
include Sent to Client, Pending, and Failed. Sent to Client means the Report Distributor received instructions
to process the print job. Pending means the Report Distributor has not requested the job yet, or is not currently
running on your computer.
3ULQW&KDUWV
The Print Charts field confirms whether or not charts will be printed.
3ULQW$FWLRQ
Under Print Action, the Re-Submit command resubmits the report for printing.
0DLO7R
The Mail To field lists the e-mail address of the person to which you sent the report.
0DLO6WDWXV
The Mail Status field confirms if the Report Distributor has mailed a copy of the report. Field entries include
Sent to Client, Pending, and Failed. Sent to Client means the Report Distributor received instructions to
process the e-mail. Pending means the Report Distributor has not requested the job yet, it is not currently
running on your computer, or there was a problem in distributing the e-mail.
$VVRFLDWHG6FKHGXOH
The Associated Schedule field specifies the associated schedule for scheduled reports.
2XWSXW/DQJXDJH
The Output Language list specifies the language used in the report tables and charts: English or French.
When you click View, the client-side Report Writer (Web page) retrieves the data files from the 6110 CCM
Server and re-creates the data set on your computer. It starts Excel and displays the report spreadsheet and
graph. If you click View to open a second report, Report Writer displays it in the same Excel session.
You can graph other results by highlighting one or more columns of data in the spreadsheet and using the
Excel Chart Wizard. You can also use the Excel chart wizard to change the grid style.
While the report is open on your computer, you can save it to your local disc drive and e-mail it to others, or
place it on a shared network drive for others to access.
If you e-mail reports to other users, the users must have Excel installed on their computers to view the reports.
:KDWWRGRLIGDWDLVPLVVLQJIURPWKHUHSRUWV
The prairieFyre Service compares the raw telephone system data to the configuration of the YourSite database
and forward relevant files to the Structured Query Language (SQL) database in real-time. Reports are run
based on the data in the SQL database.
NOTE: 6110 CCM associations are based on database teams and groups. In programming the YourSite
Database, you must create agent IDs and associate the agents to employees and to agent groups. You must
associate the agent groups to the queues for which they answer calls. You must associate the employees to
employee groups and the queues to queue groups. You must create these associations in the database in order
to view real-time data and report on these devices. If you are reporting on extensions, trunks, DNIS numbers,
and account codes, you must add these devices to the YourSite Database and associate the extensions to
extension groups, trunks to trunk groups, and DNIS numbers to DNIS groups.
If you run a report and notice that the data for a particular device is missing from the report output, verify the
device is programmed in the telephone system and in the YourSite Database. If you determine the device is
missing from the database, add it to the database and use the Summarize Data command (on the Management
Console program) to update the prairieFyre Service and the SQL database with the complete telephone system
data stored on the local hard drive. You can then produce reports on the device.
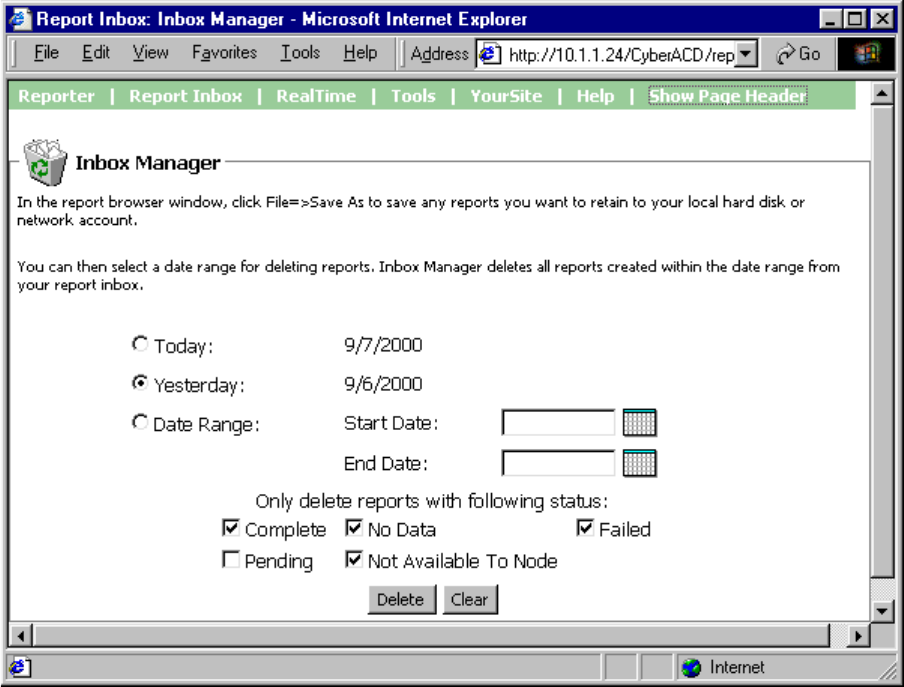
&KDSWHU5HSRUWHUDQG6FKHGXOHG5HSRUWV
'HOHWLQJUHSRUWV
You can delete reports individually in Report Inbox or by date in the Inbox Manager program.
To delete all reports submitted on a given date:
1. Click Report Inbox=>Inbox Manager.
Figure 7-17 appears.
2. Select a date range for deleting reports.
3. Click Delete.
Inbox Manager deletes all reports submitted on the date(s) in question.
)LJXUH,QER[0DQDJHUPDLQVFUHHQ
'HOHWLQJ6FKHGXOHG5HSRUWV
Inbox Manager does not delete reports you schedule to run in the future. For example, suppose you submit a
schedule on Monday, October 18, 1999 for a report generated each Tuesday at 18:45 hours. If you open Inbox
Manager on the morning of Tuesday October 19, 1999 and delete all reports submitted on Monday, October
18, the report scheduled for 18:45 hours on Tuesday will run and appear in your report inbox.
NOTE: Report Writer deletes all reports that are 30 days or older from your report inbox. For run-on-demand
reports, the request date governs the reports age. For scheduled reports, the date the system generates the
report governs the reports age. You save any reports you want to retain beyond 30 days to your hard drive or
network home directory.
OLFHQFHYLRODWLRQV
NOTE: An employee is a physical person being tracked in your call center. Employees can have multiple
agent IDs. The number of employees you program in the YourSite Database must be consistent with your
software licence. If you have more employees programmed than your licence permits, “[licence Is In
Violation of Max Agents Allowed]” will appear in place of your company name on the 6110 CCM user
interface (UI) and on any reports you generate.
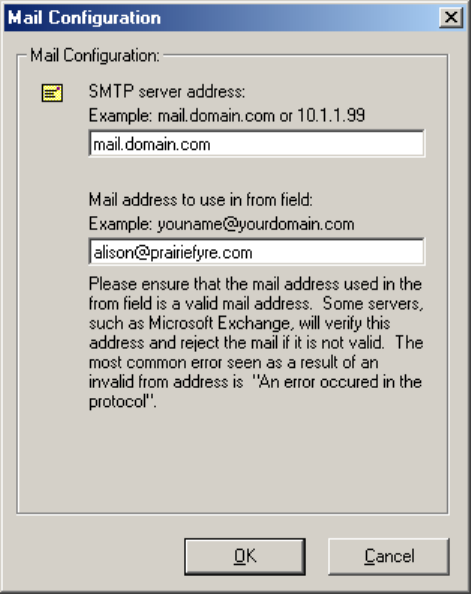
&KDSWHU5HSRUWHUDQG6FKHGXOHG5HSRUWV
5HSRUW'LVWULEXWRU
The Report Distributor application prints and e-mails your reports and displays the status of your printing and
mailing jobs. It runs in the system tray on your client computer and must be running at all times in order to
print and e-mail reports automatically.
You must have a mail client installed in order for Report Distributor to e-mail reports. In addition, you must
inform Report Distributor of the address of the SMTP mail server over which you will relay e-mails, and you
must enter a valid e-mail address.
To configure Report Distributor to e-mail reports:
1. On your system tray, right-click the Report Distributor icon and click Mail Configuration.
Figure 7-18 Mail configuration appears.
2. Under SMTP server address, type your mail server address.
3. Under Mail address to use in from field, type your e-mail address.
At one-minute intervals, Report Distributor seeks print and e-mail jobs and attempts to process the first 10
jobs in order of request date. The sort order is run-on-demand reports, scheduled reports, and then age.
NOTE: Report Distributor runs under the identity of the logged on user and prints to the default printer as
defined by the logged on user. A user who logs on but does not have a default printer setup, or does not have
adequate permissions to use the default printer causes Report Distributor to fail each print job that it attempts
to action.
)LJXUH0DLOFRQILJXUDWLRQ
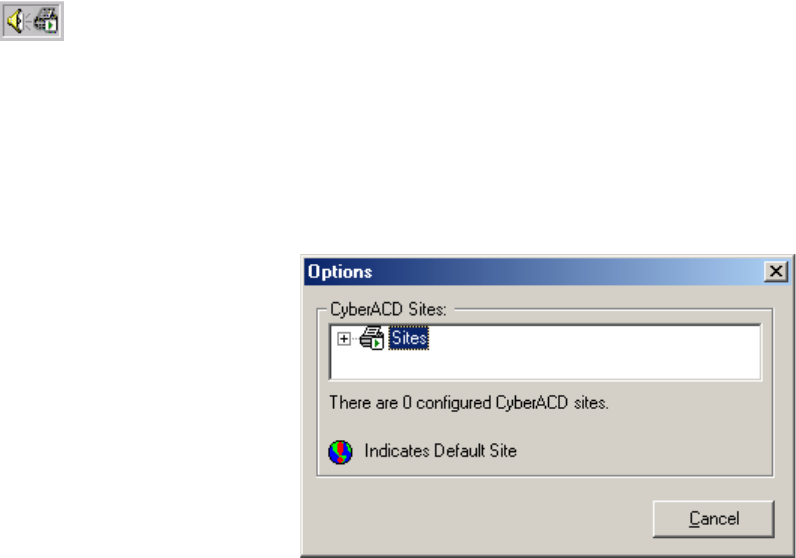
To enable the automatic printing of reports and e-mails:
1. On your system tray, right-click the Report Distributor icon and click 6110 CCM Sites.
Figure 7-19 appears.
2. Right-click Sites and click Add.
Report Distributor needs to know which 6110 CCM Server to query for historical data.
If the Report Distributor icon is not displayed on the system tray, click Start=>prairieFyre Software
Inc.=>6110 CCM Report Distributor to start Report Distributor and click Options=>6110 CCM Sites.
)LJXUH&&0VLWHV

&KDSWHU5HSRUWHUDQG6FKHGXOHG5HSRUWV
Figure 7-20 appears.
3. Type a descriptive name.
4. Type a valid 6110 CCM URL, and your 6110 CCM user name and password, and click OK.
5. Optionally repeat steps 2 to 4 to add a second URL.
6. Right-click a site, click Set Default to specify the site as default target server address for Report
Distributor, and click Close.
To view the default 6110 CCM Server address and the status of a report distributed by Report Distributor:
1. Right-click the Report Distributor icon and click Restore.
)LJXUH6LWHSURSHUWLHV
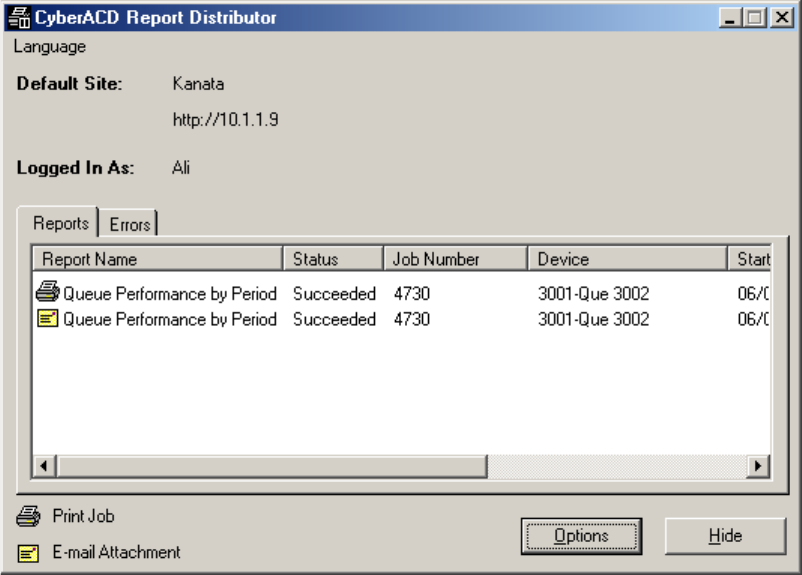
Figure 7-21 appears.
Figure 7-21 displays the default 6110 CCM Server address and the status of a report printed and e-mailed by
Report Distributor.
The Errors tab provides details on failed print or e-mail jobs. When the error box is full, it clears itself and
displays a message with the date and time it was cleared.
)LJXUH6WDWXVPHVVDJHV
&KDSWHU5HSRUWHUDQG6FKHGXOHG5HSRUWV
5HSRUWW\SHV
There are eight main divisions of report types: queue reports, agent reports, employee reports, team reports,
trunk reports, extension reports, 4Sight reports, and DNIS reports.
5HSRUWSDUDPHWHUV
You specify the following report parameters on the Queue tab of the YourSite Database application.
&DOOV$EDQGRQHG3DUDPHWHU
The Calls Abandoned Parameter specifies the value which determines whether a call is a Short Abandoned
Call or a Long Abandoned Call. If the abandon time is less than the Call Abandoned Parameter, then it is a
Short Abandoned Call. If the abandon time is more than the Call Abandoned Parameter, then it is a Long
Abandoned Call.
You assign the Calls Abandoned Parameter (called the Queue Short Abandon Time) values to ACD queues in
the YourSite Database.
Callers can abandon after they reach a trunk (before they reach the ACD queue) or while they are in queue
waiting for an available agent (either before or after the short abandon time you specify).
&DOOV$EDQGRQHG6KRUW
The Call Abandoned (Short) calls abandon with an abandon time less than the Call Abandoned Parameter.
These abandoned calls are not included in the call statistics.
&DOOV$EDQGRQHG/RQJ
The Call Abandoned (Long) calls abandon with an abandon time greater than the Call Abandoned Parameter.
These abandoned called are included in call statistics.
6HUYLFH/HYHO7LPH
The 6110 CCM reporting and real-time applications use the service level time in calculating the service level
percentage.
6HUYLFH/HYHO
The service level is the total number of calls which are answered, abandoned, and interflowed before a defined
threshold time (Service Level Time), compared to the total number of calls answered, abandoned, and
interflowed. It’s the average length of time a caller who has obtained a trunk waits for an available agent. The
service level = (Calls Answered + Long Calls Abandoned + Long Interflow) within the Service Level Time ÷
(Calls Answered + Long Calls Abandoned + Long Interflow).
6HUYLFH/HYHO3HUFHQW
The service level percent is the proportion of calls, expressed as a percentage, which are answered,
abandoned, and interflowed within a defined threshold time compared to the total number of calls answered or
abandoned (after the short abandon time).
6HUYLFH/HYHO7LPH
The service level time is the threshold time used in calculating the service level percentage, such as 90 percent
of calls answered in 20 seconds. The service level percentage and service level time are parameters you define
as your service objective.
$QVZHUHG%\
The Answered By parameter specifies the answering priority of up to four agent groups.
&DOOV2IIHUHG
All calls received by the ACD queue, regardless of how they are handled or routed, are referred to as the calls
offered. This includes Calls Answered, Long Interflowed Calls, and Long Abandoned Calls. Calls Requeued,
Path Unavailable Calls, Short Abandoned Calls and Short Interflowed Calls are not considered. Telephone
system data on the calls offered and average talk time is used by the Erlang C equation in calculating the
agents required.
&DOOV$QVZHUHG
An answered call is a call picked up by a live agent. Calls that listen to in queue RAD messages are not
considered to be answered until an agent connects.
&DOOV5HTXHXHG
When an agent receives an ACD call and fails to pick up the call after X seconds or X rings, the telephone
system places the agent in Make Busy. The telephone system requeues the call (places the call back in the
same queue) and offers it to the next available agent. This requeued e-mail message has priority over the
others and will be the next e-mail message answered.
&DOOV,QWHUIORZHG
The term interflow refers to a mechanism that directs a queue-delayed call to voice mail or to another
answering point. If the interflow timer expires, the call is removed from the ACD queue and re-directed to yet
another answering point, usually another voice mail box. The interflow time runs independently of the
overflow time.
6KRUW&DOOV,QWHUIORZHG
If, when the Interflow call is compared to the Calls Abandoned Parameter, the duration of the call is less than
the parameter, it is considered a Short Call Interflowed. A Short Call Interflow is considered to be a Path
Unavailable Call.
/RQJ&DOOV,QWHUIORZHG
If, when the Interflow call is compared to the Calls Abandoned Parameter, the duration of the call is more
than the parameter, it is considered a Long Call Interflowed.
$QVZHU
The term answer percent refers to the percentage of calls answered compared to the total number of calls
offered to the ACD queue.
&KDSWHU5HSRUWHUDQG6FKHGXOHG5HSRUWV
4XHXH5HSRUWV
Queue Reports on individual queues or queue groups reflect the service experienced by callers and caller
behavior.
The list of queue reports is as follows:
Performance Reports
• Queue and Queue Group Performance by Period Reports
• Queue and Queue Group Performance by Day of the Week
• Queue and Queue Group Performance by Day of the Month
• Queue and Queue Group Performance by Month
• Queue and Queue Group Performance by Account Code Reports
• Queue and Queue Group Performance by DNIS Reports
• Queue and Queue Group Performance by Agent Report
• Queue Group Performance by Queue Reports
Internal/External Reports
• Queue and Queue Group Internal/External Call Counts by Period Reports
Spectrum by Period Reports
• Queue and Queue Group Abandon Spectrum by Period Reports
• Queue and Queue Group Answer Spectrum by Period Reports
• Queue and Queue Group Interflow Spectrum by Period Reports
• Queue and Queue Group Talk Spectrum by Period Reports
Spectrum by Day of the Week Reports
• Queue and Queue Group Abandon Spectrum by Day of the Week
• Queue and Queue Group Answer Spectrum by Day of the Week Reports
• Queue and Queue Group Interflow Spectrum by Day of the Week Reports
• Queue and Queue Group Talk Spectrum by Day of the Week
Spectrum by Queue Reports
• Queue Group Abandon Spectrum by Queue Reports
• Queue Group Answer Spectrum by Queue Reports
• Queue Group Interflow Spectrum by Queue Reports
• Queue Group Talk Spectrum by Queue Reports
By Queue Reports
• Queue Group by Queue with Agent Information Report
ANI Reports
• Queue and Queue Group ANI by Area Code Reports
• Queue and Queue Group ANI Abandon Reports
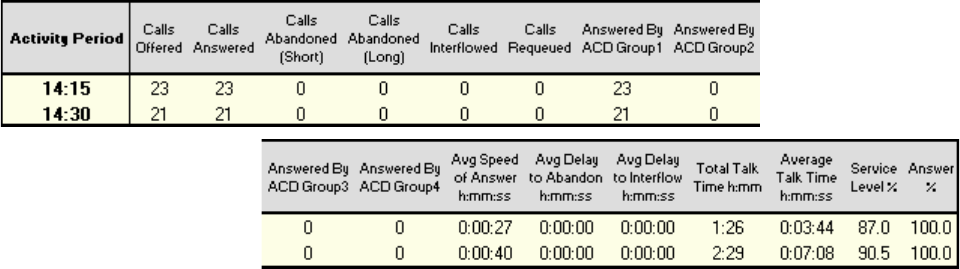
3HUIRUPDQFH5HSRUWV
3HUIRUPDQFHE\3HULRG'D\RIWKH:HHN'D\RIWKH0RQWKDQG0RQWK
The Queue and Queue Group Performance by Period Reports show the call activity of a queue and
queue group across 15-, 30-, or 60-minute intervals for the shift duration and day(s) you specify.
Queue and Queue Group Performance by Day of the Week shows the performance of each queue or
queue group for each day of one week.
Queue and Queue Group Performance by Day of the Month shows the performance of each queue or
queue group for each day of one month.
Queue and Queue Group Performance by Month shows the performance of each queue or queue group
for one month.
The following Figure illustrates the fields included in the Queue and Queue Group Performance by Period
Reports.
Queue and Queue Group Performance Reports provide the following information.
5HSRUW)LHOG 'HVFULSWLRQ
Activity Period the interval of the report in hours and minutes, by day of the week, by
day of the month, or by month
Calls Offered the count of all calls offered to the ACD queue (answer, plus long
abandon, plus long interflow)
Calls Answered the count of all calls answered
Calls Abandoned (Short) the count of all calls abandoned before the short abandon time
Calls Abandoned (Long) the count of all calls abandoned after the short abandon time
Calls Interflowed the count of al calls interflowed
Calls Requeued the count of all calls requeued back into the ACD queue - if an agent
fails to pick up a call, the telephone system places the call back in the
same queue and it is picked up by the first available agent
Answered By ACD Group1 the count of all calls answered by the first answer point
Answered By ACD Group2 the count of all calls answered by the second answer point
Answered By ACD Group3 the count of all calls answered by the third answer point
Answered By ACD Group4 the count of all calls answered by the fourth answer point
Avg Speed of Answer (h:mm:ss) the average delay before the call is answered
&KDSWHU5HSRUWHUDQG6FKHGXOHG5HSRUWV
Avg Delay to Abandon (h:mm:ss) the average elapsed time before the call is abandoned
Avg Delay to Interflow (h:mm:ss) the average elapsed time before the call interflows
Total Talk Time (h:mm) the total duration for calls answered
Average Talk Time (h:mm:ss) the average duration for calls answered
Service Level% the percentage of calls answered within a specified threshold
Answer% the percentage of offered calls answered
3HUIRUPDQFHE\$FFRXQW&RGH5HSRUWV
Queue and Queue Group Performance by Account Code Reports show the use of account codes.
Queue and Queue Group Performance by Account Code Reports provide the following information.
5HSRUW)LHOG 'HVFULSWLRQ
Account Code Number the account code tagged to the ACD queue call
ACD Calls Answered the count of all answered calls associated with the above account code
number
Total Speed of Answer (h:mm:ss) the total delay before the call is answered
Avg Speed of Answer (h:mm:ss) the average delay before the call is answered
Total Talk Time (h:mm:ss) the total duration for calls answered
Average Talk Time (h:mm:ss) the average duration for calls answered
NOTE: The prairieFyre Maintenance Manager deletes ANI records that are 15 days or older each night at
2:00 A.M. In addition, ANI records are deleted chronologically when the number of records in the database
exceeds 10,000.
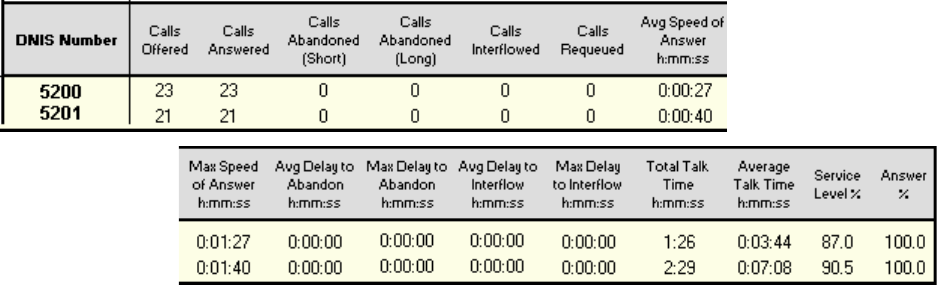
3HUIRUPDQFHE\'1,65HSRUWV
The Queue and Queue Group Performance by DNIS Reports show the call traffic on toll-free lines, and
the treatment callers who dial the toll-free lines receive for the day(s) you specify. The reports show the
statistics in hours, minutes, and seconds, and provide call counts for the toll-free line.
Dialed Number Identification Service (DNIS) is a feature of toll-free lines that identifies the telephone
number the caller dials. Each toll-free line is tagged with a DNIS number.
The following Figure illustrates the fields included in the Queue and Queue Group Performance by DNIS
Reports.
Queue and Queue Group Performance by DNIS Reports provide the following information.
5HSRUW)LHOG 'HVFULSWLRQ
DNIS Number the DNIS number as programed in the YourSite Database
Calls Offered the count of all calls offered to the ACD queue (answer, plus long
abandon, plus long interflow)
Calls Answered the count of all calls answered
Calls Abandoned (Short) the count of all calls abandoned before the short abandon time
Calls Abandoned (Long) the count of all calls abandoned after the short abandon time
Calls Interflowed the count of al calls interflowed
Calls Requeued the count of all calls requeued back into the ACD queue - if an agent
fails to pick up a call, the telephone system places the call back in the
same queue and it is picked up by the first available agent
Avg Speed of Answer (h:mm:ss) the average delay before the call is answered
Max Speed of Answer (h:mm:ss) the maximum delay before the call is answered
Avg Delay to Abandon (h:mm:ss) the average elapsed time before the call is abandoned
Max Delay to Abandon (h:mm:ss) the maximum delay before the call is abandoned
Avg Delay to Interflow (h:mm:ss) the average elapsed time before the call interflows
Max Delay to Interflow (h:mm:ss) the maximum delay before the call interflows
Total Talk Time (h:mm:ss) the total duration for calls answered
Average Talk Time (h:mm:ss) the average duration for calls answered
Service Level% the percentage of calls answered within a specified threshold
Answer% the percentage of offered calls answered
&KDSWHU5HSRUWHUDQG6FKHGXOHG5HSRUWV
3HUIRUPDQFHE\$JHQW5HSRUW
The Queue Group Performance by Agent Report shows the call performance of each agent and
therefore permits comparison of one agent’s performance against other agents’ performances.
Queue and Queue Group Performance by Agent Reports provide the following information.
5HSRUW)LHOG 'HVFULSWLRQ
Agent Number the agent ID entered by the agent
Agent Name the name associated with the agent ID in YourSite
ACD Calls Answered the count of all ACD calls answered
Total Speed of Answer (h:mm:ss) the total delay before the call is answered
Average Speed of Answer (h:mm:ss)the average delay before the call is answered
Total Talk Time (h:mm) the total duration for calls answered
Average Talk Time (h:mm:ss) the average duration for calls answered
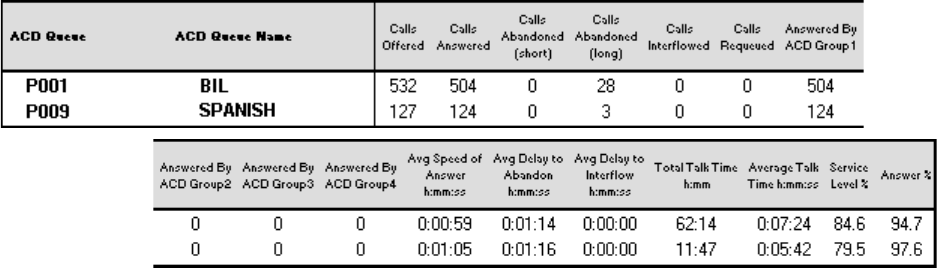
3HUIRUPDQFHE\4XHXH5HSRUWV
The Queue Group Performance by Queue Report compares the workload distribution across the
queues in a queue group for the shift duration and day(s) you specify. It reports the statistics in hours,
minutes, and seconds, and provides call counts across queues.
Queue Group Performance by Queue Reports provide the following information.
5HSRUW)LHOG 'HVFULSWLRQ
ACD Queue the queues that are members of a queue group
Calls Offered the count of all calls offered to the ACD queue (answer, plus long
abandon, plus long interflow)
Calls Answered the count of all calls answered
Calls Abandoned the count of all calls abandoned
Calls Interflowed the count of al calls interflowed
Answered By ACD Group1 the count of all calls answered by the first answer point
Answered By ACD Group2 the count of all calls answered by the second answer point
Answered By ACD Group3 the count of all calls answered by the third answer point
Answered By ACD Group4 the count of all calls answered by the fourth answer point
Avg Speed of Answer (h:mm:ss) the average delay before the call is answered
Avg Delay to Abandon (h:mm:ss) the average elapsed time before the call is abandoned
Avg Delay to Interflow (h:mm:ss) the average elapsed time before the call interflows
Total Talk Time (h:mm:ss) the total duration for calls answered
Average Talk Time (h:mm:ss) the average duration for calls answered
Service Level% the percentage of calls answered within a specified threshold
Answer% the percentage of offered calls answered
&KDSWHU5HSRUWHUDQG6FKHGXOHG5HSRUWV
,QWHUQDO([WHUQDO5HSRUWV
,QWHUQDO([WHUQDO&DOO&RXQWVE\3HULRG
The Queue Internal/External Call Counts by Period shows internal and external call activity of a queue
across 15-, 30-, or 60-minute intervals for the shift duration and day(s) you specify.
The Queue Group Internal/External Call Counts by Period shows internal and external call activity of
a queue group across 15-, 30-, or 60-minute intervals for the shift duration and day(s) you specify.
Here is a brief definition of external and internal calls:
Internal Out is a call that you make from the office to a destination within the office.
External Out is a call that you make from the office to a destination outside the office.
Internal NonACD is a nonACD call that you receive in the office from an origin within the office.
External NonACD is a nonACD call that you receive in the office from an origin outside the office.
Internal ACD is an ACD call that originates from inside the office to a destination within the office.
External ACD is an ACD call that originates from outside the office with a destination within the office.
5HSRUW)LHOG 'HVFULSWLRQ
Activity Period the interval of the report in hours and minutes, by day of the
week, by day of the month, or by month
Calls Offered the count of all calls offered to the ACD queue (answered, plus
long abandon, plus long interflow)
Calls Answered the count of all calls answered
Internal Calls Answered the count of all internal calls answered
External Calls Answered the count of all external calls answered
Calls Abandoned [short] the count of calls that abandoned before the short abandon time
Calls Abandoned [long] the count of calls that abandoned after the short abandon time
Calls Interflowed the count of all calls interflowed
Calls Requeued the count of all calls requeued back into the ACD queue - if an agent
fails to pick up a call, the telephone system places the call back in the
same queue and it is picked up by the first available agent
Total Internal Talk Time the average duration of internal calls answered
Total External Talk Time the average duration of external calls answered
Avg Talk Time for Internal Calls the average duration for internal calls answered
Avg Talk Time for External Calls the average duration for external calls answered
Avg Speed of Answer (h:mm:ss) the average delay before the call is answered
Avg Delay to Abandon (h:mm:ss) the average elapsed time before the call is abandoned
Avg Delay to Interflow (h:mm:ss) the average elapsed time before the call interflows
Total Talk Time (h:mm:ss) the total duration for answered calls
Average Talk Time (h:mm:ss) the average duration for answered calls
Service Level% the percentage of calls answered within a specified threshold
Answer% the percentage of offered calls answered
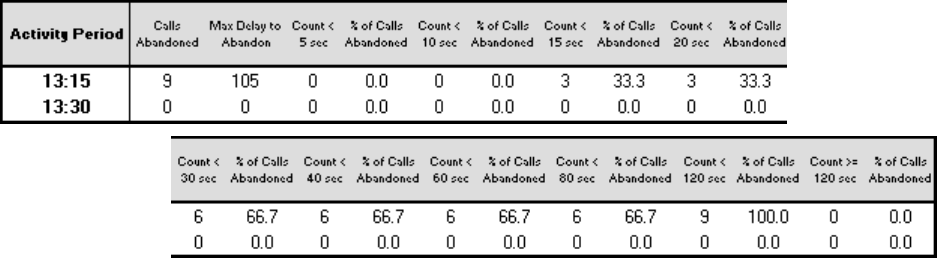
6SHFWUXPE\3HULRG5HSRUWV
$EDQGRQ$QVZHU,QWHUIORZDQG7DON6SHFWUXPE\3HULRG5HSRUWV
The spectrum reports provide a frequency distribution of calls abandoned, answered, or interflowed
based on a defined time scale.
For each time period, the Count < x sec field reflects the count of all calls for that interval and all preceding
intervals. The% of Total field reflects the percentage of all calls for that interval and all preceding intervals.
There are eight Queue and Queue Group Spectrum by Period Reports:
Queue and Queue Group Abandon Spectrum by Period Report
Queue and Queue Group Answer Spectrum by Period Report
Queue and Queue Group Interflow Spectrum by Period Report
Queue and Queue Talk Spectrum by Period Report
$EDQGRQ6SHFWUXPE\3HULRG5HSRUWV
The Queue Abandon Spectrum by Period Report provides a frequency distribution of calls abandoned
on a queue across 15-, 30-, or 60-minute intervals for the shift duration and day(s) you specify.
The Queue Group Abandon Spectrum by Period Report provides a frequency distribution of calls
abandoned on a queue group across 15-, 30-, or 60-minute intervals for the shift duration and day(s)
you specify.
The following Figure illustrates the fields included in the Queue and Queue Group Abandon Spectrum by
Period Reports.
The following are the first three fields of the Queue and Queue Group Abandon Spectrum by Period Reports.
5HSRUW)LHOG 'HVFULSWLRQ
Activity Period the interval of the report in hours and minutes, by day of the week, by day
of the month, or by month
Calls Abandoned the count of all calls abandoned for the activity period
Max Delay to Abandon the maximum delay to abandon for the activity period
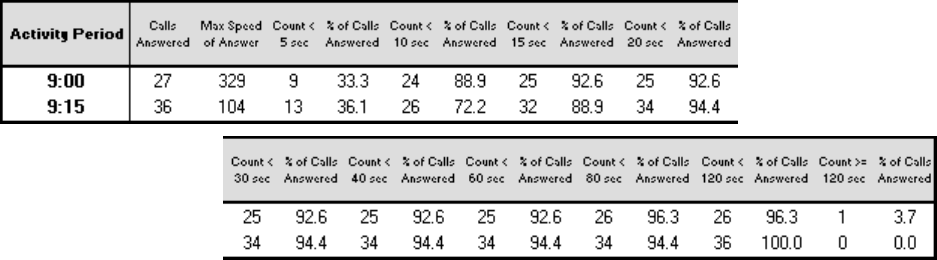
&KDSWHU5HSRUWHUDQG6FKHGXOHG5HSRUWV
The remaining fields of the Queue and Queue Group Abandon Spectrum by Period Reports provide a
frequency distribution of call patterns based on a defined time scale (5, 10, 15, 20, 30, 40, 60, 80, 120, and
>120 seconds). For each time period, the Count < x sec field reflects the count of all calls for that interval and
all preceding intervals. The% of Total field reflects the percentage of all calls for that interval and all
preceding intervals.
NOTE: For the >120 seconds time period, the Count < x sec field reflects the count of all calls for that
interval only.
$QVZHU6SHFWUXPE\3HULRG5HSRUWV
The Queue Answer Spectrum by Period Report provides a frequency distribution of calls answered on
a queue across 15-, 30-, or 60-minute intervals for the shift duration and day(s) you specify.
The Queue Group Answer Spectrum by Period Report provides a frequency distribution of calls
answered on a queue group across 15-, 30-, or 60-minute intervals for the shift duration and day(s) you
specify.
The following Figure illustrates the fields included in the Queue and Queue Group Answer Spectrum by
Period Reports.
The following are the first three fields of the ACD Queue and Queue Group Answer Spectrum by Period
Reports.
5HSRUW)LHOG 'HVFULSWLRQ
Activity Period the interval of the report in hours and minutes, by day of the week, or by
day of the month
Calls Answered the count of all calls answered for the activity period
Max Speed of Answer the maximum speed of answer for the activity period
The remaining fields of the Queue and Queue Group Answer Spectrum by Period Reports provide a
frequency distribution of call patterns based on a defined time scale (5, 10, 15, 20, 30, 40, 60, 80, 120, and
>120 seconds). For each time period, the Count < x sec field reflects the count of all calls for that interval and
all preceding intervals. The% of Total field reflects the percentage of all calls for that interval and all
preceding intervals.
NOTE: For the >120 seconds time period, the Count < x sec field reflects the count of all calls for that
interval only.
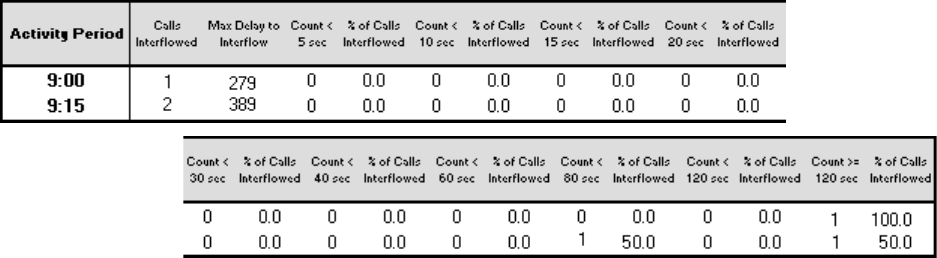
,QWHUIORZ6SHFWUXPE\3HULRG5HSRUWV
The Queue Interflow Spectrum by Period Report provides a frequency distribution of calls interflowed
on a queue across 15-, 30-, or 60-minute intervals for the shift duration and day(s) you specify.
The Queue Group Interflow Spectrum by Period Report provides a frequency distribution of calls
interflowed on a queue group across 15-, 30-, or 60-minute intervals for the shift duration and day(s)
you specify.
The following Figure illustrates the fields included in the Queue and Queue Group Interflow Spectrum by
Period Reports.
The following are the first three fields of the ACD Queue and Queue Group Interflow Spectrum by Period
Reports.
5HSRUW)LHOG 'HVFULSWLRQ
Activity Period the interval of the report in hours and minutes, by day of the week, or by
day of the month
Calls Interflowed the count of all calls interflowed for the activity period
Max Delay to Interflow the maximum delay to Interflow for the activity period
The remaining fields of the Queue and Queue Group Interflow Spectrum by Period Reports provide a
frequency distribution of call patterns based on a defined time scale (5, 10, 15, 20, 30, 40, 60, 80, 120, and
>120 seconds). For each time period, the Count < x sec field reflects the count of all calls for that interval and
all preceding intervals. The% of Total field reflects the percentage of all calls for that interval and all
preceding intervals.
NOTE: For the >120 seconds time period, the Count < x sec field reflects the count of all calls for that
interval only.
&KDSWHU5HSRUWHUDQG6FKHGXOHG5HSRUWV
7DON6SHFWUXPE\3HULRG
The Queue Talk Spectrum by Period Report provides a frequency distribution of call talk on a queue
across 15-, 30-, or 60-minute intervals for the shift duration and day(s) you specify.
The Queue Group Talk Spectrum by Period Report provides a frequency distribution of call talk on a
queue group across 15-, 30-, or 60-minute intervals for the shift duration and day(s) you specify.
The following are the first three fields of the Queue and Queue Group Talk Spectrum by Period Reports.
5HSRUW)LHOG 'HVFULSWLRQ
Activity Period the interval of the report in hours and minutes, by day of the week, or by
day of the month
Calls Answered the count of all calls answered for the activity period
Max Duration the duration of all calls answered for the activity period
The remaining fields of the Queue and Queue Group Talk Spectrum by Period Reports provide a frequency
distribution of call patterns based on a defined time scale (<10, <60, <180, <240, <300, <360, <420, <480,
<540, and >541 seconds). For each time period, the Count < x sec field reflects the count of all calls for that
interval and all preceding intervals. The% of Calls Answered field reflects the percentage of all calls for that
interval and all preceding intervals.
NOTE: For the >541 seconds time period, the Count<x sec field reflects the count of all calls for that interval
only.
6SHFWUXPE\'D\RIWKH:HHN5HSRUWV
$EDQGRQ$QVZHU,QWHUIORZDQG7DON6SHFWUXPE\'D\RIWKH:HHN5HSRUWV
The Spectrum by Day of the Week Reports provide a frequency distribution of call talk on a queue or
queue group across the days of one week.
$EDQGRQ6SHFWUXPE\'D\RIWKH:HHN5HSRUWV
The Queue Abandon Spectrum by Day of the Week Report provides a frequency distribution of calls
abandoned on a queue across 15-, 30-, or 60-minute intervals for the days of one week.
The Queue Group Abandon Spectrum by Day of the Week Report provides a frequency distribution of
calls abandoned on a queue group across 15-, 30-, or 60-minute intervals for the days of one week.
The following are the first three fields.
5HSRUW)LHOG 'HVFULSWLRQ
Activity Period the interval of the report in hours and minutes, by day of the week, or by
day of the month
Calls Abandoned the count of all calls abandoned reported for the area code
Max Delay to Abandon the maximum delay to abandon for the activity period
The remaining fields of the Queue and Queue Group Abandon Spectrum by Day of the Week Reports provide
a frequency distribution of call patterns based on a defined time scale (5, 10, 15, 20, 30, 40, 60, 80, 120, and
>120 seconds). For each time period, the Count < x sec field reflects the count of all calls for that interval and
all preceding intervals. The% of Total field reflects the percentage of all calls for that interval and all
preceding intervals.
NOTE: For the >120 seconds time period, the Count < x sec field reflects the count of all calls for that
interval only.
&KDSWHU5HSRUWHUDQG6FKHGXOHG5HSRUWV
$QVZHU6SHFWUXPE\'D\RIWKH:HHN5HSRUWV
The Queue Answer Spectrum by Day of the Week Report provides a frequency distribution of calls
answered on a queue across 15-, 30-, or 60-minute intervals for the days of one week.
The Queue Group Answer Spectrum by Day of the Week Report provides a frequency distribution of
calls answered on a queue group across 15-, 30-, or 60-minute intervals for the days of one week.
The following are the first three fields.
5HSRUW)LHOG 'HVFULSWLRQ
Activity Period the interval of the report in hours and minutes, by day of the week, or by
day of the month
Calls Answered the count of all calls answered for the activity period
Max Speed of Answer (h:mm:ss) the maximum delay before the call is answered
The remaining fields of the Queue and Queue Group Answer Spectrum by Day of the Week Reports provide a
frequency distribution of call patterns based on a defined time scale (5, 10, 15, 20, 30, 40, 60, 80, 120, and
>120 seconds). For each time period, the Count < x sec field reflects the count of all calls for that interval and
all preceding intervals. The% of Total field reflects the percentage of all calls for that interval and all
preceding intervals.
NOTE: For the >120 seconds time period, the Count < x sec field reflects the count of all calls for that
interval only.
,QWHUIORZ6SHFWUXPE\'D\RIWKH:HHN5HSRUWV
The Queue Interflow Spectrum by Day of the Week Report provides a frequency distribution of calls
interflowed on a queue across 15-, 30-, or 60-minute intervals for the days of one week.
The Queue Group Interflow Spectrum by Day of the Week Report provides a frequency distribution of
calls interflowed on a queue group across 15-, 30-, or 60-minute intervals for the days of one week.
The following are the first three fields.
5HSRUW)LHOG 'HVFULSWLRQ
Activity Period the interval of the report in hours and minutes, by day of the week, or by
day of the month
Calls Interflowed the count of all calls interflowed reported for the area code
Max Delay to Overflow the maximum delay to overflow for the activity period
The remaining fields of the Queue and Queue Group Interflow Spectrum by Day of the Week Reports provide
a frequency distribution of call patterns based on a defined time scale (5, 10, 15, 20, 30, 40, 60, 80, 120, and
>120 seconds). For each time period, the Count < x sec field reflects the count of all calls for that interval and
all preceding intervals. The% of Total field reflects the percentage of all calls for that interval and all
preceding intervals.
NOTE: For the >120 seconds time period, the Count < x sec field reflects the count of all calls for that
interval only.
7DON6SHFWUXPE\'D\RIWKH:HHN5HSRUWV
The Queue Talk Spectrum by Day of the Week Report provides a frequency distribution of call talk on
a queue across 15-, 30-, or 60-minute intervals for the days of one week.
The Queue Group Talk Spectrum by Day of the Week Report provides a frequency distribution of call
talk on a queue group across 15-, 30-, or 60-minute intervals for the days of one week.
5HSRUW)LHOG 'HVFULSWLRQ
Activity Period the interval of the report in hours and minutes, by day of the week, or by
day of the month
Calls Answered the count of all calls answered for the activity period
Max Duration the duration of all calls answered for the activity period
The remaining fields of the Queue and Queue Group Talk Spectrum by Day of the Week Reports provide a
frequency distribution of call patterns based on a defined time scale (<10, <60, <180, <240, <300, <360,
<420, <480, <540, and >541 seconds). For each time period, the Count < x sec field reflects the count of all
calls for that interval and all preceding intervals. The% of Calls Answered field reflects the percentage of all
calls for that interval and all preceding intervals.
NOTE: For the >541 seconds time period, the Count<x sec field reflects the count of all calls for that interval
only.
&KDSWHU5HSRUWHUDQG6FKHGXOHG5HSRUWV
6SHFWUXPE\4XHXH5HSRUWV
$EDQGRQ$QVZHU,QWHUIORZDQG7DON6SHFWUXPE\4XHXH5HSRUWV
Queue Spectrum by Queue Reports provides a frequency distribution of call talk on a queue across
intervals from 1-10.
The Queue Group Spectrum by Queue Report provides a frequency distribution of call talk on a queue
group across intervals from 1-10.
All of the preceding spectrum report fields are the same for Queue Group Abandon, Answer, Interflow and
Talk Spectrum by Queue Reports with one exception. The Max field alters depending on the report.
The following are the first three fields of the Queue and Queue Group Spectrum by Queue Reports.
5HSRUW)LHOG 'HVFULSWLRQ
ACD Queue the ACD queue for which the agent answered calls
ACD Queue Name the name of the ACD queue for which the agent answers calls
Calls Answered the count of all calls answered for the activity period
The next field depends on the report:
Queue and Queue Group Abandon Spectrum by Queue Reports have the Max Delay to Abandon field.
Queue and Queue Group Answer Spectrum by Queue Reports have the Max Speed of Answer field.
Queue and Queue Group Interflow Spectrum by Queue Reports have the Max Delay to Overflow field.
Queue and Queue Group Talk Spectrum by Queue Reports Max Duration field.
5HSRUW)LHOG 'HVFULSWLRQ
Max Delay to Abandon (h:mm:ss) the maximum delay before the call is abandoned
Max Speed of Answer (h:mm:ss) the maximum delay before the call is answered
Max Delay to Overflow (h:mm:ss) the maximum delay to overflow for the activity period
Max Duration (h:mm:ss) the duration of all calls answered for the activity period
The remaining fields of the Queue and Queue Group Spectrum by Queue Reports provide a frequency
distribution of call patterns based on a defined time scale (Spectral Interval 1-10). The Spectrum Interval field
reflects the count of all calls for that interval and all preceding intervals. The % of Calls Answered field
reflects the percentage of all calls for that interval and all preceding intervals.
NOTE: Spectrum Interval 10 reflects the count of all calls for that interval only.
$1,5HSRUWV
$1,E\$UHD&RGH5HSRUWV
Queue and Queue Group ANI by Area Code Reports shows the call distribution across area codes.
5HSRUW)LHOG 'HVFULSWLRQ
Area Code the area code reported by the ANI digits
Geographic Location the region represented by the area code
Calls Offered the count of all calls reported for the area code
ACD Calls Answered the count of all calls answered reported for the area code
Calls Abandoned the count of all calls abandoned reported for the area code
Calls Interflowed the count of all calls interflowed reported for the area code
Total Talk Time (h:mm:ss) the total duration for calls answered
Average Talk Time (h:mm:ss) the average duration for calls answered
Avg Speed of Answer (h:mm:ss) the average delay before the call is answered
Avg Delay to Abandon (h:mm:ss) the average elapsed time before the call is abandoned
Avg Delay to Interflow (h:mm:ss) the average elapsed time before the call interflows
$1,$EDQGRQ5HSRUWV
Queue and Queue Group ANI Abandon Reports shows the delay before a call was abandoned and the
phone number.
5HSRUW)LHOG 'HVFULSWLRQ
Date/Time the date and start time of the call record
Calling Line Number the ten digit telephone number reported by the ANI digits
Delay to Abandon (h:mm:ss) the elapsed time before the call is abandoned
&KDSWHU5HSRUWHUDQG6FKHGXOHG5HSRUWV
4XHXH*URXSE\4XHXHZLWK$JHQW,QIRUPDWLRQ
5HSRUW)LHOG 'HVFULSWLRQ
Calls Answered the count of all calls answered
Calls Requeued the count of all calls requeued back into the ACD queue - if an
agent fails to pick up a call, the telephone system places the call
back in the same queue and it is picked up by the first available
agent
Calls Interflowed the count of all calls interflowed
Calls Unavailable the count of all Path Unavailable Calls
Calls Abandoned (Long) the count of all calls that were not answered resulting in the
caller hanging up, where the call time is longer than the Short
Abandoned Time setting for the queue
Avg Time to Answer ACD Call
(h:mm:ss) the average duration before ACD calls were answered
Calls Answered by Non Programmed
Agent in 6110 CCM DB the call count of calls answered by a device where that device
was not in the list of agents in the agent groups specified in the
database
Calls Answered by Direct Agent the call count of calls answered by any agent
Avg Pure Talk Time for Direct Agent
(h:mm:ss) the average duration of calls when only one agent is involved
(the call did not have to be transferred to anyone else)
Hold Count for Direct Agent the hold count for all calls when only one agent is involved
Avg Hold Time by Direct Agent
(h:mm:ss) the average hold duration of all calls when only one agent is
involved
ACD calls Trans/Conf to Another Agentthe call count of all calls that were transferred or conferenced to
another agent, where that agent is in the database
Avg Talk Time for Trans/Conf to Agent
(h:mm:ss) the average duration of all calls that were transferred or
conferenced
Hold Count for Trans\Conf to Agentthe hold count of all calls that were transferred or conferenced
Avg Hold Time by Trans/Conf to Agent
(h:mm:ss) the average hold duration of all calls that were transferred or
conferenced
ACD Calls Trans/Conf to Non
Programmed Agent in databasethe call count of all calls that were transferred or conferenced to
another agent, where that agent is not in the database
Max Calls Waiting the maximum number of calls that waited on the path
Min Agents Available the minimum number of agents who were logged on and
not in WorkTimer, Make Busy or Do Not Disturb
Lgst Caller Waiting (h:mm:ss) the greatest length of time a caller had to wait
Avg MakeBusy Time (h:mm:ss) the average make busy time of all calls
Avg WorkTimer Time (h:mm:ss) the average duration in WorkTimer
Avg Occupancy (h:mm:ss) the average duration of time spend in any state other than
idle
$JHQW5HSRUWV
Agent and agent group reports on individual agents and agent groups show how agents spend their time.
The list of agent reports is as follows:
Performance Reports
• Agent and Agent Group Performance by Period
• Agent and Agent Group Performance by Day of the Week
• Agent and Agent Group Performance by Day of the Month
• Agent and Agent Group Performance by Month
• Agent and Agent Group Performance by Account Code
• Agent and Agent Group Performance by Queue
• Agent and Agent Group Performance by Make Busy Code
• Agent Group Performance by Agent
Internal/External Reports
• Agent and Agent Group Internal/External Call Counts by Period
• Agent and Agent Group Internal/External Call Counts by Day of the Week
• Agent and Agent Group Internal/External Call Counts by Day of the Month
• Agent and Agent Group Internal/External Call Counts by Month
Event by Period Reports
• Agent and Agent Group Event by Period (Percent)
• Agent and Agent Group Event by Period (Percent) for SX-200
• Agent and Agent Group Event by Period (h:mm:ss)
Inbound/Outbound Trace Reports
• Agent Inbound Trace Report
• Agent Outbound Trace Report
Answering Agent Reports
• Agent by Answering Agent Group Report
• Answering Agent Group by Agent
Agent Shift Reports
• Agent Shift by Period
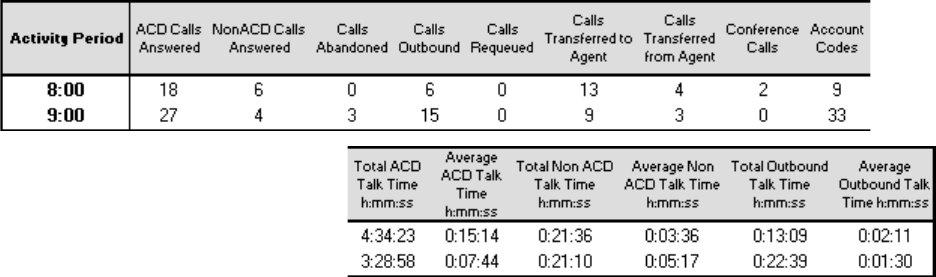
&KDSWHU5HSRUWHUDQG6FKHGXOHG5HSRUWV
3HUIRUPDQFH5HSRUWV
3HUIRUPDQFHE\3HULRG'D\RIWKH:HHN'D\RIWKH0RQWKDQG0RQWK
5HSRUWV
The Agent and Agent Group Performance by Period Report shows the call handling performance of an
agent and agent group across 15-, 30-, or 60-minute intervals for the shift duration and day(s) you
specify.
The Agent and Agent Group Performance by Day of the Week Report shows the call handling
performance of an agent and Agent Group across the days of one week.
The Agent and Agent Group Performance by Day of the Month Report shows the call handling
performance of an agent and agent group across the days of the month.
The Agent and Agent Group Performance by Month Report shows the call handling performance of an
agent and agent group across the month.
The following Figure illustrates the fields included in the Agent and Agent Group Performance by Period
Reports.
The Agent and Agent Group Performance by Period, Day of the Week, Day of the Month, and Month Reports
provide the following information.
5HSRUW)LHOG 'HVFULSWLRQ
Activity Period the interval of the report in hours and minutes, by day of the
week, by day of the month, or by month
ACD Calls Answered the count of all ACD queue calls answered for the period
Non ACD Calls Answered the count of all non-ACD queue calls answered for the period
Calls Abandoned the count of all calls abandoned at the agent’s position
Calls Outbound the count of all outbound calls
Calls Requeued the count of all requeues at the agent’s position - if an agent
fails to pick up a call, the telephone system places the call
back in the same queue and it is picked up by the first
available agent
Calls Transferred to Agent the count of all calls transferred to the agent’s position
Calls Transferred from Agent the count of all calls transferred from the agent’s position
Conference Calls the count of conference calls involving the agent
Account Codes the count of account codes entered by the agent
Total ACD Talk Time (h:mm:ss) the total duration for answered calls
Average ACD Talk Time (h:mm:ss)the average duration for answered calls
Total NonACD Talk Time (h:mm:ss)the total duration for non-ACD calls
Average NonACD Talk Time (h:mm:ss) the average duration for non-ACD calls
Total Outbound Talk Time (h:mm:ss)the total duration for outbound calls
Average Outbound Time (h:mm:ss) the average duration for outbound calls
3HUIRUPDQFHE\$FFRXQW&RGH
The Agent and Agent Group Performance by Account Code shows the Account Codes entered.
The Agent and Agent Group Performance by Account Code provides the following information.
5HSRUW)LHOG 'HVFULSWLRQ
Account Code Number the account code tagged to the ACD queue call
Name the name of the account code
If the Account Code 01 means the customer is happy, the name of
the account code could be Happy Customer.
Account Codes Entered the number of account codes entered
Total Talk Time (h:mm:ss) the total duration for answered calls
Average Talk Time (h:mm:ss) the average duration for answered calls

&KDSWHU5HSRUWHUDQG6FKHGXOHG5HSRUWV
3HUIRUPDQFHE\4XHXH5HSRUWV
The Agent Performance by Queue Reports show ACD statistics on the queues for which the agent
answered calls, and the summary total of statistics for non-ACD calls involving the agent for the shift
duration and day(s) you specify.
After you associate agents to agent groups in the YourSite Database, you can run an Agent Group
Performance by Queue Report on a particular agent group.
The Agent Group Performance by Queue Reports show ACD statistics on the queues for which the
agents in the agent group answered calls, and the summary total of statistics for non-ACD calls
involving the agents (in the agent group) for the shift duration and day(s) you specify.
The following Figure illustrates the fields included in Agent and Agent Group Performance by Queue
Reports.
The Agent and Agent Group Performance by Queue Report provides the following information. The first five
fields contain multiple records reflecting the ACD queues serving the ACD Agent and Agent Group. The
remaining fields contain a single record that reflects the totals irrespective of ACD queue.
5HSRUW)LHOG 'HVFULSWLRQ
ACD Queue the ACD queue for which the agent answered calls
ACD Calls Answered the count of all ACD queue calls answered
Total ACD Talk Time (h:mm:ss) the total duration for answered calls
Average ACD Talk Time (h:mm:ss) the average duration for answered calls
ACD Calls Requeued the count of all requeues at the agent’s position - if an agent fails to
pick up a call, the telephone system places the call back in the same
queue and it is picked up by the first available agent
Non ACD Calls Answered the count of all non-ACD calls answered
Outbound Calls the count of all outbound calls
Calls Transferred to Agent the count of all calls transferred to the agent’s position
Calls Transferred from Agent the count of all calls transferred from the agent’s position
Conference the count of conference calls involving the agent
Total Non ACD Talk Time (h:mm:ss) the total duration for non-ACD calls
Average ACD Talk Time (h:mm:ss)the average duration for non-ACD calls
Total Outbound Time (h:mm:ss) the total duration for outbound calls
Average Outbound Time (h:mm:ss) the average duration for outbound calls
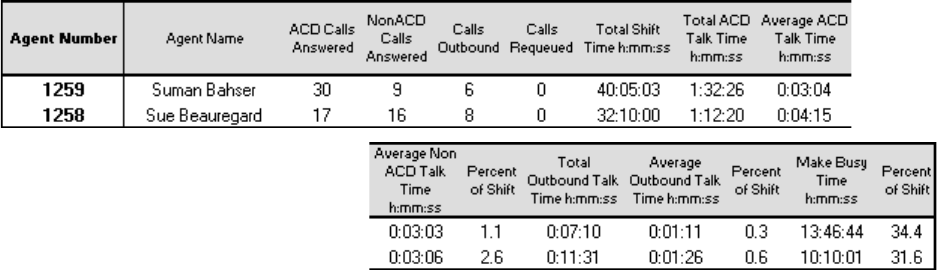
3HUIRUPDQFHE\0DNH%XV\&RGH
The Agent and Agent Group Performance by Make Busy Code shows the frequency and duration the
agent and agent group is in Make Busy.
The Agent and Agent Group Performance by Make Busy Code provides the following information.
5HSRUW)LHOG 'HVFULSWLRQ
Make Busy Code the make busy code tagged to the ACD queue call
Name the name of the make busy code
If the Make Busy Code 01 means the morning break, the name of
the account code could be Morning Break.
Make Busy Count the count of all make busy codes
Total Make Busy Time (h:mm:ss) the total time the agent spends in the make busy state
Average Make busy Time (h:mm:ss)the average time the agent spends in the make busy state
3HUIRUPDQFHE\$JHQW5HSRUW
The Agent Group Performance by Agent Report shows the workload distribution across the agents in
an agent group for the shift duration and day(s) you specify. It reports the statistics in hours, minutes,
and seconds, and provides call counts across agents.
&KDSWHU5HSRUWHUDQG6FKHGXOHG5HSRUWV
The Agent Group Performance by Agent Report provides the following information for individual agents in
the group.
5HSRUW)LHOG 'HVFULSWLRQ
Agent Number the agent ID entered by the agent
Agent Name the name associated with the above agent ID in YourSite
ACD Calls Answered the count of all ACD queue calls answered for the period
Non ACD Calls Answered the count of all non-ACD calls answered for the period
Calls Outbound the count of all outbound calls
Calls Requeued the count of all requeues at the agent’s position - if an agent fails
to pick up a call, the telephone system places the call back in the
same queue and it is picked up by the first available agent
Total Shift Time (h:mm:ss) the total elapsed time logged for the agent
Total ACD Talk Time (h:mm:ss) the total duration for answered calls
Average ACD Talk Time (h:mm:ss)the average duration for calls where the caller dials an extension
Average Non ACD Talk Time (h:mm:ss) the average duration for answered calls
Percent of Shift the percentage of shift time representing ACD call activity
Total Non ACD Talk Time (h:mm:ss)the total duration for non-ACD calls
Average ACD Talk Time (h:mm:ss)the average duration for ACD calls
Percent of Shift the percentage of shift time representing non-ACD call activity
Total Outbound Talk Time (h:mm:ss)the total duration for outbound calls
Average Outbound Talk Time (h:mm:ss) the average duration for outbound calls
Percent of Shift the percentage of shift time representing outbound call activity
Make Busy Time (h:mm:ss) the total duration spent in the make busy state
When a chart is created, the section labelled Other consists of Idle Time, DND Time, and Hold Time, to
account for 100% of the performance time.
,QWHUQDO([WHUQDO5HSRUWV
,QWHUQDO([WHUQDO&DOO&RXQWVE\3HULRG'D\RIWKH:HHN'D\RIWKH0RQWK
0RQWKDQG$JHQW5HSRUWV
Here is a brief definition of external and internal calls:
Internal Out is a call that you make from the office to a destination within the office.
External Out is a call that you make from the office to a destination outside the office.
Internal NonACD is a call that you receive in the office from an origin within the office.
External NonACD is a call that you receive in the office from an origin outside the office.
Internal ACD is an ACD call that originates from inside the office to a destination within the office.
External ACD is an ACD call that originates from outside the office with a destination within the office.
There are nine Agent and Agent Group Internal/External Call Counts Reports:
Agent and Agent Group Internal/External Call Counts by Period Reports show internal and external
call activity of an agent and agent group across 15-, 30-, or 60-minute intervals for the shift duration
and day(s) you specify.
Agent and Agent Group Internal/External Call Counts by the Day of the Week Reports show internal
and external call activity of an agent and agent group for the days of one week.
Agent and Agent Group Internal/External Call Counts by the Day of the Month Reports show internal
and external call activity of an agent and agent group for the days of the month.
Agent and Agent Group Internal/External Call Counts by Month Reports show internal and external
call activity of an agent and agent group for the month.
Agent Group Internal/External Call Counts by Agent Reports show internal and external call activity
of each agent in the agent group.
All agent internal/external call count reports have the following headings:
5HSRUW)LHOG 'HVFULSWLRQ
ACD Calls Answered the count of all ACD calls answered
Total Internal ACD Calls the total number of all ACD calls that you receive that originate
inside the office
Total Talk Internal ACD (h:mm:ss) the total duration of all ACD calls that you receive that
originate in the office
Avg Internal ACD Duration (h:mm:ss)the average duration of an ACD call that you receive that
originates in the office
Total External ACD Calls the total number of all ACD calls that originate outside the
office with a destination within the office
Total External ACD Talk (h:mm:ss)the total duration of all ACD calls that originate outside the
office with a destination within the office
Avg External ACD Duration (h:mm:ss)the average duration of an ACD call that originates outside
the office with a destination within the office
NonACD Calls Answered the total number of all nonACD calls answered
Total Internal NonACD Calls the total number of all nonACD calls that you receive that
originate in the office
Total Talk Internal NonACD (h:mm:ss)the total duration of all nonACD calls that you receive that
&KDSWHU5HSRUWHUDQG6FKHGXOHG5HSRUWV
originate in the office
Avg Internal NonACD Duration (h:mm:ss)the average duration of a nonACD call that you receive that
originates in the office
Total External NonACD Calls the total number of all nonACD calls that originate outside the
office with a destination within the office
Total External NonACD Talk (h:mm:ss)the total duration of all nonACD calls that originate outside the
office with a destination within the office
Avg External NonACD Duration (h:mm:ss)the average duration of a nonACD call that originates outside
the office with a destination within the office
Calls Outbound the total of calls that you make
Total Internal Out Calls the total number of calls that you make to destinations within
the office
Total Talk Internal Out Calls (h:mm:ss)the total duration of all calls that you make to destinations
within the office
Avg Internal Out Duration (h:mm:ss)the average duration of a call that you make to destinations
within the office
Total Talk External Out Calls (h:mm:ss)the total duration of all calls that you make to destinations
outside the office
Avg External Out Duration (h:mm:ss)the average duration of a call that you make to destinations
outside the office

(YHQWE\3HULRG5HSRUWV
(YHQWE\3HULRG3HUFHQWDQG(YHQWE\3HULRG3HUFHQW6;5HSRUWV
The Agent and Agent Event by Period (Percentages) Report displays log on and log off times for the
agent and agent group, and the percentage of time the agent spends in various agent and agent group
states for the day(s) you specify. It reports the statistics as a percentage of the total shift time.
The Agent and Agent Group Event by Period (Percentages) SX-200 Report displays log on and log off
times for the agent and agent group, and the percentage of time the agent and agent group spends in
various agent states for the day(s) you specify for the SX-200 switch. It reports the statistics as a
percentage of the total shift time.
If you specify conditions in which agents enter unavailable states (logged off, make busy, do not disturb), you
can accurately measure the time agents spend on various activities.
For example, you could specify that agents log off when they go on breaks, for lunch, or when they are away
from their desks for greater than five minutes. You could specify that agents go into make busy when they are
away from their desks less than five minutes, and that they enter do not disturb when they are in meetings or in
training.
For the SX-2000 and the SX-200 with real-time, it provides the following information.
5HSRUW)LHOG 'HVFULSWLRQ
Login Date/Time the date and time the agent logged in to the extension
Logout Date/Time the date and time the agent last logged out of the extension
Total Shift Time (h:mm:ss) the total elapsed time logged for the period for the agent
Idle Time Percentage the % of time the agent is logged on waiting to receive calls
ACD Talk Percentage the % of time the agent answers calls
ACD Hold Percentage the % of time for answered calls put on hold
NonACD Talk Percentage the % of time the agent spends on non-ACD calls
NonACD Hold Percentage the % of time the agent spends on non-ACD calls put on hold
OutBound Percentage the % of time the agent spends on outbound calls
OutBound Hold Percentage the % of time for outbound calls put on hold
Wrap Up Percentage the % of time the agent spends in the wrap up state
Make Busy Percentage the % of time the agent spends in the make busy state
DND Percentage the % of time the agent spends in the do not disturb state
Extension the extension number used by the agent
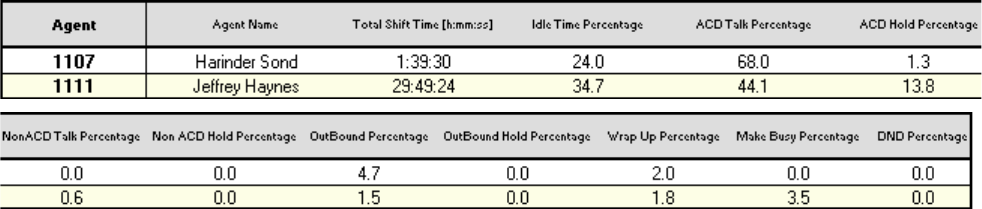
&KDSWHU5HSRUWHUDQG6FKHGXOHG5HSRUWV
For the SX-200, it provides the following information.
5HSRUW)LHOG 'HVFULSWLRQ
Login Date/Time the date and time the agent logged in to the extension
Logout Date/Time the date and time the agent last logged out of the extension
Total Shift Time (h:mm:ss) the total elapsed time logged for the period for the agent
Idle Time Percentage the % of time the agent is logged on waiting to receive calls
Make Busy Percentage the % of time the agent spends in the make busy state
Extension the extension number used by the agent
The Agent Group Event by Period (Percentages) Report compares the percentage of time agents spend in
various agent states, for an agent group a day(s) you specify. It reports the statistics as a percentage of the total
shift time.
For the SX-2000 and the SX-200 with real-time, the Agent Group Event by Period (Percentages) Report
provides the following information.
5HSRUW)LHOG 'HVFULSWLRQ
Total Shift Time (h:mm:ss) the total elapsed time logged for the period
Idle Time Percentage the% of time agents are logged on waiting to receive calls
ACD Talk Percentage the% of time agents answer calls
ACD Hold Percentage the% of time for answered calls put on hold
NonACD Talk Percentage the% of time agents spend on non-ACD calls
NonACD Hold Percentage the% of time agents spend on non-ACD calls put on hold
OutBound Percentage the% of time agents spend on outbound calls
OutBound Hold Percentage the% of time for outbound calls put on hold
Wrap Up Percentage the% of time agents spend in the wrap up state
Make Busy Percentage the% of time agents spend in the make busy state
DND Percentage the% of time agents spend in the do not disturb state
For the SX-200 with real-time, the Agent Group Event by Period (Percentages) Report provides the following
information:
5HSRUW)LHOG 'HVFULSWLRQ
Agent the agent ID entered by the agent
Agent Name the name associated with the agent ID in YourSite
Total Shift Time (h:mm:ss) the total elapsed time logged for the period
Idle Time Percentage the% of time agents are logged on waiting to receive calls
Make Busy Percentage the% of time agents spend in the make busy state
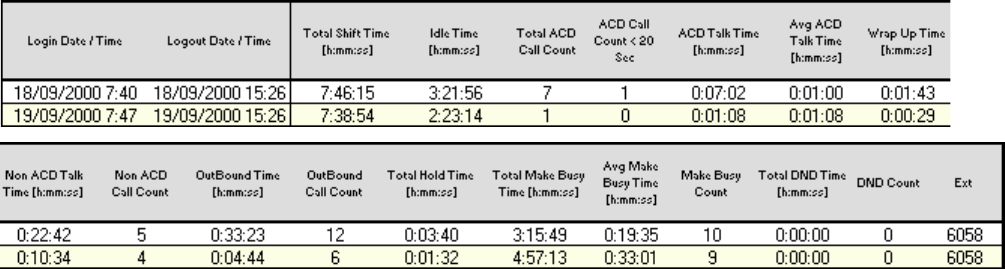
(YHQWE\3HULRGKPPVV5HSRUWV
The Agent Event by Period (h:mm:ss) Report displays log on and log off times for the agent and the
total time the agent spends in various agent states for the day(s) you specify. It reports the statistics in
hours, minutes, and seconds and provides call counts for the agent.
The Agent Group Event by Period (h:mm:ss) Report displays log on and log off times for the agent
group and the total time the agent group spends in various agent states for the day(s) you specify. It
reports the statistics in hours, minutes, and seconds and provides call counts for the agent.
The Agent Event by Period (h:mm:ss) Report is truncated to the first 1000 records. It provides the following
information.
5HSRUW)LHOG 'HVFULSWLRQ
Login Date/Time the date and time the agent logged in to the extension
Logout Date/Time the date and time the agent last logged out of the extension
Total Shift Time (h:mm:ss) the total elapsed time logged for the period for the agent
Idle Time (h:mm:ss) the total time the agent is logged on waiting to receive calls
Total ACD Call Count the total number of ACD calls the agent answers
ACD Call Count < 20 Sec the total number of ACD calls answered in less than 20 seconds
ACD Talk Time (h:mm:ss) the total time the agent answers calls
Avg ACD Talk Time (h:mm:ss) the average time the agent spent answering calls
Wrap Up Time (h:mm:ss) the total time the agent spends in the wrap up state
NonACD Talk Time (h:mm:ss) the total time the agent spends on non-ACD calls
NonACD Call Count the total number of non-ACD calls the agent answers
OutBound Time (h:mm:ss) the total time the agent spends on outbound calls
OutBound Call Count the total number of outbound calls the agent makes
Total Hold Time (h:mm:ss) the total time for answered calls put on hold
Total Make Busy Time (h:mm:ss) the total time the agent spends in the make busy state
Average Make Busy Time (h:mm:ss) the average time the agent spends in the make busy state
Make Busy Count the total number of times the agent enters the make busy state
Total DND Time (h:mm:ss) the total time the agent spends in the do not disturb state
DND Count the total number of times the agent enters the do not disturb state
Extension the extension number used by the agent
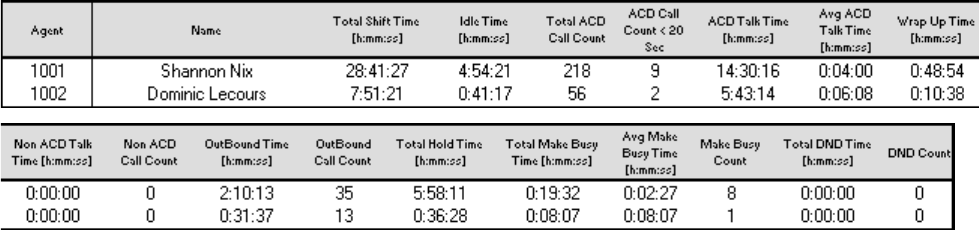
&KDSWHU5HSRUWHUDQG6FKHGXOHG5HSRUWV
The Agent Group Event by Period (h:mm:ss) Report compares the total time agents spend in various agent
states, for the agent group and day(s) you specify. It reports the statistics in hours, minutes, and seconds. It
also compares call counts across agents.
The Agent Group Event by Period (h:mm:ss) Report provides the following information.
5HSRUW)LHOG 'HVFULSWLRQ
Total Shift Time (h:mm:ss) the total elapsed time logged for the period
Idle Time (h:mm:ss) the total time agents are logged on waiting to receive calls
Total ACD Call Count the total number of ACD calls agents answer
ACD Call Count < 20 Sec the total number of ACD calls answered in less than 20 seconds
ACD Talk Time (h:mm:ss) the total time agents answer calls
Avg ACD Talk Time (h:mm:ss) the average time agents spend answering calls
Wrap Up Time (h:mm:ss) the total time agents spend in the wrap up state
NonACD Talk Time (h:mm:ss) the total time agents spend on non-ACD calls
NonACD Call Count the total number of non-ACD calls answered
OutBound Time (h:mm:ss) the total time agents spend on outbound calls
OutBound Call Count the total number of outbound calls made
Total Hold Time (h:mm:ss) the total time for answered calls put on hold
Total Make Busy Time (h:mm:ss) the total time agents spend in the make busy state
Average Make Busy Time (h:mm:ss)the average time agents spend in the make busy state
Make Busy Count the total number of times agents enter the make busy state
Total DND Time (h:mm:ss) the total time agents spend in the do not disturb state
DND Count the total number of times agents enter the do not disturb state
,QERXQG2XWERXQG7UDFH5HSRUWV
,QERXQG7UDFH5HSRUW
The Agent Inbound Trace Report shows calls received by the agent. It lists the type of calls the agent
receives and where those calls originate.
The Agent Inbound Trace Report provides the following information.
5HSRUW)LHOG 'HVFULSWLRQ
Call Start Time date and time of the call
Agent agent number
Extension the extension numbers used by agents
Call Duration the length of the call
Call Type internal or external
Queue the queue number
Agent Group agent group number 1, 2, 3, or 4
Trunk the communication line between two switching systems
Area Code the area code reported by the ANI digits
ANI the telephone number of the person calling you
DNIS the DNIS number as programed in the YourSite Database
Number Dialed the telephone number you have called
Transfer the transfer number
2XWERXQG7UDFH5HSRUW
The Agent Outbound Trace Report shows calls originated by the agent. It lists the type of calls the agent
makes and where those calls go.
The Agent Outbound Trace Report provides the following information.
5HSRUW)LHOG 'HVFULSWLRQ
Call Start Time date and time of the call
Agent agent number
Extension the extension numbers used by agents
Call Duration the length of the call
Call Type internal or external
Queue the queue number
Agent Group agent group number 1, 2, 3, or 4
Trunk the communication line between two switching systems
Area Code the area code reported by the ANI digits
ANI the telephone number of the person calling you
DNIS the DNIS number as programed in the YourSite Database
Number Dialed the telephone number you have called
Transfer the transfer number
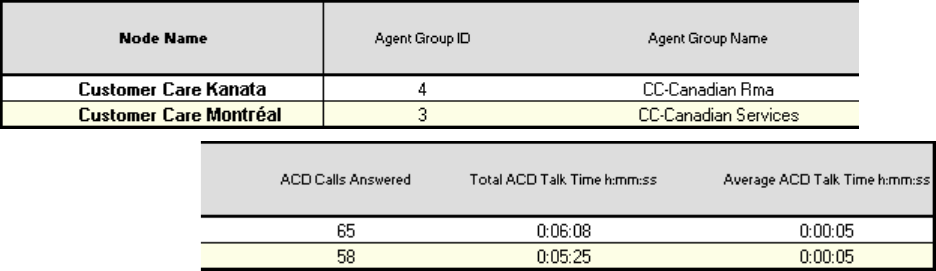
&KDSWHU5HSRUWHUDQG6FKHGXOHG5HSRUWV
$QVZHULQJ$JHQW5HSRUWV
$JHQWE\$QVZHULQJ$JHQW*URXS5HSRUW
The Agent by Answering Agent Group Report shows an agent’s workload distributed across the agent
groups for which the agent answers calls.
It shows an agent’s workload distribution across the agent groups for which the agent answers calls for the
shift duration and day(s) you specify. It reports the statistics in hours, minutes, and seconds, and provides call
counts. (If you have agents who answer for multiple agent groups, do not use the Agent Group by Agent
Report: it assumes the agents belong to only one agent group.)
The Answering Agent Group by Agent Report provides the following information for individual agents in the
group.
5HSRUW)LHOG 'HVFULSWLRQ
Agent Number the agent ID entered by the agent
Agent Name the name associated with the above agent ID in YourSite
ACD Calls Answered the count of all ACD queue calls answered for the period
Total ACD Talk Time (h:mm:ss) the total duration for answered calls
Average ACD Talk Time (h:mm:ss) the average duration for calls where the caller dials an extension
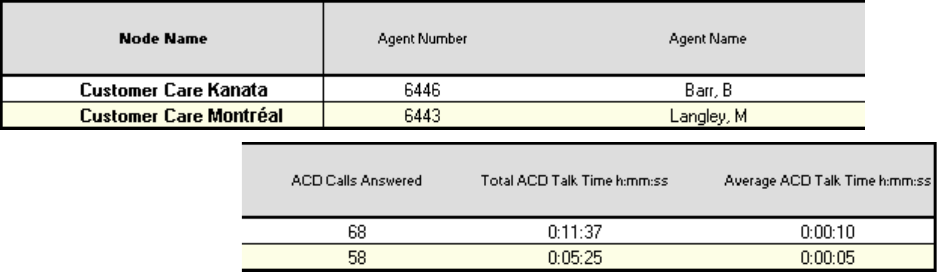
$QVZHULQJ$JHQW*URXSE\$JHQW5HSRUW
The Answering Agent Group by Agent Report shows workload distribution across agents in an agent
group.
It compares the workload distribution across the agents in an agent group for the shift duration and day(s) you
specify. It reports the statistics in hours, minutes, and seconds, and provides call counts across agents. (If you
have agents who answer for multiple agent groups, do not use the Agent Group Answering by Agent Report:
it assumes the agents belong to only one agent group.)
The Answering Agent Group by Agent Report provides the following information for individual agents in the
group.
5HSRUW)LHOG 'HVFULSWLRQ
Agent Number the agent ID entered by the agent
Agent Name the name associated with the above agent ID in YourSite
ACD Calls Answered the count of all ACD queue calls answered for the period
Total ACD Talk Time (h:mm:ss) the total duration for answered calls
Average ACD Talk Time (h:mm:ss) the average duration for calls where the caller dials an extension
&KDSWHU5HSRUWHUDQG6FKHGXOHG5HSRUWV
$JHQW6KLIW5HSRUWV
6KLIWE\3HULRG5HSRUW
The Agent Shift by Period Report shows shift activity. The data for the report is taken from the ACD
data stream.
The Agent Shift by Period Report provides the following information.
5HSRUW)LHOG'HVFULSWLRQ
Activity Period the interval of the report in hours and minutes, by day of the
week, by day of the month, or by month
Total Shift Time (h:mm:ss) the total elapsed time logged for the agent
Idle Time (h:mm:ss) the total time the agent is logged on waiting to receive calls
Total ACD Call Count the total number of ACD calls the agent answers
ACD Call Count < 20 Sec the total number of ACD calls answered in less than 20 seconds
ACD Talk Time (h:mm:ss) the total time the agent answers calls
Avg ACD Talk Time (h:mm:ss) the average time the agent spent answering calls
Wrap Up Time (h:mm:ss) the total time the agent spends in the wrap up state
NonACD Talk Time (h:mm:ss) the total time the agent spends on non-ACD calls
NonACD Call Count the total number of non-ACD calls the agent answers
OutBound Time (h:mm:ss) the total time the agent spends on outbound calls
OutBound Call Count the total number of outbound calls the agent makes
Total Hold Time (h:mm:ss) the total time for answered calls put on hold
Total Make Busy Time (h:mm:ss) the total time the agent spends in the make busy state
Average Make Busy Time (h:mm:ss)the average time the agent spends in the make busy state
Make Busy Count the total number of times the agent enters the make busy state
Total DND Time (h:mm:ss) the total time the agent spends in the do not disturb state
DND Count the total number of times the agent enters the do not disturb state
(PSOR\HH5HSRUWV
Employee Reports provide employment and performance information on agents.
The list of employee reports is as follows:
Performance Reports
• Employee and Employee Group Performance by Period
• Employee and Employee Group Performance by Day of the Week
• Employee and Employee Group Performance by Day of the Month
• Employee and Employee Group Performance by Month
• Employee and Employee Group Performance by Queue
• Employee and Employee Group Performance Make Busy Code
• Employee Performance by Agent ID
• Employee Group Performance by Employee
Internal/External Reports
• Employee and Employee Group Internal/External Call Counts by Period
• Employee and Employee Group Internal/External Call Counts by Day of the Week
• Employee and Employee Group Internal/External Call Counts by Day of the Month
• Employee and Employee Group Internal/External Call Counts by Month
• Employee Internal/External Call Counts by Employee
• Employee Group Internal/External Call Counts by Agent
Event by Period Reports
• Employee Event by Period
&KDSWHU5HSRUWHUDQG6FKHGXOHG5HSRUWV
3HUIRUPDQFH5HSRUWV
3HUIRUPDQFHE\3HULRG'D\RIWKH:HHN'D\RIWKH0RQWKDQG0RQWK
The Employee and Employee Group Performance by Period Report shows the call handling
performance of an employee and employee group for the shift duration and day(s) you specify.
The Employee and Employee Group Performance by Day of the Week Report shows the call handling
performance of an employee and employee group across the days of one week.
The Employee and Employee Group Performance by Day of the Month Report shows the call handling
performance of an employee and employee group across the days of the month.
The Employee and Employee Group Performance by Month Report shows the call handling
performance of an employee and employee group across the month.
The Employee and Employee Group Performance Reports provide the following information.
5HSRUW)LHOG'HVFULSWLRQ
Activity Period the interval of the report in hours and minutes, by day of the
week, by day of the month, or by month
ACD Calls Answered the count of all ACD queue calls answered for the period
Non ACD Calls Answered the count of all non-ACD calls answered for the period
Calls Abandoned the count of all calls abandoned at the agent’s position
Calls Outbound the count of all outbound calls
Calls Requeued the count of all requeues at the agent's position - if an agent
fails to pick up a call, the telephone system places the call back
in the same queue and it is picked up by the first available agent
Calls Transferred to Agent the count of all calls transferred to the agent’s position
Calls Transferred from Agent the count of all calls transferred from the agent’s position
Conference Calls the count of conference calls involving the agent
Account Codes the count of account codes entered by the agent
Total ACD Talk Time (h:mm:ss) the total duration for answered calls
Average ACD Talk Time (h:mm:ss)the average duration for answered calls
Total Non ACD Talk Time (h:mm:ss)the total duration for non-ACD calls
Average Non ACD Talk Time (h:mm:ss)the average duration for non-ACD calls
Total Outbound Talk Time (h:mm:ss)the total duration for outbound calls
Average Outbound Talk Time (h:mm:ss) the average duration for outbound calls
3HUIRUPDQFHE\4XHXH
The Employee Performance by Queue Reports show ACD statistics on the queues for which the
employee answered calls, and the summary total of statistics for non-ACD calls involving the employee
for the shift duration and day(s) you specify.
The Employee Group Performance by Queue Reports show ACD statistics on the queues for which the
employees in the employee group answered calls, and the summary total of statistics for non-ACD calls
involving the employee (in the employee group) for the shift duration and day(s) you specify.
The Employee and Employee Group Performance by Queue Reports provides the following information.
5HSRUW)LHOG'HVFULSWLRQ
ACD Queue the ACD queue for which the agent answered calls
ACD Calls Answered the count of all ACD queue calls answered for the period
Total ACD Talk Time (h:mm:ss) the total duration for answered calls
Average ACD Talk Time (h:mm:ss)the average duration for answered calls
ACD Calls Requeued the count of all ACD requeues at the agent’s position - if an
agent fails to pick up a call, the telephone system places the call
back in the same queue and it is picked up by the first available
agent
Non ACD Calls Answered the count of all non-ACD calls answered for the period
Calls Outbound the count of all outbound calls
Calls Transferred to Agent the count of all calls transferred to the agent’s position
Calls Transferred from Agent the count of all calls transferred from the agent’s position
Conference Calls the count of conference calls involving the agent
Total Non ACD Talk Time (h:mm:ss)the total duration for non-ACD calls
Average Non ACD Talk Time (h:mm:ss)the average duration for non-ACD calls
Total Outbound Talk Time (h:mm:ss)the total duration for outbound calls
Average Outbound Talk Time (h:mm:ss) the average duration for outbound calls
3HUIRUPDQFHE\0DNH%XV\&RGH5HSRUWV
The Employee and Employee Group Performance by Make Busy Code Reports show the frequency and
duration the employee and employee group are in Make Busy.
The Employee and Employee Group Performance by Make Busy Code provides the following information.
5HSRUW)LHOG 'HVFULSWLRQ
Make Busy Code the make busy code tagged to the ACD queue call
Name the name of the make busy code
If the Make Busy Code 01 means the morning break, the name of
the account code could be Morning Break.
Make Busy Count the count of all make busy codes
Total Make Busy Time (h:mm:ss) the total time the agent spends in the make busy state
Average Make busy Time (h:mm:ss)the average time the agent spends in the make busy state
&KDSWHU5HSRUWHUDQG6FKHGXOHG5HSRUWV
3HUIRUPDQFHE\$JHQW,'5HSRUWV
The Employee Performance by Agent ID Reports show the performance of all the agents that an
employee is.
Remember, each employee can be several agents.
Employee Performance by Agent ID Reports provide the following information.
5HSRUW)LHOG'HVFULSWLRQ
Agent Number the agent ID entered by the employee
ACD Calls Answered the count of all ACD queue calls answered for the period
Non ACD Calls Answered the count of all non-ACD calls answered for the period
Calls Outbound the count of all outbound calls
Calls Requeued the count of all requeues at the agent’s position - if an agent fails to
pick up a call, the telephone system places the call back in the same
queue and it is picked up by the first available agent
Total Shift Time (h:mm:ss) the total elapsed time logged for the agent
Total ACD Talk Time (h:mm:ss) the total duration for ACD calls
Average ACD Talk Time (h:mm:ss)the average duration for ACD calls
Percent of Shift the percentage of shift time representing ACD call activity
Total Non ACD Talk Time (h:mm:ss)the total duration for non-ACD calls
Average Non ACD Talk Time (h:mm:ss) the average duration for non-ACD calls
Percent of Shift the percentage of shift time representing non-ACD call activity
Total Outbound Talk Time (h:mm:ss)the total duration for outbound calls
Average Outbound Talk Time (h:mm:ss) the average duration for outbound calls
Percent of Shift the percentage of shift time representing outbound call activity
Make Busy Time (h:mm:ss) the total duration spent in the make busy state
3HUIRUPDQFHE\(PSOR\HH5HSRUWV
The Employee Group Performance by Employee Reports show the workload distribution across the
employees in an employee group for the shift duration and day(s) you specify. It reports the statistics in
hours, minutes, and seconds, and provides call counts across employees.
Employee Group Performance by Employee Reports provide the following employment and performance
information across agents.
5HSRUW)LHOG 'HVFULSWLRQ
Agent Name the name associated with the employee in YourSite
Employee Number the employee ID assigned to the agent
ACD Calls Answered the count of all ACD queue calls answered for the period
Non ACD Calls Answered the count of all non-ACD calls answered for the period
Calls Outbound the count of all outbound calls
Calls Requeued the count of all requeues at the agent’s position - if an agent fails to
pick up a call, the telephone system places the call back in the same
queue and it is picked up by the first available agent
Total Shift Time (h:mm:ss) the total elapsed time logged for the agent
Total ACD Talk Time (h:mm:ss) the total duration for ACD calls
Average ACD Talk Time (h:mm:ss)the average duration for ACD calls
Percent of Shift the percentage of shift time representing ACD call activity
Total Non ACD Talk Time (h:mm:ss)the total duration for non-ACD calls
Average Non ACD Talk Time (h:mm:ss) the average duration for non-ACD calls
Percent of Shift the percentage of shift time representing non-ACD call activity
Total Outbound Talk Time (h:mm:ss)the total duration for outbound calls
Average Outbound Talk Time (h:mm:ss) the average duration for outbound calls
Percent of Shift the percentage of shift time representing outbound call activity
Make Busy Time (h:mm:ss) the total duration spent in the make busy state
NOTE: Employee numbers are distinct from agent numbers. You assign them assigned to agents for
identification purposes. When an agent leaves the call center, the database maintains the agent’s call records
for some time. If you assign the outgoing agent’s, agent ID to a new agent, so that both agents share the same
agent ID, the employee ID distinguishes the two agents.
&KDSWHU5HSRUWHUDQG6FKHGXOHG5HSRUWV
,QWHUQDO([WHUQDO5HSRUWV
,QWHUQDO([WHUQDO&DOO&RXQWVE\3HULRG'D\RIWKH:HHN'D\RIWKH0RQWK
0RQWK(PSOR\HHDQG$JHQW5HSRUWV
Here is a brief definition of external and internal calls:
Internal Out is a call that you make from the office to a destination within the office.
External Out is a call that you make from the office to a destination outside the office.
Internal NonACD is a call that you receive in the office from an origin within the office.
External NonACD is a call that you receive in the office from an origin outside the office.
Internal ACD is an ACD call that originates from inside the office to a destination within the office.
External ACD is an ACD call that originates from outside the office with a destination within the office.
There are ten Employee Internal/External Call Count Reports:
Employee and Employee Group Internal/External Call Counts by Period Reports show internal and
external call activity of an employee and employee group across 15-, 30-, or 60-minute intervals for the
shift duration and day(s) you specify.
Employee and Employee Group Internal/External Call Counts by the Day of the Week Reports show
internal and external call activity of an employee and employee group for the days of one week.
Employee and Employee Group Internal/External Call Counts by the Day of the Month Reports show
internal and external call activity of an employee and employee group for the days of the month.
Employee and Employee Group Internal/External Call Counts by Month show internal and external
call activity of an employee and employee group for the month.
Employee Internal/External Call Counts by Employee show internal and external call activity of each
employee.
Employee Group Internal/External Call Counts by Agent Reports show internal and external call
activity of each agent in the employee group.
All employee internal/external call count reports have the following headings:
5HSRUW)LHOG 'HVFULSWLRQ
Activity Period the interval of the report in hours and minutes, by day of the
week, by day of the month, or by month
ACD Calls Answered the count of all ACD calls answered
Total Internal ACD Calls the total number of all ACD calls that you receive that originate
inside the office
Total Talk Internal ACD (h:mm:ss) the total duration of all ACD calls that you receive that
originate in the office
Avg Internal ACD Duration (h:mm:ss)the average duration of an ACD call that you receive that
originates in the office
Total External ACD Calls the total number of all ACD calls that originate outside the
office with a destination within the office
Total External ACD Talk (h:mm:ss)the total duration of all ACD calls that originate outside the
office with a destination within the office
Avg External ACD Duration (h:mm:ss)the average duration of an ACD call that originates outside
the office with a destination within the office
NonACD Calls Answered the total number of all nonACD calls answered
Total Internal NonACD Calls the total number of all nonACD calls that you receive that
originate in the office
Total Talk Internal NonACD (h:mm:ss)the total duration of all nonACD calls that you receive that
originate in the office
Avg Internal NonACD Duration (h:mm:ss)the average duration of a nonACD call that you receive that
originates in the office
Total External NonACD Calls the total number of all nonACD calls that originate outside the
office with a destination within the office
Total External NonACD Talk (h:mm:ss)the total duration of all nonACD calls that originate outside the
office with a destination within the office
Avg External NonACD Duration (h:mm:ss)the average duration of a nonACD call that originates outside
the office with a destination within the office
Calls Outbound the total of calls that you make
Total Internal Out Calls the total number of calls that you make to destinations within
the office
Total Talk Internal Out Calls (h:mm:ss)the total duration of all calls that you make to destinations
within the office
Avg Internal Out Duration (h:mm:ss)the average duration of a call that you make to destinations
within the office
Total Talk External Out Calls (h:mm:ss)the total duration of all calls that you make to destinations
outside the office
Avg External Out Duration (h:mm:ss)the average duration of a call that you make to destinations
outside the office
&KDSWHU5HSRUWHUDQG6FKHGXOHG5HSRUWV
(YHQWE\3HULRG5HSRUWV
(YHQWE\3HULRGKPPVV5HSRUWV
Employee Event by Period (h:mm:ss) Reports display log on and log off times for the employee and the
total time the employee spends in various agent states for the day(s) you specify. It reports the statistics
in hours, minutes, and seconds and provides call counts for the employee.
Employee Event by Period (h:mm:ss) Reports are truncated to the first 1000 records. They provide the
following information.
5HSRUW)LHOG 'HVFULSWLRQ
Login Date/Time the date and time the agent logged in to the extension
Logout Date/Time the date and time the agent last logged out of the extension
Total Shift Time (h:mm:ss) the total elapsed time logged for the period for the agent
Idle Time (h:mm:ss) the total time the agent is logged on waiting to receive calls
Total ACD Call Count the total number of ACD calls the agent answers
ACD Call Count < 20 Sec the total number of ACD calls answered in less than 20 seconds
ACD Talk Time (h:mm:ss) the total time the agent answers calls
Avg ACD Talk Time (h:mm:ss) the average time the agent spent answering calls
Wrap Up Time (h:mm:ss) the total time the agent spends in the wrap up state
NonACD Talk Time (h:mm:ss) the total time the agent spends on non-ACD calls
NonACD Call Count the total number of non-ACD calls the agent answers
OutBound Time (h:mm:ss) the total time the agent spends on outbound calls
OutBound Call Count the total number of outbound calls the agent makes
Total Hold Time (h:mm:ss) the total time for answered calls put on hold
Total Make Busy Time (h:mm:ss) the total time the agent spends in the make busy state
Average Make Busy Time (h:mm:ss)the average time the agent spends in the make busy state
Make Busy Count the total number of times the agent enters the make busy state
Total DND Time (h:mm:ss) the total time the agent spends in the do not disturb state
DND Count the total number of times the agent enters the do not disturb state
7HDP5HSRUWV
Teams are collections of agent groups used for reporting. You use Team Reports to view statistics (on
individual agents) across multiple agent groups in one report. Team Reports provide an indication of how
individual agents spend their time, and compare the performance of agents.
The list of team reports is as follows:
Performance Reports
• Team Performance by Period Reports
• Team Performance by Day of the Week
• Team Performance by Day of the Month
• Team Performance by Month
• Team Performance by Agent
• Team Performance by Queue
Event by Period Reports
• Team Event by Period (Percent)
• Team Event by Period (Percent) for SX-200
3HUIRUPDQFH5HSRUWV
3HUIRUPDQFHE\3HULRG'D\RIWKH:HHN'D\RIWKH0RQWKDQG0RQWK
5HSRUWV
Team Performance by Period Reports show the call activity of the team across 15-, 30-, or 60-minute
intervals for the shift duration and day(s) you specify.
Team Performance by Day of the Week Reports show the performance of the team for each day of one
week.
Team Performance by Day of the Month Reports show the performance of the team for each day of one
month.
Team Performance by Month Reports show the performance of the team for one month.
&KDSWHU5HSRUWHUDQG6FKHGXOHG5HSRUWV
Team Performance by Period Reports provide the following information.
5HSRUW)LHOG 'HVFULSWLRQ
Activity Period the interval of the report in hours and minutes, by day of the week,
by day of the month, or by month
ACD Calls Answered the count of all ACD queue calls answered for the period
Non ACD Calls Answered the count of all non-ACD queue calls answered for the period
Calls Abandoned the count of all calls abandoned at the agent’s position
Calls Outbound the count of all outbound calls
Calls Requeued the count of all requeues at the agent’s position - if an agent fails to
pick up a call, the telephone system places the call back in the same
queue and it is picked up by the first available agent
Transferred to Agent the count of all calls transferred to the agent’s position
Transferred from Agent the count of all calls transferred from the agent’s position
Conference Calls the count of conference calls involving the agent
Account Codes the count of account codes entered by the agent
Total ACD Talk Time (h:mm:ss) the total duration for answered calls
Average ACD Talk Time (h:mm:ss)the average duration for answered calls
Total Non ACD Talk Time (h:mm:ss)the total duration for non-ACD calls
Average Non ACD Talk Time (h:mm:ss) the average duration for non-ACD calls
Total Outbound Talk Time (h:mm:ss)the total duration for outbound calls
Average Outbound Time (h:mm:ss) the average duration for outbound calls
3HUIRUPDQFHE\$JHQW5HSRUWV
Team Performance by Agent Report shows the performance of each agent of a team.
Team Performance by Agent Reports provide the following information on individual agents.
5HSRUW)LHOG 'HVFULSWLRQ
Agent Number the agent ID entered by the agent
Agent Name the name associated with the above agent ID in YourSite
ACD Calls Answered the count of all ACD queue calls answered for the period
Non ACD Calls Answered the count of all non-ACD calls answered for the period
Calls Outbound the count of all outbound calls
ACD Calls Requeued the count of all requeues at the agent’s position - if an agent fails to
pick up a call, the telephone system places the call back in the same
queue and it is picked up by the first available agent
Total Shift Time (h:mm:ss) the total elapsed time logged for the agent
Total ACD Talk Time (h:mm:ss) the total duration for answered calls
Average ACD Talk Time (h:mm:ss)the average duration for answered calls
Percent of Shift the percentage of shift time representing ACD call activity
Total Non ACD Talk Time (h:mm:ss)the total duration for non-ACD calls
Average Non ACD Talk Time (h:mm:ss) the average duration for non-ACD calls
Percent of Shift the percentage of shift time representing non-ACD call activity
Total Outbound Talk Time (h:mm:ss)the total duration for outbound calls
Average Outbound Talk Time (h:mm:ss) the average duration for outbound calls
Percent of Shift the percentage of shift time representing outbound call activity
Make Busy Time (h:mm:ss) the total duration spent in the make busy state
3HUIRUPDQFHE\4XHXH5HSRUWV
Team Performance by Queue Reports provide the following information. The first five fields contain multiple
records reflecting the ACD queues serving the ACD Agent and Agent Group. The remaining fields contain a
single record reflecting the totals irrespective of ACD queue.
5HSRUW)LHOG 'HVFULSWLRQ
ACD Queue the ACD queue for which the agent answered calls
ACD Calls Answered the count of all ACD queue calls answered
Total ACD Talk Time (h:mm:ss) the total duration for answered calls
Average ACD Talk Time (h:mm:ss)the average duration for answered calls
ACD Calls Requeued the count of all requeues at the agent’s position - if an agent fails to
pick up a call, the telephone system places the call back in the same
queue and it is picked up by the first available agent
Non ACD Calls Answered the count of all non-ACD calls answered
Calls Outbound the count of all outbound calls
Calls Transferred to Agent the count of all calls transferred to the agent’s position
Calls Transferred from Agent the count of all calls transferred from the agent’s position
Conference the count of conference calls involving the agent
Total Non ACD Talk Time (h:mm:ss)the total duration for non-ACD calls
Average Non ACD Talk Time (h:mm:ss) the average duration for non-ACD calls
Total Outbound Time (h:mm:ss) the total duration for outbound calls
Average Outbound Time (h:mm:ss) the average duration for outbound calls
(YHQWE\3HULRG5HSRUWV
(YHQWE\3HULRG3HUFHQW
(YHQWE\3HULRG3HUFHQW6;
Team Event by Period Reports provide the following information.
5HSRUW)LHOG 'HVFULSWLRQ
Log In Time the time at which agents logged in to extensions
Log Out Time the time at which agents last logged out of extensions
Total Shift Time (h:mm:ss) the total elapsed time logged for the period
Make Busy Time (h:mm:ss) the total elapsed time in the make busy state
Extension the extension numbers used by agents
ACD Talk Time (h:mm:ss) the total duration for answered calls
ACD Hold Time (h:mm:ss) the total duration for answered calls put on hold
NonACD Talk (h:mm:ss) the total duration for non-ACD calls
NonACD Hold (h:mm:ss) the total duration for non-ACD calls put on hold
OutBound Talk (h:mm:ss) the total duration for outbound calls
OutBound Hold (h:mm:ss) the total duration for outbound calls put on hold
Wrap UpTime (h:mm:ss) the total elapsed time in the wrap up state
DND Time (h:mm:ss) the total elapsed time in the do not disturb state
&KDSWHU5HSRUWHUDQG6FKHGXOHG5HSRUWV
7UXQN5HSRUWV
Trunk Reports on individual trunks and trunk groups provide an indication of how busy your trunks are.
The list of trunk reports is as follows:
Performance Reports
• Trunk and Trunk Group Performance by Period
• Trunk and Trunk Group Performance by Day of the Week
• Trunk Performance by Trunk
Busy Minutes Reports
• Trunk Group Busy Minutes
3HUIRUPDQFH5HSRUWV
3HUIRUPDQFHE\3HULRGDQG'D\RIWKH:HHN5HSRUWV
Trunk and Trunk Group Performance by Period Reports show the call activity of the trunk and trunk
group across 15-, 30-, or 60-minute intervals for the shift duration and day(s) you specify.
Trunk and Trunk Group Performance by Day of the Week Reports show the performance of the trunk
and trunk group for each day of one week.
Trunk and Trunk Group Performance by Period Reports provide the following information.
5HSRUW)LHOG 'HVFULSWLRQ
Activity Period The interval of the report, in hours and minutes, by day of the
week, or by day of the month
ACD Calls Answered the count of all ACD calls answered for the period
Non ACD Calls Answered the count of all non-ACD calls answered for the period
Calls Abandoned the count of all abandoned calls for the period
Calls Outbound the count of all outbound calls for the period
Avg Speed of Answer (h:mm:ss) the average delay before the call is answered
Avg Delay to Abandon (h:mm:ss) the average elapsed time before the call is abandoned
Total ACD Talk Time (h:mm:ss) the total duration for answered calls
Average ACD Talk Time (h:mm:ss) the average duration for ACD calls
Total Non ACD Talk Time (h:mm:ss) the total duration for non-ACD calls
Average Non ACD Talk Time (h:mm:ss)the average duration for non-ACD calls
Total Outbound Time (h:mm:ss) the total duration for outbound calls
Average Outbound Time (h:mm:ss) the average duration for outbound calls
3HUIRUPDQFHE\7UXQN5HSRUWV
All of the preceding report fields are the same for Trunk Group Performance by Trunk Reports with one
exception: a Trunk Number column defining the member trunks replaces the Activity Period column.
%XV\0LQXWHV5HSRUWV
All Trunk Group Busy Minute Reports provide the following information.
5HSRUW)LHOG 'HVFULSWLRQ
Activity Period the interval of the report, in hours and minutes, by day of the week, or by
day of the month
Maximum Trunks Used the maximum count of trunks in the trunk group simultaneously in use
All Trunks Busy Minutes the total number of minutes all trunks were simultaneously in use
([WHQVLRQ5HSRUWV
Extension Reports on individual extensions and extension groups provide an indication of activity on
extensions.
The list of extension reports is as follows:
Performance Reports
• Extension and Extension Group Performance by Period
• Extension and Extension Group Performance by Day of the Week
• Extension and Extension Group Performance by Account Code
• Extension Group Performance by Extension
3HUIRUPDQFH5HSRUWV
3HUIRUPDQFHE\3HULRG5HSRUWV
Extension and Extension Group Performance by Period Reports provide the following information.
5HSRUW)LHOG 'HVFULSWLRQ
Activity Period the interval of the report, in hours and minutes, by day of the week,
or by day of the month
ACD Calls Answered the count of all ACD queue calls answered for the period
Non ACD Calls Answered the count of all non-ACD calls answered for the period
Calls Abandoned the count of all abandoned calls for the period
Calls Outbound the count of all outbound calls for the period
Calls Transferred to Extension the count of all calls transferred to the agent's position
Calls Transferred from Extension the count of all calls transferred from the agent's position
Conference Calls the count of conference calls involving the agent
Avg Speed of Answer (h:mm:ss) the average delay before the call is answered
Avg Delay to Abandon (h:mm:ss) the average elapsed time before the call is abandoned
Total ACD Talk Time (h:mm:ss) the total duration for answered calls
Average ACD Talk Time (h:mm:ss) the average duration for answered calls
Total Non ACD Talk Time (h:mm:ss) the total duration for non-ACD calls
Average Non ACD Talk Time (h:mm:ss) the average duration for non-ACD calls
Total Outbound Talk Time (h:mm:ss) the total duration for outbound calls
Average Outbound Talk Time (h:mm:ss) the average duration for outbound calls
&KDSWHU5HSRUWHUDQG6FKHGXOHG5HSRUWV
3HUIRUPDQFHE\([WHQVLRQ5HSRUWV
All of the preceding report fields are the same for Extension Group Performance by Extension Reports with
one exception: an Extension Number column defining the member extensions replaces the Activity Period
column.
6LJKW5HSRUWV
The 4Sight Reports allows you to use past ACD call data regarding busy and slow periods in order to aid you
in scheduling future staff. Please see the 4Sight section of the user guide.
The list of agent reports is as follows:
Forecast Reports
• 4Sight Forecast
• 4Sight Group Forecast
'1,65HSRUWV
DNIS Reports on individual queues or queue groups reflect the service experienced by callers and caller
behavior. DNIS Reports provide queue statistics for all calls involving a particular DNIS number. DNIS
Group Reports provide queue statistics for all calls involving a particular group of DNIS numbers.
The list of agent reports is as follows:
Performance Reports
• DNIS Performance and Group Performance by Period
• DNIS Performance and Group Performance by Day of the Week
• DNIS Performance and Group Performance by Day of the Month
• DNIS Performance and Group Performance by Month
• DNIS Performance and Group Performance by Queue
• DNIS Group Performance by DNIS
3HUIRUPDQFH5HSRUWV
3HUIRUPDQFHE\3HULRG'D\RIWKH:HHN'D\RIWKH0RQWKDQG0RQWK
5HSRUWV
DNIS and DNIS Group Performance by Period Reports show the DNIS and DNIS group performance
for the shift duration and day(s) you specify. They provide call counts, and report statistics in hours,
minutes, and seconds.
DNIS and DNIS Group Performance by Day of the Week show the DNIS and DNIS group performance
for the days of one week.
DNIS and DNIS Group Performance by Day of the Month Reports show the DNIS and DNIS group
performance for the days of one month.
DNIS and DNIS Group Performance by Month Reports show the DNIS and DNIS group performance
for the month.
DNIS and DNIS Group Performance by Period, Day of the Week, Day of the Month, and Month Reports
provide the following information.
5HSRUW)LHOG 'HVFULSWLRQ
Activity Period the interval of the report in hours and minutes, by day of the week, by day
of the month, or by month
Calls Offered the count of all calls offered to the ACD queue (answer, plus long
abandon, plus long interflow)
ACD Calls Answered the count of all calls answered
Calls Abandoned [short] the count of calls that abandoned before the short abandon time
Calls Abandoned [long] the count of calls that abandoned after the short abandon time
Calls Interflowed the count of all calls interflowed
Calls Requeued the count of all calls requeued back into the ACD queue - if an agent fails
to pick up a call, the telephone system places the call back in the same
queue and it is picked up by the first available agent
Answered By ACD Group1 the count of all calls answered by the first answer point
&KDSWHU5HSRUWHUDQG6FKHGXOHG5HSRUWV
Answered By ACD Group2 the count of all calls answered by the second answer point
Answered By ACD Group3 the count of all calls answered by the third answer point
Answered By ACD Group4 the count of all calls answered by the fourth answer point
Avg Speed of Answer (h:mm:ss) the average delay before the call is answered
Avg Delay to Abandon (h:mm:ss) the average elapsed time before the call is abandoned
Avg Delay to Interflow (h:mm:ss) the average elapsed time before the call interflows
Total Talk Time (h:mm:ss) the total duration for answered calls
Average Talk Time (h:mm:ss) the average duration for answered calls
Service Level % the percentage of calls answered within a specified threshold
Answer % the percentage of offered calls answered
3HUIRUPDQFHE\4XHXH5HSRUWV
The DNIS and Group DNIS Performance by Queue Reports show the DNIS and DNIS group
performance for the queue you specify.
DNIS and DNIS Group Performance by Queue Reports provide the following information.
5HSRUW)LHOG 'HVFULSWLRQ
Queue Number the queue to which the DNIS number is associated
Calls Offered the count of all calls offered to the ACD queue (answer, plus long
abandon, plus long interflow)
Calls Answered the count of all calls answered
Calls Abandoned (Short) the count of all calls abandoned before the short abandon time
Calls Abandoned (Long) the count of all calls abandoned after the short abandon time
Calls Interflowed the count of al calls interflowed
Calls Requeued the count of all calls requeued back into the ACD queue - if an agent
fails to pick up a call, the telephone system places the call back in the
same queue and it is picked up by the first available agent
Avg Speed of Answer (h:mm:ss) the average delay before the call is answered
Max Speed of Answer (h:mm:ss) the maximum delay before the call is answered
Avg Delay to Abandon (h:mm:ss) the average elapsed time before the call is abandoned
Max Delay to Abandon (h:mm:ss) the maximum delay before the call is abandoned
Avg Delay to Interflow (h:mm:ss) the average elapsed time before the call interflows
Max Delay to Interflow (h:mm:ss) the maximum delay before the call interflows
Total Talk Time (h:mm:ss) the total duration for calls answered
Average Talk Time (h:mm:ss) the average duration for calls answered
Service Level% the percentage of calls answered within a specified threshold
Answer% the percentage of offered calls answered
3HUIRUPDQFHE\'1,65HSRUWV
DNIS Group Performance by DNIS Reports show each DNIS for the DNIS group you specify.
DNIS Group Performance by DNIS Reports provide the following information.
5HSRUW)LHOG 'HVFULSWLRQ
DNIS Number the DNIS numbers that are members of a DNIS group
Calls Offered the count of all calls offered to the ACD queue (answer, plus long
abandon, plus long interflow)
ACD Calls Answered the count of all calls answered
Calls Abandoned the count of all calls abandoned
Calls Interflowed the count of al calls interflowed
Answered By ACD Group1 the count of all calls answered by the first answer point
Answered By ACD Group2 the count of all calls answered by the second answer point
Answered By ACD Group3 the count of all calls answered by the third answer point
Answered By ACD Group4 the count of all calls answered by the fourth answer point
Avg Speed of Answer (h:mm:ss) the average delay before the call is answered
Avg Delay to Abandon (h:mm:ss) the average elapsed time before the call is abandoned
Avg Delay to Interflow (h:mm:ss) the average elapsed time before the call interflows
Total Talk Time (h:mm:ss) the total duration for calls answered
Average Talk Time (h:mm:ss) the average duration for calls answered
Service Level % the percentage of calls answered within a specified threshold
Answer % the percentage of offered calls answered
&KDSWHU5HSRUWHUDQG6FKHGXOHG5HSRUWV

&KDSWHU'DWDPLQLQJWRROV
:LWK,QVSHFWRU\RXFDQILQG
LQGLYLGXDOHYHQWVWKDWVKDSH\RXU
UHSRUWV
:LWK6XSHU$XGLWRU\RXFDQYLHZ
KLVWRULFDOUHDOWLPHHYHQWVDW\RXU
RZQSDFH
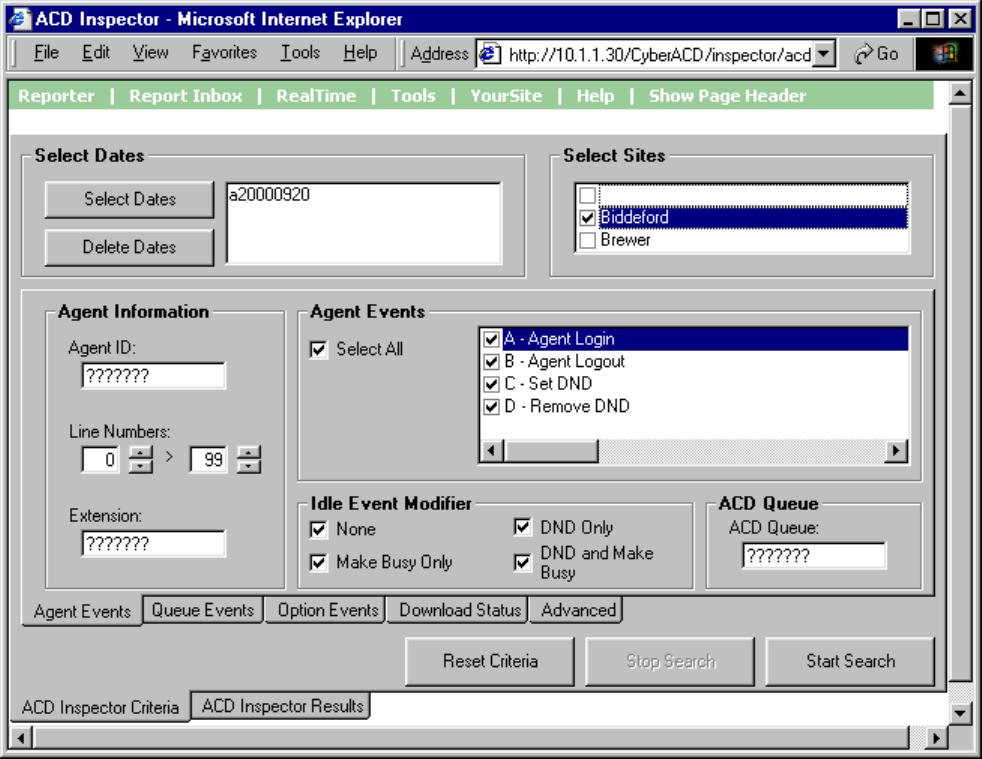
&KDSWHU'DWDPLQLQJWRROV
'DWDPLQLQJWRROV
Data-mining tools include Inspector and SuperAuditor.
The Inspector program consists of ACD Inspector, SMDR Inspector, and Advanced Inspector search tools.
Inspector finds specific call center events, such as the exact time an agent logs off at lunch. You can verify
your reports are valid by conducting searches against raw telephone system data. In a single session, you
can search through the data from multiple days to find a specific event. Your specifications do not have to
be exact. The results are displayed in an easy-to-interpret grid that can be printed or saved to file.
With Inspector, you can search on few or many parameters. For example, suppose you receive a complaint
from a caller who waited 16 minutes in queue for a customer service agent, sometime between 1:00 P.M.
and 1:30 P.M. on Monday. You can run a search and examine the activities of individual agents or all agents
in a particular agent group or queue during that interval. You can search on specific agent states and other
parameters, such as the number of calls waiting and the number of active agents.
Inspector is a search tool. SuperAuditor is a tool with which you can view historical real-time events.
$&',QVSHFWRU
When you click Tools=>ACD Inspector Figure 8-1 appears.
)LJXUH$&',QVSHFWRUPDLQVFUHHQDJHQWHYHQWV
$&'VHDUFKFULWHULD
The ACD search tabs include Agent Events, Queue Events, Option Events, Download Status, and
Advanced.
$&'VHDUFKFULWHULDDJHQWHYHQWV
Figure 8-1 displays the agent event criteria used in the search.
6HOHFW'DWHV'HOHWH'DWHV
The Select Dates button specifies one or more days to be included in the search. The Delete Dates button
deletes the search date currently selected.
6HOHFW6LWHV
The Select Sites check boxes specify the origin of the data used in the search.
$JHQW,QIRUPDWLRQ
The Agent Information boxes specify the agent’s ID and extension number, and line numbers for one or
more telephone lines to which the agent connects. You can search for agent information records for a
particular agent, or for all agents.
$JHQW(YHQWV
The Agent Events check boxes specify agent states and logon and logoff times used in the search.
,GOH(YHQW0RGLILHU
The Idle Event Modifier check boxes provide additional search criteria for the agent Idle event. You can
select one or more check boxes to include records for Idle agents who activated DND and/or Make Busy. If
you select the None check box only, the search results contain records for Idle agents who do not activate
DND or Make Busy.
NOTE: When conducting a search, if you accept the default settings (all check boxes—including the None
check box—selected) the search output will contain all event records. You can clear check boxes to narrow
down your search for records.
$&'4XHXH
The ACD Queue box specifies the ACD queue used in the search. If you enter an ACD queue number and
an agent number (in the Agent ID box), the search results contain records for all calls the agent receives
from the queue.
5HVHW&ULWHULD
The Reset Criteria button resets all search parameters to their default settings.
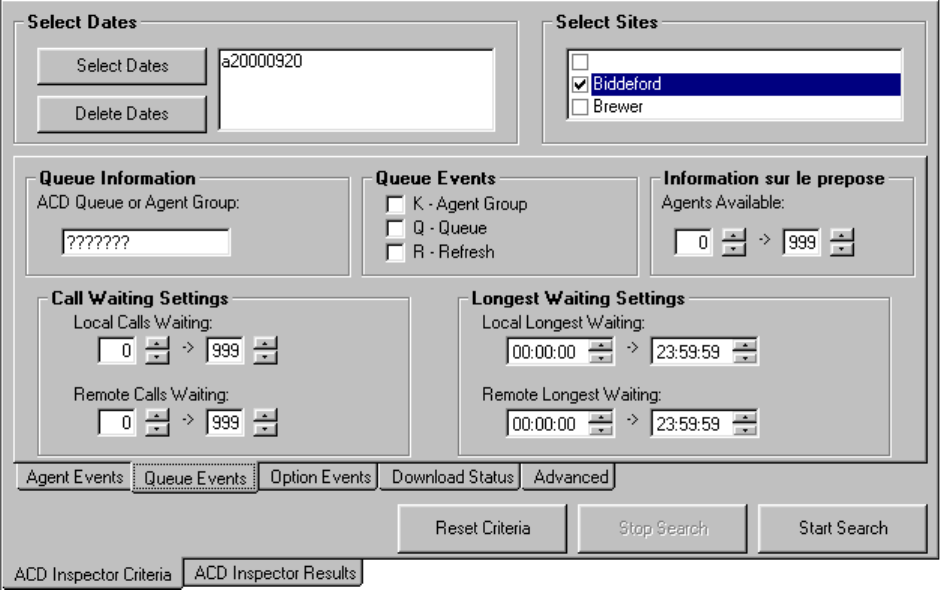
&KDSWHU'DWDPLQLQJWRROV
$&'VHDUFKFULWHULDTXHXHHYHQWV
Figure 8-2 appears when you click the Queue Events tab. It displays the queue event criteria used in the
search.
)LJXUH$&'VHDUFKFULWHULDTXHXHHYHQWV
6HOHFW'DWHV'HOHWH'DWHV
The Select Dates button specifies one or more days to be included in the search. The Delete Dates button
deletes the search date currently selected.
6HOHFW6LWHV
The Select Sites check boxes specify the origin of the data used in the search.
4XHXH,QIRUPDWLRQ
The Queue Information box specifies the ACD queue or agent group used in the search. When you enter an
ACD queue or agent group number, the search results contain records specific to the ACD queue or agent
group.
4XHXH(YHQWV
When you select all three Queue Events check boxes, the search results contain records for all agent groups
and queues, and all telephone system refresh cycles. The telephone system performs a re-synchronization
and generates a refresh record every time it notices the date or hour has changed (once an hour).

$JHQW,QIRUPDWLRQ
The Agent Information boxes specify the range of values for the Agents Available statistic used in the
search. For example, if you select a range of 5 to 10, the search results contain records for all calls during
periods when 5 to 10 agents were logged on to the ACD.
&DOO:DLWLQJ/RQJHVW:DLWLQJ6HWWLQJV
The Call Waiting Settings and Longest Waiting Settings boxes specify ranges of values for the Calls
Waiting and Longest Waiting statistics. For example, selecting a range from 10 to 999 in the Calls Waiting
box produces all records for calls received during periods when more than 10 callers waited in queue.
5HVHW&ULWHULD
The Reset Criteria button resets all search parameters to their default settings.
$&'VHDUFKFULWHULDRSWLRQHYHQWV
Figure 8-3 appears when you click the Option Events tab. It displays the time range, error, and information
criteria used in the search.
)LJXUH$&'VHDUFKFULWHULDRSWLRQHYHQWV
6HOHFW'DWHV'HOHWH'DWHV
The Select Dates button specifies one or more days to be included in the search. The Delete Dates button
deletes the search date currently selected.
6HOHFW6LWHV
The Select Sites check boxes specify the origin of the data used in the search.
&KDSWHU'DWDPLQLQJWRROV
7LPH5DQJHV
The Time Ranges boxes specify the time interval used for the search. The time interval applies to searches
on agent and queue events.
([FHSWLRQ5HFRUGV
The prairieFyre Service tags telephone system records that contain errors with an E (telephone system 1) or
e (telephone system 2). Under Exception Records, you select the Error Records check box to include these
records in the search output.
The prairieFyre Service writes a log record to the data stream upon start up. It tags the log record with an I
to indicate it is an information record. You select the Information Records check box to include log records
in the search output. ACD Inspector displays the error and information search result records on the
Exception Records tab.
In call centers that have two telephone systems, the prairieFyre Service tags records from the second
telephone system with an S. You specify the comports used by your telephone systems on the System
Settings tab of the Management Console program.
5HVHW&ULWHULD
The Reset Criteria button resets all search parameters to their default settings.
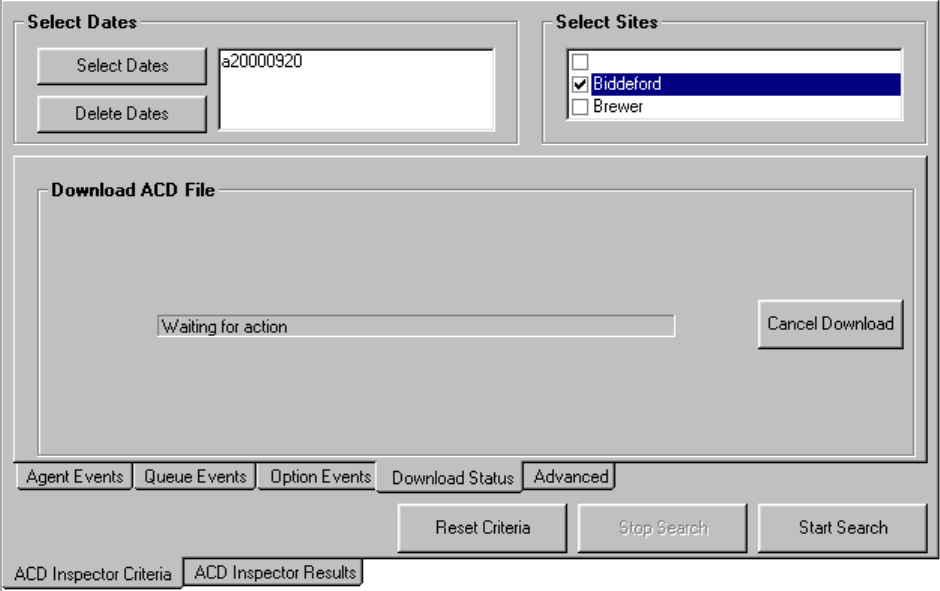
$&'VHDUFKFULWHULDGRZQORDGVWDWXV
Figure 8-4 appears when you click the Download Status tab. It displays status messages on the progress of
files being transferred from the server to the client computer. Typically you will only see status messages if
your network is slow.
)LJXUH$&'VHDUFKFULWHULDGRZQORDGVWDWXV
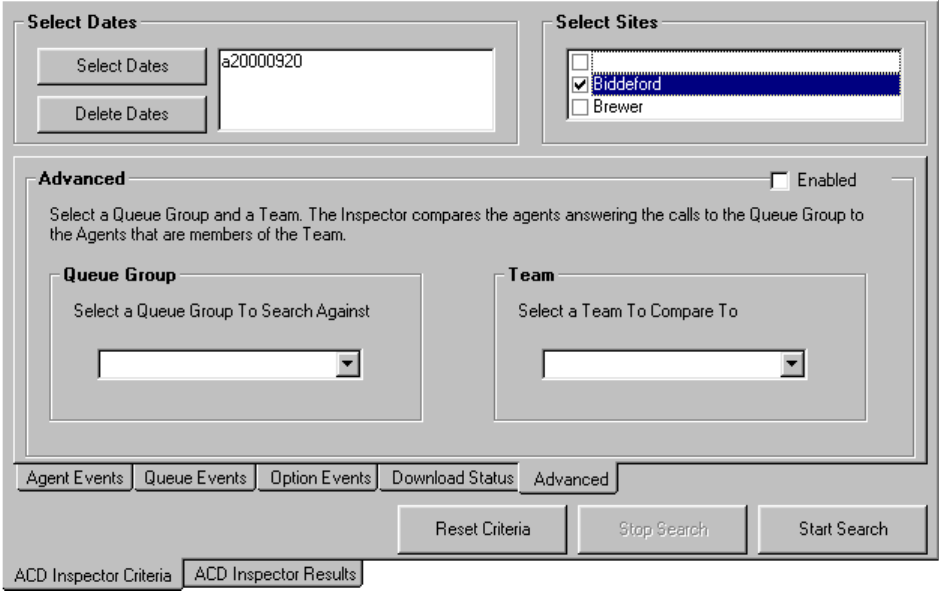
&KDSWHU'DWDPLQLQJWRROV
$&'VHDUFKFULWHULDDGYDQFHG
Figure 8-5 appears when you click the Advanced tab. It compares the agents answering calls to a particular
queue group to the agents who are members of the group and a particular team.
NOTE: When you perform an advanced search, ACD Inspector ignores all other search criteria.
You select a member from the Queue Group list and the Team list when you perform a search. Do not use
wild card symbols such as the star [ * ] or pound sign [ # ] in the search.
)LJXUH$&'VHDUFKFULWHULDDGYDQFHG
6HOHFW'DWHV'HOHWH'DWHV
The Select Dates button specifies one or more days to be included in the search. The Delete Dates button
deletes the search date currently selected.
6HOHFW6LWHV
The Select Sites check boxes specify the origin of the data used in the search.
4XHXH*URXSDQG7HDP
When you select a queue group and team, the search output displays
• The agents associated to the queues in the selected queue group
• The agents associated to the selected team
• Answered calls involving agents who are not members of the queue group
• Answered calls involving agents who are not members of the team
• The agents who answered calls that are members of the queue group or team
• The agents associated to the queue group but not to the team
• The agents associated to the team but not to the queue group
5HVHW&ULWHULD
The Reset Criteria button resets all search parameters to their default settings.
5XQQLQJVHDUFKHVLQ$&',QVSHFWRU
When you run a search, Inspector searches through the raw telephone system data on the local hard drive.
NOTE: When you program the telephone system with a path number such as six, you enter this number in
the YourSite Database as queue reporting number P006 (for the SX-2000) or P0006 (for the SX-200 and the
SX-200 with real-time). ACD queue numbers are four digits in length: P001 (for the SX-2000), or five or
six digits in length: P0001 or P00001 (for the SX-200 and the SX-200 with real-time). When you run
searches on queues in ACD Inspector, be sure to include a P preceding the queue number.
:LOGFDUG6HDUFKHV
On the ACD Inspector criteria tabs, some of the search fields contain question marks. You can enter an
extension number, such as 3000, in the Extension search field (on the Agent Events tab) and the search will
produce only records involving Extension 3000. Alternatively, you can run wildcard searches. For example,
if you enter "." in the Extension search field and P5000 in the ACD Queue or Agent Group field (on the
Queue Events tab), the search will produce only records that involve queue P5000 AND ANY extension. If
you enter "???????" in the Extension search field, the search will produce only records that involve ANY
extension.
The following example demonstrates how to run a queue event search in ACD Inspector. Suppose you want
to view the longest waiting records for Queue P001 on March 15, 2000.
To examine the longest waiting records for queue P001:
&OLFNWKH$&',QVSHFWRU&ULWHULDWDE
&OLFNWKH4XHXH(YHQWVWDE
&OLFN6HOHFW'DWHVDQGVHOHFW0DUFK
,QWKH/RFDO&DOOV:DLWLQJER[HVHQWHUWR
6HOHFWWKH44XHXHFKHFNER[
7\SH3LQWKH$&'4XHXHRU$JHQW*URXSER[
&OLFN6WDUW6HDUFK
The ACD Inspector Results - Agent Events screen appears.
&OLFNWKH4XHXH(YHQWVWDE
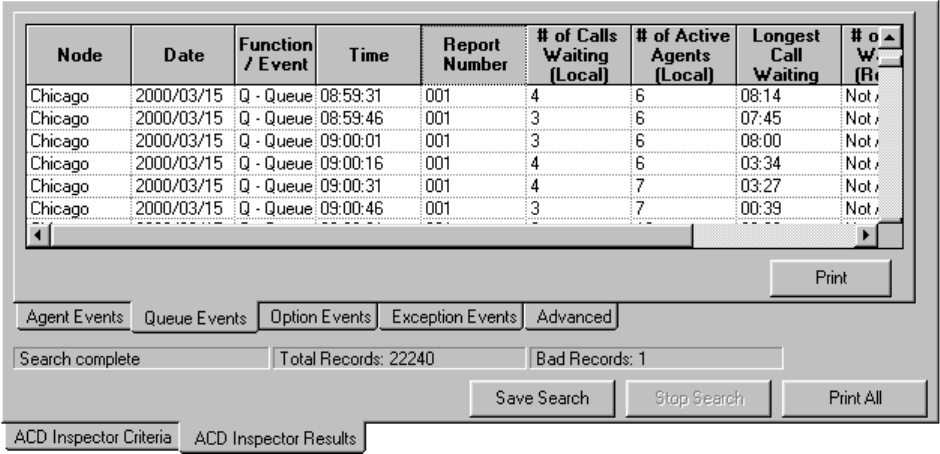
&KDSWHU'DWDPLQLQJWRROV
Figure 8-6 appears.
)LJXUH4XHXHHYHQWFDOOZDLWLQJUHFRUGV
The first record in the search output shows that at 08:59:31 hours 4 calls waited in queue and the longest
waiting caller waited eight minutes and fourteen seconds. There were 6 agents logged in (and busy).
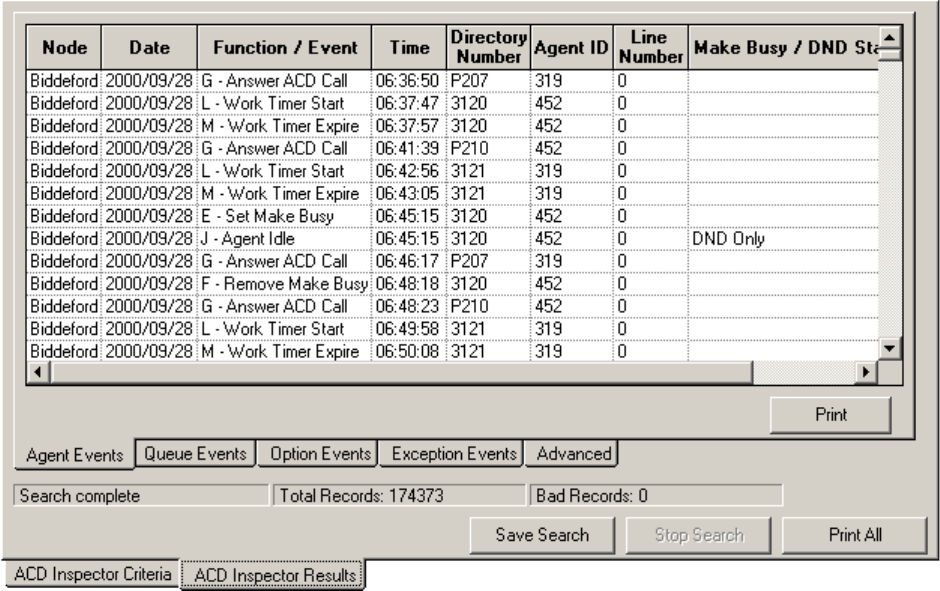
,QWHUSUHWLQJ$&'VHDUFKUHVXOWV
This section describes the ACD search output records available. When you run a search in ACD Inspector,
Figure 8-7 appears. It displays call event records for ACD agents.
)LJXUH$&'VHDUFKUHVXOWV$JHQW(YHQWVWDE
$JHQW(YHQWVWDE
The Agent Events tab displays call event records for ACD agents.
1RGH
The Node field identifies the switch that produced the event record.
'DWH
The Date field displays the date of the event record.
)XQFWLRQ(YHQW
The Function/Event field displays the following agent state, logon, and logoff events.
7LPH
The Time field displays the time the event occurred.
'LUHFWRU\1XPEHU
The Directory Number field displays the extension number used in the call.
&KDSWHU'DWDPLQLQJWRROV
$JHQW,'
The Agent ID field displays the agent number for the agent involved in the call.
/LQH1XPEHU
The Line Number field displays the telephone line the agent used to pick up or originate the call.
0DNH%XV\'1'
The Make Busy/DND field displays the Make Busy or DND status for the agent involved in the call.
The following agent event record information originates from the Mitel "SX-2000 Applications Package"
on the "SX-2000 Technical Documentation CD-ROM" (PN 9125-080-221-NA).
$JHQW/RJ,Q
This record is generated each time an agent successfully logs on. When an agent logs on, Make Busy and
DND are removed on that extension. No record is generated for the removal of Make Busy. A remove DND
record will only be generated if the extension was in DND. The extension number is the prime line of the
ACD set which an agent is logged on to.
$JHQW/RJ2XW
This record is generated whenever an agent successfully logs off. If agent A is currently logged on
extension X and agent B logs on to extension X, a log off record is automatically generated for A. This is
followed by the log on record for B. Make busy is automatically enabled on the extension when the agent
logs out. No remove make busy record is generated. The extension number is the prime line of the ACD set
which an agent is logged on.
6HW'R1RW'LVWXUE
A record is not generated when a hunt group is placed in DND. The records do not differentiate between
setting DND locally and remotely. The extension number reported is always the prime line of the ACD
extension. A set DND record will be generated for the following conditions:
• Setting DND locally by using the DND access code
• Setting DND remotely by using the remote DND access code
• Setting DND remotely by using the attendant console features key
• Setting DND locally on a SUPERSET 4 telephone by pressing the select features hardkey and
dialing the digit 2 or setting it on a SUPERSET 4DN or SUPERSET 430 telephone by pressing the
DO NOT DISTURB Feature Key
5HPRYH'R1RW'LVWXUE
The extension number is always the prime line of the ACD extension. A clear DND record will be
generated for the following conditions:
• Clearing DND locally by using an access code
• Clearing DND remotely by using the Cancel Remote DND access code
• Clearing DND remotely by using the attendant console feature key
• Clearing DND by using the Cancel All Features access code
• Clearing DND by using the Cancel All DND feature on the attendant console
• Agent logging in on an extension in DND
• Setting Make Busy
This record is generated whenever an extension is placed in the Make Busy state. A record is not generated
when an agent logs out because Set Make Busy is implied when an agent log out record is received. The
extension number is always the prime line of the ACD extension.
5HPRYH0DNH%XV\
This is similar to Set Make Busy. No record is generated when the agent logs in. The remove make busy is
implied by the log in record. The extension number is always the prime line of the ACD extension.
$QVZHU$&'&DOO
This record is generated whenever an agent answers a call that was directed to the ACD hunt group. The
event record contains the Agent ID and extension number (hunt group pilot number to which the call was
placed). The ACD extension that answered the call can be determined by using the last agent log in event
for that extension. If the ACD set does not have a logged in agent, the Agent ID area is blank and the
extension number is that extension’s prime line.
$QVZHU3HUVRQDO&DOO
All non-ACD hunt group calls are included in this category. The extension number is always the prime line
of the ACD extension that answered.
2ULJLQDWH&DOO
This record is generated whenever an agent originates a call and enters a conversation. A record is not
generated under the following conditions; entering a feature access code, dialing an invalid number, or
hanging up before the called party answers. An agent extension number is always the prime line of the
ACD set that originated the call.
$JHQW,GOH
If Work Timer is in effect, the Agent Idle record is generated when the work timer expires or when it is
cancelled. If the agent enters Make Busy while Work Timer is in effect, an Agent Idle record is generated
followed immediately by a Set Make Busy record. A record is not generated to show the end of the call or
the start of the work timer. This entire period is treated as part of the time to process the call.
If Work Timer is not in effect, the Agent Idle record is generated at the end of a call, not when the agent
hangs up. For example, if the agent presses the HANG-UP softkey and remains off hook for 5 seconds, the
record is generated when the HANG-UP is pressed, not when the agent actually goes on hook. The
extension number is always the prime line of the ACD set that is now idle.
&KDSWHU'DWDPLQLQJWRROV
:RUN7LPHU6WDUW(YHQW
This record is generated when an agent terminates an ACD call and the a work timer is started for that
agent. If the work timer cannot be started, an idle event record is generated instead.
:RUN7LPHU([SLUH(YHQW
This record is generated when the work timer expires for that agent.
&DOO+ROG(YHQW
When an agent places a call on hold, a record is generated for that line appearance. If the agent places
another call or answers a call on a second line, the call event record for the new line will not cause
confusion for the reporting package.
+ROG5HWULHYH(YHQW
When the held call is retrieved, a record is generated for that line indicating that the agent is now busy on
that line.
+ROG$EDQGRQ(YHQW
When the held call is abandoned, a record is generated for that line.

4XHXH(YHQWVWDE
Figure 8-8 appears when you click the Queue Events tab. It displays call event records for ACD queues and
agent groups.
)LJXUH$&'VHDUFKUHVXOWV4XHXH(YHQWVWDE
1RGH
The Node field identifies the switch that produced the event record.
'DWH
The Date field displays the date of the event record.
)XQFWLRQ(YHQW
The Function/Event field indicates whether the event record is for a queue or an agent group.
7LPH
The Time field displays the time the event occurred.
5HSRUW1XPEHU
The Report Number field displays the agent group or queue reporting number.
1XPEHURI&DOOV:DLWLQJ/RFDO
The Number of Calls Waiting (Local) field displays the number of callers waiting in queue for an available
agent.
&KDSWHU'DWDPLQLQJWRROV
1XPEHURI$FWLYH$JHQWV/RFDO
The Number of Active Agents (Local) field displays the number of agents that are logged on and ready to
receive ACD calls (not in Make Busy or DND).
/RQJHVW&DOO:DLWLQJ/RFDO
The Longest Call Waiting (Local) field displays the wait time for the caller waiting the longest in queue for
an available agent.
1XPEHURI&DOOV:DLWLQJ5HPRWH
The Number of Calls Waiting (Remote) field displays the number of callers waiting in a remote queue for
an available agent.
/RQJHVW&DOO:DLWLQJ5HPRWH
The Longest Call Waiting (Remote) field displays the wait time for the caller waiting the longest in a
remote queue for an available agent.
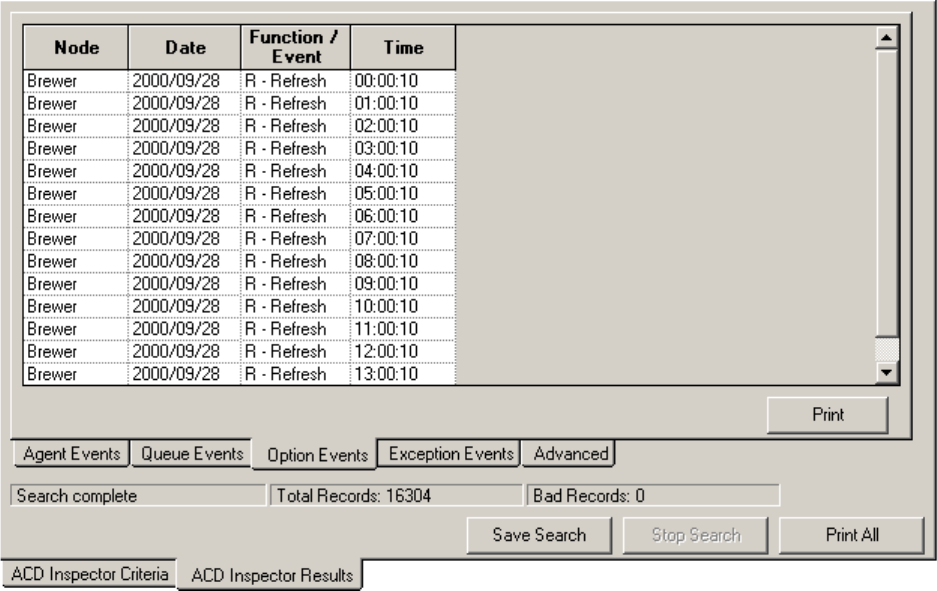
2SWLRQ(YHQWVWDE
Figure 8-9 appears when you click the Option Events tab. It displays telephone system refresh records.
)LJXUH$&'VHDUFKUHVXOWV2SWLRQ(YHQWVWDE
1RGH
The Node field identifies the switch that produced the event record.
'DWH
The Date field displays the date of the event record.
)XQFWLRQ(YHQW
The Function/Event field displays refresh records. The refresh event signifies the start of a new cycle of
group and queue statistics.
7LPH
The Time field displays the time the refresh event occurred. The telephone system performs a re-
synchronization and generates a refresh record every time it notices the date or hour has changed (once an
hour).
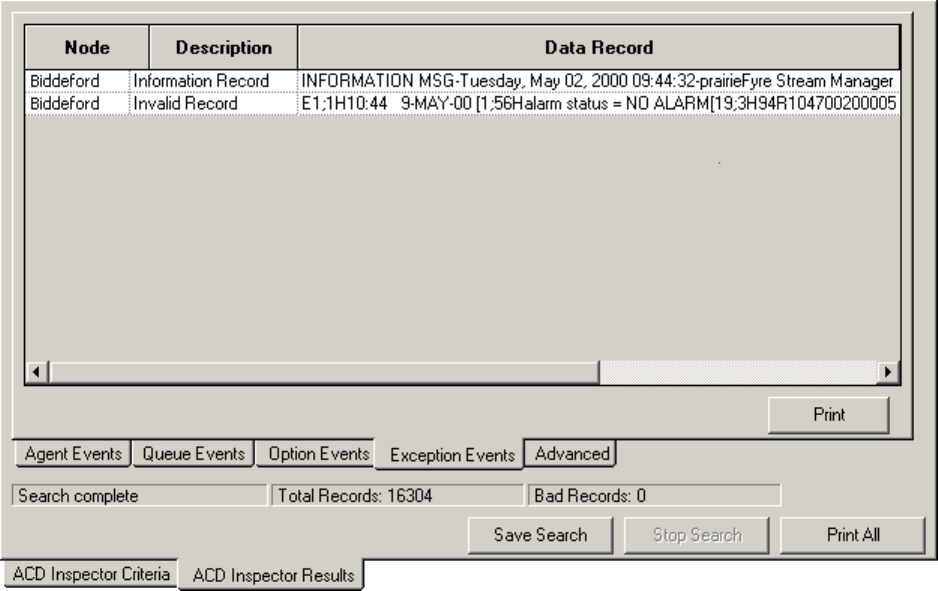
&KDSWHU'DWDPLQLQJWRROV
([FHSWLRQ(YHQWVWDE
Figure 8-10 appears when you click the Exception Events tab. It displays error and information records.
)LJXUH$&'VHDUFKUHVXOWV([FHSWLRQ(YHQWVWDE
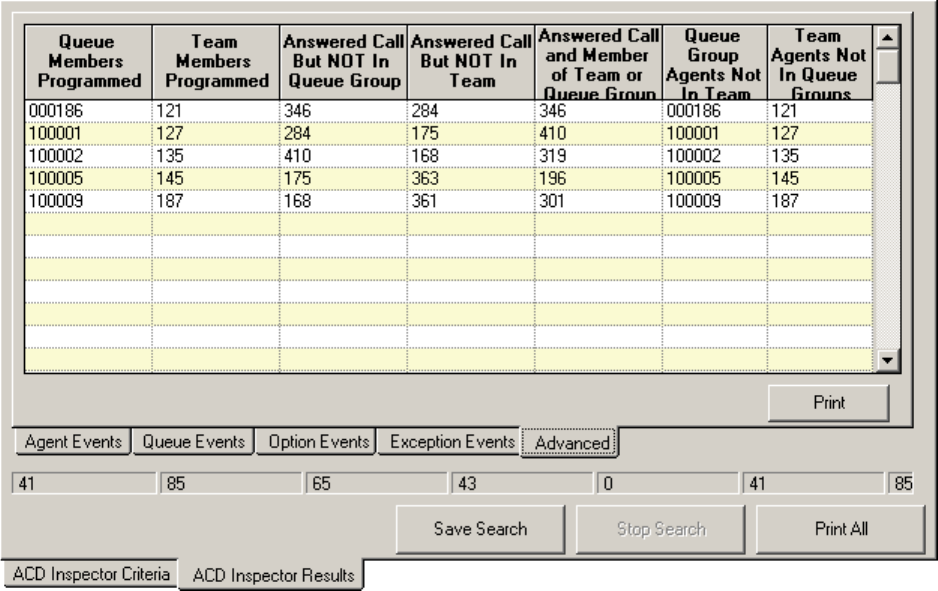
$GYDQFHG6HDUFKWDE
Figure 8-11 appears when you click the Advanced Search Results tab. It displays devices that answered
calls for the queue.
)LJXUH$&'VHDUFKUHVXOWV$GYDQFHGWDE
4XHXH0HPEHUV3URJUDPPHG
This field displays the agents associated to the queues in the selected queue group.
7HDP0HPEHUV3URJUDPPHG
This field displays the agents associated to the selected team.
$QVZHUHG&DOO%871RWLQ4XHXH*URXS
This field displays answered calls involving agents who are not programmed in the YourSite Configuration
Database as members of the queue group.
$QVZHUHG&DOO%871RWRQ7HDP
This field displays answered calls involving agents who are not programmed in the YourSite Configuration
Database as members of the team.
$QVZHUHG&DOODQG0HPEHURI7HDPRU4XHXH*URXS
This field displays the agents who answered calls that are members of the queue group or team
programmed in the YourSite Configuration Database.
4XHXH*URXS$JHQWV1RWRQ7HDP
This field displays the agents associated to the queue group but not to the team.
&KDSWHU'DWDPLQLQJWRROV
7HDP$JHQWV1RWLQ4XHXH*URXSV
This field displays the agents associated to the team but not to the queue group.
([DPSOHVRI$&'UHFRUGV
The following examples illustrate agent group and queue event records.
([DPSOH*URXS6WDWLVWLFV(YHQW
1999:12:29 006 20 14 11:33
The group statistics event indicates agent group (reporting number) 006, has 20 calls waiting, 14 available
agents and the longest waiting caller has been queued for 11 minutes, 33 seconds.
([DPSOH4XHXH6WDWLVWLFV(YHQW
1999:12:29 P121 50 34 24:08
The queue statistics event indicates queue (reporting number) 121, has 50 calls waiting, 34 available agents
and the longest waiting caller has been queued for 24 minutes, 8 seconds.
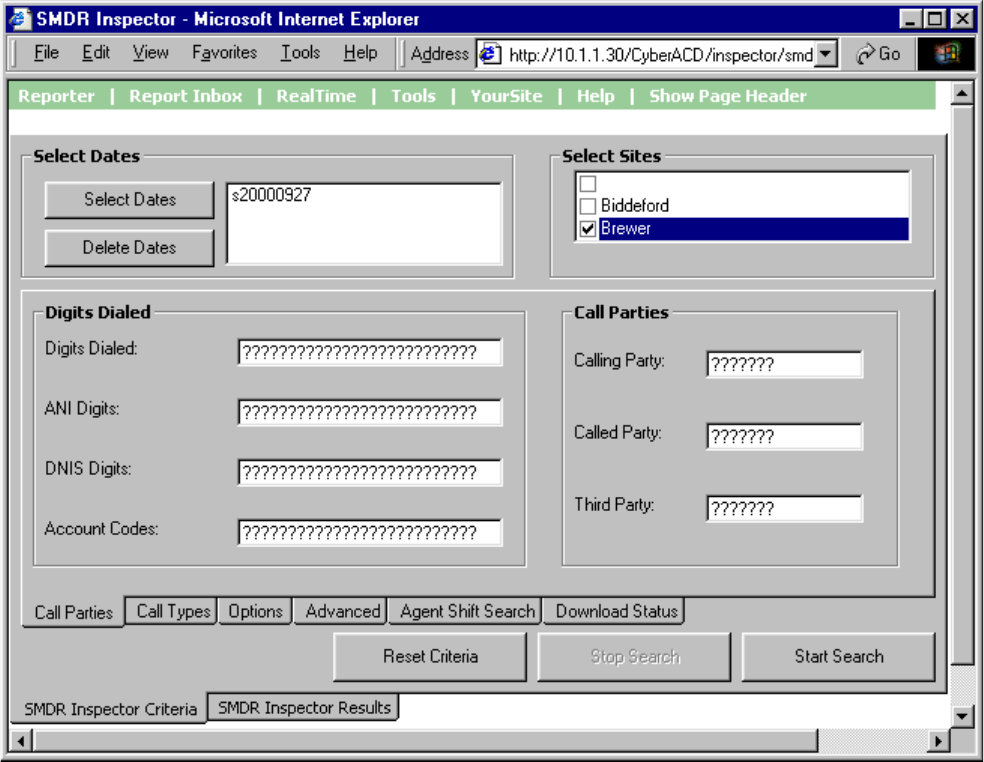
60'5,QVSHFWRU
When you click Tools=>SMDR Inspector Figure 8-12 appears. SMDR Inspector searches on call event
records.
60'5VHDUFKFULWHULD
The SMDR search tabs include Call Parties, Call Types, Options, Advanced, Agent Shift Search, and
Download Status.
)LJXUH60'5,QVSHFWRUPDLQVFUHHQFDOOSDUWLHV
60'5VHDUFKFULWHULDFDOOSDUWLHV
Figure 8-12 displays the call party criteria used in the search.
6HOHFW'DWHV'HOHWH'DWHV
The Select Dates button specifies one or more days to be included in the search. The Delete Dates button
deletes the search date currently selected.
&KDSWHU'DWDPLQLQJWRROV
6HOHFW6LWHV
The Select Sites check boxes specify the origin of the data used in the search.
'LJLWV'LDOHG
The Digits Dialed box specifies the queue number of the queue that picks up the call (for inbound calls) or
the phone number the agent dials (for outbound calls). The ANI Digits box specifies the area code and
telephone number for an inbound call. The search results contain records specific to the caller’s area code
and telephone number. The DNIS Digits box specifies the telephone number the caller dials, in call centers
where agents answer calls for more than one business or product line. The Account Code box specifies the
account code number used in the search. Agents enter account code numbers to tag inbound and outbound
calls.
&DOO3DUWLHV
The Calling Party box specifies the extension or agent number (for an outbound call), or the trunk number
(for an inbound call) used in the search. The Called Party box specifies the extension or agent number (for
an inbound call), or the trunk number (for an outbound call) used in the search. The Third Party box
searches for call records on the extension number used in a transfer.
5HVHW&ULWHULD
The Reset Criteria button resets all search parameters to their default settings.
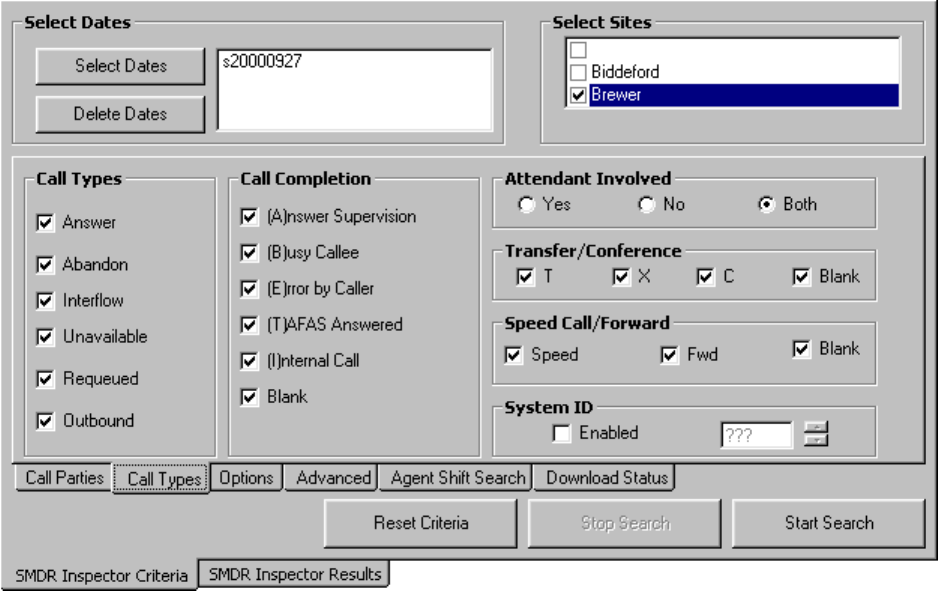
60'5VHDUFKFULWHULDFDOOW\SHV
Figure 8-13 appears when you click the Call Types tab. It displays the call type criteria used in the search.
)LJXUH60'5VHDUFKFULWHULDFDOOW\SHV
6HOHFW'DWHV'HOHWH'DWHV
The Select Dates button specifies one or more days to be included in the search. The Delete Dates button
deletes the search date currently selected.
6HOHFW6LWHV
The Select Sites check boxes specify the origin of the data used in the search.
&DOO7\SHV
The Call Types check boxes specify one or more categories of calls used in the search. The telephone
system generates an Unavailable (Path Unavailable Calls) event record when a caller dials a queue and the
queue is not available (in DND) or there are no agents logged on to answer the call.
$QVZHUHG6XSHUYLVLRQ
The Answered Supervision check box searches for call records involving calls transferred between
employees. In an answered supervised call, an employee dials another employee’s extension to transfer a
call, and waits until the employee picks up the call before hanging up.
%XV\&DOOHH
The Busy Callee check box searches for call records on queues or extensions the caller dials but finds busy.
&KDSWHU'DWDPLQLQJWRROV
(UURUE\&DOOHU
The Error by Caller check box searches for call records on numbers the caller dials that are not recognized
by the telephone system.
7$)$6$QVZHUHG
The TAFAS Answered check box searches for call records that involve calls manually picked up by agents
at alternate extensions. In a TAFAS answered call, an employee hears another employee’s phone ring and
dials a number to pick up the call.
,QWHUQDO&DOO
The Internal Call check box searches for call records on calls between employees that do not involve
trunks.
%ODQN
The Blank check box searches for call records that have no data in the Call Completion field. That is, when
the check box is selected, the search output contains records where there is nothing recorded in the Call
Completion field.
$WWHQGDQW,QYROYHG
The Attendant Involved radio buttons specify whether or not call records for calls involving an automated
attendant are used in the search.
7UDQVIHU&RQIHUHQFH
The Transfer/Conference check box searches for records on transferred or conferenced calls, or interflowed
calls that are not picked up by an agent.
6SHHG&DOO)RUZDUG
The Speed Call/Forward check boxes search for call records involving a speed dial and/or conference
function. When the Blank check box is selected, the search output contains records where there is nothing
recorded in the Speed or Fwd check boxes.
6\VWHP,'
The System ID check box searches for call records that pertain to a specific telephone system. In a multi-
site enterprise, you program each telephone system with a 3-digit system ID number. You can distinguish
records by their system ID number. The telephone system appends it to all SMDR records.
5HVHW&ULWHULD
The Reset Criteria button resets all search parameters to their default settings.
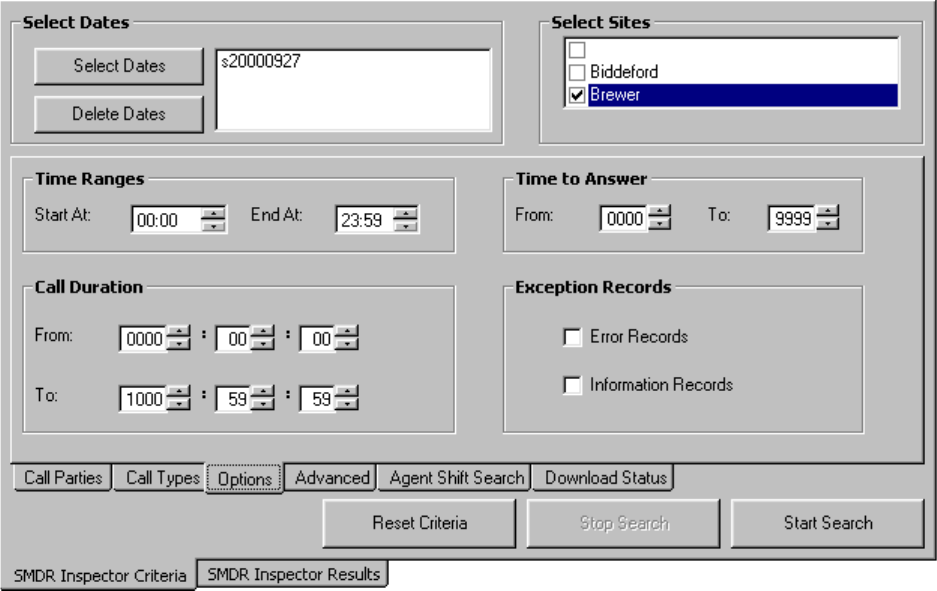
60'5VHDUFKFULWHULDRSWLRQV
Figure 8-14 appears when you click the Options tab. It displays the time range, error, and information
criteria used in the search.
)LJXUH60'5VHDUFKFULWHULDRSWLRQV
6HOHFW'DWHV'HOHWH'DWHV
The Select Dates button specifies one or more days to be included in the search. The Delete Dates button
deletes the search date currently selected.
6HOHFW6LWHV
The Select Sites check boxes specify the origin of the data used in the search.
7LPH5DQJHV
The Time Ranges boxes specifies the time interval used in the search.
7LPHWR$QVZHU
The Time to Answer boxes specify a range of values for the Time to Answer statistic used in the search. For
example, if you select a time to answer of 240 to 999 seconds, the search records include calls that were
answered by an agent after waiting at least 240 seconds to be answered.
&DOO'XUDWLRQ
The Call Duration boxes specify a range of values for the Call Duration statistic used in the search.
&KDSWHU'DWDPLQLQJWRROV
([FHSWLRQ5HFRUGV
The prairieFyre Service tags telephone system records that contain errors with an E (telephone system 1) or
e (telephone system 2). You select the Error Records check box to include these records in the search
output.
The prairieFyre Service writes a log record to the data stream upon start up. It tags the log record with an I
to indicate it is an information record. You select the Information Records check box to include log records
in the search output. ACD Inspector displays the error and information search result records on the
Exception Records tab.
In call centers that have two telephone systems, the prairieFyre Service tags records from the second
telephone system with an S. You specify the comports used by your telephone systems on the System
Settings tab of the Management Console program.
5HVHW&ULWHULD
The Reset Criteria button resets all search parameters to their default settings.
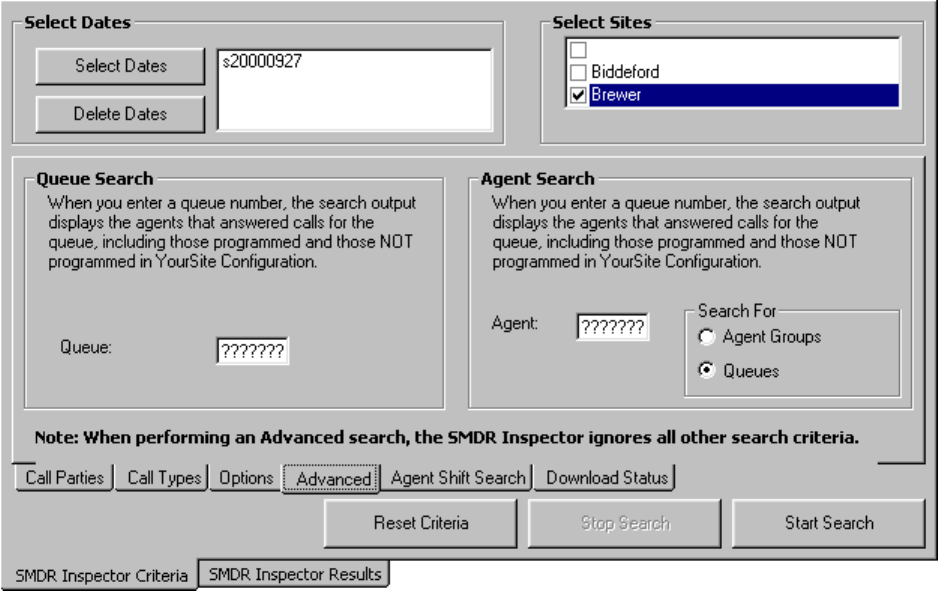
60'5VHDUFKFULWHULDDGYDQFHG
Figure 8-15 appears when you click the Advanced tab. It verifies the agents, agent groups, and queues not
programmed in the Yoursite Database.
)LJXUH60'5VHDUFKFULWHULDDGYDQFHG
If you run a report and notice that the data for a particular device is missing from the report output, verify
the device is programmed in the telephone system and in the YourSite Database. If you determine the
device is missing from the database, add it to the database and use the Summarize Data command (on the
Management Console program) to update the prairieFyre Service and the SQL database with the complete
telephone system data. You can then produce reports on the device.
NOTE: When you perform an advanced search, SMDR Inspector ignores all other search criteria.
You enter information in the Queue or the Agent box when you perform a search. Do not use wild card
symbols such as the star [ * ] or pound sign [ # ] in the search.
6HOHFW'DWHV'HOHWH'DWHV
The Select Dates button specifies one or more days to be included in the search. The Delete Dates button
deletes the search date currently selected.
6HOHFW6LWHV
The Select Sites check boxes specify the origin of the data used in the search.
4XHXH6HDUFK
When you type a queue number in the Queue box, the search output displays
&KDSWHU'DWDPLQLQJWRROV
• The agents that answered calls for the queue that are programmed in the Yoursite Database
• The agents that answered calls for the queue that are not programmed in the Yoursite Database
$JHQW6HDUFK
When you type an agent or queue number in the Agent box, the search output displays
• The queues or agent groups for which the agent answered calls that are programmed in the Yoursite
Database for the agent
• The queues or agent groups for which the agent answered calls that are not programmed in the Yoursite
Database for the agent
5HVHW&ULWHULD
The Reset Criteria button resets all search parameters to their default settings.
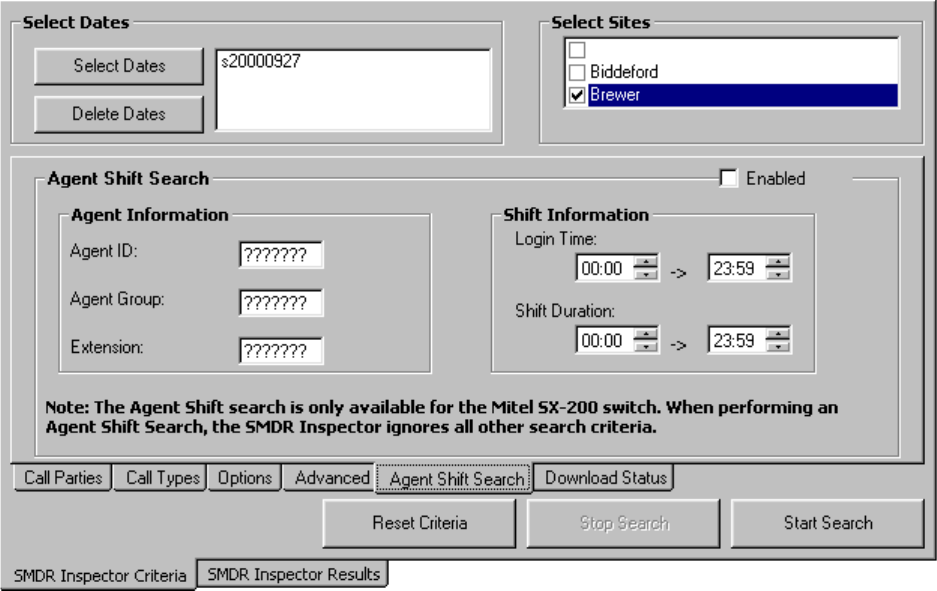
60'5VHDUFKFULWHULDDJHQWVKLIW
Figure 8-16 appears when you click the Agent Shift tab. It displays the shift information criteria used in the
search.
)LJXUH60'5VHDUFKFULWHULDDJHQWVKLIW
6HOHFW'DWHV'HOHWH'DWHV
The Select Dates button specifies one or more days to be included in the search. The Delete Dates button
deletes the search date currently selected.
6HOHFW6LWHV
The Select Sites check boxes specify the origin of the data used in the search.
$JHQW,QIRUPDWLRQ
The Agent Information boxes specify the agent ID, agent group, or extension used in the search.
6KLIW,QIRUPDWLRQ
The Shift Information boxes specify ranges of values for the login time and shift duration used in the
search.
5HVHW&ULWHULD
The Reset Criteria button resets all search parameters to their default settings.
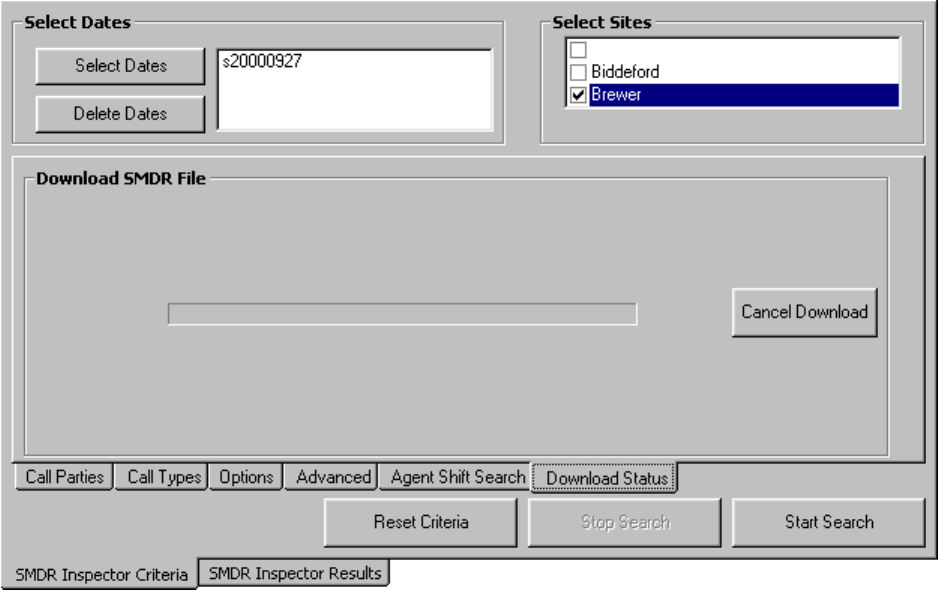
&KDSWHU'DWDPLQLQJWRROV
60'5VHDUFKFULWHULDGRZQORDGVWDWXV
Figure 8-17 appears when you click the Download Status tab. It displays status messages on the progress of
files being transferred from the server to the client computer. Typically you will only see status messages if
your network is slow.
)LJXUH60'5VHDUFKFULWHULDGRZQORDGVWDWXV
5XQQLQJVHDUFKHVLQ60'5,QVSHFWRU
When you run a search, SMDR Inspector searches through the raw telephone system data on the local hard
drive.
NOTE: When you program the telephone system with a path number such as six, you enter this number in
the YourSite Database as queue reporting number P006 (for the SX-2000) or P0006 (for the SX-200 and the
SX-200 with real-time). ACD queue numbers are four digits in length: P001 (for the SX-2000), or five or
six digits in length: P0001 or P00001 (for the SX-200 and the SX-200 with real-time). When you run
searches on queues in ACD Inspector, be sure to include a P preceding the queue number.
:LOGFDUG6HDUFKHV
On the SMDR Inspector criteria tabs, some of the search fields contain question marks. You can enter a
DNIS number, such as 3000, in the DNIS search field (on the Call Parties tab) and the search will produce
only records that involve DNIS number 3000.

Alternatively, you can run wildcard searches. For example, if you enter "." in the DNIS search field and
P5000 in the Digits Dialed field, the search will produce only records that involve queue P5000 AND ANY
DNIS number. If you enter "???????" in the DNIS search field, the search will produce only records that
involve ANY DNIS number.
To search for a string of numbers within a digits dialed string, enclose the string of numbers in parenthesis,
such as "8905". The search will produce only records that include 8905 in the digits dialed string.
To search for records where the calling, called or third party involved a trunk (BOTH T and X in one
search), put a C in the calling, called or third party field (C as in CO).
The following example demonstrates how to run an advanced search in SMDR Inspector.
Suppose your Agent Group and Queue Reports do not line up: your Agent Group Report shows less calls
answered than your Queue Report. You know that only one Agent Group is scheduled to answer calls for
the queue. You need to find out which other agents were answering calls for the queue.
To determine which other agents answered calls for the queue:
&OLFNWKH60'5,QVSHFWRU&ULWHULDWDE
&OLFNWKH$GYDQFHGWDE
&OLFN6HOHFW'DWHVDQGVHOHFW-DQXDU\
,QWKH4XHXHER[W\SH3
&OLFN6WDUW6HDUFK
The SMDR Inspector Results - SMDR Search Results screen appears.
&OLFNWKH$GYDQFHG6HDUFK5HVXOWVWDE
Figure 8-18 appears.
)LJXUH$JHQWVZKRDQVZHUHGFDOOVIRUWKHTXHXH
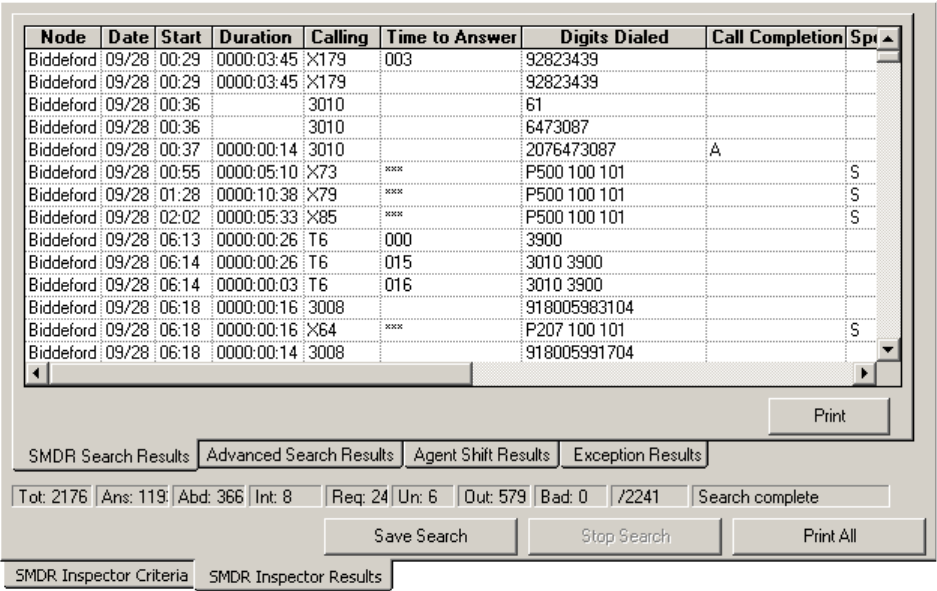
&KDSWHU'DWDPLQLQJWRROV
The search output shows
• The agents that answered calls for P121 that are programmed in the YourSite Database
• The extensions and agents that answered calls for P121 that are not programmed in the YourSite
Database
You can print the search results and compare them to the YourSite Database programming.
,QWHUSUHWLQJ60'5VHDUFKUHVXOWV
This section describes the SMDR search output records available. When you run a search in SMDR
Inspector Figure 8-19 appears.
)LJXUH60'5VHDUFKUHVXOWV60'56HDUFK5HVXOWVWDE
60'56HDUFK5HVXOWVWDE
The SMDR Search Results tab displays call event records for ACD agents. It displays call event search
records.
1RGH
The Node field identifies the switch that produced the event record.
'DWHPPGG
The date is reported numerically as a 2-digit month followed by a 2-digit day. The year is not reported.
6WDUW7LPHKKPPS
The start time of a call is reported in hours and minutes in either a 12- or 24-hour format. If a 12-hour clock
is used, the letter P indicates P.M.
'XUDWLRQRI&DOOKKPPVV
The duration of a call is reported in hours, minutes and seconds. Leading zeros are output (Maximum time
= 99 hours, 59 minutes, 59 seconds). If the call duration exceeds 100 hours, a call duration of 99 hours, 99
minutes, 99 seconds will be recorded.
&DOOLQJ3DUW\SSSS
This is the identity of the party that originated the call. It may be a station, an attendant, or an incoming
trunk, as described below:
(a) Station Number as Calling Party (cccc). A station number may be one to four digits (0-9, *, #) which
are left-justified; that is, no leading zeros.
(b) Attendant as Calling Party (ATTm). Calls originated by an attendant that do not involve a third party
are reported as a calling party by ATT followed by the console number. When the console number is in
the range of 10 through 99, the format is modified to be ATmm. If an attendant calls an outside party on
behalf of a station or trunk, that station or trunk is reported as the caller but the attendant flag symbol
[*] appears in the Attendant was Involved field.
(c) Trunk Number as Calling Party (Tnnn or Xnnn). When the originating party is an incoming CO trunk,
Tnnn appears on the record, where nnn is the number of the trunk. If the trunk number is less than three
digits long, it is left-padded with zeros. If the extended digit length option is enabled, the trunk number
nnnn may be up to four digits long, left-justified and without leading zeros. When the originating party
is an incoming non-CO trunk, Xnnn appears in the trunks record.
The T or X ensures that CO trunks and CO Attendant trunks can be distinguished from tie trunks. The
trunk number is the trunk ID specified during customer data entry in the Trunk Assignment form.
$WWHQGDQWI
This 1-digit field contains an asterisk [*] when a call is assisted by, or initially answered by, an attendant.
This flag will not appear if a call is transferred to an attendant.
7LPHWR$QVZHUWWW
This is the number of seconds from the time an incoming external call rings the destination until the call is
answered. If a call is never answered, this field displays three asterisk [***]. Leading zeros are output and
the field remains at 999 when an overflow is reached. If the MITEL Call Distribution (MCD) feature
package is installed, and the MCD report transfers option is enabled, this field contains the total time to
answer regardless of the number of times the call is rerouted. This field does not apply to Internal SMDR.
'LJLWV'LDOHG[[[
External SMDR: The external SMDR application records the digits dialed on the outgoing trunk. A
maximum of 26 digits is recorded. This number is reduced to 20 when the Report Meter Pulses option is
selected in CDE. This field does not include the trunk group access code on outgoing calls. The digits
recorded are the actual digits outpulsed on the trunk after digit modification has been performed. On
incoming calls, the digits dialed in on the trunk are recorded. When more than 26/20 digits are dialed, the
remaining digits are ignored.
&KDSWHU'DWDPLQLQJWRROV
If the MCD option is enabled, each device is listed whenever the call is rerouted, rather than the last device
as in non-MCD loads. To reflect the MCD option, the Digits Dialed on the Trunk field shows dd1 ddd2
ddd3.
Internal SMDR: The Internal SMDR application records the digits dialed on an internal line. Up to 26 digits
are recorded.
&DOO&RPSOHWLRQ6WDWXVK
External SMDR (Outgoing Calls): This reports the completion status of an outgoing call in so far as the
telephone system is able to determine it. When an outgoing call fails toll-deny checking and is dropped, this
field contains a T. When the trunk group is programmed to receive Answer Supervision and a supervision is
received, an A is reported. When the trunk group is programmed for Toll Reversal and a supervision is
received, a T is reported.
External SMDR (Incoming Calls): The telephone system can monitor the outcome of a call and can provide
a comprehensive report on call completion. When the station or hunt group to which a call is directed is
busy, a B is recorded. When an incoming trunk accesses an invalid number and receives reorder tone, an E
is reported. An E is also reported for incomplete calls. A T is reported if the incoming trunk is answered
with Trunk Answer From Any Station (TAFAS) and if an outgoing trunk call is toll denied, or if the call is
Pickup answered. When an incoming call is forwarded by an attendant to a busy station, a B appears in the
call completion status field, the number called appears as the third party, and the Attendant appears as the
called party.
Internal SMDR: An I indicates that an internal call was completed.
6SHHG&DOORU&DOO)RUZDUG)ODJV6RU)
This field contains an S when the number is speed dialed, and an F when an external call is forwarded
through the external call forward feature.
If Internal SMDR is enabled, an F is also recorded when an internal call is forwarded through the call
forward feature. However, for internal calls the Third Party field does not contain the number of the station
that initiated the call forward feature. The Third Party field is left blank because the Digit Dialed field
identifies the station that has call forward enabled.
&DOOHG3DUW\TTTT
A called party can be a station number, an attendant, or for outgoing calls, the outgoing trunk number. The
Called Party output format is identical to that used for the Calling party. See Calling Party (pppp). For
incoming calls to an attendant, the called party is recorded as the attendant unless the attendant transfers a
call to a station. For direct-in-lines, it would be the station number. On outgoing calls handled by an
attendant, the called party would be the outgoing trunk’s ID.
7UDQVIHU&RQIHUHQFH&DOO.
This field identifies calls involving three or more parties. It contains a T for supervised transfers, X for
unsupervised transfers (that is, transfer into busy reports a T, transfer into ringing reports an X), and a C for
3-way conversations or conferences.
7KLUG3DUW\UUUU
The third party field contains the number of the station to which a trunk call has been transferred. When
several transfers take place during a trunk call, the first party is the only one reported, as long as MCD
Report Transfers = No, and Record Transfers = No.
If an external call is made to a station whose call forwarding is set to an external number, the Third Party
field contains the number of the station that initiated the call forward feature. For internal calls, the Third
Party field is left blank because the Digit Dialed field identifies the station that has external call forward
enabled.
$FFRXQW&RGHDDD
Enabling the report account codes option in the SMDR Options Assignment form allows an account code
of two to 12 digits to be recorded here, if one is used to make a call. Leading zeros are reported if they are
entered.
5RXWH2SWLPL]DWLRQ)ODJV
At the starting and end nodes of a network call a flag will appear in this field if route optimization has taken
place. A route optimized call involves two different trunks to the same party: the pre-optimization trunk and
the post-optimization trunk. An SMDR record will be generated for both trunks, which will be
distinguished by a lower case r for the pre-optimization trunk, and an upper case R for the post-
optimization trunk. Route Optimization is only available with the MSDN/DPNSS Voice IV feature
package.
6\VWHP,GHQWLILHULLL
This optional 3-digit field may contain values from 000 to 999. 000 indicates that no identifier has been
entered. In the absence of a System Identifier, a Node Identifier is printed (when programmed). When more
than one node identifier exists, the first one on the programmed list is printed. When both a System ID and
a Node ID are programmed, the System ID takes precedence. Programming of System Identifiers and Node
Identifiers is described in the Customer Data Entry volume.
$1,'1,6[[[[[[[[[
ANI/DNIS digits are recorded in this field. ANI and DINS numbers can be up to 10 digits in length, and are
recorded for incoming calls on ANI/DNIS trunks. COS option ANI/DNIS reporting must be enabled.
NOTE: If you enabled the extended digit length option in the telephone system SMDR Options
Assignment form, the following fields will be affected.

&KDSWHU'DWDPLQLQJWRROV
$GYDQFHG6HDUFK5HVXOWVWDE
Figure 8-20 appears when you click the Advanced Search Results tab. It displays devices that answered
calls for the queue.
)LJXUH60'5VHDUFKUHVXOWV$GYDQFHG6HDUFK5HVXOWVWDE
'HYLFHV3URJUDPPHGLQWKH'DWDEDVH'HYLFHV1273URJUDPPHGLQWKH
'DWDEDVH
The search output shows
• The agents that answered calls for the queue that are programmed in the YourSite Database
• The extensions and agents that answered calls for the queue that are not programmed in the YourSite
Database
You can print the search results and compare them to the YourSite Database programming.
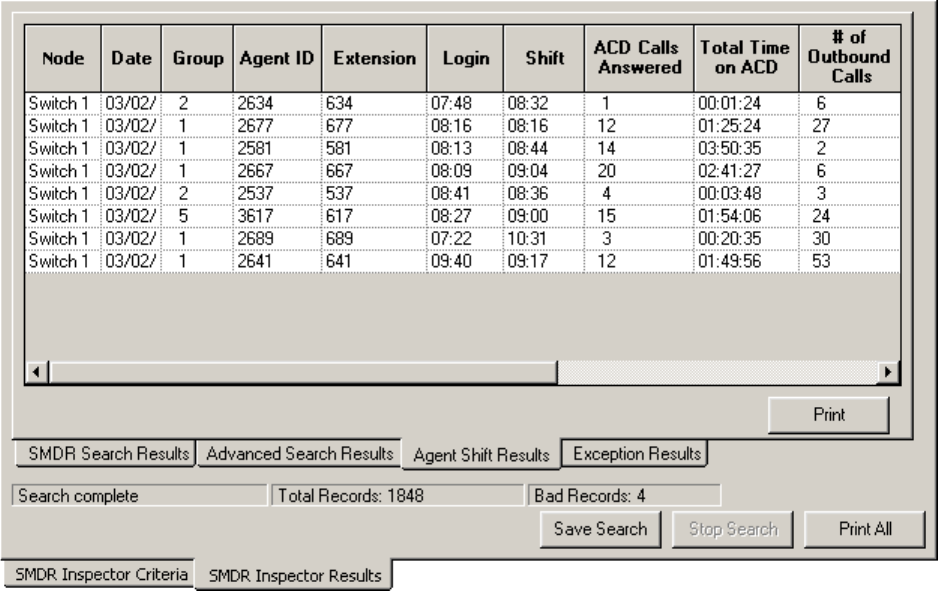
$JHQW6KLIW5HVXOWVWDE
Figure 8-21 appears when you click the Agent Shift Results tab. It displays shift activity statistics for
agents, agent groups, and extensions. .
)LJXUH60'5VHDUFKUHVXOWV$JHQW6KLIW5HVXOWVWDE
1RGH
The Node field identifies the switch that produced the event record.
'DWHPPGG
The date is reported numerically as a 2-digit month followed by a 2-digit day. The year is not reported.
*URXS
The Group field displays the agent group to which the agent belongs.
$JHQW,'
The Agent ID field displays the identification number of the agent.
([WHQVLRQ
The Extension field displays the extension to which the agent logged on.
/RJLQ
The Login field displays the time the agent logged on.
&KDSWHU'DWDPLQLQJWRROV
6KLIW
The Shift field displays the total shift time for the agent.
$&'&DOOV$QVZHUHG
The ACD Calls Answered field displays the total number of ACD calls answered by the agent.
7RWDO7LPHRQ$&'
The Total Time on ACD field displays the total time the agent spent on ACD calls.
1XPEHURI2XWERXQG&DOOV
The Number of Outbound Calls displays the total number of non-ACD calls answered by the agent.
7RWDO7LPHRQ2XWERXQG
The Total Time on Outbound calls field displays the total time the agent spent on outbound calls.
0DNH%XV\
The Make Busy field displays the number of times the agent entered the make busy state.
7RWDO7LPHLQ0DNH%XV\
The Total Time in Make Busy field displays the total time the agent spent in the make busy state.

([FHSWLRQ5HFRUGVWDE
Figure 8-22 appears when you click the Exception Results tab. It displays error and information records.
)LJXUH60'5VHDUFKUHVXOWV([FHSWLRQ5HVXOWVWDE
1RGH
The Node field identifies the switch that produced the event record.
'HVFULSWLRQ
The Description field displays the record type: Error Record or Information Record.
'DWD5HFRUG
The Data Record field displays detailed information on the exception record.

&KDSWHU'DWDPLQLQJWRROV
60'5UHFRUGILHOGV
This section describes the SMDR search output records available. The information originates from the
Mitel "SX-2000 Applications Package" on the "SX-2000 Technical Documentation CD-ROM" (PN 9125-
080-221-NA).
The telephone system records SMDR data in table format. Table 10-1 provides information used to
interpret the SMDR Inspector search output. It summarizes the SMDR record fields and provides the
meaning of the symbols used.
7DEOH6XPPDU\RIILHOGVLQ60'5UHFRUGV
1DPH )RUPDW 'HILQLWLRQ 1RWHV
Date mm/dd mm = Month
dd = Day mm = 01 - 12
dd = 01 - 31
Start Time hh:mmp hh = Hours
mm = Minutes
p = pm
hh = 00 - 12 or 00 - 23
mm = 00 - 59
p = P.M. (12-hour clock)
Duration of
Call hh:mm:ss
hhhh:mm:ss
hh:mm:ss = duration in
hours:minutes:seconds
hhhh:mm:ss = duration in
hours:minutes: seconds
hh = 00 - 99
mm = 00 - 99
ss = 00 - 99
hhhh = 0000 - 9999
mm = 00 - 99
ss = 00 - 99
Calling
Party pppp
ppppppp
cccc = Extension #
Tnnn = Trunk # (CO)
Xnnn = Trunk # (non-CO)
ATTm = Attendant
ccccccc = Extension #
Tnnnn = Trunk # (CO)
Xnnnn = Trunk # (Non-CO)
ATTmm = Attendant
c = 0 - 9, *, #
nnn = 000 - 999
m = Console # (ATmm for
Attendant 00 - 99)
c = 0 - 9, *, #
nnnn = 0000 - 9999
mm = Console #
Attendant f * = Attendant
-- = Attendant not involved Attendant answered or
initiated the call, then
transferred it to an
extension
Time to
Answer ttt ttt = time in seconds (000 -
999) *** = Call unanswered Leading zeros output.
Incoming calls only.

Digits
Dialed on
the Trunk
xx...x
x...x y...y
or
Tx...x y...y
(Network
Format)
Up to 26 (20 if metering)
digits dialed on the trunk
Network Format: up to 26
digits (20 if metering) in total
x = 0 - 9, *, #
y = 0 - 9, *, #
x...x = Node ID &
Extension # (up to 14
digits); y...y = actual digits
dialed
Tx...x = Node ID & Trunk
#
Call
Completion
Status
h A = Answer Supervision
B = Called Party Busy
E = Caller Error
I = Internal Call
R = Requeue Call
T = Toll-Denied, TAFAS
answered, or Pickup
answered
Outgoing
Incoming Direct/Dial-In
Incoming/Dial-In
Incoming
Incoming/Outgoing
Speed Call
or Call Fwd
Flags
S or F S = Number was Speed
called
F = External call forwarded
through External Call Fwd
feature or internal call
forwarded through Call
Forward feature
Outgoing
Called Party qqqq
qqqqqqq
cccc = Extension #
Tnnn = Trunk # (CO)
Xnnn = Trunk # (non-CO)
ATTm = Attendant
ccccccc = Extension #
Tnnnn = Trunk # (CO)
Xnnnn = Trunk # (non-CO)
ATTmm = Attendant
c = 0 - 9, *, #
nnn = Range specified in
telephone system form
programming
m = Console # (ATmm
for Attendant 00 - 99)
c = 0 - 9, *, #
nnnn = 0000 - 9999
mm = Console #
Transfer/
Conference
Call
K T = Supervised Transfer
X = Unsupervised Transfer
C = 3-Way or Conference
U = Path Unavailable
I = Interflow
U and I only apply to
ACD
TELEMARKETER®
2000.
7DEOH6XPPDU\RIILHOGVLQ60'5UHFRUGV
1DPH )RUPDW 'HILQLWLRQ 1RWHV

&KDSWHU'DWDPLQLQJWRROV
Third Party rrrr
rrrrrrr cccc = Extension #
cccccccc = Extension # c = 0 - 9, *, #
c = 0 - 9, *, #
Account
Code (Opt.) aa....a Length of 2 to 12 digits a = 0 - 9, space-filled
Route
Optimizatio
n Flag
(Opt.)
s r = pre-optimization trunk
R = post-optimization trunk
- = Space (no route
optimization)
System
Identifier
(Optional)
iii Entered by System ID i = 0 - 9
iii = 000 - 999
000 = No Code Entered
In the absence of a System
ID, a Node ID is printed (if
programmed). When both
System ID and Node ID
are programmed, System
ID takes precedence.
ANI/DNIS xx...xxxxxxx Format:
-aaaaaaaaaa-dddddddddd
- = blank
a = ANIS digit
d = DNIS digit
Extended Digit Length
Format:
-aaaaaaaaaa-ddddddd
For Extended Digit Length
format only the 7 right
most DNIS digits are
recorded.
7DEOH6XPPDU\RIILHOGVLQ60'5UHFRUGV
1DPH )RUPDW 'HILQLWLRQ 1RWHV
([DPSOHVRIH[WHUQDO60'5UHFRUGV
The following examples illustrate External SMDR call records, with and without Extended Digit Length,
Network Format, and SMDR Record Transfer options enabled.
([DPSOHSDUW\RXWJRLQJFDOO
06/13 11:42 00:08:29 214 16139252122 A T054 000
On June 13 at 11:42 A.M., station 214 accessed trunk number 54 and dialed 613-592-2122. Answer
supervision (A) was provided. The conversation lasted 8 minutes, 29 seconds.
([DPSOHSDUW\RXWJRLQJFDOO
05/17 10:51 00:01:52 213 201 A X082 1200 000
On May 17 at 10:51 A.M., station 213 accessed an identified tie trunk, then 201 to obtain a station in the
other telephone system. The other telephone system provided answer supervision (A) and the conversation
lasted 1 minute, 52 seconds. The trunk number was 082.
([DPSOHSDUW\LQFRPLQJFDOO
01/30 03:10P 00:02:22 T102 008 201 201 000
On January 30 at 3:10 P.M., incoming direct-in trunk number 102 rang in to station 201. The station
answered after 8 seconds and the two parties talked for 2 minutes, 22 seconds.
([DPSOHSDUW\LQFRPLQJFDOO
03/12 09:11 00:01:12 X116 007 63224 224 000
On March 12 at 9:11 A.M., dial-in tie trunk 116 dialed hunt group with access code “63”. Station 224
answered after 7 seconds, and the conversation lasted 1 minute, 12 seconds.
([DPSOH$WWHQGDQWKDQGOHGFDOORXWJRLQJWUXQN
01/30 03:27P 00:35:11 201 * 16545996951 A T052 000
On January 30, station 201 dialed the attendant and asked for an outside line. The attendant dialed 1-654-
599-6951. At 3:27 P.M., the called party answered and the conversation lasted 35 minutes, 11 seconds.
trunk number 52 was used. An A appears before the number of the trunk because the attendant handled the
call (Answer supervision).
([DPSOH$WWHQGDQWKDQGOHGFDOOLQFRPLQJWUXQN
04/15 01:42P 00:00:31 T090 *009 ATT2 000
On April 15 at 1:42 P.M., trunk 90 rang in to the attendant. After 9 seconds, the attendant at Console 2
answered. The calling party spoke to the attendant for 31 seconds, and then hung up.
([DPSOH&DOOLQJVWDWLRQWUDQVIHUFDOO
04/02 09:36 00:04:55 103 5922122 T162T 100 000
&KDSWHU'DWDPLQLQJWRROV
On April 2 at 9:36 A.M., station 103 dialed a trunk access code followed by 592-2122. The called party
answered, and after conversing, the caller transferred the called party to station 100. After further
conversation station 100 hung up. The total period for both conversations was 4 minutes, 55 seconds. trunk
equipment 162 was used for the call.
([DPSOH&DOOHGVWDWLRQWUDQVIHUFDOO
03/12 07:42 00:03:06 T162 *003 241T 215 000
On March 12 at 7:42 A.M., trunk 162 rang the console and requested station 241. The attendant took 3
seconds to answer the call. Station 241 then transferred the call to station 215. The total conversation lasted
3 minutes, 6 seconds.
([DPSOH$WWHQGDQWFRQWUROOHGFRQIHUHQFHZLWKWUXQN
03/10 09:48 00:13:40 ATT1 5924130 T178C 000
At 9:48 A.M. on March 10, the attendant dialed the CO trunk access code and seized trunk number 178.
The call was then completed by dialing 592-4130. After speaking to the called party, the attendant set up a
controlled conference (C) by dialing some internal stations and adding them to the conference in turn. The
conference lasted for 13 minutes, 40 seconds. The record does not show what or how many stations were
added.
([DPSOH,QFRPLQJFDOOFDOOIRUZDUGHQDEOHGDWFDOOHGVWDWLRQ
01/13 10:22 00:02:35 X014 5922122 FT005 1200 000
At 10:22 A.M. on January 13, a call was received on an incoming trunk, 014. Because Call Forwarding was
in effect at the called station (1200), the call was routed on a CO trunk (005) to the external number 592-
2122.
([DPSOH,QWHUQDOFDOOFDOOIRUZDUGHQDEOHGDWFDOOHGVWDWLRQ
01/13 10:25 00:05:57 1202 5922122 FT005 1200 000
At 10:25 A.M. on January 13, an internal call was generated at station 1202 to reach station 1200. Since
station 1200 had Call Forwarding in effect, the call was routed to an external number, 592-2122 via an
external CO trunk, number 005.

$GYDQFHG,QVSHFWRU
Using Advanced Inspector, you can determine why there are discrepancies between reports, verify the
programming of the telephone system and the YourSite Database, and compare the data output by the ACD
and SMDR data streams. The results are displayed in a table. The search output also provides a written
explanation for the results.
The following three examples demonstrate how to run searches in Advanced Inspector.
([DPSOH:K\DUHWKH$JHQW3HUIRUPDQFHE\3HULRG5HSRUWVDQG$JHQW
(YHQWE\3HULRG5HSRUWVGLIIHUHQW"
This search compares the SMDR and ACD data streams for agent events by time. You can search on ACD
answered calls, personal answered calls, and/or outgoing calls.
Suppose you compare the Agent Performance by Period and Agent Event by Period Reports for a particular
agent, and notice a discrepancy in the number of calls answered by the agent.
To examine the SMDR and ACD data streams for ACD answered and personal answered calls:
7\SHWKH85/KWWSZZZSUDLULHI\UHFRP>\RXU&&0(QWHUSULVHVHUYHU
DGGUHVV@&&0
&OLFN7RROV !$GYDQFHG,QVSHFWRU
The Advanced Inspector window appears. See Figure 8-23.
)LJXUH$GYDQFHG,QVSHFWRUZLQGRZ
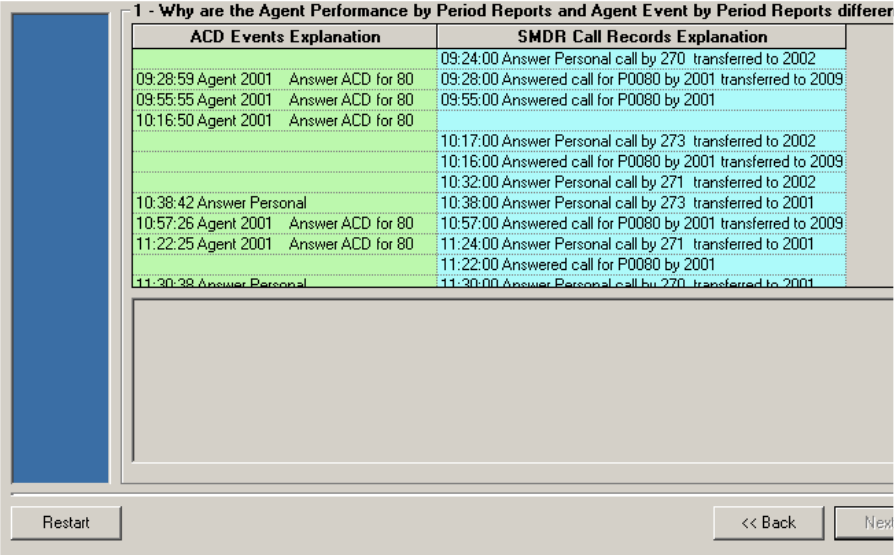
&KDSWHU'DWDPLQLQJWRROV
&OLFN:K\DUHWKH$JHQW3HUIRUPDQFHE\3HULRG5HSRUWVDQG$JHQW(YHQWE\
3HULRG5HSRUWVGLIIHUHQW DQGFOLFN1H[W
6HOHFWWKHFKHFNER[HVIRUDJHQWV\RXZRXOGOLNH,QVSHFWRUWRDQDO\]HDQGFOLFN1H[W
6HOHFWWKH$&'$QVZHUHG&DOOVDQG3HUVRQDO$QVZHUHG&DOOVFKHFNER[HVDQG
FOLFN1H[W
6HOHFWRQHRUPRUHGDWHVDQGFOLFN1H[W
Figure 8-24 appears.
)LJXUH$JHQW3HUIRUPDQFHE\3HULRGYV$JHQW(YHQWE\3HULRG

The search output for ACD answered and personal answered calls shows a discrepancy between the records
produced by the ACD stream and those produced by the SMDR stream. The ACD stream produced a
record for a personal call made at 10:16:50 and the SMDR stream did not.
The search output provides numerous possible explanations. The call center has an SX-200. The SX-200
does not support internal SMDR records, which is why the call was not reported by the SMDR stream.
([DPSOH'R,KDYH60'5UHFRUGVIRULQWHUQDOFDOOV"
If you have an SX-2000 and the Internal Calls option is enabled on the telephone system, the output from
this search provides all of the SMDR call records that pertain to internal calls, for one or more 6110 CCM
nodes.
Suppose you think your agents are answering more calls than your agent reports suggest. This may be
because Internal SMDR is not enabled on your telephone system and 6110 CCM is not reporting on internal
calls.
To determine if you have internal SMDR enabled on the telephone system:
&OLFN7RROV !$GYDQFHG,QVSHFWRU
&OLFN'R,KDYH60'5UHFRUGVIRULQWHUQDOFDOOV"DQGFOLFN1H[W
6HOHFWWKHFKHFNER[IRUWKH&&0QRGH\RXZDQWWRDQDO\]HDQGFOLFN1H[W
6HOHFWRQHRUPRUHGDWHVDQGFOLFN1H[W
Figure 8-25 appears.
)LJXUH60'5UHFRUGVIRULQWHUQDOFDOOV
The message in Figure 8-25 pertains to the SX-200. The SX-200 does not produce SMDR records for
internal calls. If you have an SX-2000 and have not purchased the Internal SMDR option and enabled it on
the telephone system, or no data was generated for internal calls, the search will not report any SMDR
records for internal calls.
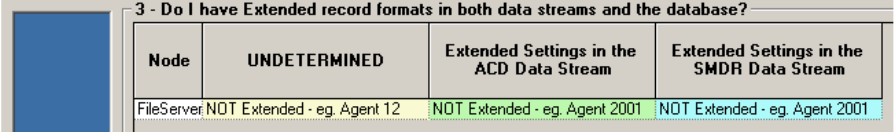
&KDSWHU'DWDPLQLQJWRROV
([DPSOH'R,KDYHH[WHQGHGUHFRUGIRUPDWVLQERWKGDWDVWUHDPVDQGWKH
GDWDEDVH"
This search compares the YourSite Database programming and the SMDR and ACD data streams to
determine if the record format for a particular node has extended agent or extension IDs.
Call centers with extended agent or extension IDs (IDs greater than four digits) must have the Extended
SMDR option enabled on the telephone system (SMDR Options/COS Assignment form) to prevent the
telephone system from truncating the call record data.
Suppose your extension reports do not show any data. This can occur when the extension numbers in the
YourSite Database are not associated to extension groups, or differ from those programmed in the
telephone system. This can also occur when the extension numbers in the telephone system are greater
than four digits and Internal SMDR is not enabled in the telephone system.
To examine the YourSite Database and SMDR and ACD data streams for extended record formats:
&OLFN7RROV !$GYDQFHG,QVSHFWRU
&OLFN'R,KDYHH[WHQGHGUHFRUGIRUPDWVLQERWKGDWDVWUHDPVDQGWKH
GDWDEDVH"DQGFOLFN1H[W
6HOHFWWKHFKHFNER[IRUWKH&&0QRGH\RXZDQWWRDQDO\]HDQGFOLFN1H[W
6HOHFWRQHRUPRUHGDWHVDQGFOLFN1H[W
Figure 8-26 appears.
)LJXUH([WHQGHGVHWWLQJVLQWKHGDWDEDVHDQG$&'DQG60'5VWUHDPV
The ACD and SMDR data streams are not generating extended agent or extension ID records. This
means the telephone system is not programmed with extended IDs and the Extended SMDR
option is not enabled. The agent and/or extension numbers in the YourSite Database are not extended.
You must configure the agent and extension IDs in the YourSite Database to mirror those of the telephone
system.

Table 10-2 describes the possible search output scenarios and what they mean in terms of the programming
of the telephone system and the YourSite Database.
7DEOH&RPSDULQJ,'VLQWKHWHOHSKRQHV\VWHPDQG<RXU6LWH'DWDEDVH
([WHQGHG
6HWWLQJV
LQ
'DWDEDVH
([WHQGHG
6HWWLQJVLQ
$&''DWD
6WUHDP
([WHQGHG
6HWWLQJVLQ
60'5'DWD
6WUHDP
'LDJQRVLV
n n n The telephone system and the YourSite Database have
agent or extension IDs with four digits.
e e e The telephone system and the YourSite Database have
agent or extension IDs greater than four digits.
e n n The telephone system has agent or extension IDs greater
than four digits. The ACD and SMDR data streams are not
generating extended ID records, possibly because
Extended SMDR is not enabled. The YourSite Database
has agent or extension IDs greater than four digits. Enable
Extended SMDR on the telephone system.
ne e The ACD and SMDR data streams are generating
extended agent or extension ID records. This means the
telephone system is programmed with extended IDs and
the Extended SMDR option is enabled. The agent and/or
extension numbers in the YourSite Database are not extended.
You must configure the agent and extension IDs in the YourSite
Database to mirror those of the telephone system.
n e n The ACD data stream is generating extended agent or
extension ID records, which means the telephone is
programmed with extended IDs. The SMDR data stream is
generating records with four digits: the SMDR records
could be truncated. Ensure the Extended SMDR option is
enabled. You must configure the agent and extension IDs in the
YourSite Database to mirror those of the telephone system.
&KDSWHU'DWDPLQLQJWRROV
You can run the following additional searches in Advanced Inspector.
6ZLWFKUHODWHGTXHVWLRQV
6KRZWKHVZLWFKW\SHIURPWKHGDWDVWUHDPVDQGWKHGDWDEDVH
The search output reports the switch type (SX-200 or SX-2000) for the node based on the programming in
the YourSite Database and the SMDR and ACD data streams, for one or more 6110 CCM nodes.
'RWKHGDWDVWUHDPVLQGLFDWHDORVVRIGDWD"
This search reports any loss of data on the SMDR or ACD data stream for the node selected. If data has
been lost, the search output displays a table with the enterprise node, file type, and record concerned.
,V5HSRUW$OO7UDQVIHUVHQDEOHGDWWKHWHOHSKRQHVZLWFK"
If you have an SX-2000 and the Report All Transfers option is enabled on the switch, a new record is
generated for each segment of a transferred call. For example, if Agent X transfers a call to Agent Y, and
the Report All Transfers option is enabled on the switch, both Agent X and Agent Y are credited for the
call. The search output provides all of the SMDR call records that pertain to the transferred call.
If you have an SX-2000 and you do not have the Report All Transfers option enabled on the switch, the
search output provides an SMDR call record for Agent X, but not for Agent Y.
The SX-200 does not support the Report All Transfers option. If you run this search on an SX-200 you will
receive the following message: “The Inspector has determined that the switch type associated to node
(Mitel SX-200)FileServer2 does NOT support Internal SMDR records.”
4XHXHUHODWHGTXHVWLRQV
$UHWKHUHDQ\FDOOVWKDWZHUHURXWHGGXHWR3DWK8QDYDLODEOH"
This search output reports any calls that were re-routed because a path (queue) was not available.
6KRZDOOUHFRUGVZKHUHWKHFDOOZDVUHTXHXHG
When an agent receives an ACD call and fails to pick up the call after X seconds or X rings, the telephone
system places the agent in the make busy state. The telephone system requeues the call (places the call back
in the same queue) and offers it to the next available agent. This requeued e-mail message has priority over
the others and will be the next e-mail message answered.
The search output provides all of the SMDR call records that pertain to calls requeued, for one or more
6110 CCM nodes. It also provides a list of the agents requeuing the calls.
6KRZWKHDQVZHULQJGHYLFHVDQGWKHLUVHDUFKRUGHUIRUDVSHFLILFTXHXH
You can specify the answering priority of up to four agent groups (per queue) in the telephone system, and
in the YourSite Database.
If the AnsBy columns in your queue reports do not display the statistics you expect, you can run the Show
the answering devices and their search order for a specific queue search and compare the answering
priority of your queues in the YourSite Database to see if it mirrors that of the telephone system. Typically,
discrepancies result from errors in programming the YourSite Database.
The search output provides the following information:
• The agents in the YourSite Database that belong to the agent groups associated to the prioritized
queues
• The agents who answered calls on the dates selected in the search
• The answering priority of the queues as programmed in the YourSite Database
• The answering priority of the queues as reflected in the SMDR data stream and programmed in the
telephone system
6KRZDOO$QVZHU$&'FDOOUHFRUGVIURPWKH$&'VWUHDPZKHUHWKHTXHXH
GRHVQRWWDNHWKHIRUP3[[[[
Sometimes queue and agent reports do not line up because agents pick up calls from queues to which they
are not associated. In this case, the queue reports contain records for the answered calls, but the agent
reports do not.
The Show all AnswerACD call records from the ACD stream where the queue does not take the form Pxxxx
search identifies agents who pick up calls for queues to which they are not associated.
The search output provides all of the ACD call records that pertain to ACD calls answered where the queue
number did not have the form Pxxxx. The search output lists the agent ID, the time the agent answered the
call, and the extension number of the agent who answered the call. It also provides a list of queues that do
not follow the Pxxxx convention.
6KRZDOOWLPHVWKH$&'VWUHDPLQGLFDWHGWKHUHZHUHQRDJHQWVDYDLODEOHIRU
DTXHXHRUDQDJHQWJURXS
This search output provides all of the ACD call records that pertain to instances when no agents were
logged in to a particular queue.
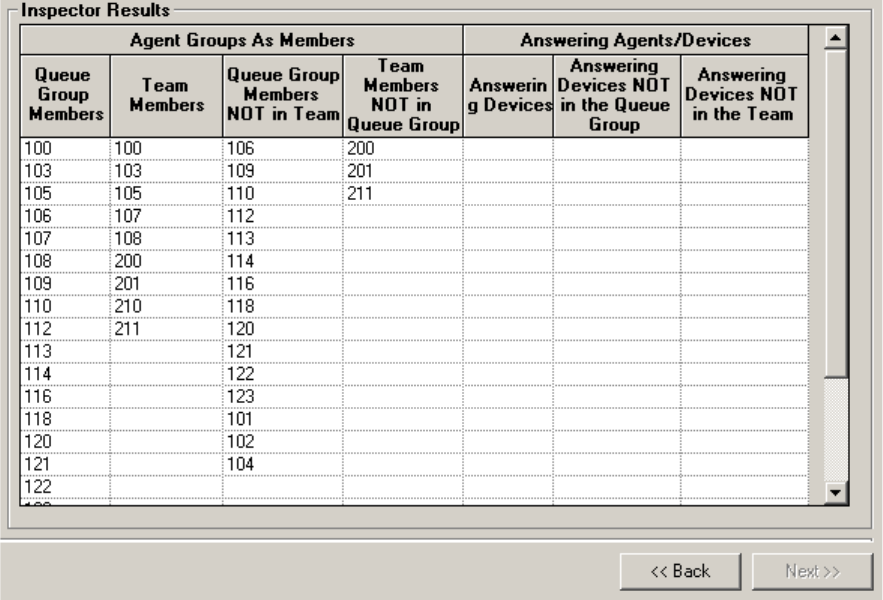
&KDSWHU'DWDPLQLQJWRROV
$JHQWUHODWHGTXHVWLRQV
&RPSDUHWKH60'5DQVZHULQJGHYLFHVWRWKHGDWDEDVHPHPEHUV
This search examines the SMDR data stream and compares the agents answering calls to a particular queue
group to the agents who are members of the group and a particular team. See Figure 8-27
When you select a queue group and team, the search output displays
• The agent group associated to the queues in the selected queue group
• The agent group associated to the selected team
• The agent group associated to the queue group but not to the team
• The agent group associated to the team but not to the queue group
• The agents who answered calls for the selected queue or queue group
• Answered calls involving agents who are not members of the queue group
• Answered calls involving agents who are not members of the team
)LJXUH$GYDQFHG,QVSHFWRUDGYDQFHGVHDUFK
6KRZWKHDJHQWVZKRDUH127DVVRFLDWHGWRDQ(PSOR\HH
This search examines the database for agents who are not linked to an employee. If an agent is not linked to
an employee then you will be unable to view that agent in real-time.
6KRZWKHDJHQWVZKRVHODVWHYHQWVZHUH127ORJRXWHYHQWV
This search examines the ACD data stream for agents who have not logged off the telephone system. You
can run this report at the end of each day to verify that all telephones were logged off.
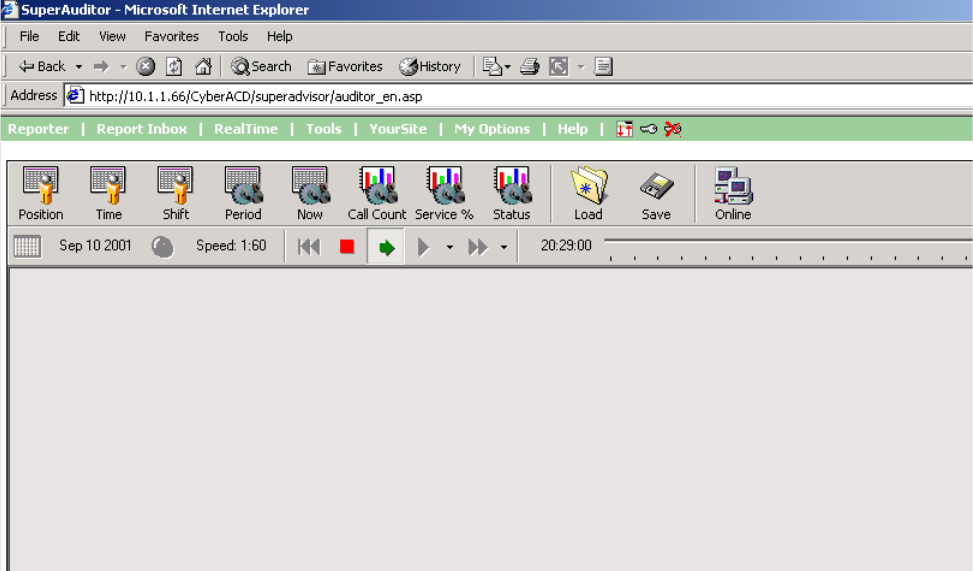
6XSHU$XGLWRU
With SuperAuditor you can view the historical real-time events, at your own pace.
SuperAuditor makes it easy for you to analyze when and why past service problems occurred. When you
determine how the call center should have reacted in the past, you will then know how the call center
should react in the future under the same conditions. For example, you notice that on July 15 you have 12
calls abandon between 10:00 AM and 10:15 AM. You can review the calls and the agents’ actions on that
date for that time period with SuperAuditor. Did all the calls arrive at the same time? Did all the agents go
on break at the same time? If all the calls arrived at once, you need to schedule more people. If all the
agents went on break at the same time, you need to adjust their break schedule.
With SuperAuditor you can also track when employees log on and log off the system. It is easy to
determine if any of the employees consistently start late or finish early.
When you click Tools=>SuperAuditor, Figure 8-28 appears.
SuperAuditor looks very similar to SuperAdvisor. The first tool bar is identical to both SuperAdvisor and
SuperAuditor. It consists of the monitors that provided availability, queue, and graphic displays on queues.
The monitors are: Agent State by Position, Employee State by Position, Agent State by time, Employee
State by Time, Agent Shift, Queue by Period, Queue Now, Queue Group Now, Call count by Queue, Queue
Service Level Percent, and Queue Status.
Remember that with SuperAdvisor you can create profiles to save threshold settings and display
characteristics you define for monitors. With SuperAuditor, you can use these existing profiles, including
alarm thresholds, when viewing past days run in real-time.
See Chapter 7 for more information on SuperAdvisor.
)LJXUH6XSHU$XGLWRU
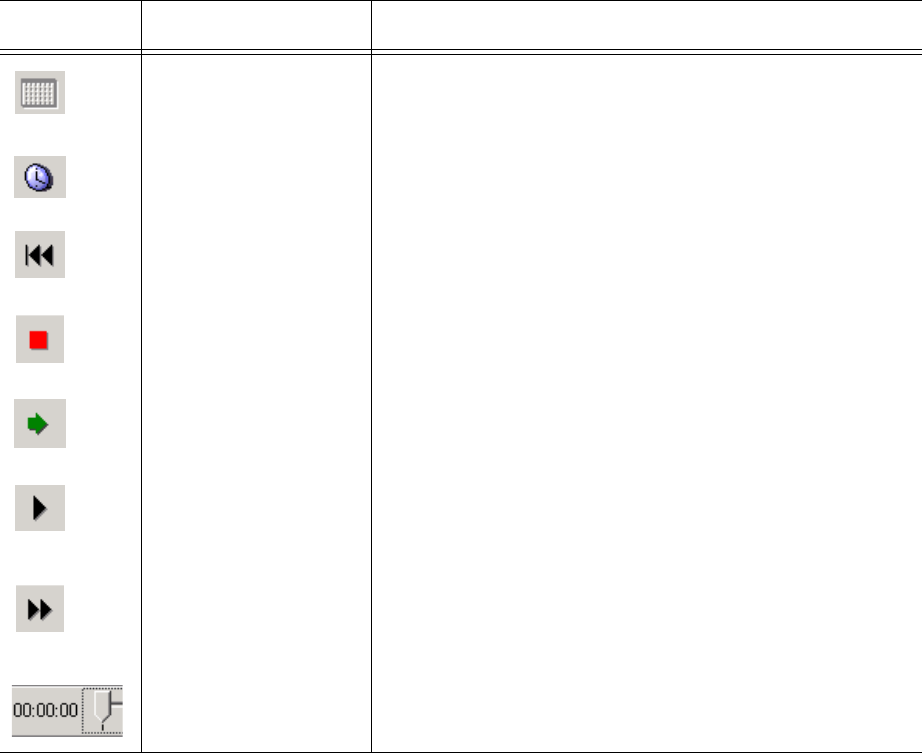
&KDSWHU'DWDPLQLQJWRROV
6XSHU$XGLWRULFRQV
SuperAuditor has a second toolbar that SuperAdvisor does not. With it you select the date of the historical
real-time events that you want to view and the speed at which to play the events. The icons are described in
Table 11-3.
7DEOH6XSHU$XGLWRU,FRQV
Icon Term Meaning
Calendar the date of the historical real-time events
Clock/Speed of audit the speed of audit, expressed as a ratio of real-time to
play speed
Rewind when real-time historical events are stopped, click to
move back to the beginning of the day
Stop stop the real-time historical events from playing
Play play the real-time historical events
Step Forward when real-time historical events are stopped, click to
move forward in time by the small increment you have
selected
Jump Forward when real-time historical events are stopped, click to
move forward in time by the large increment you have
selected
Slider displays the time at which the historical real-time
events occur
&DOHQGDU
You can select the date of the historical real-time events that you want to view by clicking on the calendar.
&ORFN6SHHGRIDXGLW
The Speed of audit is expressed as a ratio of real-time to play speed. You can select the speed from a list of
ratios that appears when you click the clock: 1:1, 1:2, 1:5, 1:10, 1:30, 1:60, and 1:120. If you select the
ratio1:1, it will take you one second to view one second of the past day. If you select 1:60, it will take you
one second to view one minute of the past day.
5HZLQG
If you click Rewind when the play is stopped, you jump back to the beginning of the day.
6WRS
You can stop the real-time historical events from playing by clicking Stop.
3OD\
You can play the real-time historical events by clicking Play.
6WHS)RUZDUG
You can select the increment (in seconds) you will advance from a list that appears when you click the
down arrow to the right of Step Forward: 1 sec, 2 sec, 5 sec, 10 sec, 15 sec, 30 sec, and 45 sec. If you select
30 seconds, then when the play is stopped, you can step forward in 30 second increments each time you
click Step Forward. When you reach the end of data for that day, you will automatically jump to the end of
the day.
-XPS)RUZDUG
You can select the increment (in minutes) you will advance from a list that appears when you click the
down arrow to the right of Jump Forward: 1 min, 2 min, 5 min, 10 min, 15 min, 30 min, and 60 min. If you
select 10 minutes, then when the play is stopped, you can jump forward in 10 minute increments each time
you click Jump Forward. When you reach the end of data for that day, you will automatically jump to the
end of the day.
6OLGHU
As you view the events of the day, the slider indicates the time at which the events occurred. The length of
the slider represents the length of the day you are viewing historical real-time events for.
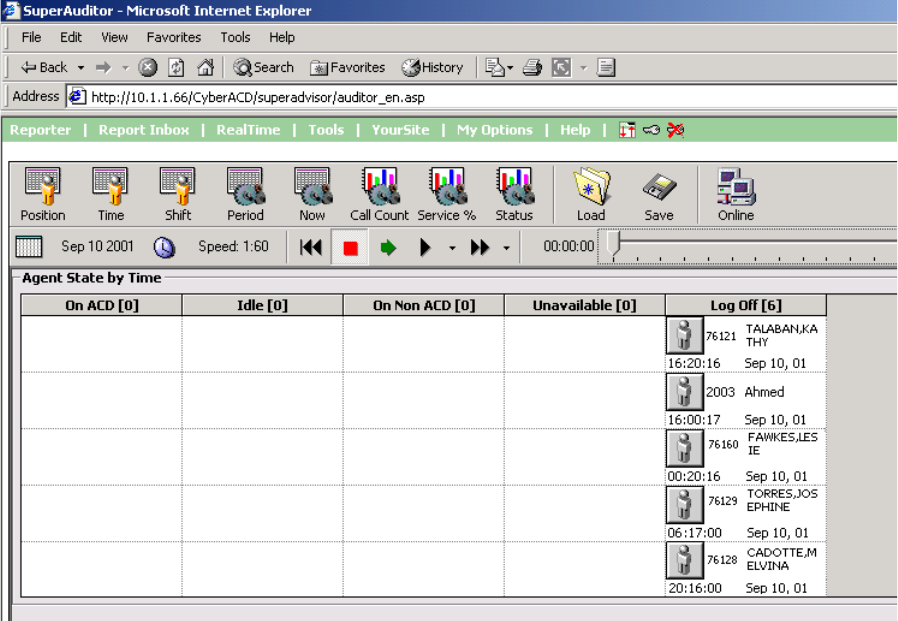
&KDSWHU'DWDPLQLQJWRROV
9LHZLQJKLVWRULFDOUHDOWLPHHYHQWV
7\SHWKH85/KWWSZZZSUDLULHI\UHFRP>\RXU&&0(QWHUSULVHVHUYHU
DGGUHVV@&&0
&OLFN7RROV !6XSHU$XGLWRU
2QWKHILUVWWRROEDUVHOHFWWKHPRQLWRU\RXZDQWWRYLHZKLVWRULFDOUHDOWLPH
HYHQWVIRU)RUH[DPSOHFOLFN7LPH !$JHQWE\7LPH
The Device IDs window appears.
6HOHFWWKH$JHQW*URXSVDQGWKH$JHQW*URXSPHPEHUV\RXZDQWWRYLHZKLVWRULFDO
UHDOWLPHHYHQWVIRU
&OLFN2.
The Agent State by Time grid appears on the SuperAuditor screen. (See Figure 8-29.)
)LJXUH6XSHU$XGLWRU$JHQW6WDWHE\7LPHVWRSSHG
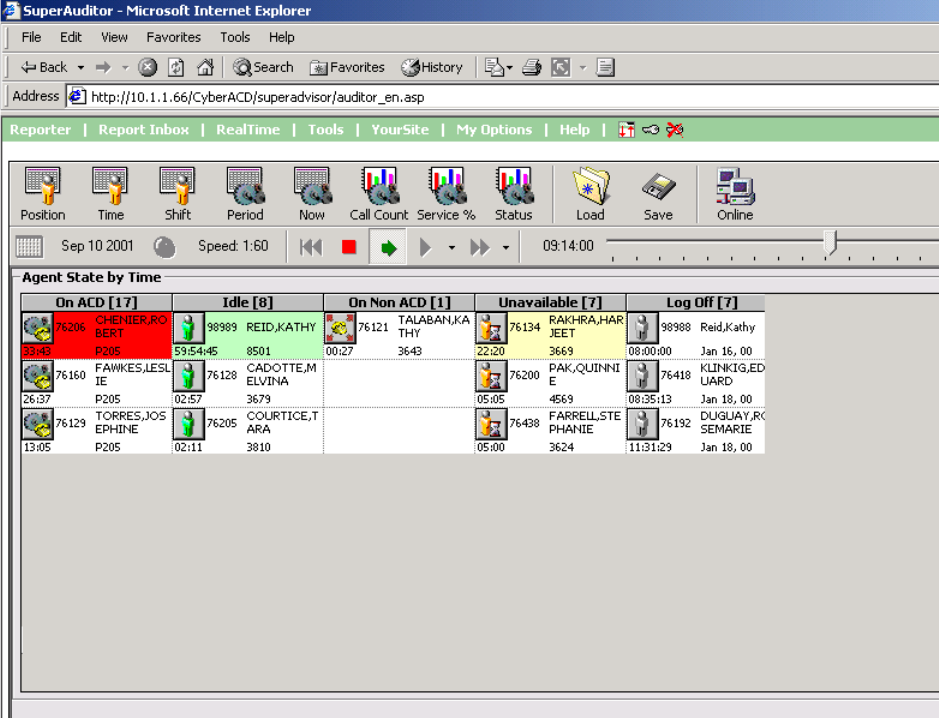
2QWKHVHFRQGWRROEDUFOLFNWKHFDOHQGDUDQGVHOHFWDGDWH
The date appears to the right of the calendar.
&OLFNWKHFORFNDQGVHOHFWWKHVSHHGRIDXGLW
The speed of audit, expressed as a ratio of real-time to play speed, appears to the right of the clock.
&OLFN3OD\WRSOD\WKHUHDOWLPHHYHQWVRIWKHVHOHFWHGGDWH
The historical real-time events start to play. (See Figure 8-30.)
&OLFN6WRSWRVWRSWKHUHDOWLPHHYHQWVRIWKHVHOHFWHGGDWH
)LJXUH6XSHU$XGLWRU$JHQW6WDWHE\7LPHSOD\LQJ
&KDSWHU'DWDPLQLQJWRROV

&KDSWHU(QWHUSULVH1RGH&(1
3HUIRUPPXOWLVLWHPRQLWRULQJDQG
UHSRUWLQJZLWK&&0(QWHUSULVH
1RGH
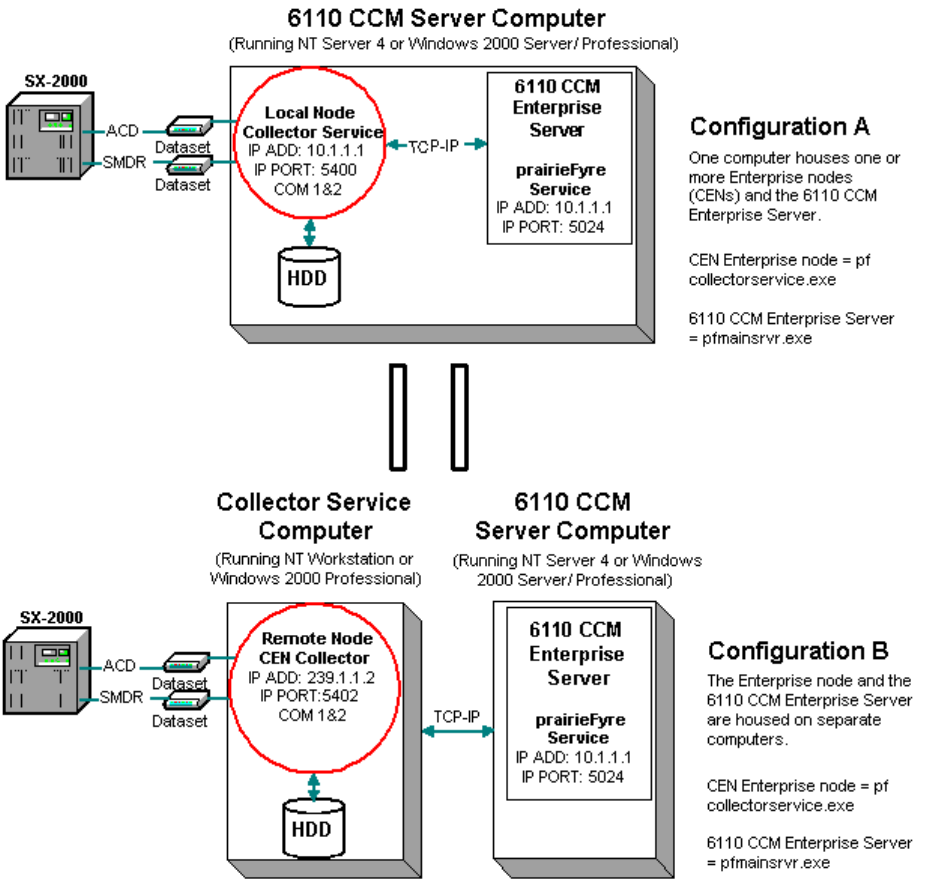
&KDSWHU(QWHUSULVH1RGH&(1
&&0(QWHUSULVH1RGH
6110 CCM Enterprise Node (CEN) is an add-on application that provides multi-site call center capabilities
using a single-server configuration.
Multi-site reporting relies on two essential services: the prairieFyre Service (on the 6110 CCM Enterprise
Server) and the Collector Service (on all enterprise nodes). At the local site, the collector(s) collects real-
time telephone system data and files it to the local hard drive. At the remote site(s), the collector (CEN)
collects real-time data, files it to the local hard drive, and streams it to the prairieFyre Service over TCP-IP.
The prairieFyre Service provides enterprise-wide statistics so you can monitor real-time activities and run
reports on any local or remote site within the enterprise.
You can run both services on a single computer or on separate computers, as illustrated in Figure 9-1.
)LJXUH&&0(QWHUSULVH1RGHVHWXS

/RFDODQGUHPRWHFROOHFWRUV
A node is a data collection point for a single SX-2000 or SX-200 telephone system. Local collectors reside
in call centers that have 6110 CCM Enterprise Server software installed. When you install 6110 CCM
Enterprise Server software, a local collector is automatically installed on the same computer.
Remote collectors, or CENs, reside in call centers within your enterprise that do not have 6110 CCM
Enterprise Server software installed. You manually install remote collector software on computers running
NT Workstation or Windows 2000 Professional.
Local and remote collector software provides PBX-neutral data collection so you can produce reports on
call centers with different Mitel telephone systems. The 6110 CCM Enterprise Server, and local and remote
nodes provide the functions listed in table 12-1.
(QWHUSULVHFRPPXQLFDWLRQV
You can view the real-time data collection and alarm configuration for any node within the enterprise, and
manage call center operations over the Web (in a browser) for any node within the enterprise.
9LHZLQJUHDOWLPHGDWDFROOHFWLRQRQWKH&&0
(QWHUSULVH6HUYHU
To view real-time data collection for all nodes (collection points):
&OLFN6WDUW !3URJUDPV !SUDLULH)\UH6RIWZDUH,QF !&&01HWZRUN
0RQLWRU
The 6110 CCM Network Monitor (a black Figure) appears in the system tray on your desktop. The 6110
CCM Network Monitor communicates with the collector to which you are connected.
7DEOH(QWHUSULVH5HVSRQVLELOLWLHV
(QWHUSULVH6HUYHU /RFDOFROOHFWRUV 5HPRWH&ROOHFWRUV
&(1V
Collects real-time ACD and
SMDR data from local and
remote CENs
Collect ACD and SMDR data
from a single telephone
system
Collect ACD and SMDR data
from a single telephone
system
Summarizes data files to SQL
and files ACD and SMDR
data to the local hard drive
File ACD and SMDR data to
the hard drive on the local
computer
File ACD and SMDR data to
the hard drive on the local
computer
Provides enterprise-wide, real-
time statistics to clients Connect to other CENs via the
6110 CCM Enterprise Server Connect to other CENs via the
6110 CCM Enterprise Server
Synchronizes the data from
remote CENs with the data
stored on the local hard drive
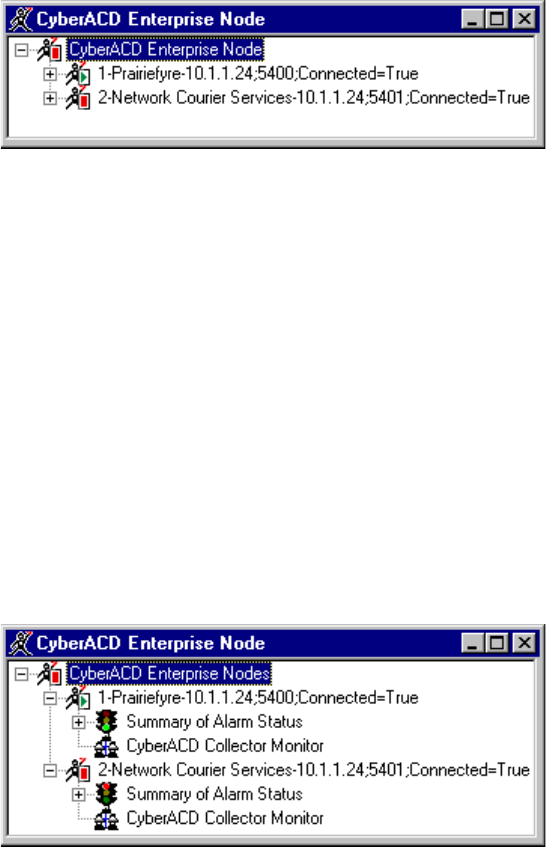
&KDSWHU(QWHUSULVH1RGH&(1
NOTE: By default, the 6110 CCM Network Monitor on the 6110 CCM Enterprise Server points to the
default data collection point. The default data collection point is the 6110 CCM Enterprise Server Collector
Service.
5LJKWFOLFNWKH&&01HWZRUN0RQLWRUDQGFOLFN1RGH,QIRUPDWLRQ
([SDQGWKH&&0(QWHUSULVH1RGHWUHH
Figure 9-2 appears.
)LJXUH&&0HQWHUSULVHQRGHV
The 6110 CCM Enterprise Node tree lists all of the local and remote nodes in the enterprise, as defined in
the Management Console application.
The preceding Figure displays two local nodes. Note that the local nodes share the same IP address as the
6110 CCM Enterprise Server, but have unique IP port numbers. Remote nodes (nodes that reside in call
centers within your enterprise that do not have 6110 CCM Enterprise Server software installed) have a
different IP address and IP port number than the 6110 CCM Enterprise Server.
([SDQGWKHILUVWQRGHDQGFOLFN&&0&ROOHFWRU0RQLWRU
The ACDLink main screen appears. It displays real-time data streaming from the telephone system to the
primary node’s Collector Service.
Figure 9-3 appears.
)LJXUH1RGHLQIRUPDWLRQ
4XLW$&'/LQN
([SDQGWKHVHFRQGQRGHDQGFOLFN&&0&ROOHFWRU0RQLWRU
The ACDLink main screen appears. It displays real-time data streaming from the telephone system to the
secondary node’s Collector Service.
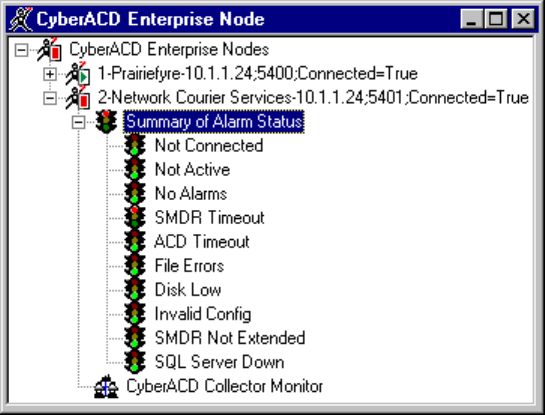
9LHZLQJGDWDDQGV\VWHPDODUPV
To view data and system alarms for a node:
,QWKH1RGHVWUHHH[SDQGWKH6XPPDU\RI$ODUP6WDWXVWUHHIRUDQRGH
Figure 9-4 appears. It displays the status of all alarms for the node currently selected.
)LJXUH6XPPDU\RI$ODUPV
5LJKWFOLFN6XPPDU\RI$ODUP6WDWXV
The 6110 CCM Collector Alarm Status Summary screen appears.
It informs you if/of
• The current time of the Collector Service computer as derived from the telephone system data stream
• The time interval during which the system raises data alarms if it detects the Collector Service is not
receiving data
• The number of records received by the Collector Service that were not valid SMDR or ACD records
• The Collector Service is not receiving SMDR or ACD data
• The telephone system is truncating agent IDs and extension numbers that exceed four characters
• The Collector Service attempted to write to the local data drive (when the disk was full) at least once
today
• The disk space is low on the disk housing the text files
(QDEOLQJDQGGLVDEOLQJWKHDODUPEHHS
An audible alarm informs you if the ACDLink application disconnects from the Collector Service. The
Disable Alarm command disables the audible alarm.
To enable the alarm:
5LJKWFOLFNWKH&&01HWZRUN0RQLWRULFRQDQGFOLFN(QDEOH$ODUP%HHS
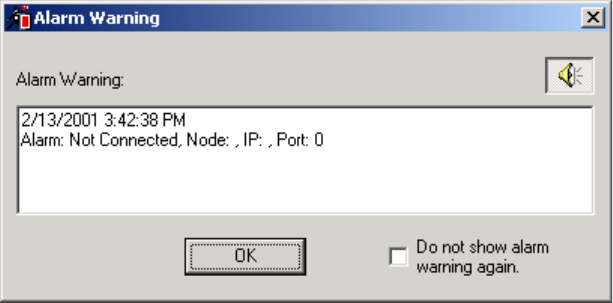
&KDSWHU(QWHUSULVH1RGH&(1
(QDEOLQJSRSXSDOHUWV
You can enable pop-up alerts that display system and data alarm information.
To enable pop-up alerts:
5LJKWFOLFNWKH&&01HWZRUN0RQLWRULFRQDQGFOLFN(QDEOH3RS8S$OHUW
If a system or data alarm occurs, Figure 9-5 is displayed on top of all open applications.
)LJXUH3RSXSDODUP
This message informs you that the Collector Service for the node has been disconnected from the telephone
system. Pop-up alarms will notify you of the same types of errors presented on the 6110 CCM Collector
Alarm Status Summary screen.
You can disable the beep that accompanies an alarm by clicking the speaker button (displayed in the
preceding Figure). You can also prevent a message from re-appearing by selecting the Do not show alarm
warning again check box.
5H,QLWLDOL]LQJWKH&ROOHFWRU6HUYLFH
The ReInitialize Collector command reconnects the ACDLink application to the Collector Service. If you
accidentally disconnect the ACDLink monitor from the Collector Service, or the system detects Collector
Service errors, the 6110 CCM Network Monitor icon turns red and blinks. You can select the Summary of
Alarm Status screen to see a summary of the errors.
NOTE: Only 6110 CCM users with "Manager" permissions can re-initialize the Collector Service.
To re-initialize the Collector Service:
5LJKWFOLFNWKH&&01HWZRUN0RQLWRULFRQDQGFOLFN5H,QLWLDOL]H&ROOHFWRU
/RJRQZLWK\RXUXVHUQDPHDQGSDVVZRUGDQGFOLFN2.

0DQDJLQJFDOOFHQWHURSHUDWLRQV
You can communicate with the 6110 CCM Enterprise Server over the Web in I.E. 5, and manage call center
operations for any node within the enterprise. If the Wide Area Network (WAN) link between a remote
node and the 6110 CCM Enterprise Server goes down, the managers and supervisors at the remote node
cannot view real-time data on their site until the WAN connection is restored. However, if the WAN link is
down, data collection at the remote node continues.
To run a 6110 CCM session:
6WDUW,(LQ\RXUEURZVHUDQGW\SHLQWKH&&0(QWHUSULVH6HUYHU,3DGGUHVV
KWWS>WKH&&0(QWHUSULVH6HUYHU,3DGGUHVV@&&0
(QWHU\RXUXVHUQDPHDQGSDVVZRUGWRORJRQWR&&0
The 6110 CCM main page appears. All menus and functions apply to all nodes in the enterprise.
In Figure 9-6, the two 6110 CCM Network Monitors communicate with the 6110 CCM Enterprise Server
Collector Service, the default data collection point. They talk to Local Node 1 over IP Address 10.1.1.1 and
IP Port 5024. The 6110 CCM Enterprise Server collects real-time ACD and SMDR data from the local
and remote nodes over TCP-IP.

&KDSWHU(QWHUSULVH1RGH&(1
)LJXUH&&0(QWHUSULVH
6HWWLQJXSHQWHUSULVHVHUYLFHV
The following example demonstrates how to set up enterprise services.
The enterprise consists of two call centers and three telephone systems. Site 1 has two telephone systems
and Site 2 has one telephone system, as illustrated in Figure 9-7.

)LJXUH&&0(QWHUSULVH
The 6110 CCM Enterprise Server resides at Site 1 in Los Angeles. Two local collectors provide data
collection for the two telephone systems at the Los Angeles site. The 6110 CCM Enterprise Server and the
local collectors reside on the same computer.
The third telephone system resides at Site 2 in Boston. The Boston node runs remote collector software and
NT Workstation or Windows 2000 Professional. It collects and stores data locally on the Boston system.
The 6110 CCM Enterprise Server in Los Angeles collects real-time data from the Boston node and files it
to the SQL database and local hard drive. This enables call center managers in Los Angeles to monitor real-
time activities and run reports on the site in Boston. During the nightly maintenance routine, the 6110 CCM
Enterprise Server synchronizes its data with the Boston database to ensure it has all of the data generated at
the remote node for the day.
In order to monitor call center activities and run reports, the supervisors at the Boston site must browse to
the 6110 CCM Enterprise Server IP address in I.E. 5. If the Wide Area Network (WAN) link between Los
Angeles and Boston goes down, the supervisors in Boston cannot view real-time data on their site until the
WAN connection is restored.
Figure 9-8 illustrates data collection at the local and remote nodes.
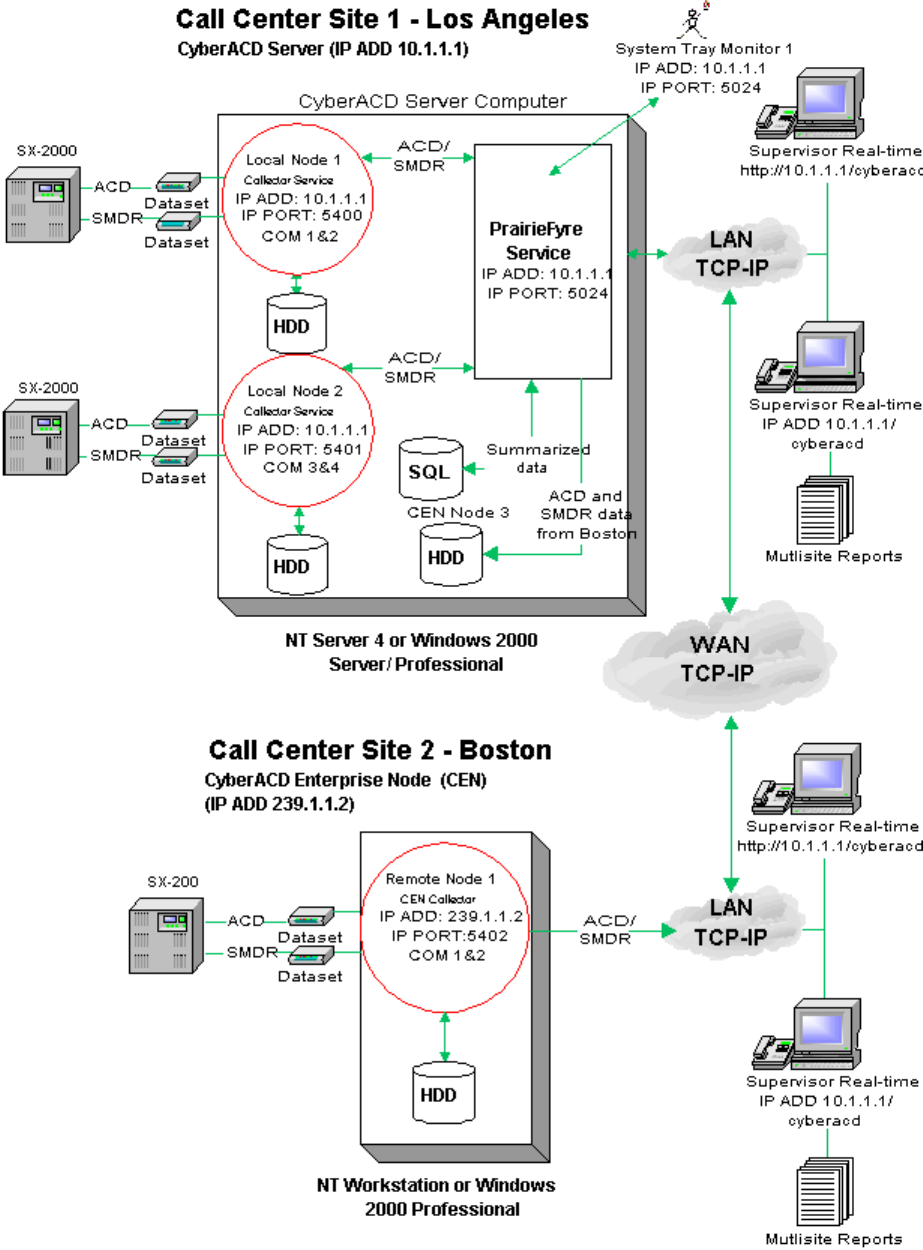
&KDSWHU(QWHUSULVH1RGH&(1
)LJXUH(QWHUSULVHVHUYLFHV
At the Los Angeles site, the manager logs on to the 6110 CCM Enterprise Server and starts the
Management Console application. The manager selects the Enterprise tab and configures the IP addresses
and IP port numbers for the two local collectors (Node 1 - IP Address: 10.1.1.1, IP Port: 5400, and Node 2
- IP Address: 10.1.1.1, IP Port: 5401), and for the remote (Node 3) CEN (IP Address: 239.1.1.2, IP Port:
5402) in the enterprise.
At the Boston site, the manager logs on to the enterprise node computer and starts the Management Console
application. The manager selects the Nodes tab and configures the IP address and IP port number ( IP
Address: 239.1.1.2, IP Port: 5402) for the Boston node.
NOTE: The managers at the Los Angeles and Boston sites must enter the same IP address and IP port
number ( IP Address: 239.1.1.2, IP Port: 5402) for the remote node in order for data transfer to occur. The
process is described in detail in the following section.
&RQILJXULQJ&&0HQWHUSULVHQRGHV
You configure collection points (collectors) in the Management Console application. There are two
versions of Management Console software: Management Console Enterprise and Management Console
Node. Call centers that have 6110 CCM Enterprise Server software installed use Management Console
Enterprise. Remote call centers that have remote collector software installed (on a computer running NT
Workstation or Windows 2000 Professional) use Management Console Node.
In a call center that has 6110 CCM Enterprise Server software installed, you start the Management Console
program on the 6110 CCM Enterprise Server only.
&RQILJXULQJORFDODQGUHPRWHFROOHFWRUVRQWKH&&0
(QWHUSULVH6HUYHU/RV$QJHOHVLQWKLVH[DPSOH
To configure the two local collectors on the 6110 CCM Enterprise Server computer:
/RJRQWRWKH:LQGRZV176HUYHUZLWKDQDFFRXQWWKDWKDVDGPLQLVWUDWLYHSULYLOHJHV
&OLFN6WDUW !3URJUDPV !SUDLULH)\UH6RIWZDUH,QF !SUDLULH)\UH
0DQDJHPHQW&RQVROHWRVWDUWWKH0DQDJHPHQW&RQVROH(QWHUSULVHDSSOLFDWLRQ
&OLFNWKH(QWHUSULVHWDE
,QWKHOHIWSDQHFOLFN(QWHUSULVH
Figure 9-9 appears. You use the Enterprise tab to configure your nodes.
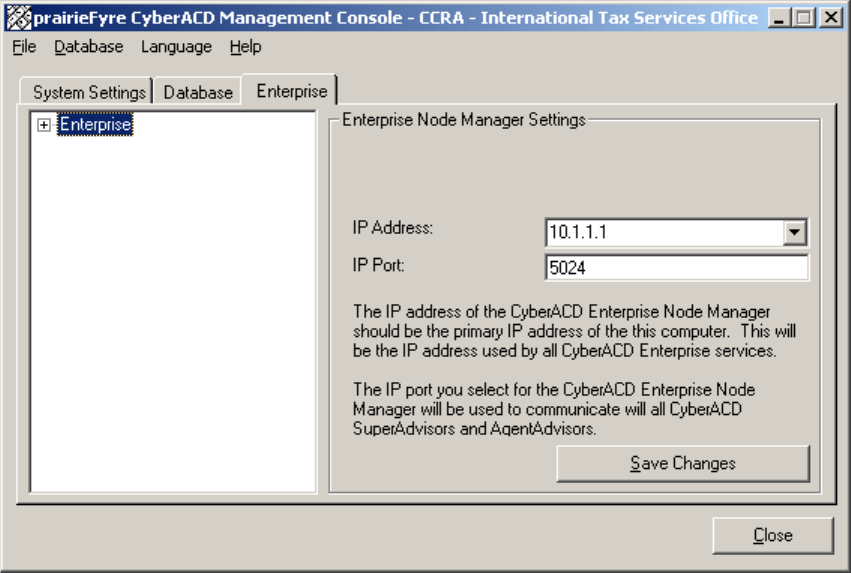
&KDSWHU(QWHUSULVH1RGH&(1
)LJXUH0DQDJHPHQW&RQVROH(QWHUSULVH(QWHUSULVHWDE
1DPH
The name box specifies a descriptive (logical) name for the collector.
,3$GGUHVV
The IP Address box specifies the IP address of the local computer where data collection occurs. This is the
6110 CCM Enterprise Server IP address. During the installation of 6110 CCM, the 6110 CCM setup
specifies an IP address and IP port number of the 6110 CCM Enterprise Server.
,33RUW
The IP Port box specifies the port number over which the 6110 CCM Enterprise Server communicates all
with real-time clients.
([SDQGWKH(QWHUSULVHWUHH
Figure 9-10 appears.
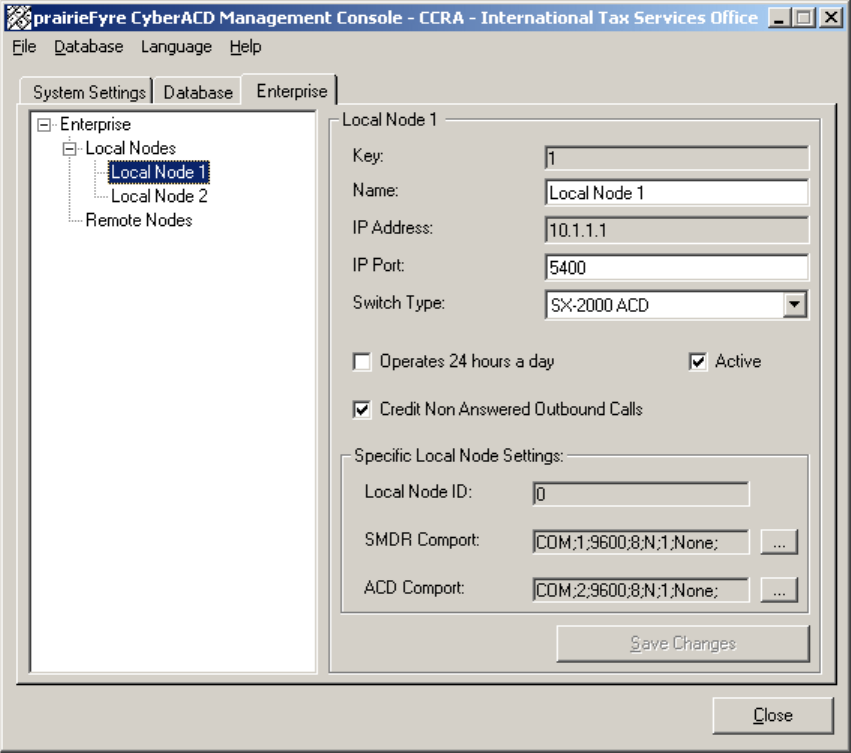
)LJXUH/RV$QJHOHVORFDOQRGHVHWWLQJV
,3$GGUHVV
The IP Address box specifies the IP address of the local computer where data collection occurs.
,33RUW
The IP Port box specifies the port number over which the 6110 CCM Enterprise Server service
communicates with local data collection mechanisms. For remote nodes, both parties must use enter the
same port number in order for communication to be successful.
6ZLWFK7\SH
The Switch Type setting specifies the type of telephone system used at the node.
2SHUDWHVKRXUVDGD\
The Operates 24 hours a day option ensures proper reporting for call centers that operate over the midnight
hour.
&KDSWHU(QWHUSULVH1RGH&(1
&UHGLW1RQ$QVZHUHG2XWERXQG&DOOV
The Credit Non Answered Outbound Calls option includes non-answered outbound calls in the data
collected for reporting.
60'5&RPSRUW
The SMDR Comport setting specifies the SMDR comport setting for the local telephone system.
$&'&RPSRUW
The ACD Comport setting specifies the ACD comport setting for the local telephone system.
5LJKWFOLFN/RFDO1RGHVDQGFOLFN$GG/RFDO
)RU/RFDO1RGHW\SHDQDPH/RFDO1RGH
9HULI\WKH,3DGGUHVVQXPEHUWKH&&0(QWHUSULVH6HUYHU,3DGGUHVV
7\SHDXQLTXH,3SRUWQXPEHULQWKLVFDVHRYHUZKLFKWKHFROOHFWRUZLOOWDONWR
WKH&&0(QWHUSULVH6HUYHUVHUYLFH
6HOHFWWKH2SHUDWHVKRXUVDGD\FKHFNER[LI\RXUFDOOFHQWHURSHUDWHVRYHUWKH
PLGQLJKWKRXU
6HOHFWWKH&UHGLW1RQ$QVZHUHG2XWERXQG&DOOVFKHFNER[LI\RXZDQWWRLQFOXGH
QRQDQVZHUHGRXWERXQGFDOOVLQWKHGDWDFROOHFWHGIRUUHSRUWLQJ
6SHFLI\60'5FRPDQG$&'FRPFRPSRUWVHWWLQJV
&OLFN6DYH&KDQJHV
5LJKWFOLFN/RFDO1RGHVDQGFOLFN$GG/RFDOWRDGGDGGLWLRQDOORFDOQRGHV
)RU/RFDO1RGHW\SHDQDPH/RFDO1RGH
7\SHDQ,3DGGUHVVQXPEHUWKH&&0(QWHUSULVH6HUYHU,3DGGUHVV
7\SHDQ,3SRUWQXPEHU
NOTE: Ensure the second local IP port number is unique.
6HOHFWDWHOHSKRQHV\VWHPW\SH6;
2SWLRQDOO\VHOHFWWKH2SHUDWHVKRXUVDGD\FKHFNER[
2SWLRQDOO\VHOHFWWKH&UHGLW1RQ$QVZHUHG2XWERXQG&DOOVFKHFNER[
6SHFLI\60'5FRPDQG$&'FRPFRPSRUWVHWWLQJV
&OLFN6DYH&KDQJHV
To configure the remote Boston node on the 6110 CCM Enterprise Server computer:
5LJKWFOLFN5HPRWH1RGHVDQGFOLFN$GG5HPRWH
)RUUHPRWH1RGHW\SHDQDPH5HPRWH1RGH
7\SHDQ,3DGGUHVVQXPEHU
7\SHDQ,3SRUWQXPEHU
6HOHFWDWHOHSKRQHV\VWHPW\SHLQWKLVFDVH6;57
2SWLRQDOO\VHOHFWWKH2SHUDWHVKRXUVDGD\FKHFNER[
2SWLRQDOO\VHOHFWWKH&UHGLW1RQ$QVZHUHG2XWERXQG&DOOVFKHFNER[
&OLFN6DYH&KDQJHV
The configuration is illustrated in Figure 9-11.
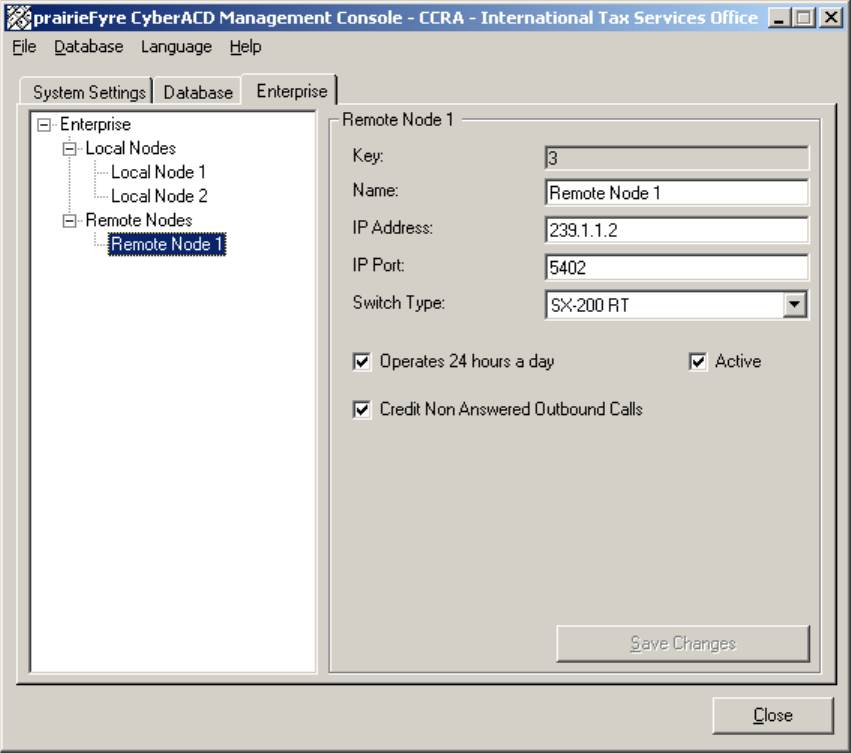
)LJXUH/RV$QJHOHVUHPRWHQRGHVHWWLQJV
,QVWDOOLQJDQGFRQILJXULQJ&(1VRIWZDUH
In multi-site call centers that use 6110 CCM, it is necessary to install 6110 CCM Enterprise Node (CEN)
software at all remote sites. CEN enables supervisors at remote sites to monitor call center activities in real-
time and run reports on their sites without having to install 6110 CCM Enterprise Server at the remote site.
To install CEN at a remote site:
6WDUW,(DQGEURZVHWRWKH&&0(QWHUSULVH6HUYHUE\W\SLQJKWWS>\RXU
&&0(QWHUSULVH6HUYHU,3DGGUHVV@&&0
2EWDLQDXVHU¶VDFFRXQWIURP\RXUV\VWHPDGPLQLVWUDWRUDQGORJRQWRWKH&&0
(QWHUSULVH6HUYHU
The 6110 CCM Enterprise Web application appears.
&OLFN+HOS !&OLHQW'RZQORDG
&OLFN&&0&OLHQW'RZQORDGWRLQVWDOOWKH&&0FOLHQWVRIWZDUH
&OLFN&&0(QWHUSULVH1RGH&(1,QVWDOODWLRQWRLQVWDOOWKH&(1VRIWZDUH
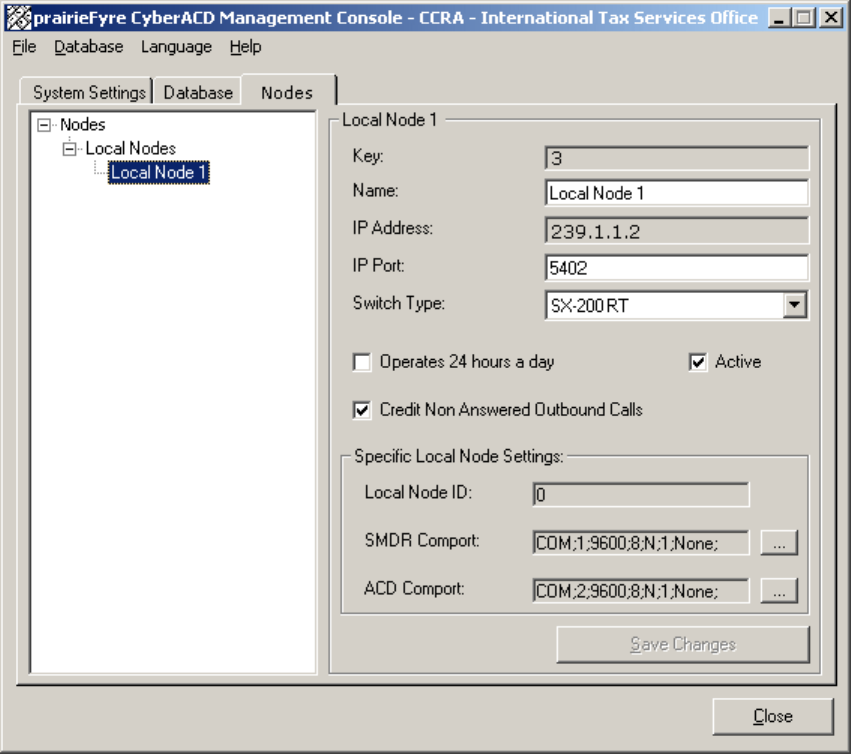
&KDSWHU(QWHUSULVH1RGH&(1
&RQILJXULQJ&(1ZLWK0DQDJHPHQW&RQVROH1RGH
To configure the Boston node:
&OLFN6WDUW !3URJUDPV !SUDLULH)\UH6RIWZDUH,QF !0DQDJHPHQW&RQVROH
&OLFN7KH1RGHVWDEDQGH[SDQGWKH1RGHVWUHH
5LJKWFOLFN/RFDO1RGHVDQGFOLFN$GG
)RUWKH%RVWRQ/RFDO1RGHW\SHDQDPH/RFDO1RGH
7\SHDQ,3DGGUHVVQXPEHU
7\SHDQ,3SRUWQXPEHU
6HOHFWDWHOHSKRQHV\VWHPW\SHLQWKLVFDVH6;57
2SWLRQDOO\VHOHFWWKH2SHUDWHVKRXUVDGD\FKHFNER[
2SWLRQDOO\VHOHFWWKH&UHGLW1RQ$QVZHUHG2XWERXQG&DOOVFKHFNER[
6SHFLI\60'5FRPDQG$&'FRPFRPSRUWVHWWLQJV
&OLFN6DYH&KDQJHV
The configuration is illustrated in Figure 9-12.
)LJXUH%RVWRQORFDOQRGHVHWWLQJV

&KDSWHU1HWZRUNDQG
&ROOHFWRU0RQLWRUV
*HWFRQQHFWHGZLWKWKH1HWZRUN
0RQLWRU&ROOHFWWHOHSKRQHV\VWHP
GDWDDQGPRQLWRULQUHDOWLPH
9LHZGHWDLOHGQRGHLQIRUPDWLRQ
ZLWKWKH&ROOHFWRU0RQLWRU
&KDSWHU1HWZRUN0RQLWRU
&&01HWZRUNDQG&ROOHFWRU0RQLWRUV
1HWZRUN0RQLWRURYHUYLHZ
You use the Network Monitor to
• monitor the 6110 CCM (Contact Center Management) Server
• to verify the Collector Monitor is collecting real-time telephone system node data
• to reset your SMDR and ACD data links
The telephone system generates an enormous amount of real-time and historical data used to manage your call
center. You use real-time data to monitor the current call load and agent availability and make minute-to-
minute adjustments. You use historical information for forecasting, staffing, and scheduling.
0HQXIXQFWLRQV
When you right-click the Network Monitor icon on the system tray a menu appears.
It provides the following commands:
• English
• French
• Popup on Alarms
• Node Information
• Exit
When you right-click the Network Monitor (not the icon), you see two additional menu items:
• Connect To
• Client Statistics
If you accidentally disconnect the Collector Monitor from the Collector Service, or the system detects
Collector Service errors, the Network Monitor icon turns red and blinks.
3RSXSRQ$ODUPV
The Enable Popup on Alarms command enables pop-up alerts that display system and data alarm
information.
1RGH,QIRUPDWLRQ
The Node Information command displays the Network Monitor.
([LW
The Exit command quits the Network Monitor.
&RQQHFW7R
The Connect To command connects the Network Monitor to a particular collector service (node).
&OLHQW6WDWLVWLFV
The Client Statistics command gives the client IP address, the client type, connection information,
and error information.
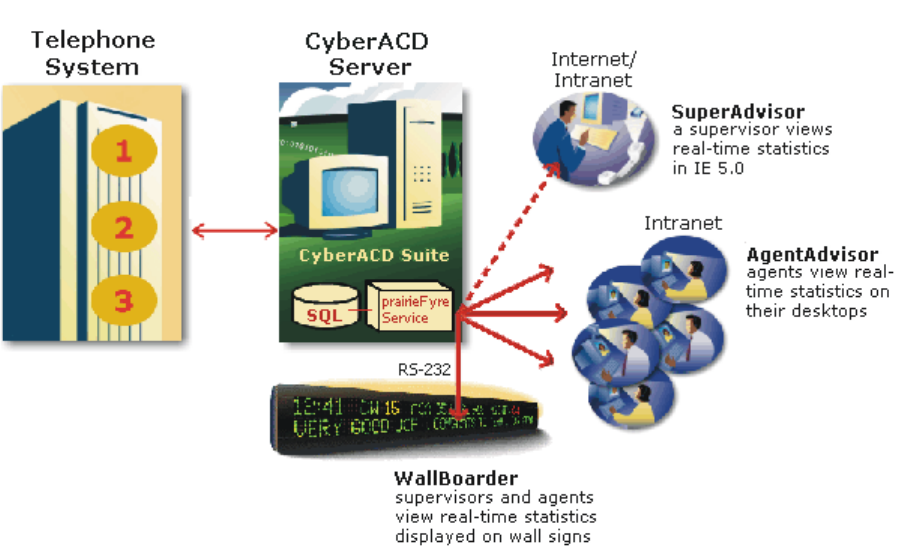
Figure 10-1 describes the connectivity between the prairieFyre Service and connected clients viewing the
6110 CCM real-time programs.
)LJXUH5HDOWLPHPRQLWRUV
6HWWLQJWKHGDWDDODUPVLQWKH0DQDJHPHQW&RQVROH
With the Management Console, you can set the days and times during which the data alarms will be activated.
For those days and times, the system will notify you if the Collector Service is not receiving data or if the
server disk space is low: the back figure in your system tray is marked with a red line and blinks. You can also
set the duration from when the data stops streaming to when you want an alarm to appear.
6HWWLQJWKH'DWD$ODUP6FKHGXOH
1. Click Start=>Programs=> Mitel Networks=>Management Console.
2. Select the System Setting tab.
3. Select Data Alarm Schedule.
The Data Alarm Schedule window appears.
4. Select the days and the hours the company is open and will be receiving calls.
5. Click OK.
6. Close the Management Console.
6HWWLQJWKH'DWD$ODUP7LPHRXW0LQXWHV
1. Click Start=>Programs=> Mitel Networks=>Management Console.
2. Select the System Setting tab.
3. Select Data Alarm Timeout Minutes.
The Data Alarm Timeout Minutes window appears.
4. Use the up or down arrows to increase or decrease the duration of the time lapse from when the data
stops streaming to when you want an alarm to appear.
5. Close the Management Console.
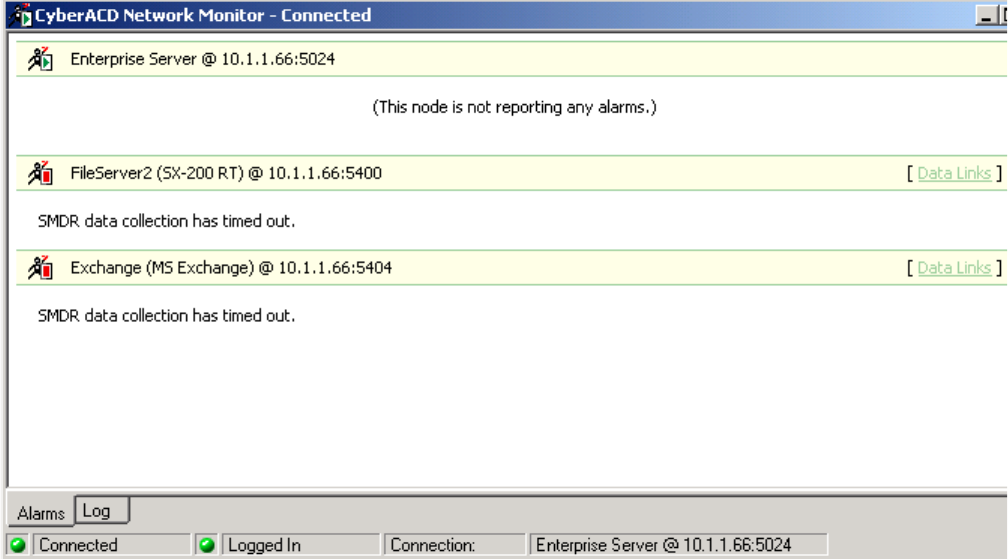
&KDSWHU1HWZRUN0RQLWRU
6WDUWLQJWKH1HWZRUN0RQLWRU
Starting the Network Monitor on the 6110 CCM Enterprise Server:
• Double-click the 6110 CCM Network Monitor icon (the black figure on the system tray).
If the Network Monitor is not active on the system tray, click Start=>Programs=>Mitel Networks=>Network
Monitor to start the monitor.
NOTE: By default, the Network Monitor on the 6110 CCM Enterprise Server points to the default data
collection point. The default data collection point is the 6110 CCM Enterprise Server Collector Service.
Starting the Network Monitor on a client computer
1. Click Help=>Client Download.
2. Click Network Monitor to install it.
3. Right-click the Network Monitor icon and click Connect To.
4. Type the 6110 CCM Enterprise Server IP address and IP port number and click OK.
5. Double-click the Network Monitor icon.
Figure 10-2 appears.
)LJXUH7KH1HWZRUN0RQLWRU
(QDEOLQJSRSXSDOHUWV
You can enable pop-up alerts that display system and data alarm information.
To enable pop-up alerts:
1. Click Start=>Programs=>Mitel Networks=>Network Monitor.
The Network Monitor (a black figure) appears in the system tray on your desktop. It communicates
with the collector to which you are connected.
2. Right-click the Network Monitor icon and click Popup on Alarms.
If a system or data alarm occurs, the Network Monitor appears on top of all open applications. This message
informs you that the Collector Service for the node has been disconnected from the telephone system. You can
prevent a message from re-appearing by selecting the Do not show alarm warning again check box.
:KDWWRGRLIGDWDLVQRWVWUHDPLQJ
There can be several reasons why data is not streaming. The following resolutions address the most common
streaming problems:
• Click Reset SMDR/ACD Link on the Collector Monitor main screen to restore the connection.
• Check the cabling connections from the telephone system to the comports.
• Release Collector Service control of the comports and use a hyperterminal session to view the
comports.
7RYLHZWKHFRPSRUWV
1. Quit 6110 CCM.
2. Click Start=>Programs=>Accessories=>Hyperterminal.
3. Create a session and verify data is flowing through the comports.
If data is not flowing through the comports, then either something is wrong with the comports, your
cabling is not properly hooked up, or the telephone system is not producing data records.
5H,QLWLDOL]LQJWKH&ROOHFWRU6HUYLFH
The ReInitialize Collector command reconnects the Collector Monitor application to the Collector Service. If
you accidentally disconnect the Collector Monitor from the Collector Service, or the system detects Collector
Service errors, the Network Monitor icon turns red and blinks.
To re-initialize the Collector Service:
1. Click Start=>Programs=>Mitel Networks=>Network Monitor.
The Network Monitor (a black figure) appears in the system tray on your desktop. It communicates
with the collector to which you are connected.
2. Right-click the Network Monitor icon and click Node Information.
3. Right-click the Network Monitor and click ReInitialize Server.
4. Log on with your user name and password and click OK.
&KDSWHU1HWZRUN0RQLWRU
&ROOHFWRU0RQLWRURYHUYLHZ
The Collector Monitor informs you if/of
• the current time of the Collector Service computer as derived from the telephone system data stream
• the time interval during which the system raises data alarms if it detects the Collector Service is not
receiving data
• the number of records received by the Collector Service that were not valid SMDR or ACD records
• the Collector Service is not receiving SMDR or ACD data
• the telephone system is truncating agent IDs and extension numbers that exceed four characters
• the Collector Service attempted to write to the local data drive (when the disk was full) at least once
today
• the disk space is low on the disk housing the text files
The Collector Service collects data from the SX-2000 and the SX-200 with real-time over SMDR and ACD,
RS-232 ports. It collects data from the SX-200 over an SMDR/Agent Shift, RS-232 port.
For the SX-2000 and the SX-200 with real-time, the Collector Service
• files telephone system data to the local hard drive
• compares the data to the configuration of the YourSite Database and forward relevant files to the
SuperAdvisor, AgentAdvisor, and WallBoarder applications in real-time over TCP-IP
• simultaneously files this data set to the Structured Query Language (SQL) database in real-time
For the SX-200, the Collector Service
• files telephone system data to the local hard drive
• compares the data to the configuration of the YourSite Database and forwards relevant files to the
Structured Query Language (SQL) database in real-time
SQL is the language used to talk to popular Relational Database Management Systems (RDBMSs). It is a
standard query language you can use to enter, query, and change data in a database. You administer the
YourSite Database using the Microsoft SQL Server, which is a database management system.
0HQXIXQFWLRQV
You use the Collector Monitor to view the following:
• Server Started
• This Node's Alarm Status
• SMDR/ACD File Name
• File Write Errors
• Records Today
• Record Last Received
• Server’s Current Time
• Clear All Data Alarms
• SMDR Data Stream/ACD Data Stream
• Record Errors
• Reset SMDR Link/Reset ACD Link
6HUYHU6WDUWHG
The Server Started field displays the date and time you started the 6110 CCM Server.
7KLV1RGH¶V$ODUP6WDWXV
The Alarm Status field displays system errors, such as SQL and comport errors. SQL errors occur when the
connection to the SQL Server software is down. Comport errors occur when the data flow to the SMDR,
ACD, and WallBoard comports is interrupted.
60'5$&')LOH1DPH
The SMDR/ACD File Name field displays the name of the text file to which the Collector Service writes
SMDR/ACD data. You can find the text file on the 6110 CCM Server in \\prairieFyre\6110 CCM\ACD
Manager. The file naming convention is S (for SMDR) YYYY/MM/DD. The date in the text file name must
match the date in the Server’s Current Time field.
)LOH:ULWH(UURUV
The File Write Errors field displays a value for the number of times the Collector Service attempts to write to
the 6110 CCM Server data drive (when the disk is full).
5HFRUGV7RGD\
Under SMDR Data Stream/ACD Data Stream, the Records Today field displays the total number of SMDR/
ACD records received for the day.
5HFRUG/DVW5HFHLYHG
Under SMDR Data Stream/ACD Data Stream, the Record Last Received field displays the date and time the
Collector Service received the SMDR/ACD record last sent.
6HUYHU¶V&XUUHQW7LPH
The Server’s Current Time field displays the current date and time set on the 6110 CCM Server.
&OHDU$OO'DWD$ODUPV
The Clear All Data Alarms button clears any current data alarms.
60'5'DWD6WUHDP$&''DWD6WUHDP
The SMDR Data Stream/ACD Data Stream field displays SMDR/ACD records as they arrive from the
telephone system.
5HFRUG(UURUV
Under SMDR Data Stream/ACD Data Stream, the Record Errors field displays the number of records
received by the Collector Service that were not valid SMDR/ACD records.
5HVHW60'5/LQN5HVHW$&'/LQN
The Reset SMDR Link/Reset ACD Link button resets the SMDR/ACD data link from the telephone system to
the Collector Service when the SMDR Data Stream/ACD Data Stream field shows no data is streaming. If
you attempt to reset the link and data does not start streaming, check your cabling connections from the
telephone system to the comports.
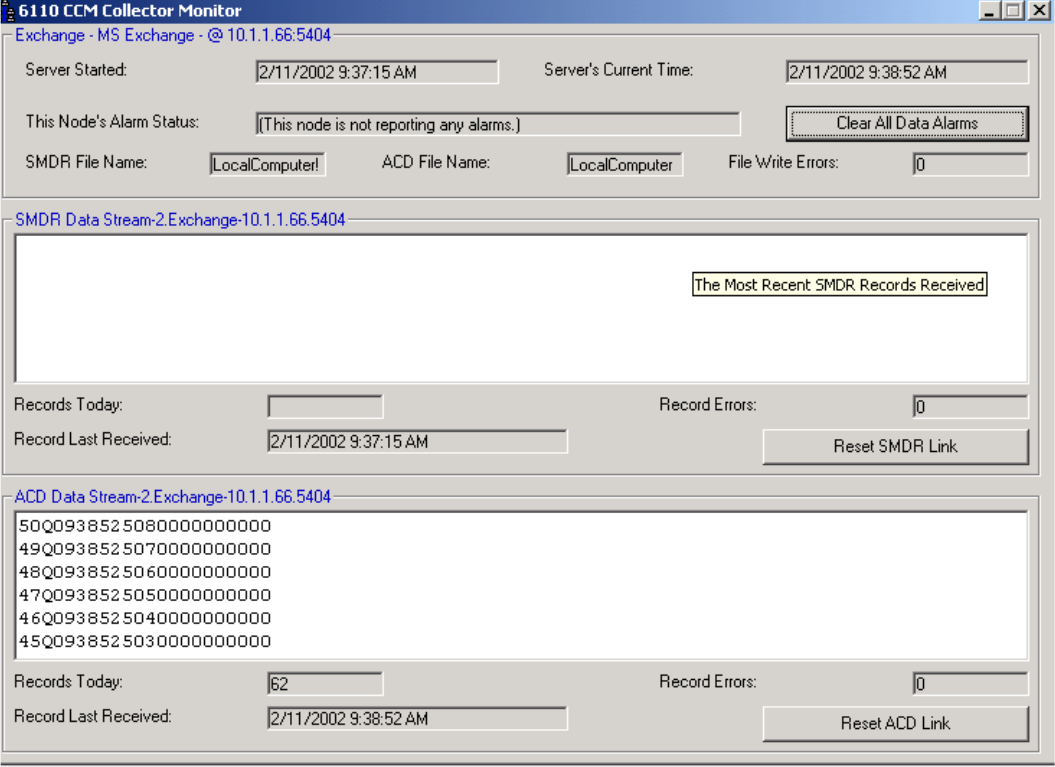
&KDSWHU1HWZRUN0RQLWRU
6WDUWLQJWKH&ROOHFWRU0RQLWRU
6WDUWLQJWKH&ROOHFWRU0RQLWRUIURPWKH&&0(QWHUSULVH6HUYHU
• When viewing the Network Monitor, click Data links.
6WDUWLQJWKH&ROOHFWRU0RQLWRURQDFOLHQWFRPSXWHU
1. Click Tools=>ACDLink on the 6110 CCM UI to start the Collector Monitor.
)LJXUH7KH&ROOHFWRU0RQLWRU

&KDSWHU:DOO%RDUGHU
3URPLQHQWO\GLVSOD\DJHQWDQG
TXHXHVWDWLVWLFVDQGQHHGWRNQRZ
LQIRUPDWLRQZLWK:DOO%RDUGHU
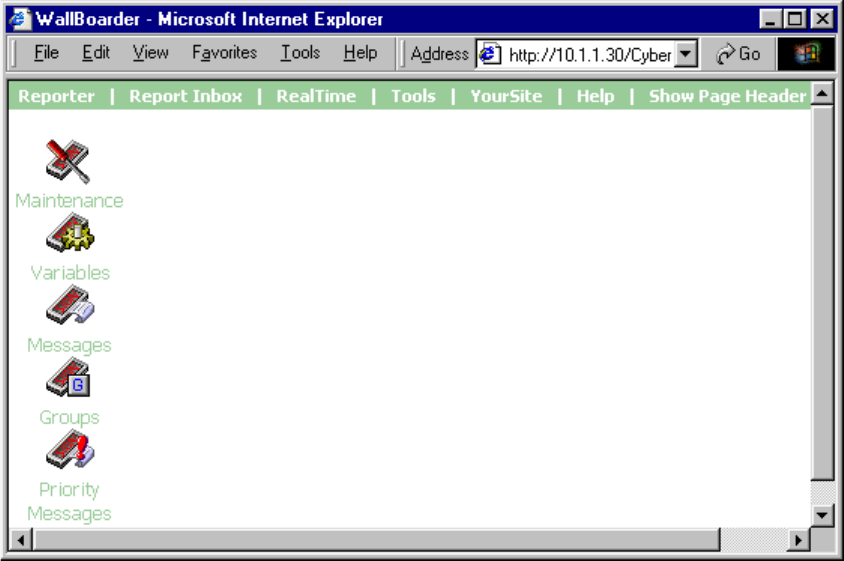
&KDSWHU:DOO%RDUGHU
:DOO%RDUGHU
The WallBoarder program displays text messages and call center statistics on one or more Spectrum Light
Emitting Diode (LED) reader boards (wall signs). Wall signs provide real-time statistics to agents and
supervisors, such as the number of calls in queue, the wait time of the longest waiting caller, and the
number of available agents. You can define display characteristics and alarm thresholds for ACD variables.
When a call center has more than one wall sign they are networked together. The first wall sign connected
to the 6110 CCM Server is the master sign. All other wall signs are slave signs. Telephone system statistics
update WallBoarder every second.
:DOO%RDUGHUPDLQVFUHHQ
When you click RealTime=>WallBoarder Figure 11-1 appears.
)LJXUH:DOO%RDUGHUPDLQVFUHHQ
:DOO%RDUGHULFRQV
WallBoarder has Maintenance, Variables, Messages, Groups, and Priority Messages components you use to
reset the signs, define the appearance of displayed performance variables, program wall sign messages,
assign wall sign messages to sign plans, and program priority messaging respectively.
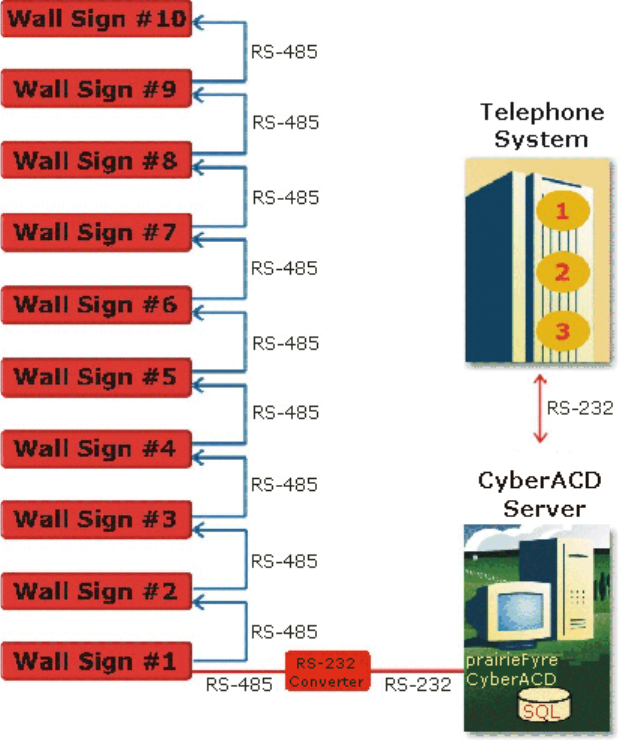
6SHFWUXPZDOOVLJQVHWXS
Figure 11-2 illustrates the connectivity between the 6110 CCM Server and the master sign (Wall Sign #1).
The 6110 CCM Server connects to the master sign over an RS-232 25-pin cable, an RS-485 converter, and
RS-485 RJ-11 cabling. The master sign connects to slave signs over RS-485 cabling.
)LJXUH6SHFWUXPVHWXS
Each wall sign has a unique address. You use a keypad provided with the master sign to set the internal
addresses of your signs. The addresses distinguish wall signs for messaging purposes. Use address 00 when
you have only one wall sign. When you have more than one wall sign, number the master unit 01.
You set the internal sign addresses with the keypad, and register them in WallBoarder on the Groups screen.
WallBoarder uses sign groups to dictate the messages displayed by particular wall signs. Each sign group
has a range of sign addresses. For example, you can specify that Sign Group #1 provide real-time displays
for wall signs one to five, Sign Group #2 provide real-time displays for wall signs six to 10, and so on.

&KDSWHU:DOO%RDUGHU
6SHFLI\LQJZDOOVLJQFRPSRUWVHWWLQJV
NOTE: The default comport settings for newer Spectrum IP/Serial wall signs are 8; None; 1. In the past,
the default comport settings were: 7; Even; 2. Please refer to Spectrum documentation to verify the correct
default comport settings.
To edit wall sign comport settings:
/RJRQWRWKH:LQGRZV176HUYHUZLWKDQDFFRXQWWKDWKDVDGPLQLVWUDWLYHSULYLOHJHV
&OLFN6WDUW !3URJUDPV !SUDLULH)\UH6RIWZDUH,QF !SUDLULH)\UH&&0
0DQDJHPHQW&RQVROHWRVWDUWWKH0DQDJHPHQW&RQVROHSURJUDP
&OLFNWKH6\VWHP6HWWLQJVWDE
'RXEOHFOLFN6LJQ&RPSRUWDQGHQWHUFRPSRUWYDOXHVIRUWKHFRPSRUWWKDWFRQQHFWV
WKHZDOOVLJQWRWKH&&06HUYHU
&OLFN2.
&RQILJXULQJZDOOVLJQPHVVDJHV
To program wall sign messages:
'HILQHWKUHVKROGFKDUDFWHULVWLFVIRUZDOOVLJQYDULDEOHVDFURVV$&'TXHXHJURXSV
&RQVWUXFWPHVVDJHVWULQJVRIXVHUGHILQHGWH[WVLJQYDULDEOHVGLVSOD\IHDWXUHVDQG
JUDSKLFV
'HILQHVLJQJURXSVWKDWVSHFLI\WKHFRQGLWLRQVLQZKLFKUHDOWLPHLQIRUPDWLRQLV
GLVSOD\HGRQRQHRUPRUHZDOOVLJQV
2SWLRQDOO\SURJUDPSULRULW\PHVVDJHVWRSURYLGHHVVHQWLDOSHUVRQDOLQIRUPDWLRQWR
DJHQWV
0DLQWHQDQFHVFUHHQ
If you see question marks [???] instead of statistics on the wall sign, this means the telephone system has
not updated 6110 CCM with ACD real-time statistics during the last 90 seconds.
You verify the connectivity of (reset) your walls signs and synchronize them to the 6110 CCM Server
computer time on the Maintenance screen illustrated in Figure 11-3.
)LJXUH0DLQWHQDQFHVFUHHQ
The Set Clock command synchronizes the wall sign clocks to the 6110 CCM Server computer time.
Synchronize your clocks to ensure scheduled messages are displayed on your wall signs at the correct time.

5HVHWWLQJZDOOVLJQV
If WallBoarder is not displaying your sign messages, you can reset your wall sign to test the connection
between the master wall sign and the 6110 CCM Server.
To reset and synchronize your wall signs:
&OLFNWKH0DLQWHQDQFH,FRQ
&OLFN5HVHW$OO6LJQVWRYHULI\\RXUQHWZRUNVLJQFRQQHFWLRQV
&OLFN6HW&ORFNWRVHWDOOZDOOVLJQFORFNVWRWKH&&06HUYHUFRPSXWHUGDWHDQG
WLPH
9DULDEOHVVFUHHQ
Table 1-1 lists the pool of ACD performance variables WallBoarder uses to configure wall sign messages.
7DEOH:DOO%RDUGHU$&'YDULDEOHV
$&'9DULDEOH 'HILQLWLRQ
Calls Waiting in
Queue the current number of callers in queue waiting for available agents,
including those listening to silence, music, or recorded announcements
Longest Waiting
Caller in Queue the current duration, in minutes and seconds, of the call waiting the
longest in queue
ACD Agent Logged
On the current number of agents logged on to the ACD
Offered Calls Today the total number of calls offered to the queue for the day
All calls received by the ACD queue, regardless of how they are handled or
routed, are referred to as the calls offered. This includes Calls Answered, Long
Interflowed Calls, and Long Abandoned Calls. Calls Requeued, Path Unavailable
Calls, Short Abandoned Calls and Short Interflowed Calls are not considered.
Telephone system data on the calls offered and average talk time is used by the
Erlang C equation in calculating the agents required.
Answered Calls
Today the total number of calls answered by agents for the day
Abandoned Calls
Today the total number of calls abandoned before being answered by agents for
the day
Answer Percentage
Today the percentage of calls answered compared to the total number of calls
offered to the ACD queue for the day
Service Percentage
Today
The service level is the total number of calls which are answered, abandoned,
and interflowed before a defined threshold time (Service Level Time),
compared to the total number of calls answered, abandoned, and interflowed.
The service level = (Calls Answered + Long Calls Abandoned + Long
Interflow) within the Service Level Time ÷ (Calls Answered + Long Calls
Abandoned + Long Interflow).

&KDSWHU:DOO%RDUGHU
The service level is comprised of the service level percent and service level time. The service level time
is the threshold time used in calculating the service level percent, such as 90 percent of calls
answered in 20 seconds.
You define and save display characteristics for sign variables (ACD variables associated with a particular
ACD queue) on the Variables screen.
NOTE: A queue must be a member of a queue group defined in the YourSite Database in order for you to
select the queue and associate it to an ACD variable in WallBoarder. This is to support real-time and report
permissions: you define permissions for database groups.
Figure 11-4 displays the screen used to define sign variables.
)LJXUH9DULDEOHVVFUHHQ
Consider the programming for Sign Variable #1 in Figure 11-4. The value for the Longest Waiting Caller
statistic will be displayed in amber when the longest waiting caller in D1003 has waited less than 20
seconds, in green when the longest waiting caller in D1003 has waited less than 45 seconds, and in red at
other times (when the longest waiting caller in D1003 has waited 46 seconds or more).
The Variables screen provides the following functions.
(GLWLQJ&XUUHQW9DULDEOH
The Editing Current Variable group displays the current (active) sign variable. You select the Enabled
check box to define alarm characteristics for the active variable and make it available for WallBoarder to
incorporate in message strings.

9DULDEOH7\SH
The Variable Type group associates an ACD variable and ACD queue to the active sign variable.
9DULDEOH,V/LQNHG7R
The Variable Is Linked To group specifies the queue or queue group associated with the ACD variable
currently selected.
9DULDEOH'LVSOD\HG
The Variable Displayed group specifies the number of characters reserved for an ACD variable in the
message string. It centers, left-justifies, or right-justifies the ACD variable within the variable string
position.
prairieFyre typically recommends you use a variable spacing of one to three character widths. The
following example shows a width of three characters for the Calls Waiting in Queue ACD variable. The
real-time value is right-justified in the variable string position.
CALLS WAITING = 1 0
NOTE: WallBoarder displays the Longest Waiting Caller statistic in hh:mm:ss. Under Variable Displayed,
type 8 for the width for the Longest Waiting Caller statistic. Otherwise, the at symbol [@] will appear on
the wall sign in place of the Longest Waiting Caller statistic.
9DULDEOH&RORU7ULJJHUHGWR9DULDEOH9DOXH
The Variable Color Triggers to Variable list defines color-coded alarms for ACD variable performance
thresholds.
'HILQLQJVLJQYDULDEOHV
To define sign variables and associated display characteristics:
,QWKH(GLWLQJ&XUUHQW9DULDEOHOLVWFOLFN6LJQ9DULDEOHDQGW\SHDQDPHWKDW
UHODWHVWRWKHYDULDEOHW\SHDQG$&'TXHXHV\RXZLOODVVRFLDWHZLWK6LJQ9DULDEOH
VXFKDV/RQJ&DOO:WJ3RU$JHQWVRQ$&'$OO3DWKV
8QGHU9DULDEOH7\SHVHOHFWDQ$&'YDULDEOHDQG$&'TXHXHWRDVVRFLDWHWR6LJQ
9DULDEOH
8QGHU9DULDEOH,V/LQNHG7RVHOHFWDTXHXHRUTXHXHJURXSWRDVVRFLDWHWRWKH$&'
YDULDEOHFXUUHQWO\VHOHFWHG
8QGHU9DULDEOH'LVSOD\HGVSHFLI\WKH$&'YDULDEOH¶VSRVLWLRQRQWKHZDOOVLJQDQG
WKHZLGWKRIGLVSOD\HGFKDUDFWHUV
8QGHU9DULDEOH&RORU7ULJJHUHGWR9DULDEOH9DOXHGHILQHSHUIRUPDQFHWKUHVKROGV
IRUWKHDFWLYHYDULDEOH&DOOV:DLWLQJLQ4XHXH
5HSHDWVWHSVWRWRGHILQHRWKHUVLJQYDULDEOHVDQGDODUPFKDUDFWHULVWLFV
&OLFN6DYHWRVDYHWKHSURJUDPPLQJWRWKH64/GDWDEDVH
You have defined sign variables. The next step in configuring wall sign messages is to construct a global
pool of sign messages.

&KDSWHU:DOO%RDUGHU
0HVVDJHVVFUHHQ
You compose, test, and save message strings displayed on wall signs on the Messages screen illustrated in
Figure 11-5. Message strings indicate to the wall sign how messages are displayed. They are constructed of
ACD variables, text, display features, and optionally graphics.
Consider the message strings defined in the following Figure. WallBoarder displays the first message string
on the top line [PS02-Top Line] of the wall sign. It displays the Long Call Wtg = component of the message
string in red [C001-Red]. The message string flashes [MO03-Flash] across the sign at display speed 2
[MI06-Display Speed 2]. It is comprised of text you type (Long Call Wtg =) and Sign Variable #1 [VA01-
Long Call Wtg - D1003], that displays the real-time value for the Longest Waiting Caller ACD variable.
The color of the sign variable statistic changes with the wait time of the longest waiting caller, as per the
threshold settings defined on the Variables tab.
WallBoarder displays the second message string in red [C001-Red] on the middle line [PS01-Middle Line]
of the wall sign.
)LJXUH0HVVDJHVVFUHHQ
The Messages screen provides the following functions.
(GLWLQJ&XUUHQW0HVVDJH
The Editing Current Message group displays the current (active) sign message. You select the Enabled
check box to define display characteristics for the active sign message and make the message available to
WallBoarder to incorporate in sign groups.
3RVLWLRQ
The Position tab specifies the vertical position of the message string on the wall sign. If you do not specify
the text position, the wall sign defaults to the fill mode: the message enters the wall sign from the upper left
corner and scrolls to fill up to three rows of text. If you specify the text position, do so before setting other
display features.
&RORUV
The Colors tab specifies the color of text you type in the message string, and the color of any pre-defined
text and graphics you select on the Special tab. You can specify different colors for each word in the text
string. If you specify text coloring, do so after specifying text positioning, but prior to specifying other
display features. Some Spectrum signs offer more color choices than other Spectrum signs. Please refer to
the Spectrum product brochure for more information.
(IIHFWV
The Effects tab specifies how messages move across wall signs. If you do not specify effects, the wall sign
defaults to the Automode option. Automode produces random message display formats, such as message
strings that flash or roll to the left.
6SHFLDO
The Special tab provides display features and illustrations you can add to message strings.
0LVFHOODQHRXV
The Miscellaneous tab specifies the speed at which WallBoarder displays message strings, the size of
message string text, the display time and date, and other features.
9DULDEOHV
The Variables tab associates ACD variables and ACD queues to sign variables, and specifies display
characteristics and color-coded alarm thresholds.
When you incorporate a sign variable, such as Sign Variable #6, in a message string, the real-time value of
the associated ACD variable is displayed.
&KDSWHU:DOO%RDUGHU
'HILQLQJVLJQPHVVDJHV
To define and test sign messages:
,QWKH(GLWLQJ&XUUHQW0HVVDJHOLVWFOLFN6LJQ0HVVDJH
&OLFNWKH3RVLWLRQWDEDQGGRXEOHFOLFNDYHUWLFDOSRVLWLRQW\SH
&OLFNWKH&RORUWDEDQGGRXEOHFOLFNDFRORUIRUWKHPHVVDJHVWULQJ
&OLFNWKH(IIHFWVWDEDQGGRXEOHFOLFNDQRSWLRQIRUPRYLQJWKHPHVVDJHDFURVVWKH
ZDOOVLJQ
&OLFNWKH6SHFLDOWDEDQGGRXEOHFOLFNRQHRUPRUHDGGLWLRQDOGLVSOD\IHDWXUHV
&OLFNWKH0LVFHOODQHRXVWDEDQGGRXEOHFOLFNDGGLWLRQDOGLVSOD\IHDWXUHV
7\SHDQDPHIRUWKHYDULDEOHVXFKDV/RQJ&DOO:DLWLQJ
&OLFNWKH9DULDEOHVWDEDQGGRXEOHFOLFNDVLJQYDULDEOH
&OLFN7HVWWRWHVWWKHPHVVDJHGLVSOD\RQWKHZDOOVLJQ
3UHVV(QWHUDQGRSWLRQDOO\HQWHUDVHFRQGPHVVDJHVWULQJWRWKHZDOOVLJQ
5HSHDWVWHSVWRWRGHILQHDQGWHVWDGGLWLRQDOZDOOVLJQPHVVDJHV
&OLFN6DYHWRVDYHWKHSURJUDPPLQJWRWKH64/GDWDEDVH
You have defined a global pool of sign messages. The next step in configuring wall sign messages is to
define sign groups and specify the conditions in which sign messages are displayed on one or more wall
signs.
*URXSVVFUHHQ
You define sign groups on the Groups screen illustrated in Figure 11-6. Sign groups dictate the messages
displayed by particular wall signs. Each wall sign has a unique address. Only sign messages addressed to a
particular wall sign will reach the wall sign.
Each sign group has a range of sign addresses. For example, you can specify that Sign Group #1 provide
real-time displays for wall signs one through five, Sign Group #2 provide real-time displays for wall signs
six to 10, and so on.
You can specify up to five statements (conditions) using sign groups. Conditions dictate which message
strings WallBoarder displays, and the priority in which WallBoarder displays them. If none of the
conditions are satisfied, WallBoarder displays the default message on all wall signs. The default message
can be a message congratulating agents, or informing them of an upcoming meeting or other need-to-know
information.
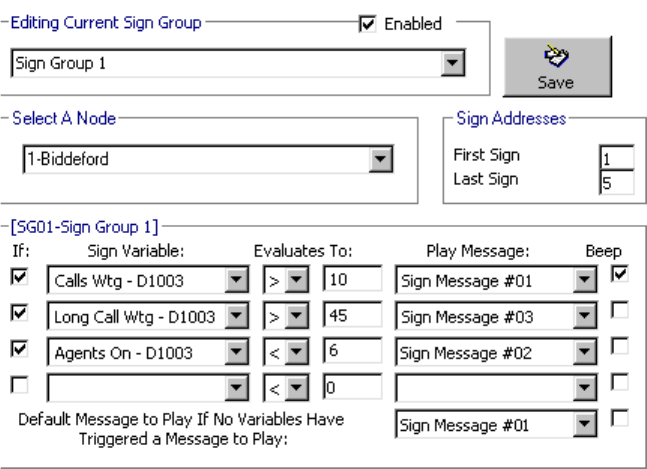
)LJXUH*URXSVVFUHHQ
Consider the sign group programming defined in the preceding Figure. The first condition specifies "If Sign
Variable #1 (the Calls Waiting in D1003) exceeds 10 play Sign Message #01." The second condition
specifies "If Sign Variable #2 (the Longest Waiting Caller in D1003) exceeds 45 seconds play Sign
Message #03. "The third condition specifies "If Sign Variable #3 (the ACD Agents Logged On to D1003)
drops below 6 play Sign Message #02."
The Groups screen provides the following functions.
(GLWLQJ&XUUHQW6LJQ*URXS
The Editing Current Sign group displays the current (active) sign group. You select the Enabled check box
to define the conditions in which message strings are displayed, and the priority in which they are displayed
for the active sign group.
6HOHFWD1RGH
The Select a Node list specifies the call center site(s) for which you are programming wall sign messages.
6LJQ$GGUHVVHV
The First Sign and Last Sign boxes associate the active sign group to a range of wall sign addresses. Each
sign group specifies the real-time display characteristics for a unique range of wall signs. For example, if
you associate Sign Group 1 to wall signs one through eight, these wall signs display the same set of sign
variables and message strings.
,I
The If check box provides access to conditional messages. You can specify up to five statements
(conditions). Conditions dictate which message strings WallBoarder displays, and the priority in which
WallBoarder displays them.
&KDSWHU:DOO%RDUGHU
6LJQ9DULDEOH
The Sign Variable list specifies the sign variable to display for the current (active) condition.
(YDOXDWHV7R
The Evaluates To group specifies the value, above or below which, WallBoarder displays the message
string associated with the sign variable for the current condition.
3OD\0HVVDJH
The Play Message list specifies the sign message to display for the current (active) condition.
%HHS
The Beep check box programs the wall sign to produce an audible beep prior to displaying a message for a
satisfied condition.
'HIDXOW0HVVDJHWR3OD\,I1R9DULDEOHV+DYH7ULJJHUHGD0HVVDJHWR3OD\
The Default Message to Play If No Variables Have Triggered a Message to Play list specifies a default
message to display on the wall sign. WallBoarder displays the message during periods when the defined
conditions ("If" statements) are not satisfied for the sign group. That is, when the call center is quiet.
'HILQLQJVLJQJURXSV
To define sign groups:
,QWKH(GLWLQJ&XUUHQW6LJQ*URXSOLVWFOLFN6LJQ*URXS
,QWKH6HOHFW$1RGHOLVWVHOHFWDFDOOFHQWHUVLWHV
,QWKH)LUVW6LJQDQG/DVW6LJQER[HVW\SHDVLJQDGGUHVVRUDUDQJHRIVLJQ
DGGUHVVHVIRU6LJQ*URXS
6HOHFWWKHXSSHUPRVW,IFKHFNER[WRGHILQHWKHILUVWFRQGLWLRQDOPHVVDJHIRU6LJQ
*URXS
,QWKH6LJQ9DULDEOHOLVWVHOHFWDVLJQYDULDEOH
,QWKH(YDOXDWHV7ROLVWVVSHFLI\WKHWKUHVKROGDERYHRUEHORZZKLFKDVLJQ
PHVVDJHLVGLVSOD\HG
,QWKH3OD\0HVVDJHOLVWVHOHFWDVLJQPHVVDJH
6HOHFWWKH%HHSFKHFNER[LI\RXZDQWDQDXGLEOHDODUPWRDFFRPSDQ\WKHPHVVDJH
5HSHDWVWHSVWRWRGHILQHRWKHUFRQGLWLRQDOPHVVDJHVIRU6LJQ*URXS
5HSHDWVWHSVWRWRGHILQHPHVVDJLQJIRUDGGLWLRQDOVLJQJURXSV
&OLFN6DYHWRVDYHWKHSURJUDPPLQJWRWKH64/GDWDEDVH
This completes the programing of wall sign messaging for your call center. You can optionally define
priority messages that WallBoarder displays at particular time intervals over the day.
3ULRULW\0HVVDJHVVFUHHQ
You define priority messages on the Priority Messages screen illustrated in Figure 11-7. Priority messages
provide agents with essential information. For example, you can program WallBoarder to display a priority
message from 6:00 P.M. to 6:15 P.M. each day reminding agents to log off, as illustrated in Figure 11-7.

)LJXUH3ULRULW\0HVVDJHVVFUHHQ
When you select the Enabled check box, WallBoarder displays the current (active) priority message on all
wall signs until you manually clear the check box; priority messages override all other sign messages.
You can define up to five priority messages. WallBoarder lists the messages in the Editing Current Priority
Message list. Typically, you define a unique display schedule for each message, such as Priority Message
#1 runs from 5:00 P.M. to 5:30 P.M. and Priority Message #2 runs from 5:30 P.M. to 6:00 P.M. In the event
that two or more schedules overlap, the order in which you list the messages dictates the priority in which
WallBoarder displays them.
The following functions are available on the Priority Messages screen.
(GLWLQJ&XUUHQW3ULRULW\0HVVDJH
The Editing Current Priority Message group displays the current (active) priority message. You select the
Enabled check box to define display characteristics for the active priority message and to enable priority
messaging.
6HOHFWD1RGH
The Select a Node list specifies the call center site(s) for which you are programming priority messages.
0HVVDJH3DUDPHWHUV
The Message Parameters group specifies the time interval during which the wall sign displays the current
(active) priority message. You can optionally program the time interval to cross midnight. The Beep check
box provides an audible alarm that accompanies the priority message displayed.
&KDSWHU:DOO%RDUGHU
3RVLWLRQ
The Position tab specifies the vertical position of the message string on the wall sign. If you do not specify
text position, the wall sign defaults to the fill mode: the message enters the wall sign from the upper left
corner and scrolls to fill up to three rows of text. If you specify text positioning, do so before setting other
display features.
&RORUV
The Colors tab specifies the color of text you type in the message string, and the color of any pre-defined
text and graphics you select on the Special tab. You can specify different colors for each word in the text
string. If you specify text coloring, do so after specifying text positioning, but prior to specifying other
display features. Some Spectrum signs offer more color choices than other Spectrum signs. Please refer to
the Spectrum product brochure for more information.
(IIHFWV
The Effects tab specifies how messages move across wall signs. If you do not specify effects, the wall sign
defaults to the Automode option. Automode produces random message display formats, such as message
strings that flash or roll to the left.
6SHFLDO
The Special tab provides display features and illustrations you can add to message strings.
0LVFHOODQHRXV
The Miscellaneous tab specifies the speed in which WallBoarder displays message strings, the size of
message string text, the display time and date, and other features.
'HILQLQJSULRULW\PHVVDJHV
To define and test priority messages:
,QWKH(GLWLQJ&XUUHQW3ULRULW\0HVVDJHOLVWFOLFN3ULRULW\0HVVDJH
,QWKH6HOHFW$1RGHOLVWVHOHFWDFDOOFHQWHUVLWHV
,QWKH0HVVDJH3DUDPHWHUVOLVWVVSHFLI\WKHWLPHLQWHUYDO:DOO%RDUGHUZLOOGLVSOD\
WKHSULRULW\PHVVDJH
6HOHFWWKH%HHSFKHFNER[LI\RXZDQWDQDXGLEOHDODUPWRDFFRPSDQ\WKHPHVVDJH
&OLFNWKH3RVLWLRQWDEDQGGRXEOHFOLFNDYHUWLFDOSRVLWLRQW\SH
&OLFNWKH&RORUWDEDQGGRXEOHFOLFNDFRORUIRUWKHPHVVDJHVWULQJ
&OLFNWKH(IIHFWVWDEDQGGRXEOHFOLFNDQRSWLRQIRUPRYLQJWKHPHVVDJHDFURVVWKH
ZDOOVLJQ
&OLFNWKH6SHFLDOWDEDQGGRXEOHFOLFNRQHRUPRUHDGGLWLRQDOGLVSOD\IHDWXUHV
&OLFNWKH0LVFHOODQHRXVWDEDQGGRXEOHFOLFNDGGLWLRQDOGLVSOD\IHDWXUHV
7\SHDPHVVDJH
&OLFN7HVWWRWHVWWKHSULRULW\PHVVDJHRQWKHZDOOVLJQ
3UHVV(QWHUDQGRSWLRQDOO\HQWHUDVHFRQGPHVVDJHVWULQJWRGLVSOD\RQWKHZDOOVLJQ
5HSHDWVWHSVWRWRGHILQHDQGWHVWDGGLWLRQDOSULRULW\PHVVDJHV
&OLFN6DYHWRVDYHWKHSURJUDPPLQJWRWKH64/GDWDEDVH

&KDSWHU6LJKW5HSRUWV
&DOFXODWHWKHDJHQWUHTXLUHPHQW
DQGSHUIRUPZKDWLIVFHQDULRV
WRGHWHUPLQHDFFHSWDEOHOHYHOVRI
VHUYLFHIRU\RXDQG\RXUFDOOHUV
&KDSWHU6LJKW
6LJKW
Effective call center management involves having the right resources in place at the right times to handle an
accurately forecasted work load at the desired level of service. Finding the right balance between resources
and traffic volumes is critical. 4Sight accurately predicts your resource requirements.
The task of estimating resource requirements is particularly challenging as the number of calls and the total
duration of calls expected for a given time interval is difficult to predict. Forecasting involves taking a year
(or preferably two or three years) of historical data generated by your telephone system and using that
information to predict future traffic volumes and patterns.
Forecasting involves examining trends in call load patterns, breaking the information down into monthly,
weekly, daily, half-hour, and 15-minute intervals that reflect call load patterns, and determining the
handling times of the calls. You then modify the forecast based on current call center activities and other
considerations, such as absenteeism, agent breaks, holidays, and training.
The accuracy of your forecast increases markedly with the size of your data sample. For example, the call
load estimate derived from data on 30 agents who receive 950 calls, will be more accurate than the call load
estimate derived from data on 10 agents who receive 280 calls during the same period. Extraneous values
for talk time, and temporary changes in agent availability become less significant as the data sample
increases in size.
The importance of accurate forecasting can not be overstated. Forecasting is the basis for estimating
required resources, such as agents, trunks, and workstations, and impacts call center operations and
performance in the following ways:
• The number of blocked and abandoned calls
• The level of service provided to callers and the callers’ perception of service
• Agent work load, call behavior, and retention
• The accuracy and usefulness of schedules
• The success of periodic sales campaigns
Conducting a forecast involves accurately estimating the three components of call load: talk time, wrap up
time, and call volume. You can apply the Erlang C equation to the estimated call load and average talk time
and predict the agent requirement for your service level percentage and service level time targets.
Call centers use the Erlang C equation for agent and delay calculations where ACD queueing is involved.
An Erlang measures telephone traffic, or the flow of calls and call attempts to your call center during a
given period of time. One Erlang equals one hour or 60 x 60 = 3,600 seconds of telephone conversation.
Erlang C predicts the resources required to keep wait (delay) times within your service level objective. The
delay time is based on three variables: the number of agents, the number of waiting callers, and the average
time it takes to handle each call.
The Erlang C formula uses your historical call load data, and the service level percentage, service level
time, and wrap up time you specify and predicts the agent requirement for the time interval and date range
in the forecast. Although Erlang C has its limitations, it is the preferred planning tool as it provides
reasonable traffic estimates for call centers that maintain good service—minimal blocking and few
abandons.
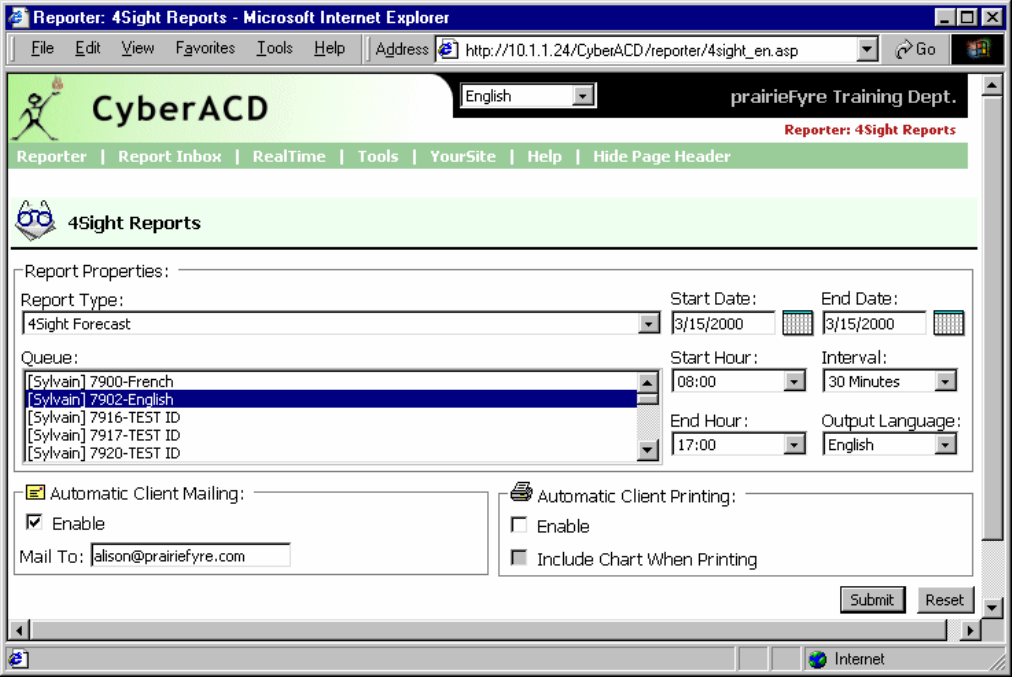
6LJKWPDLQVFUHHQ
You can generate run-on-demand or scheduled forecast reports. When you click Reporting=>4Sight Figure
12-1 appears. This is the screen you use to select report parameters for a run-on-demand 4Sight Report.
)LJXUH6LJKWPDLQVFUHHQ
4Sight provides the following report options.
5HSRUW7\SH
The Report Type list specifies the type of forecast report you produce: 4Sight Forecast (queue) or 4Sight
Group Forecast (queue group).
4XHXH
The Queue list specifies queues and queue groups you can use as a basis for the forecast.
6WDUW'DWH(QG'DWH
The Start Date and End Date lists specify the range of historical dates you use in the forecast. You can pick
any calendar date as the start date, and any date later in the calendar year as the end date.
6WDUW+RXU(QG+RXU
The Start Hour and End Hour lists specify the hours of the day included in the forecast.
&KDSWHU6LJKW
,QWHUYDO
The Interval list specifies the report period: by 15, 30, or 60 minutes.
2XWSXW/DQJXDJH
The Output Language list specifies the language used in the report tables and charts: English or French.
$XWRPDWLF&OLHQW0DLOLQJ
Under Automatic Client Mailing, the Enable check box e-mails the report spreadsheets and associated
graphs to an e-mail address you specify.
$XWRPDWLF&OLHQW3ULQWLQJ
The Automatic Client Printing check boxes print the report spreadsheet and associated graph.
)RUHFDVWSDUDPHWHUV
4Sight uses the following parameters in calculating the agents required.
&DOOORDG
The term call load refers to the combined effect of the number of calls received by the ACD queue and their
duration, or the calls offered x (average talk time + average wrap up time).
&DOOV2IIHUHG
All calls received by the ACD queue, regardless of how they are handled or routed, are referred to as the
calls offered. This includes Calls Answered, Long Interflowed Calls, and Long Abandoned Calls. Calls
Requeued, Path Unavailable Calls, Short Abandoned Calls and Short Interflowed Calls are not considered.
Telephone system data on the calls offered and average talk time is used by the Erlang C equation in
calculating the agents required.
$YHUDJHWDONWLPH
The talk time is the time the caller is connected to an agent. The average talk time is the average time the
agent spends talking to callers during a given time interval; it is the total average call duration plus any
wrap up time you add.
6HUYLFH/HYHO
The service level is the total number of calls which are answered, abandoned, and interflowed before a
defined threshold time (Service Level Time), compared to the total number of calls answered, abandoned,
and interflowed. It’s the average length of time a caller who has obtained a trunk waits for an available
agent. The service level = (Calls Answered + Long Calls Abandoned + Long Interflow) within the Service
Level Time ÷ (Calls Answered + Long Calls Abandoned + Long Interflow).
6HUYLFH/HYHO3HUFHQW
The service level percent is the proportion of calls, expressed as a percentage, which are answered,
abandoned, and interflowed within a defined threshold time compared to the total number of calls answered
or abandoned (after the short abandon time).
6HUYLFH/HYHO7LPH
The service level time is the threshold time used in calculating the service level percentage, such as 90
percent of calls answered in 20 seconds. The service level percentage and service level time are parameters
you define as your service objective.
:UDSXSWLPH
The wrap up time is the time an agent spends completing transactions associated with a call after the agent
hangs up. The wrap up time is a standardized period. If an agent requires additional time to complete
paperwork or online transactions, the agent can remove him or herself from the ACD queue temporarily for
this purpose.
*HQHUDWLQJIRUHFDVWUHSRUWV
The Erlang C formula uses your historical call load data, service level percentage, service level time, and
wrap up time and predicts the agent requirement for the time interval and date range in the forecast. The
Start Date and End Date lists specify the range of historical dates used in the forecast. The resultant
spreadsheet displays the call load and agents required across time intervals.
You can generate run-on-demand or scheduled forecast reports. Before you generate any reports, ensure
you select Help=>Client Download and download the 6110 CCM Excel report templates from the Client
Download page to your computer.
NOTE: You can generate multiple queue reports simultaneously by selecting more than one queue in the
Queue list and clicking Submit.
NOTE: Each time you run a report, Reporter retains the Start Hour, End Hour, and Interval report
parameters last selected.
If you intend to e-mail the forecast report to one or more recipients you must add the recipients to a mailing
list and associate the recipients to a group.
To set up groups for e-mailing reports:
&OLFN0\2SWLRQV !&RQWDFWV
2QWKH&RQWDFWVWDEFOLFN$GG
7\SHWKHILVWQDPHODVWQDPHDQGHPDLODGGUHVVRIWKHSHUVRQWRZKLFK\RXZDQWWR
HPDLOWKHUHSRUWDQGFOLFN2.
2SWLRQDOO\DGGDGGLWLRQDOHPDLOUHFLSLHQWVWRWKHFRQWDFWVOLVW
&OLFN*URXSV
&OLFN$GGDQGW\SHDQDPHDQGGHVFULSWLRQIRUWKHFRQWUDFWJURXSDQGFOLFN2.
2QWKH*URXSVWDEGRXEOHFOLFNWKHJURXSDGGPHPEHUVWRWKHJURXSDQGFOLFN
6DYH
To generate a run-on-demand forecast report:
&OLFN5HSRUWLQJ !6LJKW
,QWKH5HSRUW7\SHOLVWFOLFNDUHSRUWW\SH
,QWKH4XHXHOLVWVHOHFWDGHYLFH
The Start Date and End Date specify the date range for the historical data you use in the forecast.
&KDSWHU6LJKW
,QWKH6WDUW'DWHDQG(QG'DWHOLVWVFOLFNDVWDUWGDWHDQGHQGGDWHIRUWKHUHSRUW
,QWKH6WDUW+RXUDQG(QG+RXUOLVWVFOLFNDVWDUWKRXUDQGHQGKRXUIRUWKHUHSRUW
,QWKH2XWSXW/DQJXDJHOLVWVHOHFW(QJOLVKRU)UHQFK
,QWKH,QWHUYDOOLVWVHOHFWWKHIRUHFDVWLQWHUYDOE\RUPLQXWHV
8QGHU$XWRPDWLF&OLHQW3ULQWLQJ2SWLRQVVHOHFWSULQWLQJRSWLRQV
8QGHU$XWRPDWLF&OLHQW0DLOLQJ2SWLRQVVHOHFWWKH(QDEOHFKHFNER[DQGVHOHFWDQ
HPDLODGGUHVV
&OLFN6XEPLW
Figure 12-2 appears.
)LJXUH5HSRUWFRQILUPDWLRQ
The Report Writer queries the SQL database for report data and saves the data on the 6110 CCM Server.
4Sight uses service level percentage (80%), service level time (20 sec), and wrap up time (15 sec) values in
calculating the agents required. You can change these values in the resultant spreadsheet and recalculate the
agents required.
9LHZLQJIRUHFDVWUHSRUWV
NOTE: 6110 CCM permissions are based on database teams and groups. In programming the YourSite
Database, you must create agent IDs and associate the agents to employees and to agent groups. You must
associate the agent groups to the queues for which they answer calls. You must associate the employees to
employee groups and the queues to queue groups. You must create these associations in the database in
order to view real-time data and report on these devices. If you are reporting on extensions, trunks, DNIS
numbers, and account codes, you must add these devices to the YourSite Database and associate the
extensions to extension groups, trunks to trunk groups, and DNIS numbers to DNIS groups.
Report Inbox includes Today’s Reports, Yesterday’s Reports, All of Your Reports, and Inbox Manager
links.
Today’s Reports displays all of the reports generated today under your user name. Yesterday’s Reports
displays all of the reports generated yesterday under your user name. All of Your Reports displays all of the
reports generated under your user name over the last 30 days. It provides links to run-on-demand, run-from-
schedule, and all reports, by date. Inbox Manager deletes reports from your inbox by date range.
To view the 4Sight report and corresponding graphs:
&OLFN9LHZ5HSRUW,QER[XSRQVXEPLWWLQJDUHSRUWRUFOLFN5HSRUW
,QER[ !7RGD\
When you click View Report Inbox Figure 12-3 appears.
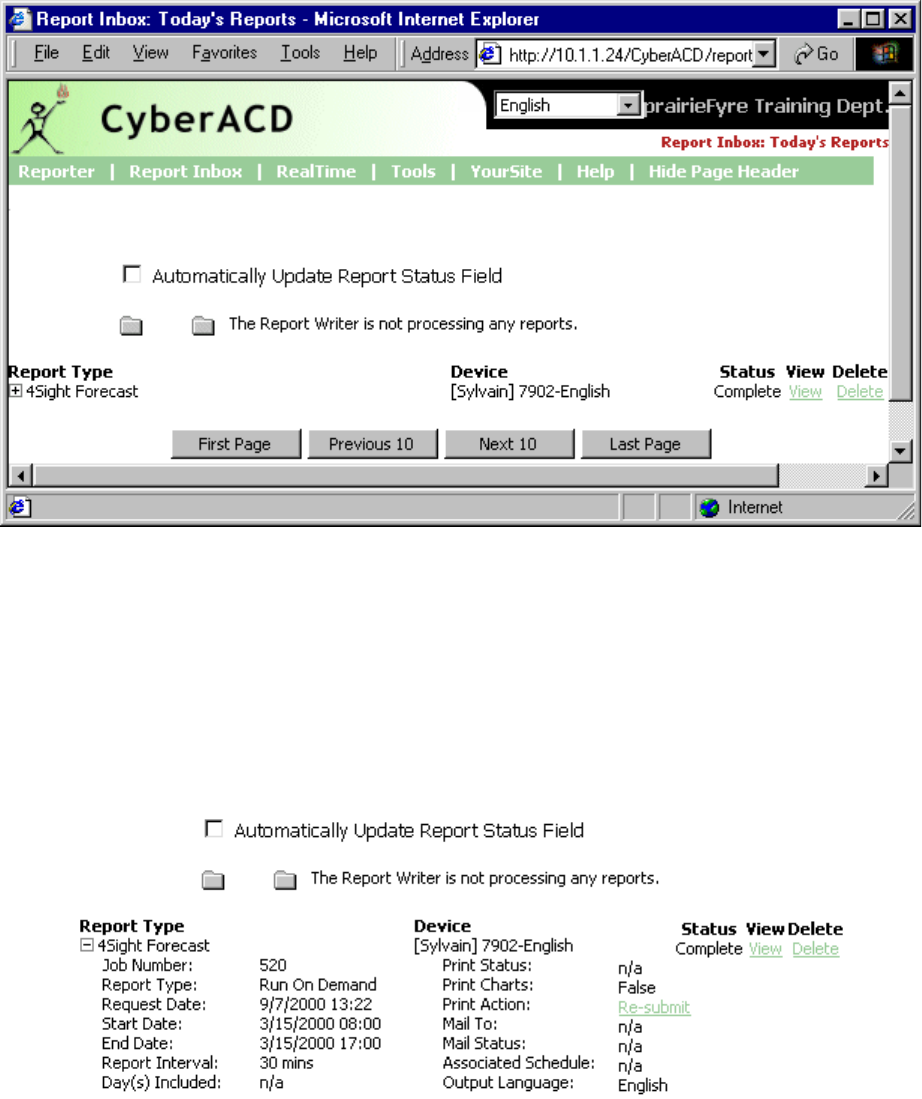
)LJXUH5HSRUW,QER[PDLQVFUHHQ
Your report inbox displays all reports generated under your user name.
6HOHFWWKH$XWRPDWLFDOO\8SGDWH5HSRUW6WDWXV)LHOGFKHFNER[WRKDYHWKH:HE
SDJHDXWRPDWLFDOO\XSGDWHGHYHU\VHFRQGV
&OLFNWKHH[SDQVLRQER[DGMDFHQWWRDIRUHFDVWUHSRUWWRYLHZUHSRUWVWDWXVGHWDLOV
Figure 12-4 appears.
)LJXUH5HSRUWVWDWXV
Report Inbox provides the following options.
5HSRUW7\SH
The Report Type field lists the forecast report name.
&KDSWHU6LJKW
'HYLFH
The Device field lists the reporting number for the device you are reporting on.
6WDWXV
The Status field confirms if your report is ready. When Complete appears in the status field the report is
waiting in your Report Inbox. When Pending appears, the report is not ready. No Data means no records
were available for the parameters you specified. Failed means the report did not generate. If a report fails,
the Report Writer logs errors in the NT event log. Clicking Re-Submit regenerates the report.
9LHZ
The View command displays reports generated in Microsoft Excel.
'HOHWH
The Delete command deletes reports from your report inbox.
3ULQW6WDWXV
The Print Status field confirms if the Report Distributor program has printed a copy of the report. Field
entries include Sent to Client, Pending, and Failed. Sent to Client means the Report Distributor received
instructions to process the print job. Pending means the Report Distributor has not requested the job yet, or
is not currently running on your computer.
3ULQW&KDUWV
The Print Charts field confirms whether or not charts will be printed.
3ULQW$FWLRQ
Under Print Action, the Re-Submit command resubmits the report for printing.
0DLO7R
The Mail To field lists the e-mail address of the person to which you sent the report.
0DLO6WDWXV
The Mail Status field confirms if the Report Distributor program has mailed a copy of the report. Field
entries include Sent to Client, Pending, and Failed. Sent to Client means the Report Distributor received
instructions to process the e-mail. Pending means the Report Distributor has not requested the job yet, it is
not currently running on your computer, or there was a problem in distributing the e-mail.
$VVRFLDWHG6FKHGXOH
The Associated Schedule field specifies the associated schedule for scheduled reports.
2XWSXW/DQJXDJH
The Output Language list specifies the language used in the report tables and charts: English or French.
&OLFNWKH9LHZHQWU\DVVRFLDWHGZLWKDIRUHFDVWUHSRUWWRRSHQWKHUHSRUW
When you click View, the client-side Report Writer (Web page) retrieves the data files from the 6110 CCM
Server and re-creates the data set on your computer. It starts Excel and displays the forecast report
spreadsheet and graphs. If you click View to open a second report, Report Writer displays it in the same
Excel session.
You can graph other results by highlighting one or more columns of data in the spreadsheet and using the
Excel Chart Wizard. You can also use the Excel chart wizard to change the grid style.
While the report is open on your computer, you can save it to your local disc drive and e-mail it to others, or
place it on a shared network drive for others to access.
If you e-mail reports to other users, the users must have Excel installed on their computers to view the
reports.
3HUIRUPLQJZKDWLIVFHQDULRV
After you run a forecast, you can perform "what-if" scenarios on the resultant data by changing the value of
parameters displayed in the Excel spreadsheet and clicking 6110 CCM=>Recalculate to recalculate the
results.
You can enter values for the calls offered, average talk time, wrap up time, and service level percentage and
time and recalculate the number of agents required. For example, you can reduce the average talk time and
recalculate the agents required across 15-minute time intervals for the shift.
:KDWWRGRLIGDWDLVPLVVLQJIURPWKHUHSRUWV
NOTE: 6110 CCM permissions are based on database teams and groups. In programming the YourSite
Database, you must create agent IDs and associate the agents to employees and to agent groups. You must
associate the agent groups to the queues for which they answer calls. You must associate the employees to
employee groups and the queues to queue groups. You must create these associations in the database in
order to view real-time data and report on these devices. If you are reporting on extensions, trunks, DNIS
numbers, and account codes, you must add these devices to the YourSite Database and associate the
extensions to extension groups, trunks to trunk groups, and DNIS numbers to DNIS groups.
If you run a report and notice that the data for a particular device is missing from the report output, verify
the device is programmed in the telephone system and in the YourSite Configuration Database. If you
determine the device is missing from the database, add it to the database and use the Summarize Data
command (on Management Console program) to update the prairieFyre Service and the SQL database with
the complete telephone system data (stored on the local hard drive). You can then produce reports on the
device.
'HOHWLQJUHSRUWV
You can delete reports individually in Report Inbox or simultaneously in the Inbox Manager program.
To delete all reports submitted on a given date:
&OLFN5HSRUW,QER[ !,QER[0DQDJHU
Figure 12-5 appears.

&KDSWHU6LJKW
)LJXUH,QER[0DQDJHUPDLQVFUHHQ
6HOHFWDGDWHUDQJHIRUGHOHWLQJUHSRUWV
&OLFN'HOHWH
Inbox Manager deletes all reports submitted on the date(s) in question.
'HOHWLQJ6FKHGXOHG5HSRUWV
Inbox Manager does not delete reports you schedule to run in the future. For example, suppose you submit
a schedule on Monday, October 18, 1999 for a report generated each Tuesday at 18:45 hours. If you open
Inbox Manager on the morning of Tuesday October 19, 1999 and delete all reports submitted on Monday,
October 18, the report scheduled for 18:45 hours on Tuesday will run and appear in your Report Inbox.
NOTE: Report Writer deletes all reports that are 30 days or older from your report inbox. For run-on-
demand reports, the request date governs the reports age. For scheduled reports, the date the system
generates the report governs the reports age. You save any reports you want to retain beyond 30 days to
your hard drive or network home directory.
OLFHQFHYLRODWLRQV
NOTE: An employee is a physical person being tracked in your call center. Employees can have multiple
agent IDs. The number of employees you program in the YourSite Database must be consistent with your
software licence. If you have more employees programmed than your licence permits, "[licence Is In
Violation of Max Agents Allowed]" will appear in place of your company name on the 6110 CCM user
interface (UI) and on any reports you generate.
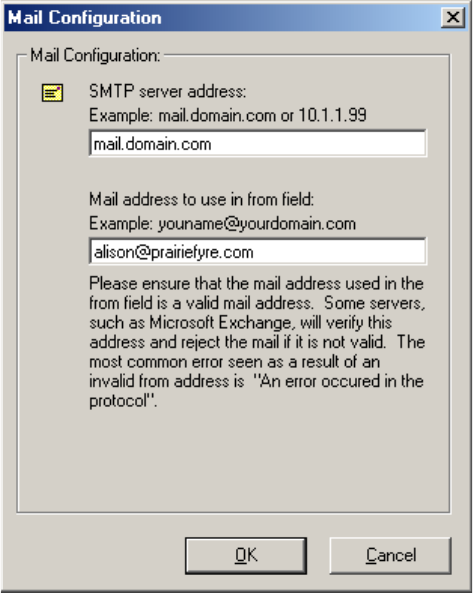
&KDSWHU6LJKW
5HSRUW'LVWULEXWRU
The Report Distributor application prints and e-mails your reports and displays the status of your printing
and mailing jobs. It runs in the system tray on your computer and must be running at all times in order to
print and e-mail reports automatically.
You must have a mail client installed in order for Report Distributor to e-mail reports. In addition, you must
inform Report Distributor of the address of the STMP mail server over which you will relay e-mails, and
you must enter a valid e-mail address.
To configure Report Distributor to e-mail reports:
2Q\RXUV\VWHPWUD\ULJKWFOLFNWKH5HSRUW'LVWULEXWRULFRQDQGFOLFN0DLO
&RQILJXUDWLRQ
Figure 12-6 Mail configuration appears.
)LJXUH0DLOFRQILJXUDWLRQ
8QGHU6073VHUYHUDGGUHVVW\SH\RXUPDLOVHUYHUDGGUHVV
8QGHU0DLODGGUHVVWRXVHLQIURPILHOGW\SH\RXUHPDLODGGUHVV
At one-minute intervals, Report Distributor seeks print and e-mail jobs and attempts to process the first 10
jobs in order of request date. The sort order is run-on-demand reports, scheduled reports, and then age.

NOTE: Report Distributor runs under the identity of the logged on user and prints to the default printer as
defined by the logged on user. A user who logs on but does not have a default printer setup, or does not
have adequate permissions to use the default printer causes Report Distributor to fail each print job that it
attempts to action.
To enable the automatic printing of reports and e-mails:
2Q\RXUV\VWHPWUD\ULJKWFOLFNWKH5HSRUW'LVWULEXWRULFRQDQGFOLFN&&0
6LWHV
If the Report Distributor icon is not displayed on the system tray, click Start=>prairieFyre Software
Inc.=>6110 CCM Report Distributor to start Report Distributor.
Figure 12-7 appears.
)LJXUH&&0VLWHV
Report Distributor needs to know which 6110 CCM Server to query for historical data.
5LJKWFOLFN6LWHVDQGFOLFN$GG
Figure 12-8 appears.
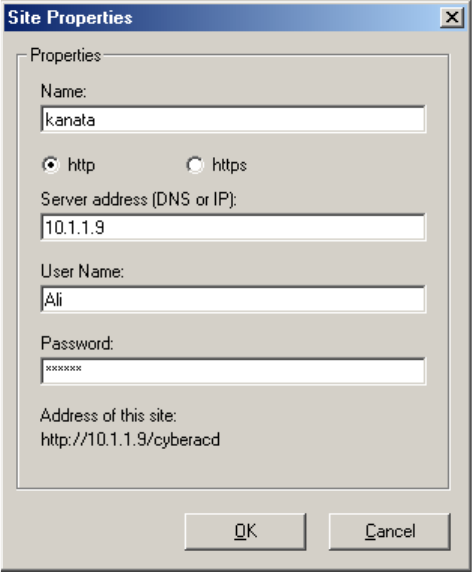
&KDSWHU6LJKW
)LJXUH6LWHSURSHUWLHV
7\SHDGHVFULSWLYHQDPH
(QWHUDYDOLG&&085/XVHUQDPHDQGSDVVZRUGDQGFOLFN2.
2SWLRQDOO\UHSHDWVWHSVWRWRDGGDVHFRQG85/
5LJKWFOLFNDVLWHFOLFN6HW'HIDXOWWRVSHFLI\WKHVLWHDVGHIDXOWWDUJHWVHUYHU
DGGUHVVIRU5HSRUW'LVWULEXWRUDQGFOLFN&ORVH
To view the default 6110 CCM Server address and the status of a report distributed by Report Distributor:
5LJKWFOLFNWKH5HSRUW'LVWULEXWRULFRQDQGFOLFN5HVWRUH
Figure 12-9 appears.

)LJXUH6WDWXVPHVVDJHV
Figure 12-9 displays the default 6110 CCM Server address and the status of a report printed and e-mailed
by Report Distributor.
The Errors tab provides details on failed print or e-mail jobs. When the error box is full, it clears itself and
displays a message with the date and time it was cleared.

&KDSWHU6LJKW
&&6
Mitel Networks 6120 Contact Center Scheduling is an add-on program that works in conjunction with
4Sight to match your staffing levels to your business needs. 4Sight exports forecast data on the agents
required to WorkFORCE, and WorkFORCE automatically schedules agents to optimize coverage and labor
costs. The following overview explains how to export, forecast, and schedule agents.
6WDUWWKH:RUN)25&(SURJUDP
2QWKH3HRSOHZLQGRZHQWHUGHSDUWPHQWQDPHVVFKHGXOHQDPHVMREWLWOHVDQG
HPSOR\HHV
4XLW:RUN)25&(
6WDUWWKH6LJKWSURJUDPRYHUWKH:HEDQGJHQHUDWHDIRUHFDVWIRUDJLYHQTXHXHRU
TXHXHJURXS
&OLFNWKH9LHZ5HSRUW,QER[LFRQDQGFOLFN9LHZWRVHHWKHIRUHFDVWUHVXOWV
&OLFNWKH&&0 !S)$GDSWLY([SRUW([FHOPHQXLWHPDQGH[SRUWWKHIRUHFDVW
GDWDWR:RUN)25&(
6HOHFWDVFKHGXOHGHSDUWPHQWDQGHPSOR\HHMREWLWOHVXFKDV,QWHUPHGLDWH$JHQW
DQGFOLFN1H[W
6WDUW:RUN)25&(DQGFOLFNWKH)RUHFDVWLFRQWRYLHZDOORIWKHDJHQWVIRUHFDVWIRU
WKHSDUWLFXODUGHSDUWPHQWDQGMREWLWOHVHOHFWHGLQVWHS
&OLFNWKH6FKHGXOHLFRQWRYLHZDJHQWVKLIWDQGDYDLODELOLW\GHWDLOV
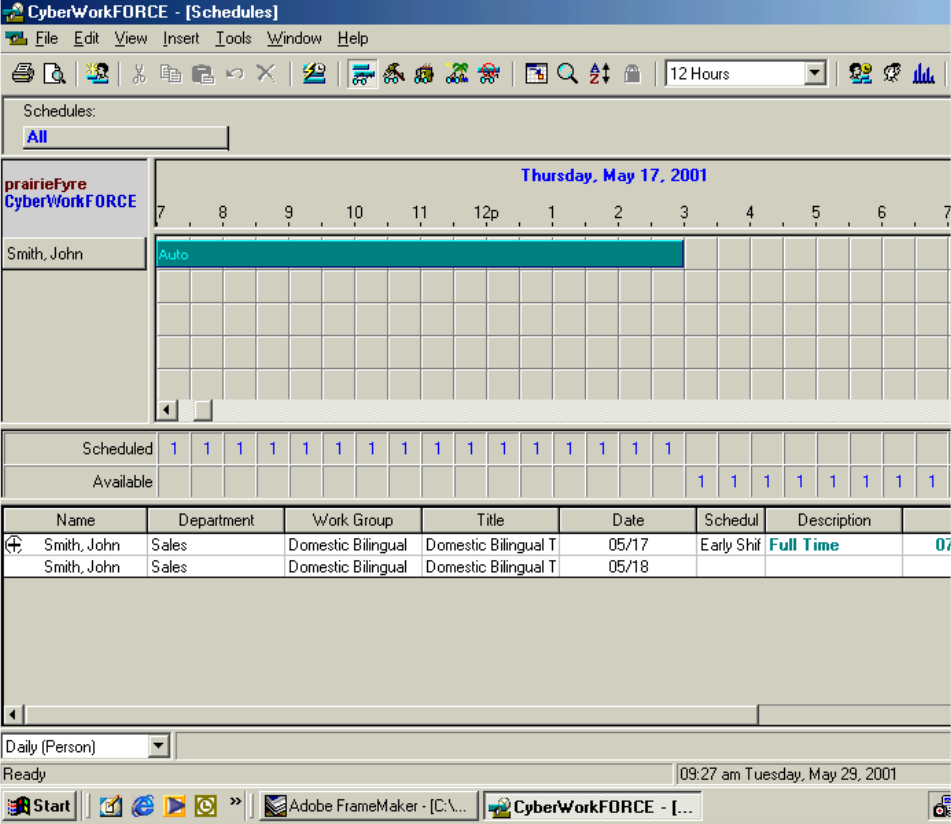
&&6PDLQVFUHHQ
When you open 6120 CCS Figure 12-10 appears. This is the screen you use to add agent shifts, and to view
and tweak agent schedules.
)LJXUH6FKHGXOHVZLQGRZ
The Schedules window provides the following menu options.
The Schedules, Departments, Titles, and Skills lists specify which information you display on the grid.
You can click View=>Totals to specify types of availability information to display, such as the total agents
forecasted and scheduled, and the total agents on break.
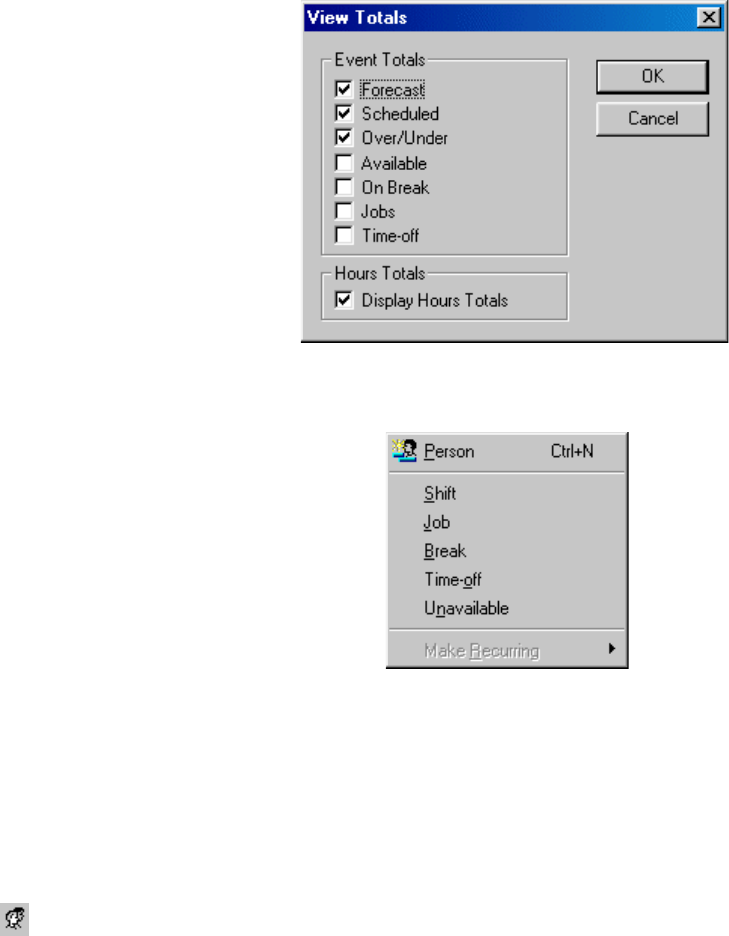
&KDSWHU6LJKW
You can click the Insert menu to add an agent and shift, and specify shift parameters.
You can select Tools=>Options to specify overtime, vacation, holiday, shift, and auto-scheduling
parameters.
([SRUWLQJIRUHFDVWLQJDQGVFKHGXOLQJDJHQWV
To forecast and schedule agents:
6WDUWWKH:RUN)25&(SURJUDP
&OLFNWKH3HRSOHLFRQ
Figure 12-11 appears.
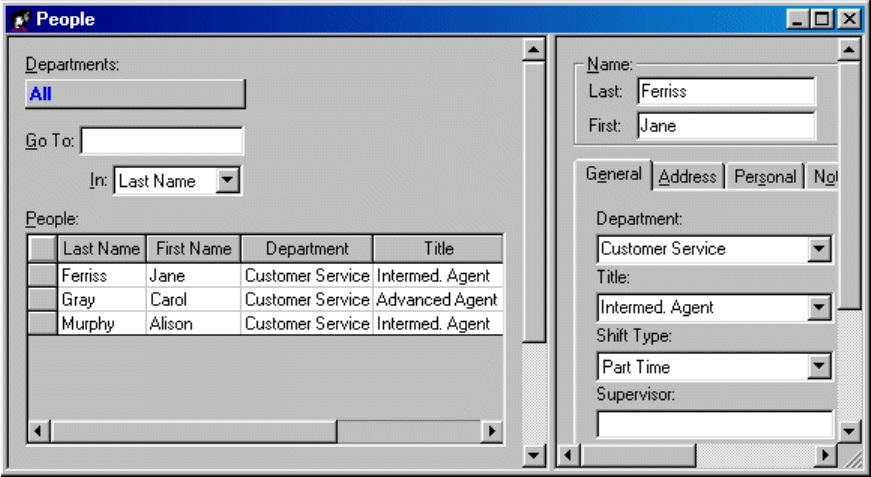
)LJXUH3HRSOHZLQGRZ
5LJKWFOLFNWKH3HRSOHJULGWRLQVHUWDJHQWVGHSDUWPHQWVVFKHGXOHVDQGMRE
FDWHJRULHV
4XLW:RUN)25&(
NOTE: The export will not be successful if you do not quit 6120 CCS.
6WDUWWKH6LJKWSURJUDP
6HOHFWDUHSRUWW\SH
6HOHFWDTXHXHRUTXHXHJURXSRQZKLFKWREDVHWKHIRUHFDVW
&KRRVHDVWDUWGDWHDQGHQGGDWHIRUWKHIRUHFDVW
6HOHFWDVWDUWKRXUDQGHQGKRXUIRUWKHIRUHFDVW
&KRRVHWKHIRUHFDVWLQWHUYDOE\PLQXWHVRQO\ZKHQJHQHUDWLQJDIRUHFDVWIRU
WKH:RUN)25&(VWDQGDORQHYHUVLRQ
&OLFN6XEPLW
4Sight renders a report and graphs in Microsoft Excel in your browser.
&OLFN9LHZ5HSRUW,QER[XSRQVXEPLWWLQJDUHSRUWRUFOLFN5HSRUW
,QER[ !7RGD\
&OLFN9LHZWRVHHWKHIRUHFDVWUHVXOWV
&OLFNWKH&&0 !S)$GDSWLY([SRUW([FHOPHQXLWHPDQGH[SRUWWKHIRUHFDVW
GDWDWR:RUN)25&(
Figure 12-12 appears.
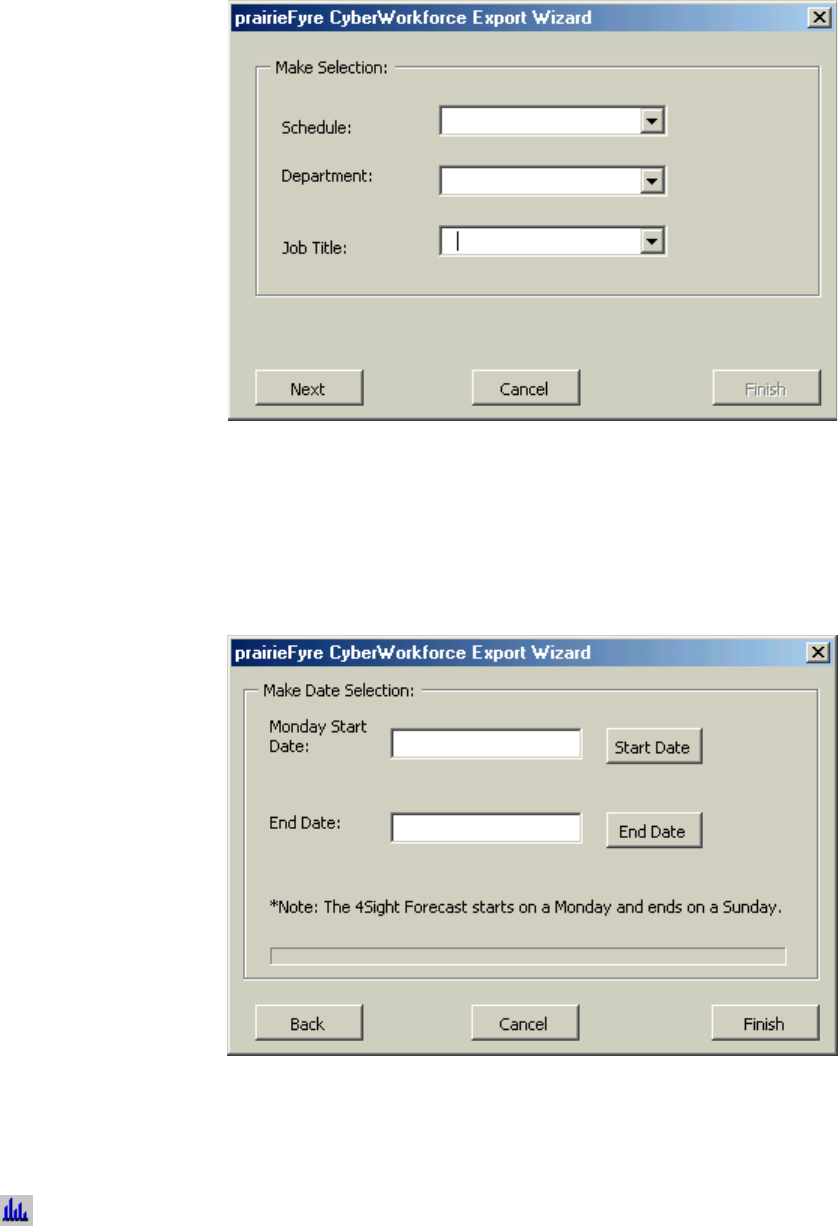
&KDSWHU6LJKW
)LJXUH6HOHFWVFKHGXOHSDUDPHWHUV
$VVRFLDWHDVFKHGXOHGHSDUWPHQWDQGHPSOR\HHMREWLWOHWRWKHIRUHFDVWGDWDDQGFOLFN
1H[W
Figure 12-13 appears.
)LJXUH6HOHFWIRUHFDVWGDWHV
6HOHFWDVWDUWGDWHDQGHQGGDWHIRUWKHIRUHFDVWDQGFOLFN)LQLVK
:DLWZKLOHWKHIRUHFDVWDQGVFKHGXOHLQIRUPDWLRQLVLQWHJUDWHG
6DYH\RXU([FHOVSUHDGVKHHWLI\RXPDGHFKDQJHVWRWKHIRUHFDVWRXWSXW
6WDUW:RUN)25&(
&OLFNWKH)RUHFDVWLFRQ
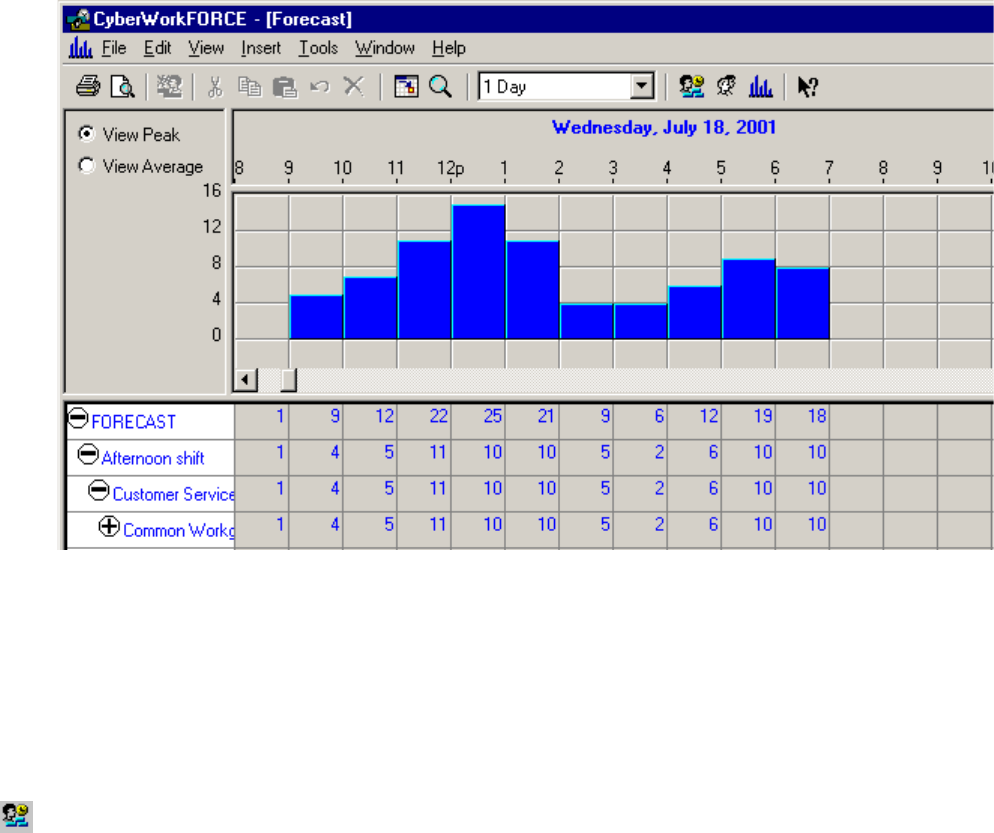
Figure 12-14 appears.
)LJXUH)RUHFDVWZLQGRZ
The Forecast window displays the agents forecast for the department, schedule, and job title you selected
when exporting data from 4Sight.
To forecast the agent requirement for Agents in Training or Advanced Agents (for the Customer Service
department), quit WorkFORCE, re-open the Excel forecast spreadsheet, click 6110 CCM=>6120 CCS
Export, and associate new schedule information to the forecast data. When you re-open the Forecast
window in WorkFORCE, forecast and schedule information is displayed for both job titles.
&OLFNWKH6FKHGXOHLFRQWRYLHZDJHQWVKLIWDQGDYDLODELOLW\GHWDLOV
Figure 12-15 appears.
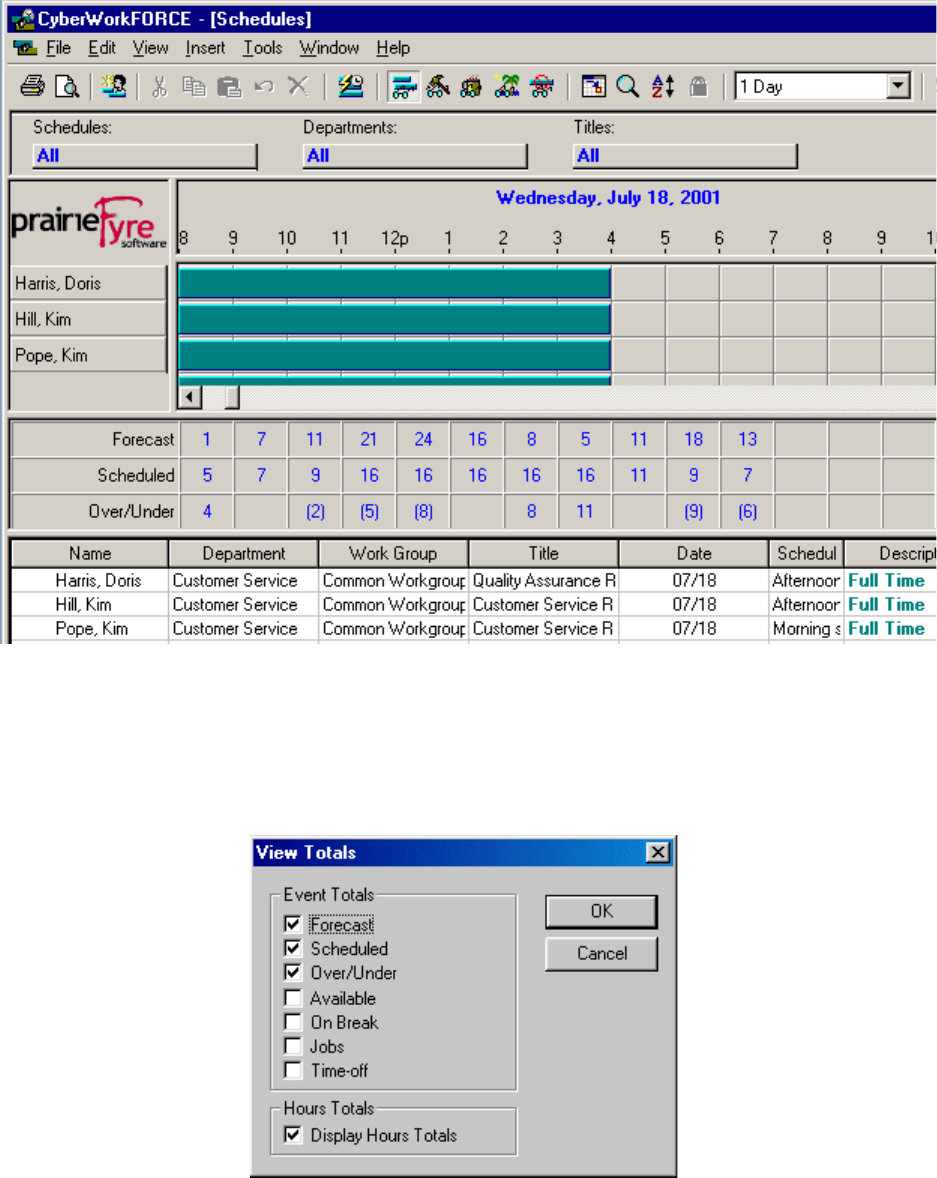
&KDSWHU6LJKW
)LJXUH6FKHGXOHZLQGRZ
Forecast, agent shift, and agent availability information is displayed.
&OLFN9LHZ !7RWDOVVHOHFWDYDLODELOLW\LQIRUPDWLRQWRGLVSOD\DQGFOLFN2.
)RUHFDVWWKHDJHQWUHTXLUHPHQWIRURWKHUGHSDUWPHQWVVFKHGXOHVDQGMREWLWOHV

&KDSWHU0LWHO1HWZRUNV0&&
7UDFNDQGGLVWULEXWHHPDLO
UHTXHVWV
0LWHO1HWZRUNV0&&
&RQILJXULQJ0&&
To configure all components of Mitel Networks™ 6150 MCC (Mulitmedia Contact Center) you
must configure 6150 MCC and some of Mitel Networks 6110 CCM (Contact Center
Management).
You can configure employees, agents, agent groups, queues, and responses with 6150 MCC
Configuration.
You can configure Account Codes and Make Busy Reason Codes with 6110 CCM Configuration.
Using Internet Explorer, type in your 6110 CCM Enterprise Server IP address http://[your
6110 CCM Enterprise Server address]/6110 CCM/
8QGHU8VHUQDPHW\SHWKHXVHUQDPH
8QGHU3DVVZRUGW\SHWKHSDVVZRUG
&OLFN<RXU6LWH !0&&&RQILJXUDWLRQ
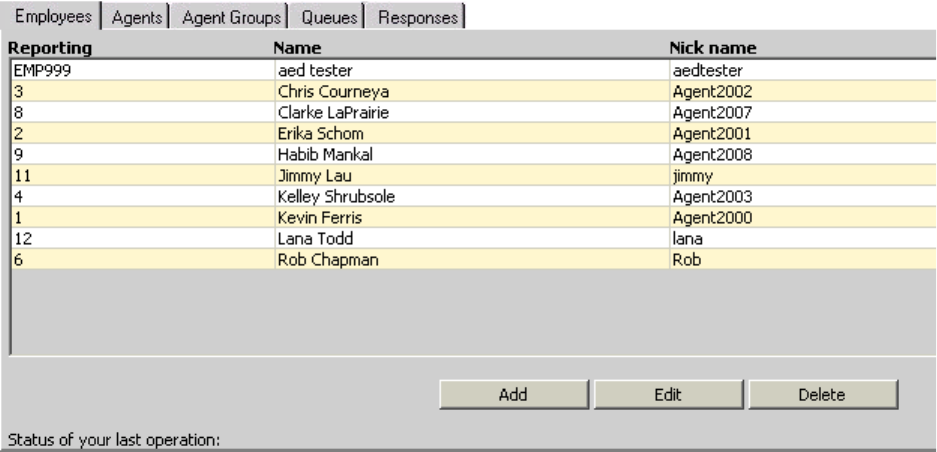
7RFRQILJXUHHPSOR\HHV
7RFRQILJXUHHPSOR\HHV
The Configuration window, Employees tab appears. (See Figure 13-1.)
$GGLQJ(PSOR\HHV
2QWKH&RQILJXUDWLRQZLQGRZFOLFNWKH(PSOR\HHVWDE
&OLFN$GG
)LJXUH&RQILJXUDWLRQZLQGRZ(PSOR\HHVWDE
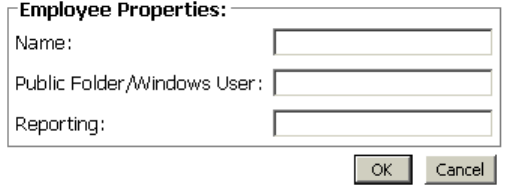
0LWHO1HWZRUNV0XOLWPHGLD&RQWDFW&HQWHU
The Employee Properties window appears. (See Figure 13-2.)
8QGHU1DPHW\SHWKHHPSOR\HH¶VILUVWQDPHVSDFHDQGODVWQDPH
The name is two words separated by a space, and can be up to 50 characters.
NOTE: The name the employee currently uses as the window user name must be entered in the
Public Folder/Windows User Name box.
8QGHU3XEOLF)ROGHU:LQGRZV8VHU1DPHW\SHWKHHPSOR\HH¶V:LQGRZVXVHU
QDPH
NOTE: The reporting number is used as identification. A reporting number for an employee can
be up to 20 characters or digits. For example, the agent Jane Smith might be reporting number
JS1. This report number would be referenced when a report is created from Jane Smith’s e-mail
data.
8QGHU5HSRUWLQJW\SHWKHUHSRUWLQJQXPEHU
&OLFN2.
Figure 13-2 Employee Properties window
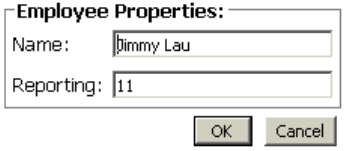
7RFRQILJXUHHPSOR\HHV
(GLWLQJ(PSOR\HHV
NOTE: You cannot edit the Public Folder/Windows User Name box therefore it does not appear
on the Employee Properties window when editing.
2QWKH&RQILJXUDWLRQZLQGRZFOLFNWKH(PSOR\HHVWDE
6HOHFWWKHHPSOR\HHZKRVHLQIRUPDWLRQ\RXZDQWWRHGLW
The Employee Properties box appears. (See Figure 13- 3.)
6HOHFWWKHQDPHRUWKHUHSRUWLQJQXPEHU\RXZDQWWRHGLW
7\SHWKHQHZQDPHRUWKHQHZUHSRUWLQJQXPEHU
&OLFN2.
Figure 13-3 Employee Properties window
'HOHWLQJ(PSOR\HHV
You must delete all agents linked to the employee before the employee can be deleted. You will
not be permitted to delete an employee without first deleting the linked agents. A single employee
can use several agent names. Employees are linked to agent names to indicate that they refer to
the same person.
&OLFNWKH$JHQWVWDE
6HOHFWDQDJHQWOLQNHGWRWKHHPSOR\HH\RXZDQWWRGHOHWH
&OLFN'HOHWH
5HSHDWXQWLODOODJHQWVOLQNHGWRWKHHPSOR\HHDUHGHOHWHG
&OLFNWKH(PSOR\HHVWDE
6HOHFWWKHHPSOR\HH\RXZDQWWRHGLW
&OLFN'HOHWH
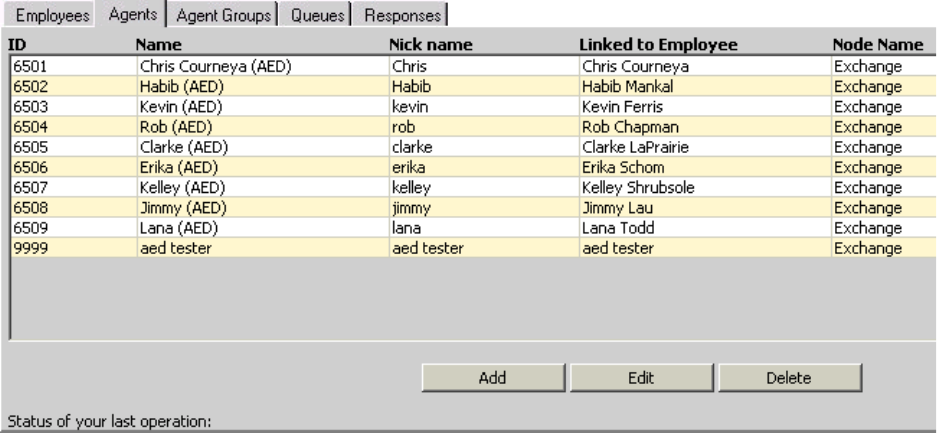
0LWHO1HWZRUNV0XOLWPHGLD&RQWDFW&HQWHU
7RFRQILJXUHDJHQWV
2QWKH&RQILJXUDWLRQZLQGRZFOLFNWKH$JHQWVWDE
The Agents window appears. (See Figure 13- 4.)
$GGLQJ$JHQWV
&OLFN$GG
Figure 13-4 Configuration window: Agents tab
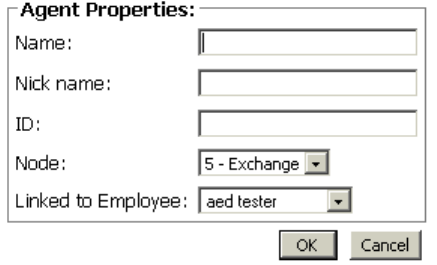
7RFRQILJXUHDJHQWV
The Agent Properties window appears. (See Figure 13- 5.)
8QGHU1DPHW\SHWKHQDPH
8QGHU1LFNQDPHW\SHWKHQLFNQDPH
8QGHU,'W\SHWKHHPSOR\HHLGHQWLILFDWLRQQXPEHU
8QGHU1RGHVHOHFWWKHQRGHIURPZKLFKWKHDJHQWZLOOUHFHLYHFDOOV
8QGHU/LQNHGWR(PSOR\HHVHOHFWWKHQDPHRIWKHHPSOR\HHZKRLVWKLVDJHQW
Figure 13-5 Agent Properties window

0LWHO1HWZRUNV0XOLWPHGLD&RQWDFW&HQWHU
(GLWLQJ$JHQWV
2QWKH&RQILJXUDWLRQZLQGRZFOLFNWKH$JHQWVWDE
6HOHFWWKHDJHQW\RXZDQWWRHGLW
&OLFN(GLW
The Agent Properties window appear. (See Figure 13- 6.)
8QGHU1DPHW\SHWKHDJHQWQDPH
The name can be up to 50 characters.
8QGHU1LFNQDPHW\SHWKHQLFNQDPH
This nick name will help you to keep track of which queue you are working on, if you have
several queues. The nick name can be up to 50 characters.
8QGHU,'W\SHWKHDJHQWLGHQWLILFDWLRQQXPEHU
The agent identification number can be from 1 to 7 digits.
8QGHU1RGHVHOHFWWKHQRGHIURPZKLFKWKHDJHQWZLOOUHFHLYHHPDLOV
A single employee can use several agent names. You must link the agent names to the employee
to indicate that they refer to the same person.
8QGHU/LQNHGWR(PSOR\HHVHOHFWWKHQDPHRIWKHHPSOR\HHZKRLVWKLVDJHQW
&OLFN2.
Figure 13-6 Agent Properties window
'HOHWLQJ$JHQWV
2QWKH&RQILJXUDWLRQZLQGRZFOLFNWKH$JHQWVWDE
6HOHFWWKHDJHQW\RXZDQWWRGHOHWH
&OLFN'HOHWH
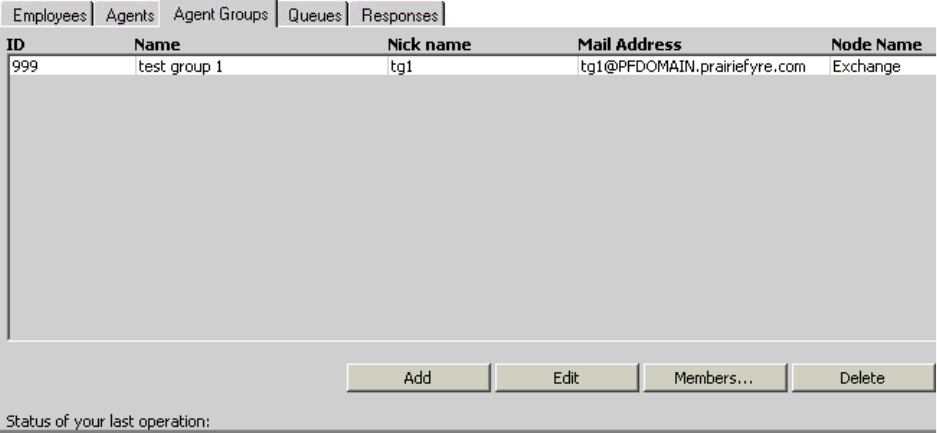
7RFRQILJXUHDJHQWJURXSV
7RFRQILJXUHDJHQWJURXSV
2QWKH&RQILJXUDWLRQZLQGRZFOLFNWKH$JHQW*URXSVWDE
The Agent Groups window appears. (See Figure 13- 7.)
$GGLQJ$JHQW*URXSV
&OLFN$GG
Figure 13-7 Configuration window: Agent Groups tab
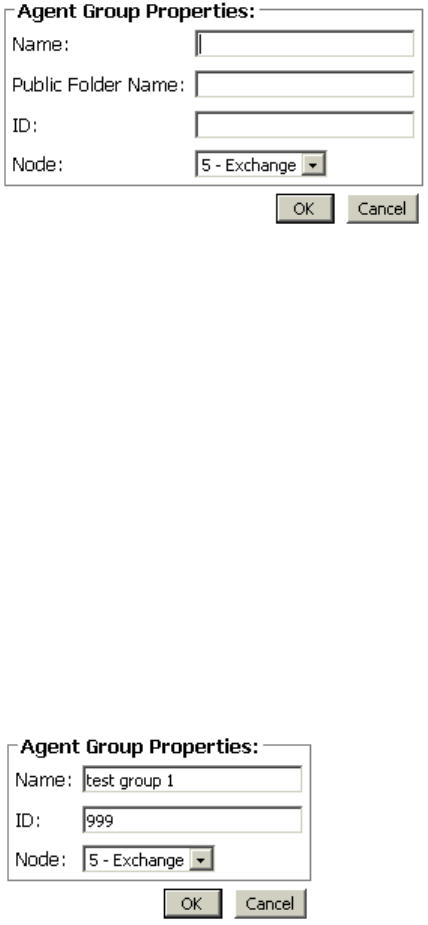
0LWHO1HWZRUNV0XOLWPHGLD&RQWDFW&HQWHU
The Agent Group Properties window appears. (See Figure 13- 8.)
8QGHU1DPHW\SHWKHDJHQWJURXSQDPH
8QGHU3XEOLF)ROGHU1DPHW\SHWKHDJHQWJURXS¶V:LQGRZVXVHUQDPH
8QGHU,'W\SHWKHDJHQWJURXSLGHQWLILFDWLRQQXPEHU
The agent group identification number must be 3 digits.
8QGHU1RGHVHOHFWWKHQRGHIURPZKLFKWKHDJHQWJURXSZLOOUHFHLYHFDOOV
&OLFN2.
Figure 13-8 Agent Group Properties window
(GLWLQJ$JHQW*URXSV
&OLFNWKH$JHQW*URXSVWDE
6HOHFWDQDJHQWJURXS
&OLFN(GLW
The Agent Group Properties window appears. (See Figure 13- 9.)
6HOHFWWKHQDPHRULGHQWLILFDWLRQ\RXZDQWWRHGLW
The agent group identification number must be 3 digits.
7\SHWKHQHZLWHP
$OWHUQDWLYHO\VHOHFWWKHQHZQRGH
&OLFN2.
Figure 13-9 Agent Group Properties window
7RFRQILJXUHDJHQWJURXSV
'HOHWLQJ$JHQW*URXSV
You must delete all queues links to the agent group before the agent group can be deleted. You
will not be permitted to delete an agent group without first deleting the linked queues.
&OLFNWKH4XHXHVWDE
6HOHFWDTXHXHOLQNHGWRWKHDJHQWJURXS\RXZDQWWRGHOHWH
&OLFN'HOHWH
5HSHDWXQWLODOOTXHXHVOLQNHGWRWKHDJHQWJURXSDUHGHOHWHG
&OLFNWKH$JHQW*URXSVWDE
6HOHFWWKHDJHQWJURXS\RXZDQWWRHGLW
&OLFN'HOHWH
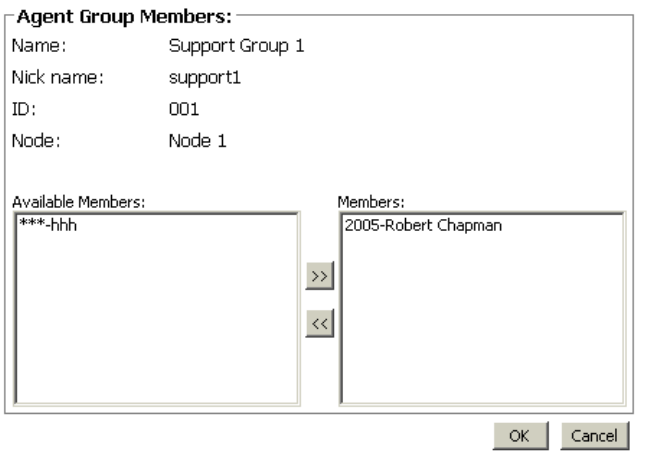
0LWHO1HWZRUNV0XOLWPHGLD&RQWDFW&HQWHU
7RFRQILJXUHPHPEHUVRIDQDJHQWJURXS
You can add or remove the agents that compose the agent group with the Members button.
$GGLQJDQDJHQWWRDQDJHQWJURXS
&OLFNWKH$JHQW*URXSVWDE
6HOHFWWKHDJHQWJURXSWRZKLFK\RXZDQWWRDGGWKHDJHQW
&OLFN0HPEHUV
The Agent Group Members window appears. (See Figure 13- 10.)
6HOHFWDQDJHQWIURPWKH$YDLODEOH0HPEHUVOLVW
&OLFNWKHDUURZVSRLQWLQJWRZDUGVWKH0HPEHUOLVW
&OLFN2.
Figure 13-10 Agent Group Members window
5HPRYLQJDQDJHQWIURPDQDJHQWJURXS
&OLFNWKH$JHQW*URXSVWDE
6HOHFWWKHDJHQWJURXSWRZKLFK\RXZDQWWRUHPRYHWKHDJHQW
&OLFN0HPEHUV
6HOHFWDQDJHQWIURPWKH0HPEHUVOLVW
&OLFNWKHDUURZVSRLQWLQJWRZDUGWKH$YDLODEOH0HPEHUVOLVW
&OLFN2.

7RFRQILJXUHTXHXHV
7RFRQILJXUHTXHXHV
&OLFNWKH4XHXHVWDE
The Queues window appears. (See Figure 13- 11.)
$GGLQJ4XHXHV
&OLFN$GG
Figure 13-11 Configuration window: Queues tab
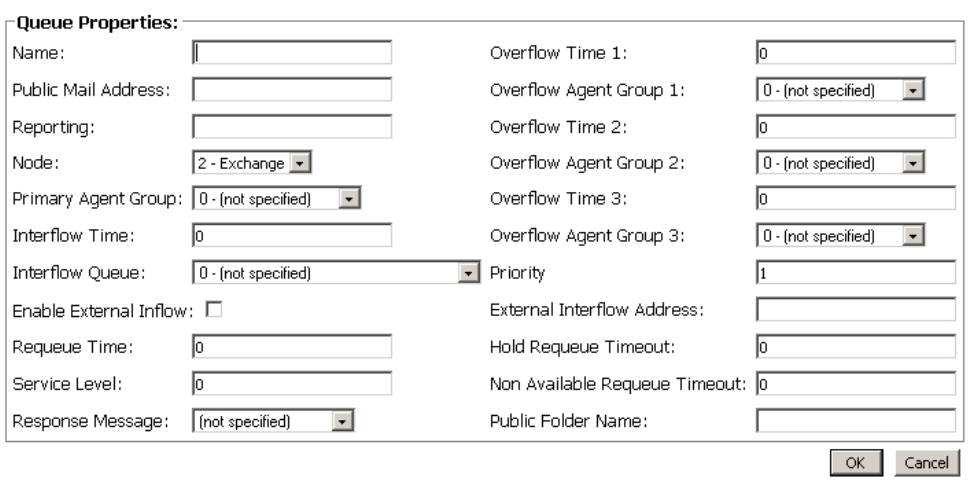
0LWHO1HWZRUNV0XOLWPHGLD&RQWDFW&HQWHU
The Queue Properties window appears. (See Figure 13- 12.)
8QGHU1DPHW\SHWKHTXHXHQDPHXSWRFKDUDFWHUV
8QGHU3XEOLF0DLO$GGUHVVW\SHWKHDGGUHVV
8QGHU5HSRUWLQJW\SHWKHTXHXHUHSRUWLQJQXPEHU3[[[
6HOHFWWKH1RGH\RXZDQW
6HOHFWWKHTXHXHWRWKH3ULPDU\$JHQW*URXSQXPEHUUDQJLQJIURP
7\SHWKH,QWHUIORZ7LPHLQPLQXWHV
6HOHFWWKH,QWHUIORZ4XHXH
,I\RXZDQWWRGLUHFWLQFRPLQJHPDLOWRDQHPDLODGGUHVVFOLFNWKH(QDEOH([WHUQDO
,QIORZFKHFNER[
7\SHWKH5HTXHXH7LPHLQPLQXWHV
7\SHWKH6HUYLFH/HYHOLQPLQXWHV
6HOHFWD5HVSRQVH0HVVDJH
7\SHWKH2YHUIORZ7LPHDQGLQPLQXWHV
6HOHFWWKHTXHXHRIWKHDJHQWJURXSIRU2YHUIORZ$JHQW*URXSDQGUDQJLQJ
IURP
7\SHWKH3ULRULW\YDOXHRIWKHTXHXH
,I\RXKDYHHQDEOHGWKH([WHUQDO,QIORZFKHFNER[W\SHWKH([WHUQDO,QWHUIORZ
$GGUHVVHPDLODGGUHVV\RXZDQWWKHLQFRPLQJHPDLOWREHGLUHFWHGWR
7\SHWKH+ROG5HTXHXH7LPHRXWLQPLQXWHV
7\SHWKH1RQ$YDLODEOH5HTXHXH7LPHRXWLQPLQXWHV
7\SHWKH3XEOLF)ROGHU1DPH
&OLFN2.
Figure 13-12 Queue Properties window
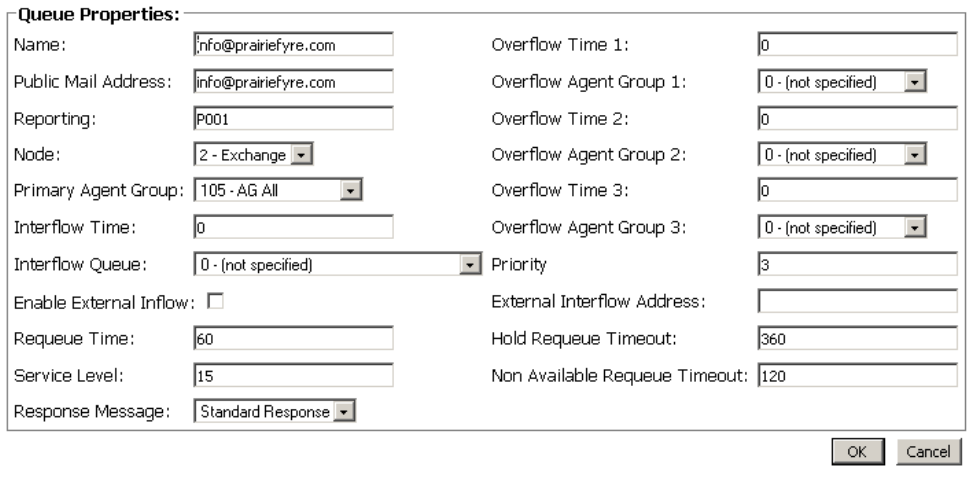
7RFRQILJXUHTXHXHV
(GLWLQJ4XHXHV
&OLFNWKH4XHXHVWDE
&OLFN(GLW
The Queue Properties window appears. (See Figure 13- 13.)
7\SHRUVHOHFWWKHLQIRUPDWLRQWREHHGLWHG
7\SHRUVHOHFWWKHFRUUHFWLQIRUPDWLRQ
&OLFN2.
Figure 13-13 Queue Properties window
'HOHWLQJ4XHXHV
Queues are linked to agent groups. Agent groups are linked to agents. You must first find the
agent group(s) linked to the queue you want to delete. Then you must find the agents that are
linked with that agent group.
You must delete all agents linked with the agent group before the agent group can be deleted. You
will not be permitted to delete an agent group without first deleting the linked agents. Then you
must delete the agent group, and only then can you delete the queue.
&OLFNWKH$JHQWVWDE
6HOHFWHDFKDJHQW\RXZDQWWRGHOHWH
&OLFN'HOHWH
&OLFNWKH$JHQW*URXSVWDE
6HOHFWHDFKDJHQWJURXS\RXZDQWWRGHOHWH
&OLFN'HOHWH
&OLFNWKH4XHXHVWDE
0LWHO1HWZRUNV0XOLWPHGLD&RQWDFW&HQWHU
6HOHFWWKHTXHXH\RXZDQWWRGHOHWH
&OLFN'HOHWH
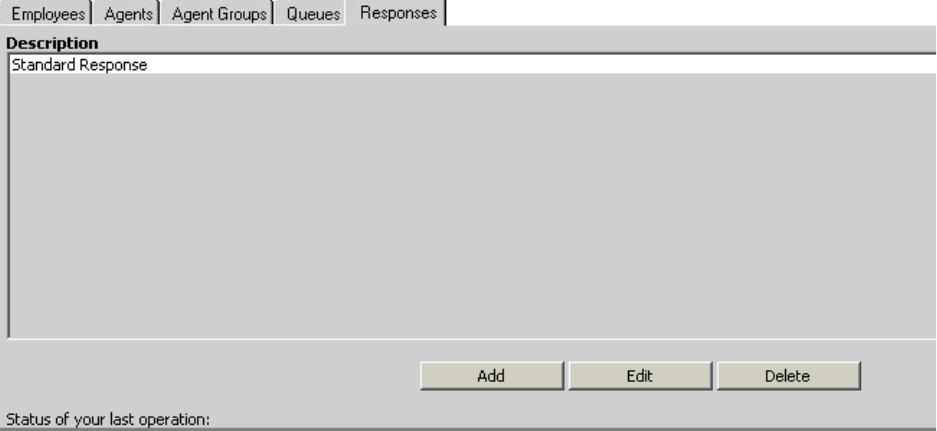
7RFRQILJXUHUHVSRQVHV
7RFRQILJXUHUHVSRQVHV
&OLFNWKH5HVSRQVHVWDE
The Responses window appears. (See Figure 13- 14.)
&OLFN$GG
Figure 13-14 Configuration window: Responses tab
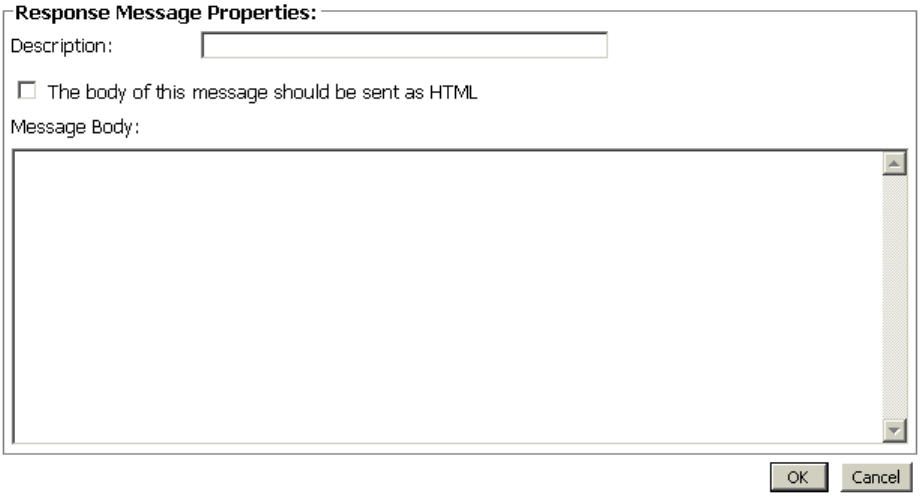
0LWHO1HWZRUNV0XOLWPHGLD&RQWDFW&HQWHU
The Response Message Properties window appears. (See Figure 13- 15.)
$GGLQJ5HVSRQVHV
8QGHU'HVFULSWLRQW\SHWKHUHVSRQVHGHVFULSWLRQ
For example, type “out of office” if you will use this response when you are out of the office.
6HOHFWWKH7KHERG\RIWKLVPHVVDJHVKRXOGEHVHQWDV+70/FKHFNER[
You must have Internet Explorer 5.5 to support the HTML features.
8QGHU0HVVDJH%RG\W\SHWKHPHVVDJH
&OLFN2.
Figure 13-15 Response Message Properties window
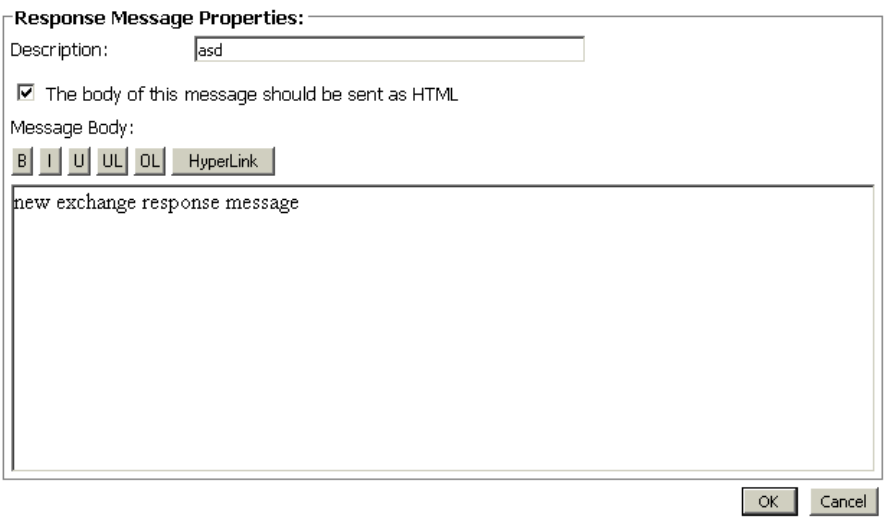
7RFRQILJXUHUHVSRQVHV
(GLWLQJ5HVSRQVHV
&OLFNWKH5HVSRQVHVWDE
6HOHFWWKHUHVSRQVH\RXZDQWWRHGLW
&OLFN(GLW
The Response Message Properties window appears. (See Figure 13- 16.)
8QGHU'HVFULSWLRQW\SHWKHQHZGHVFULSWLRQ
8QGHU0HVVDJH%RG\W\SHWKHQHZPHVVDJH
&OLFN2.
Figure 13-16 Response Message Properties window
'HOHWLQJ5HVSRQVHV
&OLFNWKH5HVSRQVHVWDE
6HOHFWWKHUHVSRQVH\RXZDQWWRGHOHWH
&OLFN'HOHWH
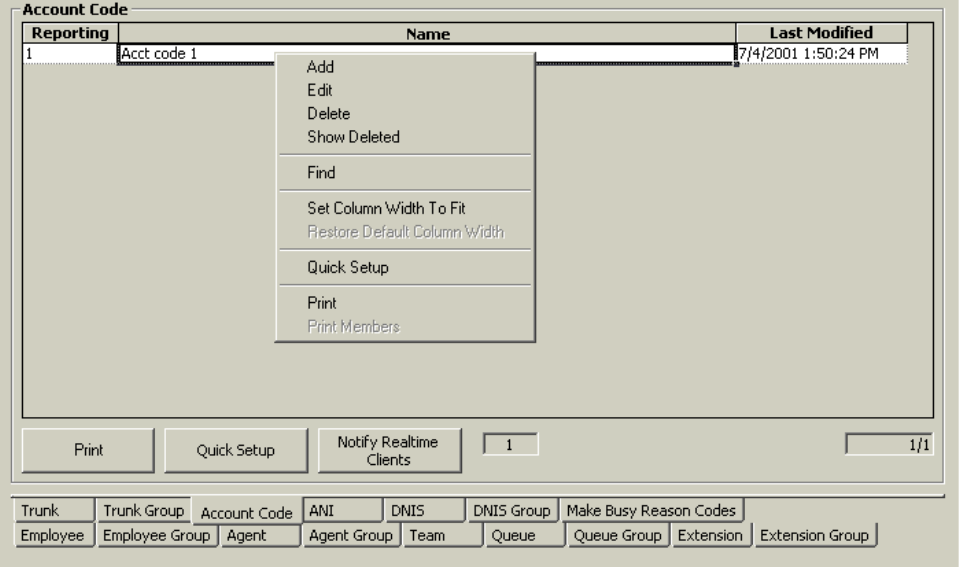
0LWHO1HWZRUNV0XOLWPHGLD&RQWDFW&HQWHU
&RQILJXULQJ&&0
8VLQJ,QWHUQHW([SORUHUW\SHWKH85/KWWS,3DGGUHVV&&0
VWDUWBHQDVS
8QGHU8VHUQDPHW\SHWKHXVHUQDPH
8QGHU3DVVZRUGW\SHWKHSDVVZRUG
&OLFN<RXU6LWH !&RQILJXUDWLRQ
7RFRQILJXUH$FFRXQW&RGHV
$GGLQJDQ$FFRXQW&RGH
&OLFNWKH$FFRXQW&RGHWDE
The Account Code window appears. (See Figure 13- 17.)
5LJKWFOLFNWKHILUVW$FFRXQW&RGHDQGVHOHFW$GG
Figure 13-17 Account Code window

7RFRQILJXUH$FFRXQW&RGHV
The Add Account Code window appears. (See Figure 13- 18.)
8QGHU5HSRUWLQJW\SHWKH$FFRXQW&RGH
8QGHU1DPHW\SHWKHQDPHRIWKH$FFRXQW&RGH
&OLFN$GG$OO
Figure 13-18 Add Account Code window
The Your Site Configuration window appears indicating the success or failure of the addition.
(See Figure 13- 19.)
&OLFN2.
Figure 13-19 Your Site Configuration window
0LWHO1HWZRUNV0XOLWPHGLD&RQWDFW&HQWHU
(GLWLQJDQ$FFRXQW&RGH
&OLFNWKH$FFRXQW&RGHWDE
5LJKWFOLFNWKH$FFRXQW&RGHVDQGVHOHFW(GLW
6HOHFWWKH$FFRXQW&RGH\RXZDQWWRHGLW
8QGHU5HSRUWLQJW\SHWKHFRUUHFW$FFRXQW&RGH
8QGHU1DPHW\SHWKHFRUUHFWQDPH
3UHVV(QWHU
&OLFN8SGDWH
The Your Site Configuration window appears indicating the success or failure of the edition.
&OLFN2.
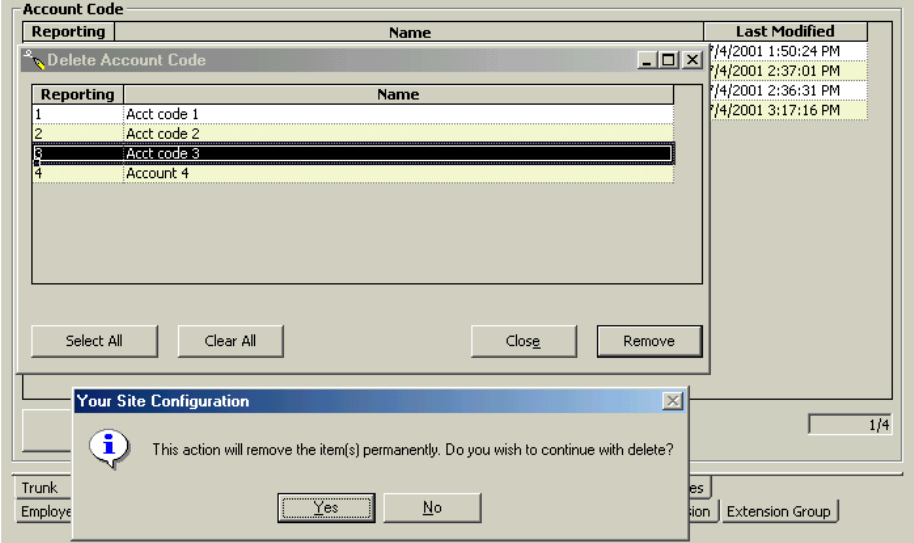
7RFRQILJXUH$FFRXQW&RGHV
'HOHWLQJDQ$FFRXQW&RGH
&OLFNWKH$FFRXQW&RGHWDE
5LJKWFOLFNWKH$FFRXQW&RGHVDQGVHOHFW'HOHWH
The Delete Account Code window appears. (See Figure 13- 20.)
6HOHFWWKH$FFRXQW&RGH\RXZDQWWRGHOHWH
&OLFN5HPRYH
The Delete Account Code window appears. (See Figure 13- 20.)
&OLFN<HV
The Your Site Configuration window appears indicating the success or failure of the deletion.
&OLFN2.
&OLFN&ORVH
Figure 13-20 Delete Account Code window

0LWHO1HWZRUNV0XOLWPHGLD&RQWDFW&HQWHU
7RFRQILJXUH0DNH%XV\5HDVRQ&RGHV
$GGLQJD0DNH%XV\5HDVRQ&RGH
&OLFNWKH0DNH%XV\5HDVRQ&RGHVWDE
5LJKWFOLFNWKHILUVW0DNH%XV\&RGHDQGVHOHFW$GG
The Make Busy Reason Codes window appears. (See Figure 13- 21.)
8QGHU5HSRUWLQJW\SHWKH0DNH%XV\&RGH
8QGHU1DPHW\SHWKHQDPHRIWKH0DNH%XV\&RGH
&OLFN$GG$OO
Figure 13-21 Add Make Busy Reason Codes window
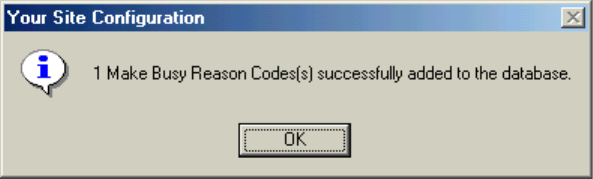
7RFRQILJXUH0DNH%XV\5HDVRQ
The Your Site Configuration window appears indicating the success or failure of the addition.
(See Figure 13- 22.)
&OLFN2.
Figure 13-22 Your Site Configuration window
(GLWLQJD0DNH%XV\5HDVRQ&RGH
&OLFNWKH0DNH%XV\5HDVRQ&RGHWDE
5LJKWFOLFNWKH0DNH%XV\5HDVRQ&RGHVDQGVHOHFW(GLW
6HOHFWWKH0DNH%XV\5HDVRQ&RGH\RXZDQWWRHGLW
8QGHU5HSRUWLQJW\SHWKHFRUUHFW0DNH%XV\5HDVRQ&RGH
8QGHU1DPHW\SHWKHFRUUHFWQDPH
3UHVV(QWHU
&OLFN8SGDWH
The Your Site Configuration window appears indicating the success or failure of the edition.
&OLFN2.
'HOHWLQJD0DNH%XV\5HDVRQ&RGH
&OLFNWKH0DNH%XV\5HDVRQ&RGHWDE
5LJKWFOLFNWKH0DNH%XV\5HDVRQ&RGHVDQGVHOHFW'HOHWH
6HOHFWWKH0DNH%XV\5HDVRQ&RGH\RXZDQWWRGHOHWH
&OLFN5HPRYH
The Your Site Configuration window appears.
&OLFN<HV
The Your Site Configuration window appears indicating the success or failure of the deletion.
&OLFN2.
&OLFN&ORVH
0LWHO1HWZRUNV0XOLWPHGLD&RQWDFW&HQWHU
&KDQJLQJ0&&RSWLRQV
There are three types of 6150 MCC options that can be changed:
5HDO7LPH6HUYHU&RQQHFWLRQ3DUDPHWHUV
0&&6WDUWXS2SWLRQV
0&&0DLO$UULYDO2SWLRQV
RealTime Server Connection Parameters options allow you to change the IP address and port
number.
The 6150 MCC Startup options allow you to change which inbox appears when Outlook 2000 is
opened, make the log on window appear when Outlook is opened, and view the 6150 MCC
shortcuts.
6150 MCC Mail Arrival Options allow you to change the way the 6150 MCC mail arrives. For
example, Outlook can be set to appear as the top window when e-mail arrives. You can also
change the sound file used to indicate an e-mail has arrived.
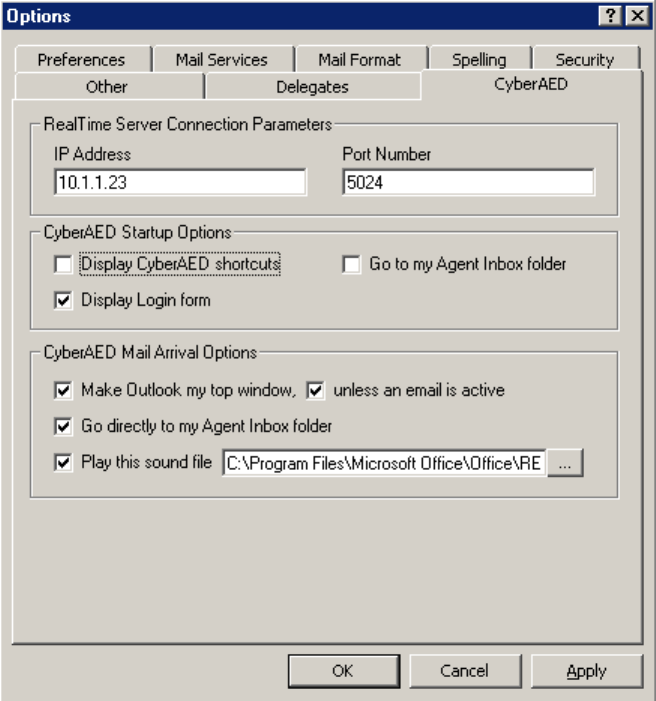
7RFKDQJHWKH,3DGGUHVVDQGSRUW
7RFKDQJHWKH,3DGGUHVVDQGSRUWQXPEHU
'RXEOHFOLFNRQWKH2XWORRNGHVNWRSLFRQ
Outlook 2000 opens.
&OLFN7RROV !2SWLRQV
The Options window appears. (See Figure 13- 23.)
&OLFNWKH0&&WDE
8QGHU,3$GGUHVVW\SHWKHFRUUHFW,3$GGUHVV
8QGHU3RUW1XPEHUW\SHWKHFRUUHFW3RUW1XPEHU
&OLFN2.
Figure 13-23 Options window: IP Address and Port Number
0LWHO1HWZRUNV0XOLWPHGLD&RQWDFW&HQWHU
7RRSHQ2XWORRN
If you have not yet installed Microsoft Outlook 2000 on the client computer, do so now.
NOTE: The user name for the client computer installation is the user’s name not prairieFyre.
See Mitel Networks 6150 Mulitmedia Contact Center Installation Guide: Installing Outlook 2000
and Starting Outlook.
The first time you start Outlook 2000 after you have installed 6150 MCC, you will be asked if the
6150 MCC plug-in should be loaded each time Outlook 2000 is started.
NOTE:
'RQRWORDGWKH0&&SOXJLQLI\RXDUHRSHQLQJ2XWORRNRQDFRPSXWHU
WKDWDFWVDVERWKVHUYHUDQGFOLHQWFRPSXWHU$VHUYHUZLOOVWDUW2XWORRNIRUUHDVRQV
DGGLWLRQDOWRHPDLOUHWULHYDO
,I\RXGRQRWORDGWKHSOXJLQ\RXZLOOQHHGWRORDGLWPDQXDOO\ZKHQ\RXZDQWWR
DFFHVV\RXU0&&HPDLO
2SHQLQJ2XWORRN
'RXEOHFOLFNWKH2XWORRNGHVNWRSLFRQ
The Inbox Microsoft Outlook window appears.
0DQXDOO\ORDGLQJWKH0&&SOXJLQ
&OLFN7RROV !2SWLRQV
The Options window appears.
&OLFNWKH2WKHUWDE
8QGHU*HQHUDOFOLFN$GYDQFHG2SWLRQV
The Advanced Options window appears.
&OLFN&20$GG,QV
6HOHFWWKH0&&2XWORRN3OXJLQFKHFNER[
&OLFN2.
&ORVHWKH2SWLRQVZLQGRZ
7RYLHZWKH0&&LQER[ZKHQ
7RYLHZWKH0&&LQER[ZKHQ2XWORRNVWDUWVXS
If the 6150 MCC plug-in is loaded, then when you open Outlook 2000, by default, you will be
directed to your 6150 MCC inbox, located in the Public Folders. That means that you already will
view the 6150 MCC inbox when Outlook starts up. (See Figure 13- 24.)
However, if the 6150 MCC plug-in is not loaded, then when you open Outlook 2000, you will be
directed to your personal inbox. You will have to go to your options window and load 6150 MCC
manually, and then change the Go to my Agent Inbox folder 6150 MCC Startup Option.
See “Manually loading the 6150 MCC plug-in” on page 386.
Go to my Agent Inbox folder 6150 MCC Startup Option
2QWKHH[SORUHUEDUXQGHU0&&FOLFN$JHQW,QER[
&OLFN7RROV !2SWLRQV
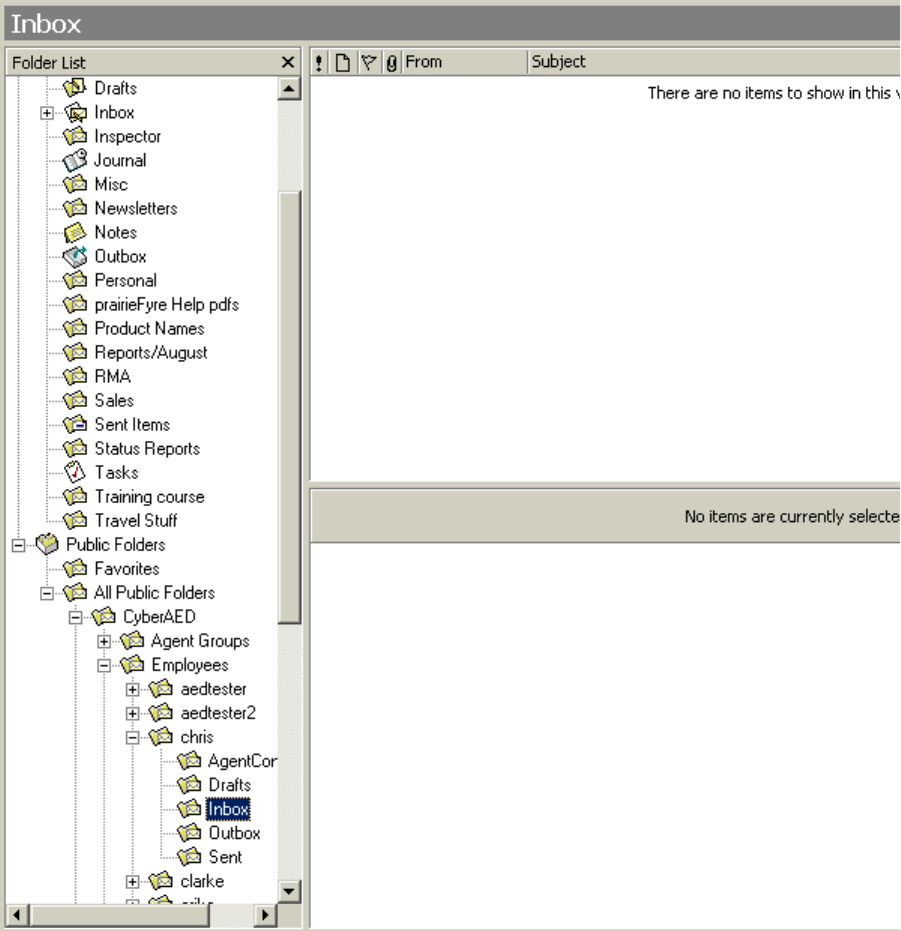
0LWHO1HWZRUNV0XOLWPHGLD&RQWDFW&HQWHU
Figure 13-24 Microsoft Outlook: 6150 MCC Inbox
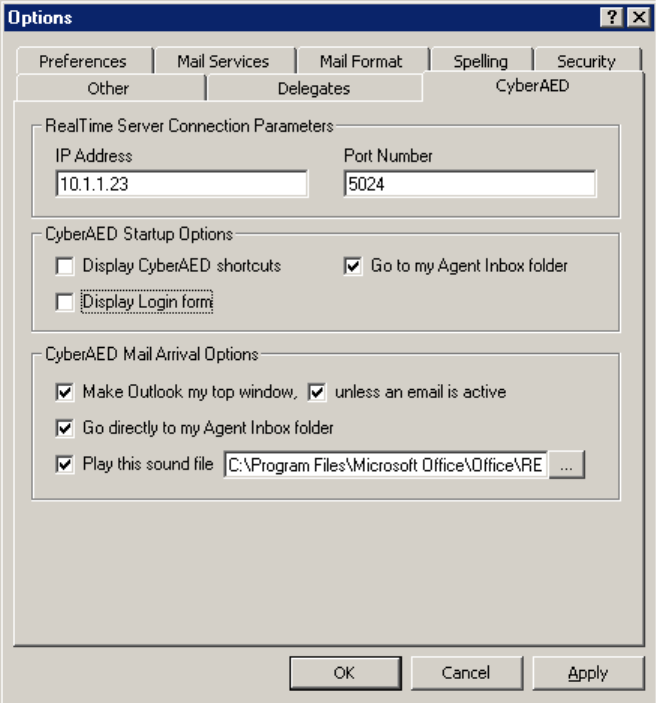
7RYLHZWKH0&&LQER[ZKHQ
The Options window appears. (See Figure 13- 25.)
&OLFNWKH0&&WDE
8QGHU0&&6WDUWXS2SWLRQVVHOHFWWKH*RWRP\$JHQW,QER[IROGHUFKHFN
ER[
&OLFN2.
Figure 13-25 Options window: Go to my Agent Inbox folder
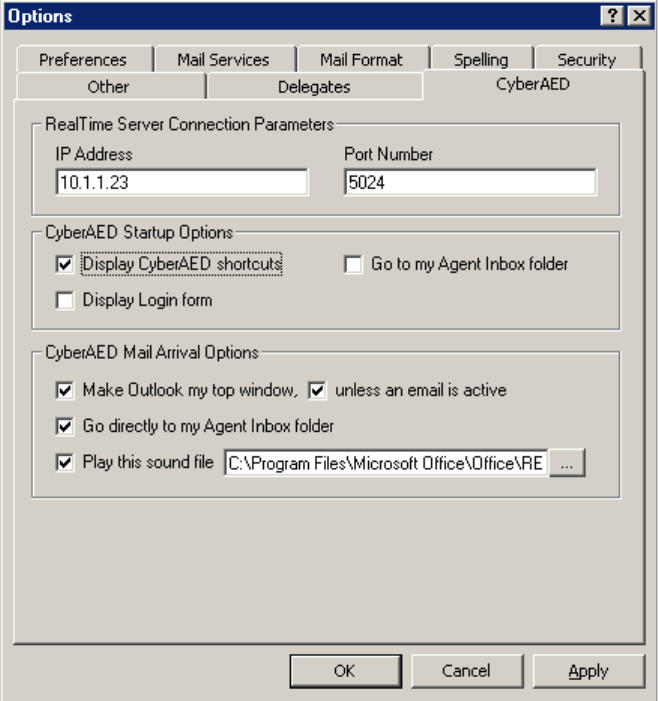
0LWHO1HWZRUNV0XOLWPHGLD&RQWDFW&HQWHU
7RGLVSOD\0&&VKRUWFXWV
You can display 6150 MCC shortcuts with the 6150 MCC Startup Options.
6HOHFW\RXU0&&LQER[
&OLFN7RROV !2SWLRQV
The Options window appears. (See Figure 13- 26.)
&OLFNWKH0&&WDE
8QGHU0&&6WDUWXS2SWLRQVVHOHFWWKH'LVSOD\0&&VKRUWFXWVFKHFN
ER[
&OLFN2.
Figure 13-26 Options window: Display 6150 MCC shortcuts

7RGLVSOD\WKHORJRQZLQGRZZKHQ
7RGLVSOD\WKHORJRQZLQGRZZKHQ2XWORRNRSHQV
You can display the log on window when Outlook 2000 opens.
6HOHFW\RXU0&&LQER[
&OLFN7RROV !2SWLRQV
The Options window appears. (See Figure 13- 27.)
&OLFNWKH0&&WDE
8QGHU0&&6WDUWXS2SWLRQVVHOHFWWKH'LVSOD\/RJLQIRUPFKHFNER[
&OLFN2.
Figure 13-27 Options window: Display 6150 MCC shortcuts

0LWHO1HWZRUNV0XOLWPHGLD&RQWDFW&HQWHU
7RPDNH2XWORRN\RXUWRSZLQGRZZKHQDQHPDLODUULYHV
You can make an incoming e-mail appear as your top window with the 6150 MCC Mail Arrival
Options.
6HOHFW\RXU0&&LQER[
&OLFN7RROV !2SWLRQV
The Options window appears. (See Figure 13- 28.)
&OLFNWKH0&&WDE
8QGHU0&&0DLO$UULYDO2SWLRQVVHOHFWWKH0DNH2XWORRNP\WRSZLQGRZ
FKHFNER[
6HOHFWWKHXQOHVVDQHPDLOLVDFWLYHFKHFNER[
&OLFN2.
Figure 13-28 Options window: Make Outlook my top window

7RGLUHFWHPDLOWRWKH0&&LQ
7RGLUHFWHPDLOWRWKH0&&LQER[
All e-mail, by default, is sent to your personal inbox. You can send 6150 MCC e-mail to your
Agent Inbox public folder with the 6150 MCC Mail Arrival Options.
6HOHFW\RXU0&&LQER[
&OLFN7RROV !2SWLRQV
The Options window appears. (See Figure 13- 29.)
&OLFNWKH0&&WDE
8QGHU0&&0DLO$UULYDO2SWLRQVVHOHFW*RGLUHFWO\WRP\$JHQW,QER[
IROGHUFKHFNER[
&OLFN2.
Figure 13-29 Options window: Go directly to my Agent Inbox folder

0LWHO1HWZRUNV0XOLWPHGLD&RQWDFW&HQWHU
7RFKDQJHWKH0&&HPDLODUULYDOVRXQGILOH
You can change the 6150 MCC e-mail arrival sound file with the 6150 MCC Mail Arrival
Options.
6HOHFW\RXU0&&LQER[
FOLFN7RROV !2SWLRQV
The Options window appears. (See Figure 13- 30.)
&OLFNWKH0&&WDE
&OLFNWKHHOOLSVHVEXWWRQ
6HOHFWWKHVRXQGILOH:$9WKDW\RXZDQW
&OLFN2SHQ
8QGHU0&&0DLO$UULYDO2SWLRQVVHOHFW3OD\WKLVVRXQGILOHFKHFNER[
&OLFN2.
Figure 13-30 Play this sound file
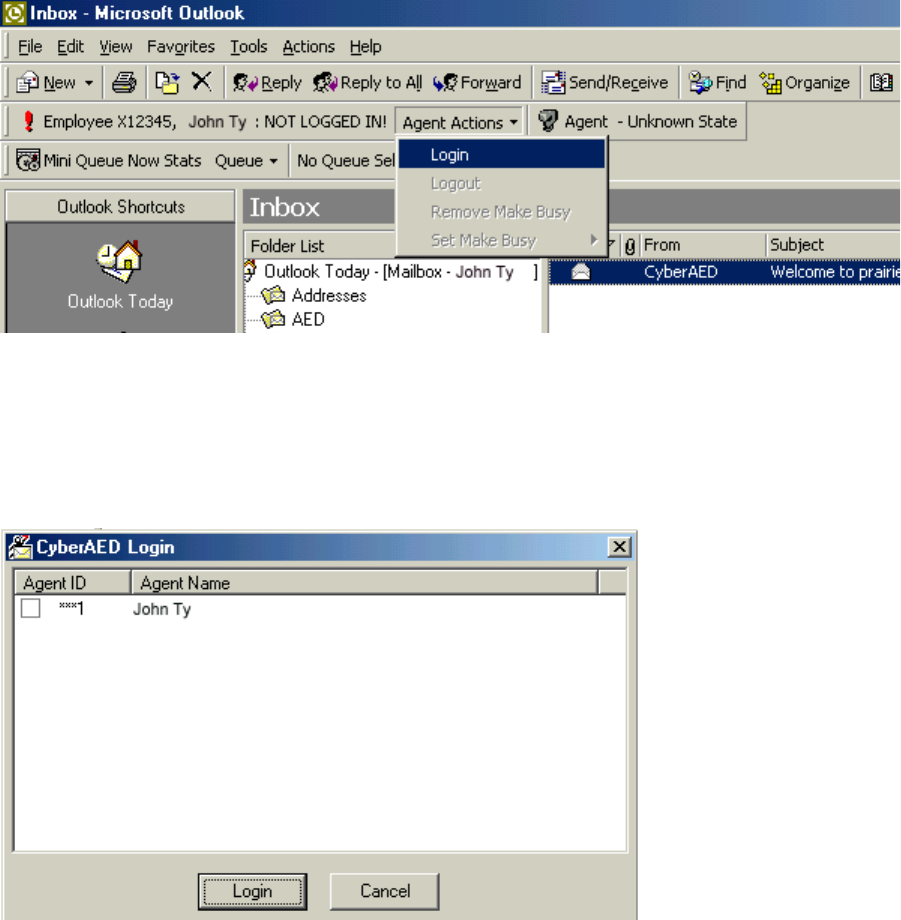
7RORJRQWR0&&
6HWWLQJDJHQWDFWLRQV
Agent actions are logging on, logging off, setting Make busy Reason Codes, and removing Make
Busy codes.
7RORJRQWR0&&
2SHQ2XWORRN
&OLFN$JHQW$FWLRQV !/RJLQ6HH)LJXUH
Figure 13-31 6150 MCC: Login
The 6150 MCC Login window appears. (See Figure 13- 32.)
&OLFNWKH$JHQW,'FKHFNER[WKDW\RXZLOOXVHWRORJRQ
&OLFN/RJLQ
Figure 13-32 6150 MCC Login window
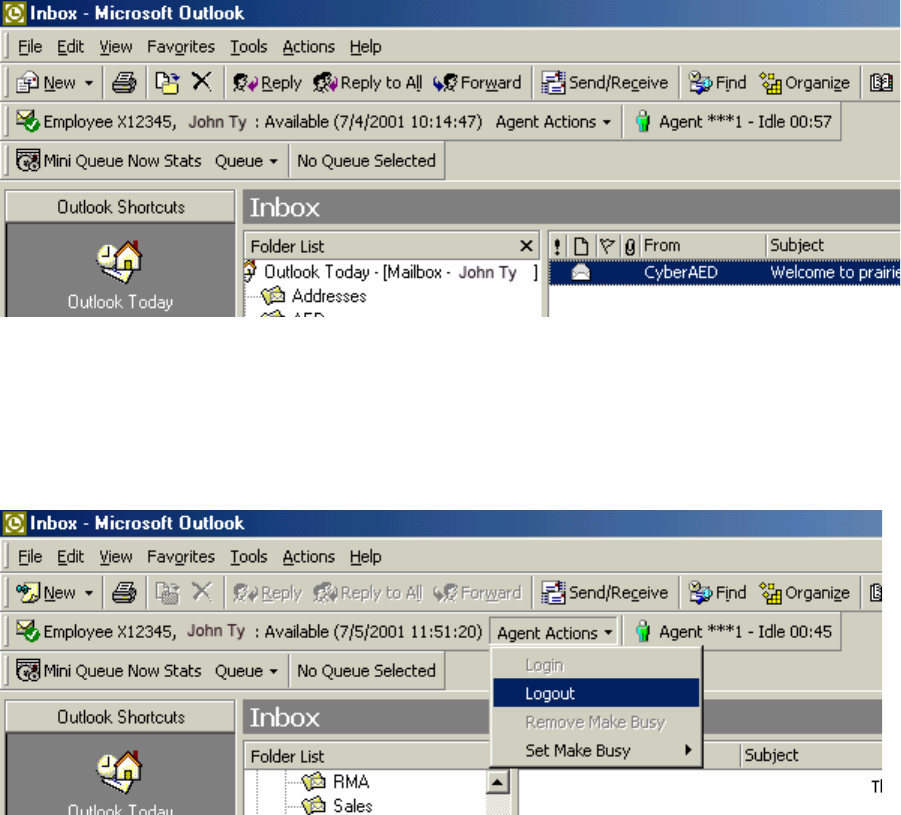
0LWHO1HWZRUNV0XOLWPHGLD&RQWDFW&HQWHU
You are now logged on and available to answer incoming e-mails. (See Figure 13- 33.)
Figure 13-33 6150 MCC: logged on and available
7RORJRIIIURP0&&
2QWKH,QER[0LFURVRIW2XWORRNZLQGRZFOLFN$JHQW$FWLRQV !/RJRXW6HH
)LJXUH
Figure 13-34 6150 MCC: Logout
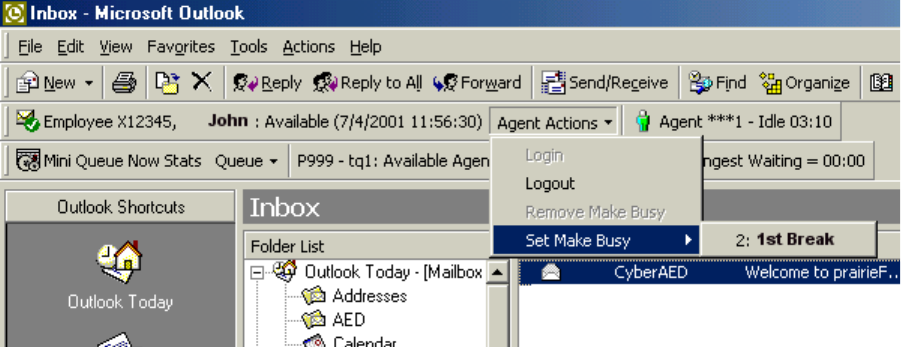
7RVHWD0DNH%XV\5HDVRQ&RGH
7RVHWD0DNH%XV\5HDVRQ&RGH
2SHQ2XWORRN
&OLFN$JHQW$FWLRQV !6HW0DNH%XV\
6HOHFWWKH0DNH%XV\5HDVRQFRGH\RXZDQWWRDSSO\6HH)LJXUH
Figure 13-35 Set Make Busy
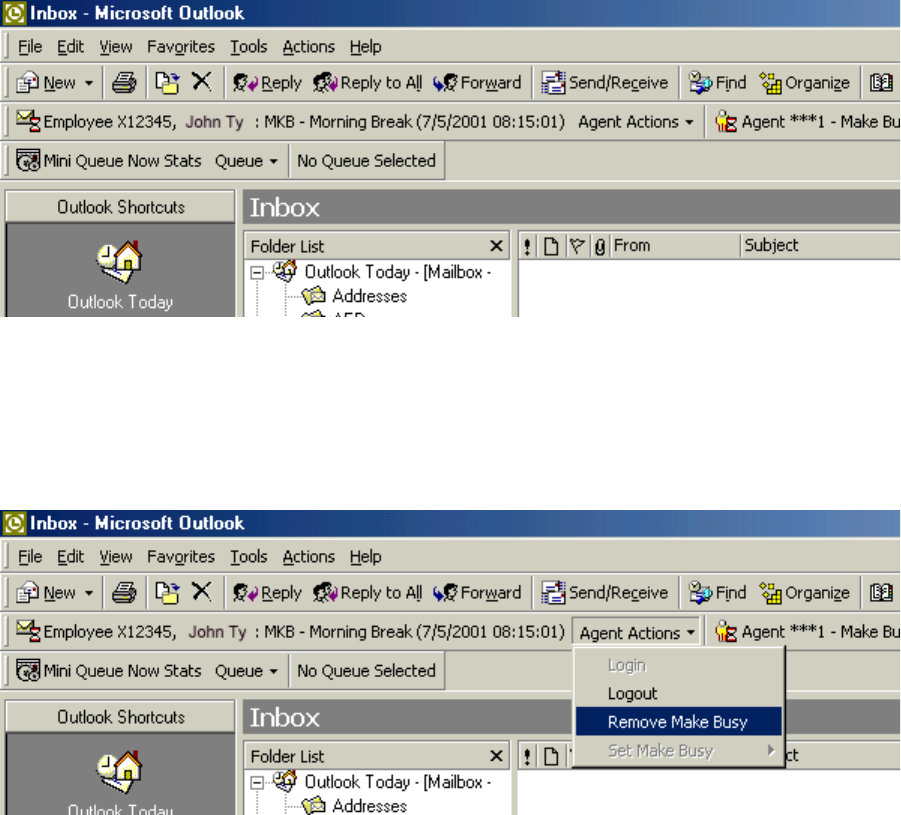
0LWHO1HWZRUNV0XOLWPHGLD&RQWDFW&HQWHU
The Make Busy Reason (MKB) code now appears as Morning Break. (See Figure 13- 36.)
Figure 13-36 Morning Break
7RUHPRYH0DNH%XV\
2QWKH,QER[0LFURVRIW2XWORRNZLQGRZFOLFN$JHQW$FWLRQV !5HPRYH0DNH
%XV\6HH)LJXUH
Figure 13-37 Remove Make Busy

7RUHPR H0DNH XV\
5HVSRQGLQJWRDQHPDLO
When you select a 6150 MCC e-mail, the e-mail window appears. (See Figure 13- 38.)
You have five options when responding to the e-mail:
6HW$FFRXQW&RGHV
+ROGWKHHPDLO
7UDQVIHUWKHHPDLO
1R5HSO\1HHGHG
6HQGWKHHPDLO
You can add an account code to indicate if the customer was happy with the service. You can hold
the e-mail while waiting for further information before you respond to the customer’s request, or
you can transfer the e-mail to another agent or queue who has the required information. You can
reply to the e-mail and send it, or you can tag it with No Reply Needed.
Figure 13-38 E-mail window
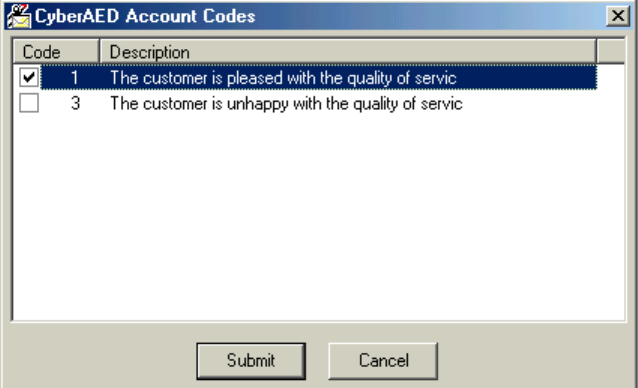
0LWHO1HWZRUNV0XOLWPHGLD&RQWDFW&HQWHU
7RVHWDQ$FFRXQW&RGH
2QWKH0&&HPDLOZLQGRZFOLFN$FFRXQW&RGHV
The 6150 MCC Account Codes window appears. (See Figure 13- 39.)
6HOHFWWKHFKHFNER[RIWKH$FFRXQW&RGH\RXZDQWWRDSSO\
&OLFN6XEPLW
Figure 13-39 6150 MCC Account Codes window
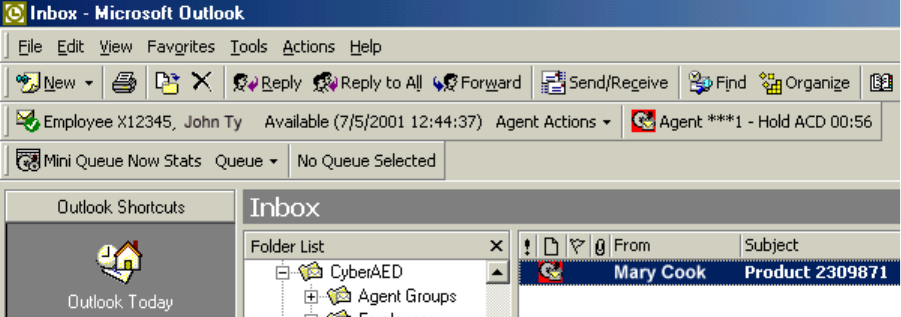
7RKROGDQHPDLO
7RKROGDQHPDLO
If you cannot answer an e-mail immediately, you can hold it until you have the information
required to answer it. You will still receive other e-mails while you are on hold. When you are
ready to answer the e-mail, you select it, respond to it, and send it as you would a new e-mail.
2QWKH0&&HPDLOZLQGRZFOLFN+ROG
The agent state will indicate that the agent is holding an e-mail. (See Figure 13- 40.)
Figure 13-40 Hold

0LWHO1HWZRUNV0XOLWPHGLD&RQWDFW&HQWHU
7RWUDQVIHUDQHPDLO
You can transfer an e-mail to an agent or to a queue.
2QWKH0&&HPDLOZLQGRZFOLFN7UDQVIHU
The 6150 MCC Transfer window appears. (See Figure 13- 41).
8QGHU7UDQVIHU7RVHOHFWDJHQWRUTXHXH
6HOHFWWKHFKHFNER[RIWKHDJHQWRUTXHXHWRZKRP\RXDUHVHQGLQJWKHHPDLO
&OLFN7UDQVIHU
Figure 13-41 6150 MCC Transfer window
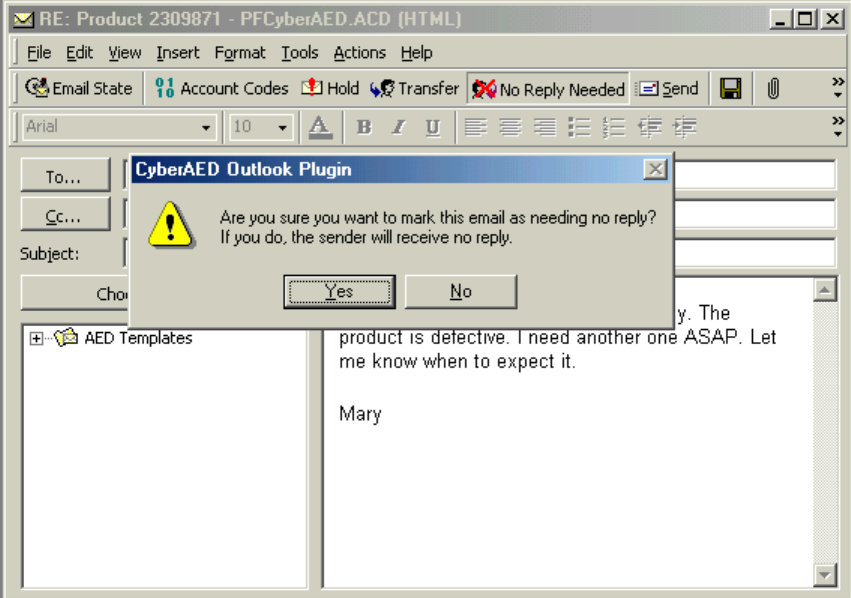
7RVHW1R5HSO\1HHGHG
7RVHW1R5HSO\1HHGHG
2QWKH0&&HPDLOZLQGRZFOLFN1R5HSO\1HHGHG
The 6150 MCC Outlook Plugin window appears. (See Figure 13- 42.)
&OLFN<HV
Figure 13-42 6150 MCC Outlook Plugin
7RVHQGDUHSO\
There is no reply button, you click send to reply to the customer.
2QWKH0&&HPDLOZLQGRZFOLFN6HQG

0LWHO1HWZRUNV0XOLWPHGLD&RQWDFW&HQWHU
9LHZLQJHPDLOKLVWRU\
You can view e-mail history with the 6150 MCC e-mail response window. (See Figure 13- 43.)
7RYLHZHPDLOKLVWRU\
&OLFNWKH&OLHQW+LVWRU\WDE
Figure 13-43 6150 MCC e-mail response window
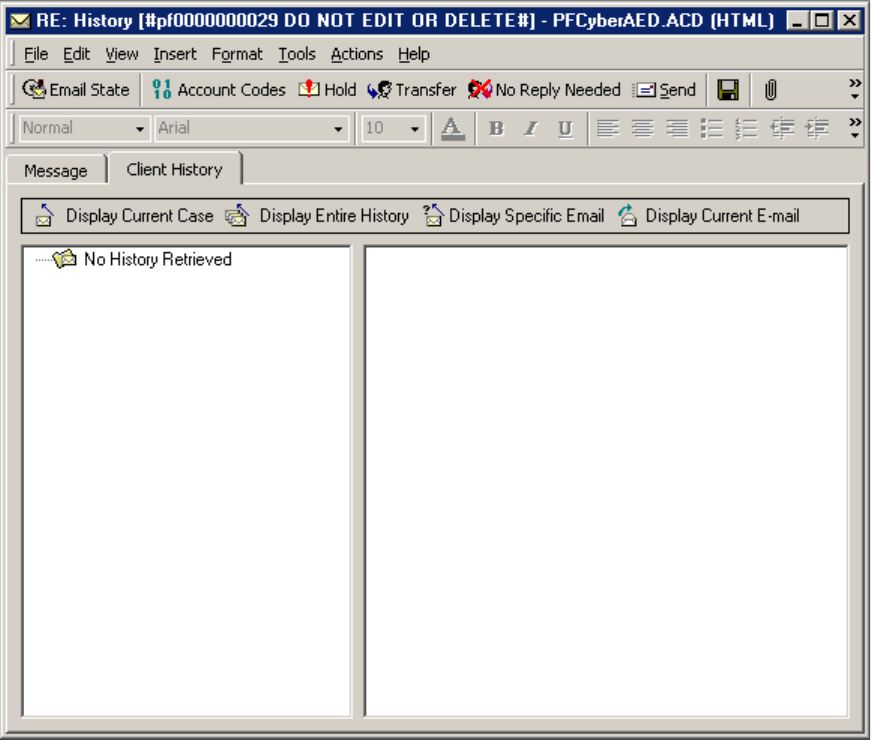
7RYLHZHPDLOKLVWRU\
No history is currently displayed. (See Figure 13- 44.)
You must choose from four types of client history:
&XUUHQWFDVH
The current case consists of the e-mail currently in the Message window and all associated
correspondence spawning from that particular e-mail.
(QWLUHKLVWRU\
The entire history consists of all e-mails from that particular client and all the responses.
6SHFLILFHPDLO
A specific e-mail that you request by inputing the message ID of that e-mail.
&XUUHQWHPDLO
The current e-mail is the e-mail currently in the Message window.
Figure 13-44 Client History tab

0LWHO1HWZRUNV0XOLWPHGLD&RQWDFW&HQWHU
7RYLHZ&XUUHQW&DVH
&OLFN'LVSOD\&XUUHQW&DVH
The e-mail currently in the Message window, and all associated correspondence spawning from
that e-mail, appears in the Client History window. (See Figure 13- 45.)
Figure 13-45 Display Current Case
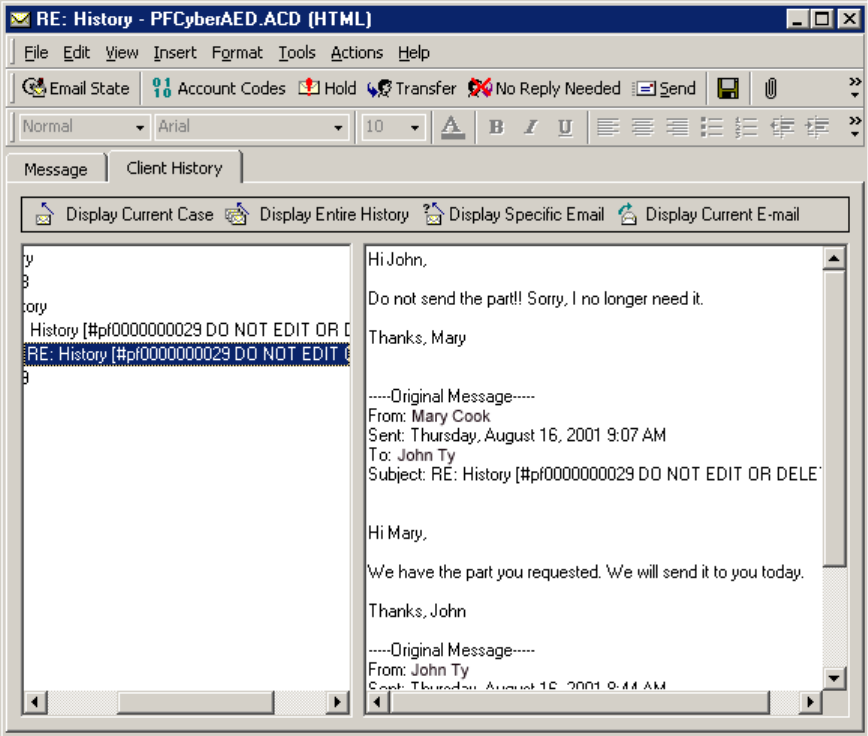
7RYLHZHPDLOKLVWRU\
7RYLHZ(QWLUH+LVWRU\
&OLFN'LVSOD\(QWLUH+LVWRU\
All e-mails from that particular client and the responses appear in the Client History window.
(See Figure 13- 46.)
Figure 13-46 Display Entire History
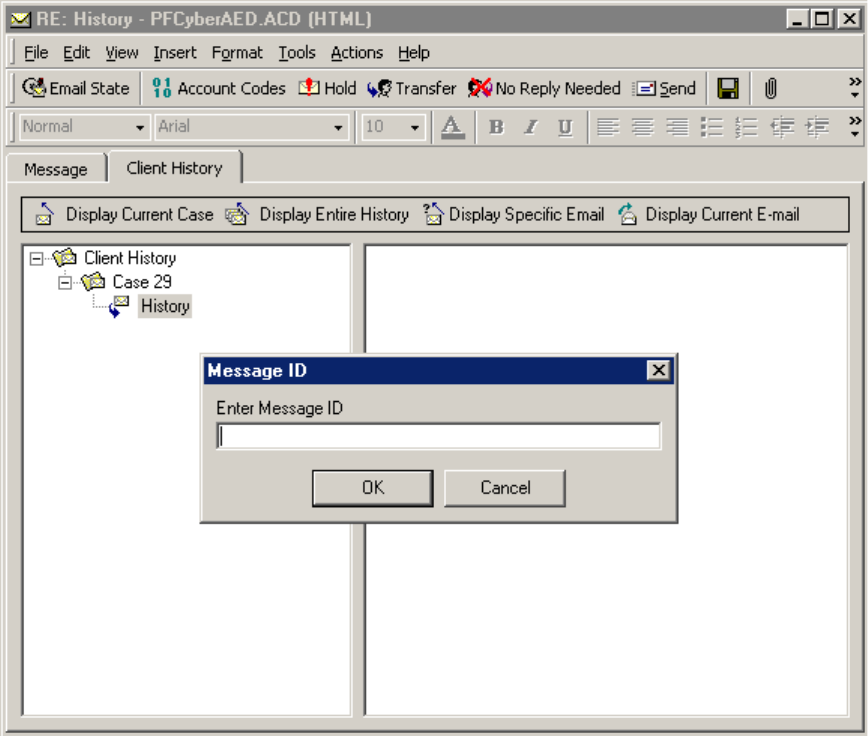
0LWHO1HWZRUNV0XOLWPHGLD&RQWDFW&HQWHU
7RYLHZD6SHFLILF(PDLO
&OLFN'LVSOD\6SHFLILF(PDLO
The Message ID box appears. (See Figure 13- 47.)
7\SHWKHGLJLW0HVVDJH,'QXPEHURIWKHPHVVDJH\RXZDQWWRYLHZSUHFHGHGE\
SI)RUH[DPSOHW\SHSI
&OLFN2.
Figure 13-47 Display Specific E-mail: Message ID
Figure 13-48
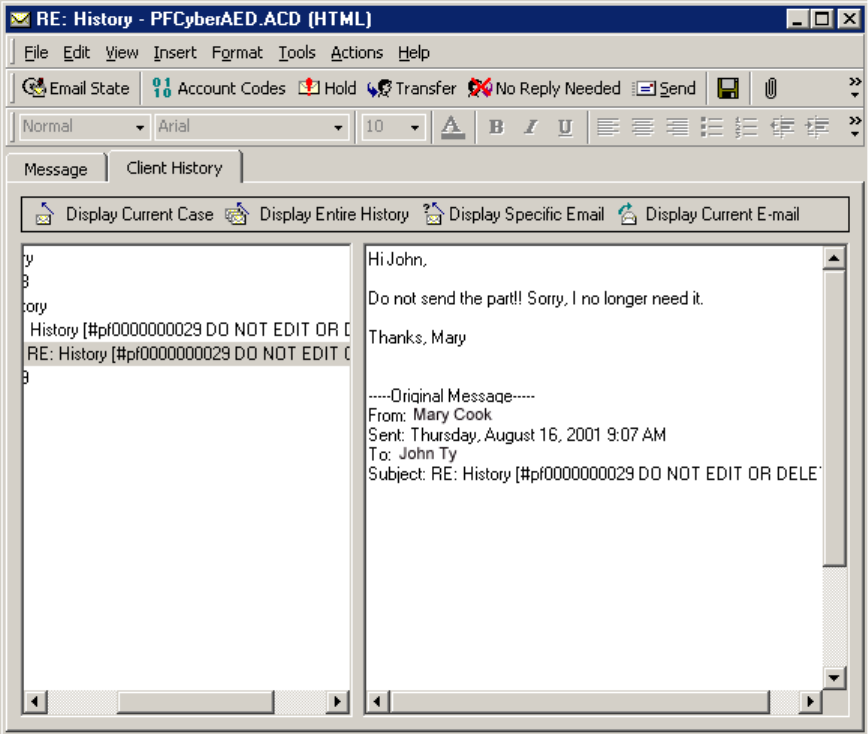
7RYLHZHPDLOKLVWRU\
The specific e-mail that you requested appears in the Client History window. (See Figure 13- 49.)
Figure 13-49 Display Specific E-mail
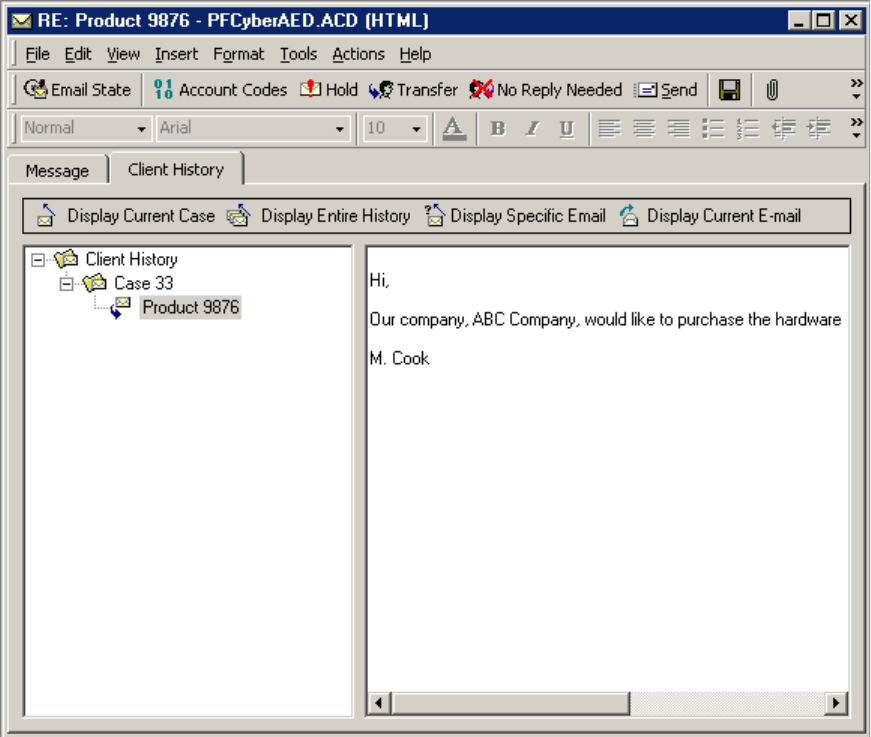
0LWHO1HWZRUNV0XOLWPHGLD&RQWDFW&HQWHU
7RYLHZWKH&XUUHQW(PDLO
&OLFN'LVSOD\&XUUHQW(PDLO
The e-mail currently in the Message window appears in the Client History window.
(See Figure 13- 50.)
Figure 13-50 Display Current E-mail
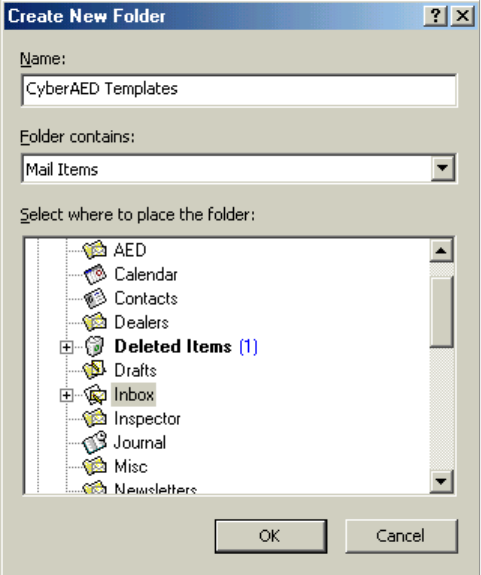
7RFUHDWHDWHPSODWH
&UHDWLQJDQGXVLQJD0&&WHPSODWH
You can create a template from a post in your personal inbox for use with each 6150 MCC queue
you are assigned. This template is then used to frame your responses and should contain standard
information. For example, the template should contain your name and your company’s e-mail
address.
7RFUHDWHDWHPSODWH
2SHQ\RXUSHUVRQDOLQER[
5LJKWFOLFN\RXUSHUVRQDOLQER[DQGVHOHFW1HZ)ROGHU
The Create New Folder window appears. (See Figure 13- 51.)
8QGHU1DPHW\SH0&&7HPSODWHV
&OLFN2.
Figure 13-51 Create New Folder
The 6150 MCC Templates folder appears under your personal inbox.
2QWKHWRROEDUQH[WWR1HZFOLFNWKHGRZQDUURZ
6HOHFW3RVWLQ7KLV)ROGHU
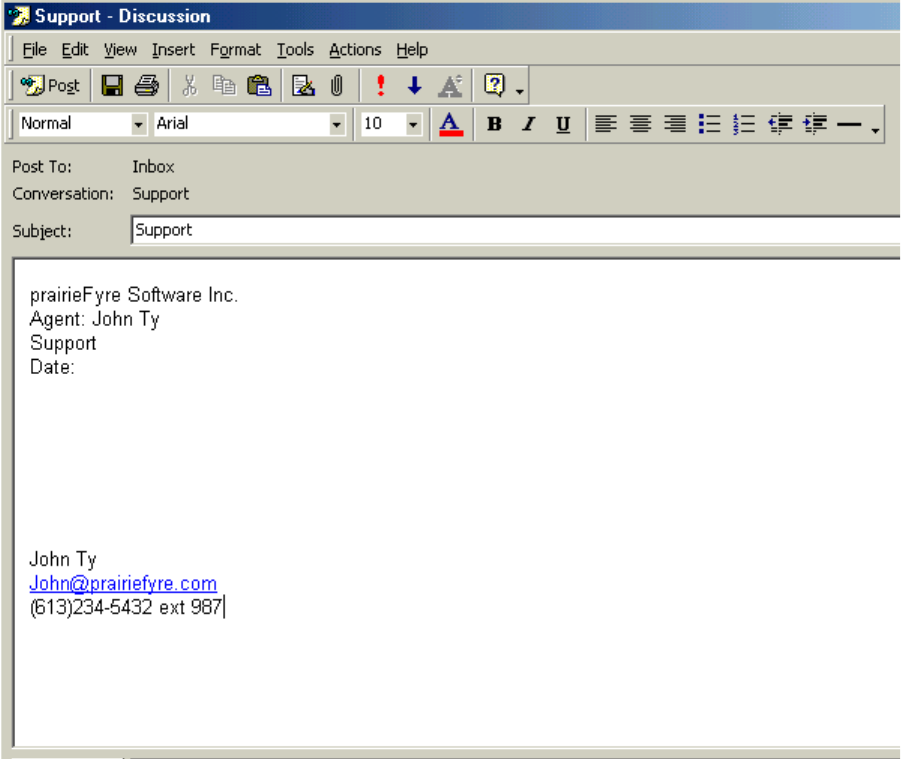
0LWHO1HWZRUNV0XOLWPHGLD&RQWDFW&HQWHU
The Untitled - Discussion window appears.
8QGHU6XEMHFWW\SHWKHQDPHRIWKHTXHXHIRUZKLFK\RXDUHFUHDWLQJWKHWHPSODWH
)RUH[DPSOHW\SH6XSSRUW
The name of the window changes to Support - Discussion. (See Figure 13- 52.)
7\SHVWDQGDUGLQIRUPDWLRQIRUWKLVWHPSODWH)RUH[DPSOHODEHOWKHWHPSODWHDVD
VXSSRUWUHVSRQVHWKHQW\SH\RXUQDPHWKHFRPSDQ\VQDPHDQGDJUHHWLQJ
&OLFN3RVW
Figure 13-52 Support - Discussion window
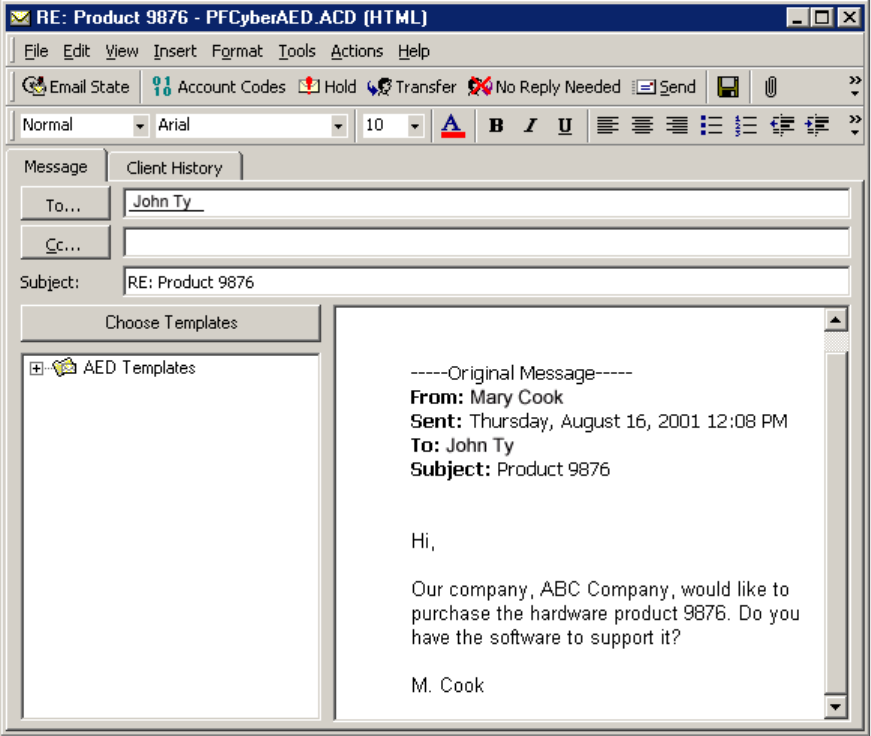
7RXVHD0&&WHPSODWH
7RXVHD0&&WHPSODWH
2SHQ\RXU0&&LQER[
6HOHFWDQXQDQVZHUHGHPDLO
The 6150 MCC e-mail window appears. (See Figure 13- 53.)
2SHQ$('7HPSODWHV
2SHQWKHWHPSODWHIRUWKHTXHXH\RXDUHFXUUHQWO\ZRUNLQJLQ)RUH[DPSOHVHOHFWWKH
WHPSODWHODEHOOHG6XSSRUW
The 6150 MCC Support Templates information will be added above the e-mail request
information.
7\SH\RXUUHVSRQVHWRWKHHPDLOLQWKHVXSSRUWWHPSODWH
&OLFN6HQG
Figure 13-53 6150 MCC e-mail window
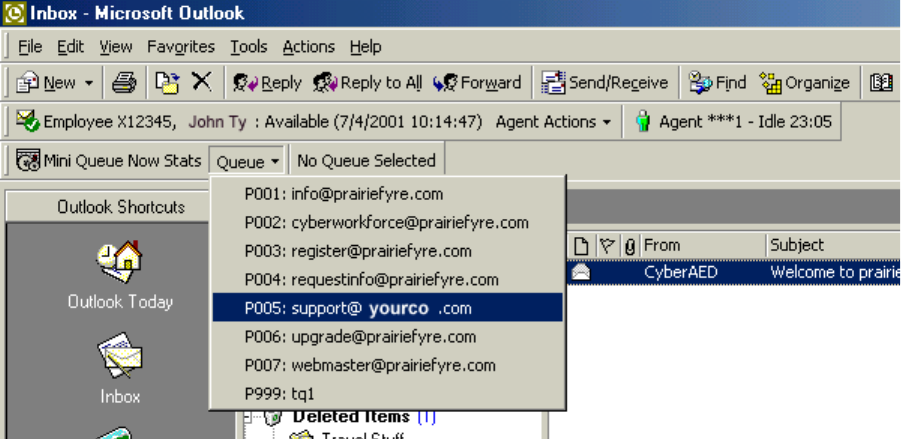
0LWHO1HWZRUNV0XOLWPHGLD&RQWDFW&HQWHU
9LHZLQJ0LQL4XHXH1RZ6WDWV
Mini Queue Now Stats provides information on the number of available agents, the number of e-
mails waiting, and the length of time the oldest e-mail has been waiting. However, if you have
AgentAdvisor (a component of 6110 CCM) you have access to much more detailed queue
information.
7RYLHZ0LQL4XHXH1RZ6WDWV
2QWKH,QER[0LFURVRIW2XWORRNZLQGRZFOLFN4XHXH
The list of queues available appears. (See Figure 13- 54.)
6HOHFWWKHTXHXHWKDW\RXZDQWWRYLHZ
Figure 13-54 Queues available

7RYLHZWKHUHSRVLWRU\
The statistics for support@prairiefyre.com can now be viewed. There are four agents available,
there are no e-mails waiting, and the length of time the oldest e-mail has waited is zero seconds.
(See Figure 13- 55.)
Figure 13-55 Support queue statistics
7RYLHZWKHUHSRVLWRU\
You can view each and every e-mail sent and the corresponding reply in the repository.
7RYLHZWKHRULJLQDOHPDLOV
,QWKH)ROGHU/LVWRI2XWORRNRSHQ5HSRVLWRU\
&OLFN2ULJLQDOV
The Originals window appears with the e-mails listed.
7RYLHZWKHHPDLOUHSOLHV
,QWKH)ROGHU/LVWRI2XWORRNRSHQ5HSRVLWRU\
&OLFN5HSOLHV
The Replies window appears with the e-mail replies listed.
0&&7HUPLQRORJ\
$SSHQGL[$
0&&7HUPLQRORJ\
(QDEOH([WHUQDO,QWHUIORZ
The enable external interflow check box allows you to direct incoming e-mail to an e-mail
address.
([WHUQDO,QWHUIORZ$GGUHVV
The external interflow address is the e-mail address the incoming e-mail is directed to.
+ROG5HTXHXH7LPHRXW
The hold requeue time is the length of time the e-mail message will sit in the assigned agent’s
queue before a warning is flashed to indicate that the e-mail message will soon be reassigned to
another agent’s queue if not answered.
,QWHUIORZ4XHXH
The interflow queue is the queue the e-mail message is directed to when it first arrives at a
company’s e-mail address.
,QWHUIORZ7LPH
The interflow is the path along which the e-mail message is directed. The interflow time is the length of
time the e-mail message will wait in the queue that the interflow directed it to. If the interflow timer
expires, the call is removed from the original queue and re-directed to another answering point, such as a
trunk. This ensures the e-mail message does not go unanswered for long.
1DPH
The name is the queue name. For example, the name might be Q1.
1RGH
The node is where 6150 MCC and 6110 CCM organizes and distributes e-mail and phone calls
throughout your company. If your company is large, you might have several nodes.
1RQ$YDLODEOH5HTXHVW7LPHRXW
6150 MCC knows which agent answered which e-mail. If a customer has already received a
response from an agent but has further questions, the customer’s next e-mail is directed back to
the original agent. However, that agent might not be available. The non available request timeout
time is the length of time the e-mail will sit in the original agent’s queue before being forwarded
to another agent. If the non available request timeout is 60 minutes, and an e-mail is sent after
office hours, then the e-mail would, of course, be forwarded to another agent.
2YHUIORZ$JHQW*URXS
The overflow agent group is the agent group that an e-mail message is forwarded to because the e-
mail message was not answered by the primary agent group within a set period of time (the
overflow time). The e-mail message is placed in the queue of the overflow agent group in addition
to keeping its place in the first queue. The first available agent in either group answers the call.
0&&7HUPLQRORJ\
If the e-mail message is not answered by overflow agent group1 within the overflow time, it is
placed in the queue of overflow agent group 2 in addition to keeping its place in the first queue
(primary agent group) and second queue (overflow agent group 1). There are three possible
overflow agent groups: overflow agent group 1, overflow agent group 2, and overflow agent
group 3.
0&&7HUPLQRORJ\
2YHUIORZ7LPH
The overflow time is the length of time an e-mail will sit in the primary agent group queue before
also being forwarded to a overflow agent group.
3ULPDU\$JHQW*URXS
The primary agent group is the group assigned to answer a particular e-mail message first.
3ULRULW\
Priority assigns priority to queues. The highest priority is 1, and the lowest priority is 10. This
allows you to answer queues of higher priority first.
3XEOLF)ROGHU1DPH
The public folder name is the windows user name.
3XEOLF0DLO$GGUHVV
The public mail address is the company e-mail address. This is the address the customers will use
to e-mail you.
5HSRUWLQJ1XPEHUIRUDTXHXH
The reporting number is assigned for reporting purposes. This report number is referenced when
creating a report about e-mail data from a particular queue. A queue reporting number must start
with P and have three digits following. For example, the reporting number for a queue might be
P123.
5HTXHXHG7LPH
The requeue time is the length of time the e-mail will sit in the assigned agent’s queue before it is
assigned to another agent’s queue.
When an agent receives an e-mail message and fails to respond to the e-mail after X seconds,
6150 MCC places the agent in Make Busy and the e-mail message is requeued (placed back in
queue). This requeued e-mail message has priority over the others and will be the next e-mail
message answered.
5HVSRQVH0HVVDJH
The response message is a message that is automatically sent to the client upon receipt of the
clients e-mail. For example, “Thank you for your interest in prairieFyre Software. We have
received your e-mail, and it is being handled by one of our agents. Please expect a reply shortly.”
The response message is created with the Responses tab.
6HUYLFH/HYHO
The term service level is total number of calls which are answered, abandoned, and interflowed before a
defined threshold time (Service Level Time), compared to the total number of calls answered, abandoned,
and interflowed. It’s the average length of time a caller who has obtained a trunk waits for an available
agent. The service level = (Calls Answered + Long Calls Abandoned + Long Interflow) within the Service
Level Time ÷ (Calls Answered + Long Calls Abandoned + Long Interflow).
0&&7HUPLQRORJ\
6HUYLFH/HYHO3HUFHQW
The service level percent is the proportion of calls, expressed as a percentage, which are
answered, abandoned, and interflowed within a defined threshold time compared to the total
number of calls answered or abandoned (after the short abandon time).
6HUYLFH/HYHO7LPH
The service level time is the threshold time used in calculating the service level percentage, such
as 90 percent of calls answered in 20 seconds. The service level percentage and service level time
are parameters you define as your service objective.
0&&7HUPLQRORJ\
*ORVVDU\
This User Tutorial includes the following terms.
$JHQW/RDG
The agent load includes the time the agent spends talking to the caller (talk time) plus wrap up time.
$QVZHUHG%\
The answered by statistic is a count of all calls answered by the first, second, third, and forth answer points.
$QVZHU3HUFHQW
The term answer percent refers to the Calls Answered compared to the Calls Offered.
$&'
An Automatic Call Distributor (ACD) is a specialized telephone system application for distributing
incoming calls. ACDs are programmed to process calls in a pre-defined order, queue calls, provide in-
queue messaging, and report on real-time and historical activities.
$1,
Automatic Number Identification (ANI) is a technology that identifies telephone numbers of callers to your
call center, so agents can receive a screen pop along with the call. Connecting a database to your telephone
system allows the caller information and call to be sent simultaneously.
$6$
The average speed of answer (ASA) is an ACD statistic that measures how long the average caller waits on
hold before his or her call is picked up by an agent.
$YHUDJH$EDQGRQ7LPH
The average abandon time is the average number of seconds callers wait in queue before they abandon a
call.
$YHUDJH7DON7LPH
The average talk time is the average time agents spent talking to callers during a given time interval; it is
the total average call duration plus any wrap up time you add.
%ORFNHG&DOO
A blocked call is a call that does not get through to the system because no trunks are available; the caller
receives a busy signal.
%XV\+RXU7UDIILF
The Busy hour traffic, measured in Erlangs, is the number of hours of call traffic (or trunk traffic) there are
during your busiest hour of operation. It is important that your busy hour Figure represent the busiest call
load your trunks will ever be offered, and not just today’s peak traffic. The busy hour traffic = (average call
duration+ average delay) x calls per hour ÷ 3600. This value represents the total trunk load (occupancy) in
hours.
*ORVVDU\
&DOO/RDG
The term call load refers to the aggregate effect of the number of calls received by the ACD queue and their
duration, or the calls offered multiplied by the (average talk time plus average wrap up time).
&DOO5RXWLQJ
Call routing refers to the set of instructions programmed in the switch that automate the movement of calls
to their intended answering points.
&DOO9ROXPH6HH&DOOV2IIHUHG
&DOOV$EDQGRQHG
An abandoned call is a call that does not reach an agent because the caller hung up.
&DOOV$EDQGRQHG3DUDPDWHU
The Calls Abandoned Parameter specifies the value which determines whether a call is a Short Abandoned
Call or a Long Abandoned Call. If the abandon time is less than the Call Abandoned Parameter, then it is a
Short Abandoned Call. If the abandon time is more than the Call Abandoned Parameter, then it is a Long
Abandoned Call.
You assign the Calls Abandoned Parameter (called the Queue Short Abandon Time) values to ACD queues
in the YourSite Database.
Callers can abandon after they reach a trunk (before they reach the ACD queue) or while they are in queue
waiting for an available agent (either before or after the short abandon time you specify).
&DOOV$EDQGRQHG6KRUW
The Call Abandoned (Short) calls abandon with an abandon time less than the Call Abandoned Parameter.
These abandoned calls are not included in the call statistics.
&DOOV$EDQGRQHG/RQJ
The Call Abandoned (Long) calls abandon with an abandon time greater than the Call Abandoned
Parameter. These abandoned called are included in call statistics.
&DOOV$QVZHUHG
An answered call is a call picked up by a live agent. Calls that listen to inqueue RAD messages are not
considered to be answered until an agent connects.
&DOOV,QWHUIORZHG
The term interflow refers to a mechanism that directs a queue-delayed call to voice mail or to another
answering point. If the interflow timer expires, the call is removed from the ACD queue and re-directed to
yet another answering point, usually another voice mail box. The interflow time runs independently of the
overflow time.
6KRUW&DOOV,QWHUIORZHG
If, when the Interflow call is compared to the Calls Abandoned Parameter, the duration of the call is less
than the parameter, it is considered a Short Call Interflowed. A Short Call Interflow is considered to be a
Path Unavailable Call.
/RQJ&DOOV,QWHUIORZHG
If, when the Interflow call is compared to the Calls Abandoned Parameter, the duration of the call is more
than the parameter, it is considered a Long Call Interflowed.
&DOOV2IIHUHG
All calls received by the ACD queue, regardless of how they are handled or routed, are referred to as the
calls offered. This includes Calls Answered, Long Interflowed Calls, and Long Abandoned Calls. Calls
Requeued, Path Unavailable Calls, Short Abandoned Calls and Short Interflowed Calls are not considered.
Telephone system data on the calls offered and average talk time is used by the Erlang C equation in
calculating the agents required.
&DOOV5HTXHXHG
When an agent receives an ACD call and fails to pick up the call after X seconds or X rings, the telephone
system places the agent in Make Busy. The telephone system requeues the call (places the call back in the
same queue) and offers it to the next available agent.
&DOOV:DLWLQJ
The calls waiting is the number of callers queued up waiting for an agent to become available,
including those listening to silence, music, or a recorded announcement.
&2
The local Central Office (CO) or telephone exchange connects subscribers’ telephone lines to switching
equipment. This allows long distance and local subscribers to connect to one another.
&7,
Computer telephony integration (CTI) is the merging of computer technology with telephone systems.
Today’s PC-based telephone systems allow you to deliver synchronized voice and data delivery, voice and
data conferencing, automatic information retrieval for calls, caller-based messaging and routing, and
desktop productivity tools.
'HOD\HG&DOO
A delayed call is a call placed in the ACD queue because it can not be immediately answered by an agent.
The ACD queue allows the caller to wait for an available agent rather than being blocked from entering the
system.
'LDODEOH1XPEHU
The term dialable number refers to the digit or series of digits a caller dials to reach an agent at an
extension, an ACD Queue, voice mail, or some other answering point.
'1,6
Dialed Number Identification Service (DNIS) is a feature of toll-free lines that provides the number the
caller dials. This assists agents who answer calls for more than one business or product line. Each business
or product line has its own toll-free number. When a toll-free number is dialed, the telephone system
forwards information to the agent allowing him/her to identify who the caller dialed.
'1'
The term do not disturb (DND) refers to an agent state in which the agent disables his/her extension to
prevent any calls from being routed there.
*ORVVDU\
(UODQJ
An Erlang measures telephone traffic, or the flow of calls and call attempts to your call center during a
given period of time. One Erlang equals one hour or 60 x 60 = 3,600 seconds of telephone conversation.
This could be one call lasting 1 hour, six calls lasting 10 minutes, or any combination of calls and call
durations which equal 60 minutes. The Erlang series of formulae provide a mathematical basis for making
predictions about randomly arriving workloads.
(UODQJ&
Erlang C was developed in 1917 by A.K. Erlang, a Danish engineer who worked for the Copenhagen
Telephone Company. The Erlang C equation is commonly used for agent and delay calculations where
ACD queueing is involved. It predicts the resources required to keep wait (delay) times within your service
level objective. The Erlang C formula uses your historical call load data and the service level percentage,
service level time, and wrap up time you specify and predicts the agent requirement for the time interval
and date range in the forecast.
([WHQVLRQ
An extension is an answering point for a call. A caller to your center is presented with options to dial
various answering points. The caller can dial an individual agent at an extension through a queue number
(address mechanism for a queue or other answering point).
*UDGHRI6HUYLFH
The grade of service (GOS) relates the number of trunks to the level of traffic, and indicates the likelihood
an attempted call will receive a busy signal. The Grade of Service (GOS) is expressed as a decimal fraction.
A GOS of P.02 means that a caller has a two percent chance of receiving a busy signal.
,QERXQG
The term inbound refers to incoming calls to your call center.
/$1
The Local Area Network (LAN) connects multiple computers together over short distances. LANs typically
operate within a building. The computers share information, applications, and peripherals, such as printers.
/RJJHG2Q
An agent is logged on when they sign in to the ACD system. The agent may or may not be ready to receive
calls.
/RJJHG2II
An agent is logged off when he or she signs out of the call center.
/RQJHVW:DLWLQJ
The longest waiting is the duration, in minutes and seconds, of the call that has been waiting the
longest in queue.
0DNH%XV\
The term make busy refers to an agent state in which the agent removes him/herself from the ACD queue.
While in make busy, the agent does not receive any ACD queue calls, but can receive calls dialed directly to
his or her extension.
0,6
The term Management Information System (MIS) refers to the manipulation or processing of data produced
by the telephone system. The MIS database uses telephone system records to provide forecasting, real-time
monitoring, and reporting functions.
2Q$&'
An agent is on ACD when he or she is involved in an ACD call.
2Q1RQ$&'
An agent is on non-ACD when he or she is currently involved in an incoming non-ACD call or an agent
originated call.
2YHUIORZ
The term overflow refers to a mechanism that limits the delay faced by callers by queuing calls against two
or more agent groups. An ACD call that can not be answered immediately is placed in an ACD queue. If the
call is not answered after a set amount of time (the overflow time), it is placed in the ACD queue of another
agent group, in addition to keeping its place in the first queue. The first available agent in either group
answers the call.
3DWK8QDYDLODEOH
A call that cannot be routed because the path (queue) is unavailable. Reasons the path might be unavailable
are: no agent is logged on, or all agents are in Do Not Disturb.
The term unavailable refers to a report field that collates all instances where an agent goes into make busy,
wrap up, and Do Not Disturb (DND) during a work shift.
3RROLQJ3ULQFLSOH
The term Pooling Principle refers to a consolidation of resources that allows the same number of call center
agents to handle more calls while maintaining service levels. The Pooling Principle also applies when
determining the number of call centers required, and how they are networked across time zones in your
ACD enterprise.
3UREDELOLW\RI'HOD\
The probability of delay is the likelihood a call will be delayed in the ACD queue. It relates the number of
agents/extensions compared to the level of traffic carried by the trunks and indicates the likelihood and
amount of delay experienced.
3671
The Public Switched Telephone Network (PSTN) is a global collection of CO’s interconnected by long
distance telephone switching systems
4XDOLW\RI6HUYLFH
The quality of service reflects an agent’s ability to provide excellent assistance to each customer.
4XHXH1XPEHU
A queue number is an address mechanism for a queue or other answering point. The programming
associated with the queue number defines the routing and timing options available to the call.
*ORVVDU\
5HDGHUERDUGVHH:DOO%RDUG
5HDO7LPH$GKHUHQFH
The term real-time adherence describes whether or not agents are performing activities they are schedule to
be doing. Workforce management tools keep supervisors informed of discrepancies between agents’ work
schedules and the actual activities they perform.
5HFRUGHG$QQRXQFHPHQW'HYLFH
A Recorded Announcement Device (RAD) is a system that provides prerecorded messages to callers
waiting in the ACD queue.
5HSRUWLQJ1XPEHU
The term reporting number refers to the number assigned to call center resources, such as agents, and to
devices, such as ACD queues, for reporting purposes.
6HUYLFH/HYHO
The service level is the total number of calls which are answered, abandoned, and interflowed before a
defined threshold time (Service Level Time), compared to the total number of calls answered, abandoned,
and interflowed. It’s the average length of time a caller who has obtained a trunk waits for an available
agent. The service level = (Calls Answered + Long Calls Abandoned + Long Interflow) within the Service
Level Time ÷ (Calls Answered + Long Calls Abandoned + Long Interflow).
6HUYLFH/HYHO3HUFHQW
The service level percent is the proportion of calls, expressed as a percentage, which are answered,
abandoned, and interflowed within a defined threshold time compared to the total number of calls answered
or abandoned (after the short abandon time).
6HUYLFH/HYHO7LPH
The service level time is the threshold time used in calculating the service level percentage, such as 90
percent of calls answered in 20 seconds. The service level percentage and service level time are parameters
you define as your service objective.
6LOHQW0RQLWRULQJ
Silent monitoring refers to the process of capturing the voice conversations between agents and callers.
Silent monitoring systems allow you to track call handling techniques and determine where improvements
can be made in individual performance. They complement ACD statistics by providing a snapshot of both
quality and productivity in your call center.
64/
Structured Query Language (SQL) is the language used to talk to popular Relational Database Management
Systems (RDBMSs). SQL is a standard query language that can be used to enter, query, and change data in
a database. SQL is also used to create and administer databases. Administration of YourSite is done using
Microsoft’s SQL Server, a database management system.
6XSSRUW6\VWHPV
Support systems are information products and technologies that allow agents to provide prompt and
complete information to callers. They provide agents with immediate online access to a customer’s records
and case history, products and services, and company policies and procedures.
7DON7LPH
The talk time is the time the caller is connected to an agent.
7&3,3
Transmission Control Protocol-Internet Protocol (TCP-IP) is the basic communication language (protocol)
of the Internet, and is used as a communications protocol in private networks (intranets). When you are set
up with direct access to the Internet, you are provided with a copy of the TCP-IP program. Other computers
that you may get information from also have a copy of TCP-IP.
7HOHSKRQH6\VWHP
The term telephone system refers to the business telephone switch or Private Branch Exchange (PBX) used
to process incoming and outgoing calls to your call center.
7LPH6WDPS
The term time stamp refers to the time collated queue statistics were last updated by the telephone
system.
7UXQN/RDG
The trunk load includes the time from when a trunk picks up a call until the agent finishes speaking to the
caller and disconnects. The trunk load does not include wrap up time.
8QDYDLODEOHVHH3DWK8QDYDLODEOH
:DOO%RDUG
A wall board is a large electronic sign placed on the wall of a call center. Wall boards provide real-time
ACD statistics to agents and supervisors, such as the number of calls in queue, the wait time of the longest
waiting caller, and the number of available agents.
:$1
Wide Area Networks (WANs) connect computers across wide geographic areas. WANs operate over
telephone carrier lines through bridges or routers. Router options enable communication between high
speed LAN links and slower speed WAN links (that tie LAN segments together).
:RUNIRUFH0DQDJHPHQW
Workforce management is the forecasting and scheduling of agents. Some workforce management systems
use telephone system data to monitor the real-time adherence of agents to scheduled activities, so you to
know how many agents are currently logged in and available to answer calls.
:UDS8S7LPH
The wrap up time is the time the agent spends completing transactions associated with a call after he or she
hangs up. The wrap up time is a standardized period of time during which an agent is not available to
receive calls. If an agent requires additional time to complete paperwork or online transactions, the agent
can remove him/herself from the ACD queue temporarily for this purpose.
*ORVVDU\
,QGH[
1XPHULFV
4Sight
deleting reports 247
exporting forecast data to
WorkFORCE 256
forecast parameters 242
generating reports 243
main function 240
performing what-if scenarios
247
printing and mailing reports 250
scheduling agents in
WorkFORCE 257
troubleshooting reports 253
viewing reports 244
$
Abandoned calls 23, 30, 130, 170
Account code numbers
as agent report statistics 143,
157, 165
as queue report statistics 127
Account codes
adding account codes to
YourSite 76
ACD. See Automatic Call Distributor
(ACD)
ACDLink
main function 49
on the CyberACD Server 52
viewing telephone system
records 51–52, 355
Adaptiv WorkFORCE
forecasting and scheduling
agents 256
main function 254
AgentAdvisor
Agent by Position statistics 204
chatting online 218
creating profiles 217
defining grid styles 213
defining performance thresholds
214
Employee by Position statistics
204
main function 202
Queue Now statistics 206–207
viewing real-time statistics 209
Agents
adding agents to YourSite 62
adherence to schedules 42
agent load 39
predicting required agents 37
scheduling agents 41
Alarms
setting alarms 340
ANIadding ANI numbers to
YourSite 77
ANI. See Automatic Number
Identification (ANI)
Answered calls 170
Answering priority
specifying the answering priority
of agent groups 69, 124, 324
Automatic Call Distributor (ACD)
22
Automatic Number Identification
(ANI) 77
Automatic Number Identification
(ANI). See also Information
technology support systems 33
Average talk time 242
%
Blocked calls 23, 39
Busy hour traffic 40
&
Call flow 22
Call load 242
Call routing
mechanisms 24
to optimize coverage 44
Callers
caller tolerance 26
customer surveys 35
Calls offered 242
Central Office (CO) 23
CO. See Central Office (CO)
Comport settings
for a single PBX 339
for a wall sign 339
for the CyberACD Server 339
Computer Telephony Integration
(CTI). See also Information
technology support systems 33
Cost-based call center 29
Costing
average call value 46
cost of delay 46
cost per call 46
creating an effective budget 45
equipment and automation costs
46
loaded labor costs 46
transmission costs 46
CTI. See Computer Telephony
Integration (CTI)
'
Data backups
backing up the CyberACD
Database 346
backing up the YourSite
Database 345
Data collection
customer surveys 35
historical data 35
real-time data 34
verifying data collection 49
viewing telephone system
records 51
workforce management systems
35
Data recovery
restoring the CyberACD
Database 346
restoring the YourSite Database
345
Database objects
viewing database objects and
performing diagnostics 342
Delayed calls 23, 39
Dialable number
adding dialable numbers to
YourSite 66, 70
Dialed Number Identification
Service (DNIS). See also Information
technology support systems 34
DNIS
adding DNIS numbers to
YourSite 78
DNIS. See Dialed Number
Identification Service
(
Employee IDs
,QGH[
adding Employee IDs to
YourSite 80
Erlang B 40–41
Erlang C 37
Extensions
adding extensions to YourSite
72
dialing extensions 24
)
Forecasting
defined 35
importance of 35
process 36
See also 4Sight 38
tweaking forecasts 37
what-if scenarios 39
*
GOS. See Grade of Service (GOS)
Grade of Service (GOS) 29, 40
+
Historical statistics
account codes 127
agents 141
ANI 138
employees 156
extensions 168
queues 125, 170
teams 164
trunks 167
,
Inbox Manager
deleting reports simultaneously
108, 118
deleting scheduled reports 118
Information technology support
systems
Automatic Number
Identification (ANI) 33
Computer Telephony Integration
(CTI) 33, 35
Dialed Number Identification
Service (DNIS) 34
Inspector
ACD record examples 294
ACD search criteria 277, 295
ACD search results 285
main function 276
running searches in ACD
Inspector 283
running searches in SMDR
Inspector 304
SMDR record examples 317
SMDR record fields and
symbols used 314
SMDR search critiera 299
SMDR search results 306
Interflow. See also Call routing 25
Interflowed calls 130, 170
IP address
Report Distributor 121, 251
0
Management Console
backing up the CyberACD
Database 346
backing up the YourSite
Database 345
editing CyberACD comport
settings 339
editing registry settings 339,
346, 361
main function 334
restoring the CyberACD
Database 346
restoring the YourSite Database
345
viewing CyberACD Database
tables 342
Management Information System
(MIS) 23
MIS. See Management Information
System (MIS)
2
Offered calls 170
Overflow. See also Call routing 25
3
Planning cycle 28
Pooling Principle 22
Probability of delay 29
PSTN. See Public Switched
Telephone Network (PSTN)
Public Switched Telephone Network
(PSTN) 23
4
Quality of service 31
Queues
adding queues to YourSite 69
dialing queues 25
queue numbers 24, 70
5
RAD. See Recorded Announcement
Device (RAD)
Random call arrival 26
RealTime Broadcast
Agent Group Summary monitor
statistics 234
Agent Information monitor
statistics 236
Path Summary monitor statistics
232
System Activity monitor
statistics 230
viewing ACD Monitor sessions
4, 227
Real-time statistics
agent and employee 177, 179,
181–182, 204
queue 184–185
queue totals 424
Recorded Announcement Device
(RAD) 23
Report Distributor
main function 3, 120, 250
verifying reports distribution
121, 251
Report Inbox
main function 100
viewing run-on-demand reports
103
viewing scheduled reports 115
Reporter
automatically mailing reports
102
automatically printing reports
102
deleting reports 124
generating run-on-demand
reports 101
main function 100
troubleshooting 107, 117
viewing run-on-demand reports
103
Requeued calls 130, 170
Revenue-based call centers 29, 40
6
Scheduled Reports
associating reports to a schedule
111
automatically mailing reports
111
automatically printing reports
111
deleting reports 108, 118
generating report schedules
107, 110, 117
main function 100
troubleshooting 107, 117
viewing scheduled reports 115
Scheduling
accuracy 45
defined 41
optimizing schedules 43
scheduling agents in
WorkFORCE 256
shrinkage factor 42
workforce management systems
35
Service level
adding service level values to
YourSite 70
calculating 30
calculating agent requirements
38
defined 29, 38
setting a corporate objective 29,
31
Service level percentage 70, 125,
242
Service level time 70, 125, 242
Short abandon time
adding short abandon time
values to YourSite 71, 124
Shrinkage factor 42
Silent monitoring 32
defining scoring parameters 32
frequency of monitoring 32
monitoring systems 32
setting performance standards
32
Spectrum wall sign setup 263
SQL. See Structured Query
Language (SQL)
Staffing. See Scheduling
Structured Query Language (SQL)
data collection 48, 107, 117
SuperAdvisor
adding, rearranging, resizing,
and sorting devices 190, 211
Agent by Position statistics 177
Agent by Time statistics 181
chatting online 200
creating profiles 198
defining chart styles 193
defining grid styles 192
defining performance thresholds
195
Employee by Position statistics
177
Employee by Time statistics
181
hiding grid fields 191
Queue Group Now statistics
185
Queue Now statistics 185
viewing real-time statistics 188
SX-200
7
Telephone Service Factor (TSF). See
Service level 29
Traffic
traffic calculators 40
traffic-carrying efficiency 24
Trunks
adding trunks to YourSite 74
predicting required trunks 39–
40
trunk load 39
TSF. See Telephone Service Factor
(TSF)
8
User’s Guide
conventions 8
9
VT100 ACD Monitors 4, 227
:
WallBoarder
configuring wall sign messages
264
defining priority messages 274
defining sign groups 272
defining sign messages 270
defining sign variables 267
main function 262
resetting wall signs 265
Spectrum sign connectivity 262
What-If scenarios 39, 247
Workforce management. See
Scheduling
Wrap up time 23, 243
<
YourSite
adding database elements 62
adding database groups 66
adding elements to database
groups 67
configuration main function 56
deleting database elements 63
deleting database groups 67
deleting elements from database
groups 68
editing database elements 62
editing database groups 67
Permissions main function 10,
89
specifying the answering priority
of agent groups 69, 124
