Manual Monitoring Application Servers
User Manual: Monitoring Application Servers
Open the PDF directly: View PDF ![]() .
.
Page Count: 522 [warning: Documents this large are best viewed by clicking the View PDF Link!]
- 1. Introduction
- 2. Monitoring WebLogic Application Servers
- 2.1 Monitoring the WebLogic Server Ver. 9.0 (and above)
- 2.1.1 The Application Processes Layer
- 2.1.2 The JVM Layer
- 2.1.2.1 WebLogic Test
- 2.1.2.2 WebLogic Threads Test
- 2.1.2.3 WebLogic Rockit JVM Test
- 2.1.2.4 WebLogic Work Managers Test
- 2.1.2.5 WebLogic Thread Pools Test
- 2.1.2.6 Tests Disabled by Default for the JVM Layer
- 2.1.2.6.1 JVM GC Test
- 2.1.2.6.2 Java Classes Test
- 2.1.2.6.3 JVM Threads Test
- 2.1.2.6.4 JVM Cpu Usage Test
- 2.1.2.6.5 JVM Memory Usage Test
- 2.1.2.6.6 JVM Uptime Test
- 2.1.2.6.7 JVM Garbage Collections Test
- 2.1.2.6.8 JVM Memory Pool Garbage Collections Test
- 2.1.2.6.9 JMX Connection to JVM
- 2.1.2.6.10 JVM File Descriptors Test
- 2.1.3 The WebLogic Service Layer
- 2.1.3.1 HTTP Test
- 2.1.3.2 WL Security Test
- 2.1.3.3 WebLogic JTA Test
- 2.1.3.4 WebLogic Servlets Test
- 2.1.3.5 WebLogic Server Test
- 2.1.3.6 WebLogic Web Applications Test
- 2.1.3.7 WebLogic Queues Test
- 2.1.3.8 WebLogic Topics Test
- 2.1.3.9 WebLogic JMS Test
- 2.1.3.10 WebLogic Clusters Test
- 2.1.3.11 File Descriptors Test
- 2.1.3.12 WebLogic Connectors Test
- 2.1.4 The WebLogic Database Layer
- 2.1.5 The WebLogic EJB Layer
- 2.2 Monitoring the WebLogic Server Ver. 6/7/8
- 2.1 Monitoring the WebLogic Server Ver. 9.0 (and above)
- 3. Monitoring WebSphere Application Servers
- 3.1 Monitoring the WebSphere Application Server Version 4/5.x
- 3.1.1 The WebSphere Service Layer
- 3.1.2 The WebSphere Database Layer
- 3.1.3 The WebSphere EJB Layer
- 3.1.4 The WebSphere Web Layer
- 3.1.4.1 WebSphereGlobalTransactions Test
- 3.1.4.2 WebSphere Local Transactions Test
- 3.1.4.3 WebSphere Servlet Sessions Test
- 3.1.4.4 WebSphere Web Applications Test
- 3.1.4.5 WebSphere ORB Summary Test
- 3.1.4.6 WebSphere Web Applications Summary Test
- 3.1.4.7 WebSphere Web Server Summary Test
- 3.1.4.8 WebSphere ORB Test
- 3.1.4.9 WebSphere Web Server Test
- 3.2 Monitoring the WebSphere Application Server 6.0 (and above)
- 3.1 Monitoring the WebSphere Application Server Version 4/5.x
- 4. Monitoring iPlanet Application Servers
- 5. Monitoring Coldfusion Application Servers
- 6. Monitoring SilverStream Application Servers
- 7. Monitoring JRun Application Servers
- 8. Monitoring Orion Servers
- 9. Monitoring Tomcat Servers
- 9.1 The JVM Layer
- 9.2 The Web Server Layer
- 9.3 The Java Application Server Layer
- 10. Monitoring SunONE Application Servers
- 11. Monitoring Oracle 9i Application Servers
- 11.1 The Oracle JVM Layer
- 11.1.1 Oracle 9i Jvm Test
- 11.1.2 Java Transactions Test
- 11.1.3 Java Classes Test
- 11.1.4 JVM Threads Test
- 11.1.5 JVM Cpu Usage Test
- 11.1.6 JVM Memory Usage Test
- 11.1.7 JVM Uptime Test
- 11.1.8 JVM Garbage Collections Test
- 11.1.9 JVM Memory Pool Garbage Collections Test
- 11.1.10 JMX Connection to JVM
- 11.1.11 JVM File Descriptors Test
- 11.2 The Oracle JDBC Layer
- 11.3 The Oracle Web Modules Layer
- 11.4 The Oracle Web Context Layer
- 11.5 The Oracle J2EE Layer
- 11.1 The Oracle JVM Layer
- 12. Monitoring Oracle 10g Application Servers
- 13. Monitoring Oracle Forms Servers
- 14. Monitoring Borland Enterprise Servers (BES)
- 15. Monitoring JBoss Application Servers
- 16. Monitoring Domino Application Servers
- 17. Conclusion

Monitoring Application Servers
eG Enterprise v6.0

Restricted Rights Legend
The information contained in this document is confidential and subject to change without notice. No
part of this document may be reproduced or disclosed to others without the prior permission of eG
Innovations Inc. eG Innovations Inc. makes no warranty of any kind with regard to the software and
documentation, including, but not limited to, the implied warranties of merchantability and fitness for
a particular purpose.
Trademarks
Microsoft Windows, Windows NT, Windows 2003, and Windows 2000 are either registered trademarks
or trademarks of Microsoft Corporation in United States and/or other countries.
The names of actual companies and products mentioned herein may be the trademarks of their
respective owners.
Copyright
©2014 eG Innovations Inc. All rights reserved.
Table of Contents
INTRODUCTION ................................................................................................................................................................................................... 1
MONITORING WEBLOGIC APPLICATION SERVERS................................................................................................................................. 2
2.1 MONITORING THE WEBLOGIC SERVER VER. 9.0 (AND ABOVE) .................................................................................................................... 3
2.1.1 The Application Processes Layer .................................................................................................................................................... 4
2.1.2 The JVM Layer ............................................................................................................................................................................... 8
2.1.3 The WebLogic Service Layer ........................................................................................................................................................ 82
2.1.4 The WebLogic Database Layer ................................................................................................................................................... 142
2.1.5 The WebLogic EJB Layer ........................................................................................................................................................... 157
2.2 MONITORING THE WEBLOGIC SERVER VER. 6/7/8 ................................................................................................................................... 180
2.2.1 The JVM Layer ........................................................................................................................................................................... 180
2.2.2 The WebLogic Service Layer ...................................................................................................................................................... 181
2.2.3 The WebLogic Database Layer ................................................................................................................................................... 182
2.2.4 The WebLogic EJB Layer ........................................................................................................................................................... 183
MONITORING WEBSPHERE APPLICATION SERVERS .......................................................................................................................... 184
3.1 MONITORING THE WEBSPHERE APPLICATION SERVER VERSION 4/5.X .................................................................................................... 184
3.1.1 The WebSphere Service Layer .................................................................................................................................................... 185
3.1.2 The WebSphere Database Layer ................................................................................................................................................. 196
3.1.3 The WebSphere EJB Layer ......................................................................................................................................................... 201
3.1.4 The WebSphere Web Layer ......................................................................................................................................................... 206
3.2 MONITORING THE WEBSPHERE APPLICATION SERVER 6.0 (AND ABOVE) ................................................................................................. 240
3.2.1 The JVM Layer ........................................................................................................................................................................... 241
3.2.2 The WAS Service Layer ............................................................................................................................................................... 242
3.2.3 The WAS Database Layer ........................................................................................................................................................... 260
3.2.4 The WAS EJB Layer .................................................................................................................................................................... 264
3.2.5 The WAS Web Layer ................................................................................................................................................................... 278
MONITORING IPLANET APPLICATION SERVERS ................................................................................................................................. 299
4.1 THE NAS SERVICE LAYER ....................................................................................................................................................................... 300
4.1.1 NAS SNMP Test .......................................................................................................................................................................... 300
MONITORING COLDFUSION APPLICATION SERVERS ......................................................................................................................... 303
5.1 THE CF SERVICE LAYER .......................................................................................................................................................................... 304
5.1.1 Coldfusion Test ........................................................................................................................................................................... 304
5.1.2 Coldfusion Log Test .................................................................................................................................................................... 306
5.2 THE CF DB ACCESS LAYER ..................................................................................................................................................................... 307
MONITORING SILVERSTREAM APPLICATION SERVERS ................................................................................................................... 309
6.1 THE SILVER STREAM SERVICE LAYER...................................................................................................................................................... 310
6.1.1 SilverStream Test ........................................................................................................................................................................ 310
MONITORING JRUN APPLICATION SERVERS ........................................................................................................................................ 313
7.1 THE JVM LAYER ...................................................................................................................................................................................... 314
7.2 THE JRUN SERVICE LAYER ..................................................................................................................................................................... 314
7.2.1 JRun Threads Test ...................................................................................................................................................................... 315
7.2.2 JRun Service Test ........................................................................................................................................................................ 317
7.2.3 JRun Server Test ......................................................................................................................................................................... 319
MONITORING ORION SERVERS .................................................................................................................................................................. 321
8.1 THE JAVA APPLICATION SERVER LAYER .................................................................................................................................................. 321
8.1.1 Java Server Web Access Test ...................................................................................................................................................... 322
MONITORING TOMCAT SERVERS.............................................................................................................................................................. 324
9.1 THE JVM LAYER ...................................................................................................................................................................................... 326
9.1.1 JMX Connection to JVM ............................................................................................................................................................. 326
9.1.2 JVM File Descriptors Test .......................................................................................................................................................... 328
9.1.3 Java Classes Test ........................................................................................................................................................................ 329
9.1.4 JVM Garbage Collections Test ................................................................................................................................................... 332
9.1.5 JVM Threads Test ....................................................................................................................................................................... 339
9.1.6 JVM Cpu Usage Test .................................................................................................................................................................. 345
9.1.7 JVM Memory Usage Test ............................................................................................................................................................ 349
9.1.8 JVM Uptime Test ........................................................................................................................................................................ 354
9.1.9 Tests Disabled by Default for a Tomcat Server ........................................................................................................................... 358
9.2 THE WEB SERVER LAYER ........................................................................................................................................................................ 370
9.2.1 Tomcat Cache Test..................................................................................................................................................................... 371
9.2.2 TomcatThreads Test .................................................................................................................................................................... 373
9.3 THE JAVA APPLICATION SERVER LAYER .................................................................................................................................................. 377
9.3.1 Tomcat Applications Test ............................................................................................................................................................ 378
9.3.2 Tomcat Connectors Test ............................................................................................................................................................. 380
9.3.3 Tomcat Jsps Test ......................................................................................................................................................................... 382
9.3.4 TomcatServlets Test .................................................................................................................................................................... 384
MONITORING SUNONE APPLICATION SERVERS .................................................................................................................................. 387
10.1 THE JVM LAYER ...................................................................................................................................................................................... 388
10.2 THE SUNONE HTTP LAYER .................................................................................................................................................................... 389
10.2.1 SunONE Http Test ....................................................................................................................................................................... 389
10.3 THE SUNONE DB LAYER ......................................................................................................................................................................... 391
10.3.1 SunONE Jdbc Test ...................................................................................................................................................................... 391
10.4 THE SUNONE TRANSACTIONS LAYER ..................................................................................................................................................... 392
10.4.1 SunONE Transactions Test ......................................................................................................................................................... 393
10.5 THE SUNONE EJB LAYER........................................................................................................................................................................ 394
10.5.1 SunONE Ejb Cache Test ............................................................................................................................................................. 394
10.5.2 SunONE EJB Pools Test ............................................................................................................................................................. 396
MONITORING ORACLE 9I APPLICATION SERVERS.............................................................................................................................. 399
11.1 THE ORACLE JVM LAYER ........................................................................................................................................................................ 401
11.1.1 Oracle 9i Jvm Test ...................................................................................................................................................................... 401
11.1.2 Java Transactions Test ............................................................................................................................................................... 402
11.1.3 Java Classes Test ........................................................................................................................................................................ 404
11.1.4 JVM Threads Test ....................................................................................................................................................................... 407
11.1.5 JVM Cpu Usage Test .................................................................................................................................................................. 413
11.1.6 JVM Memory Usage Test ............................................................................................................................................................ 417
11.1.7 JVM Uptime Test ........................................................................................................................................................................ 420
11.1.8 JVM Garbage Collections Test ................................................................................................................................................... 424
11.1.9 JVM Memory Pool Garbage Collections Test ............................................................................................................................. 427
11.1.10 JMX Connection to JVM ............................................................................................................................................................. 431
11.1.11 JVM File Descriptors Test .......................................................................................................................................................... 433
11.2 THE ORACLE JDBC LAYER ...................................................................................................................................................................... 434
11.2.1 Oracle 9i Drivers Test ................................................................................................................................................................ 434
11.2.2 Oracle 9i Connection Cache Test ............................................................................................................................................... 435
11.2.3 Oracle 9i Transactions Test ........................................................................................................................................................ 436
11.3 THE ORACLE WEB MODULES LAYER ....................................................................................................................................................... 437
11.3.1 Oracle 9i Web Modules Test ....................................................................................................................................................... 438
11.4 THE ORACLE WEB CONTEXT LAYER ........................................................................................................................................................ 439
11.4.1 Oracle 9i Web Contexts Test ....................................................................................................................................................... 440
11.5 THE ORACLE J2EE LAYER ....................................................................................................................................................................... 441
11.5.1 Oracle 9i Jsps Test ...................................................................................................................................................................... 441
11.5.2 Oracle 9i Servlets Test ................................................................................................................................................................ 443
MONITORING ORACLE 10G APPLICATION SERVERS .......................................................................................................................... 446
12.1 THE ORACLE J2EE LAYER ....................................................................................................................................................................... 447
12.1.1 Oracle Ejbs Test ......................................................................................................................................................................... 447
12.1.2 Oracle Jms Store Test ................................................................................................................................................................. 450
MONITORING ORACLE FORMS SERVERS ............................................................................................................................................... 452
13.1 THE FORMS PROCESSES LAYER ................................................................................................................................................................ 453
13.1.1 F9i Processes Test ...................................................................................................................................................................... 454
13.2 THE FORMS SERVER LAYER ..................................................................................................................................................................... 455
13.2.1 F9i Sessions Test......................................................................................................................................................................... 455
13.2.2 F9i Response Test ....................................................................................................................................................................... 457
13.3 THE FORMS USER LAYER ......................................................................................................................................................................... 458
13.3.1 F9i Users Test ............................................................................................................................................................................. 458
MONITORING BORLAND ENTERPRISE SERVERS (BES) ...................................................................................................................... 461
14.1 THE AGENT LAYER .................................................................................................................................................................................. 462
14.1.1 Agent Statistics Test .................................................................................................................................................................... 462
14.2 THE PARTITION LAYER ............................................................................................................................................................................ 463
14.2.1 Partition Stat Test ....................................................................................................................................................................... 463
14.3 THE PARTITION SERVICES LAYER ............................................................................................................................................................ 464
14.3.1 CMP Test .................................................................................................................................................................................... 465
14.3.2 Ejb Cont Stat Test ....................................................................................................................................................................... 466
14.3.3 JDBC1 Test ................................................................................................................................................................................. 467
14.3.4 JDBC2 Test ................................................................................................................................................................................. 468
14.3.5 SFBeans Test .............................................................................................................................................................................. 469
14.3.6 Transactions Test ........................................................................................................................................................................ 471
MONITORING JBOSS APPLICATION SERVERS ....................................................................................................................................... 473
15.1 THE JVM LAYER ...................................................................................................................................................................................... 475
15.2 THE JB SERVER LAYER ............................................................................................................................................................................ 476
15.2.1 Jboss JVM Test ........................................................................................................................................................................... 476
15.2.2 Jboss Server Test ........................................................................................................................................................................ 478
15.2.3 Jboss Thread Pools Test ............................................................................................................................................................. 480
15.3 THE JB CONNECTION POOL LAYER .......................................................................................................................................................... 482
15.3.1 Jboss Connection Pools Test....................................................................................................................................................... 483
15.4 THE JB SERVLET LAYER .......................................................................................................................................................................... 485
15.4.1 Jboss Servlets Test ...................................................................................................................................................................... 486
15.5 THE JB EJB LAYER .................................................................................................................................................................................. 488
15.5.1 Jboss Ejbs Test ............................................................................................................................................................................ 488
15.6 THE JB MQ LAYER .................................................................................................................................................................................. 490
15.6.1 Jboss MQ Queues Test ................................................................................................................................................................ 491
15.6.2 Jboss MQ Topics Test ................................................................................................................................................................. 494
MONITORING DOMINO APPLICATION SERVERS .................................................................................................................................. 497
16.1 ENABLING SNMP ON A DOMINO SERVER ................................................................................................................................................ 497
16.1.1 Enabling SNMP for a Domino Server on Solaris ........................................................................................................................ 498
16.1.2 Enabling SNMP for a Domino Server on Linux .......................................................................................................................... 500
16.1.3 Enabling SNMP for a Domino Server on AIX ............................................................................................................................. 502
16.1.4 Enabling SNMP for a Domino Server on Windows..................................................................................................................... 503
16.2 THE DOMINO SERVICE LAYER .................................................................................................................................................................. 508
16.2.1 Lotus Notes Web Server Test ...................................................................................................................................................... 508
16.2.2 Lotus Notes Replication Test....................................................................................................................................................... 511
CONCLUSION .................................................................................................................................................................................................... 515
Table of Figures
Figure 2.1: Layer model of the WebLogic Application server .................................................................................................................................. 4
Figure 2.2: The tests mapped to the Application Processes layer of the WebLogic server ........................................................................................ 4
Figure 2.3: The tests associated with the JVM layer.................................................................................................................................................. 9
Figure 2.4: The layers through which a Java transaction passes .............................................................................................................................. 31
Figure 2.5: The detailed diagnosis of the Slow transactions measure ...................................................................................................................... 43
Figure 2.6: The Method Level Breakup section in the At-A-Glance tab page ......................................................................................................... 44
Figure 2.7: The Component Level Breakup section in the At-A-Glance tab page ................................................................................................... 44
Figure 2.8: Query Details in the At-A-Glance tab page ........................................................................................................................................... 45
Figure 2.9: Detailed description of the query clicked on ......................................................................................................................................... 45
Figure 2.10: The Trace tab page displaying all invocations of the method chosen from the Method Level Breakup section .................................. 46
Figure 2.11: The Trace tab page displaying all methods invoked at the Java layer/sub-component chosen from the Component Level Breakup
section ............................................................................................................................................................................................................. 47
Figure 2.12: Queries displayed in the SQL/Error tab page ...................................................................................................................................... 48
Figure 2.13: Errors displayed in the SQL/Error tab page......................................................................................................................................... 48
Figure 2.14: The detailed diagnosis of the Error transactions measure .................................................................................................................... 49
Figure 2.15: Tests mapping to the WebLogic Service layer .................................................................................................................................... 82
Figure 2.16: The detailed diagnosis of the Max execution time measure ................................................................................................................ 93
Figure 2.17: Tests mapping to the WebLogic Database layer ................................................................................................................................ 142
Figure 2.18: Tests mapping to the WebLogic EJB layer ....................................................................................................................................... 158
Figure 2.19: The detailed diagnosis of the Cache hit ratio measure ....................................................................................................................... 165
Figure 2.20: The detailed diagnosis of the Threads timeout measure .................................................................................................................... 169
Figure 2.21: Layer model of the WebLogic Application server ............................................................................................................................. 180
Figure 2.22: The tests associated with the JVM layer ............................................................................................................................................ 181
Figure 2.23: Tests mapped to the WebLogic Service layer.................................................................................................................................... 182
Figure 2.24: Tests mapping to the WebLogic Database layer ................................................................................................................................ 182
Figure 2.25: Tests mapping to the WebLogic EJB layer ....................................................................................................................................... 183
Figure 3.1: Layer model for a WebSphere application server – 4/5.x .................................................................................................................... 185
Figure 3.2: Tests mapping to the WebSphere Service layer .................................................................................................................................. 185
Figure 3.3: Tests mapping to the WebSphere Database layer ................................................................................................................................ 197
Figure 3.4: Tests mapping to the WebSphere EJB layer ........................................................................................................................................ 202
Figure 3.5: Tests mapping to the WebSphere Web layer ....................................................................................................................................... 207
Figure 3.6: Layer model of the WebSphere Application server 6.0 (or above) ...................................................................................................... 241
Figure 3.7: The tests mapped to the JVM layer ..................................................................................................................................................... 242
Figure 3.8: The tests associated with the WAS Service layer ................................................................................................................................ 243
Figure 3.9: The test associated with the WAS Database layer ............................................................................................................................... 260
Figure 3.10: The tests associated with the WAS EJB layer ................................................................................................................................... 264
Figure 3.11: The tests associated with the WAS Web layer .................................................................................................................................. 278
Figure 4.1: Model of an iPlanet Application server showing the different layers monitored for the server ........................................................... 299
Figure 4.2: The NasSnmpTest that maps to the NAS Service layer of an iPlanet application server ..................................................................... 300
Figure 5.1: Layer model for a Coldfusion server ................................................................................................................................................... 303
Figure 5.2: The ColdfusionTest that maps to the CF Service layer of a Coldfusion application server ................................................................. 304
Figure 5.3: The ColdfusionTest that maps to the CF DB Access layer of a Coldfusion application server ........................................................... 308
Figure 6.1: Layer model for a SilverStream application server ............................................................................................................................. 310
Figure 6.2: Tests mapping to the Silver Stream Service layer ............................................................................................................................... 310
Figure 7.1: Layer model for a JRun application server .......................................................................................................................................... 314
Figure 7.2: The tests mapped to the JVM layer ..................................................................................................................................................... 314
Figure 7.3: Tests mapping to the JRUN Service layer ........................................................................................................................................... 315
Figure 8.1: Layer model of an Orion/Tomcat server ............................................................................................................................................. 321
Figure 8.2: Tests associated with the Java Application Server layer ..................................................................................................................... 322
Figure 9.1: The layer model of the Tomcat server ................................................................................................................................................. 324
Figure 9.2: Tests associated with JVM layer ......................................................................................................................................................... 326
Figure 9. 3: The detailed diagnosis of the CPU utilization of JVM measure ......................................................................................................... 349
Figure 9. 4: The detailed diagnosis of the Used memory measure ......................................................................................................................... 354
Figure 9.5: Tests associated with Web Server layer .............................................................................................................................................. 371
Figure 9.6: Tests associated with Java Application Server layer ........................................................................................................................... 377
Figure 10.1: The layer model of a SunONE application server ............................................................................................................................. 388
Figure 10.2: The tests mapped to the JVM layer ................................................................................................................................................... 388
Figure 10.3: Tests associated with the SunONE HTTP layer ................................................................................................................................ 389
Figure 10.4: Tests associated with the SunONE DB layer ..................................................................................................................................... 391
Figure 10.5: Test associated with the SunONE Transactions layer........................................................................................................................ 393
Figure 10.6: Tests associated with the SunONE EJB layer.................................................................................................................................... 394
Figure 11.1: The layer model of the Oracle 9i AS ................................................................................................................................................. 400
Figure 11.2: Tests associated with the Oracle JVM layer ...................................................................................................................................... 401
Figure 11.3: The tests associated with the Oracle==== JDBC layer ...................................................................................................................... 434
Figure 11.4: The tests associated with the Oracle Web Modules layer .................................................................................................................. 438
Figure 11.5: The tests associated with the Oracle Web Context layer ................................................................................................................... 440
Figure 11.6: The tests associated with the Oracle J2EE layer ................................................................................................................................ 441
Figure 12.1: The layer model of the Oracle 10G application server ...................................................................................................................... 446
Figure 12.2: The tests associated with the Oracle J2EE layer ................................................................................................................................ 447
Figure 13.1: The layer model of an Oracle Forms server ...................................................................................................................................... 452
Figure 13.2: The tests associated with the Forms Processes layer ......................................................................................................................... 453
Figure 13.3: Tests associated with the Forms Server layer .................................................................................................................................... 455
Figure 13.4: Tests associated with the Forms User layer ....................................................................................................................................... 458
Figure 14.1: The layer model of a Borland Enterprise server ................................................................................................................................ 461
Figure 14.2: The tests associated with the Agent layer .......................................................................................................................................... 462
Figure 14.3: The tests associated with the Partition layer ...................................................................................................................................... 463
Figure 14.4: The tests associated with the Partition Services layer ........................................................................................................................ 465
Figure 15.1: The layer model of a JBoss application server .................................................................................................................................. 474
Figure 15.2: The tests mapped to the JVM layer ................................................................................................................................................... 475
Figure 15.3: The tests associated with the JB Server layer .................................................................................................................................... 476
Figure 15.4: The test associated with the JB Connection Pool layer...................................................................................................................... 483
Figure 15.5: The test associated with the JB Servlet layer ..................................................................................................................................... 486
Figure 15.6: The test associated with the JB EJB layer ......................................................................................................................................... 488
Figure 15.7: The tests associated with the JB MQ layer ........................................................................................................................................ 491
Figure 16.1: The Add/Remove Programs option in the Control Panel window ..................................................................................................... 503
Figure 16.2: Select the Add/Remove Windows Components option ..................................................................................................................... 504
Figure 16.3: Selecting the Management and Monitoring Tools option .................................................................................................................. 504
Figure 16.4: Selecting the SNMP option ............................................................................................................................................................... 505
Figure 16.5: Providing the path to the Windows 2000 CD .................................................................................................................................... 505
Figure 16.6: Layer model of the Domino application server ................................................................................................................................. 507
Figure 16.7: The tests associated with the Domino Service Layer......................................................................................................................... 508

I n t r o d u c t i o n
1
Introduction
To achieve scalability and performance, most Internet application deployments have evolved into
multi-tier infrastructures where the web server tier serves as the web front-end, the business logic is
executed on middleware application servers, and the backend storage and access is provided via
database servers. While multi-tier infrastructures offer a variety of scalability and extensibility
benefits, they are also more difficult to operate and manage. When a problem occurs (e.g., a
slowdown), an administrator often has difficulty in figuring out which application(s) in the multi-tier
infrastructure could be the cause of the problem - i.e., is it the network? Or the database? Or the
WebLogic server? Or the middleware? Or the web server? Comprehensive, routine monitoring of every
infrastructure application and network device is essential to be able to troubleshoot effectively when
problems occur.
The application server middleware that hosts and supports the business logic components is often the
most complex of the multi-tier infrastructure. To offer peak performance, an application server
provides a host of complex functions and features including database connection pooling, thread
pooling, database result caching, session management, bean caching and management etc. To ensure
that the application server is functioning effectively at all times, all of these functions have to be
monitored and tracked proactively and constantly.
eG Enterprise offers specialized monitoring models for each of the most popular application servers
such as WebLogic, WebSphere, ColdFusion, Oracle 9i/10G, etc. A plethora of metrics relating to the
health of the application servers can be monitored in real-time and alerts can be generated based on
user-defined thresholds or auto-computed baselines. These metrics enable administrators to quickly
and accurately determine server availability and responsiveness, resource usage at the host-level and
at the application server level, how well the application server processes requests, how quickly the
server completes transactions, overall server security, etc.
This document engages you in an elaborate discussion on how eG Enterprise monitors each of the
popular web application servers in the market.
Chapter
1

M o n i t o r i n g W e b L o g i c A p p l i c a t i o n S e r v e r s
2
Monitoring WebLogic
Application Servers
BEA WebLogic Server is a fully-featured, standards-based application server providing the foundation
on which an enterprise can build reliable, scalable, and manageable applications. With its
comprehensive set of features, compliance with open standards, multi-tiered architecture, and support
for component-based development, WebLogic Server provides the underlying core functionality
necessary for the development and deployment of business-driven applications. Any issue with the
functioning of the WebLogic server, if not troubleshooted on time, can rupture the very core of these
business-critical applications, causing infrastructure downtime and huge revenue losses. This justifies
the need for continuously monitoring the external availability and internal operations of the WebLogic
server.
eG Enterprise provides two distinct models for monitoring WebLogic servers - the WebLogic model and
the WebLogic (6/7/8) model. As the names suggest, the WebLogic 6/7/8 model can be used to
monitor the WebLogic server version 6, 7, and 8, and the WebLogic model can be used for monitoring
WebLogic 9.0 (and above).
Regardless of the model used, the metrics obtained enable administrators to find answers to the
following persistent performance questions:
Server monitoring
Is the WebLogic process running?
Is the memory usage of the server increasing over time?
Is the server's request processing rate unusually high?
JVM monitoring
Is the JVM heap size adequate?
Is the garbage collection tuned well or is the JVM spending too much
time in garbage collection?
Thread monitoring
Are the WebLogic servers execute queues adequately sized?
Are there too many threads waiting to be serviced, thereby causing
slow response time?
Security monitoring
How many invalid login attempts have been made to the WebLogic
server?
Are these attempts recurring?
Chapter
2

M o n i t o r i n g W e b L o g i c A p p l i c a t i o n S e r v e r s
3
JMS monitoring
Are there many pending messages in the messaging server?
Is the message traffic unusually high?
Connector
monitoring
What is the usage pattern of connections in a connector pool?
Cluster monitoring
Are all the WebLogic servers in the cluster currently available?
Is the load being balanced across the cluster?
Transaction
monitoring
How many user transactions are happening?
Are there too many rollbacks occurring?
Servlet monitoring
Which servlet(s) are being extensively accessed?
What is the average invocation time for each servlet?
EJB Pool monitoring
Are there adequate numbers of beans in a bean pool?
How many beans are in use? Are there any clients waiting for a bean?
EJB Cache
monitoring
Is the cache adequately sized or are there too many cache misses?
What is the rate of EJB activations and passivations?
EJB Lock monitoring
Is there contention for locks?
How many beans are locked?
How many attempts have been made to acquire a lock for each bean?
JDBC Connection
monitoring
Are all the JDBC pools available?
Is each pool adequately sized?
What are the peak usage times and values?
How many connection leaks have occurred?
JDBC call monitoring
How many JDBC calls have been made?
What was average response time of those calls?
What are the queries that take a long time to execute?
The sections that will follow discuss each of these models in great detail.
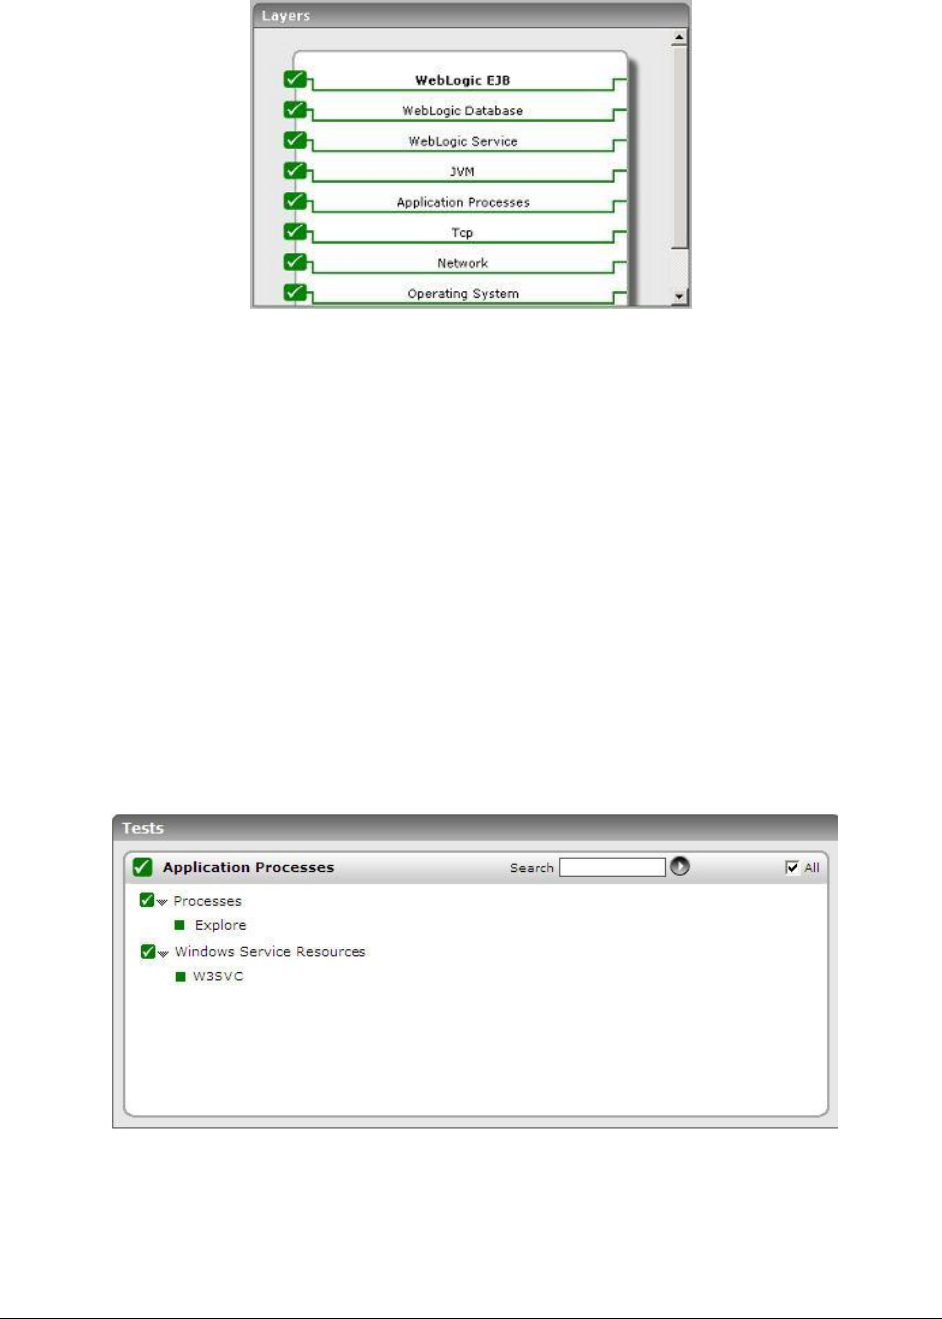
2.1 Monitoring the WebLogic Server Ver. 9.0 (and above)
The special WebLogic monitoring model (see Figure 2.1) that eG Enterprise offers provides uses JMX
(Java Management extension), the new standard for managing java components, for monitoring the
WebLogic server 9.0 (and above). JMX allows users to instrument their applications and control or
monitor them using a management console. Using this mechanism, over a hundred critical metrics
relating to a WebLogic server instance can be monitored in real-time and alerts can be generated
based on user-defined thresholds or auto-computed baselines.
M o n i t o r i n g W e b L o g i c A p p l i c a t i o n S e r v e r s
4
Figure 2.1: Layer model of the WebLogic Application server
The sections that will follow discuss the top 4 layers of Figure 2.1, and the metrics they report. In
addition, the Application Processes layer will also be touched upon, as it includes an additional test for
WebLogic servers called the Windows Service Resources test.
The remaining layers have been extensively dealt with in the Monitoring Unix and Window Servers
document.
2.1.1 The Application Processes Layer
The default Processes test mapped to this layer reports the availability and resource usage of the
processes that are critical to the functioning of the WebLogic server. For more details about the
Processes test, refer to the Monitoring Unix and Windows Servers document.
If the WebLogic server is operating on a Windows host, then, optionally, you can configure a Windows
Service Resources test for the server. This test reports the availability and resource usage of a
configured service.
Figure 2.2: The tests mapped to the Application Processes layer of the WebLogic server

M o n i t o r i n g W e b L o g i c A p p l i c a t i o n S e r v e r s
5
2.1.1.1 Windows Service Resources Test
For a configured service, this test reports whether that service is up and running or not. In addition,
the test automatically determines the ID and name of the process that corresponds to the configured
service, and measures the CPU and memory usage of that process and the I/O load imposed by the
process. This test executes only on Windows hosts.
This test is disabled by default. Enable this test only if the WebLogic server is operating on a Windows host. To
enable the test, go to the ENABLE / DISABLE TESTS page using the menu sequence : Agents -> Tests ->
Enable/Disable, pick WebLogic as the Component type, Performance as the Test type, choose this test
from the DISABLED TESTS list, and click on the << button to move the test to the ENABLED TESTS list.
Finally, click the Update button.
Purpose
Reports whether the configured service is available or not, automatically determines
the ID and name of the process that corresponds to the configured service, and
measures the CPU and memory usage of that process and the I/O load imposed by
the process
Target of the
test
A WebLogic application server
Agent
deploying the
test
An internal agent
Configurable
parameters for
the test
1. TEST PERIOD - How often should the test be executed
2. HOST – The IP address of the WebLogic server
3. PORT – The port number of the WebLogic server
4. SERVICENAME - Specify the exact name of the service to be monitored. For eg.,
to monitor the World Wide Web Publishing service, the SERVICENAME should
be: W3SVC. If your service name embeds white spaces, then specify the service
name within "double-quotes".
Outputs of the
test
One set of results for the SERVICENAME configured
Measurements
made by the
test
Measurement
Measurement
Unit
Interpretation
Service availability:
Indicates whether the
configured service is
available or not.
Percent
If the service exists on the target host
and is currently running, then this
measure will report the value 100. On
the other hand, if the service exists but
is not running, then this measure will
report the value 0. If the service does
not exist, then the test will report the
value Unknown.
CPU utiization:
Indicates the
percentage of CPU
utilized by the process
that corresponds to the
configured
SERVICENAME
Percent
A very high value could indicate that the
service is consuming excessive CPU
resources.

M o n i t o r i n g W e b L o g i c A p p l i c a t i o n S e r v e r s
6
Memory utilization:
For the process
corresponding to the
specified
SERVICENAME, this
value represents the
ratio of the resident set
size of the process to
the physical memory of
the host system,
expressed as a
percentage.
Percent
A sudden increase in memory utilization
for a process may be indicative of
memory leaks in the application.
Handle count:
Indicates the number of
handles opened by the
process mapped to the
configured
SERVICENAME.
Number
An increasing trend in this measure is
indicative of a memory leak in the
service.
Number of threads:
Indicates the number of
threads that are used
by the process that
corresponds to the
configured
SERVICENAME.
Number
Virtual memory used:
Indicates the amount of
virtual memory that is
being used by the
process that
corresponds to the
configured
SERVICENAME.
MB
I/O data rate:
Indicates the rate at
which the process
mapped to the
configured
SERVICENAME is
reading and writing
bytes in I/O operations.
Kbytes/Sec
This value counts all I/O activity
generated by a process and includes file,
network and device I/Os.

M o n i t o r i n g W e b L o g i c A p p l i c a t i o n S e r v e r s
7
I/O data operations:
Indicates the rate at
which the process
corresponding to the
specified SERVICENAME
is issuing read and write
data to file, network
and device I/O
operations.
Operations/Se
c
I/O read data rate:
Indicates the rate at
which the process that
corresponds to the
configured SERVICE
NAME is reading data
from file, network and
device I/O operations.
Kbytes/Sec
I/O write data rate:
Indicates the rate at
which the process (that
corresponds to the
configured
SERVICENAME) is
writing data to file,
network and device I/O
operations.
Kbytes/Sec
Page fault rate:
Indicates the total rate
at which page faults are
occurring for the
threads of the process
that maps to the
configured
SERVICENAME.
Faults/Sec
A page fault occurs when a thread refers
to a virtual memory page that is not in
its working set in main memory. This
may not cause the page to be fetched
from disk if it is on the standby list and
hence already in main memory, or if it is
in use by another process with
whom the page is shared.

M o n i t o r i n g W e b L o g i c A p p l i c a t i o n S e r v e r s
8
Memory working set:
Indicates the current
size of the working set
of the process that
maps to the configured
SERVICENAME.
MB
The Working Set is the set of memory
pages touched recently by the threads in
the process. If free memory in the
computer is above a threshold, pages
are left in the Working Set of a process
even if they are not in use.
When free memory falls below a
threshold, pages are trimmed from
Working Sets. If they are needed they
will then be soft-faulted back into the
Working Set before leaving main
memory.
By tracking the working set of a process
over time, you can determine if the
application has a memory
leak or not.
2.1.2 The JVM Layer
A Java virtual machine (JVM), an implementation of the Java Virtual Machine Specification, interprets
compiled java binary code for a computer's processor (or "hardware platform") so that it can perform
a Java program's instructions. The Java Virtual Machine Specification defines an abstract -- rather
than a real -- machine or processor. The Specification specifies an instruction set, a set of registers, a
stack, a garbage heap, and a method area.
The tests associated with the JVM layer of WebLogic enables administrators to perform the following
functions:
Assess the effectiveness of the garbage collection activity performed on the JVM heap
Monitor WebLogic thread usage
Evaluate the performance of the BEA JRockit JVM

M o n i t o r i n g W e b L o g i c A p p l i c a t i o n S e r v e r s
9
Figure 2.3: The tests associated with the JVM layer
2.1.2.1 WebLogic Test
This test monitors the performance of a WebLogic server by tracking the rate of requests processed by
the server, the number of requests waiting for processing, and the percentage of heap usage by the
server. While the rate of requests processed and the number of queued requests can be indicative of
performance problems with the WebLogic server, the percentage heap usage can be indicative of the
reason for the problem.
The heap size determines how often, and for how long garbage collection is performed by the Java
Virtual Machine (JVM) that hosts the WebLogic server. The Java heap is a repository for live objects,
dead objects, and free memory. When the JVM runs out of memory in the heap, all execution in the
JVM stops while a Garbage Collection (GC) algorithm goes through memory and frees space that is no
longer required by an application. This is an obvious performance hit because users accessing a
WebLogic server must wait while GC happens. No server-side work can be done during GC.
Consequently, the heap size must be tuned to minimize the amount of time that the JVM spends in
garbage collection, while at the same time maximizing the number of clients that the server can
handle at a given time. For Java 2 environments, it is recommended that the heap size be set to be as
possible without causing the host system to "swap" pages to disk (use the output of eG Enterprise's
SystemTest to gauge the amount of swapping being performed by the operating system).
Purpose
To measure statistics pertaining to a WebLogic application server
Target of the
test
A WebLogic application server
Agent
deploying the
test
An internal agent

M o n i t o r i n g W e b L o g i c A p p l i c a t i o n S e r v e r s
10
Configurable
parameters for
the test
1. TEST PERIOD - How often should the test be executed
2. HOST – The IP address of the WebLogic server
3. PORT – The port number of the WebLogic server
4. SNMPPORT – The port number on which the WebLogic server is exposing its
SNMP MIB (relevant to WebLogic server 5.1 only). For version 6.0 and above,
enter “none” in this text box.
5. SNMPVERSION – By default, the eG agent supports SNMP version 1. Accordingly,
the default selection in the SNMPVERSION list is v1. However, if a different SNMP
framework is in use in your environment, say SNMP v2 or v3, then select the
corresponding option from this list.
6. SNMPCOMMUNITY – The SNMP community string to be used with the SNMP
query to access the WebLogic server’s MIB (relevant to WebLogic server 5.1
only). For version 6.0 and above, enter “none” in this text box.
7. USERNAME – This parameter appears only when v3 is selected as the
SNMPVERSION. SNMP version 3 (SNMPv3) is an extensible SNMP Framework
which supplements the SNMPv2 Framework, by additionally supporting message
security, access control, and remote SNMP configuration capabilities. To extract
performance statistics from the MIB using the highly secure SNMP v3 protocol,
the eG agent has to be configured with the required access privileges – in other
words, the eG agent should connect to the MIB using the credentials of a user
with access permissions to be MIB. Therefore, specify the name of such a user
against the USERNAME parameter.
8. AUTHPASS – Specify the password that corresponds to the above-mentioned
USERNAME. This parameter once again appears only if the SNMPVERSION
selected is v3.
9. CONFIRM PASSWORD – Confirm the AUTHPASS by retyping it here.
10. AUTHTYPE – This parameter too appears only if v3 is selected as the
SNMPVERSION. From the AUTHTYPE list box, choose the authentication
algorithm using which SNMP v3 converts the specified USERNAME and
PASSWORD into a 32-bit format to ensure security of SNMP transactions. You
can choose between the following options:
MD5 – Message Digest Algorithm
SHA – Secure Hash Algorithm
11. ENCRYPTFLAG – This flag appears only when v3 is selected as the
SNMPVERSION. By default, the eG agent does not encrypt SNMP requests.
Accordingly, the ENCRYPTFLAG is set to NO by default. To ensure that SNMP
requests sent by the eG agent are encrypted, select the YES option.

M o n i t o r i n g W e b L o g i c A p p l i c a t i o n S e r v e r s
11
12. ENCRYPTTYPE – If the ENCRYPTFLAG is set to YES, then you will have to
mention the encryption type by selecting an option from the ENCRYPTTYPE list.
SNMP v3 supports the following encryption types:
DES – Data Encryption Standard
AES – Advanced Encryption Standard
13. ENCRYPTPASSWORD – Specify the encryption password here.
14. CONFIRM PASSWORD – Confirm the encryption password by retyping it here.
15. USER – The admin user name of the WebLogic server being monitored.
16. PASSWORD – The password of the specified admin user
17. CONFIRM PASSWORD – Confirm the password by retyping it here.
18. ENCRYPTPASS - If the specified password needs to be encrypted, set the
ENCRYPTPASS flag to YES. Otherwise, set it to NO. By default, the YES option will
be selected.
Note:
If the USEWARFILE flag is set to No, then make sure that the ENCRYPTPASS flag
is also set to No.
19. SSL – Indicate whether the SSL (Secured Socket Layer) is to be used to connect
to the WebLogic server.
20. SERVER - The name of the specific server instance to be monitored for a
WebLogic server (the default value is "localhome")
21. URL – The URL to be accessed to collect metrics pertaining to the WebLogic
server. By default, this test connects to a managed WebLogic server and
attempts to obtain the metrics of interest by accessing the local Mbeans of the
server. This parameter can be changed to a value of
http://<adminserverIP>:<adminserverPort>. In this case, the test connects
to the WebLogic admin server to collect metrics pertaining to the managed
server (specified by the HOST and PORT). The URL setting provides the
administrator with the flexibility of determining the WebLogic monitoring
configuration to use.
Note:
If the admin server is to be used for collecting measures for all the managed
WebLogic servers, then it is mandatory that the egurkha war file is deployed to
the admin server, and it is up and running.
22. VERSION - The VERSION textbox indicates the version of the Weblogic server to
be managed. The default value is "none", in which case the test auto-discovers
the weblogic version. If the value of this parameter is not "none", the test uses
the value provided (e.g., 7.0) as the weblogic version (i.e., it does not auto-
discover the weblogic server version). This parameter has been added to
address cases when the eG agent is not able to discover the WebLogic server
version.

M o n i t o r i n g W e b L o g i c A p p l i c a t i o n S e r v e r s
12
23. USEWARFILE - This flag indicates whether/not monitoring is to be done using a
Web archive file deployed on the WebLogic server (in which case, HTTP/HTTPS
is used by the server to connect to the server). If this flag is set to No, the agent
directly connects to the WebLogic server using the T3 protocol (no other file
needs to be deployed on the WebLogic server for this to work). Note that the T3
protocol-based support is available for WebLogic servers ver.9 and ver. 10 only. Also, if the
USEWARFILE parameter is set to No, make sure that the ENCRYPTPASS
parameter is set to No as well.
When monitoring a WebLogic server deployed on a Unix platform particularly, if
the USEWARFILE parameter is set to No, you have to make sure that the eG
agent install user is added to the WebLogic users group.
24. WEBLOGICJARLOCATION - Specify the location of the WebLogic server's java
archive (Jar) file. If the USEWARFILE flag is set to No, then the weblogic.jar file
specified here is used to connect to the corresponding WebLogic server using
the T3 protocol. Note that the T3 protocol-based support is available for WebLogic servers
ver.9 and ver. 10 only.
25. TIMEOUT - Specify the duration (in seconds) within which the SNMP query
executed by this test should time out in the TIMEOUT text box. The default is 10
seconds.
Outputs of the
test
One set of results for each WebLogic application server.
Measurements
made by the
test
Measurement
Measurement
Unit
Interpretation
Throughput:
Rate of requests
processed by the
WebLogic server.
Reqs/Sec
A high request rate is an indicator of
server overload. By comparing the
request rates across application servers,
an operator can gauge the effectiveness
of load balancers (if any) that are in use.
Heap usage percent:
Percentage of heap
space currently in use
by the WebLogic server.
Percent
When the heap used percent reaches
100%, the server will start garbage
collection rather than processing
requests. Hence, a very high percentage
of heap usage (close to 100%) will
dramatically lower performance. In such
a case, consider increasing the heap size
to be used.
Requests queued:
Number of requests
currently waiting to be
processed by the
server.
Number
An increase in number of queued
requests can indicate a bottleneck on the
WebLogic server. One of the reasons for
this could be a bottleneck at the server
or due one or more of the applications
hosted on the server.
Total heap size:
Current heap size of the
WebLogic server's Java
Virtual Machine
MB
M o n i t o r i n g W e b L o g i c A p p l i c a t i o n S e r v e r s
13
Free heap size:
The currently unused
portion of the WebLogic
server's Java Virtual
Machine
MB
2.1.2.2 WebLogic Threads Test
A WebLogic server (prior to version 9.x) may be configured with different execute queues. By default,
a WebLogic server is configured with one thread queue that is used for execution by all applications
running on a server instance. A common way of improving a WebLogic server’s performance is by
configuring multiple thread execute queues. For eg., a mission-critical application can be assigned to a
specific thread execute queue, thereby guaranteeing it a fixed number of execute threads. Other, less
critical applications may compete for threads in the default execute queue. While using different
thread execute queues can significantly improve performance, if the thread execute queues are not
properly configured or maintained, this could result in less than optimal performance. For eg., you
may find that while one thread queue has a number of idle threads, applications in another thread
execute queue could be waiting for execute threads to become available. In case of the WebLogic
server prior to version 9.x, the WebLogic Threads test monitors the different thread execute queues
configured for the server.
From WebLogic server 9.x onwards however, execute queues are replaced by ‘work managers’.
Therefore, while monitoring WebLogic server 9.x or above, the WebLogic Threads test will report one
set of metrics for every ‘work manager’ configured for the server. Also, the test will take an additional
ThreadPool descriptor, which will report the extent of usage of the thread pool.
Purpose
To report performance statistics pertaining to the thread execute queues of a
WebLogic server instance
Target of the
test
A WebLogic application server
Agent
deploying the
test
An internal agent

M o n i t o r i n g W e b L o g i c A p p l i c a t i o n S e r v e r s
14
Configurable
parameters for
the test
1. TEST PERIOD - How often should the test be executed
2. HOST – The IP address of the WebLogic server
3. PORT – The port number of the WebLogic server
4. USER – The admin user name of the WebLogic server being monitored.
5. PASSWORD – The password of the specified admin user
6. CONFIRM PASSWORD – Confirm the password by retyping it here.
7. ENCRYPTPASS - If the specified password needs to be encrypted, set the
ENCRYPTPASS flag to YES. Otherwise, set it to NO. By default, the YES option will
be selected.
Note:
If the USEWARFILE flag is set to No, then make sure that the ENCRYPTPASS flag
is also set to No.
8. SSL – Indicate whether the SSL (Secured Socket Layer) is to be used to connect
to the WebLogic server.
9. SERVER - The name of the specific server instance to be monitored for a
WebLogic server (the default value is "localhome")
10. URL – The URL to be accessed to collect metrics pertaining to the WebLogic
server. By default, this test connects to a managed WebLogic server and
attempts to obtain the metrics of interest by accessing the local Mbeans of the
server. This parameter can be changed to a value of
http://<adminserverIP>:<adminserverPort>. In this case, the test connects
to the WebLogic admin server to collect metrics pertaining to the managed
server (specified by the HOST and PORT). The URL setting provides the
administrator with the flexibility of determining the WebLogic monitoring
configuration to use.
Note:
If the admin server is to be used for collecting measures for all the managed
WebLogic servers, then it is mandatory that the egurkha war file is deployed to
the admin server, and it is up and running.
11. VERSION - The VERSION textbox indicates the version of the Weblogic server
to be managed. The default value is "none", in which case the test auto-
discovers the weblogic version. If the value of this parameter is not "none", the
test uses the value provided (e.g., 7.0) as the weblogic version (i.e., it does not
auto-discover the weblogic server version). This parameter has been added to
address cases when the eG agent is not able to discover the WebLogic server
version.
12. USEWARFILE - This flag indicates whether/not monitoring is to be done using a
Web archive file deployed on the WebLogic server (in which case, HTTP/HTTPS
is used by the server to connect to the server). If this flag is set to No, the agent
directly connects to the WebLogic server using the T3 protocol (no other file
needs to be deployed on the WebLogic server for this to work). Note that the T3
protocol-based support is available for WebLogic servers ver.9 and ver. 10 only. Also, if the
USEWARFILE parameter is set to No, make sure that the ENCRYPTPASS
parameter is set to No as well.

M o n i t o r i n g W e b L o g i c A p p l i c a t i o n S e r v e r s
15
When monitoring a WebLogic server deployed on a Unix platform particularly, if
the USEWARFILE parameter is set to No, you have to make sure that the eG
agent install user is added to the WebLogic users group.
13. WEBLOGICJARLOCATION - Specify the location of the WebLogic server's java
archive (Jar) file. If the USEWARFILE flag is set to No, then the weblogic.jar file
specified here is used to connect to the corresponding WebLogic server using
the T3 protocol. Note that the T3 protocol-based support is available for WebLogic servers
ver.9 and ver. 10 only.
Outputs of the
test
One set of results for each thread execute queue of a WebLogic application server.
Measurements
made by the
test
Measurement
Measurement
Unit
Interpretation
Idle threads:
Indicates the number of
idle threads assigned to
a queue.
Number
If the value of this measure is close to 0,
it indicates a probable delay in the
processing of subsequent requests.
In case of WebLogic 9.x or higher, this measure
will be available for the ThreadPool descriptor
only, and not the individual work managers.
Thread utilization:
Indicates the
percentage of threads
utilized in a queue
Percent
When this value becomes 100 %, it
indicates a heavy load on the server and
that it cannot process further requests
until a few threads become idle.
Typically, this value should be less than
90%.
In case of WebLogic 9.x or higher, this measure
will be available for the ThreadPool descriptor
only, and not the individual work managers.
Pending requests:
Indicates the number of
requests waiting in the
queue
Number
A high value of this measure can result
in significant request processing delays.
Requests:
Indicates the number of
requests that are
processed by the server
per second
Reqs/sec
While a high value of this measure is
indicative of the good health of the
server, a low value indicates a
processing bottleneck.
2.1.2.3 WebLogic Rockit JVM Test
This test exposes runtime data about the JRockit Virtual Machine (VM) that is running the current
WebLogic Server instance.
The WebLogic Rockit JVM test will work only if the following conditions are fulfilled:
The Weblogic Server must be launched on the JRockit JVM
The managementapi.jar should be on the Weblogic server's startup classpath

M o n i t o r i n g W e b L o g i c A p p l i c a t i o n S e r v e r s
16
Purpose
To report runtime data about the JRockit Virtual Machine (VM) that is running the
current WebLogic Server instance
Target of the
test
A WebLogic application server
Agent
deploying the
test
An internal agent

M o n i t o r i n g W e b L o g i c A p p l i c a t i o n S e r v e r s
17
Configurable
parameters for
the test
1. TEST PERIOD - How often should the test be executed
2. HOST – The IP address of the WebLogic server
3. PORT – The port number of the WebLogic server
4. USER – The admin user name of the WebLogic server being monitored.
5. PASSWORD – The password of the specified admin user
6. CONFIRM PASSWORD – Confirm the password by retyping it here.
7. ENCRYPTPASS - If the specified password needs to be encrypted, set the
ENCRYPTPASS flag to YES. Otherwise, set it to NO. By default, the YES option will
be selected.
Note:
If the USEWARFILE flag is set to No, then make sure that the ENCRYPTPASS flag
is also set to No.
8. SSL – Indicate whether the SSL (Secured Socket Layer) is to be used to connect
to the WebLogic server.
9. SERVER - The name of the specific server instance to be monitored for a
WebLogic server (the default value is "localhome")
10. URL – The URL to be accessed to collect metrics pertaining to the WebLogic
server. By default, this test connects to a managed WebLogic server and
attempts to obtain the metrics of interest by accessing the local Mbeans of the
server. This parameter can be changed to a value of
http://<adminserverIP>:<adminserverPort>. In this case, the test connects
to the WebLogic admin server to collect metrics pertaining to the managed
server (specified by the HOST and PORT). The URL setting provides the
administrator with the flexibility of determining the WebLogic monitoring
configuration to use.
Note:
If the admin server is to be used for collecting measures for all the managed
WebLogic servers, then it is mandatory that the egurkha war file is deployed to
the admin server, and it is up and running.
11. VERSION - The VERSION textbox indicates the version of the Weblogic server to
be managed. The default value is "none", in which case the test auto-discovers
the weblogic version. If the value of this parameter is not "none", the test uses
the value provided (e.g., 7.0) as the weblogic version (i.e., it does not auto-
discover the weblogic server version). This parameter has been added to
address cases when the eG agent is not able to discover the WebLogic server
version.
12. USEWARFILE - This flag indicates whether/not monitoring is to be done using a
Web archive file deployed on the WebLogic server (in which case, HTTP/HTTPS
is used by the server to connect to the server). If this flag is set to No, the agent
directly connects to the WebLogic server using the T3 protocol (no other file
needs to be deployed on the WebLogic server for this to work). Note that the T3
protocol-based support is available for WebLogic servers ver.9 and ver. 10 only. Also, if the
USEWARFILE parameter is set to No, make sure that the ENCRYPTPASS
parameter is set to No as well.

M o n i t o r i n g W e b L o g i c A p p l i c a t i o n S e r v e r s
18
When monitoring a WebLogic server deployed on a Unix platform particularly, if
the USEWARFILE parameter is set to No, you have to make sure that the eG
agent install user is added to the WebLogic users group.
13. WEBLOGICJARLOCATION - Specify the location of the WebLogic server's java
archive (Jar) file. If the USEWARFILE flag is set to No, then the weblogic.jar file
specified here is used to connect to the corresponding WebLogic server using
the T3 protocol. Note that the T3 protocol-based support is available for WebLogic servers
ver.9 and ver. 10 only.
Outputs of the
test
One set of results for every WebLogic server being monitored.
Measurements
made by the
test
Measurement
Measurement
Unit
Interpretation
Total heap:
Indicates the amount of
memory currently
allocated to the Virtual
Machine's Java heap.
MB
Used heap:
Indicates the amount of
Java heap memory that
is currently being used
by the Virtual Machine.
MB
If the value of this measure increases
consistently, it is indicative of heavy load
on the Virtual Machine.
Free heap:
Indicates the amount
of Java heap memory
that is currently free in
the Virtual Machine.
MB
A very low value of this measure is a
cause of concern, as it indicates a heavy
utilization of the JVM heap. Consider
increasing the JVM heap size under such
circumstances.
Total nursery:
Indicates the amount of
memory that is
currently allocated to
the nursery.
MB
GC count:
Indicates the number of
garbage collection runs
that have occurred
since the Virtual
Machine was started.
Number
If GC has run too many times during a
short interval, it indicates that the JVM is
in dire need of free heap for normal
functioning. Moreover, frequent GC
executions could cause application
performance to deteriorate. In order to
avoid this, it is recommended that you
increase the heap size or alter the GC
frequency.
GC time:
Indicates the time that
the Virtual Machine has
spent on all garbage
collection runs since the
VM was started.
Secs
M o n i t o r i n g W e b L o g i c A p p l i c a t i o n S e r v e r s
19
Total load:
Indicates the
percentage of load that
the Virtual Machine is
placing on all
processors in the host
computer.
Percent
Percent heap used:
Indicates the
percentage of the total
Java heap memory that
is currently being used
by the Virtual Machine.
Percent
2.1.2.4 WebLogic Work Managers Test
The WebLogic Server allows you to configure how your application prioitizes the execution of its work
based on rules you define and by monitoring actual runtime performance. You define the rules and
constraints for your application by defining a Work Manager and applying it either globally to WebLogic
Server domain or to a specific application component.
This test monitors the requests to applications, and helps analyze how the work manager mapped to
each application is managing the requests. By closely observing the variations to the measures
reported by this test, you can quickly identify current/potential application slowdowns, and figure out
whether changes in the corresponding work manager specification can improve application
performance.
Purpose
Monitors the requests to applications, and helps analyze how the work manager
mapped to each application is managing the requests
Target of the
test
A WebLogic application server
Agent
deploying the
test
An internal agent

M o n i t o r i n g W e b L o g i c A p p l i c a t i o n S e r v e r s
20
Configurable
parameters for
the test
1. TEST PERIOD - How often should the test be executed
2. HOST – The IP address of the WebLogic server
3. PORT – The port number of the WebLogic server
4. USER – The admin user name of the WebLogic server being monitored.
5. PASSWORD – The password of the specified admin user
6. CONFIRM PASSWORD – Confirm the password by retyping it here.
7. ENCRYPTPASS - If the specified password needs to be encrypted, set the
ENCRYPTPASS flag to YES. Otherwise, set it to NO. By default, the YES option will
be selected.
Note:
If the USEWARFILE flag is set to No, then make sure that the ENCRYPTPASS flag
is also set to No.
8. SSL – Indicate whether the SSL (Secured Socket Layer) is to be used to connect
to the WebLogic server.
9. SERVER - The name of the specific server instance to be monitored for a
WebLogic server (the default value is "localhome")
10. URL – The URL to be accessed to collect metrics pertaining to the WebLogic
server. By default, this test connects to a managed WebLogic server and
attempts to obtain the metrics of interest by accessing the local Mbeans of the
server. This parameter can be changed to a value of
http://<adminserverIP>:<adminserverPort>. In this case, the test connects
to the WebLogic admin server to collect metrics pertaining to the managed
server (specified by the HOST and PORT). The URL setting provides the
administrator with the flexibility of determining the WebLogic monitoring
configuration to use.
Note:
If the admin server is to be used for collecting measures for all the managed
WebLogic servers, then it is mandatory that the egurkha war file is deployed to
the admin server, and it is up and running.
11. VERSION - The VERSION textbox indicates the version of the Weblogic server to
be managed. The default value is "none", in which case the test auto-discovers
the weblogic version. If the value of this parameter is not "none", the test uses
the value provided (e.g., 7.0) as the weblogic version (i.e., it does not auto-
discover the weblogic server version). This parameter has been added to
address cases when the eG agent is not able to discover the WebLogic server
version.
12. USEWARFILE - This flag indicates whether/not monitoring is to be done using a
Web archive file deployed on the WebLogic server (in which case, HTTP/HTTPS
is used by the server to connect to the server). If this flag is set to No, the agent
directly connects to the WebLogic server using the T3 protocol (no other file
needs to be deployed on the WebLogic server for this to work). Note that the T3
protocol-based support is available for WebLogic servers ver.9 and ver. 10 only. Also, if the
USEWARFILE parameter is set to No, make sure that the ENCRYPTPASS
parameter is set to No as well.

M o n i t o r i n g W e b L o g i c A p p l i c a t i o n S e r v e r s
21
13. When monitoring a WebLogic server deployed on a Unix platform particularly, if
the USEWARFILE parameter is set to No, you have to make sure that the eG
agent install user is added to the WebLogic users group.
14. WEBLOGICJARLOCATION - Specify the location of the WebLogic server's java
archive (Jar) file. If the USEWARFILE flag is set to No, then the weblogic.jar file
specified here is used to connect to the corresponding WebLogic server using
the T3 protocol. Note that the T3 protocol-based support is available for WebLogic servers
ver.9 and ver. 10 only.
Outputs of the
test
One set of results for every work manager on the WebLogic server being monitored.
Measurements
made by the
test
Measurement
Measurement
Unit
Interpretation
Completed requests:
Indicates the number of
requests that were
successfully serviced by
the work manager
mapped to this
application.
Number

M o n i t o r i n g W e b L o g i c A p p l i c a t i o n S e r v e r s
22
Pending requests:
Indicates the number of
requests to this
application that are
waiting in the queue.
Number
A large number of pending requests to
an application could indicate a
bottleneck in the request processing
ability of that application. If too many
applications on the server support long-
winding request queues, it can
ultimately overload the server, and
eventually choke its performance. It is
therefore essential to quickly isolate
those applications that could be
experiencing issues with request
processing, and then initiate the relevant
remedial action on them. Comparing the
value of this measure across applications
will enable you to accurately identify
which application has the maximum
number of pending requests. Once the
application is spotted, you may want to
observe the variations in the pending
requests count over time for that
application. If you find that the value of
this measure keeps increasing with time
for that application, further investigation
may be necessary to determine the
reasons for the same. One of the
possible reasons for this could be the
lack of sufficient threads. Incoming
requests to an application cannot be
processed if adequate threads are
unavailable; such requests will hence be
in queue until such time that the server
allocates more threads to the
application.

M o n i t o r i n g W e b L o g i c A p p l i c a t i o n S e r v e r s
23
As already stated, the WebLogic server
prioritizes work and allocates threads to
an application based on the rules and
constraints defined within the work
manager that is either defined globally
or mapped specifically to that
application. Therefore, in the event of a
slow down in the request processing rate
of an application, you can consider fine-
tuning its associated work manager
definition, so as to ensure the
uninterrupted processing of requests. A
typical work manager definition should
include one request class and one/more
thread constraints. A request class
expresses a scheduling guideline that
WebLogic Server uses to allocate
threads to requests. Request classes
help ensure that high priority work is
scheduled before less important work,
even if the high priority work is
submitted after the lower priority work.
A work manager can specify any one of
the below-mentioned request classes:
Fair share request class: This
specifies the average thread-use
time required to process requests.
For example, assume that WebLogic
Server is running two modules. The
Work Manager for ModuleA specifies
a fair-share-request-class of 80 and
the Work Manager for ModuleB
specifies a fair-share-request-class
of 20. During a period of sufficient
demand, with a steady stream of
requests for each module such that
the number requests exceed the
number of threads, WebLogic Server
will allocate 80% and 20% of the
thread-usage time to ModuleA and
ModuleB, respectively.

M o n i t o r i n g W e b L o g i c A p p l i c a t i o n S e r v e r s
24
Response time request class: This
type of request class specifies a
response time goal in milliseconds.
Response time goals are not applied
to individual requests. Instead,
WebLogic Server computes a
tolerable waiting time for requests
with that class by subtracting the
observed average thread use time
from the response time goal, and
schedules requests so that the
average wait for requests with the
class is proportional to its tolerable
waiting time.
Context request class: This type of
request class assigns request classes
to requests based on context
information, such as the current user
or the current user’s group.
A constraint defines minimum and
maximum numbers of threads allocated
to execute requests and the total
number of requests that can be queued
or executing before WebLogic Server
begins rejecting requests. You can define
the following types of constraints:
max-threads-constraint—This
constraint limits the number of
concurrent threads executing
requests from the constrained work
set. The default is unlimited. For
example, consider a constraint
defined with maximum threads of 10
and shared by 3 entry points. The
scheduling logic ensures that not
more than 10 threads are executing
requests from the three entry points
combined.
min-threads-constraint—This
constraint guarantees a number of
threads the server will allocate to
affected requests to avoid deadlocks.
The default is zero.

M o n i t o r i n g W e b L o g i c A p p l i c a t i o n S e r v e r s
25
A min-threads-constraint value
of one is useful, for example, for
a replication update request,
which is called synchronously
from a peer.
capacity—This constraint causes
the server to reject requests
only when it has reached its
capacity. The default is -1. Note
that the capacity includes all
requests, queued or executing,
from the constrained work set.
Work is rejected either when an
individual capacity threshold is
exceeded or if the global
capacity is exceeded. This
constraint is independent of the
global queue threshold.
Stuck threads:
Indicates the number of
threads that are
considered to be stuck
on the basis of any
thread constraints.
Number
WebLogic Server diagnoses a thread as
stuck if it is continually working (not
idle) for a set period of time. You can
tune a server's thread detection
behavior by changing the length of time
before a thread is diagnosed as stuck,
and by changing the frequency with
which the server checks for stuck
threads.
In response to stuck threads, you can
define a Stuck Thread Work Manager
component that can shut down the Work
Manager, move the application into
admin mode, or mark the server
instance as failed.
2.1.2.5 WebLogic Thread Pools Test
Starting from WebLogic server release 9.0, every server instance uses a self-tuned thread-pool. All
requests, whether related to system administration or application activity—are processed by this
single thread pool. The self-tuning thread pool would also adjust its pool size automatically based on
the throughput history that WLS gathers every 2 seconds and based on queue size.
This test monitors how the self-tuning thread pool is being used, and in the process reports whether
there are adequate idle threads in the pool to handle additional workload that may be imposed on the
WebLogic server. The test also turns the spot light on the request (if any) that is hogging threads, and
enables you to quickly capture a sudden/consistent increase in queue size, which in turn might impact
the pool size.
Purpose
Monitors how the self-tuning thread pool is being used, and in the process reports

M o n i t o r i n g W e b L o g i c A p p l i c a t i o n S e r v e r s
26
whether there are adequate idle threads in the pool to handle additional workload
that may be imposed on the WebLogic server
Target of the
test
A WebLogic application server
Agent
deploying the
test
An internal agent

M o n i t o r i n g W e b L o g i c A p p l i c a t i o n S e r v e r s
27
Configurable
parameters for
the test
1. TEST PERIOD - How often should the test be executed
2. HOST – The IP address of the WebLogic server
3. PORT – The port number of the WebLogic server
4. USER – The admin user name of the WebLogic server being monitored.
5. PASSWORD – The password of the specified admin user
6. CONFIRM PASSWORD – Confirm the password by retyping it here.
7. ENCRYPTPASS - If the specified password needs to be encrypted, set the
ENCRYPTPASS flag to YES. Otherwise, set it to NO. By default, the YES option will
be selected.
Note:
If the USEWARFILE flag is set to No, then make sure that the ENCRYPTPASS flag
is also set to No.
8. SSL – Indicate whether the SSL (Secured Socket Layer) is to be used to connect
to the WebLogic server.
9. SERVER - The name of the specific server instance to be monitored for a
WebLogic server (the default value is "localhome")
10. URL – The URL to be accessed to collect metrics pertaining to the WebLogic
server. By default, this test connects to a managed WebLogic server and
attempts to obtain the metrics of interest by accessing the local Mbeans of the
server. This parameter can be changed to a value of
http://<adminserverIP>:<adminserverPort>. In this case, the test connects
to the WebLogic admin server to collect metrics pertaining to the managed
server (specified by the HOST and PORT). The URL setting provides the
administrator with the flexibility of determining the WebLogic monitoring
configuration to use.
Note:
If the admin server is to be used for collecting measures for all the managed
WebLogic servers, then it is mandatory that the egurkha war file is deployed to
the admin server, and it is up and running.
11. VERSION - The VERSION textbox indicates the version of the Weblogic server to
be managed. The default value is "none", in which case the test auto-discovers
the weblogic version. If the value of this parameter is not "none", the test uses
the value provided (e.g., 7.0) as the weblogic version (i.e., it does not auto-
discover the weblogic server version). This parameter has been added to
address cases when the eG agent is not able to discover the WebLogic server
version.
12. USEWARFILE - This flag indicates whether/not monitoring is to be done using a
Web archive file deployed on the WebLogic server (in which case, HTTP/HTTPS
is used by the server to connect to the server). If this flag is set to No, the agent
directly connects to the WebLogic server using the T3 protocol (no other file
needs to be deployed on the WebLogic server for this to work). Note that the T3
protocol-based support is available for WebLogic servers ver.9 and ver. 10 only. Also, if the
USEWARFILE parameter is set to No, make sure that the ENCRYPTPASS
parameter is set to No as well.

M o n i t o r i n g W e b L o g i c A p p l i c a t i o n S e r v e r s
28
13. When monitoring a WebLogic server deployed on a Unix platform particularly, if
the USEWARFILE parameter is set to No, you have to make sure that the eG
agent install user is added to the WebLogic users group.
14. WEBLOGICJARLOCATION - Specify the location of the WebLogic server's java
archive (Jar) file. If the USEWARFILE flag is set to No, then the weblogic.jar file
specified here is used to connect to the corresponding WebLogic server using
the T3 protocol. Note that the T3 protocol-based support is available for WebLogic servers
ver.9 and ver. 10 only.
Outputs of the
test
One set of results for the self-tuning thread pool on the WebLogic server being
monitored.
Measurements
made by the
test
Measurement
Measurement
Unit
Interpretation
Active threads:
Indicates the total
number of active
threads in this pool.
Number
A high value for this measure is
indicative of a high load on the
applications deployed on the WebLogic
server.
This measure is also useful for
determining usage trends. For example,
it can show the time of day and the day
of the week in which you usually reach
peak thread count. In addition, the
creation of too many threads can result
in out of memory errors or thrashing. By
watching this metric, you can reduce
excessive memory consumption before
it’s too late.

M o n i t o r i n g W e b L o g i c A p p l i c a t i o n S e r v e r s
29
Hogging threads:
Indicates the number of
threads that are
currently hogged by a
request.
Number
Ideally, the value of this measure should
be low. A very high value indicates that
a request is using up too many threads.
Hogging threads will either be declared
as stuck after the configured timeout or
will return to the pool before that. The
self-tuning mechanism will backfill if
necessary.
WebLogic Server automatically detects
when a thread in a pool becomes
“stuck.” Because a stuck thread cannot
complete its current work or accept new
work, the server logs a message each
time it diagnoses a stuck thread.
WebLogic Server diagnoses a thread as
stuck if it is continually working (not
idle) for a set period of time. You can
tune a server’s thread detection
behavior by changing the length of time
before a thread is diagnosed as stuck,
and by changing the frequency with
which the server checks for stuck
threads. Although you can change the
criteria WebLogic Server uses to
determine whether a thread is stuck,
you cannot change the default behavior
of setting the “warning” and “critical”
health states when all threads in a
particular execute queue become stuck.
Idle threads:
Indicates the number of
idle threads (i.e., the
threads that are ready
to process a new job as
and when it arrives) in
the pool.
Number
A high value is desired for this measure.
Queue length:
Indicates the number of
pending requests in the
priority queue.
Number
This measure comprises of both the
internal system requests and requests
made by the user.
A low value is desired for this measure.
A high value or a sudden increase in this
value may indicate a sudden slowdown
in responsiveness or a performance
bottleneck.

M o n i t o r i n g W e b L o g i c A p p l i c a t i o n S e r v e r s
30
Standby threads:
Indicates the number of
threads that are
currently in the standby
pool.
Number
Threads that are not needed to handle
the present work load are designated as
standby and are added to the standby
pool. These threads are activated when
more threads are needed.
Throughput:
Indicates the number of
requests in the priority
queue that are
completed.
Number
The queue monitors throughput over
time and based on history, determines
whether to adjust the thread count or
not. For example, if historical throughput
statistics indicate that a higher thread
count increased throughput, the server
increases it. Similarly, if statistics
indicate that fewer threads did not
reduce throughput, the count will be
reduced.
Total threads:
Indicates the total
number of threads in
this pool.
Number
2.1.2.6 Tests Disabled by Default for the JVM Layer
The tests discussed above are enabled by default for a WebLogic server. Besides these tests, the eG
agent can be optionally configured to execute a few other tests on the WebLogic server’s JVM so as to
report critical statistics related to the Java transactions, classes loaded/unloaded, threads used, CPU
and memory resources used, garbage collection activity, uptime of the JVM, etc. These additional tests
are disabled by default for the WebLogic server. To enable one/more tests, go to the ENABLE / DISABLE
TESTS page using the menu sequence : Agents -> Tests -> Enable/Disable, pick WebLogic as the
Component type, Performance as the Test type, choose the tests from the DISABLED TESTS list, and click on
the >> button to move the tests to the ENABLED TESTS list. Finally, click the Update button.
These JVM tests have been discussed below.
When a user initiates a transaction to a Java-based web application, the transaction typically travels
via many Java components before completing execution and sending out a response to the user.
Figure 2.4 reveals some of the Java components that a web transaction/web request visits during its
journey.
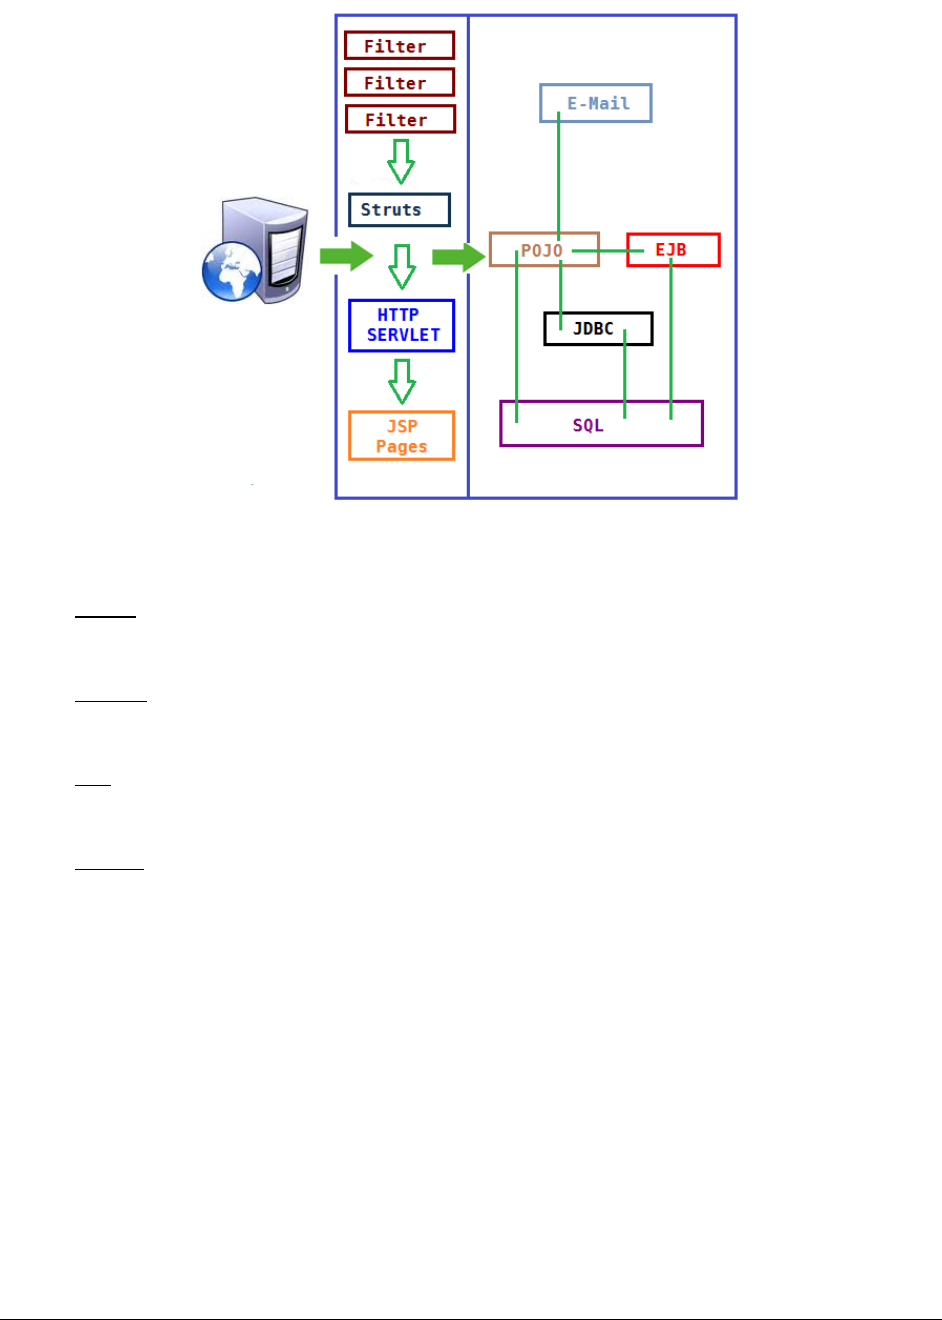
M o n i t o r i n g W e b L o g i c A p p l i c a t i o n S e r v e r s
31
Figure 2.4: The layers through which a Java transaction passes
The key Java components depicted by Figure 2.4 have been briefly described below:
Filter: A filter is a program that runs on the server before the servlet or JSP page with which
it is associated. All filters must implement javax.servlet.Filter. This interface comprises three
methods: init, doFilter, and destroy.
Servlet: A servlet acts as an intermediary between the client and the server. As servlet
modules run on the server, they can receive and respond to requests made by the client. If a
servlet is designed to handle HTTP requests, it is called an HTTP Servlet.
JSP: Java Server Pages are an extension to the Java servlet technology. A JSP is translated
into Java servlet before being run, and it processes HTTP requests and generates responses
like any servlet. Translation occurs the first time the application is run.
Struts: The Struts Framework is a standard for developing well-architected Web applications.
Based on the Model-View-Controller (MVC) design paradigm, it distinctly separates all three
levels (Model, View, and Control).
A delay experienced by any of the aforesaid Java components can adversely impact the total response
time of the transaction, thereby scarring the user experience with the web application. In addition,
delays in JDBC connectivity and slowdowns in SQL query executions (if the application interacts with a
database), bottlenecks in delivery of mails via the Java Mail API (if used), and any slow method calls,
can also cause insufferable damage to the 'user-perceived' health of a web application.
The challenge here for administrators is to not just isolate the slow transactions, but to also accurately
identify where the transaction slowed down and why - is it owing to inefficent JSPs? poorly written
servlets or struts? poor or the lack of any JDBC connectivity to the database? long running queries?
inefficient API calls? or delays in accessing the POJO methods? The eG JTM Monitor provides
administrators with answers to these questions!
With the help of the Java Transactions test, the eG JTM Monitor traces the route a configured web
transaction takes, and captures live the total responsiveness of the transaction and the response time
of each Java component it visits en route. This way, the solution proactively detects transaction
slowdowns, and also precisely points you to the Java components causing it - is it the Filters? JSPs?

M o n i t o r i n g W e b L o g i c A p p l i c a t i o n S e r v e r s
32
Servlets? Struts? JDBC? SQL query? Java Mail API? or the POJO? In addition to revealing where (i.e.,
at which Java component) a transaction slowed down, the solution also provides the following
intelligent insights, on demand, making root-cause identification and resolution easier:
A look at the methods that took too long to execute, thus leading you to those methods that
may have contributed to the slowdown;
Single-click access to each invocation of a chosen method, which provides pointers to when
and where a method spent longer than desired;
A quick glance at SQL queries and Java errors that may have impacted the responsiveness of
the transaction;
Using these interesting pointers provided by the eG JTM Monitor, administrators can diagnose the root-
cause of transaction slowdowns within minutes, rapidly plug the holes, and thus ensure that their
critical web applications perform at peak capacity at all times!
Before attempting to monitor Java transactions using the eG JTM Monitor, the following configurations
will have to be performed:
1. In the <EG_INSTALL_DIR>\lib directory (on Windows; on Unix, this will be /opt/egurkha/lib) of the eG
agent, you will find the following files:
eg_jtm.jar
aspectjrt.jar
aspectjweaver.jar
jtmConn.props
jtmLogging.props
jtmOther.props
2. Login to the system hosting the Java application to be monitored.
3. If the eG agent will be 'remotely monitoring' the target Java application (i.e., if the Java
application is to be monitored in an 'agentless manner'), then, copy all the files mentioned above
from the <EG_INSTALL_DIR>\lib directory (on Windows; on Unix, this will be /opt/egurkha/lib) of the eG
agent to any location on the Java application host.
4. Then, proceed to edit the start-up script of the Java application being monitored, and append the
following lines to it:
set JTM_HOME=<<PATH OF THE LOCAL FOLDER CONTAINING THE JAR FILES AND PROPERTY FILES
LISTED ABOVE>>
"-javaagent:%JTM_HOME%\aspectjweaver.jar"
"-DEG_JTM_HOME=%JTM_HOME%"
Note that the above lines will change based on the operating system and the web/web application server being
monitored.
Then, add the eg_jtm.jar, aspectjrt.jar, and aspectjweaver.jar files to the CLASSPATH of the Java
application being monitored.
Finally, save the file. Once this is done, then, the next time the Java application starts, the eG JTM
Monitor scans the web requests to the application for configured URL patterns. When a match is
found, the eG JTM Monitor collects the desired metrics and stores them in memory.
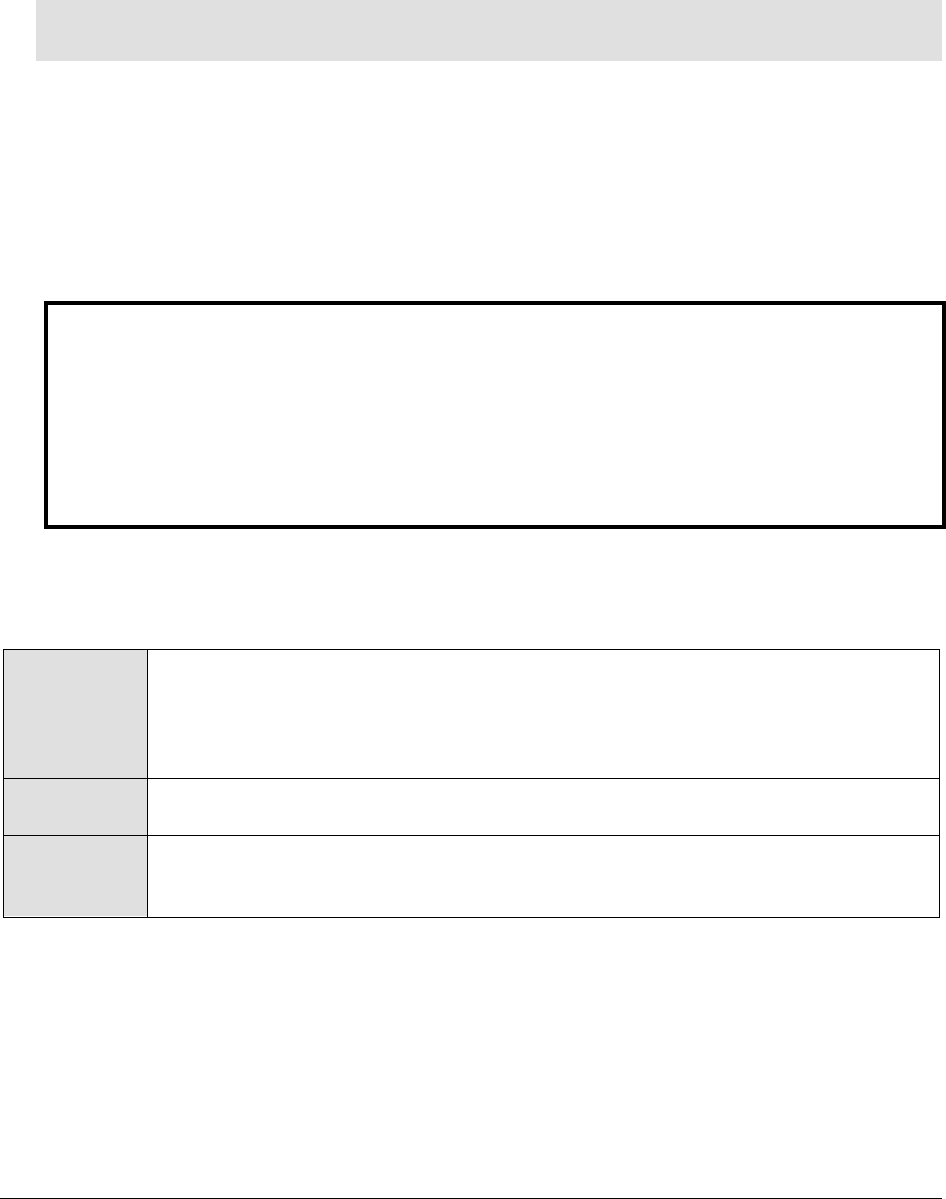
M o n i t o r i n g W e b L o g i c A p p l i c a t i o n S e r v e r s
33
Then, every time the eG agent runs the Java Transactions test, the agent will poll the eG JTM Monitor
(on the target application) for the required metrics, extract the same from the application's
memory, and report them to the eG manager.
5. Next, edit the jtmConn.props file. You will find the following lines in the file:
#Contains the connection properties of eGurkha Java Transaction Monitor
JTM_Port=13631
Designated_Agent=
By default, the JTM_Port parameter is set to 13631. If the Java application being monitored listens
on a different JTM port, then specify the same here. In this case, when managing a Java Application
using the eG administrative interface, specify the JTM_Port that you set in the jtmConn.props file as
the Port of the Java application.
Also, against the Designated_Agent parameter, specify the IP address of the eG agent which will poll
the eG JTM Monitor for metrics. If no IP address is provided here, then the eG JTM Monitor will treat
the host from which the very first 'measure request' comes in as the Designated_Agent.
6. Finally, save the jtmConn.props file.
Then, proceed to configure the Java Transactions test as discussed below.
Purpose
Traces the route a configured web transaction takes, and captures live the total
responsiveness of the transaction and the response time of each component it visits
en route. This way, the solution proactively detects transaction slowdowns, and also
precisely points you to the Java component causing it - is it the Filters? JSPs?
Servlets? Struts? JDBC? SQL query? Java Mail API? or the POJO?
Target of the
test
A Java application/web application server
Agent
deploying the
test
An internal/remote agent
Note:
In case a specific Designated_Agent is not provided, and the eG JTM Monitor treats the host from
which the very first 'measure request' comes in as the Designated_Agent, then if such a
Designated_Agent is stopped or uninstalled for any reason, the eG JTM Monitor will wait for a
maximum of 10 measure periods for that 'deemed' Designated_Agent to request for metrics. If
no requests come in for 10 consecutive measure periods, then the eG JTM Monitor will begin
responding to 'measure requests' coming in from any other eG agent.

M o n i t o r i n g W e b L o g i c A p p l i c a t i o n S e r v e r s
34
Configurable
parameters for
the test
1. TEST PERIOD - How often should the test be executed
2. HOST - The host for which the test is to be configured
3. PORT - The port number at which the specified HOST listens; if Java Transaction
Monitoring is enabled for the target Java application, then the JTM PORT has to
be specified here
4. JTM PORT – Specify the port number configured as the JTM_Port in the
jtmConn.props file described in the procedure outlined above.
5. URL PATTERNS - Provide a comma-separated list of the URL patterns of web
requests/transactions to be monitored. The format of your specification should
be as follows: <DisplayName_of_Pattern>:<Transaction_Pattern>. For instance,
your specification can be: login:*log*,ALL:*,pay:*pay*
6. FILTERED URL PATTERNS - Provide a comma-separated list of the URL patterns
of transactions/web requests to be excluded from the monitoring scope of this
test. For example, *blog*,*paycheque*
7. SLOW URL THRESHOLD - The Slow transactions measure of this test will report
the number of transactions (of the configured patterns) for which the response
time is higher than the value (in seconds) specified here.
8. METHOD EXEC CUTOFF - The detailed diagnosis of the Slow transactions
measure allows you to drill down to a URL tree, where the methods invoked by a
chosen transaction are listed in the descending order of their execution time. By
configuring an execution duration (in seconds) here, you can have the URL Tree
list only those methods that have been executing for a duration greater the
specified value. For instance, if you specify 5 here, the URL tree for a
transaction will list only those methods that have been executing for over 5
seconds, thus shedding light on the slow method calls alone.
9. MAX SLOW URLS PER TEST PERIOD - Specify the number of top-n transactions
(of a configured pattern) that should be listed in the detailed diagnosis of the
Slow transactions measure, every time the test runs. By default, this is set to
10, indicating that the detailed diagnosis of the Slow transactions measure will
by default list the top-10 transactions, arranged in the descending order of their
response times.
10. MAX ERROR URLS PER TEST PERIOD - Specify the number of top-n transactions
(of a configured pattern) that should be listed in the detailed diagnosis of the
Error transactions measure, every time the test runs. By default, this is set to
10, indicating that the detailed diagnosis of the Error transactions measure will
by default list the top-10 transactions, in terms of the number of errors they
encountered.

M o n i t o r i n g W e b L o g i c A p p l i c a t i o n S e r v e r s
35
11. DD FREQUENCY - Refers to the frequency with which detailed
diagnosis measures are to be generated for this test. The default is 1:1. This
indicates that, by default, detailed measures will be generated every time this
test runs, and also every time the test detects a problem. You can modify this
frequency, if you so desire. Also, if you intend to disable the detailed diagnosis
capability for this test, you can do so by specifying none against DD
FREQUENCY.
12. DETAILED DIAGNOSIS - To make diagnosis more efficient and accurate, the eG
Enterprise suite embeds an optional detailed diagnostic capability. With this
capability, the eG agents can be configured to run detailed, more elaborate tests
as and when specific problems are detected. To enable the detailed diagnosis
capability of this test for a particular server, choose the On option. To disable
the capability, click on the Off option.
The option to selectively enable/disable the detailed diagnosis capability will be
available only if the following conditions are fulfilled:
The eG manager license should allow the detailed diagnosis capability
Both the normal and abnormal frequencies configured for the detailed
diagnosis measures should not be 0.
Outputs of the
test
One set of results for each configured URL pattern
Measurements
made by the
test
Measurement
Measurement
Unit
Interpretation
Total transactions:
Indicates the total number of
transactions of this pattern that
the target application handled
during the last measurement
period.
Number
Avg. response time:
Indicates the average time taken
by the transactions of this
pattern to complete execution.
Secs
Compare the value of this
measure across patterns to
isolate the type of transactions
that were taking too long to
execute.
You can then take a look at the
values of the other measures to
figure out where the transaction
is spending too much time.

M o n i t o r i n g W e b L o g i c A p p l i c a t i o n S e r v e r s
36
Slow transactions:
Indicates the number of
transactions of this pattern that
were slow during the last
measurement period.
Number
This measure will report the
number of transactions with a
response time higher than the
configured SLOW URL
THRESHOLD.
A high value is a cause for
concern, as too many slow
transactions to an application can
significantly damage the user
experience with that application.
Use the detailed diagnosis of this
measure to know which
transactions are slow.
Slow transactions response
time:
Indicates the average time taken
by the slow transactions of this
pattern to execute.
Secs
Error transactions:
Indicates the number of
transactions of this pattern that
experienced errors during the
last measurement period.
Number
A high value is a cause for
concern, as too many error-prone
transactions to an application can
significantly damage the user
experience with that application.
Use the detailed diagnosis of this
measure to isolate the error
transactions.
Error transactions response
time:
Indicates the average duration
for which the transactions of this
pattern were processed before
an error condition was detected.
Secs
Filters:
Indicates the number of filters
that were accessed by the
transactions of this pattern
during the last measurement
period.
Number
A filter is a program that runs on
the server before the servlet or
JSP page with which it is
associated.

M o n i t o r i n g W e b L o g i c A p p l i c a t i o n S e r v e r s
37
Filters response time:
Indicates the average time spent
by the transactions of this
pattern at the Filters layer.
Secs
Typically, the init, doFilter, and
destroy methods are called at
the Filters layer. Issues in these
method invocations can increase
the time spent by a transaction in
the Filters Java component.
Compare the value of this
measure across patterns to
identify the transaction pattern
that spent the maximum time
with the Filters component.
If one/more transactions of a
pattern are found to be slow,
then, you can compare the value
of this measure with the other
response time values reported by
this test to determine where the
slowdown actually occurred - in
the filters, in JSPs, in servlets, in
struts, in exception handling,
when executing JDBC/SQL
queries, when sending Java mails,
or when accessing POJOs.
JSPs accessed:
Indicates the number of JSPs
accessed by the transactions of
this pattern during the last
measurement period.
Number
JSPs response time:
Indicates the average time spent
by the transactions of this
pattern at the JSP layer.
Secs
Compare the value of this
measure across patterns to
identify the transaction pattern
that spent the maximum time in
JSPs.
If one/more transactions of a
pattern are found to be slow,
then, you can compare the value
of this measure with the other
response time values reported by
this test to determine where the
slowdown actually occurred - in
the filters, in JSPs, in servlets, in
struts, in exception handling,
when executing JDBC/SQL
queries, when sending Java mails,
or when accessing POJOs..

M o n i t o r i n g W e b L o g i c A p p l i c a t i o n S e r v e r s
38
HTTP Servlets Accessed:
Indicates the number of HTTP
servlets that were accessed by
the transactions of this pattern
during the last measurement
period.
Number
HTTP servlets response time:
Indicates the average time taken
by the HTTP servlets for
processing the HTTP requests of
this pattern.
Secs
Badly written servlets can take
too long to execute, and can
hence obstruct the smooth
execution of the dependent
transactions.
By comparing the value of this
measure across patterns, you can
figure out which transaction
pattern is spending the maximum
time in Servlets.
If one/more transactions of a
pattern are found to be slow,
then, you can compare the value
of this measure with the other
response time values reported by
this test to determine where the
slowdown actually occurred - in
the filters, in JSPs, in servlets, in
struts, in exception handling,
when executing JDBC/SQL
queries, when sending Java mails,
or when accessing POJOs.
Generic servlets accessed:
Indicates the number of generic
(non-HTTP) servlets that were
accessed by the transactions of
this pattern during the last
measurement period.
Number

M o n i t o r i n g W e b L o g i c A p p l i c a t i o n S e r v e r s
39
Generic servlets response
time:
Indicates the average time taken
by the generic (non-HTTP)
servlets for processing
transactions of this pattern.
Secs
Badly written servlets can take
too long to execute, and can
hence obstruct the smooth
execution of the dependent
transactions.
By comparing the value of this
measure across patterns, you can
figure out which transaction
pattern is spending the maximum
time in Servlets.
If one/more transactions of a
pattern are found to be slow,
then, you can compare the value
of this measure with the other
response time values reported by
this test to determine where the
slowdown actually occurred - in
the filters, in JSPs, in servlets, in
struts, in exception handling,
when executing JDBC/SQL
queries, when sending Java mails,
or when accessing POJOs.
JDBC queries:
Indicates the number of JDBC
statements that were executed
by the transactions of this
pattern during the last
measurement period.
Number
The methods captured by the eG
JTM Monitor from the Java class for
the JDBC sub-component include:
Commit(), rollback(..),
close(),GetResultSet(),
executeBatch(), cancel(),
connect(String,
Properties),
getConnection(..),getPool
edConnection(..)
JDBC response time:
Indicates the average time taken
by the transactions of this
pattern to execute JDBC
statements.
Secs
By comparing the value of this
measure across patterns, you can
figure out which transaction
pattern is taking the most time to
execute JDBC queries.
If one/more transactions of a
pattern are found to be slow,
then, you can compare the value
of this measure with the other
response time values reported by
this test to determine where the
slowdown actually occurred - in
the filters, in JSPs, in servlets, in
struts, in exception handling,
when executing JDBC/SQL
queries, when sending Java mails,
or when accessing POJOs.

M o n i t o r i n g W e b L o g i c A p p l i c a t i o n S e r v e r s
40
SQL statements executed:
Indicates the number of SQL
queries executed by the
transactions of this pattern
during the last measurement
period.
Number
SQL statement time avg.:
Indicates the average time taken
by the transactions of this
pattern to execute SQL queries.
Secs
Inefficient queries can take too
long to execute on the database,
thereby significantly delaying the
responsiveness of the dependent
transactions. To know which
transactions have been most
impacted by such queries,
compare the value of this
measure across the transaction
patterns.
If one/more transactions of a
pattern are found to be slow,
then, you can compare the value
of this measure with the other
response time values reported by
this test to determine where the
slowdown actually occurred - at
the filters layer, JSPs layer,
servlets layer, struts layer, in
exception handling, when
executing JDBC/SQL queries,
when sending Java mails, or
when accessing POJOs.
Exceptions seen:
Indicates the number of
exceptions encountered by the
transactions of this pattern
during the last measurement
period.
Number
Ideally, the value of this measure
should be 0.
Exceptions response time:
Indicates the average time which
the transactions of this pattern
spent in handling exceptions.
Secs
If one/more transactions of a
pattern are found to be slow,
then, you can compare the value
of this measure with the other
response time values reported by
this test to determine where the
slowdown actually occurred - at
the filters layer, JSPs layer,
servlets layer, struts layer, in
exception handling, when
executing JDBC/SQL queries,
when sending Java mails, or
when accessing POJOs.

M o n i t o r i n g W e b L o g i c A p p l i c a t i o n S e r v e r s
41
Struts accessed:
Indicates the number of struts
accessed by the transactions of
this pattern during the last
meaurement period.
Number
The Struts framework is a
standard for developing well-
architected Web applications.
Struts response time:
Indicates the average time spent
by the transactions of this
pattern at the Struts layer.
Secs
If you compare the value of this
measure across patterns, you can
figure out which transaction
pattern spent the maximum time
in Struts.
If one/more transactions of a
pattern are found to be slow,
then, you can compare the value
of this measure with the other
response time values reported by
this test to determine where the
slowdown actually occurred - in
the filters, in JSPs, in servlets, in
struts, in exception handling,
when executing JDBC/SQL
queries, when sending Java mails,
or when accessing POJOs.
Java mails:
Indicates the number of mails
sent by the transactions of this
pattern during the last
measurement period, using the
Java mail API.
Number
The eG JTM Monitor captures any
mail that has been sent from the
monitored application using Java
Mail API. Mails sent using other
APIs are ignored by the eG JTM
Monitor.
Java mail API time:
Indicates the average time taken
by the transactions of this
pattern to send mails using the
Java mail API.
Secs
If one/more transactions of a
pattern are found to be slow,
then, you can compare the value
of this measure with the other
response time values reported by
this test to determine where the
slowdown actually occurred - in
the filters, in JSPs, in servlets, in
struts, in exception handling,
when executing JDBC/SQL
queries, when sending Java mails,
or when accessing POJOs.

M o n i t o r i n g W e b L o g i c A p p l i c a t i o n S e r v e r s
42
POJOs:
Indicates the number of
transactions of this pattern that
accessed POJOs during the last
measurement period.
Number
Plain Old Java Object (POJO)
refers to a 'generic' method in
JAVA Language. All methods that
are not covered by any of the
Java components (eg., JSPs,
Struts, Servlets, Filters,
Exceptions, Queries, etc.)
discussed above will be
automatically included under
POJO.
When reporting the number of
POJO methods, the eG agent will
consider only those methods with
a response time value that is
higher than the threshold limit
configured against the METHOD
EXEC CUTOFF parameter.
POJO avg. access time:
Indicates the average time taken
by the transactions of this
pattern to access POJOs.
Secs
If one/more transactions of a
pattern are found to be slow,
then, you can compare the value
of this measure with the other
response time values reported by
this test to determine where the
slowdown actually occurred - in
the filters, in JSPs, in servlets, in
struts, in exception handling,
when executing JDBC/SQL
queries, when sending Java mails,
or when accessing POJOs.
The detailed diagnosis of the Slow transactions measure lists the top-10 (by default) transactions of a
configured pattern that have violated the response time threshold set using the SLOW URL
THRESHOLD parameter of this test. Against each transaction, the date/time at which the transaction
was initiated/requested will be displayed. Besides the request date/time, the remote host from which
the transaction request was received and the total response time of the transaction will also be
reported. This response time is the sum total of the response times of each of the top methods (in
terms of time taken for execution) invoked by that transaction. To compute this sum total, the test
considers only those methods with a response time value that is higher than the threshold limit
configured against the METHOD EXEC CUTOFF parameter.
In the detailed diagnosis, the transactions will typically be arranged in the descending order of the
total response time; this way, you would be able to easily spot the slowest transaction. To know what
caused the transaction to be slow, you can take a look at the SUBCOMPONENT DETAILS column of the
detailed diagnosis. Here, the time spent by the transaction in each of the Java components (FILTER,
STRUTS, SERVLETS, JSPS, POJOS, SQL, JDBC, etc.) will be listed, thus leading you to the exact Java component
where the slowdown occurred.
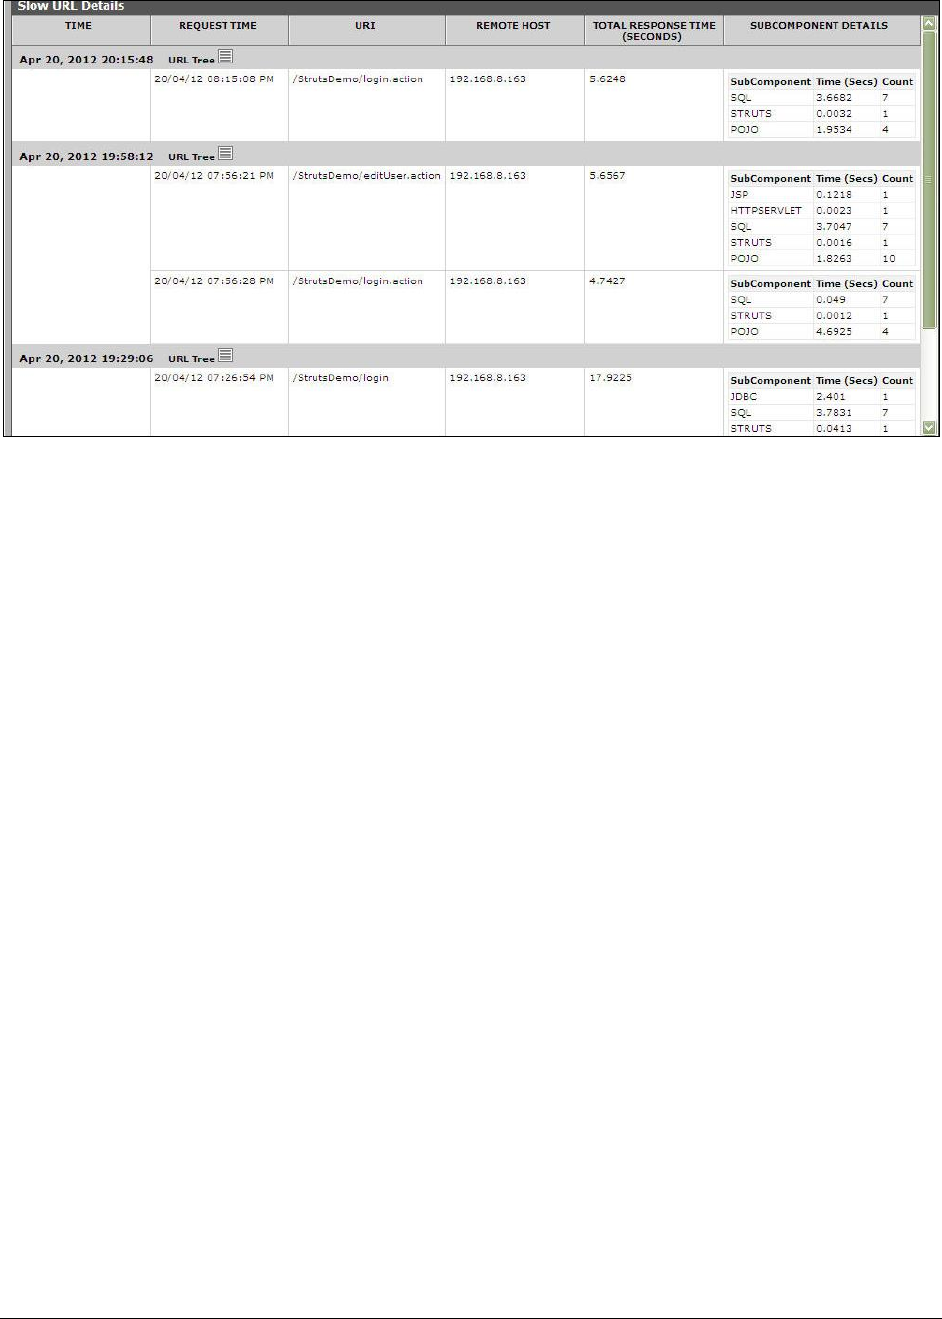
M o n i t o r i n g W e b L o g i c A p p l i c a t i o n S e r v e r s
43
Figure 2.5: The detailed diagnosis of the Slow transactions measure
You can even perform detailed method-level analysis to isolate the methods taking too long to
execute. For this, click on the URL Tree link. Figure 2.6 will then appear. In the left panel of Figure 2.6,
you will find the list of transactions that match a configured pattern; these transactions will be sorted
in the descending order of their Total Response Time (by default). This is indicated by the Total
Response Time option chosen by default from the Sort by list in Figure 2.6. If you select a transaction
from the left panel, an At-A-Glance tab page will open by default in the right panel, providing quick, yet
deep insights into the performance of the chosen transaction and the reasons for its slowness. This
tab page begins by displaying the URL of the chosen transaction, the total Response time of the
transaction, the time at which the transaction was last requested, and the Remote Host from which the
request was received.
If the Response time appears to be very high, then you can take a look at the Method Level Breakup
section to figure out which method called by which Java component (such as FILTER, STRUTS, SERVLETS,
JSPS, POJOS, SQL, JDBC, etc.) could have caused the slowdown. This section provides a horizontal bar
graph, which reveals the percentage of time for which the chosen transaction spent executing each of
the top methods (in terms of execution time) invoked by it. The legend below clearly indicates the top
methods and the layer/sub-component that invoked each method. Against every method, the number
of times that method was invoked in the Measurement Time, the Duration (in Secs) for which the method
executed, and the percentage of the total execution time of the transaction for which the method was
in execution will be displayed, thus quickly pointing you to those methods that may have contributed
to the slowdown. The methods displayed here and featured in the bar graph depend upon the METHOD
EXEC CUTOFF configuration of this test - in other words, only those methods with an execution
duration that exceeds the threshold limit configured against METHOD EXEC CUTOFF will be displayed
in the Method Level Breakup section.
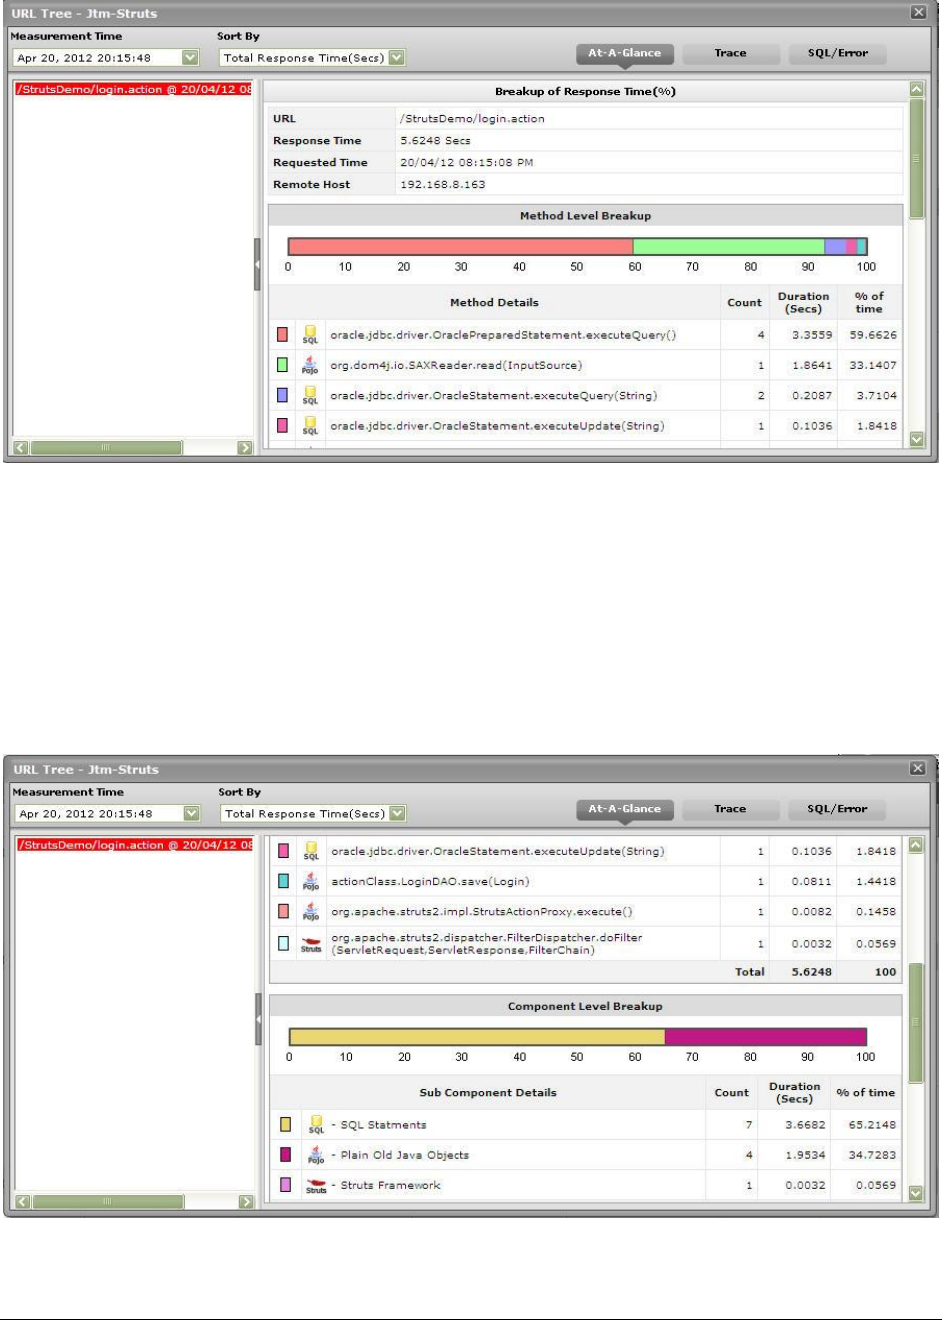
M o n i t o r i n g W e b L o g i c A p p l i c a t i o n S e r v e r s
44
Figure 2.6: The Method Level Breakup section in the At-A-Glance tab page
While the Method Level Breakup section provides method-level insights into responsiveness, for a sub-
component or layer level breakup of responsiveness scroll down the At-A-Glance tab to view the
Component Level Breakup section (see Figure 2.7). Using this horizontal bar graph, you can quickly tell
where - i.e., in which Java component - the transaction spent the maximum time. A quick glance at
the graph's legend will reveal the Java components the transaction visited, the number of methods
invoked by Java component, the Duration (Secs) for which the transaction was processed by the Java
component, and what Percentage of the total transaction response time was spent in the Java
component.
Figure 2.7: The Component Level Breakup section in the At-A-Glance tab page

M o n i t o r i n g W e b L o g i c A p p l i c a t i o n S e r v e r s
45
Besides Java methods, where the target Java application interacts with the database, long-running
SQL queries can also contribute to the poor responsiveness of a transaction. You can use the At-A-
Glance tab page to determine whether the transaction interacts with the database or not, and if so,
how healthy that interaction is. For this, scroll down the At-A-Glance tab page.
Figure 2.8: Query Details in the At-A-Glance tab page
Upon scrolling, you will find query details below the Component Level Breakup section. All the SQL queries
that the chosen transaction executes on the backend database will be listed here in the descending
order of their Duration. Corresponding to each query, you will be able to view the number of times that
query was executed, the Duration for which it executed, and what percentage of the total transaction
response time was spent in executing that query. A quick look at this tabulation would suffice to
identify the query which executed for an abnormally long time on the database, causing the
transaction's responsiveness to suffer. For a detailed query description, click on the query. Figure 2.9
will then pop up displaying the complete query and its execution duration.
Figure 2.9: Detailed description of the query clicked on
M o n i t o r i n g W e b L o g i c A p p l i c a t i o n S e r v e r s
46
This way, the At-A-Glance tab page allows you to analyze, at-a-glance, all the factors that can influence
transaction response time - be it Java methods, Java components, and SQL queries - and enables you
to quickly diagnose the source of a transaction slowdown. If, for instance, you figure out that a
particular Java method is responsible for the slowdown, you can zoom into the performance of the
'suspect method' by clicking on that method in the Method Level Breakup section of the At-A-Glance tab
page. This will automatically lead you to the Trace tab page, where all invocations of the chosen
method will be highlighted (see Figure 2.10).
Figure 2.10: The Trace tab page displaying all invocations of the method chosen from the Method Level Breakup
section
Typically, clicking on the Trace tab page will list all the methods invoked by the chosen transaction,
starting with the very first method. Methods and sub-methods (a method invoked within a method)
are arranged in a tree-structure, which can be expanded or collapsed at will. To view the sub-methods
within a method, click on the arrow icon that precedes that method in the Trace tab page. Likewise, to
collapse a tree, click once again on the arrow icon. Using the tree-structure, you can easily trace the
sequence in which methods are invoked by a transaction.
If a method is chosen for analysis from the Method Level Breakup section of the At-A-Glance tab page, the
Trace tab page will automatically bring your attention to all invocations of that method by highlighting
them (as shown by Figure 2.10). Likewise, if a Java component is clicked in the Component Level
Breakup section of the At-A-Glance section, the Trace tab page will automatically appear, displaying all
the methods invoked from the chosen Java component (as shown by Figure 2.11).
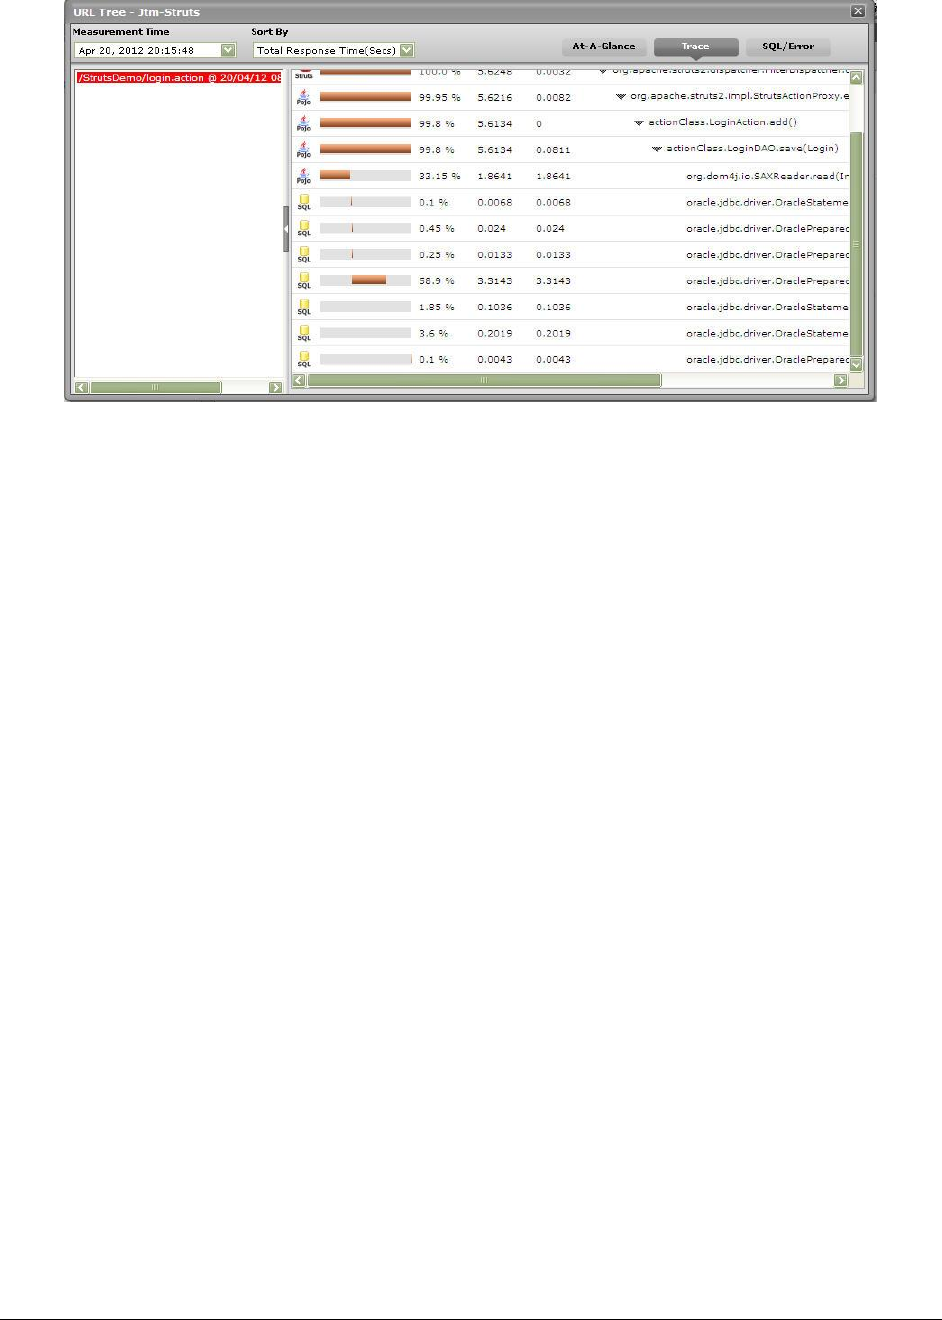
M o n i t o r i n g W e b L o g i c A p p l i c a t i o n S e r v e r s
47
Figure 2.11: The Trace tab page displaying all methods invoked at the Java layer/sub-component chosen from the
Component Level Breakup section
For every method, the Trace tab page displays a Request Processing bar, which will accurately indicate
when, in the sequence of method invocations, the said method began execution and when it ended;
with the help of this progress bar, you will be able to fairly judge the duration of the method, and also
quickly tell whether any methods were called prior to the method in question. In addition, the Trace tab
page will also display the time taken for a method to execute (Method Execution Time) and the
percentage of the time the transaction spent in executing that method. The most time-consuming
methods can thus be instantly isolated.
The Trace tab page also displays the Total Execution Time for each method - this value will be the same
as the Method Execution Time for 'stand-alone' methods - i.e., methods without any sub-methods. In the
case of methods with sub-methods however, the Total Execution Time will be the sum total of the Method
Execution Time of each sub-method invoked within. This is because, a 'parent' method completes
execution only when all its child/sub-methods finish executing.
With the help of the Trace tab page therefore, you can accurately trace the method that takes the
longest to execute, when that method began execution, and which 'parent method' (if any) invoked
the method.
Next, click on the SQL/Errors tab page. This tab page lists all the SQL queries the transaction executes
on its backend database, and/or all the errors detected in the transaction's Java code. The query list
(see Figure 2.12) is typically arranged in the descending order of the query execution Duration, and
thus leads you to the long-running queries right away! You can even scrutinize the time-consuming
query on-the-fly, and suggest improvements to your administrator instantly.
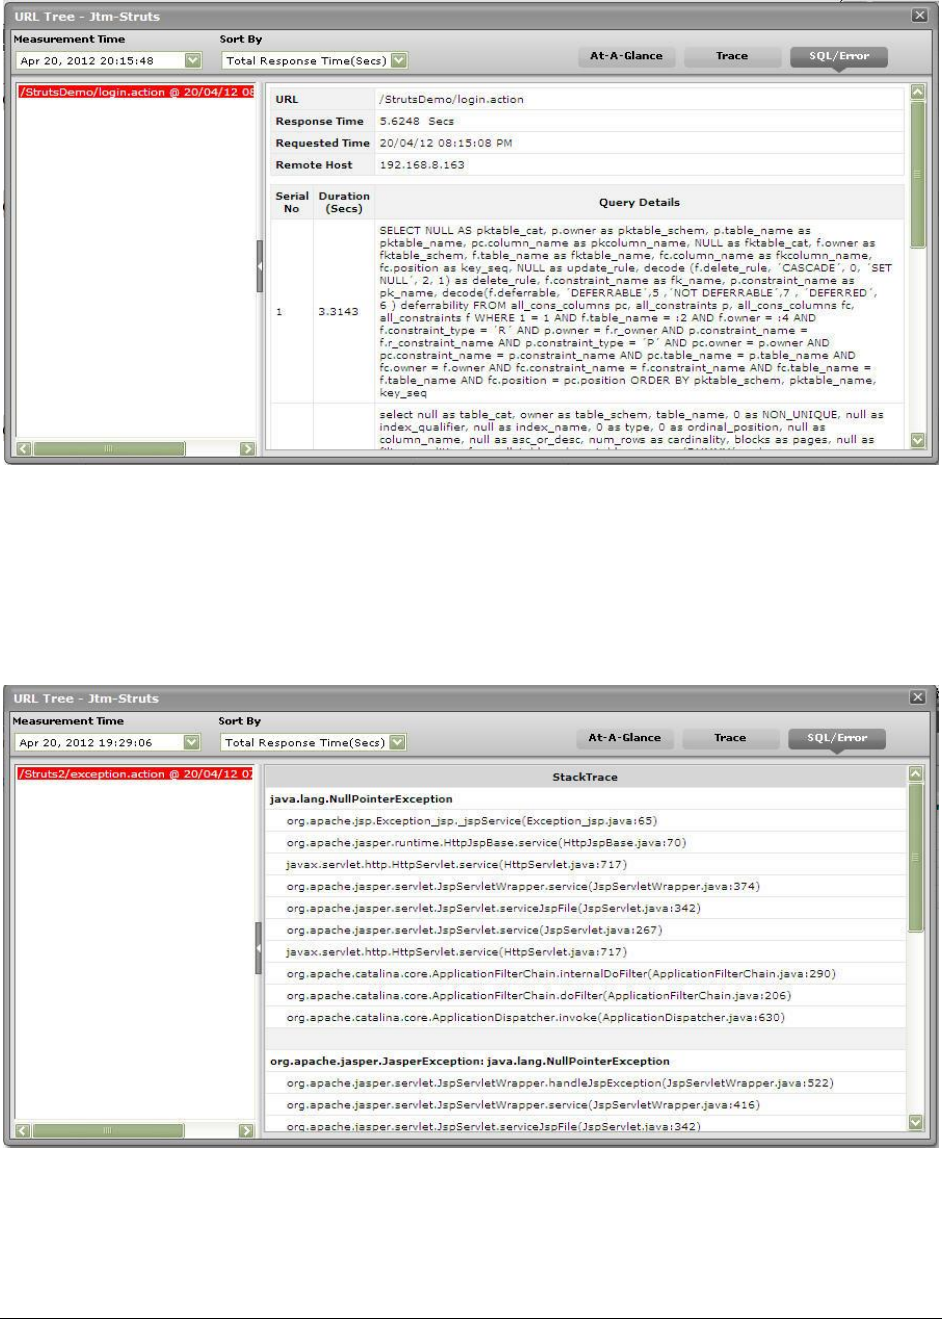
M o n i t o r i n g W e b L o g i c A p p l i c a t i o n S e r v e r s
48
Figure 2.12: Queries displayed in the SQL/Error tab page
When displaying errors, the SQL/Error tab page does not display the error message alone, but displays
the complete code block that could have caused the error to occur. By carefully scrutinizing the block,
you can easily zero-in on the 'exact line of code' that could have forced the error - this means that
besides pointing you to bugs in your code, the SQL/Error tab page also helps you initiate measures to
fix the same.
Figure 2.13: Errors displayed in the SQL/Error tab page
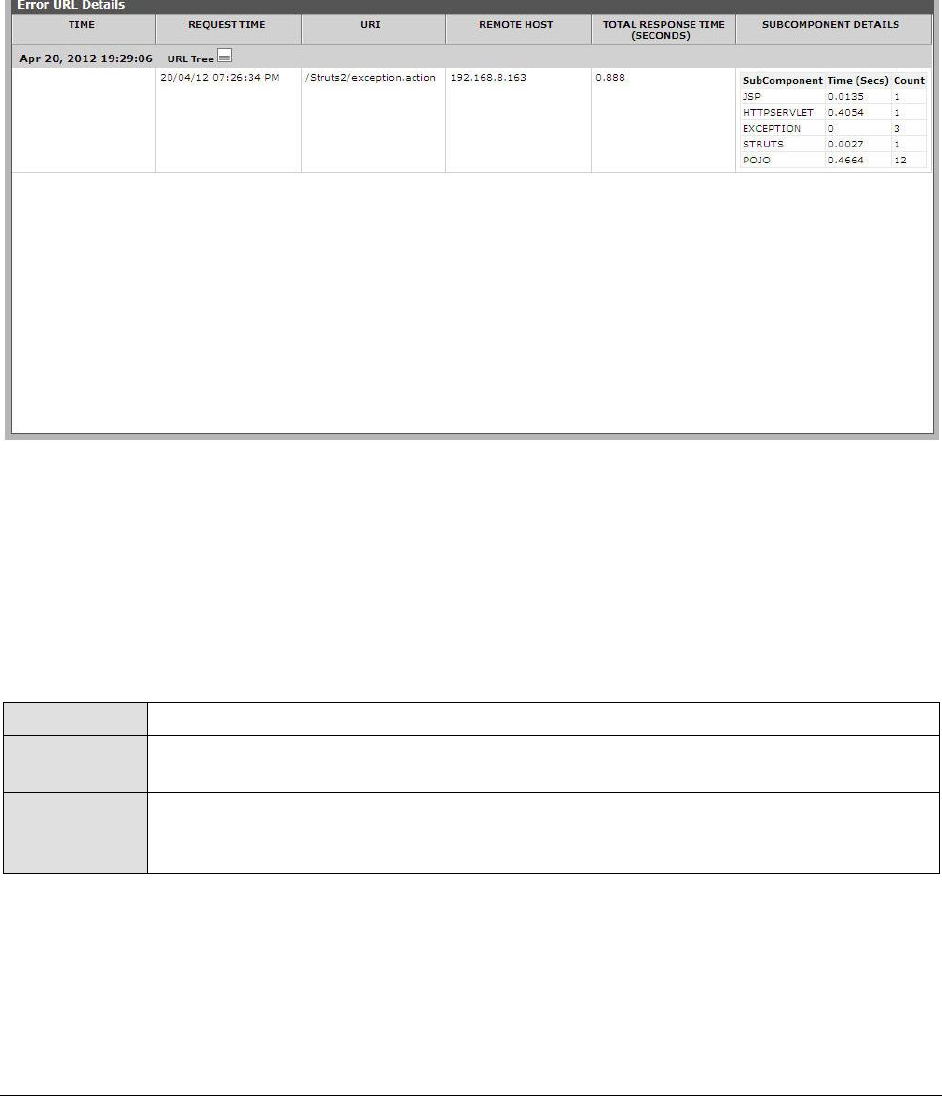
M o n i t o r i n g W e b L o g i c A p p l i c a t i o n S e r v e r s
49
This way, with the help of the three tab pages - At-A-Glance, Trace, and SQL/Error - you can effectively
analyze and accurately diagnose the root-cause of slowdowns in transactions to your Java
applications.
The detailed diagnosis of the Error transactions measure reveals the top-10 (by default) transactions,
in terms of TOTAL RESPONSE TIME, that have encountered errors. To know the nature of the errors that
occurred, click on the URL Tree icon in Figure 2.14. This will lead you to the URL Tree window, which has
already been elaborately discussed.
Figure 2.14: The detailed diagnosis of the Error transactions measure
2.1.2.6.1 JVM GC Test
Manual memory management is time consuming, and error prone. Most programs still contain leaks.
This is all doubly true with programs using exception-handling and/or threads. Garbage collection (GC)
is a part of WebLogic's JVM that automatically determines what memory a program is no longer using,
and recycles it for other use. It is also known as "automatic storage (or memory) reclamation''. The
JVMGCTest reports the performance statistics pertaining to the JVM's garbage collection.
Purpose
Reports the performance statistics pertaining to the JVM's garbage collection
Target of the
test
A WebLogic application server
Agent
deploying the
test
An internal agent

M o n i t o r i n g W e b L o g i c A p p l i c a t i o n S e r v e r s
50
Configurable
parameters for
the test
1. TEST PERIOD - How often should the test be executed
2. HOST – The IP address of the WebLogic server
3. PORT – The port number of the WebLogic server
4. JREHOME – The path to the directory in which the JVM to be monitored exists
5. LOGFILENAME – The full path to the log file which stores the GC output.
6. DETAILED DIAGNOSIS - To make diagnosis more efficient and accurate, the eG
Enterprise suite embeds an optional detailed diagnostic capability. With this
capability, the eG agents can be configured to run detailed, more elaborate tests
as and when specific problems are detected. To enable the detailed diagnosis
capability of this test for a particular server, choose the On option. To disable
the capability, click on the Off option.
The option to selectively enable/disable the detailed diagnosis capability will be
available only if the following conditions are fulfilled:
The eG manager license should allow the detailed diagnosis capability
Both the normal and abnormal frequencies configured for the detailed
diagnosis measures should not be 0.
Outputs of the
test
One set of results for every GC
Measurements
made by the
test
Measurement
Measurement
Unit
Interpretation
Number of GC:
The number of times
garbage collection has
happened.
Number
If adequate memory is not allotted to
the JVM, then the value of this measure
would be very high. A high value of this
measure is indicative of a high frequency
of GC. This is not a good sign, as GC,
during its execution, has the tendency of
suspending an application, and a high
frequency of GC would only adversely
impact the application's performance. To
avoid this, it is recommended that you
allot sufficient memory to the JVM.
The detailed diagnosis of the Number of
GC measure, if enabled, provides details
such as the heap size before GC was
performed, the heap size after GC was
performed, and the total time spent by
the JVM in garbage collection. The
difference between the heap sizes will
help administrators figure out how
effective GC is. The total GC time will
help administrators gauge how severely
GC has impacted application
performance

M o n i t o r i n g W e b L o g i c A p p l i c a t i o n S e r v e r s
51
Total GC time:
The sum of the time
taken by all garbage
collections.
Secs
If adequate memory is not allotted to
the JVM, then the value of this measure
would be very high. This is not a good
sign, as GC, during its execution, has
the tendency of suspending an
application, and a high value of this
measure would only adversely impact
the application's performance. To avoid
this, it is recommended that you allot
sufficient memory to the JVM.
Avg GC frequency:
The frequency with
which the JVM
performed GC.
Sec
If adequate memory is not allotted to
the JVM, then the value of this measure
would be very low. A low value of this
measure is indicative of a high frequency
of GC. This is not a good sign, as GC,
during its execution, has the tendency of
suspending an application, and a high
frequency of GC would only adversely
impact the application's performance. To
avoid this, it is recommended that you
allot sufficient memory to the JVM.
Avg GC pause:
The average time the
application is suspended
while garbage collection
is in progress.
Secs
If the garbage collection takes more
time to complete, then it indicates a
very high memory allocation to the JVM.
This again hinders application
performance.
Avg GC overhead:
The percentage of time
utilized by the JVM for
garbage collection
Percent
By carefully examining the application
behavior in terms of memory utilization,
you should arrive at an optimal ratio of
the number of times the GC needs to run
and how long it should take to complete.
Accordingly, memory allocation to the
JVM can be performed.
Max GC pause:
The maximum time
spent by the JVM on
garbage collection,
during the last
measurement period
Secs
Avg heap before GC:
The average heap size
prior to garbage
collection
KB
Avg heap after GC:
The average heap size
after garbage collection
KB
The difference between the value of this
measure and the Avg heap before GC
measure provides the amount of
memory that has been released by GC.
This value is a good indicator of the
effectiveness of GC.

M o n i t o r i n g W e b L o g i c A p p l i c a t i o n S e r v e r s
52
2.1.2.6.2 Java Classes Test
This test reports the number of classes loaded/unloaded from the memory.
Purpose
Reports the number of classes loaded/unloaded from the memory
Target of the
test
A WebLogic server
Agent
deploying the
test
An internal/remote agent

M o n i t o r i n g W e b L o g i c A p p l i c a t i o n S e r v e r s
53
Configurable
parameters for
the test
1. TEST PERIOD - How often should the test be executed
2. HOST - The host for which the test is to be configured
3. PORT - The port number at which the specified HOST listens
4. MODE – This test can extract metrics from the Java application using either of
the following mechanisms:
Using SNMP-based access to the Java runtime MIB statistics;
By contacting the Java runtime (JRE) of the application via JMX
To configure the test to use SNMP, select the SNMP option. On the other hand,
choose the JMX option to configure the test to use JMX instead. By default, the
JMX option is chosen here.
5. JMX REMOTE PORT – This parameter appears only if the MODE is set to JMX.
Here, specify the port at which the JMX listens for requests from remote hosts.
Ensure that you specify the same port that you configured in the
management.properties file in the <JAVA_HOME>\jre\lib\management folder used by
the target application (refer to the Monitoring Java Applications).
6. USER, PASSWORD, and CONFIRM PASSWORD – These parameters appear only if
the MODE is set to JMX. If JMX requires authentication only (but no security), then
ensure that the USER and PASSWORD parameters are configured with the
credentials of a user with read-write access to JMX. To know how to create this
user, refer to the Monitoring Java Applications document. Confirm the password
by retyping it in the CONFIRM PASSWORD text box.
7. JNDINAME – This parameter appears only if the MODE is set to JMX. The JNDINAME
is a lookup name for connecting to the JMX connector. By default, this is
jmxrmi. If you have registered the JMX connector in the RMI registry using a
different lookup name, then you can change this default value to reflect the
same.
8. SNMPPORT – This parameter appears only if the MODE is set to SNMP. Here
specify the port number through which the server exposes its SNMP MIB. Ensure
that you specify the same port you configured in the management.properties file
in the <JAVA_HOME>\jre\lib\management folder used by the target application (see
page 13).
9. SNMPVERSION – This parameter appears only if the MODE is set to SNMP. The
default selection in the SNMPVERSION list is v1. However, for this test to work,
you have to select SNMP v2 or v3 from this list, depending upon which version of
SNMP is in use in the target environment.
10. SNMPCOMMUNITY – This parameter appears only if the MODE is set to SNMP.
Here, specify the SNMP community name that the test uses to communicate
with the mail server. The default is public. This parameter is specific to SNMP v1
and v2 only. Therefore, if the SNMPVERSION chosen is v3, then this parameter
will not appear.

M o n i t o r i n g W e b L o g i c A p p l i c a t i o n S e r v e r s
54
11. USERNAME – This parameter appears only when v3 is selected as the
SNMPVERSION. SNMP version 3 (SNMPv3) is an extensible SNMP Framework
which supplements the SNMPv2 Framework, by additionally supporting message
security, access control, and remote SNMP configuration capabilities. To extract
performance statistics from the MIB using the highly secure SNMP v3 protocol,
the eG agent has to be configured with the required access privileges – in other
words, the eG agent should connect to the MIB using the credentials of a user
with access permissions to be MIB. Therefore, specify the name of such a user
against the USERNAME parameter.
12. AUTHTYPE – This parameter too appears only if v3 is selected as the
SNMPVERSION. From the AUTHTYPE list box, choose the authentication
algorithm using which SNMP v3 converts the specified USERNAME and
PASSWORD into a 32-bit format to ensure security of SNMP transactions. You
can choose between the following options:
MD5 – Message Digest Algorithm
SHA – Secure Hash Algorithm
13. ENCRYPTFLAG – This flag appears only when v3 is selected as the
SNMPVERSION. By default, the eG agent does not encrypt SNMP requests.
Accordingly, the ENCRYPTFLAG is set to NO by default. To ensure that SNMP
requests sent by the eG agent are encrypted, select the YES option.
14. ENCRYPTTYPE – If the ENCRYPTFLAG is set to YES, then you will have to
mention the encryption type by selecting an option from the ENCRYPTTYPE list.
SNMP v3 supports the following encryption types:
DES – Data Encryption Standard
AES – Advanced Encryption Standard
15. ENCRYPTPASSWORD – Specify the encryption password here.
16. CONFIRM PASSWORD – Confirm the encryption password by retyping it here.
17. TIMEOUT - This parameter appears only if the MODE is set to SNMP. Here, specify
the duration (in seconds) within which the SNMP query executed by this test
should time out in the TIMEOUT text box. The default is 10 seconds.
Outputs of the
test
One set of results for the server being monitored
Measurements
made by the
test
Measurement
Measurement
Unit
Interpretation
Classes loaded:
Indicates the number of classes
currently loaded into memory.
Number
Classes are fundamental to the
design of Java programming
language. Typically, Java

M o n i t o r i n g W e b L o g i c A p p l i c a t i o n S e r v e r s
55
Classes unloaded:
Indicates the number of classes
currently unloaded from
memory.
Number
applications install a variety of
class loaders (that is, classes that
implement java.lang.ClassLoader)
to allow different portions of the
container, and the applications
running on the container, to have
access to different repositories of
available classes and resources. A
consistent decrease in the
number of classes loaded and
unloaded could indicate a road-
block in the loading/unloading of
classes by the class loader. If left
unchecked, critical
resources/classes could be
rendered inaccessible to the
application, thereby severely
affecting its performance.
Total classes loaded:
Indicates the total number of
classes loaded into memory
since the JVM started, including
those subsequently unloaded.
Number
2.1.2.6.3 JVM Threads Test
This test reports the status of threads on the JVM, and also reveals resource-hungry threads, so that
threads that are unnecessarily consuming CPU resources can be killed.
Purpose
Reports the status of threads on the JVM, and also reveals resource-hungry threads,
so that threads that are unnecessarily consuming CPU resources can be killed
Target of the
test
A WebLogic server
Agent
deploying the
test
An internal/remote agent

M o n i t o r i n g W e b L o g i c A p p l i c a t i o n S e r v e r s
56
Configurable
parameters for
the test
1. TEST PERIOD - How often should the test be executed
2. HOST - The host for which the test is to be configured
3. PORT - The port number at which the specified HOST listens
4. MODE – This test can extract metrics from the Java application using either of
the following mechanisms:
Using SNMP-based access to the Java runtime MIB statistics;
By contacting the Java runtime (JRE) of the application via JMX
To configure the test to use SNMP, select the SNMP option. On the other hand,
choose the JMX option to configure the test to use JMX instead. By default, the
JMX option is chosen here.
5. JMX REMOTE PORT – This parameter appears only if the MODE is set to JMX.
Here, specify the port at which the JMX listens for requests from remote hosts.
Ensure that you specify the same port that you configured in the
management.properties file in the <JAVA_HOME>\jre\lib\management folder used by
the target application (refer to the Monitoring Java Applications document).
6. USER, PASSWORD, and CONFIRM PASSWORD – These parameters appear only if
the MODE is set to JMX. If JMX requires authentication only (but no security), then
ensure that the USER and PASSWORD parameters are configured with the
credentials of a user with read-write access to JMX. To know how to create this
user, refer to the Monitoring Java Applications document. Confirm the password
by retyping it in the CONFIRM PASSWORD text box.
7. JNDINAME – This parameter appears only if the MODE is set to JMX. The JNDINAME
is a lookup name for connecting to the JMX connector. By default, this is
jmxrmi. If you have registered the JMX connector in the RMI registry using a
different lookup name, then you can change this default value to reflect the
same.
8. SNMPPORT – This parameter appears only if the MODE is set to SNMP. Here
specify the port number through which the server exposes its SNMP MIB. Ensure
that you specify the same port you configured in the management.properties file
in the <JAVA_HOME>\jre\lib\management folder used by the target application (refer
to the Monitoring Java Applications document).
9. SNMPVERSION – This parameter appears only if the MODE is set to SNMP. The
default selection in the SNMPVERSION list is v1. However, for this test to work,
you have to select SNMP v2 or v3 from this list, depending upon which version of
SNMP is in use in the target environment.
10. SNMPCOMMUNITY – This parameter appears only if the MODE is set to SNMP.
Here, specify the SNMP community name that the test uses to communicate
with the mail server. The default is public. This parameter is specific to SNMP v1
and v2 only. Therefore, if the SNMPVERSION chosen is v3, then this parameter
will not appear.

M o n i t o r i n g W e b L o g i c A p p l i c a t i o n S e r v e r s
57
11. USERNAME – This parameter appears only when v3 is selected as the
SNMPVERSION. SNMP version 3 (SNMPv3) is an extensible SNMP Framework
which supplements the SNMPv2 Framework, by additionally supporting message
security, access control, and remote SNMP configuration capabilities. To extract
performance statistics from the MIB using the highly secure SNMP v3 protocol,
the eG agent has to be configured with the required access privileges – in other
words, the eG agent should connect to the MIB using the credentials of a user
with access permissions to be MIB. Therefore, specify the name of such a user
against the USERNAME parameter.
12. AUTHTYPE – This parameter too appears only if v3 is selected as the
SNMPVERSION. From the AUTHTYPE list box, choose the authentication
algorithm using which SNMP v3 converts the specified USERNAME and
PASSWORD into a 32-bit format to ensure security of SNMP transactions. You
can choose between the following options:
MD5 – Message Digest Algorithm
SHA – Secure Hash Algorithm
13. ENCRYPTFLAG – This flag appears only when v3 is selected as the
SNMPVERSION. By default, the eG agent does not encrypt SNMP requests.
Accordingly, the ENCRYPTFLAG is set to NO by default. To ensure that SNMP
requests sent by the eG agent are encrypted, select the YES option.
14. ENCRYPTTYPE – If the ENCRYPTFLAG is set to YES, then you will have to
mention the encryption type by selecting an option from the ENCRYPTTYPE list.
SNMP v3 supports the following encryption types:
DES – Data Encryption Standard
AES – Advanced Encryption Standard
15. ENCRYPTPASSWORD – Specify the encryption password here.
16. CONFIRM PASSWORD – Confirm the encryption password by retyping it here.
17. TIMEOUT - This parameter appears only if the MODE is set to SNMP. Here, specify
the duration (in seconds) within which the SNMP query executed by this test
should time out in the TIMEOUT text box. The default is 10 seconds.
18. PCT LOW CPU UTIL THREADS – This test reports the number of threads in the
JVM that are consuming low CPU. This thread count will include only those
threads for which the CPU usage is equal to or lesser than the value specified in
the PCT LOW CPU UTIL THREADS text box. The default value displayed here is
30.
19. PCT MEDIUM CPU UTIL THREADS - This test reports the number of threads in the
JVM that are consuming CPU to a medium extent. This thread count will include
only those threads for which the CPU usage is higher than the PCT LOW CPU
UTIL THREADS configuration and is lower than or equal to the value specified in
the PCT MEDIUM CPU UTIL THREADS text box. The default value displayed here
is 50.

M o n i t o r i n g W e b L o g i c A p p l i c a t i o n S e r v e r s
58
20. PCT HIGH CPU UTIL THREADS - This test reports the number of threads in the
JVM that are consuming high CPU. This thread count will include only those
threads for which the CPU usage is either greater than the PCT MEDIUM CPU
UTIL THREADS configuration, or is equal to or greater than the value specified in
the PCT HIGH CPU UTIL THREADS text box. The default value displayed here is
70.
21. DD FREQUENCY - Refers to the frequency with which detailed
diagnosis measures are to be generated for this test. The default is 1:1. This
indicates that, by default, detailed measures will be generated every time this
test runs, and also every time the test detects a problem. You can modify this
frequency, if you so desire. Also, if you intend to disable the detailed diagnosis
capability for this test, you can do so by specifying none against DD
FREQUENCY.
22. DETAILED DIAGNOSIS - To make diagnosis more efficient and accurate, the eG
Enterprise suite embeds an optional detailed diagnostic capability. With this
capability, the eG agents can be configured to run detailed, more elaborate tests
as and when specific problems are detected. To enable the detailed diagnosis
capability of this test for a particular server, choose the On option. To disable
the capability, click on the Off option.
The option to selectively enable/disable the detailed diagnosis capability will be
available only if the following conditions are fulfilled:
The eG manager license should allow the detailed diagnosis capability
Both the normal and abnormal frequencies configured for the detailed
diagnosis measures should not be 0.
Outputs of the
test
One set of results for the server being monitored
Measurements
made by the
test
Measurement
Measurement
Unit
Interpretation
Total threads:
Indicates the total number of
threads (including daemon and
non-daemon threads).
Number
Runnable threads:
Indicates the current number of
threads in a runnable state.
Number
The detailed diagnosis of this
measure, if enabled, provides the
name of the threads, the CPU
usage by the threads, the time
for which the thread was in a
blocked state, waiting state, etc.
Blocked threads:
Indicates the number of threads
that are currently in a blocked
state.
Number
If a thread is trying to take a lock
(to enter a synchronized block),
but the lock is already held by
another thread, then such a
thread is called a blocked thread.
The detailed diagnosis of this
measure, if enabled, provides in-
depth information related to the
blocked threads.

M o n i t o r i n g W e b L o g i c A p p l i c a t i o n S e r v e r s
59
Waiting threads:
Indicates the number of threads
that are currently in a waiting
state.
Number
A thread is said to be in a Waiting
state if the thread enters a
synchronized block, tries to take
a lock that is already held by
another thread, and hence, waits
till the other thread notifies that it
has released the lock.
Ideally, the value of this measure
should be low. A very high value
could be indicative of excessive
waiting activity on the JVM. You
can use the detailed diagnosis of
this measure, if enabled, to figure
out which threads are currently in
the waiting state.
While waiting, the Java
application program does no
productive work and its ability to
complete the task-at-hand is
degraded. A certain amount of
waiting may be acceptable for
Java application programs.
However, when the amount of
time spent waiting becomes
excessive or if the number of
times that waits occur exceeds a
reasonable amount, the Java
application program may not be
programmed correctly to take
advantage of the available
resources. When this happens,
the delay caused by the waiting
Java application programs
elongates the response time
experienced by an end user. An
enterprise may use Java
application programs to perform
various functions. Delays based
on abnormal degradation
consume employee time and may
be costly to corporations.
Timed waiting threads:
Indicates the number of threads
in a TIMED_WAITING state.
Number
When a thread is in the
TIMED_WAITING state, it implies
that the thread is waiting for
another thread to do something,
but will give up after a specified
time out period.
To view the details of threads in
the TIMED_WAITING state, use
the detailed diagnosis of this
measure, if enabled.

M o n i t o r i n g W e b L o g i c A p p l i c a t i o n S e r v e r s
60
Low CPU threads:
Indicates the number of threads
that are currently consuming
CPU lower than the value
configured in the PCT LOW CPU
UTIL THREADS text box.
Number
Medium CPU threads:
Indicates the number of threads
that are currently consuming
CPU that is higher than the value
configured in the PCT LOW CPU
UTIL THREADS text box and is
lower than or equal to the value
specified in the PCT MEDIUM CPU
UTIL THREADS text box.
Number
High CPU threads:
Indicates the number of threads
that are currently consuming
CPU that is either greater than
the percentage configured in the
PCT MEDIUM CPU UTIL THREADS
or lesser than or equal to the
value configured in the PCT HIGH
CPU UTIL THREADS text box.
Number
Ideally, the value of this measure
should be very low. A high value
is indicative of a resource
contention at the JVM. Under
such circumstances, you might
want to identify the resource-
hungry threads and kill them, so
that application performance is
not hampered. To know which
threads are consuming excessive
CPU, use the detailed diagnosis of
this measure.
`
Peak threads:
Indicates the highest number of
live threads since JVM started.
Number
Started threads:
Indicates the the total number of
threads started (including
daemon, non-daemon, and
terminated) since JVM started.
Number
Daemon threads:
Indicates the current number of
live daemon threads.
Number
Deadlock threads:
Indicates the current number of
deadlocked threads.
Number
Ideally, this value should be 0. A
high value is a cause for concern,
as it indicates that many threads
are blocking one another causing
the application performance to
suffer. The detailed diagnosis of
this measure, if enabled, lists the
deadlocked threads and their
resource usage.

M o n i t o r i n g W e b L o g i c A p p l i c a t i o n S e r v e r s
61
2.1.2.6.4 JVM Cpu Usage Test
This test measures the CPU utilization of the JVM. If the JVM experiences abnormal CPU usage levels,
you can use this test to instantly drill down to the classes and the methods within the classes that
contributing to the resource contention at the JVM.
Purpose
Reports the status of threads on the JVM, and also reveals resource-hungry threads,
so that threads that are unnecessarily consuming CPU resources can be killed
Target of the
test
A WebLogic server
Note:
If the MODE for the JVM Threads test is set to SNMP, then the detailed diagnosis of this test will not
display the Blocked Time and Waited Time for the threads. To make sure that detailed diagnosis
reports these details also, do the following:
Login to the server host.
Go to the <JAVA_HOME>\jre\lib\management folder used by the WebLogic server, and edit the
management.properties file in that folder.
Append the following line to the file:
com.sun.management.enableThreadContentionMonitoring
Finally, save the file.
Note:
While viewing the measures reported by the JVM Thread test, you can also view the resource usage
details and the stack trace information for all the threads, by clicking on the STACK TRACE link in the
Measurements panel.
A stack trace (also called stack backtrace or stack traceback) is a report of the active stack
frames instantiated by the execution of a program. It is commonly used to determine what threads
are currently active in the JVM, and which threads are in each of the different states – i.e., alive,
blocked, waiting, timed waiting, etc.
Typically, when the JVM begins exhibiting erratic resource usage patterns, it often takes
administrators hours, even days to figure out what is causing this anomaly – could it be owing to
one/more resource-intensive threads being executed by the WebLogic server? If so, what is
causing the thread to erode resources? Is it an inefficient piece of code? In which case, which line
of code could be the most likely cause for the spike in resource usage? To be able to answer these
questions accurately, administrators need to know the complete list of threads that are executing
on the JVM, view the stack trace of each thread, analyze each stack trace in a top-down manner,
and trace where the problem originated.

M o n i t o r i n g W e b L o g i c A p p l i c a t i o n S e r v e r s
62
Agent
deploying the
test
An internal/remote agent
Configurable
parameters for
the test
1. TEST PERIOD - How often should the test be executed
2. HOST - The host for which the test is to be configured
3. PORT - The port number at which the specified HOST listens
4. MODE – This test can extract metrics from the Java application using either of
the following mechanisms:
Using SNMP-based access to the Java runtime MIB statistics;
By contacting the Java runtime (JRE) of the application via JMX
To configure the test to use SNMP, select the SNMP option. On the other hand,
choose the JMX option to configure the test to use JMX instead. By default, the
JMX option is chosen here.
5. JMX REMOTE PORT – This parameter appears only if the MODE is set to JMX.
Here, specify the port at which the JMX listens for requests from remote hosts.
Ensure that you specify the same port that you configured in the
management.properties file in the <JAVA_HOME>\jre\lib\management folder used by
the target application (see refer to the Monitoring Java Applications document).
6. USER, PASSWORD, and CONFIRM PASSWORD – These parameters appear only if
the MODE is set to JMX. If JMX requires authentication only (but no security), then
ensure that the USER and PASSWORD parameters are configured with the
credentials of a user with read-write access to JMX. To know how to create this
user, refer to refer to the Monitoring Java Applications document. Confirm the
password by retyping it in the CONFIRM PASSWORD text box.
7. JNDINAME – This parameter appears only if the MODE is set to JMX. The JNDINAME
is a lookup name for connecting to the JMX connector. By default, this is
jmxrmi. If you have registered the JMX connector in the RMI registry using a
different lookup name, then you can change this default value to reflect the
same.
8. SNMPPORT – This parameter appears only if the MODE is set to SNMP. Here
specify the port number through which the server exposes its SNMP MIB. Ensure
that you specify the same port you configured in the management.properties file
in the <JAVA_HOME>\jre\lib\management folder used by the target application (refer
to the Monitoring Java Applications document).
9. SNMPVERSION – This parameter appears only if the MODE is set to SNMP. The
default selection in the SNMPVERSION list is v1. However, for this test to work,
you have to select SNMP v2 or v3 from this list, depending upon which version of
SNMP is in use in the target environment.
10. SNMPCOMMUNITY – This parameter appears only if the MODE is set to SNMP.
Here, specify the SNMP community name that the test uses to communicate
with the mail server. The default is public. This parameter is specific to SNMP v1
and v2 only. Therefore, if the SNMPVERSION chosen is v3, then this parameter
will not appear.

M o n i t o r i n g W e b L o g i c A p p l i c a t i o n S e r v e r s
63
11. USERNAME – This parameter appears only when v3 is selected as the
SNMPVERSION. SNMP version 3 (SNMPv3) is an extensible SNMP Framework
which supplements the SNMPv2 Framework, by additionally supporting message
security, access control, and remote SNMP configuration capabilities. To extract
performance statistics from the MIB using the highly secure SNMP v3 protocol,
the eG agent has to be configured with the required access privileges – in other
words, the eG agent should connect to the MIB using the credentials of a user
with access permissions to be MIB. Therefore, specify the name of such a user
against the USERNAME parameter.
12. AUTHTYPE – This parameter too appears only if v3 is selected as the
SNMPVERSION. From the AUTHTYPE list box, choose the authentication
algorithm using which SNMP v3 converts the specified USERNAME and
PASSWORD into a 32-bit format to ensure security of SNMP transactions. You
can choose between the following options:
MD5 – Message Digest Algorithm
SHA – Secure Hash Algorithm
13. ENCRYPTFLAG – This flag appears only when v3 is selected as the
SNMPVERSION. By default, the eG agent does not encrypt SNMP requests.
Accordingly, the ENCRYPTFLAG is set to NO by default. To ensure that SNMP
requests sent by the eG agent are encrypted, select the YES option.
14. ENCRYPTTYPE – If the ENCRYPTFLAG is set to YES, then you will have to
mention the encryption type by selecting an option from the ENCRYPTTYPE list.
SNMP v3 supports the following encryption types:
DES – Data Encryption Standard
AES – Advanced Encryption Standard
15. ENCRYPTPASSWORD – Specify the encryption password here.
16. CONFIRM PASSWORD – Confirm the encryption password by retyping it here.
17. TIMEOUT - This parameter appears only if the MODE is set to SNMP. Here, specify
the duration (in seconds) within which the SNMP query executed by this test
should time out in the TIMEOUT text box. The default is 10 seconds.
18. PROFILER HOME – JIP (Java Interactive Profiler) is a high performance, low
overhead profiler that is written entirely in Java and used extensively to gather
performance data pertaining to a JVM. The eG agent comes bundled with JIP,
and takes the help of JIP to provide detailed diagnosis information related to the
CPU usage of the JVM. To make sure that this test contacts JIP for detailed
resource usage metrics, you need to indicate the location of the JIP in the
PROFILER HOME text box.

M o n i t o r i n g W e b L o g i c A p p l i c a t i o n S e r v e r s
64
Typically, the files related to this profiler are available in <EG_INSTALL_DIR>\lib\jip
directory (in Windows; in Unix, this will be: /opt/egurkha/lib/jip). If only a single
Java application on a host is being monitored, then the jip folder can remain in
the same location. The PROFILER HOME parameter should then be configured
with /opt/egurkha/lib/jip or <EG_INSTALL_DIR>\lib\jip, as the case may be. However, if
more than one Java application on a single host is to be monitored, then first
ensure that the jip folder is copied to two different locations on the same host.
The PROFILER HOME parameter should in this case be configured with the
location of the jip folder that corresponds to the Java application for which this
test is being currently configured. For instance, say japp1 and japp2 are 2 Java
applications that are being managed by the eG Enterprise system. Assume that
the jip folder has been copied to the C:\japp1 and D:\japp2 folders. Now, while
configuring this test for the japp1 application, specify C:\japp\jip in PROFILER
HOME. Similarly, when configuring this test for the japp2 application, enter
D:\japp2\jip in PROFILER HOME.
19. PROFILER – The JIP can be turned on or off while the JVM is still running. For
the eG agent to be able to report detailed diagnosis of the CPU usage metric,
the profiler should be turned on. Accordingly, the PROFILER flag is set to On by
default. If you do not want detailed diagnosis, then you can set the PROFILER
flag to Off.
20. DD FREQUENCY - Refers to the frequency with which detailed
diagnosis measures are to be generated for this test. The default is 1:1. This
indicates that, by default, detailed measures will be generated every time this
test runs, and also every time the test detects a problem. You can modify this
frequency, if you so desire. Also, if you intend to disable the detailed diagnosis
capability for this test, you can do so by specifying none against DD
FREQUENCY.
21. DETAILED DIAGNOSIS - To make diagnosis more efficient and accurate, the eG
Enterprise suite embeds an optional detailed diagnostic capability. With this
capability, the eG agents can be configured to run detailed, more elaborate tests
as and when specific problems are detected. To enable the detailed diagnosis
capability of this test for a particular server, choose the On option. To disable
the capability, click on the Off option.
The option to selectively enable/disable the detailed diagnosis capability will be
available only if the following conditions are fulfilled:
The eG manager license should allow the detailed diagnosis capability
Both the normal and abnormal frequencies configured for the detailed
diagnosis measures should not be 0.
Outputs of the
test
One set of results for the server being monitored
Measurements
made by the
Measurement
Measurement
Unit
Interpretation
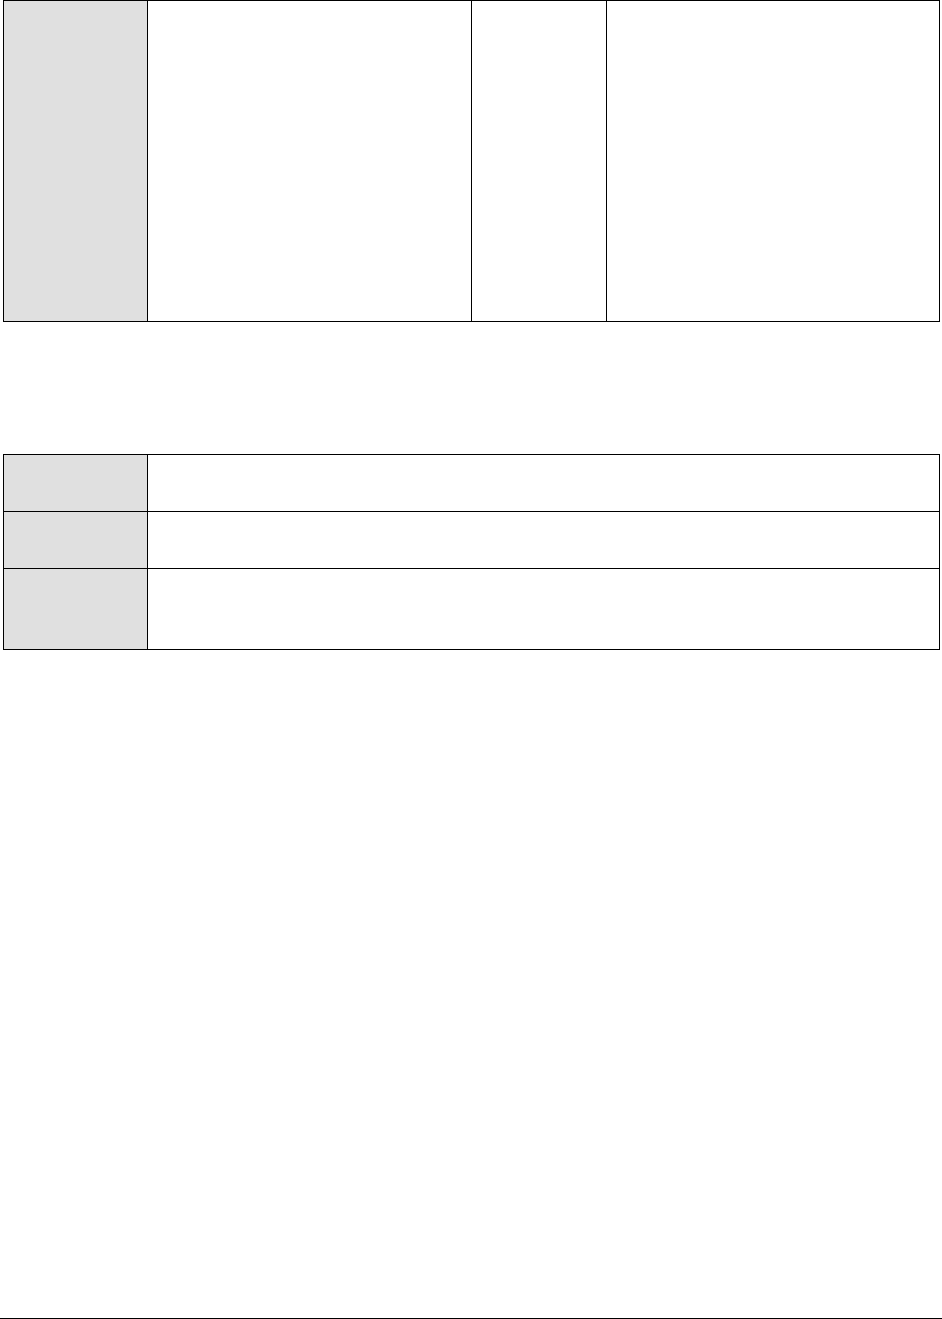
M o n i t o r i n g W e b L o g i c A p p l i c a t i o n S e r v e r s
65
test
CPU utilization of JVM:
Indicates the percentage of CPU
currently utilized by the JVM.
Percent
Ideally, this value should be low.
An unusually high value or a
consistent increase in this value is
indicative of abnormal CPU usage,
and could warrant further
investigation. In such a situation,
you can use the detailed
diagnosis of this measure, if
enabled, to determine which
methods invoked by which
classes are causing the
steady/sporadic spikes in CPU
usage.
2.1.2.6.5 JVM Memory Usage Test
This test monitors every memory type on the JVM and reports how efficiently the JVM utilizes the
memory resources of each type.
Purpose
Monitors every memory type on the JVM and reports how efficiently the JVM utilizes
the memory resources of each type
Target of the
test
A WebLogic server
Agent
deploying the
test
An internal/remote agent

M o n i t o r i n g W e b L o g i c A p p l i c a t i o n S e r v e r s
66
Configurable
parameters for
the test
1. TEST PERIOD - How often should the test be executed
2. HOST - The host for which the test is to be configured
3. PORT - The port number at which the specified HOST listens
4. MODE – This test can extract metrics from the Java application using either of
the following mechanisms:
Using SNMP-based access to the Java runtime MIB statistics;
By contacting the Java runtime (JRE) of the application via JMX
To configure the test to use SNMP, select the SNMP option. On the other hand,
choose the JMX option to configure the test to use JMX instead. By default, the
JMX option is chosen here.
5. JMX REMOTE PORT – This parameter appears only if the MODE is set to JMX.
Here, specify the port at which the JMX listens for requests from remote hosts.
Ensure that you specify the same port that you configured in the
management.properties file in the <JAVA_HOME>\jre\lib\management folder used by
the target application (see refer to the Monitoring Java Applications document).
6. USER, PASSWORD, and CONFIRM PASSWORD – These parameters appear only if
the MODE is set to JMX. If JMX requires authentication only (but no security), then
ensure that the USER and PASSWORD parameters are configured with the
credentials of a user with read-write access to JMX. To know how to create this
user, refer to refer to the Monitoring Java Applications document. Confirm the
password by retyping it in the CONFIRM PASSWORD text box.
7. JNDINAME – This parameter appears only if the MODE is set to JMX. The JNDINAME
is a lookup name for connecting to the JMX connector. By default, this is
jmxrmi. If you have registered the JMX connector in the RMI registry using a
different lookup name, then you can change this default value to reflect the
same.
8. SNMPPORT – This parameter appears only if the MODE is set to SNMP. Here
specify the port number through which the server exposes its SNMP MIB. Ensure
that you specify the same port you configured in the management.properties file
in the <JAVA_HOME>\jre\lib\management folder used by the target application (refer
to the Monitoring Java Applications document).
9. SNMPVERSION – This parameter appears only if the MODE is set to SNMP. The
default selection in the SNMPVERSION list is v1. However, for this test to work,
you have to select SNMP v2 or v3 from this list, depending upon which version of
SNMP is in use in the target environment.
10. SNMPCOMMUNITY – This parameter appears only if the MODE is set to SNMP.
Here, specify the SNMP community name that the test uses to communicate
with the mail server. The default is public. This parameter is specific to SNMP v1
and v2 only. Therefore, if the SNMPVERSION chosen is v3, then this parameter
will not appear.

M o n i t o r i n g W e b L o g i c A p p l i c a t i o n S e r v e r s
67
11. USERNAME – This parameter appears only when v3 is selected as the
SNMPVERSION. SNMP version 3 (SNMPv3) is an extensible SNMP Framework
which supplements the SNMPv2 Framework, by additionally supporting message
security, access control, and remote SNMP configuration capabilities. To extract
performance statistics from the MIB using the highly secure SNMP v3 protocol,
the eG agent has to be configured with the required access privileges – in other
words, the eG agent should connect to the MIB using the credentials of a user
with access permissions to be MIB. Therefore, specify the name of such a user
against the USERNAME parameter.
12. AUTHPASS – Specify the password that corresponds to the above-mentioned
USERNAME. This parameter once again appears only if the SNMPVERSION
selected is v3.
13. CONFIRM PASSWORD – Confirm the AUTHPASS by retyping it here.
14. AUTHTYPE – This parameter too appears only if v3 is selected as the
SNMPVERSION. From the AUTHTYPE list box, choose the authentication
algorithm using which SNMP v3 converts the specified USERNAME and
PASSWORD into a 32-bit format to ensure security of SNMP transactions. You
can choose between the following options:
MD5 – Message Digest Algorithm
SHA – Secure Hash Algorithm
15. ENCRYPTFLAG – This flag appears only when v3 is selected as the
SNMPVERSION. By default, the eG agent does not encrypt SNMP requests.
Accordingly, the ENCRYPTFLAG is set to NO by default. To ensure that SNMP
requests sent by the eG agent are encrypted, select the YES option.
16. ENCRYPTTYPE – If the ENCRYPTFLAG is set to YES, then you will have to
mention the encryption type by selecting an option from the ENCRYPTTYPE list.
SNMP v3 supports the following encryption types:
DES – Data Encryption Standard
AES – Advanced Encryption Standard
17. ENCRYPTPASSWORD – Specify the encryption password here.
18. CONFIRM PASSWORD – Confirm the encryption password by retyping it here.
19. TIMEOUT - This parameter appears only if the MODE is set to SNMP. Here, specify
the duration (in seconds) within which the SNMP query executed by this test
should time out in the TIMEOUT text box. The default is 10 seconds.
Outputs of the
test
One set of results for every memory type on the JVM being monitored
Measurements
made by the
Measurement
Measurement
Unit
Interpretation

M o n i t o r i n g W e b L o g i c A p p l i c a t i o n S e r v e r s
68
test
Initial memory:
Indicates the amount of memory
initially allocated at startup.
MB
The detailed diagnosis of this
measure, when enabled, reveals
the memory pools on the JVM,
the memory type of every pool,
and the memory manager
managing the pool.
Used memory:
Indicates the amount of memory
currently used.
MB
It includes the memory occupied
by all objects including both
reachable and unreachable
objects.
Available memory:
Indicates the amount of memory
guaranteed to be available for
use by the JVM.
MB
The amount of Available
memory may change over time.
The Java virtual machine may
release memory to the system
and committed memory could be
less than the amount of memory
initially allocated at startup.
Committed will always be greater
than or equal to used memory.
Free memory:
Indicates the amount of memory
currently available for use by the
JVM.
MB
This is the difference between
Available memory and Used
memory.
Ideally, the value of this measure
should be high.
Max free memory:
Indicates the maximum amount
of memory allocated for the JVM.
MB
Used percentage:
Indicates the percentage of used
memory.
Percent
Ideally, the value of this measure
should be low. A very high value
of this measure could indicate
excessive memory consumption
by the JVM, which in turn, could
warrant further investigation.
2.1.2.6.6 JVM Uptime Test
This test helps track whether a scheduled reboot of the JVM has occurred or not.
Purpose
Helps track whether a scheduled reboot of the JVM has occurred or not
Target of the
test
A WebLogic server
Agent
deploying the
test
An internal/remote agent

M o n i t o r i n g W e b L o g i c A p p l i c a t i o n S e r v e r s
69
Configurable
parameters for
the test
1. TEST PERIOD - How often should the test be executed
2. HOST - The host for which the test is to be configured
3. PORT - The port number at which the specified HOST listens
4. MODE – This test can extract metrics from the Java application using either of
the following mechanisms:
Using SNMP-based access to the Java runtime MIB statistics;
By contacting the Java runtime (JRE) of the application via JMX
To configure the test to use SNMP, select the SNMP option. On the other hand,
choose the JMX option to configure the test to use JMX instead. By default, the
JMX option is chosen here.
5. JMX REMOTE PORT – This parameter appears only if the MODE is set to JMX.
Here, specify the port at which the JMX listens for requests from remote hosts.
Ensure that you specify the same port that you configured in the
management.properties file in the <JAVA_HOME>\jre\lib\management folder used by
the target application (see refer to the Monitoring Java Applications document).
6. USER, PASSWORD, and CONFIRM PASSWORD – These parameters appear only if
the MODE is set to JMX. If JMX requires authentication only (but no security), then
ensure that the USER and PASSWORD parameters are configured with the
credentials of a user with read-write access to JMX. To know how to create this
user, refer to the Monitoring Java Applications document. Confirm the password
by retyping it in the CONFIRM PASSWORD text box.
7. JNDINAME – This parameter appears only if the MODE is set to JMX. The JNDINAME
is a lookup name for connecting to the JMX connector. By default, this is
jmxrmi. If you have registered the JMX connector in the RMI registry using a
different lookup name, then you can change this default value to reflect the
same.
8. SNMPPORT – This parameter appears only if the MODE is set to SNMP. Here
specify the port number through which the server exposes its SNMP MIB. Ensure
that you specify the same port you configured in the management.properties file
in the <JAVA_HOME>\jre\lib\management folder used by the target application (refer
to the Monitoring Java Applications document).
9. SNMPVERSION – This parameter appears only if the MODE is set to SNMP. The
default selection in the SNMPVERSION list is v1. However, for this test to work,
you have to select SNMP v2 or v3 from this list, depending upon which version of
SNMP is in use in the target environment.
10. SNMPCOMMUNITY – This parameter appears only if the MODE is set to SNMP.
Here, specify the SNMP community name that the test uses to communicate
with the mail server. The default is public. This parameter is specific to SNMP v1
and v2 only. Therefore, if the SNMPVERSION chosen is v3, then this parameter
will not appear.

M o n i t o r i n g W e b L o g i c A p p l i c a t i o n S e r v e r s
70
11. USERNAME – This parameter appears only when v3 is selected as the
SNMPVERSION. SNMP version 3 (SNMPv3) is an extensible SNMP Framework
which supplements the SNMPv2 Framework, by additionally supporting message
security, access control, and remote SNMP configuration capabilities. To extract
performance statistics from the MIB using the highly secure SNMP v3 protocol,
the eG agent has to be configured with the required access privileges – in other
words, the eG agent should connect to the MIB using the credentials of a user
with access permissions to be MIB. Therefore, specify the name of such a user
against the USERNAME parameter.
12. AUTHPASS – Specify the password that corresponds to the above-mentioned
USERNAME. This parameter once again appears only if the SNMPVERSION
selected is v3.
13. CONFIRM PASSWORD – Confirm the AUTHPASS by retyping it here.
14. AUTHTYPE – This parameter too appears only if v3 is selected as the
SNMPVERSION. From the AUTHTYPE list box, choose the authentication
algorithm using which SNMP v3 converts the specified USERNAME and
PASSWORD into a 32-bit format to ensure security of SNMP transactions. You
can choose between the following options:
MD5 – Message Digest Algorithm
SHA – Secure Hash Algorithm
15. ENCRYPTFLAG – This flag appears only when v3 is selected as the
SNMPVERSION. By default, the eG agent does not encrypt SNMP requests.
Accordingly, the ENCRYPTFLAG is set to NO by default. To ensure that SNMP
requests sent by the eG agent are encrypted, select the YES option.
16. ENCRYPTTYPE – If the ENCRYPTFLAG is set to YES, then you will have to
mention the encryption type by selecting an option from the ENCRYPTTYPE list.
SNMP v3 supports the following encryption types:
DES – Data Encryption Standard
AES – Advanced Encryption Standard
17. ENCRYPTPASSWORD – Specify the encryption password here.
18. CONFIRM PASSWORD – Confirm the encryption password by retyping it here.
19. TIMEOUT - This parameter appears only if the MODE is set to SNMP. Here, specify
the duration (in seconds) within which the SNMP query executed by this test
should time out in the TIMEOUT text box. The default is 10 seconds.
Outputs of the
test
One set of results for the server being monitored
Measurements
made by the
Measurement
Measurement
Unit
Interpretation

M o n i t o r i n g W e b L o g i c A p p l i c a t i o n S e r v e r s
71
test
Has JVM been restarted?:
Indicates whether or not the JVM
has restarted during the last
measurement period.
If the value of this measure is No,
it indicates that the JVM has not
restarted. The value Yes on the
other hand implies that the JVM
has indeed restarted.
The numeric values that
correspond to the reboot states
discussed above are listed in the
table below:
State
Value
Yes
1
No
0
Note:
By default, this measure reports
the value Yes or No to indicate
whether a JVM has restarted. The
graph of this measure however,
represents the same using the
numeric equivalents – 0 or 1.
Uptime during the last
measure period:
Indicates the time period that
the JVM has been up since the
last time this test ran.
Secs
If the JVM has not been restarted
during the last measurement
period and the agent has been
running continuously, this value
will be equal to the measurement
period. If the JVM was restarted
during the last measurement
period, this value will be less than
the measurement period of the
test. For example, if the
measurement period is 300 secs,
and if the JVM was restarted 120
secs back, this metric will report a
value of 120 seconds. The
accuracy of this metric is
dependent on the measurement
period – the smaller the
measurement period, greater the
accuracy.
Total uptime of the JVM:
Indicates the total time that the
JVM has been up since its last
reboot.
Secs
Administrators may wish to be
alerted if a JVM has been running
without a reboot for a very long
period. Setting a threshold for
this metric allows administrators
to determine such conditions.

M o n i t o r i n g W e b L o g i c A p p l i c a t i o n S e r v e r s
72
2.1.2.6.7 JVM Garbage Collections Test
Manual memory management is time consuming, and error prone. Most programs still contain leaks.
This is all doubly true with programs using exception-handling and/or threads. Garbage collection (GC)
is a part of a Java application’s JVM that automatically determines what memory a program is no
longer using, and recycles it for other use. It is also known as "automatic storage (or memory)
reclamation''. The JvmGarbageCollection test reports the performance statistics pertaining to the
JVM's garbage collection.
Purpose
Reports the performance statistics pertaining to the JVM's garbage collection
Target of the
test
A WebSphere server
Agent
deploying the
test
An internal/remote agent

M o n i t o r i n g W e b L o g i c A p p l i c a t i o n S e r v e r s
73
Configurable
parameters for
the test
1. TEST PERIOD - How often should the test be executed
2. HOST - The host for which the test is to be configured
3. PORT - The port number at which the specified HOST listens
4. MODE – This test can extract metrics from the Java application using either of
the following mechanisms:
Using SNMP-based access to the Java runtime MIB statistics;
By contacting the Java runtime (JRE) of the application via JMX
To configure the test to use SNMP, select the SNMP option. On the other hand,
choose the JMX option to configure the test to use JMX instead. By default, the
JMX option is chosen here.
5. JMX REMOTE PORT – This parameter appears only if the MODE is set to JMX.
Here, specify the port at which the JMX listens for requests from remote hosts.
Ensure that you specify the same port that you configured in the
management.properties file in the <JAVA_HOME>\jre\lib\management folder used by
the target application (refer to the Monitoring Java Applications document).
6. USER, PASSWORD, and CONFIRM PASSWORD – These parameters appear only if
the MODE is set to JMX. If JMX requires authentication only (but no security), then
ensure that the USER and PASSWORD parameters are configured with the
credentials of a user with read-write access to JMX. To know how to create this
user, refer to the Monitoring Java Applications document. Confirm the password
by retyping it in the CONFIRM PASSWORD text box.
7. JNDINAME – This parameter appears only if the MODE is set to JMX. The JNDINAME
is a lookup name for connecting to the JMX connector. By default, this is
jmxrmi. If you have registered the JMX connector in the RMI registry using a
different lookup name, then you can change this default value to reflect the
same.
8. SNMPPORT – This parameter appears only if the MODE is set to SNMP. Here
specify the port number through which the server exposes its SNMP MIB. Ensure
that you specify the same port you configured in the management.properties file
in the <JAVA_HOME>\jre\lib\management folder used by the target application (refer
to the Monitoring Java Applications document).
9. SNMPVERSION – This parameter appears only if the MODE is set to SNMP. The
default selection in the SNMPVERSION list is v1. However, for this test to work,
you have to select SNMP v2 or v3 from this list, depending upon which version of
SNMP is in use in the target environment.
10. SNMPCOMMUNITY – This parameter appears only if the MODE is set to SNMP.
Here, specify the SNMP community name that the test uses to communicate
with the mail server. The default is public. This parameter is specific to SNMP v1
and v2 only. Therefore, if the SNMPVERSION chosen is v3, then this parameter
will not appear.

M o n i t o r i n g W e b L o g i c A p p l i c a t i o n S e r v e r s
74
11. USERNAME – This parameter appears only when v3 is selected as the
SNMPVERSION. SNMP version 3 (SNMPv3) is an extensible SNMP Framework
which supplements the SNMPv2 Framework, by additionally supporting message
security, access control, and remote SNMP configuration capabilities. To extract
performance statistics from the MIB using the highly secure SNMP v3 protocol,
the eG agent has to be configured with the required access privileges – in other
words, the eG agent should connect to the MIB using the credentials of a user
with access permissions to be MIB. Therefore, specify the name of such a user
against the USERNAME parameter.
12. AUTHPASS – Specify the password that corresponds to the above-mentioned
USERNAME. This parameter once again appears only if the SNMPVERSION
selected is v3.
13. CONFIRM PASSWORD – Confirm the AUTHPASS by retyping it here.
14. AUTHTYPE – This parameter too appears only if v3 is selected as the
SNMPVERSION. From the AUTHTYPE list box, choose the authentication
algorithm using which SNMP v3 converts the specified USERNAME and
PASSWORD into a 32-bit format to ensure security of SNMP transactions. You
can choose between the following options:
MD5 – Message Digest Algorithm
SHA – Secure Hash Algorithm
15. ENCRYPTFLAG – This flag appears only when v3 is selected as the
SNMPVERSION. By default, the eG agent does not encrypt SNMP requests.
Accordingly, the ENCRYPTFLAG is set to NO by default. To ensure that SNMP
requests sent by the eG agent are encrypted, select the YES option.
16. ENCRYPTTYPE – If the ENCRYPTFLAG is set to YES, then you will have to
mention the encryption type by selecting an option from the ENCRYPTTYPE list.
SNMP v3 supports the following encryption types:
DES – Data Encryption Standard
AES – Advanced Encryption Standard
17. ENCRYPTPASSWORD – Specify the encryption password here.
18. CONFIRM PASSWORD – Confirm the encryption password by retyping it here.
19. TIMEOUT - This parameter appears only if the MODE is set to SNMP. Here, specify
the duration (in seconds) within which the SNMP query executed by this test
should time out in the TIMEOUT text box. The default is 10 seconds.
Outputs of the
test
One set of results for every garbage collector configured on the WebSphere server
being monitored
Measurements
made by the
Measurement
Measurement
Unit
Interpretation

M o n i t o r i n g W e b L o g i c A p p l i c a t i o n S e r v e r s
75
test
No of garbage collections
started:
Indicates the number of times
garbage collection started to
release dead objects form
memory.
Number
Time taken for garbage
collection:
Indicates the time taken to
perform the current garbage
collection operation.
Secs
Ideally, the value of both these
measures should be low. This is
because, the garbage collection
(GC) activity tends to suspend
the operations of the application
until such time that GC ends.
Longer the GC time, longer it
would take for the application to
resume its functions. To minimize
the impact of GC on application
performance, it is best to ensure
that GC activity does not take too
long to complete.
Percent of time spent by JVM
for garbage collection:
Indicates the percentage of time
spent by JVM in garbage
collection.
Percent
2.1.2.6.8 JVM Memory Pool Garbage Collections Test
While the JVM Garbage Collections test reports statistics indicating how well each collector on the JVM
performs garbage collection, the measures reported by the JVM Memory Pool Garbage Collections test help
assess the impact of the garbage collection activity on the availability and usage of memory in each
memory pool of the JVM. Besides revealing the count of garbage collections per collector and the time
taken by each collector to perform garbage collection on the individual memory pools, the test also
compares the amount of memory used and available for use pre and post garbage collection in each of
the memory pools. This way, the test enables administrators to guage the effectiveness of the
garbage collection activity on the memory pools, and helps them accurately identify those memory
pools where enough memory could not reclaimed or where the garbage collectors spent too much
time.
Purpose
Helps assess the impact of the garbage collection activity on the availability and
usage of memory in each memory pool of the JVM
Target of the
test
A WebSphere Application Server
Agent
deploying the
test
An internal/remote agent

M o n i t o r i n g W e b L o g i c A p p l i c a t i o n S e r v e r s
76
Configurable
parameters for
the test
1. TEST PERIOD - How often should the test be executed
2. HOST - The host for which the test is to be configured
3. PORT - The port number at which the specified HOST listens
4. MEASURE MODE - This test allows you the option to collect the desired metrics
using one of the following methodologies:
By contacting the Java runtime (JRE) of the application via JMX
Using GC logs
To use JMX for metrics collections, set the MEASURE MODE to JMX.
On the other hand, if you intend to use the GC log files for collecting the
required metrics, set the MEASURE MODE to Log File. In this case, you would be
required to enable GC logging. The procedure for this has been detailed in the
Monitoring Java Applications document.
5. JMX REMOTE PORT – This parameter appears only if the MODE is set to JMX.
Here, specify the port at which the JMX listens for requests from remote hosts.
Ensure that you specify the same port that you configured in the
management.properties file in the <JAVA_HOME>\jre\lib\management folder used by
the target application (refer to the Monitoring Java Applications document).
6. USER, PASSWORD, and CONFIRM PASSWORD – These parameters appear only if
the MODE is set to JMX. If JMX requires authentication only (but no security), then
ensure that the USER and PASSWORD parameters are configured with the
credentials of a user with read-write access to JMX. To know how to create this
user, refer to the Monitoring Java Applications document. Confirm the password
by retyping it in the CONFIRM PASSWORD text box.
7. JNDINAME – This parameter appears only if the MODE is set to JMX. The JNDINAME
is a lookup name for connecting to the JMX connector. By default, this is
jmxrmi. If you have registered the JMX connector in the RMI registry using a
different lookup name, then you can change this default value to reflect the
same.
8. JREHOME - This parameter will be available only if the MEASURE MODE is set to
Log File. Specify the full path to the Java Runtime Environment (JRE) used by
the target application.
9. LOGFILENAME - This parameter will be available only if the MEASURE MODE is
set to Log File. Specify the full path to the GC log file to be used for metrics
collection.
Outputs of the
test
One set of results for every GarbageCollector:MemoryPool pair on the JVM of the
server being monitored
Measurements
made by the
test
Measurement
Measurement
Unit
Interpretation
Has garbage collection
happened?:
Indicates whether garbage
collection occurred on this
memory pool in the last
measurement period.
This measure reports the value
Yes if garbage collection took
place or No if it did not take place
on the memory pool.
The numeric values that
correspond to the measure values
of Yes and No are listed below:

M o n i t o r i n g W e b L o g i c A p p l i c a t i o n S e r v e r s
77
State
Value
Yes
1
No
0
Note:
By default, this measure reports
the value Yes or No to indicate
whether a GC occurred on a
memory pool or not. The graph of
this measure however, represents
the same using the numeric
equivalents – 0 or 1.
Collection count:
Indicates the number of time in
the last measurement pool
garbage collection was started
on this memory pool.
Number
Initial memory before GC:
Indicates the initial amount of
memory (in MB) that this
memory pool requests from the
operating system for memory
management during startup,
before GC process.
MB
Comparing the value of these two
measures for a memory pool will
give you a fair idea of the
effectiveness of the garbage
collection activity.
If garbage collection reclaims a
large amount of memory from the
memory pool, then the Initial
memory after GC will drop. On
the other hand, if the garbage
collector does not reclaim much
memory from a memory pool, or
if the Java application suddenly
runs a memory-intensive process
when GC is being performed, then
the Initial memory after GC may
be higher than the Initial memory
before GC.
Initial memory after GC:
Indicates the initial amount of
memory (in MB) that this
memory pool requests from the
operating system for memory
management during startup,
after GC process
MB

M o n i t o r i n g W e b L o g i c A p p l i c a t i o n S e r v e r s
78
Max memory before GC:
Indicates the maximum amount
of memory that can be used for
memory management by this
memory pool, before GC
process.
MB
Comparing the value of these two
measures for a memory pool will
provide you with insights into the
effectiveness of the garbage
collection activity.
If garbage collection reclaims a
large amount of memory from the
memory pool, then the Max
memory after GC will drop. On
the other hand, if the garbage
collector does not reclaim much
memory from a memory pool, or
if the Java application suddenly
runs a memory-intensive process
when GC is being performed, then
the Max memory after GC value
may exceed the Max memory
before GC.
Max memory after GC:
Indicates the maximum amount
of memory (in MB) that can be
used for memory management
by this pool, after the GC
process.
MB
Committed memory before
GC:
Indicates the amount of memory
that is guaranteed to be
available for use by this memory
pool, before the GC process.
MB
Committed memory after GC:
Indicates the amount of memory
that is guaranteed to be
available for use by this memory
pool, after the GC process.
MB
Used memory before GC:
Indicates the amount of memory
used by this memory pool before
GC.
MB
Comparing the value of these two
measures for a memory pool will
provide you with insights into the
effectiveness of the garbage
collection activity.
If garbage collection reclaims a
large amount of memory from the
memory pool, then the Used
memory after GC may drop lower
than the Used memory before
GC. On the other hand, if the
garbage collector does not
reclaim much memory from a
memory pool, or if the Java
application suddenly runs a
memory-intensive process when
GC is being performed, then the
Used memory after GC value may
exceed the Used memory before
GC.
Used memory after GC:
Indicates the amount of memory
used by this memory pool after
GC.
MB

M o n i t o r i n g W e b L o g i c A p p l i c a t i o n S e r v e r s
79
Percentage memory
collected:
Indicates the percentage of
memory collected from this pool
by the GC activity.
Percent
A high value for this measure is
indicative of a large amount of
unused memory in the pool. A
low value on the other hand
indicates that the memory pool
has been over-utilized. Compare
the value of this measure across
pools to identify the pools that
have very little free memory. If
too many pools appear to be
running short of memory, it could
indicate that the target
application is consuming too
much memory, which in the long
run, can slow down the
application significantly.
Collection duration:
Indicates the time taken by this
garbage collector for collecting
unused memory from this pool.
Mins
Ideally, the value of this measure
should be low. This is because,
the garbage collection (GC)
activity tends to suspend the
operations of the application until
such time that GC ends. Longer
the GC time, longer it would take
for the application to resume its
functions. To minimize the impact
of GC on application performance,
it is best to ensure that GC
activity does not take too long to
complete.
2.1.2.6.9 JMX Connection to JVM
This test reports the availability of the target Java application, and also indicates whether JMX is
enabled on the application or not. In addition, the test promptly alerts you to slowdowns experienced
by the application, and also reveals whether the application was recently restarted or not.
Purpose
Reports the availability of the target Java application, and also indicates whether
JMX is enabled on the application or not. In addition, the test promptly alerts you to
slowdowns experienced by the application, and also reveals whether the application
was recently restarted or not
Target of the
test
A Java application
Agent
deploying the
test
An internal/remote agent

M o n i t o r i n g W e b L o g i c A p p l i c a t i o n S e r v e r s
80
Configurable
parameters for
the test
1. TEST PERIOD - How often should the test be executed
2. HOST - The host for which the test is to be configured
3. PORT - The port number at which the specified HOST listens
4. JMX REMOTE PORT – Here, specify the port at which the JMX listens for requests
from remote hosts. Ensure that you specify the same port that you configured in
the management.properties file in the <JAVA_HOME>\jre\lib\management folder used
by the target application (refer to the Monitoring Java Applications document).
5. USER, PASSWORD, and CONFIRM PASSWORD – If JMX requires authentication only
(but no security), then ensure that the USER and PASSWORD parameters are
configured with the credentials of a user with read-write access to JMX. To know
how to create this user, refer to the Monitoring Java Applications document.
Confirm the password by retyping it in the CONFIRM PASSWORD text box.
6. JNDINAME – The JNDINAME is a lookup name for connecting to the JMX connector.
By default, this is jmxrmi. If you have registered the JMX connector in the RMI
registry using a different lookup name, then you can change this default value
to reflect the same.
Outputs of the
test
One set of results for the Java application being monitored
Measurements
made by the
test
Measurement
Measurement
Unit
Interpretation
JMX availability:
Indicates whether the target
application is available or not
and whether JMX is enabled or
not on the application.
Percent
If the value of this measure is
100%, it indicates that the Java
application is available with JMX
enabled. The value 0 on the other
hand, could indicate one/both the
following:
The Java application is
unavailable;
The Java application is
available, but JMX is not
enabled;
JMX response time:
Indicates the time taken to
connect to the JMX agent of the
Java application.
Secs
A high value could indicate a
connection bottleneck.
Has the PID changed?
Indicates whether/not the
process ID that corresponds to
the Java application has
changed.
This measure will report the value
Yes if the PID of the target
application has changed; such a
change is indicative of an
application restart. If the
application has not restarted -
i.e., if the PID has not changed -
then this measure will return the
value No.

M o n i t o r i n g W e b L o g i c A p p l i c a t i o n S e r v e r s
81
2.1.2.6.10 JVM File Descriptors Test
This test reports useful statistics pertaining to file descriptors.
Purpose
Reports useful statistics pertaining to file descriptors
Target of the
test
A Java application
Agent
deploying the
test
An internal/remote agent
Configurable
parameters for
the test
1. TEST PERIOD - How often should the test be executed
2. HOST - The host for which the test is to be configured
3. PORT - The port number at which the specified HOST listens
4. JMX REMOTE PORT – Here, specify the port at which the JMX listens for requests
from remote hosts. Ensure that you specify the same port that you configured in
the management.properties file in the <JAVA_HOME>\jre\lib\management folder used
by the target application (refer to the Monitoring Java Applications document).
5. USER, PASSWORD, and CONFIRM PASSWORD – If JMX requires authentication only
(but no security), then ensure that the USER and PASSWORD parameters are
configured with the credentials of a user with read-write access to JMX. To know
how to create this user, refer to the Monitoring Java Applications document.
Confirm the password by retyping it in the CONFIRM PASSWORD text box.
6. JNDINAME – The JNDINAME is a lookup name for connecting to the JMX connector.
By default, this is jmxrmi. If you have registered the JMX connector in the RMI
registry using a different lookup name, then you can change this default value
to reflect the same.
Outputs of the
test
One set of results for the Java application being monitored
Measurements
made by the
test
Measurement
Measurement
Unit
Interpretation
Open file descriptors in JVM:
Indicates the number of file
descriptors currently open for
the application.
Number
Maximum file descriptors in
JVM:
Indicates the maximum number
of file descriptors allowed for the
application.
Number
File descriptor usage by JVM:
Indicates the file descriptor
usage in percentage.
Percent
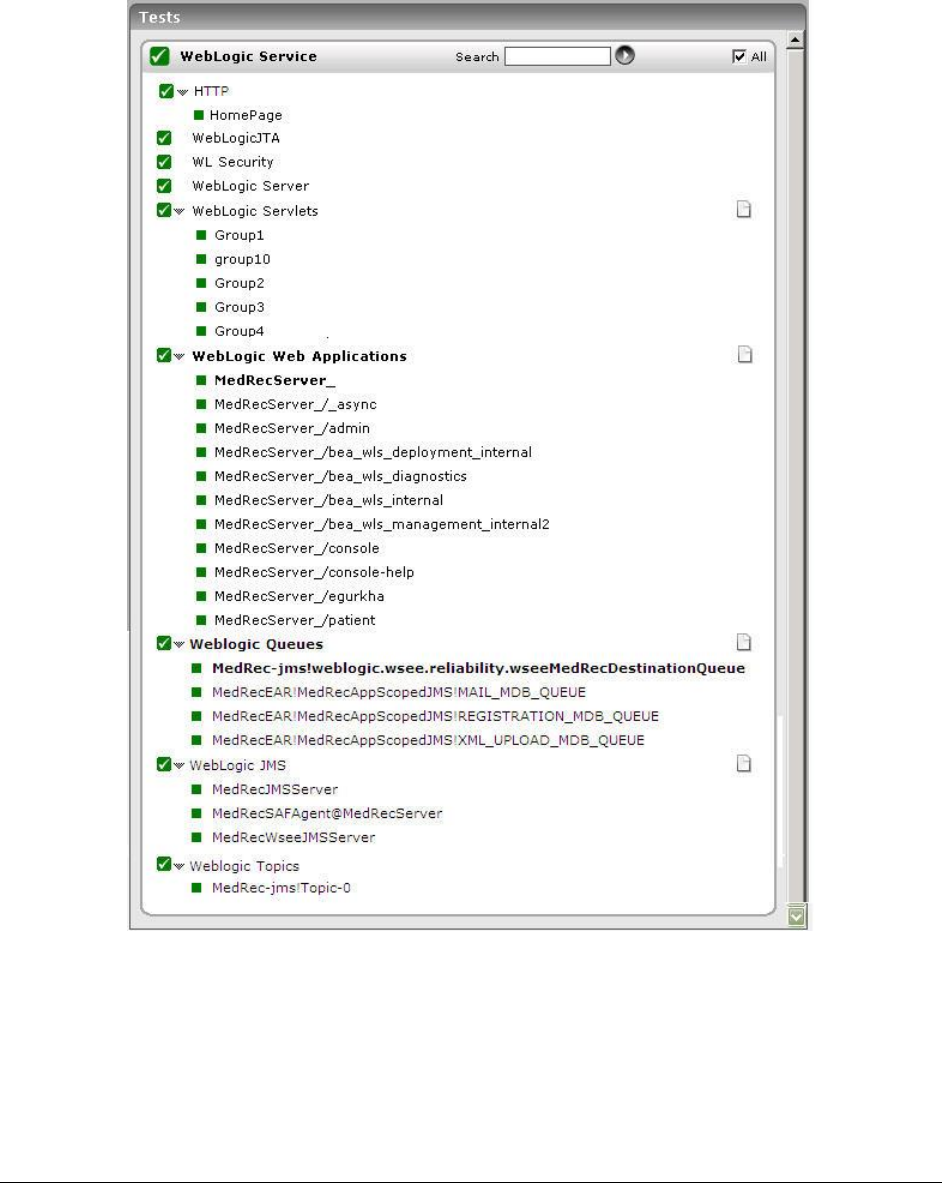
M o n i t o r i n g W e b L o g i c A p p l i c a t i o n S e r v e r s
82
2.1.3 The WebLogic Service Layer
The WebLogic Service layer tracks the health of the WebLogic service. The status of the WebLogic Service
layer is determined by the results of the tests shown in Figure 2.15.
Figure 2.15: Tests mapping to the WebLogic Service layer
2.1.3.1 HTTP Test
The details of the HTTP test that emulates a user accessing the web server component of a WebLogic
server, are provided below. Since this test can be executed from a location external to the WebLogic
server, this test presents an unbiased external perspective of the state of the web server component.
This test uses the GET command to submit its parameters.

M o n i t o r i n g W e b L o g i c A p p l i c a t i o n S e r v e r s
83
Purpose
This test measures the state of the web server component of a WebLogic server
Target
A WebLogic server
Agent
deploying this
test
An external agent executing on an eG server
Configurable
parameters for
this test
1. TEST PERIOD – How often should the test be executed
2. URL – The web page being accessed. While multiple URLs (separated by
commas) can be provided, each URL should be of the format URL name:URL
value. URL name is a unique name assigned to the URL, and the URL value is
the value of the URL. For example, a URL can be specified as
HomePage:http://192.168.10.12:7077/, where HomePage is the URL
name and http://192.168.10.12:7077/ is the URL value.
3. HOST - The host for which the test is to be configured.
4. PORT - The port to which the specified HOST listens
5. COOKIEFILE – Whether any cookies being returned by the web server need to
be saved locally and returned with subsequent requests
6. PROXYHOST – The host on which a web proxy server is running (in case a proxy
server is to be used)
7. PROXYPORT – The port number on which the web proxy server is listening
8. PROXYUSERNAME – The user name of the proxy server
9. PROXYPASSWORD – The password of the proxy server
10. CONFIRM PASSWORD – Confirm the password by retyping it here.
11. CONTENT – Is a set of instruction:value pairs that are used to validate the
content being returned by the test. If the CONTENT value is none:none, no
validation is performed. The number of pairs specified in this text box, must be
equal to the number of URLs being monitored. The instruction should be one of
Inc or Exc. Inc tells the test that for the content returned by the web server to
be valid, the content must include the specified value (a simple string search is
done in this case). An instruction of Exc instructs the test that the server's
output is valid if it does not contain the specified value. In both cases, the
content specification can include wild card patterns. For example, an Inc
instruction can be Inc:*Home page*. An Inc and an Exc instruction can be
provided in quick succession in the following format: Inc:*Home
Page*,Exc:*home.
12. CREDENTIALS – The HttpTest supports HTTP authentication. The CREDENTIALS
parameter is to be set if a specific user name / password has to be specified to
login to a page. Against this parameter, the URLname of every configured URL
will be displayed; corresponding to each listed URLname, a Username text box
and a Password text box will be made available. If the web server on which
HttpTest executes supports 'Anonymous user access', then this parameter will
take either of the following values:
o a valid Username and Password for every configured URLname
o none in both the Username and Password text boxes of all configured
URLnames (the default setting), if no user authorization is required
Some IIS web servers however, support NTLM (Integrated Windows)
authentication, where valid CREDENTIALS are mandatory. In other words, a

M o n i t o r i n g W e b L o g i c A p p l i c a t i o n S e r v e r s
84
none specification will not be supported by such IIS web servers. Therefore, in
this case, against each configured URLname, you will have to provide a valid
Username in the format: domainname\username, followed by a valid Password.
Please be sure to check if your web site requires HTTP authentication while
configuring this parameter. HTTP authentication typically involves a separate
pop-up window when you try to access the page. Many sites use HTTP POST for
obtaining the user name and password and validating the user login. In such
cases, the username and password have to be provided as part of the POST
information and NOT as part of the CREDENTIALS specification for the HTTP
test.
13. TIMEOUT - Here, specify the maximum duration (in seconds) for which the test
will wait for a response from the server. The default TIMEOUT period is 30
seconds.
Outputs of the
test
One set of outputs for every URL being monitored
Measurements
of the test
Measurement
Measurement
Unit
Interpretation
Availability:
This measurement
indicates whether the
server was able to respond
successfully to the query
made by the test.
Percent
Availability failures could be caused by
several factors such as the web server
process(es) being down, the web server
being misconfigured, a network failure,
etc. Temporary unavailability may also
occur if the web server is overloaded.
Availability is determined based on the
response code returned by the server.
A response code between 200 to 300
indicates that the server is available.
Total response time:
This measurement
indicates the time taken by
the server to respond to
the requests it receives.
Secs
Response time being high denotes a
problem. Poor response times may be
due to the server being overloaded or
misconfigured. If the URL accessed
involves the generation of dynamic
content by the server, backend
problems (e.g., an overload at the
application server or a database failure)
can also result in an increase in
response time.
Tcp connection
availability:
This measure indicates
whether the test managed
to establish a TCP
connection to the server.
Percent
Failure to establish a TCP connection
may imply that either the web server
process is not up, or that the process is
not operating correctly. In some cases
of extreme overload, the failure to
establish a TCP connection may be a
transient condition. As the load
subsides, the server may start
functioning properly again.

M o n i t o r i n g W e b L o g i c A p p l i c a t i o n S e r v e r s
85
Tcp connect time:
This measure quantifies
the time for establishing a
TCP connection to the web
server host.
Secs
Typically, the TCP connection
establishment must be very small (of
the order of a few milliseconds). Since
TCP connection establishment is
handled at the OS-level, rather than by
the application, an increase in this
value signifies a system-level
bottleneck on the host that supports
the web server.
Server response time:
This measure indicates the
time period between when
the connection was
established and when the
server sent back a HTTP
response header to the
client.
Secs
While the total response time may
depend on several factors, the server
response time is typically, a very good
indicator of a server bottleneck (e.g.,
because all the available server threads
or processes are in use).
Response code:
The response code
returned by the server for
the simulated request
Number
A value between 200 and 300 indicates
a good response. A 4xx value indicates
a problem with the requested content
(eg., page not found). A 5xx value
indicates a server error.
Content length:
The size of the content
returned by the server
Kbytes
Typically the content length returned by
the server for a specific URL should be
the same across time. Any change in
this metric may indicate the need for
further investigation on the server side.
Content validity:
This measure validates
whether the server was
successful in executing the
request made to it.
Percent
A value of 100% indicates that the
content returned by the test is valid. A
value of 0% indicates that the content
may not be valid. This capability for
content validation is especially
important for multi-tier web
applications. For example, a user may
not be able to login to the web site but
the server may reply back with a valid
HTML page where in the error message,
say, "Invalid Login" is reported. In this
case, the availability will be 100 %
(since we got a valid HTML response).
If the test is configured such that the
content parameter should exclude the
string "Invalid Login," in the above
scenario content validity would have a
value 0.
2.1.3.2 WL Security Test
This test reports security-related statistics for a WebLogic server. This test will work on WebLogic 7.x
and 8.0 only. While monitoring WebLogic 6.0, all the measures of this test will return 0.

M o n i t o r i n g W e b L o g i c A p p l i c a t i o n S e r v e r s
86
Purpose
Measures security statistics for a WebLogic server
Target of the
test
Any WebLogic managed server
Agent
deploying the
test
An internal agent
Configurable
parameters for
the test
1. TEST PERIOD - How often should the test be executed
2. HOST – The IP address of the WebLogic server
3. PORT – The port number of the WebLogic server
4. USER – The admin user name of the WebLogic server being monitored.
5. PASSWORD – The password of the specified admin user
6. CONFIRM PASSWORD – Confirm the password by retyping it here.
7. ENCRYPTPASS - If the specified password needs to be encrypted, set the
ENCRYPTPASS flag to YES. Otherwise, set it to NO. By default, the YES option will
be selected.
8. SSL – Indicate whether the SSL (Secured Socket Layer) is to be used to connect
to the WebLogic server.
9. SERVER - The name of the specific server instance to be monitored for a
WebLogic server (the default value is "localhome")
10. URL – The URL to be accessed to collect metrics pertaining to the WebLogic
server. By default, this test connects to a managed WebLogic server and
attempts to obtain the metrics of interest by accessing the local Mbeans of the
server. This parameter can be changed to a value of
http://<adminserverIP>:<adminserverPort>. In this case, the test connects
to the WebLogic admin server to collect metrics pertaining to the managed
server (specified by the HOST and PORT). The URL setting provides the
administrator with the flexibility of determining the WebLogic monitoring
configuration to use.
Note:
If the admin server is to be used for collecting measures for all the managed
WebLogic servers, then it is mandatory that the egurkha war file is deployed to
the admin server, and it is up and running.
11. VERSION - The VERSION textbox indicates the version of the Weblogic server to
be managed. The default value is "none", in which case the test auto-discovers
the weblogic version. If the value of this parameter is not "none", the test uses
the value provided (e.g., 7.0) as the weblogic version (i.e., it does not auto-
discover the weblogic server version). This parameter has been added to
address cases when the eG agent is not able to discover the WebLogic server
version.
Outputs of the
test
One set of results for every WebLogic server instance being monitored
Measurements
made by the
Measurement
Measurement
Unit
Interpretation

M o n i t o r i n g W e b L o g i c A p p l i c a t i o n S e r v e r s
87
test
Invalid login attempts:
Returns the cumulative number
of invalid logins attempted on
this server.
Attempts /
Sec
Look for an unusual number of
invalid logins.
Invalid users count high
water mark:
Returns the high water mark of
the number of users with
outstanding invalid login
attempts for this server.
Number
Current locked users:
Returns the number of currently
locked users on this server.
Number
Locked users cannot login to the
server. Hence, configure the
thresholds, so as to be alerted
when this value is greater than 0.
Locked user logins:
Returns the cumulative number
of invalid logins attempted
during the last measurement
period on this server while the
user was locked.
Number
Unlocked users:
Returns the number of times a
user has been unlocked on this
server during the last
measurement period.
Number
Users lockedout:
Returns the cumulative number
of user lockouts done on this
server during the last
measurement period.
Number
2.1.3.3 WebLogic JTA Test
This test reports transaction-related statistics for a WebLogic server.
Purpose
Reports transaction-related statistics for a WebLogic server
Target of the test
Any managed WebLogic server
Agent deploying the
test
An internal agent

M o n i t o r i n g W e b L o g i c A p p l i c a t i o n S e r v e r s
88
Configurable
parameters for the
test
1. TEST PERIOD - How often should the test be executed
2. HOST – The IP address of the WebLogic server
3. PORT – The port number of the WebLogic server
4. USER – The admin user name of the WebLogic server being monitored.
5. PASSWORD – The password of the specified admin user
6. CONFIRM PASSWORD – Confirm the password by retyping it here.
7. ENCRYPTPASS - If the specified password needs to be encrypted, set the
ENCRYPTPASS flag to YES. Otherwise, set it to NO. By default, the YES option
will be selected.
Note:
If the USEWARFILE flag is set to No, then make sure that the ENCRYPTPASS
flag is also set to No.
8. SSL – Indicate whether the SSL (Secured Socket Layer) is to be used to
connect to the WebLogic server.
9. SERVER - The name of the specific server instance to be monitored for a
WebLogic server (the default value is "localhome")
10. URL – The URL to be accessed to collect metrics pertaining to the WebLogic
server. By default, this test connects to a managed WebLogic server and
attempts to obtain the metrics of interest by accessing the local Mbeans of
the server. This parameter can be changed to a value of
http://<adminserverIP>:<adminserverPort>. In this case, the test
connects to the WebLogic admin server to collect metrics pertaining to the
managed server (specified by the HOST and PORT). The URL setting
provides the administrator with the flexibility of determining the WebLogic
monitoring configuration to use.
Note:
If the admin server is to be used for collecting measures for all the managed
WebLogic servers, then it is mandatory that the egurkha war file is deployed
to the admin server, and it is up and running.
11. VERSION - The VERSION textbox indicates the version of the Weblogic
server to be managed. The default value is "none", in which case the test
auto-discovers the weblogic version. If the value of this parameter is not
"none", the test uses the value provided (e.g., 7.0) as the weblogic version
(i.e., it does not auto-discover the weblogic server version). This parameter
has been added to address cases when the eG agent is not able to discover
the WebLogic server version.
12. USEWARFILE - This flag indicates whether/not monitoring is to be done
using a Web archive file deployed on the WebLogic server (in which case,
HTTP/HTTPS is used by the server to connect to the server). If this flag is
set to No, the agent directly connects to the WebLogic server using the T3
protocol (no other file needs to be deployed on the WebLogic server for this
to work). Note that the T3 protocol-based support is available for WebLogic servers
ver.9 and ver. 10 only. Also, if the USEWARFILE parameter is set to No, make
sure that the ENCRYPTPASS parameter is set to No as well.

M o n i t o r i n g W e b L o g i c A p p l i c a t i o n S e r v e r s
89
When monitoring a WebLogic server deployed on a Unix platform
particularly, if the USEWARFILE parameter is set to No, you have to make
sure that the eG agent install user is added to the WebLogic users group.
13. WEBLOGICJARLOCATION - Specify the location of the WebLogic server's
java archive (Jar) file. If the USEWARFILE flag is set to No, then the
weblogic.jar file specified here is used to connect to the corresponding
WebLogic server using the T3 protocol. Note that the T3 protocol-based support is
available for WebLogic servers ver.9 and ver. 10 only.
Outputs of the test
One set of results for every WebLogic server monitored
Measurements
made by the test
Measurement
Measurement
Unit
Interpretation
Total active
transactions:
Returns the number of
active transactions on the
server
Number
This metric gives an idea of the
server load.
Transaction aborts:
Returns the rate of
transactions that were
abandoned
Trans/Sec
Typically, the abandoned
transaction rate should be low.
Application rollbacks:
Returns the rate of
transactions that were
rolled back due to an
application error
Trans/Sec
Rollbacks can occur due to
various reasons. Correlate the
rollbacks on the application
server with that on the database
to isolate the cause of the
rollbacks.
Resource rollbacks:
Returns the rate of
transactions that were
rolled back due to a
resource error
Trans/Sec
System rollbacks:
Returns the rate of
transactions that were
rolled back due to an
internal system error
Trans/Sec
Rollback timeouts:
Returns the rate of
transactions that were
rolled back due to a
timeout expiration
Trans/Sec

M o n i t o r i n g W e b L o g i c A p p l i c a t i o n S e r v e r s
90
Commits:
Returns the rate of
committed transactions
Trans/Sec
Heuristic transactions:
Returns the rate of
transactions that
completed with a heuristic
status
Trans/Sec
Total rollbacks:
Returns the rate of
transactions that were
rolled back
Trans/Sec
A high value (rate) here would
mean that more number of
transactions are being rolled
back.
Total transactions:
Returns the total rate of
transactions processed.
This total includes all
committed, rolled back and
heuristic transaction
completions
Trans/Sec
2.1.3.4 WebLogic Servlets Test
This test periodically tracks the servlets invoked and reloaded, and measures the minimum,
maximum, and average response times of a specific server instance. Use the Click here hyperlink in the
test configuration page to configure the servlet groups that need to be monitored by the eG Enterprise
suite. By default, eG Enterprise system monitors only those servlets that are part of a group.
Purpose
To periodically track the servlets invoked and reloaded, and measure the
minimum, maximum, and average response times of a specific server instance
Target of the test
Any managed WebLogic server
Agent deploying the
test
An internal agent

M o n i t o r i n g W e b L o g i c A p p l i c a t i o n S e r v e r s
91
Configurable
parameters for the
test
1. TEST PERIOD - How often should the test be executed
2. HOST – The IP address of the WebLogic server
3. PORT – The port number of the WebLogic server
4. USER – The admin user name of the WebLogic server being monitored.
5. PASSWORD – The password of the specified admin user
6. CONFIRM PASSWORD – Confirm the password by retyping it here.
7. ENCRYPTPASS - If the specified password needs to be encrypted, set the
ENCRYPTPASS flag to YES. Otherwise, set it to NO. By default, the YES option
will be selected.
Note:
If the USEWARFILE flag is set to No, then make sure that the ENCRYPTPASS
flag is also set to No.
8. SSL – Indicate whether the SSL (Secured Socket Layer) is to be used to
connect to the WebLogic server.
9. SERVER - The name of the specific server instance to be monitored for a
WebLogic server (the default value is "localhome")
10. URL – The URL to be accessed to collect metrics pertaining to the WebLogic
server. By default, this test connects to a managed WebLogic server and
attempts to obtain the metrics of interest by accessing the local Mbeans of
the server. This parameter can be changed to a value of
http://<adminserverIP>:<adminserverPort>. In this case, the test
connects to the WebLogic admin server to collect metrics pertaining to the
managed server (specified by the HOST and PORT). The URL setting
provides the administrator with the flexibility of determining the WebLogic
monitoring configuration to use.
Note:
If the admin server is to be used for collecting measures for all the managed
WebLogic servers, then it is mandatory that the egurkha war file is deployed
to the admin server, and it is up and running.
11. AUTODISCOVERY – By default, the eG suite allows administrators to
configure servlet groups using the eG administrative interface, and reports
metrics pertaining to every group so created. Accordingly, by default,
AUTODISCOVERY is set to NO. If you want servlets to be discovered and
monitored automatically, then select the YES option against
AUTODISCOVERY. When this is done, the eG agent automatically discovers
all the servlets on the WebLogic server, and reports one set of measures for
every servlet hosted on the server.
12. VERSION - The VERSION textbox indicates the version of the Weblogic
server to be managed. The default value is "none", in which case the test
auto-discovers the weblogic version. If the value of this parameter is not
"none", the test uses the value provided (e.g., 7.0) as the weblogic version
(i.e., it does not auto-discover the weblogic server version). This parameter
has been added to address cases when the eG agent is not able to discover
the WebLogic server version.

M o n i t o r i n g W e b L o g i c A p p l i c a t i o n S e r v e r s
92
13. USEWARFILE - This flag indicates whether/not monitoring is to be done
using a Web archive file deployed on the WebLogic server (in which case,
HTTP/HTTPS is used by the server to connect to the server). If this flag is
set to No, the agent directly connects to the WebLogic server using the T3
protocol (no other file needs to be deployed on the WebLogic server for this
to work). Note that the T3 protocol-based support is available for WebLogic servers
ver.9 and ver. 10 only. Also, if the USEWARFILE parameter is set to No, make
sure that the ENCRYPTPASS parameter is set to No as well.
When monitoring a WebLogic server deployed on a Unix platform
particularly, if the USEWARFILE parameter is set to No, you have to make
sure that the eG agent install user is added to the WebLogic users group.
14. WEBLOGICJARLOCATION - Specify the location of the WebLogic server's
java archive (Jar) file. If the USEWARFILE flag is set to No, then the
weblogic.jar file specified here is used to connect to the corresponding
WebLogic server using the T3 protocol. Note that the T3 protocol-based support is
available for WebLogic servers ver.9 and ver. 10 only.
15. DETAILED DIAGNOSIS - To make diagnosis more efficient and accurate, the
eG Enterprise suite embeds an optional detailed diagnostic capability. With
this capability, the eG agents can be configured to run detailed, more
elaborate tests as and when specific problems are detected. To enable the
detailed diagnosis capability of this test for a particular server, choose the
On option. To disable the capability, click on the Off option.
The option to selectively enable/disable the detailed diagnosis capability will
be available only if the following conditions are fulfilled:
The eG manager license should allow the detailed diagnosis capability
Both the normal and abnormal frequencies configured for the detailed
diagnosis measures should not be 0.
Outputs of the test
One set of results for every servlet group configured
Measurements
made by the test
Measurement
Measurement
Unit
Interpretation
Max execution time of
servlet:
The average duration for
which the single longest
invocation of all the
servlets within a servlet
group executed since
creation
Number
Min execution time of
servlet:
The average duration for
which the single shortest
invocation of all the
servlets in a servlet group
executed since creation
Secs
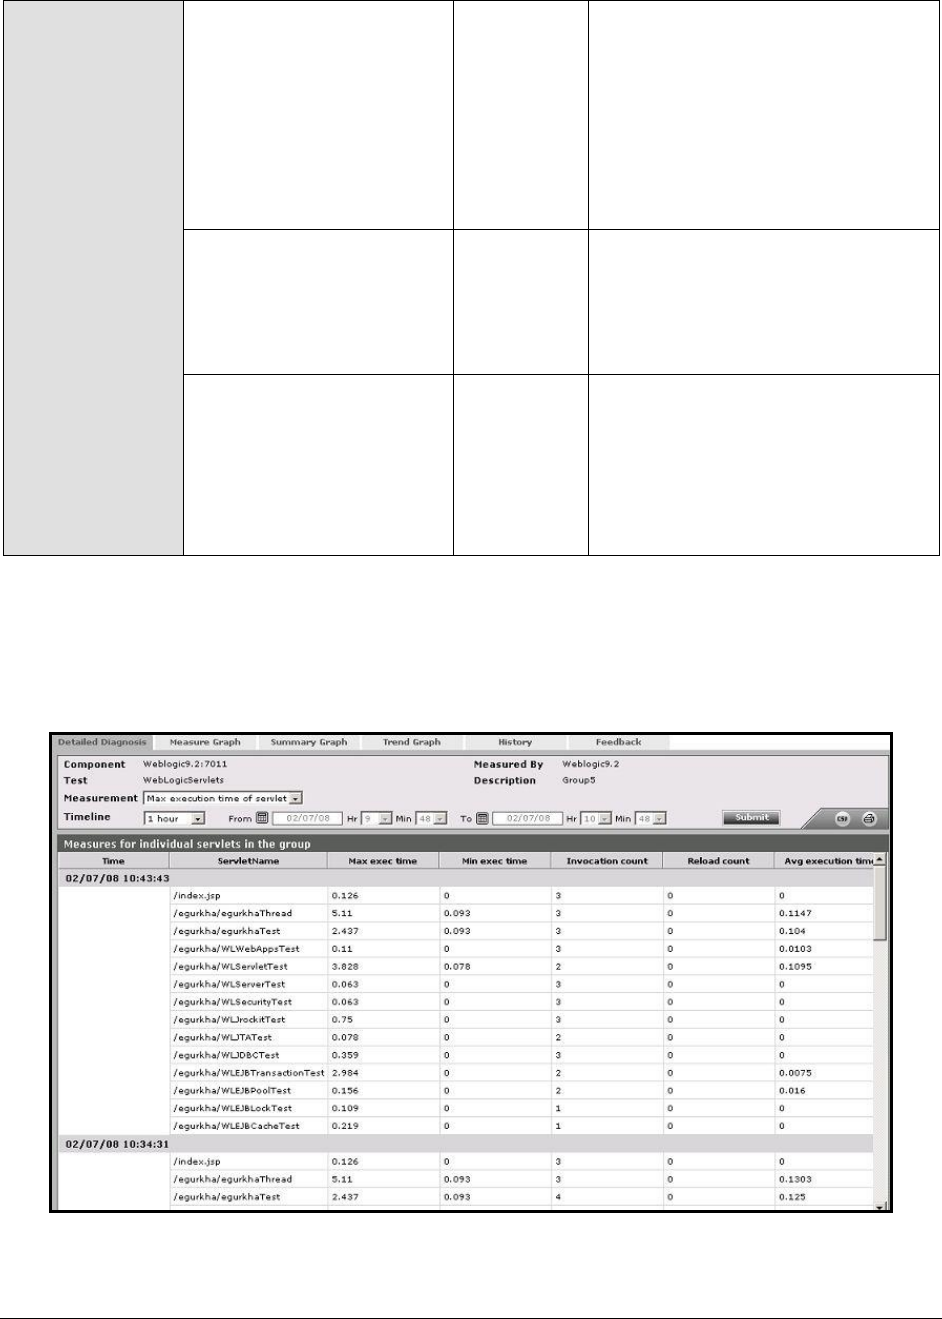
M o n i t o r i n g W e b L o g i c A p p l i c a t i o n S e r v e r s
93
Invocation count of
servlet:
The total number of times
the servlets within a
servlet group were invoked
Number
Comparing this value across
servlets can provide an indication of
the relative popularity of the
servlets. An administrator can use
information about invocations to
determine the servlet(s), by tuning
which the performance of the
service can be significantly
improved.
Reloads of servlet:
The total number of times
for which the servlets
within a servlet group were
reloaded
Number
Avg execution of
servlet:
The average of response
time of the servlets in a
servlet group
Secs
This measure indicates which
servlet(s) are providing slow
response. An increased execution
time can be attributed to poor
design of the servlet code, slow
database access or non-optimal
queries.
The detailed diagnosis of the all the above measures, if enabled, reveals the maximum execution
time, minimum execution time, invocation count, reload count, and average execution time for every
servlet in the configured servlet groups. Note that the detailed diagnosis information will not be available if the
AUTODISCOVERY parameter is set to ‘Yes’.
Figure 2.16: The detailed diagnosis of the Max execution time measure

M o n i t o r i n g W e b L o g i c A p p l i c a t i o n S e r v e r s
94
2.1.3.5 WebLogic Server Test
This test reports key run-time statistics pertaining to the instances of a WebLogic server.
Purpose
Reports key run-time statistics pertaining to the instances of a WebLogic server
Target of the test
Any managed WebLogic server
Agent deploying the
test
An internal agent

M o n i t o r i n g W e b L o g i c A p p l i c a t i o n S e r v e r s
95
Configurable
parameters for the
test
1. TESTPERIOD - How often should the test be executed
2. HOST – The IP address of the WebLogic server
3. PORT – The port number of the WebLogic server
4. USER – The admin user name of the WebLogic server being monitored.
5. PASSWORD – The password of the specified admin user
6. CONFIRM PASSWORD – Confirm the password by retyping it here.
7. ENCRYPTPASS - If the specified password needs to be encrypted, set the
ENCRYPTPASS flag to YES. Otherwise, set it to NO. By default, the YES option
will be selected.
Note:
If the USEWARFILE flag is set to No, then make sure that the ENCRYPTPASS
flag is also set to No.
8. SSL – Indicate whether the SSL (Secured Socket Layer) is to be used to
connect to the WebLogic server.
9. SERVER - The name of the specific server instance to be monitored for a
WebLogic server (the default value is "localhome")
10. URL – The URL to be accessed to collect metrics pertaining to the WebLogic
server. By default, this test connects to a managed WebLogic server and
attempts to obtain the metrics of interest by accessing the local Mbeans of
the server. This parameter can be changed to a value of
http://<adminserverIP>:<adminserverPort>. In this case, the test
connects to the WebLogic admin server to collect metrics pertaining to the
managed server (specified by the HOST and PORT). The URL setting
provides the administrator with the flexibility of determining the WebLogic
monitoring configuration to use.
Note:
If the admin server is to be used for collecting measures for all the managed
WebLogic servers, then it is mandatory that the egurkha war file is deployed
to the admin server, and it is up and running.
11. VERSION - The VERSION textbox indicates the version of the Weblogic
server to be managed. The default value is "none", in which case the test
auto-discovers the weblogic version. If the value of this parameter is not
"none", the test uses the value provided (e.g., 7.0) as the weblogic version
(i.e., it does not auto-discover the weblogic server version). This parameter
has been added to address cases when the eG agent is not able to discover
the WebLogic server version.
12. USEWARFILE - This flag indicates whether/not monitoring is to be done
using a Web archive file deployed on the WebLogic server (in which case,
HTTP/HTTPS is used by the server to connect to the server). If this flag is
set to No, the agent directly connects to the WebLogic server using the T3
protocol (no other file needs to be deployed on the WebLogic server for this
to work). Note that the T3 protocol-based support is available for WebLogic servers
ver.9 and ver. 10 only. Also, if the USEWARFILE parameter is set to No, make
sure that the ENCRYPTPASS parameter is set to No as well.

M o n i t o r i n g W e b L o g i c A p p l i c a t i o n S e r v e r s
96
When monitoring a WebLogic server deployed on a Unix platform
particularly, if the USEWARFILE parameter is set to No, you have to make
sure that the eG agent install user is added to the WebLogic users group.
13. WEBLOGICJARLOCATION - Specify the location of the WebLogic server's
java archive (Jar) file. If the USEWARFILE flag is set to No, then the
weblogic.jar file specified here is used to connect to the corresponding
WebLogic server using the T3 protocol. Note that the T3 protocol-based support is
available for WebLogic servers ver.9 and ver. 10 only.
Outputs of the test
One set of results for every WebLogic server being monitored
Measurements
made by the test
Measurement
Measurement
Unit
Interpretation
Server availability:
Indicates the state of the
WebLogic server instance.
Percent
A server instance can assume
any of the following states:
State
Description
ACTIVE_LATER
Indicates that
MaxRestart
restart
attempts have
been made in
current
RestartInterval
, and Node
Manager will
attempt
additional
restarts
FAILED
A critical
subsystem is
not functioning

M o n i t o r i n g W e b L o g i c A p p l i c a t i o n S e r v e r s
97
FAILED_NOT_R
ESTARTABLE
Indicates that
the Managed
Server has
failed or was
killed by Node
Manager as a
result of the
Managed
Server's
AutoKillIfFailed
attribute being
set to True,
but Node
Manager
cannot restart
the Managed
Server because
its AutoRestart
attribute is set
to False.
FAILED_RESTA
RTING
Indicates that
Node Manager
is currently
restarting a
failed Managed
Server

M o n i t o r i n g W e b L o g i c A p p l i c a t i o n S e r v e r s
98
RESUMING
The server is
transitioning
from the
STANDBY state
to RUNNING.
RUNNING
The server can
receive and
process
requests from
external clients
as well as
administrative
requests.
SHUTDOWN
The server is
configured but
inactive.
SHUTDOWN_I
N_PROCESS
Indicates that
the shutdown
is in progress
SHUTDOWN_P
ENDING
Indicates that
a shutdown
request has
been sent, but
the actual
shutdown
process is yet
to begin
SHUTTING_DO
WN
The server is
transitioning
from either the
RUNNING or
STANDBY state
to SHUTDOWN.
STANDBY
The server can
receive and
process only
administrative
requests.
STARTING
The server is
initializing all
it's
subsystems.
SUSPENDING
The server is
transitioning
from either the
SHUTDOWN or
RUNNING state
to STANDBY.
M o n i t o r i n g W e b L o g i c A p p l i c a t i o n S e r v e r s
99
UNKNOWN
The state of
the server
cannot be
determined,
perhaps
because it
cannot be
contacted.
If the state of the server
instance is STARTING,
RUNNING, or RESUMING, then
the value of this measure will be
100. For any other state, the
value of this measure will be 0.
Current sockets count:
Indicates the number of
sockets registered for socket
muxing on this server
instance.
Number
Sockets opened:
Indicates the total number of
registrations for socket
muxing on this server.
Number
2.1.3.6 WebLogic Web Applications Test
This test automatically discovers all the Web application components deployed on the WebLogic
server, and reports real-time performance data pertaining to each of the components.
Purpose
Reports real-time performance data pertaining to each of the Web application
components
Target of the test
Any managed WebLogic server
Agent deploying the
test
An internal agent

M o n i t o r i n g W e b L o g i c A p p l i c a t i o n S e r v e r s
100
Configurable
parameters for the
test
1. TEST PERIOD - How often should the test be executed
2. HOST – The IP address of the WebLogic server
3. PORT – The port number of the WebLogic server
4. USER – The admin user name of the WebLogic server being monitored.
5. PASSWORD – The password of the specified admin user
6. CONFIRM PASSWORD – Confirm the password by retyping it here.
7. ENCRYPTPASS - If the specified password needs to be encrypted, set the
ENCRYPTPASS flag to YES. Otherwise, set it to NO. By default, the YES option
will be selected.
Note:
If the USEWARFILE flag is set to No, then make sure that the ENCRYPTPASS
flag is also set to No.
8. SSL – Indicate whether the SSL (Secured Socket Layer) is to be used to
connect to the WebLogic server.
9. SERVER - The name of the specific server instance to be monitored for a
WebLogic server (the default value is "localhome")
10. URL – The URL to be accessed to collect metrics pertaining to the WebLogic
server. By default, this test connects to a managed WebLogic server and
attempts to obtain the metrics of interest by accessing the local Mbeans of
the server. This parameter can be changed to a value of
http://<adminserverIP>:<adminserverPort>. In this case, the test
connects to the WebLogic admin server to collect metrics pertaining to the
managed server (specified by the HOST and PORT). The URL setting
provides the administrator with the flexibility of determining the WebLogic
monitoring configuration to use.
Note:
If the admin server is to be used for collecting measures for all the managed
WebLogic servers, then it is mandatory that the egurkha war file is deployed
to the admin server, and it is up and running.
11. VERSION - The VERSION textbox indicates the version of the Weblogic
server to be managed. The default value is "none", in which case the test
auto-discovers the weblogic version. If the value of this parameter is not
"none", the test uses the value provided (e.g., 7.0) as the weblogic version
(i.e., it does not auto-discover the weblogic server version). This parameter
has been added to address cases when the eG agent is not able to discover
the WebLogic server version.
12. USEWARFILE - This flag indicates whether/not monitoring is to be done
using a Web archive file deployed on the WebLogic server (in which case,
HTTP/HTTPS is used by the server to connect to the server). If this flag is
set to No, the agent directly connects to the WebLogic server using the T3
protocol (no other file needs to be deployed on the WebLogic server for this
to work). Note that the T3 protocol-based support is available for WebLogic servers
ver.9 and ver. 10 only. Also, if the USEWARFILE parameter is set to No, make
sure that the ENCRYPTPASS parameter is set to No as well.

M o n i t o r i n g W e b L o g i c A p p l i c a t i o n S e r v e r s
101
When monitoring a WebLogic server deployed on a Unix platform
particularly, if the USEWARFILE parameter is set to No, you have to make
sure that the eG agent install user is added to the WebLogic users group.
13. WEBLOGICJARLOCATION - Specify the location of the WebLogic server's
java archive (Jar) file. If the USEWARFILE flag is set to No, then the
weblogic.jar file specified here is used to connect to the corresponding
WebLogic server using the T3 protocol. Note that the T3 protocol-based support is
available for WebLogic servers ver.9 and ver. 10 only.
Outputs of the test
One set of results for every Web application discovered on the WebLogic server
being monitored
Measurements
made by the test
Measurement
Measurement
Unit
Interpretation
Sessions open current:
Indicates the total number of
open sessions in this
component currently.
Number
Sessions open high water
mark:
Returns the high water mark
of the total number of open
sessions in this component.
Number
Sessions open total:
Returns the total number of
open sessions in this
component since the last
measurement period.
Number
This measure is indicative of the
workload on the application
component. By observing the
variations to this measure over
time, you can determine usage
trends such as the time of day
when an application is getting
the most amount of traffic.
Sessions invalid time:
Returns the invalidation
check timer interval
configured for http sessions.
Secs
2.1.3.7 WebLogic Queues Test
A JMS queue represents the point-to-point (PTP) messaging model, which enables one application to
send a message to another. PTP messaging applications send and receive messages using named
queues. A queue sender (producer) sends a message to a specific queue. A queue receiver
(consumer) receives messages from a specific queue.
This test auto-discovers the queues on a WebLogic server, and monitors each queue for the size,
number, and type of messages it holds, so that impending overloads and probable delivery
bottlenecks can be proactively isolated and corrected.

M o n i t o r i n g W e b L o g i c A p p l i c a t i o n S e r v e r s
102
Purpose
Auto-discovers the queues on a WebLogic server, and monitors each queue for
the size, number, and type of messages it holds, so that impending overloads
and probable delivery bottlenecks can be proactively isolated and corrected
Target of the test
Any managed WebLogic server
Agent deploying the
test
An internal agent

M o n i t o r i n g W e b L o g i c A p p l i c a t i o n S e r v e r s
103
Configurable
parameters for the
test
1. TEST PERIOD - How often should the test be executed
2. HOST – The IP address of the WebLogic server
3. PORT – The port number of the WebLogic server
4. USER – The admin user name of the WebLogic server being monitored.
5. PASSWORD – The password of the specified admin user
6. CONFIRM PASSWORD – Confirm the password by retyping it here.
7. ENCRYPTPASS - If the specified password needs to be encrypted, set the
ENCRYPTPASS flag to YES. Otherwise, set it to NO. By default, the YES option
will be selected.
Note:
If the USEWARFILE flag is set to No, then make sure that the ENCRYPTPASS
flag is also set to No.
8. SSL – Indicate whether the SSL (Secured Socket Layer) is to be used to
connect to the WebLogic server.
9. SERVER - The name of the specific server instance to be monitored for a
WebLogic server (the default value is "localhome")
10. URL – The URL to be accessed to collect metrics pertaining to the WebLogic
server. By default, this test connects to a managed WebLogic server and
attempts to obtain the metrics of interest by accessing the local Mbeans of
the server. This parameter can be changed to a value of
http://<adminserverIP>:<adminserverPort>. In this case, the test
connects to the WebLogic admin server to collect metrics pertaining to the
managed server (specified by the HOST and PORT). The URL setting
provides the administrator with the flexibility of determining the WebLogic
monitoring configuration to use.
Note:
If the admin server is to be used for collecting measures for all the managed
WebLogic servers, then it is mandatory that the egurkha war file is deployed
to the admin server, and it is up and running.
11. VERSION - The VERSION textbox indicates the version of the Weblogic
server to be managed. The default value is "none", in which case the test
auto-discovers the weblogic version. If the value of this parameter is not
"none", the test uses the value provided (e.g., 7.0) as the weblogic version
(i.e., it does not auto-discover the weblogic server version). This parameter
has been added to address cases when the eG agent is not able to discover
the WebLogic server version.
12. USEWARFILE - This flag indicates whether/not monitoring is to be done
using a Web archive file deployed on the WebLogic server (in which case,
HTTP/HTTPS is used by the server to connect to the server). If this flag is
set to No, the agent directly connects to the WebLogic server using the T3
protocol (no other file needs to be deployed on the WebLogic server for this
to work). Note that the T3 protocol-based support is available for WebLogic servers
ver.9 and ver. 10 only. Also, if the USEWARFILE parameter is set to No, make
sure that the ENCRYPTPASS parameter is set to No as well.

M o n i t o r i n g W e b L o g i c A p p l i c a t i o n S e r v e r s
104
When monitoring a WebLogic server deployed on a Unix platform
particularly, if the USEWARFILE parameter is set to No, you have to make
sure that the eG agent install user is added to the WebLogic users group.
13. WEBLOGICJARLOCATION - Specify the location of the WebLogic server's
java archive (Jar) file. If the USEWARFILE flag is set to No, then the
weblogic.jar file specified here is used to connect to the corresponding
WebLogic server using the T3 protocol. Note that the T3 protocol-based support is
available for WebLogic servers ver.9 and ver. 10 only.
Outputs of the test
One set of results for every queue auto-discovered on the monitored WebLogic
server
Measurements
made by the test
Measurement
Measurement
Unit
Interpretation
Messages count:
Indicates the current number
of messages in this queue.
Number
This count does not include the
messages that are pending.
Messages pending count:
Indicates the number of
pending messages in this
queue.
Number
A message is considered to be in
pending state when it is:
sent in a transaction but
not committed.
received and not
acknowledged
received and not
committed
subject to a redelivery
delay (as of WebLogic
JMS 6.1 or later)
subject to a delivery
time (as of WebLogic
JMS 6.1 or later)

M o n i t o r i n g W e b L o g i c A p p l i c a t i o n S e r v e r s
105
While momentary spikes in the
number of pending messages in
a queue is normal, if the number
is allowed to grow consistently
over time, it is bound to increase
the total number of messages in
the queue. Typically, the sum of
the values of the Messages count
and the Messages pending count
measures equals the total
number of messages in the
queue. If this sum is equal to or
is very close to the Messages
Maximum setting for the quota
resource that is mapped to this
queue, it implies that the queue
has filled up or is rapidly filling
up with messages and cannot
handle any more. When this
happens, JMS prevents further
sends with a
ResourceAllocationException.
Furthermore, such quota failures
will force multiple producers to
contend for space in the queue,
thereby degrading application
performance. To avoid this, you
can do one/more of the
following:
Increase the Messages
Maximum setting of the
quota resource mapped
to the queue;
If a quota has not been
configured for the queue,
then increase the quota
of the JMS server where
the queue is deployed;

M o n i t o r i n g W e b L o g i c A p p l i c a t i o n S e r v e r s
106
Regulate the flow of
messages into the queue
using one/more of the
following configurations:
o Blocking senders
during quota
conditions: The Send
Timeout feature
provides more
control over message
send operations by
giving message
producers the option
of waiting a specified
length of time until
space becomes
available on a
destination.
o Specifying a Blocking
Send Policy on JMS
Servers : The
Blocking Send
policies enable you
to define the JMS
server’s blocking
behavior on whether
to deliver smaller
messages before
larger ones when
multiple message
producers are
competing for space
on a destination that
has exceeded its
message quota.

M o n i t o r i n g W e b L o g i c A p p l i c a t i o n S e r v e r s
107
o Using the Flow
Control feature: With
the Flow Control
feature, you can
direct a JMS server
or destination to slow
down message
producers when it
determines that it is
becoming
overloaded.
Specifically, when
either a JMS server
or it’s destinations
exceeds its specified
byte or message
threshold, it becomes
armed and instructs
producers to limit
their message flow
(messages per
second). Producers
will limit their
production rate
based on a set of
flow control
attributes configured
for producers via the
JMS connection
factory. Starting at a
specified flow
maximum number of
messages, a
producer evaluates
whether the
server/destination is
still armed at
prescribed intervals
(for example, every
10 seconds for 60
seconds).

M o n i t o r i n g W e b L o g i c A p p l i c a t i o n S e r v e r s
108
If at each interval,
the
server/destination is
still armed, then the
producer continues
to move its rate
down to its
prescribed flow
minimum amount. As
producers slow
themselves down,
the threshold
condition gradually
corrects itself until
the
server/destination is
unarmed. At this
point, a producer is
allowed to increase
its production rate,
but not necessarily to
the maximum
possible rate. In fact,
its message flow
continues to be
controlled (even
though the
server/destination is
no longer armed)
until it reaches its
prescribed flow
maximum, at which
point it is no longer
flow controlled.
o By tuning Message
Performance
Preference: The
Messaging
Performance
Preference tuning
option on JMS
destinations enables
you to control how
long a destination
should wait (if at all)
before creating full
batches of available
messages for
delivery to
consumers.

M o n i t o r i n g W e b L o g i c A p p l i c a t i o n S e r v e r s
109
At the minimum
value, batching is
disabled. Tuning
above the default
value increases the
amount of time a
destination is willing
to wait before
batching available
messages. The
maximum message
count of a full batch
is controlled by the
JMS connection
factory’s Messages
Maximum per
Session setting. It
may take some
experimentation to
find out which value
works best for your
system. For example,
if you have a queue
with many
concurrent message
consumers, by
selecting the
Administration
Console’s Do Not
Batch Messages
value (or specifying
“0” on the
DestinationBean
MBean), the queue
will make every
effort to promptly
push messages out
to its consumers as
soon as they are
available.

M o n i t o r i n g W e b L o g i c A p p l i c a t i o n S e r v e r s
110
Conversely, if you
have a queue with
only one message
consumer that does
not require fast
response times, by
selecting the
console’s High
Waiting Threshold for
Message Batc hing
value (or specifying
“100” on the
DestinationBean
MBean), you can
ensure that the
queue only pushes
messages to that
consumer in batches.
Bytes count:
Indicates the current size of
the message that is stored in
the queue destination in
bytes.
KB
This count does not include the
pending bytes.

M o n i t o r i n g W e b L o g i c A p p l i c a t i o n S e r v e r s
111
Bytes pending count:
Indicates the current size of
the pending message that is
stored in the queue
destination in bytes.
KB
While momentary spikes in the
size of pending messages in a
queue is acceptable, if the size is
allowed to grow consistently
over time, it is bound to increase
the total size of all messages in
the queue. Typically, the sum of
the values of the
BytesCurrentCount and the
BytesPendingCount measures
indicates the total size of all
messages in the queue. If this
sum is equal to or is very close
to the Bytes Maximum setting
for the quota resource that is
mapped to this queue, it implies
that the queue has filled up or is
rapidly filling up with messages
and cannot handle any more.
When this happens, JMS
prevents further sends with a
ResourceAllocationException.
Furthermore, such quota failures
will force multiple producers to
contend for space in the queue,
thereby degrading application
performance. To avoid this, you
can do one/more of the
following:

M o n i t o r i n g W e b L o g i c A p p l i c a t i o n S e r v e r s
112
Increase the Bytes
Maximum setting of the
quota resource mapped
to the queue;
If a quota has not been
configured for the queue,
then increase the quota
of the JMS server where
the queue is deployed;
Regulate the flow of
messages into the queue
using one/more of the
following configurations:
o Blocking senders
during quota
conditions: The Send
Timeout feature
provides more
control over message
send operations by
giving message
producers the option
of waiting a specified
length of time until
space becomes
available on a
destination.
o Specifying a Blocking
Send Policy on JMS
Servers : The
Blocking Send
policies enable you
to define the JMS
server’s blocking
behavior on whether
to deliver smaller
messages before
larger ones when
multiple message
producers are
competing for space
on a destination that
has exceeded its
message quota.

M o n i t o r i n g W e b L o g i c A p p l i c a t i o n S e r v e r s
113
o Using the Flow
Control feature:
o With the Flow Control
feature, you can
direct a JMS server
or destination to slow
down message
producers when it
determines that it is
becoming
overloaded.
Specifically, when
either a JMS server
or it’s destinations
exceeds its specified
byte or message
threshold, it becomes
armed and instructs
producers to limit
their message flow
(messages per
second). Producers
will limit their
production rate
based on a set of
flow control
attributes configured
for producers via the
JMS connection
factory. Starting at a
specified flow
maximum number of
messages, a
producer evaluates
whether the
server/destination is
still armed at
prescribed intervals
(for example, every
10 seconds for 60
seconds).

M o n i t o r i n g W e b L o g i c A p p l i c a t i o n S e r v e r s
114
If at each interval,
the server/des
tination is still
armed, then the
producer continues
to move its rate
down to its
prescribed flow
minimum amount. As
producers slow
themselves down,
the threshold
condition gradually
corrects itself until
the
server/destination is
unarmed. At this
point, a producer is
allowed t o increase
its production rate,
but not necessarily to
the maximum
possible rate. In fact,
its message flow
continues to be
controlled (even
though the
server/destination is
no longer armed)
until it reaches its
prescribed flow
maximum, at which
point it is no longer
flow controlled.
o By Tuning the
MessageMaximum
configuration:
WebLogic JMS
pipelines messages
that are delivered to
asynchronous
consumers
(otherwise known as
message listeners) or
prefetch-enabled
synchronous
consumers.

M o n i t o r i n g W e b L o g i c A p p l i c a t i o n S e r v e r s
115
The messages
backlog (the size of
the pipeline)
between the JMS
server and the client
is tunable by
configuring the
MessagesMaximum
setting on the
connection factory.
In some
circumstances,
tuning this setting
may improve
performance
dramatically, such as
when the JMS
application defers
acknowledges or
commits. In this
case, BEA suggests
setting the
MessagesMaximum
value to: 2 * (ack or
commit interval) + 1.
For example, if the
JMS application
acknowledges 50
messages at a time,
set the
MessagesMaximum
value to 101. You
may also need to
configure WebLogic
clients in addition to
the WebLogic Server
instance, when
sending and
receiving large
messages.
By compressing
messages: You may
improve the
performance of
sending large
messages traveling
across JVM
boundaries and help
conserve disk space
by specifying the
automatic

M o n i t o r i n g W e b L o g i c A p p l i c a t i o n S e r v e r s
116
compression of any
messages that
exceed a user-
specified threshold
size. Message
compression can help
reduce network
bottlenecks by
automatically
reducing the size of
messages sent
across network
wires. Compressing
messages can also
conserve disk space
when storing
persistent messages
in file stores or
databases.
o By paging out
messages: With the
message paging
feature, JMS servers
automatically
attempt to free up
virtual memory
during peak message
load periods. This
feature can greatly
benefit applications
with large message
spaces.
By tuning the
Message Buffer Size:
The Message Buffer
Size option specifies
the amount of
memory that will be
used to store
message bodies in
memory before they
are paged out to
disk.

M o n i t o r i n g W e b L o g i c A p p l i c a t i o n S e r v e r s
117
The default value of
Message Buffer Size
is approximately
one-third of the
maximum heap size
for the JVM, or a
maximum of 512
megabytes. The
larger this parameter
is set, the more
memory JMS will
consume when many
messages are waiting
on queues or topics.
Once this threshold
is crossed, JMS may
write message bodies
to the directory
specified by the
Paging Directory
option in an effort to
reduce memory
usage below this
threshold.
Messages deleted count:
Indicates the number of
messages that have been
deleted from this queue.
Number
While you can design a
QueueBrowser on your JMS
server to view and delete
specific queue messages, some
messages are automatically
deleted by the server. For
instance, one-way messages
that exceed quota are silently
deleted without immediately
throwing exceptions back to the
client.
Messages moved count:
Indicates the number of
messages that have been
moved from one queue
destination to the other.
Number
Consumers count:
Indicates the current number
of consumers accessing the
queue destination.
Number
M o n i t o r i n g W e b L o g i c A p p l i c a t i o n S e r v e r s
118
2.1.3.8 WebLogic Topics Test
The publish/subscribe (pub/sub) messaging model enables an application to send a message to
multiple applications. Pub/sub messaging applications send and receive messages by subscribing to a
topic. A topic publisher (producer) sends messages to a specific topic. A topic subscriber (consumer)
retrieves messages from a specific topic.
This test auto-discovers the topics on a WebLogic server, and monitors each topic for the size,
number, and type of messages it holds, so that impending overloads and probable delivery
bottlenecks can be proactively isolated and corrected.
Purpose
Auto-discovers the topics on a WebLogic server, and monitors each topic for the
size, number, and type of messages it holds, so that impending overloads and
probable delivery bottlenecks can be proactively isolated and corrected
Target of the test
Any managed WebLogic server
Agent deploying the
test
An internal agent

M o n i t o r i n g W e b L o g i c A p p l i c a t i o n S e r v e r s
119
Configurable
parameters for the
test
1. TEST PERIOD - How often should the test be executed
2. HOST – The IP address of the WebLogic server
3. PORT – The port number of the WebLogic server
4. USER – The admin user name of the WebLogic server being monitored.
5. PASSWORD – The password of the specified admin user
6. CONFIRM PASSWORD – Confirm the password by retyping it here.
7. ENCRYPTPASS - If the specified password needs to be encrypted, set the
ENCRYPTPASS flag to YES. Otherwise, set it to NO. By default, the YES option
will be selected.
Note:
If the USEWARFILE flag is set to No, then make sure that the ENCRYPTPASS
flag is also set to No.
8. SSL – Indicate whether the SSL (Secured Socket Layer) is to be used to
connect to the WebLogic server.
9. SERVER - The name of the specific server instance to be monitored for a
WebLogic server (the default value is "localhome")
10. URL – The URL to be accessed to collect metrics pertaining to the WebLogic
server. By default, this test connects to a managed WebLogic server and
attempts to obtain the metrics of interest by accessing the local Mbeans of
the server. This parameter can be changed to a value of
http://<adminserverIP>:<adminserverPort>. In this case, the test
connects to the WebLogic admin server to collect metrics pertaining to the
managed server (specified by the HOST and PORT). The URL setting
provides the administrator with the flexibility of determining the WebLogic
monitoring configuration to use.
Note:
If the admin server is to be used for collecting measures for all the managed
WebLogic servers, then it is mandatory that the egurkha war file is deployed
to the admin server, and it is up and running.
11. VERSION - The VERSION textbox indicates the version of the Weblogic
server to be managed. The default value is "none", in which case the test
auto-discovers the weblogic version. If the value of this parameter is not
"none", the test uses the value provided (e.g., 7.0) as the weblogic version
(i.e., it does not auto-discover the weblogic server version). This parameter
has been added to address cases when the eG agent is not able to discover
the WebLogic server version.
12. USEWARFILE - This flag indicates whether/not monitoring is to be done
using a Web archive file deployed on the WebLogic server (in which case,
HTTP/HTTPS is used by the server to connect to the server). If this flag is
set to No, the agent directly connects to the WebLogic server using the T3
protocol (no other file needs to be deployed on the WebLogic server for this
to work). Note that the T3 protocol-based support is available for WebLogic servers
ver.9 and ver. 10 only. Also, if the USEWARFILE parameter is set to No, make
sure that the ENCRYPTPASS parameter is set to No as well.

M o n i t o r i n g W e b L o g i c A p p l i c a t i o n S e r v e r s
120
When monitoring a WebLogic server deployed on a Unix platform
particularly, if the USEWARFILE parameter is set to No, you have to make
sure that the eG agent install user is added to the WebLogic users group.
13. WEBLOGICJARLOCATION - Specify the location of the WebLogic server's
java archive (Jar) file. If the USEWARFILE flag is set to No, then the
weblogic.jar file specified here is used to connect to the corresponding
WebLogic server using the T3 protocol. Note that the T3 protocol-based support is
available for WebLogic servers ver.9 and ver. 10 only.
Outputs of the test
One set of results for every topic auto-discovered on the monitored WebLogic
server
Measurements
made by the test
Measurement
Measurement
Unit
Interpretation
Messages count:
Indicates the current number
of messages in this topic.
Number
This count does not include the
messages that are pending.
Messages pending count:
Indicates the number of
pending messages in this
topic.
Number
While momentary spikes in the
number of pending messages in
a topic is normal, if the number
is allowed to grow consistently
over time, it is bound to increase
the total number of messages in
the topic. Typically, the sum of
the values of the
MessagesCurrentCount and the
MessagesPendingCount
measures equals the total
number of messages in the
topic. If this sum is equal to or is
very close to the Messages
Maximum setting for the quota
resource that is mapped to this
topic, it implies that the topic
has filled up or is rapidly filling
up with messages and cannot
handle any more. When this
happens, JMS prevents further
sends with a
ResourceAllocationException.
Furthermore, such quota failures
will force multiple producers to
contend for space in the topic,
thereby degrading application
performance. To avoid this, you
can do one/more of the
following:

M o n i t o r i n g W e b L o g i c A p p l i c a t i o n S e r v e r s
121
Increase the Messages
Maximum setting of the
quota resource mapped to
the topic;
If a quota has not been
configured for the topic, then
increase the quota of the
JMS server where the topic is
deployed;
Regulate the flow of
messages into the topic
using one/more of the
following configurations:
o Blocking senders during
quota conditions: The
Send Timeout feature
provides more control
over message send
operations by giving
message producers the
option of waiting a
specified length of time
until space becomes
available on a
destination.
o Specifying a Blocking
Send Policy on JMS
Servers : The Blocking
Send policies enable you
to define the JMS
server’s blocking
behavior on whether to
deliver smaller messages
before larger ones when
multiple message
producers are competing
for space on a
destination that has
exceeded its message
quota.

M o n i t o r i n g W e b L o g i c A p p l i c a t i o n S e r v e r s
122
o Using the Flow Control
feature: With the Flow
Control feature, you can
direct a JMS server or
destination to slow down
message producers when
it determines that it is
becoming overloaded.
Specifically, when either
a JMS server or it’s
destinations exceeds its
specified byte or
message threshold, it
becomes armed and
instructs producers to
limit their message flow
(messages per second).
Producers will limit their
production rate based on
a set of flow control
attributes configured for
producers via the JMS
connection factory.
Starting at a specified
flow maximum number
of messages, a producer
evaluates whether the
server/destination is still
armed at prescribed
intervals (for example,
every 10 seconds for 60
seconds). If at each
interval, the
server/destination is still
armed, then the
producer continues to
move its rate down to its
prescribed flow minimum
amount.

M o n i t o r i n g W e b L o g i c A p p l i c a t i o n S e r v e r s
123
As producers slow
themselves down, the
threshold condition
gradually corrects itself
until the
server/destination is
unarmed. At this point, a
producer is allowed to
increase its production
rate, but not necessarily
to the maximum possible
rate. In fact, its message
flow continues to be
controlled (even though
the server/destination is
no longer armed) until it
reaches its prescribed
flow maximum, at which
point it is no longer flow
controlled.
By tuning Message
Performance Preference:
The Messaging
Performance Preference
tuning option on JMS
destinations enables you
to control how long a
destination should wait
(if at all) before creating
full batches of available
messages for delivery to
consumers. At the
minimum value, batching
is disabled. Tuning above
the default value
increases the amount of
time a destination is
willing to wait before
batching available
messages. The maximum
message count of a full
batch is controlled by the
JMS connection factory’s
Messages Maximum per
Session setting.

M o n i t o r i n g W e b L o g i c A p p l i c a t i o n S e r v e r s
124
It may take some
experimentation to find
out which value works
best for your system. For
example, if you have a
topic with many
concurrent message
consumers, by selecting
the Administration
Console’s Do Not Batch
Messages value (or
specifying “0” on the
DestinationBean MBean),
the topic will make every
effort to promptly push
messages out to its
consumers as soon as
they are available.
Conversely, if you have a
topic with only one
message consumer that
does not require fast
response times, by
selecting the console’s
High Waiting Threshold
for Message Batching
value (or specifying
“100” on the
DestinationBean MBean),
you can ensure that the
topic only pushes
messages to that
consumer in batches.
Messages moved count:
Indicates the number of
messages that have been
moved from this topic
destination to another.
Number
Bytes count:
Indicates the current size of
the message that is stored in
the topic destination in
bytes.
KB
This count does not include the
pending bytes.

M o n i t o r i n g W e b L o g i c A p p l i c a t i o n S e r v e r s
125
Bytes pending count:
Indicates the current size of
the pending message that is
stored in the topic
destination in bytes.
KB
While momentary spikes in the
size of pending messages in a
topic is acceptable, if the size is
allowed to grow consistently
over time, it is bound to increase
the total size of all messages in
the topic. Typically, the sum of
the values of the
BytesCurrentCount and the
BytesPendingCount measures
indicates the total size of all
messages in the topic. If this
sum is equal to or is very close
to the Bytes Maximum setting
for the quota resource that is
mapped to this topic, it implies
that the topic has filled up or is
rapidly filling up with messages
and cannot handle any more.
When this happens, JMS
prevents further sends with a
ResourceAllocationException.
Furthermore, such quota failures
will force multiple producers to
contend for space in the topic,
thereby degrading application
performance. To avoid this, you
can do one/more of the
following:
Increase the Bytes Maximum
setting of the quota resource
mapped to the topic;
If a quota has not been
configured for the topic, then
increase the quota of the
JMS server where the topic is
deployed;
Regulate the flow of
messages into the topic
using one/more of the
following configurations:

M o n i t o r i n g W e b L o g i c A p p l i c a t i o n S e r v e r s
126
o Blocking senders during
quota conditions: The
Send Timeout feature
provides more control
over message send
operations by giving
message producers the
option of waiting a
specified length of time
until space becomes
available on a
destination.
o Specifying a Blocking
Send Policy on JMS
Servers : The Blocking
Send policies enable you
to define the JMS
server’s blocking
behavior on whether to
deliver smaller messages
before larger ones when
multiple message
producers are competing
for space on a
destination that has
exceeded its message
quota.
o Using the Flow Control
feature: With the Flow
Control feature, you can
direct a JMS server or
destination to slow down
message producers when
it determines that it is
becoming overloaded.

M o n i t o r i n g W e b L o g i c A p p l i c a t i o n S e r v e r s
127
Specifically, when either a
JMS server or it’s
destinations exceeds its
specified byte or message
threshold, it becomes
armed and instructs
producers to limit their
message flow (messages
per second). Producers will
limit their production rate
based on a set of flow
control attributes configured
for producers via the JMS
connection factory. Starting
at a specified flow
maximum number of
messages, a producer
evaluates whether the
server/destination is still
armed at prescribed
intervals (for example,
every 10 seconds for 60
seconds). If at each
interval, the
server/destination is still
armed, then the producer
continues to move its rate
down to its prescribed flow
minimum amount. As
producers slow themselves
down, the threshold
condition gradually corrects
itself until the
server/destination is
unarmed. At this point, a
producer is allowed to
increase its production rate,
but not necessarily to the
maximum possible rate. In
fact, its message flow
continues to be controlled
(even though the
server/destination is no
longer armed) until it
reaches its prescribed flow
maximum, at which point it
is no longer flow controlled.

M o n i t o r i n g W e b L o g i c A p p l i c a t i o n S e r v e r s
128
o By Tuning the
MessageMaximum
configuration: WebLogic
JMS pipelines messages
that are delivered to
asynchronous consumers
(otherwise known as
message listeners) or
prefetch-enabled
synchronous consumers.
The messages backlog
(the size of the pipeline)
between the JMS server
and the client is tunable
by configuring the
MessagesMaximum
setting on the connection
factory. In some
circumstances, tuning
this setting may improve
performance
dramatically, such as
when the JMS application
defers acknowledges or
commits. In this case,
BEA suggests setting the
MessagesMaximum value
to: 2 * (ack or commit
interval) + 1. For
example, if the JMS
application acknowledges
50 messages at a time,
set the
MessagesMaximum value
to 101. You may also
need to configure
WebLogic clients in
addition to the WebLogic
Server instance, when
sending and receiving
large messages.

M o n i t o r i n g W e b L o g i c A p p l i c a t i o n S e r v e r s
129
o By compressing
messages: You may
improve the performance
of sending large
messages traveling
across JVM boundaries
and help conserve disk
space by specifying the
automatic compression
of any messages that
exceed a user-specified
threshold size. Message
compression can help
reduce network
bottlenecks by
automatically reducing
the size of messages
sent across network
wires. Compressing
messages can also
conserve disk space
when storing persistent
messages in file stores or
databases.
o By paging out messages:
With the message paging
feature, JMS servers
automatically attempt to
free up virtual memory
during peak message
load periods. This feature
can greatly benefit
applications with large
message spaces.

M o n i t o r i n g W e b L o g i c A p p l i c a t i o n S e r v e r s
130
o By tuning the Message
Buffer Size: The Message
Buffer Size option
specifies the amount of
memory that will be used
to store message bodies
in memory before they
are paged out to disk.
The default value of
Message Buffer Size is
approximately one-third
of the maximum heap
size for the JVM, or a
maximum of 512
megabytes. The larger
this parameter is set, the
more memory JMS will
consume when many
messages are waiting on
topics or topics. Once
this threshold is crossed,
JMS may write message
bodies to the directory
specified by the Paging
Directory option in an
effort to reduce memory
usage below this
threshold.
Consumers count:
Indicates the current number
of consumers accessing the
topic destination.
Number
Messages deleted count:
Indicates the number of
messages that have been
deleted from the topic
destination.
Number
While you can design a
QueueBrowser on your JMS
server to view and delete
specific queue messages, some
messages are automatically
deleted by the server. For
instance, one-way messages
that exceed quota are silently
deleted without immediately
throwing exceptions back to the
client.

M o n i t o r i n g W e b L o g i c A p p l i c a t i o n S e r v e r s
131
2.1.3.9 WebLogic JMS Test
This test extracts performance statistics pertaining to the Java Message Service (JMS) provided by the
WebLogic server. This test is disabled by default. To enable the test, go to the ENABLE / DISABLE TESTS
page using the menu sequence : Agents -> Tests -> Enable/Disable, pick WebLogic as the Component
type, Performance as the Test type, choose this test from the DISABLED TESTS list, and click on the >>
button to move the test to the ENABLED TESTS list. Finally, click the Update button.
Purpose
Generates performance statistics pertaining to the Java Message Service (JMS)
provided by the WebLogic server
Target of the test
Any managed WebLogic server
Agent deploying the
test
An internal agent

M o n i t o r i n g W e b L o g i c A p p l i c a t i o n S e r v e r s
132
Configurable
parameters for the
test
1. TEST PERIOD - How often should the test be executed
2. HOST – The IP address of the WebLogic server
3. PORT – The port number of the WebLogic server
4. USER – The admin user name of the WebLogic server being monitored.
5. PASSWORD – The password of the specified admin user
6. CONFIRM PASSWORD – Confirm the password by retyping it here.
7. ENCRYPTPASS - If the specified password needs to be encrypted, set the
ENCRYPTPASS flag to YES. Otherwise, set it to NO. By default, the YES option
will be selected.
Note:
If the USEWARFILE flag is set to No, then make sure that the ENCRYPTPASS
flag is also set to No.
8. SSL – Indicate whether the SSL (Secured Socket Layer) is to be used to
connect to the WebLogic server.
9. SERVER - The name of the specific server instance to be monitored for a
WebLogic server (the default value is "localhome")
10. URL – The URL to be accessed to collect metrics pertaining to the WebLogic
server. By default, this test connects to a managed WebLogic server and
attempts to obtain the metrics of interest by accessing the local Mbeans of
the server. This parameter can be changed to a value of
http://<adminserverIP>:<adminserverPort>. In this case, the test
connects to the WebLogic admin server to collect metrics pertaining to the
managed server (specified by the HOST and PORT). The URL setting
provides the administrator with the flexibility of determining the WebLogic
monitoring configuration to use.
Note:
If the admin server is to be used for collecting measures for all the managed
WebLogic servers, then it is mandatory that the egurkha war file is deployed
to the admin server, and it is up and running.
11. VERSION - The VERSION textbox indicates the version of the Weblogic
server to be managed. The default value is "none", in which case the test
auto-discovers the weblogic version. If the value of this parameter is not
"none", the test uses the value provided (e.g., 7.0) as the weblogic version
(i.e., it does not auto-discover the weblogic server version). This parameter
has been added to address cases when the eG agent is not able to discover
the WebLogic server version.
12. USEWARFILE - This flag indicates whether/not monitoring is to be done
using a Web archive file deployed on the WebLogic server (in which case,
HTTP/HTTPS is used by the server to connect to the server). If this flag is
set to No, the agent directly connects to the WebLogic server using the T3
protocol (no other file needs to be deployed on the WebLogic server for this
to work). Note that the T3 protocol-based support is available for WebLogic servers
ver.9 and ver. 10 only. Also, if the USEWARFILE parameter is set to No, make
sure that the ENCRYPTPASS parameter is set to No as well.

M o n i t o r i n g W e b L o g i c A p p l i c a t i o n S e r v e r s
133
When monitoring a WebLogic server deployed on a Unix platform
particularly, if the USEWARFILE parameter is set to No, you have to make
sure that the eG agent install user is added to the WebLogic users group.
13. WEBLOGICJARLOCATION - Specify the location of the WebLogic server's
java archive (Jar) file. If the USEWARFILE flag is set to No, then the
weblogic.jar file specified here is used to connect to the corresponding
WebLogic server using the T3 protocol. Note that the T3 protocol-based support is
available for WebLogic servers ver.9 and ver. 10 only.
Outputs of the test
One set of results for every WebLogic server being monitored
Measurements
made by the test
Measurement
Measuremen
t Unit
Interpretation
Data received:
Returns the number of
bytes received on this JMS
server since the last reset
KB/Sec
This is an indicator of the workload
on the JMS server.
Destination count high
water mark:
Returns the peak number
of destinations on this JMS
server since the last reset
Number
Session pool count:
Returns the current
number of session pools
instantiated on this JMS
server
Number
Session pool count high
water mark:
Returns the peak number
of session pools
instantiated on this JMS
server since the last reset
Number
Message received:
Returns the number of
messages received on this
destination since the last
reset
Msgs/Sec
Current data count:
Returns the current
number of bytes stored on
this JMS server. This does
not include the pending
bytes.
KB

M o n i t o r i n g W e b L o g i c A p p l i c a t i o n S e r v e r s
134
Data pending count:
Returns the current
number of bytes pending
(unacknowledged or
uncommitted) stored on
this JMS server. Pending
bytes are over and above
the current number of
bytes.
KB
Data count high water
mark:
Returns the peak number
of bytes stored in the JMS
server since the last reset
KB
Current messages:
Returns the current
number of messages
stored on this JMS server.
This does not include the
pending messages.
Number
Pending messages:
Returns the current
number of messages
pending (unacknowledged
or uncommitted) stored on
this JMS server. Pending
messages are over and
above the current number
of messages.
Number
Ideally, the count of pending
messages should be low.
Messages count high
water mark:
Returns the peak number
of messages stored in the
JMS server since the last
reset
Number
Destination current
count:
Returns the current
number of destinations for
this JMS server
Number
2.1.3.10 WebLogic Clusters Test
This test extracts cluster related statistics from a managed WebLogic server that is part of a cluster.
Server instances in a cluster communicate with each other using multicast—multicasts help the server

M o n i t o r i n g W e b L o g i c A p p l i c a t i o n S e r v e r s
135
instances in a cluster announce their services, and issue periodic heartbeats that indicate continued
availability. This test is disabled by default. To enable the test, go to the ENABLE / DISABLE TESTS page
using the menu sequence : Agents -> Tests -> Enable/Disable, pick WebLogic as the Component type,
Performance as the Test type, choose this test from the DISABLED TESTS list, and click on the >> button to
move the test to the ENABLED TESTS list. Finally, click the Update button.
Purpose
To generate cluster-related measures from a managed WebLogic server that is
part of a cluster
Target of the test
Any managed WebLogic server that is part of a cluster
Agent deploying the
test
An internal agent

M o n i t o r i n g W e b L o g i c A p p l i c a t i o n S e r v e r s
136
Configurable
parameters for the
test
1. TEST PERIOD - How often should the test be executed
2. HOST – The IP address of the WebLogic server
3. PORT – The port number of the WebLogic server
4. USER – The admin user name of the WebLogic server being monitored.
5. PASSWORD – The password of the specified admin user
6. CONFIRM PASSWORD – Confirm the password by retyping it here.
7. ENCRYPTPASS - If the specified password needs to be encrypted, set the
ENCRYPTPASS flag to YES. Otherwise, set it to NO. By default, the YES option
will be selected.
Note:
If the USEWARFILE flag is set to No, then make sure that the ENCRYPTPASS
flag is also set to No.
8. SSL – Indicate whether the SSL (Secured Socket Layer) is to be used to
connect to the WebLogic server.
9. SERVER - The name of the specific server instance to be monitored for a
WebLogic server (the default value is "localhome")
10. URL – The URL to be accessed to collect metrics pertaining to the WebLogic
server. By default, this test connects to a managed WebLogic server and
attempts to obtain the metrics of interest by accessing the local Mbeans of
the server. This parameter can be changed to a value of
http://<adminserverIP>:<adminserverPort>. In this case, the test
connects to the WebLogic admin server to collect metrics pertaining to the
managed server (specified by the HOST and PORT). The URL setting
provides the administrator with the flexibility of determining the WebLogic
monitoring configuration to use.
Note:
If the admin server is to be used for collecting measures for all the managed
WebLogic servers, then it is mandatory that the egurkha war file is deployed
to the admin server, and it is up and running.
11. VERSION - The VERSION textbox indicates the version of the Weblogic
server to be managed. The default value is "none", in which case the test
auto-discovers the weblogic version. If the value of this parameter is not
"none", the test uses the value provided (e.g., 7.0) as the weblogic version
(i.e., it does not auto-discover the weblogic server version). This parameter
has been added to address cases when the eG agent is not able to discover
the WebLogic server version.
12. USEWARFILE - This flag indicates whether/not monitoring is to be done
using a Web archive file deployed on the WebLogic server (in which case,
HTTP/HTTPS is used by the server to connect to the server). If this flag is
set to No, the agent directly connects to the WebLogic server using the T3
protocol (no other file needs to be deployed on the WebLogic server for this
to work). Note that the T3 protocol-based support is available for WebLogic servers
ver.9 and ver. 10 only. Also, if the USEWARFILE parameter is set to No, make
sure that the ENCRYPTPASS parameter is set to No as well.

M o n i t o r i n g W e b L o g i c A p p l i c a t i o n S e r v e r s
137
When monitoring a WebLogic server deployed on a Unix platform
particularly, if the USEWARFILE parameter is set to No, you have to make
sure that the eG agent install user is added to the WebLogic users group.
13. WEBLOGICJARLOCATION - Specify the location of the WebLogic server's
java archive (Jar) file. If the USEWARFILE flag is set to No, then the
weblogic.jar file specified here is used to connect to the corresponding
WebLogic server using the T3 protocol. Note that the T3 protocol-based support is
available for WebLogic servers ver.9 and ver. 10 only.
Outputs of the test
One set of results for every WebLogic server monitored
Measurements
made by the test
Measurement
Measurement
Unit
Interpretation
Alive servers:
Number of servers in the
clusters that are running
currently
Number
Ideally this number must be equal
to the actual number of servers in
the cluster.
Fragments sent:
The rate of multicast
fragments sent from this
server into the cluster
Fragments/
Sec
Fragments received:
Returns the rate of
multicast messages
received on this server
from the cluster
Fragments/
Sec
Fragments dropped:
Indicates the rate of
fragments that originated
in foreign domains/clusters
that use the same
multicast address
Fragments/
Sec
Messages lost:
Returns the rate at which
incoming multicast
messages that were lost
Msgs/Sec
Request resends:
Returns the rate of state-
delta messages that had to
be resent because a
receiving server in the
cluster missed a message
Reqs/sec

M o n i t o r i n g W e b L o g i c A p p l i c a t i o n S e r v e r s
138
Primary count:
Returns the number of
objects that the local
server hosts as primaries
Number
2.1.3.11 File Descriptors Test
A file descriptor is a handle created by a process when a file is opened. A new descriptor is created
each time the file is opened. The File Descriptor test monitors the descriptors created by an
application. This test is disabled by default. To enable the test, go to the ENABLE / DISABLE TESTS page
using the menu sequence : Agents -> Tests -> Enable/Disable, pick WebLogic as the Component type,
Performance as the Test type, choose the test from the DISABLED TESTS list, and click on the >> button to
move the test to the ENABLED TESTS list. Finally, click the Update button. only.
Purpose
Monitors the descriptors created by an application
Target of the test
Any managed WebLogic server
Agent deploying the
test
An internal agent
Configurable
parameters for the
test
1. TEST PERIOD - How often should the test be executed
2. HOST – The IP address of the WebLogic server
3. PORT – The port number of the WebLogic server
4. PSPATH – Specify the path to the ps command (The default location is
/usr/ucb). The eG user must be vested with execute permissions in order to
execute the ps command.
5. PFILESPATH - Specify the path to the pfiles command (The default is
/usr/ucb).
6. PROCESS – Takes a process name and process pattern in the format:
processName:processPattern. While the processName is a display name, the
processPattern should uniquely identify the application's process ID (PID of
the application). The processPattern can be of the form - *expr* or expr or
*expr or expr* or *expr1*expr2*... or expr1*expr2, etc. A leading '*'
signifies any number of leading characters, while a trailing '*' signifies any
number of trailing characters. For instance, the PROCESS parameter can be
configured as: iplanet:*Xms*, where iplanet is the name that will be
displayed in the eG monitor interface, and *Xms* is the process pattern that
needs to be monitored. *Xms* will monitor only those processes which
contain the string "Xms". Multiple processes can be defined as a comma-
separated list.
Outputs of the test
One set of results for every descriptor monitored
Measurements
made by the test
Measurement
Measurement
Unit
Interpretation

M o n i t o r i n g W e b L o g i c A p p l i c a t i o n S e r v e r s
139
Rlimit fd current:
The current limit of file
descriptors associated with
a particular application.
Each application has a limit
on the number of file
descriptors which it can
use. The default is 256.
Number
Number of file
descriptors open:
The number of file
descriptors which are open
at present
Number
A consistent increase in the value of
this measure over a period of time
could indicate that file handles are
not being released properly. If the
problem is not addressed soon, it
could seriously hamper application
performance.
Usage of file
descriptors:
The percentage usage of
the file descriptors for the
application
Percent
2.1.3.12 WebLogic Connectors Test
This test extracts connector related statistics from a managed WebLogic server. This test is not
available by default. To enable the test, go to the ENABLE / DISABLE TESTS page using the menu sequence
: Agents -> Tests -> Enable/Disable, pick WebLogic as the Component type, Performance as the Test
type, choose the test from the DISABLED TESTS list, and click on the >> button to move the test to the
ENABLED TESTS list. Finally, click the Update button.
Purpose
Generates connector-related statistics from a managed WebLogic server
Target of the test
Any managed WebLogic server
Agent deploying the
test
An internal agent

M o n i t o r i n g W e b L o g i c A p p l i c a t i o n S e r v e r s
140
Configurable
parameters for the
test
1. TESTPERIOD - How often should the test be executed
2. HOST – The IP address of the WebLogic server
3. PORT – The port number of the WebLogic server
4. USER – The admin user name of the WebLogic server being monitored.
5. PASSWORD – The password of the specified admin user
6. CONFIRM PASSWORD – Confirm the password by retyping it here.
7. ENCRYPTPASS - If the specified password needs to be encrypted, set the
ENCRYPTPASS flag to YES. Otherwise, set it to NO. By default, the YES option
will be selected.
Note:
If the USEWARFILE flag is set to No, then make sure that the ENCRYPTPASS
flag is also set to No.
8. SSL – Indicate whether the SSL (Secured Socket Layer) is to be used to
connect to the WebLogic server.
9. SERVER - The name of the specific server instance to be monitored for a
WebLogic server (the default value is "localhome")
10. URL – The URL to be accessed to collect metrics pertaining to the WebLogic
server. By default, this test connects to a managed WebLogic server and
attempts to obtain the metrics of interest by accessing the local Mbeans of
the server. This parameter can be changed to a value of
http://<adminserverIP>:<adminserverPort>. In this case, the test
connects to the WebLogic admin server to collect metrics pertaining to the
managed server (specified by the HOST and PORT). The URL setting
provides the administrator with the flexibility of determining the WebLogic
monitoring configuration to use.
Note:
If the admin server is to be used for collecting measures for all the managed
WebLogic servers, then it is mandatory that the egurkha war file is deployed
to the admin server, and it is up and running.
11. VERSION - The VERSION textbox indicates the version of the Weblogic
server to be managed. The default value is "none", in which case the test
auto-discovers the weblogic version. If the value of this parameter is not
"none", the test uses the value provided (e.g., 7.0) as the weblogic version
(i.e., it does not auto-discover the weblogic server version). This parameter
has been added to address cases when the eG agent is not able to discover
the WebLogic server version.
12. USEWARFILE - This flag indicates whether/not monitoring is to be done
using a Web archive file deployed on the WebLogic server (in which case,
HTTP/HTTPS is used by the server to connect to the server). If this flag is
set to No, the agent directly connects to the WebLogic server using the T3
protocol (no other file needs to be deployed on the WebLogic server for this
to work). Note that the T3 protocol-based support is available for WebLogic servers
ver.9 and ver. 10 only. Also, if the USEWARFILE parameter is set to No, make
sure that the ENCRYPTPASS parameter is set to No as well.

M o n i t o r i n g W e b L o g i c A p p l i c a t i o n S e r v e r s
141
When monitoring a WebLogic server deployed on a Unix platform
particularly, if the USEWARFILE parameter is set to No, you have to make
sure that the eG agent install user is added to the WebLogic users group.
13. WEBLOGICJARLOCATION - Specify the location of the WebLogic server's
java archive (Jar) file. If the USEWARFILE flag is set to No, then the
weblogic.jar file specified here is used to connect to the corresponding
WebLogic server using the T3 protocol. Note that the T3 protocol-based support is
available for WebLogic servers ver.9 and ver. 10 only.
Outputs of the test
One set of results for every WebLogic server being monitored
Measurements
made by the test
Measurement
Measurement
Unit
Interpretation
Connection created:
Returns the total number of
connector connections
created in this connector
pool since the pool was
instantiated
Conns/sec
Connections destroyed:
Returns the total number of
connector connections
destroyed in this connector
pool since the pool was
instantiated
Conns/sec
Connections matched:
Returns the total number of
times a request for a
connector connection was
satisfied via the use of an
existing created connection,
since the pool was
instantiated
Conns/Sec
Connection rejects:
Returns the total number of
rejected requests for a
connector connection in this
connector pool since the pool
was instantiated
Conns/Sec
Connections recycled:
Returns the total number of
connector connections that
have been recycled in this
connector pool since the pool
was instantiated
Conns/Sec
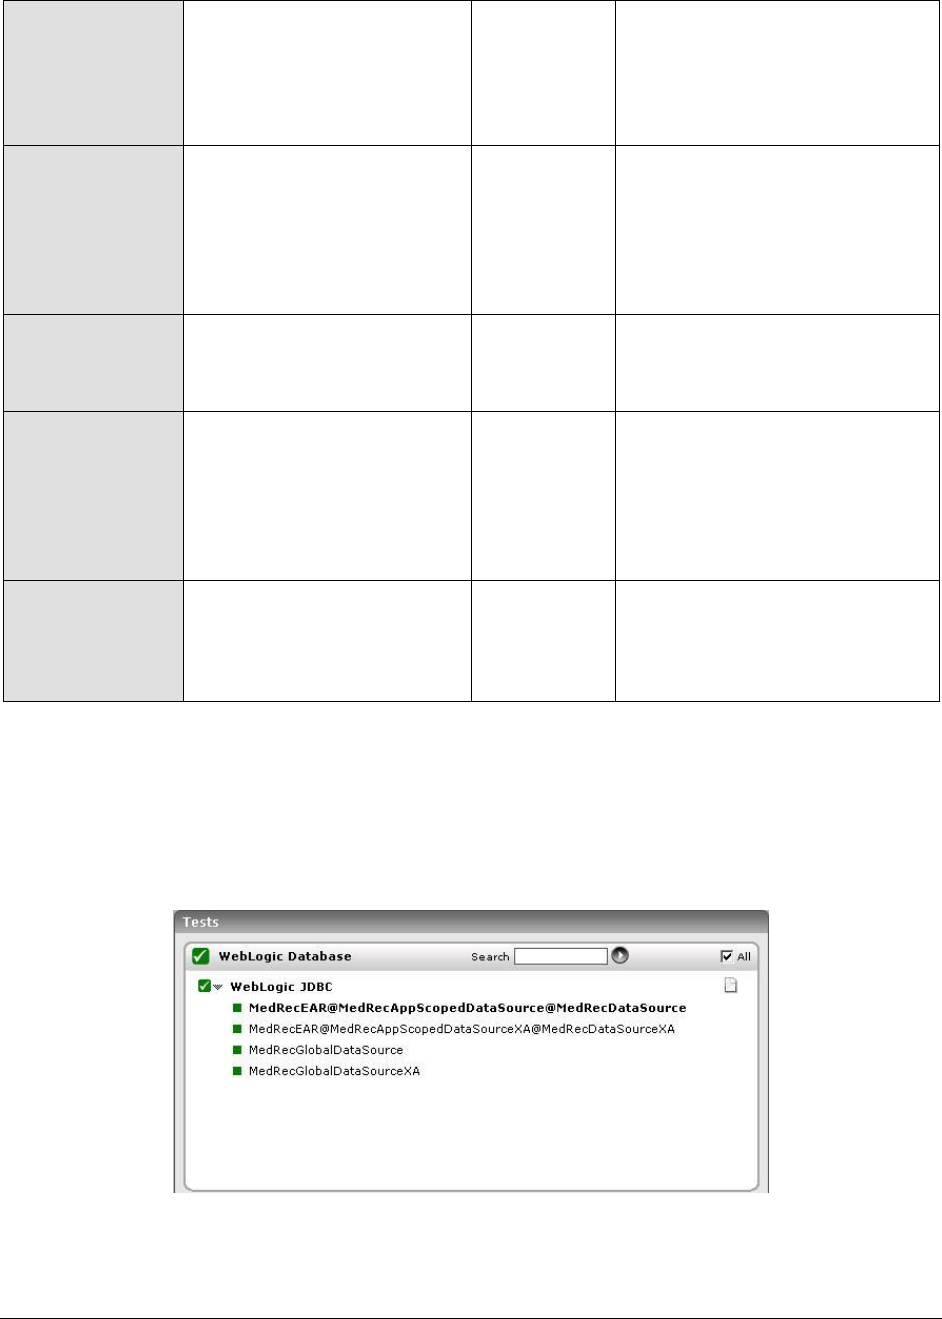
M o n i t o r i n g W e b L o g i c A p p l i c a t i o n S e r v e r s
142
Current active
connections:
Returns the current total
number of active
connections
Number
Active connections high
water mark:
Returns the high water mark
of active connections in this
connector pool since the pool
was instantiated
Number
Current free connections:
Returns the current total free
connections
Number
Free connections high
water mark:
Returns the high water mark
of free connections in this
connector pool since the pool
was instantiated
Number
Max capacity:
Returns the maximum
capacity configured for this
connector connection pool
Number
2.1.4 The WebLogic Database Layer
The status of the database connectivity from the WebLogic server to one or more backend database
servers is assessed by the WebLogic Database layer. The status of the WebLogic Database layer is
determined based on the results of a WebLogicJdbc test that is shown in Figure 2.17.
Figure 2.17: Tests mapping to the WebLogic Database layer

M o n i t o r i n g W e b L o g i c A p p l i c a t i o n S e r v e r s
143
2.1.4.1 WebLogic JDBC Test
The WebLogic JDBC test collects measures related to JDBC pools created on the WebLogic server.
Purpose
Collects measures related to JDBC pools created on the WebLogic server
Target of the
test
A WebLogic application server
Agent
deploying the
test
An internal agent

M o n i t o r i n g W e b L o g i c A p p l i c a t i o n S e r v e r s
144
Configurable
parameters for
the test
1. TEST PERIOD - How often should the test be executed
2. HOST – The IP address of the WebLogic server
3. PORT – The port number of the WebLogic server
4. SNMPPORT – The port number on which the WebLogic server is exposing its
SNMP MIB (relevant to WebLogic server 5.1 only). For version 6.0 and above,
enter “none” in this text box.
5. SNMPCOMMUNITY – The SNMP community string to be used with the SNMP
query to access the WebLogic server’s MIB (relevant to WebLogic server 5.1
only). For version 6.0 and above, enter “none” in this text box.
6. SNMPVERSION – By default, the eG agent supports SNMP version 1. Accordingly,
the default selection in the SNMPVERSION list is v1. However, if a different SNMP
framework is in use in your environment, say SNMP v2 or v3, then select the
corresponding option from this list.
7. USERNAME – This parameter appears only when v3 is selected as the
SNMPVERSION. SNMP version 3 (SNMPv3) is an extensible SNMP Framework
which supplements the SNMPv2 Framework, by additionally supporting message
security, access control, and remote SNMP configuration capabilities. To extract
performance statistics from the MIB using the highly secure SNMP v3 protocol,
the eG agent has to be configured with the required access privileges – in other
words, the eG agent should connect to the MIB using the credentials of a user
with access permissions to be MIB. Therefore, specify the name of such a user
against the USERNAME parameter.
8. AUTHPASS – Specify the password that corresponds to the above-mentioned
USERNAME. This parameter once again appears only if the SNMPVERSION
selected is v3.
9. CONFIRM PASSWORD – Confirm the AUTHPASS by retyping it here.
10. AUTHTYPE – This parameter too appears only if v3 is selected as the
SNMPVERSION. From the AUTHTYPE list box, choose the authentication
algorithm using which SNMP v3 converts the specified USERNAME and
PASSWORD into a 32-bit format to ensure security of SNMP transactions. You
can choose between the following options:
MD5 – Message Digest Algorithm
SHA – Secure Hash Algorithm
11. ENCRYPTFLAG – This flag appears only when v3 is selected as the
SNMPVERSION. By default, the eG agent does not encrypt SNMP requests.
Accordingly, the ENCRYPTFLAG is set to NO by default. To ensure that SNMP
requests sent by the eG agent are encrypted, select the YES option.

M o n i t o r i n g W e b L o g i c A p p l i c a t i o n S e r v e r s
145
12. ENCRYPTTYPE – If the ENCRYPTFLAG is set to YES, then you will have to
mention the encryption type by selecting an option from the ENCRYPTTYPE list.
SNMP v3 supports the following encryption types:
DES – Data Encryption Standard
AES – Advanced Encryption Standard
13. ENCRYPTPASSWORD – Specify the encryption password here.
14. CONFIRM PASSWORD – Confirm the encryption password by retyping it here.
15. USER – The admin user name of the WebLogic server being monitored.
16. PASSWORD – The password of the specified admin user
17. CONFIRM PASSWORD – Confirm the password by retyping it here.
18. ENCRYPTPASS - If the specified password needs to be encrypted, set the
ENCRYPTPASS flag to YES. Otherwise, set it to NO. By default, the YES option will
be selected.
Note:
If the USEWARFILE flag is set to No, then make sure that the ENCRYPTPASS flag
is also set to No.
19. SSL – Indicate whether the SSL (Secured Socket Layer) is to be used to connect
to the WebLogic server.
20. SERVER - The name of the specific server instance to be monitored for a
WebLogic server (the default value is "localhome")
21. URL – The URL to be accessed to collect metrics pertaining to the WebLogic
server. By default, this test connects to a managed WebLogic server and
attempts to obtain the metrics of interest by accessing the local Mbeans of the
server. This parameter can be changed to a value of
http://<adminserverIP>:<adminserverPort>. In this case, the test connects
to the WebLogic admin server to collect metrics pertaining to the managed
server (specified by the HOST and PORT). The URL setting provides the
administrator with the flexibility of determining the WebLogic monitoring
configuration to use.
Note:
If the admin server is to be used for collecting measures for all the managed
WebLogic servers, then it is mandatory that the egurkha war file is deployed to
the admin server, and it is up and running.
22. VERSION - The VERSION textbox indicates the version of the Weblogic server to
be managed. The default value is "none", in which case the test auto-discovers
the weblogic version. If the value of this parameter is not "none", the test uses
the value provided (e.g., 7.0) as the weblogic version (i.e., it does not auto-
discover the weblogic server version). This parameter has been added to
address cases when the eG agent is not able to discover the WebLogic server
version.

M o n i t o r i n g W e b L o g i c A p p l i c a t i o n S e r v e r s
146
23. USEWARFILE - This flag indicates whether/not monitoring is to be done using a
Web archive file deployed on the WebLogic server (in which case, HTTP/HTTPS
is used by the server to connect to the server). If this flag is set to No, the agent
directly connects to the WebLogic server using the T3 protocol (no other file
needs to be deployed on the WebLogic server for this to work). Note that the T3
protocol-based support is available for WebLogic servers ver.9 and ver. 10 only. Also, if the
USEWARFILE parameter is set to No, make sure that the ENCRYPTPASS
parameter is set to No as well.
When monitoring a WebLogic server deployed on a Unix platform particularly, if
the USEWARFILE parameter is set to No, you have to make sure that the eG
agent install user is added to the WebLogic users group.
24. WEBLOGICJARLOCATION - Specify the location of the WebLogic server's java
archive (Jar) file. If the USEWARFILE flag is set to No, then the weblogic.jar file
specified here is used to connect to the corresponding WebLogic server using
the T3 protocol. Note that the T3 protocol-based support is available for WebLogic servers
ver.9 and ver. 10 only.
25. TIMEOUT - Specify the duration (in seconds) within which the SNMP query
executed by this test should time out in the TIMEOUT text box. The default is 10
seconds.
Outputs of the
test
One set of results for each connection pool used by a WebLogic application server.
Measurements
made by the
test
Measurement
Measurement
Unit
Interpretation
Pool availability:
The current state of a
database connection pool –
whether it is available or not
Percent
A value of 100 denotes that the
pool is available; a value of 0
denotes unavailability.
Percent of connections
used:
Percentage of database
connection allocated to a
connection pool that are in use
Percent
When this value reaches 100%,
connections to the database will
either have to wait for access or will
time out. Consider increasing the
size of the connection pool in this
case. A very high percentage of use
can also result if one or more of the
applications that use the connection
pool are not releasing the
connections after their use.
Max capacity:
The maximum number of
connections configured for a
JDBC connection pool
Number
Active connections current:
The number of connections
currently in use for a JDBC
connection pool
Number

M o n i t o r i n g W e b L o g i c A p p l i c a t i o n S e r v e r s
147
Waiting for connections:
The number of requests for
connections to the database
that are currently pending
Number
A high value of pending connections
is indicative of a bottleneck during
database access. Reasons for this
could either be that the connection
pool capacity is insufficient, or that
the database server has slowed
down, causing requests to take
longer to execute their queries.
Active connections max:
The high water mark of active
connections in a pool
Number
Note the changes in the high water
mark. This can give you an idea
about the times when the JDBC
pool was most heavily used.
Waiting for connections
max:
The high water mark of
number of waiters for a
connection from the pool
Number
Note the changes in the high water
mark. This indicates periods when
the database connection pool could
have been a bottleneck.
Connections added to pool:
The number of JDBC
connections added to the pool
in the last measurement
period
Number
Leaked connections:
The number of connections
tagged as a leaked connection
during the last measurement
period. A leaked connection is
a connection that was checked
out from the connection pool
but was not returned to the
pool by calling close().
Number
A non-zero value indicates that the
application may not be releasing
connections after use. This can
result in inefficient management of
the database connections in the
pool.
Failures to reconnect:
The number of cases during
the last measurement period
when a connection pool
attempted to refresh a
connection to the database
and failed.
Number
Failures could happen if the
database is unavailable, or, the
connection was terminated.
Connection delay time:
Avg. time taken to get a
connection from the database
(in seconds)
Secs
An increase in this metric could
indicate a bottleneck in the
database tier.
Max wait to get connection:
The high water mark of the
time a thread had to wait in
order to get a connection from
the pool
Secs
M o n i t o r i n g W e b L o g i c A p p l i c a t i o n S e r v e r s
148
2.1.4.2 WL JDBC Test
This test also measures statistics pertaining to the JDBC database connection pools in use by the
WebLogic server. This test is disabled by default and is included for backward compatibility only. This
test is disabled by default. To enable the test, go to the ENABLE / DISABLE TESTS page using the menu
sequence : Agents -> Tests -> Enable/Disable, pick WebLogic as the Component type, Performance as
the Test type, choose this test from the DISABLED TESTS list, and click on the >> button to move the test
to the ENABLED TESTS list. Finally, click the Update button.
Purpose
To measure statistics pertaining to the database connection pool usage of a
WebLogic application server
Target of the
test
A WebLogic application server
Agent
deploying the
test
An internal agent

M o n i t o r i n g W e b L o g i c A p p l i c a t i o n S e r v e r s
149
Configurable
parameters for
the test
1. TEST PERIOD - How often should the test be executed
2. HOST – The IP address of the WebLogic server
3. PORT – The port number of the WebLogic server
4. SNMPPORT – The port number on which the WebLogic server is exposing its
SNMP MIB (relevant to WebLogic server 5.1 only). For version 6.0 and above,
enter “none” in this text box.
5. SNMPCOMMUNITY – The SNMP community string to be used with the SNMP
query to access the WebLogic server’s MIB (relevant to WebLogic server 5.1
only). For version 6.0 and above, enter “none” in this text box.
6. SNMPVERSION – By default, the eG agent supports SNMP version 1. Accordingly,
the default selection in the SNMPVERSION list is v1. However, if a different SNMP
framework is in use in your environment, say SNMP v2 or v3, then select the
corresponding option from this list.
7. USERNAME – This parameter appears only when v3 is selected as the
SNMPVERSION. SNMP version 3 (SNMPv3) is an extensible SNMP Framework
which supplements the SNMPv2 Framework, by additionally supporting message
security, access control, and remote SNMP configuration capabilities. To extract
performance statistics from the MIB using the highly secure SNMP v3 protocol,
the eG agent has to be configured with the required access privileges – in other
words, the eG agent should connect to the MIB using the credentials of a user
with access permissions to be MIB. Therefore, specify the name of such a user
against the USERNAME parameter.
8. AUTHPASS – Specify the password that corresponds to the above-mentioned
USERNAME. This parameter once again appears only if the SNMPVERSION
selected is v3.
9. CONFIRM PASSWORD – Confirm the AUTHPASS by retyping it here.
10. AUTHTYPE – This parameter too appears only if v3 is selected as the
SNMPVERSION. From the AUTHTYPE list box, choose the authentication
algorithm using which SNMP v3 converts the specified USERNAME and
PASSWORD into a 32-bit format to ensure security of SNMP transactions. You
can choose between the following options:
MD5 – Message Digest Algorithm
SHA – Secure Hash Algorithm
11. ENCRYPTFLAG – This flag appears only when v3 is selected as the
SNMPVERSION. By default, the eG agent does not encrypt SNMP requests.
Accordingly, the ENCRYPTFLAG is set to NO by default. To ensure that SNMP
requests sent by the eG agent are encrypted, select the YES option.

M o n i t o r i n g W e b L o g i c A p p l i c a t i o n S e r v e r s
150
12. ENCRYPTTYPE – If the ENCRYPTFLAG is set to YES, then you will have to
mention the encryption type by selecting an option from the ENCRYPTTYPE list.
SNMP v3 supports the following encryption types:
DES – Data Encryption Standard
AES – Advanced Encryption Standard
13. ENCRYPTPASSWORD – Specify the encryption password here.
14. CONFIRM PASSWORD – Confirm the encryption password by retyping it here.
15. USER – The admin user name of the WebLogic server being monitored.
16. PASSWORD – The password of the specified admin user
17. CONFIRM PASSWORD – Confirm the password by retyping it here.
18. ENCRYPTPASS - If the specified password needs to be encrypted, set the
ENCRYPTPASS flag to YES. Otherwise, set it to NO. By default, the YES option will
be selected.
Note:
If the USEWARFILE flag is set to No, then make sure that the ENCRYPTPASS flag
is also set to No.
19. SSL – Indicate whether the SSL (Secured Socket Layer) is to be used to connect
to the WebLogic server.
20. SERVER - The name of the specific server instance to be monitored for a
WebLogic server (the default value is "localhome")
21. URL – The URL to be accessed to collect metrics pertaining to the WebLogic
server. By default, this test connects to a managed WebLogic server and
attempts to obtain the metrics of interest by accessing the local Mbeans of the
server. This parameter can be changed to a value of
http://<adminserverIP>:<adminserverPort>. In this case, the test connects
to the WebLogic admin server to collect metrics pertaining to the managed
server (specified by the HOST and PORT). The URL setting provides the
administrator with the flexibility of determining the WebLogic monitoring
configuration to use.
Note:
If the admin server is to be used for collecting measures for all the managed
WebLogic servers, then it is mandatory that the egurkha war file is deployed to
the admin server, and it is up and running.

M o n i t o r i n g W e b L o g i c A p p l i c a t i o n S e r v e r s
151
22. USEWARFILE - This flag indicates whether/not monitoring is to be done using a
Web archive file deployed on the WebLogic server (in which case, HTTP/HTTPS
is used by the server to connect to the server). If this flag is set to No, the agent
directly connects to the WebLogic server using the T3 protocol (no other file
needs to be deployed on the WebLogic server for this to work). Note that the T3
protocol-based support is available for WebLogic servers ver.9 and ver. 10 only. Also, if the
USEWARFILE parameter is set to No, make sure that the ENCRYPTPASS
parameter is set to No as well.
When monitoring a WebLogic server deployed on a Unix platform particularly, if
the USEWARFILE parameter is set to No, you have to make sure that the eG
agent install user is added to the WebLogic users group.
23. WEBLOGICJARLOCATION - Specify the location of the WebLogic server's java
archive (Jar) file. If the USEWARFILE flag is set to No, then the weblogic.jar file
specified here is used to connect to the corresponding WebLogic server using
the T3 protocol. Note that the T3 protocol-based support is available for WebLogic servers
ver.9 and ver. 10 only.
24. VERSION - The VERSION textbox indicates the version of the Weblogic server to
be managed. The default value is "none", in which case the test auto-discovers
the weblogic version. If the value of this parameter is not "none", the test uses
the value provided (e.g., 7.0) as the weblogic version (i.e., it does not auto-
discover the weblogic server version). This parameter has been added to
address cases when the eG agent is not able to discover the WebLogic server
version.
Outputs of the
test
One set of results for each connection pool used by a WebLogic application server.
Measurements
made by the
test
Measurement
Measurement
Unit
Interpretation
Connection usage percent:
Percentage of database
connections allocated to a
connection pool that is in use
Percent
When this value reaches 100%,
connections to the database will
either have to wait for access or will
time out. Consider increasing the
size of the connection pool in this
case. A very high percentage of use
can also result if one or more of the
applications that use the connection
pool are not releasing the
connections after their use.
Pending connections:
Number of requests for
connections to the database
that are currently pending
Number
A high value of pending connections
is indicative of a bottleneck during
database access. Reasons for this
could either be that the connection
pool capacity is insufficient, or that
the database server has slowed
down, causing requests to take
longer to execute their queries.

M o n i t o r i n g W e b L o g i c A p p l i c a t i o n S e r v e r s
152
Max connections:
The maximum number of
connections configured for a
JDBC connection pool
Number
Current connections:
The current number of
connections in use for a JDBC
connection pool
Number
Pool availability:
The current state of a
database connection pool –
whether it is available or not
Percent
A value of 100 denotes that the
pool is available; a value of 0
denotes unavailability.
Failed reconnects:
The number of cases during
the last measurement period
when a connection pool
attempted to refresh a
connection to the database
and failed
Number
Failures could happen if the
database is unavailable, or, the
connection was terminated.
Connections to pool:
The number of JDBC
connections added to the pool
in the last measurement
period
Number
Avg connection delay:
Avg. time taken to get a
connection from the database
(in seconds)
Secs
An increase in this metric could
indicate a bottleneck in the
database tier.
Leaked connections:
Number of connections tagged
as a leaked connection during
the last measurement period.
A leaked connection is a
connection that was checked
out from the connection pool
but was not returned to the
pool by calling close().
Number
A non-zero value indicates that the
application may not be releasing
connections after use. This can
result in inefficient management of
the database connections in the
pool.
Active connections high
mark:
The high water mark of active
connections in a pool
Number
Note the changes in the high water
mark. This can provide an idea of
the times when the JDBC pool was
most heavily used.

M o n i t o r i n g W e b L o g i c A p p l i c a t i o n S e r v e r s
153
Waiting connections high
mark:
The high water mark of
number of waiters for a
connection from the pool
Number
Note the changes in the high water
mark. This indicates periods when
the database connection pool could
have been a bottleneck.
M o n i t o r i n g W e b L o g i c A p p l i c a t i o n S e r v e r s
154
2.1.4.3 Jdbc Stats Test
The JdbcStats test collects measures like how many JDBC queries have been executed, how long
those queries took to execute and what those statements are. This test is key to determining whether
the database/database queries are the cause of any slowdowns with applications executing on the
WebLogic server. This test is disabled by default. To enable the test, go to the ENABLE / DISABLE TESTS
page using the menu sequence : Agents -> Tests -> Enable/Disable, pick WebLogic as the Component
type, Performance as the Test type, choose this test from the DISABLED TESTS list, and click on the >>
button to move the test to the ENABLED TESTS list. Finally, click the Update button.
Purpose
Collects measures like how many JDBC queries have been executed, how long those
queries took to execute and what those statements are
Target of the
test
A WebLogic application server
Agent
deploying the
test
An internal agent
Note:
The Failed reconnects, Avg connection delay and Leaked connections measures will always
report 0 for WebLogic 6.0 with Service Pack 2.0.

M o n i t o r i n g W e b L o g i c A p p l i c a t i o n S e r v e r s
155
Configurable
parameters for
the test
1. TEST PERIOD - How often should the test be executed
2. HOST – The IP address of the WebLogic server
3. PORT – The port number of the WebLogic server
4. URL – The URL to be accessed to collect metrics pertaining to the WebLogic
server. By default, this test connects to a managed WebLogic server and
attempts to obtain the metrics of interest by accessing the local Mbeans of the
server. This parameter can be changed to a value of
http://<adminserverIP>:<adminserverPort>. In this case, the test connects
to the WebLogic admin server to collect metrics pertaining to the managed
server (specified by the HOST and PORT). The URL setting provides the
administrator with the flexibility of determining the WebLogic monitoring
configuration to use.
Note:
If the admin server is to be used for collecting measures for all the managed
WebLogic servers, then it is mandatory that the egurkha war file is deployed to
the admin server, and it is up and running.
5. DETAILED DIAGNOSIS - To make diagnosis more efficient and accurate, the eG
Enterprise suite embeds an optional detailed diagnostic capability. With this
capability, the eG agents can be configured to run detailed, more elaborate tests
as and when specific problems are detected. To enable the detailed diagnosis
capability of this test for a particular server, choose the On option. To disable
the capability, click on the Off option.
The option to selectively enable/disable the detailed diagnosis capability will be
available only if the following conditions are fulfilled:
The eG manager license should allow the detailed diagnosis capability
Both the normal and abnormal frequencies configured for the detailed
diagnosis measures should not be 0.
Outputs of the
test
One set of results for a WebLogic application server
Measurements
made by the
test
Measurement
Measurement
Unit
Interpretation
Total query rate:
The rate of JDBC queries that
have been executed on the
database, using the pools that
have been configured to use
the P6Spy driver
Queries/Sec
This is an indicator of the JDBC
workload.
Avg query time:
The average time taken by the
queries to execute on the
database, using the pools that
have been configured to use
the P6Spy driver
Secs
A higher average query time
signifies a performance bottleneck
at the data abase tier.

M o n i t o r i n g W e b L o g i c A p p l i c a t i o n S e r v e r s
156
Select query rate:
The rate of select queries
executed on the database,
using the pools that have been
configured to use the P6Spy
driver
Queries/Sec
Comparing the types of queries to
the database provides an idea
about the nature of workload on the
database
Avg Select query time:
The average time taken by the
select queries for executing on
the database, by using the
pools that have been
configured to use the P6Spy
driver
Secs
Unexpectedly large query times can
indicate that there is sufficient
scope to optimize database access
using better indexes.
Insert query rate:
The rate of insert queries
executed on the database,
using the pools that have been
configured to use the P6Spy
driver
Queries/Sec
Avg insert query time:
The average time taken for
executing the insert queries on
the database, using the pools
that have been configured to
use the P6Spy driver
Secs
Update query rate:
The rate of update queries
executed on the database,
using the pools that have been
configured to use the P6Spy
driver
Queries/Sec
Avg update query time:
The average time taken for
executing the update queries
on the database, using the
pools that have been
configured to use the P6Spy
driver
Secs
Delete query rate:
The rate of delete queries
executed on the database,
using the pools that have been
configured to use the P6Spy
driver
Queries/Sec

M o n i t o r i n g W e b L o g i c A p p l i c a t i o n S e r v e r s
157
Avg delete query time:
The average time taken by the
delete queries to execute on
the database, using the pools
that have been configured to
use the P6Spy driver
Secs
Commit queries rate:
The rate of commit queries
executed on the database,
using the pools that have been
configured to use the P6Spy
driver
Queries/Sec
Avg commit query time:
The average time taken by the
commit queries to execute on
the database, using the pools
that have been configured to
use the P6Spy driver
Secs
Rollback queries rate:
The rate of rollback queries
executed on the database,
using the pools that have been
configured to use the P6Spy
driver
Queries/Sec
Typically, the rate of rollbacks
should be low.
Avg rollback query time:
The average time taken by the
rollback queries to execute on
the database, using the pools
that have been configured to
use the P6Spy driver
Secs
Jdbc query error rate:
The rate of queries that have
resulted in an error
Errors/Sec
2.1.5 The WebLogic EJB Layer
Following are three different kinds of EJB components that can be hosted on a WebLogic server 6.0 or
higher:
a. A stateful session bean is an enterprise bean that acts as a server-side extension of the client
that uses it. The stateful session bean is created by a client and will work for only that client
until the client connection is dropped or the bean is explicitly removed.
b. A stateless session bean is an enterprise bean that provides a stateless service to the client
c. An entity bean represents a business object in a persistent storage mechanism such as a
database. For example, an entity bean could represent a customer, which might be stored as a
row in the customer table of a relational database
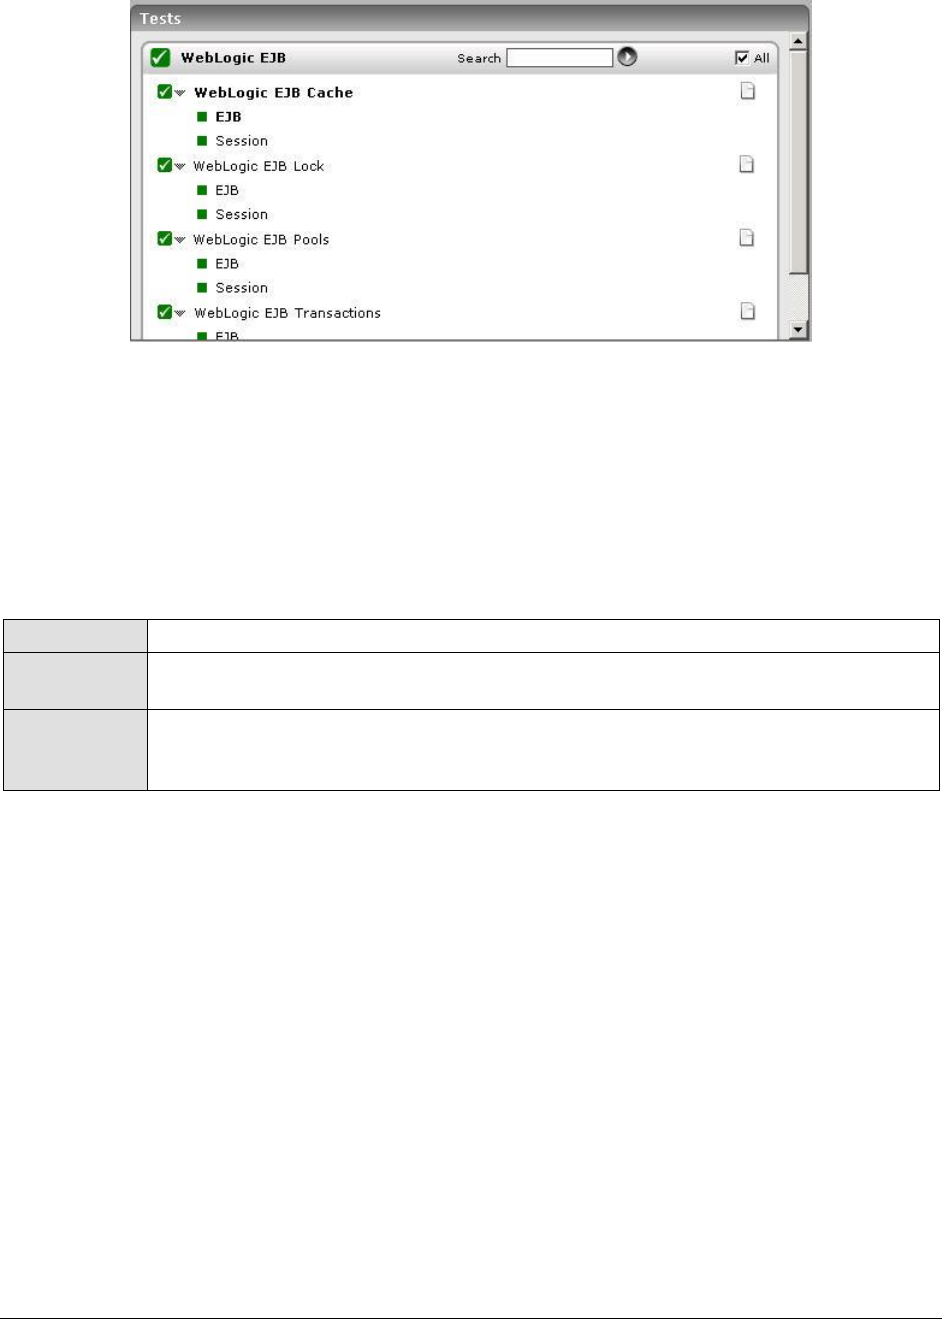
M o n i t o r i n g W e b L o g i c A p p l i c a t i o n S e r v e r s
158
Figure 2.18: Tests mapping to the WebLogic EJB layer
The Weblogic EJB layer is mapped to a wide variety of tests, each of which report key statistics
pertaining to a critical EJB operation.
2.1.5.1 WebLogic EJB Locks Test
The WebLogic EJB Lock test monitors the EJB locking activity performed by the WebLogic server. Use
the Click here hyperlink in the test configuration page to configure the EJB groups that need to be
monitored by the eG Enterprise suite. By default, the eG Enterprise system will monitor only those EJBs that are
part of a group.
Purpose
Monitors the EJB locking activity performed by the WebLogic server
Target of the
test
A WebLogic application server
Agent
deploying the
test
An internal agent

M o n i t o r i n g W e b L o g i c A p p l i c a t i o n S e r v e r s
159
Configurable
parameters for
the test
1. TEST PERIOD - How often should the test be executed
2. HOST – The IP address of the WebLogic server
3. PORT – The port number of the WebLogic server
4. USER – The admin user name of the WebLogic server being monitored.
5. PASSWORD – The password of the specified admin user
6. CONFIRM PASSWORD – Confirm the password by retyping it here.
7. ENCRYPTPASS - If the specified password needs to be encrypted, set the
ENCRYPTPASS flag to YES. Otherwise, set it to NO. By default, the YES option will
be selected.
Note:
If the USEWARFILE flag is set to No, then make sure that the ENCRYPTPASS flag
is also set to No.
8. SSL – Indicate whether the SSL (Secured Socket Layer) is to be used to connect
to the WebLogic server.
9. SERVER - The name of the specific server instance to be monitored for a
WebLogic server (the default value is "localhome")
10. AUTODISCOVERY – By default, eG Enterprise allows administrators to configure
EJB groups using the eG administrative interface, and reports metrics pertaining
to every group so created. Accordingly, by default, AUTODISCOVERY is set to
NO. If you want EJBs to be discovered and monitored automatically, then select
the YES option against AUTODISCOVERY. When this is done, the eG agent
automatically discovers all the EJBs on the WebLogic server, and reports one set
of measures for every EJB so discovered.
11. SHOWSERVERNAME - WebLogic version 8.0 and above prefixes the names of
the EJBs it hosts, with the server name specified in the SERVER text box. For
example, if the SERVER text box contains MedRecServer, then an EJB named
MedRecEAR_EntityEJB_PatientEJB on that server will be renamed by WebLogic
as MedRecServer_MedRecEAR_EntityEJB_PatientEJB. This could pose a
challenge while applying EJB groups configured (using eG) on a particular
WebLogic server to another server. This is because, when the eG Enterprise
suite lists the EJBs available for grouping, each of the displayed EJBs will be
prefixed by the corresponding SERVER name. When such EJBs are grouped and
the group is then applied to another WebLogic server, the eG Enterprise system
will not be able to extract metrics for the EJB grouping applied to the new server
due to the server name mismatch. Therefore, by default, the eG Enterprise
system sets the SHOWSERVERNAME flag to No. This ensures that the server
name specified in the SERVER text box does not prefix the EJB listing during EJB
group configuration. To enable the prefix, select the Yes option against
SHOWSERVERNAME.
Note:
If you modify the SHOWSERVERNAME setting after configuring the EJB groups,
then wait for the test to run once so that the eG agent rediscovers the EJBs on
that server. Then, delete the existing EJB groups, and repeat the group
configuration.

M o n i t o r i n g W e b L o g i c A p p l i c a t i o n S e r v e r s
160
12. URL – The URL to be accessed to collect metrics pertaining to the WebLogic
server. By default, this test connects to a managed WebLogic server and
attempts to obtain the metrics of interest by accessing the local Mbeans of the
server. This parameter can be changed to a value of
http://<adminserverIP>:<adminserverPort>. In this case, the test connects
to the WebLogic admin server to collect metrics pertaining to the managed
server (specified by the HOST and PORT). The URL setting provides the
administrator with the flexibility of determining the WebLogic monitoring
configuration to use.
Note:
If the admin server is to be used for collecting measures for all the managed
WebLogic servers, then it is mandatory that the egurkha war file is deployed to
the admin server, and it is up and running.
13. VERSION - The VERSION textbox indicates the version of the Weblogic server to
be managed. The default value is "none", in which case the test auto-discovers
the weblogic version. If the value of this parameter is not "none", the test uses
the value provided (e.g., 7.0) as the weblogic version (i.e., it does not auto-
discover the weblogic server version). This parameter has been added to
address cases when the eG agent is not able to discover the WebLogic server
version.
14. USEWARFILE - This flag indicates whether/not monitoring is to be done using a
Web archive file deployed on the WebLogic server (in which case, HTTP/HTTPS
is used by the server to connect to the server). If this flag is set to No, the agent
directly connects to the WebLogic server using the T3 protocol (no other file
needs to be deployed on the WebLogic server for this to work). Note that the T3
protocol-based support is available for WebLogic servers ver.9 and ver. 10 only. Also, if the
USEWARFILE parameter is set to No, make sure that the ENCRYPTPASS
parameter is set to No as well.
When monitoring a WebLogic server deployed on a Unix platform particularly, if
the USEWARFILE parameter is set to No, you have to make sure that the eG
agent install user is added to the WebLogic users group.
15. WEBLOGICJARLOCATION - Specify the location of the WebLogic server's java
archive (Jar) file. If the USEWARFILE flag is set to No, then the weblogic.jar file
specified here is used to connect to the corresponding WebLogic server using
the T3 protocol. Note that the T3 protocol-based support is available for WebLogic servers
ver.9 and ver. 10 only.
16. DETAILED DIAGNOSIS - To make diagnosis more efficient and accurate, the eG
Enterprise suite embeds an optional detailed diagnostic capability. With this
capability, the eG agents can be configured to run detailed, more elaborate tests
as and when specific problems are detected. To enable the detailed diagnosis
capability of this test for a particular server, choose the On option. To disable
the capability, click on the Off option.
The option to selectively enable/disable the detailed diagnosis capability will be
available only if the following conditions are fulfilled:
The eG manager license should allow the detailed diagnosis capability
Both the normal and abnormal frequencies configured for the detailed
diagnosis measures should not be 0.

M o n i t o r i n g W e b L o g i c A p p l i c a t i o n S e r v e r s
161
Outputs of the
test
One set of results for every EJB group configured using the eG administrative
interface
Measurements
made by the
test
Measurement
Measurement
Unit
Interpretation
Locked beans count:
The sum total of the beans
from within an EJB group that
are currently locked
Number
Attempts to lock rate:
The sum total of the rate at
which attempts were made to
obtain a lock on every bean
within an EJB group
Attempts/S
ec
Timeout rate:
The sum total of the rate at
which threads have timed out
waiting for a lock on every
bean within an EJB group
Timeouts/S
ec
Threads waiting rate:
The sum total of the rate at
which threads have been
waiting for a lock on every
bean in an EJB group
Threads/Sec
The detailed diagnosis of this
measure, if enabled, provides
locking information pertaining to
the individual beans in the
monitored EJB group. The details
displayed include: The Bean name,
the number of locked beans, the
number of attempts made to lock,
the timeout rate, and the threads
waiting rate of the bean. Note that
the detailed diagnosis information will not
be available if the AUTODISCOVERY
parameter is set to ‘Yes’.
2.1.5.2 WebLogic EJB Cache Test
To improve the performance and the scalability of the EJB container, WebLogic server caches EJBs.
The WebLogicEJBCache test collects measures related to EJB caching activity by the WebLogic server.
Use the Click here hyperlink in the test configuration page to configure the EJB groups that need to be
monitored by the eG Enterprise suite. By default, the eG Enterprise system will monitor only those EJBs that are
part of a group.
Purpose
Collects measures related to EJB caching activity by the WebLogic server
Target of the
test
A WebLogic application server
Agent
deploying the
test
An internal agent

M o n i t o r i n g W e b L o g i c A p p l i c a t i o n S e r v e r s
162
Configurable
parameters for
the test
1. TEST PERIOD - How often should the test be executed
2. HOST – The IP address of the WebLogic server
3. PORT – The port number of the WebLogic server
4. USER – The admin user name of the WebLogic server being monitored.
5. PASSWORD – The password of the specified admin user
6. CONFIRM PASSWORD – Confirm the password by retyping it here.
7. ENCRYPTPASS - If the specified password needs to be encrypted, set the
ENCRYPTPASS flag to YES. Otherwise, set it to NO. By default, the YES option will
be selected.
Note:
If the USEWARFILE flag is set to No, then make sure that the ENCRYPTPASS flag
is also set to No.
8. SSL – Indicate whether the SSL (Secured Socket Layer) is to be used to connect
to the WebLogic server.
9. SERVER - The name of the specific server instance to be monitored for a
WebLogic server (the default value is "localhome")
10. AUTODISCOVERY – By default, eG Enterprise allows administrators to configure
EJB groups using the eG administrative interface, and reports metrics pertaining
to every group so created. Accordingly, by default, AUTODISCOVERY is set to
NO. If you want EJBs to be discovered and monitored automatically, then select
the YES option against AUTODISCOVERY. When this is done, the eG agent
automatically discovers all the EJBs on the WebLogic server, and reports one set
of measures for every EJB so discovered.
11. SHOWSERVERNAME - WebLogic version 8.0 and above prefixes the names of
the EJBs it hosts, with the server name specified in the SERVER text box. For
example, if the SERVER text box contains MedRecServer, then an EJB named
MedRecEAR_EntityEJB_PatientEJB on that server will be renamed by WebLogic
as MedRecServer_MedRecEAR_EntityEJB_PatientEJB. This could pose a
challenge while applying EJB groups configured (using eG) on a particular
WebLogic server to another server. This is because, when the eG Enterprise
suite lists the EJBs available for grouping, each of the displayed EJBs will be
prefixed by the corresponding SERVER name. When such EJBs are grouped and
the group is then applied to another WebLogic server, the eG Enterprise system
will not be able to extract metrics for the EJB grouping applied to the new server
due to the server name mismatch. Therefore, by default, the eG Enterprise
system sets the SHOWSERVERNAME flag to No. This ensures that the server
name specified in the SERVER text box does not prefix the EJB listing during EJB
group configuration. To enable the prefix, select the Yes option against
SHOWSERVERNAME.
Note:
If you modify the SHOWSERVERNAME setting after configuring the EJB groups,
then wait for the test to run once so that the eG agent rediscovers the EJBs on
that server. Then, delete the existing EJB groups, and repeat the group
configuration.

M o n i t o r i n g W e b L o g i c A p p l i c a t i o n S e r v e r s
163
12. URL – The URL to be accessed to collect metrics pertaining to the WebLogic
server. By default, this test connects to a managed WebLogic server and
attempts to obtain the metrics of interest by accessing the local Mbeans of the
server. This parameter can be changed to a value of
http://<adminserverIP>:<adminserverPort>. In this case, the test connects
to the WebLogic admin server to collect metrics pertaining to the managed
server (specified by the HOST and PORT). The URL setting provides the
administrator with the flexibility of determining the WebLogic monitoring
configuration to use.
Note:
If the admin server is to be used for collecting measures for all the managed
WebLogic servers, then it is mandatory that the egurkha war file is deployed to
the admin server, and it is up and running.
13. VERSION - The VERSION textbox indicates the version of the Weblogic server to
be managed. The default value is "none", in which case the test auto-discovers
the weblogic version. If the value of this parameter is not "none", the test uses
the value provided (e.g., 7.0) as the weblogic version (i.e., it does not auto-
discover the weblogic server version). This parameter has been added to
address cases when the eG agent is not able to discover the WebLogic server
version.
14. USEWARFILE - This flag indicates whether/not monitoring is to be done using a
Web archive file deployed on the WebLogic server (in which case, HTTP/HTTPS
is used by the server to connect to the server). If this flag is set to No, the agent
directly connects to the WebLogic server using the T3 protocol (no other file
needs to be deployed on the WebLogic server for this to work). Note that the T3
protocol-based support is available for WebLogic servers ver.9 and ver. 10 only. Also, if the
USEWARFILE parameter is set to No, make sure that the ENCRYPTPASS
parameter is set to No as well.
When monitoring a WebLogic server deployed on a Unix platform particularly, if
the USEWARFILE parameter is set to No, you have to make sure that the eG
agent install user is added to the WebLogic users group.
15. WEBLOGICJARLOCATION - Specify the location of the WebLogic server's java
archive (Jar) file. If the USEWARFILE flag is set to No, then the weblogic.jar file
specified here is used to connect to the corresponding WebLogic server using
the T3 protocol. Note that the T3 protocol-based support is available for WebLogic servers
ver.9 and ver. 10 only.
16. DETAILED DIAGNOSIS - To make diagnosis more efficient and accurate, the eG
Enterprise suite embeds an optional detailed diagnostic capability. With this
capability, the eG agents can be configured to run detailed, more elaborate tests
as and when specific problems are detected. To enable the detailed diagnosis
capability of this test for a particular server, choose the On option. To disable
the capability, click on the Off option.
The option to selectively enable/disable the detailed diagnosis capability will be
available only if the following conditions are fulfilled:
The eG manager license should allow the detailed diagnosis capability
Both the normal and abnormal frequencies configured for the detailed
diagnosis measures should not be 0.

M o n i t o r i n g W e b L o g i c A p p l i c a t i o n S e r v e r s
164
Outputs of the
test
One set of results for every EJB group configured using the eG administrative
interface
Measurements
made by the
test
Measurement
Measurement
Unit
Interpretation
Activation rate:
The sum total of the rate at
which every bean from a
particular EJB group have been
activated
Beans/Sec
Passivation rate:
The sum total of the rate at
which the every bean from a
specific EJB group have been
passivated
Beans/Sec
Cache hit rate:
The sum total of the rate at
which attempts to access
every bean within an EJB
group, from the cache
succeeded
Hits/Sec
Cache miss rate:
The sum total of the rate at
which attempts to access
every bean within an EJB
group, from the cache failed
Misses/Sec
Cache hit ratio:
The average of the percentage
of time every bean in an EJB
group was successfully
accessed from the cache
Percent
Beans in cache:
The number of beans in the
cache
Number
The detailed diagnosis of the Cache hit ratio measure, provides the details pertaining to the EJB
caching activity of the individual beans in the EJB group being monitored (see Figure 2.19). This
information enables administrators to assess the effectiveness of the caching activity performed by the
WebLogic server. Note that the detailed diagnosis information will not be available if the AUTODISCOVERY
parameter is set to ‘Yes’.
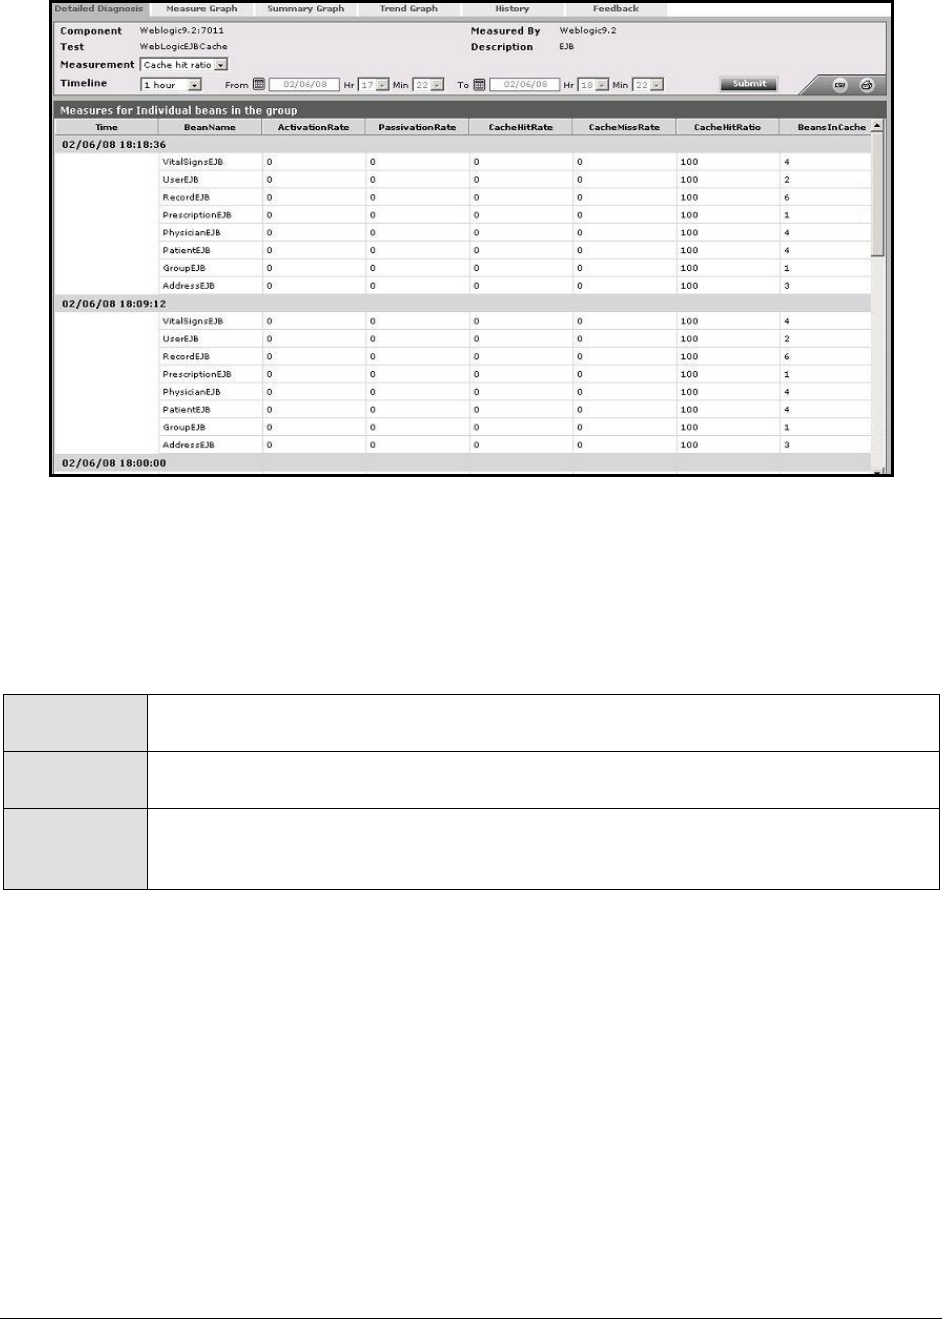
M o n i t o r i n g W e b L o g i c A p p l i c a t i o n S e r v e r s
165
Figure 2.19: The detailed diagnosis of the Cache hit ratio measure
2.1.5.3 WebLogic EJB Pools Test
This test collects measures related to the bean pooling activity performed by the WebLogic server. Use
the Click here hyperlink in the test configuration page to configure the EJB groups that need to be
monitored by the eG Enterprise suite. By default, the eG Enterprise system monitors only those EJBs that are
part of a group.
Purpose
Collects measures related to the bean pooling activity performed by the WebLogic
server
Target of the
test
A WebLogic application server
Agent
deploying the
test
An internal agent

M o n i t o r i n g W e b L o g i c A p p l i c a t i o n S e r v e r s
166
Configurable
parameters for
the test
1. TEST PERIOD - How often should the test be executed
2. HOST – The IP address of the WebLogic server
3. PORT – The port number of the WebLogic server
4. USER – The admin user name of the WebLogic server being monitored.
5. PASSWORD – The password of the specified admin user
6. CONFIRM PASSWORD – Confirm the password by retyping it here.
7. ENCRYPTPASS - If the specified password needs to be encrypted, set the
ENCRYPTPASS flag to YES. Otherwise, set it to NO. By default, the YES option will
be selected.
Note:
If the USEWARFILE flag is set to No, then make sure that the ENCRYPTPASS flag
is also set to No.
8. SSL – Indicate whether the SSL (Secured Socket Layer) is to be used to connect
to the WebLogic server.
9. SERVER - The name of the specific server instance to be monitored for a
WebLogic server (the default value is "localhome")
10. AUTODISCOVERY – By default, eG Enterprise allows administrators to configure
EJB groups using the eG administrative interface, and reports metrics pertaining
to every group so created. Accordingly, by default, AUTODISCOVERY is set to
NO. If you want EJBs to be discovered and monitored automatically, then select
the YES option against AUTODISCOVERY. When this is done, the eG agent
automatically discovers all the EJBs on the WebLogic server, and reports one set
of measures for every EJB so discovered.
11. SHOWSERVERNAME - WebLogic version 8.0 and above prefixes the names of
the EJBs it hosts, with the server name specified in the SERVER text box. For
example, if the SERVER text box contains MedRecServer, then an EJB named
MedRecEAR_EntityEJB_PatientEJB on that server will be renamed by WebLogic
as MedRecServer_MedRecEAR_EntityEJB_PatientEJB. This could pose a
challenge while applying EJB groups configured (using eG) on a particular
WebLogic server to another server. This is because, when the eG Enterprise
suite lists the EJBs available for grouping, each of the displayed EJBs will be
prefixed by the corresponding SERVER name. When such EJBs are grouped and
the group is then applied to another WebLogic server, the eG Enterprise system
will not be able to extract metrics for the EJB grouping applied to the new server
due to the server name mismatch. Therefore, by default, the eG Enterprise
system sets the SHOWSERVERNAME flag to No. This ensures that the server
name specified in the SERVER text box does not prefix the EJB listing during EJB
group configuration. To enable the prefix, select the Yes option against
SHOWSERVERNAME.
Note:
If you modify the SHOWSERVERNAME setting after configuring the EJB groups,
then wait for the test to run once so that the eG agent rediscovers the EJBs on
that server. Then, delete the existing EJB groups, and repeat the group
configuration.

M o n i t o r i n g W e b L o g i c A p p l i c a t i o n S e r v e r s
167
12. URL – The URL to be accessed to collect metrics pertaining to the WebLogic
server. By default, this test connects to a managed WebLogic server and
attempts to obtain the metrics of interest by accessing the local Mbeans of the
server. This parameter can be changed to a value of
http://<adminserverIP>:<adminserverPort>. In this case, the test connects
to the WebLogic admin server to collect metrics pertaining to the managed
server (specified by the HOST and PORT). The URL setting provides the
administrator with the flexibility of determining the WebLogic monitoring
configuration to use.
Note:
If the admin server is to be used for collecting measures for all the managed
WebLogic servers, then it is mandatory that the egurkha war file is deployed to
the admin server, and it is up and running.
13. VERSION - The VERSION textbox indicates the version of the Weblogic server to
be managed. The default value is "none", in which case the test auto-discovers
the weblogic version. If the value of this parameter is not "none", the test uses
the value provided (e.g., 7.0) as the weblogic version (i.e., it does not auto-
discover the weblogic server version). This parameter has been added to
address cases when the eG agent is not able to discover the WebLogic server
version.
14. USEWARFILE - This flag indicates whether/not monitoring is to be done using a
Web archive file deployed on the WebLogic server (in which case, HTTP/HTTPS
is used by the server to connect to the server). If this flag is set to No, the agent
directly connects to the WebLogic server using the T3 protocol (no other file
needs to be deployed on the WebLogic server for this to work). Note that the T3
protocol-based support is available for WebLogic servers ver.9 and ver. 10 only. Also, if the
USEWARFILE parameter is set to No, make sure that the ENCRYPTPASS
parameter is set to No as well.
When monitoring a WebLogic server deployed on a Unix platform particularly, if
the USEWARFILE parameter is set to No, you have to make sure that the eG
agent install user is added to the WebLogic users group.
15. WEBLOGICJARLOCATION - Specify the location of the WebLogic server's java
archive (Jar) file. If the USEWARFILE flag is set to No, then the weblogic.jar file
specified here is used to connect to the corresponding WebLogic server using
the T3 protocol. Note that the T3 protocol-based support is available for WebLogic servers
ver.9 and ver. 10 only.
16. DETAILED DIAGNOSIS - To make diagnosis more efficient and accurate, the eG
Enterprise suite embeds an optional detailed diagnostic capability. With this
capability, the eG agents can be configured to run detailed, more elaborate tests
as and when specific problems are detected. To enable the detailed diagnosis
capability of this test for a particular server, choose the On option. To disable
the capability, click on the Off option.
The option to selectively enable/disable the detailed diagnosis capability will be
available only if the following conditions are fulfilled:
The eG manager license should allow the detailed diagnosis capability
Both the normal and abnormal frequencies configured for the detailed
diagnosis measures should not be 0.

M o n i t o r i n g W e b L o g i c A p p l i c a t i o n S e r v e r s
168
Outputs of the
test
One set of results for every EJB group configured using the eG administrative
interface
Measurements
made by the
test
Measurement
Measurement
Unit
Interpretation
Beans in use:
The sum total of instances of
every bean in an EJB group
that are currently being used
from the free pool
Number
Idle beans:
The sum total of the instances
of every bean within an EJB
group that are currently
available in the free pool
Number
Waiting threads:
The sum total of threads
currently waiting for every
available bean instance in an
EJB group
Number
Thread timeouts:
The sum total of the number of
threads that have timed out
waiting for an available
instance of every bean in an
EJB group
Threads/Sec
Access attempts:
An access attempt is an
attempt made to get an
instance of a bean from the
free pool. The
Access_attempts measure
reports the sum total of all
such attempts made for every
bean in an EJB group.
Number
This measure will be available on
WebLogic servers 8.0 and above
only.
Missed attempts:
A missed attempt is a failed
attempt made to get an
instance of a bean from the
free pool. The
Missed_attempts measure
reports the sum total of all
such failed attempts made for
every bean in an EJB group.
Number
This measure will be available on
WebLogic servers 8.0 and above
only.
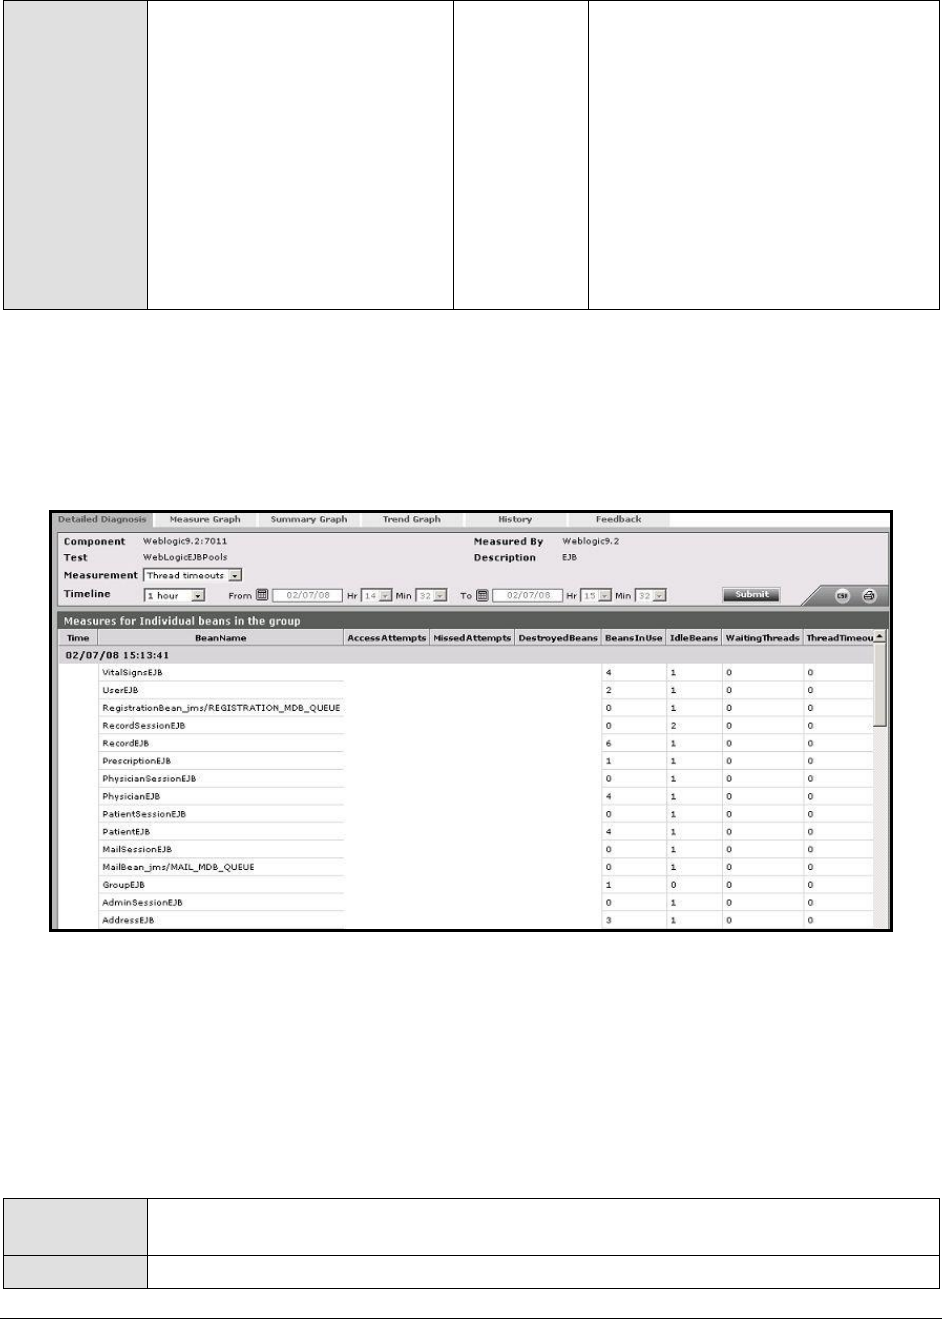
M o n i t o r i n g W e b L o g i c A p p l i c a t i o n S e r v e r s
169
Destroyed beans:
If an instance of a bean (in an
EJB group) from a pool was
destroyed due to a non-
application Exception being
thrown from it, then the bean
is deemed destroyed. The
Destroyed_beans measure
reports the sum total of all the
beans in an EJB group that
threw a non-application
Exception.
Number
This measure will be available on
WebLogic servers 8.0 and above
only.
The detailed diagnosis of the Waiting threads (see Figure 2.20) and the Thread timeouts measures
provides the details related to the usage of the individual beans present in the EJB group being
monitored. This information enables administrators to evaluate the effectiveness of the bean pooling
activity of the WebLogic server. Note that the detailed diagnosis information will not be available if the
AUTODISCOVERY parameter is set to ‘Yes’.
Figure 2.20: The detailed diagnosis of the Threads timeout measure
2.1.5.4 WebLogic EJB Pool Test
The WebLogic EJB PoolTest collects measures related to the bean pooling activity performed by the
WebLogic server. This test will be disabled by default. You can enable this test by clicking on the check
box corresponding to the test in the AGENTS – TESTS CONFIGURATION page, and then clicking on the Update
button. Use the Click here hyperlink in the test configuration page to configure the EJB groups that
need to be monitored by the eG Enterprise suite. By default, the eG Enterprise system monitors only those
EJBs that are part of a group.
Purpose
Collects measures related to the bean pooling activity performed by the WebLogic
server
Target of the
A WebLogic application server

M o n i t o r i n g W e b L o g i c A p p l i c a t i o n S e r v e r s
170
test
Agent
deploying the
test
An internal agent

M o n i t o r i n g W e b L o g i c A p p l i c a t i o n S e r v e r s
171
Configurable
parameters for
the test
1. TEST PERIOD - How often should the test be executed
2. HOST – The IP address of the WebLogic server
3. PORT – The port number of the WebLogic server
4. USER – The admin user name of the WebLogic server being monitored.
5. PASSWORD – The password of the specified admin user
6. CONFIRM PASSWORD – Confirm the password by retyping it here.
7. ENCRYPTPASS - If the specified password needs to be encrypted, set the
ENCRYPTPASS flag to YES. Otherwise, set it to NO. By default, the YES option will
be selected.
Note:
If the USEWARFILE flag is set to No, then make sure that the ENCRYPTPASS flag
is also set to No.
8. SSL – Indicate whether the SSL (Secured Socket Layer) is to be used to connect
to the WebLogic server.
9. SERVER - The name of the specific server instance to be monitored for a
WebLogic server (the default value is "localhome")
10. AUTODISCOVERY – By default, eG Enterprise allows administrators to configure
EJB groups using the eG administrative interface, and reports metrics pertaining
to every group so created. Accordingly, by default, AUTODISCOVERY is set to
NO. If you want EJBs to be discovered and monitored automatically, then select
the YES option against AUTODISCOVERY. When this is done, the eG agent
automatically discovers all the EJBs on the WebLogic server, and reports one set
of measures for every EJB so discovered.
11. SHOWSERVERNAME - WebLogic version 8.0 and above prefixes the names of
the EJBs it hosts, with the server name specified in the SERVER text box. For
example, if the SERVER text box contains MedRecServer, then an EJB named
MedRecEAR_EntityEJB_PatientEJB on that server will be renamed by WebLogic
as MedRecServer_MedRecEAR_EntityEJB_PatientEJB. This could pose a
challenge while applying EJB groups configured (using eG) on a particular
WebLogic server to another server. This is because, when the eG Enterprise
suite lists the EJBs available for grouping, each of the displayed EJBs will be
prefixed by the corresponding SERVER name. When such EJBs are grouped and
the group is then applied to another WebLogic server, the eG Enterprise system
will not be able to extract metrics for the EJB grouping applied to the new server
due to the server name mismatch. Therefore, by default, the eG Enterprise
system sets the SHOWSERVERNAME flag to No. This ensures that the server
name specified in the SERVER text box does not prefix the EJB listing during EJB
group configuration. To enable the prefix, select the Yes option against
SHOWSERVERNAME.
Note:
If you modify the SHOWSERVERNAME setting after configuring the EJB groups,
then wait for the test to run once so that the eG agent rediscovers the EJBs on
that server. Then, delete the existing EJB groups, and repeat the group
configuration.

M o n i t o r i n g W e b L o g i c A p p l i c a t i o n S e r v e r s
172
12. URL – The URL to be accessed to collect metrics pertaining to the WebLogic
server. By default, this test connects to a managed WebLogic server and
attempts to obtain the metrics of interest by accessing the local Mbeans of the
server. This parameter can be changed to a value of
http://<adminserverIP>:<adminserverPort>. In this case, the test connects
to the WebLogic admin server to collect metrics pertaining to the managed
server (specified by the HOST and PORT). The URL setting provides the
administrator with the flexibility of determining the WebLogic monitoring
configuration to use.
Note:
If the admin server is to be used for collecting measures for all the managed
WebLogic servers, then it is mandatory that the egurkha war file is deployed to
the admin server, and it is up and running.
13. VERSION - The VERSION textbox indicates the version of the Weblogic server to
be managed. The default value is "none", in which case the test auto-discovers
the weblogic version. If the value of this parameter is not "none", the test uses
the value provided (e.g., 7.0) as the weblogic version (i.e., it does not auto-
discover the weblogic server version). This parameter has been added to
address cases when the eG agent is not able to discover the WebLogic server
version.
14. USEWARFILE - This flag indicates whether/not monitoring is to be done using a
Web archive file deployed on the WebLogic server (in which case, HTTP/HTTPS
is used by the server to connect to the server). If this flag is set to No, the agent
directly connects to the WebLogic server using the T3 protocol (no other file
needs to be deployed on the WebLogic server for this to work). Note that the T3
protocol-based support is available for WebLogic servers ver.9 and ver. 10 only. Also, if the
USEWARFILE parameter is set to No, make sure that the ENCRYPTPASS
parameter is set to No as well.
When monitoring a WebLogic server deployed on a Unix platform particularly, if
the USEWARFILE parameter is set to No, you have to make sure that the eG
agent install user is added to the WebLogic users group.
15. WEBLOGICJARLOCATION - Specify the location of the WebLogic server's java
archive (Jar) file. If the USEWARFILE flag is set to No, then the weblogic.jar file
specified here is used to connect to the corresponding WebLogic server using
the T3 protocol. Note that the T3 protocol-based support is available for WebLogic servers
ver.9 and ver. 10 only.
16. DETAILED DIAGNOSIS - To make diagnosis more efficient and accurate, the eG
Enterprise suite embeds an optional detailed diagnostic capability. With this
capability, the eG agents can be configured to run detailed, more elaborate tests
as and when specific problems are detected. To enable the detailed diagnosis
capability of this test for a particular server, choose the On option. To disable
the capability, click on the Off option.
The option to selectively enable/disable the detailed diagnosis capability will be
available only if the following conditions are fulfilled:
The eG manager license should allow the detailed diagnosis capability
Both the normal and abnormal frequencies configured for the detailed
diagnosis measures should not be 0.

M o n i t o r i n g W e b L o g i c A p p l i c a t i o n S e r v e r s
173
Outputs of the
test
One set of results for every EJB group configured using the eG administrative
interface
Measurements
made by the
test
Measurement
Measurement
Unit
Interpretation
Beans in use:
The sum total of instances of
every bean in an EJB group
that are currently being used
from the free pool
Number
Idle beans:
The sum total of the instances
of every bean within an EJB
group that are currently
available in the free pool
Number
Waiting threads:
The sum total of threads
currently waiting for every
available bean instance in an
EJB group
Number
Threads timeout rate:
The sum total of the rate at
which threads have timed out
waiting for an available
instance of every bean in an
EJB group
Threads/Sec
2.1.5.5 WebLogic EJB Transactions Test
This test collects measures related to the EJB transaction activity performed by the WebLogic server.
Use the Click here hyperlink in the test configuration page to configure the EJB groups that need to be
monitored by the eG Enterprise suite. By default, the eG Enterprise system monitors only those EJBs that are
part of a group.
Purpose
Collects measures related to the EJB transaction activity performed by the WebLogic
server
Target of the
test
A WebLogic application server
Agent
deploying the
test
An internal agent

M o n i t o r i n g W e b L o g i c A p p l i c a t i o n S e r v e r s
174
Configurable
parameters for
the test
1. TEST PERIOD - How often should the test be executed
2. HOST – The IP address of the WebLogic server
3. PORT – The port number of the WebLogic server
4. USER – The admin user name of the WebLogic server being monitored.
5. PASSWORD – The password of the specified admin user
6. CONFIRM PASSWORD – Confirm the password by retyping it here.
7. ENCRYPTPASS - If the specified password needs to be encrypted, set the
ENCRYPTPASS flag to YES. Otherwise, set it to NO. By default, the YES option will
be selected.
Note:
If the USEWARFILE flag is set to No, then make sure that the ENCRYPTPASS flag
is also set to No.
8. SSL – Indicate whether the SSL (Secured Socket Layer) is to be used to connect
to the WebLogic server.
9. SERVER - The name of the specific server instance to be monitored for a
WebLogic server (the default value is "localhome")
10. AUTODISCOVERY – By default, eG Enterprise allows administrators to configure
EJB groups using the eG administrative interface, and reports metrics pertaining
to every group so created. Accordingly, by default, AUTODISCOVERY is set to
NO. If you want EJBs to be discovered and monitored automatically, then select
the YES option against AUTODISCOVERY. When this is done, the eG agent
automatically discovers all the EJBs on the WebLogic server, and reports one set
of measures for every EJB so discovered.
11. SHOWSERVERNAME - WebLogic version 8.0 and above prefixes the names of
the EJBs it hosts, with the server name specified in the SERVER text box. For
example, if the SERVER text box contains MedRecServer, then an EJB named
MedRecEAR_EntityEJB_PatientEJB on that server will be renamed by WebLogic
as MedRecServer_MedRecEAR_EntityEJB_PatientEJB. This could pose a
challenge while applying EJB groups configured (using eG) on a particular
WebLogic server to another server. This is because, when the eG Enterprise
suite lists the EJBs available for grouping, each of the displayed EJBs will be
prefixed by the corresponding SERVER name. When such EJBs are grouped and
the group is then applied to another WebLogic server, the eG Enterprise system
will not be able to extract metrics for the EJB grouping applied to the new server
due to the server name mismatch. Therefore, by default, the eG Enterprise
system sets the SHOWSERVERNAME flag to No. This ensures that the server
name specified in the SERVER text box does not prefix the EJB listing during EJB
group configuration. To enable the prefix, select the Yes option against
SHOWSERVERNAME.
Note:
If you modify the SHOWSERVERNAME setting after configuring the EJB groups,
then wait for the test to run once so that the eG agent rediscovers the EJBs on
that server. Then, delete the existing EJB groups, and repeat the group
configuration.

M o n i t o r i n g W e b L o g i c A p p l i c a t i o n S e r v e r s
175
12. URL – The URL to be accessed to collect metrics pertaining to the WebLogic
server. By default, this test connects to a managed WebLogic server and
attempts to obtain the metrics of interest by accessing the local Mbeans of the
server. This parameter can be changed to a value of
http://<adminserverIP>:<adminserverPort>. In this case, the test connects
to the WebLogic admin server to collect metrics pertaining to the managed
server (specified by the HOST and PORT). The URL setting provides the
administrator with the flexibility of determining the WebLogic monitoring
configuration to use.
Note:
If the admin server is to be used for collecting measures for all the managed
WebLogic servers, then it is mandatory that the egurkha war file is deployed to
the admin server, and it is up and running.
13. VERSION - The VERSION textbox indicates the version of the Weblogic server to
be managed. The default value is "none", in which case the test auto-discovers
the weblogic version. If the value of this parameter is not "none", the test uses
the value provided (e.g., 7.0) as the weblogic version (i.e., it does not auto-
discover the weblogic server version). This parameter has been added to
address cases when the eG agent is not able to discover the WebLogic server
version.
14. USEWARFILE - This flag indicates whether/not monitoring is to be done using a
Web archive file deployed on the WebLogic server (in which case, HTTP/HTTPS
is used by the server to connect to the server). If this flag is set to No, the agent
directly connects to the WebLogic server using the T3 protocol (no other file
needs to be deployed on the WebLogic server for this to work). Note that the T3
protocol-based support is available for WebLogic servers ver.9 and ver. 10 only. Also, if the
USEWARFILE parameter is set to No, make sure that the ENCRYPTPASS
parameter is set to No as well.
When monitoring a WebLogic server deployed on a Unix platform particularly, if
the USEWARFILE parameter is set to No, you have to make sure that the eG
agent install user is added to the WebLogic users group.
15. WEBLOGICJARLOCATION - Specify the location of the WebLogic server's java
archive (Jar) file. If the USEWARFILE flag is set to No, then the weblogic.jar file
specified here is used to connect to the corresponding WebLogic server using
the T3 protocol. Note that the T3 protocol-based support is available for WebLogic servers
ver.9 and ver. 10 only.
16. DETAILED DIAGNOSIS - To make diagnosis more efficient and accurate, the eG
Enterprise suite embeds an optional detailed diagnostic capability. With this
capability, the eG agents can be configured to run detailed, more elaborate tests
as and when specific problems are detected. To enable the detailed diagnosis
capability of this test for a particular server, choose the On option. To disable
the capability, click on the Off option.
The option to selectively enable/disable the detailed diagnosis capability will be
available only if the following conditions are fulfilled:
The eG manager license should allow the detailed diagnosis capability
Both the normal and abnormal frequencies configured for the detailed
diagnosis measures should not be 0.

M o n i t o r i n g W e b L o g i c A p p l i c a t i o n S e r v e r s
176
Outputs of the
test
One set of results for every EJB group configured using the eG administrative
interface
Measurements
made by the
test
Measurement
Measurement
Unit
Interpretation
Transaction commits:
Commit rate is the rate at
which transactions are
committed for a particular
bean. Tx_commit_rate reveals
the sum total of the commit
rates of the individual beans in
an EJB group.
Trans/Sec
Comparing this value across all the
deployed groups can give an idea of
the relative importance of the
beans within the groups, in
supporting user accesses. A sudden
change in user access patterns can
be indicative of a change in the
user workload.
Transaction rollbacks:
Rollback rate is the rate at
which the transactions are
rolled back for a particular
bean. Tx_rollback_rate reveals
the sum total of the rollback
rates of the individual beans in
an EJB group.
Trans/Sec
A high rollback rate indicates a
problem with specific beans within a
group. Possible reasons for this
could be problems with the design
and implementation of the specific
bean or problems with any of the
dependent servers of the bean
(e.g., database server).
Transaction timeouts:
The timeout rate is the rate at
which the transactions are
timed out by the bean.
Tx_timeout_rate reveals the
sum total of the timeout rates
of the individual beans in an
EJB group.
Trans/Sec
A significantly high value may
denote a load on the specific bean.
This may indicate that specific
transactions are taking too long to
process requests.
The detailed diagnosis of the
Transaction rollbacks and
Transaction timeouts measures, if
enabled, provides the commit rate,
rollback rate, and timeout rate of
the transactions conducted by each
of the beans within the EJB group
being monitored. Note that the detailed
diagnosis information will not be
available if the AUTODISCOVERY
parameter is set to ‘Yes’.
2.1.5.6 WebLogic Ejbs Test
This test monitors the state of EJB component groups hosted on a WebLogic server 6.0 or higher using
JMX. By default, this test appears disabled in the eG administrative interface (the CONFIGURE TESTS
page) and is included for backward compatibility with earlier eG versions only. To enable the test, go
to the ENABLE / DISABLE TESTS page using the menu sequence : Agents -> Tests -> Enable/Disable, pick
WebLogic as the Component type, Performance as the Test type, choose this test from the DISABLED TESTS
list, and click on the >> button to move the test to the ENABLED TESTS list. Finally, click the Update
button.
Use the Click here hyperlink in the test configuration page to configure the EJB groups that need to be
monitored by the eG Enterprise suite. Note that the eG Enterprise system monitors only those EJBs that are part
of a group.

M o n i t o r i n g W e b L o g i c A p p l i c a t i o n S e r v e r s
177
Purpose
To measure statistics pertaining to EJB groups configured on a WebLogic application
server 6.0 or higher
Target of the
test
An EJB component hosted on the WebLogic application server version 6.0 or higher
Agent
deploying the
test
An internal agent

M o n i t o r i n g W e b L o g i c A p p l i c a t i o n S e r v e r s
178
Configurable
parameters for
the test
1. TEST PERIOD - How often should the test be executed
2. HOST – The IP address of the WebLogic server
3. PORT – The port number of the WebLogic server
4. USER – The admin user name of the WebLogic server being monitored.
5. PASSWORD – The password of the specified admin user
6. CONFIRM PASSWORD – Confirm the password by retyping it here.
7. ENCRYPTPASS - If the specified password needs to be encrypted, set the
ENCRYPTPASS flag to YES. Otherwise, set it to NO. By default, the YES option will
be selected.
Note:
If the USEWARFILE flag is set to No, then make sure that the ENCRYPTPASS flag
is also set to No.
8. SSL – Indicate whether the SSL (Secured Socket Layer) is to be used to connect
to the WebLogic server.
9. SERVER - The name of the specific server instance to be monitored for a
WebLogic server (the default value is "localhome")
10. URL – The URL to be accessed to collect metrics pertaining to the WebLogic
server. By default, this test connects to a managed WebLogic server and
attempts to obtain the metrics of interest by accessing the local Mbeans of the
server. This parameter can be changed to a value of
http://<adminserverIP>:<adminserverPort>. In this case, the test connects
to the WebLogic admin server to collect metrics pertaining to the managed
server (specified by the HOST and PORT). The URL setting provides the
administrator with the flexibility of determining the WebLogic monitoring
configuration to use.
Note:
If the admin server is to be used for collecting measures for all the managed
WebLogic servers, then it is mandatory that the egurkha war file is deployed to
the admin server, and it is up and running.
11. VERSION - The VERSION textbox indicates the version of the Weblogic server to
be managed. The default value is "none", in which case the test auto-discovers
the weblogic version. If the value of this parameter is not "none", the test uses
the value provided (e.g., 7.0) as the weblogic version (i.e., it does not auto-
discover the weblogic server version). This parameter has been added to
address cases when the eG agent is not able to discover the WebLogic server
version.
12. USEWARFILE - This flag indicates whether/not monitoring is to be done using a
Web archive file deployed on the WebLogic server (in which case, HTTP/HTTPS
is used by the server to connect to the server). If this flag is set to No, the agent
directly connects to the WebLogic server using the T3 protocol (no other file
needs to be deployed on the WebLogic server for this to work). Note that the T3
protocol-based support is available for WebLogic servers ver.9 and ver. 10 only. Also, if the
USEWARFILE parameter is set to No, make sure that the ENCRYPTPASS
parameter is set to No as well.

M o n i t o r i n g W e b L o g i c A p p l i c a t i o n S e r v e r s
179
When monitoring a WebLogic server deployed on a Unix platform particularly, if
the USEWARFILE parameter is set to No, you have to make sure that the eG
agent install user is added to the WebLogic users group.
13. WEBLOGICJARLOCATION - Specify the location of the WebLogic server's java
archive (Jar) file. If the USEWARFILE flag is set to No, then the weblogic.jar file
specified here is used to connect to the corresponding WebLogic server using
the T3 protocol. Note that the T3 protocol-based support is available for WebLogic servers
ver.9 and ver. 10 only.
Outputs of the
test
One set of results for every EJB group configured
Measurements
made by the
test
Measurement
Measurement
Unit
Interpretation
Transaction commit
rate:
Indicates the rate at
which transactions are
committed for a
particular bean.
Trans/Sec
Comparing this value across all the
deployed beans can give an idea of the
relative importance of the beans in
supporting user accesses. A sudden
change in user access patterns can be
indicative of a change in the user
workload.
Transaction rollback
rate:
Indicates the rate at
which the transactions
are rolled back for a
particular bean.
Trans/Sec
A high rollback rate indicates a problem
with specific beans. Possible reasons for
this could be problems with the design
and implementation of the specific bean
or problems with any of the dependent
servers of the bean (e.g., database
server).
Transactions inflight:
Number of transactions
currently in progress
through a particular
bean.
Number
A significantly high value may denote a
load on the specific bean. This may
indicate that specific transactions are
taking too long to process requests.
Num waiting rate:
This measure
corresponds to only
stateless session bean.
This indicates the rate
at which connections
are established by the
client with the instances
of the bean.
Conns/Sec
A high value signifies that it is taking
more time for the clients to access an
instance of the bean from the pool.
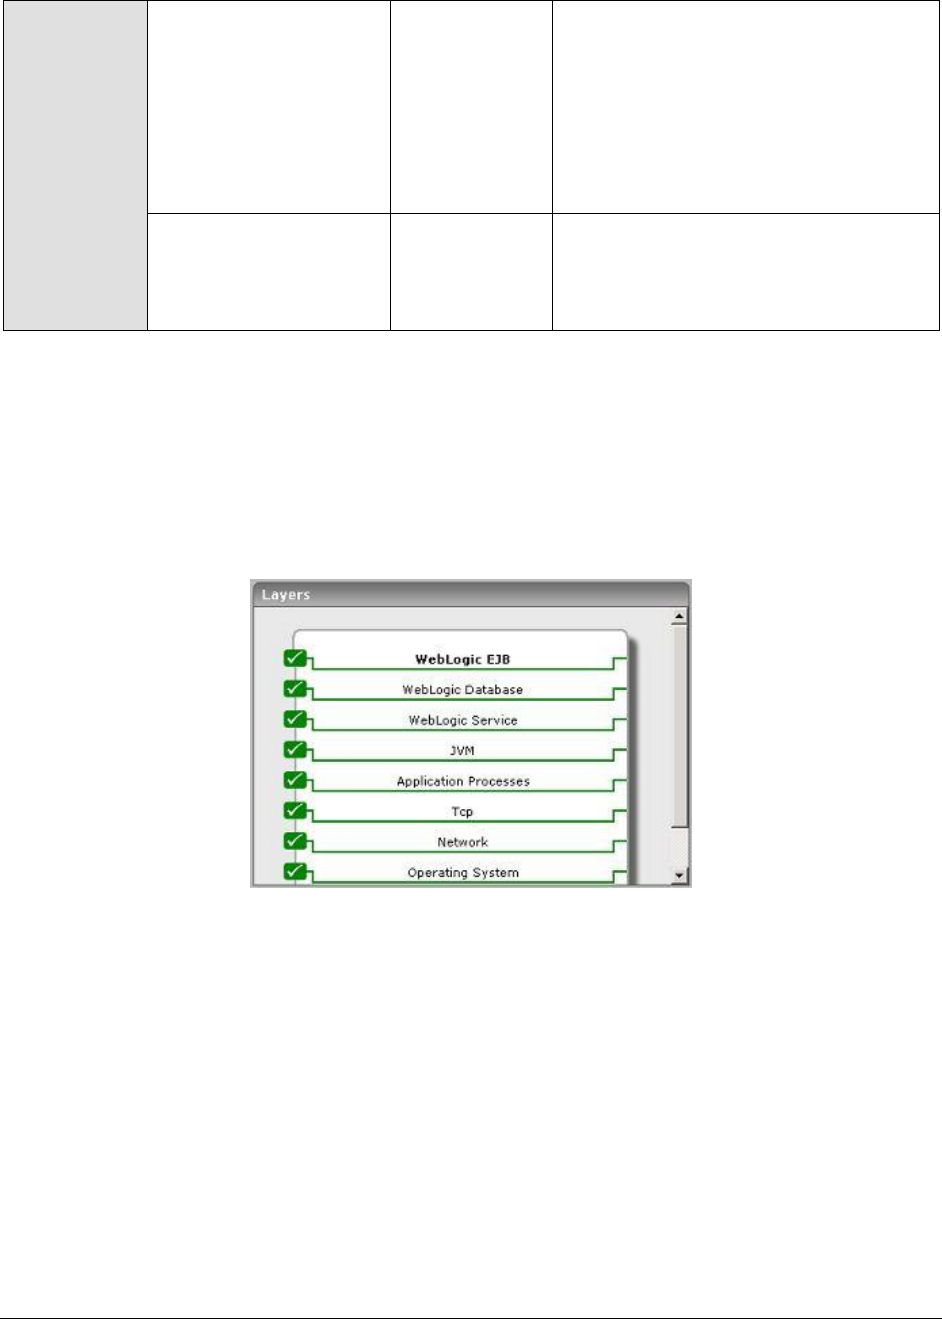
M o n i t o r i n g W e b L o g i c A p p l i c a t i o n S e r v e r s
180
Timeout rate:
This measure also
corresponds to the
stateless session beans.
The measure indicates
the rate at which
instances are timed out
by the bean.
Conns/Sec
A high value indicates a problem with a
specific bean. Again, the problem can
be specific to the bean implementation
or with any of the dependent servers of
the bean.
Idle bean percent:
The percentage of
beans those are idle in
the cache.
Percent
A high percentage indicates a memory
bottleneck. The timeout of the session
beans could be one of the possible
reasons.
2.2 Monitoring the WebLogic Server Ver. 6/7/8
The special WebLogic (6/7/8) monitoring model (see Figure 2.1) that eG Enterprise offers uses JMX
(Java Management extension), the new standard for managing java components, for monitoring
version 6, 7, and 8 of the WebLogic server. JMX allows users to instrument their applications and
control or monitor them using a management console.
Figure 2.21: Layer model of the WebLogic Application server
The sections that will follow discuss the top 4 layers of Figure 2.1, and the metrics they report. The
remaining layers have been extensively dealt with in the Monitoring Unix and Windows Servers
document.
2.2.1 The JVM Layer
A Java virtual machine (JVM), an implementation of the Java Virtual Machine Specification, interprets
compiled java binary code for a computer's processor (or "hardware platform") so that it can perform
a Java program's instructions. The Java Virtual Machine Specification defines an abstract -- rather
than a real -- machine or processor. The Specification specifies an instruction set, a set of registers, a
stack, a garbage heap, and a method area.
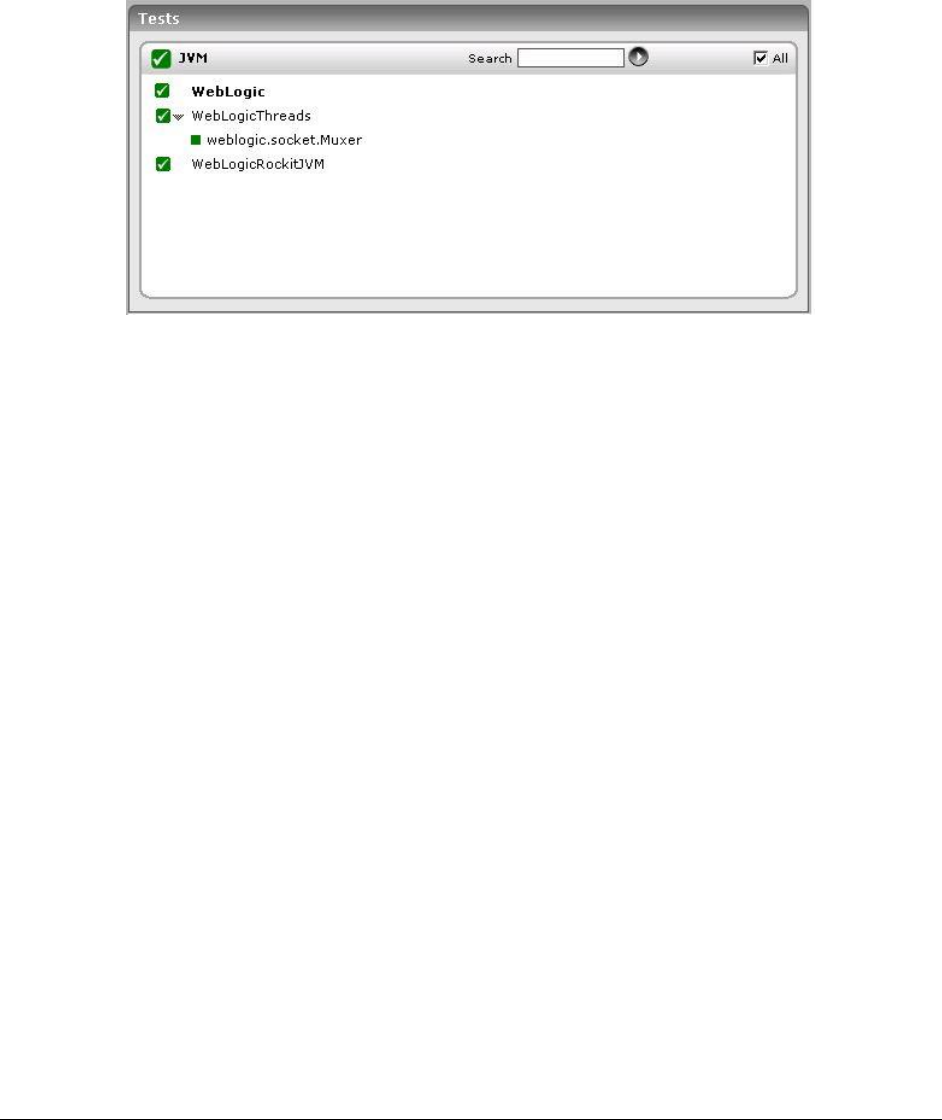
M o n i t o r i n g W e b L o g i c A p p l i c a t i o n S e r v e r s
181
The tests associated with the JVM layer of WebLogic enables administrators to perform the following
functions:
Assess the effectiveness of the garbage collection activity performed on the JVM heap
Monitor WebLogic thread usage
Evaluate the performance of the BEA JRockit JVM
Figure 2.22: The tests associated with the JVM layer
Note that the WebLogic Work Manager test is not mapped to this layer, indicating that this test is not
available for WebLogic versions 6, 7, and 8.
All the tests listed in Figure 2.2 above have been discussed in Section 2.1.1 of this document.
Therefore, let us proceed to the next layer.
2.2.2 The WebLogic Service Layer
The WebLogic Service layer tracks the health of the WebLogic service. The status of the WebLogic Service
layer is determined by the results of the tests shown in Figure 2.15.
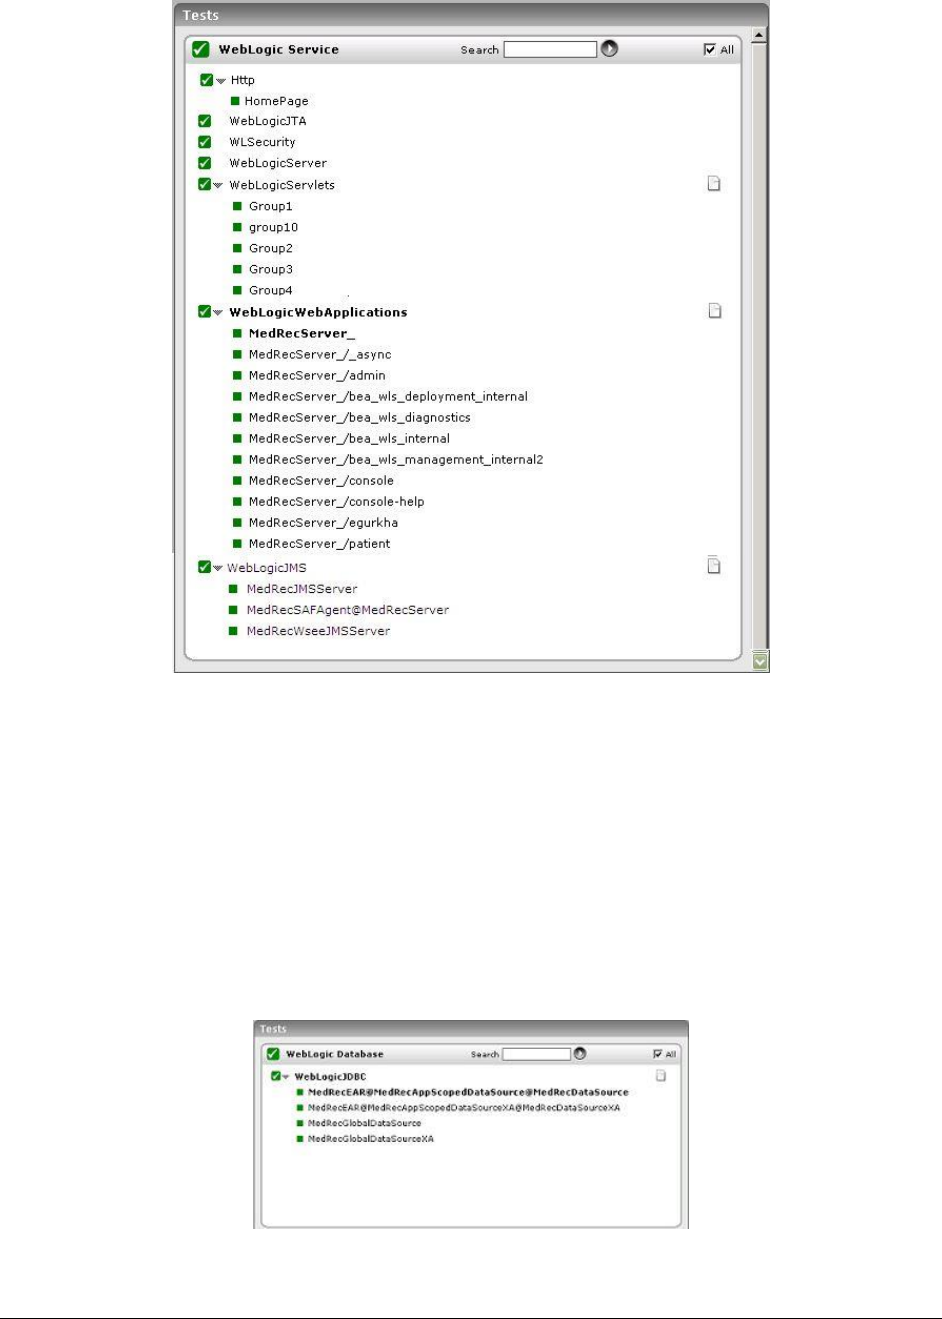
M o n i t o r i n g W e b L o g i c A p p l i c a t i o n S e r v e r s
182
Figure 2.23: Tests mapped to the WebLogic Service layer
Note that the WebLogic Queues and WebLogic Topics tests are not mapped to this layer, indicating that
these tests are not available for WebLogic versions 6, 7, and 8. All other tests depicted by Figure 2.11
have already been discussed in Section 2.1.2.6.7 of this document.
2.2.3 The WebLogic Database Layer
The status of the database connectivity from the WebLogic server to one or more backend database
servers is assessed by the WebLogic Database layer. The status of the WebLogic Database layer is
determined based on the results of a WebLogicJdbc test that is shown in Figure 2.17.
Figure 2.24: Tests mapping to the WebLogic Database layer
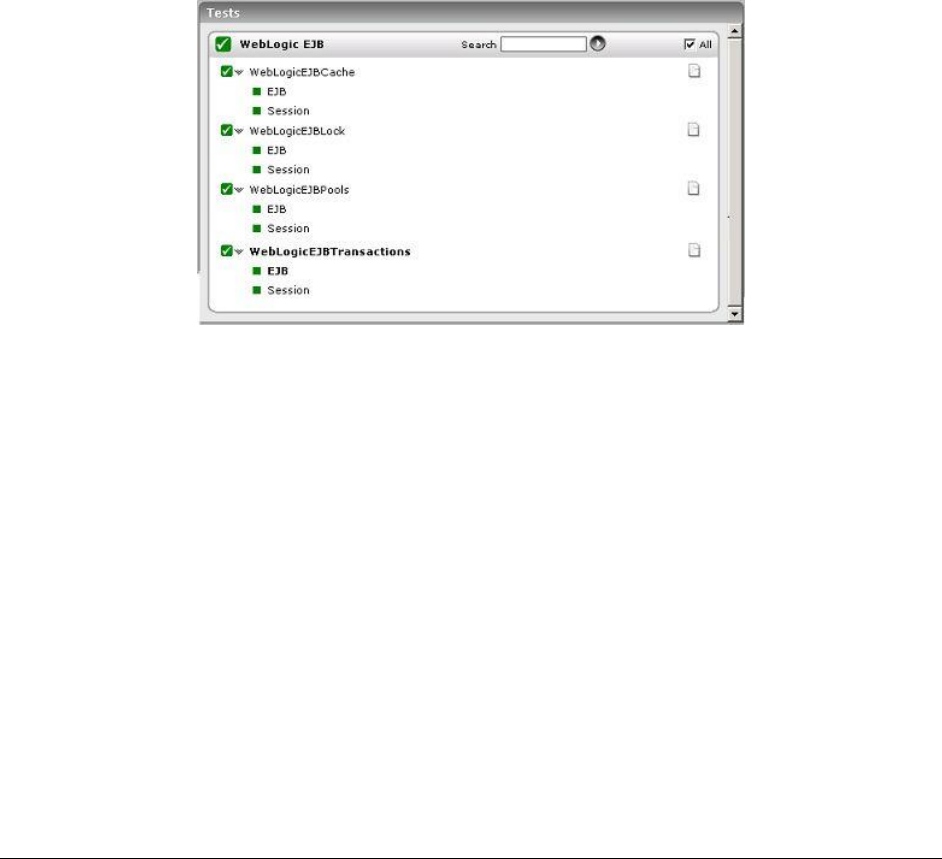
M o n i t o r i n g W e b L o g i c A p p l i c a t i o n S e r v e r s
183
The WebLogicJDBC test mapped to this layer has already been discussed in Section 2.1.4.1 of this
document. Therefore, let us move on to the next layer.
2.2.4 The WebLogic EJB Layer
Following are three different kinds of EJB components that can be hosted on a WebLogic server 6.0 or
higher:
1. A stateful session bean is an enterprise bean that acts as a server-side extension of the client
that uses it. The stateful session bean is created by a client and will work for only that client
until the client connection is dropped or the bean is explicitly removed.
2. A stateless session bean is an enterprise bean that provides a stateless service to the client
3. An entity bean represents a business object in a persistent storage mechanism such as a
database. For example, an entity bean could represent a customer, which might be stored as a
row in the customer table of a relational database
Figure 2.25: Tests mapping to the WebLogic EJB layer
These tests, once again, have already been discussed in Section 2.1.5 of this document.

M o n i t o r i n g W e b S p h e r e A p p l i c a t i o n S e r v e r s
184
Monitoring WebSphere
Application Servers
IBM WebSphere Application Server, a software application server, is the flagship product within
IBM's WebSphere brand. WAS is built using open standards such as J2EE, XML, and Web Services. It
works with a number of web servers including Apache HTTP Server, Netscape Enterprise Server,
Microsoft Internet Information Services (IIS), IBM HTTP Server for i5/OS, IBM HTTP Server for z/OS,
and IBM HTTP Server for AIX/Linux/Microsoft Windows/Solaris. It delivers the secure, scalable,
resilient application infrastructure you need for a Service Oriented Architecture (SOA).
Like any other application server, performance setbacks suffered by the WebSphere application server
too can affect the availability of critical services it supports. To avoid such an eventuality, you need to
continuously monitor the performance of the WebSphere application server.
The eG Enterprise suite facilitates 24x7 monitoring of the WebSphere application server and proactive
alerting of probable error conditions detected on the server. Since different versions of the WebSphere
application server vary in both capabilities and architecture, eG Enterprise employs different
mechanisms to monitor the various versions. This is why, eG Enterprise provides two separate
monitoring models for WebSphere Application server – one for version 4.0 (or 5.1) of the server, and
another for version 6.0 and above. While it uses the component-type WebSphere Application – 4/5.x
to monitor the former, the component-type WebSphere Application is used for monitoring the latter.
This chapter discusses both these models in great detail.
3.1 Monitoring the WebSphere Application Server Version
4/5.x
To obtain statistics specific to a WebSphere Application Server 4/5.x, an eG agent relies on the
Performance Monitoring Interface (PMI) API supported by the WebSphere server. Through eG
Enterprise's administrative interface, the webserver port number through which the WebSphere
servers’ applications can be accessed should be specified.
The layer model that the eG Enterprise suite uses for monitoring this WebSphere server is shown in
Figure 3.1.
Chapter
3
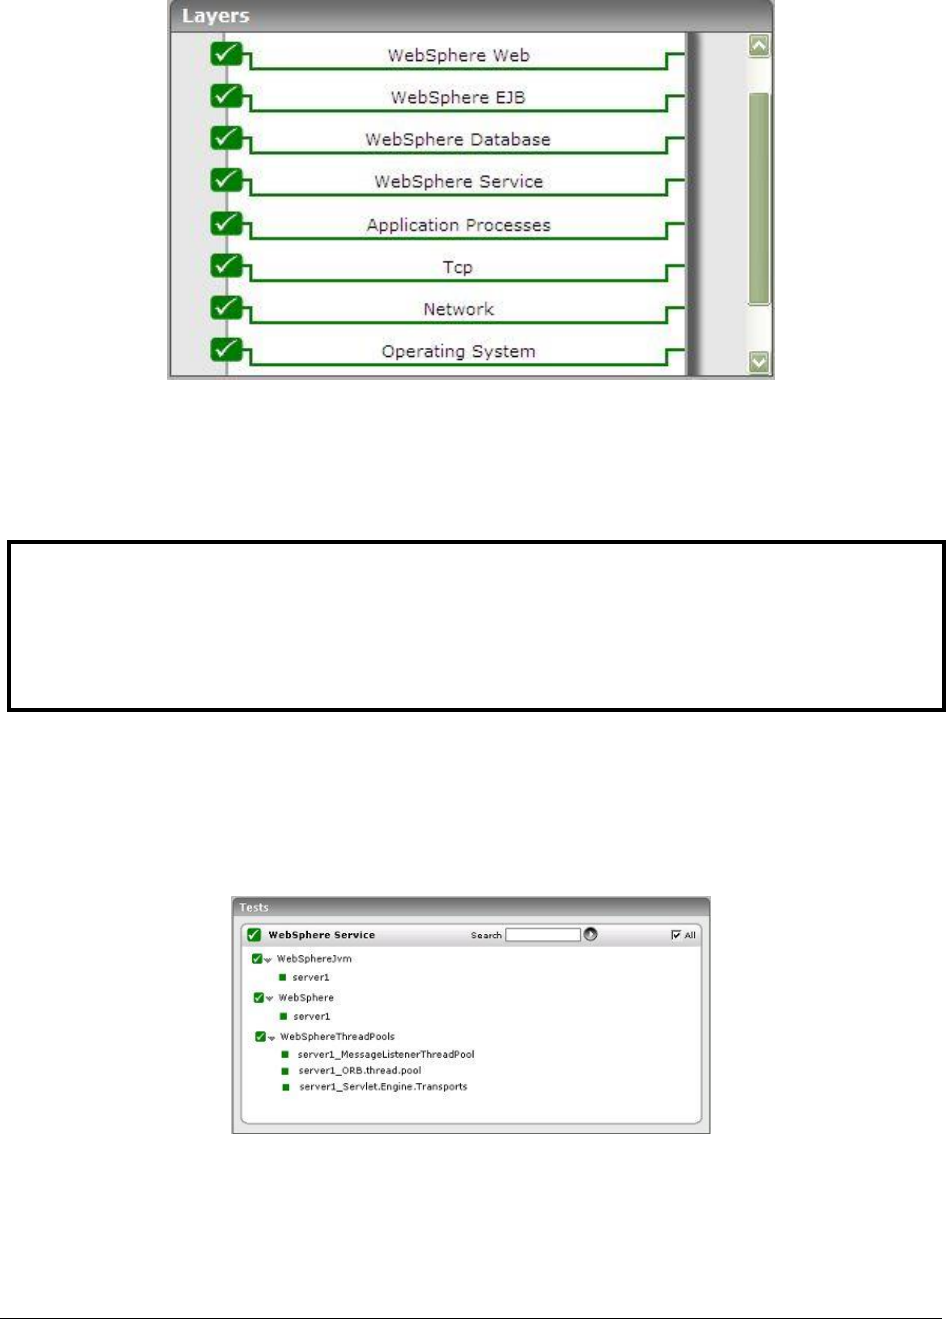
M o n i t o r i n g W e b S p h e r e A p p l i c a t i o n S e r v e r s
185
Figure 3.1: Layer model for a WebSphere application server – 4/5.x
The details pertaining to the Operating System, Network, Tcp, and Application Processes layer have been
discussed in the Monitoring Unix and Windows Servers document. Above the Application Processes layer
is the WebSphere Service layer.
3.1.1 The WebSphere Service Layer
This layer tracks the health of the WebSphere service. The status of the WebSphere Service layer is
determined by the results of the tests depicted by Figure 3.2.
Figure 3.2: Tests mapping to the WebSphere Service layer
3.1.1.1 WebSphere Jvm Test
This test monitors the usage of the WebSphere JVM heap.
Note:
The WebSphere application server uses a specific Java-based application process to execute the
class com.ibm.ejs.sm.server.AdminServer. The Processes test parameters for WebSphere
application servers should be configured to monitor this process.

M o n i t o r i n g W e b S p h e r e A p p l i c a t i o n S e r v e r s
186
Purpose
To monitor the usage of the WebSphere JVM heap
Target of the test
A WebSphere application server
Agent deploying
the test
An internal agent

M o n i t o r i n g W e b S p h e r e A p p l i c a t i o n S e r v e r s
187
Configurable
parameters for
the test
1. TEST PERIOD - How often should the test be executed
2. HOST – The IP address of the WebSphere application server
3. PORT – The port number of the WebSphere application server
4. WEBSERVERPORT – The port number through which the WebSphere
applications can be accessed (For IBMHTTPServer this information can be
found in the httpd.conf file located in $<INSTALLDIR>/conf directory.)
5. SSL – Indicate whether the SSL (Secured Socket Layer) is to be used to
connect to the WebSphere server.
6. SERVERHOSTNAME - Specify the node name of the server instance being
monitored. To know the node name, do the following
Login to the WebSphere Administrative Console.
Expand the Servers node in the tree structure in the left pane of the
console, and click on the Application Servers link within.
A list of application server instances and their corresponding node names
will then appear in the right pane of the console. From this list, you can
figure out the node name that corresponds to the application server
instance being monitored, and specify that name against the
SERVERHOSTNAME parameter.
7. NDMANAGER - The NDMANAGER parameter is applicable only under the
following circumstances:
a. If the WebSphere server being monitored belongs to a cluster, or,
b. If the WebSphere server being monitored is one of many instances of
the server running on the same host
In the case of situation (a), in the NDMANAGER text box, provide the host
name of the NODE MANAGER that manages the application servers in the cluster.
To know the name of the NODE MANAGER, do the following:
Login to the Administrative Console of the node manager using the URL
http://<IPoftheWebSphereAppServer'sNodeManager>:<Adminport>/admi
n/.
Using the tree-structure in the left pane of the Administrative Console that
appears, drill down to the Deployment Manager node within System
Administration.
Select the Configuration tab that appears in the right pane, and scroll down
to the End Points link in the Additional Properties section.
Once you locate the End Points link, click on it, and in the page that
appears, click on the SOAP_CONNECTOR_ADDRESS link.
In the subsequent page, a fully qualified domain name will be displayed
against Host. This is the name that should be specified as the host name of
the node manager in the NDMANAGER text box.
In the case of situation (b), enter the SERVERHOSTNAME itself as the
NDMANAGER. If both conditions (a) and (b) do not apply, then specify none
here.

M o n i t o r i n g W e b S p h e r e A p p l i c a t i o n S e r v e r s
188
8. CONNECTORPORT - The CONNECTORPORT parameter is applicable only under
the following circumstances:
a. If the WebSphere server being monitored belongs to a cluster, or,
b. If the WebSphere server being monitored is one of many instances of
the server running on the same host
In case of situation (a), the CONNECTORPORT parameter will take the port
number using which the node manager communicates with the WebSphere
servers in the cluster. The connector port can be a SOAP port or an RMI port.
To know the port number, do the following:
From the Node manager's host, open the
<WEBSPHERE_INSTALL_DIR>\DeploymentManager\properties\wsadmin.properties
file.
Two entries that read as follows will be present in the wsadmin.properties
file:
com.ibm.ws.scripting.port=<port_number>
#com.ibm.ws.scripting.port=<port_number>
Both the entries will have port numbers against them. However, the
uncommented entry (the entry without the #) is the one that denotes an
active port. Therefore, specify the corresponding port number as the
CONNECTORPORT.
In case of situation (b), do the following to know the CONNECTORPORT:
Login to the WebSphere Administrative Console.
Expand the Servers node in the tree-structure in the left pane of the
console, and click on the Application Servers link. A list of application server
instances will then appear in the right pane.
Click on the server instance being monitored. Doing so invokes the
Configuration of the chosen server instance appears.
Scroll down the Configuration to view the End Points link. Once you locate the
End Points link, click on it.
In the page that appears next, click on the SOAP_CONNECTOR_ADDRESS link.
The Port displayed in that page should be used as the CONNECTORPORT in
situation (b), as
If both (a) and (b) do not apply, specify none against CONNECTORPORT.
9. USER - If security has been enabled for the WebSphere server being
monitored, then provide a valid USER name to login to the WebSphere server.
If the WebSphere server does not require any authentication, then the USER
text box should contain the default value 'none'.

M o n i t o r i n g W e b S p h e r e A p p l i c a t i o n S e r v e r s
189
10. PASSWORD – If security has been enabled for the WebSphere server being
monitored, then provide the PASSWORD that corresponds to the specified
USER name. If the WebSphere server does not require any authentication,
then leave the PASSWORD text box with its default setting.
11. CONFIRM PASSWORD - If security has been enabled, confirm the specified
PASSWORD by retyping it in the CONFIRM PASSWORD text box. If the
WebSphere server does not require any authentication, then leave the
CONFIRM PASSWORD text box with its default setting.
12. ENCRYPTPASS – By default, this flag is set to YES, indicating that the
PASSWORD of the WebSphere server is encrypted by default. To disable
password encryption, select the NO option.
13. SERVERNAME – Specify the name of the WebSphere server instance to be
monitored. To know the instances of a WebSphere server currently available,
first, connect to the WebSphere Administrative console using the URL: http://<IP
address of the WebSphere server:Port number of the WebSphere server>\admin. Then,
login to the administrative console and expand the Servers node in the left
pane of the console. Next, click on the Application Servers sub-node under the
Servers node. A list of server instance Names and their corresponding Node
values will then be displayed in the right pane. One of the displayed server
instances can be specified as the value of the SERVERNAME parameter.
14. TIMEOUT - In the TIMEOUT text box, specify the maximum duration (in
seconds) for which the test will wait for a response from the application
server. The default TIMEOUT period is 60 seconds.
Outputs of the
test
One set of results for each WebSphere application server.
Measurements
made by the test
Measurement
Measurement
Unit
Interpretation
JVM total memory:
Indicates the total heap
size of the JVM.
MB
JVM used memory:
Indicates the amount of
memory that has been
utilized by the JVM
MB
A high value of this measure
indicates a heavy workload on the
WebSphere application server. In
such a case, you might want to
consider increasing the JVM heap
size.
JVM free memory:
Indicates the amount of
memory currently available
in the JVM.
MB
A very low value of this measure is
indicative of excessive memory
utilization in the JVM.
3.1.1.2 WebSphere Test
Since the WebSphere application server uses Java extensively, the performance of the Java Virtual
Memory (JVM) can impact the WebSphere server’s performance. This test measures the status of the
JVM and the server’s availability.

M o n i t o r i n g W e b S p h e r e A p p l i c a t i o n S e r v e r s
190
Purpose
To measure the JVM statistics and availability of a WebSphere application server
Target of the test
A WebSphere application server
Agent deploying
the test
An internal agent
Configurable
parameters for
the test
1. TEST PERIOD - How often should the test be executed
2. HOST – The IP address of the WebSphere application server
3. PORT – The port number of the WebSphere application server
4. WEBSERVERPORT – The port number through which the WebSphere
applications can be accessed (For IBMHTTPServer this information can be
found in the httpd.conf file located in $<INSTALLDIR>/conf directory.)
5. SSL – Indicate whether the SSL (Secured Socket Layer) is to be used to
connect to the WebSphere server.
6. SERVERHOSTNAME - Specify the node name of the server instance being
monitored. To know the node name, do the following
Login to the WebSphere Administrative Console.
Expand the Servers node in the tree structure in the left pane of the
console, and click on the Application Servers link within.
A list of application server instances and their corresponding node names
will then appear in the right pane of the console. From this list, you can
figure out the node name that corresponds to the application server
instance being monitored, and specify that name against the
SERVERHOSTNAME parameter.
7. NDMANAGER - The NDMANAGER parameter is applicable only under the
following circumstances:
a. If the WebSphere server being monitored belongs to a cluster, or,
b. If the WebSphere server being monitored is one of many instances of
the server running on the same host
In the case of situation (a), in the NDMANAGER text box, provide the host
name of the NODE MANAGER that manages the application servers in the cluster.
To know the name of the NODE MANAGER, do the following:
Login to the Administrative Console of the node manager using the URL
http://<IPoftheWebSphereAppServer'sNodeManager>:<Adminport>/admi
n/.
Using the tree-structure in the left pane of the Administrative Console that
appears, drill down to the Deployment Manager node within System
Administration.
Select the Configuration tab that appears in the right pane, and scroll down
to the End Points link in the Additional Properties section.
Once you locate the End Points link, click on it, and in the page that
appears, click on the SOAP_CONNECTOR_ADDRESS link.

M o n i t o r i n g W e b S p h e r e A p p l i c a t i o n S e r v e r s
191
In the subsequent page, a fully qualified domain name will be displayed
against Host. This is the name that should be specified as the host name of
the node manager in the NDMANAGER text box.
In the case of situation (b), enter the SERVERHOSTNAME itself as the
NDMANAGER. If both conditions (a) and (b) do not apply, then specify none
here.
8. CONNECTORPORT - The CONNECTORPORT parameter is applicable only under
the following circumstances:
a. If the WebSphere server being monitored belongs to a cluster, or,
b. If the WebSphere server being monitored is one of many instances of
the server running on the same host
In case of situation (a), the CONNECTORPORT parameter will take the port
number using which the node manager communicates with the WebSphere
servers in the cluster. The connector port can be a SOAP port or an RMI port.
To know the port number, do the following:
From the Node manager's host, open the
<WEBSPHERE_INSTALL_DIR>\DeploymentManager\properties\wsadmin.properties
file.
Two entries that read as follows will be present in the wsadmin.properties
file:
com.ibm.ws.scripting.port=<port_number>
#com.ibm.ws.scripting.port=<port_number>
Both the entries will have port numbers against them. However, the
uncommented entry (the entry without the #) is the one that denotes an
active port. Therefore, specify the corresponding port number as the
CONNECTORPORT.
In case of situation (b), do the following to know the CONNECTORPORT:
Login to the WebSphere Administrative Console.
Expand the Servers node in the tree-structure in the left pane of the
console, and click on the Application Servers link. A list of application server
instances will then appear in the right pane.
Click on the server instance being monitored. Doing so invokes the
Configuration of the chosen server instance appears.
Scroll down the Configuration to view the End Points link. Once you locate the
End Points link, click on it.
In the page that appears next, click on the SOAP_CONNECTOR_ADDRESS link.
The Port displayed in that page should be used as the CONNECTORPORT in
situation (b).
If both (a) and (b) do not apply, specify none against CONNECTORPORT.

M o n i t o r i n g W e b S p h e r e A p p l i c a t i o n S e r v e r s
192
Outputs of the
test
9. USER - If security has been enabled for the WebSphere server being
monitored, then provide a valid USER name to login to the WebSphere server.
If the WebSphere server does not require any authentication, then the USER
text box should contain the default value 'none'.
10. PASSWORD – If security has been enabled for the WebSphere server being
monitored, then provide the PASSWORD that corresponds to the specified
USER name. If the WebSphere server does not require any authentication,
then leave the PASSWORD text box with its default setting.
11. CONFIRM PASSWORD - If security has been enabled, confirm the specified
PASSWORD by retyping it in the CONFIRM PASSWORD text box. If the
WebSphere server does not require any authentication, then leave the
CONFIRM PASSWORD text box with its default setting.
12. ENCRYPTPASS - If the specified password needs to be encrypted, set the
ENCRYPTPASS flag to YES. Otherwise, set it to NO. By default, the YES option
will be selected.
13. SERVERNAME – Specify the name of the WebSphere server instance to be
monitored. To know the instances of a WebSphere server currently available,
first, connect to the WebSphere Administrative console using the URL: http://<IP
address of the WebSphere server:Port number of the WebSphere server>\admin. Then,
login to the administrative console and expand the Servers node in the left
pane of the console. Next, click on the Application Servers sub-node under the
Servers node. A list of server instance Names and their corresponding Node
values will then be displayed in the right pane. One of the displayed server
instances can be specified as the value of the SERVERNAME parameter.
14. TIMEOUT - In the TIMEOUT text box, specify the maximum duration (in
seconds) for which the test will wait for a response from the application
server. The default TIMEOUT period is 60 seconds.
Measurements
made by the test
Measurement
Measurement
Unit
Interpretation
Heap usage:
Indicates the total JVM
heap used.
Percent
A high percentage of the heap usage
indicates either the applications
running on this server might be
utilizing/leaking too much memory or
the server has reached the maximum
memory capacity.
Availability:
Indicates the availability of
the server.
Percent
A value of 100 for this measure
indicates that the server is available.
Any other value indicates that the
server is not running.
3.1.1.3 WebSphere Thread Pools Test
To optimize performance and at the same time to support concurrent accesses from users, the
application server uses thread pools. It is critical to monitor a WebSphere server’s thread pools on an
ongoing basis. This test does just that.
Purpose
To measure the statistics pertaining to the thread pools that exist in the
WebSphere application server
Target of the test
A WebSphere application server

M o n i t o r i n g W e b S p h e r e A p p l i c a t i o n S e r v e r s
193
Agent deploying
the test
An internal agent
Configurable
parameters for
the test
1. TEST PERIOD - How often should the test be executed
2. HOST – The IP address of the WebSphere application server
3. PORT – The port number of the WebSphere application server
4. WEBSERVERPORT – The port number through which the WebSphere
applications can be accessed (For IBMHTTPServer this information can be
found in the httpd.conf file located in $<INSTALLDIR>/conf directory.)
5. SSL – Indicate whether the SSL (Secured Socket Layer) is to be used to
connect to the WebSphere server.
6. SERVERHOSTNAME - Specify the node name of the server instance being
monitored. To know the node name, do the following
Login to the WebSphere Administrative Console.
Expand the Servers node in the tree structure in the left pane of the
console, and click on the Application Servers link within.
A list of application server instances and their corresponding node names
will then appear in the right pane of the console. From this list, you can
figure out the node name that corresponds to the application server
instance being monitored, and specify that name against the
SERVERHOSTNAME parameter.
7. NDMANAGER - The NDMANAGER parameter is applicable only under the
following circumstances:
a. If the WebSphere server being monitored belongs to a cluster, or,
b. If the WebSphere server being monitored is one of many instances of
the server running on the same host
In the case of situation (a), in the NDMANAGER text box, provide the host
name of the NODE MANAGER that manages the application servers in the cluster.
To know the name of the NODE MANAGER, do the following:
Login to the Administrative Console of the node manager using the URL
http://<IPoftheWebSphereAppServer'sNodeManager>:<Adminport>/admi
n/.
Using the tree-structure in the left pane of the Administrative Console that
appears, drill down to the Deployment Manager node within System
Administration.
Select the Configuration tab that appears in the right pane, and scroll down
to the End Points link in the Additional Properties section.
Once you locate the End Points link, click on it, and in the page that
appears, click on the SOAP_CONNECTOR_ADDRESS link.
In the subsequent page, a fully qualified domain name will be displayed
against Host. This is the name that should be specified as the host name of
the node manager in the NDMANAGER text box.

M o n i t o r i n g W e b S p h e r e A p p l i c a t i o n S e r v e r s
194
In the case of situation (b), enter the SERVERHOSTNAME itself as the
NDMANAGER. If both conditions (a) and (b) do not apply, then specify none
here.
8. CONNECTORPORT - The CONNECTORPORT parameter is applicable only under
the following circumstances:
a. If the WebSphere server being monitored belongs to a cluster, or,
b. If the WebSphere server being monitored is one of many instances of
the server running on the same host
In case of situation (a), the CONNECTORPORT parameter will take the port
number using which the node manager communicates with the WebSphere
servers in the cluster. The connector port can be a SOAP port or an RMI port.
To know the port number, do the following:
From the Node manager's host, open the
<WEBSPHERE_INSTALL_DIR>\DeploymentManager\properties\wsadmin.properties
file.
Two entries that read as follows will be present in the wsadmin.properties
file:
com.ibm.ws.scripting.port=<port_number>
#com.ibm.ws.scripting.port=<port_number>
Both the entries will have port numbers against them. However, the
uncommented entry (the entry without the #) is the one that denotes an
active port. Therefore, specify the corresponding port number as the
CONNECTORPORT.
In case of situation (b), do the following to know the CONNECTORPORT:
Login to the WebSphere Administrative Console.
Expand the Servers node in the tree-structure in the left pane of the
console, and click on the Application Servers link. A list of application server
instances will then appear in the right pane.
Click on the server instance being monitored. Doing so invokes the
Configuration of the chosen server instance appears.
Scroll down the Configuration to view the End Points link. Once you locate the
End Points link, click on it.
In the page that appears next, click on the SOAP_CONNECTOR_ADDRESS link.
The Port displayed in that page should be used as the CONNECTORPORT in
situation (b).
If both (a) and (b) do not apply, specify none against CONNECTORPORT.

M o n i t o r i n g W e b S p h e r e A p p l i c a t i o n S e r v e r s
195
9. USER - If security has been enabled for the WebSphere server being
monitored, then provide a valid USER name to login to the WebSphere server.
If the WebSphere server does not require any authentication, then the USER
text box should contain the default value 'none'.
10. PASSWORD – If security has been enabled for the WebSphere server being
monitored, then provide the PASSWORD that corresponds to the specified
USER name. If the WebSphere server does not require any authentication,
then leave the PASSWORD text box with its default setting.
11. CONFIRM PASSWORD - If security has been enabled, confirm the specified
PASSWORD by retyping it in the CONFIRM PASSWORD text box. If the
WebSphere server does not require any authentication, then leave the
CONFIRM PASSWORD text box with its default setting.
12. ENCRYPTPASS – By default, this flag is set to YES, indicating that the
PASSWORD of the WebSphere server is encrypted by default. To disable
password encryption, select the NO option.
14. SERVERNAME – Specify the name of the WebSphere server instance to be
monitored. To know the instances of a WebSphere server currently available,
first, connect to the WebSphere Administrative console using the URL: http://<IP
address of the WebSphere server:Port number of the WebSphere server>\admin. Then,
login to the administrative console and expand the Servers node in the left
pane of the console. Next, click on the Application Servers sub-node under the
Servers node. A list of server instance Names and their corresponding Node
values will then be displayed in the right pane. One of the displayed server
instances can be specified as the value of the SERVERNAME parameter.
15. TIMEOUT - In the TIMEOUT text box, specify the maximum duration (in
seconds) for which the test will wait for a response from the application
server. The default TIMEOUT period is 60 seconds.
http://Ttp://IPOut
puts of the test
One set of results for each thread pool that exists on a WebSphere application
server.
Measurements
made by the test
Measurement
Measurement
Unit
Interpretation
Threads created:
This measure indicates the
rate at which the threads
are being created in the
pool.
Threads/Sec
A sudden increase in the value of this
measure directly relates to an
increase in the activity happening in
this application.
Threads destroyed:
This measure indicates the
rate at which the threads
are being destroyed in the
pool.
Threads/Sec
A decrease in the value of this
measure indicates that the threads
are being active for a long period of
time, which might indicate anomalies
within the application.

M o n i t o r i n g W e b S p h e r e A p p l i c a t i o n S e r v e r s
196
Active threads:
Indicates the average
number of active threads
in the pool.
Number
A high value for this measure is
indicative of a high load on this
application and combined with the
creation and destroy rates might give
insights of the application pattern.
This measure is also useful for
determining usage trends. For
example, it can show the time of day
and the day of the week in which you
usually reach peak thread count. In
addition, the creation of too many
threads can result in out of memory
errors or thrashing. By watching this
metric, you can reduce excessive
memory consumption before it’s too
late.
Pool size:
Indicates the average
number of threads in the
pool.
Number
If the pool size is high and the
number of active threads is low, it
signifies that the threads are not
being destroyed immediately after
use.
Percent maxed:
This indicates the average
percent of time the
number of threads in the
pool reached or exceeded
the configured maximum
number.
Percent
A high value for this measure
indicates that the number of threads
in the pool needs to be increased for
effective operation of this application.
Alternatively, you may also consider
changing the maximum number of
threads that a pool can contain
However, exercise caution when
altering the maximum thread count,
as a very high thread count can
cause the app to slowdown from
excessive memory usage. Likewise,
if the maximum thread count is set
too low, it will cause requests to
block or timeout.
You can use this measure to see how
often you are reaching the maximum
thread count in a pool. This can be
used to tune other properties – such
as the amount of time before an idle
thread is destroyed and the
frequency of when new threads are
created.
3.1.2 The WebSphere Database Layer
This layer tracks the statistics of the database access (connection pools) of the applications hosted on
a WebSphere application server with the help of the WebSphereJdbc test (see Figure 3.3).
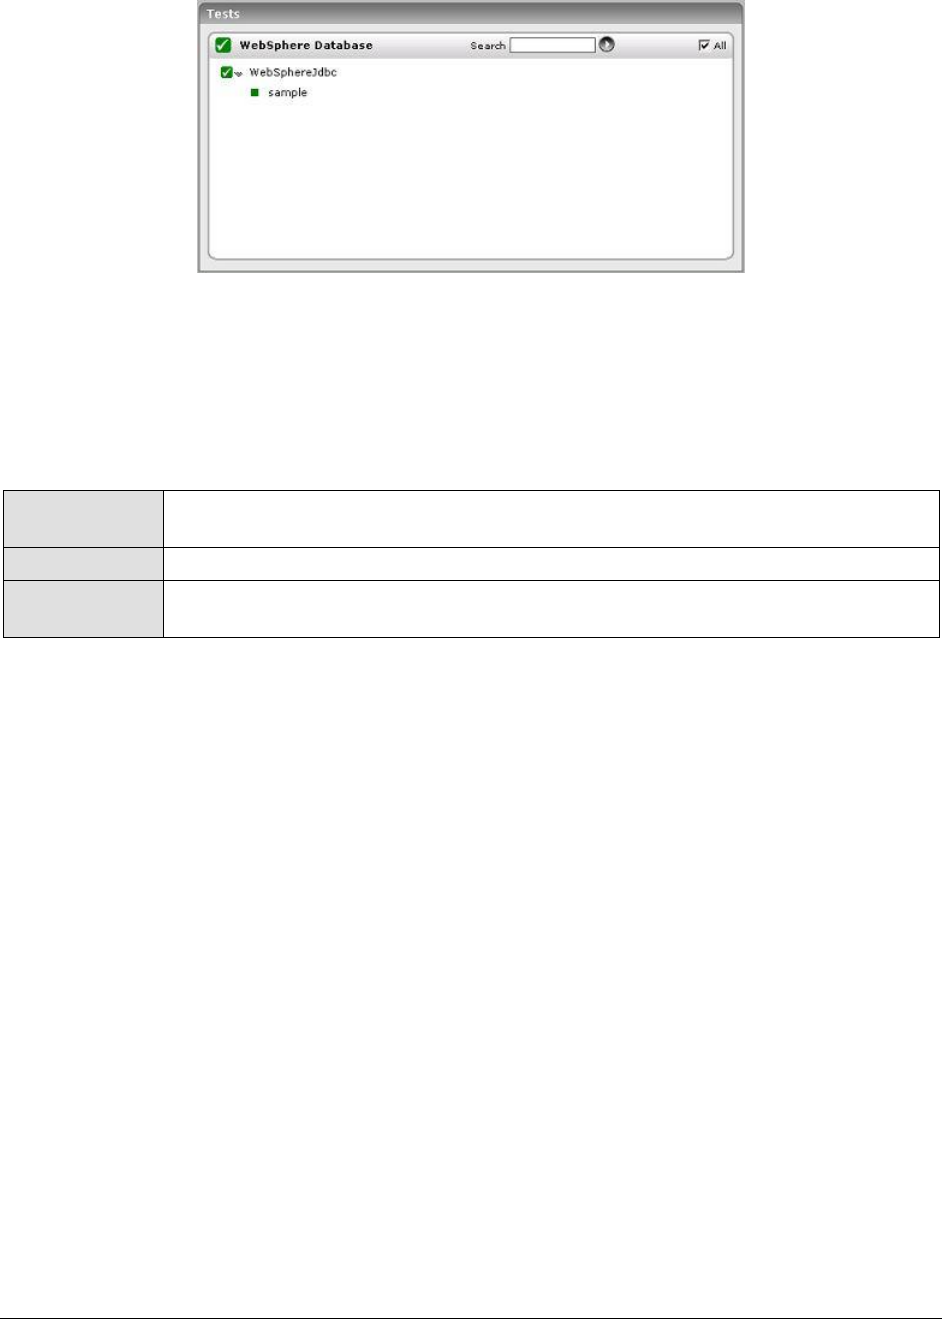
M o n i t o r i n g W e b S p h e r e A p p l i c a t i o n S e r v e r s
197
Figure 3.3: Tests mapping to the WebSphere Database layer
3.1.2.1 WebSphere JDBC Test
Rather than opening and closing connections for individual database accesses, the WebSphere
application server creates pools of database connections that are reused. To understand the
performance of a WebSphere application server, it is critical to monitor the usage of the connection
pools by the server.
Purpose
To measure the statistics pertaining to the database connection pools that exist in
the WebSphere application server
Target of the test
A WebSphere application server
Agent deploying
the test
An internal agent

M o n i t o r i n g W e b S p h e r e A p p l i c a t i o n S e r v e r s
198
Configurable
parameters for
the test
1. TEST PERIOD - How often should the test be executed
2. HOST – The IP address of the WebSphere application server
3. PORT – The port number of the WebSphere application server
4. WEBSERVERPORT – The port number through which the WebSphere
applications can be accessed.
5. SSL – Indicate whether the SSL (Secured Socket Layer) is to be used to
connect to the WebSphere server.
6. SERVERHOSTNAME - Specify the node name of the server instance being
monitored. To know the node name, do the following:
Login to the WebSphere Administrative Console.
Expand the Servers node in the tree structure in the left pane of the
console, and click on the Application Servers link within.
A list of application server instances and their corresponding node names
will then appear in the right pane of the console. From this list, you can
figure out the node name that corresponds to the application server
instance being monitored, and specify that name against the
SERVERHOSTNAME parameter.
7. NDMANAGER - The NDMANAGER parameter is applicable only under the
following circumstances:
a. If the WebSphere server being monitored belongs to a cluster, or,
b. If the WebSphere server being monitored is one of many instances of
the server running on the same host
In the case of situation (a), in the NDMANAGER text box, provide the host
name of the NODE MANAGER that manages the application servers in the cluster.
To know the name of the NODE MANAGER, do the following:
Login to the Administrative Console of the node manager using the URL
http://<IPoftheWebSphereAppServer'sNodeManager>:<Adminport>/admi
n/.
Using the tree-structure in the left pane of the Administrative Console that
appears, drill down to the Deployment Manager node within System
Administration.
Select the Configuration tab that appears in the right pane, and scroll down
to the End Points link in the Additional Properties section.
Once you locate the End Points link, click on it, and in the page that
appears, click on the SOAP_CONNECTOR_ADDRESS link.
In the subsequent page, a fully qualified domain name will be displayed
against Host. This is the name that should be specified as the host name of
the node manager in the NDMANAGER text box.
In the case of situation (b), enter the SERVERHOSTNAME itself as the
NDMANAGER. If both conditions (a) and (b) do not apply, then specify none
here.

M o n i t o r i n g W e b S p h e r e A p p l i c a t i o n S e r v e r s
199
8. CONNECTORPORT - The CONNECTORPORT parameter is applicable only under
the following circumstances:
a. If the WebSphere server being monitored belongs to a cluster, or,
b. If the WebSphere server being monitored is one of many
instances of the server running on the same host
In case of situation (a), the CONNECTORPORT parameter will take the port
number using which the node manager communicates with the WebSphere
servers in the cluster. The connector port can be a SOAP port or an RMI port.
To know the port number, do the following:
From the Node manager's host, open the
<WEBSPHERE_INSTALL_DIR>\DeploymentManager\properties\wsadmin.properties
file.
Two entries that read as follows will be present in the wsadmin.properties
file:
com.ibm.ws.scripting.port=<port_number>
#com.ibm.ws.scripting.port=<port_number>
Both the entries will have port numbers against them. However, the
uncommented entry (the entry without the #) is the one that denotes an
active port. Therefore, specify the corresponding port number as the
CONNECTORPORT.
In case of situation (b), do the following to know the CONNECTORPORT:
Login to the WebSphere Administrative Console.
Expand the Servers node in the tree-structure in the left pane of the
console, and click on the Application Servers link. A list of application server
instances will then appear in the right pane.
Click on the server instance being monitored. Doing so invokes the
Configuration of the chosen server instance appears.
Scroll down the Configuration to view the End Points link. Once you locate the
End Points link, click on it.
In the page that appears next, click on the SOAP_CONNECTOR_ADDRESS link.
The Port displayed in that page should be used as the CONNECTORPORT in
situation (b).
If both (a) and (b) do not apply, specify none against CONNECTORPORT.
9. USER - If security has been enabled for the WebSphere server being
monitored, then provide a valid USER name to login to the WebSphere server.
If the WebSphere server does not require any authentication, then the USER
text box should contain the default value 'none'.
10. PASSWORD – If security has been enabled for the WebSphere server being
monitored, then provide the PASSWORD that corresponds to the specified
USER name. If the WebSphere server does not require any authentication,
then leave the PASSWORD text box with its default setting.

M o n i t o r i n g W e b S p h e r e A p p l i c a t i o n S e r v e r s
200
11. CONFIRM PASSWORD - If security has been enabled, confirm the specified
PASSWORD by retyping it in the CONFIRM PASSWORD text box. If the
WebSphere server does not require any authentication, then leave the
CONFIRM PASSWORD text box with its default setting.
12. ENCRYPTPASS – By default, this flag is set to YES, indicating that the
PASSWORD of the WebSphere server is encrypted by default. To disable
password encryption, select the NO option.
13. SERVERNAME – Specify the name of the WebSphere server instance to be
monitored. To know the instances of a WebSphere server currently available,
first, connect to the WebSphere Administrative console using the URL: http://<IP
address of the WebSphere server:Port number of the WebSphere server>\admin. Then,
login to the administrative console and expand the Servers node in the left
pane of the console. Next, click on the Application Servers sub-node under the
Servers node. A list of server instance Names and their corresponding Node
values will then be displayed in the right pane. One of the displayed server
instances can be specified as the value of the SERVERNAME parameter.
14. TIMEOUT - In the TIMEOUT text box, specify the maximum duration (in
seconds) for which the test will wait for a response from the application
server. The default TIMEOUT period is 60 seconds.
Outputs of the
test
One set of results for each database connection pool that exists on the WebSphere
application server being monitored.
Measurements
made by the test
Measurement
Measurement
Unit
Interpretation
Database connection
rate:
Indicates the rate at which
the connections are
created in the pool.
Conns/Sec
A sudden increase in the value of this
measure directly relates to an
increase in the database activity
happening in this application.
Connection destroy
rate:
Indicates the rate at which
the connections are
released from the pool.
Conns/Sec
A decrease in the value of this
measure points to an unusual
performance of the application. The
application might not be releasing
the connections.
Connection return rate:
This measure indicates the
rate at which the
connections are being
returned to the pool.
Conns/Sec
A low value of this measure might be
due to some applications that are not
releasing the connections to the pool.
Allocate rate:
Indicates the rate at which
the connections are
allocated from the pool.
Conns/Sec
A high value for this measure
indicates more activity happening on
the server. An unusually high value
for this measure might result in the
pool running out of connections, if
the Return_rate is not concurrent.

M o n i t o r i n g W e b S p h e r e A p p l i c a t i o n S e r v e r s
201
Pool size:
Indicates the number of
connections in the pool. It
indicates the active pool
size.
Number
A growing pool size may be due to
some of the applications not
releasing connections to the pool.
Concurrent waiters:
Indicates the average
number of threads waiting
for a connection.
Number
A high value indicates a bottleneck
on the application server. This may
be caused due to unreleased
connections.
Avg wait time:
Indicates the average time
that a client waited to be
granted a connection.
Secs
An increase in this measure reflects a
server bottleneck.
Faults:
Indicates the rate at which
connection pool timeouts
occur.
Faults/Sec
A high value is indicative of a
bottleneck on the server.
Usage:
Indicates the average
percentage of connections
of the pool in use
Percent
This measure should not reach the
maximum of 100% for optimal
performance of the application
server. To reduce this value, try
increasing the pool size.
Percent maxed:
Average percentage of the
time that all connections
are in use.
Percent
A high value indicates that the pool
size needs to be increased for
effective operation of this application.
Prepared statement
cache discard rate:
Indicates the rate at which
the prepared statements
are discarded from the
cache.
Stmts/Sec
A high value indicates a bottleneck in
the application. It is a sign of
inefficient performance of the
application.
3.1.3 The WebSphere EJB Layer
The WsBeans test shown in Figure 3.4 determines the status of the WebSphere EJB layer. This layer
determines the status of specific Enterprise Java Bean (abbreviated as EJB in this manual)
components hosted on a WebSphere server. The details of these tests are provided below:
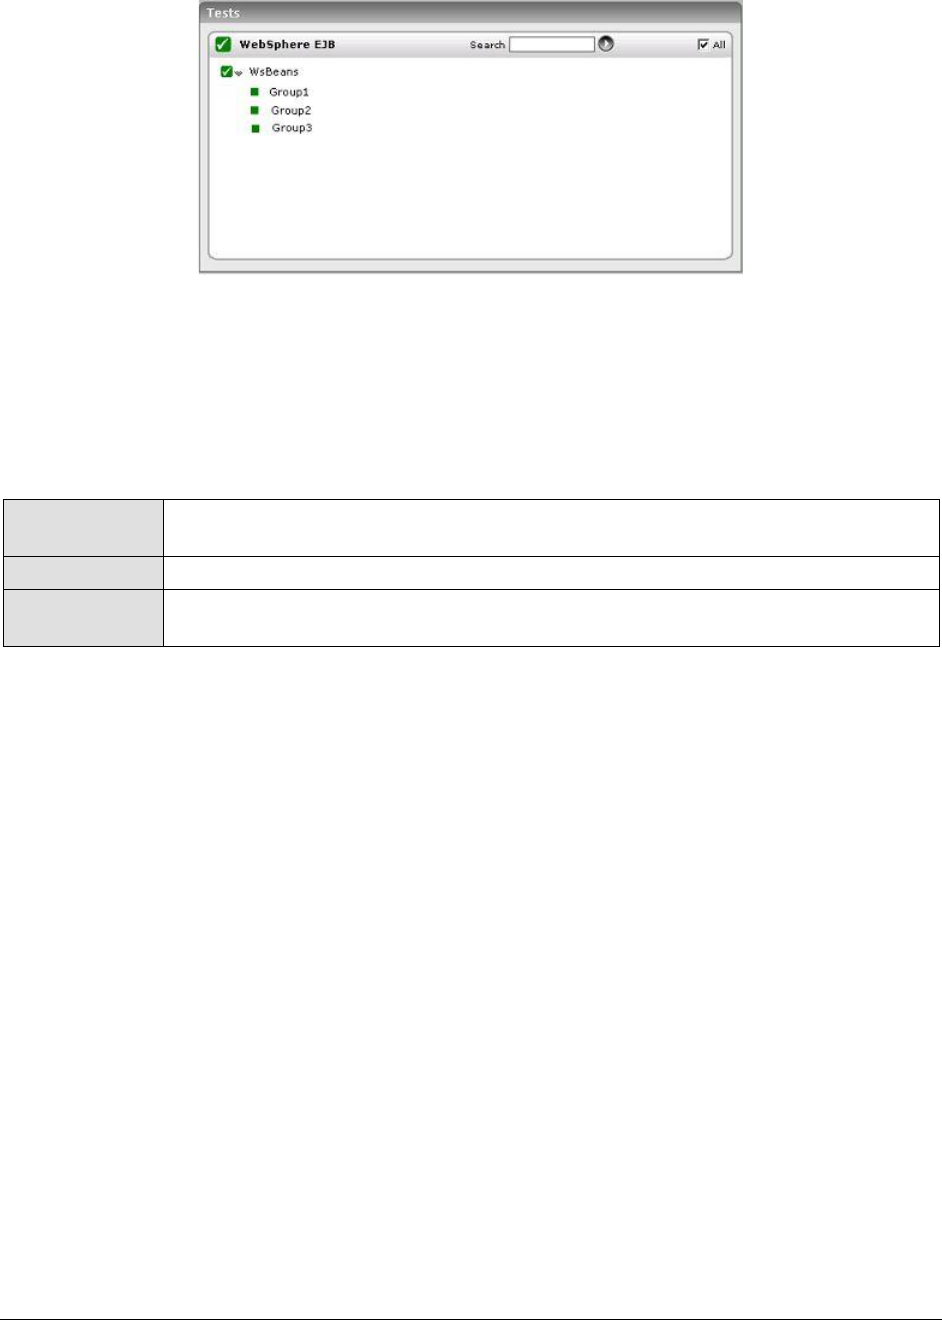
M o n i t o r i n g W e b S p h e r e A p p l i c a t i o n S e r v e r s
202
Figure 3.4: Tests mapping to the WebSphere EJB layer
3.1.3.1.1 Ws Beans Test
Enterprise Java Beans (EJB) forms the critical components of any business application. WebSphere
application server creates instances corresponding to the EJB. This test reports the performance
metrics that determines the functioning of the EJB groups. Use the Click here hyperlink in the test
configuration page to configure the EJB groups that need to be monitored by the eG Enterprise suite.
By default, the eG Enterprise system monitors only those EJBs that are part of a group.
Purpose
To measure the statistics pertaining to the Enterprise Java Bean groups configured
on the WebSphere application server.
Target of the test
A WebSphere application server
Agent deploying
the test
An internal agent

M o n i t o r i n g W e b S p h e r e A p p l i c a t i o n S e r v e r s
203
Configurable
parameters for
the test
1. TEST PERIOD - How often should the test be executed
2. HOST – The IP address of the WebSphere application server
3. PORT – The port number of the WebSphere application server
4. WEBSERVERPORT – The port number through which the WebSphere
applications can be accessed.
5. SSL – Indicate whether the SSL (Secured Socket Layer) is to be used to
connect to the WebSphere server.
6. SERVERHOSTNAME - Specify the node name of the server instance being
monitored. To know the node name, do the following
Login to the WebSphere Administrative Console.
Expand the Servers node in the tree structure in the left pane of the
console, and click on the Application Servers link within.
A list of application server instances and their corresponding node names
will then appear in the right pane of the console. From this list, you can
figure out the node name that corresponds to the application server
instance being monitored, and specify that name against the
SERVERHOSTNAME parameter.
7. NDMANAGER - The NDMANAGER parameter is applicable only under the
following circumstances:
a. If the WebSphere server being monitored belongs to a cluster, or,
b. If the WebSphere server being monitored is one of many
instances of the server running on the same host
In the case of situation (a), in the NDMANAGER text box, provide the host
name of the NODE MANAGER that manages the application servers in the cluster.
To know the name of the NODE MANAGER, do the following:
Login to the Administrative Console of the node manager using the URL
http://<IPoftheWebSphereAppServer'sNodeManager>:<Adminport>/admi
n/.
Using the tree-structure in the left pane of the Administrative Console that
appears, drill down to the Deployment Manager node within System
Administration.
Select the Configuration tab that appears in the right pane, and scroll down
to the End Points link in the Additional Properties section.
Once you locate the End Points link, click on it, and in the page that
appears, click on the SOAP_CONNECTOR_ADDRESS link.
In the subsequent page, a fully qualified domain name will be displayed
against Host. This is the name that should be specified as the host name of
the node manager in the NDMANAGER text box.
In the case of situation (b), enter the SERVERHOSTNAME itself as the
NDMANAGER. If both conditions (a) and (b) do not apply, then specify none
here.

M o n i t o r i n g W e b S p h e r e A p p l i c a t i o n S e r v e r s
204
8. CONNECTORPORT - The CONNECTORPORT parameter is applicable only under
the following circumstances:
a. If the WebSphere server being monitored belongs to a cluster, or,
b. If the WebSphere server being monitored is one of many
instances of the server running on the same host
In case of situation (a), the CONNECTORPORT parameter will take the port
number using which the node manager communicates with the WebSphere
servers in the cluster. The connector port can be a SOAP port or an RMI port.
To know the port number, do the following:
From the Node manager's host, open the
<WEBSPHERE_INSTALL_DIR>\DeploymentManager\properties\wsadmin.properties
file.
Two entries that read as follows will be present in the wsadmin.properties
file:
com.ibm.ws.scripting.port=<port_number>
#com.ibm.ws.scripting.port=<port_number>
Both the entries will have port numbers against them. However, the
uncommented entry (the entry without the #) is the one that denotes an
active port. Therefore, specify the corresponding port number as the
CONNECTORPORT.
In case of situation (b), do the following to know the CONNECTORPORT:
Login to the WebSphere Administrative Console.
Expand the Servers node in the tree-structure in the left pane of the
console, and click on the Application Servers link. A list of application server
instances will then appear in the right pane.
Click on the server instance being monitored. Doing so invokes the
Configuration of the chosen server instance appears.
Scroll down the Configuration to view the End Points link. Once you locate the
End Points link, click on it.
In the page that appears next, click on the SOAP_CONNECTOR_ADDRESS link.
The Port displayed in that page should be used as the CONNECTORPORT in
situation (b).
If both (a) and (b) do not apply, specify none against CONNECTORPORT.
9. USER - If security has been enabled for the WebSphere server being
monitored, then provide a valid USER name to login to the WebSphere server.
If the WebSphere server does not require any authentication, then the USER
text box should contain the default value 'none'.
10. PASSWORD – If security has been enabled for the WebSphere server being
monitored, then provide the PASSWORD that corresponds to the specified
USER name. If the WebSphere server does not require any authentication,
then leave the PASSWORD text box with its default setting.

M o n i t o r i n g W e b S p h e r e A p p l i c a t i o n S e r v e r s
205
11. CONFIRM PASSWORD - If security has been enabled, confirm the specified
PASSWORD by retyping it in the CONFIRM PASSWORD text box. If the
WebSphere server does not require any authentication, then leave the
CONFIRM PASSWORD text box with its default setting.
12. ENCRYPTPASS – By default, this flag is set to YES, indicating that the
PASSWORD of the WebSphere server is encrypted by default. To disable
password encryption, select the NO option.
13. AUTODISCOVERY – By default, the eG suite allows administrators to configure
EJB groups using the eG administrative interface, and reports metrics
pertaining to every group so created. Accordingly, by default,
AUTODISCOVERY is set to NO. If you want EJBs to be discovered and
monitored automatically, then select the YES option against AUTODISCOVERY.
When this is done, the eG agent automatically discovers all the EJBs on the
WebSphere server, and reports one set of measures for every EJB hosted on
the server.
14. SERVERNAME – Specify the name of the WebSphere server instance to be
monitored. To know the instances of a WebSphere server currently available,
first, connect to the WebSphere Administrative console using the URL: http://<IP
address of the WebSphere server:Port number of the WebSphere server>\admin. Then,
login to the administrative console and expand the Servers node in the left
pane of the console. Next, click on the Application Servers sub-node under the
Servers node. A list of server instance Names and their corresponding Node
values will then be displayed in the right pane. One of the displayed server
instances can be specified as the value of the SERVERNAME parameter.
15. TIMEOUT - In the TIMEOUT text box, specify the maximum duration (in
seconds) for which the test will wait for a response from the application
server. The default TIMEOUT period is 60 seconds.
16. DETAILED DIAGNOSIS - To make diagnosis more efficient and accurate, the
eG Enterprise suite embeds an optional detailed diagnostic capability. With
this capability, the eG agents can be configured to run detailed, more
elaborate tests as and when specific problems are detected.
To enable the detailed diagnosis capability of this test for a particular server,
choose the On option. To disable the capability, click on the Off option.
The option to selectively enable/disable the detailed diagnosis capability will
be available only if the following conditions are fulfilled:
The eG manager license should allow the detailed diagnosis capability
Both the normal and abnormal frequencies configured for the detailed
diagnosis measures should not be 0.
Outputs of the
test
One set of results for every EJB group configured
Measurements
made by the test
Measurement
Measurement
Unit
Interpretation

M o n i t o r i n g W e b S p h e r e A p p l i c a t i o n S e r v e r s
206
Bean instantiations:
This measure indicates the
rate at which the bean
objects are instantiated.
Instances/S
ec
A sudden increase in the rate of
instantiations indicates a bottleneck
on the server. It may be due to
greater load on the server or there
might be a loophole in the
application.
Bean destroys:
Indicates the rate at which
the bean objects are
destroyed.
Instances/S
ec
A very low value indicates a
bottleneck on the server. This might
affect the performance of the
application.
Bean method calls:
This measure indicates the
rate at which the methods
are being processed by the
server.
Methods/Sec
A high value indicates that the server
is busy.
Avg method rate:
This measure indicates the
average response time of
all methods of the remote
interface for this bean.
Secs
A sudden increase in the value of this
measure is a sign of overload on the
server.
Avg bean creation time:
Indicates the average
method response time for
creates.
Secs
This value should be low for optimal
performance of the application
server. The value may go high, if
there are more objects in the pool,
which is a sign of overload. This
measure will not be available if the
instrumentation level is set to H,
instead of X.
Bean pool size:
Indicates the average
number of objects in the
pool.
Number
A large pool size signifies that some
of the objects are not being released
by the application.
3.1.4 The WebSphere Web Layer
This layer tracks the health of all web applications and transactions that exist on the server. Figure 3.5
depicts the tests that map to this layer.
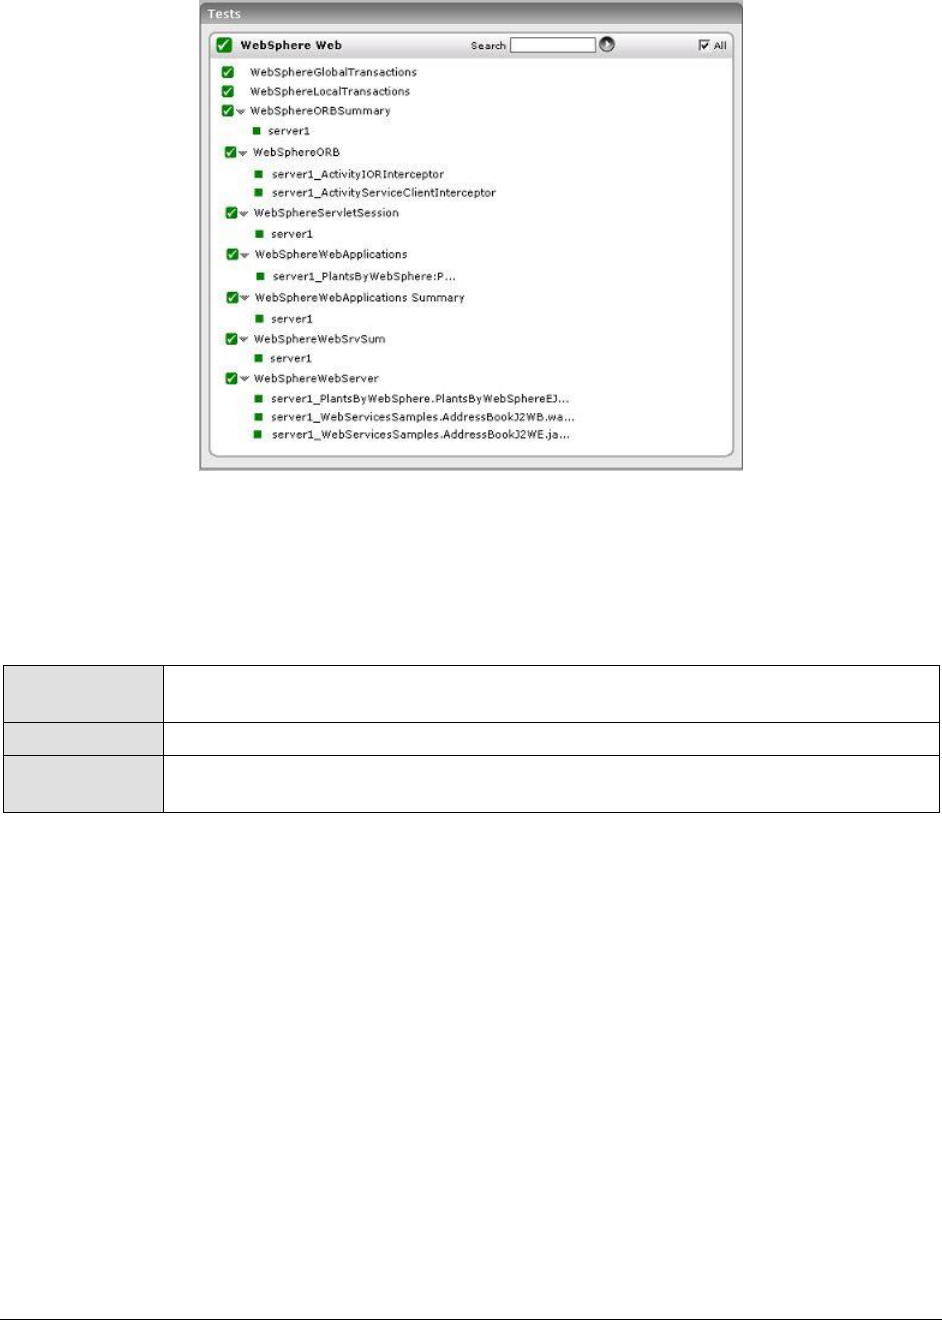
M o n i t o r i n g W e b S p h e r e A p p l i c a t i o n S e r v e r s
207
Figure 3.5: Tests mapping to the WebSphere Web layer
3.1.4.1 WebSphereGlobalTransactions Test
Transactions are the key functionality of the WebSphere application server. Global transactions are
those that take place in more than one server. This test monitors the global transactions that are
happening on different servers.
Purpose
To measure the statistics pertaining to the global transactions that take place in a
WebSphere application server
Target of the test
A WebSphere application server
Agent deploying
the test
An internal agent

M o n i t o r i n g W e b S p h e r e A p p l i c a t i o n S e r v e r s
208
Configurable
parameters for
the test
1. TEST PERIOD - How often should the test be executed
2. HOST – The IP address of the WebSphere application server
3. PORT – The port number of the WebSphere application server
4. WEBSERVERPORT – The port number through which the WebSphere
applications can be accessed.
5. SSL – Indicate whether the SSL (Secured Socket Layer) is to be used to
connect to the WebSphere server.
6. SERVERHOSTNAME - Specify the node name of the server instance being
monitored. To know the node name, do the following
Login to the WebSphere Administrative Console.
Expand the Servers node in the tree structure in the left pane of the
console, and click on the Application Servers link within.
A list of application server instances and their corresponding node names
will then appear in the right pane of the console. From this list, you can
figure out the node name that corresponds to the application server
instance being monitored, and specify that name against the
SERVERHOSTNAME parameter.
7. NDMANAGER - The NDMANAGER parameter is applicable only under the
following circumstances:
a. If the WebSphere server being monitored belongs to a cluster, or,
b. If the WebSphere server being monitored is one of many
instances of the server running on the same host
In the case of situation (a), in the NDMANAGER text box, provide the host
name of the NODE MANAGER that manages the application servers in the cluster.
To know the name of the NODE MANAGER, do the following:
Login to the Administrative Console of the node manager using the URL
http://<IPoftheWebSphereAppServer'sNodeManager>:<Adminport>/admi
n/.
Using the tree-structure in the left pane of the Administrative Console that
appears, drill down to the Deployment Manager node within System
Administration.
Select the Configuration tab that appears in the right pane, and scroll down
to the End Points link in the Additional Properties section.
Once you locate the End Points link, click on it, and in the page that
appears, click on the SOAP_CONNECTOR_ADDRESS link.
In the subsequent page, a fully qualified domain name will be displayed
against Host. This is the name that should be specified as the host name of
the node manager in the NDMANAGER text box.
In the case of situation (b), enter the SERVERHOSTNAME itself as the
NDMANAGER. If both conditions (a) and (b) do not apply, then specify none
here.

M o n i t o r i n g W e b S p h e r e A p p l i c a t i o n S e r v e r s
209
8. CONNECTORPORT - The CONNECTORPORT parameter is applicable only under
the following circumstances:
a. If the WebSphere server being monitored belongs to a cluster, or,
b. If the WebSphere server being monitored is one of many
instances of the server running on the same host
In case of situation (a), the CONNECTORPORT parameter will take the port
number using which the node manager communicates with the WebSphere
servers in the cluster. The connector port can be a SOAP port or an RMI port.
To know the port number, do the following:
From the Node manager's host, open the
<WEBSPHERE_INSTALL_DIR>\DeploymentManager\properties\wsadmin.properties
file.
Two entries that read as follows will be present in the wsadmin.properties
file:
com.ibm.ws.scripting.port=<port_number>
#com.ibm.ws.scripting.port=<port_number>
Both the entries will have port numbers against them. However, the
uncommented entry (the entry without the #) is the one that denotes an
active port. Therefore, specify the corresponding port number as the
CONNECTORPORT.
In case of situation (b), do the following to know the CONNECTORPORT:
Login to the WebSphere Administrative Console.
Expand the Servers node in the tree-structure in the left pane of the
console, and click on the Application Servers link. A list of application server
instances will then appear in the right pane.
Click on the server instance being monitored. Doing so invokes the
Configuration of the chosen server instance appears.
Scroll down the Configuration to view the End Points link. Once you locate the
End Points link, click on it.
In the page that appears next, click on the SOAP_CONNECTOR_ADDRESS link.
The Port displayed in that page should be used as the CONNECTORPORT in
situation (b).
If both (a) and (b) do not apply, specify none against CONNECTORPORT.
9. USER - If security has been enabled for the WebSphere server being
monitored, then provide a valid USER name to login to the WebSphere server.
If the WebSphere server does not require any authentication, then the USER
text box should contain the default value 'none'.
10. PASSWORD – If security has been enabled for the WebSphere server being
monitored, then provide the PASSWORD that corresponds to the specified
USER name. If the WebSphere server does not require any authentication,
then leave the PASSWORD text box with its default setting.

M o n i t o r i n g W e b S p h e r e A p p l i c a t i o n S e r v e r s
210
11. CONFIRM PASSWORD - If security has been enabled, confirm the specified
PASSWORD by retyping it in the CONFIRM PASSWORD text box. If the
WebSphere server does not require any authentication, then leave the
CONFIRM PASSWORD text box with its default setting.
12. ENCRYPTPASS – By default, this flag is set to YES, indicating that the
PASSWORD of the WebSphere server is encrypted by default. To disable
password encryption, select the NO option.
13. SERVERNAME – Specify the name of the WebSphere server instance to be
monitored. To know the instances of a WebSphere server currently available,
first, connect to the WebSphere Administrative console using the URL: http://<IP
address of the WebSphere server:Port number of the WebSphere server>\admin. Then,
login to the administrative console and expand the Servers node in the left
pane of the console. Next, click on the Application Servers sub-node under the
Servers node. A list of server instance Names and their corresponding Node
values will then be displayed in the right pane. One of the displayed server
instances can be specified as the value of the SERVERNAME parameter.
14. TIMEOUT - In the TIMEOUT text box, specify the maximum duration (in
seconds) for which the test will wait for a response from the application
server. The default TIMEOUT period is 60 seconds.
Outputs of the
test
One set of results for each WebSphere application server being monitored.
Measurements
made by the test
Measurement
Measurement
Unit
Interpretation
Global transactions
begun:
Indicates the rate at which
global transactions are
beginning to occur at the
server.
Trans/Sec
A high value indicates an overload on
the server.
Active global
transactions:
Indicates the average
number of concurrently
active global transactions.
Number
If the value of this measure is high, it
signifies greater load on the server.
This might increase the number of
waiting local transactions.
Global transaction
duration:
Indicates the average
duration of global
transactions.
Secs
A high transaction duration value
indicates increased load on the
server.
Global commit duration:
Indicates the average
duration of commit for
global transactions.
Secs
If the total time taken for committing
a global transaction is high, then it
indicates a bottleneck on the server.

M o n i t o r i n g W e b S p h e r e A p p l i c a t i o n S e r v e r s
211
Optimization rate:
Indicates the rate at which
global transactions being
converted to single phase
for optimization.
Trans/Sec
A sudden increase in this value might
be caused due to one of the following
reasons.
a. There might be more
number of requests for the
application.
b. There might be a bottleneck
on the application.
Global transaction
commits:
Indicates the rate at which
global transactions are
being committed.
Transactions
/Sec
If the rate of transactions that are
being committed is very high, it
signifies load on the server. It might
be caused when some locked
transactions are released suddenly.
Global transaction
rollbacks:
Indicates the rate at which
the global transactions are
being rolled back.
Trans/Sec
A high value indicates a problem with
the application. Possible reasons
could be the problem with the
application or with some other
dependent server (e.g. Database).
Global transaction
timeouts:
Indicates the rate at which
the global transactions are
being timed out.
Trans/Sec
Again, a rise in the value could be
due to the problem with the
application or with some other
dependent server like the database.
Global transactions
involved:
Indicates the total number
of global transactions
involved at the server.
Number
A sudden increase in the value might
be caused if the commit duration of a
transaction goes low.
Global prepare duration:
This measure indicates the
average duration of
prepare for the global
transactions.
Secs
A high value indicates a bottleneck
on the server.
3.1.4.2 WebSphere Local Transactions Test
Local transactions are those transactions that occur within the server. This test reports all the
performance metrics associated with the local transactions.
Purpose
To measure the statistics pertaining to the local transactions that take place in a
WebSphere application server
Target of the test
A WebSphere application server
Agent deploying
the test
An internal agent

M o n i t o r i n g W e b S p h e r e A p p l i c a t i o n S e r v e r s
212
Configurable
parameters for
the test
1. TEST PERIOD - How often should the test be executed
2. HOST – The IP address of the WebSphere application server
3. PORT – The port number of the WebSphere application server
4. WEBSERVERPORT – The port number through which the WebSphere
applications can be accessed.
5. SSL – Indicate whether the SSL (Secured Socket Layer) is to be used to
connect to the WebSphere server.
6. SERVERHOSTNAME - Specify the node name of the server instance being
monitored. To know the node name, do the following
Login to the WebSphere Administrative Console.
Expand the Servers node in the tree structure in the left pane of the
console, and click on the Application Servers link within.
A list of application server instances and their corresponding node names
will then appear in the right pane of the console. From this list, you can
figure out the node name that corresponds to the application server
instance being monitored, and specify that name against the
SERVERHOSTNAME parameter.
7. NDMANAGER - The NDMANAGER parameter is applicable only under the
following circumstances:
a. If the WebSphere server being monitored belongs to a cluster, or,
b. If the WebSphere server being monitored is one of many
instances of the server running on the same host
In the case of situation (a), in the NDMANAGER text box, provide the host
name of the NODE MANAGER that manages the application servers in the cluster.
To know the name of the NODE MANAGER, do the following:
Login to the Administrative Console of the node manager using the URL
http://<IPoftheWebSphereAppServer'sNodeManager>:<Adminport>/admi
n/.
Using the tree-structure in the left pane of the Administrative Console that
appears, drill down to the Deployment Manager node within System
Administration.
Select the Configuration tab that appears in the right pane, and scroll down
to the End Points link in the Additional Properties section.
Once you locate the End Points link, click on it, and in the page that
appears, click on the SOAP_CONNECTOR_ADDRESS link.
In the subsequent page, a fully qualified domain name will be displayed
against Host. This is the name that should be specified as the host name of
the node manager in the NDMANAGER text box.
In the case of situation (b), enter the SERVERHOSTNAME itself as the
NDMANAGER. If both conditions (a) and (b) do not apply, then specify none
here.

M o n i t o r i n g W e b S p h e r e A p p l i c a t i o n S e r v e r s
213
8. CONNECTORPORT - The CONNECTORPORT parameter is applicable only under
the following circumstances:
a. If the WebSphere server being monitored belongs to a cluster, or,
b. If the WebSphere server being monitored is one of many
instances of the server running on the same host
In case of situation (a), the CONNECTORPORT parameter will take the port
number using which the node manager communicates with the WebSphere
servers in the cluster. The connector port can be a SOAP port or an RMI port.
To know the port number, do the following:
From the Node manager's host, open the
<WEBSPHERE_INSTALL_DIR>\DeploymentManager\properties\wsadmin.properties
file.
Two entries that read as follows will be present in the wsadmin.properties
file:
com.ibm.ws.scripting.port=<port_number>
#com.ibm.ws.scripting.port=<port_number>
Both the entries will have port numbers against them. However, the
uncommented entry (the entry without the #) is the one that denotes an
active port. Therefore, specify the corresponding port number as the
CONNECTORPORT.
In case of situation (b), do the following to know the CONNECTORPORT:
Login to the WebSphere Administrative Console.
Expand the Servers node in the tree-structure in the left pane of the
console, and click on the Application Servers link. A list of application server
instances will then appear in the right pane.
Click on the server instance being monitored. Doing so invokes the
Configuration of the chosen server instance appears.
Scroll down the Configuration to view the End Points link. Once you locate the
End Points link, click on it.
In the page that appears next, click on the SOAP_CONNECTOR_ADDRESS link.
The Port displayed in that page should be used as the CONNECTORPORT in
situation (b).
If both (a) and (b) do not apply, specify none against CONNECTORPORT.
9. USER - If security has been enabled for the WebSphere server being
monitored, then provide a valid USER name to login to the WebSphere server.
If the WebSphere server does not require any authentication, then the USER
text box should contain the default value 'none'.
10. PASSWORD – If security has been enabled for the WebSphere server being
monitored, then provide the PASSWORD that corresponds to the specified
USER name. If the WebSphere server does not require any authentication,
then leave the PASSWORD text box with its default setting.

M o n i t o r i n g W e b S p h e r e A p p l i c a t i o n S e r v e r s
214
11. CONFIRM PASSWORD - If security has been enabled, confirm the specified
PASSWORD by retyping it in the CONFIRM PASSWORD text box. If the
WebSphere server does not require any authentication, then leave the
CONFIRM PASSWORD text box with its default setting.
12. ENCRYPTPASS – By default, this flag is set to YES, indicating that the
PASSWORD of the WebSphere server is encrypted by default. To disable
password encryption, select the NO option.
13. SERVERNAME – Specify the name of the WebSphere server instance to be
monitored. To know the instances of a WebSphere server currently available,
first, connect to the WebSphere Administrative console using the URL: http://<IP
address of the WebSphere server:Port number of the WebSphere server>\admin. Then,
login to the administrative console and expand the Servers node in the left
pane of the console. Next, click on the Application Servers sub-node under the
Servers node. A list of server instance Names and their corresponding Node
values will then be displayed in the right pane. One of the displayed server
instances can be specified as the value of the SERVERNAME parameter.
14. TIMEOUT - In the TIMEOUT text box, specify the maximum duration (in
seconds) for which the test will wait for a response from the application
server. The default TIMEOUT period is 60 seconds.
Outputs of the
test
One set of results for each WebSphere application server being monitored.
Measurements
made by the test
Measurement
Measurement
Unit
Interpretation
Local transaction begin
rate:
Indicates the rate at which
the local transactions begin
at the server.
Transactions
/Sec
A high value indicates an increased
overload on the server.
Active local
transactions:
Indicates the average
number of concurrently
active local transactions.
Number
If the value of this measure is high, it
signifies greater load on the server.
This might increase the number of
waiting local transactions.
Local transaction
duration:
Indicates the average
duration of the local
transactions.
Secs
A high transaction duration value
indicates increased load on the
server.
Local commit duration:
Indicates the average
duration of commit for
local transactions.
Secs
If the total time taken for committing
a local transaction is high, then it
indicates a bottleneck on the server.
M o n i t o r i n g W e b S p h e r e A p p l i c a t i o n S e r v e r s
215
Local transaction
commits:
Indicates the rate at which
the local transactions are
being committed.
Trans/Sec
If the rate of transactions that are
being committed is very high, it
signifies load on the server. It might
be caused when some locked
transactions are released suddenly.
Local transaction
rollbacks:
Indicates the rate at which
the local transactions are
being rolled back.
Trans/Sec
A high value indicates a problem with
the application. Possible reasons
could be the problem with application
or with some other dependent server
(e.g. Database).
Local transaction
timeouts:
Indicates the rate at which
the local transactions are
being timed out.
Trans/Sec
Again, a rise in the value could be
due to the problem with the
application or with some other
dependent server like the database.
3.1.4.3 WebSphere Servlet Sessions Test
Http sessions form a part of any business application. This test monitors the http sessions on the
WebSphere application server.
Purpose
To measure the statistics pertaining to the servlet sessions in a WebSphere
application server
Target of the test
A WebSphere application server
Agent deploying
the test
An internal agent

M o n i t o r i n g W e b S p h e r e A p p l i c a t i o n S e r v e r s
216
Configurable
parameters for
the test
1. TEST PERIOD - How often should the test be executed
2. HOST – The IP address of the WebSphere application server
3. PORT – The port number of the WebSphere application server
4. WEBSERVERPORT – The port number through which the WebSphere
applications can be accessed.
5. SSL – Indicate whether the SSL (Secured Socket Layer) is to be used to
connect to the WebSphere server.
6. SERVERHOSTNAME - Specify the node name of the server instance being
monitored. To know the node name, do the following
Login to the WebSphere Administrative Console.
Expand the Servers node in the tree structure in the left pane of the
console, and click on the Application Servers link within.
A list of application server instances and their corresponding node names
will then appear in the right pane of the console. From this list, you can
figure out the node name that corresponds to the application server
instance being monitored, and specify that name against the
SERVERHOSTNAME parameter.
7. NDMANAGER - The NDMANAGER parameter is applicable only under the
following circumstances:
a. If the WebSphere server being monitored belongs to a cluster, or,
b. If the WebSphere server being monitored is one of many
instances of the server running on the same host
In the case of situation (a), in the NDMANAGER text box, provide the host
name of the NODE MANAGER that manages the application servers in the cluster.
To know the name of the NODE MANAGER, do the following:
Login to the Administrative Console of the node manager using the URL
http://<IPoftheWebSphereAppServer'sNodeManager>:<Adminport>/admi
n/.
Using the tree-structure in the left pane of the Administrative Console that
appears, drill down to the Deployment Manager node within System
Administration.
Select the Configuration tab that appears in the right pane, and scroll down
to the End Points link in the Additional Properties section.
Once you locate the End Points link, click on it, and in the page that
appears, click on the SOAP_CONNECTOR_ADDRESS link.
In the subsequent page, a fully qualified domain name will be displayed
against Host. This is the name that should be specified as the host name of
the node manager in the NDMANAGER text box.
In the case of situation (b), enter the SERVERHOSTNAME itself as the
NDMANAGER. If both conditions (a) and (b) do not apply, then specify none
here.

M o n i t o r i n g W e b S p h e r e A p p l i c a t i o n S e r v e r s
217
8. CONNECTORPORT - The CONNECTORPORT parameter is applicable only under
the following circumstances:
a. If the WebSphere server being monitored belongs to a cluster, or,
b. If the WebSphere server being monitored is one of many
instances of the server running on the same host
In case of situation (a), the CONNECTORPORT parameter will take the port
number using which the node manager communicates with the WebSphere
servers in the cluster. The connector port can be a SOAP port or an RMI port.
To know the port number, do the following:
From the Node manager's host, open the
<WEBSPHERE_INSTALL_DIR>\DeploymentManager\properties\wsadmin.properties
file.
Two entries that read as follows will be present in the wsadmin.properties
file:
com.ibm.ws.scripting.port=<port_number>
#com.ibm.ws.scripting.port=<port_number>
Both the entries will have port numbers against them. However, the
uncommented entry (the entry without the #) is the one that denotes an
active port. Therefore, specify the corresponding port number as the
CONNECTORPORT.
In case of situation (b), do the following to know the CONNECTORPORT:
Login to the WebSphere Administrative Console.
Expand the Servers node in the tree-structure in the left pane of the
console, and click on the Application Servers link. A list of application server
instances will then appear in the right pane.
Click on the server instance being monitored. Doing so invokes the
Configuration of the chosen server instance appears.
Scroll down the Configuration to view the End Points link. Once you locate the
End Points link, click on it.
In the page that appears next, click on the SOAP_CONNECTOR_ADDRESS link.
The Port displayed in that page should be used as the CONNECTORPORT in
situation (b).
If both (a) and (b) do not apply, specify none against CONNECTORPORT.
9. USER - If security has been enabled for the WebSphere server being
monitored, then provide a valid USER name to login to the WebSphere server.
If the WebSphere server does not require any authentication, then the USER
text box should contain the default value 'none'.
10. PASSWORD – If security has been enabled for the WebSphere server being
monitored, then provide the PASSWORD that corresponds to the specified
USER name. If the WebSphere server does not require any authentication,
then leave the PASSWORD text box with its default setting.

M o n i t o r i n g W e b S p h e r e A p p l i c a t i o n S e r v e r s
218
11. CONFIRM PASSWORD - If security has been enabled, confirm the specified
PASSWORD by retyping it in the CONFIRM PASSWORD text box. If the
WebSphere server does not require any authentication, then leave the
CONFIRM PASSWORD text box with its default setting.
12. ENCRYPTPASS – By default, this flag is set to YES, indicating that the
PASSWORD of the WebSphere server is encrypted by default. To disable
password encryption, select the NO option.
13. SERVERNAME – Specify the name of the WebSphere server instance to be
monitored. To know the instances of a WebSphere server currently available,
first, connect to the WebSphere Administrative console using the URL: http://<IP
address of the WebSphere server:Port number of the WebSphere server>\admin. Then,
login to the administrative console and expand the Servers node in the left
pane of the console. Next, click on the Application Servers sub-node under the
Servers node. A list of server instance Names and their corresponding Node
values will then be displayed in the right pane. One of the displayed server
instances can be specified as the value of the SERVERNAME parameter.
14. TIMEOUT - In the TIMEOUT text box, specify the maximum duration (in
seconds) for which the test will wait for a response from the application
server. The default TIMEOUT period is 60 seconds.
Outputs of the
test
One set of results for each WebSphere application server being monitored.
Measurements
made by the test
Measurement
Measurement
Unit
Interpretation
Session creation rate:
Indicates the rate at which
the sessions are created in
the server.
Sessions/Se
c
A high value indicates a high level of
activity in this application. By
observing the variations to this
measure over time, you can
determine usage trends such as the
time of day when an application is
getting the most amount of traffic.
Invalidated sessions:
Indicates the number of
sessions that were
invalidated.
Number
This message is indicative of the
session usage pattern of this
application.
Session life time:
This measure indicates the
average lifetime of a
session.
Secs
A long session lifetime may occur due
to one of the following reasons:
a. The application may not
timeout the sessions after a
fixed interval of time.
b. The sessions in the
application might be active
for a very long time.

M o n i t o r i n g W e b S p h e r e A p p l i c a t i o n S e r v e r s
219
Active sessions:
This measure indicates the
total number of sessions
that currently are being
accessed by the requests.
Number
A high value indicates an increased
workload on the server.
Live sessions:
Indicates the total number
of valid sessions on the
server.
Number
A high value indicates an increased
workload on the server.
3.1.4.4 WebSphere Web Applications Test
A web application is a collection of different web components such as servlets, JSPs etc. This test
tracks the statistics pertaining to the web applications hosted on the WebSphere application server.
Purpose
To measure the statistics pertaining to the web applications that exist in the
WebSphere application server
Target of the test
A WebSphere application server
Agent deploying
the test
An internal agent

M o n i t o r i n g W e b S p h e r e A p p l i c a t i o n S e r v e r s
220
Configurable
parameters for
the test
1. TEST PERIOD - How often should the test be executed
2. HOST – The IP address of the WebSphere application server
3. PORT – The port number of the WebSphere application server
4. WEBSERVERPORT – The port number through which the WebSphere
applications can be accessed.
5. SSL – Indicate whether the SSL (Secured Socket Layer) is to be used to
connect to the WebSphere server.
6. SERVERHOSTNAME - Specify the node name of the server instance being
monitored. To know the node name, do the following
Login to the WebSphere Administrative Console.
Expand the Servers node in the tree structure in the left pane of the
console, and click on the Application Servers link within.
A list of application server instances and their corresponding node names
will then appear in the right pane of the console. From this list, you can
figure out the node name that corresponds to the application server
instance being monitored, and specify that name against the
SERVERHOSTNAME parameter.
7. NDMANAGER - The NDMANAGER parameter is applicable only under the
following circumstances:
a. If the WebSphere server being monitored belongs to a cluster, or,
b. If the WebSphere server being monitored is one of many
instances of the server running on the same host
In the case of situation (a), in the NDMANAGER text box, provide the host
name of the NODE MANAGER that manages the application servers in the cluster.
To know the name of the NODE MANAGER, do the following:
Login to the Administrative Console of the node manager using the URL
http://<IPoftheWebSphereAppServer'sNodeManager>:<Adminport>/admi
n/.
Using the tree-structure in the left pane of the Administrative Console that
appears, drill down to the Deployment Manager node within System
Administration.
Select the Configuration tab that appears in the right pane, and scroll down
to the End Points link in the Additional Properties section.
Once you locate the End Points link, click on it, and in the page that
appears, click on the SOAP_CONNECTOR_ADDRESS link.
In the subsequent page, a fully qualified domain name will be displayed
against Host. This is the name that should be specified as the host name of
the node manager in the NDMANAGER text box.
In the case of situation (b), enter the SERVERHOSTNAME itself as the
NDMANAGER. If both conditions (a) and (b) do not apply, then specify none
here.

M o n i t o r i n g W e b S p h e r e A p p l i c a t i o n S e r v e r s
221
8. CONNECTORPORT - The CONNECTORPORT parameter is applicable only under
the following circumstances:
a. If the WebSphere server being monitored belongs to a cluster, or,
b. If the WebSphere server being monitored is one of many
instances of the server running on the same host
In case of situation (a), the CONNECTORPORT parameter will take the port
number using which the node manager communicates with the WebSphere
servers in the cluster. The connector port can be a SOAP port or an RMI port.
To know the port number, do the following:
From the Node manager's host, open the
<WEBSPHERE_INSTALL_DIR>\DeploymentManager\properties\wsadmin.properties
file.
Two entries that read as follows will be present in the wsadmin.properties
file:
com.ibm.ws.scripting.port=<port_number>
#com.ibm.ws.scripting.port=<port_number>
Both the entries will have port numbers against them. However, the
uncommented entry (the entry without the #) is the one that denotes an
active port. Therefore, specify the corresponding port number as the
CONNECTORPORT.
In case of situation (b), do the following to know the CONNECTORPORT:
Login to the WebSphere Administrative Console.
Expand the Servers node in the tree-structure in the left pane of the
console, and click on the Application Servers link. A list of application server
instances will then appear in the right pane.
Click on the server instance being monitored. Doing so invokes the
Configuration of the chosen server instance appears.
Scroll down the Configuration to view the End Points link. Once you locate the
End Points link, click on it.
In the page that appears next, click on the SOAP_CONNECTOR_ADDRESS link.
The Port displayed in that page should be used as the CONNECTORPORT in
situation (b).
If both (a) and (b) do not apply, specify none against CONNECTORPORT.
9. USER - If security has been enabled for the WebSphere server being
monitored, then provide a valid USER name to login to the WebSphere server.
If the WebSphere server does not require any authentication, then the USER
text box should contain the default value 'none'.
10. PASSWORD – If security has been enabled for the WebSphere server being
monitored, then provide the PASSWORD that corresponds to the specified
USER name. If the WebSphere server does not require any authentication,
then leave the PASSWORD text box with its default setting.

M o n i t o r i n g W e b S p h e r e A p p l i c a t i o n S e r v e r s
222
11. CONFIRM PASSWORD - If security has been enabled, confirm the specified
PASSWORD by retyping it in the CONFIRM PASSWORD text box. If the
WebSphere server does not require any authentication, then leave the
CONFIRM PASSWORD text box with its default setting.
12. ENCRYPTPASS – By default, this flag is set to YES, indicating that the
PASSWORD of the WebSphere server is encrypted by default. To disable
password encryption, select the NO option.
13. SERVERNAME – Specify the name of the WebSphere server instance to be
monitored. To know the instances of a WebSphere server currently available,
first, connect to the WebSphere Administrative console using the URL: http://<IP
address of the WebSphere server:Port number of the WebSphere server>\admin. Then,
login to the administrative console and expand the Servers node in the left
pane of the console. Next, click on the Application Servers sub-node under the
Servers node. A list of server instance Names and their corresponding Node
values will then be displayed in the right pane. One of the displayed server
instances can be specified as the value of the SERVERNAME parameter.
14. TIMEOUT - In the TIMEOUT text box, specify the maximum duration (in
seconds) for which the test will wait for a response from the application
server. The default TIMEOUT period is 60 seconds.
Outputs of the
test
One set of results for each web application that is deployed in the WebSphere
application server being monitored.
Measurements
made by the test
Measurement
Measurement
Unit
Interpretation
Loaded servlets:
Indicates the current
number of loaded servlets.
Number
A sudden increase in the number of
loaded servlets indicates an increase
in the load on the server or for that
particular application.
Reloads:
Indicates the number of
times the servlet is being
reloaded.
Number
It is preferable to have minimum
reloads for optimal performance of
the application.
Requests:
Indicates the total number
of requests for the
servlets.
Reqs/Sec
An increase in the request rate
indicates an increase in the server
load.
Concurrent requests:
Number of requests that
are concurrently being
processed.
Number
An increase in the value of this
measure indicates an increase in the
user workload. It may also increase
due to the overload on the server.
M o n i t o r i n g W e b S p h e r e A p p l i c a t i o n S e r v e r s
223
Avg response time:
Indicates the time taken
for the completion of the
requests.
Secs
An increasing value indicates a
bottleneck on the server. This may
arise due to one of the following
reasons:
1.The server might be running out of
resources.
2. The server may be overloaded
with requests.
3. Some problem with the available
bandwidth on the network.
Errors:
Indicates the rate at which
errors or exceptions are
occurring in the servlets.
Errors/Sec
A high rate of errors might occur due
to too many requests on the
application or there might be a
bottleneck on the application.
3.1.4.5 WebSphere ORB Summary Test
This test reports statistics pertaining to the ORBs (Object Request Broker) on a WebSphere server.
Purpose
To report statistics pertaining to the ORBs (Object Request Broker) on a
WebSphere server
Target of the test
A WebSphere application server
Agent deploying
the test
An internal agent

M o n i t o r i n g W e b S p h e r e A p p l i c a t i o n S e r v e r s
224
Configurable
parameters for
the test
1. TEST PERIOD - How often should the test be executed
2. HOST – The IP address of the WebSphere application server
3. PORT – The port number of the WebSphere application server
4. WEBSERVERPORT – The port number through which the WebSphere
applications can be accessed.
5. SSL – Indicate whether the SSL (Secured Socket Layer) is to be used to
connect to the WebSphere server.
6. SERVERHOSTNAME - Specify the node name of the server instance being
monitored. To know the node name, do the following
Login to the WebSphere Administrative Console.
Expand the Servers node in the tree structure in the left pane of the
console, and click on the Application Servers link within.
A list of application server instances and their corresponding node names
will then appear in the right pane of the console. From this list, you can
figure out the node name that corresponds to the application server
instance being monitored, and specify that name against the
SERVERHOSTNAME parameter.
7. NDMANAGER - The NDMANAGER parameter is applicable only under the
following circumstances:
a. If the WebSphere server being monitored belongs to a cluster, or,
b. If the WebSphere server being monitored is one of many
instances of the server running on the same host
In the case of situation (a), in the NDMANAGER text box, provide the host
name of the NODE MANAGER that manages the application servers in the cluster.
To know the name of the NODE MANAGER, do the following:
Login to the Administrative Console of the node manager using the URL
http://<IPoftheWebSphereAppServer'sNodeManager>:<Adminport>/admi
n/.
Using the tree-structure in the left pane of the Administrative Console that
appears, drill down to the Deployment Manager node within System
Administration.
Select the Configuration tab that appears in the right pane, and scroll down
to the End Points link in the Additional Properties section.
Once you locate the End Points link, click on it, and in the page that
appears, click on the SOAP_CONNECTOR_ADDRESS link.
In the subsequent page, a fully qualified domain name will be displayed
against Host. This is the name that should be specified as the host name of
the node manager in the NDMANAGER text box.
In the case of situation (b), enter the SERVERHOSTNAME itself as the
NDMANAGER. If both conditions (a) and (b) do not apply, then specify none
here.

M o n i t o r i n g W e b S p h e r e A p p l i c a t i o n S e r v e r s
225
8. CONNECTORPORT - The CONNECTORPORT parameter is applicable only under
the following circumstances:
a. If the WebSphere server being monitored belongs to a cluster, or,
b. If the WebSphere server being monitored is one of many
instances of the server running on the same host
In case of situation (a), the CONNECTORPORT parameter will take the port
number using which the node manager communicates with the WebSphere
servers in the cluster. The connector port can be a SOAP port or an RMI port.
To know the port number, do the following:
From the Node manager's host, open the
<WEBSPHERE_INSTALL_DIR>\DeploymentManager\properties\wsadmin.properties
file.
Two entries that read as follows will be present in the wsadmin.properties
file:
com.ibm.ws.scripting.port=<port_number>
#com.ibm.ws.scripting.port=<port_number>
Both the entries will have port numbers against them. However, the
uncommented entry (the entry without the #) is the one that denotes an
active port. Therefore, specify the corresponding port number as the
CONNECTORPORT.
In case of situation (b), do the following to know the CONNECTORPORT:
Login to the WebSphere Administrative Console.
Expand the Servers node in the tree-structure in the left pane of the
console, and click on the Application Servers link. A list of application server
instances will then appear in the right pane.
Click on the server instance being monitored. Doing so invokes the
Configuration of the chosen server instance appears.
Scroll down the Configuration to view the End Points link. Once you locate the
End Points link, click on it.
In the page that appears next, click on the SOAP_CONNECTOR_ADDRESS link.
The Port displayed in that page should be used as the CONNECTORPORT in
situation (b).
If both (a) and (b) do not apply, specify none against CONNECTORPORT.
9. USER - If security has been enabled for the WebSphere server being
monitored, then provide a valid USER name to login to the WebSphere server.
If the WebSphere server does not require any authentication, then the USER
text box should contain the default value 'none'.
10. PASSWORD – If security has been enabled for the WebSphere server being
monitored, then provide the PASSWORD that corresponds to the specified
USER name. If the WebSphere server does not require any authentication,
then leave the PASSWORD text box with its default setting.

M o n i t o r i n g W e b S p h e r e A p p l i c a t i o n S e r v e r s
226
11. CONFIRM PASSWORD - If security has been enabled, confirm the specified
PASSWORD by retyping it in the CONFIRM PASSWORD text box. If the
WebSphere server does not require any authentication, then leave the
CONFIRM PASSWORD text box with its default setting.
12. ENCRYPTPASS – By default, this flag is set to YES, indicating that the
PASSWORD of the WebSphere server is encrypted by default. To disable
password encryption, select the NO option.
13. SERVERNAME – Specify the name of the WebSphere server instance to be
monitored. To know the instances of a WebSphere server currently available,
first, connect to the WebSphere Administrative console using the URL: http://<IP
address of the WebSphere server:Port number of the WebSphere server>\admin. Then,
login to the administrative console and expand the Servers node in the left
pane of the console. Next, click on the Application Servers sub-node under the
Servers node. A list of server instance Names and their corresponding Node
values will then be displayed in the right pane. One of the displayed server
instances can be specified as the value of the SERVERNAME parameter.
14. TIMEOUT - In the TIMEOUT text box, specify the maximum duration (in
seconds) for which the test will wait for a response from the application
server. The default TIMEOUT period is 60 seconds.
Outputs of the
test
One set of results for each server instance being monitored
Measurements
made by the test
Measurement
Measurement
Unit
Interpretation
Reference lookup time:
The amount of time taken
to lookup an object
reference before method
dispatch can be carried
out.
Secs
An excessively long time may
indicate an EJB container lookup
problem.
Total requests:
Indicates the total number
of requests sent to the
ORB.
Number
Concurrent requests:
Indicates the number of
requests that are
concurrently processed by
the ORB.
Number
Avg processing time:
Indicates the time it takes
a registered portable
interceptor to run.
Secs
3.1.4.6 WebSphere Web Applications Summary Test
This tes t reports statistics pertaining to the web applications deployed on a WebSphere server.

M o n i t o r i n g W e b S p h e r e A p p l i c a t i o n S e r v e r s
227
Purpose
To report statistics pertaining to the web applications deployed on a WebSphere
server
Target of the test
A WebSphere application server
Agent deploying
the test
An internal agent
Configurable
parameters for
the test
1. TEST PERIOD - How often should the test be executed
2. HOST – The IP address of the WebSphere application server
3. PORT – The port number of the WebSphere application server
4. WEBSERVERPORT – The port number through which the WebSphere
applications can be accessed.
5. SSL – Indicate whether the SSL (Secured Socket Layer) is to be used to
connect to the WebSphere server.
6. SERVERHOSTNAME - Specify the node name of the server instance being
monitored. To know the node name, do the following
Login to the WebSphere Administrative Console.
Expand the Servers node in the tree structure in the left pane of the
console, and click on the Application Servers link within.
A list of application server instances and their corresponding node names
will then appear in the right pane of the console. From this list, you can
figure out the node name that corresponds to the application server
instance being monitored, and specify that name against the
SERVERHOSTNAME parameter.
7. NDMANAGER - The NDMANAGER parameter is applicable only under the
following circumstances:
a. If the WebSphere server being monitored belongs to a cluster, or,
b. If the WebSphere server being monitored is one of many
instances of the server running on the same host
In the case of situation (a), in the NDMANAGER text box, provide the host
name of the NODE MANAGER that manages the application servers in the cluster.
To know the name of the NODE MANAGER, do the following:
Login to the Administrative Console of the node manager using the URL
http://<IPoftheWebSphereAppServer'sNodeManager>:<Adminport>/admi
n/.
Using the tree-structure in the left pane of the Administrative Console that
appears, drill down to the Deployment Manager node within System
Administration.
Select the Configuration tab that appears in the right pane, and scroll down
to the End Points link in the Additional Properties section.
Once you locate the End Points link, click on it, and in the page that
appears, click on the SOAP_CONNECTOR_ADDRESS link.

M o n i t o r i n g W e b S p h e r e A p p l i c a t i o n S e r v e r s
228
In the subsequent page, a fully qualified domain name will be displayed
against Host. This is the name that should be specified as the host name of
the node manager in the NDMANAGER text box.
8. In the case of situation (b), enter the SERVERHOSTNAME itself as the
NDMANAGER. If both conditions (a) and (b) do not apply, then specify none
here.
9. CONNECTORPORT - The CONNECTORPORT parameter is applicable only under
the following circumstances:
a. If the WebSphere server being monitored belongs to a cluster, or,
b. If the WebSphere server being monitored is one of many
instances of the server running on the same host
In case of situation (a), the CONNECTORPORT parameter will take the port
number using which the node manager communicates with the WebSphere
servers in the cluster. The connector port can be a SOAP port or an RMI port.
To know the port number, do the following:
From the Node manager's host, open the
<WEBSPHERE_INSTALL_DIR>\DeploymentManager\properties\wsadmin.properties
file.
Two entries that read as follows will be present in the wsadmin.properties
file:
com.ibm.ws.scripting.port=<port_number>
#com.ibm.ws.scripting.port=<port_number>
Both the entries will have port numbers against them. However, the
uncommented entry (the entry without the #) is the one that denotes an
active port. Therefore, specify the corresponding port number as the
CONNECTORPORT.
In case of situation (b), do the following to know the CONNECTORPORT:
Login to the WebSphere Administrative Console.
Expand the Servers node in the tree-structure in the left pane of the
console, and click on the Application Servers link. A list of application server
instances will then appear in the right pane.
Click on the server instance being monitored. Doing so invokes the
Configuration of the chosen server instance appears.
Scroll down the Configuration to view the End Points link. Once you locate the
End Points link, click on it.
In the page that appears next, click on the SOAP_CONNECTOR_ADDRESS link.
The Port displayed in that page should be used as the CONNECTORPORT in
situation (b).
If both (a) and (b) do not apply, specify none against CONNECTORPORT.

M o n i t o r i n g W e b S p h e r e A p p l i c a t i o n S e r v e r s
229
10. USER - If security has been enabled for the WebSphere server being
monitored, then provide a valid USER name to login to the WebSphere server.
If the WebSphere server does not require any authentication, then the USER
text box should contain the default value 'none'.
11. PASSWORD – If security has been enabled for the WebSphere server being
monitored, then provide the PASSWORD that corresponds to the specified
USER name. If the WebSphere server does not require any authentication,
then leave the PASSWORD text box with its default setting.
12. CONFIRM PASSWORD - If security has been enabled, confirm the specified
PASSWORD by retyping it in the CONFIRM PASSWORD text box. If the
WebSphere server does not require any authentication, then leave the
CONFIRM PASSWORD text box with its default setting.
13. ENCRYPTPASS – By default, this flag is set to YES, indicating that the
PASSWORD of the WebSphere server is encrypted by default. To disable
password encryption, select the NO option.
14. SERVERNAME – Specify the name of the WebSphere server instance to be
monitored. To know the instances of a WebSphere server currently available,
first, connect to the WebSphere Administrative console using the URL: http://<IP
address of the WebSphere server:Port number of the WebSphere server>\admin. Then,
login to the administrative console and expand the Servers node in the left
pane of the console. Next, click on the Application Servers sub-node under the
Servers node. A list of server instance Names and their corresponding Node
values will then be displayed in the right pane. One of the displayed server
instances can be specified as the value of the SERVERNAME parameter.
15. TIMEOUT - In the TIMEOUT text box, specify the maximum duration (in
seconds) for which the test will wait for a response from the application
server. The default TIMEOUT period is 60 seconds.
Outputs of the
test
One set of results for each server instance being monitored
Measurements
made by the test
Measurement
Measurement
Unit
Interpretation
Loaded servlets:
Indicates the number of
servlets that were loaded.
Number
Reloads:
Indicates the number of
servlets that were
reloaded.
Number
Total requests:
Indicates the number of
requests that the servlets
have processed.
Number
M o n i t o r i n g W e b S p h e r e A p p l i c a t i o n S e r v e r s
230
Concurrent requests:
Indicates the number of
requests that the servlets
have concurrently
processed.
Number
Avg response time:
Indicates the time it takes
for a servlet request to be
serviced.
Secs
Total errors:
Indicates the total number
of errors in the servlet/JSP.
Number
3.1.4.7 WebSphere Web Server Summary Test
This test reports statistics pertaining to the web services mounted on a WebSphere server.
Purpose
To report statistics pertaining to the web services mounted on a WebSphere
server
Target of the test
A WebSphere application server
Agent deploying
the test
An internal agent

M o n i t o r i n g W e b S p h e r e A p p l i c a t i o n S e r v e r s
231
Configurable
parameters for
the test
1. TEST PERIOD - How often should the test be executed
2. HOST – The IP address of the WebSphere application server
3. PORT – The port number of the WebSphere application server
4. WEBSERVERPORT – The port number through which the WebSphere
applications can be accessed.
5. SSL – Indicate whether the SSL (Secured Socket Layer) is to be used to
connect to the WebSphere server.
6. SERVERHOSTNAME - Specify the node name of the server instance being
monitored. To know the node name, do the following
Login to the WebSphere Administrative Console.
Expand the Servers node in the tree structure in the left pane of the
console, and click on the Application Servers link within.
A list of application server instances and their corresponding node names
will then appear in the right pane of the console. From this list, you can
figure out the node name that corresponds to the application server
instance being monitored, and specify that name against the
SERVERHOSTNAME parameter.
7. NDMANAGER - The NDMANAGER parameter is applicable only under the
following circumstances:
a. If the WebSphere server being monitored belongs to a cluster, or,
b. If the WebSphere server being monitored is one of many
instances of the server running on the same host
In the case of situation (a), in the NDMANAGER text box, provide the host
name of the NODE MANAGER that manages the application servers in the cluster.
To know the name of the NODE MANAGER, do the following:
Login to the Administrative Console of the node manager using the URL
http://<IPoftheWebSphereAppServer'sNodeManager>:<Adminport>/admi
n/.
Using the tree-structure in the left pane of the Administrative Console that
appears, drill down to the Deployment Manager node within System
Administration.
Select the Configuration tab that appears in the right pane, and scroll down
to the End Points link in the Additional Properties section.
Once you locate the End Points link, click on it, and in the page that
appears, click on the SOAP_CONNECTOR_ADDRESS link.
In the subsequent page, a fully qualified domain name will be displayed
against Host. This is the name that should be specified as the host name of
the node manager in the NDMANAGER text box.
In the case of situation (b), enter the SERVERHOSTNAME itself as the
NDMANAGER. If both conditions (a) and (b) do not apply, then specify
none here.

M o n i t o r i n g W e b S p h e r e A p p l i c a t i o n S e r v e r s
232
8. CONNECTORPORT - The CONNECTORPORT parameter is applicable only under
the following circumstances:
a. If the WebSphere server being monitored belongs to a cluster, or,
b. If the WebSphere server being monitored is one of many
instances of the server running on the same host
In case of situation (a), the CONNECTORPORT parameter will take the port
number using which the node manager communicates with the WebSphere
servers in the cluster. The connector port can be a SOAP port or an RMI port.
To know the port number, do the following:
From the Node manager's host, open the
<WEBSPHERE_INSTALL_DIR>\DeploymentManager\properties\wsadmin.properties
file.
Two entries that read as follows will be present in the wsadmin.properties
file:
com.ibm.ws.scripting.port=<port_number>
#com.ibm.ws.scripting.port=<port_number>
Both the entries will have port numbers against them. However, the
uncommented entry (the entry without the #) is the one that denotes an
active port. Therefore, specify the corresponding port number as the
CONNECTORPORT.
In case of situation (b), do the following to know the CONNECTORPORT:
Login to the WebSphere Administrative Console.
Expand the Servers node in the tree-structure in the left pane of the
console, and click on the Application Servers link. A list of application server
instances will then appear in the right pane.
Click on the server instance being monitored. Doing so invokes the
Configuration of the chosen server instance appears.
Scroll down the Configuration to view the End Points link. Once you locate the
End Points link, click on it.
In the page that appears next, click on the SOAP_CONNECTOR_ADDRESS link.
The Port displayed in that page should be used as the CONNECTORPORT in
situation (b).
If both (a) and (b) do not apply, specify none against CONNECTORPORT.
9. USER - If security has been enabled for the WebSphere server being
monitored, then provide a valid USER name to login to the WebSphere server.
If the WebSphere server does not require any authentication, then the USER
text box should contain the default value 'none'.
10. PASSWORD – If security has been enabled for the WebSphere server being
monitored, then provide the PASSWORD that corresponds to the specified
USER name. If the WebSphere server does not require any authentication,
then leave the PASSWORD text box with its default setting.

M o n i t o r i n g W e b S p h e r e A p p l i c a t i o n S e r v e r s
233
11. CONFIRM PASSWORD - If security has been enabled, confirm the specified
PASSWORD by retyping it in the CONFIRM PASSWORD text box. If the
WebSphere server does not require any authentication, then leave the
CONFIRM PASSWORD text box with its default setting.
12. ENCRYPTPASS – By default, this flag is set to YES, indicating that the
PASSWORD of the WebSphere server is encrypted by default. To disable
password encryption, select the NO option.
13. SERVERNAME – Specify the name of the WebSphere server instance to be
monitored. To know the instances of a WebSphere server currently available,
first, connect to the WebSphere Administrative console using the URL: http://<IP
address of the WebSphere server:Port number of the WebSphere server>\admin. Then,
login to the administrative console and expand the Servers node in the left
pane of the console. Next, click on the Application Servers sub-node under the
Servers node. A list of server instance Names and their corresponding Node
values will then be displayed in the right pane. One of the displayed server
instances can be specified as the value of the SERVERNAME parameter.
14. TIMEOUT - In the TIMEOUT text box, specify the maximum duration (in
seconds) for which the test will wait for a response from the application
server. The default TIMEOUT period is 60 seconds.
Outputs of the
test
One set of results for each server instance being monitored
Measurements
made by the test
Measurement
Measurement
Unit
Interpretation
Loaded services:
Indicates the number of
web services loaded by the
application server.
Number
Requests received:
Indicates the number of
requests received by the
web services.
Number
Requests dispatched:
Indicates the number of
requests dispatched by the
service to a target code.
Number
Requests successful:
Indicates the number of
requests that were
successfully responded to.
Number
Avg response time:
Indicates the average time
between receipt of a
request and the dispatch of
a response.
Secs

M o n i t o r i n g W e b S p h e r e A p p l i c a t i o n S e r v e r s
234
3.1.4.8 WebSphere ORB Test
This test reports statistics pertaining to each of the ORBs (Object Request Broker) on a WebSphere
server.
Purpose
To report statistics pertaining to each of the ORBs (Object Request Broker) on a
WebSphere server
Target of the test
A WebSphere application server
Agent deploying
the test
An internal agent

M o n i t o r i n g W e b S p h e r e A p p l i c a t i o n S e r v e r s
235
Configurable
parameters for
the test
1. TESTPERIOD - How often should the test be executed
2. HOST – The IP address of the WebSphere application server
3. PORT – The port number of the WebSphere application server
4. WEBSERVERPORT – The port number through which the WebSphere
applications can be accessed.
5. SSL – Indicate whether the SSL (Secured Socket Layer) is to be used to
connect to the WebSphere server.
6. SERVERHOSTNAME - Specify the node name of the server instance being
monitored. To know the node name, do the following:
Login to the WebSphere Administrative Console.
Expand the Servers node in the tree structure in the left pane of the
console, and click on the Application Servers link within.
A list of application server instances and their corresponding node names
will then appear in the right pane of the console. From this list, you can
figure out the node name that corresponds to the application server
instance being monitored, and specify that name against the
SERVERHOSTNAME parameter.
7. NDMANAGER - The NDMANAGER and CONNECTORPORT parameters will be
applicable only if the WebSphere application server being monitored is part of
a cluster. If so, then, in the NDMANAGER text box, provide the host name of
the node manager that manages the application servers in the cluster. If the
WebSphere server being monitored does not belong to a cluster, then specify
none in this text box. To know the name of the node manager, do the
following:
Login to the Administrative Console of the node manager using the URL
http://<IPoftheWebSphereAppServer'sNodeManager>:<Adminport>/admi
n/.
Using the tree-structure in the left pane of the Administrative Console that
appears, drill down to the Deployment Manager node within System
Administration.
Select the Configuration tab that appears in the right pane, and scroll down
to the End Points link in the Additional Properties section.
Once you locate the End Points link, click on it, and in the page that
appears, click on the SOAP_CONNECTOR_ADDRESS link.
In the subsequent page, a fully qualified domain name will be displayed
against Host. This is the name that should be specified as the host name of
the node manager in the NDMANAGER text box.

M o n i t o r i n g W e b S p h e r e A p p l i c a t i o n S e r v e r s
236
8. CONNECTORPORT - The port using which the node manager communicates
with the WebSphere servers in the cluster will have to be specified in the
CONNECTORPORT text box. If the server being monitored is not part of a
cluster, then specify none here. The connector port can be a SOAP port or an
RMI port. To know the port number, do the following:
From the Node manager's host, open the
<WEBSPHERE_INSTALL_DIR>\DeploymentManager\properties\wsadmin.properties
file.
Two entries that read as follows will be present in the wsadmin.properties
file:
com.ibm.ws.scripting.port=<port_number>
#com.ibm.ws.scripting.port=<port_number>
Both the entries will have port numbers against them. However, the
uncommented entry (the entry without the #) is the one that denotes an
active port. Therefore, specify the corresponding port number as the
CONNECTORPORT.
9. USER - If security has been enabled for the WebSphere server being
monitored, then provide a valid USER name to login to the WebSphere server.
If the WebSphere server does not require any authentication, then the USER
text box should contain the default value 'none'.
10. PASSWORD – If security has been enabled for the WebSphere server being
monitored, then provide the PASSWORD that corresponds to the specified
USER name. If the WebSphere server does not require any authentication,
then leave the PASSWORD text box with its default setting.
11. CONFIRM PASSWORD - If security has been confirm the specified PASSWORD
by retyping it in the CONFIRM PASSWORD text box. If the WebSphere server
does not require any authentication, then leave the CONFIRM PASSWORD text
box with its default setting.
12. ENCRYPTPASS – By default, this flag is set to YES, indicating that the
PASSWORD of the WebSphere server is encrypted by default. To disable
password encryption, select the NO option.
13. SERVERNAME – Specify the name of the WebSphere server instance to be
monitored. To know the instances of a WebSphere server currently available,
first, connect to the WebSphere Administrative console using the URL: http://<IP
address of the WebSphere server:Port number of the WebSphere server>\admin. Then,
login to the administrative console and expand the Servers node in the left
pane of the console. Next, click on the Application Servers sub-node under the
Servers node. A list of server instance Names and their corresponding Node
values will then be displayed in the right pane. One of the displayed server
instances can be specified as the value of the SERVERNAME parameter.
14. TIMEOUT - In the TIMEOUT text box, specify the maximum duration (in
seconds) for which the test will wait for a response from the application
server. The default TIMEOUT period is 60 seconds.
Outputs of the
test
One set of results for each server instance being monitored
M o n i t o r i n g W e b S p h e r e A p p l i c a t i o n S e r v e r s
237
Measurements
made by the test
Measurement
Measurement
Unit
Interpretation
Avg processing time:
Indicates the time this
registered portable
interceptor takes to run.
Secs
A high processing time is indicative of
a performance bottleneck.
3.1.4.9 WebSphere Web Server Test
This test reports statistics pertaining to each of the web services mounted on a WebSphere server.
Purpose
To report statistics pertaining to each of the web services mounted on a
WebSphere server
Target of the test
A WebSphere application server
Agent deploying
the test
An internal agent

M o n i t o r i n g W e b S p h e r e A p p l i c a t i o n S e r v e r s
238
Configurable
parameters for
the test
1. TESTPERIOD - How often should the test be executed
2. HOST – The IP address of the WebSphere application server
3. PORT – The port number of the WebSphere application server
4. WEBSERVERPORT – The port number through which the WebSphere
applications can be accessed.
5. SSL – Indicate whether the SSL (Secured Socket Layer) is to be used to
connect to the WebSphere server.
6. SERVERHOSTNAME - Specify the node name of the server instance being
monitored. To know the node name, do the following
Login to the WebSphere Administrative Console.
Expand the Servers node in the tree structure in the left pane of the
console, and click on the Application Servers link within.
A list of application server instances and their corresponding node names
will then appear in the right pane of the console. From this list, you can
figure out the node name that corresponds to the application server
instance being monitored, and specify that name against the
SERVERHOSTNAME parameter.
7. NDMANAGER - The NDMANAGER and CONNECTORPORT parameters will be
applicable only if the WebSphere application server being monitored is part of
a cluster. If so, then, in the NDMANAGER text box, provide the host name of
the node manager that manages the application servers in the cluster. If the
WebSphere server being monitored does not belong to a cluster, then specify
none in this text box. To know the name of the node manager, do the
following:
Login to the Administrative Console of the node manager using the URL
http://<IPoftheWebSphereAppServer'sNodeManager>:<Adminport>/admi
n/.
Using the tree-structure in the left pane of the Administrative Console that
appears, drill down to the Deployment Manager node within System
Administration.
Select the Configuration tab that appears in the right pane, and scroll down
to the End Points link in the Additional Properties section.
Once you locate the End Points link, click on it, and in the page that
appears, click on the SOAP_CONNECTOR_ADDRESS link.
In the subsequent page, a fully qualified domain name will be displayed
against Host. This is the name that should be specified as the host name of
the node manager in the NDMANAGER text box.

M o n i t o r i n g W e b S p h e r e A p p l i c a t i o n S e r v e r s
239
8. CONNECTORPORT - The port using which the node manager communicates
with the WebSphere servers in the cluster will have to be specified in the
CONNECTORPORT text box. If the server being monitored is not part of a
cluster, then specify none here. The connector port can be a SOAP port or an
RMI port. To know the port number, do the following:
From the Node manager's host, open the
<WEBSPHERE_INSTALL_DIR>\DeploymentManager\properties\wsadmin.properties
file.
Two entries that read as follows will be present in the wsadmin.properties
file:
com.ibm.ws.scripting.port=<port_number>
#com.ibm.ws.scripting.port=<port_number>
Both the entries will have port numbers against them. However, the
uncommented entry (the entry without the #) is the one that denotes an
active port. Therefore, specify the corresponding port number as the
CONNECTORPORT.
9. USER - If security has been enabled for the WebSphere server being
monitored, then provide a valid USER name to login to the WebSphere server.
If the WebSphere server does not require any authentication, then the USER
text box should contain the default value 'none'.
10. PASSWORD – If security has been enabled for the WebSphere server being
monitored, then provide the PASSWORD that corresponds to the specified
USER name. If the WebSphere server does not require any authentication,
then leave the PASSWORD text box with its default setting.
11. CONFIRM PASSWORD - If security has been confirm the specified PASSWORD
by retyping it in the CONFIRM PASSWORD text box. If the WebSphere server
does not require any authentication, then leave the CONFIRM PASSWORD text
box with its default setting.
12. ENCRYPTPASS – By default, this flag is set to YES, indicating that the
PASSWORD of the WebSphere server is encrypted by default. To disable
password encryption, select the NO option.
13. SERVERNAME – Specify the name of the WebSphere server instance to be
monitored. To know the instances of a WebSphere server currently available,
first, connect to the WebSphere Administrative console using the URL: http://<IP
address of the WebSphere server:Port number of the WebSphere server>\admin. Then,
login to the administrative console and expand the Servers node in the left
pane of the console. Next, click on the Application Servers sub-node under the
Servers node. A list of server instance Names and their corresponding Node
values will then be displayed in the right pane. One of the displayed server
instances can be specified as the value of the SERVERNAME parameter.
14. TIMEOUT - In the TIMEOUT text box, specify the maximum duration (in
seconds) for which the test will wait for a response from the application
server. The default TIMEOUT period is 60 seconds.
Outputs of the
test
One set of results for each web service on the monitored WebSphere server
instance

M o n i t o r i n g W e b S p h e r e A p p l i c a t i o n S e r v e r s
240
Measurements
made by the test
Measurement
Measurement
Unit
Interpretation
Loaded services:
Indicates the number of
instances of this web
service that have been
loaded by the application
server.
Number
Requests received:
Indicates the number of
requests received by this
web service.
Number
Requests dispatched:
Indicates the number of
requests dispatched by this
web service to a target
code.
Number
Requests successful:
Indicates the number of
requests that were
succesfully responded to
by this web service.
Number
Avg response time:
Indicates the average time
between receipt of a
request and the dispatch of
a response by this web
service.
Secs
3.2 Monitoring the WebSphere Application Server 6.0 (and
above)
As the WebSphere server 6.0 (and above) supports different capabilities and interfaces than the
earlier versions, the eG Enterprise suite offers a different monitoring model for WebSphere 6.0 (and
above). In the case of the WebSphere application server version 6.0 and above, the eG agent uses the
JMX architecture supported by the WebSphere server to gather the required metrics.
To monitor a WebSphere Application server 6.0 (and above), a specific WebSphere monitoring eG
component has to be installed on it. If the WebSphere server to be monitored uses a SOAP connector
port for its internal communications, then the egurkha6.ear application (in the /opt/egurkha/lib or the
<EG_INSTALL_DIR>\lib directory) will have to be installed on the server. On the other hand, if the target
WebSphere server uses an RMI port for communicating internally, then the egurkha6rmi.ear application
should be installed on the server. The procedure for installing the 'ear' file has been discussed in detail
in the eG Implementer's Guide.
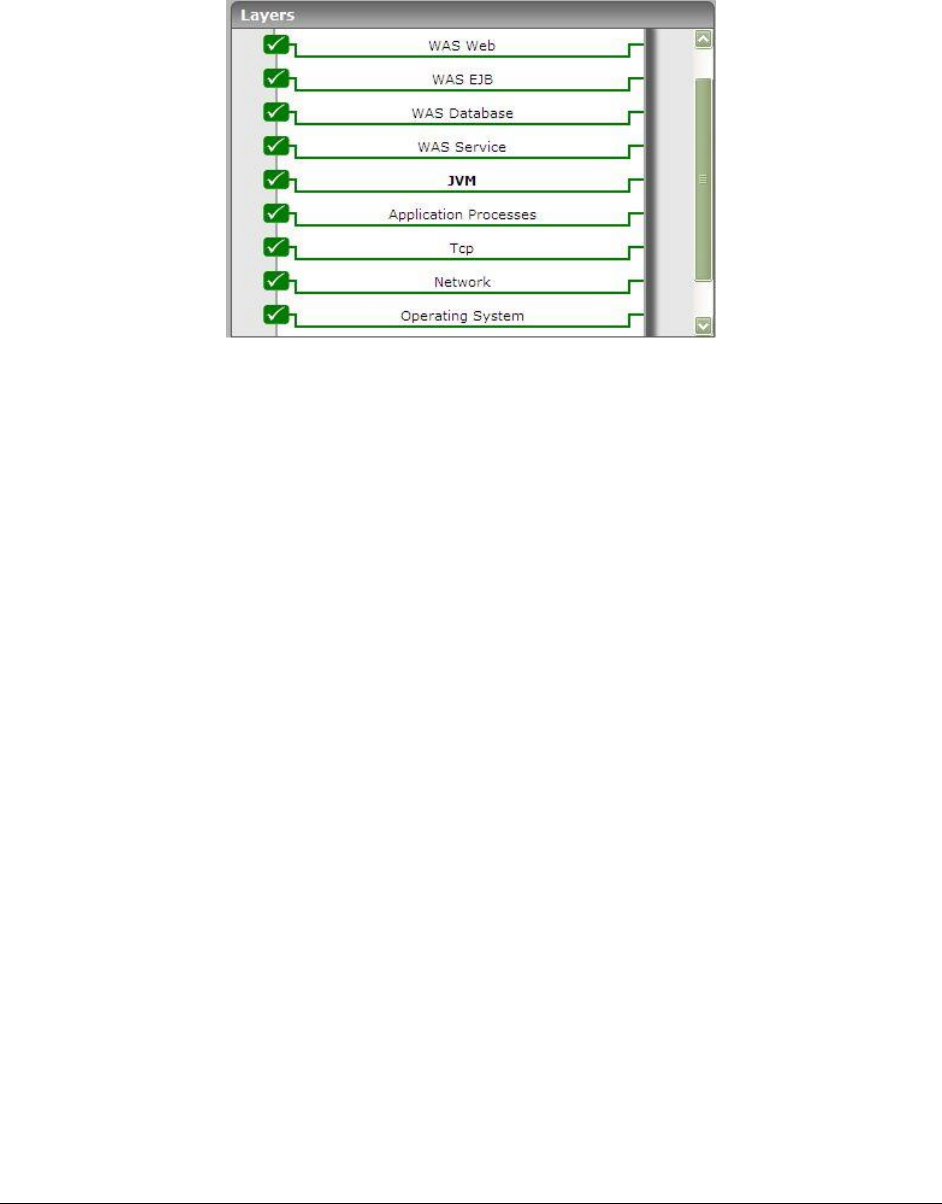
M o n i t o r i n g W e b S p h e r e A p p l i c a t i o n S e r v e r s
241
The measures extracted by egurkha6.ear or egurkha6rmi.ear (as the case may be) are captured and
displayed by the unique monitoring model that eG Enterprise prescribes for the WebSphere
Appolication server 6.0 (and above) (see Figure 3.6).
Figure 3.6: Layer model of the WebSphere Application server 6.0 (or above)
The tests executing on each of the layers depicted by Figure 3.6 extract a wealth of performance data
from the WebSphere application server, that enable WebSphere administrators to determine the
following:
Does EJB creation take too long?
Was the WebSphere cache adequately sized, or were there too many cache misses?
Is sufficient memory allotted to the WebSphere JVM?
Is the thread pool adequately sized?
Did too many connections in the database connection pool timeout?
Are transaction rollbacks happening too frequently on the server?
Are transactions taking too long to complete?
How many synchronous/asynchronous requests were processed by the WebSphere gateway?
How well does the ORB (Object Request Broker) handle requests for objects received by it?
Were any errors detected during JSP/servlet processing?
Are the web services executing on the WebSphere server too slow in responding to requests
received by it?
The sections to come will elaborate on the tests associated with the top 5 layers only.
3.2.1 The JVM Layer
By default, no tests are mapped to the JVM layer of the WebSphere Application server 6.0 (or above).
This is because, all tests reporting critical JVM-related metrics are disabled by default for the
WebSphere server. To enable one/more of these tests, open the AGENTS – TESTS CONFIGURATION page
using the Agents -> Tests -> Configure menu sequence, select WebSphere Application from the
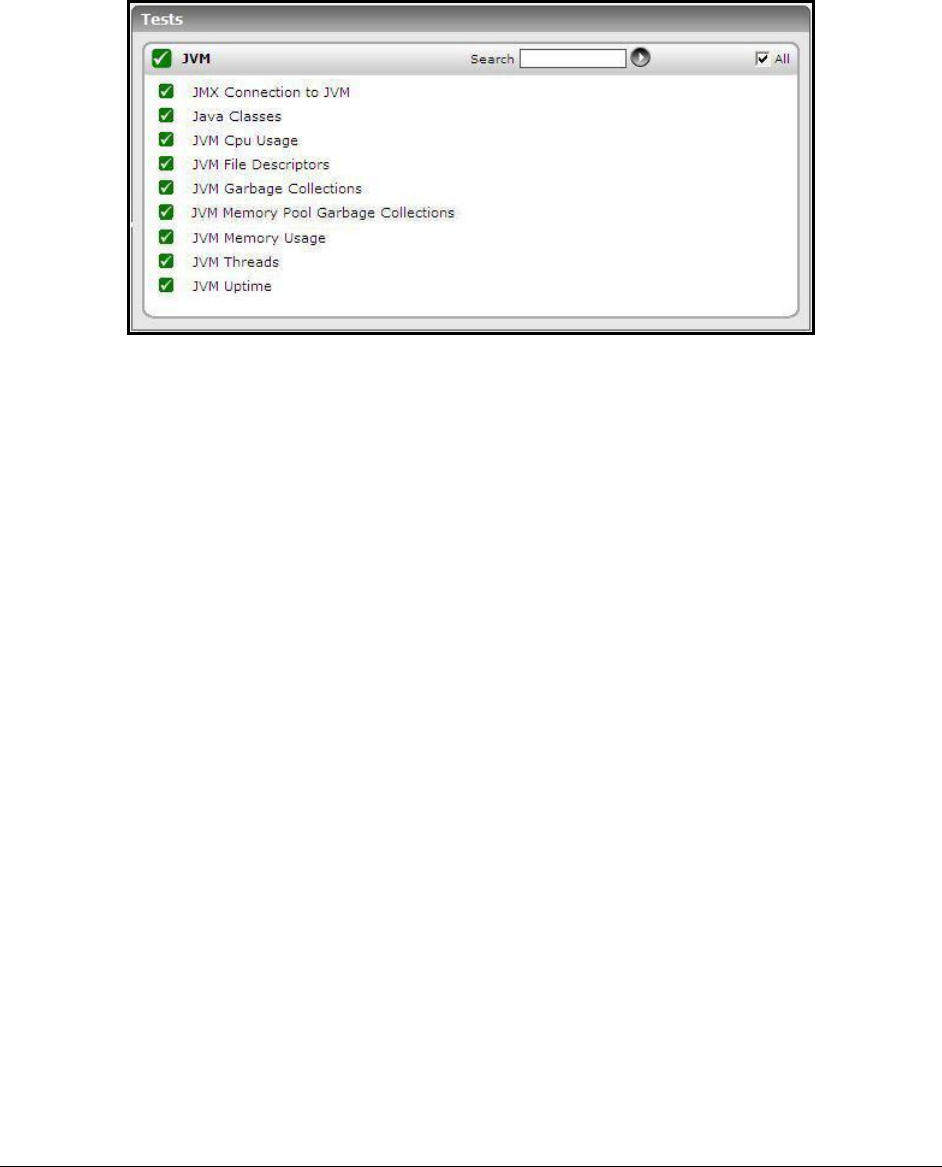
M o n i t o r i n g W e b S p h e r e A p p l i c a t i o n S e r v e r s
242
Component type list, scroll down the test list that appears to view the DISABLED TESTS section, select the
check box corresponding to the JVM test of interest to you, and then, click the Update button.
If all the JVM tests are enabled, then clicking on the JVM layer will display the test list depicted by
Figure 3.7 below.
Figure 3.7: The tests mapped to the JVM layer
These tests collectively report the resource usage and overall health of the WebSphere JVM. The
JvmGarbageCollection test has been elaborately discussed in Section 3.1.1 above, and all the other
tests have been dealt with in Chapter 0 of this document.
3.2.2 The WAS Service Layer
Using the tests associated with the WAS Service layer, the eG agents can closely observe the
performance of the following critical services executing on the WebSphere Application server:
Cache management
Object pools
Garbage collection (GC)
Thread pools
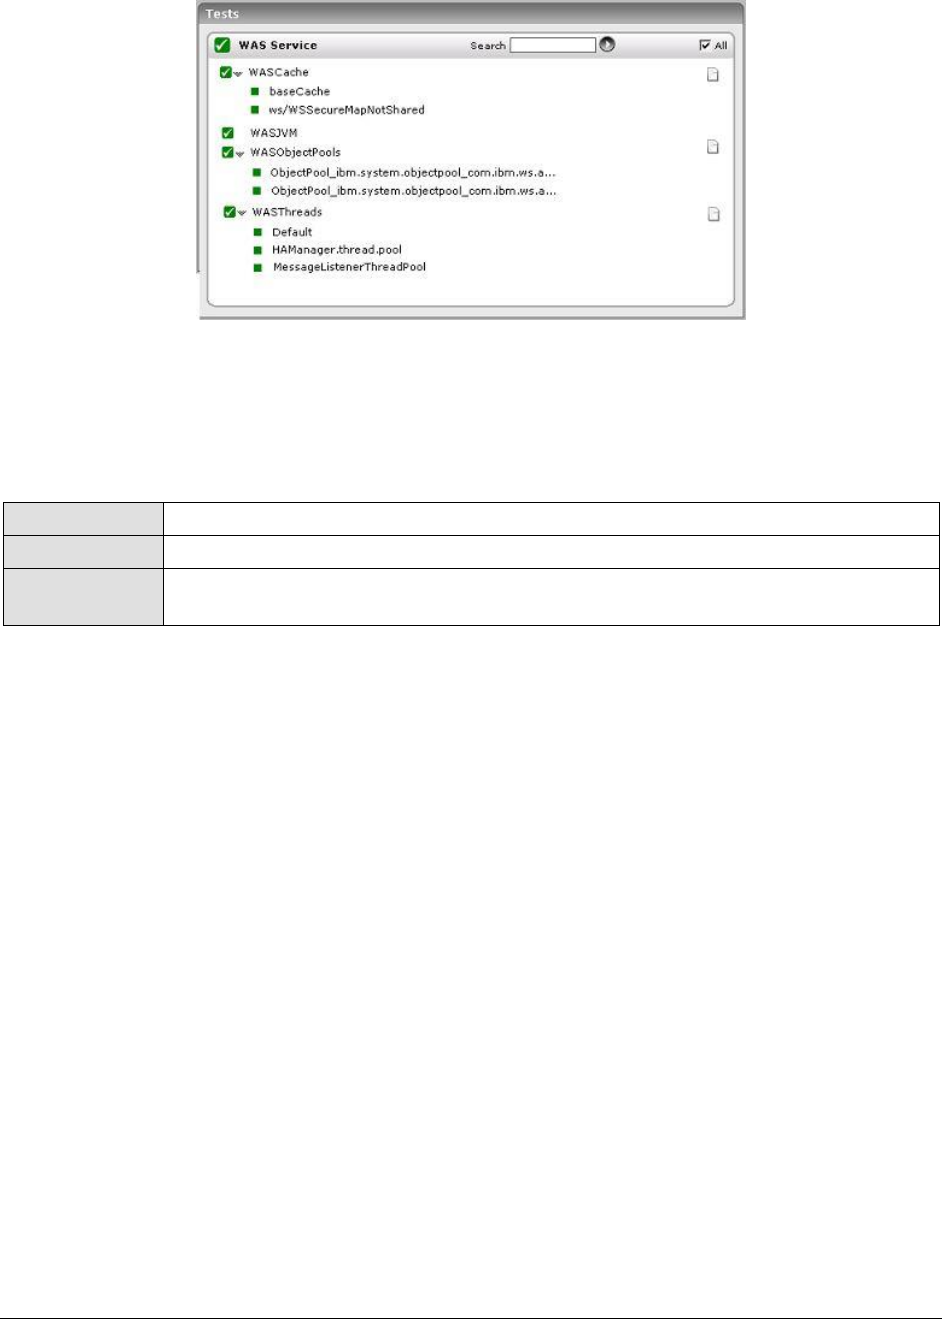
M o n i t o r i n g W e b S p h e r e A p p l i c a t i o n S e r v e r s
243
Figure 3.8: The tests associated with the WAS Service layer
3.2.2.1 WAS Cache Test
The WASCache test monitors the cache usage on the WebSphere server.
Purpose
Monitors the cache usage on the WebSphere server
Target of the test
A WebSphere application server
Agent deploying
the test
An internal agent

M o n i t o r i n g W e b S p h e r e A p p l i c a t i o n S e r v e r s
244
Configurable
parameters for
the test
1. TEST PERIOD - How often should the test be executed
2. HOST – The IP address of the WebSphere application server
3. PORT – The port number of the WebSphere application server
4. SERVERHOSTNAME – Specify the host name of the application server instance
being monitored.
5. APPPORT – Specify the port number to be used for accessing the egurkha
application that has been deployed on the server.
6. NODENAME - Specify the node name of the server instance being monitored.
To know the node name, do the following
Login to the WebSphere Administrative Console.
Expand the Servers node in the tree structure in the left pane of the
console, and click on the Application Servers link within.
A list of application server instances and their corresponding node names
will then appear in the right pane of the console. From this list, you can
figure out the Node that corresponds to the application server instance
being monitored, and specify that name against the NODENAME parameter.
7. SERVERNAME - Provide the name of the server instance being monitored in
the SERVERNAME text box. To know the server name, do the following:
Login to the WebSphere Administrative Console.
Expand the Servers node in the tree structure in the left pane of the
console, and click on the Application Servers link within.
A list of application server instances and their corresponding node names
will then appear in the right pane of the console. From this list, you can
figure out the Name of the monitored server instance, and specify that
name against the SERVERNAME parameter.
If the server instance being monitored is part of a WebSphere cluster, then
you need to provide the host name that corresponds to the connector port of
the Deployment Manager of the cluster as the SERVERNAME. To determine
the SERVERNAME in this case, do the following:
Connect to the WebSphere Administrative console using the URL: http://<IP
address of the WebSphere server:Port number of the WebSphere server>\admin > or
https://<IP address of the WebSphere server:Port number of the WebSphere
server>\admin>.
Login to the WebSphere Administrative console
Expand the System Administration node in the tree-structure in the left pane
of the console and click on the Deployment Manager sub-node within.

M o n i t o r i n g W e b S p h e r e A p p l i c a t i o n S e r v e r s
245
In the right panel, click on the Configuration tab page to view the
configuration of the Deployment Manager. In the Additional Properties section of
the Configuration tab page, expand the Ports node.
A list of ports will then appear. Click on the Details button alongside the
ports list.
If the SOAP port has been set as the connector port in your environment,
then scroll down the page that appears next until you view the Port Name,
SOAP_CONNECTOR_ADDRESS. Make note of the Host name that corresponds to
this port name. If the RMI port is the connector port in your environment,
then make note of the Host name that corresponds to the Port name,
BOOTSTRAP_ADDRESS.
Specify this Host name as the SERVERNAME.
8. CONNECTORPORT - The applications that are deployed on a server instance
use the CONNECTORPORT for all internal communications with the application
server. The connector port can be a SOAP port or an RMI port. The default
connector port however, is the SOAP port. To know the connector port
number, do the following:
Login to the WebSphere Administrative Console.
Expand the Servers node in the tree structure in the left pane of the
console, and click on Application Servers within.
A list of application server instances and their corresponding node names
will then appear in the right pane of the console. In the right pane, click
on the server name link that corresponds to the server instance that is
being monitored.
Doing so invokes the Configuration of the application server instance clicked
on. Scroll down the Configuration tab page to view the Communications
section.
Expand the Ports link in this section to view a list of ports. If the default
connector port is in use, then the port number displayed against
SOAP_CONNECTOR_ADDRESS should be specified as the CONNECTORPORT. If
an RMI port has been explicitly set as the connector port, then specify the
port number displayed against BOOTSTRAP_ADDRESS as the
CONNECTORPORT.
If the server instance being monitored is part of a WebSphere cluster, then
you need to provide the SOAP/RMI port of the Deployment Manager of the
cluster as the CONNECTORPORT. To determine the CONNECTORPORT in this
case, do the following:
Connect to the WebSphere Administrative console using the URL: http://<IP
address of the WebSphere server:Port number of the WebSphere server>\admin > or
https://<IP address of the WebSphere server:Port number of the WebSphere
server>\admin.
Login to the WebSphere Administrative console.
Expand the System Administration node in the tree-structure in the left pane
of the console and click on the Deployment Manager sub-node within.
In the right panel, click on the Configuration tab page to view the
configuration of the Deployment Manager. In the Additional Properties section of
the Configuration tab page, expand the Ports node.

M o n i t o r i n g W e b S p h e r e A p p l i c a t i o n S e r v e r s
246
A list of ports will then appear. If the default connector port is in use, then
the port number displayed against SOAP_CONNECTOR_ADDRESS should be
specified as the CONNECTORPORT. If an RMI port has been explicitly set
as the connector port, then specify the port number displayed against
BOOTSTRAP_ADDRESS as the CONNECTORPORT.
9. SSL - Select Yes if SSL (Secured Socket Layer) is to be used to connect to the
WebSphere server, and No if it is not.
10. USER - If security has been enabled for the WebSphere server being
monitored, then provide a valid USER name to login to the WebSphere server.
If the WebSphere server does not require any authentication, then the USER
text box should contain the default value 'none'.
11. PASSWORD – If security has been enabled for the WebSphere server being
monitored, then provide the PASSWORD that corresponds to the specified
USER name. If the WebSphere server does not require any authentication,
then leave the PASSWORD text box with its default setting.
12. CONFIRM PASSWORD - If security has been enabled, confirm the specified
PASSWORD by retyping it in the CONFIRM PASSWORD text box. If the
WebSphere server does not require any authentication, then leave the
CONFIRM PASSWORD text box with its default setting.
Outputs of the
test
One set of results for each cache on the server instance being monitored
Measurements
made by the test
Measurement
Measurement
Unit
Interpretation
Client requests:
Indicates the number of
requests for cacheable
objects that were
generated by applications
running on the application
server, since the last
measurement period.
Number
Explicit invalidation:
Indicates the number of
explicit invalidations since
the last measurement
period.
Number
Hits on memory:
Indicates the number of
requests for cacheable
objects that were served
from memory since the
last measurement period.
Number
While direct disk reads cause an
increase in processing overheads,
memory reads are less expensive.
Therefore, a high value of this
measure is indicative of the good
health of the server.

M o n i t o r i n g W e b S p h e r e A p p l i c a t i o n S e r v e r s
247
Hits on disk:
Indicates the number of
requests for cacheable
objects that are served
from the disk since the last
measurement period.
Number
Reading from the disk is more
expensive than reading from the
cache. Therefore, ideally, this value
should be low.
Memory cache entry:
Indicates the number of in-
memory cache entries
since the last
measurement period.
Number
Max memory cache
entry:
Indicates the maximum
number of in-memory
cache entries.
Number
Miss count:
Indicates the number of
requests for cacheable
objects that were not
served from the cache
since the last
measurement period.
Number
Ideally, this value should be low.
Remote creations:
Indicates the number of
cache entries that were
received from co-operating
dynamic caches, since the
last measurement period.
Number
Remote hits:
Indicates the number of
requests for cacheable
objects that were served
from other JVMs within the
replication domain, since
the last measurement
period.
Number
Timeout invalidations:
Indicates the number of
cache entries that were
removed from the memory
and disk because of a
timeout, since the last
measurement period.
Number
M o n i t o r i n g W e b S p h e r e A p p l i c a t i o n S e r v e r s
248
3.2.2.2 WAS JVM Test
The WASJVM test monitors the usage of the WebSphere JVM heap.
Purpose
Monitors the usage of the WebSphere JVM heap
Target of the test
A WebSphere application server
Agent deploying
the test
An internal agent
Note:
To enable the test to collect metrics related to the garbage collection and thread activity, you
should enable the Java Virtual Machine Tool Interface (JVMTI) of the WebSphere Server.

M o n i t o r i n g W e b S p h e r e A p p l i c a t i o n S e r v e r s
249
Configurable
parameters for
the test
1. TEST PERIOD - How often should the test be executed
2. HOST – The IP address of the WebSphere application server
3. PORT – The port number of the WebSphere application server
4. SERVERHOSTNAME – Specify the host name of the application server instance
being monitored.
5. APPPORT – Specify the port number to be used for accessing the egurkha
application that has been deployed on the server.
6. NODENAME - Specify the node name of the server instance being monitored.
To know the node name, do the following
Login to the WebSphere Administrative Console.
Expand the Servers node in the tree structure in the left pane of the
console, and click on the Application Servers link within.
A list of application server instances and their corresponding node names
will then appear in the right pane of the console. From this list, you can
figure out the Node that corresponds to the application server instance
being monitored, and specify that name against the NODENAME parameter.
7. SERVERNAME - Provide the name of the server instance being monitored in
the SERVERNAME text box. To know the server name, do the following:
Login to the WebSphere Administrative Console.
Expand the Servers node in the tree structure in the left pane of the
console, and click on the Application Servers link within.
A list of application server instances and their corresponding node names
will then appear in the right pane of the console. From this list, you can
figure out the Name of the monitored server instance, and specify that
name against the SERVERNAME parameter.
If the server instance being monitored is part of a WebSphere cluster, then
you need to provide the host name that corresponds to the connector port of
the Deployment Manager of the cluster as the SERVERNAME. To determine
the SERVERNAME in this case, do the following:
Connect to the WebSphere Administrative console using the URL: http://<IP
address of the WebSphere server:Port number of the WebSphere server>\admin > or
https://<IP address of the WebSphere server:Port number of the WebSphere
server>\admin>.
Login to the WebSphere Administrative console
Expand the System Administration node in the tree-structure in the left pane
of the console and click on the Deployment Manager sub-node within.

M o n i t o r i n g W e b S p h e r e A p p l i c a t i o n S e r v e r s
250
In the right panel, click on the Configuration tab page to view the
configuration of the Deployment Manager. In the Additional Properties section of
the Configuration tab page, expand the Ports node.
A list of ports will then appear. Click on the Details button alongside the
ports list.
If the SOAP port has been set as the connector port in your environment,
then scroll down the page that appears next until you view the Port Name,
SOAP_CONNECTOR_ADDRESS. Make note of the Host name that corresponds to
this port name. If the RMI port is the connector port in your environment,
then make note of the Host name that corresponds to the Port name,
BOOTSTRAP_ADDRESS.
Specify this Host name as the SERVERNAME.
8. CONNECTORPORT - The applications that are deployed on a server instance
use the CONNECTORPORT for all internal communications with the application
server. The connector port can be a SOAP port or an RMI port. The default
connector port however, is the SOAP port. To know the connector port
number, do the following:
Login to the WebSphere Administrative Console.
Expand the Servers node in the tree structure in the left pane of the
console, and click on Application Servers within.
A list of application server instances and their corresponding node names
will then appear in the right pane of the console. In the right pane, click
on the server name link that corresponds to the server instance that is
being monitored.
Doing so invokes the Configuration of the application server instance clicked
on. Scroll down the Configuration tab page to view the Communications
section.
Expand the Ports link in this section to view a list of ports. If the default
connector port is in use, then the port number displayed against
SOAP_CONNECTOR_ADDRESS should be specified as the CONNECTORPORT. If
an RMI port has been explicitly set as the connector port, then specify the
port number displayed against BOOTSTRAP_ADDRESS as the
CONNECTORPORT.
If the server instance being monitored is part of a WebSphere cluster, then
you need to provide the SOAP/RMI port of the Deployment Manager of the
cluster as the CONNECTORPORT. To determine the CONNECTORPORT in this
case, do the following:
Connect to the WebSphere Administrative console using the URL: http://<IP
address of the WebSphere server:Port number of the WebSphere server>\admin > or
https://<IP address of the WebSphere server:Port number of the WebSphere
server>\admin>.
Login to the WebSphere Administrative console.
Expand the System Administration node in the tree-structure in the left pane
of the console and click on the Deployment Manager sub-node within.
In the right panel, click on the Configuration tab page to view the
configuration of the Deployment Manager. In the Additional Properties section of
the Configuration tab page, expand the Ports node.

M o n i t o r i n g W e b S p h e r e A p p l i c a t i o n S e r v e r s
251
A list of ports will then appear. If the default connector port is in use, then
the port number displayed against SOAP_CONNECTOR_ADDRESS should be
specified as the CONNECTORPORT. If an RMI port has been explicitly set
as the connector port, then specify the port number displayed against
BOOTSTRAP_ADDRESS as the CONNECTORPORT.
9. SSL - Select Yes if SSL (Secured Socket Layer) is to be used to connect to the
WebSphere server, and No if it is not.
10. USER - If security has been enabled for the WebSphere server being
monitored, then provide a valid USER name to login to the WebSphere server.
If the WebSphere server does not require any authentication, then the USER
text box should contain the default value 'none'.
11. PASSWORD – If security has been enabled for the WebSphere server being
monitored, then provide the PASSWORD that corresponds to the specified
USER name. If the WebSphere server does not require any authentication,
then leave the PASSWORD text box with its default setting.
12. CONFIRM PASSWORD - If security has been enabled, confirm the specified
PASSWORD by retyping it in the CONFIRM PASSWORD text box. If the
WebSphere server does not require any authentication, then leave the
CONFIRM PASSWORD text box with its default setting.
Measurements
made by the test
Measurement
Measurement
Unit
Interpretation
Free memory:
Indicates the amount of
memory currently available
in the JVM.
MB
A very low value of this measure is
indicative of excessive memory
utilization in the JVM.
Used memory:
Indicates the amount of
memory that has been
currently utilized by the
JVM.
MB
A high value of this measure
indicates a heavy workload on the
WebSphere application server. In
such a case, you might want to
consider increasing the JVM heap
size.
GC count:
Indicates the number of
GC calls since the last
measurement period.
Number
If adequate memory is not allotted to
the JVM, then the value of this
measure would be very high. A high
value of this measure is indicative of
a high frequency of GC. This is not a
good sign, as GC, during its
execution, has the tendency of
suspending an application, and a
high frequency of GC would only
adversely impact the application's
performance. To avoid this, it is
recommended that you allot
sufficient memory to the JVM.

M o n i t o r i n g W e b S p h e r e A p p l i c a t i o n S e r v e r s
252
Percent gc time:
Indicates the percentage of
time spent on GC.
Percent
If adequate memory is not allotted to
the JVM, then the value of this
measure would be very high. This is
not a good sign, as GC, during its
execution, has the tendency of
suspending an application, and a
high value of this measure would
only adversely impact the
application's performance. To avoid
this, it is recommended that you allot
sufficient memory to the JVM.
Percent heap used:
Indicates the percentage of
heap memory utilized by
the JVM.
Percent
A high value of this measure
indicates a heavy workload on the
WebSphere application server. In
such a case, you might want to
consider increasing the JVM heap
size.
Objects allocated:
Indicates the number of
objects allocated in the
heap since the last
measurement period.
Number
Objects freed:
Indicates the number of
objects freed in the heap
since the last
measurement period.
Number
Objects moved:
Indicates the number of
objects in the heap since
the last measurement
period.
Number
Threads started:
Indicates the number of
threads started since the
last measurement period.
Number
A high value is indicative of high
server workload.
Threads ended:
Indicates the number of
threads that ended since
the last measurement
period.
Number
Waits for lock:
Indicates the number of
times a thread waits for a
lock, since the last
measurement period.
Number
M o n i t o r i n g W e b S p h e r e A p p l i c a t i o n S e r v e r s
253
Wait for lock time:
Indicates the average time
a thread waits for a lock.
Secs
3.2.2.3 WAS Object Pools Test
The WASObjectPools test reports critical statistics pertaining to the object pools on the WebSphere
server.
Purpose
Reports critical statistics pertaining to the object pools on the WebSphere server
Target of the test
A WebSphere application server
Agent deploying
the test
An internal agent

M o n i t o r i n g W e b S p h e r e A p p l i c a t i o n S e r v e r s
254
Configurable
parameters for
the test
1. TEST PERIOD - How often should the test be executed
2. HOST – The IP address of the WebSphere application server
3. PORT – The port number of the WebSphere application server
4. SERVERHOSTNAME – Specify the host name of the application server instance
being monitored.
5. APPPORT – Specify the port number to be used for accessing the egurkha
application that has been deployed on the server.
6. NODENAME - Specify the node name of the server instance being monitored.
To know the node name, do the following
Login to the WebSphere Administrative Console.
Expand the Servers node in the tree structure in the left pane of the
console, and click on the Application Servers link within.
A list of application server instances and their corresponding node names
will then appear in the right pane of the console. From this list, you can
figure out the Node that corresponds to the application server instance
being monitored, and specify that name against the NODENAME parameter.
7. SERVERNAME - Provide the name of the server instance being monitored in
the SERVERNAME text box. To know the server name, do the following:
Login to the WebSphere Administrative Console.
Expand the Servers node in the tree structure in the left pane of the
console, and click on the Application Servers link within.
A list of application server instances and their corresponding node names
will then appear in the right pane of the console. From this list, you can
figure out the Name of the monitored server instance, and specify that
name against the SERVERNAME parameter.
If the server instance being monitored is part of a WebSphere cluster, then
you need to provide the host name that corresponds to the connector port of
the Deployment Manager of the cluster as the SERVERNAME. To determine
the SERVERNAME in this case, do the following:
Connect to the WebSphere Administrative console using the URL: http://<IP
address of the WebSphere server:Port number of the WebSphere server>\admin > or
https://<IP address of the WebSphere server:Port number of the WebSphere
server>\admin gin to the WebSphere Administrative console
Expand the System Administration node in the tree-structure in the left pane
of the console and click on the Deployment Manager sub-node within.

M o n i t o r i n g W e b S p h e r e A p p l i c a t i o n S e r v e r s
255
In the right panel, click on the Configuration tab page to view the
configuration of the Deployment Manager. In the Additional Properties section of
the Configuration tab page, expand the Ports node.
A list of ports will then appear. Click on the Details button alongside the
ports list.
If the SOAP port has been set as the connector port in your environment,
then scroll down the page that appears next until you view the Port Name,
SOAP_CONNECTOR_ADDRESS. Make note of the Host name that corresponds to
this port name. If the RMI port is the connector port in your environment,
then make note of the Host name that corresponds to the Port name,
BOOTSTRAP_ADDRESS.
Specify this Host name as the SERVERNAME.
8. CONNECTORPORT - The applications that are deployed on a server instance
use the CONNECTORPORT for all internal communications with the application
server. The connector port can be a SOAP port or an RMI port. The default
connector port however, is the SOAP port. To know the connector port
number, do the following:
Login to the WebSphere Administrative Console.
Expand the Servers node in the tree structure in the left pane of the
console, and click on Application Servers within.
A list of application server instances and their corresponding node names
will then appear in the right pane of the console. In the right pane, click
on the server name link that corresponds to the server instance that is
being monitored.
Doing so invokes the Configuration of the application server instance clicked
on. Scroll down the Configuration tab page to view the Communications
section.
Expand the Ports link in this section to view a list of ports. If the default
connector port is in use, then the port number displayed against
SOAP_CONNECTOR_ADDRESS should be specified as the CONNECTORPORT. If
an RMI port has been explicitly set as the connector port, then specify the
port number displayed against BOOTSTRAP_ADDRESS as the
CONNECTORPORT.
If the server instance being monitored is part of a WebSphere cluster, then
you need to provide the SOAP/RMI port of the Deployment Manager of the
cluster as the CONNECTORPORT. To determine the CONNECTORPORT in this
case, do the following:
Connect to the WebSphere Administrative console using the URL: http://<IP
address of the WebSphere server:Port number of the WebSphere server>\admin > or
https://<IP address of the WebSphere server:Port number of the WebSphere
server>\admin >.
Login to the WebSphere Administrative console.
Expand the System Administration node in the tree-structure in the left pane
of the console and click on the Deployment Manager sub-node within.
In the right panel, click on the Configuration tab page to view the
configuration of the Deployment Manager. In the Additional Properties section of
the Configuration tab page, expand the Ports node.

M o n i t o r i n g W e b S p h e r e A p p l i c a t i o n S e r v e r s
256
A list of ports will then appear. If the default connector port is in use, then
the port number displayed against SOAP_CONNECTOR_ADDRESS should be
specified as the CONNECTORPORT. If an RMI port has been explicitly set
as the connector port, then specify the port number displayed against
BOOTSTRAP_ADDRESS as the CONNECTORPORT.
9. SSL - Select Yes if SSL (Secured Socket Layer) is to be used to connect to the
WebSphere server, and No if it is not.
10. USER - If security has been enabled for the WebSphere server being
monitored, then provide a valid USER name to login to the WebSphere server.
If the WebSphere server does not require any authentication, then the USER
text box should contain the default value 'none'.
11. PASSWORD – If security has been enabled for the WebSphere server being
monitored, then provide the PASSWORD that corresponds to the specified
USER name. If the WebSphere server does not require any authentication,
then leave the PASSWORD text box with its default setting.
12. CONFIRM PASSWORD - If security has been enabled, confirm the specified
PASSWORD by retyping it in the CONFIRM PASSWORD text box. If the
WebSphere server does not require any authentication, then leave the
CONFIRM PASSWORD text box with its default setting.
Measurements
made by the test
Measurement
Measurement
Unit
Interpretation
Objects created:
Indicates the number of
new objects created by the
object pool, since the last
measurement period.
Number
Objects allocated:
Indicates the current count
of objects allocated by the
object pool.
Number
Objects returned:
Indicates the current count
of objects returned to the
pool.
Number
Idle objects:
Indicates the current count
of idle objects.
Number
3.2.2.4 WAS Threads Test
To optimize performance and at the same time to support concurrent accesses from users, the
application server uses thread pools. It is critical to monitor a WebSphere server's thread pools on an
ongoing basis. This test monitors the thread pools on a WebSphere server.

M o n i t o r i n g W e b S p h e r e A p p l i c a t i o n S e r v e r s
257
Purpose
Monitors the thread pools on a WebSphere server
Target of the test
A WebSphere application server
Agent deploying
the test
An internal agent
Configurable
parameters for
the test
1. TEST PERIOD - How often should the test be executed
2. HOST – The IP address of the WebSphere application server
3. PORT – The port number of the WebSphere application server
4. SERVERHOSTNAME – Specify the host name of the application server instance
being monitored.
5. APPPORT – Specify the port number to be used for accessing the egurkha
application that has been deployed on the server.
6. NODENAME - Specify the node name of the server instance being monitored.
To know the node name, do the following
Login to the WebSphere Administrative Console.
Expand the Servers node in the tree structure in the left pane of the
console, and click on the Application Servers link within.
A list of application server instances and their corresponding node names
will then appear in the right pane of the console. From this list, you can
figure out the Node that corresponds to the application server instance
being monitored, and specify that name against the NODENAME parameter.
7. SERVERNAME - Provide the name of the server instance being monitored in
the SERVERNAME text box. To know the server name, do the following:
Login to the WebSphere Administrative Console.
Expand the Servers node in the tree structure in the left pane of the
console, and click on the Application Servers link within.
A list of application server instances and their corresponding node names
will then appear in the right pane of the console. From this list, you can
figure out the Name of the monitored server instance, and specify that
name against the SERVERNAME parameter.
If the server instance being monitored is part of a WebSphere cluster, then
you need to provide the host name that corresponds to the connector port of
the Deployment Manager of the cluster as the SERVERNAME. To determine
the SERVERNAME in this case, do the following:
Connect to the WebSphere Administrative console using the URL: http://<IP
address of the WebSphere server:Port number of the WebSphere server>\admin or
https://<IP address of the WebSphere server:Port number of the WebSphere
server>\admin.
Login to the WebSphere Administrative console
Expand the System Administration node in the tree-structure in the left pane
of the console and click on the Deployment Manager sub-node within.

M o n i t o r i n g W e b S p h e r e A p p l i c a t i o n S e r v e r s
258
In the right panel, click on the Configuration tab page to view the
configuration of the Deployment Manager. In the Additional Properties section of
the Configuration tab page, expand the Ports node.
A list of ports will then appear. Click on the Details button alongside the
ports list.
If the SOAP port has been set as the connector port in your environment,
then scroll down the page that appears next until you view the Port Name,
SOAP_CONNECTOR_ADDRESS. Make note of the Host name that corresponds to
this port name. If the RMI port is the connector port in your environment,
then make note of the Host name that corresponds to the Port name,
BOOTSTRAP_ADDRESS.
Specify this Host name as the SERVERNAME.
8. CONNECTORPORT - The applications that are deployed on a server instance
use the CONNECTORPORT for all internal communications with the application
server. The connector port can be a SOAP port or an RMI port. The default
connector port however, is the SOAP port. To know the connector port
number, do the following:
Login to the WebSphere Administrative Console.
Expand the Servers node in the tree structure in the left pane of the
console, and click on Application Servers within.
A list of application server instances and their corresponding node names
will then appear in the right pane of the console. In the right pane, click
on the server name link that corresponds to the server instance that is
being monitored.
Doing so invokes the Configuration of the application server instance clicked
on. Scroll down the Configuration tab page to view the Communications
section.
Expand the Ports link in this section to view a list of ports. If the default
connector port is in use, then the port number displayed against
SOAP_CONNECTOR_ADDRESS should be specified as the CONNECTORPORT. If
an RMI port has been explicitly set as the connector port, then specify the
port number displayed against BOOTSTRAP_ADDRESS as the
CONNECTORPORT.
If the server instance being monitored is part of a WebSphere cluster, then
you need to provide the SOAP/RMI port of the Deployment Manager of the
cluster as the CONNECTORPORT. To determine the CONNECTORPORT in this
case, do the following:
Connect to the WebSphere Administrative console using the URL: http://<IP
address of the WebSphere server:Port number of the WebSphere server>\admin or
https://<IP address of the WebSphere server:Port number of the WebSphere
server>\admin.
Login to the WebSphere Administrative console.
Expand the System Administration node in the tree-structure in the left pane
of the console and click on the Deployment Manager sub-node within.
In the right panel, click on the Configuration tab page to view the
configuration of the Deployment Manager. In the Additional Properties section of
the Configuration tab page, expand the Ports node.

M o n i t o r i n g W e b S p h e r e A p p l i c a t i o n S e r v e r s
259
A list of ports will then appear. If the default connector port is in use, then
the port number displayed against SOAP_CONNECTOR_ADDRESS should be
specified as the CONNECTORPORT. If an RMI port has been explicitly set
as the connector port, then specify the port number displayed against
BOOTSTRAP_ADDRESS as the CONNECTORPORT.
9. SSL - Select Yes if SSL (Secured Socket Layer) is to be used to connect to the
WebSphere server, and No if it is not.
10. USER - If security has been enabled for the WebSphere server being
monitored, then provide a valid USER name to login to the WebSphere server.
If the WebSphere server does not require any authentication, then the USER
text box should contain the default value 'none'.
11. PASSWORD – If security has been enabled for the WebSphere server being
monitored, then provide the PASSWORD that corresponds to the specified
USER name. If the WebSphere server does not require any authentication,
then leave the PASSWORD text box with its default setting.
12. CONFIRM PASSWORD - If security has been enabled, confirm the specified
PASSWORD by retyping it in the CONFIRM PASSWORD text box. If the
WebSphere server does not require any authentication, then leave the
CONFIRM PASSWORD text box with its default setting.
Measurements
made by the test
Measurement
Measurement
Unit
Interpretation
Active count:
Indicates the number of
threads that are currently
active.
Number
A high value for this measure is
indicative of a high load on this
application and combined with the
creation and destroy rates might give
insights of the application pattern.
This measure is also useful for
determining usage trends. For
example, it can show the time of day
and the day of the week in which you
usually reach peak thread count. In
addition, the creation of too many
threads can result in out of memory
errors or thrashing. By watching this
metric, you can reduce excessive
memory consumption before it’s too
late.
Create count:
Indicates the number of
threads that were created
since the last
measurement period.
Number
A sudden increase in the value of this
measure directly relates to an
increase in the activity happening in
this application.
Destroy count:
Indicates the number of
threads that were
destroyed since the last
measurement period.
Number
A decrease in the value of this
measure indicates that the threads
are being active for a long period of
time, which might indicate anomalies
within the application.

M o n i t o r i n g W e b S p h e r e A p p l i c a t i o n S e r v e r s
260
Pool size:
Indicates the number of
threads in the pool,
currently.
Number
If the pool size is high and the
number of active threads is low, it
signifies that the threads are not
being destroyed immediately after
use.
Threads hung count:
Indicates the number of
concurrently stopped
threads.
Number
3.2.3 The WAS Database Layer
The WAS Database layer monitors the connection pools on the WebSphere application server.
Figure 3.9: The test associated with the WAS Database layer
3.2.3.1 WAS Connection Pools Test
The WASConnPoolTest monitors the usage of the connection pools on the WebSphere server.
Purpose
Monitors the usage of the connection pools on the WebSphere server
Target of the test
A WebSphere application server
Agent deploying
the test
An internal agent
Outputs of the
test
One set of results for each connection pool being monitored

M o n i t o r i n g W e b S p h e r e A p p l i c a t i o n S e r v e r s
261
Configurable
parameters for
the test
1. TEST PERIOD - How often should the test be executed
2. HOST – The IP address of the WebSphere application server
3. PORT – The port number of the WebSphere application server
4. SERVERHOSTNAME – Specify the host name of the application server instance
being monitored.
5. APPPORT – Specify the port number to be used for accessing the egurkha
application that has been deployed on the server.
6. NODENAME - Specify the node name of the server instance being monitored.
To know the node name, do the following
Login to the WebSphere Administrative Console.
Expand the Servers node in the tree structure in the left pane of the
console, and click on the Application Servers link within.
A list of application server instances and their corresponding node names
will then appear in the right pane of the console. From this list, you can
figure out the Node that corresponds to the application server instance
being monitored, and specify that name against the NODENAME parameter.
7. SERVERNAME - Provide the name of the server instance being monitored in
the SERVERNAME text box. To know the server name, do the following:
Login to the WebSphere Administrative Console.
Expand the Servers node in the tree structure in the left pane of the
console, and click on the Application Servers link within.
A list of application server instances and their corresponding node names
will then appear in the right pane of the console. From this list, you can
figure out the Name of the monitored server instance, and specify that
name against the SERVERNAME parameter.
If the server instance being monitored is part of a WebSphere cluster, then
you need to provide the host name that corresponds to the connector port of
the Deployment Manager of the cluster as the SERVERNAME. To determine
the SERVERNAME in this case, do the following:
Connect to the WebSphere Administrative console using the URL: http://<IP
address of the WebSphere server:Port number of the WebSphere server>\admin or
https://<IP address of the WebSphere server:Port number of the WebSphere
server>\admin.
Login to the WebSphere Administrative console
Expand the System Administration node in the tree-structure in the left pane
of the console and click on the Deployment Manager sub-node within.

M o n i t o r i n g W e b S p h e r e A p p l i c a t i o n S e r v e r s
262
In the right panel, click on the Configuration tab page to view the
configuration of the Deployment Manager. In the Additional Properties section of
the Configuration tab page, expand the Ports node.
A list of ports will then appear. Click on the Details button alongside the
ports list.
If the SOAP port has been set as the connector port in your environment,
then scroll down the page that appears next until you view the Port Name,
SOAP_CONNECTOR_ADDRESS. Make note of the Host name that corresponds to
this port name. If the RMI port is the connector port in your environment,
then make note of the Host name that corresponds to the Port name,
BOOTSTRAP_ADDRESS.
Specify this Host name as the SERVERNAME.
8. CONNECTORPORT - The applications that are deployed on a server instance
use the CONNECTORPORT for all internal communications with the application
server. The connector port can be a SOAP port or an RMI port. The default
connector port however, is the SOAP port. To know the connector port
number, do the following:
Login to the WebSphere Administrative Console.
Expand the Servers node in the tree structure in the left pane of the
console, and click on Application Servers within.
A list of application server instances and their corresponding node names
will then appear in the right pane of the console. In the right pane, click
on the server name link that corresponds to the server instance that is
being monitored.
Doing so invokes the Configuration of the application server instance clicked
on. Scroll down the Configuration tab page to view the Communications
section.
Expand the Ports link in this section to view a list of ports. If the default
connector port is in use, then the port number displayed against
SOAP_CONNECTOR_ADDRESS should be specified as the CONNECTORPORT. If
an RMI port has been explicitly set as the connector port, then specify the
port number displayed against BOOTSTRAP_ADDRESS as the
CONNECTORPORT.
If the server instance being monitored is part of a WebSphere cluster, then
you need to provide the SOAP/RMI port of the Deployment Manager of the
cluster as the CONNECTORPORT. To determine the CONNECTORPORT in this
case, do the following:
Connect to the WebSphere Administrative console using the URL: http://<IP
address of the WebSphere server:Port number of the WebSphere server>\admin > or
https://<IP address of the WebSphere server:Port number of the WebSphere
server>\admin>.
Login to the WebSphere Administrative console.
Expand the System Administration node in the tree-structure in the left pane
of the console and click on the Deployment Manager sub-node within.
In the right panel, click on the Configuration tab page to view the
configuration of the Deployment Manager. In the Additional Properties section of
the Configuration tab page, expand the Ports node.

M o n i t o r i n g W e b S p h e r e A p p l i c a t i o n S e r v e r s
263
A list of ports will then appear. If the default connector port is in use, then
the port number displayed against SOAP_CONNECTOR_ADDRESS should be
specified as the CONNECTORPORT. If an RMI port has been explicitly set
as the connector port, then specify the port number displayed against
BOOTSTRAP_ADDRESS as the CONNECTORPORT.
9. SSL - Select Yes if SSL (Secured Socket Layer) is to be used to connect to the
WebSphere server, and No if it is not.
10. USER - If security has been enabled for the WebSphere server being
monitored, then provide a valid USER name to login to the WebSphere server.
If the WebSphere server does not require any authentication, then the USER
text box should contain the default value 'none'.
11. PASSWORD – If security has been enabled for the WebSphere server being
monitored, then provide the PASSWORD that corresponds to the specified
USER name. If the WebSphere server does not require any authentication,
then leave the PASSWORD text box with its default setting.
12. CONFIRM PASSWORD - If security has been enabled, confirm the specified
PASSWORD by retyping it in the CONFIRM PASSWORD text box. If the
WebSphere server does not require any authentication, then leave the
CONFIRM PASSWORD text box with its default setting.
Measurements
made by the test
Measurement
Measurement
Unit
Interpretation
Allocate count:
Indicates the number of
connections allocated to
the pool during the last
measurement period.
Number
Close count:
Indicates the number of
connections released from
the pool during the last
measurement period.
Number
Ideally, this value should be low.
Create count:
Indicates the number of
connections created during
the last measurement
period.
Number
Fault count:
Indicates the number of
connection timeouts in the
pool in the last
measurement period.
Number
Ideally, this value should be low. An
unusually high value could indicate
an application leak.
Freed count:
Indicates the number of
connections that were
returned to the pool in the
last measurement period
Number
A very low value of this measure
could result in a shortage of
connections in the pool.

M o n i t o r i n g W e b S p h e r e A p p l i c a t i o n S e r v e r s
264
Free pool size:
Indicates the current
number of free connections
in the pool.
Number
Pool size:
Indicates the current size
of the connection pool.
Number
Jdbc time:
Indicates the time taken
by the JDBC queries to
execute.
Secs
A low value is ideal.
3.2.4 The WAS EJB Layer
The WAS EJB layer extracts critical performance statistics pertaining to the following:
The EJBs deployed on the WebSphere application server
The Http sessions on the server
The global and local transactions executing on the WebSphere application server
Figure 3.10: The tests associated with the WAS EJB layer
3.2.4.1 WAS Beans Test
The WASBeans test automatically discovers the EJBs deployed on the WebSphere server and reports
critical statistics pertaining to each of the EJBs.
Purpose
Automatically discovers the EJBs deployed on the WebSphere server and reports
critical statistics pertaining to each of the EJBs
Target of the test
A WebSphere application server
Agent deploying
the test
An internal agent

M o n i t o r i n g W e b S p h e r e A p p l i c a t i o n S e r v e r s
265
Configurable
parameters for
the test
1. TEST PERIOD - How often should the test be executed
2. HOST – The IP address of the WebSphere application server
3. PORT – The port number of the WebSphere application server
4. SERVERHOSTNAME – Specify the host name of the application server instance
being monitored.
5. APPPORT – Specify the port number to be used for accessing the egurkha
application that has been deployed on the server.
6. NODENAME - Specify the node name of the server instance being monitored.
To know the node name, do the following
Login to the WebSphere Administrative Console.
Expand the Servers node in the tree structure in the left pane of the
console, and click on the Application Servers link within.
A list of application server instances and their corresponding node names
will then appear in the right pane of the console. From this list, you can
figure out the Node that corresponds to the application server instance
being monitored, and specify that name against the NODENAME parameter.
7. SERVERNAME - Provide the name of the server instance being monitored in
the SERVERNAME text box. To know the server name, do the following:
Login to the WebSphere Administrative Console.
Expand the Servers node in the tree structure in the left pane of the
console, and click on the Application Servers link within.
A list of application server instances and their corresponding node names
will then appear in the right pane of the console. From this list, you can
figure out the Name of the monitored server instance, and specify that
name against the SERVERNAME parameter.
If the server instance being monitored is part of a WebSphere cluster, then
you need to provide the host name that corresponds to the connector port of
the Deployment Manager of the cluster as the SERVERNAME. To determine
the SERVERNAME in this case, do the following:
Connect to the WebSphere Administrative console using the URL: http://<IP
address of the WebSphere server:Port number of the WebSphere server>\admin or
https://<IP address of the WebSphere server:Port number of the WebSphere
server>\admin.
Login to the WebSphere Administrative console
Expand the System Administration node in the tree-structure in the left pane
of the console and click on the Deployment Manager sub-node within.

M o n i t o r i n g W e b S p h e r e A p p l i c a t i o n S e r v e r s
266
In the right panel, click on the Configuration tab page to view the
configuration of the Deployment Manager. In the Additional Properties section of
the Configuration tab page, expand the Ports node.
A list of ports will then appear. Click on the Details button alongside the
ports list.
If the SOAP port has been set as the connector port in your environment,
then scroll down the page that appears next until you view the Port Name,
SOAP_CONNECTOR_ADDRESS. Make note of the Host name that corresponds to
this port name. If the RMI port is the connector port in your environment,
then make note of the Host name that corresponds to the Port name,
BOOTSTRAP_ADDRESS.
Specify this Host name as the SERVERNAME.
8. CONNECTORPORT - The applications that are deployed on a server instance
use the CONNECTORPORT for all internal communications with the application
server. The connector port can be a SOAP port or an RMI port. The default
connector port however, is the SOAP port. To know the connector port
number, do the following:
Login to the WebSphere Administrative Console.
Expand the Servers node in the tree structure in the left pane of the
console, and click on Application Servers within.
A list of application server instances and their corresponding node names
will then appear in the right pane of the console. In the right pane, click
on the server name link that corresponds to the server instance that is
being monitored.
Doing so invokes the Configuration of the application server instance clicked
on. Scroll down the Configuration tab page to view the Communications
section.
Expand the Ports link in this section to view a list of ports. If the default
connector port is in use, then the port number displayed against
SOAP_CONNECTOR_ADDRESS should be specified as the CONNECTORPORT. If
an RMI port has been explicitly set as the connector port, then specify the
port number displayed against BOOTSTRAP_ADDRESS as the
CONNECTORPORT.
If the server instance being monitored is part of a WebSphere cluster, then
you need to provide the SOAP/RMI port of the Deployment Manager of the
cluster as the CONNECTORPORT. To determine the CONNECTORPORT in this
case, do the following:
Connect to the WebSphere Administrative console using the URL: http://<IP
address of the WebSphere server:Port number of the WebSphere server>\admin or
https://<IP address of the WebSphere server:Port number of the WebSphere
server>\admin.
Login to the WebSphere Administrative console.
Expand the System Administration node in the tree-structure in the left pane
of the console and click on the Deployment Manager sub-node within.
In the right panel, click on the Configuration tab page to view the
configuration of the Deployment Manager. In the Additional Properties section of
the Configuration tab page, expand the Ports node.

M o n i t o r i n g W e b S p h e r e A p p l i c a t i o n S e r v e r s
267
A list of ports will then appear. If the default connector port is in use, then
the port number displayed against SOAP_CONNECTOR_ADDRESS should be
specified as the CONNECTORPORT. If an RMI port has been explicitly set
as the connector port, then specify the port number displayed against
BOOTSTRAP_ADDRESS as the CONNECTORPORT.
9. SSL - Select Yes if SSL (Secured Socket Layer) is to be used to connect to the
WebSphere server, and No if it is not.
10. USER - If security has been enabled for the WebSphere server being
monitored, then provide a valid USER name to login to the WebSphere server.
If the WebSphere server does not require any authentication, then the USER
text box should contain the default value 'none'.
11. PASSWORD – If security has been enabled for the WebSphere server being
monitored, then provide the PASSWORD that corresponds to the specified
USER name. If the WebSphere server does not require any authentication,
then leave the PASSWORD text box with its default setting.
12. CONFIRM PASSWORD - If security has been enabled, confirm the specified
PASSWORD by retyping it in the CONFIRM PASSWORD text box. If the
WebSphere server does not require any authentication, then leave the
CONFIRM PASSWORD text box with its default setting.
Outputs of the
test
One set of results for each EJB deployed on the WebSphere application server
Measurements
made by the test
Measurement
Measurement
Unit
Interpretation
Create count:
Indicates the number of
times this EJB was created
during the last
measurement period.
Number
Avg create time:
Indicates the average time
taken by a bean create
call.
Secs
Ideally, this value should be low.
Remove count:
Indicates the number of
times this bean was
removed during the last
measurement period.
Number
Avg remove time:
Indicates the average time
taken by a bean remove
call.
Secs

M o n i t o r i n g W e b S p h e r e A p p l i c a t i o n S e r v e r s
268
Activation count:
Indicates the number of
times this bean was
activated during the last
measurement period.
Number
Avg activation time:
Indicates the average time
taken by a bean activate
call, including the time at
the database.
Secs
Ideally, this value should be low.
Store count:
Indicates the number of
times this bean was stored
in the persistent storage
during the last
measurement period.
Number
Avg store time:
Indicates the average time
for storing this bean in a
persistent storage.
Secs
Instantiates count:
Indicates the number of
times this bean was
instantiated during the last
measurement period.
Number
A sudden increase in the number of
instantiations indicates a bottleneck
on the server. It may be due to
greater load on the server or there
might be a loophole in the
application.
Freed count:
Indicates the number of
times during the last
measurement period this
bean object was freed.
Number
A very low value indicates a
bottleneck on the server. This might
affect the performance of the
application.
Ready count:
Indicates the number of
concurrently ready beans.
Number
Greater the ready beans count,
better will be the application
performance.
Passive count:
Indicates the number of
beans in the passivated
state during the last
measurement.
Number
Pooled count:
Indicates the number of
objects currently in the
pool.
Number

M o n i t o r i n g W e b S p h e r e A p p l i c a t i o n S e r v e r s
269
Drains count:
Indicates the number of
times during the last
measurement period the
daemon found the pool
was idle and attempted to
clean it.
Number
Retrieve count:
Indicates the number of
calls during the last
measurement period
retrieving an object from
the pool.
Number
Retrieve success count:
Indicates the number of
times a retrieve found an
object in the pool, during
the last measurement
period.
Number
Returns count:
Indicates the number of
calls returning an object to
the pool, during the last
measurement period.
Number
Returns discard count:
Indicates the number of
times during the last
measurement period the
returning object was
discarded because the pool
was full.
Number
Ideally, this value should be low. A
consistent high value could indicate a
full pool, and consequently, an
overloaded server. You might then
want to consider resizing the pool in
order to accommodate more number
of objects.
Methods call count:
Indicates the number of
method calls during the
last measurement period.
Number
A high value indicates that the server
is busy.
Methods response time:
Indicates the average
response time of the bean
methods.
Secs
This value should be low for optimal
performance of the application
server. The value may go high, if
there are more objects in the pool,
which is a sign of overload.
Avg passivate time:
The average time taken by
a bean passivate call,
including the time at the
database
Secs
M o n i t o r i n g W e b S p h e r e A p p l i c a t i o n S e r v e r s
270
Load count:
The number of times this
bean was loaded from the
persistent storage during
the last measurement
period
Number
Avg load time:
The average time for
loading a bean data from
the persistent storage
Secs
Ideally, this value should be low.
3.2.4.2 WAS Sessions Test
HTTP sessions form a part of any business application. This test monitors the HTTP sessions on the
WebSphere application server.
Purpose
Monitors the HTTP sessions on the WebSphere application server
Target of the test
A WebSphere application server
Agent deploying
the test
An internal agent
Outputs of the
test
One set of results for each session on the WebSphere application server

M o n i t o r i n g W e b S p h e r e A p p l i c a t i o n S e r v e r s
271
Configurable
parameters for
the test
1. TEST PERIOD - How often should the test be executed
2. HOST – The IP address of the WebSphere application server
3. PORT – The port number of the WebSphere application server
4. SERVERHOSTNAME – Specify the host name of the application server instance
being monitored.
5. APPPORT – Specify the port number to be used for accessing the egurkha
application that has been deployed on the server.
6. NODENAME - Specify the node name of the server instance being monitored.
To know the node name, do the following
Login to the WebSphere Administrative Console.
Expand the Servers node in the tree structure in the left pane of the
console, and click on the Application Servers link within.
A list of application server instances and their corresponding node names
will then appear in the right pane of the console. From this list, you can
figure out the Node that corresponds to the application server instance
being monitored, and specify that name against the NODENAME parameter.
7. SERVERNAME - Provide the name of the server instance being monitored in
the SERVERNAME text box. To know the server name, do the following:
Login to the WebSphere Administrative Console.
Expand the Servers node in the tree structure in the left pane of the
console, and click on the Application Servers link within.
A list of application server instances and their corresponding node names
will then appear in the right pane of the console. From this list, you can
figure out the Name of the monitored server instance, and specify that
name against the SERVERNAME parameter.
If the server instance being monitored is part of a WebSphere cluster, then
you need to provide the host name that corresponds to the connector port of
the Deployment Manager of the cluster as the SERVERNAME. To determine
the SERVERNAME in this case, do the following:
Connect to the WebSphere Administrative console using the URL: http://<IP
address of the WebSphere server:Port number of the WebSphere server>\admin or
https://<IP address of the WebSphere server:Port number of the WebSphere
server>\admin.
Login to the WebSphere Administrative console
Expand the System Administration node in the tree-structure in the left pane
of the console and click on the Deployment Manager sub-node within.

M o n i t o r i n g W e b S p h e r e A p p l i c a t i o n S e r v e r s
272
In the right panel, click on the Configuration tab page to view the
configuration of the Deployment Manager. In the Additional Properties section of
the Configuration tab page, expand the Ports node.
A list of ports will then appear. Click on the Details button alongside the
ports list.
If the SOAP port has been set as the connector port in your environment,
then scroll down the page that appears next until you view the Port Name,
SOAP_CONNECTOR_ADDRESS. Make note of the Host name that corresponds to
this port name. If the RMI port is the connector port in your environment,
then make note of the Host name that corresponds to the Port name,
BOOTSTRAP_ADDRESS.
Specify this Host name as the SERVERNAME.
8. CONNECTORPORT - The applications that are deployed on a server instance
use the CONNECTORPORT for all internal communications with the application
server. The connector port can be a SOAP port or an RMI port. The default
connector port however, is the SOAP port. To know the connector port
number, do the following:
Login to the WebSphere Administrative Console.
Expand the Servers node in the tree structure in the left pane of the
console, and click on Application Servers within.
A list of application server instances and their corresponding node names
will then appear in the right pane of the console. In the right pane, click
on the server name link that corresponds to the server instance that is
being monitored.
Doing so invokes the Configuration of the application server instance clicked
on. Scroll down the Configuration tab page to view the Communications
section.
Expand the Ports link in this section to view a list of ports. If the default
connector port is in use, then the port number displayed against
SOAP_CONNECTOR_ADDRESS should be specified as the CONNECTORPORT. If
an RMI port has been explicitly set as the connector port, then specify the
port number displayed against BOOTSTRAP_ADDRESS as the
CONNECTORPORT.
If the server instance being monitored is part of a WebSphere cluster, then
you need to provide the SOAP/RMI port of the Deployment Manager of the
cluster as the CONNECTORPORT. To determine the CONNECTORPORT in this
case, do the following:
Connect to the WebSphere Administrative console using the URL: http://<IP
address of the WebSphere server:Port number of the WebSphere server>\admin or
https://<IP address of the WebSphere server:Port number of the WebSphere
server>\admin.
Login to the WebSphere Administrative console.
Expand the System Administration node in the tree-structure in the left pane
of the console and click on the Deployment Manager sub-node within.
In the right panel, click on the Configuration tab page to view the
configuration of the Deployment Manager. In the Additional Properties section of
the Configuration tab page, expand the Ports node.

M o n i t o r i n g W e b S p h e r e A p p l i c a t i o n S e r v e r s
273
A list of ports will then appear. If the default connector port is in use, then
the port number displayed against SOAP_CONNECTOR_ADDRESS should be
specified as the CONNECTORPORT. If an RMI port has been explicitly set
as the connector port, then specify the port number displayed against
BOOTSTRAP_ADDRESS as the CONNECTORPORT.
9. SSL - Select Yes if SSL (Secured Socket Layer) is to be used to connect to the
WebSphere server, and No if it is not.
10. USER - If security has been enabled for the WebSphere server being
monitored, then provide a valid USER name to login to the WebSphere server.
If the WebSphere server does not require any authentication, then the USER
text box should contain the default value 'none'.
11. PASSWORD – If security has been enabled for the WebSphere server being
monitored, then provide the PASSWORD that corresponds to the specified
USER name. If the WebSphere server does not require any authentication,
then leave the PASSWORD text box with its default setting.
12. CONFIRM PASSWORD - If security has been enabled, confirm the specified
PASSWORD by retyping it in the CONFIRM PASSWORD text box. If the
WebSphere server does not require any authentication, then leave the
CONFIRM PASSWORD text box with its default setting.
Measurements
made by the test
Measurement
Measurement
Unit
Interpretation
Active count:
Indicates the number of
sessions that are currently
accessed by requests.
Number
A high value indicates an increased
workload on the server.
Live count:
Indicates the number of
sessions that are currently
live.
Number
A high value indicates an increased
workload on the server.
Create count:
Indicates the number of
sessions that were newly
created since the last
measurement period.
Number
A high value indicates a high level of
activity in this application.
Invalidate count:
Indicates the number of
sessions that were
invalidated since the last
measurement period.
Number
This measure is indicative of the
session usage pattern of this
application.

M o n i t o r i n g W e b S p h e r e A p p l i c a t i o n S e r v e r s
274
Invalid session
requests:
Indicates the number of
requests that were
received since the last
measurement period, for a
session that no longer
exists.
Number
Cache discards:
Indicates the number of
session objects that were
forced out of the cache.
Number
New session failures:
Indicates the number of
times since the last
measurement period, the
request for a new session
could not be handled
because the value
exceeded the maximum
session count
Number
A consistent high value of this
measure could indicate that many
sessions have been alive for too long
a time. A long session lifetime may
occur due to one of the following
reasons:
The application may not
timeout the sessions after a
fixed interval of time.
The sessions in the
application might be active
for a very long time.
Timeout invalidates:
Indicates the number of
sessions that were
invalidated since the last
measurement period, due
to timeouts.
Number
3.2.4.3 WAS Transactions Test
Transactions are the key functionality of the WebSphere application server. The WASTransactions test
monitors these transactions.
Purpose
Monitors the transactions on the WebSphere application server
Target of the test
A WebSphere application server
Agent deploying
the test
An internal agent
Outputs of the
test
One set of results for each transaction on the WebSphere application server

M o n i t o r i n g W e b S p h e r e A p p l i c a t i o n S e r v e r s
275
Configurable
parameters for
the test
1. TEST PERIOD - How often should the test be executed
2. HOST – The IP address of the WebSphere application server
3. PORT – The port number of the WebSphere application server
4. SERVERHOSTNAME – Specify the host name of the application server instance
being monitored.
5. APPPORT – Specify the port number to be used for accessing the egurkha
application that has been deployed on the server.
6. NODENAME - Specify the node name of the server instance being monitored.
To know the node name, do the following
Login to the WebSphere Administrative Console.
Expand the Servers node in the tree structure in the left pane of the
console, and click on the Application Servers link within.
A list of application server instances and their corresponding node names
will then appear in the right pane of the console. From this list, you can
figure out the Node that corresponds to the application server instance
being monitored, and specify that name against the NODENAME parameter.
7. SERVERNAME - Provide the name of the server instance being monitored in
the SERVERNAME text box. To know the server name, do the following:
Login to the WebSphere Administrative Console.
Expand the Servers node in the tree structure in the left pane of the
console, and click on the Application Servers link within.
A list of application server instances and their corresponding node names
will then appear in the right pane of the console. From this list, you can
figure out the Name of the monitored server instance, and specify that
name against the SERVERNAME parameter.
If the server instance being monitored is part of a WebSphere cluster, then
you need to provide the host name that corresponds to the connector port of
the Deployment Manager of the cluster as the SERVERNAME. To determine
the SERVERNAME in this case, do the following:
Connect to the WebSphere Administrative console using the URL: http://<IP
address of the WebSphere server:Port number of the WebSphere server>\admin or
https://<IP address of the WebSphere server:Port number of the WebSphere
server>\admin.
Login to the WebSphere Administrative console
Expand the System Administration node in the tree-structure in the left pane
of the console and click on the Deployment Manager sub-node within.

M o n i t o r i n g W e b S p h e r e A p p l i c a t i o n S e r v e r s
276
In the right panel, click on the Configuration tab page to view the
configuration of the Deployment Manager. In the Additional Properties section of
the Configuration tab page, expand the Ports node.
A list of ports will then appear. Click on the Details button alongside the
ports list.
If the SOAP port has been set as the connector port in your environment,
then scroll down the page that appears next until you view the Port Name,
SOAP_CONNECTOR_ADDRESS. Make note of the Host name that corresponds to
this port name. If the RMI port is the connector port in your environment,
then make note of the Host name that corresponds to the Port name,
BOOTSTRAP_ADDRESS.
Specify this Host name as the SERVERNAME.
8. CONNECTORPORT - The applications that are deployed on a server instance
use the CONNECTORPORT for all internal communications with the application
server. The connector port can be a SOAP port or an RMI port. The default
connector port however, is the SOAP port. To know the connector port
number, do the following:
Login to the WebSphere Administrative Console.
Expand the Servers node in the tree structure in the left pane of the
console, and click on Application Servers within.
A list of application server instances and their corresponding node names
will then appear in the right pane of the console. In the right pane, click
on the server name link that corresponds to the server instance that is
being monitored.
Doing so invokes the Configuration of the application server instance clicked
on. Scroll down the Configuration tab page to view the Communications
section.
Expand the Ports link in this section to view a list of ports. If the default
connector port is in use, then the port number displayed against
SOAP_CONNECTOR_ADDRESS should be specified as the CONNECTORPORT. If
an RMI port has been explicitly set as the connector port, then specify the
port number displayed against BOOTSTRAP_ADDRESS as the
CONNECTORPORT.
If the server instance being monitored is part of a WebSphere cluster, then
you need to provide the SOAP/RMI port of the Deployment Manager of the
cluster as the CONNECTORPORT. To determine the CONNECTORPORT in this
case, do the following:
Connect to the WebSphere Administrative console using the URL: http://<IP
address of the WebSphere server:Port number of the WebSphere server>\admin or
https://<IP address of the WebSphere server:Port number of the WebSphere
server>\admin.
Login to the WebSphere Administrative console.
Expand the System Administration node in the tree-structure in the left pane
of the console and click on the Deployment Manager sub-node within.
In the right panel, click on the Configuration tab page to view the
configuration of the Deployment Manager. In the Additional Properties section of
the Configuration tab page, expand the Ports node.

M o n i t o r i n g W e b S p h e r e A p p l i c a t i o n S e r v e r s
277
A list of ports will then appear. If the default connector port is in use, then
the port number displayed against SOAP_CONNECTOR_ADDRESS should be
specified as the CONNECTORPORT. If an RMI port has been explicitly set
as the connector port, then specify the port number displayed against
BOOTSTRAP_ADDRESS as the CONNECTORPORT.
9. SSL - Select Yes if SSL (Secured Socket Layer) is to be used to connect to the
WebSphere server, and No if it is not.
10. USER - If security has been enabled for the WebSphere server being
monitored, then provide a valid USER name to login to the WebSphere server.
If the WebSphere server does not require any authentication, then the USER
text box should contain the default value 'none'.
11. PASSWORD – If security has been enabled for the WebSphere server being
monitored, then provide the PASSWORD that corresponds to the specified
USER name. If the WebSphere server does not require any authentication,
then leave the PASSWORD text box with its default setting.
12. CONFIRM PASSWORD - If security has been enabled, confirm the specified
PASSWORD by retyping it in the CONFIRM PASSWORD text box. If the
WebSphere server does not require any authentication, then leave the
CONFIRM PASSWORD text box with its default setting.
Measurements
made by the test
Measurement
Measurement
Unit
Interpretation
Active count:
Indicates the number of
concurrently active
transactions.
Number
If the value of this measure is high, it
signifies greater load on the server.
This might increase the number of
waiting transactions.
Commits count:
Indicates the number of
transactions that were
committed since the last
measurement period.
Number
If the number of transactions that
are being committed is very high, it
signifies load on the server. It might
be caused when some locked
transactions are released suddenly.
Rollback count:
Indicates the number of
transactions that were
rolled back since the last
measurement period.
Number
A high value indicates a problem with
the application or with some other
(e.g. Database).
Begun count:
Indicates the number of
transactions that were
started on the server since
the last measurement
period.
Number
A high value indicates an overload on
the server.
Timedout count:
Indicates the number of
transactions that timed out
since the last
measurement period.
Number
A rise in the value could be due to
the problem with the application or
with some other dependent server
like the database.
M o n i t o r i n g W e b S p h e r e A p p l i c a t i o n S e r v e r s
278
Transaction time:
Indicates the average
duration of the
transactions.
Secs
A high transaction duration value
indicates increased load on the
server.
3.2.5 The WAS Web Layer
The tests associated with the WAS Web layer monitor the web-based components operating on the
WebSphere application server, such as:
the web applications deployed on the WebSphere application server
the synchronous and asynchronous requests received by WebSphere application server
the Object Request Brokers (ORB)
the web services mounted on a WebSphere server
Figure 3.11: The tests associated with the WAS Web layer
3.2.5.1 WAS Web Applications Test
The WASWebApplications test reports statistics pertaining to the web applications deployed on a
WebSphere server.
Purpose
Reports statistics pertaining to the web applications deployed on a WebSphere
server
Target of the test
A WebSphere application server
Agent deploying
the test
An internal agent
Outputs of the
test
One set of results for each web application deployed on the WebSphere application
server

M o n i t o r i n g W e b S p h e r e A p p l i c a t i o n S e r v e r s
279
Configurable
parameters for
the test
1. TEST PERIOD - How often should the test be executed
2. HOST – The IP address of the WebSphere application server
3. PORT – The port number of the WebSphere application server
4. SERVERHOSTNAME – Specify the host name of the application server instance
being monitored.
5. APPPORT – Specify the port number to be used for accessing the egurkha
application that has been deployed on the server.
6. NODENAME - Specify the node name of the server instance being monitored.
To know the node name, do the following:
Login to the WebSphere Administrative Console.
Expand the Servers node in the tree structure in the left pane of the
console, and click on the Application Servers link within.
A list of application server instances and their corresponding node names
will then appear in the right pane of the console. From this list, you can
figure out the Node that corresponds to the application server instance
being monitored, and specify that name against the NODENAME parameter.
7. SERVERNAME - Provide the name of the server instance being monitored in
the SERVERNAME text box. To know the server name, do the following:
Login to the WebSphere Administrative Console.
Expand the Servers node in the tree structure in the left pane of the
console, and click on the Application Servers link within.
A list of application server instances and their corresponding node names
will then appear in the right pane of the console. From this list, you can
figure out the Name of the monitored server instance, and specify that
name against the SERVERNAME parameter.
If the server instance being monitored is part of a WebSphere cluster, then
you need to provide the host name that corresponds to the connector port of
the Deployment Manager of the cluster as the SERVERNAME. To determine
the SERVERNAME in this case, do the following:
Connect to the WebSphere Administrative console using the URL: http://<IP
address of the WebSphere server:Port number of the WebSphere server>\admin or
https://<IP address of the WebSphere server:Port number of the WebSphere
server>\admin.
Login to the WebSphere Administrative console
Expand the System Administration node in the tree-structure in the left pane
of the console and click on the Deployment Manager sub-node within.

M o n i t o r i n g W e b S p h e r e A p p l i c a t i o n S e r v e r s
280
In the right panel, click on the Configuration tab page to view the
configuration of the Deployment Manager. In the Additional Properties section of
the Configuration tab page, expand the Ports node.
A list of ports will then appear. Click on the Details button alongside the
ports list.
If the SOAP port has been set as the connector port in your environment,
then scroll down the page that appears next until you view the Port Name,
SOAP_CONNECTOR_ADDRESS. Make note of the Host name that corresponds to
this port name. If the RMI port is the connector port in your environment,
then make note of the Host name that corresponds to the Port name,
BOOTSTRAP_ADDRESS.
Specify this Host name as the SERVERNAME.
8. CONNECTORPORT - The applications that are deployed on a server instance
use the CONNECTORPORT for all internal communications with the application
server. The connector port can be a SOAP port or an RMI port. The default
connector port however, is the SOAP port. To know the connector port
number, do the following:
Login to the WebSphere Administrative Console.
Expand the Servers node in the tree structure in the left pane of the
console, and click on Application Servers within.
A list of application server instances and their corresponding node names
will then appear in the right pane of the console. In the right pane, click
on the server name link that corresponds to the server instance that is
being monitored.
Doing so invokes the Configuration of the application server instance clicked
on. Scroll down the Configuration tab page to view the Communications
section.
Expand the Ports link in this section to view a list of ports. If the default
connector port is in use, then the port number displayed against
SOAP_CONNECTOR_ADDRESS should be specified as the CONNECTORPORT. If
an RMI port has been explicitly set as the connector port, then specify the
port number displayed against BOOTSTRAP_ADDRESS as the
CONNECTORPORT.
If the server instance being monitored is part of a WebSphere cluster, then
you need to provide the SOAP/RMI port of the Deployment Manager of the
cluster as the CONNECTORPORT. To determine the CONNECTORPORT in this
case, do the following:
Connect to the WebSphere Administrative console using the URL: http://<IP
address of the WebSphere server:Port number of the WebSphere server>\admin or
https://<IP address of the WebSphere server:Port number of the WebSphere
server>\admin.
Login to the WebSphere Administrative console.
Expand the System Administration node in the tree-structure in the left pane
of the console and click on the Deployment Manager sub-node within.
In the right panel, click on the Configuration tab page to view the
configuration of the Deployment Manager. In the Additional Properties section of
the Configuration tab page, expand the Ports node.

M o n i t o r i n g W e b S p h e r e A p p l i c a t i o n S e r v e r s
281
A list of ports will then appear. If the default connector port is in use, then
the port number displayed against SOAP_CONNECTOR_ADDRESS should be
specified as the CONNECTORPORT. If an RMI port has been explicitly set
as the connector port, then specify the port number displayed against
BOOTSTRAP_ADDRESS as the CONNECTORPORT.
9. SSL - Select Yes if SSL (Secured Socket Layer) is to be used to connect to the
WebSphere server, and No if it is not.
10. USER - If security has been enabled for the WebSphere server being
monitored, then provide a valid USER name to login to the WebSphere server.
If the WebSphere server does not require any authentication, then the USER
text box should contain the default value 'none'.
11. PASSWORD – If security has been enabled for the WebSphere server being
monitored, then provide the PASSWORD that corresponds to the specified
USER name. If the WebSphere server does not require any authentication,
then leave the PASSWORD text box with its default setting.
12. CONFIRM PASSWORD - If security has been enabled, confirm the specified
PASSWORD by retyping it in the CONFIRM PASSWORD text box. If the
WebSphere server does not require any authentication, then leave the
CONFIRM PASSWORD text box with its default setting.
Measurements
made by the test
Measurement
Measurement
Unit
Interpretation
Loaded servlets:
Indicates the number of
servlets that were loaded
since the last
measurement period.
Number
Reload count:
Indicates the number of
servlets that were reloaded
since the last
measurement period.
Number
Request count:
Indicates the number of
requests that a servlet/JSP
processed since the last
measurement period.
Number
Concurrent requests:
Indicates the current
number of requests
processed concurrently.
Number
Error count:
Indicates the number of
errors in JSP/Servlet since
the last measurement
period.
Number
M o n i t o r i n g W e b S p h e r e A p p l i c a t i o n S e r v e r s
282
Service time:
Indicates the response
time of the JSP/servlet.
Secs
3.2.5.2 WAS Gateway Test
The WASGateway test reports the number of synchronous and asynchronous requests received by and
responses sent by the WebSphere server.
Purpose
Reports the number of synchronous and asynchronous requests received by and
responses sent by the WebSphere server
Target of the test
A WebSphere application server
Agent deploying
the test
An internal agent
Outputs of the
test
One set of results for every Gateway on the WebSphere application server being
monitored

M o n i t o r i n g W e b S p h e r e A p p l i c a t i o n S e r v e r s
283
Configurable
parameters for
the test
1. TEST PERIOD - How often should the test be executed
2. HOST – The IP address of the WebSphere application server
3. PORT – The port number of the WebSphere application server
4. SERVERHOSTNAME – Specify the host name of the application server instance
being monitored.
5. APPPORT – Specify the port number to be used for accessing the egurkha
application that has been deployed on the server.
6. NODENAME - Specify the node name of the server instance being monitored.
To know the node name, do the following
Login to the WebSphere Administrative Console.
Expand the Servers node in the tree structure in the left pane of the
console, and click on the Application Servers link within.
A list of application server instances and their corresponding node names
will then appear in the right pane of the console. From this list, you can
figure out the Node that corresponds to the application server instance
being monitored, and specify that name against the NODENAME parameter.
7. SERVERNAME - Provide the name of the server instance being monitored in
the SERVERNAME text box. To know the server name, do the following:
Login to the WebSphere Administrative Console.
Expand the Servers node in the tree structure in the left pane of the
console, and click on the Application Servers link within.
A list of application server instances and their corresponding node names
will then appear in the right pane of the console. From this list, you can
figure out the Name of the monitored server instance, and specify that
name against the SERVERNAME parameter.
If the server instance being monitored is part of a WebSphere cluster, then
you need to provide the host name that corresponds to the connector port of
the Deployment Manager of the cluster as the SERVERNAME. To determine
the SERVERNAME in this case, do the following:
Connect to the WebSphere Administrative console using the URL: http://<IP
address of the WebSphere server:Port number of the WebSphere server>\admin or
http://<IP address of the WebSphere server:Port number of the WebSphere
server>\admin.
Login to the WebSphere Administrative console
Expand the System Administration node in the tree-structure in the left pane
of the console and click on the Deployment Manager sub-node within.

M o n i t o r i n g W e b S p h e r e A p p l i c a t i o n S e r v e r s
284
In the right panel, click on the Configuration tab page to view the
configuration of the Deployment Manager. In the Additional Properties section of
the Configuration tab page, expand the Ports node.
A list of ports will then appear. Click on the Details button alongside the
ports list.
If the SOAP port has been set as the connector port in your environment,
then scroll down the page that appears next until you view the Port Name,
SOAP_CONNECTOR_ADDRESS. Make note of the Host name that corresponds to
this port name. If the RMI port is the connector port in your environment,
then make note of the Host name that corresponds to the Port name,
BOOTSTRAP_ADDRESS.
Specify this Host name as the SERVERNAME.
8. CONNECTORPORT - The applications that are deployed on a server instance
use the CONNECTORPORT for all internal communications with the application
server. The connector port can be a SOAP port or an RMI port. The default
connector port however, is the SOAP port. To know the connector port
number, do the following:
Login to the WebSphere Administrative Console.
Expand the Servers node in the tree structure in the left pane of the
console, and click on Application Servers within.
A list of application server instances and their corresponding node names
will then appear in the right pane of the console. In the right pane, click
on the server name link that corresponds to the server instance that is
being monitored.
Doing so invokes the Configuration of the application server instance clicked
on. Scroll down the Configuration tab page to view the Communications
section.
Expand the Ports link in this section to view a list of ports. If the default
connector port is in use, then the port number displayed against
SOAP_CONNECTOR_ADDRESS should be specified as the CONNECTORPORT. If
an RMI port has been explicitly set as the connector port, then specify the
port number displayed against BOOTSTRAP_ADDRESS as the
CONNECTORPORT.
If the server instance being monitored is part of a WebSphere cluster, then
you need to provide the SOAP/RMI port of the Deployment Manager of the
cluster as the CONNECTORPORT. To determine the CONNECTORPORT in this
case, do the following:
Connect to the WebSphere Administrative console using the URL: http://<IP
address of the WebSphere server:Port number of the WebSphere server>\admin or
https://<IP address of the WebSphere server:Port number of the WebSphere
server>\admin.
Login to the WebSphere Administrative console.
Expand the System Administration node in the tree-structure in the left pane
of the console and click on the Deployment Manager sub-node within.
In the right panel, click on the Configuration tab page to view the
configuration of the Deployment Manager. In the Additional Properties section of
the Configuration tab page, expand the Ports node.

M o n i t o r i n g W e b S p h e r e A p p l i c a t i o n S e r v e r s
285
A list of ports will then appear. If the default connector port is in use, then
the port number displayed against SOAP_CONNECTOR_ADDRESS should be
specified as the CONNECTORPORT. If an RMI port has been explicitly set
as the connector port, then specify the port number displayed against
BOOTSTRAP_ADDRESS as the CONNECTORPORT.
9. SSL - Select Yes if SSL (Secured Socket Layer) is to be used to connect to the
WebSphere server, and No if it is not.
10. USER - If security has been enabled for the WebSphere server being
monitored, then provide a valid USER name to login to the WebSphere server.
If the WebSphere server does not require any authentication, then the USER
text box should contain the default value 'none'.
11. PASSWORD – If security has been enabled for the WebSphere server being
monitored, then provide the PASSWORD that corresponds to the specified
USER name. If the WebSphere server does not require any authentication,
then leave the PASSWORD text box with its default setting.
12. CONFIRM PASSWORD - If security has been enabled, confirm the specified
PASSWORD by retyping it in the CONFIRM PASSWORD text box. If the
WebSphere server does not require any authentication, then leave the
CONFIRM PASSWORD text box with its default setting.
Measurements
made by the test
Measurement
Measurement
Unit
Interpretation
Sync request count:
Indicates the number of
synchronous requests that
were made, since the last
measurement period.
Number
Sync response count:
Indicates the number of
synchronous responses
that were sent, since the
last measurement period.
Number
Async request count:
Indicates the number of
asynchronous requests
that were made, since the
last measurement period.
Number
Async response count:
Indicates the number of
asynchronous responses
that were made, since the
last measurement period.
Number
3.2.5.3 WAS ORB Performance Test
The WASORBPerformance test reports statistics pertaining to the ORBs (Object Request Broker) on a
WebSphere server.

M o n i t o r i n g W e b S p h e r e A p p l i c a t i o n S e r v e r s
286
Purpose
Reports statistics pertaining to the ORBs (Object Request Broker) on a WebSphere
server
Target of the test
A WebSphere application server
Agent deploying
the test
An internal agent
Configurable
parameters for
the test
1. TEST PERIOD - How often should the test be executed
2. HOST – The IP address of the WebSphere application server
3. PORT – The port number of the WebSphere application server
4. SERVERHOSTNAME – Specify the host name of the application server instance
being monitored.
5. APPPORT – Specify the port number to be used for accessing the egurkha
application that has been deployed on the server.
6. NODENAME - Specify the node name of the server instance being monitored.
To know the node name, do the following
Login to the WebSphere Administrative Console.
Expand the Servers node in the tree structure in the left pane of the
console, and click on the Application Servers link within.
A list of application server instances and their corresponding node names
will then appear in the right pane of the console. From this list, you can
figure out the Node that corresponds to the application server instance
being monitored, and specify that name against the NODENAME parameter.
7. SERVERNAME - Provide the name of the server instance being monitored in
the SERVERNAME text box. To know the server name, do the following:
Login to the WebSphere Administrative Console.
Expand the Servers node in the tree structure in the left pane of the
console, and click on the Application Servers link within.
A list of application server instances and their corresponding node names
will then appear in the right pane of the console. From this list, you can
figure out the Name of the monitored server instance, and specify that
name against the SERVERNAME parameter.
If the server instance being monitored is part of a WebSphere cluster, then
you need to provide the host name that corresponds to the connector port of
the Deployment Manager of the cluster as the SERVERNAME. To determine
the SERVERNAME in this case, do the following:
Connect to the WebSphere Administrative console using the URL: http://<IP
address of the WebSphere server:Port number of the WebSphere server>\admin or
https://<IP address of the WebSphere server:Port number of the WebSphere
server>\admin.
Login to the WebSphere Administrative console
Expand the System Administration node in the tree-structure in the left pane
of the console and click on the Deployment Manager sub-node within.

M o n i t o r i n g W e b S p h e r e A p p l i c a t i o n S e r v e r s
287
In the right panel, click on the Configuration tab page to view the
configuration of the Deployment Manager. In the Additional Properties section of
the Configuration tab page, expand the Ports node.
A list of ports will then appear. Click on the Details button alongside the
ports list.
If the SOAP port has been set as the connector port in your environment,
then scroll down the page that appears next until you view the Port Name,
SOAP_CONNECTOR_ADDRESS. Make note of the Host name that corresponds to
this port name. If the RMI port is the connector port in your environment,
then make note of the Host name that corresponds to the Port name,
BOOTSTRAP_ADDRESS.
Specify this Host name as the SERVERNAME.
8. CONNECTORPORT - The applications that are deployed on a server instance
use the CONNECTORPORT for all internal communications with the application
server. The connector port can be a SOAP port or an RMI port. The default
connector port however, is the SOAP port. To know the connector port
number, do the following:
Login to the WebSphere Administrative Console.
Expand the Servers node in the tree structure in the left pane of the
console, and click on Application Servers within.
A list of application server instances and their corresponding node names
will then appear in the right pane of the console. In the right pane, click
on the server name link that corresponds to the server instance that is
being monitored.
Doing so invokes the Configuration of the application server instance clicked
on. Scroll down the Configuration tab page to view the Communications
section.
Expand the Ports link in this section to view a list of ports. If the default
connector port is in use, then the port number displayed against
SOAP_CONNECTOR_ADDRESS should be specified as the CONNECTORPORT. If
an RMI port has been explicitly set as the connector port, then specify the
port number displayed against BOOTSTRAP_ADDRESS as the
CONNECTORPORT.
If the server instance being monitored is part of a WebSphere cluster, then
you need to provide the SOAP/RMI port of the Deployment Manager of the
cluster as the CONNECTORPORT. To determine the CONNECTORPORT in this
case, do the following:
Connect to the WebSphere Administrative console using the URL: http://<IP
address of the WebSphere server:Port number of the WebSphere server>\admin or
https://<IP address of the WebSphere server:Port number of the WebSphere
server>\admin.
Login to the WebSphere Administrative console.
Expand the System Administration node in the tree-structure in the left pane
of the console and click on the Deployment Manager sub-node within.
In the right panel, click on the Configuration tab page to view the
configuration of the Deployment Manager. In the Additional Properties section of
the Configuration tab page, expand the Ports node.

M o n i t o r i n g W e b S p h e r e A p p l i c a t i o n S e r v e r s
288
A list of ports will then appear. If the default connector port is in use, then
the port number displayed against SOAP_CONNECTOR_ADDRESS should be
specified as the CONNECTORPORT. If an RMI port has been explicitly set
as the connector port, then specify the port number displayed against
BOOTSTRAP_ADDRESS as the CONNECTORPORT.
9. SSL - Select Yes if SSL (Secured Socket Layer) is to be used to connect to the
WebSphere server, and No if it is not.
10. USER - If security has been enabled for the WebSphere server being
monitored, then provide a valid USER name to login to the WebSphere server.
If the WebSphere server does not require any authentication, then the USER
text box should contain the default value 'none'.
11. PASSWORD – If security has been enabled for the WebSphere server being
monitored, then provide the PASSWORD that corresponds to the specified
USER name. If the WebSphere server does not require any authentication,
then leave the PASSWORD text box with its default setting.
12. CONFIRM PASSWORD - If security has been enabled, confirm the specified
PASSWORD by retyping it in the CONFIRM PASSWORD text box. If the
WebSphere server does not require any authentication, then leave the
CONFIRM PASSWORD text box with its default setting.
Measurements
made by the test
Measurement
Measurement
Unit
Interpretation
Requests count:
Indicates the number of
requests sent to the ORB,
since the last
measurement period.
Number
Concurrent requests
count:
Indicates the current
number of requests
concurrently processed by
the ORB.
Number
Lookup time:
Indicates the amount of
time taken to lookup an
object reference before
method dispatch can be
carried out.
Secs
An excessively long time may
indicate an EJB container lookup
problem.
Processing time:
Indicates the time that it
takes a registered portable
interceptor to run.
Secs

M o n i t o r i n g W e b S p h e r e A p p l i c a t i o n S e r v e r s
289
3.2.5.4 WAS Web Service Test
The WASWebServer test reports statistics pertaining to the web services mounted on a WebSphere
server.
Purpose
Reports statistics pertaining to the web services mounted on a WebSphere server
Target of the test
A WebSphere application server
Agent deploying
the test
An internal agent
Outputs of the
test
One set of results for every web service on the WebSphere application server
being monitored

M o n i t o r i n g W e b S p h e r e A p p l i c a t i o n S e r v e r s
290
Configurable
parameters for
the test
1. TEST PERIOD - How often should the test be executed
2. HOST – The IP address of the WebSphere application server
3. PORT – The port number of the WebSphere application server
4. SERVERHOSTNAME – Specify the host name of the application server instance
being monitored.
5. APPPORT – Specify the port number to be used for accessing the egurkha
application that has been deployed on the server.
6. NODENAME - Specify the node name of the server instance being monitored.
To know the node name, do the following
Login to the WebSphere Administrative Console.
Expand the Servers node in the tree structure in the left pane of the
console, and click on the Application Servers link within.
A list of application server instances and their corresponding node names
will then appear in the right pane of the console. From this list, you can
figure out the Node that corresponds to the application server instance
being monitored, and specify that name against the NODENAME parameter.
7. SERVERNAME - Provide the name of the server instance being monitored in
the SERVERNAME text box. To know the server name, do the following:
Login to the WebSphere Administrative Console.
Expand the Servers node in the tree structure in the left pane of the
console, and click on the Application Servers link within.
A list of application server instances and their corresponding node names
will then appear in the right pane of the console. From this list, you can
figure out the Name of the monitored server instance, and specify that
name against the SERVERNAME parameter.
If the server instance being monitored is part of a WebSphere cluster, then
you need to provide the host name that corresponds to the connector port of
the Deployment Manager of the cluster as the SERVERNAME. To determine
the SERVERNAME in this case, do the following:
Connect to the WebSphere Administrative console using the URL: http://<IP
address of the WebSphere server:Port number of the WebSphere server>\admin or
https://<IP address of the WebSphere server:Port number of the WebSphere
server>\admin.
Login to the WebSphere Administrative console
Expand the System Administration node in the tree-structure in the left pane
of the console and click on the Deployment Manager sub-node within.

M o n i t o r i n g W e b S p h e r e A p p l i c a t i o n S e r v e r s
291
In the right panel, click on the Configuration tab page to view the
configuration of the Deployment Manager. In the Additional Properties section of
the Configuration tab page, expand the Ports node.
A list of ports will then appear. Click on the Details button alongside the
ports list.
If the SOAP port has been set as the connector port in your environment,
then scroll down the page that appears next until you view the Port Name,
SOAP_CONNECTOR_ADDRESS. Make note of the Host name that corresponds to
this port name. If the RMI port is the connector port in your environment,
then make note of the Host name that corresponds to the Port name,
BOOTSTRAP_ADDRESS.
Specify this Host name as the SERVERNAME.
8. CONNECTORPORT - The applications that are deployed on a server instance
use the CONNECTORPORT for all internal communications with the application
server. The connector port can be a SOAP port or an RMI port. The default
connector port however, is the SOAP port. To know the connector port
number, do the following:
Login to the WebSphere Administrative Console.
Expand the Servers node in the tree structure in the left pane of the
console, and click on Application Servers within.
A list of application server instances and their corresponding node names
will then appear in the right pane of the console. In the right pane, click
on the server name link that corresponds to the server instance that is
being monitored.
Doing so invokes the Configuration of the application server instance clicked
on. Scroll down the Configuration tab page to view the Communications
section.
Expand the Ports link in this section to view a list of ports. If the default
connector port is in use, then the port number displayed against
SOAP_CONNECTOR_ADDRESS should be specified as the CONNECTORPORT. If
an RMI port has been explicitly set as the connector port, then specify the
port number displayed against BOOTSTRAP_ADDRESS as the
CONNECTORPORT.
If the server instance being monitored is part of a WebSphere cluster, then
you need to provide the SOAP/RMI port of the Deployment Manager of the
cluster as the CONNECTORPORT. To determine the CONNECTORPORT in this
case, do the following:
Connect to the WebSphere Administrative console using the URL: http://<IP
address of the WebSphere server:Port number of the WebSphere server>\admin or
https://<IP address of the WebSphere server:Port number of the WebSphere
server>\admin.
Login to the WebSphere Administrative console.
Expand the System Administration node in the tree-structure in the left pane
of the console and click on the Deployment Manager sub-node within.
In the right panel, click on the Configuration tab page to view the
configuration of the Deployment Manager. In the Additional Properties section of
the Configuration tab page, expand the Ports node.

M o n i t o r i n g W e b S p h e r e A p p l i c a t i o n S e r v e r s
292
A list of ports will then appear. If the default connector port is in use, then
the port number displayed against SOAP_CONNECTOR_ADDRESS should be
specified as the CONNECTORPORT. If an RMI port has been explicitly set
as the connector port, then specify the port number displayed against
BOOTSTRAP_ADDRESS as the CONNECTORPORT.
9. SSL - Select Yes if SSL (Secured Socket Layer) is to be used to connect to the
WebSphere server, and No if it is not.
10. USER - If security has been enabled for the WebSphere server being
monitored, then provide a valid USER name to login to the WebSphere server.
If the WebSphere server does not require any authentication, then the USER
text box should contain the default value 'none'.
11. PASSWORD – If security has been enabled for the WebSphere server being
monitored, then provide the PASSWORD that corresponds to the specified
USER name. If the WebSphere server does not require any authentication,
then leave the PASSWORD text box with its default setting.
12. CONFIRM PASSWORD - If security has been enabled, confirm the specified
PASSWORD by retyping it in the CONFIRM PASSWORD text box. If the
WebSphere server does not require any authentication, then leave the
CONFIRM PASSWORD text box with its default setting.
Measurements
made by the test
Measurement
Measurement
Unit
Interpretation
Loaded services:
Indicates the number of
web services loaded by the
application server since the
last measurement period.
Number
Dispatched requests:
Indicates the number of
requests that were
dispatched by the service
to a target code, since the
last measurement period.
Number
Processed requests:
Indicates the number of
requests dispatched
successfully with
corresponding replies,
since the last
measurement period.
Number
Received requests:
Indicates number of
requests received by the
service.
Number
M o n i t o r i n g W e b S p h e r e A p p l i c a t i o n S e r v e r s
293
Response time:
Indicates the average time
between the receipt of a
request and the return of a
reply.
Secs
A very high response time could
indicate a bottleneck at the web
service.
Request response time:
Indicates the average time
between the receipt of the
request and the dispatch
for processing the request.
Secs
Reply response time:
Indicates the average time
between the dispatch of
the reply and return of the
reply.
Secs
3.2.5.5 WAS Web Service Test
The WAS JCA Connection Pools test monitors the usage of the JCA connection pools on the WebSphere
Application server.
Purpose
Monitors the usage of the JCA connection pools on the WebSphere Application
server
Target of the test
A WebSphere application server
Agent deploying
the test
An internal agent
Outputs of the
test
One set of results for each connection pool being monitored

M o n i t o r i n g W e b S p h e r e A p p l i c a t i o n S e r v e r s
294
Configurable
parameters for
the test
1. TEST PERIOD - How often should the test be executed
2. HOST – The IP address of the WebSphere application server
3. PORT – The port number of the WebSphere application server
4. SERVERHOSTNAME – Specify the host name of the application server instance
being monitored.
5. APPPORT – Specify the port number to be used for accessing the egurkha
application that has been deployed on the server.
6. NODENAME - Specify the node name of the server instance being monitored.
To know the node name, do the following
Login to the WebSphere Administrative Console.
Expand the Servers node in the tree structure in the left pane of the
console, and click on the Application Servers link within.
A list of application server instances and their corresponding node names
will then appear in the right pane of the console. From this list, you can
figure out the Node that corresponds to the application server instance
being monitored, and specify that name against the NODENAME parameter.
7. SERVERNAME - Provide the name of the server instance being monitored in
the SERVERNAME text box. To know the server name, do the following:
Login to the WebSphere Administrative Console.
Expand the Servers node in the tree structure in the left pane of the
console, and click on the Application Servers link within.
A list of application server instances and their corresponding node names
will then appear in the right pane of the console. From this list, you can
figure out the Name of the monitored server instance, and specify that
name against the SERVERNAME parameter.
If the server instance being monitored is part of a WebSphere cluster, then
you need to provide the host name that corresponds to the connector port of
the Deployment Manager of the cluster as the SERVERNAME. To determine
the SERVERNAME in this case, do the following:
Connect to the WebSphere Administrative console using the URL: http://<IP
address of the WebSphere server:Port number of the WebSphere server>\admin or
https://<IP address of the WebSphere server:Port number of the WebSphere
server>\admin.
Login to the WebSphere Administrative console
Expand the System Administration node in the tree-structure in the left pane
of the console and click on the Deployment Manager sub-node within.

M o n i t o r i n g W e b S p h e r e A p p l i c a t i o n S e r v e r s
295
In the right panel, click on the Configuration tab page to view the
configuration of the Deployment Manager. In the Additional Properties section of
the Configuration tab page, expand the Ports node.
A list of ports will then appear. Click on the Details button alongside the
ports list.
If the SOAP port has been set as the connector port in your environment,
then scroll down the page that appears next until you view the Port Name,
SOAP_CONNECTOR_ADDRESS. Make note of the Host name that corresponds to
this port name. If the RMI port is the connector port in your environment,
then make note of the Host name that corresponds to the Port name,
BOOTSTRAP_ADDRESS.
Specify this Host name as the SERVERNAME.
8. CONNECTORPORT - The applications that are deployed on a server instance
use the CONNECTORPORT for all internal communications with the application
server. The connector port can be a SOAP port or an RMI port. The default
connector port however, is the SOAP port. To know the connector port
number, do the following:
Login to the WebSphere Administrative Console.
Expand the Servers node in the tree structure in the left pane of the
console, and click on Application Servers within.
A list of application server instances and their corresponding node names
will then appear in the right pane of the console. In the right pane, click
on the server name link that corresponds to the server instance that is
being monitored.
Doing so invokes the Configuration of the application server instance clicked
on. Scroll down the Configuration tab page to view the Communications
section.
Expand the Ports link in this section to view a list of ports. If the default
connector port is in use, then the port number displayed against
SOAP_CONNECTOR_ADDRESS should be specified as the CONNECTORPORT. If
an RMI port has been explicitly set as the connector port, then specify the
port number displayed against BOOTSTRAP_ADDRESS as the
CONNECTORPORT.
If the server instance being monitored is part of a WebSphere cluster, then
you need to provide the SOAP/RMI port of the Deployment Manager of the
cluster as the CONNECTORPORT. To determine the CONNECTORPORT in this
case, do the following:
Connect to the WebSphere Administrative console using the URL: http://<IP
address of the WebSphere server:Port number of the WebSphere server>\admin or
https://<IP address of the WebSphere server:Port number of the WebSphere
server>\admin.
Login to the WebSphere Administrative console.
Expand the System Administration node in the tree-structure in the left pane
of the console and click on the Deployment Manager sub-node within.
In the right panel, click on the Configuration tab page to view the
configuration of the Deployment Manager. In the Additional Properties section of
the Configuration tab page, expand the Ports node.

M o n i t o r i n g W e b S p h e r e A p p l i c a t i o n S e r v e r s
296
A list of ports will then appear. If the default connector port is in use, then
the port number displayed against SOAP_CONNECTOR_ADDRESS should be
specified as the CONNECTORPORT. If an RMI port has been explicitly set
as the connector port, then specify the port number displayed against
BOOTSTRAP_ADDRESS as the CONNECTORPORT.
9. SSL - Select Yes if SSL (Secured Socket Layer) is to be used to connect to the
WebSphere server, and No if it is not.
10. USER - If security has been enabled for the WebSphere server being
monitored, then provide a valid USER name to login to the WebSphere server.
If the WebSphere server does not require any authentication, then the USER
text box should contain the default value 'none'.
11. PASSWORD – If security has been enabled for the WebSphere server being
monitored, then provide the PASSWORD that corresponds to the specified
USER name. If the WebSphere server does not require any authentication,
then leave the PASSWORD text box with its default setting.
12. CONFIRM PASSWORD - If security has been enabled, confirm the specified
PASSWORD by retyping it in the CONFIRM PASSWORD text box. If the
WebSphere server does not require any authentication, then leave the
CONFIRM PASSWORD text box with its default setting.
Measurements
made by the test
Measurement
Measurement
Unit
Interpretation
Connections allocated:
Indicates the number of
connections allocated to
the pool during the last
measurement period.
Number
Connections freed:
Indicates the number of
connections that were
returned to the pool in the
last measurement period.
Number
A very low value of this measure
could result in a shortage of
connections in the pool.
Connections created:
Indicates the number of
connections created during
the last measurement
period.
Number
Connections closed:
Indicates the number of
connections released from
the pool during the last
measurement period.
Number
Ideally, this value should be low.
Connections in pool:
Indicates the number of
connections in this
connection pool.
Number

M o n i t o r i n g W e b S p h e r e A p p l i c a t i o n S e r v e r s
297
Free connections in
pool:
Indicates the number of
free connection available in
this connection pool.
Number
Waiting threads:
Indicates the number of
threads that are currently
waiting in this connection
pool
Number
Faults:
Indicates the number of
faults (for e.g., timeouts)
that occurred in this
connection pool per second
during the last
measurement period.
Faults/sec
Ideally, the value of this measure
should be zero.
Percent of the pool in
use:
Indicates the current
utilization of this
connection pool in
percentage.
Percent
This value of this measure is based
on the number of connections that
are configured for this connection
pool.
Percent of the time that
all connections are in
use:
Indicates the number of
times (expressed as
percentage) all the
connections of this
connection pool were in
use.
Percent
Avg. use time of
connections:
Indicates the average time
for which the connections
of this connection pool
were in use.
MilliSec
Avg. wait time to grand
connection:
Indicates the average time
a client has to wait before
the connections were
granted from this
connection pool.
MilliSec

M o n i t o r i n g W e b S p h e r e A p p l i c a t i o n S e r v e r s
298
Managed connections:
Indicates the number of
managed connections that
are currently in use in this
connection pool.
Number
Connections associated
with physical
connection:
Indicates the number of
connections that are
associated with physical
connections in this
connection pool.
Number
M o n i t o r i n g i P l a n e t A p p l i c a t i o n S e r v e r s
299
Monitoring iPlanet Application
Servers
The iPlanet Application server is a Java EE application server system, based on the Netscape
Application Server and NetDynamics Application Server.
Figure 4.1 depicts the Netscape Application monitoring model used by an eG agent to monitor iPlanet
application servers. The Operating System, Network, and Tcp layers have already been discussed in the
Monitoring Unix and Windows Servers document. The Application Processes layer tracks the status of
the different processes that comprise the iPlanet application server. Since the iPlanet server requires
the executive server, the C server, and the Java server to be executing in order to function effectively,
the Application Processes layer represents the cumulative state of all of these server processes. Above
the Application Processes layer is the NAS Service layer.
Figure 4.1: Model of an iPlanet Application server showing the different layers monitored for the server
Using the Netscape Application model, administrators can quickly determine the health of the NAS
server engine.
The sections that follow discuss the NAS Service layer only, as all other layers have been discussed
elaborately in the Monitoring Unix and Windows Servers document.
Chapter
4
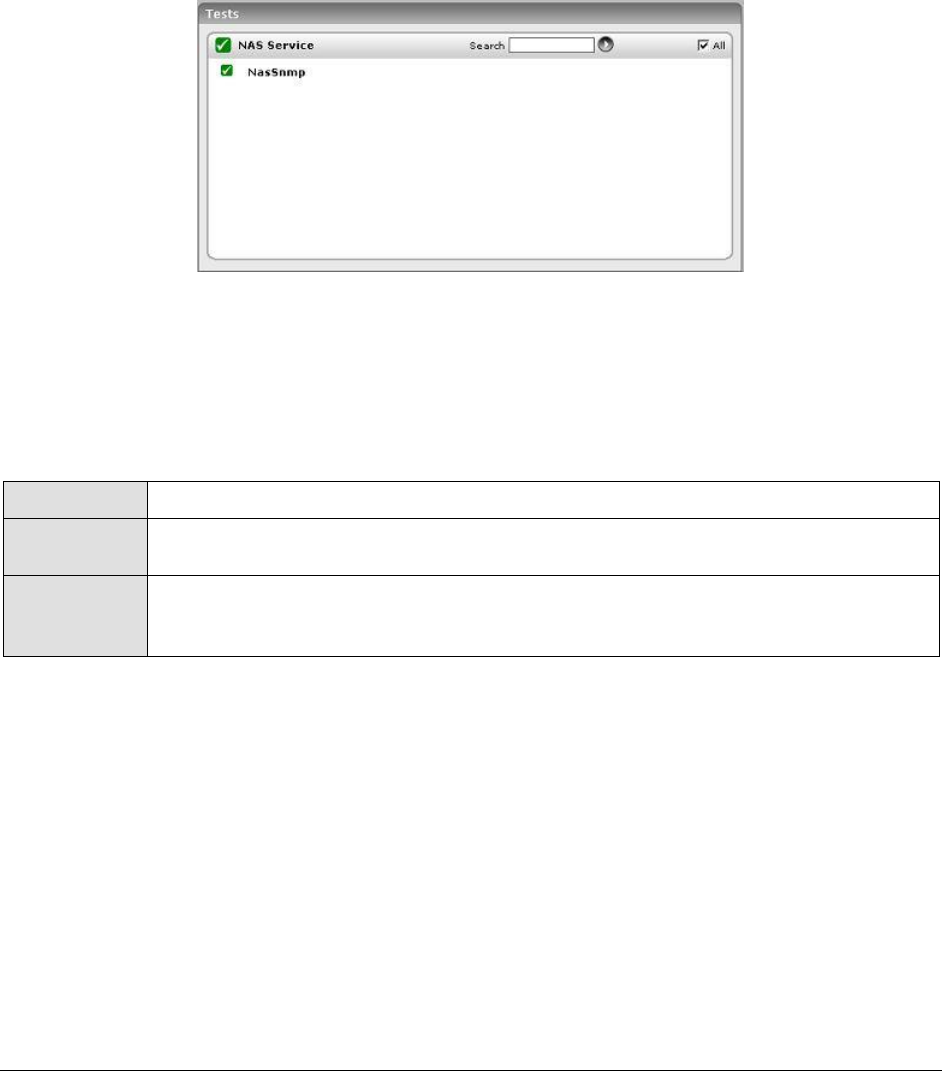
M o n i t o r i n g i P l a n e t A p p l i c a t i o n S e r v e r s
300
4.1 The NAS Service Layer
This layer represents the different services offered by the iPlanet application server. To measure the
state of these services, an eG agent uses the Simple Network Management Protocol (SNMP) support
provided by the iPlanet application server. The details of the NasSnmp test (see Figure 4.2) that
tracks the status of the iPlanet application server are listed below.
Figure 4.2: The NasSnmpTest that maps to the NAS Service layer of an iPlanet application server
4.1.1 NAS SNMP Test
For this test to function properly, the iPlanet application server’s SNMP monitoring capability should be
enabled. Please refer to the iPlanet Administrator Guide to determine how the SNMP capabilities of the
iPlanet application server can be turned on. The outputs of the NasSnmp test are listed below:
Purpose
To measure statistics pertaining to an iPlanet application server
Target of the
test
An iPlanet application server
Agent
deploying the
test
An external agent

M o n i t o r i n g i P l a n e t A p p l i c a t i o n S e r v e r s
301
Configurable
parameters for
the test
1. TEST PERIOD - How often should the test be executed
2. HOST –The host for which the test is to be configured.
3. PORT - The port to which the specified HOST listens
4. SNMPPORT – The port number on which the application server is exposing the
SNMP MIB
5. SNMPVERSION – By default, the eG agent supports SNMP version 1. Accordingly,
the default selection in the SNMPVERSION list is v1. However, if a different SNMP
framework is in use in your environment, say SNMP v2 or v3, then select the
corresponding option from this list.
6. SNMPCOMMUNITY – The SNMP community name that the test uses to
communicate with the target server. This parameter is specific to SNMP v1 and
v2 only. Therefore, if the SNMPVERSION chosen is v3, then this parameter will
not appear.
7. USERNAME – This parameter appears only when v3 is selected as the
SNMPVERSION. SNMP version 3 (SNMPv3) is an extensible SNMP Framework
which supplements the SNMPv2 Framework, by additionally supporting message
security, access control, and remote SNMP configuration capabilities. To extract
performance statistics from the MIB using the highly secure SNMP v3 protocol,
the eG agent has to be configured with the required access privileges – in other
words, the eG agent should connect to the MIB using the credentials of a user
with access permissions to be MIB. Therefore, specify the name of such a user
against the USERNAME parameter.
8. AUTHPASS – Specify the password that corresponds to the above-mentioned
USERNAME. This parameter once again appears only if the SNMPVERSION
selected is v3.
9. CONFIRM PASSWORD – Confirm the AUTHPASS by retyping it here.
10. AUTHTYPE – This parameter too appears only if v3 is selected as the
SNMPVERSION. From the AUTHTYPE list box, choose the authentication
algorithm using which SNMP v3 converts the specified USERNAME and
PASSWORD into a 32-bit format to ensure security of SNMP transactions. You
can choose between the following options:
MD5 – Message Digest Algorithm
SHA – Secure Hash Algorithm
11. ENCRYPTFLAG – This flag appears only when v3 is selected as the
SNMPVERSION. By default, the eG agent does not encrypt SNMP requests.
Accordingly, the ENCRYPTFLAG is set to NO by default. To ensure that SNMP
requests sent by the eG agent are encrypted, select the YES option.
12. ENCRYPTTYPE – If the ENCRYPTFLAG is set to YES, then you will have to
mention the encryption type by selecting an option from the ENCRYPTTYPE list.
SNMP v3 supports the following encryption types:
DES – Data Encryption Standard
AES – Advanced Encryption Standard
13. ENCRYPTPASSWORD – Specify the encryption password here.
14. CONFIRM PASSWORD – Confirm the encryption password by retyping it here.

M o n i t o r i n g i P l a n e t A p p l i c a t i o n S e r v e r s
302
15. DATA OVER TCP – By default, in an IT environment, all data transmission occurs
over UDP. Some environments however, may be specifically configured to
offload a fraction of the data traffic – for instance, certain types of data traffic or
traffic pertaining to specific components – to other protocols like TCP, so as to
prevent UDP overloads. In such environments, you can instruct the eG agent to
conduct the SNMP data traffic related to the equalizer over TCP (and not UDP).
For this, set the DATA OVER TCP flag to Yes. By default, this flag is set to No.
Outputs of the
test
One set of results for each iPlanet engine. The iPlanet application server has three
main engines – KXS, KCS, and KJS.
Measurements
made by the
test
Measurement
Measurement
Unit
Interpretation
Request rate:
Rate of requests to the
NAS engine.
Reqs/Sec
A high request rate is an indicator of
server overload. By comparing the request
rates across application servers, an
operator can gauge the effectiveness of
load balancers (if any) that are in use.
Response time:
Average response time
(in seconds) for
requests serviced by
this NAS engine.
Secs
An increase in response time associated
with one of the NAS engines can indicate a
problem with the specific engine alone.
Threads utilized:
The percentage of
threads of this engine
that are in active use.
Percent
A value of close to 100% is indicative of a
bottleneck with a specific engine.
Data transmit rate:
Rate at which the data
is transferred by the
engine in response to
the incoming requests.
KB/Sec
A sudden change in data transmit rate can
be indicative of a change in the
characteristics of key applications hosted
on the engine.
Data received rate:
Rate at which the data
is received by the
engine.
KB/Sec
A sudden increase or decrease in data rate
to the engine is indicative of either an
increase or decrease in popularity of
applications hosted on the NAS engine
under consideration.
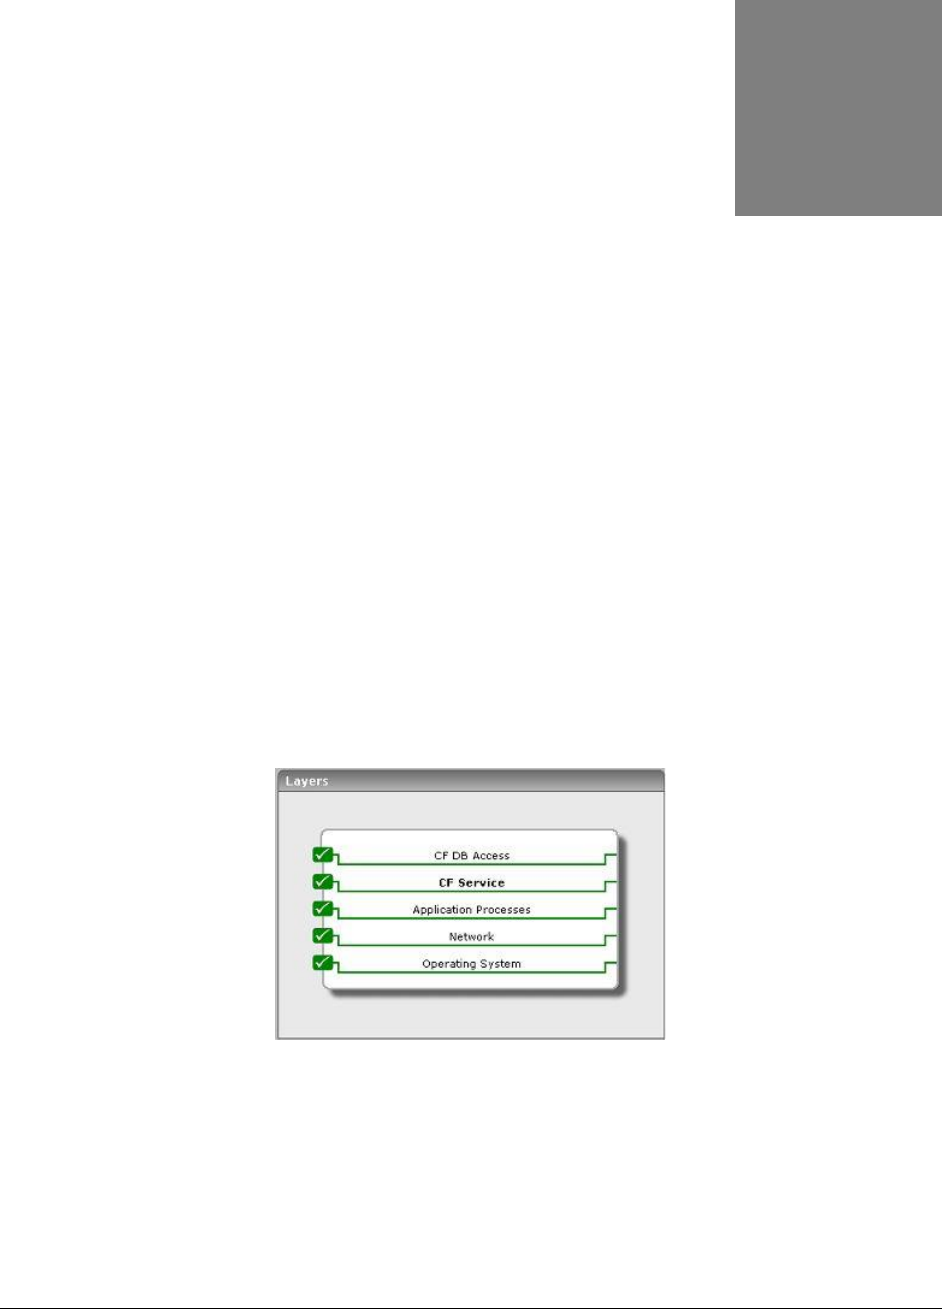
M o n i t o r i n g C o l d f u s i o n A p p l i c a t i o n S e r v e r s
303
Monitoring Coldfusion Application
Servers
ColdFusion is an application server and software development framework used for the development
of computer software in general. This application server is most often used for data-driven web sites
or intranets, and can also be used to generate remote services such as SOAP web services or Flash
remoting. Error-free functioning of the ColdFusion server is therefore a key requirement for the
continuous availability of these critical end-user services. To ensure that the ColdFusion is always
accessible and is performing to peak capacity, it is necessary to constantly watch over the
performance of the server, spot error conditions before they actually occur, and resolve the errors
with immediate effect.
eG Enterprise provides an exclusive ColdFusion monitoring model that facilitates 24x7 monitoring of
the ColdFusion server, and proactive alerting of probable problem conditions with the server. This
model is shown in Figure 5.1.
Figure 5.1: Layer model for a Coldfusion server
Every layer of this hierarchical model is mapped to one/more tests that collectively enable
administrators to determine the following:
Is the ColdFusion server overloaded with requests?
Are the applications hosted on ColdFusion able to obtain quick access to the database?
Is there an unusual increase in the data traffic to and from the server?
Chapter
5
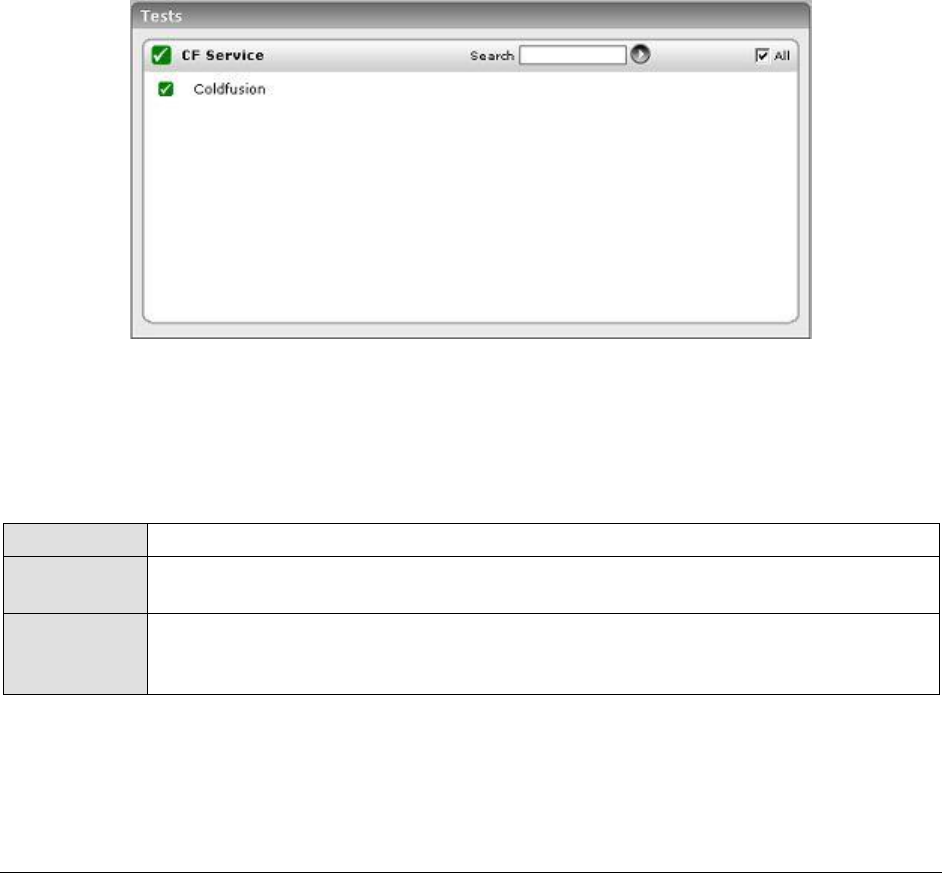
M o n i t o r i n g C o l d f u s i o n A p p l i c a t i o n S e r v e r s
304
Is the server processing requests quickly, or is the request queue growing steadily?
Is the server sending out timely responses for the requests, or is the responsiveness of the
server too slow?
The sections to come discuss each of the top 2 layers of Figure 5.1 above. The remaining layers have
been dealt with extensively in the Monitoring Unix and Windows Servers document.
5.1 The CF Service Layer
This layer represents the different services offered by the Coldfusion application server. To monitor
Coldfusion servers, the eG Enterprise suite uses monitoring capabilities supported by the Coldfusion
servers. A special test page installed on the Coldfusion server interfaces with the Coldfusion server’s
monitoring interface to extract a variety of statistics pertaining to the Coldfusion server. The status of
this layer is determined by the results of a Coldfusion test (see Figure 5.2). The details about the
Coldfusion test have been provided in the following sections.
Figure 5.2: The ColdfusionTest that maps to the CF Service layer of a Coldfusion application server
5.1.1 Coldfusion Test
This tests measures statistics pertaining to a Coldfusion server. The outputs of this test are described
below.
Purpose
To measure statistics pertaining to a Coldfusion application server
Target of the
test
A Coldfusion application server
Agent
deploying the
test
An internal agent

M o n i t o r i n g C o l d f u s i o n A p p l i c a t i o n S e r v e r s
305
Configurable
parameters for
the test
1. TEST PERIOD - How often should the test be executed
2. HOST – The host for which the test is to be configured.
3. PORT - The port to which the specified host listens
4. WEBSERVERPORT – The port number of a web server that is configured with
the Coldfusion monitoring capability. This web server has to be one that is
already configured to work with a Coldfusion application server
5. SSL - Select Yes if SSL (Secure Socket Layer) has been enabled, and No if it is
not.
Outputs of the
test
One set of results for each Coldfusion application server.
Measurements
made by the
test
Measurement
Measurement
Unit
Interpretation
Request rate:
Rate of requests to the
Coldfusion server.
Reqs/Sec
A high request rate is an indicator of
server overload. By comparing the
request rates across application
servers, an operator can gauge the
effectiveness of load balancers (if any)
that are in use.
Database access rate:
Rate of database accesses
issued by applications
executing on the
Coldfusion server.
Reqs/Sec
An unusually low or high rate of
database accesses from one or more
applications hosted on the Coldfusion
application server may provide hints on
anomalies with the applications.
Data transmit rate:
Rate at which the data is
transferred by the
application server in
response to incoming
requests.
KB/Sec
A sudden change in data transmit rate
can be indicative of a change in the
characteristics of key applications
hosted on the engine.
Data receive rate:
Rate at which the data is
received by the application
server.
KB/Sec
A sudden increase or decrease in data
rate to the application server is
indicative of either an increase or
decrease in popularity of applications
hosted on the Coldfusion application
server.
Requests queued:
Number of requests
queued waiting for service
from the Coldfusion
application server.
Number
An increase in requests queued can
indicate a bottleneck at the application
server. The problem may be caused
either because of an application server
problem, a problem with specific
applications hosted on the Coldfusion
server, or because of backend problems
(e.g., with the database server,
payment gateway, etc.).

M o n i t o r i n g C o l d f u s i o n A p p l i c a t i o n S e r v e r s
306
Requests running:
Number of requests
currently being processed
by the application server.
Number
An increase in requests running may
indicate an increase in user workload
(to be sure, correlate this value with
the data transmit and receive rates).
Alternatively, a slowdown at the
application server may also cause the
requests that are simultaneously
executing to increase.
Requests timeout rate:
Rate at which requests are
timing out while waiting
for service from the
Coldfusion server.
Reqs/Sec
An increase in the time out rate of
requests is a clear indication of a
problem with one or more applications
executing on a Coldfusion server.
Requests may time out because of an
application problem, because of failure
to access external servers (e.g.,
databases, payment gateways), or
because of server overload. By
determining whether all of the web
transactions that use the Coldfusion
server are experiencing problems, an
operator can determine if the problem
is related to the application server or
with specific applications.
Avg queue time:
Average time in seconds
spent by a request waiting
for service by the
Coldfusion server.
Secs
An increase in queuing delay reflects a
server bottleneck.
Avg response time:
Average time (in seconds)
for processing a request at
the server.
Secs
An increase in response time can occur
because there are too many
simultaneous requests or because of a
bottleneck with any of the applications
executing on the server.
Avg database access
time:
Average time (in seconds)
for database accesses from
applications executing on
the Coldfusion server.
Secs
A large value of DB access time can be
caused by poor query construction,
bottlenecks at the database server(s),
etc.
5.1.2 Coldfusion Log Test
This test monitors a ColdFusion log file for warnings. This test is disabled by default. To enable the
test, go to the ENABLE / DISABLE TESTS page using the menu sequence : Agents -> Tests ->
Enable/Disable, pick Coldfusion as the Component type, Performance as the Test type, choose this test
from the DISABLED TESTS list, and click on the >> button to move the test to the ENABLED TESTS list.
Finally, click the Update button.
Purpose
To monitor a ColdFusion log file for warnings

M o n i t o r i n g C o l d f u s i o n A p p l i c a t i o n S e r v e r s
307
Target of the
test
A ColdFusion server
Agent
deploying the
test
An internal agent
Configurable
parameters for
the test
1. TEST PERIOD - How often should the test be executed
2. HOST –The host for which the test is to be configured.
3. PORT - The port to which the specified HOST listens
4. LOGFILE – The path to the ColdFusion log file to be monitored
5. DETAILED DIAGNOSIS - To make diagnosis more efficient and accurate, the eG
Enterprise suite embeds an optional detailed diagnostic capability. With this
capability, the eG agents can be configured to run detailed, more elaborate tests
as and when specific problems are detected. To enable the detailed diagnosis
capability of this test for a particular server, choose the On option. To disable
the capability, click on the Off option.
The option to selectively enable/disable the detailed diagnosis capability will be
available only if the following conditions are fulfilled:
The eG manager license should allow the detailed diagnosis capability
Both the normal and abnormal frequencies configured for the detailed
diagnosis measures should not be 0.
Outputs of the
test
One set of results for every ColdFusion server
Measurements
made by the
test
Measurement
Measurement
Unit
Interpretation
Warnings:
The number of warnings
reported by the
ColdFusion server
during the last
measurement period.
Number
The detailed diagnosis for this metric
provides more details on the warnings
reported in the Coldfusion logs.
Information about the URLs that are
providing slow response, the number of
slow responses, and the average response
time for these accesses can also be
received.
5.2 The CF DB Access Layer
This layer tracks the statistics of the database access of the applications hosted on a Coldfusion server
with the help of the Coldfusion test (see Figure 5.3).
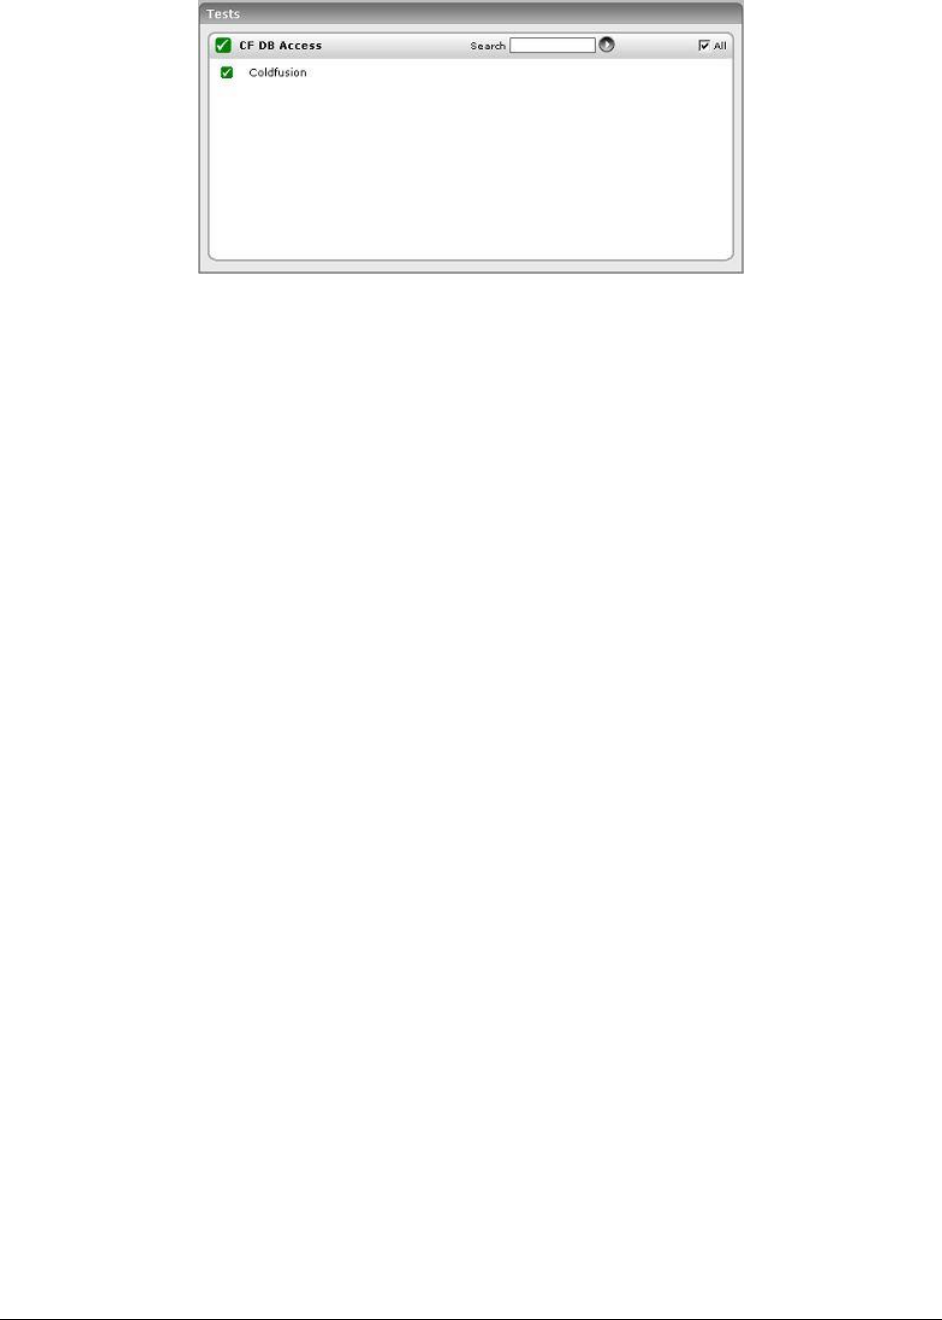
M o n i t o r i n g C o l d f u s i o n A p p l i c a t i o n S e r v e r s
308
Figure 5.3: The ColdfusionTest that maps to the CF DB Access layer of a Coldfusion application server

M o n i t o r i n g S i l v e r S t r e a m A p p l i c a t i o n S e r v e r s
309
Monitoring SilverStream Application
Servers
The SilverStream Application Server is a comprehensive, J2EE certified platform for building and
deploying enterprise-class Web applications. It supports the full Java 2 Enterprise Edition standard --
JavaServer Pages (JSP pages), Enterprise JavaBeans (EJBs), and all the other J2EE 1.2 components
and technologies.
Errors in the functioning of this application server could have an adverse impact on the overall
performance and availability of the dependent web applications; this in turn would result in
significantly decreasing the productivity of the end-users, who transact business with the help of these
web applications. To avoid such an unpleasant outcome, the SilverStream application server’s
performance should be scrutinized regularly.
eG Enterprise provides a special SilverStream monitoring model (see Figure 6.1) to periodically
monitor the helath of the Silverstream application server. The eG agents can track the availability,
performance, and usage of SilverStream application servers. Critical information about the health of a
SilverStream server such as the current load on the server, current sessions, percentage of thread
pool utilization, processing time for requests, memory usage patterns, etc., can be obtained from the
eG agents. Coupled with eG Enterprise's relative thresholding, single click diagnosis, historical
trending, and integrated monitoring capabilities, this new enhancement offers a powerful, single stop
monitoring solution for customers using SilverStream application servers.
The SilverStream server uses a SilverServer application process to start the server. The Processes test
parameters for SilverStream servers should be configured to monitor this process. To obtain statistics
specific to a SilverStream server, the eG Enterprise suite relies on the Client API provided by
SilverStream server. SilverStream server can be configured to listen on three different ports –
Runtime port, design port and Admin port. When the SilverStream server is first installed on a
particular port number, all the three port numbers will have the same value. Through eG Enterprise's
administrative interface, the Admin port number on which the SilverStream server listens must be
specified. For the eG Enterprise suite to use the SilverStream Client API, the root path of the
SilverStream installation must be specified through eG Enterprise's administrative interface. If
SilverStream server is configured to authenticate users connecting to it, a valid username and
password must be specified through eG Enterprise's administrative interface. While configuring the
parameters for this test, the value corresponding to the ISAUTHENTICATED should be “Y”.
Chapter
6
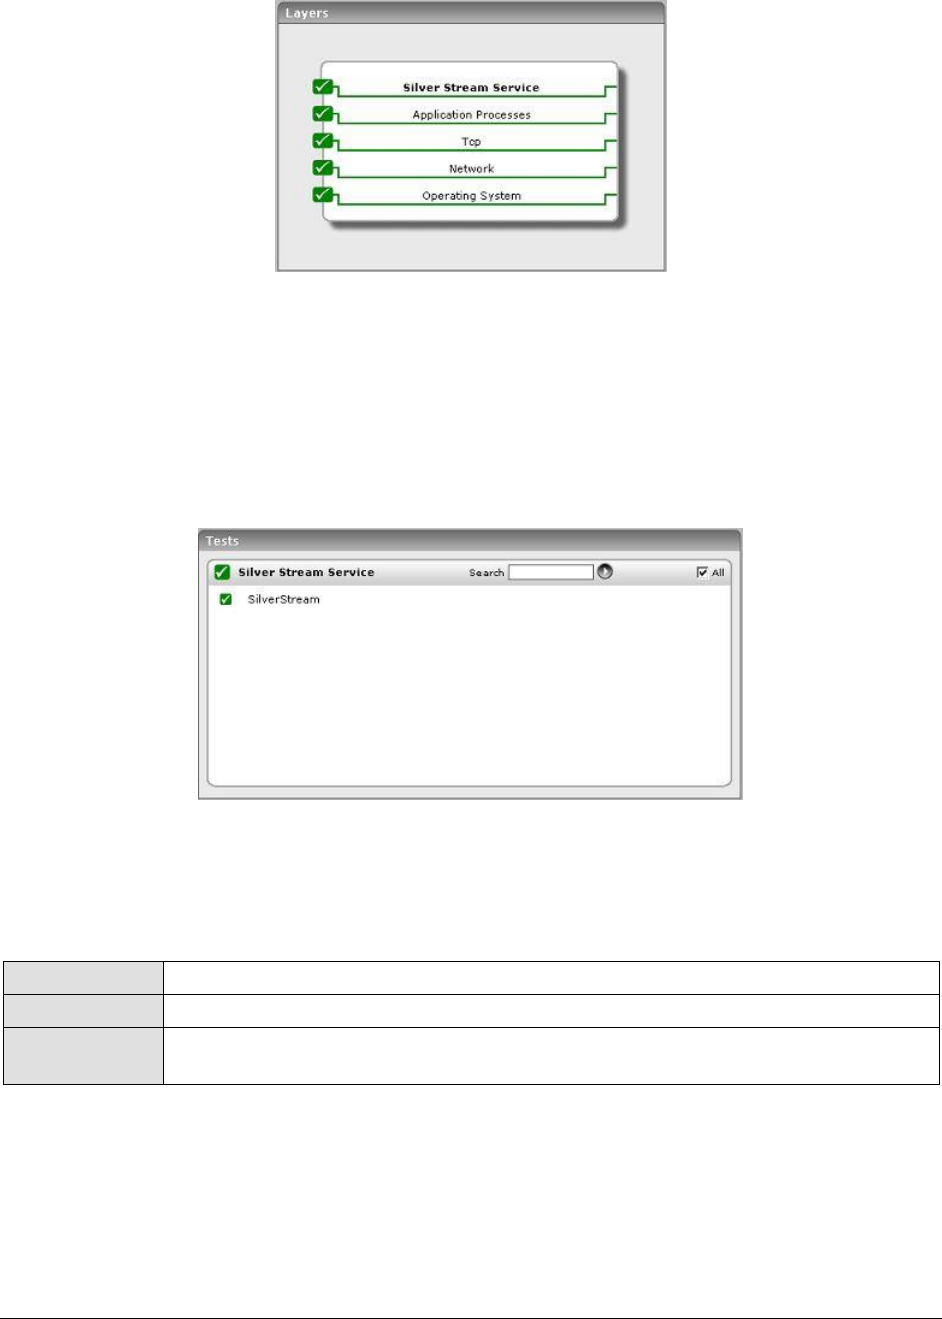
M o n i t o r i n g S i l v e r S t r e a m A p p l i c a t i o n S e r v e r s
310
Figure 6.1: Layer model for a SilverStream application server
The sections that follow elaborate on the first layer of Figure 6.1 only, as all other layers have been
extensively dealt with in the Monitoring Unix and Windows Servers document.
6.1 The Silver Stream Service Layer
This layer tracks the health of the SilverStream server using the SilverStream test (see Figure 6.2).
Figure 6.2: Tests mapping to the Silver Stream Service layer
6.1.1 SilverStream Test
Using the SilverStream client API, this test tracks various statistics relating to the SilverStream server.
Purpose
To measure the statistics pertaining to a SilverStream application server
Target of the test
A SilverStream application server
Agent deploying
the test
An internal agent

M o n i t o r i n g S i l v e r S t r e a m A p p l i c a t i o n S e r v e r s
311
Configurable
parameters for
the test
1. TEST PERIOD - How often should the test be executed
2. ADMIN PORT – The port number on which the SilverStream server is listening
for administrative purpose
3. ROOTPATH – Root path where SilverStream server is installed.
4. ISAUTHENTICATED – Is the server running in an authenticated mode or not.
Value should be entered as Y (for Yes) and N (for No).
5. USER - If the SilverStream server is running in an authenticated mode, then
the user name has to be supplied.
6. PASSWORD - If the SilverStream server is running in an authenticated mode,
then the password corresponding to the user name has to be supplied.
7. CONFIRM PASSWORD – Confirm the PASSWORD by retyping it here.
Outputs of the
test
One set of results for each SilverStream application server.
Measurements
made by the test
Measurement
Measurement
Unit
Interpretation
Server usage:
The current utilization of
the server. It is a value
between 1 and 4. A value
of 1 indicates light
utilization while a value of
4 indicates high utilization
of the server.
Number
If the server is under high utilization
for a prolonged period of time, it is
indicative of the server reaching its
maximum capacity.
Thread usage:
The percentage of threads
associated with the client
connections. This includes
threads, which may or may
not be currently handling
user requests.
Percent
If this measure reaches 100%, then
the client connections are queued
before execution. In this situation,
the total number of threads spawned
by the server can be increased
depending on the capacity.
Percent idle threads:
The percentage of threads
associated with client
connections, which are not
currently handling user
requests.
Percent
This measure is indicative of the
percent of threads waiting for further
user requests.
Request rate:
Number of requests per
second to the SilverStream
server.
Reqs/Sec
A sudden increase in this value
indicates an unusual burst of
requests for your application server.
This usually means that there is
sudden high activity on your
application or abnormal/malicious
attacks.

M o n i t o r i n g S i l v e r S t r e a m A p p l i c a t i o n S e r v e r s
312
Mean response time:
The average time taken to
process the requests
coming to the server.
Secs
A sudden increase in the mean
response time is indicative of a
bottleneck on the application server.
Max response time:
The maximum time taken
to process any request
since the start of the
server.
Secs
A sudden increase in the maximum
response time is indicative of a
bottleneck on the application server.
Data transmit rate:
The rate of data
transmitted by the server
while serving client
requests.
KB/Sec
A large increase in the data
transmission rate can be indicative of
an increase in the popularity of one
or more web sites hosted on the
server. This measure is directly
related to Request_rate.
Memory utilization:
The percentage of memory
used by the SilverStream
server inside the Java
virtual machine in which it
is running.
Percent
A sudden increase in memory
utilization may be indicative of
memory leaks in the applications
running on the server. When this
measure reaches 100%, it indicates
that the SilverStream server has
reached its maximum capacity.
Total sessions:
The total number of
sessions associated with
the server.
Number
This is indicative of the number of
user sessions maintained in the
server.
Idle sessions:
The number of sessions
associated with the server,
which is in idle state.
Number
This measure is indicative of the
number of user sessions waiting for
further user requests.

M o n i t o r i n g J R u n A p p l i c a t i o n S e r v e r s
313
Monitoring JRun Application
Servers
JRun is an application server from Macromedia that is based on Sun Microsystems' Java 2 Platform,
Enterprise Edition (J2EE). JRun consists of Java Server Page (JSP), Java servlets, Enterprise
JavaBeans, the Java Transaction Service (JTS), and the Java Messaging Service (JMS). JRun works
with the most popular Web servers including Apache, Microsoft's Internet Information Server (IIS),
and any other Web server that supports Internet Server Application Program Interface (ISAPI) or the
Web's common gateway interface (CGI).
If the JRun application server is unable to process the business logic swiftly and efficiently, end-users
are bound to experience a significant slowdown in the responsiveness of the web application they
interact with. To ensure that the applications supported by the JRun server function optimally at all
times, constant monitoring of the JRun server’s availability and internal operations is essential.
eG Enterprise presents a hierarchical JRun monitoring model (see Figure 7.1), which executes
diagnostic tests on the JRun server to extract a wide variety of performance heuristics. Using these
statistics, administrators can guage the following:
Does the JRun server have adequate threads for handling its current and anticipated
workload? Are too many requests waiting for threads?
Is the server able to process requests quickly?
Are there any requests for which processing has been delayed significantly?
Have any requests been dropped by the server?
Are too many requests awaiting processing?
How quickly does the server respond to a request?
Has sufficient memory been allocated to the server to serve requests effectively?
Is the user activity on the server unusually high?
Chapter
7
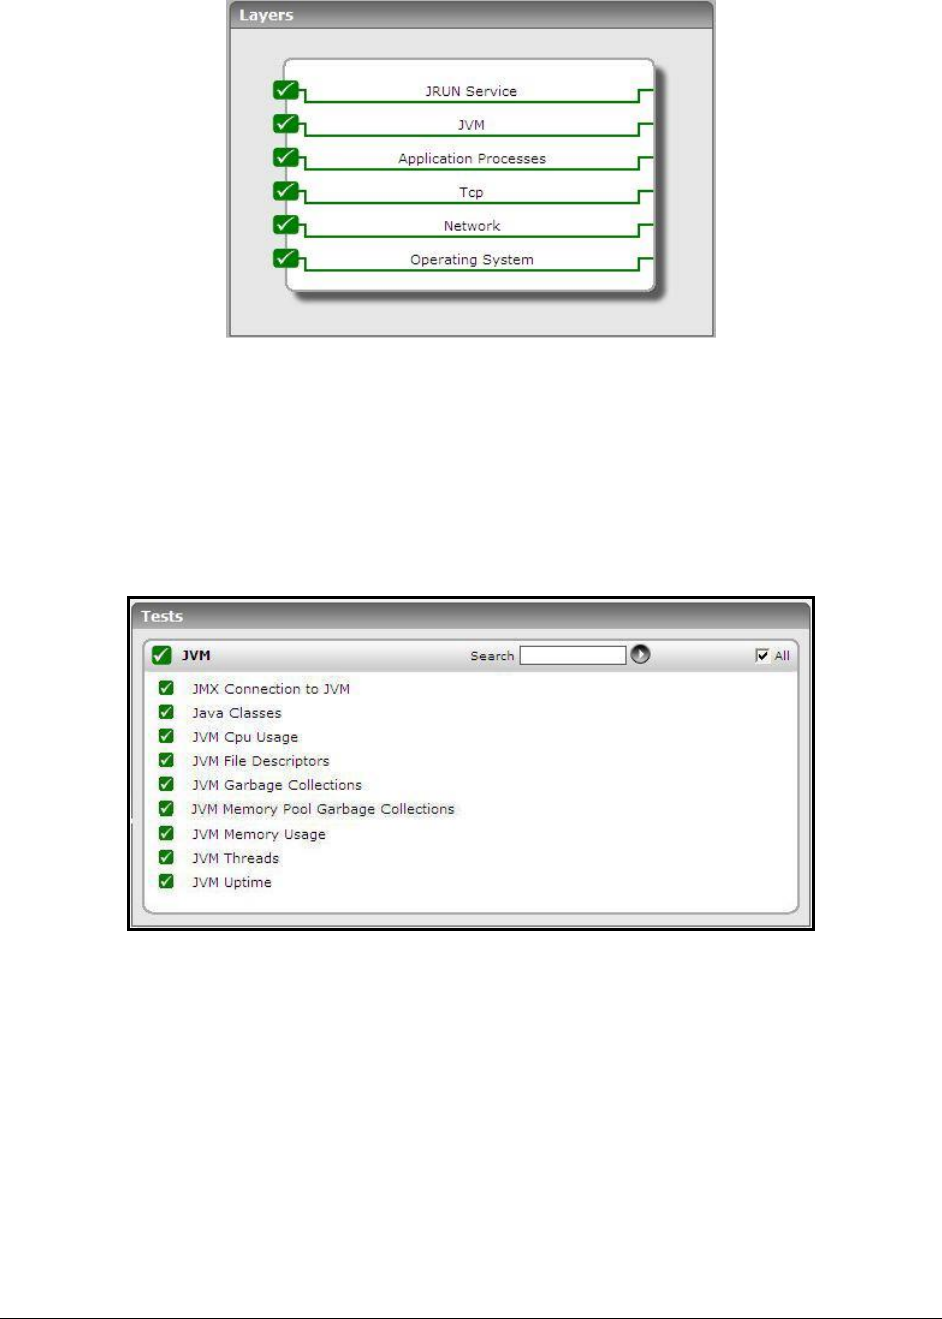
M o n i t o r i n g J R u n A p p l i c a t i o n S e r v e r s
314
Figure 7.1: Layer model for a JRun application server
The sections to come will discuss the JVM and JRUN Service layers only, as the other layers have been
discussed elaborately in the Monitoring Unix and Windows Servers document.
7.1 The JVM Layer
This layer collectively reports the resource usage and overall health of the JRun JVM.
Figure 7.2: The tests mapped to the JVM layer
All the tests listed in Figure 7.2 have been discussed in the previous chapters.
7.2 The JRUN Service Layer
This layer tracks the health of the JRun service. The status of the JRUN Service layer is determined by
the results of three tests, namely: JRunThread test, JRunService test and JRunServer test.
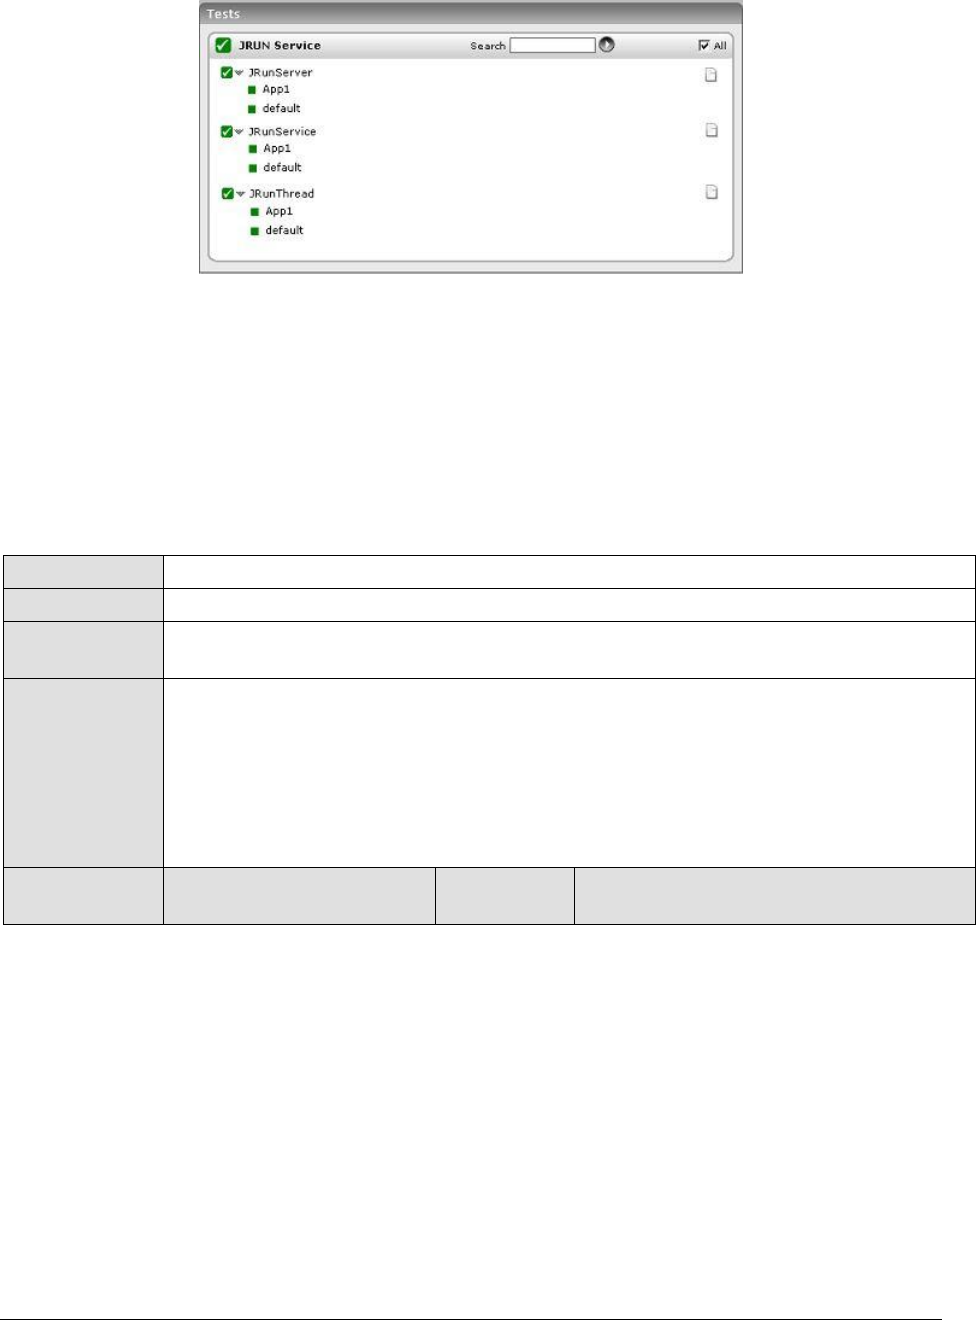
M o n i t o r i n g J R u n A p p l i c a t i o n S e r v e r s
315
Figure 7.3: Tests mapping to the JRUN Service layer
7.2.1 JRun Threads Test
The JRun server includes a thread pool, wherein each thread in the pool is used to service an incoming
request. The size of the thread pool is dynamically increased / decreased depending on the rate of
incoming requests. Since a single JRun server may comprise of multiple instances, the JrunThread test
monitors the thread pool usage for each of the server instances. One set of results is reported per
instance of a JRun server. In Figure 7.3, there are two instances of the JRun server. Hence, two sets
of results are reported corresponding to the default, App1 instances.
Purpose
To measure the thread pool usage of all the server instances of a JRun server
Target of the test
An Allaire JRun Server
Agent deploying
the test
An internal agent
Configurable
parameters for
the test
1. TEST PERIOD - How often should the test be executed
2. HOST - The host for which the test is to be configured.
3. PORT - The port number on which the host is listening
4. HOMEDIR - The directory in which the JRun server has been installed
In Windows environments, if the JRun server is installed at d:\program
files\allaire\jrun, HomeDir has to be set to d:\progra~1\allaire\jrun.
Measurements
made by the test
Measurement
Measurement
Unit
Interpretation

M o n i t o r i n g J R u n A p p l i c a t i o n S e r v e r s
316
Thread utilization:
This indicates the
percentage of existing
threads, which are
currently active.
Percent
A value consistently close to 100% is
indicative of a bottleneck in the JRun
server. In this case, incoming requests
may have to wait for threads to be
available to process the requests and the
user may see an increased delay while
accessing the server.
To improve the performance of a JRun
server 3.0, consider increasing the
jcp.endpoint.main.active.threads
property in the local.properties
configuration file (residing in the
JRUN_HOME_DIR>/servers/servername),
so that the server can allocate more
threads for processing user requests.
In case of a JRun server 4.0 modify the
activeHandlerThreads attribute of the
WebService in the jrun.xml file located
in the
<JRUN_HOME_DIR>/servers/<SERVER_NAM
E>/SERVER-INF directory.
If the value of this metric is below 20%,
the thread pool size may be set to be too
large. Hence, consider reducing the
jcp.endpoint.main.active.threads
property in local.properties file of the
JRun server 3.0.
In case of a JRun server 4.0, modify the
activeHandlerThreads attribute of the
WebService in the jrun.xml file located
in the
<JRUN_HOME_DIR>/servers/<SERVER_NAM
E>/SERVER-INF directory.
M o n i t o r i n g J R u n A p p l i c a t i o n S e r v e r s
317
Waiting threads:
This indicates the number
threads that are being
queued in the server.
Number
A high value indicates that several
threads are getting queued since the
server is busy processing other threads.
To reduce this number for a JRun server
3.0, you should increase the value of the
jcp.endpoint.main.active.threads
property in the local.properties
configuration file, so that the server's
JVM can handle more threads
simultaneously. At the same time, care
must be taken to ensure that the server
does not become less efficient.
In case of a JRun server 4.0, modify the
activeHandlerThreads attribute of the
WebService in the jrun.xml file located
in the
<JRUN_HOME_DIR>/servers/<SERVER_NAM
E>/SERVER-INF directory.
Total threads:
This metric indicates the
overall number of threads
in all states in the server.
Number
This metric must be considered in
conjunction with the Thread utilization
metric. Where possible ensure that the
number of total threads is not set to be
much larger than the maximum number
of simultaneous requests expected for
the server.
7.2.2 JRun Service Test
This test monitors the processing of requests by a JRun server.
Purpose
To measure metrics related to the performance of all the server instances of a JRun
server
Target of the test
An Allaire JRun Server
Agent deploying
the test
An internal agent
Configurable
parameters for
the test
1. TEST PERIOD - How often should the test be executed
2. HOST - The host for which the test is to be configured.
3. PORT - The port number on which the host is listening
4. HOMEDIR - The directory in which the JRun server has been installed
In Windows environments, if the JRun server is installed at d:\program
files\allaire\jrun, HomeDir has to be set to d:\progra~1\allaire\jrun.
Note:
If a new server instance is added to a JRun application server while its being monitored, it will take
at least an hour for the new instance to appear in the eG monitor console.

M o n i t o r i n g J R u n A p p l i c a t i o n S e r v e r s
318
Measurements
made by the test
Measurement
Measurement
Unit
Interpretation
Avg queue time:
This value indicates the
average time a request
spends waiting for
processing by the server.
Secs
A low value here would indicate that
the server is performing optimally. An
increase in queuing delay reflects a
server bottleneck. For a JRun server
3.0, consider increasing the
jcp.endpoint.main.active.threads
property in the local.properties
file, to ensure that additional threads
are available to process incoming
requests.
In case of a JRun server 4.0, modify
the activeHandlerThreads attribute
of the WebService in the jrun.xml file
located in the
<JRUN_HOME_DIR>/servers/<SERVER_
NAME>/SERVER-INF directory.
A number of compute intensive tasks
can also end up increasing the
queuing time for a request.
Avg processing time:
This value indicates the
average time taken by the
server to process a request.
Secs
A high value here would indicate that
processing time per request is very
high, as the requests might be
performing complex/time-consuming
computation. Consider determining
which of the server side processing
tasks is compute intensive and
explore ways of minimizing the server
processing overhead.
Avg response time:
This indicates the average
time spent by a request in
queuing and processing.
Secs
An increase in response time can
occur because there are too many
simultaneous requests or because of a
bottleneck with any of the applications
executing on the server.
Data read rate:
This indicates the total rate
of data received by the
server for all incoming
requests.
KB/Sec
An unusually high value indicates an
increase in workload to the server.
The Avg queue time metric indicates
whether the increased incoming data
rate is impacting the server
performance.
Data write rate:
This indicates the total rate
of data sent by the server in
response to all incoming
requests.
KB/Sec
An unusually high value indicates an
increase in workload to the server.
The Avg queue time metric indicates
whether the increased incoming data
rate is impacting the server
performance.
M o n i t o r i n g J R u n A p p l i c a t i o n S e r v e r s
319
Delayed requests:
This value indicates the
number of requests delayed
at the server.
Number
While the Avg queue time gives an
indicator of how long requests are
being queued, this measure provides
an indicator of how many requests
were queued at the server over the
last measurement period. This value
should be close to 0 for peak
performance.
Dropped requests:
This indicates the number of
requests that were dropped
since the server could not
process them or queue
them.
Number
This value should be close to 0 at
most times. Therefore, if a JRun
server 3.0 drops a large number of
requests, consider increasing the
parameter
jcp.endpoint.main.max.threads, in
the local.properties file. This
parameter indicates the maximum
number of requests that can be
processed or queued at any instant.
In case of a JRun server 4.0, modify
the activeHandlerThreads attribute
of the WebService in the jrun.xml file
located in the
<JRUN_HOME_DIR>/servers/<SERVER_
NAME>/SERVER-INF directory.
Request rate:
This indicates the rate of
requests handled by the
JRun server.
Reqs/sec
This value is an indicator of server
workload across all its connectors.
7.2.3 JRun Server Test
This test periodically tracks the measures related to the Java virtual machine of all the instances of a
JRun server.
Purpose
To measure the metrics related to the Java virtual machine (JVM) of all the
instances of a JRun server
Target of the test
An Allaire JRun Server
Agent deploying
the test
An internal agent
Note:
If a new server instance is added to a JRun application server while its being monitored, it will take
at least hour for the new instance to appear in the eG monitor console.

M o n i t o r i n g J R u n A p p l i c a t i o n S e r v e r s
320
Configurable
parameters for
the test
1. TEST PERIOD - How often should the test be executed
2. HOST - The host for which the test is to be configured.
3. PORT - The port number on which the host is listening
4. HOMEDIR - The directory in which the JRun server has been installed
In Windows environments, if the JRun server is installed at d:\program
files\allaire\jrun, HomeDir has to be set to d:\progra~1\allaire\jrun.
Measurements
made by the test
Measurement
Measurement
Unit
Interpretation
Total server memory:
This value indicates the
total amount of memory
that is being currently used
by the server.
MB
An unusually large usage of memory
by the server is a cause for concern.
Further analysis is required to
determine whether any of the
applications running have memory
leaks. If the memory is still low,
consider starting the server with a
higher memory usage setting.
Free server memory:
This value indicates the
total amount of memory
that is not in use by the
server.
MB
A very low value of free memory is
also an indication of high memory
utilization within the JVM.
Active sessions:
This indicates the current
number of active sessions in
the server.
Number
A high value of this measure may
indicate an increase in the server
workload.
Sessions in memory:
This indicates the number of
active sessions in the server
memory. Sessions can be
persisted to a session
repository depending upon
your JRun configuration.
Number
A high value may indicate that there
are a large number of sessions
residing in the memory. Some of
these sessions might be active or
inactive. If the value is too high,
consider changing the value of
session.persistence to false. This
would stop persistence of a session
when the server is terminated.
Note:
If a new server instance is added to a JRun application server while its being monitored, it will take
at least hour for the new instance to appear in the eG monitor console.
M o n i t o r i n g O r i o n S e r v e r s
321
Monitoring Orion Servers
An Orion Server is a J2EE-compliant application server that is used in many Internet environments.
Since a minute or marked deterioration in the performance of this application server can adversely
impact the health of the web-based application it supports, it is imperative that the Orion server is
monitored continuously, and probable problems detected quickly and accurately.
eG Enterprise has designed a specialized Orion monitoring model (see Figure 8.1), that not only
monitors the Orion server top-down, but also detects problems with the server before they occur,
automatically triages the problems and assigns priorities to each, and alerts administrators
accordingly.
Figure 8.1: Layer model of an Orion/Tomcat server
The following section deals with the top layer alone, as the other layers have already been discussed
at length in the Monitoring Unix and Windows Servers document.
8.1 The Java Application Server Layer
The tests depicted by Figure 8.2 execute on this layer, and report on the thread and memory usage of
the Orion server.
Chapter
8
M o n i t o r i n g O r i o n S e r v e r s
322
Figure 8.2: Tests associated with the Java Application Server layer
8.1.1 Java Server Web Access Test
This test reports the performance statistics pertaining to the Java Virtual Machine (JVM) running on an
Orion server.
Purpose
Reports the performance statistics pertaining to the Java Virtual Machine (JVM)
running on an Orion server.
Target of the
test
An Orion server
Agent
deploying the
test
An Internal agent
Configurable
parameters for
the test
1. TEST PERIOD - How often should the test be executed
2. HOST – The host on which the Orion/Tomcat server is running
3. PORT – The port on which the specified Orion/Tomcat server is listening for
HTTP requests
4. EGURI - The JavaServerTest makes use of a file named EgPerfTest.jsp to generate
measures. By default, this file is located in the <EG_INSTALL_DIR>/lib
directory. To execute the JavaServerTest, move this file to one of the
application directories of the Orion server. On Unix, you can execute the script
/opt/egurkha/bin/setup_jserver to do this. While configuring the JavaServerTest,
specify the location of the application directory where the EgPerfTest.jsp file
resides, in the EGURI text box, in the following format:
http://<Ipaddress:portNo/directory name>. For example, assume that
the EgPerfTest.jsp is available in the JavaTest directory of the host
192.168.10.57:7077. Therefore, EGURI would be: http://192.168.10.57:7077/JavaTest.
Outputs of the
test
One set of results for the server being monitored
Measurements
made by the
test
Measurement
Measurement
Unit
Interpretation
Active threads:
Indicates the number of
active threads in the
JVM.
Number
A high value for this measure is
indicative of a high load on the JVM.

M o n i t o r i n g O r i o n S e r v e r s
323
Total memory usage:
Indicates the total
memory available in the
JVM.
MB
A high value indicates a high processing
capability of the JVM. Watch for
increasing memory usage over time,
which could indicate a memory leak in
one or more applications hosted on the
application server.
Free memory:
Indicates the unused
memory in the JVM.
MB
A very low value of free memory is an
indication of high memory utilization on
the JVM.

M o n i t o r i n g T o m c a t S e r v e r s
324
Monitoring Tomcat Servers
The Tomcat server is a Java based Web Application container that was created to run Servlets and
JavaServer Pages (JSP) in Web applications. As part of Apache's open source Jakarta project, it has
nearly become the industry accepted standard reference implementation for both the Servlets and JSP
API.
Application developers capitalize on the capabilities of the Tomcat container to build robust web
applications that provide mission-critical services to end users. Naturally, the 24 x 7 availability and
speedy responsiveness of the Tomcat server is imperative for the applications and the dependent
businesses to remain afloat.
Using the specialized monitoring model that eG Enterprise offers for the Tomcat server (see Figure
9.1), one can extensively monitor every layer of the Tomcat server, automatically correlate
performance across the layers, and accurately locate the problem source.
Figure 9.1: The layer model of the Tomcat server
Each layer depicted by Figure 9.1 performs a number of tests on the Tomcat server and evaluates the
critical aspects of Tomcat performance such as thread usage, memory management, processing
capabilities of the servlets, efficiency of the JSP engine, etc. To enable the monitoring, you will first
Chapter
9
Note:
The eG agents are capable of monitoring Tomcat version 3.x, 4.x, 5.x, and 6.0, in an agent-based
and an agentless manner.
M o n i t o r i n g T o m c a t S e r v e r s
325
have to install a custom egtomcat application (i.e., the egtomcat.war file in the <EG_INSTALL_DIR>\lib
directory) on the server. Next, if you are monitoring Tomcat 6.0, then, after war deployment, copy the
commons-logging-api.jar file in the <CATALINA_HOME>\lib directory to the <EG_AGENT_INSTALL_DIR>\lib directory.
On the other hand, if you are monitoring Tomcat 5.x, then copy the commons-logging-api.jar file in the
<CATALINA_HOME>\bin directory to the <EG_AGENT_INSTALL_DIR>\lib directory.
The eG agent can then begin monitoring the Tomcat Server. The statistics so collected enable
administrators find quick and accurate answers to persistent performance-related queries, such as the
following:
Availability monitoring
Is the Tomcat server available?
How quickly does it respond to requests?
Thread pool usage monitoring
Have adequate threads been allocated to the
pool?
Are too many threads idle?
Servlet monitoring
Is the server taking too long to process servlets?
Which servlet is contributing to the delay?
Jasper monitoring
How frequently do reloads occur?
Are the JSPs been updated often?
Connector monitoring
How quickly are connectors processing requests?
Is there a delay in request processing? If so,
which connector is responsible for the delay?
How much traffic is generated by a connector?
Have any errors occurred during request
processing?
JVM monitoring
Has the JVM been up and running continuously?
How many classes have been loaded/unloaded by
the JVM?
Is there a garbage collection bottleneck?
Does the JVM have sufficient free memory?
Session manager monitoring
Is the server workload high? How many sessions
are currently active on the server?
Were too many sessions rejected?
Cache monitoring
Are cache hits optimal?
Are disk accesses low?
The sections to come discuss the top 3 layers of the layer model, as the remaining layers have already
been discussed in the Monitoring Unix and Windows Servers document.
Note:
The eG agent can monitor a Tomcat server, only if the Tomcat server executes on JDK 1.5 or
above.
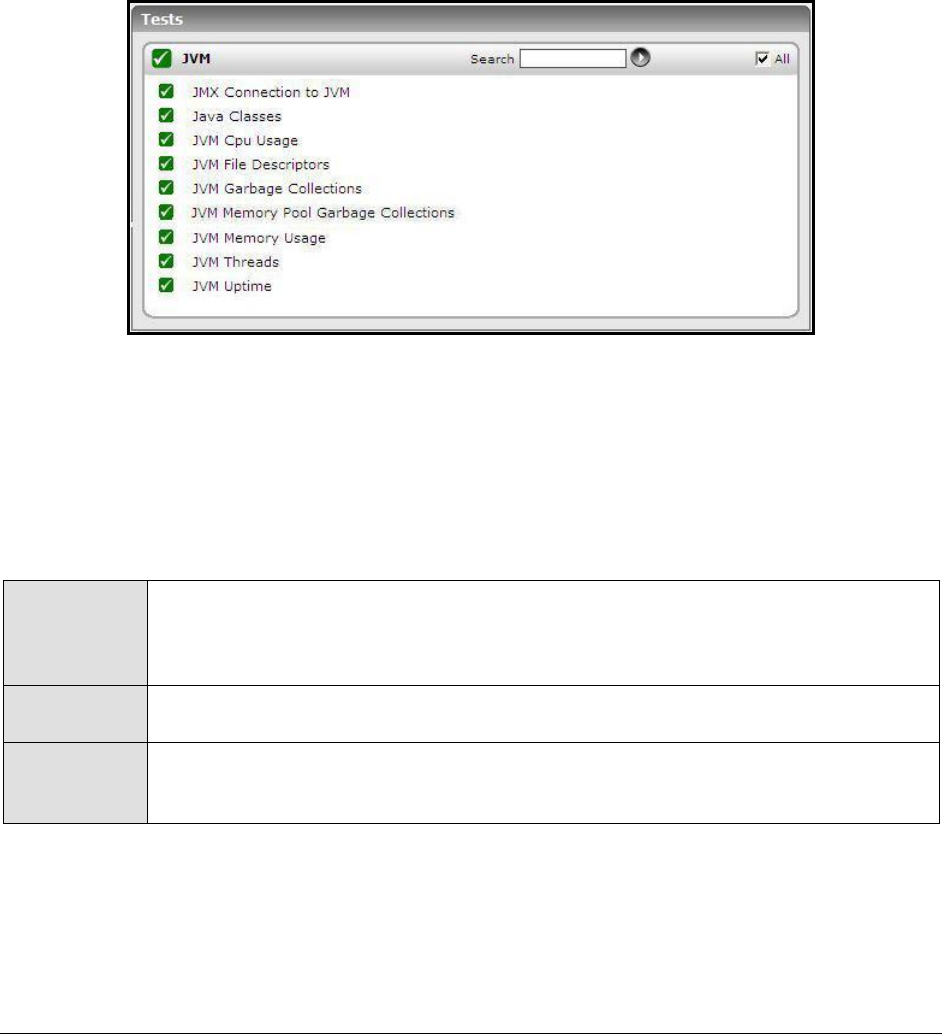
M o n i t o r i n g T o m c a t S e r v e r s
326
9.1 The JVM Layer
The tests associated with this layer provide users with valuable insight into the various aspects of Java
Virtual Machines including:
Class loading/unloading
Server availability
Garbage collection activity
Memory/CPU management
Figure 9.2: Tests associated with JVM layer
9.1.1 JMX Connection to JVM
This test reports the availability of the target Java application, and also indicates whether JMX is
enabled on the application or not. In addition, the test promptly alerts you to slowdowns experienced
by the application, and also reveals whether the application was recently restarted or not.
Purpose
Reports the availability of the target Java application, and also indicates whether
JMX is enabled on the application or not. In addition, the test promptly alerts you to
slowdowns experienced by the application, and also reveals whether the application
was recently restarted or not
Target of the
test
A Tomcat server
Agent
deploying the
test
An internal/remote agent

M o n i t o r i n g T o m c a t S e r v e r s
327
Configurable
parameters for
the test
1. TEST PERIOD - How often should the test be executed
2. HOST - The host for which the test is to be configured
3. PORT - The port number at which the specified HOST listens
4. JMX REMOTE PORT – Here, specify the port at which the JMX listens for requests
from remote hosts. Ensure that you specify the same port that you configured in
the management.properties file in the <JAVA_HOME>\jre\lib\management folder used
by the target application (refer to the Monitoring Java Applications document).
5. USER, PASSWORD, and CONFIRM PASSWORD – If JMX requires authentication only
(but no security), then ensure that the USER and PASSWORD parameters are
configured with the credentials of a user with read-write access to JMX. To know
how to create this user, refer to the Monitoring Java Applications document.
Confirm the password by retyping it in the CONFIRM PASSWORD text box.
6. JNDINAME – The JNDINAME is a lookup name for connecting to the JMX connector.
By default, this is jmxrmi. If you have registered the JMX connector in the RMI
registry using a different lookup name, then you can change this default value
to reflect the same.
Outputs of the
test
One set of results for the Java application being monitored
Measurements
made by the
test
Measurement
Measurement
Unit
Interpretation
JMX availability:
Indicates whether the target
application is available or not
and whether JMX is enabled or
not on the application.
Percent
If the value of this measure is
100%, it indicates that the Java
application is available with JMX
enabled. The value 0 on the other
hand, could indicate one/both the
following:
The Java
application is unavailable;
The Java
application is available,
but JMX is not enabled;
JMX response time:
Indicates the time taken to
connect to the JMX agent of the
Java application.
Secs
A high value could indicate a
connection bottleneck.
Has the PID changed?
Indicates whether/not the
process ID that corresponds to
the Java application has
changed.
This measure will report the value
Yes if the PID of the target
application has changed; such a
change is indicative of an
application restart. If the
application has not restarted -
i.e., if the PID has not changed -
then this measure will return the
value No.

M o n i t o r i n g T o m c a t S e r v e r s
328
9.1.2 JVM File Descriptors Test
This test reports useful statistics pertaining to file descriptors.
Purpose
Reports useful statistics pertaining to file descriptors
Target of the
test
A Tomcat server
Agent
deploying the
test
An internal/remote agent
Configurable
parameters for
the test
1. TEST PERIOD - How often should the test be executed
2. HOST - The host for which the test is to be configured
3. PORT - The port number at which the specified HOST listens
4. JMX REMOTE PORT – Here, specify the port at which the JMX listens for requests
from remote hosts. Ensure that you specify the same port that you configured in
the management.properties file in the <JAVA_HOME>\jre\lib\management folder used
by the target application (refer to the Monitoring Java Applications document).
5. USER, PASSWORD, and CONFIRM PASSWORD – If JMX requires authentication only
(but no security), then ensure that the USER and PASSWORD parameters are
configured with the credentials of a user with read-write access to JMX. To know
how to create this user, refer to the Monitoring Java Applications document.
Confirm the password by retyping it in the CONFIRM PASSWORD text box.
6. JNDINAME – The JNDINAME is a lookup name for connecting to the JMX connector.
By default, this is jmxrmi. If you have registered the JMX connector in the RMI
registry using a different lookup name, then you can change this default value
to reflect the same.
Outputs of the
test
One set of results for the Java application being monitored
Measurements
made by the
test
Measurement
Measurement
Unit
Interpretation
Open file descriptors in JVM:
Indicates the number of file
descriptors currently open for
the application.
Number
Maximum file descriptors in
JVM:
Indicates the maximum number
of file descriptors allowed for the
application.
Number
File descriptor usage by JVM:
Indicates the file descriptor
usage in percentage.
Percent

M o n i t o r i n g T o m c a t S e r v e r s
329
9.1.3 Java Classes Test
This test reports the number of classes loaded/unloaded from the memory.
Purpose
Reports the number of classes loaded/unloaded from the memory
Target of the
test
A Tomcat server
Agent
deploying the
test
An internal/remote agent

M o n i t o r i n g T o m c a t S e r v e r s
330
Configurable
parameters for
the test
1. TEST PERIOD - How often should the test be executed
2. HOST - The host for which the test is to be configured
3. PORT - The port number at which the specified HOST listens
4. MODE – This test can extract metrics from the Java application using either of
the following mechanisms:
Using SNMP-based access to the Java runtime MIB statistics;
By contacting the Java runtime (JRE) of the application via JMX
To configure the test to use SNMP, select the SNMP option. On the other hand,
choose the JMX option to configure the test to use JMX instead. By default, the
JMX option is chosen here.
5. JMX REMOTE PORT – This parameter only if the MODE is set to JMX. Here,
specify the port at which the JMX listens for requests from remote hosts. Ensure
that you specify the same port that you configured in the
management.properties file in the <JAVA_HOME>\jre\lib\management folder used by
the target application (refer to the Monitoring Java Applications document).
6. USER, PASSWORD, and CONFIRM PASSWORD – These parameters appear only if
the MODE is set to JMX. If JMX requires authentication only (but no security), then
ensure that the USER and PASSWORD parameters are configured with the
credentials of a user with read-write access to JMX. To know how to create this
user, refer to the Monitoring Java Applications document. Confirm the password
by retyping it in the CONFIRM PASSWORD text box.
7. JNDINAME – This parameter appears only if the MODE is set to JMX. The JNDINAME
is a lookup name for connecting to the JMX connector. By default, this is
jmxrmi. If you have registered the JMX connector in the RMI registry using a
different lookup name, then you can change this default value to reflect the
same.
8. SNMPPORT – This parameter appears only if the MODE is set to SNMP. Here
specify the port number through which the server exposes its SNMP MIB. Ensure
that you specify the same port you configured in the management.properties file
in the <JAVA_HOME>\jre\lib\management folder used by the target application (refer
to the Monitoring Java Applications document).
9. SNMPVERSION – This parameter appears only if the MODE is set to SNMP. The
default selection in the SNMPVERSION list is v1. However, for this test to work,
you have to select SNMP v2 or v3 from this list, depending upon which version of
SNMP is in use in the target environment.
10. SNMPCOMMUNITY – This parameter appears only if the MODE is set to SNMP.
Here, specify the SNMP community name that the test uses to communicate
with the mail server. The default is public. This parameter is specific to SNMP v1
and v2 only. Therefore, if the SNMPVERSION chosen is v3, then this parameter
will not appear.

M o n i t o r i n g T o m c a t S e r v e r s
331
11. USERNAME – This parameter appears only when v3 is selected as the
SNMPVERSION. SNMP version 3 (SNMPv3) is an extensible SNMP Framework
which supplements the SNMPv2 Framework, by additionally supporting message
security, access control, and remote SNMP configuration capabilities. To extract
performance statistics from the MIB using the highly secure SNMP v3 protocol,
the eG agent has to be configured with the required access privileges – in other
words, the eG agent should connect to the MIB using the credentials of a user
with access permissions to be MIB. Therefore, specify the name of such a user
against the USERNAME parameter.
12. AUTHPASS – Specify the password that corresponds to the above-mentioned
USERNAME. This parameter once again appears only if the SNMPVERSION
selected is v3.
13. CONFIRM PASSWORD – Confirm the AUTHPASS by retyping it here.
14. AUTHTYPE – This parameter too appears only if v3 is selected as the
SNMPVERSION. From the AUTHTYPE list box, choose the authentication
algorithm using which SNMP v3 converts the specified USERNAME and
PASSWORD into a 32-bit format to ensure security of SNMP transactions. You
can choose between the following options:
MD5 – Message Digest Algorithm
SHA – Secure Hash Algorithm
15. ENCRYPTFLAG – This flag appears only when v3 is selected as the
SNMPVERSION. By default, the eG agent does not encrypt SNMP requests.
Accordingly, the ENCRYPTFLAG is set to NO by default. To ensure that SNMP
requests sent by the eG agent are encrypted, select the YES option.
16. ENCRYPTTYPE – If the ENCRYPTFLAG is set to YES, then you will have to
mention the encryption type by selecting an option from the ENCRYPTTYPE list.
SNMP v3 supports the following encryption types:
DES – Data Encryption Standard
AES – Advanced Encryption Standard
17. ENCRYPTPASSWORD – Specify the encryption password here.
18. CONFIRM PASSWORD – Confirm the encryption password by retyping it here.
19. TIMEOUT - This parameter appears only if the MODE is set to SNMP. Here, specify
the duration (in seconds) within which the SNMP query executed by this test
should time out in the TIMEOUT text box. The default is 10 seconds.
Outputs of the
test
One set of results for the Java application being monitored
Measurements
made by the
test
Measurement
Measurement
Unit
Interpretation
Classes loaded:
Indicates the number of classes
currently loaded into memory.
Number
Classes are fundamental to the
design of Java programming
language. Typically, Java
M o n i t o r i n g T o m c a t S e r v e r s
332
Classes unloaded:
Indicates the number of classes
currently unloaded from
memory.
Number
applications install a variety of
class loaders (that is, classes that
implement java.lang.ClassLoader)
to allow different portions of the
container, and the applications
running on the container, to have
access to different repositories of
available classes and resources. A
consistent decrease in the
number of classes loaded and
unloaded could indicate a road-
block in the loading/unloading of
classes by the class loader. If left
unchecked, critical
resources/classes could be
rendered inaccessible to the
application, thereby severely
affecting its performance.
Total classes loaded:
Indicates the total number of
classes loaded into memory
since the JVM started, including
those subsequently unloaded.
Number
9.1.4 JVM Garbage Collections Test
Manual memory management is time consuming, and error prone. Most programs still contain leaks.
This is all doubly true with programs using exception-handling and/or threads. Garbage collection (GC)
is a part of a Java application’s JVM that automatically determines what memory a program is no
longer using, and recycles it for other use. It is also known as "automatic storage (or memory)
reclamation''. The JVM Garbage Collections test reports the performance statistics pertaining to the
JVM's garbage collection.
Purpose
Reports the performance statistics pertaining to the JVM's garbage collection
Target of the
test
A Tomcat server
Agent
deploying the
test
An internal/remote agent

M o n i t o r i n g T o m c a t S e r v e r s
333
Configurable
parameters for
the test
1. TEST PERIOD - How often should the test be executed
2. HOST - The host for which the test is to be configured
3. PORT - The port number at which the specified HOST listens
4. MODE – This test can extract metrics from the Java application using either of
the following mechanisms:
Using SNMP-based access to the Java runtime MIB statistics;
By contacting the Java runtime (JRE) of the application via JMX
To configure the test to use SNMP, select the SNMP option. On the other hand,
choose the JMX option to configure the test to use JMX instead. By default, the
JMX option is chosen here.
5. JMX REMOTE PORT – This parameter appears only if the MODE is set to JMX.
Here, specify the port at which the JMX listens for requests from remote hosts.
Ensure that you specify the same port that you configured in the
management.properties file in the <JAVA_HOME>\jre\lib\management folder used by
the target application (refer to the Monitoring Java Applications document).
6. USER, PASSWORD, and CONFIRM PASSWORD – These parameters appear only if
the MODE is set to JMX. If JMX requires authentication only (but no security), then
ensure that the USER and PASSWORD parameters are configured with the
credentials of a user with read-write access to JMX. To know how to create this
user, refer to the Monitoring Java Applications document. Confirm the password
by retyping it in the CONFIRM PASSWORD text box.
7. JNDINAME – This parameter appears only if the MODE is set to JMX. The JNDINAME
is a lookup name for connecting to the JMX connector. By default, this is
jmxrmi. If you have registered the JMX connector in the RMI registry using a
different lookup name, then you can change this default value to reflect the
same.
8. SNMPPORT – This parameter appears only if the MODE is set to SNMP. Here
specify the port number through which the server exposes its SNMP MIB. Ensure
that you specify the same port you configured in the management.properties file
in the <JAVA_HOME>\jre\lib\management folder used by the target application (refer
to the Monitoring Java Applications document).
9. SNMPVERSION – This parameter appears only if the MODE is set to SNMP. The
default selection in the SNMPVERSION list is v1. However, for this test to work,
you have to select SNMP v2 or v3 from this list, depending upon which version of
SNMP is in use in the target environment.
10. SNMPCOMMUNITY – This parameter appears only if the MODE is set to SNMP.
Here, specify the SNMP community name that the test uses to communicate
with the mail server. The default is public. This parameter is specific to SNMP v1
and v2 only. Therefore, if the SNMPVERSION chosen is v3, then this parameter
will not appear.

M o n i t o r i n g T o m c a t S e r v e r s
334
11. USERNAME – This parameter appears only when v3 is selected as the
SNMPVERSION. SNMP version 3 (SNMPv3) is an extensible SNMP Framework
which supplements the SNMPv2 Framework, by additionally supporting message
security, access control, and remote SNMP configuration capabilities. To extract
performance statistics from the MIB using the highly secure SNMP v3 protocol,
the eG agent has to be configured with the required access privileges – in other
words, the eG agent should connect to the MIB using the credentials of a user
with access permissions to be MIB. Therefore, specify the name of such a user
against the USERNAME parameter.
12. AUTHPASS – Specify the password that corresponds to the above-mentioned
USERNAME. This parameter once again appears only if the SNMPVERSION
selected is v3.
13. CONFIRM PASSWORD – Confirm the AUTHPASS by retyping it here.
14. AUTHTYPE – This parameter too appears only if v3 is selected as the
SNMPVERSION. From the AUTHTYPE list box, choose the authentication
algorithm using which SNMP v3 converts the specified USERNAME and
PASSWORD into a 32-bit format to ensure security of SNMP transactions. You
can choose between the following options:
MD5 – Message Digest Algorithm
SHA – Secure Hash Algorithm
15. ENCRYPTFLAG – This flag appears only when v3 is selected as the
SNMPVERSION. By default, the eG agent does not encrypt SNMP requests.
Accordingly, the ENCRYPTFLAG is set to NO by default. To ensure that SNMP
requests sent by the eG agent are encrypted, select the YES option.
16. ENCRYPTTYPE – If the ENCRYPTFLAG is set to YES, then you will have to
mention the encryption type by selecting an option from the ENCRYPTTYPE list.
SNMP v3 supports the following encryption types:
DES – Data Encryption Standard
AES – Advanced Encryption Standard
17. ENCRYPTPASSWORD – Specify the encryption password here.
18. CONFIRM PASSWORD – Confirm the encryption password by retyping it here.
19. TIMEOUT - This parameter appears only if the MODE is set to SNMP. Here, specify
the duration (in seconds) within which the SNMP query executed by this test
should time out in the TIMEOUT text box. The default is 10 seconds.
Outputs of the
test
One set of results for the Java application being monitored
Measurements
made by the
Measurement
Measurement
Unit
Interpretation
M o n i t o r i n g T o m c a t S e r v e r s
335
test
No of garbage collections
started:
Indicates the number of times
garbage collection started to
release dead objects form
memory during the last
measurement period.
Number
Time taken for garbage
collection:
Indicates the time taken to
perform the current garbage
collection operation.
Secs
Ideally, the value of both these
measures should be low. This is
because, the garbage collection
(GC) activity tends to suspend
the operations of the application
until such time that GC ends.
Longer the GC time, longer it
would take for the application to
resume its functions. To minimize
the impact of GC on application
performance, it is best to ensure
that GC activity does not take too
long to complete.
Percent of time spent by JVM
for garbage collection:
Indicates the percentage of time
spent by JVM in garbage
collection during the last
measurement period.
Percent
9.1.4.1.1 JVM Memory Pool Garbage Collections Test
While the JVM Garbage Collections test reports statistics indicating how well each collector on the JVM
performs garbage collection, the measures reported by the JVM Memory Pool Garbage Collections test help
assess the impact of the garbage collection activity on the availability and usage of memory in each
memory pool of the JVM. Besides revealing the count of garbage collections per collector and the time
taken by each collector to perform garbage collection on the individual memory pools, the test also
compares the amount of memory used and available for use pre and post garbage collection in each of
the memory pools. This way, the test enables administrators to guage the effectiveness of the
garbage collection activity on the memory pools, and helps them accurately identify those memory
pools where enough memory could not reclaimed or where the garbage collectors spent too much
time.
Purpose
Helps assess the impact of the garbage collection activity on the availability and
usage of memory in each memory pool of the JVM
Target of the
test
A Tomcat Server
Agent
deploying the
test
An internal/remote agent

M o n i t o r i n g T o m c a t S e r v e r s
336
Configurable
parameters for
the test
1. TEST PERIOD - How often should the test be executed
2. HOST - The host for which the test is to be configured
3. PORT - The port number at which the specified HOST listens
4. MEASURE MODE - This test allows you the option to collect the desired metrics
using one of the following methodologies:
By contacting the Java runtime (JRE) of the application via JMX
Using GC logs
To use JMX for metrics collections, set the MEASURE MODE to JMX.
On the other hand, if you intend to use the GC log files for collecting the
required metrics, set the MEASURE MODE to Log File. In this case, you would be
required to enable GC logging. The procedure for this has been detailed in the
Monitoring Java Applications document.
5. JMX REMOTE PORT – This parameter appears only if the MODE is set to JMX.
Here, specify the port at which the JMX listens for requests from remote hosts.
Ensure that you specify the same port that you configured in the
management.properties file in the <JAVA_HOME>\jre\lib\management folder used by
the target application (refer to the Monitoring Java Applications document).
6. USER, PASSWORD, and CONFIRM PASSWORD – These parameters appear only if
the MODE is set to JMX. If JMX requires authentication only (but no security), then
ensure that the USER and PASSWORD parameters are configured with the
credentials of a user with read-write access to JMX. To know how to create this
user, refer to the Monitoring Java Applications document. Confirm the password
by retyping it in the CONFIRM PASSWORD text box.
7. JNDINAME – This parameter appears only if the MODE is set to JMX. The JNDINAME
is a lookup name for connecting to the JMX connector. By default, this is
jmxrmi. If you have registered the JMX connector in the RMI registry using a
different lookup name, then you can change this default value to reflect the
same.
8. JREHOME - This parameter will be available only if the MEASURE MODE is set to
Log File. Specify the full path to the Java Runtime Environment (JRE) used by
the target application.
9. LOGFILENAME - This parameter will be available only if the MEASURE MODE is
set to Log File. Specify the full path to the GC log file to be used for metrics
collection.
Outputs of the
test
One set of results for every GarbageCollector:MemoryPool pair on the JVM of the
server being monitored
Measurements
made by the
test
Measurement
Measurement
Unit
Interpretation
Has garbage collection
happened?:
Indicates whether garbage
collection occurred on this
memory pool in the last
measurement period.
This measure reports the value
Yes if garbage collection took
place or No if it did not take place
on the memory pool.
The numeric values that
correspond to the measure values
of Yes and No are listed below:

M o n i t o r i n g T o m c a t S e r v e r s
337
State
Value
Yes
1
No
0
Note:
By default, this measure reports
the value Yes or No to indicate
whether a GC occurred on a
memory pool or not. The graph of
this measure however, represents
the same using the numeric
equivalents – 0 or 1.
Collection count:
Indicates the number of time in
the last measurement pool
garbage collection was started
on this memory pool.
Number
Initial memory before GC:
Indicates the initial amount of
memory (in MB) that this
memory pool requests from the
operating system for memory
management during startup,
before GC process.
MB
Comparing the value of these two
measures for a memory pool will
give you a fair idea of the
effectiveness of the garbage
collection activity.
If garbage collection reclaims a
large amount of memory from the
memory pool, then the Initial
memory after GC will drop. On
the other hand, if the garbage
collector does not reclaim much
memory from a memory pool, or
if the Java application suddenly
runs a memory-intensive process
when GC is being performed, then
the Initial memory after GC may
be higher than the Initial memory
before GC.
Initial memory after GC:
Indicates the initial amount of
memory (in MB) that this
memory pool requests from the
operating system for memory
management during startup,
after GC process
MB

M o n i t o r i n g T o m c a t S e r v e r s
338
Max memory before GC:
Indicates the maximum amount
of memory that can be used for
memory management by this
memory pool, before GC
process.
MB
Comparing the value of these two
measures for a memory pool will
provide you with insights into the
effectiveness of the garbage
collection activity.
If garbage collection reclaims a
large amount of memory from the
memory pool, then the Max
memory after GC will drop. On
the other hand, if the garbage
collector does not reclaim much
memory from a memory pool, or
if the Java application suddenly
runs a memory-intensive process
when GC is being performed, then
the Max memory after GC value
may exceed the Max memory
before GC.
Max memory after GC:
Indicates the maximum amount
of memory (in MB) that can be
used for memory management
by this pool, after the GC
process.
MB
Committed memory before
GC:
Indicates the amount of memory
that is guaranteed to be
available for use by this memory
pool, before the GC process.
MB
Committed memory after GC:
Indicates the amount of memory
that is guaranteed to be
available for use by this memory
pool, after the GC process.
MB
Used memory before GC:
Indicates the amount of memory
used by this memory pool before
GC.
MB
Comparing the value of these two
measures for a memory pool will
provide you with insights into the
effectiveness of the garbage
collection activity.
If garbage collection reclaims a
large amount of memory from the
memory pool, then the Used
memory after GC may drop lower
than the Used memory before
GC. On the other hand, if the
garbage collector does not
reclaim much memory from a
memory pool, or if the Java
application suddenly runs a
memory-intensive process when
GC is being performed, then the
Used memory after GC value may
exceed the Used memory before
GC.
Used memory after GC:
Indicates the amount of memory
used by this memory pool after
GC.
MB

M o n i t o r i n g T o m c a t S e r v e r s
339
Percentage memory
collected:
Indicates the percentage of
memory collected from this pool
by the GC activity.
Percent
A high value for this measure is
indicative of a large amount of
unused memory in the pool. A
low value on the other hand
indicates that the memory pool
has been over-utilized. Compare
the value of this measure across
pools to identify the pools that
have very little free memory. If
too many pools appear to be
running short of memory, it could
indicate that the target
application is consuming too
much memory, which in the long
run, can slow down the
application significantly.
Collection duration:
Indicates the time taken by this
garbage collector for collecting
unused memory from this pool.
Mins
Ideally, the value of this measure
should be low. This is because,
the garbage collection (GC)
activity tends to suspend the
operations of the application until
such time that GC ends. Longer
the GC time, longer it would take
for the application to resume its
functions. To minimize the impact
of GC on application performance,
it is best to ensure that GC
activity does not take too long to
complete.
9.1.5 JVM Threads Test
This test reports the status of threads running in the JVM. Details of this test can be used to identify
resource-hungry threads.
Purpose
Reports the status of threads running in the JVM
Target of the
test
A Tomcat server
Agent
deploying the
test
An internal/remote agent

M o n i t o r i n g T o m c a t S e r v e r s
340
Configurable
parameters for
the test
1. TEST PERIOD - How often should the test be executed
2. HOST - The host for which the test is to be configured
3. PORT - The port number at which the specified HOST listens
4. MODE – This test can extract metrics from the Java application using either of
the following mechanisms:
Using SNMP-based access to the Java runtime MIB statistics;
By contacting the Java runtime (JRE) of the application via JMX
To configure the test to use SNMP, select the SNMP option. On the other hand,
choose the JMX option to configure the test to use JMX instead. By default, the
JMX option is chosen here.
5. JMX REMOTE PORT – This parameter appears only if the MODE is set to JMX.
Here, specify the port at which the JMX listens for requests from remote hosts.
Ensure that you specify the same port that you configured in the
management.properties file in the <JAVA_HOME>\jre\lib\management folder used by
the target application (refer to the Monitoring Java Applications document).
6. USER, PASSWORD, and CONFIRM PASSWORD – These parameters appear only if
the MODE is set to JMX. If JMX requires authentication only (but no security), then
ensure that the USER and PASSWORD parameters are configured with the
credentials of a user with read-write access to JMX. To know how to create this
user, refer to the Monitoring Java Applications document. Confirm the password
by retyping it in the CONFIRM PASSWORD text box.
7. JNDINAME – This parameter appears only if the MODE is set to JMX. The JNDINAME
is a lookup name for connecting to the JMX connector. By default, this is
jmxrmi. If you have registered the JMX connector in the RMI registry using a
different lookup name, then you can change this default value to reflect the
same.
8. SNMPPORT – This parameter appears only if the MODE is set to SNMP. Here
specify the port number through which the server exposes its SNMP MIB. Ensure
that you specify the same port you configured in the management.properties file
in the <JAVA_HOME>\jre\lib\management folder used by the target application (refer
to the Monitoring Java Applications document).
9. SNMPVERSION – This parameter appears only if the MODE is set to SNMP. The
default selection in the SNMPVERSION list is v1. However, for this test to work,
you have to select SNMP v2 or v3 from this list, depending upon which version of
SNMP is in use in the target environment.
10. SNMPCOMMUNITY – This parameter appears only if the MODE is set to SNMP.
Here, specify the SNMP community name that the test uses to communicate
with the mail server. The default is public. This parameter is specific to SNMP v1
and v2 only. Therefore, if the SNMPVERSION chosen is v3, then this parameter
will not appear.

M o n i t o r i n g T o m c a t S e r v e r s
341
11. USERNAME – This parameter appears only when v3 is selected as the
SNMPVERSION. SNMP version 3 (SNMPv3) is an extensible SNMP Framework
which supplements the SNMPv2 Framework, by additionally supporting message
security, access control, and remote SNMP configuration capabilities. To extract
performance statistics from the MIB using the highly secure SNMP v3 protocol,
the eG agent has to be configured with the required access privileges – in other
words, the eG agent should connect to the MIB using the credentials of a user
with access permissions to be MIB. Therefore, specify the name of such a user
against the USERNAME parameter.
12. AUTHPASS – Specify the password that corresponds to the above-mentioned
USERNAME. This parameter once again appears only if the SNMPVERSION
selected is v3.
13. CONFIRM PASSWORD – Confirm the AUTHPASS by retyping it here.
14. AUTHTYPE – This parameter too appears only if v3 is selected as the
SNMPVERSION. From the AUTHTYPE list box, choose the authentication
algorithm using which SNMP v3 converts the specified USERNAME and
PASSWORD into a 32-bit format to ensure security of SNMP transactions. You
can choose between the following options:
MD5 – Message Digest Algorithm
SHA – Secure Hash Algorithm
15. ENCRYPTFLAG – This flag appears only when v3 is selected as the
SNMPVERSION. By default, the eG agent does not encrypt SNMP requests.
Accordingly, the ENCRYPTFLAG is set to NO by default. To ensure that SNMP
requests sent by the eG agent are encrypted, select the YES option.
16. ENCRYPTTYPE – If the ENCRYPTFLAG is set to YES, then you will have to
mention the encryption type by selecting an option from the ENCRYPTTYPE list.
SNMP v3 supports the following encryption types:
DES – Data Encryption Standard
AES – Advanced Encryption Standard
17. ENCRYPTPASSWORD – Specify the encryption password here.
18. CONFIRM PASSWORD – Confirm the encryption password by retyping it here.
19. TIMEOUT - This parameter appears only if the MODE is set to SNMP. Here, specify
the duration (in seconds) within which the SNMP query executed by this test
should time out in the TIMEOUT text box. The default is 10 seconds.
20. DD FREQUENCY - Refers to the frequency with which detailed
diagnosis measures are to be generated for this test. The default is 1:1. This
indicates that, by default, detailed measures will be generated every time this
test runs, and also every time the test detects a problem. You can modify this
frequency, if you so desire. Also, if you intend to disable the detailed diagnosis
capability for this test, you can do so by specifying none against DD
FREQUENCY.

M o n i t o r i n g T o m c a t S e r v e r s
342
21. DETAILED DIAGNOSIS - To make diagnosis more efficient and accurate, the eG
Enterprise suite embeds an optional detailed diagnostic capability. With this
capability, the eG agents can be configured to run detailed, more elaborate tests
as and when specific problems are detected. To enable the detailed diagnosis
capability of this test for a particular server, choose the On option. To disable
the capability, click on the Off option.
The option to selectively enable/disable the detailed diagnosis capability will be
available only if the following conditions are fulfilled:
The eG manager license should allow the detailed diagnosis capability
Both the normal and abnormal frequencies configured for the detailed
diagnosis measures should not be 0.
Outputs of the
test
One set of results for the Java application being monitored
Measurements
made by the
test
Measurement
Measurement
Unit
Interpretation
Total threads:
Indicates the total number of
threads (including daemon and
non-daemon threads).
Number
Runnable threads:
Indicates the current number of
threads in a runnable state.
Number
The detailed diagnosis of this
measure, if enabled, provides the
name of the threads, the CPU
usage by the threads, the time
for which the thread was in a
blocked state, waiting state, etc.
Blocked threads:
Indicates the number of threads
that are currently in a blocked
state.
Number
If a thread is trying to take a lock
(to enter a synchronized block),
but the lock is already held by
another thread, then such a
thread is called a blocked thread.
The detailed diagnosis of this
measure, if enabled, provides in-
depth information related to the
blocked threads.

M o n i t o r i n g T o m c a t S e r v e r s
343
Waiting threads:
Indicates the number of threads
that are currently in a waiting
state.
Number
A thread is said to be in a Waiting
state if the thread enters a
synchronized block, tries to take
a lock that is already held by
another thread, and hence, waits
till the other thread notifies that it
has released the lock.
Ideally, the value of this measure
should be low. A very high value
could be indicative of excessive
waiting activity on the JVM. You
can use the detailed diagnosis of
this measure, if enabled, to figure
out which threads are currently in
the waiting state.
While waiting, the Java
application program does no
productive work and its ability to
complete the task-at-hand is
degraded. A certain amount of
waiting may be acceptable for
Java application programs.
However, when the amount of
time spent waiting becomes
excessive or if the number of
times that waits occur exceeds a
reasonable amount, the Java
application program may not be
programmed correctly to take
advantage of the available
resources. When this happens,
the delay caused by the waiting
Java application programs
elongates the response time
experienced by an end user. An
enterprise may use Java
application programs to perform
various functions. Delays based
on abnormal degradation
consume employee time and may
be costly to corporations.
Timed waiting threads:
Indicates the number of threads
in a TIMED_WAITING state.
Number
When a thread is in the
TIMED_WAITING state, it implies
that the thread is waiting for
another thread to do something,
but will give up after a specified
time out period.
To view the details of threads in
the TIMED_WAITING state, use
the detailed diagnosis of this
measure, if enabled.

M o n i t o r i n g T o m c a t S e r v e r s
344
Low CPU threads:
Indicates the number of threads
that are currently consuming
CPU lower than the value
configured in the PCT LOW CPU
UTIL THREADS text box.
Number
Medium CPU threads:
Indicates the number of threads
that are currently consuming
CPU that is higher than the value
configured in the PCT LOW CPU
UTIL THREADS text box and is
lower than or equal to the value
specified in the PCT MEDIUM CPU
UTIL THREADS text box.
Number
High CPU threads:
Indicates the number of threads
that are currently consuming
CPU that is either greater than
the percentage configured in the
PCT MEDIUM CPU UTIL THREADS
or lesser than or equal to the
value configured in the PCT HIGH
CPU UTIL THREADS text box.
Number
Ideally, the value of this measure
should be very low. A high value
is indicative of a resource
contention at the JVM. Under
such circumstances, you might
want to identify the resource-
hungry threads. To know which
threads are consuming excessive
CPU, use the detailed diagnosis of
this measure.
`
Peak threads:
Indicates the highest number of
live threads since JVM started.
Number
Started threads:
Indicates the the total number of
threads started (including
daemon, non-daemon, and
terminated) since JVM started.
Number
Daemon threads:
Indicates the current number of
live daemon threads.
Number
Deadlock threads:
Indicates the current number of
deadlocked threads.
Number
Ideally, this value should be 0. A
high value is a cause for concern,
as it indicates that many threads
are blocking one another causing
the application performance to
suffer. The detailed diagnosis of
this measure, if enabled, lists the
deadlocked threads and their
resource usage.
M o n i t o r i n g T o m c a t S e r v e r s
345
9.1.6 JVM Cpu Usage Test
This test measures the CPU utilization of the JVM. If the JVM experiences abnormal CPU usage levels,
you can use this test to instantly drill down to the threads that are contributing to the CPU spike.
Detailed stack trace information provides insights to code level information that can highlight
problems with the design of the Java application.
Purpose
Measures the CPU utilization of the JVM
Target of the
test
A Tomcat server
Agent
deploying the
test
An internal/remote agent
Note:
If the MODE for the JVM Threads test is set to SNMP, then the detailed diagnosis of this test will not
display the Blocked Time and Waited Time for the threads. To make sure that detailed diagnosis
reports these details also, do the following:
Login to the application host.
Go to the <JAVA_HOME>\jre\lib\management folder used by the target application, and edit the
management.properties file in that folder.
Append the following line to the file:
com.sun.management.enableThreadContentionMonitoring
Finally, save the file.
Note:
If you want to collect metrics for this test from the JRE MIB – i.e, if the MODE parameter of
this test is set to SNMP – then ensure that the SNMP and SNMP Trap services are up and
running on the application host.
While monitoring a Java application executing on a Windows 2003 server using SNMP,
ensure that the community string to be used during SNMP access is explicitly added when
starting the SNMP service.

M o n i t o r i n g T o m c a t S e r v e r s
346
Configurable
parameters for
the test
1. TEST PERIOD - How often should the test be executed
2. HOST - The host for which the test is to be configured
3. PORT - The port number at which the specified HOST listens
4. MODE – This test can extract metrics from the Java application using either of
the following mechanisms:
Using SNMP-based access to the Java runtime MIB statistics;
By contacting the Java runtime (JRE) of the application via JMX
To configure the test to use SNMP, select the SNMP option. On the other hand,
choose the JMX option to configure the test to use JMX instead. By default, the
JMX option is chosen here.
5. JMX REMOTE PORT – This parameter appears only if the MODE is set to JMX.
Here, specify the port at which the JMX listens for requests from remote hosts.
Ensure that you specify the same port that you configured in the
management.properties file in the <JAVA_HOME>\jre\lib\management folder used by
the target application (refer to the Monitoring Java Applications document).
6. JNDINAME – This parameter appears only if the MODE is set to JMX. The JNDINAME
is a lookup name for connecting to the JMX connector. By default, this is
jmxrmi. If you have registered the JMX connector in the RMI registry using a
different lookup name, then you can change this default value to reflect the
same.
7. USER, PASSWORD, and CONFIRM PASSWORD – These parameters appear only if
the MODE is set to JMX. If JMX requires authentication only (but no security), then
ensure that the USER and PASSWORD parameters are configured with the
credentials of a user with read-write access to JMX. To know how to create this
user, refer to the Monitoring Java Applications document. Confirm the password
by retyping it in the CONFIRM PASSWORD text box.
8. SNMPPORT – This parameter appears only if the MODE is set to SNMP. Here
specify the port number through which the server exposes its SNMP MIB. Ensure
that you specify the same port you configured in the management.properties file
in the <JAVA_HOME>\jre\lib\management folder used by the target application (refer
to the Monitoring Java Applications document).
9. SNMPVERSION – This parameter appears only if the MODE is set to SNMP. The
default selection in the SNMPVERSION list is v1. However, for this test to work,
you have to select SNMP v2 or v3 from this list, depending upon which version of
SNMP is in use in the target environment.
10. SNMPCOMMUNITY – This parameter appears only if the MODE is set to SNMP.
Here, specify the SNMP community name that the test uses to communicate
with the mail server. The default is public. This parameter is specific to SNMP v1
and v2 only. Therefore, if the SNMPVERSION chosen is v3, then this parameter
will not appear.

M o n i t o r i n g T o m c a t S e r v e r s
347
11. USERNAME – This parameter appears only when v3 is selected as the
SNMPVERSION. SNMP version 3 (SNMPv3) is an extensible SNMP Framework
which supplements the SNMPv2 Framework, by additionally supporting message
security, access control, and remote SNMP configuration capabilities. To extract
performance statistics from the MIB using the highly secure SNMP v3 protocol,
the eG agent has to be configured with the required access privileges – in other
words, the eG agent should connect to the MIB using the credentials of a user
with access permissions to be MIB. Therefore, specify the name of such a user
against the USERNAME parameter.
12. AUTHPASS – Specify the password that corresponds to the above-mentioned
USERNAME. This parameter once again appears only if the SNMPVERSION
selected is v3.
13. CONFIRM PASSWORD – Confirm the AUTHPASS by retyping it here.
14. AUTHTYPE – This parameter too appears only if v3 is selected as the
SNMPVERSION. From the AUTHTYPE list box, choose the authentication
algorithm using which SNMP v3 converts the specified USERNAME and
PASSWORD into a 32-bit format to ensure security of SNMP transactions. You
can choose between the following options:
MD5 – Message Digest Algorithm
SHA – Secure Hash Algorithm
15. ENCRYPTFLAG – This flag appears only when v3 is selected as the
SNMPVERSION. By default, the eG agent does not encrypt SNMP requests.
Accordingly, the ENCRYPTFLAG is set to NO by default. To ensure that SNMP
requests sent by the eG agent are encrypted, select the YES option.
16. ENCRYPTTYPE – If the ENCRYPTFLAG is set to YES, then you will have to
mention the encryption type by selecting an option from the ENCRYPTTYPE list.
SNMP v3 supports the following encryption types:
DES – Data Encryption Standard
AES – Advanced Encryption Standard
17. ENCRYPTPASSWORD – Specify the encryption password here.
18. CONFIRM PASSWORD – Confirm the encryption password by retyping it here.
19. TIMEOUT - This parameter appears only if the MODE is set to SNMP. Here, specify
the duration (in seconds) within which the SNMP query executed by this test
should time out in the TIMEOUT text box. The default is 10 seconds.

M o n i t o r i n g T o m c a t S e r v e r s
348
20. DD FREQUENCY - Refers to the frequency with which detailed
diagnosis measures are to be generated for this test. The default is 1:1. This
indicates that, by default, detailed measures will be generated every time this
test runs, and also every time the test detects a problem. You can modify this
frequency, if you so desire. Also, if you intend to disable the detailed diagnosis
capability for this test, you can do so by specifying none against DD
FREQUENCY.
21. DETAILED DIAGNOSIS - To make diagnosis more efficient and accurate, the eG
Enterprise suite embeds an optional detailed diagnostic capability. With this
capability, the eG agents can be configured to run detailed, more elaborate tests
as and when specific problems are detected. To enable the detailed diagnosis
capability of this test for a particular server, choose the On option. To disable
the capability, click on the Off option.
The option to selectively enable/disable the detailed diagnosis capability will be
available only if the following conditions are fulfilled:
The eG manager license should allow the detailed diagnosis capability
Both the normal and abnormal frequencies configured for the detailed
diagnosis measures should not be 0.
Outputs of the
test
One set of results for the Java application being monitored
Measurements
made by the
test
Measurement
Measurement
Unit
Interpretation
CPU utilization of JVM:
Indicates the percentage of total
available CPU time taken up by
the JVM.
Percent
If a system has multiple
processors, this value is the total
CPU time used by the JVM divided
by the number of processors on
the system.
Ideally, this value should be low.
An unusually high value or a
consistent increase in this value is
indicative of abnormal CPU usage,
and could warrant further
investigation.
In such a situation, you can use
the detailed diagnosis of this
measure, if enabled, to determine
which runnable threads are
currently utilizing excessive CPU.
The detailed diagnosis of the CPU utilization of JVM measure lists all the CPU-consuming threads
currently executing in the JVM, in the descending order of the Percentage Cpu Time of the threads; this
way, you can quickly and accurately identify CPU-intensive threads in the JVM. In addition to CPU
usage information, the detailed diagnosis also reveals the following information for every thread:
The number of times the thread was blocked during the last measurement period, the total
duration of the blocks, and the percentage of time for which the thread was blocked;
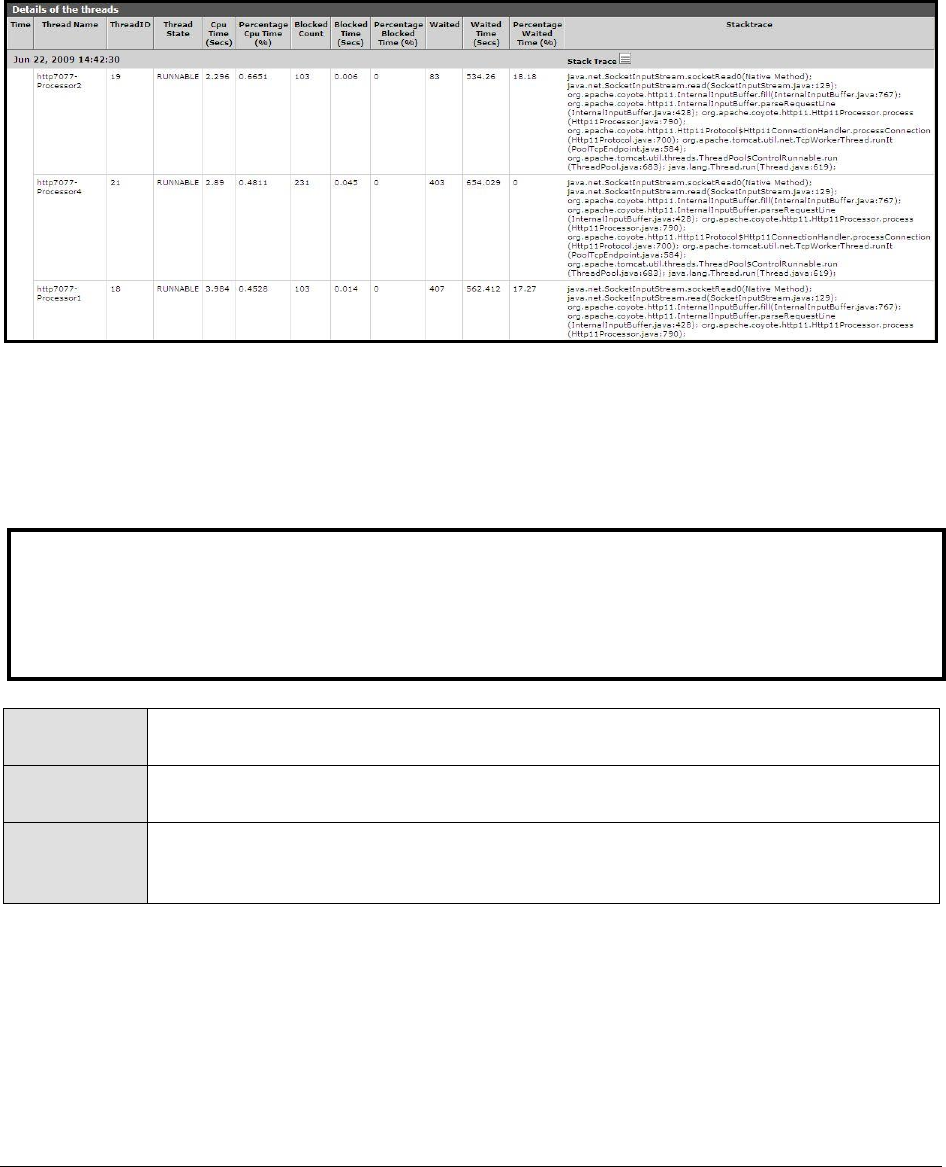
M o n i t o r i n g T o m c a t S e r v e r s
349
The number of times the thread was in wating during the last measurement period, the total
duration waited, and the percentage of time for which the thread waited;
The Stacktrace of the thread, using which you can nail the exact line of code causing the CPU
consumption of the thread to soar;
Figure 9. 3: The detailed diagnosis of the CPU utilization of JVM measure
9.1.7 JVM Memory Usage Test
This test monitors every memory type on the JVM and reports how efficiently the JVM utilizes the
memory resources of each type.
Purpose
Monitors every memory type on the JVM and reports how efficiently the JVM utilizes
the memory resources of each type
Target of the
test
A Tomcat server
Agent
deploying the
test
An internal/remote agent
Note:
This test works only on Windows platforms.
This test can provide detailed diagnosis information for only those monitored Java
applications that use JRE 1.6 or higher.

M o n i t o r i n g T o m c a t S e r v e r s
350
Configurable
parameters for
the test
1. TEST PERIOD - How often should the test be executed
2. HOST - The host for which the test is to be configured
3. PORT - The port number at which the specified HOST listens
4. MODE – This test can extract metrics from the Java application using either of
the following mechanisms:
Using SNMP-based access to the Java runtime MIB statistics;
By contacting the Java runtime (JRE) of the application via JMX
To configure the test to use SNMP, select the SNMP option. On the other hand,
choose the JMX option to configure the test to use JMX instead. By default, the
JMX option is chosen here.
5. JMX REMOTE PORT – This parameter appears only if the MODE is set to JMX.
Here, specify the port at which the JMX listens for requests from remote hosts.
Ensure that you specify the same port that you configured in the
management.properties file in the <JAVA_HOME>\jre\lib\management folder used by
the target application (refer to the Monitoring Java Applications document).
6. USER, PASSWORD, and CONFIRM PASSWORD – These parameters appear only if
the MODE is set to JMX. If JMX requires authentication only (but no security), then
ensure that the USER and PASSWORD parameters are configured with the
credentials of a user with read-write access to JMX. To know how to create this
user, refer to the Monitoring Java Applications document. Confirm the password
by retyping it in the CONFIRM PASSWORD text box.
7. JNDINAME – This parameter appears only if the MODE is set to JMX. The JNDINAME
is a lookup name for connecting to the JMX connector. By default, this is
jmxrmi. If you have registered the JMX connector in the RMI registry using a
different lookup name, then you can change this default value to reflect the
same.
8. SNMPPORT – This parameter appears only if the MODE is set to SNMP. Here
specify the port number through which the server exposes its SNMP MIB. Ensure
that you specify the same port you configured in the management.properties file
in the <JAVA_HOME>\jre\lib\management folder used by the target application (refer
to the Monitoring Java Applications document).
9. SNMPVERSION – This parameter appears only if the MODE is set to SNMP. The
default selection in the SNMPVERSION list is v1. However, for this test to work,
you have to select SNMP v2 or v3 from this list, depending upon which version of
SNMP is in use in the target environment.
10. SNMPCOMMUNITY – This parameter appears only if the MODE is set to SNMP.
Here, specify the SNMP community name that the test uses to communicate
with the mail server. The default is public. This parameter is specific to SNMP v1
and v2 only. Therefore, if the SNMPVERSION chosen is v3, then this parameter
will not appear.

M o n i t o r i n g T o m c a t S e r v e r s
351
11. USERNAME – This parameter appears only when v3 is selected as the
SNMPVERSION. SNMP version 3 (SNMPv3) is an extensible SNMP Framework
which supplements the SNMPv2 Framework, by additionally supporting message
security, access control, and remote SNMP configuration capabilities. To extract
performance statistics from the MIB using the highly secure SNMP v3 protocol,
the eG agent has to be configured with the required access privileges – in other
words, the eG agent should connect to the MIB using the credentials of a user
with access permissions to be MIB. Therefore, specify the name of such a user
against the USERNAME parameter.
12. AUTHPASS – Specify the password that corresponds to the above-mentioned
USERNAME. This parameter once again appears only if the SNMPVERSION
selected is v3.
13. CONFIRM PASSWORD – Confirm the AUTHPASS by retyping it here.
14. AUTHTYPE – This parameter too appears only if v3 is selected as the
SNMPVERSION. From the AUTHTYPE list box, choose the authentication
algorithm using which SNMP v3 converts the specified USERNAME and
PASSWORD into a 32-bit format to ensure security of SNMP transactions. You
can choose between the following options:
MD5 – Message Digest Algorithm
SHA – Secure Hash Algorithm
15. ENCRYPTFLAG – This flag appears only when v3 is selected as the
SNMPVERSION. By default, the eG agent does not encrypt SNMP requests.
Accordingly, the ENCRYPTFLAG is set to NO by default. To ensure that SNMP
requests sent by the eG agent are encrypted, select the YES option.
16. ENCRYPTTYPE – If the ENCRYPTFLAG is set to YES, then you will have to
mention the encryption type by selecting an option from the ENCRYPTTYPE list.
SNMP v3 supports the following encryption types:
DES – Data Encryption Standard
AES – Advanced Encryption Standard
17. ENCRYPTPASSWORD – Specify the encryption password here.
18. CONFIRM PASSWORD – Confirm the encryption password by retyping it here.
19. TIMEOUT - This parameter appears only if the MODE is set to SNMP. Here, specify
the duration (in seconds) within which the SNMP query executed by this test
should time out in the TIMEOUT text box. The default is 10 seconds.
20. HEAP ANALYSIS – By default, this flag is set to off. This implies that the test will
not provide detailed diagnosis information for memory usage, by default. To
trigger the collection of detailed measures, set this flag to On.
21. JAVA HOME – This parameter appears only when the HEAP ANALYSIS flag is
switched On. Here, provide the full path to the install directory of JDK 1.6 or higher
on the application host. For example, c:\JDK1.6.0.

M o n i t o r i n g T o m c a t S e r v e r s
352
22. DD FREQUENCY - Refers to the frequency with which detailed
diagnosis measures are to be generated for this test. The default is 1:1. This
indicates that, by default, detailed measures will be generated every time this
test runs, and also every time the test detects a problem. You can modify this
frequency, if you so desire. Also, if you intend to disable the detailed diagnosis
capability for this test, you can do so by specifying none against DD
FREQUENCY.
23. DETAILED DIAGNOSIS - To make diagnosis more efficient and accurate, the eG
Enterprise suite embeds an optional detailed diagnostic capability. With this
capability, the eG agents can be configured to run detailed, more elaborate tests
as and when specific problems are detected. To enable the detailed diagnosis
capability of this test for a particular server, choose the On option. To disable
the capability, click on the Off option.
The option to selectively enable/disable the detailed diagnosis capability will be
available only if the following conditions are fulfilled:
The eG manager license should allow the detailed diagnosis capability
Both the normal and abnormal frequencies configured for the detailed
diagnosis measures should not be 0.
Outputs of the
test
One set of results for every memory type on the JVM being monitored
Measurements
made by the
test
Measurement
Measurement
Unit
Interpretation
Initial memory:
Indicates the amount of memory
initially allocated at startup.
MB
Used memory:
Indicates the amount of memory
currently used.
MB
It includes the memory occupied
by all objects, including both
reachable and unreachable
objects.
Ideally, the value of this measure
should be low. A high value or a
consistent increase in the value
could indicate gradual erosion of
memory resources. In such a
situation, you can take the help of
the detailed diagnosis of this
measure (if enabled), to figure
out which class is using up
memory excessively.

M o n i t o r i n g T o m c a t S e r v e r s
353
Available memory:
Indicates the amount of memory
guaranteed to be available for
use by the JVM.
MB
The amount of Available
memory may change over time.
The Java virtual machine may
release memory to the system
and committed memory could be
less than the amount of memory
initially allocated at startup.
Committed will always be greater
than or equal to used memory.
Free memory:
Indicates the amount of memory
currently available for use by the
JVM.
MB
This is the difference between
Available memory and Used
memory.
Ideally, the value of this measure
should be high.
Max free memory:
Indicates the maximum amount
of memory allocated for the JVM.
MB
Used percentage:
Indicates the percentage of used
memory.
Percent
Ideally, the value of this measure
should be low. A very high value
of this measure could indicate
excessive memory consumption
by the JVM, which in turn, could
warrant further investigation. In
such a situation, you can take the
help of the detailed diagnosis of
this measure (if enabled), to
figure out which class is using up
memory excessively.
The detailed diagnosis of the Used memory measure, if enabled, lists all the classes that are using the
pool memory, the amount and percentage of memory used by each class, the number of instances of
each class that is currently operational, and also the percentage of currently running instances of each
class. Since this list is by default sorted in the descending order of the percentage memory usage, the
first class in the list will obviously be the leading memory consumer.
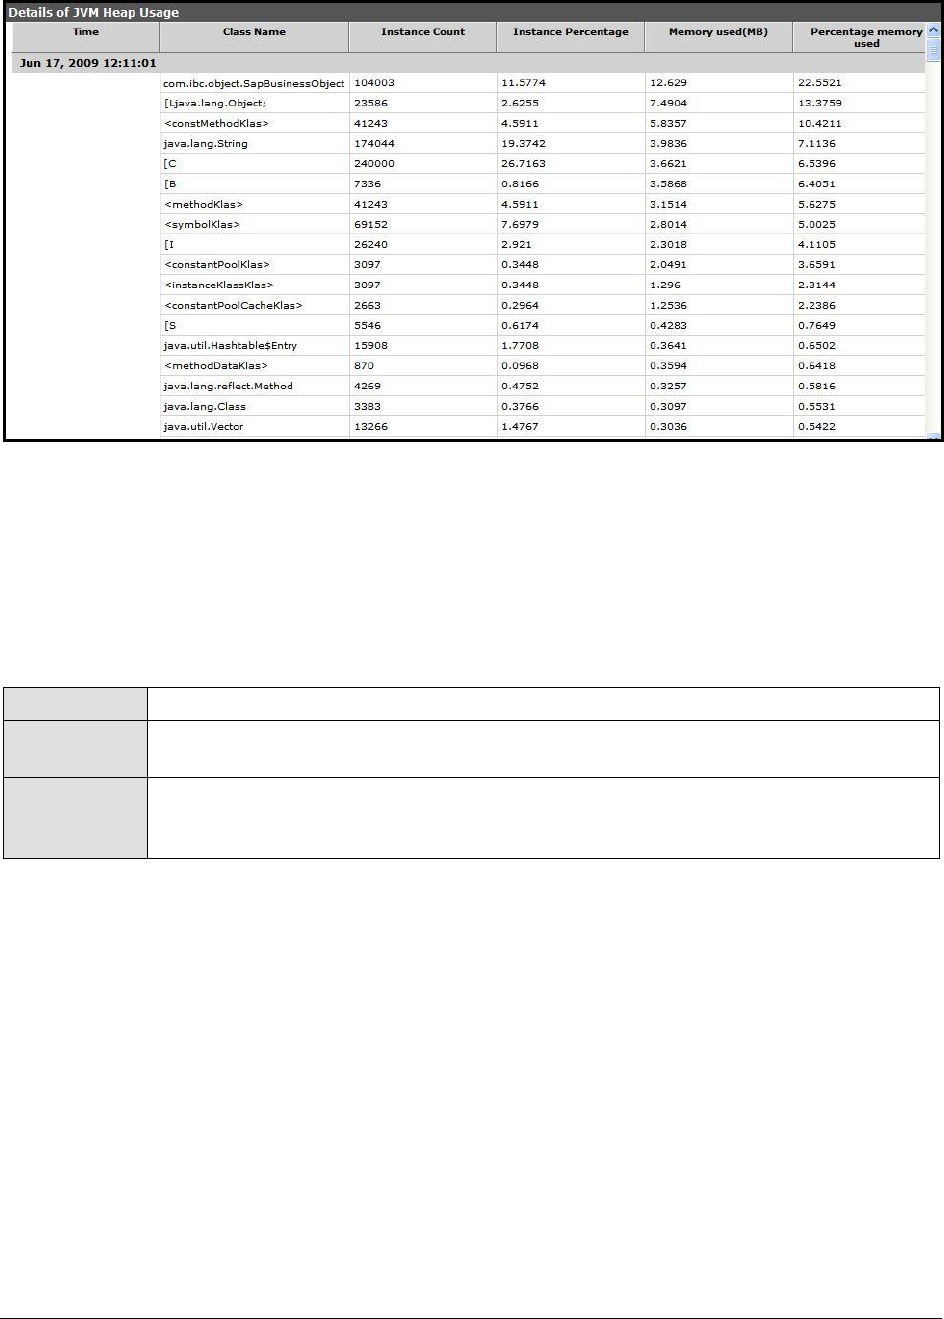
M o n i t o r i n g T o m c a t S e r v e r s
354
Figure 9. 4: The detailed diagnosis of the Used memory measure
9.1.8 JVM Uptime Test
This test tracks the uptime of a JVM. Using information provided by this test, administrators can
determine whetherthe JVM was restarted. Comparing uptime across Java applications, an admin can
determine the JVMs that have been running without any restarts for the longest time.
Purpose
Tracks the uptime of a JVM
Target of the
test
A Tomcat server
Agent
deploying the
test
An internal/remote agent

M o n i t o r i n g T o m c a t S e r v e r s
355
Configurable
parameters for
the test
1. TEST PERIOD - How often should the test be executed
2. HOST - The host for which the test is to be configured
3. PORT - The port number at which the specified HOST listens
4. MODE – This test can extract metrics from the Java application using either of
the following mechanisms:
Using SNMP-based access to the Java runtime MIB statistics;
By contacting the Java runtime (JRE) of the application via JMX
To configure the test to use SNMP, select the SNMP option. On the other hand,
choose the JMX option to configure the test to use JMX instead. By default, the
JMX option is chosen here.
5. JMX REMOTE PORT – This parameter appears only if the MODE is set to JMX.
Here, specify the port at which the JMX listens for requests from remote hosts.
Ensure that you specify the same port that you configured in the
management.properties file in the <JAVA_HOME>\jre\lib\management folder used by
the target application (refer to the Monitoring Java Applications document).
6. USER, PASSWORD, and CONFIRM PASSWORD – These parameters appear only if
the MODE is set to JMX. If JMX requires authentication only (but no security), then
ensure that the USER and PASSWORD parameters are configured with the
credentials of a user with read-write access to JMX. To know how to create this
user, refer to the Monitoring Java Applications document. Confirm the password
by retyping it in the CONFIRM PASSWORD text box.
7. JNDINAME – This parameter appears only if the MODE is set to JMX. The JNDINAME
is a lookup name for connecting to the JMX connector. By default, this is
jmxrmi. If you have registered the JMX connector in the RMI registry using a
different lookup name, then you can change this default value to reflect the
same.
8. SNMPPORT – This parameter appears only if the MODE is set to SNMP. Here
specify the port number through which the server exposes its SNMP MIB. Ensure
that you specify the same port you configured in the management.properties file
in the <JAVA_HOME>\jre\lib\management folder used by the target application (refer
to the Monitoring Java Applications document).
9. SNMPVERSION – This parameter appears only if the MODE is set to SNMP. The
default selection in the SNMPVERSION list is v1. However, for this test to work,
you have to select SNMP v2 or v3 from this list, depending upon which version of
SNMP is in use in the target environment.
10. SNMPCOMMUNITY – This parameter appears only if the MODE is set to SNMP.
Here, specify the SNMP community name that the test uses to communicate
with the mail server. The default is public. This parameter is specific to SNMP v1
and v2 only. Therefore, if the SNMPVERSION chosen is v3, then this parameter
will not appear.

M o n i t o r i n g T o m c a t S e r v e r s
356
11. USERNAME – This parameter appears only when v3 is selected as the
SNMPVERSION. SNMP version 3 (SNMPv3) is an extensible SNMP Framework
which supplements the SNMPv2 Framework, by additionally supporting message
security, access control, and remote SNMP configuration capabilities. To extract
performance statistics from the MIB using the highly secure SNMP v3 protocol,
the eG agent has to be configured with the required access privileges – in other
words, the eG agent should connect to the MIB using the credentials of a user
with access permissions to be MIB. Therefore, specify the name of such a user
against the USERNAME parameter.
12. AUTHPASS – Specify the password that corresponds to the above-mentioned
USERNAME. This parameter once again appears only if the SNMPVERSION
selected is v3.
13. CONFIRM PASSWORD – Confirm the AUTHPASS by retyping it here.
14. AUTHTYPE – This parameter too appears only if v3 is selected as the
SNMPVERSION. From the AUTHTYPE list box, choose the authentication
algorithm using which SNMP v3 converts the specified USERNAME and
PASSWORD into a 32-bit format to ensure security of SNMP transactions. You
can choose between the following options:
MD5 – Message Digest Algorithm
SHA – Secure Hash Algorithm
15. ENCRYPTFLAG – This flag appears only when v3 is selected as the
SNMPVERSION. By default, the eG agent does not encrypt SNMP requests.
Accordingly, the ENCRYPTFLAG is set to NO by default. To ensure that SNMP
requests sent by the eG agent are encrypted, select the YES option.
16. ENCRYPTTYPE – If the ENCRYPTFLAG is set to YES, then you will have to
mention the encryption type by selecting an option from the ENCRYPTTYPE list.
SNMP v3 supports the following encryption types:
DES – Data Encryption Standard
AES – Advanced Encryption Standard
17. ENCRYPTPASSWORD – Specify the encryption password here.
18. CONFIRM PASSWORD – Confirm the encryption password by retyping it here.
19. TIMEOUT - This parameter appears only if the MODE is set to SNMP. Here, specify
the duration (in seconds) within which the SNMP query executed by this test
should time out in the TIMEOUT text box. The default is 10 seconds.
M o n i t o r i n g T o m c a t S e r v e r s
357
20. DD FREQUENCY - Refers to the frequency with which detailed
diagnosis measures are to be generated for this test. The default is 1:1. This
indicates that, by default, detailed measures will be generated every time this
test runs, and also every time the test detects a problem. You can modify this
frequency, if you so desire. Also, if you intend to disable the detailed diagnosis
capability for this test, you can do so by specifying none against DD
FREQUENCY.
21. DETAILED DIAGNOSIS - To make diagnosis more efficient and accurate, the eG
Enterprise suite embeds an optional detailed diagnostic capability. With this
capability, the eG agents can be configured to run detailed, more elaborate tests
as and when specific problems are detected. To enable the detailed diagnosis
capability of this test for a particular server, choose the On option. To disable
the capability, click on the Off option.
The option to selectively enable/disable the detailed diagnosis capability will be
available only if the following conditions are fulfilled:
The eG manager license should allow the detailed diagnosis capability
Both the normal and abnormal frequencies configured for the
detailed diagnosis measures should not be 0.
Outputs of the
test
One set of results for every Java application monitored
Measurements
made by the
test
Measurement
Measurement
Unit
Interpretation
Has JVM been restarted?:
Indicates whether or not the JVM
has restarted during the last
measurement period.
If the value of this measure is No,
it indicates that the JVM has not
restarted. The value Yes on the
other hand implies that the JVM
has indeed restarted.
The numeric values that
correspond to the restart states
discussed above are listed in the
table below:
State
Value
Yes
1
No
0
Note:
By default, this measure reports
the value Yes or No to indicate
whether a JVM has restarted. The
graph of this measure however,
represents the same using the
numeric equivalents – 0 or 1.

M o n i t o r i n g T o m c a t S e r v e r s
358
Uptime during the last
measure period:
Indicates the time period that
the JVM has been up since the
last time this test ran.
Secs
If the JVM has not been restarted
during the last measurement
period and the agent has been
running continuously, this value
will be equal to the measurement
period. If the JVM was restarted
during the last measurement
period, this value will be less than
the measurement period of the
test. For example, if the
measurement period is 300 secs,
and if the JVM was restarted 120
secs back, this metric will report a
value of 120 seconds. The
accuracy of this metric is
dependent on the measurement
period – the smaller the
measurement period, greater the
accuracy.
Total uptime of the JVM:
Indicates the total time that the
JVM has been up since its last
reboot.
Secs
Administrators may wish to be
alerted if a JVM has been running
without a reboot for a very long
period. Setting a threshold for
this metric allows administrators
to determine such conditions.
9.1.9 Tests Disabled by Default for a Tomcat Server
The tests discussed above are enabled by default for a Tomcat server. In addition to these tests, the
eG agent can be optionally configured to execute a few other tests that report critical statistics related
to CPU usage, thread usage, and the uptime of the Tomcat JVM. To enable one/more of these tests,
open the AGENTS – TESTS CONFIGURATION page using the Agents -> Tests -> Configure menu sequence,
select Tomcat from the Component type list, scroll down the test list that appears to view the DISABLED
TESTS section, select the check box corresponding to the JVM test of interest to you, and then, click the
Update button. These tests have been discussed below.
9.1.9.1 Java Transactions Test
When a user initiates a transaction to a Java-based web application, the transaction typically travels
via many Java components before completing execution and sending out a response to the user.
The key Java components have been briefly described below:
Filter: A filter is a program that runs on the server before the servlet or JSP page with which
it is associated. All filters must implement javax.servlet.Filter. This interface comprises three
methods: init, doFilter, and destroy.
Servlet: A servlet acts as an intermediary between the client and the server. As servlet
modules run on the server, they can receive and respond to requests made by the client. If a
servlet is designed to handle HTTP requests, it is called an HTTP Servlet.

M o n i t o r i n g T o m c a t S e r v e r s
359
JSP: Java Server Pages are an extension to the Java servlet technology. A JSP is translated
into Java servlet before being run, and it processes HTTP requests and generates responses
like any servlet. Translation occurs the first time the application is run.
Struts: The Struts Framework is a standard for developing well-architected Web applications.
Based on the Model-View-Controller (MVC) design paradigm, it distinctly separates all three
levels (Model, View, and Control).
A delay experienced by any of the aforesaid Java components can adversely impact the total response
time of the transaction, thereby scarring the user experience with the web application. In addition,
delays in JDBC connectivity and slowdowns in SQL query executions (if the application interacts with a
database), bottlenecks in delivery of mails via the Java Mail API (if used), and any slow method calls,
can also cause insufferable damage to the 'user-perceived' health of a web application.
The challenge here for administrators is to not just isolate the slow transactions, but to also accurately
identify where the transaction slowed down and why - is it owing to inefficent JSPs? poorly written
servlets or struts? poor or the lack of any JDBC connectivity to the database? long running queries?
inefficient API calls? or delays in accessing the POJO methods? The eG JTM Monitor provides
administrators with answers to these questions!
With the help of the Java Transactions test, the eG JTM Monitor traces the route a configured web
transaction takes, and captures live the total responsiveness of the transaction and the response time
of each Java component it visits en route. This way, the solution proactively detects transaction
slowdowns, and also precisely points you to the Java components causing it - is it the Filters? JSPs?
Servlets? Struts? JDBC? SQL query? Java Mail API? or the POJO? In addition to revealing where (i.e.,
at which Java component) a transaction slowed down, the solution also provides the following
intelligent insights, on demand, making root-cause identification and resolution easier:
A look at the methods that took too long to execute, thus leading you to those methods that
may have contributed to the slowdown;
Single-click access to each invocation of a chosen method, which provides pointers to when
and where a method spent longer than desired;
A quick glance at SQL queries and Java errors that may have impacted the responsiveness of
the transaction;
Using these interesting pointers provided by the eG JTM Monitor, administrators can diagnose the root-
cause of transaction slowdowns within minutes, rapidly plug the holes, and thus ensure that their
critical web applications perform at peak capacity at all times!
Before attempting to monitor Java transactions using the eG JTM Monitor, the following configurations
will have to be performed:
1. In the <EG_INSTALL_DIR>\lib directory (on Windows; on Unix, this will be /opt/egurkha/lib) of the eG
agent, you will find the following files:
eg_jtm.jar
aspectjrt.jar
aspectjweaver.jar
jtmConn.props
jtmLogging.props
jtmOther.props
2. Login to the system hosting the Java application to be monitored.

M o n i t o r i n g T o m c a t S e r v e r s
360
3. If the eG agent will be 'remotely monitoring' the target Java application (i.e., if the Java
application is to be monitored in an 'agentless manner'), then, copy all the files mentioned above
from the <EG_INSTALL_DIR>\lib directory (on Windows; on Unix, this will be /opt/egurkha/lib) of the eG
agent to any location on the Java application host.
4. Then, proceed to edit the start-up script of the Java application being monitored, and append the
following lines to it:
set JTM_HOME=<<PATH OF THE LOCAL FOLDER CONTAINING THE JAR FILES AND PROPERTY FILES
LISTED ABOVE>>
"-javaagent:%JTM_HOME%\aspectjweaver.jar"
"-DEG_JTM_HOME=%JTM_HOME%"
Note that the above lines will change based on the operating system and the web/web application server being
monitored.
Then, add the eg_jtm.jar, aspectjrt.jar, and aspectjweaver.jar files to the CLASSPATH of the Java
application being monitored.
Finally, save the file. Once this is done, then, the next time the Java application starts, the eG JTM
Monitor scans the web requests to the application for configured URL patterns. When a match is
found, the eG JTM Monitor collects the desired metrics and stores them in memory.
Then, every time the eG agent runs the Java Transactions test, the agent will poll the eG JTM Monitor
(on the target application) for the required metrics, extract the same from the application's
memory, and report them to the eG manager.
5. Next, edit the jtmConn.props file. You will find the following lines in the file:
#Contains the connection properties of eGurkha Java Transaction Monitor
JTM_Port=13631
Designated_Agent=
By default, the JTM_Port parameter is set to 13631. If the Java application being monitored listens
on a different JTM port, then specify the same here. In this case, when managing a Java Application
using the eG administrative interface, specify the JTM_Port that you set in the jtmConn.props file as
the Port of the Java application.
Also, against the Designated_Agent parameter, specify the IP address of the eG agent which will poll
the eG JTM Monitor for metrics. If no IP address is provided here, then the eG JTM Monitor will treat
the host from which the very first 'measure request' comes in as the Designated_Agent.
6. Finally, save the jtmConn.props file.
Then, proceed to configure the Java Transactions test as discussed in Section 9.1.9.1 of this document.
Note:
In case a specific Designated_Agent is not provided, and the eG JTM Monitor treats the host from
which the very first 'measure request' comes in as the Designated_Agent, then if such a
Designated_Agent is stopped or uninstalled for any reason, the eG JTM Monitor will wait for a
maximum of 10 measure periods for that 'deemed' Designated_Agent to request for metrics. If
no requests come in for 10 consecutive measure periods, then the eG JTM Monitor will begin
responding to 'measure requests' coming in from any other eG agent.

M o n i t o r i n g T o m c a t S e r v e r s
361
9.1.9.2 JVM Details Test
This reveals the health of the Tomcat class loaders and daemon threads, and also indicates JVM
availability.
Purpose
Reveals the health of the Tomcat class loaders and daemon threads, and also
indicates JVM availability
Target of the test
Tomcat server
Agent deploying the
test
An internal agent

M o n i t o r i n g T o m c a t S e r v e r s
362
Configurable
parameters for the
test
1. TEST PERIOD - How often should the test be executed
2. HOST - The host for which the test is to be configured
3. PORT – The port number on which the Tomcat server listens
4. MEASUREMENT MODE – This test can extract metrics from Tomcat using
either of the following mechanisms:
By deploying the egtomcat.war file in the <EG_INSTALL_DIR>\lib directory of
the eG agent host on the Tomcat server;
By contacting the Java runtime (JRE) of Tomcat via JMX
To configure the test to use egtomcat.war file, first, select the War File option.
Then, refer to the Configuring and Monitoring Application Servers document
to know how to deploy the WAR file on the target Tomcat server.
On the other hand, if you want the test to use JMX instead, then first, select
the JMX option. Then, follow the procedure detailed in the Configuring and
Monitoring Application Servers document to configure the test to use JMX. By
default, the JMX option is chosen here.
5. JNDINAME – This parameter appears only if the MEASUREMENT MODE is set
to JMX. The JNDINAME is a lookup name for connecting to the JMX connector.
By default, this is jmxrmi. If you have registered the JMX connector in the
RMI registry using a different lookup name, then you can change this
default value to reflect the same.
6. JMX REMOTE PORT – This parameter appears only if the MEASUREMENT
MODE is set to JMX. Here, specify the port at which the JMX listens for
requests from remote hosts. Ensure that you specify the same port that you
configured in the catalina.sh (or catalina.bat file) file in the
<CATALINA_HOME_DIR>/bin folder of the target Tomcat server (refer to the
Configuring and Monitoring Application Servers document for more details).
7. JMX USER, JMX PASSWORD, and CONFIRM PASSWORD – These parameters
appear only if the MEASUREMENT MODE is set to JMX. If JMX requires
authentication only (but no security), then ensure that the JMX USER and JMX
PASSWORD parameters are configured with the credentials of a user with
read-write access to JMX. To know how to create this user, refer to the
Configuring and Monitoring Application Servers document. Confirm the
password by retyping it in the CONFIRM PASSWORD text box.
8. SSL - This parameter appears only if the MEASUREMENT MODE is set to War
File. Indicate YES if the Tomcat server is SSL-enabled.
9. URL - This parameter appears only if the MEASUREMENT MODE is set to War
File. Specify the URL of the managed Tomcat server to enable the test to
connect to it and extract measures from it. The URL specification should be
of the format: http://{TomcatIP}:{TomcatPort}.
10. USERNAME, PASSWORD, and CONFIRM PASSWORD – These parameters
appear only if the MEASUREMENT MODE is set to War File. In the USERNAME
text box, specify a name of a user who has been assigned the Manager role on
the Tomcat server to be monitored; these users are typically allowed to
control web applications deployed on the Tomcat server. Specify the
PASSWORD of this user, and confirm the password by retyping it in the
CONFIRM PASSWORD text box.

M o n i t o r i n g T o m c a t S e r v e r s
363
11. ENCRYPTPASS - This parameter appears only if the MEASUREMENT MODE is
set to War File. Select Yes if you want to encrypt the password.
Outputs of the test
One set of results for the Tomcat server being monitored.
Measurements
made by the test
Measurement
Measurem
ent Unit
Interpretation
Total classes loaded:
Refers to the total number of
classes that have been loaded
since the Java virtual machine
started execution.
Number
Classes loaded:
Indicates the number of
classes that have been loaded
in the Java virtual machine
since the last measurement
period.
Number
Classes are fundamental to the
design of Java programming
language. Like many server
applications, Tomcat installs a
variety of class loaders (that is,
classes that implement
java.lang.ClassLoader) to allow
different portions of the container,
and the web applications running
on the container, to have access to
different repositories of available
classes and resources. A consistent
decrease in the number of classes
loaded and unloaded could indicate
a road-block in the
loading/unloading of classes by the
class loader. If left unchecked,
critical resources/classes could be
rendered inaccessible to web
applications, thereby severely
affecting application performance.
Classes unloaded:
Indicates the total number of
classes that have been
unloaded in the Java virtual
machine since the last
measurement period.
Number
Total daemon threads:
Indicates the current number
of live daemon threads.
Number
The main function of the daemon
threads is to provide service to
other threads, running in the same
process as the daemon thread. If
the value of this measure is equal
to that of the Live_threads
measure, then JVM would stop
executing; in other words, when the
only remaining threads are the
daemon threads, then JVM shuts
down and so does Tomcat.
Live threads:
Indicates the current number
of live daemon and non-
daemon threads.
Number
M o n i t o r i n g T o m c a t S e r v e r s
364
Deadlock threads:
The current number of
deadlock threads
Number
Ideally, the value of this measure
should be 0. A non-zero value
indicates the occurrence of a
deadlock. When a thread attempts
to acquire a resource that is already
locked by another thread, a
deadlock situation arises.
Server uptime:
The uptime of Java virtual
machine
Mins
To ensure that the JVM is up and
running for a long time, you need
to make sure that at least one non-
daemon thread is executing at all
times. This is because, without any
non-daemon threads, the daemon
threads have no recipients for the
service it provides; it hence brings
down both the JVM and Tomcat.
9.1.9.3 Tomcat JVM Garbage Collection Test
Manual memory management is time consuming, and error prone. Most programs still contain leaks.
This is all doubly true with programs using exception-handling and/or threads. Garbage collection (GC)
is a part of Tomcat's JVM that automatically determines what memory a program is no longer using,
and recycles it for other use. It is also known as "automatic storage (or memory) reclamation''. The
JVMGarbage test reports the performance statistics pertaining to the JVM's garbage collection.
Purpose
Reveals how well the Tomcat's JVM performs garbage collection
Target of the test
A Tomcat server
Agent deploying the
test
An internal agent

M o n i t o r i n g T o m c a t S e r v e r s
365
Configurable
parameters for the
test
1. TEST PERIOD - How often should the test be executed
2. HOST - The host for which the test is to be configured
3. PORT – The port number on which the Tomcat server listens
4. MEASUREMENT MODE – This test can extract metrics from Tomcat using
either of the following mechanisms:
By deploying the egtomcat.war file in the <EG_INSTALL_DIR>\lib directory of
the eG agent host on the Tomcat server;
By contacting the Java runtime (JRE) of Tomcat via JMX
To configure the test to use egtomcat.war file, first, select the War File option.
Then, refer to the Configuring and Monitoring Application Servers document
to know how to deploy the WAR file on the target Tomcat server.
On the other hand, if you want the test to use JMX instead, then first, select
the JMX option. Then, follow the procedure detailed in the Configuring and
Monitoring Application Servers document to configure the test to use JMX. By
default, the JMX option is chosen here.
5. JNDINAME – This parameter appears only if the MEASUREMENT MODE is set
to JMX. The JNDINAME is a lookup name for connecting to the JMX connector.
By default, this is jmxrmi. If you have registered the JMX connector in the
RMI registry using a different lookup name, then you can change this
default value to reflect the same.
6. JMX REMOTE PORT – This parameter appears only if the MEASUREMENT
MODE is set to JMX. Here, specify the port at which the JMX listens for
requests from remote hosts. Ensure that you specify the same port that you
configured in the catalina.sh (or catalina.bat file) file in the
<CATALINA_HOME_DIR>/bin folder of the target Tomcat server (refer to the
Configuring and Monitoring Application Servers document for more details).
7. JMX USER, JMX PASSWORD, and CONFIRM PASSWORD – These parameters
appear only if the MEASUREMENT MODE is set to JMX. If JMX requires
authentication only (but no security), then ensure that the JMX USER and JMX
PASSWORD parameters are configured with the credentials of a user with
read-write access to JMX. To know how to create this user, refer to the
Configuring and Monitoring Application Servers document. Confirm the
password by retyping it in the CONFIRM PASSWORD text box.
8. SSL - This parameter appears only if the MEASUREMENT MODE is set to War
File. Indicate YES if the Tomcat server is SSL-enabled.
9. URL - This parameter appears only if the MEASUREMENT MODE is set to War
File. Specify the URL of the managed Tomcat server to enable the test to
connect to it and extract measures from it. The URL specification should be
of the format: http://{TomcatIP}:{TomcatPort}.
10. USERNAME, PASSWORD, and CONFIRM PASSWORD – These parameters
appear only if the MEASUREMENT MODE is set to War File. In the USERNAME
text box, specify a name of a user who has been assigned the Manager role on
the Tomcat server to be monitored; these users are typically allowed to
control web applications deployed on the Tomcat server. Specify the
PASSWORD of this user, and confirm the password by retyping it in the
CONFIRM PASSWORD text box.

M o n i t o r i n g T o m c a t S e r v e r s
366
11. ENCRYPTPASS - This parameter appears only if the MEASUREMENT MODE is
set to War File. Select Yes if you want to encrypt the password.
Outputs of the test
One set of results for the Tomcat server being monitored.
Measurements
made by the test
Measurement
Measurem
ent Unit
Interpretation
No of collections :
Indicates the number of
garbage collections that were
performed by the JVM since
the last measurement period.
Number
If adequate memory is not allotted
to the JVM, then the value of this
measure would be very high. A high
value of this measure is indicative
of a high frequency of GC. This is
not a good sign, as GC, during its
execution, has the tendency of
reducing the performance for
applications, and a high frequency
of GC would only adversely impact
the application's performance. To
avoid this, it is recommended that
you allot sufficient memory to the
JVM.
Time taken :
Indicates the time taken for
GC execution, since the last
measurement period.
Secs
A shorter GC execution time is
desired to avoid issues in
application performance and
database connection bottlenecks.
Elapsed time :
Indicates the percentage of
time spent on GC execution.
Percent
By carefully examining the
application behavior in terms of
memory utilization, you should
arrive at an optimal ratio of the
number of times the GC needs to
run and how long it should take to
complete. Accordingly, you can
fine-tune the GC activity.
9.1.9.4 JVM Memory Test
The memory system of the Java Virtual machines manages two types of memory, which are Heap and
Non Heap. To define Heap, the Java virtual machine is a heap that is the runtime data area from
which memory for all class instances and arrays are allocated. It is created at the Java Virtual Machine
start-up and the memory for the objects is reclaimed by an automatic memory management systems
known as Garbage collector. The Heap may be of fixed size or may be expanded and shrunk.
The Java virtual machine has a method area that is shared among all threads. This method area is
called non heap. It stores per class structures such as runtime constant pool field and method data,
and the code for methods and constructors. It is created at the Java Virtual Machine start up.
In order to ensure the uninterrupted functioning of the Tomcat server, sufficient memory resources
need to be made available to the JVM memory pools. Inadequacies in memory allocations could lead
to slow start up issues or intermittent application failures. The JVMMemoryTest periodically reports
usage statistics of the JVM memory pools, so that memory bottlenecks are promptly detected and
resolved.

M o n i t o r i n g T o m c a t S e r v e r s
367
Purpose
To indicate the memory of individual memory pools of the Java virtual machine
Target of the test
A Tomcat server
Agent deploying the
test
An internal agent

M o n i t o r i n g T o m c a t S e r v e r s
368
`Configurable
parameters for the
test
1. TEST PERIOD - How often should the test be executed
2. HOST - The host for which the test is to be configured
3. PORT – The port number on which the Tomcat server listens
4. MEASUREMENT MODE – This test can extract metrics from Tomcat using
either of the following mechanisms:
By deploying the egtomcat.war file in the <EG_INSTALL_DIR>\lib directory of
the eG agent host on the Tomcat server;
By contacting the Java runtime (JRE) of Tomcat via JMX
To configure the test to use egtomcat.war file, first, select the War File option.
Then, refer to the Configuring and Monitoring Application Servers document
to know how to deploy the WAR file on the target Tomcat server.
On the other hand, if you want the test to use JMX instead, then first, select
the JMX option. Then, follow the procedure detailed in the Configuring and
Monitoring Application Servers document to configure the test to use JMX. By
default, the JMX option is chosen here.
5. JNDINAME – This parameter appears only if the MEASUREMENT MODE is set
to JMX. The JNDINAME is a lookup name for connecting to the JMX connector.
By default, this is jmxrmi. If you have registered the JMX connector in the
RMI registry using a different lookup name, then you can change this
default value to reflect the same.
6. JMX REMOTE PORT – This parameter appears only if the MEASUREMENT
MODE is set to JMX. Here, specify the port at which the JMX listens for
requests from remote hosts. Ensure that you specify the same port that you
configured in the catalina.sh (or catalina.bat file) file in the
<CATALINA_HOME_DIR>/bin folder of the target Tomcat server (refer to the
Configuring and Monitoring Application Servers document for more details).
7. JMX USER, JMX PASSWORD, and CONFIRM PASSWORD – These parameters
appear only if the MEASUREMENT MODE is set to JMX. If JMX requires
authentication only (but no security), then ensure that the JMX USER and JMX
PASSWORD parameters are configured with the credentials of a user with
read-write access to JMX. To know how to create this user, refer to the
Configuring and Monitoring Application Servers document. Confirm the
password by retyping it in the CONFIRM PASSWORD text box.
8. SSL - This parameter appears only if the MEASUREMENT MODE is set to War
File. Indicate YES if the Tomcat server is SSL-enabled.
9. URL - This parameter appears only if the MEASUREMENT MODE is set to War
File. Specify the URL of the managed Tomcat server to enable the test to
connect to it and extract measures from it. The URL specification should be
of the format: http://{TomcatIP}:{TomcatPort}.
10. USERNAME, PASSWORD, and CONFIRM PASSWORD – These parameters
appear only if the MEASUREMENT MODE is set to War File. In the USERNAME
text box, specify a name of a user who has been assigned the Manager role on
the Tomcat server to be monitored; these users are typically allowed to
control web applications deployed on the Tomcat server. Specify the
PASSWORD of this user, and confirm the password by retyping it in the
CONFIRM PASSWORD text box.

M o n i t o r i n g T o m c a t S e r v e r s
369
11. ENCRYPTPASS - This parameter appears only if the MEASUREMENT MODE is
set to War File. Select Yes if you want to encrypt the password.
Outputs of the test
One set of results for the Tomcat server being monitored.
Measurements
made by the test
Measurement
Measurem
ent Unit
Interpretation
Used:
Indicates the amount of
memory currently in use.
MB
Free:
Indicates the amount of
unused memory currently
available in a server.
MB
Ideally, this value should be high.
An unusually low value for the
available memory can indicate a
memory bottleneck. Check the
memory utilization of individual
processes to figure out the
process(es) that has (have)
maximum memory consumption
and look to tune their memory
usages and allocations accordingly.
Initial :
Indicates the initial amount of
memory that Java virtual
machine requests from the
operating system (OS) for
memory management during
startup.
MB
An unusually high usage of memory
by the Java Virtual machine from
the OS is a cause of concern.
Further analysis is required to
determine if specific applications or
queries are consuming excess
memory.

M o n i t o r i n g T o m c a t S e r v e r s
370
Pending objects:
Indicates the number of
objects in the heap/non-heap
memory for which finalization
is pending.
Number
Finalization allows an object to
gracefully clean up after itself when
it is being collected. When the
garbage collector detects that an
object is garbage, the garbage
collector calls the object's Finalize
method (if it exists) and then the
object's memory is reclaimed - in
other words, the garbage collector
frees the memory allocated to the
object.
This measure is available only for
the Heap_Memory and
Nonheap_Memory descriptors of this
test. A high value for this measure
indicates that a chunk of heap /
non-heap memory (as the case
may be) in the JVM is awaiting
reclamation. Object finalization
facilitates efficient memory re-use,
and thus ensures that the JVM
memory pools do not run out of
memory. If the value of this
measure grows continuously, it
could imply that objects are not
releasing the memory resources
properly. This in turn could be
because the Finalize method does
not exist for some objects, or there
could be a bottleneck in the
invocation of the method. Either
way, thorough investigation can
only provide pointers to the source
of the problem.
9.2 The Web Server Layer
Using the tests associated with the Web Server layer, administrators can:
Quickly identify availability issues with the web server component of Tomcat
Effectively monitor the Tomcat cache and thread pools, and determine whether allocations are
in accordance with current and expected usage
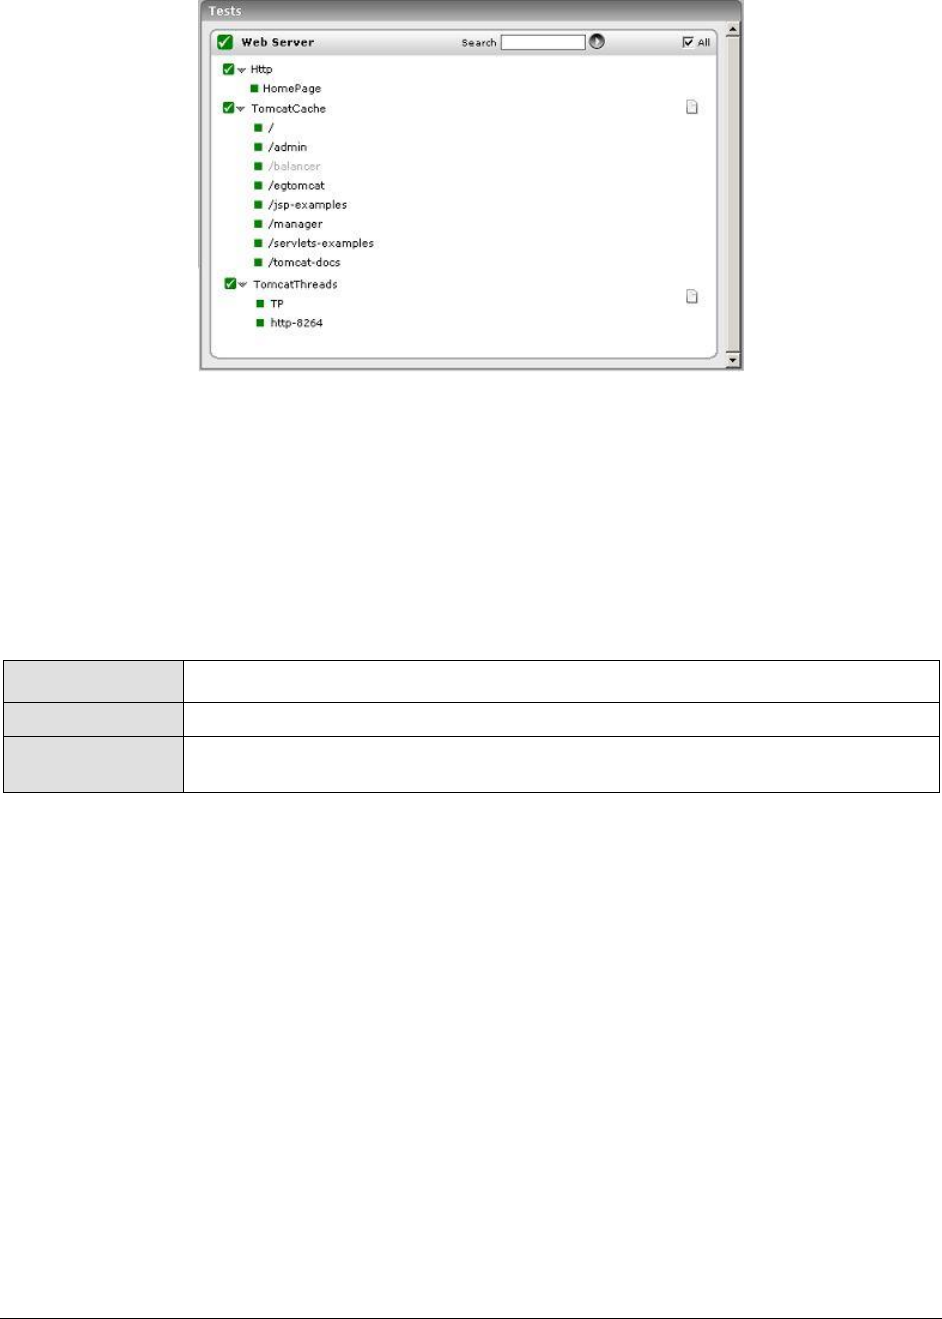
M o n i t o r i n g T o m c a t S e r v e r s
371
Figure 9.5: Tests associated with Web Server layer
The Http test associated with this layer emulates a user accessing the web server component of
Tomcat, and reports its availability and responsiveness. Since this test has been discussed elaborately
in the Monitoring Web Servers document, the sections to come will deal with the TomcatCache test
and TomcatThreads test only.
9.2.1 Tomcat Cache Test
A well-sized cache could go a long way in reducing direct disk accesses and the resultant processing
overheads. The TomcatCache test reveals whether/not the Tomcat server cache is effectively utilized.
Purpose
Reveals whether/not the Tomcat server cache is effectively utilized.
Target of the test
A Tomcat server
Agent deploying the
test
An internal agent

M o n i t o r i n g T o m c a t S e r v e r s
372
Configurable
parameters for the
test
1. TEST PERIOD - How often should the test be executed
2. HOST - The host for which the test is to be configured
3. PORT – The port number on which the Tomcat server listens
4. MEASUREMENT MODE – This test can extract metrics from Tomcat using
either of the following mechanisms:
By deploying the egtomcat.war file in the <EG_INSTALL_DIR>\lib directory of
the eG agent host on the Tomcat server;
By contacting the Java runtime (JRE) of Tomcat via JMX
To configure the test to use egtomcat.war file, first, select the War File option.
Then, refer to the Configuring and Monitoring Application Servers document
to know how to deploy the WAR file on the target Tomcat server.
On the other hand, if you want the test to use JMX instead, then first, select
the JMX option. Then, follow the procedure detailed in the Configuring and
Monitoring Application Servers document to configure the test to use JMX. By
default, the JMX option is chosen here.
5. JNDINAME – This parameter appears only if the MEASUREMENT MODE is set
to JMX. The JNDINAME is a lookup name for connecting to the JMX connector.
By default, this is jmxrmi. If you have registered the JMX connector in the
RMI registry using a different lookup name, then you can change this
default value to reflect the same.
6. JMX REMOTE PORT – This parameter appears only if the MEASUREMENT
MODE is set to JMX. Here, specify the port at which the JMX listens for
requests from remote hosts. Ensure that you specify the same port that you
configured in the catalina.sh (or catalina.bat file) file in the
<CATALINA_HOME_DIR>/bin folder of the target Tomcat server (refer to the
Configuring and Monitoring Application Servers document for more details).
7. JMX USER, JMX PASSWORD, and CONFIRM PASSWORD – These parameters
appear only if the MEASUREMENT MODE is set to JMX. If JMX requires
authentication only (but no security), then ensure that the JMX USER and JMX
PASSWORD parameters are configured with the credentials of a user with
read-write access to JMX. To know how to create this user, refer to the
Configuring and Monitoring Application Servers document. Confirm the
password by retyping it in the CONFIRM PASSWORD text box.
8. SSL - This parameter appears only if the MEASUREMENT MODE is set to War
File. Indicate YES if the Tomcat server is SSL-enabled.
9. URL - This parameter appears only if the MEASUREMENT MODE is set to War
File. Specify the URL of the managed Tomcat server to enable the test to
connect to it and extract measures from it. The URL specification should be
of the format: http://{TomcatIP}:{TomcatPort}.
10. USERNAME, PASSWORD, and CONFIRM PASSWORD – These parameters
appear only if the MEASUREMENT MODE is set to War File. In the USERNAME
text box, specify a name of a user who has been assigned the Manager role on
the Tomcat server to be monitored; these users are typically allowed to
control web applications deployed on the Tomcat server. Specify the
PASSWORD of this user, and confirm the password by retyping it in the
CONFIRM PASSWORD text box.
M o n i t o r i n g T o m c a t S e r v e r s
373
11. ENCRYPTPASS - This parameter appears only if the MEASUREMENT MODE is
set to War File. Select Yes if you want to encrypt the password.
Outputs of the test
One set of results for Tomcat server being monitored.
Measurements
made by the test
Measurement
Measurem
ent Unit
Interpretation
Access count:
The number of cache
accesses since the last
measurement period.
Number
Hits count:
Indicates the number of
requests served from the
cache since the last
measurement period.
Number
Physical I/O takes a significant
amount of time, and also increases
the CPU resources required. The
server configuration should
therefore ensure that the required
information is available on the
memory. A low value of this
measure indicates that physical I/O
is greater.
Cache size:
Indicates the current size of
cache.
KB
A high value ensures higher cache
hits and lower physical I/O.
9.2.2 TomcatThreads Test
The Http connector in the Tomcat Web server represents a Connector component that supports the
HTTP/1.1 protocol, which enables Catalina to function as a stand-alone web server, besides its ability
to execute servlets and JSP pages. A particular instance of this component listens for connections on a
specific TCP port number on the server to perform request processing and response creation. You can
have one or more such Connectors configured to form a part of a single Service with each forwarding
service to the associated Engine.
As soon as your server startup time is up, this Connector will create a number of request processing
threads which are based on the value configured for the minSpareThreads attribute. Each incoming
request requires a thread for the duration of that request. If more simultaneous requests are received
than can be handled by the currently available request processing threads, additional threads will be
created up to the configured maximum (the value of the maxThreads attribute). If still more
simultaneous requests are received, they are stacked up inside the server socket created by the
Connector, up to the configured maximum (the value of the acceptCount attribute). Any further
simultaneous requests will receive "connection refused" errors, until resources are available to process
them.
Continuous monitoring of thread pools is imperative to ensure the smooth transaction of business on
the Tomcat web server. The TomcatThreads test periodically observes thread pool usage to proactively
determine inadequacies in the allocation of threads to the pool, and to predict future thread
requirements.
Purpose
Periodically observes thread pool usage to proactively determine inadequacies in
the allocation of threads to the pool, and to predict future thread requirements

M o n i t o r i n g T o m c a t S e r v e r s
374
Target of the test
A Tomcat server
Agent deploying the
test
An internal agent

M o n i t o r i n g T o m c a t S e r v e r s
375
Configurable
parameters for the
test
1. TEST PERIOD - How often should the test be executed
2. HOST - The host for which the test is to be configured
3. PORT – The port number on which the Tomcat server listens
4. MEASUREMENT MODE – This test can extract metrics from Tomcat using
either of the following mechanisms:
By deploying the egtomcat.war file in the <EG_INSTALL_DIR>\lib directory of
the eG agent host on the Tomcat server;
By contacting the Java runtime (JRE) of Tomcat via JMX
To configure the test to use egtomcat.war file, first, select the War File option.
Then, refer to the Configuring and Monitoring Application Servers document
to know how to deploy the WAR file on the target Tomcat server.
On the other hand, if you want the test to use JMX instead, then first, select
the JMX option. Then, follow the procedure detailed in the Configuring and
Monitoring Application Servers document to configure the test to use JMX. By
default, the JMX option is chosen here.
5. JNDINAME – This parameter appears only if the MEASUREMENT MODE is set
to JMX. The JNDINAME is a lookup name for connecting to the JMX connector.
By default, this is jmxrmi. If you have registered the JMX connector in the
RMI registry using a different lookup name, then you can change this
default value to reflect the same.
6. JMX REMOTE PORT – This parameter appears only if the MEASUREMENT
MODE is set to JMX. Here, specify the port at which the JMX listens for
requests from remote hosts. Ensure that you specify the same port that you
configured in the catalina.sh (or catalina.bat file) file in the
<CATALINA_HOME_DIR>/bin folder of the target Tomcat server (refer to the
Configuring and Monitoring Application Servers document for more details).
7. JMX USER, JMX PASSWORD, and CONFIRM PASSWORD – These parameters
appear only if the MEASUREMENT MODE is set to JMX. If JMX requires
authentication only (but no security), then ensure that the JMX USER and JMX
PASSWORD parameters are configured with the credentials of a user with
read-write access to JMX. To know how to create this user, refer to the
Configuring and Monitoring Application Servers document. Confirm the
password by retyping it in the CONFIRM PASSWORD text box.
8. SSL - This parameter appears only if the MEASUREMENT MODE is set to War
File. Indicate YES if the Tomcat server is SSL-enabled.
9. URL - This parameter appears only if the MEASUREMENT MODE is set to War
File. Specify the URL of the managed Tomcat server to enable the test to
connect to it and extract measures from it. The URL specification should be
of the format: http://{TomcatIP}:{TomcatPort}.
10. USERNAME, PASSWORD, and CONFIRM PASSWORD – These parameters
appear only if the MEASUREMENT MODE is set to War File. In the USERNAME
text box, specify a name of a user who has been assigned the Manager role on
the Tomcat server to be monitored; these users are typically allowed to
control web applications deployed on the Tomcat server. Specify the
PASSWORD of this user, and confirm the password by retyping it in the
CONFIRM PASSWORD text box.

M o n i t o r i n g T o m c a t S e r v e r s
376
11. ENCRYPTPASS - This parameter appears only if the MEASUREMENT MODE is
set to War File. Select Yes if you want to encrypt the password.
Outputs of the test
One set of results for each thread pool managed by the Tomcat server being
monitored.
Measurements
made by the test
Measurement
Measurem
ent Unit
Interpretation
Thread count:
Indicates the number of
threads that are currently
assigned to a connector.
Number
Threads busy:
Indicates the number of
threads which are currently
busy in processing requests.
Number
A high value for this measure
indicates that there is hectic activity
at the connector level.
Max threads:
Indicates the maximum
number of threads that this
pool can contain.
Number
In the Tomcat server, a
maxThreads attribute can be set for
every connector to indicate the
maximum number of simultaneous
requests that can be handled by
that connector. This measure
reports this maxThreads value. The
default maxThreads value for a
connector is 200.
If the value of the Thread count
measure grows close to the value of
this measure, it indicates that the
number of threads in the pool
needs to be increased for effective
operation of this application.
Alternatively, you may also
consider changing the maximum
number of threads that a pool can
contain. However, exercise caution
when altering the maximum thread
count, as a very high thread count
can cause the app to slowdown
from excessive memory usage.
Likewise, if the maximum thread
count is set too low, it will cause
requests to block or timeout.
Max spare threads:
Indicates the maximum
number of spare threads that
can exist in a thread pool.
Number
Ideally for a connector, the default
value is set to 50, which will
determine the maximum number of
unused request processing threads
that will be allowed to exist until
the thread pool starts stopping the
unnecessary threads.
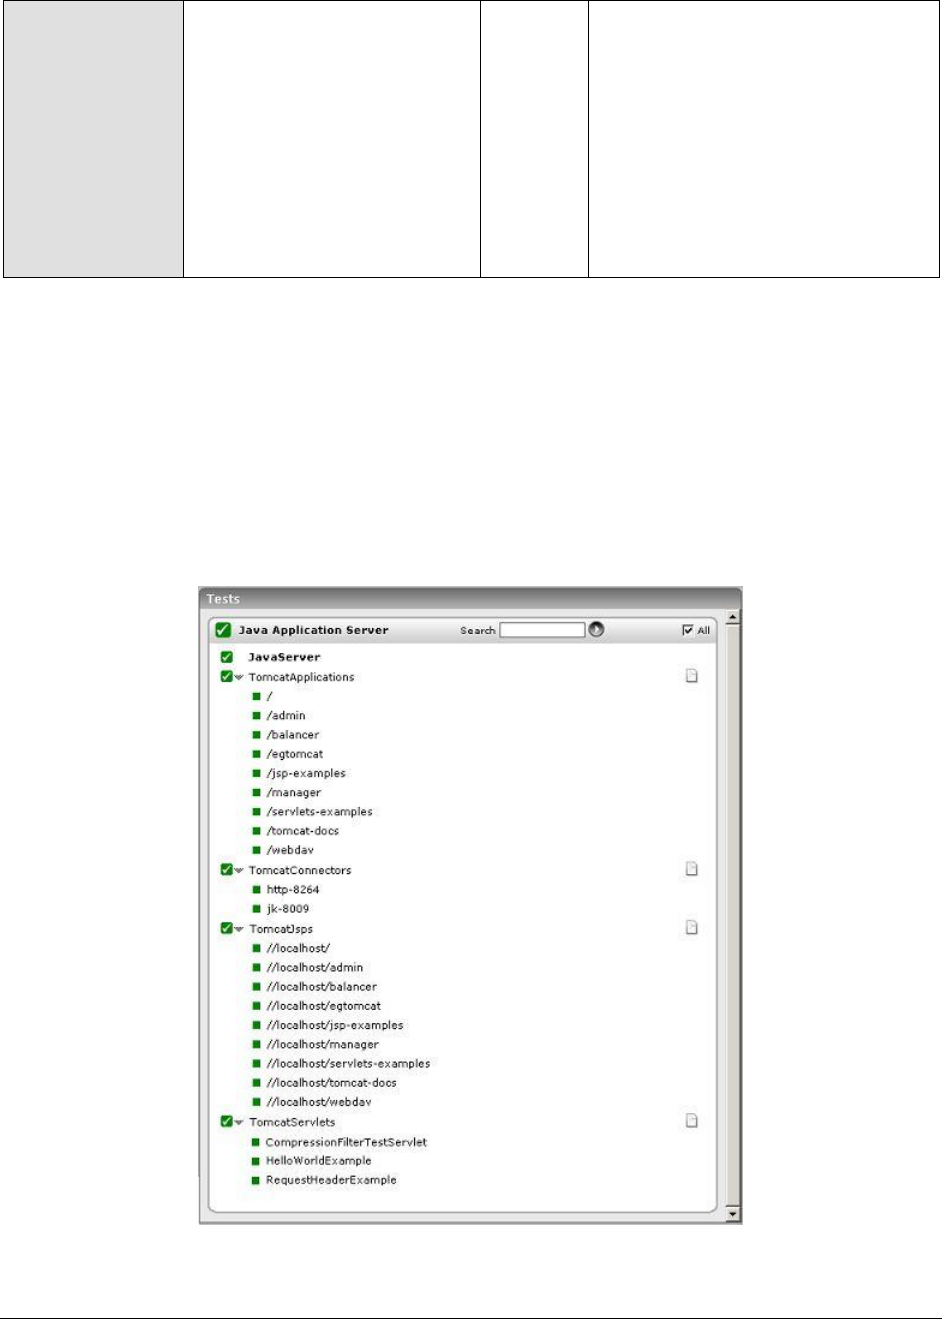
M o n i t o r i n g T o m c a t S e r v e r s
377
Min spare threads :
Indicates the minimum
number of spare threads that
are currently available for
processing requests.
Number
Generally, for a connector, the
default value for this parameter is
set to 4, which is less than the
value set in maxThreads. This
attribute will determine the number
of request processing threads that
will be created when this Connector
is first started. The connector will
also make sure it has the specified
number of idle processing threads
available.
9.3 The Java Application Server Layer
The tests associated with this layer report useful statistics related to the performance of critical
Tomcat components such as:
The Manager element
The Tomcat connector
The Tomcat JSP engine
The servlets deployed on Tomcat
Figure 9.6: Tests associated with Java Application Server layer

M o n i t o r i n g T o m c a t S e r v e r s
378
The JavaServer test that monitors the memory management capability of the Tomcat JVM has been
discussed in the Monitoring Orion Servers chapter of this document. Therefore, the sections to come
will shed light on the other tests only.
9.3.1 Tomcat Applications Test
The Manager element on the Tomcat server represents the session manager that will be used to
create and maintain HTTP sessions as requested by the associated web application. A session state is
maintained for a period, typically starting with user interactions and ending with last interaction.
Besides memory management, manager also looks into various aspects including CPU usage, network
load that large sessions introduce. The scalability and performance of any web based application
depends upon how well HTTP sessions are transmitted and managed over network.
An application must guarantee that a user's session state is properly maintained in order to exhibit
correct behavior for that user. The TomcatApplications test closely monitors the state of sessions to
every application on the Tomcat server.
Purpose
Closely monitors the state of sessions to every application on the Tomcat server
Target of the test
A Tomcat server
Agent deploying the
test
An internal agent

M o n i t o r i n g T o m c a t S e r v e r s
379
Configurable
parameters for the
test
1. TEST PERIOD - How often should the test be executed
2. HOST - The host for which the test is to be configured
3. PORT – The port number on which the Tomcat server listens
4. MEASUREMENT MODE – This test can extract metrics from Tomcat using
either of the following mechanisms:
By deploying the egtomcat.war file in the <EG_INSTALL_DIR>\lib directory of
the eG agent host on the Tomcat server;
By contacting the Java runtime (JRE) of Tomcat via JMX
To configure the test to use egtomcat.war file, first, select the War File option.
Then, refer to the Configuring and Monitoring Application Servers document
to know how to deploy the WAR file on the target Tomcat server.
On the other hand, if you want the test to use JMX instead, then first, select
the JMX option. Then, follow the procedure detailed in the Configuring and
Monitoring Application Servers document to configure the test to use JMX. By
default, the JMX option is chosen here.
5. JNDINAME – This parameter appears only if the MEASUREMENT MODE is set
to JMX. The JNDINAME is a lookup name for connecting to the JMX connector.
By default, this is jmxrmi. If you have registered the JMX connector in the
RMI registry using a different lookup name, then you can change this
default value to reflect the same.
6. JMX REMOTE PORT – This parameter appears only if the MEASUREMENT
MODE is set to JMX. Here, specify the port at which the JMX listens for
requests from remote hosts. Ensure that you specify the same port that you
configured in the catalina.sh (or catalina.bat file) file in the
<CATALINA_HOME_DIR>/bin folder of the target Tomcat server (refer to the
Configuring and Monitoring Application Servers document for more details).
7. JMX USER, JMX PASSWORD, and CONFIRM PASSWORD – These parameters
appear only if the MEASUREMENT MODE is set to JMX. If JMX requires
authentication only (but no security), then ensure that the JMX USER and JMX
PASSWORD parameters are configured with the credentials of a user with
read-write access to JMX. To know how to create this user, refer to the
Configuring and Monitoring Application Servers document. Confirm the
password by retyping it in the CONFIRM PASSWORD text box.
8. SSL - This parameter appears only if the MEASUREMENT MODE is set to War
File. Indicate YES if the Tomcat server is SSL-enabled.
9. URL - This parameter appears only if the MEASUREMENT MODE is set to War
File. Specify the URL of the managed Tomcat server to enable the test to
connect to it and extract measures from it. The URL specification should be
of the format: http://{TomcatIP}:{TomcatPort}.
10. USERNAME, PASSWORD, and CONFIRM PASSWORD – These parameters
appear only if the MEASUREMENT MODE is set to War File. In the USERNAME
text box, specify a name of a user who has been assigned the Manager role on
the Tomcat server to be monitored; these users are typically allowed to
control web applications deployed on the Tomcat server. Specify the
PASSWORD of this user, and confirm the password by retyping it in the
CONFIRM PASSWORD text box.

M o n i t o r i n g T o m c a t S e r v e r s
380
11. ENCRYPTPASS - This parameter appears only if the MEASUREMENT MODE is
set to War File. Select Yes if you want to encrypt the password.
Outputs of the test
One set of results for every application on the Tomcat server being monitored.
Measurements
made by the test
Measurement
Measurem
ent Unit
Interpretation
Active sessions:
Indicates the sessions that
are currently active.
Number
A high value for this measure is
indicative of heavy load on the
Tomcat server.
Max sessions:
Indicates the maximum
number of active sessions
that can be allowed at one
time on the Tomcat server.
Number
Expired sessions:
Indicates the number of
sessions that expired since
the last measurement period.
Number
A large number of expired sessions
could hint at the need to reset the
TIMEOUT period for sessions on the
Tomcat server.
Rejected sessions:
Indicates the number of
sessions that were rejected
since the last measurement
period.
Number
It is imperative to check if there is
any loss of session state happening
due to network congestion.
Therefore, if the value of this
measure is unusually high, the
reasons behind the unusual
occurrence would have to be
investigated. You can also consider
increasing the maximum active
session count.
9.3.2 Tomcat Connectors Test
The Http connector in the Tomcat Web server, represents a Connector component that supports the
HTTP/1.1 protocol, which enables Catalina to function as a stand-alone web server, besides its ability
to execute servlets and JSP pages. A particular instance of this component listens for connections on a
specific TCP port number on the server to perform request processing and response creation. You can
have one or more such Connectors configured to form a part of a single Service with each forwarding
service to the associated engine.
The TomcatConnectorTest observes the data traffic on each connector and measures the connector's
processing ability.
Purpose
Observes the data traffic on each connector and measures the connector's
processing ability.
Target of the test
Tomcat server
Agent deploying the
test
An internal agent

M o n i t o r i n g T o m c a t S e r v e r s
381
Configurable
parameters for the
test
1. TEST PERIOD - How often should the test be executed
2. HOST - The host for which the test is to be configured
3. PORT – The port number on which the Tomcat server listens
4. MEASUREMENT MODE – This test can extract metrics from Tomcat using
either of the following mechanisms:
By deploying the egtomcat.war file in the <EG_INSTALL_DIR>\lib directory of
the eG agent host on the Tomcat server;
By contacting the Java runtime (JRE) of Tomcat via JMX
To configure the test to use egtomcat.war file, first, select the War File option.
Then, refer to the Configuring and Monitoring Application Servers document
to know how to deploy the WAR file on the target Tomcat server.
On the other hand, if you want the test to use JMX instead, then first, select
the JMX option. Then, follow the procedure detailed in the Configuring and
Monitoring Application Servers document to configure the test to use JMX. By
default, the JMX option is chosen here.
5. JNDINAME – This parameter appears only if the MEASUREMENT MODE is set
to JMX. The JNDINAME is a lookup name for connecting to the JMX connector.
By default, this is jmxrmi. If you have registered the JMX connector in the
RMI registry using a different lookup name, then you can change this
default value to reflect the same.
6. JMX REMOTE PORT – This parameter appears only if the MEASUREMENT
MODE is set to JMX. Here, specify the port at which the JMX listens for
requests from remote hosts. Ensure that you specify the same port that you
configured in the catalina.sh (or catalina.bat file) file in the
<CATALINA_HOME_DIR>/bin folder of the target Tomcat server (refer to the
Configuring and Monitoring Application Servers document for more details).
7. JMX USER, JMX PASSWORD, and CONFIRM PASSWORD – These parameters
appear only if the MEASUREMENT MODE is set to JMX. If JMX requires
authentication only (but no security), then ensure that the JMX USER and JMX
PASSWORD parameters are configured with the credentials of a user with
read-write access to JMX. To know how to create this user, refer to the
Configuring and Monitoring Application Servers document. Confirm the
password by retyping it in the CONFIRM PASSWORD text box.
8. SSL - This parameter appears only if the MEASUREMENT MODE is set to War
File. Indicate YES if the Tomcat server is SSL-enabled.
9. URL - This parameter appears only if the MEASUREMENT MODE is set to War
File. Specify the URL of the managed Tomcat server to enable the test to
connect to it and extract measures from it. The URL specification should be
of the format: http://{TomcatIP}:{TomcatPort}.
10. USERNAME, PASSWORD, and CONFIRM PASSWORD – These parameters
appear only if the MEASUREMENT MODE is set to War File. In the USERNAME
text box, specify a name of a user who has been assigned the Manager role on
the Tomcat server to be monitored; these users are typically allowed to
control web applications deployed on the Tomcat server. Specify the
PASSWORD of this user, and confirm the password by retyping it in the
CONFIRM PASSWORD text box.

M o n i t o r i n g T o m c a t S e r v e r s
382
11. ENCRYPTPASS - This parameter appears only if the MEASUREMENT MODE is
set to War File. Select Yes if you want to encrypt the password.
Outputs of the test
One set of results for every connector configured on the Tomcat server being
monitored.
Measurements
made by the test
Measurement
Measurem
ent Unit
Interpretation
Request count:
Indicates the number of
requests received by the
connector, since the last
measurement period.
Number
Avg processing time:
Indicates the average time
taken by the connector to
process requests.
Secs
This measure is a clear indicator of
the Connector health. Ideally, this
value should be low. A very high
value indicates processing
bottlenecks.
Data sent:
Reports the data that was
sent by the connector since
the last measurement period.
KB
Data received:
Reports the data that was
received by the connector
since the last measurement
period.
KB
Both the Data sent and Data
received measures together
indicate the load on the Tomcat
server.
Error count:
Indicates the number of
errors that were reported by
the connector since the last
measurement period.
Number
Ideally, the value of this measure
should be 0. A non-zero value
warrants further investigation.
9.3.3 Tomcat Jsps Test
The TomcatJsps test monitors the performance of the JSPs used by each of the applications deployed
on Tomcat.
Purpose
Monitors the performance of the JSPs used by each of the applications deployed
on Tomcat
Target of the test
A Tomcat server
Agent deploying the
test
An internal agent

M o n i t o r i n g T o m c a t S e r v e r s
383
Configurable
parameters for the
test
1. TEST PERIOD - How often should the test be executed
2. HOST - The host for which the test is to be configured
3. PORT – The port number on which the Tomcat server listens
4. MEASUREMENT MODE – This test can extract metrics from Tomcat using
either of the following mechanisms:
By deploying the egtomcat.war file in the <EG_INSTALL_DIR>\lib directory of
the eG agent host on the Tomcat server;
By contacting the Java runtime (JRE) of Tomcat via JMX
To configure the test to use egtomcat.war file, first, select the War File option.
Then, refer to the Configuring and Monitoring Application Servers document
to know how to deploy the WAR file on the target Tomcat server.
On the other hand, if you want the test to use JMX instead, then first, select
the JMX option. Then, follow the procedure detailed in the Configuring and
Monitoring Application Servers document to configure the test to use JMX. By
default, the JMX option is chosen here.
5. JNDINAME – This parameter appears only if the MEASUREMENT MODE is set
to JMX. The JNDINAME is a lookup name for connecting to the JMX connector.
By default, this is jmxrmi. If you have registered the JMX connector in the
RMI registry using a different lookup name, then you can change this
default value to reflect the same.
6. JMX REMOTE PORT – This parameter appears only if the MEASUREMENT
MODE is set to JMX. Here, specify the port at which the JMX listens for
requests from remote hosts. Ensure that you specify the same port that you
configured in the catalina.sh (or catalina.bat file) file in the
<CATALINA_HOME_DIR>/bin folder of the target Tomcat server (refer to the
Configuring and Monitoring Application Servers document for more details).
7. JMX USER, JMX PASSWORD, and CONFIRM PASSWORD – These parameters
appear only if the MEASUREMENT MODE is set to JMX. If JMX requires
authentication only (but no security), then ensure that the JMX USER and JMX
PASSWORD parameters are configured with the credentials of a user with
read-write access to JMX. To know how to create this user, refer to the
Configuring and Monitoring Application Servers document. Confirm the
password by retyping it in the CONFIRM PASSWORD text box.
8. SSL - This parameter appears only if the MEASUREMENT MODE is set to War
File. Indicate YES if the Tomcat server is SSL-enabled.
9. URL - This parameter appears only if the MEASUREMENT MODE is set to War
File. Specify the URL of the managed Tomcat server to enable the test to
connect to it and extract measures from it. The URL specification should be
of the format: http://{TomcatIP}:{TomcatPort}.
10. USERNAME, PASSWORD, and CONFIRM PASSWORD – These parameters
appear only if the MEASUREMENT MODE is set to War File. In the USERNAME
text box, specify a name of a user who has been assigned the Manager role on
the Tomcat server to be monitored; these users are typically allowed to
control web applications deployed on the Tomcat server. Specify the
PASSWORD of this user, and confirm the password by retyping it in the
CONFIRM PASSWORD text box.
M o n i t o r i n g T o m c a t S e r v e r s
384
11. ENCRYPTPASS - This parameter appears only if the MEASUREMENT MODE is
set to War File. Select Yes if you want to encrypt the password.
Outputs of the test
One set of results for every application deployed on the Tomcat server being
monitored.
Measurements
made by the test
Measurement
Measurem
ent Unit
Interpretation
Load count:
Indicates the number of JSPs
that have been loaded into
the web application since the
last measurement period.
Number
Reload count:
Indicates the number of JSPs
that have been reloaded since
the last measurement period.
Number
As one of the rules, by default, the
JSP container will automatically
reload the translated class of a JSP
page whenever the page is
retranslated, a class called by the
page is modified (presuming the
class was loaded by the OC4J JSP
container class loader, not the
system class loader), or any page in
the same application is reloaded.
Using this measure therefore, you
can keep track of the changes
made to the JSP pages.
9.3.4 TomcatServlets Test
A servlet is a small Java program that runs within a web server. These servlets receive and respond to
requests from web clients, usually across HTTP.
Typically, these servlets run inside a servlet container that handles recurring multiple requests. The
performance and reliability of any web based application depends upon how well the requests from
web clients are managed. The TomcatServlets test enables administrators to assess the performance
of servlets on the basis of their request handling capabilities.
Purpose
Assesses the performance of servlets on the basis of their request handling
capabilities
Target of the test
A Tomcat server
Agent deploying the
test
An internal agent

M o n i t o r i n g T o m c a t S e r v e r s
385
Configurable
parameters for the
test
1. TEST PERIOD - How often should the test be executed
2. HOST - The host for which the test is to be configured
3. PORT – The port number on which the Tomcat server listens
4. MEASUREMENT MODE – This test can extract metrics from Tomcat using
either of the following mechanisms:
By deploying the egtomcat.war file in the <EG_INSTALL_DIR>\lib directory of
the eG agent host on the Tomcat server;
By contacting the Java runtime (JRE) of Tomcat via JMX
To configure the test to use egtomcat.war file, first, select the War File option.
Then, refer to the Configuring and Monitoring Application Servers document
to know how to deploy the WAR file on the target Tomcat server.
On the other hand, if you want the test to use JMX instead, then first, select
the JMX option. Then, follow the procedure detailed in the Configuring and
Monitoring Application Servers document to configure the test to use JMX. By
default, the JMX option is chosen here.
5. JNDINAME – This parameter appears only if the MEASUREMENT MODE is set
to JMX. The JNDINAME is a lookup name for connecting to the JMX connector.
By default, this is jmxrmi. If you have registered the JMX connector in the
RMI registry using a different lookup name, then you can change this
default value to reflect the same.
6. JMX REMOTE PORT – This parameter appears only if the MEASUREMENT
MODE is set to JMX. Here, specify the port at which the JMX listens for
requests from remote hosts. Ensure that you specify the same port that you
configured in the catalina.sh (or catalina.bat file) file in the
<CATALINA_HOME_DIR>/bin folder of the target Tomcat server (refer to the
Configuring and Monitoring Application Servers document for more details).
7. JMX USER, JMX PASSWORD, and CONFIRM PASSWORD – These parameters
appear only if the MEASUREMENT MODE is set to JMX. If JMX requires
authentication only (but no security), then ensure that the JMX USER and JMX
PASSWORD parameters are configured with the credentials of a user with
read-write access to JMX. To know how to create this user, refer to the
Configuring and Monitoring Application Servers document. Confirm the
password by retyping it in the CONFIRM PASSWORD text box.
8. SSL - This parameter appears only if the MEASUREMENT MODE is set to War
File. Indicate YES if the Tomcat server is SSL-enabled.
9. URL - This parameter appears only if the MEASUREMENT MODE is set to War
File. Specify the URL of the managed Tomcat server to enable the test to
connect to it and extract measures from it. The URL specification should be
of the format: http://{TomcatIP}:{TomcatPort}.
10. USERNAME, PASSWORD, and CONFIRM PASSWORD – These parameters
appear only if the MEASUREMENT MODE is set to War File. In the USERNAME
text box, specify a name of a user who has been assigned the Manager role on
the Tomcat server to be monitored; these users are typically allowed to
control web applications deployed on the Tomcat server. Specify the
PASSWORD of this user, and confirm the password by retyping it in the
CONFIRM PASSWORD text box.

M o n i t o r i n g T o m c a t S e r v e r s
386
11. ENCRYPTPASS - This parameter appears only if the MEASUREMENT MODE is
set to War File. Select Yes if you want to encrypt the password.
Outputs of the test
One set of results for every servlet on the Tomcat server being monitored.
Measurements
made by the test
Measurement
Measurem
ent Unit
Interpretation
Request count:
Indicates the number of
requests handled by the
servlet since the last
measurement period.
Number
Avg processing time:
Indicates the average time
taken by the servlet to
process the requests since
the last measurement period.
Secs
If the value of this measure
increases consistently, it indicates a
gradual deterioration in the server
performance.
Max processing time:
Indicates the maximum time
taken by the servlet to
process the requests.
Secs
If the time taken is significantly
high, check for the errors or
bottlenecks that interfere with the
servlet's normal operation.
Min processing time:
Indicates the minimum time
taken by the servlet to
process the current request.
Secs
Minimum time taken to process the
request is indicative of error free
execution of service by the servlet.
Error count:
Indicates the errors
encountered by the servlet,
when a request is processed
Number
Ideally, the value for this measure
should be 0. An error reported by
this measure is a cause of concern;
an analysis of the underlying
reasons is hence necessitated.

M o n i t o r i n g S u n O N E A p p l i c a t i o n S e r v e r s
387
Monitoring SunONE Application
Servers
The Sun ONE Application suite offers a comprehensive list of products for Internet infrastructures, i.e.,
web server, middleware application server, LDAP server, messaging server, and identity server, that
are used in many domains such as banking, trading, healthcare, and logistics to support mission-
critical services. IT infrastructures based on the Sun ONE Application suite follow the popular multi-tier
architecture wherein the web server functions as the front-end receiving client requests, the
application server hosts the business logic components, the identity server manages user policies, the
directory server handles access rights and other user information lookups, and the database server
stores and retrieves application data.
Routine monitoring of the infrastructure including the network, system, and application is imperative
to ensure that the infrastructure functions at peak performance at all times. Since each Sun ONE
application performs a different, specialized function, the monitoring has to be specific to each
application – e.g., is the mail server delivering emails? is the application server’s heap effectively
sized?. More importantly, since the different Sun ONE applications inter-operate to support the end-
user service, it is critical that the monitoring system track the inter-dependencies between
applications in order to pin-point the exact source of a performance bottleneck in the infrastructure.
The eG Sun ONE monitor offers extensive infrastructure monitoring capabilities for the Sun ONE
application suite. Pre-built models for Sun ONE web, application (see Figure 10.1), directory, and
messaging servers dictate what metrics are to be collected by eG agents, what thresholds are to be
applied to the metrics, and how the metrics are to be correlated in order to assist with problem
diagnosis.
Chapter
10
M o n i t o r i n g S u n O N E A p p l i c a t i o n S e r v e r s
388
Figure 10.1: The layer model of a SunONE application server
Using the customized model for the SunONE Application server (see Figure 10.1), you can monitor the
following:
Server up/down time monitoring
Server throughput tracking in terms of requests and data traffic
JDBC connection pool usage levels and connection failure reports
Thread pool execution status levels
Transaction-related measures including the number of transactions that are completed, rolled
back and in-progress
EJB caching efficiency, bean pool-related metrics
10.1 The JVM Layer
This layer collectively reports the resource usage and overall health of the SunONE JVM.
Figure 10.2: The tests mapped to the JVM layer
All the tests displayed in Figure 10.2 have been dealt with in the previous chapters.

M o n i t o r i n g S u n O N E A p p l i c a t i o n S e r v e r s
389
10.2 The SunONE HTTP Layer
To monitor the performance of the virtual web server on the SunONE server, use the SunONE Http
test associated with this layer (see Figure 10.3).
Figure 10.3: Tests associated with the SunONE HTTP layer
10.2.1 SunONE Http Test
This test measures the health of the virtual server configured for the SunONE Http server.
Purpose
Measures the health of the virtual server configured for the SunONE Http server
Target of the test
Any SunONE application server
Agent deploying the
test
An internal agent
Configurable
parameters for the
test
1. TEST PERIOD - How often should the test be executed
2. HOST - The host for which the test is to be configured.
3. PORT – The port number on which the SunONE application server is running
4. USER – A valid user name for the SunONE server to be monitored
5. PASSWORD – Password for the SunONE server to be monitored
6. ADMIN PORT – The port number on which the “asadmin” tool runs
7. SERVER – Name of the SunONE server to be monitored
8. APPSERVERDIR – The directory in which SunONE application server is
installed
Outputs of the test
One set of results for every virtual server configured for the web server
Measurements
made by the test
Measurement
Measurem
ent Unit
Interpretation
Request rate:
Rate of requests to the web
server during the last
measurement period.
Reqs/Sec
This measure reflects the server
workload.

M o n i t o r i n g S u n O N E A p p l i c a t i o n S e r v e r s
390
Data received:
Rate at which the data is
received by the server during
the last measurement period
KB/Sec
Data transmitted:
Rate at which the data is
transmitted by the server
during the last measurement
period.
KB/Sec
Data transmit high
watermark :
The high-water-mark of the
data transmit rate by this
server
KB
Open connections:
Number of server
threads/processes currently in
use for serving requests
Number
Ideally, this measure must be low.
Too many server threads or
processes serving user requests
could indicate a server-side
bottleneck – either with the web
server itself or with one of the
backend components that the web
server uses (e.g., database server).
Open connections high
water mark:
The high-water-mark of the
open connections count
Number
Changes in the high water mark are
indicative of times when the server
has been a performance bottleneck.
Note that the high water mark
value gets reset every time the
server is restarted.
200 responses :
Percentage of responses with
a status code in the range of
200-299 during the last
measurement period
Percent
300 responses :
Percentage of responses with
a status code in the range of
300-399 during the last
measurement period
Percent
400 errors:
Percentage of errors with a
status code in the range of
400-499 during the last
measurement period
Percent
M o n i t o r i n g S u n O N E A p p l i c a t i o n S e r v e r s
391
500 errors:
Percentage of errors with a
status code in the range of
500-599 during the last
measurement period
Percent
Other responses:
Percentage of responses with
a status code that is greater
than or equal to 600 during
the last measurement period
Percent
10.3 The SunONE DB Layer
The size of the JDBC connection pools governs the constant availability of connections to the
database. The metrics reported by the SunONE DB layer assist you in keeping a close watch on the
fluctuations in the pool size, so that additional connection requirements can be foreseen and allocated
to the pool.
Figure 10.4: Tests associated with the SunONE DB layer
10.3.1 SunONE Jdbc Test
This test reports the performance metrics related to the JDBC connection pools of a SunONE
application server.
Purpose
Reports the performance metrics related to the JDBC connection pools of a
SunONE application server
Target of the test
Any SunONE application server
Agent deploying the
test
An internal agent

M o n i t o r i n g S u n O N E A p p l i c a t i o n S e r v e r s
392
Configurable
parameters for the
test
1. TEST PERIOD - How often should the test be executed
2. HOST - The host for which the test is to be configured.
3. PORT – The port number on which the SunONE application server is running
4. USER – A valid user name for the SunONE server to be monitored
5. PASSWORD – Password for the SunONE server to be monitored
6. ADMIN PORT – The port number on which the “asadmin” tool runs
7. SERVER – Name of the SunONE server to be monitored
8. APPSERVERDIR – The directory in which SunONE application server is
installed
Outputs of the test
One set of results for every JDBC connection pool
Measurements
made by the test
Measurement
Measuremen
t Unit
Interpretation
Waiting threads:
The number of threads
that are waiting for a
database connection
Number
Ideally, this measure should have a
low value. A high value of this
measure indicates that the database
is slow or does not have additional
connections to allocate to service
requests from the web application
server.
Connections failed:
The total number of times
a thread has failed to
acquire a JDBC connection
Number
This value can increase for various
reasons – connection failures can
happen if the database server is
down or if the maximum limit of
simultaneous connections possible
has been reached. Alternatively, if
the database pool is not adequately
sized (i.e., too few maximum
connections), connection failures can
occur.
Connection timeouts:
The total number of
connection requests that
have been timed out
Number
Ideally, this measure should have a
low value. A high value of this
measure indicates that the database
is slow or does not have additional
connections to allocate to service
requests from the web application
server.
10.4 The SunONE Transactions Layer
The number of transactions that are committed and rolled back by the application server serves as a
good indicator of server workload, processing ability of the server, and potential performance issues (if
any). The test associated with the SunONE Transactions layer (see Figure 10.5) facilitates this
assessment.

M o n i t o r i n g S u n O N E A p p l i c a t i o n S e r v e r s
393
Figure 10.5: Test associated with the SunONE Transactions layer
10.4.1 SunONE Transactions Test
This test reports measures pertaining to the transactions in a SunONE application server.
Purpose
Reports measures pertaining to the transactions in a SunONE application server
Target of the test
Any SunONE application server
Agent deploying the
test
An internal agent
Configurable
parameters for the
test
1. TEST PERIOD - How often should the test be executed
2. HOST - The host for which the test is to be configured.
3. PORT – The port number on which the SunONE application server is running
4. USER – A valid user name for the SunONE server to be monitored
5. PASSWORD – Password for the SunONE server to be monitored
6. ADMIN PORT – The port number on which the “asadmin” tool runs
7. SERVER – Name of the SunONE server to be monitored
8. APPSERVERDIR – The directory in which SunONE application server is
installed
Outputs of the test
One set of results for every SunONE application server monitored
Measurements
made by the test
Measurement
Measurement
Unit
Interpretation
Transactions completed:
Returns the total number
of transactions that have
been completed by this
server
Number
M o n i t o r i n g S u n O N E A p p l i c a t i o n S e r v e r s
394
Transaction rollbacks:
Returns the total number
of transactions that have
been rolled back by this
server
Number
A high rollback rate indicates a
problem with specific beans.
Possible reasons for this could be
problems with the design and
implementation of the specific bean
or problems with any of the
dependent servers of the bean
(e.g., database server).
Transactions in flight:
Returns the total number
of transactions that are
currently in progress
Number
A significantly high value may
denote a load on the server. This
may indicate that specific
transactions are taking too long to
process requests.
10.5 The SunONE EJB Layer
SunONE application server caches stateless, entity and message driven beans. Adequately sized
caches are essential for quickly servicing client requests. Using the tests associated with this layer
(see Figure 10.6), the caching activity can be closely monitored and deficiencies in size can be
promptly reported.
Figure 10.6: Tests associated with the SunONE EJB layer
10.5.1 SunONE Ejb Cache Test
This test extracts the caching related metrics pertaining to such EJBs. Use the Click here hyperlink in
the test configuration page to configure the EJB groups that need to be monitored by the eG
Enterprise suite. By default, the eG Enterprise system will monitor only those EJBs that are part of a group.
Purpose
Monitor SunONE application server’s EJB caching activity
Target of the test
Any SunONE application server that has one or more stateless, entity, or
message driven beans
Agent deploying the
test
An internal agent

M o n i t o r i n g S u n O N E A p p l i c a t i o n S e r v e r s
395
Configurable
parameters for the
test
1. TEST PERIOD - How often should the test be executed
2. HOST - The host for which the test is to be configured.
3. PORT – The port number on which the SunONE application server is running
4. USER – A valid user name for the SunONE server to be monitored
5. PASSWORD – Password for the SunONE server to be monitored
6. ADMIN PORT – The port number on which the “asadmin” tool runs
7. SERVER – Name of the SunONE server to be monitored
8. APPSERVERDIR – The directory in which SunONE application server is
installed
9. AUTODISCOVERY – By default, the eG Enterprise suite allows administrators
to configure EJB groups using the eG administrative interface, and reports
metrics pertaining to every group so created. Accordingly, by default,
AUTODISCOVERY is set to NO. If you want EJBs to be discovered and
monitored automatically, then select the YES option against
AUTODISCOVERY. When this is done, the eG agent automatically discovers
all the EJBs on the SunONE application server, and reports one set of
measures for every EJB hosted on the server.
Outputs of the test
One set of results for every EJB group configured or EJB (as the case may be)
Measurements
made by the test
Measurement
Measurement
Unit
Interpretation
Resize quantity:
The quantity by which the
cache size is reduced when
the number of beans in the
cache equals the
maximum cache size (that
is, when cache overflow
occurs)
Number
This is a configuration parameter
for the EJB cache. This measure will
not be available for Sun Java Application
Server 8.2 and above.
Cache misses:
The number of times a
user request did not find a
bean in the cache during
the last measurement
period.
Number
Ideally, the percentage of cache
misses to cache hits should be a
low percentage.
Idle timeouts:
Rate at which the cache
cleaner thread is
scheduled. This cleaner
thread examines all beans
in the cache and
passivates those beans
that are not accessed for
cache-idle-timeout-in-
seconds.
Secs
This is a configuration parameter
for the EJB cache. This measure will
not be available for Sun Java Application
Server 8.2 and above.

M o n i t o r i n g S u n O N E A p p l i c a t i o n S e r v e r s
396
Passivations:
Number of passivations.
Applies only to stateful
session beans during the
last measurement period.
Number
Cache hits:
The number of times a
user request found an
entry in the cache during
the last measurement
period.
Number
Passivation errors:
Number of errors during
passivation. Applies only to
stateful session beans
during the last
measurement period.
Number
Beans in cache:
The number of beans in
the cache. This is the
current size of the cache
Number
The ratio of beans in cache to the
maximum beans in cache is an
indicator of the cache occupancy.
For maximum performance, the
cache occupancy and hit rate must
be high.
Expired sessions:
The number of expired
sessions removed by the
cleanup thread during the
last measurement period.
Applies only to stateful
session beans
Number
Max beans in cache:
The maximum number of
beans that can be held in
the cache beyond which
cache overflow occurs
Number
This is a configuration parameter
for the EJB cache.
Passivation successes:
Number of times
passivation completed
successfully. Applies only
to stateful session beans
Number
10.5.2 SunONE EJB Pools Test
This test reports statistics pertaining to the EJB pools for stateful session beans and entity beans. Use
the Click here hyperlink in the test configuration page to configure the EJB groups that need to be

M o n i t o r i n g S u n O N E A p p l i c a t i o n S e r v e r s
397
monitored by the eG Enterprise suite. By default, the eG Enterprise system will monitor only those EJBs that are
part of a group.
Purpose
Monitor SunONE application server’s EJB pools
Target of the test
Any SunONE application server with one or more entity beans or stateful session
beans
Agent deploying the
test
An internal agent
Configurable
parameters for the
test
1. TEST PERIOD - How often should the test be executed
2. HOST - The host for which the test is to be configured.
3. PORT – The port number on which the SunONE application server is running
4. USER – A valid user name for the SunONE server to be monitored
5. PASSWORD – Password for the SunONE server to be monitored
6. ADMIN PORT – The port number on which the “asadmin” tool runs
7. SERVER – Name of the SunONE server to be monitored
8. APPSERVERDIR – The directory in which SunONE application server is
installed
9. AUTODISCOVERY – By default, the eG Enterprise suite allows administrators
to configure EJB groups using the eG administrative interface, and reports
metrics pertaining to every group so created. Accordingly, by default,
AUTODISCOVERY is set to NO. If you want EJBs to be discovered and
monitored automatically, then select the YES option against
AUTODISCOVERY. When this is done, the eG agent automatically discovers
all the EJBs on the SunONE application server, and reports one set of
measures for every EJB hosted on the server.
Outputs of the test
One set of results for every EJB group configured or every EJB (as thee cae be)
Measurements
made by the test
Measurement
Measurement
Unit
Interpretation
Idle timeout:
Returns the time out
period set for the bean.
Sec
This is a configuration setting.
This measure will not be available for
Sun Java Application Server 8.2 and
above.
Steady pool size:
Indicates the average
number of beans that a
pool contains during the
last measurement period.
Number
This measure will not be available for
Sun Java Application Server 8.2 and
above.
Beans destroyed:
The total number of beans
in a pool that have been
destroyed by the pool
during the last
measurement period.
Number

M o n i t o r i n g S u n O N E A p p l i c a t i o n S e r v e r s
398
Waiting threads:
Returns the number of
threads that are waiting to
get an instance of the
bean
Number
The value of this measure should
be low for optimal performance.
Beans in pool:
The number of beans in
the bean pool currently
Number
Max pool size:
The maximum number of
beans that the pool can
contain
Number
This is a configuration setting.
Pool resize quantity:
This is the value by which
the pool size can be
increased or decreased, as
per the requirements.
Number
This is a configuration setting.
This measure will not be available for
Sun Java Application Server 8.2 and
above.
Beans created:
Indicates the number of
beans that have been
created for a pool, during
the last measurement
period
Number

M o n i t o r i n g O r a c l e 9 i A p p l i c a t i o n S e r v e r s
399
Monitoring Oracle 9i Application
Servers
Oracle9 i Application Server (Oracle9 i AS) is a J2EE-certified application server, which integrates all
the technology required to develop and deploy e-business portals, transactional applications, and Web
services into a single product. Oracle9 i AS provides a productive development environment for
developers to create Internet Applications including J2EE Applications, Web Services, Enterprise
Portals, Wireless and Business Intelligence Applications. Its open and integration-ready architecture
and standards compliance ensures that Web applications can integrate with any IT environment,
including legacy systems, and Oracle and non-Oracle databases.
This versatility and reliability is what makes the Oracle 9 i AS a key ingredient in advanced IT
infrastructures providing critical services to end-users. Recurring or even sporadic
operational/availability issues with the Oracle 9i AS, can therefore cause prolonged delays in the
delivery of these critical services, in turn causing service level guarantees to be violated!
To avoid the related penalties and loss of reputation, it would be good practice to constantly observe
the functioning of the Oracle 9iAS, and take action as soon as or even before a problem condition
surfaces.
eG Enterprise prescribes an exclusive O9i Application Server monitoring model (see Figure 11.1),
which runs tests on all the key components of the Oracle 9iAS from its JVM, JDBC drivers, caches, to
its web modules, web contexts, transactions, etc. By automatically analyzing the performance data
extracted by these tests from the server, eG Enterprise proactively detects potential bottlenecks to
performance, accurately pin-points the root-cause of these problems, and instantly alerts
administrators to the problem source.
Chapter
11
M o n i t o r i n g O r a c l e 9 i A p p l i c a t i o n S e r v e r s
400
Figure 11.1: The layer model of the Oracle 9i AS
Each layer of the monitoring model depicted by Figure 11.1 monitors and reports metrics on every
performance-influencing aspect of the Oracle 9i AS. Using these metrics, administrators can determine
the following:
Is the Oracle JVM available?
Does the JVM have sufficient free memory?
Is the workload on the JVM optimal?
Is the server able to connect to the database quickly?
Are too many JDBC connections open on the server?
Does the connection cache have adequate free connections?
Is the connection cache utilized effectively?
Are transaction rollbacks kept at a minimum?
Are the web modules processing requests quickly?
Is any web module taking too much time to process requests?
Does the server take too much time to service JSP and servlet requests?
The sections below discuss the metrics reported by the top 5 layers of Figure 11.1 only, as all other
layers have been dealt with in the Monitoring Unix and Windows Servers document.
Note:
To effectively monitor an Oracle 9i Application server on Unix, ensure that the install user
of the application server and that of the eG agent (which is monitoring the application
server) are the same.
Any component on an Oracle 9i Application server (be it OC4J or the Oracle HTTP server)
can be monitored by eG only if the Oracle 9i Application Server Release 2.0 is installed,
with dmctl and dmstool.
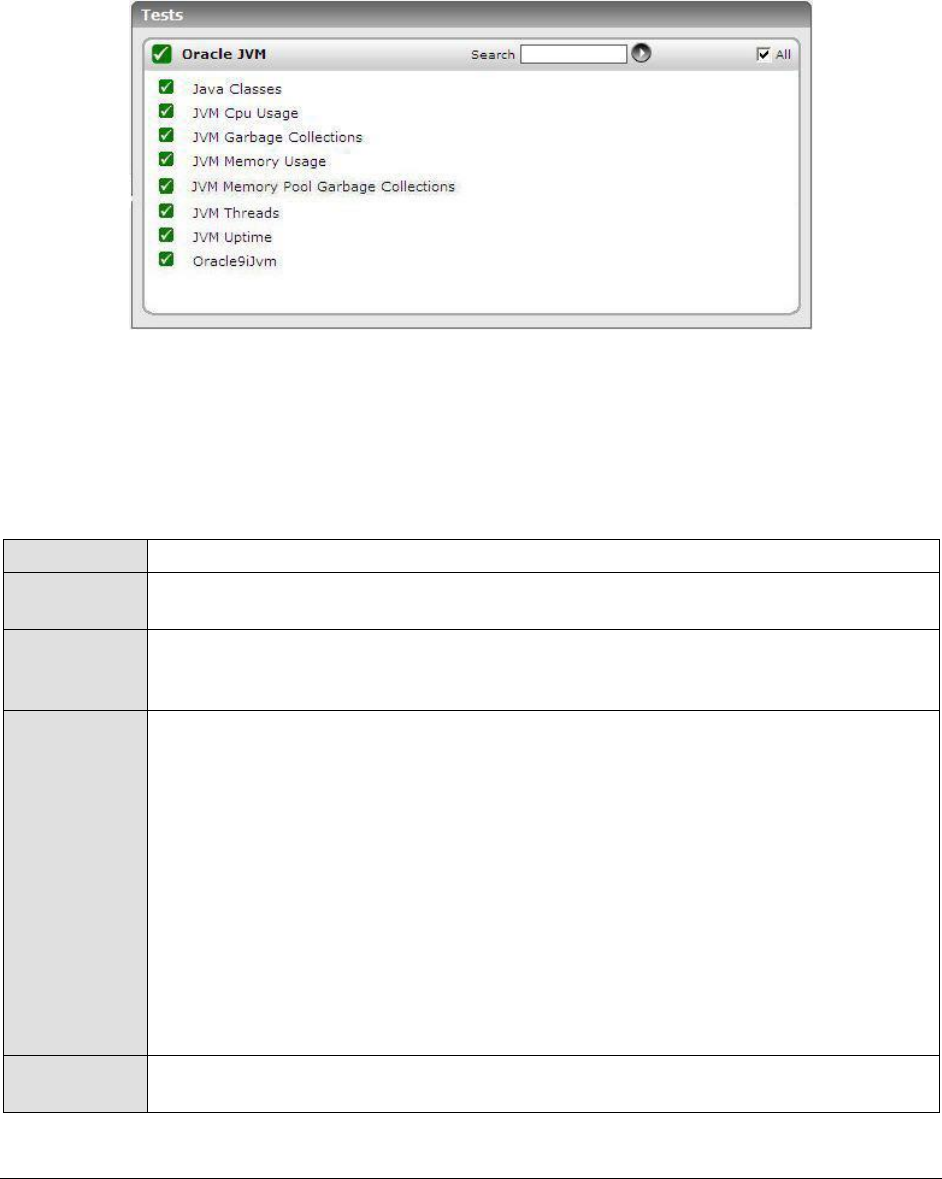
M o n i t o r i n g O r a c l e 9 i A p p l i c a t i o n S e r v e r s
401
11.1 The Oracle JVM Layer
Use the test associated with this layer to track the workload on and the memory heap usage of the
Oracle JVM.
Figure 11.2: Tests associated with the Oracle JVM layer
11.1.1 Oracle 9i Jvm Test
The JVM test is used to analyze overall JVM performance for the processes of an Oracle 9i AS instance.
The JVM metrics provide useful information about threads and heap memory allocation. You should
check these values to make sure that JVM resources are utilized within expected ranges.
Purpose
Analyzes the overall JVM performance for the processes of an Oracle 9i AS instance
Target of the
test
An Oracle 9i AS
Agent
deploying the
test
An internal Agent
Configurable
parameters for
the test
1. TEST PERIOD - How often should the test be executed
2. HOST - The host for which the test is to be configured
3. PORT - In the PORT text box, it is recommended that you provide the port at
which the OPMN (Oracle Process Manager and Notification) process of the Oracle
application server instance listens. To know at which port OPMN listens, click on
the Ports tab in the following URL:
http://<oraHttpServerIP>:<OraHttpServerport>. This tab lists the port
numbers that were assigned to the services executing on the Oracle application
server. The port number displayed against the Oracle notification server
request port entry is the OPMN port, and the same should be specified in the
PORT text box.
4. HOMEDIR – The absolute path of the directory in which the Oracle 9i application
server has been installed
Outputs of the
test
One set of results for every Oracle 9i AS instance monitored

M o n i t o r i n g O r a c l e 9 i A p p l i c a t i o n S e r v e r s
402
Measurements
made by the
test
Measurement
Measurement
Unit
Interpretation
Active thread groups:
Indicates the current number of
active thread groups in the JVM.
Number
A high value for this measure is
indicative of a high load on the
JVM.
Active threads:
Indicates the current number of
active threads in the JVM.
Number
A high value for this measure is
indicative of a high load on the
JVM.
Free heap:
Indicates the unused memory in
the JVM.
MB
The free heap value governs the
performance of the JVM. A low
value could result in excessive
garbage collection, slowing down
responses/processing in the JVM.
Min free heap:
Indicates the low water mark of
memory in the JVM since it
started.
MB
This metric indicates the time
when the free heap reached its
minimum value.
Heap usage:
Indicates the used memory in
the JVM currently.
MB
A very high value for this
measure indicates heavy load on
the JVM.
Max heap usage:
The high water mark of heap
used in the JVM since it was
started.
MB
A very high value for this
measure indicates heavy load on
the JVM.
JVM availability:
Indicates the availability of the
Oracle 9i AS instance.
Percent
If this value is 100%, then it
indicates that the JVM is running.
If it is 0, it indicates that the JVM
is not available or is not running.
11.1.2 Java Transactions Test
When a user initiates a transaction to a Java-based web application, the transaction typically travels
via many Java components before completing execution and sending out a response to the user.
The key Java components have been briefly described below:
Filter: A filter is a program that runs on the server before the servlet or JSP page with which
it is associated. All filters must implement javax.servlet.Filter. This interface comprises three
methods: init, doFilter, and destroy.
Servlet: A servlet acts as an intermediary between the client and the server. As servlet
modules run on the server, they can receive and respond to requests made by the client. If a
servlet is designed to handle HTTP requests, it is called an HTTP Servlet.
JSP: Java Server Pages are an extension to the Java servlet technology. A JSP is translated
into Java servlet before being run, and it processes HTTP requests and generates responses
like any servlet. Translation occurs the first time the application is run.

M o n i t o r i n g O r a c l e 9 i A p p l i c a t i o n S e r v e r s
403
Struts: The Struts Framework is a standard for developing well-architected Web applications.
Based on the Model-View-Controller (MVC) design paradigm, it distinctly separates all three
levels (Model, View, and Control).
A delay experienced by any of the aforesaid Java components can adversely impact the total response
time of the transaction, thereby scarring the user experience with the web application. In addition,
delays in JDBC connectivity and slowdowns in SQL query executions (if the application interacts with a
database), bottlenecks in delivery of mails via the Java Mail API (if used), and any slow method calls,
can also cause insufferable damage to the 'user-perceived' health of a web application.
The challenge here for administrators is to not just isolate the slow transactions, but to also accurately
identify where the transaction slowed down and why - is it owing to inefficent JSPs? poorly written
servlets or struts? poor or the lack of any JDBC connectivity to the database? long running queries?
inefficient API calls? or delays in accessing the POJO methods? The eG JTM Monitor provides
administrators with answers to these questions!
With the help of the Java Transactions test, the eG JTM Monitor traces the route a configured web
transaction takes, and captures live the total responsiveness of the transaction and the response time
of each Java component it visits en route. This way, the solution proactively detects transaction
slowdowns, and also precisely points you to the Java components causing it - is it the Filters? JSPs?
Servlets? Struts? JDBC? SQL query? Java Mail API? or the POJO? In addition to revealing where (i.e.,
at which Java component) a transaction slowed down, the solution also provides the following
intelligent insights, on demand, making root-cause identification and resolution easier:
A look at the methods that took too long to execute, thus leading you to those methods that
may have contributed to the slowdown;
Single-click access to each invocation of a chosen method, which provides pointers to when
and where a method spent longer than desired;
A quick glance at SQL queries and Java errors that may have impacted the responsiveness of
the transaction;
Using these interesting pointers provided by the eG JTM Monitor, administrators can diagnose the root-
cause of transaction slowdowns within minutes, rapidly plug the holes, and thus ensure that their
critical web applications perform at peak capacity at all times!
Before attempting to monitor Java transactions using the eG JTM Monitor, the following configurations
will have to be performed:
1. In the <EG_INSTALL_DIR>\lib directory (on Windows; on Unix, this will be /opt/egurkha/lib) of the eG
agent, you will find the following files:
eg_jtm.jar
aspectjrt.jar
aspectjweaver.jar
jtmConn.props
jtmLogging.props
jtmOther.props
2. Login to the system hosting the Java application to be monitored.
3. If the eG agent will be 'remotely monitoring' the target Java application (i.e., if the Java
application is to be monitored in an 'agentless manner'), then, copy all the files mentioned above
from the <EG_INSTALL_DIR>\lib directory (on Windows; on Unix, this will be /opt/egurkha/lib) of the eG
agent to any location on the Java application host.

M o n i t o r i n g O r a c l e 9 i A p p l i c a t i o n S e r v e r s
404
4. Then, proceed to edit the start-up script of the Java application being monitored, and append the
following lines to it:
set JTM_HOME=<<PATH OF THE LOCAL FOLDER CONTAINING THE JAR FILES AND PROPERTY FILES
LISTED ABOVE>>
"-javaagent:%JTM_HOME%\aspectjweaver.jar"
"-DEG_JTM_HOME=%JTM_HOME%"
Note that the above lines will change based on the operating system and the web/web application server being
monitored.
Then, add the eg_jtm.jar, aspectjrt.jar, and aspectjweaver.jar files to the CLASSPATH of the Java
application being monitored.
Finally, save the file. Once this is done, then, the next time the Java application starts, the eG JTM
Monitor scans the web requests to the application for configured URL patterns. When a match is
found, the eG JTM Monitor collects the desired metrics and stores them in memory.
Then, every time the eG agent runs the Java Transactions test, the agent will poll the eG JTM Monitor
(on the target application) for the required metrics, extract the same from the application's
memory, and report them to the eG manager.
5. Next, edit the jtmConn.props file. You will find the following lines in the file:
#Contains the connection properties of eGurkha Java Transaction Monitor
JTM_Port=13631
Designated_Agent=
By default, the JTM_Port parameter is set to 13631. If the Java application being monitored listens
on a different JTM port, then specify the same here. In this case, when managing a Java Application
using the eG administrative interface, specify the JTM_Port that you set in the jtmConn.props file as
the Port of the Java application.
Also, against the Designated_Agent parameter, specify the IP address of the eG agent which will poll
the eG JTM Monitor for metrics. If no IP address is provided here, then the eG JTM Monitor will treat
the host from which the very first 'measure request' comes in as the Designated_Agent.
6. Finally, save the jtmConn.props file.
Then, proceed to configure the Java Transactions test as discussed in Section 9.1.9.1 of this document.
11.1.3 Java Classes Test
This test reports the number of classes loaded/unloaded from the memory.
Purpose
Reports the number of classes loaded/unloaded from the memory
Note:
In case a specific Designated_Agent is not provided, and the eG JTM Monitor treats the host from
which the very first 'measure request' comes in as the Designated_Agent, then if such a
Designated_Agent is stopped or uninstalled for any reason, the eG JTM Monitor will wait for a
maximum of 10 measure periods for that 'deemed' Designated_Agent to request for metrics. If
no requests come in for 10 consecutive measure periods, then the eG JTM Monitor will begin
responding to 'measure requests' coming in from any other eG agent.

M o n i t o r i n g O r a c l e 9 i A p p l i c a t i o n S e r v e r s
405
Target of the
test
An Oracle 9i AS
Agent
deploying the
test
An internal/remote agent
Configurable
parameters for
the test
1. TEST PERIOD - How often should the test be executed
2. HOST - The host for which the test is to be configured
3. PORT - The port number at which the specified HOST listens
4. MODE – This test can extract metrics from the Java application using either of
the following mechanisms:
Using SNMP-based access to the Java runtime MIB statistics;
By contacting the Java runtime (JRE) of the application via JMX
To configure the test to use SNMP, select the SNMP option. On the other hand,
choose the JMX option to configure the test to use JMX instead. By default, the
JMX option is chosen here.
5. JMX REMOTE PORT – This parameter appears only if the MODE is set to JMX.
Here, specify the port at which the JMX listens for requests from remote hosts.
Ensure that you specify the same port that you configured in the
management.properties file in the <JAVA_HOME>\jre\lib\management folder used by
the target application (refer to the Monitoring Java Applications document).
6. USER, PASSWORD, and CONFIRM PASSWORD – These parameters appear only if
the MODE is set to JMX. If JMX requires authentication only (but no security), then
ensure that the USER and PASSWORD parameters are configured with the
credentials of a user with read-write access to JMX. To know how to create this
user, refer to the Monitoring Java Applications document. Confirm the password
by retyping it in the CONFIRM PASSWORD text box.
7. JNDINAME – This parameter appears only if the MODE is set to JMX. The JNDINAME
is a lookup name for connecting to the JMX connector. By default, this is
jmxrmi. If you have registered the JMX connector in the RMI registry using a
different lookup name, then you can change this default value to reflect the
same.
8. SNMPPORT – This parameter appears only if the MODE is set to SNMP. Here
specify the port number through which the server exposes its SNMP MIB. Ensure
that you specify the same port you configured in the management.properties file
in the <JAVA_HOME>\jre\lib\management folder used by the target application (refer
to the Monitoring Java Applications document).
9. SNMPVERSION – This parameter appears only if the MODE is set to SNMP. The
default selection in the SNMPVERSION list is v1. However, for this test to work,
you have to select SNMP v2 or v3 from this list, depending upon which version of
SNMP is in use in the target environment.
10. SNMPCOMMUNITY – This parameter appears only if the MODE is set to SNMP.
Here, specify the SNMP community name that the test uses to communicate
with the mail server. The default is public. This parameter is specific to SNMP v1
and v2 only. Therefore, if the SNMPVERSION chosen is v3, then this parameter
will not appear.

M o n i t o r i n g O r a c l e 9 i A p p l i c a t i o n S e r v e r s
406
11. USERNAME – This parameter appears only when v3 is selected as the
SNMPVERSION. SNMP version 3 (SNMPv3) is an extensible SNMP Framework
which supplements the SNMPv2 Framework, by additionally supporting message
security, access control, and remote SNMP configuration capabilities. To extract
performance statistics from the MIB using the highly secure SNMP v3 protocol,
the eG agent has to be configured with the required access privileges – in other
words, the eG agent should connect to the MIB using the credentials of a user
with access permissions to be MIB. Therefore, specify the name of such a user
against the USERNAME parameter.
12. AUTHTYPE – This parameter too appears only if v3 is selected as the
SNMPVERSION. From the AUTHTYPE list box, choose the authentication
algorithm using which SNMP v3 converts the specified USERNAME and
PASSWORD into a 32-bit format to ensure security of SNMP transactions. You
can choose between the following options:
MD5 – Message Digest Algorithm
SHA – Secure Hash Algorithm
13. ENCRYPTFLAG – This flag appears only when v3 is selected as the
SNMPVERSION. By default, the eG agent does not encrypt SNMP requests.
Accordingly, the ENCRYPTFLAG is set to NO by default. To ensure that SNMP
requests sent by the eG agent are encrypted, select the YES option.
14. ENCRYPTTYPE – If the ENCRYPTFLAG is set to YES, then you will have to
mention the encryption type by selecting an option from the ENCRYPTTYPE list.
SNMP v3 supports the following encryption types:
DES – Data Encryption Standard
AES – Advanced Encryption Standard
15. ENCRYPTPASSWORD – Specify the encryption password here.
16. CONFIRM PASSWORD – Confirm the encryption password by retyping it here.
17. TIMEOUT - This parameter appears only if the MODE is set to SNMP. Here, specify
the duration (in seconds) within which the SNMP query executed by this test
should time out in the TIMEOUT text box. The default is 10 seconds.
Outputs of the
test
One set of results for the server being monitored
Measurements
made by the
test
Measurement
Measurement
Unit
Interpretation
Classes loaded:
Indicates the number of classes
currently loaded into memory.
Number
Classes are fundamental to the
design of Java programming
language. Typically, Java

M o n i t o r i n g O r a c l e 9 i A p p l i c a t i o n S e r v e r s
407
Classes unloaded:
Indicates the number of classes
currently unloaded from
memory.
Number
applications install a variety of
class loaders (that is, classes that
implement java.lang.ClassLoader)
to allow different portions of the
container, and the applications
running on the container, to have
access to different repositories of
available classes and resources. A
consistent decrease in the
number of classes loaded and
unloaded could indicate a road-
block in the loading/unloading of
classes by the class loader. If left
unchecked, critical
resources/classes could be
rendered inaccessible to the
application, thereby severely
affecting its performance.
Total classes loaded:
Indicates the total number of
classes loaded into memory
since the JVM started, including
those subsequently unloaded.
Number
11.1.4 JVM Threads Test
This test reports the status of threads on the JVM, and also reveals resource-hungry threads, so that
threads that are unnecessarily consuming CPU resources can be killed.
Purpose
Reports the status of threads on the JVM, and also reveals resource-hungry threads,
so that threads that are unnecessarily consuming CPU resources can be killed
Target of the
test
An Oracle 9i AS
Agent
deploying the
test
An internal/remote agent

M o n i t o r i n g O r a c l e 9 i A p p l i c a t i o n S e r v e r s
408
Configurable
parameters for
the test
1. TEST PERIOD - How often should the test be executed
2. HOST - The host for which the test is to be configured
3. PORT - The port number at which the specified HOST listens
4. MODE – This test can extract metrics from the Java application using either of
the following mechanisms:
Using SNMP-based access to the Java runtime MIB statistics;
By contacting the Java runtime (JRE) of the application via JMX
To configure the test to use SNMP, select the SNMP option. On the other hand,
choose the JMX option to configure the test to use JMX instead. By default, the
JMX option is chosen here.
5. JMX REMOTE PORT – This parameter appears only if the MODE is set to JMX.
Here, specify the port at which the JMX listens for requests from remote hosts.
Ensure that you specify the same port that you configured in the
management.properties file in the <JAVA_HOME>\jre\lib\management folder used by
the target application (refer to the Monitoring Java Applications document).
6. USER, PASSWORD, and CONFIRM PASSWORD – These parameters appear only if
the MODE is set to JMX. If JMX requires authentication only (but no security), then
ensure that the USER and PASSWORD parameters are configured with the
credentials of a user with read-write access to JMX. To know how to create this
user, refer to the Monitoring Java Applications document. Confirm the password
by retyping it in the CONFIRM PASSWORD text box.
7. JNDINAME – This parameter appears only if the MODE is set to JMX. The JNDINAME
is a lookup name for connecting to the JMX connector. By default, this is
jmxrmi. If you have registered the JMX connector in the RMI registry using a
different lookup name, then you can change this default value to reflect the
same.
8. SNMPPORT – This parameter appears only if the MODE is set to SNMP. Here
specify the port number through which the server exposes its SNMP MIB. Ensure
that you specify the same port you configured in the management.properties file
in the <JAVA_HOME>\jre\lib\management folder used by the target application (refer
to the Monitoring Java Applications document).
9. SNMPVERSION – This parameter appears only if the MODE is set to SNMP. The
default selection in the SNMPVERSION list is v1. However, for this test to work,
you have to select SNMP v2 or v3 from this list, depending upon which version of
SNMP is in use in the target environment.
10. SNMPCOMMUNITY – This parameter appears only if the MODE is set to SNMP.
Here, specify the SNMP community name that the test uses to communicate
with the mail server. The default is public. This parameter is specific to SNMP v1
and v2 only. Therefore, if the SNMPVERSION chosen is v3, then this parameter
will not appear.

M o n i t o r i n g O r a c l e 9 i A p p l i c a t i o n S e r v e r s
409
11. USERNAME – This parameter appears only when v3 is selected as the
SNMPVERSION. SNMP version 3 (SNMPv3) is an extensible SNMP Framework
which supplements the SNMPv2 Framework, by additionally supporting message
security, access control, and remote SNMP configuration capabilities. To extract
performance statistics from the MIB using the highly secure SNMP v3 protocol,
the eG agent has to be configured with the required access privileges – in other
words, the eG agent should connect to the MIB using the credentials of a user
with access permissions to be MIB. Therefore, specify the name of such a user
against the USERNAME parameter.
12. AUTHTYPE – This parameter too appears only if v3 is selected as the
SNMPVERSION. From the AUTHTYPE list box, choose the authentication
algorithm using which SNMP v3 converts the specified USERNAME and
PASSWORD into a 32-bit format to ensure security of SNMP transactions. You
can choose between the following options:
MD5 – Message Digest Algorithm
SHA – Secure Hash Algorithm
13. ENCRYPTFLAG – This flag appears only when v3 is selected as the
SNMPVERSION. By default, the eG agent does not encrypt SNMP requests.
Accordingly, the ENCRYPTFLAG is set to NO by default. To ensure that SNMP
requests sent by the eG agent are encrypted, select the YES option.
14. ENCRYPTTYPE – If the ENCRYPTFLAG is set to YES, then you will have to
mention the encryption type by selecting an option from the ENCRYPTTYPE list.
SNMP v3 supports the following encryption types:
DES – Data Encryption Standard
AES – Advanced Encryption Standard
15. ENCRYPTPASSWORD – Specify the encryption password here.
16. CONFIRM PASSWORD – Confirm the encryption password by retyping it here.
17. TIMEOUT - This parameter appears only if the MODE is set to SNMP. Here, specify
the duration (in seconds) within which the SNMP query executed by this test
should time out in the TIMEOUT text box. The default is 10 seconds.
18. PCT LOW CPU UTIL THREADS – This test reports the number of threads in the
JVM that are consuming low CPU. This thread count will include only those
threads for which the CPU usage is equal to or lesser than the value specified in
the PCT LOW CPU UTIL THREADS text box. The default value displayed here is
30.
19. PCT MEDIUM CPU UTIL THREADS - This test reports the number of threads in the
JVM that are consuming CPU to a medium extent. This thread count will include
only those threads for which the CPU usage is higher than the PCT LOW CPU
UTIL THREADS configuration and is lower than or equal to the value specified in
the PCT MEDIUM CPU UTIL THREADS text box. The default value displayed here
is 50.

M o n i t o r i n g O r a c l e 9 i A p p l i c a t i o n S e r v e r s
410
20. PCT HIGH CPU UTIL THREADS - This test reports the number of threads in the
JVM that are consuming high CPU. This thread count will include only those
threads for which the CPU usage is either greater than the PCT MEDIUM CPU
UTIL THREADS configuration, or is equal to or greater than the value specified in
the PCT HIGH CPU UTIL THREADS text box. The default value displayed here is
70.
21. DD FREQUENCY - Refers to the frequency with which detailed
diagnosis measures are to be generated for this test. The default is 1:1. This
indicates that, by default, detailed measures will be generated every time this
test runs, and also every time the test detects a problem. You can modify this
frequency, if you so desire. Also, if you intend to disable the detailed diagnosis
capability for this test, you can do so by specifying none against DD
FREQUENCY.
22. DETAILED DIAGNOSIS - To make diagnosis more efficient and accurate, the eG
Enterprise suite embeds an optional detailed diagnostic capability. With this
capability, the eG agents can be configured to run detailed, more elaborate tests
as and when specific problems are detected. To enable the detailed diagnosis
capability of this test for a particular server, choose the On option. To disable
the capability, click on the Off option.
The option to selectively enable/disable the detailed diagnosis capability will be
available only if the following conditions are fulfilled:
The eG manager license should allow the detailed diagnosis capability
Both the normal and abnormal frequencies configured for the detailed
diagnosis measures should not be 0.
Outputs of the
test
One set of results for the server being monitored
Measurements
made by the
test
Measurement
Measurement
Unit
Interpretation
Total threads:
Indicates the total number of
threads (including daemon and
non-daemon threads).
Number
Runnable threads:
Indicates the current number of
threads in a runnable state.
Number
The detailed diagnosis of this
measure, if enabled, provides the
name of the threads, the CPU
usage by the threads, the time
for which the thread was in a
blocked state, waiting state, etc.
Blocked threads:
Indicates the number of threads
that are currently in a blocked
state.
Number
If a thread is trying to take a lock
(to enter a synchronized block),
but the lock is already held by
another thread, then such a
thread is called a blocked thread.
The detailed diagnosis of this
measure, if enabled, provides in-
depth information related to the
blocked threads.

M o n i t o r i n g O r a c l e 9 i A p p l i c a t i o n S e r v e r s
411
Waiting threads:
Indicates the number of threads
that are currently in a waiting
state.
Number
A thread is said to be in a Waiting
state if the thread enters a
synchronized block, tries to take
a lock that is already held by
another thread, and hence, waits
till the other thread notifies that it
has released the lock.
Ideally, the value of this measure
should be low. A very high value
could be indicative of excessive
waiting activity on the JVM. You
can use the detailed diagnosis of
this measure, if enabled, to figure
out which threads are currently in
the waiting state.
While waiting, the Java
application program does no
productive work and its ability to
complete the task-at-hand is
degraded. A certain amount of
waiting may be acceptable for
Java application programs.
However, when the amount of
time spent waiting becomes
excessive or if the number of
times that waits occur exceeds a
reasonable amount, the Java
application program may not be
programmed correctly to take
advantage of the available
resources. When this happens,
the delay caused by the waiting
Java application programs
elongates the response time
experienced by an end user. An
enterprise may use Java
application programs to perform
various functions. Delays based
on abnormal degradation
consume employee time and may
be costly to corporations.
Timed waiting threads:
Indicates the number of threads
in a TIMED_WAITING state.
Number
When a thread is in the
TIMED_WAITING state, it implies
that the thread is waiting for
another thread to do something,
but will give up after a specified
time out period.
To view the details of threads in
the TIMED_WAITING state, use
the detailed diagnosis of this
measure, if enabled.

M o n i t o r i n g O r a c l e 9 i A p p l i c a t i o n S e r v e r s
412
Low CPU threads:
Indicates the number of threads
that are currently consuming
CPU lower than the value
configured in the PCT LOW CPU
UTIL THREADS text box.
Number
Medium CPU threads:
Indicates the number of threads
that are currently consuming
CPU that is higher than the value
configured in the PCT LOW CPU
UTIL THREADS text box and is
lower than or equal to the value
specified in the PCT MEDIUM CPU
UTIL THREADS text box.
Number
High CPU threads:
Indicates the number of threads
that are currently consuming
CPU that is either greater than
the percentage configured in the
PCT MEDIUM CPU UTIL THREADS
or lesser than or equal to the
value configured in the PCT HIGH
CPU UTIL THREADS text box.
Number
Ideally, the value of this measure
should be very low. A high value
is indicative of a resource
contention at the JVM. Under
such circumstances, you might
want to identify the resource-
hungry threads and kill them, so
that application performance is
not hampered. To know which
threads are consuming excessive
CPU, use the detailed diagnosis of
this measure.
`
Peak threads:
Indicates the highest number of
live threads since JVM started.
Number
Started threads:
Indicates the the total number of
threads started (including
daemon, non-daemon, and
terminated) since JVM started.
Number
Daemon threads:
Indicates the current number of
live daemon threads.
Number
Deadlock threads:
Indicates the current number of
deadlocked threads.
Number
Ideally, this value should be 0. A
high value is a cause for concern,
as it indicates that many threads
are blocking one another causing
the application performance to
suffer. The detailed diagnosis of
this measure, if enabled, lists the
deadlocked threads and their
resource usage.
M o n i t o r i n g O r a c l e 9 i A p p l i c a t i o n S e r v e r s
413
11.1.5 JVM Cpu Usage Test
This test measures the CPU utilization of the JVM. If the JVM experiences abnormal CPU usage levels,
you can use this test to instantly drill down to the classes and the methods within the classes that
contributing to the resource contention at the JVM.
Purpose
Reports the status of threads on the JVM, and also reveals resource-hungry threads,
so that threads that are unnecessarily consuming CPU resources can be killed
Target of the
An Oracle 9i AS
Note:
If the MODE for the JVM Threads test is set to SNMP, then the detailed diagnosis of this test will not
display the Blocked Time and Waited Time for the threads. To make sure that detailed diagnosis
reports these details also, do the following:
Login to the server host.
Go to the <JAVA_HOME>\jre\lib\management folder used by the WebLogic server, and edit the
management.properties file in that folder.
Append the following line to the file:
com.sun.management.enableThreadContentionMonitoring
Finally, save the file.
Note:
While viewing the measures reported by the JVM Thread test, you can also view the resource usage
details and the stack trace information for all the threads, by clicking on the STACK TRACE link in the
Measurements panel.
A stack trace (also called stack backtrace or stack traceback) is a report of the active stack
frames instantiated by the execution of a program. It is commonly used to determine what threads
are currently active in the JVM, and which threads are in each of the different states – i.e., alive,
blocked, waiting, timed waiting, etc.
Typically, when the JVM begins exhibiting erratic resource usage patterns, it often takes
administrators hours, even days to figure out what is causing this anomaly – could it be owing to
one/more resource-intensive threads being executed by the WebLogic server? If so, what is
causing the thread to erode resources? Is it an inefficient piece of code? In which case, which line
of code could be the most likely cause for the spike in resource usage? To be able to answer these
questions accurately, administrators need to know the complete list of threads that are executing
on the JVM, view the stack trace of each thread, analyze each stack trace in a top-down manner,
and trace where the problem originated.

M o n i t o r i n g O r a c l e 9 i A p p l i c a t i o n S e r v e r s
414
test
Agent
deploying the
test
An internal/remote agent
Configurable
parameters for
the test
1. TEST PERIOD - How often should the test be executed
2. HOST - The host for which the test is to be configured
3. PORT - The port number at which the specified HOST listens
4. MODE – This test can extract metrics from the Java application using either of
the following mechanisms:
Using SNMP-based access to the Java runtime MIB statistics;
By contacting the Java runtime (JRE) of the application via JMX
To configure the test to use SNMP, select the SNMP option. On the other hand,
choose the JMX option to configure the test to use JMX instead. By default, the
JMX option is chosen here.
5. JMX REMOTE PORT – This parameter appears only if the MODE is set to JMX.
Here, specify the port at which the JMX listens for requests from remote hosts.
Ensure that you specify the same port that you configured in the
management.properties file in the <JAVA_HOME>\jre\lib\management folder used by
the target application (refer to the Monitoring Java Applications document).
6. USER, PASSWORD, and CONFIRM PASSWORD – These parameters appear only if
the MODE is set to JMX. If JMX requires authentication only (but no security), then
ensure that the USER and PASSWORD parameters are configured with the
credentials of a user with read-write access to JMX. To know how to create this
user, refer to the Monitoring Java Applications document. Confirm the password
by retyping it in the CONFIRM PASSWORD text box.
7. JNDINAME – This parameter appears only if the MODE is set to JMX. The JNDINAME
is a lookup name for connecting to the JMX connector. By default, this is
jmxrmi. If you have registered the JMX connector in the RMI registry using a
different lookup name, then you can change this default value to reflect the
same.
8. SNMPPORT – This parameter appears only if the MODE is set to SNMP. Here
specify the port number through which the server exposes its SNMP MIB. Ensure
that you specify the same port you configured in the management.properties file
in the <JAVA_HOME>\jre\lib\management folder used by the target application (refer
to the Monitoring Java Applications document).
9. SNMPVERSION – This parameter appears only if the MODE is set to SNMP. The
default selection in the SNMPVERSION list is v1. However, for this test to work,
you have to select SNMP v2 or v3 from this list, depending upon which version of
SNMP is in use in the target environment.
10. SNMPCOMMUNITY – This parameter appears only if the MODE is set to SNMP.
Here, specify the SNMP community name that the test uses to communicate
with the mail server. The default is public. This parameter is specific to SNMP v1
and v2 only. Therefore, if the SNMPVERSION chosen is v3, then this parameter
will not appear.

M o n i t o r i n g O r a c l e 9 i A p p l i c a t i o n S e r v e r s
415
11. USERNAME – This parameter appears only when v3 is selected as the
SNMPVERSION. SNMP version 3 (SNMPv3) is an extensible SNMP Framework
which supplements the SNMPv2 Framework, by additionally supporting message
security, access control, and remote SNMP configuration capabilities. To extract
performance statistics from the MIB using the highly secure SNMP v3 protocol,
the eG agent has to be configured with the required access privileges – in other
words, the eG agent should connect to the MIB using the credentials of a user
with access permissions to be MIB. Therefore, specify the name of such a user
against the USERNAME parameter.
12. AUTHTYPE – This parameter too appears only if v3 is selected as the
SNMPVERSION. From the AUTHTYPE list box, choose the authentication
algorithm using which SNMP v3 converts the specified USERNAME and
PASSWORD into a 32-bit format to ensure security of SNMP transactions. You
can choose between the following options:
MD5 – Message Digest Algorithm
SHA – Secure Hash Algorithm
13. ENCRYPTFLAG – This flag appears only when v3 is selected as the
SNMPVERSION. By default, the eG agent does not encrypt SNMP requests.
Accordingly, the ENCRYPTFLAG is set to NO by default. To ensure that SNMP
requests sent by the eG agent are encrypted, select the YES option.
14. ENCRYPTTYPE – If the ENCRYPTFLAG is set to YES, then you will have to
mention the encryption type by selecting an option from the ENCRYPTTYPE list.
SNMP v3 supports the following encryption types:
DES – Data Encryption Standard
AES – Advanced Encryption Standard
15. ENCRYPTPASSWORD – Specify the encryption password here.
16. CONFIRM PASSWORD – Confirm the encryption password by retyping it here.
17. TIMEOUT - This parameter appears only if the MODE is set to SNMP. Here, specify
the duration (in seconds) within which the SNMP query executed by this test
should time out in the TIMEOUT text box. The default is 10 seconds.
18. PROFILER HOME – JIP (Java Interactive Profiler) is a high performance, low
overhead profiler that is written entirely in Java and used extensively to gather
performance data pertaining to a JVM. The eG agent comes bundled with JIP,
and takes the help of JIP to provide detailed diagnosis information related to the
CPU usage of the JVM. To make sure that this test contacts JIP for detailed
resource usage metrics, you need to indicate the location of the JIP in the
PROFILER HOME text box.

M o n i t o r i n g O r a c l e 9 i A p p l i c a t i o n S e r v e r s
416
Typically, the files related to this profiler are available in <EG_INSTALL_DIR>\lib\jip
directory (in Windows; in Unix, this will be: /opt/egurkha/lib/jip). If only a single
Java application on a host is being monitored, then the jip folder can remain in
the same location. The PROFILER HOME parameter should then be configured
with /opt/egurkha/lib/jip or <EG_INSTALL_DIR>\lib\jip, as the case may be. However, if
more than one Java application on a single host is to be monitored, then first
ensure that the jip folder is copied to two different locations on the same host.
The PROFILER HOME parameter should in this case be configured with the
location of the jip folder that corresponds to the Java application for which this
test is being currently configured. For instance, say japp1 and japp2 are 2 Java
applications that are being managed by the eG Enterprise system. Assume that
the jip folder has been copied to the C:\japp1 and D:\japp2 folders. Now, while
configuring this test for the japp1 application, specify C:\japp\jip in PROFILER
HOME. Similarly, when configuring this test for the japp2 application, enter
D:\japp2\jip in PROFILER HOME.
19. PROFILER – The JIP can be turned on or off while the JVM is still running. For
the eG agent to be able to report detailed diagnosis of the CPU usage metric,
the profiler should be turned on. Accordingly, the PROFILER flag is set to On by
default. If you do not want detailed diagnosis, then you can set the PROFILER
flag to Off.
20. DD FREQUENCY - Refers to the frequency with which detailed
diagnosis measures are to be generated for this test. The default is 1:1. This
indicates that, by default, detailed measures will be generated every time this
test runs, and also every time the test detects a problem. You can modify this
frequency, if you so desire. Also, if you intend to disable the detailed diagnosis
capability for this test, you can do so by specifying none against DD
FREQUENCY.
21. DETAILED DIAGNOSIS - To make diagnosis more efficient and accurate, the eG
Enterprise suite embeds an optional detailed diagnostic capability. With this
capability, the eG agents can be configured to run detailed, more elaborate tests
as and when specific problems are detected. To enable the detailed diagnosis
capability of this test for a particular server, choose the On option. To disable
the capability, click on the Off option.
The option to selectively enable/disable the detailed diagnosis capability will be
available only if the following conditions are fulfilled:
The eG manager license should allow the detailed diagnosis capability
Both the normal and abnormal frequencies configured for the detailed
diagnosis measures should not be 0.
Outputs of the
test
One set of results for the server being monitored
Measurements
made by the
Measurement
Measurement
Unit
Interpretation

M o n i t o r i n g O r a c l e 9 i A p p l i c a t i o n S e r v e r s
417
test
CPU utilization of JVM:
Indicates the percentage of CPU
currently utilized by the JVM.
Percent
Ideally, this value should be low.
An unusually high value or a
consistent increase in this value is
indicative of abnormal CPU usage,
and could warrant further
investigation. In such a situation,
you can use the detailed
diagnosis of this measure, if
enabled, to determine which
methods invoked by which
classes are causing the
steady/sporadic spikes in CPU
usage.
11.1.6 JVM Memory Usage Test
This test monitors every memory type on the JVM and reports how efficiently the JVM utilizes the
memory resources of each type.
Purpose
Monitors every memory type on the JVM and reports how efficiently the JVM utilizes
the memory resources of each type
Target of the
test
An Oracle 9i AS
Agent
deploying the
test
An internal/remote agent

M o n i t o r i n g O r a c l e 9 i A p p l i c a t i o n S e r v e r s
418
Configurable
parameters for
the test
1. TEST PERIOD - How often should the test be executed
2. HOST - The host for which the test is to be configured
3. PORT - The port number at which the specified HOST listens
4. MODE – This test can extract metrics from the Java application using either of
the following mechanisms:
Using SNMP-based access to the Java runtime MIB statistics;
By contacting the Java runtime (JRE) of the application via JMX
To configure the test to use SNMP, select the SNMP option. On the other hand,
choose the JMX option to configure the test to use JMX instead. By default, the
JMX option is chosen here.
5. JMX REMOTE PORT – This parameter appears only if the MODE is set to JMX.
Here, specify the port at which the JMX listens for requests from remote hosts.
Ensure that you specify the same port that you configured in the
management.properties file in the <JAVA_HOME>\jre\lib\management folder used by
the target application (refer to the Monitoring Java Applications document).
6. USER, PASSWORD, and CONFIRM PASSWORD – These parameters appear only if
the MODE is set to JMX. If JMX requires authentication only (but no security), then
ensure that the USER and PASSWORD parameters are configured with the
credentials of a user with read-write access to JMX. To know how to create this
user, refer to the Monitoring Java Applications document. Confirm the password
by retyping it in the CONFIRM PASSWORD text box.
7. JNDINAME – This parameter appears only if the MODE is set to JMX. The JNDINAME
is a lookup name for connecting to the JMX connector. By default, this is
jmxrmi. If you have registered the JMX connector in the RMI registry using a
different lookup name, then you can change this default value to reflect the
same.
8. SNMPPORT – This parameter appears only if the MODE is set to SNMP. Here
specify the port number through which the server exposes its SNMP MIB. Ensure
that you specify the same port you configured in the management.properties file
in the <JAVA_HOME>\jre\lib\management folder used by the target application (refer
to the Monitoring Java Applications document).
9. SNMPVERSION – This parameter appears only if the MODE is set to SNMP. The
default selection in the SNMPVERSION list is v1. However, for this test to work,
you have to select SNMP v2 or v3 from this list, depending upon which version of
SNMP is in use in the target environment.
10. SNMPCOMMUNITY – This parameter appears only if the MODE is set to SNMP.
Here, specify the SNMP community name that the test uses to communicate
with the mail server. The default is public. This parameter is specific to SNMP v1
and v2 only. Therefore, if the SNMPVERSION chosen is v3, then this parameter
will not appear.

M o n i t o r i n g O r a c l e 9 i A p p l i c a t i o n S e r v e r s
419
11. USERNAME – This parameter appears only when v3 is selected as the
SNMPVERSION. SNMP version 3 (SNMPv3) is an extensible SNMP Framework
which supplements the SNMPv2 Framework, by additionally supporting message
security, access control, and remote SNMP configuration capabilities. To extract
performance statistics from the MIB using the highly secure SNMP v3 protocol,
the eG agent has to be configured with the required access privileges – in other
words, the eG agent should connect to the MIB using the credentials of a user
with access permissions to be MIB. Therefore, specify the name of such a user
against the USERNAME parameter.
12. AUTHPASS – Specify the password that corresponds to the above-mentioned
USERNAME. This parameter once again appears only if the SNMPVERSION
selected is v3.
13. CONFIRM PASSWORD – Confirm the AUTHPASS by retyping it here.
14. AUTHTYPE – This parameter too appears only if v3 is selected as the
SNMPVERSION. From the AUTHTYPE list box, choose the authentication
algorithm using which SNMP v3 converts the specified USERNAME and
PASSWORD into a 32-bit format to ensure security of SNMP transactions. You
can choose between the following options:
MD5 – Message Digest Algorithm
SHA – Secure Hash Algorithm
15. ENCRYPTFLAG – This flag appears only when v3 is selected as the
SNMPVERSION. By default, the eG agent does not encrypt SNMP requests.
Accordingly, the ENCRYPTFLAG is set to NO by default. To ensure that SNMP
requests sent by the eG agent are encrypted, select the YES option.
16. ENCRYPTTYPE – If the ENCRYPTFLAG is set to YES, then you will have to
mention the encryption type by selecting an option from the ENCRYPTTYPE list.
SNMP v3 supports the following encryption types:
DES – Data Encryption Standard
AES – Advanced Encryption Standard
17. ENCRYPTPASSWORD – Specify the encryption password here.
18. CONFIRM PASSWORD – Confirm the encryption password by retyping it here.
19. TIMEOUT - This parameter appears only if the MODE is set to SNMP. Here, specify
the duration (in seconds) within which the SNMP query executed by this test
should time out in the TIMEOUT text box. The default is 10 seconds.
Outputs of the
test
One set of results for every memory type on the JVM being monitored
Measurements
made by the
Measurement
Measurement
Unit
Interpretation

M o n i t o r i n g O r a c l e 9 i A p p l i c a t i o n S e r v e r s
420
test
Initial memory:
Indicates the amount of memory
initially allocated at startup.
MB
The detailed diagnosis of this
measure, when enabled, reveals
the memory pools on the JVM,
the memory type of every pool,
and the memory manager
managing the pool.
Used memory:
Indicates the amount of memory
currently used.
MB
It includes the memory occupied
by all objects including both
reachable and unreachable
objects.
Available memory:
Indicates the amount of memory
guaranteed to be available for
use by the JVM.
MB
The amount of Available
memory may change over time.
The Java virtual machine may
release memory to the system
and committed memory could be
less than the amount of memory
initially allocated at startup.
Committed will always be greater
than or equal to used memory.
Free memory:
Indicates the amount of memory
currently available for use by the
JVM.
MB
This is the difference between
Available memory and Used
memory.
Ideally, the value of this measure
should be high.
Max free memory:
Indicates the maximum amount
of memory allocated for the JVM.
MB
Used percentage:
Indicates the percentage of used
memory.
Percent
Ideally, the value of this measure
should be low. A very high value
of this measure could indicate
excessive memory consumption
by the JVM, which in turn, could
warrant further investigation.
11.1.7 JVM Uptime Test
This test helps track whether a scheduled reboot of the JVM has occurred or not.
Purpose
Helps track whether a scheduled reboot of the JVM has occurred or not
Target of the
test
An Oracle 9i AS
Agent
deploying the
test
An internal/remote agent

M o n i t o r i n g O r a c l e 9 i A p p l i c a t i o n S e r v e r s
421
Configurable
parameters for
the test
1. TEST PERIOD - How often should the test be executed
2. HOST - The host for which the test is to be configured
3. PORT - The port number at which the specified HOST listens
4. MODE – This test can extract metrics from the Java application using either of
the following mechanisms:
Using SNMP-based access to the Java runtime MIB statistics;
By contacting the Java runtime (JRE) of the application via JMX
To configure the test to use SNMP, select the SNMP option. On the other hand,
choose the JMX option to configure the test to use JMX instead. By default, the
JMX option is chosen here.
5. JMX REMOTE PORT – This parameter appears only if the MODE is set to JMX.
Here, specify the port at which the JMX listens for requests from remote hosts.
Ensure that you specify the same port that you configured in the
management.properties file in the <JAVA_HOME>\jre\lib\management folder used by
the target application (refer to the Monitoring Java Applications document).
6. USER, PASSWORD, and CONFIRM PASSWORD – These parameters appear only if
the MODE is set to JMX. If JMX requires authentication only (but no security), then
ensure that the USER and PASSWORD parameters are configured with the
credentials of a user with read-write access to JMX. To know how to create this
user, refer to the Monitoring Java Applications document. Confirm the password
by retyping it in the CONFIRM PASSWORD text box.
7. JNDINAME – This parameter appears only if the MODE is set to JMX. The JNDINAME
is a lookup name for connecting to the JMX connector. By default, this is
jmxrmi. If you have registered the JMX connector in the RMI registry using a
different lookup name, then you can change this default value to reflect the
same.
8. SNMPPORT – This parameter appears only if the MODE is set to SNMP. Here
specify the port number through which the server exposes its SNMP MIB. Ensure
that you specify the same port you configured in the management.properties file
in the <JAVA_HOME>\jre\lib\management folder used by the target application (refer
to the Monitoring Java Applications document).
9. SNMPVERSION – This parameter appears only if the MODE is set to SNMP. The
default selection in the SNMPVERSION list is v1. However, for this test to work,
you have to select SNMP v2 or v3 from this list, depending upon which version of
SNMP is in use in the target environment.
10. SNMPCOMMUNITY – This parameter appears only if the MODE is set to SNMP.
Here, specify the SNMP community name that the test uses to communicate
with the mail server. The default is public. This parameter is specific to SNMP v1
and v2 only. Therefore, if the SNMPVERSION chosen is v3, then this parameter
will not appear.

M o n i t o r i n g O r a c l e 9 i A p p l i c a t i o n S e r v e r s
422
11. USERNAME – This parameter appears only when v3 is selected as the
SNMPVERSION. SNMP version 3 (SNMPv3) is an extensible SNMP Framework
which supplements the SNMPv2 Framework, by additionally supporting message
security, access control, and remote SNMP configuration capabilities. To extract
performance statistics from the MIB using the highly secure SNMP v3 protocol,
the eG agent has to be configured with the required access privileges – in other
words, the eG agent should connect to the MIB using the credentials of a user
with access permissions to be MIB. Therefore, specify the name of such a user
against the USERNAME parameter.
12. AUTHPASS – Specify the password that corresponds to the above-mentioned
USERNAME. This parameter once again appears only if the SNMPVERSION
selected is v3.
13. CONFIRM PASSWORD – Confirm the AUTHPASS by retyping it here.
14. AUTHTYPE – This parameter too appears only if v3 is selected as the
SNMPVERSION. From the AUTHTYPE list box, choose the authentication
algorithm using which SNMP v3 converts the specified USERNAME and
PASSWORD into a 32-bit format to ensure security of SNMP transactions. You
can choose between the following options:
MD5 – Message Digest Algorithm
SHA – Secure Hash Algorithm
15. ENCRYPTFLAG – This flag appears only when v3 is selected as the
SNMPVERSION. By default, the eG agent does not encrypt SNMP requests.
Accordingly, the ENCRYPTFLAG is set to NO by default. To ensure that SNMP
requests sent by the eG agent are encrypted, select the YES option.
16. ENCRYPTTYPE – If the ENCRYPTFLAG is set to YES, then you will have to
mention the encryption type by selecting an option from the ENCRYPTTYPE list.
SNMP v3 supports the following encryption types:
DES – Data Encryption Standard
AES – Advanced Encryption Standard
17. ENCRYPTPASSWORD – Specify the encryption password here.
18. CONFIRM PASSWORD – Confirm the encryption password by retyping it here.
19. TIMEOUT - This parameter appears only if the MODE is set to SNMP. Here, specify
the duration (in seconds) within which the SNMP query executed by this test
should time out in the TIMEOUT text box. The default is 10 seconds.
Outputs of the
test
One set of results for the server being monitored
Measurements
made by the
Measurement
Measurement
Unit
Interpretation

M o n i t o r i n g O r a c l e 9 i A p p l i c a t i o n S e r v e r s
423
test
Has the JVM been restarted?:
Indicates whether or not the JVM
has restarted during the last
measurement period.
If the value of this measure is No,
it indicates that the JVM has not
restarted. The value Yes on the
other hand implies that the JVM
has indeed restarted.
The numeric values that
correspond to the reboot states
discussed above are listed in the
table below:
State
Value
Yes
1
No
0
Note:
By default, this measure reports
the value Yes or No to indicate
whether a JVM has restarted. The
graph of this measure however,
represents the same using the
numeric equivalents – 0 or 1.
Uptime during the last
measure period:
Indicates the time period that
the JVM has been up since the
last time this test ran.
Secs
If the JVM has not been restarted
during the last measurement
period and the agent has been
running continuously, this value
will be equal to the measurement
period. If the JVM was restarted
during the last measurement
period, this value will be less than
the measurement period of the
test. For example, if the
measurement period is 300 secs,
and if the JVM was restarted 120
secs back, this metric will report a
value of 120 seconds. The
accuracy of this metric is
dependent on the measurement
period – the smaller the
measurement period, greater the
accuracy.
Total uptime of the JVM:
Indicates the total time that the
JVM has been up since its last
reboot.
Secs
Administrators may wish to be
alerted if a JVM has been running
without a reboot for a very long
period. Setting a threshold for
this metric allows administrators
to determine such conditions.

M o n i t o r i n g O r a c l e 9 i A p p l i c a t i o n S e r v e r s
424
11.1.8 JVM Garbage Collections Test
Manual memory management is time consuming, and error prone. Most programs still contain leaks.
This is all doubly true with programs using exception-handling and/or threads. Garbage collection (GC)
is a part of a Java application’s JVM that automatically determines what memory a program is no
longer using, and recycles it for other use. It is also known as "automatic storage (or memory)
reclamation''. The JvmGarbageCollection test reports the performance statistics pertaining to the
JVM's garbage collection.
Purpose
Reports the performance statistics pertaining to the JVM's garbage collection
Target of the
test
An Oracle 9i AS
Agent
deploying the
test
An internal/remote agent

M o n i t o r i n g O r a c l e 9 i A p p l i c a t i o n S e r v e r s
425
Configurable
parameters for
the test
1. TEST PERIOD - How often should the test be executed
2. HOST - The host for which the test is to be configured
3. PORT - The port number at which the specified HOST listens
4. MODE – This test can extract metrics from the Java application using either of
the following mechanisms:
Using SNMP-based access to the Java runtime MIB statistics;
By contacting the Java runtime (JRE) of the application via JMX
To configure the test to use SNMP, select the SNMP option. On the other hand,
choose the JMX option to configure the test to use JMX instead. By default, the
JMX option is chosen here.
5. JMX REMOTE PORT – This parameter appears only if the MODE is set to JMX.
Here, specify the port at which the JMX listens for requests from remote hosts.
Ensure that you specify the same port that you configured in the
management.properties file in the <JAVA_HOME>\jre\lib\management folder used by
the target application (refer to the Monitoring Java Applications document).
6. USER, PASSWORD, and CONFIRM PASSWORD – These parameters appear only if
the MODE is set to JMX. If JMX requires authentication only (but no security), then
ensure that the USER and PASSWORD parameters are configured with the
credentials of a user with read-write access to JMX. To know how to create this
user, refer to the Monitoring Java Applications document. Confirm the password
by retyping it in the CONFIRM PASSWORD text box.
7. JNDINAME – This parameter appears only if the MODE is set to JMX. The JNDINAME
is a lookup name for connecting to the JMX connector. By default, this is
jmxrmi. If you have registered the JMX connector in the RMI registry using a
different lookup name, then you can change this default value to reflect the
same.
8. SNMPPORT – This parameter appears only if the MODE is set to SNMP. Here
specify the port number through which the server exposes its SNMP MIB. Ensure
that you specify the same port you configured in the management.properties file
in the <JAVA_HOME>\jre\lib\management folder used by the target application (refer
to the Monitoring Java Applications document).
9. SNMPVERSION – This parameter appears only if the MODE is set to SNMP. The
default selection in the SNMPVERSION list is v1. However, for this test to work,
you have to select SNMP v2 or v3 from this list, depending upon which version of
SNMP is in use in the target environment.
10. SNMPCOMMUNITY – This parameter appears only if the MODE is set to SNMP.
Here, specify the SNMP community name that the test uses to communicate
with the mail server. The default is public. This parameter is specific to SNMP v1
and v2 only. Therefore, if the SNMPVERSION chosen is v3, then this parameter
will not appear.

M o n i t o r i n g O r a c l e 9 i A p p l i c a t i o n S e r v e r s
426
11. USERNAME – This parameter appears only when v3 is selected as the
SNMPVERSION. SNMP version 3 (SNMPv3) is an extensible SNMP Framework
which supplements the SNMPv2 Framework, by additionally supporting message
security, access control, and remote SNMP configuration capabilities. To extract
performance statistics from the MIB using the highly secure SNMP v3 protocol,
the eG agent has to be configured with the required access privileges – in other
words, the eG agent should connect to the MIB using the credentials of a user
with access permissions to be MIB. Therefore, specify the name of such a user
against the USERNAME parameter.
12. AUTHPASS – Specify the password that corresponds to the above-mentioned
USERNAME. This parameter once again appears only if the SNMPVERSION
selected is v3.
13. CONFIRM PASSWORD – Confirm the AUTHPASS by retyping it here.
14. AUTHTYPE – This parameter too appears only if v3 is selected as the
SNMPVERSION. From the AUTHTYPE list box, choose the authentication
algorithm using which SNMP v3 converts the specified USERNAME and
PASSWORD into a 32-bit format to ensure security of SNMP transactions. You
can choose between the following options:
MD5 – Message Digest Algorithm
SHA – Secure Hash Algorithm
15. ENCRYPTFLAG – This flag appears only when v3 is selected as the
SNMPVERSION. By default, the eG agent does not encrypt SNMP requests.
Accordingly, the ENCRYPTFLAG is set to NO by default. To ensure that SNMP
requests sent by the eG agent are encrypted, select the YES option.
16. ENCRYPTTYPE – If the ENCRYPTFLAG is set to YES, then you will have to
mention the encryption type by selecting an option from the ENCRYPTTYPE list.
SNMP v3 supports the following encryption types:
DES – Data Encryption Standard
AES – Advanced Encryption Standard
17. ENCRYPTPASSWORD – Specify the encryption password here.
18. CONFIRM PASSWORD – Confirm the encryption password by retyping it here.
19. TIMEOUT - This parameter appears only if the MODE is set to SNMP. Here, specify
the duration (in seconds) within which the SNMP query executed by this test
should time out in the TIMEOUT text box. The default is 10 seconds.
Outputs of the
test
One set of results for every garbage collector configured on the WebSphere server
being monitored
Measurements
made by the
Measurement
Measurement
Unit
Interpretation
M o n i t o r i n g O r a c l e 9 i A p p l i c a t i o n S e r v e r s
427
test
No of garbage collections
started:
Indicates the number of times
garbage collection started to
release dead objects form
memory.
Number
Time taken for garbage
collection:
Indicates the time taken to
perform the current garbage
collection operation.
Secs
Ideally, the value of both these
measures should be low. This is
because, the garbage collection
(GC) activity tends to suspend
the operations of the application
until such time that GC ends.
Longer the GC time, longer it
would take for the application to
resume its functions. To minimize
the impact of GC on application
performance, it is best to ensure
that GC activity does not take too
long to complete.
Percent of time spent by JVM
for garbage collection:
Indicates the percentage of time
spent by JVM in garbage
collection.
Percent
11.1.9 JVM Memory Pool Garbage Collections Test
While the JVM Garbage Collections test reports statistics indicating how well each collector on the JVM
performs garbage collection, the measures reported by the JVM Memory Pool Garbage Collections test help
assess the impact of the garbage collection activity on the availability and usage of memory in each
memory pool of the JVM. Besides revealing the count of garbage collections per collector and the time
taken by each collector to perform garbage collection on the individual memory pools, the test also
compares the amount of memory used and available for use pre and post garbage collection in each of
the memory pools. This way, the test enables administrators to guage the effectiveness of the
garbage collection activity on the memory pools, and helps them accurately identify those memory
pools where enough memory could not reclaimed or where the garbage collectors spent too much
time.
Purpose
Helps assess the impact of the garbage collection activity on the availability and
usage of memory in each memory pool of the JVM
Target of the
test
An Oracle 9i AS
Agent
deploying the
test
An internal/remote agent

M o n i t o r i n g O r a c l e 9 i A p p l i c a t i o n S e r v e r s
428
Configurable
parameters for
the test
1. TEST PERIOD - How often should the test be executed
HOST - The host for which the test is to be configured
PORT - The port number at which the specified HOST listens
MEASURE MODE - This test allows you the option to collect the desired metrics
using one of the following methodologies:
By contacting the Java runtime (JRE) of the application via JMX
Using GC logs
To use JMX for metrics collections, set the MEASURE MODE to JMX.
On the other hand, if you intend to use the GC log files for collecting the
required metrics, set the MEASURE MODE to Log File. In this case, you would be
required to enable GC logging. The procedure for this has been detailed in the
Monitoring Java Applications document.
2. JMX REMOTE PORT – This parameter appears only if the MODE is set to JMX.
Here, specify the port at which the JMX listens for requests from remote hosts.
Ensure that you specify the same port that you configured in the
management.properties file in the <JAVA_HOME>\jre\lib\management folder used by
the target application (refer to the Monitoring Java Applications document).
3. USER, PASSWORD, and CONFIRM PASSWORD – These parameters appear only if
the MODE is set to JMX. If JMX requires authentication only (but no security), then
ensure that the USER and PASSWORD parameters are configured with the
credentials of a user with read-write access to JMX. To know how to create this
user, refer to the Monitoring Java Applications document. Confirm the password
by retyping it in the CONFIRM PASSWORD text box.
4. JNDINAME – This parameter appears only if the MODE is set to JMX. The JNDINAME
is a lookup name for connecting to the JMX connector. By default, this is
jmxrmi. If you have registered the JMX connector in the RMI registry using a
different lookup name, then you can change this default value to reflect the
same.
5. JREHOME - This parameter will be available only if the MEASURE MODE is set to
Log File. Specify the full path to the Java Runtime Environment (JRE) used by
the target application.
6. LOGFILENAME - This parameter will be available only if the MEASURE MODE is
set to Log File. Specify the full path to the GC log file to be used for metrics
collection.
Outputs of the
test
One set of results for every GarbageCollector:MemoryPool pair on the JVM of the
server being monitored
Measurements
made by the
test
Measurement
Measurement
Unit
Interpretation
Has garbage collection
happened:
Indicates whether garbage
collection occurred on this
memory pool in the last
measurement period.
This measure reports the value
Yes if garbage collection took
place or No if it did not take place
on the memory pool.
The numeric values that
correspond to the measure values
of Yes and No are listed below:

M o n i t o r i n g O r a c l e 9 i A p p l i c a t i o n S e r v e r s
429
State
Value
Yes
1
No
0
Note:
By default, this measure reports
the value Yes or No to indicate
whether a GC occurred on a
memory pool or not. The graph of
this measure however, represents
the same using the numeric
equivalents – 0 or 1.
Collection count:
Indicates the number of time in
the last measurement pool
garbage collection was started
on this memory pool.
Number
Initial memory before GC:
Indicates the initial amount of
memory (in MB) that this
memory pool requests from the
operating system for memory
management during startup,
before GC process.
MB
Comparing the value of these two
measures for a memory pool will
give you a fair idea of the
effectiveness of the garbage
collection activity.
If garbage collection reclaims a
large amount of memory from the
memory pool, then the Initial
memory after GC will drop. On
the other hand, if the garbage
collector does not reclaim much
memory from a memory pool, or
if the Java application suddenly
runs a memory-intensive process
when GC is being performed, then
the Initial memory after GC may
be higher than the Initial memory
before GC.
Initial memory after GC:
Indicates the initial amount of
memory (in MB) that this
memory pool requests from the
operating system for memory
management during startup,
after GC process
MB

M o n i t o r i n g O r a c l e 9 i A p p l i c a t i o n S e r v e r s
430
Max memory before GC:
Indicates the maximum amount
of memory that can be used for
memory management by this
memory pool, before GC
process.
MB
Comparing the value of these two
measures for a memory pool will
provide you with insights into the
effectiveness of the garbage
collection activity.
If garbage collection reclaims a
large amount of memory from the
memory pool, then the Max
memory after GC will drop. On
the other hand, if the garbage
collector does not reclaim much
memory from a memory pool, or
if the Java application suddenly
runs a memory-intensive process
when GC is being performed, then
the Max memory after GC value
may exceed the Max memory
before GC.
Max memory after GC:
Indicates the maximum amount
of memory (in MB) that can be
used for memory management
by this pool, after the GC
process.
MB
Committed memory before
GC:
Indicates the amount of memory
that is guaranteed to be
available for use by this memory
pool, before the GC process.
MB
Committed memory after GC:
Indicates the amount of memory
that is guaranteed to be
available for use by this memory
pool, after the GC process.
MB
Used memory before GC:
Indicates the amount of memory
used by this memory pool before
GC.
MB
Comparing the value of these two
measures for a memory pool will
provide you with insights into the
effectiveness of the garbage
collection activity.
If garbage collection reclaims a
large amount of memory from the
memory pool, then the Used
memory after GC may drop lower
than the Used memory before
GC. On the other hand, if the
garbage collector does not
reclaim much memory from a
memory pool, or if the Java
application suddenly runs a
memory-intensive process when
GC is being performed, then the
Used memory after GC value may
exceed the Used memory before
GC.
Used memory after GC:
Indicates the amount of memory
used by this memory pool after
GC.
MB

M o n i t o r i n g O r a c l e 9 i A p p l i c a t i o n S e r v e r s
431
Percentage memory
collected:
Indicates the percentage of
memory collected from this pool
by the GC activity.
Percent
A high value for this measure is
indicative of a large amount of
unused memory in the pool. A
low value on the other hand
indicates that the memory pool
has been over-utilized. Compare
the value of this measure across
pools to identify the pools that
have very little free memory. If
too many pools appear to be
running short of memory, it could
indicate that the target
application is consuming too
much memory, which in the long
run, can slow down the
application significantly.
Collection duration:
Indicates the time taken by this
garbage collector for collecting
unused memory from this pool.
Mins
Ideally, the value of this measure
should be low. This is because,
the garbage collection (GC)
activity tends to suspend the
operations of the application until
such time that GC ends. Longer
the GC time, longer it would take
for the application to resume its
functions. To minimize the impact
of GC on application performance,
it is best to ensure that GC
activity does not take too long to
complete.
11.1.10 JMX Connection to JVM
This test reports the availability of the target Java application, and also indicates whether JMX is
enabled on the application or not. In addition, the test promptly alerts you to slowdowns experienced
by the application, and also reveals whether the application was recently restarted or not.
Purpose
Reports the availability of the target Java application, and also indicates whether
JMX is enabled on the application or not. In addition, the test promptly alerts you to
slowdowns experienced by the application, and also reveals whether the application
was recently restarted or not
Target of the
test
An Oracle 9i AS
Agent
deploying the
test
An internal/remote agent

M o n i t o r i n g O r a c l e 9 i A p p l i c a t i o n S e r v e r s
432
Configurable
parameters for
the test
1. TEST PERIOD - How often should the test be executed
2. HOST - The host for which the test is to be configured
3. PORT - The port number at which the specified HOST listens
4. JMX REMOTE PORT – Here, specify the port at which the JMX listens for requests
from remote hosts. Ensure that you specify the same port that you configured in
the management.properties file in the <JAVA_HOME>\jre\lib\management folder used
by the target application (refer to the Monitoring Java Applications document).
5. USER, PASSWORD, and CONFIRM PASSWORD – If JMX requires authentication only
(but no security), then ensure that the USER and PASSWORD parameters are
configured with the credentials of a user with read-write access to JMX. To know
how to create this user, refer to the Monitoring Java Applications document.
Confirm the password by retyping it in the CONFIRM PASSWORD text box.
6. JNDINAME – The JNDINAME is a lookup name for connecting to the JMX connector.
By default, this is jmxrmi. If you have registered the JMX connector in the RMI
registry using a different lookup name, then you can change this default value
to reflect the same.
Outputs of the
test
One set of results for the Java application being monitored
Measurements
made by the
test
Measurement
Measurement
Unit
Interpretation
JMX availability:
Indicates whether the target
application is available or not
and whether JMX is enabled or
not on the application.
Percent
If the value of this measure is
100%, it indicates that the Java
application is available with JMX
enabled. The value 0 on the other
hand, could indicate one/both the
following:
The Java
application is unavailable;
The Java
application is available,
but JMX is not enabled;
JMX response time:
Indicates the time taken to
connect to the JMX agent of the
Java application.
Secs
A high value could indicate a
connection bottleneck.
Has the PID changed?
Indicates whether/not the
process ID that corresponds to
the Java application has
changed.
This measure will report the value
Yes if the PID of the target
application has changed; such a
change is indicative of an
application restart. If the
application has not restarted -
i.e., if the PID has not changed -
then this measure will return the
value No.

M o n i t o r i n g O r a c l e 9 i A p p l i c a t i o n S e r v e r s
433
11.1.11 JVM File Descriptors Test
This test reports useful statistics pertaining to file descriptors.
Purpose
Reports useful statistics pertaining to file descriptors
Target of the
test
An Oracle 9i AS
Agent
deploying the
test
An internal/remote agent
Configurable
parameters for
the test
1. TEST PERIOD - How often should the test be executed
2. HOST - The host for which the test is to be configured
3. PORT - The port number at which the specified HOST listens
4. JMX REMOTE PORT – Here, specify the port at which the JMX listens for requests
from remote hosts. Ensure that you specify the same port that you configured in
the management.properties file in the <JAVA_HOME>\jre\lib\management folder used
by the target application (refer to the Monitoring Java Applications document).
5. USER, PASSWORD, and CONFIRM PASSWORD – If JMX requires authentication only
(but no security), then ensure that the USER and PASSWORD parameters are
configured with the credentials of a user with read-write access to JMX. To know
how to create this user, refer to the Monitoring Java Applications document.
Confirm the password by retyping it in the CONFIRM PASSWORD text box.
6. JNDINAME – The JNDINAME is a lookup name for connecting to the JMX connector.
By default, this is jmxrmi. If you have registered the JMX connector in the RMI
registry using a different lookup name, then you can change this default value
to reflect the same.
Outputs of the
test
One set of results for the Java application being monitored
Measurements
made by the
test
Measurement
Measurement
Unit
Interpretation
Open file descriptors in JVM:
Indicates the number of file
descriptors currently open for
the application.
Number
Maximum file descriptors in
JVM:
Indicates the maximum number
of file descriptors allowed for the
application.
Number
File descriptor usage by JVM:
Indicates the file descriptor
usage in percentage.
Percent
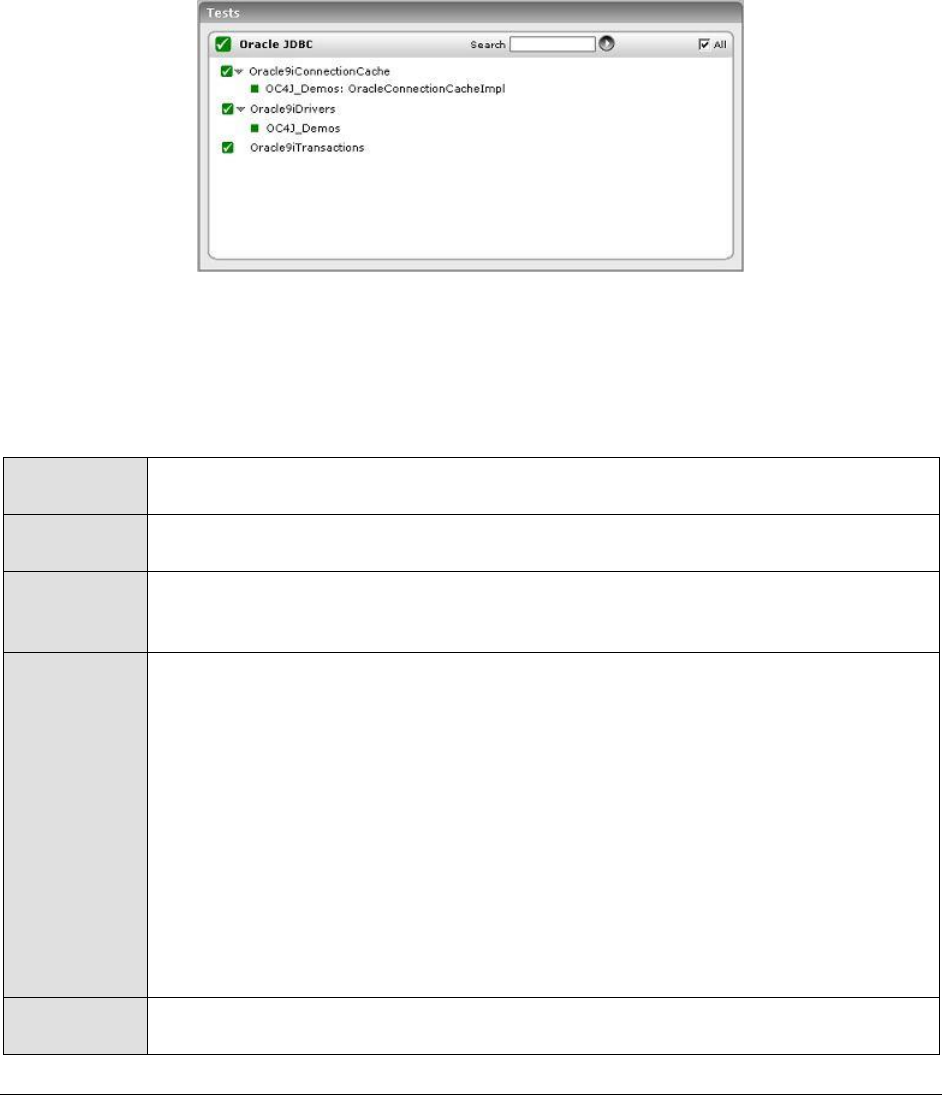
M o n i t o r i n g O r a c l e 9 i A p p l i c a t i o n S e r v e r s
434
11.2 The Oracle JDBC Layer
The tests associated with this layer (see Figure 11.3) enable administrators to:
Measure the health of the JDBC connections in every instance of the server
Monitor the usage of the connection cache
Determine the number and type of transactions executing on the server
Figure 11.3: The tests associated with the Oracle==== JDBC layer
11.2.1 Oracle 9i Drivers Test
This test reports the performance metrics related to the JDBC Connection in an instance of the Oracle
9i application server.
Purpose
Reports the performance metrics related to the JDBC Connection in Oracle 9i
application server instance
Target of the
test
An Oracle 9i AS
Agent
deploying the
test
An internal agent
Configurable
parameters for
the test
1. TEST PERIOD - How often should the test be executed
2. HOST - The host for which the test is to be configured
3. PORT - In the PORT text box, it is recommended that you provide the port at
which the OPMN (Oracle Process Manager and Notification) process of the Oracle
application server instance listens. To know at which port OPMN listens, click on
the Ports tab in the following URL:
http://<oraHttpServerIP>:<OraHttpServerport>. This tab lists the port
numbers that were assigned to the services executing on the Oracle application
server. The port number displayed against the Oracle notification server
request port entry is the OPMN port, and the same should be specified in the
PORT text box.
4. HOMEDIR – The absolute path of the directory in which the Oracle 9i application
server has been installed
Outputs of the
test
One set of results for every instance of the Oracle 9i AS monitored

M o n i t o r i n g O r a c l e 9 i A p p l i c a t i o n S e r v e r s
435
Measurements
made by the
test
Measurement
Measurement
Unit
Interpretation
Threads creating
connections:
Indicates the current number of
threads creating connections.
Number
Avg connection create time:
Indicates the average time spent
creating connections during the
last measurement period.
Secs
An increase in this metric could
indicate a bottleneck in the
database/database connection
points.
Max connection create time:
Indicates the high water mark
indicating the maximum time
spent creating connections since
the server was started.
Secs
A high value for this measure is
indicative of a bottleneck during
database access.
Connections open:
Indicates the number of
connections that have been
opened per second in the last
measurement period.
Conns/Sec
A very high value for this
measure indicates a heavy load
on database access.
Connections closed:
Indicates the number of
connections that have been
closed per second.
Conns/Sec
The value of this measure must
be equal to the Connections open.
If this value is consistently less
than Connections open, then it
indicates a potential problem -
that connections are hanging on
to the database server.
11.2.2 Oracle 9i Connection Cache Test
This test reports the performance metrics related to the connection cache of an instance of the
Oracle9i application server.
Purpose
Reports the performance metrics related to the connection cache of every instance
of the Oracle9i application server
Target of the
test
An Oracle 9i AS
Agent
deploying the
test
An internal agent

M o n i t o r i n g O r a c l e 9 i A p p l i c a t i o n S e r v e r s
436
Configurable
parameters for
the test
1. TEST PERIOD - How often should the test be executed
2. HOST - The host for which the test is to be configured
3. PORT - In the PORT text box, it is recommended that you provide the port at
which the OPMN (Oracle Process Manager and Notification) process of the Oracle
application server instance listens. To know at which port OPMN listens, click on
the Ports tab in the following URL:
http://<oraHttpServerIP>:<OraHttpServerport>. This tab lists the port
numbers that were assigned to the services executing on the Oracle application
server. The port number displayed against the Oracle notification server
request port entry is the OPMN port, and the same should be specified in the
PORT text box.
4. HOMEDIR – The absolute path of the directory in which the Oracle 9i application
server has been installed
Outputs of the
test
One set of results for every instance of the Oracle 9i AS monitored
Measurements
made by the
test
Measurement
Measurement
Unit
Interpretation
Free cache size:
Indicates the number of free
slots in the connection cache.
Number
Cache size:
Indicates the total size of the
connection cache.
Number
Cache hits:
Indicates the number of times a
request for connection has been
fulfilled by the cache.
Conns/Sec
Reading from the cache is less
expensive than reading from disk.
Therefore, the higher this value,
the better.
Cache misses:
Indicates the rate at which the
cache failed to fulfill a request
for connection.
Conns/Sec
Reading from the cache is less
expensive than reading from disk.
Therefore, the lower this value,
the better.
11.2.3 Oracle 9i Transactions Test
This test reports the performance metrics related to the transactions occurring on the Oracle9i
application server.
Purpose
Reports the performance metrics related to the transactions occurring on the
Oracle9i application server
Target of the
test
An Oracle 9i AS
Agent
deploying the
test
An internal agent

M o n i t o r i n g O r a c l e 9 i A p p l i c a t i o n S e r v e r s
437
Configurable
parameters for
the test
1. TEST PERIOD - How often should the test be executed
2. HOST - The host for which the test is to be configured
3. PORT - In the PORT text box, it is recommended that you provide the port at
which the OPMN (Oracle Process Manager and Notification) process of the Oracle
application server instance listens. To know at which port OPMN listens, click on
the Ports tab in the following URL:
http://<oraHttpServerIP>:<OraHttpServerport>. This tab lists the port
numbers that were assigned to the services executing on the Oracle application
server. The port number displayed against the Oracle notification server
request port entry is the OPMN port, and the same should be specified in the
PORT text box.
4. HOMEDIR – The absolute path of the directory in which the Oracle 9i application
server has been installed
Outputs of the
test
One set of results for every instance of the Oracle 9i AS monitored
Measurements
made by the
test
Measurement
Measurement
Unit
Interpretation
Active transactions:
Indicates the current number of
open transactions.
Number
A high value of this measure may
indicate a large number of active
transactions. Alternatively, this
may also indicate that due to
some reasons the users are not
able to complete the transactions.
Transactions commits:
Indicates the rate at which the
transactions were committed.
Trans/Sec
Transaction rollbacks:
Indicates the rate at which
transactions were rolled back
during the last measurement
period.
Trans/Sec
A high value here would mean
that more number of transactions
are being rolled back.
11.3 The Oracle Web Modules Layer
The Oracle9iWebModules test associated with this layer tracks the requests to every web module on each
of the monitored Oracle 9i AS instances.
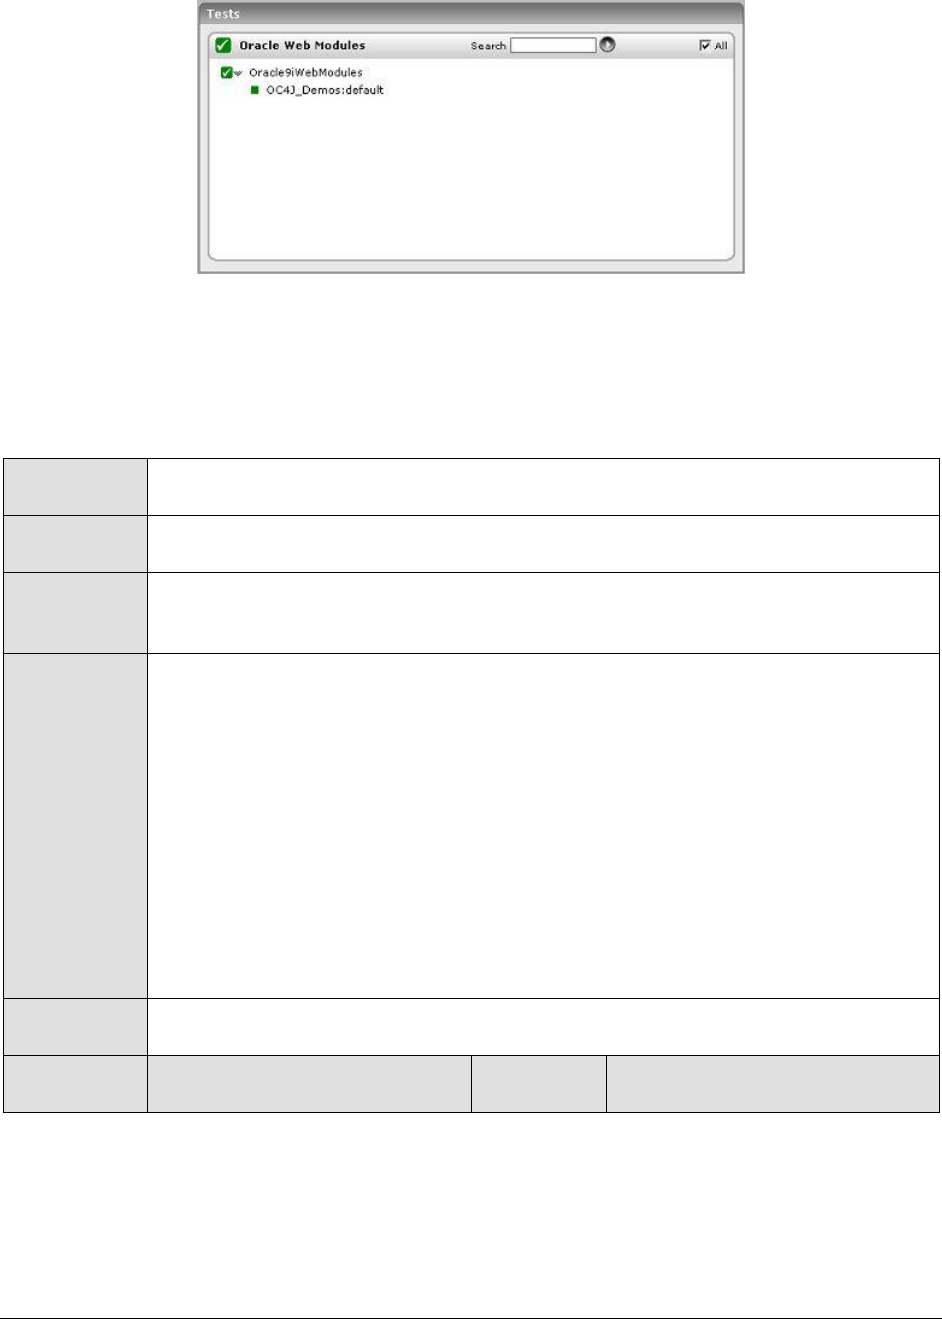
M o n i t o r i n g O r a c l e 9 i A p p l i c a t i o n S e r v e r s
438
Figure 11.4: The tests associated with the Oracle Web Modules layer
11.3.1 Oracle 9i Web Modules Test
This test reports the performance metrics related to every web module in every instance of the
Oracle9i application server.
Purpose
Reports the performance metrics related to every web module in every instance of
the Oracle9i application server
Target of the
test
An Oracle 9i AS
Agent
deploying the
test
An internal agent
Configurable
parameters for
the test
1. TEST PERIOD - How often should the test be executed
2. HOST - The host for which the test is to be configured
3. PORT - In the PORT text box, it is recommended that you provide the port at
which the OPMN (Oracle Process Manager and Notification) process of the Oracle
application server instance listens. To know at which port OPMN listens, click on
the Ports tab in the following URL:
http://<oraHttpServerIP>:<OraHttpServerport>. This tab lists the port
numbers that were assigned to the services executing on the Oracle application
server. The port number displayed against the Oracle notification server
request port entry is the OPMN port, and the same should be specified in the
PORT text box.
4. HOMEDIR – The absolute path of the directory in which the Oracle 9i application
server has been installed
Outputs of the
test
One set of results for every web module on every instance of the Oracle 9i AS
monitored
Measurements
made by the
Measurement
Measurement
Unit
Interpretation

M o n i t o r i n g O r a c l e 9 i A p p l i c a t i o n S e r v e r s
439
test
Requests active:
Indicates the current number of
threads servicing web requests.
Number
A high value of this measure
indicates a heavy load on the web
module. An increase in requests
running may indicate an increase
in user workload. Alternatively, a
slowdown of the application
server may also cause the
requests that are simultaneously
executing to increase.
Requests completed:
Indicates the average time spent
servicing web requests during
the last measurement period.
Secs
A very high value for this
measure indicates that the web
module is handling many
requests.
Avg request process time:
Indicates the average time spent
servicing web requests during
the last measurement period.
Trans/Sec
An increase in this value may be
indicative of a problem in the
application server. This increase
could also be attributed to a
problem in database tier provided
the application is using the
database for servicing the
request.
Max request process time:
Indicates the high water mark
indicating the maximum time
spend servicing a web request
Secs
Avg context resolve time:
Indicates the average time spent
to create/find the servlet context
during the last measurement
period.
Secs
A very high value is an indication
of heavy load on the web module.
Avg request parse time:
Indicates the average time spent
to read/parse requests during
the last measurement.
Secs
Comparing the total request
processing time with the context
resolution time and request
parsing time, can provide an
indication of where a request is
spending time in the O9i AS
instance.
11.4 The Oracle Web Context Layer
Using the test associated with this layer, administrators can monitor the session load on every web
context on an Oracle 9i AS instance, and can determine whether any web context is taking too much
time to create/locate a servlet instance.
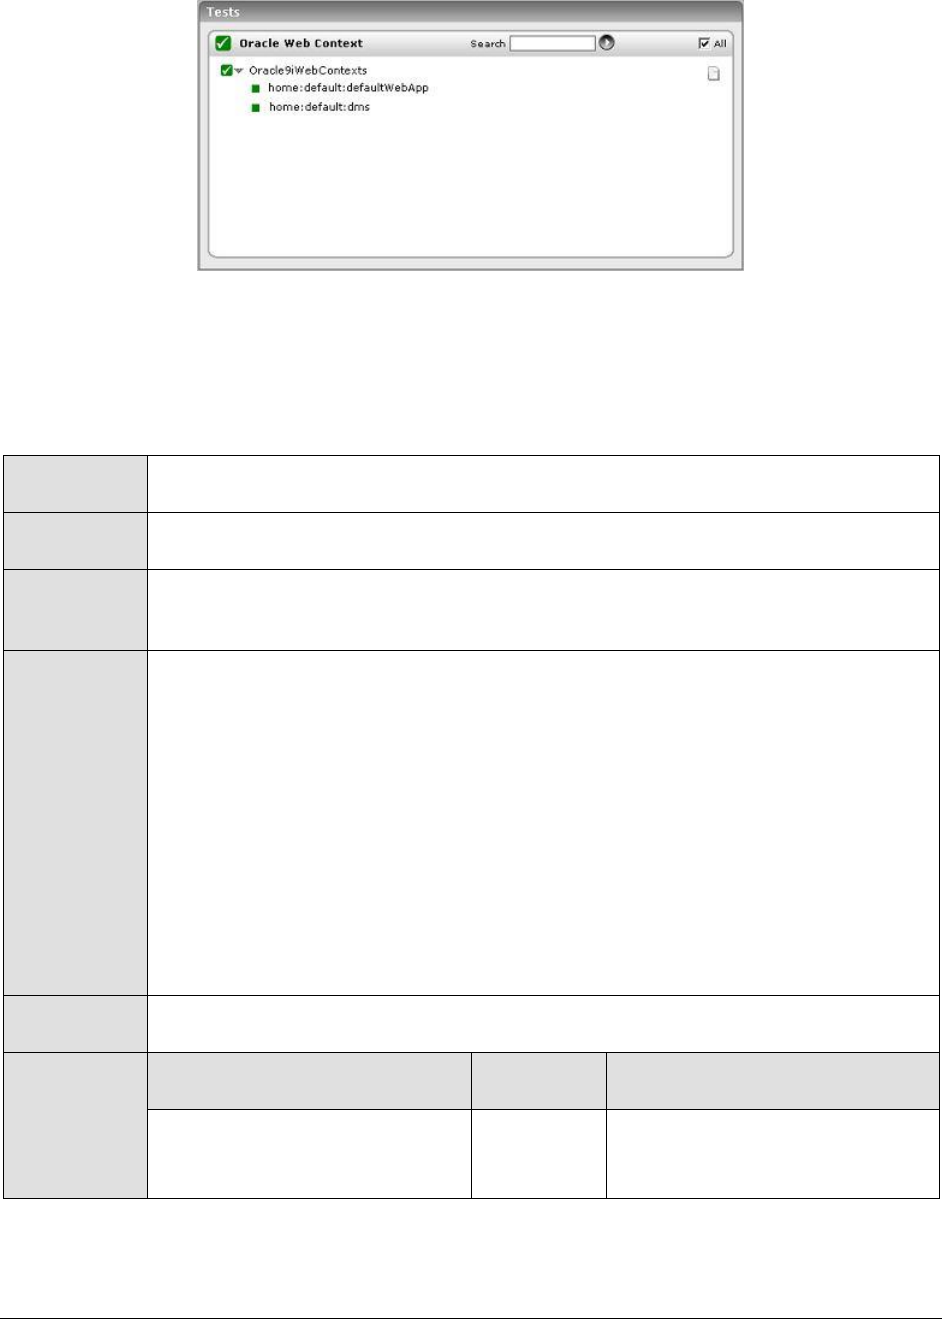
M o n i t o r i n g O r a c l e 9 i A p p l i c a t i o n S e r v e r s
440
Figure 11.5: The tests associated with the Oracle Web Context layer
11.4.1 Oracle 9i Web Contexts Test
This test reports the performance metrics related to every web context on each instance of the Oracle
9i AS.
Purpose
Reports the performance metrics related to every web context on each instance of
the Oracle 9i AS
Target of the
test
An Oracle 9i AS
Agent
deploying the
test
An internal agent
Configurable
parameters for
the test
1. TEST PERIOD - How often should the test be executed
2. HOST - The host for which the test is to be configured
3. PORT - In the PORT text box, it is recommended that you provide the port at
which the OPMN (Oracle Process Manager and Notification) process of the Oracle
application server instance listens. To know at which port OPMN listens, click on
the Ports tab in the following URL:
http://<oraHttpServerIP>:<OraHttpServerport>. This tab lists the port
numbers that were assigned to the services executing on the Oracle application
server. The port number displayed against the Oracle notification server
request port entry is the OPMN port, and the same should be specified in the
PORT text box.
4. HOMEDIR – The absolute path of the directory in which the Oracle 9i application
server has been installed
Outputs of the
test
One set of results for every web context on each instance of the Oracle 9i AS
monitored
Measurements
made by the
test
Measurement
Measurement
Unit
Interpretation
Active sessions:
Indicates the current number of
active sessions.
Number
A high value may indicate that
there is a high load on the web
context.
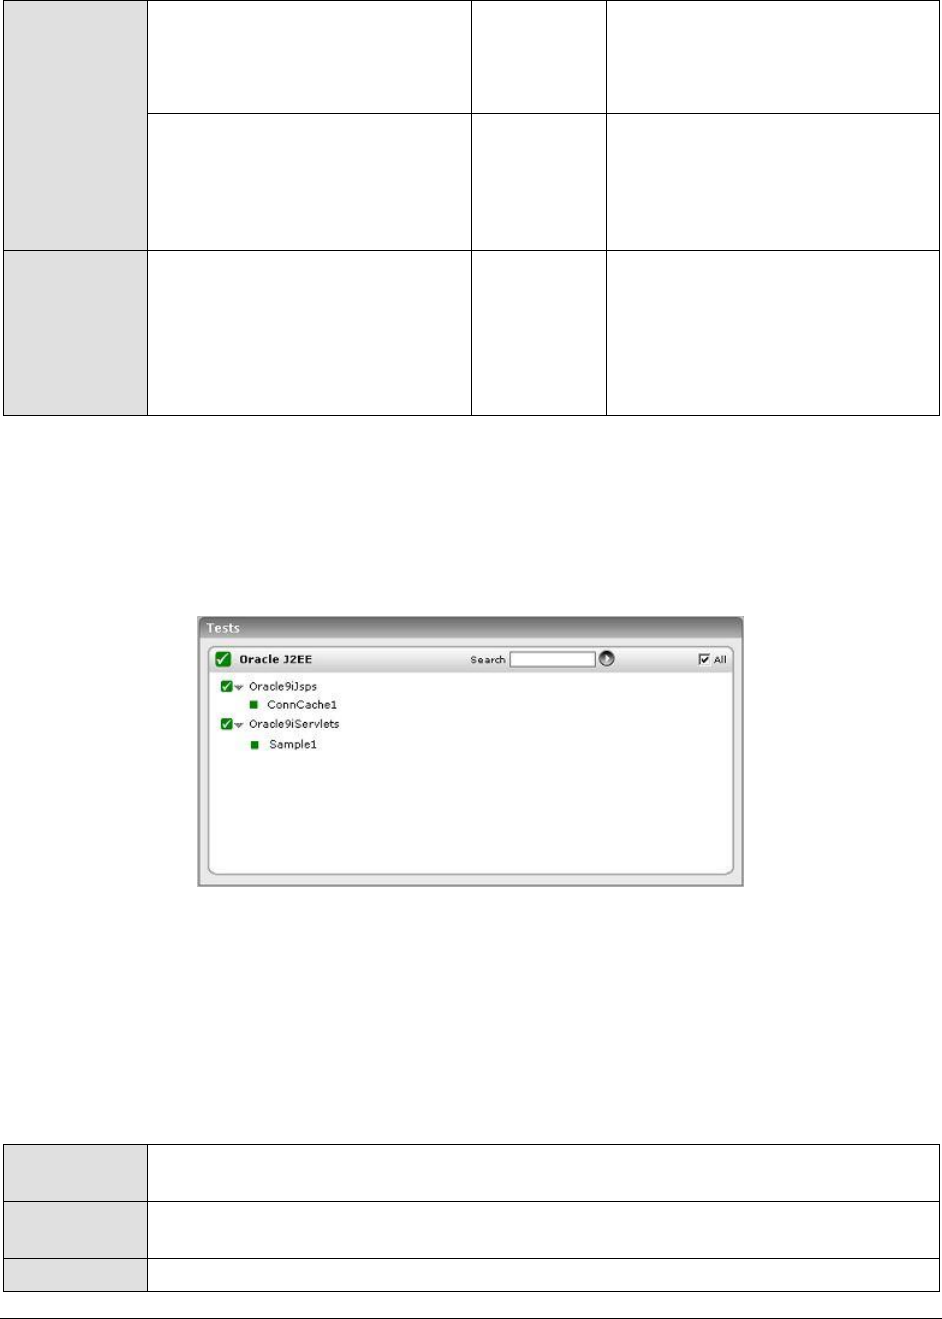
M o n i t o r i n g O r a c l e 9 i A p p l i c a t i o n S e r v e r s
441
Avg session lifetime:
Indicates the average session
life time during the last
measurement period.
Secs
A high value may indicate that a
session that was opened on this
web context may not be closed
properly.
Avg servlet resolve time:
Indicates the maximum time
spent to create/locate the servlet
instance (within the servlet
context).
Secs
Avg servlet resolve time:
Indicates the average time spent
to create/locate the servlet
instance (within the servlet
context) during the last
measurement period.
Secs
11.5 The Oracle J2EE Layer
To monitor the health of the JSPs and servlets on an Oracle 9i AS instance, use the tests associated
with this layer (see Figure 11.6).
Figure 11.6: The tests associated with the Oracle J2EE layer
11.5.1 Oracle 9i Jsps Test
This test reports the performance metrics related to the JSPs deployed in an Oracle9i application
server instance. In order to enable users to easily manage and monitor the JSPs deployed on an
Oracle 9i application server, the eG Enterprise suite provides the Click Here hyperlink, which when
clicked allows users to add, modify, or delete groups of JSPs. Note that by default eG Enterprise monitors
only those JSPs that are part of a group.
Purpose
Reports the performance metrics related to the JSPs deployed in an Oracle9i
application server instance
Target of the
test
An Oracle 9i AS
Agent
An internal agent

M o n i t o r i n g O r a c l e 9 i A p p l i c a t i o n S e r v e r s
442
deploying the
test
Configurable
parameters for
the test
1. TEST PERIOD - How often should the test be executed
2. HOST - The host for which the test is to be configured
3. PORT - In the PORT text box, it is recommended that you provide the port at
which the OPMN (Oracle Process Manager and Notification) process of the Oracle
application server instance listens. To know at which port OPMN listens, click on
the Ports tab in the following URL:
http://<oraHttpServerIP>:<OraHttpServerport>. This tab lists the port
numbers that were assigned to the services executing on the Oracle application
server. The port number displayed against the Oracle notification server
request port entry is the OPMN port, and the same should be specified in the
PORT text box.
4. HOMEDIR – The absolute path of the directory in which the Oracle 9i application
server has been installed
5. AUTODISCOVERY – By default, eG Enterprise allows administrators to configure
JSP groups using the eG administrative interface, and reports metrics pertaining
to every group so created. Accordingly, by default, AUTODISCOVERY is set to
NO. If you want JSPs to be discovered and monitored automatically, then select
the YES option against AUTODISCOVERY. When this is done, the eG agent
automatically discovers all the JSPs on the server, and reports one set of
measures for every JSP so discovered.
Outputs of the
test
One set of results for every JSP group monitored or for every JSP auto-discovered
(as the case may be)
Measurements
made by the
test
Measurement
Measurement
Unit
Interpretation
Threads serving JSPs:
Indicates the current number of
active requests for the JSP.
Number
If a majority of the
threads/processes are in use
simultaneously to serve requests
for a specific JSP, this may be
indicative of a problem with the
design of this page. Further
investigation is needed to
determine the cause of the
bottleneck - whether it is the
processing of the JSP, whether it
is a bottleneck in the database
tier, whether the database query
(ies) are non-optimal etc.
Alternatively, a slowdown of the
application server may also cause
the requests that are
simultaneously executing to
increase.

M o n i t o r i n g O r a c l e 9 i A p p l i c a t i o n S e r v e r s
443
Requests completed:
Indicates the rate at which
requests were processed by this
JSP.
Reqs/Sec
Comparing this metric across
JSPs can indicate which pages are
most accessed. Optimizing the
most heavily accessed pages can
result in a significant
improvement in the user-
perceived performance of that
web application.
Avg request process time:
Indicates the average time spent
in servicing the JSP during the
last measurement period.
Secs
An increase in this value may be
indicative of a problem in the
application server/JSP logic.
Max request process time:
Indicates the maximum time
spent servicing a JSP since the
server started.
Secs
11.5.2 Oracle 9i Servlets Test
This test reports the performance metrics pertaining to the servlets deployed in an Oracle 9i AS
instance. In order to enable users to easily manage and monitor servlets, the eG Enterprise suite
provides the Click Here hyperlink, which when clicked allows users to add, modify, or delete servlet
groups. Note that by default eG Enterprise monitors only those servlets that are part of a group.
Purpose
Reports the performance metrics related to the servlets deployed in an Oracle9i
application server instance
Target of the
test
An Oracle 9i AS
Agent
deploying the
test
An internal agent

M o n i t o r i n g O r a c l e 9 i A p p l i c a t i o n S e r v e r s
444
Configurable
parameters for
the test
1. TEST PERIOD - How often should the test be executed
2. HOST - The host for which the test is to be configured
3. PORT - In the PORT text box, it is recommended that you provide the port at
which the OPMN (Oracle Process Manager and Notification) process of the Oracle
application server instance listens. To know at which port OPMN listens, click on
the Ports tab in the following URL:
http://<oraHttpServerIP>:<OraHttpServerport>. This tab lists the port
numbers that were assigned to the services executing on the Oracle application
server. The port number displayed against the Oracle notification server
request port entry is the OPMN port, and the same should be specified in the
PORT text box.
4. HOMEDIR – The absolute path of the directory in which the Oracle 9i application
server has been installed
5. AUTODISCOVERY – By default, eG Enterprise allows administrators to configure
servlet groups using the eG administrative interface, and reports metrics
pertaining to every group so created. Accordingly, by default, AUTODISCOVERY
is set to NO. If you want servlet s to be discovered and monitored automatically,
then select the YES option against AUTODISCOVERY. When this is done, the eG
agent automatically discovers all the servlet s on the server, and reports one set
of measures for every servlet so discovered.
Outputs of the
test
One set of results for every servlet group configured or for every discovered servlet
(as the case may be)
Measurements
made by the
test
Measurement
Measurement
Unit
Interpretation
Threads for servlet:
Indicates the current number of
threads servicing this servlet.
Number
If a majority of the
threads/processes are in use
simultaneously to serve requests
for a specific servlet, this may be
indicative of a problem with a
specific servlet or one of the
components used by it.
Alternatively, a slowdown of the
application server may also cause
the requests that are
simultaneously executing to
increase for all servlets.
Requests completed:
Indicates the rate of calls to the
service() method.
Reqs/Sec
A very high value for this
measure indicates that the servlet
has been accessed many times.

M o n i t o r i n g O r a c l e 9 i A p p l i c a t i o n S e r v e r s
445
Avg request process time:
Indicates the average time spent
in servicing the servlet during
the last measurement period.
Secs
Comparing the request processing
time across servlets, an
administrator can determine
which servlet(s) can be a
performance bottleneck. An
increase in response time of a
servlet with load, could indicate a
design problem with the servlet -
eg., use of a non-optimal
database query, database
connection pool shortage,
contention for shared resources,
etc.
Max request process time:
Indicates the maximum time
spent on a servlet’s service()
call.
Secs
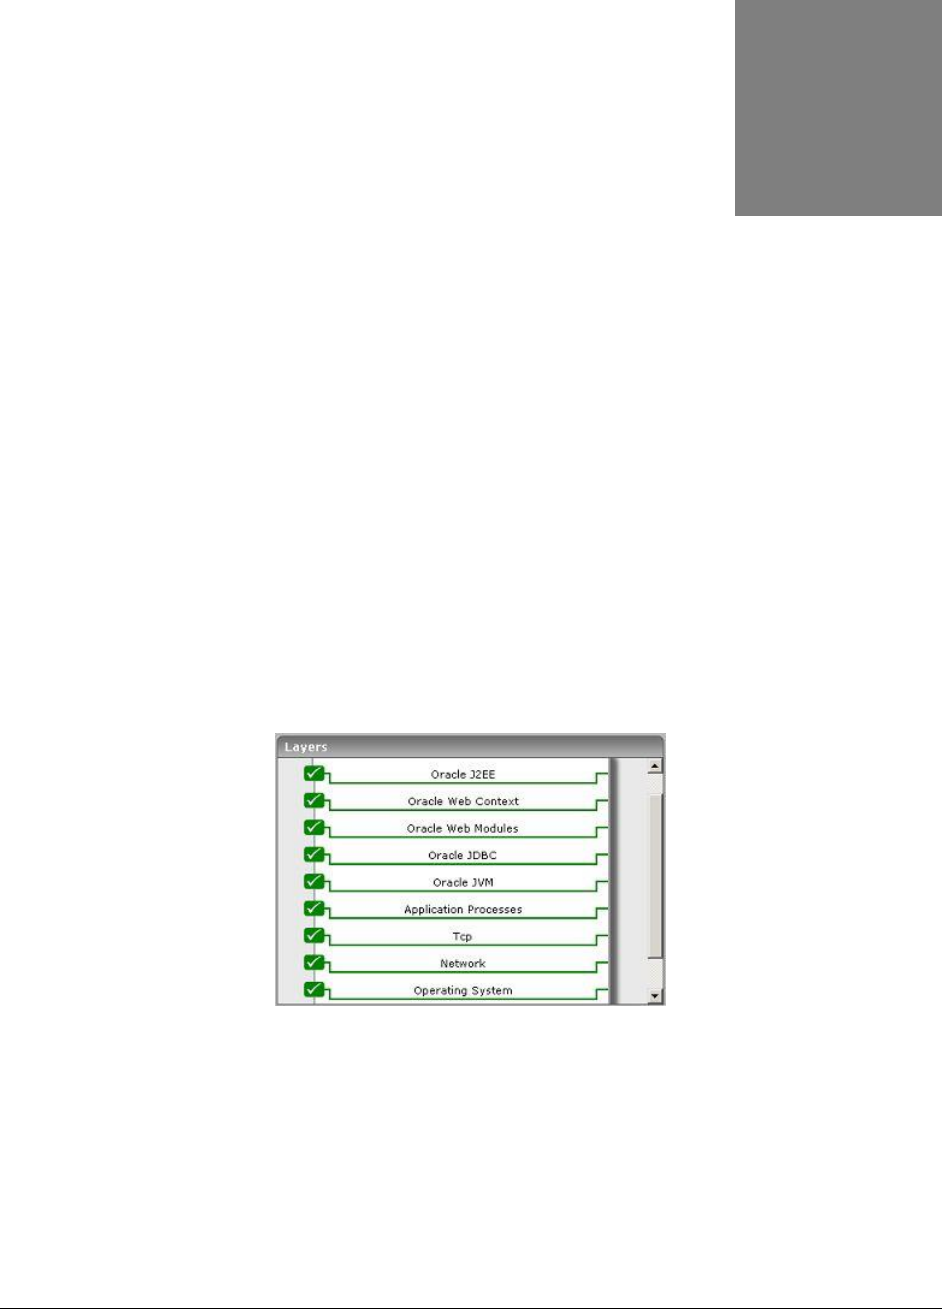
M o n i t o r i n g O r a c l e 1 0 g A p p l i c a t i o n S e r v e r s
446
Monitoring Oracle 10g Application
Servers
Oracle Application Server 10g offers a comprehensive solution for developing, integrating, and
deploying applications, portals, and Web services. Based on a powerful and scalable J2EE server,
Oracle Application Server 10g provides complete business integration and business intelligence suites,
and best-of-breed portal software. Further, it is designed for grid computing and full lifecycle support
for Service-Oriented Architecture (SOA).
In order to ensure that the quality of the business-critical services supported by the Oracle Application
server 10g does not suffer due to incapacities of the application server, it is essential that the server is
monitored 24 x 7, and its performance fine-tuned to meet the demands of the service users.
eG Enterprise provides out-of-the-box an Oracle Application monitoring model, that caters to the
specific monitoring needs of the Oracle 10g application servers (see Figure 12.1).
Figure 12.1: The layer model of the Oracle 10G application server
As you can see, the monitoring model depicted by Figure 12.1 is the same as that which eG Enterprise
offers for the Oracle 9i Application server (see Figure 11.1). The tests associated with every layer of
Figure 12.1, and the metrics that each test reports, have therefore been discussed already in Chapter
11 of this document, which focuses on the O9i Application Server model.
The difference however lies in the Oracle J2EE layer, which supports two additional tests for the Oracle
Application model– the OracleEjbs test and the OracleJmsStore test.
Chapter
12
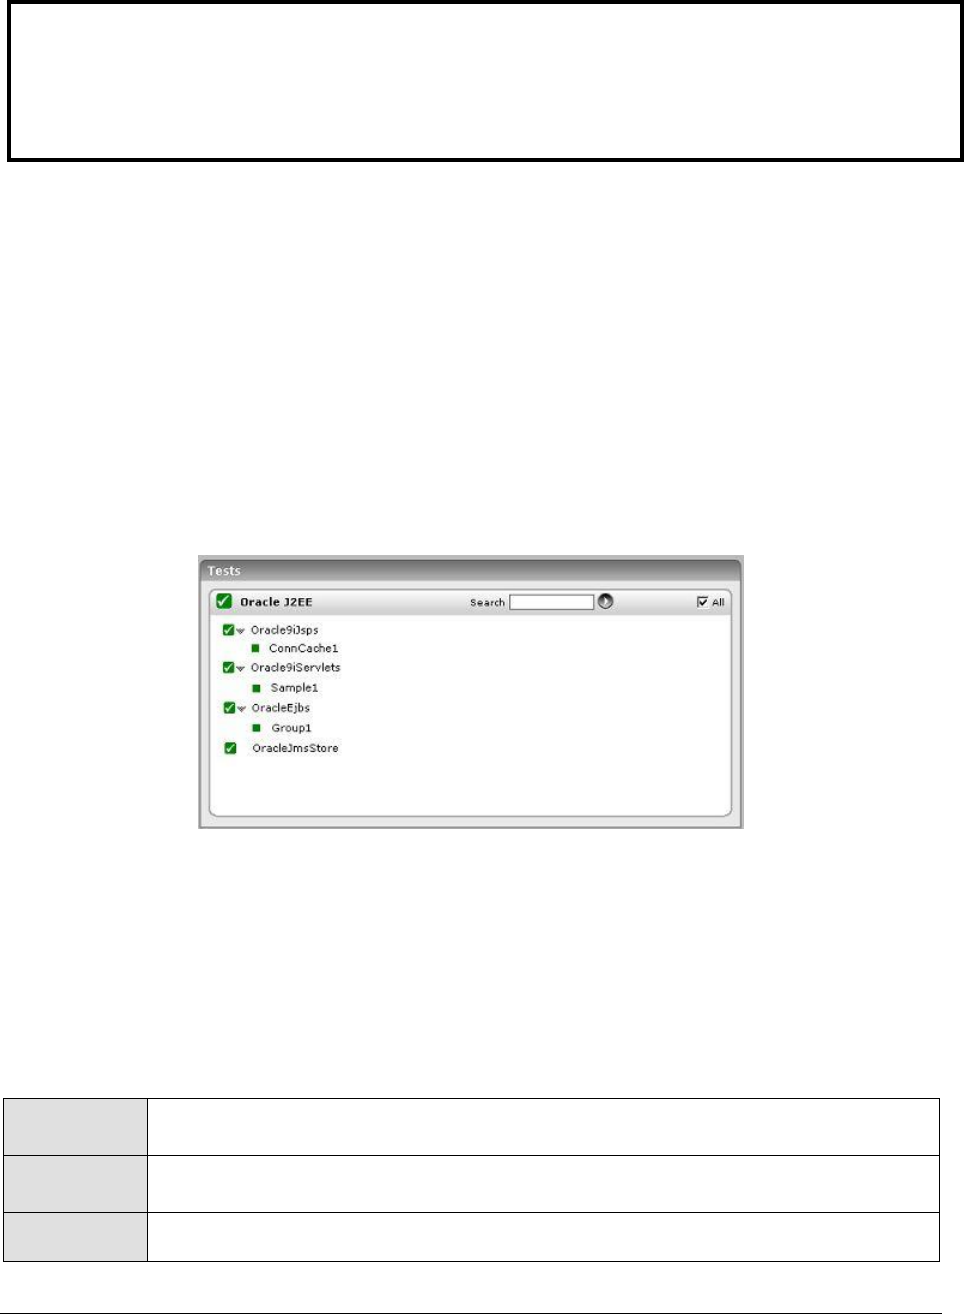
M o n i t o r i n g O r a c l e 1 0 g A p p l i c a t i o n S e r v e r s
447
Hence, the sections to come will discuss only the Oracle J2EE layer and the two new tests associated
with it.
12.1 The Oracle J2EE Layer
The tests associated with this layer monitor the health of the following:
JSPs
Servlets
The EJB container
Java Message Service (JMS)
Figure 12.2: The tests associated with the Oracle J2EE layer
12.1.1 Oracle Ejbs Test
This test monitors the state of EJB component groups hosted on an Oracle application server (10g or
higher). Use the Click here hyperlink in the test configuration page to configure the EJB groups that
need to be monitored by the eG Enterprise suite. By default, the eG Enterprise system will monitor only those
EJBs that are part of a group.
Purpose
Monitors the state of EJB component groups hosted on an Oracle application server
(10g or higher)
Target of the
test
An Oracle Application Server 10g or higher
Agent
deploying the
An internal agent
Note:
To effectively monitor an Oracle application server on Unix, ensure that the install user of the
application server and that of the eG agent (which is monitoring the application server) are the
same.

M o n i t o r i n g O r a c l e 1 0 g A p p l i c a t i o n S e r v e r s
448
test
Configurable
parameters for
the test
1. TEST PERIOD - How often should the test be executed
2. HOST - The host for which the test is to be configured
3. PORT - In the PORT text box, it is recommended that you provide the port at
which the OPMN (Oracle Process Manager and Notification) process of the Oracle
application server instance listens. To know at which port OPMN listens, click on
the Ports tab in the following URL:
http://<oraHttpServerIP>:<OraHttpServerport>. This tab lists the port
numbers that were assigned to the services executing on the Oracle application
server. The port number displayed against the Oracle notification server
request port entry is the OPMN port, and the same should be specified in the
PORT text box.
4. HOMEDIR – The absolute path of the directory in which the Oracle application
server has been installed
5. AUTODISCOVERY – By default, the eG suite allows administrators to configure
EJB groups using the eG administrative interface, and reports metrics pertaining
to every group so created. Accordingly, by default, AUTODISCOVERY is set to
NO. If you want EJBs to be discovered and monitored automatically, then select
the YES option against AUTODISCOVERY. When this is done, the eG agent
automatically discovers all the EJBs on the application server, and reports one
set of measures for every EJB on the server.
6. DETAILED DIAGNOSIS - To make diagnosis more efficient and accurate, the eG
Enterprise suite embeds an optional detailed diagnostic capability. With this
capability, the eG agents can be configured to run detailed, more elaborate tests
as and when specific problems are detected. To enable the detailed diagnosis
capability of this test for a particular server, choose the On option. To disable
the capability, click on the Off option.
The option to selectively enable/disable the detailed diagnosis capability will be
available only if the following conditions are fulfilled:
The eG manager license should allow the detailed diagnosis capability
Both the normal and abnormal frequencies configured for the detailed
diagnosis measures should not be 0.
Outputs of the
test
One set of results for every EJB group configured or every EJB auto-discovered
Measurements
made by the
test
Measurement
Measurement
Unit
Interpretation
Avg activation time:
Indicates the average time taken
for activating this bean/ beans in
this EJB group.
Secs
Avg creation time.:
Indicates the average time taken
for creating this bean/ beans in
this EJB group.
Secs

M o n i t o r i n g O r a c l e 1 0 g A p p l i c a t i o n S e r v e r s
449
Avg passivation time:
Indicates the average time taken
for passivating this bean/ beans
in this EJB group.
Secs
Avg post create time:
Indicates the average time taken
for a post create call on this
bean/ beans in this EJB group.
Secs
Avg removal time:
Indicates the average time taken
for removing this bean/ beans in
this EJB group.
Secs
Bean activations:
Indicates the number of times
this bean/ beans in this EJB
group were activated.
Number
Bean creations:
Indicates the number of times
this bean/beans in this EJB
group were created.
Number
Bean passivations:
Indicates the number of times
this bean/ beans in this EJB
group were passivated.
Number
Bean postcreations:
Indicates the number of times
this bean/ beans in this EJB
group were post created.
Number
Bean removals:
Indicates the number of times
this bean/ beans in this EJB
group were removed.
Number
Current threads activate:
Indicates the number of threads
that are currently used for
activating this bean/ beans in
this EJB group.
Number
Current threads creation:
Indicates the number of threads
that are currently used for
invoking a create call on this
bean/ beans in this EJB group.
Number

M o n i t o r i n g O r a c l e 1 0 g A p p l i c a t i o n S e r v e r s
450
Current threads passivate:
Indicates the number of threads
that are currently used for
passivating this bean/ beans in
this EJB group.
Number
Current threads postcreate:
Indicates the number of threads
that are currently used for
placing a postcreate call on this
bean/ beans in this EJB group.
Number
Current threads remove:
Indicates the number of threads
that are currently used for
removing this bean/ beans in
this EJB group.
Number
12.1.2 Oracle Jms Store Test
This test monitors the health of the Java Message Service (JMS) store that the Oracle Enterprise
Messaging Service (OEMS) supports. OEMS is a standards-based (JMS, JCA) messaging platform
offering a comprehensive set of messaging and integration features for developing and deploying
distributed applications in a service-oriented architecture (SOA) environment. OEMS also forms the
underlying messaging infrastructure for Oracle’s Enterprise Service Bus (ESB) and the BPEL Process
Manager components of Oracle Fusion Middleware.
Purpose
Monitors the health of the Java Message Service (JMS) specification that the Oracle
Enterprise Messaging Service (OEMS) supports
Target of the
test
An Oracle Application Server 10g or higher
Agent
deploying the
test
An internal agent
Configurable
parameters for
the test
1. TEST PERIOD - How often should the test be executed
2. HOST - The host for which the test is to be configured
3. PORT - In the PORT text box, it is recommended that you provide the port at
which the OPMN (Oracle Process Manager and Notification) process of the Oracle
application server instance listens. To know at which port OPMN listens, click on
the Ports tab in the following URL:
http://<oraHttpServerIP>:<OraHttpServerport>. This tab lists the port
numbers that were assigned to the services executing on the Oracle application
server. The port number displayed against the Oracle notification server
request port entry is the OPMN port, and the same should be specified in the
PORT text box.
4. HOMEDIR – The absolute path of the directory in which the Oracle application
server has been installed
Outputs of the
test
One set of results for the Oracle Application server 10g that is monitored

M o n i t o r i n g O r a c l e 1 0 g A p p l i c a t i o n S e r v e r s
451
Measurements
made by the
test
Measurement
Measurement
Unit
Interpretation
Messages count:
Indicates the total number of
messages in the store – both
committed and rolledback.
Number
Messages dequeued:
Indicates the number of
dequeued messages.
Number
Messages discarded:
Indicates the number of
messages discarded from the
store.
Number
Messages enqueued:
Indicates the number of
enqueued messages.
Number
Messages expired:
Indicates the number of expired
messages.
Number
Messages paged in:
Indicates the number of paged in
messages.
Number
Messages paged out:
Indicates the number of paged
out messages.
Number
Messages pending:
Indicates the number of
messages pending completion.
Number
Messages recovered:
Indicates the number of
recovered messages.
Number
Messages rolledback:
Indicates the number of
messages that were rolled back.
Number
Store size:
Indicates the size of the JMS
store.
MB
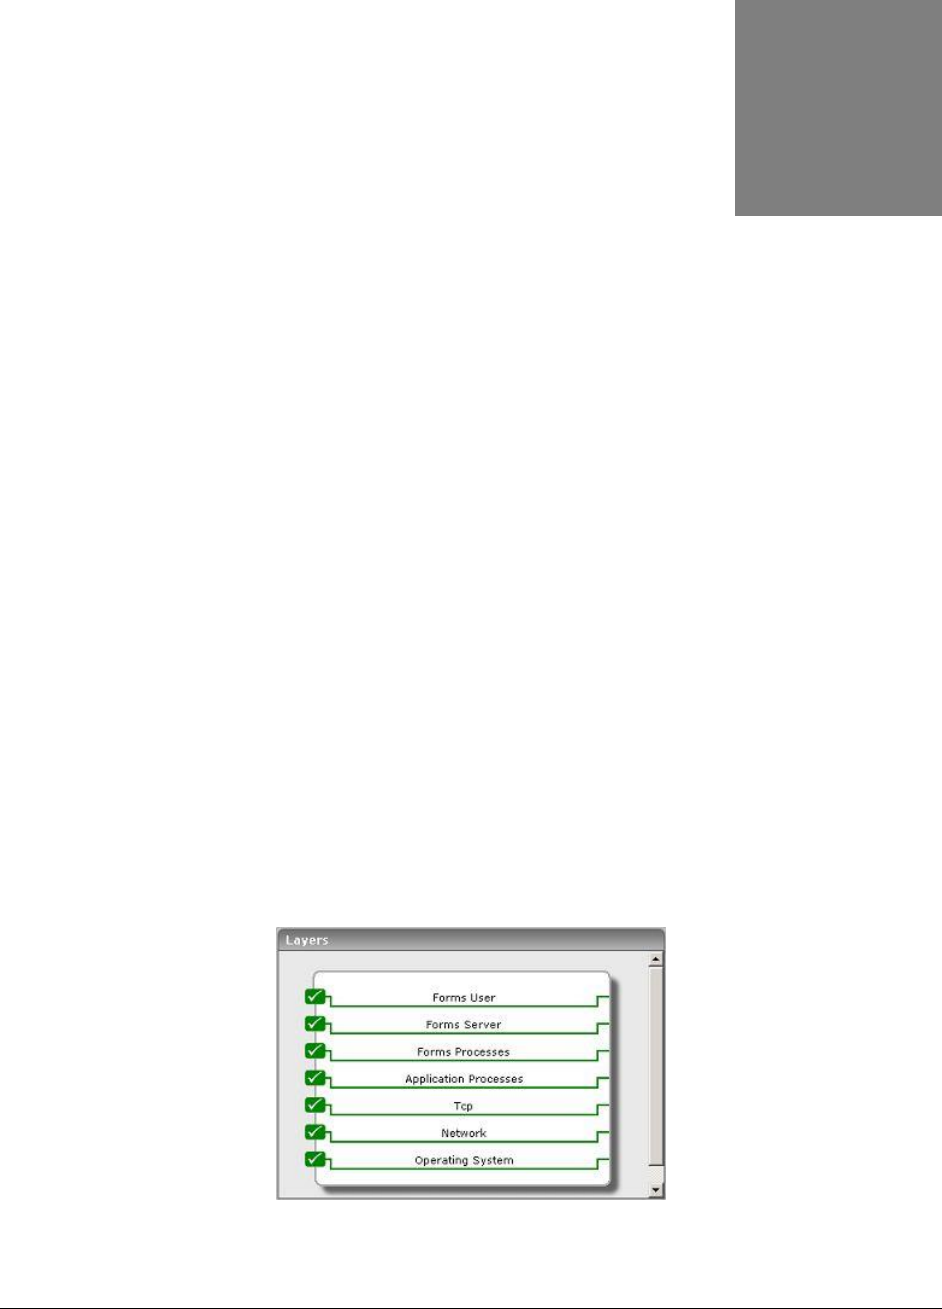
M o n i t o r i n g O r a c l e F o r m s S e r v e r s
452
Monitoring Oracle Forms Servers
An important component of the Oracle Internet Platform is the Oracle Forms Server. This application
server is optimized to deploy Oracle Forms applications in a multi-tiered environment. It delivers the
application infrastructure and the event model to ensure that Internet-based Forms applications
automatically scale and perform over any network.
Oracle Forms Developer and Oracle Forms Services provide a complete application framework for
optimal deployment of Oracle Forms applications on the Internet. The Oracle Forms Developer enables
business developers to build Java applications that are optimized for the Internet without writing any
Java code. This developer is specifically designed and optimized to build transactional database
applications for the Oracle8i/9i database. It integrates with the Oracle Designer to visually capture
business requirements and transform them into physical designs. Using Oracle Forms Developer, you
can customize Oracle's pre-packaged applications, to suit the needs of your organization.
It is therefore evident that even the slightest of disturbances in the overall performance or internal
operation of the Oracle Forms server, can adversely impact the scalability and network compatability
of the Forms applications it supports. If such an eventuality is to be prevented, then it is
recommended that you continuously monitor the Oracle Forms server for any minor/major deviations.
eG Enterprise provides an exclusive Oracle Forms9i monitoring model (see Figure 13.1) that executes
tests on the Forms server to keep track of its internal health and external availability, and alerts
administrators of impending performance issues.
Figure 13.1: The layer model of an Oracle Forms server
Chapter
13
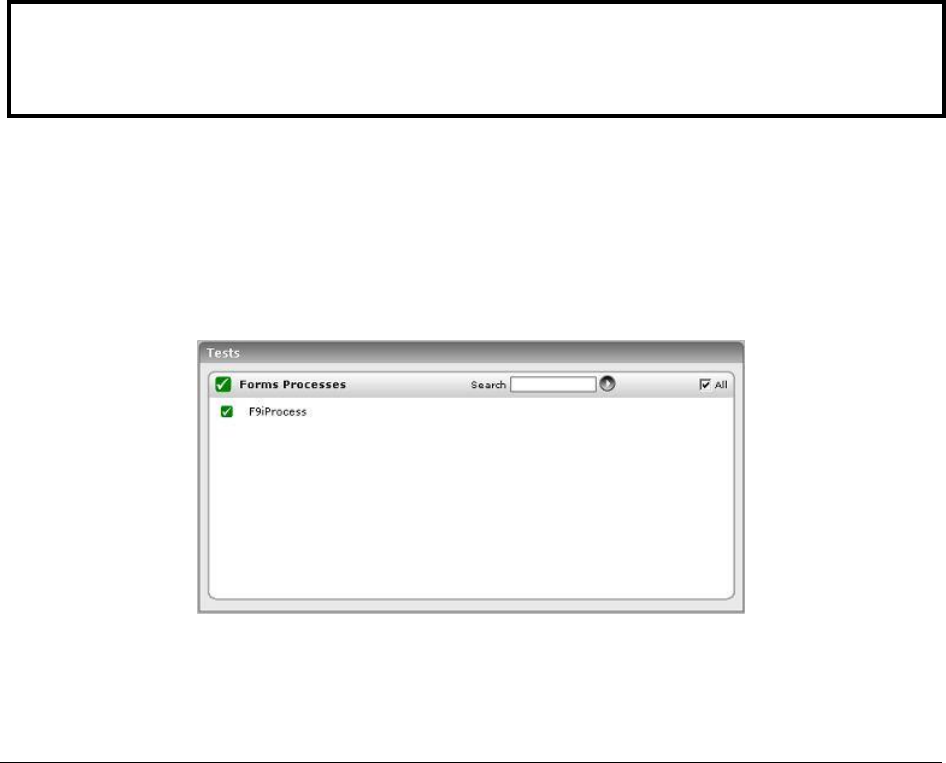
M o n i t o r i n g O r a c l e F o r m s S e r v e r s
453
The metrics that these tests collect from the Oracle Forms server, enable administrators to find quick
and accurate answers to the following performance queries:
Are all the critical Forms processes currently running?
Is the resource consumption of the Forms processes optimal?
How is the session load on the server? Are there too many sessions currently active on the
server? Which users have initiated these sessions?
Are there any idle sessions?
What is the average session duration? Have sessions remained open for unreasonably long
periods?
Is the Forms server responding slowly to user requests? If so, which user do these requests
pertain to?
Is any user's processes consuming too much CPU and memory resources?
The sections to come will discuss the top 3 layers of Figure 13.1, as all other layers have been
discussed elaborately in the Monitoring Unix and Windows Servers document.
13.1 The Forms Processes Layer
This layer is associated with an F9iProcess test that reports how well the critical Forms server processes
utilize the CPU and memory resources.
Figure 13.2: The tests associated with the Forms Processes layer
Note:
Before attempting to monitor an Oracle Forms server, ensure that its tracing capability is enabled.

M o n i t o r i n g O r a c l e F o r m s S e r v e r s
454
13.1.1 F9i Processes Test
This test reports the memory and CPU usage of the Oracle Forms 9i server processes.
Purpose
Reports the memory and CPU usage of the Oracle Forms 9i server processes
Target of the
test
An Oracle Forms Server
Agent
deploying the
test
An internal agent
Configurable
parameters for
the test
1. TEST PERIOD - How often should the test be executed
2. HOST - The host for which the test is to be configured
3. PORT - The port to which the specified HOST listens
4. FORMWORKDIR – The path to the install directory of the Oracle Forms 9i server.
Typically, this will be the <ORAHOMEDIR>/Forms90/.
5. FORMSRUNTIME - The value, "ifweb90.exe", is displayed here. This is the Forms
server runtime executable.
6. ORAHOMEDIR - The install directory of the Oracle 9i server. This specification
becomes more important when more than one Oracle 9i AS installation exists on
a host.
7. TRCCLEANUPTIME - For Oracle 9i Forms monitoring, eG requires tracing to be
enabled for the server. The trace files corresponding to completed sessions are
automatically cleaned by the eG agent. The frequency with which these files are
to be cleared from the server is to be specified in the TRCCLEANUPTIME
textbox. The default value displayed in the TRCCLEANUPTIME text box is 30
minutes.
Outputs of the
test
One set of results for every Oracle Forms server monitored
Measurements
made by the
test
Measurement
Measurement
Unit
Interpretation
Number of processes
running:
Indicates the number of Forms
processes currently running.
Number
This value indicates if too many
or too few instances
corresponding to the specified
process are executing on the
host.
CPU usage:
Indicates the percentage of CPU
time utilized by the Forms
processes.
Percent
A very high value could indicate
that the specified process is
consuming excessive CPU
resources.
Memory usage:
Indicates the percentage of
memory utilized by the Forms
processes.
Percent
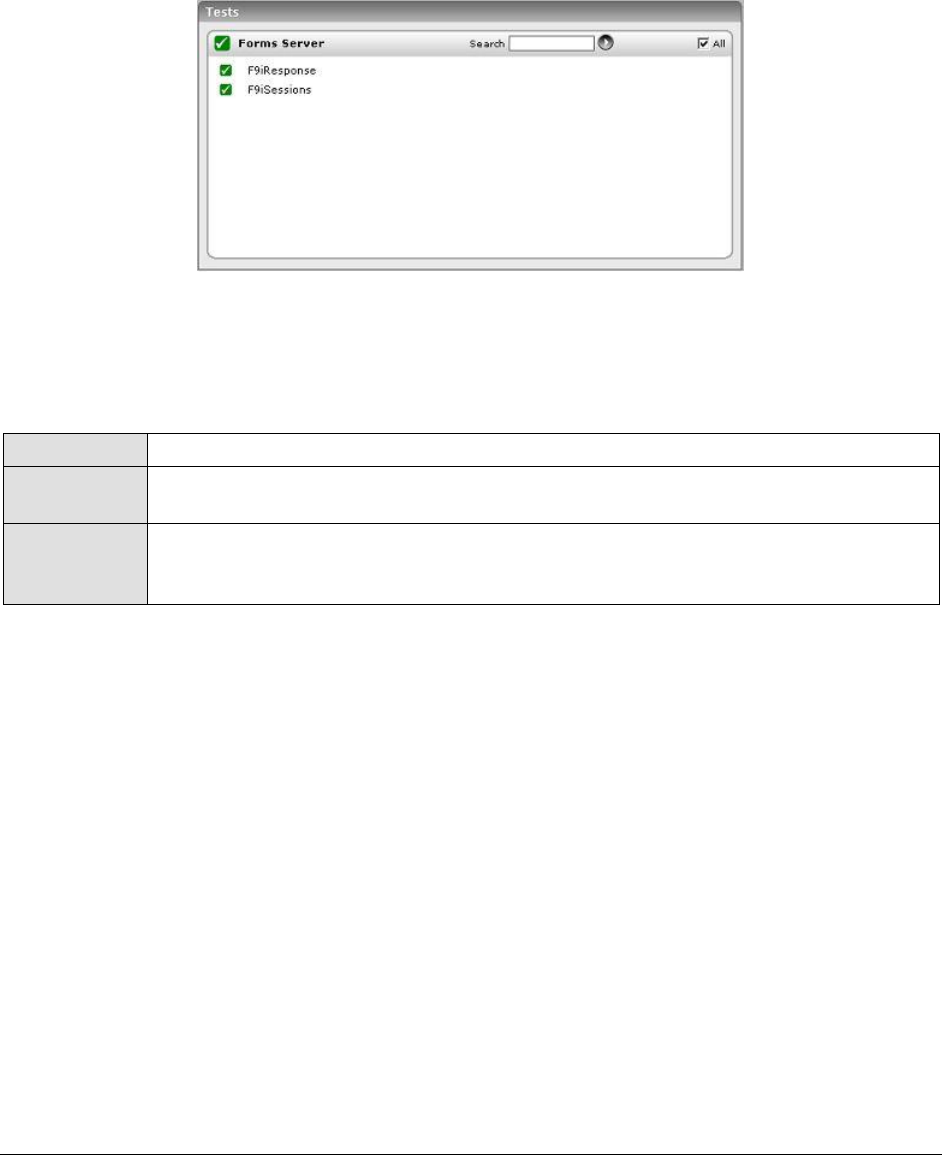
M o n i t o r i n g O r a c l e F o r m s S e r v e r s
455
13.2 The Forms Server Layer
This layer tracks the user sessions to the Forms server to identify sessions that have been open for an
unreasonably long time. In addition, the layer also measures the responsiveness of the Forms server
to client requests.
Figure 13.3: Tests associated with the Forms Server layer
13.2.1 F9i Sessions Test
This test monitors the user sessions to the Oracle Forms 9i server.
Purpose
Monitors the user sessions to the Oracle Forms 9i server
Target of the
test
An Oracle Forms Server
Agent
deploying the
test
An internal agent

M o n i t o r i n g O r a c l e F o r m s S e r v e r s
456
Configurable
parameters for
the test
1. TEST PERIOD - How often should the test be executed
2. HOST - The host for which the test is to be configured
3. PORT - The port to which the specified HOST listens
4. FORMWORKDIR – The path to the install directory of the Oracle Forms 9i server.
Typically, this will be the <ORAHOMEDIR>/Forms90/.
5. FORMSRUNTIME - The value, "ifweb90.exe", is displayed here. This is the Forms
server runtime executable.
6. ORAHOMEDIR - The install directory of the Oracle 9i server. This specification
becomes more important when more than one Oracle 9i AS installation exists on
a host.
7. TRCCLEANUPTIME - For Oracle 9i Forms monitoring, eG requires tracing to be
enabled for the server. The trace files corresponding to completed sessions are
automatically cleaned by the eG agent. The frequency with which these files are
to be cleared from the server is to be specified in the TRCCLEANUPTIME
textbox. The default value displayed in the TRCCLEANUPTIME text box is 30
minutes.
8. SESSIONIDLETIME - One of the measures returned by this test, is the number of
idle sessions. While taking a count of idle sessions, the test will consider only
those sessions that have remained idle for the duration specified in the
SESSIONIDLETIME text box. The default value displayed here is 10. This means
that the test will track those sessions that have been idle for 10 minutes or
more. You can change this value, if required.
Outputs of the
test
One set of results for every Oracle Forms server monitored
Measurements
made by the
test
Measurement
Measurement
Unit
Interpretation
Total sessions:
Indicates the total number of
Forms sessions currently
running.
Number
Tracking the value of this
measure over time provides an
idea of the workload of the Forms
server.
Active sessions:
Indicates the total number of
currently active Forms sessions.
Number
A high value may indicate that
there is a heavy processing load
on the server.
Idle sessions:
Indicates the total number of
currently idle Forms sessions.
Number
Sessions added:
Indicates the total number of
Forms sessions newly added in
the last measurement period.
Number
Sessions removed:
Indicates the total number of
Forms sessions removed in the
last measurement period.
Number
This metric can indicate unusual
session disconnects.

M o n i t o r i n g O r a c l e F o r m s S e r v e r s
457
Avg session duration:
Indicates the average duration of
all current sessions.
Mins
By tracking the average duration
of current sessions and the
number of simultaneous sessions,
a Forms administrator can obtain
critical information for capacity
planning.
13.2.2 F9i Response Test
This test measures the responsiveness of the Oracle Forms 9i server to user requests.
Purpose
Measures the responsiveness of the Oracle Forms 9i server to user requests
Target of the
test
An Oracle Forms Server
Agent
deploying the
test
An internal agent
Configurable
parameters for
the test
1. TEST PERIOD - How often should the test be executed
2. HOST - The host for which the test is to be configured
3. PORT - The port to which the specified HOST listens
4. FORMWORKDIR – The path to the install directory of the Oracle Forms 9i server.
Typically, this will be the <ORAHOMEDIR>/Forms90/.
5. FORMSRUNTIME - The value, "ifweb90.exe", is displayed here. This is the Forms
server runtime executable.
6. ORAHOMEDIR - The install directory of the Oracle 9i server. This specification
becomes more important when more than one Oracle 9i AS installation exists on
a host.
7. TRCCLEANUPTIME - For Oracle 9i Forms monitoring, eG requires tracing to be
enabled for the server. The trace files corresponding to completed sessions are
automatically cleaned by the eG agent. The frequency with which these files are
to be cleared from the server is to be specified in the TRCCLEANUPTIME
textbox. The default value displayed in the TRCCLEANUPTIME text box is 30
minutes.
Outputs of the
test
One set of results for every Oracle Forms server monitored
Measurements
made by the
test
Measurement
Measurement
Unit
Interpretation
Forms request rate:
Indicates the rate of requests
processed by the Forms server
during the last measurement
period.
Reqs/Sec
A high value may indicate that
there is a heavy load on the
Forms server
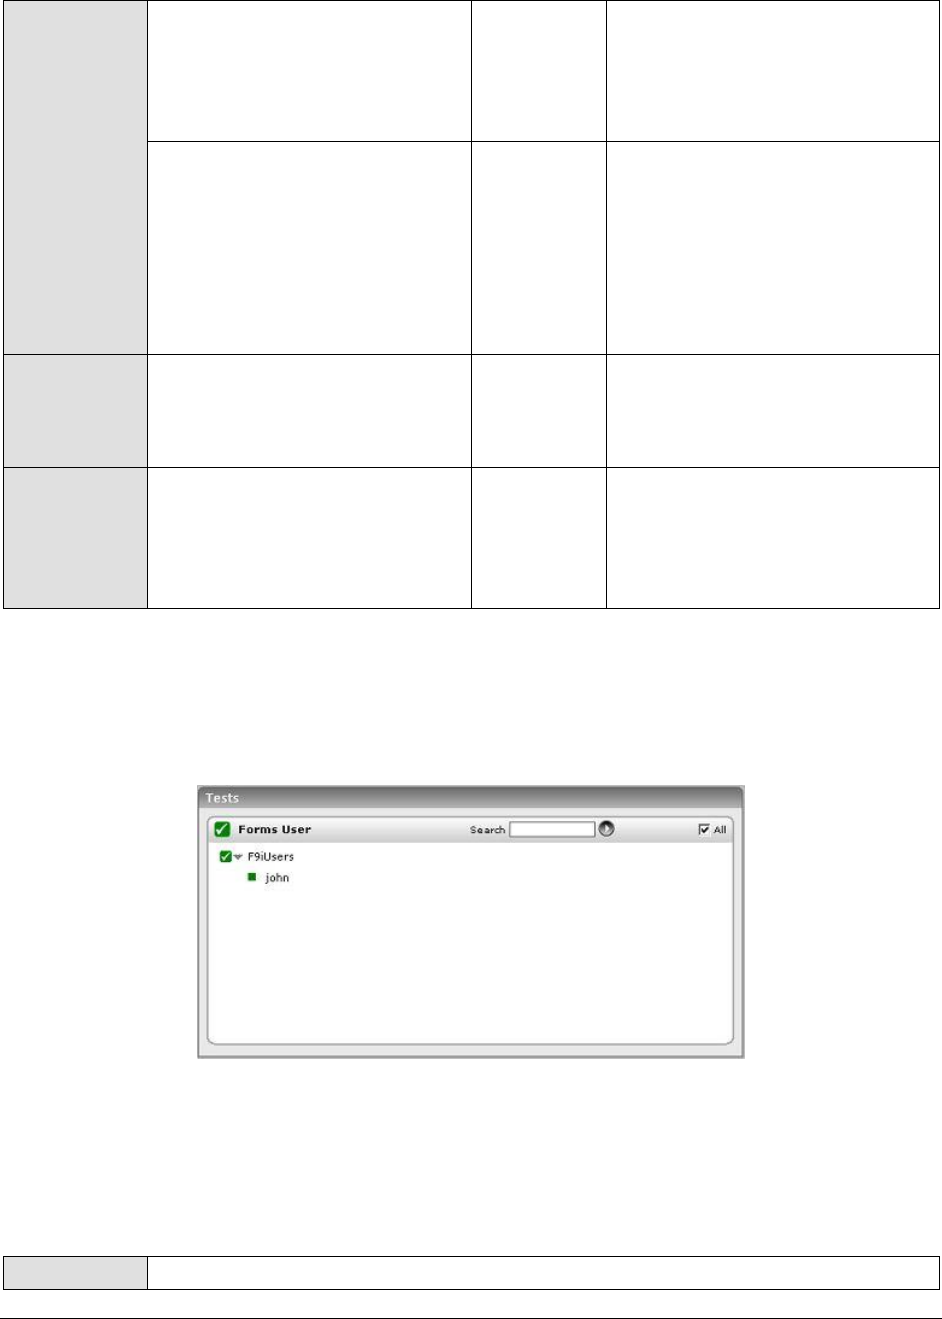
M o n i t o r i n g O r a c l e F o r m s S e r v e r s
458
Database request rate:
Indicates the rate of requests
from the Forms server to the
database server during the last
measurement period
Reqs/Sec
A high value may indicate that
there is a heavy load on the
database server
Client/network response
time:
Indicates the average time spent
by requests in the last
measurement period waiting for
responses from the client. This
measure includes the client think
time and the network latency.
Secs
A sudden increase in response
time could indicate a heavy
network traffic.
Forms server response time:
Indicates the average processing
time of requests at the Forms
server.
Secs
A sudden increase in response
time is indicative of a potential
performance bottleneck on the
Forms server.
Database response time:
Indicates the average response
time of the database server for
servicing requests passed to it
from the Forms server.
Secs
A sudden increase in response
time is indicative of a potential
performance bottleneck on the
database server.
13.3 The Forms User Layer
Use the F9iUsers test associated with this layer to track the user activity on the Forms server.
Figure 13.4: Tests associated with the Forms User layer
13.3.1 F9i Users Test
This test reports general statistics pertaining to the database users.
Purpose
Reports general statistics pertaining to the database users

M o n i t o r i n g O r a c l e F o r m s S e r v e r s
459
Target of the
test
An Oracle Forms Server
Agent
deploying the
test
An internal agent
Configurable
parameters for
the test
1. TEST PERIOD - How often should the test be executed
2. HOST - The host for which the test is to be configured
3. PORT - The port to which the specified HOST listens
4. FORMWORKDIR – The path to the install directory of the Oracle Forms 9i server.
Typically, this will be the <ORAHOMEDIR>/Forms90/.
5. FORMSRUNTIME - The value, "ifweb90.exe", is displayed here. This is the Forms
server runtime executable.
6. ORAHOMEDIR - The install directory of the Oracle 9i server. This specification
becomes more important when more than one Oracle 9i AS installation exists on
a host.
7. TRCCLEANUPTIME - For Oracle 9i Forms monitoring, eG requires tracing to be
enabled for the server. The trace files corresponding to completed sessions are
automatically cleaned by the eG agent. The frequency with which these files are
to be cleared from the server is to be specified in the TRCCLEANUPTIME
textbox. The default value displayed in the TRCCLEANUPTIME text box is 30
minutes.
Outputs of the
test
One set of results for every Oracle Forms server user being monitored
Measurements
made by the
test
Measurement
Measurement
Unit
Interpretation
Forms request rate:
Indicates the rate of requests
received by a Forms server for a
specific user during the last
measurement period.
Reqs/Sec
A comparison of this measure
across users can be used to
determine which user(s) are
heavily using the Forms server.
Database request rate:
Indicates the rate of requests to
the database issued by the
Forms server for a specific user
during the last measurement
period.
Reqs/Sec
A comparison of this measure
across users can indicate the top
users of the Forms database.
Client/network response
time:
Indicates the response time of
the client and network for this
database user.
Secs
A sudden increase in response
time could be indicative of heavy
network traffic.
Forms server response time:
Indicates the response time of
the Forms server for a particular
database user.
Secs
A sudden increase in response
time is indicative of a potential
performance bottleneck in the
Forms server.

M o n i t o r i n g O r a c l e F o r m s S e r v e r s
460
Database response time:
Indicates the response time of
the database for a particular
database user.
Secs
A sudden increase in response
time is indicative of a potential
performance bottleneck on the
database server.
Sessions:
Indicates the total number of
Forms sessions running for a
particular database user.
Number
A high value may indicate that
there is a high load on the server.
Avg session duration:
Indicates the average duration of
the Forms sessions running for a
particular database user.
Mins
Memory usage:
Indicates the percentage of
memory utilized by the Forms
processes corresponding to a
particular database user.
Percent
A sudden increase in memory
utilization for a process may be
indicative of memory leaks in the
application.
CPU usage:
Indicates the percentage of CPU
time utilized by the Forms
processes corresponding to a
particular database user.
Percent
A very high value could indicate
that the processes are consuming
excessive CPU resources.
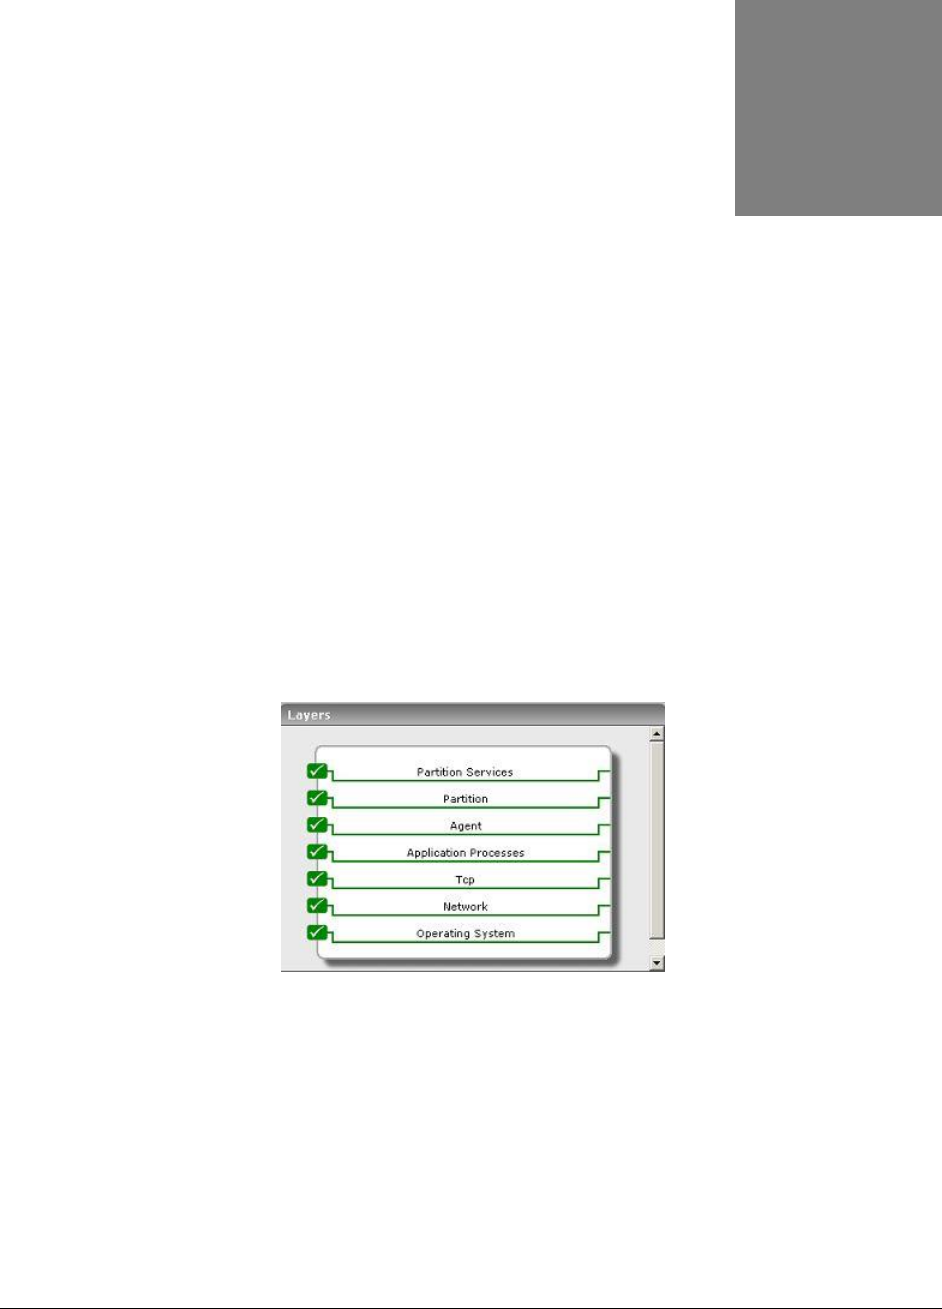
M o n i t o r i n g B o r l a n d E n t e r p r i s e S e r v e r s ( B E S )
461
Monitoring Borland Enterprise
Servers (BES)
The Borland Enterprise Server is a set of services and tools that enable users to build, deploy, and
manage enterprise applications in any corporate environment. These applications provide dynamic
content by using JSP, servlets, and Enterprise Java Bean (EJB) technologies.
Just like any other application server, it is imperative to monitor the BES also, so as to ensure the
stability of the mission-critical services it supports.
eG Enterprise has developed a specialized Borland monitoring model (see Figure 14.1), that monitors
all internal and external parameters that can affect the performance of the BES.
Figure 14.1: The layer model of a Borland Enterprise server
Every layer of Figure 14.1 is mapped to a set of tests, which when executed on the BES, extracts
critical statistics that can enable administrators to determine the following:
Does the BES management agent have adequate memory to discharge its duties?
Is sufficient memory available to the BES partitions?
Where is BES spending too much time? - is it on any of the CMP-related activities? is it on any
JDBC1 or JDBC2 activity? is it on activating or passivating EJBs? or is it on specific
transactions?
Chapter
14
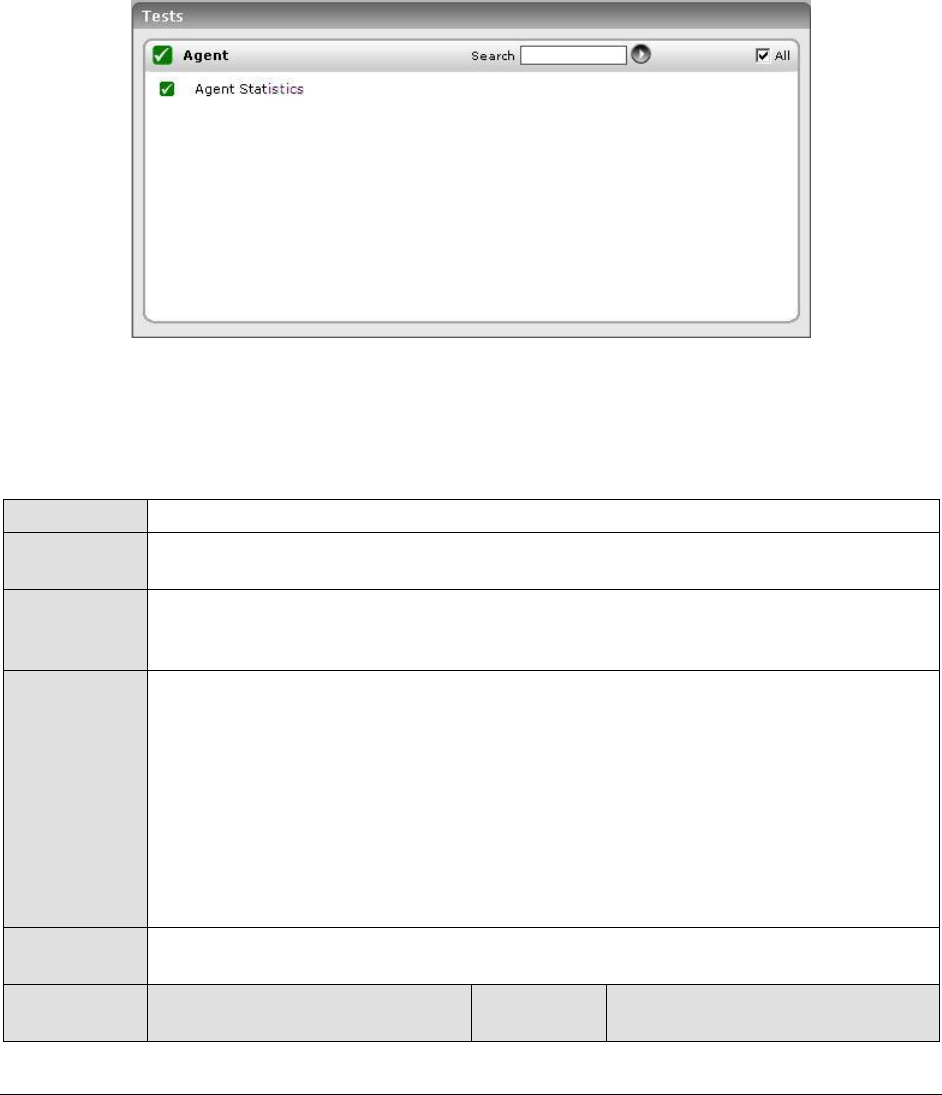
M o n i t o r i n g B o r l a n d E n t e r p r i s e S e r v e r s ( B E S )
462
The following sections discuss each of the top 3 layers of Figure 14.1 elaborately. The other layers
have already been dealt with in the Monitoring Unix and Windows Servers document.
14.1 The Agent Layer
To monitor the memory usage of the BES management agent, use the AgentStat test associated with
this layer.
Figure 14.2: The tests associated with the Agent layer
14.1.1 Agent Statistics Test
This test reports the runtime statistics pertaining to a BES management agent.
Purpose
Reports the runtime statistics pertaining to a BES management agent
Target of the
test
A BES server
Agent
deploying the
test
An internal agent
Configurable
parameters for
the test
1. TEST PERIOD - How often should the test be executed
2. HOST - The host for which the test is to be configured
3. PORT - The smart agent port number
4. MGMT_PORT_NUMBER – The port number where the management agent listens
5. USER – The name of a BES user
6. PASSWORD – The password of the specified USER
7. CONFIRM PASSWORD – Confirm the PASSWORD by retyping it here.
8. REALM - The BES server realm
Outputs of the
test
One set of results for every BES server monitored
Measurements
made by the
Measurement
Measurement
Unit
Interpretation
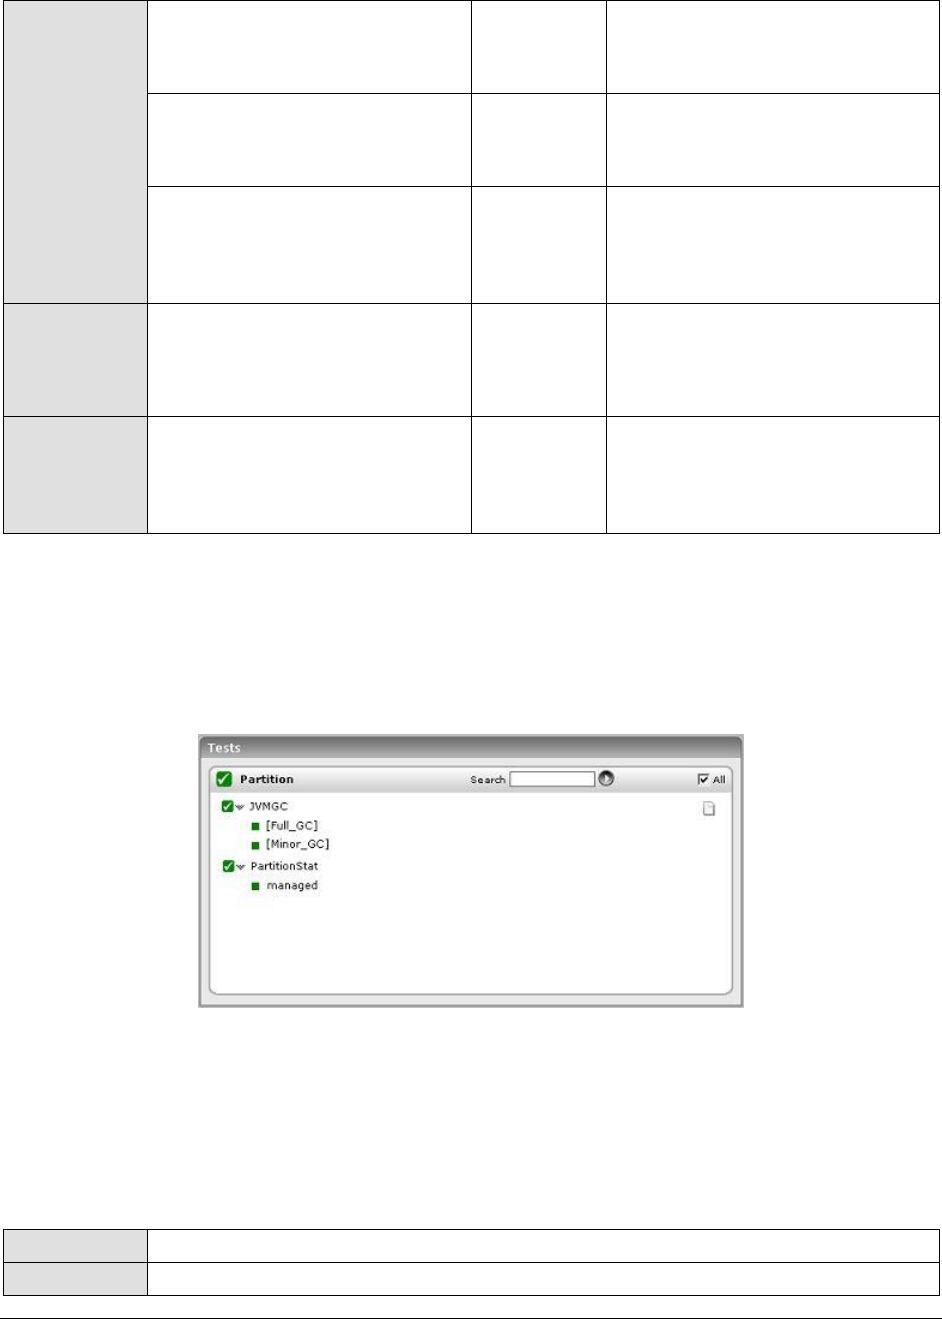
M o n i t o r i n g B o r l a n d E n t e r p r i s e S e r v e r s ( B E S )
463
test
Memory available:
Indicates the heap available for
the management agent.
MB
Memory used:
Indicates the amount of heap
used by the management agent.
MB
Max memory used:
Indicates the maximum amount
of heap used by the
management agent.
MB
Active threads:
Indicates the current number of
active threads in the
management agent
Number
Num of partitions:
Indicates the number of
partitions in use under this
management agent
Number
14.2 The Partition Layer
The tests associated with the Partition layer help administrators determine how efficiently the BES
performs garbage collection, and how well its partitions function.
Figure 14.3: The tests associated with the Partition layer
The JVMGC test has already been discussed while discussing the tests associated with a WebLogic
server. This section will therefore deal with the PartitionStat test only.
14.2.1 Partition Stat Test
The PartitionStat test reports the runtime statistics of a BES partition.
Purpose
Reports the runtime statistics pertaining of a BES partition
Target of the
A BES server

M o n i t o r i n g B o r l a n d E n t e r p r i s e S e r v e r s ( B E S )
464
test
Agent
deploying the
test
An internal Agent
Configurable
parameters for
the test
1. TEST PERIOD - How often should the test be executed
2. HOST - The host for which the test is to be configured
3. PORT - The smart agent port number
4. MGMT_PORT_NUMBER – The port number where the management agent listens
5. USER – The name of a BES user
6. PASSWORD – The password of the specified USER
7. CONFIRM PASSWORD – Confirm the PASSWORD by retyping it here.
8. REALM - The BES server realm
Outputs of the
test
One set of results for every BES partition monitored
Measurements
made by the
test
Measurement
Measurement
Unit
Interpretation
Memory available:
Indicates the heap available for
the partition.
MB
Memory used:
Indicates the amount of heap
used by the partition.
MB
Max memory used:
Indicates the maximum amount
of heap used by the partition.
MB
Active thread count:
Indicates the current number of
active threads in the partition
Number
Deployed archives:
Indicates the number of archives
deployed in the partition
Number
14.3 The Partition Services Layer
The tests mapped to this layer reports the time taken by BES for performing the following (see Figure
14.4):
CMP and other activities
JDBC1 and JDBC2 activities
Activating and Passivating stateful session beans
Different types of transactions

M o n i t o r i n g B o r l a n d E n t e r p r i s e S e r v e r s ( B E S )
465
Figure 14.4: The tests associated with the Partition Services layer
14.3.1 CMP Test
This test reports the time taken by the BES EJB container for performing CMP related activities.
Purpose
Reports the time taken by the BES EJB container for performing CMP related
activities
Target of the
test
A BES server
Agent
deploying the
test
An internal agent
Configurable
parameters for
the test
1. TEST PERIOD - How often should the test be executed
2. HOST - The host for which the test is to be configured
3. PORT - The smart agent port number
4. MGMT_PORT_NUMBER – The port number where the management agent listens
5. USER – The name of a BES user
6. PASSWORD – The password of the specified USER
7. CONFIRM PASSWORD – Confirm the PASSWORD by retyping it here.
8. REALM - The BES server realm
Outputs of the
test
One set of results for every BES partition monitored
Measurements
made by the
test
Measurement
Measurement
Unit
Interpretation
EntityHome:
Indicates the time spent in the
container, implementing
EJBHome-related operations
specific to Entity beans.
Secs

M o n i t o r i n g B o r l a n d E n t e r p r i s e S e r v e r s ( B E S )
466
Cmp:
Indicates the time spent in the
CMP engine (excluding other
CMP tasks listed explicitly).
Secs
CmpInit:
Indicates the time spent
initializing the CMP engine
(startup cost only).
Secs
CmpQuery:
Indicates the time spent in the
CMP engine doing SQL queries.
Secs
CmpUpdate:
Indicates the time spent in the
CMP engine doing SQL updates
Secs
CmpGetConn:
Indicates the time spent in the
CMP engine getting JDBC
connections (startup cost only).
Secs
CmpPrepareStmt:
Indicates the time spent in the
CMP engine preparing
statements (startup cost only).
Secs
14.3.2 Ejb Cont Stat Test
This test reports the time taken by the BES EJB container for performing various activities.
Purpose
Reports the time taken by the BES EJB container for performing various activities
Target of the
test
A BES server
Agent
deploying the
test
An internal agent
Configurable
parameters for
the test
1. TEST PERIOD - How often should the test be executed
2. HOST - The host for which the test is to be configured
3. PORT - The smart agent port number
4. MGMT_PORT_NUMBER – The port number where the management agent listens
5. USER – The name of a BES user
6. PASSWORD – The password of the specified USER
7. CONFIRM PASSWORD – Confirm the PASSWORD by retyping it here.
8. REALM - The BES server realm
Outputs of the
test
One set of results for every BES partition monitored

M o n i t o r i n g B o r l a n d E n t e r p r i s e S e r v e r s ( B E S )
467
Measurements
made by the
test
Measurement
Measurement
Unit
Interpretation
DispatchPOA:
Indicates the time spent on
receiving the TCP request, and
sending the reply.
Secs
DispatchHome:
Indicates the time spent in the
container dispatching methods
to EJBHome objects.
Secs
DispatchRemote:
Indicates the time spent in the
container dispatching methods
to EJBRemote objects.
Secs
DispatchBean:
Indicates the time spent in the
bean methods.
Secs
ResourceCommit:
Indicates the time spent
specifically in committing the
work done on the resource (that
is, in committing to a database
such as Oracle)
Secs
Synchronization:
Indicates the time spent in
various Synchronization
callbacks.
Secs
LoadClass:
Indicates the time spent loading
classes from EJB Jars, etc.
(startup cost only).
Secs
ORBActivate:
Indicates the time spent in the
ORB, allocating objects from
pools
Secs
ORBDeactivate:
Indicates the time spent in the
ORB, releasing objects to pools
Secs
14.3.3 JDBC1 Test
This test reports the time taken by BES for performing JDBC1 related activities.
Purpose
Reports the time taken by BES for performing JDBC1 related activities

M o n i t o r i n g B o r l a n d E n t e r p r i s e S e r v e r s ( B E S )
468
Target of the
test
A BES server
Agent
deploying the
test
An internal Agent
Configurable
parameters for
the test
1. TEST PERIOD - How often should the test be executed
2. HOST - The host for which the test is to be configured
3. PORT - The smart agent port number
4. MGMT_PORT_NUMBER – The port number where the management agent listens
5. USER – The name of a BES user
6. PASSWORD – The password of the specified USER
7. CONFIRM PASSWORD – Confirm the PASSWORD by retyping it here.
8. REALM - The BES server realm
Outputs of the
test
One set of results for every BES partition monitored
Measurements
made by the
test
Measurement
Measurement
Unit
Interpretation
Jdbc1GetCon:
Indicates the time spent in the
Jdbc1 data source to get a
pooled connection.
Secs
Jdbc1NewCon:
Indicates the time spent in the
Jdbc1 datasource to get a new
connection (startup cost only).
Secs
Jdbc1RegRes:
Indicates the time spent in the
Jdbc1 datasource to register a
transaction resource in
transaction service.
Secs
14.3.4 JDBC2 Test
This test reports the time taken by BES for performing JDBC2 related activities.
Purpose
Reports the time taken by BES for performing JDBC2 related activities
Target of the
test
A BES server
Agent
deploying the
test
An internal Agent

M o n i t o r i n g B o r l a n d E n t e r p r i s e S e r v e r s ( B E S )
469
Configurable
parameters for
the test
1. TEST PERIOD - How often should the test be executed
2. HOST - The host for which the test is to be configured
3. PORT - The smart agent port number
4. MGMT_PORT_NUMBER – The port number where the management agent listens
5. USER – The name of a BES user
6. PASSWORD – The password of the specified USER
7. CONFIRM PASSWORD – Confirm the PASSWORD by retyping it here.
8. REALM - The BES server realm
Outputs of the
test
One set of results for every BES partition monitored
Measurements
made by the
test
Measurement
Measurement
Unit
Interpretation
Jdbc2GetCon:
Indicates the time spent in the
Jdbc2 datasource to get a pooled
connection.
Secs
Jdbc2NewCon:
Indicates the time spent in the
Jdbc2 datasource to get a new
connection (startup cost only).
Secs
Jdbc2RegRes:
Indicates the time spent in the
Jdbc2 datasource to register a
transaction resource in
transaction service.
Secs
Jdbc2NewXaCon:
Indicates the time spent in the
Jdbc2 datasource to get a new
XA-enabled connection (startup
cost only)
Secs
Jdbc2XaStart:
Indicates the time spent in the
Jdbc2 datasource, starting a
transaction branch
Secs
Jdbc2XaEnd:
Indicates the time spent in the
Jdbc2 datasource to end a
transaction branch.
Secs
14.3.5 SFBeans Test
This test reports the time taken by the EJB container for passivating and activating stateful session
beans.

M o n i t o r i n g B o r l a n d E n t e r p r i s e S e r v e r s ( B E S )
470
Purpose
Reports the time taken by the EJB container for passivating and activating stateful
session beans
Target of the
test
A BES server
Agent
deploying the
test
An internal Agent
Configurable
parameters for
the test
1. TEST PERIOD - How often should the test be executed
2. HOST - The host for which the test is to be configured
3. PORT - The smart agent port number
4. MGMT_PORT_NUMBER – The port number where the management agent listens
5. USER – The name of a BES user
6. PASSWORD – The password of the specified USER
7. CONFIRM PASSWORD – Confirm the PASSWORD by retyping it here.
8. REALM - The BES server realm
Outputs of the
test
One set of results for every BES partition monitored
Measurements
made by the
test
Measurement
Measurement
Unit
Interpretation
Activation time:
Indicates the time spent in
activating a stateful session
bean.
Secs
If the EJB container spends more
time in passivating and activating
the bean instances, then try
increasing the timeout period for
EJBs. The default value is five
seconds. This property can be set
in the container properties file for
the Partition you are configuring.
This file is located at:
/var/servers//adm/properties/par
titions/(partition-
name)/services/ejbcontainer.prop
erties. This file can be edited to
set the
ejb.sfsb.passivation_timeout
property.

M o n i t o r i n g B o r l a n d E n t e r p r i s e S e r v e r s ( B E S )
471
Passivation time:
Indicates the time spent
passivating stateful session
beans.
Secs
If the EJB container spends more
time in passivating and activating
the bean instances, then try
increasing the timeout period for
EJBs. The default value is five
seconds. This property can be set
in the container properties file for
the Partition you are configuring.
This file is located at:
/var/servers//adm/properties/par
titions/(partition-
name)/services/ejbcontainer.prop
erties. This file can be edited to
set the
ejb.sfsb.passivation_timeout
property.
14.3.6 Transactions Test
This test reports the time taken by the EJB container for performing transaction related activities.
Purpose
Reports the time taken by the EJB container for performing transaction related
activities
Target of the
test
A BES server
Agent
deploying the
test
An internal Agent
Configurable
parameters for
the test
1. TEST PERIOD - How often should the test be executed
2. HOST - The host for which the test is to be configured
3. PORT - The smart agent port number
4. MGMT_PORT_NUMBER – The port number where the management agent listens
5. USER – The name of a BES user
6. PASSWORD – The password of the specified USER
7. CONFIRM PASSWORD – Confirm the PASSWORD by retyping it here.
8. REALM - The BES server realm
Outputs of the
test
One set of results for every BES partition monitored
Measurements
made by the
test
Measurement
Measurement
Unit
Interpretation
Begin transactions:
Indicates the time spent
beginning transactions.
Secs
Commit transactions:
Indicates the time spent
beginning transactions.
Secs

M o n i t o r i n g B o r l a n d E n t e r p r i s e S e r v e r s ( B E S )
472
Rollback transactions:
Indicates the time spent rolling
back transactions
Secs

M o n i t o r i n g J B o s s A p p l i c a t i o n S e r v e r s
473
Monitoring JBoss Application
Servers
The JBoss Application Server is a widely used Java application server that provides a J2EE certified
platform for developing and deploying enterprise Java applications, web applications, and portals, and
also offers extended enterprise services such as clustering, caching, and persistence.
To monitor the JBoss application server, eG requires administrators to deploy two specialized
components on the target server. These components are, the eG MBean Service component, and the eG
Web Component.
eG MBean Service Component: This service is started by JBoss as soon as this component
is deployed to the server. The main purpose of this component is to get the MBean server
instance running on the JBoss server. It also provides static methods which use the MBean
server instance to gather relevant statistics from the JBoss server.
eG Web Component: This web component consists of one servlet. The eG agent will connect
to this servlet by passing relevant arguments. The servlet will then invoke the corresponding
static method of the MBean service component and return the result to the eG agent. The
agent will then compute the required metrics and upload the same the eG manager.
In order to enable the eG agents to extract statistics from the JBoss server, the above-mentioned
components need to be deployed on the JBoss server.
Once the components are deployed on the JBoss server, the eG agent periodically executes tests on
the server to capture the statistics collected by the components, and reports them to the eG manager.
These tests are mapped to specific layers of the JBoss application server's layer model (see Figure
15.1).
Chapter
15

M o n i t o r i n g J B o s s A p p l i c a t i o n S e r v e r s
474
Figure 15.1: The layer model of a JBoss application server
The measures reported by the tests enable JBoss administrators to make accurate performance
judgments with respect to the following:
JVM heap monitoring
How much memory has been allocated to the
JVM heap?
Is adequate free memory available in the JVM
heap?
Request processing capability
Monitoring
Is the server taking too long to process
requests?
Are too many errors encountered by the server
during request processing?
Is the server overloaded with requests?
Thread pool monitoring
How many threads are currently busy? Does the
server appear to be handling too much load?
Note:
The JBoss monitoring model provided by eG Enterprise (see Figure 15.1) can be used to monitor a
JBoss server (versions 4.0 and 4.2.3), in an agent-based or an agentless manner.
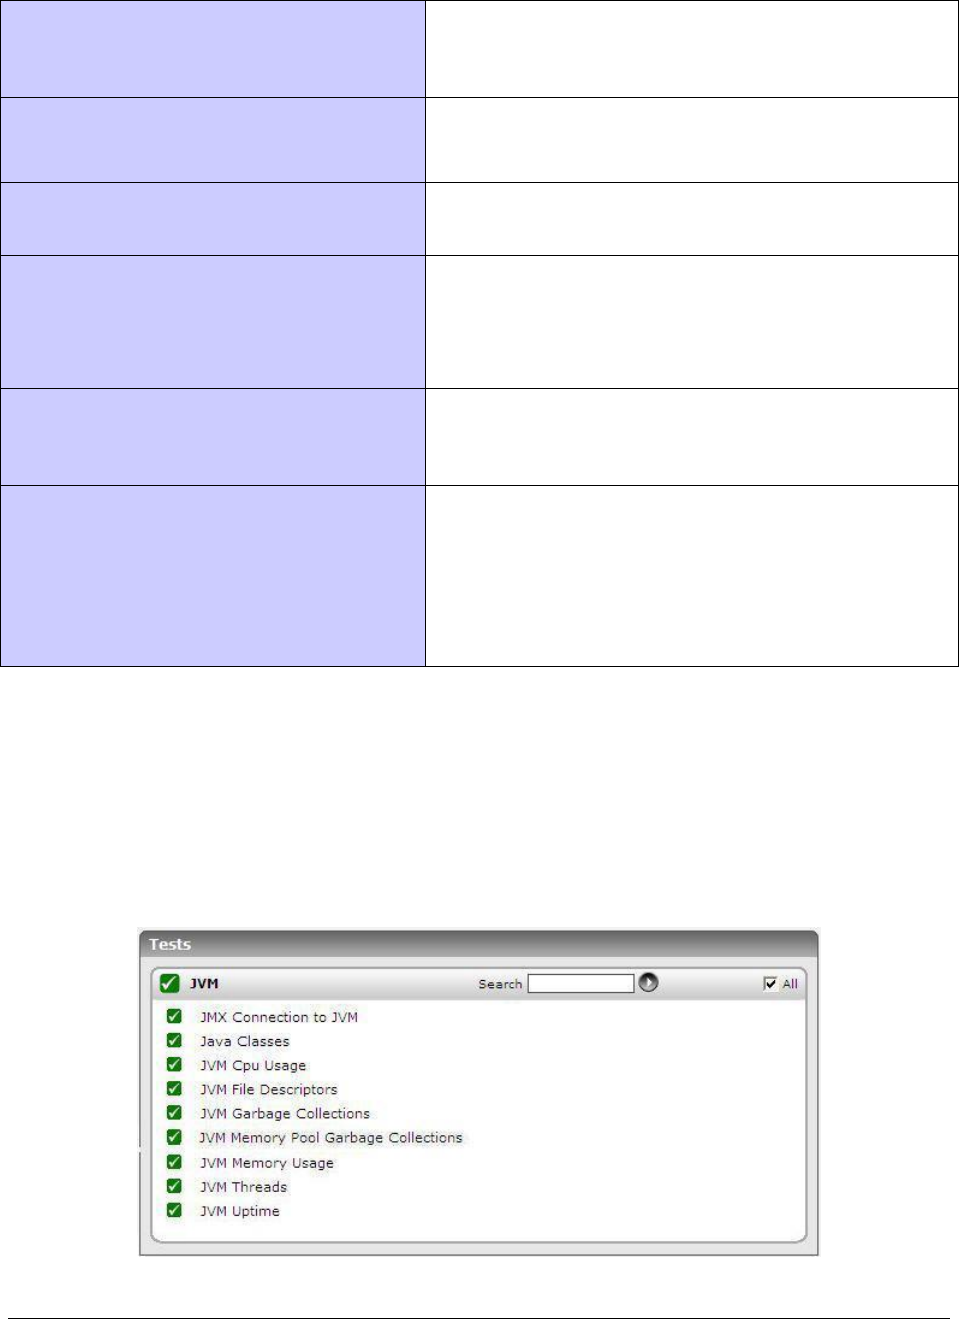
M o n i t o r i n g J B o s s A p p l i c a t i o n S e r v e r s
475
Are there adequate spare threads in the pool
for future processing requirements?
Does the thread pool require resizing?
Connection pool monitoring
Are enough connections available in the
connection pool, or do more connections have
to be allotted to the pool?
Servlet monitoring
How frequently was the servlet invoked?
Does the servlet take too long to execute?
EJB monitoring
How frequently are EJBs created/removed?
Are there any EJBs that are ready to service
clients?
How many EJBs are currently in the EJB pool?
Messaging service monitoring
Are too many messages have been enqueued?
How quickly does the queue process messages
within?
Topic monitoring
Does the topic take too long to process
messages?
What type of messages are currently available
in the topic - durable or non-durable?
How many durable subscribers are there to a
topic?
The sections to come will indulge in an elaborate discussion of the top 6 layers of the layer model
depicted by Figure 15.1. As the other layers have been dealt with in great detail in the Monitoring Unix
and Windows Servers document, this chapter will not be discussing them again.
15.1 The JVM Layer
This layer collectively reports the resource usage and overall health of the JBoss JVM.
Figure 15.2: The tests mapped to the JVM layer
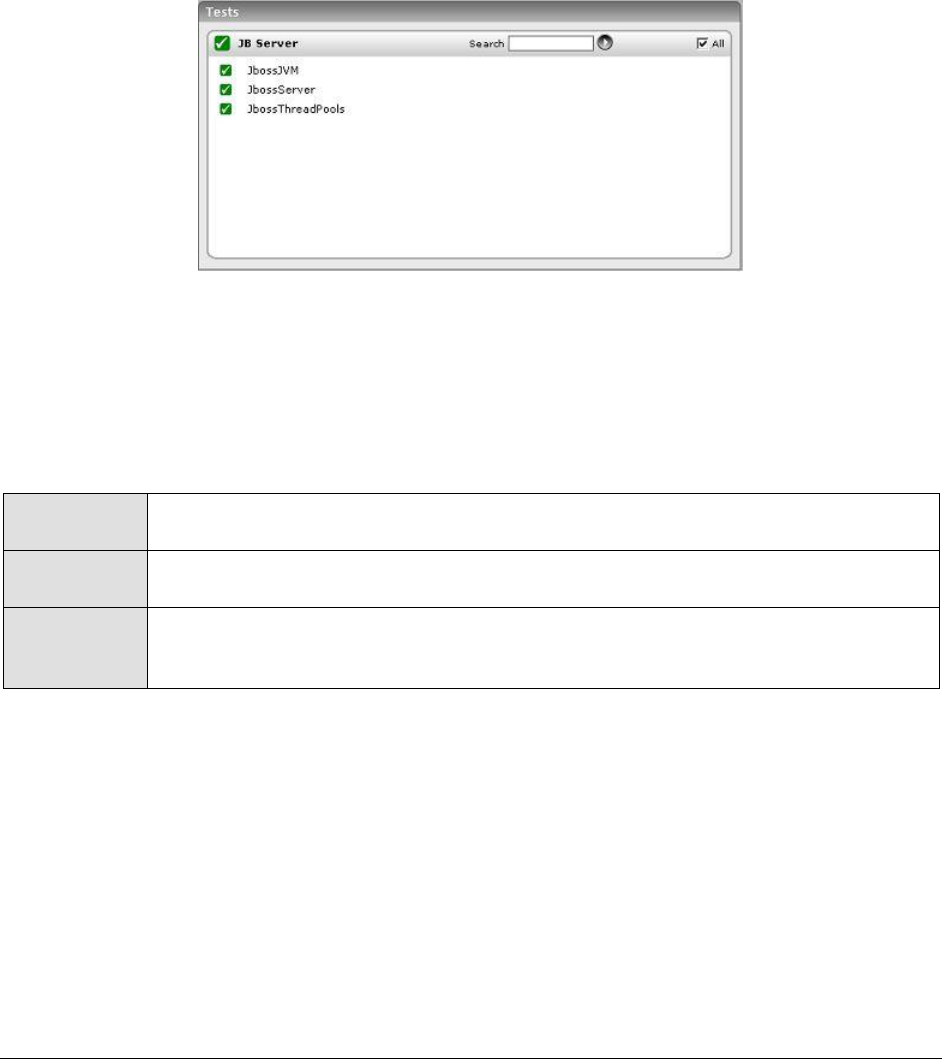
M o n i t o r i n g J B o s s A p p l i c a t i o n S e r v e r s
476
All the tests displayed in Figure 15.2 have been dealt with in the previous chapters.
15.2 The JB Server Layer
The tests associated with the JB Server layer (see Figure 15.3) measure the request processing
capability of the JBoss server by monitoring critical parameters such as thread pool usage and
memory heap utilization.
Figure 15.3: The tests associated with the JB Server layer
15.2.1 Jboss JVM Test
This test monitors the heap usage and thread usage of the Java Virtual Machine (JVM) on which the
JBoss application server runs.
Purpose
Monitors the heap usage and thread usage of the Java Virtual Machine (JVM) on
which the JBoss application server runs
Target of the
test
A JBoss application server
Agent
deploying the
test
An internal agent

M o n i t o r i n g J B o s s A p p l i c a t i o n S e r v e r s
477
Configurable
parameters for
the test
1. TEST PERIOD - How often should the test be executed
2. HOST - The host for which the test is to be configured
3. PORT - The port number at which the specified HOST listens
4. MEASUREMENT MODE – This test can extract metrics from JBoss using either of
the following mechanisms:
By deploying the EgJBossAgent.sar and egjboss.war files on the target JBoss
server;
By contacting the Java runtime (JRE) of JBoss via JMX
To configure the test to use the EgJBossAgent.sar and egjboss.war files, first, select
the War File option. Then, refer to the Configuring and Monitoring Application
Servers document to know how to deploy these files on the target JBoss server.
On the other hand, if you want the test to use JMX instead, then first, select the
JMX option. Then, follow the procedure detailed in the Configuring and
Monitoring Application Servers document to configure the test to use JMX. By
default, the JMX option is chosen here.
5. JNDINAME – This parameter appears only if the MEASUREMENT MODE is set to
JMX. The JNDINAME is a lookup name for connecting to the JMX connector. By
default, this is jmxrmi. If you have registered the JMX connector in the RMI
registry using a different lookup name, then you can change this default value
to reflect the same.
6. JMX REMOTE PORT – This parameter appears only if the MEASUREMENT MODE
is set to JMX. Here, specify the port at which the JMX listens for requests from
remote hosts. Ensure that you specify the same port that you configured in the
management.properties file of the target JBoss server (refer to the Configuring
and Monitoring Application Servers document for more details).
7. JMX USER, JMX PASSWORD, and CONFIRM PASSWORD – These parameters
appear only if the MEASUREMENT MODE is set to JMX. If JMX requires
authentication only (but no security), then ensure that the JMX USER and JMX
PASSWORD parameters are configured with the credentials of a user with read-
write access to JMX. To know how to create this user, refer to the Configuring
and Monitoring Application Servers document. Confirm the password by retyping
it in the CONFIRM PASSWORD text box.
8. SSL - This parameter appears only if the MEASUREMENT MODE is set to War File.
Indicate Yes if the JBoss server is SSL-enabled.
9. URL - This parameter appears only if the MEASUREMENT MODE is set to War File.
Specify the URL to be accessed to collect metrics pertaining to the JBoss server.
By default, this test connects to a managed JBoss server and attempts to obtain
the metrics of interest by accessing the local Mbeans of the server. Accordingly,
by default, this parameter is set to http://<JBossServerIP>:<JbossServerPort>.
Outputs of the
test
One set of results for every JBoss server monitored
Measurements
made by the
Measurement
Measurement
Unit
Interpretation
M o n i t o r i n g J B o s s A p p l i c a t i o n S e r v e r s
478
test
Free memory:
Indicates the memory available
in the JVM heap of the JBoss
application server.
MB
If this value decreases
consistently, then try increasing
the memory heap of the JVM.
Used memory:
Indicates the amount of JVM
heap memory used.
MB
Total memory:
Indicates the total memory
allocated to the JVM.
MB
Active threads:
Indicates the total number of
threads that are currently active
in the JBoss server.
Number
15.2.2 Jboss Server Test
This test monitors the requests handled by the JBoss server.
Purpose
Monitors the requests handled by the JBoss server
Target of the
test
A JBoss application server
Agent
deploying the
test
An internal agent

M o n i t o r i n g J B o s s A p p l i c a t i o n S e r v e r s
479
Configurable
parameters for
the test
1. TEST PERIOD - How often should the test be executed
2. HOST - The host for which the test is to be configured
3. PORT - The port number at which the specified HOST listens
4. MEASUREMENT MODE – This test can extract metrics from JBoss using either of
the following mechanisms:
By deploying the EgJBossAgent.sar and egjboss.war files on the target JBoss
server;
By contacting the Java runtime (JRE) of JBoss via JMX
To configure the test to use the EgJBossAgent.sar and egjboss.war files, first, select
the War File option. Then, refer to the Configuring and Monitoring Application
Servers document to know how to deploy these files on the target JBoss server.
On the other hand, if you want the test to use JMX instead, then first, select the
JMX option. Then, follow the procedure detailed in the Configuring and
Monitoring Application Servers document to configure the test to use JMX. By
default, the JMX option is chosen here.
5. JNDINAME – This parameter appears only if the MEASUREMENT MODE is set to
JMX. The JNDINAME is a lookup name for connecting to the JMX connector. By
default, this is jmxrmi. If you have registered the JMX connector in the RMI
registry using a different lookup name, then you can change this default value
to reflect the same.
6. JMX REMOTE PORT – This parameter appears only if the MEASUREMENT MODE
is set to JMX. Here, specify the port at which the JMX listens for requests from
remote hosts. Ensure that you specify the same port that you configured in the
management.properties file of the target JBoss server (refer to the Configuring
and Monitoring Application Servers document for more details).
7. JMX USER, JMX PASSWORD, and CONFIRM PASSWORD – These parameters
appear only if the MEASUREMENT MODE is set to JMX. If JMX requires
authentication only (but no security), then ensure that the JMX USER and JMX
PASSWORD parameters are configured with the credentials of a user with read-
write access to JMX. To know how to create this user, refer to the Configuring
and Monitoring Application Servers document. Confirm the password by retyping
it in the CONFIRM PASSWORD text box.
8. SSL - This parameter appears only if the MEASUREMENT MODE is set to War File.
Indicate Yes if the JBoss server is SSL-enabled.
9. URL - This parameter appears only if the MEASUREMENT MODE is set to War File.
Specify the URL to be accessed to collect metrics pertaining to the JBoss server.
By default, this test connects to a managed JBoss server and attempts to obtain
the metrics of interest by accessing the local Mbeans of the server. Accordingly,
by default, this parameter is set to http://<JBossServerIP>:<JbossServerPort>.
Outputs of the
test
One set of results for every JBoss server monitored
Measurements
made by the
Measurement
Measurement
Unit
Interpretation

M o n i t o r i n g J B o s s A p p l i c a t i o n S e r v e r s
480
test
Request rate:
Indicates the rate of requests to
the server during the last
measurement period.
Reqs/Sec
With the advent of HTTP/1.1
multiple requests can be
transmitted over the same TCP
connection. The ratio of requests
per connection can provide an
idea of the effectiveness of the
HTTP 1.1 protocol.
Data transmit rate:
Indicates the rate at which the
data was transmitted by the
server during the last
measurement period.
KB/Sec
A large increase in the data
transmission rate can be
indicative of an increase in the
popularity of one or more web
sites hosted on the server.
Data received rate:
Indicates the rate at which data
was received by the server
during the last measurement
period.
KB/Sec
An increase in this value is
indicative of an increase in user
requests to the server.
Avg request processing time:
Indicates the average time taken
by the server to process
requests.
MSecs
A high value may be an indication
of slow performance of the
server.
Max request processing time:
Indicates the maximum time
taken by the server to process
requests.
MSecs
Error rate:
Indicates the rate at which
errors were encountered by the
server in the last measurement
period.
Errors/Sec
15.2.3 Jboss Thread Pools Test
This test monitors the thread pools in the JBoss server.
Purpose
Monitors the thread pools in the JBoss server
Target of the
test
A JBoss application server
Agent
deploying the
test
An internal agent

M o n i t o r i n g J B o s s A p p l i c a t i o n S e r v e r s
481
Configurable
parameters for
the test
1. TEST PERIOD - How often should the test be executed
2. HOST - The host for which the test is to be configured
3. PORT - The port number at which the specified HOST listens
4. MEASUREMENT MODE – This test can extract metrics from JBoss using either of
the following mechanisms:
By deploying the EgJBossAgent.sar and egjboss.war files on the target JBoss
server;
By contacting the Java runtime (JRE) of JBoss via JMX
To configure the test to use the EgJBossAgent.sar and egjboss.war files, first, select
the War File option. Then, refer to the Configuring and Monitoring Application
Servers document to know how to deploy these files on the target JBoss server.
On the other hand, if you want the test to use JMX instead, then first, select the
JMX option. Then, follow the procedure detailed in the Configuring and
Monitoring Application Servers document to configure the test to use JMX. By
default, the JMX option is chosen here.
5. JNDINAME – This parameter appears only if the MEASUREMENT MODE is set to
JMX. The JNDINAME is a lookup name for connecting to the JMX connector. By
default, this is jmxrmi. If you have registered the JMX connector in the RMI
registry using a different lookup name, then you can change this default value
to reflect the same.
6. JMX REMOTE PORT – This parameter appears only if the MEASUREMENT MODE
is set to JMX. Here, specify the port at which the JMX listens for requests from
remote hosts. Ensure that you specify the same port that you configured in the
management.properties file of the target JBoss server (refer to the Configuring
and Monitoring Application Servers document for more details).
7. JMX USER, JMX PASSWORD, and CONFIRM PASSWORD – These parameters
appear only if the MEASUREMENT MODE is set to JMX. If JMX requires
authentication only (but no security), then ensure that the JMX USER and JMX
PASSWORD parameters are configured with the credentials of a user with read-
write access to JMX. To know how to create this user, refer to the Configuring
and Monitoring Application Servers document. Confirm the password by retyping
it in the CONFIRM PASSWORD text box.
8. SSL - This parameter appears only if the MEASUREMENT MODE is set to War File.
Indicate Yes if the JBoss server is SSL-enabled.
9. URL - This parameter appears only if the MEASUREMENT MODE is set to War File.
Specify the URL to be accessed to collect metrics pertaining to the JBoss server.
By default, this test connects to a managed JBoss server and attempts to obtain
the metrics of interest by accessing the local Mbeans of the server. Accordingly,
by default, this parameter is set to http://<JBossServerIP>:<JbossServerPort>.
Outputs of the
test
One set of results for each thread pool configured in the JBoss server.
Measurements
made by the
Measurement
Measurement
Unit
Interpretation

M o n i t o r i n g J B o s s A p p l i c a t i o n S e r v e r s
482
test
Current busy threads:
Indicates the number of threads
that are currently busy.
Number
The value of this measure serves
as a good indicator of server
workload.
Current thread count:
Indicates the number of threads
currently spawned in the JVM.
Number
Min spare threads:
Indicates the minimum number
of spare threads.
Number
Max spare threads:
Indicates the maximum number
of spare threads.
Number
Max threads:
Indicates the maximum number
of threads that this pool can
contain.
Number
If the number of threads in a pool
grows close to the value of this
measure, it indicates that the
number of threads in the pool
needs to be increased for
effective operation of this
application. Alternatively, you
may also consider changing the
maximum number of threads that
a pool can contain. However,
exercise caution when altering
the maximum thread count, as a
very high thread count can cause
the app to slowdown from
excessive memory usage.
Likewise, if the maximum thread
count is set too low, it will cause
requests to block or timeout.
15.3 The JB Connection Pool Layer
This layer of the JBoss application server monitors the connection pools configured in the JBoss
application server, and indicates whether the pools have been adequately sized and are being
effectively utilized.
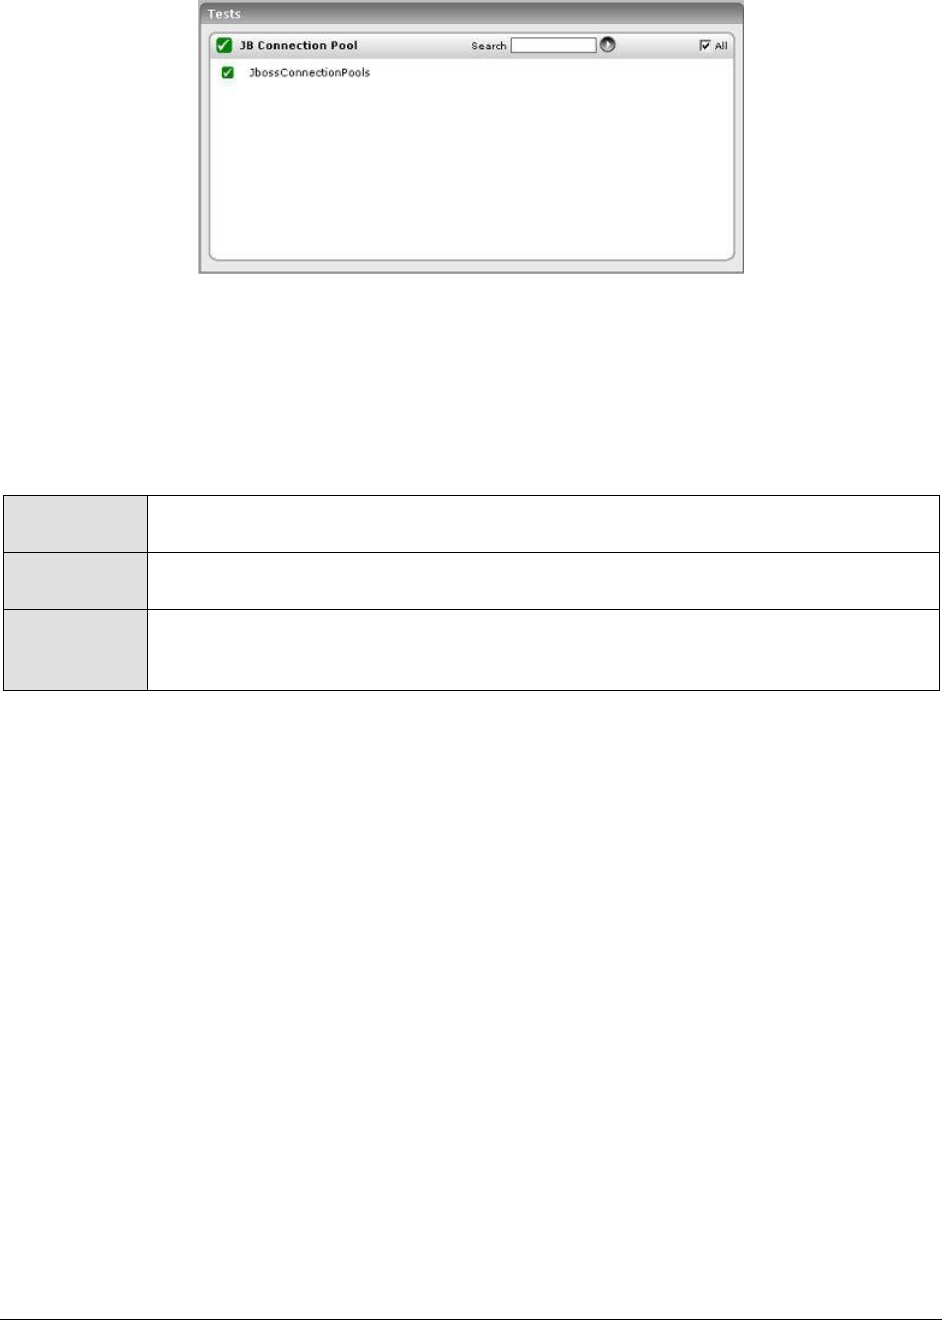
M o n i t o r i n g J B o s s A p p l i c a t i o n S e r v e r s
483
Figure 15.4: The test associated with the JB Connection Pool layer
15.3.1 Jboss Connection Pools Test
This test monitors the various connection pools configured in the JBoss server, and reveals how well
the pools have been used.
Purpose
Monitors the various connection pools configured in the JBoss server, and reveals
how well the pools have been used
Target of the
test
A JBoss application server
Agent
deploying the
test
An internal agent

M o n i t o r i n g J B o s s A p p l i c a t i o n S e r v e r s
484
Configurable
parameters for
the test
1. TEST PERIOD - How often should the test be executed
2. HOST - The host for which the test is to be configured
3. PORT - The port number at which the specified HOST listens
4. MEASUREMENT MODE – This test can extract metrics from JBoss using either of
the following mechanisms:
By deploying the EgJBossAgent.sar and egjboss.war files on the target JBoss
server;
By contacting the Java runtime (JRE) of JBoss via JMX
To configure the test to use the EgJBossAgent.sar and egjboss.war files, first, select
the War File option. Then, refer to the Configuring and Monitoring Application
Servers document to know how to deploy these files on the target JBoss server.
On the other hand, if you want the test to use JMX instead, then first, select the
JMX option. Then, follow the procedure detailed in the Configuring and
Monitoring Application Servers document to configure the test to use JMX. By
default, the JMX option is chosen here.
5. JNDINAME – This parameter appears only if the MEASUREMENT MODE is set to
JMX. The JNDINAME is a lookup name for connecting to the JMX connector. By
default, this is jmxrmi. If you have registered the JMX connector in the RMI
registry using a different lookup name, then you can change this default value
to reflect the same.
6. JMX REMOTE PORT – This parameter appears only if the MEASUREMENT MODE
is set to JMX. Here, specify the port at which the JMX listens for requests from
remote hosts. Ensure that you specify the same port that you configured in the
management.properties file of the target JBoss server (refer to the Configuring
and Monitoring Application Servers document for more details).
7. JMX USER, JMX PASSWORD, and CONFIRM PASSWORD – These parameters
appear only if the MEASUREMENT MODE is set to JMX. If JMX requires
authentication only (but no security), then ensure that the JMX USER and JMX
PASSWORD parameters are configured with the credentials of a user with read-
write access to JMX. To know how to create this user, refer to the Configuring
and Monitoring Application Servers document. Confirm the password by retyping
it in the CONFIRM PASSWORD text box.
8. SSL - This parameter appears only if the MEASUREMENT MODE is set to War File.
Indicate Yes if the JBoss server is SSL-enabled.
9. URL - This parameter appears only if the MEASUREMENT MODE is set to War File.
Specify the URL to be accessed to collect metrics pertaining to the JBoss server.
By default, this test connects to a managed JBoss server and attempts to obtain
the metrics of interest by accessing the local Mbeans of the server. Accordingly,
by default, this parameter is set to http://<JBossServerIP>:<JbossServerPort>.
Outputs of the
test
One set of results for each connection pool configured in the JBoss server.
Measurements
made by the
Measurement
Measurement
Unit
Interpretation

M o n i t o r i n g J B o s s A p p l i c a t i o n S e r v e r s
485
test
Connections created:
Indicates the total number of
connections created since the
start of the connection pool.
Number
Current connections:
Indicates the number of
connections currently in the
pool.
Number
Connections in use:
Indicates the number of
connections that are currently in
use.
Number
If the value of this measure
reaches that of the
Curr_conn_count measure, then
it indicates that the pool requires
resizing.
Connections destroyed:
Indicates the number of
connections that were destroyed
since the start of the server.
Number
Max connections in use:
Indicates the high water mark of
the connections in use count.
Number
Available connections:
Indicates the number of
connections that are currently
available in the pool for clients to
use.
Number
Ideally, this value should be high.
Min connection size:
Indicates the minimum value of
the number of connections in the
pool since the start of the pool.
Number
Max connection size:
Indicates the maximum value of
the number of connections in the
pool since the start of the pool.
Number
15.4 The JB Servlet Layer
The JB Servlet layer executes the JbossServlets test (see Figure 15.5) that monitors the performance of
the servlets deployed on the JBoss application server.
M o n i t o r i n g J B o s s A p p l i c a t i o n S e r v e r s
486
Figure 15.5: The test associated with the JB Servlet layer
15.4.1 Jboss Servlets Test
This test monitors the servlets deployed on the JBoss server. If the JBoss server hosts a large number
of servlets, then managing the individual servlets would be quiet a challenge. Therefore, to enable
administrators to manage servlets easily, the eG Enterprise system allows the configuration of servlet
groups. The eG agent executing this test will then, by default, report measures for every group that is
configured. To configure servlet groups, click on the Click here hyperlink in the test configuration page
of the JbServletTest.
Purpose
Monitors the servlets deployed on the JBoss server
Target of the
test
A JBoss application server
Agent
deploying the
test
An internal agent

M o n i t o r i n g J B o s s A p p l i c a t i o n S e r v e r s
487
Configurable
parameters for
the test
1. TEST PERIOD - How often should the test be executed
2. HOST - The host for which the test is to be configured
3. PORT - The port number at which the specified HOST listens
4. MEASUREMENT MODE – This test can extract metrics from JBoss using either of
the following mechanisms:
By deploying the EgJBossAgent.sar and egjboss.war files on the target JBoss
server;
By contacting the Java runtime (JRE) of JBoss via JMX
To configure the test to use the EgJBossAgent.sar and egjboss.war files, first, select
the War File option. Then, refer to the Configuring and Monitoring Application
Servers document to know how to deploy these files on the target JBoss server.
On the other hand, if you want the test to use JMX instead, then first, select the
JMX option. Then, follow the procedure detailed in the Configuring and
Monitoring Application Servers document to configure the test to use JMX. By
default, the JMX option is chosen here.
5. JNDINAME – This parameter appears only if the MEASUREMENT MODE is set to
JMX. The JNDINAME is a lookup name for connecting to the JMX connector. By
default, this is jmxrmi. If you have registered the JMX connector in the RMI
registry using a different lookup name, then you can change this default value
to reflect the same.
6. JMX REMOTE PORT – This parameter appears only if the MEASUREMENT MODE
is set to JMX. Here, specify the port at which the JMX listens for requests from
remote hosts. Ensure that you specify the same port that you configured in the
management.properties file of the target JBoss server (refer to the Configuring
and Monitoring Application Servers document for more details).
7. JMX USER, JMX PASSWORD, and CONFIRM PASSWORD – These parameters
appear only if the MEASUREMENT MODE is set to JMX. If JMX requires
authentication only (but no security), then ensure that the JMX USER and JMX
PASSWORD parameters are configured with the credentials of a user with read-
write access to JMX. To know how to create this user, refer to the Configuring
and Monitoring Application Servers document. Confirm the password by retyping
it in the CONFIRM PASSWORD text box.
8. SSL - This parameter appears only if the MEASUREMENT MODE is set to War File.
Indicate Yes if the JBoss server is SSL-enabled.
9. URL - This parameter appears only if the MEASUREMENT MODE is set to War File.
Specify the URL to be accessed to collect metrics pertaining to the JBoss server.
By default, this test connects to a managed JBoss server and attempts to obtain
the metrics of interest by accessing the local Mbeans of the server. Accordingly,
by default, this parameter is set to http://<JBossServerIP>:<JbossServerPort>.
Outputs of the
test
By default, the test reports one set of results for each servlet group that is
configured using the eG administrative interface.
Measurements
made by the
Measurement
Measurement
Unit
Interpretation

M o n i t o r i n g J B o s s A p p l i c a t i o n S e r v e r s
488
test
Invocation rate:
Indicates the number of times
the servlet was invoked per
second in the last measurement
period.
Invocations/
Sec
This is indicative of the load on a
servlet.
Avg invocation time:
Indicates the average time taken
to execute a servlet.
Msecs
Max invocation time:
Indicates the maximum time
taken to execute a servlet.
Msecs
15.5 The JB EJB Layer
The JB EJB layer executes the JbossEjbs test (see Figure 15.6), which evaluates the performance of the
Enterprise Java Beans (EJBs) deployed on the JBoss application server.
Figure 15.6: The test associated with the JB EJB layer
15.5.1 Jboss Ejbs Test
This test monitors the EJBs deployed on the JBoss server. If the JBoss server hosts a large number of
EJBs, then managing the individual EJBs would be quiet a challenge. Therefore, to enable
administrators to manage EJBs easily, the eG Enterprise system allows the configuration of EJB
groups. The eG agent executing this test will then, by default, report measures for every group that is
configured. To configure EJB groups, click on the Click here hyperlink in the test configuration page of
the JbEjbTest.
Purpose
Monitors the EJBs deployed on the JBoss server
Target of the
test
A JBoss application server

M o n i t o r i n g J B o s s A p p l i c a t i o n S e r v e r s
489
Agent
deploying the
test
An internal agent
Configurable
parameters for
the test
1. TEST PERIOD - How often should the test be executed
2. HOST - The host for which the test is to be configured
3. PORT - The port number at which the specified HOST listens
4. MEASUREMENT MODE – This test can extract metrics from JBoss using either of
the following mechanisms:
By deploying the EgJBossAgent.sar and egjboss.war files on the target JBoss
server;
By contacting the Java runtime (JRE) of JBoss via JMX
To configure the test to use the EgJBossAgent.sar and egjboss.war files, first, select
the War File option. Then, refer to the Configuring and Monitoring Application
Servers document to know how to deploy these files on the target JBoss server.
On the other hand, if you want the test to use JMX instead, then first, select the
JMX option. Then, follow the procedure detailed in the Configuring and
Monitoring Application Servers document to configure the test to use JMX. By
default, the JMX option is chosen here.
5. JNDINAME – This parameter appears only if the MEASUREMENT MODE is set to
JMX. The JNDINAME is a lookup name for connecting to the JMX connector. By
default, this is jmxrmi. If you have registered the JMX connector in the RMI
registry using a different lookup name, then you can change this default value
to reflect the same.
6. JMX REMOTE PORT – This parameter appears only if the MEASUREMENT MODE
is set to JMX. Here, specify the port at which the JMX listens for requests from
remote hosts. Ensure that you specify the same port that you configured in the
management.properties file of the target JBoss server (refer to the Configuring
and Monitoring Application Servers document for more details).
7. JMX USER, JMX PASSWORD, and CONFIRM PASSWORD – These parameters
appear only if the MEASUREMENT MODE is set to JMX. If JMX requires
authentication only (but no security), then ensure that the JMX USER and JMX
PASSWORD parameters are configured with the credentials of a user with read-
write access to JMX. To know how to create this user, refer to the Configuring
and Monitoring Application Servers document. Confirm the password by retyping
it in the CONFIRM PASSWORD text box.
8. SSL - This parameter appears only if the MEASUREMENT MODE is set to War File.
Indicate Yes if the JBoss server is SSL-enabled.
9. URL - This parameter appears only if the MEASUREMENT MODE is set to War File.
Specify the URL to be accessed to collect metrics pertaining to the JBoss server.
By default, this test connects to a managed JBoss server and attempts to obtain
the metrics of interest by accessing the local Mbeans of the server. Accordingly,
by default, this parameter is set to http://<JBossServerIP>:<JbossServerPort>.
Outputs of the
test
By default, the test reports one set of results for each EJB group that is configured
using the eG administrative interface.
Measurements
made by the
Measurement
Measurement
Unit
Interpretation

M o n i t o r i n g J B o s s A p p l i c a t i o n S e r v e r s
490
test
Creation rate:
Indicates the rate of creation of
beans.
EJBs/Sec
Removal rate:
Indicates the rate at which the
EJBs are removed.
EJBs/Sec
Message rate:
Indicates the rate at which
messages are handled.
Msgs/Sec
Method ready count:
Indicates the number of EJBs
where the methods are currently
in the ready state to service
clients. A Method is a function
invoked by clients on the EJB to
perform a specific task.
Number
Ready count:
Indicates the number of EJBs
that are currently ready to
service clients.
Number
Pooled count:
Indicates the number of EJBs
that are in the pool, currently.
Number
Passive count:
Indicates the number of EJB
instances that have been
passivated, currently.
Passivation is the act of storing
an EJB instance in a permanent
store like a hard disk for future
activation.
Number
15.6 The JB MQ Layer
The tests associated with the JB MQ layer (see Figure 15.7) monitor the messaging service of the JBoss
application server.
M o n i t o r i n g J B o s s A p p l i c a t i o n S e r v e r s
491
Figure 15.7: The tests associated with the JB MQ layer
The JMS API stands for Java Message Service Application Programming Interface, and is used by the
JBoss server to send asynchronous business-quality messages to other applications. In the messaging
world, messages are not sent directly to other applications. Instead, messages are sent to
destinations. A destination is the object on the JBossMQ server that clients use to send and receive
messages. There are two types of destination objects, namely, Queues and Topics. The
JbossMQQueues test and the JbossMQTopics test mapped to the JB MQ layer monitor each of the above-
mentioned destination objects, respectively.
15.6.1 Jboss MQ Queues Test
This test monitors the queues on the JBoss server. Clients that are in the point-to-point paradigm
typically use queues. They expect that message sent to a queue will be received by only one other
client once and only once. If multiple clients are receiving messages from a single queue, the
messages will be load balanced across the receivers. Queue objects, by default, will be stored under
the JNDI queue/ sub context.
Purpose
Monitors the queues on the JBoss server
Target of the
test
A JBoss application server
Agent
deploying the
test
An internal agent

M o n i t o r i n g J B o s s A p p l i c a t i o n S e r v e r s
492
Configurable
parameters for
the test
1. TEST PERIOD - How often should the test be executed
2. HOST - The host for which the test is to be configured
3. PORT - The port number at which the specified HOST listens
4. MEASUREMENT MODE – This test can extract metrics from JBoss using either of
the following mechanisms:
By deploying the EgJBossAgent.sar and egjboss.war files on the target JBoss
server;
By contacting the Java runtime (JRE) of JBoss via JMX
To configure the test to use the EgJBossAgent.sar and egjboss.war files, first, select
the War File option. Then, refer to the Configuring and Monitoring Application
Servers document to know how to deploy these files on the target JBoss server.
On the other hand, if you want the test to use JMX instead, then first, select the
JMX option. Then, follow the procedure detailed in the Configuring and
Monitoring Application Servers document to configure the test to use JMX. By
default, the JMX option is chosen here.
5. JNDINAME – This parameter appears only if the MEASUREMENT MODE is set to
JMX. The JNDINAME is a lookup name for connecting to the JMX connector. By
default, this is jmxrmi. If you have registered the JMX connector in the RMI
registry using a different lookup name, then you can change this default value
to reflect the same.
6. JMX REMOTE PORT – This parameter appears only if the MEASUREMENT MODE
is set to JMX. Here, specify the port at which the JMX listens for requests from
remote hosts. Ensure that you specify the same port that you configured in the
management.properties file of the target JBoss server (refer to the Configuring
and Monitoring Application Servers document for more details).
7. JMX USER, JMX PASSWORD, and CONFIRM PASSWORD – These parameters
appear only if the MEASUREMENT MODE is set to JMX. If JMX requires
authentication only (but no security), then ensure that the JMX USER and JMX
PASSWORD parameters are configured with the credentials of a user with read-
write access to JMX. To know how to create this user, refer to the Configuring
and Monitoring Application Servers document. Confirm the password by retyping
it in the CONFIRM PASSWORD text box.
8. SSL - This parameter appears only if the MEASUREMENT MODE is set to War File.
Indicate Yes if the JBoss server is SSL-enabled.
9. URL - This parameter appears only if the MEASUREMENT MODE is set to War File.
Specify the URL to be accessed to collect metrics pertaining to the JBoss server.
By default, this test connects to a managed JBoss server and attempts to obtain
the metrics of interest by accessing the local Mbeans of the server. Accordingly,
by default, this parameter is set to http://<JBossServerIP>:<JbossServerPort>.
10. DD FREQUENCY – It refers to the frequency with which detailed diagnosis
measures are to be generated for this test. The default is 1:1. This indicates
that, by default, detailed measures will be generated every time this test runs,
and also every time the test detects a problem. You can modify this frequency,
if you so desire. Also, if you intend to disable the detailed diagnosis capability
for this test, you can do so by specifying none against DD FREQUENCY.

M o n i t o r i n g J B o s s A p p l i c a t i o n S e r v e r s
493
11. DETAILED DIAGNOSIS - To make diagnosis more efficient and accurate, the eG
system embeds an optional detailed diagnostic capability. With this capability,
the eG agents can be configured to run detailed, more elaborate tests as and
when specific problems are detected. To enable the detailed diagnosis capability
of this test for a particular server, choose the On option against DETAILED
DIAGNOSIS. To disable the capability, click on the Off option.
Outputs of the
test
One set of results for every queue on the JBoss application server
Measurements
made by the
test
Measurement
Measurement
Unit
Interpretation
Max queue depth:
Indicates the max value of the
number of messages that were
in this queue since the start of
the queue.
Number
Message processing rate:
Indicates the rate at which
messages are being processed
by this queue.
Msgs/Sec
Receivers count:
Indicates the number of clients
that are currently configured as
receivers of messages from this
queue.
Msgs/Sec
Current queue depth:
Indicates the number of
messages currently in this
queue.
Number
A high value is indicative of
server workload, or a delivery
bottleneck.
Use the detailed diagnosis of this
measure to know the JMS ID,
Priority, Time, ProducerID, and
the contents of each Message in
the queue.
Scheduled messages count:
Indicates the number of
messages in this queue that are
currently scheduled to be
delivered.
Number
Use the detailed diagnosis of this
measure to know the JMS ID,
Priority, Time, ProducerID, and
the contents of each Message
that is scheduled for delivery.
Queue occupied:
Indicates the percentage of
queue length that is occupied by
messages.
Percent
A high value is a cause for
concern as it could indicate a
bottleneck in message delivery,
which may be heavily populating
the queue with messages.
Message delivered:
Indicates the number of
messages in this queue that
have been delivered.
Number
A high value is desired for this
measure.
M o n i t o r i n g J B o s s A p p l i c a t i o n S e r v e r s
494
Messages added:
Indicates the number of
messages that were added to
this queue during the last
measurement period.
Number
Last message sent time:
Indicates the time that elapsed
since the last message was sent
from this queue.
Secs
Ideally, the value of this measure
should be low. A high value is
indicative of a delay in message
delivery or a message processing
bottleneck.
Subscriber count:
Indicates the number of
subscribers who are registered
with this queue.
Number
Use the detailed diagnosis of this
measure to view the ID of all the
subscribers registered with the
queue.
Receivers count:
Indicates the number of clients
that are currently configured as
receivers of messages from this
queue.
Number
Use the detailed diagnosis of this
measure to view the ID of all the
receivers configured for this
queue.
15.6.2 Jboss MQ Topics Test
The JbossMQTopics test monitors the topics on the JBoss server. Topics are used in the publish-
subscribe paradigm. When a client publishes a message to a topic, he expects that a copy of the
message will be delivered to each client that has subscribed to the topic. However, if the client is not
up, running and receiving messages from the topics, it will miss messages published to the topic. To
get around this problem of missing messages, clients can start a durable subscription. This is like
having a VCR record a show you cannot watch at its scheduled time so that you can see what you
missed when you turn your TV back on. Similarly, messages meant for a durable subscriber are stored
in the persistent cache even when the subscriber is inactive. These messages are delivered to durable
subscribers when they connect to the server.
Purpose
Monitors the topics on the JBoss server
Target of the
test
A JBoss application server
Agent
deploying the
test
An internal agent

M o n i t o r i n g J B o s s A p p l i c a t i o n S e r v e r s
495
Configurable
parameters for
the test
1. TEST PERIOD - How often should the test be executed
2. HOST - The host for which the test is to be configured
3. PORT - The port number at which the specified HOST listens
4. MEASUREMENT MODE – This test can extract metrics from JBoss using either of
the following mechanisms:
By deploying the EgJBossAgent.sar and egjboss.war files on the target JBoss
server;
By contacting the Java runtime (JRE) of JBoss via JMX
To configure the test to use the EgJBossAgent.sar and egjboss.war files, first, select
the War File option. Then, refer to the Configuring and Monitoring Application
Servers document to know how to deploy these files on the target JBoss server.
On the other hand, if you want the test to use JMX instead, then first, select the
JMX option. Then, follow the procedure detailed in the Configuring and
Monitoring Application Servers document to configure the test to use JMX. By
default, the JMX option is chosen here.
5. JNDINAME – This parameter appears only if the MEASUREMENT MODE is set to
JMX. The JNDINAME is a lookup name for connecting to the JMX connector. By
default, this is jmxrmi. If you have registered the JMX connector in the RMI
registry using a different lookup name, then you can change this default value
to reflect the same.
6. JMX REMOTE PORT – This parameter appears only if the MEASUREMENT MODE
is set to JMX. Here, specify the port at which the JMX listens for requests from
remote hosts. Ensure that you specify the same port that you configured in the
management.properties file of the target JBoss server (refer to the Configuring
and Monitoring Application Servers document for more details).
7. JMX USER, JMX PASSWORD, and CONFIRM PASSWORD – These parameters
appear only if the MEASUREMENT MODE is set to JMX. If JMX requires
authentication only (but no security), then ensure that the JMX USER and JMX
PASSWORD parameters are configured with the credentials of a user with read-
write access to JMX. To know how to create this user, refer to the Configuring
and Monitoring Application Servers document. Confirm the password by retyping
it in the CONFIRM PASSWORD text box.
8. SSL - This parameter appears only if the MEASUREMENT MODE is set to War File.
Indicate Yes if the JBoss server is SSL-enabled.
9. URL - This parameter appears only if the MEASUREMENT MODE is set to War File.
Specify the URL to be accessed to collect metrics pertaining to the JBoss server.
By default, this test connects to a managed JBoss server and attempts to obtain
the metrics of interest by accessing the local Mbeans of the server. Accordingly,
by default, this parameter is set to http://<JBossServerIP>:<JbossServerPort>.
Outputs of the
test
One set of results for every topic on the JBoss application server
Measurements
made by the
Measurement
Measurement
Unit
Interpretation

M o n i t o r i n g J B o s s A p p l i c a t i o n S e r v e r s
496
test
Max topic depth:
Indicates the max value of the
number of messages in the topic
since the start of the queue.
Number
Msg process rate:
Indicates the rate at which
messages were being processed
by the topic in the last
measurement period.
Msgs/Sec
Durable messages count:
Indicates the number of durable
messages currently in the topic.
Number
Non-durable messages count:
Indicates the number of non-
durable messages currently in
the topic.
Number
Total subjects count:
Indicates the total number of
subscribers to a topic.
Number
Durable subjects count:
Indicates the number of durable
subscribers to the topic.
Number
If the total number of durable
subscribers is high, then we can
expect the total durable
messages to be stored on the
server also to be relatively on the
higher side.
Non-durable subjects count:
Indicates the number of
subscribers to the topic who are
currently non-durable.
Number

M o n i t o r i n g D o m i n o A p p l i c a t i o n S e r v e r s
497
Monitoring Domino Application
Servers
The Lotus Domino server is an open, secure platform optimized to deliver messaging, applications,
and online collaboration that integrates your enterprise systems with dynamic business processes.
Used by small and large enterprises alike, the Domino server helps harness the power of the web to
facilitate rapid application development, provides an efficient messaging mechanism, and also aids in
securing IT environments from unauthorized access.
Owing to its wide usage and the crucial role it plays in the development, delivery, and security of
business-critical services, even a semblance of a problem in the functioning of the Domino application
server could be perilious to the health, availability, and reliability of a service offering. To avoid such
adversities, it is necessary to keep a constant eye on the performance-impacting activities of the
Domino application server, so that issues come to light early and are addressed quickly.
eG Enterprise has developed an exclusive Domino application monitoring model (see Figure 16.6) for
the Domino application server, which employs an eG agent to continuously monitor the performance
of the server. This eG agent executes tests which communicate with the Domino SNMP agent to collect
key metrics relating to server performance. To facilitate this communication, SNMP should be enabled
on the application server.
16.1 Enabling SNMP on a Domino Server
Domino SNMP Agent services are provided by two types of programs:
LNSNMP -- The Lotus Notes SNMP agent. As an independent application, LNSNMP is insulated
from most Domino server malfunctions and, by itself, adds negligible overhead to the server.
Two Domino server add-ins -- the QuerySet Handler and the Event Interceptor.
The QuerySet Handler and the Event Interceptor depend on the Domino server; if the server
fails for any reason, these programs fail as well.
The following components comprise the Domino SNMP Agent architecture:
A platform-specific Master SNMP Agent -- An independent, non-Lotus, agent usually
supplied with the operating system platform that provides SNMP services for the machine. This
SNMP Agent transports the SNMP traps and Get/Set responses across the network to the
management station.
The Domino SNMP Agent consisting of:
Chapter
16

Monit o r i n g D o m i n o A p p l i c a t i o n S e r v e r s
498
o LNSNMP Agent -- The Lotus Notes SNMP agent, which receives trap notifications
from the Event Interceptor and then forwards them to the management station
using the platform-specific SNMP Agent. LNSNMP also handles requests for
Domino-related information from the management station by passing the request
to the QuerySet Handler and responding back to the management station.
o QuerySet Handler -- Which queries server statistics information, sets the value of
configurable Domino-based parameters, and returns Domino statistics information
to LNSNMP, which then forwards the information to the management station using
the platform-specific master SNMP Agent.
o Event Interceptor -- Which responds to the SNMP Trap notification for Domino
Event Handlers by instructing LNSNMP to issue a trap.
The Domino MIB -- A standard Management Information Base (MIB) file for Lotus Domino
servers that can be compiled and used by a network management program such as eG
Enterprise.
16.1.1 Enabling SNMP for a Domino Server on Solaris
To enable SNMP on a Domino server on Solaris, follow the broad steps given below:
Install the Master SNMP agent on the Domino server
Configure the Domino SNMP agent to communicate with the Master SNMP agent
Each of these steps has been discussed in great detail below.
16.1.1.1 Installing and Configuring the Master SNMP Agent on the
Domino Server
On Solaris platform, the Domino SNMP Agent uses the SMUX protocol, per RFC 1227, to communicate
with the system's Master SNMP Agent. The Solaris Master SNMP Agent does not support the SMUX
protocol, making it necessary to substitute a Master SNMP Agent that does. On Solaris platforms,
Domino includes a suitable NET-SNMP Master Agent, called NET-SNMPD, already configured to support
the SMUX protocol and the Domino SNMP Agent.
To use the NET-SNMPD that is provided with Domino, do the following:
1. Login as the root user.
2. Next, install the NET-SNMPD files. Enter this command, changing the Domino executable path if
necessary: cp /opt/lotus/notes/latest/sunspa/net-snmpd* /etc
Note:
Before using NET-SNMPD, disable any existing Master SNMP Agent. Please follow the steps
below for disabling an existing Master SNMP Agent running on Solaris.
Log in as root.
Stop the snmpdx daemon by typing, /etc/rc3.d/S76snmpdx stop.
Disable the snmpdx daemon by issuing the command, mv /etc/rc3.d/S76snmpdx
/etc/rc3.d/s76snmpdx.

Monit o r i n g D o m i n o A p p l i c a t i o n S e r v e r s
499
3. Arrange for NET-SNMPD to be restarted after a reboot. Enter these commands:
ln -f -s /etc/net-snmpd.sh /etc/init.d/net-snmpd
ln -f -s /etc/init.d/net-snmpd /etc/rc2.d/S76net-snmpd
ln -f -s /etc/init.d/net-snmpd /etc/rc1.d/K76net-snmpd
4. After installation, proceed to configure and start NET-SNMPD. Here is how:
5. Udate the /etc/net-snmpd.conf file with appropriate community names for your remote management
infrastructure. Community names are set using the rocommunity and rwcommunity directives. For
instance, to set a community named nppublic, the command would be: Set rocommunity value to
nppublic
6. To manually start NET-SNMPD, login as the root user and issue the command, /etc/net-snmpd.sh
start. To stop NET-SNMPD, use this command: /etc/net-snmpd.sh stop
16.1.1.2 Configuring the Domino SNMP Agent
The Domino SNMP Agent configuration on Solaris involves the following:
Configuring the LNSNMP agent to work with the Master SNMP Agent that is provided with the
Domino server on Solaris
Completing the configuration by starting the add-in tasks
Before attempting to configure the Domino SNMP agent, ensure the following:
The Solaris Master SNMP Agent provided with Domino should be properly installed and
configured on the server. Refer to the steps discussed in Section 16.1.1.1 for the procedure.
TCP/IP and SNMP should be properly installed and configured on the server. Ensure that the
Domino executable and the Domino data directories are in your search path.
The Domino SNMP Agent is set up to run automatically. Once the Domino SNMP Agent is
configured, it is virtually always running, even when Domino is not. If you later upgrade
Domino, stop the LNSNMP process, before beginning the upgrade process.
To configure the LNSNMP agent, do the following:
1. Login as the root-user.
2. Stop the LNSNMP process. Enter this command: lnsnmp.sh stop
3. Stop the NET-SNMP Master Agent by entering this command: /etc/net-snmpd.sh stop
4. Start the NET-SNMP Master Agent by entering this command: /etc/net-snmpd.sh start
5. Start the LNSNMP process using the command, lnsnmp.sh start
6. Create a link to the LNSNMP script. Enter this command, changing the Domino executable path if
necessary: ln -f -s /opt/lotus/notes/latest/sunspa/lnsnmp.sh /etc/init.d/lnsnmp
7. Arrange for LNSNMP to be restarted after a reboot. Enter these commands:
ln -f -s /etc/init.d/lnsnmp /etc/rc2.d/S77lnsnmp
ln -f -s /etc/init.d/lnsnmp /etc/rc1.d/K77lnsnmp
Monit o r i n g D o m i n o A p p l i c a t i o n S e r v e r s
500
After configuring the LNSNMP agent, start the Domino server add-in tasks such as the QuerySet,
Event Interceptor, and Statistic Collector tasks. To achieve this, do the following:
1. To support SNMP queries, start the QuerySet add-in task. Enter this command on the Domino
Server console: load quryset
2. To support SNMP traps for Domino events, start the Event Interceptor add-in task. Enter this
command on the Domino Server console: load intrcpt
3. To support Domino statistic threshold traps, start the Statistic Collector add-in task. Enter this
command on the Domino Server console: load collect
4. Arrange for the add-in tasks to be restarted automatically when Domino is next restarted. Add
quryset and/or intrcpt and collect to the ServerTasks variable in Domino’s notes.ini file.
ServerTasks =Update,Replica,Router,Amgr,AdminP,CalConn,Sched,LDAP,quryset,intrcpt,collect
16.1.2 Enabling SNMP for a Domino Server on Linux
To enable SNMP on a Domino server on Linux, follow the broad steps given below:
Install the Master SNMP agent on the Domino server
Configure the Domino SNMP agent to communicate with the Master SNMP agent
Each of these steps has been discussed in great detail below.
16.1.2.1 Installing and Configuring the Master SNMP Agent on the
Domino Server
Like the Solaris platform, on Linux also the Domino SNMP Agent uses the SMUX protocol, per RFC
1227, to communicate with the system's Master SNMP Agent. Some Linux distributions include a
Master SNMP Agent that supports the SMUX protocol; others do not. On Linux platforms, Domino
includes a suitable NET-SNMP Master Agent, called NET-SNMPD, already configured to support the
SMUX protocol and the Domino SNMP Agent.
To use the NET-SNMPD that is provided with Domino, do the following:
1. Login as the root user.
2. Next, install the NET-SNMPD files. Enter this command, changing the Domino executable path if
necessary: cp /opt/lotus/notes/latest/linux/net-snmpd* /etc
3. Arrange for NET-SNMPD to be restarted after a reboot. Enter these commands:
ln -f -s /etc/net-snmpd.sh /etc/rc.d/init.d/net-snmpd
chkconfig --add net-snmpd
chkconfig net-snmpd on
Note:
Before using NET-SNMPD, disable any existing MasterSNMP Agent. For information on disabling
an existing Master SNMP Agent, see your Master SNMP Agent's documentation.

Monit o r i n g D o m i n o A p p l i c a t i o n S e r v e r s
501
4. After installation, proceed to configure and start NET-SNMPD. Here is how:
5. Udate the /etc/net-snmpd.conf file with appropriate community names for your remote management
infrastructure. Community names are set using the rocommunity and rwcommunity directives. For
instance, to set a community named nppublic, the command would be, Set rocommunity value to
nppublic.
6. To manually start NET-SNMPD, login as the root user and issue the command, /etc/net-snmpd.sh
start. To stop NET-SNMPD, use the command, /etc/net-snmpd.sh stop.
16.1.2.2 Configuring the Domino SNMP Agent
The Domino SNMP Agent configuration on Linux involves the following:
Configuring the LNSNMP agent to work with the Master SNMP Agent that is provided with
Domino on Linux
Completing the configuration by starting the add-in tasks
Before attempting to configure the Domino SNMP agent, ensure the following:
The Linux Master SNMP Agent provided with Domino should be properly installed and
configured on the server. Refer to the steps discussed in Section 16.1.1.1 for the procedure.
TCP/IP and SNMP should be properly installed and configured on the server. Ensure that the
Domino executable and the Domino data directories are in your search path.
The Domino SNMP Agent is set up to run automatically. Once the Domino SNMP Agent is
configured, it is virtually always running, even when Domino is not. If you later upgrade
Domino, stop the LNSNMP process, before beginning the upgrade process.
To configure the LNSNMP agent, do the following:
1. Login as the root-user.
2. Stop the LNSNMP process. Enter this command: lnsnmp.sh stop
3. Stop the NET-SNMP Master Agent by entering this command: /etc/net-snmpd.sh stop
4. Start the NET-SNMP Master Agent by entering this command: /etc/net-snmpd.sh start
5. Start the LNSNMP process using the command, lnsnmp.sh start.
6. Arrange for LNSNMP to be restarted after a reboot. Enter these commands:
ln -f -s /opt/lotus/notes/latest/linux/lnsnmp.sh /etc/rc.d/init.d/lnsnmp
chkconfig --add lnsnmp
chkconfig lnsnmp on
After configuring the LNSNMP agent, start the Domino server add-in tasks such as the QuerySet,
Event Interceptor, and Statistic Collector tasks. To achieve this, do the following:
1. To support SNMP queries, start the QuerySet add-in task. Enter this command on the Domino
Server console: load quryset

Monit o r i n g D o m i n o A p p l i c a t i o n S e r v e r s
502
2. To support SNMP traps for Domino events, start the Event Interceptor add-in task. Enter this
command on the Domino Server console: load intrcpt
3. To support Domino statistic threshold traps, start the Statistic Collector add-in task. Enter this
command on the Domino Server console: load collect
4. Arrange for the add-in tasks to be restarted automatically when Domino is next restarted. Add
quryset and/or intrcpt and collect to the ServerTasks variable in Domino’s notes.ini file.
ServerTasks =Update,Replica,Router,Amgr,AdminP,CalConn,Sched,LDAP,quryset,intrcpt,collect
16.1.3 Enabling SNMP for a Domino Server on AIX
To enable SNMP on an AIX Domino server, you will have to configure the Domino SNMP agent. This
involves ensuring that the LNSNMP process communicates with the SNMPD subsystem (on the AIX
installation of Domino) using the SMUX protocol.
However, prior to configuring the Domino SNMP agent, make sure that the following are in place:
TCP/IP and SNMP should be properly installed and configured on the server. Also, make sure
that the Domino executable and the Domino data directories are in your search path
The trap destinations and community names for AIX should be appropriately configured in the
/etc/snmpd.conf file for your remote management infrastructure. Remember to keep the view
identifiers unique for each trap destination.
The Domino SNMP Agent is set up to run automatically. This means that once the Domino
SNMP Agent is configured, it is virtually always running, even when Domino is not. If you later
upgrade Domino you should stop the LNSNMP process before beginning the upgrade process.
Next, proceed to configure the Domino SNMP agent, using the procedure explained below:
1. Login as the root user.
2. Stop the LNSNMP process. Enter this command: lnsnmp.sh stop
3. Stop the SNMPD (SNMP Daemon) subsystem. The Simple Network Management Protocol (SNMP)
daemon is a background server process that can be run on any Transmission Control
Protocol/Internet Protocol (TCP/IP) workstation host. The daemon, acting as SNMP agent,
receives, authenticates, and processes SNMP requests from manager applications. This daemon is
installed and started by default on AIX systems. To stop SNMPD, enter this command: stopsrc -s
snmpd
4. Configure SNMPD to accept LNSNMP as an SMUX peer. Add the following line to the
/etc/snmpd.peers file: "Lotus Notes Agent" 1.3.6.1.4.1.334.72 "NotesPasswd"
5. Configure SNMPD to accept an SMUX association from LNSNMP. Add the following line to
/etc/snmpd.conf: smux 1.3.6.1.4.1.334.72 NotesPasswd
6. Start the SNMPD subsystem. Enter this command: startsrc -s snmpd
7. Start the LNSNMP process. Enter this command: lnsnmp.sh start
8. Create a link to the LNSNMP script. Enter this command, changing the Domino executable path if
necessary: ln -f -s /opt/lotus/notes/latest/ibmpow/lnsnmp.sh /etc/lnsnmp.rc
9. Arrange for LNSNMP to be restarted after a reboot. Add the following line to the end of the
/etc/rc.tcpip file: /etc/lnsnmp.rc start
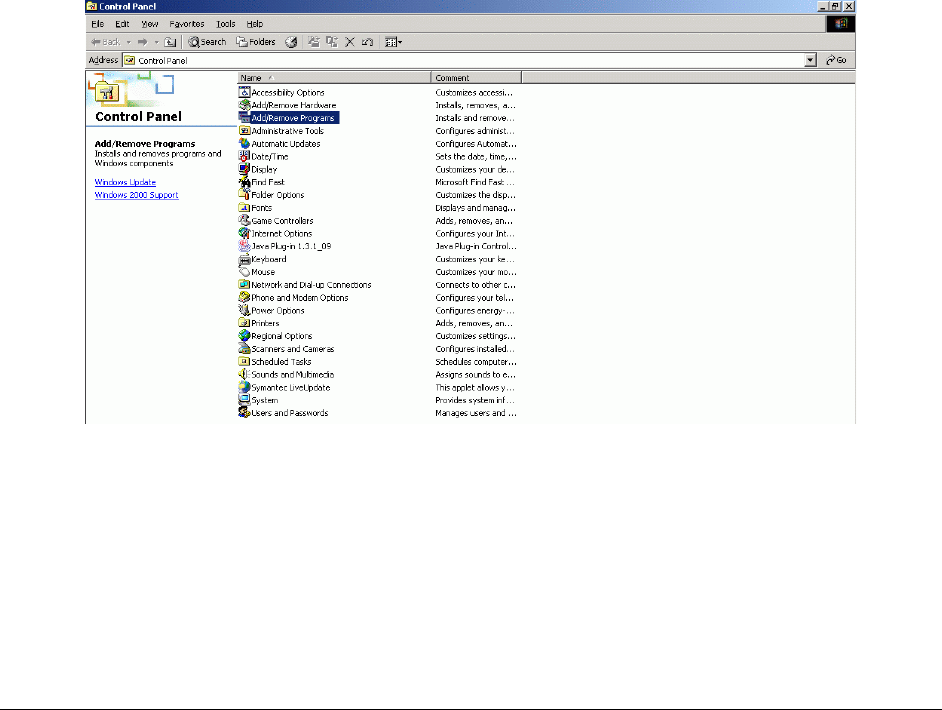
Monit o r i n g D o m i n o A p p l i c a t i o n S e r v e r s
503
After configuring the LNSNMP agent, start the Domino server add-in tasks such as the QuerySet,
Event Interceptor, and Statistic Collector tasks, using the procedure discussed in Section 16.1.2.2.
16.1.4 Enabling SNMP for a Domino Server on Windows
To enable SNMP on a Windows Domino server, follow the broad steps given below:
Install the Windows SNMP service on the target host
Install the LNSNMP agent (i.e., the Lotus Domino SNMP agent) on the target host
Configure the Lotus Domino SNMP agent as a service on the target host
Each of these steps is discussed in great detail in the sections to come.
16.1.4.1 Installing the Windows SNMP Service
To install the SNMP service on Windows 2000, do the following:
1. Login to the Windows 2000 system as an administrator.
2. Click on the Start button on the taskbar, and follow the menu sequence: Settings -> Control Panel.
3. Double-click on the Add/Remove Programs option in the Control Panel window (see Figure 16.1).
Figure 16.1: The Add/Remove Programs option in the Control Panel window
4. Next, select the Add/Remove Windows Components option from the Add/Remove Programs dialog box
(see Figure 16.2).
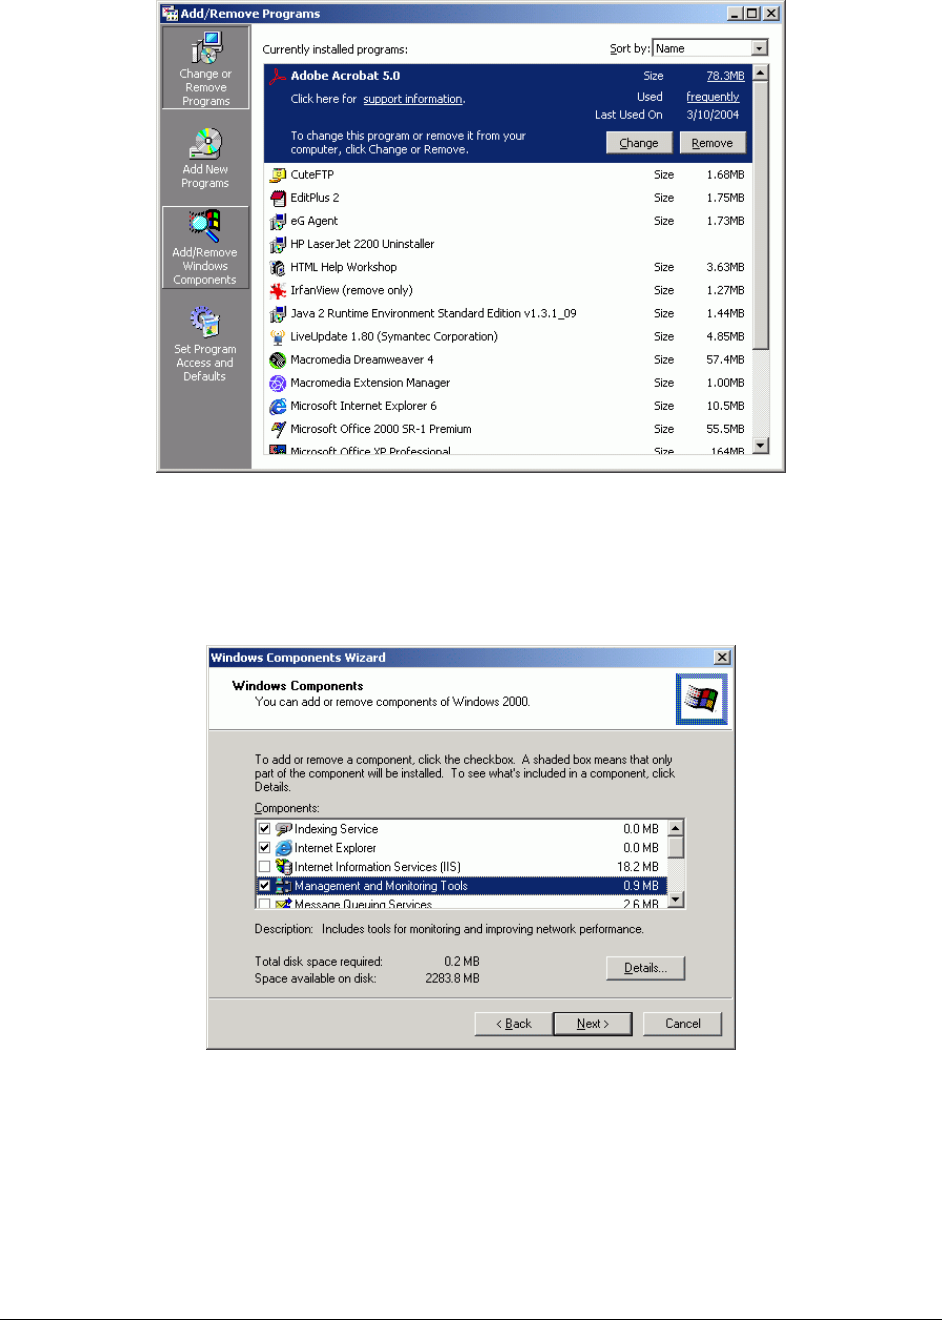
Monit o r i n g D o m i n o A p p l i c a t i o n S e r v e r s
504
Figure 16.2: Select the Add/Remove Windows Components option
5. Then, a list of windows components that can be added will appear. Select the Management and
Monitoring Tools option from this list, and click the Details button to view more details about it (see
Figure 16.3).
Figure 16.3: Selecting the Management and Monitoring Tools option
6. From the list that appears next, select the Simple Network Management Protocol (SNMP) option to add
it. Then, click the OK button (see Figure 16.4).
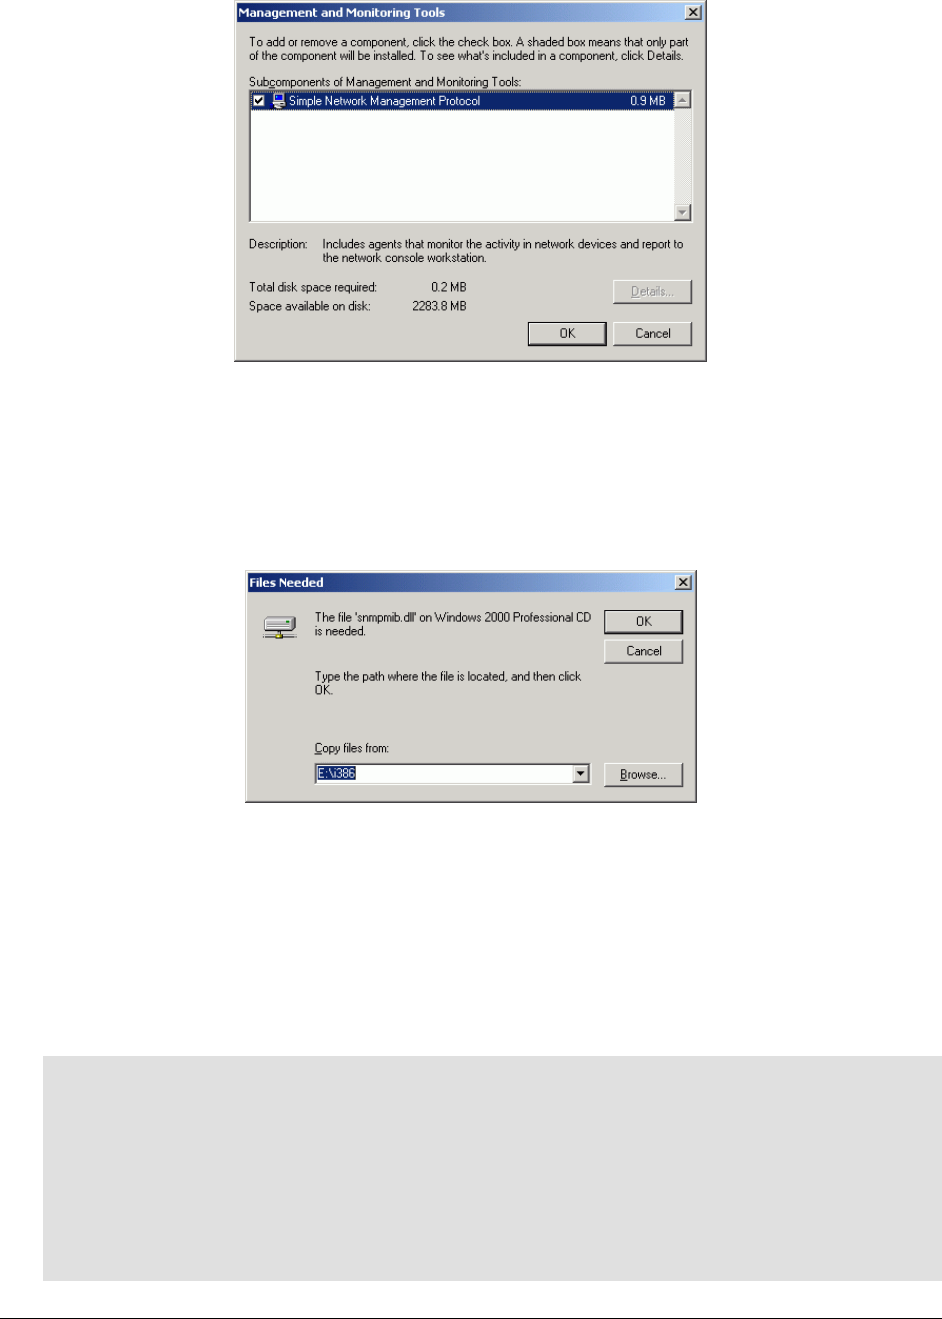
Monit o r i n g D o m i n o A p p l i c a t i o n S e r v e r s
505
Figure 16.4: Selecting the SNMP option
7. You will then return to Figure 16.3. Click the Next button here to proceed with installing the SNMP
service.
8. If you are prompted for the path to the Windows 2000 installation CD, provide the correct path,
and click on the OK button to begin installing the SNMP service (see Figure 16.5).
Figure 16.5: Providing the path to the Windows 2000 CD
16.1.4.2 Installing the LNSNMP Agent
To install the LNSNMP agent, do the following:
1. Run the nvinst.exe executable that is available in the <DOMINO_INSTALL_DIR>/w32intel folder.
2. Once execution begins, setup will prompt you to choose one of the following options:
Domino Management Agent for Windows NT installation.
Copyright (c) 1994-1999, Lotus Development Corporation. All Rights Reserved.
Lotus Domino Management Agent Install (Version 5.0)
Installation Options
---------------------------------------------------
1) Install Domino SNMP Agent Software
2) Install Domino Mail Reflector Software
3) Install Both Options 1 and 2
Q) Quit Installation

Monit o r i n g D o m i n o A p p l i c a t i o n S e r v e r s
506
Choice (1/2/3/Q): 1
3. To install the LNSNMP agent, enter 1 as the Choice.
4. Setup will then request your confirmation for adding the Collector task. Enter y to add the task.
The "Collector" task is not currently configured to run on this system. This task
is necessary if you want Notes to generate events based on statistics thresholds.
Do you want to add this task now? (y/n): y
5. Once the LNSNMP agent installation completes, the following message will appear:
Domino Management Agent successfully installed.
Please reboot the system for the changes to take effect.
D:\Lotus\Domino\w32intel>
After Rebooting start the LNSNMP Service first
And then start the Domino Server.
16.1.4.3 Configuring the LNSNMP Agent
Prior to configuring the LNSNMP agent, ensure the following:
Before using the Domino SNMP Agent, make sure TCP/IP and SNMP are properly installed and
configured on the server. Also, make sure that the Domino executable and the Domino data
directories are in your search path.
If you need to add the Windows SNMP Service to your system, be prepared to reinstall any
Windows service packs immediately after adding the Windows SNMP Service.
The Windows SNMP Service is configured by double-clicking the Network icon in the Control
Panel, then selecting the Services tab, then selecting SNMP Service, and then clicking the
Properties button. You will want to configure appropriate trap destinations and community
names for your remote management infrastructure.
The Domino SNMP Agent is configured as a Windows Service and is set up to run
automatically. This means that once the Domino SNMP Agent is configured, it is virtually
always running, even when Domino is not. If you later upgrade Domino you should stop the
LNSNMP and Windows SNMP Services before beginning the upgrade process.
To configure the LNSNMP agent, do the following:
1. Stop the LNSNMP and SNMP services. Enter these commands:
net stop lnsnmp
net stop snmp
2. Configure the Lotus Domino SNMP Agent as a service. Enter this command: lnsnmp -Sc
3. Start the SNMP and LNSNMP services. Enter these commands:
net start snmp
net start lnsnmp

Monit o r i n g D o m i n o A p p l i c a t i o n S e r v e r s
507
After configuring the LNSNMP agent, start the Domino server add-in tasks such as the QuerySet,
Event Interceptor, and Statistic Collector tasks, using the procedure discussed in Section 16.1.2.2
Once the Domino SNMP agent is completely configured, the tests executed by the eG agent (which is
monitoring the Domino server's performance), polls the SNMP agent at frequent intervals for
performance data. The SNMP agent then retrieves the desired performance statistics from the SNMP
MIB of the Domino server and forwards the same to the eG agent.
Using these statistics, administrators can easily and accurately answer the following performance
queries:
Has the Domino server's capacity been fully utilized? If not, what percentage of its capacity is
still available for request processing?
Are sufficient threads available for handling requests to the Domino server?
Are there too many concurrent connection requests to the server?
Has enough memory been allocated to the Domino processes and shared memory segments?
Are the NSF buffer pools and buffer control pools adequately sized on the Domino database?
Are hits to the database cache optimal, or does the cache require any resizing?
How many databases are currently awaiting replication and for how long have they been
waiting? Were too many databases in the queue for too long? If so, can additional replicators
be configured to share the load?
Has the cluster replicator successfully handled all replication requests to it, or have too many
requests failed?
What is the current load on the web server component of the application server? Is it too
heavy?
Is the idle session count kept at a minimum?
The tests that reveal the above are mapped to the various layers of the monitoring model of Figure
16.6.
Figure 16.6: Layer model of the Domino application server
The section that follows discusses the first layer of Figure 16.6 and the tests that are mapped to it.
While the next 2 layers have been dealt with extensively in the Monitoring Mail Servers document, the
remaining layers have been elaborately discussed in the Monitoring Unix and Windows Servers
document.
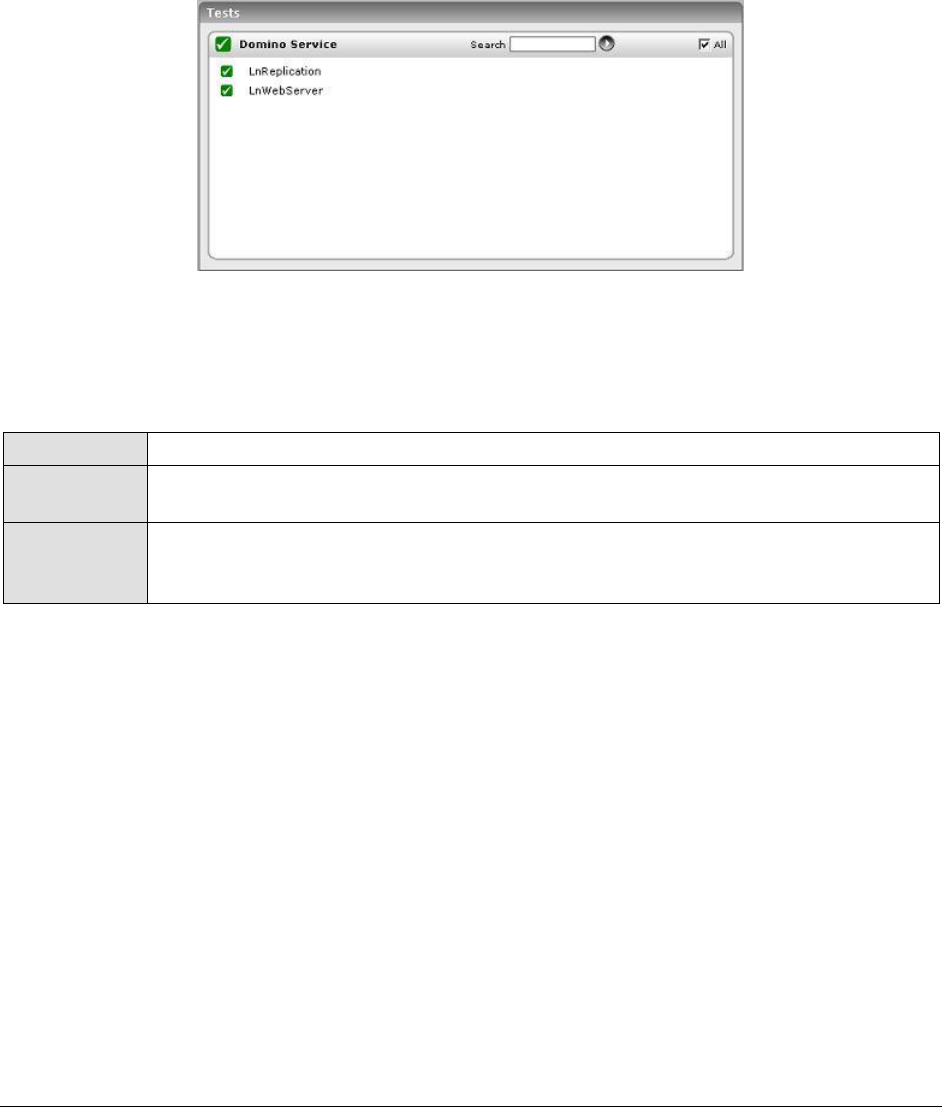
Monit o r i n g D o m i n o A p p l i c a t i o n S e r v e r s
508
16.2 The Domino Service Layer
The critical services provided by the Domino server are monitored by the tests associated with the
Domino Service layer. These include:
Servicing the web requests to its web server component
Servicing the database replication requests to servers in a cluster
Figure 16.7: The tests associated with the Domino Service Layer
16.2.1 Lotus Notes Web Server Test
This test reports the web server statistics of a Lotus Domino server.
Purpose
Reports the web server statistics of a Lotus Domino server
Target of the
test
A Domino application server
Agent
deploying the
test
An internal/remote agent

Monit o r i n g D o m i n o A p p l i c a t i o n S e r v e r s
509
Configurable
parameters for
the test
1. TEST PERIOD - How often should the test be executed
2. HOST - The host for which the test is to be configured
3. PORT - The port number at which the specified HOST listens
4. SNMPPORT - The port number through which the server exposes its SNMP MIB.
The default value is 161.
5. SNMPVERSION – By default, the eG agent supports SNMP version 1. Accordingly,
the default selection in the SNMPVERSION list is v1. However, if a different SNMP
framework is in use in your environment, say SNMP v2 or v3, then select the
corresponding option from this list.
6. SNMPCOMMUNITY – The SNMP community name that the test uses to
communicate with the target server. The default is public. This parameter is
specific to SNMP v1 and v2 only. Therefore, if the SNMPVERSION chosen is v3,
then this parameter will not appear.
7. USERNAME – This parameter appears only when v3 is selected as the
SNMPVERSION. SNMP version 3 (SNMPv3) is an extensible SNMP Framework
which supplements the SNMPv2 Framework, by additionally supporting message
security, access control, and remote SNMP configuration capabilities. To extract
performance statistics from the MIB using the highly secure SNMP v3 protocol,
the eG agent has to be configured with the required access privileges – in other
words, the eG agent should connect to the MIB using the credentials of a user
with access permissions to be MIB. Therefore, specify the name of such a user
against the USERNAME parameter.
8. AUTHPASS – Specify the password that corresponds to the above-mentioned
USERNAME. This parameter once again appears only if the SNMPVERSION
selected is v3.
9. CONFIRM PASSWORD – Confirm the AUTHPASS by retyping it here.
10. AUTHTYPE – This parameter too appears only if v3 is selected as the
SNMPVERSION. From the AUTHTYPE list box, choose the authentication
algorithm using which SNMP v3 converts the specified USERNAME and
PASSWORD into a 32-bit format to ensure security of SNMP transactions. You
can choose between the following options:
MD5 – Message Digest Algorithm
SHA – Secure Hash Algorithm
11. ENCRYPTFLAG – This flag appears only when v3 is selected as the
SNMPVERSION. By default, the eG agent does not encrypt SNMP requests.
Accordingly, the ENCRYPTFLAG is set to NO by default. To ensure that SNMP
requests sent by the eG agent are encrypted, select the YES option.
12. ENCRYPTTYPE – If the ENCRYPTFLAG is set to YES, then you will have to
mention the encryption type by selecting an option from the ENCRYPTTYPE list.
SNMP v3 supports the following encryption types:
DES – Data Encryption Standard
AES – Advanced Encryption Standard
13. ENCRYPTPASSWORD – Specify the encryption password here.
14. CONFIRM PASSWORD – Confirm the encryption password by retyping it here.

Monit o r i n g D o m i n o A p p l i c a t i o n S e r v e r s
510
15. TIMEOUT - Specify the duration (in seconds) within which the SNMP query
executed by this test should time out in the TIMEOUT text box. The default is 10
seconds.
Outputs of the
test
One set of results for the Domino application server that is monitored
Measurements
made by the
test
Measurement
Measurement
Unit
Interpretation
Request rate:
Indicates the number of requests
handled by the web server
during the last measurement
period.
Reqs/Sec
A high value is indicative of heavy
work load on the server.
HTTP connections:
Indicates the number of HTTP
connections accepted during the
last measurement period.
Conns/Sec
Current connections:
Indicates the number of current
HTTP connections.
Number
Data received rate:
Indicates the amount of data
received by the web server
during the last measurement
period.
Kbytes/Sec
Data sent rate:
Indicates the amount of data
sent by the web server during
the last measurement period.
Kbytes/Sec
Http workers:
Indicates the number of HTTP
worker processes currently
servicing web server requests.
Number
Idle session timeouts:
Indicates the number of idle
sessions timed out during the
last measurement period.
Number
Idle sessions might waste server
resources. If the load on a server
is very high and idle sessions are
also quiet a few, you may want to
reduce the idle session timeout
value so that idle sessions get
timed out more often. This way
the strain on the server is greatly
reduced, and server resources are
preserved.
Monit o r i n g D o m i n o A p p l i c a t i o n S e r v e r s
511
16.2.2 Lotus Notes Replication Test
A Domino cluster is a group of two or more servers that provides users with constant access to data,
balances the workload between servers, improves server performance, and maintains performance
when you increase the size of your enterprise. The servers in a cluster contain replicas of databases
that you want to be readily available to users at all times. If a user tries to access a database on a
cluster server that is not available, Domino opens a replica of that database on a different cluster
server, if a replica is available. Domino continuously synchronizes databases so that whichever replica
a user opens, the information is always the same.
There is a special component on the servers in a cluster, called "Cluster Replicator" that is responsible
for replication being performed between the databases. When a cluster replicator learns of a change to
a database, it immediately pushes that change to all other replicas in the cluster. All replication events
are stored in memory, and if a destination server is not available, the "Cluster Replicator" continues to
store these events in memory until the destination server bevomes available.
By default, every server in a cluster consists of a single cluster replicator. However, in order to
augment the performance of the Domino cluster, multiple replicators can be configured on a server.
The decision to introduce more replicators on a cluster server can be taken only after understanding
and analyzing how well the default replicator on the server handles the replication requests to it. The
LnReplication test periodically monitors a cluster server's replicator-related activities and reveals
critical performance statistics based on which administrators can decide whether/not to add more
replicators to it.
Purpose
Periodically monitors a cluster server's replicator-related activities
Target of the
test
A Domino application server
Agent
deploying the
test
An internal/remote agent

Monit o r i n g D o m i n o A p p l i c a t i o n S e r v e r s
512
Configurable
parameters for
the test
1. TEST PERIOD - How often should the test be executed
2. HOST - The host for which the test is to be configured
3. PORT - The port number at which the specified HOST listens
4. SNMPPORT - The port number through which the server exposes its SNMP MIB.
The default value is 161.
5. SNMPVERSION – By default, the eG agent supports SNMP version 1. Accordingly,
the default selection in the SNMPVERSION list is v1. However, if a different SNMP
framework is in use in your environment, say SNMP v2 or v3, then select the
corresponding option from this list.
6. SNMPCOMMUNITY – The SNMP community name that the test uses to
communicate with the mail server. The default is public. This parameter is
specific to SNMP v1 and v2 only. Therefore, if the SNMPVERSION chosen is v3,
then this parameter will not appear.
7. USERNAME – This parameter appears only when v3 is selected as the
SNMPVERSION. SNMP version 3 (SNMPv3) is an extensible SNMP Framework
which supplements the SNMPv2 Framework, by additionally supporting message
security, access control, and remote SNMP configuration capabilities. To extract
performance statistics from the MIB using the highly secure SNMP v3 protocol,
the eG agent has to be configured with the required access privileges – in other
words, the eG agent should connect to the MIB using the credentials of a user
with access permissions to be MIB. Therefore, specify the name of such a user
against the USERNAME parameter.
8. AUTHPASS – Specify the password that corresponds to the above-mentioned
USERNAME. This parameter once again appears only if the SNMPVERSION
selected is v3.
9. CONFIRM PASSWORD – Confirm the AUTHPASS by retyping it here.
10. AUTHTYPE – This parameter too appears only if v3 is selected as the
SNMPVERSION. From the AUTHTYPE list box, choose the authentication
algorithm using which SNMP v3 converts the specified USERNAME and
PASSWORD into a 32-bit format to ensure security of SNMP transactions. You
can choose between the following options:
MD5 – Message Digest Algorithm
SHA – Secure Hash Algorithm
11. ENCRYPTFLAG – This flag appears only when v3 is selected as the
SNMPVERSION. By default, the eG agent does not encrypt SNMP requests.
Accordingly, the ENCRYPTFLAG is set to NO by default. To ensure that SNMP
requests sent by the eG agent are encrypted, select the YES option.
12. ENCRYPTTYPE – If the ENCRYPTFLAG is set to YES, then you will have to
mention the encryption type by selecting an option from the ENCRYPTTYPE list.
SNMP v3 supports the following encryption types:
DES – Data Encryption Standard
AES – Advanced Encryption Standard
13. ENCRYPTPASSWORD – Specify the encryption password here.
14. CONFIRM PASSWORD – Confirm the encryption password by retyping it here.

Monit o r i n g D o m i n o A p p l i c a t i o n S e r v e r s
513
15. TIMEOUT - Specify the duration (in seconds) within which the SNMP query
executed by this test should time out in the TIMEOUT text box. The default is 10
seconds.
Outputs of the
test
One set of results for the Domino application server that is monitored
Measurements
made by the
test
Measurement
Measurement
Unit
Interpretation
Successful replications:
Indicates the rate of successful
replications during the last
measurement period.
Replications
/Sec
Replication failures:
Indicates the rate of failed
replications during the last
measurement period.
Replications
/Sec
Replication docs added:
Indicates the rate at which
replication docs were added
during the last measurement
period.
Docs/Sec
Replication docs deleted:
Indicates the rate at which
replication docs were deleted
during the last measurement
period.
Docs/Sec
Replication docs updated:
Indicates the rate at which
replication docs were updated
during the last measurement
period.
Docs/Sec
Avg work queue length:
Indicates the average work
queue length since server
startup.
Number

Monit o r i n g D o m i n o A p p l i c a t i o n S e r v e r s
514
Current work queue length:
Indicates the current number of
databases awaiting replication by
the cluster replicator.
Number
If the value of this measure
increases consistently, it could
indicate a replication backlog - in
other words, too many databases
could be waiting to be replicated.
In such a case, consider
configuring more replicators on
the server so that replication
workload is shared and pending
replication requests are cleared in
a timely manner. Steady spikes in
this measure could also indicate
insufficient network bandwidth to
process the transactions. If this is
the case, you should consider
setting up a private LAN for your
cluster.
Avg work queue wait time:
Indicates the average amount of
time in seconds that a database
spent on the work queue.
Secs
Since the cluster replicator checks
its queue every 15 seconds, this
number should be under 15
during periods of light load. If this
number is frequently higher than
30, you should consider adding
one or more cluster replicators.
Data received rate:
Indicates the rate at which data
was received by the replicator
during the last measurement
period.
KBytes/Sec
Data sent rate:
Indicates the rate at which data
was sent by the replicator during
the last measurement period.
KBytes/Sec

C o n c l u s i o n
515
Conclusion
This document has described in detail the monitoring paradigm used and the measurement
capabilities of the eG Enterprise suite of products with respect to application servers. For details of how
to administer and use the eG Enterprise suite of products, refer to the user manuals.
We will be adding new measurement capabilities into the future versions of the eG Enterprise suite. If
you can identify new capabilities that you would like us to incorporate in the eG Enterprise suite of
products, please contact support@eginnovations.com. We look forward to your support and
cooperation. Any feedback regarding this manual or any other aspects of the eG Enterprise suite can
be forwarded to feedback@eginnovations.com.
Chapter
17
