Manual Monitoring Cisco UCS Manager
User Manual: Monitoring Cisco UCS Manager
Open the PDF directly: View PDF ![]() .
.
Page Count: 151 [warning: Documents this large are best viewed by clicking the View PDF Link!]

Monitoring the Cisco UCS Manager
eG Enterprise v6

Restricted Rights Legend
The information contained in this document is confidential and subject to change without notice. No
part of this document may be reproduced or disclosed to others without the prior permission of eG
Innovations Inc. eG Innovations Inc. makes no warranty of any kind with regard to the software and
documentation, including, but not limited to, the implied warranties of merchantability and fitness for
a particular purpose.
Trademarks
Microsoft Windows, Windows NT, Windows 2000, Windows 2003 and Windows 2008 are either
registered trademarks or trademarks of Microsoft Corporation in United States and/or other countries.
The names of actual companies and products mentioned herein may be the trademarks of their
respective owners.
Copyright
©2015 eG Innovations Inc. All rights reserved.
Table of Contents
MONITORING THE CISCO UCS MANAGER...........................................................................................................................................1
1.1 UCS CHASSIS LAYER .......................................................................................................................................................................... 4
1.1.1 Chassis IO Modules Test ........................................................................................................................................................ 6
1.1.2 Chassis Fans Test ................................................................................................................................................................ 19
1.1.3 Chassis Details Test ............................................................................................................................................................. 30
1.1.4 Chassis Fan Modules Test .................................................................................................................................................... 42
1.1.5 Chassis IO Module Backplane Ports Test .............................................................................................................................. 51
1.1.6 Chassis PSUs Test ............................................................................................................................................................... 53
1.1.7 Chassis IO Module Fabric PortsTest..................................................................................................................................... 66
1.2 THE NETWORK LAYER ...................................................................................................................................................................... 70
1.3 THE FABRIC INTERCONNECTS LAYER................................................................................................................................................. 70
1.3.1 Fabric Interconnect PSUs Test ............................................................................................................................................. 71
1.3.2 Fabric Interconnect Ethernet Ports Test ................................................................................................................................ 82
1.3.3 Fabric Interconnect Fans Test .............................................................................................................................................. 90
1.3.4 Fabric Interconnect FC Ports Test ...................................................................................................................................... 101
1.3.5 Fabric Interconnect Details Test ......................................................................................................................................... 109
1.3.6 LAN Cloud Port Channels Test ........................................................................................................................................... 113
1.3.7 LAN Cloud PC Ethernet Ports ............................................................................................................................................ 118
1.4 THE BLADES LAYER ....................................................................................................................................................................... 121
1.4.1 Blade Overview Test .......................................................................................................................................................... 122
1.4.2 Blade Processors Test ........................................................................................................................................................ 133
1.4.3 Blade Motherboard Test ..................................................................................................................................................... 134
1.4.4 Blade Memory Arrays Test ................................................................................................................................................. 136
1.4.5 Blade NICs Test ................................................................................................................................................................. 137
CONCLUSION ......................................................................................................................................................................................... 147
x
Table of Figures
Figure 1: The architecture of the Cisco UCS .....................................................................................................................................................2
Figure 2: Layer model of the Cisco UCS Manager ............................................................................................................................................3
Figure 3: The tests mapped to the UCS Chassis layer ........................................................................................................................................6
sFigure 4: The detailed diagnosis of the Configuration state measure of the Chassis I/O Modules Test .............................................................. 19
Figure 5: The detailed diagnosis of the Overall status measure of the Chassis Fans test ..................................................................................... 30
Figure 6: A Cisco UCS Blade Server Chassis ................................................................................................................................................. 31
Figure 7: The detailed diagnosis of the Administrative state measure of the Chassis Details test ........................................................................ 42
Figure 8: The detailed diagnosis of the Overall status measure of the Chassis Fan Modules test ........................................................................ 51
Figure 9: The detailed diagnosis of the Overall status measure of the Chassis PSUs test ................................................................................... 65
Figure 10: The detailed diagnosis of the Overall status measure of the Chassis I/O Module Fabric Ports Test .................................................... 70
Figure 11: The tests mapped to the Network layer........................................................................................................................................... 70
Figure 12: The tests mapped to the Fabric Interconnects layer ......................................................................................................................... 71
Figure 13: The detailed diagnosis of the Overall status measure of the Fabric Interconnect PSUs test ................................................................ 82
Figure 14: The detailed diagnosis of the Overall status measure of the Fabric Interconnect Uplink Ethernet Ports test ........................................ 90
Figure 15: The detailed diagnosis of the Overall status measure of the Fabric Interconnect Fans test ............................................................... 100
Figure 16: The detailed diagnosis of the Fabric Interconnect Uplink FC Ports test .......................................................................................... 109
Figure 17: The detailed diagnosis of the Overall status measure of the Fabric Interconnect Details test ............................................................ 113
Figure 18: The detailed diagnosis of the Overall status measure of the LAN Cloud Port Channels Test ........................................................... 118
Figure 19: The detailed diagnosis of the Overall Status measure of the LAN Cloud PC Ethernet Ports test ...................................................... 121
Figure 20: The tests mapped to the Blades layer ........................................................................................................................................... 122

M o n i t o r i n g t h e C i s c o U C S M a n a g e r
1
Monitoring the Cisco UCS Manager
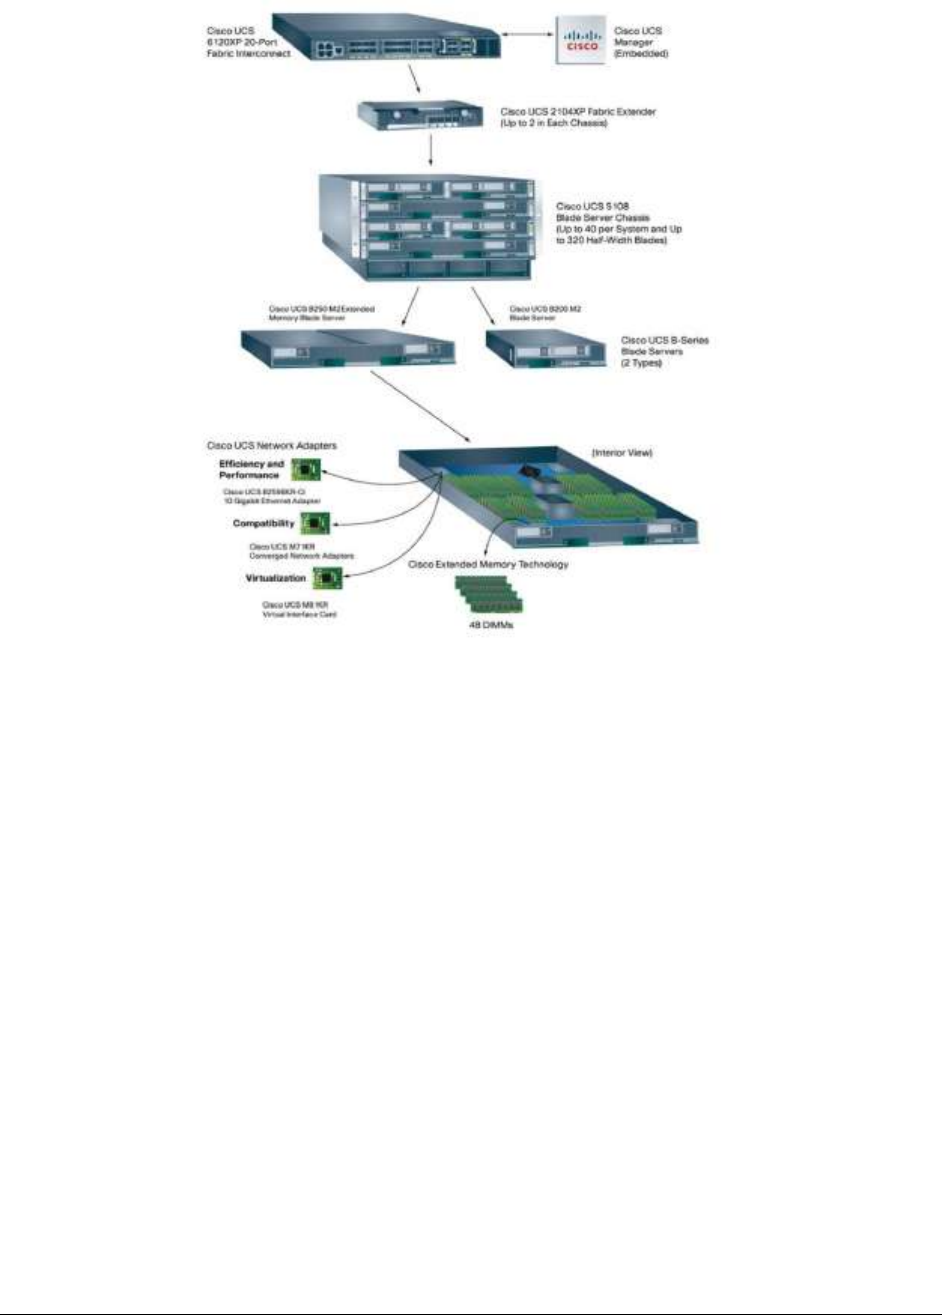
The Cisco Unified Computing System (UCS) is a data center computing solution composed of
computing hardware, virtualization software, switching fabric, and management software. The idea
behind the system is to reduce total cost of ownership and improve scalability by integrating the
different components into a cohesive platform that can be managed as a single unit. Just-In-Time
deployment of resources and 1:N redundancy are also possible with a system of this type.
Figure 1 depicts the architecture of Cisco UCS.
Chapter
1
M o n i t o r i n g t h e C i s c o U C S M a n a g e r
2
Figure 1: The architecture of the Cisco UCS
The computing component of the UCS is available in two versions; the B-Series (a modular package
consisting of a powered chassis and full or half slot blade servers), and the C-series rackmount servers
(that can be used with or without UCS, or mixed with blade UCS systems). Both form factors utilize
the same standard components seen throughout the industry, including Intel Nehalem processors and
DIMM memory. The servers are distinctive for supporting Converged Network Adapters ( CNAs), Port
Virtualization, and in some models the Catalina chipset (ASICs that expand the number of memory
sockets than can be connected to a single memory bus).
Besides the blade servers and chassis, the other core components of the Cisco UCS are as follows:
UCS manager: Cisco UCS Manager implements policy-based management of the server and
network resources. Network, storage, and server administrators all create service profiles,
allowing the manager to configure the servers, adapters, and fabric extenders and appropriate
isolation, quality of service (QoS), and uplink connectivity. It also provides APIs for integration
with existing data center systems management tools. An XML interface allows the system to
be monitored or configured by upper-level systems management tools.
UCS fabric interconnect: Networking and management for attached blades and chassis with
10 GigE and FCoE. All attached blades are part of a single management domain. Deployed in
redundant pairs, the 20-port and the 40-port offer centralized management with Cisco UCS
Manager software and virtual machine optimized services with the support for VN-Link.
Cisco Fabric Manager: manages storage networking across all Cisco SAN and unified fabrics
with control of FC and FCoE. Offers unified discovery of all Cisco Data Center 3.0 devices aa
well as task automation and reporting. Enables IT to optimize for the quality-of-service (QoS)
levels, performance monitoring, federated reporting, troubleshooting tools, discovery and
configuration automation.
M o n i t o r i n g t h e C i s c o U C S M a n a g e r
3
Fabric extenders: connect the fabric to the blade server enclosure, with 10 Gigabit Ethernet
connections and simplifying diagnostics, cabling, and management. The fabric extender is
similar to a distributed line card and also manages the chassis environment (the power supply,
fans and blades) so separate chassis management modules are not required. Each UCS
chassis can support up to two fabric extenders for redundancy.
The health of the Cisco UCS platform hence largely relies on how the blade chassis, the blade servers,
the fabric interconnects and extenders are functioning. This implies that issues in the availablity /
operability of one/more of these components, or the unexpected power/thermal/voltage failures they
may encounter can degrade the overall performance of the Cisco UCS. In order to avoid this, the
health and operational efficiency of the integral components of the platform should be continuously
monitored, and issues proactively reported.
eG Enterprise provides a 100%, web-based Cisco UCS Manager monitoring model that periodically
monitors the Cisco UCS manager, discovers the chassis, I/O modules, blades, and fabric interconnects
managed by the UCS manager, and determines the current status of each of these components.
Figure 2: Layer model of the Cisco UCS Manager
Each layer of Figure 2 is mapped to a series of tests that instantly capture current/potential
abnormalities in the state and functioning of the core components managed by the Cisco UCS
manager, and alerts administrators to the same. With the help of the metrics collected by these tests,
administrators can find quick and accurate answers for the following queries:
Are all I/O modules (i.e., fabric extenders) operating normally? Is any I/O module in a
degraded/powered-off/inoperable state currently? If so, which one is it?
Is any I/O module experiencing any critical performance issues now?
How is the power/voltage/thermal states of the I/O modules?
Is any I/O module missing?
Is the temperature of all I/O modules normal? Is any I/O module experiencing abnormal
temperatures?
Is any fan inoperable? In which chassis, does this fan exist?
Does any fan operate at abnormal speeds?
Is any fan experiencing any performance failures?
Have non-recoverable problems occurred in the power/thermal /voltage states of any fan?
How is the overall health of the chassis? Is any chassis in an inoperable state currently?

M o n i t o r i n g t h e C i s c o U C S M a n a g e r
4
Is any chassis license-insufficient?
Are the power/thermal/voltage states of all chassis normal?
Is any chassis receiving / transmitting more power than it can handle?
Which fan module is currently in an inoperable state?
Which fan module is behaving abnormally?
Are all backplane ports healthy?
Have any operational/performance issues been detected in any of the PSUs in the chassis?
Which PSU is receiving voltage over 210 volts and emitting voltage over 12 volts?
Are the fabric interconnects operating normally?
Do the fabric interconnects have enough CPU and memory resources at their disposal? Is any
fabric interconnect experiencing a CPU/memory contention?
Are the PSUs of the fabric interconnects operating normally?
Is the power/voltage input and output of the PSUs within acceptable limits?
Have any uplink ethernet ports failed?
Which uplink ethernet port is seeing very high traffic?
Are the fans of all fabric interconnects operating normally?
Is any uplink fibre channel port in an abnormal state?
Are there any disabled uplink fibre channel ports?
Is any fibre channel port seeing very high traffic?
Is any fibre channel port experiencing too many errors in transmission?
Are the blade servers in a chassis healthy?
Is any blade server unavailable?
Is the power state/slot state of the blade servers OK?
Are the blade servers utilizing memory optimally? If any blade server over-utilizing the
memory?
Is the motherboard of any blade server consuming power/current excessively?
Is the temperature of the motherboard normal? If not, then which side of the motherboard is
experiencing abnormal temperatures - the front or the rear?
Is the temperature of any memory array of any blade server very high?
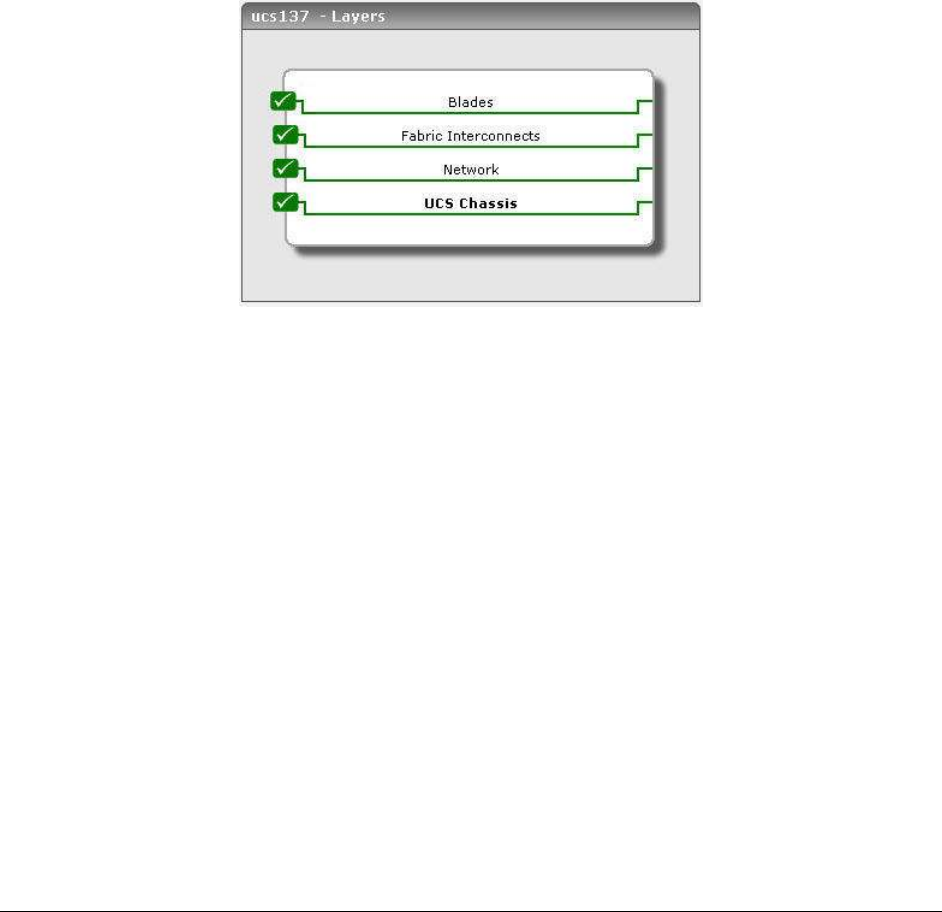
The sections that follow will discuss each layer of Figure 2 of this document.
1.1 UCS Chassis Layer
The Cisco UCS server chassis and its components are part of the Cisco Unified Computing System.
The Cisco UCS server chassis system consists of the following components:
Cisco UCS server chassis

M o n i t o r i n g t h e C i s c o U C S M a n a g e r
5
Cisco UCS blade servers-up to eight half-width or four full-width blade servers, each
containing two CPUs and holding up to two hard drives
Cisco UCS I/O Module—up to two I/O modules, each providing four ports of 10-Gb Ethernet,
Cisco Data Center Ethernet, and Fibre Channel over Ethernet (FCoE) connection to the fabric
interconnect
A number of SFP+ choices from copper to fiber
Power supplies—up to four 2500 Watt hot-swapable power supplies
Power Distribution Unit
Fan modules—eight hot-swapable fan modules
As a problem in the chassis system can affect the overall performance of the Cisco UCS platform, you
need to shield the chassis and its integral components from permanent physical or operational
damage. To achieve this, you need proactive updates of probable threats to the health of the chassis
system; these updates will enable you to initiate corrective measures before it is too late. The tests
mapped to this layer provide you with such problem updates.
With the help of these tests, you can keep an eye on the status of each chassis managed by the Cisco
UCS manager and also its core components such as the fabric extemders, fan modules, power
supplies, etc., and quickly detect abnormalities.
M o n i t o r i n g t h e C i s c o U C S M a n a g e r
6
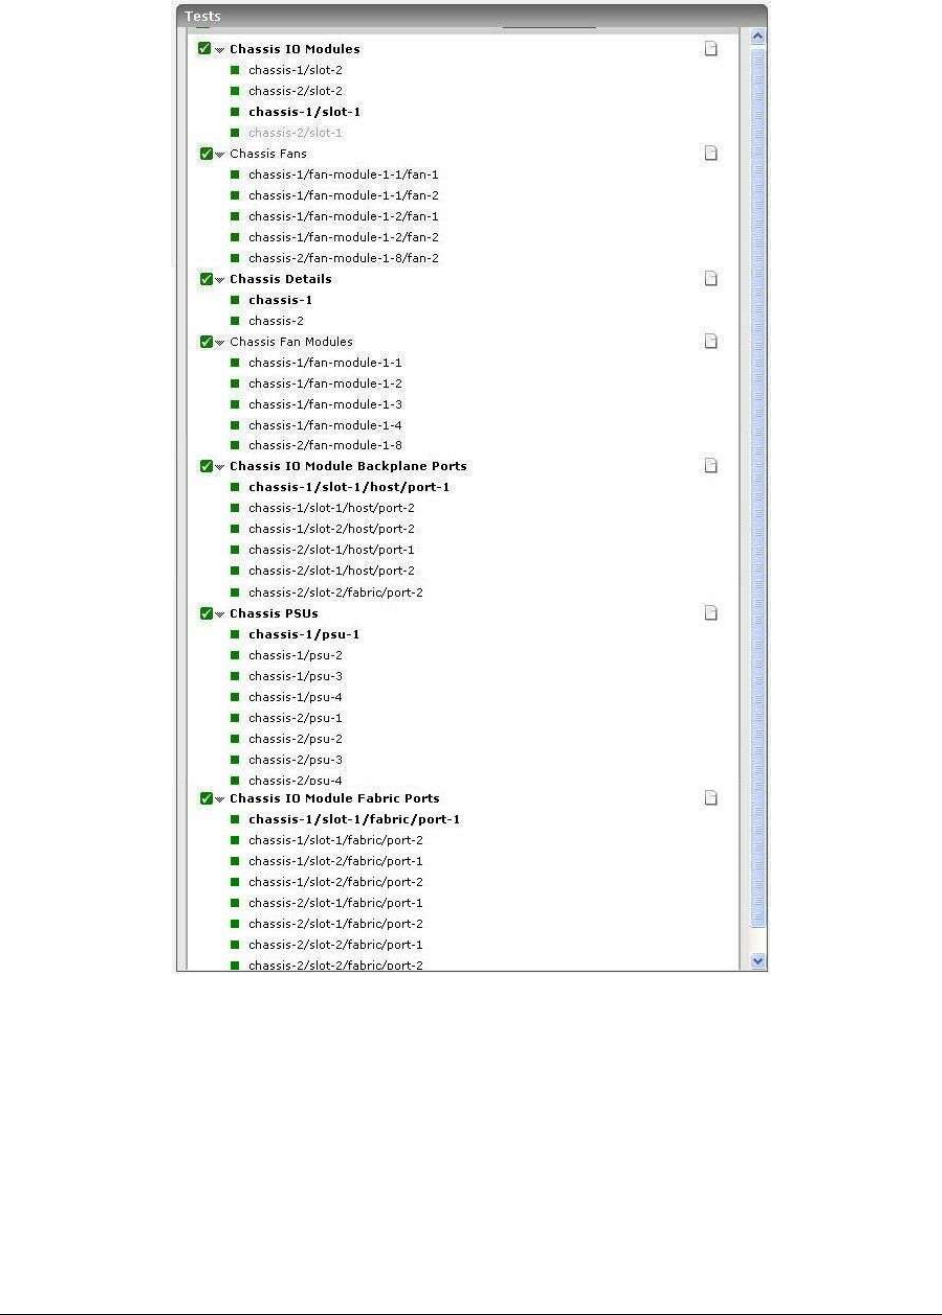
Figure 3: The tests mapped to the UCS Chassis layer
1.1.1 Chassis IO Modules Test
The Cisco UCS chassis contains I/O Modules or Fabric Extenders that allow the blade servers in the
chassis to communicate with Cisco UCS Fabric Interconnects. The chassis supports up to two I/O
Modules, each with four I/O ports.
The Cisco UCS Fabric Extenders bring the unified fabric into the blade server enclosure, providing 10
Gigabit Ethernet connections between blade servers and the fabric interconnect, simplifying
diagnostics, cabling, and management.

M o n i t o r i n g t h e C i s c o U C S M a n a g e r
7
The Cisco UCS Fabric Extenders extend the I/O fabric between the Cisco UCS Fabric Interconnects and
the Cisco Blade Server Chassis, enabling a lossless and deterministic Fibre Channel over Ethernet
(FCoE) fabric to connect all blades and chassis together. Since the fabric extender is similar to a
distributed line card, it does not do any switching and is managed as an extension of the fabric
interconnects. This approach removes switching from the chassis, reducing overall infrastructure
complexity and enabling the Cisco Unified Computing System to scale to many chassis without
multiplying the number of switches needed, reducing TCO and allowing all chassis to be managed as a
single, highly available management domain.
The Cisco UCS Fabric Extenders also manages the chassis environment (the power supply and fans as
well as the blades) in conjunction with the Fabric Interconnects. Therefore, separate chassis
management modules are not required.
Cisco UCS Fabric Extenders fit into the back of the Cisco UCS Chassis. Each Cisco UCS Chassis can
support up to two Fabric Extenders, enabling increased capacity as well as redundancy.
This test monitors the overall health of each of the I/O Modules present in every chassis managed by
the Cisco UCS manager, and in the process, promptly alerts you to abnormalities in the power,
thermal, voltage states of the modules and sudden spikes in the ambient/ASIC temperature of the
modules. This way, defective I/O modules come to light.
Purpose
Monitors the overall health of each of the I/O Modules present in every chassis of
managed by the Cisco UCS manager, and in the process, promptly alerts you to
abnormalities in the power, thermal, voltage states of the modules, or a sudden
increase in the ambient/ASIC temperature of the modules
Target of the
test
A Cisco UCS manager
Agent
deploying the
test
A remote agent

M o n i t o r i n g t h e C i s c o U C S M a n a g e r
8
Configurable
parameters for
the test
1. TESTPERIOD – How often should the test be executed
1. HOST – The IP address of the host for which the test is being configured.
2. PORT – The port at which the specified HOST listens. By default, this is NULL.
3. UCS USER and UCS PASSWORD – Provide the credentials of a user with at least
read-only privileges to the target Cisco UCS manager.
4. CONFIRM PASSWORD- Confirm the password by retyping it here.
5. SSL - By default, the Cisco UCS manager is SSL-enabled. Accordingly, the SSL
flag is set to Yes by default.
6. WEB PORT- By default, in most virtualized environments, Cisco UCS manager
listens on port 80 (if not SSL-enabeld) or on port 443 (if SSL-enabled) only. This
implies that while monitoring Cisco UCS manager, the eG agent, by default,
connects to port 80 or 443, depending upon the SSL-enabled status of Cisco
UCS manager - i.e., if Cisco UCS manager is not SSL-enabled (i.e., if the SSL
flag above is set to No), then the eG agent connects to Cisco UCS manager
using port 80 by default, and if Cisco UCS manager is SSL-enabled (i.e., if the
SSL flag is set to Yes), then the agent-Cisco UCS manager communication
occurs via port 443 by default. Accordingly, the WEBPORT parameter is set to
default by default.
In some environments however, the default ports 80 or 443 might not apply. In
such a case, against the WEBPORT parameter, you can specify the exact port at
which the Cisco UCS manager in your environment listens, so that the eG agent
communicates with that port for collecting metrics from the Cisco UCS manager.
7. DETAILED DIAGNOSIS - To make diagnosis more efficient and accurate, the eG
Enterprise suite embeds an optional detailed diagnostic capability. With this
capability, the eG agents can be configured to run detailed, more elaborate tests
as and when specific problems are detected. To enable the detailed diagnosis
capability of this test for a particular server, choose the On option. To disable
the capability, click on the Off option.
The option to selectively enable/disable the detailed diagnosis capability will be
available only if the following conditions are fulfilled:
The eG manager license should allow the detailed diagnosis capability
Both the normal and abnormal frequencies configured for the detailed
diagnosis measures should not be 0.
Outputs of the
test
One set of results for each I/O module in each chassis managed by the Cisco UCS
manager being monitored
Measurements
made by the
Measurement
Measurement
Unit
Interpretation

M o n i t o r i n g t h e C i s c o U C S M a n a g e r
9
test
Configuration
state:
Indicates the
ccurrent
onfiguration status
of this I/O module
present in this
chassis.
The States reported by this measure and
their corresponding numeric equivalents are
described in the table below:
Numeric Value
State
0
Un-initialized
1
Un-acknowledged
2
Unsupported-
connectivity
3
Ok
4
Removing
Note:
By default, this measure reports the above-
mentioned States while indicating the
configuration status of the I/O module in
this chassis. However, in the graph of this
measure, states will be represented using
the corresponding numeric equivalents i.e.,
0 to 4.
The detailed diagnosis of this measure
provides the Time, ID, PID, Side, Chassis
ID, Fabric ID, Revision, Serial Number and
Vendor attributes for each I/O module.

M o n i t o r i n g t h e C i s c o U C S M a n a g e r
10
Overall status:
Indicates the overall
status of this I/O
module present in
this chassis.
The States reported by this measure and
their corresponding numeric equivalents are
described in the table below:
Numeric Value
State
0
Unknown
1
Operable
2
Inoperable
3
Degraded
4
Powered-off
5
Power-problem
6
Removed
7
Voltage-
problem
8
Thermal-
problem
9
Performance-
problem
10
Accessibility-
problem
11
Identity-
unestablishable
12
Bios-post-
timeout
13
Disabled
51
Fabric-conn-
problem
52
Fabric-
unsupported-
conn
81
Config
82
Equipment-
problem
83
Decommissioni
ng
.

M o n i t o r i n g t h e C i s c o U C S M a n a g e r
11
84
Chassis-limit-
exceeded
100
Not-supported
101
Discovery
102
Discovery-
failed
103
Identify
104
Post-failure
105
Upgrade-
problem
106
Peer-comm-
problem
107
Auto-upgrade
Note:
By default, this measure reports the above-
mentioned States while indicating the status
of the I/O module in this chassis. However,
in the graph of this measure, states will be
represented using the corresponding
numeric equivalents only.

M o n i t o r i n g t h e C i s c o U C S M a n a g e r
12
Operability:
Indicates the
current operating
state of this I/O
module present in
this chassis.
The States reported by this measure and
their corresponding numeric equivalents are
described in the table below:
Numeric Value
State
0
Unknown
1
Operable
2
Inoperable
3
Degraded
4
Powered-off
5
Power-
problem
6
Removed
7
Voltage-
problem
8
Thermal-
problem
9
Performance-
problem
10
Accessibility-
problem
11
Identity-
unestablisha
ble
12
Bios-post-
timeout
13
Disabled
51
Fabric-conn-
problem
52
Fabric-
unsupported-
conn
81
Config
82
Equipment-
problem
83
Decommissio
ning
84
Chassis-limit-
exceeded
100
Not-
supported

M o n i t o r i n g t h e C i s c o U C S M a n a g e r
13
101
Discovery
102
Discovery-
failed
103
Identify
104
Post-failure
105
Upgrade-
problem
106
Peer-comm-
problem
107
Auto-upgrade
Note:
By default, this measure reports the above-
mentioned States while indicating the
operability of an I/O module in this chassis.
However, in the graph of this measure,
states will be represented using their
corresponding numeric equivalents only.

M o n i t o r i n g t h e C i s c o U C S M a n a g e r
14
Performance
state:
Indicates the
current
performance status
of this I/O module
present in this
chassis.
The States reported by this measure and
their corresponding numeric equivalents are
described in the table below:
Numeric Value
State
0
Unknown
1
Ok
2
Upper-non-
recoverable
3
Upper-critical
4
Upper-non-
critical
5
Lower-non-
critical
6
Lower-critical
7
Lower non-
recoverable
100
Not-supported
Note:
By default, this measure reports the above-
mentioned States while indicating the
performance state of an I/O module.
However, in the graph of this measure,
states will be represented using the
corresponding numeric equivalents.

M o n i t o r i n g t h e C i s c o U C S M a n a g e r
15
Power state:
Indicates the
current power
status of this I/O
module in this
chassis.
The State values reported by this measure
and their corresponding numeric
equivalents are described in the table
below:
Note:
By default, this measure reports the above-
mentioned States while indicating the power
state of an I/O module. However, in the
graph of this measure, states will be
represented using their corresponding
numeric equivalents only.
Numeric Value
State
0
Unknown
1
On
2
Test
3
Off
4
Online
5
Offline
6
Offduty
7
Degraded
8
Power-save
9
Error
10
Not-
supported

M o n i t o r i n g t h e C i s c o U C S M a n a g e r
16
Presence state:
Indicates the
current state of this
I/O module in this
chassis.
The State values reported by this measure
and their corresponding numeric
equivalents are described in the table
below:
Note:
By default, this measure reports the above-
mentioned States while indicating the
current state of the I/O module in this
chassis. However, in the graph of this
measure, states will be represented using
their corresponding numeric equivalents
only.
Numeric Value
State
0
Unknown
1
Empty
10
Equipped
11
Missing
12
Mismatch
13
Equipped-
not-primary
20
Equipped-
identity-
unestablisha
ble
30
Inaccessible
40
Unauthorize
d
100
Not-
supported

M o n i t o r i n g t h e C i s c o U C S M a n a g e r
17
Thermal state:
Indicates the
current thermal
state of this I/O
module present in
this chassis.
The State values reported by this measure
and their corresponding numeric
equivalents are described in the table
below:
Numeric Value
State
0
Unknown
1
Ok
2
Upper-non-
recoverable
3
Upper-critical
4
Upper-non-
critical
5
Lower-non-
critical
6
Lower-critical
7
Lower non-
recoverable
100
Not-supported
Note:
By default, this measure reports the above-
mentioned States while indicating the
thermal state of the I/O modules in this
chassis. However, in the graph of this
measure, states will be represented using
the corresponding numeric equivalents
only.
Nu
mer
ic
Val
ue
Stat
e
0
Unk
now
n
1
Ok
2
Upp
er-
non
-
rec
ove
rabl
e
3
Upp
er-
criti
cal

M o n i t o r i n g t h e C i s c o U C S M a n a g e r
18
Voltage state:
Indicates the
current voltage
state of this I/O
module present in
this chassis.
The State values reported by this measure
and their corresponding numeric
equivalents are described in the table
below:
Note:
By default, this measure reports the above-
mentioned States while indicating the
voltage state of the I/O module in this
chassis. However, in the graph of this
measure, states will be represented using
their corresponding numeric equivalents
only.
Numeric
Value
State
0
Unknown
1
Ok
2
Upper-non-
recoverable
3
Upper-critical
4
Upper-non-
critical
5
Lower-non-
critical
6
Lower-critical
7
Lower non-
recoverable
100
Not-supported
Ambient
temperature:
Indicates the
current ambient
temperature of this
I/O module present
in this chassis.
Celcius
An abnormal temperature may cause
severe damage to the I/O modules.
M o n i t o r i n g t h e C i s c o U C S M a n a g e r
19
ASIC
temperature:
Indicates the
current temperature
of the ASIC
(Application-Specific
Integrated Circuit)
in this I/O module
present in this
chassis.
Celcius
An application-specific integrated circuit
(ASIC) is an integrated circuit (IC)
customized for a particular use, rather than
intended for general-purpose use.
If an ASIC registers an abnormal
temperature, it may severely affect the
operations of the I/O module in which that
ASIC operates.
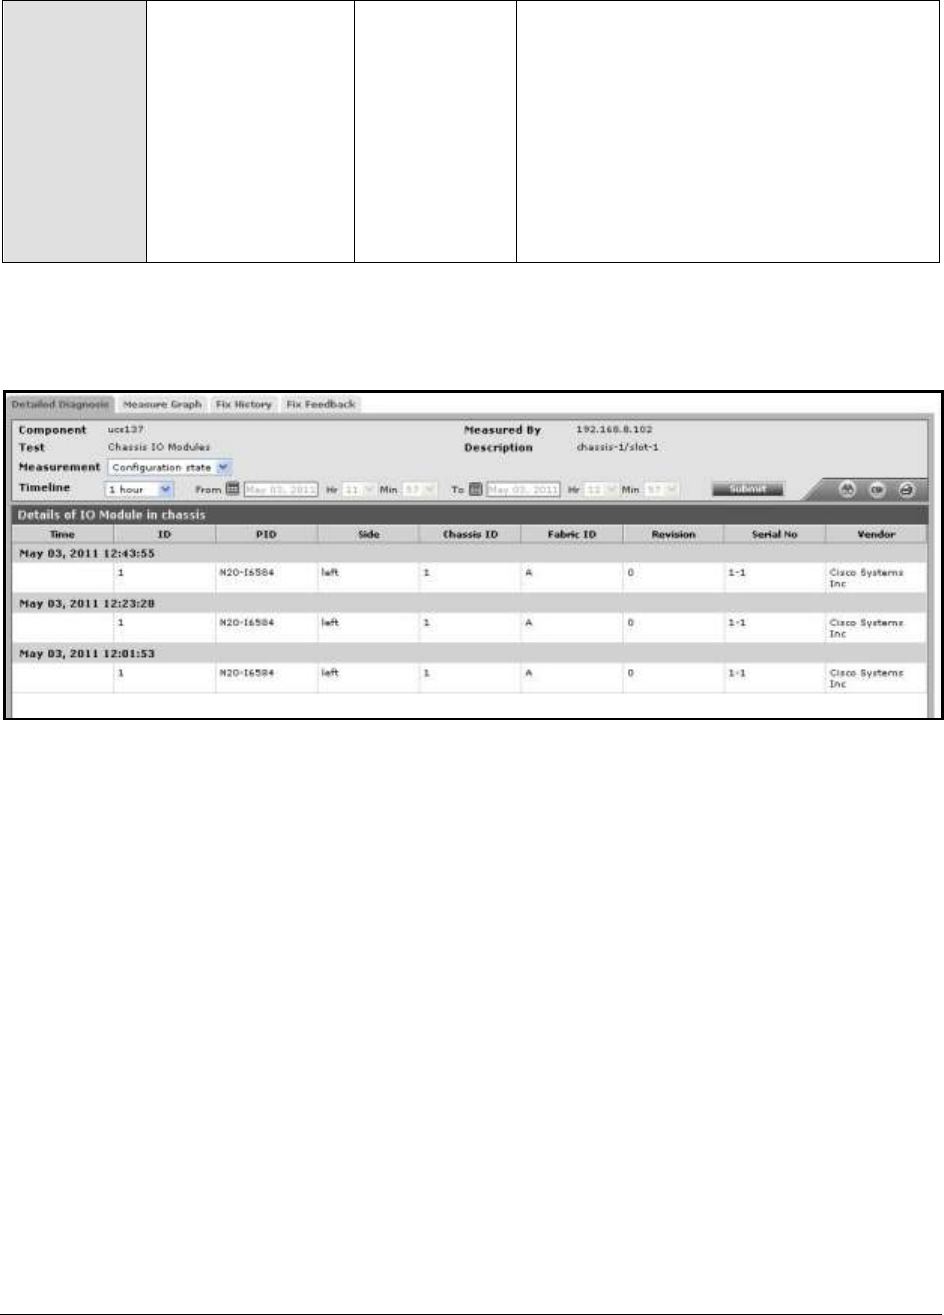
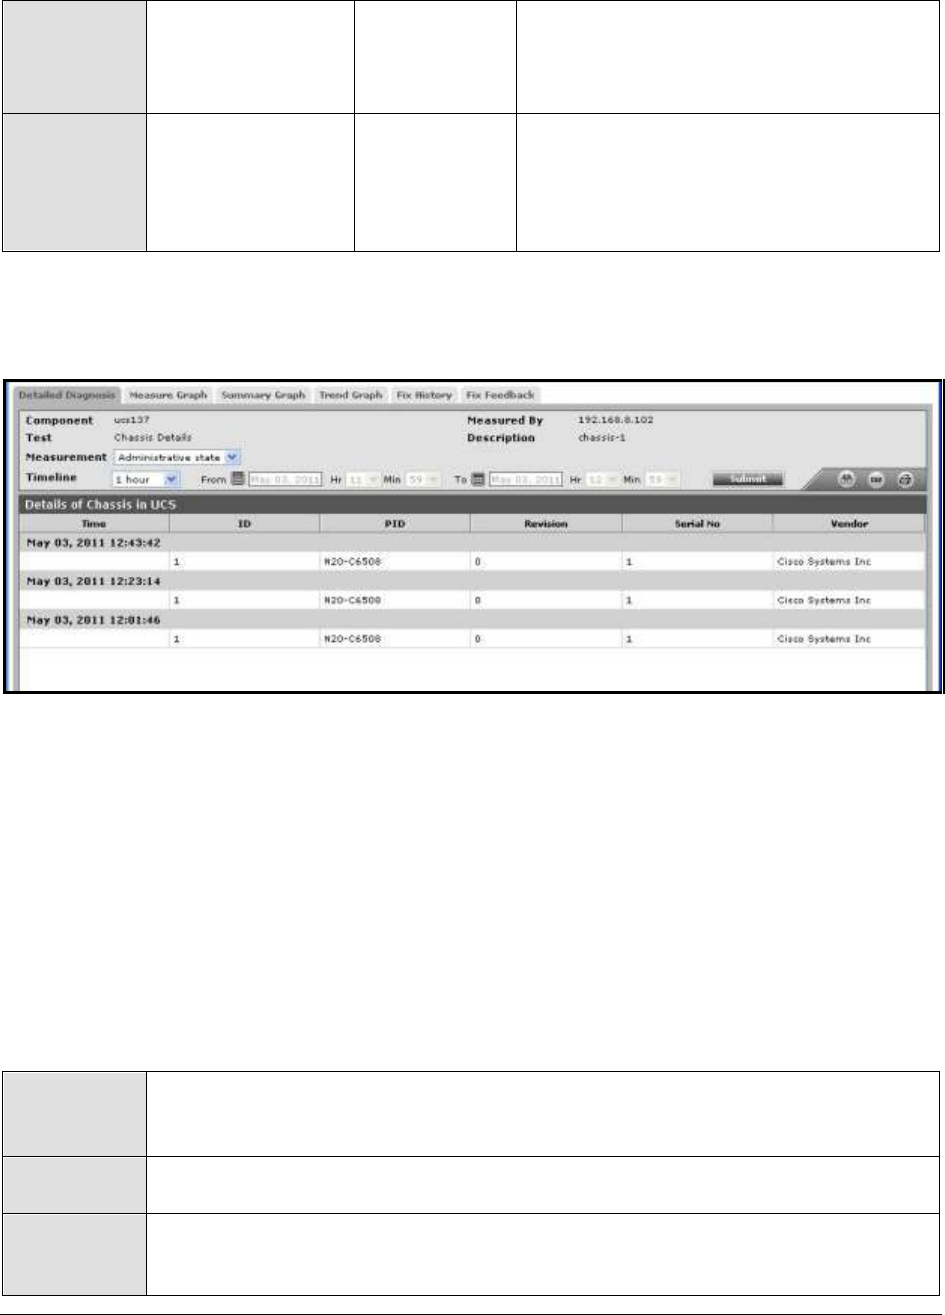
The detailed diagnosis of Configuration state measure provides the Time, ID, PID, Side, Chassis ID,
Fabric ID, Revision, Serial Number and Vendor attributes for each I/O module.
sFigure 4: The detailed diagnosis of the Configuration state measure of the Chassis I/O Modules Test
1.1.2 Chassis Fans Test
A Cisco Blade Server Chassis contains the following components:
Cisco UCS Fabric Extenders—Up to two fabric extenders (FEX), each FEX provides four ports of
10-Gigabit Ethernet, Cisco Data Center Ethernet, and Fibre Channel over Ethernet (FCoE)
SFP+ transceiver choices that include copper and fiber optic
Power supply units—Up to four 2500 W hot-swappable power supply units
Fan modules—Eight hot-swappable fan modules
Cisco UCS Blade Servers —Up to eight half-wide blade servers or four full-width blade servers,
each holding RAID capable hard drives
This test monitors the overall health of each fan present in each chassis managed by the Cisco UCS
manager, and proactively alerts users to the following:
Fans that are in an abnormal operational state;
Fans that are in a critical performance/thermal/voltage state;

M o n i t o r i n g t h e C i s c o U C S M a n a g e r
20
Fans in a degraded/errored power state;
Fans operating at abnormal speeds.
Purpose
Monitors the overall health of each fan module present in each chassis managed by
the Cisco UCS manager, and proactively alerts users to the following:
Fans that are in an abnormal operational state;
Fans that are in a critical performance/thermal/voltage state;
Fans in a degraded/errored power state;
Fans operating at abnormal speeds.
Target of the
test
A Cisco UCS manager
Agent
deploying the
test
A remote agent

M o n i t o r i n g t h e C i s c o U C S M a n a g e r
21
Configurable
parameters for
the test
1. TESTPERIOD – How often should the test be executed
2. HOST – The IP address of the host for which the test is being configured.
3. PORT – The port at which the specified HOST listens. By default, this is NULL.
4. UCS USER and UCS PASSWORD – Provide the credentials of a user with at least
read-only privileges to the target Cisco UCS manager.
5. CONFIRM PASSWORD- Confirm the password by retyping it here.
6. SSL - By default, the Cisco UCS manager is SSL-enabled. Accordingly, the SSL
flag is set to Yes by default.
7. WEB PORT- By default, in most virtualized environments, Cisco UCS manager
listens on port 80 (if not SSL-enabeld) or on port 443 (if SSL-enabled) only. This
implies that while monitoring Cisco UCS manager, the eG agent, by default,
connects to port 80 or 443, depending upon the SSL-enabled status of Cisco
UCS manager - i.e., if Cisco UCS manager is not SSL-enabled (i.e., if the SSL
flag above is set to No), then the eG agent connects to Cisco UCS manager
using port 80 by default, and if Cisco UCS manager is SSL-enabled (i.e., if the
SSL flag is set to Yes), then the agent-Cisco UCS manager communication
occurs via port 443 by default. Accordingly, the WEBPORT parameter is set to
default by default.
In some environments however, the default ports 80 or 443 might not apply. In
such a case, against the WEBPORT parameter, you can specify the exact port at
which the Cisco UCS manager in your environment listens, so that the eG agent
communicates with that port for collecting metrics from the Cisco UCS manager.
8. DETAILED DIAGNOSIS - To make diagnosis more efficient and accurate, the eG
Enterprise suite embeds an optional detailed diagnostic capability. With this
capability, the eG agents can be configured to run detailed, more elaborate tests
as and when specific problems are detected. To enable the detailed diagnosis
capability of this test for a particular server, choose the On option. To disable
the capability, click on the Off option.
The option to selectively enable/disable the detailed diagnosis capability will be
available only if the following conditions are fulfilled:
The eG manager license should allow the detailed diagnosis capability
Both the normal and abnormal frequencies configured for the detailed
diagnosis measures should not be 0.
Outputs of the
test
One set of results for each fan in each chassis managed by the Cisco UCS manager
being monitored
Measurements
made by the
Measurement
Measurement
Unit
Interpretation

M o n i t o r i n g t h e C i s c o U C S M a n a g e r
22
test
Overall status:
Indicates the overall
status of this fan
present in this
chassis.
The States reported by this measure and
their corresponding numeric equivalents are
described in the table below:
Numeric Value
State
0
Unknown
1
Operable
2
Inoperable
3
Degraded
4
Powered-off
5
Power-problem
6
Removed
7
Voltage-problem
8
Thermal-problem
9
Performance-problem
10
Accessibility-problem
11
Identity-
unestablishable
12
Bios-post-timeout
13
Disabled
51
Fabric-conn-problem
52
Fabric-unsupported-
conn
81
Config
82
Equipment-problem
83
Decommissioning
84
Chassis-limit-
exceeded
100
Not-supported
101
Discovery
102
Discovery-failed
103
Identify
104
Post-failure
105
Upgrade-problem
106
Peer-comm-problem
107
Auto-upgrade

M o n i t o r i n g t h e C i s c o U C S M a n a g e r
23
The detailed diagnosis of this measure
provides the Time, ID, PID, Module,
Revision, Serial Number, Tray and Vendor
attributes for each fan in each chassis.
Operability:
Indicates the
current operational
state of this fan
present in this
chassis.
The States reported by this measure and
their corresponding numeric equivalents are
described in the table below:
Numeric Value
State
0
Unknown
1
Operable
2
Inoperable
3
Degraded
4
Powered-off
5
Power-problem
6
Removed
7
Voltage-
problem
8
Thermal-
problem
9
Performance-
problem
10
Accessibility-
problem
11
Identity-
unestablishable
12
Bios-post-
timeout
13
Disabled
51
Fabric-conn-
problem
52
Fabric-
unsupported-
conn
81
Config
82
Equipment-
problem
83
Decommissioni
ng
.

M o n i t o r i n g t h e C i s c o U C S M a n a g e r
24
84
Chassis-limit-
exceeded
100
Not-supported
101
Discovery
102
Discovery-
failed
103
Identify
104
Post-failure
105
Upgrade-
problem
106
Peer-comm-
problem
107
Auto-upgrade
Note:
By default, this measure reports the above-
mentioned States while indicating the
operability statusof a fan. However, in the
graph of this measure, states will be
represented using their corresponding
numeric equivalents only.

M o n i t o r i n g t h e C i s c o U C S M a n a g e r
25
Performance
state:
Indicates the
current
performance status
of this fan present
in this chassis.
The States reported by this measure and
their corresponding numeric equivalents are
described in the table below:
Numeric Value
State
0
Unknown
1
Ok
2
Upper-non-
recoverable
3
Upper-
critical
4
Upper-non-
critical
5
Lower-non-
critical
6
Lower-
critical
7
Lower non-
recoverable
100
Not-
supported
Note:
By default, this measure reports the above-
mentioned States while indicating the
performance status of a fan. However, in
the graph of this measure, states will be
represented using the corresponding
numeric equivalents only.

M o n i t o r i n g t h e C i s c o U C S M a n a g e r
26
Power state:
Indicates the
current power
status of this fan
present in this
chassis.
The States reported by this measure and
their corresponding numeric equivalents are
described in the table below:
Numeric
Value
State
0
Unknown
1
On
2
Test
3
Off
4
Online
5
Offline
6
Offduty
7
Degraded
8
Power-save
9
Error
10
Not-supported
Note:
By default, this measure reports the above-
mentioned States while indicating the power
status of a fan. However, in the graph of
this measure, states will be represented
using their corresponding numeric
equivalents only.

M o n i t o r i n g t h e C i s c o U C S M a n a g e r
27
Presence state:
Indicates whether
this fan currently
exists in this chassis
or not.
The State values reported by this measure
and their corresponding numeric
equivalents are described in the table
below:
Note:
By default, this measure reports the above-
mentioned States while indicating the
current state of a fan. However, in the
graph of this measure, states will be
represented using their corresponding
numeric equivalents only.
Numeric
Value
State
0
Unknown
1
Empty
10
Equipped
11
Missing
12
Mismatch
13
Equipped-
not-primary
20
Equipped-
identity-
unestablisha
ble
30
Inaccessible
40
Unauthorized
100
Not-
supported

M o n i t o r i n g t h e C i s c o U C S M a n a g e r
28
Thermal state:
Indicates the
current thermal
state of this fan
present in this
chassis.
The State values reported by this measure
and their corresponding numeric
equivalents are described in the table
below:
Numeric Value
State
0
Unknown
1
Ok
2
Upper-non-
recoverable
3
Upper-critical
4
Upper-non-
critical
5
Lower-non-
critical
6
Lower-critical
7
Lower non-
recoverable
100
Not-
supported
Note:
By default, this measure reports the above-
mentioned States while indicating the
thermal state of a fan. However, in the
graph of this measure, states will be
represented using the corresponding
numeric equivalents only.

M o n i t o r i n g t h e C i s c o U C S M a n a g e r
29
Voltage state:
Indicates the
current voltage
state of this fan
present in this
chassis.
The State values reported by this measure
and their corresponding numeric
equivalents are described in the table
below:
Numeric Value
State
0
Unknown
1
Ok
2
Upper-non-
recoverable
3
Upper-critical
4
Upper-non-
critical
5
Lower-non-
critical
6
Lower-critical
7
Lower non-
recoverable
100
Not-supported
Note:
By default, this measure reports the above-
mentioned States while indicating the
voltage state of a fan. However, in the
graph of this measure, states will be
represented using their corresponding
numeric equivalents only.
Speed:
Indicates the speed
which this fan
operates currently.
RPM
Ideally, the speed of the fans must be
within normal limits.
The detailed diagnosis of the Overall status measure reveals the Time, ID, PID, Module, Revision,
Serial Number, Tray and Vendor attributes for each fan in each chassis.

M o n i t o r i n g t h e C i s c o U C S M a n a g e r
30
Figure 5: The detailed diagnosis of the Overall status measure of the Chassis Fans test
1.1.3 Chassis Details Test
The Cisco UCS 5100 Series Blade Server Chassis is a scalable and flexible blade server chassis for data
centers. The chassis can house up to eight half-width Cisco UCS B-Series Blade Servers and can
accommodate both half- and full-width blade form factors. Four single-phase, hot-swappable power
supplies are accessible from the front of the chassis. These power supplies are 92 percent efficient and
can be configured to support nonredundant, N+1 redundant, and grid-redundant configurations. The
rear of the chassis contains eight hot-swappable fans, four power connectors (one per power supply),
and two I/O bays for Cisco UCS 2104XP I/O modules. A passive midplane provides up to 20 Gbps of
I/O bandwidth per server slot and up to 40 Gbps of I/O bandwidth for two slots.

M o n i t o r i n g t h e C i s c o U C S M a n a g e r
31
Figure 6: A Cisco UCS Blade Server Chassis
A Cisco UCS can support multiple chassis, each with two fabric extenders for redundancy.
By running periodic health checks on each chassis managed by a Cisco UCS manager, you can
promptly identify the following:
The chassis that is currently in an abnormal operational state;
The insufficiently licensed chassis;
Empty/missing chassis;
The chassis that is experiencing serious power failures;
The chassis with fans that are in a critical thermal state;
The chassis that is handling unusually high input and output power.
Purpose
Runs periodic health checks on each chassis supported by a Cisco UCS to promptly
identify the following:
The chassis that is currently in an abnormal operational state;
The insufficiently licensed chassis;
Empty/missing chassis;
The chassis that is experiencing serious power failures;
The chassis with fans that are in a critical thermal state;

M o n i t o r i n g t h e C i s c o U C S M a n a g e r
32
The chassis that is handling unusually high input and output power
Target of the
test
A Cisco UCS manager
Agent
deploying the
test
A remote agent
Configurable
parameters for
the test
1. TESTPERIOD – How often should the test be executed
2. HOST – The IP address of the host for which the test is being configured.
3. PORT – The port at which the specified HOST listens. By default, this is NULL.
4. UCS USER and UCS PASSWORD – Provide the credentials of a user with at least
read-only privileges to the target Cisco UCS manager.
5. CONFIRM PASSWORD- Confirm the password by retyping it here.
6. SSL - By default, the Cisco UCS manager is SSL-enabled. Accordingly, the SSL
flag is set to Yes by default.
7. WEB PORT- By default, in most virtualized environments, Cisco UCS manager
listens on port 80 (if not SSL-enabeld) or on port 443 (if SSL-enabled) only. This
implies that while monitoring Cisco UCS manager, the eG agent, by default,
connects to port 80 or 443, depending upon the SSL-enabled status of Cisco
UCS manager - i.e., if Cisco UCS manager is not SSL-enabled (i.e., if the SSL
flag above is set to No), then the eG agent connects to Cisco UCS manager
using port 80 by default, and if Cisco UCS manager is SSL-enabled (i.e., if the
SSL flag is set to Yes), then the agent-Cisco UCS manager communication
occurs via port 443 by default. Accordingly, the WEBPORT parameter is set to
default by default.
In some environments however, the default ports 80 or 443 might not apply. In
such a case, against the WEBPORT parameter, you can specify the exact port at
which the Cisco UCS manager in your environment listens, so that the eG agent
communicates with that port for collecting metrics from the Cisco UCS manager.
8. DETAILED DIAGNOSIS - To make diagnosis more efficient and accurate, the eG
Enterprise suite embeds an optional detailed diagnostic capability. With this
capability, the eG agents can be configured to run detailed, more elaborate tests
as and when specific problems are detected. To enable the detailed diagnosis
capability of this test for a particular server, choose the On option. To disable
the capability, click on the Off option.
The option to selectively enable/disable the detailed diagnosis capability will be
available only if the following conditions are fulfilled:
The eG manager license should allow the detailed diagnosis capability
Both the normal and abnormal frequencies configured for the detailed
diagnosis measures should not be 0.
Outputs of the
test
One set of results for each chassis managed by the Cisco UCS manager being
monitored
Measurements
made by the
Measurement
Measurement
Unit
Interpretation

M o n i t o r i n g t h e C i s c o U C S M a n a g e r
33
test
Administrative
state:
Indicates the
current
administrative
status of this
chassis.
The States reported by this measure and
their corresponding numeric equivalents are
described in the table below:
Numeric Value
State
1
Acknowledged
2
Re-acknowledged
3
Decommission
4
Remove
Note:
By default, this measure reports the above-
mentioned States while indicating the
administrative state of a chassis. However,
in the graph of this measure, states will be
represented using their corresponding
numeric equivalents only.
The detailed diagnosis of this measure
provides the Time, ID, PID, Module,
Revision, Serial Number, Tray and Vendor
attributes for each chassis.
Configuration
state:
Indicates the
current
configuration state
of this chassis.
The States reported by this measure and
their corresponding numeric equivalents are
described in the table below:
Numeric Value
State
0
Un-initialized
1
Un-
acknowledged
2
Unsupported-
connectivity
3
Ok
4
Removing

M o n i t o r i n g t h e C i s c o U C S M a n a g e r
34
Note:
By default, this measure reports the above-
mentioned States while indicating the
configuration state of a chassis. However,
in the graph of this measure, states will be
represented using their corresponding
numeric equivalents only.
License state:
Indicates the
current license
status of this
chassis.
The States reported by this measure and
their corresponding numeric equivalents are
described in the table below:
Numeric Value
State
0
Unknown
1
License-ok
2
License-
insufficient
Note:
By default, this measure reports the above-
mentioned States while indicating the
license state of a chassis. However, in the
graph of this measure, states will be
represented using their corresponding
numeric equivalents only.

M o n i t o r i n g t h e C i s c o U C S M a n a g e r
35
Overall status:
Indicates the overall
status of this
chassis.
The States reported by this measure and
their corresponding numeric equivalents are
described in the table below:
Numeric Value
State
0
Unknown
1
Operable
2
Inoperable
3
Degraded
4
Powered-off
5
Power-problem
6
Removed
7
Voltage-problem
8
Thermal-problem
9
Performance-problem
10
Accessibility-problem
11
Identity-
unestablishable
12
Bios-post-timeout
13
Disabled
51
Fabric-conn-problem
52
Fabric-unsupported-
conn
81
Config
82
Equipment-problem
83
Decommissioning
84
Chassis-limit-
exceeded
100
Not-supported
101
Discovery
102
Discovery-failed
103
Identify
104
Post-failure
105
Upgrade-problem
106
Peer-comm-problem
107
Auto-upgrade

M o n i t o r i n g t h e C i s c o U C S M a n a g e r
36
Note:
By default, this measure reports the above-
mentioned States while indicating the overall
status of a chassis. However, in the graph
of this measure, states will be represented
using their corresponding numeric
equivalents only.

M o n i t o r i n g t h e C i s c o U C S M a n a g e r
37
Operability:
Indicates the
current operating
state of this chassis.
The States reported by this measure and
their corresponding numeric equivalents are
described in the table below:
Numeric Value
State
0
Unknown
1
Operable
2
Inoperable
3
Degraded
4
Powered-off
5
Power-problem
6
Removed
7
Voltage-problem
8
Thermal-
problem
9
Performance-
problem
10
Accessibility-
problem
11
Identity-
unestablishable
12
Bios-post-
timeout
13
Disabled
51
Fabric-conn-
problem
52
Fabric-
unsupported-
conn
81
Config
82
Equipment-
problem
83
Decommissionin
g
84
Chassis-limit-
exceeded

M o n i t o r i n g t h e C i s c o U C S M a n a g e r
38
100
Not-supported
101
Discovery
102
Discovery-failed
103
Identify
104
Post-failure
105
Upgrade-
problem
106
Peer-comm-
problem
107
Auto-upgrade
Note:
By default, this measure reports the above-
mentioned States while indicating the
operability state of a chassis. However, in
the graph of this measure, states will be
represented using their corresponding
numeric equivalents only.

M o n i t o r i n g t h e C i s c o U C S M a n a g e r
39
Power state:
Indicates the
current power
status of this
chassis.
The States reported by this measure and
their corresponding numeric equivalents are
described in the table below:
Numeric Value
State
0
Unknown
1
Ok
2
Failed
3
Input-failed
4
Input-
degraded
5
Output-
failed
6
Output-
degraded
7
Redundancy-
failed
8
Redundancy-
degraded
Note:
By default, this measure reports the above-
mentioned States while indicating the power
status of a chassis. However, in the graph
of this measure, states will be represented
using their corresponding numeric
equivalents only.

M o n i t o r i n g t h e C i s c o U C S M a n a g e r
40
Presence state:
Indicates the
current status of
this chassis.
The State values reported by this measure
and their corresponding numeric
equivalents are described in the table
below:
Note:
By default, this measure reports the above-
mentioned States while indicating the
current state of a chassis. However, in the
graph of this measure, states will be
represented using their corresponding
numeric equivalents only.
Numeric
Value
State
0
Unknown
1
Empty
10
Equipped
11
Missing
12
Mismatch
13
Equipped-
not-primary
20
Equipped-
identity-
unestablisha
ble
30
Inaccessible
40
Unauthorized
100
Not-
supported

M o n i t o r i n g t h e C i s c o U C S M a n a g e r
41
Thermal state:
Indicates the
current thermal
state of this chassis.
The State values reported by this measure
and their corresponding numeric
equivalents are described in the table
below:
Numeric Value
State
0
Unknown
1
Ok
2
Upper-non-
recoverable
3
Upper-critical
4
Upper-non-
critical
5
Lower-non-
critical
6
Lower-critical
7
Lower non-
recoverable
100
Not-
supported
Note:
By default, this measure reports the above-
mentioned States while indicating the
thermal state of a chassis. However, in the
graph of this measure, states will be
represented using the corresponding
numeric
equivalents only.
Nu
mer
ic
Val
ue
Stat
e
0
Unk
now
n
1
Ok
2
Upp
er-
non
-
rec
ove
rabl
e
3
Upp
er-
criti
cal
M o n i t o r i n g t h e C i s c o U C S M a n a g e r
42
Input power:
Indicates the
current input power
of this chassis.
Watts
An abnormally high or low power may
cause serious damage to the hardware
components of the chassis. Therefore, the
value of this measure should be low.
Output power:
Indicates the
current output
power of this
chassis.
Watts
Ideally, the value of this measure should be
low.
The detailed diagnosis of the Administrative state measure provides the Time, ID, PID, Module,
Revision, Serial Number, Tray and Vendor attributes for each chassis.
Figure 7: The detailed diagnosis of the Administrative state measure of the Chassis Details test
1.1.4 Chassis Fan Modules Test
The Cisco UCS Blade server chassis contains eight hot-swappable fan modules. These fan modules
ensure that the internals of the chassis always receive adequate air flow and the temperature within
the chassis is maintained at acceptable levels at all times. Snags in the functioning of the fan module
can hence hamper air flow, which in turn may have disastrous effects on the health of the other
chassis components.
By periodically monitoring the availability, overall health, operational state, and the exhaust
temperature of fan module, you can promptly detect abnormalities in the operations of the module
and initiate speedy remedial measures. This test does just that.
Purpose
Periodically monitors the availability, overall health, operational state, and the
exhaust temperature of each fan module, and promptly detects abnormalities in the
operations of the module, so that remedial measures can be swiftly initiated
Target of the
test
A Cisco UCS manager
Agent
deploying the
test
A remote agent

M o n i t o r i n g t h e C i s c o U C S M a n a g e r
43
Configurable
parameters for
the test
1. TESTPERIOD – How often should the test be executed
2. HOST – The IP address of the host for which the test is being configured.
3. PORT – The port at which the specified HOST listens. By default, this is NULL.
4. UCS USER and UCS PASSWORD – Provide the credentials of a user with at least
read-only privileges to the target Cisco UCS manager.
5. CONFIRM PASSWORD- Confirm the password by retyping it here.
6. SSL - By default, the Cisco UCS manager is SSL-enabled. Accordingly, the SSL
flag is set to Yes by default.
7. WEB PORT- By default, in most virtualized environments, Cisco UCS manager
listens on port 80 (if not SSL-enabeld) or on port 443 (if SSL-enabled) only. This
implies that while monitoring Cisco UCS manager, the eG agent, by default,
connects to port 80 or 443, depending upon the SSL-enabled status of Cisco
UCS manager - i.e., if Cisco UCS manager is not SSL-enabled (i.e., if the SSL
flag above is set to No), then the eG agent connects to Cisco UCS manager
using port 80 by default, and if Cisco UCS manager is SSL-enabled (i.e., if the
SSL flag is set to Yes), then the agent-Cisco UCS manager communication
occurs via port 443 by default. Accordingly, the WEBPORT parameter is set to
default by default.
In some environments however, the default ports 80 or 443 might not apply. In
such a case, against the WEBPORT parameter, you can specify the exact port at
which the Cisco UCS manager in your environment listens, so that the eG agent
communicates with that port for collecting metrics from the Cisco UCS manager.
8. DETAILED DIAGNOSIS - To make diagnosis more efficient and accurate, the eG
Enterprise suite embeds an optional detailed diagnostic capability. With this
capability, the eG agents can be configured to run detailed, more elaborate tests
as and when specific problems are detected. To enable the detailed diagnosis
capability of this test for a particular server, choose the On option. To disable
the capability, click on the Off option.
The option to selectively enable/disable the detailed diagnosis capability will be
available only if the following conditions are fulfilled:
The eG manager license should allow the detailed diagnosis capability
Both the normal and abnormal frequencies configured for the detailed
diagnosis measures should not be 0.
Outputs of the
test
One set of results for each fan module available in each chassis managed by the
Cisco UCS manager being monitored
Measurements
made by the
Measurement
Measurement
Unit
Interpretation

M o n i t o r i n g t h e C i s c o U C S M a n a g e r
44
test
Overall status:
Indicates the overall
status of this fan
module present in
this chassis.
The States reported by this measure and
their corresponding numeric equivalents are
described in the table below:
Numeric Value
State
0
Unknown
1
Operable
2
Inoperable
3
Degraded
4
Powered-off
5
Power-problem
6
Removed
7
Voltage-problem
8
Thermal-problem
9
Performance-problem
10
Accessibility-problem
11
Identity-
unestablishable
12
Bios-post-timeout
13
Disabled
51
Fabric-conn-problem
52
Fabric-unsupported-
conn
81
Config
82
Equipment-problem
83
Decommissioning
84
Chassis-limit-
exceeded
100
Not-supported
101
Discovery
102
Discovery-failed
103
Identify
104
Post-failure
105
Upgrade-problem
106
Peer-comm-problem
107
Auto-upgrade

M o n i t o r i n g t h e C i s c o U C S M a n a g e r
45
Note:
By default, this measure reports the above-
mentioned States while indicating the overall
status of a fan module. However, in the
graph of this measure, states will be
represented using their corresponding
numeric equivalents only.
The detailed diagnosis of this measure
provides the Time, ID, PID, Module,
Revision, Serial Number, Tray and Vendor
attributes for the fan module.

M o n i t o r i n g t h e C i s c o U C S M a n a g e r
46
Operability:
Indicates the
current operating
state of this fan
module in this
chassis.
The States reported by this measure and
their corresponding numeric equivalents are
described in the table below:
Numeric Value
State
0
Unknown
1
Operable
2
Inoperable
3
Degraded
4
Powered-off
5
Power-problem
6
Removed
7
Voltage-problem
8
Thermal-
problem
9
Performance-
problem
10
Accessibility-
problem
11
Identity-
unestablishable
12
Bios-post-
timeout
13
Disabled
51
Fabric-conn-
problem
52
Fabric-
unsupported-
conn
81
Config
82
Equipment-
problem
83
Decommissionin
g
84
Chassis-limit-
exceeded

M o n i t o r i n g t h e C i s c o U C S M a n a g e r
47
100
Not-supported
101
Discovery
102
Discovery-failed
103
Identify
104
Post-failure
105
Upgrade-
problem
106
Peer-comm-
problem
107
Auto-upgrade
Note:
By default, this measure reports the above-
mentioned States while indicating the
operating state of a fan module. However,
in the graph of this measure, states will be
represented using their corresponding
numeric equivalents only.

M o n i t o r i n g t h e C i s c o U C S M a n a g e r
48
Performance
state:
Indicates the
current
performance state
of this fan module
in this chassis.
The States reported by this measure and
their corresponding numeric equivalents are
described in the table below:
Numeric Value
State
0
Unknown
1
Ok
2
Upper-non-recoverable
3
Upper-critical
4
Upper-non-critical
5
Lower-non-critical
6
Lower-critical
7
Lower non-recoverable
100
Not-supported
Note:
By default, this measure reports the above-
mentioned States while indicating the
performance state of a fan module.
However, in the graph of this measure,
states will be represented using their
corresponding numeric equivalents only.
Power state:
Indicates the
current power state
of this fan module
in this chassis
The States reported by this measure and
their corresponding numeric equivalents are
described in the table below:
Numeric Value
State
0
Unknown
1
On
2
Test
3
Off
4
Online
5
Offline
6
Offduty
7
Degraded
8
Power-save
9
Error
10
Not-supported

M o n i t o r i n g t h e C i s c o U C S M a n a g e r
49
Note:
By default, this measure reports the above-
mentioned States while indicating the power
state of a fan module. However, in the
graph of this measure, states will be
represented using their corresponding
numeric equivalents only.
Presence state:
Indicates whether
this fan module
exists or not in this
chassis currently.
The States reported by this measure and
their corresponding numeric equivalents are
described in the table below:
Numeric Value
State
0
Unknown
1
Empty
10
Equipped
11
Missing
12
Mismatch
13
Equipped-not-
primary
20
Equipped-
identity-
unestablishable
30
Inaccessible
40
Unauthorized
100
Not-supported
Note:
By default, this measure reports the above-
mentioned States while indicating the
existence of a fan module in a chassis.
However, in the graph of this measure,
states will be represented using their
corresponding numeric equivalents only.

M o n i t o r i n g t h e C i s c o U C S M a n a g e r
50
Thermal state:
Indicates the
current thermal
state of this fan
module present in
this chassis.
The States reported by this measure and
their corresponding numeric equivalents are
described in the table below:
Numeric Value
State
0
Unknown
1
Ok
2
Upper-non-
recoverable
3
Upper-critical
4
Upper-non-critical
5
Lower-non-critical
6
Lower-critical
7
Lower non-
recoverable
100
Not-supported
Note:
By default, this measure reports the above-
mentioned States while indicating the
current thermal state of a fan module.
However, in the graph of this measure,
states will be represented using their
corresponding numeric equivalents only.
Exhaust
temperature:
Indicates the
current exhaust
temperature of the
fans present in this
fan module in this
chassis.
Ideally, the value of this measure should be
low, as an abnormal temperature can cause
damage to the fans in a module.
The detailed diagnosis of the Overall status measure provides the Time, ID, PID, Module, Revision,
Serial Number, Tray and Vendor attributes for the fan module.

M o n i t o r i n g t h e C i s c o U C S M a n a g e r
51
Figure 8: The detailed diagnosis of the Overall status measure of the Chassis Fan Modules test
1.1.5 Chassis IO Module Backplane Ports Test
The Cisco UCS chassis supports eight blade slots, and each blade has two Intel Xeon "Nehalem"
processors and up to 96GB of RAM. The chassis also has two SAS drive slots and a RAID controller,
plus a connection to the backplane. The chassis is responsible for providing support infrastructure to
blades via the backplane connection.
A backplane is a circuit board (usually a printed circuit board) that connects several connectors in
parallel to each other, so that each pin of each connector is linked to the same relative pin of all the
other connectors forming a computer bus. It is used as a backbone to connect several printed circuit
boards together to make up a complete computer system.
In Cisco UCS, all network traffic flows over FCoE directly from the chassis backplane to an FI (Fabric
Interconnect) device.
To make sure that the blades in the chassis receive prompt and uninterrupted networking services,
you need to frequently check whether the backplane ports of the chassis are available and operational.
The Chassis IO Module Backplane Ports test makes this verification possible. At pre-configured intervals,
this test monitors the health of each of the backplane ports in every I/O module of a chassis, and
reports whether they are operational or not. Backplane ports experiencing errors, hardware failures,
or software failures can thus be identified quickly and accurately.
Purpose
Monitors the health of each of the backplane ports in every I/O module of a chassis,
and reports whether they are operational or not
Target of the
test
A Cisco UCS manager
Agent
deploying the
test
A remote agent

M o n i t o r i n g t h e C i s c o U C S M a n a g e r
52
Configurable
parameters for
the test
1. TESTPERIOD – How often should the test be executed
2. HOST – The IP address of the host for which the test is being configured.
3. PORT – The port at which the specified HOST listens. By default, this is NULL.
4. UCS USER and UCS PASSWORD – Provide the credentials of a user with at least
read-only privileges to the target Cisco UCS.
5. CONFIRM PASSWORD- Confirm the password by retyping it here.
6. SSL - By default, the Cisco UCS manager is SSL-enabled. Accordingly, the SSL
flag is set to Yes by default.
7. WEB PORT- By default, in most virtualized environments, Cisco UCS manager
listens on port 80 (if not SSL-enabeld) or on port 443 (if SSL-enabled) only. This
implies that while monitoring Cisco UCS manager, the eG agent, by default,
connects to port 80 or 443, depending upon the SSL-enabled status of Cisco
UCS manager - i.e., if Cisco UCS manager is not SSL-enabled (i.e., if the SSL
flag above is set to No), then the eG agent connects to Cisco UCS manager
using port 80 by default, and if Cisco UCS manager is SSL-enabled (i.e., if the
SSL flag is set to Yes), then the agent-Cisco UCS manager communication
occurs via port 443 by default. Accordingly, the WEBPORT parameter is set to
default by default.
In some environments however, the default ports 80 or 443 might not apply. In
such a case, against the WEBPORT parameter, you can specify the exact port at
which the Cisco UCS manager in your environment listens, so that the eG agent
communicates with that port for collecting metrics from the Cisco UCS manager.
Outputs of the
test
One set of results for each backplane port in each I/O module of every Cisco UCS
chassis managed by the Cisco UCS manager being monitored
Measurements
made by the
Measurement
Measurement
Unit
Interpretation

M o n i t o r i n g t h e C i s c o U C S M a n a g e r
53
test
Overall status:
Indicates the overall
status of this
backplane port.
The States reported by this measure and
their corresponding numeric equivalents are
described in the table below:
Numeric Value
State
0
Indeterminate
1
Up
2
Admin-down
3
Link-down
4
Failed
5
No-license
6
Link-up
7
Hardware-failure
8
Software-failure
9
Error-disabled
10
Sfp-not-present
Note:
By default, this measure reports the above-
mentioned States while indicating the overall
health of a backplane port. However, in the
graph of this measure, states will be
represented using their corresponding
numeric equivalents only.
1.1.6 Chassis PSUs Test
A Cisco UCS Blade Server Chassis can be provided with upto four 2500 Watt hot-swappable power
supplies.
As issues in the power supply units can adversely impact the performance of the blades in a chassis,
administrators need to promptly detect power-related issues and rectify them before any irrepairable
damage is done. This test aids in the timely detection of the following anomalies related to PSUs:
Abnormalities in the overall PSU health;
Operational deficiencies;
Critical performance setbacks;
Unrecoverable power/thermal/voltage failures;
Disturbing rise in temperature;
Input/output voltage, current, and power that exceeds permissible limits.

M o n i t o r i n g t h e C i s c o U C S M a n a g e r
54
Purpose
Aids in the timely detection of the following anomalies related to PSUs:
Abnormalities in the overall PSU health;
Operational deficiencies;
Critical performance setbacks;
Unrecoverable power/thermal/voltage failures;
Disturbing rise in temperature;
Input/output voltage, current, and power that exceeds permissible limits.
Target of the
test
A Cisco UCS manager
Agent
deploying the
test
A remote agent

M o n i t o r i n g t h e C i s c o U C S M a n a g e r
55
Configurable
parameters for
the test
1. TESTPERIOD – How often should the test be executed
2. HOST – The IP address of the host for which the test is being configured.
3. PORT – The port at which the specified HOST listens. By default, this is NULL.
4. UCS USER and UCS PASSWORD – Provide the credentials of a user with at least
read-only privileges to the target Cisco UCS manager.
5. CONFIRM PASSWORD- Confirm the password by retyping it here.
6. SSL - By default, the Cisco UCS manager is SSL-enabled. Accordingly, the SSL
flag is set to Yes by default.
7. WEB PORT- By default, in most virtualized environments, Cisco UCS manager
listens on port 80 (if not SSL-enabeld) or on port 443 (if SSL-enabled) only. This
implies that while monitoring Cisco UCS manager, the eG agent, by default,
connects to port 80 or 443, depending upon the SSL-enabled status of Cisco
UCS manager - i.e., if Cisco UCS manager is not SSL-enabled (i.e., if the SSL
flag above is set to No), then the eG agent connects to Cisco UCS manager
using port 80 by default, and if Cisco UCS manager is SSL-enabled (i.e., if the
SSL flag is set to Yes), then the agent-Cisco UCS manager communication
occurs via port 443 by default. Accordingly, the WEBPORT parameter is set to
default by default.
In some environments however, the default ports 80 or 443 might not apply. In
such a case, against the WEBPORT parameter, you can specify the exact port at
which the Cisco UCS manager in your environment listens, so that the eG agent
communicates with that port for collecting metrics from the Cisco UCS manager.
8. DETAILED DIAGNOSIS - To make diagnosis more efficient and accurate, the eG
Enterprise suite embeds an optional detailed diagnostic capability. With this
capability, the eG agents can be configured to run detailed, more elaborate tests
as and when specific problems are detected. To enable the detailed diagnosis
capability of this test for a particular server, choose the On option. To disable
the capability, click on the Off option.
The option to selectively enable/disable the detailed diagnosis capability will be
available only if the following conditions are fulfilled:
The eG manager license should allow the detailed diagnosis capability
Both the normal and abnormal frequencies configured for the detailed
diagnosis measures should not be 0.
Outputs of the
test
One set of results for each PSU in each chassis managed by the Cisco UCS manager
being monitored
Measurements
made by the
Measurement
Measurement
Unit
Interpretation

M o n i t o r i n g t h e C i s c o U C S M a n a g e r
56
test
Overall status:
Indicates the overall
status of this PSU in
this chassis.
The States reported by this measure and
their corresponding numeric equivalents are
described in the table below:
Numeric Value
State
0
Unknown
1
Operable
2
Inoperable
3
Degraded
4
Powered-off
5
Power-problem
6
Removed
7
Voltage-problem
8
Thermal-problem
9
Performance-
problem
10
Accessibility-
problem
11
Identity-
unestablishable
12
Bios-post-timeout
13
Disabled
51
Fabric-conn-
problem
52
Fabric-
unsupported-conn
81
Config
82
Equipment-
problem
83
Decommissioning
84
Chassis-limit-
exceeded
100
Not-supported
101
Discovery

M o n i t o r i n g t h e C i s c o U C S M a n a g e r
57
102
Discovery-failed
103
Identify
104
Post-failure
105
Upgrade-problem
106
Peer-comm-
problem
107
Auto-upgrade
Note:
By default, this measure reports the above-
mentioned States while indicating the overall
status of a PSU. However, in the graph of
this measure, states will be represented
using their corresponding numeric
equivalents only.
The detailed diagnosis of this measure
provides the Time, ID, PID, Revision, Serial
Number and Vendor attributes for the PSU.

M o n i t o r i n g t h e C i s c o U C S M a n a g e r
58
Operability:
Indicates the
current operating
state of this PSU in
this chassis.
The States reported by this measure and
their corresponding numeric equivalents are
described in the table below:
Numeric Value
State
0
Unknown
1
Operable
2
Inoperable
3
Degraded
4
Powered-off
5
Power-problem
6
Removed
7
Voltage-
problem
8
Thermal-
problem
9
Performance-
problem
10
Accessibility-
problem
11
Identity-
unestablishable
12
Bios-post-
timeout
13
Disabled
51
Fabric-conn-
problem
52
Fabric-
unsupported-
conn
81
Config
82
Equipment-
problem
83
Decommissioni
ng
84
Chassis-limit-
exceeded

M o n i t o r i n g t h e C i s c o U C S M a n a g e r
59
100
Not-supported
101
Discovery
102
Discovery-failed
103
Identify
104
Post-failure
105
Upgrade-
problem
106
Peer-comm-
problem
107
Auto-upgrade
Note:
By default, this measure reports the above-
mentioned States while indicating the
operational state of a PSU. However, in the
graph of this measure, states will be
represented using their corresponding
numeric equivalents only.

M o n i t o r i n g t h e C i s c o U C S M a n a g e r
60
Performance
state:
Indicates the
current
performance state
of this PSU in this
chassis.
The States reported by
this measure and their
corresponding numeric
equivalents are described
in the table below:
Nu
meri
c
Valu
e
Stat
e
0
Unk
now
n
1
Ok
2
Upp
er-
non
-
reco
ver
able

M o n i t o r i n g t h e C i s c o U C S M a n a g e r
61
Power state:
Indicates the
current power state
of this PSU in this
chassis.
The States reported by
this measure and their
corresponding numeric
equivalents are described
in the table below:
Nu
meri
c
Valu
e
Stat
e
0
Unk
now
n
1
Ok
2
Upp
er-
non
-
reco
ver
able

M o n i t o r i n g t h e C i s c o U C S M a n a g e r
62
Presence state:
Indicates the
current state of this
PSU in this chassis.
The States reported by
this measure and their
corresponding numeric
equivalents are described
in the table below:
Nu
meri
c
Valu
e
Stat
e
0
Unk
now
n
1
Ok
2
Upp
er-
non
-
reco
ver
able

M o n i t o r i n g t h e C i s c o U C S M a n a g e r
63
Thermal state:
Indicates the
current thermal
state of this PSU in
this chassis.
The States reported by
this measure and their
corresponding numeric
equivalents are described
in the table below:
Nu
meri
c
Valu
e
Stat
e
0
Unk
now
n
1
Ok
2
Upp
er-
non
-
reco
ver
able

M o n i t o r i n g t h e C i s c o U C S M a n a g e r
64
Voltage state:
Indicates the
current voltage
state of this PSU in
this chassis.
The States reported by
this measure and their
corresponding numeric
equivalents are described
in the table below:
Nu
meri
c
Valu
e
Stat
e
0
Unk
now
n
1
Ok
2
Upp
er-
non
-
reco
ver
able

M o n i t o r i n g t h e C i s c o U C S M a n a g e r
65
Internal
temperature:
Indicates the
current internal
temperature of this
PSU in this chassis.
Celcius
A high temperature is a cause for concern,
as it may cause severe damage to the
PSUs, which in turn may degrade the
performance of the blade server chassis.
Input210v:
Indicates the
current input
voltage of this PSU
in this chassis.
Volts
Any value higher than 210 volts could
indicate a problem condition that may
require further investigation.
Output12v:
Indicates the
current output
voltage of this PSU
in this chassis.
Volts
Any value higher than 12 volts could
indicate a problem condition that may
require further investigation.
Output3v3:
Indicates the
current output
voltage of this PSU
in this chassis.
Volts
Any value higher than 3.3 volts could
indicate a problem condition that may
require further investigation.
Output current:
Indicates the output
current of this PSU
in this chassis.
Amps
Ideally, the value of this measure should be
low. A sudden/consistent increase in this
value could warrant an investigation.
Output power:
Indicates the output
power of this PSU in
this chassis.
Watts
Ideally, the value of this measure should be
low. A sudden/consistent increase in this
value could warrant an investigation.
The detailed diagnosis of the Overall status measure provides the Time, ID, PID, Revision, Serial
Number and Vendor attributes for the PSU.
Figure 9: The detailed diagnosis of the Overall status measure of the Chassis PSUs test

M o n i t o r i n g t h e C i s c o U C S M a n a g e r
66
1.1.7 Chassis IO Module Fabric PortsTest
A typical Cisco UCS system supports upto two I/O modules, each configured with four ports of 10-Gb
Ethernet, Cisco Data Center Ethernet, and Fibre Channel over Ethernet (FCoE) connection to the fabric
interconnect. Since the I/O module acts as a bridge between the UCS blades and the fabric
interconnect, all ethernet connections to the fabric interconnect will get suspended if one/more ports
are rendered unavailable or non-operational for a brief period. It is hence imperative that the
administrators be promptly alerted when the I/O module ports start behaving abnormally so that,
remedial measures can be initiated instantaneously to avoid a prolonged port outage. This test
monitors the overall health and availability of each of the ports in every I/O module, and sends out
proactive alerts to potential performance anomalies.
Purpose
Monitors the overall health and availability of each of the ports in every I/O module,
and sends out proactive alerts to potential performance anomalies
Target of the
test
A Cisco UCS manager
Agent
deploying the
test
A remote agent

M o n i t o r i n g t h e C i s c o U C S M a n a g e r
67
Configurable
parameters for
the test
1. TESTPERIOD – How often should the test be executed
2. HOST – The IP address of the host for which the test is being configured.
3. PORT – The port at which the specified HOST listens. By default, this is NULL.
4. UCS USER and UCS PASSWORD – Provide the credentials of a user with at least
read-only privileges to the target Cisco UCS manager.
5. CONFIRM PASSWORD- Confirm the password by retyping it here.
6. SSL - By default, the Cisco UCS manager is SSL-enabled. Accordingly, the SSL
flag is set to Yes by default.
7. WEB PORT- By default, in most virtualized environments, Cisco UCS manager
listens on port 80 (if not SSL-enabeld) or on port 443 (if SSL-enabled) only. This
implies that while monitoring Cisco UCS manager, the eG agent, by default,
connects to port 80 or 443, depending upon the SSL-enabled status of Cisco
UCS manager - i.e., if Cisco UCS manager is not SSL-enabled (i.e., if the SSL
flag above is set to No), then the eG agent connects to Cisco UCS manager
using port 80 by default, and if Cisco UCS manager is SSL-enabled (i.e., if the
SSL flag is set to Yes), then the agent-Cisco UCS manager communication
occurs via port 443 by default. Accordingly, the WEBPORT parameter is set to
default by default.
In some environments however, the default ports 80 or 443 might not apply. In
such a case, against the WEBPORT parameter, you can specify the exact port at
which the Cisco UCS manager in your environment listens, so that the eG agent
communicates with that port for collecting metrics from the Cisco UCS manager.
8. DETAILED DIAGNOSIS - To make diagnosis more efficient and accurate, the eG
Enterprise suite embeds an optional detailed diagnostic capability. With this
capability, the eG agents can be configured to run detailed, more elaborate tests
as and when specific problems are detected. To enable the detailed diagnosis
capability of this test for a particular server, choose the On option. To disable
the capability, click on the Off option.
The option to selectively enable/disable the detailed diagnosis capability will be
available only if the following conditions are fulfilled:
The eG manager license should allow the detailed diagnosis capability
Both the normal and abnormal frequencies configured for the detailed
diagnosis measures should not be 0.
Outputs of the
test
One set of results for each fabric port in each I/O module of every chassis managed
by the Cisco UCS manager being monitored

M o n i t o r i n g t h e C i s c o U C S M a n a g e r
68
Measurements
made by the
test
Measurement
Measurement
Unit
Interpretation
Overall status:
Indicates the overall
status of this port in
this I/O module.
The States reported by this measure and
their corresponding numeric equivalents are
described in the table below:
Numeric Value
State
0
Indeterminate
1
Up
2
Admin-down
3
Link-down
4
Failed
5
No-license
6
Link-up
7
Hardware-failure
8
Software-failure
9
Error-disabled
10
Sfp-not-present
Note:
By default, this measure reports the above-
mentioned States while indicating the overall
status of a port. However, in the graph of
this measure, states will be represented
using their corresponding numeric
equivalents only.
The detailed diagnosis of this measure
Time, ID, Slot ID, Chassis ID, Fabric ID,
Port Type, Role Type, Network Type,
Transport Type and Peer details of the I/O
module fabric ports.

M o n i t o r i n g t h e C i s c o U C S M a n a g e r
69
Acknowledged
state:
Indicates the
current
acknowledgment
status of this port in
this I/O module.
The States reported by this measure and
their corresponding numeric equivalents are
described in the table below:
Numeric Value
State
1
Un-initialized
2
Un-acknowledged
3
Unsupported-
connectivity
4
Ok
5
Removing
Note:
By default, this measure reports the above-
mentioned States while indicating the
acknowledgement state of a port. However,
in the graph of this measure, states will be
represented using their corresponding
numeric equivalents only.
Discovery state:
Indicates the
current discovered
status of this port in
this I/O module.
The States reported by this measure and
their corresponding numeric equivalents are
described in the table below:
Numeric Value
State
0
Absent
1
Present
2
Mis-connect
3
Missing
4
New
Note:
By default, this measure reports the above-
mentioned States while indicating the
discovery state of a port. However, in the
graph of this measure, states will be
represented using their corresponding
numeric equivalents only.
The detailed diagnosis of the Overall status measure reports the Time, ID, Slot ID, Chassis ID, Fabric
ID, Port Type, Role Type, Network Type, Transport Type and Peer details of the I/O module fabric
ports.
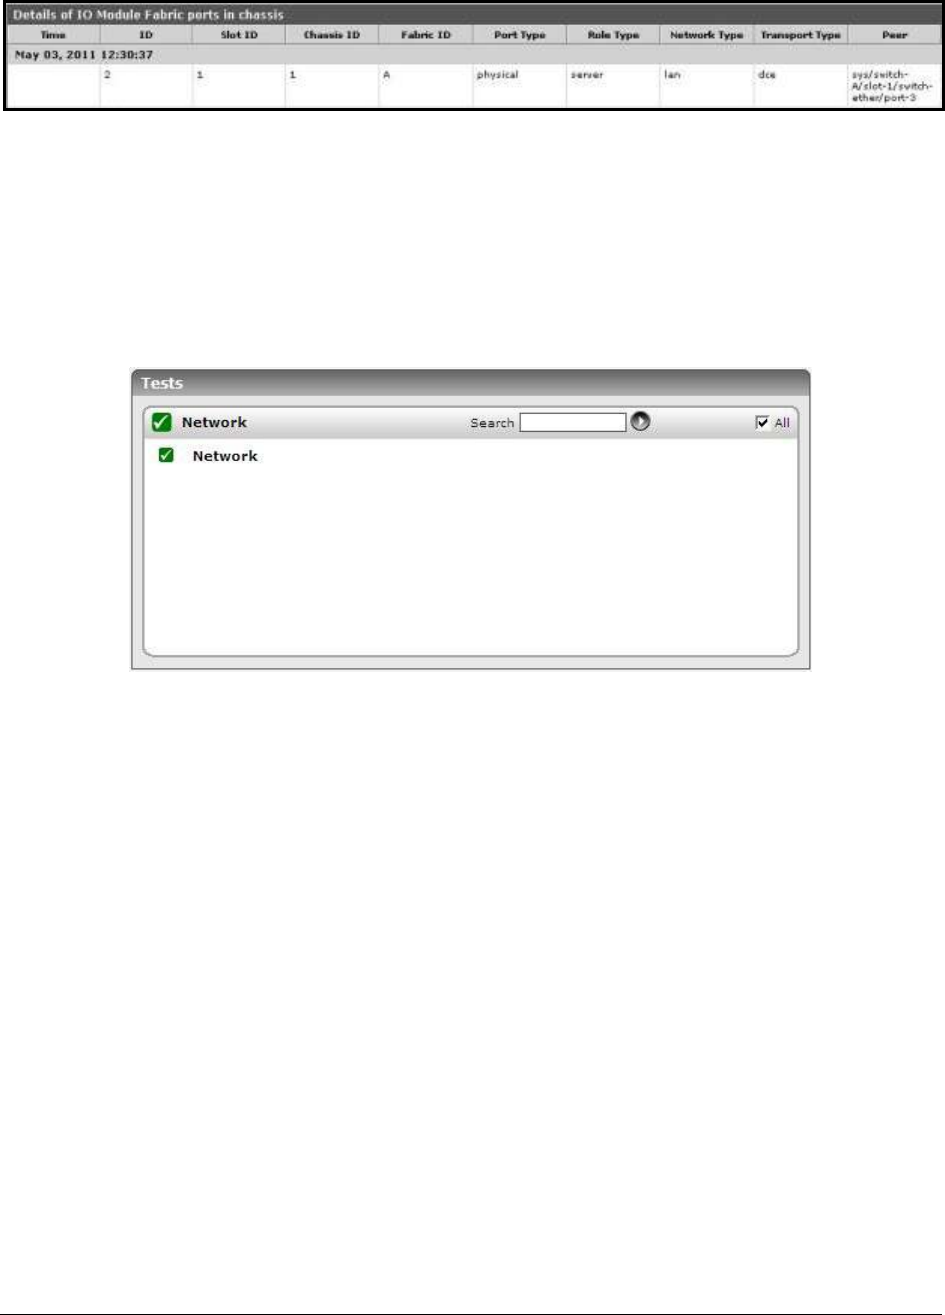
M o n i t o r i n g t h e C i s c o U C S M a n a g e r
70
Figure 10: The detailed diagnosis of the Overall status measure of the Chassis I/O Module Fabric Ports Test
1.2 The Network Layer
Determine the availability of the Cisco UCS manager the network, and quickly isolate latencies while
establishing a network connection with the Cisco UCS manager, using the tests mapped to this layer.
Figure 11: The tests mapped to the Network layer
Since the Network test mapped to this layer has already been dealt with in the Monitoring Unix and
Windows Servers document, let us proceed to take a look at the Fabric Interconnects layer in this test.
1.3 The Fabric Interconnects Layer
A core part of the Cisco Unified Computing System, the Cisco UCS Fabric Interconnects provide both
network connectivity and management capabilities to all attached blades and chassis. The Cisco UCS
Fabric Interconnects offers line-rate, low-latency, lossless 10 Gigabit Ethernet and Fibre Channel over
Ethernet (FCoE) functions.
The interconnects provide the management and communication backbone for the Cisco UCS B lades
and UCS Blade Server Chassis. All chassis, and therefore all blades, attached to the interconnects
become part of a single, highly available management domain. In addition, by supporting unified
fabric, the Cisco UCS Fabric Interconnects provides both the LAN and SAN connectivity for all blades
within its domain.
Typically deployed in redundant pairs, fabric Interconnects provide uniform access to both networks
and storage, eliminating the barriers to deploying a fully virtualized environment.
This layer monitors the fabric interconnects and their critical hardware components such as the PSUs,
the uplink and FC ports, and fans, and proactively alerts administrators to potential hardware failures
and operational issues experienced by the fabric interconnects; this way, the layer ensures the
continuous availability of the interconnects, and thus eliminates any disruption in communication for
the blades and the blade server chassis.
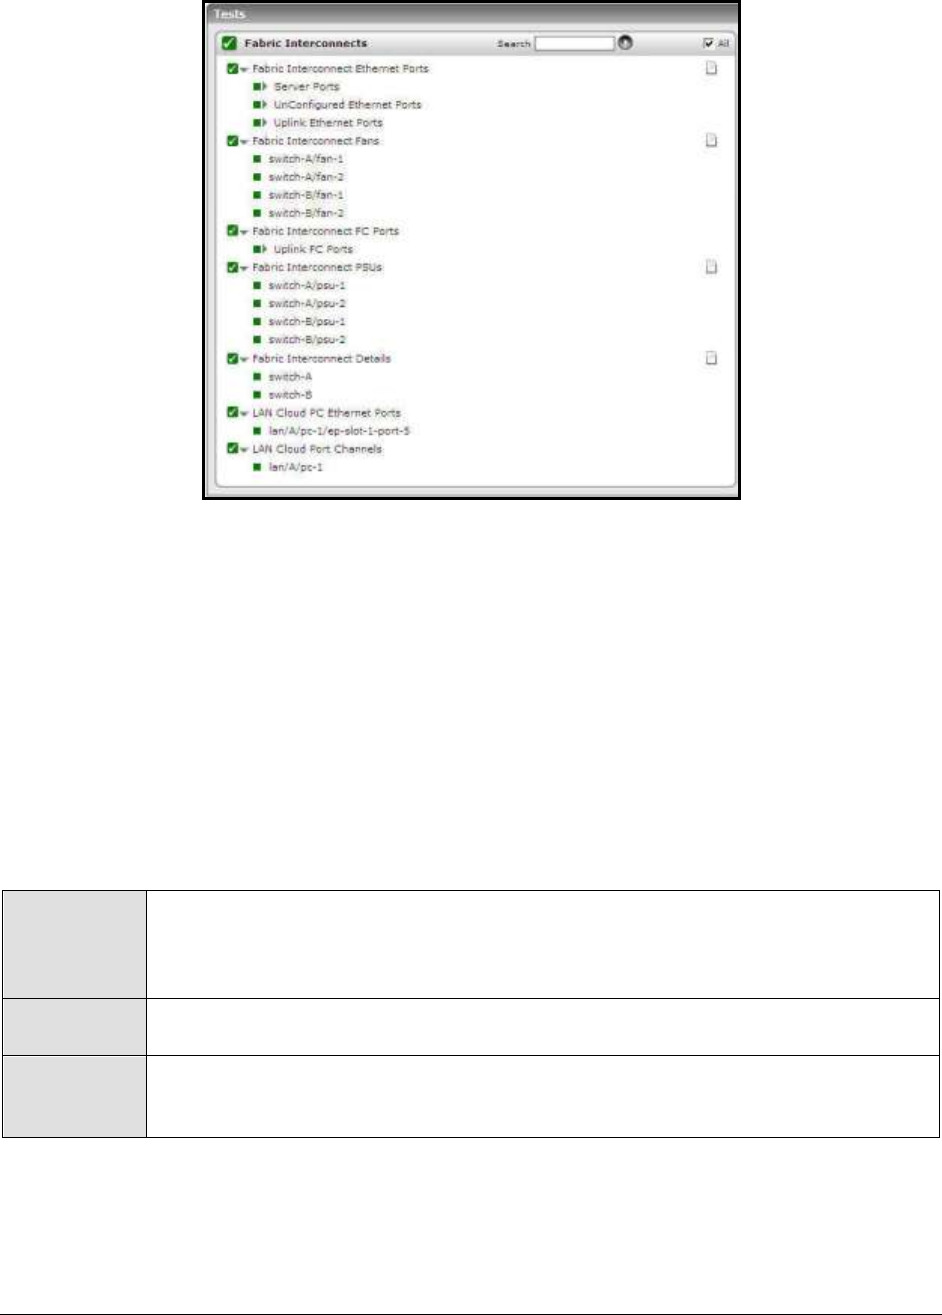
M o n i t o r i n g t h e C i s c o U C S M a n a g e r
71
Figure 12: The tests mapped to the Fabric Interconnects layer
1.3.1 Fabric Interconnect PSUs Test
The Cisco UCS Fabric Interconnects is provided with two front end slots to support Power Supply
Units. The failure of a power supply unit, if not reddressed promptly, can cause short to prolonged
breaks in the availability of the interconnects. Moreover, a sudden yet steep rise in the
power/voltage/current handled by a PSU may not only injure that PSU, but also cause damage to the
associated fabric interconnect. To avoid such adversities, the PSUs supported by each fabric
interconnect should be periodically monitored.
This test monitors the overall health of each PSU supported by every fabric interconnect and promptly
reports abnormalities such as operational issues experienced by the PSUs, critical PSU failures, serious
errors in the power/thermal/voltage state of each PSU, and inexplicable surges in the input
power/voltage/current of a PSU.
Purpose
Monitors the overall health of each PSU supported by every fabric interconnect and
promptly reports abnormalities such as operational issues experienced by the PSUs,
critical PSU failures, serious errors in the power/thermal/voltage state of each PSU,
and inexplicable surges in the input power/voltage/current of a PSU
Target of the
test
A Cisco UCS manager
Agent
deploying the
test
A remote agent

M o n i t o r i n g t h e C i s c o U C S M a n a g e r
72
Configurable
parameters for
the test
1. TESTPERIOD – How often should the test be executed
2. HOST – The IP address of the host for which the test is being configured.
3. PORT – The port at which the specified HOST listens. By default, this is NULL.
4. UCS USER and UCS PASSWORD – Provide the credentials of a user with at least
read-only privileges to the target Cisco UCS manager.
5. CONFIRM PASSWORD- Confirm the password by retyping it here.
6. SSL - By default, the Cisco UCS manager is SSL-enabled. Accordingly, the SSL
flag is set to Yes by default.
7. WEB PORT- By default, in most virtualized environments, Cisco UCS manager
listens on port 80 (if not SSL-enabeld) or on port 443 (if SSL-enabled) only. This
implies that while monitoring Cisco UCS manager, the eG agent, by default,
connects to port 80 or 443, depending upon the SSL-enabled status of Cisco
UCS manager - i.e., if Cisco UCS manager is not SSL-enabled (i.e., if the SSL
flag above is set to No), then the eG agent connects to Cisco UCS manager
using port 80 by default, and if Cisco UCS manager is SSL-enabled (i.e., if the
SSL flag is set to Yes), then the agent-Cisco UCS manager communication
occurs via port 443 by default. Accordingly, the WEBPORT parameter is set to
default by default.
In some environments however, the default ports 80 or 443 might not apply. In
such a case, against the WEBPORT parameter, you can specify the exact port at
which the Cisco UCS manager in your environment listens, so that the eG agent
communicates with that port for collecting metrics from the Cisco UCS manager.
8. DETAILED DIAGNOSIS - To make diagnosis more efficient and accurate, the eG
Enterprise suite embeds an optional detailed diagnostic capability. With this
capability, the eG agents can be configured to run detailed, more elaborate tests
as and when specific problems are detected. To enable the detailed diagnosis
capability of this test for a particular server, choose the On option. To disable
the capability, click on the Off option.
The option to selectively enable/disable the detailed diagnosis capability will be
available only if the following conditions are fulfilled:
The eG manager license should allow the detailed diagnosis capability
Both the normal and abnormal frequencies configured for the detailed
diagnosis measures should not be 0.
Outputs of the
test
One set of results for each PSU in each fabric interconnect managed by the Cisco
UCS manager being monitored
Measurements
made by the
Measurement
Measurement
Unit
Interpretation

M o n i t o r i n g t h e C i s c o U C S M a n a g e r
73
test
Overall status:
Indicates the overall
status of this PSU in
this interconnect.
The States reported by this measure and
their corresponding numeric equivalents are
described in the table below:
Numeric Value
State
0
Unknown
1
Operable
2
Inoperable
3
Degraded
4
Powered-off
5
Power-problem
6
Removed
7
Voltage-problem
8
Thermal-
problem
9
Performance-
problem
10
Accessibility-
problem
11
Identity-
unestablishable
12
Bios-post-
timeout
13
Disabled
51
Fabric-conn-
problem
52
Fabric-
unsupported-
conn
81
Config
82
Equipment-
problem
83
Decommissionin
g
84
Chassis-limit-
exceeded
100
Not-supported
101
Discovery

M o n i t o r i n g t h e C i s c o U C S M a n a g e r
74
102
Discovery-failed
103
Identify
104
Post-failure
105
Upgrade-problem
106
Peer-comm-
problem
107
Auto-upgrade
Note:
By default, this measure reports the above-
mentioned States while indicating the overall
status of a PSU. However, in the graph of
this measure, states will be represented
using their corresponding numeric
equivalents only.
The detailed diagnosis of this measure
provides the Time, ID, PID, Revision, Serial
Number and Vendor attributes of the Fabric
Interconnect PSU.

M o n i t o r i n g t h e C i s c o U C S M a n a g e r
75
Operability:
Indicates the
current operating
state of this PSU in
this fabric
interconnect.
The States reported by this measure and
their corresponding numeric equivalents are
described in the table below:
Numeric Value
State
0
Unknown
1
Operable
2
Inoperable
3
Degraded
4
Powered-off
5
Power-problem
6
Removed
7
Voltage-problem
8
Thermal-problem
9
Performance-
problem
10
Accessibility-
problem
11
Identity-
unestablishable
12
Bios-post-timeout
13
Disabled
51
Fabric-conn-
problem
52
Fabric-
unsupported-
conn
81
Config
82
Equipment-
problem
83
Decommissioning
84
Chassis-limit-
exceeded

M o n i t o r i n g t h e C i s c o U C S M a n a g e r
76
100
Not-supported
101
Discovery
102
Discovery-failed
103
Identify
104
Post-failure
105
Upgrade-
problem
106
Peer-comm-
problem
107
Auto-upgrade
Note:
By default, this measure reports the above-
mentioned States while indicating the
operational state of a PSU. However, in the
graph of this measure, states will be
represented using their corresponding
numeric equivalents only.

M o n i t o r i n g t h e C i s c o U C S M a n a g e r
77
Performance
state:
Indicates the
current
performance state
of this PSU in this
fabric interconnect.
The States reported by this measure and
their corresponding numeric equivalents are
described in the table below:
Numeric Value
State
0
Unknown
1
Ok
2
Upper-non-
recoverable
3
Upper-critical
4
Upper-non-
critical
5
Lower-non-
critical
6
Lower-critical
7
Lower non-
recoverable
100
Not-supported
Note:
By default, this measure reports the above-
mentioned States while indicating the
performance state of a PSU. However, in
the graph of this measure, states will be
represented using their corresponding
numeric equivalents only.

M o n i t o r i n g t h e C i s c o U C S M a n a g e r
78
Power state:
Indicates the
current power state
of this PSU in this
fabric interconnect.
The States reported by this measure and
their corresponding numeric equivalents are
described in the table below:
Numeric
Value
State
0
Unknown
1
On
2
Test
3
Off
4
Online
5
Offline
6
Offduty
7
Degraded
8
Power-save
9
Error
10
Not-supported
Note:
By default, this measure reports the above-
mentioned States while indicating the power
state of a PSU. However, in the graph of
this measure, states will be represented
using their corresponding numeric
equivalents only.

M o n i t o r i n g t h e C i s c o U C S M a n a g e r
79
Presence state:
Indicates the
current state of this
PSU in this fabric
interconnect.
The States reported by this measure and
their corresponding numeric equivalents are
described in the table below:
Numeric Value
State
0
Unknown
1
Empty
10
Equipped
11
Missing
12
Mismatch
13
Equipped-not-
primary
20
Equipped-
identity-
unestablishable
30
Inaccessible
40
Unauthorized
100
Not-supported
Note:
By default, this measure reports the above-
mentioned States while indicating the
current state of a PSU. However, in the
graph of this measure, states will be
represented using their corresponding
numeric equivalents only.

M o n i t o r i n g t h e C i s c o U C S M a n a g e r
80
Thermal state:
Indicates the
current thermal
state of this PSU in
this fabric
interconnect.
The States reported by this measure and
their corresponding numeric equivalents are
described in the table below:
Numeric Value
State
0
Unknown
1
Ok
2
Upper-non-
recoverable
3
Upper-critical
4
Upper-non-
critical
5
Lower-non-
critical
6
Lower-critical
7
Lower non-
recoverable
100
Not-supported
Note:
By default, this measure reports the above-
mentioned States while indicating the
current thermal state of a PSU. However, in
the graph of this measure, states will be
represented using their corresponding
numeric equivalents only.

M o n i t o r i n g t h e C i s c o U C S M a n a g e r
81
Voltage state:
Indicates the
current voltage
state of this PSU in
this fabric
interconnect.
The States reported by this measure and
their corresponding numeric equivalents are
described in the table below:
Numeric Value
State
0
Unknown
1
Ok
2
Upper-non-
recoverable
3
Upper-critical
4
Upper-non-
critical
5
Lower-non-
critical
6
Lower-critical
7
Lower non-
recoverable
100
Not-supported
Note:
By default, this measure reports the above-
mentioned States while indicating the
current voltage state of a PSU. However, in
the graph of this measure, states will be
represented using their corresponding
numeric equivalents only.
Input current:
Indicates the input
current received by
this PSU in this
fabric interconnect.
Amps
An abnormally high or low value of current
may cause severe damage to the Fabric
Interconnect PSUs.
Input power:
Indicates the input
power received by
this PSU in this
fabric interconnect.
Watts
An abnormally high or low value of input
power may cause severe damage to the
Fabric Interconnect PSUs.
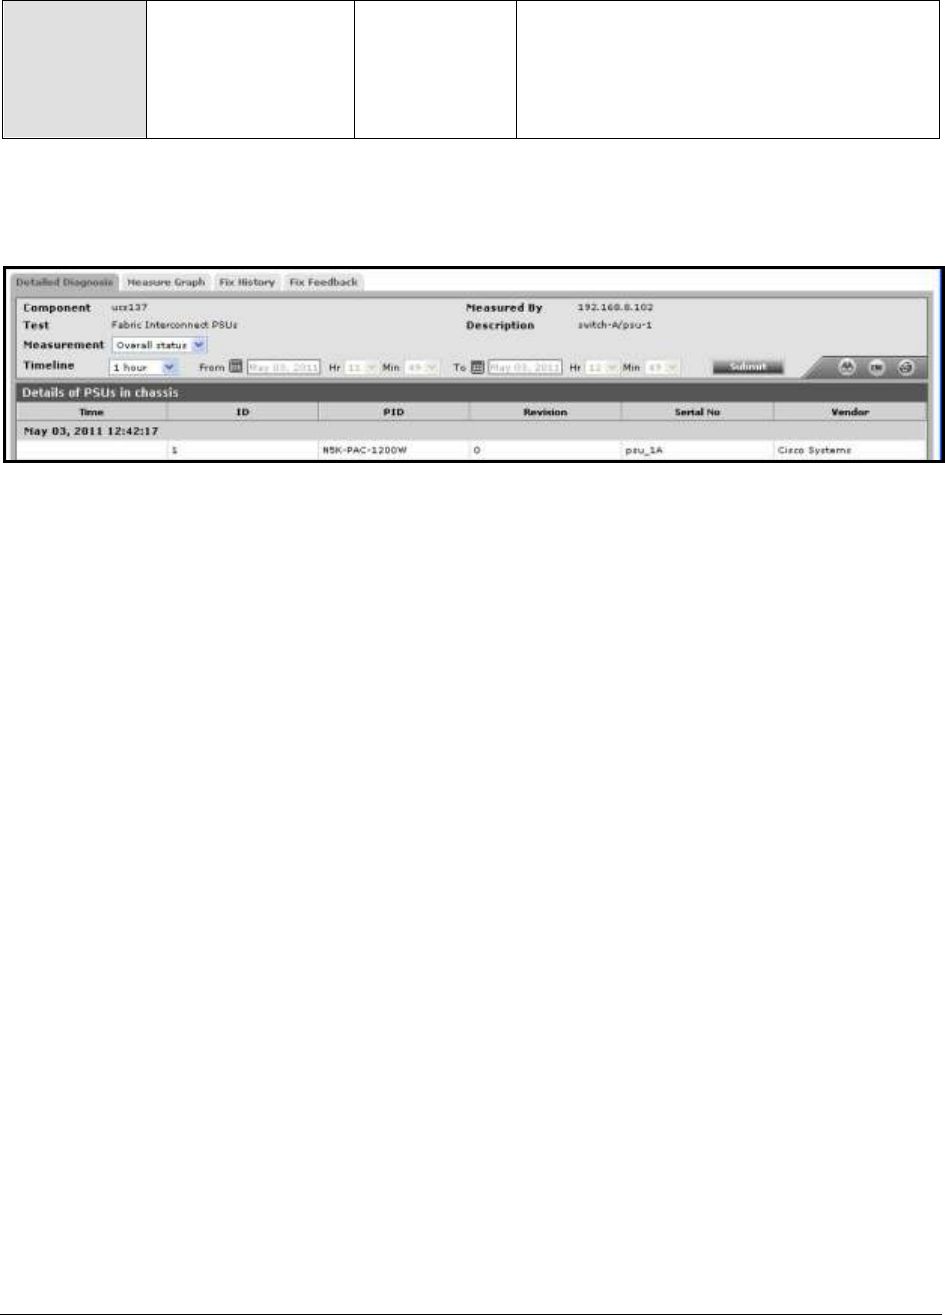
M o n i t o r i n g t h e C i s c o U C S M a n a g e r
82
Input voltage:
Indicates the input
voltage received by
this PSU in this
fabric interconnect.
Volts
An abnormally high or low value of input
voltage may cause severe damage to the
fabric interconnect PSUs.
The detailed diagnosis of the Overall status measure provides the Time, ID, PID, Revision, Serial
Number and Vendor attributes of the fabric interconnect PSU.
Figure 13: The detailed diagnosis of the Overall status measure of the Fabric Interconnect PSUs test
1.3.2 Fabric Interconnect Ethernet Ports Test
The Cisco UCS fabric interconnect includes the following key Ethernet port types:
Server Ports - Server ports handle data traffic between the fabric interconnect and the adapter
cards on the servers. You can only configure server ports on the fixed port module. Expansion
modules do not include server ports.
Uplink Ethernet Ports - Uplink Ethernet ports handle ethernet traffic between the UCS fabric
interconnect and the next layer of the network. All network-bound Ethernet traffic is pinned to
one of these ports. You can configure uplink Ethernet ports on either the fixed module or an
expansion module.
Appliance Ports - The Appliance port is intended for connecting Ethernet-based storage arrays
(such as those serving iSCSI or NFS services) directly to the Fabric Interconnect. By adding
this Appliance port type, you can ensure that any port configured as an Appliance Port will not
be selected to receive broadcast/multicast traffic from the Ethernet fabric, as well as providing
the ability to configure VLAN support on the port independently of the other Uplink ports.
FCoE Storage Ports - The FCoE Storage Port type provides similar functionality as the Appliance
Port type, while extending FCoE protocol support beyond the Fabric Interconnect. Note that
this is not intended for an FCoE connection to another FCF (FCoE Forwarder). Only direct
connection of FCoE storage devices (such as those produced by NetApp and EMC) are
supported. When an Ethernet port is configured as an FCoE Storage Port, traffic is expected to
arrive without a VLAN tag. The Ethernet headers will be stripped away and a VSAN tag will be
added to the FC frame.
In addition, the fabric interconnect supports Monitoring Ethernet Ports, and Ethernet ports that have not
yet been configured to perform any function and are hence still UnConfigured Ethernet Ports.
This test enables you to run frequent health checks on these ports so that, you can quickly identify
non-operational, overloaded, or slow ports. Whenever ethernet traffic slows down, you can use this

M o n i t o r i n g t h e C i s c o U C S M a n a g e r
83
information to figure out which ethernet port is responsible for it. Moreover, in times of heavy traffic,
this information will enable you to decide whether additional ports need to be configured using the
expansion module for handling the load.
Purpose
Enables you to run frequent health checks on different types of ethernet ports so
that, you can quickly identify non-operational, overloaded, or slow ports
Target of the
test
A Cisco UCS manager
Agent
deploying the
test
A remote agent

M o n i t o r i n g t h e C i s c o U C S M a n a g e r
84
Configurable
parameters for
the test
1. TESTPERIOD – How often should the test be executed
2. HOST – The IP address of the host for which the test is being configured.
3. PORT – The port at which the specified HOST listens. By default, this is NULL.
4. UCS USER and UCS PASSWORD – Provide the credentials of a user with at least
read-only privileges to the target Cisco UCS manager.
5. CONFIRM PASSWORD- Confirm the password by retyping it here.
6. SSL - By default, the Cisco UCS manager is SSL-enabled. Accordingly, the SSL
flag is set to Yes by default.
7. WEB PORT- By default, in most virtualized environments, Cisco UCS manager
listens on port 80 (if not SSL-enabeld) or on port 443 (if SSL-enabled) only. This
implies that while monitoring Cisco UCS manager, the eG agent, by default,
connects to port 80 or 443, depending upon the SSL-enabled status of Cisco
UCS manager - i.e., if Cisco UCS manager is not SSL-enabled (i.e., if the SSL
flag above is set to No), then the eG agent connects to Cisco UCS manager
using port 80 by default, and if Cisco UCS manager is SSL-enabled (i.e., if the
SSL flag is set to Yes), then the agent-Cisco UCS manager communication
occurs via port 443 by default. Accordingly, the WEBPORT parameter is set to
default by default.
In some environments however, the default ports 80 or 443 might not apply. In
such a case, against the WEBPORT parameter, you can specify the exact port at
which the Cisco UCS manager in your environment listens, so that the eG agent
communicates with that port for collecting metrics from the Cisco UCS manager.
8. SHOW OVERALL STATUS - By default, regardless of the Administrative state of
an Ethernet port, this test reports the Overall status of that port. In other
words, by default, this test reports the Overall status measure for an Ethernet
port, even if the Administrative state of that port is Disabled. This is because,
the SHOW OVERALL STATUS flag is set to Yes by default. If this flag is set to No
instead, then this test will report the Overall status of only those Ethernet ports
that are currently in an Enabled Administrative state.
9. DETAILED DIAGNOSIS - To make diagnosis more efficient and accurate, the eG
Enterprise suite embeds an optional detailed diagnostic capability. With this
capability, the eG agents can be configured to run detailed, more elaborate tests
as and when specific problems are detected. To enable the detailed diagnosis
capability of this test for a particular server, choose the On option. To disable
the capability, click on the Off option.
The option to selectively enable/disable the detailed diagnosis capability will be
available only if the following conditions are fulfilled:
The eG manager license should allow the detailed diagnosis capability
Both the normal and abnormal frequencies configured for the detailed
diagnosis measures should not be 0.
Outputs of the
test
One set of results for each ethernet port managed by the Cisco UCS manager being
monitored
Measurements
made by the
Measurement
Measurement
Unit
Interpretation

M o n i t o r i n g t h e C i s c o U C S M a n a g e r
85
test
Administrative
state:
Indicates the
current
administrative
status of this uplink
ethernet port in this
fabric interconnect.
This measure reports either Enabled or
Disabled as the administrative status of the
Fabric Interconnect Uplink Ethernet ports.
The states and their corresponding numeric
equivalents are shown in the table below:
Numeric Value
State
1
Enabled
2
Disabled
Note:
By default, this measure reports the above-
mentioned States while indicating the
administrative status of a Fabric
Interconnect Uplink Ethernet port.
However, in the graph of this measure,
states will be represented using their
numeric equivalents only - i.e., 1 or 2.

M o n i t o r i n g t h e C i s c o U C S M a n a g e r
86
Overall status:
Indicates the overall
status of this uplink
ethernet port in this
fabric interconnect.
The States reported by this measure and
their corresponding numeric equivalents are
described in the table below:
Numeric Value
State
0
Indeterminate
1
Up
2
Admin-down
3
Link-down
4
Failed
5
No-license
6
Link-up
7
Hardware-failure
8
Software-failure
9
Error-disabled
10
Sfp-not-present
Note:
By default, this measure reports the above-
mentioned states while indicating the
overall status of an uplink ethernet port.
However, in the graph of this measure,
states will be represented using their
corresponding numeric equivalents only.
The detailed diagnosis of this measure
provides the Time, ID, Slot ID, Port Type,
Role Type, Transport Type, Network Type,
MAC and Mode attributes for the ethernet
ports.

M o n i t o r i n g t h e C i s c o U C S M a n a g e r
87
Operational
speed:
Indicates the
current operating
speed of this uplink
ethernet port in this
fabric interconnect.
The values reported by this measure and
their corresponding numeric equivalents are
described in the table below:
Numeric Value
Measure Value
0
Indeterminate
1
1Gbps
2
10Gbps
3
20Gbps
4
40Gbps
Note:
By default, this measure reports the above-
mentioned Measure Values while indicating
the operational speed of an uplink ethernet
port. However, in the graph of this
measure, the speed will be represented
using the corresponding numeric
equivalents only.
Broadcast packets
received:
Indicates the
number of
broadcast packets
received by this
uplink ethernet port
during the last
measurement
period .
Number
In computer networking, broadcasting
refers to transmitting a packet that will be
received by every device on the network.
Broadcasting can be performed as a high
level operation in a program, for example
broadcasting Message Passing Interface, or
it may be a low level networking operation,
for example broadcasting on Ethernet.
Comparing the value of these measures
across all the uplink ethernet ports will
point you to that port which is handling the
maximum broadcast traffic.
Broadcast packets
transmitted:
Indicates the
number of
broadcast packets
transmitted by this
uplink ethernet port
during the last
measurement
period.
Number

M o n i t o r i n g t h e C i s c o U C S M a n a g e r
88
Jumbo packets
received:
Indicates the
number of jumbo
packets received by
this uplink ethernet
port during the last
measurement
period.
Number
In computer networking, jumbo frames are
Ethernet frames with more than 1500 bytes
of payload. Conventionally, jumbo frames
can carry up to 9000 bytes of payload, but
variations may exist.
In the event of a network slowdown, you
can compare the value of these measures
across all the uplink ethernet ports to
quickly isolate the port that is overloaded
with jumbo packets.
Jumbo packets
transmitted:
Indicates the
number of jumbo
packets transmitted
by this uplink
ethernet port during
the last
measurement
period.
Number
Multicast packets
received:
Indicates the
number of
multipcast packets
received by this
uplink ethernet port
during the last
measurement
period.
Number
In computer networking, multicast is the
delivery of a message or information to a
group of destination computers
simultaneously in a single transmission
from the source creating copies
automatically in other network elements,
such as routers, only when the topology of
the network requires it.
In the event of a network slowdown, you
can compare the value of these measures
across all the uplink ethernet ports to
quickly isolate the port that is overloaded
with multicast packets.
Multicast packets
transmitted:
Indicates the
number of
multipcast packets
sent by this uplink
ethernet port during
the last
measurement
period.
Number
Data received:
Indicates the
amount of data
received by this
uplink ethernet port
during the last
measurement
period.
MB
Compare the value of these measures
across all ethernet ports to determine which
port is handling the maximum data traffic.

M o n i t o r i n g t h e C i s c o U C S M a n a g e r
89
Data transmitted:
Indicates the
amount of data
transmitted by this
uplink ethernet port
during the last
measurement
period.
MB
Packets received:
Indicates the
number of packets
received by this
uplink ethernet port
during the last
measurement
period.
Number
Compare the value of these measures
across all ethernet ports to determine which
port is handling the maximum packet
traffic.
Packets
transmitted:
Indicates the
number of packets
transmitted by this
uplink ethernet port
during the last
measurement
period.
Number
Unicast packets
received:
Indicates the
number of unicast
packets received by
this uplink ethernet
port during the last
measurement
period.
Number
Unicast is the term used to describe
communication where a piece of
information is sent from one point to
another point. In this case there is just one
sender, and one receiver.
Compare the value of these measures
across all ethernet ports to determine which
port is handling the maximum unicast
packet traffic.
Unicast packets
transmitted:
Indicates the
number of unicast
packets transmitted
by this uplink
ethernet port during
the last
measurement
period.
Number
The detailed diagnosis of the Overall status measure provides the Time, ID, Slot ID, Port Type, Role
Type, Transport Type, Network Type, MAC and Mode attributes for the ethernet ports.
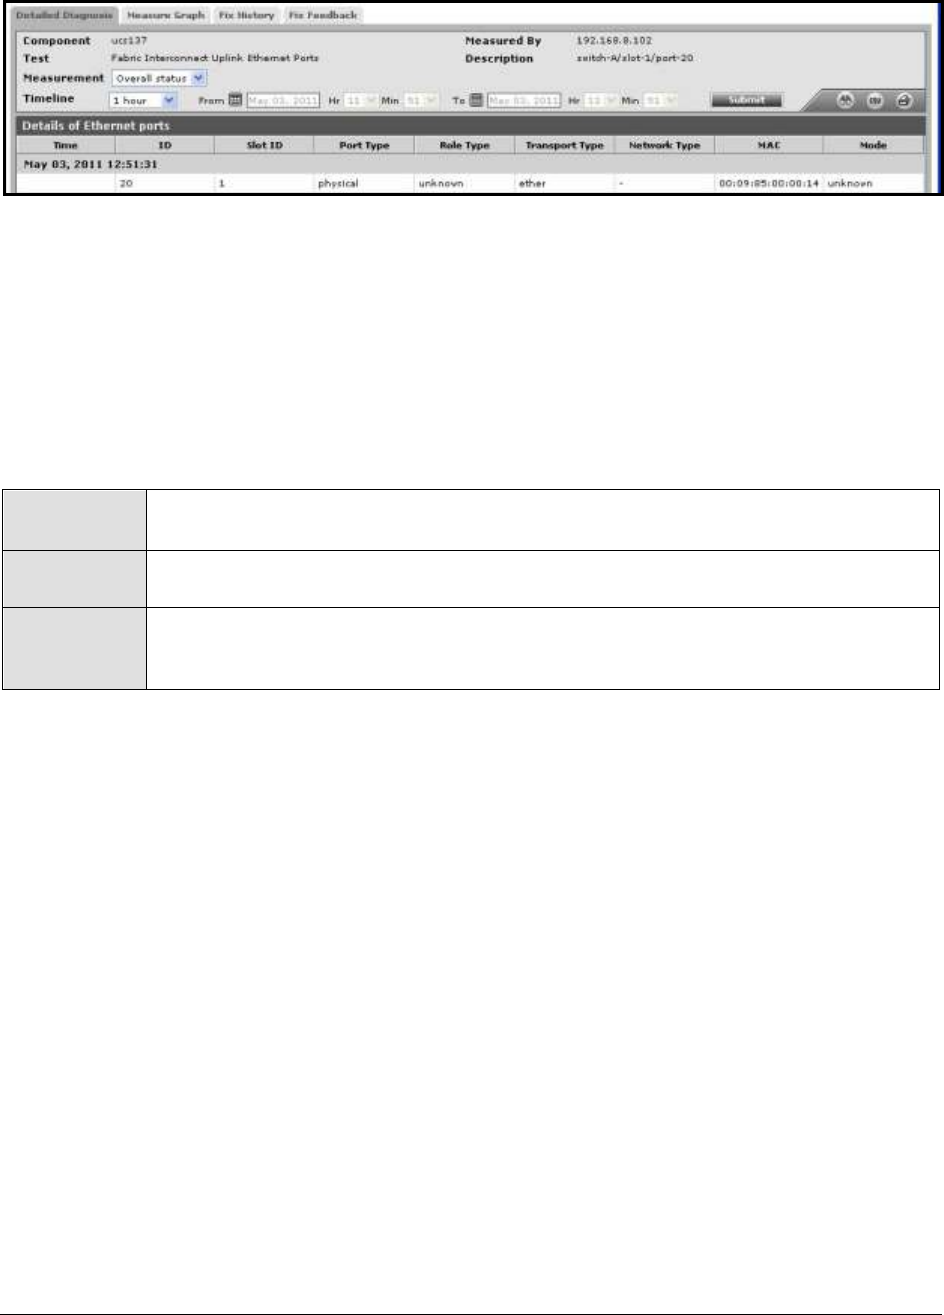
M o n i t o r i n g t h e C i s c o U C S M a n a g e r
90
Figure 14: The detailed diagnosis of the Overall status measure of the Fabric Interconnect Uplink Ethernet Ports test
1.3.3 Fabric Interconnect Fans Test
The Cisco UCS Fabric Interconnects comprise of two slots on the front of the chassis for fan modules.
Each fan module houses six fans. The combination of six fans for each module and two modules
provides the chassis with 12 fans. Use this test to closely monitor the availability, overall health, and
performance of each of these fans and report anomalies so that, you can promptly initiate measures
to ensure that adequate air flow is available in the fabric interconnects.
Purpose
Closely monitors the availability, overall health, and performance of each of the
fans in the fabric interconnects and reports anomalies
Target of the
test
A Cisco UCS manager
Agent
deploying the
test
A remote agent

M o n i t o r i n g t h e C i s c o U C S M a n a g e r
91
Configurable
parameters for
the test
1. TESTPERIOD – How often should the test be executed
2. HOST – The IP address of the host for which the test is being configured.
3. PORT – The port at which the specified HOST listens. By default, this is NULL.
4. UCS USER and UCS PASSWORD – Provide the credentials of a user with at least
read-only privileges to the target Cisco UCS manager.
5. CONFIRM PASSWORD- Confirm the password by retyping it here.
6. SSL - By default, the Cisco UCS manager is SSL-enabled. Accordingly, the SSL
flag is set to Yes by default.
7. WEB PORT- By default, in most virtualized environments, Cisco UCS manager
listens on port 80 (if not SSL-enabeld) or on port 443 (if SSL-enabled) only. This
implies that while monitoring Cisco UCS manager, the eG agent, by default,
connects to port 80 or 443, depending upon the SSL-enabled status of Cisco
UCS manager - i.e., if Cisco UCS manager is not SSL-enabled (i.e., if the SSL
flag above is set to No), then the eG agent connects to Cisco UCS manager
using port 80 by default, and if Cisco UCS manager is SSL-enabled (i.e., if the
SSL flag is set to Yes), then the agent-Cisco UCS manager communication
occurs via port 443 by default. Accordingly, the WEBPORT parameter is set to
default by default.
In some environments however, the default ports 80 or 443 might not apply. In
such a case, against the WEBPORT parameter, you can specify the exact port at
which the Cisco UCS manager in your environment listens, so that the eG agent
communicates with that port for collecting metrics from the Cisco UCS manager.
8. DETAILED DIAGNOSIS - To make diagnosis more efficient and accurate, the eG
Enterprise suite embeds an optional detailed diagnostic capability. With this
capability, the eG agents can be configured to run detailed, more elaborate tests
as and when specific problems are detected. To enable the detailed diagnosis
capability of this test for a particular server, choose the On option. To disable
the capability, click on the Off option.
The option to selectively enable/disable the detailed diagnosis capability will be
available only if the following conditions are fulfilled:
The eG manager license should allow the detailed diagnosis capability
Both the normal and abnormal frequencies configured for the detailed
diagnosis measures should not be 0.
Outputs of the
test
One set of results for each fan in each fabric interconnect managed by the Cisco
UCS manager being monitored
Measurements
made by the
Measurement
Measurement
Unit
Interpretation

M o n i t o r i n g t h e C i s c o U C S M a n a g e r
92
test
Overall status:
Indicates the overall
status of this fan in
this fabric
interconnect.
The States reported by this measure and
their corresponding numeric equivalents are
described in the table below:
Numeric Value
State
0
Unknown
1
Operable
2
Inoperable
3
Degraded
4
Powered-off
5
Power-
problem
6
Removed
7
Voltage-
problem
8
Thermal-
problem
9
Performance-
problem
10
Accessibility-
problem
11
Identity-
unestablishabl
e
12
Bios-post-
timeout
13
Disabled
51
Fabric-conn-
problem
52
Fabric-
unsupported-
conn
81
Config
82
Equipment-
problem
83
Decommissioni
ng
84
Chassis-limit-
exceeded
100
Not-supported
101
Discovery

M o n i t o r i n g t h e C i s c o U C S M a n a g e r
93
102
Discovery-failed
103
Identify
104
Post-failure
105
Upgrade-problem
106
Peer-comm-
problem
107
Auto-upgrade
Note:
By default, this measure reports the above-
mentioned States while indicating the overall
status of a fan. However, in the graph of
this measure, states will be represented
using their corresponding numeric
equivalents only.
The detailed diagnosis of this measure
provides the Time, ID, PID, Module,
Revision, Serial Number, Tray and Vendor
attributes for each fan in the fabric
interconnect.

M o n i t o r i n g t h e C i s c o U C S M a n a g e r
94
Operability:
Indicates the
current operating
state of this fan in
this fabric
interconnect.
The States reported by this measure and
their corresponding numeric equivalents are
described in the table below:
Numeric Value
State
0
Unknown
1
Operable
2
Inoperable
3
Degraded
4
Powered-off
5
Power-problem
6
Removed
7
Voltage-problem
8
Thermal-problem
9
Performance-
problem
10
Accessibility-
problem
11
Identity-
unestablishable
12
Bios-post-timeout
13
Disabled
51
Fabric-conn-
problem
52
Fabric-
unsupported-
conn
81
Config
82
Equipment-
problem
83
Decommissioning
84
Chassis-limit-
exceeded

M o n i t o r i n g t h e C i s c o U C S M a n a g e r
95
100
Not-supported
101
Discovery
102
Discovery-failed
103
Identify
104
Post-failure
105
Upgrade-
problem
106
Peer-comm-
problem
107
Auto-upgrade
Note:
By default, this measure reports the above-
mentioned States while indicating the
operational state of a fan. However, in the
graph of this measure, states will be
represented using their corresponding
numeric equivalents only.

M o n i t o r i n g t h e C i s c o U C S M a n a g e r
96
Performance
state:
Indicates the
current
performance state
of this fan in this
fabric interconnect.
The States reported by this measure and
their corresponding numeric equivalents are
described in the table below:
Numeric Value
State
0
Unknown
1
Ok
2
Upper-non-
recoverable
3
Upper-critical
4
Upper-non-
critical
5
Lower-non-
critical
6
Lower-critical
7
Lower non-
recoverable
100
Not-supported
Note:
By default, this measure reports the above-
mentioned States while indicating the
performance state of a fan. However, in the
graph of this measure, states will be
represented using their corresponding
numeric equivalents only.

M o n i t o r i n g t h e C i s c o U C S M a n a g e r
97
Power state:
Indicates the
current power state
of this fan in this
fabric interconnect.
The States reported by this measure and
their corresponding numeric equivalents are
described in the table below:
Numeric
Value
State
0
Unknown
1
On
2
Test
3
Off
4
Online
5
Offline
6
Offduty
7
Degraded
8
Power-save
9
Error
10
Not-supported
Note:
By default, this measure reports the above-
mentioned States while indicating the power
state of a fan. However, in the graph of this
measure, states will be represented using
their corresponding numeric equivalents
only.

M o n i t o r i n g t h e C i s c o U C S M a n a g e r
98
Presence state:
Indicates the
current state of this
fan in this fabric
interconnect.
The States reported by this measure and
their corresponding numeric equivalents are
described in the table below:
Numeric Value
State
0
Unknown
1
Empty
10
Equipped
11
Missing
12
Mismatch
13
Equipped-not-
primary
20
Equipped-
identity-
unestablishable
30
Inaccessible
40
Unauthorized
100
Not-supported
Note:
By default, this measure reports the above-
mentioned States while indicating the
current state of a fan. However, in the
graph of this measure, states will be
represented using their corresponding
numeric equivalents only.

M o n i t o r i n g t h e C i s c o U C S M a n a g e r
99
Thermal state:
Indicates the
current thermal
state of this fan in
this fabric
interconnect.
The States reported by this measure and
their corresponding numeric equivalents are
described in the table below:
Numeric Value
State
0
Unknown
1
Ok
2
Upper-non-
recoverable
3
Upper-critical
4
Upper-non-
critical
5
Lower-non-
critical
6
Lower-critical
7
Lower non-
recoverable
100
Not-supported
Note:
By default, this measure reports the above-
mentioned States while indicating the
current thermal state of a fan. However, in
the graph of this measure, states will be
represented using their corresponding
numeric equivalents only.
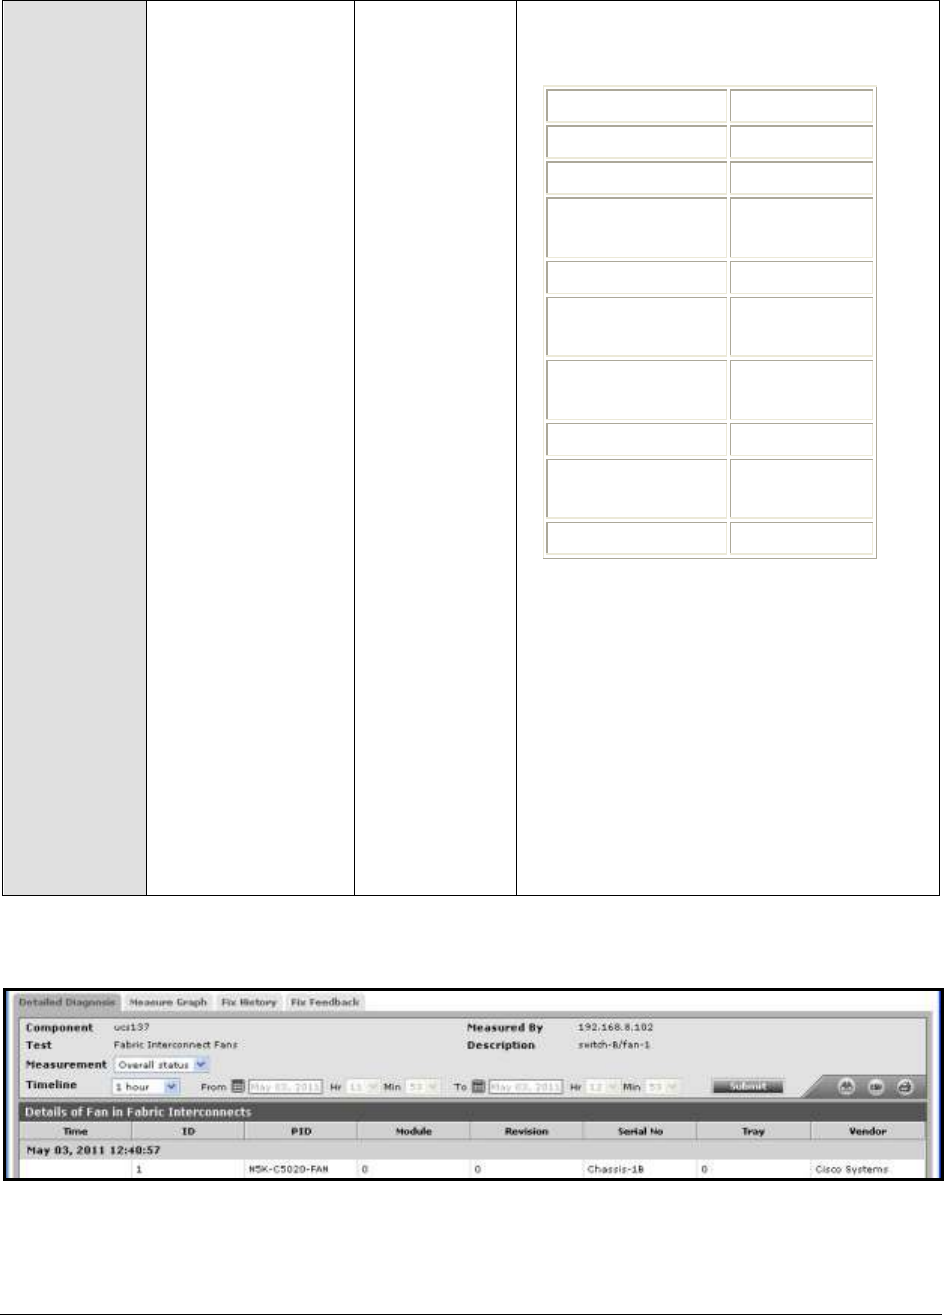
M o n i t o r i n g t h e C i s c o U C S M a n a g e r
100
Voltage state:
Indicates the
current voltage
state of this fan in
this fabric
interconnect.
The States reported by this measure and
their corresponding numeric equivalents are
described in the table below:
Numeric Value
State
0
Unknown
1
Ok
2
Upper-non-
recoverable
3
Upper-critical
4
Upper-non-
critical
5
Lower-non-
critical
6
Lower-critical
7
Lower non-
recoverable
100
Not-supported
Note:
By default, this measure reports the above-
mentioned States while indicating the
current voltage state of a fan. However, in
the graph of this measure, states will be
represented using their corresponding
numeric equivalents only.
The detailed diagnosis of the Overall status measure provides the Time, ID, PID, Module, Revision,
Serial Number, Tray and Vendor attributes for each fan in the fabric interconnect.
Figure 15: The detailed diagnosis of the Overall status measure of the Fabric Interconnect Fans test

M o n i t o r i n g t h e C i s c o U C S M a n a g e r
101
1.3.4 Fabric Interconnect FC Ports Test
The Cisco UCS fabric interconnect includes the following key Fibre Channel (FC) port types:
Uplink FC Ports : Uplink Fibre Channel ports handle FCoE traffic between the fabric interconnect
and the next layer of the network. All network-bound FCoE traffic is pinned to one of these
ports. If one/more of these ports are not operable or a traffic congestion occurs on any of
these ports, then, significant latencies can be noticed in the FCoE communication between the
corresponding interconnect and the network. To avoid this, you need to constantly observe the
operational status, overall health, and the traffic flowing to and from each of the FC ports on
every fabric interconnect, spot abnormalities quickly, and fix them before it is too late. This
test enables you to do just that.
Storage FC Ports : The Storage FC Port type allows for the direct attachment of a FC storage
device to one of the native FC ports on the Fabric Interconnect expansion modules. Like the
FCoE Storage Port type, the FC frames arriving on these ports are expected to be un-tagged –
so no connection to an MDS FC switch, etc. Each Storage FC Port is assigned a VSAN number
to keep the traffic separated within the UCS Unified Fabric. When used in this way, the Fabric
Interconnect is not providing any FC zoning configuration capabilities – all devices within a
particular VSAN will be allowed, at least at the FC switching layer (FC2), to communicate with
each other.
In addition, the fabric interconnect supports Monitoring FC Ports, and FC ports that have not yet been
configured to perform any function and are hence still UnConfigured FC Ports.
The test runs frequent health checks on each of the FC ports in every fabric interconnect, and turns
the spotlight on overloaded ports, non-operational ports, and ports that are operating at a slow pace.
Purpose
Runs frequent health checks on each of the FC ports in every fabric interconnect,
and turns the spotlight on overloaded ports, non-operational ports, and ports that
are operating at a slow pace
Target of the
test
A Cisco UCS manager
Agent
deploying the
test
A remote agent

M o n i t o r i n g t h e C i s c o U C S M a n a g e r
102
Configurable
parameters for
the test
1. TESTPERIOD – How often should the test be executed
2. HOST – The IP address of the host for which the test is being configured.
3. PORT – The port at which the specified HOST listens. By default, this is NULL.
4. UCS USER and UCS PASSWORD – Provide the credentials of a user with at least
read-only privileges to the target Cisco UCS manager.
5. CONFIRM PASSWORD- Confirm the password by retyping it here.
6. SSL - By default, the Cisco UCS manager is SSL-enabled. Accordingly, the SSL
flag is set to Yes by default.
7. WEB PORT- By default, in most virtualized environments, Cisco UCS manager
listens on port 80 (if not SSL-enabeld) or on port 443 (if SSL-enabled) only. This
implies that while monitoring Cisco UCS manager, the eG agent, by default,
connects to port 80 or 443, depending upon the SSL-enabled status of Cisco
UCS manager - i.e., if Cisco UCS manager is not SSL-enabled (i.e., if the SSL
flag above is set to No), then the eG agent connects to Cisco UCS manager
using port 80 by default, and if Cisco UCS manager is SSL-enabled (i.e., if the
SSL flag is set to Yes), then the agent-Cisco UCS manager communication
occurs via port 443 by default. Accordingly, the WEBPORT parameter is set to
default by default.
In some environments however, the default ports 80 or 443 might not apply. In
such a case, against the WEBPORT parameter, you can specify the exact port at
which the Cisco UCS manager in your environment listens, so that the eG agent
communicates with that port for collecting metrics from the Cisco UCS manager.
8. SHOW OVERALL STATUS - By default, regardless of the Administrative state of
an FC Port, this test reports the Overall status of that port. In other words, by
default, this test reports the Overall status measure for an FC port, even if the
Administrative state of that port is Disabled. This is because, the SHOW
OVERALL STATUS flag is set to Yes by default. If this flag is set to No instead,
then this test will report the Overall status of only those FC ports that are
currently in an Enabled Administrative state.
9. DETAILED DIAGNOSIS - To make diagnosis more efficient and accurate, the eG
Enterprise suite embeds an optional detailed diagnostic capability. With this
capability, the eG agents can be configured to run detailed, more elaborate tests
as and when specific problems are detected. To enable the detailed diagnosis
capability of this test for a particular server, choose the On option. To disable
the capability, click on the Off option.
The option to selectively enable/disable the detailed diagnosis capability will be
available only if the following conditions are fulfilled:
The eG manager license should allow the detailed diagnosis capability
Both the normal and abnormal frequencies configured for the detailed
diagnosis measures should not be 0.
Outputs of the
test
One set of results for each FC port in every fabric interconnect managed by the
Cisco UCS manager being monitored
Measurements
made by the
Measurement
Measurement
Unit
Interpretation

M o n i t o r i n g t h e C i s c o U C S M a n a g e r
103
test
Administrative
state:
Indicates the
current
administrative
status of this FC
port in this fabric
interconnect.
This measure reports either Enabled or
Disabled as the administrative status a
port. The states and their corresponding
numeric equivalents are shown in the table
below:
Numeric Value
State
1
Enabled
2
Disbled
Note:
By default, this measure reports the above-
mentioned States while indicating the
administrative status of an FC port.
However, in the graph of this measure,
states will be represented using their
numeric equivalents only - i.e., 1 or 2.

M o n i t o r i n g t h e C i s c o U C S M a n a g e r
104
Overall status:
Indicates the overall
status of this FC
port in this fabric
interconnect.
The States reported by this measure and
their corresponding numeric equivalents are
described in the table below:
Numeric Value
State
0
Indeterminate
1
Up
2
Admin-down
3
Link-down
4
Failed
5
No-license
6
Link-up
7
Hardware-failure
8
Software-failure
9
Error-disabled
10
Sfp-not-present
Note:
By default, this measure reports the above-
mentioned states while indicating the
overall status of an FC port. However, in
the graph of this measure, states will be
represented using their corresponding
numeric equivalents only.
The detailed diagnosis of this measure
provides the Time, ID, Slot ID, Port Type,
Network Type, Transport Type, WWPN and
Mode attributes for each FC port.

M o n i t o r i n g t h e C i s c o U C S M a n a g e r
105
Negotiated speed:
Indicates the
current operating
speed of this FC
port in this fabric
interconnect.
The values reported by this measure and
their corresponding numeric equivalents are
described in the table below:
Numeric Value
Measure Value
0
Indeterminate
1
1Gbps
2
10Gbps
Note:
By default, this measure reports the above-
mentioned Measure Values while indicating
the operational speed of an FC port.
However, in the graph of this measure, the
speed will be represented using the
corresponding numeric equivalents only.
Data received:
Indicates the
amount of data
received by this FC
port during the last
measurement
period.
MB
Compare the value of these measures
across all FC ports to determine which port
is handling the maximum data traffic.
Data transmitted:
Indicates the
amount of data sent
by this FC port
during the last
measurement
period.
MB
Packets received:
Indicates the
number of packets
received by this FC
port during the last
measurement
period.
Number
Compare the value of these measures
across all FC ports to determine which port
is handling the maximum packet traffic.

M o n i t o r i n g t h e C i s c o U C S M a n a g e r
106
Packets
transmitted:
Indicates the
number of packets
transmitted by this
FC port during the
last measurement
period.
Number
Crc received:
Indicates the
number of Cyclic
Redundancy Check
(CRC) errors that
occurred during
data trafficking in
this FC port, during
the last
measurement
period.
Errors
CRC or Cyclic Redundancy Check is a
process that helps in identifying any errors
that might occur during the data
transmission process. Data is usually
transmitted in small blocks, and a CRC
value is assigned to each block and
transmitted along with it. This CRC value is
verified at the destination to ensure that it
matches the CRC value transmitted from
the source. A CRC error occurs when the
two values (source and destination) do not
match and the test fails. The main benefit
of CRC is that it helps you ensure that data
you have received or downloaded is not
damaged or corrupt.
By comparing the value of this measure
across all FC ports, you can accurately
identify most error-prone FC port.

M o n i t o r i n g t h e C i s c o U C S M a n a g e r
107
Error received:
Indicates the total
number of errors
received by this FC
port during the last
measurement
period.
Errors
Error transmitted:
Indicates the total
number of errors
transmitted by this
FC port during the
last measurement
period.
Errors
Discard error
received:
Indicates the total
amount of data that
was discarded
during reception of
data by this FC port
since the last
measurement
period.
MB
Discard error
transmitted:
Indicates the total
amount of data that
was discarded
during data
transmission
through this FC port
since the last
measurement
period.
MB
Too long error
received:
Indicates the total
number of errors
that occurred when
data of a large size
was received by this
FC port during the
last measurement
period.
Errors
Ideally, the value of this measure should be
low. A high value is indicative of many
errors during data reception. To identify the
most error-prone port, compare the value
of this measure across FC ports.

M o n i t o r i n g t h e C i s c o U C S M a n a g e r
108
Too short error
received:
Indicates the total
number of errors
that occurred due to
truncated or corrupt
data received by
this FC port during
the last
measurement
period.
Errors
Ideally, the value of this measure should be
low. A high value is indicative of many
errors during data transmission. To identify
the most error-prone port, compare the
value of this measure across FC ports.
Signal losses:
Indicates the signal
losses that occurred
on this FC port
during data
transmission and
reception in the last
measurement
period.
Errors
Ideally, the value of this measure should be
0.
Synchronize
losses:
Indicates the losses
that occurred due to
synchronization of
this FC port with
other components
during the last
measurement
period.
Errors
Ideally, the value of this measure should be
0.
Link failures:
Indicates the link
failures that
occurred between
this FC port blade
server chassis
during the last
measurement
period.
Errors
Ideally, the value of this measure should be
0.
The detailed diagnosis of the Overall status measure provides the Time, ID, Slot ID, Port Type,
Network Type, Transport Type, WWPN and Mode attributes for each FC port.
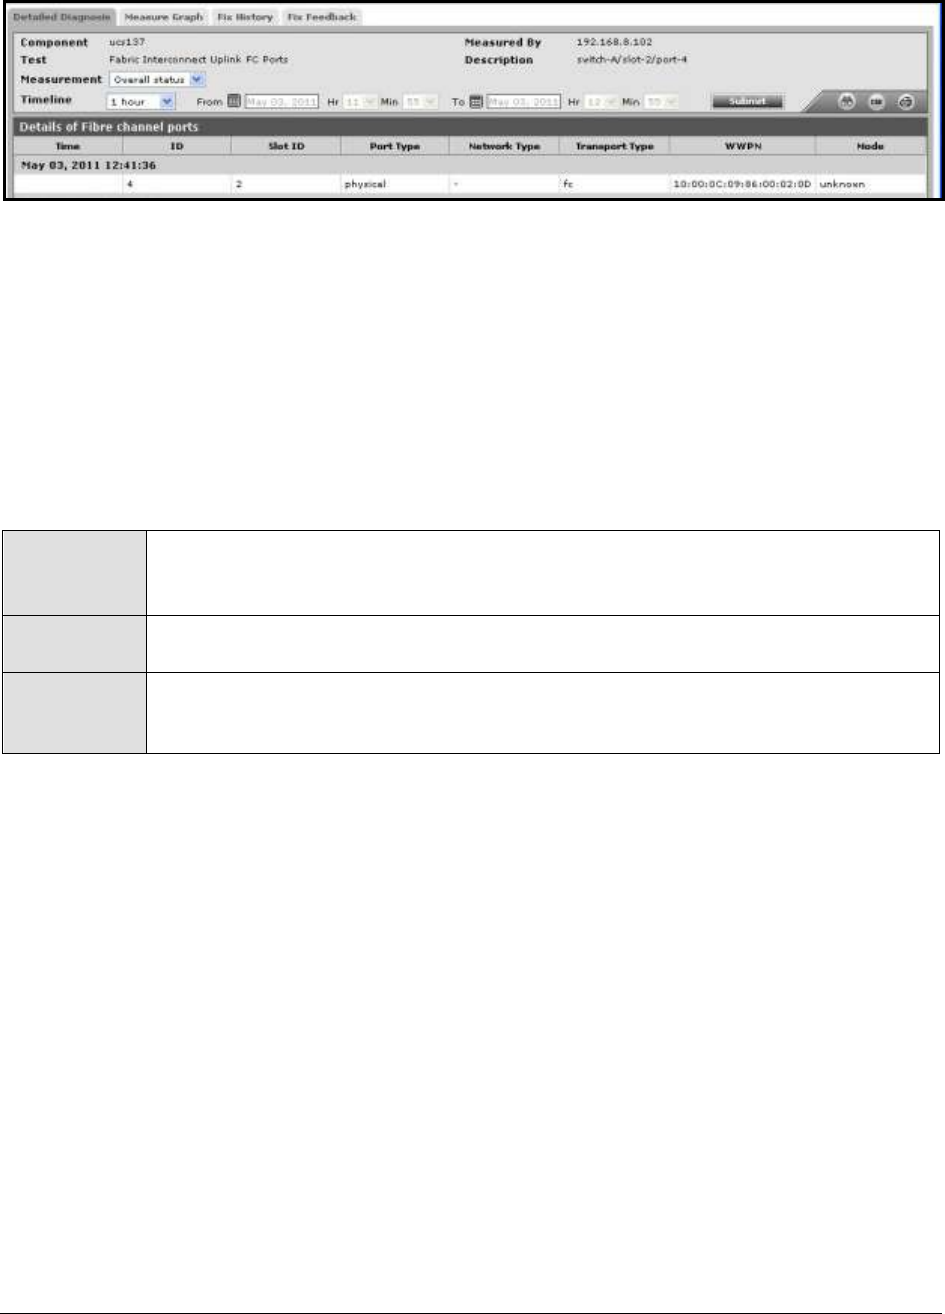
M o n i t o r i n g t h e C i s c o U C S M a n a g e r
109
Figure 16: The detailed diagnosis of the Fabric Interconnect Uplink FC Ports test
1.3.5 Fabric Interconnect Details Test
Since fabric interconnects provide both network connectivity and management capabilities for the
Cisco UCS system, an inoperable or resource-intensive fabric interconnect can shake the
communication backbone for the blade servers and the blade server chassis of the system. Likewise,
real and potential threats to the health of the interconnect hardware (eg., PSUs, mainboards, fans)
can also result in significant latencies in network traffic flow over the interconnects. With the help of
this test, you can keep track of the operational status and resource usage of the fabric interconnects,
and also be alerted to sudden spikes in the temperature of the PSUs, mainboards, and fans supported
by each interconnect.
Purpose
With the help of this test, you can keep track of the operational status and resource
usage of the fabric interconnects, and also be alerted to sudden spikes in the
temperature of the PSUs, mainboards, and fans supported by each interconnect
Target of the
test
A Cisco UCS manager
Agent
deploying the
test
A remote agent

M o n i t o r i n g t h e C i s c o U C S M a n a g e r
110
Configurable
parameters for
the test
1. TESTPERIOD – How often should the test be executed
2. HOST – The IP address of the host for which the test is being configured.
3. PORT – The port at which the specified HOST listens. By default, this is NULL.
4. UCS USER and UCS PASSWORD – Provide the credentials of a user with at least
read-only privileges to the target Cisco UCS manager.
5. CONFIRM PASSWORD- Confirm the password by retyping it here.
6. SSL - By default, the Cisco UCS manager is SSL-enabled. Accordingly, the SSL
flag is set to Yes by default.
7. WEB PORT- By default, in most virtualized environments, Cisco UCS manager
listens on port 80 (if not SSL-enabeld) or on port 443 (if SSL-enabled) only. This
implies that while monitoring Cisco UCS manager, the eG agent, by default,
connects to port 80 or 443, depending upon the SSL-enabled status of Cisco
UCS manager - i.e., if Cisco UCS manager is not SSL-enabled (i.e., if the SSL
flag above is set to No), then the eG agent connects to Cisco UCS manager
using port 80 by default, and if Cisco UCS manager is SSL-enabled (i.e., if the
SSL flag is set to Yes), then the agent-Cisco UCS manager communication
occurs via port 443 by default. Accordingly, the WEBPORT parameter is set to
default by default.
In some environments however, the default ports 80 or 443 might not apply. In
such a case, against the WEBPORT parameter, you can specify the exact port at
which the Cisco UCS manager in your environment listens, so that the eG agent
communicates with that port for collecting metrics from the Cisco UCS manager.
8. DETAILED DIAGNOSIS - To make diagnosis more efficient and accurate, the eG
Enterprise suite embeds an optional detailed diagnostic capability. With this
capability, the eG agents can be configured to run detailed, more elaborate tests
as and when specific problems are detected. To enable the detailed diagnosis
capability of this test for a particular server, choose the On option. To disable
the capability, click on the Off option.
The option to selectively enable/disable the detailed diagnosis capability will be
available only if the following conditions are fulfilled:
The eG manager license should allow the detailed diagnosis capability
Both the normal and abnormal frequencies configured for the detailed
diagnosis measures should not be 0.
Outputs of the
test
One set of results for each fabric interconnect managed by the Cisco UCS manager
being monitored
Measurements
made by the
Measurement
Measurement
Unit
Interpretation

M o n i t o r i n g t h e C i s c o U C S M a n a g e r
111
test
Overall status:
Indicates the overall
status of this fabric
interconnect.
The States reported by this measure and
their corresponding numeric equivalents are
described in the table below:
Numeric Value
State
0
Unknown
1
Operable
2
Inoperable
Note:
By default, this measure reports the above-
mentioned states while indicating the
overall status of a fabric interconnect.
However, in the graph of this measure,
states will be represented using their
corresponding numeric equivalents only.
The detailed diagnosis of this measure
provides the Time, Name, PID, Revision,
Serial Number and Vendor attributes of
each fabric interconnect.
Load:
Indicates the
percentage of CPU
utilized by this
fabric interconnect.
Percent
A high value is indicative of excessive CPU
usage, and is a cause for concern.
Available
memory:
Indicates the
amount of memory
available with this
fabric interconnect.
MB
A low value may indicate a memory
bottleneck.
Cached memory:
Indicates the
memory allotted for
cache (frequently
used main memory
locations) in this
fabric interconnect.
MB
Total memory:
Indicates the total
memory of this
fabric interconnect.
MB

M o n i t o r i n g t h e C i s c o U C S M a n a g e r
112
Fan control
inlet1:
Indicates the
temperature of fan
1 of this fabric
interconnect.
Celcius
A low value is desired for this measure.
Fan control inlet2
Indicates the
temperature of fan
2 of this fabric
interconnect.
Celcius
A low value is desired for this measure.
Fan control
inlet3:
Indicates the
temperature of fan
3 of this fabric
interconnect.
Celcius
A low value is desired for this measure.
Fan control
inlet4:
Indicates the
temperature of fan
4 of this fabric
interconnect.
Celcius
A low value is desired for this measure.
Mainboard
outlet1:
Indicates the
temperature of the
mainboard 1 of this
fabric interconnect.
Celcius
A low value is desired for this measure.
Mainboard
outlet2:
Indicates the
temperature of the
mainboard 2 of this
fabric interconnect.
Celcius
A low value is desired for this measure.
PSU control
inlet1:
Indicates the
temperature of
power supply unit 1
of this fabric
interconnect.
Celcius
A low value is desired for this measure.
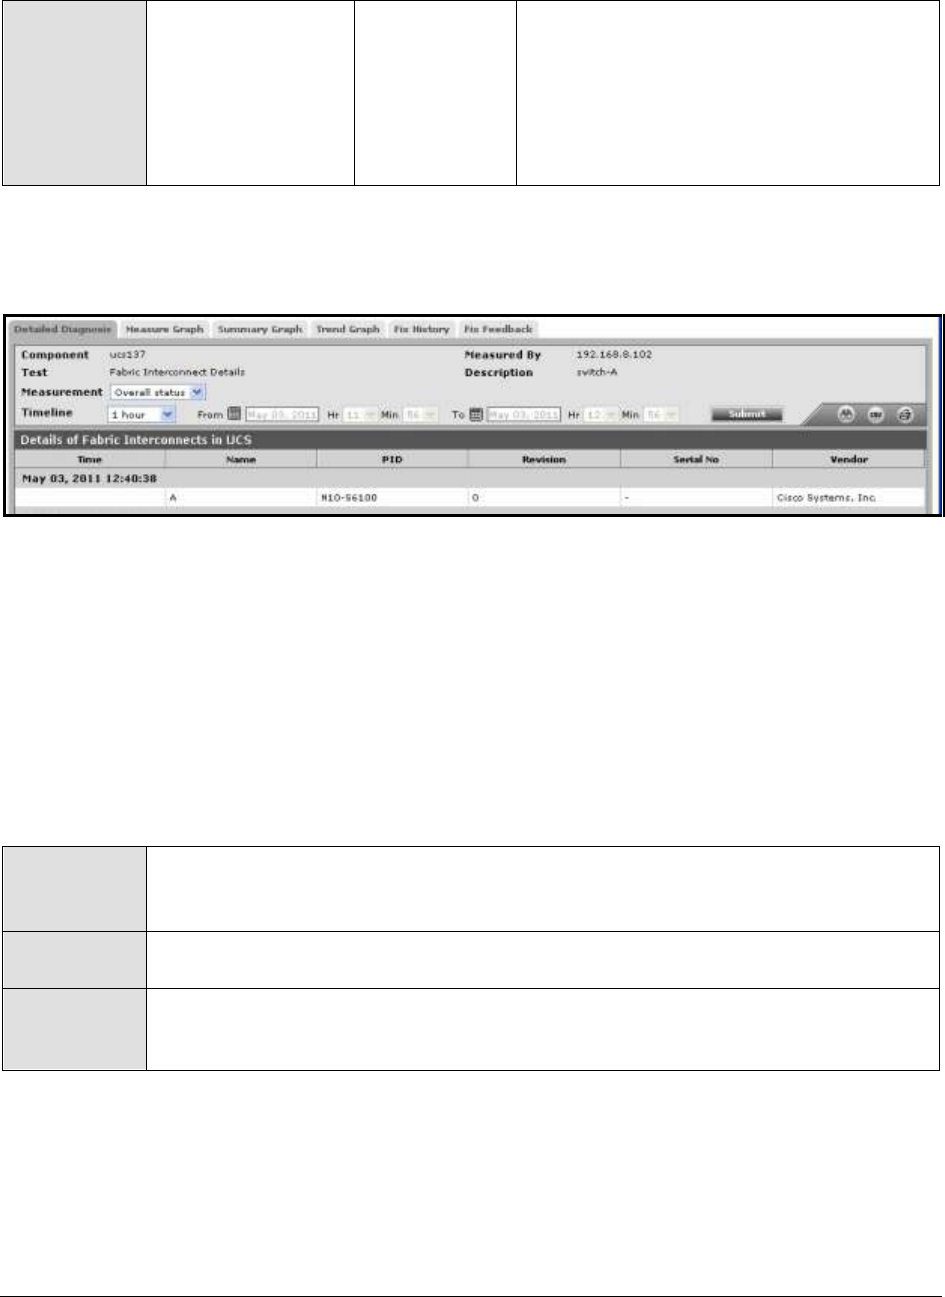
M o n i t o r i n g t h e C i s c o U C S M a n a g e r
113
PSU control
inlet2:
Indicates the
temperature of
power supply unit 2
of this fabric
interconnect.
Celcius
A low value is desired for this measure.
The detailed diagnosis of the Overall status measure provides the Time, Name, PID, Revision, Serial
Number and Vendor attributes of each fabric interconnect.
Figure 17: The detailed diagnosis of the Overall status measure of the Fabric Interconnect Details test
1.3.6 LAN Cloud Port Channels Test
You can aggregate a number of uplink ethernet ports by configuring them as a port channel, so traffic
will forward between your upstream LAN switch and Cisco UCS fabric interconnect over the aggregate
port channel ports as a single aggregated link.
This test auto-discovers the port channels configured on each Fabric Interconnect and reports the
overall health, operational speed, and VLAN status of each port channel. With the help of this test,
problematic and slow port channels can be identified.
Purpose
Auto-discovers the port channels configured on each Fabric Interconnect and reports
the overall health, operational speed, and VLAN status of each port channel. With
the help of this test, problematic and slow port channels can be identified
Target of the
test
A Cisco UCS manager
Agent
deploying the
test
A remote agent

M o n i t o r i n g t h e C i s c o U C S M a n a g e r
114
Configurable
parameters for
the test
1. TESTPERIOD – How often should the test be executed
2. HOST – The IP address of the host for which the test is being configured.
3. PORT – The port at which the specified HOST listens. By default, this is NULL.
4. UCS USER and UCS PASSWORD – Provide the credentials of a user with at least
read-only privileges to the target Cisco UCS manager.
5. CONFIRM PASSWORD- Confirm the password by retyping it here.
6. SSL - By default, the Cisco UCS manager is SSL-enabled. Accordingly, the SSL
flag is set to Yes by default.
7. WEB PORT- By default, in most virtualized environments, Cisco UCS manager
listens on port 80 (if not SSL-enabeld) or on port 443 (if SSL-enabled) only. This
implies that while monitoring Cisco UCS manager, the eG agent, by default,
connects to port 80 or 443, depending upon the SSL-enabled status of Cisco
UCS manager - i.e., if Cisco UCS manager is not SSL-enabled (i.e., if the SSL
flag above is set to No), then the eG agent connects to Cisco UCS manager
using port 80 by default, and if Cisco UCS manager is SSL-enabled (i.e., if the
SSL flag is set to Yes), then the agent-Cisco UCS manager communication
occurs via port 443 by default. Accordingly, the WEBPORT parameter is set to
default by default.
In some environments however, the default ports 80 or 443 might not apply. In
such a case, against the WEBPORT parameter, you can specify the exact port at
which the Cisco UCS manager in your environment listens, so that the eG agent
communicates with that port for collecting metrics from the Cisco UCS manager.
8. DETAILED DIAGNOSIS - To make diagnosis more efficient and accurate, the eG
Enterprise suite embeds an optional detailed diagnostic capability. With this
capability, the eG agents can be configured to run detailed, more elaborate tests
as and when specific problems are detected. To enable the detailed diagnosis
capability of this test for a particular server, choose the On option. To disable
the capability, click on the Off option.
The option to selectively enable/disable the detailed diagnosis capability will be
available only if the following conditions are fulfilled:
The eG manager license should allow the detailed diagnosis capability
Both the normal and abnormal frequencies configured for the detailed
diagnosis measures should not be 0.
Outputs of the
test
One set of results for each port channel configured on every fabric interconnect
managed by the Cisco UCS manager being monitored
Measurements
made by the
Measurement
Measurement
Unit
Interpretation

M o n i t o r i n g t h e C i s c o U C S M a n a g e r
115
test
Overall status:
Indicates the
current overall
status of this port
channel.
The values reported by this measure and
their corresponding numeric values are
described in the table below:
Measure Value
Numeric Value
Indeterminate
0
Up
1
Admin-down
2
Link-down
3
Failed
4
No-license
5
Link-up
6
Hardware-failure
7
Software-failure
8
Error-disabled
9
Sfp-not-present
10
The detailed diagnosis of this measure
provides the complete details of a port
channel, such as, the ID of the port
channel, the ID of the Fabric Interconnect
for which it is configured, the Type, the Port
type, the flow control policy, the transport,
and the port channel name.
Note:
By default, this measure reports the above-
mentioned Measure Values while indicating
the overall status of a port channel.
However, in the graph of this measure, port
channel status will be represented using
their numeric equivalents only.

M o n i t o r i n g t h e C i s c o U C S M a n a g e r
116
Administrative
state:
Indicates the
current
administrative
status of this port
channel.
The values that this measure can report
and the numeric values that correspond to
the measure values have been detailed in
the table below:
Measure Value
Numeric
Value
1
Enabled
2
Disabled
Note:
By default, this measure reports the above-
mentioned Measure Values while indicating
the administrative status of a port channel.
However, in the graph of this measure,
states will be represented using the
corresponding numeric equivalents only.
Administrative
speed:
Indicates the
current
administrative
speed of this port
channel.
Number
The values that this measure can report
and their corresponding numeric values are
available in the table below:
Measure Value
Numeric Value
1 Gbps
1
10 Gbps
2
20 Gbps
3
40 Gbps
4
Note:
By default, this measure reports the above-
mentioned Measure Values while indicating
the administrative speed of a port channel
However, in the graph of this measure,
speed will be represented using the
corresponding numeric values only. .

M o n i t o r i n g t h e C i s c o U C S M a n a g e r
117
Operational
speed:
Indicates the
current operating
speed of this port
channel.
Number
The values reported by this measure and
their corresponding numeric equivalents are
described in the table below:
Measure Value
Numeric Value
1 Gbps
1
10 Gbps
2
20 Gbps
3
40 Gbps
4
Note:
By default, this measure reports the above-
mentioned Measure Values while indicating
the operational speed of a port channel.
However, in the graph of this measure, the
speed will be represented using the
corresponding numeric equivalents only.
VLAN status:
Indicates the
current VLAN status
of this port channel.
The values this measure can report and
their corresponding numeric values have
been listed in the table below:
Numeric Value
Measure Value
0
OK
1
Missing-primary
Note:
By default, this measure reports the above-
mentioned Measure Values while indicating
the VLAN status of a port channel.
However, in the graph of this measure, the
VLAN status will be represented using the
corresponding numeric equivalents only.
The detailed diagnosis of the Overall status measure provides the complete details of a port channel,
such as, the ID of the port channel, the ID of the Fabric Interconnect for which it is configured, the
Type, the Port type, the flow control policy, the transport, and the name.
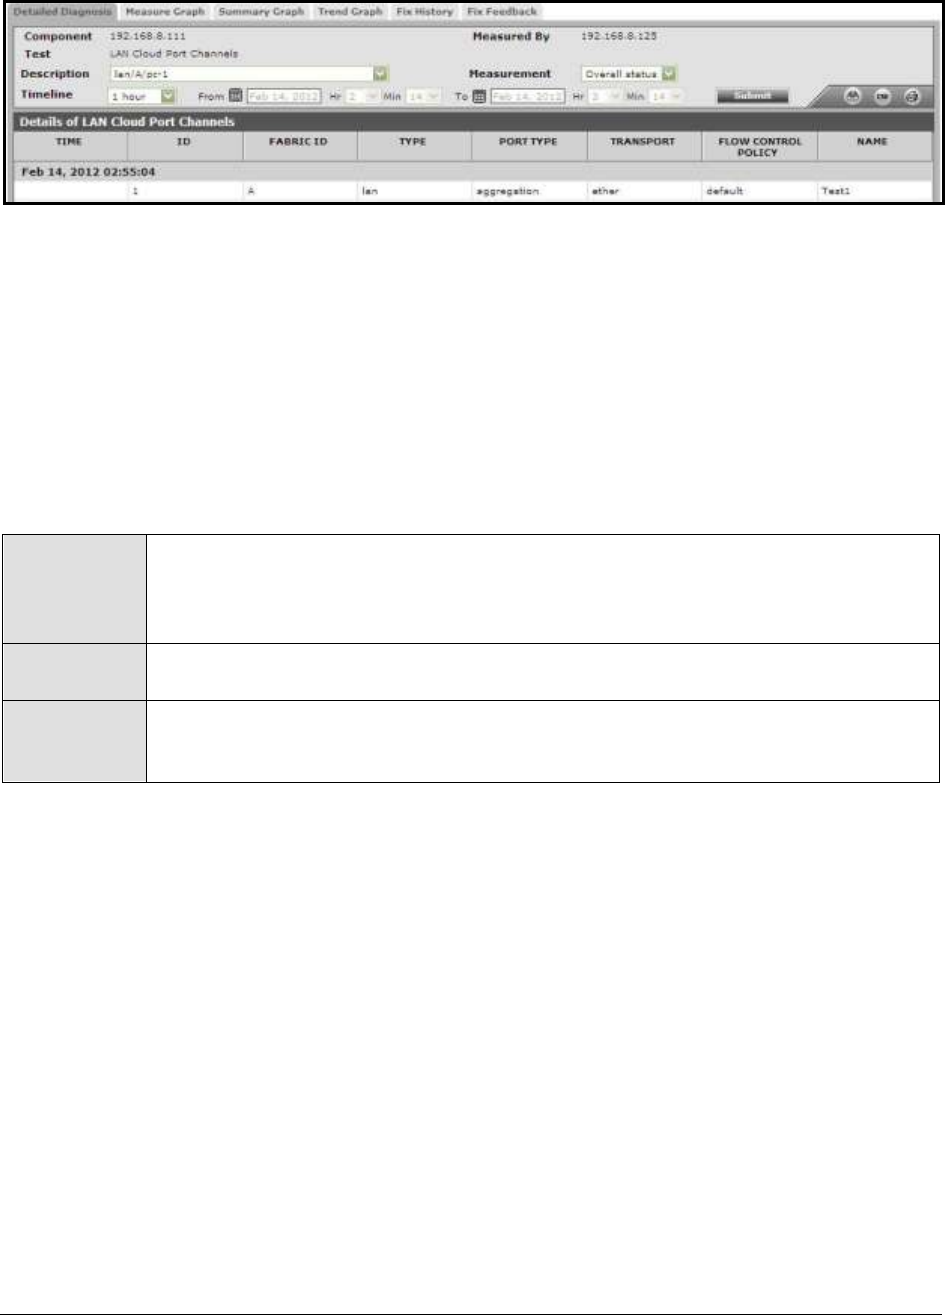
M o n i t o r i n g t h e C i s c o U C S M a n a g e r
118
Figure 18: The detailed diagnosis of the Overall status measure of the LAN Cloud Port Channels Test
1.3.7 LAN Cloud PC Ethernet Ports
You can aggregate a number of uplink ethernet ports by configuring them as a port channel, so traffic
will forward between your upstream LAN switch and Cisco UCS fabric interconnect over the aggregate
port channel ports as a single aggregated link.
This test auto-discovers the Ethernet ports aggregated in each port channel on every Fabric
Interconnect and reports the overall health, operational speed, and VLAN status of each Ethernet port.
With the help of this test, problematic and slow ports can be identified.
Purpose
Auto-discovers the Ethernet ports aggregated in each port channel on every Fabric
Interconnect and reports the overall health, operational speed, and VLAN status of
each Ethernet port. With the help of this test, problematic and slow ports can be
identified
Target of the
test
A Cisco UCS manager
Agent
deploying the
test
A remote agent

M o n i t o r i n g t h e C i s c o U C S M a n a g e r
119
Configurable
parameters for
the test
1. TESTPERIOD – How often should the test be executed
2. HOST – The IP address of the host for which the test is being configured.
3. PORT – The port at which the specified HOST listens. By default, this is NULL.
4. UCS USER and UCS PASSWORD – Provide the credentials of a user with at least
read-only privileges to the target Cisco UCS manager.
5. CONFIRM PASSWORD- Confirm the password by retyping it here.
6. SSL - By default, the Cisco UCS manager is SSL-enabled. Accordingly, the SSL
flag is set to Yes by default.
7. WEB PORT- By default, in most virtualized environments, Cisco UCS manager
listens on port 80 (if not SSL-enabeld) or on port 443 (if SSL-enabled) only. This
implies that while monitoring Cisco UCS manager, the eG agent, by default,
connects to port 80 or 443, depending upon the SSL-enabled status of Cisco
UCS manager - i.e., if Cisco UCS manager is not SSL-enabled (i.e., if the SSL
flag above is set to No), then the eG agent connects to Cisco UCS manager
using port 80 by default, and if Cisco UCS manager is SSL-enabled (i.e., if the
SSL flag is set to Yes), then the agent-Cisco UCS manager communication
occurs via port 443 by default. Accordingly, the WEBPORT parameter is set to
default by default.
In some environments however, the default ports 80 or 443 might not apply. In
such a case, against the WEBPORT parameter, you can specify the exact port at
which the Cisco UCS manager in your environment listens, so that the eG agent
communicates with that port for collecting metrics from the Cisco UCS manager.
8. DETAILED DIAGNOSIS - To make diagnosis more efficient and accurate, the eG
Enterprise suite embeds an optional detailed diagnostic capability. With this
capability, the eG agents can be configured to run detailed, more elaborate tests
as and when specific problems are detected. To enable the detailed diagnosis
capability of this test for a particular server, choose the On option. To disable
the capability, click on the Off option.
The option to selectively enable/disable the detailed diagnosis capability will be
available only if the following conditions are fulfilled:
The eG manager license should allow the detailed diagnosis capability
Both the normal and abnormal frequencies configured for the detailed
diagnosis measures should not be 0.
Outputs of the
test
One set of results for each Ethernet port in each port channel configured on every
fabric interconnect managed by the Cisco UCS manager being monitored
Measurements
made by the
Measurement
Measurement
Unit
Interpretation

M o n i t o r i n g t h e C i s c o U C S M a n a g e r
120
test
Overall status:
Indicates the
current overall
status of this port.
The values reported by this measure and
their corresponding numeric values are
described in the table below:
Measure Value
Numeric Value
Unknown
0
Up
1
Down
2
Error-
misconfigured
3
The detailed diagnosis of this measure
provides the complete details of a port,
such as, the ID of the port, the slot ID, the
Fabric Interconnect for which the port has
been configured, the Type, the Port type,
the flow control policy, the transport, and
the port, locale, and name.
Note:
By default, this measure reports the above-
mentioned Measure Values while indicating
the overall status of a port. However, in the
graph of this measure, port status will be
represented using their numeric equivalents
only.
Administrative
state:
Indicates the
current
administrative
status of this port.
The values that this measure can report
and the numeric values that correspond to
the measure values have been detailed in
the table below:
Measure Value
Numeric
Value
1
Enabled
2
Disabled
Note:
By default, this measure reports the above-
mentioned Measure Values while indicating
the administrative status of a port.
However, in the graph of this measure,
states will be represented using the
corresponding numeric equivalents only.
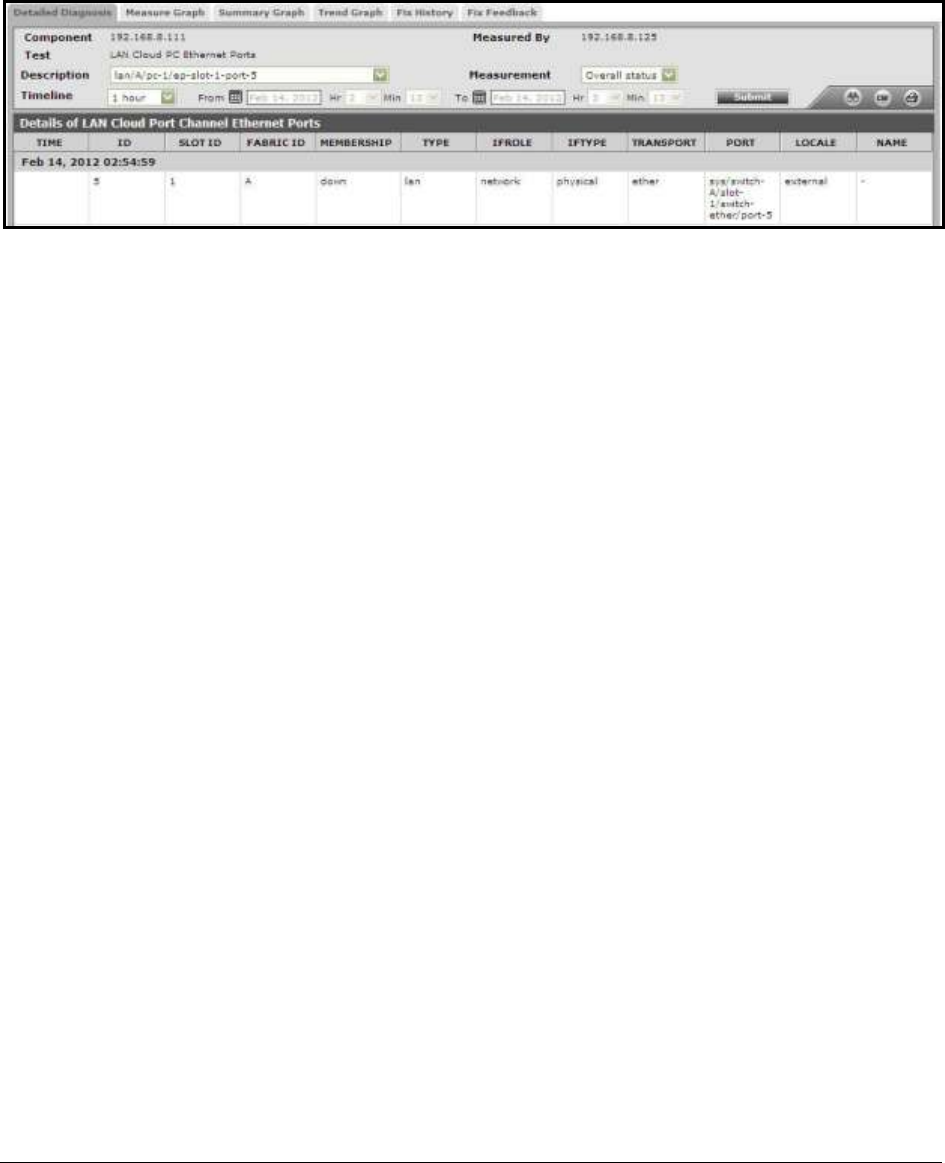
M o n i t o r i n g t h e C i s c o U C S M a n a g e r
121
The detailed diagnosis of the Overall status measure provides the complete details of a port, such as,
the ID of the port, the slot ID, the Fabric Interconnect for which the port has been configured, the
Type, the Port type, the flow control policy, the transport, and the port, locale, and name.
Figure 19: The detailed diagnosis of the Overall Status measure of the LAN Cloud PC Ethernet Ports test
1.4 The Blades Layer
The Cisco UCS B-Series Blade Servers are crucial building blocks of the Cisco Unified Computing
System, delivering scalable and flexible computing for a datacenter.
The Cisco UCS B-Series Blade Servers are based on industry-standard server technologies and
provide:
Up to two Intel Xeon Series 5500 multicore processors
Two optional front-accessible, hot-swappable SAS hard drives
Support for up to two dual-port mezzanine card connections for up to 40 Gbps of redundant
I/O throughput
Industry-standard double-data-rate 3 (DDR3) memory
Remote management through an integrated service processor that also executes policies
established in Cisco UCS Manager software
Local keyboard, video, and mouse (KVM) access through a front console port on each server
Out-of-band access by remote KVM, Secure Shell (SSH) Protocol, and virtual media (vMedia)
as well as Intelligent Platform Management Interface (IPMI)
Since these blade servers are the heart of the Cisco UCS system, even a brief non-availability or non-
operability of these servers, or sporadic hardware-related issues they encounter, will have an adverse
impact on the overall performance of the Cisco UCS system. Using the tests mapped to this layer,
administrators can closely observe the changes in the status of the blade servers, and promptly detect
deviations, so that the problems can be resolved before they affect the Cisco UCS system as a whole.
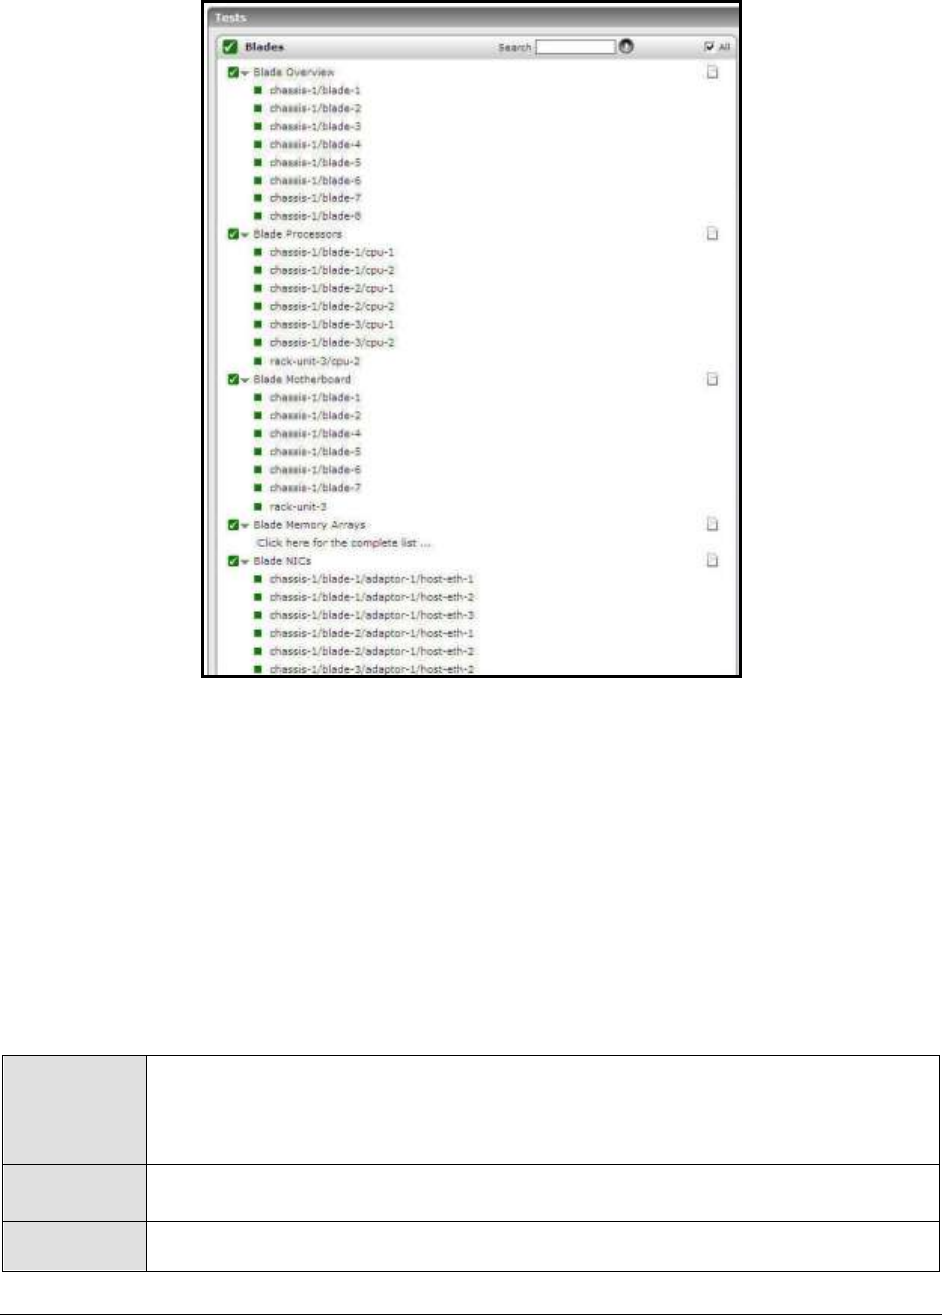
M o n i t o r i n g t h e C i s c o U C S M a n a g e r
122
Figure 20: The tests mapped to the Blades layer
1.4.1 Blade Overview Test
Blade servers are the core components of the Cisco UCS system. Unavailable/inoperable blade servers
can hence bring the entire system to a standstill. Using this test, you can continuously monitor the
overall health, operability, and availability of each blade server in each chassis managed by the Cisco
UCS manager, and be alerted to anomalies as soon as they occur, so that you can take the required
corrective actions before your mission-critical services begin to suffer. In addition, the test also
captures critical power and thermal failures experienced by the blade servers, and takes stock of the
hardware (such as processors, cores, NICs, etc.) supporting the operations of the blade server.
Purpose
Continuously monitors the overall health, operability, and availability of each blade
server in each chassis managed by the Cisco UCS manager, and alerts
administrators to anomalies as soon as they occur, so that the required corrective
actions can be taken before mission-critical services begin to suffer
Target of the
test
A Cisco UCS manager
Agent
deploying the
A remote agent

M o n i t o r i n g t h e C i s c o U C S M a n a g e r
123
test
Configurable
parameters for
the test
1. TESTPERIOD – How often should the test be executed
2. HOST – The IP address of the host for which the test is being configured.
3. PORT – The port at which the specified HOST listens. By default, this is NULL.
4. UCS USER and UCS PASSWORD – Provide the credentials of a user with at least
read-only privileges to the target Cisco UCS manager.
5. CONFIRM PASSWORD- Confirm the password by retyping it here.
6. SSL - By default, the Cisco UCS manager is SSL-enabled. Accordingly, the SSL
flag is set to Yes by default.
7. WEB PORT- By default, in most virtualized environments, Cisco UCS manager
listens on port 80 (if not SSL-enabeld) or on port 443 (if SSL-enabled) only. This
implies that while monitoring Cisco UCS manager, the eG agent, by default,
connects to port 80 or 443, depending upon the SSL-enabled status of Cisco
UCS manager - i.e., if Cisco UCS manager is not SSL-enabled (i.e., if the SSL
flag above is set to No), then the eG agent connects to Cisco UCS manager
using port 80 by default, and if Cisco UCS manager is SSL-enabled (i.e., if the
SSL flag is set to Yes), then the agent-Cisco UCS manager communication
occurs via port 443 by default. Accordingly, the WEBPORT parameter is set to
default by default.
In some environments however, the default ports 80 or 443 might not apply. In
such a case, against the WEBPORT parameter, you can specify the exact port at
which the Cisco UCS manager in your environment listens, so that the eG agent
communicates with that port for collecting metrics from the Cisco UCS manager.
8. DETAILED DIAGNOSIS - To make diagnosis more efficient and accurate, the eG
Enterprise suite embeds an optional detailed diagnostic capability. With this
capability, the eG agents can be configured to run detailed, more elaborate tests
as and when specific problems are detected. To enable the detailed diagnosis
capability of this test for a particular server, choose the On option. To disable
the capability, click on the Off option.
The option to selectively enable/disable the detailed diagnosis capability will be
available only if the following conditions are fulfilled:
The eG manager license should allow the detailed diagnosis capability
Both the normal and abnormal frequencies configured for the detailed
diagnosis measures should not be 0.
Outputs of the
test
One set of results for each blade server in each chassis managed by the Cisco UCS
manager being monitored
Measurements
made by the
Measurement
Measurement
Unit
Interpretation

M o n i t o r i n g t h e C i s c o U C S M a n a g e r
124
test
Overall status:
Indicates the overall
status of this blade
server in this
chassis.
The States reported by this measure and
their corresponding numeric equivalents are
described in the table below:
Numeric Value
State
0
Indeterminate
1
Unassociated
10
Ok
11
Discovery
12
Config
13
Unconfig
14
Power-off
15
Restart
20
Maintenance
21
Test
29
Compute-mismatch
30
Compute-failed
31
Degraded
32
Discovery-failed
33
Config-failure
34
Unconfig-failed
35
Test-failed
36
Maintenance-failed
40
Removed
41
Disabled
50
Inaccessible
60
Thermal-problem
61
Power-problem
62
Voltage-problem
63
Inoperable
101
Decomissioning
201
Bios-restore
202
Cmos-reset
203
Diagnostics
204
Diagnostics-failed

M o n i t o r i n g t h e C i s c o U C S M a n a g e r
125
Note:
By default, this measure reports the above-
mentioned states while indicating the
overall status of a blade server. However,
in the graph of this measure, states will be
represented using their corresponding
numeric equivalents only.
The detailed diagnosis of this measure
provides the Time, Slot ID, chassis ID, PID,
Revision, Serial Number, Vendor, Name,
UUID, Service Profile and Original UUID
attributes for this blade server.
Administrative
state:
Indicates the
current
administrative state
of this blade server
loaded in this
chassis.
This measure reports either In-service or
Out-of-service as the adminstrative state of
the blade servers. The numeric equivalents
corresponding to these states are shown in
the table below:
Numeric Value
State
1
In-service
2
Out-of-service
Note:
By default, this measure reports the above-
mentioned states while indicating the
administrative state of a blade server.
However, in the graph of this measure,
states will be represented using their
corresponding numeric equivalents only.

M o n i t o r i n g t h e C i s c o U C S M a n a g e r
126
Association state:
Indicates the
current associative
state of this blade
server loaded in this
chassis i.e.,
indicates whether
the blade server is
associated with the
service profile that
is preconfigured in
the Cisco UCS
Manager.
A service profile represents a logical view of
a single blade server, without needing to
know exactly which blade you are talking
about. The profile object contains the
server personality (identity and network
information). The profile can then be
associated with a single blade at a time.
Cisco UCS Manager uses service profiles to
provision the blade servers and their I/O
properties. The Cisco Unified Computing
System has a form factor-neutral
architecture, allowing administrators to
centrally manage Cisco UCS blade servers
or rack-mount servers, or incorporate both
within a single management domain.
Service profiles are created by server,
network, and storage administrators and
are stored in the Cisco UCS Fabric
Interconnects. Infrastructure policies
needed to deploy applications, such as
power and cooling, security, identity,
hardware health, and Ethernet and storage
networking, are encapsulated in the service
profile. The policies coordinate and
automate element management at every
layer of the hardware stack, including RAID
levels, BIOS settings, firmware revisions
and settings, adapter identities and
settings, VLAN and VSAN network settings,
network quality of service (QoS), and data
center connectivity. Cisco UCS Manager
provides granular Cisco Unified Computing
System visibility for higher-level
management tools from BMC, CA, HP, IBM,
and others, providing exceptional alignment
of infrastructure management with OS and
application requirements.
This measure reports the associative state
of the blade servers and their numeric
equivalents as shown in the table:
Numeric Value
State
0
None
1
Associated
2
Removing
3
Failed

M o n i t o r i n g t h e C i s c o U C S M a n a g e r
127
Note:
By default, this measure reports the above-
mentioned states while indicating the
associative state of a blade server.
However, in the graph of this measure,
states will be represented using their
corresponding numeric equivalents only.
Availability state:
Indicates the
current availability
status of this blade
server in this
chassis.
MB
This measure reports either Available or
Unavailable as the availability status of the
blade servers. The states and their
corresponding numeric equivalents are
shown in the table below:
Numeric Value
State
0
Unavailable
1
Available
Note:
By default, this measure reports the above-
mentioned states while indicating the
availability state of a blade server.
However, in the graph of this measure,
states will be represented using their
corresponding numeric equivalents only.
Checkpoint state:
Indicates the
current checkpoint
status of this blade
server loaded in this
chassis.
The States reported by this measure and
their corresponding numeric equivalents are
described in the table below:
Numeric
Value
State
0
Unknown
1
Removing
2
Shallow-checkpoint
3
Deep-checkpoint
4
Discovered
Note:
By default, this measure reports the above-
mentioned states while indicating the
checkpoint state of a blade server.
However, in the graph of this measure,
states will be represented using their
corresponding numeric equivalents only.

M o n i t o r i n g t h e C i s c o U C S M a n a g e r
128
Discovery state:
Indicates the
current discovery
status of this blade
server loaded in this
chassis.
The States reported by this measure and
their corresponding numeric equivalents are
described in the table below:
Numeric Value
State
0
Undiscovered
1
In-progress
2
Malformed-fru-ino
3
Fru-not-ready
4
Insufficiently-
equipped
8
Failed
16
Complete
32
Retry
64
Throttled
128
Illegal-fru
129
Fru-identity-
indeterminate
130
Fru-state-
indeterminate
131
Diagnostics-in-
progress
132
Efidiagnostics-in-
progress
133
Diagnostics-failed
134
Diagnostics-
complete
Note:
By default, this measure reports the above-
mentioned States while indicating the
discovery state of a blade server. However,
in the graph of this measure, states will be
represented using their corresponding
numeric equivalents only.

M o n i t o r i n g t h e C i s c o U C S M a n a g e r
129
Operability:
Indicates the
current operating
state of this blade
server loaded in this
chassis.
The States reported by this measure and
their corresponding numeric equivalents are
described in the table below:
Numeric Value
State
0
Unknown
1
Operable
2
Inoperable
3
Degraded
4
Powered-off
5
Power-problem
6
Removed
7
Voltage-problem
8
Thermal-problem
9
Performance-
problem
10
Accessibility-
problem
11
Identity-
unestablishable
12
Bios-post-timeout
13
Disabled
51
Fabric-conn-
problem
52
Fabric-
unsupported-
conn
81
Config
82
Equipment-
problem
83
Decommissioning
84
Chassis-limit-
exceeded
100
Not-supported

M o n i t o r i n g t h e C i s c o U C S M a n a g e r
130
101
Discovery
102
Discovery-failed
103
Identify
104
Post-failure
105
Upgrade-
problem
106
Peer-comm-
problem
107
Auto-upgrade
Note:
By default, this measure reports the above-
mentioned States while indicating the
operational state of a blade server.
However, in the graph of this measure,
states will be represented using their
corresponding numeric equivalents only.
Power state:
Indicates the
current power
status of this blade
server loaded in this
chassis.
The States reported by this measure and
their corresponding numeric equivalents are
described in the table below:
Numeric Value
State
0
Unknown
1
On
2
Test
3
Off
4
Online
5
Offline
6
Offduty
7
Degraded
8
Power-save
9
Error
10
Not-
supported

M o n i t o r i n g t h e C i s c o U C S M a n a g e r
131
Note:
By default, this measure reports the above-
mentioned States while indicating the power
state of a blade server. However, in the
graph of this measure, states will be
represented using their corresponding
numeric equivalents only.
Slot state:
Indicates the
current slot status
of this blade server
loaded in this
chassis.
The States reported by this measure and
their corresponding numeric equivalents are
described in the table below:
Numeric Value
State
0
Unknown
1
Empty
10
Equipped
11
Missing
12
Mismatch
13
Equipped-not-
primary
20
Equipped-
identity-
unestablishable
21
Mismatch-
identity-
unestablishable
30
Inaccessible
40
Unauthorized
Note:
By default, this measure reports the above-
mentioned States while indicating the slot
state of a blade server. However, in the
graph of this measure, states will be
represented using their corresponding
numeric equivalents only.

M o n i t o r i n g t h e C i s c o U C S M a n a g e r
132
Effective memory:
Indicates the
amount of memory
that can be
effectively used by
this blade server
present in this
chassis.
MB
Ideally, the value of this measure should be
high.
Total memory:
Indicates the total
memory available in
this blade server
present in this
chassis.
MB
Number of
processors:
Indicates the
number of Central
Proccessor Units
available in this
blade server loaded
in this chassis.
Number
Number of cores:
Indicates the total
number of cores
available on all the
CPS that are
installed in this
blade server in this
chassis.
Number
Number of cores
enabled:
Indicates the
number of core
processors that are
enabled in this
blade server in this
chassis.
Number
Number of
threads:
Indicates the
number of
processes that can
run simultaneously
on this blade server
in this chassis.
Number
This measures should be equal to either the
number of cores or twice the number of
cores if the operating system supports
hyperthreading.

M o n i t o r i n g t h e C i s c o U C S M a n a g e r
133
Number of
adapters:
Indicates the
number of adapters
available in this
blade server in this
chassis.
Number
Number of NICs:
Indicates the
number of physical
ethernet network
interface cards
(NICs) available in
this blade server in
this chassis.
Number
Number of HBAs:
Indicates the
number of physical
host bus adapters
(HBAs) available in
the blade servers.
Number
1.4.2 Blade Processors Test
The Cisco UCS B-Series Blade Servers support up to two Intel Xeon Series 5500 multicore processors.
If the temperature of a processor suddenly soars or a high voltage of current unexpectedly flows
through a processor, it can damage one/more internal components of the processor, thereby
suspending not only the processor's operations, but also that of the blade server depending on it. It is
hence imperative to keep tabs of the temperature and current changes experienced by each of the
processors of a blade server. Using this test, you can periodically check the temperature and input
current of each of the processors supported by a blade server, and promptly detect abnormalities (if
any).
Purpose
Periodically checks the temperature and input current of each of the processors
supported by a blade server, and promptly detect abnormalities (if any)
Target of the
test
A Cisco UCS manager
Agent
deploying the
test
A remote agent

M o n i t o r i n g t h e C i s c o U C S M a n a g e r
134
Configurable
parameters for
the test
1. TESTPERIOD – How often should the test be executed
2. HOST – The IP address of the host for which the test is being configured.
3. PORT – The port at which the specified HOST listens. By default, this is NULL.
4. UCS USER and UCS PASSWORD – Provide the credentials of a user with at least
read-only privileges to the target Cisco UCS manager.
5. CONFIRM PASSWORD- Confirm the password by retyping it here.
6. SSL - By default, the Cisco UCS manager is SSL-enabled. Accordingly, the SSL
flag is set to Yes by default.
9. WEB PORT- By default, in most virtualized environments, Cisco UCS manager
listens on port 80 (if not SSL-enabeld) or on port 443 (if SSL-enabled) only. This
implies that while monitoring Cisco UCS manager, the eG agent, by default,
connects to port 80 or 443, depending upon the SSL-enabled status of Cisco
UCS manager - i.e., if Cisco UCS manager is not SSL-enabled (i.e., if the SSL
flag above is set to No), then the eG agent connects to Cisco UCS manager
using port 80 by default, and if Cisco UCS manager is SSL-enabled (i.e., if the
SSL flag is set to Yes), then the agent-Cisco UCS manager communication
occurs via port 443 by default. Accordingly, the WEBPORT parameter is set to
default by default.
In some environments however, the default ports 80 or 443 might not apply. In
such a case, against the WEBPORT parameter, you can specify the exact port at
which the Cisco UCS manager in your environment listens, so that the eG agent
communicates with that port for collecting metrics from the Cisco UCS manager.
Outputs of the
test
One set of results for each processor supported by every blade server in each
chassis being monitored
Measurements
made by the
test
Measurement
Measurement
Unit
Interpretation
CPU temperature:
Indicates the
current temperature
of this processor.
Celcius
A low value is ideal for this measure. A
sudden and significant increase in this value
could be a cause for concern.
Input current:
Indicates the input
current received by
this processor.
Amps
Ideally, the value of this measure should be
low. A sudden, yet significant increase in
this value could inflict injury on the internal
components of the processor.
1.4.3 Blade Motherboard Test
Issues in the motherboard can have an adverse impact on the performance levels delivered by a blade
server. This test monitors the health of the motherboard of each blade server loaded in each chassis
managed by a Cisco UCS manager, and reveals the following:
Is the motherboard consuming power excessively?
Are the current and voltage inputs received by the motherboard in excess of its capacity?
Are the temperatures in the front and rear panels of the motherboard normal?

M o n i t o r i n g t h e C i s c o U C S M a n a g e r
135
If the temperature of the rear panel is very high, then which rear panel is contributing to this
abnormality - the left or the right rear panel?
Purpose
Monitors the health of the motherboard of each blade server loaded in a chassis
Target of the
test
A Cisco UCS manager
Agent
deploying the
test
A remote agent
Configurable
parameters for
the test
1. TESTPERIOD – How often should the test be executed
2. HOST – The IP address of the host for which the test is being configured.
3. PORT – The port at which the specified HOST listens. By default, this is NULL.
4. UCS USER and UCS PASSWORD – Provide the credentials of a user with at least
read-only privileges to the target Cisco UCS manager.
5. CONFIRM PASSWORD- Confirm the password by retyping it here.
6. SSL - By default, the Cisco UCS manager is SSL-enabled. Accordingly, the SSL
flag is set to Yes by default.
7. WEB PORT- By default, in most virtualized environments, Cisco UCS manager
listens on port 80 (if not SSL-enabeld) or on port 443 (if SSL-enabled) only. This
implies that while monitoring Cisco UCS manager, the eG agent, by default,
connects to port 80 or 443, depending upon the SSL-enabled status of Cisco
UCS manager - i.e., if Cisco UCS manager is not SSL-enabled (i.e., if the SSL
flag above is set to No), then the eG agent connects to Cisco UCS manager
using port 80 by default, and if Cisco UCS manager is SSL-enabled (i.e., if the
SSL flag is set to Yes), then the agent-Cisco UCS manager communication
occurs via port 443 by default. Accordingly, the WEBPORT parameter is set to
default by default.
In some environments however, the default ports 80 or 443 might not apply. In
such a case, against the WEBPORT parameter, you can specify the exact port at
which the Cisco UCS manager in your environment listens, so that the eG agent
communicates with that port for collecting metrics from the Cisco UCS manager.
Outputs of the
test
One set of results for each blade server loaded in each chassis managed by the
Cisco UCS manager being monitored
Measurements
made by the
test
Measurement
Measurement
Unit
Interpretation
Consumed power:
Indicates the total
power consumed by
the motherboard of
this blade server.
Watts
An unusually high value could be a cause
for concern.
Input current:
Indicates the input
current received by
the motherboard of
this blade server.
Amps
Ideally, the value of this measure should be
low. A sudden, yet significant increase in
this value could inflict injury on the
motherboard.

M o n i t o r i n g t h e C i s c o U C S M a n a g e r
136
Input voltage:
Indicates the input
voltage received by
the motherboard of
this blade server.
Volts
Ideally, the value of this measure should be
low. A sudden, yet significant increase in
this value could inflict injury on the
motherboard.
Front
temperature:
Indicates the
temperature of the
front panel of the
motherboard of this
blade server.
Celcius
A very high temperature indicates that the
motherboard is overheated.
Rear
temperature:
Indicates the
temperature of the
rear panel of the
motherboard of this
blade server.
Celcius
A very high temperature indicates that the
motherboard is overheated.
Rear temperature
right:
Indicates the
temperature of the
right rear panel of
the motherboard of
this blade server.
Celcius
A very high temperature indicates that the
motherboard is overheated.
Rear temperature
left:
Indicates the
temperature of the
left rear panel of
the motherboard of
this blade server.
Celcius
A very high temperature indicates that the
motherboard is overheated.
1.4.4 Blade Memory Arrays Test
This test monitors the temperature of each of the memory arrays of the blade servers loaded in a
chassis, and reports any abnormal increase in temperature.
Purpose
Monitors the temperature of each of the memory arrays of the blade servers loaded
in a chassis, and reports any abnormal increase in temperature
Target of the
test
A Cisco UCS manager
Agent
deploying the
test
A remote agent

M o n i t o r i n g t h e C i s c o U C S M a n a g e r
137
Configurable
parameters for
the test
1. TESTPERIOD – How often should the test be executed
2. HOST – The IP address of the host for which the test is being configured.
3. PORT – The port at which the specified HOST listens. By default, this is NULL.
4. UCS USER and UCS PASSWORD – Provide the credentials of a user with at least
read-only privileges to the target Cisco UCS manager.
5. CONFIRM PASSWORD- Confirm the password by retyping it here.
6. SSL - By default, the Cisco UCS manager is SSL-enabled. Accordingly, the SSL
flag is set to Yes by default.
7. WEB PORT- By default, in most virtualized environments, Cisco UCS manager
listens on port 80 (if not SSL-enabeld) or on port 443 (if SSL-enabled) only. This
implies that while monitoring Cisco UCS manager, the eG agent, by default,
connects to port 80 or 443, depending upon the SSL-enabled status of Cisco
UCS manager - i.e., if Cisco UCS manager is not SSL-enabled (i.e., if the SSL
flag above is set to No), then the eG agent connects to Cisco UCS manager
using port 80 by default, and if Cisco UCS manager is SSL-enabled (i.e., if the
SSL flag is set to Yes), then the agent-Cisco UCS manager communication
occurs via port 443 by default. Accordingly, the WEBPORT parameter is set to
default by default.
In some environments however, the default ports 80 or 443 might not apply. In
such a case, against the WEBPORT parameter, you can specify the exact port at
which the Cisco UCS manager in your environment listens, so that the eG agent
communicates with that port for collecting metrics from the Cisco UCS manager.
Outputs of the
test
One set of results for each memory array of every blade server loaded in each
chassis managed by the Cisco UCS manager being monitored
Measurements
made by the
test
Measurement
Measurement
Unit
Interpretation
Array
temperature:
Indicates the
current temperature
of the memory
array present in this
blade server.
Celcius
A very high temperature could indicate that
the memory array is overheated.
1.4.5 Blade NICs Test
This test auto-discovers the NICs (Network Interface Cards) supported by the UCS Blade
servers, monitors the overall health, operational state, and load on each NIC, and promptly
notifies administrators when an NIC suddenly switches to an abnormal state, becomes
overloaded, or encounters errors while sending/receiving data over the network. This way, you
can easily isolate problematic, over-used, and error-prone NICs.

M o n i t o r i n g t h e C i s c o U C S M a n a g e r
138
Purpose
Auto-discovers the NICs (Network Interface Cards) supported by the UCS Blade
servers, monitors the overall health, operational state, and load on each NIC, and
promptly notifies administrators when an NIC suddenly switches to an abnormal
state, becomes overloaded, or encounters errors while sending/receiving data over
the network
Target of the
test
A Cisco UCS manager
Agent
deploying the
test
A remote agent
Configurable
parameters for
the test
1. TESTPERIOD – How often should the test be executed
2. HOST – The IP address of the host for which the test is being configured.
3. PORT – The port at which the specified HOST listens. By default, this is NULL.
4. UCS USER and UCS PASSWORD – Provide the credentials of a user with at least
read-only privileges to the target Cisco UCS manager.
5. CONFIRM PASSWORD- Confirm the password by retyping it here.
6. SSL - By default, the Cisco UCS manager is SSL-enabled. Accordingly, the SSL
flag is set to Yes by default.
7. WEB PORT- By default, in most virtualized environments, Cisco UCS manager
listens on port 80 (if not SSL-enabeld) or on port 443 (if SSL-enabled) only. This
implies that while monitoring Cisco UCS manager, the eG agent, by default,
connects to port 80 or 443, depending upon the SSL-enabled status of Cisco
UCS manager - i.e., if Cisco UCS manager is not SSL-enabled (i.e., if the SSL
flag above is set to No), then the eG agent connects to Cisco UCS manager
using port 80 by default, and if Cisco UCS manager is SSL-enabled (i.e., if the
SSL flag is set to Yes), then the agent-Cisco UCS manager communication
occurs via port 443 by default. Accordingly, the WEBPORT parameter is set to
default by default.
In some environments however, the default ports 80 or 443 might not apply. In
such a case, against the WEBPORT parameter, you can specify the exact port at
which the Cisco UCS manager in your environment listens, so that the eG agent
communicates with that port for collecting metrics from the Cisco UCS manager.
8. DETAILED DIAGNOSIS - To make diagnosis more efficient and accurate, the eG
Enterprise suite embeds an optional detailed diagnostic capability. With this
capability, the eG agents can be configured to run detailed, more elaborate tests
as and when specific problems are detected. To enable the detailed diagnosis
capability of this test for a particular server, choose the On option. To disable
the capability, click on the Off option.
The option to selectively enable/disable the detailed diagnosis capability will be
available only if the following conditions are fulfilled:
The eG manager license should allow the detailed diagnosis capability
Both the normal and abnormal frequencies configured for the detailed
diagnosis measures should not be 0.
Outputs of the
test
One set of results for each NIC supported by every blade server loaded in each
chassis managed by the Cisco UCS manager being monitored

M o n i t o r i n g t h e C i s c o U C S M a n a g e r
139
Measurements
made by the
test
Measurement
Measurement
Unit
Interpretation
Overall status:
Indicates the
current state of this
NIC.
The values reported by this measure and
their corresponding numeric values are
described in the table below:
Measure Value
Numeric Value
Unknown
0
Operable
1
Inoperable
2
Degraded
3
Powered off
4
Power-problem
5
Removed
6
Voltage-problem
7
Thermal-problem
8
Performance-
problem
9
Accessibility-
problem
10
Identity-
unestablishable
11
Bios-post-
timeout
12
Disabled
13
Fabric-conn-
problem
51
Fabric-
unsupported-
conn
52
Config
81
Equipment-
problem
82
Decommissioning
83
Chassis-limit-
exceeded
84
Not-supported
100
Discovery
101

M o n i t o r i n g t h e C i s c o U C S M a n a g e r
140
Measure Value
Numeric Value
Discovery-failed
102
Identify
103
Post-failure
104
Upgrade-problem
105
Peer-comm-
problem
106
Auto-upgrade
107
The detailed diagnosis of this measure
provides the complete details of an NIC
such as its ID, Vendor, vNIC, PCIE Address,
MAC, Original MAC, Purpose, Name, and
Type.
Note:
By default, this measure reports the
Measure Values listed in the table above to
indicate the overall state of an NIC.
However, in the graph of this measure,
states will be represented using their
corresponding numeric equivalents only.

M o n i t o r i n g t h e C i s c o U C S M a n a g e r
141
Operability:
Indicates the
current operational
state of this NIC.
The values reported by this measure and
their corresponding numeric values are
described in the table below:
Measure Value
Numeric Value
Unknown
0
Operable
1
Inoperable
2
Degraded
3
Powered-off
4
Power-problem
5
Removed
6
Voltage-problem
7
Thermal-problem
8
Performance-
problem
9
Accessibility-
problem
10
Identity-
unestablishable
11
Bios-post-
timeout
12
Disabled
13
Fabric-conn-
problem
51
Fabric-
unsupported-
conn
52
Config
81
Equipment-
problem
82
Decommissioning
83
Chassis-limit-
exceeded
84
Not-supported
100
Discovery
101

M o n i t o r i n g t h e C i s c o U C S M a n a g e r
142
Measure Value
Numeric Value
Discovery-failed
102
Identify
103
Post-failure
104
Upgrade-problem
105
Peer-comm-
problem
106
Auto-upgrade
107
Note:
By default, this measure reports the
Measure Values listed in the table above to
indicate the operational state of an NIC.
However, in the graph of this measure,
states will be represented using their
corresponding numeric equivalents only.
Administrative
state:
Indicates the
current
administrative state
of this NIC.
The values reported by this measure and
their corresponding numeric values are
described in the table below:
Measure Value
Numeric Value
Enabled
0
Reset-
connectivity-
active
1
Reset-
connectivity-
passive
2
Reset-
connectivity
3
Note:
By default, this measure reports the
Measure Values listed in the table above to
indicate the administrative state of an NIC.
However, in the graph of this measure,
states will be represented using their
corresponding numeric equivalents only.

M o n i t o r i n g t h e C i s c o U C S M a n a g e r
143
Discovery state:
Indicates the
current discovery
state of this NIC.
The values reported by this measure and
their corresponding numeric values are
described in the table below:
Measure Value
Numeric Value
Absent
0
Present
1
Mis-connect
2
Missing
3
New
4
Note:
By default, this measure reports the
Measure Values listed in the table above to
indicate the discovery state of an NIC.
However, in the graph of this measure,
states will be represented using their
corresponding numeric equivalents only.

M o n i t o r i n g t h e C i s c o U C S M a n a g e r
144
Presence state:
Indicates the
current presence
state of this NIC.
The values reported by this measure and
their corresponding numeric values are
described in the table below:
Measure Value
Numeric Value
Unknown
0
Empty
1
Equipped
10
Missing
11
Mismatch
12
Equipped-not-
primary
13
Equipped-
identity-
unestablishable
20
Mismatch-
identity-
unestablishable
21
Inaccessible
30
Unauthorized
40
Not-supported
100
Note:
By default, this measure reports the
Measure Values listed in the table above to
indicate the presence state of an NIC.
However, in the graph of this measure,
states will be represented using their
corresponding numeric equivalents only.
Data received:
Indicates the
amount of data
received by this NIC
during the last
measurement
period.
MB
These measures are good indicators of the
load bandled by an NIC. By comparing the
value of each measure across NICs, you
can quickly identify which NIC is
experiencing heavy data traffic and when -
while receiving data? or while transmitting
data?
Data transmitted:
Indicates the
amount of data
transmitted by this
NIC during the last
measurement
period.
MB

M o n i t o r i n g t h e C i s c o U C S M a n a g e r
145
Packets received:
Indicates the
number of packets
received by this NIC
during the last
measurement
period.
Packets
These measures are good indicators of the
load bandled by an NIC. By comparing the
value of each measure across NICs, you
can quickly identify which NIC is
experiencing heavy data traffic and when -
while receiving data? or while transmitting
data?
Packets
transmitted
Indicates the
number of packets
sent by this NIC
during the last
measurement
period.
Packets
Dropped packets
received:
Indicates the
number of dropped
packets received by
this NIC during the
last measurement
period.
Packets
Dropped packets
transmitted:
Indicates the
number of dropped
packets transmitted
by this NIC during
the last
measurement
period.
Packets
Errors received:
Indicates the errors
encountered by this
NIC while receiving
data during the last
measurement
period.
Errors
Ideally, the value of both these measures
should be 0. A non-zero value indicates that
one/more errors have occurred on an NIC.
If these measure values increase with time,
you may want to compare the value of each
of these measures across NICs to quickly
zero-in on the error-prone NICs and
understand when the maximum number of
errors occurred on those NICs - while
transmitting data? or while receiving it?

M o n i t o r i n g t h e C i s c o U C S M a n a g e r
146
Errors
transmitted:
Indicates the errors
encountered by this
NIC while
transmitting data
during the last
measurement
period.
Errors

C o n c l u s i o n
147
Conclusion
This document has described in detail the monitoring paradigm used and the measurement
capabilities of the eG Enterprise suite of products with respect to Cisco UCS Manager. For details of how
to administer and use the eG Enterprise suite of products, refer to the user manuals.
We will be adding new measurement capabilities into the future versions of the eG Enterprise suite. If
you can identify new capabilities that you would like us to incorporate in the eG Enterprise suite of
products, please contact support@eginnovations.com. We look forward to your support and
cooperation. Any feedback regarding this manual or any other aspects of the eG Enterprise suite can
be forwarded to feedback@eginnovations.com.
Chapter
2
