Manual Monitoring Citrix App Controller
User Manual: Monitoring Citrix App Controller
Open the PDF directly: View PDF ![]() .
.
Page Count: 28

Monitoring the Citrix App
Controller
eG Enterprise v6

Restricted Rights Legend
The information contained in this document is confidential and subject to change without notice. No part of this
document may be reproduced or disclosed to others without the prior permission of eG Innovations Inc. eG
Innovations Inc. makes no warranty of any kind with regard to the software and documentation, including, but not
limited to, the implied warranties of merchantability and fitness for a particular purpose.
Trademarks
Microsoft Windows, Windows NT, Windows 2000, Windows 2003 and Windows 2008 are either registered trademarks
or trademarks of Microsoft Corporation in United States and/or other countries.
The names of actual companies and products mentioned herein may be the trademarks of their respective owners.
Copyright
©2014 eG Innovations Inc. All rights reserved.
Table of Contents
INTRODUCTION .................................................................................................................................................................................... 1
MONITORING CITRIX APP CONTROLLER................................................................................................................................. 2
2.1 The AppController Service Layer ............................................................................................................................................ 4
2.1.1 AppC Certificates Test ...................................................................................................................................................... 4
2.1.2 AppC Logon Status Test ................................................................................................................................................... 6
2.1.3 AppC Operations Test ....................................................................................................................................................... 8
2.2 The Applications Layer ........................................................................................................................................................... 11
2.2.1 Application Policies Test ................................................................................................................................................ 12
2.2.2 Apps Test ......................................................................................................................................................................... 15
2.3 The User and Devices Layer ................................................................................................................................................... 17
2.3.1 AppC User Logins Test................................................................................................................................................... 17
2.3.2 AppC Users Test.............................................................................................................................................................. 18
2.3.3 Devices Test..................................................................................................................................................................... 20
2.3.4 User Logons by Receiver Test........................................................................................................................................ 22
CONCLUSION ....................................................................................................................................................................................... 24
Table of Figures
Figure 1: The Citrix XenMobile Architecture ...................................................................................................................................................1
Figure 2.1: The layer model of a Citrix AppController ......................................................................................................................................3
Figure 2.2: The tests mapped to the AppController Service layer .......................................................................................................................4
Figure 2.3: The AppController management console .........................................................................................................................................9
Figure 2. 4: Configuring the Syslog server where the Syslog file is to be created ................................................................................................9
Figure 2.5: The detailed diagnosis of the Successful operations measure .......................................................................................................... 11
Figure 2.6: The tests mapped to the Applications layer .................................................................................................................................... 11
Figure 2. 7: The tests mapped to the User and Devices layer............................................................................................................................ 17
I n t r o d u c t i o n
1
Introduction
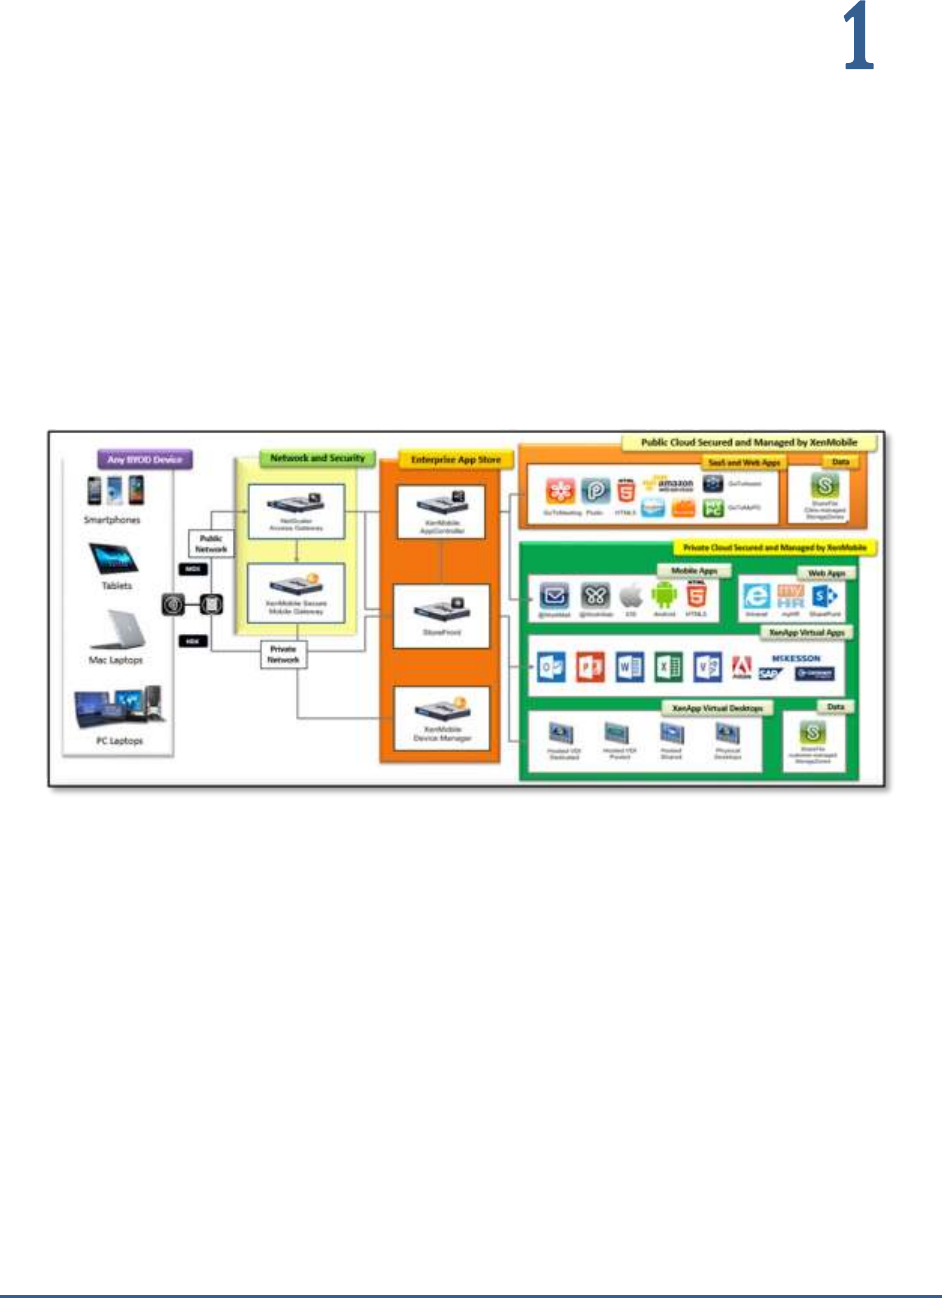
Citrix XenMobile is an enterprise mobility management solution that provides administrators with mobile device
management (MDM), mobile application management (MAM) and online file-sharing capabilities. To deliver these
services to end-users, the XenMobile software suite includes a wide range of components – the Citrix Netscaler that
authenticates remote user sessions to the app store and ensures secure access, the XenMobile App Controller that
stores the applications and data sources that can be accessed by users, Citrix ShareFile that enables efficient data
sharing and synchronization across users, and the XenMobile MDM (a.k.a the XenMobile Device Manager) that
protects the corporate network from mobile threats by applying configured mobile usage policies on devices and
detecting non-conformances.
Figure 1: The Citrix XenMobile Architecture
eG Enterprise Suite provides specialized monitors for each of the core components of the Citrix XenMobile service –
namely, the Citrix XenMobile MDM, the Citrix ShareFile, the Citrix AppController, and the Citrix Storage zones. These
out-of-the-box monitors periodically check and report the availability, responsiveness, and overall health of each of
these components, and thus reveals how the Citrix XenMobile service as a whole is performing.
This document details how eG monitors the Citrix AppController and what metrics it collects from it.

M o n i t o r i n g t h e C i t r i x A p p C o n t r o l l e r
2
Monitoring Citrix App Controller
Citrix App Controller delivers access to web, SaaS, Android, and iOS apps, as well as integrated ShareFile data and
documents. Users access their applications through Citrix Receiver, Receiver for Web or Worx Home.
With App Controller, you can provide the following benefits for each application type:
SaaS applications. Active Directory-based user identity creation and management, with SAML-based
single sign-on (SSO).
Intranet web applications. HTTP form-based SSO by using password storage.
iOS and Android apps. Unified store to which you can install MDX apps for iOS and Android devices,
and security management for MDX policies, encompassing WorxMail and WorxWeb. You can wrap iOS
and Android apps with the MDX Toolkit to create MDX apps.
ShareFile access. Delivery of files by configuring ShareFile settings and the ShareFile application
that provides seamless SAML SSO, and Active Directory-based ShareFile service user account
management.
Any issue that threatens the availability or overall health of the AppController will impact user access to all the
aforesaid applications. For instance, if the network connection to the App Controller is flaky or broken, users will
not be able to access SaaS, mobile applications, or ShareFile; as a result, user productivity will suffer. Similarly,
the inaccessibility of App Controller’s web-based management console and the use of expired certificates to
establish a connection with a mobile app can also slowdown/suspend user access. What can further weaken a
user’s experience with a mobile app are the application-level policies and device-level securities configured on
App Controller for the individual applications.
Therefore, to assure mobile device users of a high-quality experience with their applications, administrators should
closely monitor the availability of the App Controller, track user logins to App Controller and the applications these
users typically access, study the current policy settings for applications, and proactively detect abnormalities and
areas that require fine-tuning. This is exactly where the
Citrix AppController
monitoring model that eG Enterprise
provides helps!
M o n i t o r i n g t h e C i t r i x A p p C o n t ro l l e r
3
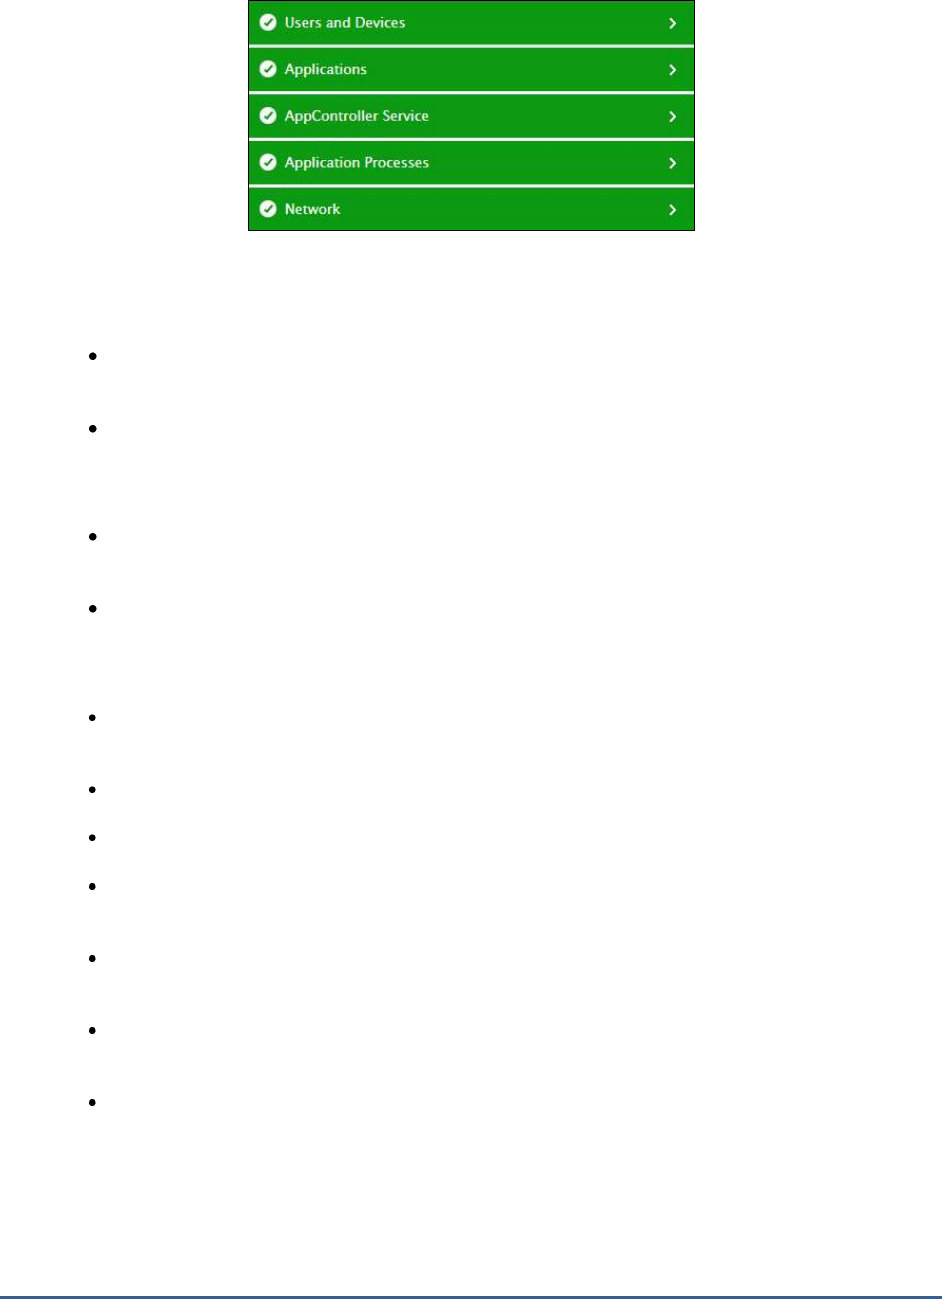
Figure 2.1: The layer model of a Citrix AppController
Each layer of this model is mapped to tests that use either/both of the following mechanisms to pull out performance
statistics related to the health and operations of the AppController:
The eG tests connect to the AppController’s management console to pull out a wide range of metrics,
and/or;
The eG tests parse a Syslog file created on the remote Syslog server used by the ApController for
collecting metrics.
To use these mechanisms, the following pre-requisites need to be fulfilled:
The eG agent should be deployed on the Syslog server that hosts the Syslog file used for metrics
collection.
The eG agent has to be configured with the credentials of a user to AppController who is vested with
‘Administrator’ privileges.
Using the metrics so collected, administrators can ascertain the following:
Is the AppController management console accessible? If so, how quickly are users able to connect to
the console?
Is any SSL certificate installed on the AppController nearing expiry? If so, which one is it?
Are there any issues logging into AppController?
What is the current session load on the AppController? Which devices are currently connected to the
AppController?
Which are the popular applications on the AppController, on the basis of the number of launches?
Which is the receiver that is used most often for accessing applications on the AppController?
Have any applications been configured to not run on jail broken or rooted devices? Which applications
are these?
Which applications block the use of the camera, microphone, and SMS composition?
M o n i t o r i n g t h e C i t r i x A p p C o n t ro l l e r
4
The sections that follow will take you on a layer-by-layer tour of the
Citrix AppController
monitoring model. However,
since the tests associated with the Network layer layer have been already dealt with in detail in the
Monitoring Unix
and Windows Servers
document this chapter will focus on the other layers only.
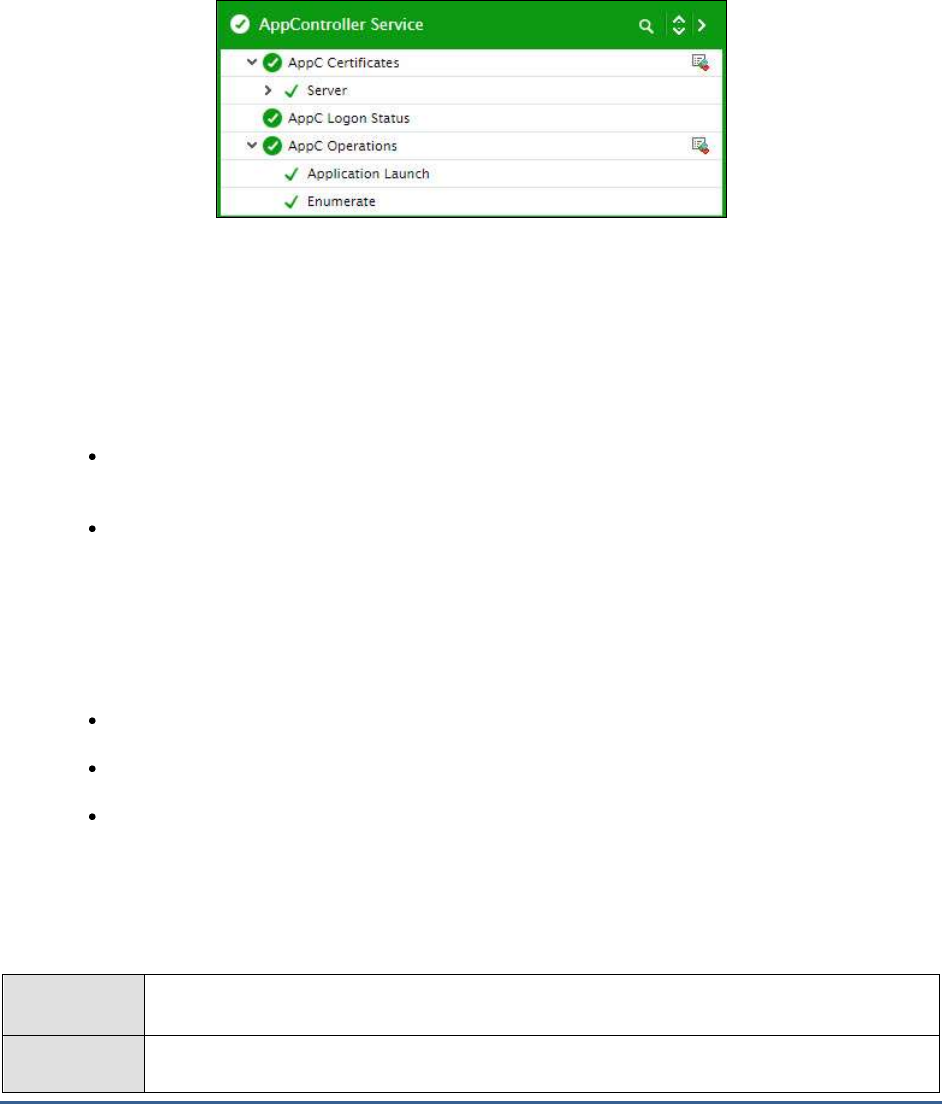
2.1 The AppController Service Layer
Figure 2.2: The tests mapped to the AppController Service layer
2.1.1 AppC Certificates Test
In App Controller, certificates are used to create secure connections and authenticate users.
To establish a secure connection, a server certificate is required at one end of the connection. A root certificate of
the Certificate Authority (CA) that issued the server certificate is required at the other end.
Server certificate. A
server certificate
certifies the identity of a server. App Controller requires this
type of digital certificate.
Root certificate. A
root certificate
identifies the CA that signed the server certificate. The root
certificate belongs to the CA. The user device requires this type of digital certificate to verify the
server certificate.
You can configure certificate chains, which contain intermediate certificates, between the server certificate and the
root certificate. Both root certificates and intermediate certificates are referred to as
trusted certificates
.
App Controller requires root and server certificates to communicate in the following ways:
Between App Controller and the App Controller management console
Between applications and App Controller
Between App Controller and StoreFront
If an active certificate ( be it a server, root, or an intermediate certificate) suddenly expires, applications will no
longer be able to communicate with AppController and vice-versa. To avoid this, administrators should proactively
identify certificates nearing expiry and renew the certificates. This is where the AppC Certificates test helps. This test
captures the expiry date of all active certificates, computes how long each active certificate will remain valid, and
proactively alerts administrators if any certificate is nearing expiry.
Purpose
Captures the expiry date of all active certificates, computes how long each active certificate will
remain valid, and proactively alerts administrators if any certificate is nearing expiry
Target of the
test
Citrix ShareFile

M o n i t o r i n g t h e C i t r i x A p p C o n t ro l l e r
5
Agent
deploying the
test
A remote agent
Configurable
parameters for
the test
1. TEST PERIOD - How often should the test be executed
2. HOST - The host for which the test is to be configured.
3. PORT – The port at which the HOST listens. By default, this is
NULL
.
4. REPORT ONLY ACTIVE CERTIFICATES – By default, this flag is set to Yes, indicating
that this test reports the validity of active certificates only. To ensure that the test reports
the validity of all certificates, set this flag to No.
5. USERNAME and PASSWORD – To pull out metrics, this test needs to login to the
AppController’s management console as a user with Administrator rights to AppController.
For this purpose, you need to configure this test with the USERNAME and PASSWORD of
a user with Administrator rights to the AppController.
6. CONFIRM PASSWORD – Confirm the PASSWORD by retyping it here.
7. SSL – Indicate whether/not AppController is SSL-enabled. By default, this flag is set to Yes.
8. DETAILED DIAGNOSIS - To make diagnosis more efficient and accurate, the eG
Enterprise suite embeds an optional detailed diagnostic capability. With this capability, the
eG agents can be configured to run detailed, more elaborate tests as and when specific
problems are detected. To enable the detailed diagnosis capability of this test for a
particular server, choose the On option. To disable the capability, click on the Off option.
The option to selectively enable/disable the detailed diagnosis capability will be available
only if the following conditions are fulfilled:
The eG manager license should allow the detailed diagnosis capability
Both the normal and abnormal frequencies configured for the detailed diagnosis
measures should not be 0.
Outputs of the
test
One set of results for every active SSL certificate installed on the AppController
Measurements
made by the
Measurement
Measurement
Unit
Interpretation
M o n i t o r i n g t h e C i t r i x A p p C o n t ro l l e r
6
test
Status:
Indicates the current status of
this SSL certificate.
The values that this measure reports and
their corresponding numeric values are listed
in the table below:
Measure Value
Numeric Value
Active
1
Expired
0
Note:
By default, this measure reports the Measure
Values discussed in the table above.
However, in the graph of this measure, the
status of the certificate is indicated using the
numeric equivalents only.
Valid upto:
Indicates how long this
certificate will remain valid.
Days
A high value is desired for this measure. A
very low value indicates that the certificate is
about to expire very soon. You may want to
consider renewing the certificate before this
eventuality strikes.
Use the detailed diagnosis of this measure to
know the exact date on which the certificate
will expire.
2.1.2 AppC Logon Status Test
Frequent login failures and inexplicable delays when accessing the AppController can have an adverse impact on a
user’s experience with AppController. To capture such failures/delays proactively and isolate their root-cause,
administrators can use the AppC Logon Status test. At configured intervals, this test emulates a user logging into
AppController. In the process, the test captures every step of the user login and reports the time taken at each step.
This way, unusual slowness in logging in can be captured and where the login process was delayed can be
determined – when connecting to the AppController? Or when authenticating?
Purpose
At configured intervals, this test emulates a user logging into AppController. In the process, the
test captures every step of the user login and reports the time taken at each step. This way,
unusual slowness in logging in can be captured and where the login process was delayed can be
determined – when connecting to the AppController? Or when authenticating?
Target of the
test
Citrix AppController
Agent
deploying the
test
A remote agent
M o n i t o r i n g t h e C i t r i x A p p C o n t ro l l e r
7
Configurable
parameters for
the test
1. TEST PERIOD - How often should the test be executed
2. HOST - The host for which the test is to be configured.
3. PORT – The port at which the HOST listens. By default, this is
NULL
.
4. USERNAME and PASSWORD – To pull out metrics, this test needs to login to the
AppController’s management console as a user with Administrator rights to AppController.
For this purpose, you need to configure this test with the USERNAME and PASSWORD of
a user with Administrator rights to the AppController.
5. CONFIRM PASSWORD – Confirm the PASSWORD by retyping it here.
6. SSL – Indicate whether/not AppController is SSL-enabled. By default, this flag is set to Yes.
Outputs of the
test
One set of results for the AppController monitored
Measurements
made by the
test
Measurement
Measurement
Unit
Interpretation
Connection status:
Indicates whether/not the
user could connect to the
AppController.
The values that this measure reports and
their corresponding numeric values are listed
in the table below:
Measure Value
Numeric Value
Success
1
Failed
0
Note:
By default, this measure reports the Measure
Values discussed in the table above.
However, in the graph of this measure, the
status of the connection is indicated using the
numeric equivalents only.
Time taken to connect:
Indicates the time taken to
connect to the AppController.
Secs
A low value is desired for this measure. A
high value indicates a connection bottleneck.

M o n i t o r i n g t h e C i t r i x A p p C o n t ro l l e r
8
Authentication status:
Indicates whether/not the
login credentials of the user
were successfully
authenticated.
The values that this measure reports and
their corresponding numeric values are listed
in the table below:
Measure Value
Numeric Value
Success
1
Failed
0
Note:
By default, this measure reports the Measure
Values discussed in the table above.
However, in the graph of this measure, the
status of the authentication is indicated using
the numeric equivalents only.
Time taken to
authenticate:
Indicates the time taken to
authenticate the user login.
Secs
A high value for this measure could indicate
an authentication delay.
Time taken to login:
Indicates the total time taken
to login.
Secs
A high value indicates a login delay. In this
case, you can compare the value of the
Time
taken to connect
and
Time taken to
authenticate
measures to know where the
login was bottlenecked.
2.1.3 AppC Operations Test
If a user complains that his/her transactions with the AppController are failing, administrators may first want to know
which steps of the user interactions are failing often. The AppC Operations test provides administrators with this
useful information. This test scans the AppController Syslog file for the type of operations users performed on
AppController. For every operation so discovered, this test then reports the number of times that operation
succeeded and the number of times it failed. This way, the test highlights those operations that failed very often and
caused the user experience with the AppController to suffer.
For this test to run and report metrics, the AppController should be configured to create a Syslog file in a remote
Syslog server, where the details and status of all user interactions with the AppController will be logged. To configure
the Syslog server where this Syslog file should be created, do the following:
Connect to the AppController management console using the URL: Error! Hyperlink reference not
valid.>
Login to the AppController as an
administrator
.
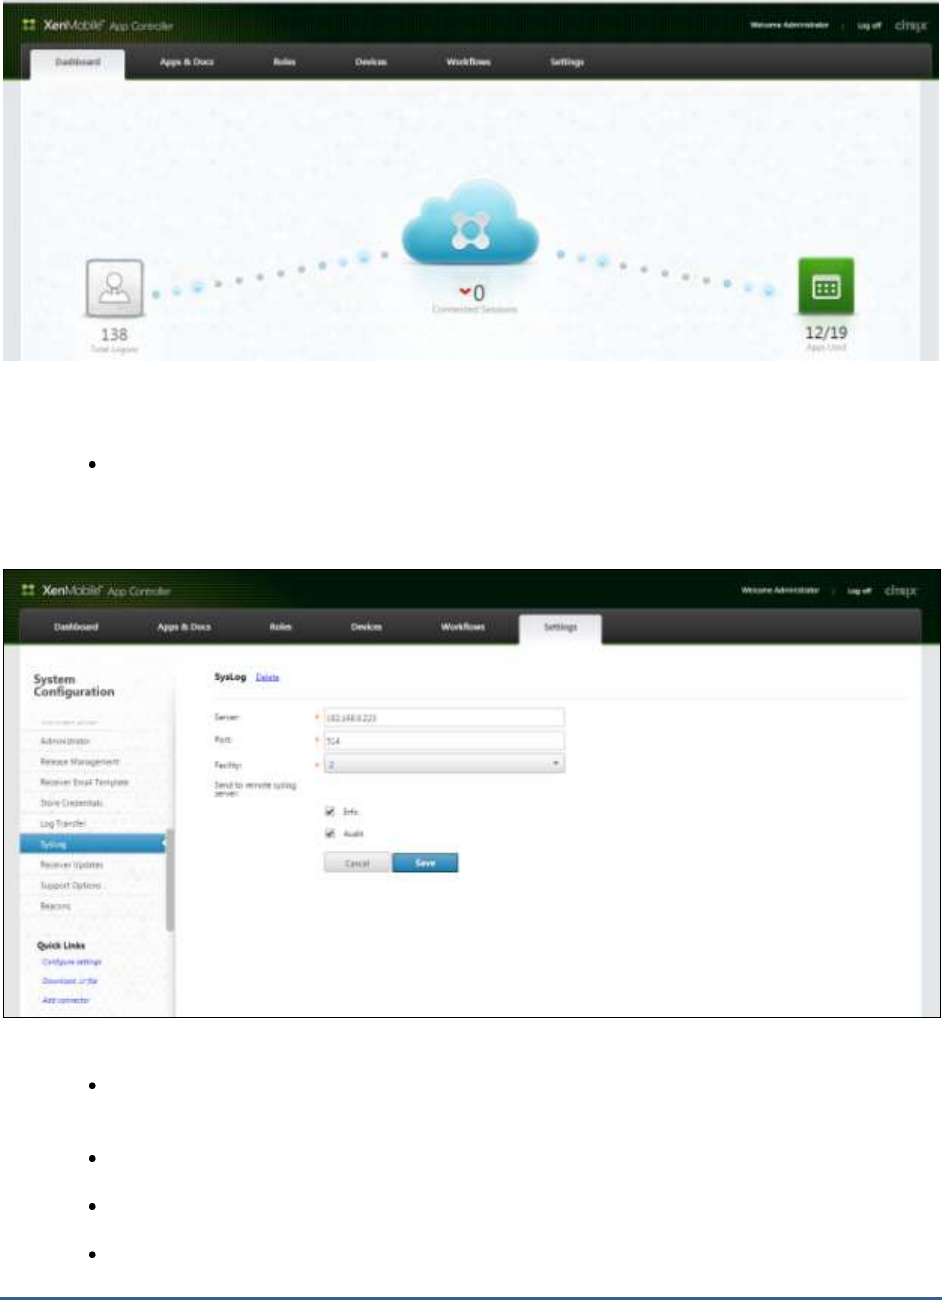
Figure 2.3 will then appear. Click the Settings option in Figure 2.3.
M o n i t o r i n g t h e C i t r i x A p p C o n t ro l l e r
9
Figure 2.3: The AppController management console
Next, scroll down the System Configuration panel of Figure 2.4 until the Syslog option becomes
visible. Then, click the Syslog option. This will bring up a Syslog page in the right panel, where you
can configure a remote Syslog server and enable Syslog file creation on the server.
Figure 2. 4: Configuring the Syslog server where the Syslog file is to be created
To configure a new Syslog server, enter the IP address of the Syslog server in the Server text box of
Figure 2.4.
Enter the Port at which the Syslog server listens.
Let the Facility remain at
2
.
Then, indicate what details should be logged in the Syslog file that will be created in the specified
Syslog server. For the eG tests to work, at least the Audit check box should be selected.

M o n i t o r i n g t h e C i t r i x A p p C o n t ro l l e r
10
Click the Save button in Figure 2.4 to register the changes.
Purpose
Scans the Syslog file for the type of operations users performed on AppController. For every
operation so discovered, this test then reports the number of times that operation succeeded
and the number of times it failed. This way, the test highlights those operations that failed very
often, resulting in a poor user experience with the AppController.
Target of the
test
Citrix AppController
Agent
deploying the
test
A remote agent
Configurable
parameters for
the test
1. TEST PERIOD - How often should the test be executed
2. HOST - The host for which the test is to be configured.
3. PORT – The port at which the HOST listens. By default, this is
NULL
.
4. LOG FILE PATH – This test reports metrics by parsing a Syslog file. Specify the full path to
the Syslog file here. To know how to configure the Syslog server where the AppController
will be creating this file, refer to page 8 of this document.
5. SSL – Indicate whether/not AppController is SSL-enabled. By default, this flag is set to Yes.
6. DETAILED DIAGNOSIS - To make diagnosis more efficient and accurate, the eG
Enterprise suite embeds an optional detailed diagnostic capability. With this capability, the
eG agents can be configured to run detailed, more elaborate tests as and when specific
problems are detected. To enable the detailed diagnosis capability of this test for a
particular server, choose the On option. To disable the capability, click on the Off option.
The option to selectively enable/disable the detailed diagnosis capability will be available
only if the following conditions are fulfilled:
The eG manager license should allow the detailed diagnosis capability
Both the normal and abnormal frequencies configured for the detailed diagnosis
measures should not be 0.
Outputs of the
test
One set of results for every operation users performed on the AppController
Measurements
made by the
test
Measurement
Measurement
Unit
Interpretation
Successful operations:
Indicates the number of times
this operation succeeded.
Number
A high value is desired for this measure.
Use the detailed diagnosis of this measure to
view the names of the users who succeeded
in performing an operation, when they
performed the operation, and the
client/receiver each user used for this
purpose.
M o n i t o r i n g t h e C i t r i x A p p C o n t ro l l e r
11
Failed operations:
Indicates the number of times
this operation failed.
Number
A very low value is desired for this measure.
Use the detailed diagnosis of this measure to
view the names of the users who failed to
perform a particular operation, when they
tried to perform that operation, and the
client/receiver each user used for this
purpose.
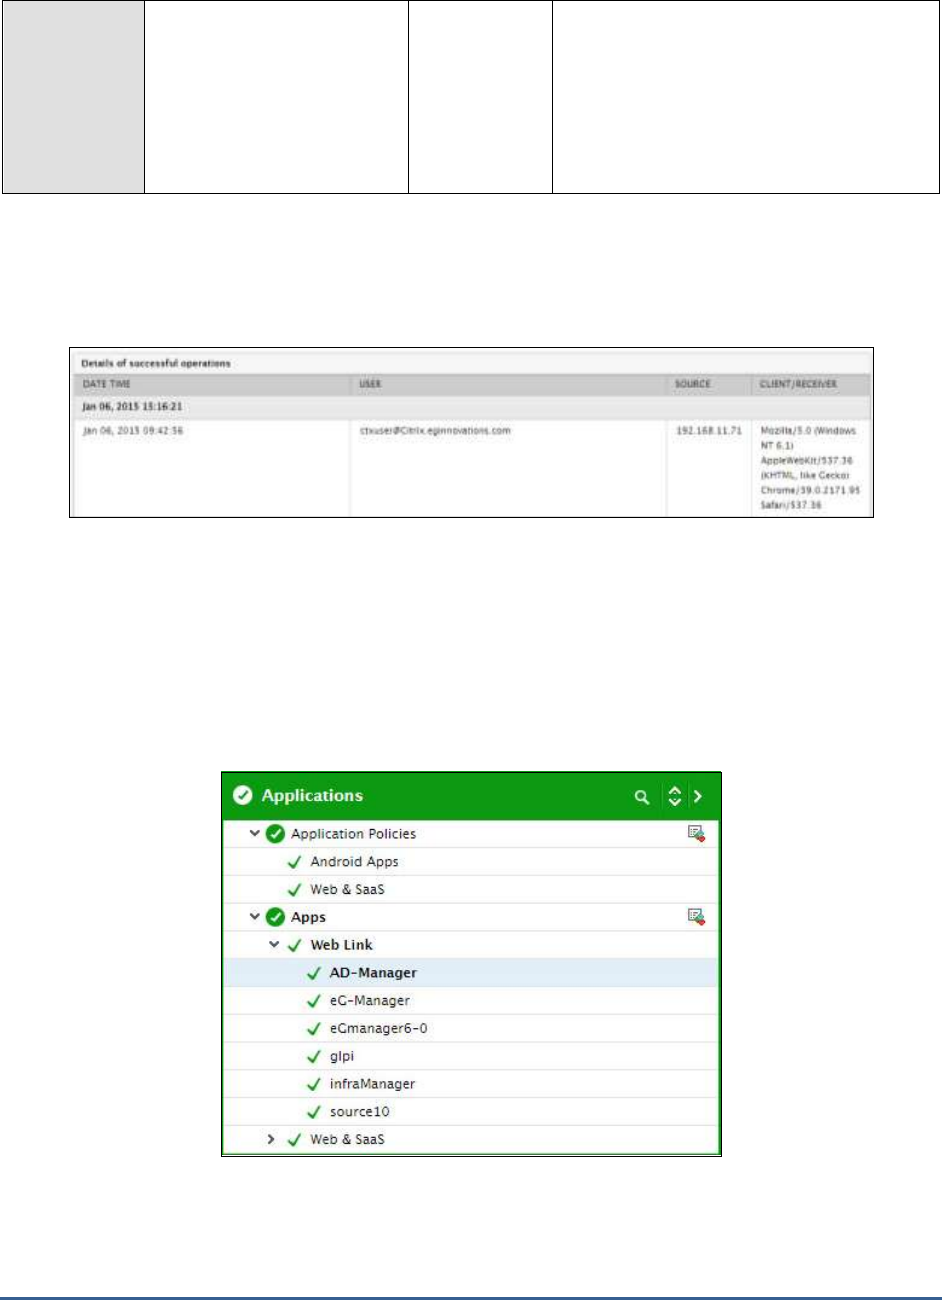
The detailed diagnosis of the
Successful operations
measure reveals the names of the users who succeeded in
performing an operation, when they performed the operation, and the client/receiver each user used for this
purpose.
Figure 2.5: The detailed diagnosis of the Successful operations measure
2.2 The Applications Layer
Using the tests mapped to this layer, application launches can be audited and the effectiveness of application policies
can be measured.
Figure 2.6: The tests mapped to the Applications layer

M o n i t o r i n g t h e C i t r i x A p p C o n t ro l l e r
12
2.2.1 Application Policies Test
You can set policies for mobile apps in the App Controller management console. Application policies for Android or
iOS apps fall into the following three main categories:
Information security. These policies are designed to protect app data and documents. The policies
dictate how information can be exchanged between apps. You can configure settings for the app to
allow or prevent user access to such operations as printing, email, text messaging, and use of the
device camera.
Application access. These policies determine the logon requirements users must meet in order to
open an app. You can configure authentication methods, settings to prevent apps from running on a
jailbroken, or rooted, device, network connection requirements, and conditions for locking or erasing
app data.
Network. These policies determine the network settings for traffic to and from the app. You can
configure the following settings: allow unrestricted access to the internal network, redirect traffic
through XenMobile App Edition by using a VPN tunnel specific to each app, or block all traffic from
accessing the internal network.
Application policies for Web & SaaS apps on the other hand, fall into the following categories:
Device security: This policy prevents jail broken or rooted devices from accessing apps.
Network: These policies determine the network settings for communicating with the app.
Periodically, administrators will have to review these policies, identify the applications on which these policies have
been configured, and decide whether the restrictions imposed by the policies on the applications should continue,
should be made stronger, or can be lifted. The Application Policies test helps administrators in this exercise. For each
category of applications delivered by the AppController, this test reports the number of applications (of that
type/category) on which certain key usage policies have been enforced. Detailed metrics collected by this test also
reveal the names of these applications. Using this information, administrators can quickly identify where policy
changes may have to be effected.
Purpose
For each category of applications delivered by the AppController, this test reports the number of
applications (of that type/category) on which certain key usage policies have been enforced
Target of the
test
Citrix AppController
Agent
deploying the
test
A remote agent
Configurable
parameters for
the test
1. TEST PERIOD - How often should the test be executed
2. HOST - The host for which the test is to be configured.
3. PORT – The port at which the HOST listens. By default, this is
NULL
.
4. USERNAME and PASSWORD – To pull out metrics, this test needs to login to the
AppController’s management console as a user with Administrator rights to AppController.
For this purpose, you need to configure this test with the USERNAME and PASSWORD of
a user with Administrator rights to the AppController.
5. CONFIRM PASSWORD – Confirm the PASSWORD by retyping it here.
6. SSL – Indicate whether/not AppController is SSL-enabled. By default, this flag is set to Yes.

M o n i t o r i n g t h e C i t r i x A p p C o n t ro l l e r
13
Outputs of the
test
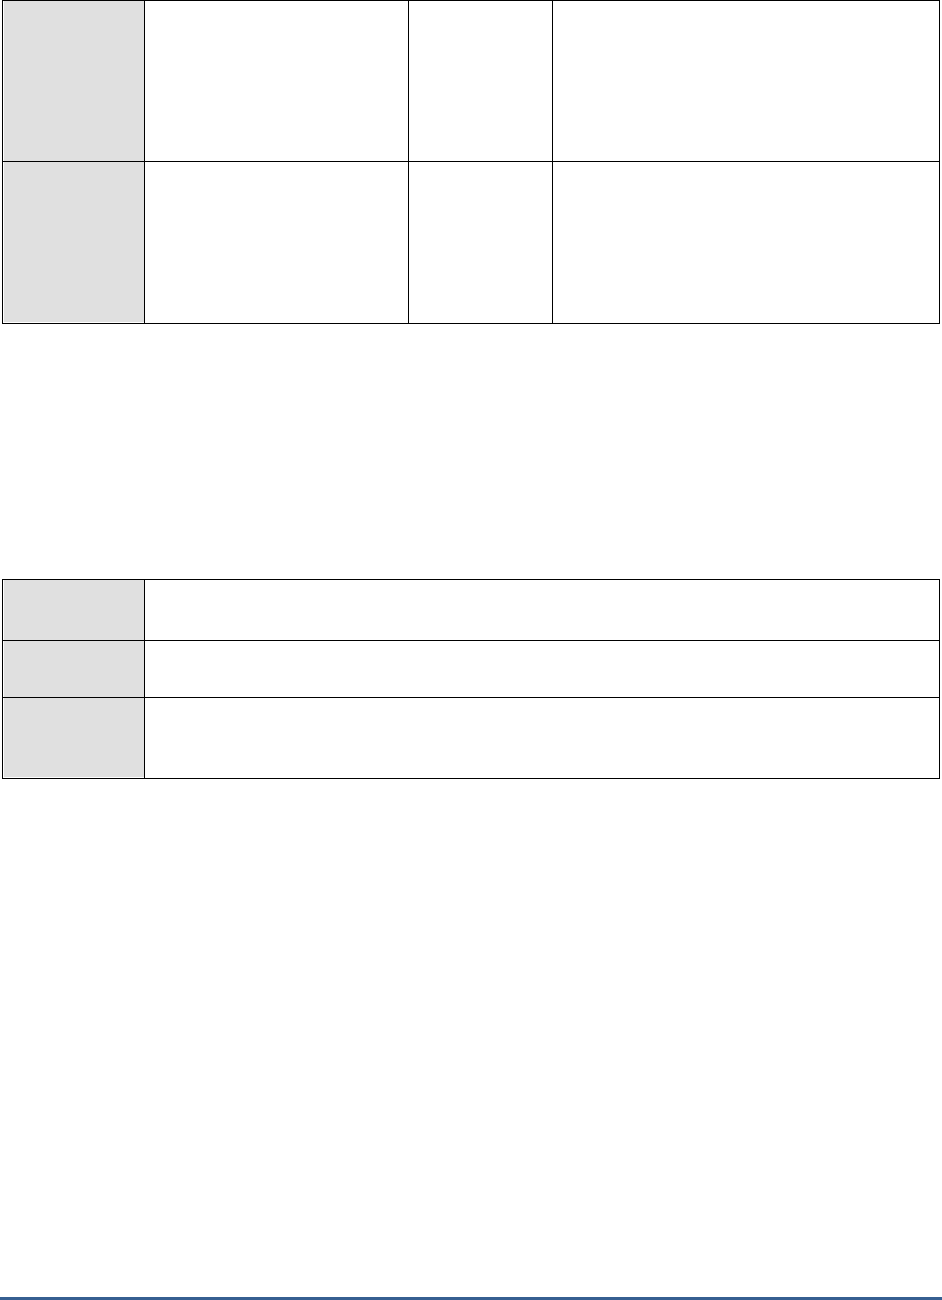
One set of results for each category of applications delivered by the AppController monitored
Measurements
made by the
test
Measurement
Measurement
Unit
Interpretation
Application blocking
jailbroken or rooted
devices:
Indicates the number of
applications of this type that
have been configured to not
run on jailbroken or rooted
devices.
Number
Use the detailed diagnosis of this measure to
identify those applications that will not run on
jailbroken or rooted devices.
Device pin or password
required applications:
Indicates the number of
applications of this type that
can be accessed only when a
device pin or a password is
provided.
Number
Use the detailed diagnosis of this measure to
identify those applications that support
password- or pin-protected access.
Camera blocking
applications:
Indicates the number of
applications of this type that
prevent the use of the
camera.
Number
Use the detailed diagnosis of this measure to
identify those applications that block camera
usage.
Microphone blocking
applications:
Indicates the number of
applications of this type that
do not allow the use of a
microphone.
Number
Use the detailed diagnosis of this measure to
identify those applications that disallow
microphone usage.
Location services blocking
applications:
Indicates the count of
applications of this type that
prevent the use of location
services (eg., GPS or
network).
Number
Use the detailed diagnosis of this measure to
know which applications prevent the use of
location services.
“SMS Compose” blocking
applications:
Indicates the number of
applications of this type that
block SMS (compose).
Number
Use the detailed diagnosis of this measure to
know which applications block SMS.

M o n i t o r i n g t h e C i t r i x A p p C o n t ro l l e r
14
“Screen Capture” blocking
applications:
Indicates the number of
applications of this type that
prevent a user-initiated
screen capture when running.
Number
Use the detailed diagnosis of this measure to
know which applications block screen capture
operations.
Device sensors blocking
applications:
Indicates the number of
applications of this type that
do not permit the use of
device sensors, like
accelerometer, motion sensor,
or gyroscope.
Number
Use the detailed diagnosis of this measure to
know which applications do not allow the use
of device sensors.
Application logs blocking
applications:
Indicates the number of
applications of this type that
block application logs.
Number
Use the detailed diagnosis of this measure to
know which applications do not allow the
logging of application events.
Full VPN tunnel enabled
applications:
Indicates the number of
applications of this type that
use an application-specific
VPN tunnel through Netscaler
Gateway for accessing the
internal network.
Number
Use the detailed diagnosis of this measure to
know which applications use a VPN tunnel to
access the internal network.
“Access limits for public
files” applications:
Indicates the number of
applications of this type that
have been configured with
‘Access limits for public files’.
Number
In the App Controller management console,
administrators can set the Access limits for
public files policy for an application. This
contains a comma-separated list. Each entry
is a regular expression path followed by (NA),
(RO), or (RW). Files matching the path are
limited to No Access, Read Only, or Read
Write access. The list is processed in order
and the first matching path is used to set the
access limit.
This policy is enforced only when the Public
file encryption policy is enabled (changed
from the Disable option to
the SecurityGroup or Application option).
This policy is applicable only to existing,
unencrypted public files and specifies when
these files are encrypted.
Use the detailed diagnosis of this measure to
know for which applications access limits
have been configured for public files.
M o n i t o r i n g t h e C i t r i x A p p C o n t ro l l e r
15
Wifi require applications:
Indicates the number of
applications of this type that
have been set to run only
when the device is connected
to a Wifi network.
Number
Use the detailed diagnosis of this measure to
know which applications require a Wifi
connection for execution.
“Network access” blocking
applications:
Indicates the number of
applications of this type that
have block all network access
for the device they run on.
Number
Use the detailed diagnosis of this measure to
know which applications block network
access for the devices they run on.
2.2.2 Apps Test
This test auto-discovers the applications configured on the AppController and reports the number of successful and
failed launches per application.
For this test to run and report metrics, the AppController should be configured to create a Syslog file in a remote
Syslog server, where the details and status of all user interactions with the AppController will be logged. To know how
to configure a remote Syslog server for the use of the AppController, refer to Page 8 of this document.
Purpose
Auto-discovers the applications configured on the AppController and reports the number of
successful and failed launches per application
Target of the
test
Citrix AppController
Agent
deploying the
test
A remote agent

M o n i t o r i n g t h e C i t r i x A p p C o n t ro l l e r
16
Configurable
parameters for
the test
1. TEST PERIOD - How often should the test be executed
2. HOST - The host for which the test is to be configured.
3. PORT – The port at which the HOST listens. By default, this is
NULL
.
4. LOG FILE PATH – This test reports metrics by parsing a Syslog file. Specify the full path to
the Syslog file here. To know how to configure the Syslog server where the AppController
will be creating this file, refer to page 8 of this document.
5. USERNAME and PASSWORD – To discover the applications configured on the
AppController, this test needs to login to the AppController’s management console as a user
with Administrator rights to AppController. For this purpose, you need to configure this
test with the USERNAME and PASSWORD of a user with Administrator rights to the
AppController.
6. CONFIRM PASSWORD – Confirm the PASSWORD by retyping it here.
7. SSL – Indicate whether/not AppController is SSL-enabled. By default, this flag is set to Yes.
8. DETAILED DIAGNOSIS - To make diagnosis more efficient and accurate, the eG
Enterprise suite embeds an optional detailed diagnostic capability. With this capability, the
eG agents can be configured to run detailed, more elaborate tests as and when specific
problems are detected. To enable the detailed diagnosis capability of this test for a
particular server, choose the On option. To disable the capability, click on the Off option.
The option to selectively enable/disable the detailed diagnosis capability will be available
only if the following conditions are fulfilled:
The eG manager license should allow the detailed diagnosis capability
Both the normal and abnormal frequencies configured for the detailed diagnosis
measures should not be 0.
Outputs of the
test
One set of results each application configured on the AppController
Measurements
made by the
test
Measurement
Measurement
Unit
Interpretation
Number of successful
application launches:
Indicates the number of times
this application was launched
successfully during the last
measurement period.
Number
Use the detailed diagnosis of this measure to
view the names of the users who successfully
launched the application, when they
launched, and the client/receiver each user
used.
Number of failed
application launches:
Indicates the number of times
this application was launched
unsuccessfully during the last
measurement period.
Number
Compare the value of this measure acros
applications to know which application failed
very often.
Use the detailed diagnosis of this measure to
view the names of the users for whom
application launches failed, when they
attempted to launch, and the client/receiver
that was used for the attempt.
M o n i t o r i n g t h e C i t r i x A p p C o n t ro l l e r
17
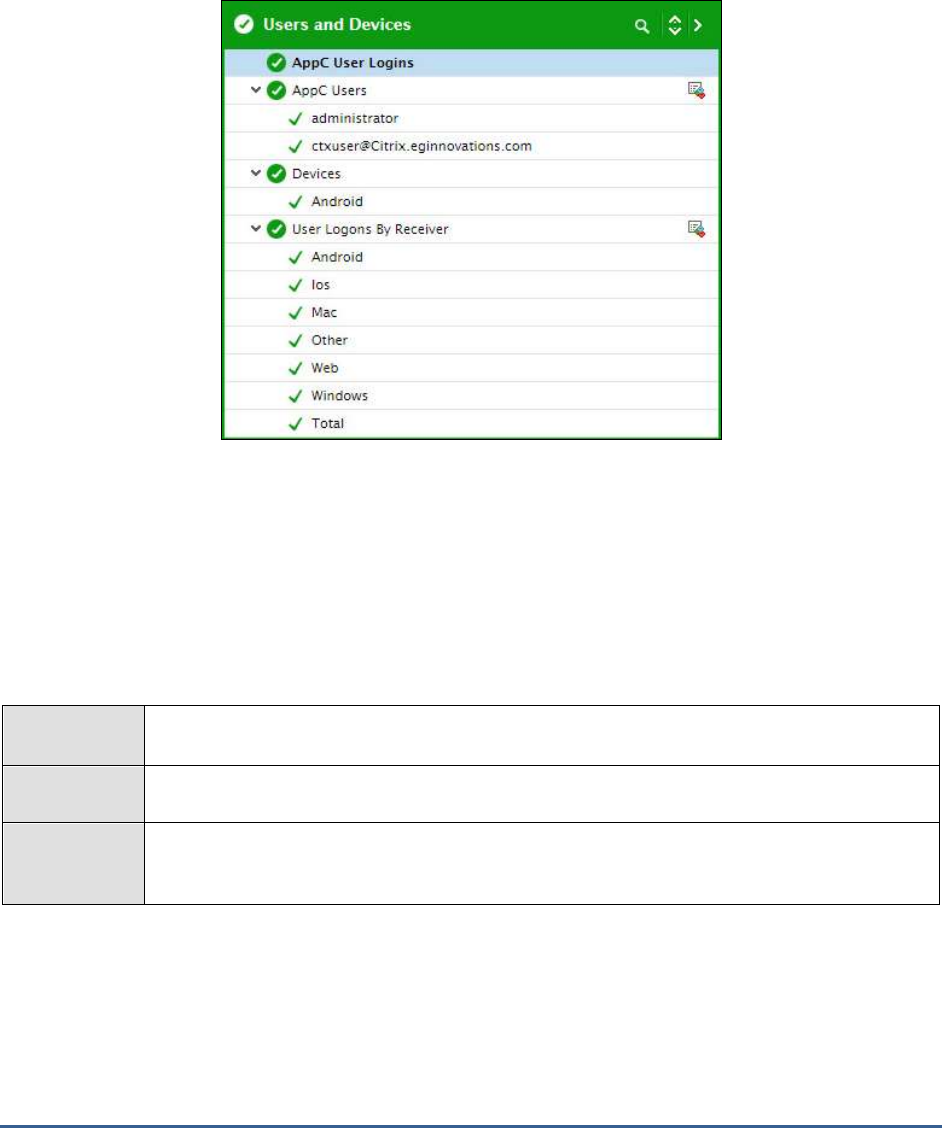
2.3 The User and Devices Layer
The tests mapped to this layer track user logins to the AppController, measures the logon duration per user, and
pinpoints the root-cause of logon slowness. In addition, this layer also keeps an eye on the devices connected to the
AppController, and points to those devices that have been locked/erased.
Figure 2. 7: The tests mapped to the User and Devices layer
2.3.1 AppC User Logins Test
By tracking user sessions to the AppController, the AppC User Logins test helps administrators gauge the workload of
the AppController and quickly capture failed login attempts.
For this test to run and report metrics, the AppController should be configured to create a Syslog file in a remote
Syslog server, where the details and status of all user interactions with the AppController will be logged. To know how
to configure a remote Syslog server for the use of the AppController, refer to Page 8 of this document.
Purpose
By tracking user sessions to the AppController, the AppC User Logins test helps administrators
gauge the workload of the AppController and quickly capture failed login attempts.
Target of the
test
Citrix AppController
Agent
deploying the
test
A remote agent

M o n i t o r i n g t h e C i t r i x A p p C o n t ro l l e r
18
Configurable
parameters for
the test
1. TEST PERIOD - How often should the test be executed
2. HOST - The host for which the test is to be configured.
3. PORT – The port at which the HOST listens. By default, this is
NULL
.
4. LOG FILE PATH – This test reports metrics by parsing a Syslog file. Specify the full path to
the Syslog file here. To know how to configure the Syslog server where the AppController
will be creating this file, refer to page 8 of this document.
5. SSL – Indicate whether/not AppController is SSL-enabled. By default, this flag is set to Yes.
Outputs of the
test
One set of results for the AppController
Measurements
made by the
test
Measurement
Measurement
Unit
Interpretation
Connected sessions:
Indicates the total number of
users currently connected to
the AppController.
Number
This is a good indicator of the current session
load on the AppController.
New logins:
Indicates the number of users
who logged in during the last
measurement period.
Number
Percentage of new logins:
Indicates the percentage of
users who logged in recently.
Percent
Session logouts:
Indicates the number of
sessions that logged out
during the last measurement
period.
Number
A sudden increase in the value of this
measure could warrant closer scrutiny.
Failed logins:
Indicates the number of
logins that failed.
Number
A low value is desired for this measure.
2.3.2 AppC Users Test
To assess a user’s experience with the AppController, administrators must track a user’s sessions on the
AppController and audit the quality of the application launches attempted by that user. The AppC Users test does
exactly this! This test auto-discovers the users who are currently logged into the AppController, and for each user,
reports the open sessions for that user and the number of successful and failed application launches per user. This
way, the test points to those users with the maximum number of failed application launches. Such users naturally are
the ones with a poor quality experience with the AppController.
For this test to run and report metrics, the AppController should be configured to create a Syslog file in a remote
Syslog server, where the details and status of all user interactions with the AppController will be logged. To know how
to configure a remote Syslog server for the use of the AppController, refer to Page 8 of this document.
M o n i t o r i n g t h e C i t r i x A p p C o n t ro l l e r
19
Purpose
Auto-discovers the users who are currently logged into the AppController, and for each user,
reports the open sessions for that user and the number of successful and failed application
launches per user
Target of the
test
Citrix AppController
Agent
deploying the
test
A remote agent
Configurable
parameters for
the test
1. TEST PERIOD - How often should the test be executed
2. HOST - The host for which the test is to be configured.
3. PORT – The port at which the HOST listens. By default, this is
NULL
.
4. LOG FILE PATH – This test reports metrics by parsing a Syslog file. Specify the full path to
the Syslog file here. To know how to configure the Syslog server where the AppController
will be creating this file, refer to page 8 of this document.
5. SHOW OTHER USERS – The test discovers the users who are currently logged into the
AppController by reading the entries in the
User
column of the specified syslog file.
Sometimes, this column may have a few blank entries. By default, this test ignores these
blank entries. This is why, the SHOW OTHER USERS flag is set to No by default. If you set
this flag to Yes, then the test will report metrics for these blank entries as well. In this case,
the test will additionally report a set of metrics for an Others descriptor. Each measure of
the Others descriptor will report a value that is an aggregate of the values recorded for the
blank entries in the Syslog file.
6. SSL – Indicate whether/not AppController is SSL-enabled. By default, this flag is set to Yes.
7. DETAILED DIAGNOSIS - To make diagnosis more efficient and accurate, the eG
Enterprise suite embeds an optional detailed diagnostic capability. With this capability, the
eG agents can be configured to run detailed, more elaborate tests as and when specific
problems are detected. To enable the detailed diagnosis capability of this test for a
particular server, choose the On option. To disable the capability, click on the Off option.
The option to selectively enable/disable the detailed diagnosis capability will be available
only if the following conditions are fulfilled:
The eG manager license should allow the detailed diagnosis capability
Both the normal and abnormal frequencies configured for the detailed diagnosis
measures should not be 0.
Outputs of the
test
One set of results for each user to the AppController
Measurements
made by the
Measurement
Measurement
Unit
Interpretation

M o n i t o r i n g t h e C i t r i x A p p C o n t ro l l e r
20
test
User sessions:
Indicates the number of open
sessions for this user
currently.
Number
This is a good indicator of the session load
imposed by a particular user on the
AppController. In the event of a session
overload, you can compare the value of this
measure across users to know which user has
contributed to the overload.
Use the detailed diagnosis of this measure to
know which applications are being accessed
by a user and which client/receiver that user
is using to launch the application.
Successful application
launches:
Indicates the number of
successful application
launches for this user.
Number
Use the detailed diagnosis of this measure to
know which applications were successfully
launched by a user and which client/receiver
that user used to launch each application.
Failed application
launches:
Indicates the number of
application launches that
failed for this user.
Percent
Use the detailed diagnosis of this measure to
know which applications a user could not
launch and which client/receiver that user
used to launch each application.
2.3.3 Devices Test
Tracking the devices connected to the AppController will not only indicate the current device load on the
AppController, but will also shed light on the current device status. Based on this status information, administrators
can determine whether/not device status needs to be changed. This is exactly what the Devices test enables
administrators to perform. This test reports the number of devices currently connected to AppController and also
reveals the number and names of the connected devices that are locked and/or erased. If a user complains that
he/she is unable to access some applications, then administrators can use this information to quickly determine
whether the user device is indeed ‘authorized’ to access the applications or have been locked out or erased. Using
the same information, administrators can also determine whether the user device is now ‘safe’ for use and can hence
be unlocked or need not be erased.
Purpose
Reports the number of devices currently connected to AppController and also reveals the
number and names of the connected devices that are locked and/or erased
Target of the
test
Citrix AppController
Agent
deploying the
test
A remote agent

M o n i t o r i n g t h e C i t r i x A p p C o n t ro l l e r
21
Configurable
parameters for
the test
1. TEST PERIOD - How often should the test be executed
2. HOST - The host for which the test is to be configured.
3. PORT – The port at which the HOST listens. By default, this is
NULL
.
4. USERNAME and PASSWORD – To pull out metrics, this test needs to login to the
AppController’s management console as a user with Administrator rights to AppController.
For this purpose, you need to configure this test with the USERNAME and PASSWORD of
a user with Administrator rights to the AppController.
5. CONFIRM PASSWORD – Confirm the PASSWORD by retyping it here.
6. SSL – Indicate whether/not AppController is SSL-enabled. By default, this flag is set to Yes.
7. DETAILED DIAGNOSIS - To make diagnosis more efficient and accurate, the eG
Enterprise suite embeds an optional detailed diagnostic capability. With this capability, the
eG agents can be configured to run detailed, more elaborate tests as and when specific
problems are detected. To enable the detailed diagnosis capability of this test for a
particular server, choose the On option. To disable the capability, click on the Off option.
The option to selectively enable/disable the detailed diagnosis capability will be available
only if the following conditions are fulfilled:
The eG manager license should allow the detailed diagnosis capability
Both the normal and abnormal frequencies configured for the detailed diagnosis
measures should not be 0.
Outputs of the
test
One set of results for the AppController monitored
Measurements
made by the
test
Measurement
Measurement
Unit
Interpretation
Total devices:
Indicates the total number of
devices currently connected
to the AppController.
Number
This is a good indicator of the current device
load on the AppController.
Locked devices:
Indicates the number of
devices connected to
AppController that are locked.
Number
If users lose an iOS or Android device, you
can lock applications on the device that App
Controller delivers, which prevents
unauthorized access to the applications. Once
the device is found, you can unlock the
applications on that device.
Use the detailed diagnosis of this measure to
identify the devices on which applications
have been locked.

M o n i t o r i n g t h e C i t r i x A p p C o n t ro l l e r
22
Erased devices:
Indicates the number of
devices connected to
AppController that have been
erased.
Number
If users lose an iOS or Android device and do
not locate the device in a specified period of
time, or if the user leaves the organization,
you can erase application data and ShareFile
documents from the user device. If you
determine that the device is safe, you can
stop erasing the data and documents on the
device.
Use the detailed diagnosis of this measure to
identify the devices on which application data
and ShareFile documents have been erased.
2.3.4 User Logons by Receiver Test
To know which receiver is used by most of the users connecting to AppController, take the help of the User Logons
by Receiver test. For every receiver connecting to the AppController, this test reports the total number of users
currently logged in via that receiver; a quick comparison of user logons across receivers will point you to the most
popular receiver.
Purpose
For every receiver connecting to the AppController, this test reports the total number of users
currently logged in via that receiver; a quick comparison of user logons across receivers will
point you to the most popular receiver
Target of the
test
Citrix AppController
Agent
deploying the
test
A remote agent
Configurable
parameters for
the test
1. TEST PERIOD - How often should the test be executed
2. HOST - The host for which the test is to be configured.
3. PORT – The port at which the HOST listens. By default, this is
NULL
.
4. USERNAME and PASSWORD – To pull out metrics, this test needs to login to the
AppController’s management console as a user with Administrator rights to AppController.
For this purpose, you need to configure this test with the USERNAME and PASSWORD of
a user with Administrator rights to the AppController.
5. CONFIRM PASSWORD – Confirm the PASSWORD by retyping it here.
6. SSL – Indicate whether/not AppController is SSL-enabled. By default, this flag is set to Yes.
Outputs of the
test
One set of results each receiver connecting to the AppController
Measurements
made by the
Measurement
Measurement
Unit
Interpretation

M o n i t o r i n g t h e C i t r i x A p p C o n t ro l l e r
23
test
Number of users currently
on:
Indicates the number of users
currently logged into
AppController via this
receiver.
Number
Compare the value of this measure across
receivers to know which receiver was used by
most of the users logged in currently.
Local users:
Indicates the number of users
from the internal network
who logged into AppController
via this receiver.
Number
External users:
Indicates the number of users
who used this receiver to log
into AppController from
outside the internal network
(for example, users who
connect from the Internet or
from remote locations).
Number

C o n c l u s i o n
24
Conclusion
This document has described in detail the monitoring paradigm used and the measurement capabilities of the eG
Enterprise suite of products with respect to the Citrix AppController. For details of how to administer and use the eG
Enterprise suite of products, refer to the user manuals.
We will be adding new measurement capabilities into the future versions of the eG Enterprise suite. If you can
identify new capabilities that you would like us to incorporate in the eG Enterprise suite of products, please contact
support@eginnovations.com. We look forward to your support and cooperation. Any feedback regarding this manual
or any other aspects of the eG Enterprise suite can be forwarded to feedback@eginnovations.com.
