Manual Monitoring Citrix Environments
User Manual: Monitoring Citrix Environments
Open the PDF directly: View PDF ![]() .
.
Page Count: 370 [warning: Documents this large are best viewed by clicking the View PDF Link!]
- 1. Introduction
- 2. Monitoring Citrix XenApp Servers
- 2.1 Monitoring Citrix XenApp Servers 4/5/6.x
- 2.1.1 The Operating System Layer
- 2.1.2 The Application Processes Layer
- 2.1.3 The Windows Services Layer
- 2.1.4 The Terminal Service Layer
- 2.1.5 The Citrix Server Layer
- 2.1.5.1 DNS Resolutions Test
- 2.1.5.2 Local Host Cache Status Test
- 2.1.5.3 XML Thread Health Test
- 2.1.5.4 IMA Service Health Test
- 2.1.5.5 Print Manager Health Test
- 2.1.5.6 Ticket Request Status Test
- 2.1.5.7 Print Spooler Health
- 2.1.5.8 Terminal Service Health
- 2.1.5.9 Citrix Connection Test
- 2.1.5.10 Citrix Authentication Test
- 2.1.5.11 Citrix Enumerations Test
- 2.1.5.12 Citrix IMA Test
- 2.1.5.13 Citrix Server Test
- 2.1.5.14 Citrix License Test
- 2.1.5.15 Citrix License Stats Test
- 2.1.5.16 Citrix Data Store Test
- 2.1.5.17 Citrix Dynamic Store Test
- 2.1.5.18 Server Work Items Test
- 2.1.5.19 User Profile Test
- 2.1.5.20 XML Threads Test
- 2.1.5.21 User Logon Test
- 2.1.5.22 Citrix XML Access Test
- 2.1.5.23 Citrix XML Tickets Test
- 2.1.5.24 User Profile Management Test
- 2.1.5.25 Data Store Check Test
- 2.1.6 The Citrix Applications Layer
- 2.1.7 The Citrix Users layer
- 2.1.8 Troubleshooting the eG Citrix Monitor
- 2.1.9 The Citrix XenApp Dashboard
- 2.2 Monitoring Citrix XenApp Servers v7 (and above)
- 2.1 Monitoring Citrix XenApp Servers 4/5/6.x
- 3. Monitoring Citrix MetaFrame Servers
- 4. Monitoring Citrix MetaFrame XP Servers
- 5. Monitoring Citrix Zone Data Collectors (ZDCs)
- 6. Monitoring the Citrix Secure Gateway
- 7. Monitoring the Citrix Secure Ticketing Authority (STA)
- 8. Monitoring Citrix License Servers
- 9. Monitoring Citrix Web Interfaces
- 10. Monitoring the Citrix Access Gateway
- 11. Monitoring the Citrix Netscaler LB
- 12. Monitoring Citrix Storefront
- 12.1 The Storefront Services Layer
- 12.1.1 Common Resources Test
- 12.1.2 Language Authentication Service Test
- 12.1.3 Password Authentication Service Test
- 12.1.4 Plug-in Resource Controller Test
- 12.1.5 Resource Subscription Test
- 12.1.6 Web Application Delivery Services Test
- 12.1.7 XML Service Test
- 12.1.8 Citrix Delivery Service Log Test
- 12.1.9 Server Groups Test
- 12.1.10 Server Details Test
- 12.1.11 Stores Test
- 12.1 The Storefront Services Layer
- 13. Conclusion

Monitoring Citrix Environments
eG Enterprise v6.0

Restricted Rights Legend
The information contained in this document is confidential and subject to change without notice. No part of this
document may be reproduced or disclosed to others without the prior permission of eG Innovations Inc. eG
Innovations Inc. makes no warranty of any kind with regard to the software and documentation, including, but not
limited to, the implied warranties of merchantability and fitness for a particular purpose.
Trademarks
Microsoft Windows, Windows NT, Windows 2000, Windows 2003 and Windows 2008 are either registered trademarks
or trademarks of Microsoft Corporation in United States and/or other countries.
The names of actual companies and products mentioned herein may be the trademarks of their respective owners.
Copyright
©2015 eG Innovations Inc. All rights reserved.
Table of Contents
INTRODUCTION .......................................................................................................................................................................... 1
MONITORING CITRIX XENAPP SERVERS ........................................................................................................................... 2
2.1 Monitoring Citrix XenApp Servers 4/5/6.x ................................................................................................................... 2
2.1.1 The Operating System Layer..................................................................................................................................... 4
2.1.1.1 PVS Write Cache Test .......................................................................................................................................... 5
2.1.2 The Application Processes Layer .............................................................................................................................. 8
2.1.2.1 HDX Port Connection Test ................................................................................................................................... 9
2.1.3 The Windows Services Layer ................................................................................................................................. 10
2.1.3.1 App-V Client Admin Log Test ............................................................................................................................ 11
2.1.3.2 App-V Client Operational Log Test .................................................................................................................... 16
2.1.3.3 App-V Client Virtual Application Log Test ........................................................................................................ 21
2.1.3.4 WinSock Errors Test ........................................................................................................................................... 26
2.1.4 The Terminal Service Layer .................................................................................................................................... 34
2.1.5 The Citrix Server Layer .......................................................................................................................................... 34
2.1.5.1 DNS Resolutions Test ......................................................................................................................................... 35
2.1.5.2 Local Host Cache Status Test .............................................................................................................................. 38
2.1.5.3 XML Thread Health Test .................................................................................................................................... 40
2.1.5.4 IMA Service Health Test..................................................................................................................................... 41
2.1.5.5 Print Manager Health Test .................................................................................................................................. 43
2.1.5.6 Ticket Request Status Test .................................................................................................................................. 44
2.1.5.7 Print Spooler Health ............................................................................................................................................ 45
2.1.5.8 Terminal Service Health...................................................................................................................................... 49
2.1.5.9 Citrix Connection Test ........................................................................................................................................ 50
2.1.5.10 Citrix Authentication Test ............................................................................................................................... 51
2.1.5.11 Citrix Enumerations Test ................................................................................................................................ 55
2.1.5.12 Citrix IMA Test ............................................................................................................................................... 56
2.1.5.13 Citrix Server Test ............................................................................................................................................ 57
2.1.5.14 Citrix License Test .......................................................................................................................................... 60
2.1.5.15 Citrix License Stats Test ................................................................................................................................. 61
2.1.5.16 Citrix Data Store Test ...................................................................................................................................... 63
2.1.5.17 Citrix Dynamic Store Test ............................................................................................................................... 64
2.1.5.18 Server Work Items Test................................................................................................................................... 66
2.1.5.19 User Profile Test ............................................................................................................................................. 67
2.1.5.20 XML Threads Test .......................................................................................................................................... 69
2.1.5.21 User Logon Test .............................................................................................................................................. 70
2.1.5.22 Citrix XML Access Test ................................................................................................................................. 80
2.1.5.23 Citrix XML Tickets Test ................................................................................................................................. 83
2.1.5.24 User Profile Management Test ........................................................................................................................ 85
2.1.5.25 Data Store Check Test ..................................................................................................................................... 90
2.1.6 The Citrix Applications Layer ................................................................................................................................. 92
2.1.6.1 Citrix XA Applications Test ............................................................................................................................... 93
2.1.6.2 App-V Applications Test .................................................................................................................................... 99
2.1.6.3 Citrix XA Application Launches Test ............................................................................................................... 104
2.1.7 The Citrix Users layer ........................................................................................................................................... 106
2.1.7.1 Citrix XA Users Test ......................................................................................................................................... 106
2.1.7.2 Citrix XA Disconnects Test .............................................................................................................................. 120
2.1.7.3 Citrix XA Logins Test ....................................................................................................................................... 122
2.1.7.4 Citrix XA Sessions Test .................................................................................................................................... 125
2.1.7.5 Citrix Receivers Test ......................................................................................................................................... 129
2.1.7.6 Citrix Clients Test ............................................................................................................................................. 131
2.1.7.7 ICA Client Access Test ..................................................................................................................................... 133
2.1.7.8 Wyse Terminals Test......................................................................................................................................... 135
2.1.7.9 ICA/RDP Listeners Test.................................................................................................................................... 137
2.1.8 Troubleshooting the eG Citrix Monitor ................................................................................................................. 138
2.1.9 The Citrix XenApp Dashboard ............................................................................................................................. 141
2.1.9.1 Overview ........................................................................................................................................................... 142
2.1.9.2 CitrixServer ....................................................................................................................................................... 161
2.1.9.3 CitrixSessions.................................................................................................................................................... 166
2.1.9.4 CitrixApplications ............................................................................................................................................. 172
2.1.9.5 CitrixUsers ........................................................................................................................................................ 178
2.1.9.6 TerminalServices .............................................................................................................................................. 183
2.2 Monitoring Citrix XenApp Servers v7 (and above) ................................................................................................. 190
2.2.1 The Application Processes Layer .......................................................................................................................... 192
2.2.1.1 Port Checks Test ............................................................................................................................................... 193
2.2.2 The Terminal Service Layer .................................................................................................................................. 195
2.2.3 The Citrix Server Layer ........................................................................................................................................ 195
2.2.4 The Citrix Applications Layer ............................................................................................................................... 195
2.2.4.1 Citrix Applications Test .................................................................................................................................... 196
2.2.5 The Citrix Users layer ........................................................................................................................................... 200
2.2.5.1 Citrix Disconnects Test ..................................................................................................................................... 200
2.2.5.2 Citrix Logins Test ............................................................................................................................................. 202
2.2.5.3 Citrix Sessions Test ........................................................................................................................................... 203
2.2.5.4 Citrix Users Test ............................................................................................................................................... 207
2.2.5.5 Citrix Multimedia Audio Logs Test .................................................................................................................. 216
2.2.5.6 Citrix Multimedia Rave Log Test ..................................................................................................................... 221
2.2.5.7 Citrix Multimedia Flash Log Test ..................................................................................................................... 226
2.2.5.8 Citrix Broker Agent Test ................................................................................................................................... 231
MONITORING CITRIX METAFRAME SERVERS ............................................................................................................. 233
3.1 The Citrix Server Layer ............................................................................................................................................. 234
3.1.1 Citrix Connection Test .......................................................................................................................................... 234
3.1.2 Citrix Authentication Test ..................................................................................................................................... 235
3.2 The Citrix Applications Layer ................................................................................................................................... 237
3.2.1 Citrix MF Applications Test ................................................................................................................................. 237
3.3 The Citrix Users Layer ............................................................................................................................................... 238
3.3.1 Citrix MetaFrame Users Test ................................................................................................................................ 239
3.3.2 Citrix Sessions Test ............................................................................................................................................... 241
3.3.3 Citrix Clients Test ................................................................................................................................................. 243
MONITORING CITRIX METAFRAME XP SERVERS ....................................................................................................... 246
MONITORING CITRIX ZONE DATA COLLECTORS (ZDCS) ......................................................................................... 247
5.1 The Citrix Farm Layer ............................................................................................................................................... 249
5.1.1 Citrix Farm Test .................................................................................................................................................... 249
5.1.2 Citrix Zones Test ................................................................................................................................................... 250
5.2 The Citrix Servers Layer ............................................................................................................................................ 251
5.2.1 Citrix Servers Test ................................................................................................................................................ 251
5.2.2 Citrix Farm Sessions Test ..................................................................................................................................... 253
5.2.3 Citrix Farm Connections Test ............................................................................................................................... 254
5.2.4 Citrix Farm Users Test .......................................................................................................................................... 256
5.2.5 Data Store Check Test ........................................................................................................................................... 262
5.3 The Citrix Licenses Layer .......................................................................................................................................... 264
5.3.1 Citrix Farm Licenses Test ..................................................................................................................................... 264
5.4 The Citrix Applications Layer ................................................................................................................................... 265
5.4.1 Citrix Application Load Test................................................................................................................................. 266
5.4.1.1 Troubleshooting the Failure of the Citrix Application Load Test on Citrix XenApp Server v6 (and above) .... 267
MONITORING THE CITRIX SECURE GATEWAY ........................................................................................................... 268
6.1.1 The CSG_SERVICE Layer ................................................................................................................................... 269
6.1.1.1 CSG Connection Test ........................................................................................................................................ 269
6.1.1.2 CSG Traffic Test ............................................................................................................................................... 271
6.1.1.3 CSG Validation Test ......................................................................................................................................... 272
6.1.1.4 CSG SSL Test ................................................................................................................................................... 273
6.1.1.5 CSG Data Test .................................................................................................................................................. 274
6.1.1.6 CSG Performance Test ...................................................................................................................................... 275
MONITORING THE CITRIX SECURE TICKETING AUTHORITY (STA) ..................................................................... 279
7.1 The STA Service Layer ............................................................................................................................................... 280
7.1.1 STA Test ............................................................................................................................................................... 280
MONITORING CITRIX LICENSE SERVERS ...................................................................................................................... 283
8.1 The Citrix License Layer ............................................................................................................................................ 284
8.1.1 Citrix Licenses Test .............................................................................................................................................. 284
MONITORING CITRIX WEB INTERFACES ....................................................................................................................... 287
9.1 The Citrix XML Service Layer .................................................................................................................................. 287
9.1.1.1 Citrix XML Access Test ................................................................................................................................... 288
MONITORING THE CITRIX ACCESS GATEWAY ............................................................................................................ 291
10.1 Monitoring the Citrix Access Gateway on Windows ............................................................................................ 291
10.1.1 The .Net Layer ...................................................................................................................................................... 292
10.1.1.1 ASP Lock Threads Test................................................................................................................................. 293
10.1.1.2 ASP .Net App Requests Test ......................................................................................................................... 294
10.1.1.3 ASP .Net Applications Test........................................................................................................................... 295
10.1.1.4 ASP .Net Workers Test ................................................................................................................................. 296
10.1.1.5 ASP .Net Sessions Test ................................................................................................................................. 298
10.1.2 The Web Server Layer .......................................................................................................................................... 300
10.1.3 The CAG Service Layer ........................................................................................................................................ 300
10.1.3.1 CAG Data Layer Test .................................................................................................................................... 300
10.1.3.2 CAG Sessions Test ........................................................................................................................................ 302
10.2 Monitoring the Citrix Access Gateway on Linux ................................................................................................. 304
10.2.1 The Operating System Layer................................................................................................................................. 304
10.2.2 Host Storage Test .................................................................................................................................................. 305
10.2.3 Host System Test .................................................................................................................................................. 307
10.2.4 The Network Layer ............................................................................................................................................... 309
10.2.5 The Tcp Layer ....................................................................................................................................................... 309
10.2.6 The Application Processes Layer .......................................................................................................................... 310
10.2.6.1 Host Processes Test ....................................................................................................................................... 311
10.2.7 The Access Gateway Service Layer ...................................................................................................................... 314
10.2.7.1 CAG Licenses Test ....................................................................................................................................... 314
10.2.7.2 CAG Logins Test .......................................................................................................................................... 316
MONITORING THE CITRIX NETSCALER LB ................................................................................................................... 319
11.1 The Operating System Layer ................................................................................................................................. 320
11.1.1 Ns Resources Test ................................................................................................................................................. 320
11.2 The Network Layer ................................................................................................................................................. 322
11.2.1.1 Ns VLANs Test ............................................................................................................................................. 323
11.3 The Netscaler Service Layer................................................................................................................................... 326
11.3.1.1 Ns HTTP Test ............................................................................................................................................... 326
11.3.1.2 Ns TCP Test .................................................................................................................................................. 329
11.3.1.3 Ns Usage Test ............................................................................................................................................... 333
MONITORING CITRIX STOREFRONT ............................................................................................................................... 340
12.1 The Storefront Services Layer ............................................................................................................................... 343
12.1.1 Common Resources Test ....................................................................................................................................... 344
12.1.2 Language Authentication Service Test .................................................................................................................. 345
12.1.3 Password Authentication Service Test .................................................................................................................. 346
12.1.4 Plug-in Resource Controller Test .......................................................................................................................... 347
12.1.5 Resource Subscription Test ................................................................................................................................... 348
12.1.6 Web Application Delivery Services Test .............................................................................................................. 350
12.1.7 XML Service Test ................................................................................................................................................. 351
12.1.8 Citrix Delivery Service Log Test .......................................................................................................................... 352
12.1.9 Server Groups Test ................................................................................................................................................ 356
12.1.10 Server Details Test ............................................................................................................................................ 357
12.1.11 Stores Test ......................................................................................................................................................... 358
CONCLUSION ........................................................................................................................................................................... 360
Table of Figures
Figure 2.1: Layer model of a Citrix XenApp server 4/5/6.x ...................................................................................................................................... 4
Figure 2.2: The tests mapped to the Operating System layer ..................................................................................................................................... 5
Figure 2.3: The tests mapped to the Application Processes layer .............................................................................................................................. 9
Figure 2.4: The test mapped to the Windows Services layer ................................................................................................................................... 11
Figure 2.5: The tests associated with the Terminal Service layer ............................................................................................................................ 34
Figure 2.6: The tests associated with the Citrix Server layer ................................................................................................................................... 35
Figure 2.7: Configuring the Citrix Authentication Test ........................................................................................................................................... 53
Figure 2.8: The Citrix Authentication test user configuration page ......................................................................................................................... 53
Figure 2.9: Adding another user .............................................................................................................................................................................. 54
Figure 2.10: Associating a single domain with different admin users ..................................................................................................................... 54
Figure 2.11: The test configuration page displaying multiple domain names, user names, and passwords ............................................................. 55
Figure 2.12: The detailed diagnosis of the Large files in user’s profile measure ..................................................................................................... 69
Figure 2.13: The detailed diagnosis of the Client side extension processed time measure ....................................................................................... 79
Figure 2.14: The detailed diagnosis of the Profile load starts measure .................................................................................................................... 79
Figure 2.15: The detailed diagnosis of the Profile unload starts measure ................................................................................................................ 80
Figure 2.16: The detailed diagnosis of the User profile load time measure ............................................................................................................. 80
Figure 2.17: A typical web interface interaction ...................................................................................................................................................... 81
Figure 2.18: Tests associated with the Citrix Applications layer ............................................................................................................................. 93
Figure 2.19: The detailed diagnosis of the Processes running measure ................................................................................................................... 98
Figure 2.20: The test associated with the Citrix Users layer .................................................................................................................................. 106
Figure 2.21: The detailed diagnosis of the User sessions measure ........................................................................................................................ 119
Figure 2.22: The detailed diagnosis of the CPU time used by user’s sessions measure ......................................................................................... 120
Figure 2.23: The detailed diagnosis of the New logins measure ............................................................................................................................ 124
Figure 2.24: The detailed diagnosis of the Sessions logged out measure ............................................................................................................... 125
Figure 2.25: The detailed diagnosis of the Active sessions measure of a Citrix server .......................................................................................... 128
Figure 2.26: The detailed diagnosis of the Uptime of Wyse terminal measure ...................................................................................................... 137
Figure 2.27: Editing the group policy .................................................................................................................................................................... 140
Figure 2.28: Turning on script execution ............................................................................................................................................................... 140
Figure 2.29: The Application Dashboard of a Citrix XenApp application ............................................................................................................. 142
Figure 2.30: Viewing the current application alerts of a particular priority ........................................................................................................... 143
Figure 2.31: Additional alarm details .................................................................................................................................................................... 144
Figure 2.32: The problem history of the target application .................................................................................................................................... 144
Figure 2.33: Configuring measures for the dial graph ........................................................................................................................................... 146
Figure 2.34: The page that appears when the dial/digital graph in the Overview dashboard of the Citrix XenApp Application is clicked ........... 147
Figure 2.35: Clicking on a Key Performance Indicator ......................................................................................................................................... 148
Figure 2.36: Enlarging the Key Performance Indicator graph ............................................................................................................................... 149
Figure 2.37: Idle sessions graph that is enlarged from the XenApp Sessions. ....................................................................................................... 150
Figure 2.38: The Details tab page of the Application Overview Dashboard .......................................................................................................... 151
Figure 2.39: Configuring measures for the dial graph ........................................................................................................................................... 152
Figure 2.40: The expanded top-n graph in the Details tab page of the Application Overview Dashboard ............................................................. 153
Figure 2.41: Time-of-day measure graphs displayed in the History tab page of the Application Overview Dashboard ........................................ 154
Figure 2.42: An enlarged measure graph of a Citrix XenApp Application ............................................................................................................ 154
Figure 2.43: Summary graphs displayed in the History tab page of the Application Overview Dashboard ........................................................... 155
Figure 2.44: An enlarged summary graph of the Citrix XenApp Application ....................................................................................................... 156
Figure 2.45: Trend graphs displayed in the History tab page of the Application Overview Dashboard ................................................................. 157
Figure 2.46: Viewing a trend graph that plots average values of a measure for a Citrix XenApp application ....................................................... 158
Figure 2.47: A trend graph plotting sum of trends for a Citrix XenApp application .............................................................................................. 158
Figure 2.48: Adding a new graph to the History tab page ...................................................................................................................................... 160
Figure 2.49: The CitrixServer Subsystem .............................................................................................................................................................. 162
Figure 2.50: An enlarged measure graph in the History tab page of the CitrixServer dashboard ........................................................................... 163
Figure 2.51: Summary graphs displayed in the History tab page of the CitrixServer Dashboard .......................................................................... 164
Figure 2.52: Trend graphs displayed in the History tab page of the CitrixServer Dashboard ................................................................................ 165
Figure 2.53: The CitrixSessions Dashboard .......................................................................................................................................................... 167
Figure 2.54: Clicking on a digital display in the CitrixSessions dashboard ........................................................................................................... 168
Figure 2.55: An enlarged measure graph in the History tab page of the Citrix Session dashboard ........................................................................ 169
Figure 2.56: Summary graphs displayed in the History tab page of the CitrixSessions Dashboard ....................................................................... 170
Figure 2.57: Trend graphs displayed in the History tab page of the CitrixSessions Dashboard ............................................................................. 171
Figure 2.58: The CitrixApplications Dashboard .................................................................................................................................................... 173
Figure 2.59: The Comparison tab page of a CitrixApplication dashboard ............................................................................................................. 174
Figure 2.60: The History tab page of CitrixApplication dashboard ....................................................................................................................... 175
Figure 2.61: An enlarged measure graph in the History tab page of the CitrixApplications dashboard ................................................................. 176
Figure 2.62: The CitrixUsers Dashboard ............................................................................................................................................................... 178
Figure 2.63: The Comparison tab page of CitrixUsers dashboard ......................................................................................................................... 179
Figure 2.64: The History tab page of CitrixUsers dashboard ................................................................................................................................. 181
Figure 2.65: An enlarged measure graph in the History tab page of the CitrixUsers dashboard ............................................................................ 181
Figure 2.66: The TerminalServices Dashboard ..................................................................................................................................................... 184
Figure 2.67: The page that appears when the digital graph in the TerminalServices dashboard of the Citrix XenApp Application is clicked ...... 185
Figure 2.68: The History tab page of a TerminalServices dashboard .................................................................................................................... 187
Figure 2.69: The enlarged graph of a measure in the TerminalServices dashboard ............................................................................................... 187
Figure 2.70: The Citrix XenDesktop 7 architecture ............................................................................................................................................... 190
Figure 2.71: The layer model of the Citrix XenApp server ................................................................................................................................... 191
Figure 2.72: The tests mapped to the Application Processes layer ........................................................................................................................ 193
Figure 2.73: Tests associated with the Citrix Applications layer ........................................................................................................................... 195
Figure 2.74: The detailed diagnosis for the Instances currently running measure.................................................................................................. 199
Figure 2.75: The tests associated with the Citrix Users layer ................................................................................................................................ 200
Figure 2.76: The detailed diagnosis of the Active Sessions measure of the Citrix XenApp .................................................................................. 206
Figure 3.1: The layer model of a Citrix MetaFrame server .................................................................................................................................... 233
Figure 3.2: Tests associated with the Citrix Server layer of a Citrix MF server .................................................................................................... 234
Figure 3.3: Test associated with the Citrix Applications layer............................................................................................................................... 237
Figure 3.4: Tests associated with the Citrix Users layer ........................................................................................................................................ 238
Figure 3.5: The detailed diagnosis of the Current connections measure ................................................................................................................ 245
Figure 4.1: Layer model of a Citrix MF XP server ................................................................................................................................................ 246
Figure 5.1: The layer model of a Citrix ZDC ........................................................................................................................................................ 248
Figure 5.2: The tests associated with the Citrix Farm layer ................................................................................................................................... 249
Figure 5.3: Tests associated with the Citrix Servers layer ..................................................................................................................................... 251
Figure 5.4: Tests associated with the Citrix Licenses test ...................................................................................................................................... 264
Figure 5.5: Tests associated with the Citrix Applications layer ............................................................................................................................. 266
Figure 6.1: The layer model of a Citrix secure gateway server .............................................................................................................................. 268
Figure 6.2: The tests associated with the CSG Service layer ................................................................................................................................. 269
Figure 7.1: The layer model of the Citrix STA ...................................................................................................................................................... 279
Figure 7.2: The test associated with the STA Service layer ................................................................................................................................... 280
Figure 8.1: Each product making a continuous connection to the license server ................................................................................................... 283
Figure 8.2: The layer model of a Citrix license server ........................................................................................................................................... 284
Figure 8.3: Tests associated with the Citrix License layer ..................................................................................................................................... 284
Figure 9.1: The layer model of the Citrix Web Interface ....................................................................................................................................... 287
Figure 9.2: The test associated with the Citrix XML Service layer ....................................................................................................................... 288
Figure 9.3: A typical web interface interaction ...................................................................................................................................................... 288
Figure 10.1: Layer model of the Citrix Access Gateway ....................................................................................................................................... 292
Figure 10.2: The tests mapped to the .Net layer .................................................................................................................................................... 293
Figure 10.3: The tests associated with the Web Server layer ................................................................................................................................. 300
Figure 10.4: The tests associated with the CAG Service layer .............................................................................................................................. 300
Figure 10.5: The layer model of the Citrix Access Gateway on Linux .................................................................................................................. 304
Figure 10.6: The tests mapped to the Operating System layer ............................................................................................................................... 305
Figure 10.7: The tests mapped to the Network layer ............................................................................................................................................. 309
Figure 10.8: The test mapped to the Tcp layer ...................................................................................................................................................... 310
Figure 10.9: The test mapped to the Application Processes layer .......................................................................................................................... 310
Figure 10.10: The tests mapped to the Access Gateway Service layer .................................................................................................................. 314
Figure 11.1: The Netscaler architecture ................................................................................................................................................................. 319
Figure 11.2: Layer model of the Citrix Nescaler ................................................................................................................................................... 320
Figure 11.3: The test associated with the Operating System layer of the Netscaler device .................................................................................... 320
Figure 11.4: The tests associated with the Network layer ...................................................................................................................................... 323
Figure 11.5: The tests associated with the Netscaler Service layer ........................................................................................................................ 326

I N T R O D UC T I O N
1
Introduction
Citrix based environments are growing in popularity as cost-effective, efficient modes of accessing a variety of
heterogeneous applications on-demand. By hosting applications on Citrix farms and making them accessible over a
distributed network, IT administrators can allow users in different locations effectively access and share hardware
resources and software licenses. While such thin-client environments offer economies of scale, there are significant
challenges in maintaining and operating these environments. In order to be an effective alternative for desktop
applications, Citrix environments must deliver the same quality of service that users have come to expect from their
desktop applications.
Typically, Citrix server farms include multiple tiers of software. A front-end web interface (Nfuse or StoreFront) server
is used to support web-based accesses to the server farm. Active directory servers handle user authentication and
rights association, while user profiles are loaded from profile servers. The authenticated requests are passed to the
Citrix XenApp servers that host a number of applications. In turn, the applications may use backend databases,
printers, etc., for different functionalities. Owing to the multi-tier nature of Citrix environments, a slow-down in one
tier (e.g., the authentication server) can cause a slow-down of the entire service. When a slow-down occurs, an
administrator of the Citrix farm has to quickly determine what the source of the problem could be - i.e., Is it the
network? Or the web interface server? Or the Active Directory server? Or the profile server? Or the Citrix XenApp
server? Or the backend database? Accurate, fast diagnosis of problems helps reduce downtime and improve
customer satisfaction.
The eG Enterprise suite offers 100% web-based monitoring of Citrix XenApp server farms. The eG Enterprise suite
includes extensive, pre-defined, customized models of the different applications in the Citrix farm including Citrix
XenApp, MetaFrame XP™ and 1.8 servers, Citrix ZDCs, Nfuse server, the Citrix StoreFront server, the access
gateways, the netscaler LB, the Secure Ticketing Authority, the Windows domain controllers, infrastructure servers
like DNS, LDAP, Active Directory, and other network devices.
This chapter discusses the monitoring models offered by eG Enterprise for each of the Citrix products.
M O N I T O RI N G C I T R I X X E N AP P S E R V E R S
2
Monitoring Citrix XenApp Servers
The foundation of the Citrix Access Suite, Citrix XenApp server, is the world’s most widely deployed server for
centrally managing heterogeneous applications and delivering their functionality as a service to workers, wherever
they may be.
Using a specialized
Citrix XenApp 4/5/6.x
monitoring model, eG Enterprise provides monitoring support to Citrix
XenApp Servers 4.0/4.5/5/6/6.5.
To monitor Citrix XenApp servers v7 (and above), eG Enterprise offers a dedicated
Citrix XenApp
monitoring model.
2.1 Monitoring Citrix XenApp Servers 4/5/6.x
In this section, we will be discussing the monitoring capabilities of the
Citrix XenApp 4/5/6.x
monitoring model alone.
This model reveals the following:
XenApp Server Monitoring
Are the Citrix servers available to service user requests?
Are there sporadic disconnects from the Citrix server?
At what times do peak usage of the servers happen and is
the server capacity adequate?
Is the user load being balanced across all the servers?
Is the data store available?
What are the access rates to the data store, the dynamic
store, and the local host cache?
How much IMA traffic is happening between servers?
Note:
While you can monitor the Citrix XenApp server 4.0, 4.5, and 5 using either agent-based or agentless
mechanisms, a Citrix XenApp 6.0/6.5 server can be monitored only in an agent-based manner. This is
because, the eG agent uses PowerShell SDK to collect metrics from the Citrix XenApp 6.0 and XenApp 6.5, and
this SDK cannot be accessed in an agentless manner.

M O N I T O RI N G C I T R I X X E N AP P S E R V E R S
3
User Monitoring
What is the average response time that critical users are
seeing when connecting to a XenApp server?
How many users are logged in to each server in the Citrix
farm?
What is the resource usage (CPU and memory) for each
user?
Are specific user profiles too large?
Operating System Monitoring
What is the average CPU and memory usage on all the
servers in the farm?
Is any unusual memory scanning/paging activity
happening on the systems?
Are the critical XenApp server and IMA processes up?
What is their resource consumption?
Published Applications Monitoring
What are the published applications on a XenApp server?
Who is using each application?
What is the resource usage for each published
application?
License Monitoring
How many product and connection licenses are available
in the farm and what is their usage?
Are there enough licenses available for each of the
published applications?
Infrastructure Services Monitoring
Is the web interface server forwarding requests to the
XenApp server?
Are the backend databases working?
What is the resource usage of the databases?
Are users able to login to the server farm? How long is
the login process taking?
What is the usage of the Microsoft Windows Domain
Controller?
M O N I T O RI N G C I T R I X X E N AP P S E R V E R S
4
Figure 2.1: Layer model of a Citrix XenApp server 4/5/6.x
The sections to come elobarate on the tests executing on the Operating System layer and each of the top 6 layers of
the monitoring model depicted by Figure 2.1, and the measures they report.
2.1.1 The Operating System Layer
The tests mapped to this layer report the health of the Windows operating system on which the XenApp server
operates.

M O N I T O RI N G C I T R I X X E N AP P S E R V E R S
5
Figure 2.2: The tests mapped to the Operating System layer
All the tests mapped to this layer, except the PVS Write Cache test, have already been discussed in the
Monitoring
Unix and Windows Servers
document. The sub-section that follows therefore will talk about the PVS Write Cache test
only.
2.1.1.1 PVS Write Cache Test
Provisioning Services (PVS) is a service utilized to stream an operating system image from a file, known as a vDisk,
to a physical or virtual computer. The recipient of the stream can be a disk less computer with the vDisk acting as its
hard disk drive. One of the primary benefits of PVS is the ability to utilize a single vDisk to stream to multiple
computers. This type of vDisk is known as a Standard vDisk and offers increased consistency, security, and
centralized management.
Standard vDisks are Read-Only. All modifications, such as application installations, are written to a temporary file
known as the Write Cache. When read requests for the newly written files come in, they are read from the write
cache.
The Write Cache file can be configured to reside in the following locations:
Cache on Provisioning Server
Cache on Target Device RAM
Cache on Target Device Hard Drive

M O N I T O RI N G C I T R I X X E N AP P S E R V E R S
6
For virtual XenApp servers, administrators typically use the server’s hard drive for storing the write cache. Storing the
write cache on the target side is beneficial as it keeps the write “close” to the target and minimizes the load on the
Provisioning Servers, but it requires more resources. If the write-cache does not have enough disk space resources to
grow, then many modifications to the vDisk will be lost. This is why, it is imperative that the write-cache is sized
right, its usage is tracked continuously, and the lack of adequate disk space for the write cache brought to the
attention of administrators rapidly. This is what the PVS Write Cache test does! This test
Purpose
Monitors the size and usage of the write cache and proactively alerts administrators when the
write-cache runs out of space
Target of the
test
A Provisioned Citrix XenApp server
Agent
deploying the
test
An internal agent
Configurable
parameters for
the test
1. TEST PERIOD - How often should the test be executed
2. HOST - Host name of the server for which the test is to be configured
3. PORT - Enter the port to which the specified HOST listens
4. PVS WRITE CACHE LOCATION – Specify the location of the write cache file to be
monitored. By default, this will be:
d:\.vdiskcache
.
5. PVS WRITE CACHE MAX SIZE – Specify the maximum size upto which the write cache
file can grow. By default, this is set to
10 GB
.
Outputs of the
test
One set of results for the provisioned Citrix XenApp server being monitored
Measurements
made by the
test
Measurement
Measurement
Unit
Interpretation
Write cache size:
Indicates the current size of
the write cache.
GB

M O N I T O RI N G C I T R I X X E N AP P S E R V E R S
7
Write cache utilization:
Indicates the percent usage
of the write cache.
Percent
The value of this measure is computed using
the following formula:
(PVS Write Cache Max Size – Write
cache size) / Write cache size * 100
If the value of this measure is close to 100%,
it indicates that the write cache may soon run
out of space. Under such circumstances, you
have the following options:
You can increase the maximum size
to which write cache can grow, or;
Redirect some items out of the write
cache and into a persistent drive.
Before increasing the maximum write cache
size, you will have to take the following into
account:
Basically the write cache will store
all writes which would have gone to
the hard disk. So if a user tends to
copy large files locally to his/her
desktop the write cache will grow at
the same pace as the files are
transferred. If there is any
application which caches files or
portions of a central DB locally for
better performance, then the write
cache will grow again.
But there are some items which will
always hit the write cache and these
are split into two areas again. On
one hand there is the user space,
which contains items such as the
user profile or internet/application
related temp files. The user related
write cache disk space needs to be
multiplied by the amount of users
logged on to a particular system.

M O N I T O RI N G C I T R I X X E N AP P S E R V E R S
8
On the other hand we have the
system space, which contains items
such as logs or system temp / cache
files, but we will also find files which
are modified by the OS or any
service for whatever reason. The
system related write cache disk
space is typically lager for server
operating systems than for
workstations.
If you choose to redirect, then one/more of
the following items can be redirected:
Windows Pagefile. In fact the PVS
Target Device driver detects if a
local drive is available and redirects
the pagefile automatically.
Windows Event Log. While the
eventlog is typically quite small
(maybe 100MB or so) many
customers redirect it for
supportability and traceability
reasons.
Citrix related logs. Same as
Windows Event Log.
Anti Virus pattern. In case the virus
scanner allows redirecting the
pattern file, doing so saves some
write cache space but it also saves
some network traffic as it is not
required to load the pattern from
scratch after every reboot.
2.1.2 The Application Processes Layer
Using the tests mapped to this layer, you can do the following:
a. Capture key application and system error events that have occurred on the server;
b. Verify whether the processes critical to the functioning of the Citrix server are currently operational or not,
and also monitor the CPU/memory usage of these processes;
c. Periodically check the availability of the Citrix server’s TCP port, the responsiveness of the port to client
requests, and also the availability of ICA connection to the port.
M O N I T O RI N G C I T R I X X E N AP P S E R V E R S
9
Figure 2.3: The tests mapped to the Application Processes layer
The section that follows will discuss the IcaConnection test alone, as all other tests mapped to this layer have already
been discussed in the
Monitoring Unix and Windows Servers
document.
2.1.2.1 HDX Port Connection Test
This test primarily checks whether the critical TCP ports on the Citrix server are up/down, and reports the
responsiveness of each configured port to client requests. For a Citrix server however, these checks might not be
adequate at all times; you could have a case where the Citrix server port is up but the server is still not responding.
When a connection is made to the Citrix server, it will typically send a message "ICA" to the client. This check
connects to the port and then validates the response from the citrix server to see if the ICA stream is being received
by the client. Hence, this test additionally reports the ICA connection availability.
Purpose
Periodically check the availability of the Citrix server’s TCP port, the responsiveness of the port
to client requests, and also the availability of ICA connection to the port.
Target of the
test
A Citrix server
Agent
deploying the
test
An external agent

M O N I T O RI N G C I T R I X X E N AP P S E R V E R S
10
Configurable
parameters for
the test
1. TEST PERIOD - How often should the test be executed
2. HOST - Host name of the server for which the test is to be configured
3. PORT - Enter the port to which the specified HOST listens
4. TARGETPORTS – Specify either a comma-separated list of port numbers that are to be
tested (eg., 1494,1495,1496), or a comma-separated list of
port name:port number
pairs
that are to be tested (eg., ica:1494,smtp:25,mssql:1433). In the latter case, the port name
will be displayed in the monitor interface. Alternatively, this parameter can take a comma-
separated list of
port name:IP address:port number
pairs that are to be tested, so as to
enable the test to try and connect to Tcp ports on multiple IP addresses. For example,
mysql:192.168.0.102:1433,egwebsite:209.15.165.127:80.
5. TIMEOUT - Here, specify the maximum duration (in seconds) for which the test will wait
for a response from the server. The default TIMEOUT period is 60 seconds.
6. ISPASSIVE – If the value chosen is YES, then the server under consideration is a passive
server in a cluster. No alerts will be generated if the server is not running. Measures will be
reported as “Not applicable’ by the agent if the server is not up.
Outputs of the
test
One set of results for every configured port name or port number
Measurements
made by the
test
Measurement
Measurement
Unit
Interpretation
TCP connection
availability:
Whether the TCP connection
is available or not.
Percent
An availability problem can be caused by
different factors – e.g., the server process
may not be up, a network problem may exist,
or there could be a configuration problem
with the DNS server.
Response time:
Time taken (in seconds) by
the server to respond to a
request.
Secs
An increase in response time can be caused
by several factors such as a server
bottleneck, a configuration problem with the
DNS server, a network problem, etc.
ICA connection
availability:
Indicates whether ICA
connection is available or not.
Percent
While the value 100 for this measure
indicates that the ICA stream is being
received by the client, the value 0 indicates
that it is not.
2.1.3 The Windows Services Layer
The test mapped to this layer indicates whether the Windows services critical to the functioning of the Citrix server
are currently available or not.
M O N I T O RI N G C I T R I X X E N AP P S E R V E R S
11
Figure 2.4: The test mapped to the Windows Services layer
Since most of the tests mapped to this layer have already been dealt with in the
Monitoring Unix and Windows
Servers
document, let us now discuss the tests that are exclusive for this server.
2.1.3.1 App-V Client Admin Log Test
This test reports the statistical information about the admin events generated by the target system.
This test will report metrics only when the App-V Client is installed on the Citrix XenApp Server.
Purpose
Reports the statistical information about the admin events generated by the target system
Target of the
An App-V Client on the target Citrix XenApp Server

M O N I T O RI N G C I T R I X X E N AP P S E R V E R S
12
test
Agent
deploying the
test
An internal agent
Configurable
parameters for
the test
1. TEST PERIOD - How often should the test be executed
2. HOST - The host for which the test is to be configured
3. PORT – Specify the port at which the specified HOST listens to. By default, this is 8080.
4. LOGTYPE – Refers to the type of event logs to be monitored. The default value is
Microsoft-AppV-Client/Admin
.
5. POLICY BASED FILTER - Using this page, administrators can configure the event
sources, event IDs, and event descriptions to be monitored by this test. In order to enable
administrators to easily and accurately provide this specification, this page provides the
following options:
Manually specify the event sources, IDs, and descriptions in the FILTER text area,
or,
Select a specification from the predefined filter policies listed in the FILTER box
For explicit, manual specification of the filter conditions, select the NO option against the
POLICY BASED FILTER field. This is the default selection. To choose from the list of pre-
configured filter policies, or to create a new filter policy and then associate the same with
the test, select the YES option against the POLICY BASED FILTER field.
6. FILTER - If the POLICY BASED FILTER flag is set to NO, then a FILTER text area will
appear, wherein you will have to specify the event sources, event IDs, and event
descriptions to be monitored. This specification should be of the following format:
{Displayname}:{event_sources_to_be_included}:{event_sources_to_be_excluded}:{event_I
Ds_to_be_included}:{event_IDs_to_be_excluded}:{event_descriptions_to_be_included}:{ev
ent_descriptions_to_be_excluded}
. For example, assume that the FILTER text area takes
the value,
OS_events:all:Browse,Print:all:none:all:none
. Here:
OS_events
is the display name that will appear as a descriptor of the test in the
monitor UI;
all
indicates that all the event sources need to be considered while monitoring. To
monitor specific event sources, provide the source names as a comma-separated
list. To ensure that none of the event sources are monitored, specify
none
.
Next, to ensure that specific event sources are excluded from monitoring, provide a
comma-separated list of source names. Accordingly, in our example,
Browse
and
Print
have been excluded from monitoring. Alternatively, you can use
all
to indicate
that all the event sources have to be excluded from monitoring, or
none
to denote
that none of the event sources need be excluded.
In the same manner, you can provide a comma-separated list of event IDs that
require monitoring. The
all
in our example represents that all the event IDs need to
be considered while monitoring.
Similarly, the
none
(following
all
in our example) is indicative of the fact that none
of the event IDs need to be excluded from monitoring. On the other hand, if you
want to instruct the eG Enterprise system to ignore a few event IDs during
monitoring, then provide the IDs as a comma-separated list. Likewise, specifying
all
makes sure that all the event IDs are excluded from monitoring.

M O N I T O RI N G C I T R I X X E N AP P S E R V E R S
13
The
all
which follows implies that all events, regardless of description, need to be
included for monitoring. To exclude all events, use
none
. On the other hand, if you
provide a comma-separated list of event descriptions, then the events with the
specified descriptions will alone be monitored. Event descriptions can be of any of
the following forms -
desc*
, or
desc
, or
*desc*
,or
desc*
, or
desc1*desc2
, etc.
desc
here refers to any string that forms part of the description. A leading '*' signifies any
number of leading characters, while a trailing '*' signifies any number of trailing
characters.
In the same way, you can also provide a comma-separated list of event descriptions
to be excluded from monitoring. Here again, the specification can be of any of the
following forms:
desc*
, or
desc
, or
*desc*
,or
desc*
, or
desc1*desc2
, etc.
desc
here
refers to any string that forms part of the description. A leading '*' signifies any
number of leading characters, while a trailing '*' signifies any number of trailing
characters. In our example however, none is specified, indicating that no event
descriptions are to be excluded from monitoring. If you use
all
instead, it would
mean that all event descriptions are to be excluded from monitoring.
By default, the FILTER parameter contains the value
:
all. Multiple filters are to be
separated by semi-colons (;).
The event sources and event IDs specified here should be exactly the
same as that which appears in the Event Viewer window.
On the other hand, if the POLICY BASED FILTER flag is set to YES, then a FILTER list
box will appear, displaying the filter policies that pre-exist in the eG Enterprise system. A
filter policy typically comprises of a specific set of event sources, event IDs, and event
descriptions to be monitored. This specification is built into the policy in the following
format:
{Policyname}:{event_sources_to_be_included}:{event_sources_to_be_excluded}:{event_ID
s_to_be_included}:{event_IDs_to_be_excluded}:{event_descriptions_to_be_included}:{eve
nt_descriptions_to_be_excluded}
To monitor a specific combination of event sources, event IDs, and event descriptions, you
can choose the corresponding filter policy from the FILTER list box. Multiple filter policies
can be so selected. Alternatively, you can modify any of the existing policies to suit your
needs, or create a new filter policy. To facilitate this, a icon appears near the FILTER
list box, once the YES option is chosen against POLICY BASED FILTER. Clicking on the
icon leads you to a page where you can modify the existing policies or create a new one.
The changed policy or the new policy can then be associated with the test by selecting the
policy name from the FILTER list box in this page.

M O N I T O RI N G C I T R I X X E N AP P S E R V E R S
14
7. USEWMI - The eG agent can either use WMI to extract event log statistics or directly parse
the event logs using event log APIs. If the USEWMI flag is YES, then WMI is used. If not,
the event log APIs are used. This option is provided because on some Windows NT/2000
systems (especially ones with service pack 3 or lower), the use of WMI access to event logs
can cause the CPU usage of the WinMgmt process to shoot up. On such systems, set the
USEWMI parameter value to NO. On the other hand, when monitoring systems that are
operating on any other flavor of Windows (say, Windows 2003/XP/2008/7/Vista/12), the
USEWMI flag should always be set to ‘Yes’.
8. STATELESS ALERTS - Typically, the eG manager generates email alerts only when the
state of a specific measurement changes. A state change typically occurs only when the
threshold of a measure is violated a configured number of times within a specified time
window. While this ensured that the eG manager raised alarms only when the problem was
severe enough, in some cases, it may cause one/more problems to go unnoticed, just
because they did not result in a state change. For example, take the case of the EventLog
test. When this test captures an error event for the very first time, the eG manager will send
out a CRITICAL email alert with the details of the error event to configured recipients. Now,
the next time the test runs, if a different error event is captured, the eG manager will keep
the state of the measure as CRITICAL, but will not send out the details of this error event to
the user; thus, the second issue will remain hidden from the user. To make sure that
administrators do not miss/overlook critical issues, the eG Enterprise monitoring solution
provides the stateless alerting capability. To enable this capability for this test, set the
STATELESS ALERTS flag to Yes. This will ensure that email alerts are generated for this
test, regardless of whether or not the state of the measures reported by this test changes.
9. DDFORINFORMATION – eG Enterprise also provides you with options to restrict the
amount of storage required for event log tests. Towards this end, the
DDFORINFORMATION and DDFORWARNING flags have been made available in this
page. By default, both these flags are set to Yes, indicating that by default, the test
generates detailed diagnostic measures for information events and warning events. If you
do not want the test to generate and store detailed measures for information events, set the
DDFORINFORMATION flag to No.
10. DDFORWARNING – To ensure that the test does not generate and store detailed
measures for warning events, set the DDFORWARNING flag to No.
11. DD FREQUENCY - Refers to the frequency with which detailed diagnosis measures are to
be generated for this test. The default is
1:1
. This indicates that, by default, detailed
measures will be generated every time this test runs, and also every time the test detects a
problem. You can modify this frequency, if you so desire. Also, if you intend to disable the
detailed diagnosis capability for this test, you can do so by specifying
none
against
DDFREQ.
12. DETAILED DIAGNOSIS - To make diagnosis more efficient and accurate, the eG
Enterprise suite embeds an optional detailed diagnostic capability. With this capability, the
eG agents can be configured to run detailed, more elaborate tests as and when specific
problems are detected. To enable the detailed diagnosis capability of this test for a
particular server, choose the On option. To disable the capability, click on the Off option.
The option to selectively enabled/disable the detailed diagnosis capability will be available
only if the following conditions are fulfilled:
o The eG manager license should allow the detailed diagnosis capability
o Both the normal and abnormal frequencies configured for the detailed diagnosis
measures should not be 0.

M O N I T O RI N G C I T R I X X E N AP P S E R V E R S
15
Outputs of the
test
One set of results for the App-V Client that is to be monitored
Measurements
made by the
test
Measurement
Measurement
Unit
Interpretation
Information messages:
Indicates the number of App-
V Client admin information
events generated when the
test was last executed.
Number
A change in the value of this measure may
indicate infrequent but successful operations
performed by one or more applications.
Please check the App-V Client admin logs in
the Event Log Viewer for more details.
Warnings:
Indicates the number of App-
V Client admin warnings that
were generated when the test
was last executed.
Number
A high value of this measure indicates
application problems that may not have an
immediate impact, but may cause future
problems in one or more applications.
Please check the App-V Client admin logs in
the Event Log Viewer for more details.
Error messages:
Indicates the number of App-
V Client admin error events
that were generated during
the last measurement period.
Number
A very low value (zero) indicates that the
system is in a healthy state and all
applications are running smoothly without
any potential problems.
An increasing trend or high value indicates
the existence of problems like loss of
functionality or data in one or more
applications.
Please check the App-V Client admin logs in
the Event Log Viewer for more details.
Critical messages:
Indicates the number of App-
V Client admin critical error
events that were generated
when the test was last
executed.
Number
A very low value (zero) indicates that the
system is in a healthy state and all
applications are running smoothly without
any potential problems.
An increasing trend or high value indicates
the existence of fatal/irrepairable problems in
one or more applications.
Please check the App-V Client admin logs in
the Event Log Viewer for more details.
Verbose messages:
Indicates the number of App-
V Client admin verbose events
that were generated when the
test was last executed.
Number
The detailed diagnosis of this measure
describes all the verbose events that were
generated during the last measurement
period.
Please check the App-V Client admin logs in
the Event Log Viewer for more details.
M O N I T O RI N G C I T R I X X E N AP P S E R V E R S
16
2.1.3.2 App-V Client Operational Log Test
This test reports the statistical information about the operation events generated by the target system.
This test will report metrics only when the App-V Client is installed on the Citrix XenApp Server.
Purpose
Reports the statistical information about the operation events generated by the target system
Target of the
test
An App-V Client on the target Citrix XenApp Server
Agent
deploying the
test
An internal agent

M O N I T O RI N G C I T R I X X E N AP P S E R V E R S
17
Configurable
parameters for
the test
1. TEST PERIOD - How often should the test be executed
2. HOST - The host for which the test is to be configured
3. PORT – Specify the port at which the specified HOST listens to. By default, this is 8080.
4. LOGTYPE – Refers to the type of event logs to be monitored. The default value is
Microsoft-AppV-Client/Operational
.
5. POLICY BASED FILTER - Using this page, administrators can configure the event
sources, event IDs, and event descriptions to be monitored by this test. In order to enable
administrators to easily and accurately provide this specification, this page provides the
following options:
Manually specify the event sources, IDs, and descriptions in the FILTER text area,
or,
Select a specification from the predefined filter policies listed in the FILTER box
For explicit, manual specification of the filter conditions, select the NO option against the
POLICY BASED FILTER field. This is the default selection. To choose from the list of pre-
configured filter policies, or to create a new filter policy and then associate the same with
the test, select the YES option against the POLICY BASED FILTER field.
6. FILTER - If the POLICY BASED FILTER flag is set to NO, then a FILTER text area will
appear, wherein you will have to specify the event sources, event IDs, and event
descriptions to be monitored. This specification should be of the following format:
{Displayname}:{event_sources_to_be_included}:{event_sources_to_be_excluded}:{event_I
Ds_to_be_included}:{event_IDs_to_be_excluded}:{event_descriptions_to_be_included}:{ev
ent_descriptions_to_be_excluded}
. For example, assume that the FILTER text area takes
the value,
OS_events:all:Browse,Print:all:none:all:none
. Here:
OS_events
is the display name that will appear as a descriptor of the test in the
monitor UI;
all
indicates that all the event sources need to be considered while monitoring. To
monitor specific event sources, provide the source names as a comma-separated
list. To ensure that none of the event sources are monitored, specify
none
.
Next, to ensure that specific event sources are excluded from monitoring, provide a
comma-separated list of source names. Accordingly, in our example,
Browse
and
Print
have been excluded from monitoring. Alternatively, you can use
all
to indicate
that all the event sources have to be excluded from monitoring, or
none
to denote
that none of the event sources need be excluded.
In the same manner, you can provide a comma-separated list of event IDs that
require monitoring. The
all
in our example represents that all the event IDs need to
be considered while monitoring.
Similarly, the
none
(following
all
in our example) is indicative of the fact that none
of the event IDs need to be excluded from monitoring. On the other hand, if you
want to instruct the eG Enterprise system to ignore a few event IDs during
monitoring, then provide the IDs as a comma-separated list. Likewise, specifying
all
makes sure that all the event IDs are excluded from monitoring.
M O N I T O RI N G C I T R I X X E N AP P S E R V E R S
18
The
all
which follows implies that all events, regardless of description, need to be
included for monitoring. To exclude all events, use
none
. On the other hand, if you
provide a comma-separated list of event descriptions, then the events with the
specified descriptions will alone be monitored. Event descriptions can be of any of
the following forms -
desc*
, or
desc
, or
*desc*
,or
desc*
, or
desc1*desc2
, etc.
desc
here refers to any string that forms part of the description. A leading '*' signifies any
number of leading characters, while a trailing '*' signifies any number of trailing
characters.
In the same way, you can also provide a comma-separated list of event descriptions
to be excluded from monitoring. Here again, the specification can be of any of the
following forms:
desc*
, or
desc
, or
*desc*
,or
desc*
, or
desc1*desc2
, etc.
desc
here
refers to any string that forms part of the description. A leading '*' signifies any
number of leading characters, while a trailing '*' signifies any number of trailing
characters. In our example however, none is specified, indicating that no event
descriptions are to be excluded from monitoring. If you use
all
instead, it would
mean that all event descriptions are to be excluded from monitoring.
By default, the FILTER parameter contains the value
:
all. Multiple filters are to be
separated by semi-colons (;).
The event sources and event IDs specified here should be exactly the
same as that which appears in the Event Viewer window.
On the other hand, if the POLICY BASED FILTER flag is set to YES, then a FILTER list
box will appear, displaying the filter policies that pre-exist in the eG Enterprise system. A
filter policy typically comprises of a specific set of event sources, event IDs, and event
descriptions to be monitored. This specification is built into the policy in the following
format:
{Policyname}:{event_sources_to_be_included}:{event_sources_to_be_excluded}:{event_ID
s_to_be_included}:{event_IDs_to_be_excluded}:{event_descriptions_to_be_included}:{eve
nt_descriptions_to_be_excluded}
To monitor a specific combination of event sources, event IDs, and event descriptions, you
can choose the corresponding filter policy from the FILTER list box. Multiple filter policies
can be so selected. Alternatively, you can modify any of the existing policies to suit your
needs, or create a new filter policy. To facilitate this, a icon appears near the FILTER
list box, once the YES option is chosen against POLICY BASED FILTER. Clicking on the
icon leads you to a page where you can modify the existing policies or create a new one.
The changed policy or the new policy can then be associated with the test by selecting the
policy name from the FILTER list box in this page.

M O N I T O RI N G C I T R I X X E N AP P S E R V E R S
19
7. USEWMI - The eG agent can either use WMI to extract event log statistics or directly parse
the event logs using event log APIs. If the USEWMI flag is YES, then WMI is used. If not,
the event log APIs are used. This option is provided because on some Windows NT/2000
systems (especially ones with service pack 3 or lower), the use of WMI access to event logs
can cause the CPU usage of the WinMgmt process to shoot up. On such systems, set the
USEWMI parameter value to NO. On the other hand, when monitoring systems that are
operating on any other flavor of Windows (say, Windows 2003/XP/2008/7/Vista/12), the
USEWMI flag should always be set to ‘Yes’.
8. STATELESS ALERTS - Typically, the eG manager generates email alerts only when the
state of a specific measurement changes. A state change typically occurs only when the
threshold of a measure is violated a configured number of times within a specified time
window. While this ensured that the eG manager raised alarms only when the problem was
severe enough, in some cases, it may cause one/more problems to go unnoticed, just
because they did not result in a state change. For example, take the case of the EventLog
test. When this test captures an error event for the very first time, the eG manager will send
out a CRITICAL email alert with the details of the error event to configured recipients. Now,
the next time the test runs, if a different error event is captured, the eG manager will keep
the state of the measure as CRITICAL, but will not send out the details of this error event to
the user; thus, the second issue will remain hidden from the user. To make sure that
administrators do not miss/overlook critical issues, the eG Enterprise monitoring solution
provides the stateless alerting capability. To enable this capability for this test, set the
STATELESS ALERTS flag to Yes. This will ensure that email alerts are generated for this
test, regardless of whether or not the state of the measures reported by this test changes.
9. DDFORINFORMATION – eG Enterprise also provides you with options to restrict the
amount of storage required for event log tests. Towards this end, the
DDFORINFORMATION and DDFORWARNING flags have been made available in this
page. By default, both these flags are set to Yes, indicating that by default, the test
generates detailed diagnostic measures for information events and warning events. If you
do not want the test to generate and store detailed measures for information events, set the
DDFORINFORMATION flag to No.
10. DDFORWARNING – To ensure that the test does not generate and store detailed
measures for warning events, set the DDFORWARNING flag to No.
11. DD FREQUENCY - Refers to the frequency with which detailed diagnosis measures are to
be generated for this test. The default is
1:1
. This indicates that, by default, detailed
measures will be generated every time this test runs, and also every time the test detects a
problem. You can modify this frequency, if you so desire. Also, if you intend to disable the
detailed diagnosis capability for this test, you can do so by specifying
none
against
DDFREQ.
12. DETAILED DIAGNOSIS - To make diagnosis more efficient and accurate, the eG
Enterprise suite embeds an optional detailed diagnostic capability. With this capability, the
eG agents can be configured to run detailed, more elaborate tests as and when specific
problems are detected. To enable the detailed diagnosis capability of this test for a
particular server, choose the On option. To disable the capability, click on the Off option.
The option to selectively enabled/disable the detailed diagnosis capability will be available
only if the following conditions are fulfilled:
o The eG manager license should allow the detailed diagnosis capability
o Both the normal and abnormal frequencies configured for the detailed diagnosis
measures should not be 0.

M O N I T O RI N G C I T R I X X E N AP P S E R V E R S
20
Outputs of the
test
One set of results for the App-V Client that is to be monitored
Measurements
made by the
test
Measurement
Measurement
Unit
Interpretation
Information messages:
Indicates the number of App-
V Client operational
information events generated
when the test was last
executed.
Number
A change in the value of this measure may
indicate infrequent but successful operations
performed by one or more applications.
Please check the App-V Client Operational
logs in the Event Log Viewer for more details.
Warnings:
Indicates the number of App-
V Client operational warnings
that were generated when the
test was last executed.
Number
A high value of this measure indicates
application problems that may not have an
immediate impact, but may cause future
problems in one or more applications.
Please check the App-V Client Operational
logs in the Event Log Viewer for more details.
Error messages:
Indicates the number of App-
V Client operational error
events that were generated
during the last measurement
period.
Number
A very low value (zero) indicates that the
system is in a healthy state and all
applications are running smoothly without
any potential problems.
An increasing trend or high value indicates
the existence of problems like loss of
functionality or data in one or more
applications.
Please check the App-V Client Operational
logs in the Event Log Viewer for more details.
Critical messages:
Indicates the number of App-
V Client operational critical
error events that were
generated when the test was
last executed.
Number
A very low value (zero) indicates that the
system is in a healthy state and all
applications are running smoothly without
any potential problems.
An increasing trend or high value indicates
the existence of fatal/irrepairable problems in
one or more applications.
Please check the App-V Client Operational
logs in the Event Log Viewer for more details.
Verbose messages:
Indicates the number of App-
V Client operational verbose
events that were generated
when the test was last
executed.
Number
The detailed diagnosis of this measure
describes all the verbose events that were
generated during the last measurement
period.
Please check the App-V Client Operational
logs in the Event Log Viewer for more details.
M O N I T O RI N G C I T R I X X E N AP P S E R V E R S
21
2.1.3.3 App-V Client Virtual Application Log Test
This test reports the statistical information about the virtual application events generated by the target system.
This test will report metrics only when the App-V Client is installed on the Citrix XenApp Server.
Purpose
Reports the statistical information about the virtual application events generated by the target
system
Target of the
test
An App-V Client on the target Citrix XenApp Server
Agent
deploying the
test
An internal agent

M O N I T O RI N G C I T R I X X E N AP P S E R V E R S
22
Configurable
parameters for
the test
1. TEST PERIOD - How often should the test be executed
2. HOST - The host for which the test is to be configured
3. PORT – Specify the port at which the specified HOST listens to. By default, this is 8080.
4. LOGTYPE – Refers to the type of event logs to be monitored. The default value is
Microsoft-AppV-Client/Virtual Applications
.
5. POLICY BASED FILTER - Using this page, administrators can configure the event
sources, event IDs, and event descriptions to be monitored by this test. In order to enable
administrators to easily and accurately provide this specification, this page provides the
following options:
Manually specify the event sources, IDs, and descriptions in the FILTER text area,
or,
Select a specification from the predefined filter policies listed in the FILTER box
For explicit, manual specification of the filter conditions, select the NO option against the
POLICY BASED FILTER field. This is the default selection. To choose from the list of pre-
configured filter policies, or to create a new filter policy and then associate the same with
the test, select the YES option against the POLICY BASED FILTER field.
6. FILTER - If the POLICY BASED FILTER flag is set to NO, then a FILTER text area will
appear, wherein you will have to specify the event sources, event IDs, and event
descriptions to be monitored. This specification should be of the following format:
{Displayname}:{event_sources_to_be_included}:{event_sources_to_be_excluded}:{event_I
Ds_to_be_included}:{event_IDs_to_be_excluded}:{event_descriptions_to_be_included}:{ev
ent_descriptions_to_be_excluded}
. For example, assume that the FILTER text area takes
the value,
OS_events:all:Browse,Print:all:none:all:none
. Here:
OS_events
is the display name that will appear as a descriptor of the test in the
monitor UI;
all
indicates that all the event sources need to be considered while monitoring. To
monitor specific event sources, provide the source names as a comma-separated
list. To ensure that none of the event sources are monitored, specify
none
.
Next, to ensure that specific event sources are excluded from monitoring, provide a
comma-separated list of source names. Accordingly, in our example,
Browse
and
Print
have been excluded from monitoring. Alternatively, you can use
all
to indicate
that all the event sources have to be excluded from monitoring, or
none
to denote
that none of the event sources need be excluded.
In the same manner, you can provide a comma-separated list of event IDs that
require monitoring. The
all
in our example represents that all the event IDs need to
be considered while monitoring.
Similarly, the
none
(following
all
in our example) is indicative of the fact that none
of the event IDs need to be excluded from monitoring. On the other hand, if you
want to instruct the eG Enterprise system to ignore a few event IDs during
monitoring, then provide the IDs as a comma-separated list. Likewise, specifying
all
makes sure that all the event IDs are excluded from monitoring.

M O N I T O RI N G C I T R I X X E N AP P S E R V E R S
23
The
all
which follows implies that all events, regardless of description, need to be
included for monitoring. To exclude all events, use
none
. On the other hand, if you
provide a comma-separated list of event descriptions, then the events with the
specified descriptions will alone be monitored. Event descriptions can be of any of
the following forms -
desc*
, or
desc
, or
*desc*
,or
desc*
, or
desc1*desc2
, etc.
desc
here refers to any string that forms part of the description. A leading '*' signifies any
number of leading characters, while a trailing '*' signifies any number of trailing
characters.
In the same way, you can also provide a comma-separated list of event descriptions
to be excluded from monitoring. Here again, the specification can be of any of the
following forms:
desc*
, or
desc
, or
*desc*
,or
desc*
, or
desc1*desc2
, etc.
desc
here
refers to any string that forms part of the description. A leading '*' signifies any
number of leading characters, while a trailing '*' signifies any number of trailing
characters. In our example however, none is specified, indicating that no event
descriptions are to be excluded from monitoring. If you use
all
instead, it would
mean that all event descriptions are to be excluded from monitoring.
By default, the FILTER parameter contains the value
:
all. Multiple filters are to be
separated by semi-colons (;).
The event sources and event IDs specified here should be exactly the
same as that which appears in the Event Viewer window.
On the other hand, if the POLICY BASED FILTER flag is set to YES, then a FILTER list
box will appear, displaying the filter policies that pre-exist in the eG Enterprise system. A
filter policy typically comprises of a specific set of event sources, event IDs, and event
descriptions to be monitored. This specification is built into the policy in the following
format:
{Policyname}:{event_sources_to_be_included}:{event_sources_to_be_excluded}:{event_ID
s_to_be_included}:{event_IDs_to_be_excluded}:{event_descriptions_to_be_included}:{eve
nt_descriptions_to_be_excluded}
To monitor a specific combination of event sources, event IDs, and event descriptions, you
can choose the corresponding filter policy from the FILTER list box. Multiple filter policies
can be so selected. Alternatively, you can modify any of the existing policies to suit your
needs, or create a new filter policy. To facilitate this, a icon appears near the FILTER
list box, once the YES option is chosen against POLICY BASED FILTER. Clicking on the
icon leads you to a page where you can modify the existing policies or create a new one.
The changed policy or the new policy can then be associated with the test by selecting the
policy name from the FILTER list box in this page.

M O N I T O RI N G C I T R I X X E N AP P S E R V E R S
24
7. USEWMI - The eG agent can either use WMI to extract event log statistics or directly parse
the event logs using event log APIs. If the USEWMI flag is YES, then WMI is used. If not,
the event log APIs are used. This option is provided because on some Windows NT/2000
systems (especially ones with service pack 3 or lower), the use of WMI access to event logs
can cause the CPU usage of the WinMgmt process to shoot up. On such systems, set the
USEWMI parameter value to NO. On the other hand, when monitoring systems that are
operating on any other flavor of Windows (say, Windows 2003/XP/2008/7/Vista/12), the
USEWMI flag should always be set to ‘Yes’.
8. STATELESS ALERTS - Typically, the eG manager generates email alerts only when the
state of a specific measurement changes. A state change typically occurs only when the
threshold of a measure is violated a configured number of times within a specified time
window. While this ensured that the eG manager raised alarms only when the problem was
severe enough, in some cases, it may cause one/more problems to go unnoticed, just
because they did not result in a state change. For example, take the case of the EventLog
test. When this test captures an error event for the very first time, the eG manager will send
out a CRITICAL email alert with the details of the error event to configured recipients. Now,
the next time the test runs, if a different error event is captured, the eG manager will keep
the state of the measure as CRITICAL, but will not send out the details of this error event to
the user; thus, the second issue will remain hidden from the user. To make sure that
administrators do not miss/overlook critical issues, the eG Enterprise monitoring solution
provides the stateless alerting capability. To enable this capability for this test, set the
STATELESS ALERTS flag to Yes. This will ensure that email alerts are generated for this
test, regardless of whether or not the state of the measures reported by this test changes.
9. DDFORINFORMATION – eG Enterprise also provides you with options to restrict the
amount of storage required for event log tests. Towards this end, the
DDFORINFORMATION and DDFORWARNING flags have been made available in this
page. By default, both these flags are set to Yes, indicating that by default, the test
generates detailed diagnostic measures for information events and warning events. If you
do not want the test to generate and store detailed measures for information events, set the
DDFORINFORMATION flag to No.
10. DDFORWARNING – To ensure that the test does not generate and store detailed
measures for warning events, set the DDFORWARNING flag to No.
11. DD FREQUENCY - Refers to the frequency with which detailed diagnosis measures are to
be generated for this test. The default is
1:1
. This indicates that, by default, detailed
measures will be generated every time this test runs, and also every time the test detects a
problem. You can modify this frequency, if you so desire. Also, if you intend to disable the
detailed diagnosis capability for this test, you can do so by specifying
none
against DD
FREQUENCY.
12. DETAILED DIAGNOSIS - To make diagnosis more efficient and accurate, the eG
Enterprise suite embeds an optional detailed diagnostic capability. With this capability, the
eG agents can be configured to run detailed, more elaborate tests as and when specific
problems are detected. To enable the detailed diagnosis capability of this test for a
particular server, choose the On option. To disable the capability, click on the Off option.
The option to selectively enabled/disable the detailed diagnosis capability will be available
only if the following conditions are fulfilled:
o The eG manager license should allow the detailed diagnosis capability
o Both the normal and abnormal frequencies configured for the detailed diagnosis
measures should not be 0.

M O N I T O RI N G C I T R I X X E N AP P S E R V E R S
25
Outputs of the
test
One set of results for the App-V Client that is to be monitored
Measurements
made by the
test
Measurement
Measurement
Unit
Interpretation
Information messages:
Indicates the number of App-
V Client virtual application
informational events that
were generated when the test
was last executed.
Number
A change in the value of this measure may
indicate infrequent but successful operations
performed by one or more applications.
Please check the App-V Client Virtual
Application logs in the Event Log Viewer for
more details.
Warnings:
Indicates the number of App-
V Client virtual application
warnings that were generated
when the test was last
executed.
Number
A high value of this measure indicates
application problems that may not have an
immediate impact, but may cause future
problems in one or more applications.
Please check the App-V Client Virtual
Application logs in the Event Log Viewer for
more details.
Error messages:
Indicates the number of App-
V Client virtual application
error events that were
generated during the last
measurement period.
Number
A very low value (zero) indicates that the
system is in a healthy state and all
applications are running smoothly without
any potential problems.
An increasing trend or high value indicates
the existence of problems like loss of
functionality or data in one or more
applications.
Please check the App-V Client Virtual
Application logs in the Event Log Viewer for
more details.
Please check the App-V Client Virtual
Application logs in the Event Log Viewer for
more details.
Critical messages:
Indicates the number of App-
V Client virtual applications
critical error events that were
generated when the test was
last executed.
Number
A very low value (zero) indicates that the
system is in a healthy state and all
applications are running smoothly without
any potential problems.
An increasing trend or high value indicates
the existence of fatal/irrepairable problems in
one or more applications.
Please check the App-V Client Virtual
Application logs in the Event Log Viewer for
more details.
M O N I T O RI N G C I T R I X X E N AP P S E R V E R S
26
Verbose messages:
Indicates the number of App-
V Client virtual application
verbose events that were
generated when the test was
last executed.
Number
The detailed diagnosis of this measure
describes all the verbose events that were
generated during the last measurement
period.
Please check the App-V Client Virtual
Application logs in the Event Log Viewer for
more details.
2.1.3.4 WinSock Errors Test
In computing, the Windows Sockets API (WSA), which was later shortened to Winsock, is a technical specification
that defines how Windows network software should access network services, especially TCP/IP. It defines a standard
interface between a Windows TCP/IP client application (such as an FTP client or a web browser) and the underlying
TCP/IP protocol stack.
The WinSock Errors test scans the Windows event logs for winsock-related errors and reports the count of such
errors.
Purpose
Reports the statistical information about the virtual application events generated by the target
system
Target of the
test
A Citrix XenApp server
Agent
deploying the
test
An internal agent

M O N I T O RI N G C I T R I X X E N AP P S E R V E R S
27
Configurable
parameters for
the test
1. TEST PERIOD - How often should the test be executed
2. HOST - The host for which the test is to be configured
3. PORT – Specify the port at which the specified HOST listens to. By default, this is 8080.
4. LOGTYPE – Refers to the type of event logs to be monitored. The default value is
Microsoft-Windows-Winsock-AFD/Operational
.
5. POLICY BASED FILTER - Using this page, administrators can configure the event
sources, event IDs, and event descriptions to be monitored by this test. In order to enable
administrators to easily and accurately provide this specification, this page provides the
following options:
Manually specify the event sources, IDs, and descriptions in the FILTER text area,
or,
Select a specification from the predefined filter policies listed in the FILTER box
For explicit, manual specification of the filter conditions, select the NO option against the
POLICY BASED FILTER field. This is the default selection. To choose from the list of pre-
configured filter policies, or to create a new filter policy and then associate the same with
the test, select the YES option against the POLICY BASED FILTER field.
6. FILTER - If the POLICY BASED FILTER flag is set to NO, then a FILTER text area will
appear, wherein you will have to specify the event sources, event IDs, and event
descriptions to be monitored. This specification should be of the following format:
{Displayname}:{event_sources_to_be_included}:{event_sources_to_be_excluded}:{event_I
Ds_to_be_included}:{event_IDs_to_be_excluded}:{event_descriptions_to_be_included}:{ev
ent_descriptions_to_be_excluded}
. For example, assume that the FILTER text area takes
the value,
OS_events:all:Browse,Print:all:none:all:none
. Here:
OS_events
is the display name that will appear as a descriptor of the test in the
monitor UI;
all
indicates that all the event sources need to be considered while monitoring. To
monitor specific event sources, provide the source names as a comma-separated
list. To ensure that none of the event sources are monitored, specify
none
.
Next, to ensure that specific event sources are excluded from monitoring, provide a
comma-separated list of source names. Accordingly, in our example,
Browse
and
Print
have been excluded from monitoring. Alternatively, you can use
all
to indicate
that all the event sources have to be excluded from monitoring, or
none
to denote
that none of the event sources need be excluded.
In the same manner, you can provide a comma-separated list of event IDs that
require monitoring. The
all
in our example represents that all the event IDs need to
be considered while monitoring.
Similarly, the
none
(following
all
in our example) is indicative of the fact that none
of the event IDs need to be excluded from monitoring. On the other hand, if you
want to instruct the eG Enterprise system to ignore a few event IDs during
monitoring, then provide the IDs as a comma-separated list. Likewise, specifying
all
makes sure that all the event IDs are excluded from monitoring.

M O N I T O RI N G C I T R I X X E N AP P S E R V E R S
28
The
all
which follows implies that all events, regardless of description, need to be
included for monitoring. To exclude all events, use
none
. On the other hand, if you
provide a comma-separated list of event descriptions, then the events with the
specified descriptions will alone be monitored. Event descriptions can be of any of
the following forms -
desc*
, or
desc
, or
*desc*
,or
desc*
, or
desc1*desc2
, etc.
desc
here refers to any string that forms part of the description. A leading '*' signifies any
number of leading characters, while a trailing '*' signifies any number of trailing
characters.
In the same way, you can also provide a comma-separated list of event descriptions
to be excluded from monitoring. Here again, the specification can be of any of the
following forms:
desc*
, or
desc
, or
*desc*
,or
desc*
, or
desc1*desc2
, etc.
desc
here
refers to any string that forms part of the description. A leading '*' signifies any
number of leading characters, while a trailing '*' signifies any number of trailing
characters. In our example however, none is specified, indicating that no event
descriptions are to be excluded from monitoring. If you use
all
instead, it would
mean that all event descriptions are to be excluded from monitoring.
By default, the FILTER parameter contains the value
:
all. Multiple filters are to be
separated by semi-colons (;).
The event sources and event IDs specified here should be exactly the
same as that which appears in the Event Viewer window.
On the other hand, if the POLICY BASED FILTER flag is set to YES, then a FILTER list
box will appear, displaying the filter policies that pre-exist in the eG Enterprise system. A
filter policy typically comprises of a specific set of event sources, event IDs, and event
descriptions to be monitored. This specification is built into the policy in the following
format:
{Policyname}:{event_sources_to_be_included}:{event_sources_to_be_excluded}:{event_ID
s_to_be_included}:{event_IDs_to_be_excluded}:{event_descriptions_to_be_included}:{eve
nt_descriptions_to_be_excluded}
To monitor a specific combination of event sources, event IDs, and event descriptions, you
can choose the corresponding filter policy from the FILTER list box. Multiple filter policies
can be so selected. Alternatively, you can modify any of the existing policies to suit your
needs, or create a new filter policy. To facilitate this, a icon appears near the FILTER
list box, once the YES option is chosen against POLICY BASED FILTER. Clicking on the
icon leads you to a page where you can modify the existing policies or create a new one.
The changed policy or the new policy can then be associated with the test by selecting the
policy name from the FILTER list box in this page.

M O N I T O RI N G C I T R I X X E N AP P S E R V E R S
29
7. USEWMI - The eG agent can either use WMI to extract event log statistics or directly parse
the event logs using event log APIs. If the USEWMI flag is YES, then WMI is used. If not,
the event log APIs are used. This option is provided because on some Windows NT/2000
systems (especially ones with service pack 3 or lower), the use of WMI access to event logs
can cause the CPU usage of the WinMgmt process to shoot up. On such systems, set the
USEWMI parameter value to NO. On the other hand, when monitoring systems that are
operating on any other flavor of Windows (say, Windows 2003/XP/2008/7/Vista/12), the
USEWMI flag should always be set to ‘Yes’.
8. STATELESS ALERTS - Typically, the eG manager generates email alerts only when the
state of a specific measurement changes. A state change typically occurs only when the
threshold of a measure is violated a configured number of times within a specified time
window. While this ensured that the eG manager raised alarms only when the problem was
severe enough, in some cases, it may cause one/more problems to go unnoticed, just
because they did not result in a state change. For example, take the case of the EventLog
test. When this test captures an error event for the very first time, the eG manager will send
out a CRITICAL email alert with the details of the error event to configured recipients. Now,
the next time the test runs, if a different error event is captured, the eG manager will keep
the state of the measure as CRITICAL, but will not send out the details of this error event to
the user; thus, the second issue will remain hidden from the user. To make sure that
administrators do not miss/overlook critical issues, the eG Enterprise monitoring solution
provides the stateless alerting capability. To enable this capability for this test, set the
STATELESS ALERTS flag to Yes. This will ensure that email alerts are generated for this
test, regardless of whether or not the state of the measures reported by this test changes.
9. DD FREQUENCY - Refers to the frequency with which detailed diagnosis measures are to
be generated for this test. The default is
1:1
. This indicates that, by default, detailed
measures will be generated every time this test runs, and also every time the test detects a
problem. You can modify this frequency, if you so desire. Also, if you intend to disable the
detailed diagnosis capability for this test, you can do so by specifying
none
against DD
FREQUENCY.
10. DETAILED DIAGNOSIS - To make diagnosis more efficient and accurate, the eG
Enterprise suite embeds an optional detailed diagnostic capability. With this capability, the
eG agents can be configured to run detailed, more elaborate tests as and when specific
problems are detected. To enable the detailed diagnosis capability of this test for a
particular server, choose the On option. To disable the capability, click on the Off option.
The option to selectively enabled/disable the detailed diagnosis capability will be available
only if the following conditions are fulfilled:
o The eG manager license should allow the detailed diagnosis capability
o Both the normal and abnormal frequencies configured for the detailed diagnosis
measures should not be 0.

M O N I T O RI N G C I T R I X X E N AP P S E R V E R S
30
Outputs of the
test
One set of results for the Client that is to be monitored
Measurements
made by the
test
Measurement
Measurement
Unit
Interpretation
Send errors:
Indicates the number of send
errors captured by the event
log during the last
measurement period.
Number
The send function and WSAsend functions
send data on a connected socket. The value
of this measure will be incremented when
errors are returned on failed send and
WSAsend requests.
Ideally, the value of this measure should be
0. In case of a non-zero value, use the
detailed diagnosis of this measure to know
what send errors occurred. Typically, event
IDs 1003, 1005, 1007, 1011, 1013, and 3007
are classified as send errors.
Receive errors:
Indicates the number of
receive errors captured by the
event log during the last
measurement period.
Number
The recv, WSARecv, and
WSARecvEx functions receive data from a
connected socket or a bound connectionless
socket. If the recv, WSARecv, and
WSARecvEx requests fail and return errors,
such errors are captured by the event log.
The value of this measure represents the
count of these errors.
Ideally, the value of this measure should be
0. In case of a non-zero value, use the
detailed diagnosis of this measure to know
what receive errors occurred. Typically, event
IDs 1004, 1006, 1009, 1012, 1015 are
classified as receive errors.
Connect errors:
Indicates the number of
connect errors captured by
the event log during the last
measurement period.
Number
The connect, ConnectEx, WSAConnect,
WSAConnectByList, or WSAConnectByName
functions typically establish a connection to a
specified socket. If calls to these functions fail
owing to errors, such error events are
captured by the event logs. The value of this
measure denotes the count of such errors.
Ideally, the value of this measure should be
0. In case of a non-zero value, use the
detailed diagnosis of this measure to know
what connect errors occurred. Typically,
event IDs 1017, 1018, 1020, 1021, 3006 are
classified as connect errors.

M O N I T O RI N G C I T R I X X E N AP P S E R V E R S
31
Accept errors:
Indicates the number of
accept errors that occurred
during the last measurement
period.
Number
The accept, AcceptEx, and WSAAccept
functions permit an incoming connection
attempt on a socket. If calls to any of these
functions fail, then the errors causing the
failures are captured by the event logs. The
value of this measure denotes the count of
such errors.
Ideally, the value of this measure should be
0. In case of a non-zero value, use the
detailed diagnosis of this measure to know
what accept errors occurred. Typically, event
IDs 1023, 1024, 1026, 1027 are classified as
accept errors.
Bind errors:
Indicates the number of bind
errors that occurred during
the last measurement period.
Number
If the implicit or explicit binding of a socket
handle fails, then errors causing the bind
failure will be captured by the event logs.
The value of this measure denotes the count
of such errors.
Ideally, the value of this measure should be
0. In case of a non-zero value, use the
detailed diagnosis of this measure to know
what bind errors occurred. Typically, event
IDs 1029 and 1030 are classified as bind
errors.

M O N I T O RI N G C I T R I X X E N AP P S E R V E R S
32
Abort errors:
Indicates the number of abort
errors that occurred during
the last measurement period.
Number
An abort/cancel operation can be Winsock-
initiated or transport-initiated. The value of
this measure represents the count of both
types of abort operations. A Winsock-initiated
abort can occur due to the following reasons:
An abort due to unread receive data
buffered after close.
An abort after a call to
the shutdown function with
the
how
parameter set to
SD_RECEIVE and a call to the
closesocket function with receive
data pending.
An abort after a failed attempt to
flush the endpoint.
An abort after an internal Winsock
error occurred.
An abort due to a connection with
errors and the application previously
requested that the connection be
aborted on certain circumstances.
One example of this case would be
an application that set SO_LINGER
with a timeout of zero and there is
still unacknowledged data on the
connection.
An abort on a connection not fully
associated with accepting endpoint.
An abort on a failed call to
the accept or AcceptEx function.
An abort due to a failed receive
operation.
An abort due to a Plug and Play
event.
An abort due to a failed flush
request.
An abort due to a failed expedited
data receive request.
An abort due to a failed send
request.
An abort due to canceled send
request.
An abort due to a canceled called to
the TransmitPackets function.

M O N I T O RI N G C I T R I X X E N AP P S E R V E R S
33
A transport-initiated abort can occur if a reset
is indicated by the transport.
Ideally, the value of this measure should be
0. In case of a non-zero value, use the
detailed diagnosis of this measure to why
aborts occurred.
Typically, event IDs 1032 and 1033 are
classified as abort errors.
Listen errors:
Indicates the number of listen
errors that occurred during
the last measurement period.
Number
Ideally, the value of this measure should be
0. In case of a non-zero value, use the
detailed diagnosis of this measure to know
what listen errors occurred. Typically, event
IDs 1026 and 1037 are classified as listen
errors.
Indication errors:
Indicates the number of
indication errors that occurred
during the last measurement
period.
Number
An indicated operation can be:
A connection indicated
operation: This occurs when
an application receives a
connection request.
A data indicated operation:
This occurs when an
application receives data on a
connected socket.
Data indicated from transport
operations: This occurs when
an application posts a receive
request and receives data.
Disconnect indicated from
transport operations: This
occurs when an application
receives a disconnect
indication.
Errors in these processes are categorized
under Indication errors. Ideally, the value of
this measure should be 0. In case of a non-
zero value, use the detailed diagnosis of this
measure to know what indication errors
occurred. Typically, event IDs 3000, 3001,
3003, 3004 are classified as indication errors.
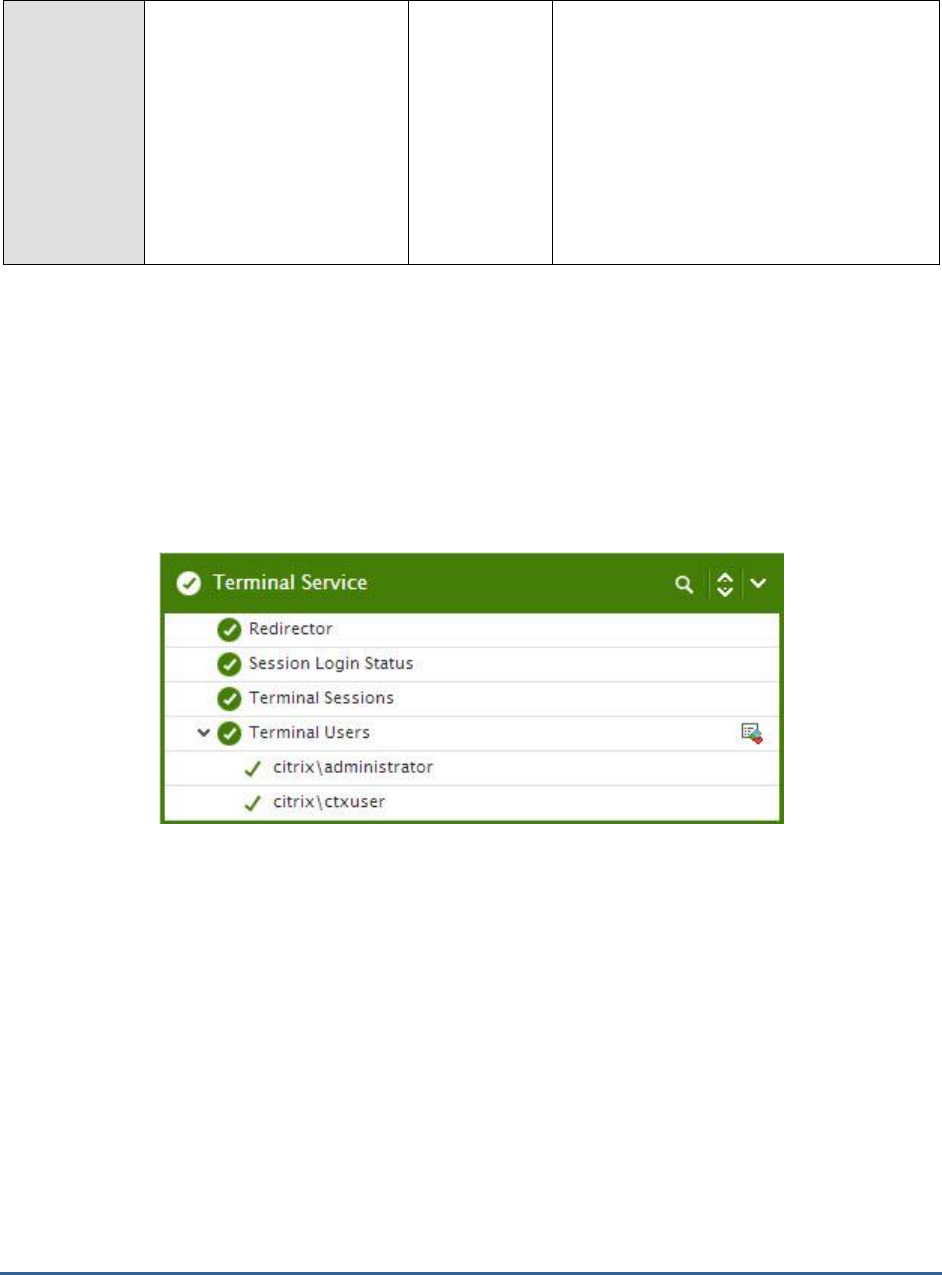
M O N I T O RI N G C I T R I X X E N AP P S E R V E R S
34
Other errors:
Indicates the number of other
errors that occurred during
the last measurement period.
Number
Errors that cannot be classified as send,
receive, connect, accept, bind, abort, listen,
or indication, will be grouped under Other
errors.
Ideally, the value of this measure should be
0. In case of a non-zero value, use the
detailed diagnosis of this measure to know
what other errors occurred. Typically, event
IDs 1000,1001,1002,1035 are classified as
other errors.
2.1.4 The Terminal Service Layer
In most environments, the Citrix XenApp server functions in conjunction with a Microsoft RDS server. To enable the
administrators of Citrix environment to monitor the movement and resource usage of the RDS clients on the Citrix
server, the eG Enterprise system has introduced the Terminal Service layer. Figure 2.5 depicts the Microsoft RDS
server tests that execute on this layer.
Figure 2.5: The tests associated with the Terminal Service layer
These tests are the same as those mapped to the Terminal Server layer of a Microsoft RDS server. These tests hence,
have already been dealt with elaborately in the
Monitoring Microsoft RDS Servers
chapter of the
Monitoring Microsoft
Applications
document. So, let us proceed to look at the Citrix Server layer.
2.1.5 The Citrix Server Layer
Citrix server-related performance parameters are monitored by the tests mapped to the Citrix Server layer. This
includes:
The Citrix IMA architecture
Processing and database updation capabilities of the server
License usage
Profile size
User login and profile loading process
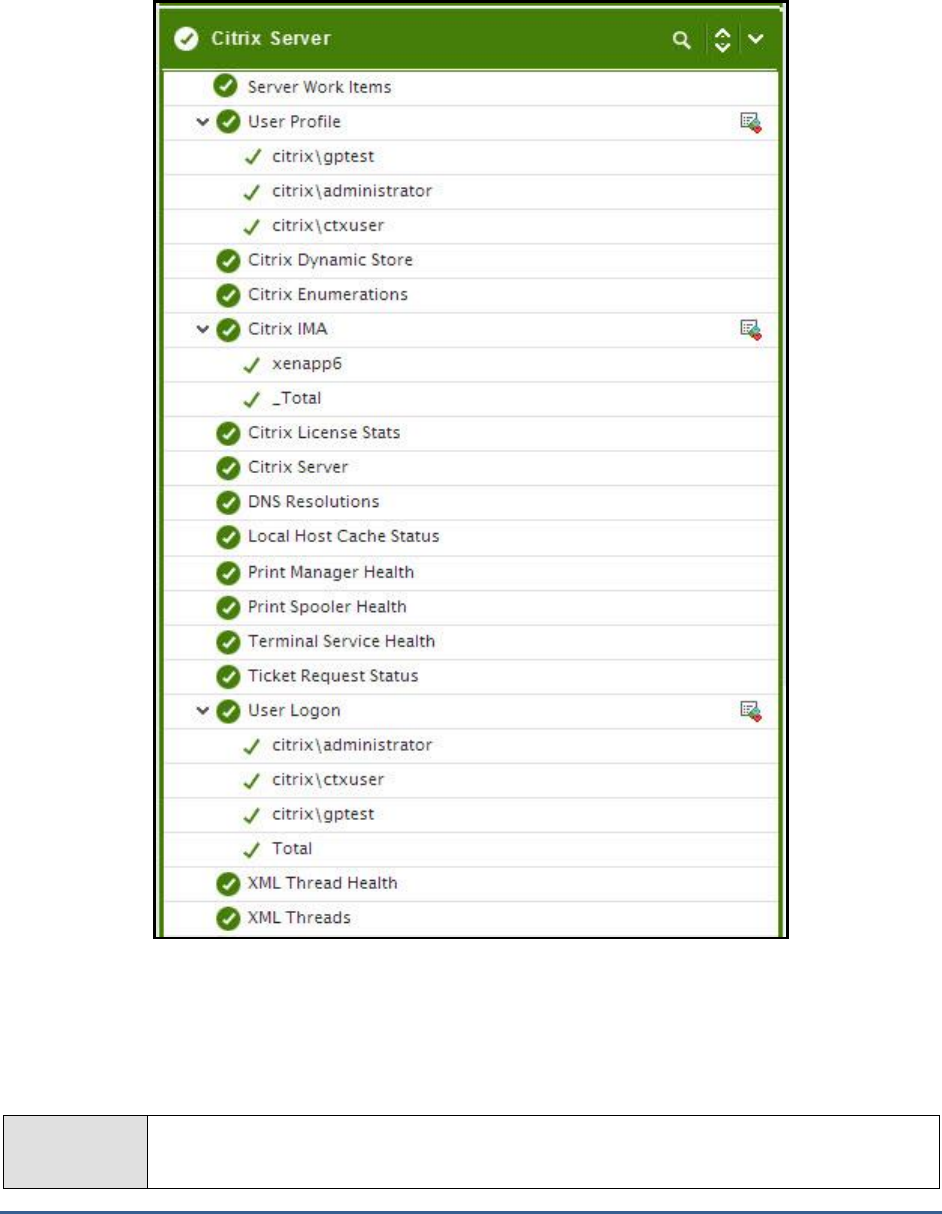
M O N I T O RI N G C I T R I X X E N AP P S E R V E R S
35
The data and dynamic stores
Figure 2.6: The tests associated with the Citrix Server layer
2.1.5.1 DNS Resolutions Test
This test performs a forward DNS lookup using the local host name to query the local DNS server in the computer's
environment for the computer's IP address, and reports whether the lookup was successful or not.
Purpose
Performs a forward DNS lookup using the local host name to query the local DNS server in the
computer's environment for the computer's IP address, and reports whether the lookup was
successful or not. The test can also be optionally configured to perform a reverse DNS lookup

M O N I T O RI N G C I T R I X X E N AP P S E R V E R S
36
and reports its success/failure.
Target of the
test
Any Citrix server
Agent
deploying the
test
An internal agent
Configurable
parameters for
the test
1. TEST PERIOD – How often should the test be executed
2. HOST – The host for which the test is to be configured
3. PORT – Refers to the port used by the Citrix server
4. HEALTH MONITOR TEST PATH - Citrix XenApp is bundled with a Health Monitoring and
Recovery (HMR) test pack, which provides a standard set of tests that can be configured to
monitor the health of many XenApp components and report failures. Since the eG agent
runs one of the HMR tests to determine the status of the forward/reverse DNS lookups, you
need to configure the eG agent with the full path to the folder containing the HMR test
pack. By default, the HEALTH MONITOR TEST PATH is set to
default
. This implies that
the eG agent runs the HMR test from its default location, which is:
C:\Progra~1\Citrix\HealthMon\Tests\Citrix
. However, if the HMR test pack is available in a
different location in your Citrix environment, then indicate that location in the HEALTH
MONITOR TEST PATH text box. For instance, your specification can be:
C:\LocalDir\Citrix\HealthMon\Tests\Citrix
.
5. REVERSE LOOKUP ENABLED - By default, this flag is set to No. This implies that the
test will not report the status of the reverse DNS lookup by default. To enable the test to
perform reverse DNS lookup and report its success/failure, set this flag to Yes.
Outputs of the
test
One set of results for every server being monitored
Measurements
made by the
Measurement
Measurement
Unit
Interpretation

M O N I T O RI N G C I T R I X X E N AP P S E R V E R S
37
test
Forward lookup status:
Indicates whether the
forward lookup of the IP
address from the local DNS is
successful or not.
This measure reports a value Success if the
IP address lookup is successful and reports a
value Failure if the lookup is not successful.
The value
Failure
may also indicate that the
returned IP address does not match with that
of the IP address that is registered locally.
The numeric values that correspond to the
above-mentioned states are as follows:
State
Numeric Value
Success
0
Failure
1
Note:
By default, this measure reports the above-
mentioned states while indicating whether
the forward lookup of the IP address is
successful or not. However, the graph of this
measure will represent success and failure
using the numeric equivalents- i.e., 0 and 1
- only.
Reverse lookup status:
Indicates whether the reverse
lookup of the IP address is
successful or not.
This measure reports a value
Success
if the
reverse lookup of the IP address is successful
and reports a value
Failure
if the reverse
lookup is not successful.
The numeric values that correspond to the
above-mentioned states are as follows:
State
Numeric Value
Success
0
Failure
1
Note:
By default, this measure reports the above-
mentioned states while indicating whether
the reverse lookup of the IP address is
successful or not. However, the graph of this
measure will represent success and failure
using the numeric equivalents- i.e.,
0 and 1
-
only.
M O N I T O RI N G C I T R I X X E N AP P S E R V E R S
38
2.1.5.2 Local Host Cache Status Test
Each XenApp server stores a subset of the data store in the Local Host Cache (LHC). The LHC performs two primary
functions:
Permits a server to function in the absence of a connection to the data store.
Improves performance by caching information used by ICA Clients for enumeration and application
resolution.
The following information is contained in the local host cache:
All servers in the farm, and their basic information.
All applications published within the farm and their properties.
All Windows network domain trust relationships within the farm.
All information specific to itself. (product code, SNMP settings, licensing information)
This test checks for data consistency (duplicate values) and integrity (corrupt entries) of the XenApp server’s local
host cache.
Purpose
Checks for data consistency (duplicate values) and integrity (corrupt entries) of the XenApp
server’s local host cache
Target of the
test
Any Citrix server
Agent
deploying the
test
An internal agent
Configurable
parameters for
the test
1. TEST PERIOD – How often should the test be executed
2. HOST – The host for which the test is to be configured
3. PORT – Refers to the port used by the Citrix server
4. HEALTH MONITOR TEST PATH - Citrix XenApp is bundled with a Health Monitoring and
Recovery (HMR) test pack, which provides a standard set of tests that can be configured to
monitor the health of many XenApp components and report failures. Since the eG agent
runs one of the HMR tests to determine the health of the local host cache (LHC), you need
to configure the eG agent with the full path to the folder containing the HMR test pack. By
default, the HEALTH MONITOR TEST PATH is set to
default
. This implies that the eG
agent runs the HMR test from its default location, which is:
C:\Progra~1\Citrix\HealthMon\Tests\Citrix
. However, if the HMR test pack is available in a
different location in your Citrix environment, then indicate that location in the HEALTH
MONITOR TEST PATH text box. For instance, your specification can be:
C:\LocalDir\Citrix\HealthMon\Tests\Citrix
.
Outputs of the
test
One set of results for every server being monitored
Measurements
made by the
Measurement
Measurement
Unit
Interpretation
M O N I T O RI N G C I T R I X X E N AP P S E R V E R S
39
test
LHC initialized status:
Indicates whether the local
host cache is initialized or
not.
This measure reports a value Success if the
local host cache is initialized successfully and
reports a value Failure if the local host cache
initialization is not successful.
The numeric values that correspond to the
above-mentioned states are as follows:
State
Numeric Value
Success
0
Failure
1
Note:
By default, this measure reports the above-
mentioned states while indicating whether
the local host cache initialization is successful
or not. However, the graph of this measure
will represent success and failure using the
numeric equivalents- i.e., 0 and 1 - only.
LHC entry's integrity
status:
Indicates whether the LHC
entry is integrated
successfully or not.
This measure reports the value
Success
if the
LHC entry is integrated successfully and
reports the value
Failure
if the LHC entry
integration is not successful. Typically, this
measure will report the value
Failure
if
one/more corrupt entries are found in the
local host cache. The only way you can fix a
corruption in the local host cache is by
deleting and recreating the local host
cache file (which is an MS Access file).
The numeric values that correspond to the
above-mentioned states are as follows:
State
Numeric Value
Success
0
Failure
1
Note:
By default, this measure reports the above-
mentioned states while indicating whether
the LHC entry is integrated successfully or
not. However, the graph of this measure will
represent success and failure using the
numeric equivalents- i.e.,
0 and 1
- only.
M O N I T O RI N G C I T R I X X E N AP P S E R V E R S
40
LHC context nodes status:
Indicates the health of the
context nodes.
This measure reports the value
Success
if the
health of the context nodes is good and
reports the value
Failure
if the health of the
context nodes is not good.
The numeric values that correspond to the
above-mentioned states are as follows:
State
Numeric Value
Success
0
Failure
1
Note:
By default, this measure reports the above-
mentioned states while indicating whether
the context nodes are healthy or not.
However, the graph of this measure will
represent success and failure using the
numeric equivalents- i.e.,
0 and 1
- only.
2.1.5.3 XML Thread Health Test
This test monitors the number of worker threads that are currently running on the Citrix XML service and alerts the
administrator when the Citrix XML service is overloaded.
Purpose
Monitors the number of worker threads that are currently running on the Citrix XML service and
alerts the administrator when the Citrix XML service is overloaded
Target of the
test
Any Citrix server
Agent
deploying the
test
An internal agent

M O N I T O RI N G C I T R I X X E N AP P S E R V E R S
41
Configurable
parameters for
the test
1. TEST PERIOD – How often should the test be executed
2. HOST – The host for which the test is to be configured
3. PORT – Refers to the port used by the Citrix server
4. HEALTH MONITOR TEST PATH - Citrix XenApp is bundled with a Health Monitoring and
Recovery (HMR) test pack, which provides a standard set of tests that can be configured to
monitor the health of many XenApp components and report failures. Since the eG agent
runs one of the HMR tests to monitor the load on the Citrix XML service, you need to
configure the eG agent with the full path to the folder containing the HMR test pack. By
default, the HEALTH MONITOR TEST PATH is set to
default
. This implies that the eG
agent runs the HMR test from its default location, which is:
C:\Progra~1\Citrix\HealthMon\Tests\Citrix
. However, if the HMR test pack is available in a
different location in your Citrix environment, then indicate that location in the HEALTH
MONITOR TEST PATH text box. For instance, your specification can be:
C:\LocalDir\Citrix\HealthMon\Tests\Citrix
.
Outputs of the
test
One set of results for every server being monitored
Measurements
made by the
test
Measurement
Measurement
Unit
Interpretation
Number of XML threads:
Indicates the number of
worker threads that are
running in the Citrix XML
service.
Number
By default, the threshold limit for the number
of working threads that are running in this
Citrix XML service is set to 15. If this
threshold value is violated, it indicates that
the Web Interface/PN Agent connections
would suffer. This measure would therefore
be a good indicator to the administrator to
identify the overload and rectify the same.
2.1.5.4 IMA Service Health Test
This test queries the Citrix IMA service and figures out whether the Citrix IMA service is running properly by
enumerating the number of applications that are deployed in this Citrix XenApp server.
Purpose
Queries the Citrix IMA service and figures out whether the Citrix IMA service is running properly
by enumerating the number of applications that are deployed in this Citrix XenApp server
Target of the
test
Any Citrix server
Agent
deploying the
test
An internal agent
M O N I T O RI N G C I T R I X X E N AP P S E R V E R S
42
Configurable
parameters for
the test
1. TEST PERIOD – How often should the test be executed
2. HOST – The host for which the test is to be configured
3. PORT – Refers to the port used by the Citrix server
4. HEALTH MONITOR TEST PATH - Citrix XenApp is bundled with a Health Monitoring and
Recovery (HMR) test pack, which provides a standard set of tests that can be configured to
monitor the health of many XenApp components and report failures. Since the eG agent
runs one of the HMR tests to determine the status of the Citrix IMA service, you need to
configure the eG agent with the full path to the folder containing the HMR test pack. By
default, the HEALTH MONITOR TEST PATH is set to
default
. This implies that the eG
agent runs the HMR test from its default location, which is:
C:\Progra~1\Citrix\HealthMon\Tests\Citrix
. However, if the HMR test pack is available in a
different location in your Citrix environment, then indicate that location in the HEALTH
MONITOR TEST PATH text box. For instance, your specification can be:
C:\LocalDir\Citrix\HealthMon\Tests\Citrix
.
Outputs of the
test
One set of results for every server being monitored
Measurements
made by the
test
Measurement
Measurement
Unit
Interpretation
Status:
Indicates the current health
status of the Citrix IMA
service.
This measure reports the value Success if
the Citrix IMA service is in good health, and
reports the value
Failure
if the Citrix IMA
service is not operating properly.
The numeric values that correspond to the
above-mentioned states are as follows:
State
Numeric Value
Success
0
Failure
1
Note:
By default, this measure reports the above-
mentioned states while indicating whether
the Citrix IMA service is in good health or not.
However, the graph of this measure will
represent success and failure using the
numeric equivalents- i.e., 0 and 1 - only.
Number of applications:
Indicates the number of
applications that were
deployed in this Citrix XenApp
server.
Number

M O N I T O RI N G C I T R I X X E N AP P S E R V E R S
43
2.1.5.5 Print Manager Health Test
The Citrix Print Manager Service manages the creation of printers and driver usage within the XenApp sessions.
This test reports the health of the Citrix Print Manager Service by enumerating the number of local session printers.
Purpose
Reports the health of the Citrix Print Manager Service by enumerating the number of local
session printers
Target of the
test
Any Citrix server
Agent
deploying the
test
An internal agent
Configurable
parameters for
the test
1. TEST PERIOD – How often should the test be executed
2. HOST – The host for which the test is to be configured
3. PORT – Refers to the port used by the Citrix server
4. HEALTH MONITOR TEST PATH - Citrix XenApp is bundled with a Health Monitoring and
Recovery (HMR) test pack, which provides a standard set of tests that can be configured to
monitor the health of many XenApp components and report failures. Since the eG agent
runs one of the HMR tests to report the health of the Citrix Print Manager service, you need
to configure the eG agent with the full path to the folder containing the HMR test pack. By
default, the HEALTH MONITOR TEST PATH is set to
default
. This implies that the eG
agent runs the HMR test from its default location, which is:
C:\Progra~1\Citrix\HealthMon\Tests\Citrix
. However, if the HMR test pack is available in a
different location in your Citrix environment, then indicate that location in the HEALTH
MONITOR TEST PATH text box. For instance, your specification can be:
C:\LocalDir\Citrix\HealthMon\Tests\Citrix
.
Outputs of the
test
One set of results for every server being monitored
Measurements
made by the
Measurement
Measurement
Unit
Interpretation
M O N I T O RI N G C I T R I X X E N AP P S E R V E R S
44
test
Status:
Indicates the current health
status of the Citrix Print
Manager Service.
This measure reports the value Success if
the Citrix Print Manager service is in good
health, and reports the value
Failure
if the
Citrix Print Manager service is not operating
properly.
The numeric values that correspond to the
above-mentioned states are as follows:
State
Numeric Value
Success
0
Failure
1
Note:
By default, this measure reports the above-
mentioned states while indicating whether
the Citrix Print Manager service is in good
health or not. However, the graph of this
measure will represent success and failure
using the numeric equivalents- i.e., 0 and 1
- only.
2.1.5.6 Ticket Request Status Test
Once a user logs in to the Citrix web interface, he/she receives a list of applications to which they have access. When
the user chooses one of the applications to open, the request is received by the web interface and forwarded to the
local XML service. The XML service then asks the IMA service for the IP address of the least busy server that has the
requested application published on it. The IMA service may have to contact the data collector for this information. In
turn, the IMA service on the least loaded server contacts the terminal services on this system to obtain a ticket which
provides the user with the permission to access the requested application.
This test reports the health of the Citrix XML Service by generating the requested ticket.
Purpose
Reports the health of the Citrix XML Service by generating the requested ticket
Target of the
test
Any Citrix server
Agent
deploying the
test
An internal agent
M O N I T O RI N G C I T R I X X E N AP P S E R V E R S
45
Configurable
parameters for
the test
1. TEST PERIOD – How often should the test be executed
2. HOST – The host for which the test is to be configured
3. PORT – Refers to the port used by the Citrix server
4. HEALTH MONITOR TEST PATH - Citrix XenApp is bundled with a Health Monitoring and
Recovery (HMR) test pack, which provides a standard set of tests that can be configured to
monitor the health of many XenApp components and report failures. Since the eG agent
runs one of the HMR tests to check whether the Citrix server could obtain a ticket or not,
you need to configure the eG agent with the full path to the folder containing the HMR test
pack. By default, the HEALTH MONITOR TEST PATH is set to
default
. This implies that
the eG agent runs the HMR test from its default location, which is:
C:\Progra~1\Citrix\HealthMon\Tests\Citrix
. However, if the HMR test pack is available in a
different location in your Citrix environment, then indicate that location in the HEALTH
MONITOR TEST PATH text box. For instance, your specification can be:
C:\LocalDir\Citrix\HealthMon\Tests\Citrix
.
Outputs of the
test
One set of results for every server being monitored
Measurements
made by the
test
Measurement
Measurement
Unit
Interpretation
Status:
Indicates whether the Citrix
server could obtain a ticket or
not.
This measure reports the value Success if
the Citrix server could obtain a ticket, and
reports the value
Failure
if the server was
denied a ticket.
The numeric values that correspond to the
above-mentioned states are as follows:
State
Numeric Value
Success
0
Failure
1
Note:
By default, this measure reports the above-
mentioned states while indicating whether
the Citrix server could obtain a ticket or not.
However, the graph of this measure will
represent success and failure using the
numeric equivalents- i.e., 0 and 1 - only.
2.1.5.7 Print Spooler Health
This test reports the health of the Microsoft Print Spooler by enumerating the printers that are available on the local
server. This test additionally enumerates the available print drivers and the print processors. This test helps you to
determine if there are any system printer issues that are to be addressed.

M O N I T O RI N G C I T R I X X E N AP P S E R V E R S
46
Purpose
Reports the health of the Microsoft Print Spooler by enumerating the printers that are available
on the local server. This test additionally enumerates the available print drivers and the print
processors. This test helps you to determine if there are any system printer issues that are to be
addressed
Target of the
test
Any Citrix server
Agent
deploying the
test
An internal agent
Configurable
parameters for
the test
1. TEST PERIOD – How often should the test be executed
2. HOST – The host for which the test is to be configured
3. PORT – Refers to the port used by the Citrix server
4. HEALTH MONITOR TEST PATH - Citrix XenApp is bundled with a Health Monitoring and
Recovery (HMR) test pack, which provides a standard set of tests that can be configured to
monitor the health of many XenApp components and report failures. Since the eG agent
runs one of the HMR tests to determine the status of the Microsoft Print Spooler, you need
to configure the eG agent with the full path to the folder containing the HMR test pack. By
default, the HEALTH MONITOR TEST PATH is set to
default
. This implies that the eG
agent runs the HMR test from its default location, which is:
C:\Progra~1\Citrix\HealthMon\Tests\Citrix
. However, if the HMR test pack is available in a
different location in your Citrix environment, then indicate that location in the HEALTH
MONITOR TEST PATH text box. For instance, your specification can be:
C:\LocalDir\Citrix\HealthMon\Tests\Citrix
.
Outputs of the
test
One set of results for every server being monitored
Measurements
made by the
Measurement
Measurement
Unit
Interpretation

M O N I T O RI N G C I T R I X X E N AP P S E R V E R S
47
test
Printer status:
Indicates the health of the
printer by enumerating the
printers on the local server.
This measure reports the value Success if
the printers on the local server are
enumerated successfully, and reports the
value
Failure
if the enumeration is
unsuccessful.
The numeric values that correspond to the
above-mentioned states are as follows:
State
Numeric Value
Success
0
Failure
1
Note:
By default, this measure reports the above-
mentioned states while indicating whether
the printers on the local server are
successfully enumerated or not. However, the
graph of this measure will represent success
and failure using the numeric equivalents-
i.e., 0 and 1 - only.

M O N I T O RI N G C I T R I X X E N AP P S E R V E R S
48
Printer processors status:
Indicates the health of the
printer processors by
enumerating the printer
processors.
This measure reports the value Success if
the printer processors are enumerated
successfully, and reports the value
Failure
if
the enumeration is unsuccessful.
The numeric values that correspond to the
above-mentioned states are as follows:
State
Numeric Value
Success
0
Failure
1
Note:
By default, this measure reports the above-
mentioned states while indicating whether
the printer processors could be successfully
enumerated or not. However, the graph of
this measure will represent success and
failure using the numeric equivalents- i.e., 0
and 1 - only.
Printer drivers status:
Indicates the health of the
printer drivers by
enumerating them.
This measure reports the value Success if
the printer drivers are enumerated
successfully, and reports the value
Failure
if
the enumeration is unsuccessful.
The numeric values that correspond to the
above-mentioned states are as follows:
State
Numeric Value
Success
0
Failure
1
Note:
By default, this measure reports the above-
mentioned states while indicating whether
the printer drivers could be successfully
enumerated or not. However, the graph of
this measure will represent success and
failure using the numeric equivalents- i.e., 0
and 1 - only.
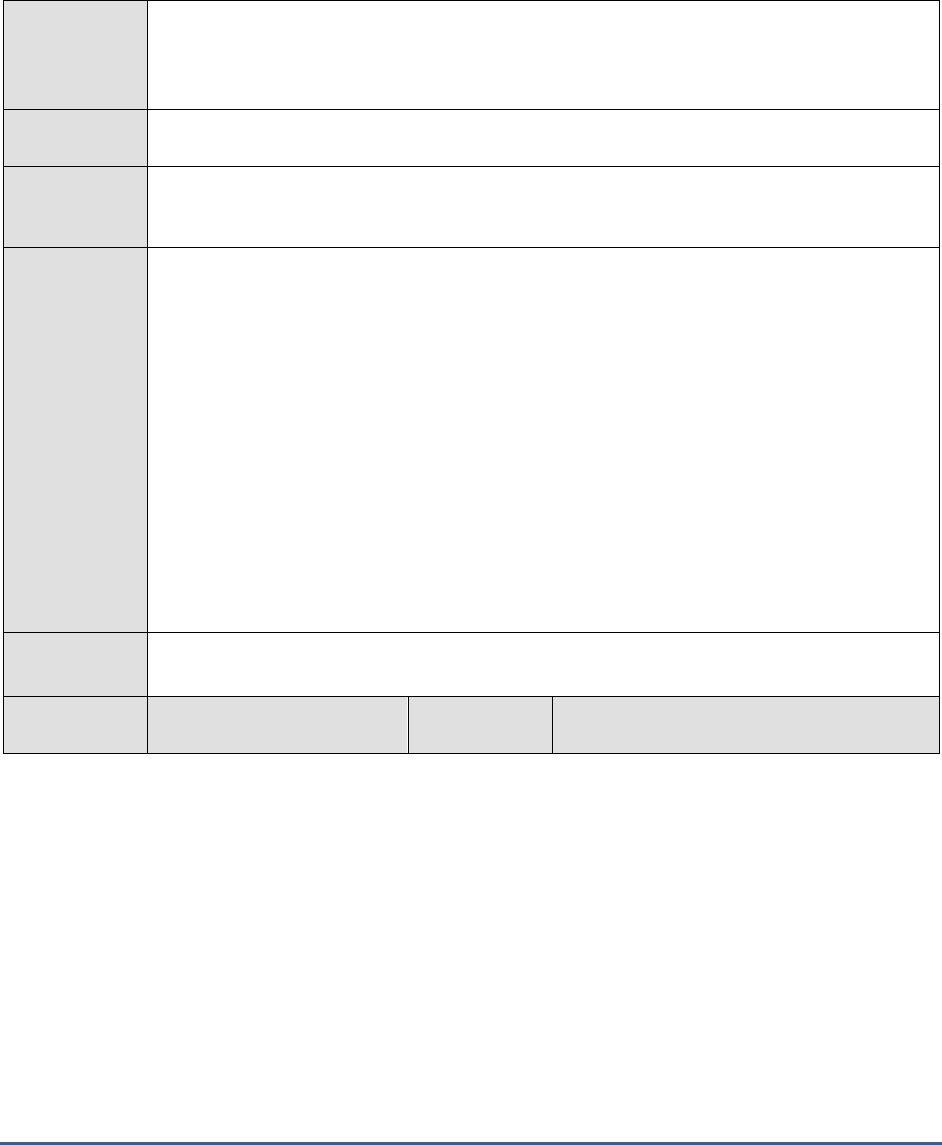
M O N I T O RI N G C I T R I X X E N AP P S E R V E R S
49
2.1.5.8 Terminal Service Health
This test reports the health of the Terminal service by enumerating the list of all local RDP and ICA sessions running
on the server. For each session, this test enumerates the session information such as user name, session state, logon
times etc., The number of sessions established on the local server impacts the response time of this test.
Purpose
Reports the health of the Terminal service by enumerating the list of all local RDP and ICA
sessions running on the server. For each session, this test enumerates the session information
such as user name, session state, logon times etc., The number of sessions established on the
local server impacts the response time of this test.
Target of the
test
Any Citrix server
Agent
deploying the
test
An internal agent
Configurable
parameters for
the test
1. TEST PERIOD – How often should the test be executed
2. HOST – The host for which the test is to be configured
3. PORT – Refers to the port used by the Citrix server
4. HEALTH MONITOR TEST PATH - Citrix XenApp is bundled with a Health Monitoring and
Recovery (HMR) test pack, which provides a standard set of tests that can be configured to
monitor the health of many XenApp components and report failures. Since the eG agent
runs one of the HMR tests to report the health of the Terminal service, you need to
configure the eG agent with the full path to the folder containing the HMR test pack. By
default, the HEALTH MONITOR TEST PATH is set to
default
. This implies that the eG
agent runs the HMR test from its default location, which is:
C:\Progra~1\Citrix\HealthMon\Tests\Citrix
. However, if the HMR test pack is available in a
different location in your Citrix environment, then indicate that location in the HEALTH
MONITOR TEST PATH text box. For instance, your specification can be:
C:\LocalDir\Citrix\HealthMon\Tests\Citrix
.
Outputs of the
test
One set of results for every server being monitored
Measurements
made by the
Measurement
Measurement
Unit
Interpretation

M O N I T O RI N G C I T R I X X E N AP P S E R V E R S
50
test
Status:
Indicates the health of the
Terminal Service by
enumerating the list of all
local RDP and ICA sessions in
the local server.
This measure reports the value Success if
the health of the Terminal service is good
and reports the value Failure if the Terminal
service fails to enumerate the local RDP and
ICA sessions on the local server.
The numeric values that correspond to the
above-mentioned states are as follows:
State
Numeric Value
Success
0
Failure
1
Note:
By default, this measure reports the above-
mentioned states while indicating whether
the Terminal service is in good health or not.
However, the graph of this measure will
represent success and failure using the
numeric equivalents- i.e., 0 and 1 - only.
2.1.5.9 Citrix Connection Test
This test performs an application-level ping to the Citrix server and measures the response from the server.
Purpose
Performs an application-level ping to the Citrix server and measures the response from the
server
Target of the
test
Any Citrix server
Agent
deploying the
test
An internal agent
Configurable
parameters for
the test
1. TEST PERIOD – How often should the test be executed
2. HOST – The host for which the test is to be configured
3. PORT – Refers to the port used by the Citrix server
4. SERVERIP - The CtxConnectionTest performs an application-level ping to a Citrix server,
and measures the response from the server. The IP address of that Citrix server has to be
specified in the SERVERIP text box. By default, the IP of the HOST will be displayed here.
This means that, by default, the Citrix HOST will try to ping its own self.
5. COUNT - Specify the number of packets to be sent by the test.

M O N I T O RI N G C I T R I X X E N AP P S E R V E R S
51
Outputs of the
test
One set of results for every server being monitored
Measurements
made by the
test
Measurement
Measurement
Unit
Interpretation
Connection availability:
Indicates the availability of
the Citrix server
Percent
A value of 100 % indicates that the Citrix
server is responding to requests. 0 indicates
that the server is not responding. A server
might not respond if it is not up and running
or if it is overloaded.
Packet loss on Citrix
connection:
Indicates the percentage of
packets sent that were
replied by the server
Percent
While 0 indicates that the server is
responding to requests, any value greater
than 0 could indicate that the server is not
able to keep up with its current load.
Avg Citrix connection
time:
Response time is the time
from packet transmission to
reception. Average response
time measures the average
value of the response time
based on replies returned by
the server.
Secs
Increase in the average response time
indicates slow-down of the server and
potential issues in handling user requests by
the server.
Max Citrix connection
time:
This is the maximum of
response times based on
replies returned by the
server.
Secs
If this value is consistently different from the
average response time, further investigation
of other server metrics may be necessary.
2.1.5.10 Citrix Authentication Test
This test emulates a user login process at the system level on a XenApp server and reports whether the login
succeeded and how long it took.
Purpose
Emulates a user login process at the system level on a XenApp server and reports whether the
login succeeded and how long it took
Target of the
test
Any Citrix server
Agent
deploying the
test
An internal agent

M O N I T O RI N G C I T R I X X E N AP P S E R V E R S
52
Configurable
parameters for
the test
1. TEST PERIOD – How often should the test be executed
2. HOST – The host for which the test is to be configured
3. PORT – Refers to the port used by the Citrix server
4. USER - This test emulates a user login process at the system level on a XenApp server.
Therefore, specify the login name of a user with interactive logon and logon locally
privileges.
5. PASSWORD - Enter the password that corresponds to the specified USER name.
6. CONFIRM PASSWORD – Confirm the specified PASSWORD by retyping it here.
7. DOMAIN - Specify the name of the domain to which the test will try to login. If the test is
to login to a local host, specify 'none' here.
If users are spread across multiple domains, then, you can configure this
test with multiple DOMAIN specifications; in this case, for every
DOMAIN, a USER-PASSWORD pair might also have to be configured.
Sometimes, you might want the test to login as specific users from the
same domain, to check how long each user login takes. Both these
scenarios require the configuration of multiple DOMAINs and/or multiple
USER names and PASSWORDs. In order to enable users to specify
these details with ease, eG Enterprise provides a special page; to access
this page, click on the Click here hyperlink at the top of the parameters in
the test configuration page. To know how to use this page, refer to
Section 2.1.5.10.1 of this document.
8. REPORT BY DOMAIN - By default, this flag is set to Yes. This implies that by default, this
test will report metrics for every
domainname\username
configured for this test. This way,
administrators will be able to quickly determine which user logged in from which domain. If
you want the TEST to report metrics for the
username
alone, then set this flag to No.
Outputs of the
test
One set of results for every user account being checked
Measurements
made by the
est
Measurement
Measurement
Unit
Interpretation
Availability:
Indicates whether the login
was successful or not
Percent
A value of 100 % indicates that the login has
succeeded. The value 0 is indicative of a
failed login.
Authentication time:
Indicates the time it took to
login
Secs
If this value is very high then it could be
owing to a configuration issue (i.e the domain
might not be configured properly) or a slow-
down/unavailability of the primary domain
server.
2.1.5.10.1 Configuring Multiple Users for the Citrix Authentication Test
Administrators of multi-domain environments might want to configure the Citrix Authentication test to emulate user
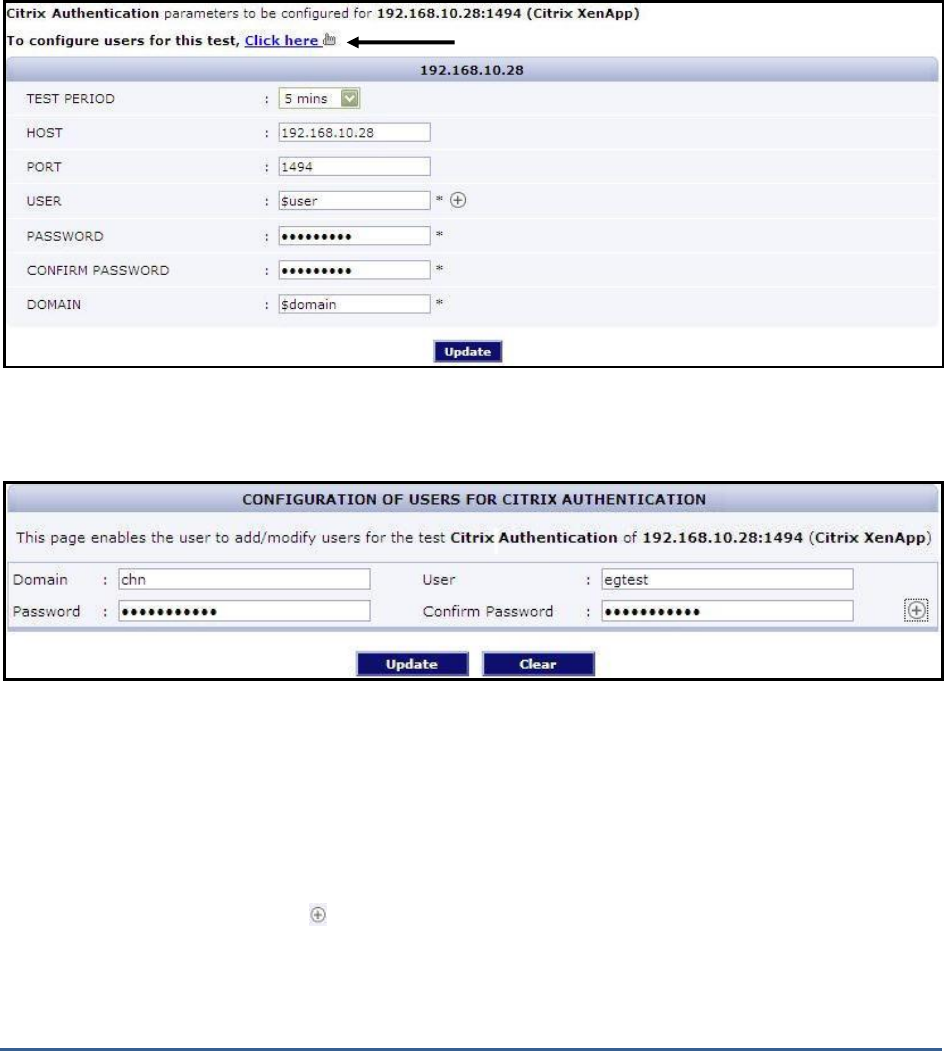
M O N I T O RI N G C I T R I X X E N AP P S E R V E R S
53
logins from multiple DOMAINs; in this case, for every DOMAIN, a USER-PASSWORD pair might have to be
configured. In some other cases, administrators might want the test to login as specific users from the same domain,
to check how long each user login takes. Both these scenarios require the configuration of multiple DOMAINs and/or
multiple USER names and PASSWORDs. In order to enable users to specify these details with ease, eG Enterprise
provides a special page; to access this page, click on the Click here hyperlink at the top of the parameters in the
CitrixAuthentication test configuration page (see Figure 2.7).
Figure 2.7: Configuring the Citrix Authentication Test
Upon clicking, Figure 2.8 will appear, using which the user details can be configured.
Figure 2.8: The Citrix Authentication test user configuration page
To add a user specification, do the following:
1. First, provide the name of the Domain from which logins are to be emulated (see Figure 2.8). If you are trying
to login to a local host, then, specify
none
here.
2. The eG agent must then be configured with the credentials of a user with interactive logon and logon locally
privileges in the specified Domain or local host. Provide the user credentials in the User and Password text boxes
in Figure 2.8, and confirm the password by retyping it in the Confirm Password text box.
3. To add more users, click on the button in Figure 2.8. This will allow you to add one more user specification
as depicted by Figure 2.9.
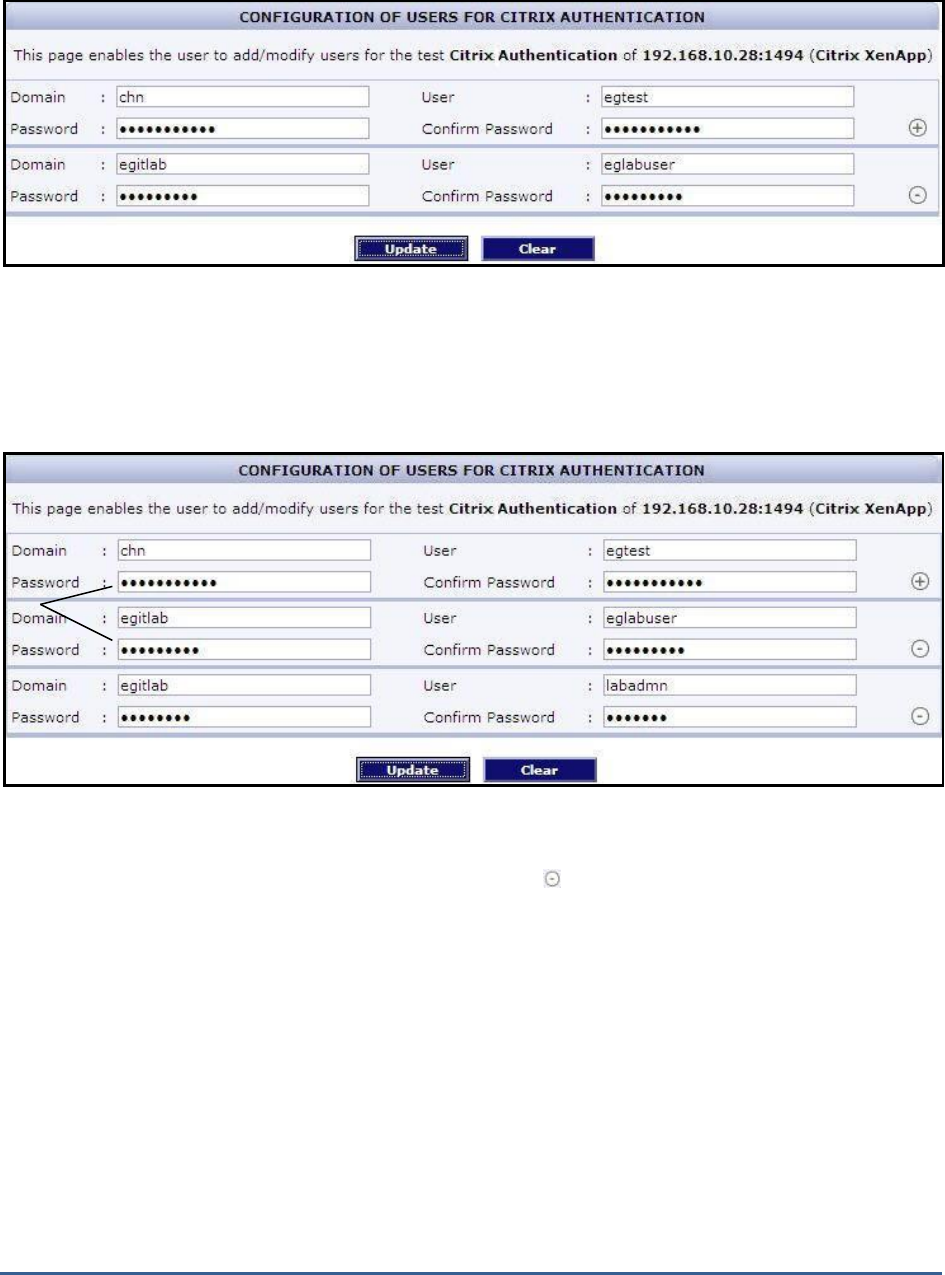
M O N I T O RI N G C I T R I X X E N AP P S E R V E R S
54
Figure 2.9: Adding another user
4. Sometimes, you might want the CitrixAuthentication test to emulate logins from a single domain but as multiple
users in that domain. For instance, you might want the test to login as user
eglabuser
and as user
labadmin
from
the same
egitlab
domain. You can configure the eG agent with the credentials of both these users as shown by
Figure 2.10.
Figure 2.10: Associating a single domain with different admin users
5. To clear all the user specifications, simply click the Clear button in Figure 2.10.
6. To remove the details of a particular user alone, just click the button corresponding to that user specification
in Figure 2.10.
7. To save the specification, just click on the Update button in Figure 2.10. This will lead you back to the test
configuration page, where you will find the multiple domain names, user names, and passwords listed against
the respective fields (see Figure 2.11).
The same ‘Domain’
mapped to
different ‘Admin
Users’
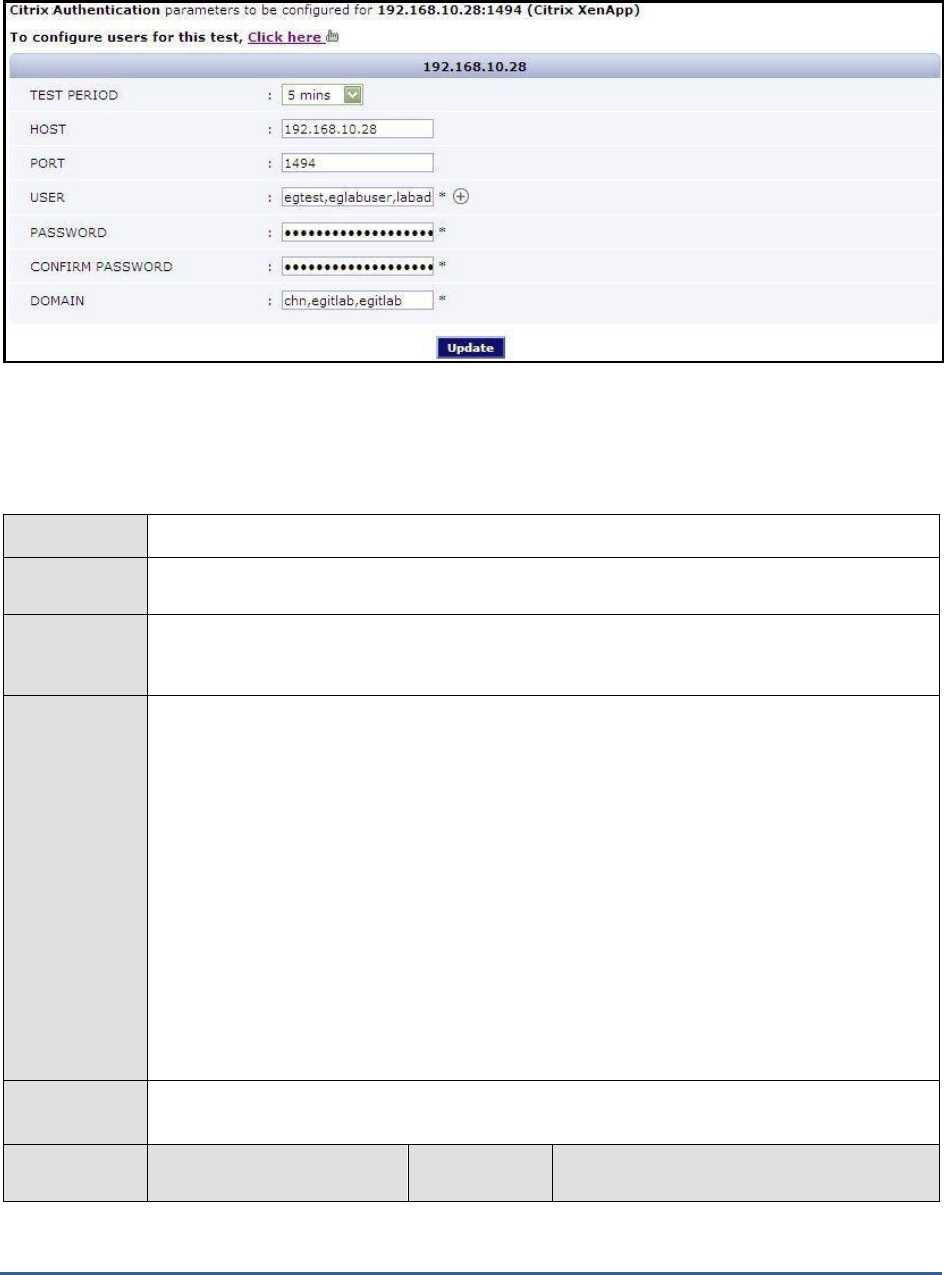
M O N I T O RI N G C I T R I X X E N AP P S E R V E R S
55
Figure 2.11: The test configuration page displaying multiple domain names, user names, and passwords
2.1.5.11 Citrix Enumerations Test
This test reports the number of filtered application enumerations per second.
Purpose
Reports the number of filtered application enumerations per second
Target of the
test
Any Citrix server
Agent
deploying the
test
An internal agent
Configurable
parameters for
the test
1. TEST PERIOD – How often should the test be executed
2. HOST – The host for which the test is to be configured
3. PORT – Refers to the port used by the Citrix server
4. SEPARATE PROCESS - By default, this parameter is set to Auto. This implies that by
default, this test auto-discovers the operating system on which the target Citrix server is
running. Based on the auto-discovered OS, the test uses either the eG agent process itself
to collect the required metrics or spawns a separate process for this purpose. If the target
server is discovered to be executing on a Windows 2003 (or earlier) platform, then the eG
agent process itself will collect the metrics reported by this test. On the other hand, if the
target server is found to execute on Windows 2008 (or above), then a separate process is
spawned for metrics collection. Alternatively, you can set this flag to true or yes. In this
case, metrics collection is performed by a separate process, regardless of the operating
system of the Citrix server. If you set this flag to false or no on the other hand, then the eG
agent process collects the metrics, regardless of the operating system of the Citrix server.
Outputs of the
test
One set of results for every Citrix server being monitored
Measurements
made by the
Measurement
Measurement
Unit
Interpretation

M O N I T O RI N G C I T R I X X E N AP P S E R V E R S
56
test
Filtered application
enumerations:
Indicates the number of WI
logons/ application
enumerations handled by an
XML Broker per second.
Enums/Sec
The value of this measure enables
administrators to accurately assess the
impact of growth / stress on the XML brokers
and zone data collectors.
2.1.5.12 Citrix IMA Test
This test reports various statistics relating to the Citrix Independent Management Architecture (IMA). Citrix IMA is an
architectural model and a protocol for server to server communications. IMA includes a collection of subsystems that
define and control the execution of Citrix products. The functions enabled by IMA include:
Central administration of all the Citrix servers
Central license management and pooling without license gateways
Centralized data store for all Citrix configurations
Auditing of administration activities, etc.
This test reports the IMA-related communications from this Citrix server to other Citrix servers. One set of results is
reported for each server to server communication.
Purpose
Reports the IMA-related communications from this Citrix server to other Citrix servers
Target of the
test
Any Citrix MetaFrame XP server
Agent
deploying the
test
An internal agent
Configurable
parameters for
the test
1. TEST PERIOD – How often should the test be executed
2. HOST – The host for which the test is to be configured
3. PORT – Refers to the port used by the Citrix server
4. SEPARATE PROCESS - By default, this parameter is set to Auto. This implies that by
default, this test auto-discovers the operating system on which the target Citrix server is
running. Based on the auto-discovered OS, the test uses either the eG agent process itself
to collect the required metrics or spawns a separate process for this purpose. If the target
server is discovered to be executing on a Windows 2003 (or earlier) platform, then the eG
agent process itself will collect the metrics reported by this test. On the other hand, if the
target server is found to execute on Windows 2008 (or above), then a separate process is
spawned for metrics collection. Alternatively, you can set this flag to true or yes. In this
case, metrics collection is performed by a separate process, regardless of the operating
system of the Citrix server. If you set this flag to false or no on the other hand, then the eG
agent process collects the metrics, regardless of the operating system of the Citrix server.
Outputs of the
test
One set of results for every server being monitored

M O N I T O RI N G C I T R I X X E N AP P S E R V E R S
57
Measurements
made by the
test
Measurement
Measurement
Unit
Interpretation
Data received rate:
Represents the rate at which
data is received by the server
from another Citrix server in
the farm.
KBytes/sec
Evaluate the IMA traffic periodically to
explore alternative configurations (e.g.,
splitting a farm) to minimize network
overheads. The IMA traffic between servers
can be high if the indirect mode of data store
access is used - in this case, only one server
in the farm directly accesses the data store.
All other servers rely on this server to access
the data store
Data transmit rate:
Represents the rate at which
IMA data is sent by a server
to another server in the farm.
KBytes/sec
Network connections:
Number of active IMA
network connections from a
server to another IMA server.
Number
2.1.5.13 Citrix Server Test
This test generates statistics relating to a Citrix server.
Purpose
Generates server-related statistics.
Target of the
test
Any Citrix server
Agent
deploying the
test
An internal agent
Configurable
parameters for
the test
1. TEST PERIOD – How often should the test be executed
2. HOST – The host for which the test is to be configured
3. PORT – Refers to the port used by the Citrix server
4. SEPARATE PROCESS - By default, this parameter is set to Auto. This implies that by
default, this test auto-discovers the operating system on which the target Citrix server is
running. Based on the auto-discovered OS, the test uses either the eG agent process itself
to collect the required metrics or spawns a separate process for this purpose. If the target
server is discovered to be executing on a Windows 2003 (or earlier) platform, then the eG
agent process itself will collect the metrics reported by this test. On the other hand, if the
target server is found to execute on Windows 2008 (or above), then a separate process is
spawned for metrics collection. Alternatively, you can set this flag to true or yes. In this
case, metrics collection is performed by a separate process, regardless of the operating
system of the Citrix server. If you set this flag to false or no on the other hand, then the eG
agent process collects the metrics, regardless of the operating system of the Citrix server.
Outputs of the
test
One set of results for every server being monitored

M O N I T O RI N G C I T R I X X E N AP P S E R V E R S
58
Measurements
made by the
test
Measurement
Measurement Unit
Interpretation
Application enumerations:
Represents the number of
application enumerations per
second
Enums/Sec
The Citrix Program Neighborhood
allows a user to get a listing of all
available applications published in the
farm. This enumeration of resources
takes place automatically every time
the user launches the Citrix Program
Neighborhood. This metric reflects the
rate of application enumerations. An
unusually high number of numerations
can slow down a Citrix server.
Application resolutions:
Represents the number of
application resolutions per
second
Resolutions/sec
When the user clicks the link to a
published application, the link is
resolved to an application. This metric
reflects the workload on the server in
terms of application accesses. The rate
of application resolutions depends on
the number of users connecting to the
farm, duration for which the average
user stays logged on, and the number
of published applications. If the rate of
application resolutions is excessively
high, consider creating multiple zones
in the farm to reduce the load on the
data collector.
Datastore connection failure:
Indicates how long the XenApp
server was disconnected from
the datastore.
Mins
The data store of the XenApp server
hosts centralized configuration data for
a server farm. The data store is critical
for central administration of the server
farm. Hence, any loss of
communication between a XenApp
servers and its data store can result in
inconsistencies in the configuration
data. A high value of this measure is
hence a cause for concern as it
indicates that the XenApp server has
been disconnected from the datastore
for a long time.
Datastore reads:
The rate of data read from the
IMA data store
KBytes/Sec
This metric reports the workload on
the data store. Since it is a central
repository for a farm, slowdown of the
data store can impact the performance
of the farm. Data store traffic is
usually high during server startup.
Datastore writes:
The rate of data written into the
IMA data store
KBytes/Sec
This metric reports the workload on
the data store. Since it is a central
repository for a farm, slowdown of the
data store can impact the performance
of the farm.

M O N I T O RI N G C I T R I X X E N AP P S E R V E R S
59
Dynamic store reads:
The rate of data read from the
IMA Dynamic store
KBytes/Sec
The dynamic store maintains
information that changes frequently
such as current sessions, disconnected
sessions, server load, etc. This metric
denotes the read rate of data from the
dynamic store.
Dynamic store writes:
The rate of data written into the
IMA Dynamic store
KBytes/Sec
The dynamic store maintains
information that changes frequently
such as current sessions, disconnected
sessions, server load, etc. This metric
denotes the rate at which data is
written to the dynamic store.
LH cache reads:
The rate of data read from the
IMA Local Host Cache
KBytes/Sec
Each server has a subset of the data
store called the local host cache. The
local host cache performs two
functions:
It permits the server to
function in the absence of a
connection to the data store.
Improves performance
by caching information used by ICA
clients for enumeration and
application resolution.
The larger the cache, greater the hits
to the cache and fewer data store
accesses. Comparing the read rate
from the local host cache and the data
store, the administrator can assess the
cache efficiency.
LH cache writes:
The rate of data written into the
IMA Local Host Cache
written/sec
KBytes/Sec
Zone elections:
Indicates the number of zone
elections that have occurred
Number
Zones in a Citrix farm serve two
purposes - (a) to collect data from
member servers in a hierarchical
structure; (b) efficiently distribute
changes to all servers in the farm. The
first server in a farm is the data
collector of the farm by default.
Elections within a zone are used to
determine the data collector for the
zone. Frequent zone elections in a
zone can result in increased network
traffic.

M O N I T O RI N G C I T R I X X E N AP P S E R V E R S
60
Zone elections won:
Indicates the number of times a
Citrix server has won a zone
election
Number
2.1.5.14 Citrix License Test
The Citrix server supports two types of licenses- a product license and a connection license. The product license is a
license to run a particular kind of Citrix product on a server. A server farm must have a product license with one
license count to run Citrix server software on each server in the server farm. The Citrix XenApp servers allocates
product licenses from a pool of available licenses for a XenApp server farm.
A connection license is a license for client connections to Citrix servers. A server farm must have a connection license
with one license count for each concurrent client connection to the Citrix servers in the farm.
This test reports the usage of both the connection and product licenses by the Citrix server. This test will be disabled
by default. To enable the test, go to the ENABLE / DISABLE TESTS page using the menu sequence : Agents -> Tests -
> Enable/Disable, pick
Citrix XenApp
as the Component type,
Performance
as the Test type, choose the test from the
DISABLED TESTS list, and click on the >> button to move the test to the ENABLED TESTS list. Finally, click the Update
button.
Purpose
Reports the usage of both the connection and product licenses by the Citrix server
Target of the
test
Any Citrix server
Agent
deploying the
test
An internal agent
5. Configura
ble
parameter
s for the
test
1. TEST PERIOD – How often should the test be executed
2. HOST – The host for which the test is to be configured
3. PORT – Refers to the port used by the Citrix server
4. REREADLICENSE – If this flag is set to Yes, then the eG agent will check for changes in
license status everytime the test runs. If this flag is set to No, then the eG agent will not
check for license changes.
Outputs of the
test
One set of results for every server being monitored
Measurements
made by the
Measurement
Measurement
Unit
Interpretation
M O N I T O RI N G C I T R I X X E N AP P S E R V E R S
61
test
Pool licenses in use:
All the Citrix servers in a
server farm typically share a
pool of licenses. This
measure reports the number
of licenses from the pool used
by the current server.
Number
Assigned licenses:
Citrix allows a number of
licenses from the pool to be
assigned to a specific server.
No other server can re-use
these assigned licenses. This
measure reports the number
of licenses that are assigned
to the current server.
Number
Assigned licenses in use:
This reports the number of
assigned licenses in use.
Number
If the number of assigned licenses in use is
much lower than the allocated number of
assigned licenses, the administrator may want
to reduce the number of assigned licenses for
this server.
Usage of assigned
licenses:
This reports the % of
assigned licenses in use.
Percent
Administrators may choose to be alerted when
the assigned license usage reaches close to
100%, so that they may increase the number
of assigned licenses if desired.
2.1.5.15 Citrix License Stats Test
This test shows the statistics of the license server while it is being accessed by the Citrix XenApp server.
Purpose
Shows the statistics of the license server while it is being accessed by the Citrix XenApp server
Target of the
test
Citrix XenApp server 4.0 and above
Agent
deploying the
test
An internal agent

M O N I T O RI N G C I T R I X X E N AP P S E R V E R S
62
5. Configura
ble
parameter
s for the
test
1. TEST PERIOD – How often should the test be executed
2. HOST – The host for which the test is to be configured
3. PORT – Refers to the port used by the Citrix server
4. SEPARATE PROCESS - By default, this parameter is set to Auto. This implies that by
default, this test auto-discovers the operating system on which the target Citrix server is
running. Based on the auto-discovered OS, the test uses either the eG agent process itself
to collect the required metrics or spawns a separate process for this purpose. If the target
server is discovered to be executing on a Windows 2003 (or earlier) platform, then the eG
agent process itself will collect the metrics reported by this test. On the other hand, if the
target server is found to execute on Windows 2008 (or above), then a separate process is
spawned for metrics collection. Alternatively, you can set this flag to true or yes. In this
case, metrics collection is performed by a separate process, regardless of the operating
system of the Citrix server. If you set this flag to false or no on the other hand, then the eG
agent process collects the metrics, regardless of the operating system of the Citrix server.
Outputs of the
test
One set of results for every server being monitored
Measurements
made by the
test
Measurement
Measurement
Unit
Interpretation
Avg license checkin
response time:
Indicates the average license
check-in response time.
Secs
Avg checkout response
time:
Indicates the average license
check-out response time.
Secs
Last recorded checkin
time:
Indicates the last recorded
license check-in response
time.
Secs
Last recorded checkout
time:
Indicates the last recorded
license check-out response
time.
Secs
License server connection
failure:
Indicates the duration for
which the Citrix XenApp
server was disconnected from
the License server.
Mins
Any value greater than 0 implies that the Citrix
XenApp server is having trouble connecting to
the license server.

M O N I T O RI N G C I T R I X X E N AP P S E R V E R S
63
2.1.5.16 Citrix Data Store Test
The CitrixDataStore test monitors the Citrix XenApp server's datastore.
Purpose
Monitors the Citrix XenApp server's datastore
Target of the
test
Citrix XenApp server 4.0 and above
Agent
deploying the
test
An internal agent
5. Configura
ble
parameter
s for the
test
1. TEST PERIOD – How often should the test be executed
2. HOST – The host for which the test is to be configured
3. PORT – Refers to the port used by the Citrix server
4. SEPARATE PROCESS - By default, this parameter is set to Auto. This implies that by
default, this test auto-discovers the operating system on which the target Citrix server is
running. Based on the auto-discovered OS, the test uses either the eG agent process itself
to collect the required metrics or spawns a separate process for this purpose. If the target
server is discovered to be executing on a Windows 2003 (or earlier) platform, then the eG
agent process itself will collect the metrics reported by this test. On the other hand, if the
target server is found to execute on Windows 2008 (or above), then a separate process is
spawned for metrics collection. Alternatively, you can set this flag to true or yes. In this
case, metrics collection is performed by a separate process, regardless of the operating
system of the Citrix server. If you set this flag to false or no on the other hand, then the eG
agent process collects the metrics, regardless of the operating system of the Citrix server.
Outputs of the
test
One set of results for every server being monitored
Measurements
made by the
test
Measurement
Measurement
Unit
Interpretation
Errors found:
Indicates whether any errors
have occurred in the
datastore or not.
Number
While the value 1 indicates the existence of
errors in the datastore, the value 0 indicates
that no errors have occurred in the datastore.
Application errors:
Indicates the number of
application errors found in
the datastore.
Number
Groups errors found:
Indicates the number of
group errors found in the
datastore.
Number
Server errors found:
Indicates the number of
server errors found in the
datastore.
Number

M O N I T O RI N G C I T R I X X E N AP P S E R V E R S
64
2.1.5.17 Citrix Dynamic Store Test
This test monitors the Citrix XenApp server's dynamic store.
Purpose
Monitors the Citrix XenApp server's dynamic store
Target of the
test
Citrix XenApp server 4.0 and above
Agent
deploying the
test
An internal agent
5. Configura
ble
parameter
s for the
test
1. TEST PERIOD – How often should the test be executed
2. HOST – The host for which the test is to be configured
3. PORT – Refers to the port used by the Citrix server
4. SEPARATE PROCESS - By default, this parameter is set to Auto. This implies that by
default, this test auto-discovers the operating system on which the target Citrix server is
running. Based on the auto-discovered OS, the test uses either the eG agent process itself
to collect the required metrics or spawns a separate process for this purpose. If the target
server is discovered to be executing on a Windows 2003 (or earlier) platform, then the eG
agent process itself will collect the metrics reported by this test. On the other hand, if the
target server is found to execute on Windows 2008 (or above), then a separate process is
spawned for metrics collection. Alternatively, you can set this flag to true or yes. In this
case, metrics collection is performed by a separate process, regardless of the operating
system of the Citrix server. If you set this flag to false or no on the other hand, then the eG
agent process collects the metrics, regardless of the operating system of the Citrix server.
Outputs of the
test
One set of results for every server being monitored
Measurements
made by the
test
Measurement
Measurement
Unit
Interpretation
Gateway update count:
Indicates the number of
dynamic store update packets
sent to remote data collectors
during the last measurement
period.
Number
Gateway update sent:
Indicates the number of bytes
of data sent across gateways
to remote data collectors
during the last measurement
period.
KB

M O N I T O RI N G C I T R I X X E N AP P S E R V E R S
65
Query count:
Indicates the number of
dynamic store queries that
have been performed during
the last measurement period.
Number
Query request received:
Indicates the number of bytes
of data received in dynamic
store query request packets
during the last measurement
period.
KB
Query response sent:
Indicates the number of bytes
of data sent in response to
dynamic store queries during
the last measurement period.
KB
Read rate:
Indicates the rate at which
data was read from the IMA
Dynamic store during the last
measurement period.
Reads/Sec
Write rate:
Indicates the rate at which
data was written to the IMA
Dynamic Store during the last
measurement period.
Writes/Sec
Update requests received:
Indicates the number of bytes
of data received in dynamic
store update packets during
the last measurement period.
KB
Update packets received:
Indicates the number of
update packets received by
the dynamic store during the
last measurement period.
Number
Update response sent:
Indicates the number of bytes
of data sent in response to
dynamic store update packets
during the last measurement
period.
KB

M O N I T O RI N G C I T R I X X E N AP P S E R V E R S
66
2.1.5.18 Server Work Items Test
This test reports critical statistics related to the status of work items.
Purpose
Reports critical statistics related to the status of work items
Target of the
test
Any Citrix server
Agent
deploying the
test
An internal agent
Configurable
parameters for
the test
1. TEST PERIOD – How often should the test be executed
2. HOST – The host for which the test is to be configured
3. PORT – Refers to the port used by the Citrix server
4. SEPARATE PROCESS - By default, this parameter is set to Auto. This implies that by
default, this test auto-discovers the operating system on which the target Citrix server is
running. Based on the auto-discovered OS, the test uses either the eG agent process itself
to collect the required metrics or spawns a separate process for this purpose. If the target
server is discovered to be executing on a Windows 2003 (or earlier) platform, then the eG
agent process itself will collect the metrics reported by this test. On the other hand, if the
target server is found to execute on Windows 2008 (or above), then a separate process is
spawned for metrics collection. Alternatively, you can set this flag to true or yes. In this
case, metrics collection is performed by a separate process, regardless of the operating
system of the Citrix server. If you set this flag to false or no on the other hand, then the eG
agent process collects the metrics, regardless of the operating system of the Citrix server.
Outputs of the
test
One set of results for every Citrix server monitored
Measurements
made by the
test
Measurement
Measurement
Unit
Interpretation
Resolution work items
currently being executed:
Reports the number of
resolution work items that are
currently being executed.
Number
Resolution work items
ready for execution:
Indicates the number of
resolution work items that are
currently ready to be
executed.
Number
Work items currently
being executed:
Indicates the number of work
items that are currently being
executed.
Number
M O N I T O RI N G C I T R I X X E N AP P S E R V E R S
67
Work items pending
execution:
Indicates the current number
of work items that are not yet
ready to be executed.
Number
Work items ready for
execution:
Indicates the number of work
items that are ready to be
executed currently by IMA
Threads.
Number
Attention is needed if this measure is
sustained at 2 for one minute.
2.1.5.19 User Profile Test
User profiles are the heart of the Citrix environment. User profiles contain the configuration settings, which bring the
user desktop alive. One of the major problems in a server-based computing environment like Citrix is that the user's
login process takes more time to open the user's desktop. This happens if the user profile size is huge. The
UserProfile test monitors the size of the Citrix user profiles and raises an alarm if the profile size exceeds the profile
quota size.
Purpose
Monitors the size of the Citrix user profiles and raises an alarm if the profile size exceeds the
profile quota size
Target of the
test
Any Citrix server
Agent
deploying the
test
An internal agent

M O N I T O RI N G C I T R I X X E N AP P S E R V E R S
68
Configurable
parameters for
the test
1. TEST PERIOD – How often should the test be executed
2. HOST – The host for which the test is to be configured
3. PORT – Refers to the port used by the Citrix server
4. PROFILESIZELIMIT - Specify the profile quota size (in MB). The default value is 50 MB.
5. EXCLUDE - Provide a comma-separated list of users who need to be excluded from the
analysis. By default, this parameter is set to
All_Users
, indicating that, by default, the test
will not monitor the
All_Users
profile.
6. CURRENTUSERSONLY - If this is set to true, then the profile sizes of only those users
who are currently logged into the server will be monitored. If this is set to false, eG
Enterprise will perform profile monitoring for all the users to the server.
7. FILESIZELIMIT - Takes the file quota size (in KB). The default size is 10000 KB.
8. REPORT BY DOMAIN - By default, this flag is set to Yes. This implies that by default, this
test will report metrics for every
domainname\username
to the server. This way,
administrators will be able to quickly determine which user belongs to which domain. If you
want the test to report metrics for every
username
alone, then set this flag to No.
9. DETAILED DIAGNOSIS - To make diagnosis more efficient and accurate, the eG
Enterprise suite embeds an optional detailed diagnostic capability. With this capability, the
eG agents can be configured to run detailed, more elaborate tests as and when specific
problems are detected. To enable the detailed diagnosis capability of this test for a
particular server, choose the On option. To disable the capability, click on the Off option.
The option to selectively enable/disable the detailed diagnosis capability will be available
only if the following conditions are fulfilled:
The eG manager license should allow the detailed diagnosis capability
Both the normal and abnormal frequencies configured for the detailed diagnosis
measures should not be 0.
Outputs of the
test
One set of results for every user profile on the Citrix server monitored
Measurements
made by the
test
Measurement
Measurement
Unit
Interpretation
Is user profile exceeding
quota?:
Indicates whether the profile
size exceeds the profile quota
size by comparing the current
profile size with the
configured
PROFILESIZELIMIT
parameter.
Boolean
If this measure shows 0, it indicates that the
current profile size has not exceeded the
quota size. The value 1 indicates that the
current profile size has exceeded the quota
size.
Current profile size:
Indicates the current profile
size.
MB
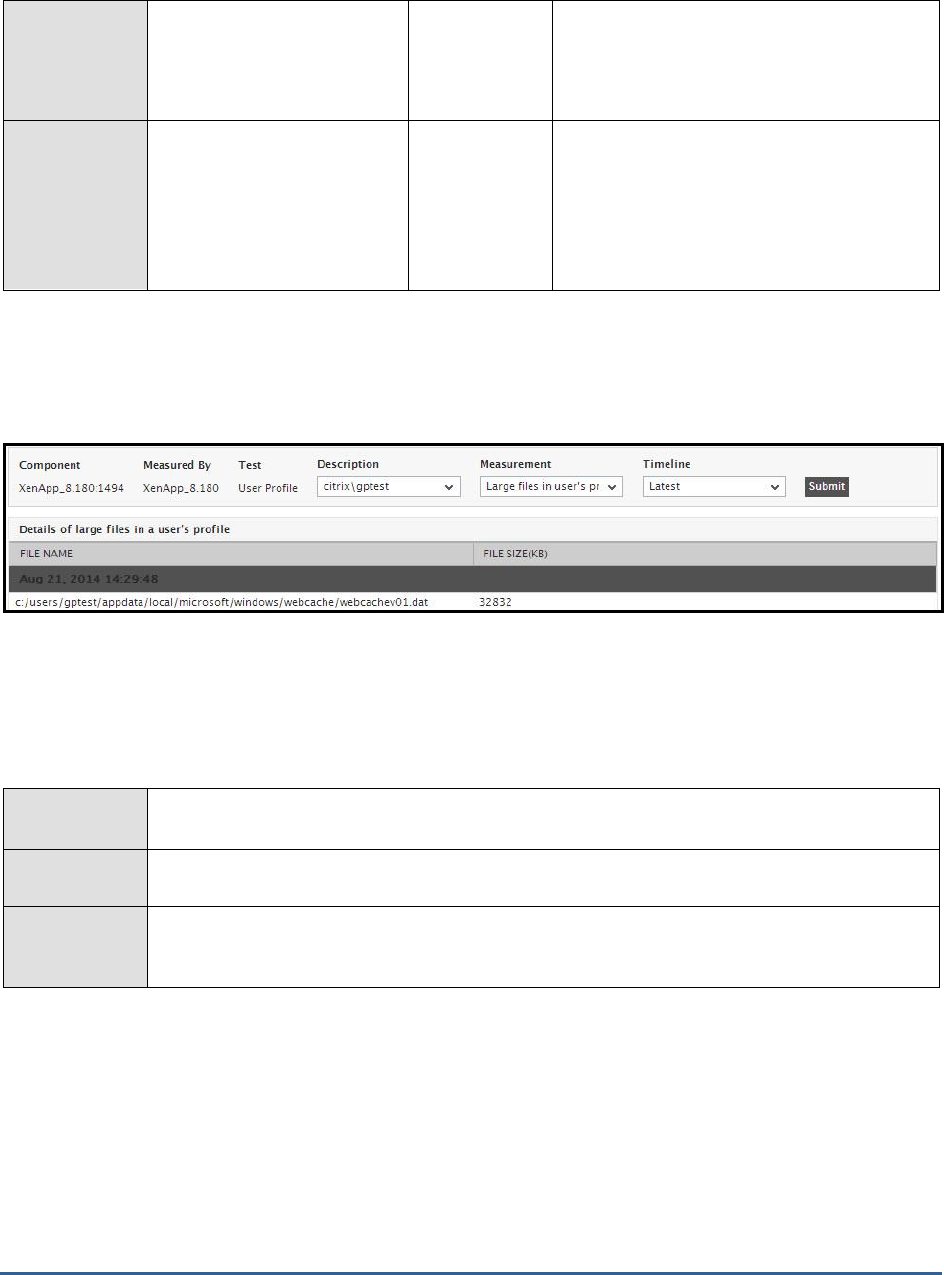
M O N I T O RI N G C I T R I X X E N AP P S E R V E R S
69
Number of files in user’s
profile:
Indicates the number of files
available in the user profile.
Number
Large files in user’s
profile:
The number of files in the
user profile, which exceed the
allowable FILESIZELIMIT
parameter.
Number
The detailed diagnosis of this measure, if
enabled, lists all the files that have exceeded
the configured FILESIZELIMIT.
Use the detailed diagnosis of the
Large files in user’s profile
measure to know which files have exceeded the
configured FILESIZELIMIT. If a profile takes too long to load, then using these diagnositics, administrators can
identify the exact file in the profile that could be contributing to loading delay.
Figure 2.12: The detailed diagnosis of the Large files in user’s profile measure
2.1.5.20 XML Threads Test
This test monitors the usage of XML threads, and reports whether or not the XML service has adequate threads for
processing requests.
Purpose
Monitors the usage of XML threads, and reports whether or not the XML service has adequate
threads for processing requests
Target of the
test
Any Citrix server
Agent
deploying the
test
An internal agent

M O N I T O RI N G C I T R I X X E N AP P S E R V E R S
70
Configurable
parameters for
the test
1. TEST PERIOD – How often should the test be executed
2. HOST – The host for which the test is to be configured
3. PORT – Refers to the port used by the Citrix server
4. SEPARATE PROCESS - By default, this parameter is set to Auto. This implies that by
default, this test auto-discovers the operating system on which the target Citrix server is
running. Based on the auto-discovered OS, the test uses either the eG agent process itself
to collect the required metrics or spawns a separate process for this purpose. If the target
server is discovered to be executing on a Windows 2003 (or earlier) platform, then the eG
agent process itself will collect the metrics reported by this test. On the other hand, if the
target server is found to execute on Windows 2008 (or above), then a separate process is
spawned for metrics collection. Alternatively, you can set this flag to true or yes. In this
case, metrics collection is performed by a separate process, regardless of the operating
system of the Citrix server. If you set this flag to false or no on the other hand, then the eG
agent process collects the metrics, regardless of the operating system of the Citrix server.
Outputs of the
test
One set of results for every Citrix server monitored
Measurements
made by the
test
Measurement
Measurement
Unit
Interpretation
Max XML threads:
Indicates the maximum
number of XML threads.
Number
Busy XML threads:
Indicates the number of units
of work the XML service is
currently processing.
Number
By default, the maximum number of requests
that the XML service can process at any one
time is 16. If this measure is sustained at 16
for one minute or longer, it indicates that all
the XML threads have been used up and the
XML service cannot service any more
requests.
Current XML threads:
Indicates the current number
of XML threads.
Number
2.1.5.21 User Logon Test
The process of a user logging into a Citrix or Microsoft RDS server is fairly complex. First, the domain controller is
discovered and the login credentials are authenticated. Then, the corresponding user profile is identified and loaded.
Next, group policies are applied and logon scripts are processed to setup the user environment. In the meantime,
additional processing may take place for a user – say, applying system profiles, creating new printers for the user,
and so on. A slowdown in any of these steps can significantly delay the logon process for a user. Since logons on
Windows happen sequentially, this may adversely impact the logins for other users who may be trying to access the
XenApp/Microsoft RDS server at the same time. Hence, if a user complains that he/she is unable to access an
application/desktop published on Citrix/Microsoft RDS, administrators must be able to rapidly isolate exactly where
the logon process is stalling and for which user. The typical process for monitoring and troubleshooting the login
process on Windows 2003 is to use the user environment debugging mechanism. To enable this on Windows 2003
and to set the logging level associated with the userenv.log file, perform the following steps:
M O N I T O RI N G C I T R I X X E N AP P S E R V E R S
71
Start a registry editor (e.g., regedit.exe).
Navigate to the HKEY_LOCAL_MACHINE\SOFTWARE\Microsoft\Windows NT\CurrentVersion\Winlogon
registry subkey.
From the Edit menu, select New, DWORD Value.
Enter the name UserEnvDebugLevel, then press Enter.
Double-click the new value, set it to 65538 (decimal) - which corresponds to the debugger output.
Once these changes are enabled, details about the Windows login process are logged into the file
%systemroot%\debug\usermode\userenv.log. The log file is written to the
%Systemroot%\Debug\UserMode\Userenv.log file. If the Userenv.log file is larger than 300 KB, the file is renamed
Userenv.bak, and a new Userenv.log file is created. This action occurs when a user logs on locally or by using
Terminal Services, and the Winlogon process starts. However, because the size check only occurs when a user logs
on, the Userenv.log file may grow beyond the 300 KB limit. The 300 KB limit cannot be modified.
The User Logon test periodically checks the userenv log file on Windows 2003 to monitor the user login and profile
loading process and accurately identify where the process is bottlenecked. On Windows 2008 (or above), this test
takes the help of the Windows event logs to capture anomalies in the user login and profile loading process and
report where the process is bottlenecked - – in the authentication process? during profile loading? during GPO
processing and if so, which GPO?
By default, this test is disabled. To enable the test, go to the ENABLE / DISABLE TESTS page using the menu sequence
: Agents -> Tests -> Enable/Disable, pick
Citrix XenApp
as the Component type,
Performance
as the Test type,
choose the test from the DISABLED TESTS list, and click on the >> button to move the test to the ENABLED TESTS list.
Finally, click the Update button.
Purpose
Periodically checks the userenv log file on Windows 2003 to monitor the user login and profile
loading process and accurately identify where the process is bottlenecked. On Windows 2008 (or
above), this test takes the help of the Windows event logs to capture anomalies in the user login
and profile loading process and report its root-cause.
Target of the
test
Any Citrix server
Agent
deploying the
test
An internal agent

M O N I T O RI N G C I T R I X X E N AP P S E R V E R S
72
Configurable
parameters for
the test
1. TEST PERIOD – How often should the test be executed
2. HOST – The host for which the test is to be configured
3. PORT – Refers to the port used by the Citrix server
4. REPORT TOTAL – By default, this flag is set to No. In this case therefore, the test will
only report metrics for every user to the XenApp server. If this flag is set to Yes, then the
test will report metrics for a
Total
descriptor – the metrics reported by this descriptor will be
aggregated across all users to the XenApp server. This way, XenApp administrators will
receive a system-wide overview of the health of the profile loading/unloading process.
5. REPORT FOR EACH USER – By default, this flag is set to Yes. This implies that, by
default, the test will report metrics for each user to the XenApp server. If you set this flag to
No, then make sure that the REPORT TOTAL flag is set to ‘Yes’. Because, if both the
REPORT FOR EACH USER and the REPORT TOTAL flags are set to No, then the test will
not run! On the other hand, if only the REPORT TOTAL flag is set to Yes, the test will only
report metrics for the
Total
descriptor. Moreover, if both the REPORT TOTAL and the
REPORT FOR EACH USER flags are set to Yes, then the test will report metrics per user
and will additionally report metrics for the
Total
descriptor as well.
6. REPORT BY DOMAIN NAME – By default, this flag is set to No. This means that, by
default, the test will report metrics for each
username
only. You can set this flag to Yes, to
ensure that the test reports metrics for each
domainname\username
.
7. REPORT UNKNOWN – By default, this flag is set to No. Accordingly, the test, by default,
disregards user sessions that have remained active on the server for a duration lesser than
the TEST PERIOD. If you want the test to report metrics for such users as well, then set
this flag to Yes. In this case, the test will additionally support an
Unknown
descriptor – the
metrics reported by this descriptor will be aggregated across all such user sessions that
have been active on the server only for a limited duration.
8. DETAILED DIAGNOSIS - To make diagnosis more efficient and accurate, the eG
Enterprise suite embeds an optional detailed diagnostic capability. With this capability, the
eG agents can be configured to run detailed, more elaborate tests as and when specific
problems are detected. To enable the detailed diagnosis capability of this test for a
particular server, choose the On option. To disable the capability, click on the Off option.
The option to selectively enable/disable the detailed diagnosis capability will be available
only if the following conditions are fulfilled:
The eG manager license should allow the detailed diagnosis capability
Both the normal and abnormal frequencies configured for the detailed diagnosis
measures should not be 0.
Outputs of the
test
One set of results for every user to the Citrix XenApp server monitored
Measurements
made by the
test
Measurement
Measurement
Unit
Interpretation

M O N I T O RI N G C I T R I X X E N AP P S E R V E R S
73
Logon duration:
Indicates the average time
taken by this user for logging
in during the last
measurement period.
Msecs
If this value is abnormally high for any user,
then, you can compare the
User account
discovery time
,
LDAP bind time to Active
Directory
,
Client side extension processed
time
,
DC discovery time, Total group policy
object file access time
,
Avg system policy
processing time
and
User profile load time
measures to know exactly where that user’s
login process experienced a bottleneck - is it
when loading the profile? is it when
processing system policies? is it when
processing group policies? is it when
interacting with AD for authenticating the
user login?
This measure will not be available for Citrix
XenApp Servers operating on Windows 2003.
User account discovery:
Indicates the amount of time
taken by the system call to
get account information for
this user during the last
measurement period.
Msecs
Compare the value of this measure across
users to know which user’s logon process
spent maximum time in retrieving account
information.
This measure will not be available for Citrix
XenApp Servers operating on Windows 2003.
LDAP bind time to Active
Directory:
Indicates the amount of time
taken by the LDAP call for
this user to connect and bind
to Active Directory during the
last measurement period.
MSecs
Compare the value of this measure across
users to know which user’s logon process
spent maximum time in connecting to Active
Directory. Besides impacting authentication
time, high LDAP bind time may also affect
group policy processing.
This measure will not be available for Citrix
XenApp Servers operating on Windows 2003.

M O N I T O RI N G C I T R I X X E N AP P S E R V E R S
74
Client side extension
processed time:
Indicates the amount of time
that client side extensions
took for processing group
policies for this user during
the last measurement period.
MSecs
Compare the value of this measure across
users to know which user’s logon process
spent maximum time in group policy
processing.
If this measure reports an unusually high
value for any user, then, you may want to
check the value of the
LDAP bind time to
Active Directory
measure for that user to
figure out if a delay in connecting to AD is
affecting group policy processing. This is
because, group policies are built on top of
AD, and hence rely on the directory service’s
infrastructure for their operation. As a
consequence, DNS and AD issues may affect
Group Policies severely. One could say that if
an AD issue does not interfere with
authentication, at the very least it will
hamper group policy processing.
You can also use the detailed diagnosis of
this measure to know which client side
extension was used to process which group
policy for a particular user.
This measure will not be available for Citrix
XenApp Servers operating on Windows 2003.
DC discovery time:
Indicates the time taken to
discover the domain
controller to be used for
processing group policies for
this user during the last
measurement period.
MSecs
Compare the value of this measure across
users to know which user’s logon process
spent maximum time in domain controller
discovery.
This measure will not be available for Citrix
XenApp Servers operating on Windows 2003.
Total group policy object
file accessed tme:
Indicates the amount of time
the logon process took to
access group policy object
files for this user during the
last measurement period.
MSecs
Compare the value of this measure across
users to know which user’s logon process
spent maximum time in accessing the group
policy object file.
This measure will not be available for Citrix
XenApp Servers operating on Windows 2003.

M O N I T O RI N G C I T R I X X E N AP P S E R V E R S
75
User profile load time:
Indicates the amount of time
it took to load this user’s
profile successfully in the last
measurement period.
MSecs
Compare the value of this measure across
users to know which user’s profile took the
longest time to load. One of the common
reasons for long profile load times is large
profile size. In such circumstances, you can
use the
User Profile
test to determine the
current size of this user’s profile. If the profile
size is found to be large, you can conclude
that it is indeed the size of the profile which
is affecting the profile load time.
Another reason would be the absence of a
profile. If the user does not already have a
profile a new one is created. This slows down
the initial logon quite a bit compared to
subsequent logons. The main reason is that
Active Setup runs the IE/Mail/Theme
initialization routines.
Moreover, this measure reports the
averag
e
time taken for loading a user’s profile across
all the sessions of that user. To know the
profile load time per user session, use the
detailed diagnosis of this measure. This will
accurately pinpoint the session in which the
profile took the longest to load.
This measure will not be available for Citrix
XenApp Servers operating on Windows 2003.
Profile load starts:
Indicates the number of
times this user’s profile was
loaded in the last
measurement period.
Number
This metric gives an idea of the rate at which
users are logging in to the server.
Group policy starts:
Indicates the number of
group policy applications
started for this user in the
last measurement period.
Number
Logon performance improves when fewer
Group Policies are applied. Merge GPOs when
possible instead of having multiple GPOs.
Group policy completes:
Indicates the number of
group policy applications
completed for this user in the
last measurement period.
Number

M O N I T O RI N G C I T R I X X E N AP P S E R V E R S
76
Client side extensions
applied:
Indicates the number of client
side extensions used for
processing group policies for
this user during the last
measurement period.
Number
Max group policy time:
Indicates the maximum time
taken for applying group
policies for this user in the
last measurement period.
Msecs
This measure will be available only for Citrix
XenApp servers operating on Windows 2003.
Profile load starts:
Indicates the number of
profile loads started for this
user in the last measurement
period.
Number
Use the detailed diagnosis of this measure to
know the details of the user sessions in which
profile loads were started.
Profile load successes:
Indicates the number of
successful profile loads for
this user in the last
measurement period.
Number
Profile loading failures:
Indicates the number of
profile load failures for this
user in the last measurement
period.
Number
An unusual increase in number of profile
loading failures is a cause for concern. The
userenv.log/event logs file will have details of
what profile loads failed and why.
Profile load failures
percent:
Indicates the percentage of
profile loads that failed for
this user in the last
measurement period.
Percent
A low value is desired for this measure.
Compare the value of this measure across
users to know which user’s profile failed to
load most often.

M O N I T O RI N G C I T R I X X E N AP P S E R V E R S
77
Avg user profile load time:
Indicates the average time it
took to load this user’s
profile successfully in the last
measurement period.
Msecs
Ideally, profile load time should be low for
any user. A high value or a consistent rise in
this value is a cause for concern, as it
indicates a delay in profile loading. This in
turn will have a negative impact on user
experience. One of the common reasons for
long profile load times is large profile size.
Compare the value of this measure across
users to identify that user whose profile took
the longest to load. Then, use the
User
Profile
test to determine the current size of
this user’s profile. If the profile size is found
to be large, you can conclude that it is indeed
the size of the profile which is affecting the
profile load time.
This measure will be available only for Citrix
XenApp servers operating on Windows 2003.
Max profile load time:
Indicates the maximum time
it took to load a profile during
the last measurement period.
Msecs
This measure will be available only for Citrix
XenApp servers operating on Windows 2003.
Profile unload starts:
Indicates the number of
profile unloads started for this
user during the last
measurement period.
Number
Use the detailed diagnosis of this measure
measure to know when a user’s session was
initiated and how long each session remained
active on the XenApp server. From this, you
can infer how many sessions were active for
a user on the server and the duration of each
session, and thus identify long-running
sessions for the user.
Profile unload successes:
Indicates the number of
successful profile unloads for
this user during the last
measurement period.
Number
Profile unload failures:
Indicates the number of
unsuccessful profile unloads
during the last measurement
period.
Number
Profile unload failures
percent:
Indicates the profile unload
failures as a percentage of
the total profile unloads.
Percent

M O N I T O RI N G C I T R I X X E N AP P S E R V E R S
78
Avg user profile unload
time:
Indicates the average time
for unloading a profile during
the last measurement period.
Msecs
This measure will be available only for Citrix
XenApp servers operating on Windows 2003.
Max profile unload time:
Indicates the maximum time
for unloading a profile during
the last measurement period.
Msecs
This measure will be available only for Citrix
XenApp servers operating on Windows 2003.
System policy starts:
Indicates the number of
system policy processes that
were started for this user in
the last measurement period.
Number
System policy completes:
Indicates the number of
system policy completions for
this user in the last
measurement period.
Number
Compare the total number of starts to
completions. if there is a significant
discrepancy, this denotes a bottleneck in
system policy application. Check the
userenv.log file for more details.
Avg system policy
processing time:
Indicates the average time
taken for applying system
policies in the last
measurement period for this
user.
Msecs
If the system policy times are long, check the
detailed diagnosis to view if the policy
handling is taking time for all users. Analyze
the userenv.log to determine the reason for
any slowdown.
Max system policy time:
Indicates the maximum time
for applying system policies
for this user in the last
measurement period.
Msecs
As stated earlier, the user logon process includes a series of steps – eg., domain discovery,
authentication, GPO application, profile loading, etc. - that culminate in a user gaining access to an
application deployed on a XenApp server. These individual steps may not always occur in sequence –
i.e., one after another; in fact usually, they occur parallely. This is why, the value of the
Logon
duration
measure will not be an aggregate of the time values reported by the other metrics of the
User Logon
test.
You can use the detailed diagnosis of the
Client side extension processed time
measure to know which client side
extension was used to process which group policy for a particular user.
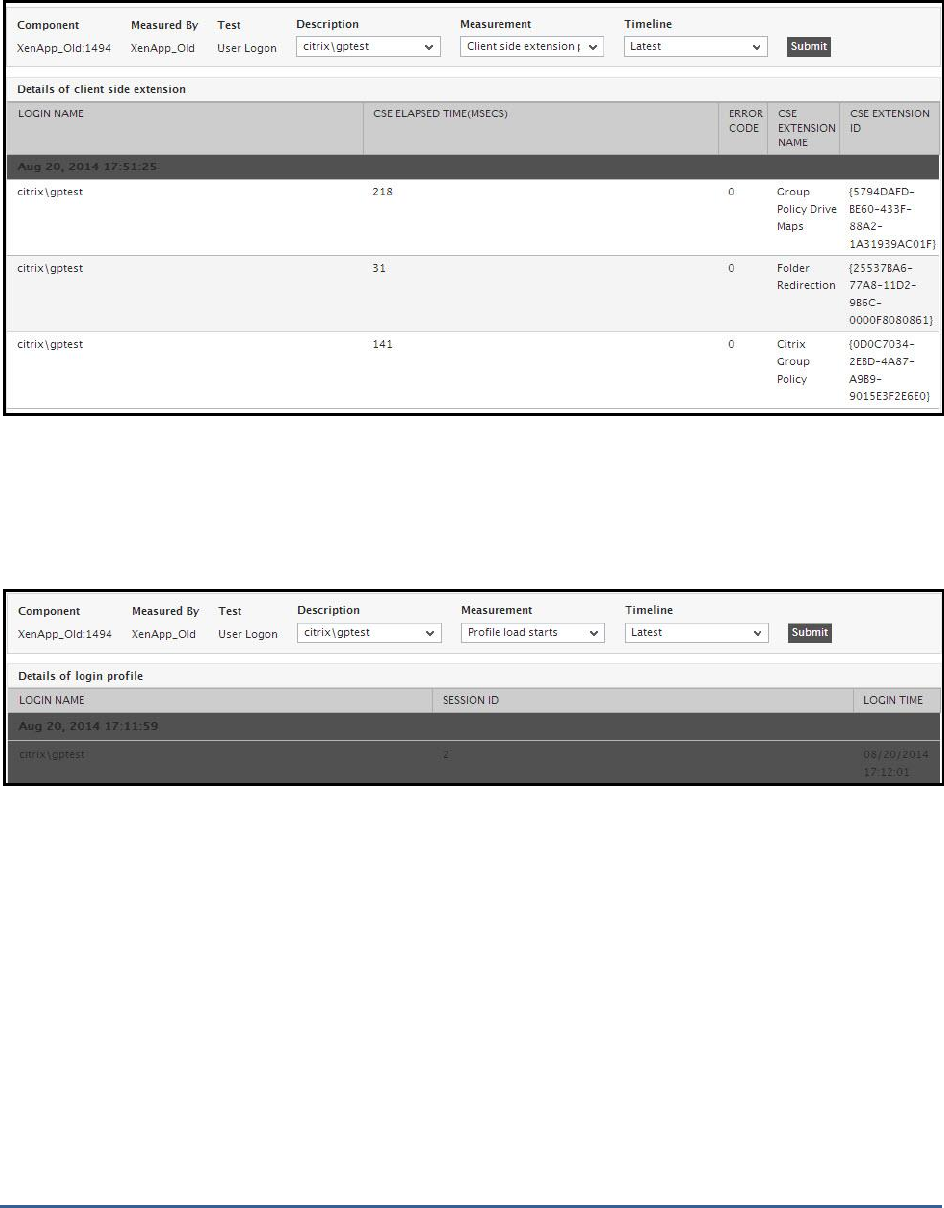
M O N I T O RI N G C I T R I X X E N AP P S E R V E R S
79
Figure 2.13: The detailed diagnosis of the Client side extension processed time measure
Using the detailed diagnosis of the
Profile load starts
measure, you can identify the user sessions in which the profile
was loaded and the time at which the session was initiated.
Figure 2.14: The detailed diagnosis of the Profile load starts measure
Use the detailed diagnosis of the
Profile unload starts
measure to know when a user’s session was initiated and how
long each session remained active on the XenApp server. From this, you can infer how many sessions were active
for a user on the server and the duration of each session, and thus identify long-running sessions for the user.
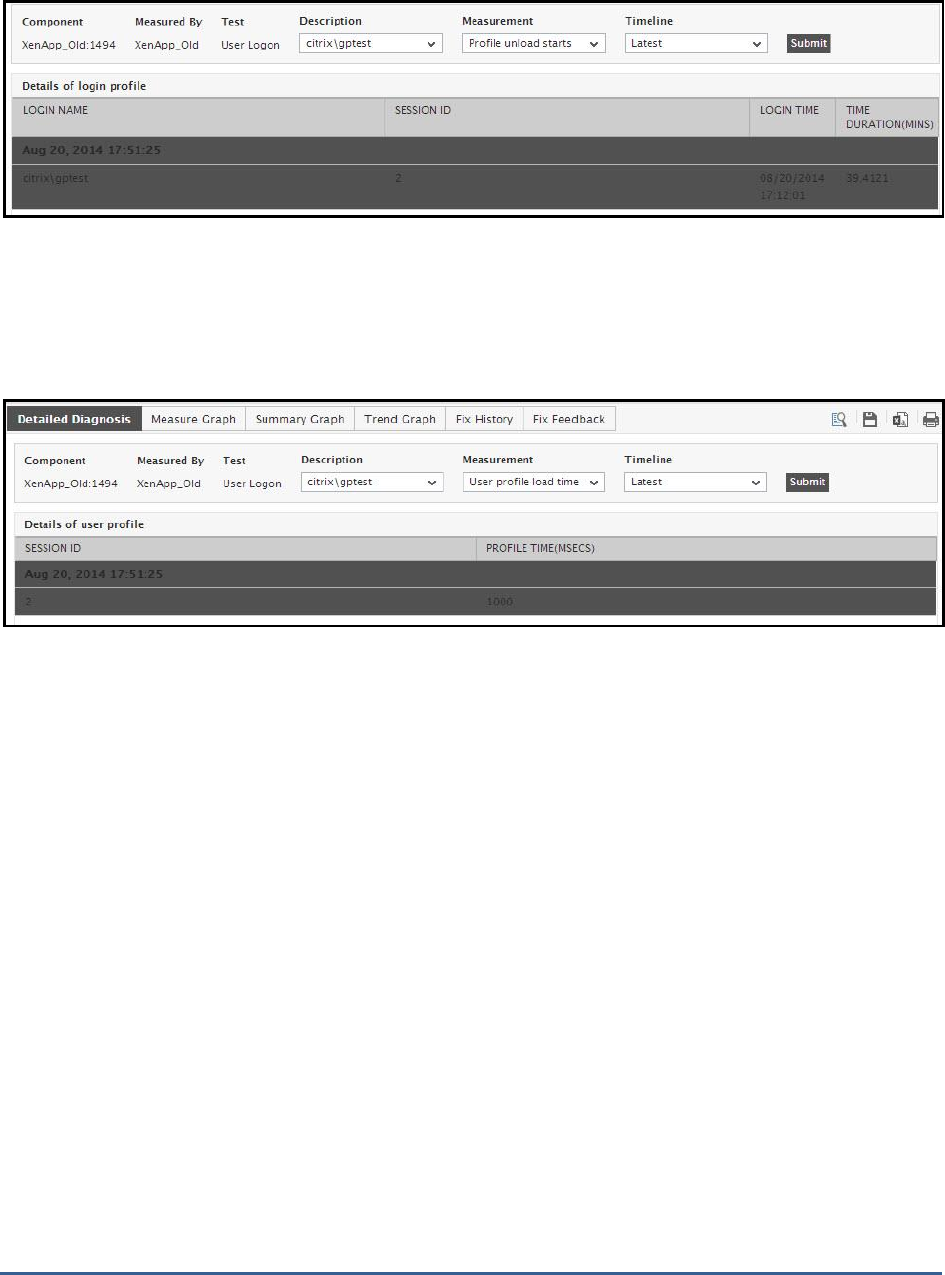
M O N I T O RI N G C I T R I X X E N AP P S E R V E R S
80
Figure 2.15: The detailed diagnosis of the Profile unload starts measure
To know the profile load time per user session, use the detailed diagnosis of the
User profile load time
measure. This
will accurately pinpoint the session in which the profile took the longest to load.
Figure 2.16: The detailed diagnosis of the User profile load time measure
2.1.5.22 Citrix XML Access Test
The Citrix XML Access Test verifies the interactions between the web interface, the XML service, and the IMA service.
A typical web interface interaction is composed of the following (see Figure 2.17):
1. Client device users utilize a Web browser to view the Log in page and enter their user credentials.
2. The NFuse server reads users’ information and uses the Web Interface’s classes to forward the information to
the Citrix XML Service; this service can execute on the Citrix Web Interface or on each of the XenApp servers in
a server farm. If the XML service is on the servers in a farm, the designated server acts as a broker between the
NFuse server and the XenApp servers in the farm.
3. The Citrix XML Service on the designated server then retrieves a list of applications from the servers that users
can access. These applications comprise the user’s application set. The Citrix XML Service retrieves the
application set from the Independent Management Architecture (IMA) system and Program Neighborhood
Service, respectively.
4. The Citrix XML Service then returns the user’s application set information to the Web Interface’s classes running
on the server.
5. The user then clicks on the application of interest to him/her to access it.
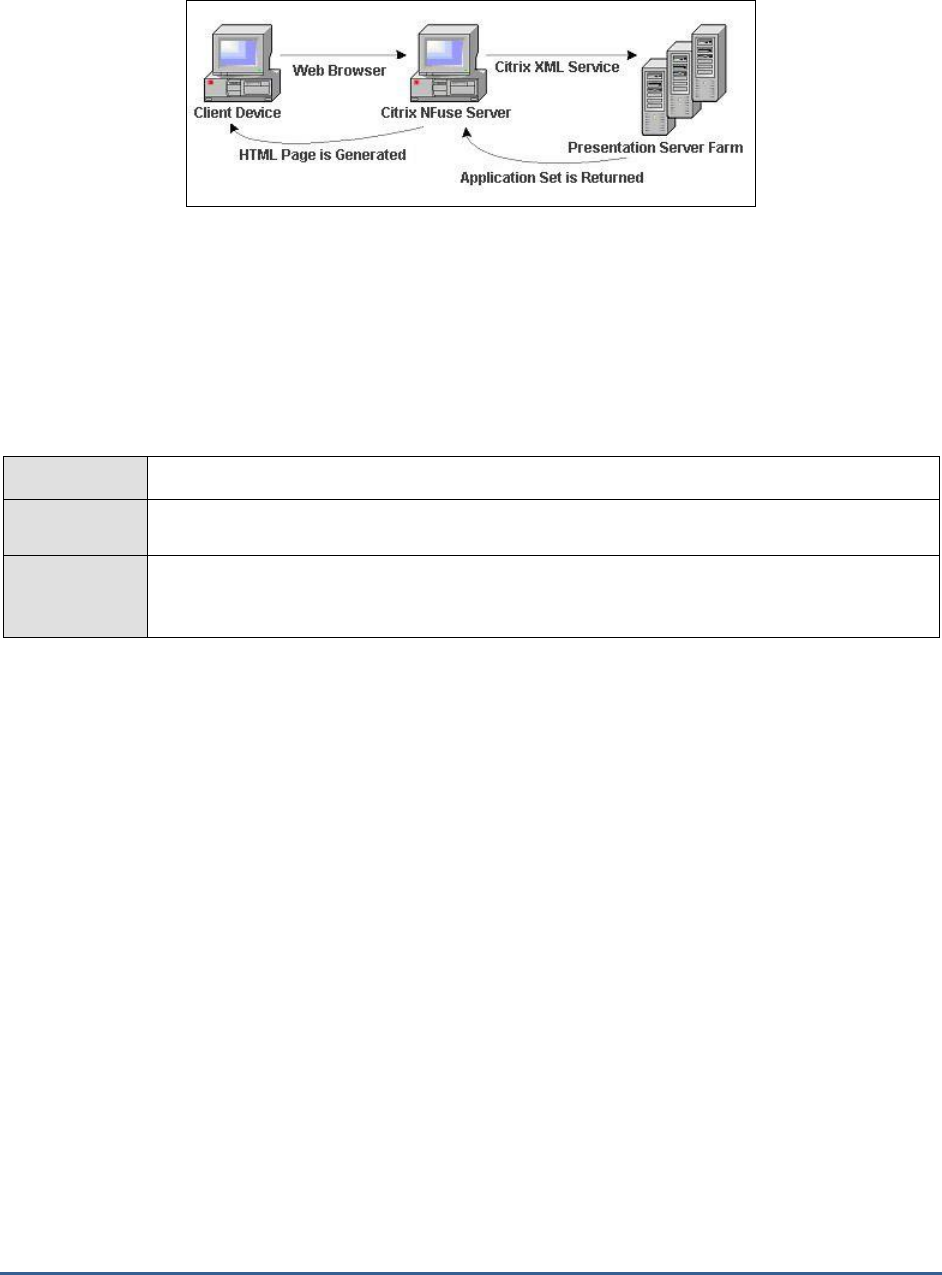
M O N I T O RI N G C I T R I X X E N AP P S E R V E R S
81
Figure 2.17: A typical web interface interaction
If the Citrix XML service executes on the XenApp servers in a farm, then you can use this test to evaluate the
availability and responsiveness of the XML service. This test emulates a user accessing an XML port for a list of
applications available to him/her. By emulating a request, this test checks that the entire application enumeration
process involving the XML service and IMA service of Citrix is functioning properly. This test is disabled by default. To
enable the test, go to the ENABLE / DISABLE TESTS page using the menu sequence : Agents -> Tests ->
Enable/Disable, pick
Citrix XenApp
as the Component type,
Performance
as the Test type, choose the test from the
DISABLED TESTS list, and click on the >> button to move the test to the ENABLED TESTS list. Finally, click the Update
button.
Purpose
Verifies the interactions between the web interface, the XML service, and the IMA service
Target of the
test
Any Citrix Web Interface
Agent
deploying the
test
An external agent

M O N I T O RI N G C I T R I X X E N AP P S E R V E R S
82
Configurable
parameters for
the test
1. TEST PERIOD – How often should the test be executed
2. HOST – The host for which the test is to be configured
3. PORT – Refers to the port used by the Citrix server
4. USER - This test emulates a user logging into the NFuse server and requesting for a list of
applications available to him/her. Therefore, in the USER text box, provide a valid user
name which the test should use for logging into the NFuse server.
5. PASSWORD - Provide the PASSWORD of the specified USER.
6. CONFIRM PASSWORD - Confirm the password by retyping it in the CONFIRM
PASSWORD box.
7. SSL - The web interface through which these tests are executing may be configured for
HTTP or HTTPS access. If HTTPS access is configured, then this parameter should be set to
YES.
8. DOMAIN - Provide the domain to which the user logs in.
9. DOMAINTYPE - A Citrix web interface can be set up to authenticate users by connecting
to a Windows domain, or a Unix domain, or a Novell domain. The DOMAINTYPE value
represents the type of domain being used to validate the user. The default value is "NT".
For Unix, use "UNIX" and for Novell, use "NDS".
10. XMLPORT - Specify the port on which the Citrix XML Service is executing.
11. NO OF TRIES and SLEEP TIME - In environments where network connections are
normally fuzzy and latencies are to be expected, the availability and response time checks
performed by this test, may not always report accurate results. False alarms may hence be
generated. In such environments therefore, you may want the test to try connecting to the
XML service a few more times before reporting the availability and responsiveness of the
service. To instruct the test to do so, you can use the NO OF TRIES and SLEEP TIME
parameters. In the NO OF TRIES text box, indicate the number of times the test should try
reconnecting to the XML service, and in the SLEEP TIME text box, specify how long (in
seconds) the test should wait for a response from the service before attempting to
reconnect. Both these parameters are set to 1 by default.
12. TIMEOUT - Specify the duration (in seconds) for which the test needs to wait for a
response from the server. At the end of this duration, the test will timeout. The default is 30
seconds.
Outputs of the
test
One set of results for every Citrix Web Interface monitored
Measurements
made by the
test
Measurement
Measurement
Unit
Interpretation
Connection availability:
Tracks if the Citrix XML
service is available to handle
any requests.
Percent
If the TCP connection to the XML service port
fails, this metric has a value of 0. Otherwise,
it has a value of 100.

M O N I T O RI N G C I T R I X X E N AP P S E R V E R S
83
Authentication status:
Indicates if the user
authentication succeeded.
Percent
It has a value of 100 if the user was
authenticated, and a value of 0 if the
authentication failed. If the user login is valid,
yet authentication fails, the problem then lies
with the Citrix IMA service's communication
with the domain controller/active directory
server.
Application enumeration
status:
This metric indicates if the
Citrix web interface was able
to enumerate the applications
available for the user logging
in.
Percent
A value of 0 indicates that application
enumeration failed, while a value of 100
denotes that the application enumeration
operation succeeded. If authentication
succeeds but application enumeration fails,
then the problem is most likely to be in the
Citrix XML service, its interaction with the
IMA service, or with the IMA service itself.
TCP connection time:
Indicates the time taken to
establish a TCP connection to
the Citrix XML service.
Secs
If this value is significantly high, it could
probably be because the network latency is
high or the Citrix web interface host is
overloaded.
Total response time:
Represents the total time
taken for a user to login to
the Citrix web interface and
enumerate all the
applications.
Secs
The value of this metric indicates the
responsiveness of the Citrix web interface
and its connectivity to the XML service.
2.1.5.23 Citrix XML Tickets Test
Once a user logs in to the Citrix web interface, he/she receives a list of applications to which they have access. When
the user chooses one of the applications to open, the request is received
by the web interface and forwarded to the local XML service. The XML service then asks the IMA service for the IP
address of the least busy server that has the requested application published on it. The IMA service may have to
contact the data collector for this information. In turn, the IMA service on the least loaded server contacts the
terminal services on this system to obtain a ticket which provides the user with the permission to access the
requested application.
The CitrixXmlTicket test is used to validate that the XML to IMA service interaction and the interaction between the
IMA service and the terminal service on each system are working as expected. This test
connects to the web interface (specified by the xmlHost and xmlPort parameters) and issues an XML request asking
the XML service for permission to login and access the application.
This test is disabled by default. To enable the test, go to the ENABLE / DISABLE TESTS page using the menu sequence
: Agents -> Tests -> Enable/Disable, pick
Citrix XenApp
as the Component type,
Performance
as the Test type,
choose the test from the DISABLED TESTS list, and click on the >> button to move the test to the ENABLED TESTS list.
Finally, click the Update button.
Purpose
Is used to validate that the XML to IMA service interaction and the interaction between the IMA

M O N I T O RI N G C I T R I X X E N AP P S E R V E R S
84
service and the terminal service on each system are working as expected
Target of the
test
Any Citrix server
Agent
deploying the
test
An external agent
Configurable
parameters for
the test
1. TEST PERIOD – How often should the test be executed
2. HOST – The host for which the test is to be configured
3. PORT – Refers to the port used by the Citrix server
4. USER - This test connects to the web interface and issues an XML request asking the XML
service for permission to login and access the application. Therefore, in the USER text box,
provide a valid user name which the test should use for connecting to the web interface.
5. PASSWORD - Provide the PASSWORD of the specified USER.
6. CONFIRM PASSWORD - Confirm the password by retyping it in the CONFIRM
PASSWORD box.
7. SSL - The web interface through which these tests are executing may be configured for
HTTP or HTTPS access. If HTTPS access is configured, then this parameter should be set to
YES.
8. DOMAIN - Provide the domain to which the user logs in.
9. DOMAINTYPE - A Citrix web interface can be set up to authenticate users by connecting
to a Windows domain, or a Unix domain, or a Novell domain. The DOMAINTYPE value
represents the type of domain being used to validate the user. The default value is "NT".
For Unix, use "UNIX" and for Novell, use "NDS" in the domainType setting.
10. XMLHOST - Provide the IP/hostname of the web interface to which this test will attempt
to connect.
11. XMLPORT - Provide the port number (respectively) of the web interface to which this test
will attempt to connect.
Outputs of the
test
One set of results for every Citrix server monitored
Measurements
made by the
test
Measurement
Measurement
Unit
Interpretation
Connection availability:
Tracks if the Citrix Nfuse
service is available to handle
any requests.
Percent
If the TCP connection to the XML service port
fails, this metric has a value of 0. Otherwise,
it has a value of 100.
Authentication status:
Indicates if the user
authentication succeeded.
Percent
It has a value of 100 if the user was
authenticated, and a value of 0 if the
authentication failed. If the user login is valid,
yet authentication fails, the problem then lies
with the Citrix IMA service's communication
with the domain controller/active directory
server.

M O N I T O RI N G C I T R I X X E N AP P S E R V E R S
85
Ticket status:
Indicates if the Citrix XenApp
server (actually the IMA
service) was able to
communicate with the
terminal service and retrieve
a ticket approving the user's
access to the application of
interest.
Percent
A value of 0 indicates that a valid ticket was
not received.
TCP connection time:
Indicates the time taken to
establish a TCP connection to
the Citrix XML service port.
Secs
If this value is significantly high, it could
probably be because the network latency is
high or the Citrix web interface host is
overloaded.
Response time for Citrix
ticket generation:
Represents the total time
taken for a user to login to
the Citrix web interface and
request to access an
application.
Secs
The value of this metric indicates the
responsiveness of the Citrix IMA service.
2.1.5.24 User Profile Management Test
User logon is a complex and resource intensive process on a Citrix XenApp system, and is a key determinant of the
quality of a user's experience with the Citrix XenApp environment. This process is initiated when a XenApp farm load
balancing algorithm selects the system where a published application or desktop, which a user has selected, will be
started and ends when the application or desktop is running and the user is able to interact with it.
Delays in the user logon process can therefore serve as key spoilers of a user's experience with the Citrix XenApp
farm, causing significant loss of revenue and reputation in mission-critical environments.
One of the common causes for delays in user logons are delays in the loading of user profiles. To reduce the time
taken to load profiles and thus minimize the user logon time, many Citrix administrators in recent times have been
using the Citrix Profile Management solution. Citrix Profile Management is a profile type that supersedes all other
profiles for the user.
During logon, the Profile management service manages the user settings in a Citrix user profile. This service helps
minimize the user logon time by enabling administrators to exclude (and include) certain files and folders in order to
prevent extraneous settings from needlessly being copied with the profile. For example, some applications may
create folders and files that account for tens or hundreds of megabytes—data that is really not required. By excluding
these items, the profile is thus smaller, and smaller profiles load faster. Alternatively, you could elect to only include
specific files and folders, thus keeping to a minimum the amount of profile data being managed within the user‘s
profile.
Also, upon logoff, the Profile management service merges back only changed user settings to the centrally stored
user settings (user‘s store).
In environments where the Citrix Profile Management service is utilized therefore, the user experience with the
XenApp farm greatly depends upon how efficient the service is.
To ascertain the efficiency of the Citrix Profile Management service, administrators may have to periodically track the

M O N I T O RI N G C I T R I X X E N AP P S E R V E R S
86
logon/logoff duration and profile size of each user to a Citrix XenApp server and determine whether/not the Profile
management service has succeeded in minimizing both user logon times and profile sizes. The User Profile
Management test helps administrators perform this check at pre-configured intervals. The 'per-user' performance
results reported by this test will not only enable administrators to judge the effectiveness of the Profile management
service in its entirety, but will also shed light on those user logons/logoffs that are still experiencing delays; this
provides insights into how the service can be fine-tuned to enhance the XenApp experience of such users.
Purpose
Enables administrators to judge the effectiveness of the Profile management service in its
entirety, sheds light on those user logons/logoffs that are still experiencing delays, and thus
provides insights into how the service can be fine-tuned to enhance the XenApp experience of
such users
Target of the
test
Any Citrix server
Agent
deploying the
test
An internal agent
Configurable
parameters for
the test
1. TEST PERIOD – How often should the test be executed
2. HOST – The host for which the test is to be configured
3. PORT – Refers to the port used by the Citrix server
Outputs of the
test
One set of results for every user to the Citrix server monitored
Measurements
made by the
test
Measurement
Measurement
Unit
Interpretation
Logon Duration:
Indicates the duration of
logon processing for this
user.
Secs
This value helps to measure the reduction in
logon times when the Profile Management
service 'streams' the profile. Ideally therefore,
this value should be low. A high value or a
consistent increase in the value of this
measure could indicate that profile loading
still takes a lot of time at logon - this could be
owing to a large profile size. You can then
check the value reported by the
Logon Bytes
measure to know the profile size at logon. If
profile sizes continue to grow at logon
despite the use of Profile management, it is
indicative of the ineffectiveness of profile
management. You may then have to fine-
tune the feature to further reduce the profile
size by excluding more unnecessary files from
the profile, or you may have to explore other
options such as roaming profiles, mandatory
profiles, etc.

M O N I T O RI N G C I T R I X X E N AP P S E R V E R S
87
Logon Bytes:
Indicates the size of this
user's profile when it is
retrieved from the user's
store at logon.
MB
Ideally, the value of this measure should be
low. A low profile size could result in faster
profile loading at logon, lesser time to login,
and consequently, a richer user experience
with the XenApp server.
If profile sizes continue to grow despite the
use of Profile management, it is indicative of
the ineffectiveness of profile management.
You may then have to fine-tune the feature
to further reduce the profile size by excluding
more unnecessary files from the profile.
Logoff Duration:
Indicates the duration of
logoff processing for this
user.
Secs
A low value is desired for this measure. A
high value could indicate that the profile
management service takes too long to update
the user's store with changes in the user
settings. This could be because of a bad
network connection between the XenApp
server and the user's store, or because too
many changes are waiting to be written to
the user store.
Logoff Bytes:
Indicates the size of this
user's profile when it is
copied to the user store at
logoff.
MB
This measure provides a fair idea of the
volume of changes that were copied to the
user's store at logoff.
Local Profile Setup
Duration:
Indicates the time taken to
create or prepare this user's
profile on the local computer.
Secs
A low value is desired for these measures.
If a user complaints of delays during logon,
you can use the value of these measures to
determine where the XenApp server is
spending too much time - is it when setting
up the local profile? or is it when deleting the
local profile?
Delete Local Profile
Duration:
Indicates the time spent
deleting this user's local
profiles during the initial
migration.
Secs
Processed Logon Files
Under 1KB:
Indicates the number of
locally copied files for this
user's profile that are
synchronized during logon
and categorized by the file
size of 1KB.
Number
All the Processed Logon Files measures
help Citrix administrators to understand
whether/not 'profile streaming' (performed by
the Profile Management service) has helped
in reducing the number of locally copied files
during logon.
All the Processed Logoff Files measures

M O N I T O RI N G C I T R I X X E N AP P S E R V E R S
88
Processed Logoff Files
Under 1KB:
Indicates the number of
locally copied file for this
user's profile that are
synchronized during logoff
and categorized by the file
size of 1KB.
Number
help Citrix administrators to understand how
many files changed when the user session
was in progress.
Processed Logon Files
from 1KB to 10KB:
Indicates the number of
locally copied files for this
user's profile that are
synchronized during logon
and categorized by the file
size ranging from 1KB to
10KB.
Number
Processed Logoff Files
from 1KB to 10KB:
Indicates the number of
locally copied files for this
user's profile that are
synchronized during logoff
and categorized by the file
size ranging from 1KB to
10KB.
Number
Processed Logon Files
from 10KB to 100KB:
Indicates the number of
locally copied files for this
user's profile that are
synchronized during logon
and categorized by the file
size ranging from 10KB to
100KB.
Number
All the Processed Logon Files measures
help Citrix administrators to understand
whether/not 'profile streaming' (performed by
the Profile Management service) has helped
in the reducing the number of locally copied
files during logon.
All the Processed Logoff Files measures
help Citrix administrators to understand how
many files changed when the user session
was in progress.
Processed Logoff Files
from 10KB to 100KB:
Indicates the number of
locally copied files for this
user's profile that are
synchronized during logoff
and categorized by the file
size ranging from 1KB to
10KB.
Number

M O N I T O RI N G C I T R I X X E N AP P S E R V E R S
89
Processed Logon Files
from 100KB to 1MB:
Indicates the number of
locally copied files for this
user's profile that are
synchronized during logon
and categorized by the file
size ranging from 100KB to
1MB.
Number
Processed Logoff Files
from 100KB to 1MB:
Indicates the number of
locally copied files for this
user's profile that are
synchronized during logoff
and categorized by the file
size ranging from 100KB to
1MB.
Number
Processed Logon Files
from 1MB to 5MB:
Indicates the number of
locally copied files for this
user's profile that are
synchronized during logon
and categorized by the file
size ranging from 1MB to
5MB.
Number

M O N I T O RI N G C I T R I X X E N AP P S E R V E R S
90
Processed Logoff Files
from 1MB to 5MB:
Indicates the number of
locally copied files for this
user's profile that are
synchronized during logoff
and categorized by the file
size ranging from 1MB to
5MB.
Number
All the Processed Logon Files measures
help Citrix administrators to understand
whether/not 'profile streaming' (performed by
the Profile Management service) has helped
in the reducing the number of locally copied
files during logon.
All the Processed Logoff Files measures
help Citrix administrators to understand how
many files changed when the user session
was in progress.
Processed Logon Files
Above 5MB:
Indicates the number of
locally copied files for this
user's profile that are
synchronized during logon
and categorized by the file
size above 5MB.
Number
Processed Logoff Files
Above 5MB:
Indicates the number of
locally copied files for this
user's profile that are
synchronized during logoff
and categorized by the file
size above 5MB.
Number
2.1.5.25 Data Store Check Test
When a XenApp server farm is deployed, it must have an associated data store. The data store provides a repository
of persistent information, including:
Farm configuration information
Published application configurations
Server configurations
Citrix administrator accounts
Printer configurations
Servers in a farm query the data store for configuration information when attempting to come online. If the data
store is unavailable or is inaccessible for long hours, servers in the farm will remain offline the whole time, thus
denying users access to their critical applications. To avoid this, administrators can run the Data Store Check test at
frequent intervals, check whether/not the server is able to connect to the data store, and in this way, detect
connection failures before farm users complain. In the event of a connection failure, administrators can also use the
detailed metrics collected by this test to determine the reason for the connection failure and resolve it.
Purpose
Checks whether/not the server is able to connect to the data store, and in the process, helps

M O N I T O RI N G C I T R I X X E N AP P S E R V E R S
91
detect connection failures before farm users complain
Target of the
test
Any Citrix server
Agent
deploying the
test
An internal/remote agent
Configurable
parameters for
the test
1. TEST PERIOD – How often should the test be executedor
2. HOST – The host for which the test is to be configured
3. PORT – Refers to the port used by the Citrix server
4. DSCHECKPATH – This test uses XenApp’s Data Store Checker tool to verify whether/not
the monitored XenApp server is able to connect to the data store. To enable the test to use
this tool, you need to specify the full path to the location of DSCheck.exe in the
DSCHECKPATH text box. For instance, your path can be:
C:\Program Files
(x86)\Citrix\system32.
5. DETAILED DIAGNOSIS - To make diagnosis more efficient and accurate, the eG
Enterprise suite embeds an optional detailed diagnostic capability. With this capability, the
eG agents can be configured to run detailed, more elaborate tests as and when specific
problems are detected. To enable the detailed diagnosis capability of this test for a
particular server, choose the On option. To disable the capability, click on the Off option.
The option to selectively enable/disable the detailed diagnosis capability will be available
only if the following conditions are fulfilled:
The eG manager license should allow the detailed diagnosis capability
Both the normal and abnormal frequencies configured for the detailed diagnosis
measures should not be 0.
Outputs of the
test
One set of results for the Citrix server monitored
Measurements
made by the
Measurement
Measurement
Unit
Interpretation

M O N I T O RI N G C I T R I X X E N AP P S E R V E R S
92
test
Connectivity status:
Indicates whether the server
succeeded or failed in
establishing a connection with
the data store.
The values that this measure can take and
their corresponding numeric values are as
follows:
Measure
Value
Numeric Value
Failure
0
Success
1
If the value reported is Failure, you can use
the detailed diagnosis of this test to
determine the reason for the connection
failure.
Note:
By default, this measure reports the above-
mentioned Measure Values to indicate the
connectivity status of the data store.
However, the graph of this measure will
represent the same using the numeric
equivalents only.
2.1.6 The Citrix Applications Layer
Using the tests mapped to this layer, the resource usage per application executing on the Citrix server can be
measured.
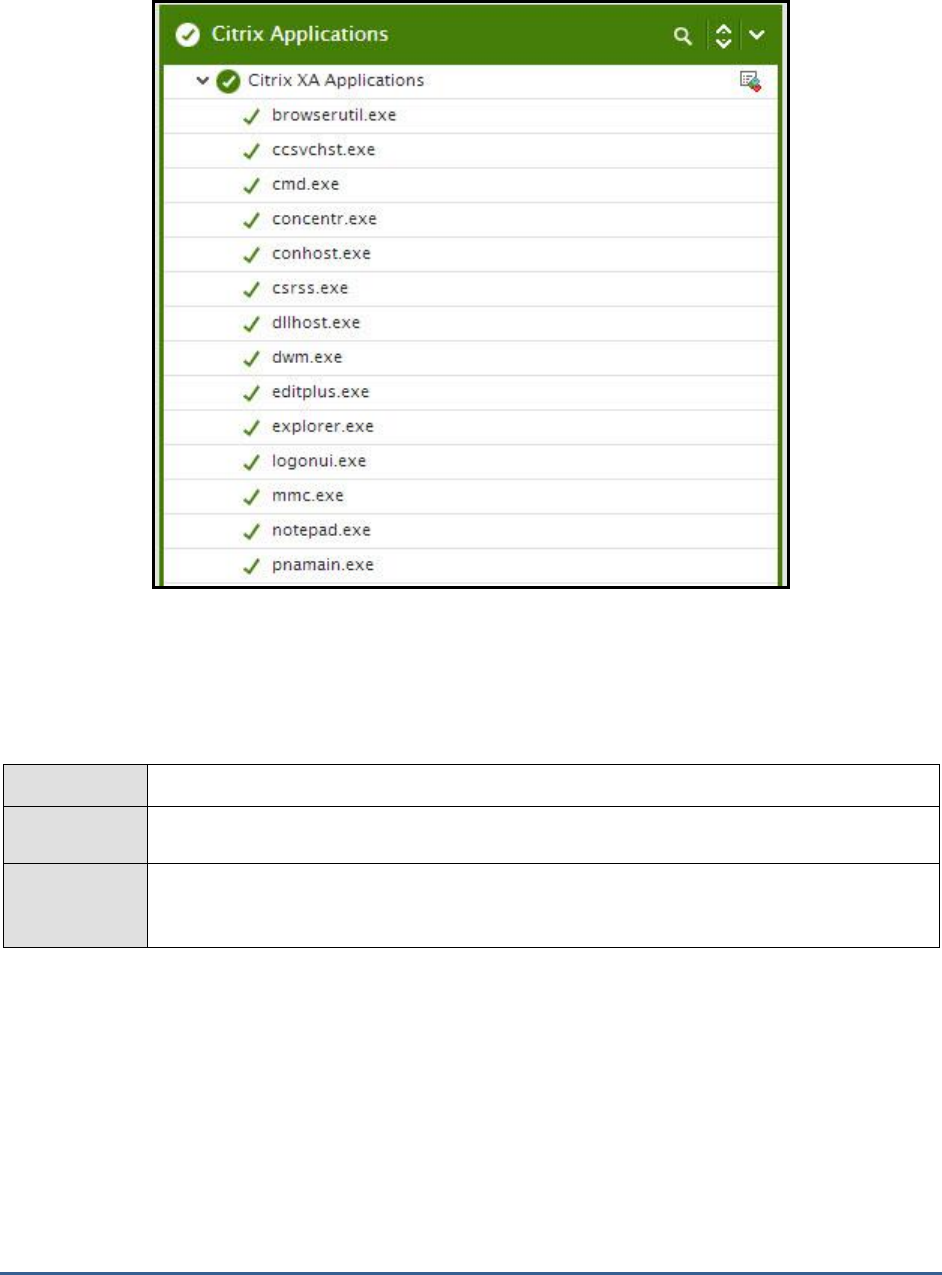
M O N I T O RI N G C I T R I X X E N AP P S E R V E R S
93
Figure 2.18: Tests associated with the Citrix Applications layer
2.1.6.1 Citrix XA Applications Test
This test reports statistics pertaining to the different applications executing on a Citrix server and their usage by Citrix
clients. One set of results is reported for each application.
Purpose
Returns the performance measures pertaining to the applications executing on the Citrix server
Target of the
test
Any Citrix server
Agent
deploying the
test
An internal agent

M O N I T O RI N G C I T R I X X E N AP P S E R V E R S
94
Configurable
parameters for
the test
1. TEST PERIOD – How often should the test be executed
2. HOST – The host for which the test is to be configured
3. PORT – Refers to the port used by the Citrix server
4. APPS - By default, the APPS text box will contain 'all'. This means that, by default, the eG
Enterprise system will monitor all the applications running on a Citrix server. Alternatively,
you can provide a comma-separated list of applications that require monitoring. For
example:
winword.exe, acrobat.exe
. To monitor the published applications only, specify
'published'.
5. APPSBYNAME - This parameter is relevant only if the "apps" parameter is "published" -
that is, the agent is monitoring only published applications. By default, this parameter is set
to "no", which means the agent monitors the applications by process name (e.g., msword,
iexplore, sfttray, excel, etc.). If this parameter is set to "yes", the agent reports by
published application name (e.g., Microsoft Word instead of "msword").
6. This parameter is particularly relevant if a virtual client like the Softgrid client is deployed
on Citrix. In this case, all the user processes will run the Softgrid client (ie, sfttray.exe) and
by just monitoring the process names, administrators will not be able to differentiate
Microsoft Word instances from Microsoft Excel instances being served by the Softgrid client.
If the appsbyname parameter is "yes", the agent compares the full process command
including arguments with the published application information and is able to differentiate
applications that may be served using the same executable program.
7. SHOWPUBLISHEDDESKTOPS - By default, this flag is set to No. If set to Yes, then the
detailed diagnosis of the test, which typically reveals the users accessing an application and
the resource usage of each such user, will now additionally indicate the exact published
desktop that has been used by the user to access the application.
8. REPORTBYCLIENTNAME - By default, this flag is set to No. If set to Yes, then an
additional CLIENT NAME column will appear in the detailed diagnosis of this test. This column
will indicate the host name of the client machine from which the users accessed the
configured applications. When many users access an application on a Citrix XenApp server
using the same login credentials, then multiple rows of information in the detailed diagnosis
will display the same Username. Under such circumstances, it would be more useful to have
the detailed diagnosis also indicate the client machine from which each user accessed that
application. To achieve this, set the REPORTBYCLIENTNAME flag to Yes.
9. APPS REDISCOVER PERIOD - By default, the test rediscovers the applications running
on a Citrix server, every 15 minutes; this is why, the APPS REDISCOVER PERIOD is set
to 15 by default. You can override this default setting by specifying a different duration (in
minutes) in the APPS REDISCOVER PERIOD text box.

M O N I T O RI N G C I T R I X X E N AP P S E R V E R S
95
10. CTXAPPDISCTIMERANGE - Typically, when monitoring a Citrix server/farm on which
numerous applications have been deployed, the processing overheads of this test may
increase every time the test performs application discovery. You may hence prefer to
rediscover the applications on these servers/farms only during such times the user
activity/load on the server/farm is low. To schedule application rediscovery during the 'low-
activity' time window of a XenApp server, you can use the CTXAPPDISCTIMERANGE
parameter. Here, specify a time range in the following format:
Starting
Hrs-Ending Hrs
. The
Hrs
here should be in the 24-hour format. For instance, to make sure that the test
performs application rediscovery only during 8PM and 11PM every day, your
CTXAPPDISCTIMERANGE specification will be:
20-23
. Note that you cannot suffix your
'Hrs' specification with 'Minutes' or 'Seconds'.
11. BY DEFAULT, THE CTXAPPDISCTIMERANGE is
none
; this implies that applications are
by default rediscovered only in the frequency specified against APPS REDISCOVER
PERIOD. However, if a valid time range is provided against the CTXAPPDISCTIMERANGE
parameter, then this time range will automatically override the APPS REDISCOVER
PERIOD.
12. DOMAIN NAME, DOMAIN USER, DOMAIN PASSWORD, and CONFIRM PASSWORD –
A Citrix XenApp server (v6.5) can run in the controller mode or the worker mode. In the
controller mode, the XenApp server can perform all farm management tasks. However, in
the worker mode, a XenApp server can only host user sessions.
By default, the DOMAIN NAME, DOMAIN USER, DOMAIN PASSWORD, and CONFIRM
PASSWORD parameters are set to
none
. If the XenApp server being monitored is the
controller in a farm, then this default value will automatically apply. In other words, in this
case, you can leave the values of these parameters as
none
. On the other hand, if the
target XenApp server is a worker in the farm, then first, you will have to configure the
name of the domain in which the XenApp server operates in the DOMAIN NAME text box.
Then, you need to configure the test with the credentials of a user with Citrix Farm
Administrator rights, using the DOMAIN USER and DOMAIN PASSWORD text boxes.
Finally, you will have to confirm the DOMAIN PASSWORD by retyping it in the CONFIRM
PASSWORD text box.
Note:
If the XenApp server is a worker in the farm, then, in addition to configuring the
DOMAIN NAME, DOMAIN USER, DOMAIN PASSWORD parameters, the following
pre-requisites should also be fulfilled for this test to report metrics:
Make sure that the Citrix XenApp Commands Remoting service is running in
the Controller server.
The port 2513 must be open on the Controller server in the farm.

M O N I T O RI N G C I T R I X X E N AP P S E R V E R S
96
13. SHOW WORKER GROUPS - Worker groups are collections of XenApp servers, residing in
the same farm, that are managed as a single unit. You can publish applications to a worker
group. If you want to know the worker group to which every auto-discovered application
has been published, then set this parameter to Yes. Once this is done, then the descriptors
(i.e., the auto-discovered applications) of this test will be grouped by the name of the
worker group to which they belong. By default, this parameter is set to No.
14. REPORT BY DOMAIN NAME – By default, this flag is set to Yes. This implies that by
default, the detailed diagnosis of this test will display the
domainname\username
of each
user who accessed an application on the server. This way, administrators will be able to
quickly determine which user logged into the server from which domain. If you want the
detailed diagnosis to display only the
username
of these users, set this flag to No.
15. ENABLE BROWSER MONITORING – By default, this flag is set to No, indicating that the
eG agent does not monitor browser activity on the XenApp server. If this flag is set to Yes,
then, whenever one/more IE (Internet Explorer) browser instances on the XenApp server
are accessed, the detailed diagnosis of the
Processes running
measure will additionally
reveal the URL being accessed via each IE instance and the resources consumed by every
URL. Armed with this information, administrators can identify the web sites that are
responsible for excessive resource usage by an IE instance.
16. DETAILED DIAGNOSIS - To make diagnosis more efficient and accurate, the eG
Enterprise suite embeds an optional detailed diagnostic capability. With this capability, the
eG agents can be configured to run detailed, more elaborate tests as and when specific
problems are detected. To enable the detailed diagnosis capability of this test for a
particular server, choose the On option. To disable the capability, click on the Off option.
The option to selectively enable/disable the detailed diagnosis capability will be available
only if the following conditions are fulfilled:
The eG manager license should allow the detailed diagnosis capability
Both the normal and abnormal frequencies configured for the detailed diagnosis
measures should not be 0.
Outputs of the
test
One set of results is reported for each application.
Measurements
made by the
test
Measurement
Measurement
Unit
Interpretation
Processes running:
Number of instances of the
published application
currently executing on the
Citrix server
Number
This value indicates if too many or too few
instances corresponding to an application are
executing on the host.
Cpu usage:
Percentage of CPU used by
the published application
Percent
A very high value could indicate that the
specified application is consuming excessive
CPU resources.

M O N I T O RI N G C I T R I X X E N AP P S E R V E R S
97
Memory usage:
This value represents the
ratio of the resident set size
of the memory utilized by the
application to the physical
memory of the host system,
expressed as a percentage.
Percent
A sudden increase in memory utilization for
an application may be indicative of memory
leaks in the application.
Handle count:
Indicates the number of
handles opened by this
application.
Number
An increasing trend in this measure is
indicative of a memory leak in the
application.
Number of threads:
Indicates the number of
threads that are used by this
application.
Number
Virtual memory used:
Indicates the amount of
virtual memory that is being
used by this application.
MB
I/O data rate:
Indicates the rate at which
this application is reading and
writing bytes in I/O
operations.
Kbytes/Sec
This value counts all I/O activity generated
by an application and includes file, network
and device I/Os.
I/O data operations:
Indicates the rate at which
this application is issuing read
and write data to file,
network and device I/O
operations.
Operations/Sec
I/O read data rate:
Indicates the rate at which
this application is reading
data from file, network and
device I/O operations.
Kbytes/Sec
I/O write data rate:
Indicates the rate at which
this application is writing data
to file, network and device
I/O operations.
Kbytes/Sec
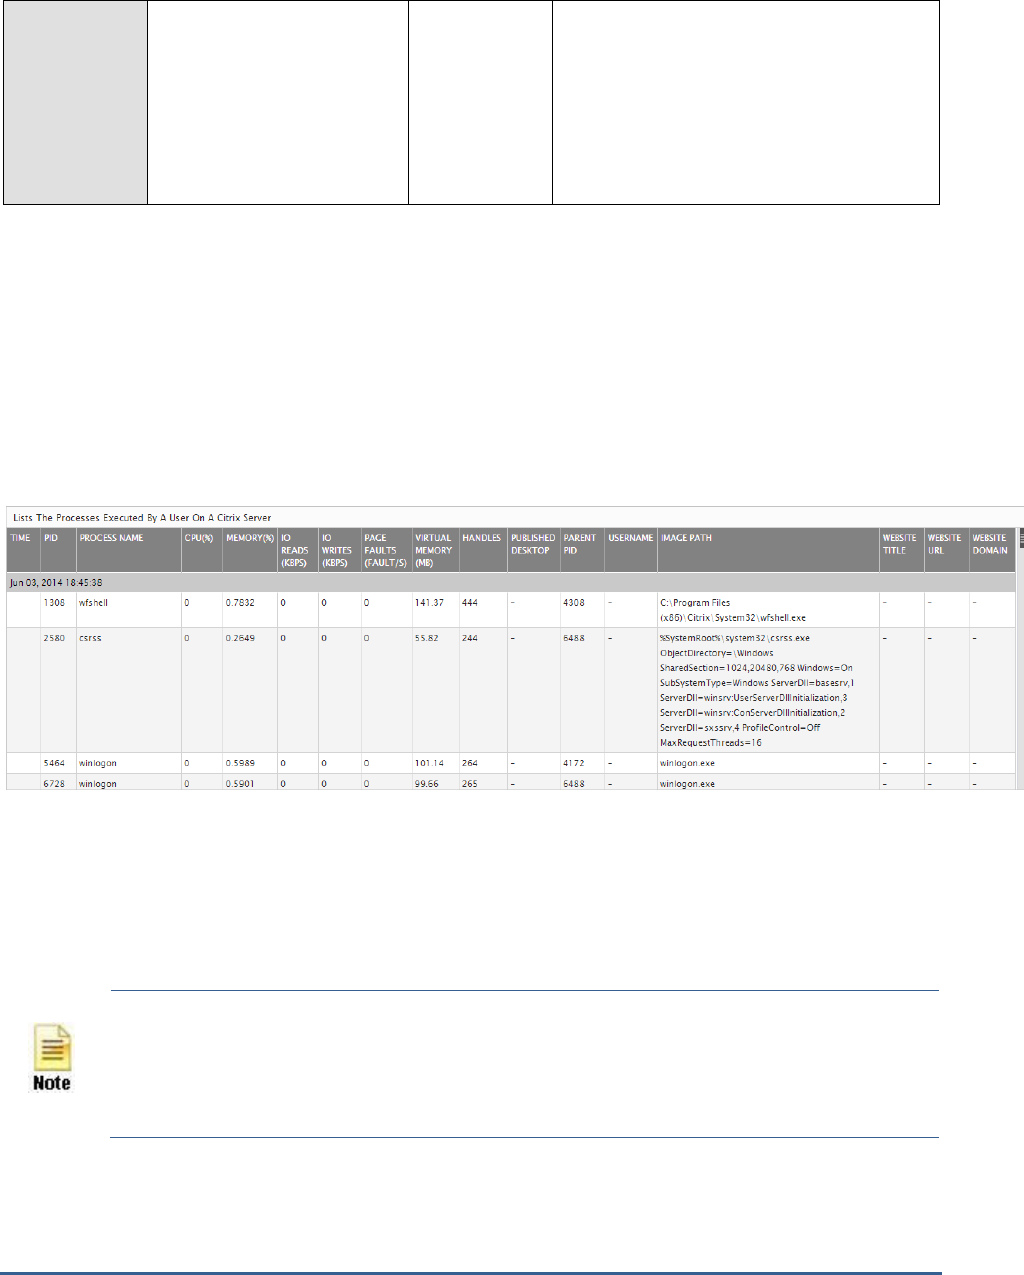
M O N I T O RI N G C I T R I X X E N AP P S E R V E R S
98
Page fault rate:
Indicates the total rate at
which page faults are
occurring for the
threads of this application.
Faults/Sec
A page fault occurs when a thread refers to a
virtual memory page that is not in its working
set in main memory. This may not cause the
page to be fetched from disk if it is on the
standby list and hence already in main
memory, or if it is in use by another process
with
whom the page is shared.
The detailed diagnosis of the
Processes running
measure, if enabled, lists the applications running on the XenApp
server, the process ids that correspond to each running application instance, the user who accessed each instance,
and the overall resource usage of each of instances. This information enables the Citrix administrator to identify the
processes that are utilizing resources excessively and those that may be leaking memory. In the event of a server
overload/memory leak, the Citrix administrator might decide to terminate these processes (see Figure 2.19). In
addition, the detailed diagnosis reveals the location from which each process instance runs (i.e., the IMAGE PATH).
If multiple versions of an application are published in different locations on the XenApp server and a user runs each
of these versions, then the IMAGE PATH will indicate the exact application version each process instance
corresponds to – resource-hungry versions can thus be identifed.
Figure 2.19: The detailed diagnosis of the Processes running measure
Moreover, if one or more browser instances are found to consume excessive CPU, memory and disk I/O resources on
a server or a desktop, then for each such browser instance, administrators can now see a mapping of browser
process to URL being accessed, as well as the resources used by each browser process in the detailed
diagnosis. Armed with this information, administrators can determine the steps required to avoid excessive resource
usage by browser instances – e.g., whether specific web sites are responsible for this, whether users are accessing
web sites (e.g., youtube, facebook, etc.) that they should not be accessing from a corporate network, etc.
The eG agent will perform browser activity monitoring only if the ENABLE
BROWSER MONITORING flag is set to Yes.
The eG agent will monitor browser activity only of the browser being accessed is
Internet Explorer.

M O N I T O RI N G C I T R I X X E N AP P S E R V E R S
99
2.1.6.2 App-V Applications Test
This test reports statistics pertaining to the different applications executing on an App-V client and their usage. In
addition, this test also reports the statistics pertaining to the processes running on the APP-V client.
This test will report metrics only when the App-V Client is installed on the Citrix XenApp Server.
Purpose
Reports statistics pertaining to the different applications executing on an App-V client and their
usage. In addition, this test also reports the statistics pertaining to the processes running on the
APP-V client.
Target of the
test
An App-V Client on the target Citrix XenAPP Server
Agent
deploying the
test
An internal agent
Configurable
parameters for
the test
1. TEST PERIOD - How often should the test be executed
2. HOST – The host for which the test is to be configured
3. PORT – The port at which the specified HOST listens. By default, this is
NULL
.
4. REPORT BY DOMAIN NAME – By default, this flag is set to No. This means that, by
default, the test will report metrics for each
username
only. You can set this flag to Yes, to
ensure that the test reports metrics for each
domainname\username
.
5. EXTENDED STATISTICS – By default, this test provides you with detailed measures on
the resource utilization of each application. If you wish to obtain only the CPU and memory
related measures, then set the EXTENDED STATISTICS flag to No.
6. DETAILED DIAGNOSIS - To make diagnosis more efficient and accurate, the eG
Enterprise suite embeds an optional detailed diagnostic capability. With this capability, the
eG agents can be configured to run detailed, more elaborate tests as and when specific
problems are detected. To enable the detailed diagnosis capability of this test for a
particular server, choose the On option. To disable the capability, click on the Off option.
The option to selectively enabled/disable the detailed diagnosis capability will be available
only if the following conditions are fulfilled:
o The eG manager license should allow the detailed diagnosis capability
o Both the normal and abnormal frequencies configured for the detailed diagnosis
measures should not be 0.
Outputs of the
test
One set of results for each application of the target App-V Client that is to be monitored

M O N I T O RI N G C I T R I X X E N AP P S E R V E R S
100
Measurements
made by the
test
Measurement
Measurement
Unit
Interpretation
Total size:
Indicates the total size of this
virtual application package.
MB
The detailed diagnosis of this measure lists
the Version of the application, Application ID,
Version ID of the applicaition and the
application path.
Is loading?:
Indicates whether this
application is currently
loading or not on the App-V
client.
This measure reports a value
True
if the
application is currently being loaded and a
value
False
if otherwise.
These measure values and their
corresponding numeric values are listed in
the table below:
Measure Value
Numeric Value
True
1
False
0
Note:
By default, this measure reports the values
Yes
or
No
to indicate whether this application
is currently being loaded on the client or not.
The graph of this measure however is
represented using the numeric equivalents -
0 or 1
.
Loaded percentage:
Indicates the percentage of
this application that is
currently being loaded on the
App-V client.
Percent

M O N I T O RI N G C I T R I X X E N AP P S E R V E R S
101
In use?:
Indicates whether this
application is currently in use
or not.
This measure reports a value
True
if the
application is currently in use and a value
False
if otherwise.
These measure values and their
corresponding numeric values are listed in
the table below:
Measure Value
Numeric Value
True
1
False
0
Note:
By default, this measure reports the values
Yes
or
No
to indicate whether this application
is currently in use. The graph of this measure
however is represented using the numeric
equivalents -
0 or 1
.
Any user based pending
tasks available?
Indicates whether any tasks
are pending for the user using
this application.
This measure reports a value
Yes
if any tasks
are pending for the user using the application
and a value
No
if otherwise.
These measure values and their
corresponding numeric values are listed in
the table below:
Measure Value
Numeric Value
Yes
1
No
0
Note:
By default, this measure reports the values
Yes
or
No
to indicate whether any tasks are
currently pending for the user using this
application. The graph of this measure
however is represented using the numeric
equivalents -
0 or 1
.

M O N I T O RI N G C I T R I X X E N AP P S E R V E R S
102
Any global based pending
tasks available:
Indicates whether any global
tasks are pending for this
application.
This measure reports a value
Yes
if any tasks
are pending for the user using the application
and a value
No
if otherwise.
These measure values and their
corresponding numeric values are listed in
the table below:
Measure Value
Numeric Value
Yes
1
No
0
Note:
By default, this measure reports the values
Yes
or
No
to indicate whether any tasks are
currently pending for the user using this
application. The graph of this measure
however is represented using the numeric
equivalents -
0 or 1
.
Processes running:
Indicates the number of
instances of this application
currently executing.
Number
This value indicates if too many or too few
instances corresponding to an application are
executing on the host. The detailed diagnosis
of this measure, if enabled, displays the
complete list of processes executing, the
users executing them, and their individual
resource utilization.
CPU utilization:
Indicates the percentage of
CPU used by this application.
Percent
A very high value could indicate that the
specified application is consuming excessive
CPU resources.
Memory utilization:
This value represents the
ratio of the resident set size
of the memory utilized by the
application to the physical
memory of the host system,
expressed as a percentage.
Percent
A sudden increase in memory utilization for
an application may be indicative of memory
leaks in the application.
Handle count:
Indicates the number of
handles opened by this
application.
Number
An increasing trend in this measure is
indicative of a memory leak in the process.
I/O data rate:
Indicates the rate at which
processes are reading and
writing bytes in I/O
operations.
Kbytes/Sec
This value counts all I/O activity generated
by each process and includes file, network
and device I/Os.

M O N I T O RI N G C I T R I X X E N AP P S E R V E R S
103
I/O data operations:
Indicates the rate at which
this application process is
issuing read and write data to
file, network and device I/O
operations.
Operations/Sec
I/O read data rate:
Indicates the rate at which
the process is reading data
from file, network and device
I/O operations.
Kbytes/Sec
I/O write data rate:
Indicates the rate at which
the process is writing data to
file, network and device I/O
operations.
Kbytes/Sec
Number of threads:
Indicates the number of
threads that are used by this
application.
Number
Page fault rate:
Indicates the total rate at
which page faults are
occurring for the threads of
all matching application
processes.
Faults/Sec
A page fault occurs when a thread refers to a
virtual memory page that is not in its working
set in main memory. This may not cause the
page to be fetched from disk if it is on the
standby list and hence already in main
memory, or if it is in use by another process
with whom the page is shared.
Virtual memory used:
Indicates the amount of
virtual memory that is being
used by the application.
MB
M O N I T O RI N G C I T R I X X E N AP P S E R V E R S
104
Memory working set:
Indicates the current size of
the working set of a process.
MB
The Working Set is the set of memory pages
touched recently by the threads in the
process. If free memory in the computer is
above a threshold, pages are left in the
Working Set of a process even if they are not
in use.
When free memory falls below a threshold,
pages are trimmed from Working Sets. If
they are needed they will then be soft-faulted
back into the Working Set before leaving
main memory. If a process pattern matches
multiple processes, the memory working set
reported is the sum of the working sets for
the processes that match the specified
pattern. Detailed diagnosis for this test
provides details of the individual processes
and their individual working sets.
Comparing the working set across processes
indicates which process(es) are taking up
excessive memory. By tracking the working
set of a process over time, you can determine
if the application has a memory leak or not.
2.1.6.3 Citrix XA Application Launches Test
To know which published applications on the XeAnApp server are currently accessed by users and how many
instances of each application have been launched presently, use the Citrix XA Application Launches test. Detailed
diagnostics, if enabled, reveal the users accessing the published applications and the thin clients from which the
users are connecting to the XenApp server.
This test is disabled by default. To enable the test, select the Enable/Disable option from the Tests menu of the
Agents tile, select Component type as
Citrix XenApp 4/5/6.x
, pick this test from the DISABLED TESTS list, click the <
button, and click Update to save the changes.
Purpose
To know which published applications on the XeAnApp server are currently accessed by users
and how many instances of each application have been launched presently
Target of the
test
Any Citrix server
Agent
deploying the
test
An internal agent

M O N I T O RI N G C I T R I X X E N AP P S E R V E R S
105
Configurable
parameters for
the test
1. TEST PERIOD – How often should the test be executed
2. HOST – The host for which the test is to be configured
3. PORT – Refers to the port used by the Citrix server
4. DOMAIN NAME, DOMAIN USER, DOMAIN PASSWORD, and CONFIRM PASSWORD –
A Citrix XenApp server (v6.5) can run in the controller mode or the worker mode. In the
controller mode, the XenApp server can perform all farm management tasks. However, in
the worker mode, a XenApp server can only host user sessions.
By default, the DOMAIN NAME, DOMAIN USER, DOMAIN PASSWORD, and CONFIRM
PASSWORD parameters are set to
none
. If the XenApp server being monitored is the
controller in a farm, then this default value will automatically apply. In other words, in this
case, you can leave the values of these parameters as
none
. On the other hand, if the
target XenApp server is a worker in the farm, then first, you will have to configure the
name of the domain in which the XenApp server operates in the DOMAIN NAME text box.
Then, you need to configure the test with the credentials of a user with Citrix Farm
Administrator rights, using the DOMAIN USER and DOMAIN PASSWORD text boxes.
Finally, you will have to confirm the DOMAIN PASSWORD by retyping it in the CONFIRM
PASSWORD text box.
5. REPORT BY DOMAIN NAME – By default, this flag is set to Yes. This implies that by
default, the detailed diagnosis of this test will display the
domainname\username
of each
user who logged into the Citrix server. This way, administrators will be able to quickly
determine which user logged in from which domain. If you want the detailed diagnosis to
display the
username
alone, then set this flag to No.
Outputs of the
test
One set of results for every ‘published application’ on the XenApp server that is currently
launched
Measurements
made by the
test
Measurement
Measurement
Unit
Interpretation
Application launches:
Represents the number of
instances of this published
application that have been
launched currently.
Number
Use the detailed diagnosis of this measure to
know which users are currently accessing the
application and the clients from which the
users are connecting.
Note:
If the XenApp server is a worker in the farm, then, in addition to configuring the
DOMAIN NAME, DOMAIN USER, DOMAIN PASSWORD parameters, the following
pre-requisites should also be fulfilled for this test to report metrics:
Make sure that the Citrix XenApp Commands Remoting service is running in
the Controller server.
The port 2513 must be open on the Controller server in the farm.
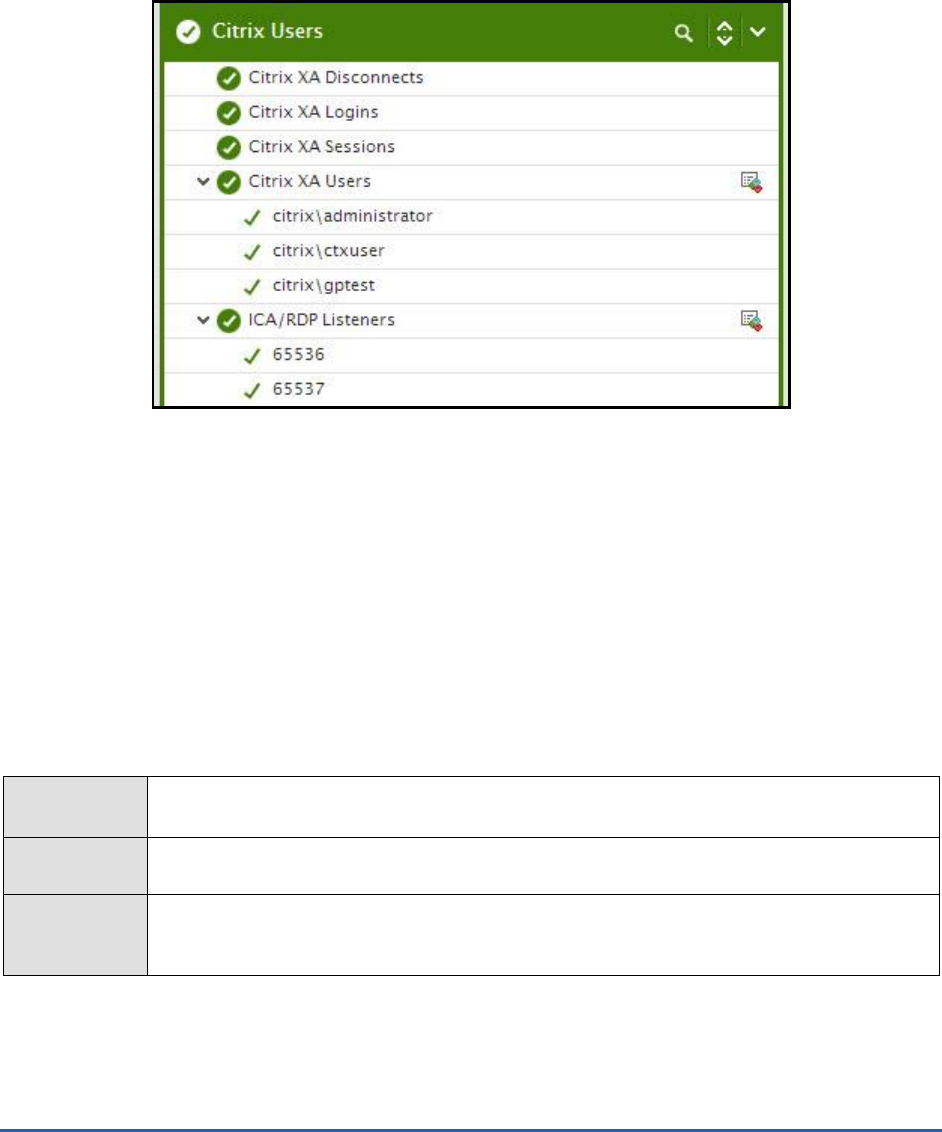
M O N I T O RI N G C I T R I X X E N AP P S E R V E R S
106
2.1.7 The Citrix Users layer
To accurately assess the individual user experience on the Citrix server, use the tests mapped to the Citrix Users
layer.
Figure 2.20: The test associated with the Citrix Users layer
2.1.7.1 Citrix XA Users Test
A Citrix environment is a shared environment in which multiple users connect to a Citrix server/server farm and
access a wide variety of applications. When server resources are shared, excessive resource utilization by a single
user could impact the performance for other users. Therefore, continuous monitoring of the activities of each and
every user on the server is critical. Towards this end, the Citrix XA Users test assesses the traffic between the user
terminal and the server, and also monitors the resources taken up by a user's session on the server. The results of
this test can be used in troubleshooting and proactive monitoring. For example, when a user reports a performance
problem, an administrator can quickly check the bandwidth usage of the user's session, the CPU/memory/disk usage
of this user's session as well as the resource usage of other user sessions. The administrator also has access to
details on what processes/applications the user is accessing and their individual resource usage. This information can
be used to spot any offending processes/ applications.
Purpose
Tracks every user connection from the Citrix client to the server, and monitors the resource
utilization of every user on the Citrix server
Target of the
test
Any Citrix server
Agent
deploying the
test
An internal agent

M O N I T O RI N G C I T R I X X E N AP P S E R V E R S
107
Configurable
parameters for
the test
1. TEST PERIOD - How often should the test be executed
2. HOST – The host for which the test is to be configured.
3. PORT – Refers to the port used by the Citrix MF XP server.
4. USERNAMES - Specify the name of the user whose performance statistics need to be
generated. By default, "all" will be displayed here, indicating that the eG agent, by default,
reports statistics pertaining to all users who are currently logged in. Multiple user names can
be specified as a comma-separated list. In such cases, the eG agent will report statistics for
the users listed in the arguments only.
5. FARMNAME - If the Citrix server for which this test is being configured belongs to a Citrix
farm, then provide the name of the Citrix farm server that controls it, in the FARMNAME
text box. While specifying the FARMNAME, ensure that you provide the same name that
was specified against the HOST/NICK NAME field while managing the Citrix farm server using
the eG Enterprise system. In the event of a name mismatch, eG will be unable to extract
the required measures for this test. By default, ‘none’ will be displayed here.
6. FARMPORT – Specify the port number at which the Citrix farm listens.
7. APPSBYNAME - By default, this flag is set to No - i.e., the detailed diagnosis for a user
reports the process name(s) being run by the user. If this parameter is set to Yes, the
agent compares the full process command including arguments with the published
application information and reports the process that the user is running plus the application
that the user is accessing (e.g., MSWord (sfftray) - in this example, MSWord is the
published application name, and sfftray is the Softgrid client executable that is streaming
this application from a Softgrid server).
8. SHOWPUBLISHEDDESKTOPS - By default, this flag is set to No. If set to Yes, then the
detailed diagnosis of the test, which typically lists the resource-intensive
processes/applications accessed by a user, will additionally indicate the exact published
desktop that has been used by the user or used to access the application.
9. REPORTTOTAL - By default, this flag is set to No. If set to Yes, then the test will report
measures for only a
Total
descriptor. For this descriptor, the test will report the aggregate
resource usage across all users to the Citrix server. The default setting (No) of the flag on
the other hand, implies that the test reports a set of metrics for each user to the server, by
default.
10. REPORTBYCLIENTNAME - By default, this flag is set to No. If set to Yes, this test will
report metrics for each client machine from which users logged into the XenApp server -
i.e., the host name of the client machines will be the descriptors of this test. In this case
therefore, the User name column of the detailed diagnosis of this test will indicate the
names of the users who logged into the XenApp server.
On the other hand, if the REPORTBYCLIENTNAME flag is set to No, then user names will
be the descriptors of the test, and the User name column in the detailed diagnosis will
display a '-' (hyphen).

M O N I T O RI N G C I T R I X X E N AP P S E R V E R S
108
11. APPS REDISCOVER PERIOD - By default, the test rediscovers the applications running
on a Citrix server, every 15 minutes; this is why, the APPS REDISCOVER PERIOD is set
to 15 by default. You can override this default setting by specifying a different duration (in
minutes) in the APPS REDISCOVER PERIOD text box.
12. CTXAPPDISCTIMERANGE - Typically, when monitoring a Citrix server/farm on which
numerous applications have been deployed, the processing overheads of this test may
increase every time the test performs application discovery. You may hence prefer to
rediscover the applications on these servers/farms only during such times the user
activity/load on the server/farm is low. To schedule application rediscovery during the 'low-
activity' time window of a XenApp server, you can use the CTXAPPDISCTIMERANGE
parameter. Here, specify a time range in the following format:
Starting
Hrs-Ending Hrs
. The
Hrs
here should be in the 24-hour format. For instance, to make sure that the test
performs application rediscovery only during 8PM and 11PM every day, your
CTXAPPDISCTIMERANGE specification will be:
20-23
. Note that you cannot suffix your
'Hrs' specification with 'Minutes' or 'Seconds'.
By default, the CTXAPPDISCTIMERANGE is
none
; this implies that applications are by
default rediscovered only in the frequency specified against APPS REDISCOVER
PERIOD. However, if a valid time range is provided against the
CTXAPPDISCTIMERANGE parameter, then this time range will automatically override the
APPS REDISCOVER PERIOD.
13. SEPARATE PROCESS - By default, this parameter is set to Auto. This implies that by
default, this test auto-discovers the operating system on which the target Citrix server is
running. Based on the auto-discovered OS, the test uses either the eG agent process itself
to collect the required metrics or spawns a separate process for this purpose. If the target
server is discovered to be executing on a Windows 2003 (or earlier) platform, then the eG
agent process itself will collect the metrics reported by this test. On the other hand, if the
target server is found to execute on Windows 2008 (or above), then a separate process is
spawned for metrics collection. Alternatively, you can set this flag to true or yes. In this
case, metrics collection is performed by a separate process, regardless of the operating
system of the Citrix server. If you set this flag to false or no on the other hand, then the eG
agent process collects the metrics, regardless of the operating system of the Citrix server.

M O N I T O RI N G C I T R I X X E N AP P S E R V E R S
109
14. DOMAIN NAME, DOMAIN USER, DOMAIN PASSWORD, and CONFIRM PASSWORD –
A Citrix XenApp server (v6.5) can run in the controller mode or the worker mode. In the
controller mode, the XenApp server can perform all farm management tasks. However, in
the worker mode, a XenApp server can only host user sessions.
By default, the DOMAIN NAME, DOMAIN USER, DOMAIN PASSWORD, and CONFIRM
PASSWORD parameters are set to
none
. If the XenApp server being monitored is the
controller in a farm, then this default value will automatically apply. In other words, in this
case, you can leave the values of these parameters as
none
. On the other hand, if the
target XenApp server is a worker in the farm, then first, you will have to configure the
name of the domain in which the XenApp server operates in the DOMAIN NAME text box.
Then, you need to configure the test with the credentials of a user with Citrix Farm
Administrator rights, using the DOMAIN USER and DOMAIN PASSWORD text boxes.
Finally, you will have to confirm the DOMAIN PASSWORD by retyping it in the CONFIRM
PASSWORD text box.
15. SHOW WORKER GROUPS - Worker groups are collections of XenApp servers, residing in
the same farm, that are managed as a single unit. You can publish applications to a worker
group. If you want to know the worker group to which every application accessed by a user
has been published, then set this parameter to Yes. If both the SHOW WORKER GROUPS
and APPSBYNAME flags are set to Yes, the detailed diagnosis of this test will display the
worker group name along with the name of the application accessed by the user. By
default, this parameter is set to No.
16. REPORT BY DOMAIN NAME – By default, this flag is set to Yes. This implies that by
default, this test will report metrics for every
domainname\username
. This way,
administrators will know which user logged in from which domain. If you want the test to
report metrics for every
username
only, then set this flag to No.
Note:
If the XenApp server is a worker in the farm, then, in addition to configuring the
DOMAIN NAME, DOMAIN USER, DOMAIN PASSWORD parameters, the following
pre-requisites should also be fulfilled for this test to report metrics:
Make sure that the Citrix XenApp Commands Remoting service is running in
the Controller server.
The port 2513 must be open on the Controller server in the farm.

M O N I T O RI N G C I T R I X X E N AP P S E R V E R S
110
17. ENABLE BROWSER MONITORING – By default, this flag is set to No, indicating that the
eG agent does not monitor browser activity on the XenApp server. If this flag is set to Yes,
then, whenever one/more IE (Internet Explorer) browser instances on the XenApp server
are accessed, the detailed diagnosis of the
User sessions
measure will additionally reveal
the URL being accessed via each IE instance and the resources consumed by every
URL. Armed with this information, administrators can identify the web sites that are
responsible for excessive resource usage by an IE instance.
18. COLLECT EXTENDED METRICS – By default, this parameter is set to No, indicating that
the test will report only a standard set of user experience metrics. To enable the test to
collect additional metrics per user, set this flag to Yes.
19. DETAILED DIAGNOSIS - To make diagnosis more efficient and accurate, the eG
Enterprise suite embeds an optional detailed diagnostic capability. With this capability, the
eG agents can be configured to run detailed, more elaborate tests as and when specific
problems are detected. To enable the detailed diagnosis capability of this test for a
particular server, choose the On option. To disable the capability, click on the Off option.
The option to selectively enable/disable the detailed diagnosis capability will be available
only if the following conditions are fulfilled:
The eG manager license should allow the detailed diagnosis capability
Both the normal and abnormal frequencies configured for the detailed diagnosis
measures should not be 0.
Outputs of the
test
One set of results for every user logged into the Citrix server
Measurements
made by the
test
Measurement
Measurement
Unit
Interpretation
User sessions:
Represents the current
number of sessions for a
particular user
Number
A value of 0 indicates that the user is not
currently connected to the Citrix server.
Use the detailed diagnosis of this measure to
know the details of the sessions.
Latency last:
Represents the average client
latency for the last request
from a user. The latency is
measured by the Citrix server
based on packets sent to and
from each client during a
session - this includes
network delay plus server
side processing
delays. The value reported is
the average of the last
latencies for all the current
sessions of a user.
Secs
This measure will be reported only if the
COLLECT EXTENDED METRICS flag is set
to ‘Yes’.

M O N I T O RI N G C I T R I X X E N AP P S E R V E R S
111
Latency avg:
Represents the average client
latency for a user. The value
reported is the average of the
latencies for all the current
sessions of a user.
Secs
A consistently high latency may be indicative
of performance degradations with the Citrix
servers. Possible reasons for an increase in
latency could be increased network delays,
network congestion, Citrix server slow-down,
too many simultaneous users on the Citrix
server etc. Typically latencies on a Citrix
server will be below 5 secs.
This measure will be reported only if the
COLLECT EXTENDED METRICS flag is set
to ‘Yes’.
Latency deviation:
The latency deviation
represents the difference
between the minimum and
maximum measured latency
values for a session. The
value reported is the average
of the latency deviations for
all the current sessions of a
user.
Secs
Ideally, the deviation in latencies over a
session should be minimum so as to provide
a consistent experience for the user.
This measure will be reported only if the
COLLECT EXTENDED METRICS flag is set
to ‘Yes’.
Memory usage for user’s
processes:
This value represents the
ratio of the resident set size
of the memory utilized by the
user to the physical memory
of the host system, expressed
as a percentage. If a user is
connected via multiple
sessions, the value reported
is the sum of all memory
utilizations across all the
sessions.
Percent
This value indicates the percentage of
memory resources that are used up by a
specific user. By comparing this value across
users, an administrator can identify the most
heavy users of the Citrix server. Check the
detailed diagnosis to view the offending
processes/applications.

M O N I T O RI N G C I T R I X X E N AP P S E R V E R S
112
CPU usage for user’s
processes:
The CPU utilization for a
session is the percentage of
time that all of the
threads/processes of a user
session used the processor to
execute instructions. If a user
is connected via multiple
sessions, the value reported
is the sum of all CPU
utilizations across all the
sessions. Also, in multi-
processor environments, the
average CPU usage per
processor is reported as the
value of this measure – i.e., if
your Citrix server is using an
8-core processor and the
total CPU usage of a user
across all his/her sessions
amounts to 40%, then this
measure will report CPU
usage as 5 % (40/8
processors = 5).
Percent
This measure serves as a good indicator of
CPU usage in load-balanced environments,
where the user load is balanced across all
processors. Excessive CPU usage by a user
can impact performance for other users. This
is why, a high value for this measure is a
cause for concern. In such cases, check the
detailed diagnosis to view the offending
processes/applications.
Input bandwidth:
Indicates the average
bandwidth used for client to
server communications for all
the sessions of a user
KB/Sec
Output bandwidth:
Indicates the average
bandwidth used for server to
client communications for all
the sessions of a user
KB/Sec
Input line speed:
Indicates the average line
speed from the client to the
server for all the sessions of a
user
KB/Sec
Output line speed:
Indicates the average line
speed from the server to the
client for all the sessions of a
user
KB/Sec

M O N I T O RI N G C I T R I X X E N AP P S E R V E R S
113
Input compression:
Indicates the average
compression ratio for client to
server traffic for all the
sessions of a user
Number
Output compression:
Indicates the average
compression ratio for server
to client traffic for all the
sessions of a user
Number
I/O reads for user's
processes:
Indicates the rate of I/O
reads done by all processes
being run by a user.
KBps
These metrics measure the collective I/O
activity (which includes file, network and
device I/O's) generated by all the processes
being executed by a user. When viewed
along with the system I/O metrics reported
by the DiskActivityTest, these measures help
you determine the network I/O. Comparison
across users helps identify the user who is
running the most I/O-intensive processes.
Check the detailed diagnosis for the offending
processes/applications.
I/O writes for user’s
processes:
Indicates the rate of I/O
writes done by all processes
being run by a user.
KBps
Page faults for user’s
processes:
Indicates the rate of page
faults seen by all processes
being run by a user.
Faults/Sec
Page Faults occur in the threads executing in
a process. A page fault occurs when a thread
refers to a virtual memory page that is not in
its working set in main memory. If the page
is on the standby list and hence already in
main memory, or if the page is in use by
another process with whom the page is
shared, then the page fault will not cause the
page to be fetched from disk. Excessive page
faults could result in decreased performance.
Compare values across users to figure out
which user is causing most page faults.
Virtual memory of user’s
processes:
Indicates the total virtual
memory being used by all
processes being run by a
user.
MB
Comparison across users reveals the user
who is being a drain on the virtual memory
space.
Handles used by user’s
processes:
Indicates the total number of
handles being currently held
by all processes of a user.
Number
A consistent increase in the handle count
over a period of time is indicative of
malfunctioning of programs. Compare this
value across users to see which user is using
a lot of handles. Check detailed diagnosis for
further information.

M O N I T O RI N G C I T R I X X E N AP P S E R V E R S
114
Audio bandwidth input:
Indicates the bandwidth used
while transmitting
sound/audio to this user.
Kbps
Comparing these values across users will
reveal which user is sending/receiving
bandwidth-intensive sound/audio files over
the ICA channel.
To minimize bandwidth consumption, you
may want to consider disabling client audio
mapping.
Audio bandwidth output:
Indicates the bandwidth used
while receiving sound/audio
from this user.
Kbps
COM bandwidth input:
Indicates the bandwidth used
when sending data to this
user’s COM port.
Kbps
Comparing these values across users will
reveal which user’s COM port is
sending/receiving bandwidth-intensive data
over the ICA channel.
This measure will be reported only if the
COLLECT EXTENDED METRICS flag is set
to ‘Yes’.
COM bandwidth ouput:
Indicates the bandwidth used
when receiving data from this
user’s COM port.
Kbps
Drive bandwidth input:
Indicates the bandwidth used
when this user performs file
operations on the mapped
drive on the virtual desktop.
Kbps
Comparing the values of these measures
across users will reveal which user is
performing bandwidth-intensive file
operations over the ICA channel.
If bandwidth consumption is too high, you
may want to consider disabling client drive
mapping on the client device. Client drive
mapping allows users logged on to a virtual
desktop from a client device to access their
local drives transparently from the ICA
session. Alternatively, you can conserve
bandwidth by even refraining from accessing
large files with client drive mapping over the
ICA connection.
These measures will be reported only if the
COLLECT EXTENDED METRICS flag is set
to ‘Yes’.
Drive bandwidth output:
Indicates the bandwidth used
when the virtual desktop
performs file operations on
the client’s drive.
Kbps
Printer bandwidth input:
Indicates the bandwidth used
when this user prints to a
desktop printer over the ICA
channel.
Kbps
Comparing the values of these measures
across users will reveal which user is issuing
bandwidth-intensive print commands over the
ICA channel.
If bandwidth consumption is too high, you
may want to consider disabling printing.
Alternatively, you can avoid printing large
documents over the ICA connection.
Printer bandwidth output:
Indicates the bandwidth used
when the desktop responds
to print jobs issued by this
user.
Kbps

M O N I T O RI N G C I T R I X X E N AP P S E R V E R S
115
Speed screen data
channel bandwidth input:
Indicates the bandwidth used
from this user to the virtual
desktop for data channel
traffic.
Kbps
Comparing the values of these measures
across users will reveal which user has been
transmitting/receiving bandwidth-intensive
data channel traffic.
These measures will be reported only if the
COLLECT EXTENDED METRICS flag is set
to ‘Yes’.
Speed screen data
channel bandwidth
output:
Indicates the bandwidth used
from virtual desktop to this
user for data channel traffic.
Kbps
HDX media stream for
flash data bandwidth
input:
Indicates the bandwidth used
from this user to virtual
desktop for flash data traffic.
Kbps
Comparing the values of these measures
across users will reveal which user has been
transmitting/receiving bandwidth-intensive
flash data.
HDX media stream for
flash data bandwidth
output:
Indicates the bandwidth used
from the virtual desktop to
this user for flash data traffic
Kbps
HDX media stream for
flash v2 data bandwidth
input:
Indicates the bandwidth used
from this user to virtual
desktop for flash v2 data
traffic.
Kbps
Comparing the values of these measures
across users will reveal which user has been
transmitting/receiving bandwidth-intensive
flash v2 data.
HDX media stream for
flash v2 data bandwidth
output:
Indicates the bandwidth used
from the virtual desktop to
this user for flash v2 data
traffic
Kbps
PN bandwidth input:
Indicates the bandwidth used
from this user to virtual
desktop by Program
Neighborhood to obtain
application set details.
Kbps
Comparing the values of these measures
across users will reveal which user has been
transmitting/receiving bandwidth-intensive
PN traffic.
These measures will be reported only if the
COLLECT EXTENDED METRICS flag is set

M O N I T O RI N G C I T R I X X E N AP P S E R V E R S
116
PN bandwidth output:
Indicates the bandwidth,
used from the virtual desktop
to this user by Program
Neighborhood to obtain
application set details.
Kbps
to ‘Yes’.
CPU time used by user’s
sessions:
Indicates the percentage of
time, across all processors,
this user hogged the CPU.
Percent
The
CPU usage for user’s processes
measure
averages out the total CPU usage of a
user on the basis of the number of
processors. For instance, if your Citrix
server is using an 8-core processor and the
total CPU usage of a user across all his/her
sessions amounts to 80%, then the value of
the
CPU usage for user’s processes
measure
for that user will be 10 % (80/8 processors =
10). This accurately denotes the extent of
CPU usage in an environment where load is
uniformly balanced across multiple
processors. However, in environments where
load is not well-balanced, the
CPU usage for
user’s processes
measure may not be an
accurate indicator of CPU usage per user. For
instance, if a single processor is used nearly
80% of the time by a user, and other 7
processors in the 8-core processor
environment are idle, the
CPU usage for
user’s processes
measure will still report CPU
usage as 10%. This may cause
administrators to miss out on the fact that
the user is actually hogging a particular
processor! In such environments therefore,
its best to use the
CPU time used by user’s
sessions
measure! By reporting the total CPU
usage of a user across all his/her sessions
and across all the processors the target Citrix
server supports, this measure serves as the
true indicator of the level of CPU usage by a
user in dynamic environments. For instance,
in the example above, the
CPU time used by
user’s sessions
of the user will be 80% (and
not 10%, as in the case of the
CPU usage for
user’s processes
measure). A high value or a
consistent increase in the value of this
measure is hence serious and demands
immediate attention. In such situations, use
the detailed diagnosis of this measure to
know what CPU-intensive activities are being
performed by the user.

M O N I T O RI N G C I T R I X X E N AP P S E R V E R S
117
Bandwidth usage of user’s
sessions:
Indicates the percentage HDX
bandwidth consumption of
this user.
Percent
Compare the value of this measure across
users to know which user is consuming the
maximum HDX bandwidth.
ThinWire bandwidth
input:
Indicates the bandwidth used
from client to server for
ThinWire traffic.
Kbps
Typically, ICA traffic is comprised of many
small packets, as well as a some large
packets. Large packets are commonly
generated for initial session screen paints and
printing jobs, whereas the ongoing user
session is principally comprised of many small
packets. For the most part, these small
packets are the highest priority ICA data
called Thinwire. Thinwire incorporates mouse
movements and keystrokes.
Compare the value of these measures across
users to know which user’s keystrokes and
mouse movements are generating
bandwidth-intensive traffic.
These measures will be reported only if the
COLLECT EXTENDED METRICS flag is set
to ‘Yes’.
Thinwire bandwith
output:
Indicates the bandwidth used
from server to client for
ThinWire traffic.
Kbps
Seamless bandwidth
input:
Indicates the bandwidth used
from client to server for
published applications that
are not embedded in a
session window.
Kbps
Compare the value of these measures across
users to know which user is accessing
bandwidth-intensive applications that are not
in a session window.
These measures will be reported only if the
COLLECT EXTENDED METRICS flag is set
to ‘Yes’.
Seamless bandwidth
output:
Indicates the bandwidth used
from server to client for
published applications that
are not embedded in a
session window.
Kbps
Resource shares:
Indicates the total number of
resource shares used by this
user.
Number
By comparing the value of this measure
across users, you can identify the user who is
hogging the resources.
This measure will be reported only if the
COLLECT EXTENDED METRICS flag is set
to ‘Yes’.
M O N I T O RI N G C I T R I X X E N AP P S E R V E R S
118
Screen refresh latency –
last:
Indicates the time it took for
the screen to refresh for this
user in the last measurement
period.
Secs
Screen refresh latency –
avg
Indicates the average time it
takes for the screen to
refresh for this user. The
value reported is the average
of the latencies for all the
current sessions of a user.
Secs
A consistently high latency may be indicative
of performance degradations with the Citrix
servers.
Screen refresh latency -
deviation:
The latency deviation
represents the difference
between the minimum and
maximum measured screen
refresh latency values for a
session.
Secs
Ideally, the deviation in screen refresh
latencies over a session should be minimum
so as to provide a consistent experience for
the user.
This measure will be reported only if the
COLLECT EXTENDED METRICS flag is set
to ‘Yes’.
When a Citrix user being monitored by the eG agent logs out of the Citrix server, then the name of
the user will not be displayed as a descriptor of the CitrixUsers test in the eG monitor interface.
The detailed diagnosis of the
User sessions
measure (and the
CPU usage of user’s processes
and
Memory usage of
user’s processes
measures), if enabled, provides the list of processes executed by a user on the Citrix server, and the
CPU and memory utilization of such processes (see Figure 2.21). This information enables the Citrix administrator to
identify the processes that are utilizing resources excessively and those that may be leaking memory. In the event of
a server overload/memory leak, the Citrix administrator might decide to terminate these processes (see Figure 2.19).
In addition, the detailed diagnosis reveals the location from which each application instance runs (i.e., the IMAGE
PATH). If multiple versions of an application are published in different locations on the XenApp server and a user
runs each of these versions, then the IMAGE PATH will indicate the exact application version each process instance
corresponds to – resource-hungry versions can thus be identifed. Where one/more instances of the Internet Explorer
browser are running, the detailed diagnosis additionally displays the website URL accessed using each IE instance,
the domain of every URL, and the website title. In the event of excessive resource usage by an IE instance, this
information will shed light on the resource-intensive web site that was being accessed.
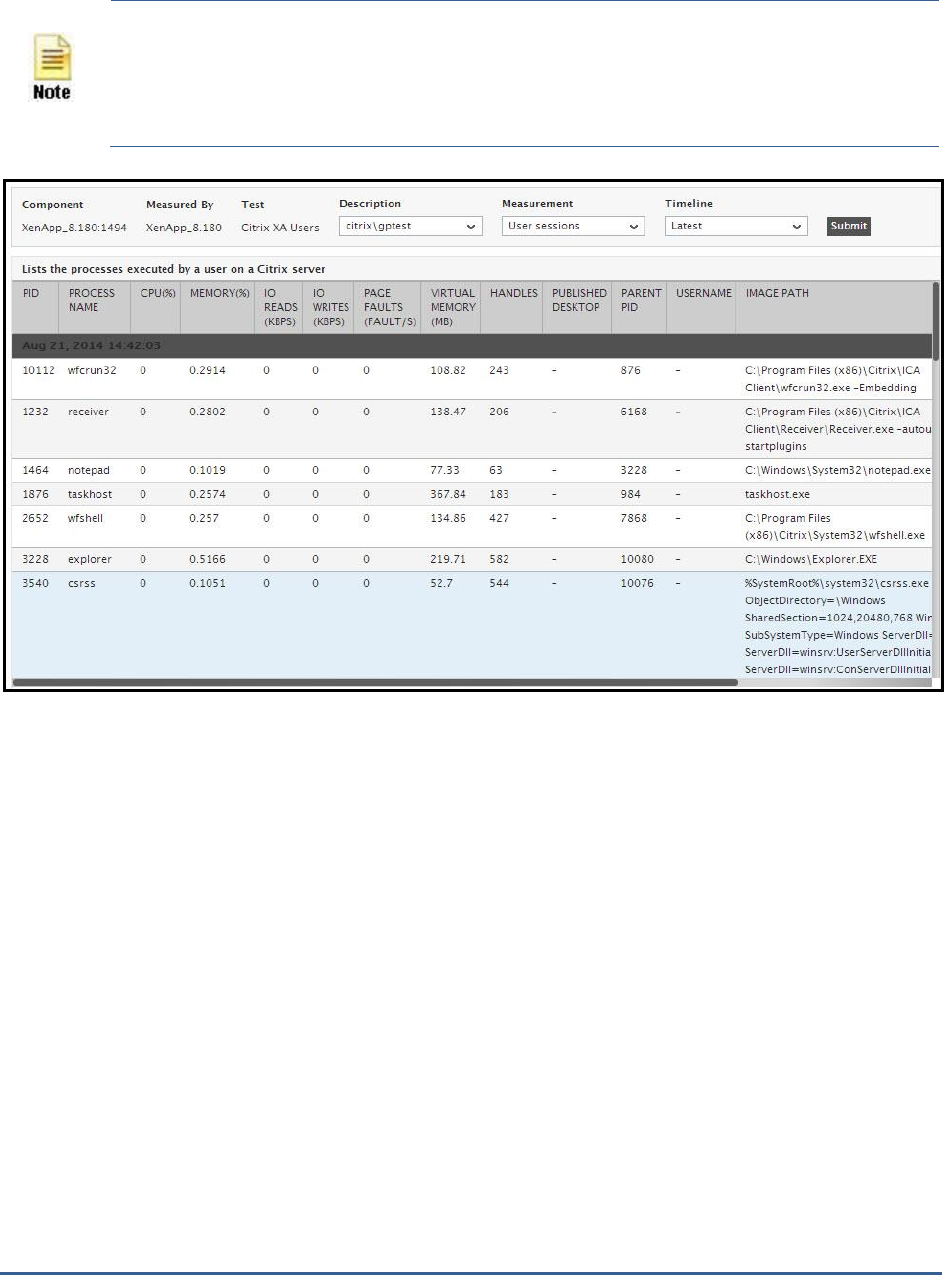
M O N I T O RI N G C I T R I X X E N AP P S E R V E R S
119
The eG agent will perform browser activity monitoring only if the ENABLE
BROWSER MONITORING flag is set to Yes.
The eG agent will monitor browser activity only of the browser being accessed is
Internet Explorer.
Figure 2.21: The detailed diagnosis of the User sessions measure
The detailed diagnosis of the CPU time used by user’s sessions measure, if enabled, provides the list of processes
executed by a user on the Citrix server, and the percentage of time for which each process was hogging the CPU.
This percentage denotes the total percentage of time the process was using the CPU resources across all the
processors that are supported by the XenApp server. This leads you to the exact process that is draining the CPU
resources of the server. In addition, the detailed diagnosis reveals the location from which each application instance
runs (i.e., the IMAGE PATH). If multiple versions of an application are published in different locations on the
XenApp server and a user runs each of these versions, then the IMAGE PATH will indicate the exact application
version each process instance corresponds to – resource-hungry versions can thus be identifed. Where one/more
instances of the Internet Explorer browser are running, the detailed diagnosis additionally displays the website URLs
accessed using each IE instance, the domain of every URL, and the website title. In the event of excessive resource
usage by an IE instance, this information will shed light on the resource-intensive web site that was being accessed.
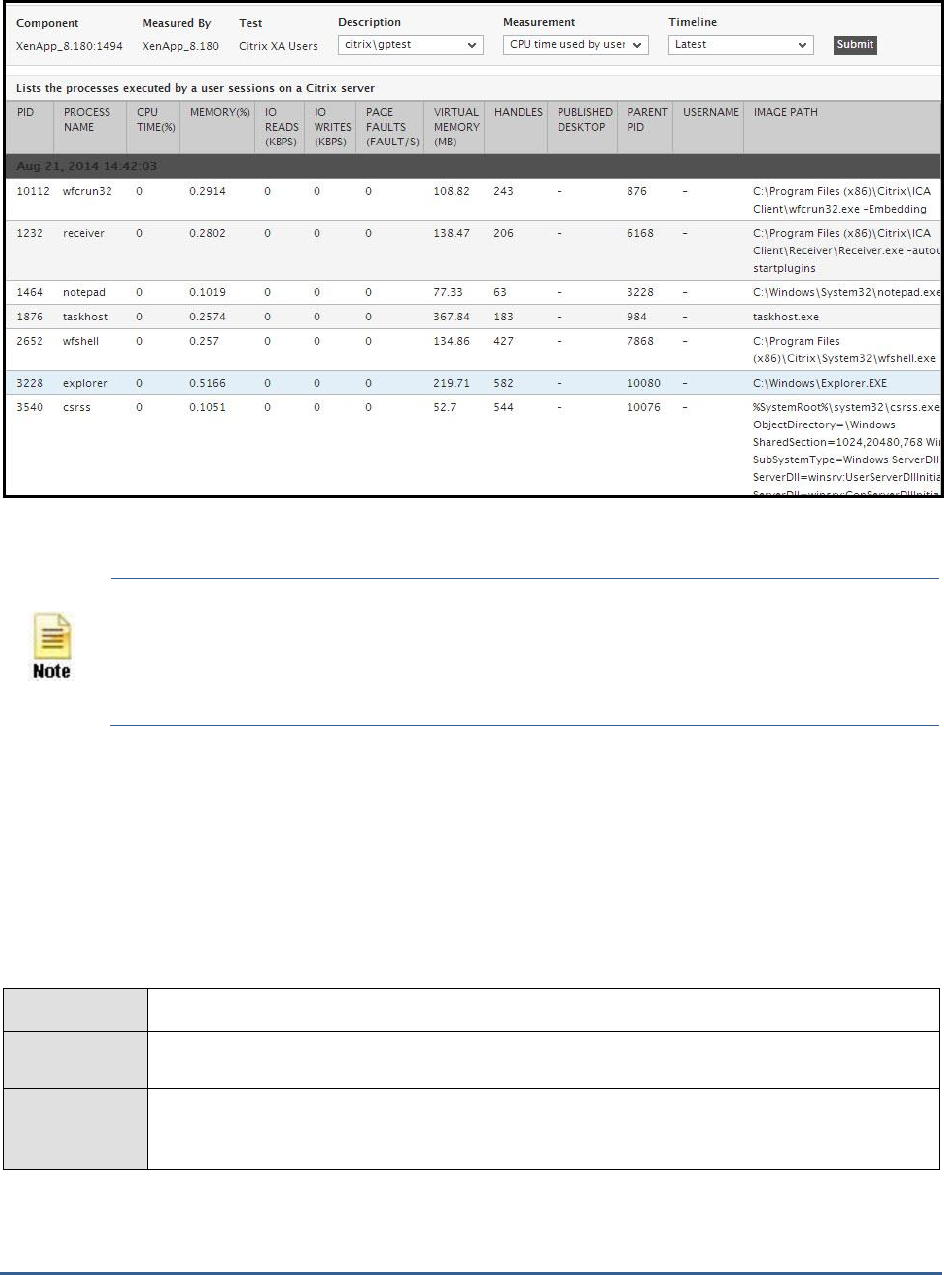
M O N I T O RI N G C I T R I X X E N AP P S E R V E R S
120
Figure 2.22: The detailed diagnosis of the CPU time used by user’s sessions measure
The eG agent will perform browser activity monitoring only if the ENABLE
BROWSER MONITORING flag is set to Yes.
The eG agent will monitor browser activity only of the browser being accessed is
Internet Explorer.
2.1.7.2 Citrix XA Disconnects Test
A user session is terminated when a user logs off from the Citrix/Terminal server or when the session is abruptly
interrupted (e.g., due to server, network, or application errors). When a user logs off, all the applications started by
the user are terminated. However, when a user disconnects, the applications started by the user will keep running on
the server consuming resources. Hence, the number of disconnected sessions on a Citrix/Terminal server should be
kept to a minimum. Abrupt disconnects can significantly impact the end user experience, and hence, it is important
to monitor the number of disconnected sessions at any point of time.
Purpose
Measures the number of disconnected Citrix user sessions
Target of the
test
Any Citrix server
Agent
deploying the
test
An internal agent

M O N I T O RI N G C I T R I X X E N AP P S E R V E R S
121
Configurable
parameters for
the test
1. TEST PERIOD – How often should the test be executed
2. HOST – The host for which the test is to be configured
3. PORT – Refers to the port used by the Citrix server
4. RECONNECTPERIOD - This parameter is used by the test while computing the value for
the Quick reconnects by users measure. This measure counts all the users who reconnected
to the Citrix server within the short period of time (in minutes) specified against
RECONNECTPERIOD.
5. REPORT BY DOMAIN NAME - By default, this flag is set to Yes. This implies that by
default, the detailed diagnosis of this test will display the
domainname\username
of each
user who disconnected from the server recently. This way, administrators will be able to
quickly determine which user belongs to which domain. If you want the detailed diagnosis
to display the
username
alone, then set this flag to No.
6. DD FREQUENCY - Refers to the frequency with which detailed diagnosis measures are to
be generated for this test. The default is
1:1
. This indicates that, by default, detailed
measures will be generated every time this test runs, and also every time the test detects a
problem. You can modify this frequency, if you so desire. Also, if you intend to disable the
detailed diagnosis capability for this test, you can do so by specifying
none
against DD
FREQUENCY.
7. DETAILED DIAGNOSIS - To make diagnosis more efficient and accurate, the eG
Enterprise suite embeds an optional detailed diagnostic capability. With this capability, the
eG agents can be configured to run detailed, more elaborate tests as and when specific
problems are detected. To enable the detailed diagnosis capability of this test for a
particular server, choose the On option. To disable the capability, click on the Off option.
The option to selectively enable/disable the detailed diagnosis capability will be available
only if the following conditions are fulfilled:
The eG manager license should allow the detailed diagnosis capability
Both the normal and abnormal frequencies configured for the detailed diagnosis
measures should not be 0.
Outputs of the
test
One set of results is reported for each Citrix server being monitored
Measurements
made by the
test
Measurement
Measurement
Unit
Interpretation
Total disconnected
sessions:
Indicates the total number of
sessions that are in the
disconnected state.
Number
New disconnects:
Indicates the number of
sessions that were
disconnected in the last
measurement period.
Number
The detailed diagnosis for this measure
indicates the user, session ID, and client type
for each newly disconnected session. This
information can be used to track whether
specific users are being disconnected often
M O N I T O RI N G C I T R I X X E N AP P S E R V E R S
122
Quick reconnects by
users:
Indicates the number of users
who reconnected soon after a
disconnect.
Number
The detailed diagnosis of this measure, if
enabled lists the users who have reconnected
quickly.
2.1.7.3 Citrix XA Logins Test
The Citrix XA Logins test monitors the new logins to the Citrix server.
Purpose
Monitors the new logins to the Citrix server
Target of the
test
Any Citrix server
Agent
deploying the
test
An internal agent

M O N I T O RI N G C I T R I X X E N AP P S E R V E R S
123
Configurable
parameters for
the test
1. TEST PERIOD – How often should the test be executed
2. HOST – The host for which the test is to be configured
3. PORT – Refers to the port used by the Citrix server
4. REPORTUSINGMANAGERTIME - By default, this flag is set to Yes. This indicates that
the user login time displayed in the DETAILED DIAGNOSIS page for this test and in the Thin
Client reports will be based on the eG manager's time zone by default. Set this flag to No if
you want the login times displayed in the DETAILED DIAGNOSIS page for this test and in the
Thin Client reports to be based on the Terminal server's local time.
5. DOMAIN NAME, DOMAIN USER, DOMAIN PASSWORD, and CONFIRM PASSWORD –
A Citrix XenApp server (v6.5) can run in the controller mode or the worker mode. In the
controller mode, the XenApp server can perform all farm management tasks. However, in
the worker mode, a XenApp server can only host user sessions.
6. By default, the DOMAIN NAME, DOMAIN USER, DOMAIN PASSWORD, and CONFIRM
PASSWORD parameters are set to
none
. If the XenApp server being monitored is the
controller in a farm, then this default value will automatically apply. In other words, in this
case, you can leave the values of these parameters as
none
. On the other hand, if the
target XenApp server is a worker in the farm, then first, you will have to configure the
name of the domain in which the XenApp server operates in the DOMAIN NAME text box.
Then, you need to configure the test with the credentials of a user with Citrix Farm
Administrator rights, using the DOMAIN USER and DOMAIN PASSWORD text boxes.
Finally, you will have to confirm the DOMAIN PASSWORD by retyping it in the CONFIRM
PASSWORD text box.
7. REPORT BY DOMAIN NAME – By default, this flag is set to Yes. This implies that by
default, the detailed diagnosis of this test will display the
domainname\username
of each
user session that logged out. This default setting ensures that administrators are able to
quickly determine the domains to which the users who logged out belonged. You can set
this flag to No if you want detailed diagnosis to display only the
username
of the users who
logged out.
8. DD FREQUENCY - Refers to the frequency with which detailed diagnosis measures are to
be generated for this test. The default is
1:1
. This indicates that, by default, detailed
measures will be generated every time this test runs, and also every time the test detects a
problem. You can modify this frequency, if you so desire. Also, if you intend to disable the
detailed diagnosis capability for this test, you can do so by specifying
none
against DD
FREQUENCY.
Note:
If the XenApp server is a worker in the farm, then, in addition to configuring the
DOMAIN NAME, DOMAIN USER, DOMAIN PASSWORD parameters, the following
pre-requisites should also be fulfilled for this test to report metrics:
Make sure that the Citrix XenApp Commands Remoting service is running in
the Controller server.
The port 2513 must be open on the Controller server in the farm.
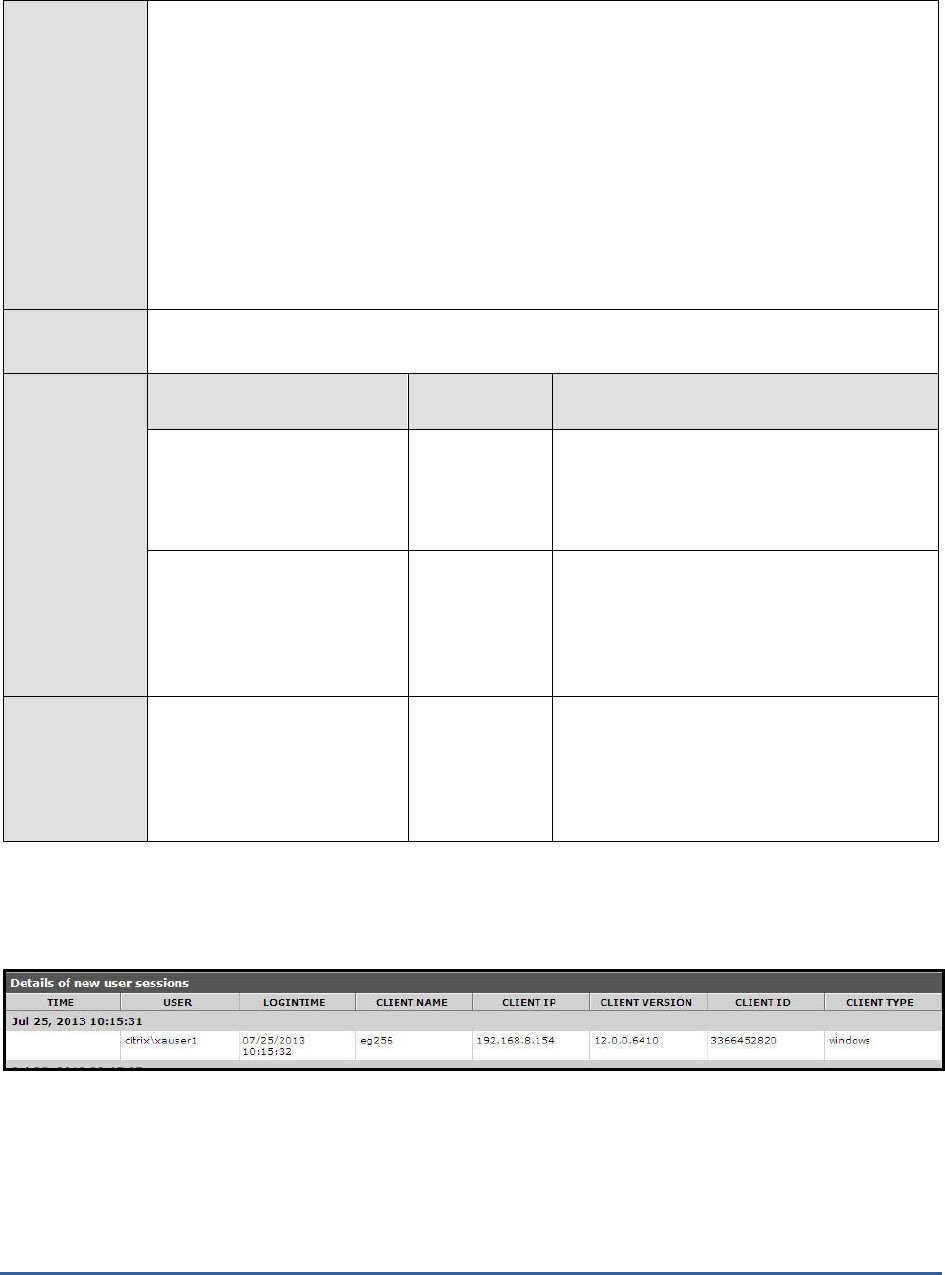
M O N I T O RI N G C I T R I X X E N AP P S E R V E R S
124
9. DETAILED DIAGNOSIS - To make diagnosis more efficient and accurate, the eG
Enterprise suite embeds an optional detailed diagnostic capability. With this capability, the
eG agents can be configured to run detailed, more elaborate tests as and when specific
problems are detected. To enable the detailed diagnosis capability of this test for a
particular server, choose the On option. To disable the capability, click on the Off option.
The option to selectively enable/disable the detailed diagnosis capability will be available
only if the following conditions are fulfilled:
The eG manager license should allow the detailed diagnosis capability
Both the normal and abnormal frequencies configured for the detailed diagnosis
measures should not be 0.
Outputs of the
test
One set of results is reported for each Citrix server being monitored
Measurements
made by the
test
Measurement
Measurement
Unit
Interpretation
New logins:
Indicates the number of new
logins to the Citrix server in
the last measurement period.
Number
A consistent zero value could indicate a
connection issue.
You can use the detailed diagnosis of this
test to know which users logged in recently.
Percent new logins:
Indicates the percentage of
current sessions that logged
in during the last
measurement period.
Percent
Sessions logging out:
Indicates the number of
sessions that logged out.
Number
If all the current sessions suddenly log out, it
indicates a problem condition that requires
investigation.
The detailed diagnosis of this measure lists
the sessions that logged out.
Using the detailed diagnosis of the
New logins
measure, you can not only identify the users who logged in recently,
but can also figure out when each user logged in and from which client machine.
Figure 2.23: The detailed diagnosis of the New logins measure
With the help of the detailed diagnosis of the
Sessions logged out
measure, you can identify the users who logged
out, when every user logged in and from which client machine, and the duration of each user’s session. Abnormally
long sessions on the server can thus be identified.

M O N I T O RI N G C I T R I X X E N AP P S E R V E R S
125
Figure 2.24: The detailed diagnosis of the Sessions logged out measure
2.1.7.4 Citrix XA Sessions Test
This test reports performance statistics related to Citrix user sessions.
Purpose
Reports performance statistics related to Citrix user sessions
Target of the
test
Any Citrix server
Agent
deploying the
test
An internal agent
Configurable
parameters for
the test
1. TEST PERIOD – How often should the test be executed
2. HOST – The host for which the test is to be configured
3. PORT – Refers to the port used by the Citrix server
4. REPORTUSINGMANAGERTIME - By default, this flag is set to Yes. This indicates that
the user login time displayed in the DETAILED DIAGNOSIS page for this test and in the Thin
Client reports will be based on the eG manager's time zone by default. Set this flag to No if
you want the login times displayed in the DETAILED DIAGNOSIS page for this test and in the
Thin Client reports to be based on the Terminal server's local time.
M O N I T O RI N G C I T R I X X E N AP P S E R V E R S
126
5. IGNORE DOWN SESSION IDS – By default, this parameter is set to
65536,65537,65538
– these are nothing but the default ports at which the listener component listens. If any of
these ports go down, then by default, this test will not count any of the sessions that failed
when attempting to connect to that port as a Down session. You can override this default
setting by adding more ports or by removing one/more existing ports.
6. DOMAIN NAME, DOMAIN USER, DOMAIN PASSWORD, and CONFIRM PASSWORD –
A Citrix XenApp server (v6.5) can run in the controller mode or the worker mode. In the
controller mode, the XenApp server can perform all farm management tasks. However, in
the worker mode, a XenApp server can only host user sessions.
By default, the DOMAIN NAME, DOMAIN USER, DOMAIN PASSWORD, and CONFIRM
PASSWORD parameters are set to
none
. If the XenApp server being monitored is the
controller in a farm, then this default value will automatically apply. In other words, in this
case, you can leave the values of these parameters as
none
. On the other hand, if the
target XenApp server is a worker in the farm, then first, you will have to configure the
name of the domain in which the XenApp server operates in the DOMAIN NAME text box.
Then, you need to configure the test with the credentials of a user with Citrix Farm
Administrator rights, using the DOMAIN USER and DOMAIN PASSWORD text boxes.
Finally, you will have to confirm the DOMAIN PASSWORD by retyping it in the CONFIRM
PASSWORD text box.
7. REPORT BY DOMAIN NAME – By default, this flag is set to Yes. This implies that by
default, the detailed diagnosis of this test will display the
domainname\username
of each
user who logged into the Citrix server. This way, administrators will be able to quickly
determine which user logged in from which domain. If you want the detailed diagnosis to
display the
username
alone, then set this flag to No.
Note:
If the XenApp server is a worker in the farm, then, in addition to configuring the
DOMAIN NAME, DOMAIN USER, DOMAIN PASSWORD parameters, the following
pre-requisites should also be fulfilled for this test to report metrics:
Make sure that the Citrix XenApp Commands Remoting service is running in
the Controller server.
The port 2513 must be open on the Controller server in the farm.

M O N I T O RI N G C I T R I X X E N AP P S E R V E R S
127
8. DETAILED DIAGNOSIS - To make diagnosis more efficient and accurate, the eG
Enterprise suite embeds an optional detailed diagnostic capability. With this capability, the
eG agents can be configured to run detailed, more elaborate tests as and when specific
problems are detected. To enable the detailed diagnosis capability of this test for a
particular server, choose the On option. To disable the capability, click on the Off option.
The option to selectively enable/disable the detailed diagnosis capability will be available
only if the following conditions are fulfilled:
The eG manager license should allow the detailed diagnosis capability
Both the normal and abnormal frequencies configured for the detailed diagnosis
measures should not be 0.
Outputs of the
test
One set of results for every server being monitored
Measurements
made by the
test
Measurement
Measurement
Unit
Interpretation
Active sessions:
Indicates the number of
active Citrix user sessions
currently on the server.
Number
This measure gives an idea of the server
workload in terms of active sessions.
Tracking the number of active sessions with
time, a Citrix administrator can obtain
information that can help him/her plan the
capacity of their Citrix environment. The
detailed diagnosis capability, if enabled, lists
the active and inactive sessions on the Citrix
server.
Idle sessions:
Indicates the number of
sessions that are initialized
and are currently ready to
accept connections.
Number
To optimize the performance of a server, two
default (idle) sessions are initialized before
any client connections are made. For
performance reasons, the number of idle
sessions should be less than ten. Note that
this test does not differentiate between RDP
and ICA sessions.
Connected sessions:
Indicates the current number
of sessions that are
connected, but no user has
logged on to the server.
Number
A consistent increase in the value of this
measure could indicate that users are having
trouble logging in. Further investigation may
hence be required. Note that this test does
not differentiate between RDP and ICA
sessions.
Connecting sessions:
Indicates the number of
sessions that are in the
process of connecting.
Number
A very high value for this measure indicates a
problem with the session or connection. Note
that this test does not differentiate between
RDP and ICA sessions.
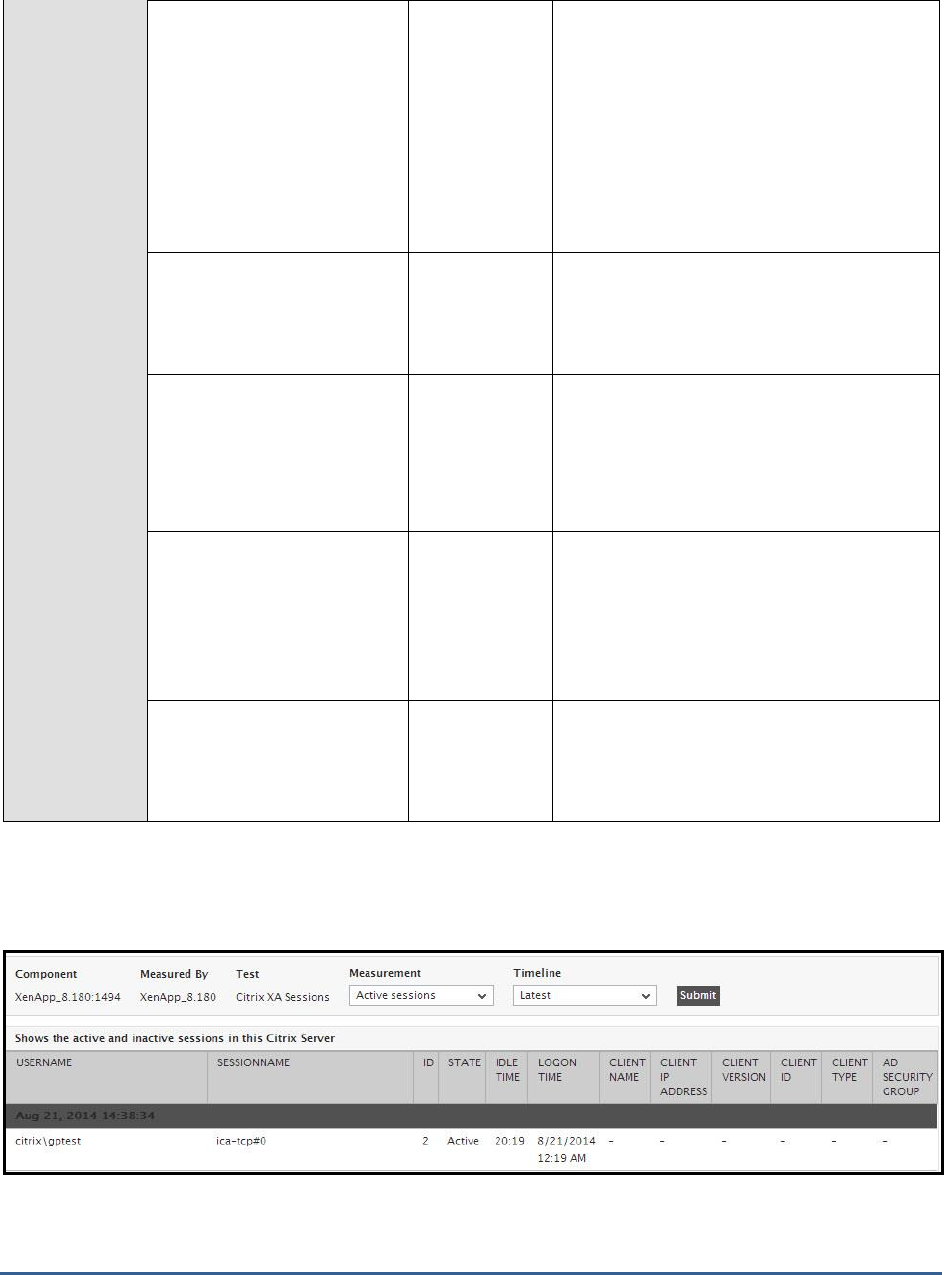
M O N I T O RI N G C I T R I X X E N AP P S E R V E R S
128
Disconnected sessions:
Indicates the number of
sessions from which users
have disconnected, but which
are still active and can be
reconnected.
Number
Too many disconnected sessions running
indefinitely on a Citrix server cause excessive
consumption of the server resources. To
avoid this, a session limit is typically
configured for disconnected sessions on the
Citrix server. When a session limit is reached
for a disconnected session, the session ends,
which permanently deletes it from the server.
Note that this test does not differentiate
between RDP and ICA sessions.
Listen sessions:
Indicates the current number
of sessions that are ready to
accept connections.
Number
Note that this test does not differentiate
between RDP and ICA sessions.
Shadow sessions:
Indicates the current number
of sessions that are remotely
controlling other sessions.
Number
A non-zero value for this measure indicates
the existence of shadow sessions that are
allowed to view and control the user activity
on another session. Such sessions help in
troubleshooting/resolving problems with
other sessions under their control.
Down sessions:
Indicates the current number
of sessions that could not be
initialized or terminated.
Number
Ideally, the value of this measure should be
0.
By default, if sessions to any of these ports –
65536, 65537, 65538 – could not be initialized
or terminated, they will not be counted as a
‘down session’.
Init sessions:
Indicates the current number
of sessions that are
initializing.
Number
A high value for this measure could indicate
that many sessions are currently experiencing
initialization problems.
The detailed diagnosis capability of the
Active sessions
measure, if enabled, lists the active and inactive sessions on
the Citrix server.
Figure 2.25: The detailed diagnosis of the Active sessions measure of a Citrix server
M O N I T O RI N G C I T R I X X E N AP P S E R V E R S
129
2.1.7.5 Citrix Receivers Test
If a user complains of slowness when accessing applications/dekstops launched on a Citrix server, administrators
may instantly want to know which type of client device that user is connecting from – is it a mobile phone? a laptop?
a tablet? what is its IP address? what is its version? This knowledge will ease the troubleshooting pains of
administrators as it will clearly indicate if the slowdown occurred owing to the usage of an unsupported or an
outdated device. To obtain this knowledge, administrators can use the Citrix Receivers test. With the help of this
test, administrators can identify the client devices that are connecting via Citrix Receiver, determine which user is
logging into the Citrix environment using which device, and in the process, figure out if any device-related issues are
contributing to a user’s unsatisfactory experience with Citrix.
Purpose
Auto-discovers the client devices that are connecting via Citrix Receiver, reports which user is
logging into the Citrix environment using which device, helps administrators figure out if any
device-related issues are contributing to a user’s unsatisfactory experience with Citrix
Target of the
test
Any Citrix server
Agent
deploying the
test
An internal agent

M O N I T O RI N G C I T R I X X E N AP P S E R V E R S
130
Configurable
parameters for
the test
1. TEST PERIOD – How often should the test be executed
2. HOST – The host for which the test is to be configured
3. PORT – Refers to the port used by the Citrix server.
4. DOMAIN NAME, DOMAIN USER, DOMAIN PASSWORD, and CONFIRM PASSWORD –
A Citrix XenApp server (v6.5) can run in the controller mode or the worker mode. In the
controller mode, the XenApp server can perform all farm management tasks. However, in
the worker mode, a XenApp server can only host user sessions.
5. By default, the DOMAIN NAME, DOMAIN USER, DOMAIN PASSWORD, and CONFIRM
PASSWORD parameters are set to
none
. If the XenApp server being monitored is the
controller in a farm, then this default value will automatically apply. In other words, in this
case, you can leave the values of these parameters as
none
. On the other hand, if the
target XenApp server is a worker in the farm, then first, you will have to configure the
name of the domain in which the XenApp server operates in the DOMAIN NAME text box.
Then, you need to configure the test with the credentials of a user with Citrix Farm
Administrator rights, using the DOMAIN USER and DOMAIN PASSWORD text boxes.
Finally, you will have to confirm the DOMAIN PASSWORD by retyping it in the CONFIRM
PASSWORD text box.
REPORT BY DOMAIN NAME – By default, this flag is set to Yes. This implies that by default,
the detailed diagnosis of this test will display the
domainname\username
of each user who
logged into the Citrix server. This way, administrators will be able to quickly determine which
user logged in from which domain. If you want the detailed diagnosis to display the
username
alone, then set this flag to No.
6. REPORT BY RECEIVER TYPE - By default, this flag is set to No. This implies that by
default, this test will report one set of metrics for every client version. To make sure that
the test reports metrics for each client type instead, set this flag to Yes.
Note:
If the XenApp server is a worker in the farm, then, in addition to configuring the
DOMAIN NAME, DOMAIN USER, DOMAIN PASSWORD parameters, the following
pre-requisites should also be fulfilled for this test to report metrics:
Make sure that the Citrix XenApp Commands Remoting service is running in
the Controller server.
The port 2513 must be open on the Controller server in the farm.

M O N I T O RI N G C I T R I X X E N AP P S E R V E R S
131
7. DETAILED DIAGNOSIS - To make diagnosis more efficient and accurate, the eG
Enterprise suite embeds an optional detailed diagnostic capability. With this capability, the
eG agents can be configured to run detailed, more elaborate tests as and when specific
problems are detected. To enable the detailed diagnosis capability of this test for a
particular server, choose the On option. To disable the capability, click on the Off option.
The option to selectively enable/disable the detailed diagnosis capability will be available
only if the following conditions are fulfilled:
The eG manager license should allow the detailed diagnosis capability
Both the normal and abnormal frequencies configured for the detailed diagnosis
measures should not be 0.
Outputs of the
test
One set of results for every client type/client version auto-discovered
Measurements
made by the
test
Measurement
Measurement
Unit
Interpretation
Users connected from this
type:
Indicates the number of users
who are currently connected
to Citrix via devices of this
type/version.
Number
Use the detailed diagnosis of this measure to
know which user connected via devices of a
particular type/version.
2.1.7.6 Citrix Clients Test
This test measures the client connections to and from a Citrix server. This test is disabled by default.
To enable the test, go to the ENABLE / DISABLE TESTS page using the menu sequence : Agents -> Tests ->
Enable/Disable, pick
Citrix XenApp
as the Component type,
Performance
as the Test type, choose the test from the
DISABLED TESTS list, and click on the >> button to move the test to the ENABLED TESTS list. Finally, click the Update
button.
Purpose
To monitor the TCP connections to and from a Citrix server
Target of the
test
A Citrix server
Agent
deploying the
test
Internal agent

M O N I T O RI N G C I T R I X X E N AP P S E R V E R S
132
Configurable
parameters for
the test
1. TEST PERIOD – How often should the test be executed
2. HOST – The host for which the test is to be configured
3. PORT – Refers to the port used by the Citrix server
4. SERVERIP - By default, the SERVERIP field will display the IP address of the Citrix
server.
5. DETAILED DIAGNOSIS - To make diagnosis more efficient and accurate, the eG
Enterprise suite embeds an optional detailed diagnostic capability. With this capability, the
eG agents can be configured to run detailed, more elaborate tests as and when specific
problems are detected. To enable the detailed diagnosis capability of this test for a
particular server, choose the On option. To disable the capability, click on the Off option.
The option to selectively enable/disable the detailed diagnosis capability will be available
only if the following conditions are fulfilled:
The eG manager license should allow the detailed diagnosis capability
Both the normal and abnormal frequencies configured for the detailed diagnosis
measures should not be 0.
Outputs of the
test
One set of results for every server being monitored
Measurements
made by the
test
Measurement
Measurement
Unit
Interpretation
Current connections:
The number of TCP
connections currently
established by clients to the
Citrix server
Number
This measure directly indicates the loading on
the Citrix server from clients. Typically one
connection is established per active session
to the Citrix server.
New connections added:
The number of new TCP
connections initiated by
clients to the Citrix server
during the last measurement
period
Number
Tracking the new connections over time can
provide an indication of when clients login to
the Citrix server. A spurt of connections and
disconnections may be indicative of sporadic
failures of the Citrix server.
Old connections removed:
The number of TCP
connections that were
removed because the clients
may have disconnected from
the Citrix server during the
last measurement period
Number
A large number of sudden connection drops
may be early warning indicators of problems
with the Citrix server.

M O N I T O RI N G C I T R I X X E N AP P S E R V E R S
133
Avg duration of current
connections:
The average time from when
a connection is established to
when the corresponding
connection is disconnected.
The duration of a connection
is measured from its start
time to the current time. The
accuracy of this measurement
is limited by the frequency at
which this test is run.
Secs
This value can provide an indicator of how
long clients stay connected to a Citrix server.
This information together with the number of
simultaneous clients can be useful for
capacity planning in Citrix environments (i.e.,
how to size the Citrix server). The detailed
diagnosis capability, if enabled, lists the
clients currently connected to the Citrix
server.
2.1.7.7 ICA Client Access Test
A Citrix environment is a shared environment in which multiple users connect to a Citrix XenApp server from remote
terminals using the ICA protocol. One of the key factors influencing user experience in such an environment is the
latency seen by the users when connecting to the server. High network latencies or packet losses during transmission
can cause significant slow-downs in request processing by the server. Hence, monitoring latencies between the
server and individual client terminals is important.
The IcaClient test is executed by the eG agent on a Citrix XenApp server. This test auto-discovers the users who are
currently logged on to the server and the IP address from which they are connecting to the Citrix server. For each
user, the test monitors the quality of the link between the client and the Citrix server.
Using this test, an administrator can identify user sessions that are being impacted by high latencies or by excessive
packet drops. In some cases, a Citrix server may regard a user session as active, even though the network link
connecting the user terminal to the Citrix server has failed. The IcaClientTest alerts administrators to such situations.
To enable the test, go to the ENABLE / DISABLE TESTS page using the menu sequence : Agents -> Tests ->
Enable/Disable, pick
Citrix XenApp
as the Component type,
Performance
as the Test type, choose the test from the
DISABLED TESTS list, and click on the >> button to move the test to the ENABLED TESTS list. Finally, click the Update
button.
Purpose
Reports on the latencies seen by users connecting to a Citrix XenApp server
Target
A Citrix XenApp server
Agent deploying
this test
Internal agent
Configurable
parameters for
this test
1. TEST PERIOD - How often should the test be executed
2. HOST - The host for which the test is to be configured.
3. PORT - The port at which the HOST listens
4. DISPLAYDOMAIN - By default, the DISPLAYDOMAIN flag is set to Yes; this indicates
that the ICA Client Access test, by default, will report metrics for every
domainname\username
who is currently connected to the server. This way, administrators
can quickly figure out which user is connecting to the server from which domain. You can
set this flag to No to ensure that this test reports metrics for each
username
only.
5. PACKETSIZE - The size of packets used for the test (in bytes)

M O N I T O RI N G C I T R I X X E N AP P S E R V E R S
134
6. PACKETCOUNT – The number of packets exchanged between the Citrix server and the
user terminal during the test
7. TIMEOUT - How long after transmission should a packet be deemed lost (in seconds)
8. PACKETINTERVAL - Represents the interval (in milliseconds) between successive packet
transmissions during the execution of this test.
9. REPORTUNAVAILABILITY – By default, this flag is set to No. This implies that, by
default, the test will not report the unavailability of network connection between a user
terminal and the Citrix server. In other words, if the
Packet loss
measure of this test
registers the value
100%
for any user, then, by default, this test will not report any
measure for that user; under such circumstances, the corresponding user name will not
appear as a descriptor of this test. You can set this flag to Yes, if you want the test to
report and alert you to the unavailability of the network connection between a user
terminal and the Citrix server.
Outputs of the
test
One set of outputs for every user currently connected to the Citrix server
Measurements of
the test
Measurement
Measurement
Unit
Interpretation
Number of user sessions:
Indicates the current number
of sessions for a particular
user
Number
The value 0 indicates that the user is not
currently connected to the Citrix server.
Avg network latency:
Indicates the average delay
between transmission of a
request by the agent on a
Citrix server and receipt of
the response back from the
user terminal.
Secs
Comparing the value of this measure
across users will enable administrators to
quickly and accurately identify users who
are experiencing higher latency when
connecting to a Citrix server.
Min network latency:
Indicates the minimum delay
between transmission of a
request by the agent on a
Citrix server and receipt of
the response back from the
user terminal.
Secs
A significant increase in the minimum
round-trip time is often a sure sign of a
poor link between the server and a user's
terminal.
Packet loss:
Indicates the percentage of
packets lost during data
exchange between the Citrix
server and the user terminal.
Percent
Comparing the value of this measure
across users will enable administrators to
quickly and accurately identify users who
are experiencing slowdowns because of
poor performance on the network links
between their terminals and the Citrix
server.

M O N I T O RI N G C I T R I X X E N AP P S E R V E R S
135
2.1.7.8 Wyse Terminals Test
Wyse thin clients are secure access devices that provide a simpler and easier way to deliver the productivity and
application flexibility of a PC without the PC downside.
Users can connect to a Citrix server/server farm from a Wyse terminal to access critical applications. Whenever a
user complaints of issues with his/her terminal, you can use this test to figure out which terminal the user is
connecting from, whether that terminal is up and running, and if so, for how long.
This test is disabled by default. To enable the test, go to the ENABLE / DISABLE TESTS page using the menu sequence
: Agents -> Tests -> Enable/Disable, pick
Citrix XenApp
as the Component type,
Performance
as the Test type,
choose the test from the DISABLED TESTS list, and click on the >> button to move the test to the ENABLED TESTS list.
Finally, click the Update button.
Purpose
Reports the uptime of the Wyse terminal
Target
A Citrix XenApp server
Note:
If the same user is connecting to the Citrix server from multiple client terminals, the value of the
Number of user sessions
,
Avg network latency
, and
Packet loss
measures will be averaged across
all the sessions of that user. The
Min network latency
measure, on the other hand, will display the
least value reported for
Minimum delay
across all the sessions of that user.
When a user logs out, the number of sessions will be reduced by 1. If the number of user sessions
becomes 0, the corresponding entry for that user in the eG user interface will be removed after a
short period of time.
By default, the ICA Client Access test spawns a maximum of one thread at a time for monitoring
each of the ICA connections to a Citrix server. Accordingly, the MaxIcaClientThreads parameter in
the eg_tests.ini file (in the <EG_INSTALL_DIR>\manager\config directory) is set to 1 by default. In
large Citrix farms however, numerous concurrent users attempt to connect to the Citrix server from
multiple remote client terminals. To enhance the efficiency of the test and to make sure that it
scales to monitor the large number of ICA connections to the Citrix server, you might want to
consider increasing the value of the MaxIcaClientThreads parameter. If this parameter is set to say,
15, then, it implies that the test will spawn a maximum of 15 threads at one shot, thus monitoring
15 ICA connections to the Citrix server, simultaneously.
Sometimes, the ICA Client Access test may not work on Citrix XenApp v6.5. This is because, some
installations of Citrix XenApp v6.5 may not support the performance object named ICA Session,
which the test uses for reporting metrics. In such cases, follow the steps given below to enable the
ICA Session performance object and its counters:
o Login to the Windows system that hosts the Citrix XenApp server v6.5.
o Open the command prompt as Run as administrator.
o Issue the following command at the prompt:
regsvr32 c:\windows\system32\icaperf.dll

M O N I T O RI N G C I T R I X X E N AP P S E R V E R S
136
Agent deploying
this test
Internal agent
Configurable
parameters for
this test
1. TEST PERIOD - How often should the test be executed
2. HOST - The host for which the test is to be configured.
3. PORT - The port at which the HOST listens
4. SNMPPORT - The port number through which the Wyse terminal exposes its SNMP MIB.
The default value is 161.
5. SNMPVERSION – By default, the eG agent supports SNMP version 1. Accordingly, the
default selection in the SNMPVERSION list is v1. However, if a different SNMP framework
is in use in your environment, say SNMP v2 or v3, then select the corresponding option
from this list.
6. SNMPCOMMUNITY – The SNMP community name that the test uses to communicate
with the Cisco router. This parameter is specific to SNMP v1 and v2 only. Therefore, if the
SNMPVERSION chosen is v3, then this parameter will not appear.
7. USERNAME – This parameter appears only when v3 is selected as the SNMPVERSION.
SNMP version 3 (SNMPv3) is an extensible SNMP Framework which supplements the
SNMPv2 Framework, by additionally supporting message security, access control, and
remote SNMP configuration capabilities. To extract performance statistics from the MIB
using the highly secure SNMP v3 protocol, the eG agent has to be configured with the
required access privileges – in other words, the eG agent should connect to the MIB using
the credentials of a user with access permissions to be MIB. Therefore, specify the name
of such a user against the USERNAME parameter.
8. AUTHPASS – Specify the password that corresponds to the above-mentioned
USERNAME. This parameter once again appears only if the SNMPVERSION selected is
v3.
9. CONFIRM PASSWORD – Confirm the AUTHPASS by retyping it here.
10. AUTHTYPE – This parameter too appears only if v3 is selected as the SNMPVERSION.
From the AUTHTYPE list box, choose the authentication algorithm using which SNMP v3
converts the specified USERNAME and PASSWORD into a 32-bit format to ensure
security of SNMP transactions. You can choose between the following options:
MD5 – Message Digest Algorithm
SHA – Secure Hash Algorithm
11. ENCRYPTFLAG – This flag appears only when v3 is selected as the SNMPVERSION. By
default, the eG agent does not encrypt SNMP requests. Accordingly, the ENCRYPTFLAG
is set to NO by default. To ensure that SNMP requests sent by the eG agent are encrypted,
select the YES option.
12. ENCRYPTTYPE – If the ENCRYPTFLAG is set to YES, then you will have to mention
the encryption type by selecting an option from the ENCRYPTTYPE list. SNMP v3
supports the following encryption types:
DES – Data Encryption Standard
AES – Advanced Encryption Standard
13. ENCRYPTPASSWORD – Specify the encryption password here.
14. CONFIRM PASSWORD – Confirm the encryption password by retyping it here.

M O N I T O RI N G C I T R I X X E N AP P S E R V E R S
137
15. TIMEOUT - Specify the duration (in seconds) within which the SNMP query executed by
this test should time out in the TIMEOUT text box. The default is 10 seconds.
16. DATA OVER TCP – By default, in an IT environment, all data transmission occurs over
UDP. Some environments however, may be specifically configured to offload a fraction of
the data traffic – for instance, certain types of data traffic or traffic pertaining to specific
components – to other protocols like TCP, so as to prevent UDP overloads. In such
environments, you can instruct the eG agent to conduct the SNMP data traffic related to
the equalizer over TCP (and not UDP). For this, set the DATA OVER TCP flag to Yes. By
default, this flag is set to No.
17. DETAILED DIAGNOSIS - To make diagnosis more efficient and accurate, the eG
Enterprise suite embeds an optional detailed diagnostic capability. With this capability, the
eG agents can be configured to run detailed, more elaborate tests as and when specific
problems are detected. To enable the detailed diagnosis capability of this test for a
particular server, choose the On option. To disable the capability, click on the Off option.
The option to selectively enable/disable the detailed diagnosis capability will be available
only if the following conditions are fulfilled:
The eG manager license should allow the detailed diagnosis capability
Both the normal and abnormal frequencies configured for the detailed diagnosis
measures should not be 0.
Outputs of the
test
One set of outputs for every Wyse terminal user currently connected to the Citrix server
Measurements of
the test
Measurement
Measurement
Unit
Interpretation
Uptime of Wyse terminal:
Indicates how long the Wyse
terminal from which this user
is connecting has been up
and running.
Secs
A low reported by this measure could
indicate that the Wyse terminal has
rebooted recently.
The detailed diagnosis of the
Uptime of Wyse terminal
measure reveals the name, serial number, IP address, and
MAC address of the Wyse terminal from which the user is currently connecting to the Citrix server.
Figure 2.26: The detailed diagnosis of the Uptime of Wyse terminal measure
2.1.7.9 ICA/RDP Listeners Test
The listener component runs on the XenApp/Terminal server and is responsible for listening for and accepting new
ICA/RDP client connections, thereby allowing users to establish new sessions on the XenApp/Terminal server. If this
listener component is down, users may not be able to establish a connection with the XenApp server!
M O N I T O RI N G C I T R I X X E N AP P S E R V E R S
138
This is why, if a user to the XenApp server complains of the inaccessibility of the server, administrators should first
check whether the Citrix listener component is up and running or not. The ICA/RDP Listeners test helps
administrators perform this check. This test tracks the status of the default listener ports and reports whether any of
the ports is down.
Purpose
Tracks the status of the default listener ports and reports whether any of the ports is down
Target
A Citrix XenApp server
Agent deploying
this test
Internal agent
Configurable
parameters for
this test
1. TEST PERIOD - How often should the test be executed
2. HOST - The host for which the test is to be configured.
3. PORT - The port at which the HOST listens
4. SESSION IDS – The default listener ports -
65536,65537,65538
– will be displayed here
by default. You can override this default specification by adding more ports or by
removing one/more existing ports.
Outputs of the
test
One set of outputs for every listener port configured
Measurements of
the test
Measurement
Measurement
Unit
Interpretation
Is listener down?:
Indicates whether/not this
listener port is down.
This measure reports the value
Yes
if the
listener port is down and
No
if the port is
up and running. The numeric values that
correspond to these measure values are
as follows:
Measure
Value
Numeric Value
Yes
0
No
1
Note:
By default, this measure reports the
above-mentioned Measure Values to
indicate the status of a listener port.
However, the graph of this measure will
represent the same using the numeric
equivalents only.
2.1.8 Troubleshooting the eG Citrix Monitor
As mentioned already, the eG agent monitoring Citrix XenApp servers of version 6.0/6.5 uses powershell scripts to

M O N I T O RI N G C I T R I X X E N AP P S E R V E R S
139
run tests and pull out metrics from these servers. If the XenApp tests fail, then, first check whether the
Powershell
SDK
pre-exists on the eG agent host. If not, download the SDK from
http://community.citrix.com/display/xa/XenApp+6+PowerShell+SDK, and install it on the monitored XenApp server.
Once the SDK is installed, the eG agent should be able to execute the powershell scripts on the monitored Citrix
XenApp servers (v6.0/6.5) without any additional configuration. However, if the tests continue to fail, then check
whether any Active Directory Group Policy has been configured to prevent the execution of powershell scripts. If so,
you can do either of the following:
d. Change the Group Policy definition to allow the execution of the powershell scripts, (OR)
e. Reconfigure the target XenApp server alone to allow script execution
Each of these steps have been detailed below:
Changing Group Policy Definition
To modify the Active Directory Group Policy to allow script execution, do the following:
1. Login to the Active Directory server.
2. On Windows 2008, follow the Start -> Programs -> Administrative Tools -> Group Policy Management menu
sequence.
3. From the tree-structure in the left panel of the window that appears, select the node that represents the group
policy of interest to you.
4. Right-click on the group policy and select the Edit option.
5. The window depicted by Figure 2.20 will then appear. In the left panel of this window, expand the node
representing the policy you have chosen to modify, and then follow the node sequence, Computer
Configuration -> Administrative Templates -> Windows Components -> Windows Powershell (as
indicated by Figure 2.20).
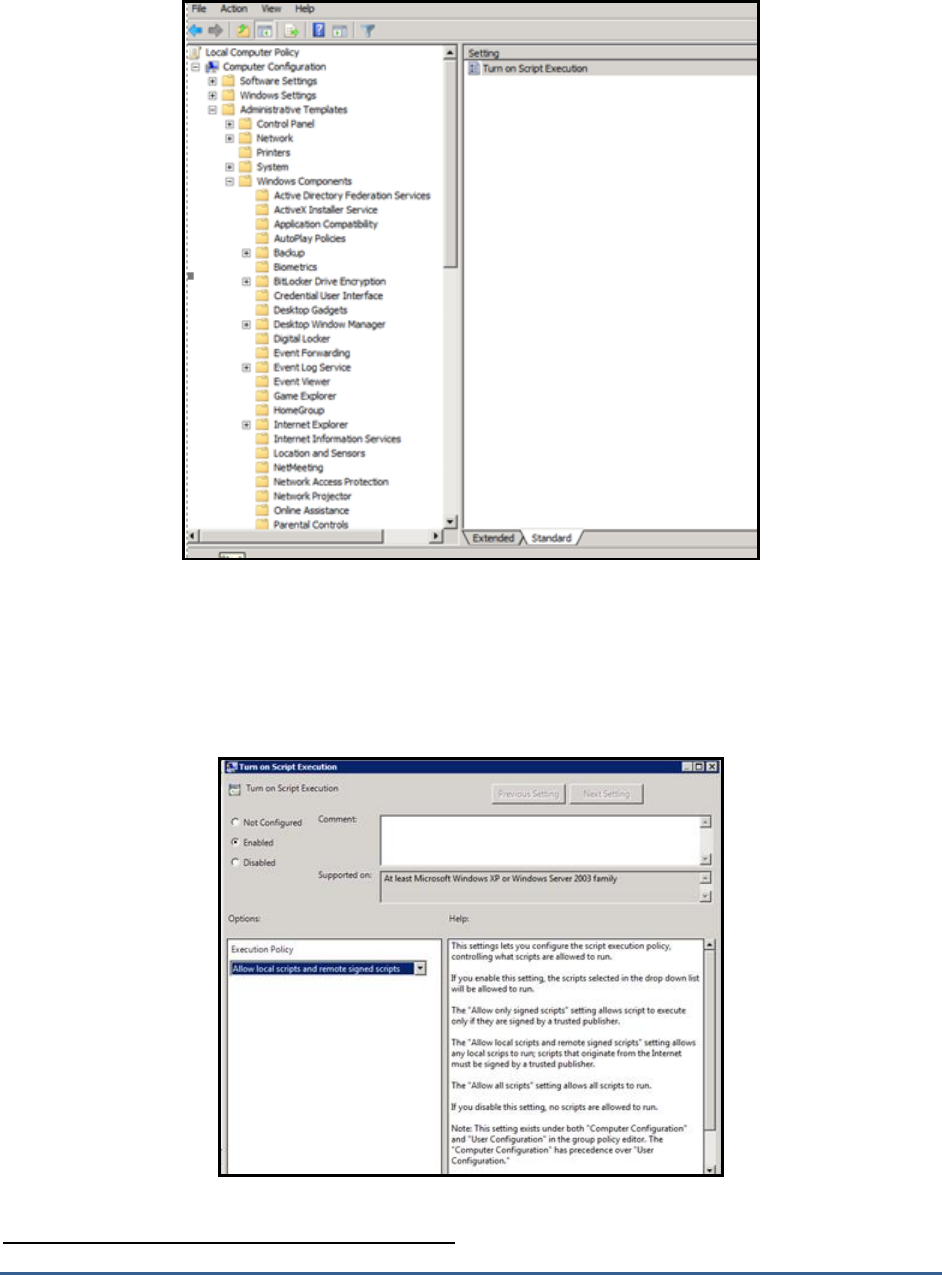
M O N I T O RI N G C I T R I X X E N AP P S E R V E R S
140
Figure 2.27: Editing the group policy
6. The right panel will change to display a Turn on Script Execution setting (see Figure 2.20). Right-click on that
setting and select Edit. This will invoke Figure 2.21.
7. Select the Enabled option from Figure 2.21 to turn on script execution, and then click the Apply and OK buttons
to save the changes.
Figure 2.28: Turning on script execution
Reconfiguring the monitored Citrix XenApp server

M O N I T O RI N G C I T R I X X E N AP P S E R V E R S
141
Typically, if the powershell script execution policy has been set to Restricted for a XenApp server, then, upon
installing an eG agent on that server, the execution policy will automatically change to RemoteSigned. This will
enable the eG agent to execute powershell scripts on that server and report metrics.
However, if you later define an AD group policy setting that restricts script execution, then the group policy setting
will over-ride the server-specific setting. In such cases, the XenApp tests will fail. If you do not want to change the
Group Policy definition to allow script execution, then, you can set the script execution policy of the target XenApp
server alone to RemoteSigned , so that the eG agent on that server can execute powershell scripts on the server.
For this, do the following:
f. Login to the agent host.
g. First, check the execution policy of the XenApp server. For this, from the PowerShell command prompt,
switch to the root directory, and issue the following command:
get-ExecutionPolicy
h. If the output of this command is RemoteSigned, it indicates that the eG agent has the privileges required
for script execution. On the other hand, if the output of this command is Restricted, you may have to
change the policy to RemoteSigned to enable the eG agent to execute the scripts. For this, from the
PowerShell command prompt, switch to the root directory, and issue the following command:
set-ExecutionPolicy remotesigned
2.1.9 The Citrix XenApp Dashboard
In order to ascertain how well an application is/has been performing, analysis of the performance of the System and
Network layers of that application alone might not suffice. A closer look at the health of the Application Layers is also
necessary, so as to promptly detect instantaneous operational issues with the target application, and also proactively
identify persistent problems or a consistent performance degradation experienced by the application. To provide
administrators with such in-depth insights into overall application performance and to enable them to accurately
isolate the root-cause of any application-level slowdown, eG Enterprise offers the Application Dashboard. Each of the
critical applications monitored by eG Enterprise is accompanied by an exclusive application dashboard. The contents
of the dashboard will therefore primarily vary depending upon the application being monitored. Figure 2.29 for
instance depicts the Application Dashboard of a Citrix XenApp server.
Note:
If the execution policy for a XenApp server has already been set to Unrestricted or RemoteSigned, the eG
agent setup process will not alter that setting.
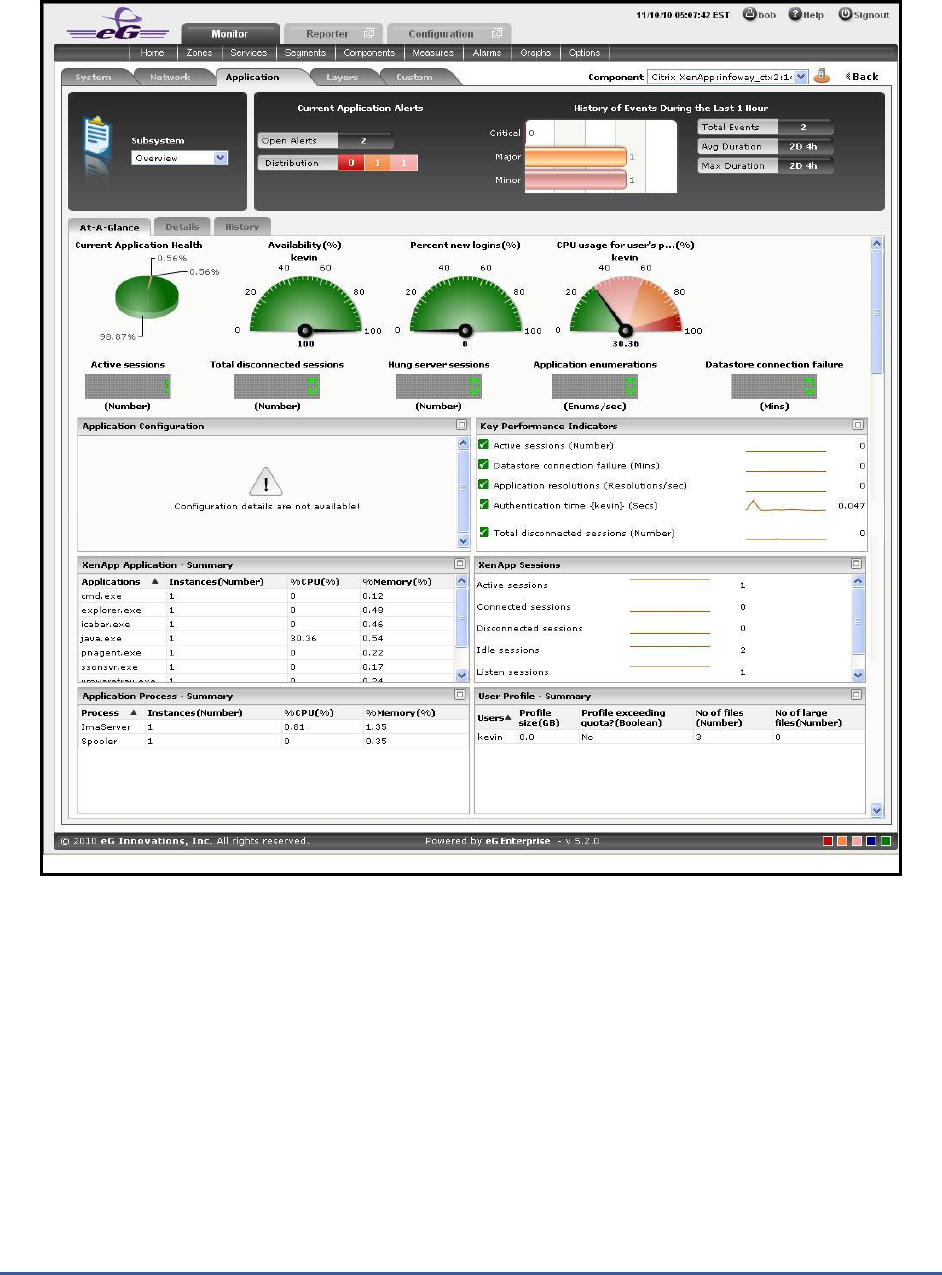
M O N I T O RI N G C I T R I X X E N AP P S E R V E R S
142
Figure 2.29: The Application Dashboard of a Citrix XenApp application
The contents of the Application dashboard are governed by the Subsystem chosen from Figure 2.29, just like that of
the System and Network dashboards. By default, the Overview option is chosen from the Subsystem list. If need be,
this default setting can be changed by picking a different option from the Subsystem list. The sections that follow will
discuss each of the Subsystems offered by the Citrix XenApp application dashboard shown in Figure 2.29 above.
2.1.9.1 Overview
The Overview dashboard of a Citrix XenApp application provides an all-round view of the health of the Citrix XenApp
application that is being monitored, and helps the administrators to pinpoint the problematic areas. Hence using this
dashboard, you can determine the following queries in a quick and easy way.
i. Has the application encountered any issue currently? If so, what is the issue and how critical is it?
j. How problem-prone has the application been during the last 24 hours? Which application layer has been
badly hit?
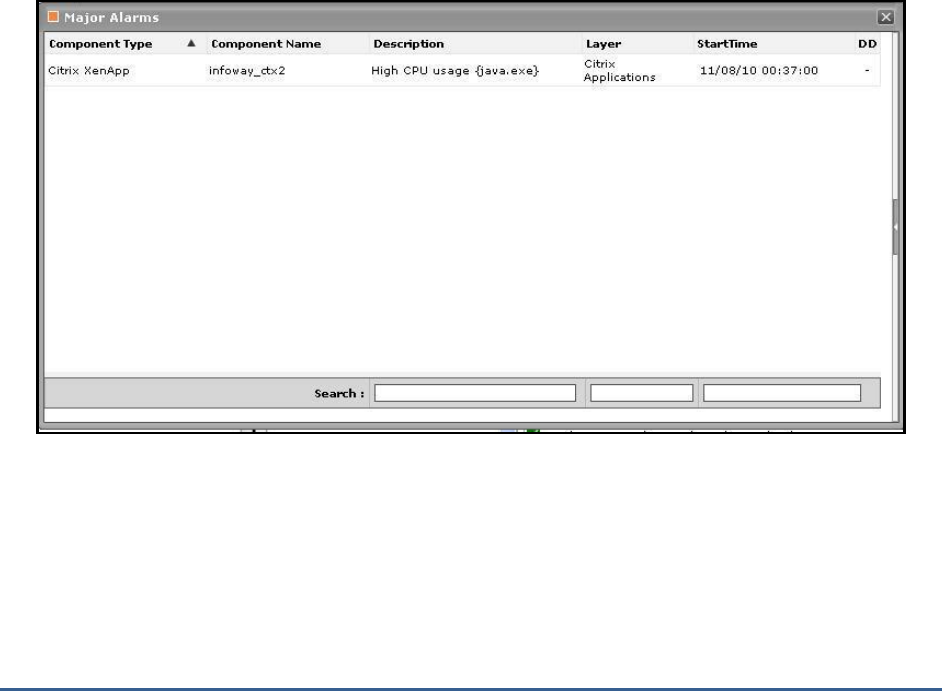
M O N I T O RI N G C I T R I X X E N AP P S E R V E R S
143
k. Has the administrative staff been able to resolve all past issues? On an average, how long do the
administrative personnel take to resolve an issue?
l. Are all the key performance parameters of the application operating normally?
m. Is the Citrix XenApp application utilizing CPU optimally or is the current CPU usage very high? Did the CPU
usage increase suddenly or gradually - i.e., over a period of time?
n. How many active sessions are available? What are those sessions?
o. Are there any disconnected sessions? If so, when was it disconnected? What was the problem behind the
disconnected session?
p. How many application processes have been running? What is the CPU utilization of each of those
applications? Is there any abnormal increase in CPU utilization over a period of time?
q. How many users are active in the current time period? How many files are available for that particular
user?
The contents of the Overview Dashboard have been elaborated on hereunder:
1. The Current Application Alerts section of Figure 2.29 reveals the number and type of issues currently affecting
the performance of the Citrix XenApp application that is being monitored. To know more about the issues at
hand, click on any cell against Distribution that represents the problem priority of interest to you; the details of
the current problems of that priority will then appear as depicted by Figure 2.30.
Figure 2.30: Viewing the current application alerts of a particular priority
2. If the pop-up window of Figure 2.30 reveals too many problems, you can use the Search text boxes that have
been provided at the end of the Description, Layer, and StartTime columns to run quick searches on the contents
of these columns, so that the alarm of your interest can be easily located. For instance, to find the alarm with a
specific description, you can provide the whole/part of the alarm description in the text box at the end of the
Description column; this will result in the automatic display of all the alarms with descriptions that contain the
specified search string.
3. To zoom into the exact layer, test, and measure that reported any of the listed problems, click on any of the
alarms in the Alarms window of Figure 2.30. Doing so will introduce an Alarm Details section into the Alarms

M O N I T O RI N G C I T R I X X E N AP P S E R V E R S
144
window (see Figure 2.31), which provides the complete information related to the problem clicked on These
details include the Site affected by the problem for which the alarm was raised, the test that reported the
problem, and the percent usage indicating the Last Measure.
Figure 2.31: Additional alarm details
4. While the list of current issues faced by the application serves as a good indicator of the current state of the
application, to know how healthy/otherwise the application has been over the time, a look at the problem history
of the application is essential. Therefore, the dashboard provides the History of Events section; this section
presents a bar chart, where every bar indicates the total number of problems along with their corresponding
severity, which was experienced by the Citrix XenApp application during the last 1 hour (by default). Clicking on
a bar here will lead you to Figure 2.32, which provides a detailed history of problems of that priority. Alongside
the bar chart, you will also find a table displaying the average and maximum duration for problem resolution;
this table helps you determine the efficiency of your administrative staff.
Figure 2.32: The problem history of the target application

M O N I T O RI N G C I T R I X X E N AP P S E R V E R S
145
If required, you can override the default time period of 1 hour of the event history, by following the steps
below:
Click the button at the top of the dashboard to invoke the Dashboard Settings window.
Select the Event History option from the Default timeline for list.
Set a different default timeline by selecting an option from the Timeline list.
Finally, click the Update button.
5. In the dashboard, you will find that the History of Events section is followed by an At-A-Glance section. This
section reveals the current status of some critical metrics and key components of the Citrix XenApp application at
a single glance, using pie charts, digital displays and gauge charts. For instance, the Current Application Health
pie chart indicates the current health of the application by representing the number of application-related metrics
that are in various states. Clicking on a slice here will take you to Figure 2.32 that provides a detailed problem
history.
6. The dial and digital graphs that follow will provide you with quick updates on the status of a pre-configured set
of resource usage-related metrics pertaining to the Citrix XenApp application. If required, you can configure the
dial graphs to display the threshold values of the corresponding measures along with their actual values, so that
deviations can be easily detected. For this purpose, do the following:
Click the button at the top of the dashboard to invoke the Dashboard Settings window.
Set the Show Thresholds flag in the window to Yes.
Finally, click the Update button.
7. You can customize the At-A-Glance tab page further by overriding the default measure list for which dial/digital
graphs are being displayed in that tab. To achieve this, do the following:
Click on the icon at the top of the Application Dashboard. In the Dashboard Settings window that
appears, select Application from the Module list, and Overview from the Sub-System list.
To add measures for the dial graph, pick the Dial Graph option from the Add/Delete Measures for list.
Upon selection of the Dial Graph option, the pre-configured measures for the dial graph will appear in
the Existing Value(s) list. Similarly, to add a measure to the digital display, pick the Digital Graph
option from the Add/Delete Measures for list. In this case, the Existing Value(s) list box will display all
those measures for which digital displays pre-exist.
Next, select the Test that reports the said measure, pick the measure of interest from the Measures
list, provide a Display name for the measure, and click the Add button to add the chosen measure to
the Existing Value(s) list. Note that while configuring measures for a dial graph the 'Measures' list will
display only those measures that report percentage values.
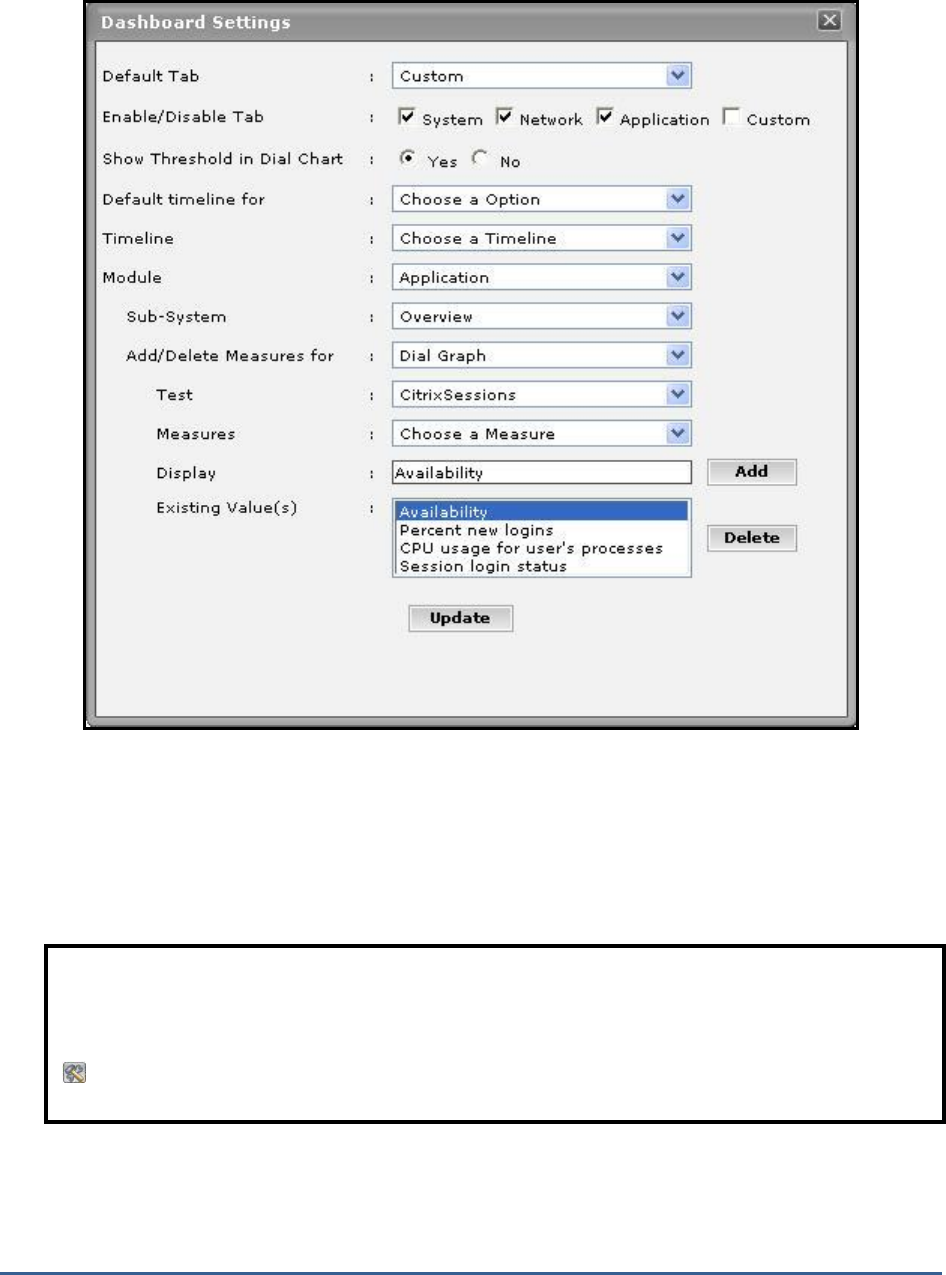
M O N I T O RI N G C I T R I X X E N AP P S E R V E R S
146
Figure 2.33: Configuring measures for the dial graph
If you want to delete one/more measures from the dial/digital graphs, then, as soon as you choose
the Dial Graph or Digital Graph option from the Add/Delete Measures for list, pick any of the displayed
measures from the Existing Value(s) list, and click the Delete button.
Finally, click the Update button to register the changes.
8. Clicking on a dial/digital graph will lead you to the layer model page of the Citrix XenApp Application; this page
will display the exact layer-test combination that reports the measure represented by the dial/digital graph.
Note:
Only users with Admin or Supermonitor privileges can enable/disable the system, network, and application
dashboards, or can customize the contents of such dashboards using the Dashboard Settings window.
Therefore, whenever a user without Admin or Supermonitor privileges logs into the monitoring console, the
button will not appear.
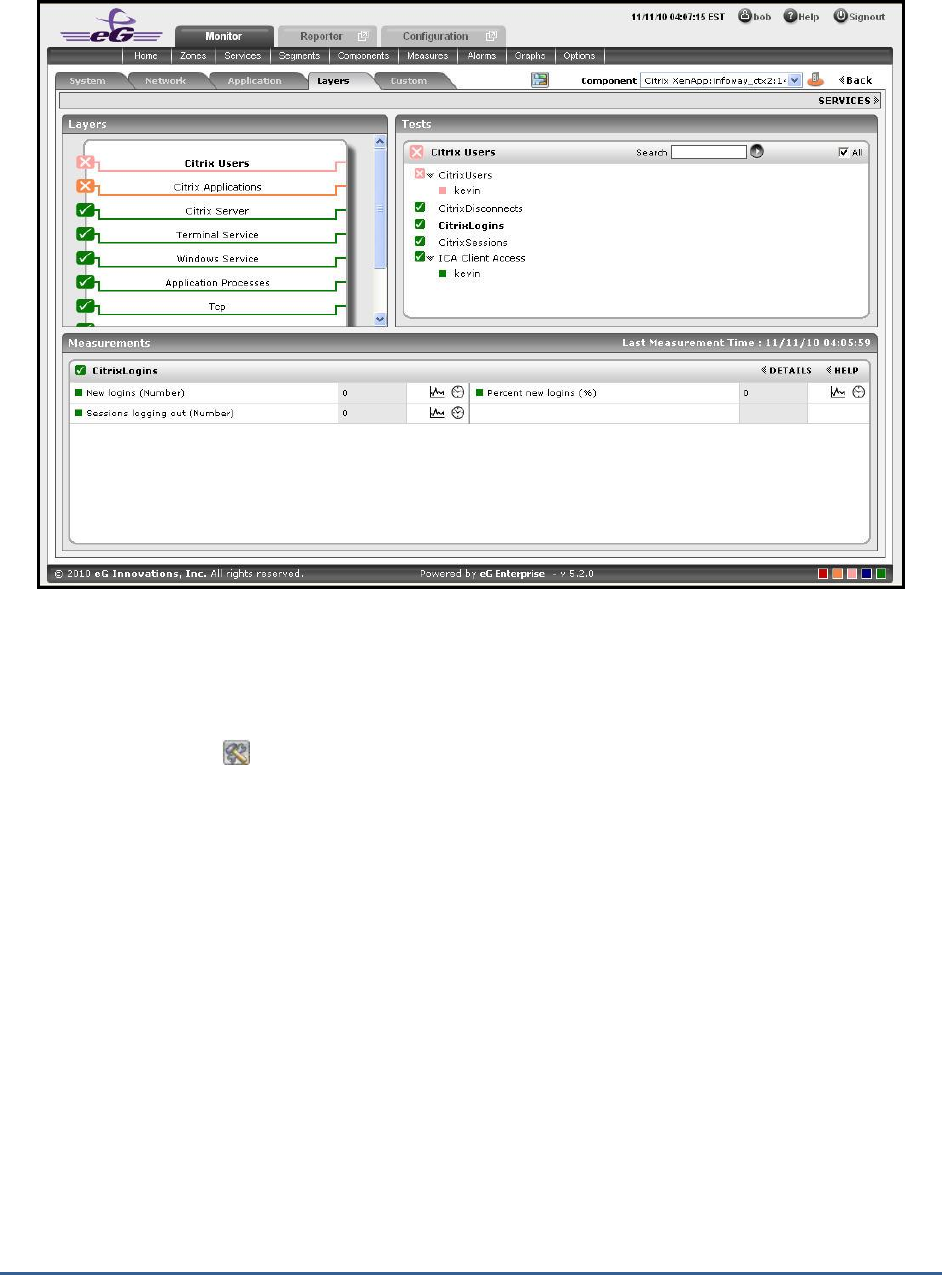
M O N I T O RI N G C I T R I X X E N AP P S E R V E R S
147
Figure 2.34: The page that appears when the dial/digital graph in the Overview dashboard of the Citrix XenApp
Application is clicked
9. If your eG license enables the Configuration Management capability, then, an Application Configuration section
will appear here providing the basic configuration of the application. You can configure the type of configuration
data that is to be displayed in this section by following the steps below:
Click on the icon at the top of the Application Dashboard. In the Dashboard Settings window that
appears, select Application from the Module list, and Overview from the Sub-System list.
To add more configuration information to this section, first, pick the Application Configuration option
from the Add/Delete Measures for list. Upon selection of this option, all the configuration measures
that pre-exist in the Configuration Management section will appear in the Existing Value(s) list.
Next, select the config Test that reports the said measure, pick the measure of interest from the
Measures list, provide a Display name for the measure, and click the Add button to add the chosen
measure to the Existing Value(s) list.
If you want to delete one/more measures from this section, then, as soon as you choose the
Application Configuration option from the Add/Delete Measures for list, pick any of the displayed
measures from the Existing Value(s) list, and click the Delete button.
Finally, click the Update button to register the changes.
10. Next to this section, you will find a pre-configured list of Key Performance Indicators of the Citrix XenApp
application. Besides indicating the current state of and current value reported by a default collection of critical
metrics, this section also reveals ‘miniature’ graphs of each metric, so that you can instantly study how that
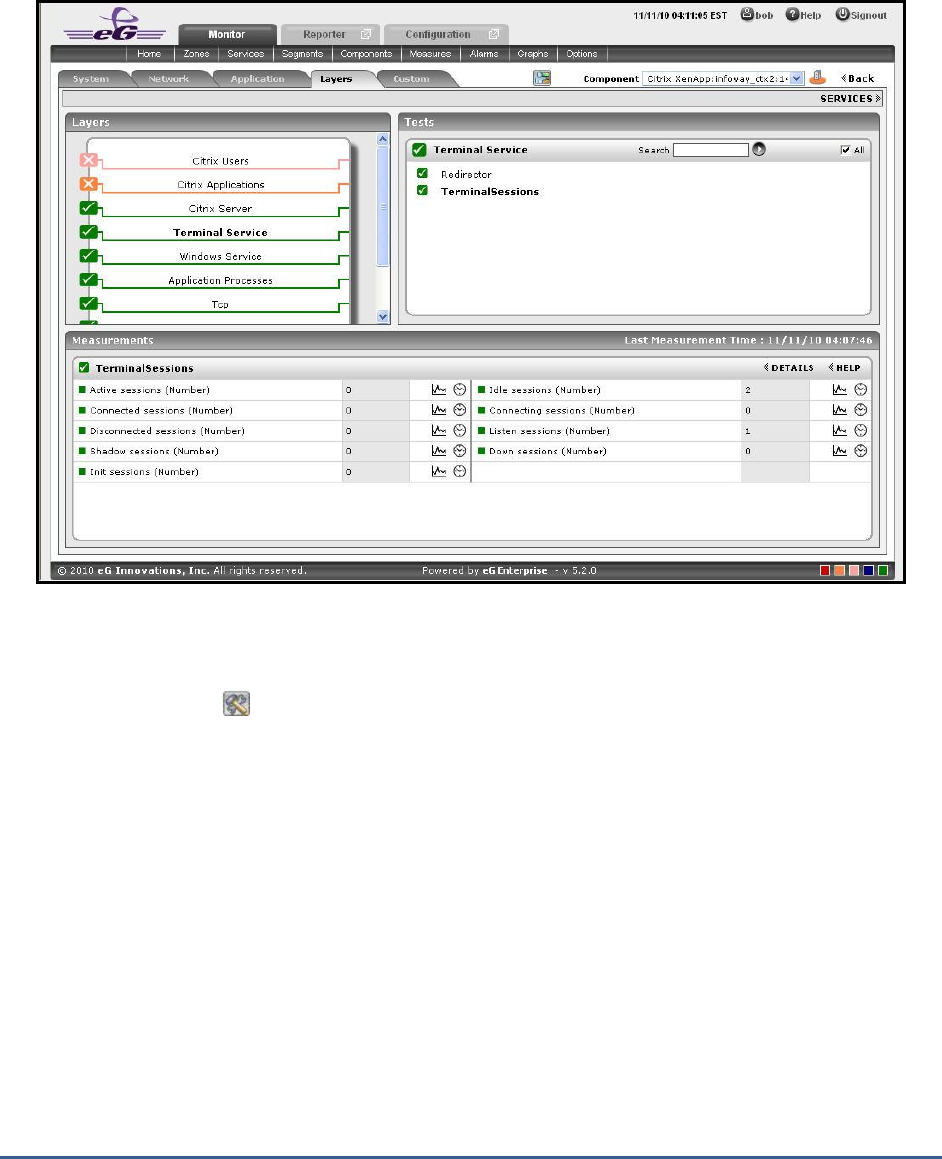
M O N I T O RI N G C I T R I X X E N AP P S E R V E R S
148
measure has behaved during the last 1 hour (by default) and thus determine whether the change in state of the
measure was triggered by a sudden dip in performance or a consistent one. Clicking on a measure here will lead
you to Figure 2.35, which displays the layer and test that reports the measure.
Figure 2.35: Clicking on a Key Performance Indicator
11. You can, if required, override the default measure list in the Key Performance Indicators section by adding more
critical measures to the list or by removing one/more existing ones from the list. For this, do the following:
Click on the icon at the top of the Application Dashboard. In the Dashboard Settings window that
appears, select Application from the Module list, and Overview from the Sub-System list.
To add more metrics to the Key Performance Indicators section, first, pick the Performance Indicator
option from the Add/Delete Measures for list. Upon selection of this option, all the measures that pre-
exist in the Key Performance Indicators section will appear in the Existing Value(s) list.
Next, select the Test that reports the said measure, pick the measure of interest from the Measures
list, provide a Display name for the measure, and click the Add button to add the chosen measure to
the Existing Value(s) list.
If you want to delete one/more measures from this section, then, as soon as you choose the Key
Performance Indicators option from the Add/Delete Measures for list, pick any of the displayed
measures from the Existing Value(s) list, and click the Delete button.
Finally, click the Update button to register the changes.
12. Clicking on a ‘miniature’ graph that corresponds to a key performance indicator will enlarge the graph, so that
you can view and analyze the measure behaviour more clearly, and can also alter the Timeline and dimension
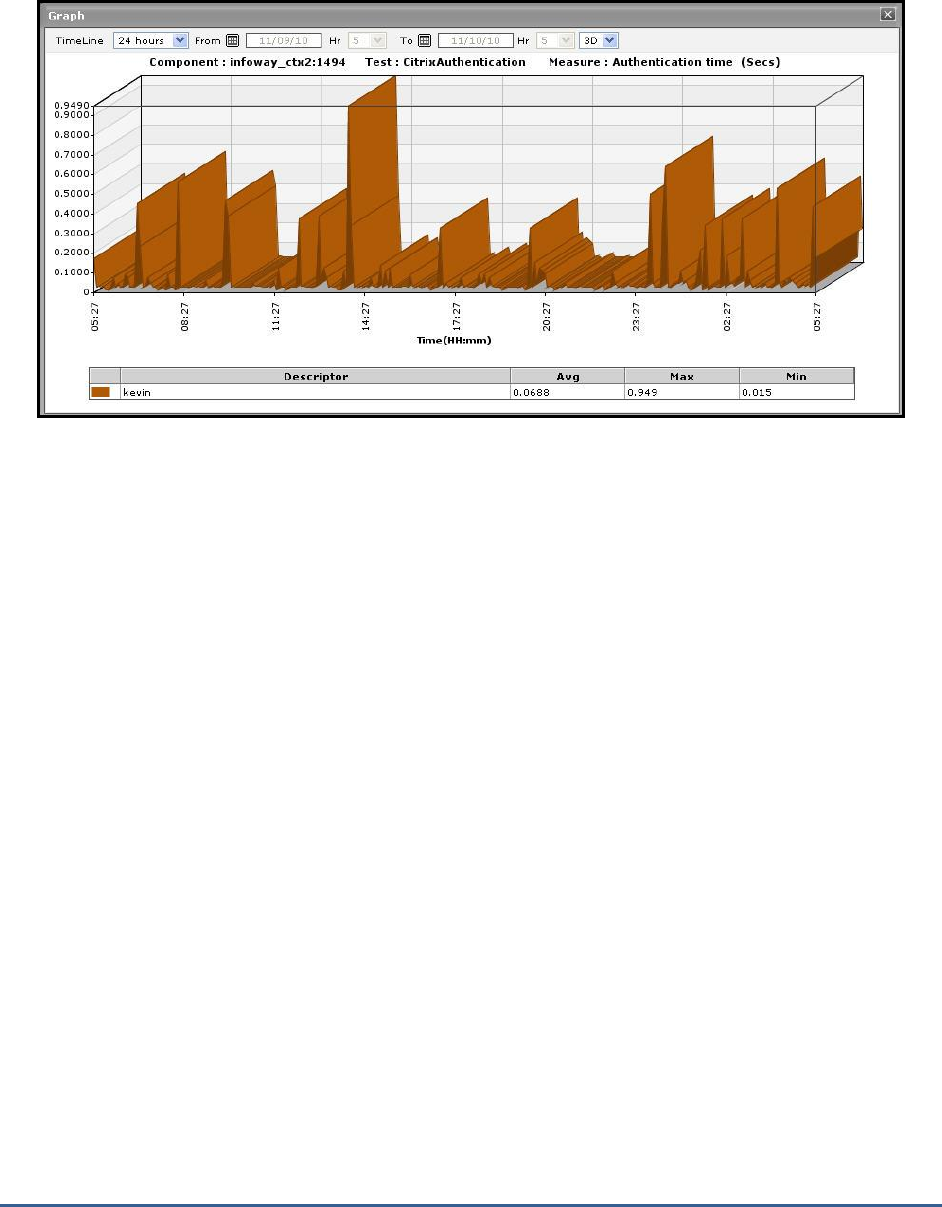
M O N I T O RI N G C I T R I X X E N AP P S E R V E R S
149
(3D/ 2D) of the graph, if need be.
Figure 2.36: Enlarging the Key Performance Indicator graph
13. This way, the first few sections of the At-A-Glance tab page helps you to understand the issues that are
currently affecting the application health, and when they actually originated. However, to diagnose the root-
cause of these issues, you would have to take help from the remaining sections of the At-A-Glance tab page. For
instance, the Key Performance Indicators section may reveal a slowdown in the Citrix server. But, to determine
whether this slowdown is owing to too many instances of an application executing on the server, or due to
excessive resource usage by one/more applications/OS-level processes on the server, you need to focus on the
XenApp Application - Summary section and the Application Process - Summary section in the dashboard. The
XenApp Application - Summary section lists the applications that are currently executing on the XenApp server,
and for each application, reveals:
The percent CPU utilization of that application;
The percentage of memory that is utilized by that application;
The number of instances of that application that are currently operational
14. This section turns your attention to the most resource-hungry applications on the Citrix XenApp server.
15. The XenApp Sessions section provides you with a quick overview of the current session activity on the Citrix
XenApp server. Session overloads, idle sessions that are unnecessarily consuming resources, and hung server
sessions causing slowdowns can be instantly detected using this section. Each measure displayed here is
associated with a miniature graph. By clicking on the graph, you can view an enlarged graph of that particular
session-related measure for a default period of 24 hours, and infer whether any abnormal activity has taken
place during the default timeline. This default timeline can be altered according to the user’s desire.
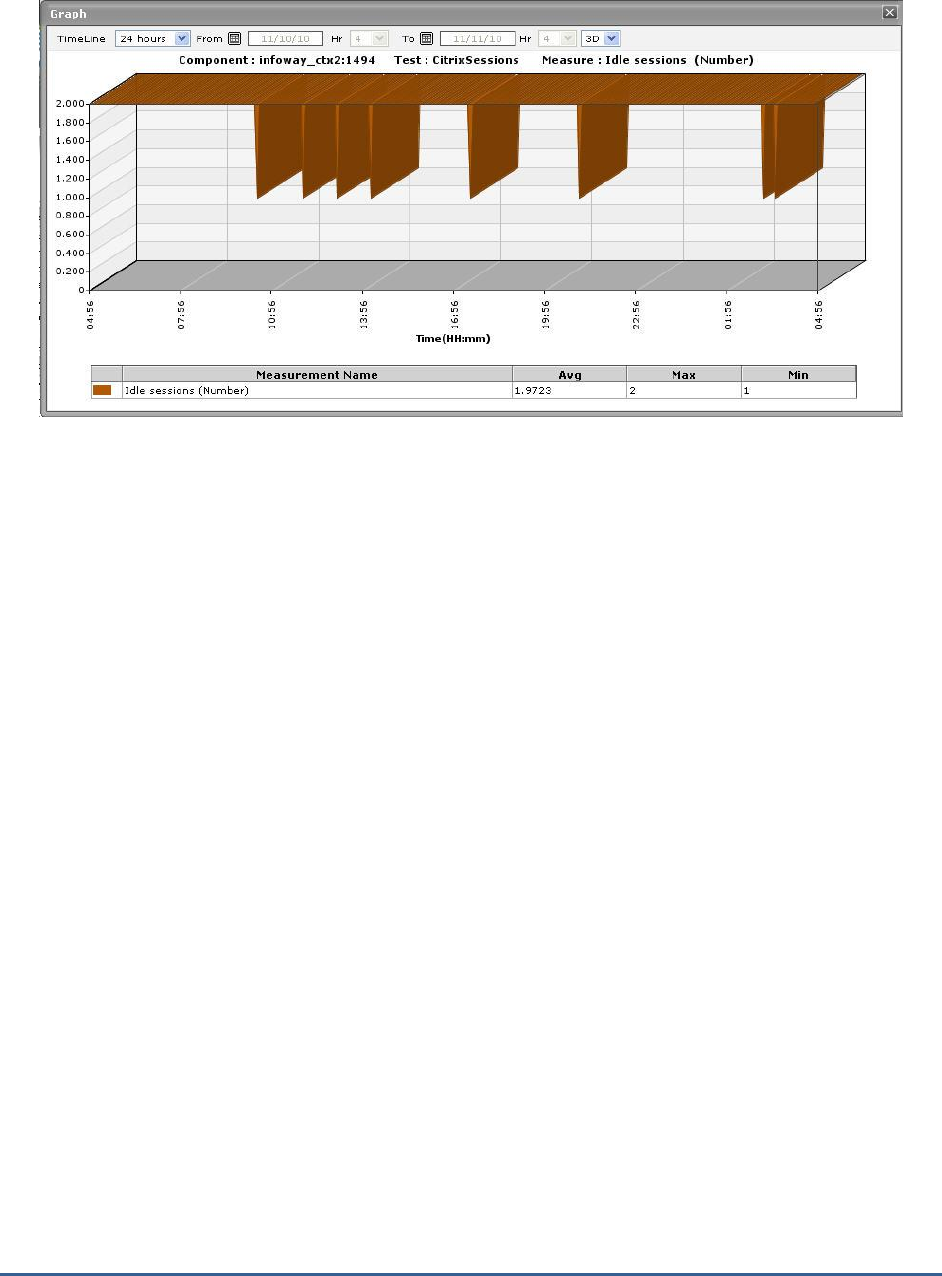
M O N I T O RI N G C I T R I X X E N AP P S E R V E R S
150
Figure 2.37: Idle sessions graph that is enlarged from the XenApp Sessions.
16. The Application Process - Summary section, on the other hand, traces the percent CPU usage and percent
memory usage of each of the Citrix XenApp processes that are currently executing on the target host, and thus
leads you to the resource-intensive processes. By default, the process list provided by this section is sorted in the
alphabetical order of the process names. If need be, you can change the sort order so that the processes are
arranged in, say, the descending order of values displayed in the Instances column - this column displays the
number of instances of each process that is in execution currently. To achieve this, simply click on the column
heading - Instances. Doing so tags the Instances label with a down arrow icon - this icon indicates that the
process list is currently sorted in the descending order of the instance count. To change the sort order to
‘ascending’, all you need to do is just click again on the Instances label or the down arrow icon. Similarly, you can
sort the process list based on any column available in the Application Process - Summary section.
17. While the At-A-Glance tab page reveals the current state of the Citrix XenApp application and the overall
resource usage of the application, to perform additional diagnosis on problem conditions highlighted by the At-A-
Glance tab page and to accurately pinpoint their root-cause, you need to switch to the Details tab page by
clicking on it. For instance, the At-A-Glance tab page may that the CPU usage of an application is very high, but
to know which user is utilizing that application, you will have to use the Details tab page.
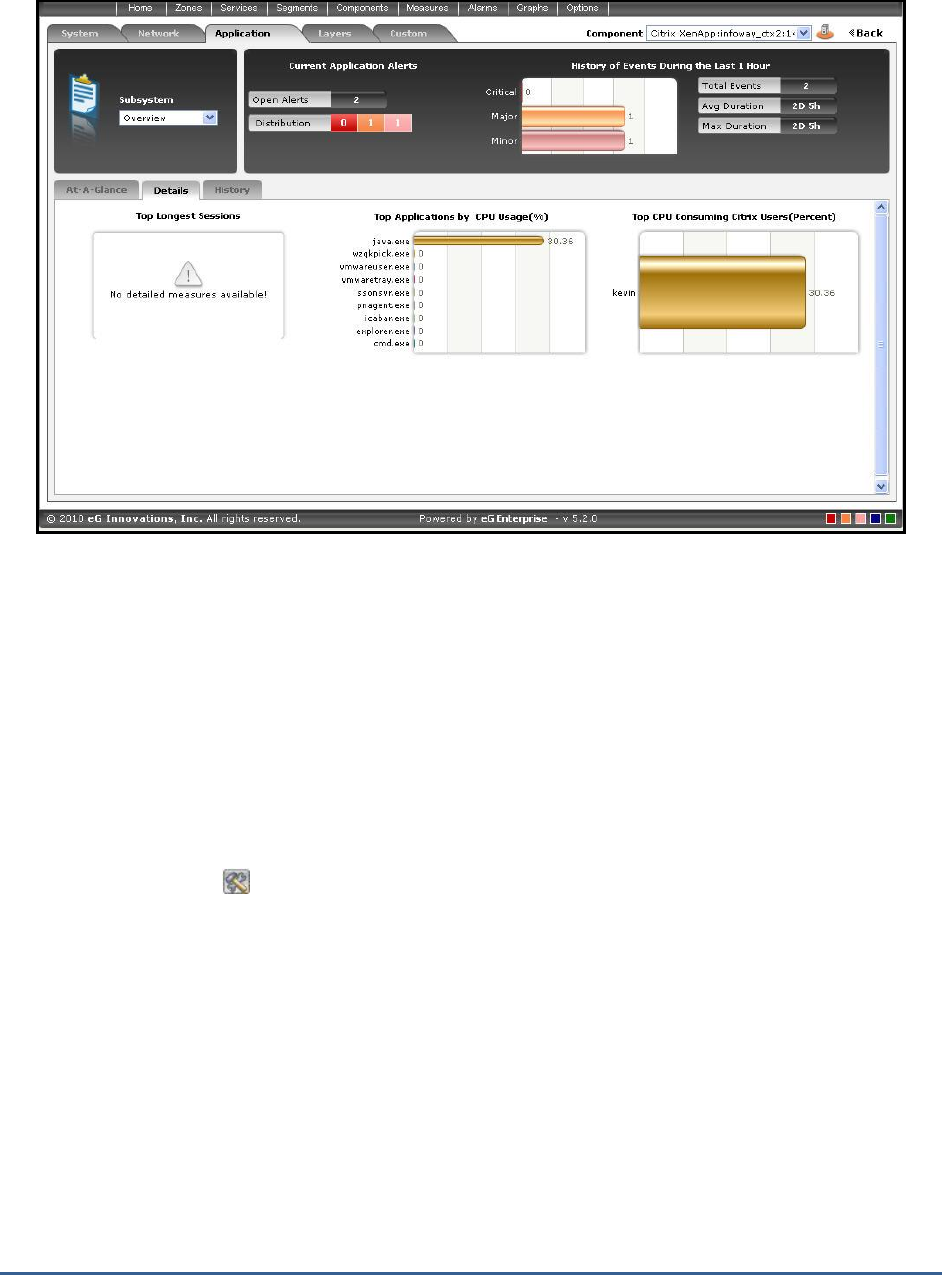
M O N I T O RI N G C I T R I X X E N AP P S E R V E R S
151
Figure 2.38: The Details tab page of the Application Overview Dashboard
18. The Details tab page comprises of a default set of comparison bar graphs using which you can accurately
determine the following:
What are the longest sessions on the Citrix server?
What are the resource-intensive applications on the Citrix server?
Which user is utilizing the maximum CPU resources on the server?
19. If required, you can configure the Details tab page to include comparison graphs for more measures, or can
even remove one/more existing graphs by removing the corresponding measures. To achieve this, do the
following:
Click on the icon at the top of the Application Dashboard. In the Dashboard Settings window that
appears, select Application from the Module list, and Overview from the Sub-System list.
To add measures for comparison graphs, first, pick the Comparison Graph option from the Add/Delete
Measures for list. Upon selection of this option, the pre-configured measures for comparison graphs
will appear in the Existing Value(s) list.
Next, select the Test that reports the said measure, pick the measure of interest from the Measures
list, provide a Display name for the measure, and click the Add button to add the chosen measure to
the Existing Value(s) list.
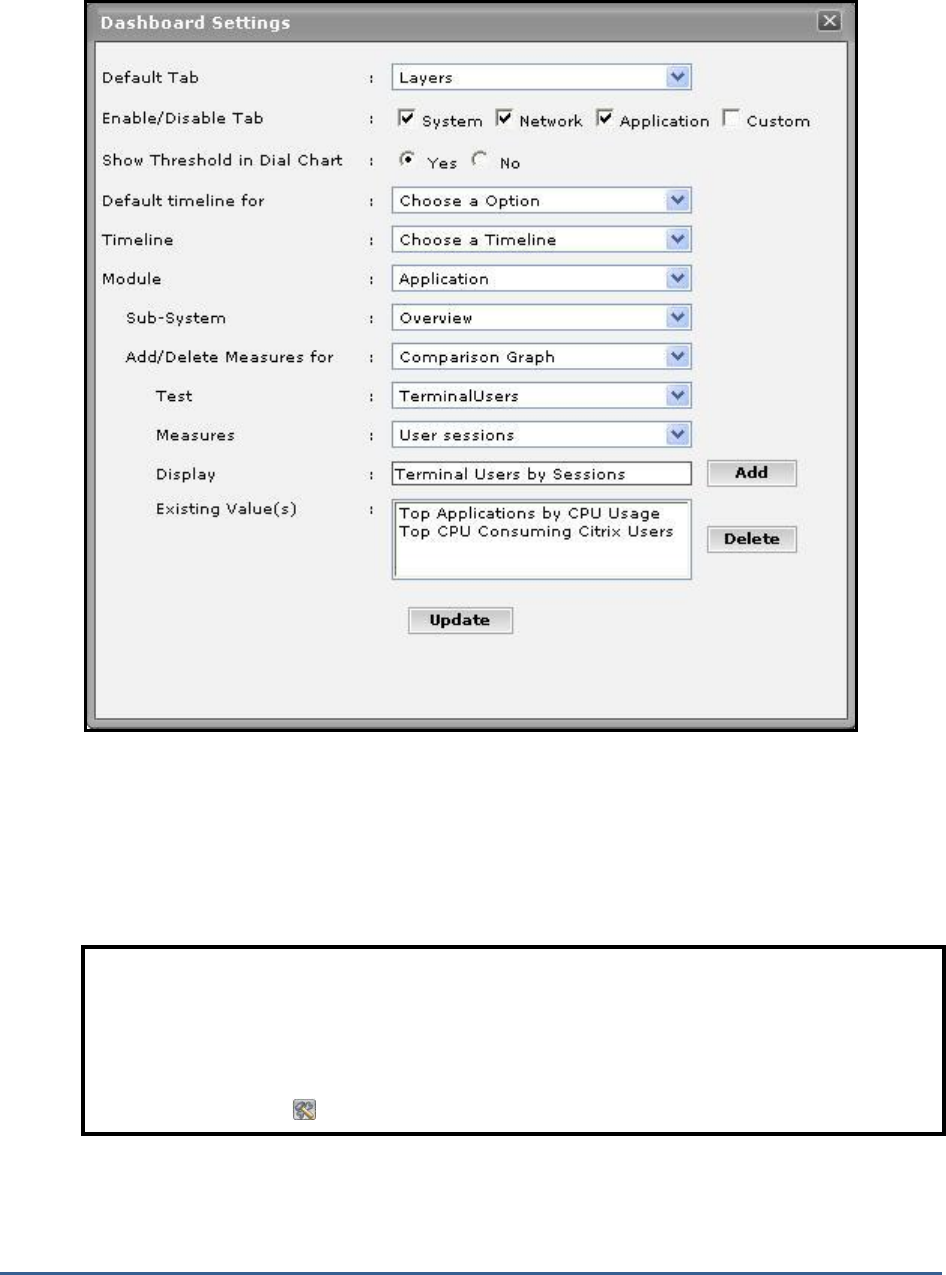
M O N I T O RI N G C I T R I X X E N AP P S E R V E R S
152
Figure 2.39: Configuring measures for the dial graph
If you want to delete one/more measures for which comparison graphs pre-exist in the details tab
page, then, as soon as you choose the Comparison Graph option from the Add/Delete Measures for
list, pick any of the displayed measures from the Existing Value(s) list, and click the Delete button.
Finally, click the Update button to register the changes.
20. By default, the comparison bar graphs list the top-10 applications and users only. To view the complete list of
applications and users, simply click on the corresponding graph in Figure 2.38. This enlarges the graph as
Note:
Only users with Admin or Supermonitor privileges can enable/disable the system, network, and
application dashboards, or can customize the contents of such dashboards using the Dashboard
Settings window. Therefore, whenever a user without Admin or Supermonitor privileges logs into the
monitoring console, the button will not appear.
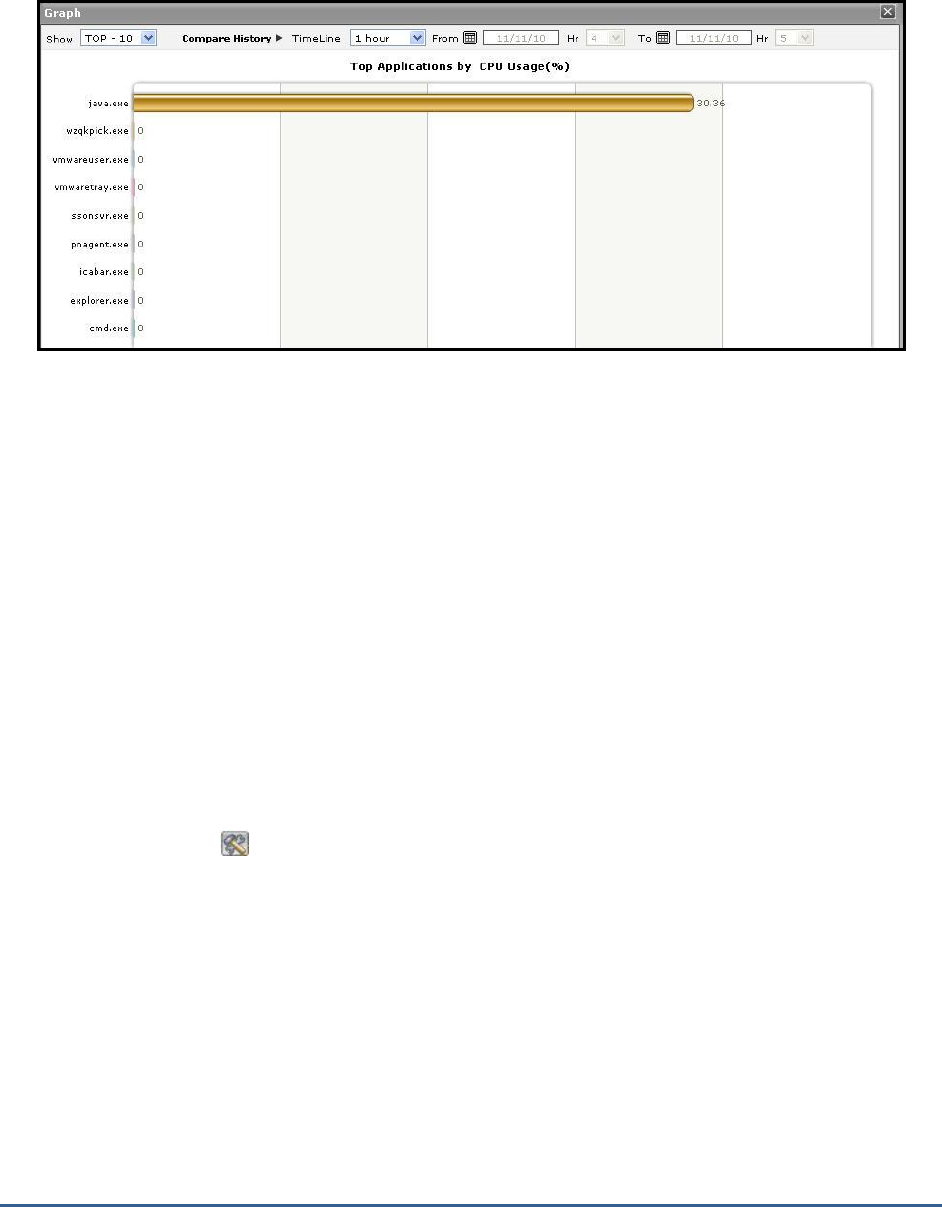
M O N I T O RI N G C I T R I X X E N AP P S E R V E R S
153
depicted by Figure 2.40.
Figure 2.40: The expanded top-n graph in the Details tab page of the Application Overview Dashboard
21. Though the enlarged graph lists all the applications or users (as the case may be) by default, you can customize
the enlarged graph to display the details of only a few of the best/worst-performing users and applications by
picking a TOP-N or LAST-N option from the Show list in Figure 2.40.
22. Another default aspect of the enlarged graph is that it pertains to the current period only. Sometimes however,
you might want to know what occurred during a point of time in the past; for instance, while trying to
understand the reason behind a sudden spike in CPU usage on a particular day last week, you might want to first
determine which application is guilty of abnormal CPU consumption on the same day. To figure this out, the
enlarged graph allows you to compare the historical performance of applications or users. For this purpose, click
on the Compare History link in Figure 1.12 and select the TimeLine of your choice.
23. For detailed time-of-day / trend analysis of the historical performance of a Citrix XenApp application, use the
History tab page. By default, this tab page (see Figure 2.41) provides time-of-day graphs of critical measures
extracted from the target Citrix XenApp application, using which you can understand how performance has
varied during the default period of 24 hours. In the event of a problem, these graphs will help you determine
whether the problem occurred suddenly or grew with time. To alter the timeline of all the graphs simultaneously,
click on the Timeline link at the right, top corner of the History tab page of Figure 2.41.
24. You can even override the default timeline (of 24 hours) of the measure graphs, by following the steps below:
Click on the icon at the top of the Application Dashboard.
In the Dashboard Settings window that appears, select History Graph from the Default Timeline for list.
Then, choose a Timeline for the graph.
Finally, click the Update button.
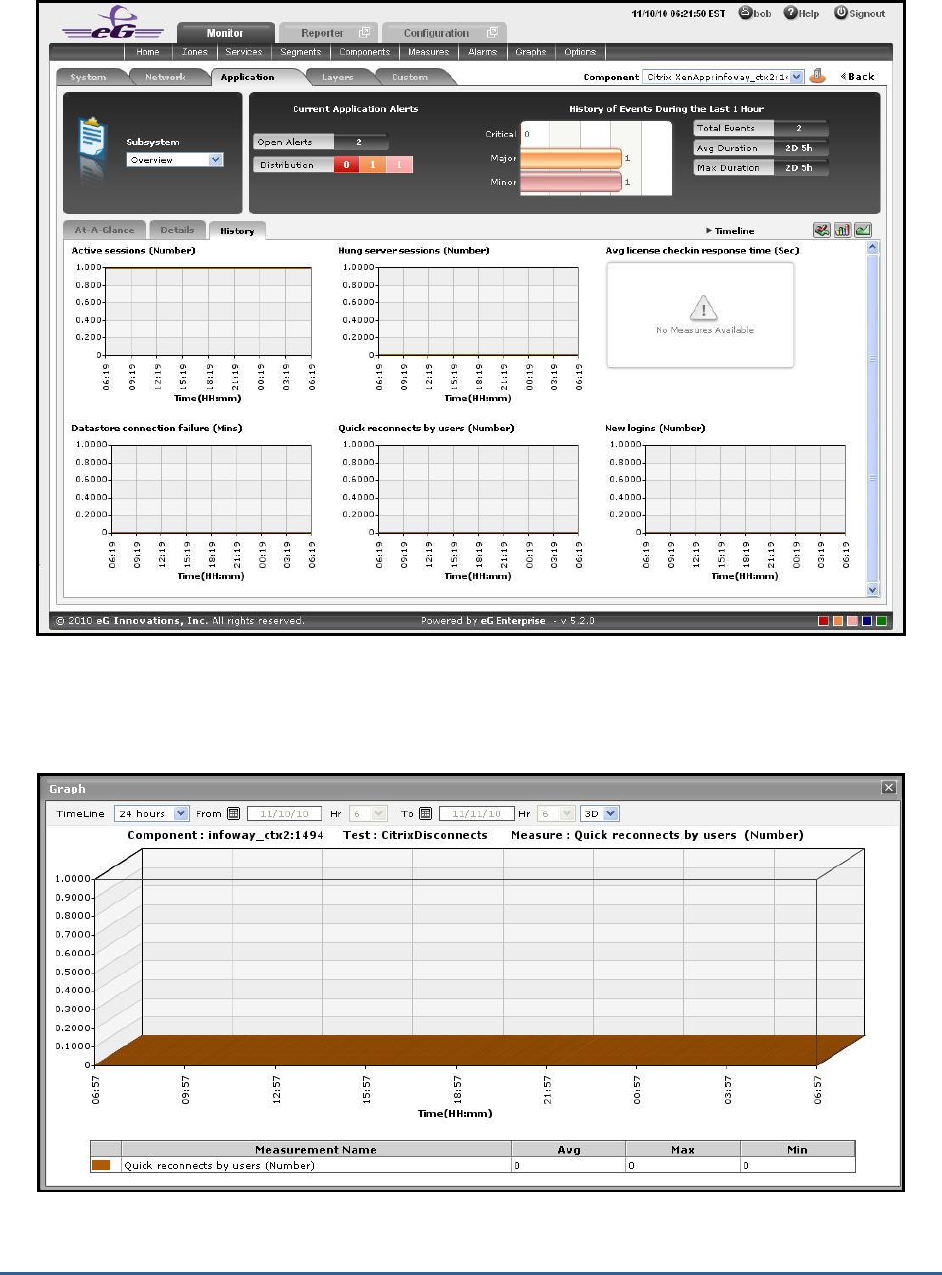
M O N I T O RI N G C I T R I X X E N AP P S E R V E R S
154
Figure 2.41: Time-of-day measure graphs displayed in the History tab page of the Application Overview Dashboard
25. You can click on any of the graphs to enlarge it, and can change the Timeline of that graph in the enlarged
mode.
Figure 2.42: An enlarged measure graph of a Citrix XenApp Application
26. In case of tests that support descriptors, the enlarged graph will, by default, plot the values for the TOP-10
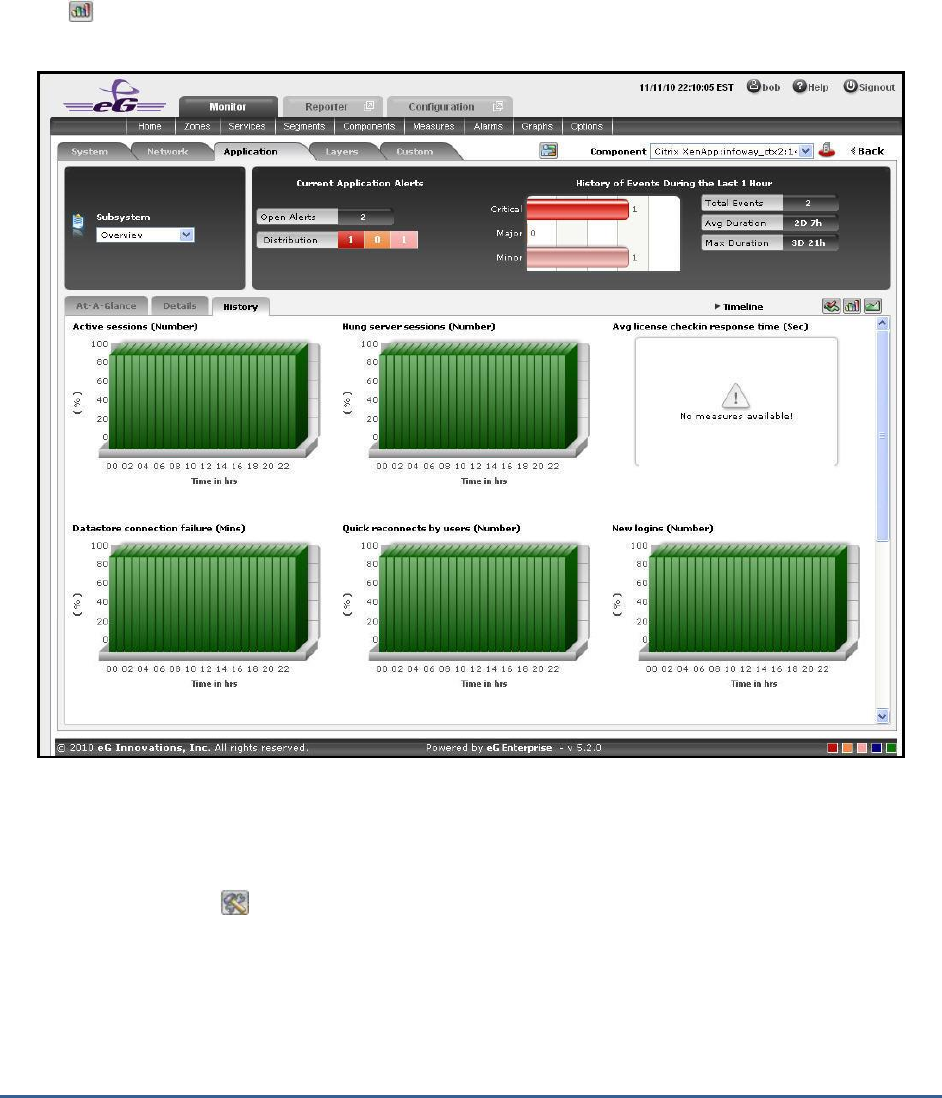
M O N I T O RI N G C I T R I X X E N AP P S E R V E R S
155
descriptors alone. To configure the graph to plot the values of more or less number of descriptors, select a
different TOP-N / LAST-N option from the Show list in Figure 2.42.
27. If you want to quickly perform service level audits on the Citrix XenApp server, then summary graphs may be
more appropriate than the default measure graphs. For instance, a summary graph might come in handy if you
want to determine the percentage of time during the last 24 hours the Citrix XenApp server was available. Using
such a graph, you can determine whether the availability levels guaranteed by the Citrix XenApp server were met
or not, and if not, how frequently did the server falter in this regard. To invoke such summary graphs, click on
the icon at the right, top corner of the History tab page. Figure 2.43 will then appear.
Figure 2.43: Summary graphs displayed in the History tab page of the Application Overview Dashboard
28. You can alter the timeline of all the summary graphs at one shot by clicking the Timeline link at the right, top
corner of the History tab page of Figure 2.43. You can even alter the default timeline (of 24 hours) for these
graphs, by following the steps given below:
Click on the icon at the top of the Application Dashboard.
In the Dashboard Settings window that appears, select Summary Graph from the Default Timeline for
list.
Then, choose a Timeline for the graph.
Finally, click the Update button.
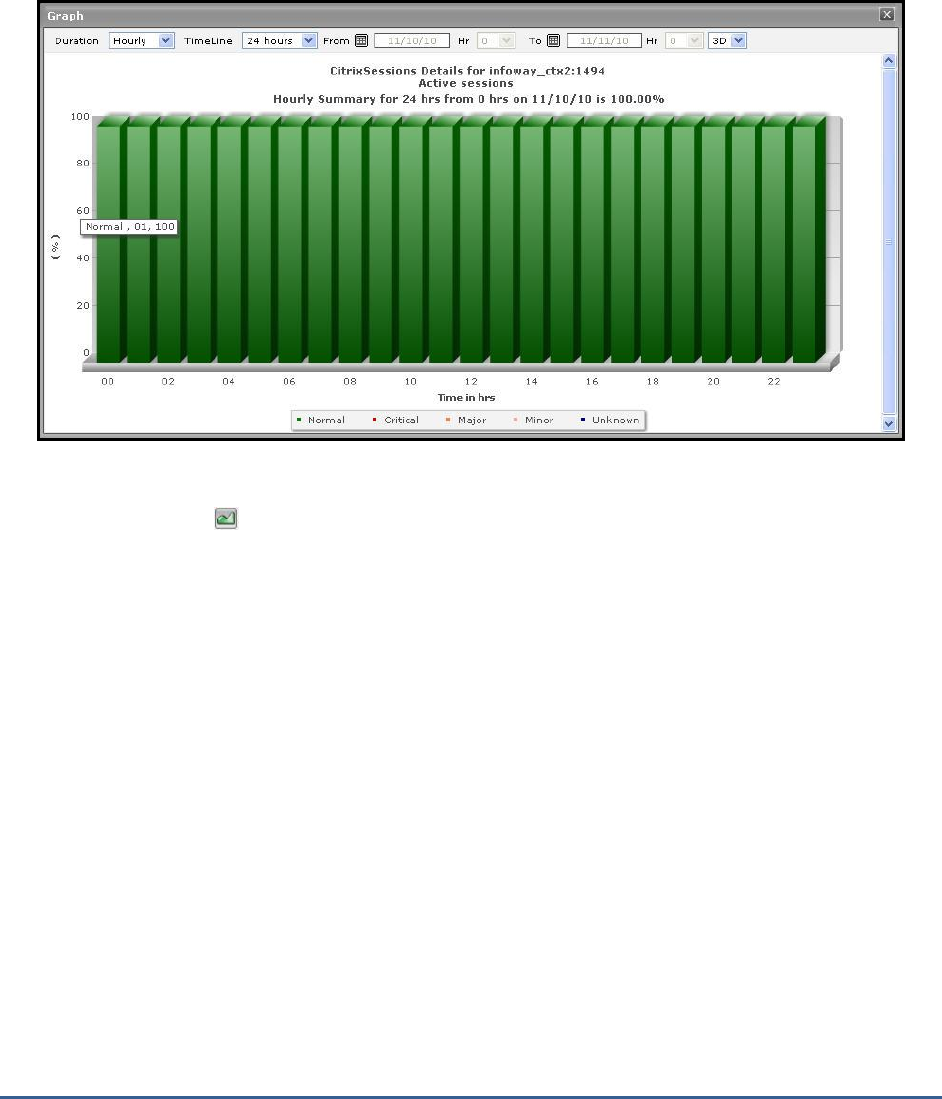
M O N I T O RI N G C I T R I X X E N AP P S E R V E R S
156
29. To change the timeline of a particular graph, click on it; this will enlarge the graph as depicted by Figure 2.44.
In the enlarged mode, you can alter the Timeline of the graph. Also, though the graph plots hourly summary
values by default, you can pick a different Duration for the graph in the enlarged mode, so that daily/monthly
performance summaries can be analyzed.
Figure 2.44: An enlarged summary graph of the Citrix XenApp Application
30. To perform effective analysis of the past trends in performance, and to accurately predict future measure
behavior, click on the icon at the right, top corner of the History tab page. These trend graphs typically show
how well and how badly a measure has performed every hour during the last 24 hours (by default). For instance,
the Active Sessions trend graph will point you to when (during the last 24 hours) the number of active sessions
to the Citrix server had peaked, and when it was very low. If the gap between the minimum and maximum
values is marginal, you can conclude that the number of active sessions has been more or less constant during
the designated period; this implies that the active session has neither increased nor decreased steeply during the
said timeline. On the other hand, a wide gap between the maximum and minimum values is indicative erratic
session load on the server, and may necessitate further investigation. By carefully studying the trend graph, you
can even determine the points of time at which the session has behaved abnormally during the stated timeline,
and this knowledge can greatly aid further diagnosis.
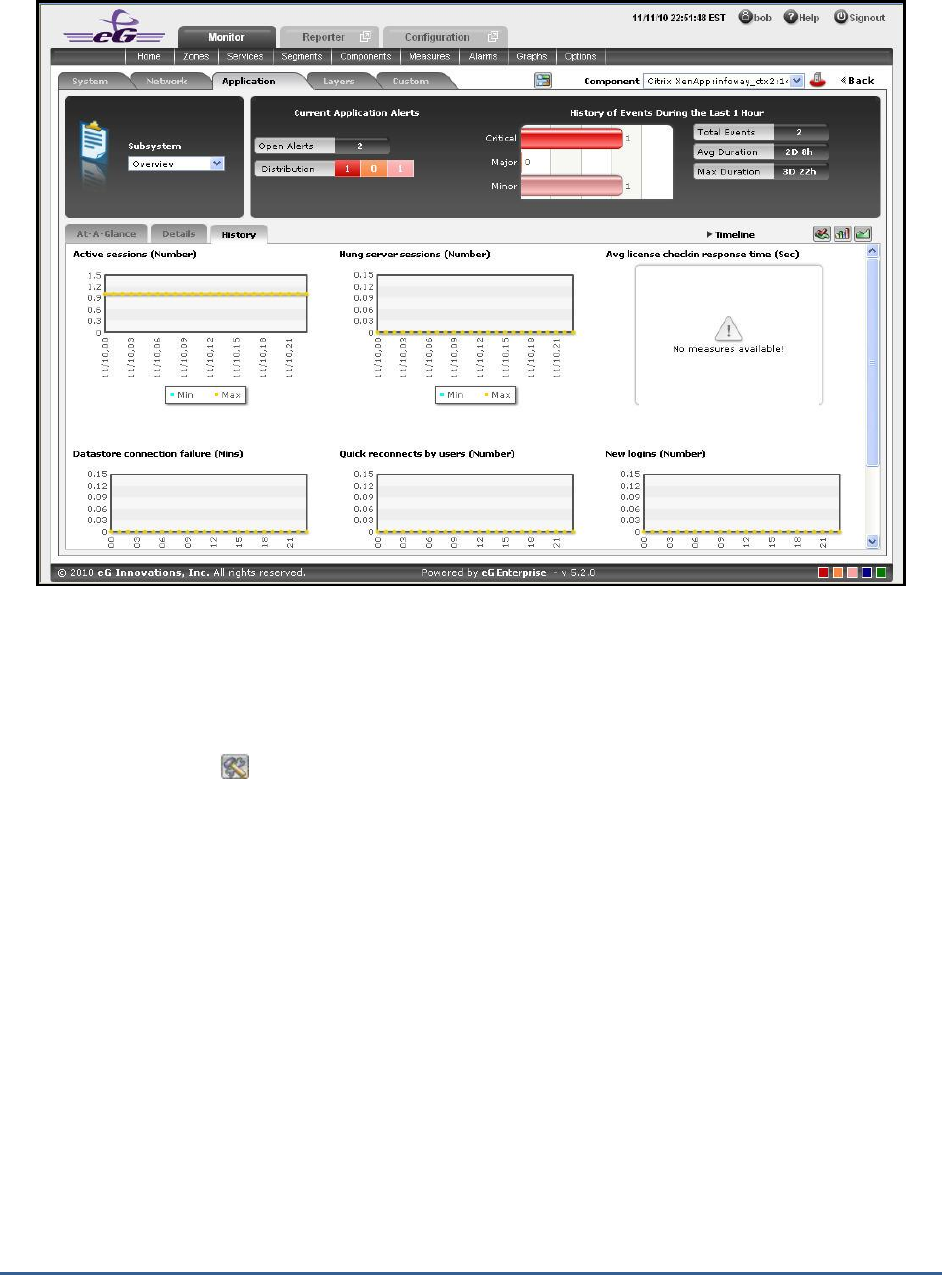
M O N I T O RI N G C I T R I X X E N AP P S E R V E R S
157
Figure 2.45: Trend graphs displayed in the History tab page of the Application Overview Dashboard
31. To analyze trends over a broader time scale, click on the Timeline link at the right, top corner of the History tab
page, and edit the Timeline of the trend graphs. Clicking on any of the miniature graphs in this tab page will
enlarge that graph, so that you can view the plotted data more clearly and even change its Timeline.
32. To override the default timeline (of 24 hours) of the trend graphs, do the following:
Click on the icon at the top of the Application Dashboard.
In the Dashboard Settings window that appears, select Trend Graph from the Default Timeline for list.
Then, choose a Timeline for the graph.
Finally, click the Update button.
33. Besides the timeline, you can even change the Duration of the trend graph in the enlarged mode. By default,
Hourly trends are plotted in the trend graph. By picking a different option from the Duration list, you can ensure
that Daily or Monthly trends are plotted in the graph instead.
34. Also, by default, the trend graph only plots the minimum and maximum values registered by a measure.
Accordingly, the Graph type is set to Min/Max in the enlarged mode. If need be, you can change the Graph type
to Avg, so that the average trend values of a measure are plotted for the given Timeline. For instance, if an
average trend graph is plotted for the
Active Sessions
measure, then the resulting graph will enable
administrators to ascertain how many sessions, on an average, were active on the Citrix server during a specified
timeline; such a graph can help you assess how session load has changed during a given timeline.
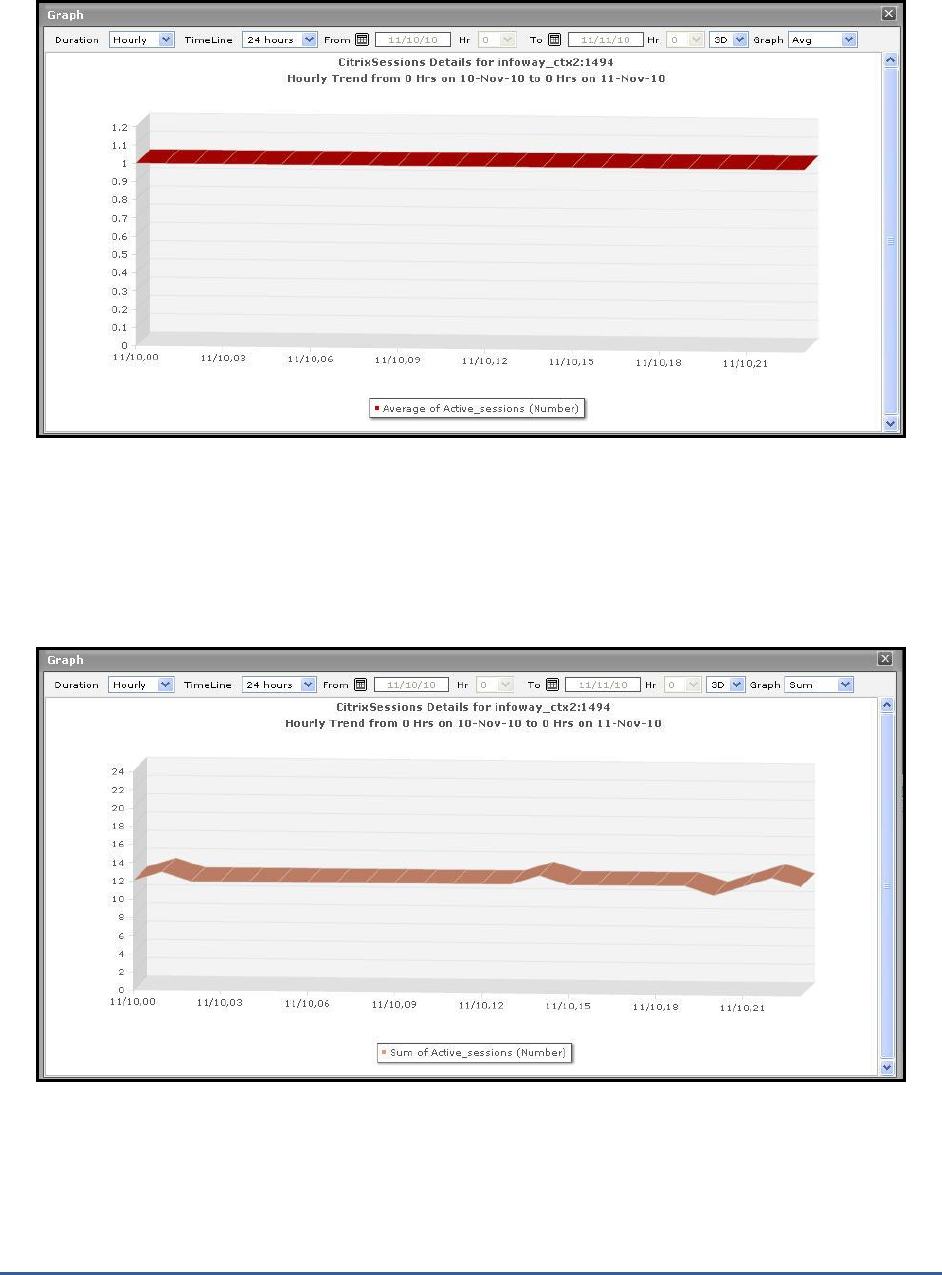
M O N I T O RI N G C I T R I X X E N AP P S E R V E R S
158
Figure 2.46: Viewing a trend graph that plots average values of a measure for a Citrix XenApp application
35. Likewise, you can also choose Sum as the Graph type to view a trend graph that plots the sum of the values of
a chosen measure for a specified timeline. For instance, if you plot a 'sum of trends' graph for the measure that
reports the number of active sessions of the application, then, the resulting graph will enable you to analyze, on
an hourly/daily/monthly basis (depending upon the Duration chosen), how the level of session activity on the
Citrix server has varied.
Figure 2.47: A trend graph plotting sum of trends for a Citrix XenApp application

M O N I T O RI N G C I T R I X X E N AP P S E R V E R S
159
36. At any point in time, you can switch to the measure graphs by clicking on the button.
37. Typically, the History tab page displays measure, summary, and trend graphs for a default set of measures. If
you want to add graphs for more measures to this tab page or remove one/more measures for which graphs
pre-exist in this tab page, then, do the following:
Click the button at the top of the dashboard.
The Dashboard Settings window then appears. From the Module list of Figure 2.48, pick Application,
choose Overview as the Sub-System, and then, select History Graph from the Add/Delete Measures for
list.
Note:
In case of descriptor-based tests, the Summary and Trend graphs displayed in the History tab page typically
plot the values for a single descriptor alone. To view the graph for another descriptor, pick a descriptor from
the drop-down list made available above the corresponding summary/trend graph.
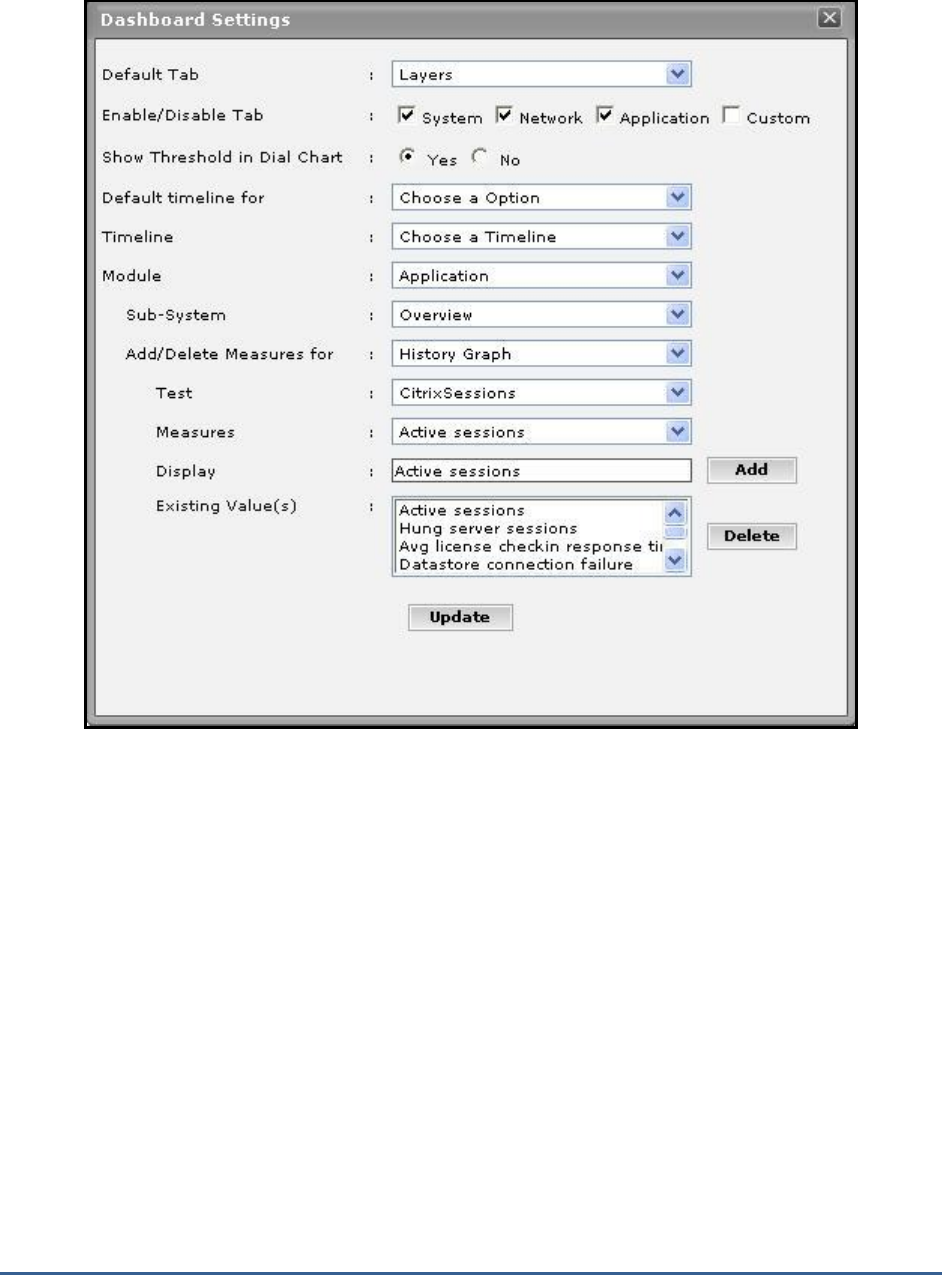
M O N I T O RI N G C I T R I X X E N AP P S E R V E R S
160
Figure 2.48: Adding a new graph to the History tab page
The measures for which graphs pre-exist in the History tab page will be automatically displayed in the
Existing Value(s) list. To delete a measure, and in effect, its corresponding graph as well, select the
measure from the Existing Value(s) list, click the Delete button, and then click the Update button.
To add a new graph, first, pick the Test that reports the measure for which a graph is to be
generated.
Next, select the Measure of interest.
Provide a Display name for the measure. Then, click the Add button to add the measure to the
Existing Values(s) list. Finally, click the Update button.
This will add a new measure, summary, and trend graph for the chosen measure, to the History tab
page.

M O N I T O RI N G C I T R I X X E N AP P S E R V E R S
161
2.1.9.2 CitrixServer
To periodically assess the availability of a Citrix server, quickly measure the load-handling capacity of the server, and
promptly detect aberrations in the internal operations of the server, select the CitrixServer option from the
Subsystem list.
Note:
Only users with Admin or Supermonitor privileges can enable/disable the system, network, and application
dashboards, or can customize the contents of such dashboards using the Dashboard Settings window.
Therefore, whenever a user without Admin or Supermonitor privileges logs into the monitoring console, the
button will not appear.
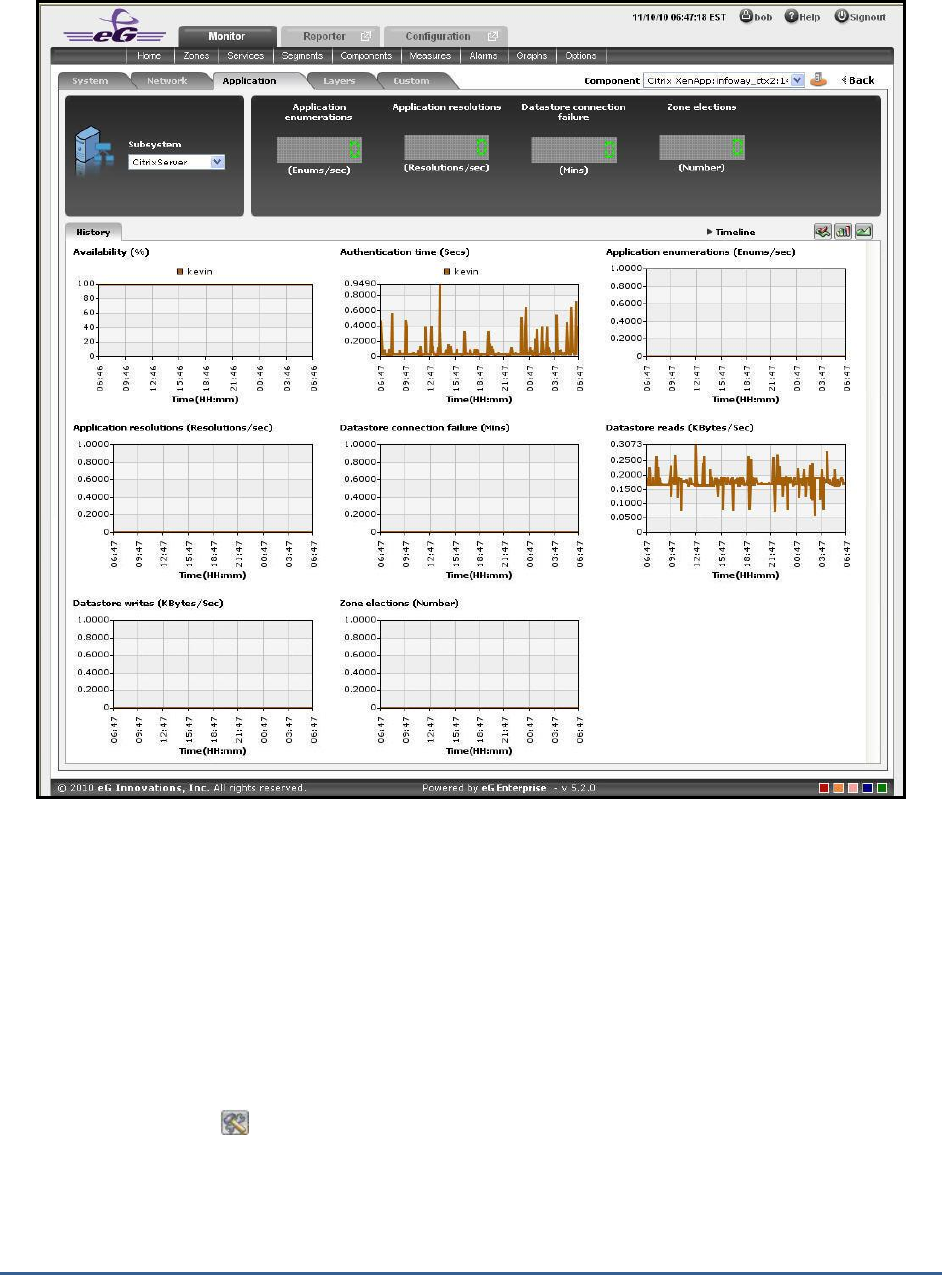
M O N I T O RI N G C I T R I X X E N AP P S E R V E R S
162
Figure 2.49: The CitrixServer Subsystem
The contents of the CitrixServer subsystem that then appears (see Figure 2.49) are as follows:
1. The dashboard begins with digital displays that report the current values of pre-configured metrics; typically,
critical server-related metrics can be configured for display here. Using these displays, you can quickly visualize
the overall health of the server.
2. The History tab page that follows the Digital display section offers measure graphs of pre-configured metrics,
which help analyze the performance of the Citrix server over time. By quickly cross-correlating and time-
correlating across these metrics, you can rapidly identify the root-cause of many performance issues.
3. By default, these historical graphs track the time-of-day variations in the performance of the Citrix server during
the last 24 hours. You can override this default timeline by following the steps discussed below:
Click on the icon at the top of the Application Dashboard.
In the Dashboard Settings window that appears, select History Graph from the Default Timeline for list.
Then, choose a Timeline for the graph.
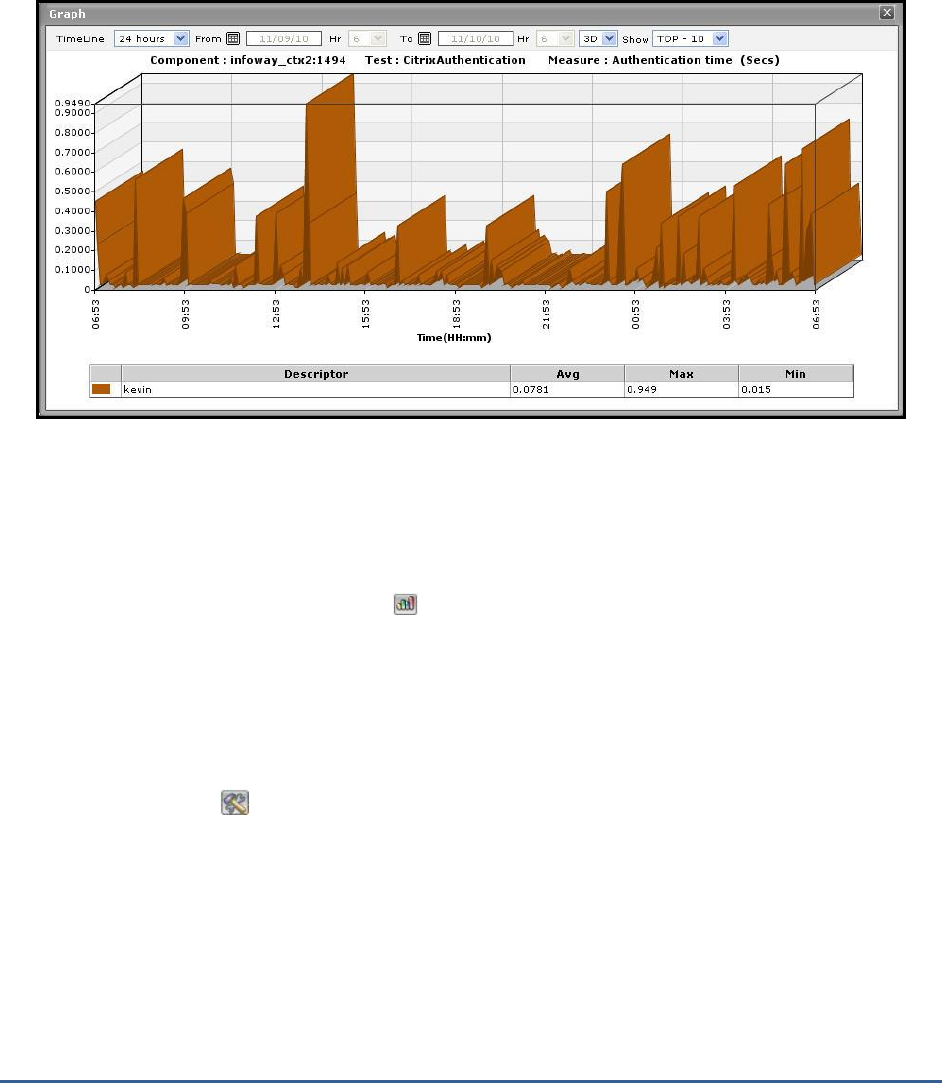
M O N I T O RI N G C I T R I X X E N AP P S E R V E R S
163
Finally, click the Update button.
4. To change the timeline of all the measure graphs at one shot, just click on the Timeline link at the right, top
corner of the History tab page. To alter the timeline for a single graph, just click on that graph - this will enlarge
the graph. You can change the Timeline of the graph in the enlarged mode.
Figure 2.50: An enlarged measure graph in the History tab page of the CitrixServer dashboard
5. In case of graphs that plot values for multiple descriptors, you can also change the number of descriptors for
which the graph should plot values. By default, the enlarged graph reveals the variations in the performance of
the TOP-10 descriptors. If need be, you can pick a different TOP-N or LAST-N option from the Show list in the
enlarged graph.
6. Instead of these measure graphs, you can, if required, view summary graphs of the server-related measures in
the History tab page. For this, click on the icon at the right, top corner of the History tab page. Summary
graphs help you figure out the percentage of time during the last 24 hours (by default) the quality of service
delivered by the Citrix XenApp server was compromised. While monitoring mission-critical applications that are
governed by rigid service level agreements, summary graphs will help you determine whether the guaranteed
availability of the server was met or not, and if not, how often was the server not available.
7. You can override the default timeline (of 24 hours) of the summary graphs by following the steps discussed
below:
Click on the icon at the top of the Application Dashboard.
In the Dashboard Settings window that appears, select Summary Graph from the Default Timeline for
list.
Then, choose a Timeline for the graph.
Finally, click the Update button.
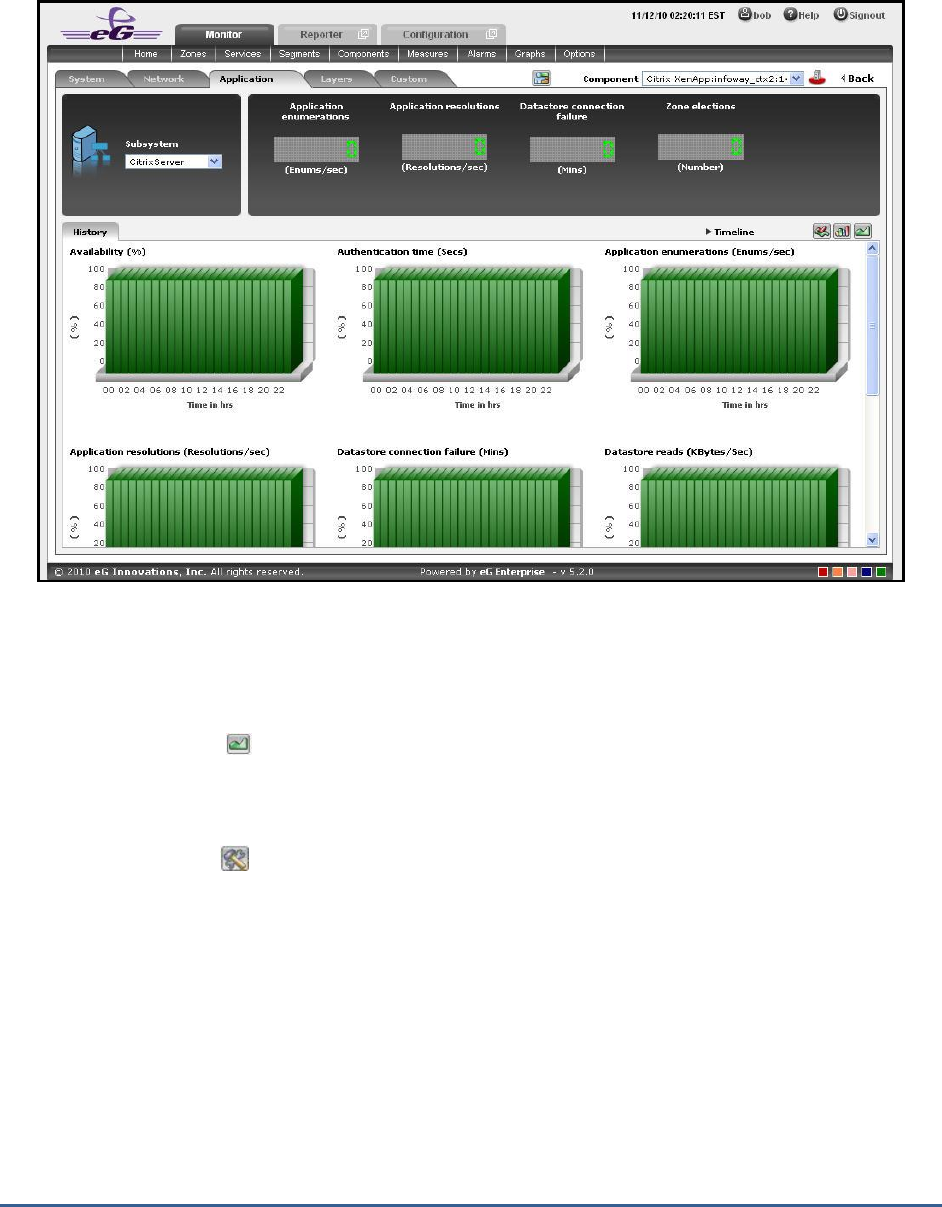
M O N I T O RI N G C I T R I X X E N AP P S E R V E R S
164
Figure 2.51: Summary graphs displayed in the History tab page of the CitrixServer Dashboard
8. Here again, you can change the Timeline of all the summary graphs by clicking on the Timeline link in Figure
2.51, or click on a graph, enlarge it, and change its Timeline in the enlarged mode. Also, though the graph plots
hourly summary values by default, you can pick a different Duration for the graph in the enlarged mode, so that
daily/monthly performance summaries can be analyzed.
9. You can click on the icon at the right, top corner of the History tab page to view trend graphs of the
metrics. By default, these trend graphs plot the maximum and minimum health state values for every hour of the
last 24 hours (by default). The default timeline of 24 hours can be overridden by following the steps discussed
below:
Click on the icon at the top of the Application Dashboard.
In the Dashboard Settings window that appears, select Trend Graph from the Default Timeline for list.
Then, choose a Timeline for the graph.
Finally, click the Update button.
10. Using these trend graphs, you can understand the variations in the overall health of the Citrix XenApp server
during the last 24 hours (by default), deduce the future health trends, and accordingly recommend changes to
the application.
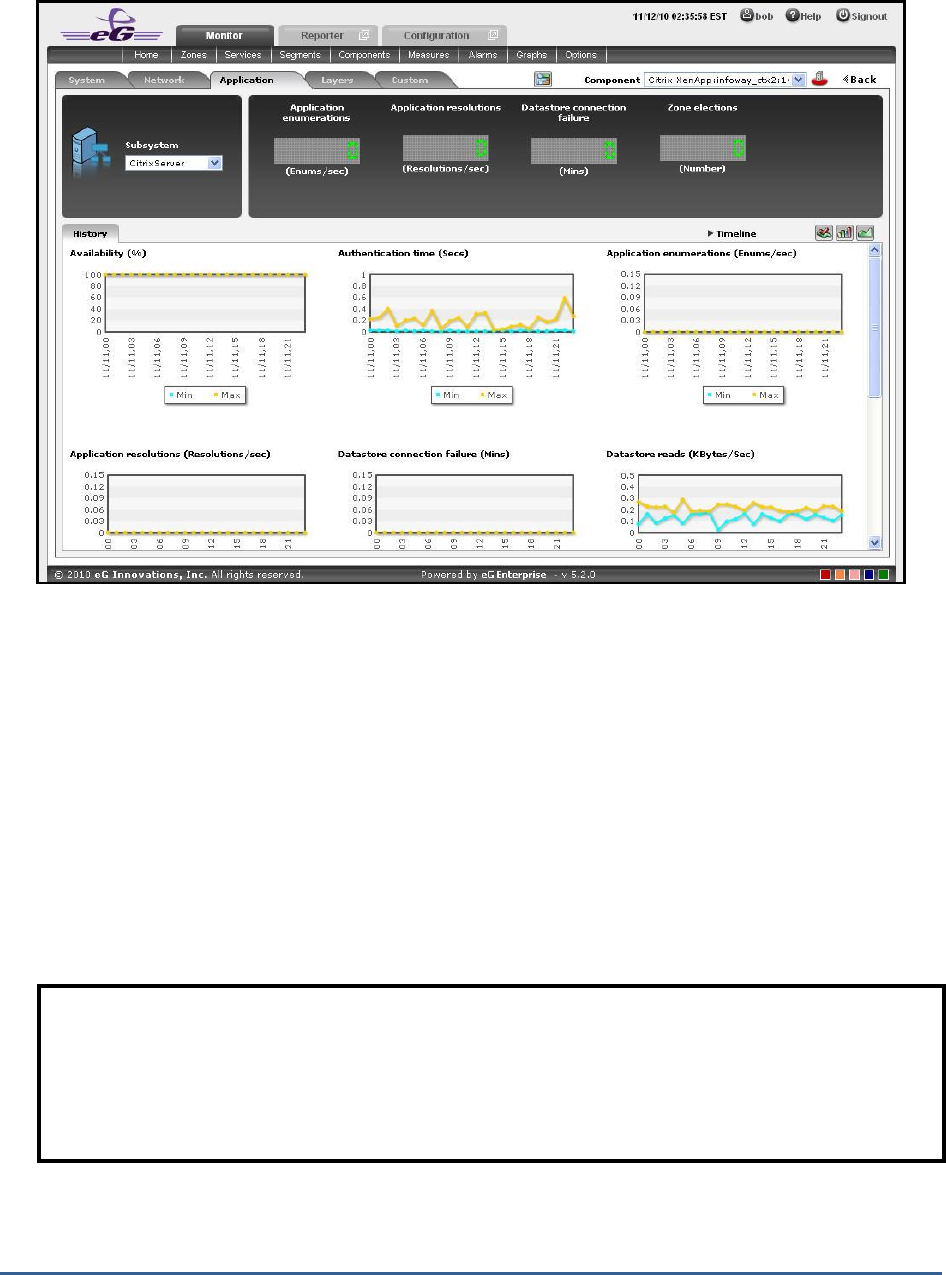
M O N I T O RI N G C I T R I X X E N AP P S E R V E R S
165
Figure 2.52: Trend graphs displayed in the History tab page of the CitrixServer Dashboard
11. Here again, you can change the Timeline of all the trend graphs by clicking on the Timeline link in Figure 2.52,
or click on a graph, enlarge it, and change its Timeline in the enlarged mode. Also, though the graph plots hourly
trend values by default, you can pick a different Duration for the graph in the enlarged mode, so that
daily/monthly performance trends can be analyzed. IThe timeline of this graph can be altered at runtime by
12. Also, by default, the trend graph only plots the minimum and maximum values registered by a measure.
Accordingly, the Graph type is set to Min/Max in the enlarged mode. If need be, you can change the Graph type
to Avg, so that the average trend values of a measure are plotted for the given Timeline. Such a graph will
enable you to assess whether the memory resources were utilized effectively or not, over time.
13. Likewise, you can also choose Sum as the Graph type to view a trend graph that plots the sum of the values of
a chosen measure for a specified timeline. For instance, a 'sum of trends' Availability will enable you to analyze,
on an hourly/daily/monthly basis (depending upon the Duration chosen), whether the server was available during
the specified timeline.
Note:
In case of descriptor-based tests, the Summary and Trend graphs displayed in the History tab page typically
plot the values for a single descriptor alone. To view the graph for another descriptor, pick a descriptor from
the drop-down list made available above the corresponding summary/trend graph.
M O N I T O RI N G C I T R I X X E N AP P S E R V E R S
166
14. At any point in time, you can switch to the measure graphs by clicking on the button.
15. Typically, the History tab page displays measure, summary, and trend graphs for a default set of measures. If
you want to add graphs for more measures to this tab page or remove one/more measures for which graphs
pre-exist in this tab page, then, do the following:
Click the button at the top of the dashboard.
The Dashboard Settings window then appears. From the Module list of Figure 2.48, pick Application,
choose CitrixServer as the Sub-System, and then, select History Graph from the Add/Delete Measures
for list.
The measures for which graphs pre-exist in the History tab page will be automatically displayed in the
Existing Value(s) list. To delete a measure, and in effect, its corresponding graph as well, select the
measure from the Existing Value(s) list, click the Delete button, and then click the Update button.
To add a new graph, first, pick the Test that reports the measure for which a graph is to be
generated.
Next, select the Measure of interest.
Provide a Display name for the measure. Then, click the Add button to add the measure to the
Existing Values(s) list. Finally, click the Update button.
This will add a new measure, summary, and trend graph for the chosen measure to the History tab
page.
2.1.9.3 CitrixSessions
If you require an integrated dashboard for analyzing the present/past performance and problem information
pertaining to the sessions that are executed on the Citrix XenApp application, select the CitrixSessions option from
the Subsystem list. This option helps you to efficiently and accurately diagnose the root-cause of the session-related
abnormalities. Using this single, central dashboard, you can ascertain the following quickly and easily:
Are all the sessions active on this particular application?
How long has a particular session been in an idle state? What is the exact time period of the idle
session?
Note:
Only users with Admin or Supermonitor privileges can enable/disable the system, network, and
application dashboards, or can customize the contents of such dashboards using the Dashboard Settings
window. Therefore, whenever a user without Admin or Supermonitor privileges logs into the monitoring
console, the button will not appear.
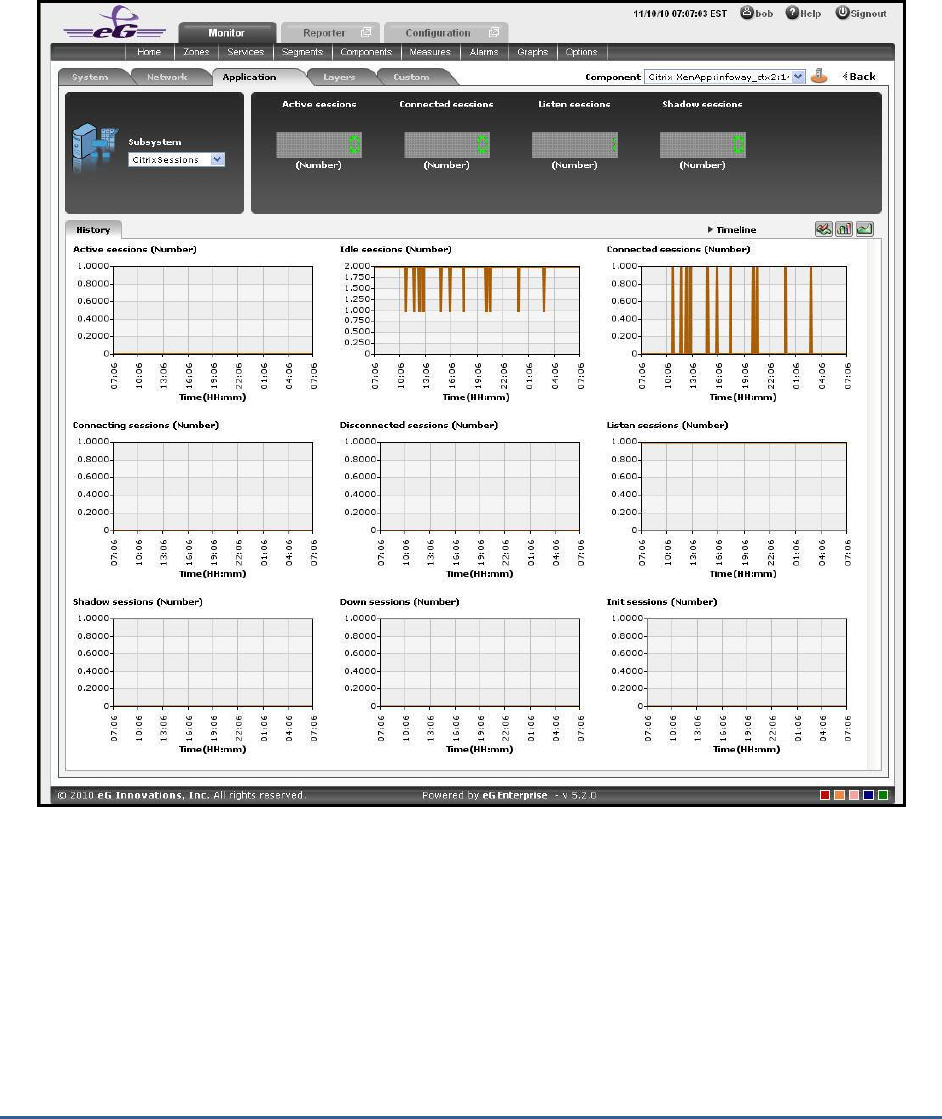
M O N I T O RI N G C I T R I X X E N AP P S E R V E R S
167
Are there any disconnected sessions?
Has the application been unavailable during a particular session?
Figure 2.53: The CitrixSessions Dashboard
The contents of this dashboard are discussed hereunder:
1. The Digital display section, displays the session activity in numbers. For instance the number of active session
will be displayed in this section which can be viewed at a single glance. Clicking on a Digital display will lead
you to Figure 2.53, which displays the layer and test that reports the measure.
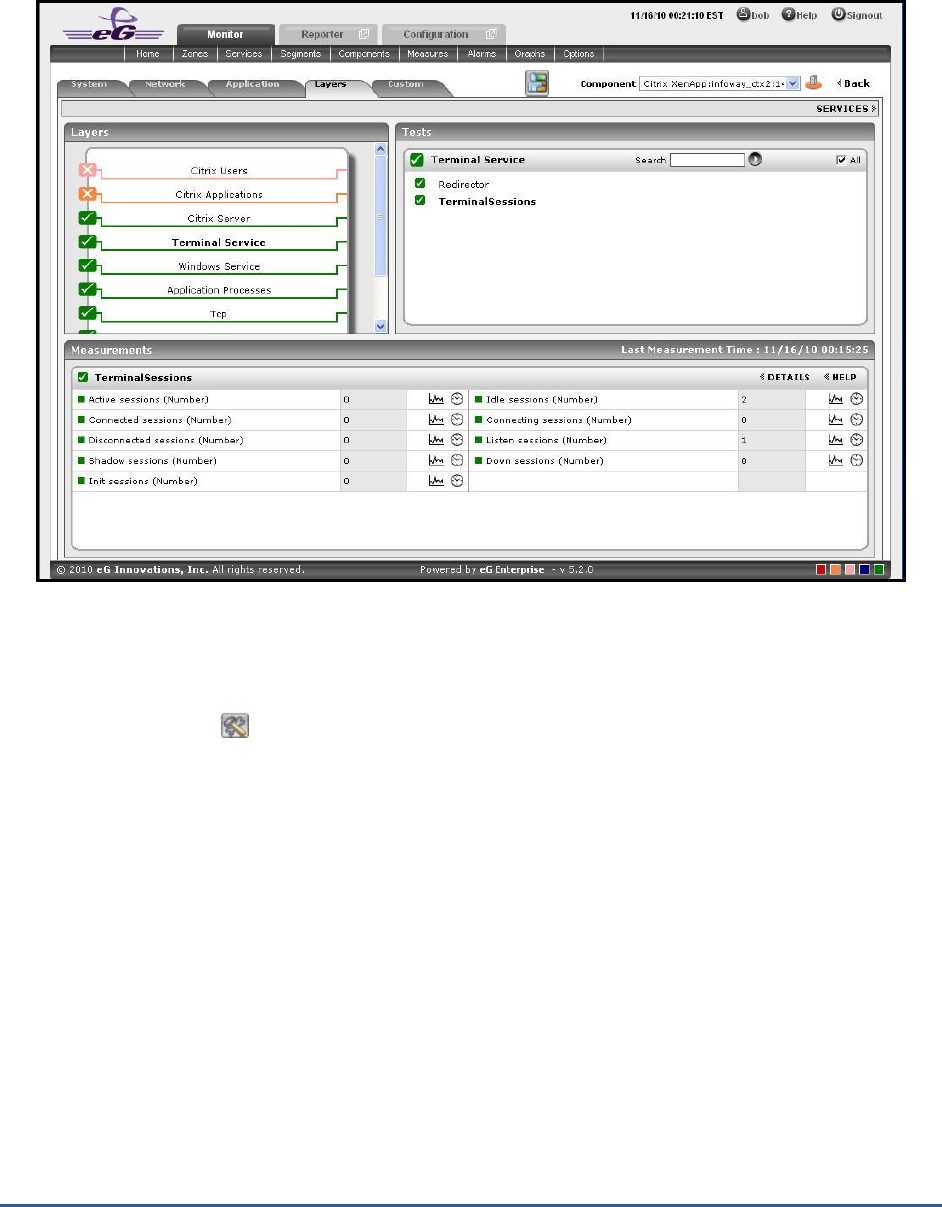
M O N I T O RI N G C I T R I X X E N AP P S E R V E R S
168
Figure 2.54: Clicking on a digital display in the CitrixSessions dashboard
2. For historically analyzing the session activity of the Citrix XenApp application, click on the History tab page. This
tab page displays time-of-day graphs for all the thread-related measures for default duration of 24 hours. You
can override this default timeline (of 24 hours) by following the steps below:
Click on the icon at the top of the Application Dashboard.
In the Dashboard Settings window that appears, select History Graph from the Default Timeline for list.
Then, choose a Timeline for the graph.
Finally, click the Update button.
3. Say, you suddenly notice that the session state has been idle for a while; in such a case, you can use these
measure graphs to figure out when during the last 24 hours the session has been idle. If required, you can even
look beyond the last 24 hours - i.e., you can find out whether the anomaly originated much earlier. For this, you
just need to click on the graph of interest to you. This will enlarge the graph; in the enlarged mode, you can
alter the graph Timeline, so that the performance of that measure can be analyzed over a broader time window.
In this mode, you can even change the graph dimension from 3D to 2D, or vice-versa.
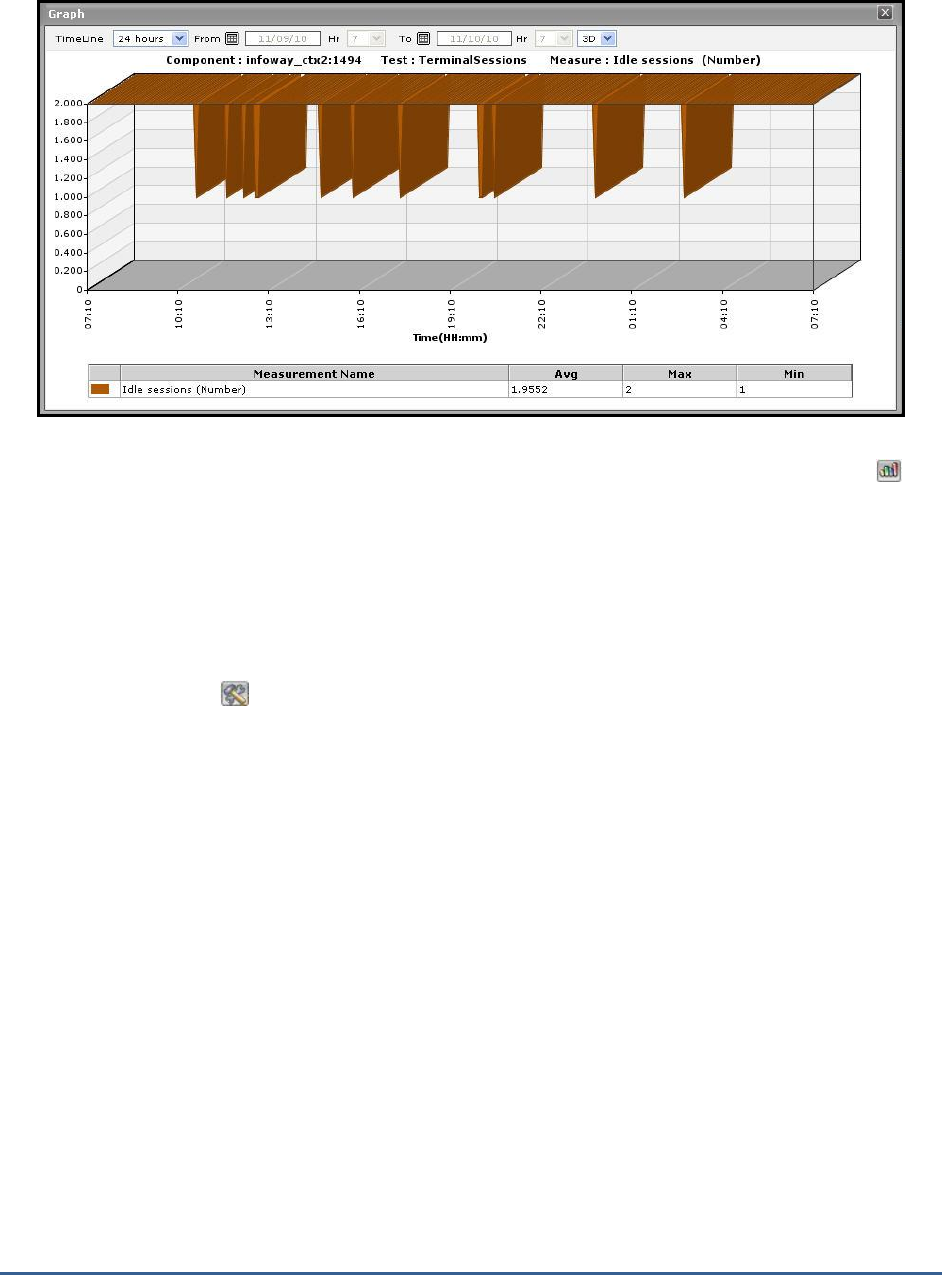
M O N I T O RI N G C I T R I X X E N AP P S E R V E R S
169
Figure 2.55: An enlarged measure graph in the History tab page of the Citrix Session dashboard
4. To view summary graphs on Idle sessions state instead of the default measure graphs, just click on the icon
at the right, top corner of the History tab page. Figure 2.56 will then appear. The summary graphs of Figure 2.56
reveal the percentage of time during the last 24 hours (by default) the Citrix XenApp application has been idle.
These graphs will therefore be useful to figure out the type of issues (whether critical/major/minor) the
application was experiencing. These graphs also help to determine whether the assured service levels were
delivered or not.
5. The default duration (of 24 hours) of the summary graphs can be overridden by following the procedure
discussed below:
Click on the icon at the top of the Application Dashboard.
In the Dashboard Settings window that appears, select Summary Graph from the Default Timeline for
list.
Then, choose a Timeline for the graph.
Finally, click the Update button.

M O N I T O RI N G C I T R I X X E N AP P S E R V E R S
170
Figure 2.56: Summary graphs displayed in the History tab page of the CitrixSessions Dashboard
6. Use the Timeline link at the right, top corner of the tab page to change the timeline of all the summary graphs
at one shot. For altering the timeline of a single graph, click on it; this will enlarge the graph. In the enlarged
mode, you can change the Timeline of the summary graph and modify the dimension (3D/2D) of the graph. Also,
by default, hourly summaries are plotted in the summary graph; you can configure these graphs to plot
daily/monthly summaries instead by picking the relevant option from the Duration list in the enlarged mode.
7. If you want to view the past trends of various sessions, click on the icon at the right, top corner of the
History tab page. Figure 2.57 will then appear. Using the trend graphs displayed in Figure 2.57, you can better
assess the current sessions of your application and can accordingly plan its future availability. By default, these
trend graphs plot the maximum and minimum values registered by every session related measure during every
hour for the last 24 hours. From this data, you can clearly figure out when during the last 24 hours the
application performance has peaked and when it has been below-normal.
8. The default duration (of 24 hours) of the trend graphs can be overridden by following the procedure discussed
below:
Click on the icon at the top of the Application Dashboard.
In the Dashboard Settings window that appears, select Trend Graph from the Default Timeline for list.
Then, choose a Timeline for the graph.
Finally, click the Update button.
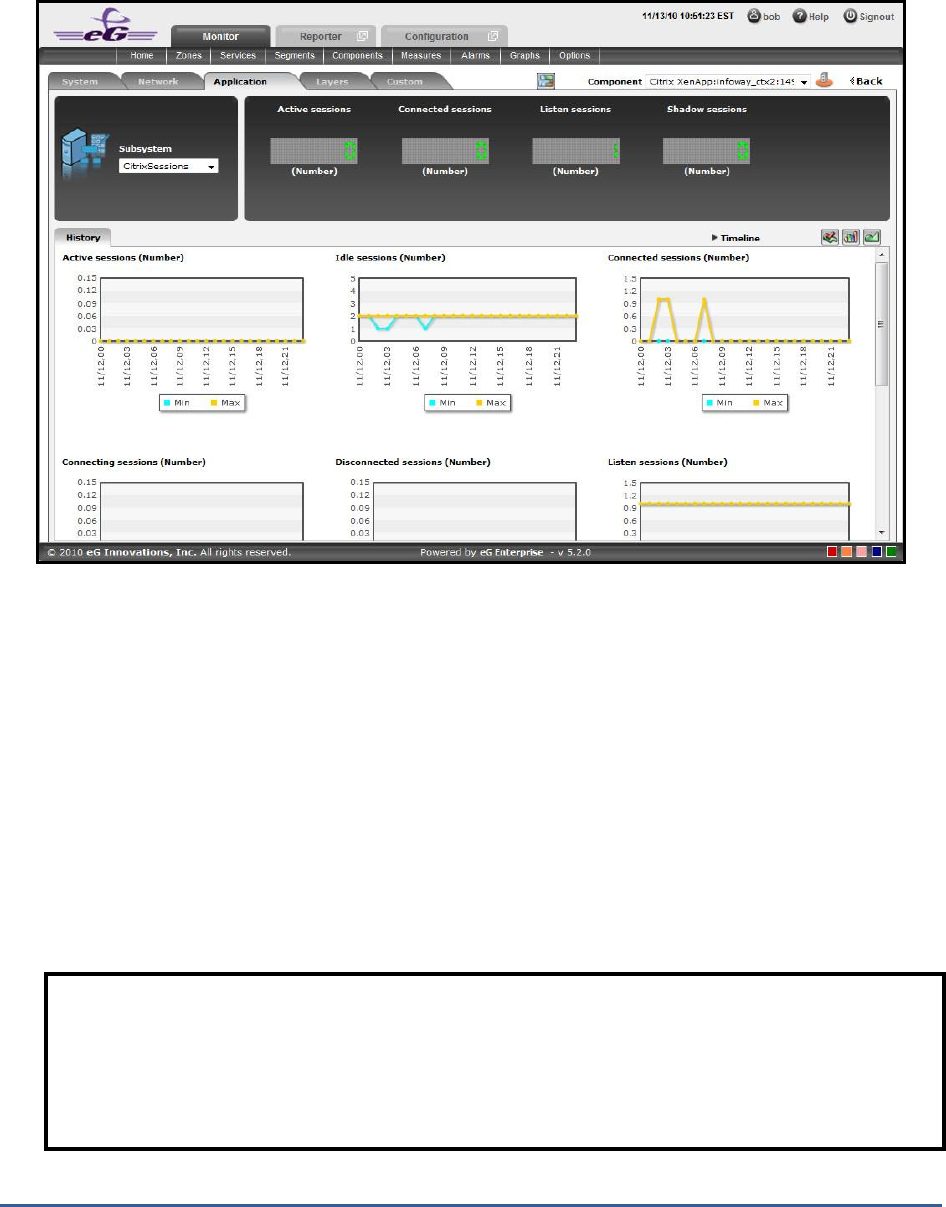
M O N I T O RI N G C I T R I X X E N AP P S E R V E R S
171
Figure 2.57: Trend graphs displayed in the History tab page of the CitrixSessions Dashboard
9. Use the Timeline link at the right, top corner of the tab page to change the timeline of all the trend graphs at
one shot. For altering the timeline of a single graph, click on it; this will enlarge the graph. In the enlarged
mode, you can change the Timeline of the trend graph and modify the dimension (3D/2D) of the graph. Also, by
default, hourly trends are plotted in the trend graph; you can configure these graphs to plot daily/monthly trend
values instead by picking the relevant option from the Duration list in the enlarged mode. Moreover, by default,
the trend graphs plot only the minimum and maximum values registered by a measure during the specified
timeline - this graph will enable you to isolate those times at which performance of that measure had peaked
and the times it had fared poorly. For instance, using the default trend graph for the
Idle sessions
measure, you
can clearly identify when too many sessions were idle and when the number of Idle sessions were minimum. If
need be, you can select the Avg option from the Graph type list in the enlarged mode to make sure that the
trend graph plots the average trend values for the specified timeline - in the case of the above example, such a
graph will help you understand how the number of Idle sessions has varied during the set timeline. Alternatively,
you can select the Sum option from the Graph type list to have the trend graph plot the sum of trends for the
specified timeline.
Note:
In case of descriptor-based tests, the Summary and Trend graphs displayed in the History tab page typically
plot the values for a single descriptor alone. To view the graph for another descriptor, pick a descriptor from
the drop-down list made available above the corresponding summary/trend graph.
M O N I T O RI N G C I T R I X X E N AP P S E R V E R S
172
10. At any point in time, you can switch to the measure graphs by clicking on the button.
11. Typically, the History tab page displays measure, summary, and trend graphs for a default set of measures. If
you want to add graphs for more measures to this tab page or remove one/more measures for which graphs
pre-exist in this tab page, then, do the following:
Click the button at the top of the dashboard.
The Dashboard Settings window then appears. From the Module list of Figure 2.48, pick Application,
choose CitrixSessions as the Sub-System, and then, select History Graph from the Add/Delete
Measures for list.
The measures for which graphs pre-exist in the History tab page will be automatically displayed in the
Existing Value(s) list. To delete a measure, and in effect, its corresponding graph as well, select the
measure from the Existing Value(s) list, click the Delete button, and then click the Update button.
To add a new graph, first, pick the Test that reports the measure for which a graph is to be
generated.
Next, select the Measure of interest.
Provide a Display name for the measure. Then, click the Add button to add the measure to the
Existing Values(s) list. Finally, click the Update button.
This will add a new measure, summary, and trend graph for the chosen measure to the History tab
page.
2.1.9.4 CitrixApplications
Select the CitrixApplications option from the Subsystem list to know how efficiently the applications are used by the
Citrix XenApp. Upon selection of this Subsystem Figure 2.58 will appear.
Note:
Only users with Admin or Supermonitor privileges can enable/disable the system, network, and application
dashboards, or can customize the contents of such dashboards using the Dashboard Settings window.
Therefore, whenever a user without Admin or Supermonitor privileges logs into the monitoring console,
the button will not appear.
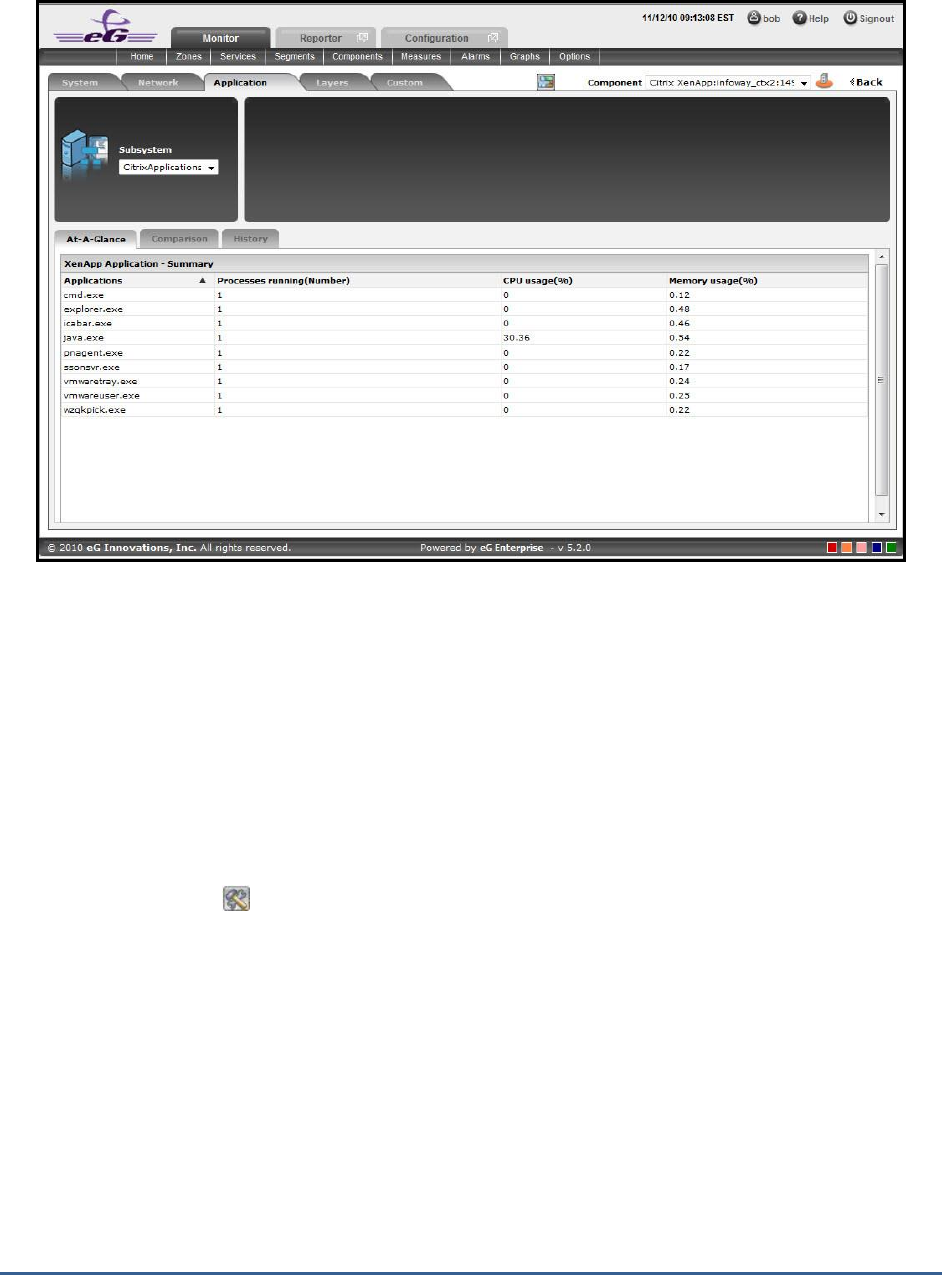
M O N I T O RI N G C I T R I X X E N AP P S E R V E R S
173
Figure 2.58: The CitrixApplications Dashboard
The contents of this dashboard are as follows:
1. The At-A-Glance tab page (see Figure 2.58) contains a XenApp Application-Summary section which provides an
insight view of the Applications that are available for the Citrix XenApp. The Applications can either be sorted in
alphabetical order or can be sorted according to their current health status such as Processes running, CPU
Usage and Memory usage.
2. As shown in Figure 2.58, the Comparison tab page that follows the At-A-Glance tab page provides a series of
top-10 charts, using which you can quickly isolate those Applications that are leading the lot in the following
default performance areas: Instances, amount of CPU used, amount of memory used. This default list of
performance areas (i.e., measures) for top-n chart generation can be overridden by following the steps
discussed below:
Click on the icon at the top of the Application Dashboard. In the Dashboard Settings window that
appears, select Application from the Module list, and CitrixApplications from the Sub-System list.
To add new measures for which top-n graphs are to be displayed in the Comparison tab page, first,
pick the Comparison Graph option from the Add/Delete Measures for list. Upon selection of this option,
the pre-configured measures for comparison graphs will appear in the Existing Value(s) list.
Next, select the Test that reports the said measure, pick the measure of interest from the Measures
list, provide a Display name for the measure, and click the Add button to add the chosen measure to
the Existing Value(s) list.
If you want to delete one/more measures for which comparison graphs pre-exist in the Comparison
tab page, then, as soon as you choose the Comparison Graph option from the Add/Delete Measures
for list, pick any of the displayed measures from the Existing Value(s) list, and click the Delete button.
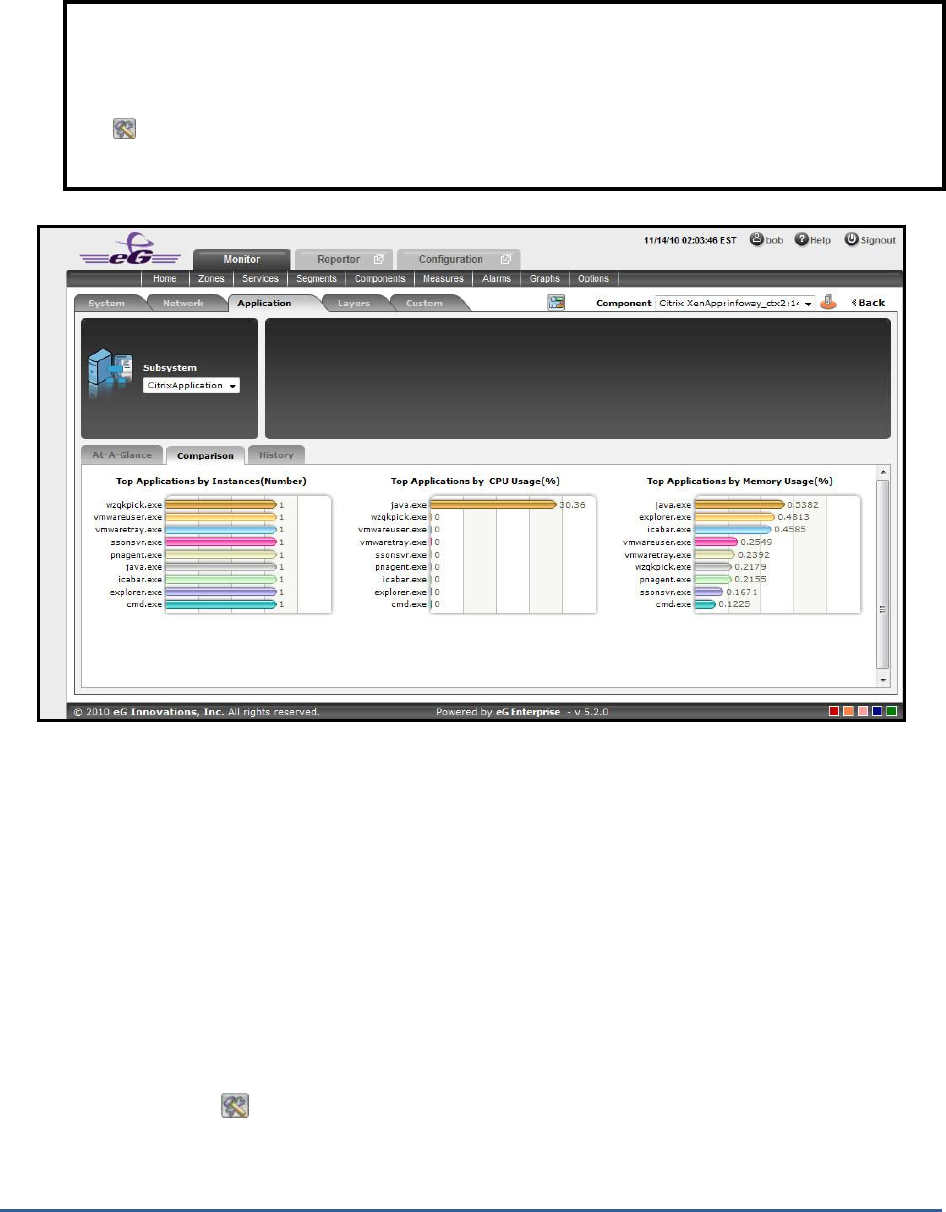
M O N I T O RI N G C I T R I X X E N AP P S E R V E R S
174
Finally, click the Update button to register the changes.
Figure 2.59: The Comparison tab page of a CitrixApplication dashboard
3. If an application slowdown can be attributed to the lack of adequate CPU or Memory resources, then these top-
10 bar charts can aid you in swiftly nailing the exact application that could be serving as the source of this CPU
or memory contention.
4. Typically, these bar charts depict the current usage data. Sometimes however, you might want to detect which
Application was over-utilizing any resource at some point of time in the past. In such a case, you will have to
click on the corresponding graph in the Comparison tab page to enlarge it. In the enlarged mode, you can click
on the Compare History link, so that you can alter the graph Timeline, and view which application was being fully
utilized during the specified timeline.
5. The History tab page in Figure 2.60 below, by default, provides a series of measure graphs that reveal how the
Application has been performing over the default duration of the last 24 hours. The CPU and Memory utilization
as well as the number of Processes that are running currently can be identified. The default duration of 24 hours
can be overridden using the procedure discussed below:
Click on the icon at the top of the Application Dashboard.
In the Dashboard Settings window that appears, select History Graph from the Default Timeline for list.
Note:
Only users with Admin or Supermonitor privileges can enable/disable the system, network, and application
dashboards, or can customize the contents of such dashboards using the Dashboard Settings window.
Therefore, whenever a user without Admin or Supermonitor privileges logs into the monitoring console,
the button will not appear.
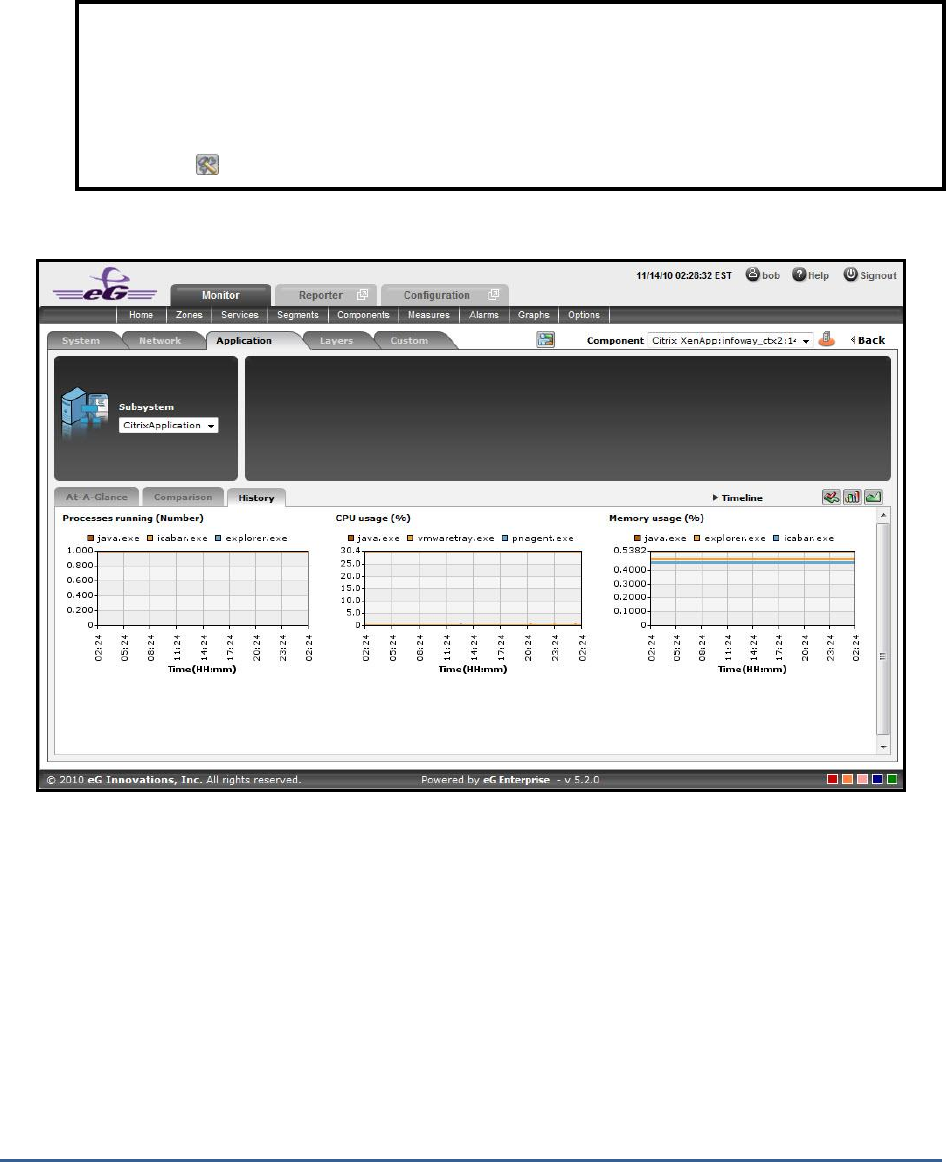
M O N I T O RI N G C I T R I X X E N AP P S E R V E R S
175
Then, choose a Timeline for the graph.
Finally, click the Update button.
Figure 2.60: The History tab page of CitrixApplication dashboard
6. If need be, you can even alter the timeline of all these measure graphs so that you can analyze performance
across days and weeks; for this, simply click the Timeline link at the right, top corner of the History tab page and
change the timeline for the graphs using the calendar that pops out. To change the timeline of a single graph
alone, simply click on that graph to enlarge it, and then modify the Timeline of the graph in the enlarged mode.
In the enlarged mode, you can even change the dimension of the measure graph (3d / 2d). Figure 2.61 shows
an enlarged measure graph.
Note:
Only users with Admin or Supermonitor privileges can enable/disable the system, network, and
application dashboards, or can customize the contents of such dashboards using the Dashboard Settings
window. Therefore, whenever a user without Admin or Supermonitor privileges logs into the monitoring
console, the button will not appear.
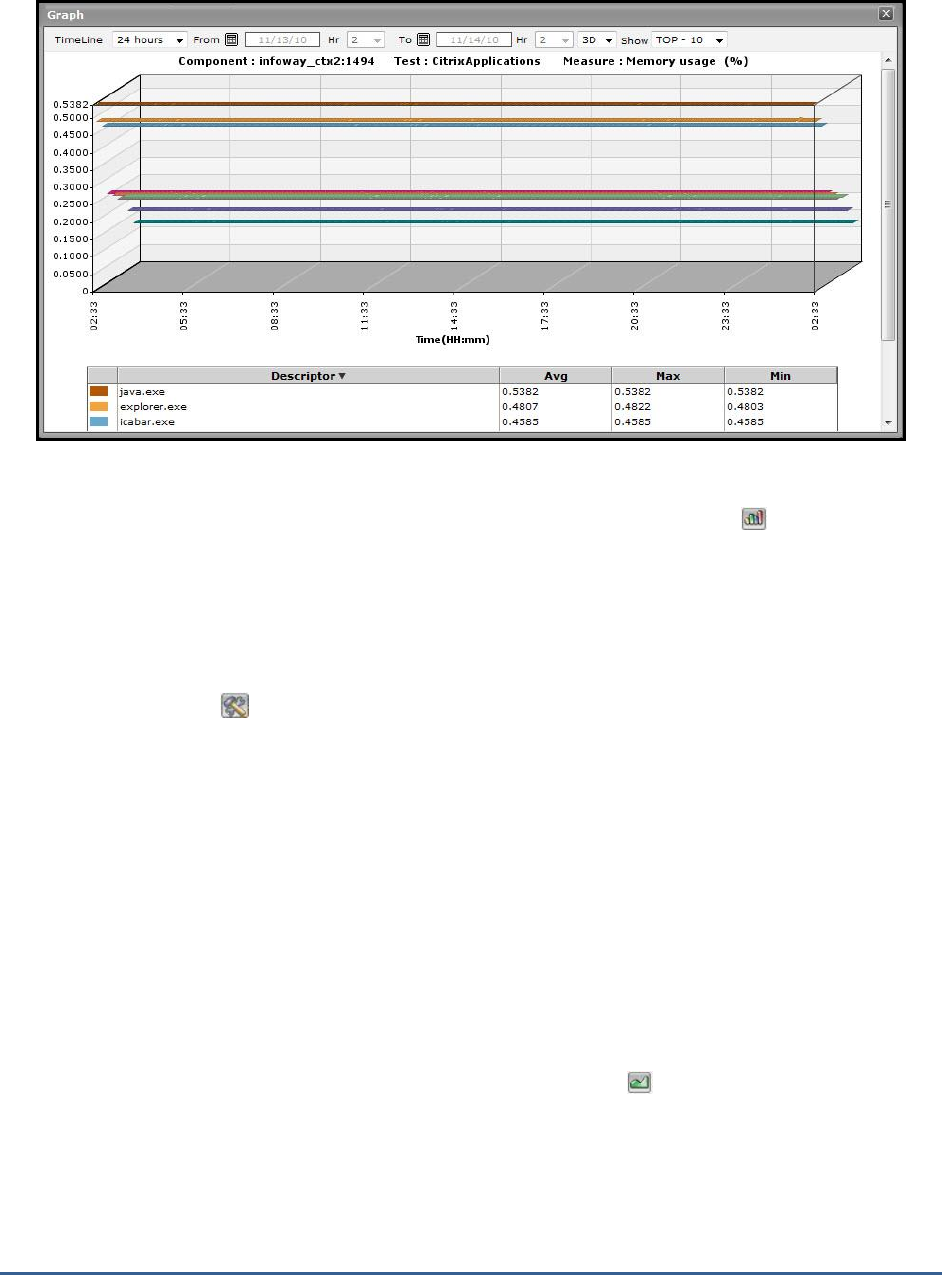
M O N I T O RI N G C I T R I X X E N AP P S E R V E R S
176
Figure 2.61: An enlarged measure graph in the History tab page of the CitrixApplications dashboard
7. To determine the service level achievements / slippages of the Citrix Application, you need to view summary
graphs of the measures and not the default measure graphs. For this, just click on the icon at the right, top
corner of the History tab page.
8. Besides revealing the efficiency of your administrative staff in recognizing bottlenecks and mitigating them,
these summary graphs also indicate whether the CitrixApplication has been able to maintain the assured
performance levels during the default duration of 24 hours.
9. To override this default duration, follow the steps below:
Click on the icon at the top of the Application Dashboard.
In the Dashboard Settings window that appears, select Summary Graph from the Default Timeline for
list.
Then, choose a Timeline for the graph.
Finally, click the Update button.
10. In case of the summary graphs too, you can change the Timeline of all graphs by clicking on the Timeline link at
the right, top corner of the History tab page. To alter the timeline of a single graph, here again, you will have to
click on that graph, enlarge it, and modify the timeline. Also, by default, hourly summaries are plotted in the
summary graph; you can configure these graphs to plot daily/monthly summaries instead by picking the relevant
option from the Duration list in the enlarged mode.
11. To analyze past trends in the loading/unloading of classes, click on the icon at the right, top corner of the
History tab page.
12. These trend graphs, by default, plot the minimum and maximum values that every measure registered during
each hour of the last 24 hours (by default). Using such graphs, you can accurately point to the time during which
the performance of the Application was at peak, and the times at which there was a lull. By carefully observing
these past trends, you can effectively analyze the performance of the application, predict future performances
accordingly, and suggest measures to enhance the efficiency. Here again, you can change the timeline of all

M O N I T O RI N G C I T R I X X E N AP P S E R V E R S
177
graphs using the Timeline link in Figure 2.60, or just a particular graph by clicking on it and enlarging it.
13. For changing the default duration (of 24 hours) of the trend graphs, do the following:
Click on the icon at the top of the Application Dashboard.
In the Dashboard Settings window that appears, select Trend Graph from the Default Timeline for list.
Then, choose a Timeline for the graph.
Finally, click the Update button.
14. In addition, when a trend graph is enlarged, it is not just the Timeline that you can modify. The Duration of the
graph can also be altered. By default, trend graphs reveal only the hourly trends in performance. By picking the
relevant option from the Duration list, you can ensure that the trend graph in question plots daily/monthly trend
values instead. Also, in the enlarged mode, the Graph type can also be modified. Since the default Graph type is
Min/Max, the trend graph, by default, reveals the minimum and maximum values registered by a measure. If
need be, you can select the Avg or Sum option from the Graph type list to plot average trend values of a
measure or sum of trends (as the case may be) in the graph.
15. At any point in time, you can switch to the measure graphs by clicking on the button.
16. Typically, the History tab page displays measure, summary, and trend graphs for a default set of measures. If
you want to add graphs for more measures to this tab page or remove one/more measures for which graphs
pre-exist in this tab page, then, do the following:
Click the button at the top of the dashboard.
The Dashboard Settings window then appears. From the Module list of Figure 2.48, pick Application,
choose CitrixApplicaations as the Sub-System, and then, select History Graph from the Add/Delete
Measures for list.
The measures for which graphs pre-exist in the History tab page will be automatically displayed in the
Existing Value(s) list. To delete a measure, and in effect, its corresponding graph as well, select the
measure from the Existing Value(s) list, click the Delete button, and then click the Update button.
To add a new graph, first, pick the Test that reports the measure for which a graph is to be
generated.
Next, select the Measure of interest.
Provide a Display name for the measure. Then, click the Add button to add the measure to the
Existing Values(s) list. Finally, click the Update button.
Note:
In case of descriptor-based tests, the Summary and Trend graphs displayed in the History tab page typically
plot the values for a single descriptor alone. To view the graph for another descriptor, pick a descriptor from
the drop-down list made available above the corresponding summary/trend graph.
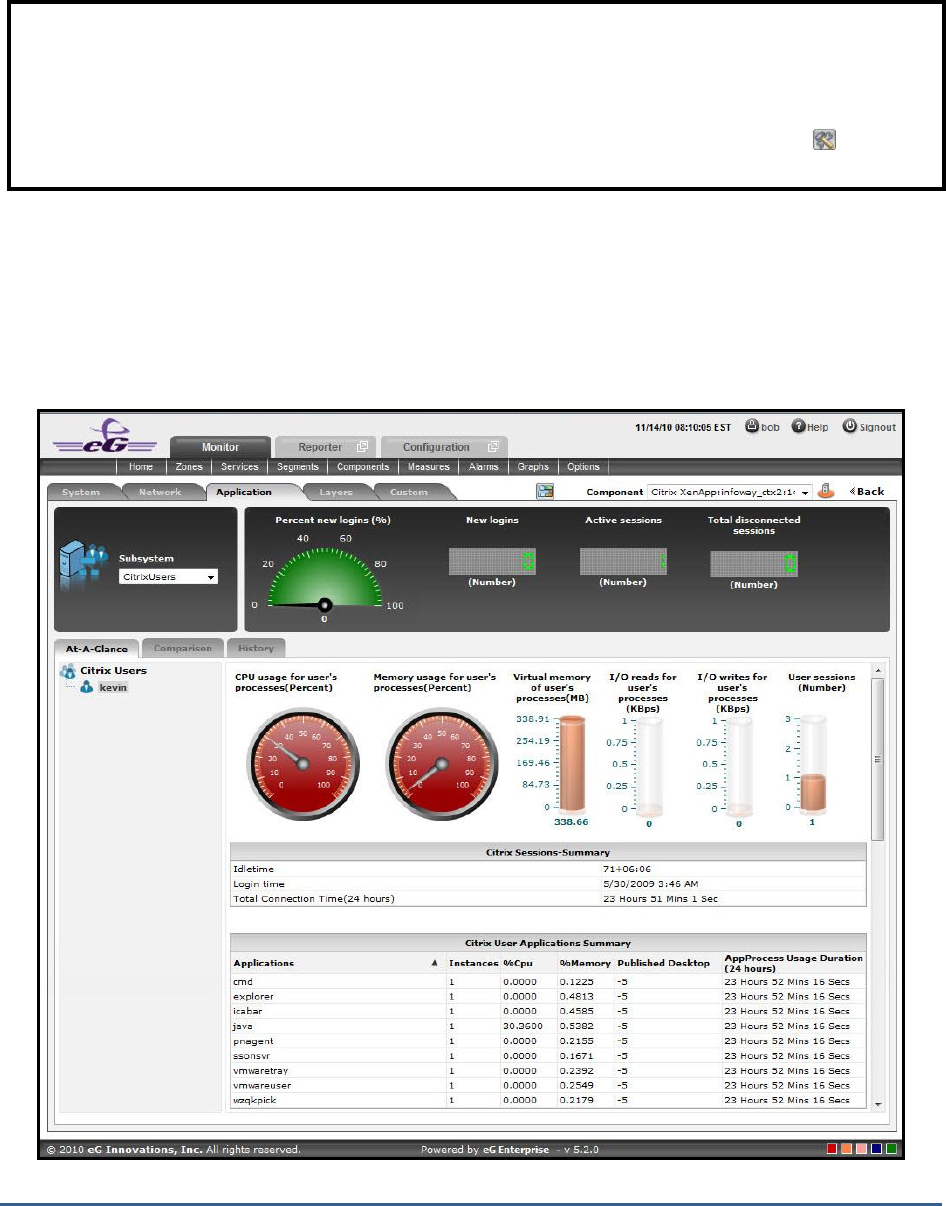
M O N I T O RI N G C I T R I X X E N AP P S E R V E R S
178
This will add a new measure, summary, and trend graph for the chosen measure to the History tab
page.
2.1.9.5 CitrixUsers
Select the CitrixUsers option from the Subsystem list to know how many Users are currently accessing the Citrix
XenApp application. Upon selection of this Subsystem Figure 2.62 will appear.
Figure 2.62: The CitrixUsers Dashboard
Note:
Only users with Admin or Supermonitor privileges can enable/disable the system, network, and application
dashboards, or can customize the contents of such dashboards using the Dashboard Settings window. Therefore,
whenever a user without Admin or Supermonitor privileges logs into the monitoring console, the button will
not appear.
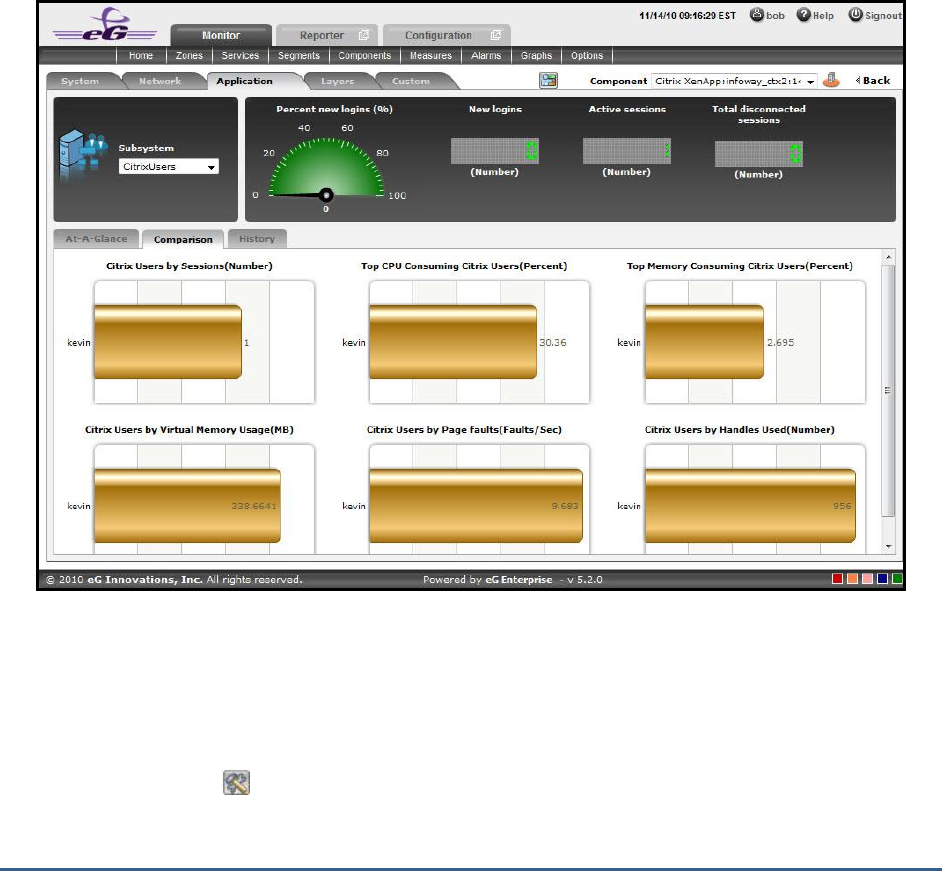
M O N I T O RI N G C I T R I X X E N AP P S E R V E R S
179
The contents of this dashboard are as follows:
1. A dial chart for Percent new logins and digital displays for various user sessions provide an insight view of the
user login information at a single glance Clicking on a dial chart / digital display will lead you to the
corresponding layer and test that reports the measure.
2. The At-A-Glance tab page (see Figure 2.62) contains a Citrix Users left panel which lists out the number of
users who are currently active for this session. A context-sensitive right panel provides an insight view of the
user information that is available for the Citrix XenApp. The user’s processes information can be viewed at a
single glance with the help of dial charts and cylindrical charts.
3. The Citrix Sessions – Summary (see Figure 2.62) in the right panel indicates the user session information such
as Login time, Idle Time and Total Connected Time, at a single glance.
4. The Citrix User Application Summary (see Figure 2.62) lists the number of Applications that are currently used
by the user. The applications can be sorted either in alphabetical order or in accordance with the application
specific information that is available next to each application name.
Figure 2.63: The Comparison tab page of CitrixUsers dashboard
5. As shown in Figure 2.63, the Comparison tab page that follows the At-A-Glance tab page provides a series of
top-10 charts, using which you can quickly isolate the Users who are currently active for this session. These
graphs provide an insight view of various session related activities that are performed for each user login. This
default list of performance areas (i.e., measures) for top-n chart generation can be overridden by following the
steps discussed below:
Click on the icon at the top of the Application Dashboard. In the Dashboard Settings window that
appears, select Application from the Module list, and CitrixUsers from the Sub-System list.
M O N I T O RI N G C I T R I X X E N AP P S E R V E R S
180
To add new measures for which top-n graphs are to be displayed in the Comparison tab page, first,
pick the Comparison Graph option from the Add/Delete Measures for list. Upon selection of this option,
the pre-configured measures for comparison graphs will appear in the Existing Value(s) list.
Next, select the Test that reports the said measure, pick the measure of interest from the Measures
list, provide a Display name for the measure, and click the Add button to add the chosen measure to
the Existing Value(s) list.
If you want to delete one/more measures for which comparison graphs pre-exist in the Comparison
tab page, then, as soon as you choose the Comparison Graph option from the Add/Delete Measures
for list, pick any of the displayed measures from the Existing Value(s) list, and click the Delete button.
Finally, click the Update button to register the changes.
6. If an application slowdown can be attributed to the lack of adequate resources, then these top-10 bar charts
can aid you in swiftly nailing the exact resource location that could be serving as the source of this resource
contention.
7. Typically, these bar charts depict the current usage data. Sometimes however, you might want to detect which
Application was over-utilizing the resources at some point of time in the past. In such a case, you will have to
click on the corresponding graph in the Comparison tab page to enlarge it. In the enlarged mode, you can click
on the Compare History link, so that you can alter the graph Timeline, and view which user was the leading
memory consumer during the specified timeline.
8. The History tab page below, by default, provides a series of measure graphs that reveal how the Application
has been performing over the default duration of the last 24 hours. The CPU and Memory utilization as well as
the number of Processes that are running currently can be identified. The default duration of 24 hours can be
overridden using the procedure discussed below:
Click on the icon at the top of the Application Dashboard.
In the Dashboard Settings window that appears, select History Graph from the Default Timeline for list.
Then, choose a Timeline for the graph.
Finally, click the Update button.
Note:
Only users with Admin or Supermonitor privileges can enable/disable the system, network, and
application dashboards, or can customize the contents of such dashboards using the Dashboard Settings
window. Therefore, whenever a user without Admin or Supermonitor privileges logs into the monitoring
console, the button will not appear.
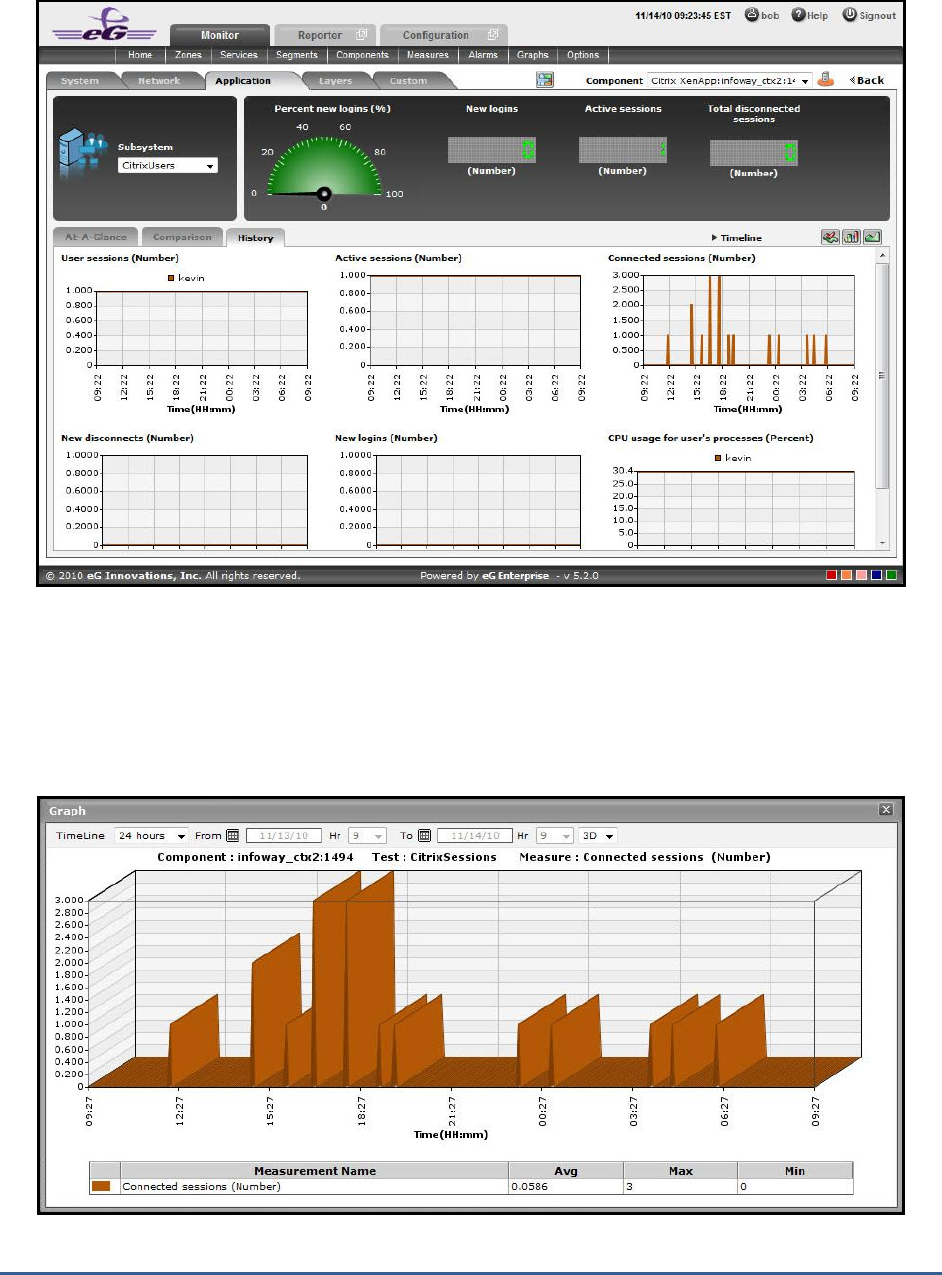
M O N I T O RI N G C I T R I X X E N AP P S E R V E R S
181
Figure 2.64: The History tab page of CitrixUsers dashboard
17. If need be, you can even alter the timeline of all these measure graphs so that you can analyze performance
across days and weeks; for this, simply click the Timeline link at the right, top corner of the History tab page and
change the timeline for the graphs using the calendar that pops out. To change the timeline of a single graph
alone, simply click on that graph to enlarge it, and then modify the Timeline of the graph in the enlarged mode.
In the enlarged mode, you can even change the dimension of the measure graph (3D / 2D).
Figure 2.65: An enlarged measure graph in the History tab page of the CitrixUsers dashboard

M O N I T O RI N G C I T R I X X E N AP P S E R V E R S
182
18. To determine the service level achievements / slippages of the CitrixUsers, you need to view summary graphs
of the measures and not the default measure graphs. For this, just click on the icon at the right, top corner
of the History tab page.
19. Besides revealing the efficiency of your administrative staff in recognizing bottlenecks and mitigating them,
these summary graphs also indicate whether the CitrixUsers are able to acquire the assured performance levels
during the default duration of 24 hours.
20. To override this default duration, follow the steps below:
Click on the icon at the top of the Application Dashboard.
In the Dashboard Settings window that appears, select Summary Graph from the Default Timeline for
list.
Then, choose a Timeline for the graph.
Finally, click the Update button.
21. In case of the summary graphs too, you can change the Timeline of all graphs by clicking on the Timeline link at
the right, top corner of the History tab page. To alter the timeline of a single graph, here again, you will have to
click on that graph, enlarge it, and modify the timeline. Also, by default, hourly summaries are plotted in the
summary graph; you can configure these graphs to plot daily/monthly summaries instead by picking the relevant
option from the Duration list in the enlarged mode.
22. To analyze past trends in the loading/unloading of classes, click on the icon at the right, top corner of the
History tab page.
23. These trend graphs, by default, plot the minimum and maximum values that every measure registered during
each hour of the last 24 hours (by default). Using such graphs, you can accurately point to the time windows in
which the performance of the Application was at peak, and the times at which there was a lull. By carefully
observing these past trends, you can effectively analyze the performance of the application, predict future
performances accordingly, and suggest measures to enhance the efficiency. Here again, you can change the
timeline of all graphs using the Timeline link in Figure 2.64, or just a particular graph by clicking on it and
enlarging it.
24. For changing the default duration (of 24 hours) of the trend graphs, do the following:
Click on the icon at the top of the Application Dashboard.
In the Dashboard Settings window that appears, select Trend Graph from the Default Timeline for list.
Then, choose a Timeline for the graph.
Finally, click the Update button.
25. In addition, when a trend graph is enlarged, it is not just the Timeline that you can modify. The Duration of the
graph can also be altered. By default, trend graphs reveal only the hourly trends in performance. By picking the
relevant option from the Duration list, you can ensure that the trend graph in question plots daily/monthly trend
values instead. Also, in the enlarged mode, the Graph type can also be modified. Since the default Graph type is
Min/Max, the trend graph, by default, reveals the minimum and maximum values registered by a measure. If
need be, you can select the Avg or Sum option from the Graph type list to plot average trend values of a
measure or sum of trends (as the case may be) in the graph.

M O N I T O RI N G C I T R I X X E N AP P S E R V E R S
183
26. At any point in time, you can switch to the measure graphs by clicking on the button.
27. Typically, the History tab page displays measure, summary, and trend graphs for a default set of measures. If
you want to add graphs for more measures to this tab page or remove one/more measures for which graphs
pre-exist in this tab page, then, do the following:
Click the button at the top of the dashboard.
The Dashboard Settings window then appears. From the Module list of Figure 2.48, pick Application,
choose CitrixUsers as the Sub-System, and then, select History Graph from the Add/Delete Measures
for list.
The measures for which graphs pre-exist in the History tab page will be automatically displayed in the
Existing Value(s) list. To delete a measure, and in effect, its corresponding graph as well, select the
measure from the Existing Value(s) list, click the Delete button, and then click the Update button.
To add a new graph, first, pick the Test that reports the measure for which a graph is to be
generated.
Next, select the Measure of interest.
Provide a Display name for the measure. Then, click the Add button to add the measure to the
Existing Values(s) list. Finally, click the Update button.
This will add a new measure, summary, and trend graph for the chosen measure to the History tab
page.
2.1.9.6 TerminalServices
To investigate issues relating to the terminal services of the Citrix XenApp application, select TerminalServices as the
Subsystem. Figure 2.66 will then appear.
Note:
In case of descriptor-based tests, the Summary and Trend graphs displayed in the History tab page typically
plot the values for a single descriptor alone. To view the graph for another descriptor, pick a descriptor from
the drop-down list made available above the corresponding summary/trend graph.
Note:
Only users with Admin or Supermonitor privileges can enable/disable the system, network, and application
dashboards, or can customize the contents of such dashboards using the Dashboard Settings window. Therefore,
whenever a user without Admin or Supermonitor privileges logs into the monitoring console, the button will
not appear.

M O N I T O RI N G C I T R I X X E N AP P S E R V E R S
184
Figure 2.66: The TerminalServices Dashboard
The contents of the TerminalServices dashboard are as follows:
1. The digital graphs section indicates the number of Active sessions, Network errors and Hung server sessions at
a single glance. Clicking on a digital graph will lead you to the layer model page of the Citrix XenApp
Application; this page will display the exact layer-test combination (see Figure 2.67) that reports the measure
represented by the digital graph.
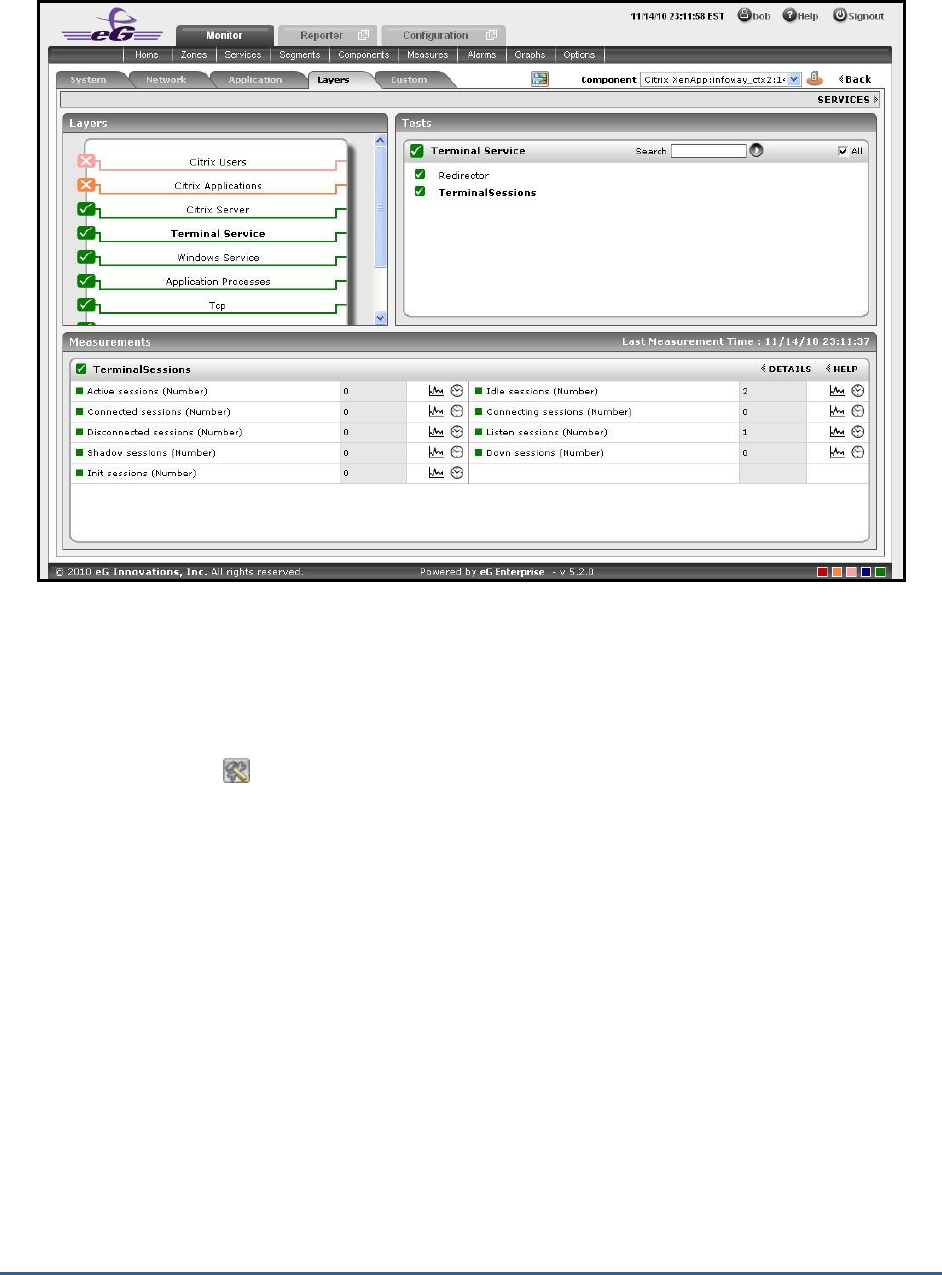
M O N I T O RI N G C I T R I X X E N AP P S E R V E R S
185
Figure 2.67: The page that appears when the digital graph in the TerminalServices dashboard of the Citrix XenApp
Application is clicked
2. The Comparison tab page (see Figure 2.68) provides a series of graphs for the Terminal Users activity. These
graphs provide an insight view of various session related activities that are performed for each Terminal User.
This default list of performance areas (i.e., measures) for top-n chart generation can be overridden by following
the steps discussed below:
Click on the icon at the top of the Application Dashboard. In the Dashboard Settings window that
appears, select Application from the Module list, and TerminalServices from the Sub-System list.
To add new measures for which top-n graphs are to be displayed in the Comparison tab page, first,
pick the Comparison Graph option from the Add/Delete Measures for list. Upon selection of this option,
the pre-configured measures for comparison graphs will appear in the Existing Value(s) list.
Next, select the Test that reports the said measure, pick the measure of interest from the Measures
list, provide a Display name for the measure, and click the Add button to add the chosen measure to
the Existing Value(s) list.
If you want to delete one/more measures for which comparison graphs pre-exist in the Comparison
tab page, then, as soon as you choose the Comparison Graph option from the Add/Delete Measures
for list, pick any of the displayed measures from the Existing Value(s) list, and click the Delete button.
Finally, click the Update button to register the changes.

M O N I T O RI N G C I T R I X X E N AP P S E R V E R S
186
3. If an application slowdown can be attributed to the lack of adequate resources, then these top-10 bar charts
can aid you in swiftly nailing the exact resource location that could be serving as the source of this resource
contention.
4. Typically, these bar charts depict the current usage data. Sometimes however, you might want to detect which
Application was over-utilizing the resources at some point of time in the past. In such a case, you will have to
click on the corresponding graph in the Comparison tab page to enlarge it. In the enlarged mode, you can click
on the Compare History link, so that you can alter the graph Timeline, and view which memory pool was the
leading memory consumer during the specified timeline.
5. The History tab page depicted below, by default, displays time-of-day graphs revealing the user’s processes
statistics for a default period of 24 hours. If the eG agent reports about a particular session which is down, these
graphs will help determine when exactly in the last 24 hours the anomaly has occurred. This default duration of
24 hours can be overridden using the following steps:
Click on the icon at the top of the Application Dashboard.
In the Dashboard Settings window that appears, select History Graph from the Default Timeline for list.
Then, choose a Timeline for the graph.
Finally, click the Update button.
Note:
Only users with Admin or Supermonitor privileges can enable/disable the system, network, and
application dashboards, or can customize the contents of such dashboards using the Dashboard
Settings window. Therefore, whenever a user without Admin or Supermonitor privileges logs into the
monitoring console, the button will not appear.
Note:
Only users with Admin or Supermonitor privileges can enable/disable the system, network, and application
dashboards, or can customize the contents of such dashboards using the Dashboard Settings window.
Therefore, whenever a user without Admin or Supermonitor privileges logs into the monitoring console,
the button will not appear.
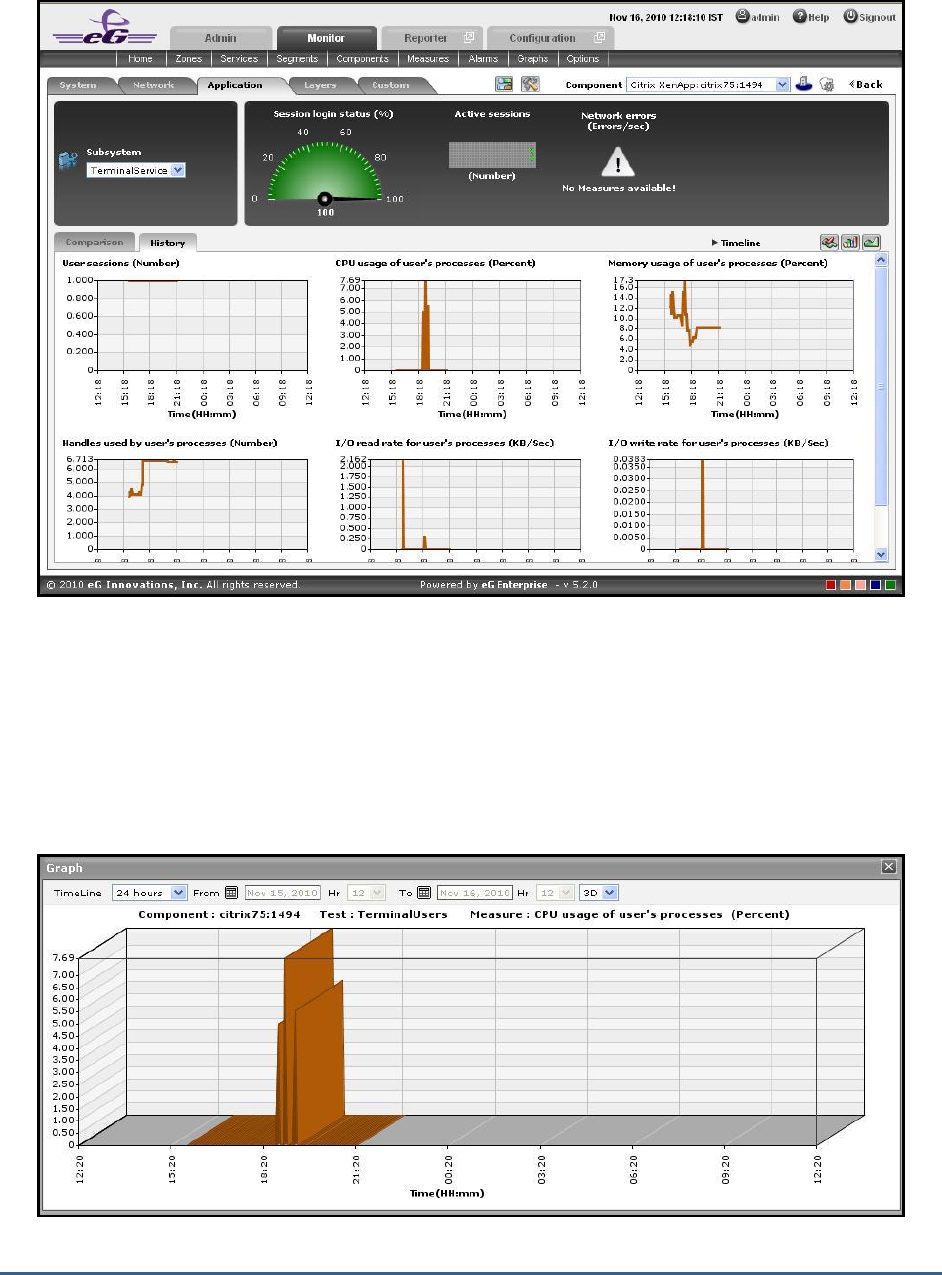
M O N I T O RI N G C I T R I X X E N AP P S E R V E R S
187
Figure 2.68: The History tab page of a TerminalServices dashboard
6. A careful study of this graph over time periods longer than 24 hours, can reveal intermittent breaks (if any) in
various measures of the user’s processes. To ensure that all graphs plot values for longer time periods, click on
the Timeline link at the right, top corner of the History tab page, and then change the timeline using the
calendar that pops out. To modify the timeline for a particular graph alone, click on the graph to enlarge it, and
alter the timeline in the enlarged mode. Besides the timeline, you can even change the graph dimension (3D /
2D) in the enlarged mode. Figure 1.41 shows an enlarged graph of a measure that is represented in the History
tab page.
Figure 2.69: The enlarged graph of a measure in the TerminalServices dashboard

M O N I T O RI N G C I T R I X X E N AP P S E R V E R S
188
7. Sometimes, you might have to periodically determine the percentage of time for which certain critical Citrix
XenApp applications have been running, so that you know whether/not the application has been able to maintain
the desired service levels. To run such checks, summary graphs of the user’s processes measures are useful. To
view summary graphs in the History tab page, click on the icon at the right, top corner of the History tab
page.
8. These summary graphs reveal the percentage of time during the last 24 hours (by default) the Citrix XenApp
has experienced issues related to the terminal service. To override this default timeline, do the following:
Click on the icon at the top of the Application Dashboard.
In the Dashboard Settings window that appears, select Summary Graph from the Default Timeline for
list.
Then, choose a Timeline for the graph.
Finally, click the Update button.
9. To perform the summary analysis over a broader time window, click on the Timeline link at the right, top corner
of the History tab page and change the timeline; this will alter the timeline for all the graphs. To change the
timeline of a particular graph alone, click on the graph to enlarge it, and then alter its timeline. Also, by default,
hourly summaries are plotted in the summary graph; you can configure these graphs to plot daily/monthly
summaries instead by picking the relevant option from the Duration list in the enlarged mode. Here again, the
graph dimension (3D / 2D) can be altered.
10. Similarly, you can analyze the TerminalServices trends by viewing trend graphs in the History tab page. For this,
click on the icon at the right, top corner of the tab page.
11. These trend graphs, by default, plot the minimum and maximum values registered by every uptime-related
measure during every hour for the last 24 hours. Using these graphs, you can ascertain when during the last 24
hours uptime was very high, and when it was low. The default duration of 24 hours can be overridden using the
procedure discussed below:
Click on the icon at the top of the Application Dashboard.
In the Dashboard Settings window that appears, select Summary Graph from the Default Timeline for
list.
Then, choose a Timeline for the graph.
Finally, click the Update button.
12. To perform trend analysis over a longer time span, click on the Timeline link at the right, top corner of the
History tab page and change the timeline; this will alter the timeline for all the graphs. To change the timeline of
a particular graph alone, click on the graph to enlarge it, and then alter its timeline. In addition to the timeline,
the graph dimension (3D / 2D), the graph Duration, and the Graph type can also be changed in the enlarged
mode. By default, the graph Duration is Hourly, indicating that trend graphs plot hourly trend values by default.
To ensure that these graphs plot the daily/monthly trend values instead, select the relevant option from the
Duration list. Similarly, as already mentioned, trend graphs plot only the minimum and maximum values
registered by a measure during the specified timeline. Accordingly, the Graph type is set to Min/Max by default in
the enlarged mode. If you want the trend graph to plot the average trend values instead, set the Graph type to
Avg. On the other hand, to configure the trend graph to plot the sum of trends set the Graph type to Sum.

M O N I T O RI N G C I T R I X X E N AP P S E R V E R S
189
13. At any point in time, you can switch to the measure graphs by clicking on the button.
14. Typically, the History tab page displays measure, summary, and trend graphs for a default set of measures. If
you want to add graphs for more measures to this tab page or remove one/more measures for which graphs
pre-exist in this tab page, then, do the following:
Click the button at the top of the dashboard.
The Dashboard Settings window then appears. From the Module list of Figure 1.20, pick Application,
choose TerminalServices as the Sub-System, and then, select History Graph from the Add/Delete
Measures for list.
The measures for which graphs pre-exist in the History tab page will be automatically displayed in the
Existing Value(s) list. To delete a measure, and in effect, its corresponding graph as well, select the
measure from the Existing Value(s) list, click the Delete button, and then click the Update button.
To add a new graph, first, pick the Test that reports the measure for which a graph is to be
generated.
Next, select the Measure of interest.
Provide a Display name for the measure. Then, click the Add button to add the measure to the
Existing Values(s) list. Finally, click the Update button.
This will add a new measure, summary, and trend graph for the chosen measure to the History tab
page.
Note:
In case of descriptor-based tests, the Summary and Trend graphs displayed in the History tab page typically
plot the values for a single descriptor alone. To view the graph for another descriptor, pick a descriptor from
the drop-down list made available above the corresponding summary/trend graph.
Note:
Only users with Admin or Supermonitor privileges can enable/disable the system, network, and
application dashboards, or can customize the contents of such dashboards using the Dashboard
Settings window. Therefore, whenever a user without Admin or Supermonitor privileges logs into the
monitoring console, the button will not appear.
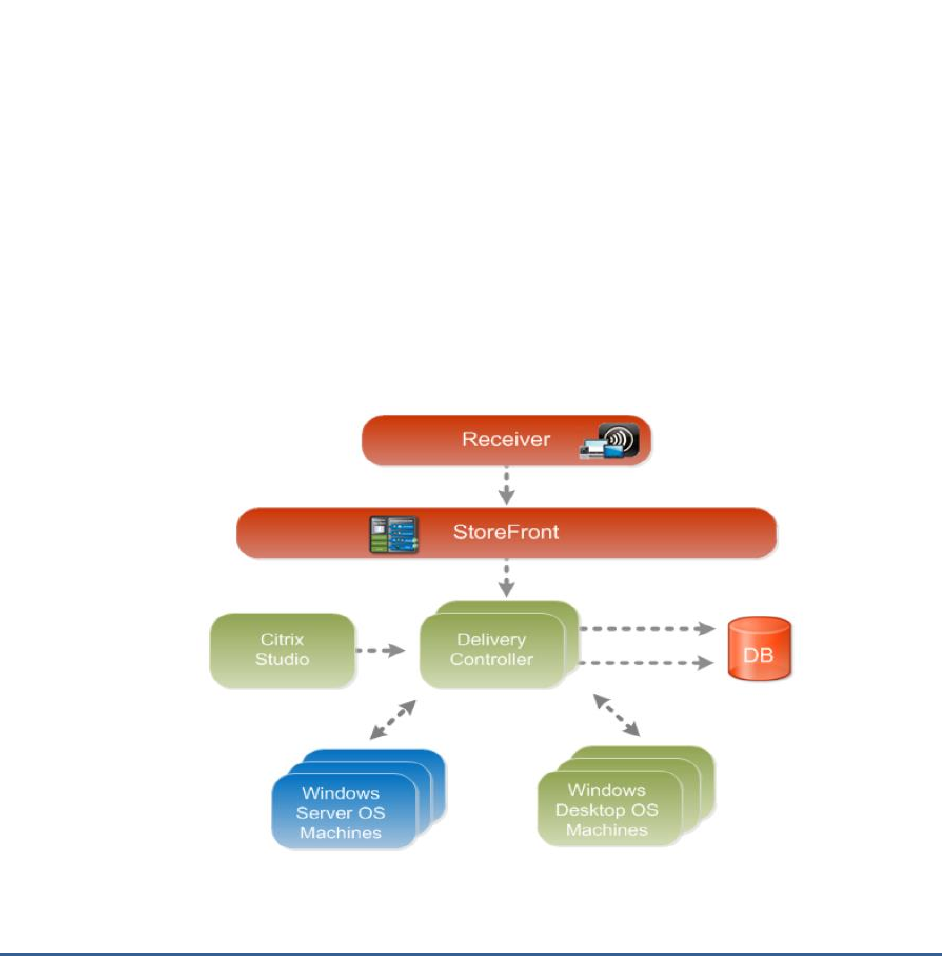
M O N I T O RI N G C I T R I X X E N AP P S E R V E R S
190
2.2 Monitoring Citrix XenApp Servers v7 (and above)
Citrix XenDesktop 7 is the latest release from Citrix. XenDesktop 7 represents the merging of the XenApp and
XenDesktop technologies into one cohesive package that's built on the same back-end components. Previously,
XenApp servers were running on the Citrix Independent Management Architecture. Citrix XenDesktop 7 however is
built on the Citrix FlexCast Management Architecture. This architecture is made up out of Delivery Controllers and
Agents. XenDesktop 7 supports two types of Delivery Agents: one for Windows Server OS machines and one for
Windows Desktop OS machines. As shown in the diagram below, both Delivery Agents communicate with the same
set of Delivery Controllers and share the common management infrastructure in XenDesktop 7. This infrastructure
consists of the following core components:
Receiver provides users with self-service access to published resources.
StoreFront authenticates users to site(s) hosting resources and manages stores of desktops and
applications that users access.
Studio is a single management console that enables you to configure and manage your deployment. Studio
provides various wizards to guide you through the process of setting up an environment, creating workloads
to host applications and desktops, and assigning applications and desktops to users.
Delivery Controller distributes applications and desktops, manages user access, and optimizes
connections to applications. Each site will have one or more delivery controllers.
Server OS Machines are the “XenApp” replacement – these are VMs or physical machines based on the
Windows Server operating system used for delivering applications or hosted shared desktops to users.
Desktop OS Machines are the “XenDesktop” replacement – these are VMs or physical machines based on
the Windows Desktop operating system used for delivering personalized desktops to users, or applications
from desktop operating systems.
Figure 2.70: The Citrix XenDesktop 7 architecture
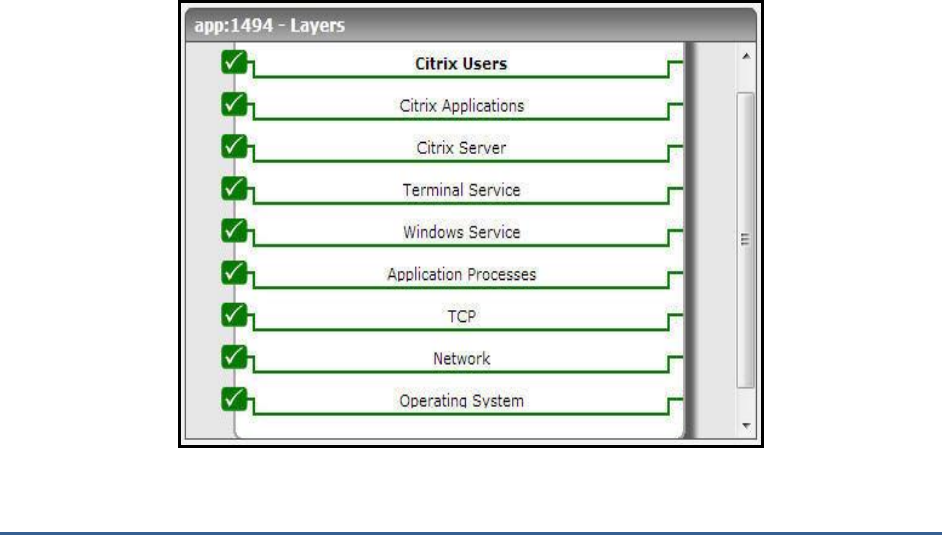
M O N I T O RI N G C I T R I X X E N AP P S E R V E R S
191
Since these components closely co-ordinate with each other to deliver desktops and applications to end-users, a
problem with any of these core components – say, the unavailability of StoreFront to authorize user logins, the failure
of the broker service, performance bottlenecks with the hypervisor, resource-intensive user sessions to the Server OS
machines, snags in the internal operations of the Desktop OS machines – can significantly impact the user experience
with Citrix XenDesktop 7. Therefore, to ensure a high-quality user experience with the application/desktop delivery
service, administrators should closely monitor each component of the XenDesktop 7 infrastructure, proactively
capture performance dips, and accurately isolate where the root-cause of the problem lies – is it with StoreFront? Is
it with the delivery controller? Is it with the Server OS machines? Is it with the virtualized platform? Or is it with the
Desktop OS machines? This is where eG Enterprise helps!
The eG Enterprise Suite performs end-to-end monitoring of the Citrix XenDesktop 7 infrastructure!
Dedicated, web-based monitoring models are offered by eG for each component in the XenDesktop 7 infrastructure.
While the
Citrix StoreFront
model focuses on the health of StoreFront and promptly captures issues in user
authentication, the
Citrix XenDesktop Broker
component monitors the Delivery Controller (or the XenDesktop broker)
and reports how well it manages the delivery agents and brokers connections to the Server OS and Desktop OS
machines. Moreover the
Citrix XenApp
model that eG Enterprise provides zooms into the overall performance and
problems related to the Server OS machines (that typically run Citrix XenApp 7) and helps isolate pain-points. Also,
to monitor the resources allocated to and the resource usage of hypervisors and the Desktop OS machines operating
on them, eG Enterprise offers a specialized monitoring model per hypervisor (such as Citrix XenServer, VMware
vSphere, Microsoft Hyper—V, etc.).
Detailed service topology maps in eG represent how these heterogeneous models interact with each other and how
dependencies flow.
In the event of a slowdown, eG’s patented virtualization-aware root-cause analysis engine analyzes these
dependencies, auto-correlates the performance results captured from the different monitoring models in the light of
these dependencies, and accurately diagnoses the source of the slowdown. Proactive email/SMS/web-based alerts
are then promptly sent out to administrators to alert them to the potential slowdown and what is causing it. This
way, eG Enterprise emerges as the ideal solution for monitoring Citrix XenDesktop 7.
This section deep dives into the
Citrix XenApp
monitoring model that eG Enterprise offers.
Figure 2.71: The layer model of the Citrix XenApp server

M O N I T O RI N G C I T R I X X E N AP P S E R V E R S
192
Each layer of Figure 2.1 above is mapped to a series of tests that periodically check on the availability,
responsiveness, and overall performance of the XenApp server, and report a wealth of performance information
related to the server. Using the metrics so reported, administrators can find quick and accurate answers to the
following performance queries:
Server Monitoring
Is the Citrix XenApp server available to service user requests?
Are there sporadic disconnects from the Citrix XenApp server?
At what times do peak usage of the servers happen and is the
server capacity adequate?
User Monitoring
What is the average response time that critical users are
seeing when connecting to Citrix XenApp?
How many users are logged in to each Citrix XenApp in the
Citrix farm?
What is the resource usage (CPU and memory) for each user?
Operating System Monitoring
What is the average CPU and memory usage on all the servers
in the farm?
Is any unusual memory scanning/paging activity happening on
the systems?
Are the critical Citrix XenApp server processes processes up?
What is their resource consumption?
Published Applications Monitoring
What are the published applications on the server?
Who is using each application?
What is the resource usage for each published application?
The Operating System, Network, TCP and Windows Service layers of the
Citrix XenApp
are similar to that of a
Windows
server model. Since these tests have been dealt with in the
Monitoring Unix and Windows Servers
document, Section 1.1 focuses on the Application Processes layer.
2.2.1 The Application Processes Layer
This layer tracks the TCP ports and reports the availability and responsiveness of each port. Besides, this layer
depicts the states of the different processes that must be executing for the application service to be available. Since
the Processes and Windows Processes tests mapped to this layer are detailed in the
Monitoring Unix and Windows
document, let us now discuss the Port Checks test in detail.
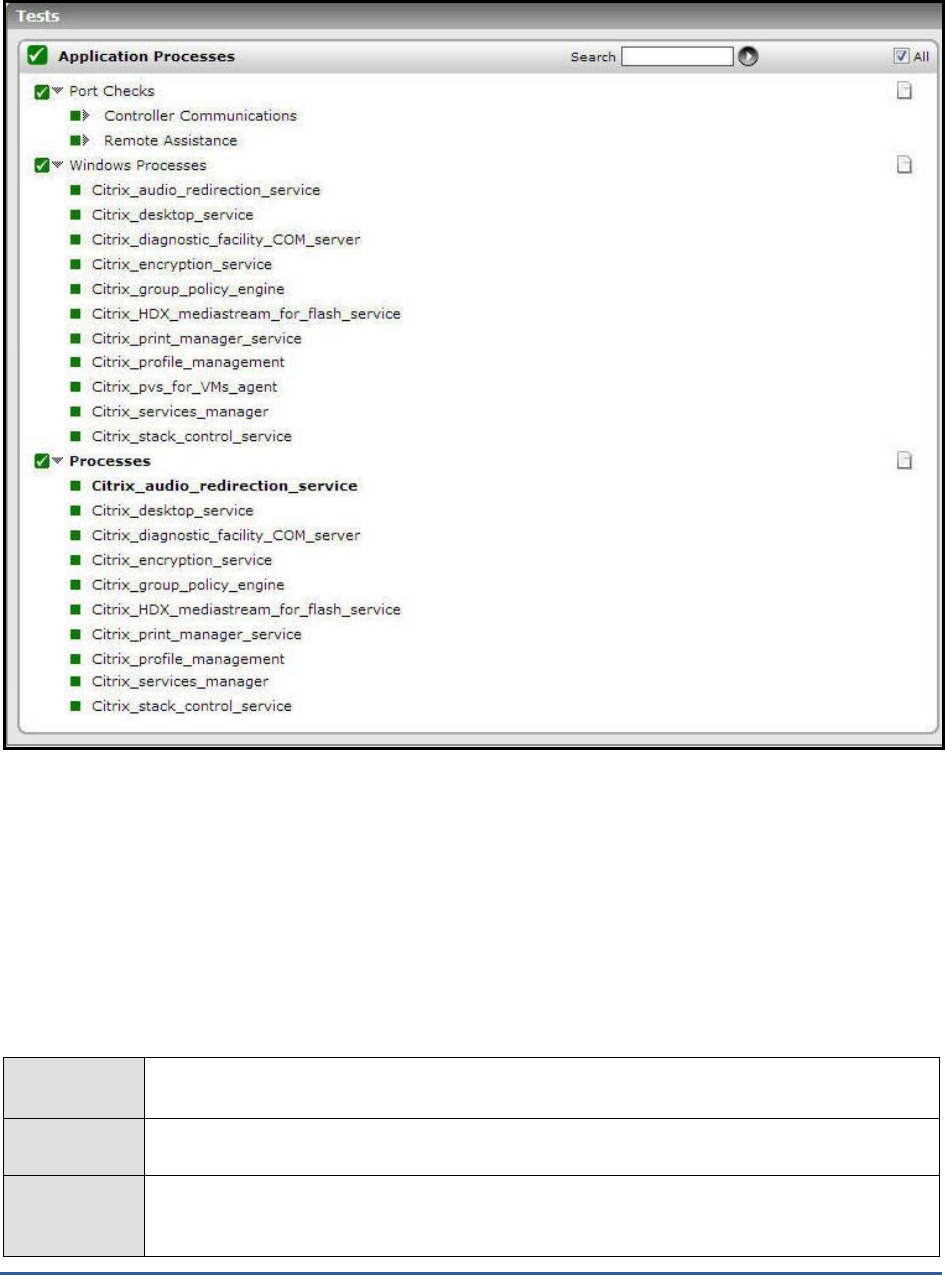
M O N I T O RI N G C I T R I X X E N AP P S E R V E R S
193
Figure 2.72: The tests mapped to the Application Processes layer
2.2.1.1 Port Checks Test
This test primarily checks whether the critical TCP ports on the Citrix XenApp server are up/down, and reports the
responsiveness of each configured port to client requests. However, these checks might not be adequate at all times;
you could have a case where the Citrix XenApp server port is up but the server is still not responding. When a
connection is made to the Citrix XenApp server, it will typically send a message "ICA" to the client. This check
connects to the port and then validates the response from the Citrix XenApp server to see if the ICA stream is being
received by the client. Hence, this test additionally reports the ICA connection availability.
Purpose
Primarily checks whether the critical TCP ports on the Citrix XenApp server are up/down, and
reports the responsiveness of each configured port to client requests
Target of the
test
A Citrix XenApp server
Agent
deploying the
test
An internal/remote agent

M O N I T O RI N G C I T R I X X E N AP P S E R V E R S
194
Configurable
parameters for
the test
1. TEST PERIOD - How often should the test be executed
2. HOST - The host for which the test is to be configured.
3. PORT – The port number at which the specified HOST listens to. By default, this is 1494.
4. TARGETPORTS – Specify either a comma-separated list of port numbers that are to be
tested (eg., 1494,1495,1496), or a comma-separated list of
port name:port number
pairs
that are to be tested (eg., ica:1494,smtp:25,mssql:1433). In the latter case, the port name
will be displayed in the monitor interface. Alternatively, this parameter can take a comma-
separated list of
port name:IP address:port number
pairs that are to be tested, so as to
enable the test to try and connect to Tcp ports on multiple IP addresses. For example,
mysql:192.168.0.102:1433
,
egwebsite:209.15.165.127:80
.
5. TIMEOUT - Here, specify the maximum duration (in seconds) for which the test will wait
for a response from the server. The default TIMEOUT period is 60 seconds.
6. ISPASSIVE - If the value chosen is YES, then the server under consideration is a passive
server in a cluster. No alerts will be generated if the server is not running. Measures will be
reported as “Not applicable” by the agent if the server is not up.
Outputs of the
test
One set of results for each port that is to be monitored
Measurements
made by the
test
Measurement
Measurement
Unit
Interpretation
TCP connection
availability:
Indicates whether the TCP
connection is available or not.
Percent
An availability problem can be caused by
different factors – e.g., the server process
may not be up, a network problem may exist,
or there could be a configuration problem
with the DNS server.
Response time:
Indicates the time taken by
the server to respond to a
request.
Secs
An increase in response time can be caused
by several factors such as a server
bottleneck, a configuration problem with the
DNS server, a network problem, etc.
ICA connection
availability:
Indicates whether ICA
connection is available or
not.
Percent
While the value 100 for this measure
indicates that the ICA stream is being
received by the client, the value 0 indicates
that it is not.
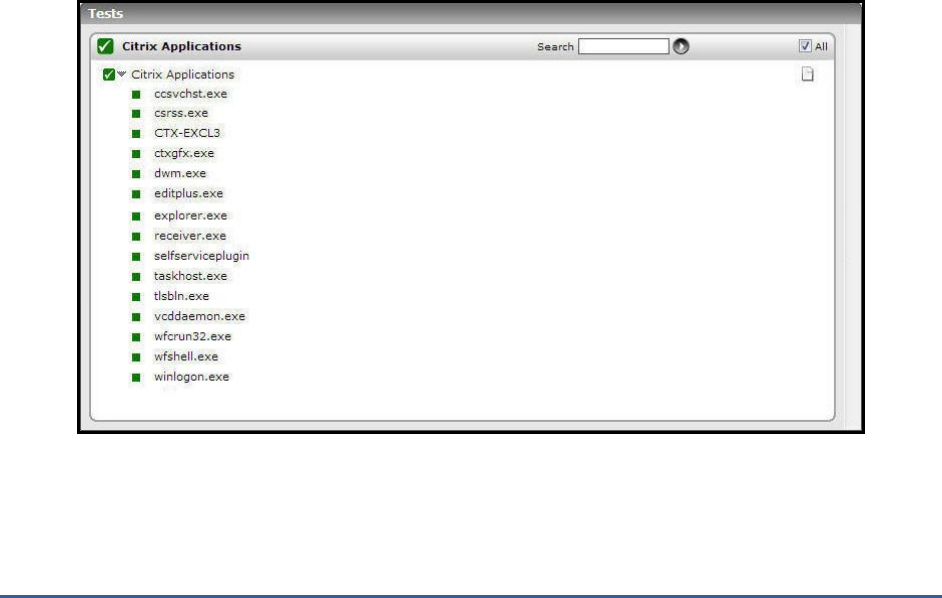
M O N I T O RI N G C I T R I X X E N AP P S E R V E R S
195
2.2.2 The Terminal Service Layer
In most environments, the Citrix XenApp 7 (or above) server functions in conjunction with a Terminal server. To
enable the administrators of XenDesktop 7 environment to monitor the movement and resource usage of the
Terminal clients on the Citrix XenApp server, the eG Enterprise system has introduced the Terminal Service layer. The
tests mapped to this layer are the same as those mapped to the Terminal Server layer of a Windows Terminal server.
These tests hence, have already been dealt with elaborately in the
Monitoring Microsoft RDS Servers
chapter of the
Monitoring Microsoft Applications
document. So, let us proceed to look at the Citrix Server layer.
2.2.3 The Citrix Server Layer
Citrix XenApp server-related performance parameters are monitored by the tests mapped to the Citrix Server layer.
This includes:
Profile size
User login and profile loading process
User profile management
Since there tests are already discussed in the Section 2.1 of this document, let us now proceed to discuss the Citrix
Applications layer.
2.2.4 The Citrix Applications Layer
Using the tests mapped to this layer, the resource usage per application executing on the Citrix XenApp server can
be measured.
Figure 2.73: Tests associated with the Citrix Applications layer

M O N I T O RI N G C I T R I X X E N AP P S E R V E R S
196
2.2.4.1 Citrix Applications Test
This test reports statistics pertaining to the different applications executing on a Citrix XenApp server and their usage
by Citrix clients.
Purpose
Returns the performance measures pertaining to the applications executing on the Citrix XenApp
server
Target of the
test
Citrix XenApp
Agent
deploying the
test
An internal agent

M O N I T O RI N G C I T R I X X E N AP P S E R V E R S
197
Configurable
parameters for
the test
1. TEST PERIOD - How often should the test be executed
2. HOST - The host for which the test is to be configured.
3. PORT – The port number at which the specified HOST listens to. By default, this is 1494.
4. SHOW PUBLISHED APPS – Using this flag, you can indicate whether the test should
monitor published applications alone or all applications running on the server. By default,
this flag is set to No, indicating that all applications will be monitored by default. To
monitor only published applications, you need to set this flag to Yes. However, prior to
changing the flag status to ‘Yes’, you need to make sure that a ‘Citrix XenDesktop Broker’
component is also managed by the eG Enterprise system and is reporting metrics.
5. SHOW PUBLISHED DESKTOPS – By default, this flag is set to No. If this flag is set to
Yes, then the detailed diagnosis of this test will list the resource-intensive
processes/applications accessed by a user along with the exact published desktop that has
been used by the user to access the application. Note that, in the detailed diagnosis, the
‘host name’ of the monitored server will be displayed as the ‘published desktop name’.
6. REPORT BY DOMAIN NAME – By default, this flag is set to Yes. This implies that by
default, the detailed diagnosis of this test will display the
domainname\username
of each
user who accessed an application on the server. This way, administrators will be able to
quickly determine which user logged into the server from which domain. If you want the
detailed diagnosis to display only the
username
of these users, set this flag to No.
7. DD FREQUENCY – Refers to the frequency with which detailed diagnosis measures are to
be generated for this test. The default is
1:1
. This indicates that, by default, detailed
measures will be generated every time this test runs, and also every time the test detects a
problem. You can modify this frequency, if you so desire. Also, if you intend to disable the
detailed diagnosis capability for this test, you can do so by specifying
none
against DD
FREQUENCY.
8. DETAILED DIAGNOSIS - To make diagnosis more efficient and accurate, the eG
Enterprise suite embeds an optional detailed diagnostic capability. With this capability, the
eG agents can be configured to run detailed, more elaborate tests as and when specific
problems are detected. To enable the detailed diagnosis capability of this test for a
particular server, choose the On option. To disable the capability, click on the Off option.
The option to selectively enable/disable the detailed diagnosis capability will be available
only if the following conditions are fulfilled:
The eG manager license should allow the detailed diagnosis capability
Both the normal and abnormal frequencies configured for the detailed diagnosis
measures should not be 0.
Outputs of the
test
One set of results for each application that is monitored
Measurements
made by the
Measurement
Measurement
Unit
Interpretation

M O N I T O RI N G C I T R I X X E N AP P S E R V E R S
198
test
Instances currently
running:
Number of instances of the
published application
currently executing on this
Citrix XenApp server.
Number
This value indicates if too many or too few
instances corresponding to an application are
executing on the host.
Use the Detailed diagnosis of this measure to
identify all the users executing this
application and comparing the users will help
you to identify which user is utilizing the
maximum memory, CPU etc
CPU usage:
Indicates the percentage of
CPU used by the published
application.
Percent
A very high value could indicate that the
specified application is consuming excessive
CPU resources.
Memory usage:
This value represents the
ratio of the resident set size
of the memory utilized by the
application to the physical
memory of the host system,
expressed as a percentage.
Percent
A sudden increase in memory utilization for
an application may be indicative of memory
leaks in the application.
Handle count:
Indicates the number of
handles opened by this
application.
Number
An increasing trend in this measure is
indicative of a memory leak in the
application.
Number of threads:
Indicates the number of
threads that are used by the
application.
Number
I/O data rate:
Indicates the rate at which
this application is reading and
writing bytes in I/O
operations.
KBytes/Sec
This value counts all I/O activity generated
by each instance of the application and
includes file, network and device I/Os.
I/O data operations:
Indicates the rate at which
this application is issuing read
and write data to file, network
and device I/O operations.
Operations/Sec
I/O read data rate:
Indicates the rate at which
this application is reading
data from file, network and
device I/O operations.
KBytes/Sec

M O N I T O RI N G C I T R I X X E N AP P S E R V E R S
199
I/O write data rate:
Indicates the rate at which
this application is writing data
to file, network and device
I/O operations.
KBytes/Sec
Page fault rate:
Indicates the total rate at
which page faults are
occurring for the
threads of all matching
applications.
Faults/Sec
This measure is a good indicator of the load
on the application.
A page fault occurs when a thread refers to a
virtual memory page that is not in its working
set in main memory. This may not cause the
page to be fetched from disk if it is on the
standby list and hence already in main
memory, or if it is in use by another
application with whom the page is shared.
Virtual memory used:
Indicates the amount of
virtual memory that is being
used by this application.
MB
The detailed diagnosis of the
Instances currently running
measure, if enabled, lists the user sessions that are
currently open, the process ids of the processes being executed by each of the users, and the CPU and memory
utilization (in %) of each of these processes.Additionally, this detailed diagnosis helps you in identifying the handles
that are opened, the thread count, the read/write operations as well as the I/O operations for each application. This
information enables the Citrix administrator to identify the processes with a high CPU/memory utilization. In the
event of a server overload, the Citrix administrator might decide to terminate these processes (see Figure 2.4).
Figure 2.74: The detailed diagnosis for the Instances currently running measure
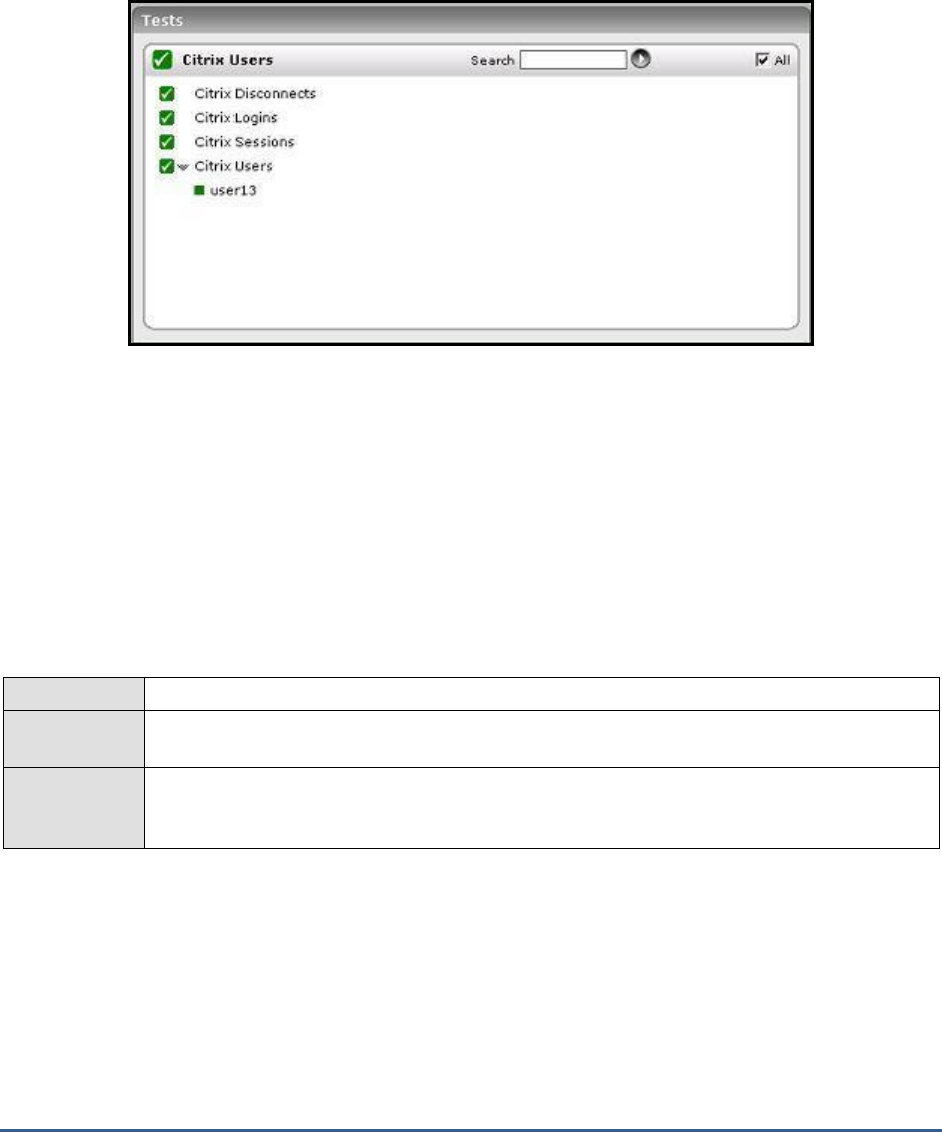
M O N I T O RI N G C I T R I X X E N AP P S E R V E R S
200
2.2.5 The Citrix Users layer
To accurately assess the individual user experience on the Citrix XenApp server, use the tests mapped to the Citrix
Users layer.
Figure 2.75: The tests associated with the Citrix Users layer
2.2.5.1 Citrix Disconnects Test
A user session is terminated when a user logs off from the Citrix XenApp server or when the session is abruptly
interrupted (e.g., due to server, network, or application errors). When a user logs off, all the applications started by
the user are terminated. However, when a user disconnects, the applications started by the user will keep running on
the server consuming resources. Hence, the number of disconnected sessions on a Citrix XenApp server should be
kept to a minimum. Abrupt disconnects can significantly impact the end user experience, and hence, it is important
to monitor the number of disconnected sessions at any point of time. This test measures the number of disconnected
user sessions.
Purpose
Measures the number of disconnected user sessions
Target of the
test
Citrix XenApp
Agent
deploying the
test
An internal agent

M O N I T O RI N G C I T R I X X E N AP P S E R V E R S
201
Configurable
parameters for
the test
1. TEST PERIOD - How often should the test be executed
2. HOST - The host for which the test is to be configured.
3. PORT – The port number at which the specified HOST listens to. By default, this is 1494.
4. RECONNECT PERIOD – This parameter is used by the test while computing the value for
the Quick reconnects measure. This measure counts all the users who reconnected to the
Citrix XenApp within the short period of time (in minutes) specified against RECONNECT
PERIOD.
5. REPORT BY DOMAIN NAME – By default, this flag is set to Yes. This implies that by default,
the detailed diagnosis of this test will display the
domainname\username
of each user who
disconnected from the server recently. This way, administrators will be able to quickly
determine which user belongs to which domain. If you want the detailed diagnosis to
display the
username
alone, then set this flag to No.
6. DD FREQUENCY – Refers to the frequency with which detailed diagnosis measures are to
be generated for this test. The default is
1:1
. This indicates that, by default, detailed
measures will be generated every time this test runs, and also every time the test detects a
problem. You can modify this frequency, if you so desire. Also, if you intend to disable the
detailed diagnosis capability for this test, you can do so by specifying
none
against DD
FREQUENCY.
7. DETAILED DIAGNOSIS - To make diagnosis more efficient and accurate, the eG Enterprise
suite embeds an optional detailed diagnostic capability. With this capability, the eG agents
can be configured to run detailed, more elaborate tests as and when specific problems are
detected. To enable the detailed diagnosis capability of this test for a particular server,
choose the On option. To disable the capability, click on the Off option.
The option to selectively enable/disable the detailed diagnosis capability will be available
only if the following conditions are fulfilled:
The eG manager license should allow the detailed diagnosis capability
Both the normal and abnormal frequencies configured for the detailed diagnosis
measures should not be 0.
Outputs of the
test
One set of results for the Citrix XenApp server that is to be monitored
Measurements
made by the
test
Measurement
Measurement
Unit
Interpretation
New disconnects:
Indicates the number of
sessions that were
disconnected during the last
measurement period.
Number
The detailed diagnosis of this measure
indicates the user, session ID, and client type
for each newly disconnected session. This
information can be used to track whether
specific users are being disconnected often.
Quick reconnects:
Indicates the number of users
who reconnected soon after a
disconnect.
Number
The detailed diagnosis of this measure, if
enabled lists the users who have reconnected
quickly.

M O N I T O RI N G C I T R I X X E N AP P S E R V E R S
202
Total disconnects:
Indicates the total number of
sessions that are in the
disconnected state.
Number
2.2.5.2 Citrix Logins Test
The Citrix Logins test monitors the new logins to the Citrix XenApp server.
Purpose
Monitors the new logins to the Citrix XenApp server
Target of the
test
Citrix XenApp
Agent
deploying the
test
An internal agent
Configurable
parameters for
the test
1. TEST PERIOD - How often should the test be executed
2. HOST - The host for which the test is to be configured.
3. PORT – The port number at which the specified HOST listens to. By default, this is 1494.
4. REPORT USING MANAGERTIME – By default, this flag is set to Yes. This indicates that
the user login time displayed in the DETAILED DIAGNOSIS page for this test and in the Thin
Client reports will be based on the eG manager's time zone by default. Set this flag to No if
you want the login times displayed in the DETAILED DIAGNOSIS page for this test and in the
Thin Client reports to be based on the Terminal server's local time.
5. REPORT BY DOMAIN NAME – By default, this flag is set to Yes. This implies that by
default, the detailed diagnosis of this test will display the
domainname\username
of each
user session that logged out. This default setting ensures that administrators are able to
quickly determine the domains to which the users who logged out belonged. You can set
this flag to No if you want detailed diagnosis to display only the
username
of the users who
logged out.
6. DD FREQUENCY – Refers to the frequency with which detailed diagnosis measures are to
be generated for this test. The default is
1:1
. This indicates that, by default, detailed
measures will be generated every time this test runs, and also every time the test detects a
problem. You can modify this frequency, if you so desire. Also, if you intend to disable the
detailed diagnosis capability for this test, you can do so by specifying
none
against DD
FREQUENCY.
7. DETAILED DIAGNOSIS – To make diagnosis more efficient and accurate, the eG Enterprise
suite embeds an optional detailed diagnostic capability. With this capability, the eG agents
can be configured to run detailed, more elaborate tests as and when specific problems are
detected. To enable the detailed diagnosis capability of this test for a particular server,
choose the On option. To disable the capability, click on the Off option.
The option to selectively enable/disable the detailed diagnosis capability will be available
only if the following conditions are fulfilled:
The eG manager license should allow the detailed diagnosis capability
Both the normal and abnormal frequencies configured for the detailed diagnosis
measures should not be 0.

M O N I T O RI N G C I T R I X X E N AP P S E R V E R S
203
Outputs of the
test
One set of results for the Citrix XenApp that is to be monitored
Measurements
made by the
test
Measurement
Measurement
Unit
Interpretation
New logins:
Indicates the number of new
logins to this Citrix XenApp
during the last measurement
period.
Number
A consistent zero value could indicate a
connection issue.
Using the detailed diagnosis of the
New
logins
measure, you can not only identify the
users who logged in recently, but can also
figure out when each user logged in and from
which client machine.
Percent new logins:
Indicates the percentage of
current sessions that logged
in during the last
measurement period.
Percent
Sessions logging out:
Indicates the number of
sessions that logged out.
Number
If all the current sessions suddenly log out, it
indicates a problem condition that requires
investigation.
With the help of the detailed diagnosis of the
Sessions logging out
measure, you can
identify the users who logged out, when
every user logged in and from which client
machine, and the duration of each user’s
session. Abnormally long sessions on the
server can thus be identified.
2.2.5.3 Citrix Sessions Test
This test reports performance statistics related to Citrix user sessions of the Citrix XenApp server.
Purpose
Reports performance statistics related to Citrix user sessions
Target of the
test
Citrix XenApp
Agent
deploying the
test
An internal agent

M O N I T O RI N G C I T R I X X E N AP P S E R V E R S
204
Configurable
parameters for
the test
1. TEST PERIOD - How often should the test be executed
2. HOST - The host for which the test is to be configured.
3. PORT – The port number at which the specified HOST listens to. By default, this is 1494.
4. IGNORE DOWN SESSION IDS - By default, this parameter is set to
65536,65537,65538
–
these are nothing but the default ports at which the listener component listens. If any of
these ports go down, then by default, this test will not count any of the sessions that failed
when attempting to connect to that port as a Down session. You can override this default
setting by adding more ports or by removing one/more existing ports.
5. REPORT USING MANAGERTIME – By default, this flag is set to Yes. This indicates that
the user login time displayed in the DETAILED DIAGNOSIS page for this test and in the Thin
Client reports will be based on the eG manager's time zone by default. Set this flag to No if
you want the login times displayed in the DETAILED DIAGNOSIS page for this test and in the
Thin Client reports to be based on the Terminal server's local time.
6. REPORT BY DOMAIN NAME - By default, this flag is set to Yes. This implies that by
default, the detailed diagnosis of this test will display the
domainname\username
of each
user session that logged out. This default setting ensures that administrators are able to
quickly determine the domains to which the users who logged out belonged. You can set
this flag to No if you want detailed diagnosis to display only the
username
of the users who
logged out.
7. DD FREQUENCY - Refers to the frequency with which detailed diagnosis measures are to
be generated for this test. The default is
1:1
. This indicates that, by default, detailed
measures will be generated every time this test runs, and also every time the test detects a
problem. You can modify this frequency, if you so desire. Also, if you intend to disable the
detailed diagnosis capability for this test, you can do so by specifying
none
against DD
FREQUENCY.
8. DETAILED DIAGNOSIS – To make diagnosis more efficient and accurate, the eG
Enterprise suite embeds an optional detailed diagnostic capability. With this capability, the
eG agents can be configured to run detailed, more elaborate tests as and when specific
problems are detected. To enable the detailed diagnosis capability of this test for a
particular server, choose the On option. To disable the capability, click on the Off option.
The option to selectively enable/disable the detailed diagnosis capability will be available
only if the following conditions are fulfilled:
The eG manager license should allow the detailed diagnosis capability
Both the normal and abnormal frequencies configured for the detailed diagnosis
measures should not be 0.
Outputs of the
test
One set of results for the Citrix XenApp that is to be monitored
Measurements
made by the
Measurement
Measuremen
t Unit
Interpretation

M O N I T O RI N G C I T R I X X E N AP P S E R V E R S
205
test
Active sessions:
Indicates the number of user
sessions that are currently active
on this server.
Number
This measure gives an idea of the server
workload in terms of active sessions.
Tracking the number of active sessions with
time, a Citrix administrator can obtain
information that can help him/her plan the
capacity of their Cenvironment. The detailed
diagnosis capability, if enabled, lists the
active and inactive sessions on the Citrix
XenApp server.
Idle sessions:
Indicates the number of
sessions that are initialized and
are currently ready to accept
connections.
Number
To optimize the performance of a server, two
default (idle) sessions are initialized before
any client connections are made. For
performance reasons, the number of idle
sessions should be less than ten. Note that
this test does not differentiate between RDP
and ICA sessions.
Connected sessions:
Indicates the current number of
sessions that are connected, but
no user has logged on to the
server.
Number
A consistent increase in the value of this
measure could indicate that users are having
trouble logging in. Further investigation may
hence be required. Note that this test does
not differentiate between RDP and ICA
sessions.
Connecting sessions:
Indicates the number of
sessions that are in the process
of connecting.
Number
A very high value for this measure indicates a
problem with the session or connection. Note
that this test does not differentiate between
RDP and ICA sessions.
Disconnected sessions:
Indicates the number of
sessions from which users have
disconnected, but which are still
active and can be reconnected.
Number
Too many disconnected sessions running
indefinitely on a Citrix XenApp server cause
excessive consumption of the server
resources. To avoid this, a session limit is
typically configured for disconnected sessions
on the Citrix XenApp server. When a session
limit is reached for a disconnected session,
the session ends, which permanently deletes
it from the server. Note that this test does
not differentiate between RDP and ICA
sessions.
Listen sessions:
Indicates the current number of
sessions that are ready to
accept connections.
Number
Note that this test does not differentiate
between RDP and ICA sessions.
Shadow sessions:
Indicates the current number of
sessions that are remotely
controlling other sessions.
Number
A non-zero value for this measure indicates
the existence of shadow sessions that are
allowed to view and control the user activity
on another session. Such sessions help in
troubleshooting/resolving problems with
other sessions under their control.
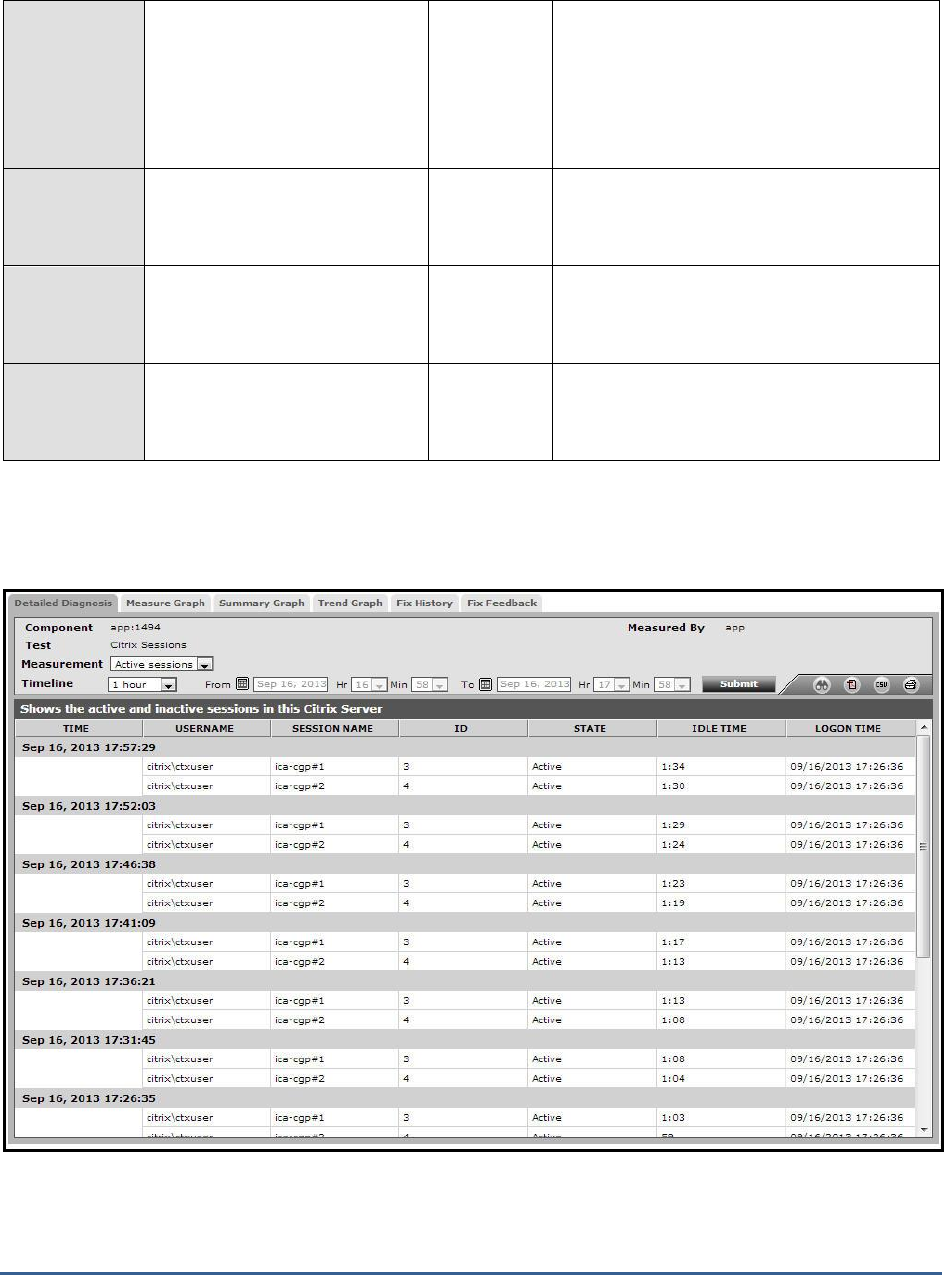
M O N I T O RI N G C I T R I X X E N AP P S E R V E R S
206
Down sessions:
Indicates the current number of
sessions that could not be
initialized or terminated.
Number
Ideally, the value of this measure should be
0.
By default, if sessions to any of these ports –
65536, 65537, 65538 – could not be initialized
or terminated, they will not be counted as a
‘down session’.
Init sessions:
Indicates the current number of
sessions that are initializing.
Number
A high value for this measure could indicate
that many sessions are currently experiencing
initialization problems.
Inactive sessions:
Indicates the current number of
user sessions that are inactive.
Number
Total sessions:
Indicates the total number of
sessions on the xendesktop
Number
The detailed diagnosis capability of the
Active sessions
measure, if enabled, lists the active and inactive sessions on
the Citrix XenApp server.
Figure 2.76: The detailed diagnosis of the Active Sessions measure of the Citrix XenApp
M O N I T O RI N G C I T R I X X E N AP P S E R V E R S
207
2.2.5.4 Citrix Users Test
The Citrix XenDesktop 7 environment is a shared environment in which multiple users may connect to a Citrix
XenApp server/server farm and access a wide variety of applications. When server resources are shared, excessive
resource utilization by a single user could impact the performance for other users. Therefore, continuous monitoring
of the activities of each and every user on the server is critical. Towards this end, the Citrix Users test assesses the
traffic between the user terminal and the server, and also monitors the resources taken up by a user's session on the
server. The results of this test can be used in troubleshooting and proactive monitoring. For example, when a user
reports a performance problem, an administrator can quickly check the bandwidth usage of the user's session, the
CPU/memory/disk usage of this user's session as well as the resource usage of other user sessions. The administrator
also has access to details on what processes/applications the user is accessing and their individual resource usage.
This information can be used to spot any offending processes/ applications.
Purpose
Monitors the resource utilization of every user on the Citrix XenApp server
Target of the
test
A Citrix XenApp server
Agent
deploying the
test
An internal agent

M O N I T O RI N G C I T R I X X E N AP P S E R V E R S
208
Configurable
parameters for
the test
1. TEST PERIOD - How often should the test be executed
2. HOST - The host for which the test is to be configured.
3. PORT – The port number at which the specified HOST listens to. By default, this is 1745.
4. SHOW PUBLISHED APPS – Using this flag, you can indicate whether the test should
monitor published applications alone or all applications running on the server. By default,
this flag is set to No, indicating that all applications will be monitored by default. To
monitor only published applications, you need to set this flag to Yes. However, prior to
changing the flag status to ‘Yes’, you need to make sure that a ‘Citrix XenDesktop Broker’
component is also managed by the eG Enterprise system and is reporting metrics..
5. SHOW PUBLISHED DESKTOPS – By default, this flag is set to No. If this flag is set to
Yes, then the detailed diagnosis of this test will list the resource-intensive
processes/applications accessed by a user along with the exact published desktop that has
been used by the user to access the application. Note that, in the detailed diagnosis, the
‘host name’ of the monitored server will be displayed as the ‘published desktop name’.
6. REPORT BY DOMAIN NAME – By default, this flag is set to Yes. This implies that by
default, the detailed diagnosis of this test will display the
domainname\username
of each
user who accessed an application on the server. This way, administrators will be able to
quickly determine which user logged into the server from which domain. If you want the
detailed diagnosis to display only the
username
of these users, set this flag to No.
7. DD FREQUENCY – Refers to the frequency with which detailed diagnosis measures are to
be generated for this test. The default is
1:1
. This indicates that, by default, detailed
measures will be generated every time this test runs, and also every time the test detects a
problem. You can modify this frequency, if you so desire. Also, if you intend to disable the
detailed diagnosis capability for this test, you can do so by specifying
none
against DD
FREQUENCY.
8. DETAILED DIAGNOSIS - To make diagnosis more efficient and accurate, the eG
Enterprise suite embeds an optional detailed diagnostic capability. With this capability, the
eG agents can be configured to run detailed, more elaborate tests as and when specific
problems are detected. To enable the detailed diagnosis capability of this test for a
particular server, choose the On option. To disable the capability, click on the Off option.
The option to selectively enable/disable the detailed diagnosis capability will be available
only if the following conditions are fulfilled:
The eG manager license should allow the detailed diagnosis capability
Both the normal and abnormal frequencies configured for the detailed diagnosis
measures should not be 0.
Outputs of the
test
One set of results for the Citrix XenApp that is to be monitored
Measurements
made by the
Measurement
Measurement
Unit
Interpretation

M O N I T O RI N G C I T R I X X E N AP P S E R V E R S
209
test
CPU usage for user's
processes:
The CPU utilization for a
session is the percentage of
time that all of the
threads/processes of a user
session used the processor to
execute instructions. If a user
is connected via multiple
sessions, the value reported is
the sum of all cpu utilizations
across all the sessions.
Percent
This value indicates the percentage of Cpu
resources that are used by a specific
user. Excessive CPU usage by a user can
impact performance for other users. Check
the detailed diagnosis to view the offending
processes/applications.
Handles used by user's
processes:
Indicates the total number of
handles being currently held
by all processes of a user.
Number
A consistent increase in the handle count
over a period of time is indicative of
malfunctioning of programs. Compare this
value across users to see which user is using
a lot of handles. Check detailed diagnosis for
further information.
Audio bandwidth input:
Indicates the bandwidth used
while transmitting
sound/audio to this user.
Kbps
Comparing these values across users will
reveal which user is sending/receiving
bandwidth-intensive sound/audio files over
the ICA channel.
To minimize bandwidth consumption, you
may want to consider disabling client audio
mapping.
Audio bandwidth output:
Indicates the bandwidth used
while receiving sound/audio
from this user.
Kbps
Input bandwidth:
Indicates the average
bandwidth used for client to
server communications for all
the sessions of a user.
KB/Sec
Output bandwidth:
Indicates the average
bandwidth used for server to
client communications for all
the sessions of a user.
KB/Sec
COM bandwidth input:
Indicates the bandwidth used
when sending data to this
user’s COM port.
Kbps
Comparing these values across users will
reveal which user’s COM port is
sending/receiving bandwidth-intensive data
over the ICA channel.
COM bandwidth output:
Indicates the bandwidth used
when receiving data from this
user’s COM port.

M O N I T O RI N G C I T R I X X E N AP P S E R V E R S
210
Input compression:
Indicates the average
compression ratio for client to
server traffic for all the
sessions of a user.
Number
Output compression:
Indicates the average
compression ratio for server
to client traffic for all the
sessions of a user.
Number
Drive bandwidth input:
Indicates the bandwidth used
when this user performs file
operations on the mapped
drive on the virtual desktop.
Kbps
Comparing the values of these measures
across users will reveal which user is
performing bandwidth-intensive file
operations over the ICA channel.
If bandwidth consumption is too high, you
may want to consider disabling client drive
mapping on the client device. Client drive
mapping allows users logged on to a virtual
desktop from a client device to access their
local drives transparently from the ICA
session. Alternatively, you can conserve
bandwidth by even refraining from accessing
large files with client drive mapping over the
ICA connection.
Drive bandwidth output:
Indicates the bandwidth used
when the virtual desktop
performs file operations on
the client’s drive.
Kbps
HDX media stream for
flash data bandwidth
input:
Indicates the bandwidth used
from this user to virtual
desktop for flash data traffic.
Kbps
Comparing the values of these measures
across users will reveal which user has been
transmitting/receiving bandwidth-intensive
flash data.
HDX media stream for
flash data bandwidth
output:
Indicates the bandwidth used
from the virtual desktop to
this user for flash data traffic.
Kbps
PN bandwidth input:
Indicates the bandwidth used
from this user to virtual
desktop by Program
Neighborhood to obtain
application set details.
Kbps
Comparing the values of these measures
across users will reveal which user has been
transmitting/receiving bandwidth-intensive
PN traffic.

M O N I T O RI N G C I T R I X X E N AP P S E R V E R S
211
PN bandwidth output:
Indicates the bandwidth, used
from the virtual desktop to
this user by Program
Neighborhood to obtain
application set details.
Kbps
I/O read rate for user's
processes:
Indicates the rate of I/O
reads done by all processes
being run by a user.
KBps
These metrics measure the collective I/O
activity (which includes file, network and
device I/O's) generated by all the processes
being executed by a user. When viewed
along with the system I/O metrics reported
by the DiskActivityTest, these measures help
you determine the network I/O. Comparison
across users helps identify the user who is
running the most I/O-intensive processes.
Check the detailed diagnosis for the offending
processes/applications.
I/O write rate for user's
processes:
Indicates the rate of I/O
writes done by all processes
being run by a user.
KBps
Latency avg:
Indicates the average client
latency for a user. The value
reported is the average of the
latencies for all the current
sessions of a user.
Secs
Latency deviation:
The latency deviation
represents the difference
between the minimum and
maximum measured latency
values for a session. The
value reported is the average
of the latency deviations for
all the current sessions of a
user.
Secs
Ideally, the deviation in latencies over a
session should be minimum so as to provide
a consistent experience for the user.
Latency last:
Represents the average client
latency for the last request
from a user. The latency is
measured by rhe Citrix
XenApp server based on
packets sent to and from each
client during a session - this
includes network delay plus
server side processingdelays.
The value reported is the
average of the last latencies
for all the current sessions of
a user.
Secs
A consistently high latency may be indicative
of performance degradations with the Citrix
XenApp servers. Possible reasons for an
increase in latency could be increased
network delays, network congestion, server
slow-down, too many simultaneous users on
the server etc. Typically latencies on a erver
will be below 5 secs.

M O N I T O RI N G C I T R I X X E N AP P S E R V E R S
212
Memory usage for user's
processes:
This value represents the
ratio of the resident set size
of the memory utilized by the
user to the physical memory
of the host system, expressed
as a percentage. If a user is
connected via multiple
sessions, the value reported is
the sum of all memory
utilizations across all the
sessions.
Percent
This value indicates the percentage of
memory resources that are used up by a
specific user. By comparing this value across
users, an administrator can identify the most
heavy users of the Citrix XenApp
server. Check the detailed diagnosis to view
the offending processes/applications.
User sessions:
Indicates the current number
of sessions for a particular
user.
Number
A value of 0 indicates that the user is not
currently connected to the Citrix XenApp
server.
Use the detailed diagnosis of this measure to
know the details of the sessions.
Input line speed:
Indicates the average line
speed from the client to the
server for all the sessions of a
user.
Kbps
Output line speed:
Indicates the average line
speed from the server to the
client for all the sessions of a
user.
Kbps
Printer bandwidth input:
Indicates the bandwidth used
when this user prints to a
desktop printer over the ICA
channel.
Kbps
Comparing the values of these measures
across users will reveal which user is issuing
bandwidth-intensive print commands over the
ICA channel.
If bandwidth consumption is too high, you
may want to consider disabling printing.
Alternatively, you can avoid printing large
documents over the ICA connection.
Printer bandwidth output:
Indicates the bandwidth used
when the desktop responds to
print jobs issued by this user.
Kbps
Speed screen data
channel bandwidth input:
Indicates the bandwidth used
from this user to the virtual
desktop for data channel
traffic.
Kbps
Comparing the values of these measures
across users will reveal which user has been
transmitting/receiving bandwidth-intensive
data channel traffic.

M O N I T O RI N G C I T R I X X E N AP P S E R V E R S
213
Speed screen data
channel bandwidth
output:
Indicates the bandwidth used
from virtual desktop to this
user for data channel traffic.
Kbps
HDX media stream for
flash v2 data bandwidth
input:
Indicates the bandwidth used
from this user to virtual
desktop for flash v2 data
traffic.
Kbps
Comparing the values of these measures
across users will reveal which user has been
transmitting/receiving bandwidth-intensive
flash v2 data.
HDX media stream for
flash v2 data bandwidth
output:
Indicates the bandwidth used
from the virtual desktop to
this user for flash v2 data
traffic.
Kbps
Page faults for user's
processes:
Indicates the rate of page
faults seen by all processes
being run by a user.
Faults/Sec
Page Faults occur in the threads executing in
a process. A page fault occurs when a thread
refers to a virtual memory page that is not in
its working set in main memory. If the page
is on the standby list and hence already in
main memory, or if the page is in use by
another process with whom the page is
shared, then the page fault will not cause the
page to be fetched from disk. Excessive page
faults could result in decreased performance.
Compare values across users to figure out
which user is causing most page faults.
Virtual memory of user's
processes:
Indicates the total virtual
memory being used by all
processes being run by a
user.
MB
Comparison across users reveals the user
who is being a drain on the virtual memory
space.

M O N I T O RI N G C I T R I X X E N AP P S E R V E R S
214
Processor time used by
user's sessions:
Indicates the percentage of
time, across all processors,
this user hogged the CPU.
Percent
The
CPU usage for user’s processes
measure
averages out the total CPU usage of a
user on the basis of the number of
processors. For instance, if your Citrix
XenApp server is using an 8-core processor
and the total CPU usage of a user across all
his/her sessions amounts to 80%, then the
value of the
CPU usage for user’s processes
measure for that user will be 10 % (80/8
processors = 10). This accurately denotes the
extent of CPU usage in an environment
where load is uniformly balanced across
multiple processors. However, in
environments where load is not well-
balanced, the
CPU usage for user’s processes
measure may not be an accurate indicator of
CPU usage per user. For instance, if a single
processor is used nearly 80% of the time by
a user, and other 7 processors in the 8-core
processor environment are idle, the
CPU
usage for user’s processes
measure will still
report CPU usage as 10%. This may cause
administrators to miss out on the fact that
the user is actually hogging a particular
processor! In such environments therefore,
its best to use the
CPU time used by user’s
sessions
measure! By reporting the total CPU
usage of a user across all his/her sessions
and across all the processors the target Citrix
XenApp server supports, this measure serves
as the true indicator of the level of CPU
usage by a user in dynamic environments.
For instance, in the example above, the
Processor time used by user's sessions
of the
user will be 80% (and not 10%, as in the
case of the
CPU usage for user’s processes
measure). A high value or a consistent
increase in the value of this measure is hence
serious and demands immediate attention. In
such situations, use the detailed diagnosis of
the
CPU usage for user’s processes
measure
to know what CPU-intensive activities are
being performed by the user.
Bandwidth usage:
Indicates the percentage HDX
bandwidth consumption of
this user.
Percent
Compare the value of this measure across
users to know which user is consuming the
maximum HDX bandwidth.

M O N I T O RI N G C I T R I X X E N AP P S E R V E R S
215
ThinWire bandwidth
input:
Indicates the bandwidth used
from client to server for
ThinWire traffic.
Kbps
Typically, ICA traffic is comprised of many
small packets, as well as a some large
packets. Large packets are commonly
generated for initial session screen paints and
printing jobs, whereas the ongoing user
session is principally comprised of many small
packets. For the most part, these small
packets are the highest priority ICA data
called Thinwire. Thinwire incorporates mouse
movements and keystrokes.
Compare the value of these measures across
users to know which user’s keystrokes and
mouse movements are generating
bandwidth-intensive traffic.
Thinwire bandwith
output:
Indicates the bandwidth used
from server to client for
ThinWire traffic.
Kbps
Seamless bandwidth
input:
Indicates the bandwidth used
from client to server for
published applications that
are not embedded in a
session window.
Kbps
Compare the value of these measures across
users to know which user is accessing
bandwidth-intensive applications that are not
in a session window.
Seamless bandwidth
output:
Indicates the bandwidth used
from server to client for
published applications that
are not embedded in a
session window.
Kbps
Resource shares:
Indicates the total number of
resource shares used by this
user.
Number
By comparing the value of this measure
across users, you can identify the user who is
hogging the resources.
M O N I T O RI N G C I T R I X X E N AP P S E R V E R S
216
2.2.5.5 Citrix Multimedia Audio Logs Test
To troubleshoot issues with the audio experience on Citrix XenApp, you can use the the Citrix Multimedia Audio Logs
test. This test periodically searches the
Citrix-Multimedia-AudioSVC/Admin
logs for specific patterns of event
IDs/event sources/event descriptions and alerts administrators if messages matching the configured patterns are
found.
Purpose
Periodically searches the
Citrix-Multimedia-AudioSVC/Admin
logs for specific patterns of event
IDs/event sources/event descriptions and alerts administrators if messages matching the
configured patterns are found
Target of the
test
A Citrix XenApp server
Agent
deploying the
test
An internal agent

M O N I T O RI N G C I T R I X X E N AP P S E R V E R S
217
Configurable
parameters for
the test
1. TEST PERIOD - How often should the test be executed
2. HOST - The host for which the test is to be configured
3. PORT – Refers to the port used by the EventLog Service. Here it is null.
4. LOGTYPE – Refers to the type of event logs to be monitored. The default value is
Citrix-
Multimedia-AudioSVC/Admin
.
5. POLICY BASED FILTER - Using this page, administrators can configure the event
sources, event IDs, and event descriptions to be monitored by this test. In order to enable
administrators to easily and accurately provide this specification, this page provides the
following options:
Manually specify the event sources, IDs, and descriptions in the FILTER text
area, or,
Select a specification from the predefined filter policies listed in the FILTER box
For explicit, manual specification of the filter conditions, select the NO option against the
POLICY BASED FILTER field. This is the default selection. To choose from the list of pre-
configured filter policies, or to create a new filter policy and then associate the same with
the test, select the YES option against the POLICY BASED FILTER field.
6. FILTER - If the POLICY BASED FILTER flag is set to NO, then a FILTER text area will
appear, wherein you will have to specify the event sources, event IDs, and event
descriptions to be monitored. This specification should be of the following format:
{Displayname}:{event_sources_to_be_included}:{event_sources_to_be_excluded}:{event_I
Ds_to_be_included}:{event_IDs_to_be_excluded}:{event_descriptions_to_be_included}:{ev
ent_descriptions_to_be_excluded}
. For example, assume that the FILTER text area takes
the value,
OS_events:all:Browse,Print:all:none:all:none
. Here:
OS_events
is the display name that will appear as a descriptor of the test in the
monitor UI;
all
indicates that all the event sources need to be considered while monitoring. To
monitor specific event sources, provide the source names as a comma-separated
list. To ensure that none of the event sources are monitored, specify
none
.
Next, to ensure that specific event sources are excluded from monitoring, provide
a comma-separated list of source names. Accordingly, in our example,
Browse
and
Print
have been excluded from monitoring. Alternatively, you can use
all
to
indicate that all the event sources have to be excluded from monitoring, or
none
to denote that none of the event sources need be excluded.
In the same manner, you can provide a comma-separated list of event IDs that
require monitoring. The
all
in our example represents that all the event IDs need
to be considered while monitoring.

M O N I T O RI N G C I T R I X X E N AP P S E R V E R S
218
Similarly, the
none
(following
all
in our example) is indicative of the fact that
none of the event IDs need to be excluded from monitoring. On the other hand,
if you want to instruct the eG Enterprise system to ignore a few event IDs during
monitoring, then provide the IDs as a comma-separated list. Likewise, specifying
all
makes sure that all the event IDs are excluded from monitoring.
The
all
which follows implies that all events, regardless of description, need to be
included for monitoring. To exclude all events, use
none
. On the other hand, if
you provide a comma-separated list of event descriptions, then the events with
the specified descriptions will alone be monitored. Event descriptions can be of
any of the following forms -
desc*
, or
desc
, or
*desc*
,or
desc*
, or
desc1*desc2
,
etc.
desc
here refers to any string that forms part of the description. A leading '*'
signifies any number of leading characters, while a trailing '*' signifies any
number of trailing characters.
In the same way, you can also provide a comma-separated list of event
descriptions to be excluded from monitoring. Here again, the specification can be
of any of the following forms:
desc*
, or
desc
, or
*desc*
,or
desc*
, or
desc1*desc2
, etc.
desc
here refers to any string that forms part of the
description. A leading '*' signifies any number of leading characters, while a
trailing '*' signifies any number of trailing characters. In our example however,
none is specified, indicating that no event descriptions are to be excluded from
monitoring. If you use
all
instead, it would mean that all event descriptions are to
be excluded from monitoring.
By default, the FILTER parameter contains the value
: all:all:none:all:none:all:none
. Multiple
filters are to be separated by semi-colons (;).
Note:
The event sources and event IDs specified here should be exactly the same as that which
appears in the Event Viewer window.
On the other hand, if the POLICY BASED FILTER flag is set to YES, then a FILTER list
box will appear, displaying the filter policies that pre-exist in the eG Enterprise system. A
filter policy typically comprises of a specific set of event sources, event IDs, and event
descriptions to be monitored. This specification is built into the policy in the following
format:
{Policyname}:{event_sources_to_be_included}:{event_sources_to_be_excluded}:{event_ID
s_to_be_included}:{event_IDs_to_be_excluded}:{event_descriptions_to_be_included}:{eve
nt_descriptions_to_be_excluded}
To monitor a specific combination of event sources, event IDs, and event descriptions, you
can choose the corresponding filter policy from the FILTER list box. Multiple filter policies
can be so selected. Alternatively, you can modify any of the existing policies to suit your
needs, or create a new filter policy. To facilitate this, a Click here link appears just above
the test configuration section, once the YES option is chosen against POLICY BASED
FILTER. Clicking on the Click here link leads you to a page where you can modify the
existing policies or create a new one. The changed policy or the new policy can then be
associated with the test by selecting the policy name from the FILTER list box in this page.

M O N I T O RI N G C I T R I X X E N AP P S E R V E R S
219
7. USEWMI - The eG agent can either use WMI to extract event log statistics or directly
parse the event logs using event log APIs. If the USEWMI flag is YES, then WMI is used. If
not, the event log APIs are used. This option is provided because on some Windows
NT/2000 systems (especially ones with service pack 3 or lower), the use of WMI access to
event logs can cause the CPU usage of the WinMgmt process to shoot up. On such systems,
set the USEWMI parameter value to NO. On the other hand, when monitoring systems that
are operating on any other flavor of Windows (say, Windows 2003/XP/2008/7/Vista/12), the
USEWMI flag should always be set to ‘Yes’.
8. STATELESS ALERTS - Typically, the eG manager generates email alerts only when the
state of a specific measurement changes. A state change typically occurs only when the
threshold of a measure is violated a configured number of times within a specified time
window. While this ensured that the eG manager raised alarms only when the problem was
severe enough, in some cases, it may cause one/more problems to go unnoticed, just
because they did not result in a state change. For example, take the case of the EventLog
test. When this test captures an error event for the very first time, the eG manager will
send out a CRITICAL email alert with the details of the error event to configured recipients.
Now, the next time the test runs, if a different error event is captured, the eG manager will
keep the state of the measure as CRITICAL, but will not send out the details of this error
event to the user; thus, the second issue will remain hidden from the user. To make sure
that administrators do not miss/overlook critical issues, the eG Enterprise monitoring
solution provides the stateless alerting capability. To enable this capability for this test, set
the STATELESS ALERTS flag to Yes. This will ensure that email alerts are generated for
this test, regardless of whether or not the state of the measures reported by this test
changes.
9. EVENTS DURING RESTART - By default, the EVENTS DURING RESTART flag is set to
Yes. This ensures that whenever the agent is stopped and later started, the events that
might have occurred during the period of non-availability of the agent are included in the
number of events reported by the agent. Setting the flag to No ensures that the agent,
when restarted, ignores the events that occurred during the time it was not available.
10. DDFORINFORMATION – eG Enterprise also provides you with options to restrict the
amount of storage required for event log tests. Towards this end, the
DDFORINFORMATION and DDFORWARNING flags have been made available in this
page. By default, both these flags are set to Yes, indicating that by default, the test
generates detailed diagnostic measures for information events and warning events. If you
do not want the test to generate and store detailed measures for information events, set
the DDFORINFORMATION flag to No.
11. DDFORWARNING – To ensure that the test does not generate and store detailed
measures for warning events, set the DDFORWARNING flag to No.
12. DD FREQUENCY - Refers to the frequency with which detailed diagnosis measures are to
be generated for this test. The default is
1:1
. This indicates that, by default, detailed
measures will be generated every time this test runs, and also every time the test detects a
problem. You can modify this frequency, if you so desire. Also, if you intend to disable the
detailed diagnosis capability for this test, you can do so by specifying
none
against DD
FREQUENCY.

M O N I T O RI N G C I T R I X X E N AP P S E R V E R S
220
13. DETAILED DIAGNOSIS - To make diagnosis more efficient and accurate, the eG
Enterprise suite embeds an optional detailed diagnostic capability. With this capability, the
eG agents can be configured to run detailed, more elaborate tests as and when specific
problems are detected. To enable the detailed diagnosis capability of this test for a
particular server, choose the On option. To disable the capability, click on the Off option.
The option to selectively enabled/disable the detailed diagnosis capability will be available
only if the following conditions are fulfilled:
The eG manager license should allow the detailed diagnosis capability
Both the normal and abnormal frequencies configured for the detailed diagnosis
measures should not be 0.
Outputs of the
test
One set of results for the FILTER configured
Measurements
made by the
test
Measurement
Measurement
Unit
Interpretation
Error messages:
This refers to the number
of error events that were
generated.
Number
A very low value (zero) indicates that the
audio is in a healthy state.
An increasing trend or high value indicates
the existence of problems.
Use the detailed diagnosis of this measure for
more details.
Information messages:
This refers to the number
of information events
generated when the test
was last executed.
Number
A change in the value of this measure may
indicate infrequent but successful audio
operations.
Use the detailed diagnosis of this measure for
more details.
Warnings:
This refers to the number
of warnings that were
generated when the test
was last executed.
Number
A high value of this measure indicates audio
problems that may not have an immediate
impact, but may cause future problems.
Use the detailed diagnosis of this measure for
more details.

M O N I T O RI N G C I T R I X X E N AP P S E R V E R S
221
Critical messages:
Indicates the number of
critical events that were
generated when the test
was last executed.
Number
A critical event is one that an audio
component cannot automatically recover
from.
This measure is applicable only for Windows
2008/Windows Vista/Windows 7 systems.
An increasing trend or high value indicates
the existence of fatal/irrepairable problems in
the audio.
The detailed diagnosis of this measure
describes all the critical audio events that
were generated during the last measurement
period.
Verbose messages:
Indicates the number of
verbose events that were
generated when the test
was last executed.
Number
Verbose logging provides more details in the
log entry, which will enable you to
troubleshoot issues better.
This measure is applicable only for Windows
2008/Windows Vista/Windows 7 systems.
The detailed diagnosis of this measure
describes all the verbose events that were
generated during the last measurement
period.
2.2.5.6 Citrix Multimedia Rave Log Test
RAVE (Remote Audio and Video Extensions) is the technology behind SpeedScreen Multimedia Acceleration. RAVE
supports high quality playback of media streams that can be decoded by a media player that uses DirectShow or
DirectX Media Objects (DMO). To determine whether SpeedScreen Multimedia Acceleration is functioning or not and
to investigate issues in the same, administrators can use the
Citrix-Multimedia-Rave/Admin
logs that Windows
provides. This test provides administrators with insights into these logs. It scans the
Citrix-Multimedia-Rave/Admin
logs for specific patterns of event IDs/event sources/event descriptions. If entries matching these patterns are found
in the logs captured recently, this test reports the number and nature of such messages.
Purpose
Scans the
Citrix-Multimedia-Rave/Admin
logs for specific patterns of event IDs/event
sources/event descriptions. If entries matching these patterns are found in the logs captured
recently, this test reports the number and nature of such messages
Target of the
test
A Citrix XenApp server
Agent
deploying the
test
An internal agent

M O N I T O RI N G C I T R I X X E N AP P S E R V E R S
222
Configurable
parameters for
the test
1. TEST PERIOD - How often should the test be executed
2. HOST - The host for which the test is to be configured
3. PORT – Refers to the port used by the EventLog Service. Here it is null.
4. LOGTYPE – Refers to the type of event logs to be monitored. The default value is
Citrix-
Multimedia-Rave/Admin
.
5. POLICY BASED FILTER - Using this page, administrators can configure the event
sources, event IDs, and event descriptions to be monitored by this test. In order to enable
administrators to easily and accurately provide this specification, this page provides the
following options:
Manually specify the event sources, IDs, and descriptions in the FILTER text
area, or,
Select a specification from the predefined filter policies listed in the FILTER box
For explicit, manual specification of the filter conditions, select the NO option against the
POLICY BASED FILTER field. This is the default selection. To choose from the list of pre-
configured filter policies, or to create a new filter policy and then associate the same with
the test, select the YES option against the POLICY BASED FILTER field.
6. FILTER - If the POLICY BASED FILTER flag is set to NO, then a FILTER text area will
appear, wherein you will have to specify the event sources, event IDs, and event
descriptions to be monitored. This specification should be of the following format:
{Displayname}:{event_sources_to_be_included}:{event_sources_to_be_excluded}:{event_I
Ds_to_be_included}:{event_IDs_to_be_excluded}:{event_descriptions_to_be_included}:{ev
ent_descriptions_to_be_excluded}
. For example, assume that the FILTER text area takes
the value,
OS_events:all:Browse,Print:all:none:all:none
. Here:
OS_events
is the display name that will appear as a descriptor of the test in the
monitor UI;
all
indicates that all the event sources need to be considered while monitoring. To
monitor specific event sources, provide the source names as a comma-separated
list. To ensure that none of the event sources are monitored, specify
none
.
Next, to ensure that specific event sources are excluded from monitoring, provide
a comma-separated list of source names. Accordingly, in our example,
Browse
and
Print
have been excluded from monitoring. Alternatively, you can use
all
to
indicate that all the event sources have to be excluded from monitoring, or
none
to denote that none of the event sources need be excluded.
In the same manner, you can provide a comma-separated list of event IDs that
require monitoring. The
all
in our example represents that all the event IDs need
to be considered while monitoring.

M O N I T O RI N G C I T R I X X E N AP P S E R V E R S
223
Similarly, the
none
(following
all
in our example) is indicative of the fact that
none of the event IDs need to be excluded from monitoring. On the other hand,
if you want to instruct the eG Enterprise system to ignore a few event IDs during
monitoring, then provide the IDs as a comma-separated list. Likewise, specifying
all
makes sure that all the event IDs are excluded from monitoring.
The
all
which follows implies that all events, regardless of description, need to be
included for monitoring. To exclude all events, use
none
. On the other hand, if
you provide a comma-separated list of event descriptions, then the events with
the specified descriptions will alone be monitored. Event descriptions can be of
any of the following forms -
desc*
, or
desc
, or
*desc*
,or
desc*
, or
desc1*desc2
,
etc.
desc
here refers to any string that forms part of the description. A leading '*'
signifies any number of leading characters, while a trailing '*' signifies any
number of trailing characters.
In the same way, you can also provide a comma-separated list of event
descriptions to be excluded from monitoring. Here again, the specification can be
of any of the following forms:
desc*
, or
desc
, or
*desc*
,or
desc*
, or
desc1*desc2
, etc.
desc
here refers to any string that forms part of the
description. A leading '*' signifies any number of leading characters, while a
trailing '*' signifies any number of trailing characters. In our example however,
none is specified, indicating that no event descriptions are to be excluded from
monitoring. If you use
all
instead, it would mean that all event descriptions are to
be excluded from monitoring.
By default, the FILTER parameter contains the value
: all:all:none:all:none:all:none
. Multiple
filters are to be separated by semi-colons (;).
Note:
The event sources and event IDs specified here should be exactly the same as that which
appears in the Event Viewer window.
On the other hand, if the POLICY BASED FILTER flag is set to YES, then a FILTER list
box will appear, displaying the filter policies that pre-exist in the eG Enterprise system. A
filter policy typically comprises of a specific set of event sources, event IDs, and event
descriptions to be monitored. This specification is built into the policy in the following
format:
{Policyname}:{event_sources_to_be_included}:{event_sources_to_be_excluded}:{event_ID
s_to_be_included}:{event_IDs_to_be_excluded}:{event_descriptions_to_be_included}:{eve
nt_descriptions_to_be_excluded}
To monitor a specific combination of event sources, event IDs, and event descriptions, you
can choose the corresponding filter policy from the FILTER list box. Multiple filter policies
can be so selected. Alternatively, you can modify any of the existing policies to suit your
needs, or create a new filter policy. To facilitate this, a Click here link appears just above
the test configuration section, once the YES option is chosen against POLICY BASED
FILTER. Clicking on the Click here link leads you to a page where you can modify the
existing policies or create a new one. The changed policy or the new policy can then be
associated with the test by selecting the policy name from the FILTER list box in this page.

M O N I T O RI N G C I T R I X X E N AP P S E R V E R S
224
7. USEWMI - The eG agent can either use WMI to extract event log statistics or directly
parse the event logs using event log APIs. If the USEWMI flag is YES, then WMI is used. If
not, the event log APIs are used. This option is provided because on some Windows
NT/2000 systems (especially ones with service pack 3 or lower), the use of WMI access to
event logs can cause the CPU usage of the WinMgmt process to shoot up. On such systems,
set the USEWMI parameter value to NO. On the other hand, when monitoring systems that
are operating on any other flavor of Windows (say, Windows 2003/XP/2008/7/Vista/12), the
USEWMI flag should always be set to ‘Yes’.
8. STATELESS ALERTS - Typically, the eG manager generates email alerts only when the
state of a specific measurement changes. A state change typically occurs only when the
threshold of a measure is violated a configured number of times within a specified time
window. While this ensured that the eG manager raised alarms only when the problem was
severe enough, in some cases, it may cause one/more problems to go unnoticed, just
because they did not result in a state change. For example, take the case of the EventLog
test. When this test captures an error event for the very first time, the eG manager will
send out a CRITICAL email alert with the details of the error event to configured recipients.
Now, the next time the test runs, if a different error event is captured, the eG manager will
keep the state of the measure as CRITICAL, but will not send out the details of this error
event to the user; thus, the second issue will remain hidden from the user. To make sure
that administrators do not miss/overlook critical issues, the eG Enterprise monitoring
solution provides the stateless alerting capability. To enable this capability for this test, set
the STATELESS ALERTS flag to Yes. This will ensure that email alerts are generated for
this test, regardless of whether or not the state of the measures reported by this test
changes.
9. EVENTS DURING RESTART - By default, the EVENTS DURING RESTART flag is set to
Yes. This ensures that whenever the agent is stopped and later started, the events that
might have occurred during the period of non-availability of the agent are included in the
number of events reported by the agent. Setting the flag to No ensures that the agent,
when restarted, ignores the events that occurred during the time it was not available.
10. DDFORINFORMATION – eG Enterprise also provides you with options to restrict the
amount of storage required for event log tests. Towards this end, the
DDFORINFORMATION and DDFORWARNING flags have been made available in this
page. By default, both these flags are set to Yes, indicating that by default, the test
generates detailed diagnostic measures for information events and warning events. If you
do not want the test to generate and store detailed measures for information events, set
the DDFORINFORMATION flag to No.
11. DDFORWARNING – To ensure that the test does not generate and store detailed
measures for warning events, set the DDFORWARNING flag to No.
12. DD FREQUENCY - Refers to the frequency with which detailed diagnosis measures are to
be generated for this test. The default is
1:1
. This indicates that, by default, detailed
measures will be generated every time this test runs, and also every time the test detects a
problem. You can modify this frequency, if you so desire. Also, if you intend to disable the
detailed diagnosis capability for this test, you can do so by specifying
none
against DD
FREQUENCY.

M O N I T O RI N G C I T R I X X E N AP P S E R V E R S
225
13. DETAILED DIAGNOSIS - To make diagnosis more efficient and accurate, the eG
Enterprise suite embeds an optional detailed diagnostic capability. With this capability, the
eG agents can be configured to run detailed, more elaborate tests as and when specific
problems are detected. To enable the detailed diagnosis capability of this test for a
particular server, choose the On option. To disable the capability, click on the Off option.
The option to selectively enabled/disable the detailed diagnosis capability will be available
only if the following conditions are fulfilled:
The eG manager license should allow the detailed diagnosis capability
Both the normal and abnormal frequencies configured for the detailed diagnosis
measures should not be 0.
Outputs of the
test
One set of results for the FILTER configured
Measurements
made by the
test
Measurement
Measurement
Unit
Interpretation
Error messages:
This refers to the number
of error events that were
generated.
Number
A very low value (zero) indicates that
SpeedScreen Multimedia Acceleration is
functioning properly.
An increasing trend or high value indicates
the existence of problems.
Use the detailed diagnosis of this measure for
more details.
Information messages:
This refers to the number
of information events
generated when the test
was last executed.
Number
A change in the value of this measure may
indicate infrequent but successful
SpeedScreen Multimedia Acceleration
operations.
Use the detailed diagnosis of this measure for
more details.
Warnings:
This refers to the number
of warnings that were
generated when the test
was last executed.
Number
A high value of this measure indicates
SpeedScreen Multimedia Acceleration
problems that may not have an immediate
impact, but may cause future problems.
Use the detailed diagnosis of this measure for
more details.

M O N I T O RI N G C I T R I X X E N AP P S E R V E R S
226
Critical messages:
Indicates the number of
critical events that were
generated when the test
was last executed.
Number
A critical event is one that an SpeedScreen
Multimedia Acceleration cannot automatically
recover from.
This measure is applicable only for Windows
2008/Windows Vista/Windows 7 systems.
An increasing trend or high value indicates
the existence of fatal/irrepairable problems in
the RAVE techology.
The detailed diagnosis of this measure
describes all the critical events related to
RAVE that were generated during the last
measurement period.
Verbose messages:
Indicates the number of
verbose events that were
generated when the test
was last executed.
Number
Verbose logging provides more details in the
log entry, which will enable you to
troubleshoot issues better.
This measure is applicable only for Windows
2008/Windows Vista/Windows 7 systems.
The detailed diagnosis of this measure
describes all the verbose events that were
generated during the last measurement
period.
2.2.5.7 Citrix Multimedia Flash Log Test
If Flash redirection does not work for clients connecting to the XenDesktop server 7.0 (or above), administrators can
use the
Citrix-Multimedia-Flash/Admin
logs to investigate the reasons for the same. The Citrix Multimedia Flash Log
test scans the
Citrix-Multimedia-Flash/Admin
logs for specific patterns of event IDs/event sources/event descriptions.
If entries matching these patterns are found in the logs captured recently, this test reports the number and nature of
such messages.
Purpose
Scans the
Citrix-Multimedia-Flash/Admin
logs for specific patterns of event IDs/event
sources/event descriptions. If entries matching these patterns are found in the logs captured
recently, this test reports the number and nature of such messages
Target of the
test
A Citrix XenApp server
Agent
deploying the
test
An internal agent

M O N I T O RI N G C I T R I X X E N AP P S E R V E R S
227
Configurable
parameters for
the test
1. TEST PERIOD - How often should the test be executed
2. HOST - The host for which the test is to be configured
3. PORT – Refers to the port used by the EventLog Service. Here it is null.
4. LOGTYPE – Refers to the type of event logs to be monitored. The default value is
Citrix-
Multimedia-Flash/Admin
.
5. POLICY BASED FILTER - Using this page, administrators can configure the event
sources, event IDs, and event descriptions to be monitored by this test. In order to enable
administrators to easily and accurately provide this specification, this page provides the
following options:
Manually specify the event sources, IDs, and descriptions in the FILTER text
area, or,
Select a specification from the predefined filter policies listed in the FILTER box
For explicit, manual specification of the filter conditions, select the NO option against the
POLICY BASED FILTER field. This is the default selection. To choose from the list of pre-
configured filter policies, or to create a new filter policy and then associate the same with
the test, select the YES option against the POLICY BASED FILTER field.
6. FILTER - If the POLICY BASED FILTER flag is set to NO, then a FILTER text area will
appear, wherein you will have to specify the event sources, event IDs, and event
descriptions to be monitored. This specification should be of the following format:
{Displayname}:{event_sources_to_be_included}:{event_sources_to_be_excluded}:{event_I
Ds_to_be_included}:{event_IDs_to_be_excluded}:{event_descriptions_to_be_included}:{ev
ent_descriptions_to_be_excluded}
. For example, assume that the FILTER text area takes
the value,
OS_events:all:Browse,Print:all:none:all:none
. Here:
OS_events
is the display name that will appear as a descriptor of the test in the
monitor UI;
all
indicates that all the event sources need to be considered while monitoring. To
monitor specific event sources, provide the source names as a comma-separated
list. To ensure that none of the event sources are monitored, specify
none
.
Next, to ensure that specific event sources are excluded from monitoring, provide
a comma-separated list of source names. Accordingly, in our example,
Browse
and
Print
have been excluded from monitoring. Alternatively, you can use
all
to
indicate that all the event sources have to be excluded from monitoring, or
none
to denote that none of the event sources need be excluded.
In the same manner, you can provide a comma-separated list of event IDs that
require monitoring. The
all
in our example represents that all the event IDs need
to be considered while monitoring.

M O N I T O RI N G C I T R I X X E N AP P S E R V E R S
228
Similarly, the
none
(following
all
in our example) is indicative of the fact that
none of the event IDs need to be excluded from monitoring. On the other hand,
if you want to instruct the eG Enterprise system to ignore a few event IDs during
monitoring, then provide the IDs as a comma-separated list. Likewise, specifying
all
makes sure that all the event IDs are excluded from monitoring.
The
all
which follows implies that all events, regardless of description, need to be
included for monitoring. To exclude all events, use
none
. On the other hand, if
you provide a comma-separated list of event descriptions, then the events with
the specified descriptions will alone be monitored. Event descriptions can be of
any of the following forms -
desc*
, or
desc
, or
*desc*
,or
desc*
, or
desc1*desc2
,
etc.
desc
here refers to any string that forms part of the description. A leading '*'
signifies any number of leading characters, while a trailing '*' signifies any
number of trailing characters.
In the same way, you can also provide a comma-separated list of event
descriptions to be excluded from monitoring. Here again, the specification can be
of any of the following forms:
desc*
, or
desc
, or
*desc*
,or
desc*
, or
desc1*desc2
, etc.
desc
here refers to any string that forms part of the
description. A leading '*' signifies any number of leading characters, while a
trailing '*' signifies any number of trailing characters. In our example however,
none is specified, indicating that no event descriptions are to be excluded from
monitoring. If you use
all
instead, it would mean that all event descriptions are to
be excluded from monitoring.
By default, the FILTER parameter contains the value
: all:all:none:all:none:all:none
. Multiple
filters are to be separated by semi-colons (;).
Note:
The event sources and event IDs specified here should be exactly the same as that which
appears in the Event Viewer window.
On the other hand, if the POLICY BASED FILTER flag is set to YES, then a FILTER list
box will appear, displaying the filter policies that pre-exist in the eG Enterprise system. A
filter policy typically comprises of a specific set of event sources, event IDs, and event
descriptions to be monitored. This specification is built into the policy in the following
format:
{Policyname}:{event_sources_to_be_included}:{event_sources_to_be_excluded}:{event_ID
s_to_be_included}:{event_IDs_to_be_excluded}:{event_descriptions_to_be_included}:{eve
nt_descriptions_to_be_excluded}
To monitor a specific combination of event sources, event IDs, and event descriptions, you
can choose the corresponding filter policy from the FILTER list box. Multiple filter policies
can be so selected. Alternatively, you can modify any of the existing policies to suit your
needs, or create a new filter policy. To facilitate this, a Click here link appears just above
the test configuration section, once the YES option is chosen against POLICY BASED
FILTER. Clicking on the Click here link leads you to a page where you can modify the
existing policies or create a new one. The changed policy or the new policy can then be
associated with the test by selecting the policy name from the FILTER list box in this page.

M O N I T O RI N G C I T R I X X E N AP P S E R V E R S
229
7. USEWMI - The eG agent can either use WMI to extract event log statistics or directly
parse the event logs using event log APIs. If the USEWMI flag is YES, then WMI is used. If
not, the event log APIs are used. This option is provided because on some Windows
NT/2000 systems (especially ones with service pack 3 or lower), the use of WMI access to
event logs can cause the CPU usage of the WinMgmt process to shoot up. On such systems,
set the USEWMI parameter value to NO. On the other hand, when monitoring systems that
are operating on any other flavor of Windows (say, Windows 2003/XP/2008/7/Vista/12), the
USEWMI flag should always be set to ‘Yes’.
8. STATELESS ALERTS - Typically, the eG manager generates email alerts only when the
state of a specific measurement changes. A state change typically occurs only when the
threshold of a measure is violated a configured number of times within a specified time
window. While this ensured that the eG manager raised alarms only when the problem was
severe enough, in some cases, it may cause one/more problems to go unnoticed, just
because they did not result in a state change. For example, take the case of the EventLog
test. When this test captures an error event for the very first time, the eG manager will
send out a CRITICAL email alert with the details of the error event to configured recipients.
Now, the next time the test runs, if a different error event is captured, the eG manager will
keep the state of the measure as CRITICAL, but will not send out the details of this error
event to the user; thus, the second issue will remain hidden from the user. To make sure
that administrators do not miss/overlook critical issues, the eG Enterprise monitoring
solution provides the stateless alerting capability. To enable this capability for this test, set
the STATELESS ALERTS flag to Yes. This will ensure that email alerts are generated for
this test, regardless of whether or not the state of the measures reported by this test
changes.
9. EVENTS DURING RESTART - By default, the EVENTS DURING RESTART flag is set to
Yes. This ensures that whenever the agent is stopped and later started, the events that
might have occurred during the period of non-availability of the agent are included in the
number of events reported by the agent. Setting the flag to No ensures that the agent,
when restarted, ignores the events that occurred during the time it was not available.
10. DDFORINFORMATION – eG Enterprise also provides you with options to restrict the
amount of storage required for event log tests. Towards this end, the
DDFORINFORMATION and DDFORWARNING flags have been made available in this
page. By default, both these flags are set to Yes, indicating that by default, the test
generates detailed diagnostic measures for information events and warning events. If you
do not want the test to generate and store detailed measures for information events, set
the DDFORINFORMATION flag to No.
11. DDFORWARNING – To ensure that the test does not generate and store detailed
measures for warning events, set the DDFORWARNING flag to No.
12. DD FREQUENCY - Refers to the frequency with which detailed diagnosis measures are to
be generated for this test. The default is
1:1
. This indicates that, by default, detailed
measures will be generated every time this test runs, and also every time the test detects a
problem. You can modify this frequency, if you so desire. Also, if you intend to disable the
detailed diagnosis capability for this test, you can do so by specifying
none
against DD
FREQUENCY.

M O N I T O RI N G C I T R I X X E N AP P S E R V E R S
230
13. DETAILED DIAGNOSIS - To make diagnosis more efficient and accurate, the eG
Enterprise suite embeds an optional detailed diagnostic capability. With this capability, the
eG agents can be configured to run detailed, more elaborate tests as and when specific
problems are detected. To enable the detailed diagnosis capability of this test for a
particular server, choose the On option. To disable the capability, click on the Off option.
The option to selectively enabled/disable the detailed diagnosis capability will be available
only if the following conditions are fulfilled:
The eG manager license should allow the detailed diagnosis capability
Both the normal and abnormal frequencies configured for the detailed diagnosis
measures should not be 0.
Outputs of the
test
One set of results for the FILTER configured
Measurements
made by the
test
Measurement
Measurement
Unit
Interpretation
Error messages:
This refers to the number
of error events that were
generated.
Number
A very low value (zero) indicates that Flash
technology is functioning properly.
An increasing trend or high value indicates
the existence of problems.
Use the detailed diagnosis of this measure for
more details.
Information messages:
This refers to the number
of information events
generated when the test
was last executed.
Number
A change in the value of this measure may
indicate infrequent but successful Flash
operations.
Use the detailed diagnosis of this measure for
more details.
Warnings:
This refers to the number
of warnings that were
generated when the test
was last executed.
Number
A high value of this measure indicates Flash
problems that may not have an immediate
impact, but may cause future problems.
Use the detailed diagnosis of this measure for
more details.
Critical messages:
Indicates the number of
critical events that were
generated when the test
was last executed.
Number
A critical event is one that Flash cannot
automatically recover from.
This measure is applicable only for Windows
2008/Windows Vista/Windows 7 systems.
An increasing trend or high value indicates
the existence of fatal/irrepairable problems in
the Flash techology.
The detailed diagnosis of this measure
describes all the critical events related to
Flash that were generated during the last
measurement period.

M O N I T O RI N G C I T R I X X E N AP P S E R V E R S
231
Verbose messages:
Indicates the number of
verbose events that were
generated when the test
was last executed.
Number
Verbose logging provides more details in the
log entry, which will enable you to
troubleshoot issues better.
This measure is applicable only for Windows
2008/Windows Vista/Windows 7 systems.
The detailed diagnosis of this measure
describes all the verbose events that were
generated during the last measurement
period.
2.2.5.8 Citrix Broker Agent Test
A broker agent lies at the heart of any VDI deployment, and is the key component for assigning resources to end
users. The Citrix broker is what the client talks to in order to know what VM it is allowed to access.It is the middle
component between desktops in the data center and the client and its waits for connections. When someone logs in,
the Citrix broker is the one that checks with Active Directory to make sure the user is authorized. Then it checks its
own DB to figure out what desktop this user has access to and finally allows the user access to the list of desktops
and eventually hands that off. It also allows you to manage the Desktop sessions and Application sessions etc.
By keeping an eye on the Citrix Broker Agent, you can understand the current session load on the broker, the clients
contributing to the load, and the nature of the sessions. This is exactly what the Citrix Broker Agent Test does. This
test monitors the Citrix broker agent and reports the count of clients registered with the Citrix broker, the session
load imposed by these clients on the Citrix server, and the nature of this load - – i.e., are they application sessions?
or are they desktop sessions?
Purpose
Monitors the Citrix broker agent and reports the count of clients registered with the Citrix broker,
the session load imposed by these clients on the Citrix server, and the nature of this load - – i.e.,
are they application sessions? or are they desktop sessions?
Target of the
test
Citrix XenApp
Agent
deploying the
test
An internal agent
Configurable
parameters for
the test
1. TEST PERIOD - How often should the test be executed
2. HOST - The host for which the test is to be configured.
3. PORT – The port number at which the specified HOST listens to. By default, this is 1494.
Outputs of the
test
One set of results for the Citrix XenApp server that is to be monitored
Measurements
made by the
Measurement
Measuremen
t Unit
Interpretation

M O N I T O RI N G C I T R I X X E N AP P S E R V E R S
232
test
Registrations:
Indicates the number of client
machines that registered with
the Citrix Broker during the lst
measurement period.
Number
Deregistrations:
Indicates the number of
machines that deregistered from
the Citrix server during the last
measurement period.
Number
Total application sessions:
Indicates the number of
application sessions running on
the Citrix server during the last
measurement period.
Number
Total desktop sessions:
Indicates the number of desktop
sessions that running on the
Citrix server during the last
measurement period.
Number
Total sessions:
Indicates the total number of
sessions on the Citrix server
during the last measurement
period.
Number
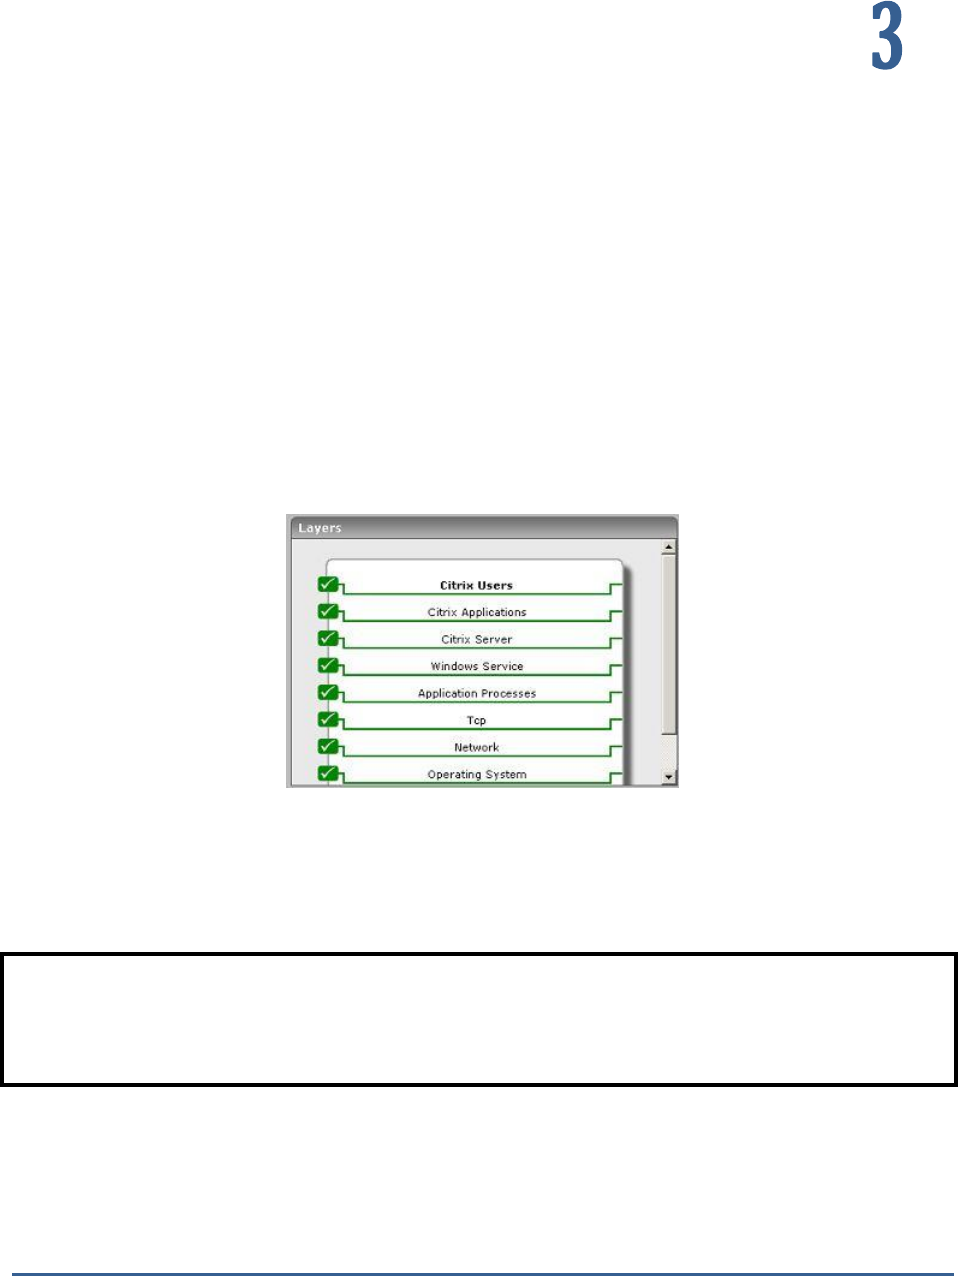
M O N I T O RI N G C I T R I X M E T AF R A M E S E R V E R S
233
Monitoring Citrix MetaFrame
Servers
To ensure backward compatability with previous versions of Citrix, eG Enterprise continues to provide monitoring
support to Citrix MetaFrame servers, which in eG Enterprise paralance is
Citrix MF
server.
Figure 3.1 depicts the specialized monitoring model that eG Enterprise prescribes for the
Citrix MF
server.
Figure 3.1: The layer model of a Citrix MetaFrame server
Since the bottom 5 layers have been discussed elaborately in the
Monitoring Unix and Windows Servers document,
the sections that follow will discus the top 3 layers of Figure 3.1 only.
Note:
Before installing an agent on a Citrix MetaFrame 1.8 server, ensure that MetaFrame Service Pack 3.0 pre-exists.

M O N I T O RI N G C I T R I X M E T A F R A ME S E R V E R S
234
3.1 The Citrix Server Layer
The tests associated (see Figure 3.2) with the Citrix Server layer validates the authentication function performed by
the server, and indicates the availability and responsiveness of the MetaFrame server to client requests.
Figure 3.2: Tests associated with the Citrix Server layer of a Citrix MF server
3.1.1 Citrix Connection Test
This test performs an application-level ping to the Citrix server and measures the response from the server.
Purpose
Performs an application-level ping to the Citrix server and measures the response from the
server
Target of the
test
Any Citrix server
Agent
deploying the
test
An internal agent
Configurable
parameters for
the test
1. TEST PERIOD – How often should the test be executed
2. HOST – The host for which the test is to be configured
3. PORT – Refers to the port used by the Citrix server
4. SERVERIP - The CitrixConnection test performs an application-level ping to a Citrix server,
and measures the response from the server. The IP address of that Citrix server has to be
specified in the SERVERIP text box. By default, the IP of the HOST will be displayed here.
This means that, by default, the Citrix HOST will try to ping its own self.
5. COUNT - Specify the number of packets to be sent by the test.
Outputs of the
test
One set of results for every server being monitored
Measurements
made by the
Measurement
Measurement
Unit
Interpretation

M O N I T O RI N G C I T R I X M E T A F R A ME S E R V E R S
235
test
Connection availability:
Indicates the availability of
the Citrix server
Percent
A value of 100 % indicates that the Citrix
server is responding to requests. 0 indicates
that the server is not responding. A server
might not respond if it is not up and running
or if it is overloaded.
Packet loss on Citrix
connection:
Indicates the percentage of
packets sent that were
replied by the server
Percent
While 0 indicates that the server is
responding to requests, any value greater
than 0 could indicate that the server is not
able to keep up with its current load.
Avg Citrix connection
time:
Response time is the time
from packet transmission to
reception. Average response
time measures the average
value of the response time
based on replies returned by
the server.
Secs
Increase in the average response time
indicates slow-down of the server and
potential issues in handling user requests by
the server.
Max Citrix connection
time:
This is the maximum of
response times based on
replies returned by the
server.
Secs
If this value is consistently different from the
average response time, further investigation
of other server metrics may be necessary.
3.1.2 Citrix Authentication Test
This test emulates a user logging into a Windows domain or local host and reports whether the login succeeded and
how long it took.
Purpose
Emulates a user logging into a windows domain or local host and reports whether the login
succeeded and how long it took
Target of the
test
Any Citrix server
Agent
deploying the
test
An internal agent

M O N I T O RI N G C I T R I X M E T A F R A ME S E R V E R S
236
Configurable
parameters for
the test
1. TEST PERIOD – How often should the test be executed
2. HOST – The host for which the test is to be configured
3. PORT – Refers to the port used by the Citrix server
4. USER - This test emulates a user logging into a Microsoft Windows domain or a local host.
Therefore, specify the login name of the user here.
5. PASSWORD - Enter the password that corresponds to the specified USERNAME.
6. CONFIRM PASSWORD – Confirm the specified PASSWORD by retyping it here.
7. DOMAIN - Specify the name of the domain to which the test will try to login. If the test is
to login to a local host, specify 'none' here.
8. REPORT BY DOMAIN - By default, this flag is set to Yes. This implies that by default, this
test will report metrics for every
domainname\username
configured for this test. This way,
administrators will be able to quickly determine which user logged in from which domain. If
you want the detailed diagnosis to display the
username
alone, then set this flag to No.
Outputs of the
test
One set of results for every user account being checked
Measurements
made by the
test
Measurement
Measurement
Unit
Interpretation
Availability:
Indicates whether the login
was successful or not
Percent
A value of 100 % indicates that the login has
succeeded. The value 0 is indicative of a
failed login.
Authentication time:
Indicates the time it took to
login
Secs
If this value is very high then it could be
owing to a configuration issue (i.e the domain
might not be configured properly) or a slow-
down/unavailability of the primary domain
server.
Note:
If users are spread across multiple domains, then, you can configure this test with
multiple DOMAIN specifications; in this case, for every DOMAIN, a USER-
PASSWORD pair might also have to be configured. Sometimes, you might want the
test to login as specific users from the same domain, to check how long each user
login takes. Both these scenarios require the configuration of multiple DOMAINs
and/or multiple USER names and PASSWORDs. In order to enable users to specify
these details with ease, eG Enterprise provides a special page; to access this page,
click on the Click here hyperlink at the top of the parameters in the test configuration
page. To know how to use this page, refer to Section 2.1.5.10.1 of this document.

M O N I T O RI N G C I T R I X M E T A F R A ME S E R V E R S
237
3.2 The Citrix Applications Layer
Using the CitrixMfApplications test, the Citrix Applications layer measures the resource usage of critical applications
executing on the MetaFrame server.
Figure 3.3: Test associated with the Citrix Applications layer
3.2.1 Citrix MF Applications Test
This test reports statistics pertaining to the different applications executing on a Citrix MetaFrame server and their
usage by Citrix clients.
Purpose
Returns the performance measures pertaining to the applications executing on the Citrix server
Target of the
test
Any Citrix MetaFrame server
Agent
deploying the
test
An internal agent
Configurable
parameters for
the test
1. TEST PERIOD – How often should the test be executed
2. HOST – The host for which the test is to be configured
3. PORT – Refers to the port used by the Citrix server
4. APPS - By default, this text box will contain 'published'. This means that, by default, the
eG Enterprise system will auto-discover all the applications that have been published on the
Citrix server and monitor them. Alternatively, you can provide a comma-separated list of
applications that require monitoring. For example:
winword.exe, acrobat.exe
. To monitor all
the applications running on a Citrix server, specify 'all'. This option is particularly useful
when a Citrix server hosts a published desktop. In such a case, specifying 'all' will ensure
that all the applications executing on the published desktop are monitored.
Outputs of the
test
One set of results is reported for each application.
Measurements
made by the
Measurement
Measurement
Unit
Interpretation
M O N I T O RI N G C I T R I X M E T A F R A ME S E R V E R S
238
test
Number of processes:
Number of instances of the
published application
currently executing on the
Citrix server
Number
This value indicates if too many or too few
instances corresponding to an application are
executing on the host.
Cpu usage:
Percentage of CPU used by
the published application
Percent
A very high value could indicate that the
specified application is consuming excessive
CPU resources.
Memory usage:
This value represents the
ratio of the resident set size
of the memory utilized by the
application to the physical
memory of the host system,
expressed as a percentage.
Percent
A sudden increase in memory utilization for
an application may be indicative of memory
leaks in the application.
3.3 The Citrix Users Layer
The tests associated with the Citrix Users layer see (Figure 3.4) enable Citrix administrators to continuously observe
user sessions on the Citrix server and assess the complete user-experience starting from the connection speed to the
resource usage of the individual users and the traffic and errors they generate.
Figure 3.4: Tests associated with the Citrix Users layer
Note:
This test is relevant to Citrix MetaFrame 1.8 servers only.

M O N I T O RI N G C I T R I X M E T A F R A ME S E R V E R S
239
3.3.1 Citrix MetaFrame Users Test
This test reports the performance statistics pertaining to the users of the Citrix Metaframe server.
Purpose
Reports the performance statistics pertaining to the users of the Citrix Metaframe server
Target of the
test
Any Citrix MetaFrame server
Agent
deploying the
test
An internal agent
Configurable
parameters for
the test
1. TEST PERIOD – How often should the test be executed
2. HOST – The host for which the test is to be configured
3. PORT – Refers to the port used by the Citrix server
4. USERNAMES - Specify the name of the user whose performance statistics need to be
generated. If you specify "All" here, then the eG agent will report statistics pertaining to all
users who are currently logged in. When a user logs out, statistics will no longer be
reported for that user. Multiple user names can be specified as a comma-separated list. In
such cases, the eG agent will report statistics for the users listed in the arguments only.
When a user is not logged in, all the measures reported for that user will be zero values.
5. FARMNAME - If the Citrix server for which this test is being configured belongs to a Citrix
farm, then provide the name of the Citrix farm server that controls it, in the FARMNAME
text box. While specifying the FARMNAME, ensure that you provide the same name that
was specified against the HOST/NICK NAME field while managing the Citrix farm server using
the eG Enterprise system. In the event of a name mismatch, eG will be unable to extract
the required measures for this test. By default, ‘none’ will be displayed here.
6. FARMPORT – Specify the port number at which the Citrix farm listens.
7. DETAILED DIAGNOSIS - To make diagnosis more efficient and accurate, the eG
Enterprise suite embeds an optional detailed diagnostic capability. With this capability, the
eG agents can be configured to run detailed, more elaborate tests as and when specific
problems are detected. To enable the detailed diagnosis capability of this test for a
particular server, choose the On option. To disable the capability, click on the Off option.
The option to selectively enable/disable the detailed diagnosis capability will be available
only if the following conditions are fulfilled:
The eG manager license should allow the detailed diagnosis capability
Both the normal and abnormal frequencies configured for the detailed diagnosis
measures should not be 0.
Note:
This test is relevant to Citrix MetaFrame 1.8 servers only.

M O N I T O RI N G C I T R I X M E T A F R A ME S E R V E R S
240
Outputs of the
test
One set of results for every user
Measurements
made by the
test
Measurement
Measurement
Unit
Interpretation
Sessions:
Represents the current number
of sessions for a particular user
Number
A value of 0 indicates that the user is not
currently connected to the Citrix
server. The detailed diagnosis of the
Sessions
measure, if enabled, provides
the list of processes executed by a user
on the Citrix server, and the CPU and
memory utilization of each of these
processes. This information will help an
administrator identify the processes that
were initiated by a user, and which of
those processes are consuming a large
amount of CPU time and memory. Such
processes can then be stopped, if found
necessary.
CPU usage:
The cpu utilization for a session
is the percentage of time that
all of the threads/processes of a
user session used the processor
to execute instructions. If a
user is connected via multiple
sessions, the value reported is
the sum of all cpu utilizations
across all the sessions.
Percent
This value indicates the percentage of
Cpu resources that are used by a specific
user.
Memory usage:
This value represents the ratio
of the resident set size of the
memory utilized by the user to
the physical memory of the host
system, expressed as a
percentage. If a user is
connected via multiple sessions,
the value reported is the sum of
all memory utilizations across all
the sessions.
Percent
This value indicates the percentage of
memory resources that are used up by a
specific user. By comparing this value
across users, an administrator can identify
the most heavy users of the Citrix server.
Input bandwidth:
Indicates the average
bandwidth used for client to
server communications for all
the sessions of a user
KB/Sec
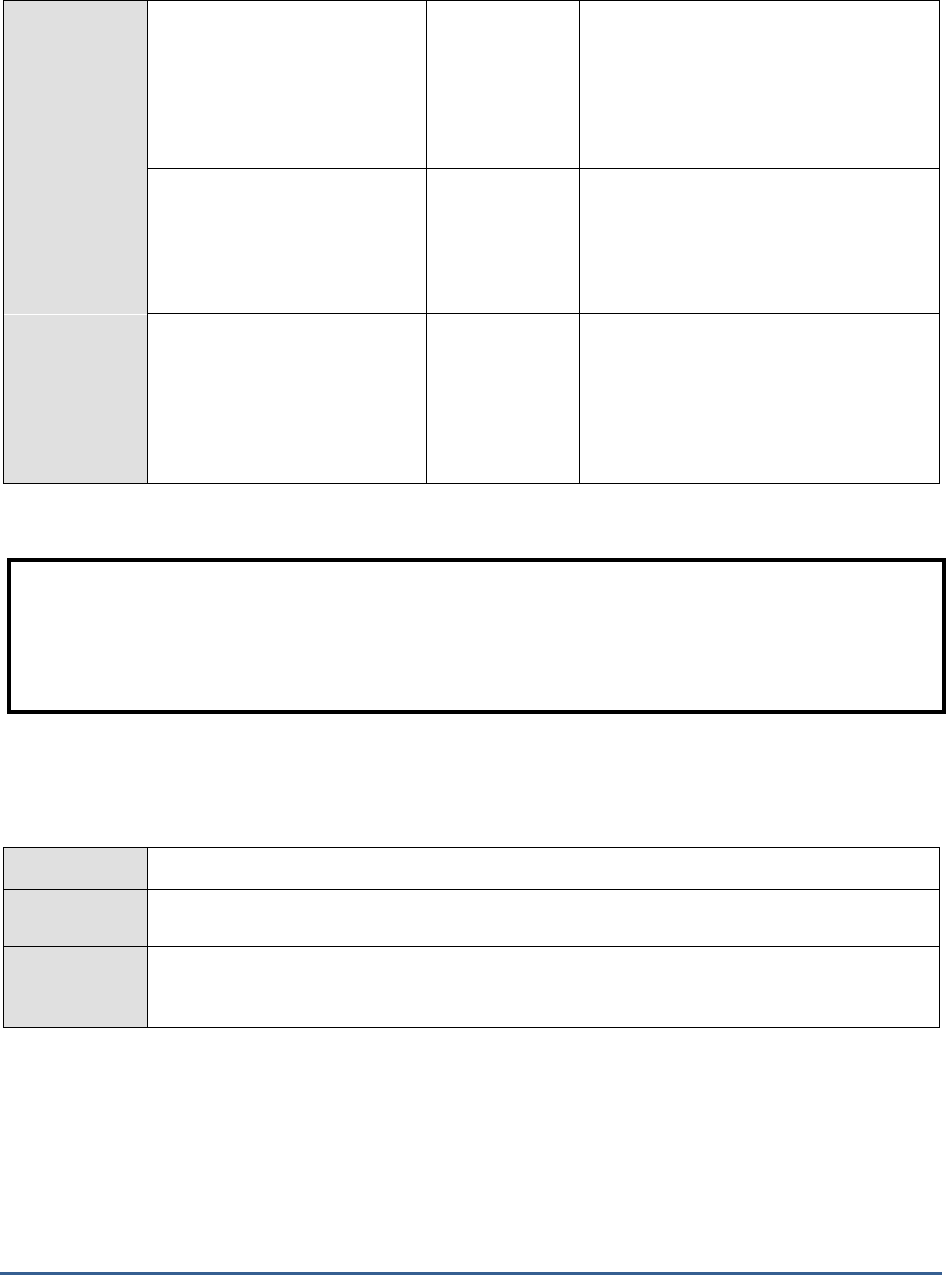
M O N I T O RI N G C I T R I X M E T A F R A ME S E R V E R S
241
Input errors:
The average number of input
errors of all types for all the
sessions of a user. Example:
Lost ACK's, badly formed
packets, etc.
Errors/Sec
Output bandwidth:
Indicates the average
bandwidth used for server to
client communications for all
the sessions of a user
KB/Sec
Output errors:
The average number of output
errors of all types for all the
sessions of a user. Example:
Lost ACK's, badly formed
packets, etc.
Errors/Sec
3.3.2 Citrix Sessions Test
This test reports performance statistics related to Citrix user sessions.
Purpose
Reports performance statistics related to Citrix user sessions
Target of the
test
Any Citrix server
Agent
deploying the
test
An internal agent
Note:
When a Citrix user being monitored by the eG agent logs out of the Citrix server, then the name of the user will
not be displayed as a descriptor of the CitrixMetaFrameUsers test in the eG monitor interface.

M O N I T O RI N G C I T R I X M E T A F R A ME S E R V E R S
242
Configurable
parameters for
the test
1. TEST PERIOD – How often should the test be executed
2. HOST – The host for which the test is to be configured
3. PORT – Refers to the port used by the Citrix server
4. REPORT BY DOMAIN - By default, this flag is set to Yes. This implies that by default, this
test will report metrics for every
domainname\username
configured for this test. This way,
administrators will be able to quickly determine which user logged in from which domain. If
you want the detailed diagnosis to display the
username
alone, then set this flag to No.
5. DETAILED DIAGNOSIS - To make diagnosis more efficient and accurate, the eG
Enterprise suite embeds an optional detailed diagnostic capability. With this capability, the
eG agents can be configured to run detailed, more elaborate tests as and when specific
problems are detected. To enable the detailed diagnosis capability of this test for a
particular server, choose the On option. To disable the capability, click on the Off option.
The option to selectively enable/disable the detailed diagnosis capability will be available
only if the following conditions are fulfilled:
The eG manager license should allow the detailed diagnosis capability
Both the normal and abnormal frequencies configured for the detailed diagnosis
measures should not be 0.
Outputs of the
test
One set of results for every server being monitored
Measurements
made by the
test
Measurement
Measurement
Unit
Interpretation
Active sessions:
Indicates the number of
active Citrix user sessions
currently on the server.
Number
This measure gives an idea of the server
workload in terms of active sessions.
Tracking the number of active sessions with
time, a Citrix administrator can obtain
information that can help him/her plan the
capacity of their Citrix environment. The
detailed diagnosis capability, if enabled, lists
the active and inactive sessions on the Citrix
server.
Idle sessions:
Indicates the number of
sessions that are initialized
and are currently ready to
accept connections.
Number
To optimize the performance of a server, two
default (idle) sessions are initialized before
any client connections are made. For
performance reasons, the number of idle
sessions should be less than ten. Note that
this test does not differentiate between RDP
and ICA sessions.
Connected sessions:
Indicates the current number
of sessions that are
connected, but no user has
logged on to the server.
Number
A consistent increase in the value of this
measure could indicate that users are having
trouble logging in. Further investigation may
hence be required. Note that this test does
not differentiate between RDP and ICA
sessions.

M O N I T O RI N G C I T R I X M E T A F R A ME S E R V E R S
243
Connecting sessions:
Indicates the number of
sessions that are in the
process of connecting.
Number
A very high value for this measure indicates a
problem with the session or connection. Note
that this test does not differentiate between
RDP and ICA sessions.
Disconnected sessions:
Indicates the number of
sessions from which users
have disconnected, but which
are still active and can be
reconnected.
Number
Too many disconnected sessions running
indefinitely on a Citrix server cause excessive
consumption of the server resources. To
avoid this, a session limit is typically
configured for disconnected sessions on the
Citrix server. When a session limit is reached
for a disconnected session, the session ends,
which permanently deletes it from the server.
Note that this test does not differentiate
between RDP and ICA sessions.
Listen sessions:
Indicates the current number
of sessions that are ready to
accept connections.
Number
Note that this test does not differentiate
between RDP and ICA sessions.
Shadow sessions:
Indicates the current number
of sessions that are remotely
controlling other sessions.
Number
A non-zero value for this measure indicates
the existence of shadow sessions that are
allowed to view and control the user activity
on another session. Such sessions help in
troubleshooting/resolving problems with
other sessions under their control.
Down sessions:
Indicates the current number
of sessions that could not be
initialized or terminated.
Number
Ideally, the value of this measure should be
0.
Init sessions:
Indicates the current number
of sessions that are
initializing.
Number
A high value for this measure could indicate
that many sessions are currently experiencing
initialization problems.
3.3.3 Citrix Clients Test
This test measures the client connections to and from a Citrix server.
Purpose
To monitor the TCP connections to and from a Citrix server
Target of the
test
A Citrix server
Agent
deploying the
test
Internal agent

M O N I T O RI N G C I T R I X M E T A F R A ME S E R V E R S
244
Configurable
parameters for
the test
1. TEST PERIOD – How often should the test be executed
2. HOST – The host for which the test is to be configured
3. PORT – Refers to the port used by the Citrix server
4. SERVERIP - By default, the SERVERIP field will display the IP address of the Citrix
server.
5. DETAILED DIAGNOSIS - To make diagnosis more efficient and accurate, the eG
Enterprise suite embeds an optional detailed diagnostic capability. With this capability, the
eG agents can be configured to run detailed, more elaborate tests as and when specific
problems are detected. To enable the detailed diagnosis capability of this test for a
particular server, choose the On option. To disable the capability, click on the Off option.
The option to selectively enable/disable the detailed diagnosis capability will be available
only if the following conditions are fulfilled:
The eG manager license should allow the detailed diagnosis capability
Both the normal and abnormal frequencies configured for the detailed diagnosis
measures should not be 0.
Outputs of the
test
One set of results for every server being monitored
Measurements
made by the
test
Measurement
Measurement
Unit
Interpretation
Current connections:
The number of TCP
connections currently
established by clients to the
Citrix server
Number
This measure directly indicates the loading on
the Citrix server from clients. Typically one
connection is established per active session
to the Citrix server.
New connections added:
The number of new TCP
connections initiated by
clients to the Citrix server
during the last measurement
period
Number
Tracking the new connections over time can
provide an indication of when clients login to
the Citrix server. A spurt of connections and
disconnections may be indicative of sporadic
failures of the Citrix server.
Old connections removed:
The number of TCP
connections that were
removed because the clients
may have disconnected from
the Citrix server during the
last measurement period
Number
A large number of sudden connection drops
may be early warning indicators of problems
with the Citrix server.
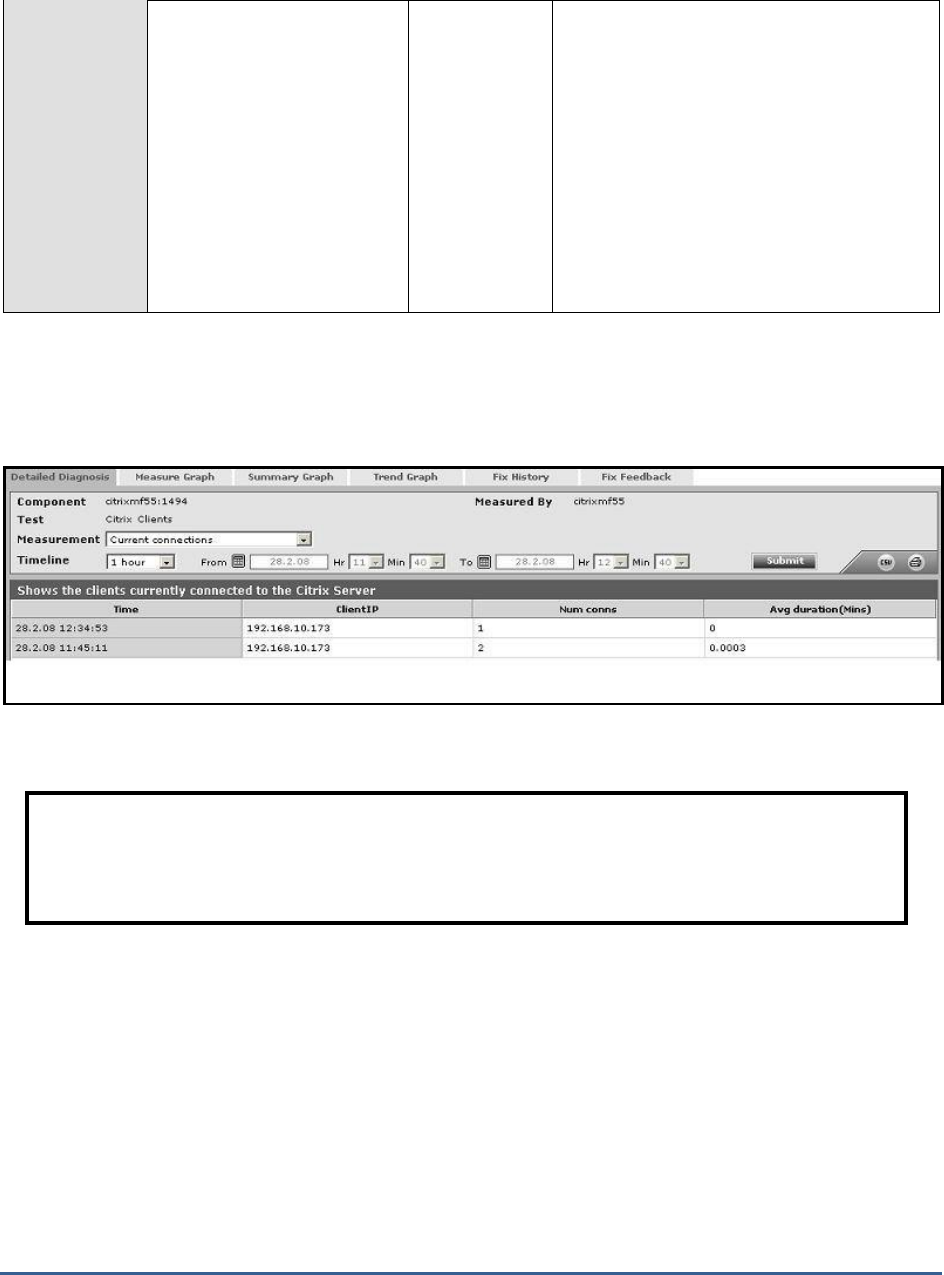
M O N I T O RI N G C I T R I X M E T A F R A ME S E R V E R S
245
Avg duration of current
connections:
The average time from when
a connection is established to
when the corresponding
connection is disconnected.
The duration of a connection
is measured from its start
time to the current time. The
accuracy of this measurement
is limited by the frequency at
which this test is run.
Secs
This value can provide an indicator of how
long clients stay connected to a Citrix server.
This information together with the number of
simultaneous clients can be useful for
capacity planning in Citrix environments (i.e.,
how to size the Citrix server). The detailed
diagnosis capability, if enabled, lists the
clients currently connected to the Citrix
server.
The detailed diagnosis of the
Current connections
and
Avg duration of current connections
measures, if enabled, lists
the clients currently connected to the Citrix server (see Figure 3.5) and the duration for which each of the
connections were alive.
Figure 3.5: The detailed diagnosis of the Current connections measure
Note:
The Citrix Disconnections test has already been dealt with in Section 2.1.7.2 of Chapter 2 of this
document.
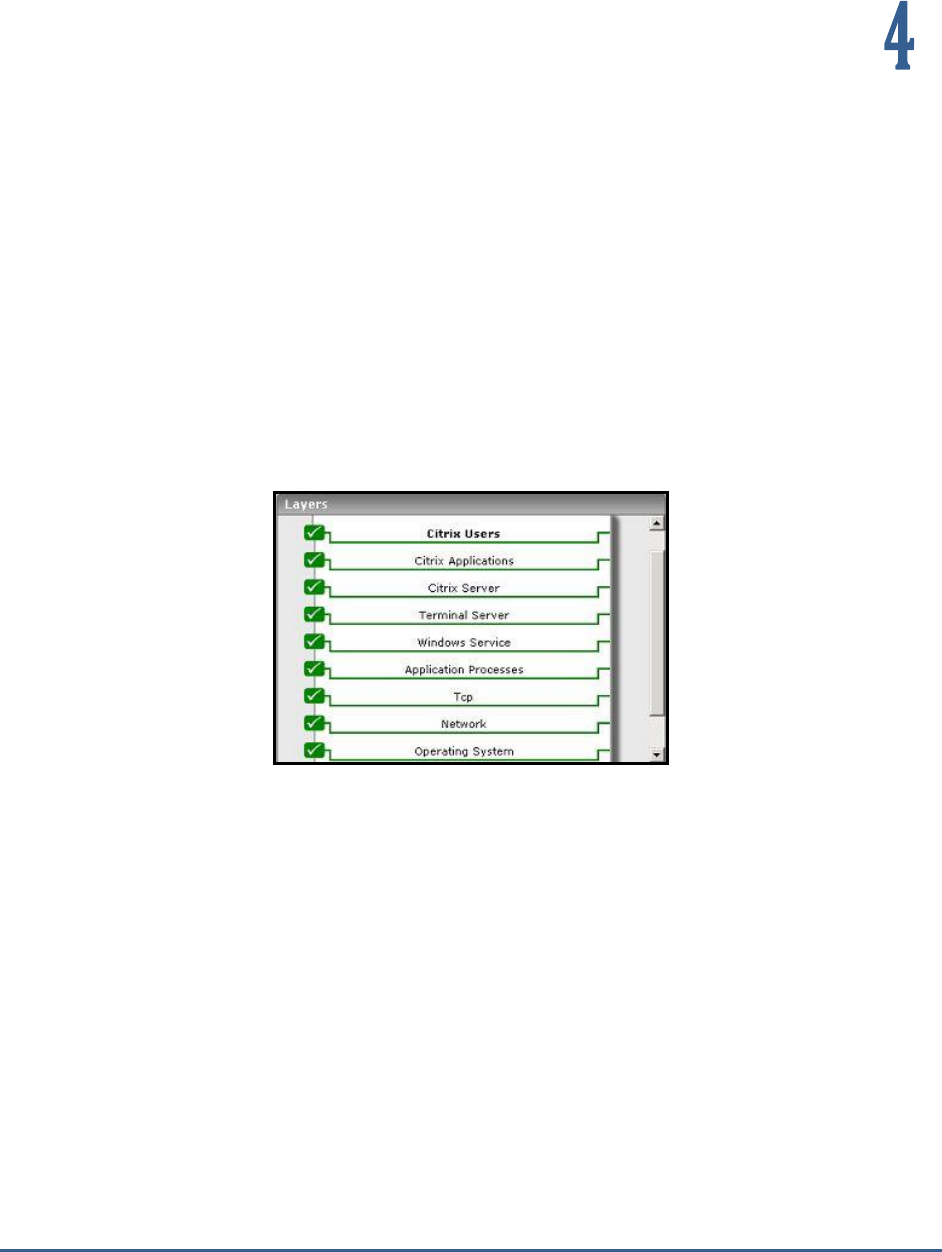
M O N I T O RI N G C I T R I X M E T A F R A ME X P S E R V E R S
246
Monitoring Citrix MetaFrame XP
Servers
To ensure backward compatability with older versions of Citrix, eG Enterprise continues to provide monitoring
support to the Citrix MetaFrame XP Server, referred to as
Citrix MF XP
in the eG Enterprise parlance.
Figure 4.1: Layer model of a Citrix MF XP server
The layer model of the
Citrix MF XP
server (see Figure 4.1) is the same as that of the
Citrix
server. Except for a few
exclusive Citrix XenApp server-related tests, almost all other tests that execute on a Citrix XenApp server apply to the
Citrix MF XP server model too. The exceptions are:
Citrix Data Store test
Citrix Dynamic Store test
Citrix License Stats test

M O N I T O RI N G C I T R I X Z O N E D A T A C O L L E C T O R S ( Z D C S )
247
Monitoring Citrix Zone Data
Collectors (ZDCs)
Zones are logical groupings of Citrix servers usually based on geographical location. Servers that are members of the
same zone share information through their zone’s data collector (ZDC). The ZDC then shares information with the
rest of the ZDCs in the farm. The ZDC’s job is to keep track of the following changes that are reported to it by the
servers in its zone:
Server load: The server load is calculated by each server and reported to that server’s ZDC upon any
change in the load.
Client connections: Any logon, logoff, disconnect, or reconnect of a client to a server is reported by
that server to its ZDC.
Published applications: Information on the usage of published applications is reported to the ZDC by
each server;
Server changes: Changes to the IP address of the server or server shutdowns and startups are
reported to the ZDC
License usage: Real-time license usage is reported to the ZDC.
The ZDC pools together all of this information for the servers in its zone, and immediately reports any changes to the
rest of the ZDCs in the server farm. Besides, the ZDC is also responsible for ensuring that all the servers in its zone
are still active.
It is therefore evident that the continuous availability and proper functioning of the servers in a zone relies heavily on
how well the ZDC discharges its duties. A mal-functioning ZDC can wreak havoc on a Citrix server zone, causing
rather alarming issues such as non-availability of the Citrix servers, excessive license usage, overloading, etc. The
only means by which such anomalies can be averted is by periodically monitoring the performance of the ZDC.
eG Enterprise presents an exclusive
Citrix ZDC
monitoring model (see Figure 5.1), which executes tests on the ZDC
at frequent intervals, and reports a wide range of performance statistics which help Citrix administrators accurately
guage how well the ZDC manages the servers in its zone.
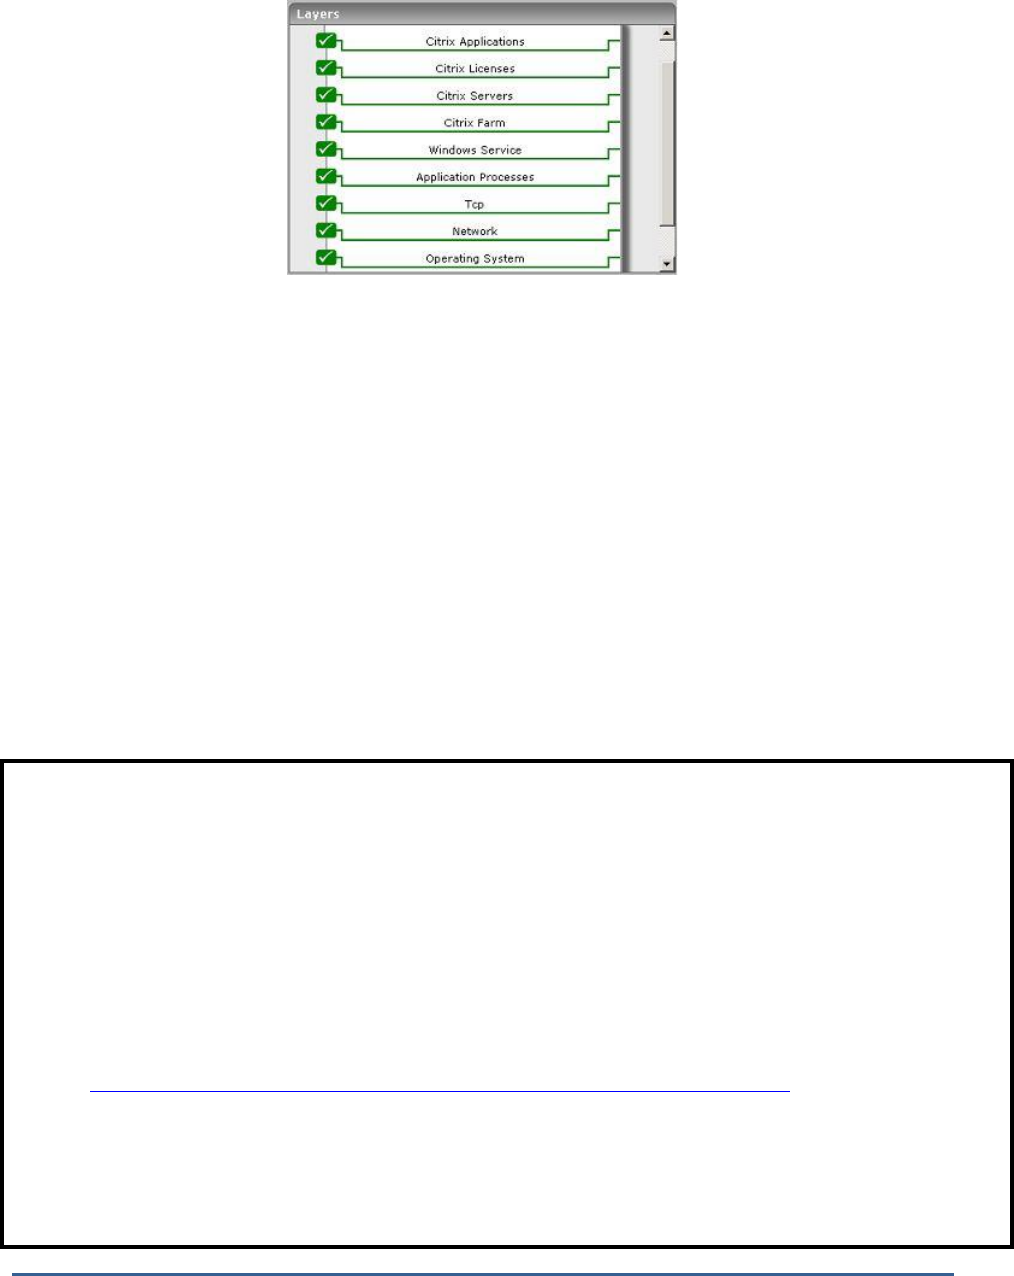
M O N I T O RI N G C I T R I X Z O N E D A T A C O L L E C T O R S ( Z D C S )
248
Figure 5.1: The layer model of a Citrix ZDC
Using the metrics reported by each layer of Figure 5.1, administrators can find quick and accurate answers to the
following performance queries:
Is the Citrix ZDC available? If so, how quickly does it respond to requests?
Is the workload balanced across all servers in the zone?
Is license usage across servers in the zone, optimal?
Are all servers in the zone available, or has any server been rendered inaccessible?
Is any server in the zone unreasonably slow in responding to requests?
How is the session activity across servers in the zone? Are there too many disconnected sessions on the
zone?
Is any application published on a zone server, experiencing overloads?
Has any application run out of licenses?
Is any application disabled on a server?
Note:
Though eG Enterprise provides both agentless and agent-based monitoring support to Citrix ZDCs, Citrix XenApp 6.0/6.5
servers functioning as ZDCs can be monitored in an agent-based manner only. This is because, the eG agent uses
PowerShell SDK to collect metrics from the Citrix XenApp 6.0/6.5 server, and this SDK cannot be accessed in an agentless
manner.
Therefore, prior to monitoring a Citrix XenApp 6.0/6.5 server that operates as a ZDC, make sure that an internal agent is
installed and configured on that server, and then, follow the steps below:
a. Login to the agent host.
b. Download the PowerShell SDK from the following URL:
http://community.citrix.com/display/xa/XenApp+6+PowerShell+SDK
c. Install the PowerShell SDK on the agent host.
d. Finally, from the PowerShell command prompt, switch to the root directory, and issue the following command:
Set-ExecutionPolicy unrestricted
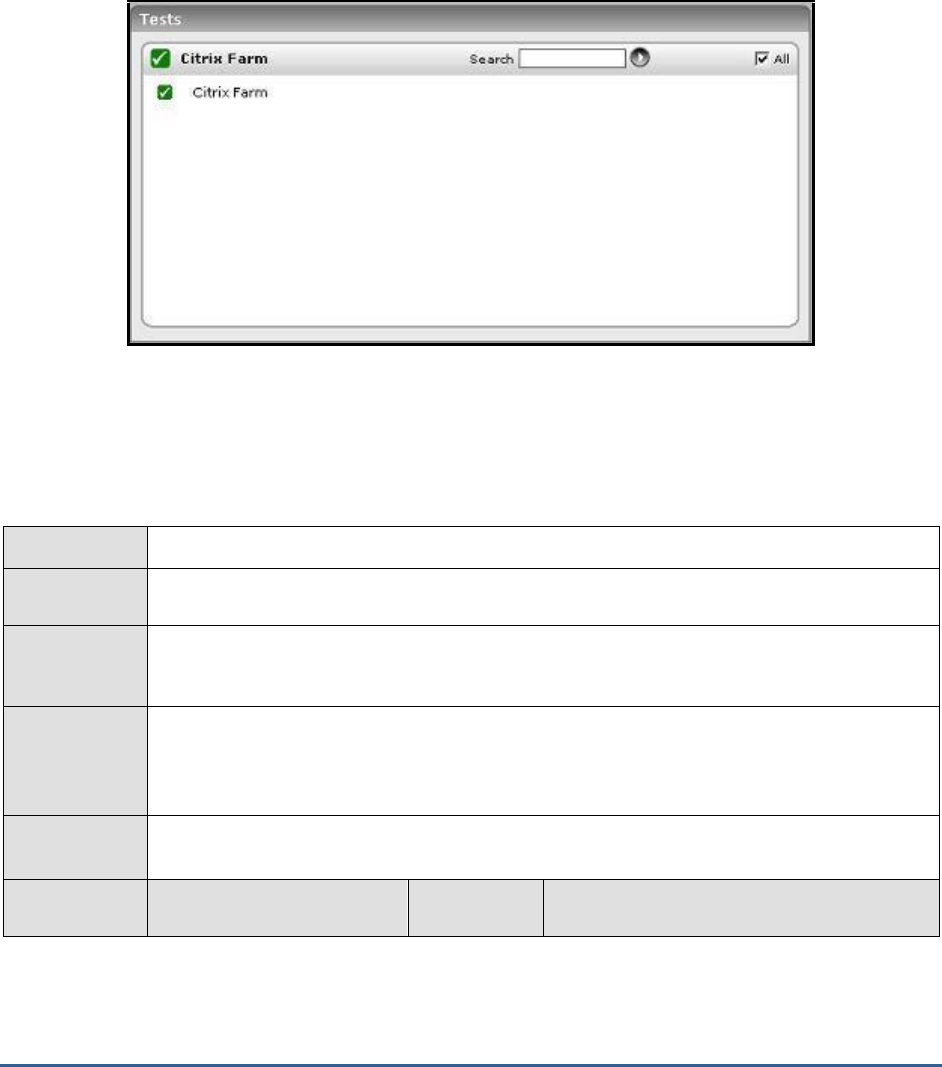
M O N I T O RI N G C I T R I X Z O N E D A T A C O L L E C T O R S ( Z D C S )
249
5.1 The Citrix Farm Layer
Verify the availability and responsiveness of a Citrix farm by executing the CitrixFarm test that is mapped to this
layer.
Figure 5.2: The tests associated with the Citrix Farm layer
5.1.1 Citrix Farm Test
The Citrix Farm test reports the availability and responsiveness of the Citrix ZDC associated with a Citrix farm/zone.
In addition, the test also reports the number of zones and servers in the farm.
Purpose
Reports the availability and responsiveness of a Citrix farm/zone
Target of the
test
A Citrix ZDC
Agent
deploying the
test
An external agent
Configurable
parameters for
the test
1. TEST PERIOD – How often should the test be executed
2. HOST – The host for which the test is to be configured
3. PORT – Refers to the port used by the Citrix ZDC
Outputs of the
test
One set of results for the Citrix ZDC being monitored
Measurements
made by the
Measurement
Measurement
Unit
Interpretation

M O N I T O RI N G C I T R I X Z O N E D A T A C O L L E C T O R S ( Z D C S )
250
test
Farm availability:
Indicates the availability of
the ZDC.
Percent
The availability is 100% when the server is
responding to a request and 0% when it is
not. Availability problems may be caused by a
misconfiguration / malfunctioning of the
server, or if the server has not been started.
Response time:
Indicates the time taken by
the ZDC to respond to a user
query
Secs
A sudden increase in response time is
indicative of a bottleneck at the server.
Number of zones in the
farm:
Indicates the number of
zones in the farm.
Number
Use the detailed diagnosis of this measure to
know the names of the zones.
Number of XenApp
servers in the farm:
Indicates the number of
XenApp servers in the farm.
Number
Use the detailed diagnosis of this measure to
know the names and IP addresses of the
servers in the farm and the zones to which the
servers belong.
5.1.2 Citrix Zones Test
This test reports the total number of servers and the number of online servers in each zone in a Citrix farm.
Purpose
Reports the total number of servers and the number of online servers in each zone in a Citrix
farm
Target of the
test
A Citrix ZDC
Agent
deploying the
test
An internal agent
Configurable
parameters for
the test
1. TEST PERIOD – How often should the test be executed
2. HOST – The host for which the test is to be configured
3. PORT – Refers to the port used by the Citrix ZDC
Outputs of the
test
One set of results for each zone in the Citrix farm being monitored
Measurements
made by the
test
Measurement
Measurement
Unit
Interpretation
Number of all servers in
the zone:
Indicates the total number of
servers in this zone.
Number
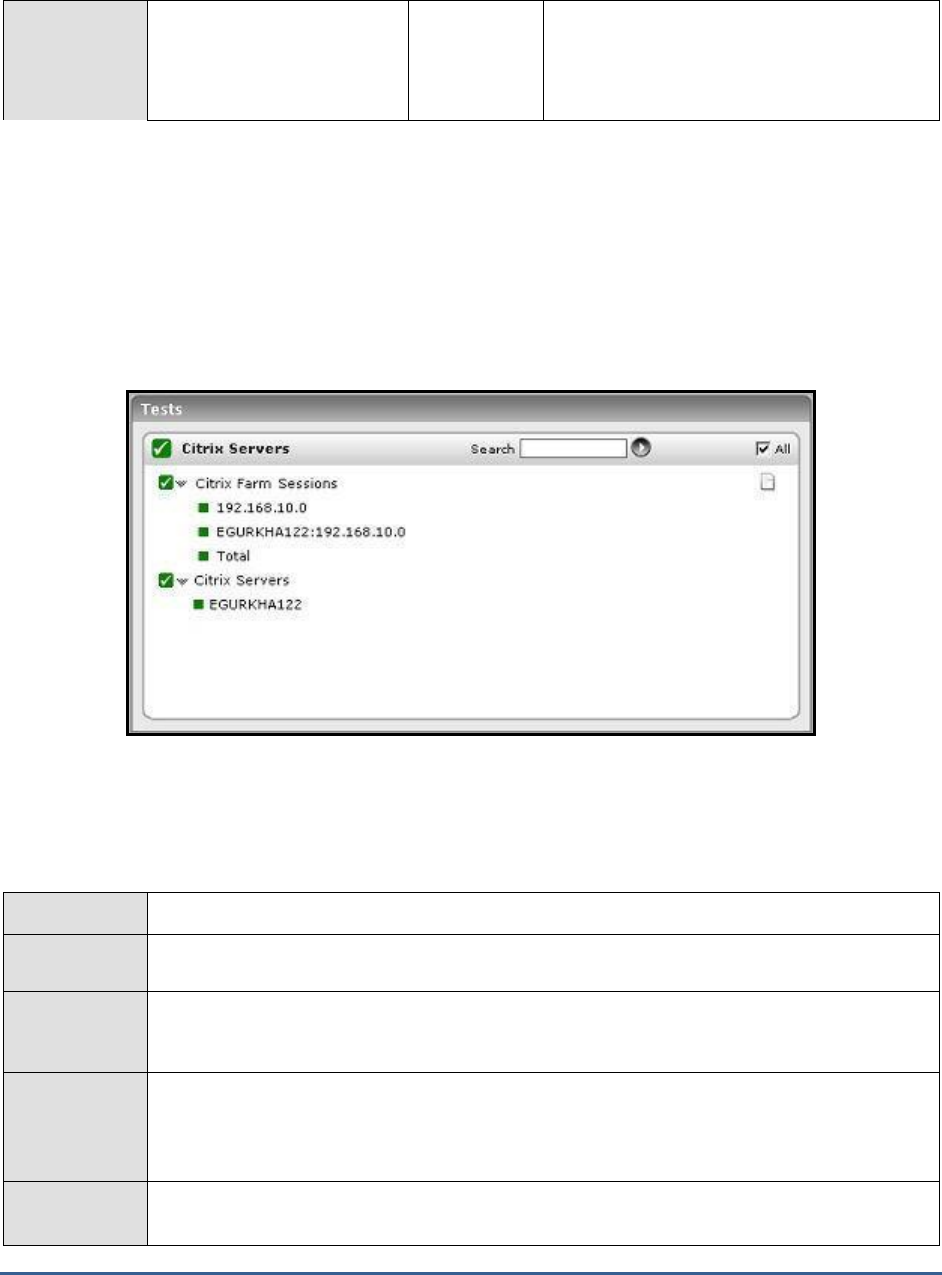
M O N I T O RI N G C I T R I X Z O N E D A T A C O L L E C T O R S ( Z D C S )
251
Number of all online
servers in the zone:
Indicates the number of
online servers in this zone.
Number
The detailed diagnosis of this measure will
reveal the farm, the zone, and the name and
IP address of the online server.
5.2 The Citrix Servers Layer
The tests associated with this layer enable administrators to monitor the availability, license usage, and the load on
every server in a server zone. In addition, the layer also monitors the session and user activity on the server zone, as
seen from the ZDC.
Figure 5.3: Tests associated with the Citrix Servers layer
5.2.1 Citrix Servers Test
This test reports the status of each of the servers in the server farm.
Purpose
Reports the status of each of the servers in the server farm
Target of the
test
Any Citrix ZDC
Agent
deploying the
test
An internal agent
Configurable
parameters for
the test
1. TEST PERIOD – How often should the test be executed
2. HOST – The host for which the test is to be configured
3. PORT – Refers to the port used by the Citrix server
Outputs of the
test
One set of results for each server in a server farm

M O N I T O RI N G C I T R I X Z O N E D A T A C O L L E C T O R S ( Z D C S )
252
Measurements
made by the
test
Measurement
Measurement
Unit
Interpretation
Is Data collection
enabled?:
Indicates whether a server in
the server farm is a data
collector or not
Boolean
One of the servers in a farm is configured as
the data collector for that farm. This measure
indicates which of the servers in a farm
functions as the data collector.
Server availability:
Indicates the availability of a
server in the server farm
Percent
A value of 100 is reported if a server is Online,
and a value of 0 is reported if the server is
Offline.
Server load:
This value reports the server
load as indicated by the Citrix
load monitor divided by 100.
Number
The value reported is based on the load
evaluators configured for a server. An
administrator can choose to configure one or
more of several load evaluators that consider
the number of users logged in, the
CPU/disk/memory utilization, etc. Load
evaluators enable Citrix administrators to
analyze how effectively and efficiently the
Citrix servers in a zone share load. Since the
value of this measure is based on the load
evaluators, administrators can compare the
value reported by this measure across the
Citrix servers in the farm, and accurately
identify the server that is currently overloaded.
Assigned licenses:
Besides pooling licenses,
Citrix allows the licenses to
be assigned specifically to
different servers. Licenses
assigned to a server cannot
be reused by other servers.
This metric reports the
number of licenses assigned
to a server.
Number
Assigned licenses in use:
This metric reports the
number of licenses assigned
to a server that are in use.
Number
Assigned licenses usage:
This metric indicates the
percentage of assigned
licenses that are in use.
Percent
A value close to 100% indicates that there
may not be sufficient assigned licenses to
handle user requests.

M O N I T O RI N G C I T R I X Z O N E D A T A C O L L E C T O R S ( Z D C S )
253
5.2.2 Citrix Farm Sessions Test
This test reports key statistics pertaining to the user sessions on the Citrix farm server.
Purpose
Reports key statistics pertaining to the user sessions on the Citrix farm server
Target of the
test
Any Citrix ZDC
Agent
deploying the
test
An internal agent
Configurable
parameters for
the test
1. TEST PERIOD – How often should the test be executed
2. HOST – The host for which the test is to be configured
3. PORT – Refers to the port used by the Citrix ZDC
4. SERVERSTATS - If you want the test to report session statistics per server, then set the
SERVERSTATS parameter to True. If this is the case, the statistics for individual servers in
the zone are shown. By default, the SERVERSTATS parameter is set to False indicating
that, by default, the test reports metrics for every Citrix zone in a farm, and not for every
server.
5. SERVERZONENAME - The SERVERZONENAME parameter is relevant only if the
SERVERSTATS parameter is set to True. In such a case, if the SERVERZONENAME flag
is also set to True, then the descriptors of the test will be of the form:
ServerName:ZoneName
. If this flag is set to False instead, the descriptors of the test will
be of the form:
ZoneName:ServerName
.
Outputs of the
test
One set of results for each farm server
Measurements
made by the
test
Measurement
Measurement
Unit
Interpretation
Unknown sessions:
Indicates the number of
current sessions that are in
an Unknown state.
Number
Active sessions:
Indicates the number of
active sessions currently on
the Citrix farm.
Number
This measure gives an idea of the farm
workload in terms of active sessions. Tracking
the number of active sessions with time, a
Citrix administrator can obtain information that
can help him/her plan the capacity of their
Citrix farm. The detailed diagnosis capability, if
enabled, lists the active and inactive sessions
on the Citrix farm.
Connected sessions:
Indicates the current number
of sessions that are
connected.
Number
A consistent increase in the value of this
measure could indicate that users are having
trouble logging in. Further investigation may
hence be required.

M O N I T O RI N G C I T R I X Z O N E D A T A C O L L E C T O R S ( Z D C S )
254
Connecting sessions:
Indicates the number of
sessions that are in the
process of connecting.
Number
A very high value for this measure indicates a
problem with the session or connection.
Shadow sessions:
Indicates the number of
sessions that are remotely
controlling other sessions.
Number
A non-zero value for this measure indicates
the existence of shadow sessions that are
allowed to view and control the user activity
on another session. Such sessions help in
troubleshooting/resolving problems with other
sessions under their control.
Disconnected sessions:
Indicates the number of
sessions from which users
have disconnected, but which
are still active and can be
reconnected.
Number
Too many disconnected sessions running
indefinitely on a Citrix server cause excessive
consumption of the server resources. To avoid
this, a session limit is typically configured for
disconnected sessions on the Citrix server.
When a session limit is reached for a
disconnected session, the session ends, which
permanently deletes it from the server.
Listen sessions:
Indicates the current number
of sessions that are ready to
accept connections.
Number
Reset sessions:
Indicates the current number
of sessions, the states of
which were reset while in
progress.
Number
Down sessions:
Indicates the current number
of sessions that could not be
initialized or terminated.
Number
Ideally, the value of this measure should be 0.
Initializing sessions:
Indicates the current number
of sessions that are
initializing.
Number
A very high value for this measure could
indicate that too many sessions are currently
experiencing initialization problems.
Stale sessions:
Indicates the current number
of sessions that are stale.
Number
5.2.3 Citrix Farm Connections Test
This test tracks the connectivity of the different servers in the zone with the central ZDC of the zone. Every time the

M O N I T O RI N G C I T R I X Z O N E D A T A C O L L E C T O R S ( Z D C S )
255
test executes, it sends ICA packets to a server and measures the server availability and response time. This test is
disabled by default. To enable the test, go to the ENABLE / DISABLE TESTS page using the menu sequence : Agents ->
Tests -> Enable/Disable, pick
Citrix ZDC
as the Component type,
Performance
as the Test type, choose the test from
the DISABLED TESTS list, and click on the >> button to move the test to the ENABLED TESTS list. Finally, click the
Update button.
Purpose
Tracks the connectivity of the different servers in the farm with the central farm server
Target of the
test
Any Citrix ZDC
Agent
deploying the
test
An internal agent
Configurable
parameters for
the test
1. TEST PERIOD – How often should the test be executed
2. HOST – The host for which the test is to be configured
3. PORT – Refers to the port used by the Citrix server
4. COUNT - Specify the number of packets to be sent by the test
Outputs of the
test
One set of results for the ZDC being monitored
Measurements
made by the
test
Measurement
Measurement
Unit
Interpretation
Farm connection
availability:
Indicates the availability of
the server.
Percent
A value of 100 % indicates that the Citrix
server is responding to requests. 0 indicates
that the server is not responding. A server
might not respond if it is not up and running
or if it is overloaded.
Packet loss to server:
Indicates the percentage of
packets sent that were
replied by the server.
Percent
While 0 indicates that the server is responding
to requests, any value greater than 0 could
indicate that the server is not able to keep up
with its current load.
Avg response time:
Response time is the time
from packet transmission to
reception. Average response
time measures the average
value of the response time
based on replies returned by
the server.
Secs
Increase in the average response time
indicates slow-down of the server and
potential issues in handling user requests by
the server.
Max response time:
This is the maximum of
response times based on
replies returned by the
server.
Secs
If this value is consistently different from the
average response time, further investigation of
other server metrics may be necessary.
M O N I T O RI N G C I T R I X Z O N E D A T A C O L L E C T O R S ( Z D C S )
256
5.2.4 Citrix Farm Users Test
A Citrix environment is a shared environment in which multiple users connect to a Citrix server/server farm and
access a wide variety of applications. When the resources of a server zone are shared, excessive resource utilization
by a single user could impact the performance for other users. Therefore, continuous monitoring of the activities of
each and every user on the farm is critical. Towards this end, the CitrixFarmUsers test assesses the traffic between
the user terminal and the Citrix zone, and also monitors the resources taken up by a user's session on the zone. The
results of this test can be used in troubleshooting and proactive monitoring. For example, when a user reports a
performance problem, an administrator can quickly check the bandwidth usage of the user's session, the
CPU/memory/disk usage of this user's session as well as the resource usage of other user sessions. The administrator
also has access to details on what processes/applications the user is accessing and their individual resource usage.
This information can be used to spot any offending processes/ applications.
This test is disabled by default. To enable the test, go to the ENABLE / DISABLE TESTS page using the menu sequence
: Agents -> Tests -> Enable/Disable, pick
Citrix ZDC
as the Component type,
Performance
as the Test type, choose
the test from the DISABLED TESTS list, and click on the >> button to move the test to the ENABLED TESTS list. Finally,
click the Update button.
Purpose
Tracks every user connection from Citrix clients to the ZDC, and monitors the resource utilization
of every user on the zone
Target of the
test
Any Citrix ZDC
Agent
deploying the
test
An internal agent
Configurable
parameters for
the test
1. TEST PERIOD – How often should the test be executed
2. HOST – The host for which the test is to be configured
3. PORT – Refers to the port used by the Citrix server
4. SHOWPUBLISHEDDESKTOPS - By default, this flag is set to No. If set to Yes, then the
detailed diagnosis of the test, which typically lists the resource-intensive
processes/applications accessed by a user, will additionally indicate the exact published
desktop that has been used by the user or used to access the application.
5. DETAILED DIAGNOSIS - To make diagnosis more efficient and accurate, the eG
Enterprise suite embeds an optional detailed diagnostic capability. With this capability, the
eG agents can be configured to run detailed, more elaborate tests as and when specific
problems are detected. To enable the detailed diagnosis capability of this test for a
particular server, choose the On option. To disable the capability, click on the Off option.
The option to selectively enable/disable the detailed diagnosis capability will be available
only if the following conditions are fulfilled:
The eG manager license should allow the detailed diagnosis capability
Both the normal and abnormal frequencies configured for the detailed diagnosis
measures should not be 0.
Outputs of the
test
One set of results for each user logged into the Citrix zone

M O N I T O RI N G C I T R I X Z O N E D A T A C O L L E C T O R S ( Z D C S )
257
Measurements
made by the
test
Measurement
Measurement
Unit
Interpretation
User sessions:
Represents the current
number of sessions for a
particular user
Number
A value of 0 indicates that the user is not
currently connected to the Citrix farm.
Latency last:
Represents the average client
latency for the last request
from a user. The value
reported is the average of the
last latencies for all the
current sessions of a user.
Secs
A consistently high latency may be indicative
of performance degradations with the Citrix
farms. Possible reasons for an increase in
latency could be increased network delays,
network congestion, Citrix farm slow-down,
too many simultaneous users on the Citrix
farm etc.
Latency avg:
Represents the average client
latency for a user. The value
reported is the average of the
latencies for all the current
sessions of a user.
Secs
Latency deviation:
The latency deviation
represents the difference
between the minimum and
maximum measured latency
values for a session. The
value reported is the average
of the latency deviations for
all the current sessions of a
user.
Secs
Ideally, the deviation in latencies over a
session should be minimum so as to provide
a consistent experience for the user.
Memory usage by user’s
processes:
This value represents the
ratio of the resident set size
of the memory utilized by the
user to the physical memory
of the host system, expressed
as a percentage. If a user is
connected via multiple
sessions, the value reported
is the sum of all memory
utilizations across all the
sessions.
Percent
This value indicates the percentage of
memory resources that are used up by a
specific user. By comparing this value across
users, an administrator can identify the most
heavy users of the Citrix farm. Check the
detailed diagnosis to view the offending
processes/applications.

M O N I T O RI N G C I T R I X Z O N E D A T A C O L L E C T O R S ( Z D C S )
258
CPU usage:
The CPU utilization for a
session is the percentage of
time that all of the
threads/processes of a user
session used the processor to
execute instructions. If a user
is connected via multiple
sessions, the value reported
is the sum of all
CPUutilizations across all the
sessions.
Percent
This value indicates the percentage of Cpu
resources that are used by a specific
user. Excessive CPU usage by a user can
impact performance for other users. Check
the detailed diagnosis to view the offending
processes/applications.
Input bandwidth:
Indicates the average
bandwidth used for client to
server communications for all
the sessions of a user
KB/Sec
Output bandwidth:
Indicates the average
bandwidth used for server to
client communications for all
the sessions of a user
KB/Sec
Input line speed:
Indicates the average line
speed from the client to the
server for all the sessions of a
user
KB/Sec
Output line speed:
Indicates the average line
speed from the server to the
client for all the sessions of a
user
KB/Sec
Input compression:
Indicates the average
compression ratio for client to
server traffic for all the
sessions of a user
Number
Output compression:
Indicates the average
compression ratio for server
to client traffic for all the
sessions of a user
Number

M O N I T O RI N G C I T R I X Z O N E D A T A C O L L E C T O R S ( Z D C S )
259
I/O read rate for user’s
processes:
Indicates the rate of I/O
reads done by all processes
being run by a user.
Kbps
These metrics measure the collective I/O
activity (which includes file, network and
device I/O's) generated by all the processes
being executed by a user. When viewed
along with the system I/O metrics reported
by the DiskActivity test, these measures help
you determine the network I/O. Comparison
across users helps identify the user who is
running the most I/O-intensive processes.
Check the detailed diagnosis for the offending
processes/applications.
I/O write rate for user’s
processes:
Indicates the rate of I/O
writes done by all processes
being run by a user.
Kbps
Page faults for user’s
processes:
Indicates the rate of page
faults seen by all processes
being run by a user.
Faults/Sec
Page Faults occur in the threads executing in
a process. A page fault occurs when a thread
refers to a virtual memory page that is not in
its working set in main memory. If the page
is on the standby list and hence already in
main memory, or if the page is in use by
another process with whom the page is
shared, then the page fault will not cause the
page to be fetched from disk. Excessive page
faults could result in decreased performance.
Compare values across users to figure out
which user is causing most page faults.
Virtual memory for user’s
processes:
Indicates the total virtual
memory being used by all
processes being run by a
user.
MB
Comparison across users reveals the user
who is being a drain on the virtual memory
space.
Handles used by user’s
processes:
Indicates the total number of
handles being currently held
by all processes of a user.
Number
A consistent increase in the handle count
over a period of time is indicative of
malfunctioning of programs. Compare this
value across users to see which user is using
a lot of handles. Check detailed diagnosis for
further information.
Audio bandwidth input:
Indicates the bandwidth used
while transmitting
sound/audio to this user.
Kbps
Comparing these values across users will
reveal which user is sending/receiving
bandwidth-intensive sound/audio files over
the ICA channel.
To minimize bandwidth consumption, you
may want to consider disabling client audio
mapping.
Audio bandwidth input:
Indicates the bandwidth used
while receiving sound/audio
from this user.
Kbps

M O N I T O RI N G C I T R I X Z O N E D A T A C O L L E C T O R S ( Z D C S )
260
COM bandwidth input:
Indicates the bandwidth used
when sending data to this
user’s COM port.
Kbps
Comparing these values across users will
reveal which user’s COM port is
sending/receiving bandwidth-intensive data
over the ICA channel.
COM bandwidth ouput:
Indicates the bandwidth used
when receiving data from this
user’s COM port.
Kbps
Drive bandwidth input:
Indicates the bandwidth used
when this user performs file
operations on the mapped
drive on the virtual desktop.
Kbps
Comparing the values of these measures
across users will reveal which user is
performing bandwidth-intensive file
operations over the ICA channel.
If bandwidth consumption is too high, you
may want to consider disabling client drive
mapping on the client device. Client drive
mapping allows users logged on to a virtual
desktop from a client device to access their
local drives transparently from the ICA
session. Alternatively, you can conserve
bandwidth by even refraining from accessing
large files with client drive mapping over the
ICA connection.
Drive bandwidth output:
Indicates the bandwidth used
when the virtual desktop
performs file operations on
the client’s drive.
Kbps
Printer bandwidth input:
Indicates the bandwidth used
when this user prints to a
desktop printer over the ICA
channel.
Kbps
Comparing the values of these measures
across users will reveal which user is issuing
bandwidth-intensive print commands over the
ICA channel.
If bandwidth consumption is too high, you
may want to consider disabling printing.
Alternatively, you can avoid printing large
documents over the ICA connection.
Printer bandwidth output:
Indicates the bandwidth used
when the desktop responds
to print jobs issued by this
user.
Kbps
Session bandwidth input:
Indicates the bandwidth used
from this user to the virtual
desktop for a session
Kbps
Comparing the values of these measures
across users will reveal which user and which
virtual desktop is performing bandwidth-
intensive operations for a session.
Session bandwidth
output:
Indicates the bandwidth used
from the virtual desktop to
this user for a session.
Kbps

M O N I T O RI N G C I T R I X Z O N E D A T A C O L L E C T O R S ( Z D C S )
261
Session compression
input:
Indicates the compression
ratio used from this user to
the virtual desktop for a
session.
Number
Compression reduces the size of the data that
is transacted over the ICA channel.
Comparing the values of these measures
across users will reveal which client has been
configured with a very low and a very high
compression ratio.
In the event of high bandwidth usage over an
ICA channel, you can set a higher
compression ratio for the corresponding client
and thus reduce bandwidth consumption.
Session compression
output:
Indicates the compression
ratio used from the virtual
desktop to this user for a
session.
Number
Speed screen data
channel bandwidth input:
Indicates the bandwidth used
from this user to the virtual
desktop for data channel
traffic.
Kbps
Comparing the values of these measures
across users will reveal which user has been
transmitting/receiving bandwidth-intensive
data channel traffic.
Speed screen data
channel bandwidth
output:
Indicates the bandwidth used
from virtual desktop to this
user for data channel traffic.
Kbps
Speed screen multimedia
acceleration bandwidth
input:
Indicates the bandwidth used
from this user to virtual
desktop for multimedia
traffic.
Kbps
Comparing the values of these measures
across users will reveal which user has been
transmitting/receiving bandwidth-intensive
multimedia traffic.
Speed screen multimedia
acceleration bandwidth
output:
Indicates the bandwidth used
from the virtual desktop to
this user for multimedia
traffic
Kbps
HDX media stream for
flash data bandwidth
input:
Indicates the bandwidth used
from this user to virtual
desktop for flash data traffic.
Kbps
Comparing the values of these measures
across users will reveal which user has been
transmitting/receiving bandwidth-intensive
flash data.

M O N I T O RI N G C I T R I X Z O N E D A T A C O L L E C T O R S ( Z D C S )
262
HDX media stream for
flash data bandwidth
output:
Indicates the bandwidth used
from the virtual desktop to
this user for flash data traffic
Kbps
USB bandwidth input:
Indicates the bandwidth used
from this user to the virtual
desktop for the USB port-
related traffic.
Kbps
Comparing the values of these measures
across users will reveal which user has been
transmitting/receiving bandwidth-intensive
USB traffic.
USB bandwidth output:
Indicates the bandwidth used
from the virtual desktop to
this user for the USB port-
related traffic.
Kbps
5.2.5 Data Store Check Test
When a XenApp server farm is deployed, it must have an associated data store. The data store provides a repository
of persistent information, including:
Farm configuration information
Published application configurations
Server configurations
Citrix administrator accounts
Printer configurations
When servers in a zone attempt to come online, they query the data store for configuration information via the ZDC.
If the data store is unavailable or is inaccessible to the ZDC for long hours, servers in the zone will remain offline the
whole time, thus denying users access to their critical applications. To avoid this, administrators can run the Data
Store Check test at frequent intervals, check whether/not the ZDC is able to connect to the data store, and in this
way, detect connection failures before farm users complain. In the event of a connection failure, administrators can
also use the detailed metrics collected by this test to determine the reason for the connection failure and resolve it.
Purpose
Checks whether/not the ZDC is able to connect to the data store, and in the process, helps
detect connection failures before farm users complain
Target of the
test
Any Citrix ZDC
Agent
deploying the
test
An internal/remote agent
M O N I T O RI N G C I T R I X Z O N E D A T A C O L L E C T O R S ( Z D C S )
263
Configurable
parameters for
the test
1. TEST PERIOD – How often should the test be executedor
2. HOST – The host for which the test is to be configured
3. PORT – Refers to the port used by the Citrix ZDC
4. DSCHECKPATH – This test uses XenApp’s Data Store Checker tool to verify whether/not
the monitored ZDC is able to connect to the data store. To enable the test to use this tool,
you need to specify the full path to the location of DSCheck.exe in the DSCHECKPATH
text box. For instance, your path can be:
C:\Program Files (x86)\Citrix\system32.
5. DETAILED DIAGNOSIS - To make diagnosis more efficient and accurate, the eG
Enterprise suite embeds an optional detailed diagnostic capability. With this capability, the
eG agents can be configured to run detailed, more elaborate tests as and when specific
problems are detected. To enable the detailed diagnosis capability of this test for a
particular server, choose the On option. To disable the capability, click on the Off option.
The option to selectively enable/disable the detailed diagnosis capability will be available
only if the following conditions are fulfilled:
The eG manager license should allow the detailed diagnosis capability
Both the normal and abnormal frequencies configured for the detailed diagnosis
measures should not be 0.
Outputs of the
test
One set of results for the Citrix ZDC monitored
Measurements
made by the
test
Measurement
Measurement
Unit
Interpretation
Connectivity status:
Indicates whether the ZDC
succeeded or failed in
establishing a connection with
the data store.
The values that this measure can take and
their corresponding numeric values are as
follows:
Measure
Value
Numeric Value
Failure
0
Success
1
If the value reported is Failure, you can use
the detailed diagnosis of this test to
determine the reason for the connection
failure.
Note:
By default, this measure reports the above-
mentioned Measure Values to indicate the
connectivity status of the data store.
However, the graph of this measure will
represent the same using the numeric
equivalents only.
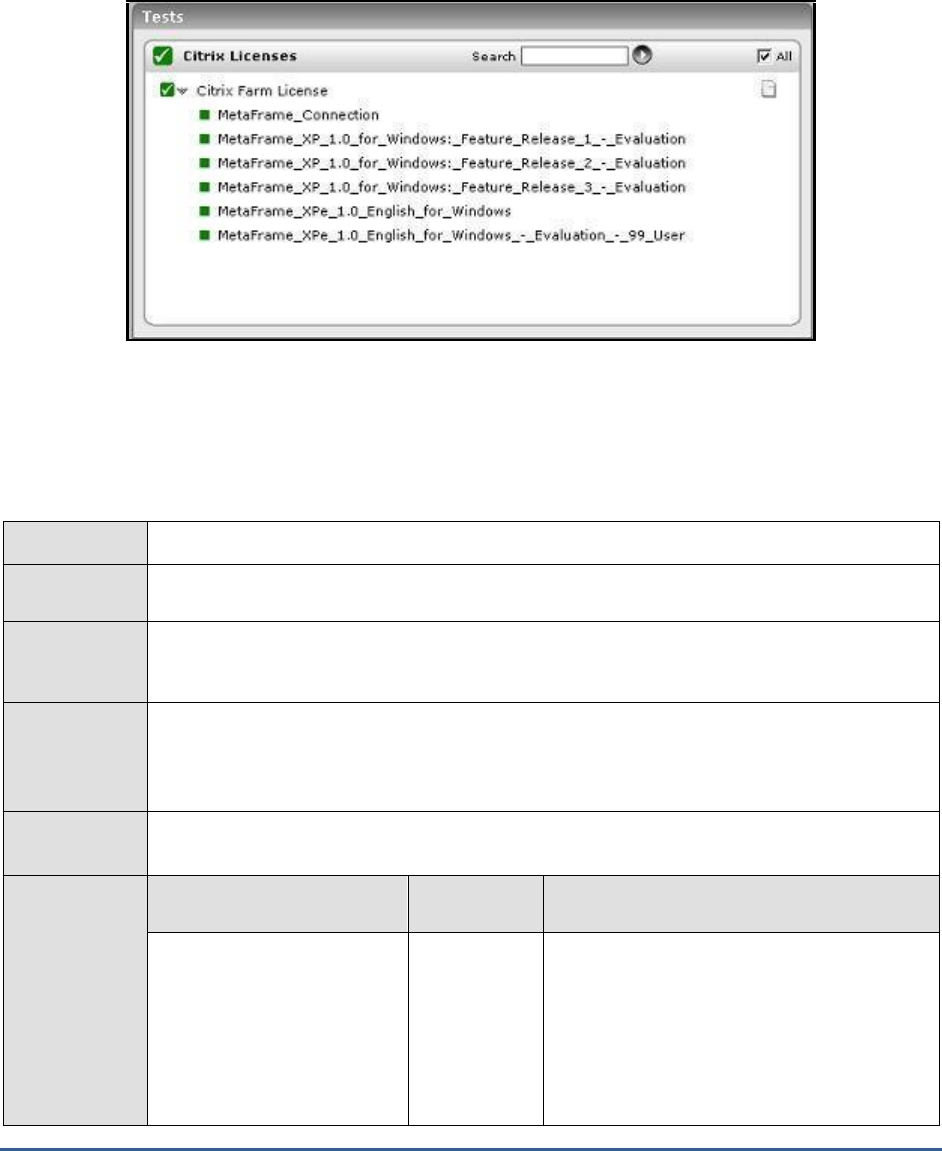
M O N I T O RI N G C I T R I X Z O N E D A T A C O L L E C T O R S ( Z D C S )
264
5.3 The Citrix Licenses Layer
To track the product and connection licenses for a Citrix server zone, use the CitrixFarmLicense test.
Figure 5.4: Tests associated with the Citrix Licenses test
5.3.1 Citrix Farm Licenses Test
This test reports the license usage of a Citrix server farm. This test tracks both the product and connection license
for a zone.
Purpose
Reports the license usage of a Citrix zone
Target of the
test
Any Citrix ZDC
Agent
deploying the
test
An internal agent
Configurable
parameters for
the test
1. TEST PERIOD – How often should the test be executed
2. HOST – The host for which the test is to be configured
3. PORT – Refers to the port used by the Citrix server
Outputs of the
test
One set of results for every license
Measurements
made by the
test
Measurement
Measurement
Unit
Interpretation
Pool licenses in use:
One of the main purposes of
a Citrix server farm is to
reuse/distribute licenses
across servers. This metric
reports the number of
licenses in use.
Number

M O N I T O RI N G C I T R I X Z O N E D A T A C O L L E C T O R S ( Z D C S )
265
Pool licenses available:
This metric reports the
number of pool licenses that
are available for use by
servers in the server farm.
Number
Pool licenses usage:
This metric reports the
percentage of pooled licenses
that are in use.
Percent
If the pool license usage reaches close to
100%, the server farm may be running out of
licenses.
Assigned licenses:
Besides pooling licenses,
Citrix allows the licenses to
be assigned specifically to
different servers. Licenses
assigned to a server cannot
be reused by other servers.
This metric reports the
number of licenses assigned
to a server.
Number
Assigned licenses in use:
This metric reports the
number of licenses assigned
to a server that are in use.
Number
Assigned licenses usage:
This metric indicates the
percentage of assigned
licenses that are in use.
Percent
A value close to 100% indicates that there
may not be sufficient assigned licenses to
handle user requests.
5.4 The Citrix Applications Layer
The CitrixApplicationLoad test that is mapped to this layer enables you to identify the most popular application in the
Citrix zone, as it reveals the load per application.
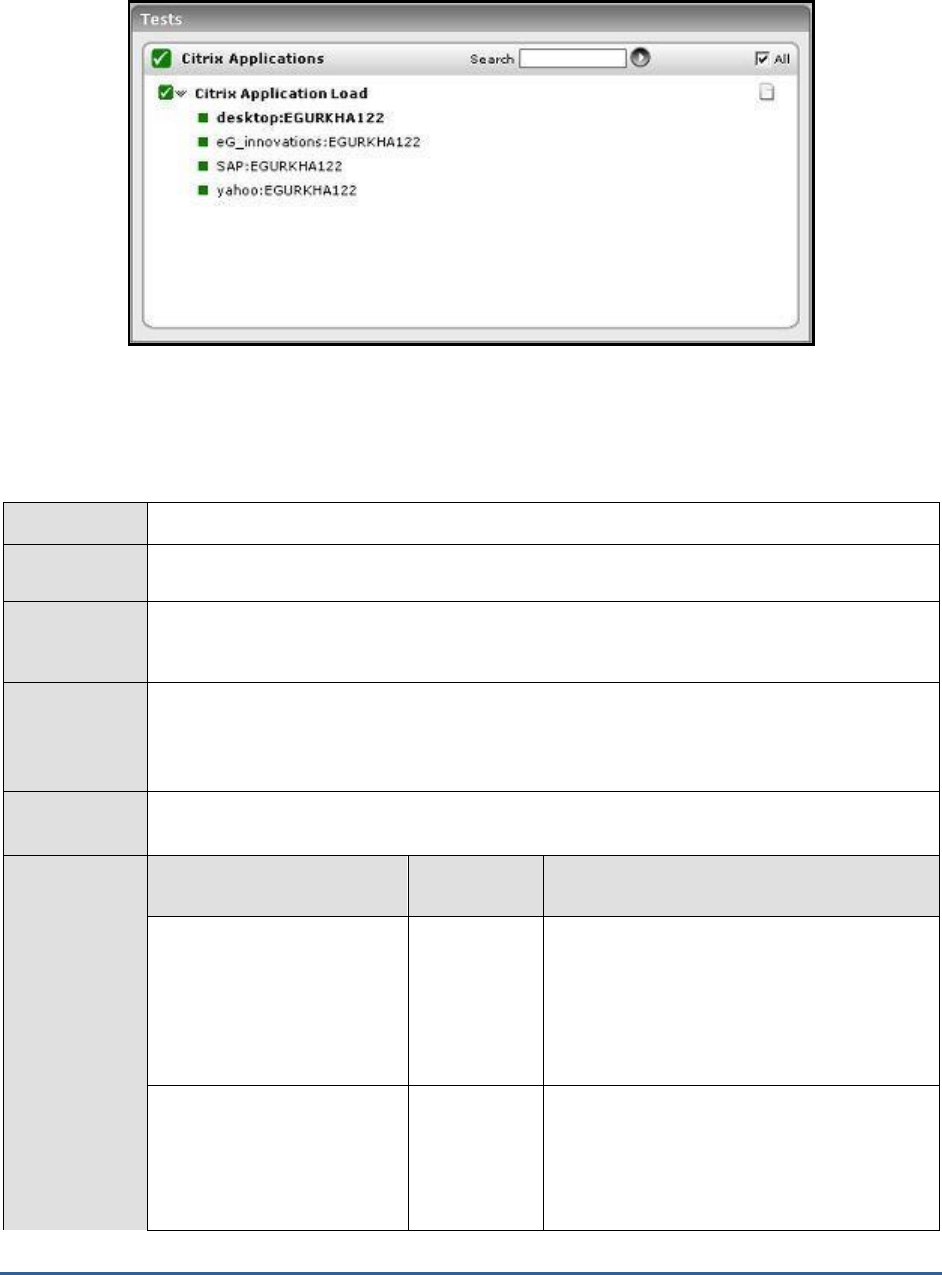
M O N I T O RI N G C I T R I X Z O N E D A T A C O L L E C T O R S ( Z D C S )
266
Figure 5.5: Tests associated with the Citrix Applications layer
5.4.1 Citrix Application Load Test
This test reports the load on all the applications hosted in the server zone.
Purpose
Reports the load on all the applications hosted in the server zone
Target of the
test
Any Citrix ZDC
Agent
deploying the
test
An internal agent
Configurable
parameters for
the test
1. TEST PERIOD – How often should the test be executed
2. HOST – The host for which the test is to be configured
3. PORT – Refers to the port used by the Citrix server
Outputs of the
test
One set of results is reported for each application/server pair (i.e., the descriptors of the test
indicate the application:server name).
Measurements
made by the
test
Measurement
Measurement
Unit
Interpretation
Is load normal?:
Indicates whether the load on
the application (on the
specific server indicated by
the descriptor) is normal or
not.
Boolean
A value of 1 indicates normalcy. The Citrix
application load evaluator is used to gauge
normalcy.
Is application
overloaded?:
Indicates whether the
application running on a
server is overloaded or not
Boolean
A value of 1 indicates that the application
running on the server may be overloaded (as
measured by the Citrix application load
evaluator).

M O N I T O RI N G C I T R I X Z O N E D A T A C O L L E C T O R S ( Z D C S )
267
is application out of
licenses?:
Indicates whether the server
is running out of licenses or
not
Percent
A value of 1 indicates that there may not be
sufficient licenses to handle user requests for
this application on the specific server indicated
by the test descriptor.
Is disabled?:
Indicates whether the
application has been disabled
for the server or not
Boolean
A value of 1 indicates that this application may
be disabled for the server that is indicated by
the test descriptor
5.4.1.1 Troubleshooting the Failure of the Citrix Application Load Test on Citrix
XenApp Server v6 (and above)
Citrix Load Management is handled by the load evaluator, which is simply a set of rules that determine a particular
server’s “score”, or current load value. It is the “score” that determines how load is distributed within the server
farm. Load evaluators can be applied to servers and/or published applications.
In Citrix XenApp v6 (and above), the load evaluator is set only at the server-level and not for the individual
applications that have been published on the server. This is why, the Citrix Application Load test fails on Citrix
XenApp server v6 (and above). To avoid test failure, you need to manually set the load evaluator for each application
published on the Citrix XenApp server v6 (and above).
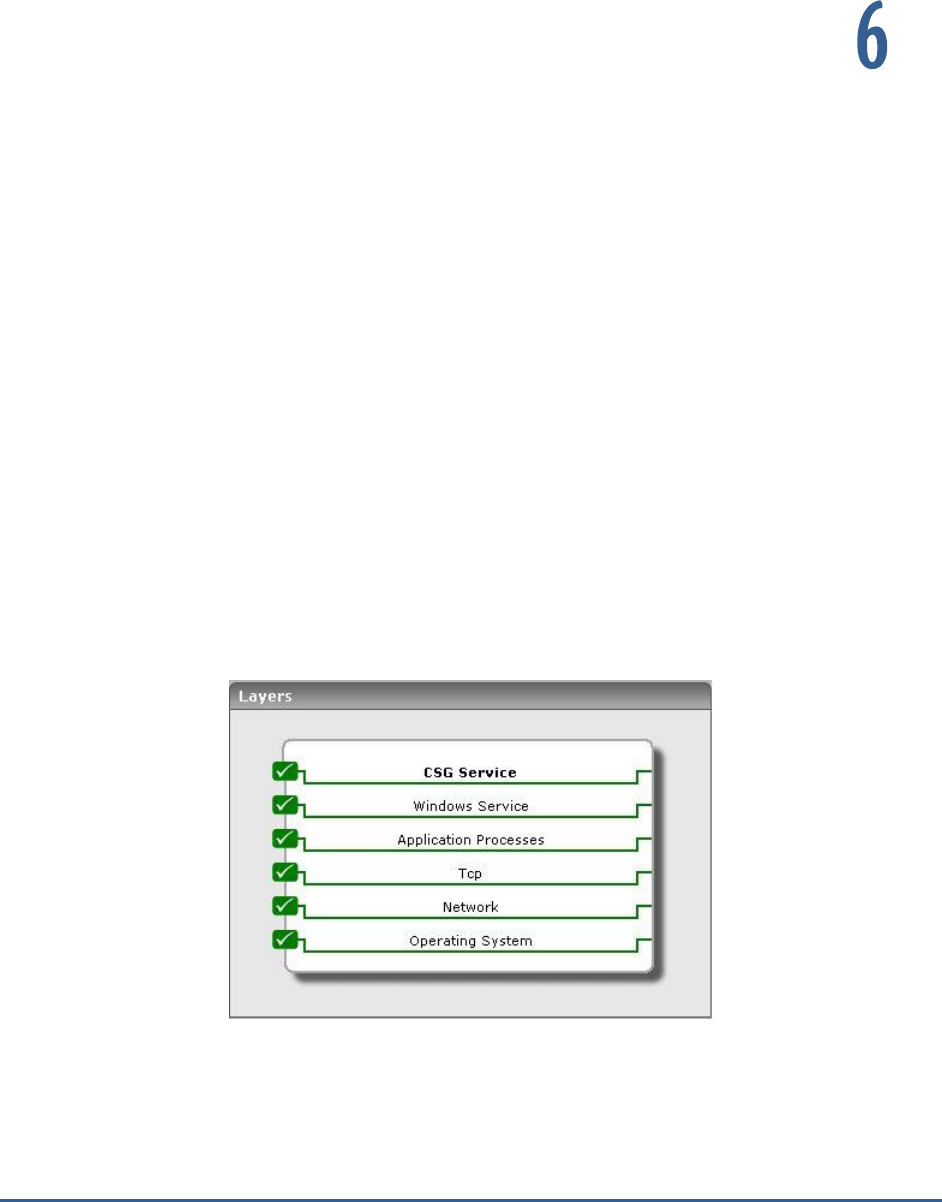
M O N I T O RI N G T H E C I T R I X S E C U R E G A T E W A Y
268
Monitoring the Citrix Secure
Gateway
Citrix Secure Gateway of the Citrix Access Suite is a Citrix infrastructure component which can be used to secure
access to resources and applications hosted on servers running one or more Citrix server products. The Secure
Gateway transparently encrypts and authenticates all user connections to protect against data tampering and theft.
In order to maintain data integrity and safety, it is imperative to ensure the uninterrupted functioning of the Citrix
Secure Gateway. eG Enterprise's specialized monitoring model for the
Citrix Secure Gateway
keeps close tabs on
every critical step of the authentication operation performed by the Secure Gateway server, so that potential security
breaches are spotted and sealed before they disrupt normal server functions; this includes, the identification of
connection bottlenecks, monitoring data transmitted to and from the server to detect a possible overload, assessing
how effectively the server handles SSL handshakes, determining whether/not the server properly validates login
credentials, etc.
Figure 6.1: The layer model of a Citrix secure gateway server
The tests mapped to each of the layers present in Figure 6.1 aid in the monitoring of one or more of the aforesaid
performance parameters. As the lower 5 layers of the layer model have been dealt with extensively in the
Monitoring
Unix and Windows Servers
document, this section will discuss the CSG Service layer only.
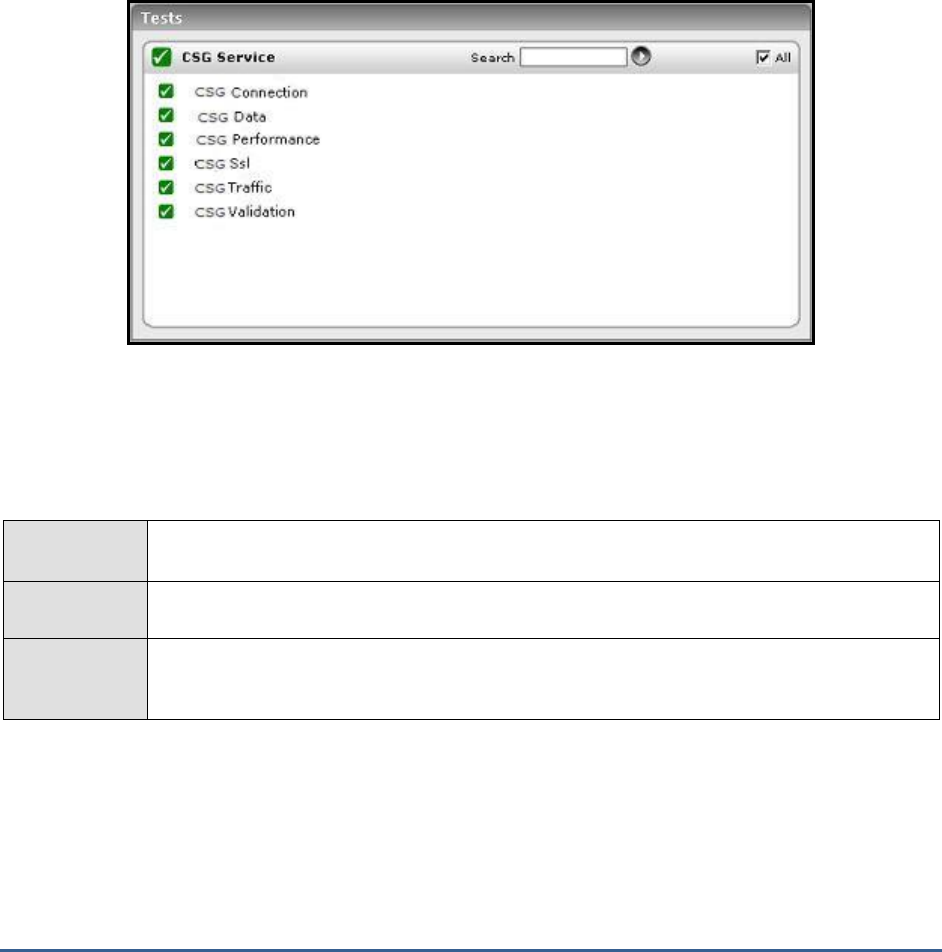
M O N I T O RI N G T H E C I T R I X S E C U R E G A T E W A Y
269
6.1.1 The CSG_SERVICE Layer
Using the tests associated with this layer, you can monitor:
Connection attempts made to the server and their success and failure rates
Data sent to and received by the server
The status of validations performed
SSL handshakes
Figure 6.2: The tests associated with the CSG Service layer
6.1.1.1 CSG Connection Test
The CSG Connection test reports statistics related to the connections established between the ICA client and the
Citrix Secure Gateway Server.
Purpose
Reports statistics related to the connections established between the ICA client and the Citrix
Secure Gateway Server
Target of the
test
Any Citrix Secure Gateway server
Agent
deploying the
test
An external agent

M O N I T O RI N G T H E C I T R I X S E C U R E G A T E W A Y
270
Configurable
parameters for
the test
1. TEST PERIOD – How often should the test be executed
2. HOST – The host for which the test is to be configured
3. PORT – Refers to the port used by the Citrix secure gateway server
4. DETAILED DIAGNOSIS - To make diagnosis more efficient and accurate, the eG
Enterprise suite embeds an optional detailed diagnostic capability. With this capability, the
eG agents can be configured to run detailed, more elaborate tests as and when specific
problems are detected. To enable the detailed diagnosis capability of this test for a
particular server, choose the On option. To disable the capability, click on the Off option.
The option to selectively enable/disable the detailed diagnosis capability will be available
only if the following conditions are fulfilled:
The eG manager license should allow the detailed diagnosis capability
Both the normal and abnormal frequencies configured for the detailed diagnosis
measures should not be 0.
Outputs of the
test
One set of results is reported for every Citrix secure gateway server being monitored
Measurements
made by the
test
Measurement
Measurement
Unit
Interpretation
Active HTTP connections:
The total number of
HTTP/HTTPS client sessions
currently active through
Secure Gateway.
Number
This measure is incremented for each
successful client connection request and is
decremented for each disconnected or
terminated HTTP/S connection.
Active ICA connections:
The total number of ICA
Client sessions currently
active through the Secure
Gateway Service.
Number
The measure is incremented for each
successful ICA Client connection request and
decremented for each disconnected or
terminated ICA connection.
Active other connections:
These are connections to the
Logon Agent or the Web
Interface to MetaFrame XP.
This measure indicates the
total number of client
sessions currently active
through the Secure Gateway
Service that are not yet
authenticated.
Number
The measure is incremented for each
successful client connection request and is
decremented for each disconnected or
terminated non-ICA or HTTP/S connection.
Pending connections:
The total number of client
connection requests that
were accepted but have not
yet completed the connection
process.
Number
The measure is incremented when a client
connection request is accepted and is
decremented when the client connection
request succeeds or fails.

M O N I T O RI N G T H E C I T R I X S E C U R E G A T E W A Y
271
Percentfailed
connections:
Percentage of failed
connections.
Percent
Failed connections:
The total number of failed
client connection requests.
Number
The measure is incremented when a client fails
to complete the handshaking process or a
connection could not be established to the
requested resource. The constant increase in
failed connections, interprets failure due to
various factors like Timed Out, SSL error,
Server Connect error, Authentication error and
Access control list errors. The detailed
diagnosis capability of this measure, if
enabled, provides the number of connections
which failed due to each of the above-
mentioned reasons.
6.1.1.2 CSG Traffic Test
This test reports the statistics pertaining to the to and fro data traffic between the ICA Client and the Citrix Secure
Gateway after the connection has been established.
Purpose
Reports statistics pertaining to the to and fro data traffic between the ICA Client and the
MetaFrame server after the connection has been established
Target of the
test
Any Citrix Secure Gateway server
Agent
deploying the
test
An internal agent
Configurable
parameters for
the test
1. TEST PERIOD – How often should the test be executed
2. HOST – The host for which the test is to be configured
3. PORT – Refers to the port used by the Citrix secure gateway server
Outputs of the
test
One set of results is reported for every Citrix secure gateway server being monitored
Measurements
made by the
test
Measurement
Measurement
Unit
Interpretation
Data receive rate:
The total number of bytes
(for all client connections)
sent to the Secure Gateway
Service by any connected
client.
KB/Sec
The measure is increased when the Secure
Gateway Service reads some data from a
connected client.

M O N I T O RI N G T H E C I T R I X S E C U R E G A T E W A Y
272
Data send rate:
The total number of bytes
(for all client connections)
sent to the client(s) from the
Secure Gateway Service.
KB/Sec
The measure is increased when the Secure
Gateway Service sends data to any connected
client.
6.1.1.3 CSG Validation Test
This test reports results of the validations done by the Secure Ticket Authority before getting access to the Citrix
Gateway Server.
Purpose
Reports results of the validations done by the Secure Ticket Authority before getting access to
the Citrix Gateway Server
Target of the
test
Any Citrix Secure Gateway server
Agent
deploying the
test
An internal agent
Configurable
parameters for
the test
1. TEST PERIOD – How often should the test be executed
2. HOST – The host for which the test is to be configured
3. PORT – Refers to the port used by the Citrix secure gateway server
Outputs of the
test
One set of results is reported for every Citrix secure gateway server being monitored
Measurements
made by the
test
Measurement
Measurement
Unit
Interpretation
Failed ticket validations:
The rate of unsuccessful STA
ticket validation requests.
Validations/Se
c
If a ticket is not validated by the STA or the
Secure Gateway Service, the measure is
increased. More than 5 ticket validations
indicate that the client configuration in the
Metaframe should be investigated.
Failed access token
validations:
The total number of
unsuccessful access token
validations.
Errors/Sec
This counter is incremented if an access token
cannot be validated by the Authentication
Service or there is an error while the Secure
Gateway Service is attempting to validate the
access token. More than 3 validation errors
interprets that the state of the tickets
generated should be verified or the connation
between the Client and SecureGateway should
be checked.
Successful validations:
The rate of validations
succeeded
Validations/Se
c

M O N I T O RI N G T H E C I T R I X S E C U R E G A T E W A Y
273
Successful cache
validations:
The rate at which successful
access token validations
occur in the Secure Gateway
Service matching the
contents of its cache.
Validations/Se
c
The measure is increased when the Secure
Gateway Service successfully validates an
access token by checking if it has the access
token in its cache.
Successful STA
validations:
The rate at which successful
validations occur through
Authentication Service in
response to access token
validation requests from the
Secure Gateway Service.
Validations/Se
c
The measure is increased when the
Authentication Service returns a validation
successful message.
6.1.1.4 CSG SSL Test
This test monitors the SSL handshakes handled by a Citrix Secure Gateway.
Purpose
Monitors the SSL handshakes handled by a Citrix Secure Gateway
Target of the
test
Any Citrix Secure Gateway server
Agent
deploying the
test
An internal agent
Configurable
parameters for
the test
1. TEST PERIOD – How often should the test be executed
2. HOST – The host for which the test is to be configured
3. PORT – Refers to the port used by the Citrix secure gateway server
Outputs of the
test
One set of results is reported for every Citrix secure gateway server being monitored
Measurements
made by the
test
Measurement
Measurement
Unit
Interpretation
SSL Handshakes:
The number of SSL
handshakes handled by the
CSG in the last measurement
period.
Number
SSL handshake rate:
The rate at which SSL
handshakes are being
handled by the CSG.
Handshakes/S
ec
This value is one of the representations of the
workload on the CSG.

M O N I T O RI N G T H E C I T R I X S E C U R E G A T E W A Y
274
Pending SSL handshakes:
The number of SSL
handshakes currently in
progress between the CSG
and clients.
Number
Ideally, this value should be low.
Avg SSL handshake time:
The average time taken for
an SSL handshake to
complete.
Secs
This value indicates whether SSL handshakes
are slowing down user access to the Citrix
infrastructure.
6.1.1.5 CSG Data Test
This test monitors the data to and from the Citrix Secure Gateway to clients. Protocol-wise breakup of the data
communicated is also provided.
Purpose
Monitors the data to and from the Citrix Secure Gateway to clients
Target of the
test
Any Citrix Secure Gateway server
Agent
deploying the
test
An internal agent
Configurable
parameters for
the test
1. TEST PERIOD – How often should the test be executed
2. HOST – The host for which the test is to be configured
3. PORT – Refers to the port used by the Citrix secure gateway server
Outputs of the
test
One set of results is reported for every Citrix secure gateway server being monitored
Measurements
made by the
test
Measurement
Measurement
Unit
Interpretation
Traffic rate to clients:
The rate of data transmitted
to clients by the CSG.
KB/Sec
This value represents the workload on the
CSG.
CGP data rate to clients:
The rate of CGP protocol data
transmitted by the CSG to
clients.
KB/Sec
SOCKS traffic to clients:
The rate of SOCKS protocol
data transmitted by the CSG
to clients.
KB/Sec

M O N I T O RI N G T H E C I T R I X S E C U R E G A T E W A Y
275
HTTP traffic to clients:
The rate of HTTP/HTTPS
protocol data transmitted by
the CSG to clients.
KB/Sec
Data traffic from clients:
The rate of data transmitted
from clients by the CSG.
KB/Sec
This value represents the workload from the
CSG.
CGP data from clients:
The rate of CGP protocol data
transmitted from the CSG to
clients.
KB/Sec
SOCKS traffic from
clients:
The rate of SOCKS protocol
data transmitted from the
CSG to clients.
KB/Sec
HTTP traffic from clients:
The rate of HTTP/HTTPS
protocol data transmitted
from the CSG to clients.
KB/Sec
6.1.1.6 CSG Performance Test
This test monitors connections to the Citrix Secure Gateway.
Purpose
Monitors connections to the Citrix Secure Gateway
Target of the
test
Any Citrix Secure Gateway server
Agent
deploying the
test
An internal agent
Configurable
parameters for
the test
1. TEST PERIOD – How often should the test be executed
2. HOST – The host for which the test is to be configured
3. PORT – Refers to the port used by the Citrix secure gateway server
Outputs of the
test
One set of results is reported for every Citrix secure gateway server being monitored
Measurements
made by the
Measurement
Measurement
Unit
Interpretation

M O N I T O RI N G T H E C I T R I X S E C U R E G A T E W A Y
276
test
Successful connections to
the CSG:
The number of successful
connections handled by the
Citrix Secure Gateway during
the last measurement period.
Number
Successful CGP
connections:
The number of successful
CSG protocol connections
handled by the Citrix Secure
Gateway during the last
measurement period.
Number
Successful SOCKS
connections:
The number of successful
SOCKS protocol connections
handled by the Citrix Secure
Gateway during the last
measurement period.
Number
Successful HTTP
connections:
The number of successful
HTTP/HTTPS protocol
connections handled by the
Citrix Secure Gateway during
the last measurement period.
Number
Current active
connections to the CSG:
The number of connections
currently being handled by
the CSG.
Number
If the number of active connections is
unusually high or low, it may indicate a
situation that warrants further investigation to
see if the Citrix infrastructure is working well.
Active CGP connections:
The number of CGP
connections currently being
handled by the CSG.
Number
Active Socks connections
to the CSG:
The number of SOCKS
connections currently being
handled by the CSG.
Number

M O N I T O RI N G T H E C I T R I X S E C U R E G A T E W A Y
277
Active HTTP connections
to the CSG:
The number of HTTP/HTTPS
connections currently being
handled by the CSG.
Number
Failed connections to the
CSG:
The total number of failed
client connection requests
during the last measurement
period.
Number
This value is the sum of the Failed
Connections (Timed Out), Failed Connections
(SSL Error), and Failed Connections (General
Client Error) counters.
Percent failed
connections:
The percentage of total
connections handled that
failed.
Percent
Client timeouts:
The total number of client
connection requests that
were accepted but timed out
before completing the
protocol handshake during
the last measurement period.
Number
SSL handshake errors:
The total number of client
connection requests that
were accepted but did not
successfully complete the SSL
handshake during the last
measurement period.
Number
Client errors:
The total number of client
connection requests that
failed to connect to the
Secure Gateway for any
reason other than timing out
or SSL handshake error
during the last measurement
period.
Number

M O N I T O RI N G T H E C I T R I X S E C U R E G A T E W A Y
278
Avg client connection
time:
The average amount of time
(in Secs) for a client
connection request to
complete the connection
process.
Secs
Failed backend
connections:
The total number of backend
connections that failed in the
last measurement period.
Number
Clients that successfully connect to the Secure
Gateway may not successfully connect to
backend servers, such as a Web server. These
connections are not counted as part of the
failed client connection count.
Pending connections:
The total number of client
connection requests
accepted, but not yet
completed by the Secure
Gateway.
Number
Pending connections are still active and have
not timed out or failed. An increase in pending
connections indicates a potential bottleneck at
the CSG.

M O N I T O RI N G T H E C I T R I X S E C U R E TI C K E T I N G A U T H O RI T Y ( S T A )
279
Monitoring the Citrix Secure
Ticketing Authority (STA)
Secure Ticketing Authority (STA) works hand-in-hand with any Secure Gateway Server for accessing resources and
applications hosted by one or more Citrix Access Suite products. STA is a core component of the Citrix Secure
Gateway. The vital functions of the STA are generating Tickets and validating them in the future, for access to the
resources on the Citrix server.
Errors in ticket generation and validation, if not resolved in time, could result in critical resources remaining
inaccessible to users. Continuous monitoring and proactive alerting of probable error conditions could help prevent
such situations. The specialized monitoring model that eG Enterprise provides for the
Citrix STA
(see Figure 7.1),
enables 24 x 7 monitoring of the STA, and proactive alerting of issues that surface.
Figure 7.1: The layer model of the Citrix STA
Using this model (see Figure 7.1), administrators can find quick answers to the following performance queries related
to the Citrix STA:
How many tickets were successfully generated by the STA? Did the STA fail to generate any tickets?
Were too many tickets and data retrieval requests invalidated by the STA?
Have many ticket requests timed out? Should the timeout setting be reset?
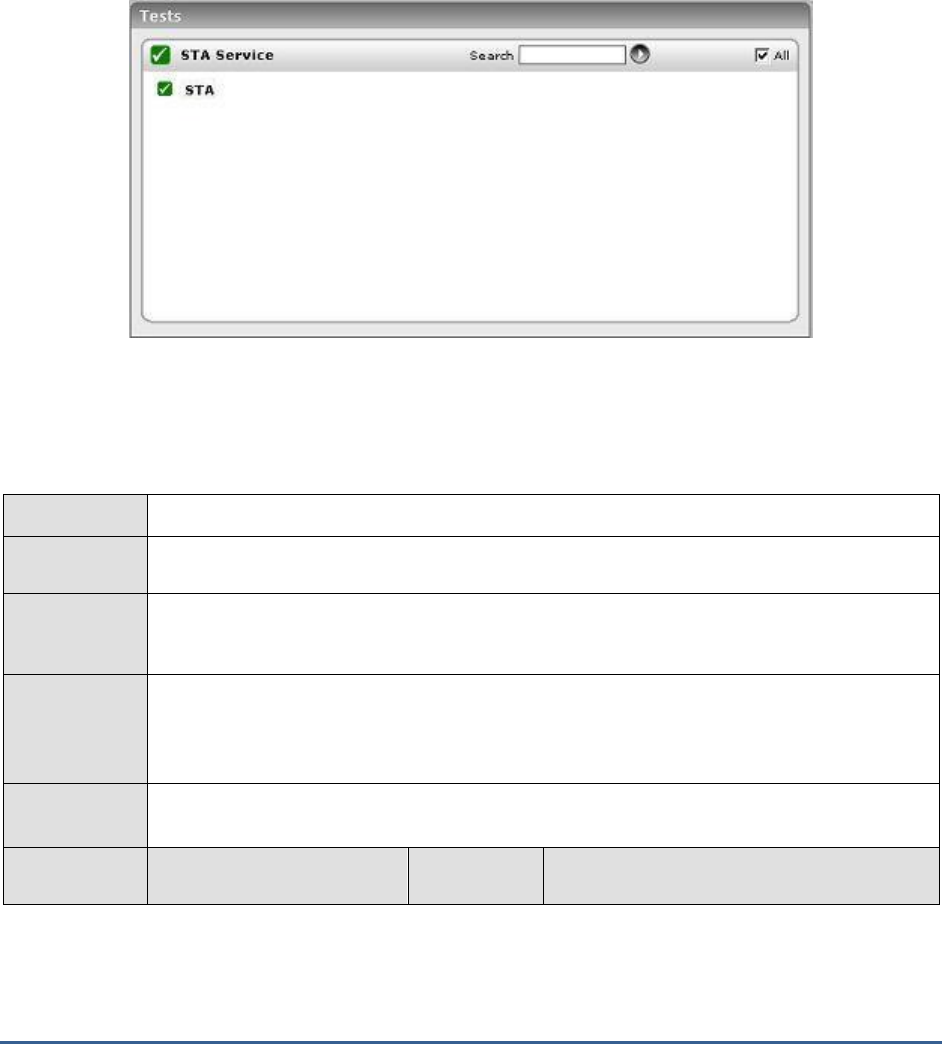
M O N I T O RI N G T H E C I T R I X S E C U R E TI C K E T I N G A U T H O RI T Y ( S T A )
280
Since the four layers at the bottom of Figure 7.1 have been dealt with extensively in the
Monitoring Unix and
Windows Servers
document, the section that follows will discuss the STA Service layer alone.
7.1 The STA Service Layer
The tests associated with this layer monitor the crucial ticket generation and validation functions of the STA, and
report their status.
Figure 7.2: The test associated with the STA Service layer
7.1.1 STA Test
The STA test reports the status of the tickets requested and generated by the Secure Ticket Authority.
Purpose
Reports the status of the Tickets requested and generated by the Secure Ticket Authority
Target of the
test
Any Citrix STA
Agent
deploying the
test
An internal agent
Configurable
parameters for
the test
1. TEST PERIOD – How often should the test be executed
2. HOST – The host for which the test is to be configured
3. PORT – Refers to the port used by the Citrix STA
Outputs of the
test
One set of results is reported for every Citrix STA being monitored
Measurements
made by the
Measurement
Measurement
Unit
Interpretation

M O N I T O RI N G T H E C I T R I X S E C U R E TI C K E T I N G A U T H O RI T Y ( S T A )
281
test
Validated data requests:
The rate at which successful
ticket validation and data
retrieval requests were
received during the lifetime of
the STA.
Requests/Sec
Failed data requests:
The rate at which
unsuccessful ticket validation
and data retrieval requests
were received during the
lifetime of the STA.
Requests/Sec
Validated ticket requests:
The rate at which successful
ticket generation requests
were received during the
lifetime of the STA
Requests/Sec
Failed ticket requests:
The rate at which
unsuccessful ticket generation
requests were received
during the lifetime of the
STA.
Requests/Sec
Active tickets:
The total count of active
tickets currently held in the
STA.
Number
Percent bad data
requests:
The total percentage of
unsuccessful ticket validation
and data retrieval requests
received during the lifetime of
the STA
Percent
Percent bad ticket
requests:
The total percentage of
unsuccessful ticket generation
requests received during the
lifetime of the STA
Percent
Ticket timeouts:
The rate at which ticket
timeouts occur at the STA
Timeouts/Sec

M O N I T O RI N G T H E C I T R I X S E C U R E TI C K E T I N G A U T H O RI T Y ( S T A )
282
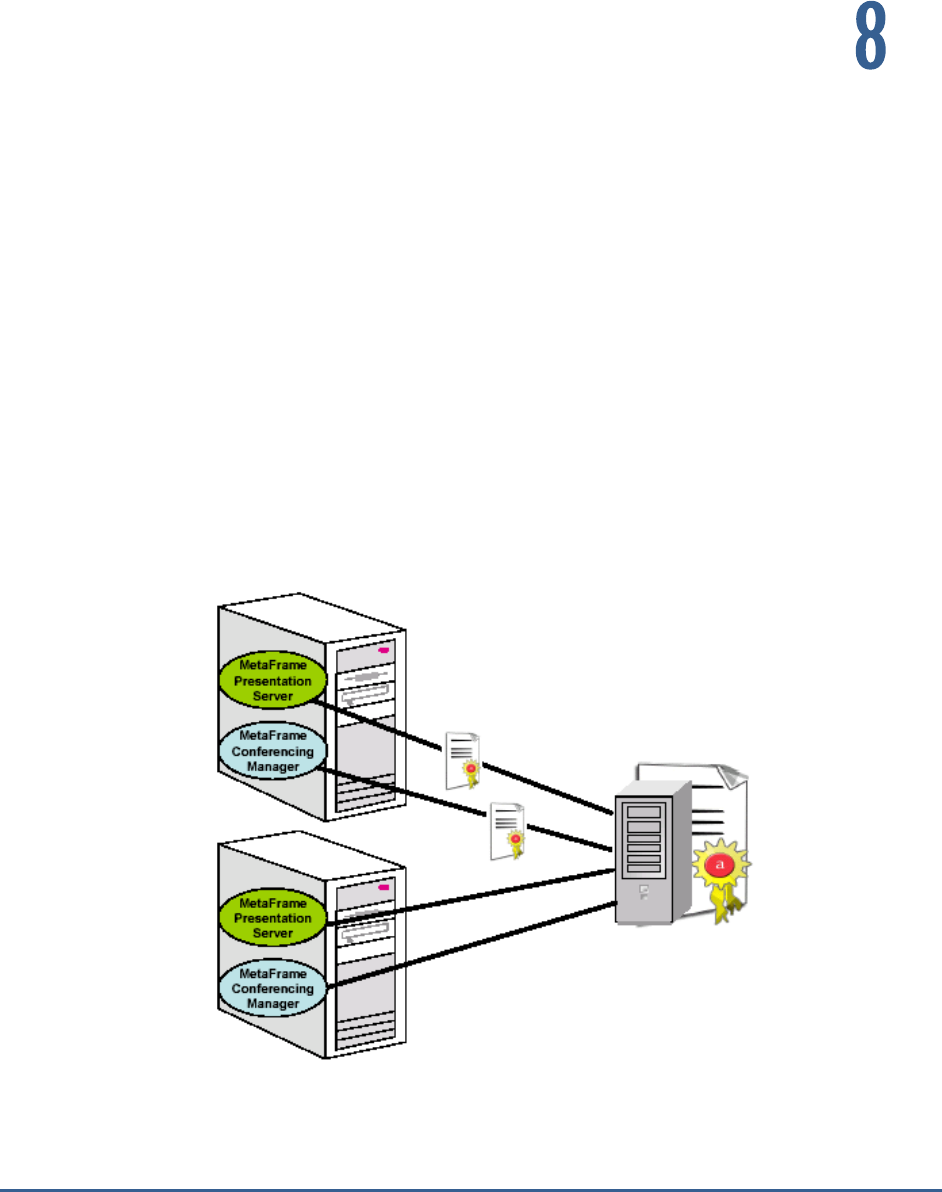
M O N I T O RI N G C I T R I X L I C EN SE S E R V E R S
283
Monitoring Citrix License Servers
Every Citrix Access Suite product environment must have at least one shared or dedicated license server. Citrix
Access Suite products seek permission from this license server to run. The first time a user connects to a Citrix
Access Suite product (for example, the user starts a published application), the product requests a license from the
license server. When the license server grants a license request, the Citrix Access Suite product reserves a license for
its use. Reserving licenses for this purpose is known as
checking out licenses
. When the user logs off from the
product server, the product returns the license to the license server. This process is known as
checking in licenses
.
Citrix Access Suite products use a continuously open connection to the license server to check out licenses. Every
time a Citrix Access Suite product starts, it opens a connection to the license server by checking out the
startup
license
. The startup license is a Citrix system file that enables Citrix Access Suite products to maintain a connection to
the license server. The following figure shows that each product on a server forms its own constant connection to the
license server.
Figure 8.1: Each product making a continuous connection to the license server
Each product on a server makes a continuous connection to the license server. The license server can support up to
2000 continuous connections. If connections to the license server fail, then naturally, it would result in the user been
denied access to a critical Citrix Access Suite product; if the failure persists or occurs frequently, then the user is
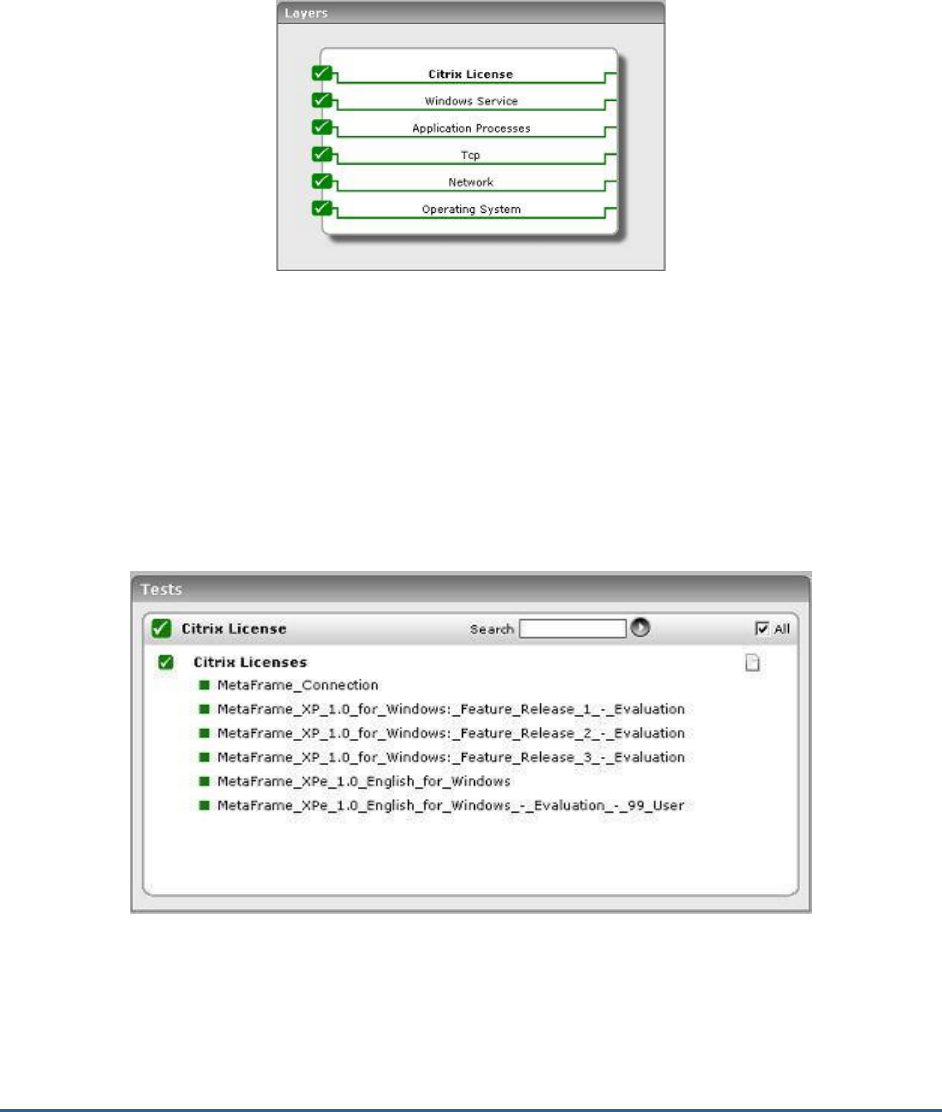
M O N I T O RI N G C I T R I X L I C EN SE S E R V E R S
284
bound to be dissatisfied with the quality of the service. In order to avoid such situations, connection and operational
issues of the license server should be detected and resolved at the earliest, so that users have no cause for
complaints. Continuous monitoring of the connections to the License server, and thorough monitoring of the key
functions performed by the server can alone ensure service continuity. To provide such complete monitoring, eG
Enterprise embeds an exclusive
Citrix License
monitoring model (see Figure 8.2).
Figure 8.2: The layer model of a Citrix license server
Every layer of this model is mapped to a wide variety of tests that keep a constant check on every operational aspect
of the License server and report its status. The sections to come will discuss the Citrix License layer only, as the
remaining layers have already been dealt with in the
Monitoring Unix and Windows Servers
document.
8.1 The Citrix License Layer
To ascertain future license requirements and to detect license abuse, it is essential to closely follow the current
license usage of the Access Suite. The tests mapped to the Citrix License layer enable this.
Figure 8.3: Tests associated with the Citrix License layer
8.1.1 Citrix Licenses Test
The CitrixLicense test reports statistics pertaining to the license usage of the Citrix Access Suite.

M O N I T O RI N G C I T R I X L I C EN SE S E R V E R S
285
Purpose
Reports statistics pertaining to the license usage of the Citrix Access Suite
Target of the
test
Any Citrix License Server
Agent
deploying the
test
An internal agent
Configurable
parameters for
the test
1. TEST PERIOD – How often should the test be executed. Since the CitrixLicense test is a
resource-intensive test, it is recommended that you run the test less frequently.
Accordingly, the TEST PERIOD for this test has been, by default, set to 10 minutes.
2. HOST – The host for which the test is to be configured
3. PORT – Refers to the port used by the Citrix License server
4. CITRIXHOME - Provide the full path to the install directory of the Citrix License server
being monitored. By default, 'none' will be displayed here. In such a case, eG will auto-
discover the install directory. Alternatively, you can explicitly specify the exact location of
the install directory here. For example,
c:\progra~1\CitrixLicense
.
5. REREAD LICENSE - If this flag is set to Yes, then the eG agent will check for changes in
license status everytime the test runs. If this flag is set to No, then the eG agent will not
check for license changes.
5. DETAILED DIAGNOSIS - To make diagnosis more efficient and accurate, the eG
Enterprise suite embeds an optional detailed diagnostic capability. With this capability, the
eG agents can be configured to run detailed, more elaborate tests as and when specific
problems are detected. To enable the detailed diagnosis capability of this test for a
particular server, choose the On option. To disable the capability, click on the Off option.
The option to selectively enable/disable the detailed diagnosis capability will be available
only if the following conditions are fulfilled:
The eG manager license should allow the detailed diagnosis capability
Both the normal and abnormal frequencies configured for the detailed diagnosis
measures should not be 0.
Outputs of the
test
One set of results is reported for every Citrix license being managed by the monitored Citrix
License server
Measurements
made by the
test
Measurement
Measurement
Unit
Interpretation
Licenses installed:
Indicates the number of
licenses installed.
Number
Licenses in use:
Indicates the number of
licenses currently being used.
Number
If this measure is equal to
Licenses installed
,
then it indicates that all the licenses have been
utilized. The detailed diagnosis of this measure
will reveal the details of the used licenses.
Available licenses:
Indicates the number of
licenses not in use.
Number

M O N I T O RI N G C I T R I X L I C EN SE S E R V E R S
286
License utilization:
Indicates the percentage of
licenses currently being used.
Percent
If this value is 100, then it indicates that all
the licenses have been used up.
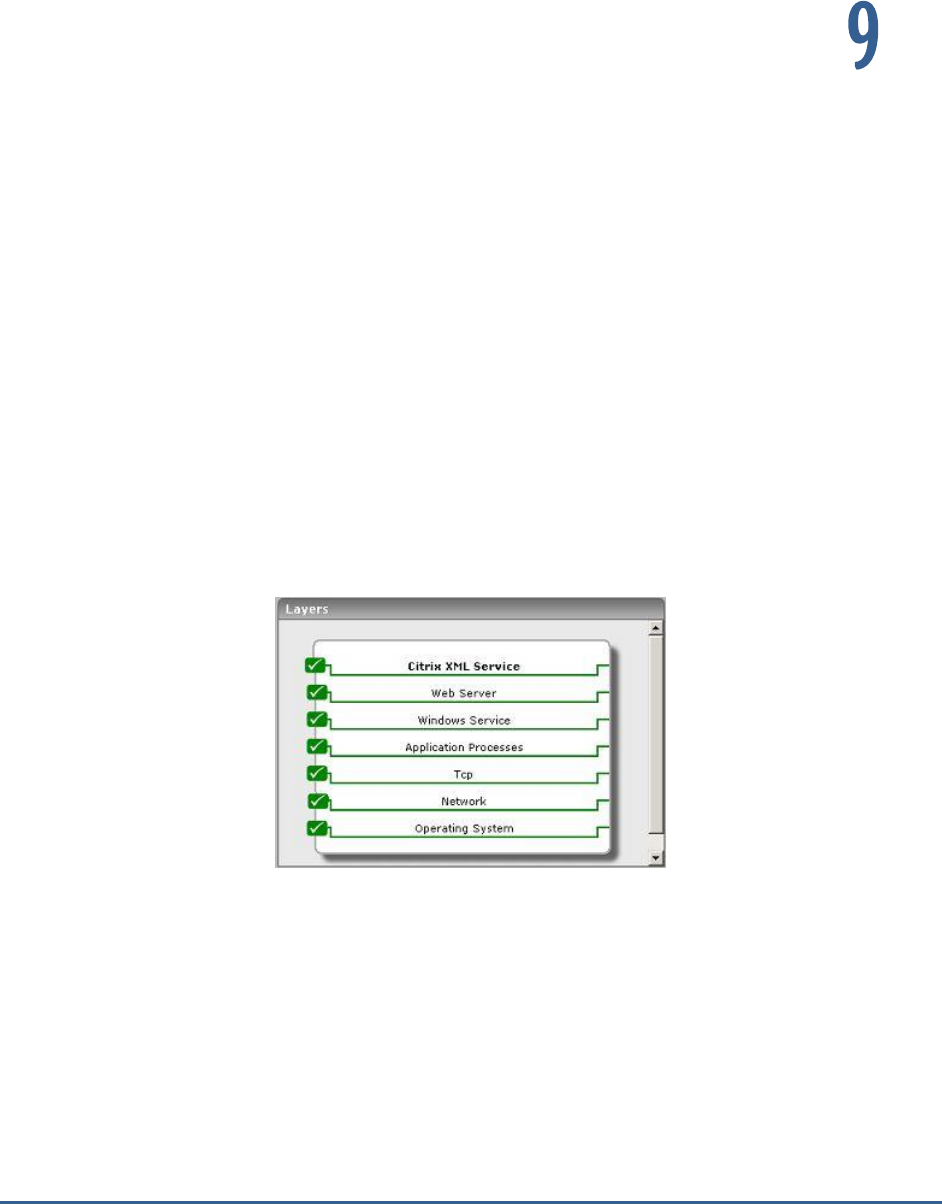
M O N I T O RI N G C I T R I X W E B I N T E R F A C E S
287
Monitoring Citrix Web Interfaces
One of the key components of the Citrix access architecture is the Citrix Web Interface. When a user tries to login to
the web front-end from a browser, the request is received and forwarded by
the web interface to the XML broker. The XML service translates and then forwards the user's application list request
to the Citrix IMA service. The IMA service uses the user information to contact the Domain controller to validate the
user and his/her access rights. The IMA service then builds a list of applications that the user has access to and
returns this list to the XML service, which in turn, reformats the output in XML format and returns it via the web
interface to the user.
To periodically monitor the data-flow between the web interface, the XML service, and the IMA service, and to keep
track of the web interface’s availability at all times, the eG Enterprise suite provides a specialized
Citrix Web Interface
monitoring model (see Figure 9.1). Every layer of this hierarchical model is associated with tests that run at frequent
intervals to verify whether all critical parameters of the server are in good health.
Figure 9.1: The layer model of the Citrix Web Interface
This section will discuss the Citrix XML Service only, as all other layers have been discussed extensively in the
Monitoring Web Servers
and
Monitoring Unix and Windows Servers
documents.
9.1 The Citrix XML Service Layer
This layer executes a test (see Figure 9.2) that checks whether the entire login and application enumeration process
using the web interface (i.e., involving the XML service and IMA service of Citrix) is functioning properly.
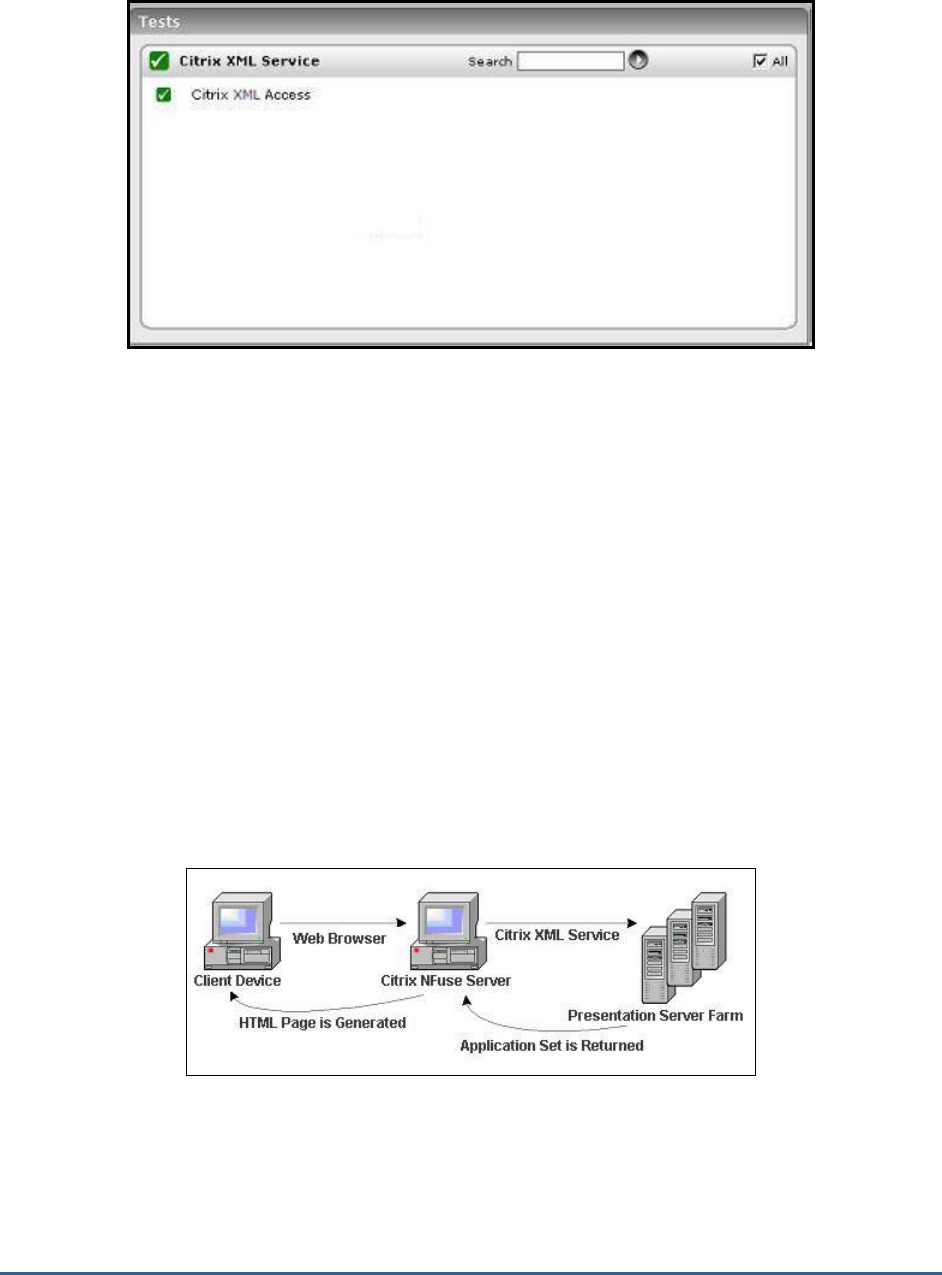
M O N I T O RI N G C I T R I X W E B I N T E R F A C E S
288
Figure 9.2: The test associated with the Citrix XML Service layer
9.1.1.1 Citrix XML Access Test
This test verifies the interactions between the web interface, the XML service, and the IMA service.
A typical web interface interaction is composed of the following (see Figure 9.3):
1. Client device users utilize a Web browser to view the Log in page and enter their user credentials.
2. The web interface reads users’ information and uses the Web Interface’s classes to forward the information to
the Citrix XML Service; this service can execute on the Citrix Web Interface or on each of the XenApp servers in
a server farm. The designated server acts as a broker between the NFuse server and the XenApp servers in a
farm.
3. The Citrix XML Service then retrieves a list of applications from the servers that users can access. These
applications comprise the user’s application set. The Citrix XML Service retrieves the application set from the
Independent Management Architecture (IMA) system and Program Neighborhood Service, respectively.
4. The Citrix XML Service then returns the user’s application set information to the Web Interface’s classes.
5. The user then clicks on the application of interest to him/her to access it.
Figure 9.3: A typical web interface interaction
If the Citrix XML service executes on a Citrix Web Interface, then you can use this test to evaluate the availability and
responsiveness of the XML service. This test emulates a user logging in to theweb interface and requesting for a list
of applications available to him/her. By emulating a request, this test checks that the entire login and application
enumeration process using the web interface (i.e., involving the XML service and IMA service of Citrix) is functioning
properly.

M O N I T O RI N G C I T R I X W E B I N T E R F A C E S
289
Purpose
Verifies the interactions between the web interface, the XML service, and the IMA service
Target of the
test
Any Citrix Web Interface
Agent
deploying the
test
An external agent
Configurable
parameters for
the test
1. TEST PERIOD – How often should the test be executed
2. HOST – The host for which the test is to be configured
3. PORT – Refers to the port used by the Citrix server
4. USER - This test emulates a user logging into the NFuse server and requesting for a list of
applications available to him/her. Therefore, in the USER text box, provide a valid user
name which the test should use for logging into the NFuse server.
5. PASSWORD - Provide the PASSWORD of the specified USER.
6. CONFIRM PASSWORD - Confirm the password by retyping it in the CONFIRM
PASSWORD box.
7. SSL - The web interface through which these tests are executing may be configured for
HTTP or HTTPS access. If HTTPS access is configured, then this parameter should be set to
YES.
8. DOMAIN - Provide the domain to which the user logs in.
9. DOMAINTYPE - A Citrix web interface can be set up to authenticate users by connecting
to a Windows domain, or a Unix domain, or a Novell domain. The DOMAINTYPE value
represents the type of domain being used to validate the user. The default value is "NT".
For Unix, use "UNIX" and for Novell, use "NDS" in the domainType setting.
10. XMLPORT - Specify the port on which the Citrix XML Service is executing. In some Citrix
environments, the XML service might share its port with the web server on Citrix NFuse. In
such cases, the XMLPORT will be the same as the PORT specification.
11. TIMEOUT - Specify the duration (in seconds) for which the test needs to wait for a
response from the server. At the end of this duration, the test will timeout.
Outputs of the
test
One set of results for every Citrix Web Interface monitored
Measurements
made by the
test
Measurement
Measurement
Unit
Interpretation
Connection availability:
Tracks if the Citrix XML
service is available to handle
any requests.
Percent
If the TCP connection to the XML service port
fails, this metric has a value of 0. Otherwise,
it has a value of 100.
Authentication status:
Indicates if the user
authentication succeeded.
Percent
It has a value of 100 if the user was
authenticated, and a value of 0 if the
authentication failed. If the user login is valid,
yet authentication fails, the problem then lies
with the Citrix IMA service's communication
with the domain controller/active directory
server.

M O N I T O RI N G C I T R I X W E B I N T E R F A C E S
290
Application enumeration
status:
This metric indicates if the
Citrix web interface was able
to enumerate the applications
available for the user logging
in.
Percent
A value of 0 indicates that application
enumeration failed, while a value of 100
denotes that the application enumeration
operation succeeded. If authentication
succeeds but application enumeration fails,
then the problem is most likely to be in the
Citrix XML service, its interaction with the
IMA service, or with the IMA service itself.
TCP connection time:
Indicates the time taken to
establish a TCP connection to
the Citrix XML service.
Secs
If this value is significantly high, it could
probably be because the network latency is
high or the Citrix web interface host is
overloaded.
Total response time:
Represents the total time
taken for a user to login to
the Citrix web interface and
enumerate all the
applications.
Secs
The value of this metric indicates the
responsiveness of the Citrix web interface
and its connectivity to the XML service.

M O N I T O RI N G T H E C I T R I X AC C E S S G A T EW A Y
291
Monitoring the Citrix Access
Gateway
Citrix Access Gateway™ products are universal SSL VPN appliances providing a secure, always-on, single point-of-
access to an organization’s applications and data. A comprehensive range of appliances and editions allow Access
Gateway to meet the needs of any size organization, from small businesses to the most demanding global
enterprises.
The Access Gateway appliance is deployed in an organization’s demilitarized zone, and creates a virtual TCP
connection with the client computer. Client computers launch the Citrix Secure Access Agent by simply accessing a
secure Web URL or using the desktop icon. The Access Gateway then authenticates these credentials with a
corporate authentication server and, if the credentials are correct, finishes the handshake with the client PC. Once
authenticated, the Secure Access Agent is launched in the client compter, at which all network traffic destined for
certain private networks is captured and redirected over the secure tunnel to the Access Gateway.
The error-free functioning of such an appliance is of tremendous significance in environments that span geographies
and which support mission-critical applications handling highly sensitive information (like in the case of mobile/VoIP
communication). Such environments often have to deal with concurrent access requests from remote users at
disparate locations. With a defective Access Gateway, remote traffic could go unscanned and therefore unsecured,
exposing the applications and resources to unauthorized usage, or worse, malicious virus attacks.
eG Enterprise offers out-of-the-box two specialized models for monitoring the Citrix Access Gateway – the
Citrix
Access Gateway – Windows
model that focuses on the health of the Citrix Access Gateway operating on a Windows
platform, and the
Citrix Access Gateway – Linux
model, which is a dedicated model for monitoring the Citrix Access
Gateway component operating on Linux.
Using these models, administrators can constantly keep an eye on the operations of the Access Gateway and be
proactively alerted of even minor non-conformances, so that the problem is resolved before non-genuine users gain
access to critical applications and data.
The sections that will follow discuss both these models in detail.
10.1 Monitoring the Citrix Access Gateway on Windows
Figure 10.1 depicts the
Citrix Access Gateway – Windows
model.

M O N I T O RI N G T H E C I T R I X AC C E S S G A T EW A Y
292
Figure 10.1: Layer model of the Citrix Access Gateway
Every layer in the layer model of Figure 10.1 is attached to a wide variety of tests that explore one/more
performance aspects of the Access Gateway. With the help of the results reported by these tests, the following
performance queries can be easily answered; in the light of these answers, probable issues with the Access Gateway
can be instantly detected.
Is there a processing bottleneck on the Access Gateway?
What are the type of requests that are being processed, and how quickly is the Access Gateway able to
respond to them? Which requests are taking too long?
Are the context pools adequately sized, or are too many requests waiting for contexts?
Is the Access Gateway able to create/load sessions quickly upon request, or is there a bottleneck there
that requires investigation?
Is the session cache hit ratio optimal, or do more sessions need to be allocated to the cache?
The sections below discuss the top 3 layers of the layer model only, as the other layers have all been discussed
thoroughly in the
Monitoring Unix and Windows Servers
document.
10.1.1 The .Net Layer
The .Net layer tracks the health of the ASP .Net framework on which the Access Gateway operates. Figure 10.2
reveals the tests mapped to this layer.
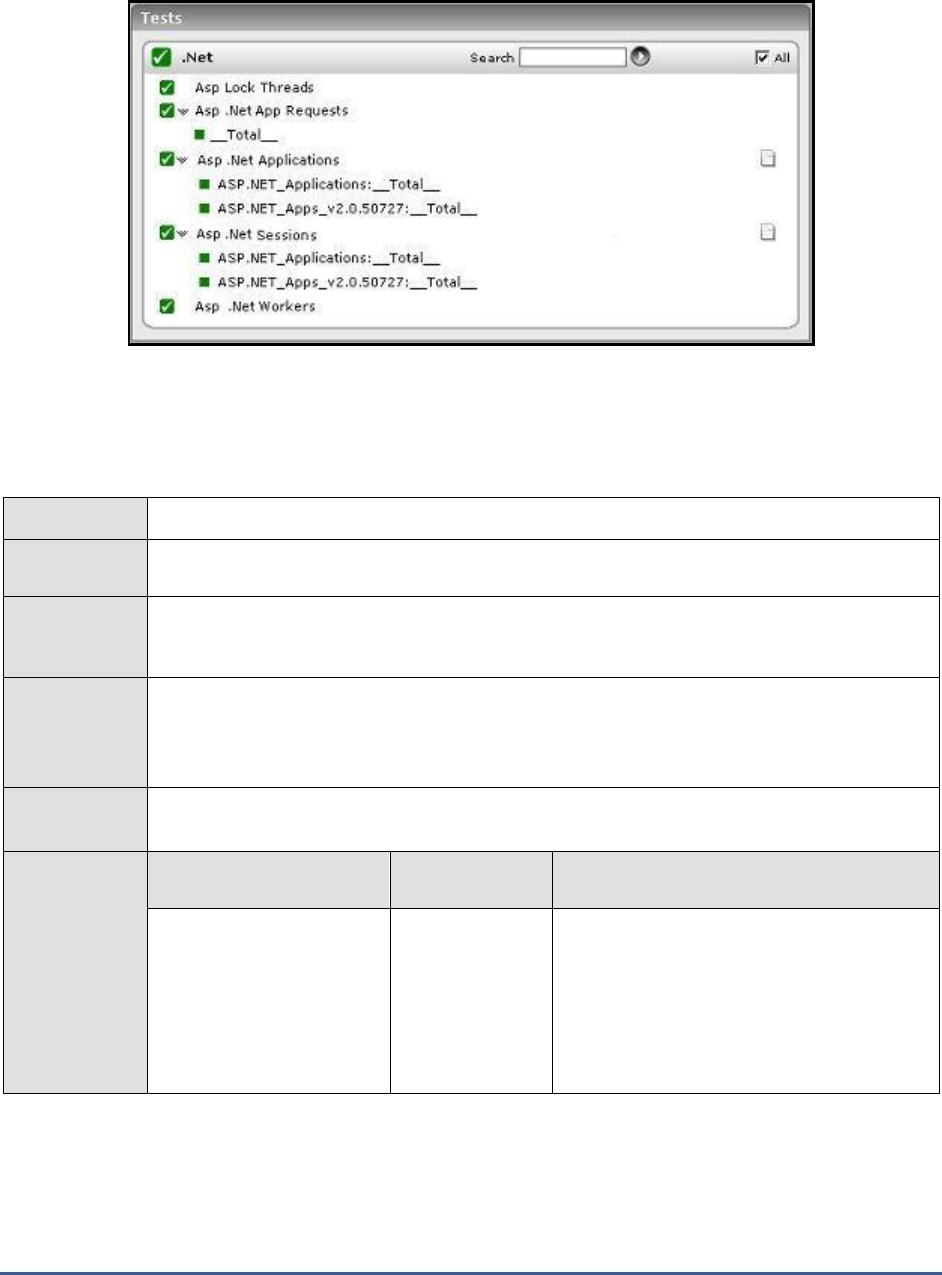
M O N I T O RI N G T H E C I T R I X AC C E S S G A T EW A Y
293
Figure 10.2: The tests mapped to the .Net layer
10.1.1.1 ASP Lock Threads Test
This test provides information about managed locks and threads that an application uses.
Purpose
Provides information about managed locks and threads that an application uses
Target of the
test
A Citrix Access Gateway
Agent
deploying the
test
An internal agent
Configurable
parameters for
the test
1. TEST PERIOD - How often should the test be executed
2. HOST - The host for which the test is to be configured
3. PORT - The port at which the specified HOST listens
Outputs of the
test
One set of results for the Citrix Access Gateway being monitored
Measurements
made by the
test
Measurement
Measurement
Unit
Interpretation
Current logical threads:
The number of current
managed thread objects in
the application. This
measure maintains the
count of both running and
stopped threads.
Number

M O N I T O RI N G T H E C I T R I X AC C E S S G A T EW A Y
294
Current physical
threads:
The number of native
operating system threads
created and owned by the
common language runtime
to act as underlying
threads for managed
thread objects. This
measure does not include
the threads used by the
runtime in its internal
operations.
Number
Current recognized
threads:
The number of threads that
are currently recognized by
the runtime. These threads
are associated with a
corresponding managed
thread object.
Number
Contention rate:
The rate at which threads
in the runtime attempt to
acquire a managed lock
unsuccessfully.
Rate/Sec
Current queue length:
The total number of
threads that are currently
waiting to acquire a
managed lock in the
application.
Number
10.1.1.2 ASP .Net App Requests Test
This test monitors how well the application domain handles requests.
Purpose
Monitors how well the application domain handles requests
Target of the
test
A Citrix Access Gateway
Agent
deploying the
test
An internal agent
Configurable
parameters for
the test
1. TEST PERIOD - How often should the test be executed
2. HOST - The host for which the test is to be configured
3. PORT - The port at which the specified HOST listens

M O N I T O RI N G T H E C I T R I X AC C E S S G A T EW A Y
295
Outputs of the
test
One set of results for every application domain on the ASP .NET framework
Measurements
made by the
test
Measurement
Measurement
Unit
Interpretation
Requests executing:
The number of requests
currently executing.
Number
This measure is incremented when the
HttpRuntime begins to process the request
and is decremented after the HttpRuntime
finishes the request.
Requests app queue:
The number of requests
currently in the application
request queue.
Number
Requests not found:
The number of requests
that did not find the
required resource.
Number
Requests not
authorized:
The number of request
failed due to unauthorized
access.
Number
Values greater than 0 indicate that proper
authorization has not been provided, or
invalid authors are trying to access a
particular resource.
Requests timed out:
The number of requests
timed out.
Number
Requests succeeded:
The rate at which requests
succeeded
Requests/Sec
10.1.1.3 ASP .Net Applications Test
This test reports key statistics pertaining to applications deployed on the ASP .NET objects in the Citrix Access
Gateway.
Purpose
Reports key statistics pertaining to applications deployed on the ASP .NET objects in the Citrix
Access Gateway
Target of the
test
Citrix Access Gateway
Agent
deploying the
test
An internal agent
Configurable
parameters for
the test
1. TEST PERIOD - How often should the test be executed
2. HOST - The host for which the test is to be configured
3. PORT - The port at which the specified HOST listens

M O N I T O RI N G T H E C I T R I X AC C E S S G A T EW A Y
296
Outputs of the
test
One set of results for every ASP .NET object discovered in the Citrix Access Gateway
Measurements
made by the
test
Measurement
Measurement
Unit
Interpretation
Request rate:
Indicates the number of
requests executed per
second.
Number
This represents the current throughput of the
application.
Pipeline instances:
Indicates the number of
active pipeline instances for
the ASP.NET application.
Number
Since only one execution thread can run
within a pipeline instance, this number gives
the maximum number of concurrent requests
that are being processed for a given
application. Ideally, the value of this measure
should be low.
Number of errors:
Indicates the total sum of
all errors that occur during
the execution of HTTP
requests.
Number
This measure should be kept at 0 or a very
low value.
10.1.1.4 ASP .Net Workers Test
This test reports statistics pertaining to the performance of the worker process of the ASP .NET framework of the
Citrix Access Gateway.
Purpose
Reports statistics pertaining to the performance of the worker process of the ASP .NET
framework of the Citrix Access Gateway
Target of the
test
Citrix Access Gateway
Agent
deploying the
test
An internal agent
Configurable
parameters for
the test
1. TEST PERIOD - How often should the test be executed
2. HOST - The host for which the test is to be configured
3. PORT - The port at which the specified HOST listens
Outputs of the
test
One set of results for Citrix Access Gateway monitored
Measurements
made by the
Measurement
Measurement
Unit
Interpretation

M O N I T O RI N G T H E C I T R I X AC C E S S G A T EW A Y
297
test
Application restarts:
The number of application
restarts.
Number
In a perfect world, the application domain will
and should survive for the life of the process.
Even if a single restart occurs, it is a cause
for concern because proactive and reactive
restarts cause automatic recycling of the
worker process. Moreover, restarts warrant
recreation of the application domain and
recompilation of the pages, both of which
consume a lot of time. To investigate the
reasons for a restart, check the values set in
the processModel configuration.
Applications running:
The number of applications
currently running.
Number
Requests current:
The number of requests
currently handled by the
ASP.NET ISAPI. This
includes those that are
queued , executing, or
waiting to be written to the
client.
Number
Request execution time:
The number of seconds
taken to execute the last
request.
Number
In version 1.0 of the framework, the
execution time begins when the worker
process receives the request, and stop when
the ASP.NET ISAPI sends
HSE_REQ_DONE_WITH_SESSION to IIS. In
version 1.1 of the framework, execution
begins when the HttpContext for the request
is created, and stop before the response is
sent to IIS. The value of this measure should
be stable. Any sudden change from the
previous recorded values should be notified.
Requests queued:
The number of requests
currently queued.
Number
When running on IIS 5.0, there is a queue
between inetinfo and aspnet_wp, and there is
one queue for each virtual directory. When
running on IIS 6.0, there is a queue where
requests are posted to the managed
ThreadPool from native code, and a queue
for each virtual directory. This counter
includes requests in all queues. The queue
between inetinfo and aspnet_wp is a named
pipe through which the request is sent from
one process to the other. The number of
requests in this queue increases if there is a
shortage of available I/O threads in the
aspnet_wp process. On IIS 6.0 it increases
when there are incoming requests and a
shortage of worker threads.

M O N I T O RI N G T H E C I T R I X AC C E S S G A T EW A Y
298
Requests rejected:
The number of rejected
requests
Number
Requests are rejected when one of the queue
limits is exceeded. An excessive value of this
measure hence indicates that the worker
process is unable to process the requests due
to overwhelming load or low memory in the
processor.
Requests wait time:
The number of seconds
that the most recent
request spent waiting in
the queue, or named pipe
that exists between inetinfo
and aspnet_wp. This does
not include any time spent
waiting in the application
queues.
Secs
Worker processes
running:
The current number of
aspnet_wp worker
processes
Number
Every application executing on the .NET
server corresponds to a worker process.
Sometimes, during active or proactive
recycling, a new worker process and the
worker process that is being replaced may
coexist. Under such circumstances, a single
application might have multiple worker
processes executing for it. Therefore, if the
value of this measure is not the same as that
of Applications_running, then it calls for
closer examination of the reasons behind the
occurrence.
Worker process
restarts:
The number of aspnet_wp
process restarts in the
machine
Number
Process restarts are expensive and
undesirable. The values of this metric are
dependent upon the process model
configuration settings, as well as unforeseen
access violations, memory leaks, and
deadlocks.
10.1.1.5 ASP .Net Sessions Test
This test monitors the application sessions to the ASP .NET framework of the Citrix Access Gateway.
Purpose
Monitors the sessions to the ASP .NET framework of the Citrix Access Gateway
Target of the
test
Citrix Access Gateway
Agent
deploying the
test
An internal agent

M O N I T O RI N G T H E C I T R I X AC C E S S G A T EW A Y
299
Configurable
parameters for
the test
1. TEST PERIOD - How often should the test be executed
2. HOST - The host for which the test is to be configured
3. PORT - The port at which the specified HOST listens
Outputs of the
test
One set of results for every application session to the ASP .NET framework
Measurements
made by the
test
Measurement
Measurement
Unit
Interpretation
SQL connections:
Indicates the number of
connections to the SQL
Server used by session
state.
Number
An unusually high value may indicate a
sudden increase in sessions to the SQL
Server.
State server
connections:
Indicates the number of
connections to the
StateServer used by
session state.
Number
An unusually high value may indicate a
sudden increase in sessions to the
StateServer.
Abandoned ASPNet
application sessions:
Indicates the number of
sessions that have been
explicitly abandoned during
the last measurement
period.
Number
Active ASPNet
application sessions:
Indicates the currently
active sessions.
Number
Timedout ASPNet
application sessions:
Indicates the number of
sessions that timed out
during the last
measurement period.
Number
ASPNet application
sessions:
Indicates the total number
of sessions during the last
measurement period.
Number
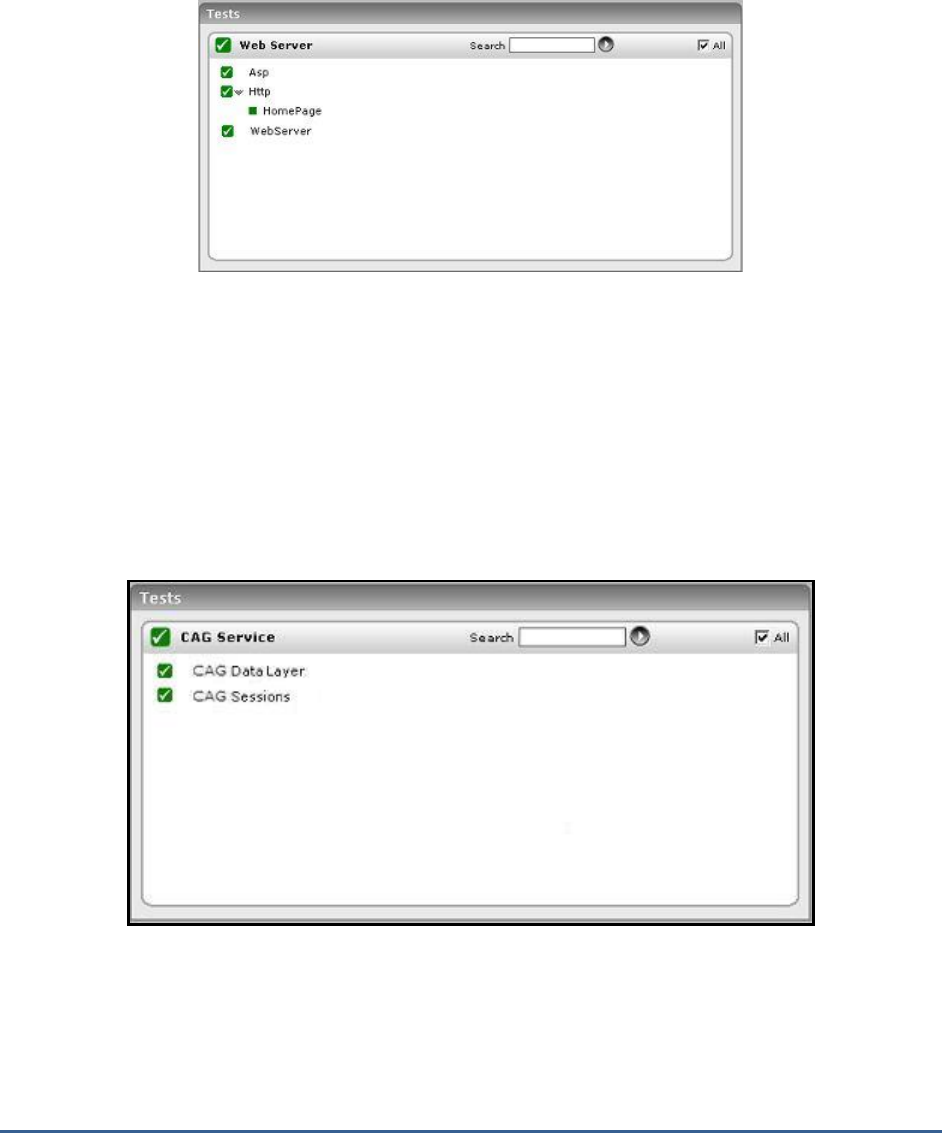
M O N I T O RI N G T H E C I T R I X AC C E S S G A T EW A Y
300
10.1.2 The Web Server Layer
To track the availability, responsiveness, and overall health of the web server component of the Citrix Access
Gateway, use the tests associated with this layer.
Figure 10.3: The tests associated with the Web Server layer
Since these tests have already been discussed in the
Monitoring Web Servers
document, let us straight away proceed
to the CAG Service layer.
10.1.3 The CAG Service Layer
This layer continuously monitors the requests to the CAG, so as to proactively detect processing bottlenecks (if any),
and keeps a check on any unsusual session behavior or session cache usage.
Figure 10.4: The tests associated with the CAG Service layer
10.1.3.1 CAG Data Layer Test
This test monitors the data layer of the Citrix Access Gateway, and reports the type of requests that are being
received by the Access Gateway and how well it processes the requests; in the process, the test reveals processing
bottlenecks (if any).

M O N I T O RI N G T H E C I T R I X AC C E S S G A T EW A Y
301
Purpose
Monitors the data layer of the Citrix Access Gateway
Target of the
test
A Citrix Access Gateway
Agent
deploying the
test
An internal agent
Configurable
parameters for
the test
1. TEST PERIOD – How often should the test be executed
2. HOST – The host for which the test is to be configured
3. PORT – Refers to the port used by the Citrix Access Gateway
Outputs of the
test
One set of results for every Citrix Access Gateway being monitored
Measurements
made by the
test
Measurement
Measurement
Unit
Interpretation
Contexts in CAG data
layer pool:
Indicates the number of
contexts in the pool.
Number
Context requests waiting:
Indicates the number of
context requests waiting on
the data layer.
Number
The Citrix Access Gateway embeds
SmartAccess capabilities by means of which
the Access Gateway can not only grant/deny
users access to specific
applications/information, but can also
determine what the user can do with the
information/application so accessed. For
example, based on the access device and/or
location, organizations can control whether
users are allowed to view, print, edit or save
information. This is also known as Contextual
Access Control.
The value of this measure indicates the
number of requests that are currently waiting
for the Access Gateway to provide context-
based access. A high value of this measure
implies that context requests are not being
processed quickly; this could be owing to a
processing bottleneck, and hence warrants
further investigation.
Commit rate:
Indicates the rate of commits
during the last measurement
period.
Commits/Sec

M O N I T O RI N G T H E C I T R I X AC C E S S G A T EW A Y
302
Update rate:
Indicates the rate of updates
during the last measurement
period.
Updates/Sec
Delete rate:
Indicates the rate of deletes
during the last measurement
period.
Deletes/Sec
Insert rate:
Indicates the rate of inserts
during the last measurement
period.
Inserts/Sec
Context rate:
Indicates the rate of contexts
during the last measurement
period.
Contexts/Sec
Streams created:
Indicates the rate at which
streams were created during
the last measurement period.
Creates/Sec
The application streaming feature simplifies
application deployment to end users. With
the application streaming feature, you can
install and configure an application on one
file server and deliver it to any desktop or
server on demand. While publishing a
streamed application for access by end users,
you also need to configure the Access
Gateway to allow such a user access. These
measures help administrators gauge how well
the Access Gateway handles user requests
for published applications.
Read streams created:
Indicates the rate at which
read streams were created.
Creates/Sec
Write streams created:
Indicates the rate at which
write streams were created.
Creates/Sec
Stream data read rate:
Indicates the rate at which
stream data was read.
KB/Sec
Stream data write rate:
Indicates the rate at which
stream data was written.
KB/Sec
10.1.3.2 CAG Sessions Test
This test monitors the sessions to the Citrix Access Gateway, exposes delays or other abnormalities in session
creation/validation/loading, and stark inefficiencies (if any) in session cache utilization.
Purpose
Monitors the sessions to the Citrix Access Gateway
Target of the
test
A Citrix Access Gateway

M O N I T O RI N G T H E C I T R I X AC C E S S G A T EW A Y
303
Agent
deploying the
test
An internal agent
Configurable
parameters for
the test
1. TEST PERIOD – How often should the test be executed
2. HOST – The host for which the test is to be configured
3. PORT – Refers to the port used by the Citrix Access Gateway
Outputs of the
test
One set of results for every Citrix Access Gateway being monitored
Measurements
made by the
test
Measurement
Measurement
Unit
Interpretation
CAG sessions started:
Indicates the rate at which
sessions were created on the
Citrix Access Gateway.
Creates/Sec
CAG sessions updated:
Indicates the rate at which
the sessions were updated
during the last measurement
period.
Updates/Sec
CAG sessions validated:
Indicates the rate at which
sessions were validated
during the last measurement
period.
Validates/Sec
CAG sessions loaded:
Indicates the rate at which
sessions were loaded during
the last measurement period.
Updates/Sec
CAG sessions saved:
Indicates the rate at which
sessions were saved during
the last measurement period.
Saves/Sec
CAG sessions deleted:
Indicates the rate at which
sessions were deleted during
the last measurement period.
Deletes/Sec
CAG session cache hits:
Indicates the rate at which
session requests were
serviced by the session-cache
during the last measurement
period.
Hits/Sec
Ideally, this value should be high. A low value
indicates that session requests are often
fulfilled by direct disk accesses, thus
increasing the processing overheads. You
might want to increase the session cache
size, if the situation persists.
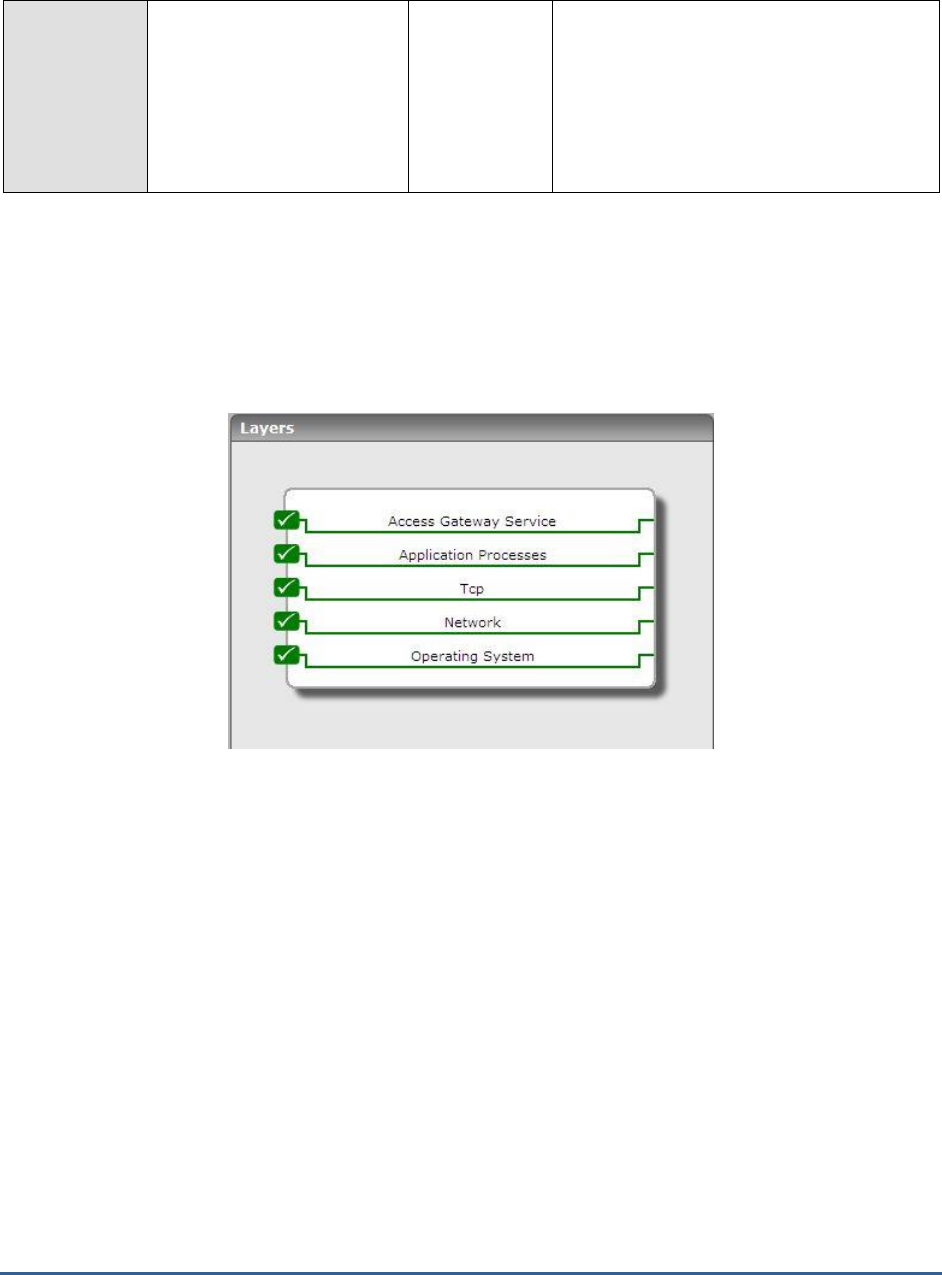
M O N I T O RI N G T H E C I T R I X AC C E S S G A T EW A Y
304
CAG session cache
misses:
Indicates the rate at which
the session-cache could not
service session requests
during the last measurement
period.
Misses/Sec
Ideally, this value should be low. A high value
indicates that session requests are often
fulfilled by direct disk accesses, thus
increasing the processing overheads. You
might want to increase the session cache
size, if the situation persists.
10.2 Monitoring the Citrix Access Gateway on Linux
Figure 10.5 depicts the
Citrix Access Gateway – Linux
monitoring model that eG Enterprise offers.
Figure 10.5: The layer model of the Citrix Access Gateway on Linux
Each layer is mapped to tests that periodically poll the SNMP MIB of the Citrix Access Gateway to retrieve useful
performance statistics. These statistics reveal the following:
r. Have any login attempts to the CAG failed?
s. Have any administrative login attempts failed?
t. Has the connection pool been utilized optimally or have too many connections been used already?
The sections that follow discuss each layer at length.
10.2.1 The Operating System Layer
Using the tests mapped to this layer, administrators can track the usage of every storage area of the CAG and
instantly identify the areas that are running out of storage space. In addition, the layer also monitors the number of
processes running on the CAG and the number of users currently connected to it.
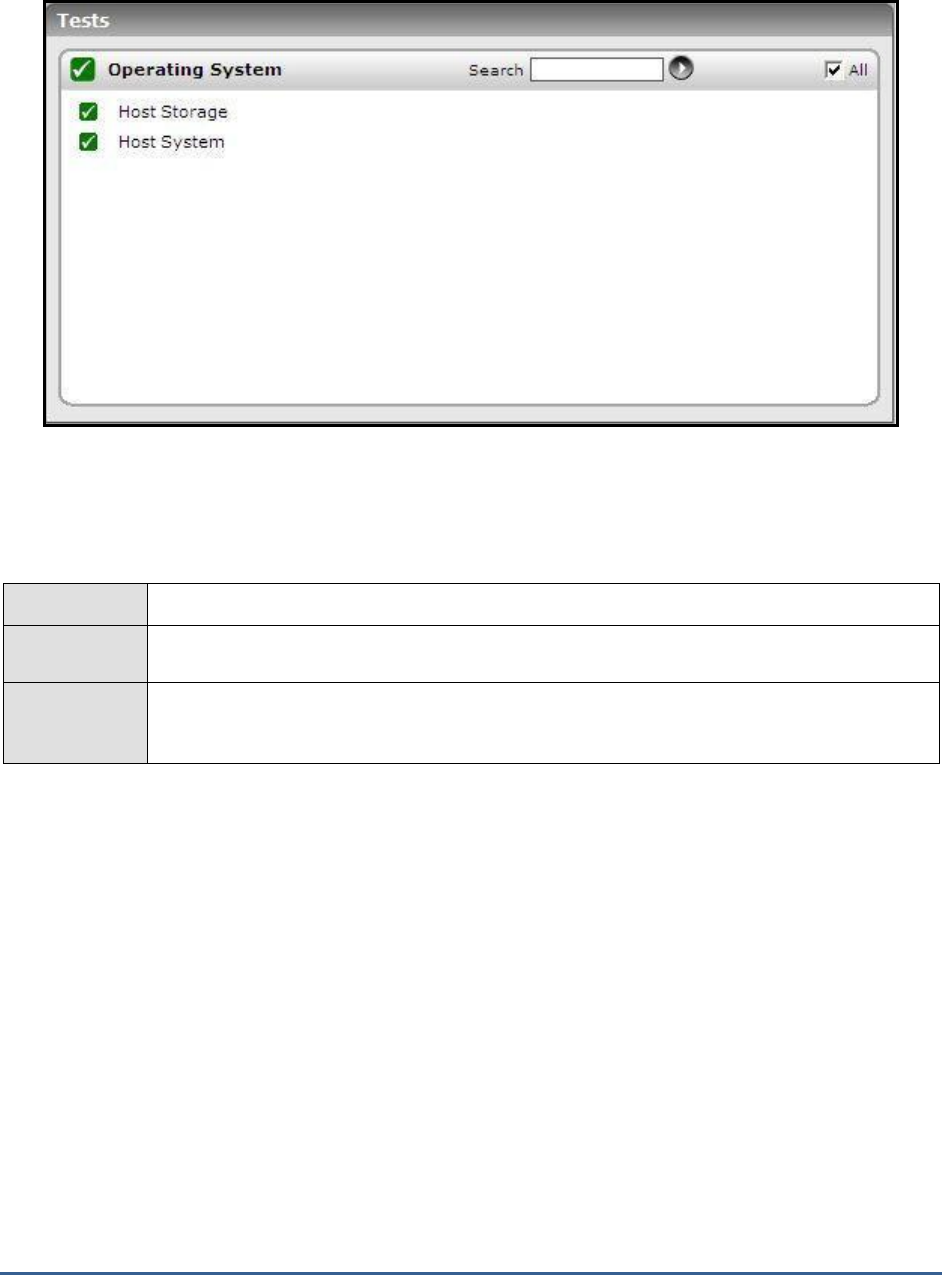
M O N I T O RI N G T H E C I T R I X AC C E S S G A T EW A Y
305
Figure 10.6: The tests mapped to the Operating System layer
10.2.2 Host Storage Test
This test auto-discovers all the storage areas of the CAG and tracks the usage of each of these areas.
Purpose
Auto-discovers all the storage areas associated with a server
Target of the
test
CAG on Linux
Agent
deploying the
test
A remote agent

M O N I T O RI N G T H E C I T R I X AC C E S S G A T EW A Y
306
Configurable
parameters for
the test
1. TEST PERIOD - How often should the test be executed
2. HOST - The host for which the test is to be configured
3. SNMPPORT - The port used to poll for SNMP statistics (default 161)
4. SNMPVERSION – By default, the eG agent supports SNMP version 1. Accordingly, the
default selection in the SNMPVERSION list is v1. However, if a different SNMP framework
is in use in your environment, say SNMP v2 or v3, then select the corresponding option from
this list.
5. SNMPCOMMUNITY – The SNMP community name that the test uses to communicate with
the target host. This parameter is specific to SNMP v1 and v2 only. Therefore, if the
SNMPVERSION chosen is v3, then this parameter will not appear.
6. USERNAME – This parameter appears only when v3 is selected as the SNMPVERSION.
SNMP version 3 (SNMPv3) is an extensible SNMP Framework which supplements the
SNMPv2 Framework, by additionally supporting message security, access control, and
remote SNMP configuration capabilities. To extract performance statistics from the MIB
using the highly secure SNMP v3 protocol, the eG agent has to be configured with the
required access privileges – in other words, the eG agent should connect to the MIB using
the credentials of a user with access permissions to be MIB. Therefore, specify the name of
such a user against the USERNAME parameter.
7. AUTHPASS – Specify the password that corresponds to the above-mentioned
USERNAME. This parameter once again appears only if the SNMPVERSION selected is v3.
8. CONFIRM PASSWORD – Confirm the AUTHPASS by retyping it here.
9. AUTHTYPE – This parameter too appears only if v3 is selected as the SNMPVERSION.
From the AUTHTYPE list box, choose the authentication algorithm using which SNMP v3
converts the specified USERNAME and PASSWORD into a 32-bit format to ensure security
of SNMP transactions. You can choose between the following options:
MD5 – Message Digest Algorithm
SHA – Secure Hash Algorithm
10. ENCRYPTFLAG – This flag appears only when v3 is selected as the SNMPVERSION. By
default, the eG agent does not encrypt SNMP requests. Accordingly, the ENCRYPTFLAG is
set to NO by default. To ensure that SNMP requests sent by the eG agent are encrypted,
select the YES option.
11. ENCRYPTTYPE – If the ENCRYPTFLAG is set to YES, then you will have to mention the
encryption type by selecting an option from the ENCRYPTTYPE list. SNMP v3 supports the
following encryption types:
DES – Data Encryption Standard
AES – Advanced Encryption Standard
12. ENCRYPTPASSWORD – Specify the encryption password here.
13. CONFIRM PASSWORD – Confirm the encryption password by retyping it here.
14. TIMEOUT – Specify the duration (in seconds) beyond which the SNMP query executed by
this test should time out. The default is 10 seconds.
Outputs of the
test
One set of results for every storage area on the server being monitored

M O N I T O RI N G T H E C I T R I X AC C E S S G A T EW A Y
307
Measurements
made by the
test
Measurement
Measurement
Unit
Interpretation
Storage size:
Represents the total size of
a storage area associated
with a server.
GB
Usage of storage area:
This metric denotes the
percentage capacity of a
storage area that is
currently allocated.
Percent
A value close to 100% denotes a storage
area that is highly used.
Free space on storage
area:
This metric denotes the
amount of storage of a
storage area that is
currently available for use.
GB
Allocation failures on
storage area:
The number of requests for
storage represented by this
entity that could not be
honored in the last
measurement period
because there was not
enough storage available to
service application requests
Number
Ideally, there should be no allocation failures.
10.2.3 Host System Test
This test monitors the number of users accessing the CAG device and the processes executing on the device.
Purpose
Monitors the number of users accessing a server and the processes executing on a server
Target of the
test
CAG on Linux
Agent
deploying the
test
A remote agent

M O N I T O RI N G T H E C I T R I X AC C E S S G A T EW A Y
308
Configurable
parameters for
the test
1. TEST PERIOD - How often should the test be executed
2. HOST - The host for which the test is to be configured
3. SNMPPORT - The port used to poll for SNMP statistics (default 161)
4. SNMPVERSION – By default, the eG agent supports SNMP version 1. Accordingly, the
default selection in the SNMPVERSION list is v1. However, if a different SNMP framework
is in use in your environment, say SNMP v2 or v3, then select the corresponding option from
this list.
5. SNMPCOMMUNITY – The SNMP community name that the test uses to communicate with
the target host. This parameter is specific to SNMP v1 and v2 only. Therefore, if the
SNMPVERSION chosen is v3, then this parameter will not appear.
6. USERNAME – This parameter appears only when v3 is selected as the SNMPVERSION.
SNMP version 3 (SNMPv3) is an extensible SNMP Framework which supplements the
SNMPv2 Framework, by additionally supporting message security, access control, and
remote SNMP configuration capabilities. To extract performance statistics from the MIB
using the highly secure SNMP v3 protocol, the eG agent has to be configured with the
required access privileges – in other words, the eG agent should connect to the MIB using
the credentials of a user with access permissions to be MIB. Therefore, specify the name of
such a user against the USERNAME parameter.
7. AUTHPASS – Specify the password that corresponds to the above-mentioned
USERNAME. This parameter once again appears only if the SNMPVERSION selected is v3.
8. CONFIRM PASSWORD – Confirm the AUTHPASS by retyping it here.
9. AUTHTYPE – This parameter too appears only if v3 is selected as the SNMPVERSION.
From the AUTHTYPE list box, choose the authentication algorithm using which SNMP v3
converts the specified USERNAME and PASSWORD into a 32-bit format to ensure security
of SNMP transactions. You can choose between the following options:
MD5 – Message Digest Algorithm
SHA – Secure Hash Algorithm
10. ENCRYPTFLAG – This flag appears only when v3 is selected as the SNMPVERSION. By
default, the eG agent does not encrypt SNMP requests. Accordingly, the ENCRYPTFLAG is
set to NO by default. To ensure that SNMP requests sent by the eG agent are encrypted,
select the YES option.
11. ENCRYPTTYPE – If the ENCRYPTFLAG is set to YES, then you will have to mention the
encryption type by selecting an option from the ENCRYPTTYPE list. SNMP v3 supports the
following encryption types:
DES – Data Encryption Standard
AES – Advanced Encryption Standard
12. ENCRYPTPASSWORD – Specify the encryption password here.
13. CONFIRM PASSWORD – Confirm the encryption password by retyping it here.
14. TIMEOUT – Specify the duration (in seconds) beyond which the SNMP query executed by
this test should time out. The default is 10 seconds.
Outputs of the
test
One set of results for each server being monitored
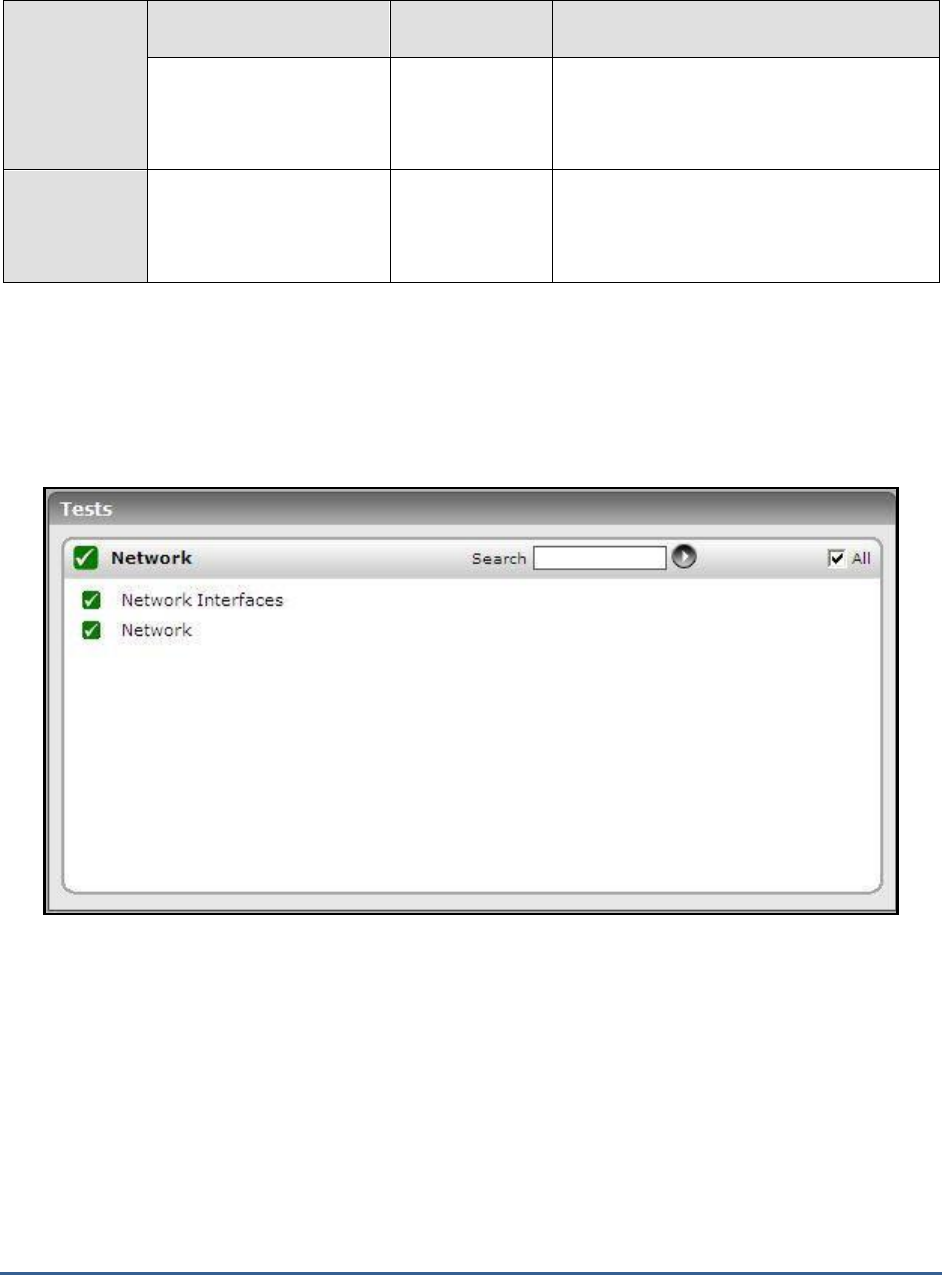
M O N I T O RI N G T H E C I T R I X AC C E S S G A T EW A Y
309
Measurements
made by the
test
Measurement
Measurement
Unit
Interpretation
Current users:
The current number of
users logged in to the
server being monitored.
Number
Current processes:
The current number of
processes executing on the
server being monitored.
Number
10.2.4 The Network Layer
Monitor the availability and responsiveness of the CAG over the network, and also measure the bandwidth usage of
each network interface supported by the CAG, with the help of the tests mapped to this layer.
Figure 10.7: The tests mapped to the Network layer
Since these tests have already been discussed in the
Monitoring Unix and Windows Servers
document, let us proceed
to the next layer.
10.2.5 The Tcp Layer
This layer measures the health of TCP connections to and from the CAG and also tracks TCP retransmissions.
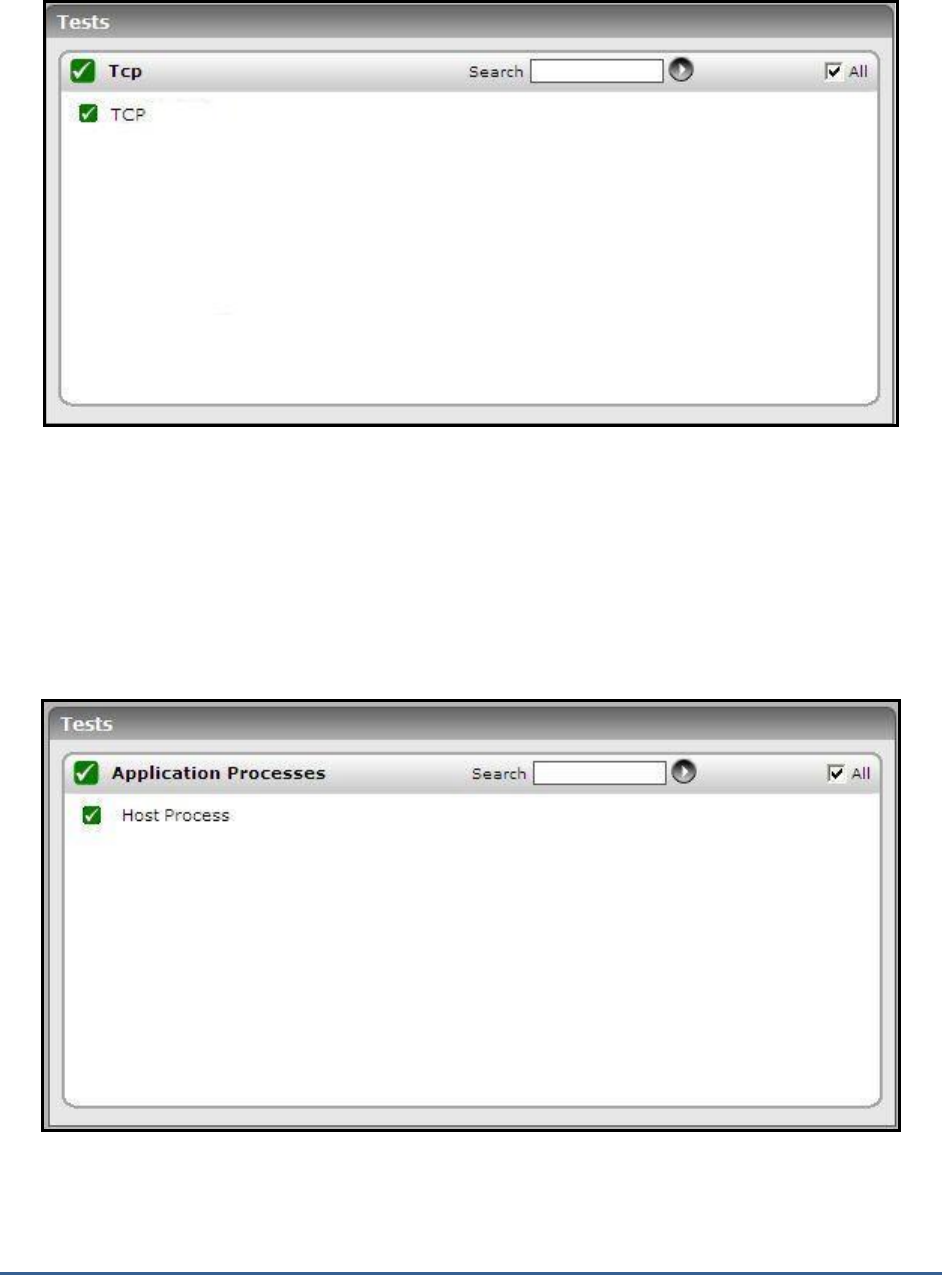
M O N I T O RI N G T H E C I T R I X AC C E S S G A T EW A Y
310
Figure 10.8: The test mapped to the Tcp layer
As this test has been discussed elaborately in the
Monitoring Network elements
document, let us move to the next
layer.
10.2.6 The Application Processes Layer
You can track the availability and resource usage of critical processes executing on the CAG using the test mapped to
this layer.
Figure 10.9: The test mapped to the Application Processes layer

M O N I T O RI N G T H E C I T R I X AC C E S S G A T EW A Y
311
10.2.6.1 Host Processes Test
The Host Processes test monitors the specific processes executing on CAG and reports the resource usage of the
processes.
Purpose
Monitors the processes executing on the CAG and reports the resource usage of specific
processes
Target of the
test
CAG on Linux
Agent
deploying the
test
A remote agent

M O N I T O RI N G T H E C I T R I X AC C E S S G A T EW A Y
312
Configurable
parameters for
the test
1. TEST PERIOD - How often should the test be executed
2. HOST - The host for which the test is to be configured
3. SNMPPORT - The port used to poll for SNMP statistics (default 161)
4. SNMPVERSION – By default, the eG agent supports SNMP version 1. Accordingly, the
default selection in the SNMPVERSION list is v1. However, if a different SNMP framework
is in use in your environment, say SNMP v2 or v3, then select the corresponding option from
this list.
5. SNMPCOMMUNITY – The SNMP community name that the test uses to communicate with
the target server. This parameter is specific to SNMP v1 and v2 only. Therefore, if the
SNMPVERSION chosen is v3, then this parameter will not appear.
6. USERNAME – This parameter appears only when v3 is selected as the SNMPVERSION.
SNMP version 3 (SNMPv3) is an extensible SNMP Framework which supplements the
SNMPv2 Framework, by additionally supporting message security, access control, and
remote SNMP configuration capabilities. To extract performance statistics from the MIB
using the highly secure SNMP v3 protocol, the eG agent has to be configured with the
required access privileges – in other words, the eG agent should connect to the MIB using
the credentials of a user with access permissions to be MIB. Therefore, specify the name of
such a user against the USERNAME parameter.
7. AUTHPASS – Specify the password that corresponds to the above-mentioned
USERNAME. This parameter once again appears only if the SNMPVERSION selected is v3.
8. CONFIRM PASSWORD – Confirm the AUTHPASS by retyping it here.
9. AUTHTYPE – This parameter too appears only if v3 is selected as the SNMPVERSION.
From the AUTHTYPE list box, choose the authentication algorithm using which SNMP v3
converts the specified USERNAME and PASSWORD into a 32-bit format to ensure security
of SNMP transactions. You can choose between the following options:
MD5 – Message Digest Algorithm
SHA – Secure Hash Algorithm
10. ENCRYPTFLAG – This flag appears only when v3 is selected as the SNMPVERSION. By
default, the eG agent does not encrypt SNMP requests. Accordingly, the ENCRYPTFLAG is
set to NO by default. To ensure that SNMP requests sent by the eG agent are encrypted,
select the YES option.
11. ENCRYPTTYPE – If the ENCRYPTFLAG is set to YES, then you will have to mention the
encryption type by selecting an option from the ENCRYPTTYPE list. SNMP v3 supports the
following encryption types:
DES – Data Encryption Standard
AES – Advanced Encryption Standard
12. ENCRYPTPASSWORD – Specify the encryption password here.
13. CONFIRM PASSWORD – Confirm the encryption password by retyping it here.

M O N I T O RI N G T H E C I T R I X AC C E S S G A T EW A Y
313
14. PROCESS - Should contain the specific processes to be monitored. Each process to be
monitored is specified in the format "name:pattern". The regular expression pattern denotes
patterns that will be used to match processes on the server. For instance, to monitor all the
Java processes on a server, specify the argument "java_processes:*java*".
15. USEPROCESSPATH - In some operating systems (example, OpenVMS), the process
name in the HOST RESOURCES MIB will be an empty string, and the process path will
include the process name. In such cases therefore, the test should be explicitly instructed to
search the process path strings for the configured process names/patterns. To ensure this,
set the USEPROCESSPATH parameter to true. By default, this parameter is set to false.
Operating systems where process name (in the HOST RESOURCES MIB) is not an empty
string can go with this default setting.
16. TIMEOUT – Specify the duration (in seconds) beyond which the SNMP query executed by
this test should time out. The default is 10 seconds.
Outputs of the
test
One set of results for every configured process pattern
Measurements
made by the
test
Measurement
Measurement
Unit
Interpretation
Processes running:
The number of processes
currently executing on the
server that match the
pattern specified as
parameter.
Number
This value indicates if too many or too few
processes corresponding to an application are
executing on the host.
Memory utilization:
The total memory usage of
all processes executing on
the server that match the
pattern specified as
parameter. The memory
usage is specified as a
percentage of the total
memory available on the
server.
Percent
A very high value could indicate that
processes corresponding to the specified
pattern are consuming excessive memory
resources.
Memory size:
The total memory usage(in
MB) of all processes
executing on the server
that match the pattern
specified as parameter.
MB
A sudden increase in memory utilization for a
process(es) may be indicative of memory
leaks in the application.
CPU utilization:
The total CPU utilization of
all processes executing on
the server that match the
configured process pattern.
Percent
A high value could signify a CPU bottleneck.
The CPU utilization may be high because a
few processes are consuming a lot of CPU, or
because there are too many processes
contending for a limited resource. Check the
currently running processes to see the exact
cause of the problem.
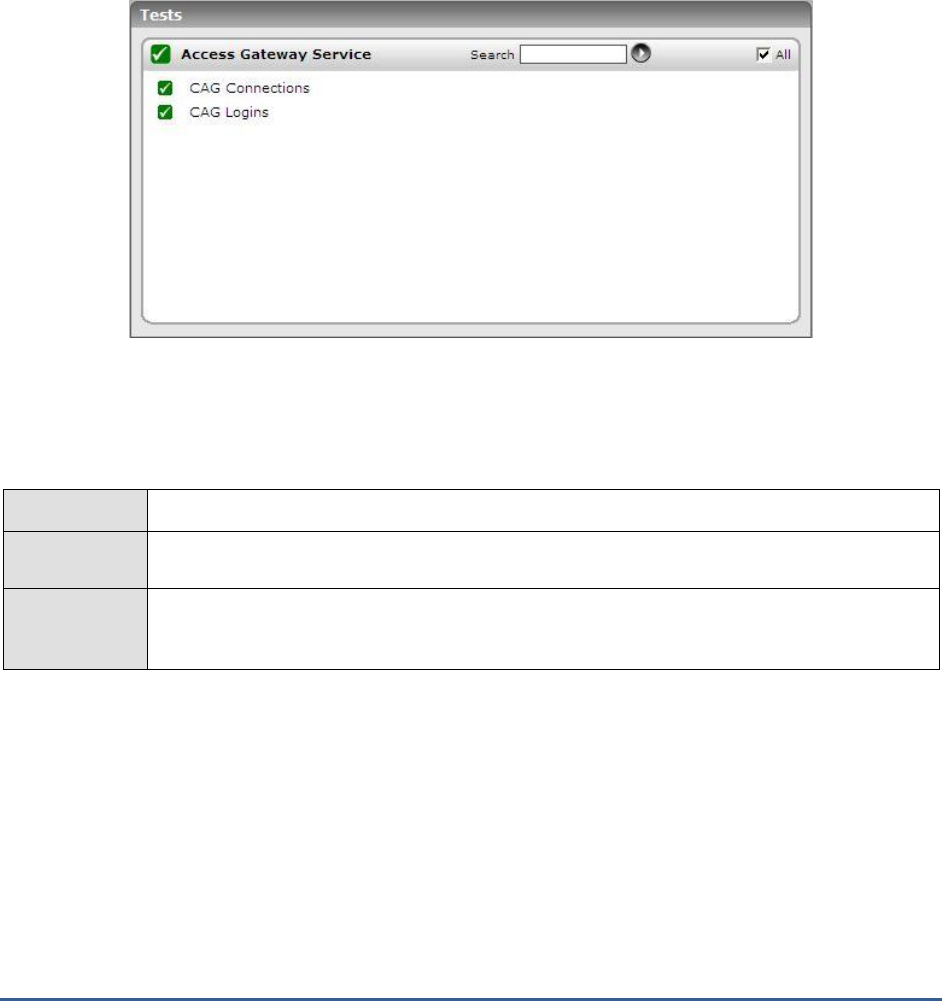
M O N I T O RI N G T H E C I T R I X AC C E S S G A T EW A Y
314
10.2.7 The Access Gateway Service Layer
The tests mapped to this layer monitors the efficiency with which the CAG performs its core functions, which include:
Login authentication
Managing client connections
Figure 10.10: The tests mapped to the Access Gateway Service layer
10.2.7.1 CAG Licenses Test
This test monitors how well the CAG manages connections to the Citrix server.
Purpose
Monitors how well the CAG manages connections to the Citrix server
Target of the
test
CAG on Linux
Agent
deploying the
test
An internal/remote agent

M O N I T O RI N G T H E C I T R I X AC C E S S G A T EW A Y
315
Configurable
parameters for
the test
1. TEST PERIOD - How often should the test be executed
2. HOST - The host for which the test is to be configured
3. SNMPPORT - The port used to poll for SNMP statistics (default 161)
4. SNMPVERSION – By default, the eG agent supports SNMP version 1. Accordingly, the
default selection in the SNMPVERSION list is v1. However, if a different SNMP framework
is in use in your environment, say SNMP v2 or v3, then select the corresponding option from
this list.
5. SNMPCOMMUNITY – The SNMP community name that the test uses to communicate with
the target server. This parameter is specific to SNMP v1 and v2 only. Therefore, if the
SNMPVERSION chosen is v3, then this parameter will not appear.
6. USERNAME – This parameter appears only when v3 is selected as the SNMPVERSION.
SNMP version 3 (SNMPv3) is an extensible SNMP Framework which supplements the
SNMPv2 Framework, by additionally supporting message security, access control, and
remote SNMP configuration capabilities. To extract performance statistics from the MIB
using the highly secure SNMP v3 protocol, the eG agent has to be configured with the
required access privileges – in other words, the eG agent should connect to the MIB using
the credentials of a user with access permissions to be MIB. Therefore, specify the name of
such a user against the USERNAME parameter.
7. AUTHPASS – Specify the password that corresponds to the above-mentioned
USERNAME. This parameter once again appears only if the SNMPVERSION selected is v3.
8. CONFIRM PASSWORD – Confirm the AUTHPASS by retyping it here.
9. AUTHTYPE – This parameter too appears only if v3 is selected as the SNMPVERSION.
From the AUTHTYPE list box, choose the authentication algorithm using which SNMP v3
converts the specified USERNAME and PASSWORD into a 32-bit format to ensure security
of SNMP transactions. You can choose between the following options:
MD5 – Message Digest Algorithm
SHA – Secure Hash Algorithm
10. ENCRYPTFLAG – This flag appears only when v3 is selected as the SNMPVERSION. By
default, the eG agent does not encrypt SNMP requests. Accordingly, the ENCRYPTFLAG is
set to NO by default. To ensure that SNMP requests sent by the eG agent are encrypted,
select the YES option.
11. ENCRYPTTYPE – If the ENCRYPTFLAG is set to YES, then you will have to mention the
encryption type by selecting an option from the ENCRYPTTYPE list. SNMP v3 supports the
following encryption types:
DES – Data Encryption Standard
AES – Advanced Encryption Standard
12. ENCRYPTPASSWORD – Specify the encryption password here.
13. CONFIRM PASSWORD – Confirm the encryption password by retyping it here.

M O N I T O RI N G T H E C I T R I X AC C E S S G A T EW A Y
316
14. TIMEOUT – Specify the duration (in seconds) beyond which the SNMP query executed by
this test should time out. The default is 10 seconds.
Outputs of the
test
One set of results for the CAG monitored
Measurements
made by the
test
Measurement
Measurement
Unit
Interpretation
Total licenses installed
on the Access Gateway:
Indicates the maximum
number of client
connections.
Number
Licenses in use:
Indicates the number of
connections currently used.
Number
Disabled licenses:
Indicates the number of
connections currently
disabled.
Number
Licenses available for
use:
Indicates the number of
connections currently
unused.
Number
Available licenses
percent:
Indicates the percentage of
unused connections.
Percent
Ideally, this value should be high. A low value
indicates that too many connections are
currently in use, and that the pool might not
have enough connections to support
subsequent connection requests. This can
severely affect the user experience with the
CAG.
10.2.7.2 CAG Logins Test
This test tracks the user logins to CAG, and captures failed login attempts.
Purpose
Tracks the user logins to CAG, and captures failed login attempts
Target of the
test
CAG on Linux
Agent
deploying the
test
An internal/remote agent

M O N I T O RI N G T H E C I T R I X AC C E S S G A T EW A Y
317
Configurable
parameters for
the test
1. TEST PERIOD - How often should the test be executed
2. HOST - The host for which the test is to be configured
3. SNMPPORT - The port used to poll for SNMP statistics (default 161)
4. SNMPVERSION – By default, the eG agent supports SNMP version 1. Accordingly, the
default selection in the SNMPVERSION list is v1. However, if a different SNMP framework
is in use in your environment, say SNMP v2 or v3, then select the corresponding option from
this list.
5. SNMPCOMMUNITY – The SNMP community name that the test uses to communicate with
the target server. This parameter is specific to SNMP v1 and v2 only. Therefore, if the
SNMPVERSION chosen is v3, then this parameter will not appear.
6. USERNAME – This parameter appears only when v3 is selected as the SNMPVERSION.
SNMP version 3 (SNMPv3) is an extensible SNMP Framework which supplements the
SNMPv2 Framework, by additionally supporting message security, access control, and
remote SNMP configuration capabilities. To extract performance statistics from the MIB
using the highly secure SNMP v3 protocol, the eG agent has to be configured with the
required access privileges – in other words, the eG agent should connect to the MIB using
the credentials of a user with access permissions to be MIB. Therefore, specify the name of
such a user against the USERNAME parameter.
7. AUTHPASS – Specify the password that corresponds to the above-mentioned
USERNAME. This parameter once again appears only if the SNMPVERSION selected is v3.
8. CONFIRM PASSWORD – Confirm the AUTHPASS by retyping it here.
9. AUTHTYPE – This parameter too appears only if v3 is selected as the SNMPVERSION.
From the AUTHTYPE list box, choose the authentication algorithm using which SNMP v3
converts the specified USERNAME and PASSWORD into a 32-bit format to ensure security
of SNMP transactions. You can choose between the following options:
MD5 – Message Digest Algorithm
SHA – Secure Hash Algorithm
10. ENCRYPTFLAG – This flag appears only when v3 is selected as the SNMPVERSION. By
default, the eG agent does not encrypt SNMP requests. Accordingly, the ENCRYPTFLAG is
set to NO by default. To ensure that SNMP requests sent by the eG agent are encrypted,
select the YES option.
11. ENCRYPTTYPE – If the ENCRYPTFLAG is set to YES, then you will have to mention the
encryption type by selecting an option from the ENCRYPTTYPE list. SNMP v3 supports the
following encryption types:
DES – Data Encryption Standard
AES – Advanced Encryption Standard
12. ENCRYPTPASSWORD – Specify the encryption password here.
13. CONFIRM PASSWORD – Confirm the encryption password by retyping it here.
14. TIMEOUT – Specify the duration (in seconds) beyond which the SNMP query executed by
this test should time out. The default is 10 seconds.

M O N I T O RI N G T H E C I T R I X AC C E S S G A T EW A Y
318
Outputs of the
test
One set of results for the CAG monitored
Measurements
made by the
test
Measurement
Measurement
Unit
Interpretation
Total logins:
Indicates the number of
logins during the last
measurement period.
Number
Client user logins:
Indicates the number of
successful client logins to
the CAG during the last
measurement period.
Number
Failed logins:
Indicates the number of
client logins that failed
during the last
measurement period.
Number
Ideally, this value should be 0.
Admin user logins:
Indicates the number of
successful admin user
logins during the last
measurement period.
Number
Failed admin user
logins:
Indicates the number of
failed admin user logins
during the last
measurement period.
Percent
Ideally, this value should be 0.
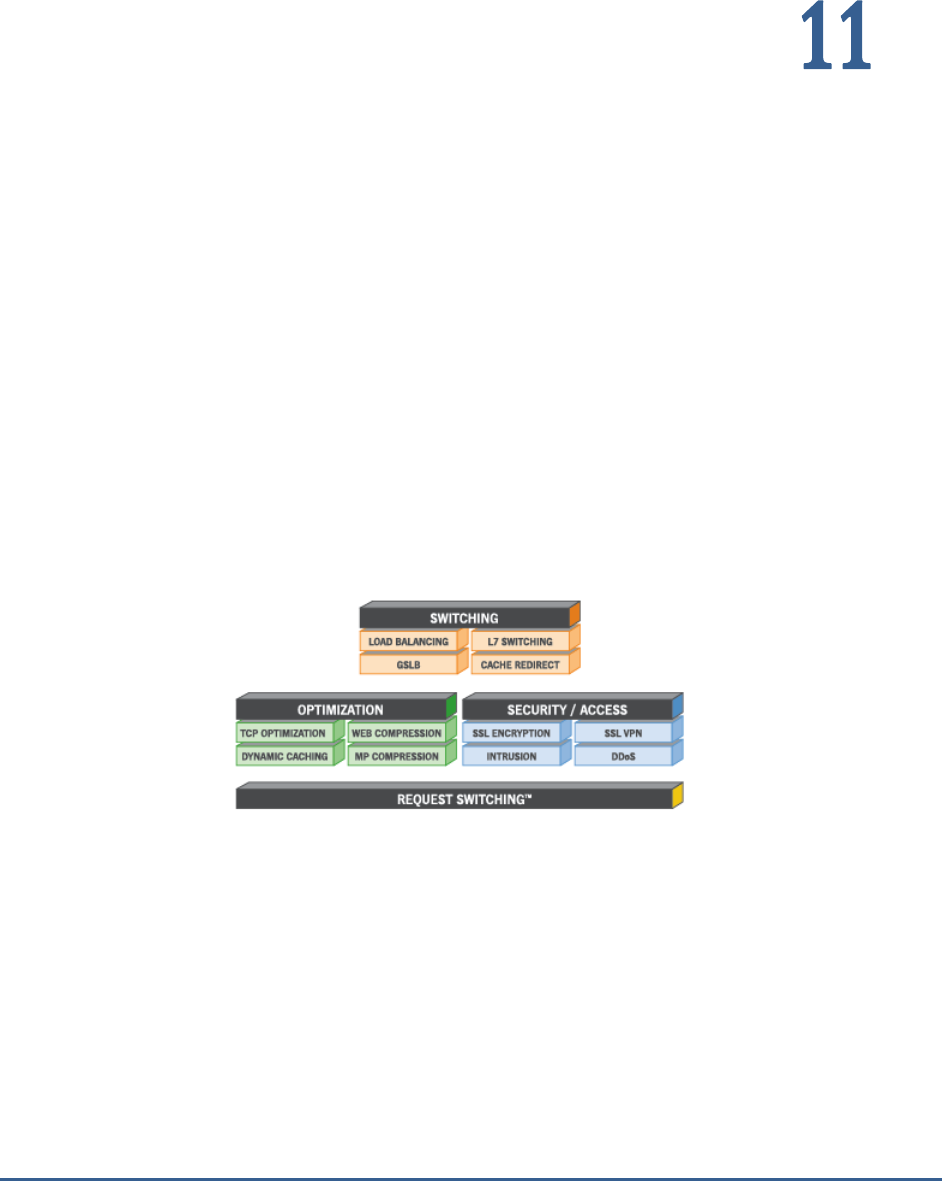
M O N I T O RI N G T H E C I T R I X NE T S C A L E R L B
319
Monitoring the Citrix Netscaler LB
Citrix NetScaler application delivery solutions combine the features and functions of traditional data center point
products - load balancing, caching, compression, SSL acceleration, and attack defense - into a single network
appliance, built from the ground up to maximize the performance of mission-critical applications.
All Citrix NetScaler products are built on Citrix’s patented Request Switching™ architecture, the industry’s only wire-
speed technology that handles every application request based on powerful user-defined policies. The Citrix
NetScaler application-aware policy engine, AppExpert™, allows the creation of detailed policy-based decisions for
individual requests, irrespective of connections. AppExpert lets administrators build sophisticated application request
handling policies that enable powerful, comprehensive application-based features.
Figure 11.1: The Netscaler architecture
As business entities have begun to rely enormously on the Citrix Netscaler solutions to deliver service continuity and
to ensure the secure transaction of business, the smooth functioning of the Netscaler appliance has become super-
critical in Citrix infrastructures today. Round-the-clock monitoring of Netscaler products, proactive error reporting,
and swift error-clearance are a must to ensure that the Citrix Netscaler is always up and running, and is well enough
to attend to application requests from users.
The eG Enterprise-developed specialized
Netscaler LB
monitoring model uses the Netscaler's SNMP MIB to track the
Netscaler availability and performance 24x7, warns administrators of probable issues in the functioning of Netscaler,
and thus wards off potential performance bottlenecks.
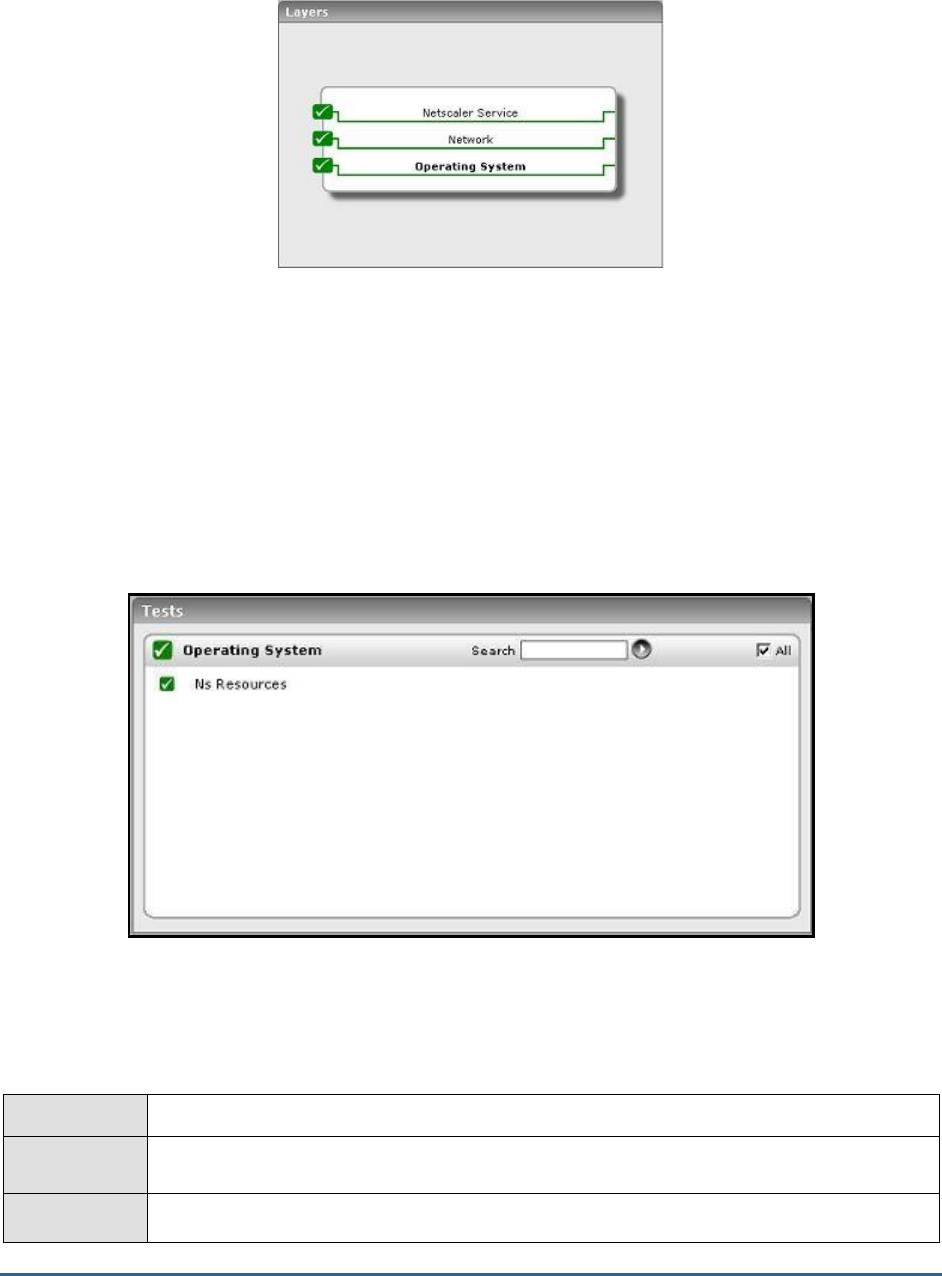
M O N I T O RI N G T H E C I T R I X NE T S C A L E R L B
320
Figure 11.2: Layer model of the Citrix Nescaler
Each layer of this hierarchical layer model is mapped to tests that periodically execute on the Netscaler appliance to
evaluate its performance. These tests use the SNMPPORT and SNMPCOMMUNITY string configurations to connect
to the SNMP MIB of the Netscaler appliance, and extract a wide range of performance statistics from the MIB. The
sections to come will discuss the tests associated with the each of the layers of the Netscaler monitoring model.
11.1 The Operating System Layer
Using the NsResources test associated with it, the Operating System layer tracks the memory and CPU utilization of
the Netscaler host.
Figure 11.3: The test associated with the Operating System layer of the Netscaler device
11.1.1 Ns Resources Test
The NsResources test monitors the resource usage of the Netscaler device.
Purpose
Monitors the resource usage of the Netscaler device
Target of the
test
A Citrix Netscaler Appliance
Agent
deploying the
An external agent

M O N I T O RI N G T H E C I T R I X NE T S C A L E R L B
321
test
Configurable
parameters for
the test
1. TEST PERIOD – How often should the test be executed
2. HOST – The host for which the test is to be configured
3. PORT – Refers to the port used by the Citrix Netscaler appliance. By default, this is NULL.
4. SNMPPORT - The port number through which the monitored component exposes its
SNMP MIB.
5. SNMPVERSION – By default, the eG agent supports SNMP version 1. Accordingly, the
default selection in the SNMPVERSION list is v1. However, if a different SNMP framework
is in use in your environment, say SNMP v2 or v3, then select the corresponding option from
this list.
6. SNMPCOMMUNITY – The SNMP community name that the test uses to communicate with
the target device. This parameter is specific to SNMP v1 and v2 only. Therefore, if the
SNMPVERSION chosen is v3, then this parameter will not appear.
7. USERNAME – This parameter appears only when v3 is selected as the SNMPVERSION.
SNMP version 3 (SNMPv3) is an extensible SNMP Framework which supplements the
SNMPv2 Framework, by additionally supporting message security, access control, and
remote SNMP configuration capabilities. To extract performance statistics from the MIB
using the highly secure SNMP v3 protocol, the eG agent has to be configured with the
required access privileges – in other words, the eG agent should connect to the MIB using
the credentials of a user with access permissions to be MIB. Therefore, specify the name of
such a user against the USERNAME parameter.
8. AUTHPASS – Specify the password that corresponds to the above-mentioned
USERNAME. This parameter once again appears only if the SNMPVERSION selected is v3.
9. CONFIRM PASSWORD – Confirm the AUTHPASS by retyping it here.
10. AUTHTYPE – This parameter too appears only if v3 is selected as the SNMPVERSION.
From the AUTHTYPE list box, choose the authentication algorithm using which SNMP v3
converts the specified USERNAME and PASSWORD into a 32-bit format to ensure security
of SNMP transactions. You can choose between the following options:
MD5 – Message Digest Algorithm
SHA – Secure Hash Algorithm
11. ENCRYPTFLAG – This flag appears only when v3 is selected as the SNMPVERSION. By
default, the eG agent does not encrypt SNMP requests. Accordingly, the ENCRYPTFLAG is
set to NO by default. To ensure that SNMP requests sent by the eG agent are encrypted,
select the YES option.
12. ENCRYPTTYPE – If the ENCRYPTFLAG is set to YES, then you will have to mention the
encryption type by selecting an option from the ENCRYPTTYPE list. SNMP v3 supports the
following encryption types:
DES – Data Encryption Standard
AES – Advanced Encryption Standard
13. ENCRYPTPASSWORD – Specify the encryption password here.
14. CONFIRM PASSWORD – Confirm the encryption password by retyping it here.

M O N I T O RI N G T H E C I T R I X NE T S C A L E R L B
322
15. TIMEOUT – Specify the duration (in seconds) beyond which the SNMP query issues by this
test should time out. The default period is 10 seconds.
Outputs of the
test
One set of results for the Citrix Netscaler being monitored
Measurements
made by the
test
Measurement
Measurement
Unit
Interpretation
CPU usage:
Indicates the current CPU
usage of the Netscaler
device.
Percent
A value close to 100% indicates a CPU
bottleneck on the Netscaler device.
Memory usage:
Indicates the percentage of
memory available on the
Netscaler device that is
currently in use.
Percent
System memory:
Indicates the amount of
memory available/configured
on the Netscaler device.
MB
This is a configuration metric.
Number of CPUs:
Indicates the number of
processing units available on
the Netscaler device.
Number
This is a configuration metric.
SSL cards:
Indicates the number of cards
available for SSL processing
by the Netscaler device.
Number
This is a configuration metric.
11.2 The Network Layer
Besides indicating the availability and responsiveness of network connections to the Netscaler device, the tests
mapped to the Network layer also reveals the health of network interfaces supported by the device, and the
performance of each of the VLANs configured on the device.
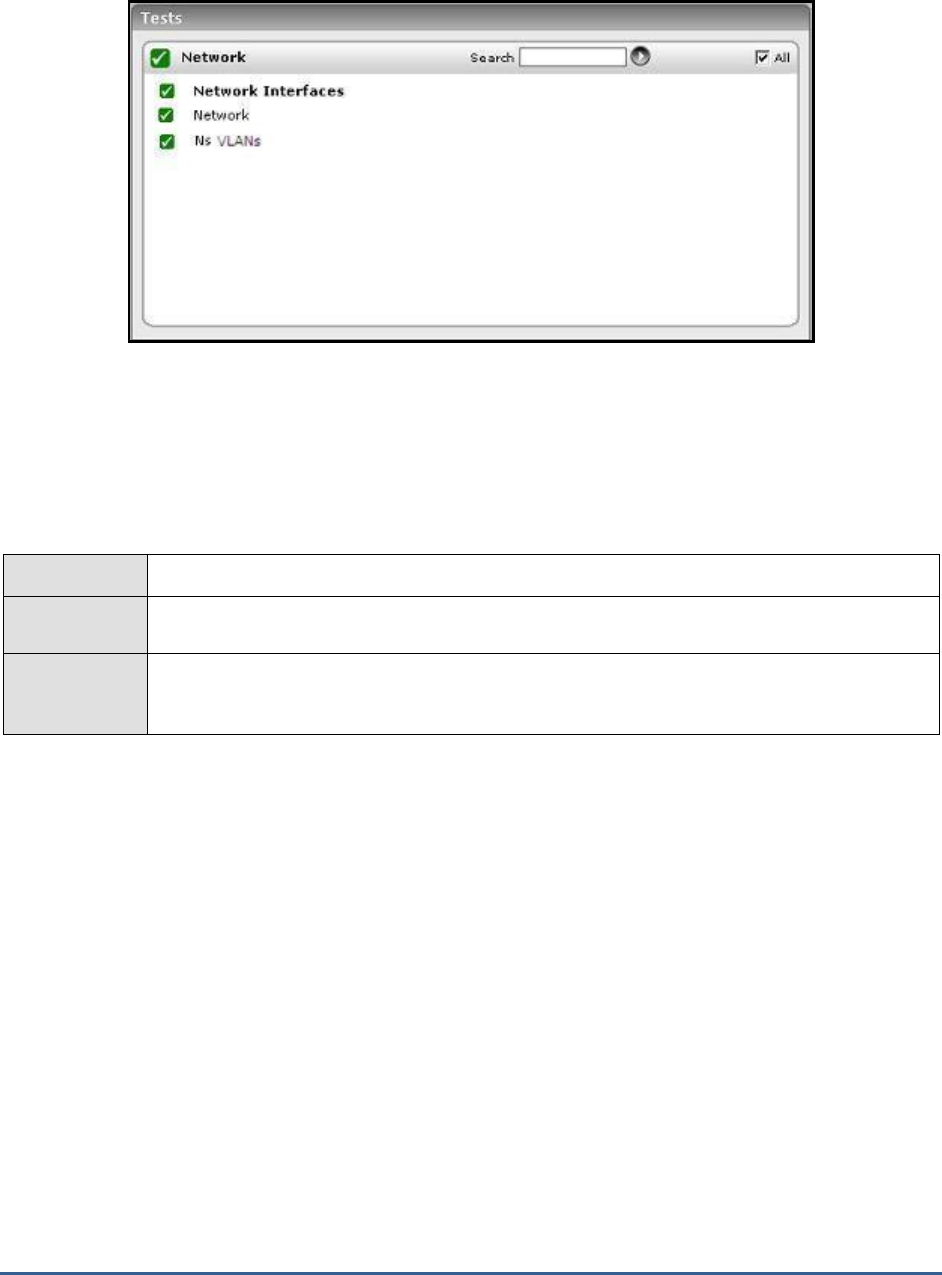
M O N I T O RI N G T H E C I T R I X NE T S C A L E R L B
323
Figure 11.4: The tests associated with the Network layer
Since the Network test and NetworkInterfaces test have been dealt with in great detail in the
Monitoring Unix and
Windows Servers
document, the following section discusses the NsVlans test only.
11.2.1.1 Ns VLANs Test
The Ns VLANs test monitors the network traffic over each of the VLANs configured on the Netscaler device.
Purpose
Monitors the network traffic over each of the VLANs configured on the Netscaler device
Target of the
test
A Citrix Netscaler Appliance
Agent
deploying the
test
An external agent

M O N I T O RI N G T H E C I T R I X NE T S C A L E R L B
324
Configurable
parameters for
the test
1. TEST PERIOD – How often should the test be executed
2. HOST – The host for which the test is to be configured
3. PORT – Refers to the port used by the Citrix Netscaler appliance. By default, this is NULL.
4. SNMPPORT - The port number through which the monitored component exposes its
SNMP MIB.
5. SNMPVERSION – By default, the eG agent supports SNMP version 1. Accordingly, the
default selection in the SNMPVERSION list is v1. However, if a different SNMP framework
is in use in your environment, say SNMP v2 or v3, then select the corresponding option from
this list.
6. SNMPCOMMUNITY – The SNMP community name that the test uses to communicate with
the target device. This parameter is specific to SNMP v1 and v2 only. Therefore, if the
SNMPVERSION chosen is v3, then this parameter will not appear.
7. USERNAME – This parameter appears only when v3 is selected as the SNMPVERSION.
SNMP version 3 (SNMPv3) is an extensible SNMP Framework which supplements the
SNMPv2 Framework, by additionally supporting message security, access control, and
remote SNMP configuration capabilities. To extract performance statistics from the MIB
using the highly secure SNMP v3 protocol, the eG agent has to be configured with the
required access privileges – in other words, the eG agent should connect to the MIB using
the credentials of a user with access permissions to be MIB. Therefore, specify the name of
such a user against the USERNAME parameter.
8. AUTHPASS – Specify the password that corresponds to the above-mentioned
USERNAME. This parameter once again appears only if the SNMPVERSION selected is v3.
9. CONFIRM PASSWORD – Confirm the AUTHPASS by retyping it here.
10. AUTHTYPE – This parameter too appears only if v3 is selected as the SNMPVERSION.
From the AUTHTYPE list box, choose the authentication algorithm using which SNMP v3
converts the specified USERNAME and PASSWORD into a 32-bit format to ensure security
of SNMP transactions. You can choose between the following options:
MD5 – Message Digest Algorithm
SHA – Secure Hash Algorithm
11. ENCRYPTFLAG – This flag appears only when v3 is selected as the SNMPVERSION. By
default, the eG agent does not encrypt SNMP requests. Accordingly, the ENCRYPTFLAG is
set to NO by default. To ensure that SNMP requests sent by the eG agent are encrypted,
select the YES option.
12. ENCRYPTTYPE – If the ENCRYPTFLAG is set to YES, then you will have to mention the
encryption type by selecting an option from the ENCRYPTTYPE list. SNMP v3 supports the
following encryption types:
DES – Data Encryption Standard
AES – Advanced Encryption Standard
13. ENCRYPTPASSWORD – Specify the encryption password here.
14. CONFIRM PASSWORD – Confirm the encryption password by retyping it here.
15. TIMEOUT – Specify the duration (in seconds) beyond which the SNMP query issues by this
test should time out. The default period is 10 seconds.

M O N I T O RI N G T H E C I T R I X NE T S C A L E R L B
325
Outputs of the
test
One set of results for every VLAN configured on the Citrix Netscaler being monitored
Measurements
made by the
test
Measurement
Measurement
Unit
Interpretation
Packets received:
Indicates the rate at which
packets were received on a
VLAN during the last
measurement period.
Packets/Sec
Data receive rate:
Indicates the rate at which
data was received over a
VLAN during the last
measurement period.
MB/Sec
Packets sent:
Indicates the rate at which
packets were transmitted on
a VLAN during the last
measurement p.
Packets/Sec
Data transmit rate:
Indicates the rate at which
data was transmitted over a
VLAN during the last
measurement period.
MB/Sec
Packets dropped:
Indicates the packets
dropped over a VLAN during
the last measurement period.
Number
Packet drop ratio:
Indicates the percentage of
the total packets handled
(i.e., sum of the packets
received and transmitted)
which were dropped during
the last measurement period.
Percent
Ideally, this value should be close to 0.
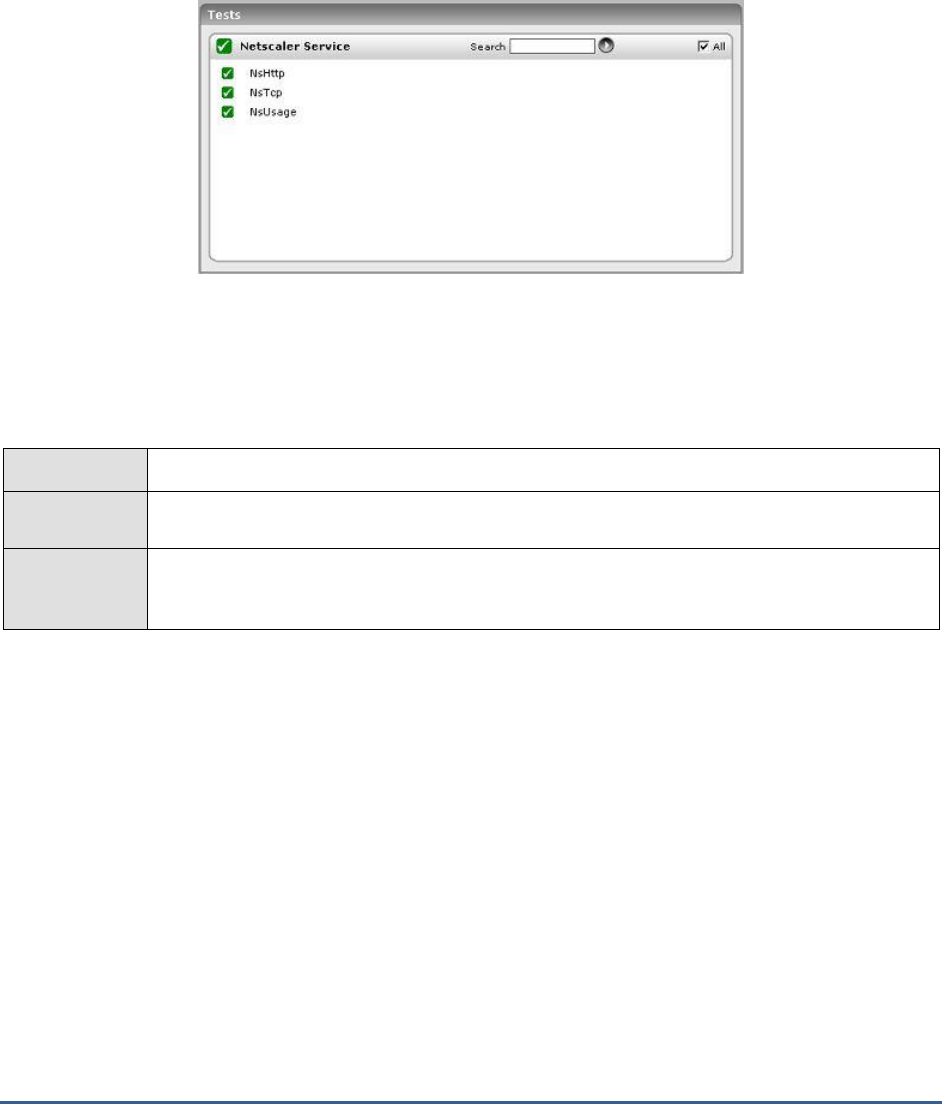
M O N I T O RI N G T H E C I T R I X NE T S C A L E R L B
326
11.3 The Netscaler Service Layer
Using the tests associated with it, this layer monitors the HTTP requests to the Netscaler device, its responses, and
TCP traffic to and from the device; it also periodically watches the load on the device, so that the administrator is
promptly alerted upon an overload.
Figure 11.5: The tests associated with the Netscaler Service layer
11.3.1.1 Ns HTTP Test
This test monitors HTTP connections handled by the Netscaler appliance, and reveals whether all HTTP requests
have been responded to, and whether any incomplete requests/responses have been received/sent by the Netscaler.
Purpose
Monitors HTTP connections handled by the Netscaler appliance
Target of the
test
A Citrix Netscaler Appliance
Agent
deploying the
test
An external agent

M O N I T O RI N G T H E C I T R I X NE T S C A L E R L B
327
Configurable
parameters for
the test
1. TEST PERIOD – How often should the test be executed
2. HOST – The host for which the test is to be configured
3. PORT – Refers to the port used by the Citrix Netscaler appliance. By default, this is NULL.
4. SNMPPORT - The port number through which the monitored component exposes its
SNMP MIB.
5. SNMPVERSION – By default, the eG agent supports SNMP version 1. Accordingly, the
default selection in the SNMPVERSION list is v1. However, if a different SNMP framework
is in use in your environment, say SNMP v2 or v3, then select the corresponding option from
this list.
6. SNMPCOMMUNITY – The SNMP community name that the test uses to communicate with
the target device. This parameter is specific to SNMP v1 and v2 only. Therefore, if the
SNMPVERSION chosen is v3, then this parameter will not appear.
7. USERNAME – This parameter appears only when v3 is selected as the SNMPVERSION.
SNMP version 3 (SNMPv3) is an extensible SNMP Framework which supplements the
SNMPv2 Framework, by additionally supporting message security, access control, and
remote SNMP configuration capabilities. To extract performance statistics from the MIB
using the highly secure SNMP v3 protocol, the eG agent has to be configured with the
required access privileges – in other words, the eG agent should connect to the MIB using
the credentials of a user with access permissions to be MIB. Therefore, specify the name of
such a user against the USERNAME parameter.
8. AUTHPASS – Specify the password that corresponds to the above-mentioned
USERNAME. This parameter once again appears only if the SNMPVERSION selected is v3.
9. CONFIRM PASSWORD – Confirm the AUTHPASS by retyping it here.
10. AUTHTYPE – This parameter too appears only if v3 is selected as the SNMPVERSION.
From the AUTHTYPE list box, choose the authentication algorithm using which SNMP v3
converts the specified USERNAME and PASSWORD into a 32-bit format to ensure security
of SNMP transactions. You can choose between the following options:
MD5 – Message Digest Algorithm
SHA – Secure Hash Algorithm
11. ENCRYPTFLAG – This flag appears only when v3 is selected as the SNMPVERSION. By
default, the eG agent does not encrypt SNMP requests. Accordingly, the ENCRYPTFLAG is
set to NO by default. To ensure that SNMP requests sent by the eG agent are encrypted,
select the YES option.
12. ENCRYPTTYPE – If the ENCRYPTFLAG is set to YES, then you will have to mention the
encryption type by selecting an option from the ENCRYPTTYPE list. SNMP v3 supports the
following encryption types:
DES – Data Encryption Standard
AES – Advanced Encryption Standard
13. ENCRYPTPASSWORD – Specify the encryption password here.
14. CONFIRM PASSWORD – Confirm the encryption password by retyping it here.
15. TIMEOUT – Specify the duration (in seconds) beyond which the SNMP query issues by this
test should time out. The default period is 10 seconds.

M O N I T O RI N G T H E C I T R I X NE T S C A L E R L B
328
Outputs of the
test
One set of results for every Citrix Netscaler being monitored
Measurements
made by the
test
Measurement
Measurement
Unit
Interpretation
New HTTP requests:
Indicates the number of new
HTTP requests to the
netscaler device in the last
measurement period.
Number
This is an indicator of workload on the
netscaler device.
HTTP 1.0 requests:
Indicates the number of new
HTTP v 1.0 requests to the
netscaler device in the last
measurement period.
Number
Since HTTP 1.0 connections are not capable
of providing information about the client's
ability to accept compressed data, which is
one of the features of the Netscaler devices,
it is important to be able to monitor the
number of HTTP 1.0 connections relative to
the the total connections.
Requests with incomplete
headers:
Indicates the number of
incomplete HTTP header
received in the last
measurement period with
incomplete headers.
Number
The Netscaler performs content filtering by
inspecting every incoming request according
to user-configured rules, which are based on
HTTP headers. If these headers are
incomplete, the Netscaler would not be able
to interpret the rules correctly, thus exposing
the server to potential attacks. A high value
of this measure is hence, undesirable; the
reasons for the same should be investigated
and the root-cause should be promptly
addressed.
Incomplete HTTP
requests:
Indicates the number of
incomplete HTTP requests
received in the last
measurement period.
Number
Incomplete responses:
Indicates the number of
incomplete HTTP responses
from the Netscaler device
during the last measurement
period.
Number
This value should typically be small under
normal operation.

M O N I T O RI N G T H E C I T R I X NE T S C A L E R L B
329
Pipelined requests:
Indicates the number of
pipelined requests since the
last measurement period.
Number
HTTP/1.1 allows multiple HTTP requests to
be written out to a socket together without
waiting for the corresponding responses. The
requestor then waits for the responses to
arrive in the order in which they were
requested. The act of
pipelining
the requests
can result in a dramatic improvement in page
loading times, especially over high latency
connections.
Server busy errors:
Indicates number of HTTP
requests for which server
busy errors were sent during
the last measurement period.
Number
Ideally, this value should be close to 0.
Http gets:
Indicates the number of
HTTP GETs received during
the last measurement period.
Number
By analyzing HTTP GET and POST requests
and filtering out known bad signatures, you
can defend against HTTP-based attacks such
as variants of Nimda and Code Red virus.
Http posts:
Indicates the number of
HTTP POSTs received during
the last measurement period.
Number
HTTP responses:
Indicates the number of new
HTTP responses generated
from the Netscaler device
during the last measurement
period.
Number
Compare the value of new requests and
responses. These values should be close to
each other. A significant deviation may
indicate a bottleneck or malfuntioning of the
Netscaler device.
HTTP 1.0 responses:
Indicates the number of new
HTTP v 1.0 responses sent
back during the last
measurement period.
Number
11.3.1.2 Ns TCP Test
This test monitors TCP connections and retransmissions handled by the Netscaler appliance.
Purpose
Monitors TCP connections and retransmissions handled by the Netscaler appliance
Target of the
test
A Citrix Netscaler Appliance
Agent
deploying the
An external agent

M O N I T O RI N G T H E C I T R I X NE T S C A L E R L B
330
test
Configurable
parameters for
the test
1. TEST PERIOD – How often should the test be executed
2. HOST – The host for which the test is to be configured
3. PORT – Refers to the port used by the Citrix Netscaler appliance. By default, this is NULL.
4. SNMPPORT - The port number through which the monitored component exposes its
SNMP MIB.
5. SNMPVERSION – By default, the eG agent supports SNMP version 1. Accordingly, the
default selection in the SNMPVERSION list is v1. However, if a different SNMP framework
is in use in your environment, say SNMP v2 or v3, then select the corresponding option from
this list.
6. SNMPCOMMUNITY – The SNMP community name that the test uses to communicate with
the target device. This parameter is specific to SNMP v1 and v2 only. Therefore, if the
SNMPVERSION chosen is v3, then this parameter will not appear.
7. USERNAME – This parameter appears only when v3 is selected as the SNMPVERSION.
SNMP version 3 (SNMPv3) is an extensible SNMP Framework which supplements the
SNMPv2 Framework, by additionally supporting message security, access control, and
remote SNMP configuration capabilities. To extract performance statistics from the MIB
using the highly secure SNMP v3 protocol, the eG agent has to be configured with the
required access privileges – in other words, the eG agent should connect to the MIB using
the credentials of a user with access permissions to be MIB. Therefore, specify the name of
such a user against the USERNAME parameter.
8. AUTHPASS – Specify the password that corresponds to the above-mentioned
USERNAME. This parameter once again appears only if the SNMPVERSION selected is v3.
9. CONFIRM PASSWORD – Confirm the AUTHPASS by retyping it here.
10. AUTHTYPE – This parameter too appears only if v3 is selected as the SNMPVERSION.
From the AUTHTYPE list box, choose the authentication algorithm using which SNMP v3
converts the specified USERNAME and PASSWORD into a 32-bit format to ensure security
of SNMP transactions. You can choose between the following options:
MD5 – Message Digest Algorithm
SHA – Secure Hash Algorithm
11. ENCRYPTFLAG – This flag appears only when v3 is selected as the SNMPVERSION. By
default, the eG agent does not encrypt SNMP requests. Accordingly, the ENCRYPTFLAG is
set to NO by default. To ensure that SNMP requests sent by the eG agent are encrypted,
select the YES option.
12. ENCRYPTTYPE – If the ENCRYPTFLAG is set to YES, then you will have to mention the
encryption type by selecting an option from the ENCRYPTTYPE list. SNMP v3 supports the
following encryption types:
DES – Data Encryption Standard
AES – Advanced Encryption Standard
13. ENCRYPTPASSWORD – Specify the encryption password here.
14. CONFIRM PASSWORD – Confirm the encryption password by retyping it here.

M O N I T O RI N G T H E C I T R I X NE T S C A L E R L B
331
15. TIMEOUT – Specify the duration (in seconds) beyond which the SNMP query issues by this
test should time out. The default period is 10 seconds.
Outputs of the
test
One set of results for every Citrix Netscaler being monitored
Measurements
made by the
test
Measurement
Measurement
Unit
Interpretation
Server connections:
Indicates the number of
server connections in the
NetScaler device.
Number
Client connections:
Indicates the number of client
connections in the NetScaler
device.
Number
Connections serving
requests:
Indicates the number of
connections to the Netscaler
device that are currently
serving requests.
Number
This metric is a key indicator of the workload
handled by the Netscaler device.
Server connections in
established state:
Indicates the number of
server connections in
NetScaler in established
state.
Number
Client connections in
established state:
Indicates the number of client
connections in NetScaler in
established state.
Number
Spare connections:
Indicates the number of
spare connections ready to be
used.
Number

M O N I T O RI N G T H E C I T R I X NE T S C A L E R L B
332
Surge queue length:
Indicates number of number
of connections in surge
queue.
Number
The Netscaler device can be used to limit the
number of simultaneous requests that are
passed on to a server. When a request is
completed, additional requests are forwarded
to the server. If a request arrives and the
server is handling the maximum configured
number of requests, the Netscaler device
places the new request in a surge queue,
where the request waits for its turn to be
sent to the server for processing. The surge
queue allows a server to run at peak capacity
without the risk of having it spiral out of
control because of a surge of incoming
requests. The surge queue length indicates
whether a server is able to keep up with its
incoming workload or not. If the surge queue
is consistently greater than 0, this indicates
that the server is not able to keep up with
the workload and additional server capacity is
required. On the other hand, a periodic surge
is not a cause for concern.
Server connections
opened:
Indicates the total number of
opened server connections.
Number
Client connections
opened:
Indicates the total number of
opened client connections.
Number
Data traffic received:
Indicates the TCP traffic
received during the last
measurement period.
MB/Sec
Data transmit rate:
Indicates the TCP traffic
transmitted during the last
measurement period.
MB/Sec
Connection establishment
timeouts:
Indicates the number of
times connection
establishment timed out
during the last measurement
period.
Number

M O N I T O RI N G T H E C I T R I X NE T S C A L E R L B
333
Connection retries:
Indicates the number of
times TCP connection
established was retried during
the last measurement period.
Number
Client retransmissions:
Indicates the number of
retranmissions from clients
during the last measurement
period.
Number
Ideally, the number of retransmissions should
be a small fraction (< 5%) of the total
number of transmissions.
Server retransmissions:
Indicates the number of
retranmissions from servers
during the last measurement
period.
Number
Ideally, the number of retransmissions should
be a small fraction (< 5%) of the total
number of transmissions.
Retransmits sent:
Indicates the number of
retranmissions sent during
the last measurement period.
Number
TCP retransmission
failures:
Indicates the number of
retranmission failures during
the last measurement period.
Number
11.3.1.3 Ns Usage Test
This test monitors the workload on the Netscaler appliance and the usage of its CPU resources.
Purpose
Monitors HTTP connections handled by the Netscaler appliance
Target of the
test
A Citrix Netscaler Appliance
Agent
deploying the
test
An internal agent

M O N I T O RI N G T H E C I T R I X NE T S C A L E R L B
334
Configurable
parameters for
the test
1. TEST PERIOD – How often should the test be executed
2. HOST – The host for which the test is to be configured
3. PORT – Refers to the port used by the Citrix Netscaler appliance. By default, this is NULL.
4. SNMPPORT - The port number through which the monitored component exposes its
SNMP MIB.
5. SNMPVERSION – By default, the eG agent supports SNMP version 1. Accordingly, the
default selection in the SNMPVERSION list is v1. However, if a different SNMP framework
is in use in your environment, say SNMP v2 or v3, then select the corresponding option from
this list.
6. SNMPCOMMUNITY – The SNMP community name that the test uses to communicate with
the target device. This parameter is specific to SNMP v1 and v2 only. Therefore, if the
SNMPVERSION chosen is v3, then this parameter will not appear.
7. USERNAME – This parameter appears only when v3 is selected as the SNMPVERSION.
SNMP version 3 (SNMPv3) is an extensible SNMP Framework which supplements the
SNMPv2 Framework, by additionally supporting message security, access control, and
remote SNMP configuration capabilities. To extract performance statistics from the MIB
using the highly secure SNMP v3 protocol, the eG agent has to be configured with the
required access privileges – in other words, the eG agent should connect to the MIB using
the credentials of a user with access permissions to be MIB. Therefore, specify the name of
such a user against the USERNAME parameter.
8. AUTHPASS – Specify the password that corresponds to the above-mentioned
USERNAME. This parameter once again appears only if the SNMPVERSION selected is v3.
9. CONFIRM PASSWORD – Confirm the AUTHPASS by retyping it here.
10. AUTHTYPE – This parameter too appears only if v3 is selected as the SNMPVERSION.
From the AUTHTYPE list box, choose the authentication algorithm using which SNMP v3
converts the specified USERNAME and PASSWORD into a 32-bit format to ensure security
of SNMP transactions. You can choose between the following options:
MD5 – Message Digest Algorithm
SHA – Secure Hash Algorithm
11. ENCRYPTFLAG – This flag appears only when v3 is selected as the SNMPVERSION. By
default, the eG agent does not encrypt SNMP requests. Accordingly, the ENCRYPTFLAG is
set to NO by default. To ensure that SNMP requests sent by the eG agent are encrypted,
select the YES option.
12. ENCRYPTTYPE – If the ENCRYPTFLAG is set to YES, then you will have to mention the
encryption type by selecting an option from the ENCRYPTTYPE list. SNMP v3 supports the
following encryption types:
DES – Data Encryption Standard
AES – Advanced Encryption Standard
13. ENCRYPTPASSWORD – Specify the encryption password here.
14. CONFIRM PASSWORD – Confirm the encryption password by retyping it here.

M O N I T O RI N G T H E C I T R I X NE T S C A L E R L B
335
15. TIMEOUT – Specify the duration (in seconds) beyond which the SNMP query issues by this
test should time out. The default period is 10 seconds.
Outputs of the
test
One set of results for every Citrix Netscaler being monitored
Measurements
made by the
test
Measurement
Measurement
Unit
Interpretation
New client connections:
Indicates the number of new
client connections to the
Netscaler device in the last
measurement period.
Number
New server connections:
Indicates the number of new
connections established
between servers and the
Netscaler device in the last
measurement period.
Number
Tcp offload factor:
This factor monitors the
connections from the
Netscaler device to servers as
a factor of the connections it
receives from clients.
Percent
One of the key benefits of the Netscaler
device is its ability to offload TCP connection
processing from the servers to the Netscaler
device itself. By doing so, the Netscaler
device allows the existing server
infrastructure to support a larger workload.
The lower the value of this metric, the
greater the benefits of the Netscaler device.
Current client
connections:
Indicates the number of
connections currently
established by clients to the
Netscaler device.
Number
Current server
connections:
Indicates the number of
connections currently
established by the Netscaler
device to servers.
Number

M O N I T O RI N G T H E C I T R I X NE T S C A L E R L B
336
Client connections
refused:
Indicates the number of
connections from clients that
were refused by the Netscaler
device during the last
measurement period.
Number
This value should be close to 0 for ideal
operation.
Cookie sequence
mismatch rejects:
Indicates the number of
connections rejected because
of syn cookie sequence
number mismatch.
Number
Normal SYN cookies contain encoded
information that makes it near impossible to
request a connection to a host from a forged
(spoofed) originating address. In this
scenario, the attacker must guess a valid TCP
sequence number used by that server to
connect to some other legitimate host. The
cryptographic protection in the standard SYN
cookie makes this attack possible with as few
as one million guesses, which is not
impossible for a determined attacker.
NetScaler uses an enhanced SYN cookie
protection scheme that is fully compatible
with the TCP/IP protocol, but have rendered
the “forged connection” technique obsolete.
Each new connection is unrelated to previous
connections, and knowing a valid sequence
number used for a previous connection will
not enable an attacker to forge a connection.
A large value of this measure could indicate
failed attempts made to hack into a network.
Further investigation is hence, necessary.
Cookie signature
mismatch rejects:
Indicates the number of
connections rejected because
of syn cookie signature
mismatch.
Number

M O N I T O RI N G T H E C I T R I X NE T S C A L E R L B
337
Unacknowledged SYNs
received:
Indicates the number of
connections dropped because
of unacknowledged SYN
packets.
Number
When a client attempts to establish a TCP
connection to a server, the client and server
exchange a set sequence of messages. This
connection technique applies to all TCP
connections (for example, Telnet, web, E-
mail, and so on). The sequence for the TCP
connections are:
The client sends a SYN message
to the server.
The server acknowledges the
SYN message by sending a
SYN-ACK message to the client.
The client finishes establishing
the connection by responding to
the server with an ACK message
When the sequence is complete, the
connection between the client and server is
open, and service-specific data can be
exchanged between the client and server.
The potential for attack arises at the point
when the back-end server has sent an
acknowledgement (SYN-ACK) to the client
but has not received the ACK message from
the client; this is referred to as a half-open
connection in the server.
A high value of this measure indicates that
too many such half-open connections exist in
the server, which could consume excessive
system memory, causing the server system
to crash or hang, or deny service to
legitimate clients.
Open connections to
servers:
Indicates the number of
connections established with
servers.
Number

M O N I T O RI N G T H E C I T R I X NE T S C A L E R L B
338
Server connection hits:
Indicates the number of client
transactions in the last
measurement period that
used the server connection in
the reuse pool.
Number
Netscaler appliances support a 'Connection
Keep-Alive' feature that is enabled for HTTP
protocols, so that persistent connections are
available between the system and the client
over the WAN link and also between the
system and the server. This is achieved by
mimicking HTTP “connection-persistence”
behavior to both the client and server. The
server always perceives that it is
communicating with a persistent client (even
if the client is not persistent) and the client
always thinks it is communicating with a
persistent server (even if the server is
configured not to do keep-alive; for example,
the server is configured to do one request
per connection). One of the key benefits of
this feature to a server is the creation and
maintenance of a pool of ready-to-go fast
server connections (i.e., the reuse pool). This
pool ensures that connection requests from
clients are serviced by the pool itself without
having to open actual connections on the
server, and thus greatly reduces the
connection-burden on the server.
If the value of the
Server connection hits
measure is very low or the
Server connection
misses
measure is very high, it indicates that
the pool is not been effectively utilized. A
very low
Server connection pool hit ratio
is
also indicative of the same. If such a situation
persists, it can only result in more physical
connections been opened on the server, and
consequently, excessive CPU and memory
erosion at the server-level. You can counter
this abnormal event by ensuring that the
Connection Keep-Alive feature is always
enabled.
Server connection misses:
Indicates the number of new
connections made during the
last measurement period
because the server
connection was unavailable in
reuse pool.
Number
Server connection pool hit
ratio:
This metric is a measure of
the efficiency of the server
reuse pool.
Percent

M O N I T O RI N G T H E C I T R I X NE T S C A L E R L B
339
CPU usage:
Indicates the current CPU
usage of the Netscaler
device.
Percent
Ideally, this value should be low.

M o n i t o r i n g C i t r i x S t o r e F r o n t
340
Monitoring Citrix Storefront
Citrix StoreFront, which is the successor to Citrix Web Interface, authenticates users to XenDesktop sites, XenApp
farms, App Controller (SaaS Apps), and VDI-in-a-Box enumerating and aggregating available desktops and
applications into stores that users access through Citrix Receiver for Android, iOS, Linux, Windows, Win8/RT or
Receiver for Web sites. Storefront enables next generation features such as:
Unified StoreFront for XenApp and XenDesktop resources that can also deliver SaaS & Native Mobile
applications (through App Controller).
Simplified Account Provisioning, which enables users to connect to assigned desktops and applications by
simply entering their email or server address, or by opening a Provisioning File in Receiver.
Access from any Receiver with a consistent user experience, including automatic fallback to Receiver for
HTML5 on Receiver for Web sites if a native client isn’t available locally and can’t be installed.
Synchronization of resource subscriptions across all platforms and devices (Follow-me Apps & Data).
Cross-farm aggregation and de-duplication, that aggregates and delivers a unique set of applications from
multiple farms across different sites.
Farm-Based Optimal HDX Connection Routing, which enables the use of the nearest NetScaler Gateway for
HDX traffic routing independent of the NetScaler Gateway used for initial authentication.
The architecture of the Citrix Storefront is explained in Figure 12.1.
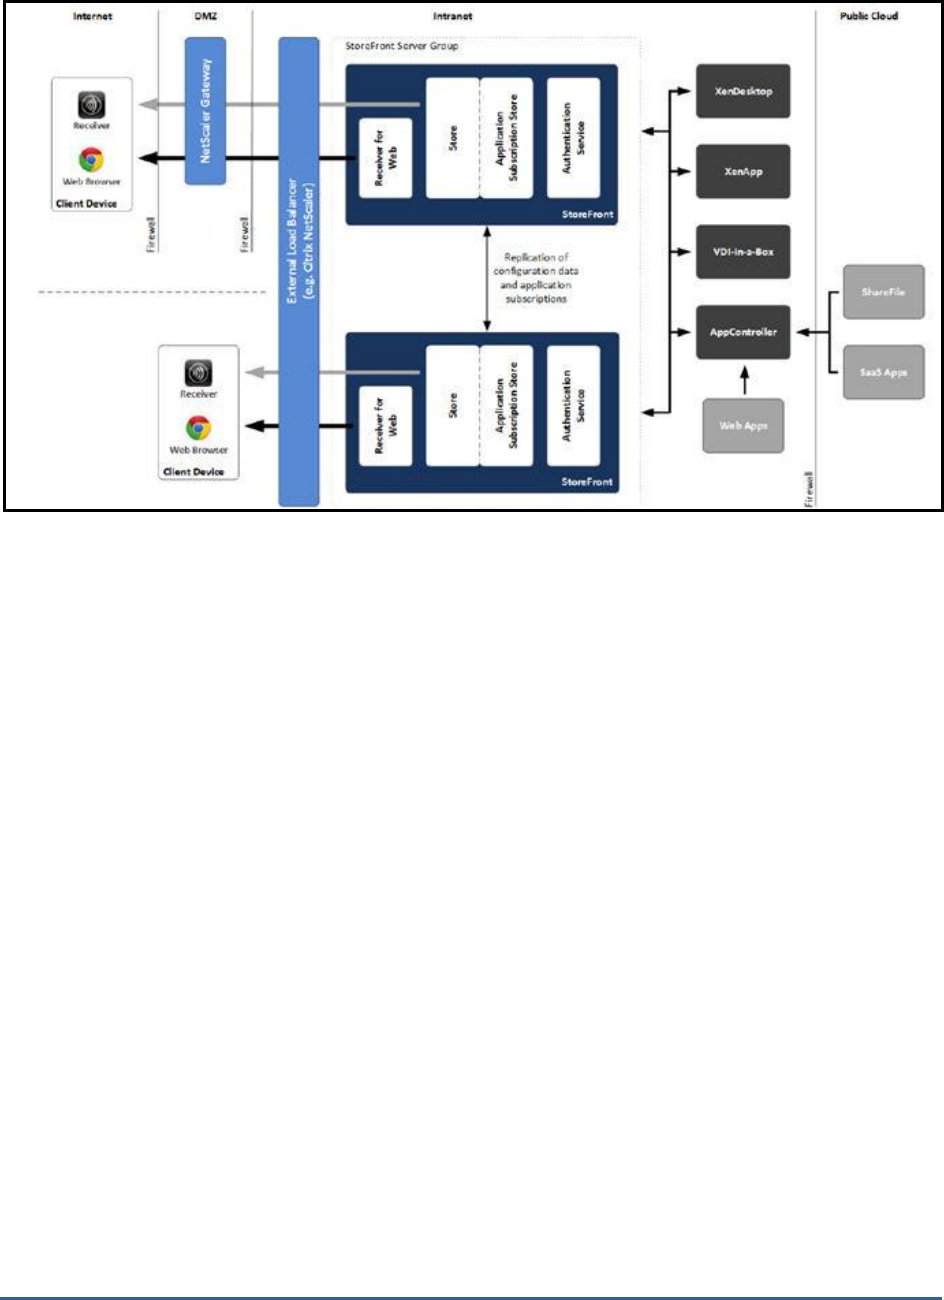
M o n i t o r i n g C i t r i x S t o r e F r o n t
341
Figure 12.1: The Citrix Storefront architecture
StoreFront consists of the following components:
Authentication service: This service, which is an integral part of StoreFront, authenticates users to
XenDesktop sites, XenApp farms, and App Controller (for SaaS apps). The authentication service ensures
that users only need to log on to StoreFront/Receiver once.
Store: The store retrieves user credentials from the authentication service to authenticate users to the
components providing the resources. The store also enumerates and aggregates the resources currently
available from XenDesktop sites, XenApp farms, and App Controller (SaaS Apps). Users access the store
through Citrix Receiver or a Receiver for Web site.
Application Subscription Store (Data Store): This store saves and indexes the application or desktop
subscriptions of the users on a per-StoreFront Store basis. In contrast to older versions of StoreFront,
where an external Microsoft SQL database was required, the new Application Subscription Store uses the
built-in Microsoft Windows Extensible Storage Engine to store details of users’ app subscriptions locally on
StoreFront servers. When joining a StoreFront server to a Server Group the replication of data between all
members is configured automatically.
Receiver for Web site: This site enables users to access stores through a webpage. Furthermore, this site
can verify the version of Receiver installed locally on the endpoint and guide the user through an upgrade
or installation procedure if required. In scenarios where Receiver cannot be locally Receiver for HTML5 can
be enabled for the Receiver for Web sites so that users can access resources directly within HTML5-
compatible web browsers.
Desktop Appliance site: Desktop Appliance sites provide users of non-domain desktops with an experience
similar to that of users with domain-joined desktops. The web browsers on desktop appliances are
configured to start in full-screen mode displaying the logon screen for a Desktop Appliance site. When a
user logs on to a site, by default, the first desktop (in alphabetical order) available to the user in the store
for which the site is configured starts automatically. Desktop Appliance sites are only created by default
when StoreFront is installed and configured as part of a XenDesktop installation.
XenApp Services site: Users with older Citrix clients that cannot be upgraded can access stores by
configuring their clients with the XenApp Services URL for a store. This site can also be used from domain-
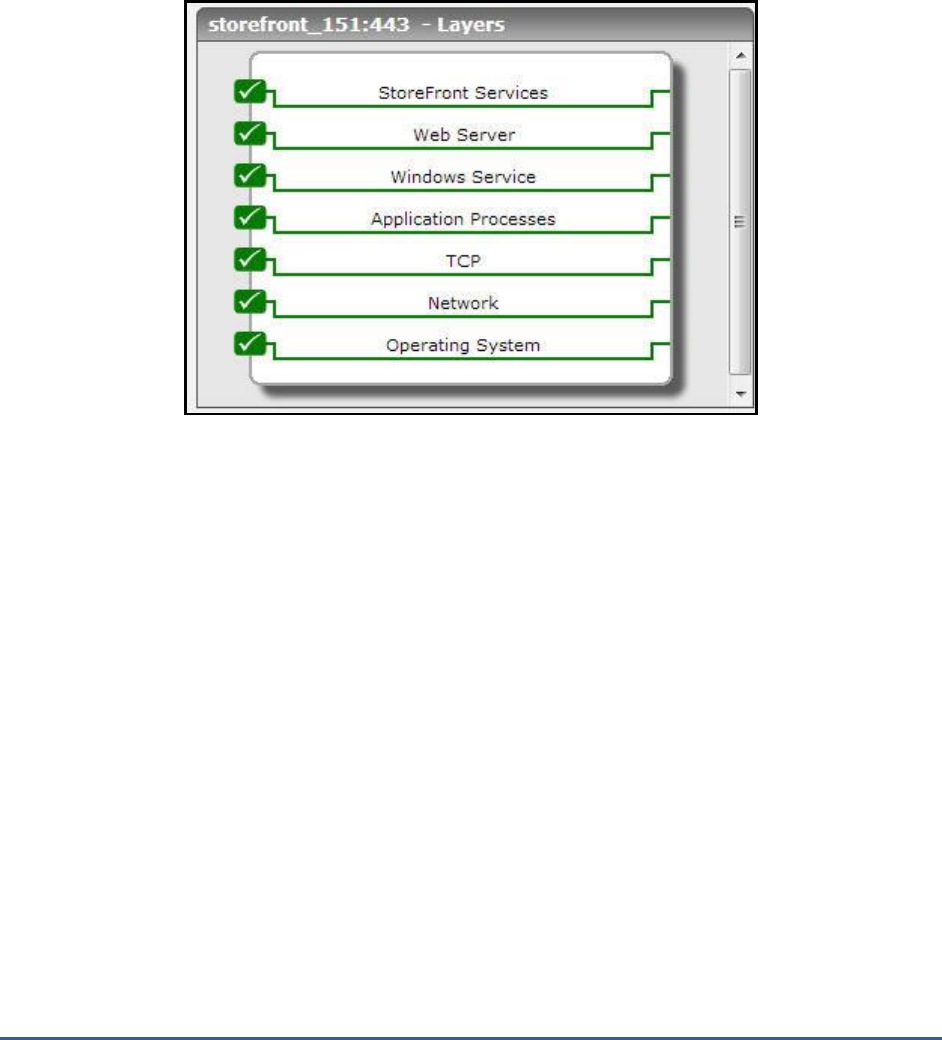
M o n i t o r i n g C i t r i x S t o r e F r o n t
342
joined desktop appliances and repurposed PCs running the Citrix Desktop Lock.
NetScaler Gateway: Citrix NetScaler Gateway is a physical or virtual appliance, which provides secure
remote access to internal resources. The appliance is typically located within the DMZ and exposed to the
Internet. When a user connects to NetScaler Gateway they will need to authenticate before any access to
internal resources is granted. The access can be controlled by the admin by means of granular application-
level policies and action controls.
As already mentioned, the
Citrix Storefront
model of eG Enterprise monitors the health of the storefront and the user
authentication.
Figure 12.2: The layer model of the Citrix Storefront
Each layer of Figure 12.2 above is mapped to a series of tests that periodically monitors the Citrix Storefront server
and checks on the following:
How well the resources were accessed?
The time taken to access the resources;
How well the resources were accessed using the ICA protocol?;
How well the resources were accessed using the RADE (Rapid Application Delivery) process?;
The rate at which the users were authenticated based on their chosen language preference;
The time taken to authenticate the users;
The rate at which the password change requests from the users were processed?
The time taken to change the password upon user requests;
How well the authentication store stores the user information, retrieves the information and deletes the
user information?;
How well the resources and sessions were accessed using the Citrix Dazzle?;
What is the rate at which the user subscriptions were added, deleted, modified, enabled etc?;
The time taken to retrieve the user subscriptions from the authentication store;
How well the users are authenticated to access the controller through the Web Application Delivery
service?
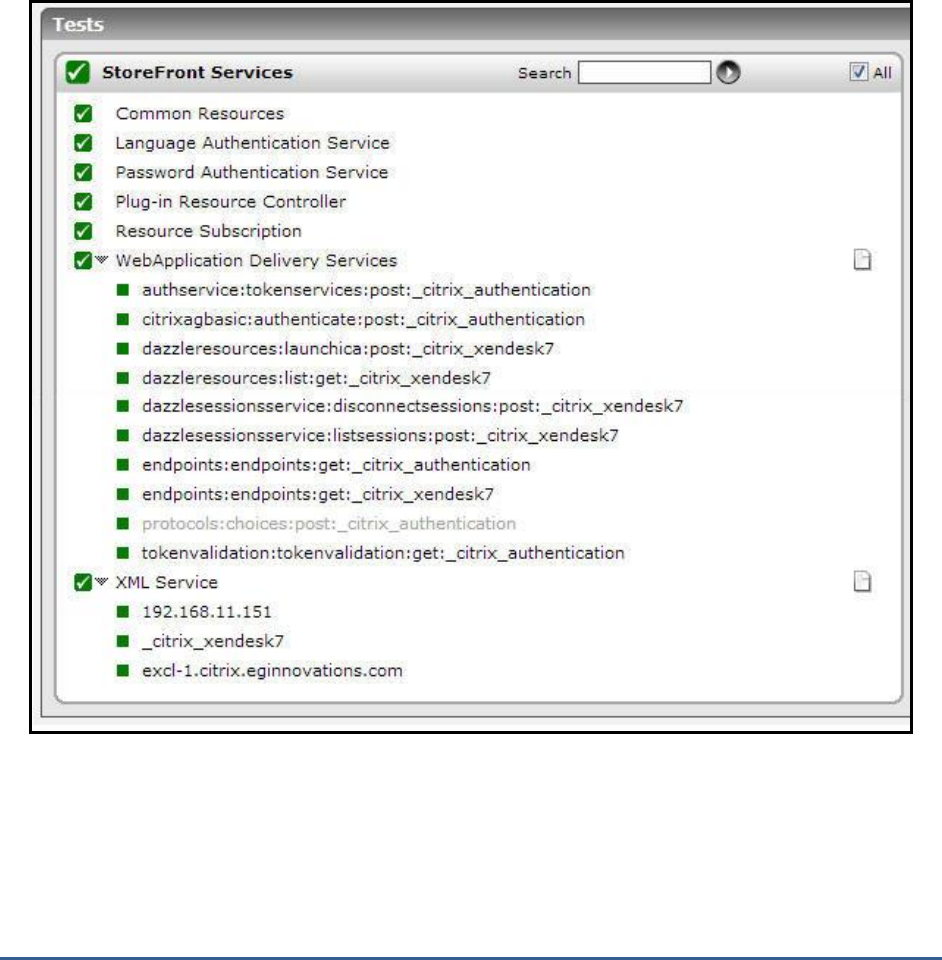
M o n i t o r i n g C i t r i x S t o r e F r o n t
343
How well the Citrix Storefront is accessed through the XML service?
The Operating System, Network, TCP, Application Processes, Windows Service and Web Server layers of Citrix
XenDesktop Apps are similar to that of a
Windows
server model. Since these tests have been dealt with in the
Monitoring Unix and Windows Servers
document, Section 1.1 focuses on the Storefront Services layer.
12.1 The Storefront Services Layer
This layer tracks the rate at which the resources were accessed from the Citrix Sotrefront, the details pertaining to
the user subscriptions, the rate at which the users are authenticated based on their language preference, the rate at
which the change password requests from users are processed, the time taken to change the password in the store,
the rate at which the applications/resources were accessed through the Citrix Dazzle etc.
Figure 12.3: The tests mapped to the Storefront Services layer

M o n i t o r i n g C i t r i x S t o r e F r o n t
344
12.1.1 Common Resources Test
Using this test, you can easily identify the rate at which the resources were accessed from the store, the resources
were accessed using ICA protocol and RADE (Rapid Application DElivery) process. In addition, the time taken for
accessing the resources using the ICA protocol and the RADE process can also be identified easily.
Purpose
Helps you in identifying the rate at which the resources were accessed from the store, the
resources were accessed using ICA protocol and RADE (Rapid Application DElivery) process. In
addition, the time taken for accessing the resources using the ICA protocol and the RADE
process can also be identified easily.
Target of the
test
Citrix Storefront server
Agent
deploying the
test
An internal/remote agent
Configurable
parameters for
the test
1. TEST PERIOD - How often should the test be executed
2. HOST - The host for which the test is to be configured.
3. PORT – The port number at which the specified HOST listens to. By default, this is 443.
Outputs of the
test
One set of results for the Citrix Storefront server being monitored
Measurements
made by the
test
Measurement
Measurement
Unit
Interpretation
All resources calls:
Indicates the rate at which
the resources were accessed
from the store of this server.
Calls/sec
ICA launch calls:
Indicates the rate at which
the resources were accessed
using ICA protocol from the
store of this server.
Calls/sec
ICA launch average time:
Indicates the average time
taken to access the resources
using the ICA protocol from
the store of this server.
Secs
Rade launch calls:
Indicates the rate at which
the resources were accessed
using the RADE (Rapid
Application Delivery) process
from the store of this server.
Calls/sec

M o n i t o r i n g C i t r i x S t o r e F r o n t
345
Rade launch average
time:
Indicates the average time
taken to access the resources
using the RADE process from
the store of this server.
Secs
12.1.2 Language Authentication Service Test
In large virtualized environments, at any given point of time, thousands of users from different zones of the world
may be trying to access the published applications and virtual desktops. In such a situation, language plays a major
role when a user tries to login through the Citrix Receiver. Based on the language preference of the users, the
Language Authentication Service test helps you to determine the rate at which the users are authenticated and how
long it took for the Citrix Storefront to authenticate the users. In addition, this test helps you to identify the rate at
which the change password requests have been entertained and the average time taken to change the password.
Purpose
Helps you to determine the rate at which the users are authenticated and how long it took for
the Citrix Storefront to authenticate the users. In addition, this test helps you to identify the rate
at which the change password requests have been entertained and the average time taken to
change the password.
Target of the
test
Citrix Storefront server
Agent
deploying the
test
An internal/remote agent
Configurable
parameters for
the test
1. TEST PERIOD - How often should the test be executed
2. HOST - The host for which the test is to be configured.
3. PORT – The port number at which the specified HOST listens to. By default, this is 443.
Outputs of the
test
One set of results for the Citrix Storefront server being monitored
Measurements
made by the
test
Measurement
Measurement
Unit
Interpretation
Authenticate calls:
Indicates the rate at which
users are authenticated by
this citrix storefront based on
their chosen language
preference.
Calls/sec
A high value is desired for this measure.
Authenticate average
time:
Indicates the average time
taken by this citrix storefront
server to authenticate the
users.
Secs
A low value is desired for this measure. A
gradual increase in the value of this measure
is an indication of the unavailability of the
database that is required for authentication
or a performance bottleneck.

M o n i t o r i n g C i t r i x S t o r e F r o n t
346
Change password calls:
Indicates the rate at which
the password change request
from the users are processed
by this citrix storefront server.
Calls/sec
Change password average
time:
Indicates the average time
taken by this citrix storefront
server nto process the
password change request
from users.
Secs
12.1.3 Password Authentication Service Test
When a user tries to login to access the virtual machines or published applications using their login credentials from
the Citrix Receiver, the Citrix Credential Wallet Service of the Citrix Storefront server helps in authenticating the
password entered by the user with the password that is already stored in the authentication store. Using the
Password Authentication Service test, administrators can easily analyze the rate at which the user information is
authenticated by the Citrix Wallet Service and the rate at which the user requests are retrieved and serviced to the
users. Additionally, you can idetnify how well the user requests are deleted after being serviced by the Citrix Wallet
service. This test is a perfect choice for monitoring the user authentication and the load on the virtualized
environment!
Purpose
Analyze the rate at which the user information is authenticated by the Citrix Wallet Service and
the rate at which the user requests are retrieved and serviced to the users. Additionally, you can
identify how well the user requests are deleted after being serviced by the Citrix Wallet service.
Target of the
test
Citrix Storefront server
Agent
deploying the
test
An internal/remote agent
Configurable
parameters for
the test
1. TEST PERIOD - How often should the test be executed
2. HOST - The host for which the test is to be configured.
3. PORT – The port number at which the specified HOST listens to. By default, this is 443.
Outputs of the
test
One set of results for the Citrix Storefront server that is to be monitored
Measurements
made by the
test
Measurement
Measurement
Unit
Interpretation
Store entry calls:
Indicates the rate at which
the authentication store
stores the entry information
i.e., the user requests.
Calls/sec
M o n i t o r i n g C i t r i x S t o r e F r o n t
347
Retrieve entry calls:
Indicates the rate at which
the user information is
retrieved from the
authentication store by the
Citrix Credential Wallet
Service upon user requests.
Calls/sec
Delete entry calls:
Indicates the rate at which
the user requests are deleted
after the request is serviced
by the Citrix Credential Wallet
Service.
Calls/sec
12.1.4 Plug-in Resource Controller Test
Citrix Dazzle is a plug-in for Citrix Receiver that allows users to subscribe to only those available published resources
that they choose.
This test helps the administrators to analyze the rate at which the image responses were received for the resources
accessed through the citrix dazzle and the rate at which the resources were actually accessed. In addition, you could
analyze the session related information of the resources, the whole body calls and the cache calls that were updated
upon user requests.
Purpose
Helps the administrators to analyze the rate at which the image response were received for the
resources accessed through the citrix dazzle and the rate at which the resources were actually
accessed. In addition, you could analyze the session related information of the resources, the
whole body calls and the cache calls that were updated upon user requests.
Target of the
test
Citrix Storefront server
Agent
deploying the
test
An internal/remote agent
Configurable
parameters for
the test
1. TEST PERIOD - How often should the test be executed
2. HOST - The host for which the test is to be configured.
3. PORT – The port number at which the specified HOST listens to. By default, this is 443.
Outputs of the
test
One set of results for the Citrix Storefront server that is to be monitored
Measurements
made by the
Measurement
Measurement
Unit
Interpretation

M o n i t o r i n g C i t r i x S t o r e F r o n t
348
test
Image response whole
body calls:
Indicates the rate of image
responses received for the
resources accessed through
the citrix dazzle.
Calls/sec
List convert resources
calls:
Indicates the rate at which
the resources were accessed
through the citrix dazzle.
Calls/sec
List sessions whole body
calls:
Indicates the rate at which
the sessions were accessed
through the citrix dazzle.
Calls/sec
List whole body calls:
Indicates the rate of whole
body calls through the citrix
dazzle.
Calls/sec
Update resources image
cache calls:
Indicates the rate at which
the cache calls are updated
upon user requests for image
resources.
Calls/Sec
12.1.5 Resource Subscription Test
In order to identify the load on the virtualized environment i.e., to identify the details of the user subscriptions, use
the Resource Subscription test.
This test helps the administrators to identify the rate at which the user subscriptions are added, disposed, enabled,
retrieved, removed, modified etc. Additionally, administrators may get to know the time taken to retrieve the user
subscriptions from the store and the time taken to modify the user subsciptions.
Purpose
Helps the administrators to identify the rate at which the user subscriptions are added, disposed,
enabled, retrieved, removed, modified etc. Additionally, administrators may get to know the time
taken to retrieve the user subscriptions from the store and the time taken to modify the user
subsciptions.
Target of the
test
Citrix Storefront server
Agent
deploying the
test
An internal/remote agent

M o n i t o r i n g C i t r i x S t o r e F r o n t
349
Configurable
parameters for
the test
1. TEST PERIOD - How often should the test be executed
2. HOST - The host for which the test is to be configured.
3. PORT – The port number at which the specified HOST listens to. By default, this is 443.
Outputs of the
test
One set of results for the Citrix Storefront server that is to be monitored
Measurements
made by the
test
Measurement
Measuremen
t Unit
Interpretation
Add subscriptions calls:
Indicates the rate at which the
user subscriptions were added
to the store of this server.
Calls/sec
Dispose calls:
Indicates the rate at which the
user subscriptions were disposed
from the store of this server.
Calls/sec
Enabled calls:
Indicates the rate at which the
user subscriptions were enabled
on this server.
Calls/sec
Get subscriptions calls:
Indicates the rate at which the
subscriptions were retrieved
from the store of this server.
Calls/sec
Get subscriptions average
time:
Indicates the average time
taken to retrieve the user
subscriptions from the store.
Secs
Remove subscriptions calls:
Indicates the rate at which the
subscriptions were removed
from the store.
Calls/sec
Remove subscriptions
average time:
Indicates the average time
taken to remove the
subscriptions from the store.
Secs

M o n i t o r i n g C i t r i x S t o r e F r o n t
350
Save changes calls:
Indicates the rate at which the
changes made to the user
subscriptions were saved on the
store.
Calls/sec
Update subscription calls:
Indicates the rate at which the
user subscriptions were updated
on the store.
Calls/sec
12.1.6 Web Application Delivery Services Test
The Citrix Self service plugin is used to customize the applications that are frequently used by the users in the Citrix
Receiver dashboard, once the users are authenticated on the Citrix Storefront.
This test reports the rate at which the users are authenticated to access the controller while accessing the
applications through the Citrix Self service plugin and the time taken for authenticating the users to access the
controller.
Purpose
Reports the rate at which the users are authenticated to access the controller while accessing
the applications through the Citrix Self service plugin and the time taken for authenticating the
users to access the controller.
Target of the
test
Citrix Storefront server
Agent
deploying the
test
An internal/remote agent
Configurable
parameters for
the test
1. TEST PERIOD - How often should the test be executed
2. HOST - The host for which the test is to be configured.
3. PORT – The port number at which the specified HOST listens to. By default, this is 443.
Outputs of the
test
One set of results for the web application delivery service that is to be monitored
Measurements
made by the
test
Measurement
Measurement
Unit
Interpretation
Controller action calls:
Indicates the rate at which
the users accessing through
the Citrix Self service plugin
are authenticated to access
the controller.
Calls/sec

M o n i t o r i n g C i t r i x S t o r e F r o n t
351
Controller action average
time:
Indicates the average time
taken for authenticating the
users accessing the controller
through the Citrix Self service
plugin.
Secs
12.1.7 XML Service Test
The XML Service supplies the Citrix Storefront and the users connected through the Citrix Storefront with the name
of the applications that are available in the virtual environment.
This test helps you in identifying the rate at which the web interface is accessed through the XML service and the
rate at which the errors were generated when there was a glitch in accessing the web interface through the service.
Purpose
Helps you in identifying the rate at which the web interface is accessed through the XML service
and the rate at which the errors were generated when there was a glitch in accessing the web
interface through the service.
Target of the
test
Citrix Storefront server
Agent
deploying the
test
An internal/remote agent
Configurable
parameters for
the test
1. TEST PERIOD - How often should the test be executed
2. HOST - The host for which the test is to be configured.
3. PORT – The port number at which the specified HOST listens to. By default, this is 443.
Outputs of the
test
One set of results for the Citrix Storefront server being monitored
Measurements
made by the
test
Measurement
Measurement
Unit
Interpretation
Network traffic calls:
Indicates the rate at which
the web interface is accessed
through the XML service.
Calls/sec
Network traffic error calls:
Indicates the rate at which
the errors were generated
while the web interface was
accessed through the XML
service.
Calls/sec

M o n i t o r i n g C i t r i x S t o r e F r o n t
352
12.1.8 Citrix Delivery Service Log Test
This test periodically scans the Citrix Delivery Service logs for configured patterns of errors/warnings and promptly
captures and reports error/warning messages that match the specified patterns.
Configurable
parameters for
the test
1. TEST PERIOD - How often should the test be executed
2. HOST - The host for which the test is to be configured
3. PORT – Refers to the port used by the EventLog Service. Here it is null.
4. LOGTYPE – Refers to the type of event logs to be monitored. The default value is
application
.
5. POLICY BASED FILTER - Using this page, administrators can configure the event
sources, event IDs, and event descriptions to be monitored by this test. In order to enable
administrators to easily and accurately provide this specification, this page provides the
following options:
Manually specify the event sources, IDs, and descriptions in the FILTER text area,
or,
Select a specification from the predefined filter policies listed in the FILTER box
For explicit, manual specification of the filter conditions, select the NO option against the
POLICY BASED FILTER field. This is the default selection. To choose from the list of pre-
configured filter policies, or to create a new filter policy and then associate the same with
the test, select the YES option against the POLICY BASED FILTER field.
6. FILTER - If the POLICY BASED FILTER flag is set to NO, then a FILTER text area will
appear, wherein you will have to specify the event sources, event IDs, and event
descriptions to be monitored. This specification should be of the following format:
{Displayname}:{event_sources_to_be_included}:{event_sources_to_be_excluded}:{event_I
Ds_to_be_included}:{event_IDs_to_be_excluded}:{event_descriptions_to_be_included}:{ev
ent_descriptions_to_be_excluded}
. For example, assume that the FILTER text area takes
the value,
OS_events:all:Browse,Print:all:none:all:none
. Here:
u.
OS_events
is the display name that will appear as a descriptor of the test in the
monitor UI;
v.
all
indicates that all the event sources need to be considered while monitoring. To
monitor specific event sources, provide the source names as a comma-separated list.
To ensure that none of the event sources are monitored, specify
none
.
w. Next, to ensure that specific event sources are excluded from monitoring, provide a
comma-separated list of source names. Accordingly, in our example,
Browse
and
Print
have been excluded from monitoring. Alternatively, you can use
all
to indicate that all
the event sources have to be excluded from monitoring, or
none
to denote that none of
the event sources need be excluded.
x. In the same manner, you can provide a comma-separated list of event IDs that require
monitoring. The
all
in our example represents that all the event IDs need to be
considered while monitoring.

M o n i t o r i n g C i t r i x S t o r e F r o n t
353
y. Similarly, the
none
(following
all
in our example) is indicative of the fact that none of
the event IDs need to be excluded from monitoring. On the other hand, if you want to
instruct the eG Enterprise system to ignore a few event IDs during monitoring, then
provide the IDs as a comma-separated list. Likewise, specifying
all
makes sure that all
the event IDs are excluded from monitoring.
z. The all which follows implies that all events, regardless of description, need
to be included for monitoring. To exclude all events, use none. On the other
hand, if you provide a comma-separated list of event descriptions, then the
events with the specified descriptions will alone be monitored. Event
descriptions can be of any of the following forms - desc*, or desc, or
*desc*,or desc*, or desc1*desc2, etc. desc here refers to any string that
forms part of the description. A leading '*' signifies any number of leading
characters, while a trailing '*' signifies any number of trailing characters.
aa. In the same way, you can also provide a comma-separated list of event
descriptions to be excluded from monitoring. Here again, the specification
can be of any of the following forms: desc*, or desc, or *desc*,or desc*, or
desc1*desc2, etc. desc here refers to any string that forms part of the
description. A leading '*' signifies any number of leading characters, while a
trailing '*' signifies any number of trailing characters. In our example
however, none is specified, indicating that no event descriptions are to be
excluded from monitoring. If you use all instead, it would mean that all
event descriptions are to be excluded from monitoring.
By default, the FILTER parameter contains the value
:
all:all:none:all:none:all:none.
Multiple filters are to be separated by semi-colons (;).
Note:
The event sources and event IDs specified here should be exactly the same as that which
appears in the Event Viewer window.
On the other hand, if the POLICY BASED FILTER flag is set to YES, then a FILTER list
box will appear, displaying the filter policies that pre-exist in the eG Enterprise system. A
filter policy typically comprises of a specific set of event sources, event IDs, and event
descriptions to be monitored. This specification is built into the policy in the following
format:
{Policyname}:{event_sources_to_be_included}:{event_sources_to_be_exclude
d}:{event_IDs_to_be_included}:{event_IDs_to_be_excluded}:{event_descripti
ons_to_be_included}:{event_descriptions_to_be_excluded}
To monitor a specific combination of event sources, event IDs, and event descriptions, you
can choose the corresponding filter policy from the FILTER list box. Multiple filter policies
can be so selected. Alternatively, you can modify any of the existing policies to suit your
needs, or create a new filter policy. To facilitate this, a Click here link appears just above
the test configuration section, once the YES option is chosen against POLICY BASED
FILTER. Clicking on the Click here link leads you to a page where you can modify the
existing policies or create a new one. The changed policy or the new policy can then be
associated with the test by selecting the policy name from the FILTER list box in this page.

M o n i t o r i n g C i t r i x S t o r e F r o n t
354
7. USEWMI - The eG agent can either use WMI to extract event log statistics or directly
parse the event logs using event log APIs. If the USEWMI flag is YES, then WMI is used. If
not, the event log APIs are used. This option is provided because on some Windows 2000
systems (especially ones with service pack 3 or lower), the use of WMI access to event logs
can cause the CPU usage of the WinMgmt process to shoot up. On such systems, set the
USEWMI parameter value to NO.
8. STATELESS ALERTS - Typically, the eG manager generates email alerts only when the
state of a specific measurement changes. A state change typically occurs only when the
threshold of a measure is violated a configured number of times within a specified time
window. While this ensured that the eG manager raised alarms only when the problem was
severe enough, in some cases, it may cause one/more problems to go unnoticed, just
because they did not result in a state change. For example, take the case of the EventLog
test. When this test captures an error event for the very first time, the eG manager will
send out a CRITICAL email alert with the details of the error event to configured recipients.
Now, the next time the test runs, if a different error event is captured, the eG manager will
keep the state of the measure as CRITICAL, but will not send out the details of this error
event to the user; thus, the second issue will remain hidden from the user. To make sure
that administrators do not miss/overlook critical issues, the eG Enterprise monitoring
solution provides the stateless alerting capability. To enable this capability for this test, set
the STATELESS ALERTS flag to Yes. This will ensure that email alerts are generated for
this test, regardless of whether or not the state of the measures reported by this test
changes.
9. EVENTS DURING RESTART - By default, the EVENTS DURING RESTART flag is set to
Yes. This ensures that whenever the agent is stopped and later started, the events that
might have occurred during the period of non-availability of the agent are included in the
number of events reported by the agent. Setting the flag to No ensures that the agent,
when restarted, ignores the events that occurred during the time it was not available.
10. DDFORINFORMATION – eG Enterprise also provides you with options to restrict the
amount of storage required for event log tests. Towards this end, the
DDFORINFORMATION and DDFORWARNING flags have been made available in this
page. By default, both these flags are set to Yes, indicating that by default, the test
generates detailed diagnostic measures for information events and warning events. If you
do not want the test to generate and store detailed measures for information events, set
the DDFORINFORMATION flag to No.
11. DDFORWARNING – To ensure that the test does not generate and store detailed
measures for warning events, set the DDFORWARNING flag to No.
12. DD FREQUENCY - Refers to the frequency with which detailed diagnosis measures are to
be generated for this test. The default is
1:1
. This indicates that, by default, detailed
measures will be generated every time this test runs, and also every time the test detects a
problem. You can modify this frequency, if you so desire. Also, if you intend to disable the
detailed diagnosis capability for this test, you can do so by specifying
none
against DD
FREQUENCY.

M o n i t o r i n g C i t r i x S t o r e F r o n t
355
13. DETAILED DIAGNOSIS - To make diagnosis more efficient and accurate, the eG
Enterprise suite embeds an optional detailed diagnostic capability. With this capability, the
eG agents can be configured to run detailed, more elaborate tests as and when specific
problems are detected. To enable the detailed diagnosis capability of this test for a
particular server, choose the On option. To disable the capability, click on the Off option.
The option to selectively enable/disable the detailed diagnosis capability will be available
only if the following conditions are fulfilled:
The eG manager license should allow the detailed diagnosis capability
Both the normal and abnormal frequencies configured for the detailed diagnosis
measures should not be 0.
Outputs of the
test
One set of results for the FILTER configured
Measurements
made by the
test
Measurement
Measurement
Unit
Interpretation
Information messages:
This refers to the number
of application information
events generated when the
test was last executed.
Number
A change in the value of this measure may
indicate infrequent but successful operations
performed by one or more applications.
Please check the Citrix Delivery Service Logs
in the Event Log Viewer for more details.
Warnings:
This refers to the number
of warnings that were
generated when the test
was last executed.
Number
A high value of this measure indicates
problems with the broker that may not have
an immediate impact, but may cause future
problems in one or more machines of this
broker.
Please check the Citrix Delivery Service Logs
in the Event Log Viewer for more details.
Error messages:
This refers to the number
of application error events
that were generated.
Number
A very low value (zero) indicates that the
system is in a healthy state and all
applications are running smoothly without
any potential problems.
An increasing trend or high value indicates
the existence of problems like loss of
functionality or data in one or more
applications.
Please check the Citrix Delivery Service Logs
in the Event Log Viewer for more details.

M o n i t o r i n g C i t r i x S t o r e F r o n t
356
Critical messages:
Indicates the number of
critical events that were
generated when the test
was last executed.
Number
A critical event is one that an application or a
component cannot automatically recover
from. This measure is applicable only for
Windows 2008/Windows Vista/Windows 7
systems.
A very low value (zero) indicates that the
system is in a healthy state and all
applications are running smoothly without
any potential problems.
An increasing trend or high value indicates
the existence of fatal/irrepairable problems in
one or more applications.
The detailed diagnosis of this measure
describes all the critical application events
that were generated during the last
measurement period.
Please check the Citrix Delivery Service Logs
in the Event Log Viewer for more details.
Verbose messages:
Indicates the number of
verbose events that were
generated when the test
was last executed.
Number
Verbose logging provides more details in the
log entry, which will enable you to
troubleshoot issues better.
This measure is applicable only for Windows
2008/Windows Vista/Windows 7 systems.
The detailed diagnosis of this measure
describes all the verbose events that were
generated during the last measurement
period.
Please check the Citrix Delivery Service Logs
in the Event Log Viewer for more details.
12.1.9 Server Groups Test
StoreFront can be configured either on a single server or as a multiple server deployment where two/more servers
are grouped under a server group. Server groups not only provide additional capacity, but also greater availability.
To know the number and names of servers in a server group, use the Server Groups test.
Purpose
Reports the number of servers in a server group
Target of the
test
Citrix Storefront server
Agent
deploying the
test
An internal/remote agent

M o n i t o r i n g C i t r i x S t o r e F r o n t
357
Configurable
parameters for
the test
1. TEST PERIOD - How often should the test be executed
2. HOST - The host for which the test is to be configured.
3. PORT – The port number at which the specified HOST listens to. By default, this is 443.
4. DD FREQUENCY - Refers to the frequency with which detailed diagnosis measures are to
be generated for this test. The default is
1:1
. This indicates that, by default, detailed
measures will be generated every time this test runs, and also every time the test detects a
problem. You can modify this frequency, if you so desire. Also, if you intend to disable the
detailed diagnosis capability for this test, you can do so by specifying
none
against DD
FREQUENCY.
5. DETAILED DIAGNOSIS - To make diagnosis more efficient and accurate, the eG
Enterprise suite embeds an optional detailed diagnostic capability. With this capability, the
eG agents can be configured to run detailed, more elaborate tests as and when specific
problems are detected. To enable the detailed diagnosis capability of this test for a
particular server, choose the On option. To disable the capability, click on the Off option.
The option to selectively enable/disable the detailed diagnosis capability will be available
only if the following conditions are fulfilled:
The eG manager license should allow the detailed diagnosis capability
Both the normal and abnormal frequencies configured for the detailed diagnosis
measures should not be 0.
Outputs of the
test
One set of results for the Citrix Storefront monitored
Measurements
made by the
test
Measurement
Measurement
Unit
Interpretation
Number of servers:
Indicates the number of
servers in the server group.
Number
Use the detailed diagnosis of this measure to
know which servers are part of the server
group.
12.1.10 Server Details Test
In a Storefront server group, configuration information and details of users' application subscriptions are stored on
and synchronized between all the servers in that group. This means that if a StoreFront server becomes unavailable
for any reason, users can continue to access their stores using the remaining servers. Meanwhile, the configuration
and subscription data on the failed server are automatically updated when it reconnects to the server group.
If a server in a group is unable to synchronize its data with other members of the group or is taking too long to do
so, Storefront wil not be able to deliver on its promise of high availability. Administrators should hence periodically
check whether the StoreFront server being monitored is in sync with other servers in that group, and if not, figure
out what is causing the non-sync – is it because the server is taking an abnormally long time to synchronize its data
with other group members? The Server Details test helps administrators find answers to this question! This test
promptly captures any data non-sync that may exist between a monitored server and the server group to which it
belongs and also reveals if it is owing to latencies in synchronization.
Purpose
Promptly captures any data non-sync that may exist between a monitored server and the server
group to which it belongs and also reveals if it is owing to latencies in synchronization.
M o n i t o r i n g C i t r i x S t o r e F r o n t
358
Target of the
test
Citrix Storefront server
Agent
deploying the
test
An internal/remote agent
Configurable
parameters for
the test
1. TEST PERIOD - How often should the test be executed
2. HOST - The host for which the test is to be configured.
3. PORT – The port number at which the specified HOST listens to. By default, this is 443.
Outputs of the
test
One set of results for the Citrix Storefront monitored
Measurements
made by the
test
Measurement
Measurement
Unit
Interpretation
Synchronization status:
Indicates whether/not the
contents are in sync with all
Storefront servers in the
group.
The values that this measure can take and
their corresponding numeric values are as
follows:
Measure Value
Numeric Value
Sync not done
0
Sync completed
100
Note:
By default, this measure reports the Measure
Values listed above to indicate the
synchronization state. The graph of this
measure however, represemts the same
using numeric equivalents only.
Synchronization duration:
Indicates the time taken for
synchronization.
Secs
A high value or a consistent increase in the
value of this measure is a cause for concern,
as it indicates synchronization delays.
12.1.11 Stores Test
StoreFront stores enumerate and aggregate desktops and applications from XenDesktop sites, XenApp farms, and
AppController, making these resources available to users. You can create as many stores as you need; for example,
you might want to create a store for a particular group of users or to aggregate a specific set of resources.
If users complain that they are unable to access a store, administrators should be able to instantly figure what is
causing the inaccessibility – is it because the store is unavailable? or is because of the store’s poor responsiveness to
user requests? This is where the Stores test helps! This test auto-discovers the stores configured on the Storefront
server and reports the availability and responsiveness of each store, so that unavailable and unresponsive stores can
be accurately isolated.
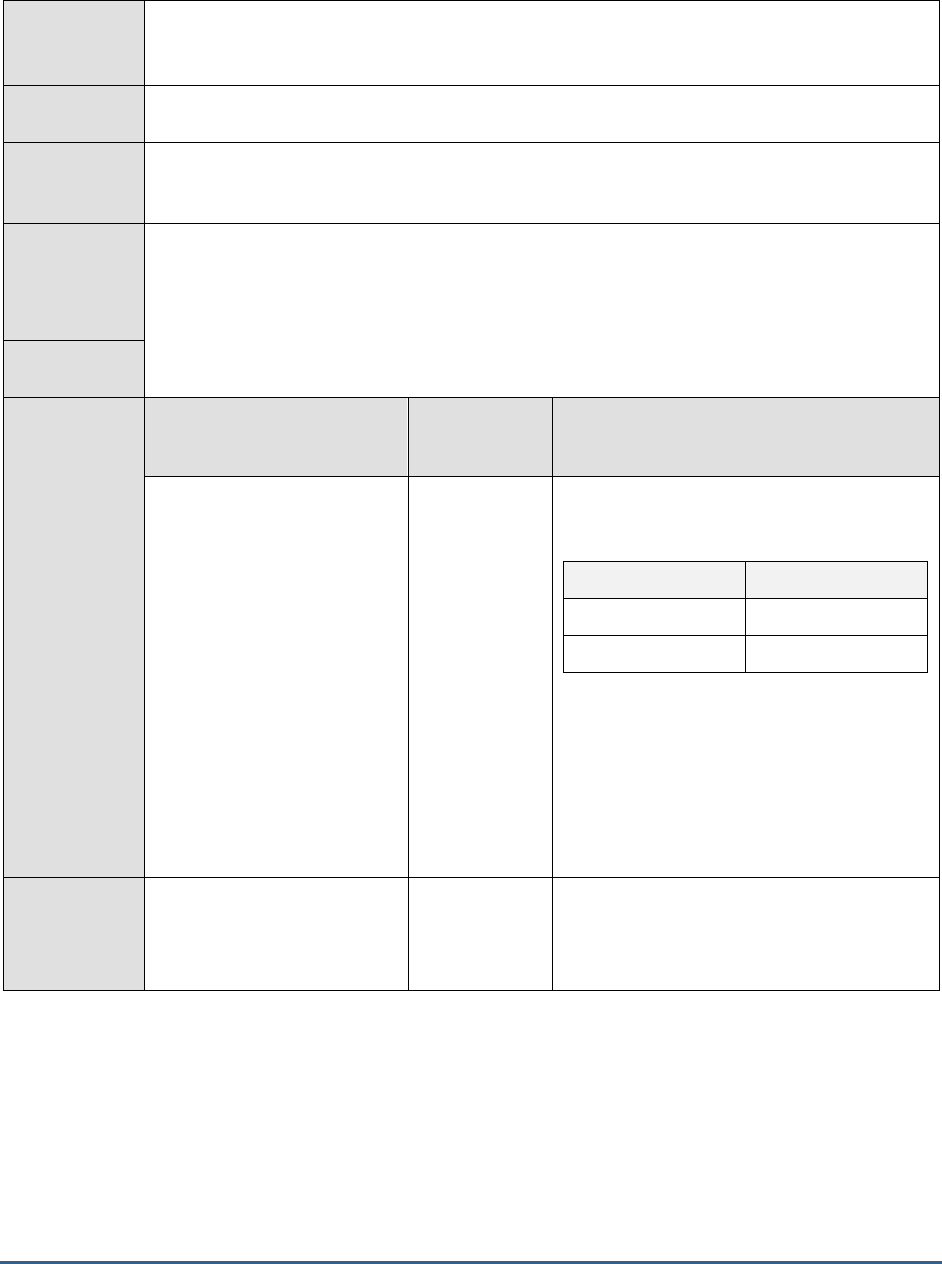
M o n i t o r i n g C i t r i x S t o r e F r o n t
359
Purpose
Auto-discovers the stores configured on the StoreFront server and reports the availability and
responsiveness of each store, so that unavailable and unresponsive stores can be accurately
isolated
Target of the
test
Citrix Storefront server
Agent
deploying the
test
An internal/remote agent
Configurable
parameters for
the test
1. TEST PERIOD - How often should the test be executed
2. HOST - The host for which the test is to be configured.
3. PORT – The port number at which the specified HOST listens to. By default, this is 443.
Outputs of the
test
One set of results for the each store configured on the Citrix Storefront monitored
Measurements
made by the
test
Measurement
Measurement
Unit
Interpretation
Availability:
Indicates whether/not this
store is available.
The values that this measure can take and
their corresponding numeric values are as
follows:
Measure Value
Numeric Value
Nolt available
0
Available
100
Note:
By default, this measure reports the Measure
Values listed above to indicate the availability
of a store. The graph of this measure
however, represemts the same using the
numeric equivalents only.
Response time:
Indicates the time taken by
this store to respond to user
requests.
Secs
A high value or a consistent increase in the
value of this measure is a cause for concern,
as it indicates poor responsiveness.

C O NC L U S I O N
360
Conclusion
This document has described in detail the monitoring paradigm used and the measurement capabilities of the eG
Enterprise suite of products with respect to Citrix Environments. For details of how to administer and use the eG
Enterprise suite of products, refer to the user manuals.
We will be adding new measurement capabilities into the future versions of the eG Enterprise suite. If you can
identify new capabilities that you would like us to incorporate in the eG Enterprise suite of products, please contact
support@eginnovations.com. We look forward to your support and cooperation. Any feedback regarding this manual
or any other aspects of the eG Enterprise suite can be forwarded to feedback@eginnovations.com.
