Manual Monitoring Citrix Xendesktop Site
User Manual: Monitoring Citrix Xendesktop Site
Open the PDF directly: View PDF ![]() .
.
Page Count: 66

Monitoring Citrix XenDesktop
Site
eG Enterprise v6.0

Restricted Rights Legend
The information contained in this document is confidential and subject to change without notice. No part of this
document may be reproduced or disclosed to others without the prior permission of eG Innovations Inc. eG
Innovations Inc. makes no warranty of any kind with regard to the software and documentation, including, but not
limited to, the implied warranties of merchantability and fitness for a particular purpose.
Trademarks
Microsoft Windows, Windows NT, Windows 2003, and Windows 2000 are either registered trademarks or trademarks
of Microsoft Corporation in United States and/or other countries.
The names of actual companies and products mentioned herein may be the trademarks of their respective owners.
Copyright
©2014 eG Innovations Inc. All rights reserved.
Table of Contents
MONITORING THE CITRIX XENDESKTOP BROKER SITE .............................................................................................. 1
1.1 The Infrastructures Layer .................................................................................................................................................. 3
1.1.1 Hypervisor Details Test............................................................................................................................................. 3
1.2 The Sites Layer ................................................................................................................................................................. 8
1.2.1 Site Details Test ........................................................................................................................................................ 8
1.3 The Controllers Layer ..................................................................................................................................................... 14
1.3.1 Controller Details Test ............................................................................................................................................ 14
1.3.2 Controller Services Test .......................................................................................................................................... 17
1.4 The Delivery Groups Layer ............................................................................................................................................ 27
1.4.1 Desktop OS Machines Test ..................................................................................................................................... 28
1.4.2 Failed Machines Test .............................................................................................................................................. 32
1.4.3 Server OS Machines Test ........................................................................................................................................ 34
1.4.4 Machine Catalogs Test ............................................................................................................................................ 39
1.5 The Users Layer .............................................................................................................................................................. 43
1.5.1 Logon Performance Test ......................................................................................................................................... 44
1.5.2 Session Details Test ................................................................................................................................................ 49
1.5.3 User Connection Failures ........................................................................................................................................ 52
1.5.4 User Connections Test ............................................................................................................................................ 54
1.5.5 User Logon Performance Test ................................................................................................................................. 56
CONCLUSION ............................................................................................................................................................................. 62
Table of Figures
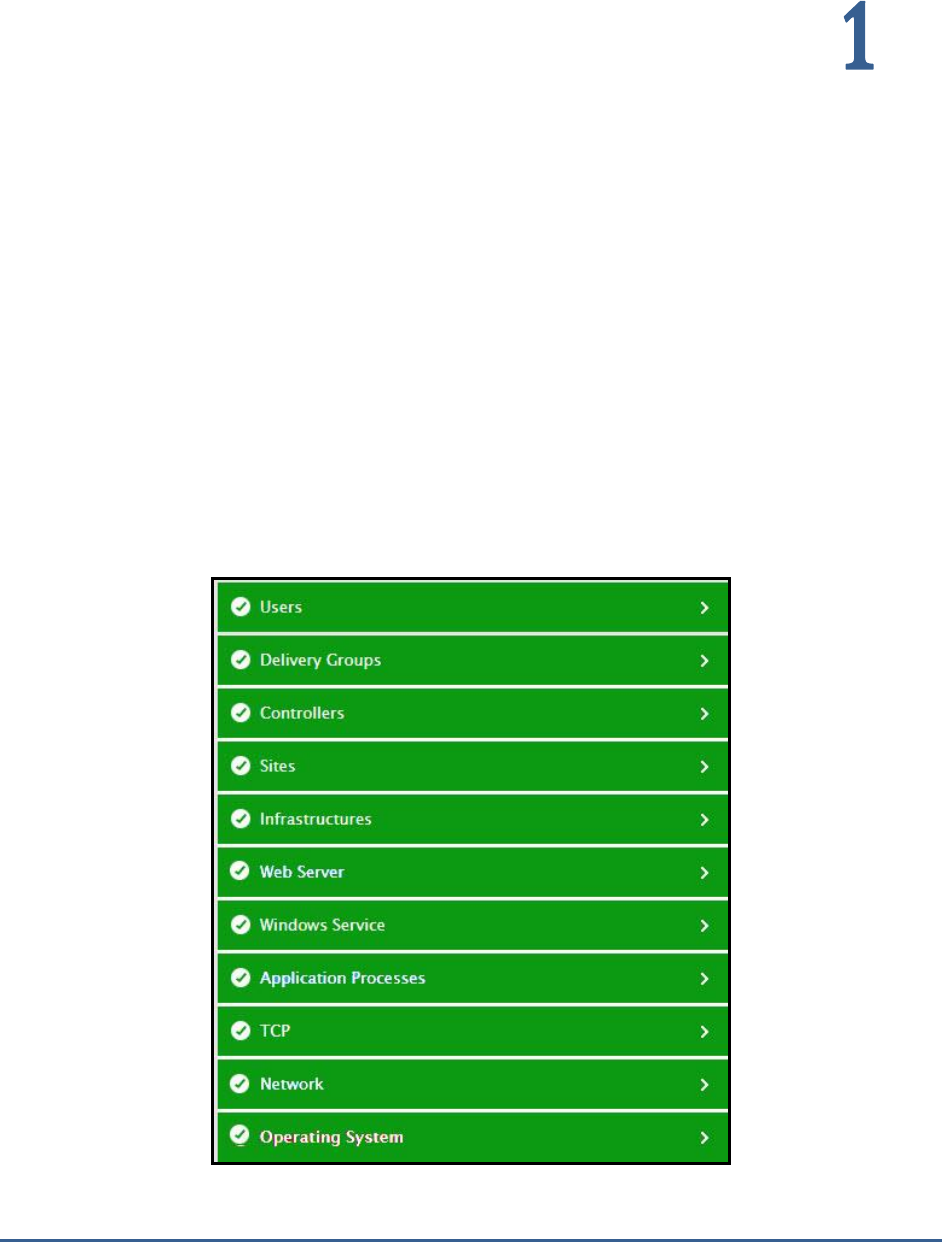
Figure 1.1: The layer model of a Citrix XenDesktop Site.......................................................................................................................................... 1
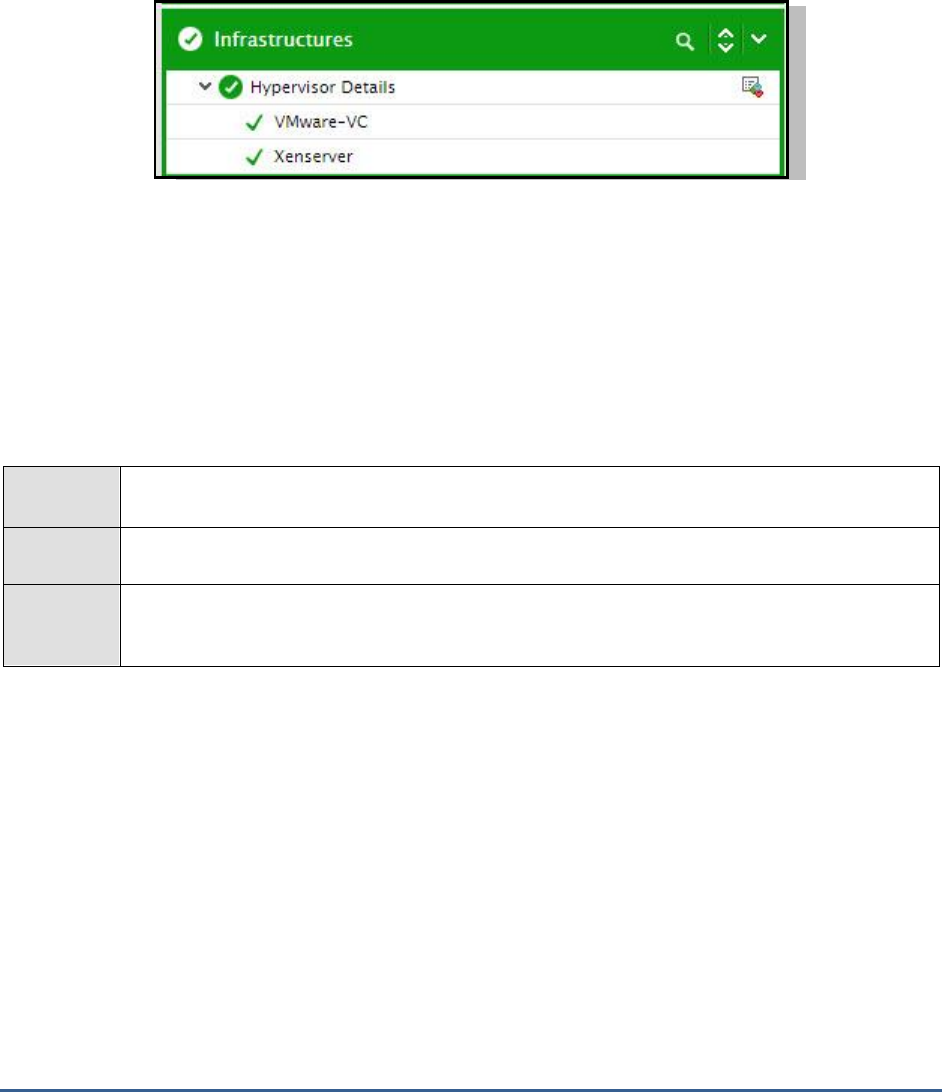
Figure 1.2: The tests mapped to the Infrastructures layer .......................................................................................................................................... 3
Figure 2.4: The detailed diagnosis of the State of the controller’s connection to hypervisor measure ....................................................................... 8
Figure 1.3: The test mapped to the Sites layer ........................................................................................................................................................... 8
Figure 1.4: The detailed diagnosis of the License server availability measure ........................................................................................................ 13
Figure 1.5: The detailed diagnosis of the Total brokers for this site measure .......................................................................................................... 13
Figure 1.6: The tests mapped to the Controllers layer ............................................................................................................................................. 14
Figure 1.7: The detailed diagnosis of the Controller state measure ......................................................................................................................... 17
Figure 1.8: The tests mapped to the Delivery Groups layer ..................................................................................................................................... 28
Figure 1.9: The detailed diagnosis of the Total machines measure .......................................................................................................................... 31
Figure 1.10: The detailed diagnosis of the Power state measure.............................................................................................................................. 39
Figure 1.11: The detailed diagnosis of the Allocation type measure ....................................................................................................................... 43
Figure 1.12: The tests mapped to the Users layer .................................................................................................................................................... 44
M O N I T O RI N G T H E C I T R I X XE N D E S K T O P B R O K E R S I TE
1
Monitoring the Citrix XenDesktop
Broker Site
Deployment of XenDesktop in a single geographical location may be called as a site. A site therefore typically
comprises of one/more brokers that point to the same database, a database server, a license server, a Citrix Studio,
Citrix StoreFront, hypervisors, virtual machines, and XenApp servers on the server-side, and receivers at the client
side.
Monitoring a XenDesktop site will therefore provide administrators with an overview of the hypervisors used, delivery
groups managed, and desktops delivered by all the controllers in the site, and also points to probable problem areas.
For this site-level overview of performance, eG Enterprise provides a dedicated
XenDesktop Site
monitoring model.
Figure 1.1: The layer model of a Citrix XenDesktop Site

M O N I T O RI N G C I T R I X X E N DE S K T OP B R OK E R SI T E
2
Each layer in Figure 1.1. above is mapped to tests that to pull out a wealth of performance information related to a
broker site. To enable the eG agent to collect these metrics, you need to deploy the agent on any broker in the site.
This agent then leverages the Citrix ODATA API and runs Citrix Powershell SDK commands on the broker to report on
site composition and to monitor the connectivity between the monitored broker and key site components such as the
license server, database server, hypervisors, etc. In the process, breaks in connectivity between the broker and a
hypervisor and unavailability of the license server/database server can be promptly detected. In addition, delivery
groups managed by all the brokers in the site are monitored, and state of server/desktop OS machines in each group
is reported, so that powered-off/unavailable machines can be isolated.
Using the metrics so collected, administrators can find quick and accurate answers for the following performance
queries:
Is the controller not able to communicate with any hypervisor? If so, which hypervisor is it?
Is the license server in the site available? If so, how quickly is it responding to requests?
Have any controllers in the site been inactive for a long time? Which brokers are these?
Is any controller powered-off now?
Which controller in the site has failed?
Are the critical site services running on the controller being monitored?
Which delivery group is overloaded with desktop sessions?
Are any machines in the site waiting for image updates? Which ones are these and which delivery
group do they belong to?
Which machines are in the 'Suspended' or 'Powered off' state currently?
Which machines in the site have failed to start?
Which machines are stuck on boot?
Which are the machines that have violated their maximum load limit?
Is any machine in the maintenance mode?
Which machine has the highest load evaluator index? What is contributing to this - high
CPU/memory/disk space usage? or high user session load?
How many catalogs have been configured on the broker? What are they? What is the type of each
catalog?
How many machines in each catalog have been assigned to users, and how many are unassigned?
Does any catalog consist of machines that do not belong to any delivery group?
Which user's logon is taking the maximum time? Where is the user experiencing delays - when
brokering? at VM startup? during HDX connection? during authentication? when applying GPOs? at the
time of logon script execution? when loading user profile? when handing off keyboard and mouse
control to the user?
M O N I T O RI N G C I T R I X X E N DE S K T OP B R OK E R SI T E
3
This document will elaborate on the top 5 layers of Figure 1.1 only.
1.1 The Infrastructures Layer
Use the test mapped to this layer to determine connectivity issues (if any) between the broker and the hosting
platform.
Figure 1.2: The tests mapped to the Infrastructures layer
1.1.1 Hypervisor Details Test
This test reports the status of the connection between the XenDesktop broker and each server that hosts the
machines. In the absence of a healthy connection between the two, the broker may not be able to provision
machines on-demand.
If users complaint of any delay in the servicing of their machine requests, you may want to use this test to check the
connection status between the broker and the server hosting that machine, so that connection errors (if any) can be
promptly detected.
Purpose
Reports the status of the connection between the XenDesktop broker and each server that hosts
the machines
Target of
the test
A broker in a Citrix XenDesktop Site
Agent
deploying
the test
An internal agent

M O N I T O RI N G C I T R I X X E N DE S K T OP B R OK E R SI T E
4
Configurabl
e
parameters
for the test
1. TEST PERIOD - How often should the test be executed
2. HOST - The host for which the test is to be configured.
3. PORT – The port number at which the specified HOST listens to. By default, this is 80.
4. DOMAIN, USERNAME and PASSWORD – To connect to a delivery controller in a site and pull
out metrics from it, the eG agent requires Farm Administrator rights. In order to configure the
eG agent with Farm Administrator privileges, specify the DOMAIN to which the target controller
belongs and enter the credentials of the Farm Administrator in the USERNAME and
PASSWORD text boxes.
5. CONFIRM PASSWORD – Confirm the PASSWORD by retping it here.
6. DETAILED DIAGNOSIS - To make diagnosis more efficient and accurate, the eG Enterprise
suite embeds an optional detailed diagnostic capability. With this capability, the eG agents can
be configured to run detailed, more elaborate tests as and when specific problems are
detected. To enable the detailed diagnosis capability of this test for a particular server, choose
the On option. To disable the capability, click on the Off option.
The option to selectively enable/disable the detailed diagnosis capability will be available only if
the following conditions are fulfilled:
The eG manager license should allow the detailed diagnosis capability
Both the normal and abnormal frequencies configured for the detailed diagnosis
measures should not be 0.
Outputs of
the test
One set of results for each hypervisor with which the target controller communicates
Measureme
nts made
Measurement
Measurement
Unit
Interpretation

M O N I T O RI N G C I T R I X X E N DE S K T OP B R OK E R SI T E
5
by the test
State of controller’s
connection to hypervisor:
Indicates the status of the
connection between the broker
and this hosting server.
This test reports one of the following values
to indicate the status of the connection
between the broker and a hosting server:
On
InMaintenanceMode
Unavailable
The numeric values that correspond to the
above-mentioned states are as follows:
State
Numeric
Value
Description
On
1
Indicates that the
broker is in
contact with the
hypervisor
InMainten
anceMode
2
Indicates that the
hosting server
(e.g., XenServer,
Hyper-V) through
which machines
are managed, is
under
maintenance
Unavailabl
e
3
Indicates that the
broker is unable
to contact the
hypervisor
Note:
By default, this measure reports the above-
mentioned States while indicating the
connection status of the broker and the
hypervisor. However, in the graph of this
measure, the same will be represented using
the corresponding numeric equivalents –
1 to
3
– only.
The detailed diagnosis capability of this
measure if enabled, reveals the connection
name, connection type, Hypervisor address,
the preferred controller and the user who is
accessing the hypervisor.
M O N I T O RI N G C I T R I X X E N DE S K T OP B R OK E R SI T E
6
Is controller’s connection to
hypervisor in maintenance
mode?:
Indicates whether the connection
between the broker and the
hosting server is in maintenance
mode.
This measure reports a value
Yes
if the
connection between the broker and the
hosting server is in maintenance mode and
No
if otherwise.
The numeric values corresponding to the
above-mentioned measure values are as
follows:
Measure Value
Numeric Value
Yes
1
No
0
Note:
By default, this measure reports the above-
mentioned Measure Values while indicating
whether the connection between the broker
and the hosting server is in maintenance
mode. However, the graph of this measure
will be represented using the corresponding
numeric equivalents i.e.,
0
or
1
only.
Is controller’s connection to
hypervisor in persistent?:
Indicates whether/not the
connection is persistent between
the broker and the hosting
server.
This measure reports a value
Yes
if the
connection between the broker and the
hosting server is persistent and
No
if
otherwise.
The numeric values corresponding to the
above-mentioned Measure Values are as
follows:
Measure Value
Numeric Value
Yes
1
No
0
Note:
By default, this measure reports the above-
mentioned Measure Values while indicating
whether the connection between the broker
and the hosting server is persistent.
However, the graph of this measure will be
represented using the corresponding numeric
equivalents i.e.,
0
or
1
only.
M O N I T O RI N G C I T R I X X E N DE S K T OP B R OK E R SI T E
7
Is local storage caching
enabled?:
Indicates whether the local
storage caching is enabled or
not.
This measure reports a value
Yes
if the local
storage caching capability is enabled and
No
if otherwise.
The numeric values corresponding to the
above-mentioned measure values are as
follows:
Measure Value
Numeric Value
Yes
1
No
0
Note:
By default, this measure reports the above-
mentioned Measure Values while indicating
whether the local storage caching capability
is enabled. However, the graph of this
measure will be represented using the
corresponding numeric equivalents i.e.,
0
or
1
only.
Is machine creation service
used to create VMs?:
Indicates whether/not the
machine creation service is used
to create provisioned machines.
This measure reports a value
Yes
if the
machine creation service is used to create
provisioned machines and
No
if otherwise.
The numeric values corresponding to the
above-mentioned measure values are as
follows:
Measure Value
Numeric Value
Yes
1
No
0
Note:
By default, this measure reports the above-
mentioned Measure Values while indicating
whether the machine creation service is used
to create provisioned machines. However, in
the graph of this measure, the same will be
represented using the corresponding numeric
equivalents i.e.,
0
or
1
only.
M O N I T O RI N G C I T R I X X E N DE S K T OP B R OK E R SI T E
8
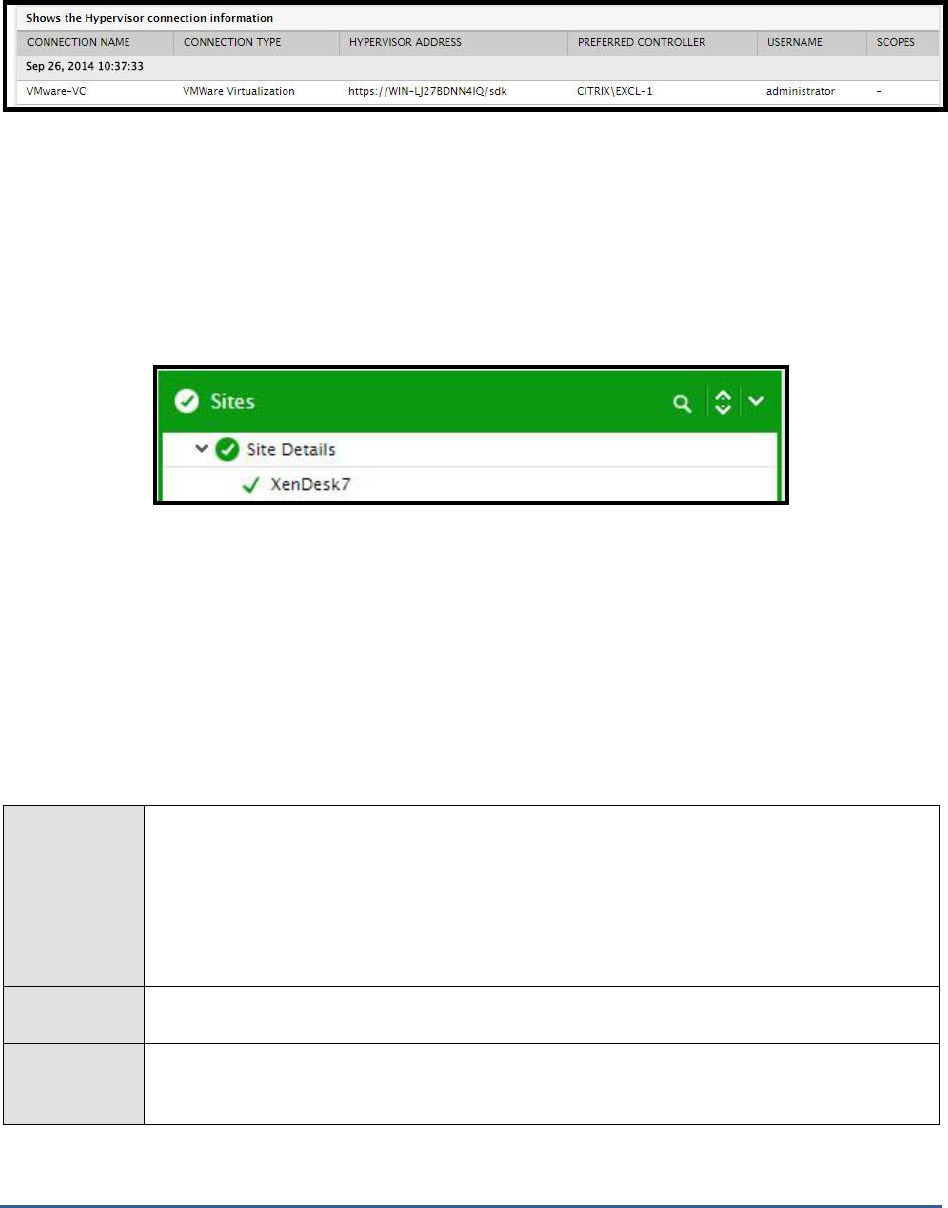
The detailed diagnosis of the
State of the controller’s connection to hypervisor
measure reveals the connection name,
connection type, Hypervisor address, the preferred controller and the user who is accessing the hypervisor.
Figure 1.1: The detailed diagnosis of the State of the controller’s connection to hypervisor measure
1.2 The Sites Layer
Using the test mapped to this layer, you can monitor the availability and responsiveness of the license server in the
site, the session related information and the number of brokers managed by this site.
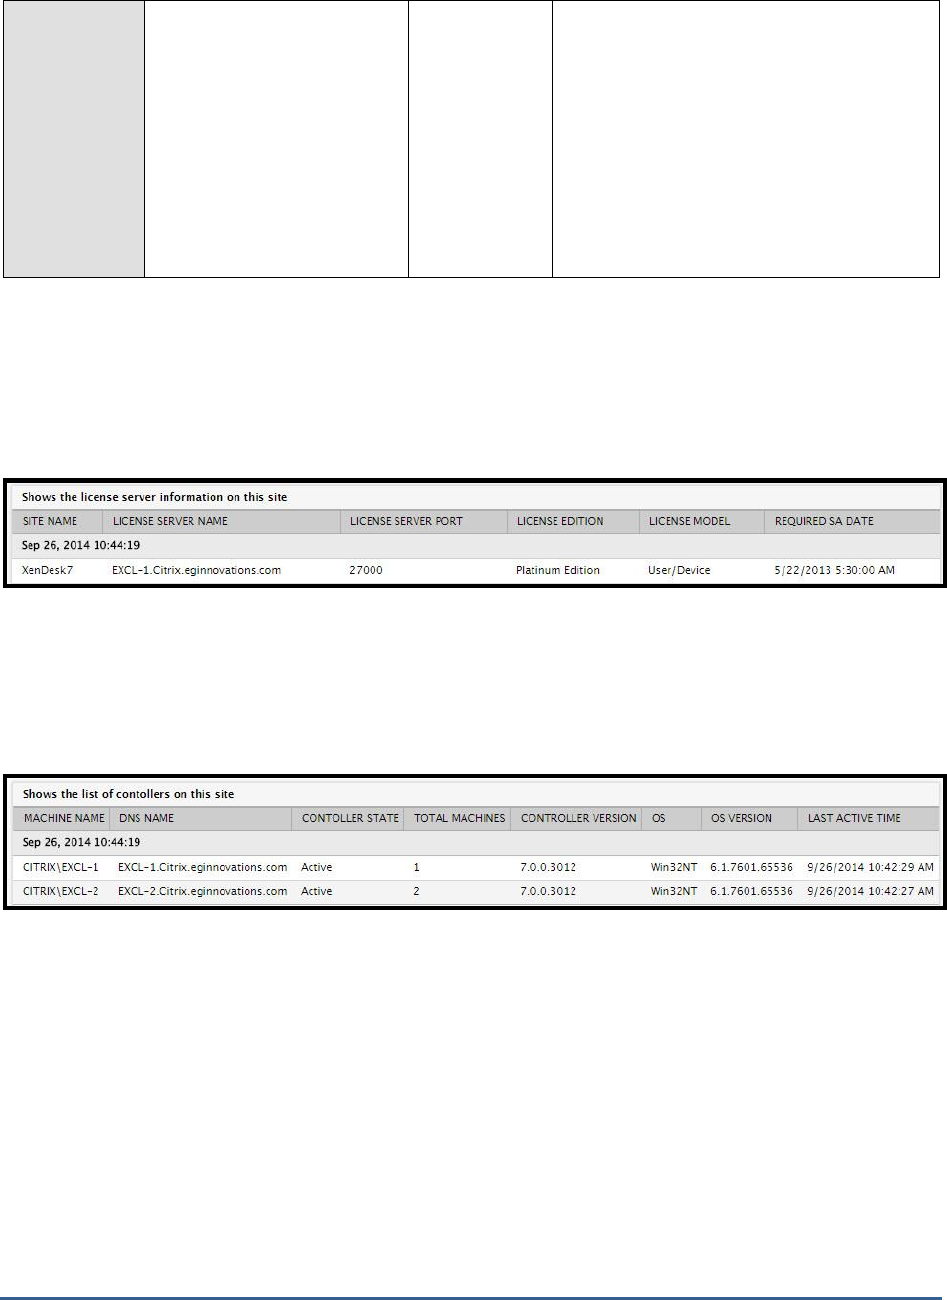
Figure 1.3: The test mapped to the Sites layer
1.2.1 Site Details Test
This test promptly alerts administrators to the following anomalies related to the monitored site:
The sudden non-availability of the license server in the site;
Poor responsiveness of the license server;
A session overload on the site;
Inactive brokers in the site
Purpose
This test promptly alerts administrators to the following anomalies related to the monitored site:
The sudden non-availability of the license server in the site;
Poor responsiveness of the license server;
A session overload on the site;
Inactive brokers in the site
Target of the
test
A broker in a Citrix XenDesktop Site
Agent
deploying the
test
An internal agent

M O N I T O RI N G C I T R I X X E N DE S K T OP B R OK E R SI T E
9
Configurable
parameters for
the test
1. TEST PERIOD - How often should the test be executed
2. HOST - The host for which the test is to be configured.
3. PORT – The port number at which the specified HOST listens to. By default, this is 80.
4. DOMAIN, USERNAME and PASSWORD – To connect to a delivery controller in a site and
pull out metrics from it, the eG agent requires Farm Administrator rights. In order to
configure the eG agent with Farm Administrator privileges, specify the DOMAIN to which the
target controller belongs and enter the credentials of the Farm Administrator in the
USERNAME and PASSWORD text boxes.
5. CONFIRM PASSWORD – Confirm the PASSWORD by retping it here.
6. DETAILED DIAGNOSIS - To make diagnosis more efficient and accurate, the eG Enterprise
suite embeds an optional detailed diagnostic capability. With this capability, the eG agents
can be configured to run detailed, more elaborate tests as and when specific problems are
detected. To enable the detailed diagnosis capability of this test for a particular server,
choose the On option. To disable the capability, click on the Off option.
The option to selectively enable/disable the detailed diagnosis capability will be available
only if the following conditions are fulfilled:
The eG manager license should allow the detailed diagnosis capability
Both the normal and abnormal frequencies configured for the detailed diagnosis
measures should not be 0.
Outputs of the
test
One set of results for the XenDesktop server site to which the target broker belongs
Measurements
made by the
test
Measurement
Measurement
Unit
Interpretation
License server availability:
Indicates the availability of
the license server in this site.
Percent
If the license server is available, a value of
100
is shown and if the license server is not
available, a value of
0
is shown.
Since the license server is responsible for
managing the licenses for all the components
of XenDesktop, the non-availability of the
license server, should have serious
repercussions on the performance of the
XenDesktop site. However, such adversities
are averted by the 90-day grace period that
XenDesktop embeds; this allows the system
to function normally for 90 days if the license
server becomes unavailable.
Moreover, if this measure reports that the
license server is unavailable, then you may
instantly want to know which license server
the XenDesktop is communicating with. At
this juncture, you can use the detailed
diagnosis of this measure (if enabled) to
ascertain the name of the license server and
the port at which it listens.

M O N I T O RI N G C I T R I X X E N DE S K T OP B R OK E R SI T E
10
License server response
time:
Indicates the time taken by
the broker to establish a
connection with the license
server.
Secs
Ideally, the response time should be low.
Active licensed sessions:
Indicates the total number of
licensed sessions that are
currently active on this site.
Number
This measure is a good indicator of the load
on this site and the extent of license usage.
Is DNS resolution
enabled?:
Indicates whether the DNS
resolution is enabled or not
on this site.
The values and their corresponding numeric
values that this measure could report are:
Measure
Value
Numeric Value
No
0
Yes
1
Note:
By default, this measure reports the values
Yes
or
No
while indicating whether DNS
resolution is enabled or not on this site.
However, in the graph of this measure, the
same will be represented using the
corresponding numeric equivalents of
0
and
1
only.

M O N I T O RI N G C I T R I X X E N DE S K T OP B R OK E R SI T E
11
Is secure ICA required?:
Indicates whether/not a
secure ICA is required for this
site.
By default, client-server communications are
obfuscated at a basic level through the
SecureICA feature, which can be used to
encrypt the ICA protocol.
Plug-ins use the ICA protocol to encode user
input (keystrokes and mouse clicks) and
address it to a server farm for processing.
Server farms use the ICA protocol to format
application output (display and audio) and
return it to the client device.
You can increase the level of encryption for
the ICA protocol when you publish a resource
or after you publish a resource.
In addition to situations when you want to
protect against internal security threats, such
as eavesdropping, you may want to use ICA
encryption in the following situations:
You need to secure communications from
devices that use Microsoft DOS or run on
Win16 systems
You have older devices running plug-in
software that cannot be upgraded to use SSL
As an alternative to SSL/TLS encryption,
when there is no risk of a “man-in-the-
middle” attack
The values that this measure can report and
their corresponding numeric values are:
Measure
Value
Numeric Value
No
0
Yes
1
Note:
By default, this measure reports the values
Yes
or
No
while indicating whether a secure
ICA is required for this site or not. However,
in the graph of this measure, the same will
be represented using the corresponding
numeric equivalents of
0
and
1
only.

M O N I T O RI N G C I T R I X X E N DE S K T OP B R OK E R SI T E
12
Is the trust request sent
to the XML service port?
Indicates whether/not trust
requests were sent to the
XML service.
Trusting requests sent to the XML Service
means:
Smooth Roaming works when
connecting with the Web Interface
using pass-through or smart card
authentication, and when
connecting with the online plug-in
using smart card authentication or
the Kerberos pass-through option.
For example, you can use
workspace control to assist health-
care workers in a hospital using
smart cards, who need to move
quickly among workstations and be
able to pick up where they left off in
published applications.
XenApp can use the information
passed on from Access Gateway
(Version 4.0 or later) to control
application access and session
policies. This information includes
Access Gateway filters that can be
used to control access to published
applications and to set XenApp
session policies. If you do not trust
requests sent to the XML Service,
this additional information is
ignored.
The values that this measure can report and
their corresponding numeric values are:
Measure
Value
Numeric Value
No
0
Yes
1
Note:
By default, this measure reports the values
Yes
or
No
while indicating whether/not trust
requests were sent to the XML service.
However, in the graph of this measure, the
same will be represented using the
corresponding numeric equivalents of
0
and
1
only.
M O N I T O RI N G C I T R I X X E N DE S K T OP B R OK E R SI T E
13
Total brokers on this site:
Indicates the total number of
brokers that are configured
for this site.
Number
The detailed diagnosis of the
Total brokers
for this site
measure displays the names of
the brokers of this site, the machine on which
the broker is installed, total number of
desktops managed by this broker, the state
of the broker, the version of the broker, the
type of operating system, the version of the
operating system, the last time at which the
broker was active. This information helps you
to identify the brokers that are active and are
utilized effectively.
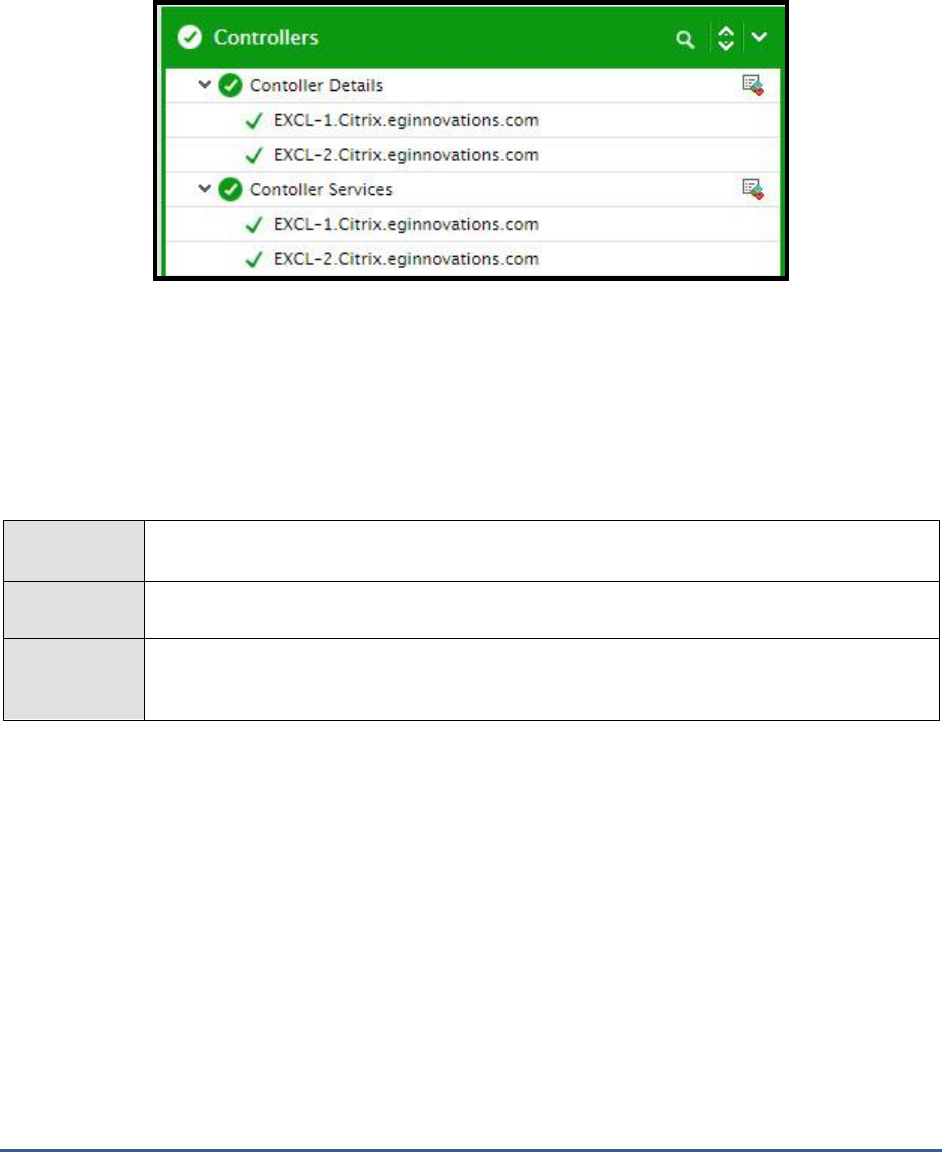
The detailed diagnosis of the
License server availability
measure displays the name of the License server in the
site and the port at which it listens. Alongside, the detailed diagnosis displays the desktop model, desktop edition,
application model and application edition that is compatible with the license. The date on which the license would
finally expire/the last date for renewal of the license is provided in the
REQUIRED SA DATE
column. This information
enables administrators to effectively troubleshoot issues with the availability of the License server.
Figure 1.4: The detailed diagnosis of the License server availability measure
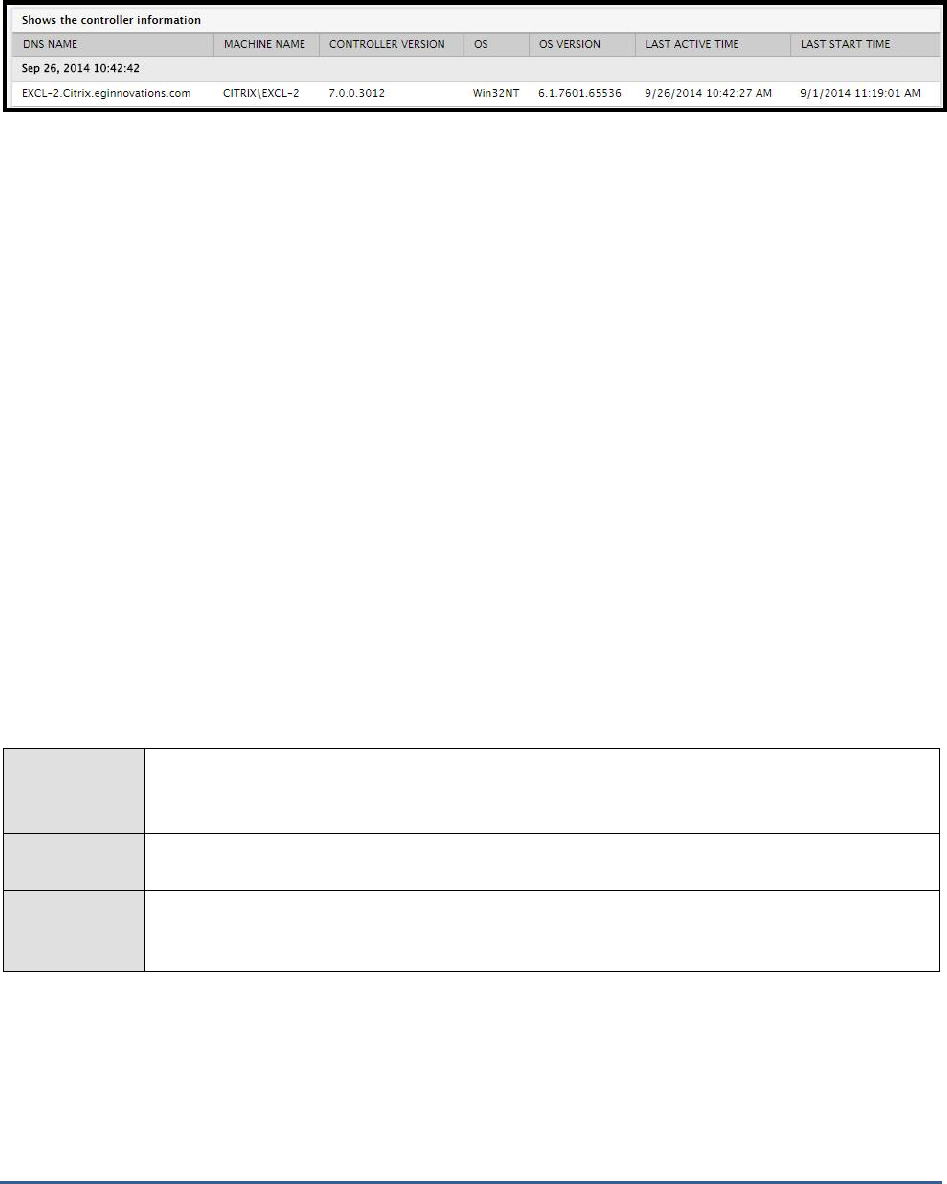
The detailed diagnosis of the
Total brokers for this site
measure displays the names of the brokers of this site, the
machine on which the broker is installed, total number of desktops managed by this broker, the state of the broker,
the version of the broker, the type of operating system, the version of the operating system, the last time at which
the broker was active. This information helps you to identify the brokers that are active and are utilized effectively.
Figure 1.5: The detailed diagnosis of the Total brokers for this site measure
M O N I T O RI N G C I T R I X X E N DE S K T OP B R OK E R SI T E
14
1.3 The Controllers Layer
For each controller in a site, the tests mapped to this layer report the current state of the controller and the state of
each critical service running on the controller. Abnormalities in controller operations can thus be captured quickly.
Figure 1.6: The tests mapped to the Controllers layer
1.3.1 Controller Details Test
Controllers are server machines running instances of the broker service. This test auto-discovers the delivery
controllers configured within a site, and reports the current status of each controller and the count of machines
registered with every controller.
Purpose
Auto-discovers the delivery controllers configured within a site, and reports the current status of
each controller and the count of machines registered with every controller
Target of the
test
A broker in a Citrix XenDesktop Site
Agent
deploying the
test
An internal agent

M O N I T O RI N G C I T R I X X E N DE S K T OP B R OK E R SI T E
15
Configurable
parameters for
the test
1. TEST PERIOD - How often should the test be executed
2. HOST - The host for which the test is to be configured.
3. PORT – The port number at which the specified HOST listens to. By default, this is 80.
4. DOMAIN, USERNAME and PASSWORD – To connect to a delivery controller in a site and
pull out metrics from it, the eG agent requires Farm Administrator rights. In order to
configure the eG agent with Farm Administrator privileges, specify the DOMAIN to which the
target controller belongs and enter the credentials of the Farm Administrator in the
USERNAME and PASSWORD text boxes.
5. CONFIRM PASSWORD – Confirm the PASSWORD by retping it here.
6. DETAILED DIAGNOSIS - To make diagnosis more efficient and accurate, the eG Enterprise
suite embeds an optional detailed diagnostic capability. With this capability, the eG agents
can be configured to run detailed, more elaborate tests as and when specific problems are
detected. To enable the detailed diagnosis capability of this test for a particular server,
choose the On option. To disable the capability, click on the Off option.
The option to selectively enable/disable the detailed diagnosis capability will be available
only if the following conditions are fulfilled:
The eG manager license should allow the detailed diagnosis capability
Both the normal and abnormal frequencies configured for the detailed diagnosis
measures should not be 0.
Outputs of the
test
One set of results for the XenDesktop server site to which the target broker belongs
Measurements
made by the
Measurement
Measurement
Unit
Interpretation

M O N I T O RI N G C I T R I X X E N DE S K T OP B R OK E R SI T E
16
test
Controller state:
Indicates the current state of
this desktop delivery
controller (broker).
Number
This test reports one of the following values
to indicate the current state of a destop
delivery controller:
Active – Indicates that the broker is
powered-on and fully operational
On – Indicates that the broker is
powered-on, but not fully
operational
Failed – Indicates that the broker
has failed due to some reason
Off – Indicates that the broker is
powered-off
The numeric values that correspond to the
above-mentioned states are as follows:
State
Numeric
Value
Active
1
On
2
Failed
3
Off
4
Note:
By default, this measure reports the above-
mentioned States while indicating the current
state of a broker. However, the graph of this
measure will represent states using the
corresponding numeric equivalents – i.e.,
1 to
4
.
The detailed diagnosis of this measure
reveals when the controller was last
accessed, when it was last started, and also
displays the site services that were active on
the controller during its last access.
Total registered machines:
Indicates the number of
machines that are currently
registered with this broker.
Number
M O N I T O RI N G C I T R I X X E N DE S K T OP B R OK E R SI T E
17
The detailed diagnosis of the
Controller state
measure reveals when the controller was last accessed, when it was
last started, and also displays the name of the machine on which the broker is installed, the version of the broker,
the Operating system of the machine and the Operating system version.
Figure 1.7: The detailed diagnosis of the Controller state measure
1.3.2 Controller Services Test
The broker service is responsible for the brokering of user sessions to desktops or applications, and for power
management of the underlying machines. Every controller in a site runs an instance of the broker service. In addition
to the broker service, the following critical services also run on a controller:
AD identity service
Configuration service
Host service
Machine creation service
Admin service
Monitoring service
Logging service
This test periodically checks the health of each of these services on the target controller in a XenDesktop site, and
reports abnormalities (if any). With the help of this test, you can promptly detect which services have failed.
Purpose
Periodically checks the health of each of these services on the target controller in a XenDesktop
site, and reports abnormalities (if any). With the help of this test, you can promptly detect which
services have failed.
Target of the
test
A broker in a Citrix XenDesktop Site
Agent
deploying the
test
An internal agent

M O N I T O RI N G C I T R I X X E N DE S K T OP B R OK E R SI T E
18
Configurable
parameters for
the test
1. TEST PERIOD - How often should the test be executed
2. HOST - The host for which the test is to be configured.
3. PORT – The port number at which the specified HOST listens to. By default, this is 80.
4. DOMAIN, USERNAME and PASSWORD – To connect to a delivery controller in a site and
pull out metrics from it, the eG agent requires Farm Administrator rights. In order to
configure the eG agent with Farm Administrator privileges, specify the DOMAIN to which the
target controller belongs and enter the credentials of the Farm Administrator in the
USERNAME and PASSWORD text boxes.
5. CONFIRM PASSWORD – Confirm the PASSWORD by retping it here.
6. DETAILED DIAGNOSIS - To make diagnosis more efficient and accurate, the eG Enterprise
suite embeds an optional detailed diagnostic capability. With this capability, the eG agents
can be configured to run detailed, more elaborate tests as and when specific problems are
detected. To enable the detailed diagnosis capability of this test for a particular server,
choose the On option. To disable the capability, click on the Off option.
The option to selectively enable/disable the detailed diagnosis capability will be available
only if the following conditions are fulfilled:
The eG manager license should allow the detailed diagnosis capability
Both the normal and abnormal frequencies configured for the detailed diagnosis
measures should not be 0.
Outputs of the
test
One set of results for every controller configured within a site
Measurements
made by the
Measurement
Measurement
Unit
Interpretation

M O N I T O RI N G C I T R I X X E N DE S K T OP B R OK E R SI T E
19
test
Broker service status:
Indicates the current status of
the broker service on this
broker.
Number
The Citrix Broker Service brokers connections
from endpoint devices to desktops and
applications.
The numeric values that correspond to the
Measure Values that this measure can take
are as follows:
Measure Value
Numeric
Value
OK
1
DBUnconfigured
2
DBRejectedConnection
3
InvalidDBConfigured
4
DBNewerVersionThanService
5
DBOlderVersionThanService
6
DBVersionChangeInProgress
7
PendingFailure
8
Failed
9
Unknown
10
DBNotFound
11
DBMissingOptionalFeature
12
DBMissingMandatoryFeature
13
Note:
By default, this measure reports the above-
mentioned Measure Values while indicating
the current state of the broker service.
However, in the graph of this measure, the
same will be represented using the
corresponding numeric equivalents – i.e.,
1 to
13
.
M O N I T O RI N G C I T R I X X E N DE S K T OP B R OK E R SI T E
20
AD identity service status:
Indicates the current status of
the AD Identity Service on
this broker.
The Citrix AD Identity Service manages active
directory computer accounts. Once the
broker validates a user login, this service
connects to the broker’s database to identify
the virtual desktop that is assigned to the
user who has logged in.
The values that this measure reports and the
numeric values that correspond to them are
as follows:
Measure Value
Numeric
Value
OK
1
DBUnconfigured
2
DBRejectedConnection
3
InvalidDBConfigured
4
DBNotFound
5
DBNewerVersionThanService
6
DBOlderVersionThanService
7
DBVersionChangeInProgress
8
Failed
9
Unknown
10
Note:
By default, this measure reports the above-
mentioned Measure Values while indicating
the current status of the AD Identity Service.
However, in the graph of this measure, the
same will be represented using the
corresponding numeric equivalents – i.e.,
1 to
10
.

M O N I T O RI N G C I T R I X X E N DE S K T OP B R OK E R SI T E
21
Configuration service
status:
Indicates the current status of
the Configuration Service on
this broker.
The Citrix Configuration Service stores the
configuration information related to Citrix
services in the broker’s MS SQL database.
The values that this measure can report and
their corresponding numeric values are as
follows:
Measure Value
Numeric
Value
OK
1
DBUnconfigured
2
DBRejectedConnection
3
InvalidDBConfigured
4
DBNotFound
5
DBNewerVersionThanService
6
DBOlderVersionThanService
7
DBVersionChangeInProgress
8
Failed
9
Unknown
10
Note:
By default, this measure reports the above-
mentioned Measure Values while indicating
the current status of the Configuration
service. However, in the graph of this
measure, the same will be represented using
the corresponding numeric equivalents – i.e.,
1 to 10
.
M O N I T O RI N G C I T R I X X E N DE S K T OP B R OK E R SI T E
22
Host service status:
Indicates the current status of
the Host service on this
broker.
The Citrix Host Service manages host and
hypervisor connections.
The values that this measure can take and
their corresponding numeric values are as
follows:
Measure Value
Numeric
Value
OK
1
DBUnconfigured
2
DBRejectedConnection
3
InvalidDBConfigured
4
DBNotFound
5
DBNewerVersionThanService
6
DBOlderVersionThanService
7
DBVersionChangeInProgress
8
Failed
9
Unknown
10
Note:
By default, this measure reports the above-
mentioned Measure Values while indicating
the current status of the Configuration
service. However, in the graph of this
measure, the same will be represented using
the corresponding numeric equivalents – i.e.,
1 to 10
.
M O N I T O RI N G C I T R I X X E N DE S K T OP B R OK E R SI T E
23
Machine creation service
status:
Indicates the current status of
the Machine Creation Service
on this broker.
The Citrix Machine Creation Service creates
new virtual machines.
Once a valid user logs into the XenDesktop
Broker via the Web Interface, the
XenDesktop Broker manages the delivery
groups by building, starting, and shutting
down the desktops as required. At this
juncture, the XenDesktop Broker relies on
Machine Creation Services (MCS) to deliver
the appropriate desktop image to the Pooled
and Dedicated delivery groups.
The values that this measure can take and
their corresponding numeric equivalents are
as follows:
Measure Value
Numeric
Value
OK
1
DBUnconfigured
2
DBRejectedConnection
3
InvalidDBConfigured
4
DBNotFound
5
DBNewerVersionThanService
6
DBOlderVersionThanService
7
DBVersionChangeInProgress
8
Failed
9
Unknown
10
Note:
By default, this measure reports the above-
mentioned Measure Values while indicating
the current status of the Machine creation
service. However, in the graph of this
measure, the same will be represented using
the corresponding numeric equivalents – i.e.,
1 to 10
.
M O N I T O RI N G C I T R I X X E N DE S K T OP B R OK E R SI T E
24
Admin service status:
Indicates the current status of
the Delegated Administration
service on this broker.
The Delegated Administration Service (DAS)
stores information about Citrix administrators
and the rights they have. Services in the
XenDesktop deployment use the DAS to
determine whether a particular user has the
privilege to perform an operation or not.
The values that this measure can report and
their corresponding numeric equivalents are
as follows:
Measure Value
Numeric
Value
OK
1
DBUnconfigured
2
DBRejectedConnection
3
InvalidDBConfigured
4
DBNotFound
5
DBNewerVersionThanService
6
DBOlderVersionThanService
7
DBVersionChangeInProgress
8
Failed
9
Unknown
10
Note:
By default, this measure reports the above-
mentioned Measure Values while indicating
the current status of the Delegated
Administration service. However, in the graph
of this measure, the same will be represented
using the corresponding numeric equivalents
– i.e.,
1 to 10
.
M O N I T O RI N G C I T R I X X E N DE S K T OP B R OK E R SI T E
25
Licensing service status:
Indicates the current status of
the Licensing service on this
broker.
The values that this measure can take and
their corresponding numeric values are as
follows:
Measure Value
Numeric
Value
OK
1
DBUnconfigured
2
DBRejectedConnection
3
InvalidDBConfigured
4
DBNotFound
5
DBNewerVersionThanService
6
DBOlderVersionThanService
7
DBVersionChangeInProgress
8
Failed
9
Unknown
10
Note:
By default, this measure reports the above-
mentioned Measure Values while indicating
the current status of the Licensing service.
However, in the graph of this measure, the
same will be represented using the
corresponding numeric equivalents – i.e.,
1 to
10
.
M O N I T O RI N G C I T R I X X E N DE S K T OP B R OK E R SI T E
26
Monitoring service status:
Indicates the current status of
the Monitoring service on this
broker.
The Citrix Monitor Service monitors the
Flexcast system. Citrix FlexCast is a delivery
technology that allows an IT administrator to
personalize virtual desktops to meet the
performance, security and flexibility
requirements of end users. Currently, there
are five different FlexCast models available.
The values that this measure can take and
their corresponding numeric values are as
follows:
Measure Value
Numeric
Value
OK
1
DBUnconfigured
2
DBRejectedConnection
3
InvalidDBConfigured
4
DBNotFound
5
DBNewerVersionThanService
6
DBOlderVersionThanService
7
DBVersionChangeInProgress
8
Failed
9
Unknown
10
Note:
By default, this measure reports the above-
mentioned Measure Values while indicating
the current status of the Monitoring service.
However, in the graph of this measure, the
same will be represented using the
corresponding numeric equivalents – i.e.,
1 to
10
.
M O N I T O RI N G C I T R I X X E N DE S K T OP B R OK E R SI T E
27
Logging service status:
Indicates the current status of
the Logging service on this
broker.
The Configuration Logging Service logs
configuration changes or administrator
requested state changes made to the site.
The values that this measure can take and
their corresponding numeric values are as
follows:
Measure Value
Numeric
Value
OK
1
DBUnconfigured
2
DBRejectedConnection
3
InvalidDBConfigured
4
DBNotFound
5
DBNewerVersionThanService
6
DBOlderVersionThanService
7
DBVersionChangeInProgress
8
Failed
9
Unknown
10
Note:
By default, this measure reports the above-
mentioned Measure Values while indicating
the current status of the Monitoring service.
However, in the graph of this measure, the
same will be represented using the
corresponding numeric equivalents – i.e.,
1 to
10
.
1.4 The Delivery Groups Layer
The tests mapped to this layer monitor the desktop OS and server OS machines in each delivery group configured on
the broker in a site and report the status of these machines.
M O N I T O RI N G C I T R I X X E N DE S K T OP B R OK E R SI T E
28
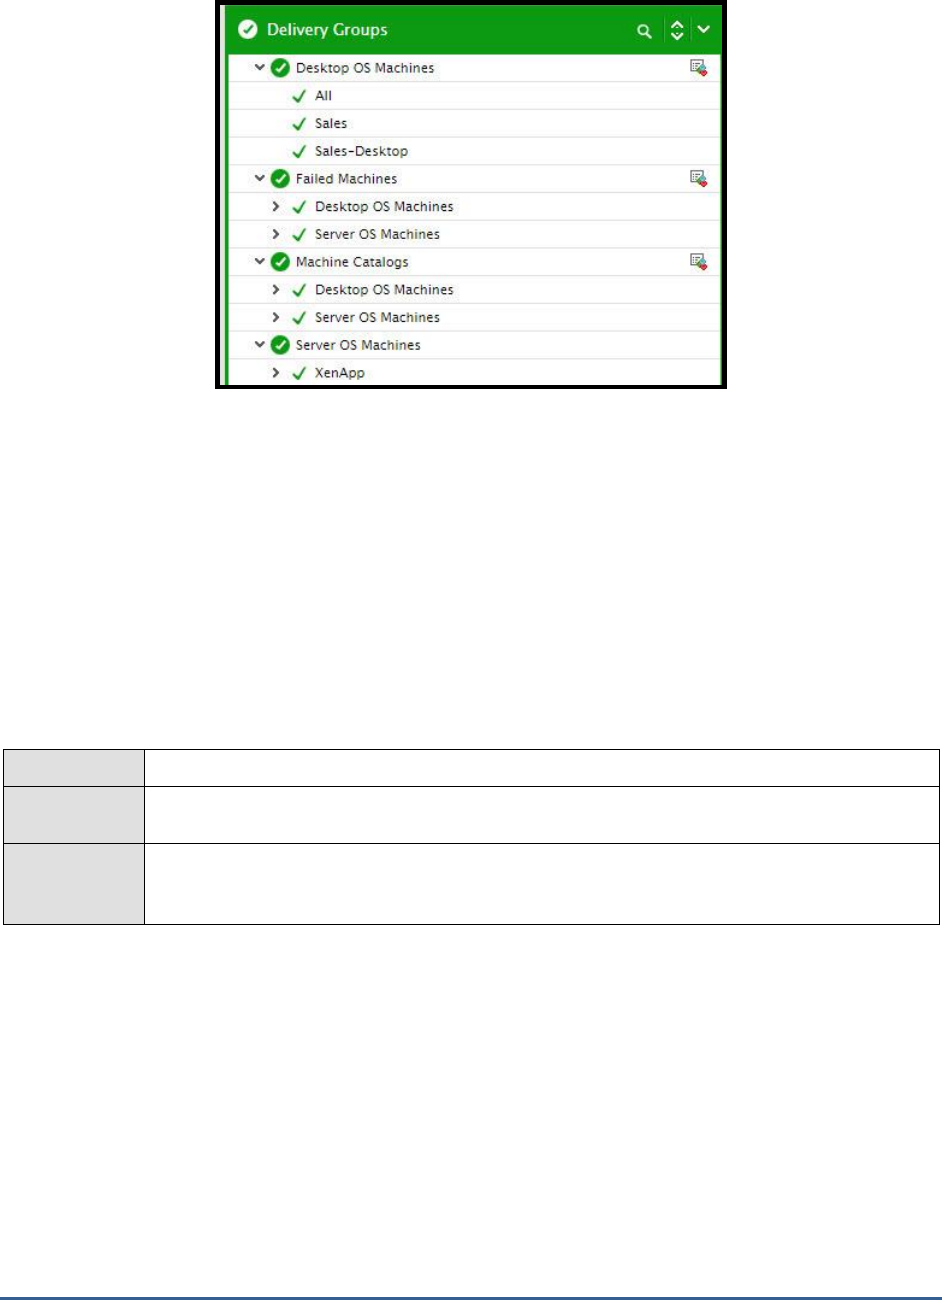
Figure 1.8: The tests mapped to the Delivery Groups layer
1.4.1 Desktop OS Machines Test
XenDesktop supports two types of Delivery Agents: one for Windows Server OS machines and one for Windows
Desktop OS machines. Desktop OS Machines are VMs or physical machines based on the Windows Desktop
operating system used for delivering personalized desktops to users, or applications from desktop operating systems.
Delivery groups consist of virtual desktops and applications that are pooled, pre-assigned, or assigned on first use.
Each group can contain only one type of desktop or application.
To track the status of desktop OS machines in each delivery group configured in a site, use the Desktop OS Machines
test.
Purpose
To track the status of desktop OS machines in each delivery group configured in a site
Target of the
test
A broker in a Citrix XenDesktop Site
Agent
deploying the
test
An internal agent

M O N I T O RI N G C I T R I X X E N DE S K T OP B R OK E R SI T E
29
Configurable
parameters for
the test
1. TEST PERIOD - How often should the test be executed
2. HOST - The host for which the test is to be configured.
3. PORT – The port number at which the specified HOST listens to. By default, this is 80.
4. CONTROLLER IP ADDRESS – Specify the IP address of the delivery controller (i.e.,
broker) in the site with which the eG agent should communicate for collecting performance
metrics.
5. CONTROLLER PORT – Specify the port number of the delivery controller (i.e., broker) in
the site with which the eG agent should communicate for collecting performance metrics.
6. USERNAME and PASSWORD – To connect to a delivery controller and pull out metrics
from it, the eG agent requires Farm Administrator rights. In order to configure the eG agent
with Farm Administrator privileges, specify the credentials of the Farm Administrator in the
USERNAME and PASSWORD text boxes.
7. CONFIRM PASSWORD – Confirm the PASSWORD by retping it here.
8. FULLY QUALIFIED DOMAIN NAME – Here, specify the fully-qualified name of the domain
to which the specified controller belongs.
9. SSL – Indicate whether/not the controller used for metrics collection is SSL-enabled. By
default, this flag is set to Yes.
10. DETAILED DIAGNOSIS - To make diagnosis more efficient and accurate, the eG Enterprise
suite embeds an optional detailed diagnostic capability. With this capability, the eG agents
can be configured to run detailed, more elaborate tests as and when specific problems are
detected. To enable the detailed diagnosis capability of this test for a particular server,
choose the On option. To disable the capability, click on the Off option.
The option to selectively enable/disable the detailed diagnosis capability will be available
only if the following conditions are fulfilled:
The eG manager license should allow the detailed diagnosis capability
Both the normal and abnormal frequencies configured for the detailed diagnosis
measures should not be 0.
Outputs of the
test
One set of results for each delivery group containing desktop OS machines in the site
Measurements
made by the
test
Measurement
Measurement
Unit
Interpretation
Total machines:
Indicates the total number of
machines in this group.
Number
Use the detailed diagnosis of this measure to
know which desktop OS machines are part of
a delivery group.
Preparing machines:
Indicates the number of
machines in this group that
are currently preparing
sessions for users.
Number

M O N I T O RI N G C I T R I X X E N DE S K T OP B R OK E R SI T E
30
Pending image update
machines:
Indicates the number of
machines managed by this
delivery group to which
updates are currently
pending.
Number
Use the detailed diagnosis of this measure to
know which machines are awaiting updates.
Maintenance mode
enabled machines:
Indicates the number of
machines in this group for
which maintenance mode has
been enabled.
Number
Powered on machines:
Indicates the number of
machines in this desktop
group that are currently
powered on.
Number
Use the detailed diagnosis of this measure to
know which machines are currently powered
on.
Suspended machines:
Indicates the number of
machines in this delivery
group that are currently in the
Suspended state.
Number
Use the detailed diagnosis of this measure to
know which machines are currently in the
Suspended state.
Powered off machines:
Indicates the number of
machines in this delivery
group that are currently
powered off.
Number
Use the detailed diagnosis of this measure to
know which machines are currently in the
powered off.
Unavailable machines:
Indicates the number of
machines in the following
power states:
Unavailable
Unmanaged
Unknown
Number
A low value is desired for this measure.
The detailed diagnosis of this measure will
reveal the complete details of the unavailable
machines, such as, the machine name, IP
address, the machine type, the delivery
group and catalog to which the machine
belongs, the hosting server on which the
machine operates, the name of the
hypervisor and the controller on which the
machine operates, the user who is active on
the session, the location at whih the changes
made by the user is stored, the provision
type of the machine, and the application
published on the machine, if the machine is a
XenAPP server.
M O N I T O RI N G C I T R I X X E N DE S K T OP B R OK E R SI T E
31
Assigned machines:
Indicates the number of
machines that are assigned to
users in this delivery group.
Number
Use the detailed diagnosis of this measure to
know which machines are assigned to users.
Unassigned machines:
Indicates the number of
machines in this delivery
group that are not assigned
to users.
Number
Use the detailed diagnosis of this measure to
know which machines are not assigned to
users.
Resuming machines:
Indicates the number of
machines in this group that
are in the Resume state
currently.
Number
Use the detailed diagnosis of this measure to
know which machines are in the Resume
state.
Total sessions:
Indicates the total number of
user sessions to this delivery
group.
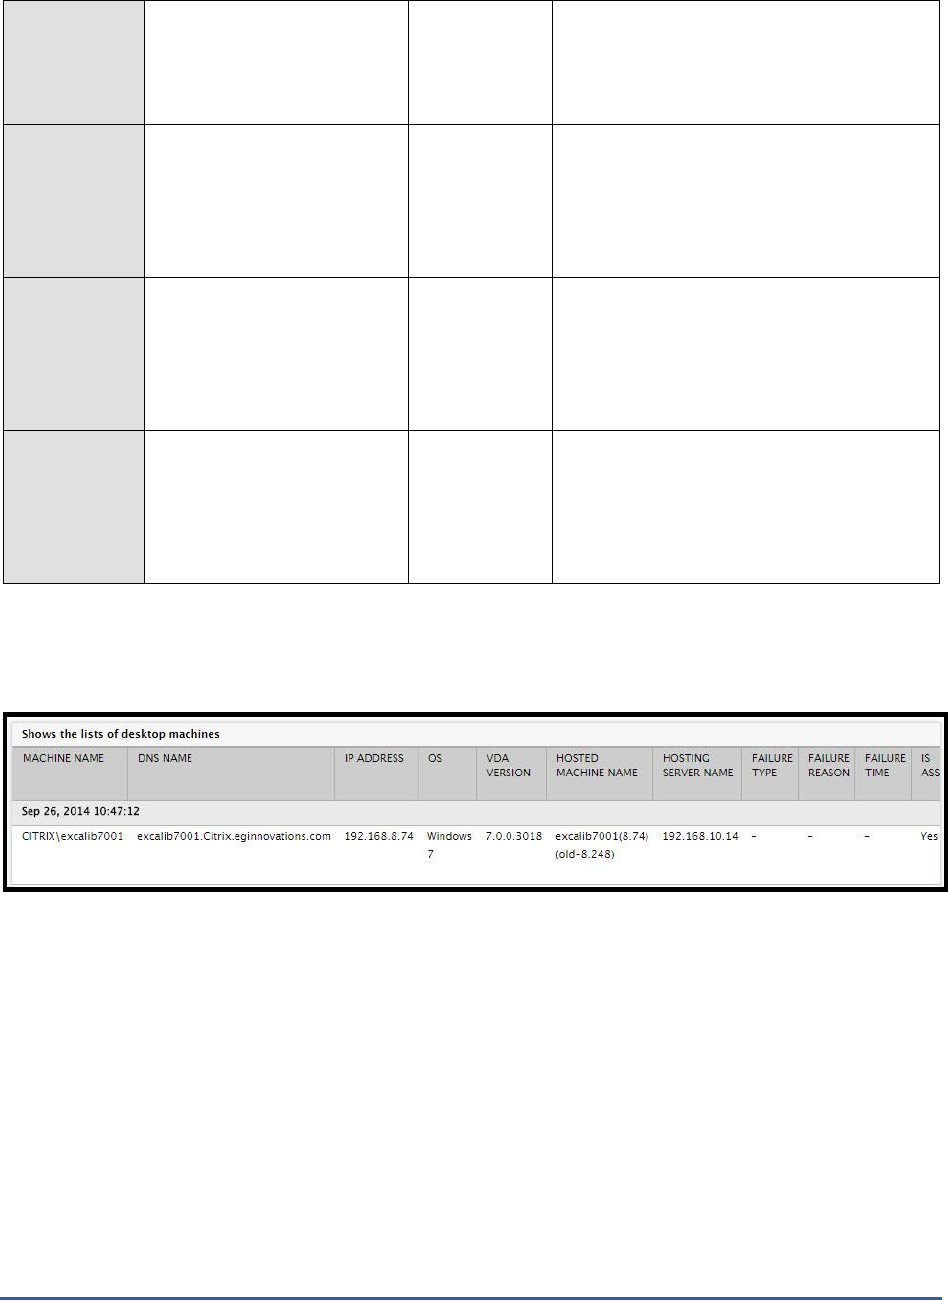
Use the detailed diagnosis of the
Total machines
measure to know which desktop OS machines are part of a delivery
group.
Figure 1.9: The detailed diagnosis of the Total machines measure
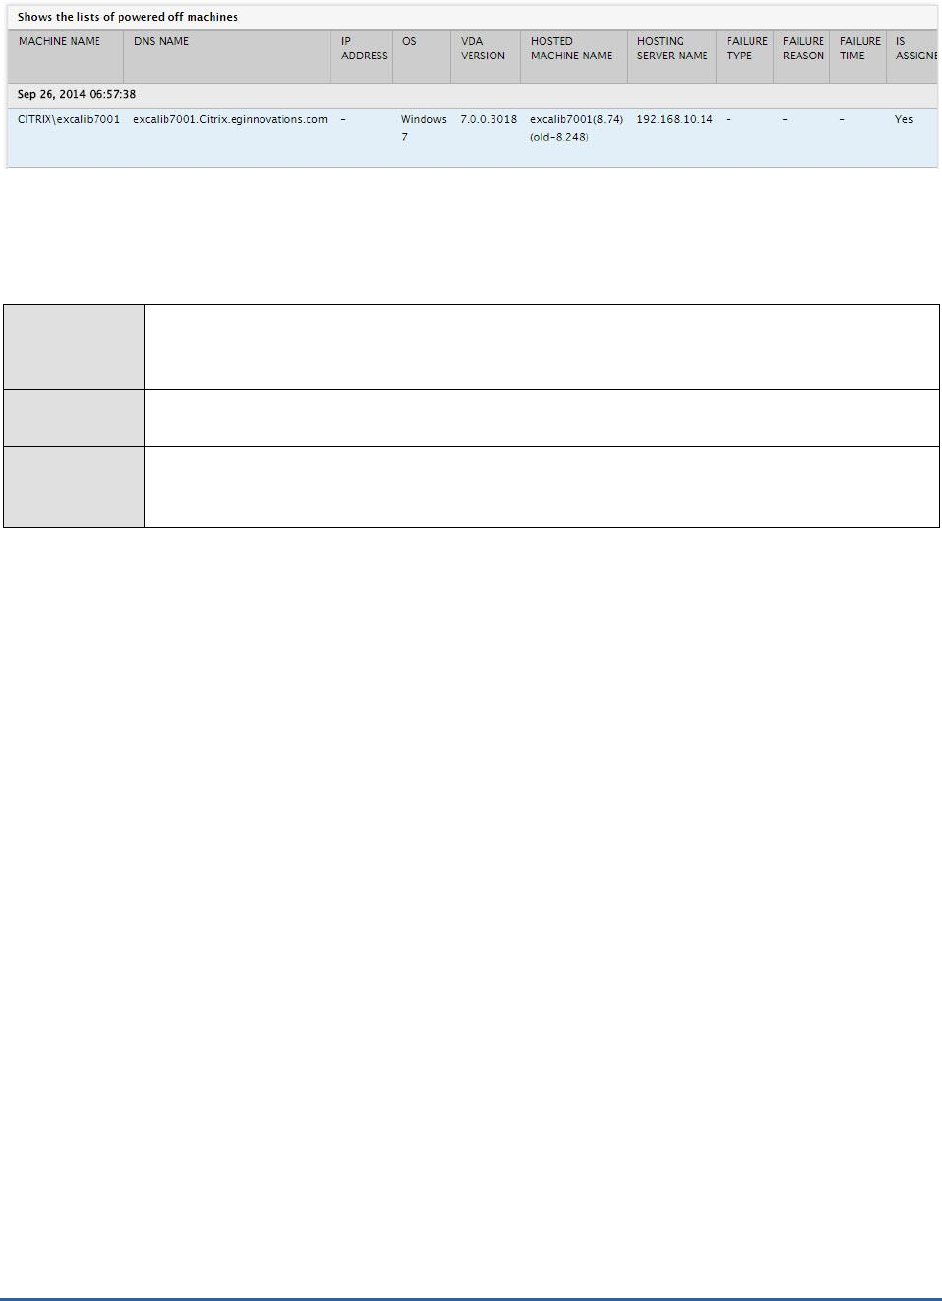
For a list of powered off machines in a delivery goup, use the detailed diagnosis of the
Powered off machines
measure.
M O N I T O RI N G C I T R I X X E N DE S K T OP B R OK E R SI T E
32
1.4.2 Failed Machines Test
Using this test, administrator can figure out how many machines of which type are currently in a state of failure. The
names of these machines and the precise failure state they are in presently can also be ascertained.
Purpose
Using this test, administrator can figure out how many machines of which type are currently in a
state of failure. The names of these machines and the precise failure state they are in presently
can also be ascertained
Target of the
test
A broker in a Citrix XenDesktop Site
Agent
deploying the
test
An internal agent

M O N I T O RI N G C I T R I X X E N DE S K T OP B R OK E R SI T E
33
Configurable
parameters for
the test
1. TEST PERIOD - How often should the test be executed
2. HOST - The host for which the test is to be configured.
3. PORT – The port number at which the specified HOST listens to. By default, this is 80.
4. CONTROLLER IP ADDRESS – Specify the IP address of the delivery controller (i.e.,
broker) in the site with which the eG agent should communicate for collecting performance
metrics.
5. CONTROLLER PORT – Specify the port number of the delivery controller (i.e., broker) in
the site with which the eG agent should communicate for collecting performance metrics.
6. USERNAME and PASSWORD – To connect to a delivery controller and pull out metrics
from it, the eG agent requires Farm Administrator rights. In order to configure the eG agent
with Farm Administrator privileges, specify the credentials of the Farm Administrator in the
USERNAME and PASSWORD text boxes.
7. CONFIRM PASSWORD – Confirm the PASSWORD by retping it here.
8. FULLY QUALIFIED DOMAIN NAME – Here, specify the fully-qualified name of the domain
to which the specified controller belongs.
9. SSL – Indicate whether/not the controller used for metrics collection is SSL-enabled. By
default, this flag is set to Yes.
10. REPORT BY MACHINE TYPE – If you want the results of this test to be grouped by
machine type – i.e., grouped into Desktop OS Machines and Server OS Machines –
then set this flag to Yes. If not, set this flag to No.
11. DETAILED DIAGNOSIS - To make diagnosis more efficient and accurate, the eG Enterprise
suite embeds an optional detailed diagnostic capability. With this capability, the eG agents
can be configured to run detailed, more elaborate tests as and when specific problems are
detected. To enable the detailed diagnosis capability of this test for a particular server,
choose the On option. To disable the capability, click on the Off option.
The option to selectively enable/disable the detailed diagnosis capability will be available
only if the following conditions are fulfilled:
The eG manager license should allow the detailed diagnosis capability
Both the normal and abnormal frequencies configured for the detailed diagnosis
measures should not be 0.
Outputs of the
test
One set of results for each delivery group configured for the XenDesktop broker ste
Measurements
made by the
test
Measurement
Measurement
Unit
Interpretation
Machines that failed to
start:
Indicates the number of
machines in this delivery
group that failed to start.
Number
The value of this measure refers to the
number of failures that occurred due to a
guest machine being unable to start as in
disk is detached when attempting to boot or
the hosting server reported that the VM could
not be booted up.
Use the detailed diagnosis of this measure to
know which machines failed to start.

M O N I T O RI N G C I T R I X X E N DE S K T OP B R OK E R SI T E
34
Machines stuck on boot:
Indicates the number of
machines that are stuck on
boot.
Number
This measure refers to the number of failures
that occurred due to the guest operating
system being unable to boot up fully. For
example, OS BSOD during boot or unable to
locate the boot partition.
Use the detailed diagnosis of this measure to
know which machines were stuck on boot.
Unregistered machines:
Indicates the number of
machines in this delivery
group that are not registered
with the broker.
Number
Machine registration can fail due to loss of
network connectivity between the machine
and the broker, the clocks on the two being
out of sync or the Desktop Service not
running on the desktop.
Use the detailed diagnosis of this measure to
identify the unregistered machines.
Maximum load:
Indicates the number of
machines in this delivery
group that have violated their
maximum load limit.
Number
This measure applies only to Server OS
Machines.
The value of this measure refers to the
number of failures that occurred owing to too
many sessions on the machine or because
CPU or memory usage of the machines
crossed the threshold specified for the
delivery group.
Use the detailed diagnosis of this measure to
identify the loaded machines.
1.4.3 Server OS Machines Test
Server OS Machines are VMs or physical machines based on the Windows Server operating system used for
delivering applications or hosted shared desktops to users.
This test auto-discovers the Server OS Machines in the site and reports the session load on, resource usage of, and
current state of each machine. This way, administrators can quickly identify machines that are experiencing heavy
load and those that are consuming resources abnormally.
Purpose
Auto-discovers the Server OS Machines in the site and reports the session load on, resource
usage of, and current state of each machine
Target of the
test
A broker in the Citrix XenDesktop site
Agent
deploying the
test
An internal agent

M O N I T O RI N G C I T R I X X E N DE S K T OP B R OK E R SI T E
35
Configurable
parameters for
the test
1. TEST PERIOD - How often should the test be executed
2. HOST - The host for which the test is to be configured.
3. PORT – The port number at which the specified HOST listens to. By default, this is 80.
4. CONTROLLER IP ADDRESS – Specify the IP address of the delivery controller (i.e.,
broker) in the site with which the eG agent should communicate for collecting performance
metrics.
5. CONTROLLER PORT – Specify the port number of the delivery controller (i.e., broker) in
the site with which the eG agent should communicate for collecting performance metrics.
6. USERNAME and PASSWORD – To connect to a delivery controller and pull out metrics
from it, the eG agent requires Farm Administrator rights. In order to configure the eG agent
with Farm Administrator privileges, specify the credentials of the Farm Administrator in the
USERNAME and PASSWORD text boxes.
7. CONFIRM PASSWORD – Confirm the PASSWORD by retping it here.
8. FULLY QUALIFIED DOMAIN NAME – Here, specify the fully-qualified name of the domain
to which the specified controller belongs.
9. SSL – Indicate whether/not the controller used for metrics collection is SSL-enabled. By
default, this flag is set to Yes.
10. REPORT BY DELIVERY GROUP – If you want the results of this test to be grouped by
delivery group then set this flag to Yes. In this case therefore, the delivery groups
containing the server OS machines will be the primary descriptors of this test; expanding
them will reveal the secondary descriptors – i.e., the server OS machines in each delivery
group. If you want the results of this test to be indexed only by the names of the server OS
machines, then set this flag to No.
11. DETAILED DIAGNOSIS - To make diagnosis more efficient and accurate, the eG Enterprise
suite embeds an optional detailed diagnostic capability. With this capability, the eG agents
can be configured to run detailed, more elaborate tests as and when specific problems are
detected. To enable the detailed diagnosis capability of this test for a particular server,
choose the On option. To disable the capability, click on the Off option.
The option to selectively enable/disable the detailed diagnosis capability will be available
only if the following conditions are fulfilled:
The eG manager license should allow the detailed diagnosis capability
Both the normal and abnormal frequencies configured for the detailed diagnosis
measures should not be 0.
Outputs of the
test
One set of results for each server OS machine running in the XenDesktop broker ste
Measurements
made by the
test
Measurement
Measurement
Unit
Interpretation
M O N I T O RI N G C I T R I X X E N DE S K T OP B R OK E R SI T E
36
Power state:
Indicates the current power
state of this server OS
machine.
The values this measure can report and their
corresponding numeric values are listed in
then table below:
Measure Value
Numeric Value
Unknown
0
Unavailable
1
Off
2
On
3
Suspended
4
Turning on
5
Turning Off
6
Suspending
7
Resuming
8
Unmanaged
9
Using the detailed diagnosis of the
Power
state
measure you can view the complete
configuration details of the server OS
machine.
Note:
By default, this measure reports the Measure
Values in the table above to indicate the
power state of a server OS machine.
However, in the graph of this measure, the
same will be represented using the
corresponding numeric equivalents only.

M O N I T O RI N G C I T R I X X E N DE S K T OP B R OK E R SI T E
37
Maintenance mode:
Indicates whether/not this
machine is in the
maintenance mode currently.
The values this measure can report and their
corresponding numeric values are listed in
then table below:
Measure Value
Numeric Value
Off
0
On
1
Note:
By default, this measure reports the Measure
Values in the table above to indicate
whether/not a server OS machine is in the
maintenance mode. However, in the graph of
this measure, the same will be represented
using the corresponding numeric equivalents
only.
Pending image update:
Indicates whether/not image
updates are pending on this
machine.
The values this measure can report and their
corresponding numeric values are listed in
then table below:
Measure Value
Numeric Value
No
0
Yes
1
Note:
By default, this measure reports the Measure
Values in the table above to indicate
whether/not image updates are pending on
this server OS machine. However, in the
graph of this measure, the same will be
represented using the corresponding numeric
equivalents only.

M O N I T O RI N G C I T R I X X E N DE S K T OP B R OK E R SI T E
38
Is this physical machine?:
Indicates whether this server
OS machine is a physical or
virtual machine.
The values this measure can report and their
corresponding numeric values are listed in
then table below:
Measure Value
Numeric Value
No
0
Yes
1
Note:
By default, this measure reports the Measure
Values in the table above to indicate
whether/not a server OS machine is a
physical machine. However, in the graph of
this measure, the same will be represented
using the corresponding numeric equivalents
only.
Total sessions:
Indicates the total number of
user sessions on this server
OS machine.
Number
This is a good indicator of the current session
load on a server OS machine. Compare the
value of this measure across machines to
know which machine is overloaded with
sessions.
Load evaluator index:
Indicates the load evaluator
index of this machine.
Percent
A server’s load index may be the aggregate
of:
Various computer performance
counter based metrics, namely
CPU, Memory and Disk Usage
Session Count
It is designed to indicate how suitable a
XenApp Worker is to receive a new user
session. It is the Delivery Controller’s
responsibility to calculate the load index
based on the aggregate of the normalized
load rule indexes generated by the various
load rules. As only the Delivery Controller can
determine the session load, a server’s overall
load index is calculated on the Delivery
Controller and not the Virtual Delivery Agent.
By comparing the value of this measure
across server OS machines, you can figure
out whether or not load is uniformly balanced
across all servers in the site.
M O N I T O RI N G C I T R I X X E N DE S K T OP B R OK E R SI T E
39
CPU:
Indicates the CPU load
evaluator index of this server
OS machine.
Percent
A high value is indicative of excessive CPU
usage by the machine over time.
Memory:
Indicates the memory load
evaluator index of this server
OS machine.
Percent
A high value is indicative of excessive
memory usage by the machine over time.
Disk:
Indicates the disk load
evaluator index of this server
OS machine.
Percent
A high value is indicative of excessive disk
usage by the machine over time.
Session count:
Indicates the session count
load evaluator index of this
server OS machine.
Percent
A high value indicates that the machine has
been consistently handling many user
sessions.
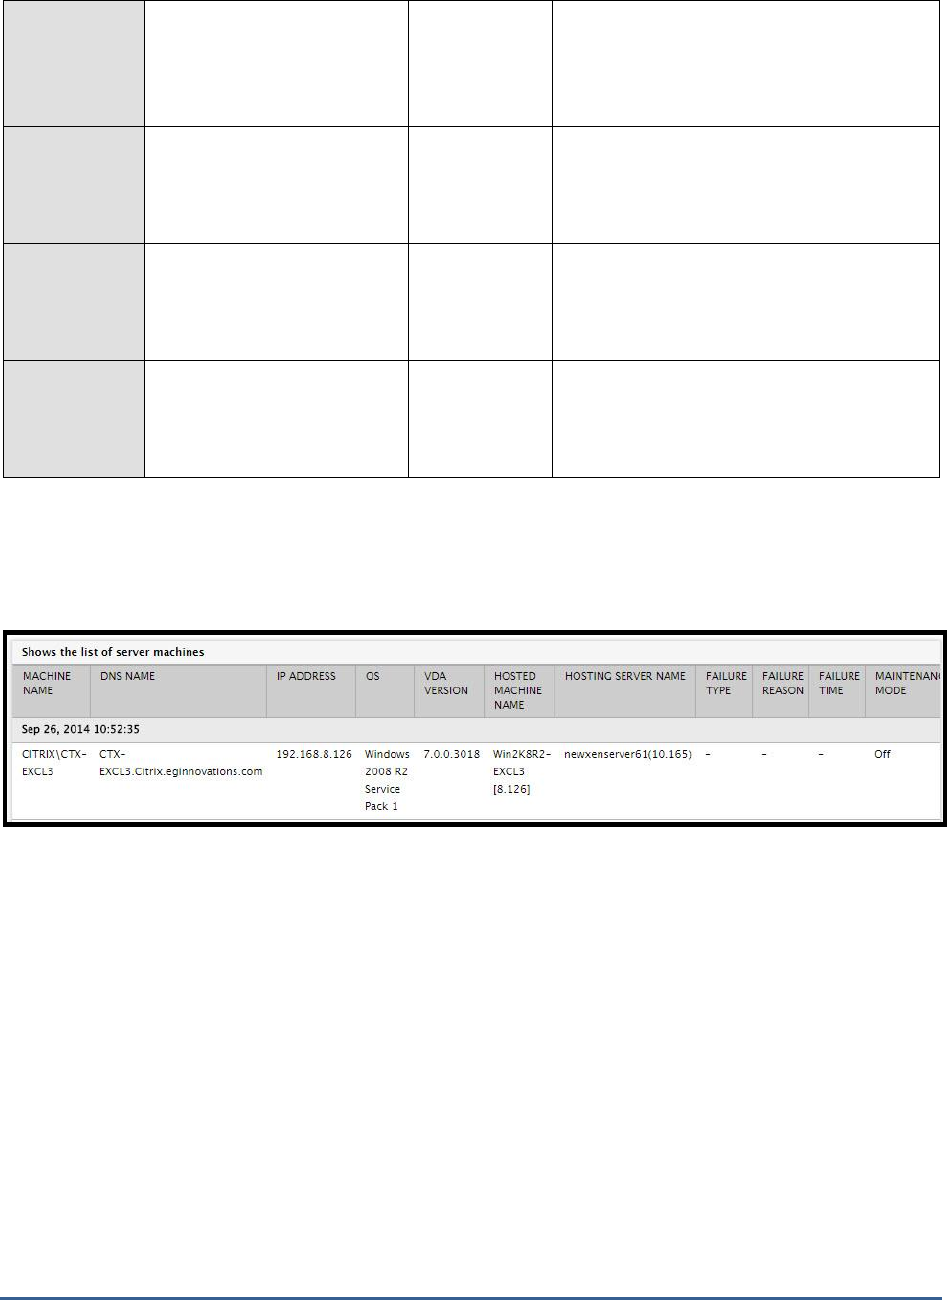
Using the detailed diagnosis of the
Power state
measure you can view the details of the server OS machine such as
the IP address, DNS name, OS of the machine, the server hosting the machine, and the current status of that
machine.
Figure 1.10: The detailed diagnosis of the Power state measure
1.4.4 Machine Catalogs Test
In XenDesktop, collections of virtual machines (VMs) or physical computers of the same type are managed as a
single entity called a catalog. To deliver desktops to users, the machine administrator creates a catalog of machines
and the assignment administrator allocates machines from the catalog to users by creating delivery groups.
This test auto-discovers the catalogs managed by the XenDesktop site being monitored, and reports useful statistics
related to each catalog, which reveal:
The catalog type;
The type of desktops allocated to each catalog;
The availability, usage, and assignment of desktops in each catalog

M O N I T O RI N G C I T R I X X E N DE S K T OP B R OK E R SI T E
40
Purpose
Auto-discovers the catalogs managed by the XenDesktop site being monitored, and reports
useful statistics related to each catalog
Target of the
test
A broker in a XenDesktop site
Agent
deploying the
test
An internal agent
Configurable
parameters for
the test
1. TEST PERIOD - How often should the test be executed
2. HOST - The host for which the test is to be configured.
3. PORT – The port number at which the specified HOST listens to. By default, this is 80.
4. DOMAIN, USERNAME and PASSWORD – To connect to a delivery controller in a site and
pull out metrics from it, the eG agent requires Farm Administrator rights. In order to
configure the eG agent with Farm Administrator privileges, specify the DOMAIN to which the
target controller belongs and enter the credentials of the Farm Administrator in the
USERNAME and PASSWORD text boxes.
5. CONFIRM PASSWORD – Confirm the PASSWORD by retping it here.
6. REPORT BY MACHINE TYPE – If you want the results of this test to be grouped by
machine type – i.e., grouped into Desktop OS Machines and Server OS Machines –
then set this flag to Yes. If not, set this flag to No.
7. DETAILED DIAGNOSIS - To make diagnosis more efficient and accurate, the eG Enterprise
suite embeds an optional detailed diagnostic capability. With this capability, the eG agents
can be configured to run detailed, more elaborate tests as and when specific problems are
detected. To enable the detailed diagnosis capability of this test for a particular server,
choose the On option. To disable the capability, click on the Off option.
The option to selectively enable/disable the detailed diagnosis capability will be available
only if the following conditions are fulfilled:
The eG manager license should allow the detailed diagnosis capability
Both the normal and abnormal frequencies configured for the detailed diagnosis
measures should not be 0.
Outputs of the
test
One set of results for every catalog on each broker configured within a site
Measurements
made by the
Measurement
Measurement
Unit
Interpretation

M O N I T O RI N G C I T R I X X E N DE S K T OP B R OK E R SI T E
41
test
Allocation type:
Indicates the allocation type
of the machines available in
this catalog.
Number
This measure can report any one of the
following values:
Static
Permanent
Random
Unknown
The table below provides the numeric values
that correspond to the allocation types listed
above, and a brief description of each type:
Allocation
Type
Numeric
Value
Description
Static
1
Indicates that the
machines in this
catalog are either
assigned by the
administrator or
assigned on first
use to users. This
assignment will
change only when
the administrator
explicitly changes
the assignments.
Permanent
2
Indicates that the
machines in this
catalog are
permanently
assigned to the
user.
Random
3
Indicates that the
machines in this
catalog are picked
in random and
are temporarily
assigned to the
user.
Note:
By default, this measure reports the
Allocation Types listed in the table above.
However, the graph of this measure will
represent the allocation types using their
corresponding numeric equivalents – i.e.,
1
to
3
.

M O N I T O RI N G C I T R I X X E N DE S K T OP B R OK E R SI T E
42
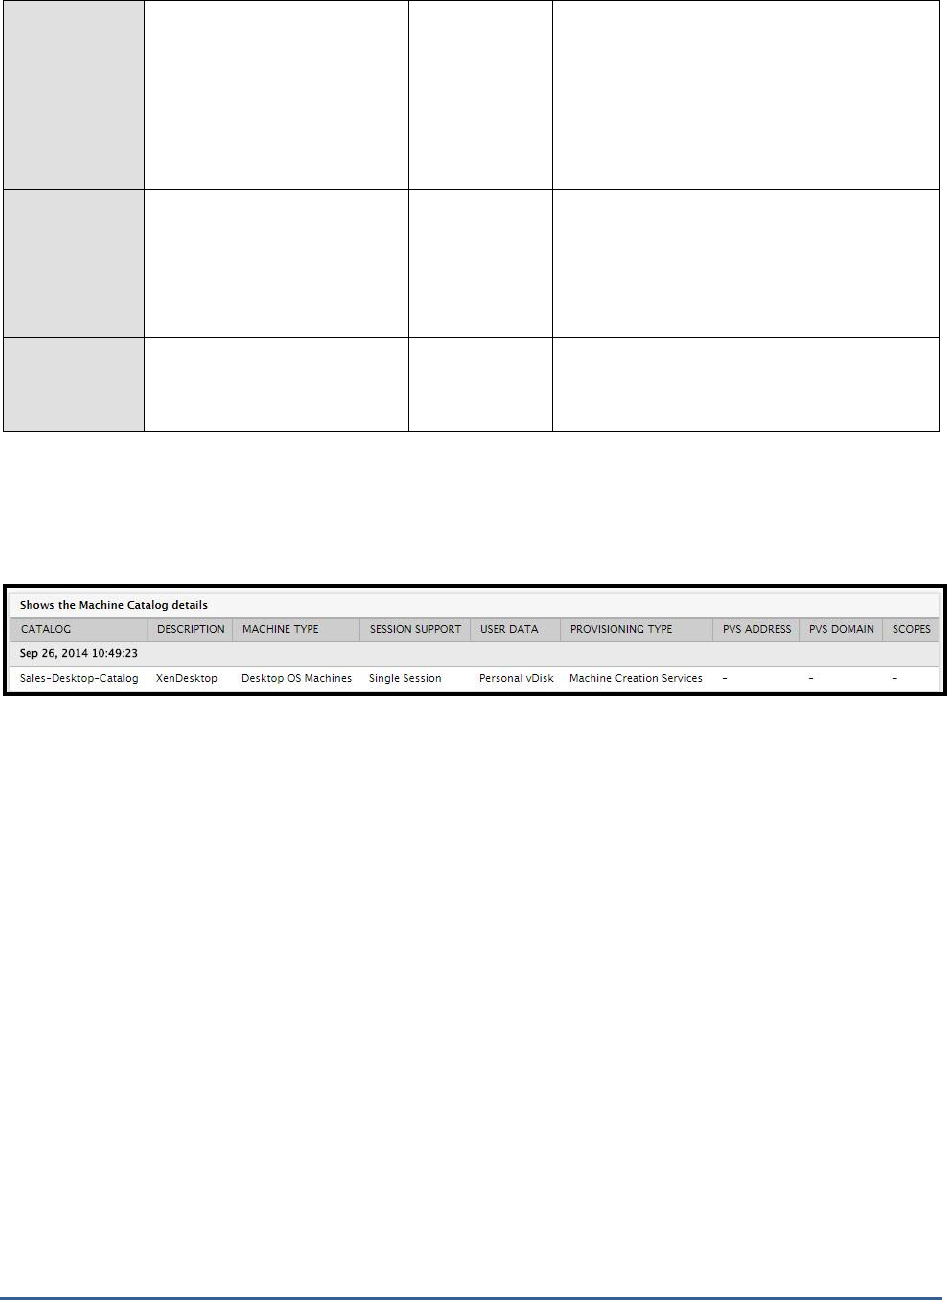
The detailed diagnosis of this measure if
enabled, lists the catalog to which the
machine belongs, the machine type, the
number of sessions supported by the
machine i.e, either Single session or Multi
session, the location used for storing user
data, the provisioning type and the scopes
associated with the chosen catalog.
Are physical machines?:
Indicates whether/not the
machines in this catalog are
power managed by the
broker.
This measure reports a value
Yes
if the
machines are power managed by the broker
and No, if otherwise.
The table below provides the numeric values
that correspond to the abovementioned
values:
Measure Value
Numeric Value
Yes
1
No
0
Note:
By default, this measure reports whether the
machines are power managed by the broker
or not. However, the graph of this measure
will be represented using their corresponding
numeric equivalents – i.e.,
0
or
1
.
Entitled machines used in
delivery groups:
Indicates the number of
assigned machines (to users)
in this catalog that are within
delivery groups.
Number
Entitled machines
available for delivery
groups:
Indicates the number of
machines in this catalog that
are available to users within
delivery groups.
Number
Machines not entitled
available for delivery
groups:
Indicates the number of
machines within the delivery
groups that are not yet
assigned to users.
Number
M O N I T O RI N G C I T R I X X E N DE S K T OP B R OK E R SI T E
43
Machines not entitled
used in delivery groups:
Indicates the number of
unassigned machines in this
catalog within the delivery
groups but are still used in
the pool.
Number
Machines used in delivery
groups:
Indicates the number of
machines in this catalog that
are within delivery groups.
Number
Total machines in catalog:
Indicates the total number of
machines in this catalog.
Number
The detailed diagnosis of the
Allocation type
measure if enabled, lists the catalog to which the machine belongs, the
machine type, the number of sessions supported by the machine i.e, either Single session or Multi session, the
location used for storing user data, the provisioning type and the scopes associated with the chosen catalog.
Figure 1.11: The detailed diagnosis of the Allocation type measure
1.5 The Users Layer
Use the tests mapped to this layer to monitor user logons to the broker, assess user load, capture bottlenecks in the
logon process, and detect user connection failures.
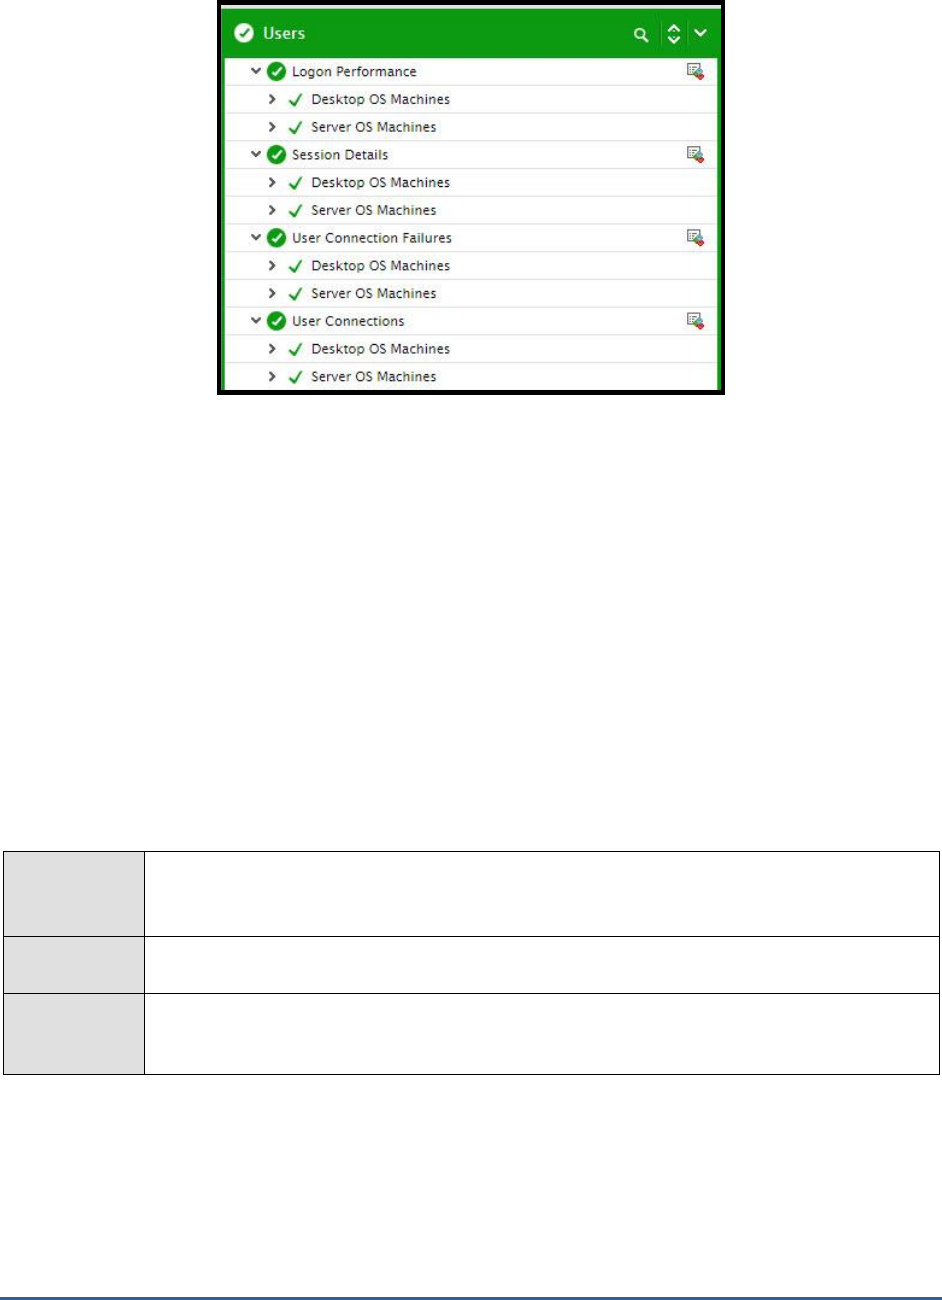
M O N I T O RI N G C I T R I X X E N DE S K T OP B R OK E R SI T E
44
Figure 1.12: The tests mapped to the Users layer
1.5.1 Logon Performance Test
The process of a user logging into a desktop/server OS machine managed by a XenDesktop Broker is complex. First,
the user’s login credentials are authenticated. Then, the corresponding user profile is identified and loaded. Next,
group policies are applied and logon scripts are processed to setup the user environment. Then, a HDX connection is
established with the VM, subsequent to which, the VM starts and hands off keyboard and mouse control to the user.
In the meantime, additional processing may take place for a user – say, applying system profiles, creating new
printers for the user, and so on. A slowdown in any of these steps can significantly delay the logon process for a user
and may adversely impact the logins for other users who may be trying to access desktops/applications at the same
time. Hence, if a user complains that he/she is unable to access an application/desktop, administrators must be able
to rapidly isolate exactly where the logon process is stalling and for which user.
The Logon Performance test tracks user connections to each delivery group configured in a site, measures the
average time taken for users to access desktops/applications delivered by each group, isolates the group to which
user logins are slow, and accurately pinpoints where the login process is bottlenecked. Detailed diagnostics provided
by this test point to the precise user who is experiencing the slowness.
Purpose
Tracks user connections to each delivery group configured in a site, measures the average time
taken for users to access desktops/applications delivered by each group, isolates the group to
which user logins are slow, and accurately pinpoints where the login process is bottlenecked.
Target of the
test
A broker in a XenDesktop broker site
Agent
deploying the
test
An internal agent

M O N I T O RI N G C I T R I X X E N DE S K T OP B R OK E R SI T E
45
Configurable
parameters for
the test
1. TEST PERIOD - How often should the test be executed
2. HOST - The host for which the test is to be configured.
3. PORT – The port number at which the specified HOST listens to. By default, this is 80.
4. CONTROLLER IP ADDRESS – Specify the IP address of the delivery controller (i.e.,
broker) in the site with which the eG agent should communicate for collecting performance
metrics.
5. CONTROLLER PORT – Specify the port number of the delivery controller (i.e., broker) in
the site with which the eG agent should communicate for collecting performance metrics.
6. USERNAME and PASSWORD – To connect to a delivery controller and pull out metrics
from it, the eG agent requires Farm Administrator rights. In order to configure the eG agent
with Farm Administrator privileges, specify the credentials of the Farm Administrator in the
USERNAME and PASSWORD text boxes.
7. CONFIRM PASSWORD – Confirm the PASSWORD by retping it here.
8. FULLY QUALIFIED DOMAIN NAME – Here, specify the fully-qualified name of the domain
to which the specified controller belongs.
9. SSL – Indicate whether/not the controller used for metrics collection is SSL-enabled. By
default, this flag is set to Yes.
10. REPORT BY MACHINE TYPE – If you want the results of this test to be grouped by
machine type then set this flag to Yes. In this case therefore, the machine types (desktop or
server OS machines) will be the primary descriptors of this test; expanding them will reveal
the secondary descriptors – i.e., the delivery groups containing machines of each type. If
you want the results of this test to be indexed only by the names of delivery groups, then
set this flag to No.
11. DD FREQUENCY - Refers to the frequency with which detailed diagnosis measures are to
be generated for this test. The default is
1:1
. This indicates that, by default, detailed
measures will be generated every time this test runs, and also every time the test detects a
problem. You can modify this frequency, if you so desire. Also, if you intend to disable the
detailed diagnosis capability for this test, you can do so by specifying
none
against dd
frequency.
12. DETAILED DIAGNOSIS - To make diagnosis more efficient and accurate, the eG Enterprise
suite embeds an optional detailed diagnostic capability. With this capability, the eG agents
can be configured to run detailed, more elaborate tests as and when specific problems are
detected. To enable the detailed diagnosis capability of this test for a particular server,
choose the On option. To disable the capability, click on the Off option.
The option to selectively enable/disable the detailed diagnosis capability will be available
only if the following conditions are fulfilled:
The eG manager license should allow the detailed diagnosis capability
Both the normal and abnormal frequencies configured for the detailed diagnosis
measures should not be 0.
Outputs of the
test
One set of results for each delivery group configured in the XenDesktop broker ste
Measurements
made by the
test
Measurement
Measurement
Unit
Interpretation

M O N I T O RI N G C I T R I X X E N DE S K T OP B R OK E R SI T E
46
Average logon duration:
Indicates the average time
taken for users to login to
desktops/applications offered
by this delivery group.
Secs
If this measure reports a high value
consistently, it could indicate a slowdown in
the logon process.
You can use the detailed diagnosis of this
measure to understand the logon experience
of each user to the delivery group, identify
that user who took the maximum time to
login, and accurately isolate where he/she
experienced slowness.
Logons:
Indicates the number of users
who recently logged into
desktops/applications
delivered by this delivery
group.
Number
This is a good indicator of the current user
load on a delivery group.
Brokering duration:
Indicates time taken to
complete the process of
brokering sessions to this
deliver group.
Secs
A high value indicates that brokering is taking
a long time.
If the
Average logon duration
is very high,
you may want to compare the value of this
measure with that of the
Time taken for
starting VM, HDX connection duration,
Authentication time, GPOs duration, Logon
scripts duration, Profile load time, and
Interactive session duration
measures to
know where exactly the user logon process
slowed down – is it during authentication? Is
it during brokering? Is it when establishing
the HDX connection? Is it when applying
GPOs? Is it during logon scripts execution? Is
it while loading user profiles? Is it when
starting the VM? Or is it when handing over
control to the user?
Time taken for starting
VM:
Indicates the time taken for
starting the machines in this
delivery group.
Secs
A high value indicates that machines are
taking too long to startup.
If the
Average logon duration
is very high,
you may want to compare the value of this
measure with that of the
Brokering duration,
HDX connection duration, Authentication
time, GPOs duration, Logon scripts duration,
Profile load time, and Interactive session
duration
measures to know where exactly the
user logon process slowed down – is it during
authentication? Is it during brokering? Is it
when establishing the HDX connection? Is it
when applying GPOs? Is it during logon
scripts execution? Is it while loading user
profiles? Is it when starting the VM? Or is it
when handing over control to the user?

M O N I T O RI N G C I T R I X X E N DE S K T OP B R OK E R SI T E
47
HDX connection duration:
Indicates the time taken to
complete the steps required
for setting up the HDX
connection from the client to
the machines in this delivery
group.
Secs
A high value indicates that HDX connections
are taking time to be established.
If the
Average logon duration
is very high,
you may want to compare the value of this
measure with that of the
Brokering duration,
Time taken for starting VM, Authentication
time, GPOs duration, Logon scripts duration,
Profile load time, and Interactive session
duration
measures to know where exactly the
user logon process slowed down – is it during
authentication? Is it during brokering? Is it
when establishing the HDX connection? Is it
when applying GPOs? Is it during logon
scripts execution? Is it while loading user
profiles? Is it when starting the VM? Or is it
when handing over control to the user?
Authentication time:
Indicates the time time taken
to authenticate remoe
sessions to the machines in
this delivery group.
Secs
A high value indicates authentication delays.
If the
Average logon duration
is very high,
you may want to compare the value of this
measure with that of the
Brokering duration,
Time taken for starting VM, HDX connection
duration, GPOs duration, Logon scripts
duration, Profile load time, and Interactive
session duration
measures to know where
exactly the user logon process slowed down
– is it during authentication? Is it during
brokering? Is it when establishing the HDX
connection? Is it when applying GPOs? Is it
during logon scripts execution? Is it while
loading user profiles? Is it when starting the
VM? Or is it when handing over control to the
user?
GPOs duration:
Indicates the time taken to
apply group policy settings on
the machines in this delivery
group.
Secs
A high value indicates that GPO application is
taking time.
If the
Average logon duration
is very high,
you may want to compare the value of this
measure with that of the
Brokering duration,
Time taken for starting VM, HDX connection
duration, Authentication time, Logon scripts
duration, Profile load time, and Interactive
session duration
measures to know where
exactly the user logon process slowed down
– is it during authentication? Is it during
brokering? Is it when establishing the HDX
connection? Is it when applying GPOs? Is it
during logon scripts execution? Is it while
loading user profiles? Is it when starting the
VM? Or is it when handing over control to the
user?

M O N I T O RI N G C I T R I X X E N DE S K T OP B R OK E R SI T E
48
Logon scripts duration:
Indicates the time taken for
logon scripts to be executed
on the machines in this
delivery group.
Secs
A high value indicates that logon script
execution is taking time.
If the
Average logon duration
is very high,
you may want to compare the value of this
measure with that of the
Brokering duration,
Time taken for starting VM, HDX connection
duration, Authentication time, GPOs duration,
Profile load time, and Interactive session
duration
measures to know where exactly the
user logon process slowed down – is it during
authentication? Is it during brokering? Is it
when establishing the HDX connection? Is it
when applying GPOs? Is it during logon
scripts execution? Is it while loading user
profiles? Is it when starting the VM? Or is it
when handing over control to the user?
Profile load time:
Indicates the time taken by
the logon process to load the
profile of the users to this
delivery group.
Secs
A high value indicates that profiles are taking
too long to load.
If the
Average logon duration
is very high,
you may want to compare the value of this
measure with that of the
Brokering duration,
Time taken for starting VM, HDX connection
duration, Authentication time, GPOs duration,
Logon scripts duration, and Interactive
session duration
measures to know where
exactly the user logon process slowed down
– is it during authentication? Is it during
brokering? Is it when establishing the HDX
connection? Is it when applying GPOs? Is it
during logon scripts execution? Is it while
loading user profiles? Is it when starting the
VM? Or is it when handing over control to the
user?
Interactive session
duration:
Indicates the time taken by
the logon process to handoff
keyboard and mouse control
to the users to this delivery
group.
Secs
A high value indicates delays in handing off
keyboard and mouse control to users.
If the
Average logon duration
is very high,
you may want to compare the value of this
measure with that of the
Brokering duration,
Time taken for starting VM, HDX connection
duration, Authentication time, GPOs duration,
Logon scripts duration, and Profile load time
measures to know where exactly the user
logon process slowed down – is it during
authentication? Is it during brokering? Is it
when establishing the HDX connection? Is it
when applying GPOs? Is it during logon
scripts execution? Is it while loading user
profiles? Is it when starting the VM? Or is it
when handing over control to the user?

M O N I T O RI N G C I T R I X X E N DE S K T OP B R OK E R SI T E
49
1.5.2 Session Details Test
By tracking sessions to each delivery group configured on a site, administrators can not only assess the load on the
delivery groups, but can also quickly identify problematic sessions – these could be sessions that are disconnected,
sessions that are in an Unknown state, sessions that are reconnecting for some reason. This is what the Session
Detaiils test does! This test monitors the user sessions to each delivery group in a site, points administrators to
overloaded groups, and also reports the status of sessions to each group, so that problem sessions can be isolated
and their problems can be investigated.
Purpose
Monitors the user sessions to each delivery group in a site, points administrators to overloaded
groups, and also reports the status of sessions to each group, so that problem sessions can be
isolated and their problems can be investigated
Target of the
test
A broker in a Citrix XenDesktop site
Agent
deploying the
test
An internal agent

M O N I T O RI N G C I T R I X X E N DE S K T OP B R OK E R SI T E
50
Configurable
parameters for
the test
1. TEST PERIOD - How often should the test be executed
2. HOST - The host for which the test is to be configured.
3. PORT – The port number at which the specified HOST listens to. By default, this is 80.
4. CONTROLLER IP ADDRESS – Specify the IP address of the delivery controller (i.e.,
broker) in the site with which the eG agent should communicate for collecting performance
metrics.
5. CONTROLLER PORT – Specify the port number of the delivery controller (i.e., broker) in
the site with which the eG agent should communicate for collecting performance metrics.
6. USERNAME and PASSWORD – To connect to a delivery controller and pull out metrics
from it, the eG agent requires Farm Administrator rights. In order to configure the eG agent
with Farm Administrator privileges, specify the credentials of the Farm Administrator in the
USERNAME and PASSWORD text boxes.
7. CONFIRM PASSWORD – Confirm the PASSWORD by retping it here.
8. FULLY QUALIFIED DOMAIN NAME – Here, specify the fully-qualified name of the domain
to which the specified controller belongs.
9. SSL – Indicate whether/not the controller used for metrics collection is SSL-enabled. By
default, this flag is set to Yes.
10. REPORT BY MACHINE TYPE – If you want the results of this test to be grouped by
machine type then set this flag to Yes. In this case therefore, the machine types (desktop or
server OS machines) will be the primary descriptors of this test; expanding them will reveal
the secondary descriptors – i.e., the delivery groups containing machines of each type. If
you want the results of this test to be indexed only by the names of delivery groups, then
set this flag to No.
11. DD FREQUENCY - Refers to the frequency with which detailed diagnosis measures are to
be generated for this test. The default is
1:1
. This indicates that, by default, detailed
measures will be generated every time this test runs, and also every time the test detects a
problem. You can modify this frequency, if you so desire. Also, if you intend to disable the
detailed diagnosis capability for this test, you can do so by specifying
none
against dd
frequency.
12. DETAILED DIAGNOSIS - To make diagnosis more efficient and accurate, the eG Enterprise
suite embeds an optional detailed diagnostic capability. With this capability, the eG agents
can be configured to run detailed, more elaborate tests as and when specific problems are
detected. To enable the detailed diagnosis capability of this test for a particular server,
choose the On option. To disable the capability, click on the Off option.
The option to selectively enable/disable the detailed diagnosis capability will be available
only if the following conditions are fulfilled:
The eG manager license should allow the detailed diagnosis capability
Both the normal and abnormal frequencies configured for the detailed diagnosis
measures should not be 0.
Outputs of the
test
One set of results for each delivery group configured in the XenDesktop broker ste
Measurements
made by the
Measurement
Measurement
Unit
Interpretation

M O N I T O RI N G C I T R I X X E N DE S K T OP B R OK E R SI T E
51
test
Active sessions:
Indicates the number of user
sessions that are currently
active on this delivery group.
Number
This is a good indicator of the current session
load on a delivery group. A consistent zero
value however could indicate a connection
issue.
You can compare the value of this measure
across delivery groups to kow which delivery
group is handling the maximum number of
sessions currently.
To determine the details of the currently
active sessions, use the detailed diagnosis of
this
measure.
Connected sessions:
Indicates the number of
sessions that are currently
connected to this delivery
group.
Number
Use the detailed diagnosis of this measure to
view the details of connected sessions.
Disconnected sessions:
Indicates the number of
sessions that are currently
disconnected from this
delivery group.
Number
If all the current sessions suddenly log out, it
indicates a problem condition that requires
investigation. The detailed diagnosis of this
measure lists the sessions that were logged
out.
Reconnecting sessions:
Indicates the number of
sessions that are reconnecting
with this delivery group soon
after a disconnect.
Number
Preparing sessions:
Indicates the number of
sessions to this delivery group
that are currently in the
Preparing
state.
Number
Non-brokered sessions:
Indicates the number of user
sessions that are not brokered
by the machines managed by
this delivery group.
Number
Unknown sessions:
Indicates the number of
sessions to this delivery group
that are currently in
Unknown
state.
Number

M O N I T O RI N G C I T R I X X E N DE S K T OP B R OK E R SI T E
52
Other sessions:
Indicates the number of
sessions to this delivery group
that are currently in
Other
state.
Number
Pending sessions:
Indicates the number of
sessions to this delivery group
that are currently pending.
Number
1.5.3 User Connection Failures
If a user complains that his/her connections to a desktop/application failed, then adinistrators must be able to quickly
detect the failure and accurately zero-in on the reason for the failure, so that the problem can be fixed and the user
connection can be restored. The User Connection Failures test helps administrators do just that! This test monitors
the user connections to each delivery group in a site, promptly detects connection failures, and accurately indicates
what caused the failure – is it due to a problem at the client side? is it owing to configuration errors? is it because of
machine failures? is it due to the exhaustion of delivery group capacity? Or is it due to the absence of a license?
Purpose
Monitors the user connections to each delivery group in a site, promptly detects connection
failures, and accurately indicates what caused the failure – is it due to a problem at the client
side? is it owing to configuration errors? is it because of machine failures? is it due to the
exhaustion of delivery group capacity? Or is it due to the absence of a license?
Target of the
test
A Citrix XenDesktop Director
Agent
deploying the
test
An internal agent

M O N I T O RI N G C I T R I X X E N DE S K T OP B R OK E R SI T E
53
Configurable
parameters for
the test
1. TEST PERIOD - How often should the test be executed
2. HOST - The host for which the test is to be configured.
3. PORT – The port number at which the specified HOST listens to. By default, this is 80.
4. CONTROLLER IP ADDRESS – Specify the IP address of the delivery controller (i.e.,
broker) in the site with which the eG agent should communicate for collecting performance
metrics.
5. CONTROLLER PORT – Specify the port number of the delivery controller (i.e., broker) in
the site with which the eG agent should communicate for collecting performance metrics.
6. USERNAME and PASSWORD – To connect to a delivery controller and pull out metrics
from it, the eG agent requires Farm Administrator rights. In order to configure the eG agent
with Farm Administrator privileges, specify the credentials of the Farm Administrator in the
USERNAME and PASSWORD text boxes.
7. CONFIRM PASSWORD – Confirm the PASSWORD by retping it here.
8. FULLY QUALIFIED DOMAIN NAME – Here, specify the fully-qualified name of the domain
to which the specified controller belongs.
9. SSL – Indicate whether/not the controller used for metrics collection is SSL-enabled. By
default, this flag is set to Yes.
10. REPORT BY MACHINE TYPE – If you want the results of this test to be grouped by
machine type then set this flag to Yes. In this case therefore, the machine types (desktop or
server OS machines) will be the primary descriptors of this test; expanding them will reveal
the secondary descriptors – i.e., the delivery groups containing machines of each type. If
you want the results of this test to be indexed only by the names of delivery groups, then
set this flag to No.
11. DD FREQUENCY - Refers to the frequency with which detailed diagnosis measures are to
be generated for this test. The default is
1:1
. This indicates that, by default, detailed
measures will be generated every time this test runs, and also every time the test detects a
problem. You can modify this frequency, if you so desire. Also, if you intend to disable the
detailed diagnosis capability for this test, you can do so by specifying
none
against dd
frequency.
12. DETAILED DIAGNOSIS - To make diagnosis more efficient and accurate, the eG Enterprise
suite embeds an optional detailed diagnostic capability. With this capability, the eG agents
can be configured to run detailed, more elaborate tests as and when specific problems are
detected. To enable the detailed diagnosis capability of this test for a particular server,
choose the On option. To disable the capability, click on the Off option.
The option to selectively enable/disable the detailed diagnosis capability will be available
only if the following conditions are fulfilled:
The eG manager license should allow the detailed diagnosis capability
Both the normal and abnormal frequencies configured for the detailed diagnosis
measures should not be 0.
Outputs of the
test
One set of results for each delivery group configured in the XenDesktop broker ste
Measurements
made by the
Measurement
Measurement
Unit
Interpretation

M O N I T O RI N G C I T R I X X E N DE S K T OP B R OK E R SI T E
54
test
Client connection failures:
Indicates the number of
connections to this delivery
group that failed due to a
problem at the client side.
Number
The value of this measure indicates the
number of connection failures that occurred
due to the inability of the client side to
complete the session connection; for
example, connection timed out, server was
not reachable.
Configuration errors:
Indicates the number of
connections to this delivery
group that failed due to
configuration errors.
Number
Connection failures can also occur when
administrators change the configuration of
the broker; for instance, a failure may occur
when administrators put a delivery group or a
machine in maintenance mode.
Machine failures:
Indicates the number of
connections to this delivery
group that failed due to
machine failures.
Number
This refers to connections that failed because
the machines that need to launch the
sessions itself failed. For probable reasons,
refer to the measures of the
Failed Machines
test.
Unavailable capacity:
Indicates the number of
connections to this delivery
group that failed because the
configured capacity of the
machines was consumed.
Number
This refers to failures that occurred due to
the configured capacity of a particular
delivery group having been completely
consumed. For example, too many users
logged into a Server Desktop OS delivery
group or a user accessing a Pooled Random
delivery group once all the machines in the
delivery group are already assigned to other
users.
Unavailable licenses:
Indicates the number of
connections to this delivery
group that failed because of
the absence of a license.
Number
These are failures that occur due to the
inability of the delivery controller to acquire a
license from the license server to launch a
session.
1.5.4 User Connections Test
This test reports the number of users who recently connected with the machines/applications in each delivery group
configured in the broker site. Sudden spikes in user connections to a delivery group can thus be identified.
Purpose
Reports the number of users who recently connected with the machines/applications in each
delivery group configured in the broker site. Sudden spikes in user connections to a delivery
group can thus be identified
Target of the
test
A Citrix XenDesktop Director
Agent
deploying the
test
An internal agent

M O N I T O RI N G C I T R I X X E N DE S K T OP B R OK E R SI T E
55
Configurable
parameters for
the test
1. TEST PERIOD - How often should the test be executed
2. HOST - The host for which the test is to be configured.
3. PORT – The port number at which the specified HOST listens to. By default, this is 80.
4. CONTROLLER IP ADDRESS – Specify the IP address of the delivery controller (i.e.,
broker) in the site with which the eG agent should communicate for collecting performance
metrics.
5. CONTROLLER PORT – Specify the port number of the delivery controller (i.e., broker) in
the site with which the eG agent should communicate for collecting performance metrics.
6. USERNAME and PASSWORD – To connect to a delivery controller and pull out metrics
from it, the eG agent requires Farm Administrator rights. In order to configure the eG agent
with Farm Administrator privileges, specify the credentials of the Farm Administrator in the
USERNAME and PASSWORD text boxes.
7. CONFIRM PASSWORD – Confirm the PASSWORD by retping it here.
8. FULLY QUALIFIED DOMAIN NAME – Here, specify the fully-qualified name of the domain
to which the specified controller belongs.
9. SSL – Indicate whether/not the controller used for metrics collection is SSL-enabled. By
default, this flag is set to Yes.
10. REPORT BY MACHINE TYPE – If you want the results of this test to be grouped by
machine type then set this flag to Yes. In this case therefore, the machine types (desktop or
server OS machines) will be the primary descriptors of this test; expanding them will reveal
the secondary descriptors – i.e., the delivery groups containing machines of each type. If
you want the results of this test to be indexed only by the names of delivery groups, then
set this flag to No.
11. DD FREQUENCY - Refers to the frequency with which detailed diagnosis measures are to
be generated for this test. The default is
1:1
. This indicates that, by default, detailed
measures will be generated every time this test runs, and also every time the test detects a
problem. You can modify this frequency, if you so desire. Also, if you intend to disable the
detailed diagnosis capability for this test, you can do so by specifying
none
against dd
frequency.
12. DETAILED DIAGNOSIS - To make diagnosis more efficient and accurate, the eG Enterprise
suite embeds an optional detailed diagnostic capability. With this capability, the eG agents
can be configured to run detailed, more elaborate tests as and when specific problems are
detected. To enable the detailed diagnosis capability of this test for a particular server,
choose the On option. To disable the capability, click on the Off option.
The option to selectively enable/disable the detailed diagnosis capability will be available
only if the following conditions are fulfilled:
The eG manager license should allow the detailed diagnosis capability
Both the normal and abnormal frequencies configured for the detailed diagnosis
measures should not be 0.
Outputs of the
test
One set of results for each delivery group configured in the XenDesktop broker ste
Measurements
made by the
Measurement
Measurement
Unit
Interpretation
M O N I T O RI N G C I T R I X X E N DE S K T OP B R OK E R SI T E
56
test
New connections:
Indicates the number of new
connections to this delivery
group since the last
measurement period.
Number
Use the detailed diagnosis of this measure to
view the details of each new connection.
1.5.5 User Logon Performance Test
The Logon Performance test monitors the user logon process from a delivery group perspective; in other words, it
monitors user logins to the desktops/applications in a delivery group, measures the ‘aggregate’ duration of the login
across all users to that group, and thus points to bottlenecks in the user logon process to that group.
The User Logon Performance test on the other hand, provides the user-perspective to logon monitoring. In other
words, this test tracks each user who logs into a desktop or accesses an application via the XenDesktop broker,
reports in real-time the logon experience of that user, and pinpoints where exactly that user’s logon slowed down.
When a user complaints of delays in accessing his/her virtual desktop, this test will lead administrators straight to
what is causing the delay. Detailed diagnositics provided by this test reveal which machines/applications a user is
accessing and which delivery group these machines/applications belong to.
Purpose
Tracks each user who logs into a desktop or accesses an application via the XenDesktop broker,
reports in real-time the logon experience of that user, and pinpoints where exactly that user’s
logon slowed down
Target of the
test
A broker in a Citrix XenDesktop site
Agent
deploying the
test
An internal agent

M O N I T O RI N G C I T R I X X E N DE S K T OP B R OK E R SI T E
57
Configurable
parameters for
the test
1. TEST PERIOD - How often should the test be executed
2. HOST - The host for which the test is to be configured.
3. PORT – The port number at which the specified HOST listens to. By default, this is 80.
4. CONTROLLER IP ADDRESS – Specify the IP address of the delivery controller (i.e.,
broker) in the site with which the eG agent should communicate for collecting performance
metrics.
5. CONTROLLER PORT – Specify the port number of the delivery controller (i.e., broker) in
the site with which the eG agent should communicate for collecting performance metrics.
6. USERNAME and PASSWORD – To connect to a delivery controller and pull out metrics
from it, the eG agent requires Farm Administrator rights. In order to configure the eG agent
with Farm Administrator privileges, specify the credentials of the Farm Administrator in the
USERNAME and PASSWORD text boxes.
7. CONFIRM PASSWORD – Confirm the PASSWORD by retping it here.
8. FULLY QUALIFIED DOMAIN NAME – Here, specify the fully-qualified name of the domain
to which the specified controller belongs.
9. SSL – Indicate whether/not the controller used for metrics collection is SSL-enabled. By
default, this flag is set to Yes.
10. DD FREQUENCY - Refers to the frequency with which detailed diagnosis measures are to
be generated for this test. The default is
1:1
. This indicates that, by default, detailed
measures will be generated every time this test runs, and also every time the test detects a
problem. You can modify this frequency, if you so desire. Also, if you intend to disable the
detailed diagnosis capability for this test, you can do so by specifying
none
against dd
frequency.
11. DETAILED DIAGNOSIS - To make diagnosis more efficient and accurate, the eG Enterprise
suite embeds an optional detailed diagnostic capability. With this capability, the eG agents
can be configured to run detailed, more elaborate tests as and when specific problems are
detected. To enable the detailed diagnosis capability of this test for a particular server,
choose the On option. To disable the capability, click on the Off option.
The option to selectively enable/disable the detailed diagnosis capability will be available
only if the following conditions are fulfilled:
The eG manager license should allow the detailed diagnosis capability
Both the normal and abnormal frequencies configured for the detailed diagnosis
measures should not be 0.
Outputs of the
test
One set of results for each user to the XenDesktop broker in the ste
Measurements
made by the
test
Measurement
Measurement
Unit
Interpretation
Average logon duration:
Indicates the average time
taken for this user to login to
desktops/access applications.
Secs
If this measure reports a high value
consistently, it could indicate a slowdown in
the logon process.
Compare the value of this measure across
users to know which user’s logon is taking
the longest.

M O N I T O RI N G C I T R I X X E N DE S K T OP B R OK E R SI T E
58
Logons:
Indicates the number of times
this user has logged in since
the last measurement period
Number
Brokering duration:
Indicates time taken by this
user to complete the process
of brokering sessions.
Secs
A high value indicates that brokering is taking
a long time.
If the
Average logon duration
is very high,
you may want to compare the value of this
measure with that of the
Time taken for
starting VM, HDX connection duration,
Authentication time, GPOs duration, Logon
scripts duration, Profile load time, and
Interactive session duration
measures to
know where exactly the user logon process
slowed down – is it during authentication? Is
it during brokering? Is it when establishing
the HDX connection? Is it when applying
GPOs? Is it during logon scripts execution? Is
it while loading user profiles? Is it when
starting the VM? Or is it when handing over
control to the user?
Time taken for starting
VM:
Indicates the time taken by
the broker to start the
machines accessed by this
user.
Secs
A high value indicates that machines are
taking too long to startup.
If the
Average logon duration
is very high,
you may want to compare the value of this
measure with that of the
Brokering duration,
HDX connection duration, Authentication
time, GPOs duration, Logon scripts duration,
Profile load time, and Interactive session
duration
measures to know where exactly the
user logon process slowed down – is it during
authentication? Is it during brokering? Is it
when establishing the HDX connection? Is it
when applying GPOs? Is it during logon
scripts execution? Is it while loading user
profiles? Is it when starting the VM? Or is it
when handing over control to the user?

M O N I T O RI N G C I T R I X X E N DE S K T OP B R OK E R SI T E
59
HDX connection duration:
Indicates the time taken by
the broker to complete the
steps required for setting up
the HDX connection from this
user to the machines
accessed by the user.
Secs
A high value indicates that HDX connections
are taking time to be established.
If the
Average logon duration
is very high,
you may want to compare the value of this
measure with that of the
Brokering duration,
Time taken for starting VM, Authentication
time, GPOs duration, Logon scripts duration,
Profile load time, and Interactive session
duration
measures to know where exactly the
user logon process slowed down – is it during
authentication? Is it during brokering? Is it
when establishing the HDX connection? Is it
when applying GPOs? Is it during logon
scripts execution? Is it while loading user
profiles? Is it when starting the VM? Or is it
when handing over control to the user?
Authentication time:
Indicates the time taken by
the broker to authenticate
this user’s sessions.
Secs
A high value indicates authentication delays.
If the
Average logon duration
is very high,
you may want to compare the value of this
measure with that of the
Brokering duration,
Time taken for starting VM, HDX connection
duration, GPOs duration, Logon scripts
duration, Profile load time, and Interactive
session duration
measures to know where
exactly the user logon process slowed down
– is it during authentication? Is it during
brokering? Is it when establishing the HDX
connection? Is it when applying GPOs? Is it
during logon scripts execution? Is it while
loading user profiles? Is it when starting the
VM? Or is it when handing over control to the
user?
GPOs duration:
Indicates the time taken to
apply group policy settings on
the machines accessed by this
user.
Secs
A high value indicates that GPO application is
taking time.
If the
Average logon duration
is very high,
you may want to compare the value of this
measure with that of the
Brokering duration,
Time taken for starting VM, HDX connection
duration, Authentication time, Logon scripts
duration, Profile load time, and Interactive
session duration
measures to know where
exactly the user logon process slowed down
– is it during authentication? Is it during
brokering? Is it when establishing the HDX
connection? Is it when applying GPOs? Is it
during logon scripts execution? Is it while
loading user profiles? Is it when starting the
VM? Or is it when handing over control to the
user?

M O N I T O RI N G C I T R I X X E N DE S K T OP B R OK E R SI T E
60
Logon scripts duration:
Indicates the time taken for
logon scripts to be executed
on the machines accessed by
this user.
Secs
A high value indicates that logon script
execution is taking time.
If the
Average logon duration
is very high,
you may want to compare the value of this
measure with that of the
Brokering duration,
Time taken for starting VM, HDX connection
duration, Authentication time, GPOs duration,
Profile load time, and Interactive session
duration
measures to know where exactly the
user logon process slowed down – is it during
authentication? Is it during brokering? Is it
when establishing the HDX connection? Is it
when applying GPOs? Is it during logon
scripts execution? Is it while loading user
profiles? Is it when starting the VM? Or is it
when handing over control to the user?
Profile load time:
Indicates the time taken by
the logon process to load the
profile of this user.
Secs
A high value indicates that profiles are taking
too long to load.
If the
Average logon duration
is very high,
you may want to compare the value of this
measure with that of the
Brokering duration,
Time taken for starting VM, HDX connection
duration, Authentication time, GPOs duration,
Logon scripts duration, and Interactive
session duration
measures to know where
exactly the user logon process slowed down
– is it during authentication? Is it during
brokering? Is it when establishing the HDX
connection? Is it when applying GPOs? Is it
during logon scripts execution? Is it while
loading user profiles? Is it when starting the
VM? Or is it when handing over control to the
user?

M O N I T O RI N G C I T R I X X E N DE S K T OP B R OK E R SI T E
61
Interactive session
duration:
Indicates the time taken by
the logon process to handoff
keyboard and mouse control
to this user.
Secs
A high value indicates delays in handing off
keyboard and mouse control to users.
If the
Average logon duration
is very high,
you may want to compare the value of this
measure with that of the
Brokering duration,
Time taken for starting VM, HDX connection
duration, Authentication time, GPOs duration,
Logon scripts duration, and Profile load time
measures to know where exactly the user
logon process slowed down – is it during
authentication? Is it during brokering? Is it
when establishing the HDX connection? Is it
when applying GPOs? Is it during logon
scripts execution? Is it while loading user
profiles? Is it when starting the VM? Or is it
when handing over control to the user?

C o n c l u s i o n
62
Conclusion
This document has described in detail the monitoring paradigm used and the measurement capabilities of the eG
Enterprise suite of products with respect to the Citrix Xendesktop Broker Site. For details of how to administer and
use the eG Enterprise suite of products, refer to the user manuals.
We will be adding new measurement capabilities into the future versions of the eG Enterprise suite. If you can
identify new capabilities that you would like us to incorporate in the eG Enterprise suite of products, please contact
support@eginnovations.com. We look forward to your support and cooperation. Any feedback regarding this manual
or any other aspects of the eG Enterprise suite can be forwarded to feedback@eginnovations.com.
