Manual Monitoring Java Applications
User Manual: Monitoring Java Applications
Open the PDF directly: View PDF ![]() .
.
Page Count: 120 [warning: Documents this large are best viewed by clicking the View PDF Link!]
- 1. Monitoring a Java Application
- 1.1 How does eG Enterprise Monitor Java Applications?
- 1.2 The Java Transactions Layer
- 1.3 The JVM Internals Layer
- 1.4 The JVM Engine Layer
- 1.5 What the eG Enterprise Java Monitor Reveals?
- 1.5.1 Identifying and Diagnosing a CPU Issue in the JVM
- 1.5.2 Identifying and Diagnosing a Thread Blocking Issue in the JVM
- 1.5.3 Identifying and Diagnosing a Thread Waiting Situation in the JVM
- 1.5.4 Identifying and Diagnosing a Thread Deadlock Situation in the JVM
- 1.5.5 Identifying and Diagnosing Memory Issues in the JVM
- 1.5.6 Identifying and Diagnosing the Root-Cause of Slowdowns in Java Transactions
- 2. Conclusion

Monitoring Java Applications
eG Enterprise v6.0

Restricted Rights Legend
The information contained in this document is confidential and subject to change without notice. No part of this
document may be reproduced or disclosed to others without the prior permission of eG Innovations Inc. eG
Innovations Inc. makes no warranty of any kind with regard to the software and documentation, including, but not
limited to, the implied warranties of merchantability and fitness for a particular purpose.
Trademarks
Microsoft Windows, Windows NT, Windows 2003, and Windows 2000 are either registered trademarks or trademarks
of Microsoft Corporation in United States and/or other countries.
The names of actual companies and products mentioned herein may be the trademarks of their respective owners.
Copyright
©2015 eG Innovations Inc. All rights reserved.
Table of Contents
MONITORING A JAVA APPLICATION ................................................................................................................................... 1
1.1 How does eG Enterprise Monitor Java Applications? ....................................................................................................... 2
1.1.1 Enabling JMX Support for JRE ................................................................................................................................ 2
1.1.2 Enabling SNMP Support for JRE ............................................................................................................................ 14
1.2 The Java Transactions Layer ........................................................................................................................................... 19
1.2.1 Java Transactions Test ............................................................................................................................................ 20
1.3 The JVM Internals Layer ................................................................................................................................................ 38
1.3.1 JMX Connection to JVM ........................................................................................................................................ 39
1.3.2 JVM File Descriptors Test ...................................................................................................................................... 40
1.3.3 Java Classes Test ..................................................................................................................................................... 41
1.3.4 JVM Garbage Collections Test ............................................................................................................................... 44
1.3.5 JVM Memory Pool Garbage Collections Test ........................................................................................................ 47
1.3.6 JVM Threads Test ................................................................................................................................................... 52
1.4 The JVM Engine Layer ................................................................................................................................................... 62
1.4.1 JVM Cpu Usage Test .............................................................................................................................................. 63
1.4.2 JVM Memory Usage Test ....................................................................................................................................... 68
1.4.3 JVM Uptime Test .................................................................................................................................................... 74
1.4.4 JVM Leak Suspects Test ......................................................................................................................................... 78
1.5 What the eG Enterprise Java Monitor Reveals? .............................................................................................................. 88
1.5.1 Identifying and Diagnosing a CPU Issue in the JVM .............................................................................................. 89
1.5.2 Identifying and Diagnosing a Thread Blocking Issue in the JVM ........................................................................... 93
1.5.3 Identifying and Diagnosing a Thread Waiting Situation in the JVM ...................................................................... 98
1.5.4 Identifying and Diagnosing a Thread Deadlock Situation in the JVM .................................................................. 102
1.5.5 Identifying and Diagnosing Memory Issues in the JVM ....................................................................................... 106
1.5.6 Identifying and Diagnosing the Root-Cause of Slowdowns in Java Transactions................................................. 109
CONCLUSION ........................................................................................................................................................................... 115
Table of Figures
Figure 1: Layer model of the Java Application .......................................................................................................................................................... 1
Figure 2: Selecting the Properties option ................................................................................................................................................................... 6
Figure 3: The Properties dialog box .......................................................................................................................................................................... 7
Figure 4: Deselecting the ‘Use simple file sharing’ option ........................................................................................................................................ 8
Figure 5: Clicking the Advanced button .................................................................................................................................................................... 8
Figure 6: Verfying whether the Owner of the file is the same as the application Owner ........................................................................................... 9
Figure 7: Disinheriting permissions borrowed from a parent directory ................................................................................................................... 10
Figure 8: Copying the inherited permissions ........................................................................................................................................................... 10
Figure 9: Granting full control to the file owner ...................................................................................................................................................... 11
Figure 10: Scrolling down the jmxremote.password file to view 2 commented entries ........................................................................................... 12
Figure 11: The jmxremote.access file ...................................................................................................................................................................... 13
Figure 12: Uncommending the ‘controlRole’ line ................................................................................................................................................... 13
Figure 13: Appending a new username password pair............................................................................................................................................. 14
Figure 14: Assigning rights to the new user in the jmxremote.access file ............................................................................................................... 14
Figure 15: The snmp.acl file .................................................................................................................................................................................... 16
Figure 16: The snmp.acl file revealing the SNMP ACL example ............................................................................................................................ 16
Figure 17: Uncommenting the code block ............................................................................................................................................................... 17
Figure 18: The edited block ..................................................................................................................................................................................... 18
Figure 19: The test mapped to the Java Transactions layer...................................................................................................................................... 20
Figure 20: The layers through which a Java transaction passes ............................................................................................................................... 21
Figure 21: How eG monitors Java transactions ....................................................................................................................................................... 22
Figure 22: The eG Application Server Agent tracking requests using Java threads ................................................................................................. 24
Figure 23: The detailed diagnosis of the Slow transactions measure ....................................................................................................................... 32
Figure 24: The Method Level Breakup section in the At-A-Glance tab page .......................................................................................................... 33
Figure 25: The Component Level Breakup section in the At-A-Glance tab page .................................................................................................... 34
Figure 26: Query Details in the At-A-Glance tab page ............................................................................................................................................ 34
Figure 27: Detailed description of the query clicked on .......................................................................................................................................... 35
Figure 28: The Trace tab page displaying all invocations of the method chosen from the Method Level Breakup section ..................................... 35
Figure 29: The Trace tab page displaying all methods invoked at the Java layer/sub-component chosen from the Component Level Breakup
section ............................................................................................................................................................................................................ 36
Figure 30: Queries displayed in the SQL/Error tab page ......................................................................................................................................... 37
Figure 31: Errors displayed in the SQL/Error tab page ........................................................................................................................................... 37
Figure 32: The detailed diagnosis of the Error transactions measure ....................................................................................................................... 38
Figure 33: The tests associated with the JVM Internals layer .................................................................................................................................. 39
Figure 34: Editing the startup script file of a sample Java application ..................................................................................................................... 52
Figure 35: The STACK TRACE link ...................................................................................................................................................................... 60
Figure 36: Stack trace of a resource-intensive thread .............................................................................................................................................. 61
Figure 37: Thread diagnosis of live threads ............................................................................................................................................................. 61
Figure 38: The tests associated with the JVM Engine layer .................................................................................................................................... 63
Figure 39: The detailed diagnosis of the CPU utilization of JVM measure ............................................................................................................. 67
Figure 40: The detailed diagnosis of the Used memory measure ............................................................................................................................. 73
Figure 41: A sample code ........................................................................................................................................................................................ 79
Figure 42: The detailed diagnosis of the Leak suspect classes measure .................................................................................................................. 88
Figure 43: The detailed diagnosis of the Number of objects measure ..................................................................................................................... 88
Figure 44: The Java application being monitored functioning normally .................................................................................................................. 89
Figure 45: The High cpu threads measure indicating that a single thread is consuming CPU excessively .............................................................. 90
Figure 46: The detailed diagnosis of the High cpu threads measure ....................................................................................................................... 90
Figure 47: Viewing the stack trace as part of the detailed diagnosis of the High cpu threads measure .................................................................... 91
Figure 48: Stack trace of the CPU-intensive thread ................................................................................................................................................. 91
Figure 49: The LogicBuilder.java file ..................................................................................................................................................................... 92
Figure 50: The High cpu threads measure reporting a 0 value ................................................................................................................................. 93
Figure 51: The value of the Blocked threads measure being incremented by 1 ....................................................................................................... 94
Figure 52: The detailed diagnosis of the Blocked threads measure revealing the details of the blocked thread ....................................................... 94
Figure 53: The Stack Trace of the blocked thread ................................................................................................................................................... 95
Figure 54: The DbConnection.java program file ..................................................................................................................................................... 96
Figure 55: The lines of code preceding line 126 of the DbConnection.java program file ........................................................................................ 96
Figure 56: Viewing the stack trace of the ObjectManagerThread ............................................................................................................................ 97
Figure 57: The lines of code in the ObjectManager.java source file ........................................................................................................................ 97
Figure 58: Comparing the ObjectManager and DbConnection classes .................................................................................................................... 98
Figure 59: The Waiting threads ............................................................................................................................................................................... 99
Figure 60: The detailed diagnosis of the Waiting threads measure .......................................................................................................................... 99
Figure 61: Viewing the stack trace of the waiting thread ....................................................................................................................................... 100
Figure 62: The Thread Diagnosis window for Waiting threads ............................................................................................................................. 100
Figure 63 : The stack trace for the SessionController thread ................................................................................................................................. 101
Figure 64: The UserSession.java file ..................................................................................................................................................................... 101
Figure 65: The JVM Threads test reporting 0 Deadlock threads ........................................................................................................................... 102
Figure 66: The Deadlock threads measure value increasing in the event of a deadlock situation .......................................................................... 103
Figure 67: The detailed diagnosis page revealing the deadlocked threads ............................................................................................................. 103
Figure 68: Viewing the stack trace of the dadlocked threads in the detailed diagnosis page ................................................................................. 103
Figure 69: The stack trace for the ResourceDataOne thread .................................................................................................................................. 104
Figure 70 : The stack trace for the ResourceDataTwo thread ................................................................................................................................ 105
Figure 71: The lines of code executed by the ResourceDataOne thread ................................................................................................................ 105
Figure 72: The lines of code executed by the ResourceDataTwo thread ............................................................................................................... 106
Figure 73: The Used memory measure indicating the amount of pool memory being utilized .............................................................................. 107
Figure 74: The detailed diagnosis of the Used memory measure ........................................................................................................................... 107
Figure 75: Choosing a different Sory By option and Measurement Time .............................................................................................................. 108
Figure 76: The method that is invoking the SapBusinessObject ............................................................................................................................ 108
Figure 77: The layer model of a sample Java application indicating too many slow transactions ......................................................................... 109
Figure 78: The detailed diagnosis of the Slow transactions response time measure .............................................................................................. 110
Figure 79: The At-A-Glance tab page of the URL tree .......................................................................................................................................... 111
Figure 80: The Trace tab page highlighting the single instance of the org.dom5j.io.SAXReaer.read(InputSource) method in our example ......... 112
Figure 81: The Component Level Breakup ........................................................................................................................................................... 113
Figure 82: The Trace tab page displaying all the methods invoked by the POJO layer ......................................................................................... 114
M o n i t o r i n g a J a v a A p p l i c a t i o n
1
Monitoring a Java Application
Java applications are predominantly used in enterprises today owing to their multi-platform nature. Once written, a
Java application can be run on heterogeneous platforms with no additional configuration. This is why, the Java
technology is widely used in the design and delivery of many critical web and non-web-based applications.
The prime concern of the administrators of these applications is knowing how well the application is functioning, and
how to troubleshoot issues (if any) in the performance of these applications. Most web application server vendors
prescribe custom APIs for monitoring – for instance, WebSphere and WebLogic allow administrators to use their
built-in APIs for performance monitoring and problem detection. The details of these APIs and how eG Enterprise
uses them to monitor the application server in question is discussed elaborately in the previous chapters of this
document.
Besides such applications, you might have stand-alone Java applications that do not provide any APIs for monitoring.
To enable users to monitor the overall health of such stand-alone Java applications, eG Enterprise offers a generic
monitoring model called the
Java Application
.
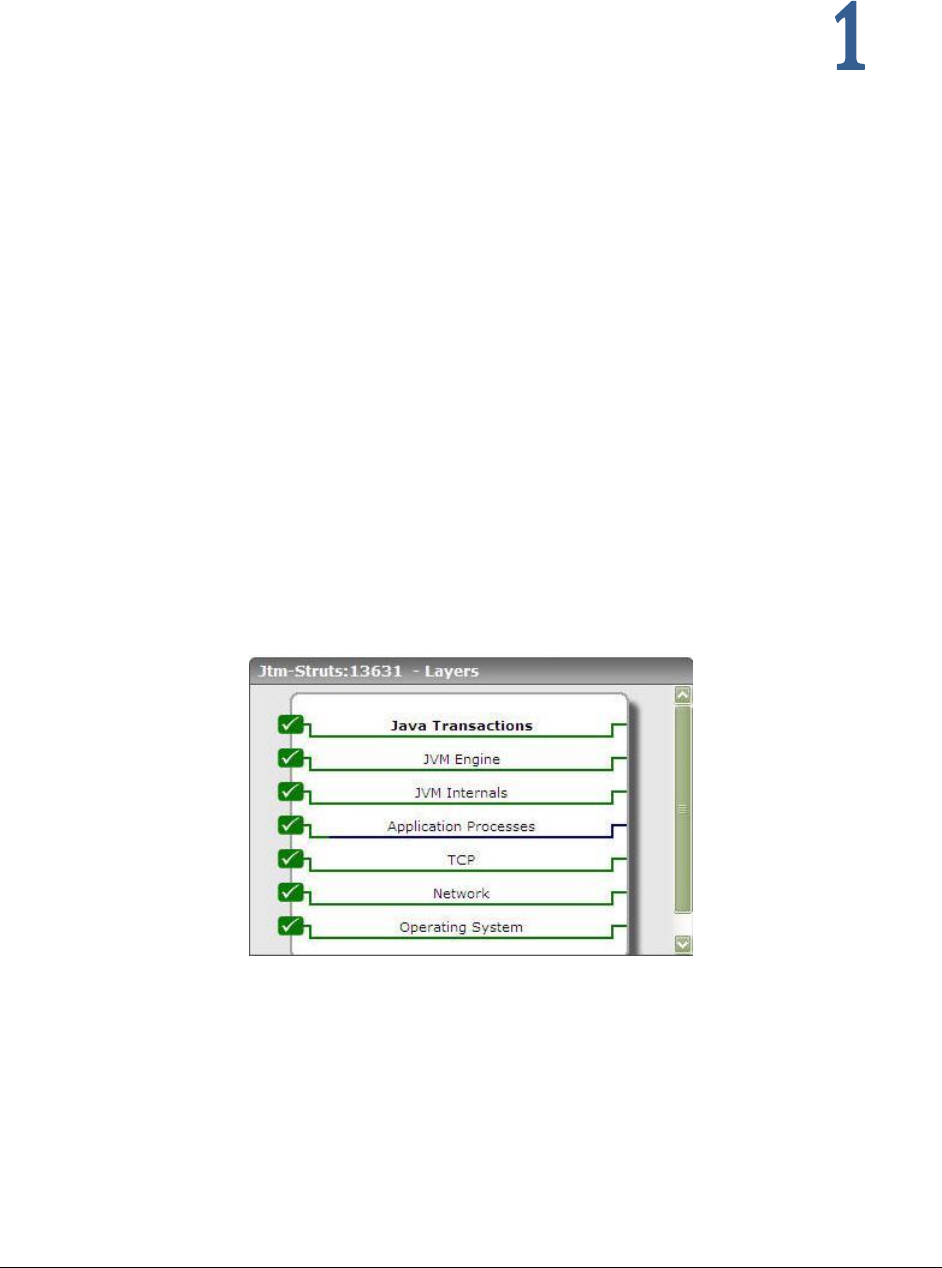
Figure 1: Layer model of the Java Application
Each layer of Figure 1 above is mapped to a series of tests that report critical statistics pertaining to the Java
application being monitored. Using these statistics, administrators can figure out the following:
a. Has the Java heap been sized properly?
b. How effective is garbage collection? Is it impacting application performance?
c. Often, Java programs use threads. A single program may involve multiple concurrent threads running in
parallel. Is there excessive blocking between threads due to synchronization issues during application
design?
M o n i t o r i n g a J a v a A p p l i c a t i o n
2
d. Are there runaway threads, which are taking too many CPU cycles? If such threads exist, which portions of
code are responsible for spawning such threads?
e. Is the JVM managing its memory resources efficiently or is the free memory on the JVM very less? Which
type of memory is being utilized by the JVM increasingly?
f. Has a scheduled JVM restart occurred? If so, when?
1.1 How does eG Enterprise Monitor Java Applications?
The
Java Application
model that eG Enterprise prescribes provides both
agentless
and
agent-based
monitoring
support to Java applications. The eG agent, deployed either on the application host or on a remote Windows host in
the environment (depending upon the monitoring approach – whether agent-based or agentless), can be configured
to connect to the JRE used by the application and pull out metrics of interest, using either of the following
methodologies:
JMX (Java Management Extensions)
SNMP (Simple Network Management Protocol)
The eG agent uses the specifications prescribed by JSR 174 to perform JVM monitoring.
This is why, each test mapped to the top 2 layers of Figure 1 provides administrators with the option to pick a
monitoring MODE - i.e., either JMX or SNMP. The remaining test configuration depends upon the mode chosen.
Since both JMX and SNMP support are available for JRE 1.5 and above only, the
Java Application
model can be used
to monitor only those applications that are running JRE 1.5 and above.
The sections to come discuss how to enable JMX and SNMP for JRE.
1.1.1 Enabling JMX Support for JRE
In older versions of Java (i.e., JDK/JRE 1.1, 1.2, and 1.3), very little instrumentation was built in, and custom-
developed byte-code instrumentation had to be used to perform monitoring. From JRE/JDK 1.5 and above however,
support for Java Management Extensions (JMX) were pre-built into JRE/JDK. JMX enables external programs like the
eG agent to connect to the JRE of an application and pull out metrics in real-time.

M o n i t o r i n g a J a v a A p p l i c a t i o n
3
This section discusses the procedure for enabling JMX support for the JRE of any generic Java
application that may be monitored using eG Enterprise. To know how to enable JMX support for the
JRE of key application servers monitored out-of-the-box by eG Eterprise, refer to the relevant chapters
of the
Configuring and Monitoring Application Servers
document.
By default, JMX requires no authentication or security (SSL). In this case therefore, to use JMX for pulling out metrics
from a target application, the following will have to be done:
1. Login to the application host.
2. The <JAVA_HOME>\jre\lib\management folder used by the target application will typically contain the following
files:
o
management.properties
o
jmxremote.access
o
jmxremote.password.template
o
snmp.acl.template
3. Edit the
managerment.properties
file, and append the following lines to it:
com.sun.management.jmxremote.port=<Port No>
com.sun.management.jmxremote.ssl=false
com.sun.management.jmxremote.authenticate=false
For instance, if the JMX listens on port 9005, then the first line of the above specification would be:
com.sun.management.jmxremote.port=9005
4. Then, save the file.
5. Next, edit the start-up script of the target application, and add the following line to it:
-Dcom.sun.management.config.file=<management.properties_file_path>
-Djava.rmi.server.hostname=<IP Address>
6. For instance, on a Windows host, the
<management.properties_file_path>
can be expressed as:
D:\bea\jrockit_150_11\jre\lib\management\management.properties
7. On other hand, on a Unix/Linux/Solaris host, a sample
<management.properties_file_path>
specification will be
as follows: /usr/jdk1.5.0_05/jre/lib/management/management.properties
8. In the second line, set the <IP Address> to the IP address using which the Java application has been managed
in the eG Enterprise system. Alternatively, you can add the following line to the startup script:
-
Djava.rmi.server.hostname=localhost
9. Save this script file too.
10. Next, during test configuration, do the following:
Set JMX as the mode;
Set the port that you defined in step 3 above (in the
management.properties
file) as the jmx remote
port;
Set the user and password parameters to
none
.

M o n i t o r i n g a J a v a A p p l i c a t i o n
4
Update the test configuration.
On the other hand, if JMX requires only authentication (and no security), then the following steps will apply:
1. Login to the application host. If the application is executing on a Windows host, then, login to the host as a
local/domain administrator.
2. As stated earlier, the <JAVA_HOME>\jre\lib\management folder used by the target application will typically contain
the following files:
o
management.properties
o
jmxremote.access
o
jmxremote.password.template
o
snmp.acl.template
3. First, copy the
jmxremote.password.template
file to any other location on the host, rename it as as
jmxremote.password
, and then, copy it back to the <JAVA_HOME>\jre\lib\management folder.
4. Next, edit the
jmxremote.password
file and the
jmxremote.access
file to create a user with
read-write
access to
the JMX. To know how to create such a user, refer to Section 1.1.1.2 of this document.
5. Then, proceed to make the
jmxremote.password
file secure by granting a single user “full access” to that file.
For monitoring applications executing on Windows in particular, only the
Owner
of the
jmxremote.password
file
should have full control of that
file. To know how to grant this privilege to the
Owner
of the file, refer to Section
1.1.1.1.
6. In case of applications executing on Solaris / Linux hosts on the other hand, any user can be granted full access
to the
jmxremote.password
file, by following the steps below:
Login to the host as the user who is to be granted full control of the
jmxremote.password
file.
Issue the following command:
chmod 600 jmxremote.password
This will automatically grant the login user full access to the
jmxremote.password
file.
7. Next, edit the
management.properties
file, and append the following lines to it:
com.sun.management.jmxremote.port=<Port No>
com.sun.management.jmxremote.ssl=false
com.sun.management.jmxremote.authenticate=true
com.sun.management.jmxremote.access.file=<Path of jmxremote.access>
com.sun.management.jmxremote.password.file=<Path of jmxremote.password>
For instance, assume that the JMX remote port is 9005, and the
jmxremote.access
and
jmxremote.password
files
exist in the following directory on a Windows host: D:\bea\jrockit_150_11\jre\lib\management. The specification
above will then read as follows:
com.sun.management.jmxremote.port=9005
com.sun.management.jmxremote.access.file=D:\\bea\\jrockit_150_11\\jre\\lib\\managem
ent\\jmxremote.access
com.sun.management.jmxremote.password.file=D:\\bea\\jrockit_150_11\\jre\\lib\\manag
ement\\jmxremote.password
M o n i t o r i n g a J a v a A p p l i c a t i o n
5
8. If the application in question is executing on a Unix/Solaris/Linux host, and the
jmxremote.access
and
jmxremote.password
files reside in the /usr/jdk1.5.0_05/jre/lib/management folder of the host, then the last 2
lines of the specification will be:
com.sun.management.jmxremote.access.file=/usr/jdk1.5.0_05/jre/lib/management/jmxre
mote.access
com.sun.management.jmxremote.password.file=/usr/jdk1.5.0_05/jre/lib/management/jmx
remote.password
9. Finally, save the file.
10. Then, edit the start-up script of the target web application server, include the following line in it, and save the
file:
-Dcom.sun.management.config.file=<management.properties_file_path>
-Djava.rmi.server.hostname=<IP Address>
11. For instance, on a Windows host, the
<management.properties_file_path>
can be expressed as:
D:\bea\jrockit_150_11\jre\lib\management\management.properties
12. On other hand, on a Linux/Solaris host, a sample
<management.properties_file_path>
specification will be as
follows: /usr/jdk1.5.0_05/jre/lib/management/management.properties
13. In the second line, set the <IP Address> to the IP address using which the Java application has been managed
in the eG Enterprise system. Alternatively, you can add the following line to the startup script of the target web
application server:
-Djava.rmi.server.hostname=localhost
14. Next, during test configuration, do the following:
Set JMX as the mode;
Ensure that the port number configured in the
management.properties
file at step 5 above is set as
the jmx remote port;
Make sure that the user and password parameters of the test are that of a user with
readwrite
rights
to JMX. To know how to create a new user and assign the required rights to him/her, refer to Section
1.1.1.2.
eG Enterprise cannot use JMX that requires both authentication and security (SSL), for
monitoring the target Java application.
M o n i t o r i n g a J a v a A p p l i c a t i o n
6
1.1.1.1 Securing the ‘jmxremote.password’ file
To enable the eG agent to use JMX (that requires authentication only) for monitoring a Windows-based Java
application, you need to ensure that the
jmxremote.password
file in the <JAVA_HOME>\jre\lib\management folder used
by the target application is accessible only by the Owner of that file. To achieve this, do the following:
1. Login to the Windows host as a local/domain administrator.
2. Browse to the location of the
jmxremote.password
file using Windows Explorer.
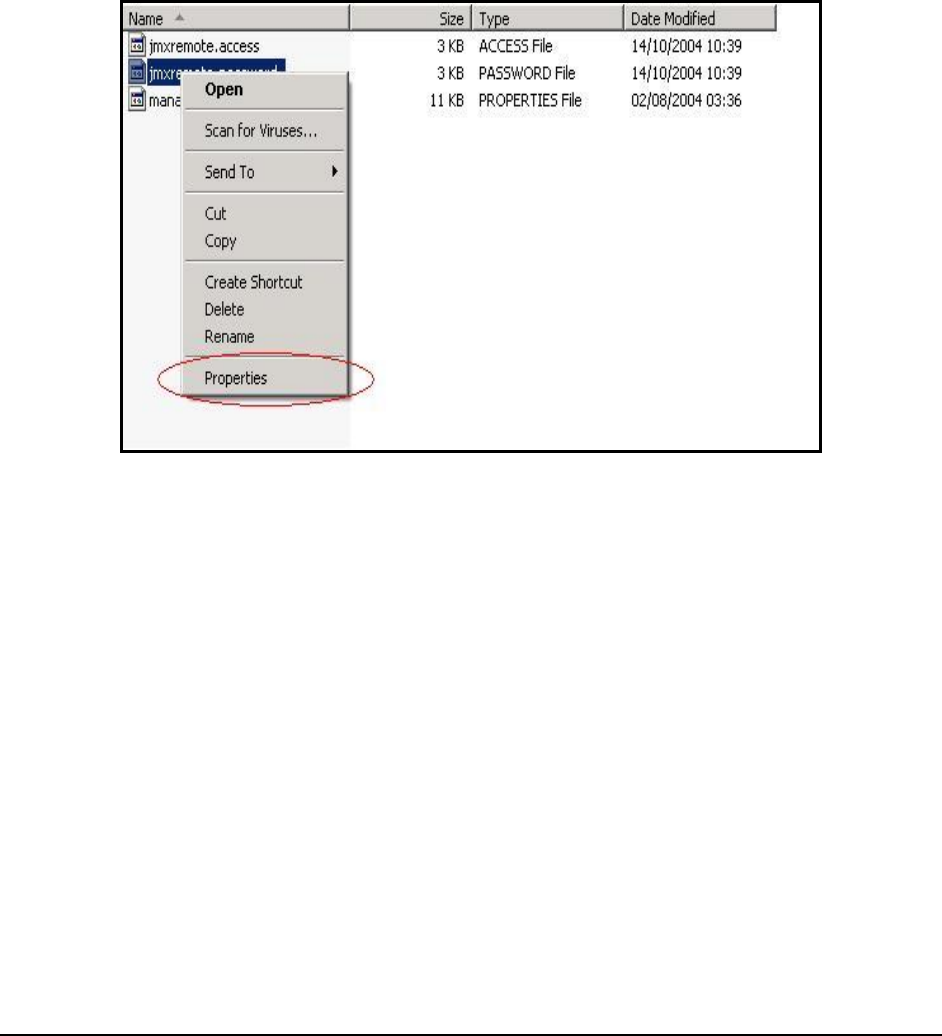
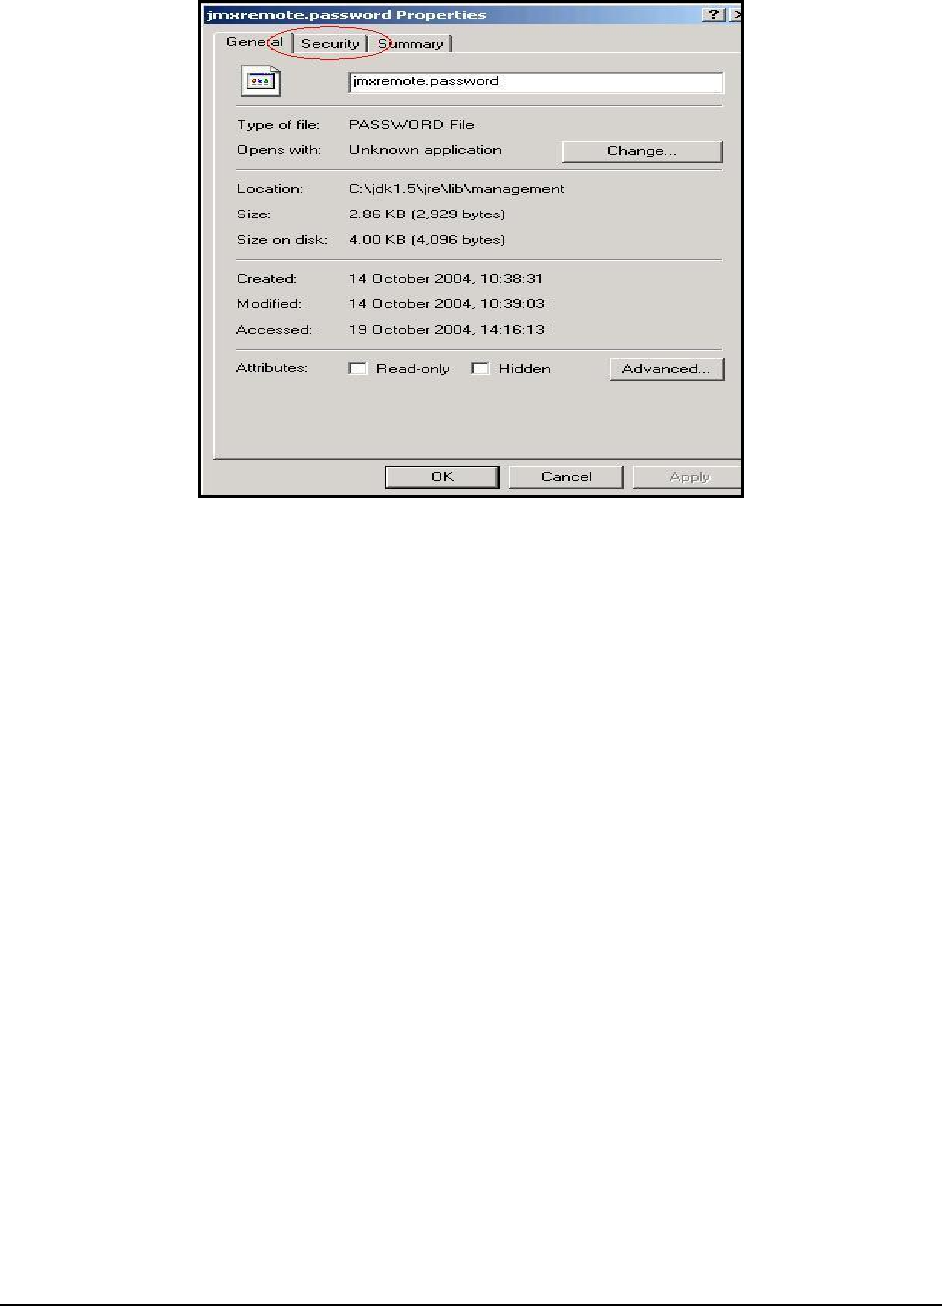
3. Next, right-click on the
jmxremote.password
file and select the Properties option (see Figure 2).
Figure 2: Selecting the Properties option
4. From Figure 3 that appears next, select the Security tab.
M o n i t o r i n g a J a v a A p p l i c a t i o n
7
Figure 3: The Properties dialog box
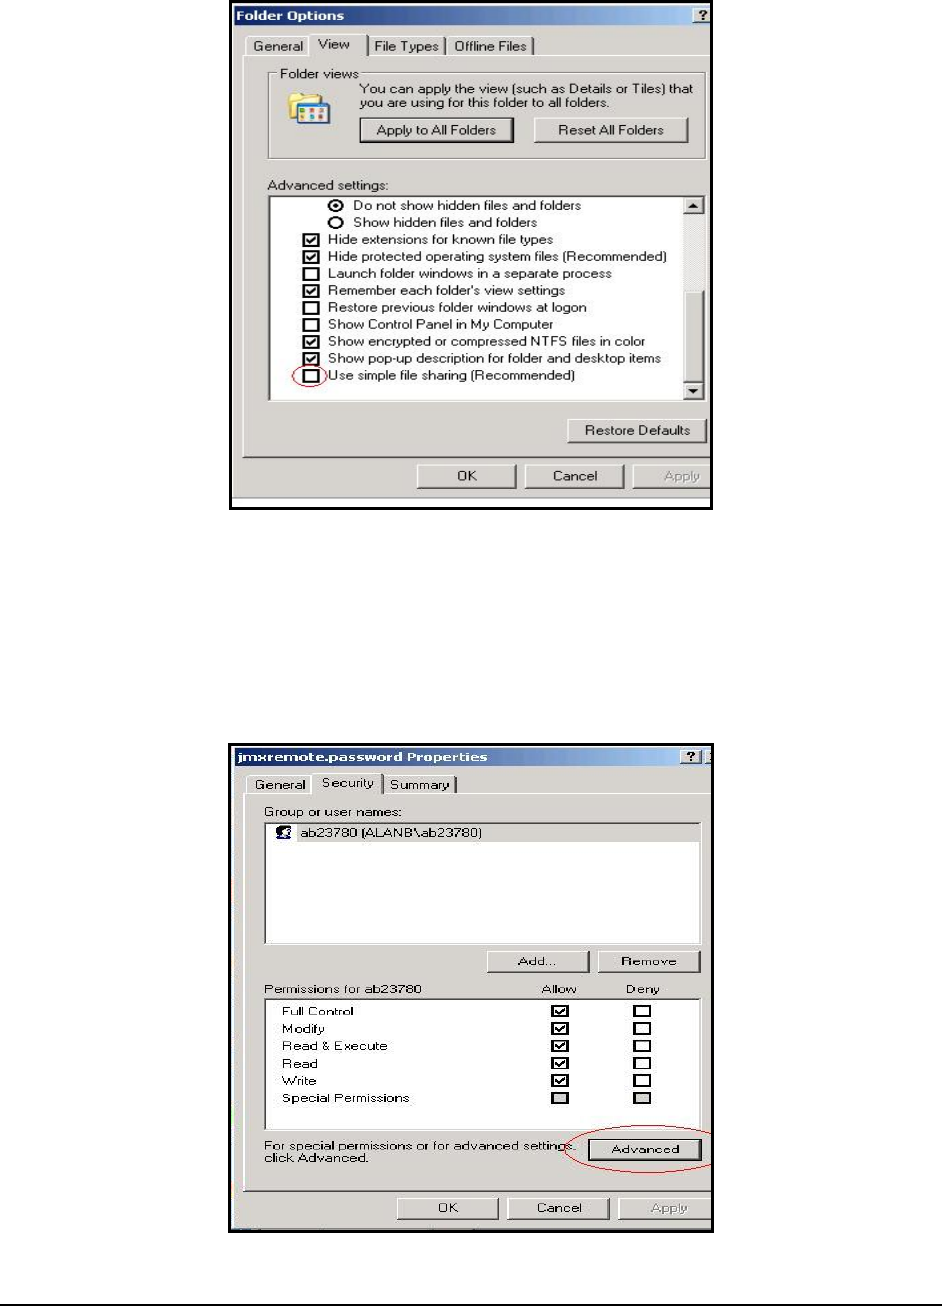
However, if you are on Windows XP and the computer is not part of a domain, then the Security tab may be
missing. To reveal the Security tab, do the following:
Open Windows Explorer, and choose Folder Options from the Tools menu.
Select the View tab, scroll to the bottom of the Advanced Settings section, and clear the check box
next to Use Simple File Sharing.
M o n i t o r i n g a J a v a A p p l i c a t i o n
8
Figure 4: Deselecting the ‘Use simple file sharing’ option
Click OK to apply the change
When you restart Windows Explorer, the Security tab would be visible.
5. Next, select the Advanced button in the Security tab of Figure 5.
Figure 5: Clicking the Advanced button
M o n i t o r i n g a J a v a A p p l i c a t i o n
9
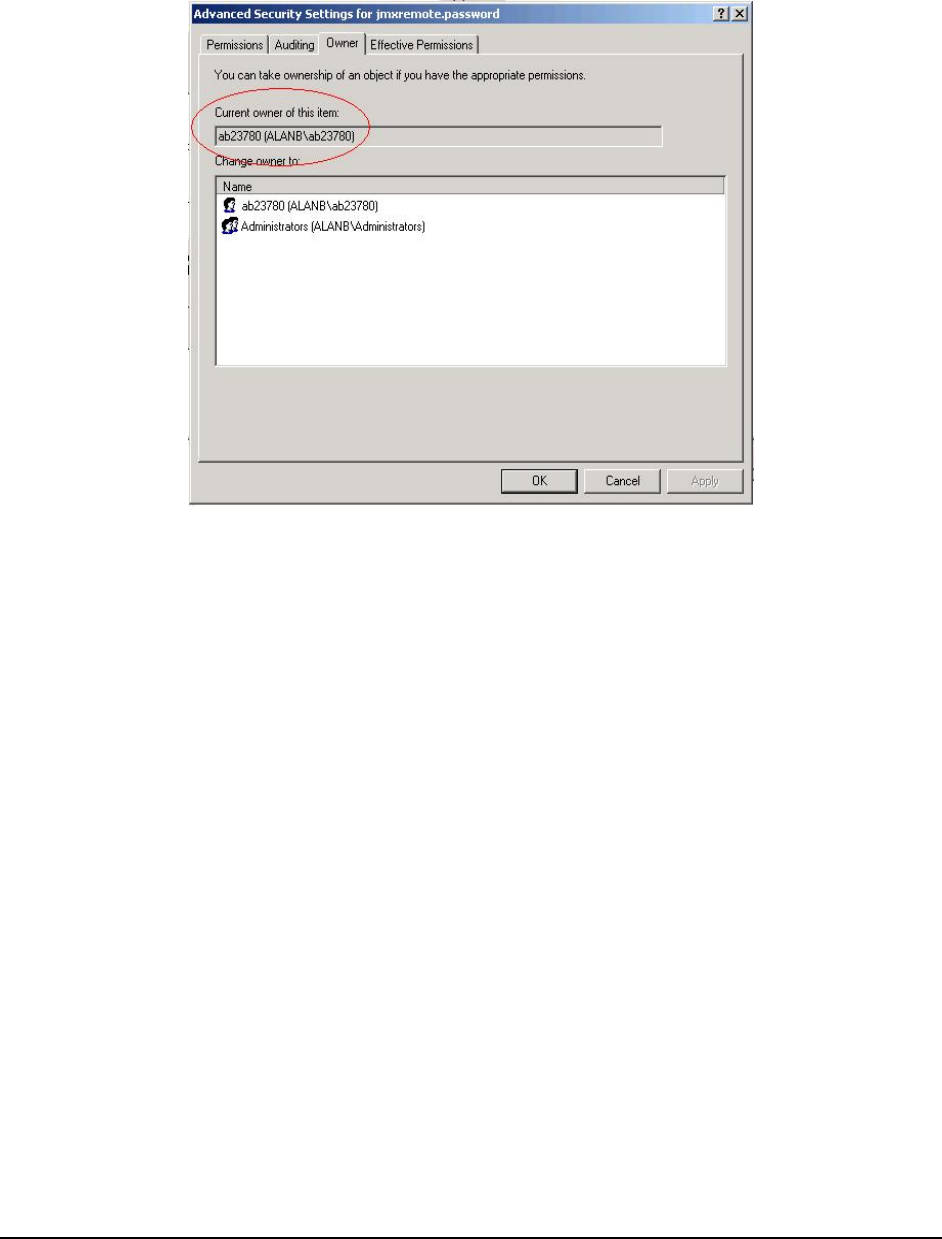
6. Select the Owner tab to see who the owner of the file is.
Figure 6: Verfying whether the Owner of the file is the same as the application Owner
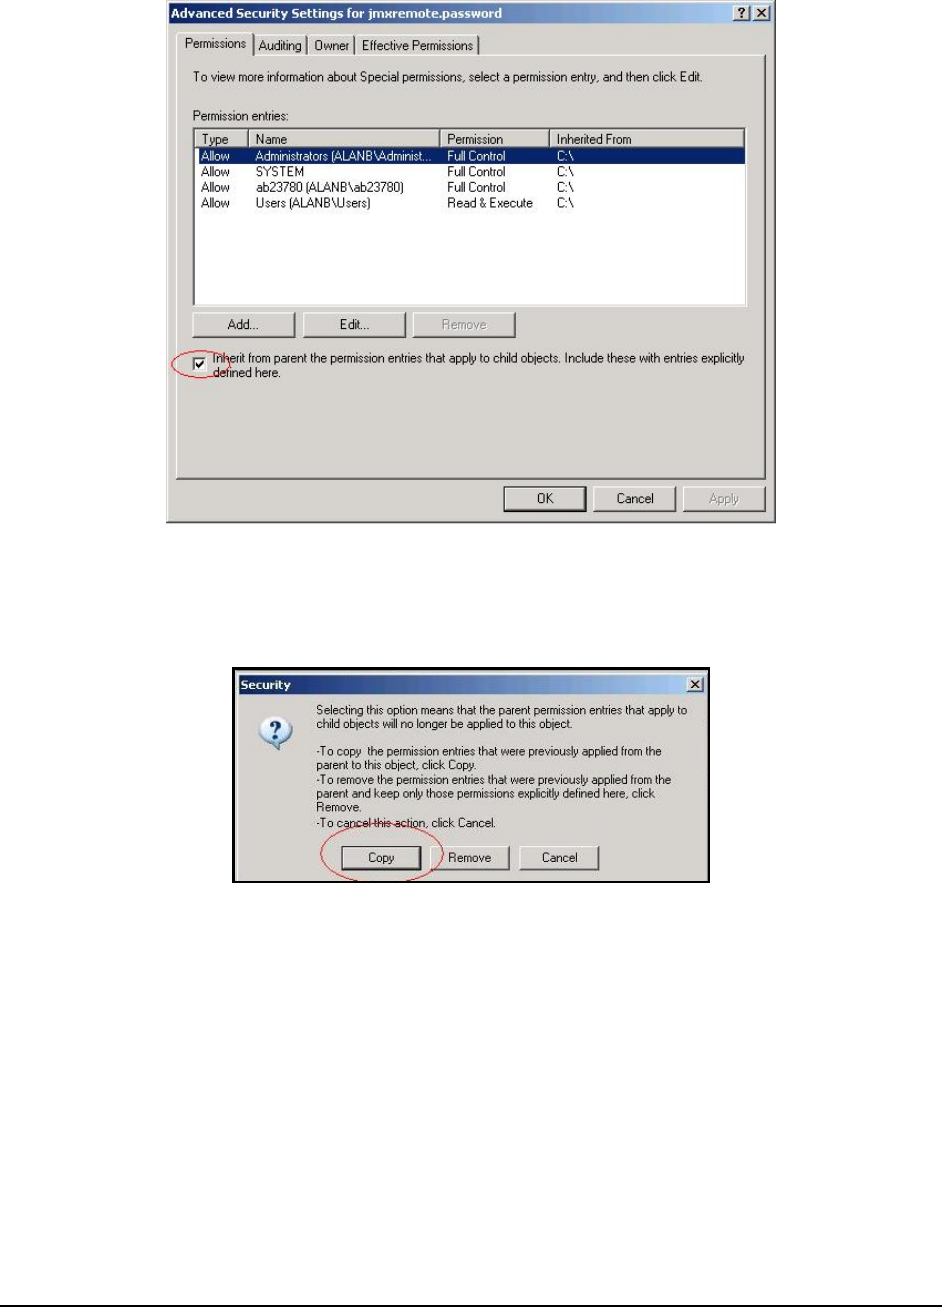
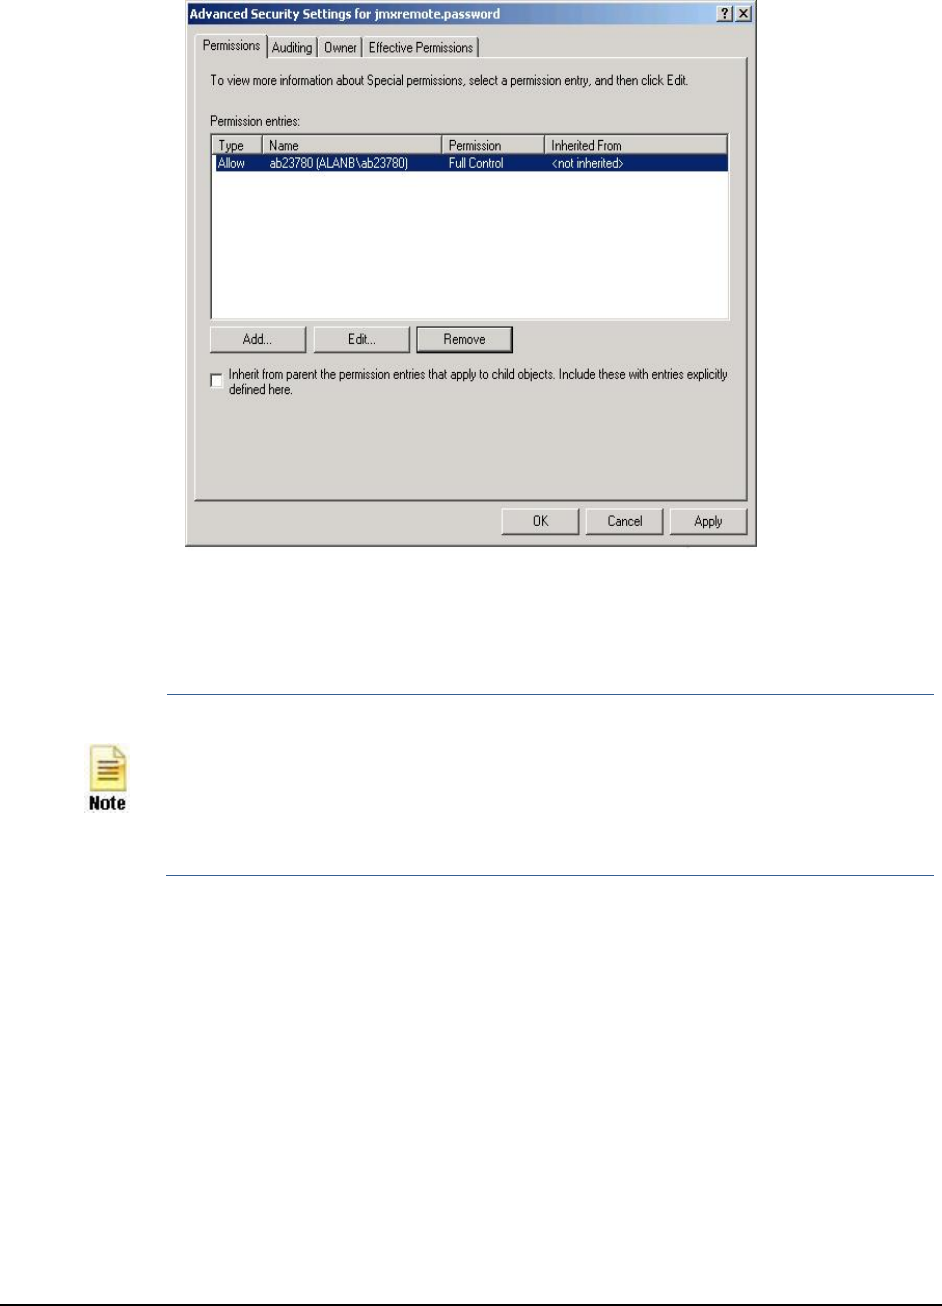
7. Then, proceed to select the Permissions tab in Figure 6 to set the permissions. If the
jmxremote.password
file
has inherited its permissions from a parent directory that allows users or groups other than the Owner to access
the file, then clear the Inherit from parent the permission entries that apply to child objects check box in Figure
7.
M o n i t o r i n g a J a v a A p p l i c a t i o n
10
Figure 7: Disinheriting permissions borrowed from a parent directory
8. At this point, you will be prompted to confirm whether the inherited permissions should be copied from the
parent or removed. Press the Copy button in Figure 8.
Figure 8: Copying the inherited permissions
9. Next, remove all permission entries that allow the
jmxremote.password
file to be accessed by users or groups
other than the file Owner. For this, click the user or group and press the Remove button in Figure 9. At the end
of this exercise, only a single permission entry granting Full Control to the owner should remain in Figure 9.
M o n i t o r i n g a J a v a A p p l i c a t i o n
11
Figure 9: Granting full control to the file owner
10. Finally, click the Apply and OK buttons to register the changes. The password file is now secure, and can only
be accessed by the file owner.
If you are trying to enable JMX on a Linux host, you might encounter issues with the way
hostnames are resolved.
To solve it you might have to set the -Djava.rmi.server.hostname=<hostname or localhost or
ip> property in the startup script of the target web application server.
If you are in local, simply try with -Djava.rmi.server.hostname=localhost or -
Djava.rmi.server.hostname=127.0.0.1.
M o n i t o r i n g a J a v a A p p l i c a t i o n
12
1.1.1.2 Configuring the eG Agent to Support JMX Authentication
If the eG agent needs to use JMX for monitoring a Java application, and this JMX requires authentication only (and
not security), then every test to be executed by such an eG agent should be configured with the credentials of a valid
user to JMX, with
read-write rights
. The steps for creating such a user are detailed below:
1. Login to the application host. If the application being monitored is on a Windows host, then login as a
local/domain administrator to the host.
2. Go to the <JAVA_HOME>\jre\lib\management folder used by the target application to view the following files:
o
management.properties
o
jmxremote.access
o
jmxremote.password.template
o
snmp.acl.template
3. Copy the
jmxremote.password.template
file to a different location, rename it as
jmxremote.password
, and copy
it back to the <JAVA_HOME>\jre\lib\management folder.
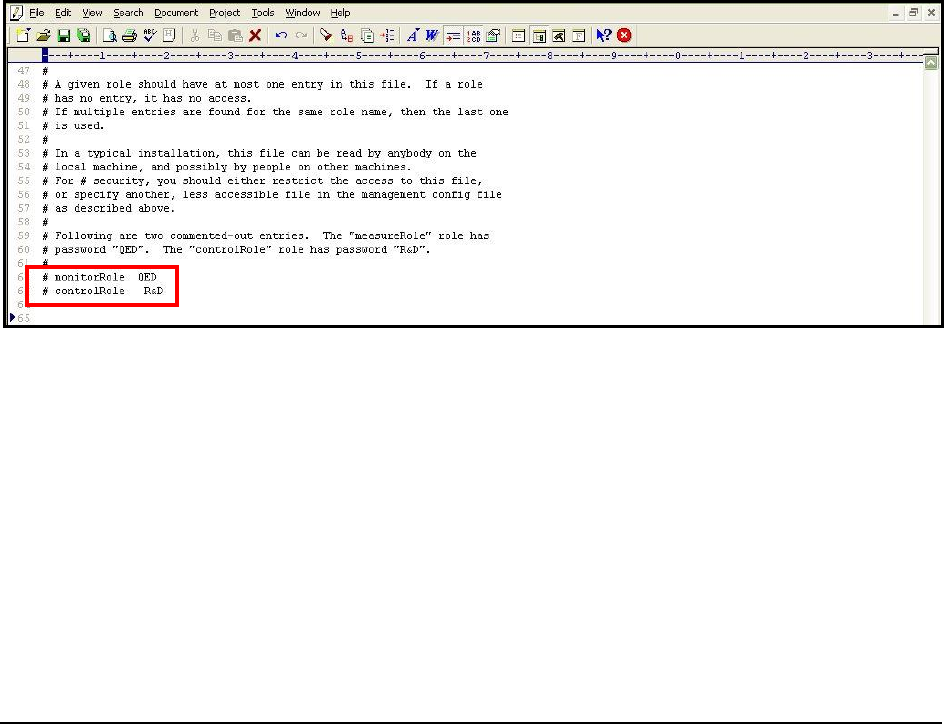
4. Open the
jmxremote.password
file and scroll down to the end of the file. By default, you will find the
commented entries indicated by Figure 10 below:
Figure 10: Scrolling down the jmxremote.password file to view 2 commented entries
5. The two entries indicated by Figure 10 are sample
username password
pairs with access to JMX. For instance,
in the first sample entry of Figure 10,
monitorRole
is the
username
and
QED
is the
password
corresponding to
monitorRole
. Likewise, in the second line, the
controlRole
user takes the password
R&D
.
6. If you want to use one of these pre-defined
username password
pairs during test configuration, then simply
uncomment the corresponding entry by removing the
#
symbol preceding that entry. However, prior to that,
you need to determine what privileges have been granted to both these users. For that, open the
jmxremote.access
file in the editor.
M o n i t o r i n g a J a v a A p p l i c a t i o n
13
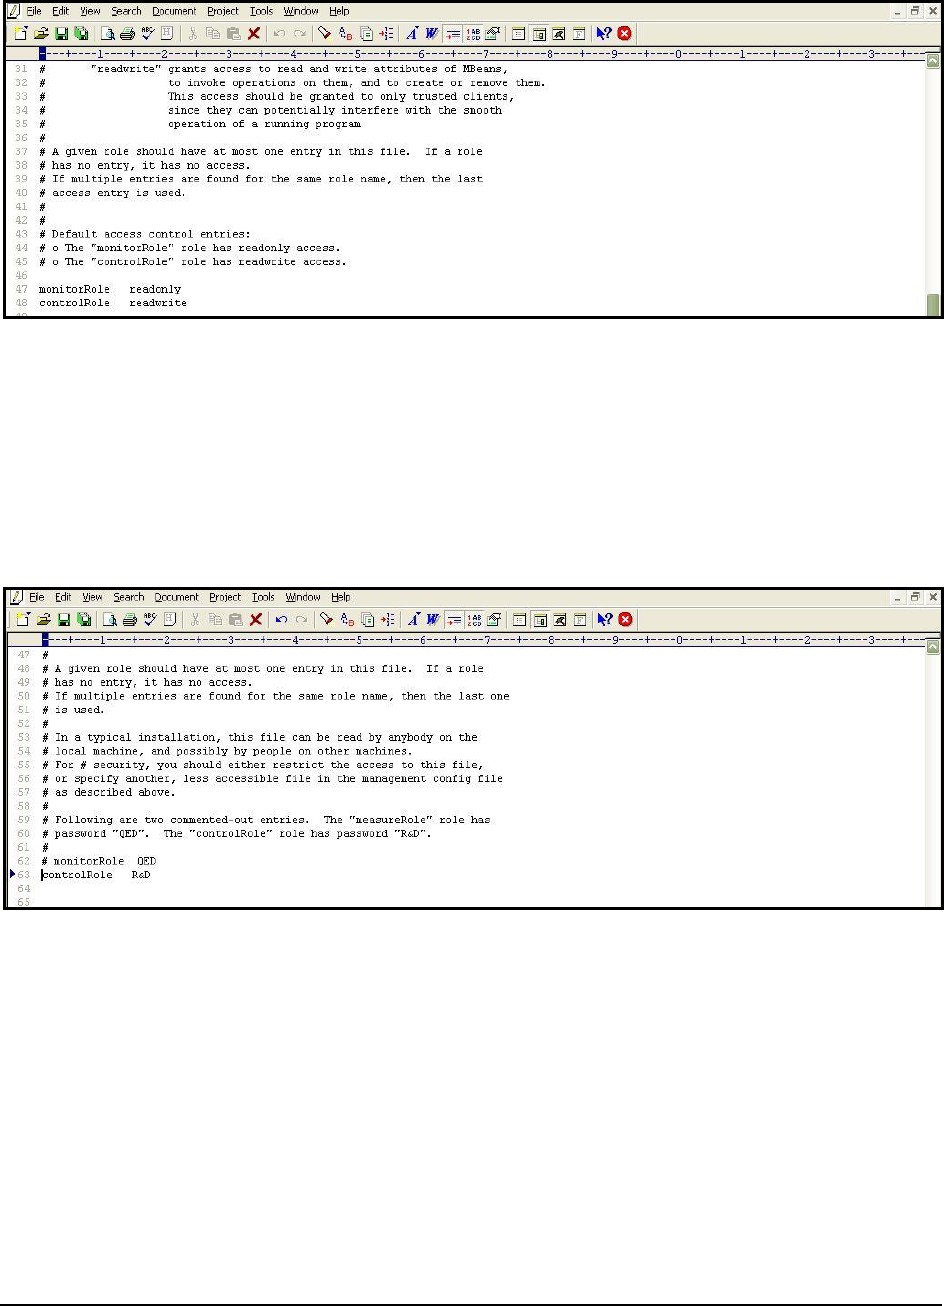
Figure 11: The jmxremote.access file
7. Scrolling down the file (as indicated by Figure 11) will reveal 2 lines, each corresponding to the sample
username
available in the
jmxremote.password
file. Each line denotes the access rights of the corresponding
user. As is evident from Figure 11, the user
monitorRole
has only
readonly
rights, while user
controlRole
has
readwrite
rights. Since the eG agent requires
readwrite
rights to be able to pull out key JVM-related statistics
using JMX, we will have to configure the test with the credentials of the user
controlRole
.
8. For that, first, edit the
jmxremote.password
file and uncomment the
controlRole <password>
line as depicted
by Figure 12.
Figure 12: Uncommending the ‘controlRole’ line
9. Then, save the file. You can now proceed to configure the tests with the user name
controlRole
and password
R&D
.
10. Alternatively, instead of going with these default credentials, you can create a new
username password
pair in
the
jmxremote.password
file, assign
readwrite
rights to this user in the
jmxremote.access
file, and then
configure the eG tests with the credentials of this new user. For instance, let us create a user
john
with
password
john
and assign
readwrite
rights to
john
.
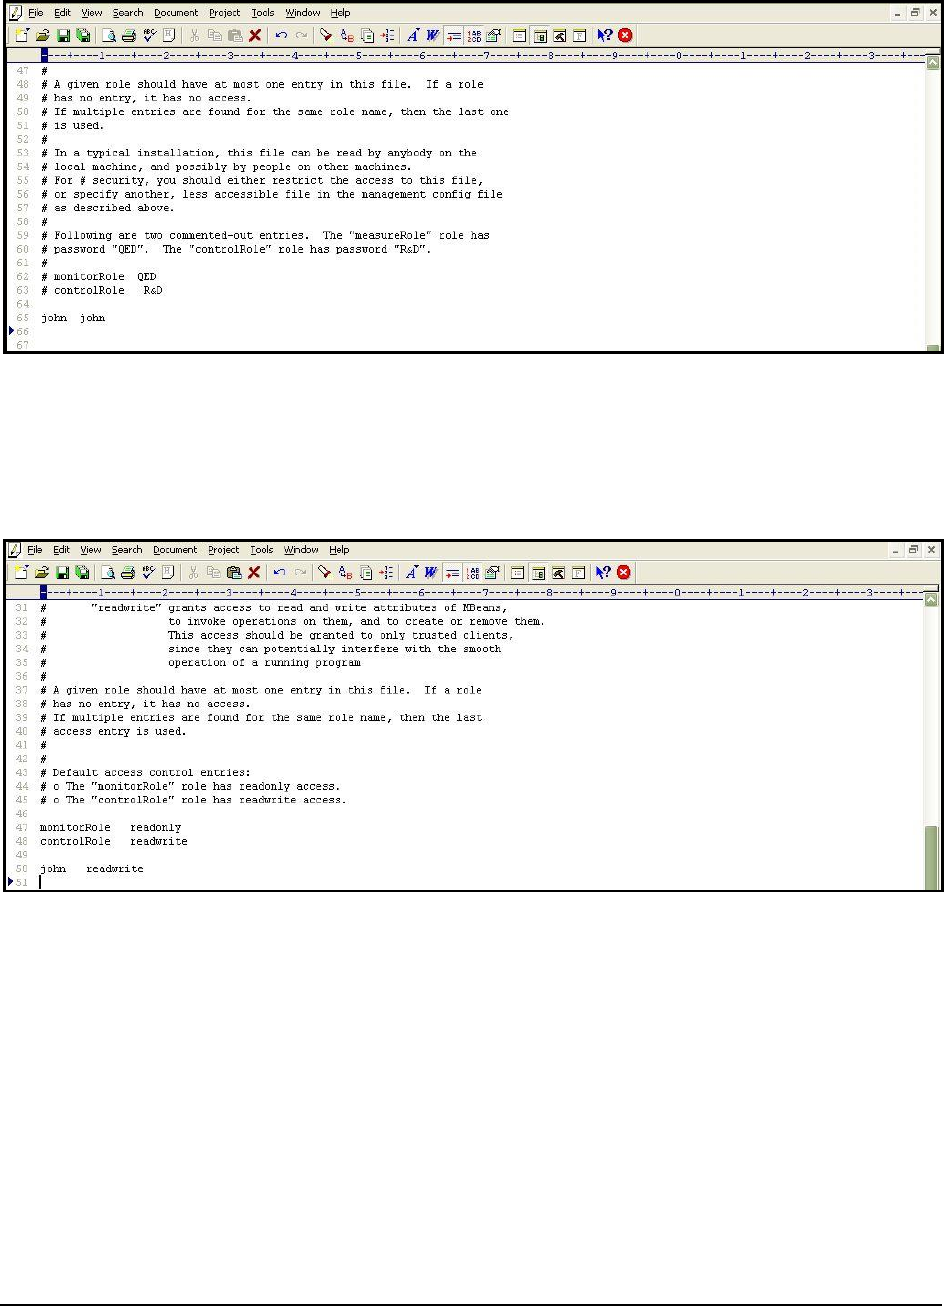
11. For this purpose, first, edit the
jmxremote.password
file, and append the following line (see Figure 13) to it:
john john
M o n i t o r i n g a J a v a A p p l i c a t i o n
14
Figure 13: Appending a new username password pair
12. Save the
jmxremote.password
file.
13. Then, edit the
jmxremote.access
file, and append the following line (see Figure 14) to it:
john readwrite
Figure 14: Assigning rights to the new user in the jmxremote.access file
14. Then, save the
jmxremote.access
file.
15. Finally, proceed to configure the tests with the user name and password,
john
and
john
, respectively.
1.1.2 Enabling SNMP Support for JRE
Instead of JMX, you can configure the eG agent to monitor a Java application using SNMP-based access to the Java
runtime MIB statistics.
In some environments, SNMP access might have to be authenticated by an ACL (Access Control List), and in some
other cases, it might not require an ACL.
If SNMP access does not require ACL authentication, then follow the steps below to enable SNMP support:
1. Login to the application host.

M o n i t o r i n g a J a v a A p p l i c a t i o n
15
2. Ensure that the SNMP service and the SNMP Trap Service are running on the host.
3. Next, edit the
management.properties
file in the <JAVA_HOME>\jre\lib\management folder used by the target
application.
4. Append the following lines to the file:
com.sun.management.snmp.port=<Port No>
com.sun.management.snmp.interface=0.0.0.0
com.sun.management.snmp.acl=false
For instance, if the SNMP port is 1166, then the first line of the above specification will be:
com.sun.management.snmp.port=1166
If the second line of the specification is set to
0.0.0.0
, then, it indicates that the JRE will accept SNMP requests
from any host in the environment
.
To ensure that the JRE services only those SNMP requests that are received
from the eG agent, set the second line of the specification to the IP address of the agent host. For instance, if
the eG agent to monitor the Java application is executing on
192.168.10.152
, then the second line of the
specification will be:
com.sun.management.snmp.interface=192.168.10.152
5. Next, edit the start-up script of the target application, include the following line it, and save the script file.
-Dcom.sun.management.config.file=<management.properties_file_path>
6. For instance, on a Windows host, the
<management.properties_file_path>
can be expressed as:
D:\bea\jrockit_150_11\jre\lib\management\management.properties.
7. On other hand, on a Unix/Linux/Solaris host, a sample
<management.properties_file_path>
specification will be
as follows: /usr/jdk1.5.0_05/jre/lib/management/management.properties.
On the contrary, if SNMP access requires ACL authentication, then follow the steps below to enable SNMP support for
the JRE:
1. Login to the application host. If the target application is executing on a Windows host, login as a local/domain
administrator.
2. Ensure that the SNMP service and SNMP Trap Service are running on the host.
3. Copy the
snmp.acl.template
file in the <JAVA_HOME>\jre\lib\management folder to another location on the local
host. Rename the
snmap.acl.template
file as
snmp.acl
, and copy the
snmp.acl
file back to the
<JAVA_HOME>\jre\lib\management folder.
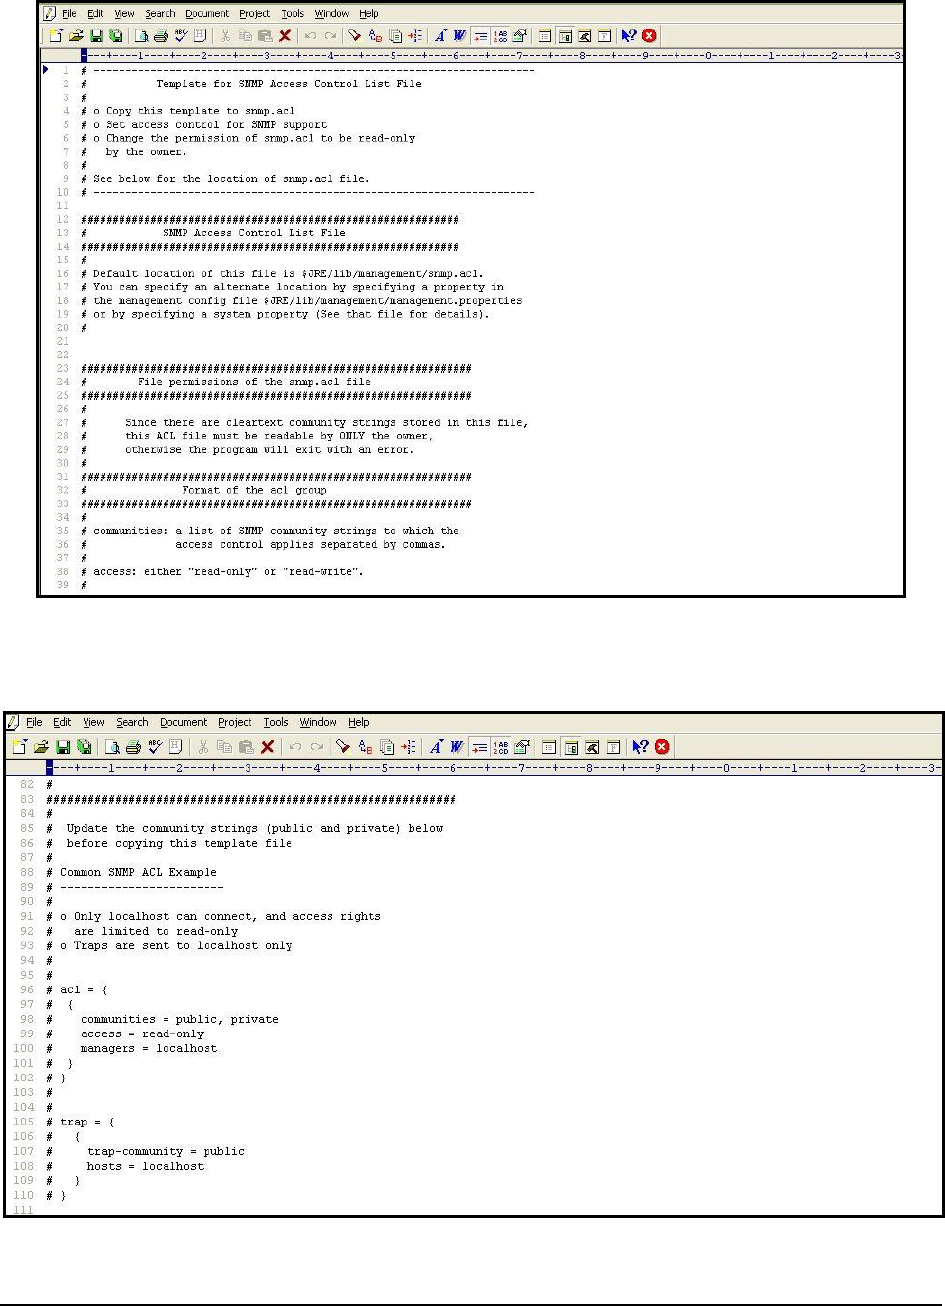
4. Next, edit the
snmp.acl
file, and set rules for SNMP access in the file.
M o n i t o r i n g a J a v a A p p l i c a t i o n
16
Figure 15: The snmp.acl file
5. For that, first scroll down the file to view the sample code block revealed by Figure 16.
Figure 16: The snmp.acl file revealing the SNMP ACL example
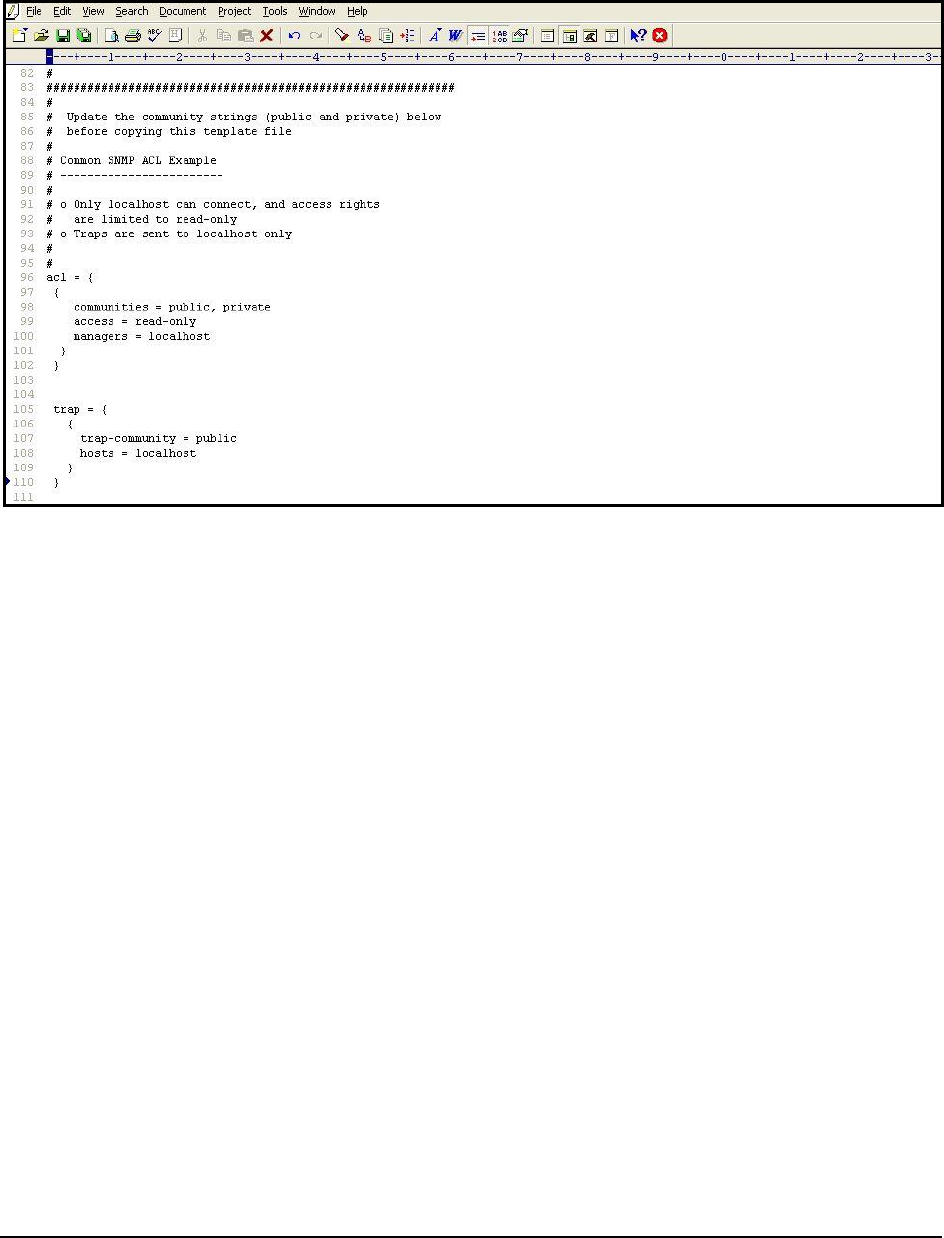
6. Uncomment the code block by removing the # symbol preceding each line of the block as indicated by Figure
M o n i t o r i n g a J a v a A p p l i c a t i o n
17
17.
Figure 17: Uncommenting the code block
7. Next, edit the code block to suit your environment.
8. The
acl
block expects the following parameters:
communities
: Provide a comma-separated list of community strings, which an SNMP request should
carry for it to be serviced by this JRE; in the example illustrated by Figure 17, the community strings
recognized by this JRE are
public
and
private
. You can add more to this list, or remove a
community
string
from this list, if need be.
access
: Indicate the access rights that SNMP requests containing the defined
communities
will have;
in Figure 17, SNMP requests containing the community string
public
or
private
, will have only
read-
only
access to the MIB statistics. To grant full access, you can specify
rea-write
instead.
managers :
Specify a comma-separated list of SNMP managers or hosts from which SNMP requests
will be accepted by this JRE; in the example illustrated by Figure 17, all SNMP requests from the
localhost
will be serviced by this JRE. Typically, since the SNMP requests originate from an eG agent,
the IP of the eG agent should be configured against the
managers
parameter. For instance, if the IP
address of the agent host is
192.16.10.160
, then, to ensure that the JRE accepts requests from the eG
agent alone, set
managers
to
192.168.10.160
, instead of
localhost
.
9. Every
acl
block in the
snmp.acl
file should have a corresponding
trap
block. This
trap
block should be
configured with the following values:
trap-community
: Provide a comma-separated list of community strings that can be used by SNMP
traps sent by the Java application to the
managers
specified in the
acl
block. In the example of Figure
17, all SNMP traps sent by the Java application being monitored should use the community string
public
only.
M o n i t o r i n g a J a v a A p p l i c a t i o n
18
hosts
: Specify a comma-separated list of IP addresses / host names of hosts from which SNMP traps
can be sent. In the case of Figure 17, traps can be sent by the
localhost
only. If a single
snmp.acl
file
is being centrally used by multiple applications/devices executing on multiple hosts, then to ensure
that all such applications are able to send traps to the configured SNMP
managers
(in the
acl
block),
you can provide the IP address/hostname of these applications as a comma-separated list against
hosts
.
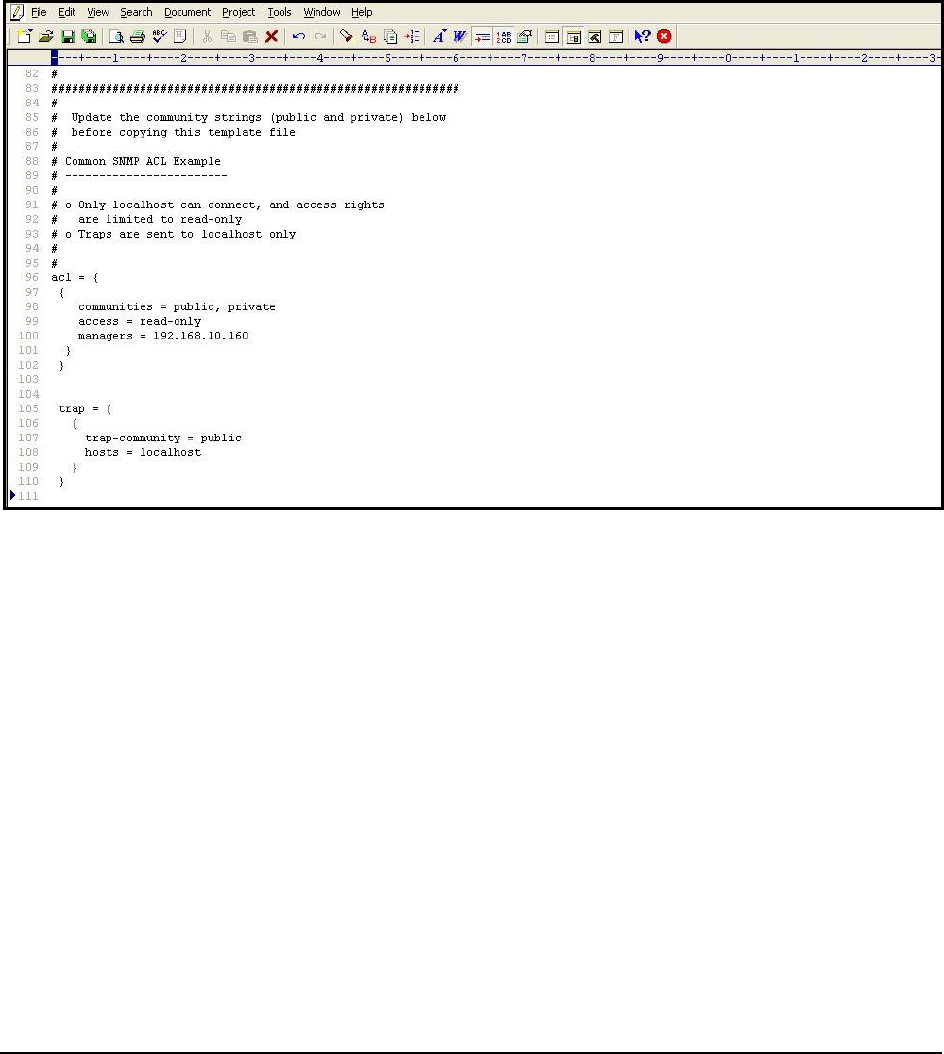
10. Figure 18 depicts how the
acl
and
trap
blocks can be slightly changed to suit the monitoring needs of an
application.
Figure 18: The edited block
11. Then, proceed to make the
snmp.acl
file secure by granting a single user “full access” to that file. For
monitoring applications executing on Windows in particular, only the
Owner
of the
snmp,.acl
file should have
full control of that
file. To know how to grant this privilege to the
Owner
of a file, refer to Section 1.1.1.1. This
section actually details the procedure for making the
jmxremote.password
file on Windows, secure. Use the
same procedure for making the
snmp.acl
file on Windows secure, but make sure that you select the
snmp.acl
file and not the
jmxremote.password
file.
12. In case of applications executing on Solaris / Linux hosts on the other hand, any user can be granted full access
to the
snmp.acl
file, by following the steps below:
Login to the host as the user who is to be granted full control of the
snmp.acl
file.
Issue the following command:
chmod 600 snmp.acl
This will automatically grant the login user full access to the
jmxremote.password
file.
13. Next, edit the
management.properties
file in the <JAVA_HOME>\jre\lib\management folder used by the target
application.

M o n i t o r i n g a J a v a A p p l i c a t i o n
19
14. Append the following lines to the file:
com.sun.management.snmp.port=<PortNo>
com.sun.management.snmp.interface=0.0.0.0
com.sun.management.snmp.acl=true
com.sun.management.snmp.acl.file=<Path_of_snmp.acl>
If the second line of the specification is set to
0.0.0.0
, then, it indicates that the JRE will accept SNMP requests
from any host in the environment
.
To ensure that the JRE services only those SNMP requests that are received
from the eG agent, set the second line of the specification to the IP address of the agent host.
For example, if the Java application being monitored listens for SNMP requests at port number 1166, the eG
agent monitoring the Java application is deployed on
192.168.10.152
,
and these SNMP requests need to be
authenticated using the
snmp.acl
file in the D:\bea\jrockit_150_11\jre\lib directory, then the above specification
will read as follows:
com.sun.management.snmp.port=1166
com.sun.management.snmp.interface=192.168.10.152
com.sun.management.snmp.acl=true
com.sun.management.snmp.acl.file=D:\\bea\\jrockit_150_11\\jre\\lib\\management\\sn
mp.acl
15. However, if the application in question is executing on a Unix/Solaris/Linux host, and the
snmp.acl
file is in the
/usr/jdk1.5.0_05/jre/lib/management folder of the host, then the last line of the specification will be:
com.sun.management.snmp.acl.file =/usr/jdk1.5.0_05/jre/lib/management/snmp.acl
16. Next, edit the start-up script of the target application, include the following line in it, and save the script file.
-Dcom.sun.management.config.file=<management.properties_file_path>
17. For instance, on a Windows host, the
<management.properties_file_path>
can be expressed as:
D:\bea\jrockit_150_11\jre\lib\management\management.properties.
18. On other hand, on a Unix/Linux/Solaris host, a sample
<management.properties_file_path>
specification will be
as follows: /usr/jdk1.5.0_05/jre/lib/management/management.properties.
The sections to come discuss the top 2 layers of Figure 1, as the remaining layers have already been discussed at
length in the
Monitoring Unix and Windows Servers
document.
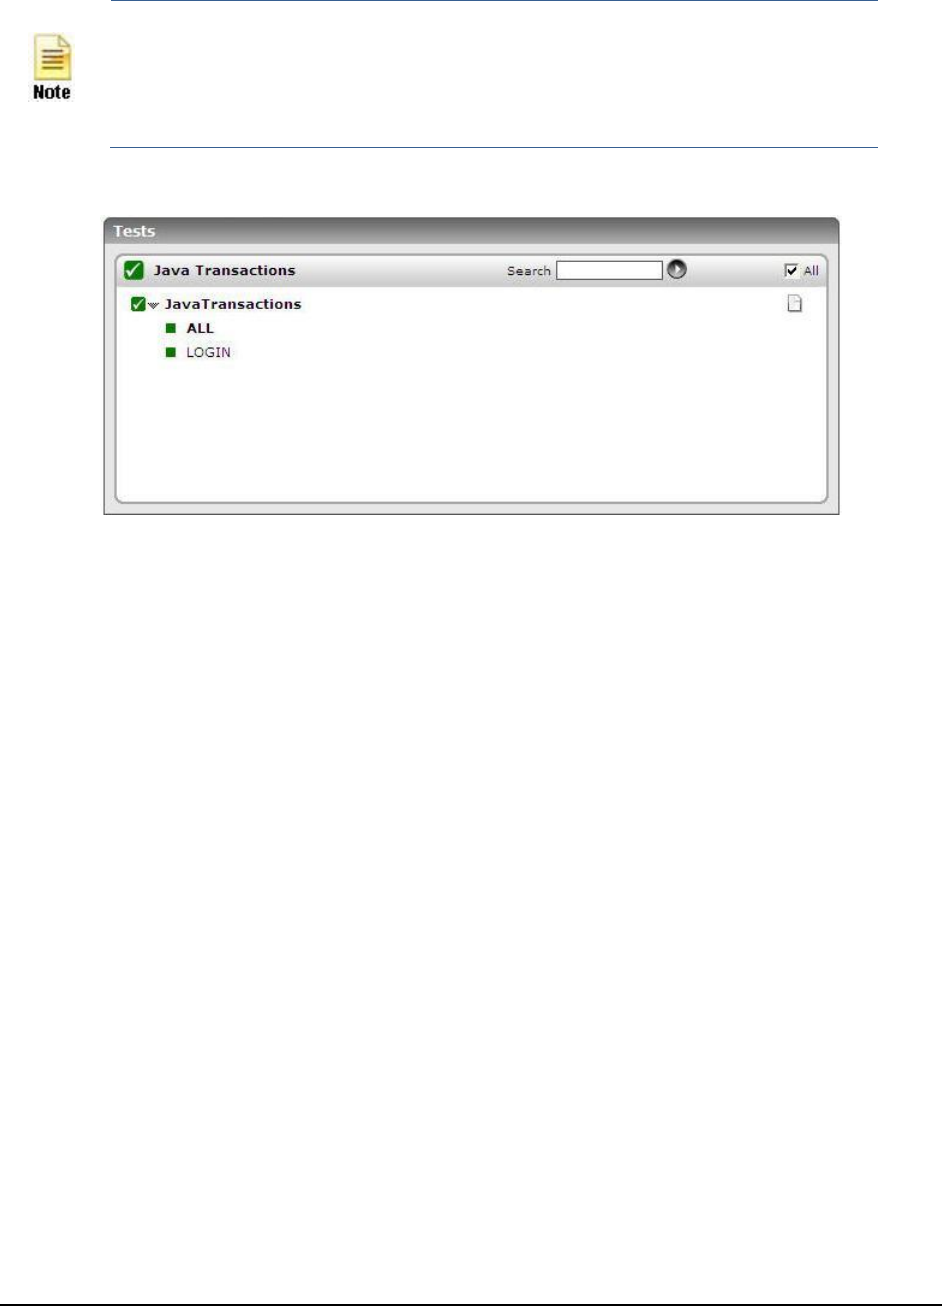
1.2 The Java Transactions Layer
By default, this layer will not be available for any monitored Java Application. This is because, the Java Transactions
test mapped to this layer is disabled by default. To enable the test, follow the
Agents -> Tests -> Enable/Disable
menu sequence, select
Java Application
as the Component type,
Performance
as the Test type, and then select Java
Transactions from the DISABLED TESTS list. Click the Enable button to enable the selected test, and click the Update
button to save the changes.
The Java Transactions test, once enabled, will allow you to monitor configured patterns of transactions to the target
Java application, and report their response times, so that slow transactions and transaction exceptions are isolated
and the reasons for the same analyzed. For the Java Transactions test to execute, you need to enable the Java
Transaction Monitoring (JTM) capability of the eG agent. The procedure for the same has been discussed in Section
1.2.1.1 of this document.
M o n i t o r i n g a J a v a A p p l i c a t i o n
20
Java Transaction Monitoring (JTM) can be enabled only for those Java applications that use
JDK 1.5 or higher.
Figure 19: The test mapped to the Java Transactions layer
1.2.1 Java Transactions Test
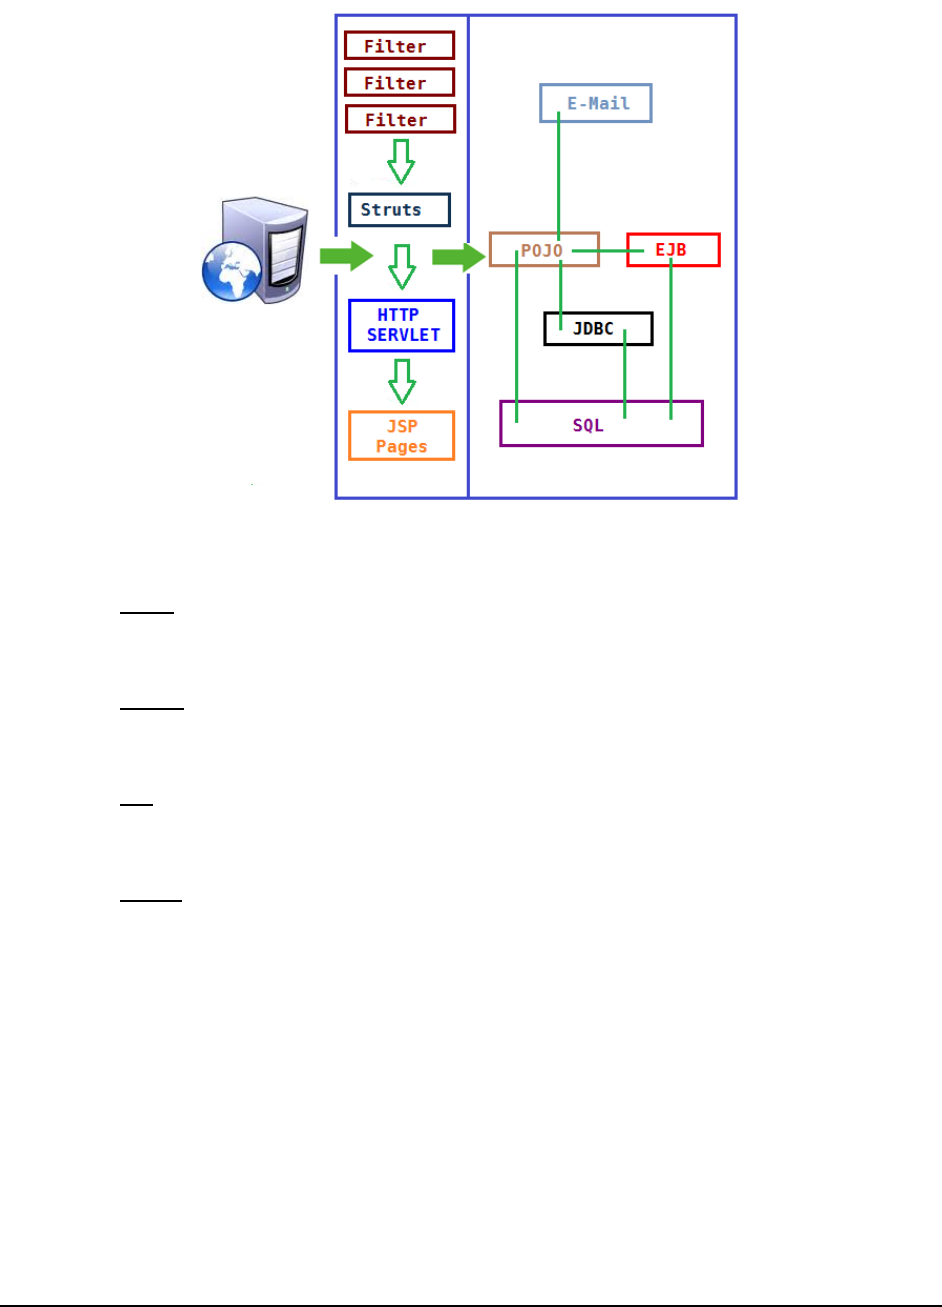
When a user initiates a transaction to a J2EE application, the transaction typically travels via many sub-components
before completing execution and sending out a response to the user.
Figure 20 reveals some of the sub-components that a web transaction/web request visits during its journey.
M o n i t o r i n g a J a v a A p p l i c a t i o n
21
Figure 20: The layers through which a Java transaction passes
The key sub-components depicted by Figure 20 have been briefly described below:
Filter: A filter is a program that runs on the server before the servlet or JSP page with which it is
associated. All filters must implement javax.servlet.Filter. This interface comprises three methods:
init, doFilter, and destroy.
Servlet: A servlet acts as an intermediary between the client and the server. As servlet modules run
on the server, they can receive and respond to requests made by the client. If a servlet is designed to
handle HTTP requests, it is called an HTTP Servlet.
JSP: Java Server Pages are an extension to the Java servlet technology. A JSP is translated into Java
servlet before being run, and it processes HTTP requests and generates responses like any servlet.
Translation occurs the first time the application is run.
Struts: The Struts Framework is a standard for developing well-architected Web applications. Based
on the Model-View-Controller (MVC) design paradigm, it distinctly separates all three levels (Model,
View, and Control).
A delay experienced by any of the aforesaid sub-components can adversely impact the total response time of the
transaction, thereby scarring the user experience with the web application. In addition, delays in JDBC connectivity
and slowdowns in SQL query executions (if the application interacts with a database), bottlenecks in delivery of mails
via the Java Mail API (if used), and any slow method calls, can also cause insufferable damage to the 'user-
perceived' health of a web application.
The challenge here for administrators is to not just isolate the slow transactions, but to also accurately identify where
the transaction slowed down and why - is it owing to inefficent JSPs? poorly written servlets or struts? poor or the
lack of any JDBC connectivity to the database? long running queries? inefficient API calls? or delays in accessing the
POJO methods? The eG JTM Monitor provides administrators with answers to these questions!
With the help of the Java Transactions test, the eG JTM Monitor traces the route a configured web transaction takes,
and captures live the total responsiveness of the transaction and the response time of each Java component it visits
en route. This way, the solution proactively detects transaction slowdowns, and also precisely points you to the sub-
M o n i t o r i n g a J a v a A p p l i c a t i o n
22
components causing it - is it the Filters? JSPs? Servlets? Struts? JDBC? SQL query? Java Mail API? or the POJO? In
addition to revealing where (i.e., at which Java component) a transaction slowed down, the solution also provides
the following intelligent insights, on demand, making root-cause identification and resolution easier:
A look at the methods that took too long to execute, thus leading you to those methods that may have
contributed to the slowdown;
Single-click access to each invocation of a chosen method, which provides pointers to when and where
a method spent longer than desired;
A quick glance at SQL queries and Java errors that may have impacted the responsiveness of the
transaction;
Using these interesting pointers provided by the eG JTM Monitor, administrators can diagnose the root-cause of
transaction slowdowns within minutes, rapidly plug the holes, and thus ensure that their critical web applications
perform at peak capacity at all times!
1.2.1.1 How does eG Perform Java Transaction Monitoring?
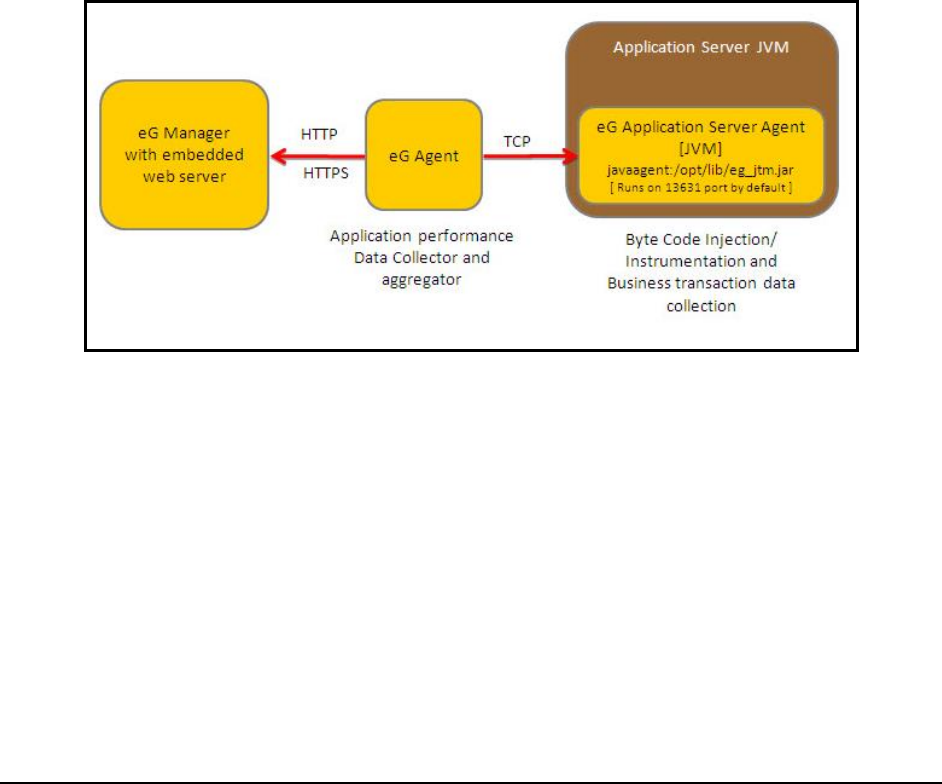
Figure 21 depicts how eG monitors Java transactions.
Figure 21: How eG monitors Java transactions
M o n i t o r i n g a J a v a A p p l i c a t i o n
23
To track the live transactions to a J2EE application, eG Enterprise requires that a special eG Application Server Agent
be deployed on the target application. The eG Application Server Agent is available as a file named eg_jtm.jar on the
eG agent host, which has to be copied to the system hosting the application being monitored. The detailed steps for
deployment have been discussed hereunder:
In the <EG_INTALL_DIR>\lib directory (on Windows; on Unix, this will be /opt/egurkha/lib) of the eG agent, you will find
the following files:
eg_jtm.jar
aspectjrt.jar
aspectjweaver.jar
jtmConn.props
jtmLogging.props
jtmOther.props
Login to the system hosting the Java application to be monitored.
If the eG agent will be 'remotely monitoring' the target Java application (i.e., if the Java application is to be
monitored in an 'agentless manner'), then, copy all the files mentioned above from the <EG_INSTALL_DIR>\lib directory
(on Windows; on Unix, this will be /opt/egurkha/lib) of the eG agent to any location on the Java application host.
Then, proceed to edit the start-up script of the Java application being monitored, and append the following lines to
it:
set JTM_HOME=<<PATH OF THE LOCAL FOLDER CONTAINING THE JAR FILES AND PROPERTY FILES
LISTED ABOVE>>
"-javaagent:%JTM_HOME%\aspectjweaver.jar"
"-DEG_JTM_HOME=%JTM_HOME%"
Note that the above lines will change based on the operating system and the web/web application server being
monitored.
Then, add the eg_jtm.jar, aspectjrt.jar, and aspectjweaver.jar files to the CLASSPATH of the Java application being
monitored.
Finally, save the file.
Next, edit the jtmConn.props file. You will find the following lines in the file:
#Contains the connection properties of eGurkha Java Transaction Monitor
JTM_Port=13631
Designated_Agent=
By default, the JTM_Port parameter is set to 13631. If the Java application being monitored listens on a different JTM
port, then specify the same here. In this case, when managing a Java Application using the eG administrative
interface, specify the JTM_Port that you set in the jtmConn.props file as the Port of the Java application.
Also, against the Designated_Agent parameter, specify the IP address of the eG agent which will poll the eG JTM
Monitor for metrics. If no IP address is provided here, then the eG JTM Monitor will treat the host from which the
very first 'measure request' comes in as the Designated_Agent.
M o n i t o r i n g a J a v a A p p l i c a t i o n
24
In case a specific Designated_Agent is not provided, and the eG JTM Monitor treats the host from
which the very first 'measure request' comes in as the Designated_Agent, then if such a
Designated_Agent is stopped or uninstalled for any reason, the eG JTM Monitor will wait for a
maximum of 10 measure periods for that 'deemed' Designated_Agent to request for metrics. If no
requests come in for 10 consecutive measure periods, then the eG JTM Monitor will begin responding
to 'measure requests' coming in from any other eG agent.
Finally, save the jtmConn.props file.
Restart the Java application.
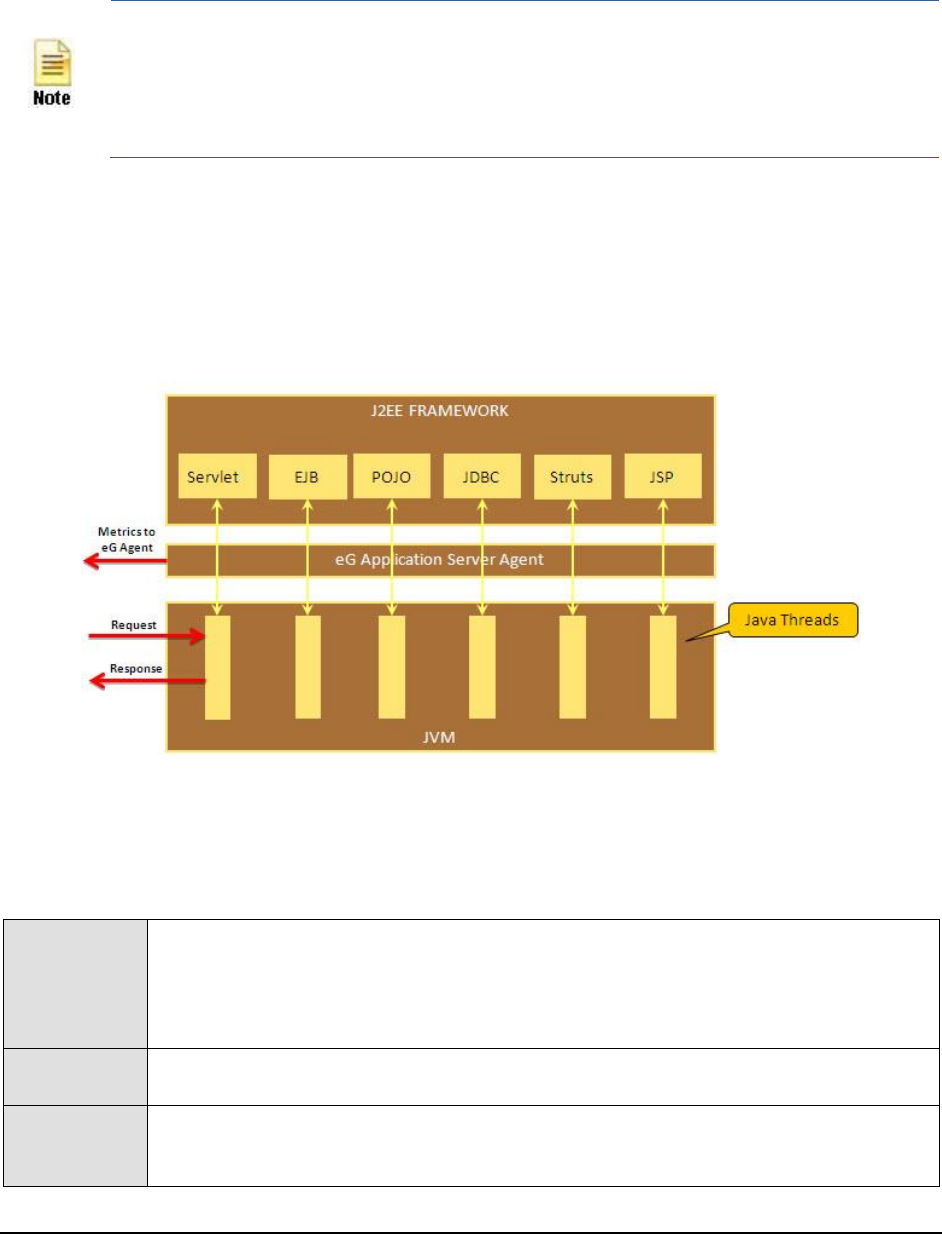
Each request in the J2EE architecture is handled by a thread. Once the Java application is restarted therefore, the eG
Application Sever Agent uses the thread ID and thread local data to keep track of requests to configured URL
patterns (see Figure 22).
Figure 22: The eG Application Server Agent tracking requests using Java threads
In the process, the eG Application Sever Agent collects metrics for each URL pattern and stores them in memory.
Then, every time the Java Transactions test runs, the eG agent will poll the eG Application Server Agent for the
required metrics, extract the same from the memory, and report them to the eG manager.
The table below explains how to configure the Java Transactions test and what measures it reports.
Purpose
Traces the route a configured web transaction takes, and captures live the total responsiveness
of the transaction and the response time of each component it visits en route. This way, the
solution proactively detects transaction slowdowns, and also precisely points you to the Java
component causing it - is it the Filters? JSPs? Servlets? Struts? JDBC? SQL query? Java Mail API?
or the POJO?
Target of the
test
A Java application
Agent
deploying the
test
An internal/remote agent

M o n i t o r i n g a J a v a A p p l i c a t i o n
25
Configurable
parameters for
the test
1. TEST PERIOD - How often should the test be executed
2. HOST - The host for which the test is to be configured
3. PORT - The port number at which the specified HOST listens; if Java Transaction
Monitoring is enabled for the target Java application, then the JTM PORT has to be
specified here
4. JTM PORT – Specify the port number configured as the JTM_Port in the jtmConn.props
file described in the procedure outlined above.
5. URL PATTERNS - Provide a comma-separated list of the URL patterns of web
requests/transactions to be monitored. The format of your specification should be as
follows:
<DisplayName_of_Pattern>:<Transaction_Pattern>
. For instance, your
specification can be:
login:*log*,ALL:*,pay:*pay*
6. FILTERED URL PATTERNS - Provide a comma-separated list of the URL patterns of
transactions/web requests to be excluded from the monitoring scope of this test. For
example,
*blog*,*paycheque*
7. SLOW URL THRESHOLD - The
Slow transactions
measure of this test will report the
number of transactions (of the configured patterns) for which the response time is higher
than the value (in seconds) specified here.
8. METHOD EXEC CUTOFF - The detailed diagnosis of the
Slow transactions
measure
allows you to drill down to a URL tree, where the methods invoked by a chosen transaction
are listed in the descending order of their execution time. By configuring an execution
duration (in seconds) here, you can have the URL Tree list only those methods that have
been executing for a duration greater the specified value. For instance, if you specify
5
here, the URL tree for a transaction will list only those methods that have been executing
for over 5 seconds, thus shedding light on the slow method calls alone.
9. MAX SLOW URLS PER TEST PERIOD - Specify the number of top-n transactions (of a
configured pattern) that should be listed in the detailed diagnosis of the
Slow transactions
measure, every time the test runs. By default, this is set to
10
, indicating that the detailed
diagnosis of the
Slow transactions
measure will by default list the top-10 transactions,
arranged in the descending order of their response times.
10. MAX ERROR URLS PER TEST PERIOD - Specify the number of top-n transactions (of a
configured pattern) that should be listed in the detailed diagnosis of the
Error transactions
measure, every time the test runs. By default, this is set to
10
, indicating that the detailed
diagnosis of the
Error transactions
measure will by default list the top-10 transactions, in
terms of the number of errors they encountered.

M o n i t o r i n g a J a v a A p p l i c a t i o n
26
11. DD FREQUENCY - Refers to the frequency with which detailed diagnosis measures are to
be generated for this test. The default is
1:1
. This indicates that, by default, detailed
measures will be generated every time this test runs, and also every time the test detects
a problem. You can modify this frequency, if you so desire. Also, if you intend to disable
the detailed diagnosis capability for this test, you can do so by specifying
none
against DD
FREQUENCY.
12. DETAILED DIAGNOSIS - To make diagnosis more efficient and accurate, the eG
Enterprise suite embeds an optional detailed diagnostic capability. With this capability, the
eG agents can be configured to run detailed, more elaborate tests as and when specific
problems are detected. To enable the detailed diagnosis capability of this test for a
particular server, choose the On option. To disable the capability, click on the Off option.
The option to selectively enable/disable the detailed diagnosis capability will be available
only if the following conditions are fulfilled:
The eG manager license should allow the detailed diagnosis capability
Both the normal and abnormal frequencies configured for the detailed diagnosis
measures should not be 0.
Outputs of the
test
One set of results for each configured URL pattern
Measurements
made by the
test
Measurement
Measurement
Unit
Interpretation
Total transactions:
Indicates the total number of
transactions of this pattern that the
target application handled during the
last measurement period.
Number
Avg. response time:
Indicates the average time taken by
the transactions of this pattern to
complete execution.
Secs
Compare the value of this measure
across patterns to isolate the type of
transactions that were taking too long
to execute.
You can then take a look at the values
of the other measures to figure out
where the transaction is spending too
much time.
Slow transactions:
Indicates the number of transactions
of this pattern that were slow during
the last measurement period.
Number
This measure will report the number of
transactions with a response time
higher than the configured SLOW
URL THRESHOLD.
A high value is a cause for concern, as
too many slow transactions to an
application can significantly damage
the user experience with that
application.
Use the detailed diagnosis of this
measure to know which transactions
are slow.

M o n i t o r i n g a J a v a A p p l i c a t i o n
27
Slow transactions response time:
Indicates the average time taken by
the slow transactions of this pattern
to execute.
Secs
Error transactions:
Indicates the number of transactions
of this pattern that experienced
errors during the last measurement
period.
Number
A high value is a cause for concern, as
too many error-prone transactions to
an application can significantly
damage the user experience with that
application.
Use the detailed diagnosis of this
measure to isolate the error
transactions.
Error transactions response time:
Indicates the average duration for
which the transactions of this pattern
were processed before an error
condition was detected.
Secs
Filters:
Indicates the number of filters that
were accessed by the transactions of
this pattern during the last
measurement period.
Number
A filter is a program that runs on the
server before the servlet or JSP page
with which it is associated.
Filters response time:
Indicates the average time spent by
the transactions of this pattern at the
Filters layer.
Secs
Typically, the init, doFilter, and
destroy methods are called at the
Filters layer. Issues in these method
invocations can increase the time
spent by a transaction in the Filters
Java component.
Compare the value of this measure
across patterns to identify the
transaction pattern that spent the
maximum time with the Filters
component.
If one/more transactions of a pattern
are found to be slow, then, you can
compare the value of this measure
with the other response time values
reported by this test to determine
where the slowdown actually occurred
- in the filters, in JSPs, in servlets, in
struts, in exception handling, when
executing JDBC/SQL queries, when
sending Java mails, or when accessing
POJOs.
JSPs accessed:
Indicates the number of JSPs
accessed by the transactions of this
pattern during the last measurement
period.
Number

M o n i t o r i n g a J a v a A p p l i c a t i o n
28
JSPs response time:
Indicates the average time spent by
the transactions of this pattern at the
JSP layer.
Secs
Compare the value of this measure
across patterns to identify the
transaction pattern that spent the
maximum time in JSPs.
If one/more transactions of a pattern
are found to be slow, then, you can
compare the value of this measure
with the other response time values
reported by this test to determine
where the slowdown actually occurred
- in the filters, in JSPs, in servlets, in
struts, in exception handling, when
executing JDBC/SQL queries, when
sending Java mails, or when accessing
POJOs..
HTTP Servlets Accessed:
Indicates the number of HTTP
servlets that were accessed by the
transactions of this pattern during the
last measurement period.
Number
HTTP servlets response time:
Indicates the average time taken by
the HTTP servlets for processing the
HTTP requests of this pattern.
Secs
Badly written servlets can take too
long to execute, and can hence
obstruct the smooth execution of the
dependent transactions.
By comparing the value of this
measure across patterns, you can
figure out which transaction pattern is
spending the maximum time in
Servlets.
If one/more transactions of a pattern
are found to be slow, then, you can
compare the value of this measure
with the other response time values
reported by this test to determine
where the slowdown actually occurred
- in the filters, in JSPs, in servlets, in
struts, in exception handling, when
executing JDBC/SQL queries, when
sending Java mails, or when accessing
POJOs.
Generic servlets accessed:
Indicates the number of generic
(non-HTTP) servlets that were
accessed by the transactions of this
pattern during the last measurement
period.
Number

M o n i t o r i n g a J a v a A p p l i c a t i o n
29
Generic servlets response time:
Indicates the average time taken by
the generic (non-HTTP) servlets for
processing transactions of this
pattern.
Secs
Badly written servlets can take too
long to execute, and can hence
obstruct the smooth execution of the
dependent transactions.
By comparing the value of this
measure across patterns, you can
figure out which transaction pattern is
spending the maximum time in
Servlets.
If one/more transactions of a pattern
are found to be slow, then, you can
compare the value of this measure
with the other response time values
reported by this test to determine
where the slowdown actually occurred
- in the filters, in JSPs, in servlets, in
struts, in exception handling, when
executing JDBC/SQL queries, when
sending Java mails, or when accessing
POJOs.
JDBC queries:
Indicates the number of JDBC
statements that were executed by the
transactions of this pattern during the
last measurement period.
Number
The methods captured by the eG JTM
Monitor from the Java class for the
JDBC sub-component include:
Commit(), rollback(..),
close(),GetResultSet(),
executeBatch(), cancel(),
connect(String,
Properties),
getConnection(..),getPool
edConnection(..)
JDBC response time:
Indicates the average time taken by
the transactions of this pattern to
execute JDBC statements.
Secs
By comparing the value of this
measure across patterns, you can
figure out which transaction pattern is
taking the most time to execute JDBC
queries.
If one/more transactions of a pattern
are found to be slow, then, you can
compare the value of this measure
with the other response time values
reported by this test to determine
where the slowdown actually occurred
- in the filters, in JSPs, in servlets, in
struts, in exception handling, when
executing JDBC/SQL queries, when
sending Java mails, or when accessing
POJOs.
SQL statements executed:
Indicates the number of SQL queries
executed by the transactions of this
pattern during the last measurement
period.
Number

M o n i t o r i n g a J a v a A p p l i c a t i o n
30
SQL statement time avg.:
Indicates the average time taken by
the transactions of this pattern to
execute SQL queries.
Secs
Inefficient queries can take too long to
execute on the database, thereby
significantly delaying the
responsiveness of the dependent
transactions. To know which
transactions have been most impacted
by such queries, compare the value of
this measure across the transaction
patterns.
If one/more transactions of a pattern
are found to be slow, then, you can
compare the value of this measure
with the other response time values
reported by this test to determine
where the slowdown actually occurred
- at the filters layer, JSPs layer,
servlets layer, struts layer, in
exception handling, when executing
JDBC/SQL queries, when sending Java
mails, or when accessing POJOs.
Exceptions seen:
Indicates the number of exceptions
encountered by the transactions of
this pattern during the last
measurement period.
Number
Ideally, the value of this measure
should be 0.
Exceptions response time:
Indicates the average time which the
transactions of this pattern spent in
handling exceptions.
Secs
If one/more transactions of a pattern
are found to be slow, then, you can
compare the value of this measure
with the other response time values
reported by this test to determine
where the slowdown actually occurred
- at the filters layer, JSPs layer,
servlets layer, struts layer, in
exception handling, when executing
JDBC/SQL queries, when sending Java
mails, or when accessing POJOs.
Struts accessed:
Indicates the number of struts
accessed by the transactions of this
pattern during the last meaurement
period.
Number
The Struts framework is a standard for
developing well-architected Web
applications.

M o n i t o r i n g a J a v a A p p l i c a t i o n
31
Struts response time:
Indicates the average time spent by
the transactions of this pattern at the
Struts layer.
Secs
If you compare the value of this
measure across patterns, you can
figure out which transaction pattern
spent the maximum time in Struts.
If one/more transactions of a pattern
are found to be slow, then, you can
compare the value of this measure
with the other response time values
reported by this test to determine
where the slowdown actually occurred
- in the filters, in JSPs, in servlets, in
struts, in exception handling, when
executing JDBC/SQL queries, when
sending Java mails, or when accessing
POJOs.
Java mails:
Indicates the number of mails sent by
the transactions of this pattern during
the last measurement period, using
the Java mail API.
Number
The eG JTM Monitor captures any mail
that has been sent from the monitored
application using Java Mail API. Mails
sent using other APIs are ignored by
the eG JTM Monitor.
Java mail API time:
Indicates the average time taken by
the transactions of this pattern to
send mails using the Java mail API.
Secs
If one/more transactions of a pattern
are found to be slow, then, you can
compare the value of this measure
with the other response time values
reported by this test to determine
where the slowdown actually occurred
- in the filters, in JSPs, in servlets, in
struts, in exception handling, when
executing JDBC/SQL queries, when
sending Java mails, or when accessing
POJOs.
POJOs:
Indicates the number of transactions
of this pattern that accessed POJOs
during the last measurement period.
Number
Plain Old Java Object (POJO) refers to
a 'generic' method in JAVA Language.
All methods that are not covered by
any of the Java components (eg.,
JSPs, Struts, Servlets, Filters,
Exceptions, Queries, etc.) discussed
above will be automatically included
under POJO.
When reporting the number of POJO
methods, the eG agent will consider
only those methods with a response
time value that is higher than the
threshold limit configured against the
METHOD EXEC CUTOFF parameter.
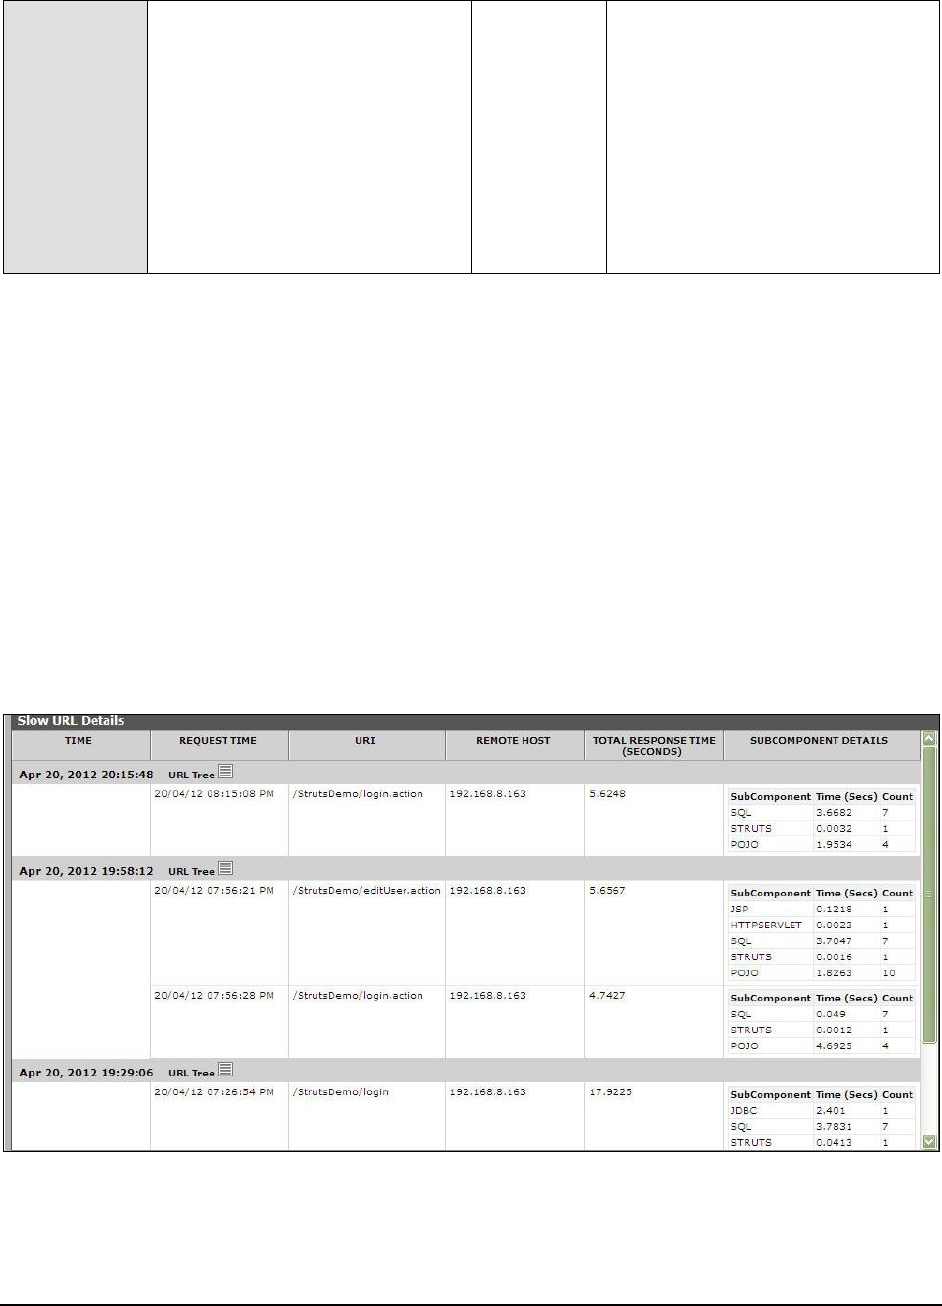
M o n i t o r i n g a J a v a A p p l i c a t i o n
32
POJO avg. access time:
Indicates the average time taken by
the transactions of this pattern to
access POJOs.
Secs
If one/more transactions of a pattern
are found to be slow, then, you can
compare the value of this measure
with the other response time values
reported by this test to determine
where the slowdown actually occurred
- in the filters, in JSPs, in servlets, in
struts, in exception handling, when
executing JDBC/SQL queries, when
sending Java mails, or when accessing
POJOs.
The detailed diagnosis of the
Slow transactions
measure lists the top-10 (by default) transactions of a configured
pattern that have violated the response time threshold set using the SLOW URL THRESHOLD parameter of this
test. Against each transaction, the date/time at which the transaction was initiated/requested will be displayed.
Besides the request date/time, the remote host from which the transaction request was received and the total
response time of the transaction will also be reported. This response time is the sum total of the response times of
each of the top methods (in terms of time taken for execution) invoked by that transaction. To compute this sum
total, the test considers only those methods with a response time value that is higher than the threshold limit
configured against the METHOD EXEC CUTOFF parameter.
In the detailed diagnosis, the transactions will typically be arranged in the descending order of the total response
time; this way, you would be able to easily spot the slowest transaction. To know what caused the transaction to be
slow, you can take a look at the SUBCOMPONENT DETAILS column of the detailed diagnosis. Here, the time spent by
the transaction in each of the Java components (FILTER, STRUTS, SERVLETS, JSPS, POJOS, SQL, JDBC, etc.) will be
listed, thus leading you to the exact Java component where the slowdown occurred.
Figure 23: The detailed diagnosis of the Slow transactions measure
You can even perform detailed method-level analysis to isolate the methods taking too long to execute. For this, click
on the URL Tree link. Figure 24 will then appear. In the left panel of Figure 24, you will find the list of transactions
that match a configured pattern; these transactions will be sorted in the descending order of their
Total Response
Time
(by default). This is indicated by the Total Response Time option chosen by default from the Sort by list in
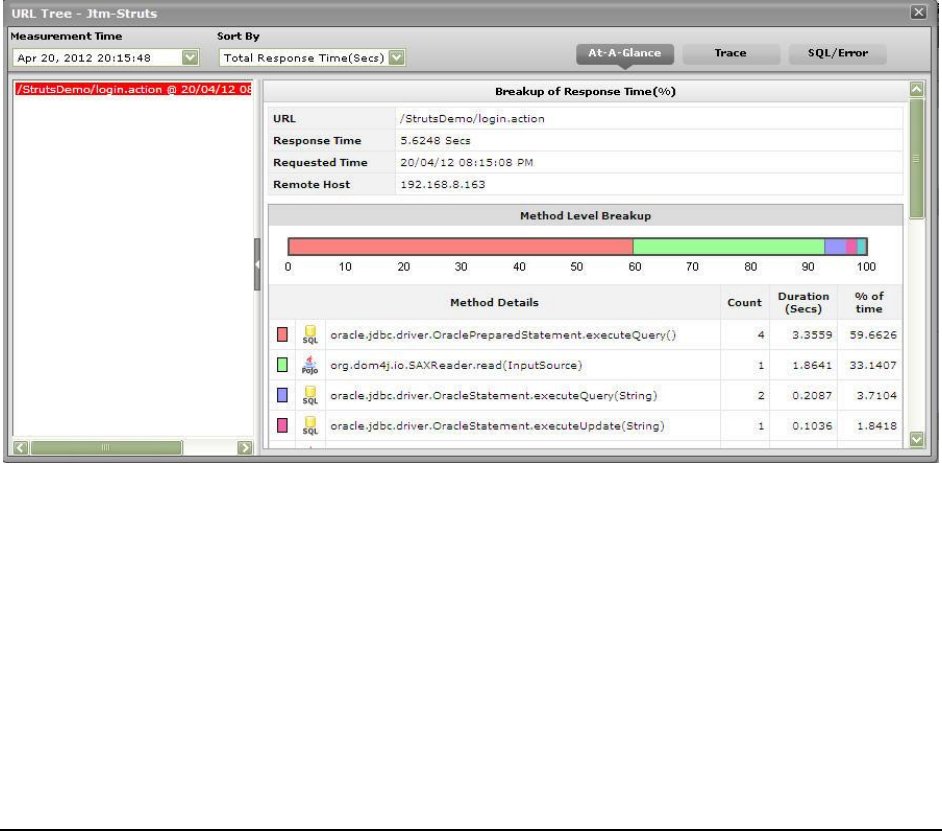
M o n i t o r i n g a J a v a A p p l i c a t i o n
33
Figure 24. If you select a transaction from the left panel, an At-A-Glance tab page will open by default in the right
panel, providing quick, yet deep insights into the performance of the chosen transaction and the reasons for its
slowness. This tab page begins by displaying the URL of the chosen transaction, the total Response time of the
transaction, the time at which the transaction was last requested, and the Remote Host from which the request was
received.
If the Response time appears to be very high, then you can take a look at the Method Level Breakup section to figure
out which method called by which Java component (such as FILTER, STRUTS, SERVLETS, JSPS, POJOS, SQL, JDBC, etc.)
could have caused the slowdown. This section provides a horizontal bar graph, which reveals the percentage of time
for which the chosen transaction spent executing each of the top methods (in terms of execution time) invoked by it.
The legend below clearly indicates the top methods and the layer/sub-component that invoked each method. Against
every method, the number of times that method was invoked in the Measurement Time, the Duration (in Secs) for
which the method executed, and the percentage of the total execution time of the transaction for which the method
was in execution will be displayed, thus quickly pointing you to those methods that may have contributed to the
slowdown. The methods displayed here and featured in the bar graph depend upon the METHOD EXEC CUTOFF
configuration of this test - in other words, only those methods with an execution duration that exceeds the threshold
limit configured against METHOD EXEC CUTOFF will be displayed in the Method Level Breakup section.
Figure 24: The Method Level Breakup section in the At-A-Glance tab page
While the Method Level Breakup section provides method-level insights into responsiveness, for a sub-component or
layer level breakup of responsiveness scroll down the At-A-Glance tab to view the Component Level Breakup section
(see Figure 25). Using this horizontal bar graph, you can quickly tell where - i.e., in which Java component - the
transaction spent the maximum time. A quick glance at the graph's legend will reveal the Java components the
transaction visited, the number of methods invoked by Java component, the Duration (Secs) for which the
transaction was processed by the Java component, and what Percentage of the total transaction response time was
spent in the Java component.
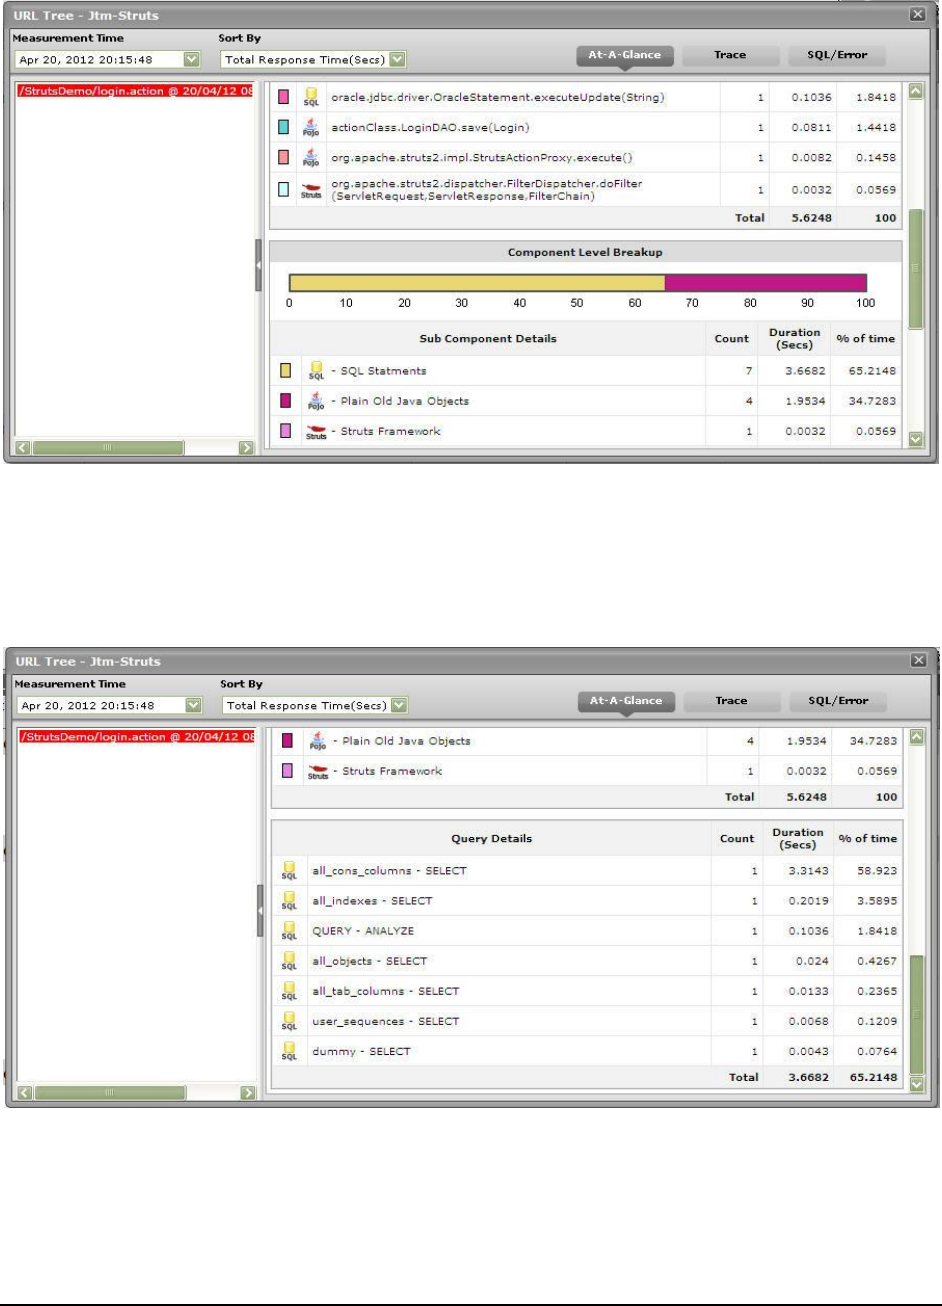
M o n i t o r i n g a J a v a A p p l i c a t i o n
34
Figure 25: The Component Level Breakup section in the At-A-Glance tab page
Besides Java methods, where the target Java application interacts with the database, long-running SQL queries can
also contribute to the poor responsiveness of a transaction. You can use the At-A-Glance tab page to determine
whether the transaction interacts with the database or not, and if so, how healthy that interaction is. For this, scroll
down the At-A-Glance tab page.
Figure 26: Query Details in the At-A-Glance tab page
Upon scrolling, you will find query details below the Component Level Breakup section. All the SQL queries that the
chosen transaction executes on the backend database will be listed here in the descending order of their Duration.
Corresponding to each query, you will be able to view the number of times that query was executed, the Duration for
which it executed, and what percentage of the total transaction response time was spent in executing that query. A
quick look at this tabulation would suffice to identify the query which executed for an abnormally long time on the
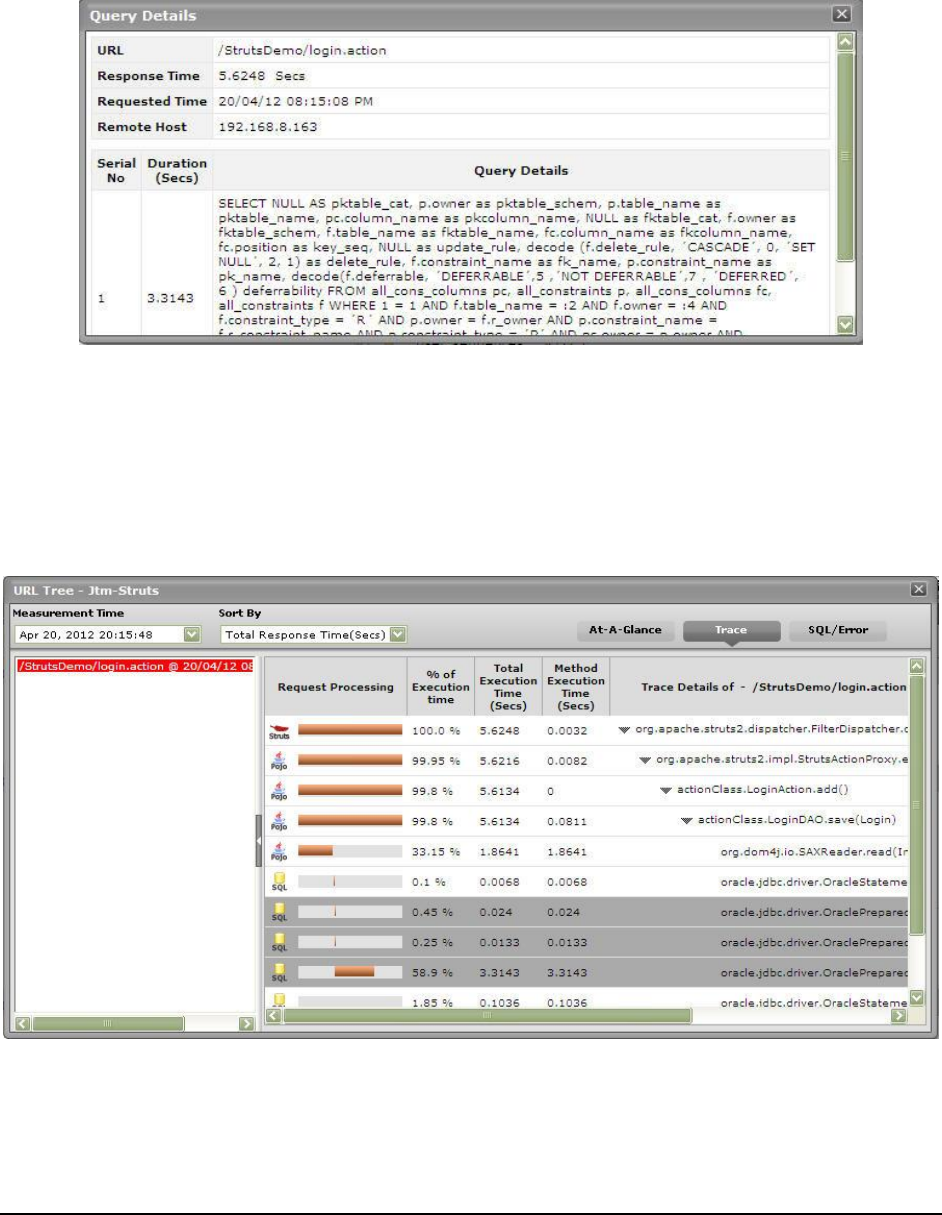
M o n i t o r i n g a J a v a A p p l i c a t i o n
35
database, causing the transaction's responsiveness to suffer. For a detailed query description, click on the query.
Figure 27 will then pop up displaying the complete query and its execution duration.
Figure 27: Detailed description of the query clicked on
This way, the At-A-Glance tab page allows you to analyze, at-a-glance, all the factors that can influence transaction
response time - be it Java methods, Java components, and SQL queries - and enables you to quickly diagnose the
source of a transaction slowdown. If, for instance, you figure out that a particular Java method is responsible for the
slowdown, you can zoom into the performance of the 'suspect method' by clicking on that method in the Method
Level Breakup section of the At-A-Glance tab page. This will automatically lead you to the Trace tab page, where all
invocations of the chosen method will be highlighted (see Figure 28).
Figure 28: The Trace tab page displaying all invocations of the method chosen from the Method Level Breakup
section
Typically, clicking on the Trace tab page will list all the methods invoked by the chosen transaction, starting with the
very first method. Methods and sub-methods (a method invoked within a method) are arranged in a tree-structure,
which can be expanded or collapsed at will. To view the sub-methods within a method, click on the arrow icon that
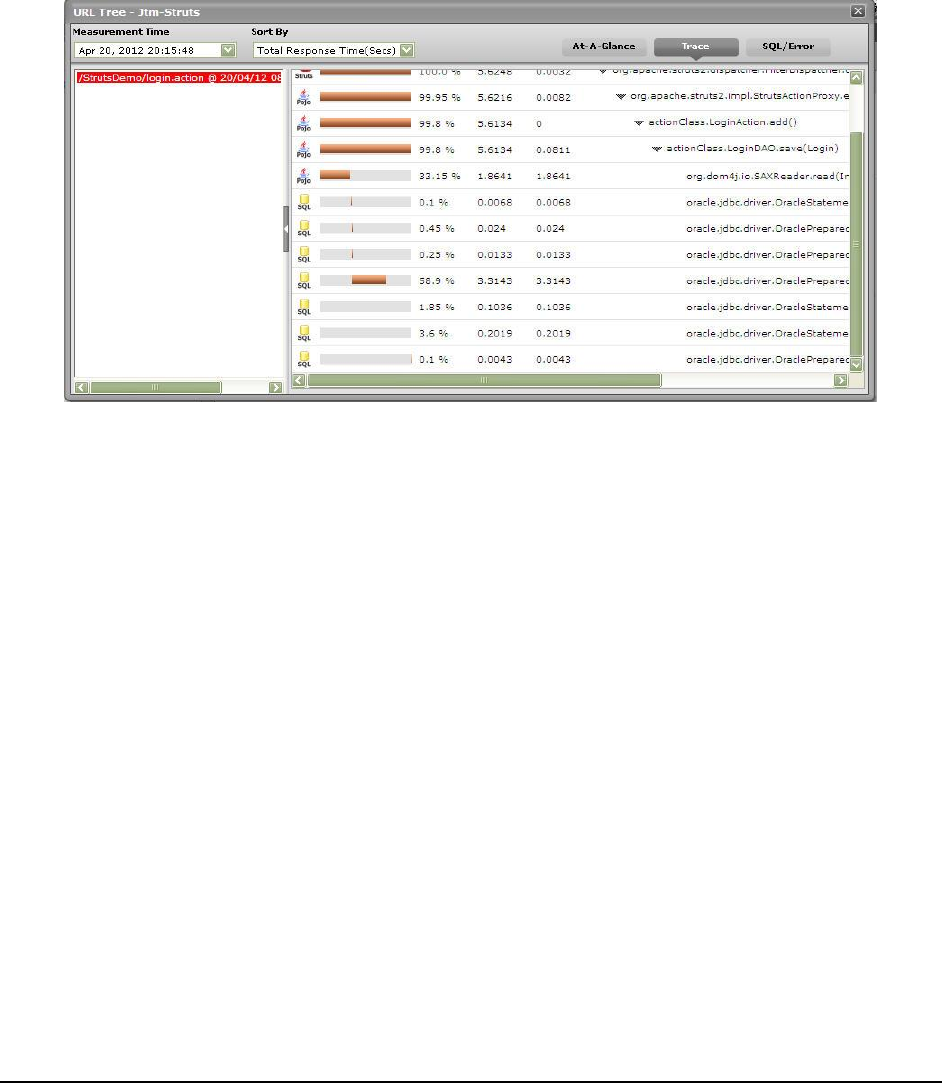
M o n i t o r i n g a J a v a A p p l i c a t i o n
36
precedes that method in the Trace tab page. Likewise, to collapse a tree, click once again on the arrow icon. Using
the tree-structure, you can easily trace the sequence in which methods are invoked by a transaction.
If a method is chosen for analysis from the Method Level Breakup section of the At-A-Glance tab page, the Trace tab
page will automatically bring your attention to all invocations of that method by highlighting them (as shown by
Figure 28). Likewise, if a Java component is clicked in the Component Level Breakup section of the At-A-Glance
section, the Trace tab page will automatically appear, displaying all the methods invoked from the chosen Java
component (as shown by Figure 29).
Figure 29: The Trace tab page displaying all methods invoked at the Java layer/sub-component chosen from the
Component Level Breakup section
For every method, the Trace tab page displays a Request Processing bar, which will accurately indicate when, in the
sequence of method invocations, the said method began execution and when it ended; with the help of this progress
bar, you will be able to fairly judge the duration of the method, and also quickly tell whether any methods were
called prior to the method in question. In addition, the Trace tab page will also display the time taken for a method
to execute (Method Execution Time) and the percentage of the time the transaction spent in executing that method.
The most time-consuming methods can thus be instantly isolated.
The Trace tab page also displays the Total Execution Time for each method - this value will be the same as the
Method Execution Time for 'stand-alone' methods - i.e., methods without any sub-methods. In the case of methods
with sub-methods however, the Total Execution Time will be the sum total of the Method Execution Time of each sub-
method invoked within. This is because, a 'parent' method completes execution only when all its child/sub-methods
finish executing.
With the help of the Trace tab page therefore, you can accurately trace the method that takes the longest to
execute, when that method began execution, and which 'parent method' (if any) invoked the method.
Next, click on the SQL/Errors tab page. This tab page lists all the SQL queries the transaction executes on its
backend database, and/or all the errors detected in the transaction's Java code. The query list (see Figure 30) is
typically arranged in the descending order of the query execution Duration, and thus leads you to the long-running
queries right away! You can even scrutinize the time-consuming query on-the-fly, and suggest improvements to your
administrator instantly.
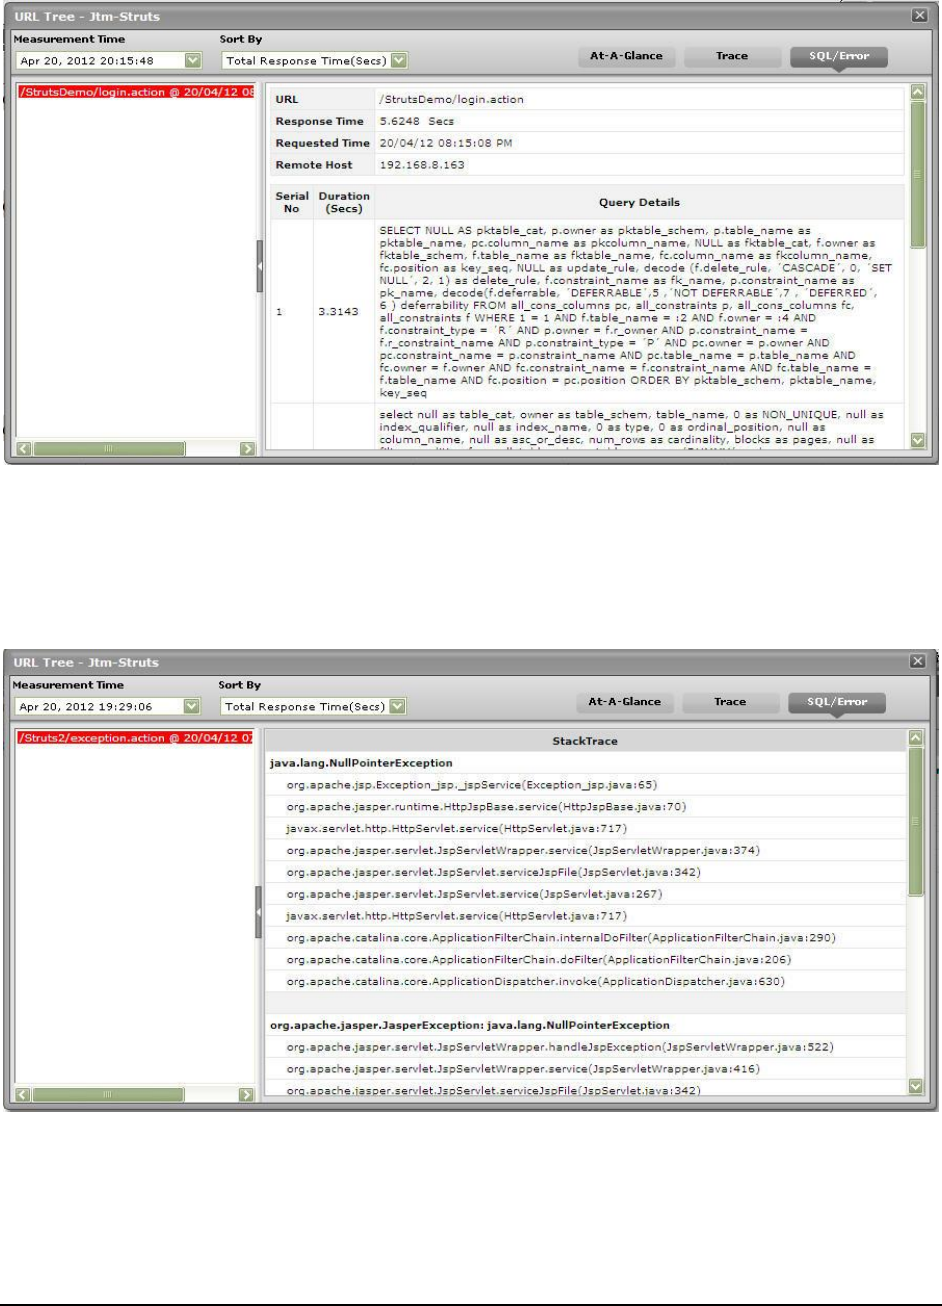
M o n i t o r i n g a J a v a A p p l i c a t i o n
37
Figure 30: Queries displayed in the SQL/Error tab page
When displaying errors, the SQL/Error tab page does not display the error message alone, but displays the complete
code block that could have caused the error to occur. By carefully scrutinizing the block, you can easily zero-in on the
'exact line of code' that could have forced the error - this means that besides pointing you to bugs in your code, the
SQL/Error tab page also helps you initiate measures to fix the same.
Figure 31: Errors displayed in the SQL/Error tab page
This way, with the help of the three tab pages - At-A-Glance, Trace, and SQL/Error - you can effectively analyze and
accurately diagnose the root-cause of slowdowns in transactions to your Java applications.
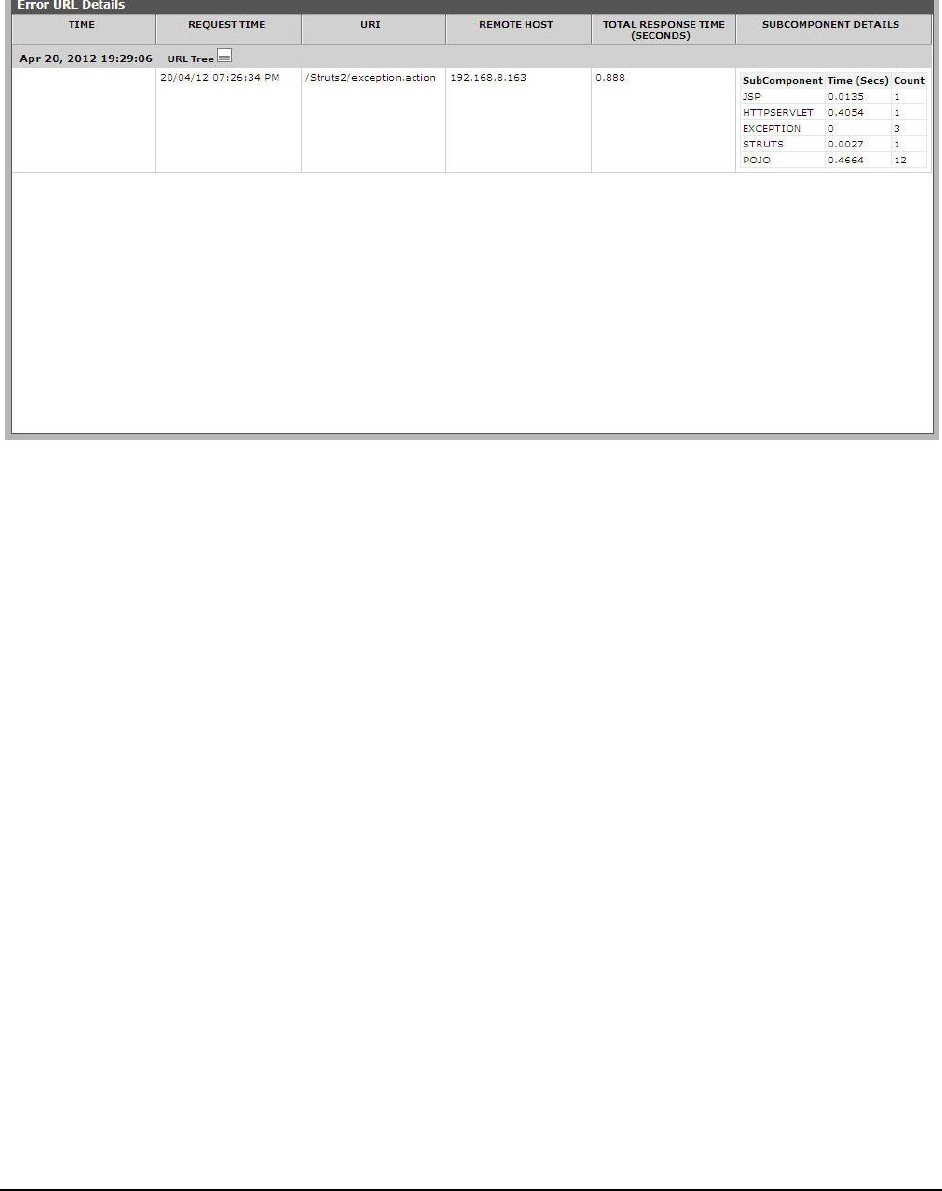
M o n i t o r i n g a J a v a A p p l i c a t i o n
38
The detailed diagnosis of the
Error transactions
measure reveals the top-10 (by default) transactions, in terms of
TOTAL RESPONSE TIME, that have encountered errors. To know the nature of the errors that occurred, click on the
URL Tree icon in Figure 32. This will lead you to the URL Tree window, which has already been elaborately discussed.
Figure 32: The detailed diagnosis of the Error transactions measure
1.3 The JVM Internals Layer
The tests associated with this layer measure the internal health of the Java Virtual Machine (JVM), and enables
administrators to find accurate answers to the following performance queries:
g. How many classes have been loaded/unloaded from memory?
h. Did garbage collection take too long to complete? If so, which memory pools spent too much time in
garbage collection?
i. Are too many threads in waiting state in the JVM?
j. Which threads are consuming CPU?
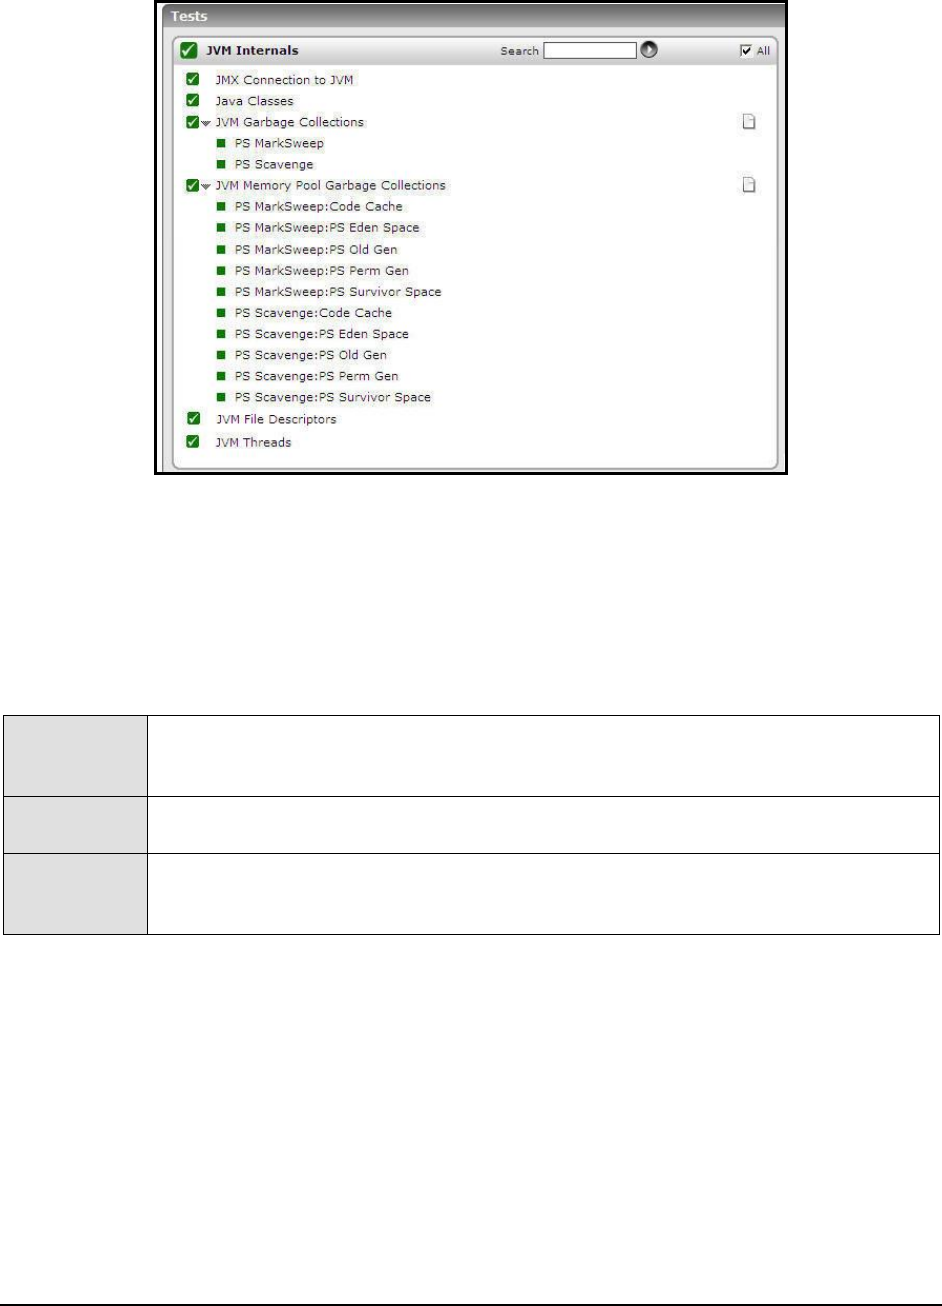
M o n i t o r i n g a J a v a A p p l i c a t i o n
39
Figure 33: The tests associated with the JVM Internals layer
1.3.1 JMX Connection to JVM
This test reports the availability of the target Java application, and also indicates whether JMX is enabled on the
application or not. In addition, the test promptly alerts you to slowdowns experienced by the application, and also
reveals whether the application was recently restarted or not.
Purpose
Reports the availability of the target Java application, and also indicates whether JMX is enabled
on the application or not. In addition, the test promptly alerts you to slowdowns experienced by
the application, and also reveals whether the application was recently restarted or not
Target of the
test
A Java application
Agent
deploying the
test
An internal/remote agent
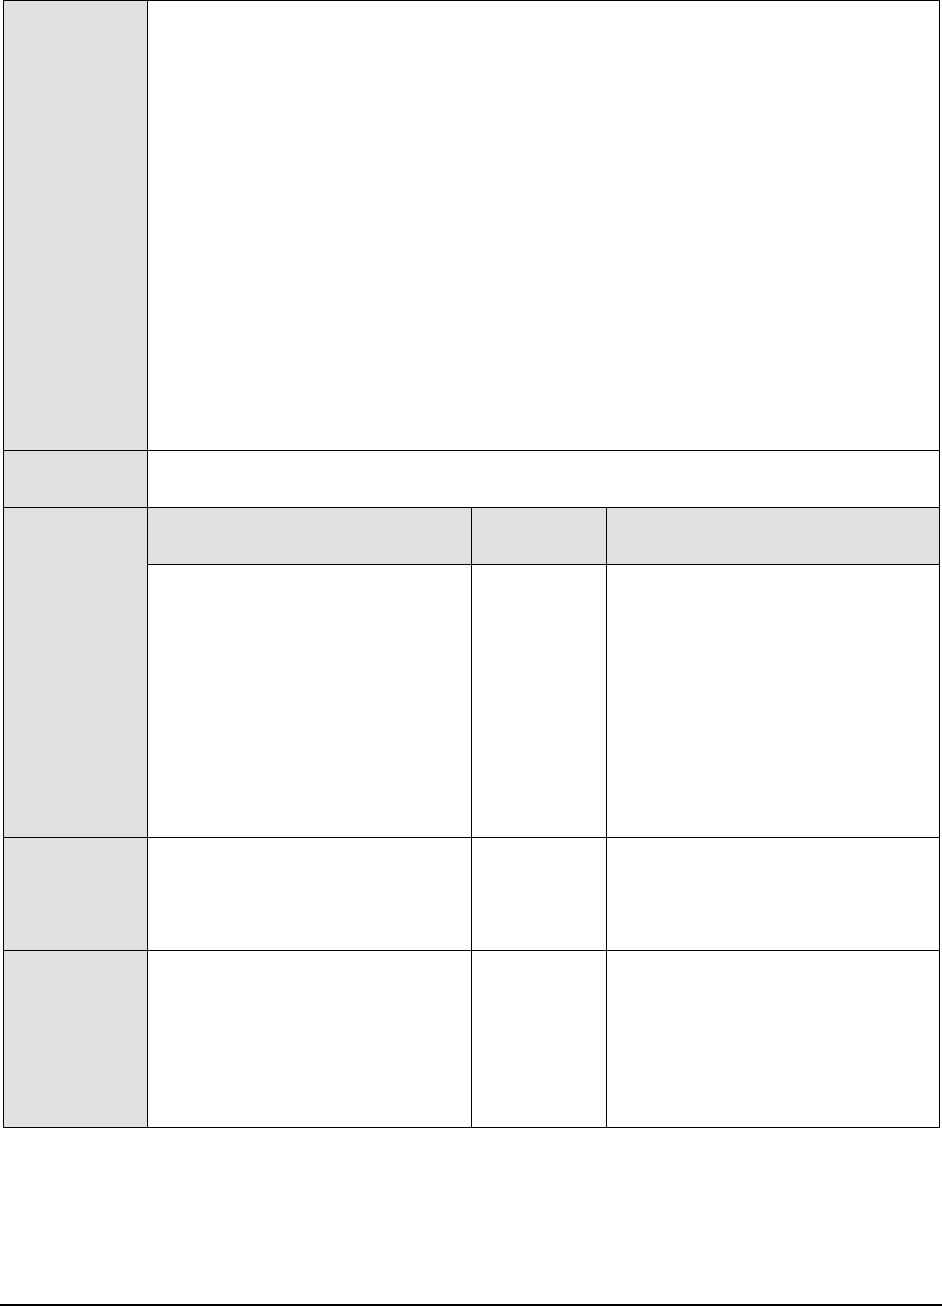
M o n i t o r i n g a J a v a A p p l i c a t i o n
40
Configurable
parameters for
the test
1. TEST PERIOD - How often should the test be executed
2. HOST - The host for which the test is to be configured
3. PORT - The port number at which the specified HOST listens
4. JMX REMOTE PORT – Here, specify the port at which the JMX listens for requests from
remote hosts. Ensure that you specify the same port that you configured in the
management.properties
file in the <JAVA_HOME>\jre\lib\management folder used by the
target application (see page 3).
5. USER, PASSWORD, and CONFIRM PASSWORD – If JMX requires authentication only
(but no security), then ensure that the USER and PASSWORD parameters are configured
with the credentials of a user with
read-write
access to JMX. To know how to create this
user, refer to Section 1.1.1.2. Confirm the password by retyping it in the CONFIRM
PASSWORD text box.
6. JNDINAME – The JNDINAME is a lookup name for connecting to the JMX connector. By
default, this is
jmxrmi
. If you have resgistered the JMX connector in the RMI registery
using a different lookup name, then you can change this default value to reflect the same.
Outputs of the
test
One set of results for the Java application being monitored
Measurements
made by the
test
Measurement
Measurement
Unit
Interpretation
JMX availability:
Indicates whether the target
application is available or not and
whether JMX is enabled or not on the
application.
Percent
If the value of this measure is 100%,
it indicates that the Java application is
available with JMX enabled. The value
0 on the other hand, could indicate
one/both the following:
k. The Java application is
unavailable;
l. The Java application is
available, but JMX is not
enabled;
JMX response time:
Indicates the time taken to connect
to the JMX agent of the Java
application.
Secs
A high value could indicate a
connection bottleneck.
Has the PID changed?
Indicates whether/not the process ID
that corresponds to the Java
application has changed.
This measure will report the value Yes
if the PID of the target application has
changed; such a change is indicative
of an application restart. If the
application has not restarted - i.e., if
the PID has not changed - then this
measure will return the value No.
1.3.2 JVM File Descriptors Test
This test reports useful statistics pertaining to file descriptors.
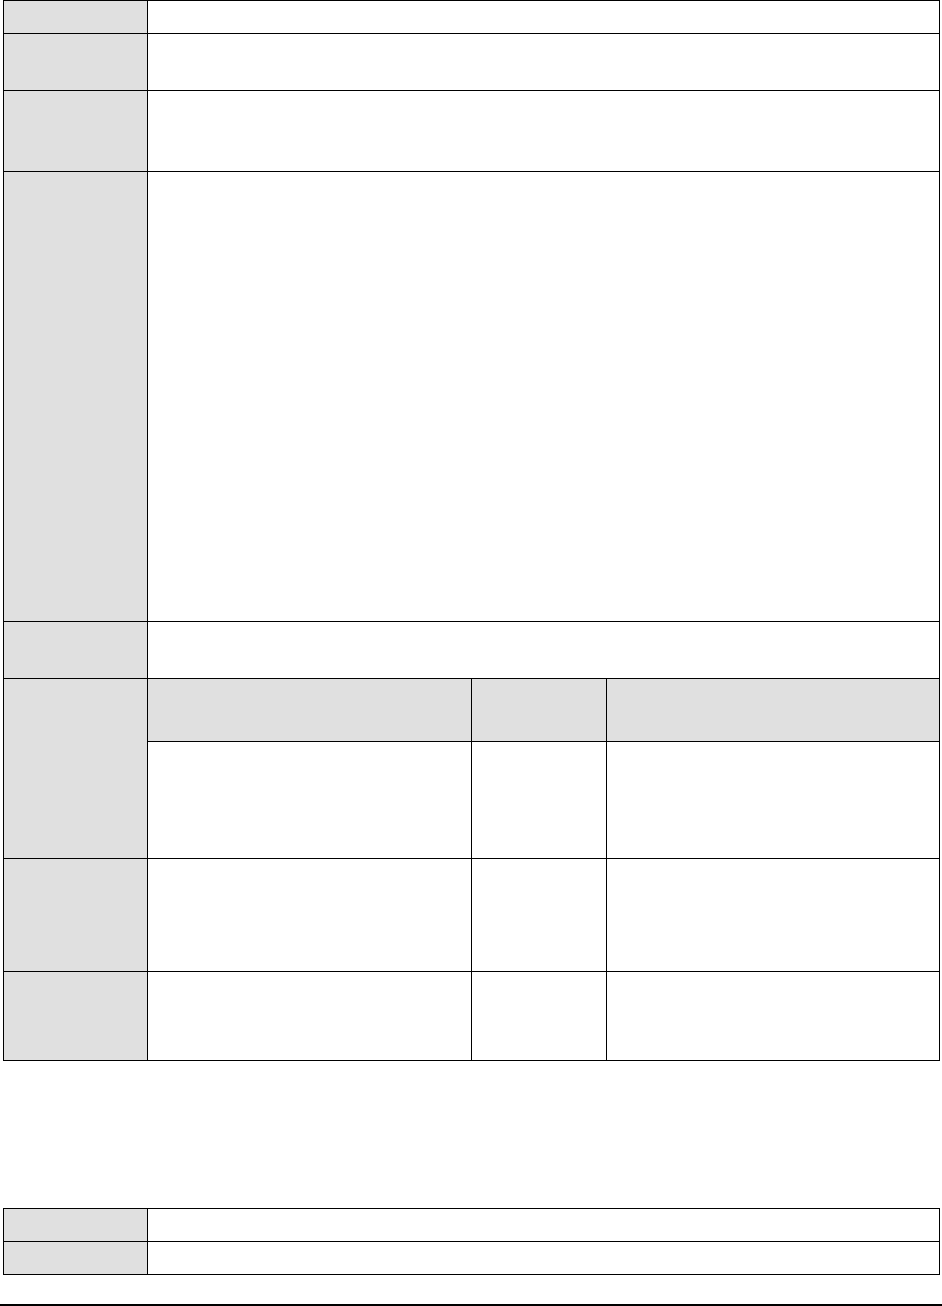
M o n i t o r i n g a J a v a A p p l i c a t i o n
41
Purpose
Reports useful statistics pertaining to file descriptors
Target of the
test
A Java application
Agent
deploying the
test
An internal/remote agent
Configurable
parameters for
the test
1. TEST PERIOD - How often should the test be executed
2. HOST - The host for which the test is to be configured
3. PORT - The port number at which the specified HOST listens
4. JMX REMOTE PORT – Here, specify the port at which the JMX listens for requests from
remote hosts. Ensure that you specify the same port that you configured in the
management.properties
file in the <JAVA_HOME>\jre\lib\management folder used by the
target application (see page 3).
5. USER, PASSWORD, and CONFIRM PASSWORD – If JMX requires authentication only
(but no security), then ensure that the USER and PASSWORD parameters are configured
with the credentials of a user with
read-write
access to JMX. To know how to create this
user, refer to Section 1.1.1.2. Confirm the password by retyping it in the CONFIRM
PASSWORD text box.
6. JNDINAME – The JNDINAME is a lookup name for connecting to the JMX connector. By
default, this is
jmxrmi
. If you have resgistered the JMX connector in the RMI registery
using a different lookup name, then you can change this default value to reflect the same.
Outputs of the
test
One set of results for the Java application being monitored
Measurements
made by the
test
Measurement
Measurement
Unit
Interpretation
Open file descriptors in JVM:
Indicates the number of file
descriptors currently open for the
application.
Number
Maximum file descriptors in JVM:
Indicates the maximum number of
file descriptors allowed for the
application.
Number
File descriptor usage by JVM:
Indicates the file descriptor usage in
percentage.
Percent
1.3.3 Java Classes Test
This test reports the number of classes loaded/unloaded from the memory.
Purpose
Reports the number of classes loaded/unloaded from the memory
Target of the
A Java application
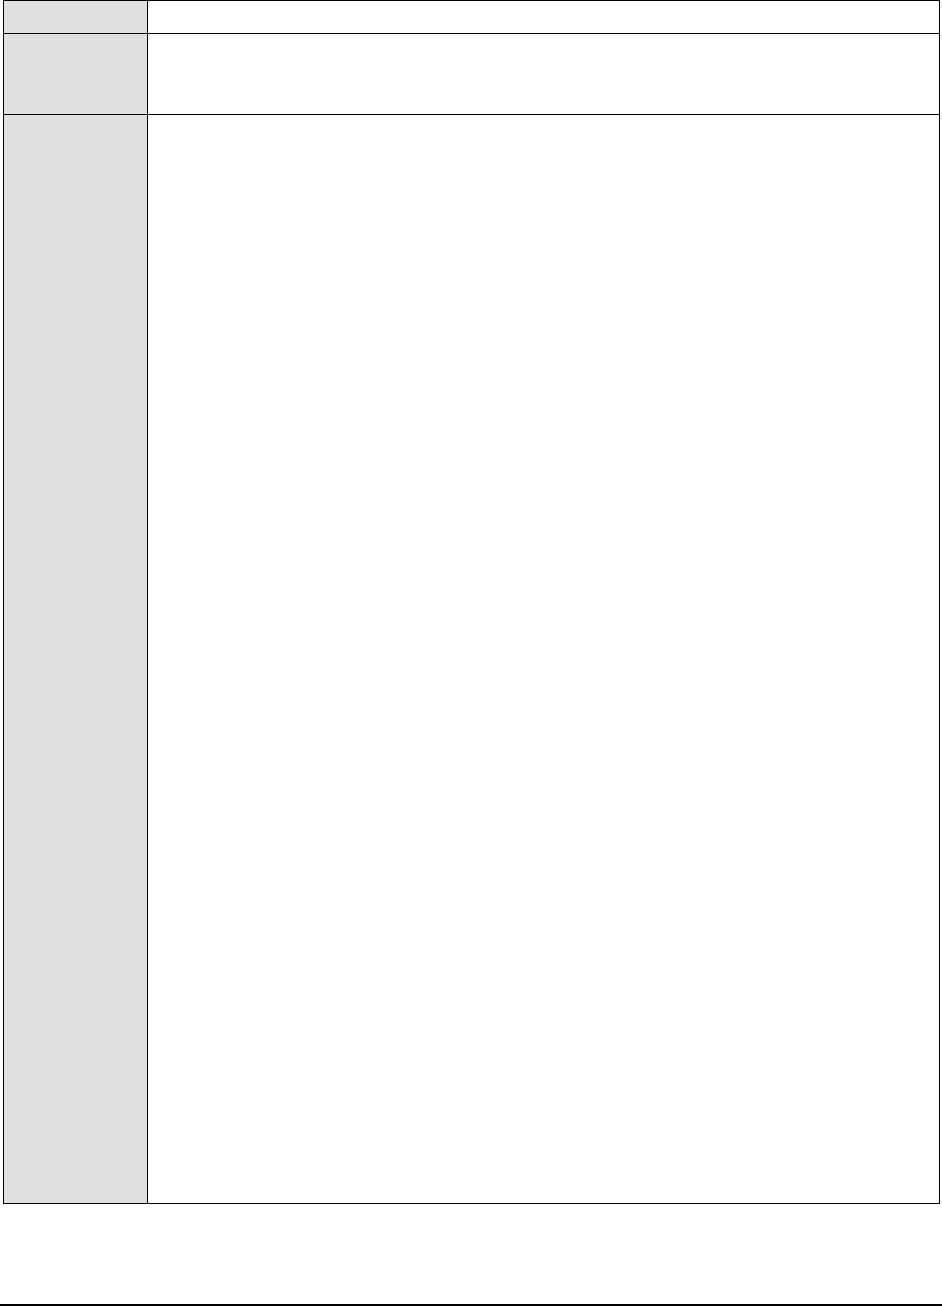
M o n i t o r i n g a J a v a A p p l i c a t i o n
42
test
Agent
deploying the
test
An internal/remote agent
Configurable
parameters for
the test
1. TEST PERIOD - How often should the test be executed
2. HOST - The host for which the test is to be configured
3. PORT - The port number at which the specified HOST listens
4. MODE – This test can extract metrics from the Java application using either of the
following mechanisms:
Using SNMP-based access to the Java runtime MIB statistics;
By contacting the Java runtime (JRE) of the application via JMX
To configure the test to use SNMP, select the SNMP option. On the other hand, choose the
JMX option to configure the test to use JMX instead. By default, the JMX option is chosen
here.
5. JMX REMOTE PORT – This parameter appers only if the MODE is set to JMX. Here,
specify the port at which the JMX listens for requests from remote hosts. Ensure that you
specify the same port that you configured in the
management.properties
file in the
<JAVA_HOME>\jre\lib\management folder used by the target application (see page 3).
6. USER, PASSWORD, and CONFIRM PASSWORD – These parameters appear only if the
MODE is set to JMX. If JMX requires authentication only (but no security), then ensure that
the USER and PASSWORD parameters are configured with the credentials of a user with
read-write
access to JMX. To know how to create this user, refer to Section 1.1.1.2.
Confirm the password by retyping it in the CONFIRM PASSWORD text box.
7. JNDINAME – This parameter appears only if the MODE is set to JMX. The JNDINAME is a
lookup name for connecting to the JMX connector. By default, this is
jmxrmi
. If you have
resgistered the JMX connector in the RMI registery using a different lookup name, then
you can change this default value to reflect the same.
8. SNMPPORT – This parameter appears only if the MODE is set to SNMP. Here specify the
port number through which the server exposes its SNMP MIB. Ensure that you specify the
same port you configured in the
management.properties
file in the
<JAVA_HOME>\jre\lib\management folder used by the target application (see page 15).
9. SNMPVERSION – This parameter appears only if the MODE is set to SNMP. The default
selection in the SNMPVERSION list is v1. However, for this test to work, you have to
select SNMP v2 or v3 from this list, depending upon which version of SNMP is in use in the
target environment.
10. SNMPCOMMUNITY – This parameter appears only if the MODE is set to SNMP. Here,
specify the SNMP community name that the test uses to communicate with the mail server.
The default is public. This parameter is specific to SNMP v1 and v2 only. Therefore, if the
SNMPVERSION chosen is v3, then this parameter will not appear.

M o n i t o r i n g a J a v a A p p l i c a t i o n
43
11. USERNAME – This parameter appears only when v3 is selected as the SNMPVERSION.
SNMP version 3 (SNMPv3) is an extensible SNMP Framework which supplements the
SNMPv2 Framework, by additionally supporting message security, access control, and
remote SNMP configuration capabilities. To extract performance statistics from the MIB
using the highly secure SNMP v3 protocol, the eG agent has to be configured with the
required access privileges – in other words, the eG agent should connect to the MIB using
the credentials of a user with access permissions to be MIB. Therefore, specify the name of
such a user against the USERNAME parameter.
12. AUTHPASS – Specify the password that corresponds to the above-mentioned
USERNAME. This parameter once again appears only if the SNMPVERSION selected is
v3.
13. CONFIRM PASSWORD – Confirm the AUTHPASS by retyping it here.
14. AUTHTYPE – This parameter too appears only if v3 is selected as the SNMPVERSION.
From the AUTHTYPE list box, choose the authentication algorithm using which SNMP v3
converts the specified USERNAME and PASSWORD into a 32-bit format to ensure
security of SNMP transactions. You can choose between the following options:
MD5 – Message Digest Algorithm
SHA – Secure Hash Algorithm
15. ENCRYPTFLAG – This flag appears only when v3 is selected as the SNMPVERSION. By
default, the eG agent does not encrypt SNMP requests. Accordingly, the ENCRYPTFLAG
is set to NO by default. To ensure that SNMP requests sent by the eG agent are encrypted,
select the YES option.
16. ENCRYPTTYPE – If the ENCRYPTFLAG is set to YES, then you will have to mention the
encryption type by selecting an option from the ENCRYPTTYPE list. SNMP v3 supports
the following encryption types:
DES – Data Encryption Standard
AES – Advanced Encryption Standard
17. ENCRYPTPASSWORD – Specify the encryption password here.
18. CONFIRM PASSWORD – Confirm the encryption password by retyping it here.
19. TIMEOUT - This parameter appears only if the MODE is set to SNMP. Here, specify the
duration (in seconds) within which the SNMP query executed by this test should time out in
the TIMEOUT text box. The default is 10 seconds.
20. DATA OVER TCP – This parameter is applicable only if MODE is set to SNMP. By default,
in an IT environment, all data transmission occurs over UDP. Some environments however,
may be specifically configured to offload a fraction of the data traffic – for instance, certain
types of data traffic or traffic pertaining to specific components – to other protocols like
TCP, so as to prevent UDP overloads. In such environments, you can instruct the eG agent
to conduct the SNMP data traffic related to the equalizer over TCP (and not UDP). For this,
set the DATA OVER TCP flag to Yes. By default, this flag is set to No.
Outputs of the
test
One set of results for the Java application being monitored
Measurements
made by the
Measurement
Measurement
Unit
Interpretation
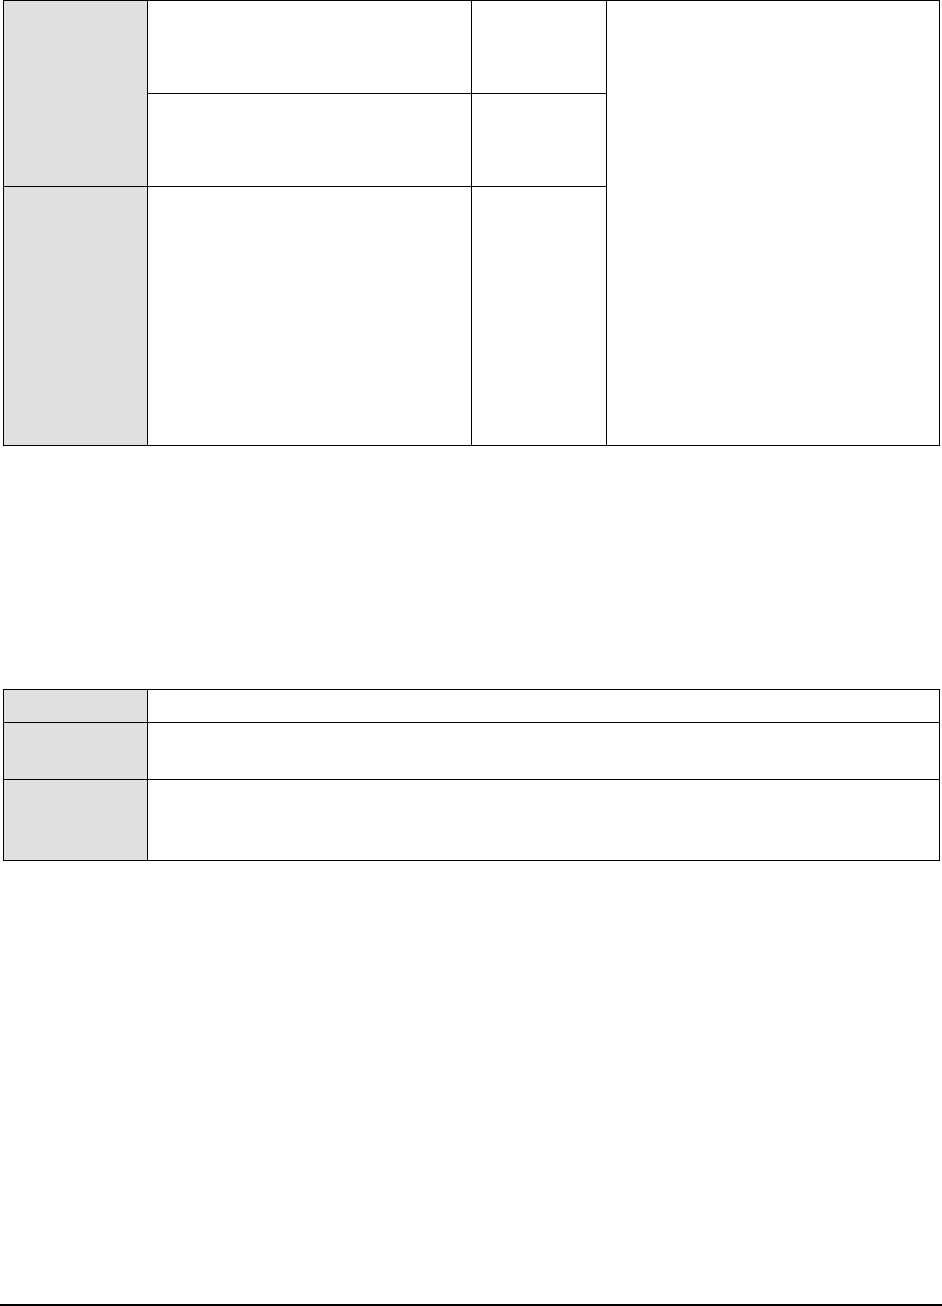
M o n i t o r i n g a J a v a A p p l i c a t i o n
44
test
Classes loaded:
Indicates the number of classes
currently loaded into memory.
Number
Classes are fundamental to the design
of Java programming language.
Typically, Java applications install a
variety of class loaders (that is, classes
that implement java.lang.ClassLoader)
to allow different portions of the
container, and the applications running
on the container, to have access to
different repositories of available
classes and resources. A consistent
decrease in the number of classes
loaded and unloaded could indicate a
road-block in the loading/unloading of
classes by the class loader. If left
unchecked, critical resources/classes
could be rendered inaccessible to the
application, thereby severely affecting
its performance.
Classes unloaded:
Indicates the number of classes
currently unloaded from memory.
Number
Total classes loaded:
Indicates the total number of classes
loaded into memory since the JVM
started, including those subsequently
unloaded.
Number
1.3.4 JVM Garbage Collections Test
Manual memory management is time consuming, and error prone. Most programs still contain leaks. This is all
doubly true with programs using exception-handling and/or threads. Garbage collection (GC) is a part of a Java
application’s JVM that automatically determines what memory a program is no longer using, and recycles it for other
use. It is also known as "automatic storage (or memory) reclamation''. The JVM Garbage Collections test reports the
performance statistics pertaining to the JVM's garbage collection.
Purpose
Reports the performance statistics pertaining to the JVM's garbage collection
Target of the
test
A Java application
Agent
deploying the
test
An internal/remote agent

M o n i t o r i n g a J a v a A p p l i c a t i o n
45
Configurable
parameters for
the test
1. TEST PERIOD - How often should the test be executed
2. HOST - The host for which the test is to be configured
3. PORT - The port number at which the specified HOST listens
4. MODE – This test can extract metrics from the Java application using either of the
following mechanisms:
Using SNMP-based access to the Java runtime MIB statistics;
By contacting the Java runtime (JRE) of the application via JMX
To configure the test to use SNMP, select the SNMP option. On the other hand, choose the
JMX option to configure the test to use JMX instead. By default, the JMX option is chosen
here.
5. JMX REMOTE PORT – This parameter appers only if the MODE is set to JMX. Here,
specify the port at which the JMX listens for requests from remote hosts. Ensure that you
specify the same port that you configured in the
management.properties
file in the
<JAVA_HOME>\jre\lib\management folder used by the target application (see page 3).
6. USER, PASSWORD, and CONFIRM PASSWORD – These parameters appear only if the
MODE is set to JMX. If JMX requires authentication only (but no security), then ensure that
the USER and PASSWORD parameters are configured with the credentials of a user with
read-write
access to JMX. To know how to create this user, refer to Section 1.1.1.2.
Confirm the password by retyping it in the CONFIRM PASSWORD text box.
7. JNDINAME – This parameter appears only if the MODE is set to JMX. The JNDINAME is a
lookup name for connecting to the JMX connector. By default, this is
jmxrmi
. If you have
resgistered the JMX connector in the RMI registery using a different lookup name, then
you can change this default value to reflect the same.
8. SNMPPORT – This parameter appears only if the MODE is set to SNMP. Here specify the
port number through which the server exposes its SNMP MIB. Ensure that you specify the
same port you configured in the
management.properties
file in the
<JAVA_HOME>\jre\lib\management folder used by the target application (see page 15).
9. SNMPVERSION – This parameter appears only if the MODE is set to SNMP. The default
selection in the SNMPVERSION list is v1. However, for this test to work, you have to
select SNMP v2 or v3 from this list, depending upon which version of SNMP is in use in the
target environment.
10. SNMPCOMMUNITY – This parameter appears only if the MODE is set to SNMP. Here,
specify the SNMP community name that the test uses to communicate with the mail server.
The default is public. This parameter is specific to SNMP v1 and v2 only. Therefore, if the
SNMPVERSION chosen is v3, then this parameter will not appear.
M o n i t o r i n g a J a v a A p p l i c a t i o n
46
11. USERNAME – This parameter appears only when v3 is selected as the SNMPVERSION.
SNMP version 3 (SNMPv3) is an extensible SNMP Framework which supplements the
SNMPv2 Framework, by additionally supporting message security, access control, and
remote SNMP configuration capabilities. To extract performance statistics from the MIB
using the highly secure SNMP v3 protocol, the eG agent has to be configured with the
required access privileges – in other words, the eG agent should connect to the MIB using
the credentials of a user with access permissions to be MIB. Therefore, specify the name of
such a user against the USERNAME parameter.
12. AUTHPASS – Specify the password that corresponds to the above-mentioned
USERNAME. This parameter once again appears only if the SNMPVERSION selected is
v3.
13. CONFIRM PASSWORD – Confirm the AUTHPASS by retyping it here.
14. AUTHTYPE – This parameter too appears only if v3 is selected as the SNMPVERSION.
From the AUTHTYPE list box, choose the authentication algorithm using which SNMP v3
converts the specified USERNAME and PASSWORD into a 32-bit format to ensure
security of SNMP transactions. You can choose between the following options:
MD5 – Message Digest Algorithm
SHA – Secure Hash Algorithm
15. ENCRYPTFLAG – This flag appears only when v3 is selected as the SNMPVERSION. By
default, the eG agent does not encrypt SNMP requests. Accordingly, the ENCRYPTFLAG
is set to NO by default. To ensure that SNMP requests sent by the eG agent are encrypted,
select the YES option.
16. ENCRYPTTYPE – If the ENCRYPTFLAG is set to YES, then you will have to mention the
encryption type by selecting an option from the ENCRYPTTYPE list. SNMP v3 supports
the following encryption types:
DES – Data Encryption Standard
AES – Advanced Encryption Standard
17. ENCRYPTPASSWORD – Specify the encryption password here.
18. CONFIRM PASSWORD – Confirm the encryption password by retyping it here.
19. TIMEOUT - This parameter appears only if the MODE is set to SNMP. Here, specify the
duration (in seconds) within which the SNMP query executed by this test should time out in
the TIMEOUT text box. The default is 10 seconds.
20. DATA OVER TCP – This parameter is applicable only if MODE is set to SNMP. By default,
in an IT environment, all data transmission occurs over UDP. Some environments however,
may be specifically configured to offload a fraction of the data traffic – for instance, certain
types of data traffic or traffic pertaining to specific components – to other protocols like
TCP, so as to prevent UDP overloads. In such environments, you can instruct the eG agent
to conduct the SNMP data traffic related to the equalizer over TCP (and not UDP). For this,
set the DATA OVER TCP flag to Yes. By default, this flag is set to No.
Outputs of the
test
One set of results for each garbage collector that is reclaiming the unused memory on the JVM
of the Java application being monitored
Measurements
made by the
Measurement
Measurement
Unit
Interpretation
M o n i t o r i n g a J a v a A p p l i c a t i o n
47
test
No of garbage collections
started:
Indicates the number of times this
garbage collector was started to
release dead objects from memory
during the last measurement period.
Number
Time taken for garbage
collection:
Indicates the time taken to by this
garbage collector to perform the
current garbage collection operation.
Secs
Ideally, the value of both these
measures should be low. This is
because, the garbage collection (GC)
activity tends to suspend the
operations of the application until such
time that GC ends. Longer the GC
time, longer it would take for the
application to resume its functions. To
minimize the impact of GC on
application performance, it is best to
ensure that GC activity does not take
too long to complete.
Percent of time spent by JVM for
garbage collection:
Indicates the percentage of time
spent by this garbage collector on
garbage collection during the last
measurement period.
Percent
1.3.5 JVM Memory Pool Garbage Collections Test
While the JVM Garbage Collections test reports statistics indicating how well each collector on the JVM performs
garbage collection, the measures reported by the JVM Memory Pool Garbage Collections test help assess the impact
of the garbage collection activity on the availability and usage of memory in each memory pool of the JVM. Besides
revealing the count of garbage collections per collector and the time taken by each collector to perform garbage
collection on the individual memory pools, the test also compares the amount of memory used and available for use
pre and post garbage collection in each of the memory pools. This way, the test enables administrators to guage the
effectiveness of the garbage collection activity on the memory pools, and helps them accurately identify those
memory pools where enough memory could not reclaimed or where the garbage collectors spent too much time.
Purpose
Helps assess the impact of the garbage collection activity on the availability and usage of
memory in each memory pool of the JVM
Target of the
test
A Java application
Agent
deploying the
test
An internal/remote agent
M o n i t o r i n g a J a v a A p p l i c a t i o n
48
Configurable
parameters for
the test
1. TEST PERIOD - How often should the test be executed
2. HOST - The host for which the test is to be configured
3. PORT - The port number at which the specified HOST listens
4. MEASURE MODE - This test allows you the option to collect the desired metrics using one
of the following methodologies:
By contacting the Java runtime (JRE) of the application via JMX
Using GC logs
To use JMX for metrics collections, set the measure mode to JMX.
On the other hand, if you intend to use the GC log files for collecting the required metrics,
set the MEASURE MODE to Log File. In this case, you would be required to enable GC
logging. The procedure for this has been detailed in Section 1.3.5.1 of this document.
5. JMX REMOTE PORT – This parameter will be available only if the MEASURE MODE is
set to JMX. Here, specify the port at which the JMX listens for requests from remote hosts.
Ensure that you specify the same port that you configured in the
management.properties
file in the <JAVA_HOME>\jre\lib\management folder used by the target application (see page
3).
6. JNDINAME – This parameter will be available only if the MEASURE MODE is set to JMX.
The JNDINAME is a lookup name for connecting to the JMX connector. By default, this is
jmxrmi
. If you have resgistered the JMX connector in the RMI registery using a different
lookup name, then you can change this default value to reflect the same.
7. USER, PASSWORD, and CONFIRM PASSWORD – This parameter will be available only
if the MEASURE MODE is set to JMX. If JMX requires authentication only (but no
security), then ensure that the USER and PASSWORD parameters are configured with
the credentials of a user with
read-write
access to JMX. To know how to create this user,
refer to Section 1.1.1.2. Confirm the password by retyping it in the CONFIRM
PASSWORD text box.
8. JREHOME - This parameter will be available only if the MEASURE MODE is set to Log
File. Specify the full path to the Java Runtime Environment (JRE) used by the target
application.
9. LOGFILENAME - This parameter will be available only if the MEASURE MODE is set to
Log File. Specify the full path to the GC log file to be used for metrics collection.
Outputs of the
test
One set of results for every
GarbageCollector:MemoryPool
pair on the JVM of the Java
application being monitored
Measurements
made by the
test
Measurement
Measurement
Unit
Interpretation
Has garbage collection
happened:
Indicates whether garbage collection
occurred on this memory pool in the
last measurement period.
This measure reports the value
Yes
if
garbage collection took place or
No
if
it did not take place on the memory
pool.
The numeric values that correspond to
the measure values of Yes and No are
listed below:
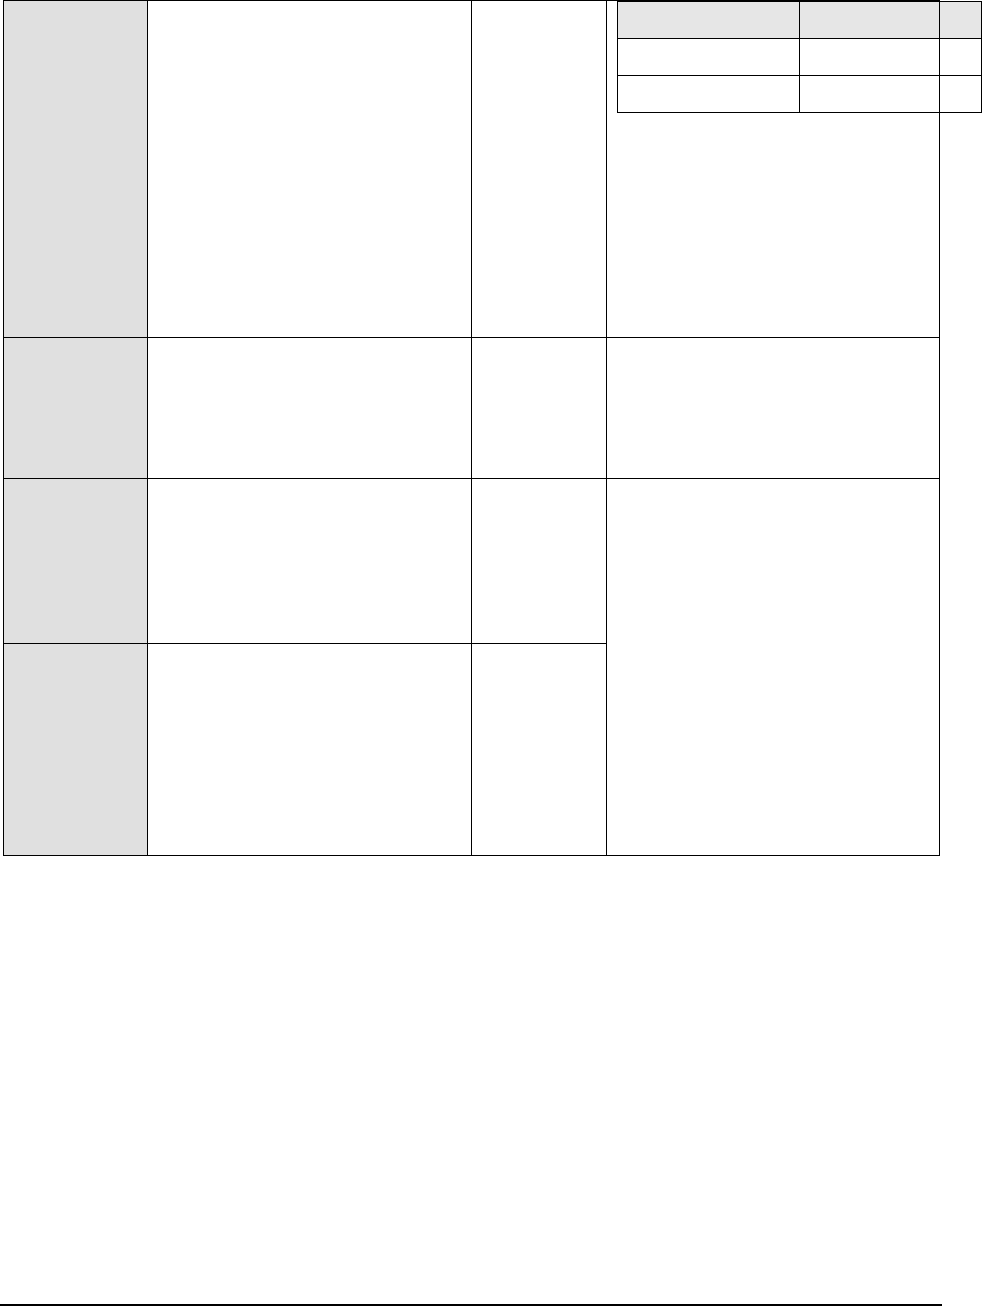
M o n i t o r i n g a J a v a A p p l i c a t i o n
49
State
Value
Yes
1
No
0
Note:
By default, this measure reports the
value
Yes
or
No
to indicate whether a
GC occurred on a memory pool or not.
The graph of this measure however,
represents the same using the numeric
equivalents –
0
or
1
.
Collection count:
Indicates the number of time in the
last measurement pool garbage
collection was started on this memory
pool.
Number
Initial memory before GC:
Indicates the initial amount of
memory (in MB) that this memory
pool requests from the operating
system for memory management
during startup, before GC process.
MB
Comparing the value of these two
measures for a memory pool will give
you a fair idea of the effectiveness of
the garbage collection activity.
If garbage collection reclaims a large
amount of memory from the memory
pool, then the
Initial memory after GC
will drop. On the other hand, if the
garbage collector does not reclaim
much memory from a memory pool, or
if the Java application suddenly runs a
memory-intensive process when GC is
being performed, then the
Initial
memory after GC
may be higher than
the
Initial memory before GC
.
Initial memory after GC:
Indicates the initial amount of
memory (in MB) that this memory
pool requests from the operating
system for memory management
during startup, after GC process
MB

M o n i t o r i n g a J a v a A p p l i c a t i o n
50
Max memory before GC:
Indicates the maximum amount of
memory that can be used for memory
management by this memory pool,
before GC process.
MB
Comparing the value of these two
measures for a memory pool will
provide you with insights into the
effectiveness of the garbage collection
activity.
If garbage collection reclaims a large
amount of memory from the memory
pool, then the
Max memory after GC
will drop. On the other hand, if the
garbage collector does not reclaim
much memory from a memory pool, or
if the Java application suddenly runs a
memory-intensive process when GC is
being performed, then the
Max
memory after GC
value may exceed
the
Max memory before GC
.
Max memory after GC:
Indicates the maximum amount of
memory (in MB) that can be used for
memory management by this pool,
after the GC process.
MB
Committed memory before GC:
Indicates the amount of memory that
is guaranteed to be available for use
by this memory pool, before the GC
process.
MB
Committed memory after GC:
Indicates the amount of memory that
is guaranteed to be available for use
by this memory pool, after the GC
process.
MB
Used memory before GC:
Indicates the amount of memory
used by this memory pool before GC.
MB
Comparing the value of these two
measures for a memory pool will
provide you with insights into the
effectiveness of the garbage collection
activity.
If garbage collection reclaims a large
amount of memory from the memory
pool, then the
Used memory after GC
may drop lower than the
Used
memory before GC
. On the other
hand, if the garbage collector does not
reclaim much memory from a memory
pool, or if the Java application
suddenly runs a memory-intensive
process when GC is being performed,
then the
Used memory after GC
value
may exceed the
Used memory before
GC
.
Used memory after GC:
Indicates the amount of memory
used by this memory pool after GC.
MB
M o n i t o r i n g a J a v a A p p l i c a t i o n
51
Percentage of memory collected:
Indicates the percentage of memory
collected from this pool by the GC
activity.
Percent
A high value for this measure is
indicative of a large amount of unused
memory in the pool. A low value on
the other hand indicates that the
memory pool has been over-utilized.
Compare the value of this measure
across pools to identify the pools that
have very little free memory. If too
many pools appear to be running short
of memory, it could indicate that the
target application is consuming too
much memory, which in the long run,
can slow down the application
significantly.
Collection duration:
Indicates the time taken by this
garbage collector for collecting
unused memory from this pool.
Mins
Ideally, the value of this measure
should be low. This is because, the
garbage collection (GC) activity tends
to suspend the operations of the
application until such time that GC
ends. Longer the GC time, longer it
would take for the application to
resume its functions. To minimize the
impact of GC on application
performance, it is best to ensure that
GC activity does not take too long to
complete.
1.3.5.1 Enabling GC Logging
If you want the JVM Memory Pools Garbage Collections test to use the GC log file to report metrics, then, you first
need to enable GC logging. For this, follow the steps below:
1. Edit the startup script file of the Java application being monitored. Figure 20 depicts the startup script file of a
sample application.
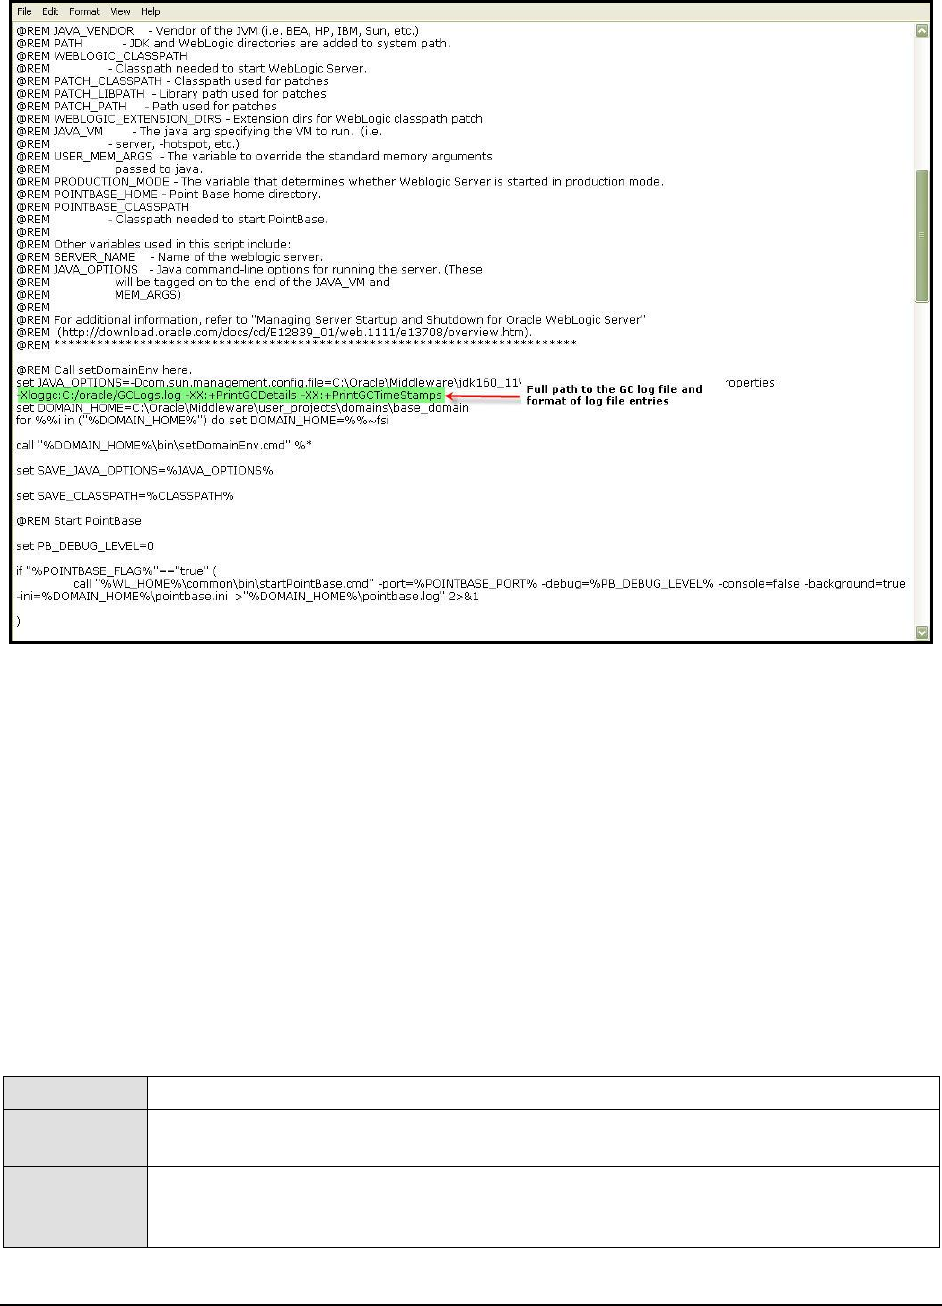
M o n i t o r i n g a J a v a A p p l i c a t i o n
52
Figure 34: Editing the startup script file of a sample Java application
2. Add the line indicated by Figure 20 to the startup script file. This line should be of the following format:
-Xloggc:<Full path to the GC log file to which GC details are to be logged> -XX:+PrintGCDetails -
XX:+PrintGCTimeStamps
Here, the entry, -XX:+PrintGCDetails -XX:+PrintGCTimeStamps, refers to the format in which GC details are to
be logged in the specified log file. Note that this test can monitor only those GC log files which contain log
entries of this format.
3. Finally, save the file and restart the application.
1.3.6 JVM Threads Test
This test reports the status of threads running in the JVM. Details of this test can be used to identify resource-hungry
threads.
Purpose
Reports the status of threads running in the JVM
Target of the
test
A Java application
Agent
deploying the
test
An internal/remote agent

M o n i t o r i n g a J a v a A p p l i c a t i o n
53
Configurable
parameters for
the test
1. TEST PERIOD - How often should the test be executed
2. HOST - The host for which the test is to be configured
3. PORT - The port number at which the specified HOST listens
4. MODE – This test can extract metrics from the Java application using either of the
following mechanisms:
Using SNMP-based access to the Java runtime MIB statistics;
By contacting the Java runtime (JRE) of the application via JMX
To configure the test to use SNMP, select the SNMP option. On the other hand, choose the
JMX option to configure the test to use JMX instead. By default, the JMX option is chosen
here.
5. JMX REMOTE PORT – This parameter appears only if the MODE is set to JMX. Here,
specify the port at which the JMX listens for requests from remote hosts. Ensure that you
specify the same port that you configured in the
management.properties
file in the
<JAVA_HOME>\jre\lib\management folder used by the target application (see page 3).
6. USER, PASSWORD, and CONFIRM PASSWORD – These parameters appear only if the
MODE is set to JMX. If JMX requires authentication only (but no security), then ensure that
the USER and PASSWORD parameters are configured with the credentials of a user with
read-write
access to JMX. To know how to create this user, refer to Section 1.1.1.2.
Confirm the password by retyping it in the CONFIRM PASSWORD text box.
7. JNDINAME – This parameter appears only if the MODE is set to JMX. The JNDINAME is a
lookup name for connecting to the JMX connector. By default, this is
jmxrmi
. If you have
resgistered the JMX connector in the RMI registery using a different lookup name, then
you can change this default value to reflect the same.
8. SNMPPORT – This parameter appears only if the MODE is set to SNMP. Here specify the
port number through which the server exposes its SNMP MIB. Ensure that you specify the
same port you configured in the
management.properties
file in the
<JAVA_HOME>\jre\lib\management folder used by the target application (see page 15).
9. SNMPVERSION – This parameter appears only if the MODE is set to SNMP. The default
selection in the SNMPVERSION list is v1. However, for this test to work, you have to
select SNMP v2 or v3 from this list, depending upon which version of SNMP is in use in the
target environment.
10. SNMPCOMMUNITY – This parameter appears only if the MODE is set to SNMP. Here,
specify the SNMP community name that the test uses to communicate with the mail server.
The default is public. This parameter is specific to SNMP v1 and v2 only. Therefore, if the
SNMPVERSION chosen is v3, then this parameter will not appear.

M o n i t o r i n g a J a v a A p p l i c a t i o n
54
11. USERNAME – This parameter appears only when v3 is selected as the SNMPVERSION.
SNMP version 3 (SNMPv3) is an extensible SNMP Framework which supplements the
SNMPv2 Framework, by additionally supporting message security, access control, and
remote SNMP configuration capabilities. To extract performance statistics from the MIB
using the highly secure SNMP v3 protocol, the eG agent has to be configured with the
required access privileges – in other words, the eG agent should connect to the MIB using
the credentials of a user with access permissions to be MIB. Therefore, specify the name of
such a user against the USERNAME parameter.
12. AUTHPASS – Specify the password that corresponds to the above-mentioned
USERNAME. This parameter once again appears only if the SNMPVERSION selected is
v3.
13. CONFIRM PASSWORD – Confirm the AUTHPASS by retyping it here.
14. PCT MEDIUM CPU UTIL THREADS - By default, the PCT MEDIUM CPU UTIL
THREADS parameter is set to 50. This implies that, by default, the threads for which the
current CPU consumption is between 50% and 70% (the default value of the PCT HIGH
CPU UTIL THREADS parameter) willl be counted as medium CPU-consuming threads.
The count of such threads will be reported as the value of the Medium CPU threads
measure.
15. This default setting also denotes that threads that consume less than 50% CPU will, by
default, be counted as Low CPU threads. If need be, you can modify the value of this PCT
MEDIUM CPU UTIL THREADS parameter to change how much CPU should be used by a
thread for it to qualify as a medium CPU-consuming thread. This will consequently alter the
count of low CPU-consuming threads as well.
16. PCT HIGH CPU UTIL THREADS - By default, the PCT HIGH CPU UTIL THREADS
parameter is set to 70. This implies that, by default, the threads that are currently
consuming over 70% of CPU time are counted as high CPU consumers. The count of such
threads will be reported as the value of the High CPU threads measure. If need be, you
can modify the value of this parameter to change how much CPU should be used by a
thread for it to qualify as a high CPU-consuming thread.
17. AUTHTYPE – This parameter too appears only if v3 is selected as the SNMPVERSION.
From the AUTHTYPE list box, choose the authentication algorithm using which SNMP v3
converts the specified USERNAME and PASSWORD into a 32-bit format to ensure
security of SNMP transactions. You can choose between the following options:
MD5 – Message Digest Algorithm
SHA – Secure Hash Algorithm

M o n i t o r i n g a J a v a A p p l i c a t i o n
55
18. ENCRYPTFLAG – This flag appears only when v3 is selected as the SNMPVERSION. By
default, the eG agent does not encrypt SNMP requests. Accordingly, the ENCRYPTFLAG
is set to NO by default. To ensure that SNMP requests sent by the eG agent are encrypted,
select the YES option.
19. ENCRYPTTYPE – If the ENCRYPTFLAG is set to YES, then you will have to mention the
encryption type by selecting an option from the ENCRYPTTYPE list. SNMP v3 supports
the following encryption types:
DES – Data Encryption Standard
AES – Advanced Encryption Standard
20. ENCRYPTPASSWORD – Specify the encryption password here.
21. CONFIRM PASSWORD – Confirm the encryption password by retyping it here.
22. TIMEOUT - This parameter appears only if the MODE is set to SNMP. Here, specify the
duration (in seconds) within which the SNMP query executed by this test should time out in
the TIMEOUT text box. The default is 10 seconds.
23. USEPS - This flag is applicable only for AIX LPARs. By default, on AIX LPARs, this test
uses the tprof command to compute CPU usage. Accordingly, the USEPS flag is set to No
by default. On some AIX LPARs however, the tprof command may not function properly
(this is an AIX issue). While monitoring such AIX LPARs therefore, you can configure the
test to use the ps command instead for metrics collection. To do so, set the USEPS flag to
Yes.
Note:
Alternatively, you can set the AIXusePS flag in the [AGENT_SETTINGS] section of the
eg_tests.ini file (in the <EG_INSTALL_DIR>\manager\config directory) to yes (default: no) to
enable the eG agent to use the ps command for CPU usage computations on AIX LPARs. If
this global flag and the USEPS flag for a specific component are both set to no, then the
test will use the default tprof command to compute CPU usage for AIX LPARs. If either of
these flags is set to yes, then the ps command will perform the CPU usage computations
for monitored AIX LPARs.
In some high-security environments, the tprof command may require some special
privileges to execute on an AIX LPAR (eg.,
sudo
may need to be used to run tprof). In such
cases, you can prefix the tprof command with another command (like
sudo
) or the full path
to a script that grants the required privileges to tprof. To achieve this, edit the eg_tests.ini
file (in the <EG_INSTALL_DIR>\manager\config directory), and provide the prefix of your
choice against the AixTprofPrefix parameter in the [AGENT_SETTINGS] section. Finally, save
the file. For instance, if you set the AixTprofPrefix parameter to
sudo
, then the eG agent
will call the tprof command as
sudo tprof
.
M o n i t o r i n g a J a v a A p p l i c a t i o n
56
24. DATA OVER TCP – This parameter is applicable only if MODE is set to SNMP. By default,
in an IT environment, all data transmission occurs over UDP. Some environments however,
may be specifically configured to offload a fraction of the data traffic – for instance, certain
types of data traffic or traffic pertaining to specific components – to other protocols like
TCP, so as to prevent UDP overloads. In such environments, you can instruct the eG agent
to conduct the SNMP data traffic related to the equalizer over TCP (and not UDP). For this,
set the DATA OVER TCP flag to Yes. By default, this flag is set to No.
25. DD FREQUENCY - Refers to the frequency with which detailed diagnosis measures are to
be generated for this test. The default is
1:1
. This indicates that, by default, detailed
measures will be generated every time this test runs, and also every time the test detects
a problem. You can modify this frequency, if you so desire. Also, if you intend to disable
the detailed diagnosis capability for this test, you can do so by specifying
none
against DD
FREQUENCY.
26. DETAILED DIAGNOSIS - To make diagnosis more efficient and accurate, the eG
Enterprise suite embeds an optional detailed diagnostic capability. With this capability, the
eG agents can be configured to run detailed, more elaborate tests as and when specific
problems are detected. To enable the detailed diagnosis capability of this test for a
particular server, choose the On option. To disable the capability, click on the Off option.
The option to selectively enable/disable the detailed diagnosis capability will be available
only if the following conditions are fulfilled:
The eG manager license should allow the detailed diagnosis capability
Both the normal and abnormal frequencies configured for the detailed diagnosis
measures should not be 0.
Outputs of the
test
One set of results for the Java application being monitored
Measurements
made by the
test
Measurement
Measurement
Unit
Interpretation
Total threads:
Indicates the total number of threads
(including daemon and non-daemon
threads).
Number
Runnable threads:
Indicates the current number of
threads in a runnable state.
Number
The detailed diagnosis of this measure,
if enabled, provides the name of the
threads, the CPU usage by the
threads, the time for which the thread
was in a blocked state, waiting state,
etc.
M o n i t o r i n g a J a v a A p p l i c a t i o n
57
Blocked threads:
Indicates the number of threads that
are currently in a blocked state.
Number
If a thread is trying to take a lock (to
enter a synchronized block), but the
lock is already held by another thread,
then such a thread is called a blocked
thread.
The detailed diagnosis of this measure,
if enabled, provides in-depth
information related to the blocked
threads.
Waiting threads:
Indicates the number of threads that
are currently in a waiting state.
Number
A thread is said to be in a Waiting
state if the thread enters a
synchronized block, tries to take a lock
that is already held by another thread,
and hence, waits till the other thread
notifies that it has released the lock.
Ideally, the value of this measure
should be low. A very high value could
be indicative of excessive waiting
activity on the JVM. You can use the
detailed diagnosis of this measure, if
enabled, to figure out which threads
are currently in the waiting state.
While waiting, the Java application
program does no productive work and
its ability to complete the task-at-hand
is degraded. A certain amount of
waiting may be acceptable for Java
application programs. However, when
the amount of time spent waiting
becomes excessive or if the number of
times that waits occur exceeds a
reasonable amount, the Java
application program may not be
programmed correctly to take
advantage of the available resources.
When this happens, the delay caused
by the waiting Java application
programs elongates the response time
experienced by an end user. An
enterprise may use Java application
programs to perform various functions.
Delays based on abnormal degradation
consume employee time and may be
costly to corporations.

M o n i t o r i n g a J a v a A p p l i c a t i o n
58
Timed waiting threads:
Indicates the number of threads in a
TIMED_WAITING state.
Number
When a thread is in the
TIMED_WAITING state, it implies that
the thread is waiting for another
thread to do something, but will give
up after a specified time out period.
To view the details of threads in the
TIMED_WAITING state, use the
detailed diagnosis of this measure, if
enabled.
Low CPU threads:
Indicates the number of threads that
are currently consuming CPU lower
than the value configured in the PCT
MEDIUM CPU UTIL THREADS text
box.
Number
Medium CPU threads:
Indicates the number of threads that
are currently consuming CPU that is
higher than the value configured in
the PCT MEDIMUM CPU UTIL
THREADS text box and is lower than
or equal to the value specified in the
PCT HIGH CPU UTIL THREADS text
box.
Number
High CPU threads:
Indicates the number of threads that
are currently consuming CPU that is
greater than the percentage
configured in the PCT HIGH CPU
UTIL THREADS text box.
Number
Ideally, the value of this measure
should be very low. A high value is
indicative of a resource contention at
the JVM. Under such circumstances,
you might want to identify the
resource-hungry threads. To know
which threads are consuming
excessive CPU, use the detailed
diagnosis of this measure.
`
Peak threads:
Indicates the highest number of live
threads since JVM started.
Number
Total threads:
Indicates the the total number of
threads started (including daemon,
non-daemon, and terminated) since
JVM started.
Number
Daemon threads:
Indicates the current number of live
daemon threads.
Number
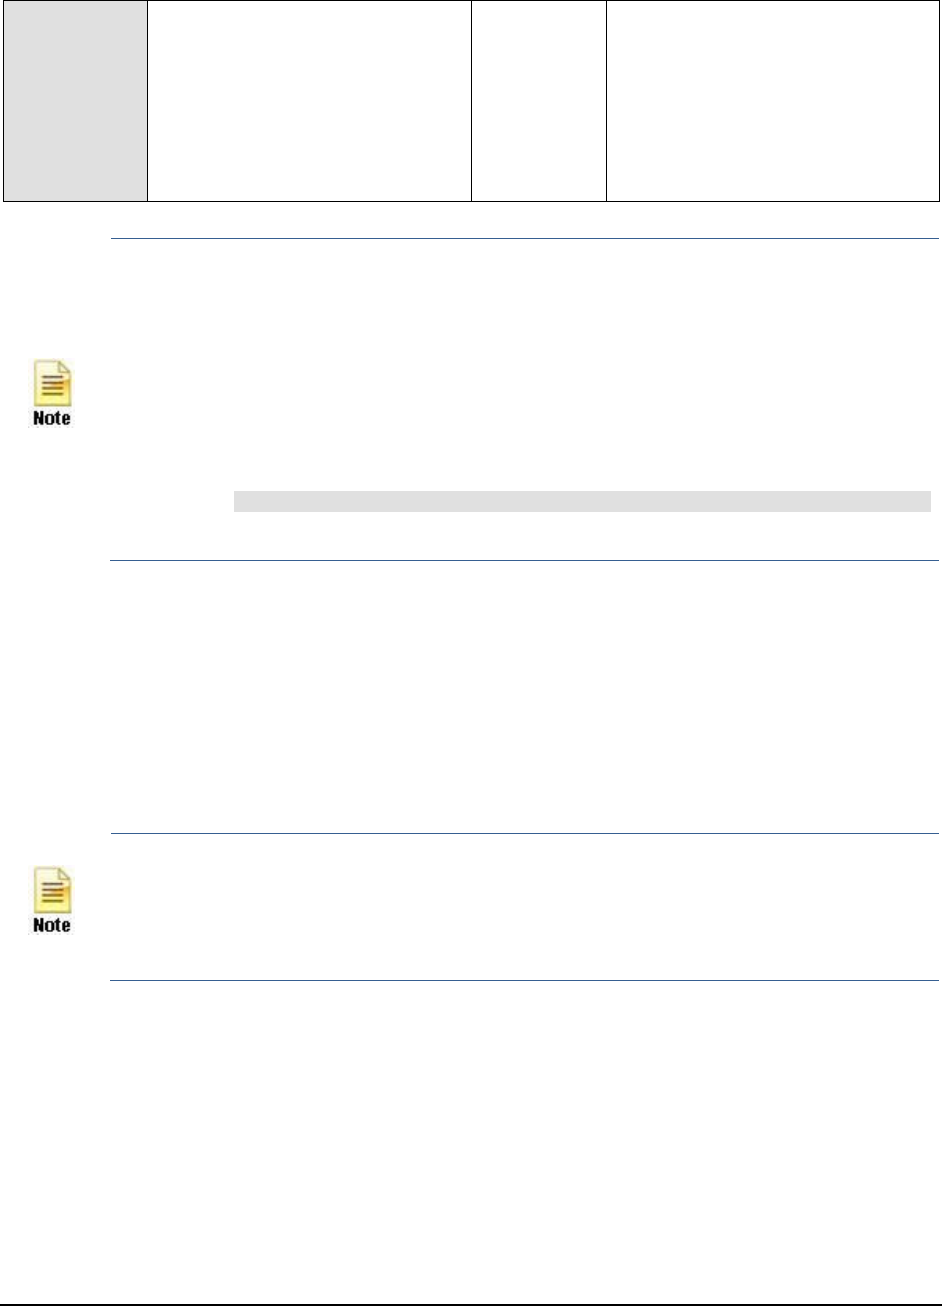
M o n i t o r i n g a J a v a A p p l i c a t i o n
59
Deadlock threads:
Indicates the current number of
deadlocked threads.
Number
Ideally, this value should be 0. A high
value is a cause for concern, as it
indicates that many threads are
blocking one another causing the
application performance to suffer. The
detailed diagnosis of this measure, if
enabled, lists the deadlocked threads
and their resource usage.
If the mode for the JVM Threads test is set to SNMP, then the detailed diagnosis of this test will not
display the Blocked Time and Waited Time for the threads. To make sure that detailed diagnosis
reports these details also, do the following:
Login to the application host.
Go to the <JAVA_HOME>\jre\lib\management folder used by the target application, and
edit the
management.properties
file in that folder.
Append the following line to the file:
com.sun.management.enableThreadContentionMonitoring
Finally, save the file.
1.3.6.1 Accessing Stack Trace using the STACK TRACE link in the Measurements
Panel
While viewing the measures reported by the JVM Thread test, you can also view the resource usage details and the
stack trace information for all the threads, by clicking on the STACK TRACE link in the Measurements panel.
If the mode set for the JVM Thread test is SNMP, the stack trace details may not be available.
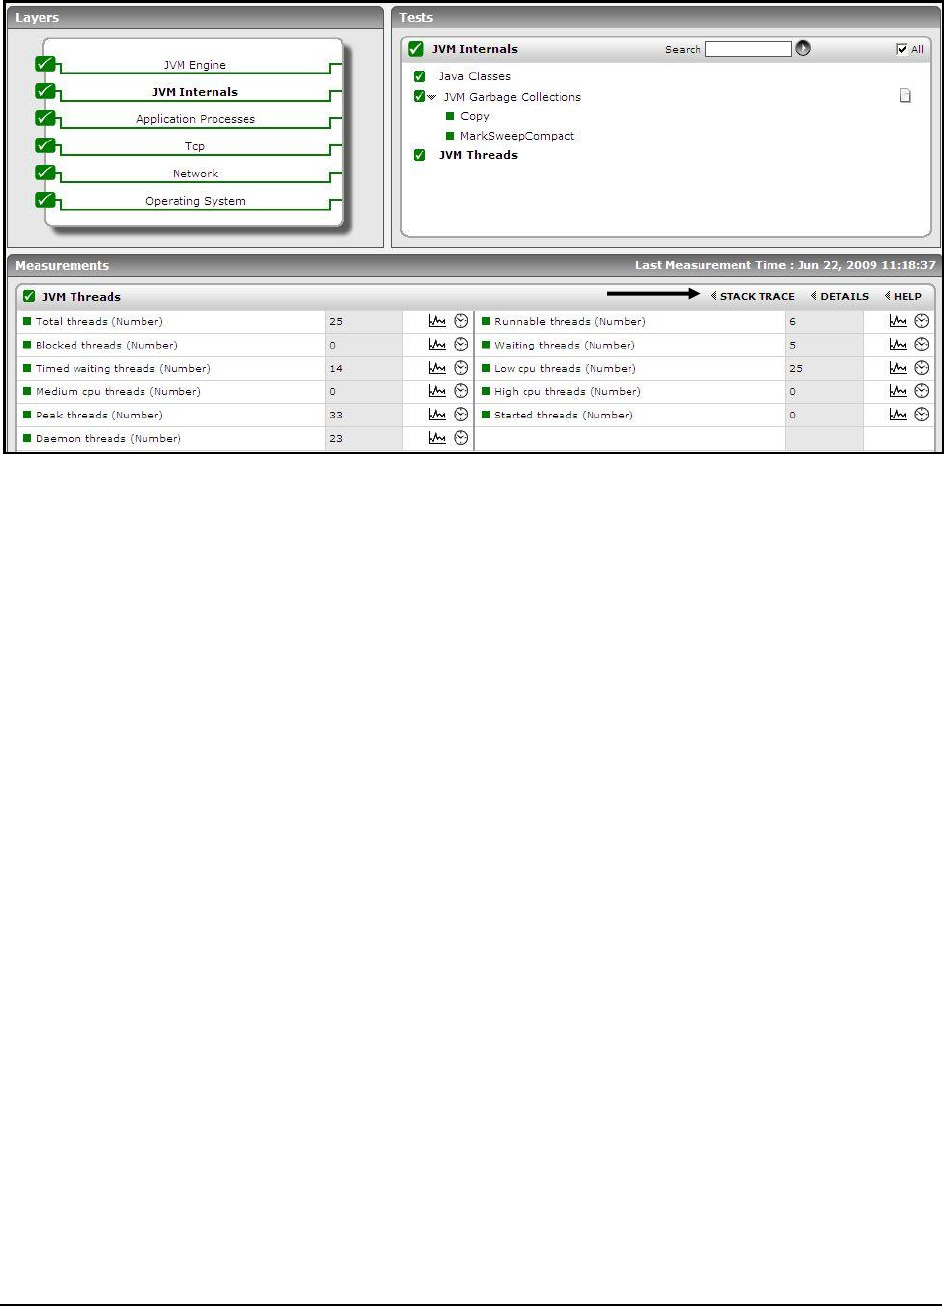
M o n i t o r i n g a J a v a A p p l i c a t i o n
60
Figure 35: The STACK TRACE link
A stack trace (also called stack backtrace or stack traceback) is a report of the active stack frames instantiated
by the execution of a program. It is commonly used to determine what threads are currently active in the JVM, and
which threads are in each of the different states – i.e., alive, blocked, waiting, timed waiting, etc.
Typically, when a Java application begins exhibiting erratic resource usage patterns, it often takes administrators
hours, even days to figure out what is causing this anomaly – could it be owing to one/more resource-intensive
threads being executed by the application? If so, what is causing the thread to erode resources? Is it an inefficient
piece of code? In which case, which line of code could be the most likely cause for the spike in resource usage? To
be able to answer these questions accurately, administrators need to know the complete list of threads that the
application executes, view the stack trace of each thread, analyze each stack trace in a top-down manner, and trace
where the problem originated.
eG Enterprise simplifies this seemingly laborious procedure by not only alerting administrators instantly to excessive
resource usage by a target application, but also by automatically identifying the problematic thread(s), and providing
the administrator with quick and easy access to the stack trace information of that thread; with the help of stack
trace, administrators can effortlessly drill down to the exact line of code that requires optimization.
To access the stack trace information of a thread, click on the STACK TRACE link in the Measurements panel of
Figure 35.
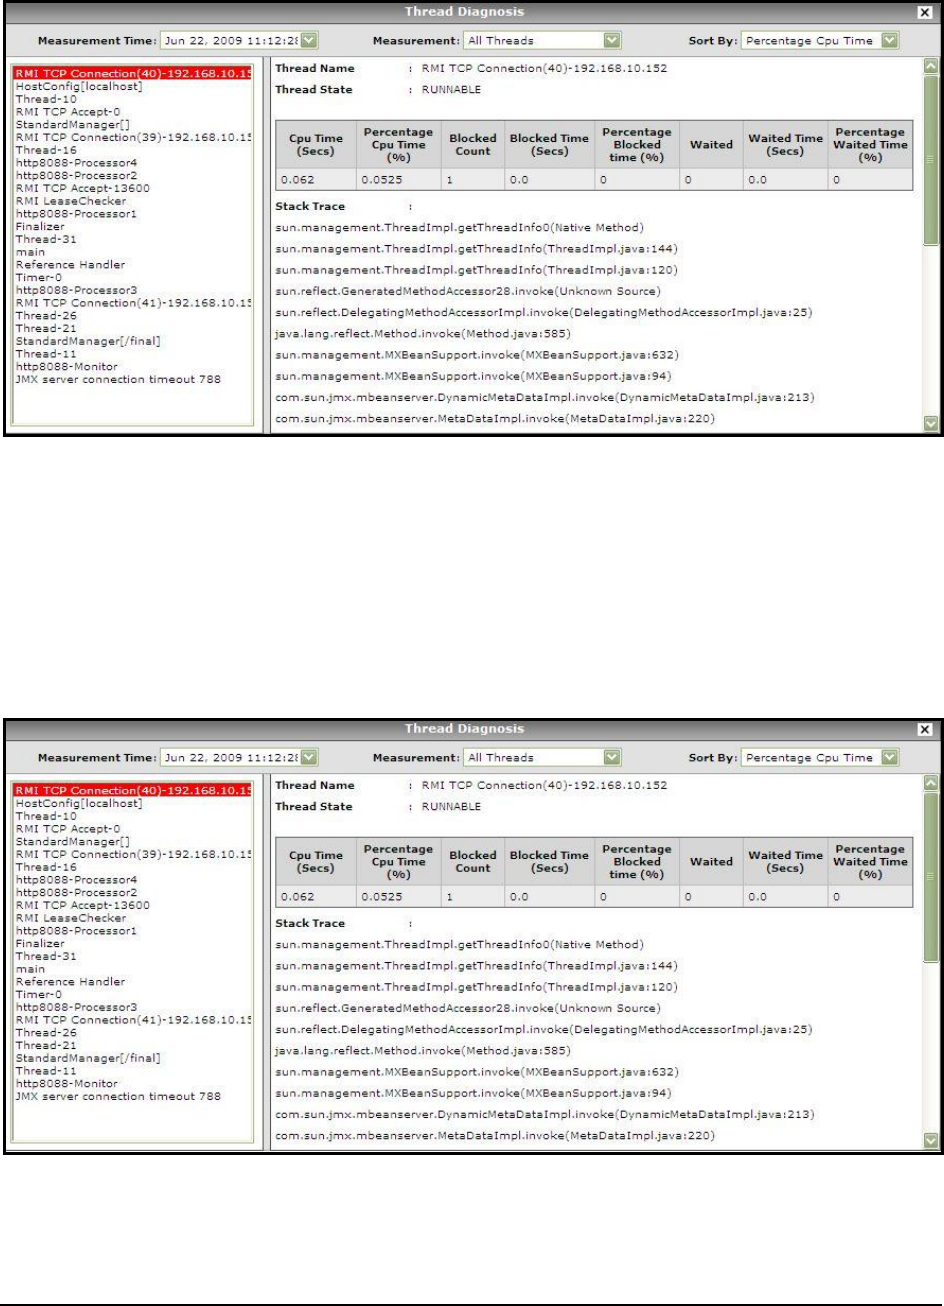
M o n i t o r i n g a J a v a A p p l i c a t i o n
61
Figure 36: Stack trace of a resource-intensive thread
Figure 36 that appears comprises of two panels. The left panel, by default, lists all the threads that the target
application executes, starting with the threads that are currently live. Accordingly, the All Threads option is chosen by
default from the Measurement list. If need be, you can override the default setting by choosing a different option
from the Measurement list – in other words, instead of viewing the complete list of threads, you can choose to view
threads of a particular type or which are in a particular state alone in Figure 36, by selecting a different Measurement
from Figure 36. For instance, to ensure that the left panel displays only those threads that are currently in a runnable
state, select the Live threads option from the Measurement list. The contents of the left panel will change as depicted
by Figure 37.
Figure 37: Thread diagnosis of live threads
Also, the thread list in the left panel is by default sorted in the descending order of the Percent Cpu Time of the
threads. This implies that, by default, the first thread in the list will be the thread that is currently active and
consuming the maximum CPU. You can change the sort order by selecting a different option from the Sort by list in
Figure 37.

M o n i t o r i n g a J a v a A p p l i c a t i o n
62
Typically, the contents of the right panel change according to the thread chosen from the left. Since the first thread
is the default selection in the left panel, and this thread by default consumes the maximum CPU, we can conclude
that the right panel will by default display the details of the leading CPU consumer. Besides the name and state of
the chosen thread, the right panel will provide the following information:
Cpu Time : The amount of CPU processing time (in seconds) consumed by the thread during the last
measurement period;
Percent Cpu Time: The percentage of time the thread was using the CPU during the last measurement
period;
Blocked Count: The number of the times during the last measurement period the thread was blocked
waiting for another thread;
Blocked Time: The total duration for which the thread was blocked during the last measurement period;
Percentage Blocked Time: The percentage of time (in seconds) for which the thread was blocked during the
last measurement period;
Waited: The number of times during the last measurement period the thread was waiting for some event to
happen (eg., wait for a thread to finish, wait for a timing event to finish, etc.);
Waited Time: The total duration (in seconds) for which the thread was waiting during the last measurement
period;
Percentage Waited Time: The percentage of time for which the thread was waiting during the last
measurement period.
In addition to the above details, the right panel provides the Stack Trace of the thread.
In the event of a sudden surge in the CPU usage of the target Java application, the Thread Diagnosis window of
Figure 37 will lead you to the CPU-intensive thread, and will also provide you with the Stack Trace of that thread. By
analyzing the stack trace in a top-down manner, you can figure out which method/routine called which, and thus
locate the exact line of code that could have contributed to the sudden CPU spike.
If the CPU usage has been increasing over a period of time, then, you might have to analyze the stack trace for
one/more prior periods, so as to perform accurate root-cause diagnosis. By default, the Thread Diagnosis window of
Figure 37 provides the stack trace for the current measurement period only. If you want to view the stack trace for a
previous measurement period, you will just have to select a different option from the Measurement Time list. By
reviewing the code executed by a thread for different measurement periods, you can figure out out if the same line
of code is responsible for the increase in CPU usage.
1.4 The JVM Engine Layer
The JVM Engine layer measures the overall health of the JVM engine by reporting statistics related to the following:
The CPU usage by the engine
How the JVM engine manages memory
The uptime of the engine
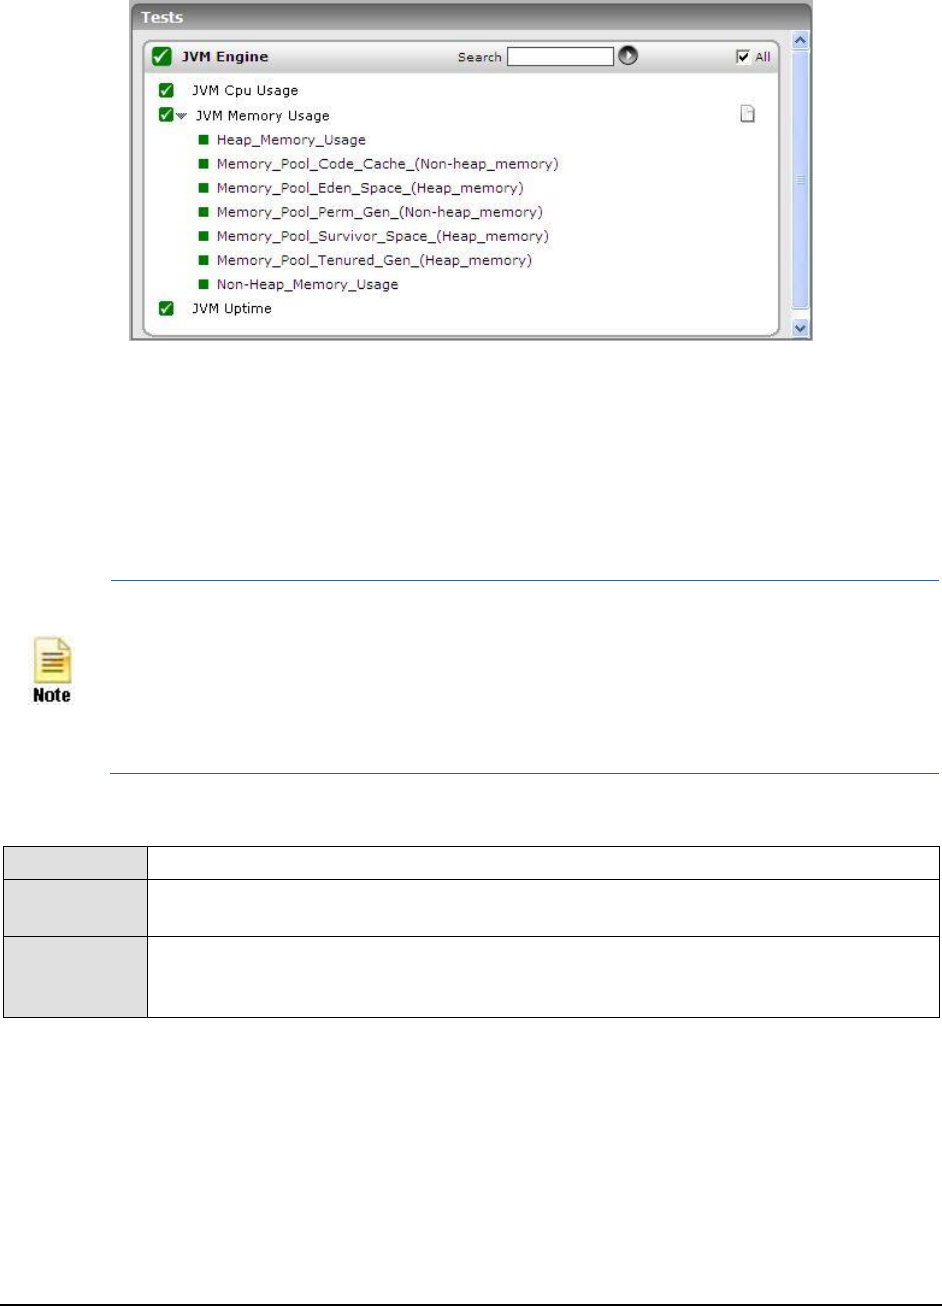
M o n i t o r i n g a J a v a A p p l i c a t i o n
63
Figure 38: The tests associated with the JVM Engine layer
1.4.1 JVM Cpu Usage Test
This test measures the CPU utilization of the JVM. If the JVM experiences abnormal CPU usage levels, you can use
this test to instantly drill down to the threads that are contributing to the CPU spike. Detailed stack trace information
provides insights to code level information that can highlight problems with the design of the Java application.
If you want to collect metrics for this test from the JRE MIB – i.e, if the mode
parameter of this test is set to SNMP – then ensure that the SNMP and SNMP Trap
services are up and running on the application host.
While monitoring a Java application executing on a Windows 2003 server using SNMP,
ensure that the
community string
to be used during SNMP access is explicitly added
when starting the SNMP service.
Purpose
Measures the CPU utilization of the JVM
Target of the
test
A Java application
Agent
deploying the
test
An internal/remote agent

M o n i t o r i n g a J a v a A p p l i c a t i o n
64
Configurable
parameters for
the test
1. TEST PERIOD - How often should the test be executed
2. HOST - The host for which the test is to be configured
3. PORT - The port number at which the specified HOST listens
4. MODE – This test can extract metrics from the Java application using either of the
following mechanisms:
Using SNMP-based access to the Java runtime MIB statistics;
By contacting the Java runtime (JRE) of the application via JMX
To configure the test to use SNMP, select the SNMP option. On the other hand, choose the
JMX option to configure the test to use JMX instead. By default, the JMX option is chosen
here.
5. JMX REMOTE PORT – This parameter appers only if the MODE is set to JMX. Here,
specify the port at which the JMX listens for requests from remote hosts. Ensure that you
specify the same port that you configured in the
management.properties
file in the
<JAVA_HOME>\jre\lib\management folder used by the target application (see page 3).
6. JNDINAME – This parameter appears only if the MODE is set to JMX. The JNDINAME is a
lookup name for connecting to the JMX connector. By default, this is
jmxrmi
. If you have
resgistered the JMX connector in the RMI registery using a different lookup name, then
you can change this default value to reflect the same.
7. USER, PASSWORD, and CONFIRM PASSWORD – These parameters appear only if the
MODE is set to JMX. If JMX requires authentication only (but no security), then ensure that
the USER and PASSWORD parameters are configured with the credentials of a user with
read-write
access to JMX. To know how to create this user, refer to Section 1.1.1.2.
Confirm the password by retyping it in the CONFIRM PASSWORD text box.
8. SNMPPORT – This parameter appears only if the MODE is set to SNMP. Here specify the
port number through which the server exposes its SNMP MIB. Ensure that you specify the
same port you configured in the
management.properties
file in the
<JAVA_HOME>\jre\lib\management folder used by the target application (see page 15).
9. SNMPVERSION – This parameter appears only if the MODE is set to SNMP. The default
selection in the SNMPVERSION list is v1. However, for this test to work, you have to
select SNMP v2 or v3 from this list, depending upon which version of SNMP is in use in the
target environment.
10. SNMPCOMMUNITY – This parameter appears only if the MODE is set to SNMP. Here,
specify the SNMP community name that the test uses to communicate with the mail server.
The default is public. This parameter is specific to SNMP v1 and v2 only. Therefore, if the
SNMPVERSION chosen is v3, then this parameter will not appear.

M o n i t o r i n g a J a v a A p p l i c a t i o n
65
11. USERNAME – This parameter appears only when v3 is selected as the SNMPVERSION.
SNMP version 3 (SNMPv3) is an extensible SNMP Framework which supplements the
SNMPv2 Framework, by additionally supporting message security, access control, and
remote SNMP configuration capabilities. To extract performance statistics from the MIB
using the highly secure SNMP v3 protocol, the eG agent has to be configured with the
required access privileges – in other words, the eG agent should connect to the MIB using
the credentials of a user with access permissions to be MIB. Therefore, specify the name of
such a user against the USERNAME parameter.
12. AUTHPASS – Specify the password that corresponds to the above-mentioned
USERNAME. This parameter once again appears only if the SNMPVERSION selected is
v3.
13. CONFIRM PASSWORD – Confirm the AUTHPASS by retyping it here.
14. AUTHTYPE – This parameter too appears only if v3 is selected as the SNMPVERSION.
From the AUTHTYPE list box, choose the authentication algorithm using which SNMP v3
converts the specified USERNAME and PASSWORD into a 32-bit format to ensure
security of SNMP transactions. You can choose between the following options:
MD5 – Message Digest Algorithm
SHA – Secure Hash Algorithm
15. ENCRYPTFLAG – This flag appears only when v3 is selected as the SNMPVERSION. By
default, the eG agent does not encrypt SNMP requests. Accordingly, the ENCRYPTFLAG
is set to NO by default. To ensure that SNMP requests sent by the eG agent are encrypted,
select the YES option.
16. ENCRYPTTYPE – If the ENCRYPTFLAG is set to YES, then you will have to mention the
encryption type by selecting an option from the ENCRYPTTYPE list. SNMP v3 supports
the following encryption types:
DES – Data Encryption Standard
AES – Advanced Encryption Standard
17. ENCRYPTPASSWORD – Specify the encryption password here.
18. CONFIRM PASSWORD – Confirm the encryption password by retyping it here.
19. TIMEOUT - This parameter appears only if the MODE is set to SNMP. Here, specify the
duration (in seconds) within which the SNMP query executed by this test should time out in
the TIMEOUT text box. The default is 10 seconds.

M o n i t o r i n g a J a v a A p p l i c a t i o n
66
20. USEPS - This flag is applicable only for AIX LPARs. By default, on AIX LPARs, this test
uses the tprof command to compute CPU usage. Accordingly, the USEPS flag is set to No
by default. On some AIX LPARs however, the tprof command may not function properly
(this is an AIX issue). While monitoring such AIX LPARs therefore, you can configure the
test to use the ps command instead for metrics collection. To do so, set the USEPS flag to
Yes.
Note:
Alternatively, you can set the AIXusePS flag in the [AGENT_SETTINGS] section of the
eg_tests.ini file (in the <EG_INSTALL_DIR>\manager\config directory) to yes (default: no) to
enable the eG agent to use the ps command for CPU usage computations on AIX LPARs. If
this global flag and the USEPS flag for a specific component are both set to no, then the
test will use the default tprof command to compute CPU usage for AIX LPARs. If either of
these flags is set to yes, then the ps command will perform the CPU usage computations
for monitored AIX LPARs.
In some high-security environments, the tprof command may require some special
privileges to execute on an AIX LPAR (eg.,
sudo
may need to be used to run tprof). In such
cases, you can prefix the tprof command with another command (like
sudo
) or the full path
to a script that grants the required privileges to tprof. To achieve this, edit the eg_tests.ini
file (in the <EG_INSTALL_DIR>\manager\config directory), and provide the prefix of your
choice against the AixTprofPrefix parameter in the [AGENT_SETTINGS] section. Finally, save
the file. For instance, if you set the AixTprofPrefix parameter to
sudo
, then the eG agent
will call the tprof command as
sudo tprof
.
21. DATA OVER TCP – This parameter is applicable only if MODE is set to SNMP. By default,
in an IT environment, all data transmission occurs over UDP. Some environments however,
may be specifically configured to offload a fraction of the data traffic – for instance, certain
types of data traffic or traffic pertaining to specific components – to other protocols like
TCP, so as to prevent UDP overloads. In such environments, you can instruct the eG agent
to conduct the SNMP data traffic related to the equalizer over TCP (and not UDP). For this,
set the DATA OVER TCP flag to Yes. By default, this flag is set to No.
22. DD FREQUENCY - Refers to the frequency with which detailed diagnosis measures are to
be generated for this test. The default is
1:1
. This indicates that, by default, detailed
measures will be generated every time this test runs, and also every time the test detects
a problem. You can modify this frequency, if you so desire. Also, if you intend to disable
the detailed diagnosis capability for this test, you can do so by specifying
none
against DD
FREQUENCY.
23. DETAILED DIAGNOSIS - To make diagnosis more efficient and accurate, the eG
Enterprise suite embeds an optional detailed diagnostic capability. With this capability, the
eG agents can be configured to run detailed, more elaborate tests as and when specific
problems are detected. To enable the detailed diagnosis capability of this test for a
particular server, choose the On option. To disable the capability, click on the Off option.
The option to selectively enable/disable the detailed diagnosis capability will be available
only if the following conditions are fulfilled:
The eG manager license should allow the detailed diagnosis capability
Both the normal and abnormal frequencies configured for the detailed diagnosis
measures should not be 0.
Outputs of the
test
One set of results for the Java application being monitored
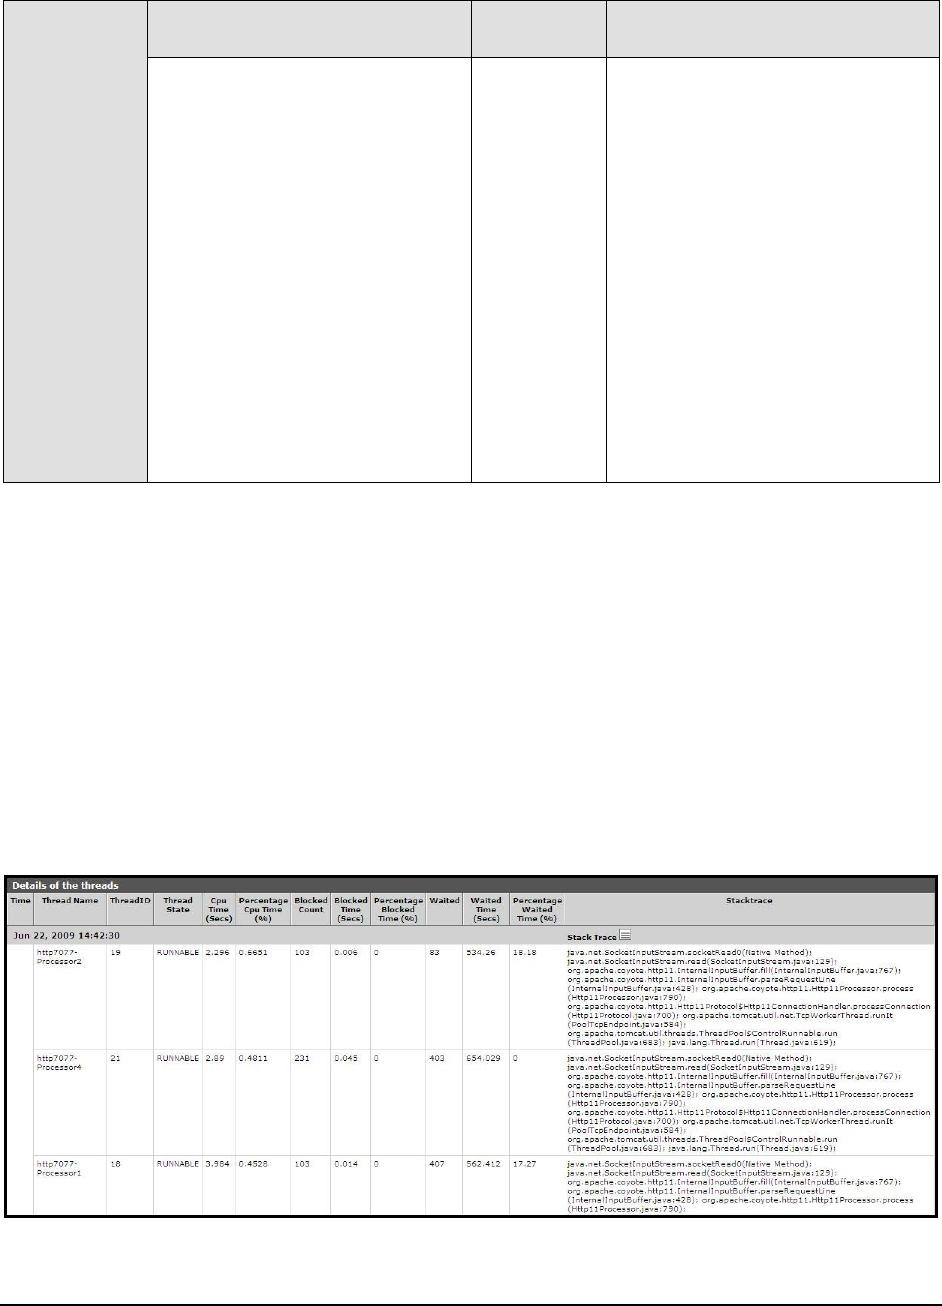
M o n i t o r i n g a J a v a A p p l i c a t i o n
67
Measurements
made by the
test
Measurement
Measurement
Unit
Interpretation
CPU utilization of JVM:
Indicates the percentage of total
available CPU time taken up by the
JVM.
Percent
If a system has multiple processors,
this value is the total CPU time used
by the JVM divided by the number of
processors on the system.
Ideally, this value should be low. An
unusually high value or a consistent
increase in this value is indicative of
abnormal CPU usage, and could
warrant further investigation.
In such a situation, you can use the
detailed diagnosis of this measure, if
enabled, to determine which runnable
threads are currently utilizing
excessive CPU.
The detailed diagnosis of the
CPU utilization of JVM
measure lists all the CPU-consuming threads currently executing
in the JVM, in the descending order of the Percentage Cpu Time of the threads; this way, you can quickly and
accurately identify CPU-intensive threads in the JVM. In addition to CPU usage information, the detailed diagnosis
also reveals the following information for every thread:
The number of times the thread was blocked during the last measurement period, the total duration of
the blocks, and the percentage of time for which the thread was blocked;
The number of times the thread was in wating during the last measurement period, the total duration
waited, and the percentage of time for which the thread waited;
The Stacktrace of the thread, using which you can nail the exact line of code causing the CPU
consumption of the thread to soar;
Figure 39: The detailed diagnosis of the CPU utilization of JVM measure
M o n i t o r i n g a J a v a A p p l i c a t i o n
68
1.4.2 JVM Memory Usage Test
This test monitors every memory type on the JVM and reports how efficiently the JVM utilizes the memory resources
of each type.
This test works only on Windows platforms.
This test can provide detailed diagnosis information for only those monitored Java
applications that use JRE 1.6 or higher.
Purpose
Monitors every memory type on the JVM and reports how efficiently the JVM utilizes the memory
resources of each type
Target of the
test
A Java application
Agent
deploying the
test
An internal/remote agent

M o n i t o r i n g a J a v a A p p l i c a t i o n
69
Configurable
parameters for
the test
1. TEST PERIOD - How often should the test be executed
2. HOST - The host for which the test is to be configured
3. PORT - The port number at which the specified HOST listens
4. MODE – This test can extract metrics from the Java application using either of the
following mechanisms:
Using SNMP-based access to the Java runtime MIB statistics;
By contacting the Java runtime (JRE) of the application via JMX
To configure the test to use SNMP, select the SNMP option. On the other hand, choose the
JMX option to configure the test to use JMX instead. By default, the JMX option is chosen
here.
5. JMX REMOTE PORT – This parameter appers only if the MODE is set to JMX. Here,
specify the port at which the JMX listens for requests from remote hosts. Ensure that you
specify the same port that you configured in the
management.properties
file in the
<JAVA_HOME>\jre\lib\management folder used by the target application (see page 3).
6. USER, PASSWORD, and CONFIRM PASSWORD – These parameters appear only if the
MODE is set to JMX. If JMX requires authentication only (but no security), then ensure that
the USER and PASSWORD parameters are configured with the credentials of a user with
read-write
access to JMX. To know how to create this user, refer to Section 1.1.1.2.
Confirm the password by retyping it in the CONFIRM PASSWORD text box.
7. JNDINAME – This parameter appears only if the MODE is set to JMX. The JNDINAME is a
lookup name for connecting to the JMX connector. By default, this is
jmxrmi
. If you have
resgistered the JMX connector in the RMI registery using a different lookup name, then
you can change this default value to reflect the same.
8. SNMPPORT – This parameter appears only if the MODE is set to SNMP. Here specify the
port number through which the server exposes its SNMP MIB. Ensure that you specify the
same port you configured in the
management.properties
file in the
<JAVA_HOME>\jre\lib\management folder used by the target application (see page 15).
9. SNMPVERSION – This parameter appears only if the MODE is set to SNMP. The default
selection in the SNMPVERSION list is v1. However, for this test to work, you have to
select SNMP v2 or v3 from this list, depending upon which version of SNMP is in use in the
target environment.
10. SNMPCOMMUNITY – This parameter appears only if the MODE is set to SNMP. Here,
specify the SNMP community name that the test uses to communicate with the mail server.
The default is public. This parameter is specific to SNMP v1 and v2 only. Therefore, if the
SNMPVERSION chosen is v3, then this parameter will not appear.

M o n i t o r i n g a J a v a A p p l i c a t i o n
70
11. USERNAME – This parameter appears only when v3 is selected as the SNMPVERSION.
SNMP version 3 (SNMPv3) is an extensible SNMP Framework which supplements the
SNMPv2 Framework, by additionally supporting message security, access control, and
remote SNMP configuration capabilities. To extract performance statistics from the MIB
using the highly secure SNMP v3 protocol, the eG agent has to be configured with the
required access privileges – in other words, the eG agent should connect to the MIB using
the credentials of a user with access permissions to be MIB. Therefore, specify the name of
such a user against the USERNAME parameter.
12. AUTHPASS – Specify the password that corresponds to the above-mentioned
USERNAME. This parameter once again appears only if the SNMPVERSION selected is
v3.
13. CONFIRM PASSWORD – Confirm the AUTHPASS by retyping it here.
14. AUTHTYPE – This parameter too appears only if v3 is selected as the SNMPVERSION.
From the AUTHTYPE list box, choose the authentication algorithm using which SNMP v3
converts the specified USERNAME and PASSWORD into a 32-bit format to ensure
security of SNMP transactions. You can choose between the following options:
MD5 – Message Digest Algorithm
SHA – Secure Hash Algorithm
15. ENCRYPTFLAG – This flag appears only when v3 is selected as the SNMPVERSION. By
default, the eG agent does not encrypt SNMP requests. Accordingly, the ENCRYPTFLAG
is set to NO by default. To ensure that SNMP requests sent by the eG agent are encrypted,
select the YES option.
16. ENCRYPTTYPE – If the ENCRYPTFLAG is set to YES, then you will have to mention the
encryption type by selecting an option from the ENCRYPTTYPE list. SNMP v3 supports
the following encryption types:
DES – Data Encryption Standard
AES – Advanced Encryption Standard
17. ENCRYPTPASSWORD – Specify the encryption password here.
18. CONFIRM PASSWORD – Confirm the encryption password by retyping it here.
19. TIMEOUT - This parameter appears only if the MODE is set to SNMP. Here, specify the
duration (in seconds) within which the SNMP query executed by this test should time out in
the TIMEOUT text box. The default is 10 seconds.
20. DATA OVER TCP – This parameter is applicable only if MODE is set to SNMP. By default,
in an IT environment, all data transmission occurs over UDP. Some environments however,
may be specifically configured to offload a fraction of the data traffic – for instance, certain
types of data traffic or traffic pertaining to specific components – to other protocols like
TCP, so as to prevent UDP overloads. In such environments, you can instruct the eG agent
to conduct the SNMP data traffic related to the equalizer over TCP (and not UDP). For this,
set the DATA OVER TCP flag to Yes. By default, this flag is set to No.

M o n i t o r i n g a J a v a A p p l i c a t i o n
71
21. HEAP ANALYSIS – By default, this flag is set to off. This implies that the test will not
provide detailed diagnosis information for memory usage, by default. To trigger the
collection of detailed measures, set this flag to On.
Note:
If heap analysis is switched On, then the eG agent will be able to collect detailed
measures only if the Java application being monitored uses JDK 1.6 OR HIGHER.
22. JAVA HOME – This parameter appears only when the HEAP ANALYSIS flag is switched
On. Here, provide the full path to the install directory of JDK 1.6 or higher on the application
host. For example,
c:\JDK1.6.0
.
23. EXCLUDE PACKAGES - The detailed diagnosis of this test, if enabled, lists the Java
classes/packages that are using the pool memory and the amount of memory used by
each class/package. To enable administrators to focus on the memory consumed by those
classes/packages that are specific to their application, without being distracted by the
memory consumption of basic Java classes/packages, the test, by default, excludes some
common Java packages from the detailed diagnosis. The packages excluded by default are
as follows:
All packages that start with the string
java
or
javax
- in other words,
java.*
and
javax.*
.
Arrays of primitive data types - eg.,
[Z
, which is a one-dimensional array of type
boolean,
[[B
, which is a 2-dimensional array of type byte, etc.
A few class loaders - eg.,
<symbolKlass>, <constantPoolKlass>,
<instanceKlassKlass>, <constantPoolCacheKlass>
, etc.
This is why, the EXCLUDE PACKAGES parameter is by default configured with the
packages mentioned above. You can, if required, append more packages or patterns of
packages to this comma-separated list. This will ensure that such packages also are
excluded from the detailed diagnosis of the test. Note that the EXCLUDE PACKAGES
parameter is of relevance only if the HEAP ANALSIS flag is set to 'Yes'.
24. INCLUDE PACKAGES - By default, this is set to
all
. This indicates that, by default, the
detailed diagnosis of the test (if enabled) includes all classes/packages associated with the
monitored Java application, regardless of whether they are basic Java packages or those
that are crucial to the functioning of the application. However, if you want the detailed
diagnosis to provide the details of memory consumed by a specific set of classes/packages
alone, then, provide a comma-separated list of classes/packages to be included in the
detailed diagnosis in the INCLUDE PACKAGES text box. Note that the INCLUDE
PACKAGES parameter is of relevance only if the HEAP ANALSIS flag is set to 'Yes'.

M o n i t o r i n g a J a v a A p p l i c a t i o n
72
25. DD FREQUENCY - Refers to the frequency with which detailed diagnosis measures are to
be generated for this test. The default is
1:1
. This indicates that, by default, detailed
measures will be generated every time this test runs, and also every time the test detects
a problem. You can modify this frequency, if you so desire. Also, if you intend to disable
the detailed diagnosis capability for this test, you can do so by specifying
none
against DD
FREQUENCY.
26. DETAILED DIAGNOSIS - To make diagnosis more efficient and accurate, the eG
Enterprise suite embeds an optional detailed diagnostic capability. With this capability, the
eG agents can be configured to run detailed, more elaborate tests as and when specific
problems are detected. To enable the detailed diagnosis capability of this test for a
particular server, choose the On option. To disable the capability, click on the Off option.
The option to selectively enable/disable the detailed diagnosis capability will be available
only if the following conditions are fulfilled:
The eG manager license should allow the detailed diagnosis capability
Both the normal and abnormal frequencies configured for the detailed diagnosis
measures should not be 0.
Outputs of the
test
One set of results for every memory type on the JVM being monitored
Measurements
made by the
test
Measurement
Measurement
Unit
Interpretation
Initial memory:
Indicates the amount of memory
initially allocated at startup.
MB
Used memory:
Indicates the amount of memory
currently used.
MB
It includes the memory occupied by all
objects, including both reachable and
unreachable objects.
Ideally, the value of this measure
should be low. A high value or a
consistent increase in the value could
indicate gradual erosion of memory
resources. In such a situation, you can
take the help of the detailed diagnosis
of this measure (if enabled), to figure
out which class is using up memory
excessively.
Available memory:
Indicates the amount of memory
guaranteed to be available for use by
the JVM.
MB
The amount of Available memory
may change over time. The Java
virtual machine may release memory
to the system and committed memory
could be less than the amount of
memory initially allocated at startup.
Committed will always be greater than
or equal to used memory.
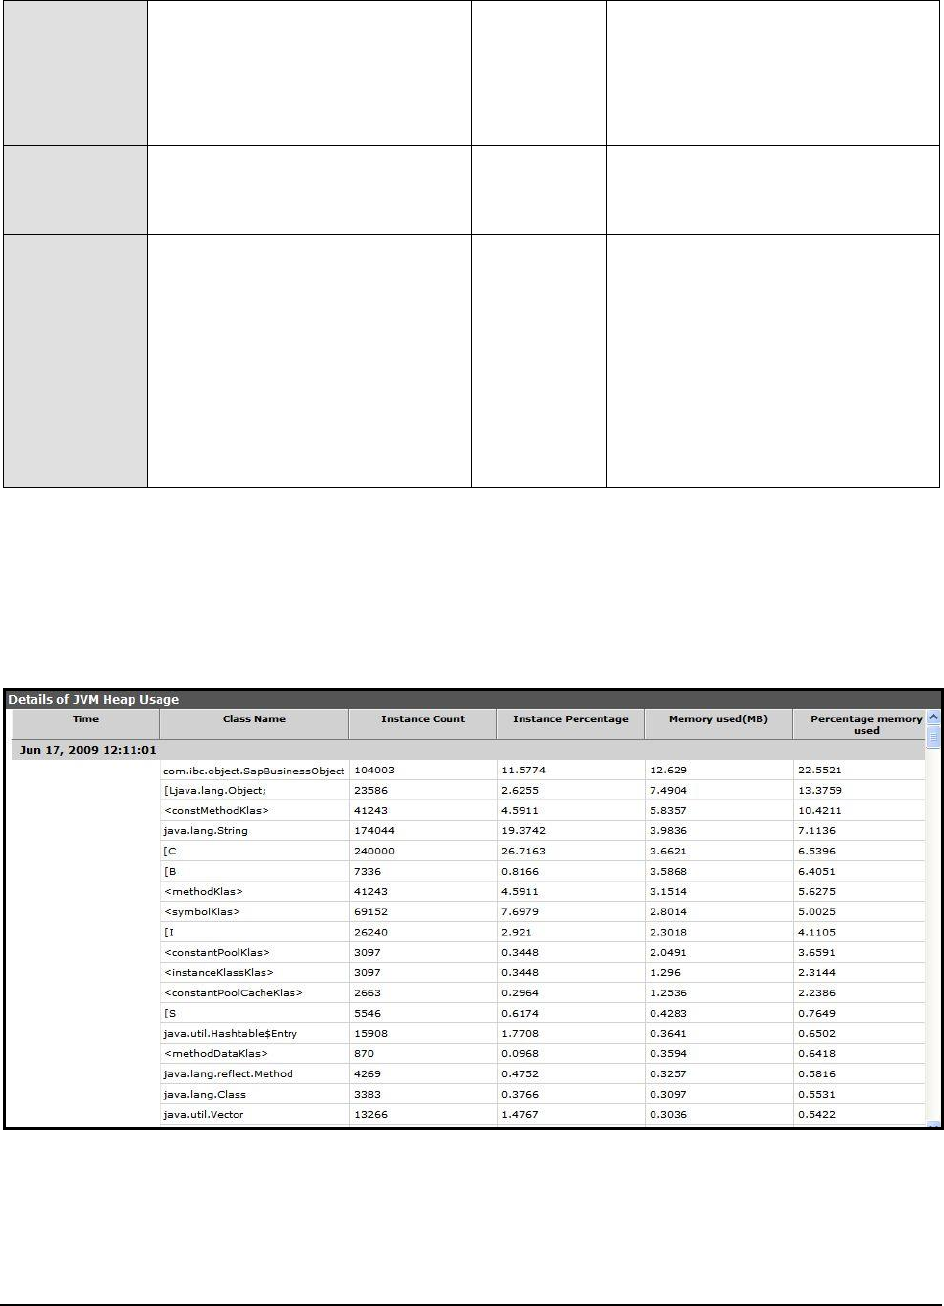
M o n i t o r i n g a J a v a A p p l i c a t i o n
73
Free memory:
Indicates the amount of memory
currently available for use by the
JVM.
MB
This is the difference between
Available memory and Used
memory.
Ideally, the value of this measure
should be high.
Max free memory:
Indicates the maximum amount of
memory allocated for the JVM.
MB
Used percentage:
Indicates the percentage of used
memory.
Percent
Ideally, the value of this measure
should be low. A very high value of
this measure could indicate excessive
memory consumption by the JVM,
which in turn, could warrant further
investigation. In such a situation, you
can take the help of the detailed
diagnosis of this measure (if enabled),
to figure out which class is using up
memory excessively.
The detailed diagnosis of the
Used memory
measure, if enabled, lists all the classes that are using the pool memory,
the amount and percentage of memory used by each class, the number of instances of each class that is currently
operational, and also the percentage of currently running instances of each class. Since this list is by default sorted in
the descending order of the percentage memory usage, the first class in the list will obviously be the leading memory
consumer.
Figure 40: The detailed diagnosis of the Used memory measure
M o n i t o r i n g a J a v a A p p l i c a t i o n
74
1.4.3 JVM Uptime Test
This test tracks the uptime of a JVM. Using information provided by this test, administrators can determine whether
the JVM was restarted. Comparing uptime across Java applications, an admin can determine the JVMs that have been
running without any restarts for the longest time.
Purpose
Tracks the uptime of a JVM
Target of the
test
A Java application
Agent
deploying the
test
An internal/remote agent

M o n i t o r i n g a J a v a A p p l i c a t i o n
75
Configurable
parameters for
the test
1. TEST PERIOD - How often should the test be executed
2. HOST - The host for which the test is to be configured
3. PORT - The port number at which the specified HOST listens
4. MODE – This test can extract metrics from the Java application using either of the
following mechanisms:
Using SNMP-based access to the Java runtime MIB statistics;
By contacting the Java runtime (JRE) of the application via JMX
To configure the test to use SNMP, select the SNMP option. On the other hand, choose the
JMX option to configure the test to use JMX instead. By default, the JMX option is chosen
here.
5. JMX REMOTE PORT – This parameter appears only if the MODE is set to JMX. Here,
specify the port at which the JMX listens for requests from remote hosts. Ensure that you
specify the same port that you configured in the
management.properties
file in the
<JAVA_HOME>\jre\lib\management folder used by the target application (see page 3).
6. USER, PASSWORD, and CONFIRM PASSWORD – These parameters appear only if the
MODE is set to JMX. If JMX requires authentication only (but no security), then ensure that
the USER and PASSWORD parameters are configured with the credentials of a user with
read-write
access to JMX. To know how to create this user, refer to Section 1.1.1.2.
Confirm the password by retyping it in the CONFIRM PASSWORD text box.
7. JNDINAME – This parameter appears only if the MODE is set to JMX. The JNDINAME is a
lookup name for connecting to the JMX connector. By default, this is
jmxrmi
. If you have
resgistered the JMX connector in the RMI registery using a different lookup name, then
you can change this default value to reflect the same.
8. SNMPPORT – This parameter appears only if the MODE is set to SNMP. Here specify the
port number through which the server exposes its SNMP MIB. Ensure that you specify the
same port you configured in the
management.properties
file in the
<JAVA_HOME>\jre\lib\management folder used by the target application (see page 15).
9. SNMPVERSION – This parameter appears only if the MODE is set to SNMP. The default
selection in the SNMPVERSION list is v1. However, for this test to work, you have to
select SNMP v2 or v3 from this list, depending upon which version of SNMP is in use in the
target environment.
10. SNMPCOMMUNITY – This parameter appears only if the MODE is set to SNMP. Here,
specify the SNMP community name that the test uses to communicate with the mail server.
The default is public. This parameter is specific to SNMP v1 and v2 only. Therefore, if the
SNMPVERSION chosen is v3, then this parameter will not appear.

M o n i t o r i n g a J a v a A p p l i c a t i o n
76
11. USERNAME – This parameter appears only when v3 is selected as the SNMPVERSION.
SNMP version 3 (SNMPv3) is an extensible SNMP Framework which supplements the
SNMPv2 Framework, by additionally supporting message security, access control, and
remote SNMP configuration capabilities. To extract performance statistics from the MIB
using the highly secure SNMP v3 protocol, the eG agent has to be configured with the
required access privileges – in other words, the eG agent should connect to the MIB using
the credentials of a user with access permissions to be MIB. Therefore, specify the name of
such a user against the USERNAME parameter.
12. AUTHPASS – Specify the password that corresponds to the above-mentioned
USERNAME. This parameter once again appears only if the SNMPVERSION selected is
v3.
13. CONFIRM PASSWORD – Confirm the AUTHPASS by retyping it here.
14. AUTHTYPE – This parameter too appears only if v3 is selected as the SNMPVERSION.
From the AUTHTYPE list box, choose the authentication algorithm using which SNMP v3
converts the specified USERNAME and PASSWORD into a 32-bit format to ensure
security of SNMP transactions. You can choose between the following options:
MD5 – Message Digest Algorithm
SHA – Secure Hash Algorithm
15. ENCRYPTFLAG – This flag appears only when v3 is selected as the SNMPVERSION. By
default, the eG agent does not encrypt SNMP requests. Accordingly, the ENCRYPTFLAG
is set to NO by default. To ensure that SNMP requests sent by the eG agent are encrypted,
select the YES option.
16. ENCRYPTTYPE – If the ENCRYPTFLAG is set to YES, then you will have to mention the
encryption type by selecting an option from the ENCRYPTTYPE list. SNMP v3 supports
the following encryption types:
DES – Data Encryption Standard
AES – Advanced Encryption Standard
17. ENCRYPTPASSWORD – Specify the encryption password here.
18. CONFIRM PASSWORD – Confirm the encryption password by retyping it here.
19. TIMEOUT - This parameter appears only if the MODE is set to SNMP. Here, specify the
duration (in seconds) within which the SNMP query executed by this test should time out in
the TIMEOUT text box. The default is 10 seconds.
M o n i t o r i n g a J a v a A p p l i c a t i o n
77
20. DATA OVER TCP – This parameter is applicable only if MODE is set to SNMP. By default,
in an IT environment, all data transmission occurs over UDP. Some environments however,
may be specifically configured to offload a fraction of the data traffic – for instance, certain
types of data traffic or traffic pertaining to specific components – to other protocols like
TCP, so as to prevent UDP overloads. In such environments, you can instruct the eG agent
to conduct the SNMP data traffic related to the equalizer over TCP (and not UDP). For this,
set the DATA OVER TCP flag to Yes. By default, this flag is set to No.
21. DD FREQUENCY - Refers to the frequency with which detailed diagnosis measures are to
be generated for this test. The default is
1:1
. This indicates that, by default, detailed
measures will be generated every time this test runs, and also every time the test detects
a problem. You can modify this frequency, if you so desire. Also, if you intend to disable
the detailed diagnosis capability for this test, you can do so by specifying
none
against DD
FREQUENCY.
22. DETAILED DIAGNOSIS - To make diagnosis more efficient and accurate, the eG
Enterprise suite embeds an optional detailed diagnostic capability. With this capability, the
eG agents can be configured to run detailed, more elaborate tests as and when specific
problems are detected. To enable the detailed diagnosis capability of this test for a
particular server, choose the On option. To disable the capability, click on the Off option.
The option to selectively enable/disable the detailed diagnosis capability will be available
only if the following conditions are fulfilled:
The eG manager license should allow the detailed diagnosis capability
Both the normal and abnormal frequencies configured for the detailed diagnosis
measures should not be 0.
Outputs of the
test
One set of results for every Java application monitored
Measurements
made by the
Measurement
Measurement
Unit
Interpretation
M o n i t o r i n g a J a v a A p p l i c a t i o n
78
test
Has JVM been restarted?:
Indicates whether or not the JVM has
restarted during the last
measurement period.
If the value of this measure is
No
, it
indicates that the JVM has not
restarted. The value
Yes
on the other
hand implies that the JVM has indeed
restarted.
The numeric values that correspond to
the restart states discussed above are
listed in the table below:
State
Value
Yes
1
No
0
Note:
By default, this measure reports the
value
Yes
or
No
to indicate whether a
JVM has restarted. The graph of this
measure however, represents the
same using the numeric equivalents –
0
or
1
.
Uptime during the last measure
period:
Indicates the time period that the
JVM has been up since the last time
this test ran.
Secs
If the JVM has not been restarted
during the last measurement period
and the agent has been running
continuously, this value will be equal
to the measurement period. If the JVM
was restarted during the last
measurement period, this value will be
less than the measurement period of
the test. For example, if the
measurement period is 300 secs, and
if the JVM was restarted 120 secs
back, this metric will report a value of
120 seconds. The accuracy of this
metric is dependent on the
measurement period – the smaller the
measurement period, greater the
accuracy.
Total uptime of the JVM:
Indicates the total time that the JVM
has been up since its last reboot.
Secs
Administrators may wish to be alerted
if a JVM has been running without a
reboot for a very long period. Setting a
threshold for this metric allows
administrators to determine such
conditions.
1.4.4 JVM Leak Suspects Test
Java implements automatic garbage collection (GC); once you stop using an object, you can depend on the garbage
collector to collect it. To stop using an object, you need to eliminate all references to it. However, when a program
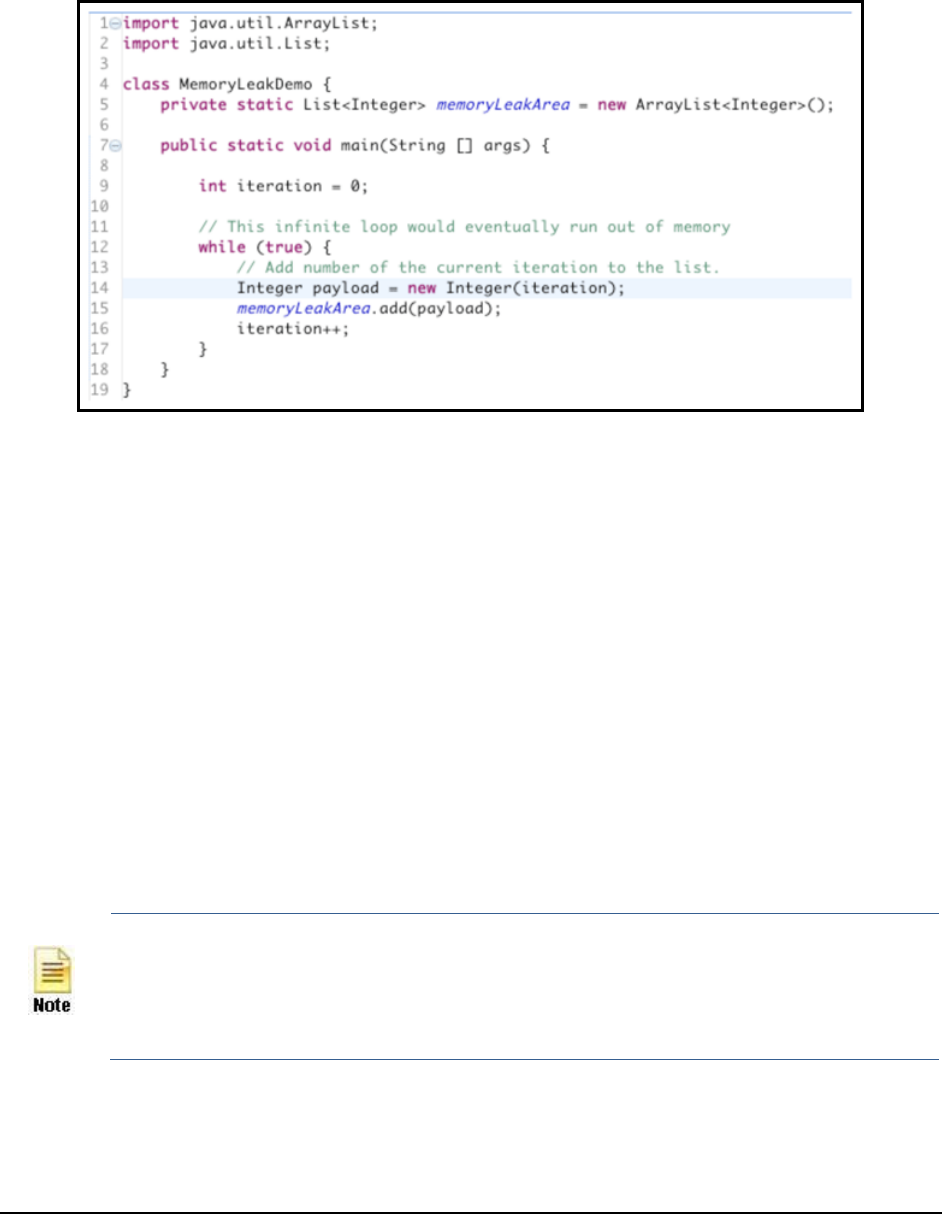
M o n i t o r i n g a J a v a A p p l i c a t i o n
79
never stops using an object by keeping a permanent reference to it, memory leaks occur. For example, let’s consider
the piece of code below:
Figure 41: A sample code
In the example above, we continue adding new elements to the list memoryLeakArea without ever removing
them. In addition, we keep references to the memoryLeakArea, thereby preventing GC from collecting the list
itself. So although there is GC available, it cannot help because we are still using memory. The more time passes the
more memory we use, which in effect requires an infinite amount memory for this program to continue running.
When no more memory is remaining, an OutOfMemoryError alert will be thrown and generate an exception like this:
Exception in thread "main" java.lang.OutOfMemoryError: Java heap space at
MemoryLeakDemo.main(MemoryLeakDemo.java:14)
Typically, such alerts signal a potential memory leak!
A memory leak can diminish the performance of your mission-critical Java applications by reducing the amount of
available memory. Eventually, in the worst case, it may cause the application to crash due to thrashing. To avert
such unwarranted application failures, it is imperative that memory leaks are detected at the earliest and the objects
responsible for them accurately isolated. This is where, the JVM Leak Suspects
test helps! This test continuously
monitors the JVM heap usage and promptly alerts administrators when memory usage crosses a configured limit. The
detailed diagnostics of the test will then lead you to the classes that are consuming memory excessively, thereby
pointing you to those classes that may have caused the leak.
This test will work only if the monitored Java application uses JRE 1.6 or higher.
M o n i t o r i n g a J a v a A p p l i c a t i o n
80
This test is disabled by default. To enable the test, follow the Agents -> Tests -> Enable/Disable menu sequence.
Select
Java application
as the Component type and
Performance
as the Test type. From the DISABLED TESTS list, pick
this test and click the Enable button to enable it.
Purpose
Continuously monitors the JVM heap usage and promptly alerts administrators when memory
usage crosses a configured limit
Target of the
test
A Java application
Agent
deploying the
test
An internal/remote agent

M o n i t o r i n g a J a v a A p p l i c a t i o n
81
Configurable
parameters for
the test
1. TEST PERIOD - How often should the test be executed
2. HOST - The host for which the test is to be configured
3. PORT - The port number at which the specified HOST listens
4. MODE – This test can extract metrics from the Java application using either of the
following mechanisms:
Using SNMP-based access to the Java runtime MIB statistics;
By contacting the Java runtime (JRE) of the application via JMX
To configure the test to use SNMP, select the SNMP option. On the other hand, choose the
JMX option to configure the test to use JMX instead. By default, the JMX option is chosen
here.
5. JMX REMOTE PORT – This parameter appears only if the MODE is set to JMX. Here,
specify the port at which the JMX listens for requests from remote hosts. Ensure that you
specify the same port that you configured in the
management.properties
file in the
<JAVA_HOME>\jre\lib\management folder used by the target application (see page 3).
6. USER, PASSWORD, and CONFIRM PASSWORD – These parameters appear only if the
MODE is set to JMX. If JMX requires authentication only (but no security), then ensure that
the USER and PASSWORD parameters are configured with the credentials of a user with
read-write
access to JMX. To know how to create this user, refer to Section 1.1.1.2.
Confirm the password by retyping it in the CONFIRM PASSWORD text box.
7. JNDINAME – This parameter appears only if the MODE is set to JMX. The JNDINAME is a
lookup name for connecting to the JMX connector. By default, this is
jmxrmi
. If you have
resgistered the JMX connector in the RMI registery using a different lookup name, then
you can change this default value to reflect the same.
8. SNMPPORT – This parameter appears only if the MODE is set to SNMP. Here specify the
port number through which the server exposes its SNMP MIB. Ensure that you specify the
same port you configured in the
management.properties
file in the
<JAVA_HOME>\jre\lib\management folder used by the target application (see page 15).
9. SNMPVERSION – This parameter appears only if the MODE is set to SNMP. The default
selection in the SNMPVERSION list is v1. However, for this test to work, you have to
select SNMP v2 or v3 from this list, depending upon which version of SNMP is in use in the
target environment.
10. SNMPCOMMUNITY – This parameter appears only if the MODE is set to SNMP. Here,
specify the SNMP community name that the test uses to communicate with the mail server.
The default is public. This parameter is specific to SNMP v1 and v2 only. Therefore, if the
SNMPVERSION chosen is v3, then this parameter will not appear.

M o n i t o r i n g a J a v a A p p l i c a t i o n
82
11. USERNAME – This parameter appears only when v3 is selected as the SNMPVERSION.
SNMP version 3 (SNMPv3) is an extensible SNMP Framework which supplements the
SNMPv2 Framework, by additionally supporting message security, access control, and
remote SNMP configuration capabilities. To extract performance statistics from the MIB
using the highly secure SNMP v3 protocol, the eG agent has to be configured with the
required access privileges – in other words, the eG agent should connect to the MIB using
the credentials of a user with access permissions to be MIB. Therefore, specify the name of
such a user against the USERNAME parameter.
12. AUTHPASS – Specify the password that corresponds to the above-mentioned
USERNAME. This parameter once again appears only if the SNMPVERSION selected is
v3.
13. CONFIRM PASSWORD – Confirm the AUTHPASS by retyping it here.
14. AUTHTYPE – This parameter too appears only if v3 is selected as the SNMPVERSION.
From the AUTHTYPE list box, choose the authentication algorithm using which SNMP v3
converts the specified USERNAME and PASSWORD into a 32-bit format to ensure
security of SNMP transactions. You can choose between the following options:
MD5 – Message Digest Algorithm
SHA – Secure Hash Algorithm
15. ENCRYPTFLAG – This flag appears only when v3 is selected as the SNMPVERSION. By
default, the eG agent does not encrypt SNMP requests. Accordingly, the ENCRYPTFLAG
is set to NO by default. To ensure that SNMP requests sent by the eG agent are encrypted,
select the YES option.
16. ENCRYPTTYPE – If the ENCRYPTFLAG is set to YES, then you will have to mention the
encryption type by selecting an option from the ENCRYPTTYPE list. SNMP v3 supports
the following encryption types:
DES – Data Encryption Standard
AES – Advanced Encryption Standard
17. ENCRYPTPASSWORD – Specify the encryption password here.
18. CONFIRM PASSWORD – Confirm the encryption password by retyping it here.
19. TIMEOUT - This parameter appears only if the MODE is set to SNMP. Here, specify the
duration (in seconds) within which the SNMP query executed by this test should time out in
the TIMEOUT text box. The default is 10 seconds.
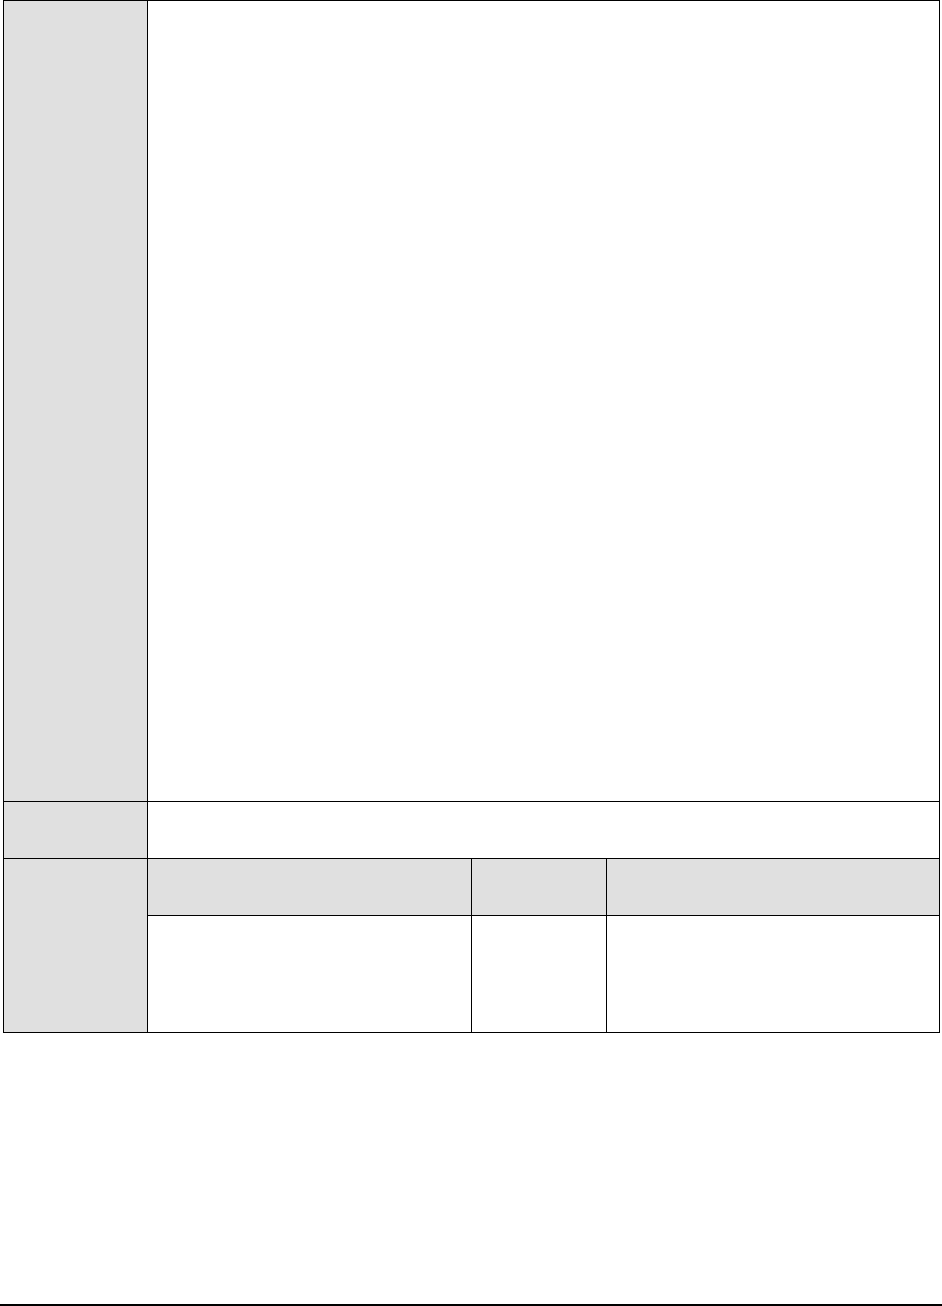
M o n i t o r i n g a J a v a A p p l i c a t i o n
83
20. PCT HEAP LIMIT - This test counts all those classes that are consuming memory beyond
the limit (in percentage) specified against PCT HEAP LIMIT as ‘memory leak suspects’.
This count is reported as the value of the
Leak suspect classes
measure. By default, 30
(%) is the PCT HEAP LIMIT. This implies that the test, by default, reports each class that
consumes over 30% of the
Allocated heap memory
as a
Leak suspect class
. Such classes
are listed as part of detailed diagnostics.
21. DATA OVER TCP – This parameter is applicable only if MODE is set to SNMP. By default,
in an IT environment, all data transmission occurs over UDP. Some environments however,
may be specifically configured to offload a fraction of the data traffic – for instance, certain
types of data traffic or traffic pertaining to specific components – to other protocols like
TCP, so as to prevent UDP overloads. In such environments, you can instruct the eG agent
to conduct the SNMP data traffic related to the equalizer over TCP (and not UDP). For this,
set the DATA OVER TCP flag to Yes. By default, this flag is set to No.
22. DD FREQUENCY - Refers to the frequency with which detailed diagnosis measures are to
be generated for this test. The default is
1:1
. This indicates that, by default, detailed
measures will be generated every time this test runs, and also every time the test detects
a problem. You can modify this frequency, if you so desire. Also, if you intend to disable
the detailed diagnosis capability for this test, you can do so by specifying
none
against DD
FREQUENCY.
23. DETAILED DIAGNOSIS - To make diagnosis more efficient and accurate, the eG
Enterprise suite embeds an optional detailed diagnostic capability. With this capability, the
eG agents can be configured to run detailed, more elaborate tests as and when specific
problems are detected. To enable the detailed diagnosis capability of this test for a
particular server, choose the On option. To disable the capability, click on the Off option.
The option to selectively enable/disable the detailed diagnosis capability will be available
only if the following conditions are fulfilled:
The eG manager license should allow the detailed diagnosis capability
Both the normal and abnormal frequencies configured for the detailed diagnosis
measures should not be 0.
Outputs of the
test
One set of results for every Java application monitored
Measurements
made by the
test
Measurement
Measurement
Unit
Interpretation
Allocated Heap Memory:
Indicates the total amount of memory
space occupied by the objects that
are currently loaded on to the JVM.
MB
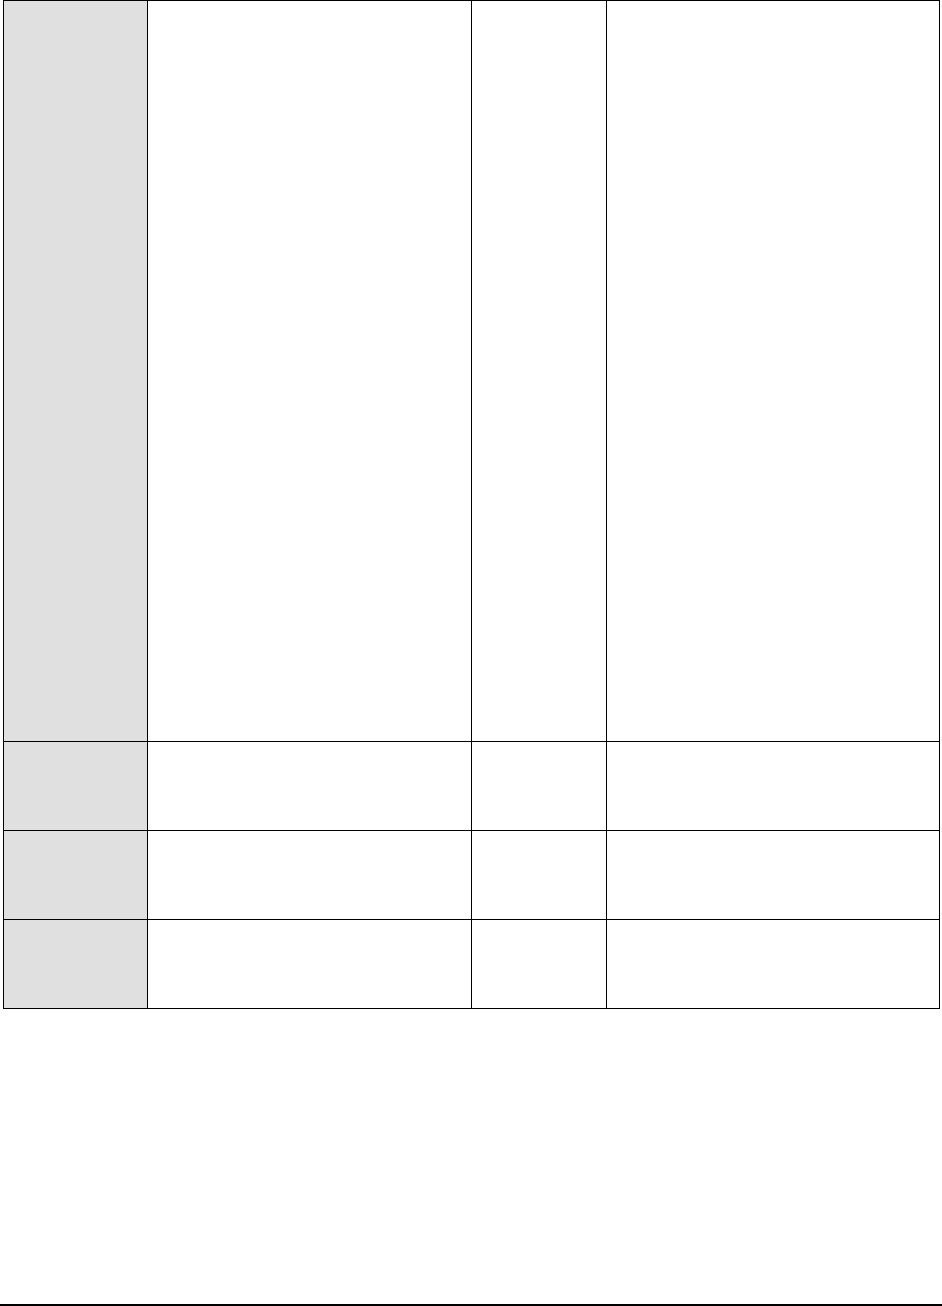
M o n i t o r i n g a J a v a A p p l i c a t i o n
84
Leak suspected classes:
Indicates the number of classes that
are memory leak suspects.
Number
Use the detailed diagnosis of this
measure to know which classes are
using more memory than the
configured PCT HEAP LIMIT.
Remember that all applications/classes
that throw
OutofMemory
exceptions
need not be guilty of leaking memory.
Such an exception can occur even if a
class requires more memory for
normal functioning. To distinguish
between a memory leak and an
application that simply needs more
memory, we need to look at the "peak
load" concept. When program has just
started no users have yet used it, and
as a result it typically needs much less
memory then when thousands of users
are interacting with it. Thus,
measuring memory usage immediately
after a program starts is not the best
way to gauge how much memory it
needs! To measure how much memory
an application needs, memory size
measurements should be taken at the
time of peak load—when it is most
heavily used. Therefore, it is good
practice to check the memory usage of
the ‘suspected classes’ at the time of
peak load to determine whether they
are indeed leaking memory or not.
Number of objects:
Indicates the number of objects
present in the JVM.
Number
Use the detailed diagnosis of this
measure to view the top-20 classes in
the JVM in terms of memory usage.
Number of classes:
Indicates the number of classes
currently present in the JVM.
Number
Number of class loaders:
Indicates the number of class loaders
currently present in the JVM.
Number
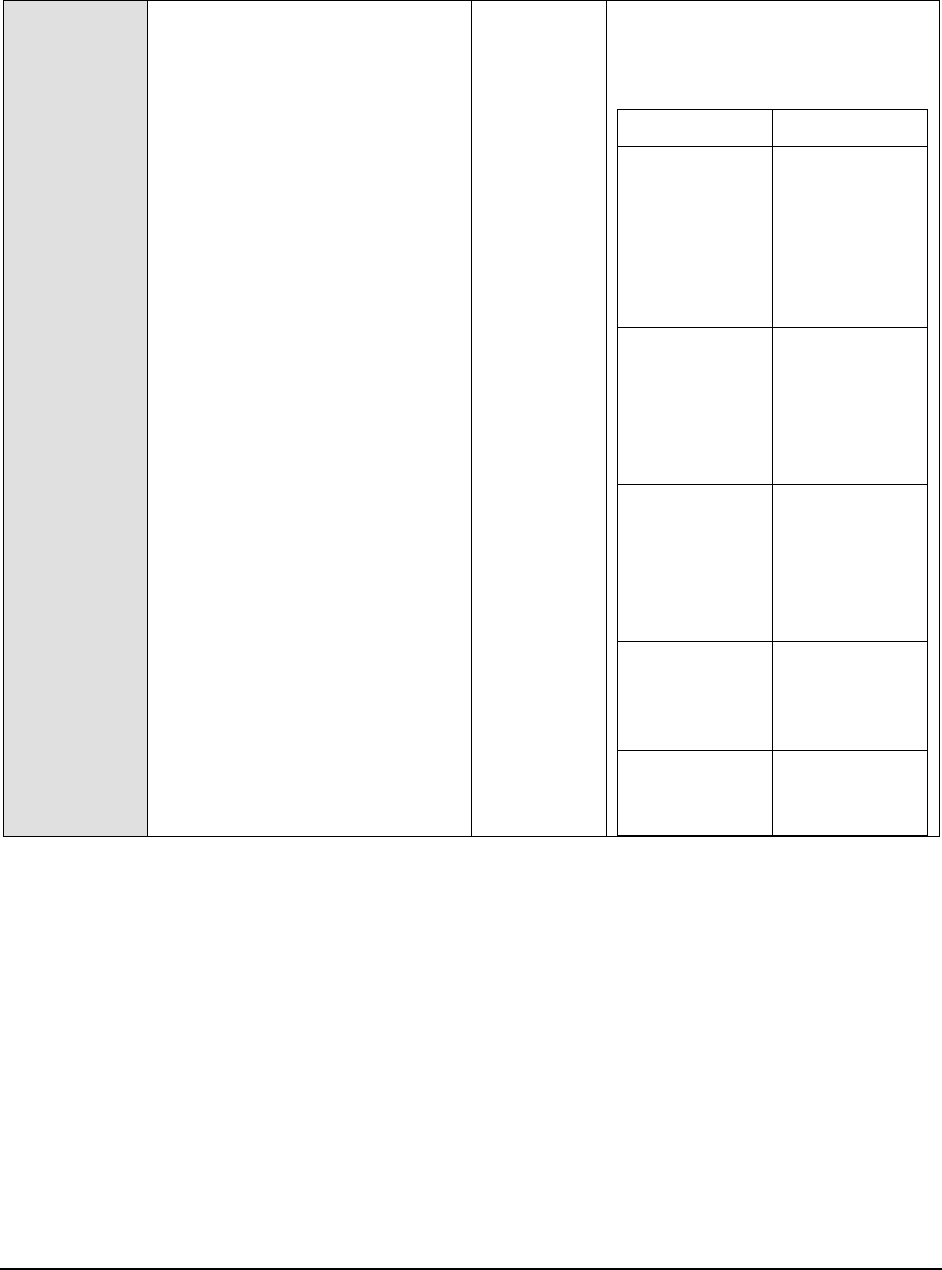
M o n i t o r i n g a J a v a A p p l i c a t i o n
85
Number of GC roots:
Indicate the number of GC roots
currently present in the JVM.
Number
A garbage collection root is an object
that is accessible from outside the
heap. The following reasons make
an object a GC root:
Reason
Description
System Class
Class loaded by
bootstrap/syste
m class loader.
For example,
everything from
the rt.jar
like java.util.
JNI Local
Local variable in
native code,
such as user
defined JNI
code or JVM
internal code
JNI Global
Global variable
in native code,
such as user
defined JNI
code or JVM
internal code
Thread Block
Object referred
to from a
currently active
thread block
Thread
A started, but
not stopped,
thread
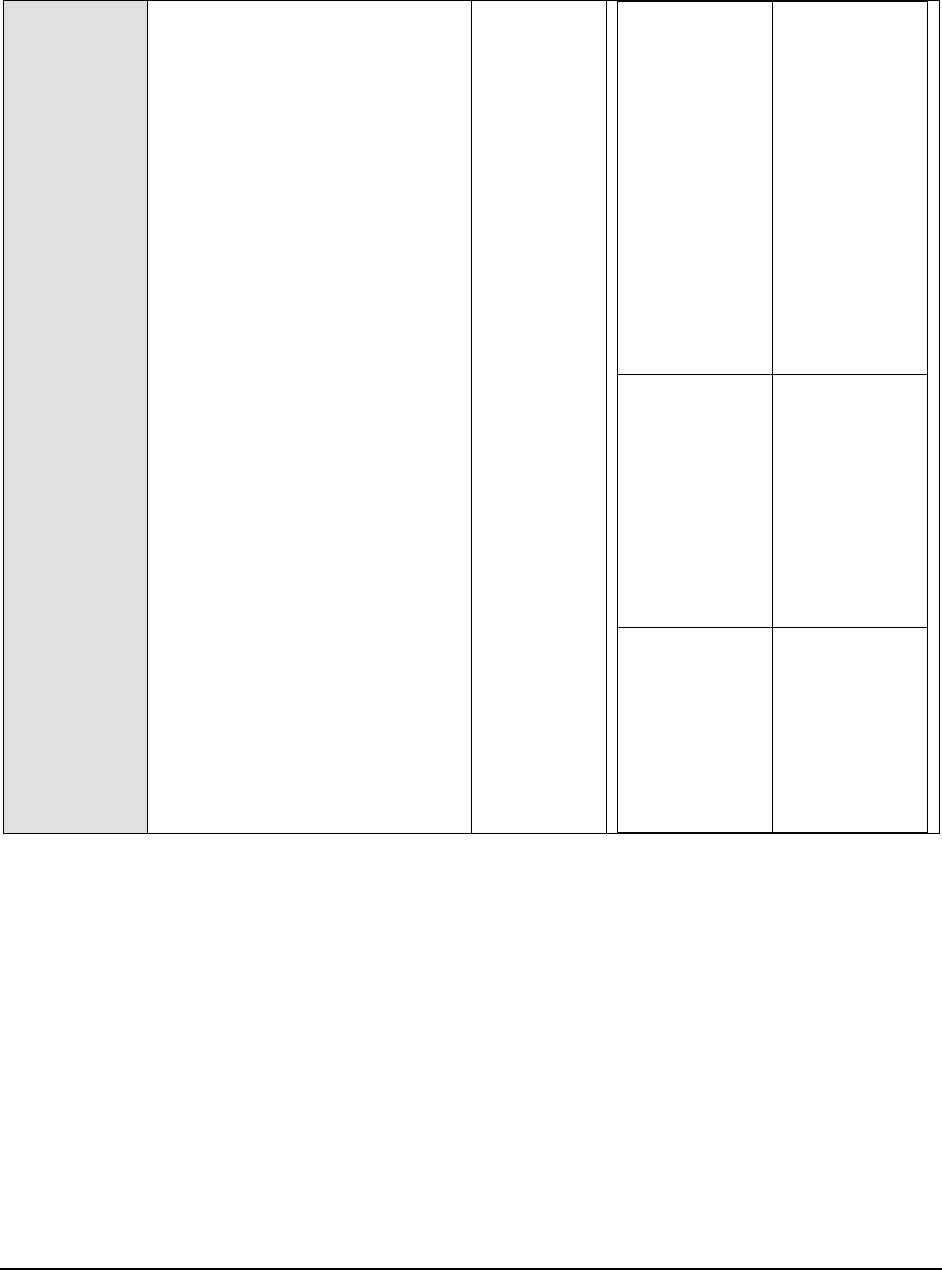
M o n i t o r i n g a J a v a A p p l i c a t i o n
86
Busy Monitor
Everything that
has
called wait() or
notify() or that
is synchronized.
For example, by
calling synchro
nized(Object)
or by entering a
synchronized
method. Static
method means
class, non-static
method means
object
Java Local
Local variable.
For example,
input
parameters or
locally created
objects of
methods that
are still in the
stack of a
thread.
Native Stack
In or out
parameters in
native code,
such as user
defined JNI
code or JVM
internal code. or
reflection.
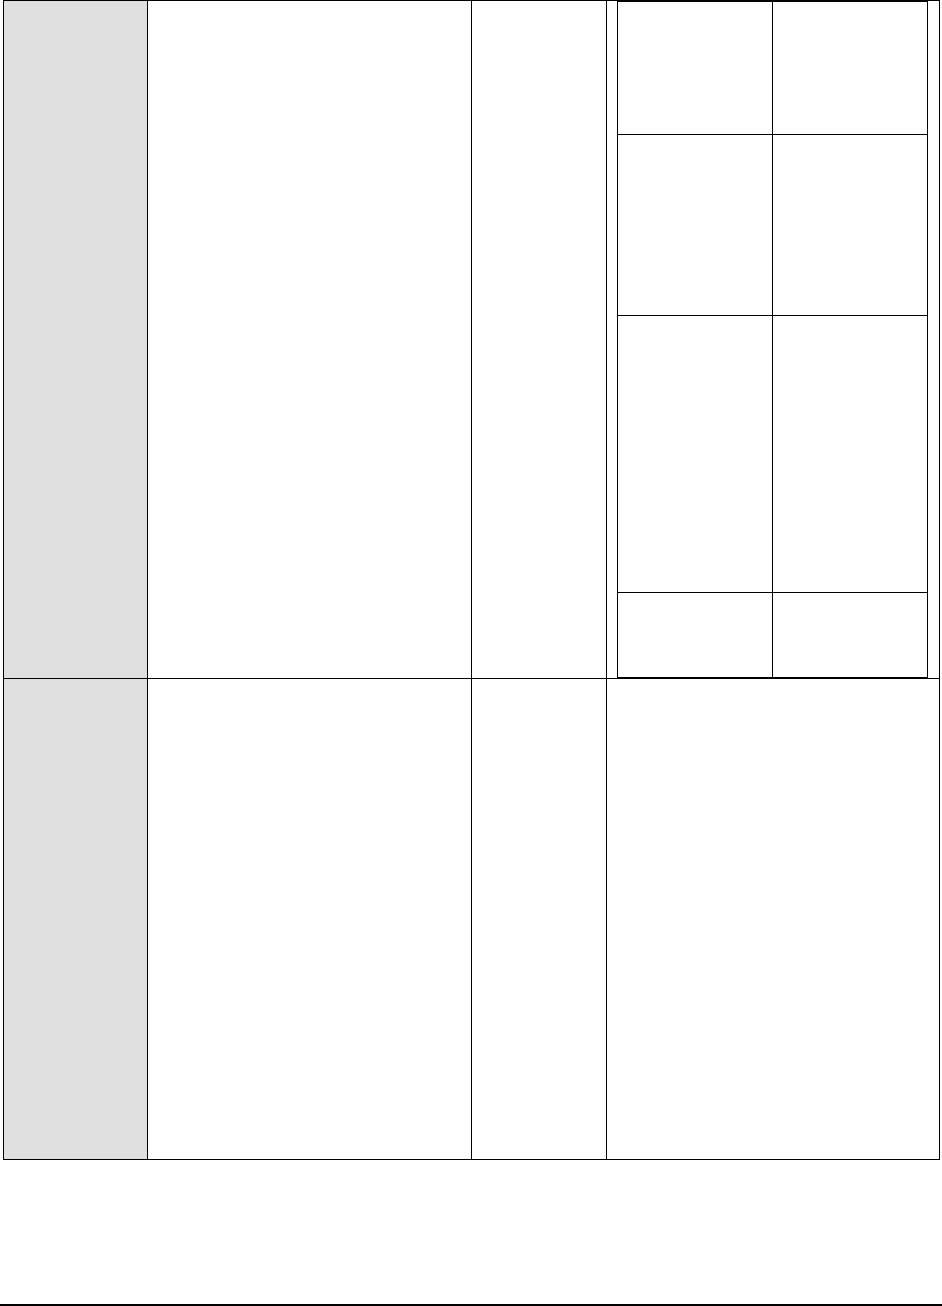
M o n i t o r i n g a J a v a A p p l i c a t i o n
87
Finalizer
An object which
is in a queue
awaiting its
finalizer to be
run.
Unfinalized
An object which
has a finalize
method, but has
not been
finalized and is
not yet on the
finalizer queue.
Unreachable
An object which
is unreachable
from any other
root, but has
been marked as
a root by MAT
to retain objects
which otherwise
would not be
included in the
analysis.
Unknown
An object of
unknown root
type.
Objects pending for finalization:
Indicates the number of objects that
are pending for finalization.
Number
Sometimes an object will need to
perform some action when it is
destroyed. For example, if an object is
holding some non-java resource such
as a file handle or window character
font, then you might want to make
sure these resources are freed before
an object is destroyed. To handle such
situations, Java provides a mechanism
called finalization. By using finalization,
you can define specific actions that will
occur when an object is just about to
be reclaimed by the garbage collector.
A high value for this measure indicates
the existence of many objects that are
still occupying the JVM memory space
and are unable to be reclaimed by GC.
A consistent rise in this value is also a
sign of a memory leak.
The detailed diagnosis of the
Leak suspected classes
measure lists the names of all classes for which the memory
usage is over the configured PCT HEAP LIMIT. In addition, the detailed diagnosis also reveals the PERCENTAGE
RETAINED HEAP of each class - this is the percentage of the total
Allocated heap size
that is used by every class. From
this, you can easily infer which class is consuming the maximum memory, and is hence, the key memory leak
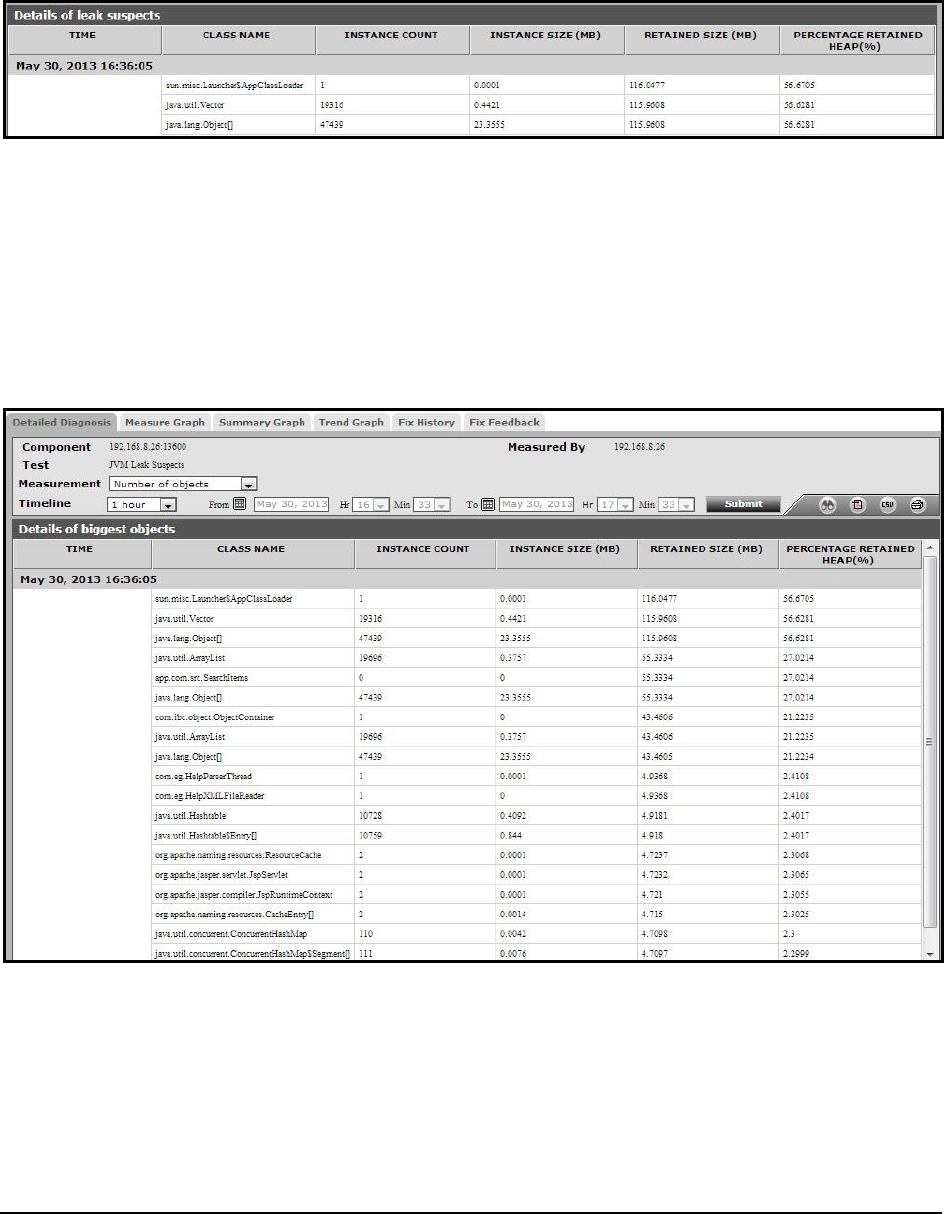
M o n i t o r i n g a J a v a A p p l i c a t i o n
88
suspect. By observing the memory usage of this class during times of peak load, you can corroborate eG’s findings -
i.e., you can know for sure whether that class is indeed leaking memory or not!
Figure 42: The detailed diagnosis of the Leak suspect classes measure
The detailed diagnosis of the
Number of objects
measure lists the names of the top-20 classes in the JVM, in terms
of memory usage. In addition, the detailed diagnosis also reveals the PERCENTAGE RETAINED HEAP of each class - this
is the percentage of the total
Allocated heap size
that is used by every class. From this, you can easily infer which
class is consuming the maximum memory, and is hence, the key memory leak suspect. By observing the memory
usage of this class during times of peak load, you can corroborate eG’s findings - i.e., you can know for sure whether
that class is indeed leaking memory or not!
Figure 43: The detailed diagnosis of the Number of objects measure
1.5 What the eG Enterprise Java Monitor Reveals?
This section discusses how administrators can effortlessly and accurately diagnose the root-cause of issues
experienced by Java applications, using thclasse eG JVM Monitor. Each of the sub-sections that follow take the case
of a sample application problem, and illustrates the steps to be followed to troubleshoot the problem in the eG
monitoring console.
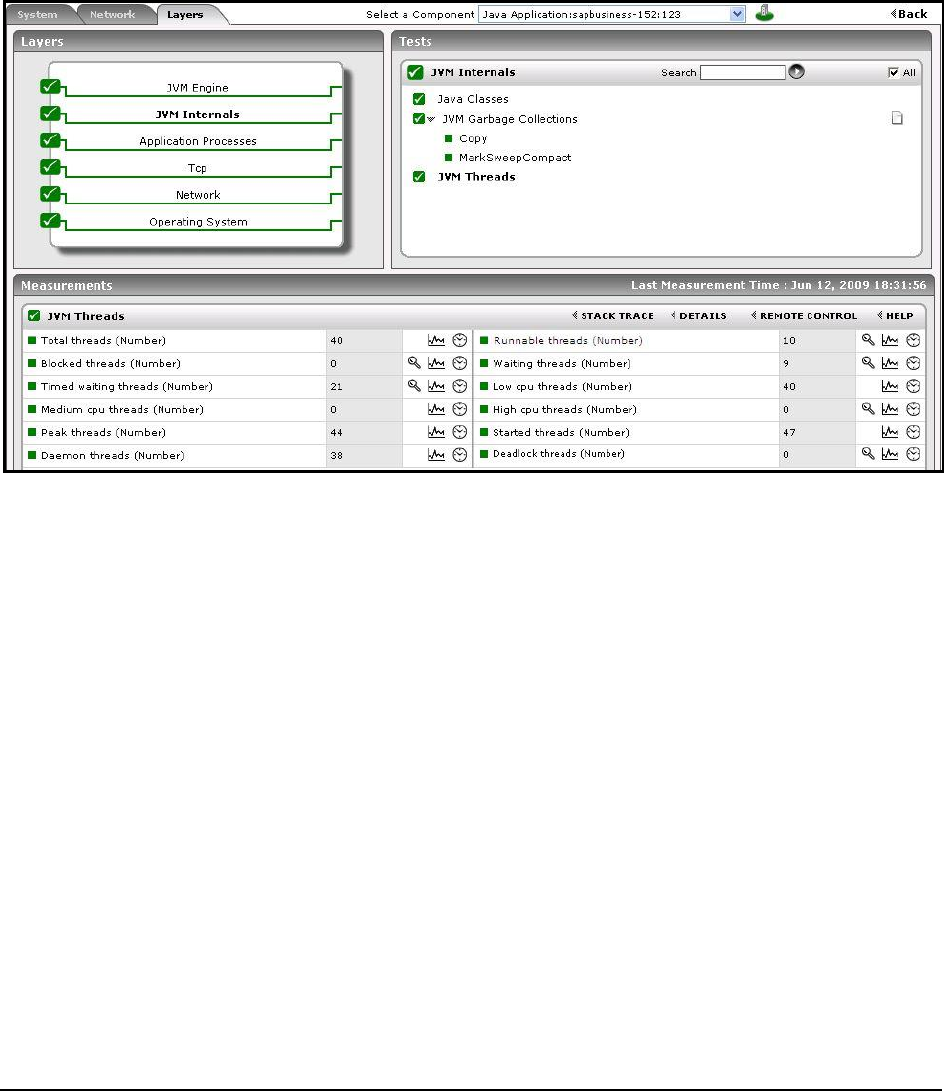
M o n i t o r i n g a J a v a A p p l i c a t i o n
89
1.5.1 Identifying and Diagnosing a CPU Issue in the JVM
In this section, let us consider the case of the Java application,
sapbusiness-152:123
, which is being monitored by eG
Enterprise. Assume that this application is running on a Tomcat server.
Initially, the application was functioning normally, as indicated by Figure 44. There are no high CPU threads.
Figure 44: The Java application being monitored functioning normally
Now, assume that suddenly, one of the threads executed by the application starts to run abnormally, consuming
excessive CPU resources. This is indicated by a change in the value of the
High cpu threads
measure reported by the
JVM Threads test mapped to the JVM Internals layer of the
Java Application
monitoring model (see Figure 44). As you
can see, as long as the
sapbusiness
application was performing well, the value of the
High cpu threads
measure was
0 (see Figure 44). However, as soon as a thread began exhibiting abnormal CPU usage trends, the value changed to
1 (see Figure 45).
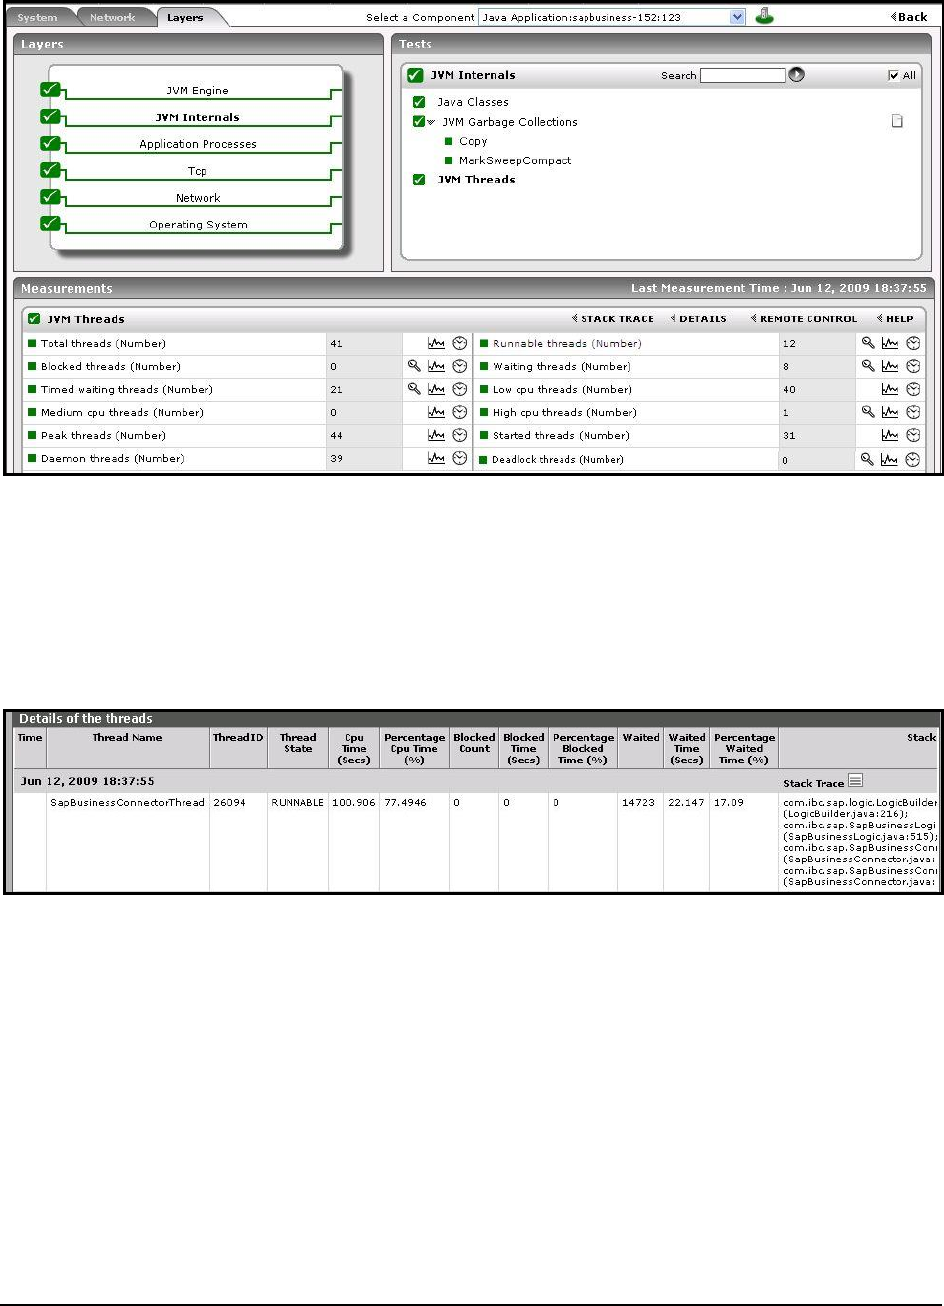
M o n i t o r i n g a J a v a A p p l i c a t i o n
90
Figure 45: The High cpu threads measure indicating that a single thread is consuming CPU excessively
To know which thread is consuming too much CPU, click on the DIAGNOSIS icon (i.e., the magnifying glass icon)
corresponding to the
High cpu threads
measure in Figure 45. Figure 46 then appears revealing the name of the CPU-
intensive thread (
SapBusinessConnectorThread
)
and the percentage of CPU used by the thread during the last
measurement period. In addition, Figure 46 also reveals the number of times the thread was blocked, the total
duration of the blocks, the number of times the thread was in waiting, and the percentage of time waited, thereby
revealing how resource-intensive the thread has been during the last measurement period.
Figure 46: The detailed diagnosis of the High cpu threads measure
Let us now get back to the CPU usage issue. Now that we know which thread is causing the CPU usage spike, we
next need to determine what is causing this thread to erode the CPU resources. To facilitate this analysis, the
detailed diagnosis page of Figure 46 also provides the Stack Trace for the thread. You might have to scroll left to
view the complete Stack Trace of the thread (see Figure 47).
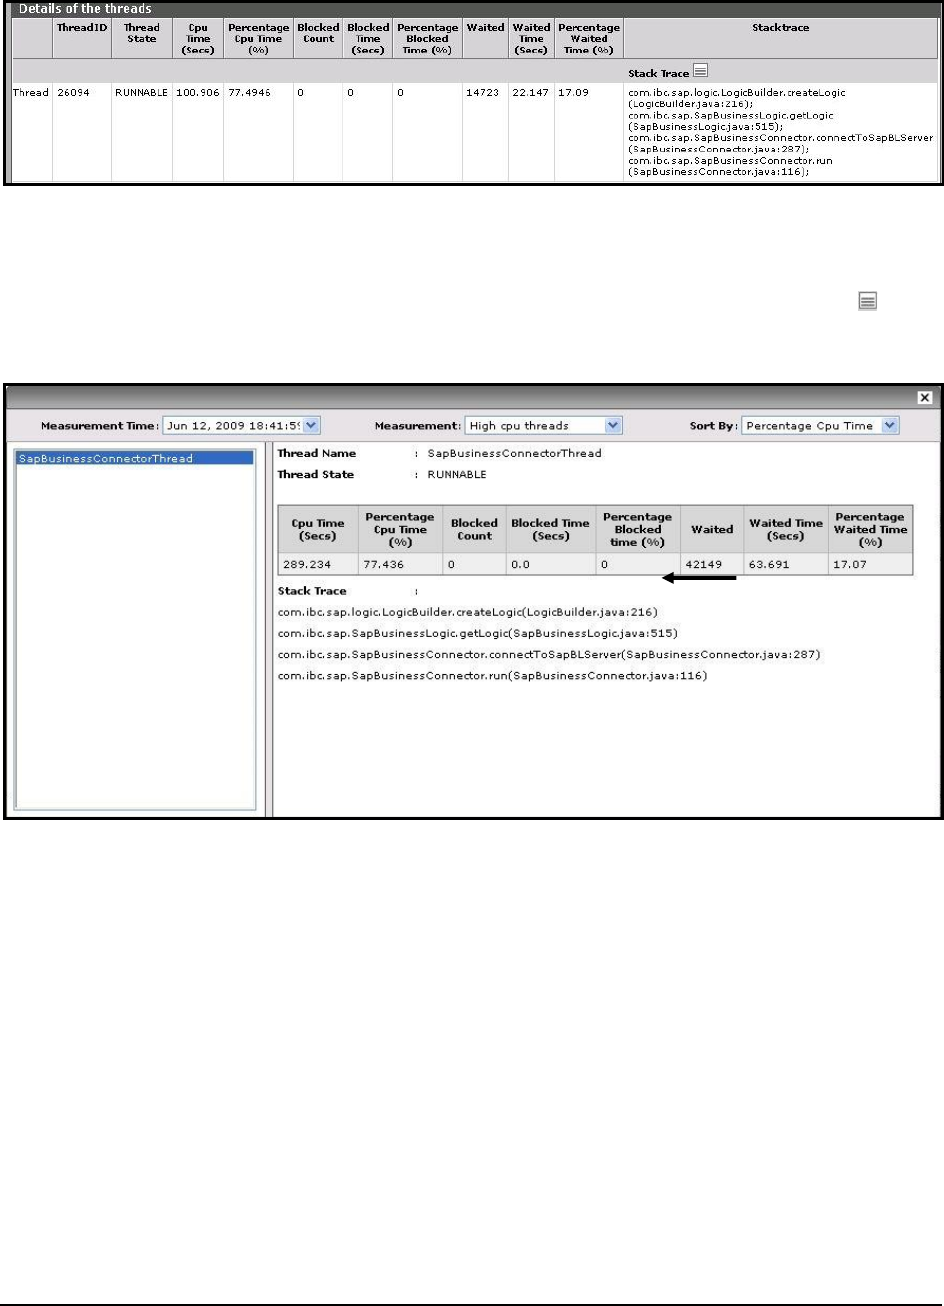
M o n i t o r i n g a J a v a A p p l i c a t i o n
91
Figure 47: Viewing the stack trace as part of the detailed diagnosis of the High cpu threads measure
The stack trace is useful in determining exactly which line of code the thread was executing when we took the last
diagnosis snapshot and what was the code execution path that the thread had taken.
To view the stack trace of the CPU-intensive thread more clearly and to analyze it closely, click on the icon in
Figure 47 or the Stack Trace label adjacent to the icon. Figure 48 then appears.
Figure 48: Stack trace of the CPU-intensive thread
As you can see, Figure 48 provides two panels. The left panel of Figure 48, by default, displays all the high CPU-
consuming threads sorted in the descending order of their CPU usage. Accordingly, the High cpu threads measure is
chosen by default from the Measurement list, and the Percentage Cpu Time is the default selection in the Sort By list
in Figure 48. These default selections can however be changed by picking a different option from the Measurement
and Sort By lists.
The right panel on the other hand, typically displays the current state, overall resource usage, and the Stack Trace
for the thread chosen from the left panel. By default however, the right panel provides the stack trace for the leading
CPU consumer.
In the case of our example, since only a single thread is currently utilizing CPU excessively, the name of that thread
(i.e,
SapBusinessConnectorThread
)
alone will appear in the left panel of Figure 48. The right panel too therefore, will
display the details of the
SapBusinessConnectorThread
only. Let us begin to analyze the Stack Trace of this thread
carefully.
Stack trace information should always be viewed in a top-down manner. The method most likely to be the cause of
the problem is the one on top. In the example of Figure 48, this is
com.ibc.sap.logic.LogicBuilder.createLogic
. The
line of code that was executed last when the snapshot was taken is within the
createLogic
method of the
com.ibc.sap.logic.LogicBuilder
class. This is line number 216 of the
LogicBuilder.java
source file.
The subsequent lines
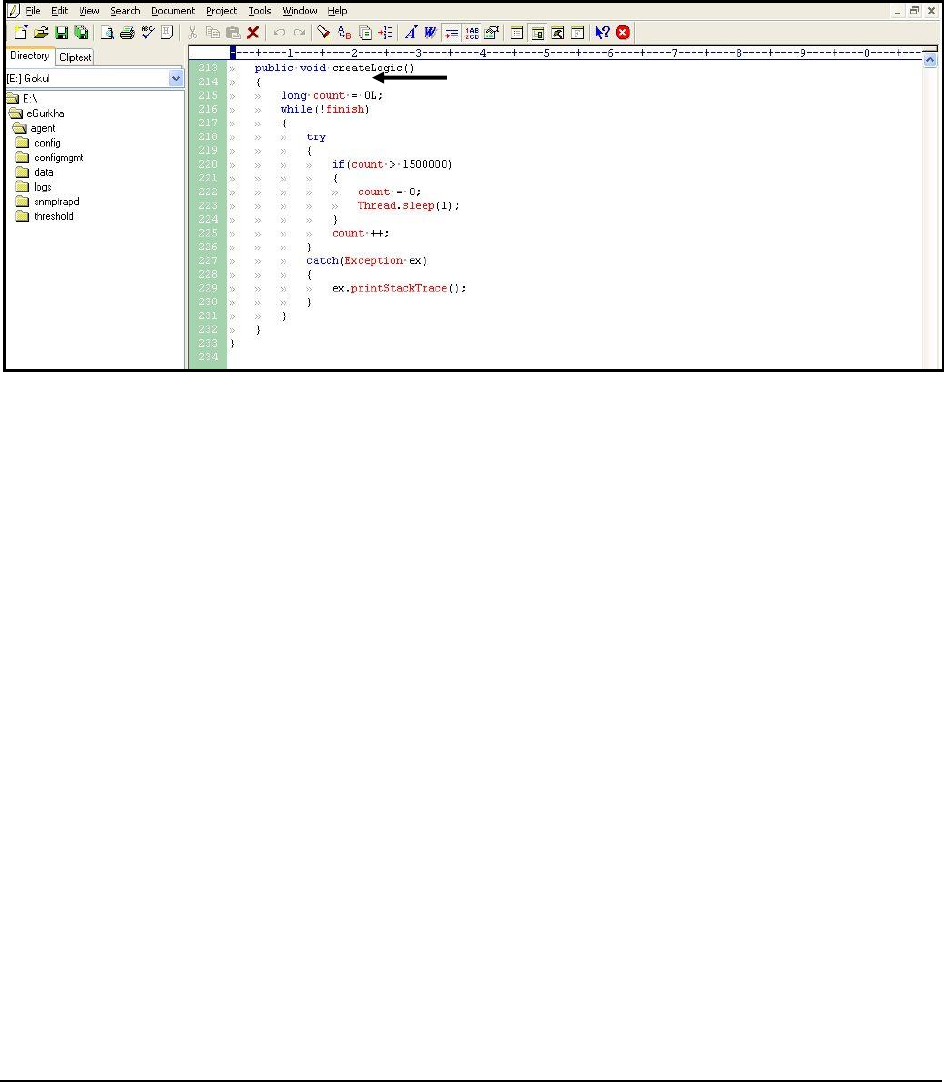
M o n i t o r i n g a J a v a A p p l i c a t i o n
92
of the stack trace indicate the sequence of method calls that resulted in
com.ibc.sap.logic.LogicBuilder.createLogic
being invoked. In this example,
com.ibc.sap.logic.LogicBuilder.createLogic
has been invoked from the method
com.ibc.sap.SapBusinessLogic.getLogic.
This invocation has been done by line 515 of
SapBusinessLogic.java
source
file.
To verify if the stack trace is correct in identifying the exact line of the source code that is responsible for the sudden
increase in CPU consumption by the
SapBusinessConnectorThread
, let us review the LogicBuilder.java file in an editor
(see Figure 49).
Figure 49: The LogicBuilder.java file
Figure 49 indicates line 216 of the LogicBuilder.java file. At this line, a
while
loop seems to have been initiated. This
code is supposed to loop 1,500,000 times and then sleep waiting for count to decrease. Instead, a problem in the
code – the value of count being reset to 0 at line 222 - is causing the while loop to execute forever, thereby resulting
in one of the threads in the JVM taking a lot of CPU. Deleting the code at line 222 would solve this problem. Once
this is done, then the
SapConnectorThread
will no longer consume too much CPU; this in turn will decrement the
value of the
High Cpu threads
measure by 1 (see Figure 50).
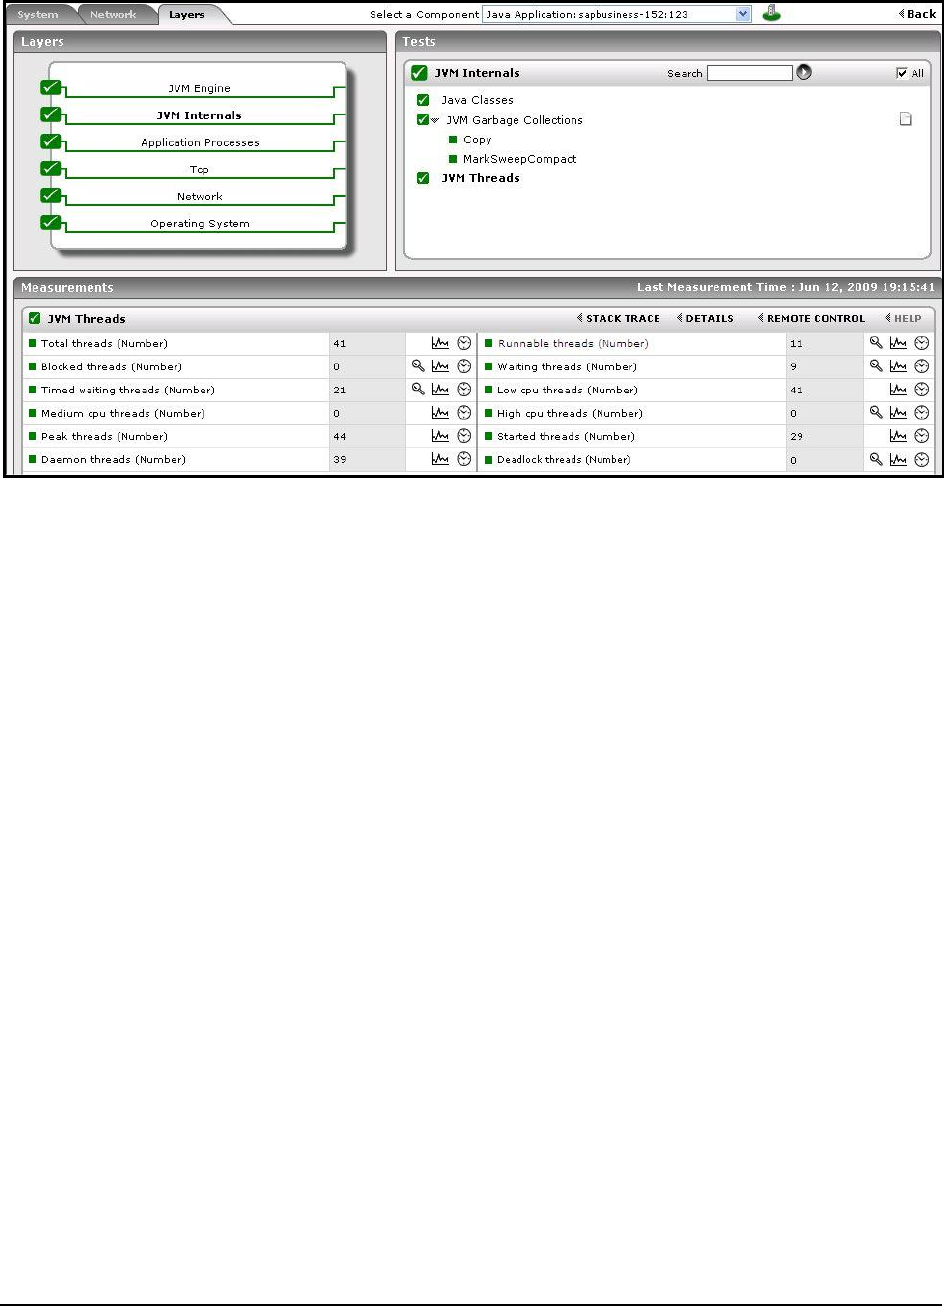
M o n i t o r i n g a J a v a A p p l i c a t i o n
93
Figure 50: The High cpu threads measure reporting a 0 value
With that, we have seen how a simple sequence of steps bundled into the eG JVM Monitor, help an administrator in
identifying not only a CPU-intensive thread, but also the exact line of code executed by that thread that could be
triggering the spike in usage.
1.5.2 Identifying and Diagnosing a Thread Blocking Issue in the JVM
This section once again takes the example of the
sapbusiness
application used by Section 1.4.1. Here, we will see
how the eG JVM Monitor instantly identifies blocked threads, and intelligently diagnoses the reason for the blockage.
If a thread executing within the
sapbusiness
application gets blocked, the value of the
Blocked threads
measure
reported by the JVM Threads test mapped to the JVM Internals layer, gets incremented by 1. When this happens, eG
Enterprise automatically raises this as a problem condition and changes the state of the
Blocked threads
measure
(see Figure 51).
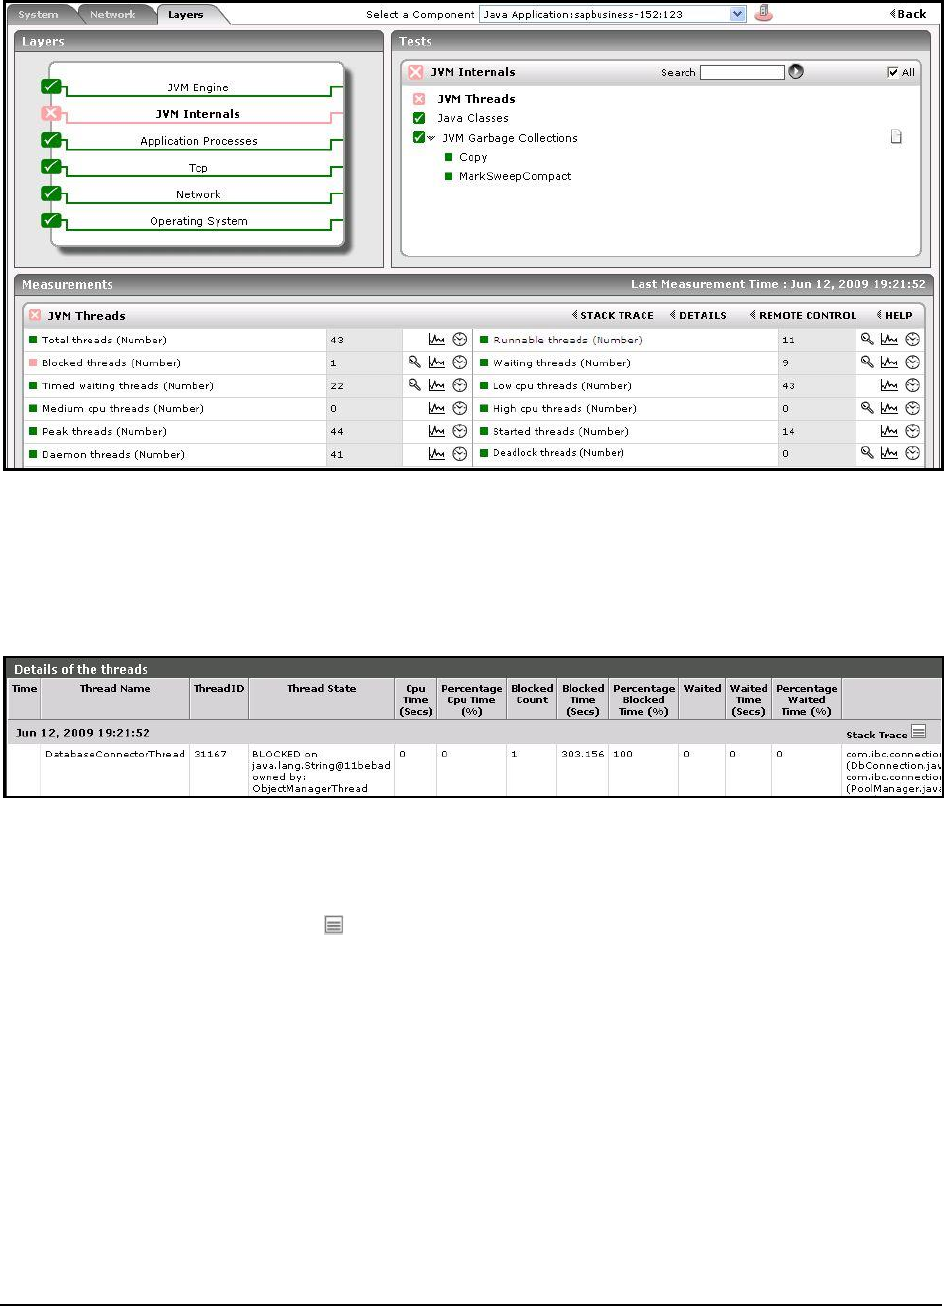
M o n i t o r i n g a J a v a A p p l i c a t i o n
94
Figure 51: The value of the Blocked threads measure being incremented by 1
According to Figure 51, the eG JVM Monitor has detected that a thread running in the
sapclient
application has been
blocked. To know which thread this is and for how long it has been blocked, click on the DIAGNOSIS icon
corresponding to the
Blocked threads
measure. Figure 52 will then appear revealing the name of the blocked thread,
how long it was blocked, the CPU usage of the thread, and the time for which the thread was in waiting.
Figure 52: The detailed diagnosis of the Blocked threads measure revealing the details of the blocked thread
Figure 52 clearly indicates that the
DatabaseConnectorThread
running in the
sapbusiness
application was blocked
100%
of the time. The next step is to figure out who or what is blocking the thread, and why. To achieve this, we
need to analyze the stack trace information of the blocked thread. To access the stack trace of the
DatabaseConnectorThread
, click on the icon in Figure 52 or the Stack Trace label adjacent to the icon. Figure 53
then appears.
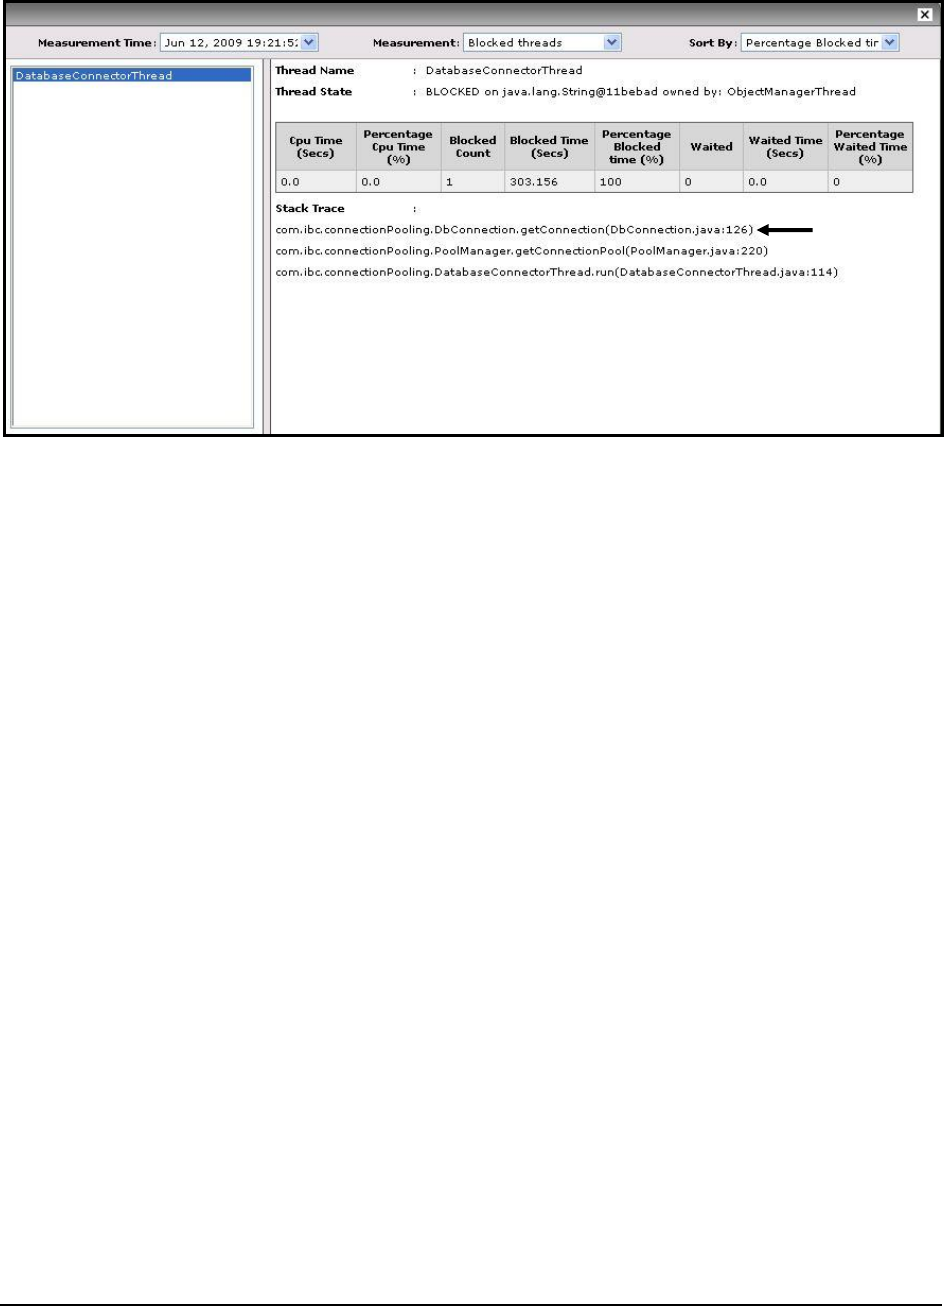
M o n i t o r i n g a J a v a A p p l i c a t i o n
95
Figure 53: The Stack Trace of the blocked thread
While the left panel of Figure 53 displays the
DatabaseConnectorThread
, the right panel provides the following
information about the
DatabaseConnectorThread
:
The Thread State indicating the thread that is blocking the
DatabaseConnectorThread
, and the object
on which the block occurred; from the right panel of Figure 53, we can infer that the
DatabaseConnectorThread
has been blocked on the
java.lang.Strin@11bebad
object owned by the
ObjectManagerThread
.
The CPU usage of the
DatabaseConnectorThread
, and the number of times and duration for which this
thread has been blocked and has been in waiting;
The Stack Trace of the
DatabaseConnectorThread
.
Now that we have identified the blocked thread, let us proceed to determine the root-cause for this block. For this
purpose, the Stack Trace of the
DatabaseConnectorThread
needs to be analyzed. As stated earlier, the stack trace
needs to be analyzed in the top-down manner to identify the method that could have caused the block. Accordingly,
we can conclude that the first method in the Stack Trace in Figure 53 is most likely to have introduced the block.
This method, as can be seen from Figure 21, executes the lines of code starting from line 126 contained within the
Java program file named DbConnection.java. In all probability, the problem should exist in this code block only.
Reviewing this code block can therefore shed more light on the reasons for the
DatabaseConnectorThread
getting
blocked. Hence, let us first open the DbConnection.java file in an editor (see Figure 54).
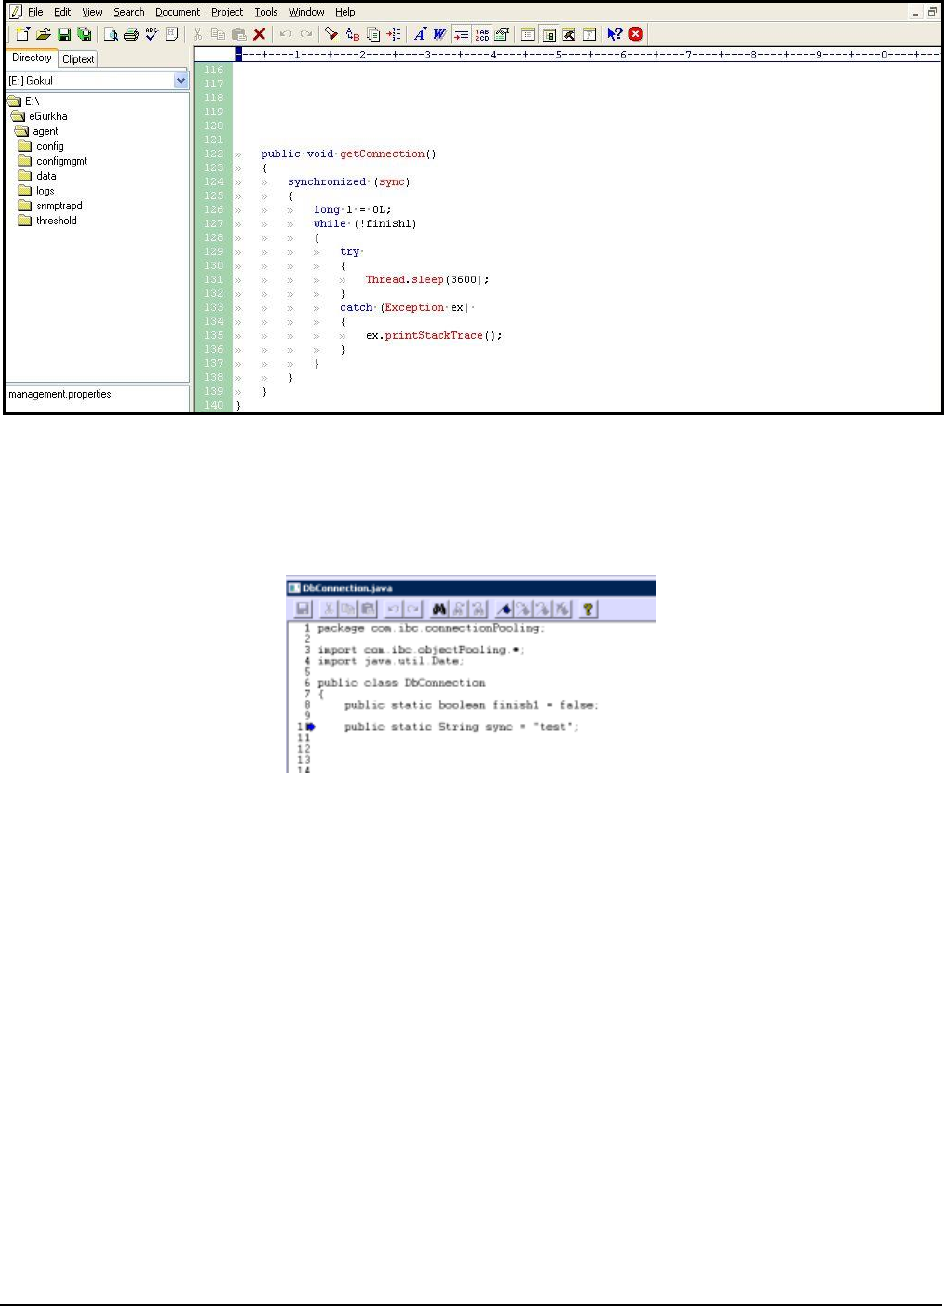
M o n i t o r i n g a J a v a A p p l i c a t i o n
96
Figure 54: The DbConnection.java program file
Line 126 of Figure 54 is within a
synchronized
block. The object used to synchronize the accesses to this block is a
variable named “sync”. Looking at the variable declarations at the top of the source code, we can see that the “sync”
variable refers to the static string “test” (see Figure 37).
Figure 55: The lines of code preceding line 126 of the DbConnection.java program file
By comparing information form stack trace and the source we can see that the
DatabaseConnectorThread
is stuck
entering the synchronized block. Access to the synchronized block is exclusive – so some other thead is blocking this
DatabaseConnectorThread
from entering the synchronized block. Looking at the stack trace again (see Figure 35),
we can see the name of the blocking thread. The blocking thread is the thread named “ObjectManagerThread”.
We can now use the stack trace tool again to see the stack trace of the blocking
ObjectManagerThread
.
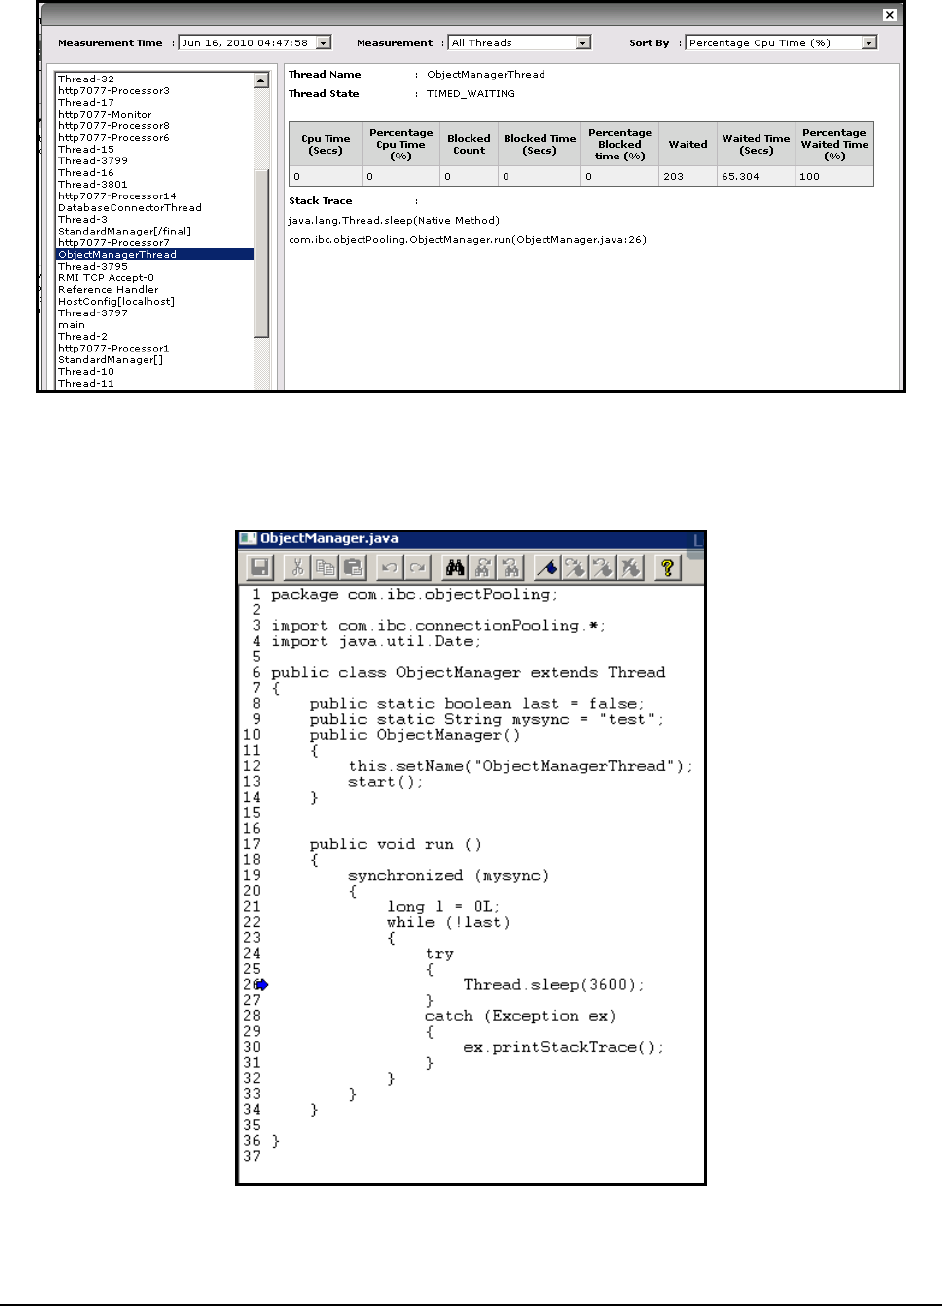
M o n i t o r i n g a J a v a A p p l i c a t i o n
97
Figure 56: Viewing the stack trace of the ObjectManagerThread
From here, we can see that the
ObjectManagerThread
went into a timed waiting state at line number 26 of the
ObjectManager.java source code.
Figure 57: The lines of code in the ObjectManager.java source file
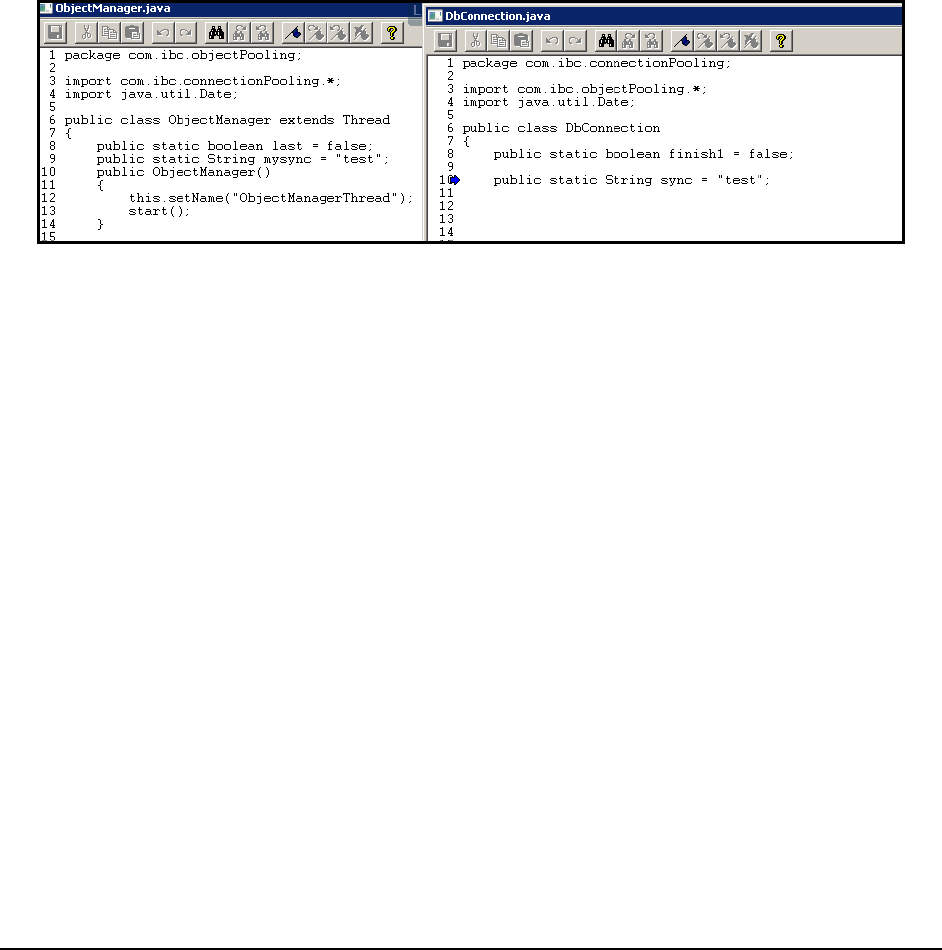
M o n i t o r i n g a J a v a A p p l i c a t i o n
98
Again, using a text editor, we can see that the
ObjectManager
thread enters a 3600 second timed wait at line 26.
This sleep call is inside a synchronized block with the local variable “mysync” being used as the object to synchronize
on.
The key to troubleshooting this problem is to look at the variable declarations at the top of each source code file.
On the surface, it is not clear why the
ObjectManager
thread, which synchronizes a block using a variable called
“mysync” which is local to this class would be blocked by the
DbConnection
thread, which synchronizes on a variable
called “sync” that is local to the
DbConnection
class.
An astute java programmer, however, would know to look at the variable declarations at the top of each source code
file. In that way, one will quickly observe that both the "mysync" variable of the
ObjectManager
class and the "sync"
variable of the
DbConnection
class in fact refer to the same static string: “test”.
Figure 58: Comparing the ObjectManager and DbConnection classes
So, even though the programmer has given two different variable names in the two classes, the two classes refer to
and are synchronizing on the same static string object “test”. This is why two unrelated threads are interfering with
each other’s execution.
Modifying the two classes –
ObjectManager
and
DbConnection
– so that the variables "mysync" and "sync" point to
two different strings by using the new object creator resolves the problem in this case.
We have demonstrated here a real-world example, where because of the careless use of variables, one could end up
in a scenario where one thread blocks another. The solution in this case to avoid this problem is to define non-static
variables that the two classes can use for synchronization. This example has demonstrated how the eG Java Monitor
can help diagnose and resolve a complex multi-thread synchronization problem in a Java application.
1.5.3 Identifying and Diagnosing a Thread Waiting Situation in the
JVM
This section takes the help of the
sapbusiness
application yet again to demonstrate how the eG JVM Monitor quickly
isolates waiting threads and identifies the root-cause for the thread waits.
Whenever a thread goes into waiting, the value of the
Waiting threads
measure reported by the JVM Threads test
mapped to the JVM Internals layer gets incremented by 1 (see Figure 59).
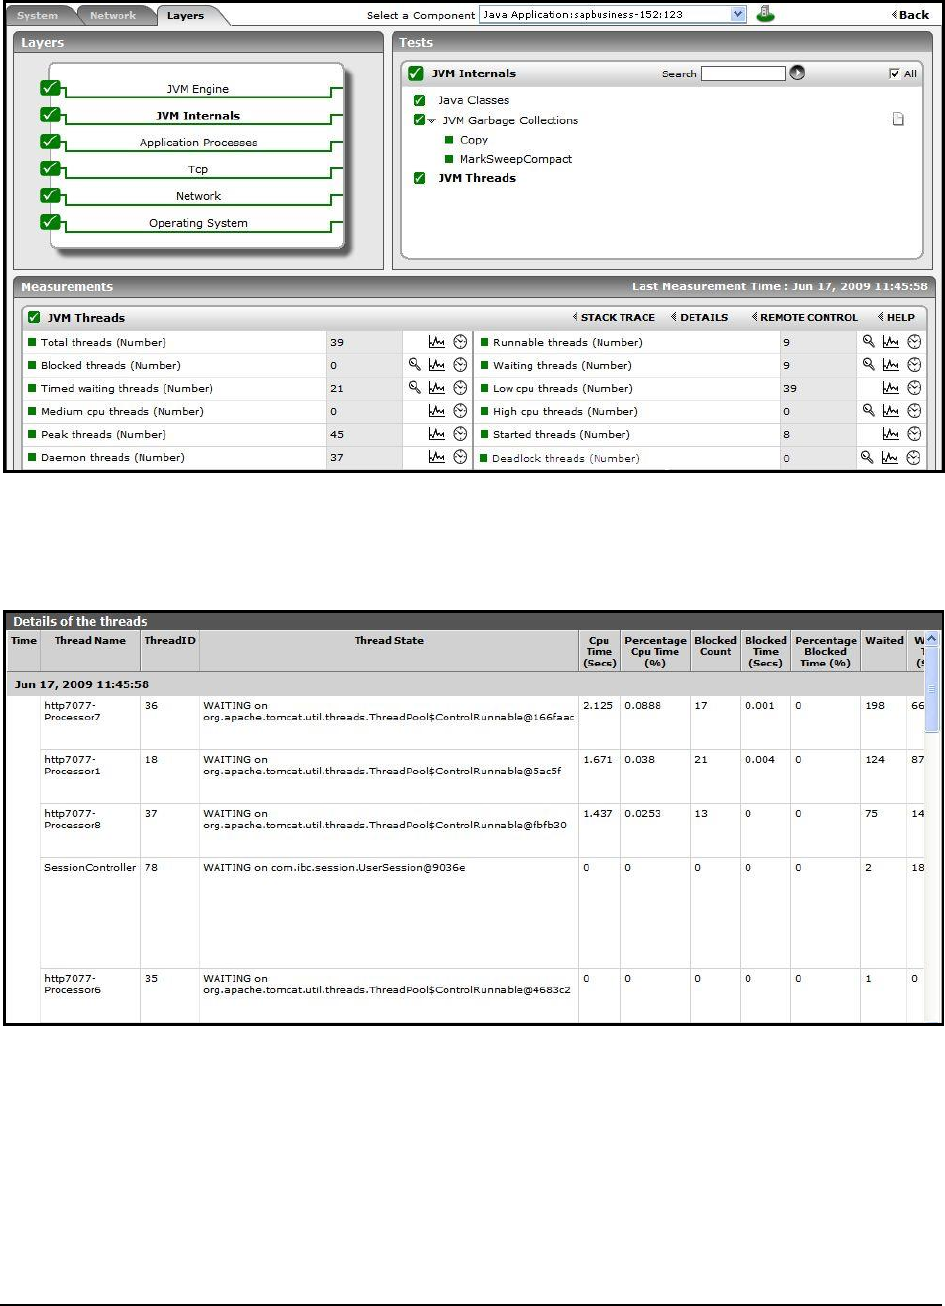
M o n i t o r i n g a J a v a A p p l i c a t i o n
99
Figure 59: The Waiting threads
To know which threads are in waiting, click on the DIAGNOSIS icon corresponding to the
Waiting threads
measure in
Figure 59. Figure 60 then appears listing all the threads that are currently in waiting.
Figure 60: The detailed diagnosis of the Waiting threads measure
Of the threads listed in Figure 60, those that begin with
http*
are Tomcat’s java threads. For these threads to be in a
waiting state is normal, and hence, these threads can be ignored. Only the SessionController thread indicated by
Figure 60 is an application-specific thread. To know why this thread has been in waiting, you need to study the stack
trace of the thread; for this, first scroll to the left of Figure 60. You will then be able to view the stack trace of the
thread.
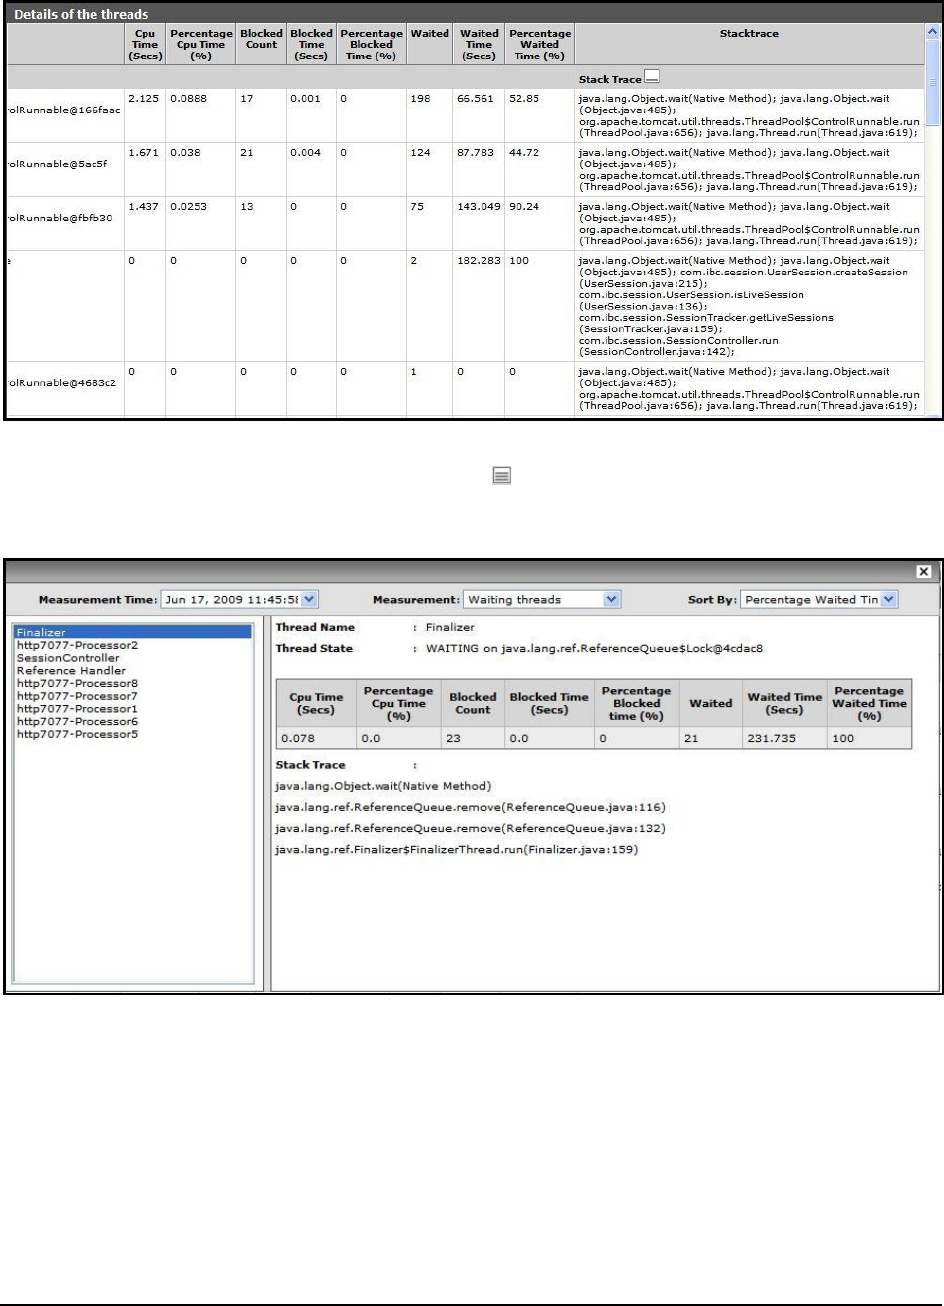
M o n i t o r i n g a J a v a A p p l i c a t i o n
100
Figure 61: Viewing the stack trace of the waiting thread
If you want to view the stack trace more clearly, click on the icon in Figure 61 or the Stack Trace label adjacent to
the icon. Figure 62 then appears.
Figure 62: The Thread Diagnosis window for Waiting threads
The left panel of Figure 62 lists all the waiting threads, with the thread that registered the highest waiting time
being selected by default. Since we are interested in the user-defined SessionController thread, select it from the left
panel. The right panel will then change as depicted by Figure 63 below.
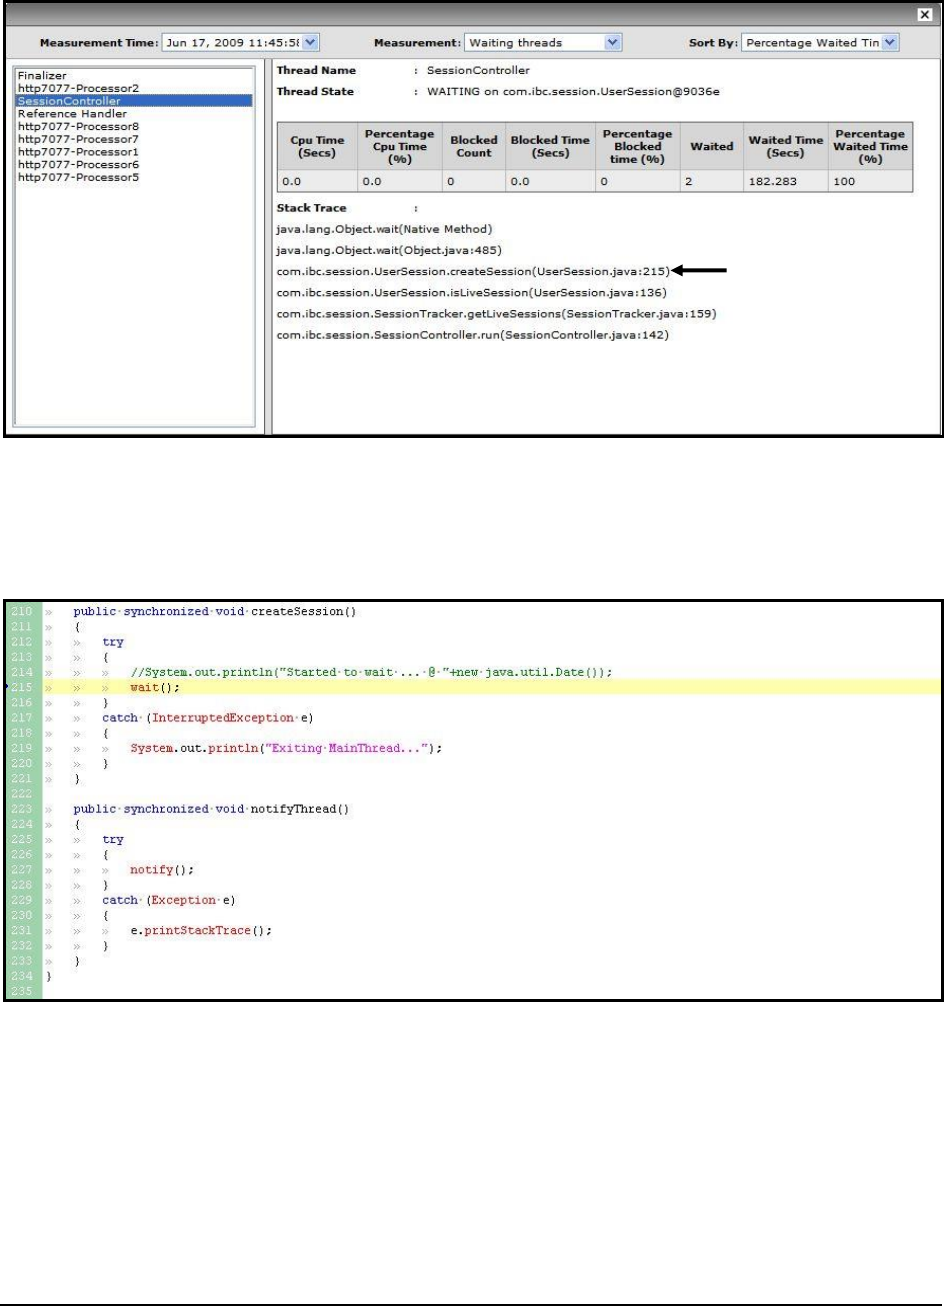
M o n i t o r i n g a J a v a A p p l i c a t i o n
101
Figure 63 : The stack trace for the SessionController thread
A close look at the stack trace reveals that the thread could have gone into the waiting mode while executing the
code block starting at line 215 of the UserSession.java program file. To zero-in on the precise code that could have
caused the thread to wait, open the UserSession.java file in an editor, and locate line 215 in it.
Figure 64: The UserSession.java file
The code block starting at line 215 of Figure 64 explicitly puts the thread in the wait state until such time that the
notify()
method is called to change the wait state to a runnable state. This piece of code will have to be optimized to
reduce or even completely eliminate the waiting period of the SessionController thread.
With that, we have demonstrated the eG JVM Monitor’s ability to detect waiting threads and lead you to the precise
line of code that could have put the threads in a wait state.
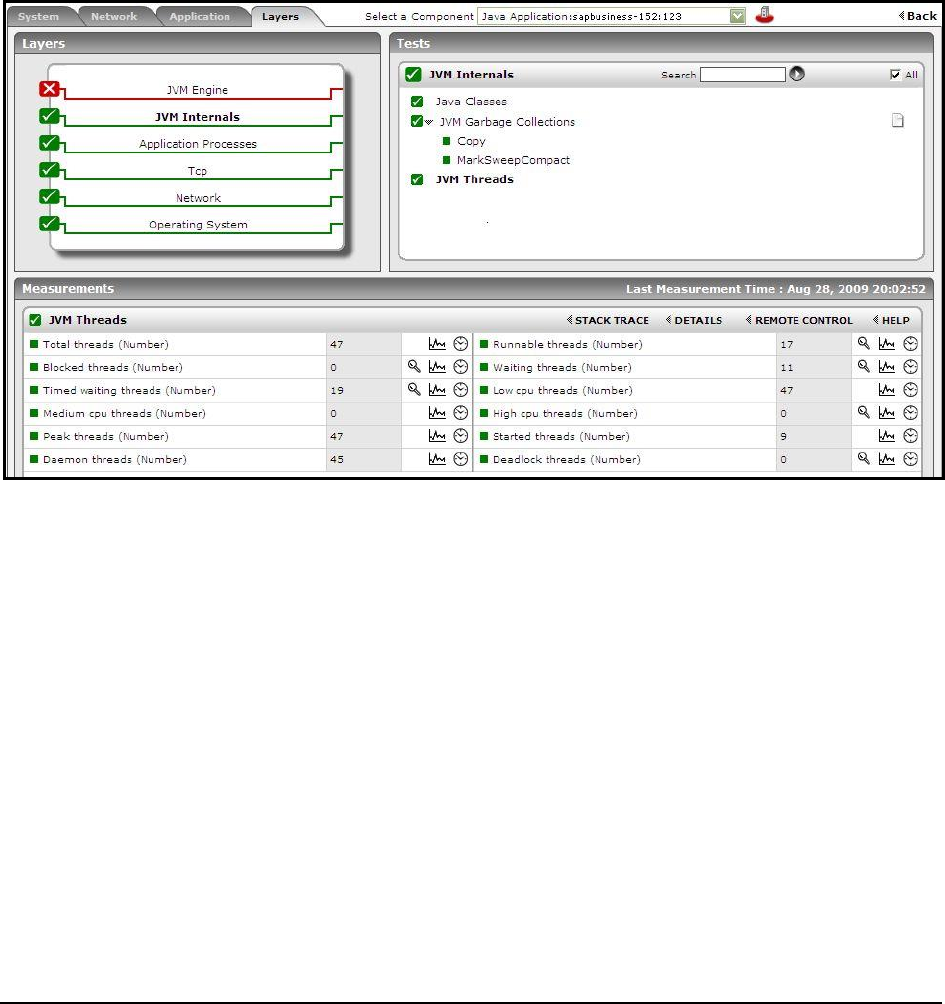
M o n i t o r i n g a J a v a A p p l i c a t i o n
102
1.5.4 Identifying and Diagnosing a Thread Deadlock Situation in the
JVM
In this section, the
sapclient
application is used one more time to explain how the eG JVM Monitor can be used to
report on deadlock situations in your JVM, and to diagnose the root-cause of the deadlock.
Until a deadlock situation arises, the Deadlock threads measure reported by the JVM Threads test will report only
0
as
its value (see Figure 65).
Figure 65: The JVM Threads test reporting 0 Deadlock threads
When, say 2 threads are deadlocked for a particular resource/object, then the Deadlock threads measure will report
the value
2
, as depicted by Figure 66. Since a deadlock situation arises when two/more threads try to block each
other from accessing a memory object or a resource, the value of the Blocked threads measure too will increase in
the event of a deadlock; in the case of our example therefore, you will find that the Blocked threads measure too
reports the value
2
.
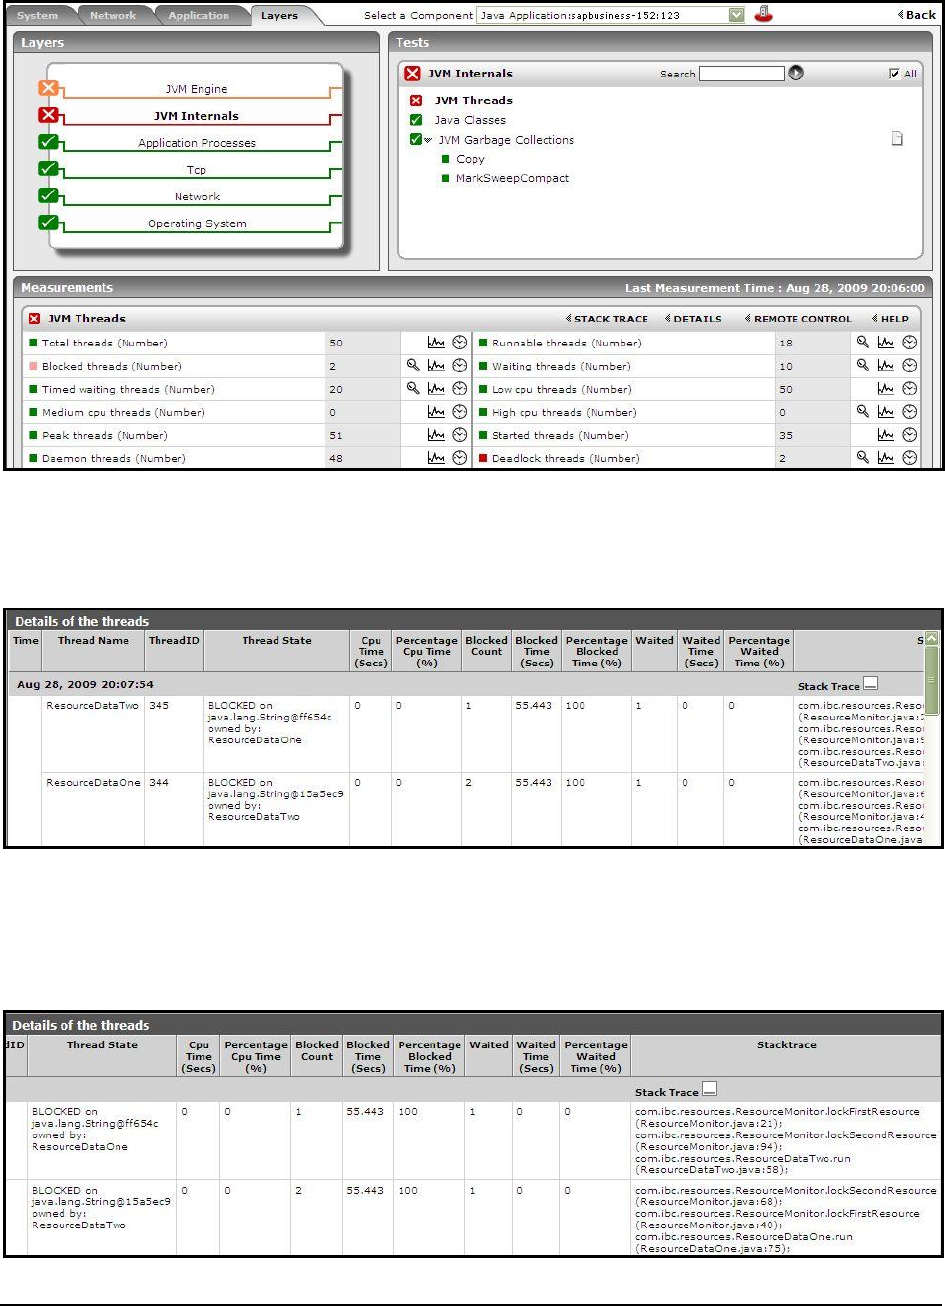
M o n i t o r i n g a J a v a A p p l i c a t i o n
103
Figure 66: The Deadlock threads measure value increasing in the event of a deadlock situation
To know which threads are in a deadlock, click on the DIAGNOSIS icon corresponding to the Deadlock threads
measure. Figure 67 then appears.
Figure 67: The detailed diagnosis page revealing the deadlocked threads
Figure 67 clearly reveals that 2 threads, namely – the
ResourceDataTwo
and the
ResourceDataOne
thread- are in a
deadlock currently. To figure out why these two threads are deadlocked, you would have to carefully review the
stack trace of both these threads. For this purpose, scroll to the left of Figure 67 to view the stack trace clearly.
Figure 68: Viewing the stack trace of the dadlocked threads in the detailed diagnosis page
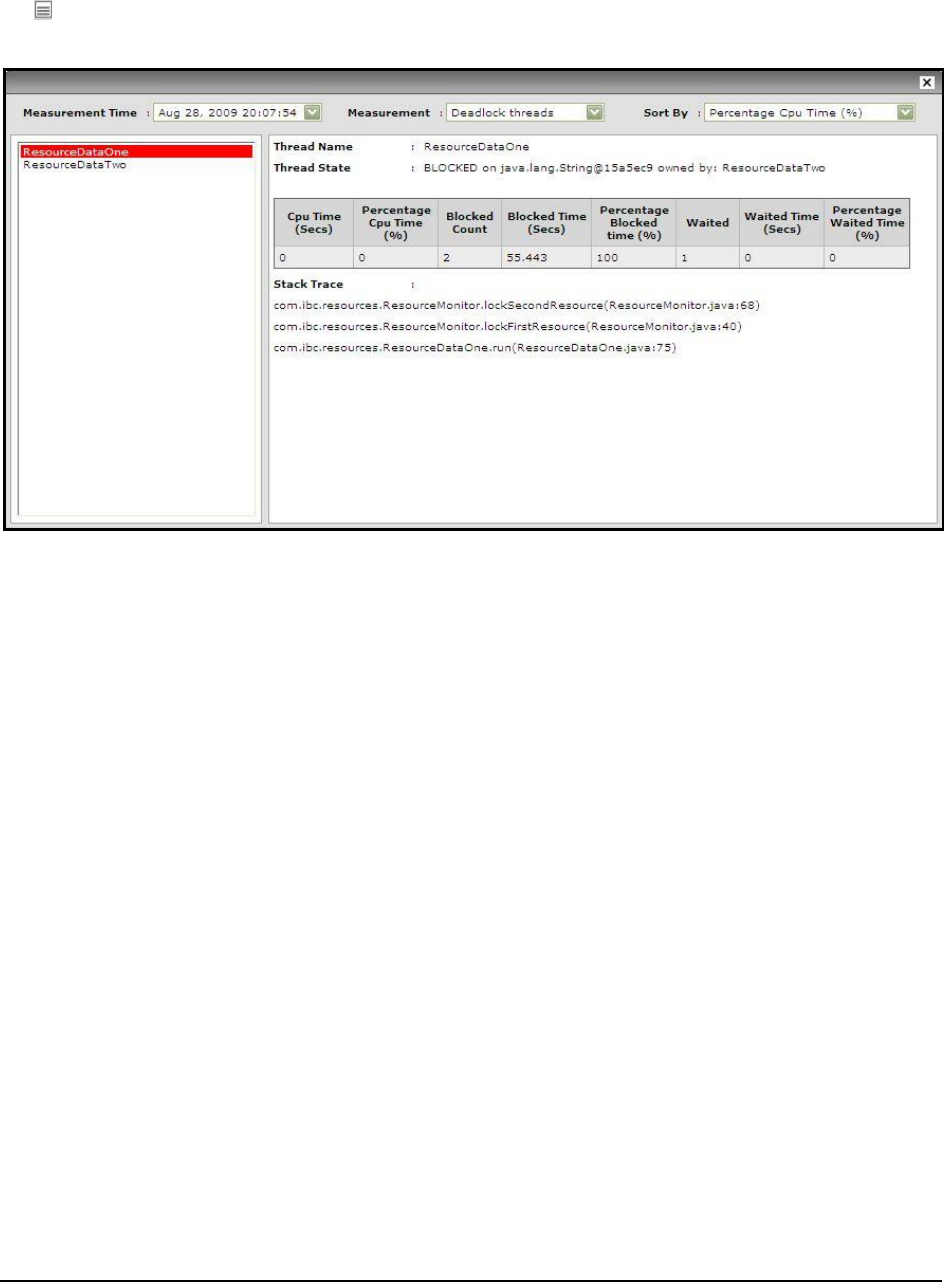
M o n i t o r i n g a J a v a A p p l i c a t i o n
104
To keenly focus on the stack trace, without being distracted by the other columns in Figure 67 and Figure 68, click on
the icon in Figure 68 or the Stack Trace label adjacent to the icon. Figure 69 then appears.
Figure 69: The stack trace for the ResourceDataOne thread
The left panel of Figure 69 lists the 2 deadlocked threads, with the thread that is the leading CPU consumer being
selected by default – in the case of our example, this is the
ResourceDataOne
thread. For this default selection, the
contents of the right panel will be as depicted by Figure 69 above. From the Thread State, it is evident that the
ResourceDataOne
thread
has been blocked on an object that is owned by the
ResourceDataTwo
thread.
If you closely scrutinize the stack trace of
ResourceDataOne
, you will uncover that once the thread started running, it
executed line 40 of the
ResourceMonitor.java
program
file, which in turn invoked line 68 of the same file; the
deadlock appears to have occurred at line 68 only.
Let us now shift our focus to the
ResourceDataTwo
thread. To view the stack trace of this thread, click on the thread
name in the left panel of Figure 69. As you can see, the Thread State clearly indicates that the
ResouceDataTwo
thread has been blocked by the
ResourceDataOne
thread. With that, we can conclude that both threads are blocking
each other, thus making for an ideal deadlock situation.
Analysis of the stack trace of the
ResourceDataTwo
thread (see Figure 70) reveals that once started, the thread
executed line 94 of the
ResourceMonitor.java
file, which in turn invoked line 21 of the same file; since no lines of
code have been executed subsequently, we can conclude that the deadlock occurred at line 21 only.
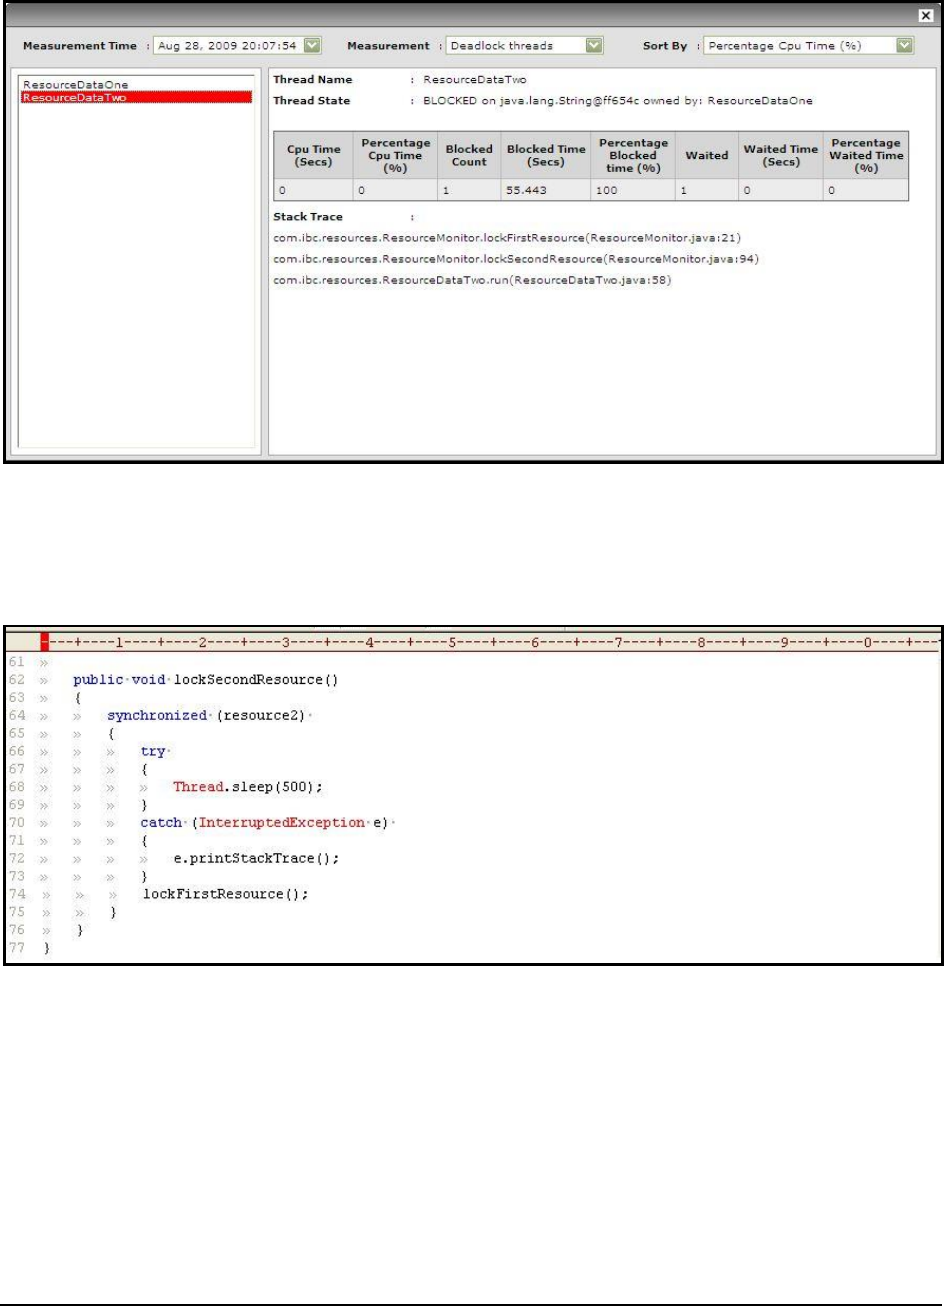
M o n i t o r i n g a J a v a A p p l i c a t i o n
105
Figure 70 : The stack trace for the ResourceDataTwo thread
From the above discussion, we can infer both the threads deadlocked while attempting to execute code contained
within the
ResourceMonitor.java
file. We now need to examine the code in this file to figure out why the deadlock
occurred. Let us therefore open the
ResourceMonitor.java
file.
Figure 71: The lines of code executed by the ResourceDataOne thread
If you can recall, the stack trace of the
ResourceDataOne
thread indicated a problem while executing the code
around line number 68 (see Figure 69) of the
ResourceMonitor.java
file. Figure 71 depicts this piece of code.
According to this code, the
ResourceDataOne
thread calls a
lockSecondResource()
method, which in turn invokes a
synchronized
block that puts the thread to sleep for 500 milliseconds; a synchronized method, when called by a
thread, cannot be invoked by any other thread until its original caller releases the method.
Going back to Figure 71, at the end of the sleep duration of 500 milliseconds, the
synchronized
block will invoke
another method named
lockFirstResource()
. However, note that this method and the
lockSecondResource()
method
are also called by the
ResourceDataTwo
thread. To verify this, let us proceed to review the lines of code executed by
the
ResourceDataTwo
thread (see Figure 72).
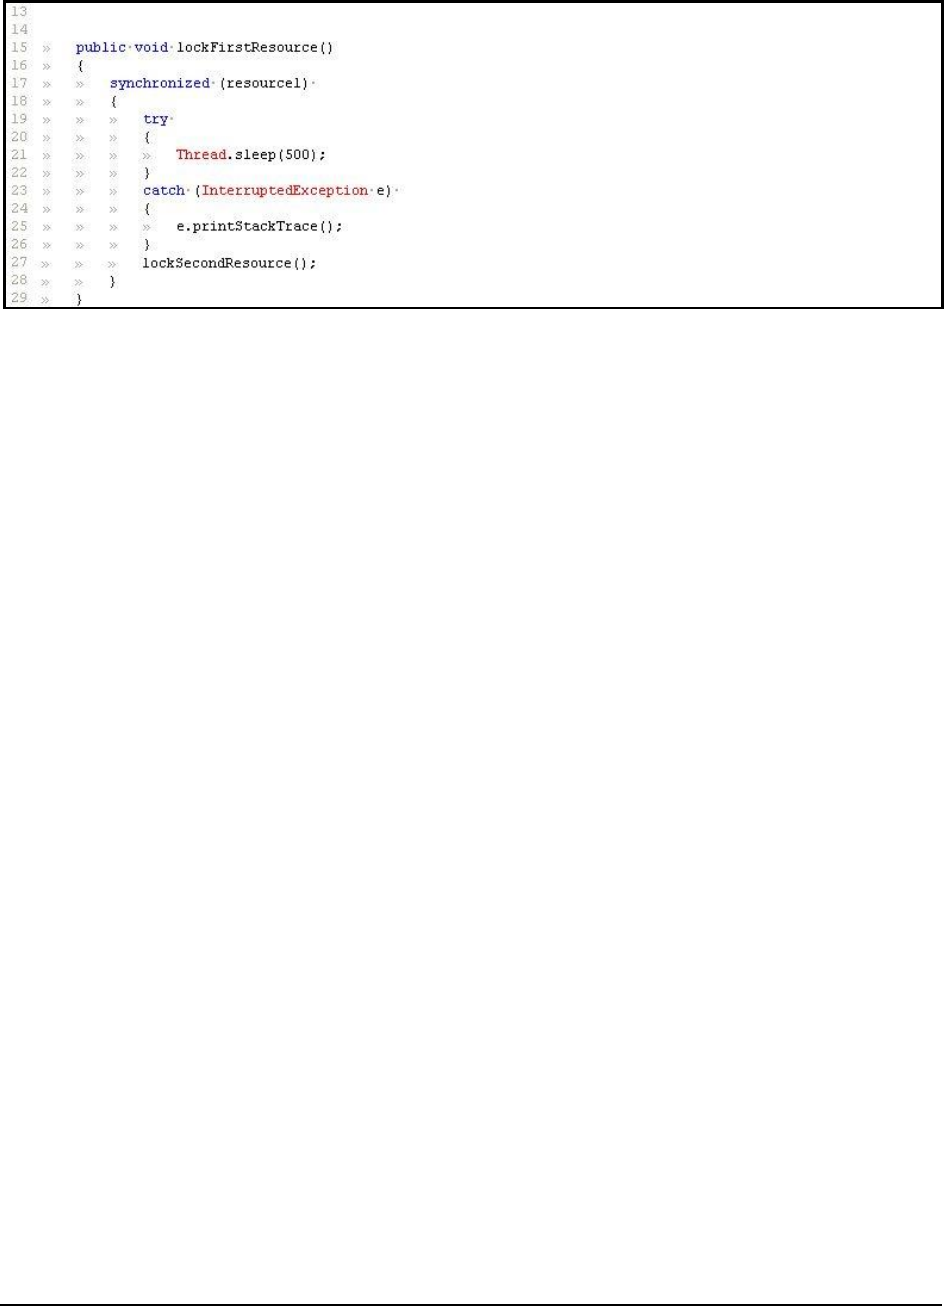
M o n i t o r i n g a J a v a A p p l i c a t i o n
106
Figure 72: The lines of code executed by the ResourceDataTwo thread
As per the stack trace corresponding to the
ResourceDataTwo
thread (see Figure 70), the deadlock creeps in at line
21 of the
ResourceMonitor.java
file. Figure 72 depicts the code around line 21 of the
ResourceMonitor.java
file. This
code reveals that the
ResourceDataTwo
thread executes a
lockFirstResource()
method, which in turn invokes a
synchronized
block; within this block, the thread is put to sleep for 500 milliseconds. Once the sleep ends, the block
will invoke the
lockSecondResource()
method; both this method and the
lockFirstResource()
method are also
executed by the
ResourceDataOne
thread.
From the discussion above, the following are evident:
The
ResourceDataOne
thread will not be able to execute the
lockSecondResource
() method, since the
ResourceDataTwo
thread calls this method within a
synchronized
block – this implies that the
ResourceDataTwo
thread will ‘block’ the
ResourceDataOne
thread from executing the
lockSecondResource
() method until such time that
ResourceDataTwo
executes the method.
The
ResourceDataTwo
thread on the other hand, will not be able to execute the
lockFirstResource()
method, since the
ResourceDataOne
thread calls this method within a
synchronized
block – this
implies that the
ResourceDataOne
thread will ‘block’ the
ResourceDataTwo
thread from executing the
lockFirstResource
() method until such time that
ResourceDataOne
executes the method.
Since both threads keep blocking each other, a deadlock situation occurs.
With that, we have demonstrated the eG JVM Monitor’s ability to detect deadlock threads and lead you to the precise
line of code that could have caused the deadlock.
1.5.5 Identifying and Diagnosing Memory Issues in the JVM
This section takes the example of the
sapclient
application again to demonstrate the effectiveness of the eG JVM
Monitor in proactively detecting and alerting administrators to memory contentions experienced by Java applications.
If the usage of a memory pool increases, the eG JVM Monitor indicates the same using the
Used memory
measure
for that pool reported by the JVM Memory Usage test mapped to the JVM Engine layer.
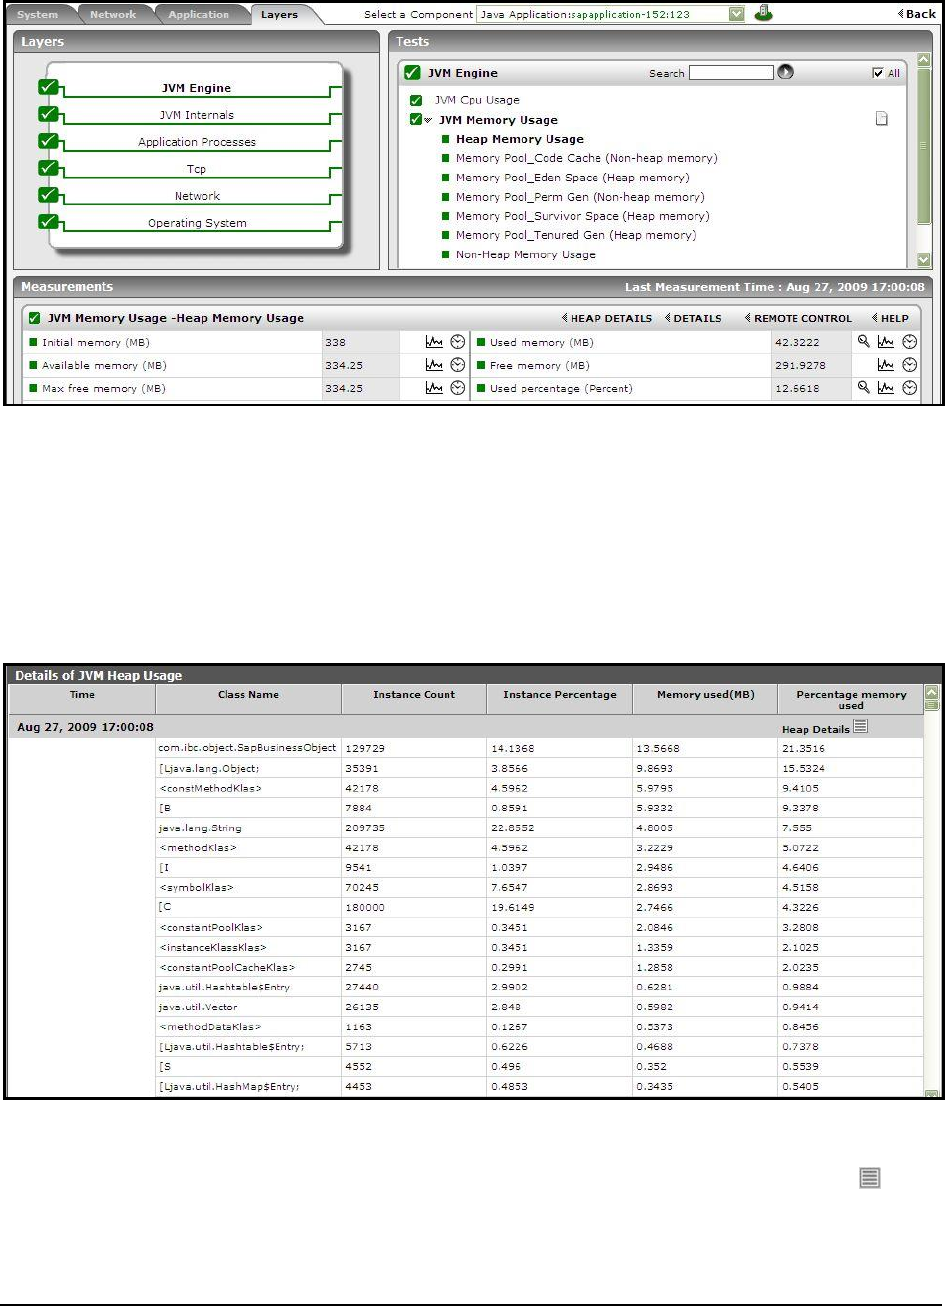
M o n i t o r i n g a J a v a A p p l i c a t i o n
107
Figure 73: The Used memory measure indicating the amount of pool memory being utilized
To know which class is consuming memory excessively, click on the DIAGNOSIS icon corresponding to the
Used
memory
measure in Figure 73. Figure 74 then appears listing all the classes that are using the pool memory, the
amount and percentage of memory used by each class, the number of instances of each class that is currently
operational, and also the percentage of currently running instances of each class. Since this list is by default sorted in
the descending order of the percentage memory usage, the first class in the list will obviously be the leading memory
consumer. In the case of our example, the memory contention in the
sapbusiness
application has been caused by the
22% heap memory usage of the
com.ibc.object.SapBusinessObject
class.
Figure 74: The detailed diagnosis of the Used memory measure
Sometimes, you might want to sort the classes by another column or quickly switch to another measurement period
to analyze the memory usage during that time frame. To achieve this, click on the Heap Details link or the button
next to it. Figure 53 then appears, allowing you the flexibility to view memory-consuming classes based on a Sort by
option and a Measurement Time of your choice.
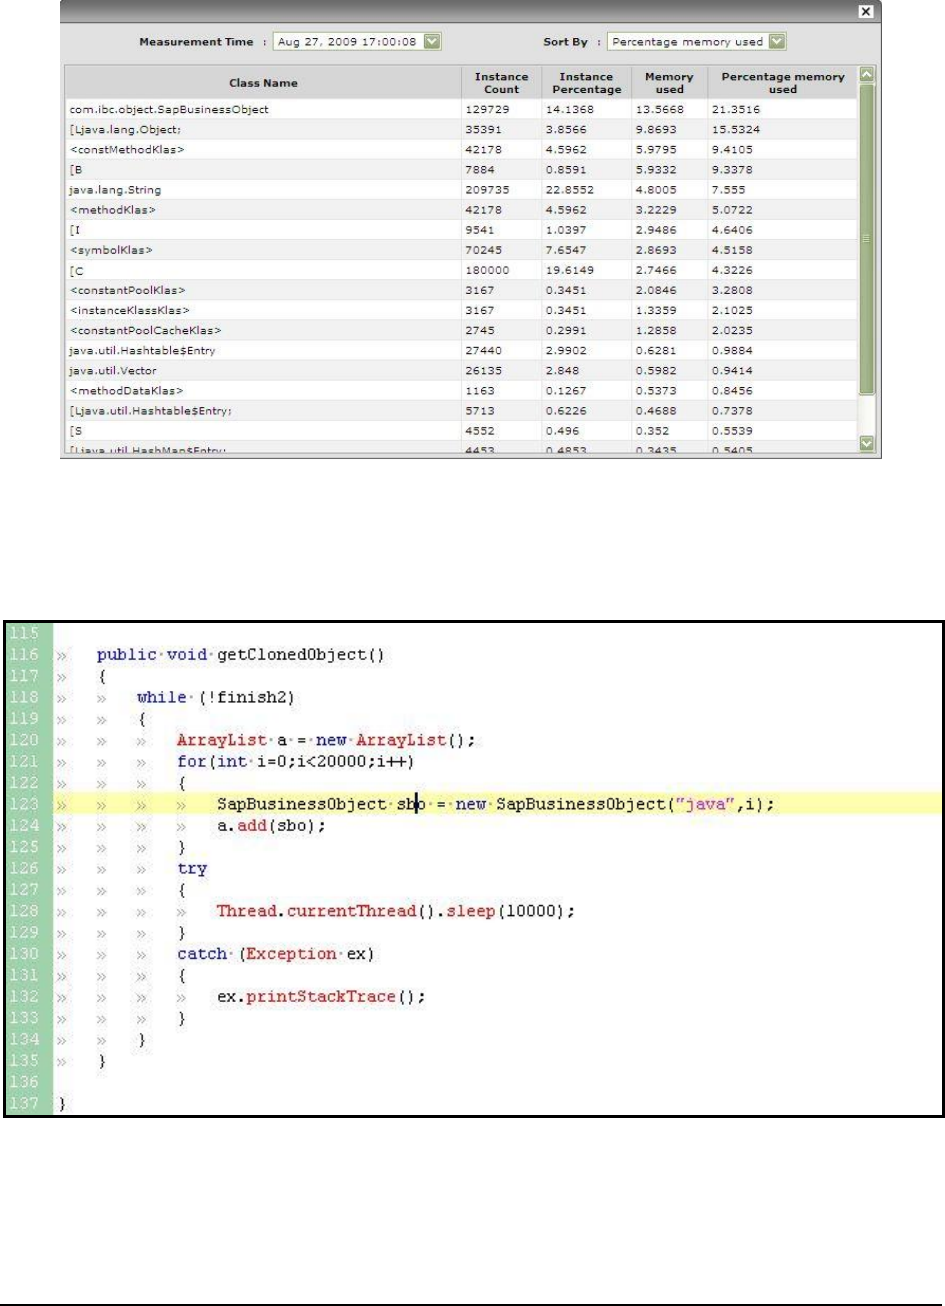
M o n i t o r i n g a J a v a A p p l i c a t i o n
108
Figure 75: Choosing a different Sory By option and Measurement Time
Careful examination of the method that calls the
SapBusinessObject
(see Figure 76) reveals that an
endless while
loop
is causing an array list named
a
to be populated with 20,000 instances of the
SapBusinessObject
, every 10
seconds! The continuous addition of objects is quiet obviously depleting the memory available to the JVM.
Figure 76: The method that is invoking the SapBusinessObject
This is how the eG JVM Monitor greatly simplifies the process of identifying the source of memory bottlenecks in a
Java application.
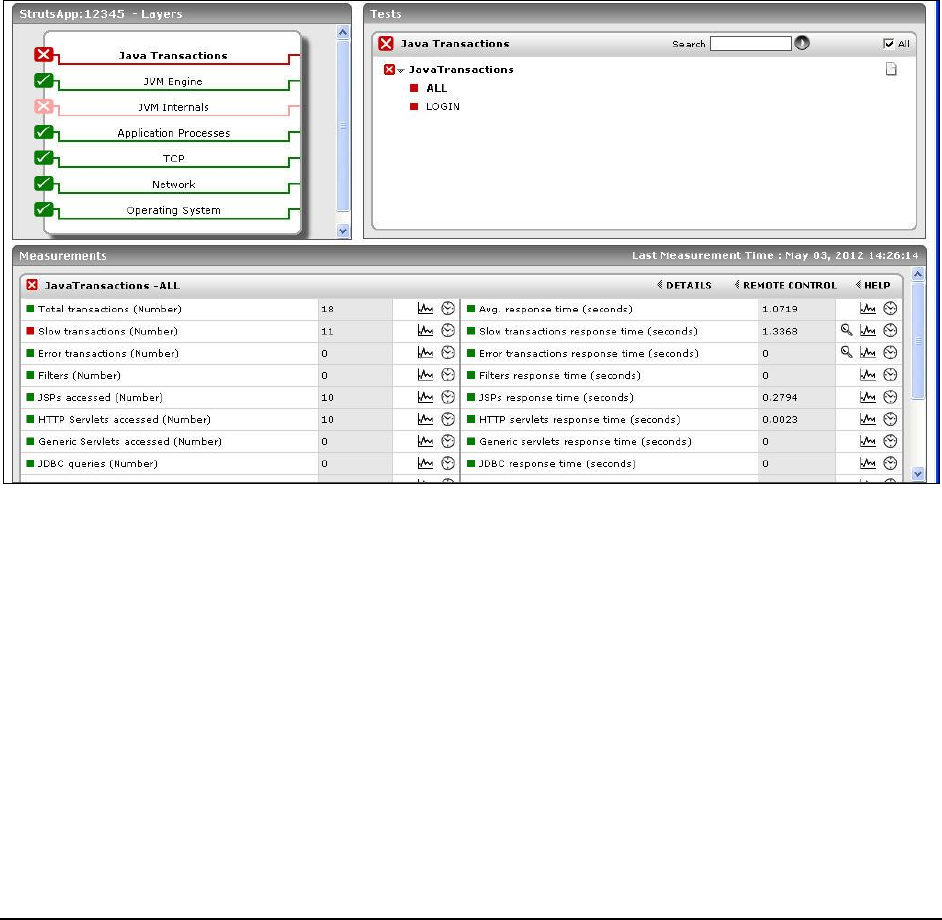
M o n i t o r i n g a J a v a A p p l i c a t i o n
109
1.5.6 Identifying and Diagnosing the Root-Cause of Slowdowns in
Java Transactions
This section takes the example of a Java application to demonstrate how effectively the eG JTM Monitor identifies
transactions that are responding slowly and isolates the root-cause of the slowdown.
If one/more transactions executing on a Java application experience a slowdown, the
Slow Transactions
measure of
the Java Transactions test captures the delay and reports the count of transactions that have been affected. From
Figure 77, it is evident that 11 transactions executiing on the sample Java application in our example are slowing
down. Too many slow transactions to an application can significantly damage the user experience with that
application - this is why, this problem has been flagged as a Critical problem by the eG Enterprise system, and the
state of the Slow Transactions measure has been set as Critical. The
Slow transactions response time
measure
reported by the same test indicates how slowly these transactions are responding. To know which transactions are
slow, click on the 'magnifying glass' icon adjacent to the
Slow transactions response time
measure.
Figure 77: The layer model of a sample Java application indicating too many slow transactions
This will lead you to Figure 78, where you can view the URL of the top-10 (by default) slow transactions. These
transactions will be arranged in the descending order of the TOTAL RESPONSE TIME. We can thus conclude that the
transaction with the URL, "/StrutsDemo/login;jsessionid=...", with the highest response time of over
1.5 seconds
, is
the slowest transaction on the target application. But, what is causing this slowdown and where did it originate? The
SUBCOMPONENT DETAILS column of Figure 78 answers these questions.
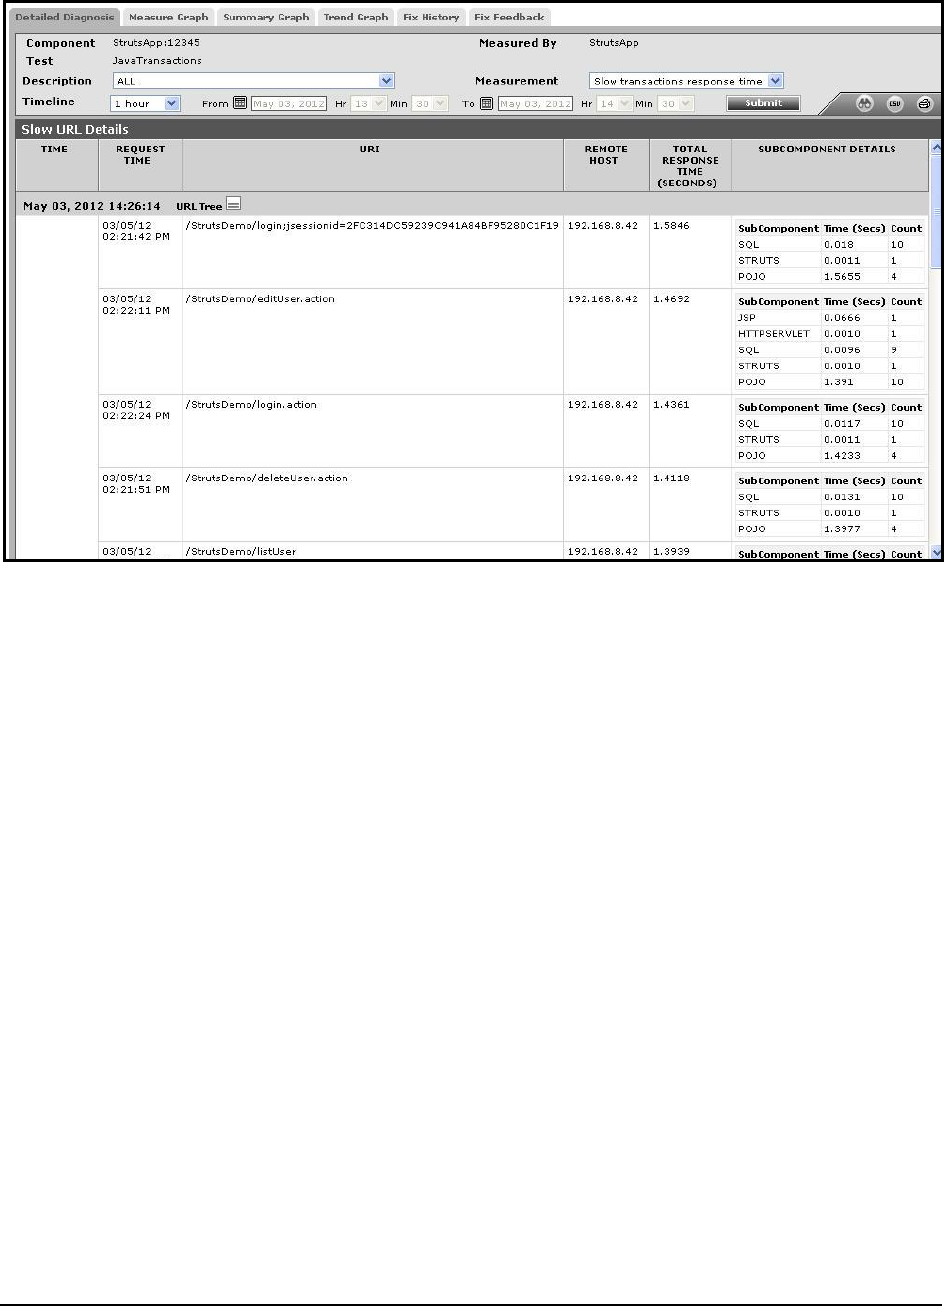
M o n i t o r i n g a J a v a A p p l i c a t i o n
110
Figure 78: The detailed diagnosis of the Slow transactions response time measure
When a user initiates a transaction to a Java-based web application, the transaction typically travels many
layers/sub-components (in Java) before completing execution and sending out a response to the user. These
layers/sub-components can be FILTERS, STRUTS, JSPs, SERVLETS, POJOs, JAVA MAIL APIs, JDBC QUERIES, or SQL
STATEMENTS. A variety of methods are typically invoked at each layer/sub-component. A delay in the execution of
any of these methods/queries can impact the execution of the transaction. The SUBCOMPONENT DETAILS column of
Figure 78 will reveal the layers/sub-components that the corresponding transaction visited during its journey, and the
time the transaction spent at each layer/sub-component. Using this information, you can quickly identify the
layer/sub-component at which the slowdown might have occurred. In the case of our example, the POJO sub-
component, with a total response time of over
1.3 seconds
, is guilty of consuming too much time. We can thus
conclude that the slowdown may have originated at the POJO layer. But, which method is causing the slowdown? To
figure this out, click on the URL Tree icon in Figure 78. This will invoke Figure 79.
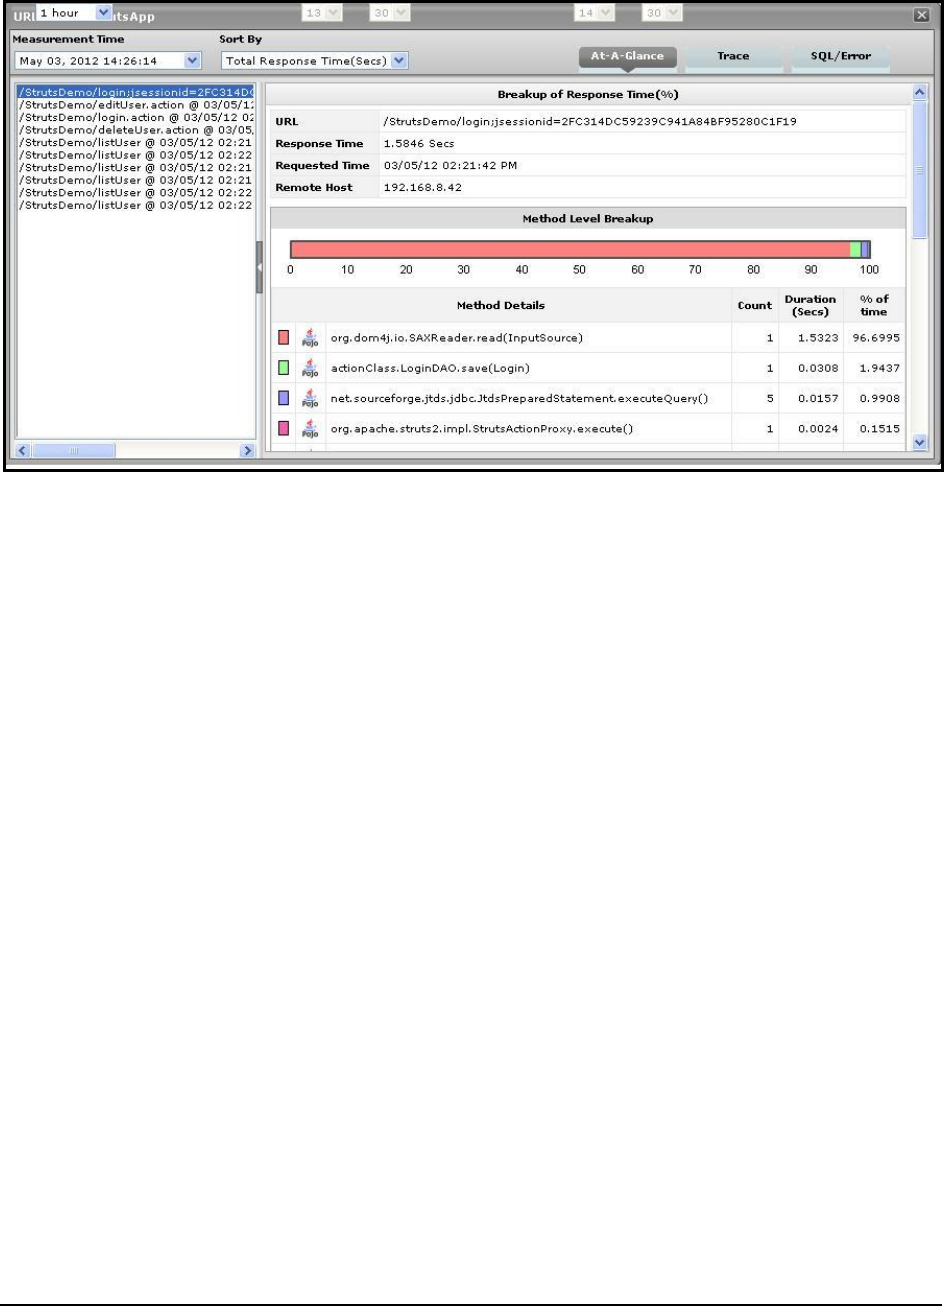
M o n i t o r i n g a J a v a A p p l i c a t i o n
111
Figure 79: The At-A-Glance tab page of the URL tree
In the left panel of Figure 79, you will find the list of slow transactions sorted in the descending order of their
Total
Response Time
. By default, the slowest transaction in our example, the "/StrutsDemo/login;jsessionid=...", will be
chosen from the left panel. The At-A-Glance tab page, which will be open by default in the right panel, will provide
quick, yet deep insights into the performance of the chosen transaction and the reasons for its slowness.
You can take a look at the Method Level Breakup section in the At-A-Glance tab page to figure out which method
called by which layer/sub-component (such as FILTER, STRUTS, SERVLETS, JSPS, POJOS, SQL, JDBC, etc.) could have
caused the slowdown. This section provides a horizontal bar graph, which reveals the percentage of time the chosen
transaction spent executing each of the top methods (in terms of execution time) invoked by it. The legend below
clearly indicates the top methods and the layer/sub-component that invoked each method. Previously, we had
deduced that one/more methods invoked at the POJO layer could have hampered transaction execution. The bar
graph and the legend in the Method Level Breakup section corroborate this finding, as the most time-consuming
method, as inferred from Figure 79, is the org.dom5j.io.SAXReaer.read(InputSource), which is invoked by the POJO
component (indicated by the POJO icon). The legend also reveals that this method has been running for over 1.5
seconds, and is hogging nearly 97% of the total execution time (i.e., response time) of the transaction. The question
now which invocation of the org.dom5j.io.SAXReaer.read(InputSource) method could have contributed to the
slowdown. Thankfully, the Count column of the legend reveals that this POJO method has been invoked only once! To
know when and how the method was called, click on the org.dom5j.io.SAXReaer.read(InputSource) method in the
Method Level Breakup section of Figure 80. Doing so automatically switches control to the Trace tab page in the right
panel (see Figure 80).
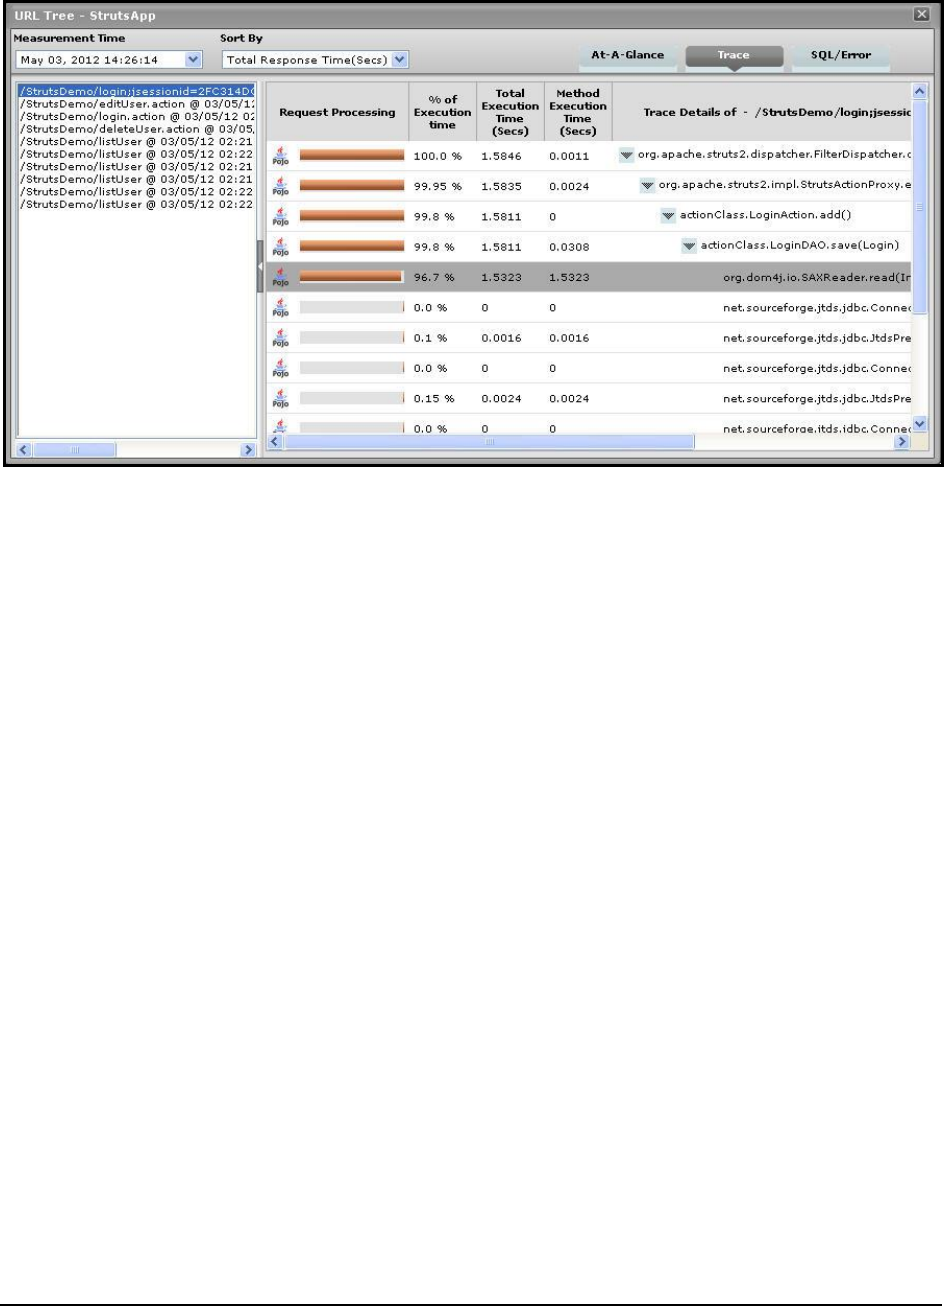
M o n i t o r i n g a J a v a A p p l i c a t i o n
112
Figure 80: The Trace tab page highlighting the single instance of the org.dom5j.io.SAXReaer.read(InputSource)
method in our example
Typically, the Trace tab page lists all the methods invoked by the chosen transaction, starting with the very first
method. Methods and sub-methods (a method invoked within a method) are arranged in a tree-structure, which can
be expanded or collapsed at will. To view the sub-methods within a method, click on the arrow icon that precedes
that method in the Trace tab page. Likewise, to collapse a tree, click once again on the arrow icon. Using the tree-
structure, you can easily trace the sequence in which methods are invoked by a transaction.
If a method is chosen for analysis from the Method Level Breakup section of the At-A-Glance tab page, the Trace tab
page will automatically bring your attention to all invocations of that method by highlighting them (as shown by
Figure 80). Since the org.dom5j.io.SAXReaer.read(InputSource) method was invoked only once, Figure 80 highlights
it. From the invocation sequence indicated by the Trace Details column of Figure 76, it is clear that the delay in the
execution of the org.dom5j.io.SAXReaer.read(InputSource) method has rippled and affected the execution of all its
'parent methods', thus significantly affecting transaction performance. We can thus conclude that the
org.dom5j.io.SAXReaer.read(InputSource) method, with a response time of over 1.5 seconds, is the source of the
slowdown experienced by the transaction. To confirm these findings, you can use the Component Level Breakup
section that appears when scrolling down the the At-A-Glance tab page (see Error! Reference source not
found.).
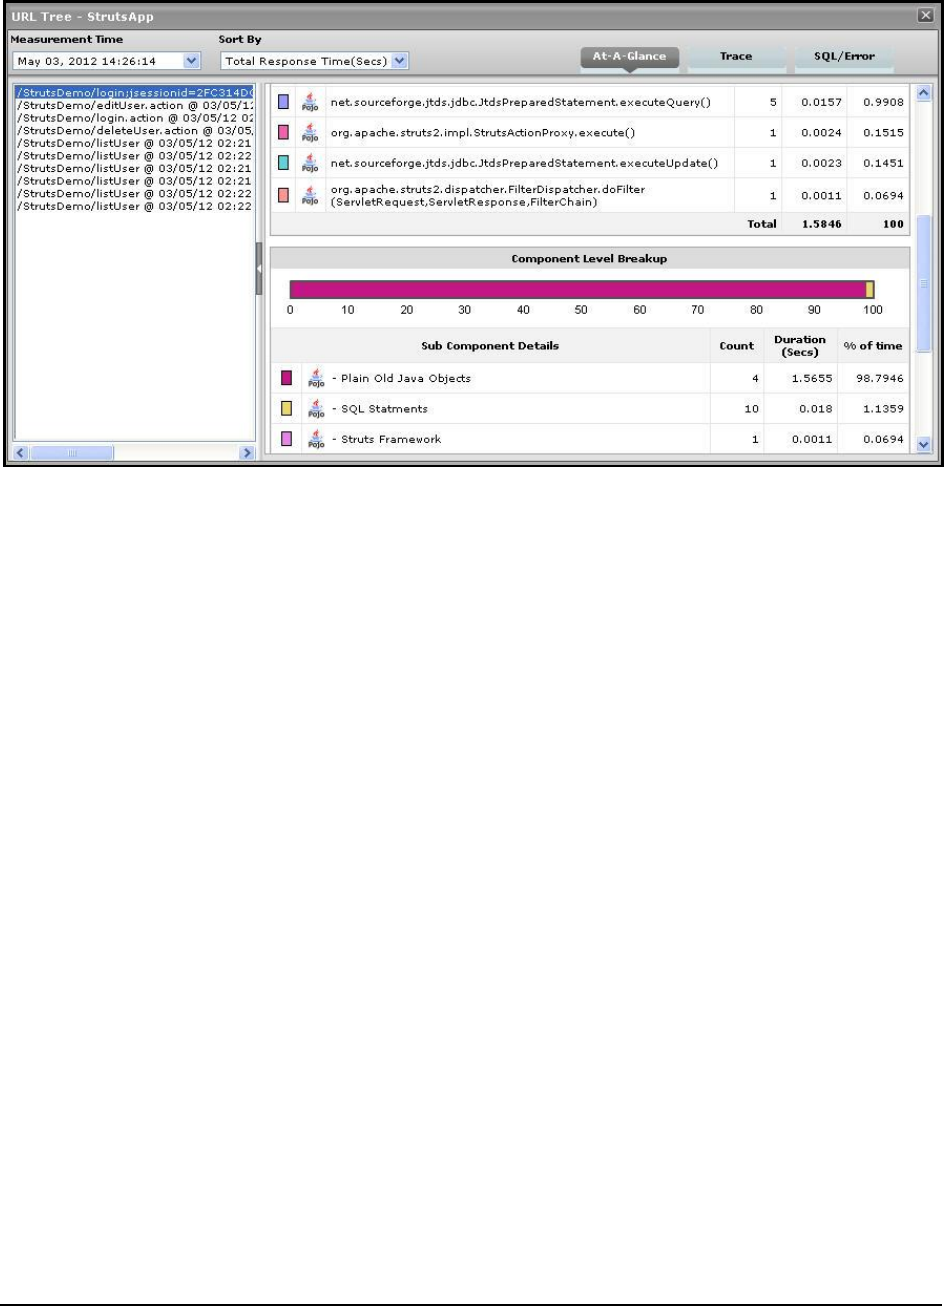
M o n i t o r i n g a J a v a A p p l i c a t i o n
113
Figure 81: The Component Level Breakup
Using the horizontal bar graph in this section, you can quickly tell where - i.e., at which Java layer/sub-component -
the transaction spent the maximum time. A quick glance at the graph's legend will reveal the layers/sub-components
the transaction visited, the number of methods invoked by each layer/sub-component, the Duration (Secs) for which
the transaction was processed at the layer/sub-component, and what Percentage of the total transaction response
time was spent at the layer/sub-component. From Figure 81 in our example, it is evident that the transaction has
spent considerable time at the POJO layer. To know the exact duration, take a look at the Duration and % of time
column. The transaction has apparently pent nearly 98% of its time at the POJO layer - this amounts of over
1.5
seconds
.
To know which methods are causing it, click on the top layer in the legend of the Component Level Breakup section.
Doing so will invoke the Trace tab page yet again (see Figure 79), but this time displaying all the methods invoked by
the POJO layer alone. A quick look at Figure 79 reveals that the org.dom5j.io.SAXReaer.read(InputSource) method
invoked by the parent method has been executing for over
1.5
seconds, and could hence be causing the slowdown.
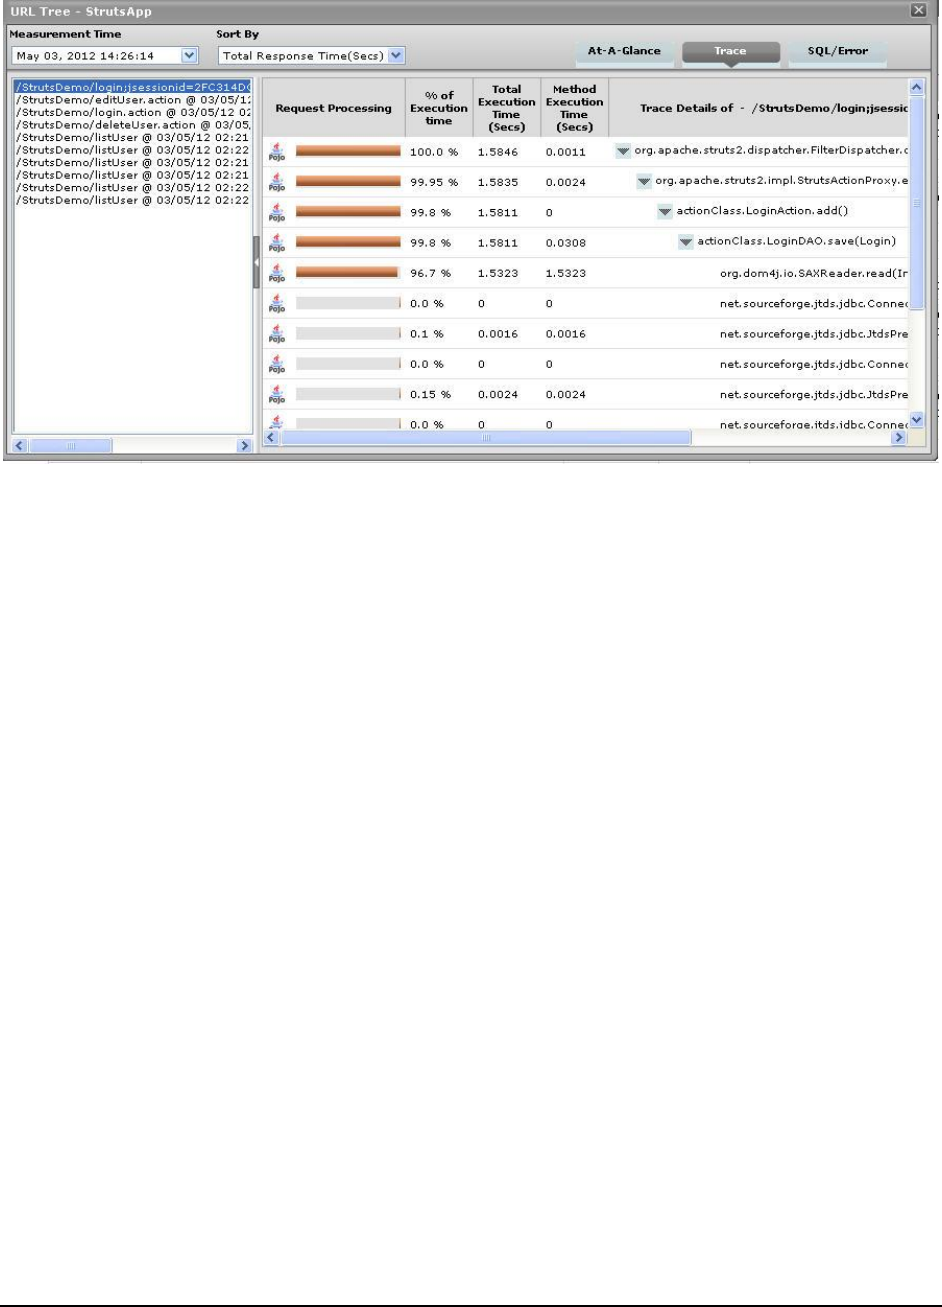
M o n i t o r i n g a J a v a A p p l i c a t i o n
114
Figure 82: The Trace tab page displaying all the methods invoked by the POJO layer
By closely scrutinizing the parent method's code and that of the org.dom5j.io.SAXReaer.read(InputSource) method,
you will be able to detect coding inconsistencies, which when removed, can make the code more efficient and faster!

C o n c l u s i o n
115
Conclusion
This document has clearly explained how eG Enterprise monitors Java Applications. For more information on eG
Enterprise, please visit our web site at www.eginnovations.com or write to us at sales@eginnovations.com.
