Manual Monitoring Mail Servers
User Manual: Monitoring Mail Servers
Open the PDF directly: View PDF ![]() .
.
Page Count: 159 [warning: Documents this large are best viewed by clicking the View PDF Link!]
- 1. Introduction
- 2. Monitoring Generic Mail Servers
- 3. Monitoring Exchange 2000/2003 Servers
- 3.1 The Epoxy Layer
- 3.2 The Exchange AD Layer
- 3.3 The Mail Service Layer
- 3.3.1 Exchange Connectors Test
- 3.3.2 Mail Test
- 3.3.3 Exchange Mail Transfer Test
- 3.3.4 Exchange Mail Retrieval Test
- 3.3.5 Exchange PC Status Test
- 3.3.6 Exchange MTA Status Test
- 3.3.7 Exchange MTA Connections Test
- 3.3.8 Exchange Queueing Test
- 3.3.9 Exchange Traffic Test
- 3.3.10 Exchange Mail Service Test
- 3.3.11 Virus Scans Test
- 3.3.12 Exchange Clients Test
- 3.4 The Exchange Store Layer
- 4. Monitoring MS Exchange Server 5.5
- 5. Monitoring Lotus Domino Mail Servers
- 6. Monitoring Qmail Servers
- 7. Monitoring the Exchange Messaging Service
- 8. Externally Monitoring Mail Servers
- 9. Externally Monitoring the Exchange server
- 10. Monitoring the Exchange Cluster Service
- 11. Monitoring the IronPort AsyncOS Mail Server
- 12. Conclusion

Monitoring Mail Servers
eG Enterprise v5.6

Restricted Rights Legend
The information contained in this document is confidential and subject to change without notice. No
part of this document may be reproduced or disclosed to others without the prior permission of eG
Innovations Inc. eG Innovations Inc. makes no warranty of any kind with regard to the software and
documentation, including, but not limited to, the implied warranties of merchantability and fitness for
a particular purpose.
Trademarks
Microsoft Windows, Windows NT, Windows 2003, and Windows 2000 are either registered trademarks
or trademarks of Microsoft Corporation in United States and/or other countries.
The names of actual companies and products mentioned herein may be the trademarks of their
respective owners.
Copyright
©2013 eG Innovations Inc. All rights reserved.
Table of Contents
INTRODUCTION ................................................................................................................................................................................................... 1
MONITORING GENERIC MAIL SERVERS ..................................................................................................................................................... 2
2.1 THE MAIL SERVICE LAYER .......................................................................................................................................................................... 2
2.1.1 Mail Test ......................................................................................................................................................................................... 3
MONITORING EXCHANGE 2000/2003 SERVERS ........................................................................................................................................... 7
3.1 THE EPOXY LAYER ..................................................................................................................................................................................... 10
3.1.1 Exchange Epoxy Test .................................................................................................................................................................... 11
3.2 THE EXCHANGE AD LAYER ....................................................................................................................................................................... 12
3.2.1 Exchange AD Processes Test ........................................................................................................................................................ 12
3.2.2 Exchange Cache Test .................................................................................................................................................................... 13
3.2.3 Exchange Categorizer Queue Test ................................................................................................................................................ 14
3.3 THE MAIL SERVICE LAYER ........................................................................................................................................................................ 15
3.3.1 Exchange Connectors Test ............................................................................................................................................................ 16
3.3.2 Mail Test ....................................................................................................................................................................................... 16
3.3.3 Exchange Mail Transfer Test ........................................................................................................................................................ 17
3.3.4 Exchange Mail Retrieval Test ....................................................................................................................................................... 20
3.3.5 Exchange PC Status Test .............................................................................................................................................................. 21
3.3.6 Exchange MTA Status Test ........................................................................................................................................................... 22
3.3.7 Exchange MTA Connections Test ................................................................................................................................................. 25
3.3.8 Exchange Queueing Test............................................................................................................................................................... 28
3.3.9 Exchange Traffic Test ................................................................................................................................................................... 28
3.3.10 Exchange Mail Service Test .......................................................................................................................................................... 30
3.3.11 Virus Scans Test ............................................................................................................................................................................ 34
3.3.12 Exchange Clients Test ................................................................................................................................................................... 36
3.4 THE EXCHANGE STORE LAYER .................................................................................................................................................................. 39
3.4.1 Disconnected Mailboxes Test ........................................................................................................................................................ 39
3.4.2 Exchange Database Test ............................................................................................................................................................... 41
3.4.3 Exchange Mailbox Store Test ....................................................................................................................................................... 43
3.4.4 Exchange Public Store Test .......................................................................................................................................................... 45
3.4.5 Store VM Status Test ..................................................................................................................................................................... 47
3.4.6 Exchange MailBox Test ................................................................................................................................................................ 48
3.4.7 Exchange Store Groups Test ......................................................................................................................................................... 50
3.4.8 Exchange Mailbox Status Test ...................................................................................................................................................... 52
MONITORING MS EXCHANGE SERVER 5.5 ................................................................................................................................................ 56
4.1 THE EXCHANGE 5.5 SERVICE LAYER.......................................................................................................................................................... 57
4.1.1 MsXCache Test ............................................................................................................................................................................. 57
4.1.2 MsXDBTest ................................................................................................................................................................................... 58
4.1.3 MsXMailRetrieval Test ................................................................................................................................................................. 60
4.1.4 MsXMailService Test .................................................................................................................................................................... 61
4.1.5 MsXStore Test ............................................................................................................................................................................... 63
4.1.6 MsXMail Test ................................................................................................................................................................................ 65
MONITORING LOTUS DOMINO MAIL SERVERS ...................................................................................................................................... 69
5.1 THE DOMINO DATABASE LAYER ................................................................................................................................................................ 70
5.1.1 Lotus Notes Database Test ............................................................................................................................................................ 71
5.1.2 Mailbox Size Test .......................................................................................................................................................................... 75
5.1.3 Domino Database Test .................................................................................................................................................................. 75
5.2 THE DOMINO SERVER LAYER ..................................................................................................................................................................... 78
5.2.1 Lotus Notes MTA Test ................................................................................................................................................................... 79
5.2.2 Lotus Domino Test ........................................................................................................................................................................ 81
5.2.3 Lotus Notes Network Test ............................................................................................................................................................. 85
5.2.4 Lotus Notes Server Test ................................................................................................................................................................ 87
5.2.5 Domino Memory Test .................................................................................................................................................................... 90
5.3 THE DOMINO SERVICE LAYER .................................................................................................................................................................... 92
5.3.1 Lotus Notes Mail Test ................................................................................................................................................................... 93
5.3.2 Lotus Notes LDAP Test ................................................................................................................................................................. 97
5.3.3 Lotus Notes Calendar Test .......................................................................................................................................................... 100
5.3.4 NRPC Test .................................................................................................................................................................................. 102
5.3.5 Domino NRPC Test ..................................................................................................................................................................... 104
5.3.6 Domino Mail Stats Test ............................................................................................................................................................... 106
5.3.7 Domino Network Test ................................................................................................................................................................. 109
MONITORING QMAIL SERVERS ................................................................................................................................................................. 112
6.1 THE QMAIL SERVICE LAYER .................................................................................................................................................................... 113
6.1.1 Qmail Service Test ...................................................................................................................................................................... 113
6.2 THE QMAIL QUEUE LAYER ...................................................................................................................................................................... 114
6.2.1 Qmail Queues Test ...................................................................................................................................................................... 114
6.3 THE QMAIL SEND LAYER......................................................................................................................................................................... 115
6.3.1 Qmail Delivery Test .................................................................................................................................................................... 116
6.3.2 Qmail Messages Test .................................................................................................................................................................. 117
6.3.3 Qmail Snd Concur Test ............................................................................................................................................................... 118
MONITORING THE EXCHANGE MESSAGING SERVICE ....................................................................................................................... 120
7.1 THE MESSENGER SERVICE LAYER ............................................................................................................................................................ 120
7.1.1 Exchange Messenger Test ........................................................................................................................................................... 121
EXTERNALLY MONITORING MAIL SERVERS ........................................................................................................................................ 124
EXTERNALLY MONITORING THE EXCHANGE SERVER ..................................................................................................................... 125
MONITORING THE EXCHANGE CLUSTER SERVICE ............................................................................................................................ 127
10.1 THE MAIL SERVICE LAYER ...................................................................................................................................................................... 128
MONITORING THE IRONPORT ASYNCOS MAIL SERVER .................................................................................................................... 129
11.1 THE OPERATING SYSTEM LAYER ............................................................................................................................................................. 130
11.1.1 Asyncos CPU Status Test ............................................................................................................................................................ 130
11.1.2 Asyncos Fan Status Test.............................................................................................................................................................. 133
11.1.3 Asyncos Disk I/O Status Test ...................................................................................................................................................... 135
11.1.4 Asyncos Memory Details Test ..................................................................................................................................................... 137
11.1.5 Asyncos Power Status Test .......................................................................................................................................................... 139
11.1.6 Asyncos Raid Status Test ............................................................................................................................................................ 142
11.1.7 Asyncos Temperature Status Test ................................................................................................................................................ 144
11.2 THE NETWORK LAYER ............................................................................................................................................................................. 146
11.3 THE ASYNCOS SERVICE LAYER ................................................................................................................................................................ 146
11.3.1 Asyncos DNS Details Test ........................................................................................................................................................... 147
11.3.2 Asyncos Queue Details Test ........................................................................................................................................................ 149
11.3.3 Asyncos Mail Threads Test ......................................................................................................................................................... 151
CONCLUSION .................................................................................................................................................................................................... 154
Table of Figures
Figure 2.1: Layer model for a generic mail server ..................................................................................................................................................... 2
Figure 2.2: Tests mapping to the Mail Service layer ................................................................................................................................................. 3
Figure 3.1: Architecture of a Microsoft Exchange server .......................................................................................................................................... 8
Figure 3.2: Layer model of an Exchange 2000/2003 server ...................................................................................................................................... 9
Figure 3.3: Tests mapping to the Epoxy layer ......................................................................................................................................................... 11
Figure 3.4: The tests associated with the Exchange AD layer ................................................................................................................................. 12
Figure 3.5: Tests mapping to the Mail Service layer ............................................................................................................................................... 15
Figure 3.6: The Active Directory Users and Computers console ............................................................................................................................. 33
Figure 3.7: Properties of the chosen user account.................................................................................................................................................... 34
Figure 3.8: The tests associated with the Exchange Store layer ............................................................................................................................... 39
Figure 4.1: Layers of MS Exchange Server 5.5 ...................................................................................................................................................... 57
Figure 4.2: Tests mapping to the Xchange55_Service layer .................................................................................................................................... 57
Figure 4.3: The Exchange Administrator window ................................................................................................................................................... 68
Figure 5.1: Layer model for a Lotus Domino mail server ........................................................................................................................................ 70
Figure 5.2: Tests mapping to the Domino Database layer ....................................................................................................................................... 70
Figure 5.3: Tests mapping to the Domino Server layer ........................................................................................................................................... 79
Figure 5.4: Tests mapping to the Domino Service layer .......................................................................................................................................... 92
Figure 6.1: The layer model of a Qmail server ...................................................................................................................................................... 112
Figure 6.2: The tests associated with the QMail Service layer .............................................................................................................................. 113
Figure 6.3: The test associated with the QmailQueueTest ..................................................................................................................................... 114
Figure 6.4: The tests associated with the QMail Send layer .................................................................................................................................. 115
Figure 7.1: Layer model of the Exchange Messaging service ................................................................................................................................ 120
Figure 7.2: The test associated with the Messenger Service layer ......................................................................................................................... 121
Figure 8.1: Layer model of the External Mail server ............................................................................................................................................. 124
Figure 9.1: Layer model of the Exchange Server .................................................................................................................................................. 125
Figure 10.1: Layer model of the Exchange Cluster service ................................................................................................................................... 128
Figure 10.2: Tests mapping to the Mail Service layer ........................................................................................................................................... 128
Figure 11.1: Layer model of the IronPort AsyncOS Mail server ........................................................................................................................... 129
Figure 11.2: The tests mapped to the Operating System layer ............................................................................................................................... 130
Figure 11.3: The test mapped to this layer ............................................................................................................................................................. 146
Figure 11.4: The tests mapped to the Asyncos Service layer ................................................................................................................................. 147

I n t r o d u c t i o n
1
Introduction
Web servers may be the most important and ubiquitous servers on the Internet, but mail servers rank
a close second. E-mail is generally considered the most important service provided by the Internet,
which makes servers that move and store mail a crucial piece of software. Naturally, these
components also need constant monitoring.
eG Enterprise provides varied models for monitoring the health of a wide variety of mail servers.
These models execute tests on the mail servers at pre-configured intervals, and report plenty of useful
performance metrics which reveal the availability of the mail server, time taken by the server to
send/receive mails, the health of critical internal components and services offered by the mail server,
the effectiveness of the protocols employed while mailing, etc.
This document discusses the monitoring models that eG Enterprise prescribes for monitoring each
popular mail server.
Chapter
1
M o n i t o r i n g G e n e r i c M a i l S e r v e r s
2
Monitoring Generic Mail Servers
The Mail server model that eG Enterprise offers out-of-the-box, is typically meant for situations where
administrators only want to know whether the mail server is available or not, how quickly is it able to
send/receive mails, and alongside determine the overall health of the mail server host. To assess
these performance parameters, users can manage any mail server, regardless of type (Exchange,
Domino, etc.), as a generic Mail server using the eG administrative interface.
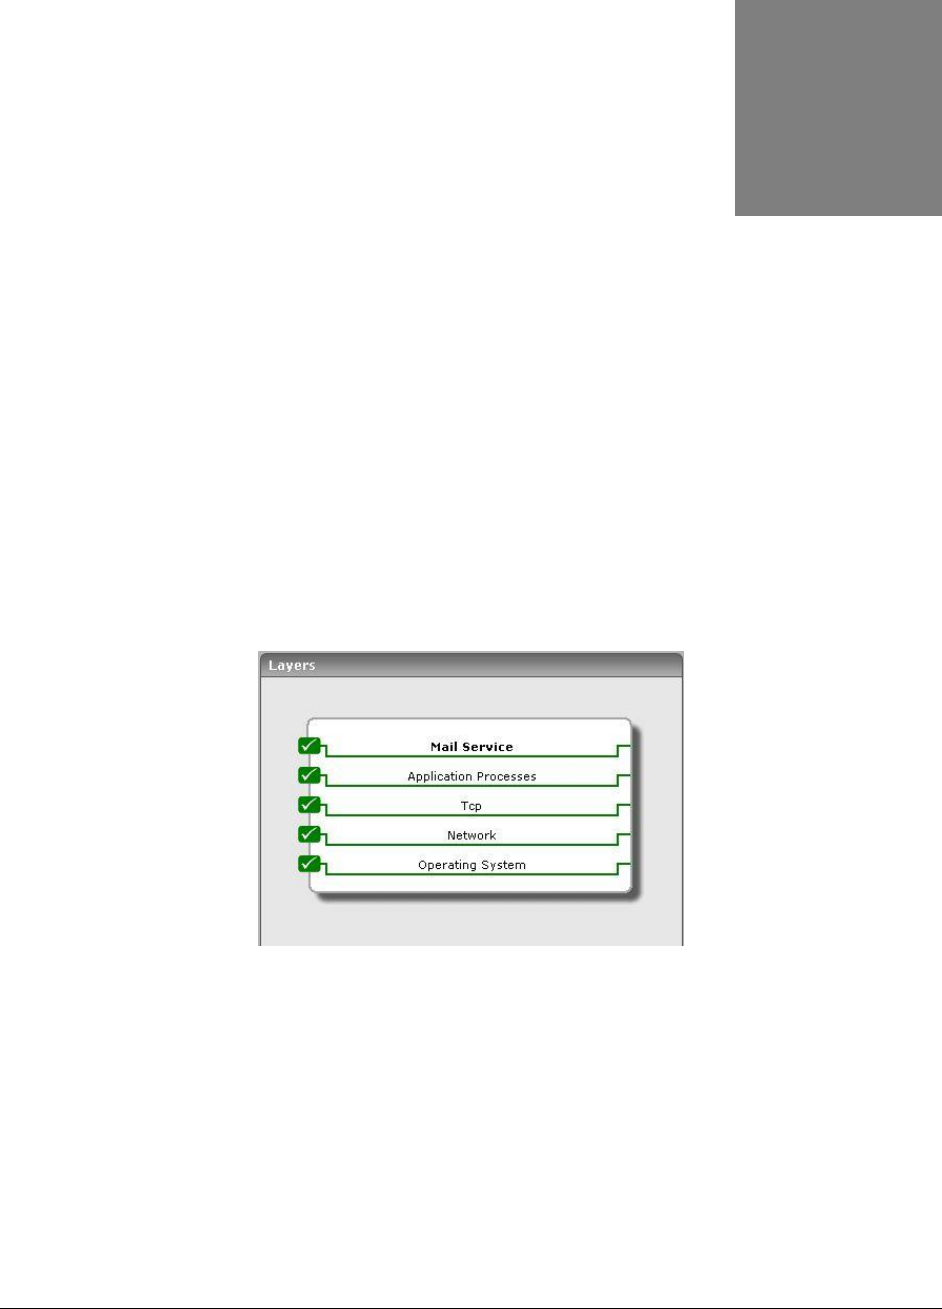
The layer model that the eG Enterprise suite uses for monitoring generic mail servers is shown in
Figure 2.1. The Operating System, Network, Tcp, and Application Processes layers have already been
discussed in the Monitoring Unix and Windows Servers document. This chapter therefore will deal with
the Mail Service layer only.
Figure 2.1: Layer model for a generic mail server
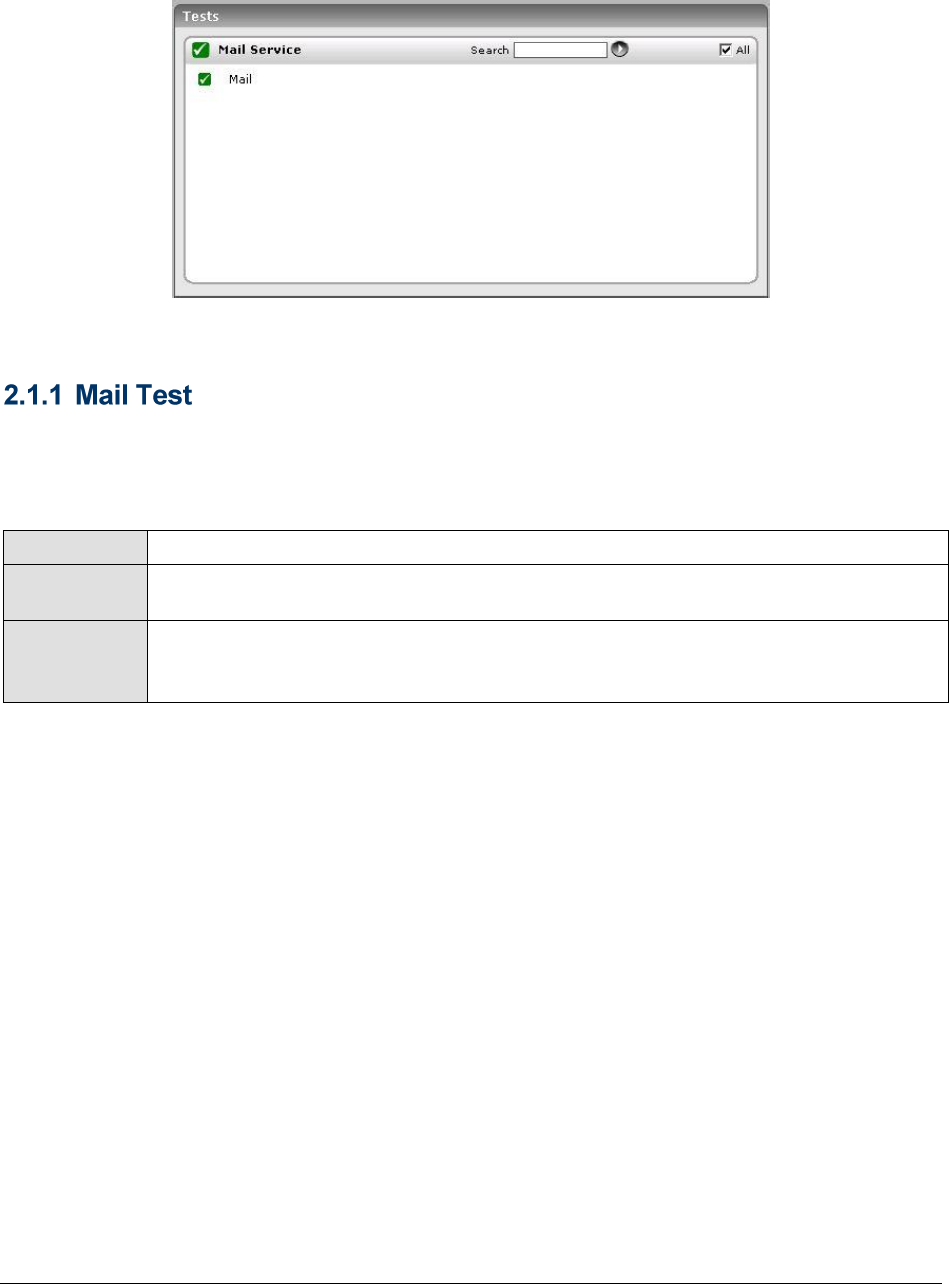
2.1 The Mail Service Layer
This layer handles the connectivity of the mail server to different hosts in the environment using the
Mail test that is shown in Figure 2.2.
Chapter
2
M o n i t o r i n g G e n e r i c M a i l S e r v e r s
3
Figure 2.2: Tests mapping to the Mail Service layer
This test monitors the availability of the mail server from an external perspective. To do this, the Mail
Test sends a test mail periodically from one user account to another and measures whether the mail
was sent successfully and what the delivery time was. This test uses SMTP protocol for sending and
POP3 or IMAP protocols for receiving mails.
Purpose
This test measures the status of a mail server.
Target of the
test
A mail server
Agent
deploying the
test
An external agent
M o n i t o r i n g G e n e r i c M a i l S e r v e r s
4
Configurable
parameters for
the test
1. TESTPERIOD - Indicates how often this test needs to be executed.
2. HOST - Indicates the IP address of the mail server
3. - The port number of the mail server’s routing engine
4. SENDPORT - The SMTP port of the mail server. The default SMTP port is 25.
5. SENDUSER - Denotes the user name with which the test sends mails.
6. SENDPASSWORD - The password associated with the above user name. The
SENDUSER and SENDPASSWORD can be ‘none’ if the target mail server does not
need authentication to send mails.
7. – Confirm the by retyping it here.
8. FROMID - Takes the email id from which the test generates mails.
9. TOID - Takes the email id to which the test sends mails. It is advisable that a
separate email account be created for the MailTest.
10. PROTOCOL - The protocol to be used for receiving the mails (could be POP3 or
IMAP).
11. RECEIVEHOST - Indicates the IP address at which the test receives mails.
Typically, this would be the IP address of a POP3 or IMAP server.
12. RECEIVEPORT - Indicates the port number of the host, which receives the mails.
The default port for POP3 is 110 and that of IMAP is 143.
13. RECEIVEUSER - Indicates the user name with which the test receives mails.
14. RECEIVEPASSWORD - Indicates the password corresponding to the above user.
15. – Confirm the by retyping it here.
Here are example settings of the Mail Test parameters:
SENDUSER = none
SENDPASSWORD = none
FROMID = mailtest@test.com
TOID = mailtest@test.com
PROTOCOL = POP3
RECEIVEHOST = mail.test.com (the POP3 server's host)
RECEIVEPORT = 110
RECEIVEUSER = mailtest
RECEIVEPASSWORD = mailtest's password
It is advisable that you create a separate user account on your mail server for this
test to use.
Outputs of the
test
One set of results for every mail server monitored
Measurements
made by the
Measurement
Measurement
Unit
Interpretation

M o n i t o r i n g G e n e r i c M a i l S e r v e r s
5
test
Ability to send mail:
Indicates the
availability of the mail
server to which the
test attempts to
connect to send mail
Percent
A value of 0 indicates that the test was not
successful in sending a mail. Possible
reasons for this could include the mail
server being down, the network connection
to the server not being available, etc.
Abiity to receive
mail:
Indicates the
availability of the
POP3/IMAP server to
which the test
attempts to connect to
receive mail messages
Percent
A value of 0 indicates that the test was not
successful in receiving a mail message from
the POP3/IMAP server. Possible reasons for
this could include the POP3/IMAP server
being down, the user login being invalid, a
failure of the authentication system that the
POP3/IMAP server uses for authenticating
user requests, etc.
Outstanding
messages:
Indicates the number
of messages that have
been sent but have not
been received
Number
A large value is usually associated with a
very high value of the Roundtrip_time
measurement. This is usually attributable to
excessive load on the SMTP mail server.
Delivery delays may also happen if the
server is not able to send mail out (e.g.,
due to DNS failures, due to large number of
failed messages which are being retried
often, etc.).
Roundtrip time:
The average delay
between the
transmission of one
message and its
reception by a user.
Mins
This is a key measure of the quality of the
mail service. An increase in Roundtrip_time
may be indicative of a problem with the
SMTP mail service. Possible reasons could
include spamming, queuing failures, disk
space being full, etc.
Note:
The accuracy of the Roundtrip time measurement is dependent on the frequency at which the Mail
test is executed. For example, assume that Mail test is executed once every 5 minutes. Since the
Mail test only checks for message receptions every time it executes, the Roundtrip time may be
reported as 5mins even if the message has actually been delivered to the user within a minute of
its transmission.

M o n i t o r i n g G e n e r i c M a i l S e r v e r s
6
Note:
Apart from Processes test, a TCP Port Status test also executes on the Application Processes layer of
the Mail server. For more details about the TCP Port Status test, refer to the Monitoring Generic
Servers document.

Monitoring Exchange 2000/2003 Servers
7
Monitoring Exchange 2000/2003
Servers
Microsoft's Exchange 2000/2003 server is an enterprise messaging system that is tightly integrated
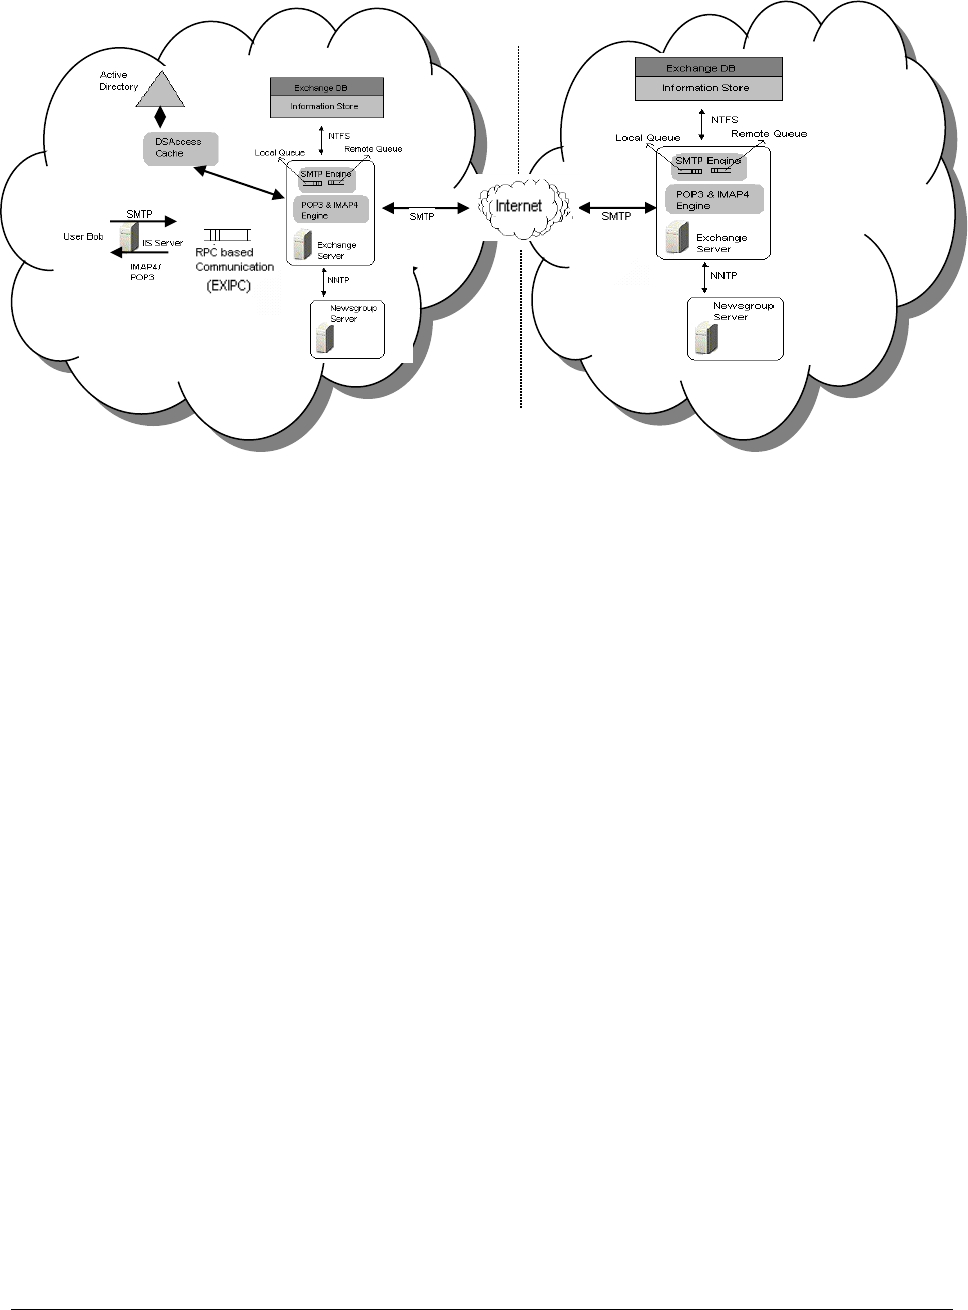
with the Windows 2000/2003 operating system. Figure 3.1 shows how the Exchange 2000/2003
Server interacts with the Internet Information Server and Active Directory within a domain. This figure
also depicts how an Exchange 2000/2003 Server belonging to one domain communicates with another
Exchange 2000/2003 server on another domain. The Simple Mail Transport Protocol (SMTP) is the
primary protocol used by the Exchange server for sending e-mails and connecting to another
Exchange server that are available in other domains. An user connecting to the Exchange server uses
SMTP to send and Post Office Protocol (POP3) or Internet Messaging Access Protocol version 4.0
(IMAP4) to receive e-mails from the mailbox. SMTP, POP3, and IMAP4 are all implemented using
virtual servers in the IIS server. Alternatively, clients also use MAPI which is based on remote
procedure calls to communicate with the Exchange server.
Since IIS and Exchange servers run in separate address spaces, an RPC based communication layer is
necessary to forward the requests to the corresponding mail protocol engines which are residing on
the Exchange server. This layer is called the Exchange InterProcess Communication Layer (EXIPC).
The Exchange 2000/2003 Server internally uses two queues namely, the local queue and the remote
queue. The local queue is meant for sending e-mails to users belonging to the same domain. The
remote queue is used for sending e-mails to users of other domains.
The Exchange server stores all the e-mails in a repository called the Exchange Database. The server
uses NTFS to connect to the Exchange Database. The user e-mail address and credentials are stored
in the Active Directory. The Exchange server uses a cache (called the DSAccess cache) to avoid
frequent accesses to the Active Directory service.
Chapter
3
Monitoring Exchange 2000/2003 Servers
8
Figure 3.1: Architecture of a Microsoft Exchange server
The Exchange server uses Network News Transport Protocol (NNTP) to communicate with Newsgroup
servers. NNTP is also implemented using a virtual server in the IIS server.
Since the Exchange server relies on Windows 2000/2003 Active Directory, Internet Information
Services and Domain Name System, the Exchange server administrators need to be more proactive
than reactive to ensure that critical messaging services remain available to the customers and end-
users. One of the most common complaints that Exchange administrators receive from users is that of
slow mail performance. The key challenge for an administrator here is to determine where and why a
slow-down is occurring (e.g., is there a problem is receiving data from clients over a network? is the
slow-down in the Exchange server's processing? or is the problem due to slow disk read/writes at the
operating system level?), and what can be done to solve this problem.
The eG monitor for Exchange makes monitoring and managing Exchange server performance easy and
efficient. Using either an agent-based on an agentless approach, administrators can monitor various
aspects of the Exchange server's performance including the instantaneous occupancy of the different
Exchange server queues, the access patterns of users, and the interaction of the Exchange server with
the Active Directory. eG Enterprise's unique layer model representation (see Figure 3.2) provides an
intuitive and elegant way to correlate the application performance with network, CPU, memory, and
disk performance, thereby allowing administrators to quickly interpret where the performance
bottlenecks may be.
Domain A
Domain B
Monitoring Exchange 2000/2003 Servers
9
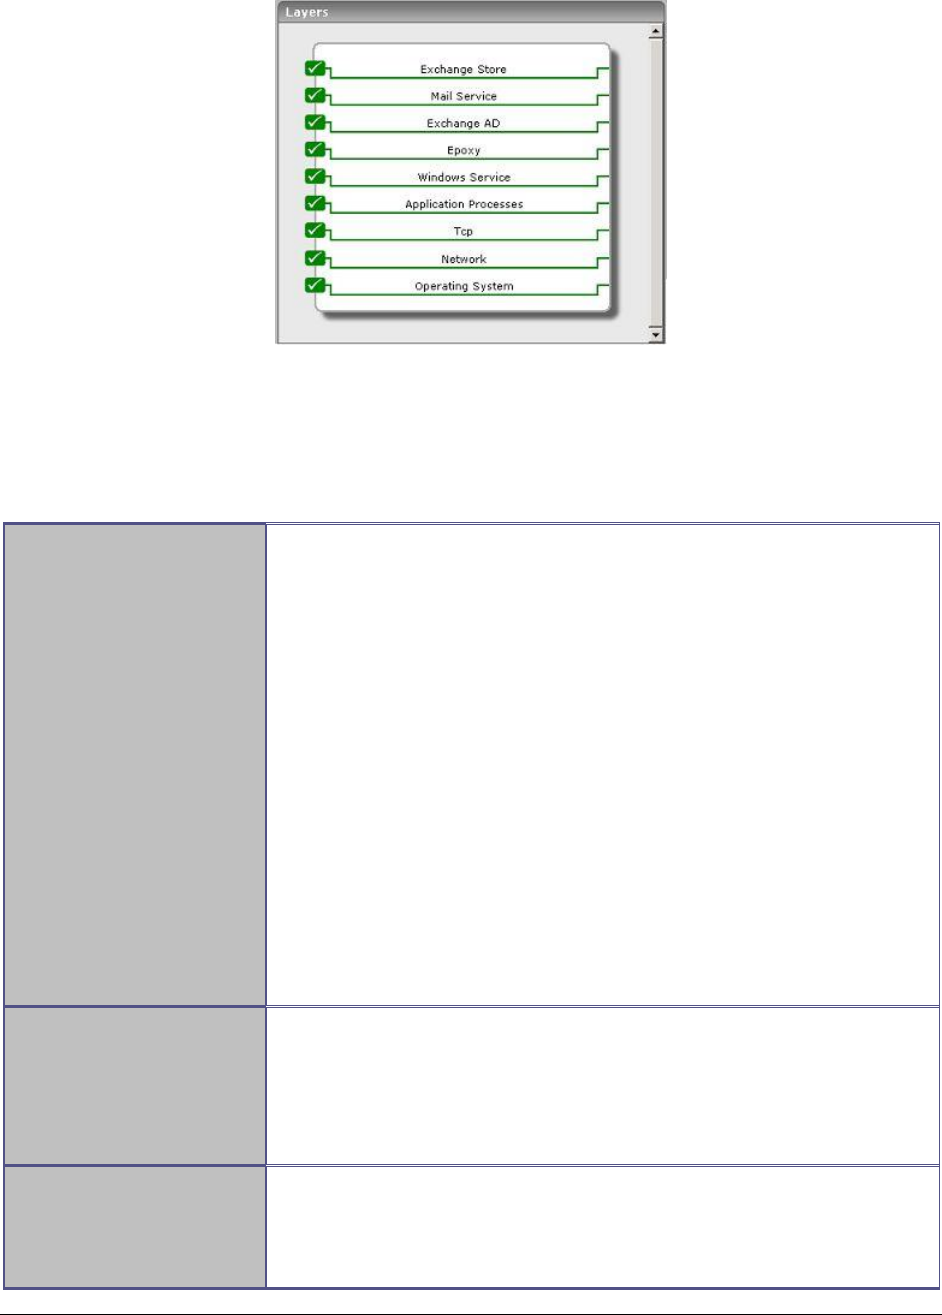
Figure 3.2: Layer model of an Exchange 2000/2003 server
Data collected by the eG agents is stored in a relational database, so historical analysis and diagnosis
can be performed to determine how the server can be reconfigured for optimal performance. The key
performance-related questions that the data so collected helps answer, are listed in the table below.
Service Monitoring
Are client requests reaching the Exchange server, and is the
response time acceptable?
Are any of the Exchange server queues indicating a
malfunctioning/slow-down of the server?
Are RPC requests from MAPI clients being queued for processing
at the Exchange server, or any change in the server's processing
rate of RPC requests?
Is there any queue buildup at the Epoxy layer between the
Exchange store and Microsoft IIS?
Are many retries being attempted for mail delivery?
Is there a significant slowdown in local mail delivery time? What
is the delivery time of mail to remote locations?
Are there any critical errors related to Exchange in the
Windowsevent logs?
Is the exchange database configured correctly? Are there enough
log buffers, and is the cache hit ratio within acceptable limits?
Process Monitoring
Are the critical Exchange processes working?
Is any process consuming excessive CPU or memory?
Is there any unusual activity on the server (e.g., backup jobs,
antivirus software) that can be impacting the Exchange server's
performance?
Mail Traffic Monitoring
What is the workload on the server in terms of RPC requests from
MAPI clients like Outlook?
Is there any unusual increase in mail traffic activity?
What are the peak times and how many users are connected at

Monitoring Exchange 2000/2003 Servers
10
that time?
Network Monitoring
Are there network congestion/collision issues that could be
slowing performance as seen by end users?
Is there excessive queueing of requests on any of the network
interfaces of the system hosting the Exchange server?
Memory Monitoring
Does the system hosting the Exchange server have sufficient free
memory?
Are there excessive page faults occurring that could be impacting
performance?
Disk Monitoring
Is there a disk bottleneck on the system hosting the Exchange
server?
Are there requests queued on any of the disks on the system
hosting the Exchange server?
Are disk read/writes to any of the disks on the system very slow?
Is the load on the disks balanced well or is one of the disks
handling a much higher load than the others?
CPU Monitoring
Is the system CPU on the Exchange server very heavily used?
Which process(es) are taking up CPU? Is there a specific time
period daily when system usage tends to peak?
Active Directory
Monitoring
Is the Exchange server able to communicate with the Active
Directory server?
Is the length of the categorizer queue which handles requests to
the global catalogs unusually high?
The sections to come describe each layer of Figure 3.2.
3.1 The Epoxy Layer
Epoxy (ExIPC) is a shared memory mechanism that enables the Internet Information Services
(inetinfo.exe) and the Microsoft Exchange Information Store (store.exe) processes to quickly shuttle
data back and forth. This allows for bi-directional inter-process communication between inetinfo.exe
(which accepts requests for internet protocols such as WebDav, IMAP4, NNTP, POP3, and SMTP) and
the store.exe process. This memory is also used by DSAccess, the Exchange component that caches
the Active Directory Information. The Epoxy layer reports statistics pertaining to Epoxy.
If there are performance issues in either the Store.exe or Inetinfo.exe processes, it is common for a
queue to build up in the Epoxy as one process performs faster than the other. The Store_out_queue
contains messages sent from the Store.exe process to the Inetinfo.exe process. The Client_out_queue
contains messages from the Inetinfo.exe process to the Store.exe process. By monitoring these
queues, an exchange administrator can determine which queues are building up and degrading
performance.
Monitoring Exchange 2000/2003 Servers
11
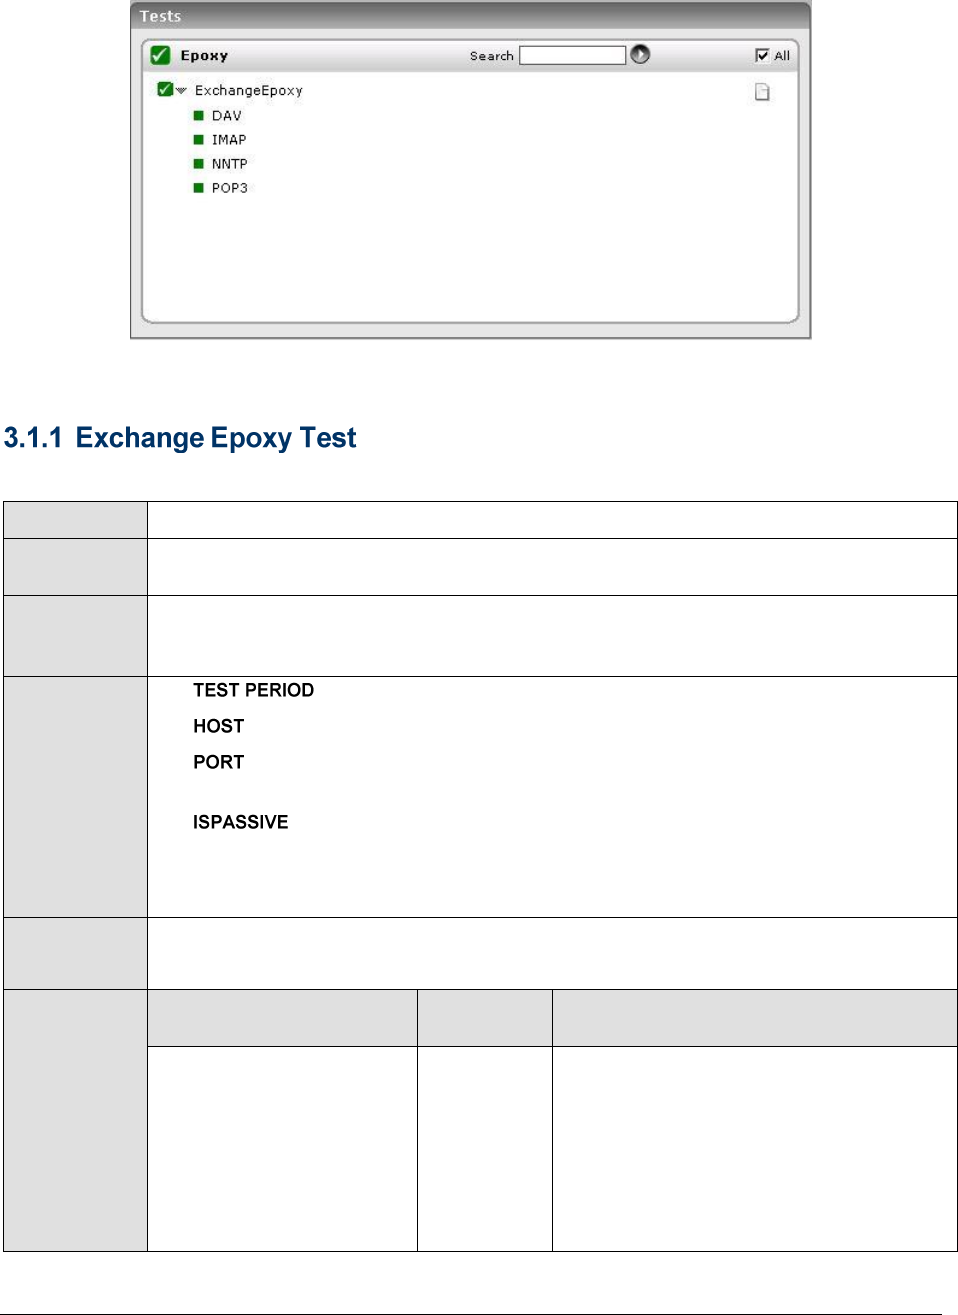
Figure 3.3: Tests mapping to the Epoxy layer
The ExchangeEpoxy test reports statistics pertaining to the Epoxy on an Exchange 2000/2003.
Purpose
Reports statistics pertaining to the Epoxy (ExIPC)
Target of the
test
An Exchange server 2000/2003
Agent
deploying the
test
An internal agent
Configurable
parameters for
the test
1. - How often should the test be executed
2. - The IP address of the machine where the Exchange server is installed.
3. – The port number through which the Exchange server communicates. The
default is 691.
4. – If the value chosen is YES, then the Exchange server under
consideration is a passive server in an Exchange cluster. No alerts will be
generated if the server is not running. Measures will be reported as “Not
applicable’ by the agent if the server is not up.
Outputs of the
test
One set of results for every Epoxy being monitored
Measurements
made by the
test
Measurement
Measurement
Unit
Interpretation
Client out queue length:
The number of messages
sent by the Inetinfo.exe
process that are in the
queue.
Number
This queue size should be below 10 at all
times. If the queue size exceeds 10, it is
indicative of a bottleneck in the
Inetinfo.exe process.
Monitoring Exchange 2000/2003 Servers
12
Exchange store out
queue length:
The number of messages
sent by the Store.exe
process that are in the
queue.
Number
This queue size should be below 10 at all
times. If the queue size exceeds 10, it is
indicative of a bottleneck in the Store.exe
process.
Disk performance issues on the Exchange
store may prevent the Store.exe process
from effectively handling incoming
requests.
3.2 The Exchange AD Layer
An Exchange server depends on the global catalog domain controllers. Any adverse performance of
the Active Directory servers can impact the Exchange server’s performance. The Exchange AD layer
monitors the Exchange server’s interactions with the Active Directory server. The tests associated with
this layer are shown below.
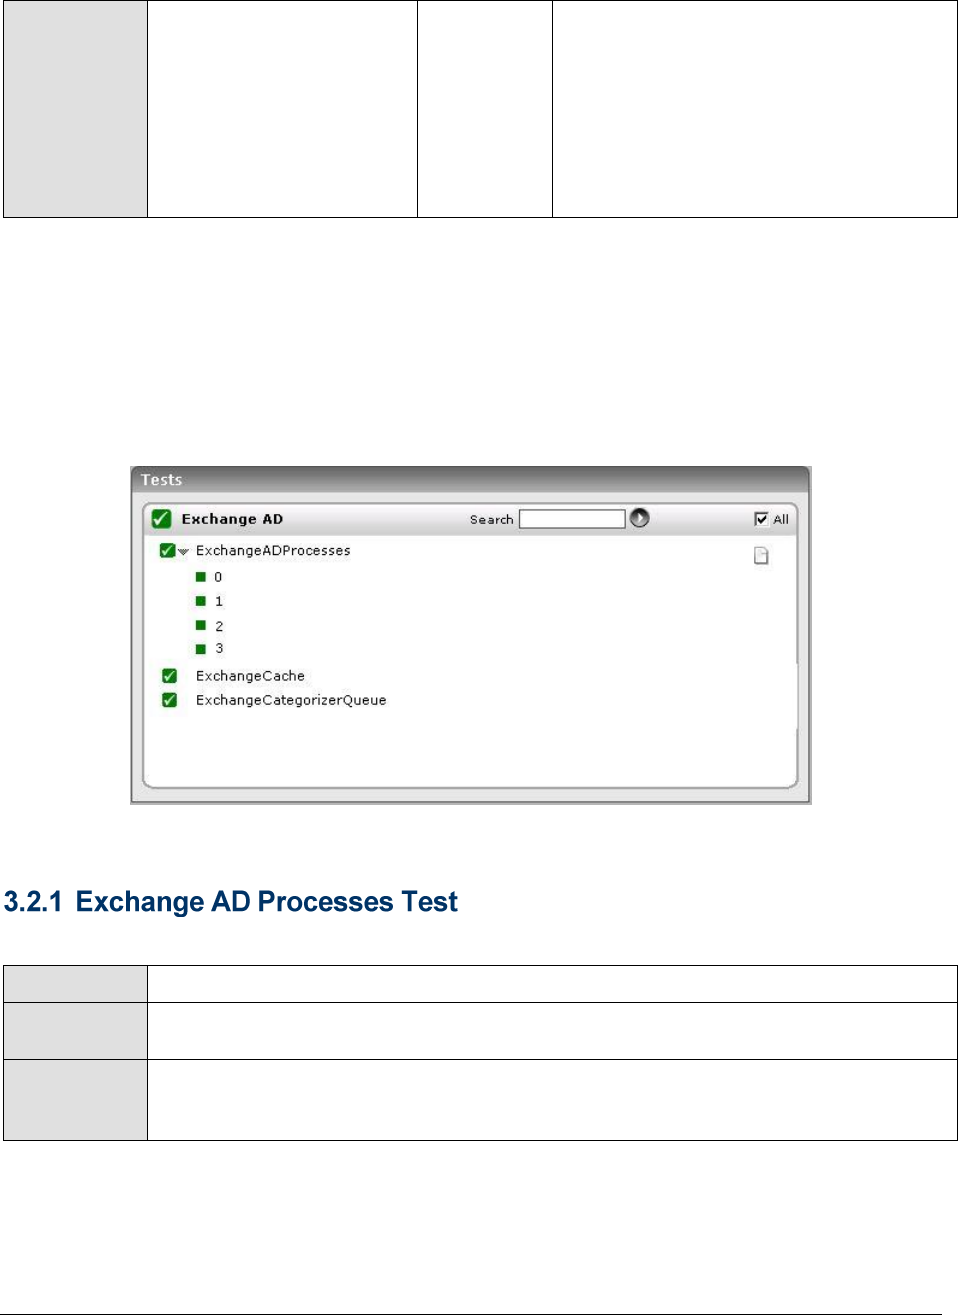
Figure 3.4: The tests associated with the Exchange AD layer
This test reports whether there is a slow-down in communicating with the global catalogs.
Purpose
Reports whether there is a slow-down in communicating with the global catalogs
Target of the
test
An Exchange server 2000/2003
Agent
deploying the
test
An internal agent
Monitoring Exchange 2000/2003 Servers
13
Configurable
parameters for
the test
1. - How often should the test be executed
2. - The IP address of the machine where the Exchange server is installed.
3. – The port number through which the Exchange server communicates. The
default is 691.
4. – If the value chosen is YES, then the Exchange server under
consideration is a passive server in an Exchange cluster. No alerts will be
generated if the server is not running. Measures will be reported as “Not
applicable’ by the agent if the server is not up.
Outputs of the
test
One set of results for every Exchange server process
Measurements
made by the
test
Measurement
Measurement
Unit
Interpretation
LDAP read time:
The time that an LDAP
read request from the
Exchange server takes to
be fulfilled.
Secs
The average value should be less than 50
milliseconds. Spikes (Maximum) should
not be higher than 100milliseconds.
LDAP search time:
The time that an LDAP
search request takes to be
fulfilled.
Secs
The Average value should be less than 50
milliseconds. Spikes (Maximum) should
not be higher than 100 milliseconds.
This test measures the performance of the Exchange Server Directory Service Access (DSAccess)
cache. The DSAccess cache is a shared memory cache that is used by several components such as the
information store, message categorizer (a component in that handles distribution lists), message
transfer agent (MTA, used in non-SMTP delivery) or any other component or service that requires
directory service information. This cache improves the performance of messaging operations like
sending e-mails and provides access to both configuration information and recipient data from the
Active Directory to Exchange server. The idea of DSAccess cache is used to reduce the number of
queries going directly to the Active Directory. This caching implementation helps to reduce the cost
overhead associated with the direct access to the Active Directory.
To attain the maximum performance, the cache memory can be increased by tuning the registry key
“MaxMemory” available under the tree
“HKEY_LOCAL_MACHINE\System\CurrentControlSet\Services\MSExchangeDSAccess”.
Purpose
This test monitors the performance of Exchange Server DSAccess cache.
Target of the
test
An Exchange server 2000/2003
Agent
deploying the
An internal agent
Monitoring Exchange 2000/2003 Servers
14
test
Configurable
parameters for
the test
1. - How often should the test be executed
2. - The IP address of the machine where the Exchange Server is installed.
3. – The port number through which the Exchange Server communicates.
4. – If the value chosen is YES, then the Exchange server under
consideration is a passive server in an Exchange cluster. No alerts will be
generated if the server is not running. Measures will be reported as “Not
applicable’ by the agent if the server is not up.
Outputs of the
test
One set of results for every Exchange server being monitored
Measurements
made by the
test
Measurement
Measurement
Unit
Interpretation
Cache hit ratio:
This measure indicates the
rate at which the events
are being generated in the
DSAccess cache.
(An event is generated
whenever an object has
been located in the
DSAccess cache or
whenever new objects
have been added in the
cache.)
Percent
A zero value for this measure may
indicate that the Exchange server is not
performing any activity on the Active
directory or no operations are happening
on the Exchange server itself.
A non-zero value indicates that the
directory service has found the required
objects in the DSAccess cache thereby
reducing the access to the Active
Directory.
A non-zero value for this measure also
may indicate that the required objects are
not found in the DSAccess cache thereby
resulting in the addition of newer objects
from the Active Directory.
A high value for this measure ensures
better performance of the Exchange
server.
This test indicates how well SMTP is processing LDAP lookups against the global catalog servers. The
Exchange Categorizer queue length should be around zero unless the server is expanding distribution
lists. While expanding distribution lists, this counter can occasionally go up higher. This is an excellent
measure of how healthy the global catalogs are. If there are slow global catalogs, this queue length
will increase.
Purpose
Indicates how well SMTP is processing LDAP lookups against the Global catalog
servers
Target of the
test
An Exchange server 2000/2003
Agent
deploying the
An internal agent
Monitoring Exchange 2000/2003 Servers
15
test
Configurable
parameters for
the test
1. - How often should the test be executed
2. - The IP address of the machine where the Exchange Server is installed.
3. – The port number through which the Exchange Server communicates.
4. – If the value chosen is YES, then the Exchange server under
consideration is a passive server in an Exchange cluster. No alerts will be
generated if the server is not running. Measures will be reported as “Not
applicable’ by the agent if the server is not up.
Outputs of the
test
One set of results for every Exchange server being monitored
Measurements
made by the
test
Measurement
Measurement
Unit
Interpretation
Categorizer queue
length:
This value indicates how
well SMTP is processing
LDAP lookups against the
Global catalog servers.
Number
The value should be below 10 most of the
time.
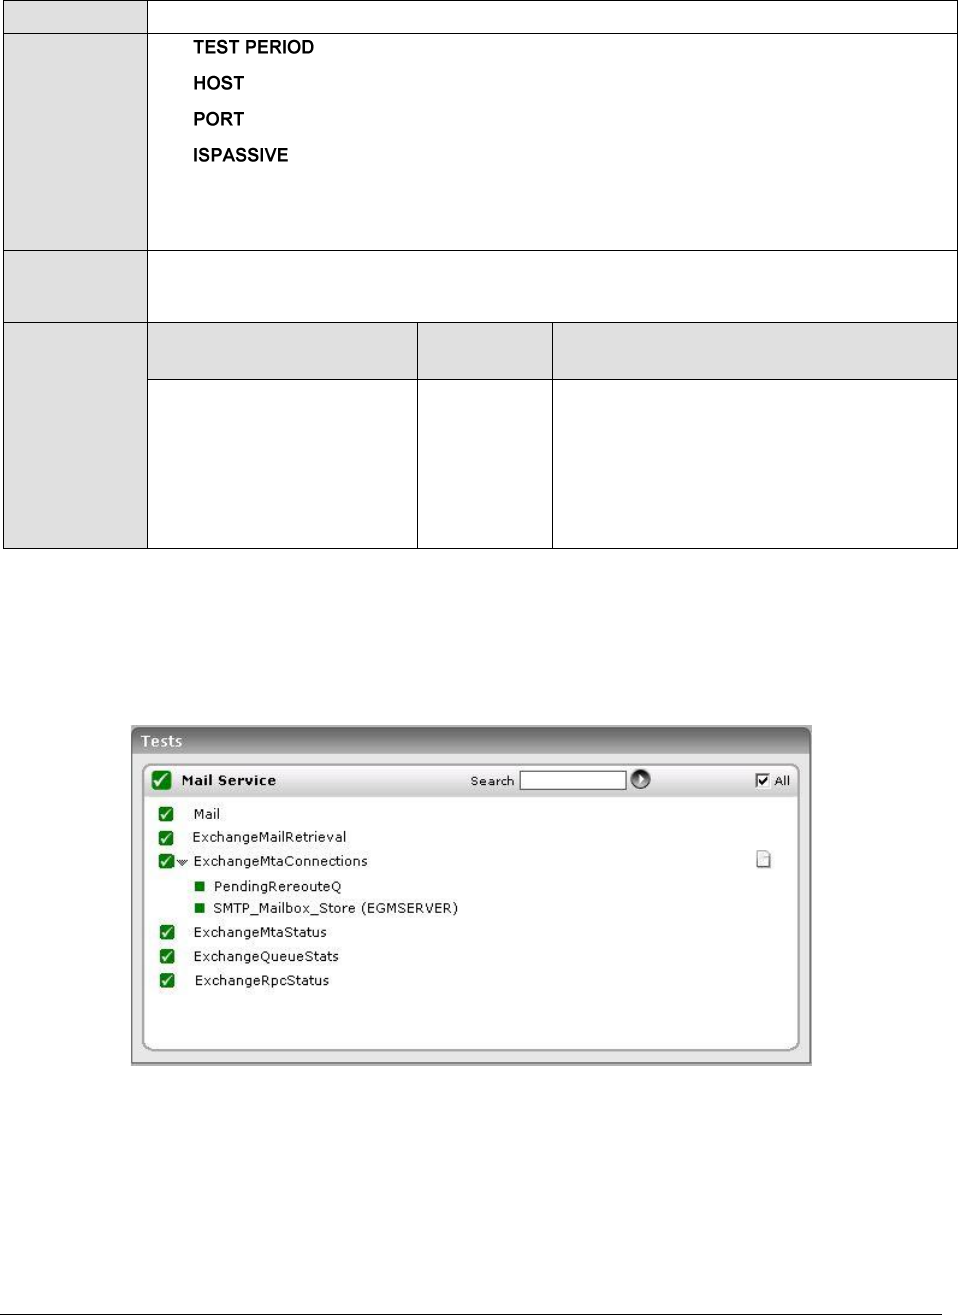
3.3 The Mail Service Layer
This layer handles the connectivity of the Exchange server to different hosts in the environment.
Figure 3.5: Tests mapping to the Mail Service layer
This layer also monitors the traffic on the protocols that have been described below.
The Internet Messaging Access Protocol version 4.0 (IMAP4) works like POP3. This protocol enables
clients to access and manipulate messages stored within their mailboxes. Unlike POP3, IMAP4 allows a
user to access multiple e-mail folders, search through a mailbox, and maintain read and unread
message flags. In addition, a user can download an entire message or a portion of a message, such as
an attachment. The traffic statistics pertaining to the use of POP3 and IMAP4 protocols via an
Monitoring Exchange 2000/2003 Servers
16
Exchange server are monitored using eG Enterprise's XchgMailRetrieval test (see Figure 3.5). SMTP is
the primary protocol that is used by mail clients to send email messages to a mail server. Moreover,
SMTP is also the main mechanism used by mail servers to exchange emails between themselves. eG
Enterprise's XchgMailTransfer test (not shown in Figure 3.5) is used to monitor SMTP protocol usage
statistics for an Exchange server.
A connector is a software module that allows integration of third party applications (e.g., fax
applications, integration with MS MQ, connection to an external POP3 service, etc.) into an Exchange
mail server environment. Monitoring the status of each of the connectors registered with the Exchange
server is important, so as failure of a connector can impact services being offered to users of the
Exchange server. This test monitors the status of the different exchange connectors registered with an
Exchange server. This test is disabled by default. To enable the test, go to the ENABLE / DISABLE TESTS
page using the menu sequence : Agents -> Tests -> Enable/Disable, pick Exchange as the Component
type, set Performance as the Test type, choose this test from the DISABLED TESTS list, and click on the >>
button to move the test to the ENABLED TESTS list. Finally, click the Update button.
Purpose
Monitors the status of the different exchange connectors registered with an Exchange
server
Target of the
test
An Exchange server 2000/2003
Agent
deploying the
test
An internal agent
Configurable
parameters for
the test
1. - How often should the test be executed
2. - The IP address of the machine where the Exchange Server is installed.
3. – The port number through which the Exchange Server communicates.
Outputs of the
test
One set of results for every Exchange connector being monitored
Measurements
made by the
test
Measurement
Measurement
Unit
Interpretation
Exchange connector
status:
Indicates the current
status of this connector.
Percent
When the value is 100, it means that the
connector is up and if it is 0 then it
means that the connector is down.
Mail test has already been discussed elaborately in the previous chapter. This test is to be used if the
Exchange server is configured to support SMTP and POP3/IMAP access. In the case of Exchange
2000/2003 servers, the Mail test takes an additional parameter. If the value chosen against
this parameter is YES, then the Exchange server under consideration is a passive server in an
Exchange cluster. No alerts will be generated if the server is not running. Measures will be reported as
“Not applicable’ by the agent if the server is not up. This Parameter is applicable to Exchange
2000/2003 servers only, though it appears in the Mail test configuration pages of MS Exchange 5.5 and
Lotus Domino servers.
Monitoring Exchange 2000/2003 Servers
17
Exchange Servers use SMTP as the default transport for messages across servers and to the Internet.
All mail that is not being sent from senders and recipients homed on the same server goes through
SMTP.
The following steps trace the path of a message:
1. The message is submitted using MAPI or SMTP
2. The message is then categorized, which means the Exchange server consults the Active Directory
for information regarding its recipients.
3. The message is routed, which means the Exchange server decides if the message should be
delivered locally (the recipient is homed on this server) or to which server should this message be
sent (to the Internet, another server, other domains, and so on).
4. SMTP either delivers the mail locally or queues it for remote transfer
The local and remote queues are key indicators of bottlenecks on the Exchange server. The
ExchangeMailTransfer Test monitors both these queues. This test is disabled by default. To enable the
test, go to the ENABLE / DISABLE TESTS page using the menu sequence : Agents -> Tests ->
Enable/Disable, pick Exchange as the Component type, Performance as the Test type, choose the test
from the DISABLED TESTS list, and click on the >> button to move the test to the ENABLED TESTS list.
Finally, click the Update button..
Purpose
This test monitors the both the local and remote queues of an Exchange server, and
also reports statistics pertaining to the SMTP protocol.
Target of the
test
An Exchange server
Agent
deploying the
test
An internal agent
Configurable
parameters for
the test
1. - How often should the test be executed
2. - The IP address of the machine where the Exchange server is installed.
3. – The port number through which the Exchange server communicates.
4. – If the value chosen is YES, then the Exchange server under
consideration is a passive server in an Exchange cluster. No alerts will be
generated if the server is not running. Measures will be reported as “Not
applicable’ by the agent if the server is not up.
Outputs of the
test
One set of results for every Exchange server being monitored.
Measurements
made by the
Measurement
Measurement
Unit
Interpretation

Monitoring Exchange 2000/2003 Servers
18
test
Local queue size:
This measure indicates the
number of messages in the
SMTP queue for local
delivery.
Number
This measure is close to zero under
normal operating conditions. The
maximum value should be less than
1000. Also, the queue should remain
steady near its average, with small
variance.
If this measure increases steadily over a
period, there is probably a problem with
the information store to which the user is
trying to deliver.
In the majority of cases, a buildup of
messages in the Local Delivery queue
indicates a performance issue or outages
on the server, because the server is no
longer able to deliver the incoming mail in
a timely manner. This hold up can come
from a slowness in consulting Active
Directory or in handing messages off for
local delivery or SMTP. It can also come
from databases being dismounted.
Remote queue size:
This measure indicates the
number of messages SMTP
queue for remote delivery.
Number
This measure is close to zero under
normal operating conditions. The
maximum value should be less than
1000. Also, the queue should remain
steady near its average, with a small
variance.
The value of this measure may increase if
mails are sent to different external
domains.
A rise in this measure means that value is
not being sent to other servers. This
failure to send mail can be explained by
outages or performance issues with the
network or remote servers. Those
outages or performance issues are
causing the network or remote servers
from receiving the mail efficiently.
Current SMTP
connections:
This measure shows the
total number of current
inbound connections.
Number
A zero value for this measure either
indicates that no SMTP clients are
accessing the Exchange server or some
network problems exist that is blocking
the user requests.
A substantial high value for this measure
indicates that the SMTP server is
overloaded.
This problem can be solved by limiting
the number of connections to the SMTP
virtual server in the Exchange System
Manager.

Monitoring Exchange 2000/2003 Servers
19
Bad mails:
This measure indicates the
number of bad mails
generated from the time
this test was last executed.
Number
A non-zero value for this measure
indicates that the mails are not delivered
to the destination.
This situation may arise due to one of the
following reasons:
1. No recipients might have been
mentioned for the mail
2. A network failure
3. A general failure in the Exchange
server
Data received:
This measure shows the
rate at which the Exchange
server receives data.
KB/Sec
An above normal value for this measure
over a period may indicate that the SMTP
server is overloaded.
Limiting the number of simultaneous
connections to the SMTP virtual server in
the Exchange System Manager can solve
this problem.
Data sent:
This measure shows the
rate at which the Exchange
server sends data.
KB/Sec
A high value over a period is indicative of
an excessive use of the SMTP server.
Limiting the number of simultaneous
connections to the SMTP virtual server in
the Exchange System Manager can solve
this problem.
Avg message delivery
retries:
Messages that could not be
delivered by the Exchange
server are sent to the retry
queue.
This measure indicates the
number of messages
entering the retry queue
as a fraction of the overall
message delivery.
Number
This measure is a good indicator of the
general message delivery problems in the
target environment.
This measure should be close to zero.
If a large number of messages are being
retried, this measure will approach to 1.
Avg retry messages
sent:
This measure shows the
average number of retries
per outbound message
sent as a fraction of the
overall messages that is
being sent from the
Exchange server.
Number
This measure should be close to zero
under normal operating conditions.
If a large proportion of the sent messages
are entering the retry queue, this
measure will approach to 1.
Monitoring Exchange 2000/2003 Servers
20
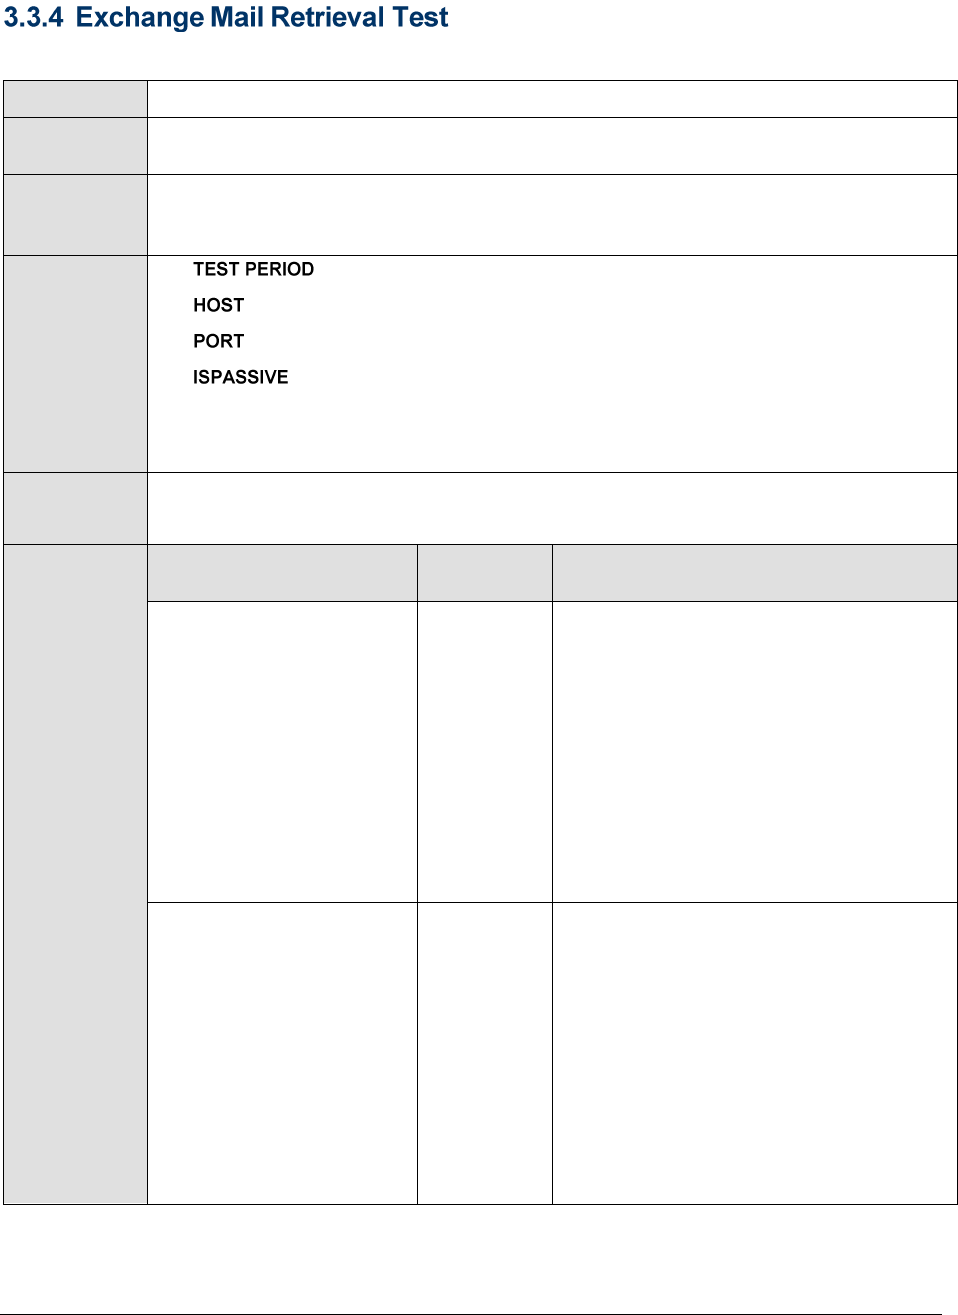
This test monitors the usage of POP3 and IMAP protocols via an Exchange server.
Purpose
This test monitors the usage of POP3 and IMAP protocols via an Exchange server
Target of the
test
An Exchange server 2000/2003
Agent
deploying the
test
An internal agent
Configurable
parameters for
the test
1. - How often should the test be executed
2. - The IP address of the machine where the Exchange server is installed.
3. – The port number through which the Exchange server communicates.
4. – If the value chosen is YES, then the Exchange server under
consideration is a passive server in an Exchange cluster. No alerts will be
generated if the server is not running. Measures will be reported as “Not
applicable’ by the agent if the server is not up.
Outputs of the
test
One set of results for every Exchange server being monitored
Measurements
made by the
test
Measurement
Measurement
Unit
Interpretation
Current POP3
connections:
This measure shows the
number of current POP3
connections to the server.
Number
A high value for this measure indicates
that a large number of POP3 clients are
connected to the Exchange server.
This measure helps the administrator in
planning or upgrading the following
parameters:
1. The server’s memory requirements
2. Control of unnecessary traffic on the
mail server
3. The server’s processing capabilities
Current IMAP
connections:
This measure shows the
number of current IMAP
connections to the server.
Number
A high value for this measure indicates
that a large number of IMAP clients are
connected to the Exchange server.
This measure helps the administrator in
planning or upgrading the following
parameters:
1. The server’s memory requirements
2. Control of unnecessary traffic on the
mail server
3. The server’s processing capabilities
Monitoring Exchange 2000/2003 Servers
21
POP3 authentication
failures:
This measure shows the
number of POP3
authentication failures
since the last
measurement.
Number
A high value for this measure indicates
that either the Exchange server is down
or invalid/erroneous user credentials are
being used during authentication
resulting in a failure.
IMAP authentication
failures:
This measure shows the
number of IMAP
authentication failures
since the last
measurement.
Number
A high value for this measure indicates
that either the Exchange server is down
or invalid/erroneous user credentials are
being used during authentication
resulting in a failure.
When using Outlook clients in MAPI mode, clients’ actions in Outlook translate to remote procedure
calls (RPCs) between the clients and the server. If the client is running in online mode, these RPC calls
occur synchronously. Any delay by the server in fulfilling these synchronous requests directly affects
user experience and the responsiveness of Outlook. Conversely, if the client is running in cached
mode, the majority of these requests will be handled asynchronously. Asynchronous processing means
that the performance of the RPC mechanism does not affect the overall user experience.
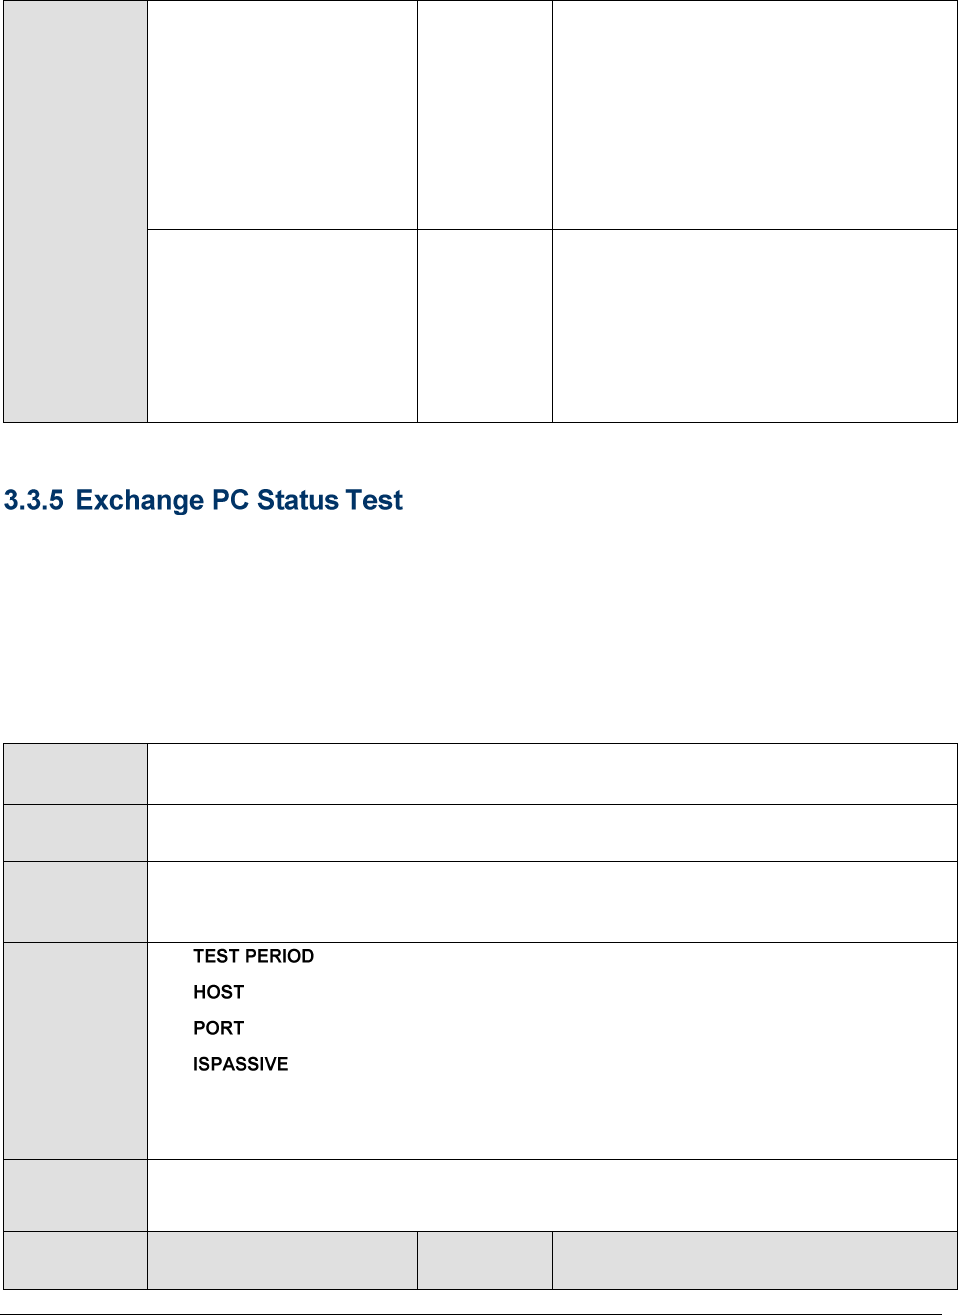
The ExchangeRpcStatus test monitors the performance of RPC mechanisms between the clients and
the Exchange server.
Purpose
Monitors the performance of RPC mechanisms between the clients and the Exchange
server
Target of the
test
An Exchange server 2000/2003
Agent
deploying the
test
An internal agent
Configurable
parameters for
the test
1. - How often should the test be executed
2. - The IP address of the machine where the Exchange server is installed.
3. – The port number through which the Exchange server communicates.
4. – If the value chosen is YES, then the Exchange server under
consideration is a passive server in an Exchange cluster. No alerts will be
generated if the server is not running. Measures will be reported as “Not
applicable’ by the agent if the server is not up.
Outputs of the
test
One set of results for every Exchange server being monitored
Measurements
made by the
Measurement
Measurement
Unit
Interpretation

Monitoring Exchange 2000/2003 Servers
22
test
RPC operations:
Indicates the rate of RPC
operations handled by the
Exchange information
store during the last
measurement period.
Operations/
Sec
Generally, spikes in RPC requests that do
not increase RPC operations/sec
indicate that there are
bottlenecks preventing the store from
fulfilling the requests in a timely
manner. It is relatively simple
to identify where the bottlenecks are
occurring with regards to RPC requests
and RPC operations/sec.
If the client experiences delays, but the
RPC requests are zero and the RPC
operations/sec are low, the performance
problem is happening before Exchange
processes the requests (that is, before
the Microsoft Exchange Information
Store service actually gets the incoming
requests). All other combinations
point to a problem either while Exchange
processes the requests or after
Exchange processes those requests.
Current RPC requests:
Indicates the number of
MAPI RPC requests
presently being serviced
by the Microsoft Exchange
Information Store service.
Number
The Exchange server is configured with a
pre-set maximum number of RPC
requests that can be handled
simultaneously (default is 100).
If this value is exceeded, client requests
to the server will be rejected.
This measure should be below 30 most of
the time.
RPC traffic:
Indicates the number of
MAPI RPC packets being
handled by the Exchange
Information Store during
the last measurement
period.
Packets/Sec
RPC latency:
Indicates the RPC latency
in milliseconds, averaged
for the past 1024
packets.
Secs
This value should be below 50ms at all
times. A slowdown in RPC packet
processing can adversely impact the user
experience.
The Exchange MTA (Message Transfer Agent) is a core component of Exchange Server 2000/2003 and
is responsible for all non-SMTP message transfer. This includes message transfer to external X.400
messaging systems and Exchange servers connected through X.400 connectors. Message transfer to
non-Exchange messaging systems, such as Lotus Notes and Domino or Microsoft Exchange Connector
for Novell GroupWise, is controlled by the Exchange MTA through MAPI-based connectors, such as

Monitoring Exchange 2000/2003 Servers
23
Microsoft Exchange Connector for Lotus Notes or Microsoft Exchange Connector for Novell GroupWise.
Exchange MTA is also responsible for remote procedure call (RPC)-based communication with
Exchange Server 5.5.
A healthy MTA is key to the error-free transmission of messages across MTAs. Any deterioration in the
processing ability of the MTA could therefore result in slower delivery or even non-delivery of critical
messages, longer outstanding message queues, and consequently, an inefficient mail server. The
ExchangeMtaStatus test monitors the status of an Exchange server's MTA and proactively alerts
administrators of abnormalities (if any) in MTA-related operations, so that issues can be resolved
quickly and the MTA can resume functioning normally in no time.
Purpose
Monitors the status of an Exchange server's MTA
Target of the
test
An Exchange server 2000/2003
Agent
deploying the
test
An internal agent
Configurable
parameters for
the test
1. - How often should the test be executed
2. - The IP address of the machine where the Exchange server is installed.
3. – The port number through which the Exchange server communicates.
4. – If the value chosen is YES, then the Exchange server under
consideration is a passive server in an Exchange cluster. No alerts will be
generated if the server is not running. Measures will be reported as “Not
applicable’ by the agent if the server is not up.
Outputs of the
test
One set of results for every Exchange server being monitored
Measurements
made by the
test
Measurement
Measurement
Unit
Interpretation
Mta associations:
Indicates the number of
open associations that this
MTA currently has to other
MTAs.
Number
Messages/sec handled
by an MTA:
Indicates the rate at which
messages are processed
by this MTA during the last
measurement period.
Messages/S
ec
A consistent dip in this value is a cause
for concern, and warrants further
investigation.
Message data rate to
MTA:
Indicates the rate at which
message data is processed
by this MTA during the last
measurement period.
KB/Sec
This measure again is a good indicator of
the processing ability of the MTA. A high
value is hence desired.

Monitoring Exchange 2000/2003 Servers
24
Free elements:
Indicates the number of
free buffer elements
currently in the MTA pool.
Number
Free headers in the
MTA:
Indicates the number of
free buffer headers
currently in the MTA pool.
Number
Threads in use in MTA:
Indicates the number of
threads currently in use by
the MTA.
Number
This number can be used to determine
whether additional processors might be
beneficial.
Work queue length in
MTA:
Indicates the number of
outstanding messages
currently in the work
queue.
Number
This value represents the number of
messages not yet processed to
completion by the MTA. A steady increase
in this value implies that messages are
not being processed as fast as they
should be. This is a clear indicator of a
bottleneck at the MTA or a malfunctioning
connector component.
XAPI gateways:
Indicates the number of
XAPI gateways connected
to the MTA using the XAPI
interface.
Number
To communicate with the Exchange store,
the MTA uses an internal API named
XAPI, which is a wrapper around MAPI.
XAPI gateways handle the message
transfer in and out of the message
queues in the Exchange store. A single
gateway can have multiple XAPI gateway
sessions. The XAPI_receive_rate and
XAPI_transmit_rate measures serve as
effective indicators of the health of the
XAPI interface.
XAPI clients:
Indicates the number of
XAPI clients connected to
the MTA using the XAPI
interface. A single client
can have multiple XAPI
client sessions.
Number
XAPI receive rate
Indicates the rate at which
data is received over a
XAPI connection.
KB/Sec
XAPI transmit rate:
Indicates the rate at which
data is transmitted over a
XAPI connection.
KB/Sec
Monitoring Exchange 2000/2003 Servers
25
TCP data receive rate in
MTA:
Indicates the rate at which
data is received over a
TCP/IP connection.
KB/Sec
The Exchange MTA uses a number of
thread pools to handle communication
tasks between the various layers of the
Open Systems Interconnection (OSI)
stack. These thread pools include reliable
transfer service (RTS) threads, kernel
threads, RPC threads, transport threads,
and TCP/IP or X.25 threads. However, the
TCP/IP protocol does not fit exactly into
the OSI stack. This is because the TCP/IP
protocol, although a layered protocol
stack, is not OSI- compliant (although
most elements of TCP/IP can be mapped
to OSI). To support X.400 communication
over TCP/IP according to the OSI
standard, the Exchange MTA implements
a Transport Protocol Class 0 (TP0)
interface on top of TCP/IP. The values of
these measures indicate the rate at which
data is exchanged over the TCP/IP
protocol.
TCP data transmit rate
from MTA:
Indicates the rate at which
data is transmitted over a
TCP/IP connection.
KB/Sec
X25 receive rate:
Indicates the rate at which
data is received over an
X.25 connection.
KB/Sec
The X.25 protocol is an OSI-compliant
protocol designed specifically for wide
area network (WAN) connections on
packet-switching networks (such as a
public X.400 provider). It is the network
protocol that operates on top of HDLC so
that the local system can communicate
with the next node in the X.25 network.
The values of these measures reveal the
effectiveness of the X.25 protocol.
X25 transmit rate:
The rate at which data is
transmitted over an X.25
connection.
KB/Sec
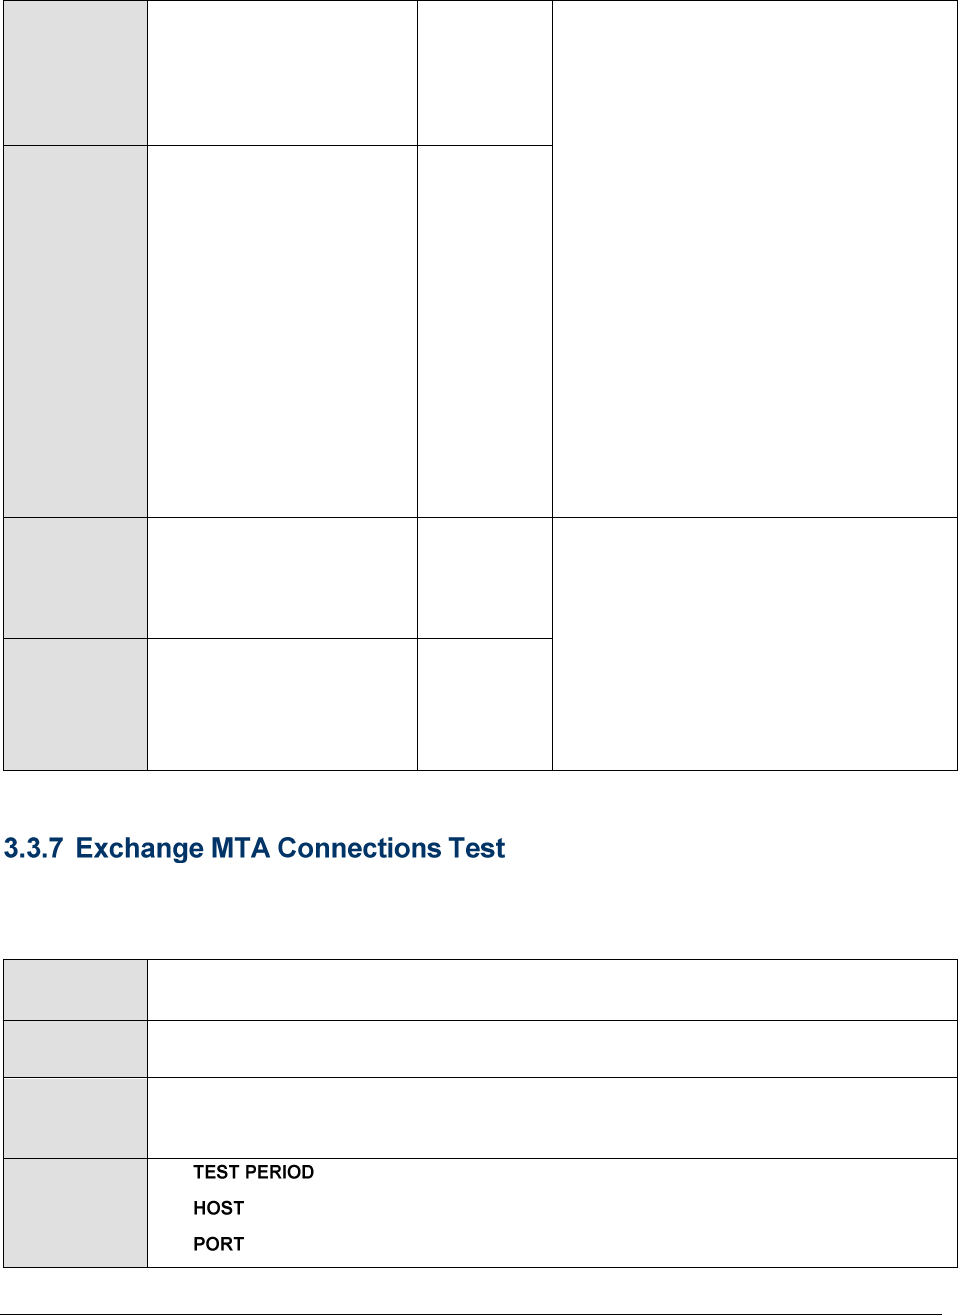
This test tracks the connections to and from message transfer agents
of Exchange servers. The statistics reported by this test can indicate the connection
over which maximum message traffic is flowing.
Purpose
Tracks the connections to and from message transfer agents
of Exchange servers.
Target of the
test
An Exchange server 2000/2003
Agent
deploying the
test
An internal agent
Configurable
parameters for
the test
1. - How often should the test be executed
2. - The IP address of the machine where the Exchange server is installed.
3. – The port number through which the Exchange server communicates.

Monitoring Exchange 2000/2003 Servers
26
Outputs of the
test
One set of results for every MTA connection being monitored
Measurements
made by the
test
Measurement
Measurement
Unit
Interpretation
Inbound associations:
Indicates the current
number of inbound
(remote initiated)
associations with the
entity.
Number
Outbound associations:
Indicates the current
number of outbound
(locally initiated)
associations with the
entity.
Number
Messages queued in
MTA:
Indicates the number of
outstanding messages
currently queued for
transfer to
the entity.
Number
A consistently increasing value could
indicate that fewer messages are being
processed by the MTA. This could
necessitate further scrutiny.
Data in MTA queue:
Indicates the total volume
of message content
currently stored in an
entity's queue.
KB
Recipients in MTA
queue:
Indicates the total number
of recipients specified in all
messages currently stored
in the entity's queue.
Number
Data receive rate over
MTA connection:
Indicates the rate at which
message data is received
from the connected
entity during the last
measurement period.
KB/Sec
These values indicate the level of activity
on an MTA connection.

Monitoring Exchange 2000/2003 Servers
27
Data transmit rate over
MTA connection:
Indicates the rate at which
message data is sent from
the connected
entity during the last
measurement period.
KB/Sec
Data received:
Indicates the amount of
message data received
from the connected
entity during the last
measurement period.
KB
The values of these measures indicate the
load handled by an MTA connection.
Data transmitted:
Indicates the amount of
message data transmitted
to the connected entity
during the last
measurement period.
KB
Message receive rate
over MTA connection:
Indicates the rate at which
messages are received
from the connected entity
during the last
measurement period.
Messages/S
ec
The values of these measures indicate
how quickly messages are processed by
the MTA connection.
Message transmit rate
over MTA connection:
Indicates the rate at which
messages are sent to the
connected entity during
the last measurement
period.
Messages/S
ec
Messages inbound:
Indicates the number of
messages received from
the connected
entity during the last
measurement period.
Number
These values indicate the message traffic
on an MTA connection.
Messages outbound:
Indicates the number of
messages sent by the
connected
entity during the last
measurement period.
Number
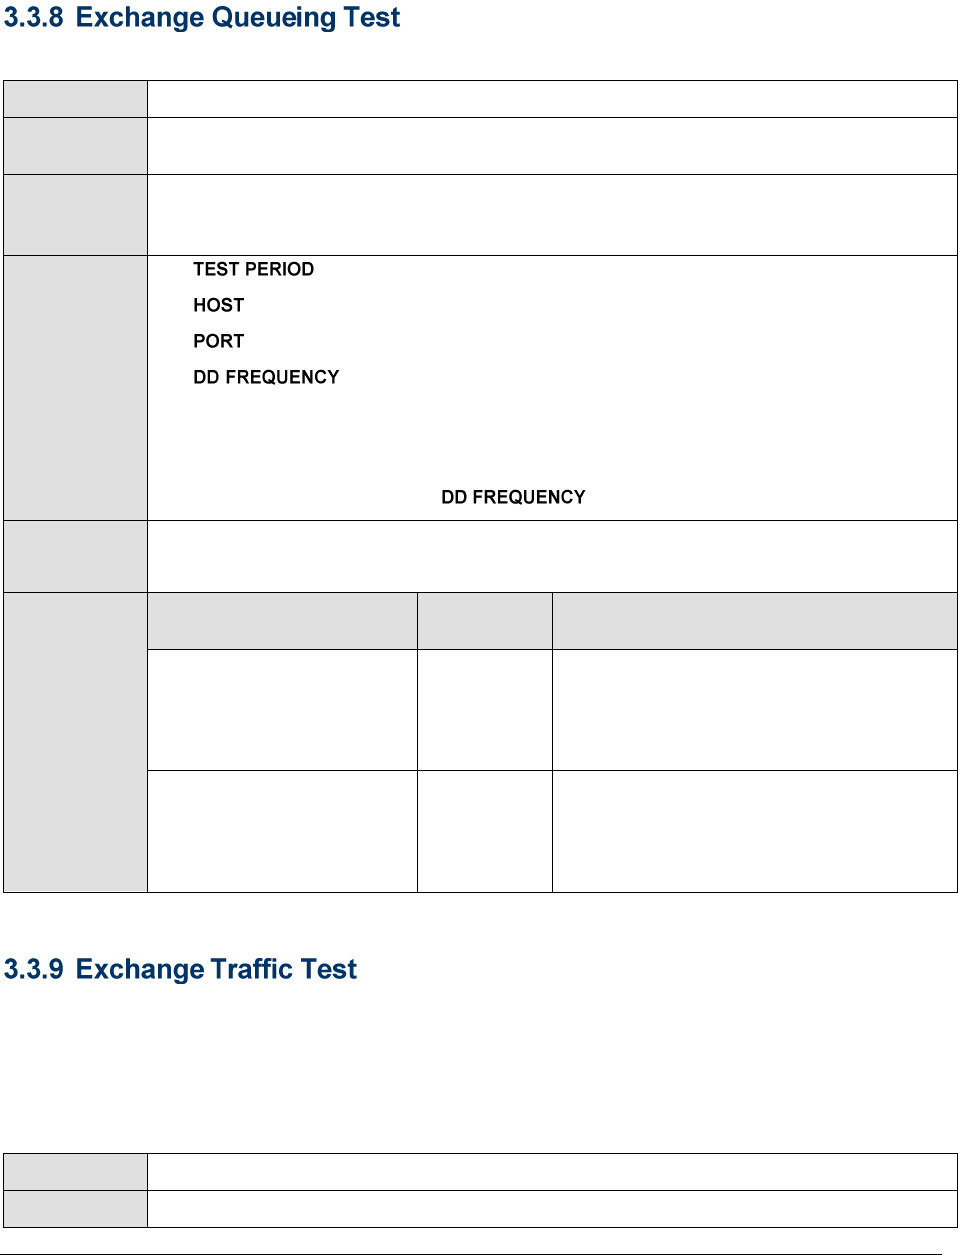
Monitoring Exchange 2000/2003 Servers
28
This test monitors the different SMTP and X.400 queues on an Exchange server.
Purpose
This test monitors the different SMTP and X.400 queues on an Exchange server.
Target of the
test
An Exchange server 2000/2003
Agent
deploying the
test
An internal agent
Configurable
parameters for
the test
1. - How often should the test be executed
2. - The IP address of the machine where the Exchange server is installed.
3. – The port number through which the Exchange server communicates.
4. - Refers to the frequency with which detailed diagnosis measures
are to be generated for this test. The default is 1:1. This indicates that, by default,
detailed measures will be generated every time this test runs, and also every time
the test detects a problem. You can modify this frequency, if you so desire. Also, if
you intend to disable the detailed diagnosis capability for this test, you can do so
by specifying none against .
Outputs of the
test
One set of results for the Exchange server being monitored
Measurements
made by the
test
Measurement
Measurement
Unit
Interpretation
Messages in queue:
Indicates the number of
messages currently in the
queue.
Number
An unusually high number of messages in
the queue is indicative of
any problem with the corresponding
queue or its end points.
Data in queue:
Indicates the amount of
message data currently in
the queue.
KB
When monitoring an Exchange server, it is critical to understand the workload on the server. For
example, how much mail traffic is the server handling? How many of these mails are intended for local
(i.e., internal) recipients, and how many are intended for external recipients? Further, this information
when provided over time can be used to determine what days or hours are the busiest periods. The
ExchangeTraffic test addresses these requirements. To enable this test, the message tracking log
setting of the Exchange server needs to be turned on. This test is disabled by default.
Purpose
Measures the mail traffic that can be handled by the server
Target of the
An Exchange server 2000/2003

Monitoring Exchange 2000/2003 Servers
29
test
Agent
deploying the
test
An internal agent
Configurable
parameters for
the test
1. - How often should the test be executed
2. - The IP address of the machine where the Exchange server is installed.
3. – The port number through which the Exchange server communicates.
Outputs of the
test
One set of results for the Exchange server being monitored
Measurements
made by the
test
Measurement
Measurement
Unit
Interpretation
Mails sent:
Indicates the number of
mails sent by the
Exchange mail server
during the last
measurement period.
Number
Using the values reported for the
'Internal' and 'External' descriptors, you
can determine the traffic generated by
internal and external (i.e from the local
domain to domains not included in the
DOMAINNAME list) mails. The 'total'
descriptor is the sum of internal and
external mail traffic. A sudden increase in
mail activity may require investigation -
e.g. to determine whether any user is
spamming other users/mailboxes.
Mails received:
Indicates the number of
mails received by the
Exchange mail server in
the last measurement
period.
Number
If there is an unusual increase in the
incoming mail traffic, you can use the
values reported for the 'Internal' and
'External' descriptors, to identify the root-
cause of the spike - is it due to internal
(i.e., within the domains indicated by the
DOMAINNAME list) mails or external (i.e
from the local domain to domains not
included in the DOMAINNAME list) mails?
Once again, the 'total' descriptor is the
sum of internal and external mail traffic.
Mail data sent:
Indicates the mail traffic
(in MB) sent by the
Exchange server to
internal and external users
in the last measurement
period.
MB
Both these measures indicate the
workload and amount of data handled by
the Exchange mail server. An abnormal
data size might require deeper
investigation to figure out whether any
unusually large attachments were
sent/received.
Mail data received:
Indicates the mail traffic
(in MB) received by the
Exchange server from
internal and external users
in the last measurement
period.
MB
Monitoring Exchange 2000/2003 Servers
30
This test monitors the availability and performance of a Microsoft Exchange mail server from an
external perspective. The test mimics the mail client activity by using the MAPI (Messaging Application
Programming Interface) for sending and receiving mails. This test is disabled by default. To enable the
test, go to the ENABLE / DISABLE TESTS page using the menu sequence : Agents -> Tests ->
Enable/Disable, pick Exchange as the Component type, Performance as the Test type, choose the test
from the DISABLED TESTS list, and click on the >> button to move the test to the ENABLED TESTS list.
Finally, click the Update button.
Purpose
Monitors the availability and performance of a Microsoft Exchange mail server from
an external perspective
Target of the
test
An Exchange server
Agent deploying
the test
An external agent
Note:
This test uses only a Microsoft Outlook 2003 mail client for sending/receiving mails from the
server; therefore, you can, if you so desire, configure a separate Outlook Mail client on the
Exchange server for use by this test. Note that the XChgMailTest will not work with Microsoft
Outlook Client 2000/2002.
The eG external agent that is executing the XchgMail test, should be installed on a
Windows 2000 server/client in the same domain as the Exchange 2000/2003 server.
The Microsoft Outlook client used by the test should have been installed with the
Collaboration Data Objects option enabled; to know how to modify your Outlook installation to
enable this option, refer to the Configuring and Monitoring Mail Servers document.
The administrator configuring the test should ensure that the mailbox being used in the
test, exists on the Exchange 2000/2003 server.
The eGurkhaAgent service should run using the account information of the user whose
mailbox has been configured for the XchgMail test.
MAPI should be configured in the Exchange 2000/2003 server.
The Exchange client should exist in the system on which this test is executed.
Monitoring Exchange 2000/2003 Servers
31
Configurable
parameters for
the test
1. - How often should the test be executed
2. - The IP address of the machine where the Exchange server is installed.
3. – The port number through which the Exchange server communicates.
4. – If the value chosen is YES, then the Exchange server under
consideration is a passive server in an Exchange cluster. No alerts will be
generated if the server is not running. Measures will be reported as “Not
applicable’ by the agent if the server is not up.
5. - Specify the email ID on the Exchange server that is to be
used by this test for sending/receiving mails. To know the email ID that
corresponds to a user mailbox, refer to the procedure discussed in Page 32.
6. - The IP address of the Exchange server being monitored; by
default, the IP address of t he HOST is displayed here.
7. - The port number at which the SMTPSERVER listens; by default, it is
25.
8. – The profile that the email ID in the XCHGMAILBOXNAME text
box is configured to use. To know the existing profiles, open the Control Panel on
the Microsoft Outlook client that houses the that has been
configured for this test, and double-click on the Mail option within. The Mail Setup
dialog box will open. Click on the Show Profiles button therein to view the existing
list of profiles.
Outputs of the
test
One set of results for every Exchange server being monitored
Measurements
made by the test
Measurement
Measurement
Unit
Interpretation
Can mails be sent?:
Indicates the availability
of the mail server for
receiving the mails sent
by the test.
Percent
A value of 0 indicates that the test was
not successful in sending a mail. Possible
reasons for this could include the mail
server being down, the network
connection to the server not being
available, or the test configuration
information being incorrect.
Sent messages:
Indicates the number of
messages sent to the mail
server.
Number
A value of –1 indicates that the mail
server may be down or the configuration
information may be incorrect.
Avg time to send
messages:
Indicates time taken to
send a mail from to the
mail server
Secs
A high value of this measure could
indicate high network traffic or that the
mail server is busy.

Monitoring Exchange 2000/2003 Servers
32
Can mails be received?:
Indicates the availability
of the exchange server
for sending mails to the
mail client
Percent
The value of 0 indicates that the test was
not successful in receiving a mail
message from the Exchange server.
Possible reasons could be incorrect
configuration information.
Received messages:
Indicates the number of
messages received by the
mail client from the mail
server
Number
The value of 0 indicates that the test was
not successful in receiving mail messages
from the Exchange server. The possible
reasons could be:
The sent messages could be in
the message queue of the mail
server but not routed to the mail
box
Configuration information may be
incorrect
Network failure
The mail service may not be
running in the user account
Mail received time:
Indicates the time taken
by the mail client to
receive a mail from the
mail server
Secs
A high value in this measure indicates
that the mail server is busy or the
network traffic is high.
Avg roundtrip time:
The average of the round
trip time (the time lapse
between transmission and
reception of a message by
the server) of all the
messages received by the
mail server during the
last measurement period
Mins
This is a key measure of quality of the
mail service. An increase in the value of
this measure may be indicative of a
problem with the mail service. Possible
reasons could include queuing failures,
disk space being full, etc.
Max roundtrip time:
The high water mark of
the round trip time (the
time lapse between
transmission and
reception of a message by
the server) of all
messages received by the
mail server during the
last measurement period
Mins
If the value of the Received messages
measure is 1, then the value of the Max
roundtrip time measure will be the same as
the Avg roundtrip time.
To know the email ID to be specified against , do the following:
1. On the Exchange server, follow the menu sequence, Programs -> Administrative Tools (or Control
Panel -> Administrative Tools) -> Active Directory Users and Computers.
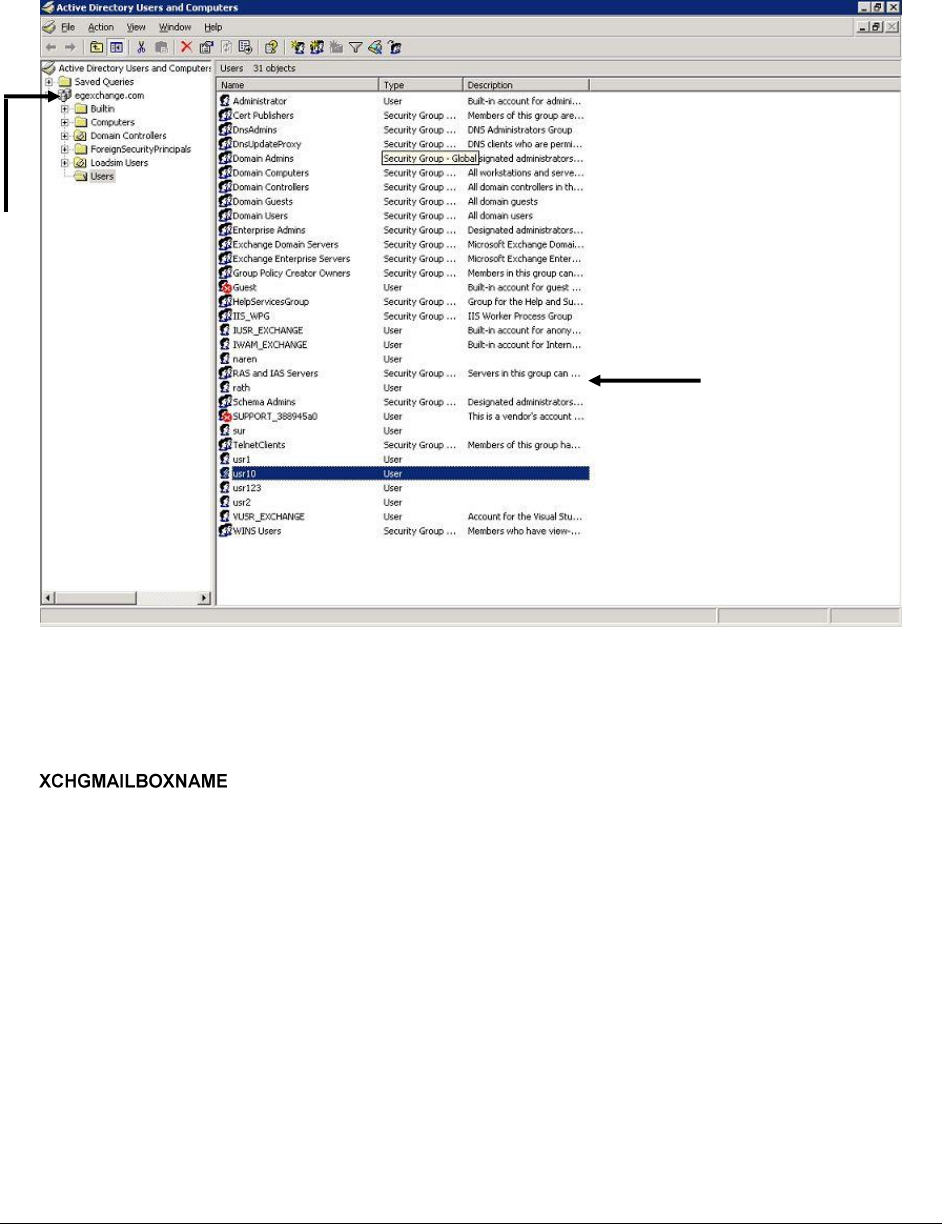
Monitoring Exchange 2000/2003 Servers
33
2. Figure 3.6 will then appear. In the tree structure in the left pane of Figure 3.6, expand the node
that corresponds to the Site on the Exchange server, and then, click on the Users folder within.
Figure 3.6: The Active Directory Users and Computers console
3. From the list of user accounts displayed in the right pane, select the account that you intend using
for the test and double-click on it.
4. Figure 3.7 will then appear displaying the properties of the chosen mailbox. For configuring the
parameter of this test, specify the E-mail address displayed in Figure 3.7.
Site
List of user
accounts
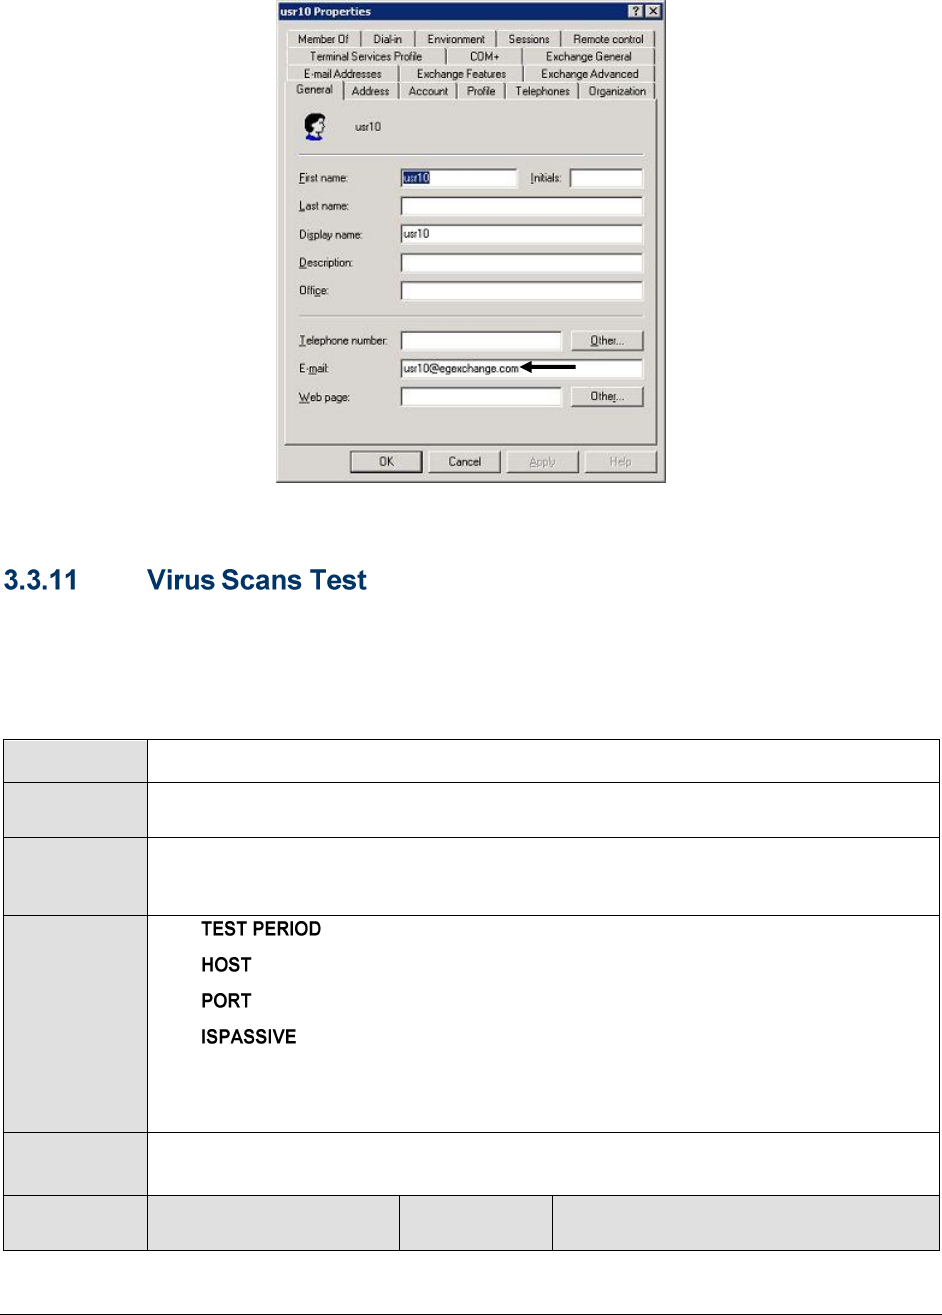
Monitoring Exchange 2000/2003 Servers
34
Figure 3.7: Properties of the chosen user account
Messages received on an Exchange server and the attachments they contain are often scanned by
anti-virus software prior to acceptance and delivery. This test monitors the performance of the mail
scanning and virus processing sub system. Information about bottlenecks in the Virus scanning
subsystem, or situations when excessive viruses are being delivered via mail messages or
attachments can be detected by this test.
Purpose
Monitors the performance of the mail scanning and virus processing sub system.
Target of the
test
An Exchange server 2000/2003
Agent
deploying the
test
An internal agent
Configurable
parameters for
the test
1. - How often should the test be executed
2. –The host for which the test is to be configured.
3. - The variable name of the port for which the test is to be configured.
4. – If the value chosen is YES, then the Exchange server under
consideration is a passive server in an Exchange cluster. No alerts will be
generated if the server is not running. Measures will be reported as “Not
applicable’ by the agent if the server is not up.
Outputs of the
test
One set of results for the Exchange server being monitored
Measurements
made by the
Measurement
Measurement
Unit
Interpretation

Monitoring Exchange 2000/2003 Servers
35
test
Virus scan queue
length:
The number of requests
that are currently
queued for virus
scanning.
Number
An excessive value for this metric could
result in slowdown of mail delivery.
Files cleaned by virus
check:
The percentage of all
files scanned during the
last measurement period
that required to be
cleaned.
Percent
Files quarantined by
virus check:
The percentage of all
files scanned during the
last measurement period
that required to be
quarantined.
Percent
Messages cleaned by
virus check:
The percentage of
messages scanned
during the last
measurement period
that required to be
cleaned.
Percent
Messages
quarantined:
The percentage of all
messages scanned
during the last
measurement period
that required to be
quarantined
Percent
File clean rate:
The rate at which
separate files were
cleaned by virus scanner
during the last
measurement period
Files/Sec
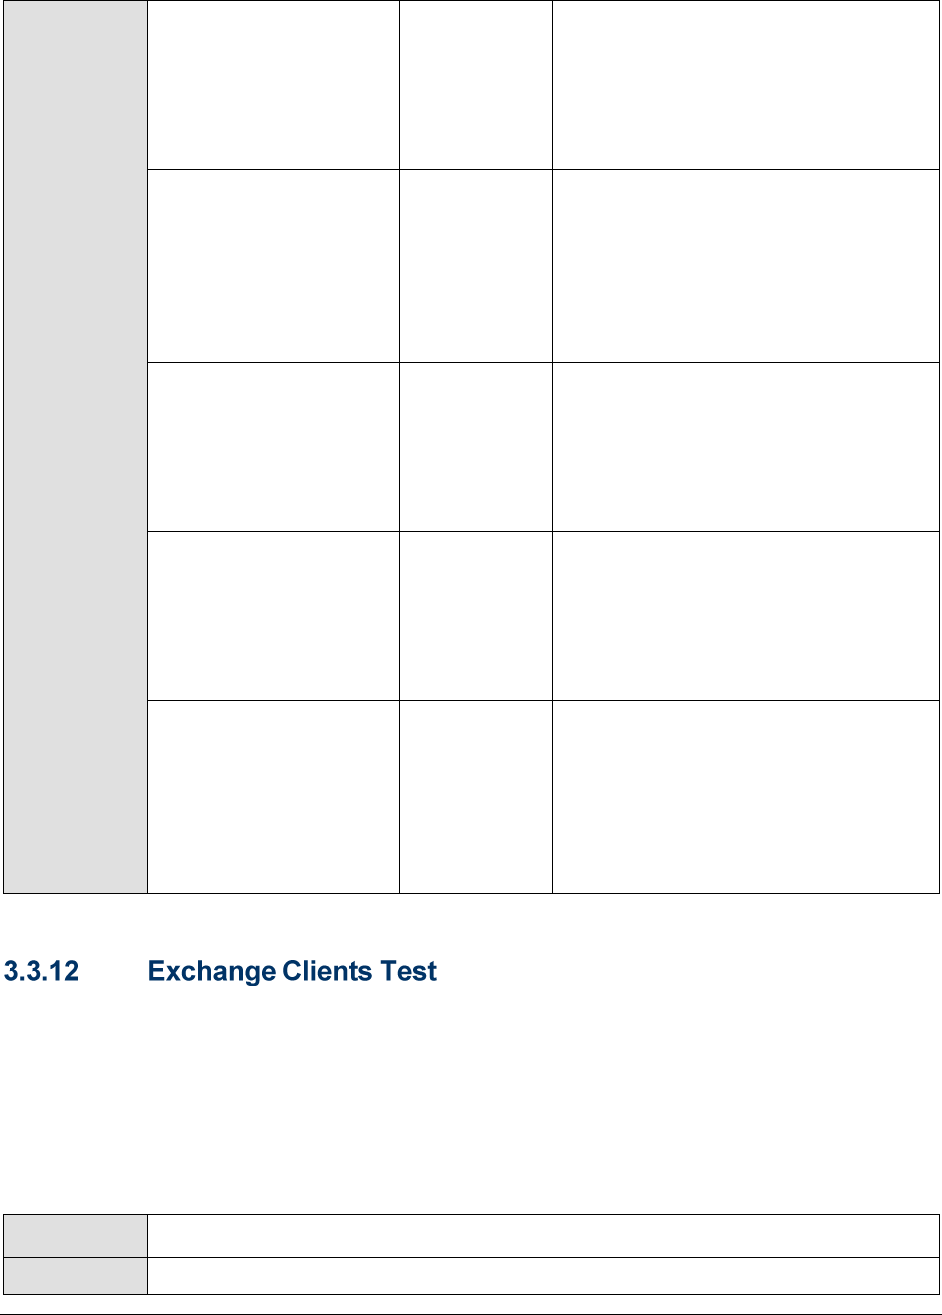
Monitoring Exchange 2000/2003 Servers
36
File scan rate:
The rate at which
separate files are
processed by virus
scanner during the last
measurement period.
Files/Sec
A very low scan rate could result in
over-crowded scan queues, which
would eventually slowdown mail
delivery.
File quarantine rate:
The rate at which
separate files were
marked to be
quarantined by virus
scanner during the last
measurement period.
Files/Sec
Message clean rate:
The rate at which top-
level messages were
cleaned by virus scanner
during the last
measurement period.
Msgs/Sec
Message process rate:
The rate at which top-
level messages were
processed by virus
scanner during the last
measurement period.
Msgs/Sec
Ideally, messages should be quickly
processed by the virus scanner. Any dip
in this rate is a cause for concern, as it
would lengthen scan queues and
ultimately delay mail delivery.
Message quarantine
rate:
The rate at which top-
level messages were put
into quarantine by virus
scanner during the last
measurement period.
Msgs/Sec
Monitoring the RPC activity to an Exchange server and the responsiveness of the server to RPC
requests can provide an indication of user satisfaction levels with the performance of the Exchange
server. Foreground RPCs happen during interactions of Outlook clients with the Exchange server, and
any slow down or failure of these RPCs will be directly visible to users of the Exchange server.
Background RPCs are caused by “behind-the-scene” activities internal to the Exchange server.
The Exchange Clients Test monitors the performance of RPC activities on the Exchange server. Since
RPC related metrics are available only from Exchange Server 2003 onwards, this test is only relevant
for Exchange 2003 or higher versions.
Purpose
Monitors the performance of RPC activities on the Exchange server.
Target of the
An Exchange server 2003/2007

Monitoring Exchange 2000/2003 Servers
37
test
Agent
deploying the
test
An internal agent or remote agent
Configurable
parameters for
the test
1. - How often should the test be executed
2. –The host for which the test is to be configured.
3. - The variable name of the port for which the test is to be configured.
Outputs of the
test
One set of results for the Exchange server being monitored
Measurements
made by the
test
Measurement
Measurement
Unit
Interpretation
RPC attempts:
The rate at which RPC
calls were attempted to
the Exchange server
during the last
measurement period.
Atttempts/sec
This metric provides an indicator of the
RPC workload on the server.
RPC failures:
This metric is the rate of
failed RPCs to the
Exchange server during
the last measurement
period.
Failures/Sec
Typically, this value should be low
RPC successes:
The rate of successful
RPC requests handled by
the Exchange server
during the last
measurement period.
Successes/Se
c
Foreground RPC
failures:
This metric is the client-
reported rate of failed
foreground RPCs during
the last measurement
period.
Failures/sec
Typically, this value should be low.

Monitoring Exchange 2000/2003 Servers
38
Foreground RPC
successes:
Shows the client-
reported rate of
successful foreground
RPCs handled by the
Exchange server during
the last measurement
period.
Successes/Se
c
RPC success ratio:
This metric is the ratio of
the foreground RPC
successes to the total
number of foreground
RPCs attempted during
the last measurement
period, expressed as a
percentage.
%
This metric is one measure of client
satisfaction levels with the Exchange
server. The closer this value is to 100,
the better the client satisfaction level.
RPCs with latency >
2secs:
Shows the client-
reported rate of
successful RPCs during
the last measurement
period with latencies > 2
seconds.
Rpcs/sec
RPCs with latency >
5secs:
Shows the client-
reported rate of
successful RPCs during
the last measurement
period with latencies > 5
seconds.
Rpcs/sec
RPCs with latency >
10secs:
Shows the client-
reported rate of
successful RPCs during
the last measurement
period with latencies >
10 seconds
Rpcs/sec
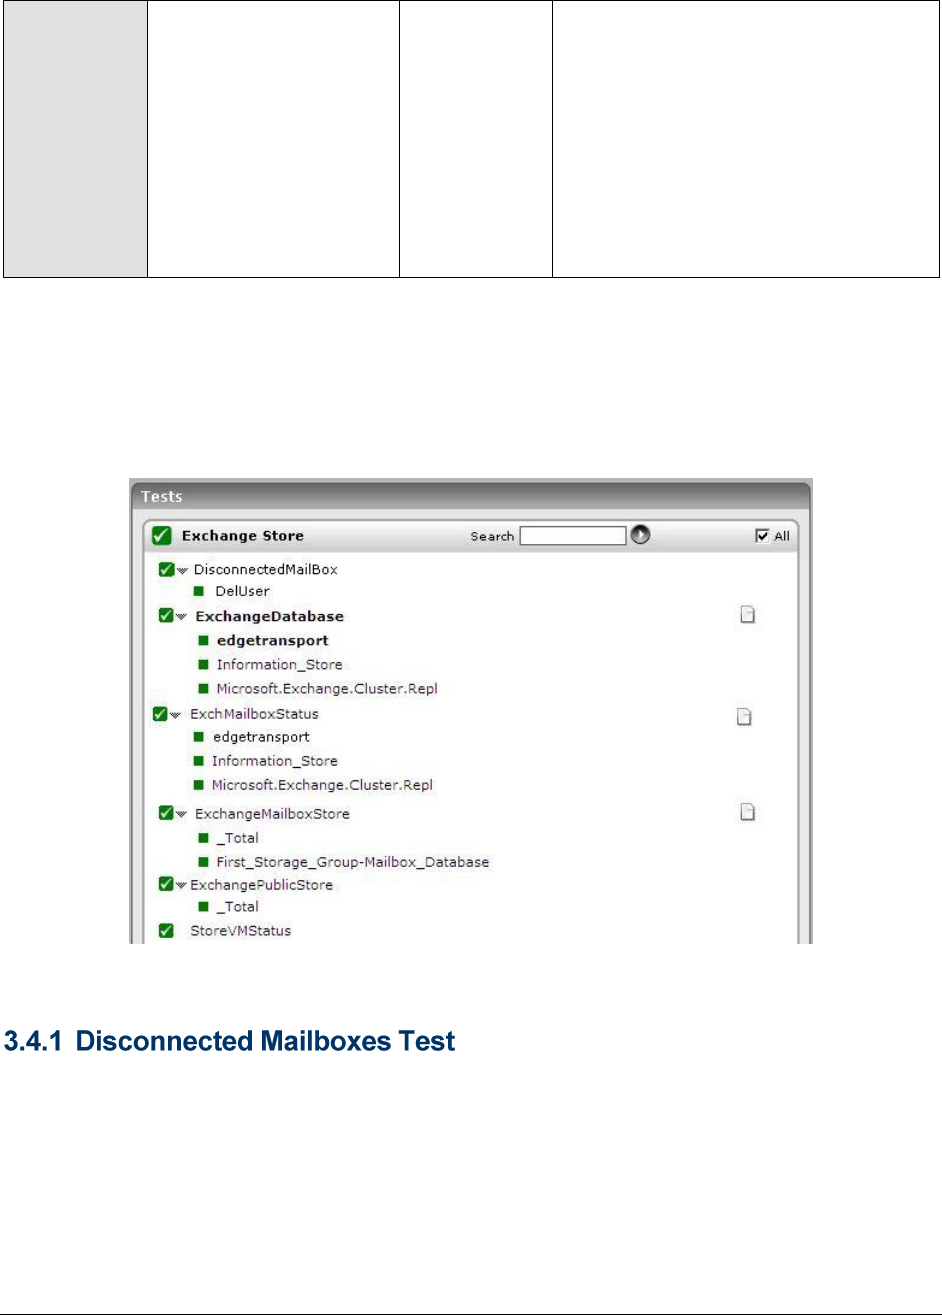
Monitoring Exchange 2000/2003 Servers
39
Fast RPC ratio:
This metric indicates
whether client RPCs are
happening fast or not.
%
This metric is another key measure of
client performance. This metric is
computed as the ratio of successful
client RPCs with latency less than 2
seconds to the total number of
successful RPCs, expressed as a
percentage. Hence, the value of this
metric indicates the percentage of client
RPCs that are taking more than 2
seconds. A value closer to 100 indicates
better RPC performance.
3.4 The Exchange Store Layer
The tests associated with the Exchange Store layer report statistics revealing the health of the mailbox
stores and the Exchange database, and alerts administrators to mailbox disconnects.
Figure 3.8: The tests associated with the Exchange Store layer
On an Exchange server, when a mailbox enabled user or a mailbox is deleted, the mailbox will be
moved to a disconnected state and is left in the mail store for a retention period (this is a
configuration setting - usually about 30 days). While the mailbox is in a disconnected state,
administrators have the option to reconnect to the mailbox and restore the user/mailbox at any time
during the retention period. Once the retention period is reached, the mailbox is removed permanently
from the mail store.
Exchange administrators need to monitor the disconnected mailboxes on their servers for two reasons.
First, by checking what mailboxes are in the disconnected state, administrators can identify if any
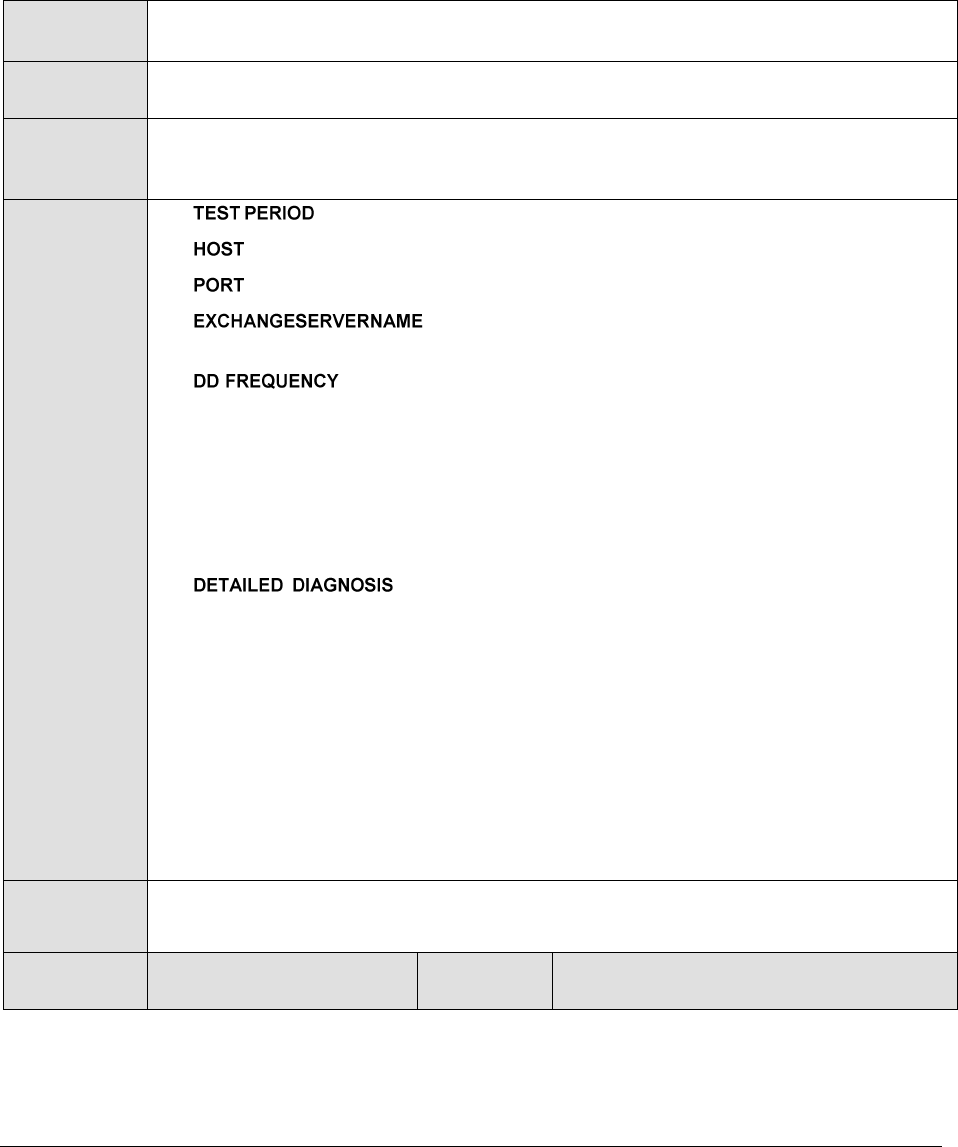
Monitoring Exchange 2000/2003 Servers
40
mailbox or user has been inadvertently deleted. Secondly, by tracking the time for a disconnected
mailbox to be purged by the system, administrators can determine when the storage space reserved
for the disconnected mailbox will be released.
The DisconnectedMailBox test automatically discovers and monitors the disconnected mailboxes on an
Exchange server. This test works only on Exchange 2003 or higher. The measures reported by this
test are given below.
Purpose
Automatically discovers and monitors the disconnected mailboxes on an Exchange
2003 server
Target of the
test
An Exchange 2003 Server only
Agent
deploying the
test
An internal agent
Configurable
parameters for
the test
1. - How often should the test be executed
2. - The IP address of the machine where the Exchange Server is installed.
3. – The port number through which the Exchange Server communicates.
4. - Enter the name of the Exchange server to be
monitored.
5. - The DD FREQUENCY refers to the frequency with which detailed
diagnosis measures are to be generated. The default is 1:1. This indicates that, by
default, detailed measures will be generated every time this test runs, and also
every time the test detects a problem. Typically, detailed diagnosis frequencies
are set globally, using the DIAGNOSIS CONFIGURATION page that appears when
the Configure -> Diagnosis menu sequence is followed. This global setting can be
overridden at the test-level using the DD FREQUENCY parameter. To disable the
detailed diagnosis capability for a test, you can set this parameter to 0:0.
6. - To make diagnosis more efficient and accurate, the eG
Enterprise suite embeds an optional detailed diagnostic capability. With this
capability, the eG agents can be configured to run detailed, more elaborate tests
as and when specific problems are detected. To enable the detailed diagnosis
capability of this test for a particular server, choose the On option. To disable the
capability, click on the Off option.
The option to selectively enable/disable the detailed diagnosis capability will be
available only if the following conditions are fulfilled:
The eG manager license should allow the detailed diagnosis capability
Both the normal and abnormal frequencies configured for the detailed
diagnosis measures should not be 0.
Outputs of the
test
One set of results for every mailbox on the Exchange 2003 server being monitored
Measurements
made by the
Measurement
Measurement
Unit
Interpretation
Monitoring Exchange 2000/2003 Servers
41
test
Is mailbox
disconnected?:
Indicates whether the
mailbox is disconnected or
not.
Boolean
When the value is 1, it means that this
mailbox is disconnected.
Messages in
disconnected mailbox:
The total number of
messages that are in the
disconnected mailbox
Number
Disconnected mailbox
size:
Indicates the total size of
the disconnected mailbox.
MB
Time to purge
disconnected mailbox:
Indicates the time left
before a disconnected
mailbox is to be removed
permanently from the mail
store.
Hours
Administrators can configure alerts to be
generated before a disconnected mailbox
is to be removed from the Exchange
server, so that they can cross verify
whether the deletion is valid.
The detailed diagnosis of this measure, if
enabled, displays the date and time at
which the disconnected mailbox was
marked for permanent deletion (the
Mailbox_deletion_date), and the date and
time at which the mailbox is likely to be
permanently removed from the Exchange
server (the Mailbox_purge_date). This
knowledge enables administrators to
configure alerts that are to be generated
before a disconnected mailbox is to be
removed from the Exchange server, so
that they can cross verify whether the
deletion is valid.
This test measures the performance of the Exchange server database. The Exchange server database
comprises of files with “.edb” and “.stm” extensions. A database is a collection of mailboxes. A pair of
“.edb” and “.stm” files makes a mailbox.
When an Internet mail message enters into the Exchange server, the body of the message is saved in
the “.stm” file, and the header information (From, To, Cc, Time Sent, and so on) is converted to Rich
Text Format (RTF), and then stored in the “.edb” file. The transaction log file maintains the state and
integrity of “.edb” and “.stm” files.
Purpose
This test monitors the performance of Exchange server database.
Target of the
test
An Exchange server 2000/2003

Monitoring Exchange 2000/2003 Servers
42
Agent
deploying the
test
An internal agent
Configurable
parameters for
the test
1. - How often should the test be executed
2. - The IP address of the machine where the Exchange server is installed.
3. – The port number through which the Exchange server communicates.
4. – If the value chosen is YES, then the Exchange server under
consideration is a passive server in an Exchange cluster. No alerts will be
generated if the server is not running. Measures will be reported as “Not
applicable’ by the agent if the server is not up.
Outputs of the
test
One set of results for every Exchange server being monitored
Measurements
made by the
test
Measurement
Measurement
Unit
Interpretation
Database cache hit
ratio:
This measure shows the
percentage of database
requests that were fulfilled
by the database buffer
pool without incurring disk
input/output activity.
Percent
A significantly low value indicates that the
Exchange server is not having enough
free memory. Increasing the memory
available to the server may solve this
problem.
Database tables cache
hit ratio:
This measure shows the
percentage of database
tables opened using the
cached schema
information.
Percent
A significantly low value indicates that the
Exchange server is not having enough
free memory. Increasing the memory
available to the server may solve this
problem.
Log record waits:
This measure shows the
number of log records that
cannot be added to the log
buffers because the log
buffers are full.
Records/Sec
This measure should be as close to zero
as possible.
Abnormal values of this metric indicate
that the size of the log buffer is
insufficient.
The average value should be below 10
per second. Spikes (maximum values)
should not be higher than 100 per
second.
Log thread waits:
This measure shows the
number of threads waiting
for their data to be written
to the log buffer so that
the update of the database
can be completed.
Number
This measure should be as low as
possible.
A high value for this measure may
indicate that the transaction log buffer
might be a bottleneck.
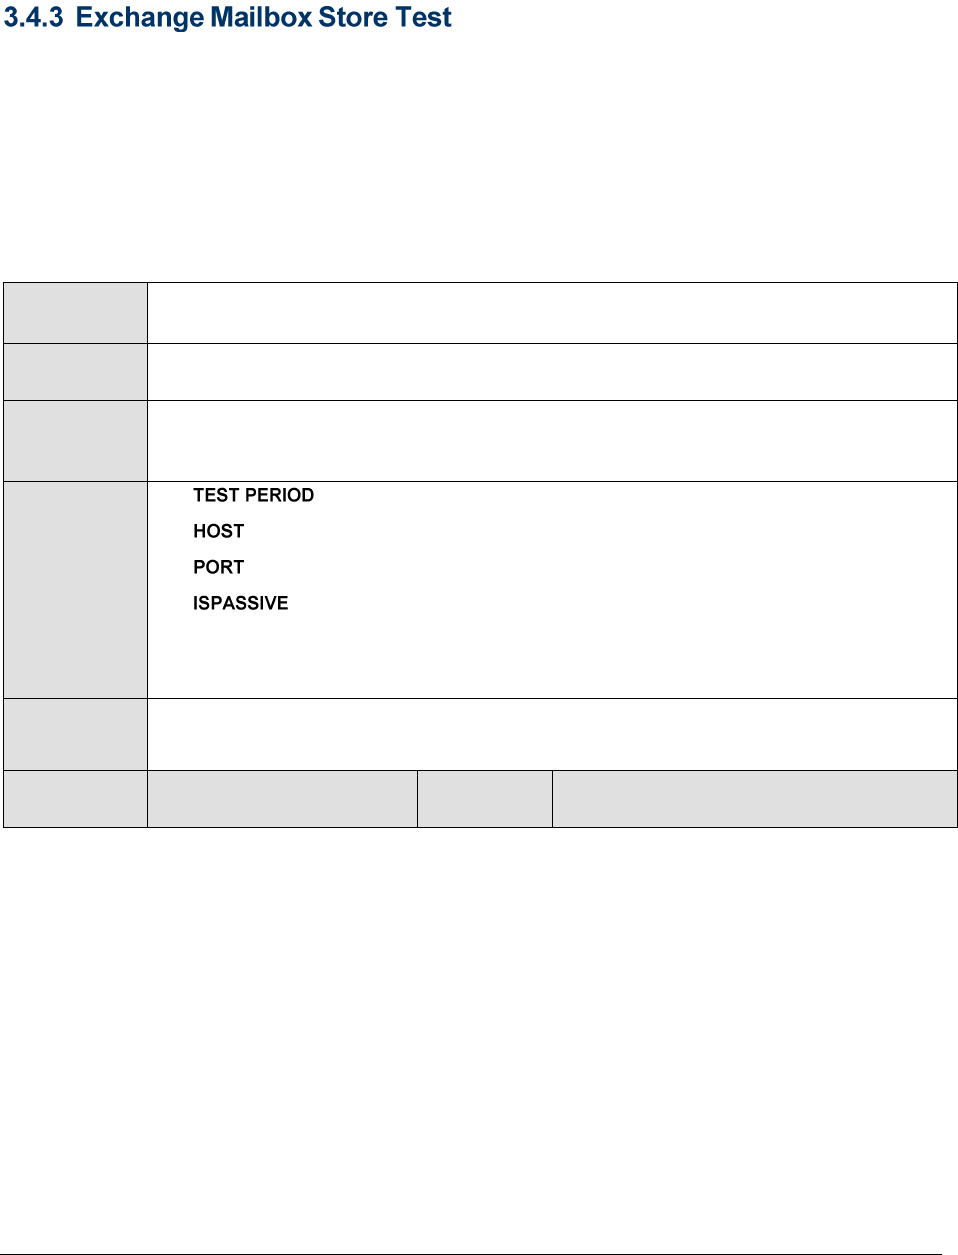
Monitoring Exchange 2000/2003 Servers
43
The Information store is responsible for data storage and management. It is the interface between the
clients and the server running Exchange Server. There are two components of the Information Store,
namely:
Mailboxes
Public Folders
The XchgMailboxStore test reports statistics pertaining to the Mailbox component of the Information
store.
Purpose
Measures the performance of the mailbox component of the Exchange Information
Store
Target of the
test
An Exchange server 2000/2003
Agent
deploying the
test
An internal agent
Configurable
parameters for
the test
1. - How often should the test be executed
2. - The IP address of the machine where the Exchange server is installed.
3. – The port number through which the Exchange server communicates.
4. – If the value chosen is YES, then the Exchange server under
consideration is a passive server in an Exchange cluster. No alerts will be
generated if the server is not running. Measures will be reported as “Not
applicable’ by the agent if the server is not up.
Outputs of the
test
One set of results for every Information store being monitored
Measurements
made by the
Measurement
Measurement
Unit
Interpretation

Monitoring Exchange 2000/2003 Servers
44
test
Active client logons:
The number of logons that
have been active on the
information store within
the last ten minutes time
interval.
Number
When a MAPI client (outlook) connects,
the first request to the server will
establish a session. Once the session is
established, the client will make a request
to logon to the current session.
Sometimes, the number of Active client
logons can be larger than the number of
mailboxes on the server. This may be
caused by any of the following:
A client frequently keeps more
than one logon per session. Thus,
each user that is reading mails
may have 2 (or more) active
logons.
Additionally, it includes users
from other databases or other
servers who are logged on to
other users' mailboxes (such as in
the case of checking calendar
tasks, if the users have shared
their calendars)
If the users are logging on and
logging off frequently.
In short, Active client logons are
incremented with each logon, and
removed every 10 minutes if they are
inactive. If clients are logging on multiple
times in a 10 minute period, the
active client logons number can be higher
than "Client logons".
Client logons:
The number of ‘distinct’
users logging into their
information store.
Number
This measure is a good indicator of user
activity in the Exchange Server. This
information can be used by the
administrator for planning the capacity of
the mail server.
Mail messages in send
queue:
The number of messages
in the send queue of an
information store.
Number
This measure is usually zero under
normal conditions.
This measure can be non-zero in the case
of very busy systems (2000 users and
more).
Mail receive queue
length:
This measure shows the
number of messages in the
receiving queue of the
information store.
Number
This measure is usually zero under
normal conditions.
A non-zero value for this measure
indicates that the SMTP service is choking
up memory.
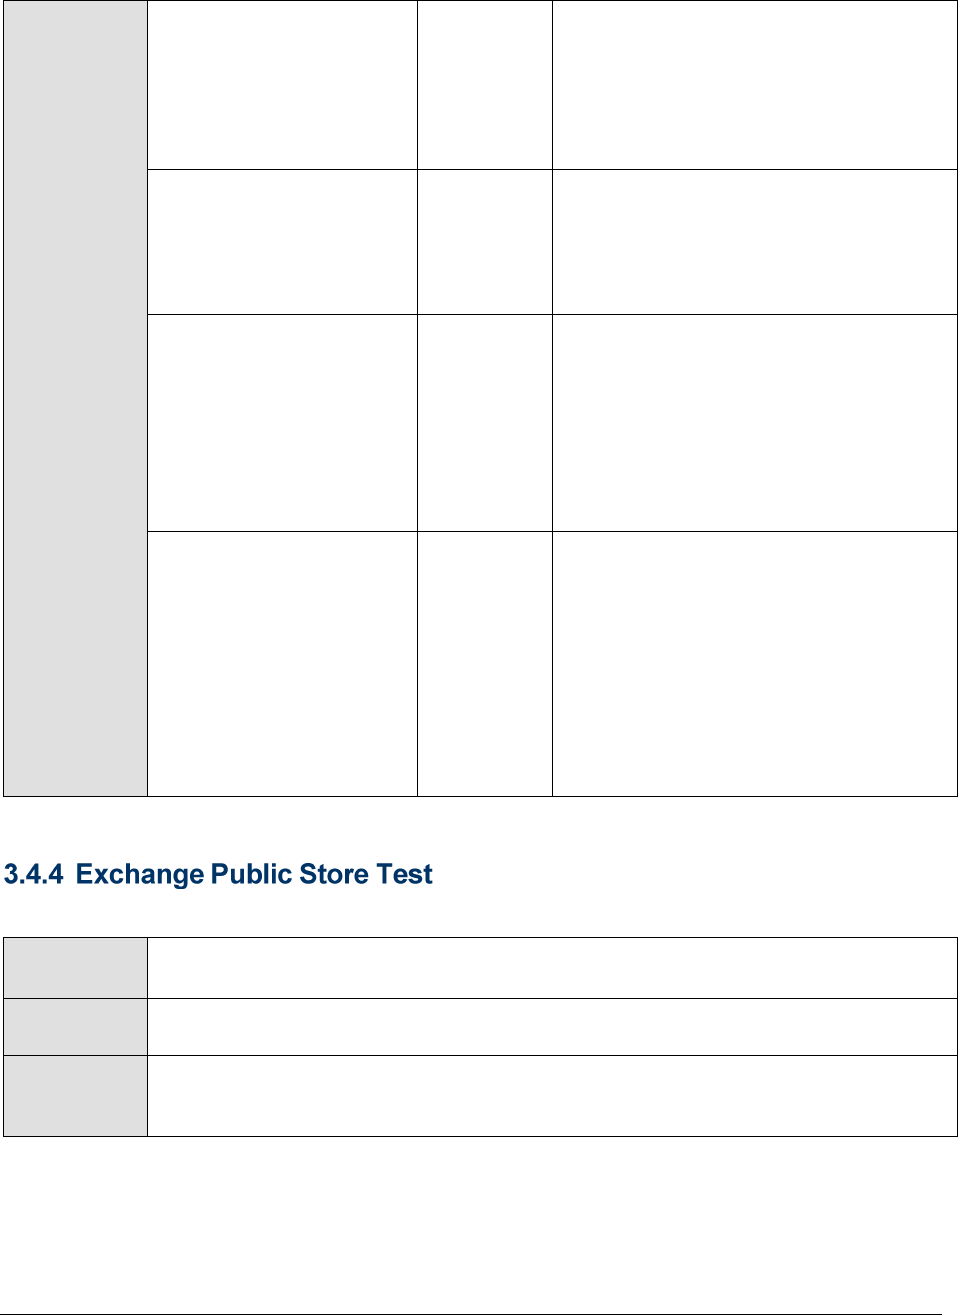
Monitoring Exchange 2000/2003 Servers
45
Mails opened:
This measure indicates the
rate at which the requests
to open the messages are
being submitted to the
information store.
Msgs/Sec
This measure shows the overall picture of
user activity. An abnormally high value
for this measure may indicate that the
Exchange 2000 Server is overloaded.
Mails sent:
This measure indicates the
rate at which messages
are sent by the information
store.
Msgs/Min
Avg mail delivery time:
This measure indicates the
average time between the
submission of a message
to the information store
and the submission to
other storage providers for
the last 10 messages.
Secs
A non-zero value for this measure
indicates a change in user workload.
An abnormally high value for this
measure indicates inability to deliver to
one or more destinations. One of the
possible reasons for this can be a network
failure.
Avg local mail delivery
time:
This measure indicates the
average time between the
submission of a message
to the information store
and the delivery to all local
recipients (recipients on
the same server) for the
last 10 messages.
Secs
A non-zero value for this measure
indicates a change in the user workload.
An abnormally high value for this
measure may indicate that the server is
overloaded.
This test reports statistics pertaining to the public folders of the Information store.
Purpose
Measures the performance of the mailbox component of the Exchange Information
Store
Target of the
test
An Exchange server 2000/2003
Agent
deploying the
test
An internal agent

Monitoring Exchange 2000/2003 Servers
46
Configurable
parameters for
the test
1. - How often should the test be executed
2. - The IP address of the machine where the Exchange server is installed.
3. – The port number through which the Exchange server communicates.
4. – If the value chosen is YES, then the Exchange server under
consideration is a passive server in an Exchange cluster. No alerts will be
generated if the server is not running. Measures will be reported as “Not
applicable’ by the agent if the server is not up.
Outputs of the
test
One set of results for every Information store being monitored
Measurements
made by the
test
Measurement
Measurement
Unit
Interpretation
Active client logons:
The number of active client
logons into the Information
store.
Number
Client logons:
The number of clients
logging into their
Information store.
Number
This measure is a good indicator of user
activity in the Exchange Server. This
information can be used by the
administrator for planning the capacity of
the mail server.
Mail send queue size:
The number of messages
currently in the send
queue of an information.
Number
This measure is usually zero under
normal conditions.
This measure can be non-zero in the case
of very busy systems (2000 users and
more).
Mail received queue
size:
This measure shows the
number of messages
currently in the receiving
queue of the information
store.
Number
This measure is usually zero under
normal conditions.
A non-zero value for this measure
indicates that the SMTP service is choking
up memory.
Mails opened:
This measure indicates the
rate at which the requests
to open the messages are
being submitted to the
information store.
Msgs/Sec
This measure shows the overall picture of
user activity. An abnormally high value
for this measure may indicate that the
Exchange 2000 Server is overloaded.
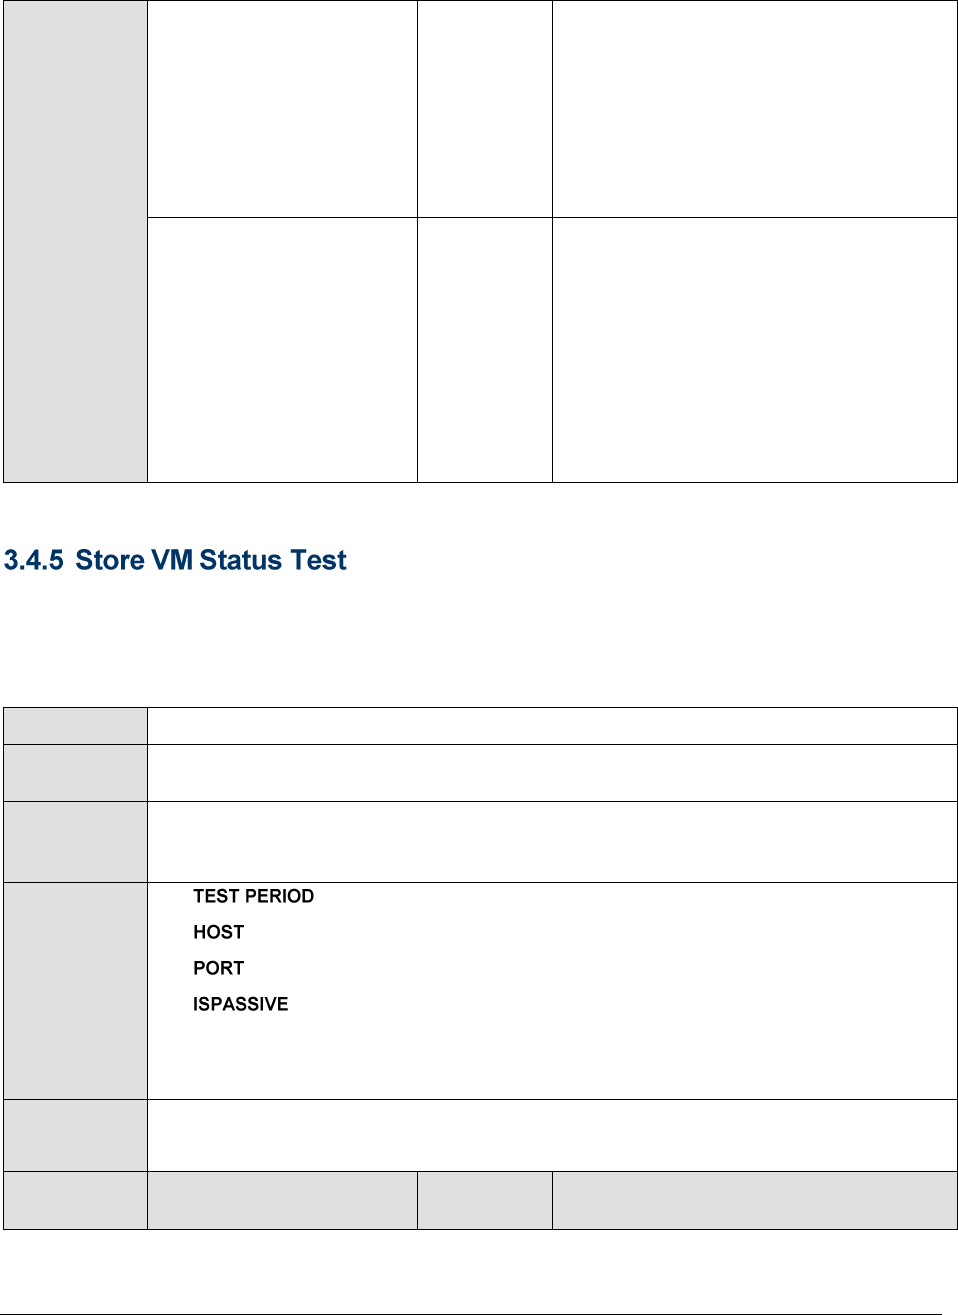
Monitoring Exchange 2000/2003 Servers
47
Avg mail delivery time:
This measure indicates the
average time between the
submission of a message
to the information store
and the submission to
other storage providers for
the last 10 messages.
Secs
A non-zero value for this measure
indicates a change in user workload.
An abnormally high value for this
measure indicates inability to deliver to
one or more destinations. One of the
possible reasons for this can be a network
failure.
Avg local mail delivery
time:
This measure indicates the
average time between the
submission of a message
to the information store
and the delivery to all local
recipients (recipients on
the same server) for the
last 10 messages.
Secs
A non-zero value for this measure
indicates a change in the user workload.
An abnormally high value for this
measure may indicate that the server is
overloaded.
Each store.exe process of a server has limited amount of memory called the Store Virtual memory
that it can address. The StoreVMStatus test reports statistics related to the usage of the Exchange
store's virtual memory.
Purpose
This test monitors the performance of Exchange server database.
Target of the
test
An Exchange server 2000/2003
Agent
deploying the
test
An internal agent
Configurable
parameters for
the test
1. - How often should the test be executed
2. - The IP address of the machine where the Exchange server is installed.
3. – The port number through which the Exchange server communicates.
4. – If the value chosen is YES, then the Exchange server under
consideration is a passive server in an Exchange cluster. No alerts will be
generated if the server is not running. Measures will be reported as “Not
applicable” by the agent if the server is not up.
Outputs of the
test
One set of results for every Exchange server being monitored
Measurements
made by the
Measurement
Measurement
Unit
Interpretation
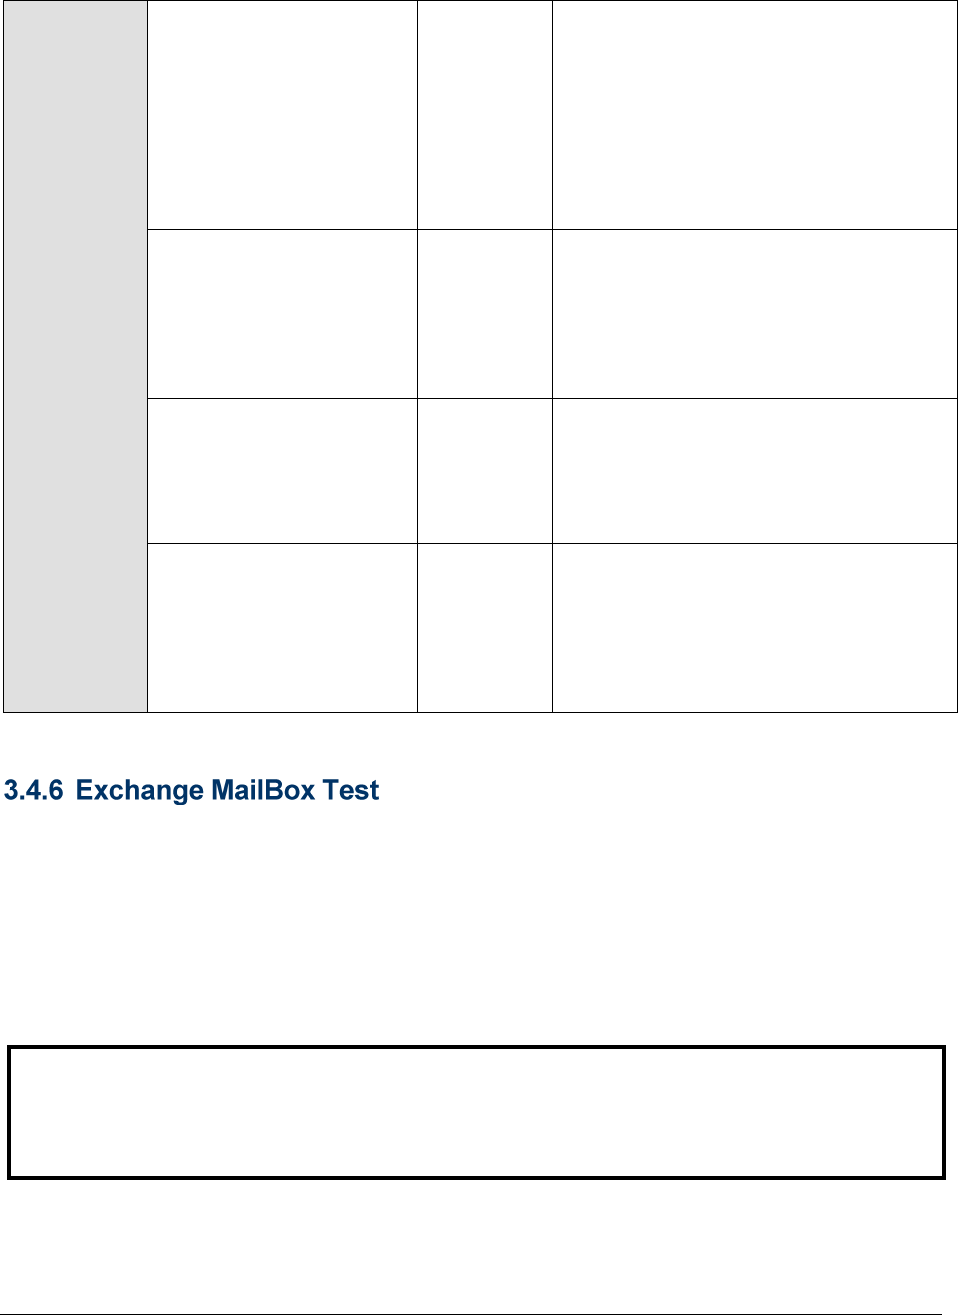
Monitoring Exchange 2000/2003 Servers
48
test
Largest block size:
It is the largest free block
of virtual memory.
MB
At no point should this value go below 32
MB. As you scale a server to
accommodate more users and more
usage, the server may run low on virtual
memory. When a server is low on virtual
memory, overall performance degrades
as the low situation forces the store.exe
process to use the page file and begin
paging rapidly.
16MB free blocks in
virtual memory:
The total number of free
virtual memory blocks that
are greater than or equal
to 16MB.
Number
At no point should this value go below 1.
Free blocks in virtual
memory:
The total number of free
virtual memory blocks
regardless of size.
Number
At no point should this value go below 1.
Large memory blocks in
virtual memory:
The sum of all the free
virtual memory blocks that
are greater than or equal
to 16MB
MB
At no point should this value go below 50
MB.
This test automatically discovers all the mailboxes on a monitored Exchange 2000/2003 server, and
reports the usage of each mailbox. Mailbox monitoring enables Exchange administrators to be
proactively alerted when the mailbox usage grows close to the mailbox quota. In the long run, such a
practice could deter mailbox users from storing unnecessary mails, thus automatically making room
for important ones. This test is disabled by default. To enable the test, go to the ENABLE / DISABLE TESTS
page using the menu sequence : Agents -> Tests -> Enable/Disable, pick Exchange as the Component
type, Performance as the Test type, choose the test from the DISABLED TESTS list, and click on the >>
button to move the test to the ENABLED TESTS list. Finally, click the Update button.
Note:
In order to enable this test to run, the eG agent executing the test should be configured to run
using the Exchange administrator account.
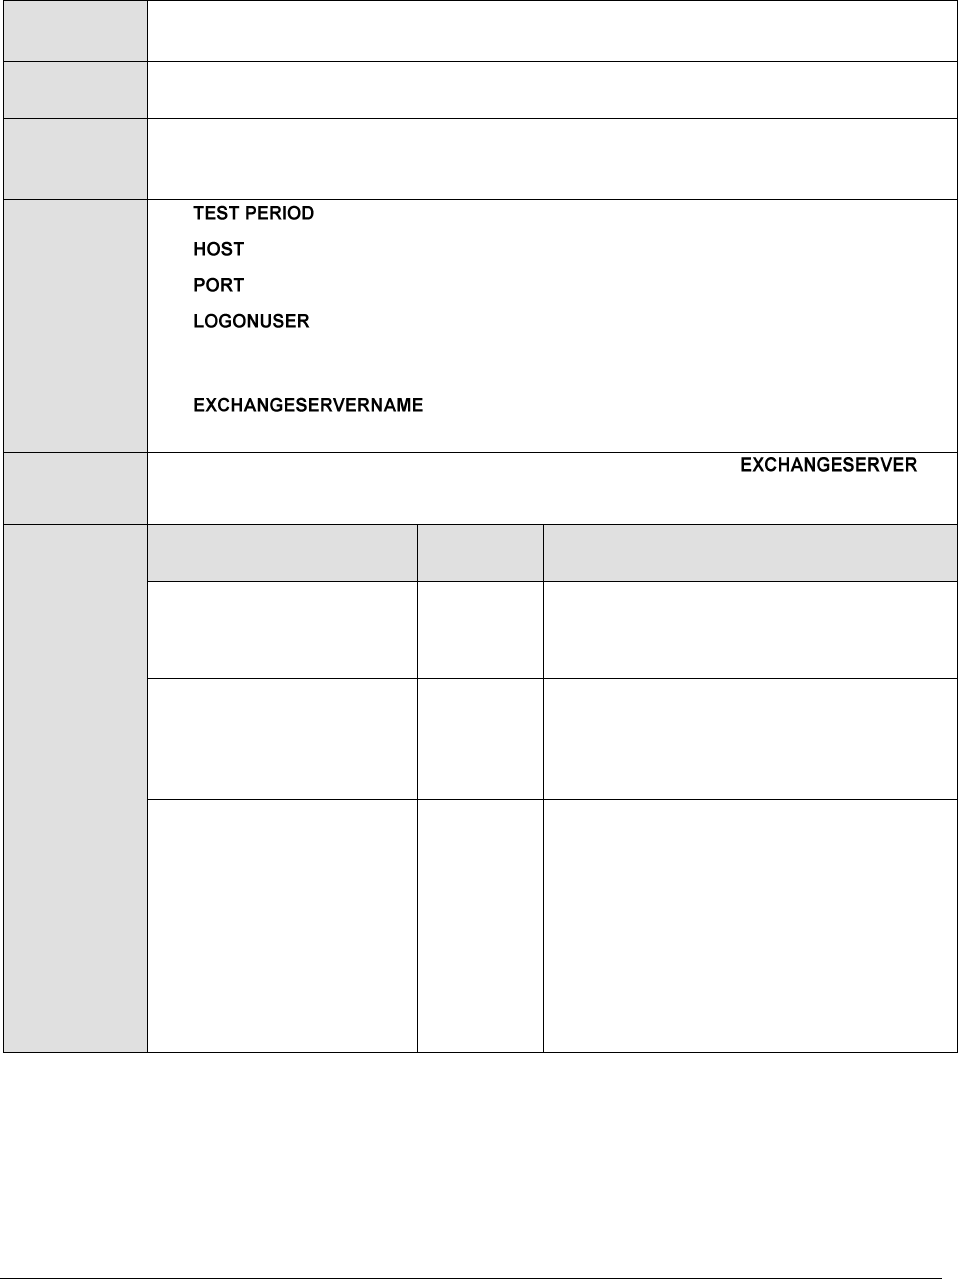
Monitoring Exchange 2000/2003 Servers
49
Purpose
Automatically discovers all the mailboxes on a monitored Exchange 2000/2003 server,
and reports the usage of each mailbox
Target of the
test
An Exchange server 2000/2003
Agent
deploying the
test
An internal agent
Configurable
parameters for
the test
1. - How often should the test be executed
2. - The IP address of the machine where the Exchange server is installed.
3. – The port number through which the Exchange server communicates.
4. - By default, a "*" is displayed here, indicating that the test
automatically discovers all the mailboxes configured for all the users on the
Exchange server.
5. - The name of the Exchange server instance on which
mailbox monitoring is to be performed.
Outputs of the
test
One set of results for every mailbox configured on the specified
Measurements
made by the
test
Measurement
Measuremen
t Unit
Interpretation
Exchange mailbox size:
Indicates the current size
of this mailbox.
MB
Quota size:
Indicates the maximum
size upto which the
mailbox can grow.
MB
Exchange mailbox
usage:
Indicates the percentage
of mailbox space that has
been utilized currently.
Percent
This is computed as
Mailbox_size/Quota_size*100. If the value
of this measure is very high, it indicates
that the mailbox is being over-utilized. If
the situation is left unchecked, then soon
the mail server will bounce off all new
mails that are being delivered to the
mailbox. You might want to clear
unwanted mails from your mailbox to
prevent such an occurrence.
Monitoring Exchange 2000/2003 Servers
50
A Storage Group will contain one or more Mailbox and Public Folder stores, depending on the version
and the needs of the organization. Mailbox stores contain the user and system mailboxes and the
Public Folder Store contains the Public Folders and their contents.
A default Exchange installation will create a Storage Group that contains a Mailbox Store and a Public
Folder Store. Each Mailbox Store is made up of a database set that contains two files:
Priv1.edb is a rich-text database file that contains the email messages, text attachments and
headers for the users e-mail messages
Priv1.stm is a streaming file that contains multi-media data that is formatted as MIME data.
Similarly, each Public Folder Store is made up of a database set that also contains two files:
Pub1.edb is a rich-text database file that contains the messages, text attachments and
headers for files stored in the Public Folder tree.
Pub1.stm is a streaming file that contains multi-media data that is formatted as MIME data
For every EDB file there will be an associated STM file.
The ExchangeStoreGroups test periodically observes the fluctuations in the store group size and the
size of the mailbox and public folder stores within. Using the statistics reported by this test,
administrators can effectively analyze and accurately predict growth trends and its implications on
server performance; based on these inferences, administrators can even initiate, if required, measures
to reconfigure the store group so as to prepare it for handling any additional load that is anticipated.
This test is disabled by default. To enable the test, go to the ENABLE / DISABLE TESTS page using the
menu sequence : Agents -> Tests -> Enable/Disable, pick Exchange as the Component type,
Performance as the Test type, choose the test from the DISABLED TESTS list, and click on the >> button to
move the test to the ENABLED TESTS list. Finally, click the Update button.
Purpose
Periodically observes the fluctuations in the store group size and the size of the
mailbox and public folder stores within
Target of the
test
An Exchange server 2000/2003
Agent
deploying the
test
An internal agent
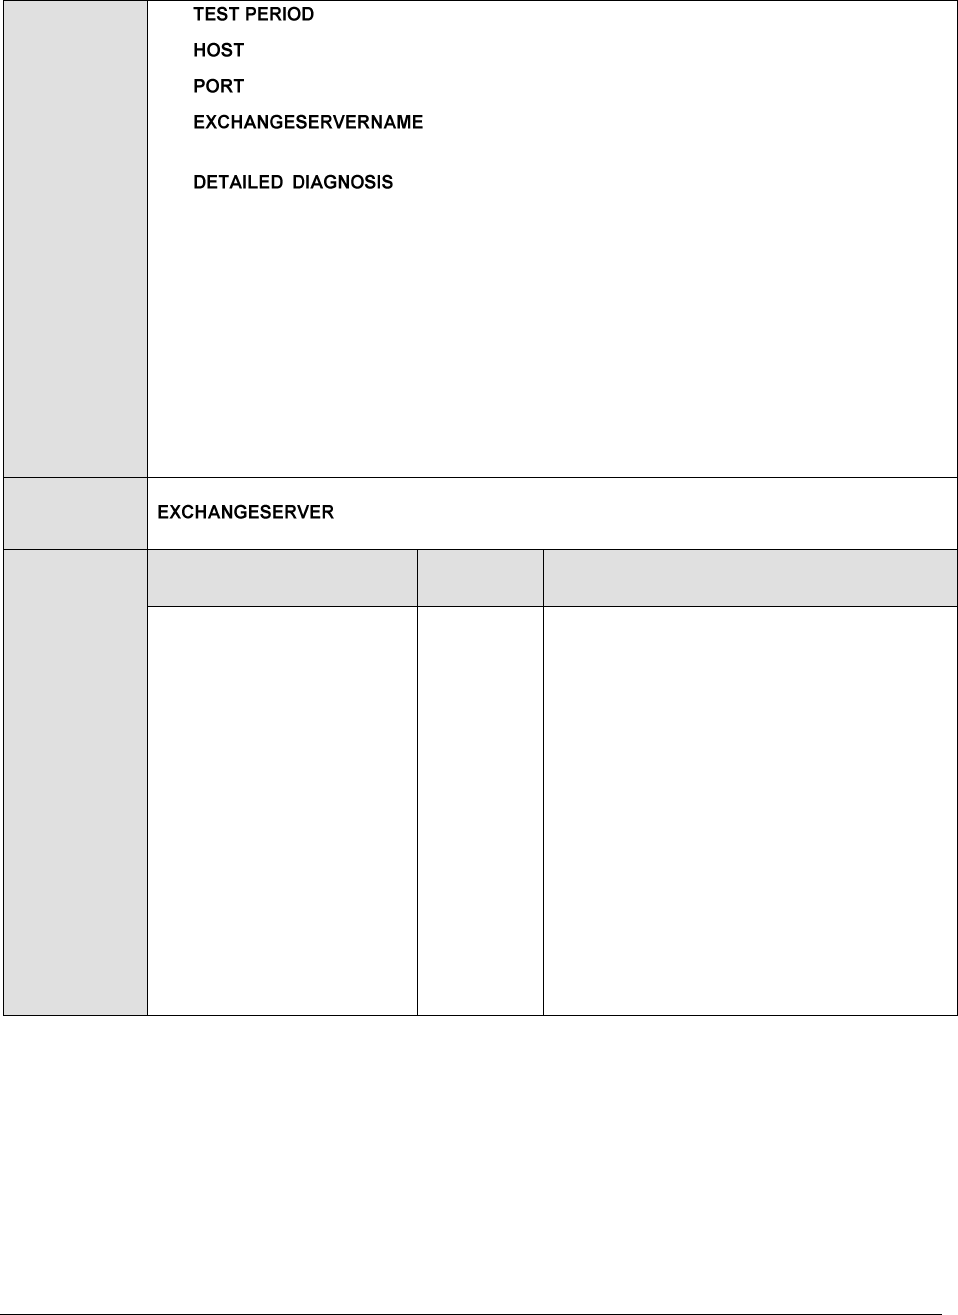
Monitoring Exchange 2000/2003 Servers
51
Configurable
parameters for
the test
1. - How often should the test be executed
2. - The IP address of the machine where the Exchange server is installed.
3. – The port number through which the Exchange server communicates.
4. - The name of the Exchange server instance on which
the store group(s) to be monitored exists.
5. - To make diagnosis more efficient and accurate, the eG
Enterprise suite embeds an optional detailed diagnostic capability. With this
capability, the eG agents can be configured to run detailed, more elaborate tests
as and when specific problems are detected. To enable the detailed diagnosis
capability of this test for a particular server, choose the On option. To disable the
capability, click on the Off option.
The option to selectively enable/disable the detailed diagnosis capability will be
available only if the following conditions are fulfilled:
The eG manager license should allow the detailed diagnosis capability
Both the normal and abnormal frequencies configured for the detailed
diagnosis measures should not be 0.
Outputs of the
test
One set of results for every store group configured on the specified
Measurements
made by the
test
Measurement
Measuremen
t Unit
Interpretation
Exchange mailbox store
size:
Indicates the current size
of the mailbox stores
within this store group.
MB
If the database size appears to be growing
continuously, you might want to consider
splitting one large database into multiple
smaller databases so as to ease
management.
The detailed diagnosis of the Exchange
mailbox store size measure, if enabled,
reveals the size of the EDB and STM files
within each mailbox store of the monitored
store group. A look at this break-up is
recommended when the value of this
measure shows sudden/steady increase;
with the help of this detailed diagnosis
information, you can quickly determine the
root-cause of the anomaly - is it the EDB
file or the STM file?
Monitoring Exchange 2000/2003 Servers
52
Exchange public folder
store size:
Indicates the current size
of the public folder stores
within this store group.
MB
If the database size appears to be growing
continuously, you might want to consider
splitting one large database into multiple
smaller databases so as to ease
management.
The detailed diagnosis of the Exchange
public folder store size measure, if
enabled, reveals the size of the EDB and
STM files within each public folder store of
the monitored store group. A look at this
break-up is recommended when the value
of this measure shows sudden/steady
increase; with the help of this detailed
diagnosis information, you can quickly
determine the root-cause of the anomaly -
is it the EDB file or the STM file?
Exchange total storage
group size:
Indicates the total size of
this store group.
MB
This, in effect, is a sum of the Exchange
mailbox store size and Exchange public
folder store size measures. If you find the
value of this measure increasing
consistently, you might want to create
additional storage groups so that the load
is balanced across the groups. On an
Exchange 2003 server for instance, up to
4 store groups can be created.
Alternatively, you might also want to
consider splitting one large database into
multiple smaller databases so as to ease
management.
Mounting a database puts it online, thereby making its data available to users. If a mailbox database
is not mounted, then users will be denied access to the mailbox data. It is therefore important that the
mount status of the mailbox databases is monitored periodically.
The Exchange Mailbox Status test reports the mount status of every mailbox database in an Exchange
server.
Purpose
Reports the mount status of every mailbox database in an Exchange server
Target of the
test
An Exchange server 2000/2003
Agent
deploying the
test
An internal agent

Monitoring Exchange 2000/2003 Servers
53
Configurable
parameters for
the test
1. - How often should the test be executed
2. - The IP address of the machine configured with the Mailbox server role.
3. – The port number through which the Mailbox server communicates. The
default is 691.
4. – Specify the full path to the Exchange management
shell. By default, this will be none.
Outputs of the
test
One set of results for every Mailbox database being monitored
Measurements
made by the
Measurement
Measurement
Unit
Interpretation
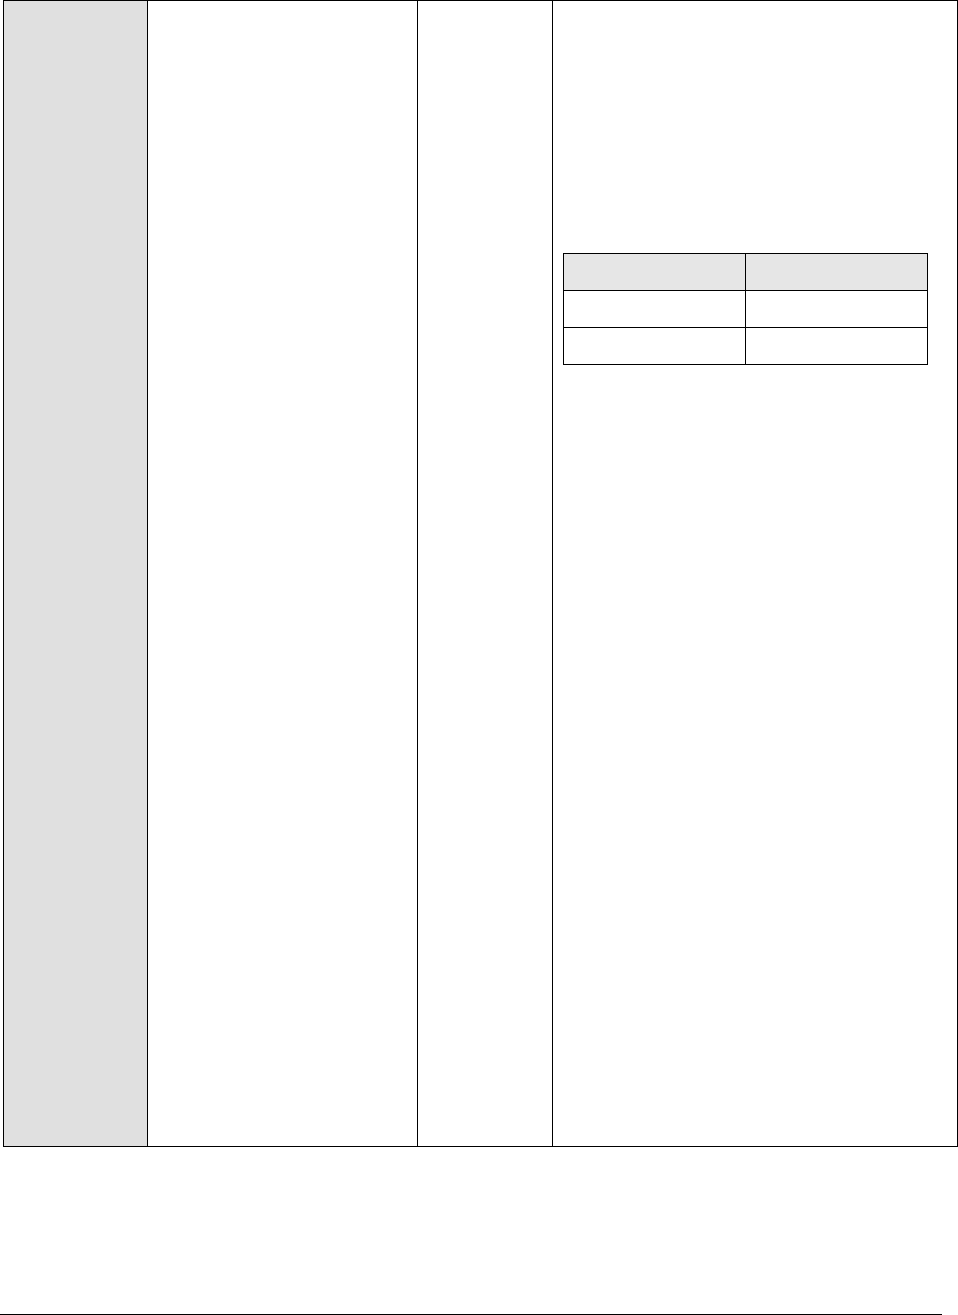
Monitoring Exchange 2000/2003 Servers
54
test
Mount status of
mailbox:
Indicates the mount status
of this mailbox database.
If the value of this measure is Mounted, it
indicates that the database is mounted.
The value Dismounted, on the other
hand, implies that the database is not
mounted.
The numeric values that correspond to
the mount status’ discussed above are
listed in the table below:
State
Value
Mounted
100
Dismounted
0
Note:
By default, this measure reports the
value Mounted or Dismounted to indicate
the mount status of a mailbox. The graph
of this measure however, represents the
mount status using the numeric
equivalents – 0 or 100.
An unmounted database can render
critical data inaccessible to users.
Commonly, mounting issues may occur
owing to one/more of the following
reasons:
To mount a database, typically,
the user should belong to the
local Administrators group for
the target server and should be
assigned the Exchange Server
Administrator role. If the user
account used for mounting does
not have these privileges, then
the database will not mount.
You can mount a database only if
the Microsoft Exchange
Information Store service is
running. If this service is not
running, then you would be
unable to mount the database.
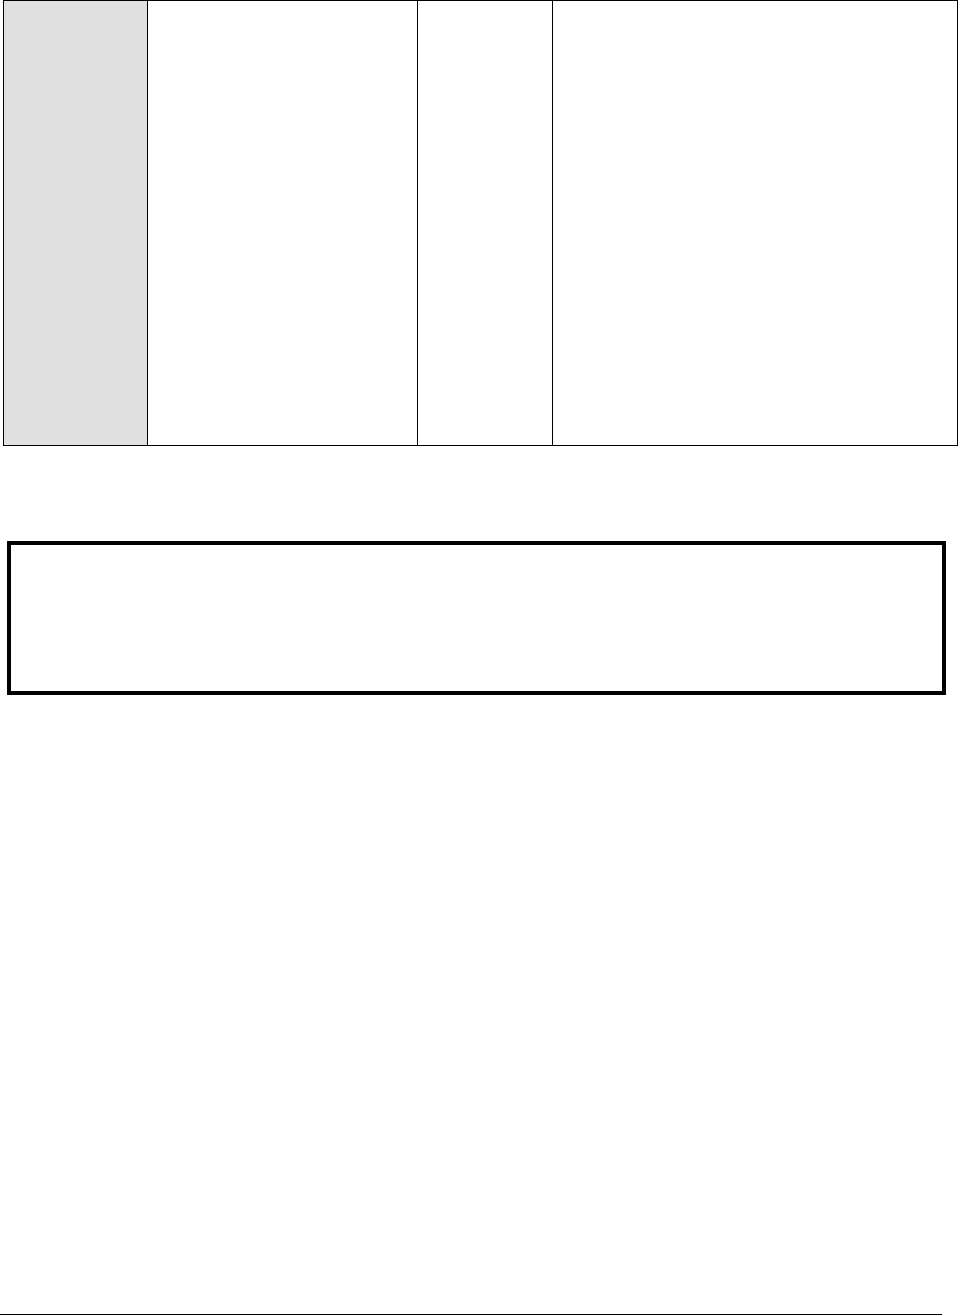
Monitoring Exchange 2000/2003 Servers
55
An Exchange mailbox database
might not be able to mount if it
reaches the 16-GB limit
If a file-level antivirus software
deletes or modifies the
transaction log files, then the
database might not mount.
Hardware issues can prevent a
database from mounting.
If Exchange runs out of hard
drive space, then the databases
might not mount.
If hard disk NTFS file system
permissions have been modified,
then the databases might not
mount.
Note:
Apart from Processes test, a TcpPortStatus test also executes on the Application Processes layer of
the Exchange server. For more details about the TCP Port Status test, refer to the Monitoring
Generic Servers document.

M o n i t o r i n g M S E x c h a n g e S e r v e r 5 . 5
56
Monitoring MS Exchange Server 5.5
Microsoft Exchange Server 5.5 is a client-server messaging system. Exchange Server 5.5 offers a
transparent connection to existing networks and mail servers. It provides users with an innovative
electronic mail system, online forms etc.
Microsoft Exchange Server 5.5 is the primary mail server for the Windows NT Server operating
system. The OS allows the server to take advantage of the platform’s reliability, scalability and
multitasking capabilities. For example, Windows NT Server multitasking capability allows Microsoft
Exchange Server to simultaneously update directory information, transfer information to a client, and
route information to other servers and foreign systems.
The server-side components perform actions that the client-side components request, such as looking
up names in the directory, sending messages, and storing information in private and public folders.
These components often reside on a dedicated computer where Microsoft Exchange Server is installed.
The server-side components are:
Directory
Information store
Message transfer agent (MTA)
System attendant
This means that, for the client-server interaction to function smoothly, each of these components
should operate without a glitch. Issues with the internal health of these components can affect the
responsiveness of the mail server, causing user dissatisfaction. By constantly monitoring the internal
operations of the mail servers, such problems can be averted.
Like the Exchange server model, eG Enterprise suite offers a specialized Exchange 5.5 monitoring
model (see Figure 4.1) for the MS Exchange Server 5.5. The tests associated with this model
continuously checks whether the core components of the MS Exchange server 5.5 are operating to
peak capacity or no, and promptly alert administrators to potential performance issues.
Chapter
4
M o n i t o r i n g M S E x c h a n g e S e r v e r 5 . 5
57
Figure 4.1: Layers of MS Exchange Server 5.5
The Network, Tcp, Application Processes, and Windows Service layers have already been discussed in the
Monitoring Unix and Windows Servers document. The Mail Service layer too has been dealt with
elaborately in the Monitoring Generic Mail Servers chapter of this document. The sections to come
therefore, will elaborate on the Exchange 5.5 Service layer only.
4.1 The Exchange 5.5 Service Layer
This layer monitors the various components that are responsible for enabling the Exchange service,
such as the Exchange server database, Exchange server cache. More details about the Exchange
Server 5.5 activities are available in the following sections. The tests that map to this layer are
depicted by Figure 4.2 below:
Figure 4.2: Tests mapping to the Xchange55_Service layer
This test monitors the performance of Exchange Server Directory, the server-side core component.
The Microsoft Exchange Server directory contains objects that are the principal means for applications
to find and access services, mailboxes, recipients, public folders, and other addressable objects within
the messaging system.
The directory consists of two components:
Directory database
Directory service agent.
M o n i t o r i n g M S E x c h a n g e S e r v e r 5 . 5
58
The directory database stores directory information like recipients, distribution lists, servers, and
messaging infrastructure. The directory service agent manipulates the information in the directory
database and handles directory requests from applications and services.
Purpose
This test monitors the performance of Exchange Server 5.5 Directory Cache.
Target of the
test
An MS Exchange Server 5.5
Agent
deploying the
test
An internal agent
Configurable
parameters for
the test
1. – How often should the test be executed
2. - The IP address of the machine where the Exchange Server 5.5 is installed.
3. – The port number through which the Exchange Server 5.5 communicates.
The default port number is 25.
Outputs of the
test
One set of results for every Exchange Server 5.5 being monitored
Measurements
made by the
test
Measurement
Measurement
Unit
Interpretation
Cache hit ratio:
This measure indicates the
percentage of database
requests that were fulfilled
by the Exchange directory
cache without causing a
Input/Output operation.
Percent
A zero value for this measure may
indicate that the Exchange Server 5.5 is
not performing any activity on the
Exchange directory or no operations are
happening on the Exchange Server 5.5
itself.
A non-zero value indicates that the
directory service has found the required
objects in the directory cache thereby
reducing the access.
A high value for this measure ensures
better performance of the Exchange
Server 5.5.
This test monitors the performance of Exchange Server Database. The information store is key to
database management in Exchange Server. This server-side component is responsible for storing
data, such as e-mail messages in user mailboxes and information in public folders. The information
store is actually two separate databases. The private information store database, called Priv.eb and
Public information store, called Pub.ebd.
The private information store manages data in user mailboxes. The public information store manages
data in public folders.
Microsoft Exchange Server relies on an embedded database engine that lays out the structure of the
disk for Exchange Server and manages memory. The Exchange database engine caches the disk in
memory by swapping 4 KB chunks of data, called pages, in and out of memory. The engine updates
the pages in memory and takes care of writing new or updated pages back to the disk. The database
engine commits a transaction only when it can guarantee that the data is durable and protected from

M o n i t o r i n g M S E x c h a n g e S e r v e r 5 . 5
59
crashes or other failures. The database engine will only successfully commit data when it is sure it has
flushed that data from memory to the transaction log file on disk.
Purpose
This test monitors the performance of Exchange Server 5.5 Database.
Target of the
test
An Exchange Server 5.5
Agent
deploying the
test
An internal agent
Configurable
parameters for
the test
1. – How often should the test be executed
2. - The IP address of the machine where the Exchange Server 5.5 is installed.
3. – The port number through which the Exchange Server 5.5 communicates.
The default port number is 25.
Outputs of the
test
One set of results for every Exchange Server 5.5 being monitored
Measurements
made by the
test
Measurement
Measurement
Unit
Interpretation
Database cache hit
ratio:
This measure shows the
percentage of database
requests that were fulfilled
by the information store
cache without incurring
disk input/output activity.
Percent
A significantly low value indicates that the
Exchange Server 5.5 is not having
enough free memory. Increasing the
memory may solve this problem.
Database tables cache
hit ratio:
This measure shows the
percentage of database
tables opened using the
cached schema
information.
Percent
A significantly low value indicates that the
Exchange Server 5.5 is not having
enough free memory. Increasing the
memory may solve this problem.
Log record waiting rate:
This measure shows the
number of log records that
cannot be added to the log
buffers because the log
buffers are full.
Recrds/Sec
This measure should be as close to zero
as possible.
If it is not, it might indicate that the size
of the log buffer might be a bottleneck.
Increasing the memory may solve this
problem.
Log threads waiting:
This measure shows the
number of threads waiting
for their data to be written
to the log buffer so that
the update of the database
can be completed.
Number
This measure should be as low as
possible.
A high value for this measure may
indicate that the log buffer might be a
bottleneck. Increasing the memory may
solve this problem.
M o n i t o r i n g M S E x c h a n g e S e r v e r 5 . 5
60
This test monitors the performance of Post Office Protocol version 3 (POP3) and Internet Messaging
Access Protocol (IMAP).
POP3 is an Internet protocol that allows a POP3 client to download e-mail from the messaging server
like Exchange Server 5.5. This protocol works well for computers that are unable to maintain a
continuous connection to a messaging server. Microsoft Exchange Server implements this protocol as
a process of the information store.
Internet Messaging Access Protocol (IMAP) works like POP3. This protocol enables clients to access
and manipulate messages stored within their mailboxes. Unlike POP3, IMAP4 allows a user to access
multiple e-mail folders, search through a mailbox, and maintain read and unread message flags. In
addition, a user can download an entire message or a portion of a message, such as an attachment.
Like POP3, IMAP4 also runs as a process of the information store.
Purpose
This test monitors the usage of POP3 and IMAP protocols via an Exchange Server 5.5
Target of the
test
An Exchange Server 5.5
Agent
deploying the
test
An internal agent
Configurable
parameters for
the test
1. – How often should the test be executed
2. – The IP address of the machine where the Exchange Server 5.5 is installed.
3. – The port number through which the Exchange Server 5.5 communicates.
The default port number is 25.
Outputs of the
test
One set of results for every Exchange Server 5.5 being monitored
Measurements
made by the
test
Measurement
Measurement
Unit
Interpretation
Current POP3
connections:
This measure shows the
number of current POP3
connections to the server.
Number
A high value for this measure indicates
that a large number of POP3 clients are
connected to the Exchange Server 5.5.
This measure helps the administrator in
planning or upgrading the following
parameters:
Server’s memory requirements
Control of unnecessary traffic on
the mail server
Server’s processing capabilities
M o n i t o r i n g M S E x c h a n g e S e r v e r 5 . 5
61
Current IMAP
connections:
This measure shows the
number of current IMAP
connections to the server.
Number
A high value for this measure indicates
that a large number of IMAP clients are
connected to the Exchange Server 5.5.
This measure helps the administrator in
planning or upgrading the following
parameters:
Server’s memory requirements
Control of unnecessary traffic on
the mail server
Server’s processing capabilities
Current POP3 waits:
This measure shows the
number of outstanding
requests from POP3
clients.
Number
A high value for this measure indicates
that either Exchange Server 5.5 is down
or Exchange Server is overloaded with
jobs.
Current IMAP waits:
This measure shows the
number of outstanding
requests from IMAP
clients.
Number
A high value for this measure indicates
that either the Exchange Server 5.5 is
down or Exchange Server is overloaded
with jobs.
The MsXMailService test reports general statistics pertaining to the MS Exchange Server 5.5.
Purpose
Reports general statistics pertaining to the MS Exchange Server 5.5
Target of the
test
An Exchange Server 5.5
Agent
deploying the
test
An internal agent
Configurable
parameters for
the test
1. – How often should the test be executed
2. - The IP address of the machine where the Exchange Server 5.5 is installed.
3. – The port number through which the Exchange Server 5.5 communicates.
The default port number is 25.
Outputs of the
test
One set of results for every Exchange Server 5.5 being monitored
Measurements
made by the
test
Measurement
Measurement
Unit
Interpretation

M o n i t o r i n g M S E x c h a n g e S e r v e r 5 . 5
62
Inbound queue size:
The number of messages
received from the Internet
destined for this MS
Exchange Server
Number
This metric checks the inbound side of
the MS Exchange server. A consistently
high queue size could indicate that the
server is not able to cope with the
incoming traffic.
Outbound queue size:
The number of messages
from this MS Exchange
Server, that are queued to
be delivered to the
Internet
Number
Typically, the outbound queue length
should be short.
MTS in queue:
The number of messages
awaiting final delivery in
this MS Exchange Server
Number
MTS out queue:
The number of messages
waiting to be converted to
Internet Mail format
Number
Incoming connections:
The number of current
SMTP connections to the
Internet Mail Service (IMS)
established by other SMTP
hosts
Number
Outgoing connections:
The number of current
SMTP connections the
Internet Mail Service has
established to other SMTP
hosts
Number
Failed connections:
The current number of
SMTP connection attempts
made by the InternetMail
Service to other hosts,
that have failed
Number
A lot of failures can occur if the Exchange
server is not able to connect to remote
server(s) over the Internet
Rejected connections:
The current number of
SMTP connections from
other hosts that the
Internet Mail Service has
rejected
Number
There may be many reasons why an
Exchange server can reject connections
from other hosts. eg., based on access
control specifications, if the remote host's
DNS name cannot be resolved.
M o n i t o r i n g M S E x c h a n g e S e r v e r 5 . 5
63
Incoming messages:
The current number of
Internet messages
delivered into MS
Exchange Server
Number
Outgoing messages:
The current number of
outbound messages
delivered to their
destinations
This test monitors the performance of Exchange Server information store, a server-side component.
The information store makes it possible for users to send mail and use public folders. The information
store performs the following tasks:
Stores public folders in the public information store.
Stores user’s messages in the private information store.
Maintains storage.
Delivers messages addressed to users on the same server as the sender.
Forwards messages addressed to recipients on other servers and systems to the message
transfer agent (MTA) to deliver.
Purpose
This test monitors the performance of the information store in Exchange Server 5.5.
Target of the
test
An Exchange Server 5.5
Agent
deploying the
test
An internal agent
Configurable
parameters for
the test
1. – How often should the test be executed
2. - The IP address of the machine where the Exchange Server 5.5 is installed.
3. – The port number through which the Exchange Server 5.5 communicates. The
default port number is 25.
Outputs of the
test
One set of results for every Exchange Server 5.5 being monitored
Measurements
made by the
Measurement
Measurement
Unit
Interpretation

M o n i t o r i n g M S E x c h a n g e S e r v e r 5 . 5
64
test
Current users:
This measure shows the
actual number of users
(not connections) currently
using the information
store.
Number
This measure is a good indicator of user activity
in the Exchange 5.5 Server. This information
can be used by the administrator for planning
the capacity of the mail server.
Mail send queue size:
This measure indicates the
number of messages in the
send queue of an
information store.
Number
This measure is usually zero under normal
conditions.
This measure can be non-zero in the case of
very busy systems (2000 users and more).
Mail receive queue size:
This measure shows the
number of messages in the
receiving queue of the
information store.
Number
This measure is usually zero under normal
conditions.
A non-zero value for this measure indicates
that the SMTP service is choking up memory.
Mail sent rate:
This measure indicates the
rate at which messages
are being sent to other
storage providers via the
Message Transfer Agent
(MTA).
MTA is a component of
Microsoft Exchange Server
that sends and distributes
information between
Microsoft Exchange Server
systems or between
Microsoft Exchange Server
and a foreign system. Each
MTA is associated with one
information store.
Msgs/Min
A high value over a period for this measure
indicates the one of the following:
Microsoft Exchange MTA service is down
Microsoft Exchange MTA service is
choking up memory
The Exchange Server 5.5 is overloaded.
Mail opens:
This measure indicates the
rate at which the requests,
to open the messages are
being submitted to the
private information store.
Msgs/Sec
This measure shows the overall picture of user
activity. An abnormally high value for this
measure may indicate that the Exchange
Server 5.5 is overloaded.
Folder opens:
This measure indicates the
rate at which requests, to
open the folders are being
submitted to the public
information store.
Reqs/Sec
This measure is another good indicator of user
activity on the mail folders.
M o n i t o r i n g M S E x c h a n g e S e r v e r 5 . 5
65
Avg mail delivery time:
This measure indicates the
average time between the
submission of a message
to the information store
and the submission to the
MTA for the last 10
messages.
Secs
A non-zero value for this measure indicates a
change in user workload.
An abnormally high value for this measure
indicates inability to deliver to one or more
destinations. One of the possible reasons for
this can be a network failure.
Avg mail local delivery
time:
This measure indicates the
average time between the
submission of a message
to the information store
and the delivery to all local
recipients (recipients on
the same server) for the
last 10 messages.
Secs
A non-zero value for this measure indicates a
change in the user workload.
An abnormally high value for this measure may
indicate that the server is overloaded.
This test monitors the availability and performance of a Microsoft Exchange mail server from an
external perspective. The test mimics the mail client activity by using the MAPI (Messaging Application
Programming Interface) for sending and receiving mails. Note that Microsoft Mail account needs to be
configured in the Exchange server in order to run this test. This test is disabled by default. To enable
the test, go to the ENABLE / DISABLE TESTS page using the menu sequence : Agents -> Tests ->
Enable/Disable, pick Exchange as the Component type, Performance as the Test type, choose the test
from the DISABLED TESTS list, and click on the >> button to move the test to the ENABLED TESTS list.
Finally, click the Update button.
Purpose
Monitors the availability and performance of a Microsoft Exchange mail server from an
external perspective
Target of the
test
An MS Exchange 5.5 Server
Note:
The eG external agent that is executing the MsXMail test, should be installed on a Windows
NT server/client in the same domain as the Exchange 5.5 server.
The administrator configuring the test should ensure that the mailbox being used in the
test, exists on the Exchange 5.5 server.
The eGurkhaAgent service should run using the account information of the user whose
mailbox has been configured for the MsXMail test.

M o n i t o r i n g M S E x c h a n g e S e r v e r 5 . 5
66
Agent
deploying the
test
An internal agent
Configurable
parameters for
the test
1. - How often should the test be executed
2. - The IP address of the machine where the Exchange 5.5 Server is installed.
3. – The port number through which the Exchange 5.5 Server communicates.
The default port number is 25.
4. - Specify the user name or the user ID of a user mail box
available on the Exchange server that is to be used for this test.
5. - The name of the site in the Exchange server to which the
mailbox belongs
6. - The name of the organization in the Exchange server to which
the specified site belongs
Outputs of the
test
One set of results for every Exchange 5.5 Server being monitored
Measurements
made by the
test
Measurement
Measurement
Unit
Interpretation
Ability to send mails:
Indicates the availability of
the mail server for
receiving the mails sent by
the test
Percent
A value of 0 indicates that the test was
not successful in sending a mail. Possible
reasons for this could include the mail
server being down, the network
connection to the server not being
available, or the test configuration
information being incorrect.
Sent messages:
Indicates the number of
messages sent to the mail
server.
Number
A value of –1 indicates that the mail
server may be down or the configuration
information may be incorrect.
Time to send mails:
Indicates time taken to
send a mail from to the
mail server
Secs
A high value of this measure could
indicate high network traffic or that the
mail server is busy.
Ability to receive mails:
Indicates the availability of
the exchange server for
sending mails to the mail
client
Percent
The value of 0 indicates that the test was
not successful in receiving a mail
message from the Exchange server.
Possible reasons could be incorrect
configuration information.

M o n i t o r i n g M S E x c h a n g e S e r v e r 5 . 5
67
Received messages:
Indicates the number of
messages received by the
mail client from the mail
server
Number
The value of 0 indicates that the test was
not successful in receiving mail messages
from the Exchange server. The possible
reasons could be:
The sent messages could be in
the message queue of the mail
server but not routed to the mail
box
Configuration information may be
incorrect
Network failure
The mail service may not be
running in the user account
Mail received time:
Indicates the time taken
by the mail client to
receive a mail from the
mail server
Secs
A high value in this measure indicates
that the mail server is busy or the
network traffic is high.
Avg roundtrip time:
The average of the round
trip time (the time lapse
between transmission and
reception of a message by
the server) of all the
messages received by the
mail server during the last
measurement period
Mins
This is a key measure of quality of the
mail service. An increase in this value
may be indicative of a problem with the
mail service. Possible reasons could
include queuing failures, disk space being
full, etc.
Max roundtrip time:
The high water mark of the
round trip time (the time
lapse between
transmission and reception
of a message by the
server) of all messages
received by the mail server
during the last
measurement period
Mins
If the value of the Received messages
measure is 1, then the value of the Max
roundtrip time measure will be the same as
the Avg roundtrip time.
To know the site and organization on which the mailbox configured for the test exists, use the
Microsoft Exchange Administrator console. This console can be opened using the menu sequence:
Start -> Programs -> Microsoft Exchange -> Microsoft Exchange Administrator. A sample
Administrator Window has been given below.
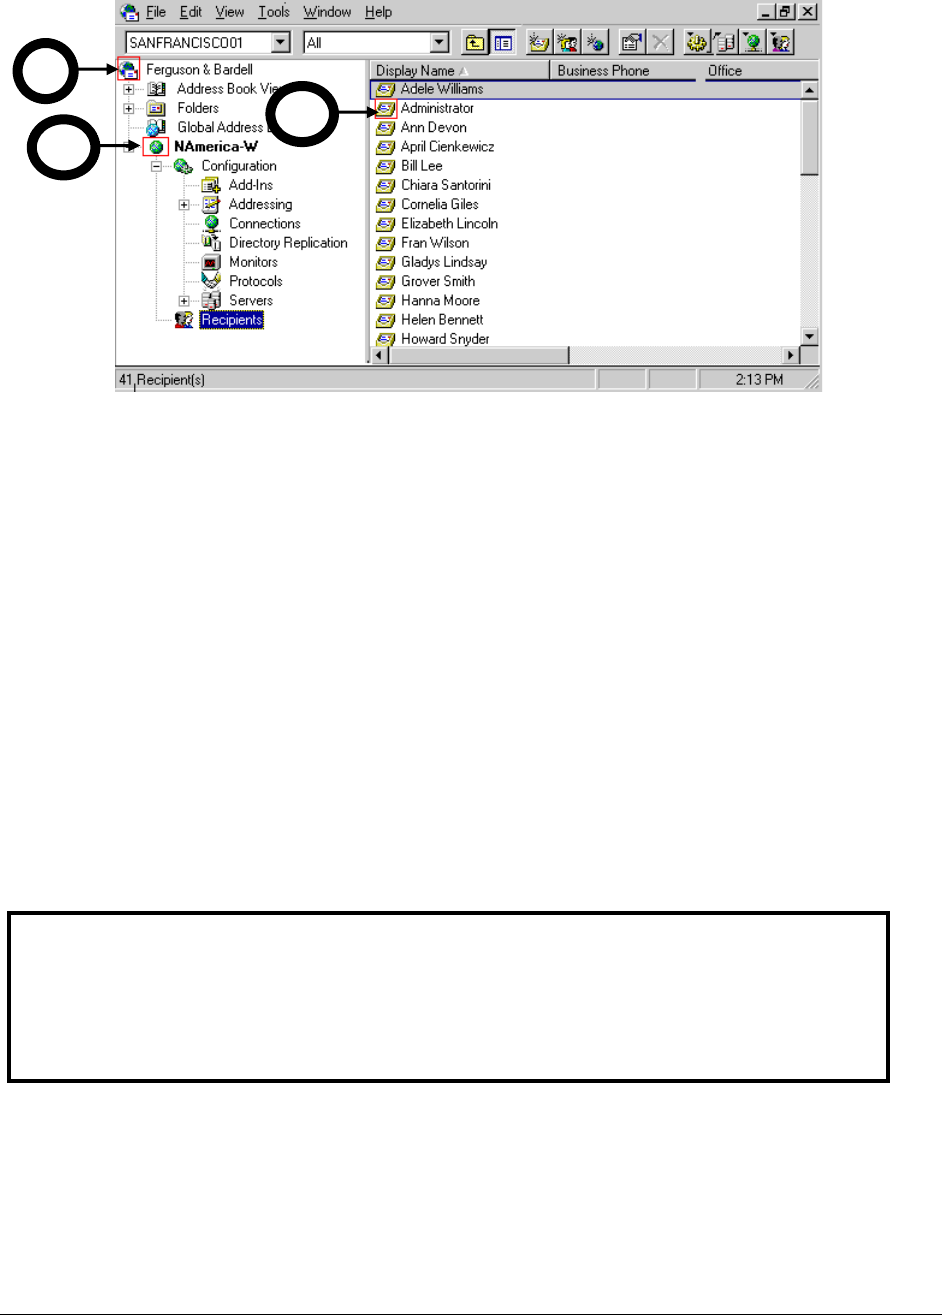
M o n i t o r i n g M S E x c h a n g e S e r v e r 5 . 5
68
Figure 4.3: The Exchange Administrator window
A
The icon marked A represents an organization in the Exchange server. The
text following the icon is the name of the organization. In our illustration, this
is Ferguson & Bardell. An organization is the root or starting point of Microsoft
Exchange server directory objects.
B
The icon marked B represents a site. The text following this icon is the name
of the site. In our illustration, the site name is NAmerica-W. A site is nothing
but a group of one or more Exchange server computers connected to the
same local area network (LAN). An organization can consist of multiple sites.
C
The icon marked C represents a mail box within an Exchange server. The text
following the icon is the name of the mailbox. In our illustration, Administrator
is the name of a mailbox under the NAmerica-W site. A mailbox is a private
repository for email and other information. To view the complete list of mail
boxes within a site, click on the Recipients sub-node under that site in the
left pane of the Administrator window.
A
B
C
Note:
Apart from Processes test, a TcpPortStatus test also executes on the Application Processes
layer of the Exchange Server 5.5. For more details about the TCP Port Status test, refer to
the Monitoring Generic Servers document.

M o n i t o r i n g L o t u s D o m i n o M a i l S e r v e r s
69
Monitoring Lotus Domino Mail
Servers
The Domino server family is an integrated messaging and Web application software platform. The
Lotus Domino mail server is a powerful messaging server for corporate intranets and the Internet. Its
integrated services deliver reliability, superior administration capabilities, and good performance for an
organization.
To ensure that such a popular mail server always serves corporates to the best of its ability, the
critical internal processes of the server are to be monitored constantly for both availability and overall
effectiveness. These processes include:
Agent Manager
HTTP
SMTP
Server
POP3
Router
Database Replicator
IMAP server
The Domino Mail server monitoring model (see Figure 5.1) that eG Enterprise offers, periodically
verifies the health of the services and processes that are integral to the normal functioning of the mail
server, and alerts administrators even when the smallest of issues surface.
Chapter
5
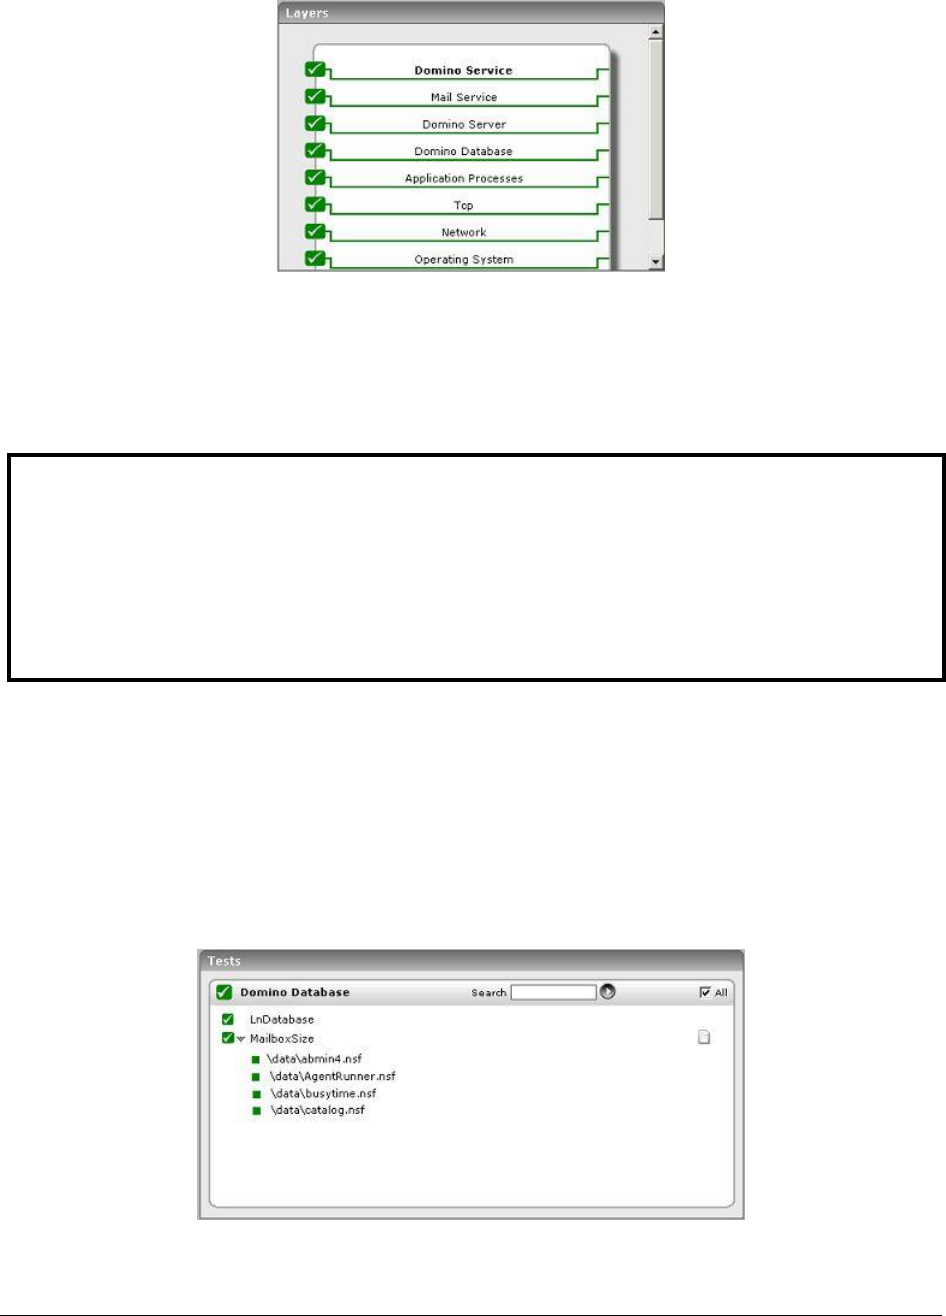
M o n i t o r i n g L o t u s D o m i n o M a i l S e r v e r s
70
Figure 5.1: Layer model for a Lotus Domino mail server
The Operating System, Network, Tcp, and Application Processes layers of Figure 5.1 have been explained
adequately in the Monitoring Unix and Windows Servers document. The Mail Service layer’s significance
can be ascertained from the Monitoring Generic Mail Servers chapter in this document. This chapter
therefore will discuss only the Domino Database, Domino Server, and Domino Service layers.
5.1 The Domino Database Layer
The Domino mail server database is one of the most important components. A Domino database is a
single file containing multiple documents. A document in Domino database can be compared to
records in a conventional database, but a Domino document is more sophisticated than a typical
database record, containing rich text, pictures, objects, and many other types of information. This
layer tracks the health of the Domino database with the help of the LnDatabase test shown in Figure
5.2.
Figure 5.2: Tests mapping to the Domino Database layer
Note:
An eG agent uses the SNMP Management Information Base (MIB) of the Domino mail server to
monitor it. Hence, for the eG agent to monitor the Domino Mail server, it is essential to install the
Lotus Notes’ SNMP agent. Before installing the SNMP agent, the SNMP service on the
corresponding operating system should be enabled. Please refer to the Domino mail server
reference manuals for detailed instructions.
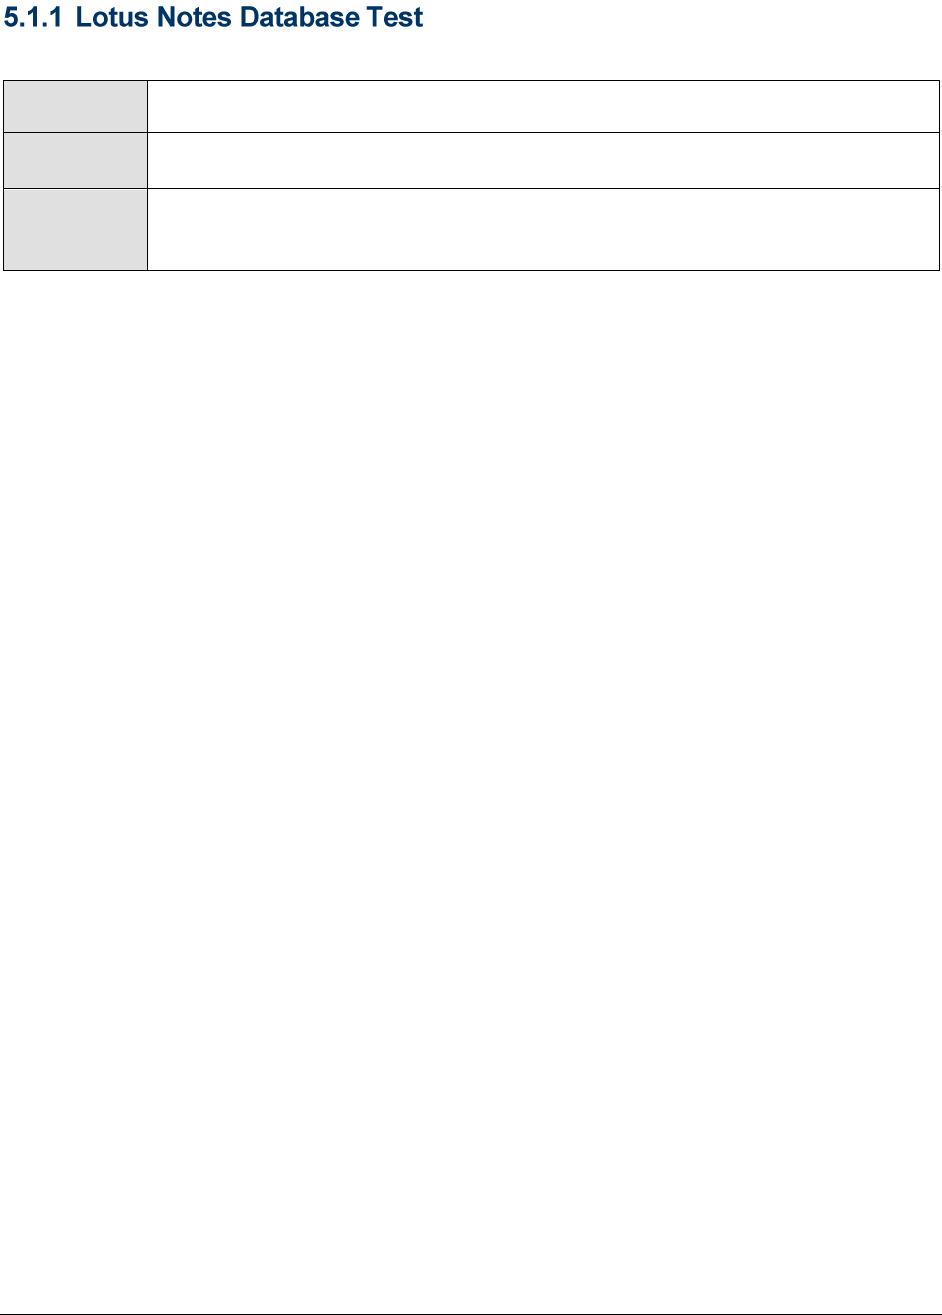
M o n i t o r i n g L o t u s D o m i n o M a i l S e r v e r s
71
This test reports database related metrics of the Lotus Domino server.
Purpose
Reports database related metrics of the Lotus Domino server
Target of the
test
A Domino mail server
Agent
deploying the
test
An internal agent
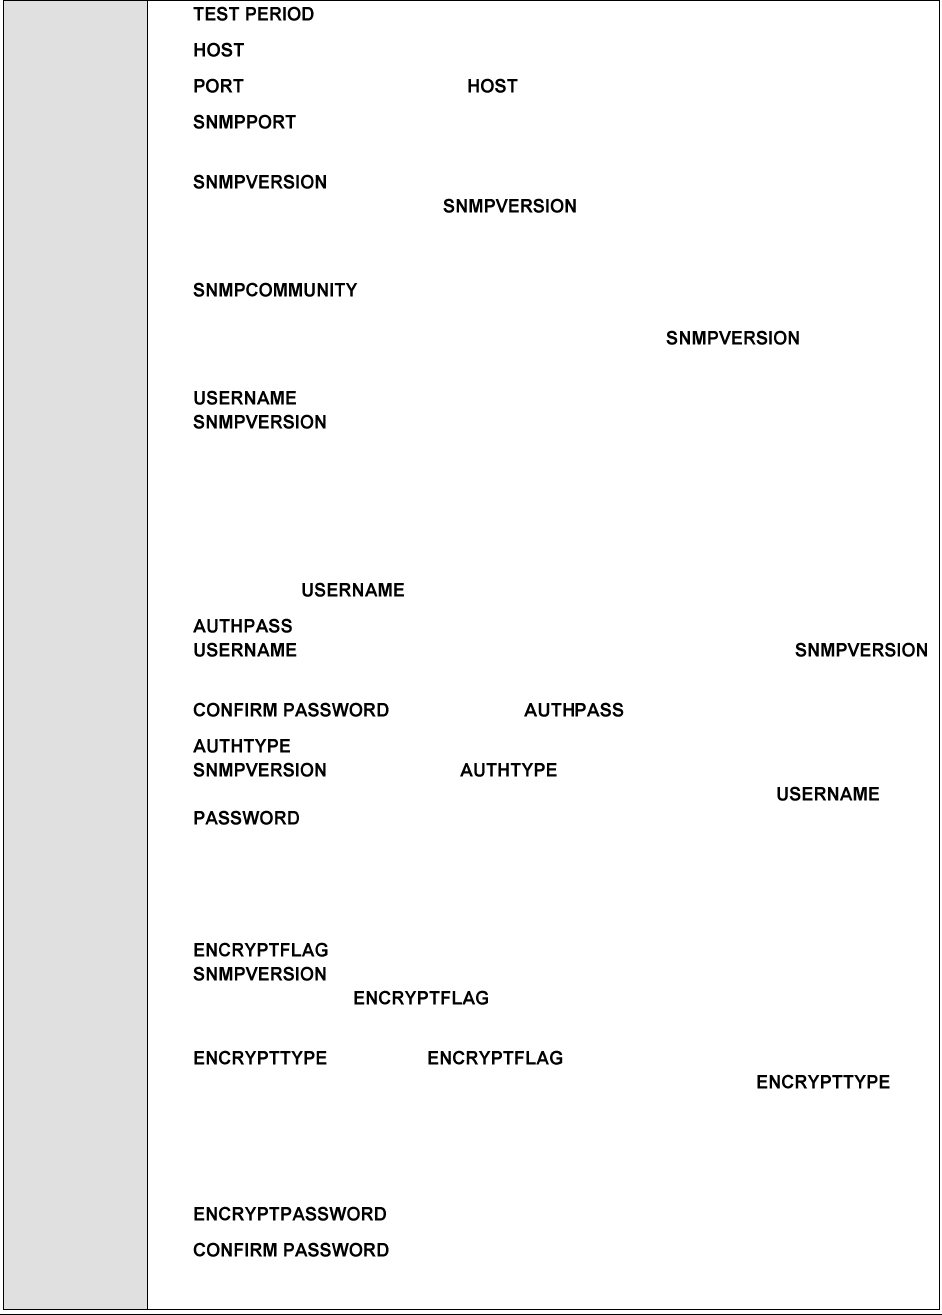
M o n i t o r i n g L o t u s D o m i n o M a i l S e r v e r s
72
Configurable
parameters for
the test
1. - How often should the test be executed
2. –The host for which the test is to be configured.
3. – The port at which the listens
4. – The port number on which the mail server is exposing the SNMP
MIB. The default is 161.
5. – By default, the eG agent supports SNMP version 1. Accordingly,
the default selection in the list is v1. However, if a different SNMP
framework is in use in your environment, say SNMP v2 or v3, then select the
corresponding option from this list.
6. – The SNMP community name that the test uses to
communicate with the mail server. The default is public. This parameter is
specific to SNMP v1 and v2 only. Therefore, if the chosen is v3,
then this parameter will not appear.
7. – This parameter appears only when v3 is selected as the
. SNMP version 3 (SNMPv3) is an extensible SNMP Framework
which supplements the SNMPv2 Framework, by additionally supporting message
security, access control, and remote SNMP configuration capabilities. To extract
performance statistics from the MIB using the highly secure SNMP v3 protocol,
the eG agent has to be configured with the required access privileges – in other
words, the eG agent should connect to the MIB using the credentials of a user
with access permissions to be MIB. Therefore, specify the name of such a user
against the parameter.
8. – Specify the password that corresponds to the above-mentioned
. This parameter once again appears only if the
selected is v3.
9. – Confirm the by retyping it here.
10. – This parameter too appears only if v3 is selected as the
. From the list box, choose the authentication
algorithm using which SNMP v3 converts the specified and
into a 32-bit format to ensure security of SNMP transactions. You
can choose between the following options:
MD5 – Message Digest Algorithm
SHA – Secure Hash Algorithm
6. – This flag appears only when v3 is selected as the
. By default, the eG agent does not encrypt SNMP requests.
Accordingly, the is set to NO by default. To ensure that SNMP
requests sent by the eG agent are encrypted, select the YES option.
7. – If the is set to YES, then you will have to
mention the encryption type by selecting an option from the list.
SNMP v3 supports the following encryption types:
DES – Data Encryption Standard
AES – Advanced Encryption Standard
8. – Specify the encryption password here.
9. – Confirm the encryption password by retyping it here.

M o n i t o r i n g L o t u s D o m i n o M a i l S e r v e r s
73
10. – Specify the duration (in seconds) beyond which the SNMP query
issues by this test should time out. The default period is 10 seconds.
Outputs of the
test
One set of results for database files on the mail server being monitored
Measurements
made by the
test
Measurement
Measurement
Unit
Interpretation
Buffer control pool
size:
Indicates the size of the
buffer control pool.
MB
Buffer control pool
used:
Indicates the number of
bytes used in the buffer
control pool.
MB
The value 0 may indicate that the
measure's value is too large to be
passed via snmp.
Buffer pool allocated:
Indicates the number of
bytes allocated from the
buffer pool.
MB
Buffer pool max:
Indicates the maximum
size of the buffer pool.
MB
Buffer pool used:
Indicates the number of
buffers used from the
buffer pool.
MB
NSF pool size:
Indicates the size of the
NSF Pool.
KB
The NSF Buffer Pool is a section of
memory dedicated to buffering I/O
transfers between the NIF (Notes Index
Facility) indexing functions and disk
storage. By changing the size of NSF
Buffer Pool you can control the size of
the memory section used for this
buffering. The NSF Buffer Pool is the
only Domino memory pool that is
configurable by the user. Therefore,
while setting the NSF buffer pool size,
you need to consider the number of
users, the size and number of views,
and the number of databases.
NSF pool used:
Indicates the amount of
space used in the NSF
pool.
KB
If the value of this measure decreases
consistently, it indicates a steady
erosion of space in the NSF pool. Resize
the NSF pool, so that more memory is
available for indexing or buffering I/O
transfers.

M o n i t o r i n g L o t u s D o m i n o M a i l S e r v e r s
74
Buffer pool percent
reads:
Indicates the
percentage of buffer
pool reads.
Percent
Buffer pool reads:
Indicates the number of
buffer pool reads.
Number
Buffer pool writes:
Indicates the number of
buffer pool writes.
Number
Current cache
entries:
Indicates the number of
databases currently in
the cache.
Number
Administrators should monitor this
number to see whether it approaches
the NSF_DBCACHE_MAXENTRIES
setting. If it does, it indicates that the
cache is under pressure. If this
situation recurs, the administrator
should increase the setting for
NSF_DBCACHE_MAXENTRIES.
Database cache hits:
Indicates the number of
times an
lnDBCacheInitialDbOpe
n is satisfied by finding
a database in the
cache.
Number
Database cache
initial opens:
The number of times a
user/server opened a
database that was not
already being used by
another user/server
Number
By comparing this number to
Db_cache_hits, administrators can
gauge the effectiveness of the caching
activity.
Database cache hit
ratio:
Indicates the
percentage of hits to
opens.
Percent
A high 'hits-to-opens' ratio indicates the
database cache is working effectively,
since most users are opening databases
in the cache without having to wait for
the usual time required by an initial
(non-cache) open. If the ratio is low (in
other words, more users are having to
wait for databases not in the cache to
open), the administrator can increase
the NSF_DBCACHE_MAXENTRIES
settings.
M o n i t o r i n g L o t u s D o m i n o M a i l S e r v e r s
75
Database cache max
entries:
Indicates the number of
times a database is not
placed into the cache.
Number
Database cache
rejections:
Indicates the number of
times a database is not
placed into the cache.
Number
A database might not be placed into the
cache when it is closed because
lnDBCacheCurrentEntries equals or
exceeds lnDBCacheMaxEntries * 1.5.
This number should stay low. If it
begins to rise, you should increase the
NSF_DbCache_Maxentries settings.
The MailboxSizeTest reports the size of the individual Domino database files.
Purpose
Reports the size of the individual Domino database files
Target of the
test
A Domino mail server
Agent
deploying the
test
An internal agent
Configurable
parameters for
the test
1. - How often should the test be executed
2. –The host for which the test is to be configured.
3. – The port number of the Domino mail server.
4. – The install directory of Lotus Notes.
Outputs of the
test
One set of results for every database file on the mail server being monitored
Measurements
made by the
test
Measurement
Measurement
Unit
Interpretation
Databases size:
Indicates the size of
this Domino database
file.
MB
This test tracks various statistics pertaining to the Domino database. This test is disabled by default
and has been retained only to ensure backward compatibility with previous versions of the eG
Enterprise suite.
Purpose
To measure statistics pertaining to the Domino database
Target of the
A Domino mail server

M o n i t o r i n g L o t u s D o m i n o M a i l S e r v e r s
76
test
Agent
deploying the
test
An internal agent

M o n i t o r i n g L o t u s D o m i n o M a i l S e r v e r s
77
Configurable
parameters for
the test
1. - How often should the test be executed
2. –The host for which the test is to be configured.
3. - The variable name of the port for which the test is to be configured.
4. – The port number on which the mail server is exposing the SNMP
MIB.
5. – By default, the eG agent supports SNMP version 1. Accordingly,
the default selection in the list is v1. However, if a different SNMP
framework is in use in your environment, say SNMP v2 or v3, then select the
corresponding option from this list.
6. – The SNMP community name that the test uses to
communicate with the mail server. This parameter is specific to SNMP v1 and v2
only. Therefore, if the chosen is v3, then this parameter will not
appear.
7. – This parameter appears only when v3 is selected as the
. SNMP version 3 (SNMPv3) is an extensible SNMP Framework
which supplements the SNMPv2 Framework, by additionally supporting message
security, access control, and remote SNMP configuration capabilities. To extract
performance statistics from the MIB using the highly secure SNMP v3 protocol,
the eG agent has to be configured with the required access privileges – in other
words, the eG agent should connect to the MIB using the credentials of a user
with access permissions to be MIB. Therefore, specify the name of such a user
against the parameter.
8. – Specify the password that corresponds to the above-mentioned
. This parameter once again appears only if the
selected is v3.
9. – Confirm the by retyping it here.
10. – This parameter too appears only if v3 is selected as the
. From the list box, choose the authentication
algorithm using which SNMP v3 converts the specified and
into a 32-bit format to ensure security of SNMP transactions. You
can choose between the following options:
MD5 – Message Digest Algorithm
SHA – Secure Hash Algorithm
11. – This flag appears only when v3 is selected as the
. By default, the eG agent does not encrypt SNMP requests.
Accordingly, the is set to NO by default. To ensure that SNMP
requests sent by the eG agent are encrypted, select the YES option.
12. – If the is set to YES, then you will have to
mention the encryption type by selecting an option from the list.
SNMP v3 supports the following encryption types:
DES – Data Encryption Standard
AES – Advanced Encryption Standard
13. – Specify the encryption password here.
14. – Confirm the encryption password by retyping it here.

M o n i t o r i n g L o t u s D o m i n o M a i l S e r v e r s
78
15. – Specify the duration (in seconds) beyond which the SNMP query
issues by this test should time out. The default period is 10 seconds.
Outputs of the
test
One set of results for every mail server being monitored
Measurements
made by the
test
Measurement
Measurement
Unit
Interpretation
Current cache
entries:
Indicates the number of
databases currently in
the cache.
Number
Administrators should monitor this
measure to see whether it approaches
the NSF_DBCACHE_MAXENTRIES
setting in NOTES.ini file. If it does,
this indicates that the cache is under
pressure. If this situation occurs
frequently, the administrator should
increase the setting for
NSF_DBCACHE_MAXENTRIES.
Cache hit ratio:
This value indicates the
percentage of pages
found in the cache
without having to read
from disk.
Percent
A high value for this measure indicates
that the database cache is working
effectively, as most users are opening
databases in the cache without having
to wait for the usual time required by
an initial (non-cache) open. A low
value for this measure indicates that
more users are waiting to open a
database that is not in the cache. The
Administrator can increase the
NSF_DBCACHE_MAXENTRIES settings
to prevent this situation.
Max cache entries:
The number of
databases that the
server can currently
hold in its cache at a
time.
Number
This measure shows the maximum
cache_curr_entries configured for this
server.
5.2 The Domino Server Layer
The tests associated with this layer monitor:
The MTA service of the Domino mail server
The session-handling capacity of the server
The memory usage by the server
The data traffic to and from each of the key ports on the server
The availability and request-processing ability of the server
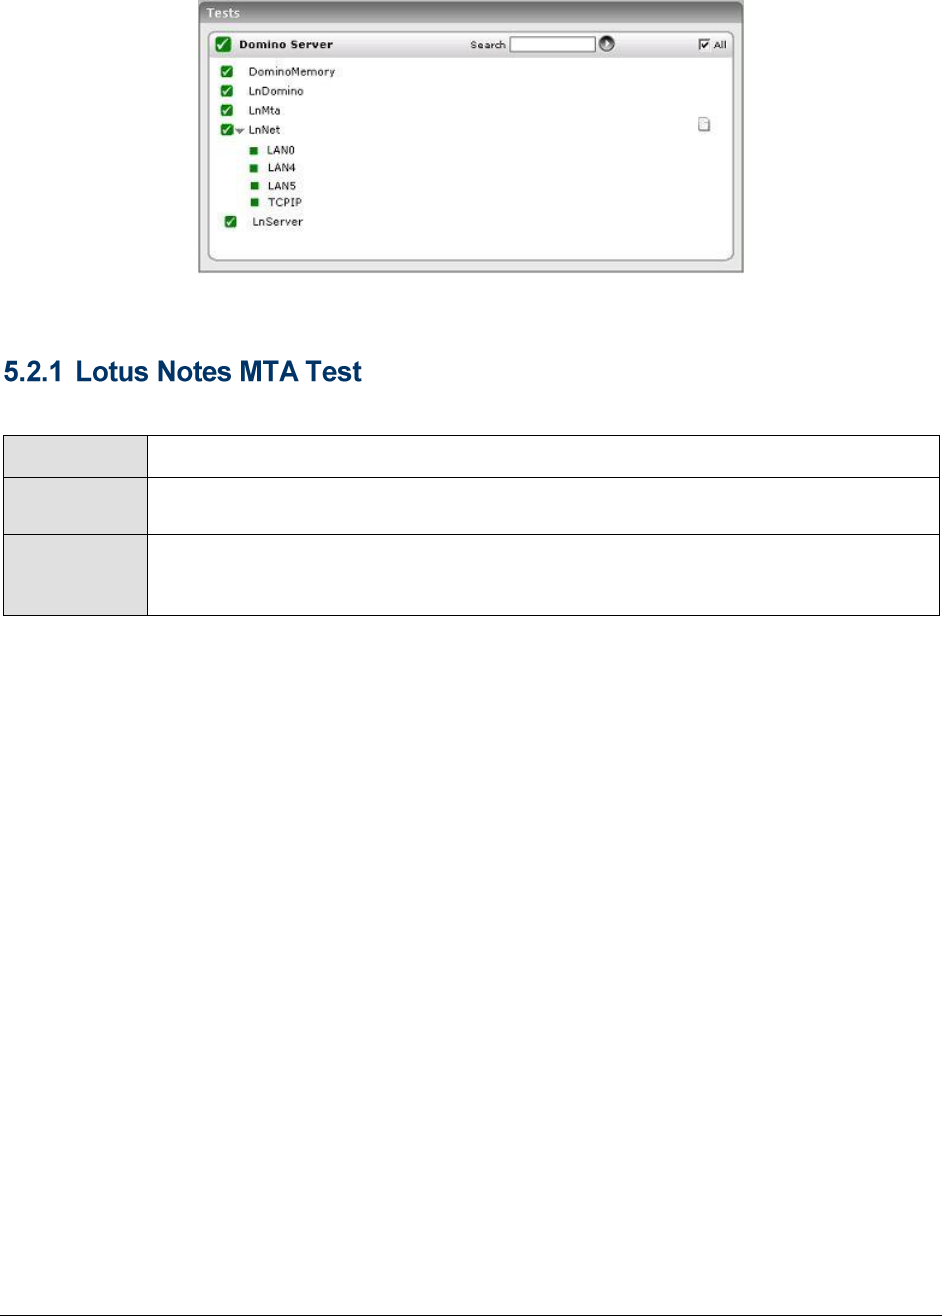
M o n i t o r i n g L o t u s D o m i n o M a i l S e r v e r s
79
Figure 5.3: Tests mapping to the Domino Server layer
The Lotus Notes MTA Test monitors the MTA (Mail Transfer Agent) service of the Domino mail server.
Purpose
Monitors the MTA (Mail Transfer Agent) service of the Domino mail server
Target of the
test
A Domino mail server
Agent
deploying the
test
An internal agent

M o n i t o r i n g L o t u s D o m i n o M a i l S e r v e r s
80
Configurable
parameters for
the test
1. - How often should the test be executed
2. –The host for which the test is to be configured.
3. – The port at which the listens
4. – The port number on which the mail server is exposing the SNMP
MIB. The default is 161.
5. – By default, the eG agent supports SNMP version 1. Accordingly,
the default selection in the list is v1. However, if a different SNMP
framework is in use in your environment, say SNMP v2 or v3, then select the
corresponding option from this list.
6. – The SNMP community name that the test uses to
communicate with the mail server. The default is public. This parameter is
specific to SNMP v1 and v2 only. Therefore, if the chosen is v3,
then this parameter will not appear.
7. – This parameter appears only when v3 is selected as the
. SNMP version 3 (SNMPv3) is an extensible SNMP Framework
which supplements the SNMPv2 Framework, by additionally supporting message
security, access control, and remote SNMP configuration capabilities. To extract
performance statistics from the MIB using the highly secure SNMP v3 protocol,
the eG agent has to be configured with the required access privileges – in other
words, the eG agent should connect to the MIB using the credentials of a user
with access permissions to be MIB. Therefore, specify the name of such a user
against the parameter.
8. – Specify the password that corresponds to the above-mentioned
. This parameter once again appears only if the
selected is v3.
9. – Confirm the by retyping it here.
10. – This parameter too appears only if v3 is selected as the
. From the list box, choose the authentication
algorithm using which SNMP v3 converts the specified and
into a 32-bit format to ensure security of SNMP transactions. You
can choose between the following options:
MD5 – Message Digest Algorithm
SHA – Secure Hash Algorithm
11. – This flag appears only when v3 is selected as the
. By default, the eG agent does not encrypt SNMP requests.
Accordingly, the is set to NO by default. To ensure that SNMP
requests sent by the eG agent are encrypted, select the YES option.
12. – If the is set to YES, then you will have to
mention the encryption type by selecting an option from the list.
SNMP v3 supports the following encryption types:
DES – Data Encryption Standard
AES – Advanced Encryption Standard
13. – Specify the encryption password here.
14. – Confirm the encryption password by retyping it here.
M o n i t o r i n g L o t u s D o m i n o M a i l S e r v e r s
81
15. – Specify the duration (in seconds) beyond which the SNMP query
issues by this test should time out. The default period is 10 seconds.
Outputs of the
test
One set of results for the Domino mail server being monitored
Measurements
made by the
test
Measurement
Measurement
Unit
Interpretation
Dead messages:
Indicates the number of
dead mail messages.
Number
Pending recipients:
Indicates the number of
recipients waiting for
mails.
Number
Waiting messages:
Indicates the number of
messages that are in
the process of being
routed.
Number
Mail transfer failure:
Indicates the number of
messages that the MTA
could not transfer.
Number
Data transferred:
Indicates the amount of
data transferred
outbound / into any of
the mail boxes by this
MTA.
KB
Transferred
messages:
Indicates the total
number of messages
transferred outbound /
into any of the mail
boxes by this MTA.
Number
The Lotus Domino test monitors how well the Lotus Domino mail server handles client sessions.
Purpose
Monitors how well the Lotus Domino mail server handles client sessions
Target of the
test
A Domino mail server
Agent
deploying the
An internal agent

M o n i t o r i n g L o t u s D o m i n o M a i l S e r v e r s
82
test
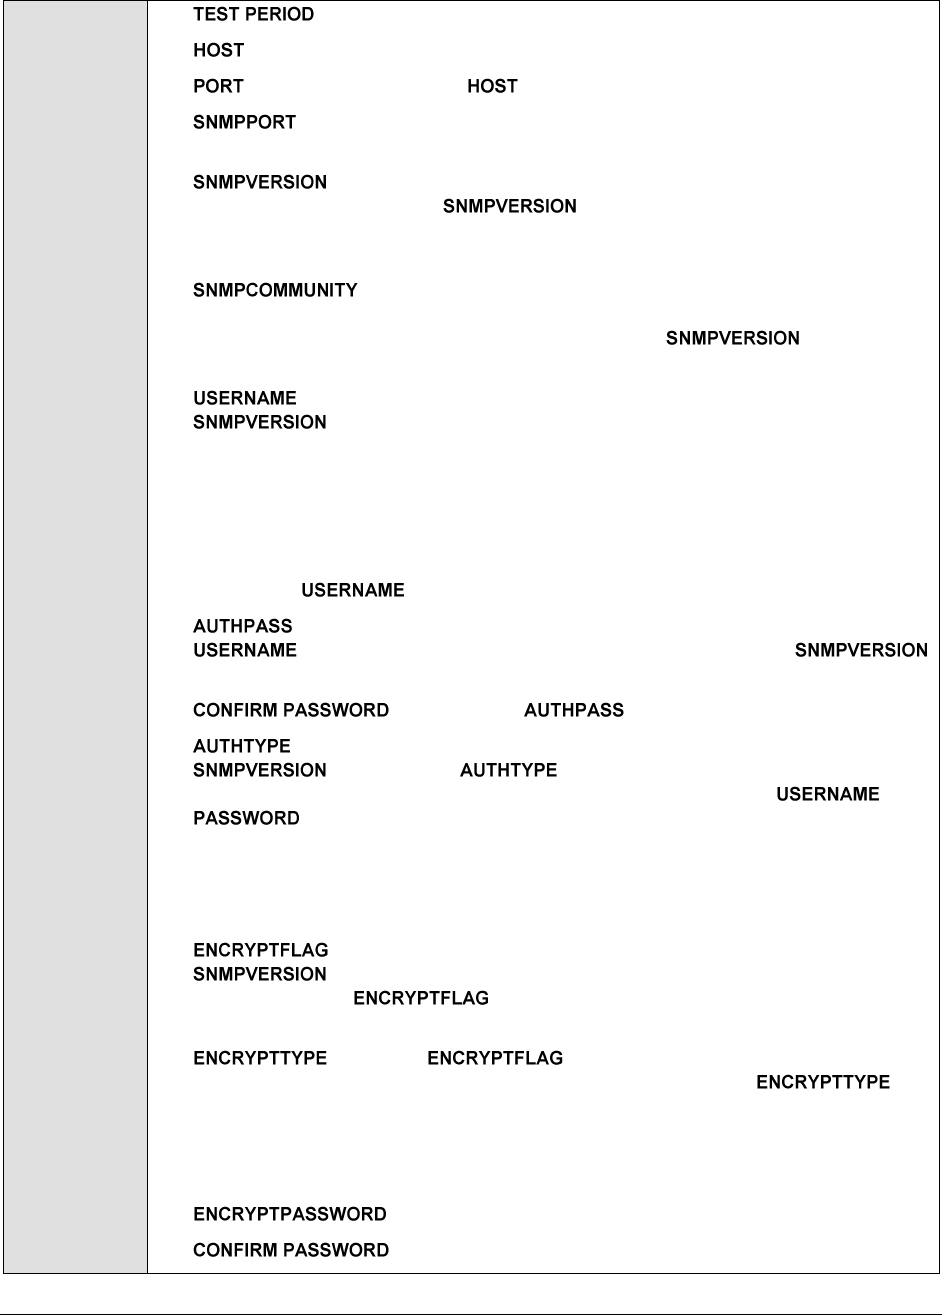
M o n i t o r i n g L o t u s D o m i n o M a i l S e r v e r s
83
Configurable
parameters for
the test
1. - How often should the test be executed
2. –The host for which the test is to be configured.
3. – The port at which the listens
4. – The port number on which the mail server is exposing the SNMP
MIB. The default is 161.
5. – By default, the eG agent supports SNMP version 1. Accordingly,
the default selection in the list is v1. However, if a different SNMP
framework is in use in your environment, say SNMP v2 or v3, then select the
corresponding option from this list.
6. – The SNMP community name that the test uses to
communicate with the mail server. The default is public. This parameter is
specific to SNMP v1 and v2 only. Therefore, if the chosen is v3,
then this parameter will not appear.
7. – This parameter appears only when v3 is selected as the
. SNMP version 3 (SNMPv3) is an extensible SNMP Framework
which supplements the SNMPv2 Framework, by additionally supporting message
security, access control, and remote SNMP configuration capabilities. To extract
performance statistics from the MIB using the highly secure SNMP v3 protocol,
the eG agent has to be configured with the required access privileges – in other
words, the eG agent should connect to the MIB using the credentials of a user
with access permissions to be MIB. Therefore, specify the name of such a user
against the parameter.
8. – Specify the password that corresponds to the above-mentioned
. This parameter once again appears only if the
selected is v3.
9. – Confirm the by retyping it here.
10. – This parameter too appears only if v3 is selected as the
. From the list box, choose the authentication
algorithm using which SNMP v3 converts the specified and
into a 32-bit format to ensure security of SNMP transactions. You
can choose between the following options:
MD5 – Message Digest Algorithm
SHA – Secure Hash Algorithm
11. – This flag appears only when v3 is selected as the
. By default, the eG agent does not encrypt SNMP requests.
Accordingly, the is set to NO by default. To ensure that SNMP
requests sent by the eG agent are encrypted, select the YES option.
12. – If the is set to YES, then you will have to
mention the encryption type by selecting an option from the list.
SNMP v3 supports the following encryption types:
DES – Data Encryption Standard
AES – Advanced Encryption Standard
13. – Specify the encryption password here.
14. – Confirm the encryption password by retyping it here.

M o n i t o r i n g L o t u s D o m i n o M a i l S e r v e r s
84
15. – Specify the duration (in seconds) beyond which the SNMP query
issues by this test should time out. The default period is 10 seconds.
Outputs of the
test
One set of results for the Domino mail server being monitored
Measurements
made by the
test
Measurement
Measurement
Unit
Interpretation
Current threads:
Indicates the number of
Domino threads
available to service
requests.
Number
Peak active threads:
Indicates the high
watermark of active
threads.
Number
Peak current threads:
Indicates the high
watermark of current
threads.
Number
Request last minute:
Indicates the number of
Domino requests that
came in the last minute.
Number
Request last 5min:
Indicates the number of
Domino requests that
were received in the
last 5 minutes.
Number
Request last hour:
Indicates the number of
Domino requests that
were received in the
last 1 hour.
Number
Requests handled:
Indicates the number of
Domino requests that
are currently been
handled by the Domino
mail server.
Number
Database cache hit
rate:
Indicates the Domino
database cache hit rate.
Hits/Sec

M o n i t o r i n g L o t u s D o m i n o M a i l S e r v e r s
85
This test reports statistics related to the network traffic handled by the Domino ports.
Purpose
Reports statistics related to the network traffic handled by the Domino ports
Target of the
test
A Domino mail server
Agent
deploying the
test
An internal agent

M o n i t o r i n g L o t u s D o m i n o M a i l S e r v e r s
86
Configurable
parameters for
the test
1. - How often should the test be executed
2. –The host for which the test is to be configured.
3. – The port at which the listens
4. – The port number on which the mail server is exposing the SNMP
MIB. The default is 161.
5. – By default, the eG agent supports SNMP version 1. Accordingly,
the default selection in the list is v1. However, if a different SNMP
framework is in use in your environment, say SNMP v2 or v3, then select the
corresponding option from this list.
6. – The SNMP community name that the test uses to
communicate with the mail server. The default is public. This parameter is
specific to SNMP v1 and v2 only. Therefore, if the chosen is v3,
then this parameter will not appear.
7. – This parameter appears only when v3 is selected as the
. SNMP version 3 (SNMPv3) is an extensible SNMP Framework
which supplements the SNMPv2 Framework, by additionally supporting message
security, access control, and remote SNMP configuration capabilities. To extract
performance statistics from the MIB using the highly secure SNMP v3 protocol,
the eG agent has to be configured with the required access privileges – in other
words, the eG agent should connect to the MIB using the credentials of a user
with access permissions to be MIB. Therefore, specify the name of such a user
against the parameter.
8. – Specify the password that corresponds to the above-mentioned
. This parameter once again appears only if the
selected is v3.
9. – Confirm the by retyping it here.
10. – This parameter too appears only if v3 is selected as the
. From the list box, choose the authentication
algorithm using which SNMP v3 converts the specified and
into a 32-bit format to ensure security of SNMP transactions. You
can choose between the following options:
MD5 – Message Digest Algorithm
SHA – Secure Hash Algorithm
11. – This flag appears only when v3 is selected as the
. By default, the eG agent does not encrypt SNMP requests.
Accordingly, the is set to NO by default. To ensure that SNMP
requests sent by the eG agent are encrypted, select the YES option.
12. – If the is set to YES, then you will have to
mention the encryption type by selecting an option from the list.
SNMP v3 supports the following encryption types:
DES – Data Encryption Standard
AES – Advanced Encryption Standard
13. – Specify the encryption password here.
14. – Confirm the encryption password by retyping it here.
M o n i t o r i n g L o t u s D o m i n o M a i l S e r v e r s
87
15. – Specify the duration (in seconds) beyond which the SNMP query
issues by this test should time out. The default period is 10 seconds.
Outputs of the
test
One set of results for every Domino port
Measurements
made by the
test
Measurement
Measurement
Unit
Interpretation
Data received:
Indicates the total data
received (in KB).
KB
Data sent:
Indicates the total kb
sent.
KB
Inbound sessions:
Indicates the number of
inbound sessions
established.
Number
Outbound sessions:
Indicates the number of
outbound sessions
established.
Number
Dropped sessions:
Indicates the number of
sessions dropped due to
low network resources.
Number
Concurrent session
limit:
Indicates the current
limit on the number of
concurrent sessions
allowed.
Number
The LnServer test reports key statistics pertaining to the Domino mail server.
Purpose
Reports key statistics pertaining to the Domino mail server
Target of the
test
A Domino mail server
Agent
deploying the
test
An internal agent

M o n i t o r i n g L o t u s D o m i n o M a i l S e r v e r s
88
Configurable
parameters for
the test
1. - How often should the test be executed
2. –The host for which the test is to be configured.
3. – The port at which the listens
4. – The port number on which the mail server is exposing the SNMP
MIB. The default is 161.
5. – By default, the eG agent supports SNMP version 1. Accordingly,
the default selection in the list is v1. However, if a different SNMP
framework is in use in your environment, say SNMP v2 or v3, then select the
corresponding option from this list.
6. – The SNMP community name that the test uses to
communicate with the mail server. The default is public. This parameter is
specific to SNMP v1 and v2 only. Therefore, if the chosen is v3,
then this parameter will not appear.
7. – This parameter appears only when v3 is selected as the
. SNMP version 3 (SNMPv3) is an extensible SNMP Framework
which supplements the SNMPv2 Framework, by additionally supporting message
security, access control, and remote SNMP configuration capabilities. To extract
performance statistics from the MIB using the highly secure SNMP v3 protocol,
the eG agent has to be configured with the required access privileges – in other
words, the eG agent should connect to the MIB using the credentials of a user
with access permissions to be MIB. Therefore, specify the name of such a user
against the parameter.
8. – Specify the password that corresponds to the above-mentioned
. This parameter once again appears only if the
selected is v3.
9. – Confirm the by retyping it here.
10. – This parameter too appears only if v3 is selected as the
. From the list box, choose the authentication
algorithm using which SNMP v3 converts the specified and
into a 32-bit format to ensure security of SNMP transactions. You
can choose between the following options:
MD5 – Message Digest Algorithm
SHA – Secure Hash Algorithm
11. – This flag appears only when v3 is selected as the
. By default, the eG agent does not encrypt SNMP requests.
Accordingly, the is set to NO by default. To ensure that SNMP
requests sent by the eG agent are encrypted, select the YES option.
12. – If the is set to YES, then you will have to
mention the encryption type by selecting an option from the list.
SNMP v3 supports the following encryption types:
DES – Data Encryption Standard
AES – Advanced Encryption Standard
13. – Specify the encryption password here.
14. – Confirm the encryption password by retyping it here.

M o n i t o r i n g L o t u s D o m i n o M a i l S e r v e r s
89
15. – Specify the duration (in seconds) beyond which the SNMP query
issues by this test should time out. The default period is 10 seconds.
Outputs of the
test
One set of results for the Domino mail server being monitored
Measurements
made by the
test
Measurement
Measurement
Unit
Interpretation
Availability:
Indicates the availability
of the Domino mail
server.
Percent
Each server in a cluster periodically
determines its own workload based on
the response time of the requests the
server has processed recently. The
workload is expressed as a number
from 0 to 100, where 0 indicates a
heavily loaded server and 100 indicates
a lightly loaded server. This number is
called the server availability index. As
response times increase, the server
availability index decreases.
The server availability index is
approximately equal to the percentage
of the total server capacity that is still
available. For example, if the server
availability index is 65, you still have
approximately 65% of the capacity of
your server available. Although the
servers in your enterprise may vary in
power and resources, the server
availability index represents the same
thing on each server -- the amount of
total availability of that server that is
still available
Server worker
threads:
Indicates the maximum
number of concurrent
transactions to create.
Number
Current users:
Indicates the number of
users who have
currently opened
sessions with the
server.
Number
Dropped sessions:
Indicates the number of
sessions dropped from
the server.
Number
M o n i t o r i n g L o t u s D o m i n o M a i l S e r v e r s
90
Transaction rate:
Indicates the rate at
which transactions
occur on the server.
Trans/Min
Transactions
completed:
Indicates the number of
transactions that have
been completed.
Number
Closed old sessions:
Indicates the number of
sessions that were
dropped because of too
many concurrent users.
Number
This test tracks statistics pertaining to the memory usage of the Domino mail server.
Purpose
To measure statistics pertaining to the memory usage of the Domino mail server
Target of the
test
A Domino mail server
Agent
deploying the
test
An internal agent

M o n i t o r i n g L o t u s D o m i n o M a i l S e r v e r s
91
Configurable
parameters for
the test
1. - How often should the test be executed
2. –The host for which the test is to be configured.
3. - The variable name of the port for which the test is to be configured.
4. – The port number on which the mail server is exposing the SNMP
MIB
5. – By default, the eG agent supports SNMP version 1. Accordingly,
the default selection in the list is v1. However, if a different SNMP
framework is in use in your environment, say SNMP v2 or v3, then select the
corresponding option from this list.
6. – The SNMP community name that the test uses to
communicate with the mail server. This parameter is specific to SNMP v1 and v2
only. Therefore, if the chosen is v3, then this parameter will not
appear.
7. – This parameter appears only when v3 is selected as the
. SNMP version 3 (SNMPv3) is an extensible SNMP Framework
which supplements the SNMPv2 Framework, by additionally supporting message
security, access control, and remote SNMP configuration capabilities. To extract
performance statistics from the MIB using the highly secure SNMP v3 protocol,
the eG agent has to be configured with the required access privileges – in other
words, the eG agent should connect to the MIB using the credentials of a user
with access permissions to be MIB. Therefore, specify the name of such a user
against the parameter.
8. – Specify the password that corresponds to the above-mentioned
. This parameter once again appears only if the
selected is v3.
9. – Confirm the by retyping it here.
10. – This parameter too appears only if v3 is selected as the
. From the list box, choose the authentication
algorithm using which SNMP v3 converts the specified and
into a 32-bit format to ensure security of SNMP transactions. You
can choose between the following options:
MD5 – Message Digest Algorithm
SHA – Secure Hash Algorithm
11. – This flag appears only when v3 is selected as the
. By default, the eG agent does not encrypt SNMP requests.
Accordingly, the is set to NO by default. To ensure that SNMP
requests sent by the eG agent are encrypted, select the YES option.
12. – If the is set to YES, then you will have to
mention the encryption type by selecting an option from the list.
SNMP v3 supports the following encryption types:
DES – Data Encryption Standard
AES – Advanced Encryption Standard
13. – Specify the encryption password here.
14. – Confirm the encryption password by retyping it here.
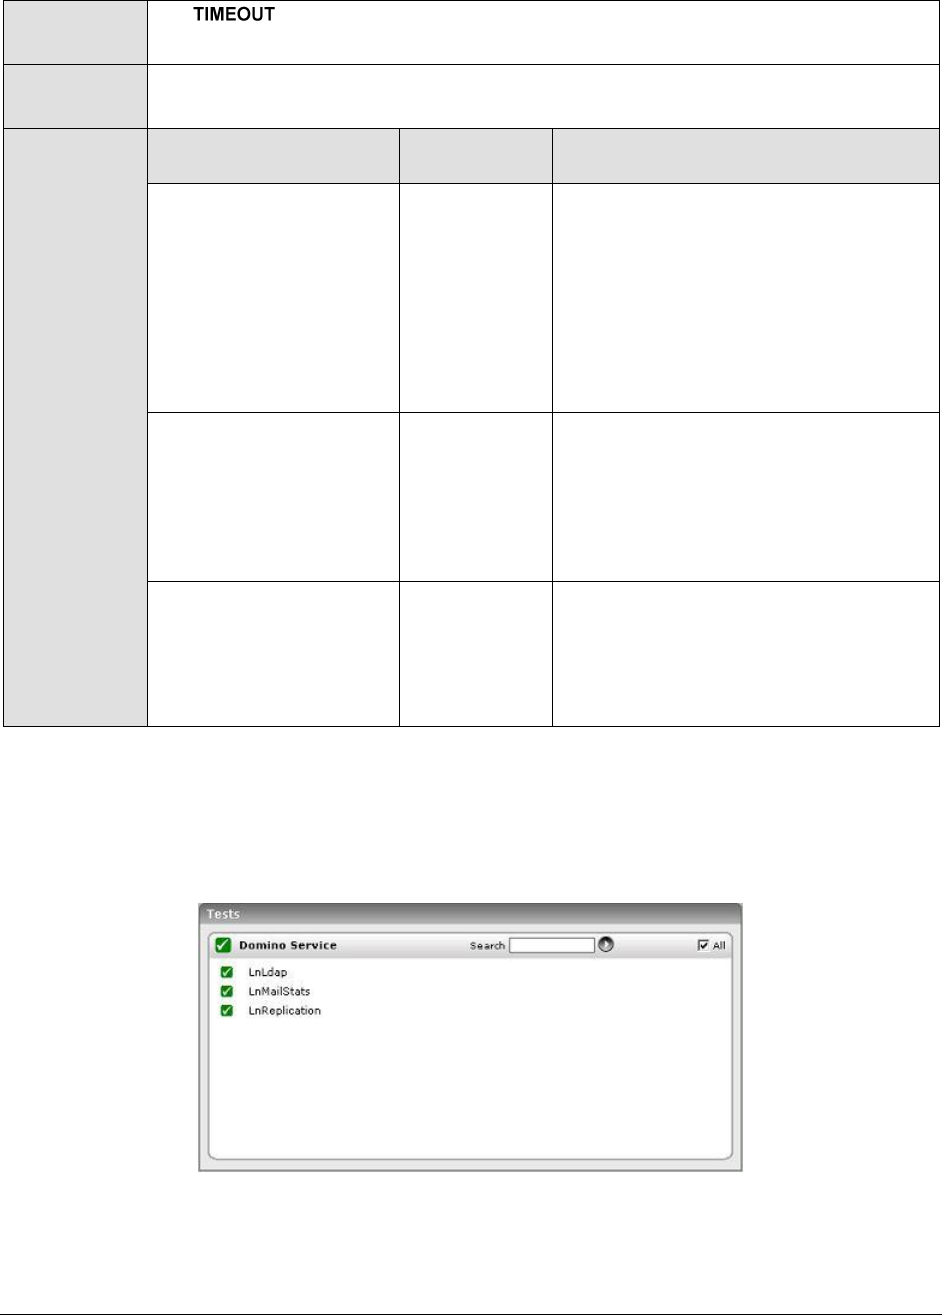
M o n i t o r i n g L o t u s D o m i n o M a i l S e r v e r s
92
15. – Specify the duration (in seconds) beyond which the SNMP query
issues by this test should time out. The default period is 10 seconds.
Outputs of the
test
One set of results for the Domino mail server being monitored
Measurements
made by the
test
Measurement
Measurement
Unit
Interpretation
Total memory
allocated:
Indicates the total
memory that has been
allocated to the
processes and shared
memory.
MB
This measure shows the memory
requirement of the Domino mail server.
This can be used to see the relative
amount of memory being used
compared to the total memory available
on the server. For effective
performance, this measure depends on
the database file size and the number
of CPUs on the machine.
Memory allocation for
process:
This measure shows the
total memory allocated
for the Domino
processes.
MB
For effective performance, this measure
depends on the database file size and
the number of CPUs on the machine.
Shared memory
allocation:
Indicates the total
shared memory
allocated.
MB
This measure shows the shared
memory allocated for Domino. For
effective performance, this measure
depends on the database file size and
the number of CPUs on the machine.
5.3 The Domino Service Layer
This layer tracks the health of the key Domino services using the tests depicted in Figure 5.4.
Figure 5.4: Tests mapping to the Domino Service layer
M o n i t o r i n g L o t u s D o m i n o M a i l S e r v e r s
93
This test reports the delivery statistics related to the Domino mail server.
Purpose
Reports the delivery statistics related to the Domino mail server
Target of the
test
A Domino mail server
Agent
deploying the
test
An internal agent

M o n i t o r i n g L o t u s D o m i n o M a i l S e r v e r s
94
Configurable
parameters for
the test
1. - How often should the test be executed
2. –The host for which the test is to be configured.
3. – The port at which the listens
4. – The port number on which the mail server is exposing the SNMP
MIB. The default is 161.
5. – By default, the eG agent supports SNMP version 1. Accordingly,
the default selection in the list is v1. However, if a different SNMP
framework is in use in your environment, say SNMP v2 or v3, then select the
corresponding option from this list.
6. – The SNMP community name that the test uses to
communicate with the mail server. The default is public. This parameter is
specific to SNMP v1 and v2 only. Therefore, if the chosen is v3,
then this parameter will not appear.
7. – This parameter appears only when v3 is selected as the
. SNMP version 3 (SNMPv3) is an extensible SNMP Framework
which supplements the SNMPv2 Framework, by additionally supporting message
security, access control, and remote SNMP configuration capabilities. To extract
performance statistics from the MIB using the highly secure SNMP v3 protocol,
the eG agent has to be configured with the required access privileges – in other
words, the eG agent should connect to the MIB using the credentials of a user
with access permissions to be MIB. Therefore, specify the name of such a user
against the parameter.
8. – Specify the password that corresponds to the above-mentioned
. This parameter once again appears only if the
selected is v3.
9. – Confirm the by retyping it here.
10. – This parameter too appears only if v3 is selected as the
. From the list box, choose the authentication
algorithm using which SNMP v3 converts the specified and
into a 32-bit format to ensure security of SNMP transactions. You
can choose between the following options:
MD5 – Message Digest Algorithm
SHA – Secure Hash Algorithm
11. – This flag appears only when v3 is selected as the
. By default, the eG agent does not encrypt SNMP requests.
Accordingly, the is set to NO by default. To ensure that SNMP
requests sent by the eG agent are encrypted, select the YES option.
12. – If the is set to YES, then you will have to
mention the encryption type by selecting an option from the list.
SNMP v3 supports the following encryption types:
DES – Data Encryption Standard
AES – Advanced Encryption Standard
13. – Specify the encryption password here.
14. – Confirm the encryption password by retyping it here.

M o n i t o r i n g L o t u s D o m i n o M a i l S e r v e r s
95
15. – Specify the duration (in seconds) beyond which the SNMP query
issues by this test should time out. The default period is 10 seconds.
Outputs of the
test
One set of results for the Domino mail server being monitored
Measurements
made by the
test
Measurement
Measurement
Unit
Interpretation
Average mail delivery
time:
Indicates the average
time taken for mail
delivery.
Secs
Max delivery time:
Indicates the maximum
time taken for mail
delivery.
Secs
Data transferred:
Indicates the total size
of all mail messages
delivered during the last
measurement period.
KB
Mail routing failures:
Indicates the number of
mail routing failures
that happened during
the last measurement
period.
Number
Mails delivered:
Indicates the number of
messages received by
the router during the
last measurement
period.
Number
Mail deliveries:
Indicates the count of
actual mail items
delivered during the last
measurement period.
Number
The value of this measure may be
different from the value of the Mails
delivered measure, as the latter counts
individual messages.
Waiting mails:
Indicates the outgoing
mail messages currently
in MAIL.BOX waiting for
transfer.
Number

M o n i t o r i n g L o t u s D o m i n o M a i l S e r v e r s
96
Waiting mail
recipients:
Indicates the number of
pending mail messages
awaiting local delivery.
Number
Waiting DNS
resolutions:
Indicates the number of
mail messages in
MAIL.BOX waiting for
DNS resolutions.
Number
A large value for this metric indicates
problems in the DNS server or in the
mail server to DNS server
communication.
Transferred mails:
Indicates the number of
messages that he
router has attempted to
transfer during the last
measurement period.
Number
Mail transfer failures:
Indicates the number of
messages the router is
unable to transfer
during the last
measurement period.
Number
Mails routed:
Indicates the number of
mail messages the
router routed during the
last measurement
period.
Number
Dead mails:
Indicates the number of
dead (undeliverable)
messages currently in
MAIL.BOX.
Number
Mails on hold:
Indicates the number of
mail messages in the
message queue that are
on hold currently.
Mails pending:
Indicates the number of
mail messages pending
currently.
Number
M o n i t o r i n g L o t u s D o m i n o M a i l S e r v e r s
97
Mails routed via nrpc:
Indicates the number of
mail messages moved
from MAIL.BOX via
NRPC during the last
measurement period.
Number
Mails routed via
smtp:
Indicates the number of
mail messages moved
from MAIL.BOX via
SMTP during the last
measurement period.
Number
Average mail size
delivered:
Indicates the average
size of delivered mails.
KB
This test reports statistics pertaining to the LDAP sessions with the Domino mail server.
Purpose
Reports statistics pertaining to the LDAP sessions with the Domino mail server
Target of the
test
A Domino mail server
Agent
deploying the
test
An internal agent

M o n i t o r i n g L o t u s D o m i n o M a i l S e r v e r s
98
Configurable
parameters for
the test
1. - How often should the test be executed
2. –The host for which the test is to be configured.
3. – The port at which the listens
4. – The port number on which the mail server is exposing the SNMP
MIB. The default is 161.
5. – By default, the eG agent supports SNMP version 1. Accordingly,
the default selection in the list is v1. However, if a different SNMP
framework is in use in your environment, say SNMP v2 or v3, then select the
corresponding option from this list.
6. – The SNMP community name that the test uses to
communicate with the mail server. The default is public. This parameter is
specific to SNMP v1 and v2 only. Therefore, if the chosen is v3,
then this parameter will not appear.
7. – This parameter appears only when v3 is selected as the
. SNMP version 3 (SNMPv3) is an extensible SNMP Framework
which supplements the SNMPv2 Framework, by additionally supporting message
security, access control, and remote SNMP configuration capabilities. To extract
performance statistics from the MIB using the highly secure SNMP v3 protocol,
the eG agent has to be configured with the required access privileges – in other
words, the eG agent should connect to the MIB using the credentials of a user
with access permissions to be MIB. Therefore, specify the name of such a user
against the parameter.
8. – Specify the password that corresponds to the above-mentioned
. This parameter once again appears only if the
selected is v3.
9. – Confirm the by retyping it here.
10. – This parameter too appears only if v3 is selected as the
. From the list box, choose the authentication
algorithm using which SNMP v3 converts the specified and
into a 32-bit format to ensure security of SNMP transactions. You
can choose between the following options:
MD5 – Message Digest Algorithm
SHA – Secure Hash Algorithm
11. – This flag appears only when v3 is selected as the
. By default, the eG agent does not encrypt SNMP requests.
Accordingly, the is set to NO by default. To ensure that SNMP
requests sent by the eG agent are encrypted, select the YES option.
12. – If the is set to YES, then you will have to
mention the encryption type by selecting an option from the list.
SNMP v3 supports the following encryption types:
DES – Data Encryption Standard
AES – Advanced Encryption Standard
13. – Specify the encryption password here.
14. – Confirm the encryption password by retyping it here.

M o n i t o r i n g L o t u s D o m i n o M a i l S e r v e r s
99
15. – Specify the duration (in seconds) beyond which the SNMP query
issues by this test should time out. The default period is 10 seconds.
Outputs of the
test
One set of results for the Domino mail server being monitored
Measurements
made by the
test
Measurement
Measurement
Unit
Interpretation
Sessions queue size:
Indicates the number of
incoming sessions
awaiting processing in
the LDAP Listener work
queue.
Number
Active LDAP
sessions:
Indicates the current
number of LDAP server
tasks.
Number
Sessions data
received:
Indicates the data
received by this LDAP
server.
MB
Sessions data sent:
Indicates the data sent
by this LDAP server.
MB
Sessions busy
threads:
Indicates the number of
LDAP server tasks
currently running.
Number
Sessions idle
threads:
Indicates the number of
LDAP server tasks
currently idle.
Number
Total sessions:
Indicates the total
number of LDAP server
tasks.
Number
M o n i t o r i n g L o t u s D o m i n o M a i l S e r v e r s
100
This test reports metrics related to the Calendar service of the Lotus Domino server. This test is
disabled by default. To enable the test, go to the ENABLE / DISABLE TESTS page using the menu sequence
: Agents -> Tests -> Enable/Disable, pick Domino Mail as the Component type, Performance as the Test
type, choose the test from the DISABLED TESTS list, and click on the >> button to move the test to the
ENABLED TESTS list. Finally, click the Update button.
Purpose
Reports metrics related to the Calendar service of the Lotus Domino server
Target of the
test
A Domino mail server
Agent
deploying the
test
An internal agent

M o n i t o r i n g L o t u s D o m i n o M a i l S e r v e r s
101
Configurable
parameters for
the test
1. - How often should the test be executed
2. –The host for which the test is to be configured.
3. – The port at which the listens
4. – The port number on which the mail server is exposing the SNMP
MIB. The default is 161.
5. – By default, the eG agent supports SNMP version 1. Accordingly,
the default selection in the list is v1. However, if a different SNMP
framework is in use in your environment, say SNMP v2 or v3, then select the
corresponding option from this list.
6. – The SNMP community name that the test uses to
communicate with the mail server. The default is public. This parameter is
specific to SNMP v1 and v2 only. Therefore, if the chosen is v3,
then this parameter will not appear.
7. – This parameter appears only when v3 is selected as the
. SNMP version 3 (SNMPv3) is an extensible SNMP Framework
which supplements the SNMPv2 Framework, by additionally supporting message
security, access control, and remote SNMP configuration capabilities. To extract
performance statistics from the MIB using the highly secure SNMP v3 protocol,
the eG agent has to be configured with the required access privileges – in other
words, the eG agent should connect to the MIB using the credentials of a user
with access permissions to be MIB. Therefore, specify the name of such a user
against the parameter.
8. – Specify the password that corresponds to the above-mentioned
. This parameter once again appears only if the
selected is v3.
9. – Confirm the by retyping it here.
10. – This parameter too appears only if v3 is selected as the
. From the list box, choose the authentication
algorithm using which SNMP v3 converts the specified and
into a 32-bit format to ensure security of SNMP transactions. You
can choose between the following options:
MD5 – Message Digest Algorithm
SHA – Secure Hash Algorithm
11. – This flag appears only when v3 is selected as the
. By default, the eG agent does not encrypt SNMP requests.
Accordingly, the is set to NO by default. To ensure that SNMP
requests sent by the eG agent are encrypted, select the YES option.
12. – If the is set to YES, then you will have to
mention the encryption type by selecting an option from the list.
SNMP v3 supports the following encryption types:
DES – Data Encryption Standard
AES – Advanced Encryption Standard
13. – Specify the encryption password here.
14. – Confirm the encryption password by retyping it here.

M o n i t o r i n g L o t u s D o m i n o M a i l S e r v e r s
102
15. – Specify the duration (in seconds) beyond which the SNMP query
issues by this test should time out. The default period is 10 seconds.
Outputs of the
test
One set of results for the Domino mail server being monitored
Measurements
made by the
test
Measurement
Measurement
Unit
Interpretation
Total appts
resources:
Indicates the total
number of scheduled
appointment and
resource reservations.
Number
Total users
resources:
Indicates the total
number of resources
that have been
reserved, and the
number of users with
scheduled
appointments.
Number
Total sched appts:
Indicates the total
number of scheduled
appointments.
Number
Total reservations:
Indicates the total
number of reservations
for resources.
Number
Total resources:
Indicates the total
number of resources
that have been
reserved.
Number
Total users:
Indicates the total
number of users who
have scheduled
appointments.
Number
The Nrpc test reports whether a Notes client is able to connect to the Lotus Domino mail server, and
also measures the responsiveness of the mail server. This test is disabled by default. To enable the
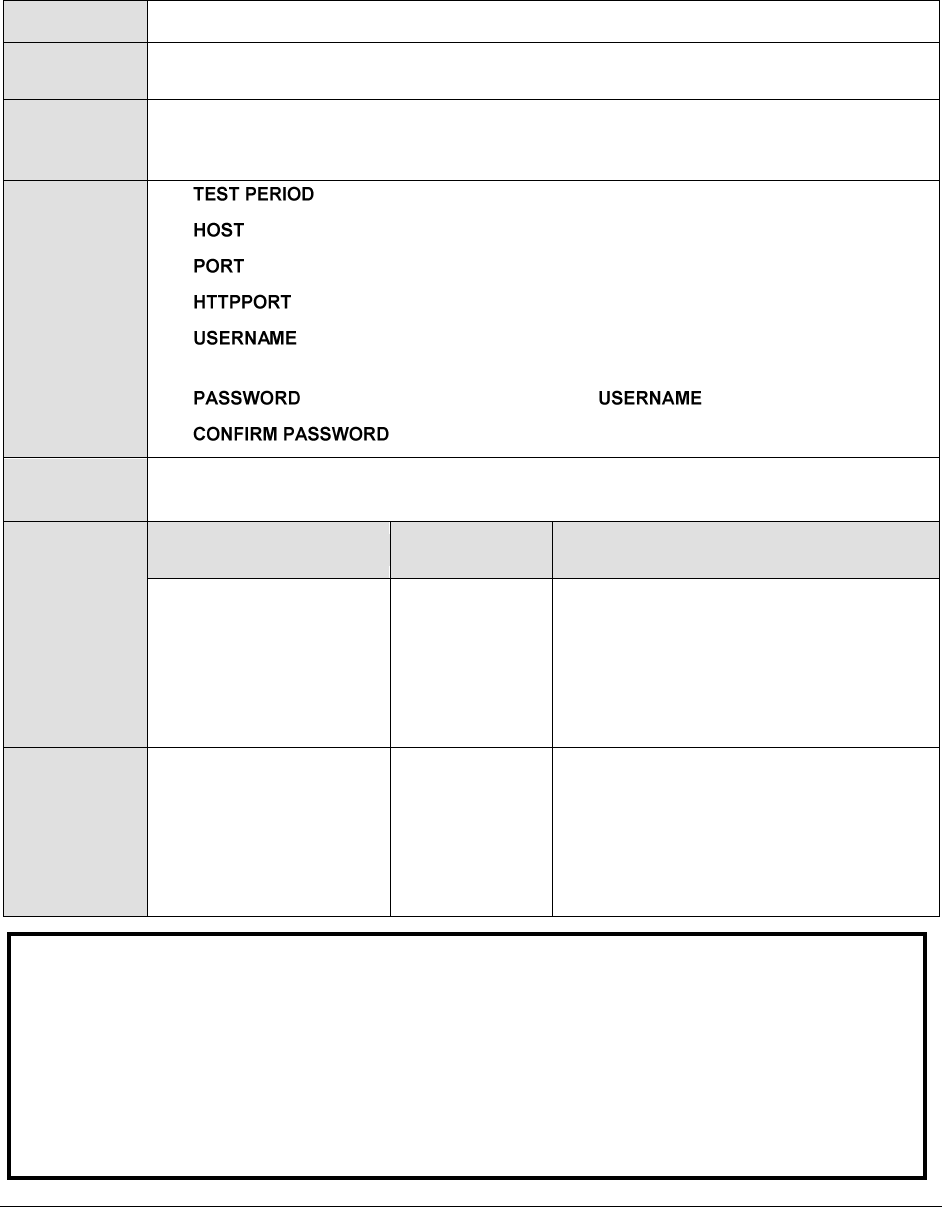
M o n i t o r i n g L o t u s D o m i n o M a i l S e r v e r s
103
test, go to the ENABLE / DISABLE TESTS page using the menu sequence : Agents -> Tests ->
Enable/Disable, pick Domino mail as the Component type, Performance as the Test type, choose the test
from the DISABLED TESTS list, and click on the >> button to move the test to the ENABLED TESTS list.
Finally, click the Update button.
Purpose
Reports metrics related to the Calendar service of the Lotus Domino server
Target of the
test
A Domino mail server
Agent
deploying the
test
An internal agent
Configurable
parameters for
the test
1. - How often should the test be executed
2. –The host for which the test is to be configured.
3. – The port number to which the server being configured listens.
4. – The port of the Domino HTTP server.
5. – The user name using which the test needs to connect to the
Domino mail server.
6. – The password of the specified .
7. – Confirm the password by retyping it here.
Outputs of the
test
One set of results for the Domino mail server being monitored
Measurements
made by the
test
Measurement
Measurement
Unit
Interpretation
NRPC availability:
Indicates whether the
Notes client is able to
connect to the Domino
server via the Domino
router.
Percent
While the value 100 indicates that a
connection has been established, 0
indicates a lack of connectivity.
NRPC response time:
Indicates the time
taken by the Domino
mail server to respond
to requests from
clients.
Secs
Note:
This test will report measures only if the following are in place:
The Domino HTTP Server should be running.
The DIIOP task of the Domino mail server should have been started.
The NCSO.jar file available in the <LOTUSNOTES_INSTALL_DIR>\Domino\Data\domino\java
directory should be copied to the <EG_INSTALL_DIR>\lib directory.
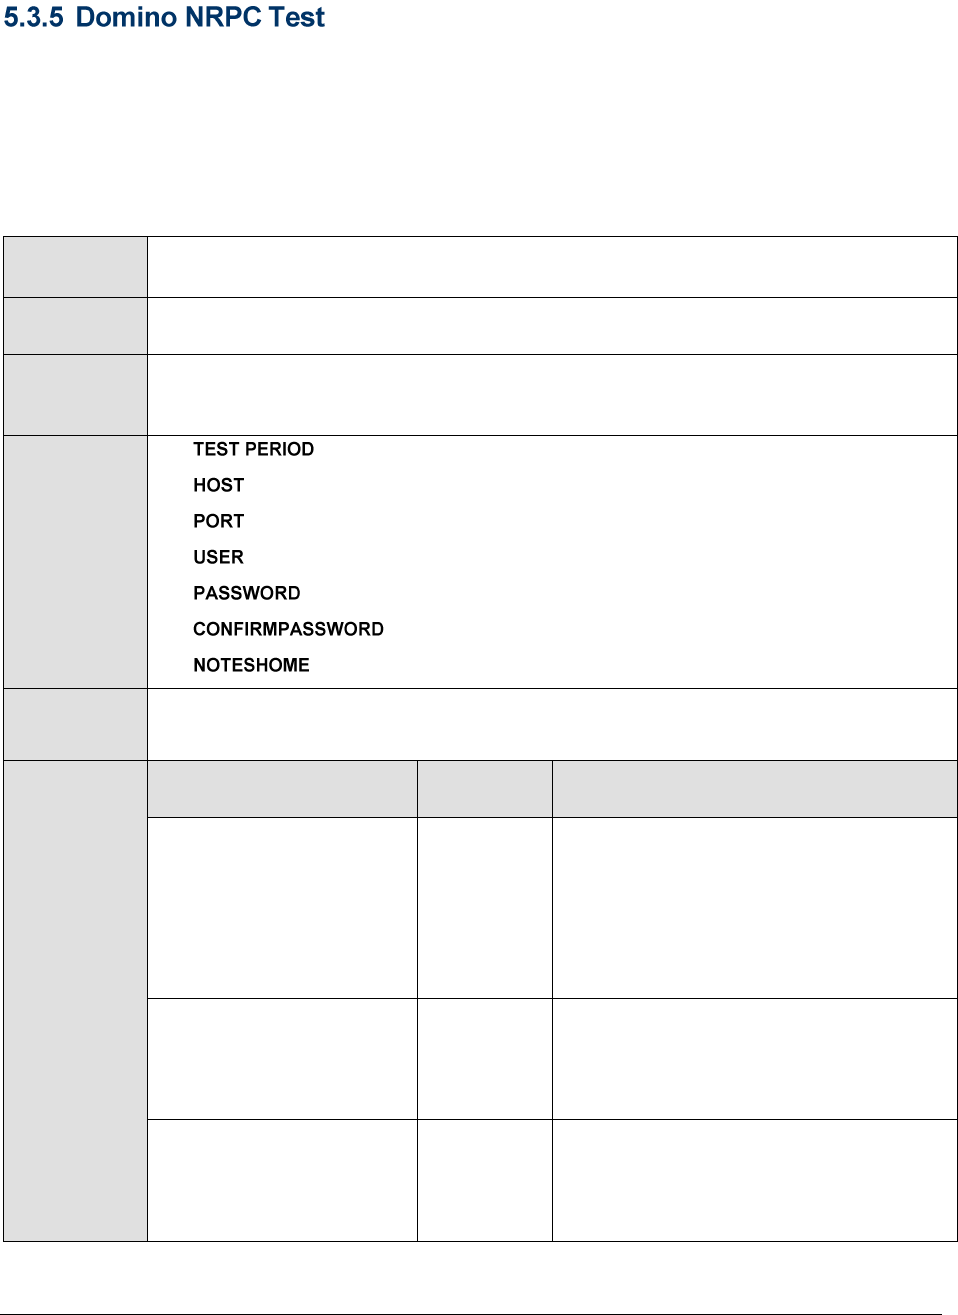
M o n i t o r i n g L o t u s D o m i n o M a i l S e r v e r s
104
This test monitors the availability and performance of the Lotus Domino mail server from an external
perspective. The test mimics the mail client activity by using the Domino Notes Remote Procedure Call
(NRPC) protocol for sending and receiving mails. To enable the test, go to the ENABLE / DISABLE TESTS
page using the menu sequence : Agents -> Tests -> Enable/Disable, pick Domino mail as the
Component type, Performance as the Test type, choose the test from the DISABLED TESTS list, and click on
the >> button to move the test to the ENABLED TESTS list. Finally, click the Update button.
Purpose
Monitors the availability and performance of the Lotus Domino mail server from an
external perspective
Target of the
test
A Lotus Domino Mail server
Agent
deploying the
test
An internal agent
Configurable
parameters for
the test
1. - How often should the test be executed
2. - The IP address of the machine where the Domino server is installed.
3. – The port number through which the Domino mail server communicates
4. - The user name of the sender on the mail server
5. - The password that corresponds to the specified sender
6. - Confirm the password by retyping it here.
7. - Specify the full path to the Lotus mail client. For eg., d:/Lotus.
Outputs of the
test
One set of results for every Lotus Domino mail server being monitored
Measurements
made by the
test
Measurement
Measurement
Unit
Interpretation
Ability to send mails:
Indicates the availability of
the mail server for
receiving the mails sent by
the test.
Percent
A value of 0 indicates that the test was
not successful in sending a mail. Possible
reasons for this could include the mail
server being down, the network
connection to the server not being
available, or the test configuration
information being incorrect.
Sent messages:
Indicates the number of
messages sent to the mail
server.
Number
A value of –1 indicates that the mail
server may be down or the configuration
information may be incorrect.
Time to send mails:
Indicates time taken to
send a mail from to the
mail server.
Secs
A high value of this measure could
indicate high network traffic or that the
mail server is busy.

M o n i t o r i n g L o t u s D o m i n o M a i l S e r v e r s
105
Ability to receive mails:
Indicates the availability of
the mail server for sending
mails to the mail client.
Percent
The value of 0 indicates that the test was
not successful in receiving a mail
message from the mail server. Possible
reasons could be incorrect configuration
information.
Received messages:
Indicates the number of
messages received by the
mail client from the mail
server.
Number
The value of 0 indicates that the test was
not successful in receiving mail messages
from the mail server. The possible
reasons could be:
The sent messages could be in
the message queue of the mail
server but not routed to the mail
box
Configuration information may be
incorrect
Network failure
The mail service may not be
running in the user account
Time to receive mail:
Indicates the time taken
by the mail client to
receive a mail from the
mail server.
Secs
A high value in this measure indicates
that the mail server is busy or the
network traffic is high.
Avg round-trip time:
The average of the round
trip time (the time lapse
between transmission and
reception of a message by
the server) of all the
messages received by the
mail server during the last
measurement period.
Mins
This is a key measure of quality of the
mail service. An increase in
Roundtrip_time may be indicative of a
problem with the mail service. Possible
reasons could include queuing failures,
disk space being full, etc.
Max round-trip time:
The high water mark of the
round trip time (the time
lapse between
transmission and reception
of a message by the
server) of all messages
received by the mail server
during the last
measurement period.
Mins
If the value of the Rcvd_msgs measure is
1, then the value of the
Max_roundtrip_time measure will be the
same as the Avg_roundtrip_time.
M o n i t o r i n g L o t u s D o m i n o M a i l S e r v e r s
106
This test, executed by an internal agent, tracks statistics pertaining to the services of the Domino mail
server. This test is disabled by default, and has been retained only to ensure backward compatibility
with previous versions of the eG Enterprise suite.
Purpose
To measure statistics pertaining to services of Domino mail server
Target of the
test
A Domino mail server
Agent
deploying the
test
An internal agent
Note:
1. Notes client must be installed on the system where this test will be executed.
2. This test will execute only on Windows environments.
3. The lcppn22.dll is required by the user to run the DominoNrpc test. To download this dll, do
the following:
a. Connect to the URL:
http://www14.software.ibm.com/webapp/download/preconfig.jsp?id=2004-06-
07+07%3A42%3A38.563764R&S_TACT=104AH%20W42&S_CMP=&s=
b. Download the Lotus Notes C++ API Toolkit in the URL to a location in your local disk.
c. An executable file (.exe) gets downloaded, which when executed, creates a notescpp
directory in the specified location.
d. Also, an lcppn22.dll gets created within this notescpp directory.
e. Copy this lcppn22.dll to the <LOTUS_NOTES_INSTALL_DIR>\notes directory.
Note:
The eG external agent that is executing the Domino NRPC test, should be installed on a
Windows NT/2000/2003 system that is in the same domain as the Lotus Domino mail server.
The Lotus Domino mail client should also be installed on this system for the DominoNrpcTest
to work.
While deciding on a mailbox to be used for configuring the test, the administrator should first
check whether the mailbox exists on the Domino server.
M o n i t o r i n g L o t u s D o m i n o M a i l S e r v e r s
107
Configurable
parameters for
the test
1. - How often should the test be executed
2. –The host for which the test is to be configured.
3. - The variable name of the port for which the test is to be configured.
4. – The port number on which the mail server is exposing the SNMP
MIB
5. – By default, the eG agent supports SNMP version 1. Accordingly,
the default selection in the list is v1. However, if a different SNMP
framework is in use in your environment, say SNMP v2 or v3, then select the
corresponding option from this list.
6. – The SNMP community name that the test uses to
communicate with the mail server. This parameter is specific to SNMP v1 and v2
only. Therefore, if the chosen is v3, then this parameter will not
appear.
7. – This parameter appears only when v3 is selected as the
. SNMP version 3 (SNMPv3) is an extensible SNMP Framework
which supplements the SNMPv2 Framework, by additionally supporting message
security, access control, and remote SNMP configuration capabilities. To extract
performance statistics from the MIB using the highly secure SNMP v3 protocol,
the eG agent has to be configured with the required access privileges – in other
words, the eG agent should connect to the MIB using the credentials of a user
with access permissions to be MIB. Therefore, specify the name of such a user
against the parameter.
8. – Specify the password that corresponds to the above-mentioned
. This parameter once again appears only if the
selected is v3.
9. – Confirm the by retyping it here.
10. – This parameter too appears only if v3 is selected as the
. From the list box, choose the authentication
algorithm using which SNMP v3 converts the specified and
into a 32-bit format to ensure security of SNMP transactions. You
can choose between the following options:
MD5 – Message Digest Algorithm
SHA – Secure Hash Algorithm
11. – This flag appears only when v3 is selected as the
. By default, the eG agent does not encrypt SNMP requests.
Accordingly, the is set to NO by default. To ensure that SNMP
requests sent by the eG agent are encrypted, select the YES option.
12. – If the is set to YES, then you will have to
mention the encryption type by selecting an option from the list.
SNMP v3 supports the following encryption types:
DES – Data Encryption Standard
AES – Advanced Encryption Standard
13. – Specify the encryption password here.
14. – Confirm the encryption password by retyping it here.

M o n i t o r i n g L o t u s D o m i n o M a i l S e r v e r s
108
15. – Specify the duration (in seconds) beyond which the SNMP query
issues by this test should time out. The default period is 10 seconds.
Outputs of the
test
One set of results for every database being monitored
Measurements
made by the
test
Measurement
Measurement
Unit
Interpretation
Delivered mails:
Indicates the number of
mails received by the
router during the last
measurement period.
Number
This measure is indicative of the
throughput of the server. If this number
is high, the mail server is processing
high volume of mails. A low value
indicates a lower throughput.
Dead mails:
The number of dead
(undeliverable) mail
messages during the
last measurement
period.
Number
A high value of this measure indicates a
problem in delivering mails. This value
should be preferably zero.
Waiting mails:
Number of mail
messages currently
waiting to be routed.
Number
A high value over a long period of time
indicates a problem in delivering mails.
This value should be preferably low. A
high value of this measure over a
period of time may lead to dead mails
and poor performance of the server.
Avg mail delivery
time:
Indicates the average
time for mail delivery in
seconds.
Secs
A high value of this measure shows
inefficiency of the server. Desirably,
this value should be low. Administrators
can compare this value with
Cache_hit_ratio. If the value of
Cache_hit_ratio is found to be low,
there may be a problem due to
improper database.
Mail transfer failures:
Indicates the number of
mail messages that the
router was unable to
transfer during the last
measurement period.
Number
This value should be low or preferably
zero. A high value indicates poor
performance of the server or incorrect
addresses.
Mails waiting local
delivery:
Number of mails
currently waiting to be
delivered to the users.
Number
A relatively high value of this measure
may indicate that there is a problem in
the local network or name resolution.
M o n i t o r i n g L o t u s D o m i n o M a i l S e r v e r s
109
This test, executed by an internal agent, tracks statistics pertaining to the network traffic through the
Domino mail server network ports. This test is disabled by default, and has been retained only to
ensure backward compatibility with previous versions of the eG Enterprise suite.
Purpose
To measure the statistics pertaining to the network traffic through Domino mail
server network ports
Target of the
test
A Domino mail server
Agent
deploying the
test
An internal agent

M o n i t o r i n g L o t u s D o m i n o M a i l S e r v e r s
110
Configurable
parameters for
the test
1. - How often should the test be executed
2. –The host for which the test is to be configured.
3. - The variable name of the port for which the test is to be configured.
4. – The port number on which the mail server is exposing the SNMP
MIB
5. – By default, the eG agent supports SNMP version 1. Accordingly,
the default selection in the list is v1. However, if a different SNMP
framework is in use in your environment, say SNMP v2 or v3, then select the
corresponding option from this list.
6. – The SNMP community name that the test uses to
communicate with the mail server. This parameter is specific to SNMP v1 and v2
only. Therefore, if the chosen is v3, then this parameter will not
appear.
7. – This parameter appears only when v3 is selected as the
. SNMP version 3 (SNMPv3) is an extensible SNMP Framework
which supplements the SNMPv2 Framework, by additionally supporting message
security, access control, and remote SNMP configuration capabilities. To extract
performance statistics from the MIB using the highly secure SNMP v3 protocol,
the eG agent has to be configured with the required access privileges – in other
words, the eG agent should connect to the MIB using the credentials of a user
with access permissions to be MIB. Therefore, specify the name of such a user
against the parameter.
8. – Specify the password that corresponds to the above-mentioned
. This parameter once again appears only if the
selected is v3.
9. – Confirm the by retyping it here.
10. – This parameter too appears only if v3 is selected as the
. From the list box, choose the authentication
algorithm using which SNMP v3 converts the specified and
into a 32-bit format to ensure security of SNMP transactions. You
can choose between the following options:
MD5 – Message Digest Algorithm
SHA – Secure Hash Algorithm
11. – This flag appears only when v3 is selected as the
. By default, the eG agent does not encrypt SNMP requests.
Accordingly, the is set to NO by default. To ensure that SNMP
requests sent by the eG agent are encrypted, select the YES option.
12. – If the is set to YES, then you will have to
mention the encryption type by selecting an option from the list.
SNMP v3 supports the following encryption types:
DES – Data Encryption Standard
AES – Advanced Encryption Standard
13. – Specify the encryption password here.
14. – Confirm the encryption password by retyping it here.

M o n i t o r i n g L o t u s D o m i n o M a i l S e r v e r s
111
15. – Specify the duration (in seconds) beyond which the SNMP query
issues by this test should time out. The default period is 10 seconds.
Outputs of the
test
One set of results for every Domino mail server being monitored
Measurements
made by the
test
Measurement
Measurement
Unit
Interpretation
Data traffic in:
Indicates the rate at
which the data is being
received by the port
specified in the info.
KB/Sec
This measure indicates the throughput
of data on a particular port.
Data traffic out:
Indicates the rate at
which the data is being
sent from the port
specified in the info.
KB/Sec
This measure indicates the throughput
of data on a particular port.
Inbound sessions:
Indicates the number of
inbound sessions
established on the port.
Sessions/Sec
This measure can be used with dropped
session rate. If this measure is high and
sessions are being dropped then
concurrent session limit can be
increased.
Outbound sessions:
The number of
outbound sessions
established on the port
specified in the info.
Sessions/Sec
This measure can be used with dropped
session rate. If this measure is high and
sessions are being dropped then
concurrent session limit can be
increased.
Dropped sessions:
Indicates the number of
sessions that have been
dropped due to low
network resources.
Sessions/Sec
If this value is continuously high
administrators can think of increasing
the concurrent_sessions_limit
Concurrent sessions:
Indicates the limit on
the number of
concurrent sessions on
the port specified in the
info.
Number
This measure gives an idea about the
maximum limit of the inbound and
outbound sessions.
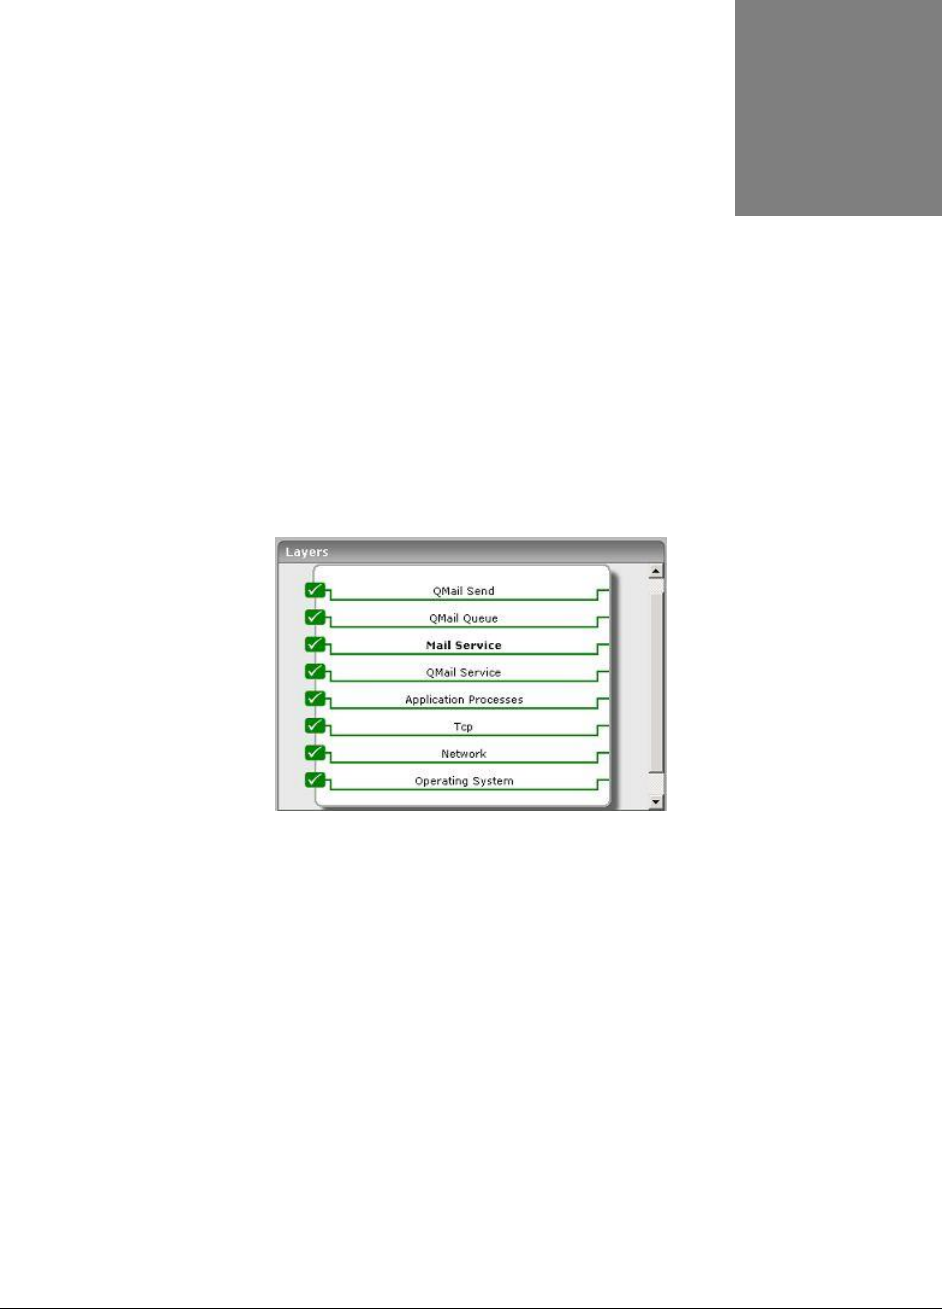
M o n i t o r i n g Q m a i l S e r v e r s
112
Monitoring Qmail Servers
Qmail is a simple message transfer agent. It is meant as a replacement for the entire sendmail-
binmail system on typical Internet-connected UNIX hosts. It offers POP3, and support for mail
retrieval.
Just like other mail servers, eG Enterprise offers an exclusive model for monitoring a Qmail server as
well.
Figure 6.1: The layer model of a Qmail server
The tests mapped to every layer of Figure 6.1 extract critical statistics using which administrators can
guage the efficiency of the mail server.
The bottom 4 layers of the Figure 6.1 have already been discussed in the Monitoring Unix and
Windows Servers document. The Mail Service layer, finds a place in Chapter 2 of this document itself.
Hence, the sections to come delve deep into the Qmail Service, Qmail Queue, and the Qmail Send layers
only.
Chapter
6
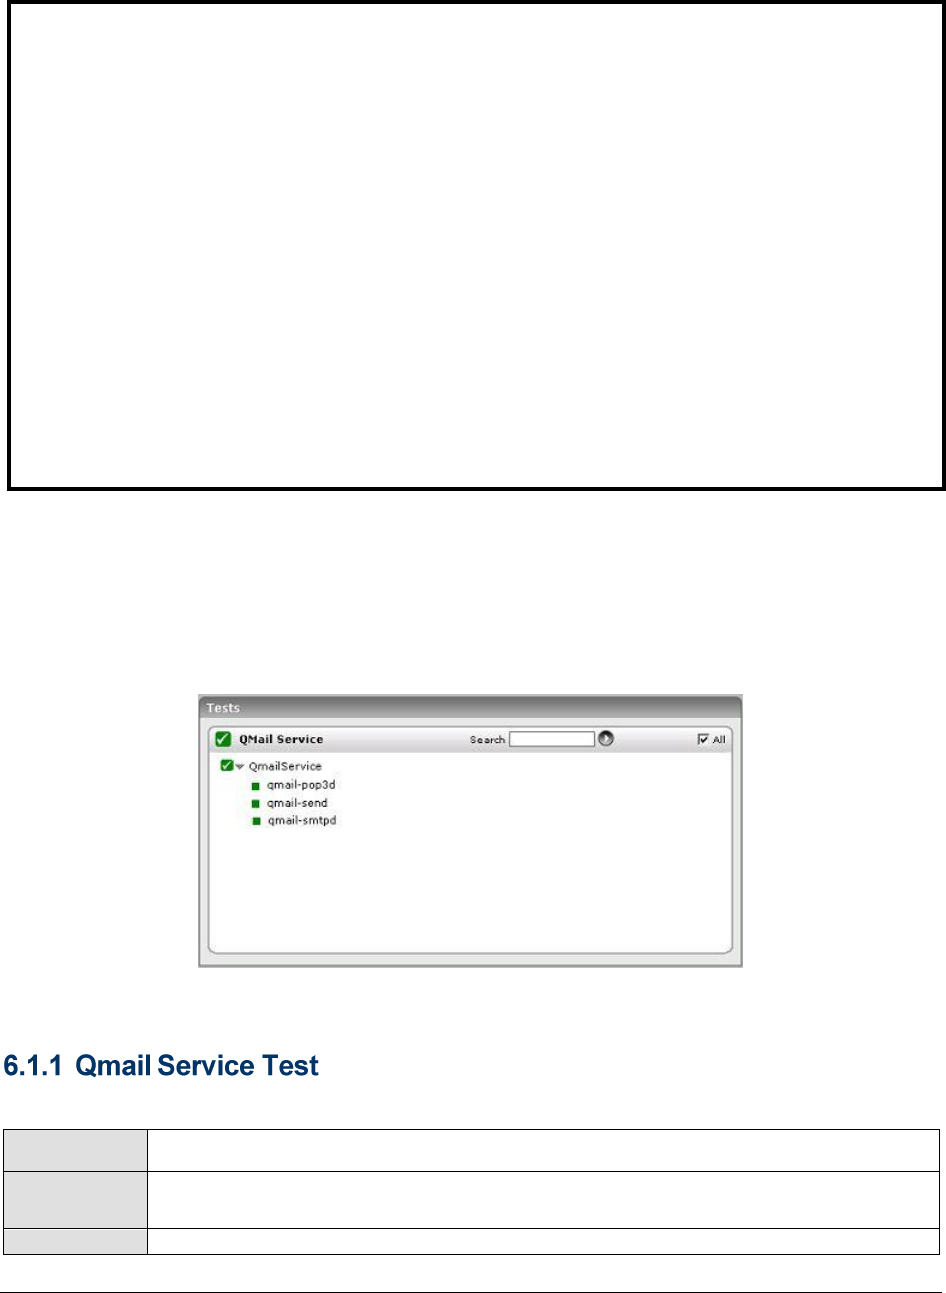
M o n i t o r i n g Q m a i l S e r v e r s
113
6.1 The QMail Service Layer
The test associated with this layer report the availability of the services configured for the Qmail MTA.
Figure 6.2: The tests associated with the QMail Service layer
The Qmail Service test checks the availability of the services running for the Qmail MTA.
Purpose
Checks the availability of the services running for the Qmail MTA
Target of the
test
A Qmail server
Agent
An internal agent
Note:
For the Qmail tests to work effectively, ensure that the following are in place:
The following packages should be installed along with Qmail:
o netqmail-1.05
o daemontools-0.76
o ucspi-tcp-0.88
A detailed Qmail installation procedure is available in the following URL:
www.lifewithqmail.org.
All executable files (under /package/admin/daemontools-0.76/command) related to the
qmail admin services should have links under /usr/local/bin.
The executable file svstat (in the /usr/local/bin directory) must be given special
executable permission using the command: chmod u+s svstat. Only a super-user can
execute this command.
The eG agent user should be added to the qmail group.
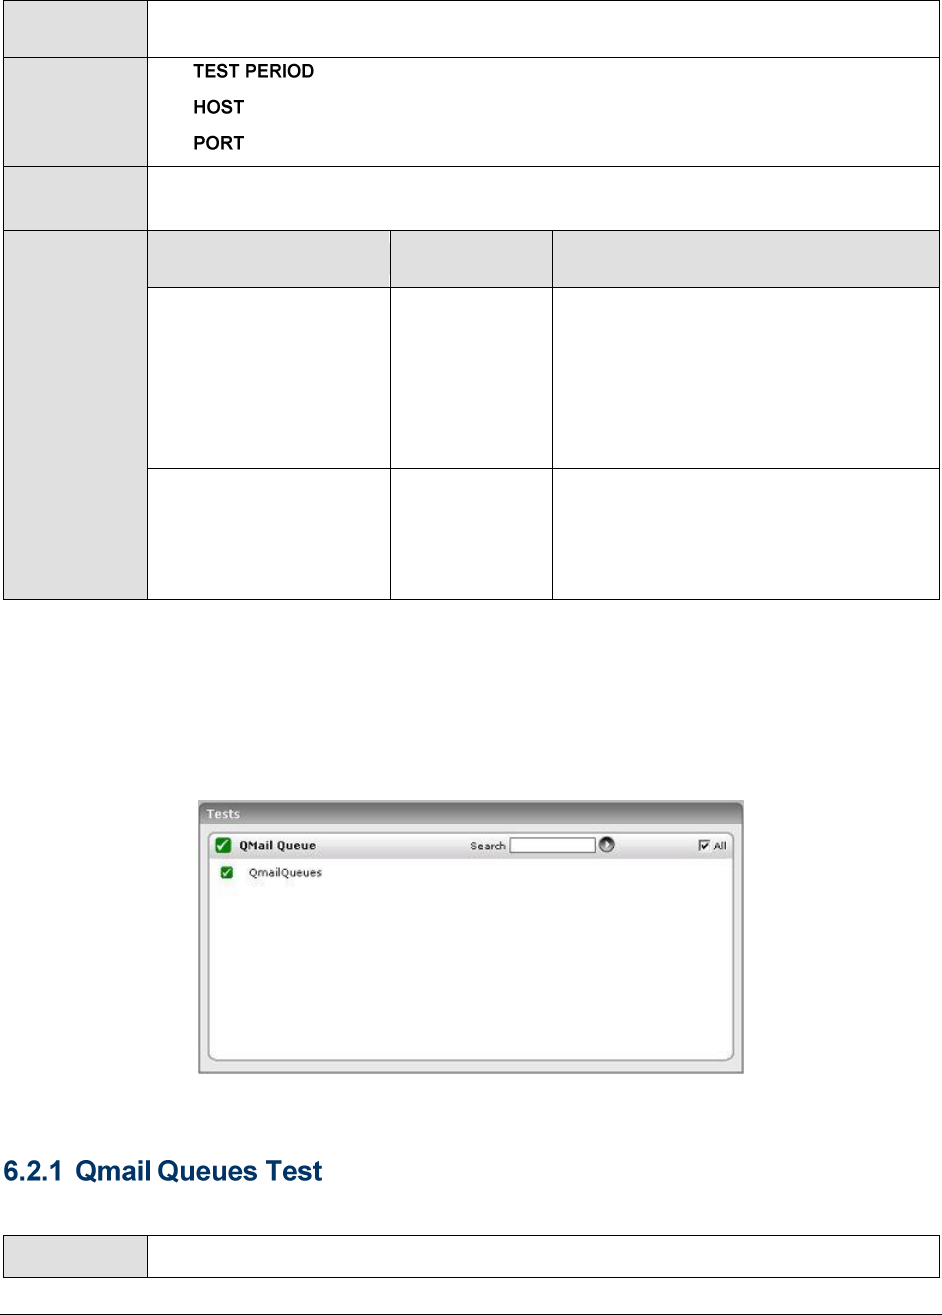
M o n i t o r i n g Q m a i l S e r v e r s
114
deploying the
test
Configurable
parameters for
the test
1. - How often should the test be executed
2. –The host on which the Qmail server is executing
3. - The port at which the Qmail server listens
Outputs of the
test
One set of results for every Qmail service being monitored
Measurements
made by the
test
Measurement
Measurement
Unit
Interpretation
Availability:
Checks the availability
of the service.
Percent
A value of 100 indicates that the
specified service has been configured
and is currently executing. A value of 0
for this measure indicates that the
specified service has been configured
on the server but is not running at this
time.
Service downtime:
The time that has
elapsed since the
service has been
stopped.
Secs
A value of 0 indicates that the service is
normal . A value more than 0 indicates
that the service has not been running
for some time.
6.2 The QMail Queue Layer
The test associated with this layer reveals the number of messages in queue, and thus indicates the
speed with which the Qmail server processes messages.
Figure 6.3: The test associated with the QmailQueueTest
This test monitors the performance of the queues in the Qmail server.
Purpose
Monitors the performance of the queues in the Qmail server
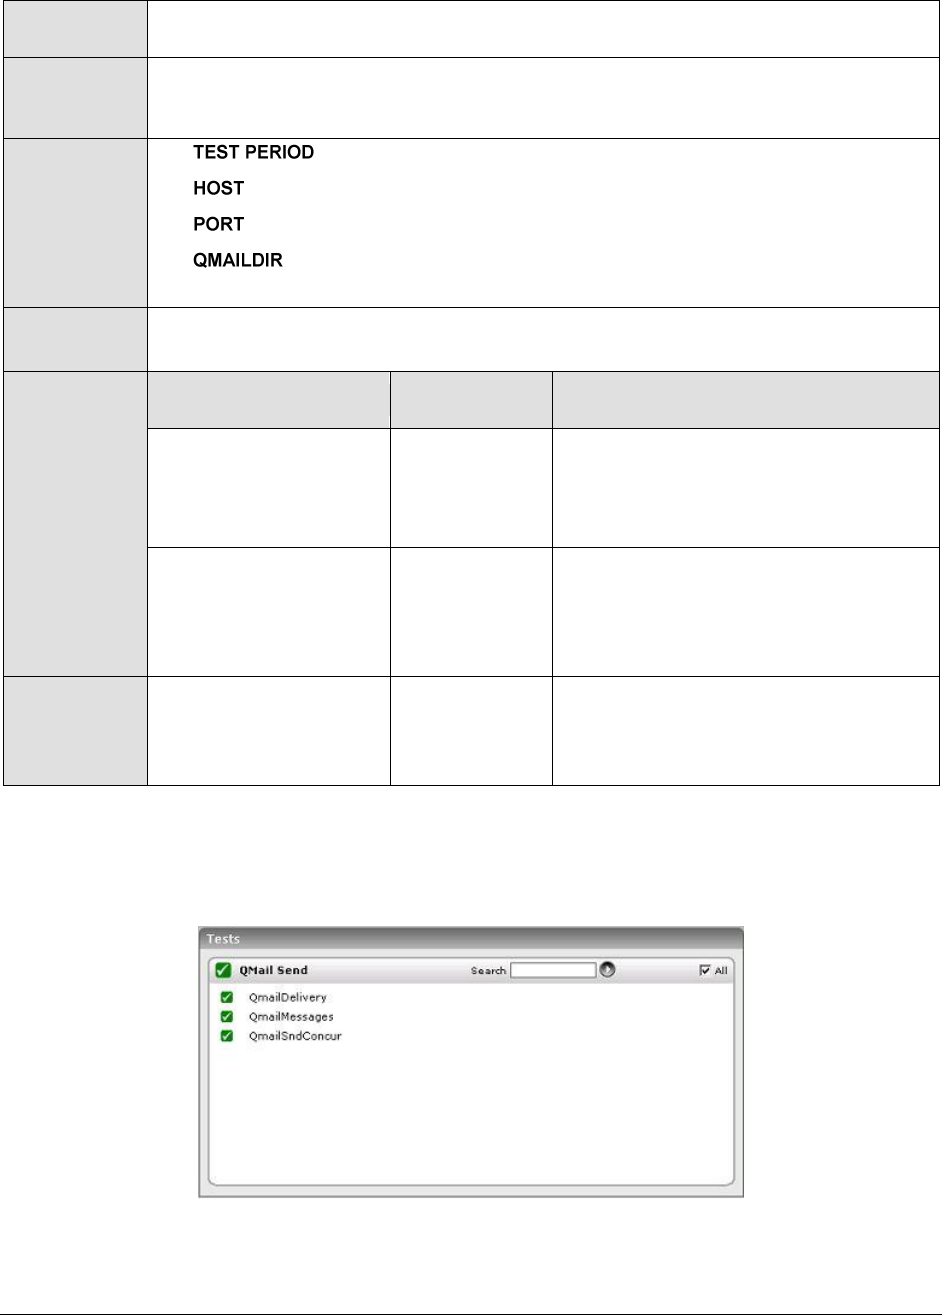
M o n i t o r i n g Q m a i l S e r v e r s
115
Target of the
test
A Qmail server
Agent
deploying the
test
An internal agent
Configurable
parameters for
the test
1. - How often should the test be executed
2. –The host on which the Qmail server is executing
3. - The port at which the Qmail server listens
4. – Specify the complete path to the Qmail install directory. For
example, /var/qmail.
Outputs of the
test
One set of results for every Qmail server being monitored
Measurements
made by the
test
Measurement
Measurement
Unit
Interpretation
Queue messages:
The total number of
messages in queue.
Number
A very high value indicates that Qmail
is unable to process the messages
faster. A value zero indicates that no
messages are in queue to process.
Not preprocess
messages:
The number of
messages that were not
pre-processed.
Number
A high value indicates that the qmail-
send service is not running. A value of
zero indicates that all the messages
have been processed.
Queue size:
The total queue size.
KB
A very high value indicates that Qmail
is unable to process the messages
faster. A value zero indicates that no
messages are in queue to process.
6.3 The QMail Send Layer
The tests associated with this layer monitor the performance of the Qmail-send service.
Figure 6.4: The tests associated with the QMail Send layer
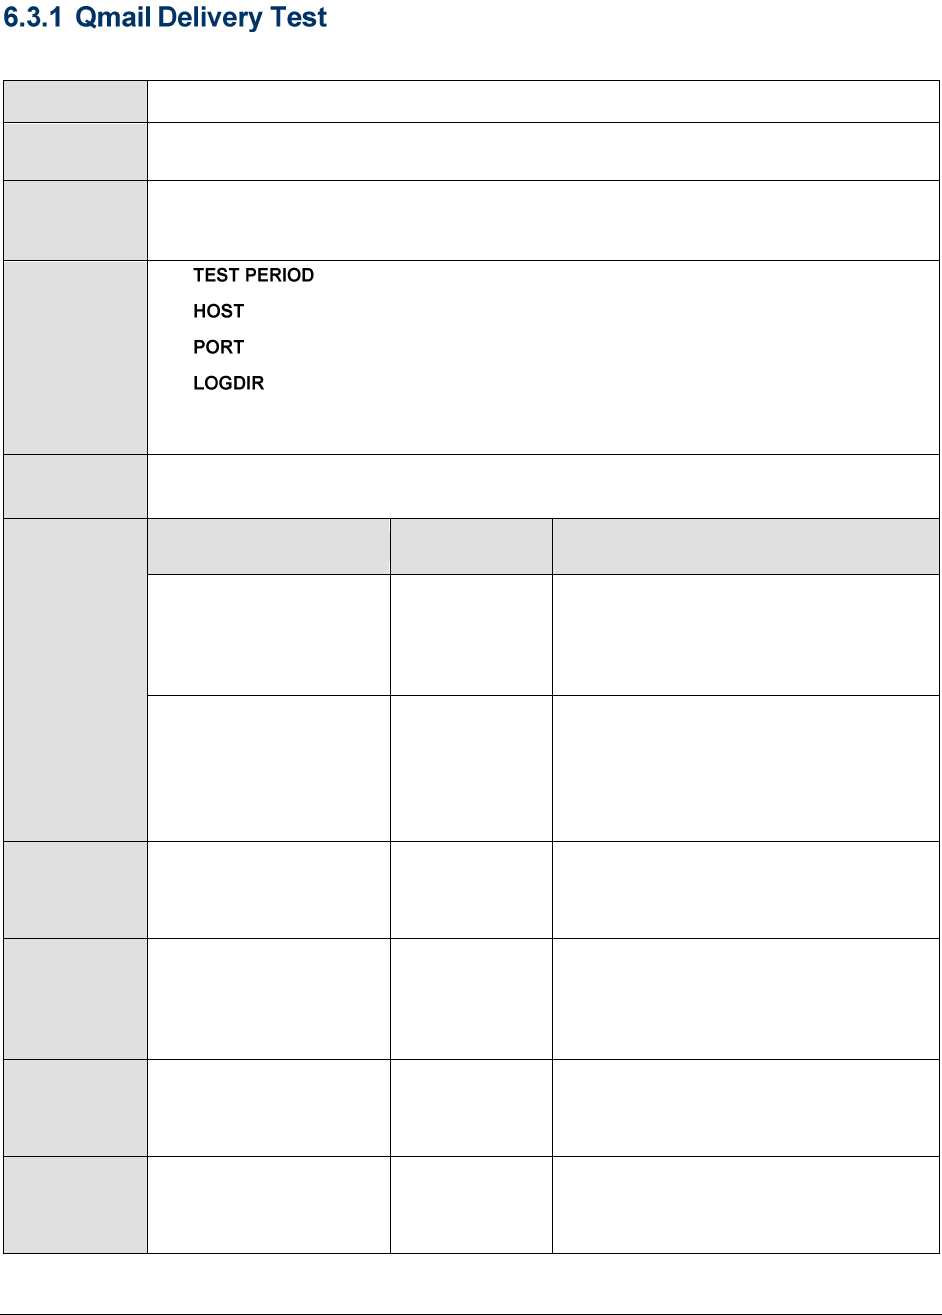
M o n i t o r i n g Q m a i l S e r v e r s
116
This test tracks key statistics pertaining to the delivery status of messages.
Purpose
Monitors the performance of the mail delivery by a Qmail server
Target of the
test
A Qmail server
Agent
deploying the
test
An internal agent
Configurable
parameters for
the test
1. - How often should the test be executed
2. –The host on which the Qmail server is executing
3. - The port at which the Qmail server listens
4. – This test parses the qmail log files to extract the required measures.
Therefore, in the LOGDIR text box here, specify the complete path to the qmail
log directory, which stores the log files. For example, /var/log/qmail.
Outputs of the
test
One set of results for every Qmail server being monitored
Measurements
made by the
test
Measurement
Measurement
Unit
Interpretation
Delivery attempts:
The number of delivery
attempts during the last
measurement period.
Number
Success deliveries:
The number of
successful deliveries
during the last
measurement period.
Number
Failures:
The number of delivery
attempts that failed
Number
Deferrals:
The number of delivery
attempts that were
deferred.
Number
Remote success:
The number of remote
successful deliveries.
Number
Local success:
The number of local
successful deliveries.
Number
M o n i t o r i n g Q m a i l S e r v e r s
117
Rate of mail delivery:
The rate at which the
delivery attempts were
made.
Operations/Sec
Rate of success:
The rate at which
messages were
successfully delivered.
Operations/Sec
This test returns message-centric performance metrics.
Purpose
Returns message-centric performance metrics for a Qmail server
Target of the
test
A Qmail server
Agent
deploying the
test
An internal agent
Configurable
parameters for
the test
1. - How often should the test be executed
2. –The host for which the test is to be configured
3. - The port at which the specified listens
4. – This test parses the qmail log files to extract the required measures.
Therefore, in the LOGDIR text box here, specify the complete path to the qmail
log directory, which stores the log files. For example, /var/log/qmail.
Outputs of the
test
One set of results for every Qmail server being monitored
Measurements
made by the
test
Measurement
Measurement
Unit
Interpretation
Messages
transferred:
The number of
messages transferred.
Number
Data transferred:
Data transferred by the
mail server during the
last measurement
period.
KB
Bounce messages:
The number of bounced
messages.
Number
M o n i t o r i n g Q m a i l S e r v e r s
118
Thrown away
messages:
The number of
messages that were
discarded because they
bounced thrice.
Number
Transfer rate:
The rate at which bytes
were transferred.
KB/Sec
This test tracks the concurrency checks for local and remote messages.
Purpose
Tracks the concurrency checks for local and remote messages
Target of the
test
A Qmail server
Agent
deploying the
test
An internal agent
Configurable
parameters for
the test
1. - How often should the test be executed
2. –The host on which the Qmail server is executing
3. - The port at which the Qmail server listens
4. – This test parses the qmail log files to extract the required measures.
Therefore, in the LOGDIR text box here, specify the complete path to the qmail
log directory, which stores the log files. For example, /var/log/qmail.
Outputs of the
test
One set of results for every Qmail server being monitored
Measurements
made by the
test
Measurement
Measurement
Unit
Interpretation
Local concurrency:
The maximum number
of concurrent local
deliveries.
Number
Remote concurrency:
The maximum number
of concurrent remote
deliveries.
Number
Percent local:
The percentage of local
concurrent messages
that were delivered.
Percent

M o n i t o r i n g Q m a i l S e r v e r s
119
Percent remote:
The percentage of
remote concurrent
messages that were
delivered.
Percent
Note:
Apart from Processes test, a TCP Port Status test also executes on the Application Processes layer of
the Qmail server. For more details about the TCP Port Status test, refer to the Monitoring Generic
Servers document.
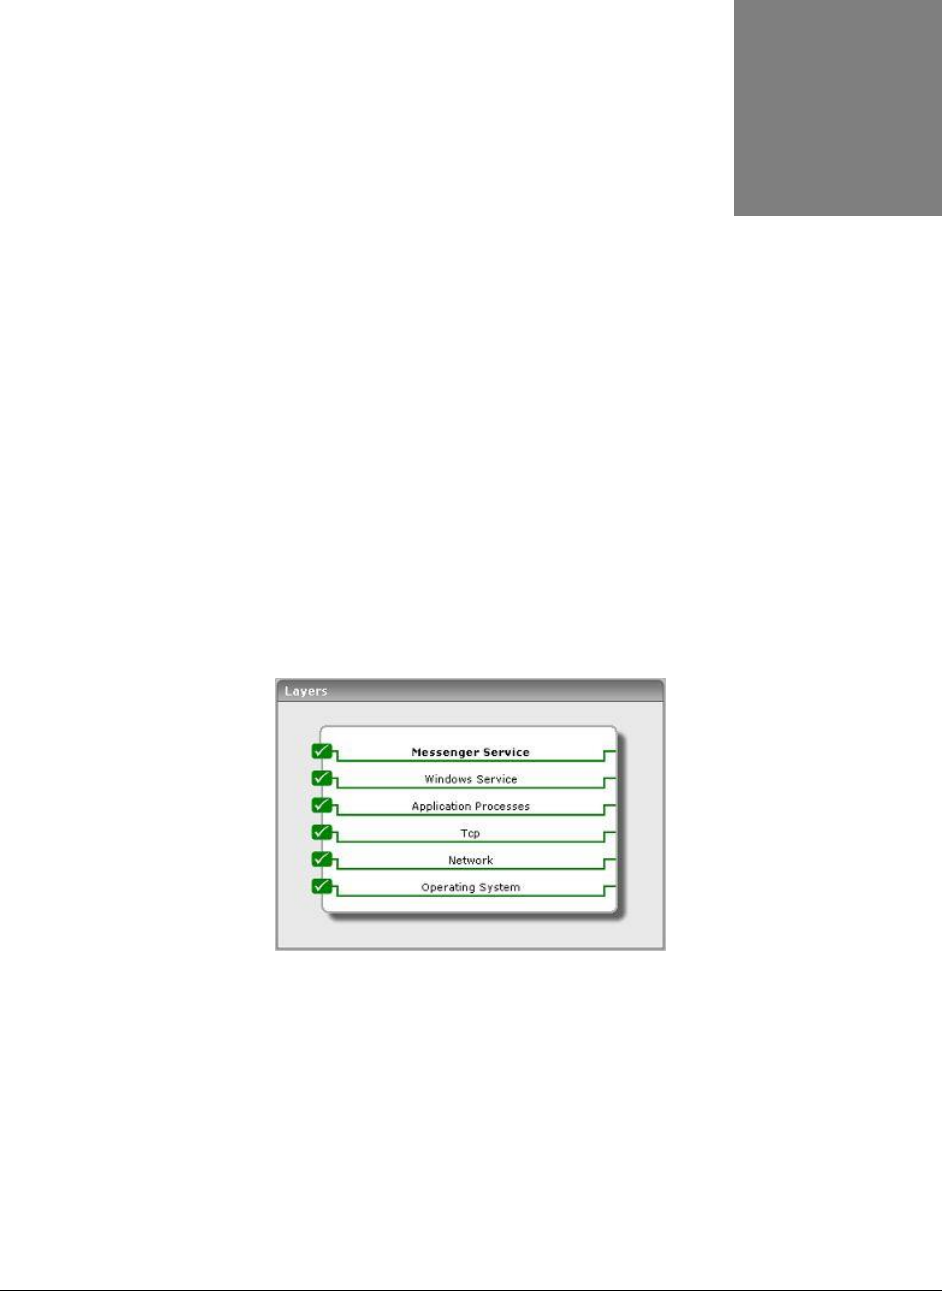
M o n i t o r i n g t h e E x c h a n g e M e s s a g i n g S e r v i c e
120
Monitoring the Exchange Messaging
Service
Exchange IM (Instant Messenger), provided within Exchange 2000, gives users the ability to
communicate with one another in an immediate, interactive environment that conveys presence and
status information. To ensure hassle-free and prompt communication between users in an
environment, the effectiveness of this service should be periodically checked.
The eG Enterprise model for the Exchange Messaging service (see Figure 7.1) monitors the IM service
at frequent intervals, and alerts administrators if its functioning is faulty – say, if too many requests to
the service or responses from the service fail for no palpable reason, or, it too many messages are in
queue awaiting delivery.
Figure 7.1: Layer model of the Exchange Messaging service
The sections to come discuss the Messenger Service alone, as all other layers and related tests have
been discussed either in this document itself or in other documents.
7.1 The Messenger Service Layer
This layer monitors the Exchange Messaging service, and reports key metrics related to the user
activity on the server.
Chapter
7
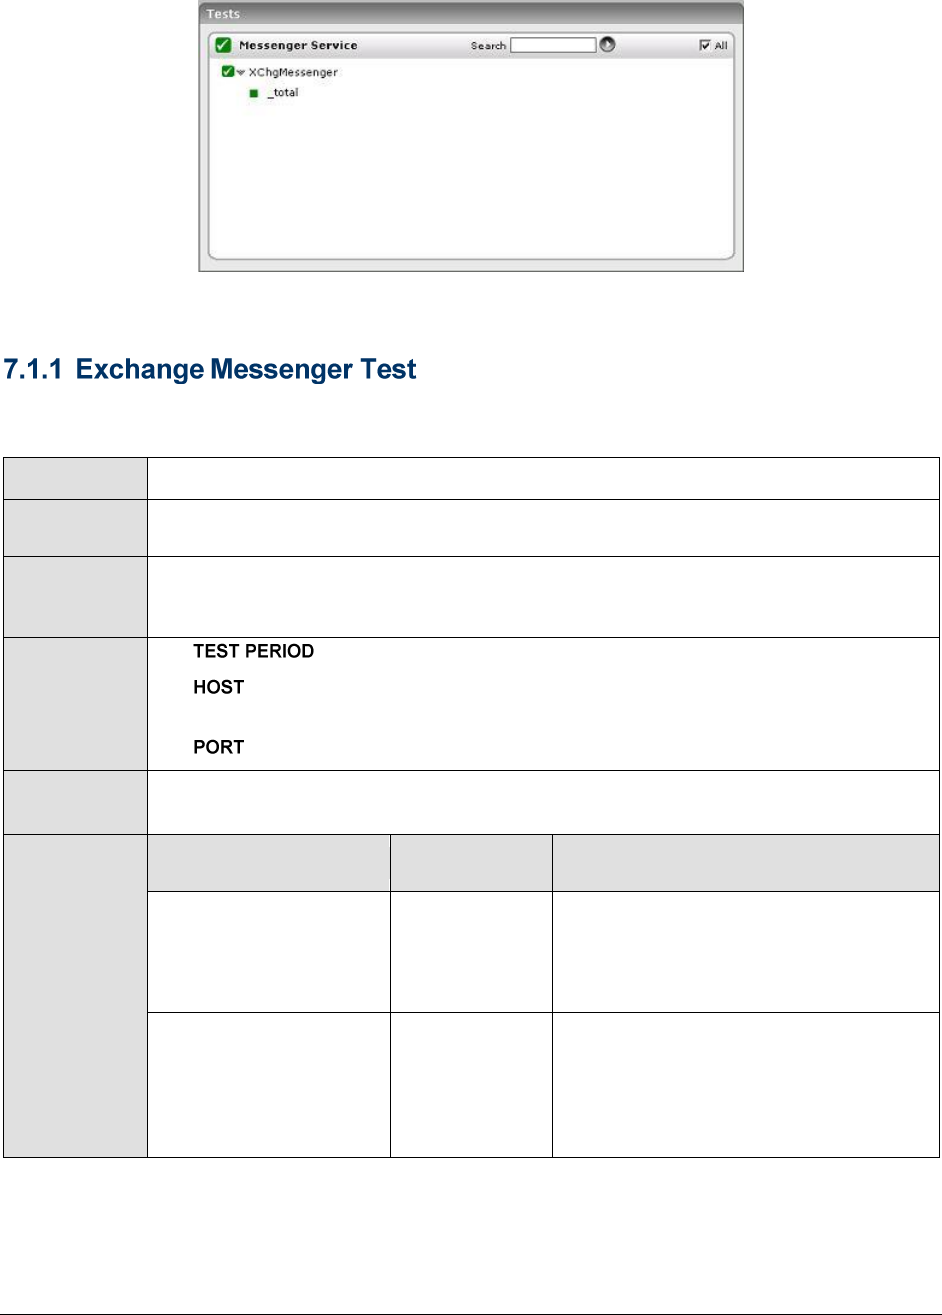
M o n i t o r i n g t h e E x c h a n g e M e s s a g i n g S e r v i c e
121
Figure 7.2: The test associated with the Messenger Service layer
This test monitors the Instant Messenger of an Exchange 2000 server, and reports key metrics related
to the user activity on the server.
Purpose
Monitors the Instant messaging service of an Exchange 2000 server
Target of the
test
An Instant Messenger Virtual Server
Agent
deploying the
test
An internal agent
Configurable
parameters for
the test
1. - How often should the test be executed
2. –The IP/host name of the Exchange 2000 server hosting the Instant
Messaging Service
3. - The port number of the Instant Messenger Virtual Server
Outputs of the
test
One set of results for an Instant Messenger Virtual Server being monitored
Measurements
made by the
test
Measurement
Measurement
Unit
Interpretation
Current users online:
Indicates the number of
users currently online.
Number
A high value of this measure is
indicative of the excessive usage of the
instant messaging service.
Current
subscriptions:
Indicates the number of
subscriptions currently
active.
Number

M o n i t o r i n g t h e E x c h a n g e M e s s a g i n g S e r v i c e
122
Number of messages
queued:
Indicates the number of
messages queued in the
instant messenger
Number
Current polling
requests:
Indicates the number of
polling requests
currently active
Number
Failed requests:
Indicates the average
number of requests
which have failed per
second, including those
rejected due to server
load
Reqs/Sec
Failed responses:
Indicates the average
number of responses
that could not be sent,
per second
Reqs/Sec
Input requests:
Indicates the average
number of requests
received over the
network per second
Reqs/Sec
Input notifies:
Indicates the average
number of NOTIFY
requests serviced per
second
Notify/Sec
Input subscribes:
Indicates the average
number of SUBSCRIBE
requests serviced per
second
Subscribes/Sec
Input unsubscribes:
Indicates the average
number of
UNSUBSCRIBE requests
serviced per second
Unsubscribes/S
ec

M o n i t o r i n g t h e E x c h a n g e M e s s a g i n g S e r v i c e
123
Output notifies:
Indicates the average
number of NOTIFY
requests issued per
second.
Notify/Sec
Output requests:
Indicates the average
number of requests
sent across the network
per second.
Reqs/Sec
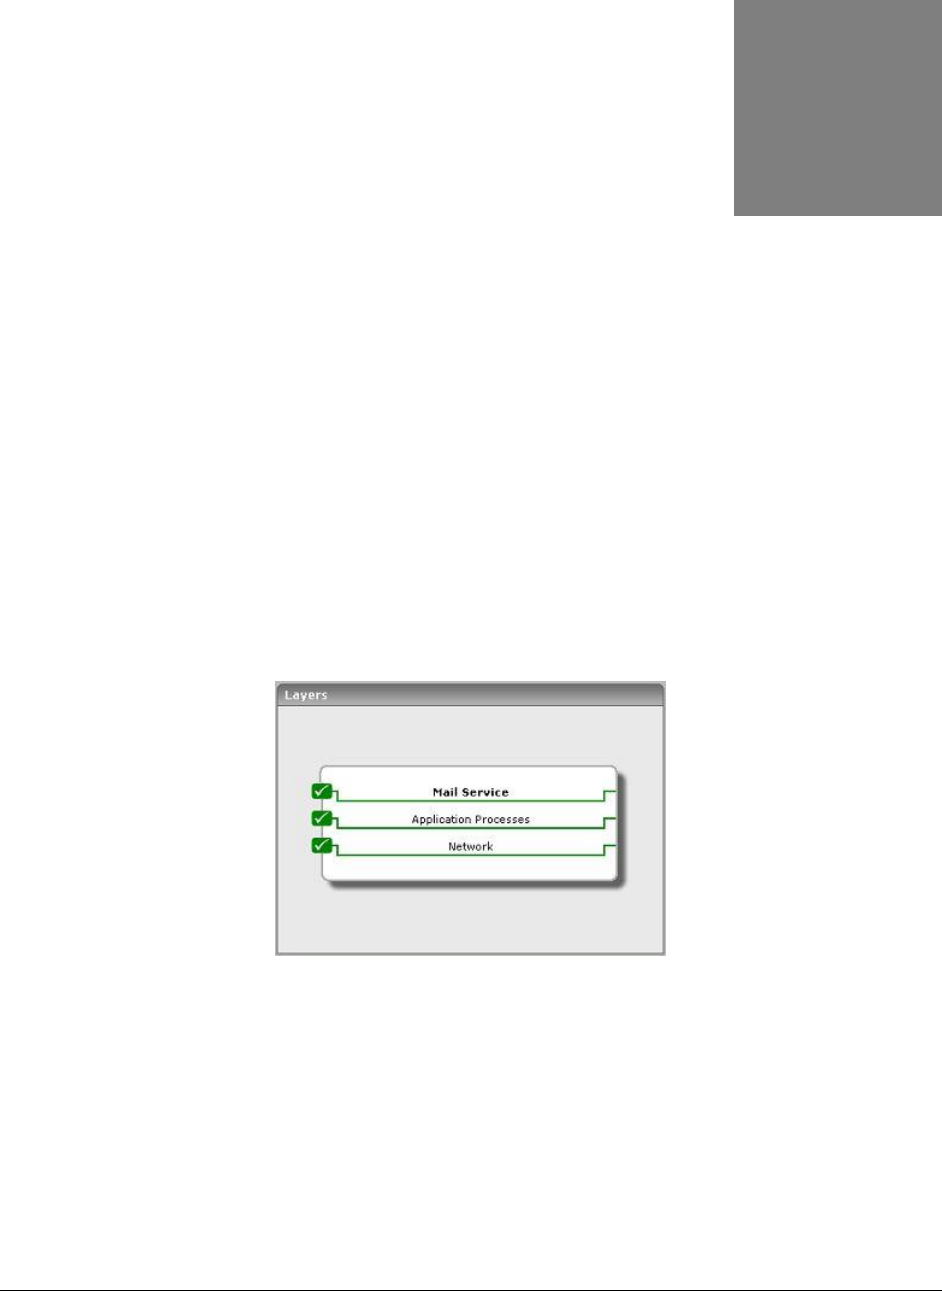
E x t e r n a l l y M o n i t o r i n g M a i l S e r v e r s
124
Externally Monitoring Mail Servers
The generic Mail server offered by eG Enterprise requires that an agent be deployed on the mail server
being monitored, so that the critical processes running on the mail server host, their resource
utilization, and other OS-level metrics are extracted from within the host. However, in some
environments, administrators might not have access to mail servers for installing agents; yet, they
might be interested in knowing whether the mail server is available / not, and how well it processes
mails. To enable such administrators to extract only external metrics such as availability and
responsiveness, the eG Enterprise suite prescribes the External Mail model (see Figure 8.1). To use
this model, an external agent would suffice. This agent employs native application-level protocols to
determine the overall network health, mail server availability, and how quickly the server processes
mails.
Figure 8.1: Layer model of the External Mail server
Only the Network test is mapped to the Network layer; this external test, upon execution, reveals
network bottlenecks that could be denying users access to the mail server. The TcpPortStatus test that
is mapped to the Application Processes layer indicates whether/not critical TCP ports are available. The
Mail test that is associated with the Mail Service layer is executed by an external agent; the test
emulates a mail send-receive activity to verify the availability of the mail server and the speed with
which it sends/receives mails. For an in-depth discussion on the Mail test, refer to Chapter 2 of this
document. For details regarding the other tests mapped to this layer, please refer to the Monitoring
Unix and Windows Servers document.
Chapter
8
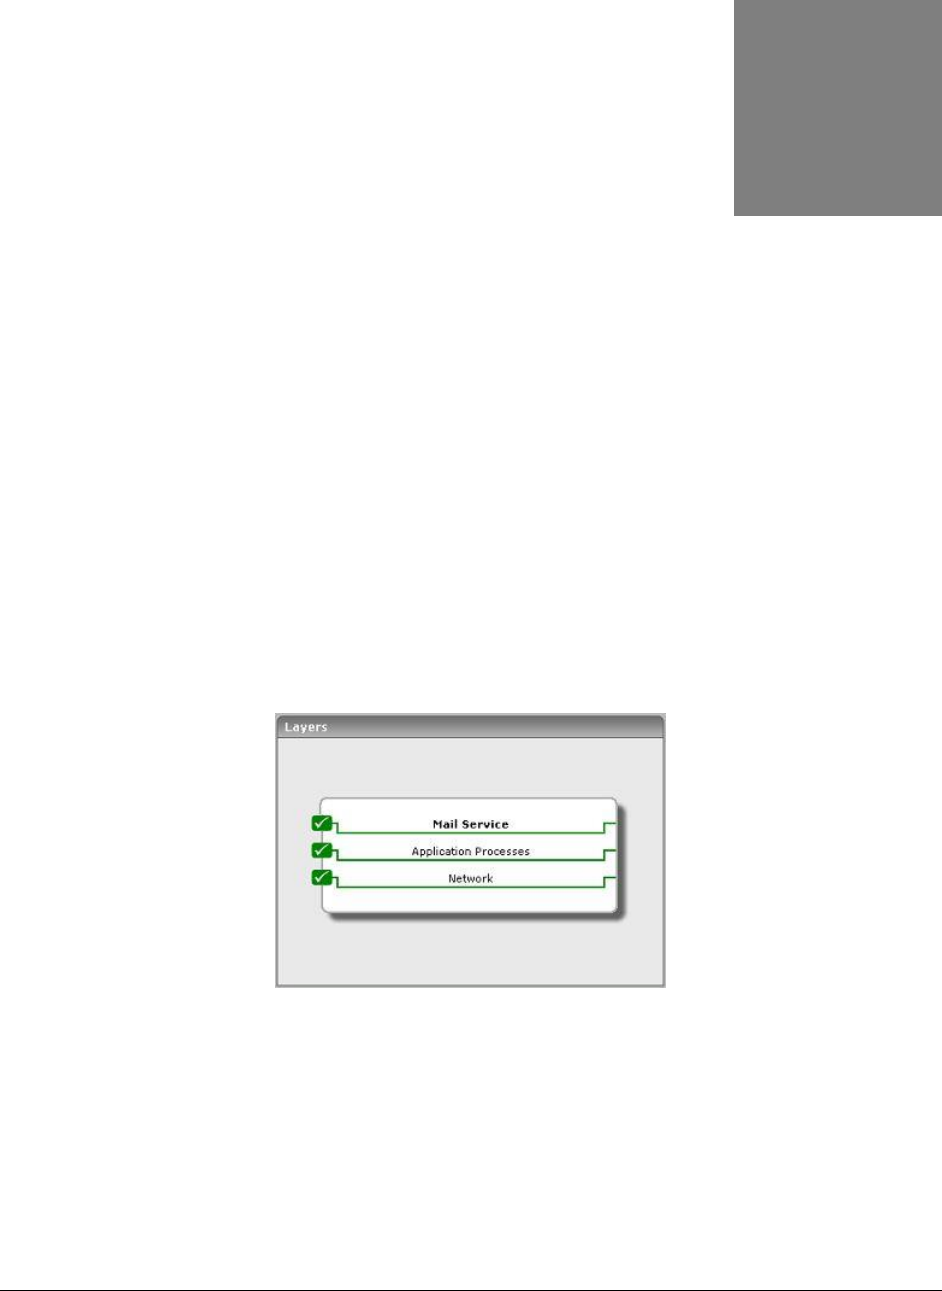
E x t e r n a l l y M o n i t o r i n g t h e E x c h a n g e M a i l S e r v e r s
125
Externally Monitoring the Exchange
server
eG Enterprise prescribes an Exchange server model (already discussed) that requires an agent to be
deployed on the Exchange 2000/2003 server to continuously monitor its internal health. However,
some administrators might not have access to the Exchange mail servers for installing agents. Such
administrators might at least want to know whether the Exchange server is available or not, and if so,
how responsive it is to requests. To capture and view such external metrics alone, eG Enterprise offers
the exclusive, External Exchange server model (see Figure 9.1). Using a single eG external agent and
no application-level instrumentation, this model can indicate the availability of the Exchange mail
server, the efficiency with which it processes messages, the overall health of the network connection
between the agent host and the mail server host, and the availability of critical TCP ports on the mail
server.
Figure 9.1: Layer model of the Exchange Server
Only the Network test is mapped to the Network layer; this external test, upon execution, reveals
network bottlenecks that could be denying users access to the mail server. The TcpPortStatus test that
is mapped to the Application Processes layer indicates whether/not critical TCP ports are available. The
Mail test that is associated with the Mail Service layer is executed by an external agent; the test
emulates a mail send-receive activity to verify the availability of the mail server and the speed with
which it sends/receives mails.
Chapter
9

E x t e r n a l l y M o n i t o r i n g t h e E x c h a n g e M a i l S e r v e r s
126
For an in-depth discussion on the Mail test, refer to Chapter 2 of this document. For details regarding
the other tests mapped to this layer, please refer to the Monitoring Unix and Windows Servers
document.

M o n i t o r i n g t h e E x c h a n g e C l u s t e r S e r v i c e
127
Monitoring the Exchange Cluster
Service
An Exchange cluster service is a collection of physical Exchange mail servers that can act as a single
logical server. Requests to a cluster are routed through a virtual cluster server that is assigned a
cluster IP address and TCP port. Requests to this server can be handled by any of the individual nodes
in the cluster at any given point in time, depending on which node is active at that time.
Since clusters are deployed in environments where 24*7 availability and responsiveness are critical, it
is imperative that the performance of the clusters is monitored all the time.
To monitor an Exchange cluster, an eG external agent is deployed, which emulates a mail send-
receive activity on the Exchange cluster. The emulated requests are directed at the virtual cluster
server. Therefore, you need to manage the virtual cluster server as an Exchange Cluster service using
the eG administrative interface.
The layer model used by the eG Enterprise suite to monitor the Exchange cluster service is given
below (see Figure 10.1)
Chapter
10
Note:
For more details on how eG Enterprise monitors clusters, refer to Chapter 7 of the eG User
Manual.
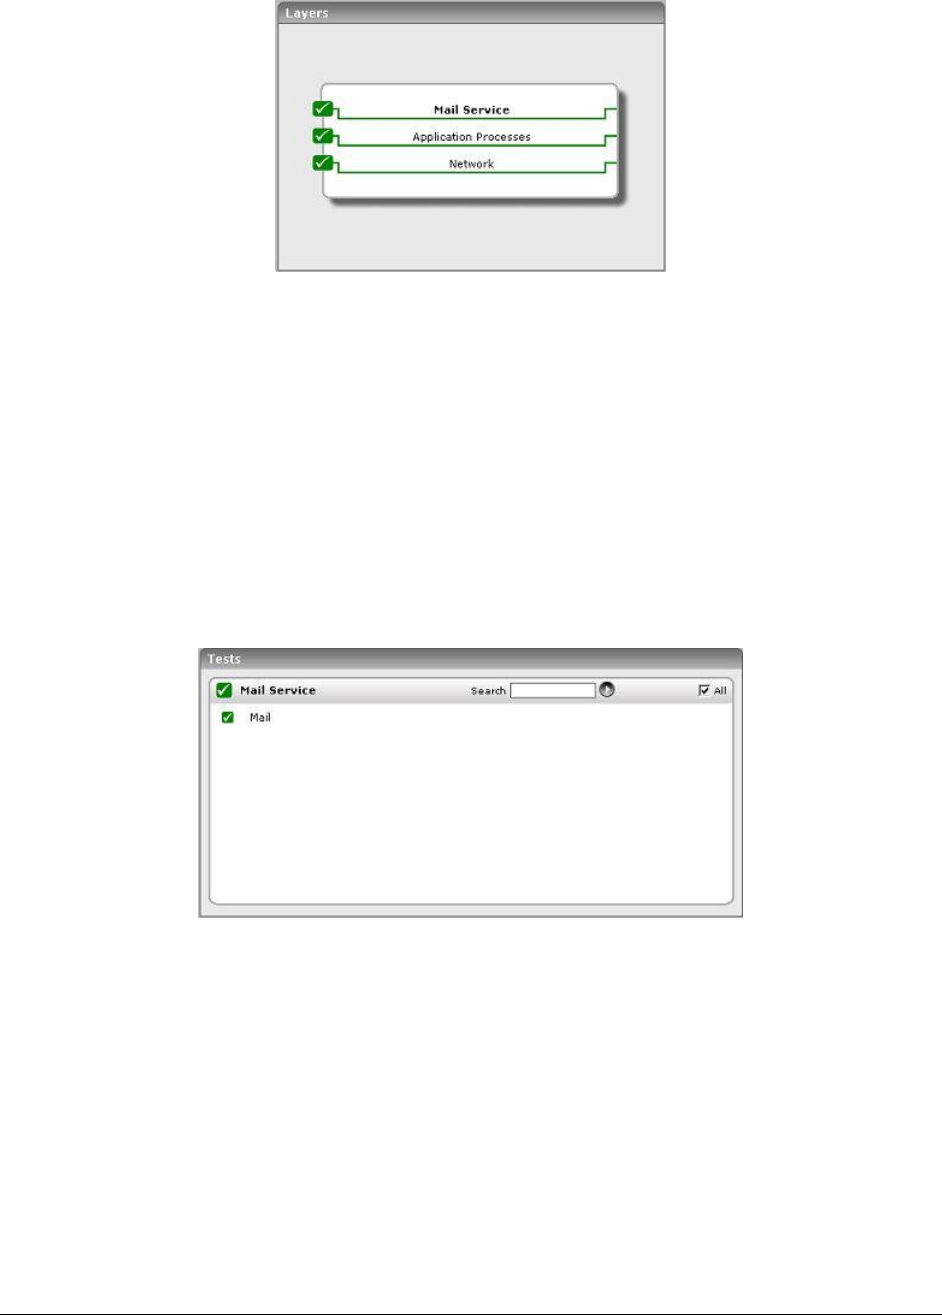
M o n i t o r i n g t h e E x c h a n g e C l u s t e r S e r v i c e
128
Figure 10.1: Layer model of the Exchange Cluster service
The following section will deal with the first layer of Figure 10.1 only.
10.1 The Mail Service Layer
The Mail test associated with this layer, emulates a mail send-receive activity on the cluster to
determine its availability and responsiveness. The test sends the emulated request to the virtual
cluster server (i.e., the Exchange Cluster), which will promptly forward the request to that node in the
cluster that currently owns the cluster server. If at least one node in the cluster is currently active,
then the mail will be successfully sent/received, indicating the good health of the cluster. On the other
hand, if none of the nodes in the cluster are active, then the emulated request will fail, indicating the
non-availability of the cluster.
Figure 10.2: Tests mapping to the Mail Service layer
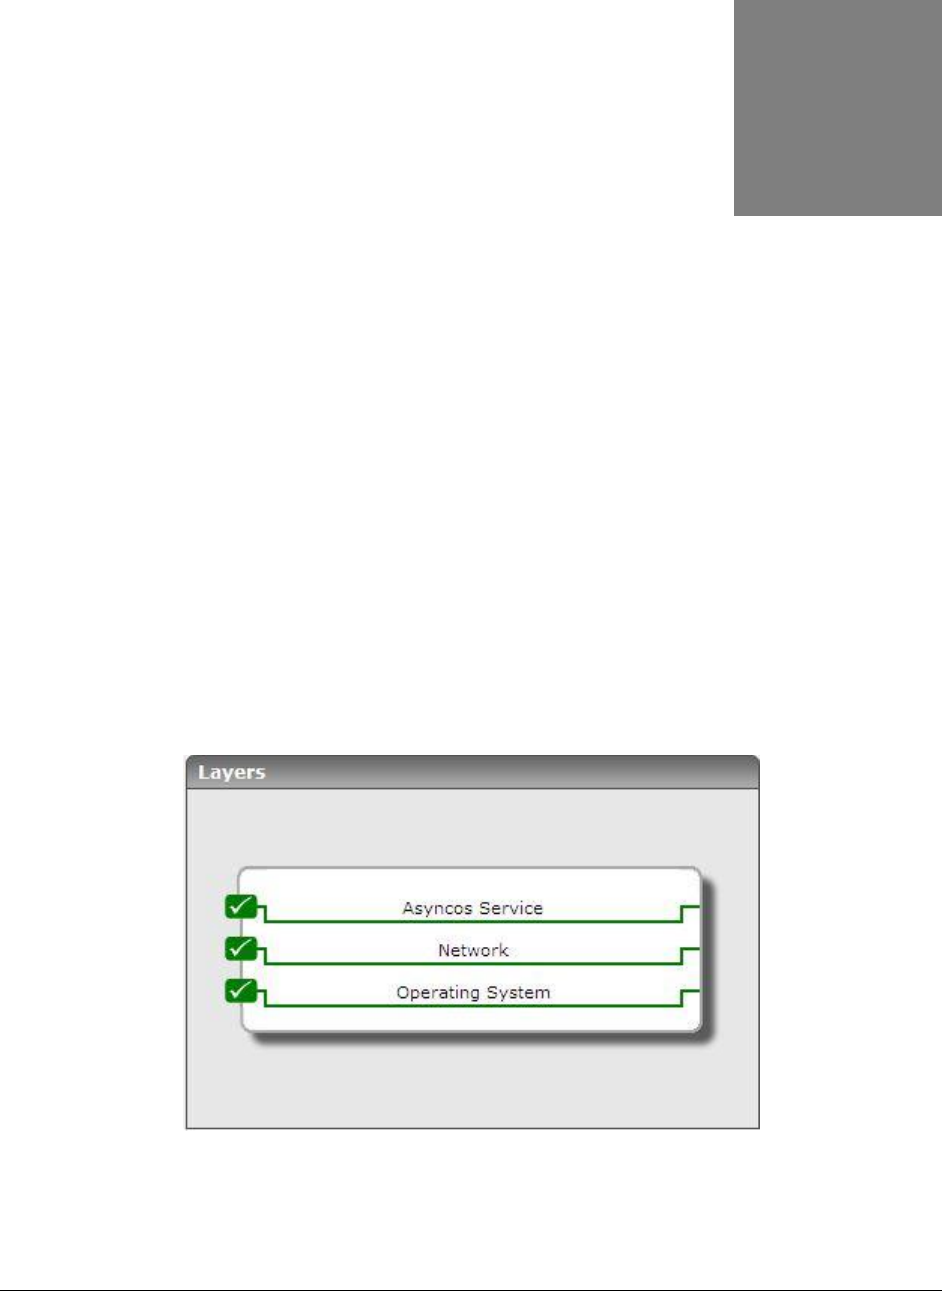
M o n i t o r i n g t h e I r o n P o r t A s y n c O S M a i l S e r v e r
129
Monitoring the IronPort AsyncOS
Mail Server
All IronPort appliances are built from the ground up and are powered by IronPort's unique AsyncOS™
operating system for high performance and high security. Designed to meet the inbound and outbound
needs of the world's largest email infrastructures, IronPort appliances contain advanced mail delivery
features such as robust queue management, bounce handling and connection management.
If any of these features malfunction, it can overwhelm the email infrastructure with numerous mails,
and can even make it vulnerable to virus/spam attacks. In order to avoid such adversites, it is
essential to continuously monitor the health of the Ironport appliance.
eG Enterprise embeds a 100% web-based IromPort AsyncOS Mail monitoring model that monitors the
critical hardware and services offered by the IronPort appliance, so that abnormalities are captured
early and remedied promptly.
Figure 11.1: Layer model of the IronPort AsyncOS Mail server
Chapter
11
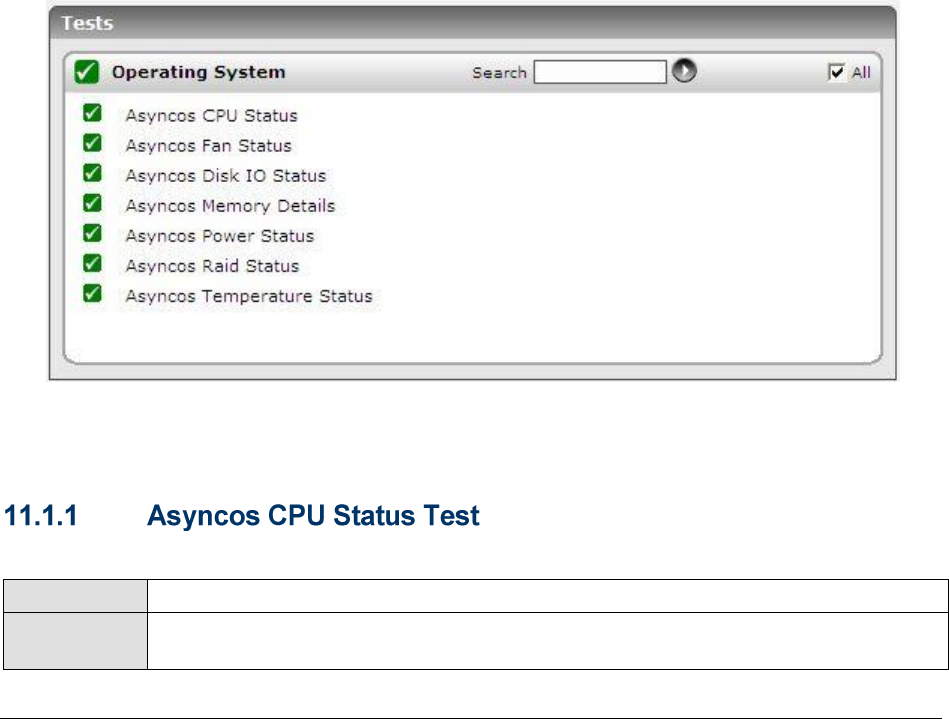
M o n i t o r i n g t h e I r o n P o r t A s y n c O S M a i l S e r v e r
130
Each layer of Figure 11.1 is mapped to a series of tests that reports a wealth of performance metrics
related to the appliance. These metrics can provide accurate answers for the following performance
queries:
Is there a CPU bottleneck on the appliance?
Is the fan on the appliance running abnormally fast?
Is there a memory shortage on the appliance?
Is the power supply to the appliance faulty?
Has there been a RAID failure?
Is the temperature of the appliance very high?
Are too many requests to the DNS server outstanding?
Is the email queue full?
Are there enough email threads to perform mail transfer?
11.1 The Operating System Layer
The tests mapped to this layer can proactively alert administrators to the potential failure of critical
AsyncOS hardware such as fans, processors, power supply, memory partitions, and temperature
sensors.
Figure 11.2: The tests mapped to the Operating System layer
This test reveals how efficiently the IronPort appliance uses the CPU resources available to it.
Purpose
Reveals how efficiently the Ironport appliance uses the CPU resources available to it.
Target of the
test
An IronPort AsyncOS Mail server

M o n i t o r i n g t h e I r o n P o r t A s y n c O S M a i l S e r v e r
131
Agent
deploying the
test
External/remote agent

M o n i t o r i n g t h e I r o n P o r t A s y n c O S M a i l S e r v e r
132
Configurable
parameters for
the test
1. - How often should the test be executed
2. – The IP address of the Cisco Router.
3. - The port number through which the Cisco router exposes its SNMP
MIB. The default value is 161.
4. – By default, the eG agent supports SNMP version 1. Accordingly,
the default selection in the list is v1. However, if a different SNMP
framework is in use in your environment, say SNMP v2 or v3, then select the
corresponding option from this list.
5. – The SNMP community name that the test uses to
communicate with the Cisco router. This parameter is specific to SNMP v1 and v2
only. Therefore, if the chosen is v3, then this parameter will not
appear.
6. – This parameter appears only when v3 is selected as the
. SNMP version 3 (SNMPv3) is an extensible SNMP Framework
which supplements the SNMPv2 Framework, by additionally supporting message
security, access control, and remote SNMP configuration capabilities. To extract
performance statistics from the MIB using the highly secure SNMP v3 protocol,
the eG agent has to be configured with the required access privileges – in other
words, the eG agent should connect to the MIB using the credentials of a user
with access permissions to be MIB. Therefore, specify the name of such a user
against the parameter.
7. – Specify the password that corresponds to the above-mentioned
. This parameter once again appears only if the
selected is v3.
8. – Confirm the by retyping it here.
9. – This parameter too appears only if v3 is selected as the
. From the list box, choose the authentication algorithm
using which SNMP v3 converts the specified and into a
32-bit format to ensure security of SNMP transactions. You can choose between
the following options:
MD5 – Message Digest Algorithm
SHA – Secure Hash Algorithm
10. – This flag appears only when v3 is selected as the .
By default, the eG agent does not encrypt SNMP requests. Accordingly, the
is set to NO by default. To ensure that SNMP requests sent by the
eG agent are encrypted, select the YES option.
11. – If the is set to YES, then you will have to mention
the encryption type by selecting an option from the list. SNMP v3
supports the following encryption types:
DES – Data Encryption Standard
AES – Advanced Encryption Standard
12. – Specify the encryption password here.
13. – Confirm the encryption password by retyping it here.
M o n i t o r i n g t h e I r o n P o r t A s y n c O S M a i l S e r v e r
133
14. - Specify the duration (in seconds) within which the SNMP query
executed by this test should time out in the TIMEOUT text box. The default is 10
seconds.
Outputs of the
test
One set of results for the appliance being monitored.
Measurements
made by the
test
Measurement
Measurement
Unit
Interpretation
CPU utilization:
Total percentage CPU
utilization of the
appliance.
Percent
A very high value could indicate a CPU
bottleneck at the appliance.
This test reports the speed of the fans on the IronPort appliance.
Purpose
Reports the speed of the fans on the IronPort appliance
Target of the
test
An IronPort AsyncOS Mail server
Agent
deploying the
test
External/remote agent

M o n i t o r i n g t h e I r o n P o r t A s y n c O S M a i l S e r v e r
134
Configurable
parameters for
the test
1. - How often should the test be executed
2. – The IP address of the Cisco Router.
3. - The port number through which the Cisco router exposes its SNMP
MIB. The default value is 161.
4. – By default, the eG agent supports SNMP version 1. Accordingly,
the default selection in the list is v1. However, if a different SNMP
framework is in use in your environment, say SNMP v2 or v3, then select the
corresponding option from this list.
5. – The SNMP community name that the test uses to
communicate with the Cisco router. This parameter is specific to SNMP v1 and v2
only. Therefore, if the chosen is v3, then this parameter will not
appear.
6. – This parameter appears only when v3 is selected as the
. SNMP version 3 (SNMPv3) is an extensible SNMP Framework
which supplements the SNMPv2 Framework, by additionally supporting message
security, access control, and remote SNMP configuration capabilities. To extract
performance statistics from the MIB using the highly secure SNMP v3 protocol,
the eG agent has to be configured with the required access privileges – in other
words, the eG agent should connect to the MIB using the credentials of a user
with access permissions to be MIB. Therefore, specify the name of such a user
against the parameter.
7. – Specify the password that corresponds to the above-mentioned
. This parameter once again appears only if the
selected is v3.
8. – Confirm the by retyping it here.
9. – This parameter too appears only if v3 is selected as the
. From the list box, choose the authentication algorithm
using which SNMP v3 converts the specified and into a
32-bit format to ensure security of SNMP transactions. You can choose between
the following options:
MD5 – Message Digest Algorithm
SHA – Secure Hash Algorithm
10. – This flag appears only when v3 is selected as the .
By default, the eG agent does not encrypt SNMP requests. Accordingly, the
is set to NO by default. To ensure that SNMP requests sent by the
eG agent are encrypted, select the YES option.
11. – If the is set to YES, then you will have to mention
the encryption type by selecting an option from the list. SNMP v3
supports the following encryption types:
DES – Data Encryption Standard
AES – Advanced Encryption Standard
12. – Specify the encryption password here.
13. – Confirm the encryption password by retyping it here.
M o n i t o r i n g t h e I r o n P o r t A s y n c O S M a i l S e r v e r
135
14. - Specify the duration (in seconds) within which the SNMP query
executed by this test should time out in the TIMEOUT text box. The default is 10
seconds.
Outputs of the
test
One set of results for the appliance being monitored.
Measurements
made by the
test
Measurement
Measurement
Unit
Interpretation
Speed:
Indicates the speed of
the fan.
Rpm
An unusually high or low value could
indicate a problem.
This test reports the percentage of disk I/O utilized by the appliance.
Purpose
Reports the percentage of disk I/O utilized by the appliance
Target of the
test
An IronPort AsyncOS Mail server
Agent
deploying the
test
External/remote agent

M o n i t o r i n g t h e I r o n P o r t A s y n c O S M a i l S e r v e r
136
Configurable
parameters for
the test
1. - How often should the test be executed
2. – The IP address of the Cisco Router.
3. - The port number through which the Cisco router exposes its SNMP
MIB. The default value is 161.
4. – By default, the eG agent supports SNMP version 1. Accordingly,
the default selection in the list is v1. However, if a different SNMP
framework is in use in your environment, say SNMP v2 or v3, then select the
corresponding option from this list.
5. – The SNMP community name that the test uses to
communicate with the Cisco router. This parameter is specific to SNMP v1 and v2
only. Therefore, if the chosen is v3, then this parameter will not
appear.
6. – This parameter appears only when v3 is selected as the
. SNMP version 3 (SNMPv3) is an extensible SNMP Framework
which supplements the SNMPv2 Framework, by additionally supporting message
security, access control, and remote SNMP configuration capabilities. To extract
performance statistics from the MIB using the highly secure SNMP v3 protocol,
the eG agent has to be configured with the required access privileges – in other
words, the eG agent should connect to the MIB using the credentials of a user
with access permissions to be MIB. Therefore, specify the name of such a user
against the parameter.
7. – Specify the password that corresponds to the above-mentioned
. This parameter once again appears only if the
selected is v3.
8. – Confirm the by retyping it here.
9. – This parameter too appears only if v3 is selected as the
. From the list box, choose the authentication algorithm
using which SNMP v3 converts the specified and into a
32-bit format to ensure security of SNMP transactions. You can choose between
the following options:
MD5 – Message Digest Algorithm
SHA – Secure Hash Algorithm
10. – This flag appears only when v3 is selected as the .
By default, the eG agent does not encrypt SNMP requests. Accordingly, the
is set to NO by default. To ensure that SNMP requests sent by the
eG agent are encrypted, select the YES option.
11. – If the is set to YES, then you will have to mention
the encryption type by selecting an option from the list. SNMP v3
supports the following encryption types:
DES – Data Encryption Standard
AES – Advanced Encryption Standard
12. – Specify the encryption password here.
13. – Confirm the encryption password by retyping it here.
M o n i t o r i n g t h e I r o n P o r t A s y n c O S M a i l S e r v e r
137
14. - Specify the duration (in seconds) within which the SNMP query
executed by this test should time out in the TIMEOUT text box. The default is 10
seconds.
Outputs of the
test
One set of results for the appliance being monitored.
Measurements
made by the
test
Measurement
Measurement
Unit
Interpretation
Disk io utilization:
Indicates the
percentage of disk I/O
utilized.
Percent
This test reports the usage and status of memory resources on the appliance.
Purpose
Reports the usage and status of memory resources on the appliance
Target of the
test
An IronPort AsyncOS Mail server
Agent
deploying the
test
External/remote agent

M o n i t o r i n g t h e I r o n P o r t A s y n c O S M a i l S e r v e r
138
Configurable
parameters for
the test
1. - How often should the test be executed
2. – The IP address of the Cisco Router.
3. - The port number through which the Cisco router exposes its SNMP
MIB. The default value is 161.
4. – By default, the eG agent supports SNMP version 1. Accordingly,
the default selection in the list is v1. However, if a different SNMP
framework is in use in your environment, say SNMP v2 or v3, then select the
corresponding option from this list.
5. – The SNMP community name that the test uses to
communicate with the Cisco router. This parameter is specific to SNMP v1 and v2
only. Therefore, if the chosen is v3, then this parameter will not
appear.
6. – This parameter appears only when v3 is selected as the
. SNMP version 3 (SNMPv3) is an extensible SNMP Framework
which supplements the SNMPv2 Framework, by additionally supporting message
security, access control, and remote SNMP configuration capabilities. To extract
performance statistics from the MIB using the highly secure SNMP v3 protocol,
the eG agent has to be configured with the required access privileges – in other
words, the eG agent should connect to the MIB using the credentials of a user
with access permissions to be MIB. Therefore, specify the name of such a user
against the parameter.
7. – Specify the password that corresponds to the above-mentioned
. This parameter once again appears only if the
selected is v3.
8. – Confirm the by retyping it here.
9. – This parameter too appears only if v3 is selected as the
. From the list box, choose the authentication algorithm
using which SNMP v3 converts the specified and into a
32-bit format to ensure security of SNMP transactions. You can choose between
the following options:
MD5 – Message Digest Algorithm
SHA – Secure Hash Algorithm
10. – This flag appears only when v3 is selected as the .
By default, the eG agent does not encrypt SNMP requests. Accordingly, the
is set to NO by default. To ensure that SNMP requests sent by the
eG agent are encrypted, select the YES option.
11. – If the is set to YES, then you will have to mention
the encryption type by selecting an option from the list. SNMP v3
supports the following encryption types:
DES – Data Encryption Standard
AES – Advanced Encryption Standard
12. – Specify the encryption password here.
13. – Confirm the encryption password by retyping it here.
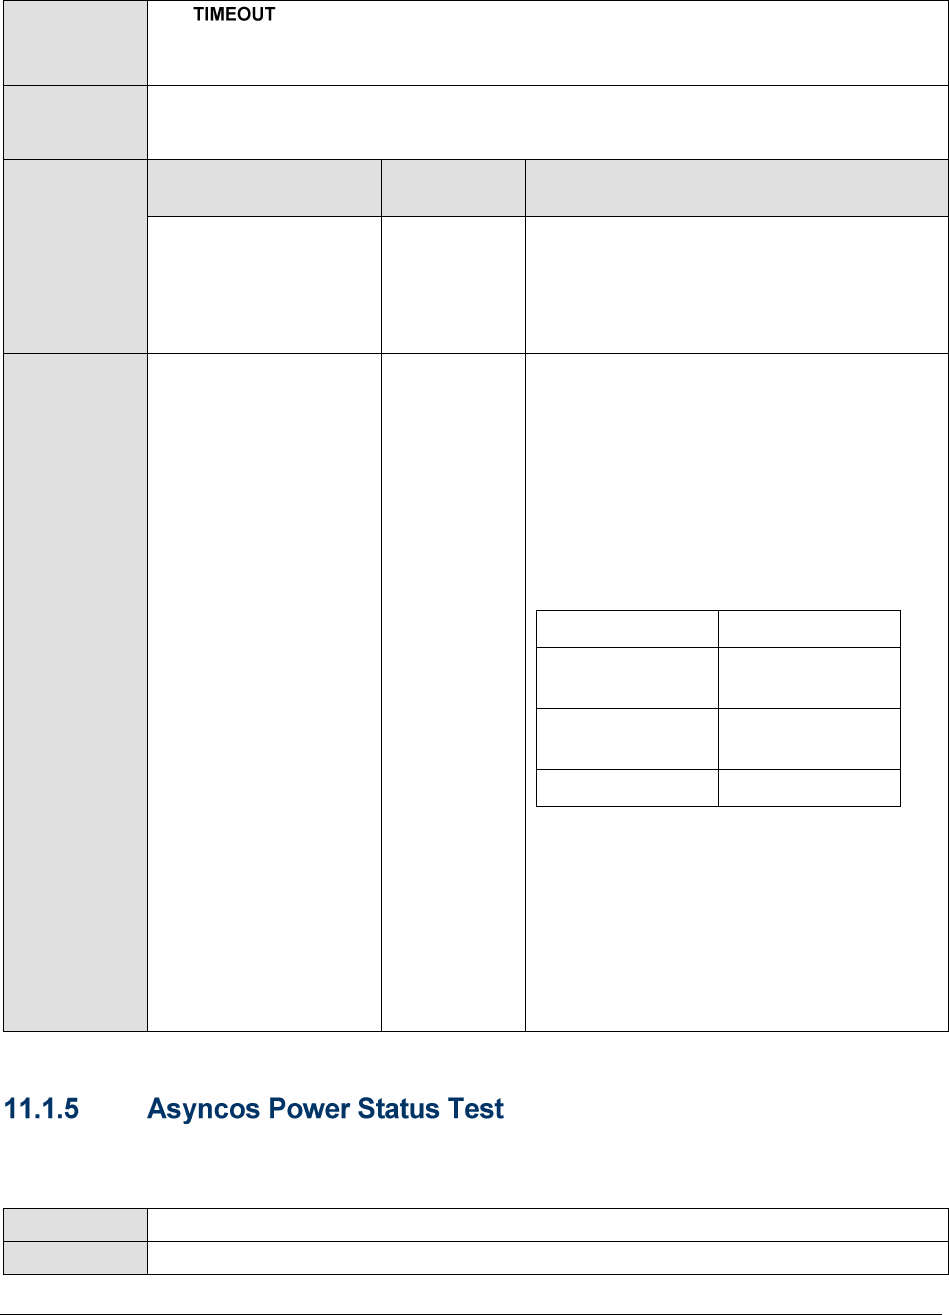
M o n i t o r i n g t h e I r o n P o r t A s y n c O S M a i l S e r v e r
139
14. - Specify the duration (in seconds) within which the SNMP query
executed by this test should time out in the TIMEOUT text box. The default is 10
seconds.
Outputs of the
test
One set of results for the appliance being monitored.
Measurements
made by the
test
Measurement
Measurement
Unit
Interpretation
Memory utilization:
Indicates the
percentage of memory
utilized by the
appliance.
Percent
A high value could indicate a memory
bottleneck
Availability:
Indicates the memory
availability status of
the mail transfer
process.
If memory is full, then this measure will
report the value Memory full. If sufficient
memory resources are not available, then,
this measure will report the value Memory
shortage. If sufficient memory resources
are available, then, this measure will report
the value Memory available.
The numeric values that correspond to the
status values discussed above are as
follows:
State
Numeric Value
Memory
Available
1
Memory
Shortage
2
Memory Full
3
Note:
By default, this measure reports the values
Memory full, Memory available and Memory
shortage to indicate the memory availability
status. The graph of this measure however,
represents the status using the numeric
equivalents - 1 to 3.
This test indicates the status of the power supply to the appliance.
Purpose
Indicates the status of the power supply to the appliance
Target of the
An IronPort AsyncOS Mail server

M o n i t o r i n g t h e I r o n P o r t A s y n c O S M a i l S e r v e r
140
test
Agent
deploying the
test
External/remote agent
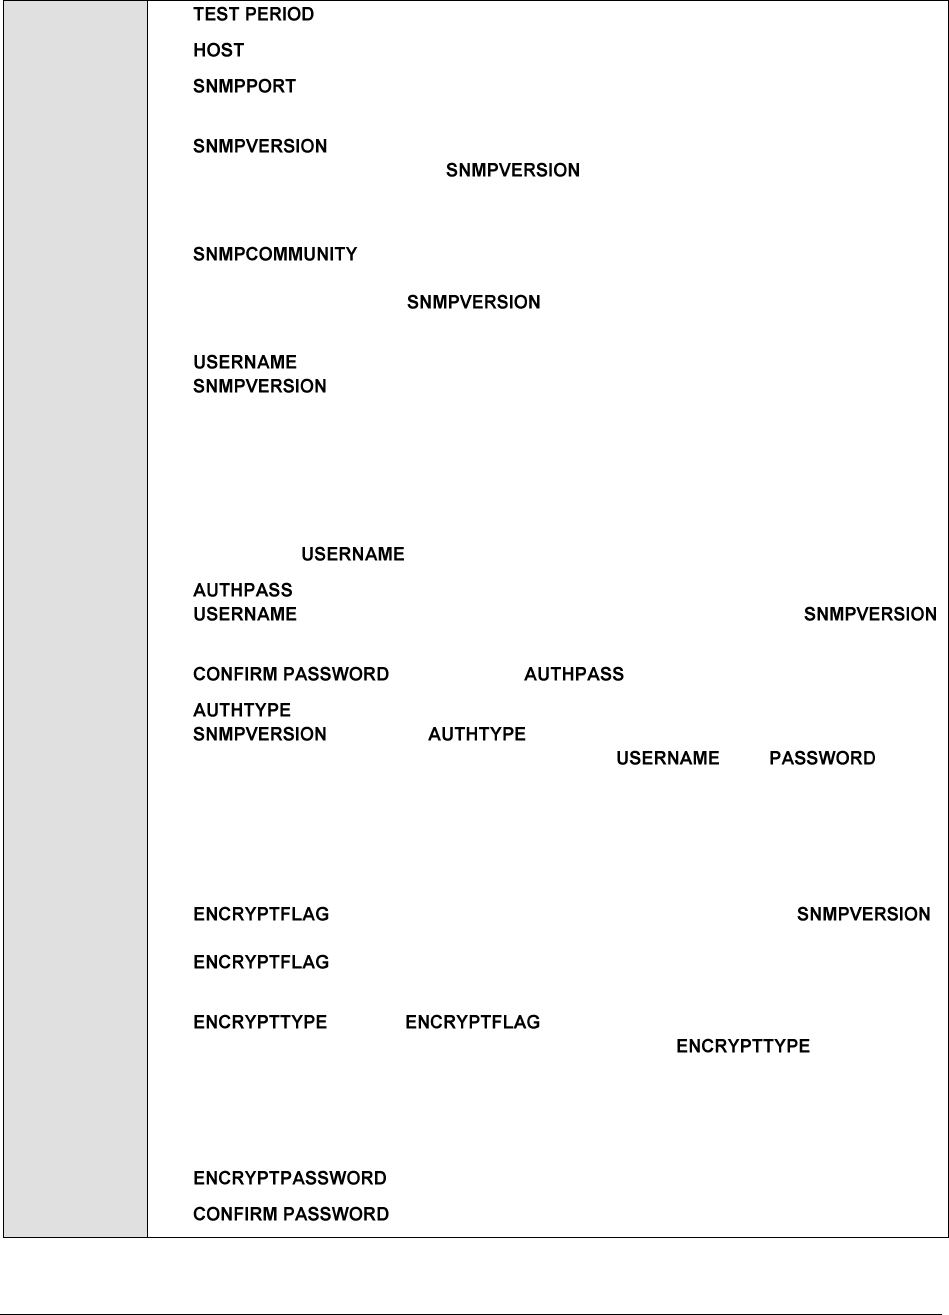
M o n i t o r i n g t h e I r o n P o r t A s y n c O S M a i l S e r v e r
141
Configurable
parameters for
the test
1. - How often should the test be executed
2. – The IP address of the Cisco Router.
3. - The port number through which the Cisco router exposes its SNMP
MIB. The default value is 161.
4. – By default, the eG agent supports SNMP version 1. Accordingly,
the default selection in the list is v1. However, if a different SNMP
framework is in use in your environment, say SNMP v2 or v3, then select the
corresponding option from this list.
5. – The SNMP community name that the test uses to
communicate with the Cisco router. This parameter is specific to SNMP v1 and v2
only. Therefore, if the chosen is v3, then this parameter will not
appear.
6. – This parameter appears only when v3 is selected as the
. SNMP version 3 (SNMPv3) is an extensible SNMP Framework
which supplements the SNMPv2 Framework, by additionally supporting message
security, access control, and remote SNMP configuration capabilities. To extract
performance statistics from the MIB using the highly secure SNMP v3 protocol,
the eG agent has to be configured with the required access privileges – in other
words, the eG agent should connect to the MIB using the credentials of a user
with access permissions to be MIB. Therefore, specify the name of such a user
against the parameter.
7. – Specify the password that corresponds to the above-mentioned
. This parameter once again appears only if the
selected is v3.
8. – Confirm the by retyping it here.
9. – This parameter too appears only if v3 is selected as the
. From the list box, choose the authentication algorithm
using which SNMP v3 converts the specified and into a
32-bit format to ensure security of SNMP transactions. You can choose between
the following options:
MD5 – Message Digest Algorithm
SHA – Secure Hash Algorithm
10. – This flag appears only when v3 is selected as the .
By default, the eG agent does not encrypt SNMP requests. Accordingly, the
is set to NO by default. To ensure that SNMP requests sent by the
eG agent are encrypted, select the YES option.
11. – If the is set to YES, then you will have to mention
the encryption type by selecting an option from the list. SNMP v3
supports the following encryption types:
DES – Data Encryption Standard
AES – Advanced Encryption Standard
12. – Specify the encryption password here.
13. – Confirm the encryption password by retyping it here.
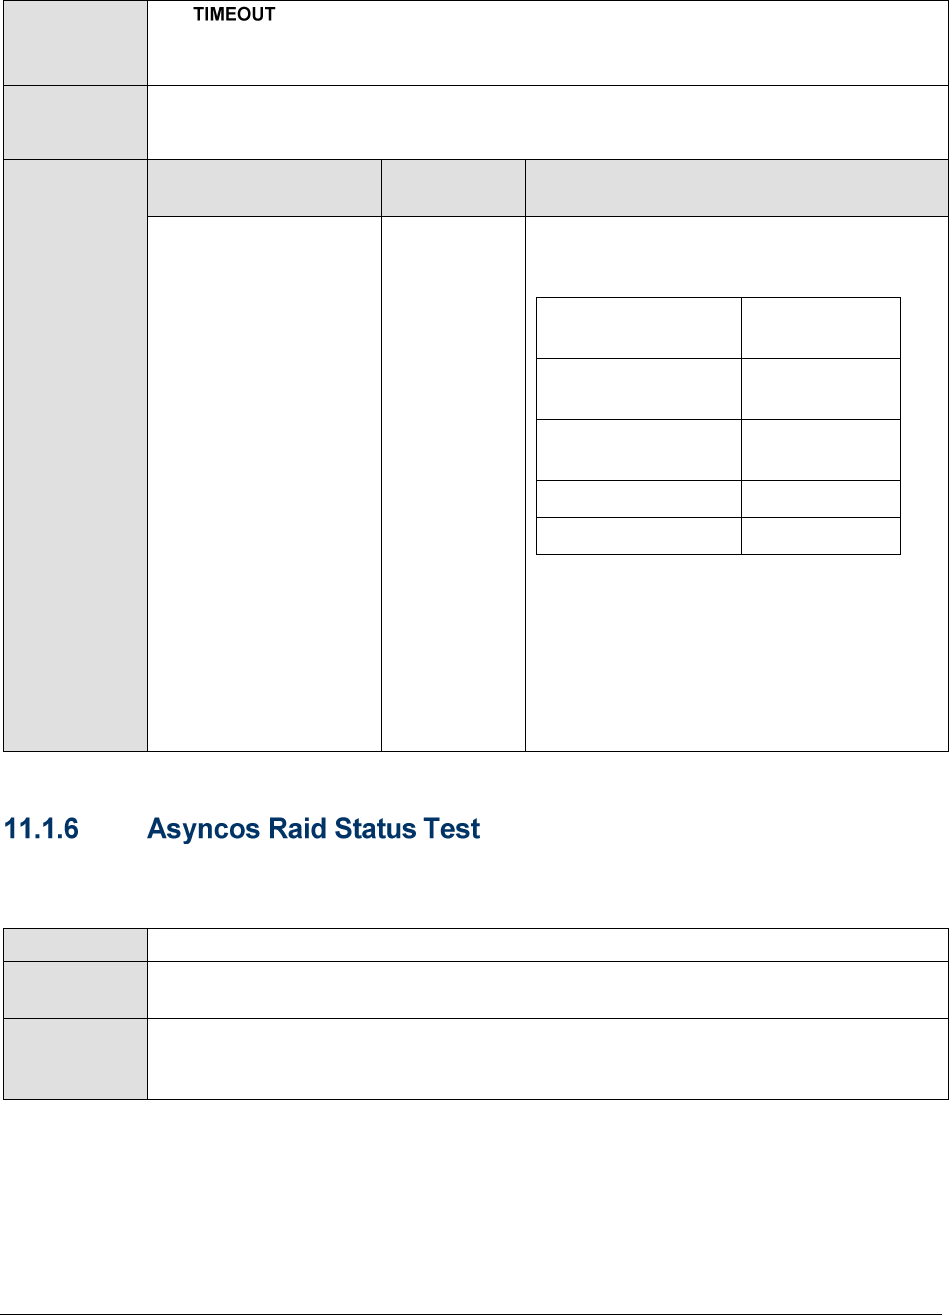
M o n i t o r i n g t h e I r o n P o r t A s y n c O S M a i l S e r v e r
142
14. - Specify the duration (in seconds) within which the SNMP query
executed by this test should time out in the TIMEOUT text box. The default is 10
seconds.
Outputs of the
test
One set of results for the appliance being monitored.
Measurements
made by the
test
Measurement
Measurement
Unit
Interpretation
Availability:
Indicates the current
of the power supply to
the appliance.
The states reported by this measure and
the numeric values that correspond to each
state are discussed in the table below:
State
Numeric
Value
powerSupplyNotIns
talled
1
powerSupplyHealth
y
2
powerSupplyNoAC
3
powerSupplyFaulty
4
Note:
By default, this measure reports the States
listed in the table above to indicate the
power supply status. The graph of this
measure however, represents the status
using the numeric equivalents - 1 to 4
This test reports the RAID status.
Purpose
Reports the RAID status
Target of the
test
An IronPort AsyncOS Mail server
Agent
deploying the
test
External/remote agent

M o n i t o r i n g t h e I r o n P o r t A s y n c O S M a i l S e r v e r
143
Configurable
parameters for
the test
1. - How often should the test be executed
2. – The IP address of the Cisco Router.
3. - The port number through which the Cisco router exposes its SNMP
MIB. The default value is 161.
4. – By default, the eG agent supports SNMP version 1. Accordingly,
the default selection in the list is v1. However, if a different SNMP
framework is in use in your environment, say SNMP v2 or v3, then select the
corresponding option from this list.
5. – The SNMP community name that the test uses to
communicate with the Cisco router. This parameter is specific to SNMP v1 and v2
only. Therefore, if the chosen is v3, then this parameter will not
appear.
6. – This parameter appears only when v3 is selected as the
. SNMP version 3 (SNMPv3) is an extensible SNMP Framework
which supplements the SNMPv2 Framework, by additionally supporting message
security, access control, and remote SNMP configuration capabilities. To extract
performance statistics from the MIB using the highly secure SNMP v3 protocol,
the eG agent has to be configured with the required access privileges – in other
words, the eG agent should connect to the MIB using the credentials of a user
with access permissions to be MIB. Therefore, specify the name of such a user
against the parameter.
7. – Specify the password that corresponds to the above-mentioned
. This parameter once again appears only if the
selected is v3.
8. – Confirm the by retyping it here.
9. – This parameter too appears only if v3 is selected as the
. From the list box, choose the authentication algorithm
using which SNMP v3 converts the specified and into a
32-bit format to ensure security of SNMP transactions. You can choose between
the following options:
MD5 – Message Digest Algorithm
SHA – Secure Hash Algorithm
10. – This flag appears only when v3 is selected as the .
By default, the eG agent does not encrypt SNMP requests. Accordingly, the
is set to NO by default. To ensure that SNMP requests sent by the
eG agent are encrypted, select the YES option.
11. – If the is set to YES, then you will have to mention
the encryption type by selecting an option from the list. SNMP v3
supports the following encryption types:
DES – Data Encryption Standard
AES – Advanced Encryption Standard
12. – Specify the encryption password here.
13. – Confirm the encryption password by retyping it here.
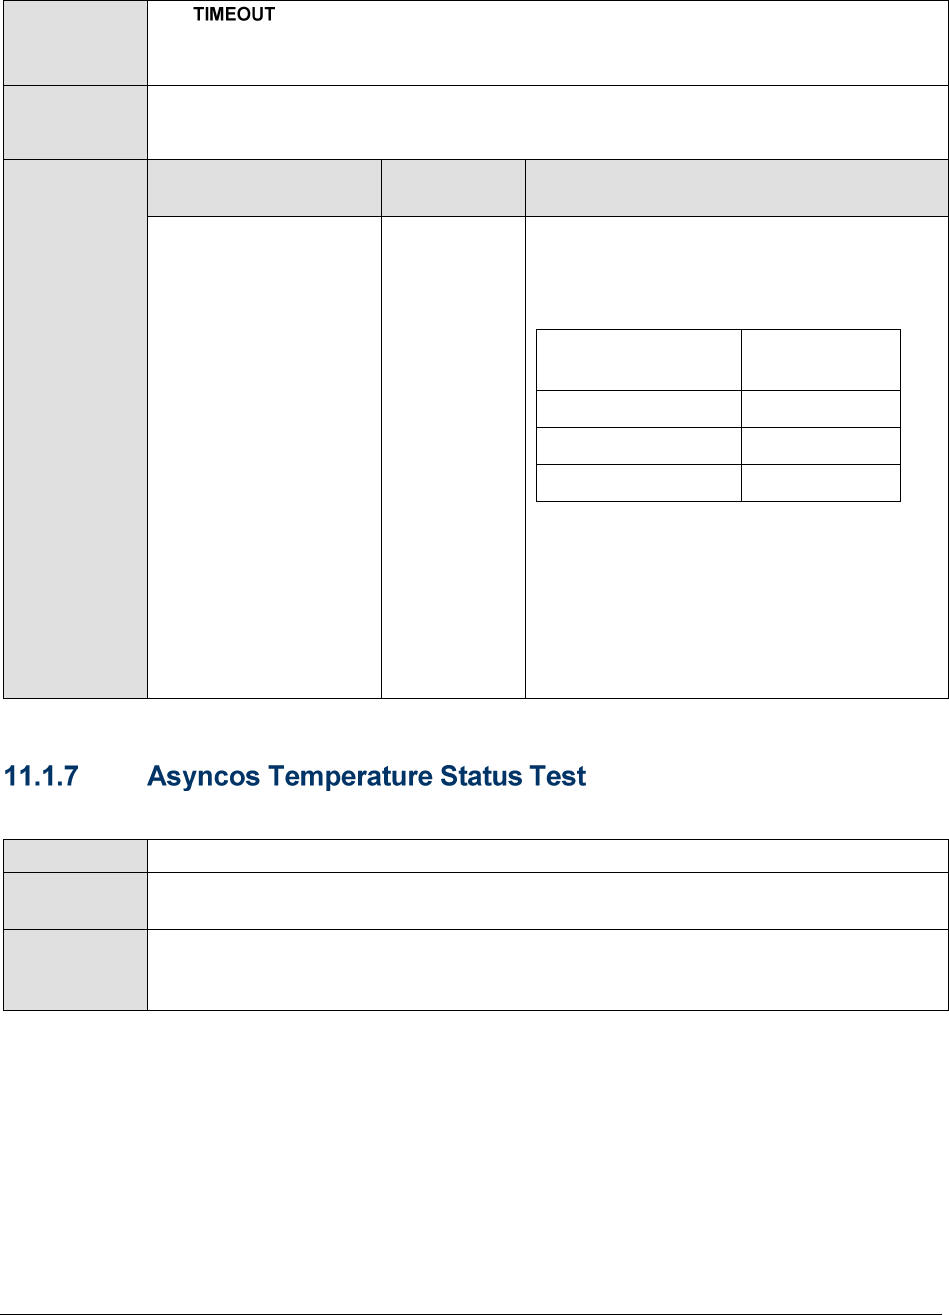
M o n i t o r i n g t h e I r o n P o r t A s y n c O S M a i l S e r v e r
144
14. - Specify the duration (in seconds) within which the SNMP query
executed by this test should time out in the TIMEOUT text box. The default is 10
seconds.
Outputs of the
test
One set of results for the appliance being monitored.
Measurements
made by the
test
Measurement
Measurement
Unit
Interpretation
Raid State:
Indicates the current
status of the RAID.
The states reported by this measure and
the numeric values that correspond to each
state are discussed in the table below:
State
Numeric
Value
Drive Healthy
1
Drive Failure
2
Drive Rebuild
3
Note:
By default, this measure reports the States
listed in the table above to indicate the
RAID status. The graph of this measure
however, represents the status using the
numeric equivalents - 1 to 3.
This test reports the current temperature of the appliance.
Purpose
Reports the current temperature of the appliance
Target of the
test
An IronPort AsyncOS Mail server
Agent
deploying the
test
External/remote agent

M o n i t o r i n g t h e I r o n P o r t A s y n c O S M a i l S e r v e r
145
Configurable
parameters for
the test
1. - How often should the test be executed
2. – The IP address of the Cisco Router.
3. - The port number through which the Cisco router exposes its SNMP
MIB. The default value is 161.
4. – By default, the eG agent supports SNMP version 1. Accordingly,
the default selection in the list is v1. However, if a different SNMP
framework is in use in your environment, say SNMP v2 or v3, then select the
corresponding option from this list.
5. – The SNMP community name that the test uses to
communicate with the Cisco router. This parameter is specific to SNMP v1 and v2
only. Therefore, if the chosen is v3, then this parameter will not
appear.
6. – This parameter appears only when v3 is selected as the
. SNMP version 3 (SNMPv3) is an extensible SNMP Framework
which supplements the SNMPv2 Framework, by additionally supporting message
security, access control, and remote SNMP configuration capabilities. To extract
performance statistics from the MIB using the highly secure SNMP v3 protocol,
the eG agent has to be configured with the required access privileges – in other
words, the eG agent should connect to the MIB using the credentials of a user
with access permissions to be MIB. Therefore, specify the name of such a user
against the parameter.
7. – Specify the password that corresponds to the above-mentioned
. This parameter once again appears only if the
selected is v3.
8. – Confirm the by retyping it here.
9. – This parameter too appears only if v3 is selected as the
. From the list box, choose the authentication algorithm
using which SNMP v3 converts the specified and into a
32-bit format to ensure security of SNMP transactions. You can choose between
the following options:
MD5 – Message Digest Algorithm
SHA – Secure Hash Algorithm
10. – This flag appears only when v3 is selected as the .
By default, the eG agent does not encrypt SNMP requests. Accordingly, the
is set to NO by default. To ensure that SNMP requests sent by the
eG agent are encrypted, select the YES option.
11. – If the is set to YES, then you will have to mention
the encryption type by selecting an option from the list. SNMP v3
supports the following encryption types:
DES – Data Encryption Standard
AES – Advanced Encryption Standard
12. – Specify the encryption password here.
13. – Confirm the encryption password by retyping it here.
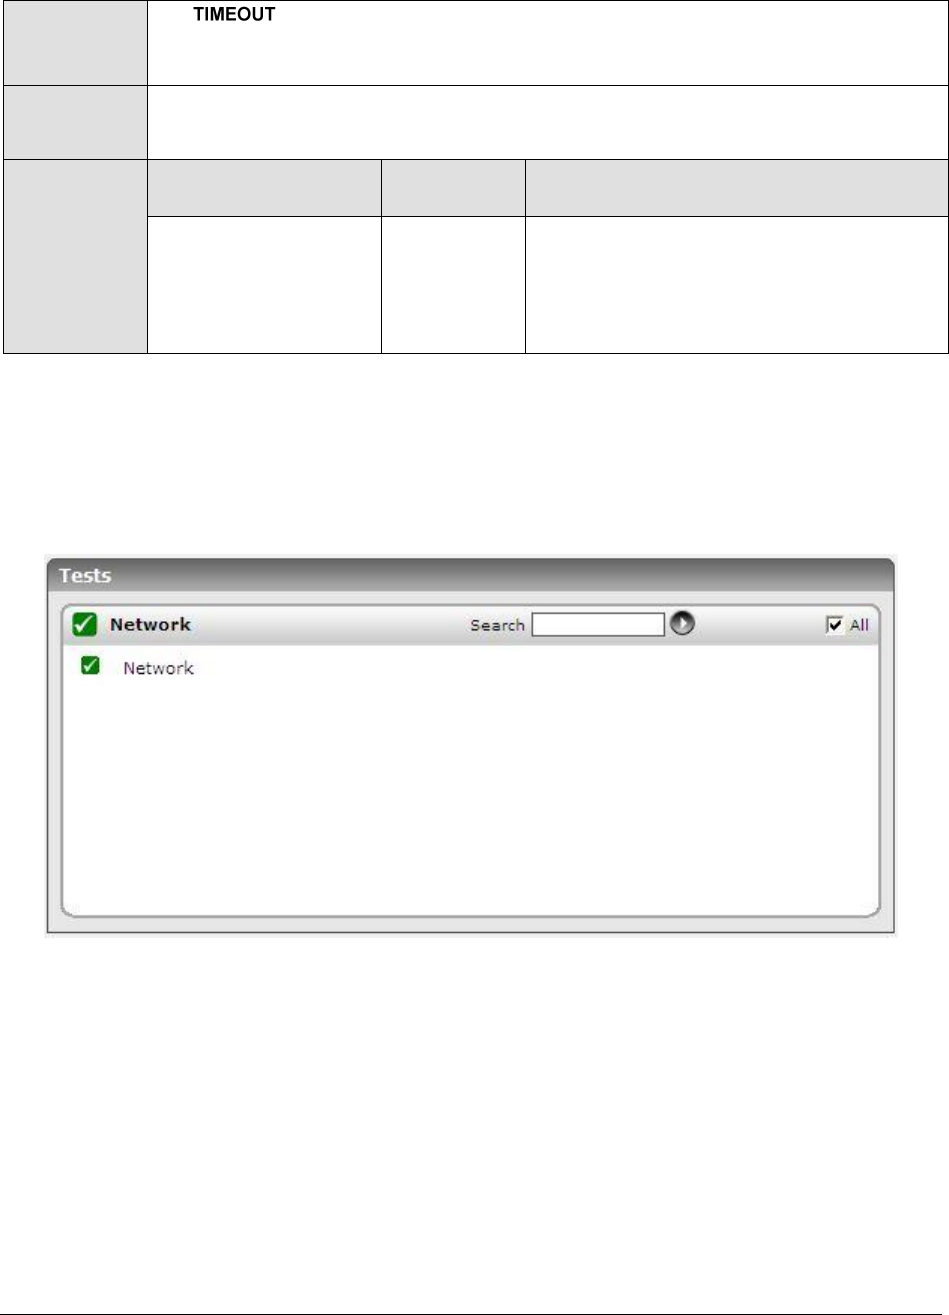
M o n i t o r i n g t h e I r o n P o r t A s y n c O S M a i l S e r v e r
146
14. - Specify the duration (in seconds) within which the SNMP query
executed by this test should time out in the TIMEOUT text box. The default is 10
seconds.
Outputs of the
test
One set of results for the appliance being monitored.
Measurements
made by the
test
Measurement
Measurement
Unit
Interpretation
Current
temperature:
Indicates the current
temperature of the
appliance.
Celsius
A high value could be indicative of a
problem, and may hence require further
investigation.
11.2 The Network Layer
The test mapped to this layer reveals whether/not the appliance is available over the network, and
how good/bad the network connection is.
Figure 11.3: The test mapped to this layer
Since the test mapped to this layer has already been discussed in the Monitoring Unix and Windows
Servers document, let us proceed to the next layer.
11.3 The Asyncos Service Layer
Using the tests mapped to this layer, you can quickly capture issues with the DNS server, the email
queue, and mail thread usage.
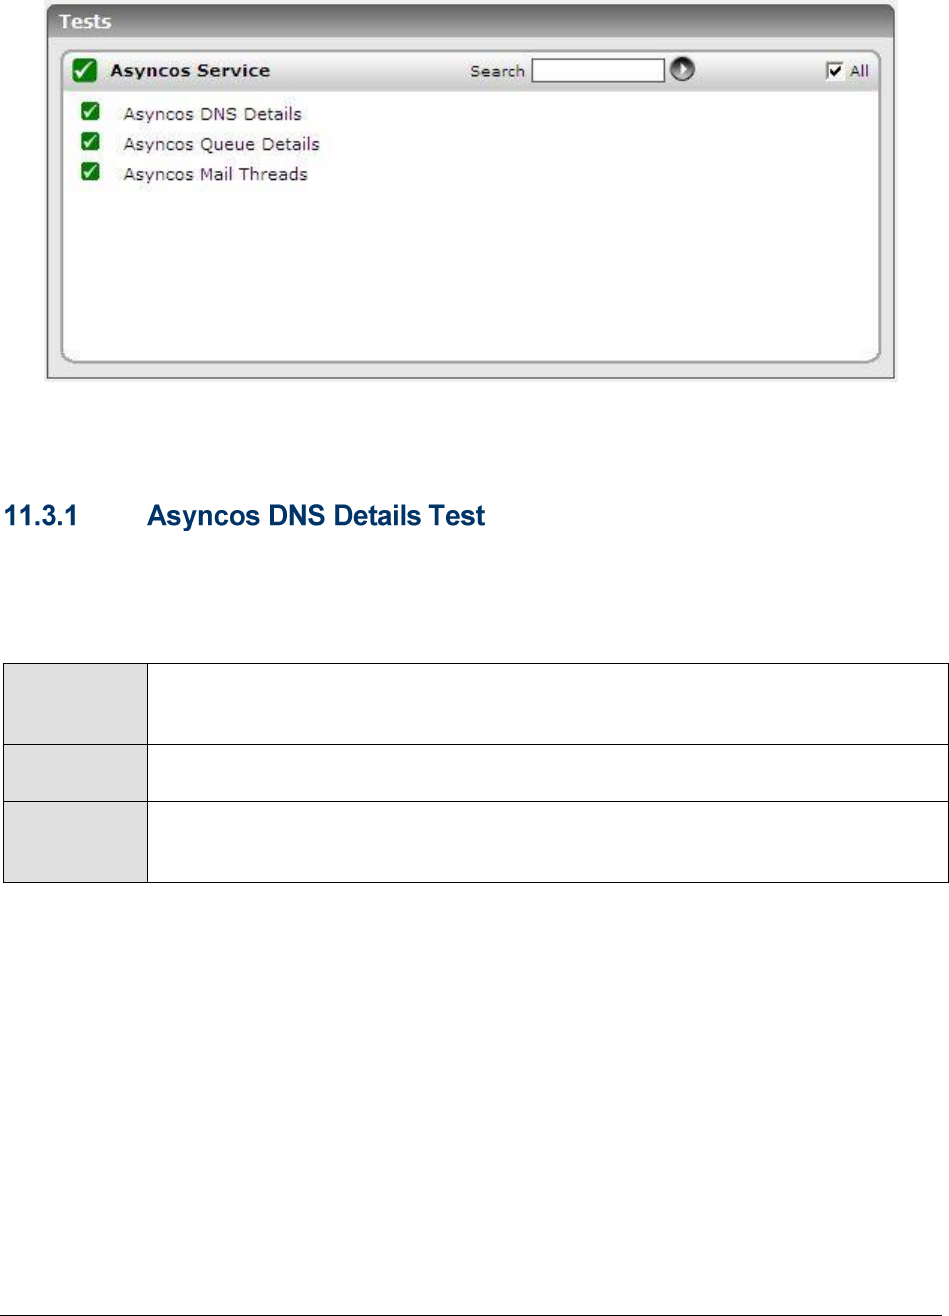
M o n i t o r i n g t h e I r o n P o r t A s y n c O S M a i l S e r v e r
147
Figure 11.4: The tests mapped to the Asyncos Service layer
This test reveals whether/not the DNS server was able to service all host name resolution requests it
received, so that administrators can determine whether issues with the DNS server had contributed to
many mails being undelivered by the appliance.
Purpose
Reveals whether/not the DNS server was able to service all host name resolution
requests it received, so that administrators can determine whether issues with the
DNS server had contributed to many mails being undelivered by the appliance
Target of the
test
An IronPort AsyncOS Mail server
Agent
deploying the
test
External/remote agent

M o n i t o r i n g t h e I r o n P o r t A s y n c O S M a i l S e r v e r
148
Configurable
parameters for
the test
1. - How often should the test be executed
2. – The IP address of the Cisco Router.
3. - The port number through which the Cisco router exposes its SNMP
MIB. The default value is 161.
4. – By default, the eG agent supports SNMP version 1. Accordingly,
the default selection in the list is v1. However, if a different SNMP
framework is in use in your environment, say SNMP v2 or v3, then select the
corresponding option from this list.
5. – The SNMP community name that the test uses to
communicate with the Cisco router. This parameter is specific to SNMP v1 and v2
only. Therefore, if the chosen is v3, then this parameter will not
appear.
6. – This parameter appears only when v3 is selected as the
. SNMP version 3 (SNMPv3) is an extensible SNMP Framework
which supplements the SNMPv2 Framework, by additionally supporting message
security, access control, and remote SNMP configuration capabilities. To extract
performance statistics from the MIB using the highly secure SNMP v3 protocol,
the eG agent has to be configured with the required access privileges – in other
words, the eG agent should connect to the MIB using the credentials of a user
with access permissions to be MIB. Therefore, specify the name of such a user
against the parameter.
7. – Specify the password that corresponds to the above-mentioned
. This parameter once again appears only if the
selected is v3.
8. – Confirm the by retyping it here.
9. – This parameter too appears only if v3 is selected as the
. From the list box, choose the authentication algorithm
using which SNMP v3 converts the specified and into a
32-bit format to ensure security of SNMP transactions. You can choose between
the following options:
MD5 – Message Digest Algorithm
SHA – Secure Hash Algorithm
10. – This flag appears only when v3 is selected as the .
By default, the eG agent does not encrypt SNMP requests. Accordingly, the
is set to NO by default. To ensure that SNMP requests sent by the
eG agent are encrypted, select the YES option.
11. – If the is set to YES, then you will have to mention
the encryption type by selecting an option from the list. SNMP v3
supports the following encryption types:
DES – Data Encryption Standard
AES – Advanced Encryption Standard
12. – Specify the encryption password here.
13. – Confirm the encryption password by retyping it here.
M o n i t o r i n g t h e I r o n P o r t A s y n c O S M a i l S e r v e r
149
14. - Specify the duration (in seconds) within which the SNMP query
executed by this test should time out in the TIMEOUT text box. The default is 10
seconds.
Outputs of the
test
One set of results for the appliance being monitored.
Measurements
made by the
test
Measurement
Measurement
Unit
Interpretation
Outstanding dns
requests:
Indicates the number
of DNS requests that
have been sent but for
which no reply has
been received yet.
Number
A high value could indicate a bottleneck
with the DNS server.
Pending dns
requests:
Indicates the number
of DNS requests that
have not been sent to
the DNS server.
Number
This test monitors the usage of the email queue by the IronPort appliance.
Purpose
Monitors the usage of the email queue by the IronPort appliance
Target of the
test
An IronPort AsyncOS Mail server
Agent
deploying the
test
External/remote agent

M o n i t o r i n g t h e I r o n P o r t A s y n c O S M a i l S e r v e r
150
Configurable
parameters for
the test
1. - How often should the test be executed
2. – The IP address of the Cisco Router.
3. - The port number through which the Cisco router exposes its SNMP
MIB. The default value is 161.
4. – By default, the eG agent supports SNMP version 1. Accordingly,
the default selection in the list is v1. However, if a different SNMP
framework is in use in your environment, say SNMP v2 or v3, then select the
corresponding option from this list.
5. – The SNMP community name that the test uses to
communicate with the Cisco router. This parameter is specific to SNMP v1 and v2
only. Therefore, if the chosen is v3, then this parameter will not
appear.
6. – This parameter appears only when v3 is selected as the
. SNMP version 3 (SNMPv3) is an extensible SNMP Framework
which supplements the SNMPv2 Framework, by additionally supporting message
security, access control, and remote SNMP configuration capabilities. To extract
performance statistics from the MIB using the highly secure SNMP v3 protocol,
the eG agent has to be configured with the required access privileges – in other
words, the eG agent should connect to the MIB using the credentials of a user
with access permissions to be MIB. Therefore, specify the name of such a user
against the parameter.
7. – Specify the password that corresponds to the above-mentioned
. This parameter once again appears only if the
selected is v3.
8. – Confirm the by retyping it here.
9. – This parameter too appears only if v3 is selected as the
. From the list box, choose the authentication algorithm
using which SNMP v3 converts the specified and into a
32-bit format to ensure security of SNMP transactions. You can choose between
the following options:
MD5 – Message Digest Algorithm
SHA – Secure Hash Algorithm
10. – This flag appears only when v3 is selected as the .
By default, the eG agent does not encrypt SNMP requests. Accordingly, the
is set to NO by default. To ensure that SNMP requests sent by the
eG agent are encrypted, select the YES option.
11. – If the is set to YES, then you will have to mention
the encryption type by selecting an option from the list. SNMP v3
supports the following encryption types:
DES – Data Encryption Standard
AES – Advanced Encryption Standard
12. – Specify the encryption password here.
13. – Confirm the encryption password by retyping it here.
M o n i t o r i n g t h e I r o n P o r t A s y n c O S M a i l S e r v e r
151
14. - Specify the duration (in seconds) within which the SNMP query
executed by this test should time out in the TIMEOUT text box. The default is 10
seconds.
Outputs of the
test
One set of results for the appliance being monitored.
Measurements
made by the
test
Measurement
Measurement
Unit
Interpretation
Queue utilization:
Indicates the
percentage of the
email queue that is
being utilized.
Percent
A high value is typically indicative of a large
number of undelivered emails. If left
unchecked, it can overwhelm the email
service, thereby significantly degrading its
overall performance.
Availability:
Indicates the current
state of the email
queue.
The states reported by this measure and
the numeric values that correspond to each
state are discussed in the table below:
State
Numeric
Value
QueueSpace
Available
1
QueueSpace
Shortage
2
Queue Full
3
Note:
By default, this measure reports the States
listed in the table above to indicate the
email queue status. The graph of this
measure however, represents the status
using the numeric equivalents - 1 to 3.
This test reports the number of mail threads in use and the count of open sockets on the appliance.
Purpose
Reports the number of mail threads in use and the count of open sockets on the
appliance
Target of the
test
An IronPort AsyncOS Mail server
Agent
deploying the
test
External/remote agent

M o n i t o r i n g t h e I r o n P o r t A s y n c O S M a i l S e r v e r
152
Configurable
parameters for
the test
1. - How often should the test be executed
2. – The IP address of the Cisco Router.
3. - The port number through which the Cisco router exposes its SNMP
MIB. The default value is 161.
4. – By default, the eG agent supports SNMP version 1. Accordingly,
the default selection in the list is v1. However, if a different SNMP
framework is in use in your environment, say SNMP v2 or v3, then select the
corresponding option from this list.
5. – The SNMP community name that the test uses to
communicate with the Cisco router. This parameter is specific to SNMP v1 and v2
only. Therefore, if the chosen is v3, then this parameter will not
appear.
6. – This parameter appears only when v3 is selected as the
. SNMP version 3 (SNMPv3) is an extensible SNMP Framework
which supplements the SNMPv2 Framework, by additionally supporting message
security, access control, and remote SNMP configuration capabilities. To extract
performance statistics from the MIB using the highly secure SNMP v3 protocol,
the eG agent has to be configured with the required access privileges – in other
words, the eG agent should connect to the MIB using the credentials of a user
with access permissions to be MIB. Therefore, specify the name of such a user
against the parameter.
7. – Specify the password that corresponds to the above-mentioned
. This parameter once again appears only if the
selected is v3.
8. – Confirm the by retyping it here.
9. – This parameter too appears only if v3 is selected as the
. From the list box, choose the authentication algorithm
using which SNMP v3 converts the specified and into a
32-bit format to ensure security of SNMP transactions. You can choose between
the following options:
MD5 – Message Digest Algorithm
SHA – Secure Hash Algorithm
10. – This flag appears only when v3 is selected as the .
By default, the eG agent does not encrypt SNMP requests. Accordingly, the
is set to NO by default. To ensure that SNMP requests sent by the
eG agent are encrypted, select the YES option.
11. – If the is set to YES, then you will have to mention
the encryption type by selecting an option from the list. SNMP v3
supports the following encryption types:
DES – Data Encryption Standard
AES – Advanced Encryption Standard
12. – Specify the encryption password here.
13. – Confirm the encryption password by retyping it here.

M o n i t o r i n g t h e I r o n P o r t A s y n c O S M a i l S e r v e r
153
14. - Specify the duration (in seconds) within which the SNMP query
executed by this test should time out in the TIMEOUT text box. The default is 10
seconds.
Outputs of the
test
One set of results for the appliance being monitored.
Measurements
made by the
test
Measurement
Measurement
Unit
Interpretation
Open socket count:
Indicates the number
of open sockets or
files.
Number
Mail thread count:
Indicates the number
of threads that
perform tasks related
to mail transfer.
Number

C o n c l u s i o n
154
Conclusion
This document has described in detail the monitoring paradigm used and the measurement
capabilities of the eG Enterprise suite of products with respect to mail servers. For details of how to
administer and use the eG Enterprise suite of products, refer to the user manuals.
We will be adding new measurement capabilities into the future versions of the eG Enterprise suite. If
you can identify new capabilities that you would like us to incorporate in the eG Enterprise suite of
products, please contact support@eginnovations.com. We look forward to your support and
cooperation. Any feedback regarding this manual or any other aspects of the eG Enterprise suite can
be forwarded to feedback@eginnovations.com.
Chapter
12
