Manual Monitoring SAP Environments
User Manual: Monitoring SAP Environments
Open the PDF directly: View PDF ![]() .
.
Page Count: 302 [warning: Documents this large are best viewed by clicking the View PDF Link!]

Monitoring SAP Environments
eG Enterprise v6

Restricted Rights Legend
The information contained in this document is confidential and subject to change without notice. No part of this
document may be reproduced or disclosed to others without the prior permission of eG Innovations Inc. eG
Innovations Inc. makes no warranty of any kind with regard to the software and documentation, including, but not
limited to, the implied warranties of merchantability and fitness for a particular purpose.
Trademarks
Microsoft Windows, Windows NT, Windows 2000, Windows 2003 and Windows 2008 are either registered trademarks
or trademarks of Microsoft Corporation in United States and/or other countries.
The names of actual companies and products mentioned herein may be the trademarks of their respective owners.
Copyright
©2014 eG Innovations Inc. All rights reserved.
Table of Contents
INTRODUCTION .................................................................................................................................................................................... 1
MONITORING THE SAP ABAP INSTANCE ................................................................................................................................... 2
2.1 Why Monitor the SAP AS ABAP System? ............................................................................................................................. 3
2.2 How does eG Enterprise Monitor the SAP AS ABAP System?............................................................................................. 4
2.3 The SAP Basis Layer................................................................................................................................................................. 6
2.3.1 Enqueue Status Test .......................................................................................................................................................... 7
2.3.2 R3 Buffers Test................................................................................................................................................................ 10
2.3.3 Memory Management Test ............................................................................................................................................. 20
2.3.4 Roll Page Test .................................................................................................................................................................. 23
2.4 The SAP Work Processses Layer ........................................................................................................................................... 26
2.4.1 Spool Service Test ........................................................................................................................................................... 28
2.4.2 Background Processes Test ............................................................................................................................................ 31
2.4.3 Background Services Test............................................................................................................................................... 32
2.4.4 Dialog Activity Test ........................................................................................................................................................ 34
2.4.5 Table Space Test.............................................................................................................................................................. 36
2.4.6 Database Buffer Test ....................................................................................................................................................... 38
2.4.7 Sap Group Lb Test .......................................................................................................................................................... 40
2.4.8 Sap Message Information Test ....................................................................................................................................... 42
2.4.9 Sap Messages Test........................................................................................................................................................... 43
2.4.10 Spool Processes Test ....................................................................................................................................................... 45
2.4.11 Spool requests Test.......................................................................................................................................................... 49
2.4.12 Work processes Test........................................................................................................................................................ 52
2.4.13 Update Performance Test ................................................................................................................................................ 57
2.4.14 R3 Database Log Test ..................................................................................................................................................... 59
2.4.15 Enqueue Test ................................................................................................................................................................... 63
2.4.16 Database consistency Test .............................................................................................................................................. 66
2.4.17 Update requests Test ....................................................................................................................................................... 68
2.4.18 Idoc wait monitor Test .................................................................................................................................................... 72
2.5 The SAP Workload Layer ....................................................................................................................................................... 77
2.5.1 Background jobs Test ...................................................................................................................................................... 78
2.5.2 Job statistics Test ............................................................................................................................................................. 82
2.5.3 Task Types Load Test ..................................................................................................................................................... 85
2.5.4 Transaction Load Test ..................................................................................................................................................... 98
2.6 The SAP Gateway Layer ....................................................................................................................................................... 111
2.6.1 IDoc Statistics Test........................................................................................................................................................ 111
2.6.2 qRFC Queues Test......................................................................................................................................................... 115
2.6.3 Gateways Test................................................................................................................................................................ 122
2.6.4 RFC Calls Test............................................................................................................................................................... 124
2.6.5 tRFC calls Test .............................................................................................................................................................. 126
2.6.6 Internet Communication Manager Test ....................................................................................................................... 129
2.7 The SAP Service Layer ......................................................................................................................................................... 134
2.7.1 Batch Inputs Test ........................................................................................................................................................... 135
2.7.2 Event linkages Test ....................................................................................................................................................... 141
2.7.3 R3 Dumps Test .............................................................................................................................................................. 144
2.7.4 R3 Status Messages Test ............................................................................................................................................... 146
2.7.5 Dialog Response Test .................................................................................................................................................... 148
2.7.6 R3 Connection Test ....................................................................................................................................................... 151
2.7.7 R3 Users Test................................................................................................................................................................. 153
2.7.8 R3 Log Test ................................................................................................................................................................... 155
2.7.9 Syslog errors Test .......................................................................................................................................................... 159
2.7.10 TemSe Test .................................................................................................................................................................... 162
2.7.11 CTS Monitor Test .......................................................................................................................................................... 164
2.7.12 New alerts in the last measure period .......................................................................................................................... 167
2.7.13 Performance Attributes for Monitors ........................................................................................................................... 172
2.8 The SAP Users Layer ............................................................................................................................................................ 180
2.8.1 User Load Test............................................................................................................................................................... 180
2.8.2 User logons Test ............................................................................................................................................................ 192
2.9 Viewing the SAP Alerts ........................................................................................................................................................ 195
2.10 Viewing the Performance Attribute Tree ......................................................................................................................... 199
MONITORING THE INTERNET TRANSACTION SERVER (ITS)........................................................................................ 200
3.1 The AGate Server layer ......................................................................................................................................................... 201
3.1.1 AGate Server Test ......................................................................................................................................................... 201
3.2 The AGate Service Layer ...................................................................................................................................................... 203
3.2.1 AGate Access Test ........................................................................................................................................................ 203
3.2.2 AGate Status Test .......................................................................................................................................................... 204
3.2.3 AGate Transactions Test ............................................................................................................................................... 205
MONITORING THE SAP WEB APPLICATION SERVER ....................................................................................................... 207
4.1 The SAP WAS Kernel Layer ................................................................................................................................................ 209
4.1.1 Kernel Config Test ........................................................................................................................................................ 210
4.1.2 Application Threads Test .............................................................................................................................................. 218
4.1.3 Cluster Connections Test .............................................................................................................................................. 221
4.1.4 Pool Data Aggregate Test ............................................................................................................................................. 224
4.1.5 System Threads Test ..................................................................................................................................................... 226
4.2 The Web Server Layer........................................................................................................................................................... 229
4.3 The SAP WAS Service Layer ............................................................................................................................................... 229
4.3.1 MBeans Cache Test ....................................................................................................................................................... 230
4.3.2 HTTP Connections Test ................................................................................................................................................ 232
4.3.3 HTTP Requests Test...................................................................................................................................................... 235
4.3.4 JMX Notify Queue Test ................................................................................................................................................ 237
4.3.5 Log Config Test ............................................................................................................................................................. 239
4.3.6 MBeans Register Test ................................................................................................................................................... 241
4.3.7 P4 Connections Test ...................................................................................................................................................... 243
4.3.8 P4 Usage Test ................................................................................................................................................................ 245
4.3.9 Sap WAS Beans Test .................................................................................................................................................... 247
4.3.10 Sap WAS Memory Test ................................................................................................................................................ 251
4.3.11 Sap WAS Sessions Test ................................................................................................................................................ 252
4.3.12 Sap WAS Transactions Test ......................................................................................................................................... 255
4.3.13 Timeouts Test ................................................................................................................................................................ 257
4.3.14 WasJndiRegistry Test.................................................................................................................................................... 259
4.3.15 WebContainer Test ........................................................................................................................................................ 261
MONITORING MAXDB .................................................................................................................................................................... 265
5.1 The MAXDB Net Layer ........................................................................................................................................................ 266
5.1.1 Db Connection Test ....................................................................................................................................................... 267
5.2 The MAXDB Memory Layer ............................................................................................................................................... 268
5.2.1 Db Data Area Stats Test ................................................................................................................................................ 268
5.2.2 Db Locks Test ................................................................................................................................................................ 270
5.2.3 Db Lock Waits Test....................................................................................................................................................... 273
5.2.4 Db Log Queue Test ....................................................................................................................................................... 274
5.2.5 Db Log Test ................................................................................................................................................................... 276
5.2.6 Db Oms Stats Test ......................................................................................................................................................... 278
5.3 The MAXDB Cache Layer ................................................................................................................................................... 280
5.3.1 Db Data Cache Test....................................................................................................................................................... 280
5.3.2 Db I/O Cache Test ......................................................................................................................................................... 282
5.4 The MAXDB Service Layer ................................................................................................................................................. 284
5.4.1 Db Session Cache Test .................................................................................................................................................. 285
5.4.2 Db Activity Test ............................................................................................................................................................ 287
5.4.3 Db I/O Stats Test ........................................................................................................................................................... 288
5.4.4 Db Query Test ............................................................................................................................................................... 290
5.4.5 Db Sessions Test............................................................................................................................................................ 292
CONCLUSION ..................................................................................................................................................................................... 294
Table of Figures
Figure 2.1: A SAP dual-stack system ...............................................................................................................................................................2
Figure 2.2: The structure of an ABAP application server ...................................................................................................................................3
Figure 2.3: The layer model of a SAP R/3 server ..............................................................................................................................................4
Figure 2.4: The tests associated with the R/3 Basis System layer .......................................................................................................................6
Figure 2.5: The Buffers Monitor tree-structure................................................................................................................................................ 12
Figure 2.6: Opening the SAPlogon tool .......................................................................................................................................................... 15
Figure 2.7: Clicking on the Logon button ....................................................................................................................................................... 15
Figure 2.8: Logging into the SAP Easy access console .................................................................................................................................... 16
Figure 2.9: Accessing the Client Maintenance node ........................................................................................................................................ 16
Figure 2.10: The Clients list........................................................................................................................................................................... 17
Figure 2.11: Opening the SAPlogon tool ........................................................................................................................................................ 18
Figure 2.12: Clicking on the Logon button ..................................................................................................................................................... 18
Figure 2.13: Logging into the SAP Easy access console .................................................................................................................................. 19
Figure 2.14: Navigating to the Control Panel node .......................................................................................................................................... 19
Figure 2.15: Viewing the SAP R/3 server instances......................................................................................................................................... 20
Figure 2.16: Elements of the SAP memory ..................................................................................................................................................... 24
Figure 2.17: The tests associated with the R/3 Components layer..................................................................................................................... 27
Figure 2.18: The Spool System Monitor ......................................................................................................................................................... 47
Figure 2.19: The tests mapped to the SAP Workload Layer ............................................................................................................................. 77
Figure 2.20: The tests associated with the SAP Gateway layer ....................................................................................................................... 111
Figure 2.21: The tests associated with the SAP Service layer ......................................................................................................................... 135
Figure 5.1: The detailed diagnosis of the Total number of alerts measure ....................................................................................................... 171
Figure 2.22: The detailed diagnosis of the Total number of performance attributes measure ............................................................................ 176
Figure 2.23: Selecting a system to login to.................................................................................................................................................... 177
Figure 2.24: Logging into the chosen system ................................................................................................................................................ 177
Figure 2.25: Double-clicking on the CCMS Monitor Sets sub-node ............................................................................................................... 178
Figure 2.26: Viewing the monitor sets and monitors...................................................................................................................................... 179
Figure 2.27: The tests mapped to the SAP Users layer................................................................................................................................... 180
Figure 2.28: The SAP Alerts page with the filter criteria ............................................................................................................................... 196
Figure 2.29: The SAP Alerts page displaying all alerts, regardless of status .................................................................................................... 197
Figure 2.30: The SAP Alerts page displaying only the active alerts ................................................................................................................ 198
Figure 2.31: The Metrics page ..................................................................................................................................................................... 199
Figure 3.1: The layer model of the AGate component of ITS ......................................................................................................................... 201
Figure 3.2: The tests associated with the AGate Server layer ......................................................................................................................... 201
Figure 3.3: The tests associated with the AGate Service layer ........................................................................................................................ 203
Figure 4.1: The SAP Web AS Architecture................................................................................................................................................... 207
Figure 4.2: The layer model of the SAP Web AS .......................................................................................................................................... 208
Figure 4.3: The tests associated with the SAP WAS Kernel layer................................................................................................................... 210
Figure 4.4: Determining the name and cluster ID of a server process ............................................................................................................. 214
Figure 4.5: The SAP Web Application Server ............................................................................................................................................... 215
Figure 4.6: The page showing a dispatcher ID and server ID ......................................................................................................................... 216
Figure 4.7: The instance.properties file......................................................................................................................................................... 217
Figure 4.8: The test executing on the Web Server layer ................................................................................................................................. 229
Figure 4.9: The tests associated with the SAP WAS Service layer ................................................................................................................. 230
Figure 5.2: Layer model of a MaxDB server ................................................................................................................................................. 266
Figure 5.3: The test associated with the MAXDB Net layer ........................................................................................................................... 267
Figure 5.4: The tests associated with the MAXDB Memory layer .................................................................................................................. 268
Figure 5.5: The tests associated with the MAXDB Cache layer ..................................................................................................................... 280
Figure 5.6: The tests associated with the MAXDB Service ............................................................................................................................ 285

I N T R O D U C T I O N
1
Introduction
'Simple' is one word that has never been used to refer to a SAP environment. In fact, with the introduction of the
SAP Enterprise architecture which comprises of multiple tiers of applications to allow for web-based access to SAP
services, IT infrastructures have become even more complex. Although it offers scalability, the SAP Enterprise
architecture makes SAP monitoring and management more challenging. In this architecture, the tight inter-
dependencies between different tiers (web, J2EE, ABAP, database, etc.) implies that a problem in one tier can impact
the other tiers as well. Hence, a seemingly insignificant dip in the performance of one of the application tiers can
result in an administrator's worst nightmare - an infrastructure-wide slowdown! In such a scenario, the
administrator's challenge is how quickly can he/she find out where the problem is - Network? Firewall? Web/Citrix?
J2EE? ABAP instance? Database? - and resolve the problem quickly, so as to ensure high uptime.
The eG SAP monitor offers 100% web-based monitoring of every layer of each tier of the SAP environment from any
where, at any time. Be it a network router, a firewall, a SAP Internet Transaction server, a SAP ABAP instance, the
SAP Netweaver, or an Oracle database, the eG Enterprise suite includes customized models for all of these
infrastructure components. These models determine what metrics are collected, how often, how the results of the
monitoring are interpreted to provide proactive alerts, and how the metrics are correlated to determine where the
root-cause of problems lie.
This document discusses the monitoring model that eG Enterprise prescribes for each element in a typical SAP
infrastructure.
M O N I T O R I N G T H E S A P A B A P I N S T A N C E
2
Monitoring the SAP ABAP Instance
SAP NetWeaver is SAP's integrated technology computing platform and is the technical foundation for many SAP
applications since the SAP Business Suite. It provides the development and runtime environment for SAP applications
and can be used for custom development and integration with other applications and systems.
One of the vital components of SAP NetWeaver is its Application Platform, which is implemented by the SAP
NetWeaver Application Server (a.k.a, the SAP NetWeaver AS or the SAP NW AS).
The SAP NetWeaver Application Server can execute ABAP and/or Java programs, based on how you install the
server.
If you install the SAP Netweaver Application Server as an ABAP system, you will be able to run only ABAP programs
on that server. SAP ERP 6 is one example of a SAP business application that predominantly runs on NW AS ABAP. If
the SAP NW AS is installed as a Java system, then you will only be able to run Java programs on it. The SAP
NetWeaver Portal 7.0 application for instance, runs on NW AS Java. Alternatively, SAP NW AS can also be installed as
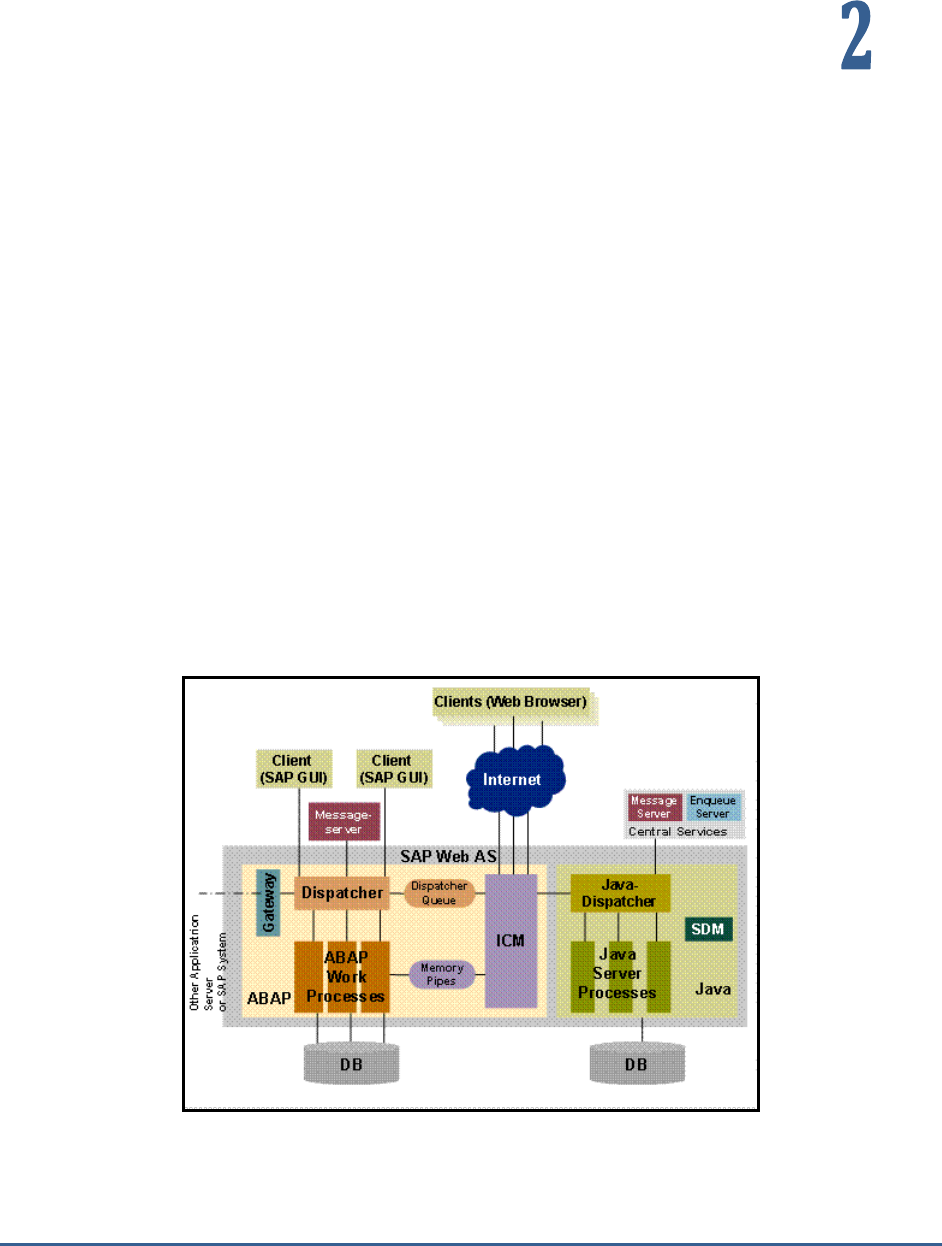
a dual-stack system, where both ABAP and Java programs can be run. For example, SAP PI 7.1 (Process Integration)
runs on a dual stack that includes both AS ABAP and AS Java platforms.
Figure 2.1: A SAP dual-stack system
To ensure that potential performance aberrations with the ABAP/Java systems are captured and resolved before
users complain, eG Enterprise provides two dedicated monitoring models – one for each of the installation modes of
the SAP NW AS. While the
SAP ABAP Instance
monitoring model focuses on the problems and performance of SAP

M O N I T O R I N G T H E S A P A B A P I N S T A N C E
3
NW AS ABAP system, the
SAP WAS
monitoring model focuses on the health and issues related to the SAP NW AS
Java system.
This chapter elaborately discusses the SAP NW AS ABAP system and the
SAP ABAP Instance
monitoring model that
corresponds to it.
2.1 Why Monitor the SAP AS ABAP System?
ABAP application servers are important software components of NetWeaver AS ABAP since all ABAP programs run on
these servers. These application servers execute ABAP applications and communicate with the presentation
components, the database, and also with each other, using the message server. The following diagram shows the
structure of an ABAP application server:
Figure 2.2: The structure of an ABAP application server
As can be inferred from Figure 2.2, a typical SAP NetWeaver ABAP framework is structured as a multi-tier
infrastructure, where the SAP GUI serves as the web front-end through which users login and place requests, the
ABAP application server serves as the middle-ware that processes the user requests and sends out responses to the
user, and a database server functions as the backend where processed data is stored for posterity.
If you zoom into the ABAP application server tier of Figure 2.2 above, you will notice that, in addition to several work
processes, the ABAP application server contains a dispatcher, a gateway and the shared memory. The tasks of these
components are briefly described in the following:
Work Processes: Work processes are components that are able to execute an application (that is,
one dialog step each). Each work process is linked to a memory area containing the context of the
application being run. The context contains the current data for the application program. This needs
to be available in each dialog step.
Dispatcher: The dispatcher is the link between the work processes and the users logged onto the
ABAP application server (that is, the SAP GUIs of theseusers). Its task is to receive requests for dialog
M O N I T O R I N G T H E S A P A B A P I N S T A N C E
4
steps from the SAP GUI and direct them to a free work process. In the same way, it directs screen
output resulting from the dialog step back to the appropriate user.
Gateway: This is the interface for the communication protocols of NetWeaver AS ABAP (RFC,
CPI/C). It can communicate with other ABAP application servers of the same NW AS, with other SAP
Systems, or with external non-SAP systems.
Shared Memory: All of the work processes on an ABAP application server use a common main
memory area called shared memory to save contexts or to buffer constant data locally. The resources
that all work processes use (such as programs and table contents) are contained in shared memory
Since these components are closely inter-related to each other, the problem in any one component can adversely
impact the performance of the other components, ultimately delaying the access to and the execution of ABAP
applications running on the AS ABAP application server. SAP administrators are therefore faced with the challenge of
not just proactively detecting such a slowdown, but also quickly and accurately diagnosing the reason for the same –
is it because the dispatcher is unavailable? is it because the gateway has failed? Is it owing to the lack of free work
processes? or is due to poor memory management by the ABAP system? This is where eG’s
SAP AS ABAP Instance
monitoring model (see Figure 2.2) helps!
Figure 2.3: The layer model of a SAP R/3 server
This model determines what metrics are collected, how often, how the results of the monitoring are interpreted to
provide proactive alerts, and how the metrics are correlated to determine where the root-cause of problems lie.
2.2 How does eG Enterprise Monitor the SAP AS ABAP
System?
To collect the metrics, this
SAP AS ABAP Instance
model takes advantage of the CCMS SAP monitoring architecture.
Using SAP's CCMS interfaces, eG agents collect and report on hundreds of performance and availability metrics of all
the components of the SAP NW AS ABAP system - from the host operating system, to the network, to the critical SAP
processes, the SAP database, SAP background jobs, SAP users, trasactions, etc.

M O N I T O R I N G T H E S A P A B A P I N S T A N C E
5
The metrics so collected enable SAP administrators to find answers to queries that have for long hounded SAP ABAP
administrators:
SAP Service
Monitoring
Is the SAP service working well? What are the response times? Is any step
slowing down the entire service interaction?
Are the critical application processes running? What is their resource usage?
Network & System
Monitoring
How is the network performance impacting the overall service performance?
Are the servers properly sized in terms of CPU, memory, disk activity, etc.?
Are there any critical alerts in the system event logs?
Web Application
Server Monitoring
How many sessions are currently being handled by the SAP web/application
server, and are there sufficient processes configured to handle the load?
Is the workload properly balanced across SAP web application server
instances?
What is the processing time of critical transactions on the server?
Were there any errors while connecting to the R/3 server?
Is the application server’s memory adequately sized? Is the free memory too
low?
SAP R/3 Server
Monitoring
Are the buffers of the SAP R/3 server sized appropriately? Are there unusually
high swap ins/outs?
How many requests are queued waiting for free worker processes or data
locks?
What jobs are executing on the server ? Is the server adequately configured to
handle the load?
What time of day/day of week is the server activity at its peak and what jobs
are executing then?
Are there sufficient dialog processes configured to handle incoming user
requests?
Are there any ABAP dumps happening, indicating errors in the R/3 system?
SAP R/3 Database
Monitoring
Is the SAP R/3 database accessible? How are the critical cache hit ratios of the
database server?
Are any of the database tablespaces reaching capacity?
Monitoring SAP R/3
Alerts
How many alerts have been raised on the SAP R/3 server? Are too many alerts
active?
Have too many red and yellow alerts been raised on the SAP R/3 server?
Have any alerts auto-completed?
Monitoring
Performance
Attributes of the SAP
R/3 Server
How many performance attributes are available for each of the configured
monitors?
Does any monitor have too many red and yellow performance attributes? If so,
which monitor is this?
Which monitor has inactive performance attributes?
M O N I T O R I N G T H E S A P A B A P I N S T A N C E
6
This chapter will discuss the top 6 layers of the layer model depicted by Figure 2.2, as all the other layers have been
discussed in the
Monitoring Unix and Windows Servers
document.
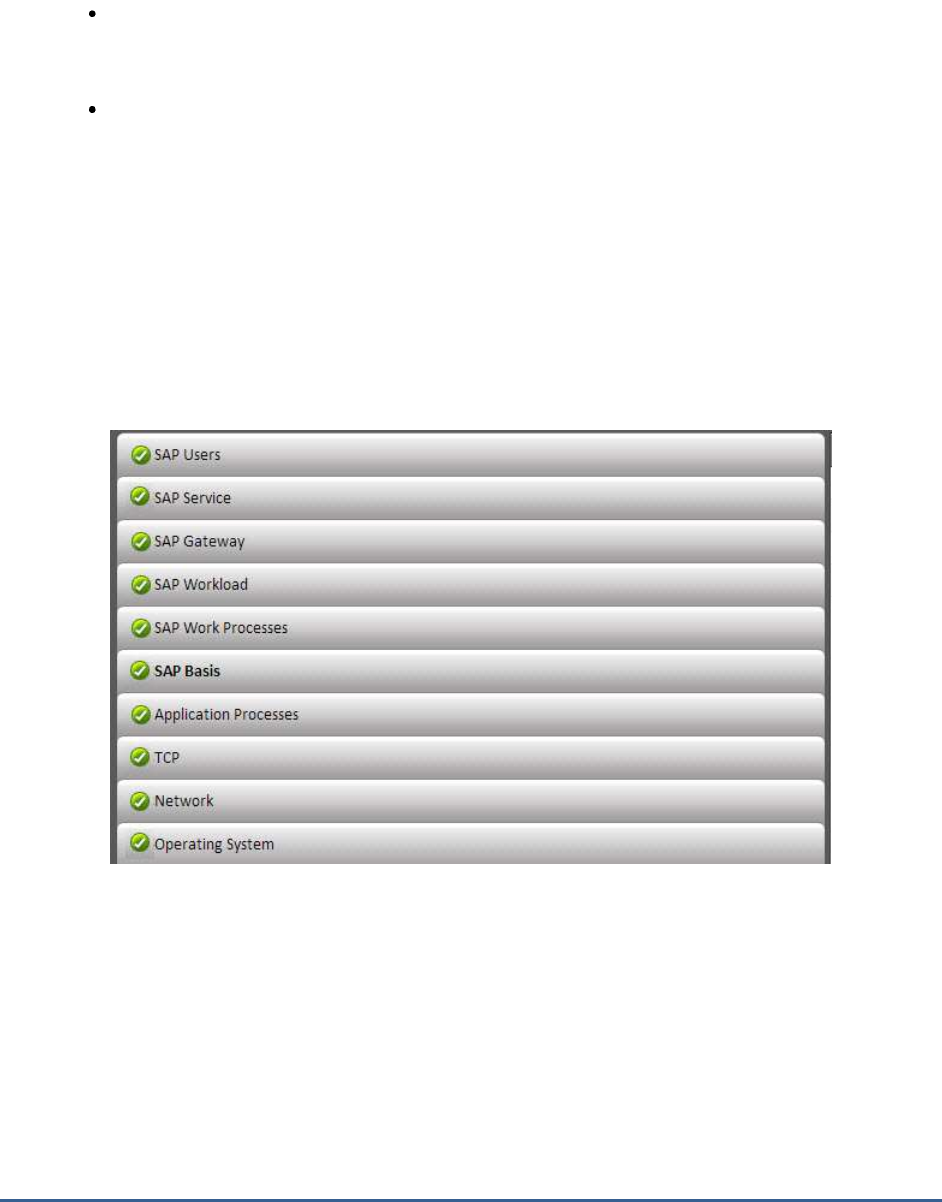
2.3 The SAP Basis Layer
Using the tests depicted in Figure 2.4.3, administrators can assess the efficiency with which the SAP NW AS ABAP
system manages its memory resources.
Figure 2.4: The tests associated with the R/3 Basis System layer

M O N I T O R I N G T H E S A P A B A P I N S T A N C E
7
2.3.1 Enqueue Status Test
The Enqueue service allows ABAP applications to lock data so that only they can use it. The locking of the data
avoids parallel changes to the data, which would lead to data inconsistency. The enqueue work process is in charge
of the lock management system. It allows multiple application servers to synchronize their access to the database
and maintain data consistency. The locks are managed by the enqueue work process using a lock table that resides
in the main memory. The enqueue work process sets an SAP lock by writing entries in the lock table; but prior to
that, the enqueue work process checks the lock table to determine whether/not the requested lock object is already
locked, and if locked, what type of lock is active on the object.
While SAP supports many types of locks, from a performance perspective, the following types are most critical:
Exclusive: Exclusive locks are used to avoid parallel modification of the data, which means that
exclusively locked data can be displayed or modified by only one user.
Exclusive but not cumulative: Locks of this type can be called only once. So a lock request will be
rejected if an exclusive lock already exists.
Too many exclusive locks held for long durations can be detrimental to SAP system performance, as they can
block users from updating critical transactions. This is why, SAP administrators need to keep track of such locks,
promptly detect unreleased locks, and figure out the reasons for the same. To enable this lock analysis, eG
Enterprise provides the Enqueue Status test. For each exclusive lock type (i.e., exclusive and exclusive but not
cumulative), this test reports the number of locks of that type for which entries exist in the lock table and the
number of locks that have remained active over different time periods ranging from 1 hour to over 1 day. In the
process, the test points administrators to those lock types that were unreleased for significantly long time
windows, thus impacting SAP system performance. Detailed metrics provided by the test will lead administrators
straight to the exact locks that were held for broad time frames and the user who held them!
Purpose
For each exclusive lock type (i.e., exclusive and exclusive but not cumulative), this test
reports the number of locks of that type for which entries exist in the lock table and the
number of locks that have remained active over different time periods ranging from 1 hour
to over 1 day. In the process, the test points administrators to those lock types that were
unreleased for significantly long time windows, thus impacting SAP system performance.
Detailed metrics provided by the test will lead administrators straight to the exact locks that
were held for broad time frames and the user who held them!
Target of the
test
A SAP R/3 server
Agent
deploying the
test
An internal/remote agent

M O N I T O R I N G T H E S A P A B A P I N S T A N C E
8
Configurable
parameters for
the test
1. TEST PERIOD - How often should the test be executed
2. HOST - Host name of the server for which the test is to be configured
3. PORTNO - Enter the port to which the specified HOST listens
4. CLIENTNAME – Specify the ID of the client system that is connecting to the R/3 server. To
view a list of client IDs to choose from, follow the procedure discussed in Page 14.
5. SAPUSER - Provide a valid user name for logging into the SAP R/3 server. In order to
enable the eG Enterprise suite to effectively monitor SAP, the name of a SAPUSER with
either of the following profiles need to be specified: S_A.SYSTEM (super administrator) or
SAP_ALL (all authorizations for SAP).
6. PASSWORD - The password of the specified SAPUSER.
7. CONFIRMPASSWORD - Confirm the password by retyping it here.
8. SYSNO - An indicator of the TCP/IP port at which the SAP server listens. For example, for a
server that listens at port 3200, the SYSNO will be '00'. Similarly, if the SAP server port is
3201, the SYSNO will have to be specified as '01'. Therefore, in the SYSNO text box
specify the system number of the SAP server with which the specified client communicates.
9. ROUTER - If the SAP client with the specified CLIENTNAME exists in a network external to
the SAP server, then a router will be used to enable the server-client communication. In
such a case, specify the IP of the router in the ROUTER text box. If both the client and the
server exist in the same network, then specify 'none' against the ROUTER text box.
10. INSTANCENAME - Specify the name of the SAP R/3 instance to be monitored. To view the
complete list of instances to choose from, do the follow the procedure discussed in Page 17
of this document.
11. TIMEOUT - Indicate the duration (in seconds) for which this test should wait for a response
from the SAP R/3 server. By default, this is set to 120 seconds.
12. JCO VERSION – The eG agent uses the SAP JCO library to connect to the SAP ABAP
system and pull out metrics. To enable the eG agent to make this connection and query the
metrics, you need to specify the version of the SAP JCO library that the agent needs to use.
For instance, to instruct the eG agent to use JCO v2.1.19, it would suffice if you specify the
‘major version number’ alone against JCO VERSION – in the case of this example, this will
be
2.x
.
13. DD FREQUENCY - Refers to the frequency with which detailed diagnosis measures are to
be generated for this test. The default is
1:1
. This indicates that, by default, detailed
measures will be generated every time this test runs, and also every time the test detects a
problem. You can modify this frequency, if you so desire. Also, if you intend to disable the
detailed diagnosis capability for this test, you can do so by specifying
none
against DD
FREQUENCY.

M O N I T O R I N G T H E S A P A B A P I N S T A N C E
9
14. DETAILED DIAGNOSIS - To make diagnosis more efficient and accurate, the eG
Enterprise suite embeds an optional detailed diagnostic capability. With this capability, the
eG agents can be configured to run detailed, more elaborate tests as and when specific
problems are detected. To enable the detailed diagnosis capability of this test for a
particular server, choose the On option. To disable the capability, click on the Off option.
The option to selectively enable/disable the detailed diagnosis capability will be available
only if the following conditions are fulfilled:
The eG manager license should allow the detailed diagnosis capability
Both the normal and abnormal frequencies configured for the detailed diagnosis
measures should not be 0.
15. ISPASSIVE – If the value chosen is YES, then the server under consideration is a passive
server in a SAP R/3 cluster. No alerts will be generated if the server is not running.
Measures will be reported as “Not applicable” by the agent if the server is not up.
Outputs of the
test
One set of results for each exclusive lock type and one set of results for an
All
descriptor that
reports aggregated performance results across all lock types
Measurements
made by the
test
Measurement
Measurement
Unit
Interpretation
Number of locks:
Indicates the number of locks
of this type currently held.
Number
A low value is desired for this measure.
Compare the value of this measure
across lock types to know which lock
type contains the maximum number of
locks.
Percentage of locks:
Indicates the percentage of
total locks currently held that
are of this type.
Percent
A low value is desired for both exclusive lock
types. A high value indicates that a majority
of the locks are exclusive locks, which is a
cause for concern.
5 mins to 1 hour locks:
Indicates the number of locks
of this type that were held for
a duration between 5 minutes
to 1 hour.
Number
Normally, locks are automatically released
when transactions are committed or when
users finish working on the data. If locks
remain unreleased for long time periods, it
may not always be a cause for alarm, as it
may be owing to something as routine as
long-running background jobs that update
the database. Some other times, unreleased
locks can cause serious performance issues
to the SAP system.
This is why, high values reported by any of
these measures cannot be ignored. In such
situations, it is best to immediately
investigate the reason why locks were held
for such a long duration. To know which
precise locks were unreleased by which user
and why, use the detailed diagnosis of this
measure.
1 hour to 1 day locks:
Indicates the number of locks
of this type that were held for
a duration between 1 hour to
1 day.
Number
Locks older than 1 day:
Indicates the number of locks
of this type that were held for
over a day.
Number
M O N I T O R I N G T H E S A P A B A P I N S T A N C E
10
Some of the most common reasons for
unreleased locks are as follows:
Abnormal termination of the SAP
GUI: If users shut down their PCs
without logging off SAP, or if the
SAP GUI terminates for other
reasons, such as network or
communication problems, the user
session may remain active in the
SAP system. If this happens while
the user had lock entries, sometimes
these locks remain unreleased since
the user is no longer active in the
system. In these cases, you can
manually release the lock by
deleting it from the lock entry list, or
you can force log off the user from
the User Overview Monitor in the
application server where the user
was logged on.
Inactive SAP GUI: When users
currently working on the system
leave their presentation services
with unfinished transactions, locks
will not be released. You can release
such locks by deleting them from
the lock entry list, but only after
confirming that they are not coming
from important background jobs.
Problems in update processing:
When there are update modules
that are unprocessed by the syste,
these modules do not release the
locks. The update module releases
the locks only when the update
records have been completely
processed or they have abnormally
terminated with an error status.
Only update modules with status
INIT or AUTO can hold locks.
2.3.2 R3 Buffers Test
This test reports statistics relating to the SAP R/3 server's buffers. The goal of buffer setting is to have a sufficiently
large buffer to maintain a high hit rate and to do so with a low rate of swapping and a minimal effect on operating
system paging. The test contains values for the following SAP buffers, sorted by application server:

M O N I T O R I N G T H E S A P A B A P I N S T A N C E
11
Name of the MTE
Contents of the Buffer
Program
Compiled SAP programs
Generic Key
Wholly or partly buffered database tables
SingleRecord
Individual records from utilized database tables
Screen
Screen pages from ABAP programs
CUA
Menus and pushbuttons from the ABAP screen pages
TableDefinition
Table Definitions from the SAP R/3 Repository
FieldDescription
Field descriptions from the SAP R/3 Repository
InitialRecords
Initial record layout (initial values for the fields of a database
segment) for a table
ShortNameTAB
Combination of TTAB and FTAB buffers
In the table above, the term MTE stands for a Monitoring Tree Element. According to the SAP monitoring
architecture, every SAP component/sub-system requiring monitoring, such as the buffer system, the dialog system,
background processing etc., is termed as a
Monitor
. Each of these
Monitors
and their respective attributes are
organized in the form of a tree-structure known as the monitoring tree, where the
Monitor
itself will be the pivotal
node, and its key attributes the sub-nodes. Each of these attributes is otherwise referred to as a monitoring tree
element (MTE).
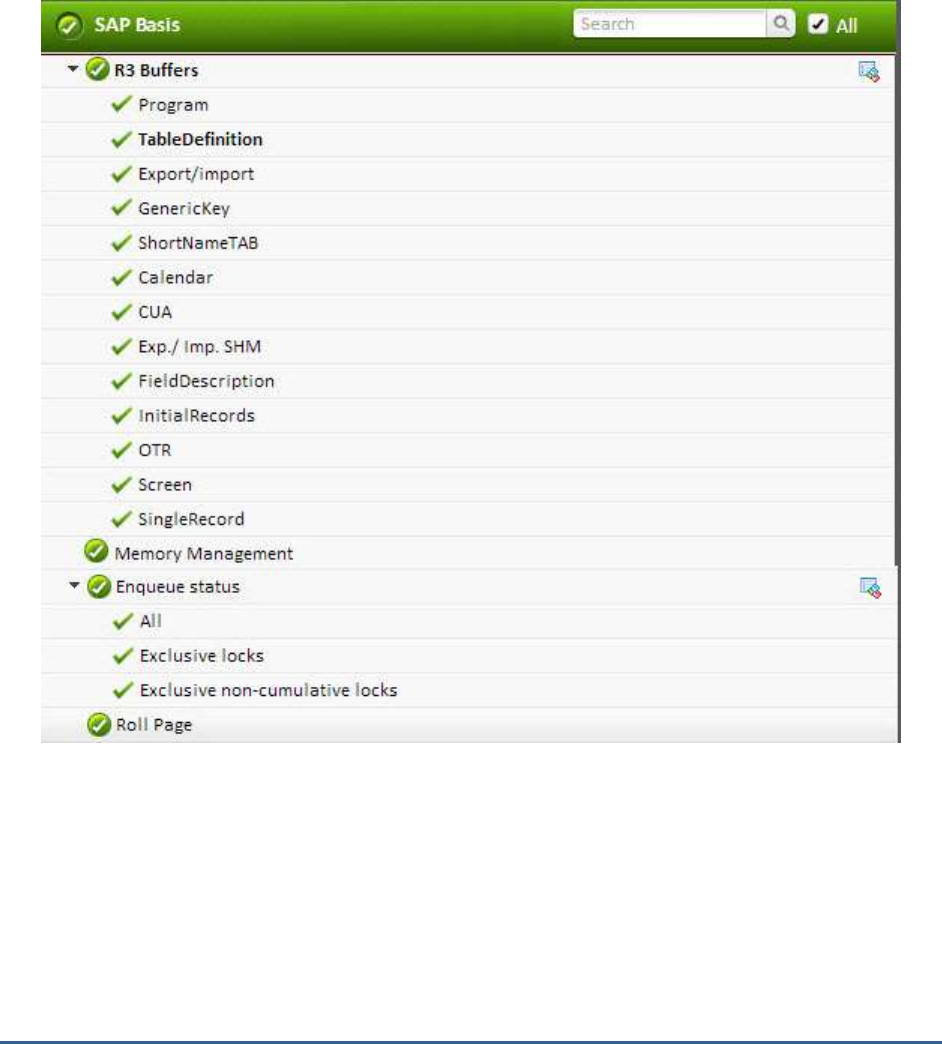
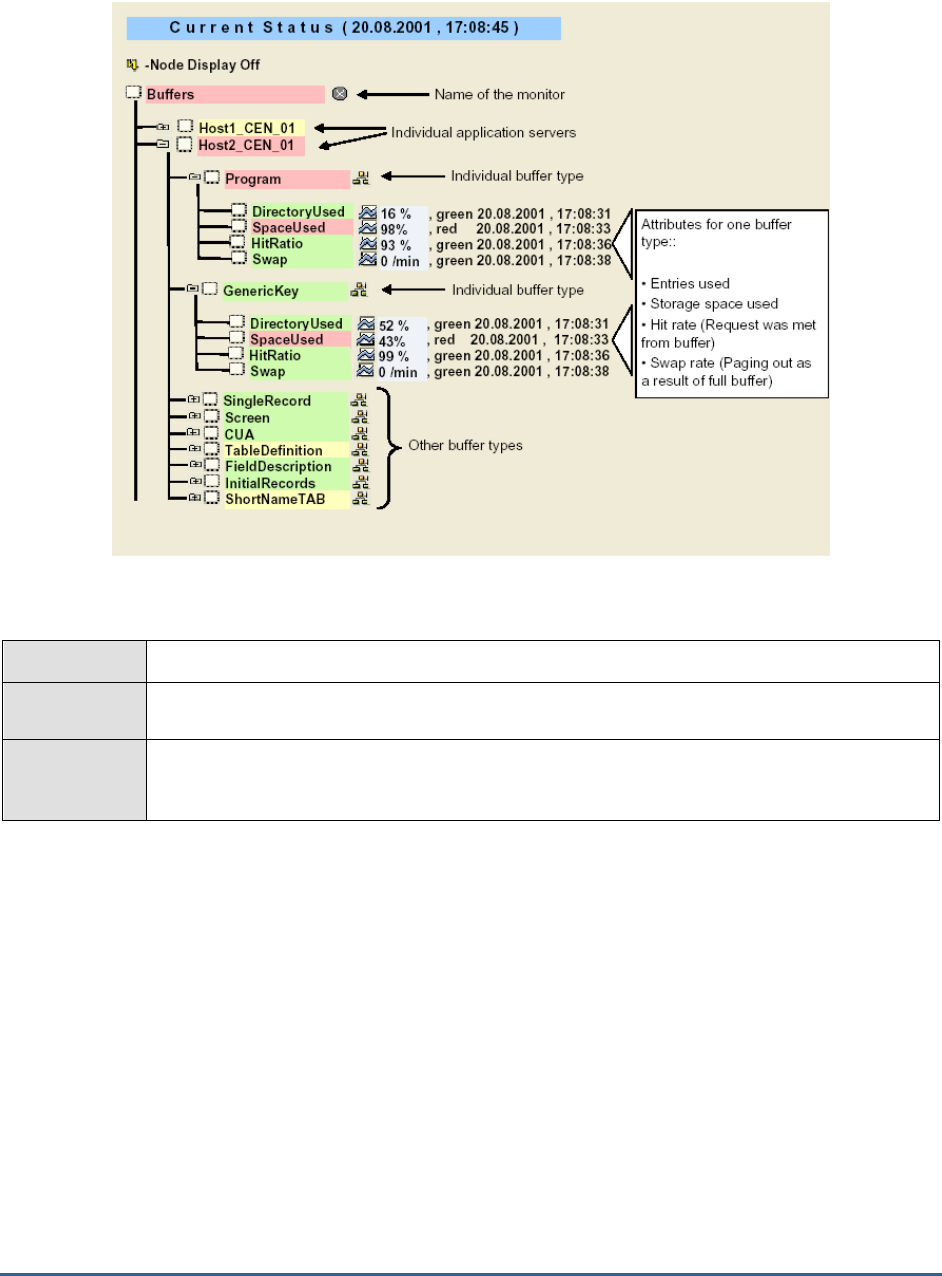
Figure 2.5 depicts the tree-structure of the
Buffers Monitor
. From this figure it can be inferred that the name of the
monitor,
Buffers, is the primary node of the monitoring tree. Each of the buffer types, which are the sub-nodes of
Buffers, will therefore become MTEs. Similarly, the attributes such as
DirectoryUsed, SpaceUsed
, etc., that are
associated with every buffer type, also become MTEs. The eG agent executing the R3BufferTest reports the values of
these attributes only.
M O N I T O R I N G T H E S A P A B A P I N S T A N C E
12
Figure 2.5: The Buffers Monitor tree-structure
Purpose
Reports statistics relating to the SAP R/3 server's buffers
Target of the
test
A SAP R/3 server
Agent
deploying the
test
An internal/remote agent

M O N I T O R I N G T H E S A P A B A P I N S T A N C E
13
Configurable
parameters for
the test
1. TEST PERIOD - How often should the test be executed
2. HOST - Host name of the server for which the test is to be configured
3. PORT - Enter the port to which the specified HOST listens
4. CLIENTNAME – Specify the ID of the client system that is connecting to the R/3 server. To
view a list of client IDs to choose from, follow the procedure discussed in Page 14.
5. INSTANCENAME - Specify the name of the SAP R/3 instance to be monitored. To view the
complete list of instances to choose from, do the follow the procedure discussed in Page 17
of this document.
6. SAPUSER - Provide a valid user name for logging into the SAP R/3 server. In order to
enable the eG Enterprise suite to effectively monitor SAP, the name of a SAPUSER with
either of the following profiles need to be specified: S_A.SYSTEM (super administrator) or
SAP_ALL (all authorizations for SAP).
7. PASSWORD - The password of the specified SAPUSER.
8. CONFIRMPASSWORD - Confirm the password by retyping it here.
9. SYSNO - An indicator of the TCP/IP port at which the SAP server listens. For example, for a
server that listens at port 3200, the SYSNO will be '00'. Similarly, if the SAP server port is
3201, the SYSNO will have to be specified as '01'. Therefore, in the SYSNO text box
specify the system number of the SAP server with which the specified client communicates.
10. ROUTER - If the SAP client with the specified CLIENTNAME exists in a network external to
the SAP server, then a router will be used to enable the server-client communication. In
such a case, specify the IP of the router in the ROUTER text box. If both the client and the
server exist in the same network, then specify 'none' against the ROUTER text box.
11. TIMEOUT - Indicate the duration (in seconds) for which this test should wait for a response
from the SAP R/3 server. By default, this is set to 120 seconds.
12. JCO VERSION – The eG agent uses the SAP JCO library to connect to the SAP ABAP
system and pull out metrics. To enable the eG agent to make this connection and query the
metrics, you need to specify the version of the SAP JCO library that the agent needs to use.
For instance, to instruct the eG agent to use JCO v2.1.19, it would suffice if you specify the
‘major version number’ alone against JCO VERSION – in the case of this example, this will
be
2.x
.
13. ISPASSIVE – If the value chosen is YES, then the server under consideration is a passive
server in a SAP R/3 cluster. No alerts will be generated if the server is not running.
Measures will be reported as “Not applicable” by the agent if the server is not up.
Outputs of the
test
One set of results for every MTE
Measurements
made by the
test
Measurement
Measurement
Unit
Interpretation
M O N I T O R I N G T H E S A P A B A P I N S T A N C E
14
Directory entries used:
The percentage usage of the
directory (number of entries)
Percent
The buffer directories point to the location of
the objects stored in the buffer. If one runs
out of directory entries , then no new objects
can be placed in the buffer, and the free
space cannot be used.
Buffer space used:
The percentage of buffer
storage space been used
currently.
Percent
If the buffer size is less, then for many
requests the buffer cannot be used leading
to more swapping; therefore, the buffer size
has to be increased.
Hit ratio:
The percentage of database
queries that were met from
the buffer.
Percent
In general, poor buffer quality means that a
buffer is too small. If a buffer is too small,
then the chances increase that requested
objects (table entries, programs, and so on)
will not be found in it. The result is a lower
hit ratio, and, if the buffer is already full,
increased swapping.
To improve the hit ratio, increase the size of
a buffer.
Buffer swaps:
The rate of swaps due to a
filled buffer.
Swaps/Min
Swapping increases as requested objects
force older objects out of the buffer.
Increase the size of the buffer if the swap
rate is very high and the hit ratio is low.
In order to extract metrics from within a SAP R/3 server, the SAP tests need to login to the server as a valid SAP
client. To achieve this, the tests take the CLIENTNAME as one of the parameters. As a SAP R/3 server can support
multiple clients, it is essential to determine which client you want a test to login as. Therefore, take a look at the list
of clients supported by the R/3 server being monitored, before specifying a CLIENTNAME. To do so, follow the
steps given below:
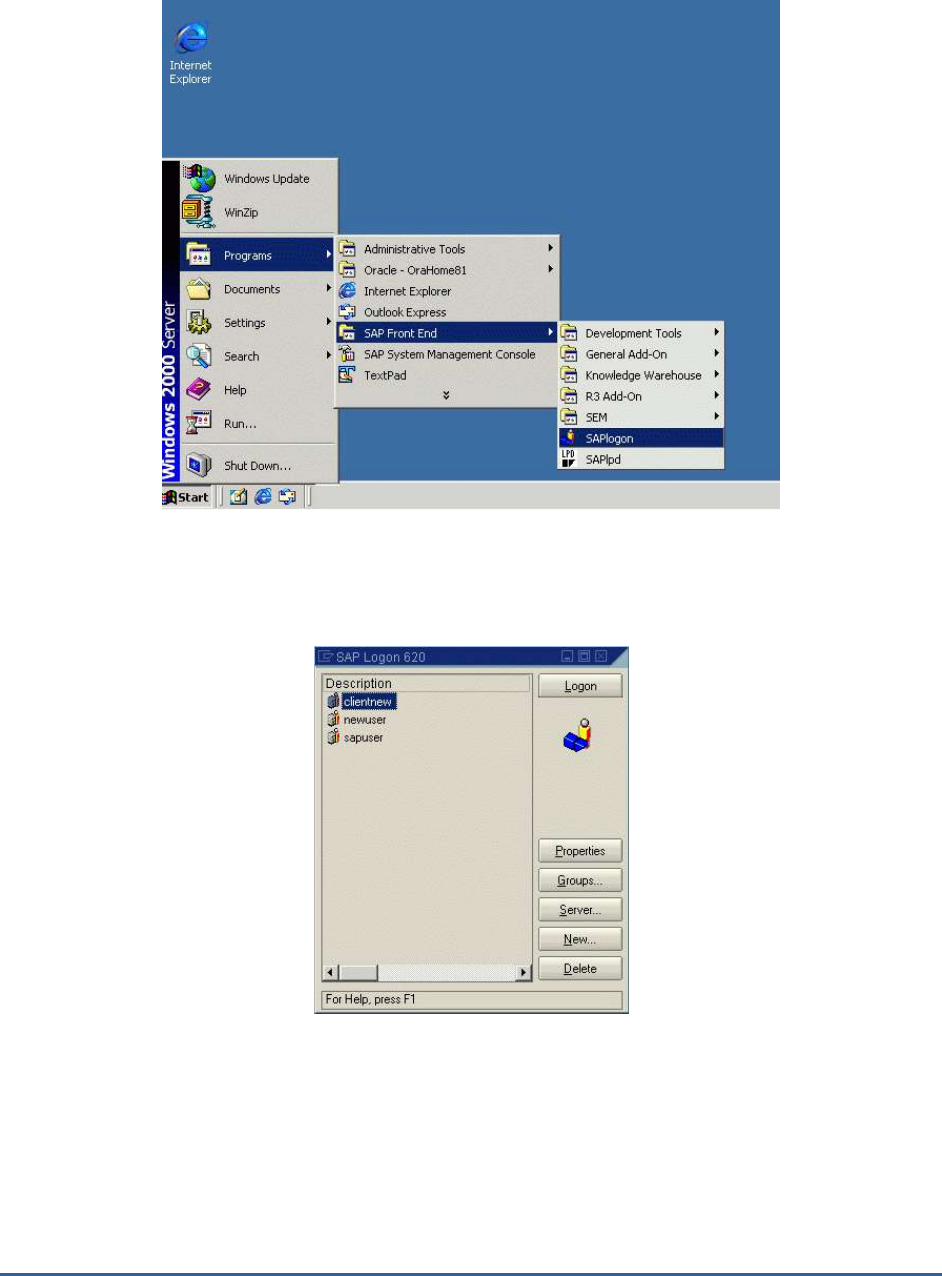
1. From any SAP client, execute the SAPlogon tool using the menu sequence: Start -> Programs -> SAP Front End
-> SAPlogon (see Figure 2.6).

M O N I T O R I N G T H E S A P A B A P I N S T A N C E
15
Figure 2.6: Opening the SAPlogon tool
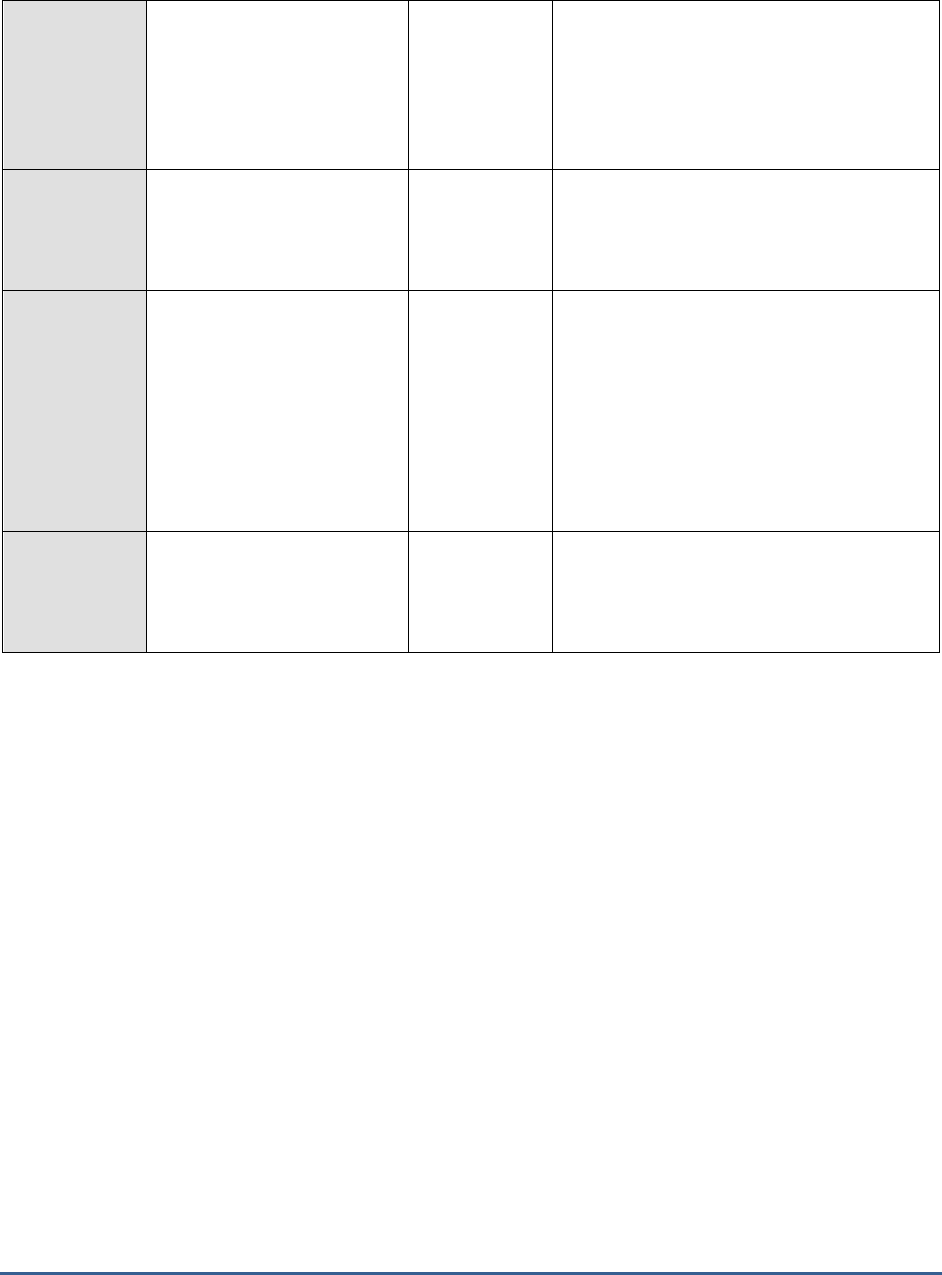
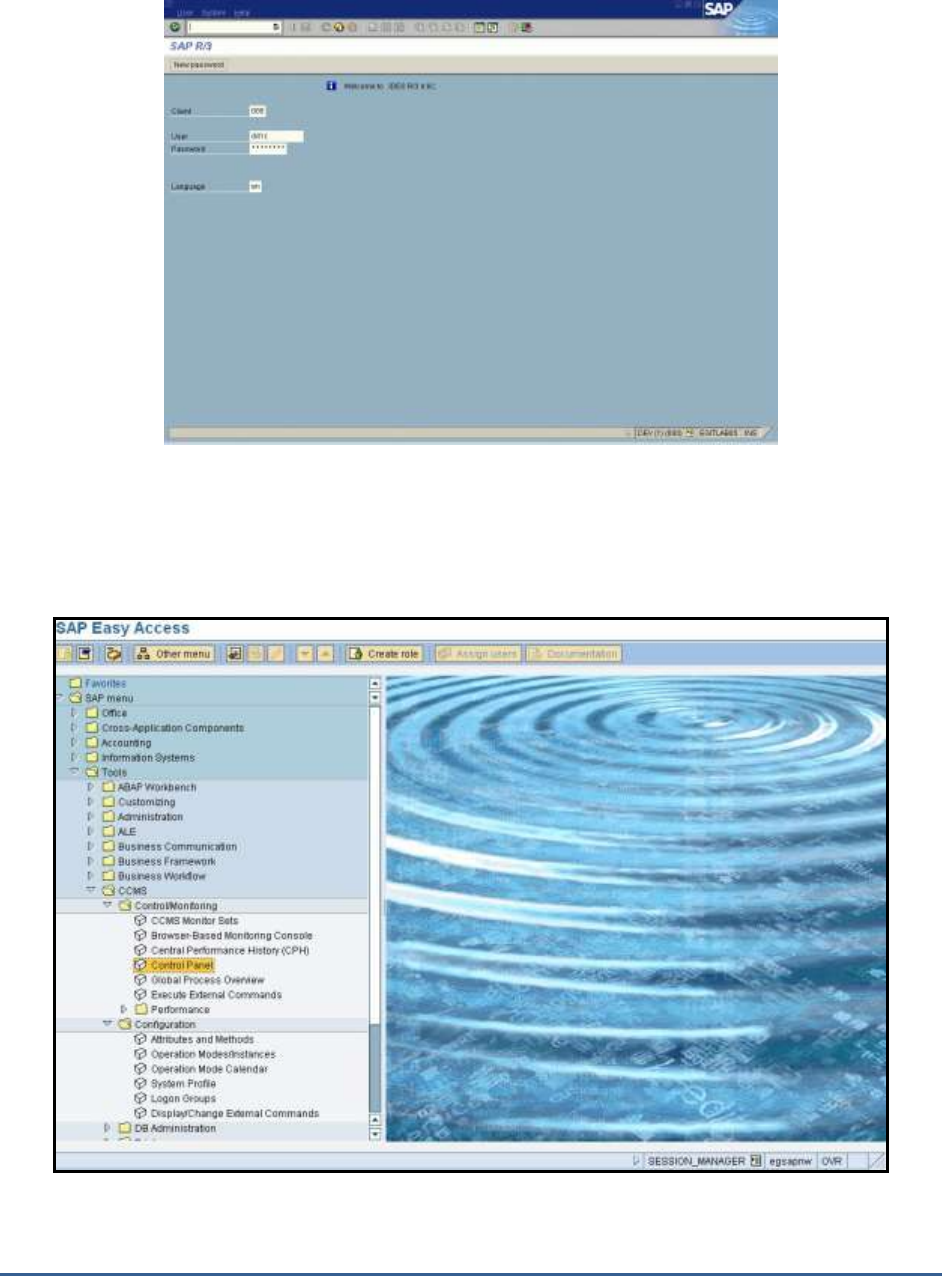
2. Click on the Logon button in the dialog box that appears (see Figure 2.7), and login to the SAP R/3 server using
a valid user name and password (see Figure 2.8).
Figure 2.7: Clicking on the Logon button
M O N I T O R I N G T H E S A P A B A P I N S T A N C E
16
Figure 2.8: Logging into the SAP Easy access console
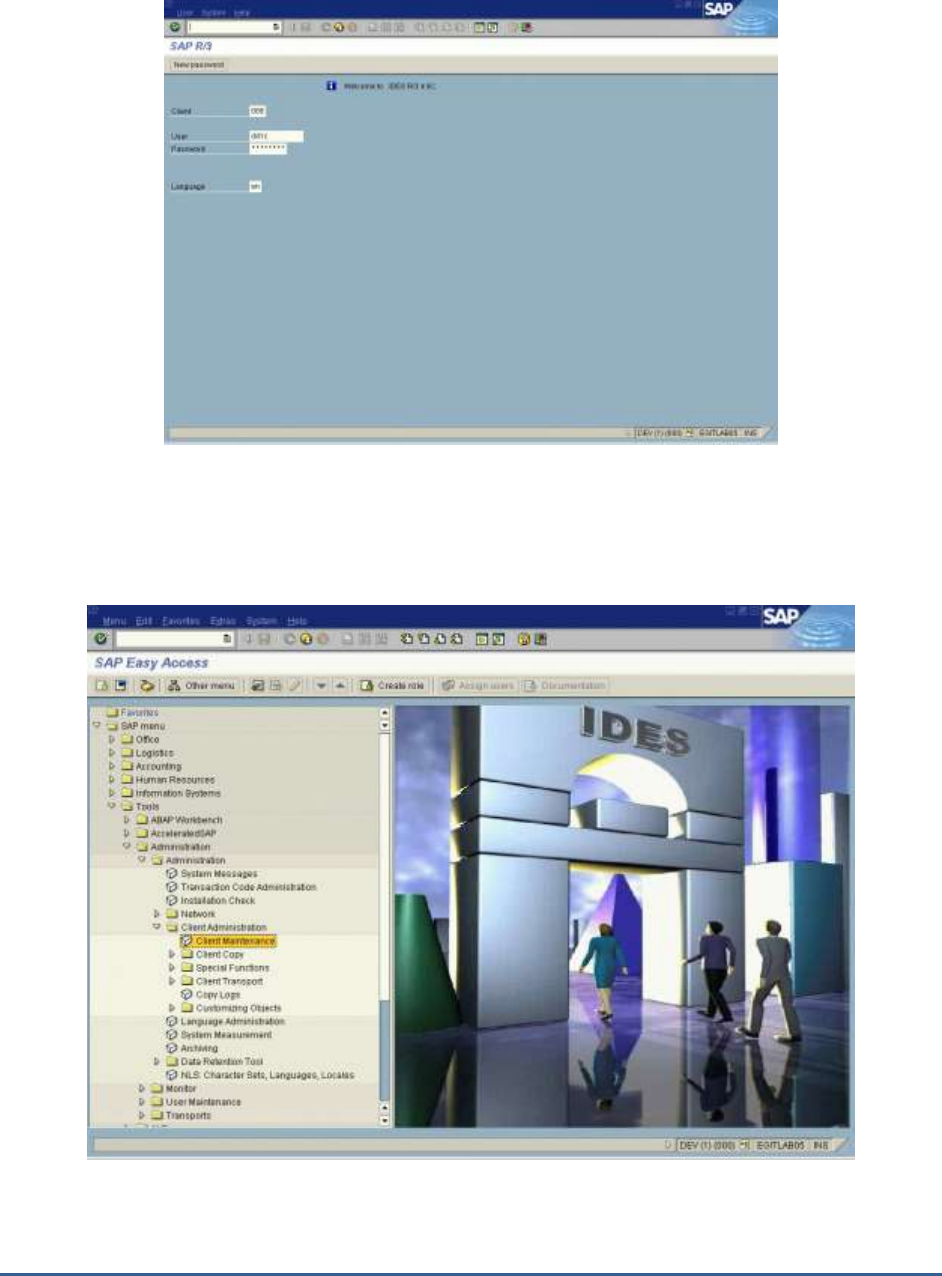
3. Using the tree-structure in the SAP Easy Access console that appears (see Figure 2.9), navigate to the Client
Maintenance node. The node sequence to be used is: SAP menu -> Tools -> Administration -> Client
Administration -> Client Maintenance.
Figure 2.9: Accessing the Client Maintenance node
4. Double-click on the Client Maintenance node in Figure 2.9.
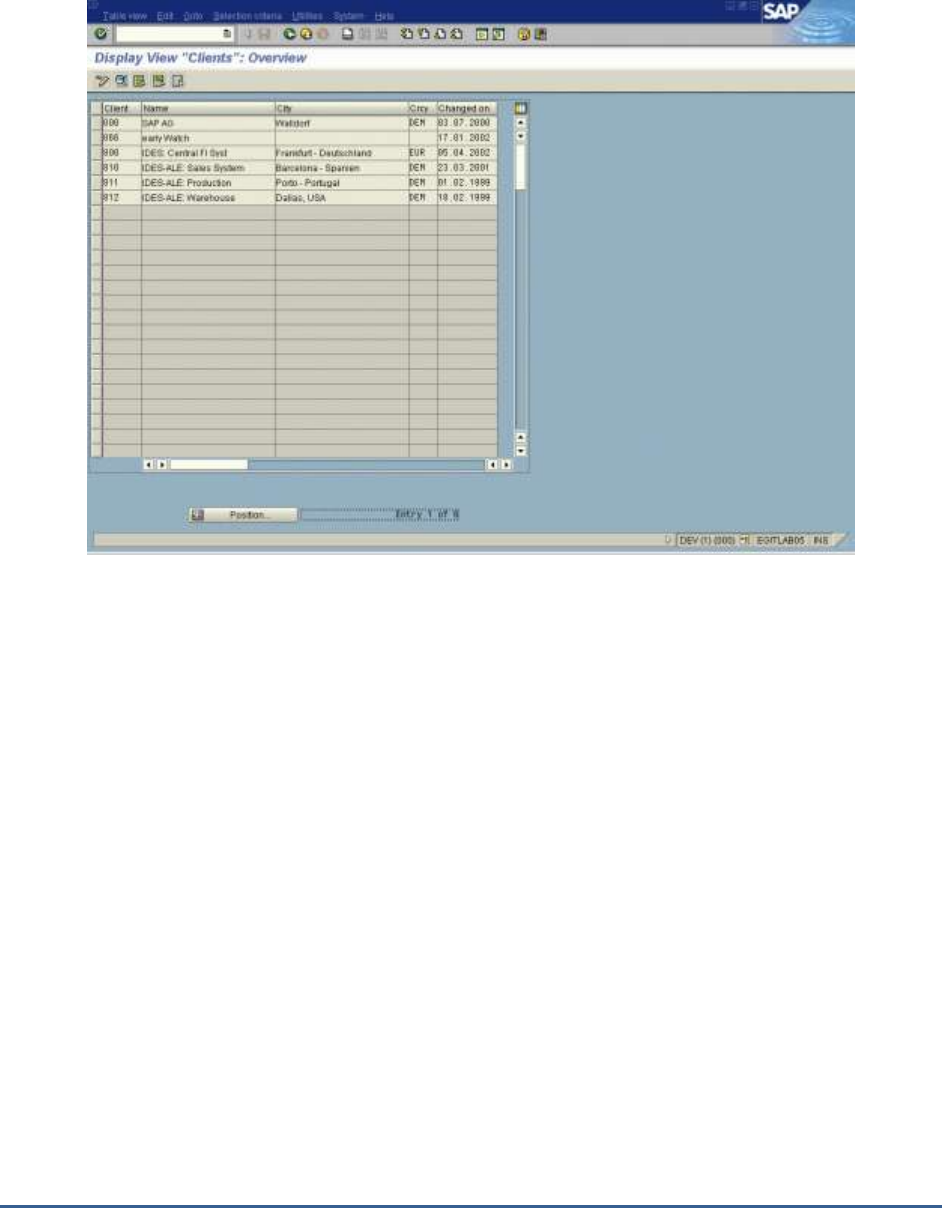
5. A Display View "Clients" page will appear (see Figure 2.10), which will display the details of SAP clients. Any of
M O N I T O R I N G T H E S A P A B A P I N S T A N C E
17
the values of the Client column in this page, can be provided as the CLIENTNAME.
Figure 2.10: The Clients list
The eG agent connects to a particular instance of the SAP R/3 server to collect the desired metrics. To enable this
connection, all the SAP R/3 tests need to be configured with the name of the R/3 instance to connect to. For this
purpose, the SAP R/3 tests take an INSTANCENAME parameter. Before providing a value for this parameter, you
may want to take a look at all the instances currently configured on the R/3 server, so that you can decide which
instance name should be configured for the test. For this purpose, do the following:
1. From any SAP client, execute the SAPlogon tool using the menu sequence: Start -> Programs -> SAP Front
End -> SAPlogon (see Figure 2.6).
M O N I T O R I N G T H E S A P A B A P I N S T A N C E
18
Figure 2.11: Opening the SAPlogon tool
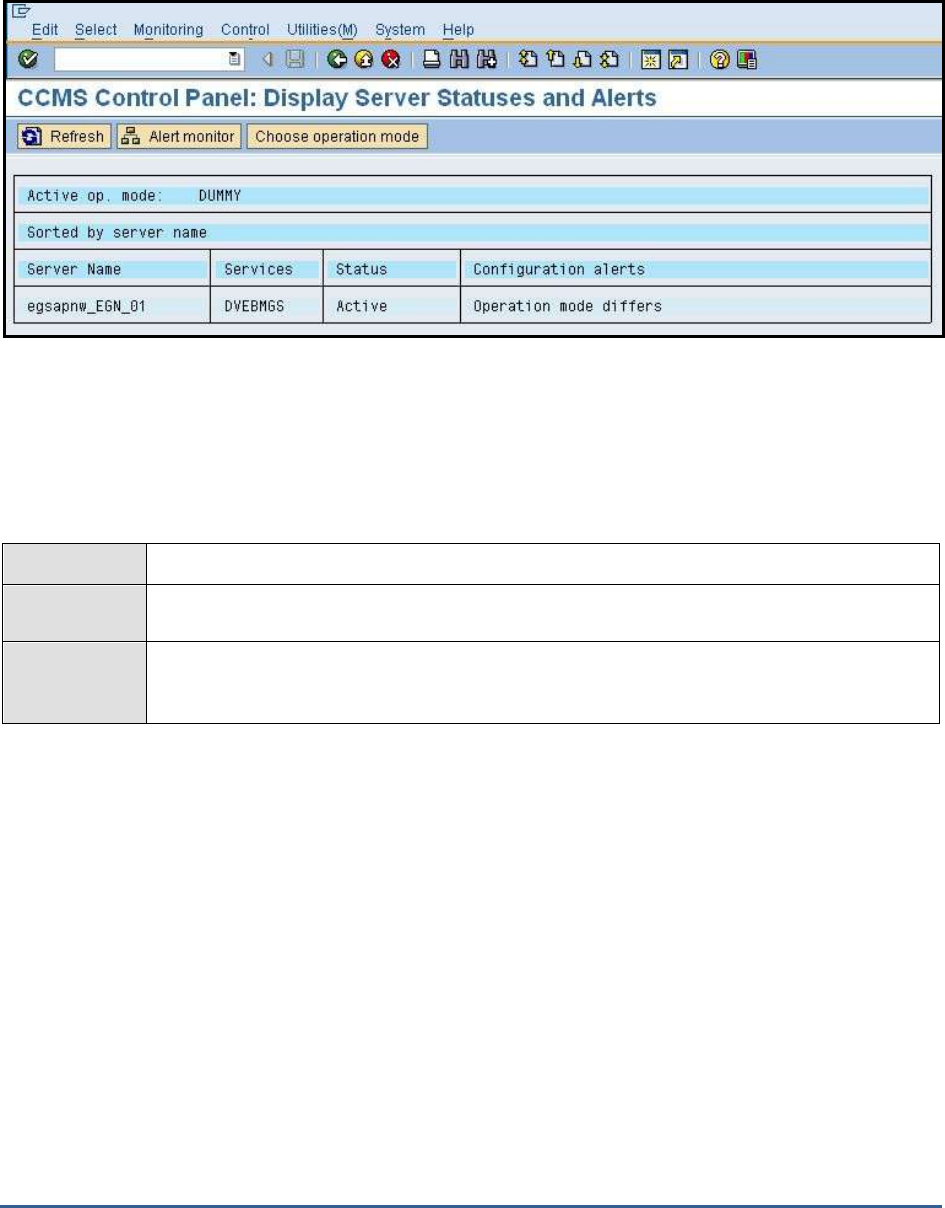
6. Click on the Logon button in the dialog box that appears (see Figure 2.7), and login to the SAP R/3 server using
a valid user name and password (see Figure 2.8).
Figure 2.12: Clicking on the Logon button
M O N I T O R I N G T H E S A P A B A P I N S T A N C E
19
Figure 2.13: Logging into the SAP Easy access console
7. In the tree-structure of the SAP Easy Access console that appears (see Figure 2.9), follow the node sequence:
SAP menu -> Tools ->CCMS->Control/Monitoring->Control Panel.
Figure 2.14: Navigating to the Control Panel node
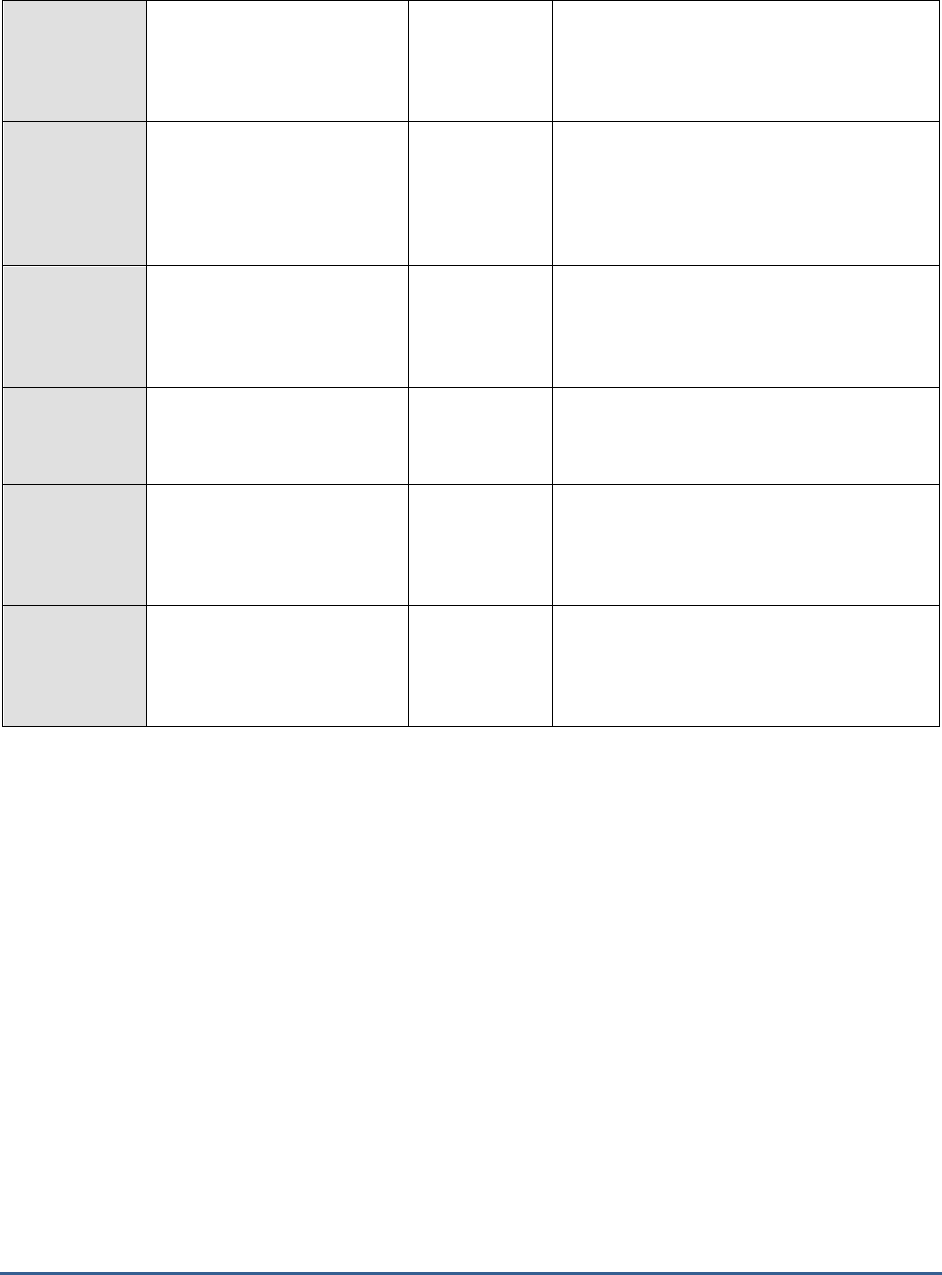
8. Double-click on the Control Panel node. A Display Server Statuses and Alerts page will appear, which will
display the details of the SAP servers. Any of the values of the Server Name column in this page can be
M O N I T O R I N G T H E S A P A B A P I N S T A N C E
20
provided as the value of the INSTANCENAME parameter.
Figure 2.15: Viewing the SAP R/3 server instances
2.3.3 Memory Management Test
This test monitors the basic functions of the SAP Memory Management System and advises on how best to configure
the system depending upon the platform used, the available resources, etc. It also sheds light on the hardware and
operating system usage.
Purpose
Monitors the basic functions of the SAP Memory Management System
Target of the
test
A SAP R/3 server
Agent
deploying the
test
An internal/remote agent

M O N I T O R I N G T H E S A P A B A P I N S T A N C E
21
Configurable
parameters for
the test
1. TEST PERIOD - How often should the test be executed
2. HOST - Host name of the server for which the test is to be configured
3. PORTNO - Enter the port to which the specified HOST listens
4. CLIENTNAME – Specify the ID of the client system that is connecting to the R/3 server. To
view a list of client IDs to choose from, follow the procedure discussed in Page 14.
5. SAPUSER - Provide a valid user name for logging into the SAP R/3 server. In order to
enable the eG Enterprise suite to effectively monitor SAP, the name of a SAPUSER with
either of the following profiles need to be specified: S_A.SYSTEM (super administrator) or
SAP_ALL (all authorizations for SAP).
6. PASSWORD - The password of the specified SAPUSER.
7. CONFIRMPASSWORD - Confirm the password by retyping it here.
8. SYSNO - An indicator of the TCP/IP port at which the SAP server listens. For example, for a
server that listens at port 3200, the SYSNO will be '00'. Similarly, if the SAP server port is
3201, the SYSNO will have to be specified as '01'. Therefore, in the SYSNO text box
specify the system number of the SAP server with which the specified client communicates.
9. ROUTER - If the SAP client with the specified CLIENTNAME exists in a network external to
the SAP server, then a router will be used to enable the server-client communication. In
such a case, specify the IP of the router in the ROUTER text box. If both the client and the
server exist in the same network, then specify 'none' against the ROUTER text box.
10. INSTANCENAME - Specify the name of the SAP R/3 instance to be monitored. To view the
complete list of instances to choose from, do the follow the procedure discussed in Page 17
of this document.
11. TIMEOUT - Indicate the duration (in seconds) for which this test should wait for a response
from the SAP R/3 server. By default, this is set to 120 seconds.
12. JCO VERSION – The eG agent uses the SAP JCO library to connect to the SAP ABAP
system and pull out metrics. To enable the eG agent to make this connection and query the
metrics, you need to specify the version of the SAP JCO library that the agent needs to use.
For instance, to instruct the eG agent to use JCO v2.1.19, it would suffice if you specify the
‘major version number’ alone against JCO VERSION – in the case of this example, this will
be
2.x
.
13. ISPASSIVE – If the value chosen is YES, then the server under consideration is a passive
server in a SAP R/3 cluster. No alerts will be generated if the server is not running.
Measures will be reported as “Not applicable” by the agent if the server is not up.
Outputs of the
test
One set of results for every SAP R/3 server being monitored
Measurements
made by the
test
Measurement
Measurement
Unit
Interpretation
Heap memory total
allocation:
The total size of heap
memory (private memory).
MB

M O N I T O R I N G T H E S A P A B A P I N S T A N C E
22
Heap memory peak use:
A high watermark of heap
memory usage.
Percent
Heap memory recent peak
use:
The peak usage of heap
memory in recent times.
Percent
Heap memory actual
usage:
The percentage of heap
memory actually used.
Percent
Extended memory
allocated:
Indicates the total size of the
extended memory.
MB
Extended memory peak
use:
The high watermark of the
stack memory usage since
startup.
Percent
Extended memory rec
peak use:
Indicates the peak usage
achieved in the recent period
for extended memory.
Percent
High extended memory
usage:
The actual usage of extended
memory.
Percent
High extended memory
attached:
The percentage of extended
memory in user contexts that
is active in WPs now.
Percent
Number of extended
memory slots:
The number of extended
memory slots.
Number
M O N I T O R I N G T H E S A P A B A P I N S T A N C E
23
Extended memory slot
peak use:
Indicates the peak usage of
the extended memory slots.
Percent
Extended memory slot rec
peak use:
The peak usage of the
extended memory slots in
recent times.
Percent
Usage of extended
memory slots:
The percentage of extended
memory slots actually used.
Percent
Private work processes:
The number of restarted
private work processes.
Number
Dialog work processes
restarted:
The number of restarted
dialog processes.
Number
Non-dialog work process
restarts:
The number of non-dialog
processes restarted.
Number
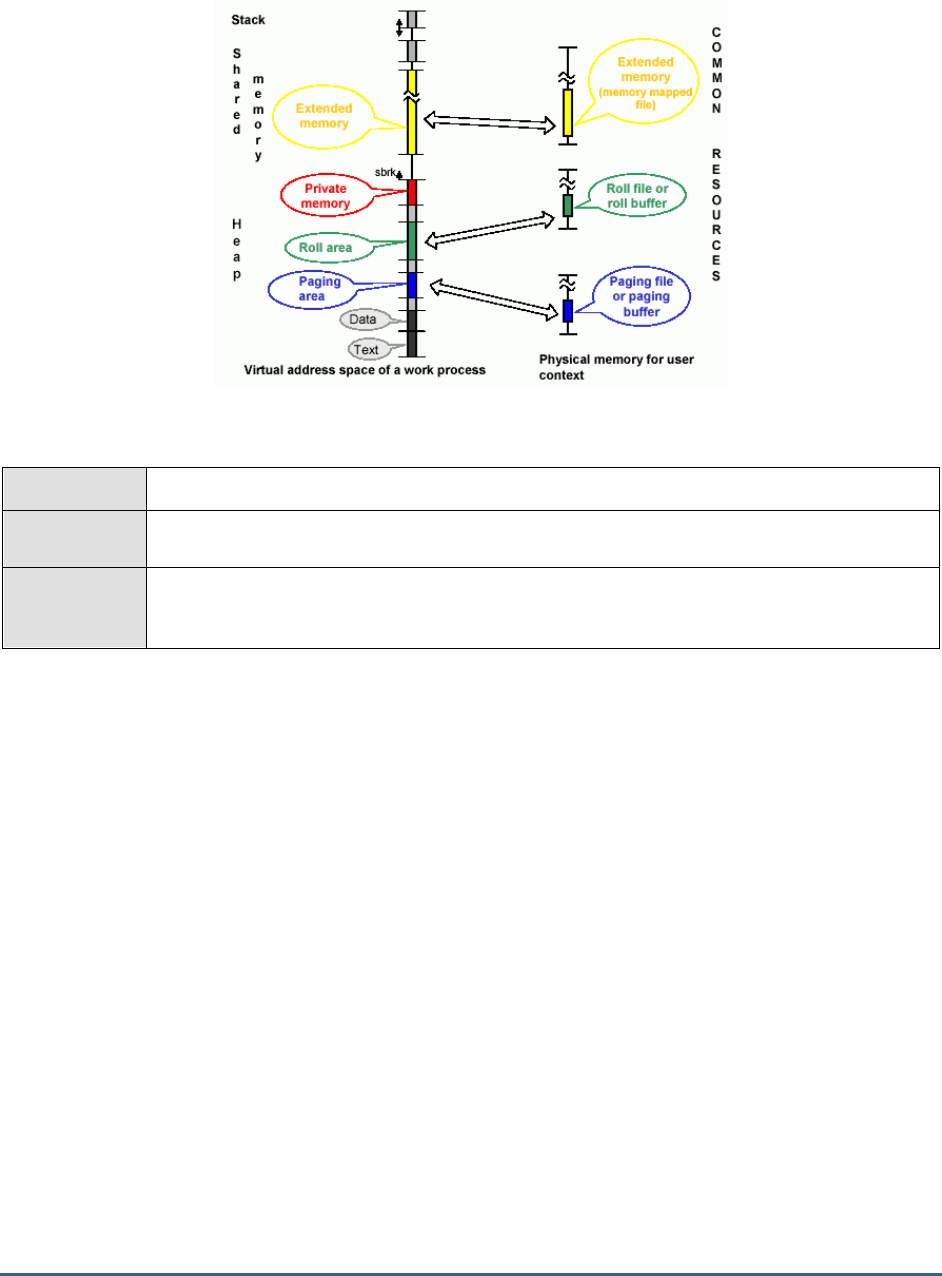
2.3.4 Roll Page Test
Roll area and Paging area are two very important concepts of memory management. Roll area is a memory area with
a set size that belongs to a work process. It is located in the heap of the virtual address space of the work process.
Disk area (swap space) is used as an extension of the physical memory for temporary storage. When SAP tries to
keep track of processes requiring more physical memory than available, then data is moved to and from the swap
space. If only segments of the processes are so copied, it is called paging.
Figure 2.16 depicts the elements of the SAP memory.
M O N I T O R I N G T H E S A P A B A P I N S T A N C E
24
Figure 2.16: Elements of the SAP memory
This test extracts statistics specific to these two memory concepts.
Purpose
Extracts statistics specific to the roll area and paging area
Target of the
test
A SAP R/3 server
Agent
deploying the
test
An internal/remote agent

M O N I T O R I N G T H E S A P A B A P I N S T A N C E
25
Configurable
parameters for
the test
1. TEST PERIOD - How often should the test be executed
2. HOST - Host name of the server for which the test is to be configured
3. PORTNO - Enter the port to which the specified HOST listens
4. CLIENTNAME – Specify the ID of the client system that is connecting to the R/3 server. To
view a list of client IDs to choose from, follow the procedure discussed in Page 14.
5. SAPUSER - Provide a valid user name for logging into the SAP R/3 server. In order to
enable the eG Enterprise suite to effectively monitor SAP, the name of a SAPUSER with
either of the following profiles need to be specified: S_A.SYSTEM (super administrator) or
SAP_ALL (all authorizations for SAP).
6. PASSWORD - The password of the specified SAPUSER.
7. CONFIRMPASSWORD - Confirm the password by retyping it here.
8. SYSNO - An indicator of the TCP/IP port at which the SAP server listens. For example, for a
server that listens at port 3200, the SYSNO will be '00'. Similarly, if the SAP server port is
3201, the SYSNO will have to be specified as '01'. Therefore, in the SYSNO text box
specify the system number of the SAP server with which the specified client communicates.
9. ROUTER - If the SAP client with the specified CLIENTNAME exists in a network external to
the SAP server, then a router will be used to enable the server-client communication. In
such a case, specify the IP of the router in the ROUTER text box. If both the client and the
server exist in the same network, then specify 'none' against the ROUTER text box.
10. INSTANCENAME - Specify the name of the SAP R/3 instance to be monitored. To view the
complete list of instances to choose from, do the follow the procedure discussed in Page 17
of this document.
11. TIMEOUT - Indicate the duration (in seconds) for which this test should wait for a response
from the SAP R/3 server. By default, this is set to 120 seconds.
12. JCO VERSION – The eG agent uses the SAP JCO library to connect to the SAP ABAP
system and pull out metrics. To enable the eG agent to make this connection and query the
metrics, you need to specify the version of the SAP JCO library that the agent needs to use.
For instance, to instruct the eG agent to use JCO v2.1.19, it would suffice if you specify the
‘major version number’ alone against JCO VERSION – in the case of this example, this will
be
2.x
.
13. ISPASSIVE – If the value chosen is YES, then the server under consideration is a passive
server in a SAP R/3 cluster. No alerts will be generated if the server is not running.
Measures will be reported as “Not applicable” by the agent if the server is not up.
Outputs of the
test
One set of results for every SAP R/3 server being monitored
Measurements
made by the
test
Measurement
Measurement
Unit
Interpretation
M O N I T O R I N G T H E S A P A B A P I N S T A N C E
26
Paging area used:
The percentage utilization of
the swap space (paging
area).
Percent
Paging utilizes CPU resources, performs disk
reads / writes, and hence is considered an
expensive operation. However, paging itself
occurs only when the memory is low.
Therefore, if more paging area is used, it
means one has to kill some processes or
increase physical memory size.
Roll area used:
The percentage of roll area
that has been used.
Percent
When the context of a work process changes,
the data is copied from the roll area to a
common resource called the roll file. First the
process tries to occupy the roll area of the
memory. When roll area is full, extended
memory is used up by the process.
The default value is specified in transaction
RZ11, and is determined dynamically.
Roll area should not be changed manually.
If one has to still to make changes on one's
platform, keep in mind the following
dependencies:
rdisp/ROLL_SHM should be
adjusted if ztta/roll_area is
changed.
rdisp/ROLL_MAXFS must be
adjusted if ztta/roll_area is
changed.
ztta/roll_area must be
larger than, or the same
size as ztta/roll_first.
2.4 The SAP Work Processses Layer
Numerous services execute on the R/3 server, each of which is crucial to its smooth functioning. The tests associated
with the R/3 Components layer (see Figure 2.17) monitor these critical services and report performance issues in their
operations (if any).

M O N I T O R I N G T H E S A P A B A P I N S T A N C E
27
Figure 2.17: The tests associated with the R/3 Components layer

M O N I T O R I N G T H E S A P A B A P I N S T A N C E
28
2.4.1 Spool Service Test
The Spool Service monitoring object contains the most important attributes about the spool system. This test
monitors the functioning of the spool system, and reports the extent of its utilization, the length of the wait queues,
etc.
Purpose
Monitors the functioning of the spool system, and reports the extent of its utilization, the length
of the wait queues, etc.
Target of the
test
A SAP R/3 server
Agent
deploying the
test
An internal/remote agent

M O N I T O R I N G T H E S A P A B A P I N S T A N C E
29
Configurable
parameters for
the test
1. TEST PERIOD - How often should the test be executed
2. HOST - Host name of the server for which the test is to be configured
3. PORTNO - Enter the port to which the specified HOST listens
4. CLIENTNAME – Specify the ID of the client system that is connecting to the R/3 server. To
view a list of client IDs to choose from, follow the procedure discussed in Page 14.
5. SAPUSER - Provide a valid user name for logging into the SAP R/3 server. In order to
enable the eG Enterprise suite to effectively monitor SAP, the name of a SAPUSER with
either of the following profiles need to be specified: S_A.SYSTEM (super administrator) or
SAP_ALL (all authorizations for SAP).
6. PASSWORD - The password of the specified SAPUSER.
7. CONFIRMPASSWORD - Confirm the password by retyping it here.
8. SYSNO - An indicator of the TCP/IP port at which the SAP server listens. For example, for a
server that listens at port 3200, the SYSNO will be '00'. Similarly, if the SAP server port is
3201, the SYSNO will have to be specified as '01'. Therefore, in the SYSNO text box
specify the system number of the SAP server with which the specified client communicates.
9. ROUTER - If the SAP client with the specified CLIENTNAME exists in a network external to
the SAP server, then a router will be used to enable the server-client communication. In
such a case, specify the IP of the router in the ROUTER text box. If both the client and the
server exist in the same network, then specify 'none' against the ROUTER text box.
10. INSTANCENAME - Specify the name of the SAP R/3 instance to be monitored. To view the
complete list of instances to choose from, do the follow the procedure discussed in Page 17
of this document.
11. TIMEOUT - Indicate the duration (in seconds) for which this test should wait for a response
from the SAP R/3 server. By default, this is set to 120 seconds.
12. JCO VERSION – The eG agent uses the SAP JCO library to connect to the SAP ABAP
system and pull out metrics. To enable the eG agent to make this connection and query the
metrics, you need to specify the version of the SAP JCO library that the agent needs to use.
For instance, to instruct the eG agent to use JCO v2.1.19, it would suffice if you specify the
‘major version number’ alone against JCO VERSION – in the case of this example, this will
be
2.x
.
13. ISPASSIVE – If the value chosen is YES, then the server under consideration is a passive
server in a SAP R/3 cluster. No alerts will be generated if the server is not running.
Measures will be reported as “Not applicable” by the agent if the server is not up.
Outputs of the
test
One set of results for every SAP R/3 server being monitored
Measurements
made by the
test
Measurement
Measurement
Unit
Interpretation
Utilization of the spool
work processes:
The percentage utilization of
the spool work processes.
Percent

M O N I T O R I N G T H E S A P A B A P I N S T A N C E
30
Spool work processes:
The number of spool work
processes.
Percent
Output requests are buffered in the
dispatcher queue on the spool server until a
free work process accepts them. A high value
for this measure therefore, indicates the non-
availability of idle work processes for
servicing the output requests in the
dispatcher queue. This, in turn, could be due
to a heavy workload on the spool server.
Requests in the spool
service queue:
The percentage of space in
the spool requests queue that
has been utilized.
Percent
The spool requests queue takes output
requests from the dispatcher queue when a
free work process in the spool server accepts
the output request. A high value here, once
again indicates a heavy workload on the
server, due to which very few work processes
are free to accept the enqueued output
requests.
Requests in process-
specific request queues:
The percentage of space
being utilized in the special
spool request queues for
processing requests in
sequence.
Percent
If a spool server has several spool work
processes, output requests can overtake each
other. To maintain the sequence of requests,
there are special work process-specific
request queues, each with requests for one
particular output device.
Pages in spool requests
queue:
The number of pages in the
spool requests queue.
Number
Device cache used:
The percentage of the device
cache in use.
Percent
The device cache contains device definitions
and sever assignments for all work processes.
Entries are taken into the cache as required,
and can be removed again if the cache
becomes full.
Fixed device cache area
used:
The percentage of space in
the fixed device cache that is
currently in use.
Percent
The fixed device cache contains information
about the output devices for which there are
requests in the host spool system that have
not yet been reported as finished. The cache
must therefore contain at least as many
entries as the number of devices that can be
concurrently used.
Host spool requests list
used:
The percentage of space in
the host spool requests list in
use.
Percent
The host spool requests limit the number of
requests in the host spool which can be
managed with the spool service. To minimize
database accesses, the list must be stored in
shared memory. It deals with status queries
for the current requests.

M O N I T O R I N G T H E S A P A B A P I N S T A N C E
31
2.4.2 Background Processes Test
This test measures the extent of usage of the background processes.
Purpose
Measures the extent of usage of the background processes
Target of the
test
A SAP R/3 server
Agent
deploying the
test
An internal/remote agent
Configurable
parameters for
the test
1. TEST PERIOD - How often should the test be executed
2. HOST - Host name of the server for which the test is to be configured
3. PORTNO - Enter the port to which the specified HOST listens
4. CLIENTNAME – Specify the ID of the client system that is connecting to the R/3 server. To
view a list of client IDs to choose from, follow the procedure discussed in Page 14.
5. SAPUSER - Provide a valid user name for logging into the SAP R/3 server. In order to
enable the eG Enterprise suite to effectively monitor SAP, the name of a SAPUSER with
either of the following profiles need to be specified: S_A.SYSTEM (super administrator) or
SAP_ALL (all authorizations for SAP).
6. PASSWORD - The password of the specified SAPUSER.
7. CONFIRMPASSWORD - Confirm the password by retyping it here.
8. SYSNO - An indicator of the TCP/IP port at which the SAP server listens. For example, for a
server that listens at port 3200, the SYSNO will be '00'. Similarly, if the SAP server port is
3201, the SYSNO will have to be specified as '01'. Therefore, in the SYSNO text box
specify the system number of the SAP server with which the specified client communicates.
9. ROUTER - If the SAP client with the specified CLIENTNAME exists in a network external
to the SAP server, then a router will be used to enable the server-client communication. In
such a case, specify the IP of the router in the ROUTER text box. If both the client and the
server exist in the same network, then specify 'none' against the ROUTER text box.
10. INSTANCENAME - Specify the name of the SAP R/3 instance to be monitored. To view the
complete list of instances to choose from, do the follow the procedure discussed in Page 17
of this document.
11. TIMEOUT - Indicate the duration (in seconds) for which this test should wait for a response
from the SAP R/3 server. By default, this is set to 120 seconds.
12. JCO VERSION – The eG agent uses the SAP JCO library to connect to the SAP ABAP
system and pull out metrics. To enable the eG agent to make this connection and query the
metrics, you need to specify the version of the SAP JCO library that the agent needs to use.
For instance, to instruct the eG agent to use JCO v2.1.19, it would suffice if you specify the
‘major version number’ alone against JCO VERSION – in the case of this example, this will
be
2.x
.
13. ISPASSIVE – If the value chosen is YES, then the server under consideration is a passive
server in a SAP R/3 cluster. No alerts will be generated if the server is not running.
Measures will be reported as “Not applicable” by the agent if the server is not up.
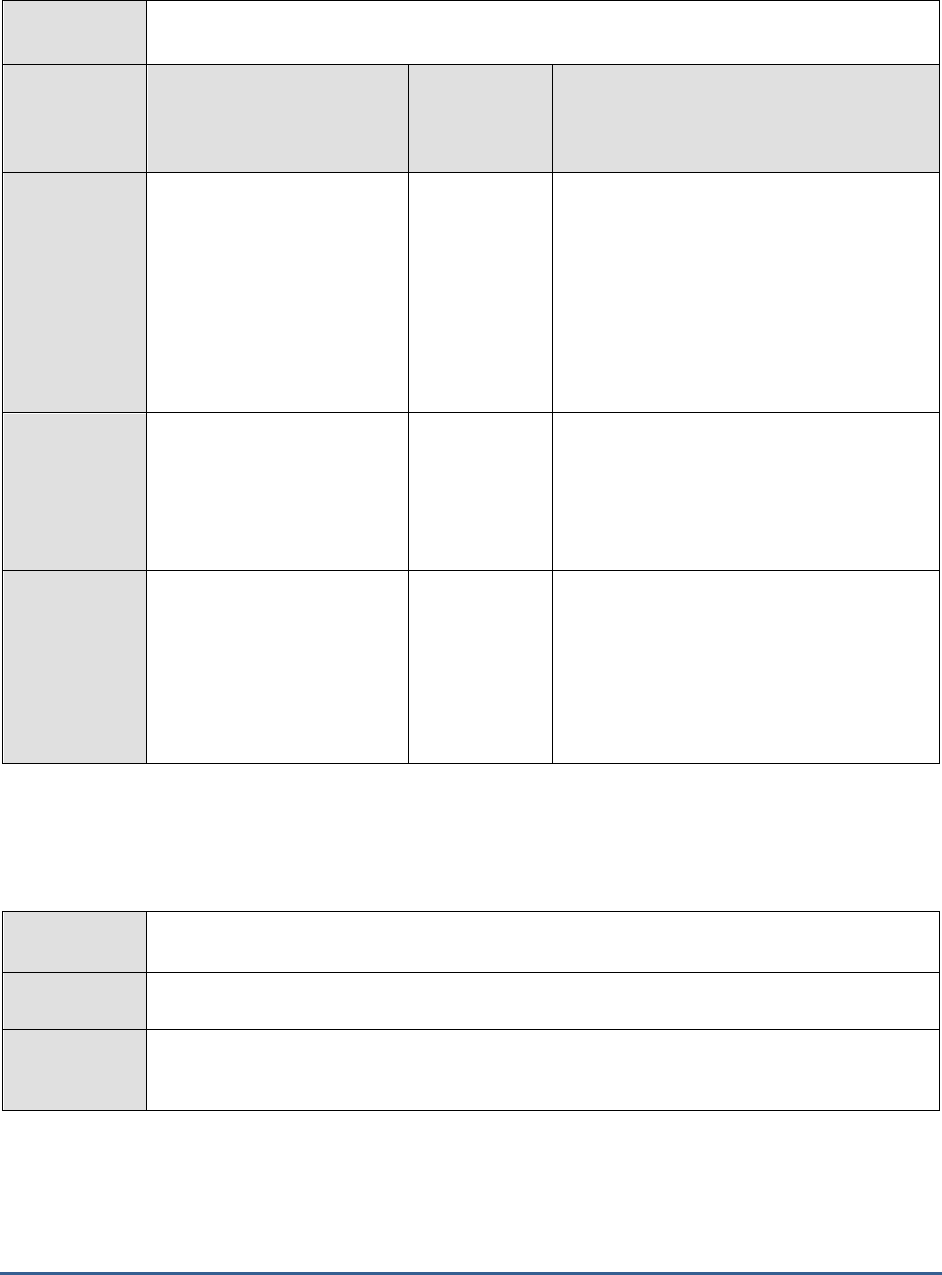
M O N I T O R I N G T H E S A P A B A P I N S T A N C E
32
Outputs of the
test
One set of results for every background server of the SAP R/3 server being monitored
Measurements
made by the
test
Measurement
Measurement
Unit
Interpretation
Utilization of background
work processes:
The percentage of the
background processing
capacity currently utilized.
The value is averaged over
the background work
processes and by default,
averaged over the last hour.
Percent
This measure and the
System wide queue
length
measure (of the
BackgroundService
test) show if there is a serious bottleneck in
the background processing capacity. The
optimal situation is to maintain a high level of
utilization of the work processes and a short
wait queue.
Running background
processes:
The number of background
work processes running on an
application server.
Number
It does not make sense to have more than 2-
3 work processes per CPU on a background
server, as these work processes will already
be fully utilizing the CPU. Set the number of
these processes using the system parameter
rdisp/wp_no_btc.
Server queue length:
The number of released jobs
that are explicitly to be
executed on this application
server, but for which there
are no free background work
processes.
Jobs
An alert for this measure when there is a
short
System wide queue length
suggests
that the distribution of jobs is not optimal.
Only specify a target server if it is absolutely
necessary.
2.4.3 Background Services Test
This test monitors the background services that are key to the smooth functioning of background processes.
Purpose
Monitors the background services that are key to the smooth functioning of background
processes
Target of the
test
A SAP R/3 server
Agent
deploying the
test
An internal/remote agent

M O N I T O R I N G T H E S A P A B A P I N S T A N C E
33
Configurable
parameters for
the test
1. TEST PERIOD - How often should the test be executed
2. HOST - Host name of the server for which the test is to be configured
3. PORTNO - Enter the port to which the specified HOST listens
4. CLIENTNAME – Specify the ID of the client system that is connecting to the R/3 server. To
view a list of client IDs to choose from, follow the procedure discussed in Page 14.
5. SAPUSER - Provide a valid user name for logging into the SAP R/3 server. In order to
enable the eG Enterprise suite to effectively monitor SAP, the name of a SAPUSER with
either of the following profiles need to be specified: S_A.SYSTEM (super administrator) or
SAP_ALL (all authorizations for SAP).
6. PASSWORD - The password of the specified SAPUSER.
7. CONFIRMPASSWORD - Confirm the password by retyping it here.
8. SYSNO - An indicator of the TCP/IP port at which the SAP server listens. For example, for a
server that listens at port 3200, the SYSNO will be '00'. Similarly, if the SAP server port is
3201, the SYSNO will have to be specified as '01'. Therefore, in the SYSNO text box
specify the system number of the SAP server with which the specified client communicates.
9. ROUTER - If the SAP client with the specified CLIENTNAME exists in a network external
to the SAP server, then a router will be used to enable the server-client communication. In
such a case, specify the IP of the router in the ROUTER text box. If both the client and the
server exist in the same network, then specify 'none' against the ROUTER text box.
10. INSTANCENAME - Specify the name of the SAP R/3 instance to be monitored. To view the
complete list of instances to choose from, do the follow the procedure discussed in Page 17
of this document.
11. TIMEOUT - Indicate the duration (in seconds) for which this test should wait for a response
from the SAP R/3 server. By default, this is set to 120 seconds.
12. JCO VERSION – The eG agent uses the SAP JCO library to connect to the SAP ABAP
system and pull out metrics. To enable the eG agent to make this connection and query the
metrics, you need to specify the version of the SAP JCO library that the agent needs to use.
For instance, to instruct the eG agent to use JCO v2.1.19, it would suffice if you specify the
‘major version number’ alone against JCO VERSION – in the case of this example, this will
be
2.x
.
13. ISPASSIVE – If the value chosen is YES, then the server under consideration is a passive
server in a SAP R/3 cluster. No alerts will be generated if the server is not running.
Measures will be reported as “Not applicable” by the agent if the server is not up.
Outputs of the
test
One set of results for every SAP R/3 server being monitored
Measurements
made by the
test
Measurement
Measurement
Unit
Interpretation
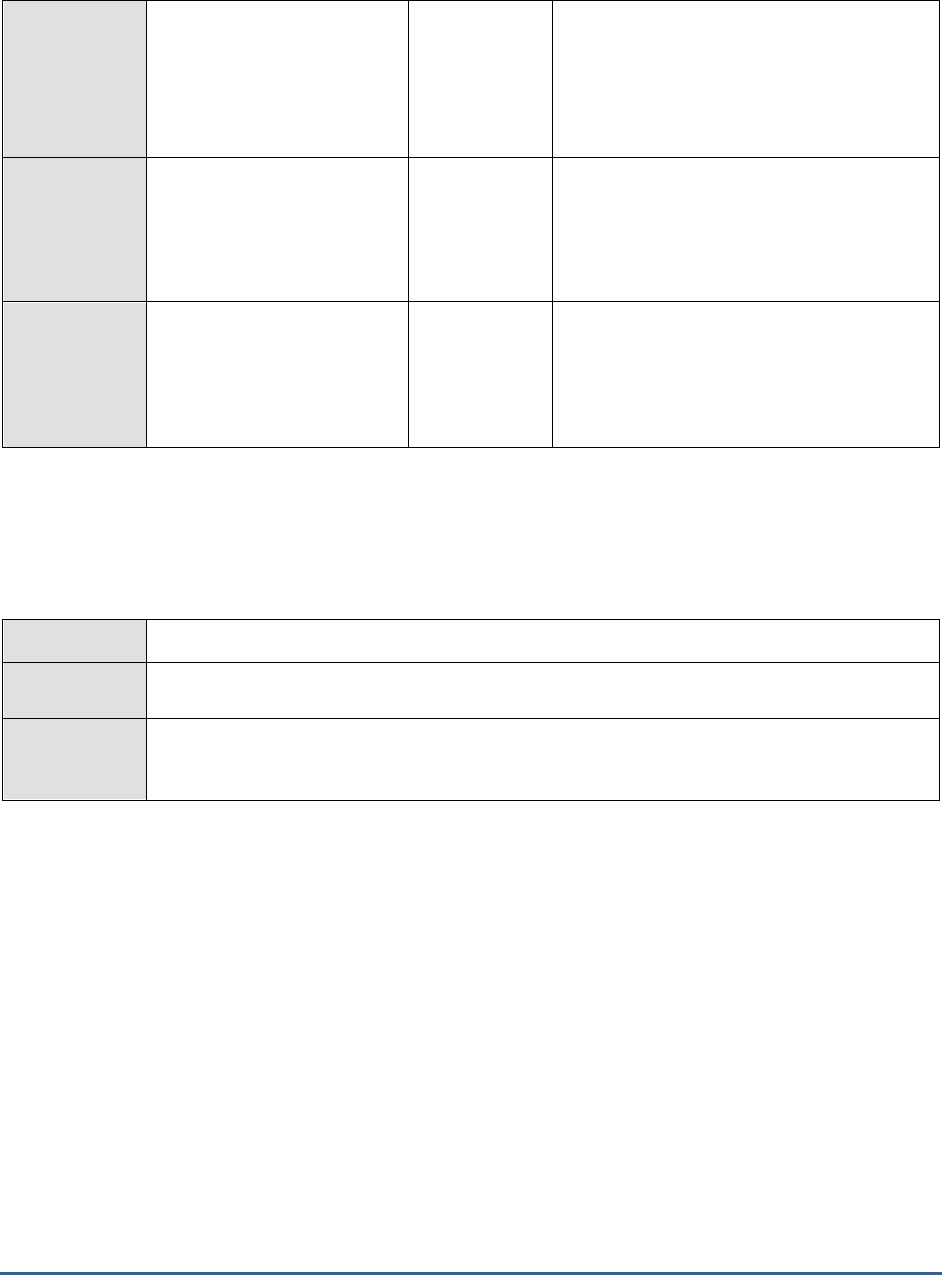
M O N I T O R I N G T H E S A P A B A P I N S T A N C E
34
System wide queue
length:
The number of jobs that are
waiting for free background
processes for their execution.
Number
Background jobs are usually defined without
a target server specification. This ensures
optimal distribution of the workload from the
jobs. This attribute is the best for showing
capacity problems in background processing.
A short wait queue is the optimal situation.
System wide free
background processes:
The number of free
background work processes
in the entire system.
Number
System wide class A
processes:
The number of class A
background processes in the
entire system.
Number
2.4.4 Dialog Activity Test
The Dialog service is the one which responds to the user requests to an R/3 server. This test reports performance
statistics pertaining to the Dialog service of the R/3 server.
Purpose
Reports performance statistics pertaining to the Dialog service of the R/3 server
Target of the
test
A SAP R/3 server
Agent
deploying the
test
An internal/remote agent

M O N I T O R I N G T H E S A P A B A P I N S T A N C E
35
Configurable
parameters for
the test
1. TEST PERIOD - How often should the test be executed
2. HOST - Host name of the server for which the test is to be configured
3. PORTNO - Enter the port to which the specified HOST listens
4. CLIENTNAME – Specify the ID of the client system that is connecting to the R/3 server.
To view a list of client IDs to choose from, follow the procedure discussed in Page 14.
5. SAPUSER - Provide a valid user name for logging into the SAP R/3 server. In order to
enable the eG Enterprise suite to effectively monitor SAP, the name of a SAPUSER with
either of the following profiles need to be specified: S_A.SYSTEM (super administrator) or
SAP_ALL (all authorizations for SAP).
6. PASSWORD - The password of the specified SAPUSER.
7. CONFIRMPASSWORD - Confirm the password by retyping it here.
8. SYSNO - An indicator of the TCP/IP port at which the SAP server listens. For example, for
a server that listens at port 3200, the SYSNO will be '00'. Similarly, if the SAP server port
is 3201, the SYSNO will have to be specified as '01'. Therefore, in the SYSNO text box
specify the system number of the SAP server with which the specified client communicates.
9. ROUTER - If the SAP client with the specified CLIENTNAME exists in a network external
to the SAP server, then a router will be used to enable the server-client communication. In
such a case, specify the IP of the router in the ROUTER text box. If both the client and
the server exist in the same network, then specify 'none' against the ROUTER text box.
10. INSTANCENAME - Specify the name of the SAP R/3 instance to be monitored. To view
the complete list of instances to choose from, do the follow the procedure discussed in
Page 17 of this document.
11. TIMEOUT - Indicate the duration (in seconds) for which this test should wait for a
response from the SAP R/3 server. By default, this is set to 120 seconds.
12. JCO VERSION – The eG agent uses the SAP JCO library to connect to the SAP ABAP
system and pull out metrics. To enable the eG agent to make this connection and query
the metrics, you need to specify the version of the SAP JCO library that the agent needs to
use. For instance, to instruct the eG agent to use JCO v2.1.19, it would suffice if you
specify the ‘major version number’ alone against JCO VERSION – in the case of this
example, this will be
2.x
.
13. ISPASSIVE – If the value chosen is YES, then the server under consideration is a passive
server in a SAP R/3 cluster. No alerts will be generated if the server is not running.
Measures will be reported as “Not applicable” by the agent if the server is not up.
Outputs of the
test
One set of results for every SAP R/3 server being monitored
Measurements
made by the
test
Measurement
Measurement
Unit
Interpretation

M O N I T O R I N G T H E S A P A B A P I N S T A N C E
36
Utilization of the dialog
processes:
The percentage utilization of
the dialog work processes of
an application server.
Percent
Dialog work processes:
The number of dialog work
processes.
Number
Dispatcher wait queue
length:
The percentage utilization of
the dispatcher wait queue.
Percent
With normal workload, this value is around
0%. A long wait queue is a sign that the
application server has too few work
processes or too high a CPU workload.
Long runners:
Indicates how long the long-
running dialog processes
have been running.
Secs
Long-running tasks can block other users'
dialog steps and can produce a general
degradation of dialog response time for
interactive users. Resolving this problem
requires analysis of long-running dialog steps.
Corrective measures include moving users to
another application server, asking users to
schedule long-running reports or other
actions as background jobs in off-peak time
periods, etc.
Dialog steps:
The number of dialog steps
per minute.
Steps/min
A high value combined with a high Dialog
process time points to a general overload; a
very low value, indicates an error.
Users logged in:
The number of users logged
in.
Number
2.4.5 Table Space Test
This test monitors the database tablespaces.
Purpose
Monitors the database tablespaces
Target of the
test
A SAP R/3 server
Agent
deploying the
test
An internal/remote agent

M O N I T O R I N G T H E S A P A B A P I N S T A N C E
37
Configurable
parameters for
the test
1. TEST PERIOD - How often should the test be executed
2. HOST - Host name of the server for which the test is to be configured
3. PORTNO - Enter the port to which the specified HOST listens
4. CLIENTNAME – Specify the ID of the client system that is connecting to the R/3 server. To
view a list of client IDs to choose from, follow the procedure discussed in Page 14.
5. SAPUSER - Provide a valid user name for logging into the SAP R/3 server. In order to
enable the eG Enterprise suite to effectively monitor SAP, the name of a SAPUSER with
either of the following profiles need to be specified: S_A.SYSTEM (super administrator) or
SAP_ALL (all authorizations for SAP).
6. PASSWORD - The password of the specified SAPUSER.
7. CONFIRMPASSWORD - Confirm the password by retyping it here.
8. SYSNO - An indicator of the TCP/IP port at which the SAP server listens. For example, for a
server that listens at port 3200, the SYSNO will be '00'. Similarly, if the SAP server port is
3201, the SYSNO will have to be specified as '01'. Therefore, in the SYSNO text box
specify the system number of the SAP server with which the specified client communicates.
9. ROUTER - If the SAP client with the specified CLIENTNAME exists in a network external to
the SAP server, then a router will be used to enable the server-client communication. In
such a case, specify the IP of the router in the ROUTER text box. If both the client and
the server exist in the same network, then specify 'none' against the ROUTER text box.
10. INSTANCENAME - Specify the name of the SAP R/3 instance to be monitored. To view the
complete list of instances to choose from, do the follow the procedure discussed in Page 17
of this document.
11. JCO VERSION – The eG agent uses the SAP JCO library to connect to the SAP ABAP
system and pull out metrics. To enable the eG agent to make this connection and query the
metrics, you need to specify the version of the SAP JCO library that the agent needs to use.
For instance, to instruct the eG agent to use JCO v2.1.19, it would suffice if you specify the
‘major version number’ alone against JCO VERSION – in the case of this example, this will
be
2.x
.
12. TIMEOUT - Indicate the duration (in seconds) for which this test should wait for a response
from the SAP R/3 server. By default, this is set to 120 seconds.
13. ISPASSIVE – If the value chosen is YES, then the server under consideration is a passive
server in a SAP R/3 cluster. No alerts will be generated if the server is not running.
Measures will be reported as “Not applicable” by the agent if the server is not up.
Outputs of the
test
One set of results for every tablespace on the database
Measurements
made by the
test
Measurement
Measurement
Unit
Interpretation
Space free:
The amount of free space in
the database tablespaces.
MB

M O N I T O R I N G T H E S A P A B A P I N S T A N C E
38
Space used:
The percentage of used up
area of the various
tablespaces in the database.
Percent
2.4.6 Database Buffer Test
This test reports statistics pertaining to the buffer cache for database operations.
Purpose
Reports statistics pertaining to the buffer cache for database operations
Target of the
test
A SAP R/3 server
Agent
deploying the
test
An internal/remote agent

M O N I T O R I N G T H E S A P A B A P I N S T A N C E
39
Configurable
parameters for
the test
1. TEST PERIOD - How often should the test be executed
2. HOST - Host name of the server for which the test is to be configured
3. PORTNO - Enter the port to which the specified HOST listens
4. CLIENTNAME – Specify the ID of the client system that is connecting to the R/3 server. To
view a list of client IDs to choose from, follow the procedure discussed in Page 14.
5. SAPUSER - Provide a valid user name for logging into the SAP R/3 server. In order to
enable the eG Enterprise suite to effectively monitor SAP, the name of a SAPUSER with
either of the following profiles need to be specified: S_A.SYSTEM (super administrator) or
SAP_ALL (all authorizations for SAP).
6. PASSWORD - The password of the specified SAPUSER.
7. CONFIRMPASSWORD - Confirm the password by retyping it here.
8. SYSNO - An indicator of the TCP/IP port at which the SAP server listens. For example, for a
server that listens at port 3200, the SYSNO will be '00'. Similarly, if the SAP server port is
3201, the SYSNO will have to be specified as '01'. Therefore, in the SYSNO text box
specify the system number of the SAP server with which the specified client communicates.
9. ROUTER - If the SAP client with the specified CLIENTNAME exists in a network external to
the SAP server, then a router will be used to enable the server-client communication. In
such a case, specify the IP of the router in the ROUTER text box. If both the client and the
server exist in the same network, then specify 'none' against the ROUTER text box.
10. INSTANCENAME - Specify the name of the SAP R/3 instance to be monitored. To view the
complete list of instances to choose from, do the follow the procedure discussed in Page 17
of this document.
11. JCO VERSION - The eG agent uses the SAP JCO library to connect to the SAP ABAP system
and pull out metrics. To enable the eG agent to make this connection and query the
metrics, you need to specify the version of the SAP JCO library that the agent needs to use.
For instance, to instruct the eG agent to use JCO v2.1.19, it would suffice if you specify the
‘major version number’ alone against JCO VERSION – in the case of this example, this will
be
2.x
.
12. TIMEOUT - Indicate the duration (in seconds) for which this test should wait for a response
from the SAP R/3 server. By default, this is set to 120 seconds.
13. ISPASSIVE – If the value chosen is YES, then the server under consideration is a passive
server in a SAP R/3 cluster. No alerts will be generated if the server is not running.
Measures will be reported as “Not applicable” by the agent if the server is not up.
Outputs of the
test
One set of results for every SAP R/3 server being monitored
Measurements
made by the
test
Measurement
Measurement
Unit
Interpretation
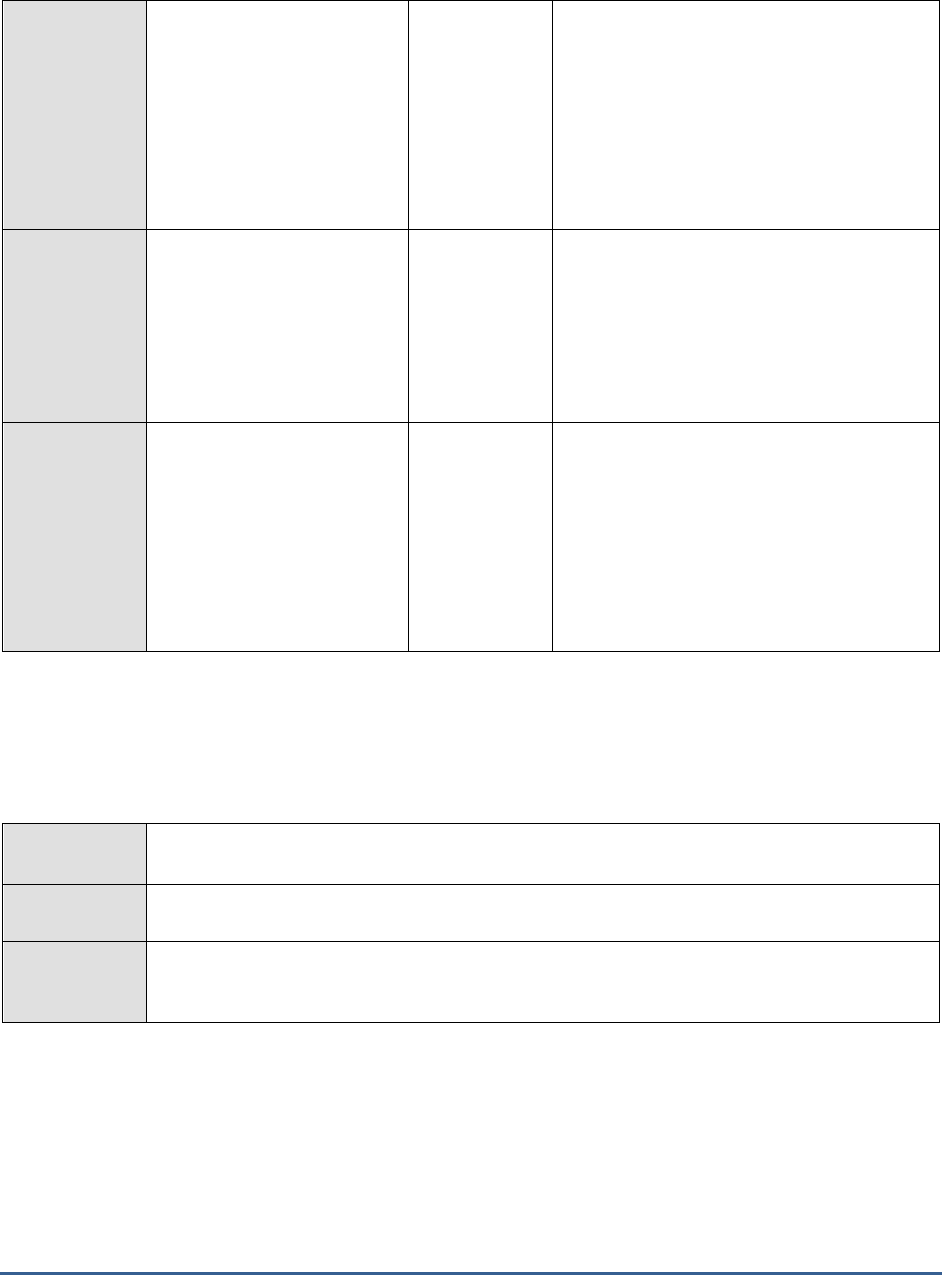
M O N I T O R I N G T H E S A P A B A P I N S T A N C E
40
Buffer cache hit ratio:
The percentage of time the
database server is able to
satisfy a request directly from
the cache.
Percent
Physical I/O takes significant amount of time
and also increases CPU resources required.
The database configuration should be tuned
to ensure that a required block will be most
likely in memory. The extent to which this is
achieved is measured using this measure.
Ratio should be 80% or higher. A lower value
indicates insufficient memory allocation to the
database buffer cache.
Library cache hit ratio:
Library cache is a buffer that
contains the shared SQL and
PL/SQL areas. The library
cache hit ratio indicates the
percentage of shared SQL
statements being reparsed.
Percent
For a well-tuned database, this ratio is 90%.
A lower hit ratio may indicate that the
memory allocation to the library cache is
insufficient. A low value can degrade the
database performance.
Redo log buffer entries:
The number of entries in the
redo log buffer describing
changes made to the
database.
Number
The changes made to the database are first
written to the redo log buffer. The database
then periodically writes batches of the redo
entries to the online redo log files. The lesser
the number of entries in the Redo Buffer, the
lesser the database changes are reflected in
the buffer. Therefore, there will be higher
disk reads and system performance will
decrease.
2.4.7 Sap Group Lb Test
The Sap Group Lb test automatically discovers the logon groups on a SAP message server, and monitors the status of
load balancing on each of the SAP R/3 application server(s) associated with a logon group.
Purpose
Monitors the status of load balancing on each of the SAP R/3 application server(s) associated
with a logon group
Target of the
test
The SAP Messaging server
Agent
deploying the
test
An internal/remote agent

M O N I T O R I N G T H E S A P A B A P I N S T A N C E
41
Configurable
parameters for
the test
1. TEST PERIOD - How often should the test be executed
2. HOST - Host name of the server for which the test is to be configured
3. PORT - Enter the port to which the specified HOST listens
4. MESSAGEPORT - Specify the port number of the SAP Message server.
5. LIBRARY PATH - This test uses an
lgtst
command to extract critical statistics from the SAP
Message server. Specify the full path to the library files used in the execution of the
lgtst
command.
6. COMMAND PATH - Specify the full path to the
lgtst
executable in the COMMAND PATH
text box.
Note:
The MESSAGEPORT, LIBRARYPATH and COMMANDPATH parameters are
applicable only to non-windows platforms.
7. COUNT - Specify the number of SAP R/3 servers to be polled by the
lgtst
command, so as
to determine whether load balancing has been enabled on the R/3 server or not.
8. ISPASSIVE - If the value chosen is YES, then the server under consideration is a passive
server in a SAP R/3 cluster. No alerts will be generated if the server is not running.
Measures will be reported as “Not applicable” by the agent if the server is not up.
Outputs of the
test
One set of results for every logon group discovered
Measurements
made by the
test
Measurement
Measurement
Unit
Interpretation
Number of unique
servers:
Indicates the number of
distinct application servers
that are currently
communicating under the
same group through the
Message Server.
Number
Load balanced:
Indicates whether the SAP
logon group is load-balanced
or not.
Percent
If the value of this measure is 0, it means
that load-balancing is not enabled for the
logon group. The client's request will be
served by the dialog server which has first
taken up the request. The value 100 indicates
that the logon group is load-balanced.
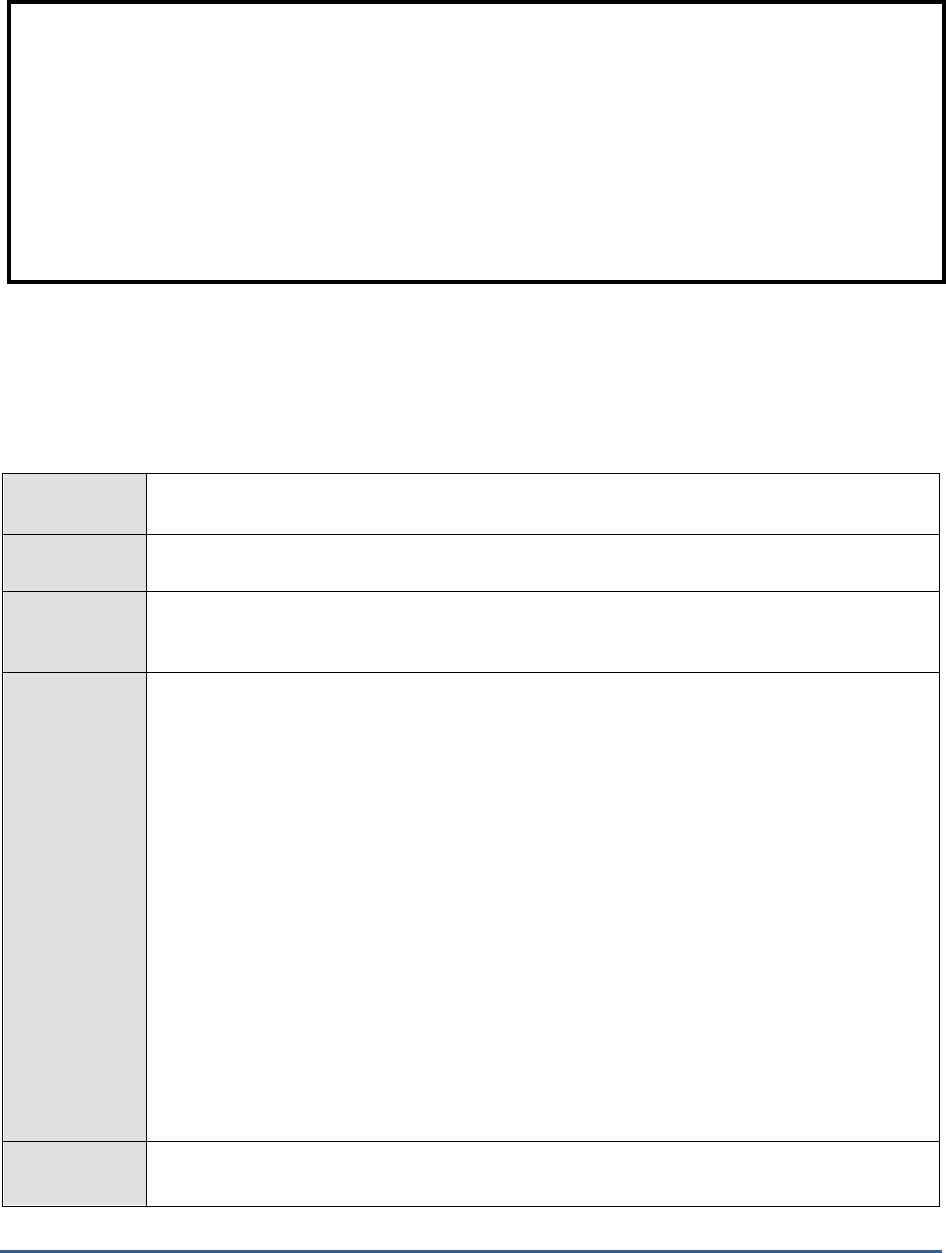
M O N I T O R I N G T H E S A P A B A P I N S T A N C E
42
2.4.8 Sap Message Information Test
The Sap Message Information test reveals whether the connection between the SAP R/3 server and the SAP
Messaging server is available or not.
Purpose
Reveals whether the connection between the SAP R/3 server and the SAP Messaging server is
available or not
Target of the
test
The SAP Messaging server
Agent
deploying the
test
An internal/external/remote agent
Configurable
parameters for
the test
1. TEST PERIOD - How often should the test be executed
2. HOST - Host name of the server for which the test is to be configured
3. PORT - Enter the port to which the specified HOST listens
4. MESSAGEPORT - Specify the port number of the SAP Message server.
5. LIBRARY PATH - This test uses an
lgtst
command to extract critical statistics from the SAP
Message server. Specify the full path to the library files used in the execution of the
lgtst
command.
6. COMMAND PATH - Specify the full path to the
lgtst
executable in the COMMAND PATH
text box.
Note:
The MESSAGEPORT, LIBRARYPATH and COMMANDPATH parameters are
applicable only to non-windows platforms.
7. ISPASSIVE - If the value chosen is YES, then the server under consideration is a passive
server in a SAP R/3 cluster. No alerts will be generated if the server is not running.
Measures will be reported as “Not applicable” by the agent if the server is not up.
Outputs of the
test
One set of results for the SAP R/3 server being monitored
Note:
This test uses an lgtst command to extract critical statistics from the SAP Message
server. With this command, you can check the active instances of your SAP System
and check existing logon groups directly at the operating system level. To ensure that
this test functions smoothly, the lgtst command needs to be copied to the
/opt/egurkha/bin directory (on Unix, or the <EG_INSTALL_DIR>\bin on Windows).
Another pre-requisite for the smooth execution of this test is that, in the transaction
SMLG, the External RFC Permitted attribute will have to be defined for any one of the
logon groups on the SAP Message server.
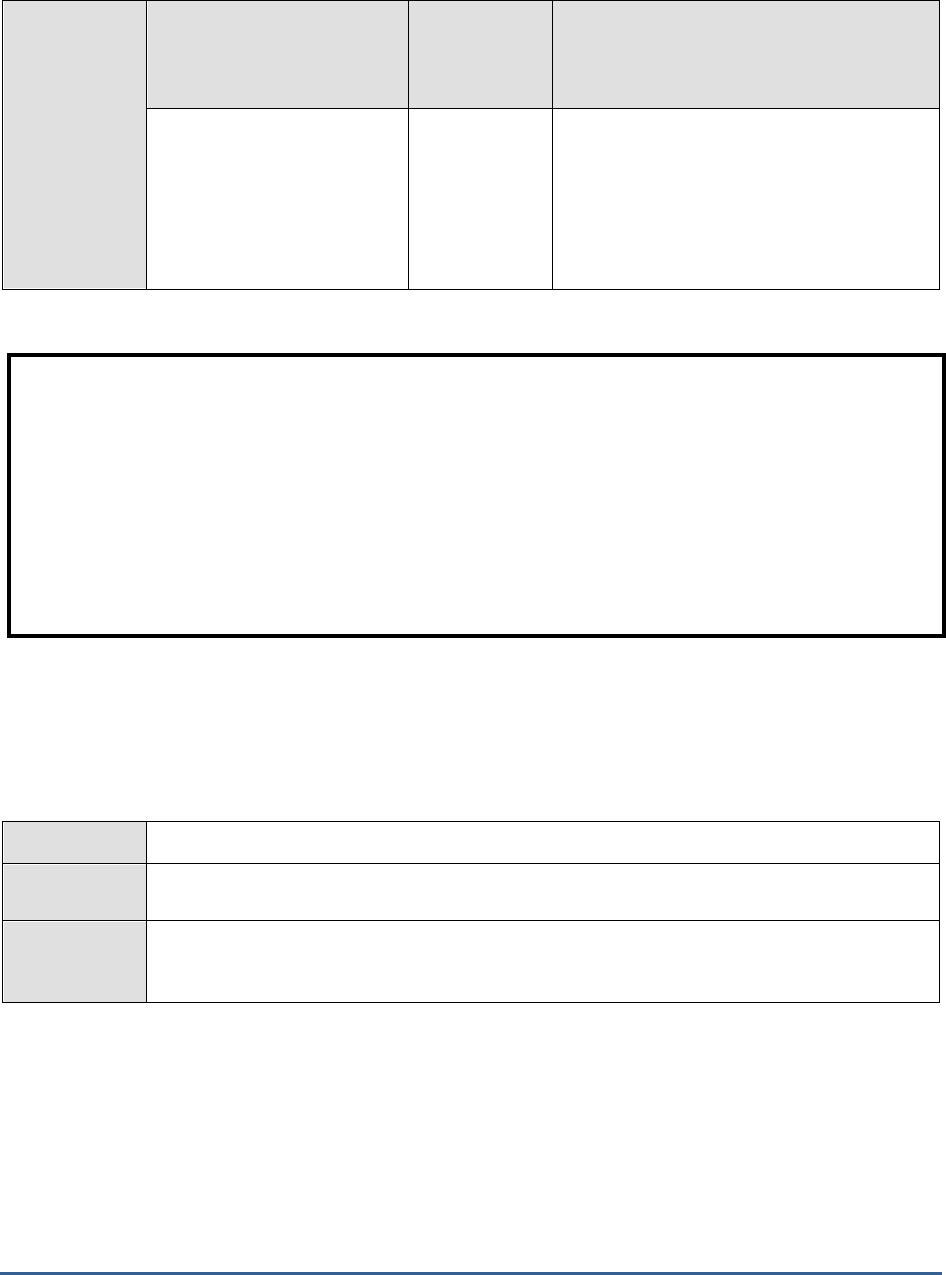
M O N I T O R I N G T H E S A P A B A P I N S T A N C E
43
Measurements
made by the
test
Measurement
Measurement
Unit
Interpretation
Availability:
Indicates whether a SAP R/3
application server is currently
available for communicating
with a SAP Message server.
Percent
If the value of this measure is 0, it means
that the R/3 application server can no longer
communicate with other R/3 servers
(especially if central instance and dialog
instance are installed in separate systems).
The value 100 indicates the availability of the
R/3 application server.
2.4.9 Sap Messages Test
The Sap Messages test reports the number of SAP R/3 servers that are communicating with the SAP Messaging
server.
Purpose
Reports the number of SAP R/3 servers that are communicating with the SAP Messaging server
Target of the
test
The SAP Messaging server
Agent
deploying the
test
An internal/remote agent
Note:
This test uses an lgtst command to extract critical statistics from the SAP Message
server. With this command, you can check the active instances of your SAP System
and check existing logon groups directly at the operating system level. To ensure that
this test functions smoothly, the lgtst command needs to be copied to the
/opt/egurkha/bin directory (on Unix, or the <EG_INSTALL_DIR>\bin on Windows).
Another pre-requisite for the smooth execution of this test is that, in the transaction
SMLG, the External RFC Permitted attribute will have to be defined for any one of the
logon groups on the SAP Message server.

M O N I T O R I N G T H E S A P A B A P I N S T A N C E
44
Configurable
parameters for
the test
1. TEST PERIOD - How often should the test be executed
2. HOST - Host name of the server for which the test is to be configured
3. PORT - Enter the port to which the specified HOST listens
4. MESSAGEPORT - Specify the port number of the SAP Message server.
5. LIBRARY PATH - This test uses an
lgtst
command to extract critical statistics from the SAP
Message server. Specify the full path to the library files used in the execution of the
lgtst
command.
6. COMMAND PATH - Specify the full path to the
lgtst
executable in the COMMAND PATH
text box.
Note:
The MESSAGEPORT, LIBRARYPATH and COMMANDPATH parameters are
applicable only to non-windows platforms.
7. ISPASSIVE - If the value chosen is YES, then the server under consideration is a passive
server in a SAP R/3 cluster. No alerts will be generated if the server is not running.
Measures will be reported as “Not applicable” by the agent if the server is not up.
8. DETAILED DIAGNOSIS - To make diagnosis more efficient and accurate, the eG
Enterprise suite embeds an optional detailed diagnostic capability. With this capability, the
eG agents can be configured to run detailed, more elaborate tests as and when specific
problems are detected. To enable the detailed diagnosis capability of this test for a
particular server, choose the On option. To disable the capability, click on the Off option.
The option to selectively enable/disable the detailed diagnosis capability will be available
only if the following conditions are fulfilled:
o The eG manager license should allow the detailed diagnosis capability
o Both the normal and abnormal frequencies configured for the detailed diagnosis
measures should not be 0.
Outputs of the
test
One set of results for the SAP R/3 server being monitored
Measurements
made by the
test
Measurement
Measurement
Unit
Interpretation
Reachable application
servers:
Indicates the number of
application servers that are
currently communicating with
the SAP Message server.
Number
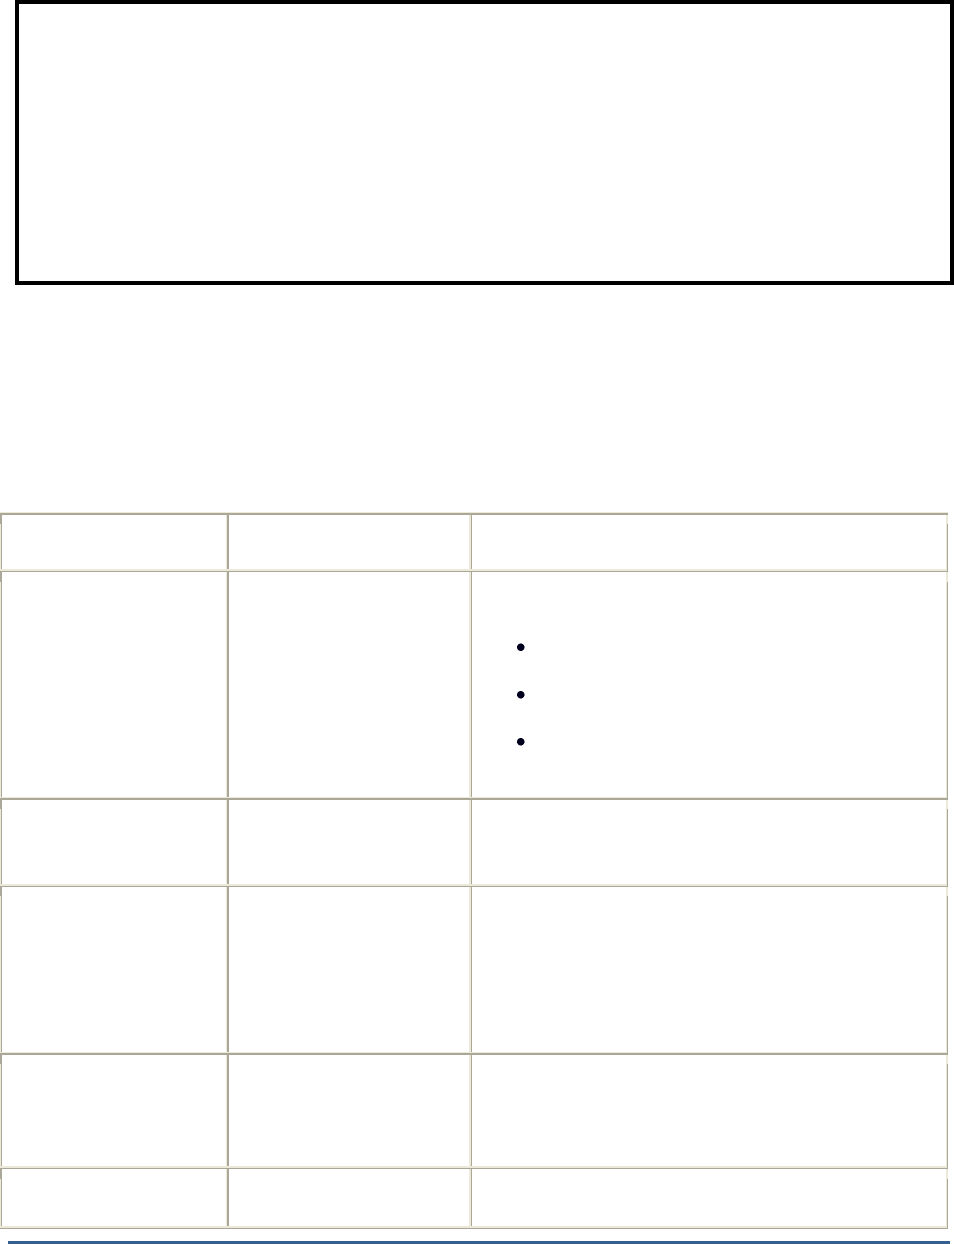
M O N I T O R I N G T H E S A P A B A P I N S T A N C E
45
2.4.10 Spool Processes Test
This test reports measures pertaining to the different request processing groups. For classification of the output
requests, we recommend that you assign both the spool servers and the output devices to different classes. By
having different spool servers that process different types (and priorities) of requests you can avoid, or at least
control, mutual obstruction of output requests. The Processing Groups MTE contains the possible processing groups:
MTE
Description
Notes
ProcessingGroup Adm
Spool administration
tasks
Examples:
Activation of delayed requests
Deletion of obsolete requests
Rerouting of requests in the case of
server failure
ProcessingGroup Reg
Normal requests
Normal requests are requests to devices that are
assigned to a spool server
ProcessingGroup Fro
Requests for front end
output devices
Front end output devices are defined by the user
at operating system level. In the R/3 system,
there must be only one output device with the
access method F (front end) which sends output
requests to the user's standard printer.
ProcessingGroup Vol
Requests classified as
mass printing
Mass printing means very large requests. Assign
these requests to a separate spool server, to
avoid the obstruction of other output requests.
ProcessingGroup Pro
Requests classified as
Assign the output requests that are required for
Note:
This test uses an lgtst command to extract critical statistics from the SAP Message
server. With this command, you can check the active instances of your SAP System
and check existing logon groups directly at the operating system level. To ensure that
this test functions smoothly, the lgtst command needs to be copied to the
/opt/egurkha/bin directory (on Unix, or the <EG_INSTALL_DIR>\bin on Windows).
Another pre-requisite for the smooth execution of this test is that, in the transaction
SMLG, the External RFC Permitted attribute will have to be defined for any one of the
logon groups on the SAP Message server.
M O N I T O R I N G T H E S A P A B A P I N S T A N C E
46
production printing
trouble free productive operation to the
production printing processing group.
ProcessingGroup Dsk
Requests classified as
desktop printing
Assign printers at one's workspace to the desktop
printing processing group. As they are often not
available, they could obstruct other tasks. Do not
use this group for routine operations.
ProcessingGroup Tst
Requests classified as
test printing
Assign output devices which are a new device
type or for which configuration is being tested to
the test printing processing group.
In the table above, the term MTE stands for a Monitoring Tree Element. According to the SAP monitoring
architecture, every SAP component/sub-system requiring monitoring, such as the buffer system, the dialog system,
background processing etc., is termed as a
Monitor
. Each of these
Monitors
and their respective attributes are
organized in the form of a tree-structure known as the monitoring tree, where the
Monitor
itself will be the pivotal
node, and its key attributes the sub-nodes. Each of these attributes is otherwise referred to as a monitoring tree
element (MTE).
Figure 2.18 depicts the tree-structure of the
Spool System Monitor
. From this figure it can be inferred that the
monitor,
Spool System, is the primary node of the monitoring tree. One of the sub-nodes of this
monitor
is
Processing Groups
. This sub-node and each of the nodes within (i.e., the individual processing groups and their
attributes) will therefore become individual MTEs of the Spool System Monitor. The eG agent executing the
SpoolProcessTest
extracts the values of the key attributes of each of the processing groups.
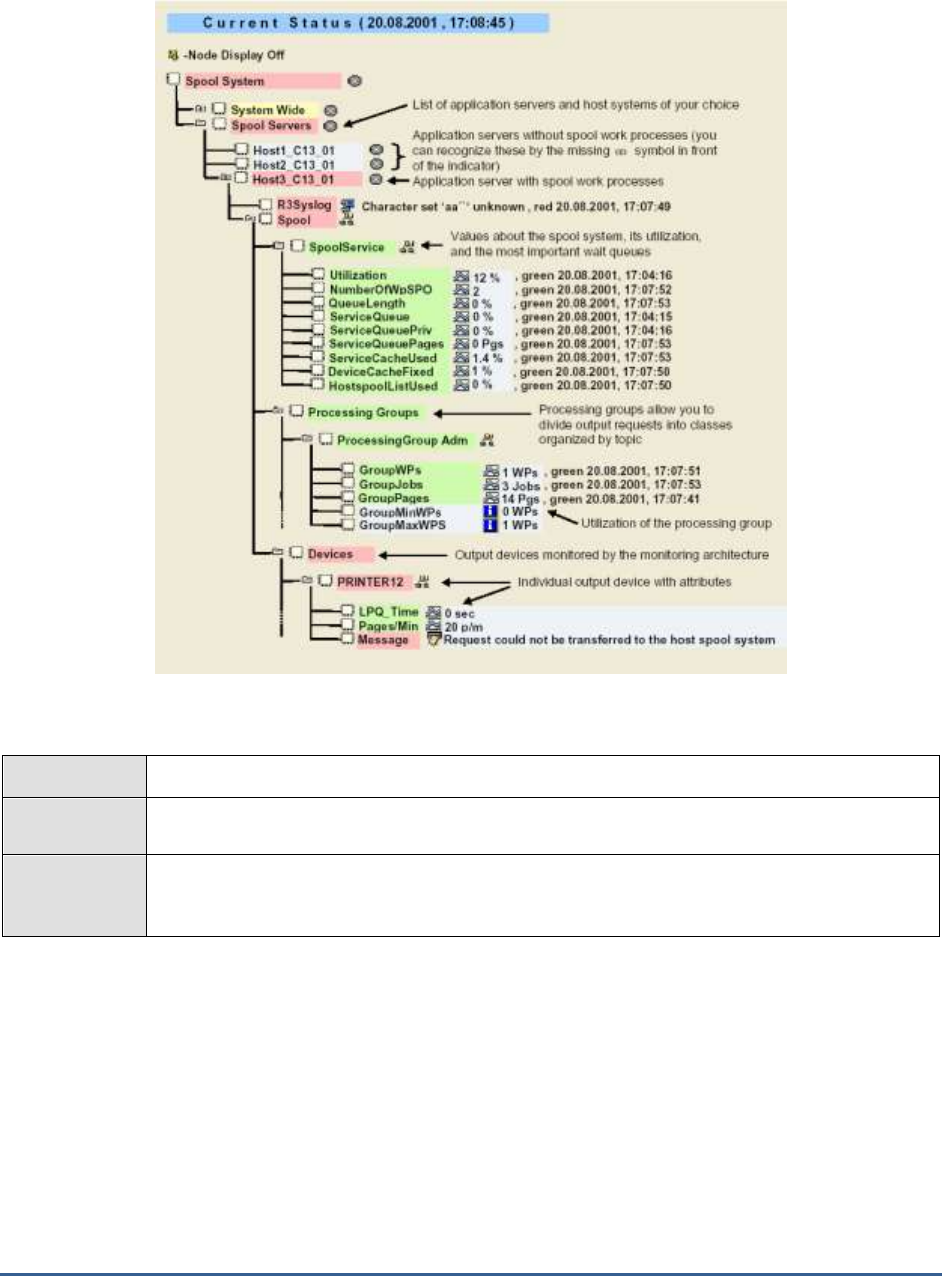
M O N I T O R I N G T H E S A P A B A P I N S T A N C E
47
Figure 2.18: The Spool System Monitor
Purpose
Reports measures pertaining to the different request processing groups
Target of the
test
A SAP R/3 server
Agent
deploying the
test
An internal/remote agent

M O N I T O R I N G T H E S A P A B A P I N S T A N C E
48
Configurable
parameters for
the test
1. TEST PERIOD - How often should the test be executed
2. HOST - Host name of the server for which the test is to be configured
3. PORTNO - Enter the port to which the specified HOST listens
4. CLIENTNAME – Specify the ID of the client system that is connecting to the R/3 server.
To view a list of client IDs to choose from, follow the procedure discussed in Page 14.
5. SAPUSER - Provide a valid user name for logging into the SAP R/3 server. In order to
enable the eG Enterprise suite to effectively monitor SAP, the name of a SAPUSER with
either of the following profiles need to be specified: S_A.SYSTEM (super administrator) or
SAP_ALL (all authorizations for SAP).
6. PASSWORD - The password of the specified SAPUSER.
7. CONFIRMPASSWORD - Confirm the password by retyping it here.
8. SYSNO - An indicator of the TCP/IP port at which the SAP server listens. For example, for
a server that listens at port 3200, the SYSNO will be '00'. Similarly, if the SAP server port
is 3201, the SYSNO will have to be specified as '01'. Therefore, in the SYSNO text box
specify the system number of the SAP server with which the specified client communicates.
9. ROUTER - If the SAP client with the specified CLIENTNAME exists in a network external
to the SAP server, then a router will be used to enable the server-client communication. In
such a case, specify the IP of the router in the ROUTER text box. If both the client and
the server exist in the same network, then specify 'none' against the ROUTER text box.
10. INSTANCENAME - Specify the name of the SAP R/3 instance to be monitored. To view
the complete list of instances to choose from, do the follow the procedure discussed in
Page 17 of this document.
11. JCO VERSION - The eG agent uses the SAP JCO library to connect to the SAP ABAP
system and pull out metrics. To enable the eG agent to make this connection and query
the metrics, you need to specify the version of the SAP JCO library that the agent needs to
use. For instance, to instruct the eG agent to use JCO v2.1.19, it would suffice if you
specify the ‘major version number’ alone against JCO VERSION – in the case of this
example, this will be
2.x
.
12. TIMEOUT - Indicate the duration (in seconds) for which this test should wait for a
response from the SAP R/3 server. By default, this is set to 120 seconds.
13. ISPASSIVE – If the value chosen is YES, then the server under consideration is a passive
server in a SAP R/3 cluster. No alerts will be generated if the server is not running.
Measures will be reported as “Not applicable” by the agent if the server is not up.
Outputs of the
test
One set of results for every processing group on a SAP R/3 server
Measurements
made by the
test
Measurement
Measurement
Unit
Interpretation
M O N I T O R I N G T H E S A P A B A P I N S T A N C E
49
Group work processes:
The number of group spool
work processes.
Number
Group jobs:
The number of group spool
requests.
Number
Group pages:
Peak usage achieved in the
recent period for stack
memory.
Number
2.4.11 Spool requests Test
The SAP System differentiates between two types of request when printing:
Spool request: A spool request is a document for which a print function has been selected. However, it
has not yet been output to a printer or another device. The output data for the print document is stored
partly formatted in a data store until an output request is created, that is, until it is sent to a particular
output device.
The spool system uses a spool request to store the print data temporarily and to access it. The data is
stored in a temporary format. You can also display the print document.
The system automatically assigns a 10-digit ID number to a spool request.
Output request: From the point of view of the SAP spool system, an output request outputs the print
data of a spool request to a particular output device.
Multiple output requests may exist for a single spool request. Each represents an instance of the output of
the same spool request. Each of these output requests may have different attributes, such as the target
printer or number of copies.
By differentiating between spool request and output requests, the spool system provides a means of
storing the data temporarily.
This test monitors the spool requests of the target SAP ABAP instance and reports how many spool requests were
created? Using this test, administrators may figure out how many spool requests were error prone. Apart from this,
you can figure out the number of output problems and output errors encountered by the output requests for a
corresponding spool request. This way, administrators may figure out what exactly caused the errors while
processing the spool requests and when exactly were the errors at their peak!
Purpose
Monitors the spool requests of the target SAP ABAP instance and reports how many spool
requests were created? Using this test, administrators may figure out how many spool requests
were error prone? Apart from this, you can figure out the number of output problems and
output errors encountered by the output requests for a corresponding spool request. This way,
administrators may figure out what exactly caused the errors while processing the spool
requests and when exactly were the errors at their peak!
Target of the
A SAP R/3 server

M O N I T O R I N G T H E S A P A B A P I N S T A N C E
50
test
Agent
deploying the
test
An internal/remote agent
Configurable
parameters for
the test
1. TEST PERIOD - How often should the test be executed
2. HOST - Host name of the server for which the test is to be configured
3. PORTNO - Enter the port to which the specified HOST listens
4. CLIENTNAME – Specify the ID of the client system that is connecting to the R/3 server. To
view a list of client IDs to choose from, follow the procedure discussed in Page 14.
5. SAPUSER - Provide a valid user name for logging into the SAP R/3 server. In order to
enable the eG Enterprise suite to effectively monitor SAP, the name of a SAPUSER with
either of the following profiles need to be specified: S_A.SYSTEM (super administrator) or
SAP_ALL (all authorizations for SAP).
6. PASSWORD - The password of the specified SAPUSER.
7. CONFIRMPASSWORD - Confirm the password by retyping it here.
8. SYSNO - An indicator of the TCP/IP port at which the SAP server listens. For example, for a
server that listens at port 3200, the SYSNO will be '00'. Similarly, if the SAP server port is
3201, the SYSNO will have to be specified as '01'. Therefore, in the SYSNO text box
specify the system number of the SAP server with which the specified client communicates.
9. ROUTER - If the SAP client with the specified CLIENTNAME exists in a network external
to the SAP server, then a router will be used to enable the server-client communication. In
such a case, specify the IP of the router in the ROUTER text box. If both the client and the
server exist in the same network, then specify 'none' against the ROUTER text box.
10. INSTANCENAME - Specify the name of the SAP R/3 instance to be monitored. To view
the complete list of instances to choose from, do the follow the procedure discussed in Page
17 of this document.
11. JCOVERSION - The eG agent uses the SAP JCO library to connect to the SAP ABAP system
and pull out metrics. To enable the eG agent to make this connection and query the
metrics, you need to specify the version of the SAP JCO library that the agent needs to use.
For instance, to instruct the eG agent to use JCO v2.1.19, it would suffice if you specify the
‘major version number’ alone against JCO VERSION – in the case of this example, this will
be
2.x
.
12. TIMEOUT - Indicate the duration (in seconds) for which this test should wait for a response
from the SAP R/3 server. By default, this is set to 120 seconds.
13. ISPASSIVE – If the value chosen is YES, then the server under consideration is a passive
server in a SAP R/3 cluster. No alerts will be generated if the server is not running.
Measures will be reported as “Not applicable” by the agent if the server is not up.
14. DD FREQUENCY - Refers to the frequency with which detailed diagnosis measures are to
be generated for this test. The default is
1:1
. This indicates that, by default, detailed
measures will be generated every time this test runs, and also every time the test detects a
problem. You can modify this frequency, if you so desire. Also, if you intend to disable the
detailed diagnosis capability for this test, you can do so by specifying
none
against DD
FREQUENCY.
M O N I T O R I N G T H E S A P A B A P I N S T A N C E
51
15. DETAILED DIAGNOSIS - To make diagnosis more efficient and accurate, the eG
Enterprise suite embeds an optional detailed diagnostic capability. With this capability, the
eG agents can be configured to run detailed, more elaborate tests as and when specific
problems are detected. To enable the detailed diagnosis capability of this test for a
particular server, choose the On option. To disable the capability, click on the Off option.
The option to selectively enable/disable the detailed diagnosis capability will be available
only if the following conditions are fulfilled:
o The eG manager license should allow the detailed diagnosis capability
o Both the normal and abnormal frequencies configured for the detailed diagnosis
measures should not be 0.
Outputs of the
test
One set of results for every processing group on a SAP R/3 server
Measurements
made by the
test
Measurement
Measurement
Unit
Interpretation
Spool requests:
Indicates the number of spool
requests created during the
last measurement period.
Requests
These measures are a good indicator of the
load on the spool system.
Spool request rate:
Indicates the rate at which
spool requests were created
during the last measurement
period.
Requests/sec
Total number of spool
errors:
Indicates the total number of
outstanding spool requests
with errors.
Requests
Ideally, the value of this measure should be
zero.
Spool error rate:
Indicates the rate of spool
requests with errors during
the last measurement period.
Requests/sec
A sudden/gradual increase in the value of this
measure indicates that the overall spool
system is error prone.
Total number of output
problems:
Indicates the number of
output problems encountered
by the output requests for a
corresponding spool request.
Requests
These output problems are encountered
while executing the output requests
corresponding a spool request. However, you
can infer that there was an output for the
request but problems were encountered
during printing.

M O N I T O R I N G T H E S A P A B A P I N S T A N C E
52
Rate of output problems:
Indicates the rate at which
output problems were
encountered by the output
requests.
Requests/sec
A sudden/gradual increase in the value of this
measure indicates issues with output device
connectivity or printing issues.
Total number of output
errors:
Indicates the number of
output errors encountered by
the output requests for a
corresponding spool request.
Requests
The output errors occur when there is no
output for a particular output request.
Rate of output errors:
Indicates the rate at which
the output errors were
encountered by the output
requests during the last
measurement period.
Requests/sec
A sudden/gradual increase in the value of this
measure indicates issues with output device
connectivity or printing issues.
New spool errors:
Indicates the number of spool
requests with errors during
the last measurement period.
Requests
Ideally, the value of this measure should be
zero.
The detailed diagnosis of this measure if
enabled, lists the request number,
corresponding output request status, title,
output device, timestamp etc.,
New output problems:
Indicates the number of
output problems encountered
by the output requests during
the last measurement period.
Requests
The detailed diagnosis of this measure if
enabled, lists the spool request number,
output device, total output requests
processed, number of output problems,
number of requests with no printout,
timestamp etc.
New output errors:
Indicates the number of
output errors encountered by
the output requests during
the last measurement period.
Requests
Ideally, the value of this measure should be
zero.
The detailed diagnosis of this measure if
enabled, lists the spool request number,
output device, total output requests
processed, number of output problems,
number of requests with no printout,
timestamp etc.,
2.4.12 Work processes Test
Work processes execute the individual dialog steps in R/3 applications. For each type of work process,
this test reports the numerical statistics of the work processes in various states. In addition, this test helps
administrators in analyzing the CPU utilization of the work processes so that resource intensive work
processes can be identified. This way, administrators may figure out how well the work processes are

M O N I T O R I N G T H E S A P A B A P I N S T A N C E
53
utilized in the target environment and what is really causing the slowdown of the environment – is it due to
the unavailability of free work processes? or are too many work processes on hold or in PRIV mode?
Purpose
Reports measures pertaining to the different request processing groups
Target of the
test
A SAP R/3 server
Agent
deploying the
test
An internal/remote agent
Configurable
parameters for
the test
1. TEST PERIOD - How often should the test be executed
2. HOST - Host name of the server for which the test is to be configured
3. PORTNO - Enter the port to which the specified HOST listens
4. CLIENTNAME – Specify the ID of the client system that is connecting to the R/3 server.
To view a list of client IDs to choose from, follow the procedure discussed in Page 14.
5. SAPUSER - Provide a valid user name for logging into the SAP R/3 server. In order to
enable the eG Enterprise suite to effectively monitor SAP, the name of a SAPUSER with
either of the following profiles need to be specified: S_A.SYSTEM (super administrator) or
SAP_ALL (all authorizations for SAP).
6. PASSWORD - The password of the specified SAPUSER.
7. CONFIRMPASSWORD - Confirm the password by retyping it here.
8. SYSNO - An indicator of the TCP/IP port at which the SAP server listens. For example, for
a server that listens at port 3200, the SYSNO will be '00'. Similarly, if the SAP server port
is 3201, the SYSNO will have to be specified as '01'. Therefore, in the SYSNO text box
specify the system number of the SAP server with which the specified client communicates.
9. ROUTER - If the SAP client with the specified CLIENTNAME exists in a network external
to the SAP server, then a router will be used to enable the server-client communication. In
such a case, specify the IP of the router in the ROUTER text box. If both the client and
the server exist in the same network, then specify 'none' against the ROUTER text box.
10. INSTANCENAME - Specify the name of the SAP R/3 instance to be monitored. To view
the complete list of instances to choose from, do the follow the procedure discussed in
Page 17 of this document.
11. JCOVERSION - The eG agent uses the SAP JCO library to connect to the SAP ABAP
system and pull out metrics. To enable the eG agent to make this connection and query
the metrics, you need to specify the version of the SAP JCO library that the agent needs to
use. For instance, to instruct the eG agent to use JCO v2.1.19, it would suffice if you
specify the ‘major version number’ alone against JCO VERSION – in the case of this
example, this will be
2.x
.

M O N I T O R I N G T H E S A P A B A P I N S T A N C E
54
12. TIMEOUT - Indicate the duration (in seconds) for which this test should wait for a
response from the SAP R/3 server. By default, this is set to 120 seconds.
13. ISPASSIVE – If the value chosen is YES, then the server under consideration is a passive
server in a SAP R/3 cluster. No alerts will be generated if the server is not running.
Measures will be reported as “Not applicable” by the agent if the server is not up.
14. DD FREQUENCY - Refers to the frequency with which detailed diagnosis measures are to
be generated for this test. The default is
1:1
. This indicates that, by default, detailed
measures will be generated every time this test runs, and also every time the test detects
a problem. You can modify this frequency, if you so desire. Also, if you intend to disable
the detailed diagnosis capability for this test, you can do so by specifying
none
against DD
FREQUENCY.
15. DETAILED DIAGNOSIS - To make diagnosis more efficient and accurate, the eG
Enterprise suite embeds an optional detailed diagnostic capability. With this capability, the
eG agents can be configured to run detailed, more elaborate tests as and when specific
problems are detected. To enable the detailed diagnosis capability of this test for a
particular server, choose the On option. To disable the capability, click on the Off option.
The option to selectively enable/disable the detailed diagnosis capability will be available
only if the following conditions are fulfilled:
o The eG manager license should allow the detailed diagnosis capability
o Both the normal and abnormal frequencies configured for the detailed diagnosis
measures should not be 0.
Outputs of the
test
One set of results for every processing group on a SAP R/3 server
Measurements
made by the
test
Measurement
Measurement
Unit
Interpretation
Free work processes:
Indicates the number of work
processes of this type that
are currently free.
Number
A high value is desired for these measures.
Sufficient number of free work processes are
needed to handle sudden spikes in activity. It
is important that free dialog work processes
are available so that administrators will be
able to login and troubleshoot other issues.
Percentage of free work
processes:
Indicates the percentage of
work processes of this type
that are currently free.
Percent

M O N I T O R I N G T H E S A P A B A P I N S T A N C E
55
Work processes on hold:
Indicates the number of work
processes of this type that
are currently on hold.
Number
Work processes are held when a particular
user holds the work proceses while waiting
for some message. These processes cannot
be released to the free pool until the message
is received. Work processes on PRIV mode
are also counted as on hold. Some issues
can cause work processes to be held
indefinitely thereby severely
limiting/exhausting the number of free work
processes.
The detailed diagnosis of this measure if
enabled, lists the process ID, CPU utilization,
user, report being run, table being accessed,
elapsed time etc.,
Percentage of work
processes on hold:
Indicates the percentage of
work processes of this type
that are currently on hold.
Percent
A low value is desired for this measure. If
there is a sudden surge in the value of this
measure, then it would adversely affect the
performance of the server by exhausting the
number of free work processes. Using the
Work processes on hold
measure
administrators may figure out the work
processes that are held for a longer duration
and examine the real cause.
Work processes in PRIV
mode:
Indicates the number of work
processes of this type that
are currently in PRIV mode.
Number
A work process enters PRIV mode when
either extended memory is exhausted or the
process has used the amount of memory
specified in ztta/roll_extension. The work
process then starts utilizing the heap area
which is not appreciated. If the memory
utilized is greater than the one set against
the abap/heaplimit profile parameter, then the
work process has to be restarted after
terminating the user (i.e., after user sign out
process). This will help administrators to
restore the work processes from the PRIV
mode.
A low value is desired for this measure. An
increasing trend in the value of this measure
indicates severe performance bottleneck.
The detailed diagnosis of this measure if
enabled, lists the process ID, user, report
being run, table being accessed, elapsed
time etc.,

M O N I T O R I N G T H E S A P A B A P I N S T A N C E
56
Percentage of work
processes in PRIV mode:
Indicates the percentage of
work processes of this type
that are currently in PRIV
mode.
Percent
A low value is desired for this measure. The
system will automatically terminate the
executing transactions if more than a certain
percentage of work processes are in PRIV
mode and the user is inactive for a certain
period of time.
Running work processes:
Indicates the number of work
processes of this type that
are currently running.
Number
Comparing the value of this measure across
the types helps you in identifying the work
processes type that is highly utilized. This
data can be very useful for capacity planning
and fine tuning.
The detailed diagnosis of this measure lists
the work process details thereby providing a
snapshot view of the work processes that are
currently executing.
Stopped work processes:
Indicates the work processes
of this type that are currently
in
Stopped
state.
Number
The work processes would be in Stopped
state when the work processes have been
aborted and are not to be restarted. This
usually happens because of a serious startup
issue for the work process which needs to be
fixed before the work process can be started
again.
The detailed diagnosis of this measure lists
the details about these work processes such
as the process ID, user, report being run,
table being accessed, elapsed time etc.,
Total number of work
processes:
Indicates the total number of
work processes of this type
that are configured to run.
Number
Comparing the value of this measure helps
administrators in planning the capacity of
each work processes type and fine tune it
accordingly.
Dumps:
Indicates the total number of
created by the work
processes of this type during
the last measurement period.
Number
The detailed diagnosis of this measure if
enabled, lists the name of the work
processes that had errors / dumps, the
CPU utilization, number of dumps
thrown, user, report running, table
accessed etc., Using these details
administrators can deduce the reason
behind the creation of dumps.
Request queue utilization:
Indicates the percent of
request queue for the work
processes of this type that is
currently utilized.
Percent
A high value for this measure indicates a
sudden surge in the user activity which helps
administrators to validate the distribution of
work processes.
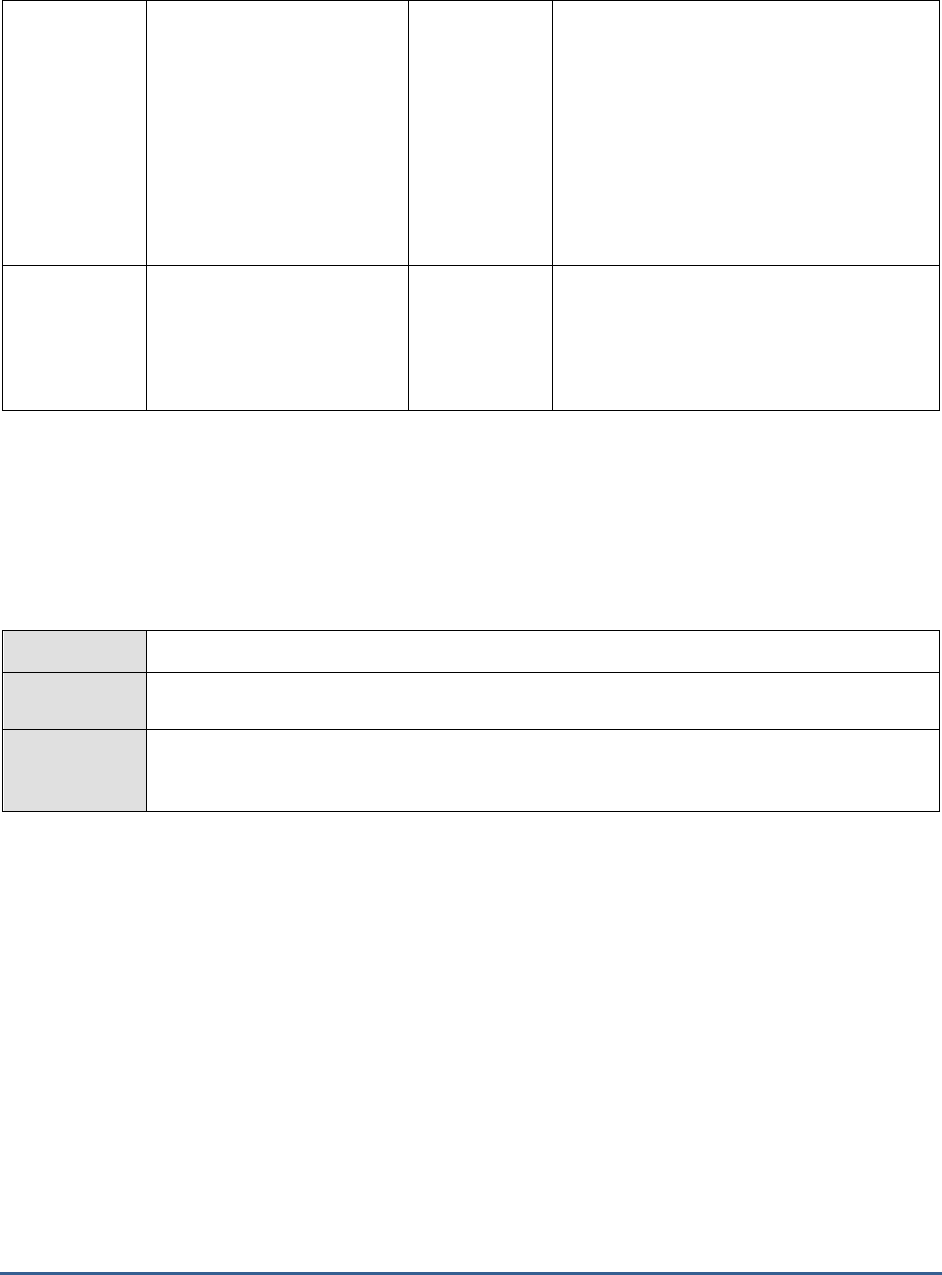
M O N I T O R I N G T H E S A P A B A P I N S T A N C E
57
CPU utilization:
Indicates the overall CPU
utilization of the work
processes of this type.
Percent
This measure indicates service level CPU
utilization of the various services (work
process types) such as Dialog service, Update
service, Spool service etc., This mesure helps
administrators to identify the resource
intensive work processes and figure out the
real reason that is hogging the resources.
The detailed diagnosis of this measure if
enabled, provides a sorted list of work
processes by CPU utilization.
Waiting requests:
Indicates the number of
requests for this work process
type that are waiting to be
processed.
Number
A higher number of waiting requests results
in high dispatcher wait time and response
time. This helps to provision and distribute
work processes appropriately.
2.4.13 Update Performance Test
The update system is designed to reduce the workload of the SAP transactions when significant changes are made to
the database. The changes are carried out asynchronously - usually with short delays in between - by special update
work processes. This is why the update system is widely used in SAP transactions (by almost every transaction that
changes business data), although transactions also can change the data directly in the database.
This test tracks the performance of the update system on a SAP R/3 server.
Purpose
Tracks the performance of the update system on a SAP R/3 server
Target of the
test
A SAP R/3 server
Agent
deploying the
test
An internal/remote agent

M O N I T O R I N G T H E S A P A B A P I N S T A N C E
58
Configurable
parameters for
the test
1. TEST PERIOD - How often should the test be executed
2. HOST - Host name of the server for which the test is to be configured
3. PORTNO - Enter the port to which the specified HOST listens
4. CLIENTNAME – Specify the ID of the client system that is connecting to the R/3 server. To
view a list of client IDs to choose from, follow the procedure discussed in Page 14.
5. SAPUSER - Provide a valid user name for logging into the SAP R/3 server. In order to
enable the eG Enterprise suite to effectively monitor SAP, the name of a SAPUSER with
either of the following profiles need to be specified: S_A.SYSTEM (super administrator) or
SAP_ALL (all authorizations for SAP).
6. PASSWORD - The password of the specified SAPUSER.
7. CONFIRMPASSWORD - Confirm the password by retyping it here.
8. SYSNO - An indicator of the TCP/IP port at which the SAP server listens. For example, for a
server that listens at port 3200, the SYSNO will be '00'. Similarly, if the SAP server port is
3201, the SYSNO will have to be specified as '01'. Therefore, in the SYSNO text box
specify the system number of the SAP server with which the specified client communicates.
9. INSTANCENAME - Specify the name of the SAP R/3 instance to be monitored. To view the
complete list of instances to choose from, do the follow the procedure discussed in Page 17
of this document.
10. JCOVERSION - The eG agent uses the SAP JCO library to connect to the SAP ABAP system
and pull out metrics. To enable the eG agent to make this connection and query the
metrics, you need to specify the version of the SAP JCO library that the agent needs to use.
For instance, to instruct the eG agent to use JCO v2.1.19, it would suffice if you specify the
‘major version number’ alone against JCO VERSION – in the case of this example, this will
be
2.x
.
11. ISPASSIVE – If the value chosen is YES, then the server under consideration is a passive
server in a SAP R/3 cluster. No alerts will be generated if the server is not running.
Measures will be reported as “Not applicable” by the agent if the server is not up.
12. TIMEOUT - Indicate the duration (in seconds) for which this test should wait for a response
from the SAP R/3 server. By default, this is set to 120 seconds.
13. ROUTER - If the SAP client with the specified CLIENTNAME exists in a network external
to the SAP server, then a router will be used to enable the server-client communication. In
such a case, specify the IP of the router in the ROUTER text box. If both the client and the
server exist in the same network, then specify 'none' against the ROUTER text box.
Outputs of the
test
One set of results for the SAP R/3 server being monitored
Measurements
made by the
test
Measurement
Measurement
Unit
Interpretation
Response time for
updates:
The time taken for the
update.
Secs
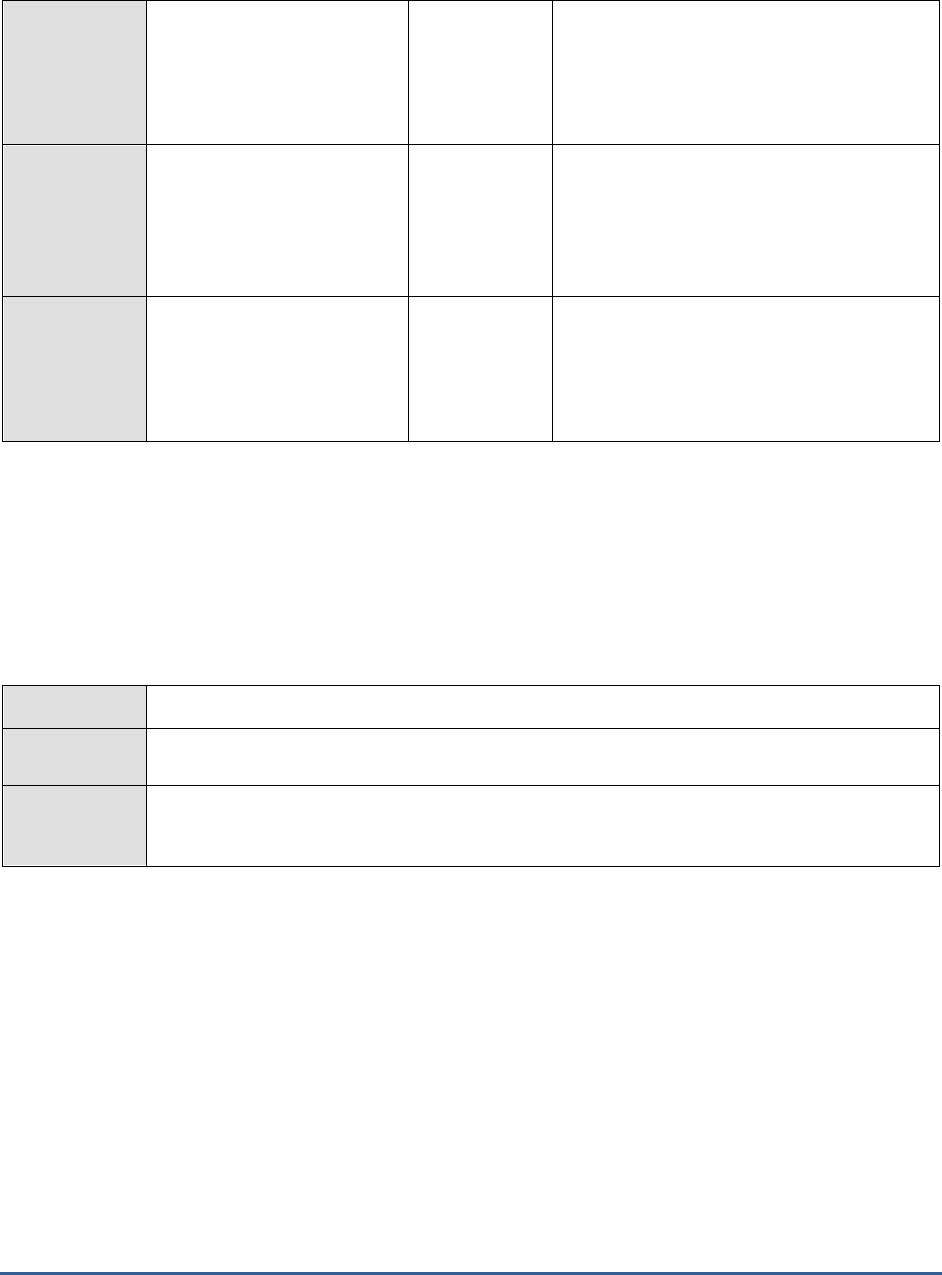
M O N I T O R I N G T H E S A P A B A P I N S T A N C E
59
Wait time of the update
process:
The wait time of the update
processes in the dispatcher
queue.
Secs
Utilization of the update
processes:
The percentage utilization of
the update work processes.
Percent
Update work processes:
The number of work
processes of type Update 1
(high priority) and Update 2
(low priority).
Number
There must be atleast one Update 1 type
work process in the system.
2.4.14 R3 Database Log Test
The R3 Database Log Test monitors database logs for specific error patterns. This test is disabled by default. This
test is disabled by default. To enable the test, go to the ENABLE / DISABLE TESTS page using the menu sequence :
Agents -> Tests -> Enable/Disable, pick
SAP R/3
as the Component type, set
Performance
as the Test type, choose
this test from the DISABLED TESTS list, and click on the >> button to move the test to the ENABLED TESTS list. Finally,
click the Update button.
Purpose
Monitors database logs for specific error patterns
Target of the
test
The SAP R/3 server database logs
Agent
deploying the
test
An internal agent

M O N I T O R I N G T H E S A P A B A P I N S T A N C E
60
Configurable
parameters for
the test
1. TEST PERIOD - How often should the test be executed
2. HOST - The host for which the test is to be configured.
3. PORT – The port at which the server listens
4. ALERTFILE - Specify the path to the database log file to be monitored. For eg.,
/usr/john/cejkxihy.sta
. Multiple log file paths can be provided as a comma-separated list -
eg.,
/user/john/cejkxihy.sta,/tmp/log/sejkxsig.tse
.
Also, instead of a specific log file path, the path to the directory containing log files can be
provided - eg.,
/user/logs
. This ensures that eG monitors the most recent log files in the
specified directory. Specific log file name patterns can also be specified. For example, to
monitor the latest log files with names containing the string 'dblogs', the parameter
specification can be,
/tmp/usr/*dblogs*
. Here, '*' indicates leading/trailing spaces (as the
case may be). In this case, the eG agent first enumerates all the log files in the specified
path that match the given pattern, and then picks only the latest log file from the result set
for monitoring.
You can also configure the path in the following format:
Name@logfilepath
. Here,
Name
represents the display name of the path being configured. Accordingly, the parameter
specification for the 'dblogs' example discussed above can be:
dblogs@/tmp/db/*dblogs*
.
In this case, the display name 'slogs' will alone be displayed as descriptors of the test.
Every time this test is executed, the eG agent verifies the following:
a. Whether any changes have occurred in the size and/or timestamp of the log
files that were monitoring during the last measurement period;
b. Whether any new log files (that match the ALERTFILE specification) have been
newly added since the last measurement period;
If a few lines have been added to a log file that was monitored previously, then the eG
agent monitors the additions to that log file, and then proceeds to monitor newer log files
(if any). If an older log file has been overwritten, then, the eG agent monitors this log file
completely, and then proceeds to monitor the newer log files (if any).
5. SEARCHPATTERN - Enter the specific patterns of alerts to be monitored. The pattern
should be in the following format:
<PatternName>:<Pattern>
, where
<PatternName>
is
the pattern name that will be displayed in the monitor interface and
<Pattern>
is an
expression of the form - *expr* or expr or *expr or expr*, etc. A leading '*' signifies any
number of leading characters, while a trailing '*' signifies any number of trailing characters.
For example, say you specify BRSPACE:BR100* in the SEARCHPATTERN text box. This
indicates that "BRSPACE" is the pattern name to be displayed in the monitor interface.
"BR100*" indicates that the test will monitor only those lines in the database log which start
with the term "BR100". A single pattern may also be of the form e1+e2, where +
signifies an OR condition. That is, the PatternName is matched if either e1 is true or e2 is
true.
Multiple search patterns can be specified as a comma-separated list. For example:
BRSPACE:BR100*,BRCONNECT:BR02*.

M O N I T O R I N G T H E S A P A B A P I N S T A N C E
61
If the ALERTFILE specification is of the format
Name@logfilepath
, then the descriptor for
this test in the eG monitor interface will be of the format:
Name:PatternName
. On the other
hand, if the ALERTFILE specification consists only of a comma-separated list of log file
paths, then the descriptors will be of the format:
LogFilePath:PatternName
.
If you want all the messages in a log file to be monitored, then your specification would be:
<PatternName>:*
.
6. LINES - Specify two numbers in the format x:y. This means that when a line in the alert
file matches a particular pattern, then x lines before the matched line and y lines after the
matched line will be reported in the detail diagnosis output (in addition to the matched
line). The default value here is 0:0. Multiple entries can be provided as a comma-separated
list.
If you give 0:0,1:1 as the value for LINES and if the corresponding value in the
SEARCHPATTERN filed is like BRSPACE:BR100*,BRCONNECT:BR02* then:
0:0 will be applied to BRSPACE:BR100* pattern
1:1 will be applied to BRCONNECT:BR02* pattern
7. EXCLUDEPATTERN - Provide a comma-separated list of patterns to be excluded from
monitoring in the EXCLUDEPATTERN text box. For example
*critical*,*exception*
. By
default, this parameter is set to 'none'.
8. UNIQUEMATCH - By default, the UNIQUEMATCH parameter is set to FALSE, indicating
that, by default, the test checks every line in the log file for the existence of each of the
configured SEARCHPATTERNS. By setting this parameter to TRUE, you can instruct the
test to ignore a line and move to the next as soon as a match for one of the configured
patterns is found in that line. For example, assume that
Pattern1:*fatal*,Pattern2:*error*
is
the SEARCHPATTERN that has been configured. If UNIQUEMATCH is set to FALSE,
then the test will read every line in the log file completely to check for the existence of
messages embedding the strings 'fatal' and 'error'. If both the patterns are detected in the
same line, then the number of matches will be incremented by 2. On the other hand, if
UNIQUEMATCH is set to TRUE, then the test will read a line only until a match for one of
the configured patterns is found and not both. This means that even if the strings 'fatal' and
'error' follow one another in the same line, the test will consider only the first match and not
the next. The match count in this case will therefore be incremented by only 1.

M O N I T O R I N G T H E S A P A B A P I N S T A N C E
62
1. ROTATINGFILE - This flag governs the display of descriptors for this test in the eG
monitoring console.
If this flag is set to true and the ALERTFILE text box contains the full path to a specific
(log/text) file, then, the descriptors of this test will be displayed in the following format:
Directory_containing_monitored_file:<SearchPattern>
. For instance, if the ALERTFILE
parameter is set to
c:\eGurkha\logs\syslog.txt
, and ROTATINGFILE is set to true, then,
your descriptor will be of the following format:
c:\eGurkha\logs:<SearchPattern>
. On the
other hand, if the ROTATINGFILE flag had been set to false, then the descriptors will be of
the following format:
<FileName>:<SearchPattern>
- i.e.,
syslog.txt:<SearchPattern>
in
the case of the example above.
If this flag is set to true and the ALERTFILE parameter is set to the directory containing log
files, then, the descriptors of this test will be displayed in the format:
Configured_directory_path:<SearchPattern>.
For instance, if the ALERTFILE parameter is
set to
c:\eGurkha\logs
, and ROTATINGFILE is set to true, then, your descriptor will be:
c:\eGurkha\logs:<SearchPattern>
. On the other hand, if the ROTATINGFILE parameter
had been set to false, then the descriptors will be of the following format:
Configured_directory:<SearchPattern>
- i.e.,
logs:<SearchPattern>
in the case of the
example above.
If this flag is set to true and the ALERTFILE parameter is set to a specific file pattern,
then, the descriptors of this test will be of the following format:
<FilePattern>:<SearchPattern>
. For instance, if the ALERTFILE parameter is set to
c:\eGurkha\logs\*sys*
, and ROTATINGFILE is set to true, then, your descriptor will be:
*sys*:<SearchPattern>
. In this case, the descriptor format will not change even if the
ROTATINGFILE flag status is changed .
2. ISPASSIVE – If the value chosen is YES, then the server under consideration is a passive
server in a SAP R/3 cluster. No alerts will be generated if the server is not running.
Measures will be reported as “Not applicable” by the agent if the server is not up.
3. DD FREQUENCY - Refers to the frequency with which detailed diagnosis measures are to
be generated for this test. The default is
1:1
. This indicates that, by default, detailed
measures will be generated every time this test runs, and also every time the test detects a
problem. You can modify this frequency, if you so desire. Also, if you intend to disable the
detailed diagnosis capability for this test, you can do so by specifying
none
against DD
FREQUENCY.
4. DETAILED DIAGNOSIS - To make diagnosis more efficient and accurate, the eG
Enterprise suite embeds an optional detailed diagnostic capability. With this capability, the
eG agents can be configured to run detailed, more elaborate tests as and when specific
problems are detected. To enable the detailed diagnosis capability of this test for a
particular server, choose the On option. To disable the capability, click on the Off option.
The option to selectively enable/disable the detailed diagnosis capability will be available
only if the following conditions are fulfilled:
The eG manager license should allow the detailed diagnosis capability
Both the normal and abnormal frequencies configured for the detailed diagnosis
measures should not be 0.
Outputs of the
test
One set of results for every SEARCHPATTERN
Measurements
made by the
Measurement
Measurement
Unit
Interpretation
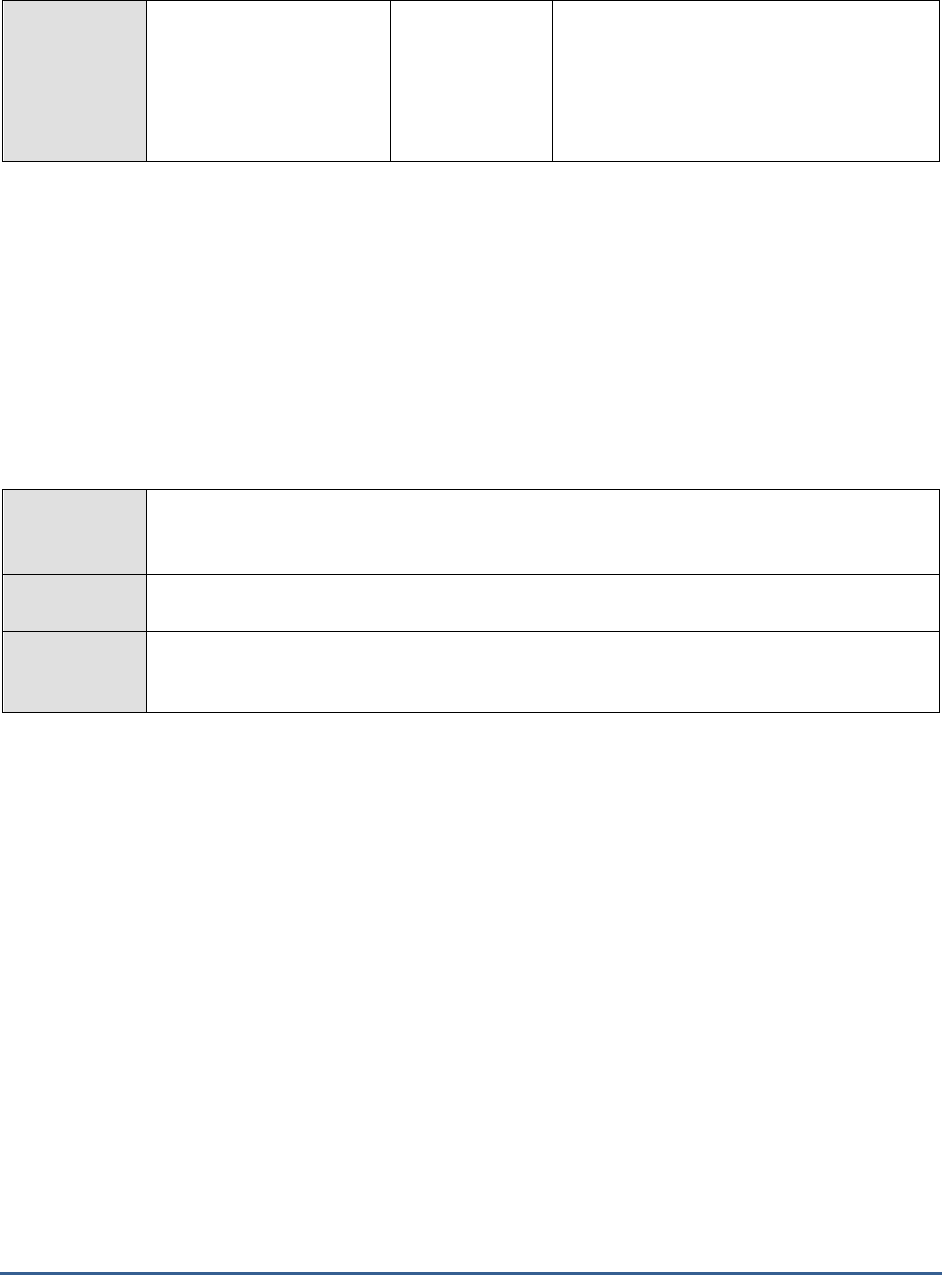
M O N I T O R I N G T H E S A P A B A P I N S T A N C E
63
test
Messages:
Indicates the number of
messages of the configured
patterns that were added
to the database log when
the test was last executed.
Number
The value of this measure is a clear indicator
of the number of “new” alerts that have
come into the monitored database logs.
2.4.15 Enqueue Test
The Enqueue service allows SAP R/3 applications to lock data so that only they can use it. Locking the data prevents
parallel changes to the same data, which would lead to data inconsistency. There is one instance of an enqueue
service for each system - this instance becomes the central instance of the system by virtue of having this service.
This Enqueue Client collects performance values for requests from other instances to this service. The Enqueue
server provides the enqueue service for the system.
This test monitors the performance of the enqueue service and reports how well the owner IDs in the loack table
were utilized. In addition, this test reports how well the elementary lock IDs were utilized and how many errors were
encountered in the enqueue work process.
Purpose
Monitors the performance of the enqueue service and reports how well the owner IDs in the
loack table were utilized. In addition, this test reports how well the elementary lock IDs were
utilized and how many errors were encountered in the enqueue work process
Target of the
test
A SAP R/3 server
Agent
deploying the
test
An internal/remote agent

M O N I T O R I N G T H E S A P A B A P I N S T A N C E
64
Configurable
parameters for
the test
1. TEST PERIOD - How often should the test be executed
2. HOST - Host name of the server for which the test is to be configured
3. PORTNO - Enter the port to which the specified HOST listens
4. CLIENTNAME – Specify the ID of the client system that is connecting to the R/3 server. To
view a list of client IDs to choose from, follow the procedure discussed in Page 14.
5. SAPUSER - Provide a valid user name for logging into the SAP R/3 server. In order to
enable the eG Enterprise suite to effectively monitor SAP, the name of a SAPUSER with
either of the following profiles need to be specified: S_A.SYSTEM (super administrator) or
SAP_ALL (all authorizations for SAP).
6. PASSWORD - The password of the specified SAPUSER.
7. CONFIRMPASSWORD - Confirm the password by retyping it here.
8. SYSNO - An indicator of the TCP/IP port at which the SAP server listens. For example, for a
server that listens at port 3200, the SYSNO will be '00'. Similarly, if the SAP server port is
3201, the SYSNO will have to be specified as '01'. Therefore, in the SYSNO text box
specify the system number of the SAP server with which the specified client communicates.
9. ROUTER - If the SAP client with the specified CLIENTNAME exists in a network external to
the SAP server, then a router will be used to enable the server-client communication. In
such a case, specify the IP of the router in the ROUTER text box. If both the client and the
server exist in the same network, then specify 'none' against the ROUTER text box.
10. INSTANCENAME - Specify the name of the SAP R/3 instance to be monitored. To view the
complete list of instances to choose from, do the follow the procedure discussed in Page 17
of this document.
11. JCOVERSION - The eG agent uses the SAP JCO library to connect to the SAP ABAP system
and pull out metrics. To enable the eG agent to make this connection and query the
metrics, you need to specify the version of the SAP JCO library that the agent needs to use.
For instance, to instruct the eG agent to use JCO v2.1.19, it would suffice if you specify the
‘major version number’ alone against JCO VERSION – in the case of this example, this will
be
2.x
.
12. TIMEOUT - Indicate the duration (in seconds) for which this test should wait for a response
from the SAP R/3 server. By default, this is set to 120 seconds.
13. ISPASSIVE – If the value chosen is YES, then the server under consideration is a passive
server in a SAP R/3 cluster. No alerts will be generated if the server is not running.
Measures will be reported as “Not applicable” by the agent if the server is not up.
Outputs of the
test
One set of results for every SAP R/3 server being monitored
Measurements
made by the
test
Measurement
Measurement
Unit
Interpretation

M O N I T O R I N G T H E S A P A B A P I N S T A N C E
65
Client enqueue frequency:
The rate of Enqueue
operations (logical data locks)
coming from another instance
to the central instance.
Locks/Min
This is a relative measure of activity in the
system, useful only for analyzing unusual
events or patterns of activity in an application
server. The R/3 enqueue service is capable of
handling very high rates of operation. Should
an alert occur, it indicates that the wait times
for lock operations are having an adverse
effect on the overall dialog response time.
These situations are of a temporary nature
and should correct themselves. They are
likely to occur only under unusual
circumstances, such as massively parallel
execution of RFC calls to a particular server.
Server queue length:
The percentage length of the
wait queue for the enqueue
service
Percent
If an error occurs in this MTE, analyze the
problem by executing the following diagnosis
function in the lock management:
Call Transaction SM12 and choose Extras ->
Diagnosis or -> Diagnosis in update. With
SAP'S agreement, you can use the extended
diagnosis functions that are displayed by
entering the OK codes "TEST".
Owner names utilization:
Indicates the percentage of
owner IDs in the lock table
that are currently utilized.
Percent
Every time the enqueue server receives a
lock request, the system checks the lock
table to determine whether the request
collides with an existing lock . If this is the
case, the request is rejected. Otherwise, the
new lock is written to the lock table. This lock
table available in the main memory of the
enqueue server records the current locks in
the system.
For each elementary lock, the table specifies
the owner, lock mode, name, and the fields
in the locked table.
If the value of this measure is close to 100%,
it indicates that all the owner IDs in the lock
table are exhausted and hence, new locks
cannot be created unless the existing locks
assigned to the owner IDs are released.
Granule arguments
utilization:
Indicates the percentage of
lock arguments in the lock
table that are currently
utilized.
Percent
The locks of different owners or with different
lock modes containing the same lock
argument occupy one entry in the lock table.
If the value of this measure is close to 100%,
it indicates that all the lock argument s in the
lock table are exhausted and new locks
cannot be created unless the existing locks
are released.
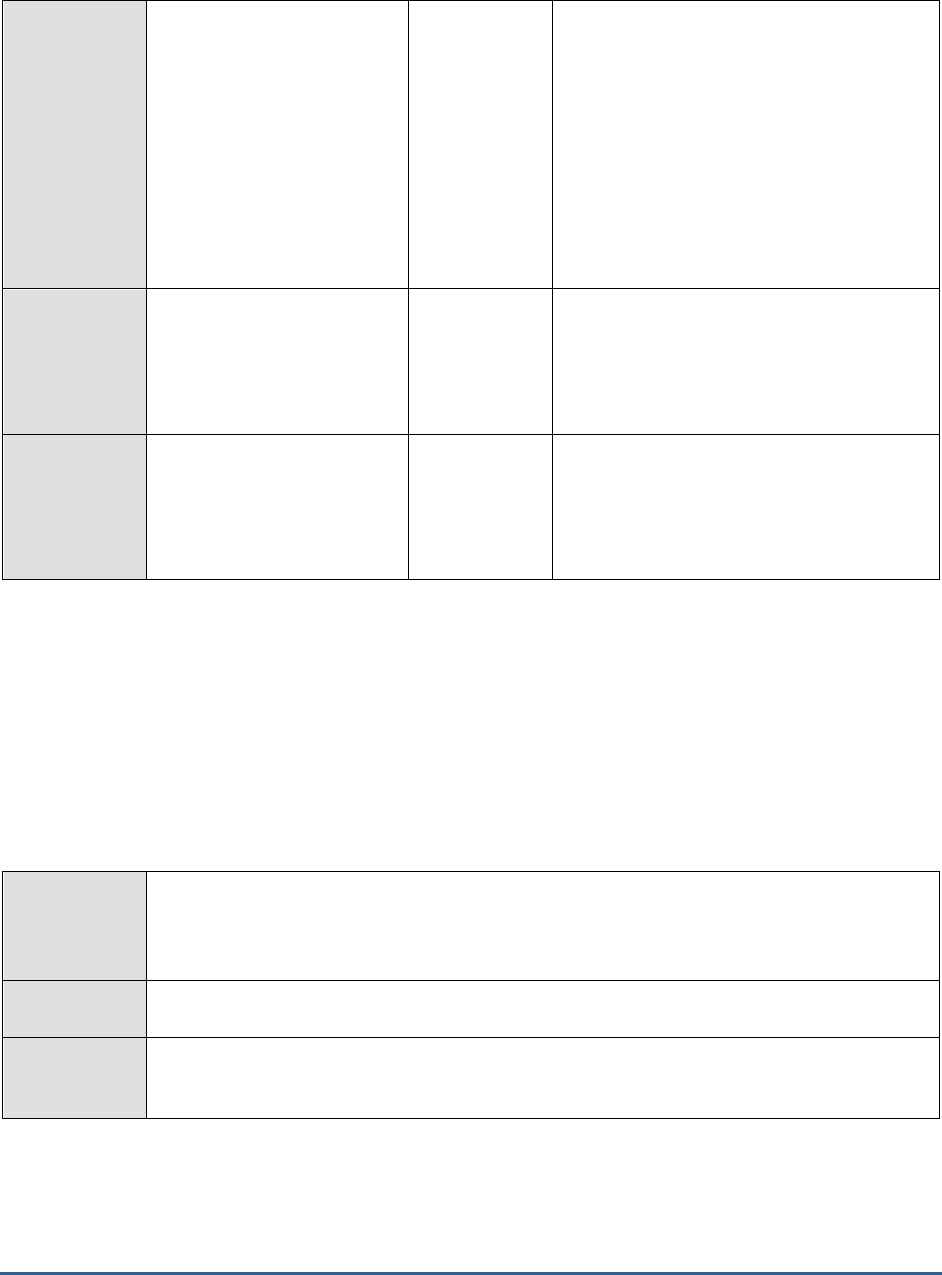
M O N I T O R I N G T H E S A P A B A P I N S T A N C E
66
Granule entries
utilization:
Indicates the percentage of
elementary locks in the lock
table that are currently
utilized.
Percent
An elementary lock corresponds to a data
record in the lock table. For each elementary
lock, the table specifies the owner, lock
mode, name, and the fields in the locked
table.
If the value of this measure is close to 100%.
It indicates that all the elementary locks in
the lock table are utilized and hence, new
locks cannot be created unless the existing
elementary locks are released from the lock
table.
Enqueue work process
errors:
Indicates the number of
errors encountered by the
enqueue work process.
Number
Ideally, the value of this measure should be
zero.
Enqueue work process
error rate:
Indicates the rate of enqueue
work process errors
encountered.
Errors/Min
2.4.16 Database consistency Test
A database consistency check performs a thorough check of the entire database. It examines all tables in the
database to find out whether index and data pages are correctly linked and indexes are in proper-sorted order. It
also checks that all pointers are consistent and that the data information on each page, and page offsets are
reasonable. It enables the early recognition of problems and thus prevents problem escalation and possible loss of
data.
Using this test, administrators can figure out how many primary and secondary indices were affected i.e.,
inconsistent while each type of database consistency check is performed. In addition, you can also figure out the
number of tables and views that were affected when the database consistency check is performed.
Purpose
Using this test, administrators can figure out how many primary and secondary indices were
affected i.e., inconsistent while each type of database consistency check is performed. In
addition, you can also figure out the number of tables and views that were affected when the
database consistency check is performed.
Target of the
test
A SAP R/3 server
Agent
deploying the
test
An internal/remote agent

M O N I T O R I N G T H E S A P A B A P I N S T A N C E
67
Configurable
parameters for
the test
1. TEST PERIOD - How often should the test be executed
2. HOST - Host name of the server for which the test is to be configured
3. PORTNO - Enter the port to which the specified HOST listens
4. CLIENTNAME – Specify the ID of the client system that is connecting to the R/3 server. To
view a list of client IDs to choose from, follow the procedure discussed in Page 14.
5. SAPUSER - Provide a valid user name for logging into the SAP R/3 server. In order to
enable the eG Enterprise suite to effectively monitor SAP, the name of a SAPUSER with
either of the following profiles need to be specified: S_A.SYSTEM (super administrator) or
SAP_ALL (all authorizations for SAP).
6. PASSWORD - The password of the specified SAPUSER.
7. CONFIRMPASSWORD - Confirm the password by retyping it here.
8. SYSNO - An indicator of the TCP/IP port at which the SAP server listens. For example, for a
server that listens at port 3200, the SYSNO will be '00'. Similarly, if the SAP server port is
3201, the SYSNO will have to be specified as '01'. Therefore, in the SYSNO text box
specify the system number of the SAP server with which the specified client communicates.
9. ROUTER - If the SAP client with the specified CLIENTNAME exists in a network external to
the SAP server, then a router will be used to enable the server-client communication. In
such a case, specify the IP of the router in the ROUTER text box. If both the client and the
server exist in the same network, then specify 'none' against the ROUTER text box.
10. INSTANCENAME - Specify the name of the SAP R/3 instance to be monitored. To view the
complete list of instances to choose from, do the follow the procedure discussed in Page 17
of this document.
11. TIMEOUT - Indicate the duration (in seconds) for which this test should wait for a response
from the SAP R/3 server. By default, this is set to 120 seconds.
12. ISPASSIVE – If the value chosen is YES, then the server under consideration is a passive
server in a SAP R/3 cluster. No alerts will be generated if the server is not running.
Measures will be reported as “Not applicable” by the agent if the server is not up.
13. JCOVERSION – The eG agent uses the SAP JCO library to connect to the SAP ABAP system
and pull out metrics. To enable the eG agent to make this connection and query the
metrics, you need to specify the version of the SAP JCO library that the agent needs to use.
For instance, to instruct the eG agent to use JCO v2.1.19, it would suffice if you specify the
‘major version number’ alone against JCO VERSION – in the case of this example, this will
be
2.x
.
Outputs of the
test
One set of results for every SAP R/3 server being monitored
Measurements
made by the
test
Measurement
Measurement
Unit
Interpretation
M O N I T O R I N G T H E S A P A B A P I N S T A N C E
68
Primary indexes:
Indicates the number of
primary indices that were
affected while performing this
type of database consisteny
check.
Number
A low value is desired for this measure.
Secondary indexes:
Indicates the number of
secondary indices that were
affected while performing this
type of database consisteny
check.
Number
A low value is desired for this measure.
Tables:
Indicates the number of
tables that were affected
while performing this type of
database consisteny check.
Number
A high value indicates that the tables in the
database are inconsistent. Early detection of
such tables will help administrators prevent
possible loss of data.
Views:
Indicates the number of
views that were affected
while performing this type of
database consisteny check.
Number
2.4.17 Update requests Test
An update request, or update record, describes the data changes determined in an SAP LUW. These changes should
be made completely, or not all (this means, in a database LUW). This refers only to V1 updates. V2 updates are
triggered once the V1 update is complete, and are processed in a separate database LUW.
An update request is identified by its update key.
When the dialog transaction ends (COMMIT WORK), and the update process is called, an update header is created.
Then the update record is created. The update data is contained in the update modules that was created using the
ABAP command CALL FUNCTION '…' IN UPDATE TASK. The function module type is defined in the
transaction for maintaining function modules (transaction SE37). Whenever there are too many data changes in the
target environment, then it indicates that so many update requests will be created to effect those changes. With an
increase in the volume of data changes, administrators may need to check the volume of the update requests too.
The time taken for an update request to complete processing depends on the changes that were made to the target
environment. Therefore, when too many update requests are created in the environment, administrators need to
identify the update requests that are taking too long to process, update requests that are stopped and are stuck for a
longer duration. This is exactly where the Update requests Test helps! Using this test, you can figure out how many
update requests were created and how many were actually stopped/stuck in the target environment. In addition,
administrators can figure out the update requests that encountered errors.
Purpose
Helps you figure out how many update requests were created and how many were actually
stopped/stuck in the target environment. In addition, administrators can figure out the update
requests that encountered errors.

M O N I T O R I N G T H E S A P A B A P I N S T A N C E
69
Target of the
test
A SAP R/3 server
Agent
deploying the
test
An internal/remote agent
Configurable
parameters for
the test
1. TEST PERIOD - How often should the test be executed
2. HOST - Host name of the server for which the test is to be configured
3. PORTNO - Enter the port to which the specified HOST listens
4. CLIENTNAME – Specify the ID of the client system that is connecting to the R/3 server. To
view a list of client IDs to choose from, follow the procedure discussed in Page 14.
5. SAPUSER - Provide a valid user name for logging into the SAP R/3 server. In order to
enable the eG Enterprise suite to effectively monitor SAP, the name of a SAPUSER with
either of the following profiles need to be specified: S_A.SYSTEM (super administrator) or
SAP_ALL (all authorizations for SAP).
6. PASSWORD - The password of the specified SAPUSER.
7. CONFIRMPASSWORD - Confirm the password by retyping it here.
8. SYSNO - An indicator of the TCP/IP port at which the SAP server listens. For example, for a
server that listens at port 3200, the SYSNO will be '00'. Similarly, if the SAP server port is
3201, the SYSNO will have to be specified as '01'. Therefore, in the SYSNO text box
specify the system number of the SAP server with which the specified client communicates.
9. ROUTER - If the SAP client with the specified CLIENTNAME exists in a network external to
the SAP server, then a router will be used to enable the server-client communication. In
such a case, specify the IP of the router in the ROUTER text box. If both the client and the
server exist in the same network, then specify 'none' against the ROUTER text box.
10. INSTANCENAME - Specify the name of the SAP R/3 instance to be monitored. To view the
complete list of instances to choose from, do the follow the procedure discussed in Page 17
of this document.
11. TIMEOUT - Indicate the duration (in seconds) for which this test should wait for a response
from the SAP R/3 server. By default, this is set to 120 seconds.
12. ISPASSIVE – If the value chosen is YES, then the server under consideration is a passive
server in a SAP R/3 cluster. No alerts will be generated if the server is not running.
Measures will be reported as “Not applicable” by the agent if the server is not up.
13. JCOVERSION – The eG agent uses the SAP JCO library to connect to the SAP ABAP system
and pull out metrics. To enable the eG agent to make this connection and query the
metrics, you need to specify the version of the SAP JCO library that the agent needs to use.
For instance, to instruct the eG agent to use JCO v2.1.19, it would suffice if you specify the
‘major version number’ alone against JCO VERSION – in the case of this example, this will
be
2.x
.

M O N I T O R I N G T H E S A P A B A P I N S T A N C E
70
14. STUCKUPDATECUTOFF – Specify the time duration (in minutes) beyond which the
update requests in the following states are classified as
stuck
:
VB_RUN_V1,
VB_RUN_V2,
VB_RESTART_V1,
VB_RESTART_V2,
initial,
auto(sys) and
auto(dia)
15. DD FREQUENCY - Refers to the frequency with which detailed diagnosis measures are to
be generated for this test. The default is 1:1. This indicates that, by default, detailed
measures will be generated every time this test runs, and also every time the test detects a
problem. You can modify this frequency, if you so desire. Also, if you intend to disable the
detailed diagnosis capability for this test, you can do so by specifying none against dd
frequency.
16. DETAILED DIAGNOSIS - To make diagnosis more efficient and accurate, the eG
Enterprise suite embeds an optional detailed diagnostic capability. With this capability, the
eG agents can be configured to run detailed, more elaborate tests as and when specific
problems are detected. To enable the detailed diagnosis capability of this test for a
particular server, choose the On option. To disable the capability, click on the Off option.
The option to selectively enable/disable the detailed diagnosis capability will be available
only if the following conditions are fulfilled:
o The eG manager license should allow the detailed diagnosis capability
o Both the normal and abnormal frequencies configured for the detailed diagnosis
measures should not be 0.
Outputs of the
test
One set of results for every SAP R/3 server being monitored
Measurements
made by the
test
Measurement
Measurement
Unit
Interpretation
Number of update
requests created:
Indicates the number of
update requests that were
created during the last
measurement period.
Requests

M O N I T O R I N G T H E S A P A B A P I N S T A N C E
71
Rate of update requests
created:
Indicates the rate at which
update requests were created
during the last measurement
period.
Requests/sec
This measure is a good indicator of the load
on the system.
Total number of stopped
updates:
Indicates the total number of
update requests that were
stopped since the start of the
server.
Requests
The update requests may be stopped due to
various reasons such as database issues,
longer wait period to connect to the server,
the update server being inactive for a longer
time etc.
Rate of stopped update
requests:
Indicates the rate at which
update requests were
stopped during the last
measurement period.
Percent
Total number of error
updates:
Indicates the total number of
errors encountered in the
update request since the start
of the server.
Number
Ideally, the value of this measure should be
zero.
Rate of update requests
with errors:
Indicates the rate at which
errors were encountered in
the update requests during
the last measurement period.
Requests/sec
An increasing trend for this measure indicates
an error with the update system. If so,
update system can be deactivated to prevent
issues relating to the abnormally terminated
updates and reactivated once the issue has
been resolved.
Total number of updates
stuck:
Indicates the total number of
update requests that were
stuck while processing since
the start of the server.
Requests
Stuck updates are hanging updates that have
not been marked as error updates. Stuck
updates may need to be manually processed
depending upon their actual status.
Rate of update requests
stuck:
Indicates the rate at which
update requests were stuck
while processing during the
last measurement period.
Requests/sec
M O N I T O R I N G T H E S A P A B A P I N S T A N C E
72
New updates stopped:
Indicates the number of
update requests that were
stopped during the last
measurement period.
Number
New updates with errors:
Indicates the number of
errors encountered in the
update requests during the
last measurement period.
Number
Ideally, the value of this measure should be
zero.
New updates stuck:
Indicates the number of
updates that were stuck while
processing during the last
measurement period.
Number
2.4.18 Idoc wait monitor Test
Idocs are structured ASCII files (or a virtual equivalent). They are the file format used by SAP ABAP to exchange data
with foreign systems. Idocs is the acronym for Interchange Document. This indicates a set of (electronic) information
which builds a logical entity. An IDoc is e.g. all the data of a single customer in your customer master data file, or the
IDoc is all the data of a single invoice.
An SAP ABAP application creates data and updates the database appropriately. An application can be a transaction, a
stand-alone ABAP Report or any tool that can update a database within SAP ABAP. If the application thinks that data
needs to be distributed to a foreign system, it triggers the
IDoc outbound routine
, usually by leaving a descriptive
message record in the message table
NAST
. The application then either directly calls the IDoc engine or a collector
job eventually picks up all due IDoc messages and determines what to do with them. If the engine believes that data
is ready to be sent to a partner system, then it determines the function module which can collect and wrap the
required IDoc data into an IDoc. In IDoc customising, you specify the name of the function module to use. This can
either be one which is predefined by ABAP standard or a user-written one. When the IDoc is created it is stored in an
R/3 table and from there it is sent to the foreign system.
IDoc inbound routines,
on the other hand, are function modules with a standard interface, which will interpret the
received IDoc data and prepare it for processing. The received IDoc data is processed record by record and
interpreted according to the segment information provided with each record. The prepared data can then be
processed by an application, a function module, or a self-written program.
Any slowdown noticed in electronic data exchange between the SAP ABAP system and foreign systems therefore, can
be attributed to bottlenecks or errors in the transmission/reception of Idocs. Administrators should hence closely
monitor inbound and outbound IDoc traffic to proactively detect probable slowdowns in inter-system
communications, and accurately tell where the slowdown occurred and why, so that the communication bottlenecks
can be promptly cleared. This is where the IDoc wait monitor test helps.
This test monitors the inbound and outbound Idocs generated during the past hour and reports the rate at which
these Idocs were processed at various stages of transmission/reception, thus accurately pointing to processing
slowdowns and where exactly the processing was bottlenecked. In addition, the test also reports the number of
Idocs that were found to be erroneous every second and the exact stage of transmission/reception at which the rate
of errors peaked!
Purpose
Monitors the inbound and outbound Idocs generated during the past hour and reports the rate
at which these Idocs were processed at various stages of transmission/reception, thus

M O N I T O R I N G T H E S A P A B A P I N S T A N C E
73
accurately pointing to processing slowdowns and where exactly the processing was
bottlenecked. In addition, the test also reports the number of Idocs that were found to be
erroneous every second and the exact stage of transmission/reception at which the rate of
errors peaked!
Target of the
test
A SAP R/3 server
Agent
deploying the
test
An internal/remote agent

M O N I T O R I N G T H E S A P A B A P I N S T A N C E
74
Configurable
parameters for
the test
1. TEST PERIOD - How often should the test be executed
2. HOST - Host name of the server for which the test is to be configured
3. PORTNO - Enter the port to which the specified HOST listens
4. CLIENTNAME – Specify the ID of the client system that is connecting to the R/3 server. To
view a list of client IDs to choose from, follow the procedure discussed in Page 14.
5. SAPUSER - Provide a valid user name for logging into the SAP R/3 server. In order to
enable the eG Enterprise suite to effectively monitor SAP, the name of a SAPUSER with
either of the following profiles need to be specified: S_A.SYSTEM (super administrator) or
SAP_ALL (all authorizations for SAP).
6. PASSWORD - The password of the specified SAPUSER.
7. CONFIRMPASSWORD - Confirm the password by retyping it here.
8. SYSNO - An indicator of the TCP/IP port at which the SAP server listens. For example, for a
server that listens at port 3200, the SYSNO will be '00'. Similarly, if the SAP server port is
3201, the SYSNO will have to be specified as '01'. Therefore, in the SYSNO text box
specify the system number of the SAP server with which the specified client communicates.
9. ROUTER - If the SAP client with the specified CLIENTNAME exists in a network external to
the SAP server, then a router will be used to enable the server-client communication. In
such a case, specify the IP of the router in the ROUTER text box. If both the client and the
server exist in the same network, then specify 'none' against the ROUTER text box.
10. INSTANCENAME - Specify the name of the SAP R/3 instance to be monitored. To view the
complete list of instances to choose from, do the follow the procedure discussed in Page 17
of this document.
11. TIMEOUT - Indicate the duration (in seconds) for which this test should wait for a response
from the SAP R/3 server. By default, this is set to 120 seconds.
12. ISPASSIVE – If the value chosen is YES, then the server under consideration is a passive
server in a SAP R/3 cluster. No alerts will be generated if the server is not running.
Measures will be reported as “Not applicable” by the agent if the server is not up.
13. JCOVERSION – The eG agent uses the SAP JCO library to connect to the SAP ABAP system
and pull out metrics. To enable the eG agent to make this connection and query the
metrics, you need to specify the version of the SAP JCO library that the agent needs to use.
For instance, to instruct the eG agent to use JCO v2.1.19, it would suffice if you specify the
‘major version number’ alone against JCO VERSION – in the case of this example, this will
be
2.x
.
14. DD FREQUENCY - Refers to the frequency with which detailed diagnosis measures are to
be generated for this test. The default is 1:1. This indicates that, by default, detailed
measures will be generated every time this test runs, and also every time the test detects a
problem. You can modify this frequency, if you so desire. Also, if you intend to disable the
detailed diagnosis capability for this test, you can do so by specifying none against dd
frequency.
Outputs of the
test
One set of results for every SAP R/3 server being monitored

M O N I T O R I N G T H E S A P A B A P I N S T A N C E
75
Measurements
made by the
test
Measurement
Measurement
Unit
Interpretation
Open change pointers:
Indicates the number of
Idocs generated for the
change pointers that are still
in the
Waiting
state for the
last 1 hour.
Number
Change Pointers are log entries to
remember all modified records relevant
for ALE. Change pointers are log entries
to table BDCP, which are written every
time a transaction modifies certain fields.
Outbound ready for
dispatch:
Indicates the number of
outbound Idocs that were
ready for dispatch during the
last 1 hour.
Number
Outbound in external
system:
Indicates the number of
outbound Idocs that were
waiting in the external system
during the last 1 hour.
Number
Outbound errors in Idoc
interface:
Indicates the number of
outbound Idocs that
encountered errors in the
interface during the last 1
hour.
Number
Ideally, the value of this measure should be
zero.
Outbound errors in
external system:
Indicates the number of
outbound Idocs that were
error prone in the external
system during the last 1 hour.
Number
Ideally, the value of this measure should be
zero.
Inbound generated:
Indicates the number of
Idocs that were in the
Waiting
state during the last
1 hour.
Number
M O N I T O R I N G T H E S A P A B A P I N S T A N C E
76
Inbound errors in Idoc
interface:
Indicates the number of
inbound Idocs that
encountered errors in the
interface during the last 1
hour.
Number
Inbound errors in
application:
Indicates the number of
inbound Idocs with
application errors during the
last 1 hour.
Number
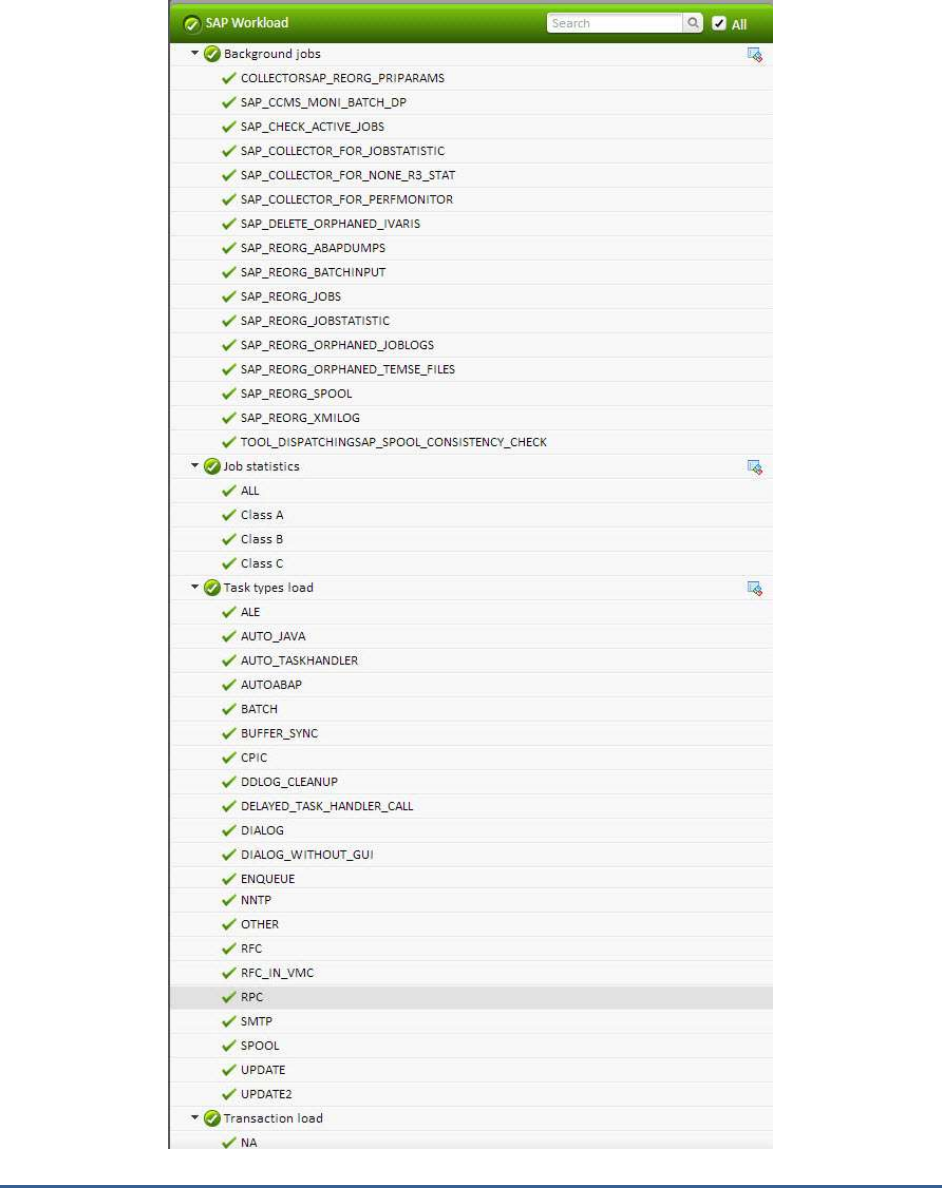
M O N I T O R I N G T H E S A P A B A P I N S T A N C E
77
2.5 The SAP Workload Layer
Figure 2.19: The tests mapped to the SAP Workload Layer
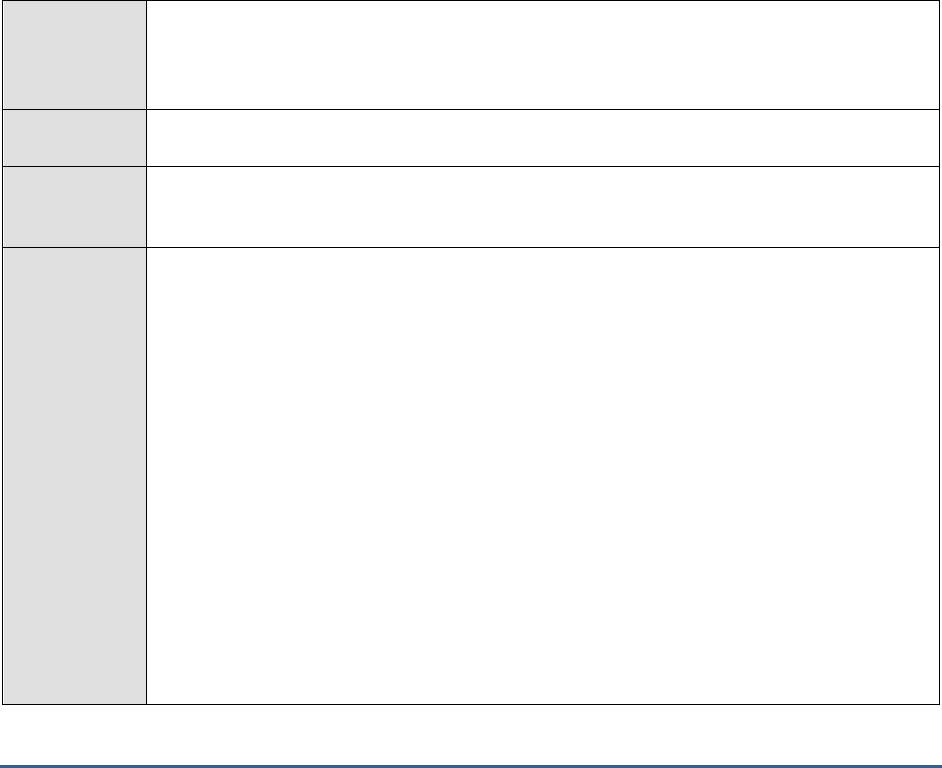
M O N I T O R I N G T H E S A P A B A P I N S T A N C E
78
2.5.1 Background jobs Test
SAP background processing automates routine tasks and helps you optimize your organization’s SAP computing
resources. Using background processing, you tell the SAP System to run programs for you. Background processing
lets you move long-running or resource-intensive program runs to times when the system load is low. It also lets you
delegate to the system the task of running reports or programs. Your dialog sessions are not tied up, and reports
that run in the background are not subject to the dialog-step run-time limit that applies to interactive sessions.
The SAP System offers sophisticated support for background processing. You can choose from a variety of methods
for scheduling and managing jobs. You can run both SAP-internal and external programs. And, for easier scheduling
and management, you can run related programs as " job steps" within a single background processing job, allowing
a single background job to accomplish a complex task that consists of multiple processing steps.
Often job execution takes too long when the job consists of too many complex tasks. This prolonged execution of a
job may consume a considerable amount of resources and therefore hamper the execution of other background jobs.
In order to figure out the background jobs that are executing for a longer time and the status of the job,
administrators may use the Background jobs test! This test monitors the current status and the previous status of
each background job that is executing, the time taken for job execution and the time delay encountered by the jobs
during execution. This way, administrators can figure out the background job that is executing for a longer duration
and blocking valuable resources.
Purpose
Monitors the current status and the previous status of each background job that is executing,
the time taken for job execution and the time delay encountered by the jobs during execution.
This way, administrators can figure out the background job that is executing for a longer
duration and blocking valuable resources.
Target of the
test
A SAP R/3 server
Agent
deploying the
test
An internal/remote agent
Configurable
parameters for
the test
1. TEST PERIOD - How often should the test be executed
2. HOST - Host name of the server for which the test is to be configured
3. PORTNO - Enter the port to which the specified HOST listens
4. CLIENTNAME – Specify the ID of the client system that is connecting to the R/3 server. To
view a list of client IDs to choose from, follow the procedure discussed in Page 14.
5. SAPUSER - Provide a valid user name for logging into the SAP R/3 server. In order to
enable the eG Enterprise suite to effectively monitor SAP, the name of a SAPUSER with
either of the following profiles need to be specified: S_A.SYSTEM (super administrator) or
SAP_ALL (all authorizations for SAP).
6. PASSWORD - The password of the specified SAPUSER.
7. CONFIRMPASSWORD - Confirm the password by retyping it here.
8. SYSNO - An indicator of the TCP/IP port at which the SAP server listens. For example, for a
server that listens at port 3200, the SYSNO will be '00'. Similarly, if the SAP server port is
3201, the SYSNO will have to be specified as '01'. Therefore, in the SYSNO text box
specify the system number of the SAP server with which the specified client communicates.

M O N I T O R I N G T H E S A P A B A P I N S T A N C E
79
9. ROUTER - If the SAP client with the specified CLIENTNAME exists in a network external to
the SAP server, then a router will be used to enable the server-client communication. In
such a case, specify the IP of the router in the ROUTER text box. If both the client and the
server exist in the same network, then specify 'none' against the ROUTER text box.
10. INSTANCENAME - Specify the name of the SAP R/3 instance to be monitored. To view the
complete list of instances to choose from, do the follow the procedure discussed in Page 17
of this document.
11. JCO VERSION - The eG agent uses the SAP JCO library to connect to the SAP ABAP system
and pull out metrics. To enable the eG agent to make this connection and query the
metrics, you need to specify the version of the SAP JCO library that the agent needs to use.
For instance, to instruct the eG agent to use JCO v2.1.19, it would suffice if you specify the
‘major version number’ alone against JCO VERSION – in the case of this example, this will
be
2.x
.
12. TIMEOUT - Indicate the duration (in seconds) for which this test should wait for a response
from the SAP R/3 server. By default, this is set to 120 seconds.
13. MAXLOGLINES - In order to troubleshoot the jobs that were aborted, the eG agent
facilitates collecting the last n lines of the jobs that were aborted. To achieve this, specify
the number of lines of an aborted job that needs to be retreived for troubleshooting in the
MAXLOGLINES parameter. By default, the value of this parameter is
3.
14. USERJOBS - Sometimes, adminsitrators may wish to periodically monitor certain
background jobs. To monitor such jobs, specify a comma-separated list of jobs in the
format:
Job:Time period (in hours)
in the USERJOBS text box. Say for example, you wish
to monitor a job named
Print
with a time period of 2 hours, then specify
Print:2
in the
USERJOBS text box. By default,
none
is specified against this text box.
15. STANDARDJOBMOITOR – If you wish to monitor the standard jobs in the target SAP R/3
instance, then set the STANDARDJOBMONITOR flag to Yes. If you set this flag to No,
then standard jobs will not be monitored. By default, the value of this flag is Yes.
16. DD FREQUENCY - Refers to the frequency with which detailed diagnosis measures are to
be generated for this test. The default is 1:1. This indicates that, by default, detailed
measures will be generated every time this test runs, and also every time the test detects a
problem. You can modify this frequency, if you so desire. Also, if you intend to disable the
detailed diagnosis capability for this test, you can do so by specifying none against dd
frequency.
17. DETAILED DIAGNOSIS - To make diagnosis more efficient and accurate, the eG
Enterprise suite embeds an optional detailed diagnostic capability. With this capability, the
eG agents can be configured to run detailed, more elaborate tests as and when specific
problems are detected. To enable the detailed diagnosis capability of this test for a
particular server, choose the On option. To disable the capability, click on the Off option.
The option to selectively enable/disable the detailed diagnosis capability will be available
only if the following conditions are fulfilled:
o The eG manager license should allow the detailed diagnosis capability
o Both the normal and abnormal frequencies configured for the detailed diagnosis
measures should not be 0.
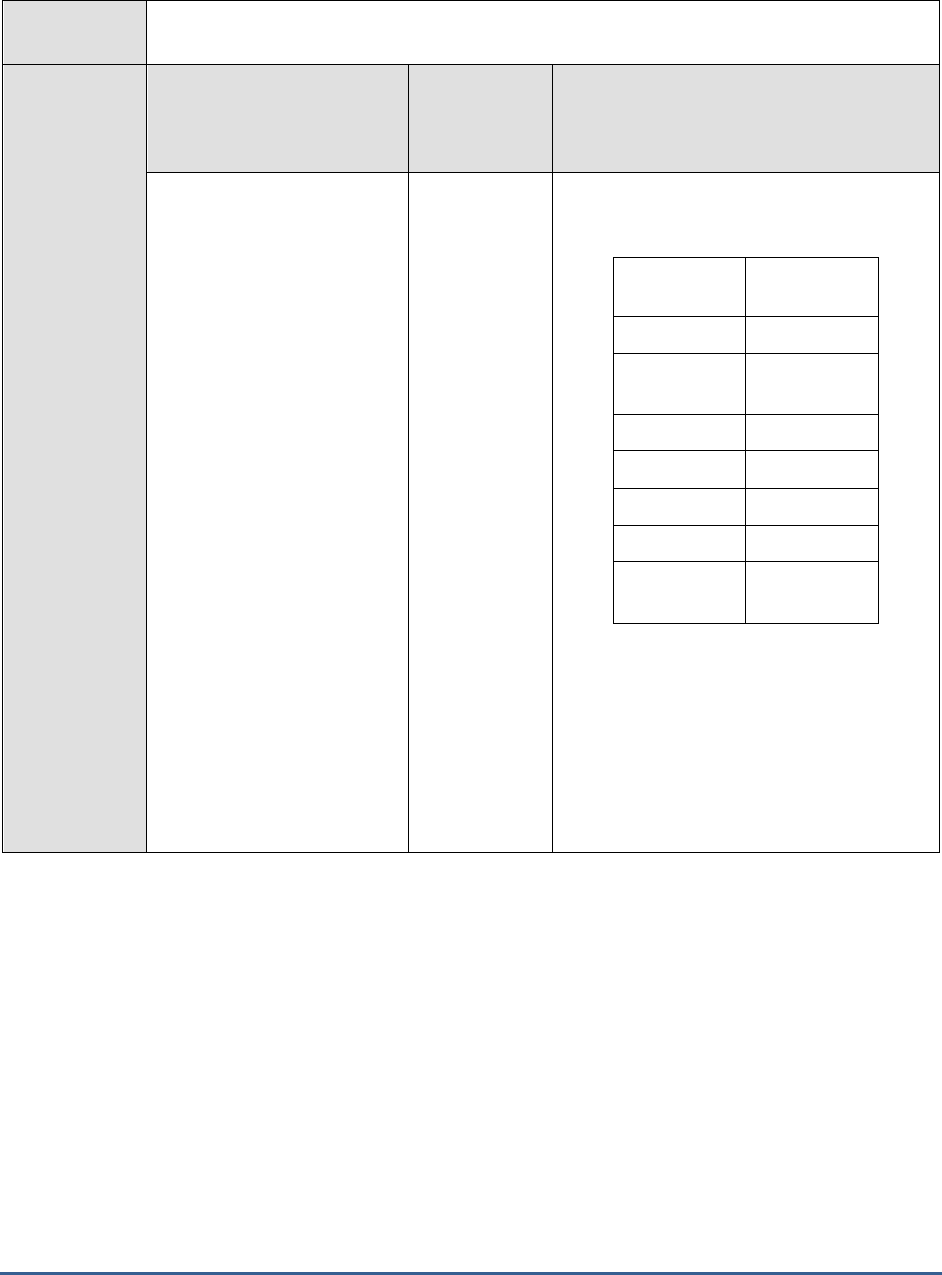
M O N I T O R I N G T H E S A P A B A P I N S T A N C E
80
Outputs of the
test
One set of results for every SAP R/3 server being monitored
Measurements
made by the
test
Measurement
Measurement
Unit
Interpretation
Current status:
Indicates the current status
of this job execution.
The values that this measure reports and
their numeric equivalents are provided in the
table below:
Measure
value
Numeric
value
N/A
0
Planned or
Scheduled
1
Released
2
Ready
3
Active
4
Finished
5
Cancelled or
Aborted
6
Note:
By default, this measure reports one of the
values listed under Measure Values to
indicate the current status of this job
execution. In the graph of this measure
however, the same is represented using the
numeric equivalents i.e.,
0
to
6
only.
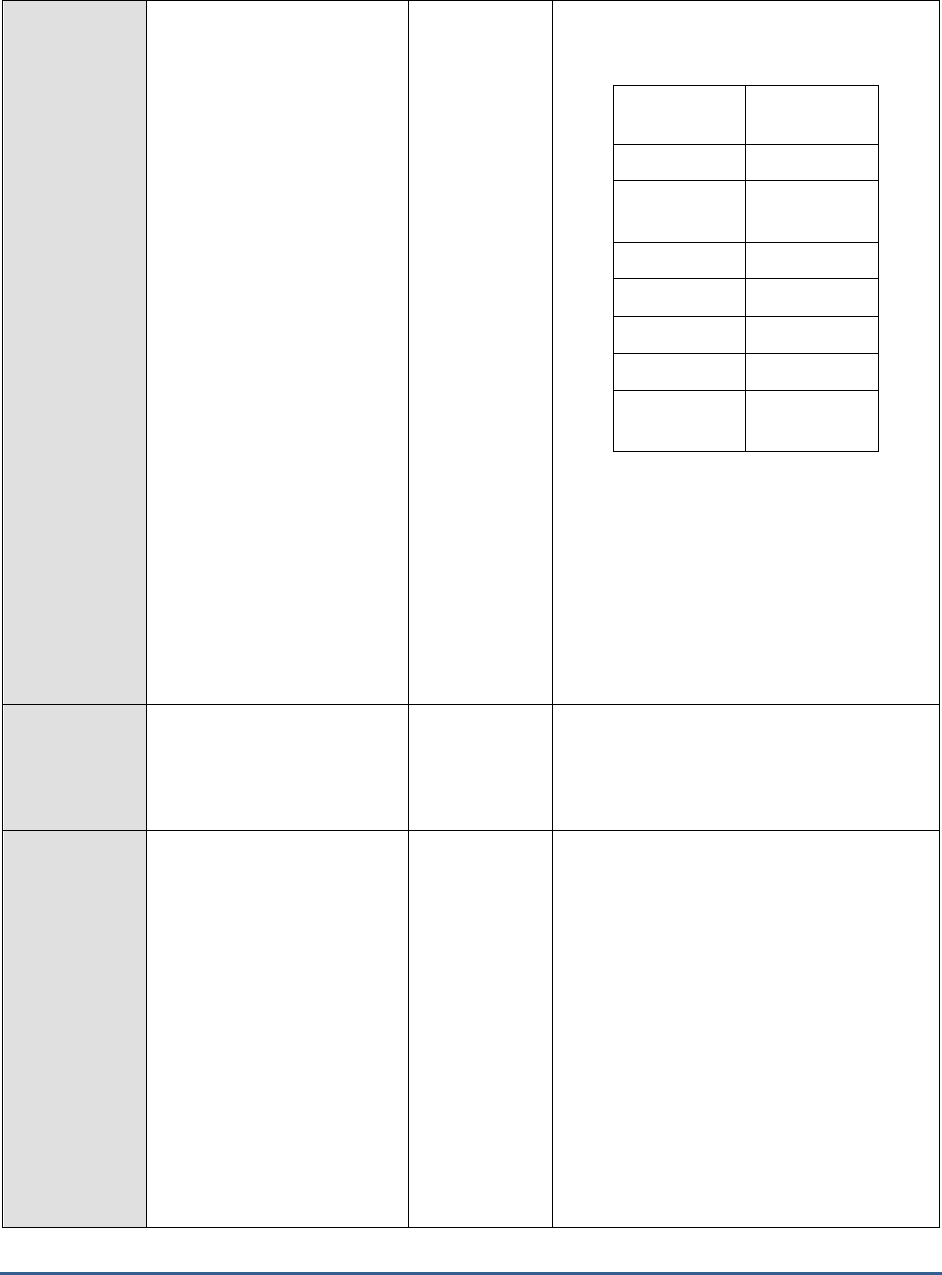
M O N I T O R I N G T H E S A P A B A P I N S T A N C E
81
Previous status:
Indicates the status of this
job that was executed before
the last known execution of
this job.
The values that this measure reports and
their numeric equivalents are provided in the
table below:
Measure
value
Numeric
value
N/A
0
Planned or
Scheduled
1
Released
2
Ready
3
Active
4
Finished
5
Cancelled or
Aborted
6
Note:
By default, this measure reports one of the
values listed under Measure Values to
indicate the status of the job execution
before the last known execution. In the graph
of this measure however, the same is
represented using the numeric equivalents
i.e.,
0
to
6
only.
Duration:
Indicates the total time taken
to execute this job.
Minutes
Compare the value of this measure across the
jobs to figure out the job that took too long
to execute.
Delay:
Indicates the time delay
encountered by this job
during execution.
Minutes
A low value is desired for this measure.
If there is an alarming increase in the value
of this measure, it indicates that adequate
background processes are not available for
executing this job. The background processes
may not be available when there are too
many job executions and when a job is
executing endlessly. In such cases,
administrators need to overlook the issue and
rectify the same before any serious
performance degradation of the server
occurs.
Comapring the value of this measure across
the jobs will help you identify the job that
encountered the maximum time delay.
M O N I T O R I N G T H E S A P A B A P I N S T A N C E
82
2.5.2 Job statistics Test
This test monitors the distribution of background jobs according to the job status. Apart from montoring the overall
job execution, this test helps to debug issues that occurred due to long running jobs, aborted jobs and jobs with high
start delays.
Purpose
Monitors the distribution of background jobs according to the job status. Apart from montoring the
overall job execution, this test helps to debug issues that occurred due to long running jobs,
aborted jobs and jobs with high start delays.
Target of the
test
A SAP R/3 server
Agent
deploying the
test
An internal/remote agent

M O N I T O R I N G T H E S A P A B A P I N S T A N C E
83
Configurable
parameters for
the test
1. TEST PERIOD - How often should the test be executed
2. HOST - Host name of the server for which the test is to be configured
3. PORTNO - Enter the port to which the specified HOST listens
4. CLIENTNAME – Specify the ID of the client system that is connecting to the R/3 server. To
view a list of client IDs to choose from, follow the procedure discussed in Page 14.
5. SAPUSER - Provide a valid user name for logging into the SAP R/3 server. In order to enable
the eG Enterprise suite to effectively monitor SAP, the name of a SAPUSER with either of the
following profiles need to be specified: S_A.SYSTEM (super administrator) or SAP_ALL (all
authorizations for SAP).
6. PASSWORD - The password of the specified SAPUSER.
7. CONFIRMPASSWORD - Confirm the password by retyping it here.
8. SYSNO - An indicator of the TCP/IP port at which the SAP server listens. For example, for a
server that listens at port 3200, the SYSNO will be '00'. Similarly, if the SAP server port is
3201, the SYSNO will have to be specified as '01'. Therefore, in the SYSNO text box specify
the system number of the SAP server with which the specified client communicates.
9. ROUTER - If the SAP client with the specified CLIENTNAME exists in a network external to
the SAP server, then a router will be used to enable the server-client communication. In such a
case, specify the IP of the router in the ROUTER text box. If both the client and the server
exist in the same network, then specify 'none' against the ROUTER text box.
10. INSTANCENAME - Specify the name of the SAP R/3 instance to be monitored. To view the
complete list of instances to choose from, do the follow the procedure discussed in Page 17 of
this document.
11. TIMEOUT - Indicate the duration (in seconds) for which this test should wait for a response
from the SAP R/3 server. By default, this is set to 120 seconds.
12. JCOVERSION - The eG agent uses the SAP JCO library to connect to the SAP ABAP system
and pull out metrics. To enable the eG agent to make this connection and query the metrics,
you need to specify the version of the SAP JCO library that the agent needs to use. For
instance, to instruct the eG agent to use JCO v2.1.19, it would suffice if you specify the ‘major
version number’ alone against JCO VERSION – in the case of this example, this will be
2.x
.
13. MAXLOGLINES - In order to troubleshoot the jobs that were aborted, the eG agent facilitates
collecting the last n lines of the jobs that were aborted. To achieve this, specify the number of
lines of an aborted job that needs to be retreived for troubleshooting in the MAXLOGLINES
parameter. By default, the value of this parameter is
3.
14. LONGRUNNINGCUTOFF - Specify the time duration in hours beyond which a job is classified
as a long running job in the LONGRUNNINGCUTOFF text box.
15. HIGHDELAYCUTOFF - Generally, there may be a permissible time delay while a job is
started. Specify the duration of such time delay in seconds beyond which the job is classifed as
a job with a higher start delay in the HIGHDELAYCUTOFF text box

M O N I T O R I N G T H E S A P A B A P I N S T A N C E
84
16. DETAILED DIAGNOSIS - To make diagnosis more efficient and accurate, the eG Enterprise
suite embeds an optional detailed diagnostic capability. With this capability, the eG agents can
be configured to run detailed, more elaborate tests as and when specific problems are
detected. To enable the detailed diagnosis capability of this test for a particular server, choose
the On option. To disable the capability, click on the Off option.
The option to selectively enable/disable the detailed diagnosis capability will be available only if
the following conditions are fulfilled:
o The eG manager license should allow the detailed diagnosis capability
o Both the normal and abnormal frequencies configured for the detailed diagnosis measures
should not be 0.
Outputs of the
test
One set of results for every SAP R/3 server being monitored
Measurements
made by the
test
Measurement
Measurement
Unit
Interpretation
Active jobs:
Indicates the number of jobs of
this priority class that are
currently active.
Number
Ready jobs:
Indicates the number of jobs of
this priority class that are
waiting for execution by the
background work processes.
Number
A low value is desired for this measure. If
there is a sudden/gradual increase in the
value of this measure, then it indicates that
the background work processes are
insufficient to execute the jobs. Therefore,
administrators may need to check the
number of background work processes and
provision them accordingly.
Long running jobs:
Indicates the number of jobs of
this priority class that have been
running for a duration longer
than than the cutoff time
specified in the
LONGRUNNINGCUTOFF
parameter.
Number
Generally, the jobs may be classified as a
long running job when the job is stuck during
execution and loops the execution several
times without completion. A high value for
this measure is a cause of concern as long
running jobs consume too much of resources
thus leading to the performance degradation
of the SAP instance.
The detailed diagnosis of this measure if
enabled, lists the name of the job, job count,
report name, user details, timestamps,
duration etc.,

M O N I T O R I N G T H E S A P A B A P I N S T A N C E
85
New jobs:
Indicates the number of jobs of
this priority class that were
started during the last
measurement period.
Number
A gradual decrease in the value of this
measure is a cause of concecrn.
Administrators may need to check the
number of backgroung processes that are
free and provision them according so that the
background processes can execute the jobs
continuously.
New jobs with start delays:
Indicates the number of jobs of
this priority class that started
with a delay time greater than
the time specified against the
HIGHDELAYCUTOFF
parameter while configuring the
test.
Number
A low value is desired for this measure.
The jobs may be started with a delay due to
various reasons such as unavailable
background work processes, scheduling
issues between the originating server and
target server, other dependencies etc., This
measure helps detect such issues by
providing the details of these jobs including
the exact start delay in milliseconds.
Aborted or cancelled jobs:
Indicates the number of jobs of
this priority class that were
cancelled/aborted during the last
measurement period.
Number
Jobs may be abruptly terminated either
manually or due to underlying program errors.
Program errors could in turn be due to
various issues such as authentication, file
access, dead locks, updates, tablespace,
memory, programming errors, dependencies
etc., Therefore, a sudden/gradual increase in
the value is a cause of concern which
indicates severe performance degradation fo
the target server.
The detailed diagnosis of this measure if
enabled, provides details and logs for the
aborted/cancelled jobs in order to facilitate
troubleshooting.
Average job start delay:
Indicates the average time delay
experienced in starting the jobs
of this priority class.
Milliseconds
Comparing the value of this measure across
the priority classes helps you identify the
class in which the jobs experienced the
maximum start delay.
Finished jobs:
Indicates the number of jobs of
this priority class that completed
execution during the last
measurement period.
Number
A high value is desired for this measure.
This measure is a good indicator of the
performance of the background processing
system. The higher the value of this measure
the greater is the performace of the targe
server.
2.5.3 Task Types Load Test
Typically, every work process in the SAP AS ABAP system specializes in a particular task type. These task types are
as follows:
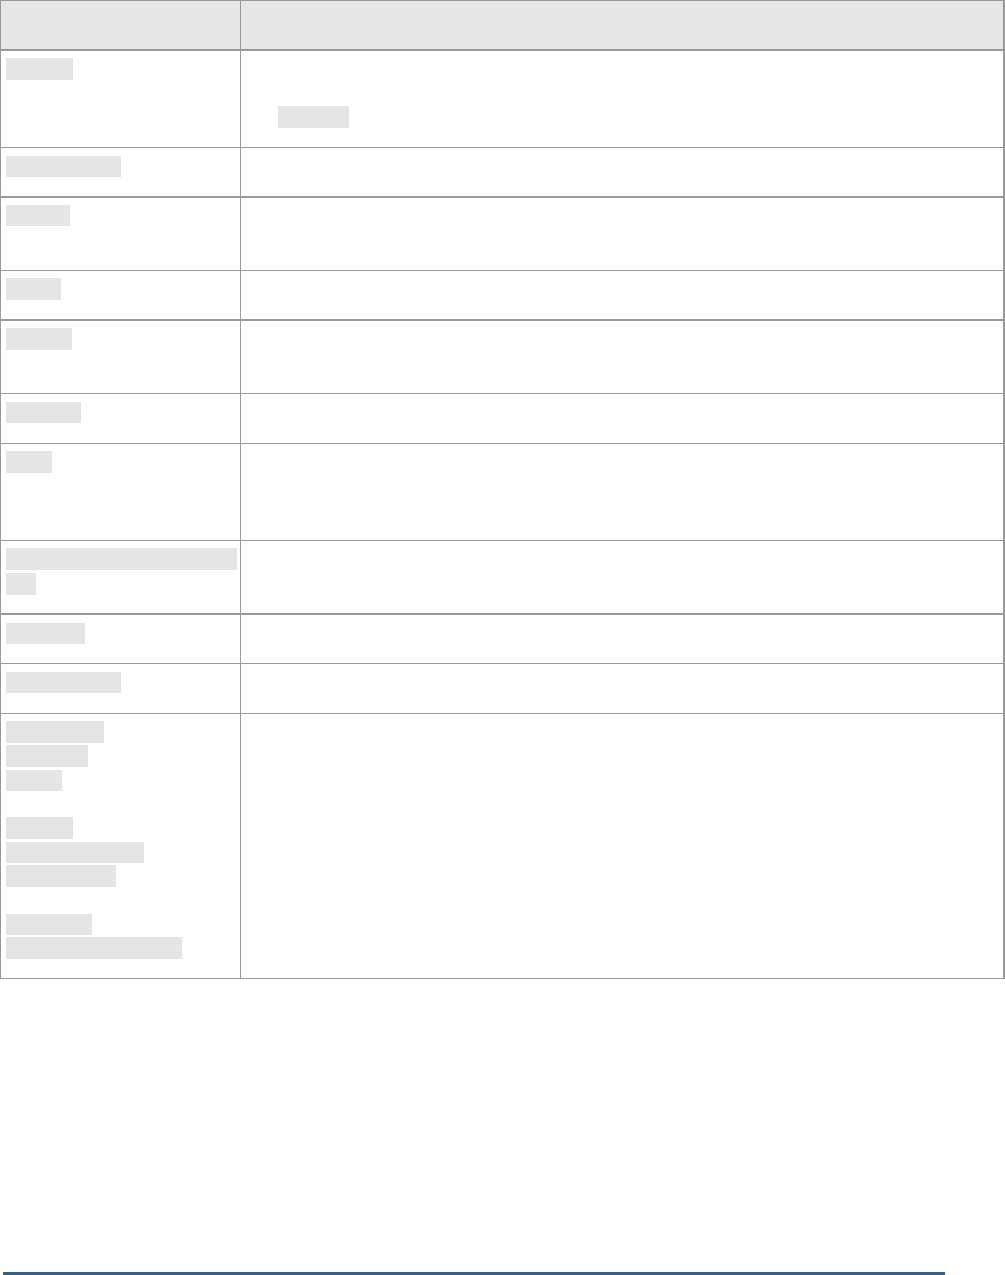
M O N I T O R I N G T H E S A P A B A P I N S T A N C E
86
Task Type
Explanation
B.INPUT
Transaction step in batch input mode; it is processed by the dialog work process (update
dialogs generated in batch input are always processed synchronously, they belong to
the UPDATE task type).
BACKGROUND
Transaction step that was started by a background processing work process.
DIALOG
Usually a transaction step started online by a user (for example, editor dialogs or manual
postings).
SPOOL
Transaction step of a spool work process
UPDATE
Transaction step of the SAP update task; it is automatically started by the dispatcher on a host
with an active update process (update processes are usually installed on the database host)
UPDATE2
V2 update
LCOM
The Fast RFC (fRFC or LCOM-RFC) is a very fast form of data transfer that uses a shared
memory pipeline. It is only used in internal communication between ABAP and Java in the SAP
Web AS.
HTTP, HTTPS, NNTP, SMTP,
FTP
Requests from the ICM that are based on the corresponding Internet protocols
ENQUEUE
Enqueue handler
DIALOG(-)GUI
Dialog without GUI
EXT.PLUGIN
AUTOTH (Auto task handler)
RPCTH (Task handler remote
procedure call)
RFCVMC (RFC inside VMC)
DDLOG CLEANUP
DEL. THCALL (Delayed task
handler call)
AUTOJAVA
HTTP/JSP, HTTPS/JSP
The statistical evaluations of these task types are only relevant for internal SAP purposes.
In addition to the above, there are some task types that do not correspond to any work process; these tasks
represent specific applications in the dialog work process. Such task types are as follows:
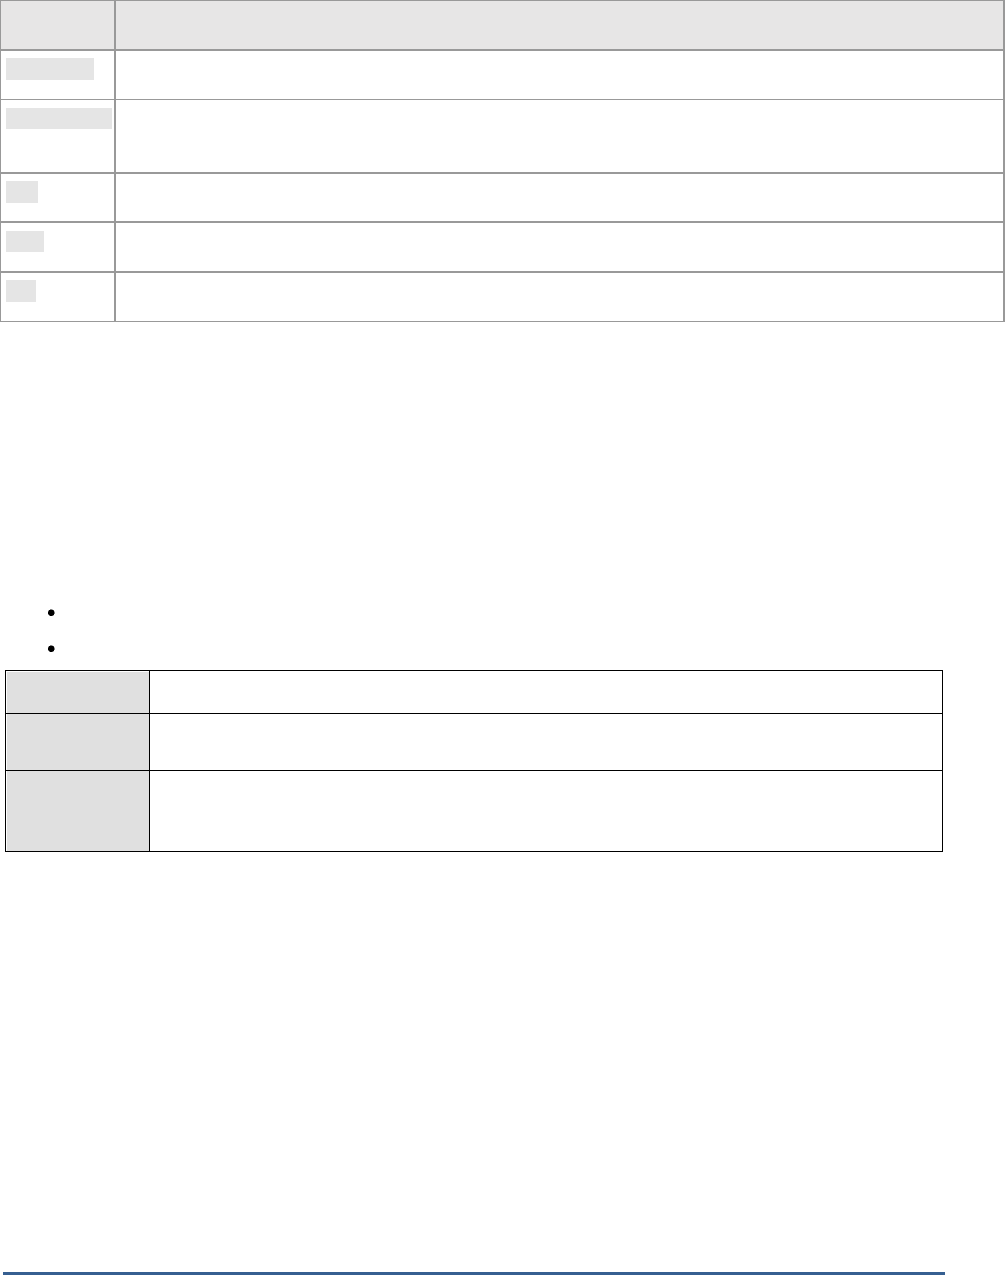
M O N I T O R I N G T H E S A P A B A P I N S T A N C E
87
Task Type
Explanation
AUTOABAP
Automatically-processed report (for example, for monitoring tools)
BUFFERSYNC
A synchronization of the local table buffers regularly requested by the SAP system (the time interval is
controlled by the profile parameter rdisp/bufreftime).
RFC
Remote Function Call in the ABAP system; it is processed by the dialog work process
CPIC
Other communication using the CPIC interface; it is processed by the dialog work process
ALE
iDoc processing; it is processed by the dialog work process
Tasks, regardless of their type, add to the workload of a SAP AS ABAP system. In the event of a slowdown therefore,
administrators should check the workload generated by each task type, analyze whether/not the ABAP system has
the processing power to handle the load, isolate the task types where processing is bottlenecked, and understand
where the bottleneck occurred – at the dispatcher? When rolling in user contexts? When loading objects? When
waiting for RFC calls? When interacting with the database? when performing enqueue operations? The Task Types
Load test provides administrators with answers to these questions!
This test auto-discovers the task types handled by the SAP ABAP system, and for each task type, reports the
resource usage of the transactions of that type, measures the processing time of the transactions at various stages,
and accurately pinpoints the following:
The task type(s) that is consuming more resources than normal;
The task type(s) that is taking too long to be processed and why;
Purpose
Monitors the performance of the enqueue service
Target of the
test
A SAP R/3 server
Agent
deploying the
test
An internal/remote agent

M O N I T O R I N G T H E S A P A B A P I N S T A N C E
88
Configurable
parameters for
the test
1. TEST PERIOD - How often should the test be executed
2. HOST - Host name of the server for which the test is to be configured
3. PORTNO - Enter the port to which the specified HOST listens
4. CLIENTNAME – Specify the ID of the client system that is connecting to the R/3 server. To
view a list of client IDs to choose from, follow the procedure discussed in Page 14.
5. SAPUSER - Provide a valid user name for logging into the SAP R/3 server. In order to
enable the eG Enterprise suite to effectively monitor SAP, the name of a SAPUSER with
either of the following profiles need to be specified: S_A.SYSTEM (super administrator) or
SAP_ALL (all authorizations for SAP).
6. PASSWORD - The password of the specified SAPUSER.
7. CONFIRMPASSWORD - Confirm the password by retyping it here.
8. SYSNO - An indicator of the TCP/IP port at which the SAP server listens. For example, for a
server that listens at port 3200, the SYSNO will be '00'. Similarly, if the SAP server port is
3201, the SYSNO will have to be specified as '01'. Therefore, in the SYSNO text box
specify the system number of the SAP server with which the specified client communicates.
9. ROUTER - If the SAP client with the specified CLIENTNAME exists in a network external to
the SAP server, then a router will be used to enable the server-client communication. In
such a case, specify the IP of the router in the ROUTER text box. If both the client and the
server exist in the same network, then specify 'none' against the ROUTER text box.
10. INSTANCENAME - Specify the name of the SAP R/3 instance to be monitored. To view the
complete list of instances to choose from, do the follow the procedure discussed in Page 17
of this document.
11. TIMEOUT - Indicate the duration (in seconds) for which this test should wait for a response
from the SAP R/3 server. By default, this is set to 120 seconds.
12. JCO VERSION – The eG agent uses the SAP JCO library to connect to the SAP ABAP
system and pull out metrics. To enable the eG agent to make this connection and query the
metrics, you need to specify the version of the SAP JCO library that the agent needs to use.
For instance, to instruct the eG agent to use JCO v2.1.19, it would suffice if you specify the
‘major version number’ alone against JCO VERSION – in the case of this example, this will
be
2.x
.
13. MAXIMUM STEPS – To report workload metrics, the eG agent will have to typically analyze
numerous dialog steps of activity on the SAP ABAP system. To reduce the stress on the eG
agent, you can limit the number of dialog steps the eG agent needs to process in order to
make a fair assessment of the workload and the processing ability of the ABAP system. This
limit can be specified against MAXIMUM STEPS. By default, this limit is set to 5000.

M O N I T O R I N G T H E S A P A B A P I N S T A N C E
89
14. DETAILED DIAGNOSIS - To make diagnosis more efficient and accurate, the eG
Enterprise suite embeds an optional detailed diagnostic capability. With this capability, the
eG agents can be configured to run detailed, more elaborate tests as and when specific
problems are detected. To enable the detailed diagnosis capability of this test for a
particular server, choose the On option. To disable the capability, click on the Off option.
The option to selectively enable/disable the detailed diagnosis capability will be available
only if the following conditions are fulfilled:
The eG manager license should allow the detailed diagnosis capability
Both the normal and abnormal frequencies configured for the detailed diagnosis
measures should not be 0.
Outputs of the
test
One set of results for every task type handled by the SAP AS ABAP instance being monitored
Measurements
made by the
test
Measurement
Measurement
Unit
Interpretation
Activity:
Indicates the rate of steps
executed for transactions of
this task type in the last
measurement period.
Steps/Sec
This is a good indicator of the workload
imposed by a task type on the SAP ABAP
instance. You can compare the value of this
measure across task types to know which
task type is generating the maximum load.
CPU utilization:
Indicates the percentage of
CPU resources utilized by the
transactions of this task type.
Percent
Compare the value of this measure across
task types to know which task type is using
the maximum CPU and is probably causing a
CPU contention on the system. You may then
want to observe how this task type has been
using CPU over time and figure out whether
the CPU usage of that task type remains
consistently high; if so, it could mean that
that task type requires more processing
power to execute. You may then want to
consider resizing the SAP ABAP system with
more CPU resources.
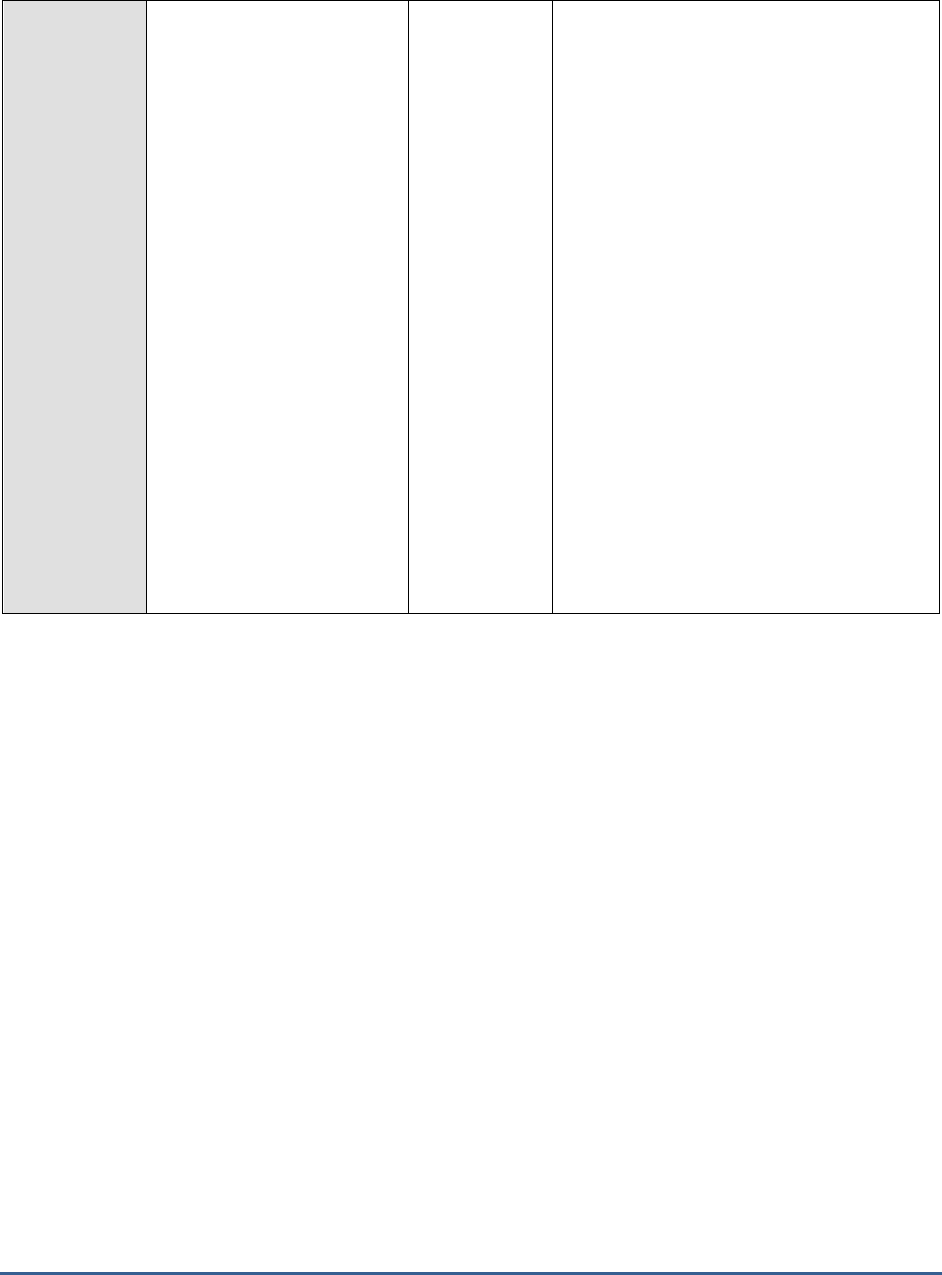
M O N I T O R I N G T H E S A P A B A P I N S T A N C E
90
Total memory:
Indicates the total memory
used by the transactions of
this task type during the last
measurement period.
MB
This measure is the sum total of the roll
memory, extended memory, and heap
memory used by a process.
By comparing the value of this measure
across task types, you can accurately identify
that task type which is consuming the
maximum memory. If the memory usage of
this task type has been abnormally high
consistently, it could indicate that the task
type is basically memory-intensive and
requires more memory resources for proper
execution. You should then figure out how
much memory and of what type should be
allocated to the task. For this, you may want
to determine which memory type was being
used the highest over time – is it heap
memory? Roll memory? Or extended
memory. The values of the
PRIV mode heap
memory
and the
Extended memory
metrics
will help administrators figure this out.
You can also use the detailed diagnosis of
this measure to identify the top 3 memory-
consuming transactions of a particular task
type.
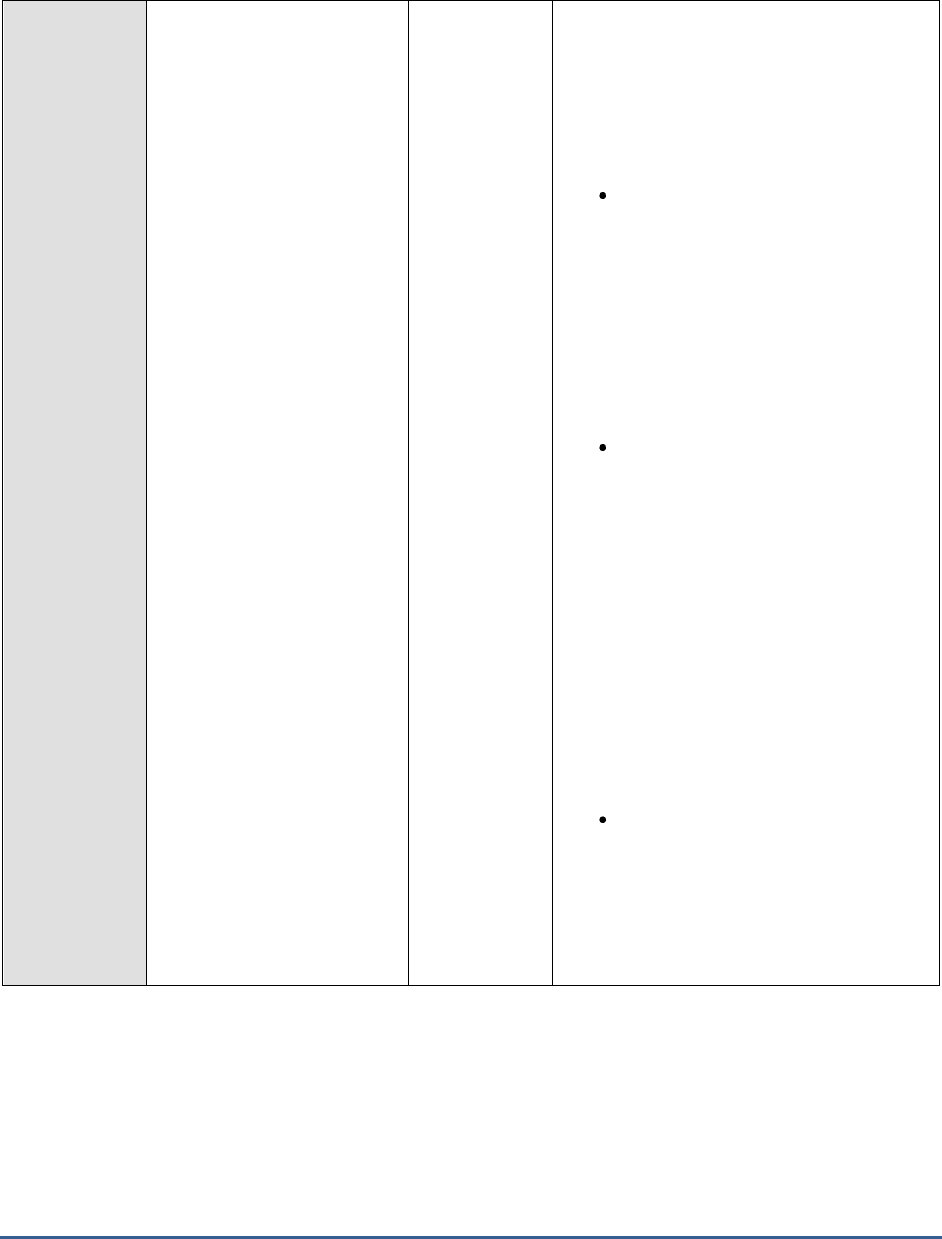
M O N I T O R I N G T H E S A P A B A P I N S T A N C E
91
PRIV mode heap memory:
Indicates the maximum
PRIV mode heap memory
consumed by transactions
of this task type in the
last measure period.
MB
SAP’s memory management system assigns
memory to a work process. The order in
which a work process is assigned the memory
type depends on the work process type,
either dialog or non-dialog), and the
underlying operating system. Some of the
memory types are as follows:
Roll area: The roll area memory is
used for the initial memory assigned
to a user context, and (if available)
for additional memory if the
expanded memory is full. The roll
area consists of 2 segments. The
first segment is assigned to the work
process first as memory. If this is
used up, the work process has more
memory assigned to it.
Extended memory: Each ABAP work
process has a part reserved in its
virtual address space for extended
memory. The majority of the user
context is stored in the extended
memory. You can map the extended
memory from the common resource
onto any work process, and after
onto another process on the same
address in the virtual address space.
This is important if you work with
pointers in the ABAP program. The
value of the
Extended memory
measure indicates how each task
type is using this memory type.
Private memory: If a dialog work
process has used up the roll area
assigned to it and the extended
memory, private memory is
assigned to the work process. The
work process goes into PRIV mode
(private). Other processes cannot

M O N I T O R I N G T H E S A P A B A P I N S T A N C E
92
use private (heap) memory. After
releasing the assigned memory, the
operating system still considers the
(virtual) memory as being occupied
by the allocating process.
A consistent increase in the value of
the
PRIV mode heap memory
measure for a task type therefore
indicates that transactions of that
type are continuously using up all
the roll area and extended memory,
and are being forced to reach out to
the private memory. This could
mean that the task type is memory-
intensive. If too many task types are
found to be using PRIV heap
memory, it could mean that the
work processes are sized with
insufficient roll area and extended
memory. You may want hence want
to allocate more roll area and
extended memory to make sure that
private memory usage is minimal.
Extended memory:
Indicates the maximum
extended memory used
by transactions of this
task type in the last
measure period.
MB
Work process restarts:
Indicates the number of
work process restarts
caused by transactions of
this task type in the last
measure period.
Number
One of the common reasons for work process
restarts is excessive usage of private
memory. The work process, if it has used a
lot of private memory, is restarted when the
user context is terminated and the local
memory is returned. The restart makes the
local memory available again for other
processes.
Regardless of what caused it, work process
restarts are performance-impacting and need
to be kept at a minimum.

M O N I T O R I N G T H E S A P A B A P I N S T A N C E
93
Maximum response time
of a step:
Indicates the maximum
response time of the
transaction steps of this task
type in the last measurement
period.
Secs
An SAP transaction normally extends over
several transaction steps. During these steps,
data such as variables, internal tables, and
screen lists are built up and stored in the
main memory of the application server.
This measure compares the response time of
all the transaction steps executed by a task
type in the last measurement period and
reports the highest response time.
Use the detailed diagnosis of this measure to
identify the top 3 steps executed for this task
type with highest response times. This leads
you to the probable cause for delay in the
execution of this task type in the last five
minutes. Apart from the response time break
up, the report and CUA programs that were
running are also shown as part of detailed
diagnosis.
Total response time:
Indicates the total
response time per
transaction of this task
type within the last
measure period.
Seconds/transa
ction
This measure includes the response time
taken at the server and the round trip times.
Ideally, the value of this measure should be
low. High values are indicative of poor
responsiveness.
Compare the value of this measure across
task types to identify the task type that is
least responsive. To know the reason for the
delay, you can compare the value of the
GUI
time, GUI Net time, Server response time,
Processing time, Dispatcher wait time, Load
and generation time, Roll time, Database
request time, Lock time, and RFC time
measures for that task type. This will
accurately pinpoint where the task spent
maximum time – in the dispatcher queue? at
the server end? in processing? when loading
objects? when rolling in user contexts? when
performing database operations? when
performing enqueue operations? Or in
waiting for RFC calls?
You can also use the detailed diagnosis of
this measure to view the details of the top 3
transaction invocations that were least
responsive.

M O N I T O R I N G T H E S A P A B A P I N S T A N C E
94
GUI time:
Indicates the average time
taken for round trip
communication steps
between client and server in
between a transaction of
this task type.
Secons/transac
tion
If the values of these measures are
excessive, check that the hardware
requirements for the presentation server are
met and that the network between the
application servers and the presentation
servers is not experiencing shortages or slow
traffic.
GUI Net time:
Indicates the average front
end net time taken for the
first and last steps of
transactions of this task
type.
Seconds/transa
ction
Server response time:
Indicates the average
response time of a
transaction of this task
type at the server end.
Seconds/transa
ction
In the event of a processing slowdown, you
can compare the value of this measure with
other response time measures reported by
this test to understand where the processing
bottleneck lies.
Processing time:
Indicates the average time
taken to process a
transaction of this task
type.
Secons/transac
tion
A high value for this measure may indicate
that ABAP programs are very complex and
the work processes spend a large amount of
time interpreting what is to be done.
The processing time of the DIALOG task type
for instance should be below twice the CPU
time. The same for the UPDATE task type
should be about 50% higher than that of the
DIALOG task type.

M O N I T O R I N G T H E S A P A B A P I N S T A N C E
95
Dispatcher wait time:
Indicates the average time
that the transactions of
this task type spent waiting
for a free work process at the
dispatcher.
Seconds/transa
ction
When the dispatcher receives a processing
request, it looks for a free SAP work process
of the required type and then sends the
request to this work process, which begins
the work. If all SAP work processes of the
required type are busy when the request
initially reaches the dispatcher, the request is
placed in the dispatcher queue. In the
dispatcher queue, the request waits until a
work process of the required type is free. As
soon as a work process is free, the
dispatcher sends the request to it. This time
the request spends in the dispatcher queue is
indicated as the dispatcher wait time.
For the DIALOG task type for instance, the
value of this measure should be less than
10% of the value of the
Total response time
measure. Higher values are indicative of
performance problems. One common cause
of such performance problems may be
insufficient work processes.
Load and generation time:
Indicates the average time
spent for a transaction of
this task type for loading
and generation.
Seconds/transa
ction
All ABAP programs and screens that are
required but not yet available in the
application server buffers must be loaded or
generated. The time it takes to do this is
indicated as load and generation time.
Loading a program also entails accessing
database tables that store the ABAP
programs.
Typically, for a DIALOG task type, the load
time per step should not be greater than 50
ms.
High values could indicate problems with
memory configuration, small buffer sizes,
wrong parameter settings or a CPU
bottleneck.

M O N I T O R I N G T H E S A P A B A P I N S T A N C E
96
Roll time:
Indicates the average time
spent by a transaction of
this task type for rolling in
user contexts or when waiting
for roll out.
Secs
AN SAP transaction normally extends over
several transaction steps. During these steps,
data such as variables, internal tables, and
screen lists are built up and stored in the
main memory of the application server. This
data is known as user context. Different
transaction steps are normally processed by
different dialog work processes. At the
beginning of a transaction step, the user
context is made available to the appropriate
work process.This procedure is called roll-in.
Roll-out on the other hand saves the current
user-context data to virtual memory at the
conclusion of a transaction step. The time a
transaction step waited in the roll-area is
called
roll wait t
ime.
The value of this measure is the sum total of
roll-in time and roll wait time.
A high value for this measure indicates that a
particular task type is either taking too long
to roll in user contexts or is waiting too long
in the roll-area for a roll-out to occur. Since a
user context is moved out of the local
memory of a work process and moved into
the roll buffer during the roll-in process,
improperly sized roll buffers can cause
slowdowns in this process. Lack of adequate
space in the extended memory can also
contribute to a slowdown when rolling in user
contexts.
Possible causes for high roll wait times may
be due to having all work processes in the
target system occupied. It is very important
to configure the instances properly, especially
when they are designed to handle RFC
communication.

M O N I T O R I N G T H E S A P A B A P I N S T A N C E
97
Database request time:
Indicates the average time
spent by transactions of this
task type for performing
database operations such as
selects, inserts, updates,
deletes and commits.
Secons/transac
tion
When data is read or changed in the dataase,
the time required is known as Database
request time. This time is measured from the
moment the database request is sent to the
database server and runs until the moment
the data is returned to the application server.
Ideally, for the DIALOG task type, the value
of this measure should be 40% of the total
response time. Many factors can can cause
worrysome spikes in this value. This could be
problems in the database such as expensive
SQL statement or wrong parameter settings
in the database level. In addition, issues in
network connectivity between the application
server and the database can also adversely
impact this value. This is because, the
Database request time
not only includes the
time required by the database to produce the
requested data, but also the time required for
network transfer of that data. In addition, I/O
contention experienced by the physical disks
can also affect this time.
Lock time:
Indicates the average time
spent performing enqueue
operations for a transaction
of this task type.
Seconds/Trans
action
The enqueue service allows SAP ABAP
applications to lock data so that only they can
use it. Locking the data prevents parallel
changes to the same data, which would lead
to data inconsistency.
The
Lock time
measure reports the time from
sending an enqueue request to the SAP
enqueue server to the receipt of the results.
For a DIALOG task type typically, the
Lock
time
should be less than 5 ms. Any value
higher than that would represent a problem
that migh affect system stability. Network
problems can also increase the value of this
measure.
M O N I T O R I N G T H E S A P A B A P I N S T A N C E
98
RFC time:
Indicates the average time
spent waiting for RFC calls to
get executed in a
transaction of this task
type.
Secons/Transa
ction
The value of this measure includes
CPIC
(Common Programming Interface
Communication) time
as well. CPIC is
typically used by the SAP system for
program-to-program communication.
An increase in RFC time can increase
roll wait
time
considerably. When synchronous RFCs
are called, the work process executes a roll
out and may have to wait for the
end of the RFC in the roll area, even if the
dialog step is not yet completed. In the roll
area, RFC server programs can also wait for
other RFCs sent to them. The time a
transaction step waited in the roll-area is
called
roll wait t
ime.
The absence of adequate work processes can
cause the RFC time and consequently, the
roll wait time to increase. Besides ensuring
that the SAP ABAP system is sized with
sufficient work processes, you can also set
the following parameters properly to better
balance RFC load:
rdisp/rfc_max_comm_entries: This
specifies the maximum number of
communications in an instance. No
more dialog work processes will be
given to the program calling the
target system after this number is
reached.
rdisp/rfc_min_wait_dia_wp: This
specifies the number of work
processes to be always available for
online users.
2.5.4 Transaction Load Test
SAP transactions are units of work that define the workload of a SAP ABAP system. When users to a SAP ABAP
program complain of a slowdown, administrators should be able to instantly locate the exact transaction at which the
slowdown occurred and what is causing the delay – is it because the transaction is resource-intensive? Is it because
the transaction spent too much time in the dispatcher queue? is it owing to the time spent loading objects? Is it
because database operations consumed too much time? Is it due to complex enqueue operations? or did waiting for
RFC calls to complete contribute to the transaction slowdown? The Transaction Load test helps answer these
questions!
For every transaction invocation, this test reports the resource usage of and load imposed by that transaction on the
SAP ABAP system, indicates how well the system is processing the load, proactively detects overload conditions and
processing bottlenecks (if any), and accurately points administrators to the source of the bottlneck – i.e., it precisely
pinpoints which transaction is being processed slowly, which exact transaction step caused the delay, and why.

M O N I T O R I N G T H E S A P A B A P I N S T A N C E
99
Purpose
For every transaction invocation, this test reports the resource usage of and load imposed by
that transaction on the SAP ABAP system, indicates how well the system is processing the load,
proactively detects overload conditions and processing bottlenecks (if any), and accurately
points administrators to the source of the bottlneck – i.e., it precisely pinpoints which
transaction is being processed slowly and why.
Target of the
test
A SAP R/3 server
Agent
deploying the
test
An internal/remote agent

M O N I T O R I N G T H E S A P A B A P I N S T A N C E
100
Configurable
parameters for
the test
1. TEST PERIOD - How often should the test be executed
2. HOST - Host name of the server for which the test is to be configured
3. PORTNO - Enter the port to which the specified HOST listens
4. CLIENTNAME – Specify the ID of the client system that is connecting to the R/3 server. To
view a list of client IDs to choose from, follow the procedure discussed in Page 14.
5. SAPUSER - Provide a valid user name for logging into the SAP R/3 server. In order to
enable the eG Enterprise suite to effectively monitor SAP, the name of a SAPUSER with
either of the following profiles need to be specified: S_A.SYSTEM (super administrator) or
SAP_ALL (all authorizations for SAP).
6. PASSWORD - The password of the specified SAPUSER.
7. CONFIRMPASSWORD - Confirm the password by retyping it here.
8. SYSNO - An indicator of the TCP/IP port at which the SAP server listens. For example, for a
server that listens at port 3200, the SYSNO will be '00'. Similarly, if the SAP server port is
3201, the SYSNO will have to be specified as '01'. Therefore, in the SYSNO text box
specify the system number of the SAP server with which the specified client communicates.
9. ROUTER - If the SAP client with the specified CLIENTNAME exists in a network external to
the SAP server, then a router will be used to enable the server-client communication. In
such a case, specify the IP of the router in the ROUTER text box. If both the client and the
server exist in the same network, then specify 'none' against the ROUTER text box.
10. INSTANCENAME - Specify the name of the SAP R/3 instance to be monitored. To view the
complete list of instances to choose from, do the follow the procedure discussed in Page 17
of this document.
11. TIMEOUT - Indicate the duration (in seconds) for which this test should wait for a response
from the SAP R/3 server. By default, this is set to 120 seconds.
12. JCO VERSION – The eG agent uses the SAP JCO library to connect to the SAP ABAP
system and pull out metrics. To enable the eG agent to make this connection and query the
metrics, you need to specify the version of the SAP JCO library that the agent needs to use.
For instance, to instruct the eG agent to use JCO v2.1.19, it would suffice if you specify the
‘major version number’ alone against JCO VERSION – in the case of this example, this will
be
2.x
.
13. MAXIMUM STEPS – To report workload metrics, the eG agent will have to typically analyze
numerous dialog steps of activity on the SAP ABAP system. To reduce the stress on the eG
agent, you can limit the number of dialog steps the eG agent needs to process in order to
make a fair assessment of the workload and the processing ability of the ABAP system. This
limit can be specified against MAXIMUM STEPS. By default, this limit is set to 5000.
14. INCLUDE TCODES – By default, this test monitors only those transactions that were
invoked in the last measurement period. However, if you want a few critical transactions to
be monitored all the time – i.e., regardless of their status (whether they were invoked or
not) in the last measurement period – then, you can provide a comma-separated list of the
transaction codes of such transactions against INCLUDE TCODES.

M O N I T O R I N G T H E S A P A B A P I N S T A N C E
101
15. DD FREQUENCY - Refers to the frequency with which detailed diagnosis measures are to
be generated for this test. The default is
1:1
. This indicates that, by default, detailed
measures will be generated every time this test runs, and also every time the test detects a
problem. You can modify this frequency, if you so desire. Also, if you intend to disable the
detailed diagnosis capability for this test, you can do so by specifying
none
against DD
FREQUENCY.
16. DETAILED DIAGNOSIS - To make diagnosis more efficient and accurate, the eG
Enterprise suite embeds an optional detailed diagnostic capability. With this capability, the
eG agents can be configured to run detailed, more elaborate tests as and when specific
problems are detected. To enable the detailed diagnosis capability of this test for a
particular server, choose the On option. To disable the capability, click on the Off option.
The option to selectively enable/disable the detailed diagnosis capability will be available
only if the following conditions are fulfilled:
The eG manager license should allow the detailed diagnosis capability
Both the normal and abnormal frequencies configured for the detailed diagnosis
measures should not be 0.
Outputs of the
test
One set of results for every transaction handled by the SAP AS ABAP instance being monitored
Measurements
made by the
test
Measurement
Measurement
Unit
Interpretation
Activity:
Indicates the rate of steps
executed for this transaction
in the last measurement
period.
Steps/Sec
This is a good indicator of the workload
imposed by a transaction on the SAP ABAP
instance. You can compare the value of this
measure across transactions to know which
transaction is generating the maximum load.
CPU utilization:
Indicates the percentage of
CPU resources utilized by this
transaction.
Percent
Compare the value of this measure across
transactions to know which transaction is
using the maximum CPU and is probably
causing a CPU contention on the system. You
may then want to observe how this
transaction has been using CPU over time
and figure out whether the CPU usage of that
transaction remains consistently high; if so, it
could mean that that transaction requires
more processing power to execute. You may
then want to consider resizing the SAP ABAP
system with more CPU resources.

M O N I T O R I N G T H E S A P A B A P I N S T A N C E
102
Total memory:
Indicates the total memory
used by this transaction
during the last measurement
period.
MB
This measure is the sum total of the roll
memory, extended memory, and heap
memory used by a process.
By comparing the value of this measure
across transactions, you can accurately
identify that transaction which is consuming
the maximum memory. If the memory usage
of this transaction has been abnormally high
consistently, it could indicate that the
transaction is basically memory-intensive and
requires more memory resources for proper
execution. You should then figure out how
much memory and of what type should be
allocated to the task. For this, you may want
to determine which memory type was being
used the highest over time – is it heap
memory? Roll memory? Or extended
memory. The values of the
PRIV mode heap
memory
and the
Extended memory
metrics
will help administrators figure this out.
You can also use the detailed diagnosis of
this measure to identify the top 3 memory-
consuming steps of a particular transaction.
M O N I T O R I N G T H E S A P A B A P I N S T A N C E
103
PRIV mode heap memory:
Indicates the maximum
PRIV mode heap memory
consumed by this
transaction in the last
measure period.
MB
SAP’s memory management system assigns
memory to a work process. The order in
which a work process is assigned the memory
type depends on the work process type,
either dialog or non-dialog), and the
underlying operating system. Some of the
memory types are as follows:
Roll area: The roll area memory is
used for the initial memory assigned
to a user context, and (if available)
for additional memory if the
expanded memory is full. The roll
area consists of 2 segments. The
first segment is assigned to the work
process first as memory. If this is
used up, the work process has more
memory assigned to it.
Extended memory: Each ABAP work
process has a part reserved in its
virtual address space for extended
memory. The majority of the user
context is stored in the extended
memory. You can map the extended
memory from the common resource
onto any work process, and after
onto another process on the same
address in the virtual address space.
This is important if you work with
pointers in the ABAP program. The
value of the
Extended memory
measure indicates how each
transaction is using this memory
type.
Private memory: If a dialog work
process has used up the roll area
assigned to it and the extended
memory, private memory is
assigned to the work process. The
work process goes into PRIV mode
(private). Other processes cannot

M O N I T O R I N G T H E S A P A B A P I N S T A N C E
104
use private (heap) memory. After
releasing the assigned memory, the
operating system still considers the
(virtual) memory as being occupied
by the allocating process.
A consistent increase in the value of
the
PRIV mode heap memory
measure for a transaction therefore
indicates that transactions of that
type are continuously using up all
the roll area and extended memory,
and are being forced to reach out to
the private memory. This could
mean that the transaction is
memory-intensive. If too many
transactions are found to be using
PRIV heap memory, it could mean
that the work processes are sized
with insufficient roll area and
extended memory. You may hence
want to allocate more roll area and
extended memory to make sure that
private memory usage is minimal.
Extended memory:
Indicates the maximum
extended memory used
by this transaction in the
last measure period.
MB
Work process restarts:
Indicates the number of
work process restarts
caused by this transaction
in the last measure
period.
Number
One of the common reasons for work process
restarts is excessive usage of private
memory. The work process, if it has used a
lot of private memory, is restarted when the
user context is terminated and the local
memory is returned. The restart makes the
local memory available again for other
processes.
Regardless of what caused it, work process
restarts are performance-impacting and need
to be kept at a minimum.

M O N I T O R I N G T H E S A P A B A P I N S T A N C E
105
Maximum response time
of a step:
Indicates the maximum
response time of the
transaction steps of this
transaction in the last
measurement period.
Secs
An SAP transaction normally extends over
several transaction steps. During these steps,
data such as variables, internal tables, and
screen lists are built up and stored in the
main memory of the application server.
This measure compares the response time of
all the transaction steps executed by a
transaction in the last measurement period
and reports the highest response time.
Use the detailed diagnosis of this measure to
identify the top 3 steps executed by this
transaction with highest response times. This
leads you to the probable cause for delay in
the execution of a transaction in the last five
minutes. Apart from the response time break
up, the report and CUA programs that were
running are also shown as part of detailed
diagnosis.
Total response time:
Indicates the total response
time per invocation of this
transaction within the last
measure period.
Seconds/transa
ction
This measure includes the response time
taken at the server and the round trip times.
Ideally, the value of this measure should be
low. High values are indicative of poor
responsiveness.
Compare the value of this measure across
transactions to identify which transaction is
least responsive. To know the reason for the
delay, you can compare the value of the
GUI
time, GUI Net time, Server response time,
Processing time, Dispatcher wait time, Load
and generation time, Roll time, Database
request time, Lock time, and RFC time
measures for that transaction. This will
accurately pinpoint where a transaction spent
maximum time – in the dispatcher queue? at
the server end? in processing? when loading
objects? when rolling in user contexts? when
performing database operations? when
performing enqueue operations? Or in
waiting for RFC calls?
You can also use the detailed diagnosis of
this measure to view the details of the top 3
transaction invocations that were least
responsive.

M O N I T O R I N G T H E S A P A B A P I N S T A N C E
106
GUI time:
Indicates the average time
taken for round trip
communication steps
between client and server in
between an invocation of
this transaction.
Secons/transac
tion
If the values of these measures are
excessive, check that the hardware
requirements for the presentation server are
met and that the network between the
application servers and the presentation
servers is not experiencing shortages or slow
traffic.
GUI Net time:
Indicates the average front
end net time taken for the
first and last steps of this
transaction.
Seconds/transa
ction
Server response time:
Indicates the average
response time of an
invocation of this
transaction at the server
end.
Seconds/transa
ction
In the event of a processing slowdown, you
can compare the value of this measure with
other response time measures reported by
this test to understand where the processing
bottleneck lies.
Processing time:
Indicates the average time
taken to process an
invocation of this
transaction.
Secons/transac
tion
A high value for this measure may indicate
that ABAP programs are very complex and
the work processes spend a large amount of
time interpreting what is to be done.
The processing time of transactions executed
by the dialog work process for instance
should be below twice the CPU time.
Dispatcher wait time:
Indicates the average time
that an invocation of this
transaction spent waiting
for a free work process at the
dispatcher.
Seconds/transa
ction
When the dispatcher receives a processing
request, it looks for a free SAP work process
of the required type and then sends the
request to this work process, which begins
the work. If all SAP work processes of the
required type are busy when the request
initially reaches the dispatcher, the request is
placed in the dispatcher queue. In the
dispatcher queue, the request waits until a
work process of the required type is free. As
soon as a work process is free, the
dispatcher sends the request to it. This time
the request spends in the dispatcher queue is
indicated as the dispatcher wait time.
For the transactions of the dialog work
process for instance, the value of this
measure should be less than 10% of the
value of the
Total response time
measure.
Higher values are indicative of performance
problems. One common cause of such
performance problems may be insufficient
work processes.
M O N I T O R I N G T H E S A P A B A P I N S T A N C E
107
Load and generation time:
Indicates the average time
spent by an invocation of
this transaction for loading
and generation.
Seconds/transa
ction
All ABAP programs and screens that are
required but not yet available in the
application server buffers must be loaded or
generated. The time it takes to do this is
indicated as load and generation time.
Loading a program also entails accessing
database tables that store the ABAP
programs.
Typically, for the transactions of the dialog
work process, the load time per step should
not be greater than 50 ms.
High values could indicate problems with
memory configuration, small buffer sizes,
wrong parameter settings or a CPU
bottleneck.

M O N I T O R I N G T H E S A P A B A P I N S T A N C E
108
Roll time:
Indicates the average time
spent by an invocation of
this transaction for rolling
in user contexts and when
waiting for roll out.
Secs
An SAP transaction normally extends over
several transaction steps. During these steps,
data such as variables, internal tables, and
screen lists are built up and stored in the
main memory of the application server. This
data is known as user context. Different
transaction steps are normally processed by
different dialog work processes. At the
beginning of a transaction step, the user
context is made available to the appropriate
work process.This procedure is called roll-in.
Roll-out on the other hand saves the current
user-context data to virtual memory at the
conclusion of a transaction step. The time a
transaction step waited in the roll-area is
called
roll wait t
ime.
The value of this measure is the sum total of
roll-in time and roll wait time.
A high value for this measure indicates that
this transaction is either taking too long to
roll in user contexts or is waiting too long in
the roll-area for a roll-out to occur. Since a
user context is moved out of the local
memory of a work process and moved into
the roll buffer during the roll-in process,
improperly sized roll buffers can cause
slowdowns in this process. Lack of adequate
space in the extended memory can also
contribute to a slowdown when rolling in user
contexts.
Possible causes for high roll wait times may
be due to having all work processes in the
target system occupied. It is very important
to configure the instances properly, especially
when they are designed to handle RFC
communication.

M O N I T O R I N G T H E S A P A B A P I N S T A N C E
109
Database request time:
Indicates the average time
spent by an invocation this
transaction for performing
database operations such as
selects, inserts, updates,
deletes and commits.
Secons/transac
tion
When data is read or changed in the
database, the time required is known as
Database request time. This time is
measured from the moment the database
request is sent to the database server and
runs until the moment the data is returned to
the application server.
Ideally, for the transactions of the dialog
work process, the value of this measure
should be 40% of the total response time.
Many factors can can cause worrysome
spikes in this value. This could be problems in
the database such as expensive SQL
statement or wrong parameter settings in the
database level. In addition, issues in network
connectivity between the application server
and the database can also adversely impact
this value. This is because, the
Database
request time
not only includes the time
required by the database to produce the
requested data, but also the time required for
network transfer of that data. In addition, I/O
contention experienced by the physical disks
can also affect this time.
Lock time:
Indicates the average time
that an invocation of this
transaction spent performing
enqueue operations.
Seconds/Trans
action
The enqueue service allows SAP ABAP
applications to lock data so that only they can
use it. Locking the data prevents parallel
changes to the same data, which would lead
to data inconsistency.
The
Lock time
measure reports the time from
sending an enqueue request to the SAP
enqueue server to the receipt of the results.
For the transactions of the dialog work
process for example, the
Lock time
should be
less than 5 ms. Any value higher than that
would represent a problem that might affect
system stability. Network problems can also
increase the value of this measure.

M O N I T O R I N G T H E S A P A B A P I N S T A N C E
110
RFC time:
Indicates the average time an
invocation of this transaction
spent waiting for RFC calls to
get executed.
Secons/Transa
ction
The value of this measure includes
CPIC
(Common Programming Interface
Communication) time
as well. CPIC is
typically used by the SAP system for
program-to-program communication.
An increase in RFC time can increase
roll wait
time
considerably. When synchronous RFCs
are called, the work process executes a roll
out and may have to wait for the
end of the RFC in the roll area, even if the
dialog step is not yet completed. In the roll
area, RFC server programs can also wait for
other RFCs sent to them. The time a
transaction step waited in the roll-area is
called
roll wait t
ime.
The absence of adequate work processes can
cause the RFC time and consequently, the
roll wait time to increase. Besides ensuring
that the SAP ABAP system is sized with
sufficient work processes, you can also set
the following parameters properly to better
balance RFC load:
rdisp/rfc_max_comm_entries: This
specifies the maximum number of
communications in an instance. No
more dialog work processes will be
given to the program calling the
target system after this number is
reached.
rdisp/rfc_min_wait_dia_wp: This
specifies the number of work
processes to be always available for
online users.
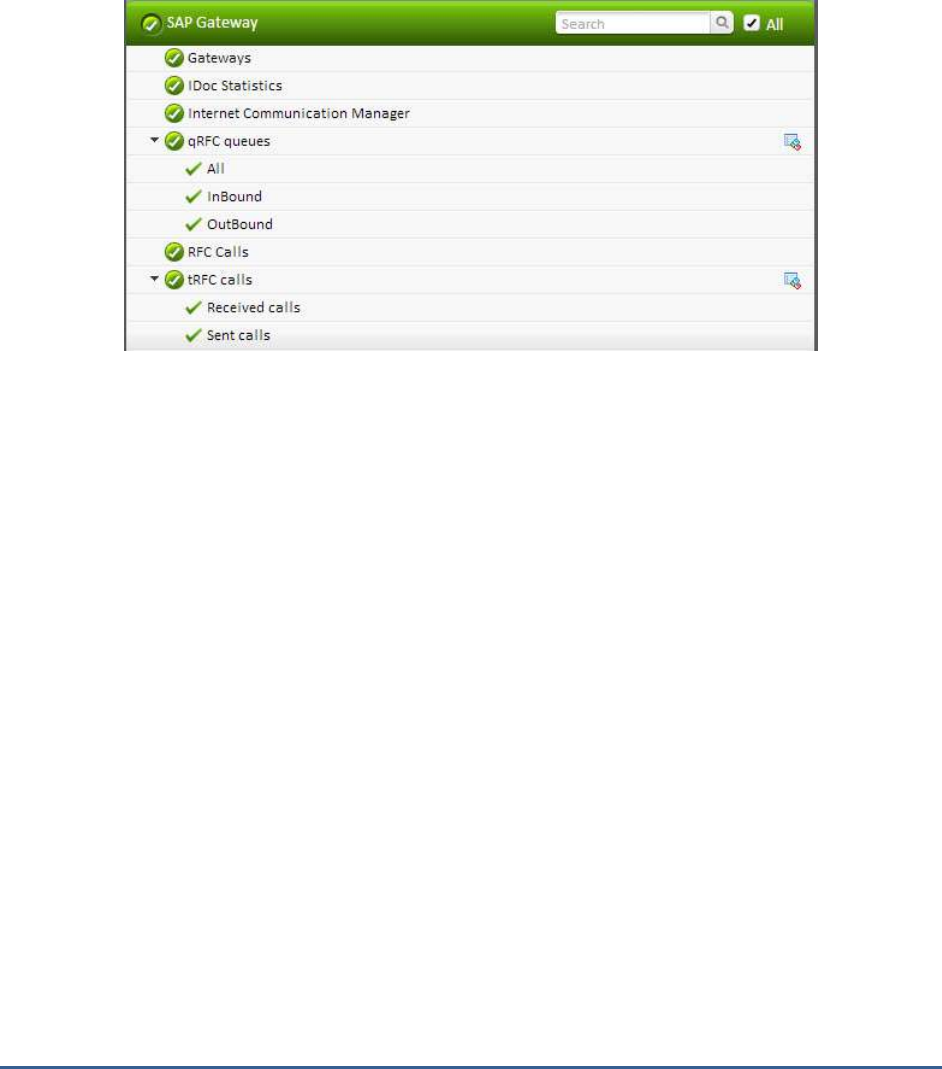
M O N I T O R I N G T H E S A P A B A P I N S T A N C E
111
2.6 The SAP Gateway Layer
Using the tests associated with the R3 Gateway layer (see Figure 2.20), administrators can determine the health of
communications between the SAP systems and external programs.
Figure 2.20: The tests associated with the SAP Gateway layer
2.6.1 IDoc Statistics Test
Idocs are structured ASCII files (or a virtual equivalent). They are the file format used by SAP ABAP to exchange data
with foreign systems. Idocs is the acronym for Interchange Document. This indicates a set of (electronic) information
which builds a logical entity. An IDoc is e.g. all the data of a single customer in your customer master data file, or the
IDoc is all the data of a single invoice.
An SAP ABAP application creates data and updates the database appropriately. An application can be a transaction, a
stand-alone ABAP Report or any tool that can update a database within SAP ABAP. If the application thinks that data
needs to be distributed to a foreign system, it triggers the
IDoc outbound routine
, usually by leaving a descriptive
message record in the message table
NAST
. The application then either directly calls the IDoc engine or a collector
job eventually picks up all due IDoc messages and determines what to do with them. If the engine believes that data
is ready to be sent to a partner system, then it determines the function module which can collect and wrap the
required IDoc data into an IDoc. In IDoc customising, you specify the name of the function module to use. This can
either be one which is predefined by ABAP standard or a user-written one. When the IDoc is created it is stored in an
R/3 table and from there it is sent to the foreign system.
IDoc inbound routines,
on the other hand, are function modules with a standard interface, which will interpret the
received IDoc data and prepare it for processing. The received IDoc data is processed record by record and
interpreted according to the segment information provided with each record. The prepared data can then be
processed by an application, a function module, or a self-written program.
Any slowdown noticed in electronic data exchange between the SAP ABAP system and foreign systems therefore, can
be attributed to bottlenecks or errors in the transmission/reception of Idocs. Administrators should hence closely
monitor inbound and outbound IDoc traffic to proactively detect probable slowdowns in inter-system
communications, and accurately tell where the slowdown occurred and why, so that the communication bottlenecks
can be promptly cleared. This is where the IDoc Statistics test helps.

M O N I T O R I N G T H E S A P A B A P I N S T A N C E
112
This test monitors the Idocs generated and reports the rate at which these Idocs were processed at various stages of
transmission/reception, thus accurately pointing to processing slowdowns and where exactly the processing was
bottlenecked. In addition, the test also reports the number of Idocs that were found to be erroneous every second
and the exact stage of transmission/reception at which the rate of errors peaked! This way, the test leads
administrators to errors in electronic data exchange that may have delayed communication significantly, and where
such delays were frequent!
Purpose
Monitors the Idocs generated and reports the rate at which these Idocs were processed at
various stages of transmission/reception, thus accurately pointing to processing slowdowns and
where exactly the processing was bottlenecked. In addition, the test also reports the number of
Idocs that were found to be erroneous every second and the exact stage of
transmission/reception at which the rate of errors peaked! This way, the test leads
administrators to errors in electronic data exchange that may have delayed communication
significantly, and where such delays were frequent!
Target of the
test
A SAP ABAP instance
Agent
deploying the
test
An internal/remote agent
Configurable
parameters for
the test
1. TEST PERIOD - How often should the test be executed
2. HOST - Host name of the server for which the test is to be configured

M O N I T O R I N G T H E S A P A B A P I N S T A N C E
113
3. PORTNO - Enter the port to which the specified HOST listens
4. CLIENTNAME – Specify the ID of the client system that is connecting to the R/3 server. To
view a list of client IDs to choose from, follow the procedure discussed in Page 14.
5. SAPUSER - Provide a valid user name for logging into the SAP R/3 server. In order to
enable the eG Enterprise suite to effectively monitor SAP, the name of a SAPUSER with
either of the following profiles need to be specified: S_A.SYSTEM (super administrator) or
SAP_ALL (all authorizations for SAP).
6. PASSWORD - The password of the specified SAPUSER.
7. CONFIRMPASSWORD - Confirm the password by retyping it here.
8. SYSNO - An indicator of the TCP/IP port at which the SAP server listens. For example, for a
server that listens at port 3200, the SYSNO will be '00'. Similarly, if the SAP server port is
3201, the SYSNO will have to be specified as '01'. Therefore, in the SYSNO text box
specify the system number of the SAP server with which the specified client communicates.
9. ROUTER - If the SAP client with the specified CLIENTNAME exists in a network external to
the SAP server, then a router will be used to enable the server-client communication. In
such a case, specify the IP of the router in the ROUTER text box. If both the client and the
server exist in the same network, then specify 'none' against the ROUTER text box.
10. INSTANCENAME - Specify the name of the SAP R/3 instance to be monitored. To view the
complete list of instances to choose from, do the follow the procedure discussed in Page 17
of this document.
11. TIMEOUT - Indicate the duration (in seconds) for which this test should wait for a response
from the SAP R/3 server. By default, this is set to 120 seconds.
12. JCOVERSION - The eG agent uses the SAP JCO library to connect to the SAP ABAP system
and pull out metrics. To enable the eG agent to make this connection and query the
metrics, you need to specify the version of the SAP JCO library that the agent needs to use.
For instance, to instruct the eG agent to use JCO v2.1.19, it would suffice if you specify the
‘major version number’ alone against JCO VERSION – in the case of this example, this will
be
2.x
.
13. DD FREQUENCY - Refers to the frequency with which detailed diagnosis measures are to
be generated for this test. The default is
1:1
. This indicates that, by default, detailed
measures will be generated every time this test runs, and also every time the test detects a
problem. You can modify this frequency, if you so desire. Also, if you intend to disable the
detailed diagnosis capability for this test, you can do so by specifying
none
against DD
FREQUENCY.
14. DETAILED DIAGNOSIS - To make diagnosis more efficient and accurate, the eG
Enterprise suite embeds an optional detailed diagnostic capability. With this capability, the
eG agents can be configured to run detailed, more elaborate tests as and when specific
problems are detected. To enable the detailed diagnosis capability of this test for a
particular server, choose the On option. To disable the capability, click on the Off option.
The option to selectively enable/disable the detailed diagnosis capability will be available
only if the following conditions are fulfilled:
The eG manager license should allow the detailed diagnosis capability
Both the normal and abnormal frequencies configured for the detailed diagnosis
measures should not be 0.

M O N I T O R I N G T H E S A P A B A P I N S T A N C E
114
Outputs of the
test
One set of results for the SAP ABAP instance being monitored
Measurements
made by the
test
Measurement
Measurement
Unit
Interpretation
Number of new Idocs:
Indicates the number of
Idcos of this type that were
created during the last
measurement period.
Idocs
A high value is desired for this measure.
Rate of new Idocs:
Indicates the rate at which
the Idocs of this type were
generated during the last
measurement period.
Idocs/sec
This measure gives an overview of
outbound/inbound data transfer rate using the
Idocs.
Total number of error
Idocs:
Indicates the total number of
Idocs of this type with errors.
Idocs
Ideally, the value of this measure should be
zero.
A non-zero value is desired for this measure.
If this measure reports a non-zero value, then
use the detailed diagnosis of the
Total
number of Idocs with interface errors
measure and the
Total number of Idocs with
external system or application errors
measure
to know which Idocs have errors and where
in the processing cycle these errors occurred.
Rate of error Idocs:
Indicates the rate of Idocs
errors of this type during the
last measurement period.
Idocs/sec
A low value is desired for this measure.
Total number of Idocs
with interface errors:
Indicates the total number of
Idocs of this type with
interface errors.
Idocs
Using the detailed diagnosis of this measure,
you can accurately identify the Idocs that are
experiencing interface errors and at which
exact state these errors have occurred. This
way, you can quickly get to the source of the
errors, eliminate them, and ensure that the
electronic data exchange is not disrupted for
long hours.
Rate of Idocs with
interface errors:
Indicates the rate of Idocs of
this type with interface
errors.
Idocs/sec

M O N I T O R I N G T H E S A P A B A P I N S T A N C E
115
Total number of Idocs
with external system or
application errors:
Indicates the total number of
Idocs of this type with
external system errors or
application errors.
Idocs
Ideally, the value of this measure should be
zero.
Rate of Idocs with
external system or
application errors:
Indicates the rate of Idocs of
this type with external errors
or application errors.
Idocs/sec
Idocs with recent
unprocessed interface
errors:
Indicates the number of
Idocs of this type with
unprocessed interface errors
during the last measurement
period.
Number
Ideally, the value of this measure should be
zero.
The detailed diagnosis of this measure if
enabled, lists the details of these Idocs such
as the Idoc number, type, error message,
recipient and sender details, creation and
modified timestamps and number of data
records.
Idocs with recent
unprocessed external
system or application
errors:
Indicates the number of
Idocs of this type with
external system errors or
application errors during the
last measurement period.
Number
Ideally, the value of this measure should be
zero.
The detailed diagnosis of this measure if
enabled, lists the details of these Idocs such
as the Idoc number, type, error message,
recipient and sender details, creation and
modified timestamps and number of data
records.
2.6.2 qRFC Queues Test
All types of applications are instructed to communicate with other applications. This communication may take place
within an SAP system, with another SAP system, or with an application from a remote external system. An interface
that can be used for dealing with this task is the RemoteFunction Call (RFC). RFCs can be used to start applications
in remote systems, and to execute particular functions.
Whereas the first version of the RFC, the synchronous RFC, (sRFC) required both systems involved to be active in
order to produce a synchronous communication, the subsequent generations of RFC had a greater range of features
at their disposal (such as serialization, guarantee for one-time-only execution, and that the receiver system does not
have to be available). These features were further enhanced through the queued RFC with inbound/outbound
queue.
qRFC performs a serialization of tRFC (Transactional RFC) using wait queues. While the actual sending process is
done by the tRFC, inbound and outbound queues are added to the tRFC, thus resulting in a qRFC (queued Remote
Function Call). The sender system is called the client system, while the target system corresponds to the server
system.
In qRFC, the following communication scenarios are possible:
M O N I T O R I N G T H E S A P A B A P I N S T A N C E
116
qRFC with outbound queue
qRFC with inbound queue (and outbound queue)
Figure 2.21 depicts both these communication scenarios:
As you can see, in a qRFC with an outbound queue, the sender system uses an outbound queue to serialize the
data that is being sent. This means that function modules which depend on each other (such as update and then
change) are put into the outbound queue of the sender system, and are guaranteed to be sent to the target
system one after each other and one time only. The called system (server) has no knowledge of the outbound queue
in the sender system (client), meaning that in this scenario, every SAP system can also communicate with a non-SAP
system. (Note: the programming code of the server system must not be changed. However, it must be tRFC-
capable.)
In the qRFC with inbound queue scenario on the other hand, for an outbound queue in the sender system
(client), there is also an inbound queue in the target system (server). In other words, if a qRFC with inbound queue
exists, it means that an outbound queue also exists in the sender system. This guarantees the sequence and
efficiently controls the resources in the client system and server system. The inbound queue only processes as many
function modules as the system resources in the target system (server) at that time allow. This prevents a server
from being blocked by a client.
Two systems can engage in smooth, uninterrupted communication using qRFC only if the outbound and inbound
queues operate in an error-free manner. To be able to promptly capture deficiencies in queue execution and rapidly
isolate the reasons for the same, administrators should closely monitor the inbound and outbound qRFC queues. This
can be achieved using the qRFC queues test. For each type (inbound and outbound) of queue, this test reports the
number of queues that are experiencing errors currently and the count of queues that took too long to complete. In
the process, the test turns the spotlight on those queues that may be responsible for unexpected breaks or
prolonged delays (if any) in inter-system communication, and also reveals what could be causing such queues to
perform poorly.
Purpose
For each type (inbound and outbound) of queue, this test reports the number of queues that are
experiencing errors currently and the count of queues that took too long to complete. In the
process, the test turns the spotlight on those queues that may be responsible for unexpected
breaks or prolonged delays (if any) in inter-system communication, and also reveals what could
be causing such queues to perform poorly
Target of the
test
A SAP R/3 server
Agent
deploying the
test
An internal/remote agent

M O N I T O R I N G T H E S A P A B A P I N S T A N C E
117
Configurable
parameters for
the test
1. TEST PERIOD - How often should the test be executed
2. HOST - Host name of the server for which the test is to be configured
3. PORT - Enter the port to which the specified HOST listens
4. CLIENTNAME – Specify the ID of the client system that is connecting to the R/3 server. To
view a list of client IDs to choose from, follow the procedure discussed in Page 14.
5. SAPUSER - Provide a valid user name for logging into the SAP R/3 server. In order to
enable the eG Enterprise suite to effectively monitor SAP, the name of a SAPUSER with
either of the following profiles need to be specified: S_A.SYSTEM (super administrator) or
SAP_ALL (all authorizations for SAP).
6. PASSWORD - The password of the specified SAPUSER.
7. CONFIRMPASSWORD - Confirm the password by retyping it here.
8. SYSNO - An indicator of the TCP/IP port at which the SAP server listens. For example, for a
server that listens at port 3200, the SYSNO will be '00'. Similarly, if the SAP server port is
3201, the SYSNO will have to be specified as '01'. Therefore, in the SYSNO text box
specify the system number of the SAP server with which the specified client communicates.
9. ROUTER - If the SAP client with the specified CLIENTNAME exists in a network external to
the SAP server, then a router will be used to enable the server-client communication. In
such a case, specify the IP of the router in the ROUTER text box. If both the client and the
server exist in the same network, then specify 'none' against the ROUTER text box.
10. INSTANCENAME - Specify the name of the SAP R/3 instance to be monitored. To view the
complete list of instances to choose from, do the follow the procedure discussed in Page 17
of this document.
11. TIMEOUT - Indicate the duration (in seconds) for which this test should wait for a response
from the SAP R/3 server. By default, this is set to 120 seconds.
12. LONGREADYCUTOFF (HRS) – This test reports the
Long ready state queues
measure,
which is the number of queues stuck in the
Ready
state for a long time. To report this
measure, this test counts all queues that have been in the
Ready
state in excess of the
duration (in hours) specified against LONGREADYCUTOFF (HRS).
13. LONGRUNNINGCUTOFF (HRS) – This test reports the
Long running queues
measure,
which is the number of queues that have been running for a long time. To report this
measure, this test counts all queues that have been running for over a period of time (in
hours) specified against LONGRUNNINGCUTOFF (HRS).
14. JCO VERSION - The eG agent uses the SAP JCO library to connect to the SAP ABAP system
and pull out metrics. To enable the eG agent to make this connection and query the
metrics, you need to specify the version of the SAP JCO library that the agent needs to use.
For instance, to instruct the eG agent to use JCO v2.1.19, it would suffice if you specify the
‘major version number’ alone against JCO VERSION – in the case of this example, this will
be
2.x
.
M O N I T O R I N G T H E S A P A B A P I N S T A N C E
118
15. DD FREQUENCY - Refers to the frequency with which detailed diagnosis measures are to
be generated for this test. The default is
1:1
. This indicates that, by default, detailed
measures will be generated every time this test runs, and also every time the test detects a
problem. You can modify this frequency, if you so desire. Also, if you intend to disable the
detailed diagnosis capability for this test, you can do so by specifying
none
against DD
FREQUENCY.
16. DETAILED DIAGNOSIS - To make diagnosis more efficient and accurate, the eG
Enterprise suite embeds an optional detailed diagnostic capability. With this capability, the
eG agents can be configured to run detailed, more elaborate tests as and when specific
problems are detected. To enable the detailed diagnosis capability of this test for a
particular server, choose the On option. To disable the capability, click on the Off option.
The option to selectively enable/disable the detailed diagnosis capability will be available
only if the following conditions are fulfilled:
The eG manager license should allow the detailed diagnosis capability
Both the normal and abnormal frequencies configured for the detailed diagnosis
measures should not be 0.
Outputs of the
test
One set of results for every qRFC queue type on the server being monitored; an additional
All
descriptor is also supported, which aggregates metrics across queue types.
Measurements
made by the
test
Measurement
Measurement
Unit
Interpretation
Number of queue entries:
Indicates the number of
queue entries for this queue
type.
Number
Queue entries refer to the function modules
that are sequentially arranged and placed in
an inbound/outbound queue (as the case
may be), for consumption by a target system.
A high value or a consistently increasing
value for this measure therefore indicates
that the inbound/outbound queue is long or
is growing. This could imply an overload or a
processing bottleneck at the sender/receiver
system (as the case may be). You can
compare the value of this measure between
inbound
and
outbound
queues to understand
where the bottleneck is – at the sender
system or the target system? .
Number of queues:
Indicates the current number
of queues of this queue type.
Number
The inbound queue scheduler and the
outbound queue scheduler ensure that the
corresponding queues (inbound and
outbound) are processed in parallel. An
increase in the number of queues impairs the
performance of the scheduler, as it can no
longer process the queues in parallel. Its
hence best to limit the number of
inbound/outbound queues.

M O N I T O R I N G T H E S A P A B A P I N S T A N C E
119
Blocked queues:
Indicates the current number
of queues in blocked state.
Number
Ideally, the value of this measure should be
0. A non-zero value indicates that one/more
inbound/outbound queues are blocked. qRFC
queues can be blocked due to various
reasons such as no free work processes
(SYSLOAD), target system error (SYSFAIL),
transmission error(CPICERR), explicit lock,
dependent lock, debugging, waiting for
update, LUW execution error, LUW data
modification.
SYSFAIL queues:
Indicates the current number
of queues of this type in the
SYSFAIL error status.
Number
Ideally, the value of this measure should be
0. If this measure reports a non-zero value
instead, it indicates that a serious error
occurred when the first logical unit of work
(LUW) of one/more queues was being
executed. SYSFAIL errors interrupt execution
of the LUW and generates short dumps on
the target system.
To know which queues encountered SYSFAIL
errors, use the detailed diagnosis of this
measure.
SYSLOAD queues:
Indicates the current number
of queues of this type in the
SYSLOAD error state.
Number
Ideally, the value of this measure should be
0. If this measure reports a non-zero value
instead, it indicates that at the time of the
qRFC call, no DIALOG work processes were
free in the sending system. If these errors
persist, the number of dialog work processes
can be increased accordingly.
To know which queues encountered
SYSLOAD errors, use the detailed diagnosis
of this measure.

M O N I T O R I N G T H E S A P A B A P I N S T A N C E
120
CPICERR queues:
Indicates the current number
of queues of this type in the
CPICERR error state.
Number
Ideally, the value of this measure should be
0. If this measure reports a non-zero value
instead, it indicates that during transmission
or processing of the first LUW of one/more
queues, a network or communication error
occurred. Status CPICERR may also exist in
the following cases although no
communication error occurred: A qRFC
application finds out that a LUW cannot be
processed any further due to a temporary
error in the application and therefore calls the
RESTART_OF_BACKGROUNDTASK function
module to prompt the qRFC Manager to
cancel the execution of this LUW and to
repeat this LUW later. In this case, qRFC
simulates a communication error with the
text "Command to tRFC/qRFC: Execute LUW
once again." If this error occurs very often,
you must contact the corresponding
application.
To know which queues encountered the
CPICERR errors, use the detailed diagnosis of
this measure.
Waiting queues:
Indicates the current number
of queues of this type in the
WAITING state.
Number
Ideally, the value of this measure should be
0. If this measure reports a non-zero value
instead, it indicates that the first LUW of
some queues has dependencies to other
queues, and at least one of these queues
currently still contains other LUWs with
higher priorities. Queues can also go into
waiting, if there are updates in the
transaction and and the queues have to
wait until the update ends.
To know which queues are in the WAITING
state currently, use the detailed diagnosis of
this measure.

M O N I T O R I N G T H E S A P A B A P I N S T A N C E
121
NoSend queues:
Indicates the current number
of queues of this type in the
NOSEND state.
Number
If this measure reports a non-zero value, it
indicates that the LUWs of some queues were
never sent but retrieved by a special
application. These queues are only used
internally at SAP. Even if a LUW has been
read by the corresponding application (BW,
CRM), this status does not change. This LUW
is only deleted from the queue if this
application confirms collection (collective
confirmation possible). Under no
circumstances should this status be reset and
the queue activated.
Use the detailed diagnosis of this measure to
know which queues are NOSEND queues.
Long ready state queues:
Indicates the number of
queues that have been in the
READY state for a long time.
Number
This measure reports the count of all queues
that have been in the READY state for a
period of time greater than the
LONGREADYCUTOFF (HRS) specification.
Typically, the READY state is a temporary
state. If this state becomes permanent for a
queue or is prolonged, it could be because
that queue has been locked manually via a
transaction/program and then unlocked
without being activated at the same time.
Under such circumstances, the queue must
be activated explicitly.
Long running queues:
Indicates the number of
queues that have been
running for a long time.
Number
This measure reports the count of all queues
that have been in the RUNNING state for a
period of time greater than the
LONGRUNNINGCUTOFF (HRS)
specification.
If a queue hangs in the RUNNING state for
more than 30 minutes, this may mean that
the work process responsible for sending this
LUW has been terminated. In this case, you
can activate this queue again.
Note that activating a queue in status
RUNNING may cause a LUW to be executed
several times if this LUW is still being
processed in the target system at that time.
SAP therefore recommends a waiting time of
at least 30 minutes before you reactivate the
queue.

M O N I T O R I N G T H E S A P A B A P I N S T A N C E
122
2.6.3 Gateways Test
The SAP Gateway carries out CPI-C services within the SAP world, which are based on TCP/IP. These services enable
SAP systems and external programs to communicate with one another. As RFC is based on CPI-C, all RFC
connections also pass through the SAP Gateway. This test reports statistics pertaining to this SAP gateway.
Purpose
Reports statistics pertaining to the SAP gateway
Target of the
test
A SAP R/3 server
Agent
deploying the
test
An internal/remote agent

M O N I T O R I N G T H E S A P A B A P I N S T A N C E
123
Configurable
parameters for
the test
1. TEST PERIOD - How often should the test be executed
2. HOST - Host name of the server for which the test is to be configured
3. PORTNO - Enter the port to which the specified HOST listens
4. CLIENTNAME – Specify the ID of the client system that is connecting to the R/3 server.
To view a list of client IDs to choose from, follow the procedure discussed in Page 14.
5. SAPUSER - Provide a valid user name for logging into the SAP R/3 server. In order to
enable the eG Enterprise suite to effectively monitor SAP, the name of a SAPUSER with
either of the following profiles need to be specified: S_A.SYSTEM (super administrator) or
SAP_ALL (all authorizations for SAP).
6. PASSWORD - The password of the specified SAPUSER.
7. CONFIRMPASSWORD - Confirm the password by retyping it here.
8. SYSNO - An indicator of the TCP/IP port at which the SAP server listens. For example, for
a server that listens at port 3200, the SYSNO will be '00'. Similarly, if the SAP server port
is 3201, the SYSNO will have to be specified as '01'. Therefore, in the SYSNO text box
specify the system number of the SAP server with which the specified client communicates.
9. ROUTER - If the SAP client with the specified CLIENTNAME exists in a network external
to the SAP server, then a router will be used to enable the server-client communication. In
such a case, specify the IP of the router in the ROUTER text box. If both the client and
the server exist in the same network, then specify 'none' against the ROUTER text box.
10. INSTANCENAME - Specify the name of the SAP R/3 instance to be monitored. To view
the complete list of instances to choose from, do the follow the procedure discussed in
Page 17 of this document.
11. TIMEOUT - Indicate the duration (in seconds) for which this test should wait for a
response from the SAP R/3 server. By default, this is set to 120 seconds.
12. JCO VERSION - The eG agent uses the SAP JCO library to connect to the SAP ABAP
system and pull out metrics. To enable the eG agent to make this connection and query
the metrics, you need to specify the version of the SAP JCO library that the agent needs to
use. For instance, to instruct the eG agent to use JCO v2.1.19, it would suffice if you
specify the ‘major version number’ alone against JCO VERSION – in the case of this
example, this will be
2.x
.
13. ISPASSIVE – If the value chosen is YES, then the server under consideration is a passive
server in a SAP R/3 cluster. No alerts will be generated if the server is not running.
Measures will be reported as “Not applicable” by the agent if the server is not up.
Outputs of the
test
One set of results for the SAP R/3 server being monitored
Measurements
made by the
test
Measurement
Measurement
Unit
Interpretation

M O N I T O R I N G T H E S A P A B A P I N S T A N C E
124
Gateway clients:
The number of gateway
clients who are currently
connected to the SAP server,
expressed as a percentage of
the maximum number of
gateway clients allowed.
Percent
For example, if the gateway can administrate
300 clients, and there are currently 30 clients
logged on to the gateway, the value is 10%.
If the value is near 100%, the maximum
number of clients can be changed using the
profile parameter gw/max_sys.
Gateway connections
utilized:
The number of gateway
connections currently utilized,
expressed as a percentage of
the maximum number of
gateway connections allowed.
Percent
Remote gateways:
Of the total number of
gateways, what percentage is
consumed by remote
gateways.
Percent
If the value is near 100%, the maximum
number of gateways can be changed using
the profile parameter rdisp/max_gateways.
To administrate gateway connections, call
transaction SMGW on the server in question.
Gateway admin entries:
Of the maximum number of
gateway admin entries that
are allowed, what percentage
is being currently utilized.
Percent
If the value is near 100%, the maximum
number of entries can be changed using the
profile parameter rdisp/max_comm_entries.
Gateway work processes:
Of the maximum number of
gateway work processes
allowed, what percentage is
being used currently.
Percent
If a value is near 100%, the maximum
number of work processes can be changed
using the profile parameter gw/max_wp.
Gateway overflow usage:
Of the total gateway size,
what percentage of gateway
overflow has been used.
Percent
If a value is near 100%, the maximum
overflow size can be changed using the
profile parameter gw/max_overflow_size.
2.6.4 RFC Calls Test
This test monitors the RFC connections that pass through the SAP gateway.
Purpose
Monitors the RFC connections that pass through the SAP gateway
Target of the
test
A SAP R/3 server
Agent
deploying the
An internal/remote agent

M O N I T O R I N G T H E S A P A B A P I N S T A N C E
125
test
Configurable
parameters for
the test
1. TEST PERIOD - How often should the test be executed
2. HOST - Host name of the server for which the test is to be configured
3. PORTNO - Enter the port to which the specified HOST listens
4. CLIENTNAME – Specify the ID of the client system that is connecting to the R/3 server. To
view a list of client IDs to choose from, follow the procedure discussed in Page 14.
5. SAPUSER - Provide a valid user name for logging into the SAP R/3 server. In order to
enable the eG Enterprise suite to effectively monitor SAP, the name of a SAPUSER with
either of the following profiles need to be specified: S_A.SYSTEM (super administrator) or
SAP_ALL (all authorizations for SAP).
6. PASSWORD - The password of the specified SAPUSER.
7. CONFIRMPASSWORD - Confirm the password by retyping it here.
8. SYSNO - An indicator of the TCP/IP port at which the SAP server listens. For example, for a
server that listens at port 3200, the SYSNO will be '00'. Similarly, if the SAP server port is
3201, the SYSNO will have to be specified as '01'. Therefore, in the SYSNO text box
specify the system number of the SAP server with which the specified client communicates.
9. ROUTER - If the SAP client with the specified CLIENTNAME exists in a network external
to the SAP server, then a router will be used to enable the server-client communication. In
such a case, specify the IP of the router in the ROUTER text box. If both the client and the
server exist in the same network, then specify 'none' against the ROUTER text box.
10. INSTANCENAME - Specify the name of the SAP R/3 instance to be monitored. To view the
complete list of instances to choose from, do the follow the procedure discussed in Page 17
of this document.
11. TIMEOUT - Indicate the duration (in seconds) for which this test should wait for a response
from the SAP R/3 server. By default, this is set to 120 seconds.
12. JCO VERSION - The eG agent uses the SAP JCO library to connect to the SAP ABAP
system and pull out metrics. To enable the eG agent to make this connection and query the
metrics, you need to specify the version of the SAP JCO library that the agent needs to use.
For instance, to instruct the eG agent to use JCO v2.1.19, it would suffice if you specify the
‘major version number’ alone against JCO VERSION – in the case of this example, this will
be
2.x
.
13. ISPASSIVE – If the value chosen is YES, then the server under consideration is a passive
server in a SAP R/3 cluster. No alerts will be generated if the server is not running.
Measures will be reported as “Not applicable” by the agent if the server is not up.
Outputs of the
test
One set of results for the SAP R/3 server being monitored
Measurements
made by the
test
Measurement
Measurement
Unit
Interpretation

M O N I T O R I N G T H E S A P A B A P I N S T A N C E
126
Communication errors in
outbound RFC calls:
The number of
communication errors in
outbound RFC calls.
Number
Execution errors in
outbound RFC calls:
The number of execution
errors in outbound RFC calls.
Number
Outbound calls without
RFC resources:
The number of errors with no
server resources for
outbound calls.
Number
Inbound RFC calls:
The number of inbound RFC
calls.
Number
2.6.5 tRFC calls Test
Transactional RFC (tRFC) and qRFC are variants of the Remote Function Call that make the data transfer between
different systems more reliable and more secure. For each type of tRFC call, this test reports the number of calls that
were receorded , the number of calls that were executed. Using this test, administrators may figure out how many
calls were in states such as CPICERR, SYSFAIL, other states etc.
urpose
For each type of tRFC call, this test reports the number of calls that were receorded , the
number of calls that were executed. Using this test, administrators may figure out how many
calls were in states such as CPICERR, SYSFAIL, other states etc.
Target of the
test
A SAP R/3 server
Agent
deploying the
test
An internal/remote agent
Configurable
parameters for
the test
1. TEST PERIOD - How often should the test be executed
2. HOST - Host name of the server for which the test is to be configured
3. PORT - Enter the port to which the specified HOST listens

M O N I T O R I N G T H E S A P A B A P I N S T A N C E
127
4. CLIENTNAME – Specify the ID of the client system that is connecting to the R/3 server. To
view a list of client IDs to choose from, follow the procedure discussed in Page 14.
5. SAPUSER - Provide a valid user name for logging into the SAP R/3 server. In order to
enable the eG Enterprise suite to effectively monitor SAP, the name of a SAPUSER with
either of the following profiles need to be specified: S_A.SYSTEM (super administrator) or
SAP_ALL (all authorizations for SAP).
6. PASSWORD - The password of the specified SAPUSER.
7. CONFIRMPASSWORD - Confirm the password by retyping it here.
8. SYSNO - An indicator of the TCP/IP port at which the SAP server listens. For example, for a
server that listens at port 3200, the SYSNO will be '00'. Similarly, if the SAP server port is
3201, the SYSNO will have to be specified as '01'. Therefore, in the SYSNO text box
specify the system number of the SAP server with which the specified client communicates.
9. ROUTER - If the SAP client with the specified CLIENTNAME exists in a network external to
the SAP server, then a router will be used to enable the server-client communication. In
such a case, specify the IP of the router in the ROUTER text box. If both the client and the
server exist in the same network, then specify 'none' against the ROUTER text box.
10. INSTANCENAME - Specify the name of the SAP R/3 instance to be monitored. To view the
complete list of instances to choose from, do the follow the procedure discussed in Page 17
of this document.
11. TIMEOUT - Indicate the duration (in seconds) for which this test should wait for a response
from the SAP R/3 server. By default, this is set to 120 seconds.
12. LONGWAITINGCUTOFF - Specify the time duration in hours beyond which the tRFC calls
are classified as
stuck
in the LONGWAITINGCUTOFF text box.
13. STUCKSTATES – By default, tRFC calls are prone to get stuck when in
MAILED
or
RECORDED
states. In order to monitor those tRFC call that are stuck in these states, specify
these states as a comma-separated list in the STUCK STATES text box. The default is
MAILED,RECORDED. If you wish to monitor the tRFC calls that are stuck in HOLD state,
then you can specify
MAILED,RECORDED,HOLD
in this text box.
14. NEEDDDFOR OTHERSTATES - If you wish to disable the detailed diagnosis capability for
the Calls in other states measure of this test, then set the NEED DD FOR OTHER STATES
parameter to No. By default, this is set to Yes.
15. JCOVERSION – The eG agent uses the SAP JCO library to connect to the SAP ABAP system
and pull out metrics. To enable the eG agent to make this connection and query the
metrics, you need to specify the version of the SAP JCO library that the agent needs to use.
For instance, to instruct the eG agent to use JCO v2.1.19, it would suffice if you specify the
‘major version number’ alone against JCO VERSION – in the case of this example, this will
be
2.x
.
16. DD FREQUENCY - Refers to the frequency with which detailed diagnosis measures are to
be generated for this test. The default is 1:1. This indicates that, by default, detailed
measures will be generated every time this test runs, and also every time the test detects a
problem. You can modify this frequency, if you so desire. Also, if you intend to disable the
detailed diagnosis capability for this test, you can do so by specifying none against dd
frequency.

M O N I T O R I N G T H E S A P A B A P I N S T A N C E
128
17. DETAILED DIAGNOSIS - To make diagnosis more efficient and accurate, the eG
Enterprise suite embeds an optional detailed diagnostic capability. With this capability, the
eG agents can be configured to run detailed, more elaborate tests as and when specific
problems are detected. To enable the detailed diagnosis capability of this test for a
particular server, choose the On option. To disable the capability, click on the Off option.
The option to selectively enable/disable the detailed diagnosis capability will be available
only if the following conditions are fulfilled:
o The eG manager license should allow the detailed diagnosis capability
o Both the normal and abnormal frequencies configured for the detailed diagnosis
measures should not be 0.
Outputs of the
test
One set of results for every SAP R/3 server being monitored
Measurements
made by the
test
Measurement
Measurement
Unit
Interpretation
Calls recorded:
Indicates the number of tRFC
calls of this type that were
recorded during the last
measurement period.
Number
A sudden/gradual increase in the value of this
measure could indicate issues such as
insufficient configuration of connection
resources for transactions.
Calls executed:
Indicates the number of tRFC
calls of this type that were
executed during the last
measurement period.
Number
CPICERR calls:
Indicates the number of tRFC
calls of this type with
communication errors i.e., the
number of tRFC calls in
CPICERR state during the last
measurement period.
Number
CPICERR error arises due to connection of
communication issues with the target system
or external component. CPICERR calls may
be retried.
The detailed diagnosis of this measure if
enabled, lists the details about these calls
such as the host, process ID, timestamp,
destination, function, user, retries, Tcode and
error message.
SYSFAIL calls:
Indicates the number of tRFC
calls of this type that were in
SYSFAIL state during the last
measurement period.
Number
SYSFAIL error arises due to error in execution
of tRFC call in target system or external
component.
The detailed diagnosis of this measure if
enabled lists the details about these calls
such as the host, process ID, timestamp,
destination, function, user, retries, Tcode and
error message.

M O N I T O R I N G T H E S A P A B A P I N S T A N C E
129
Number of calls mailed:
Indicates the number of tRFC
calls of this type for which
CMC (protocol X400)
connection was initiated
during the last measurement
period.
Number
Calls executed in target:
Indicates the total number of
tRFC calls of this type that
were executed in the target
SAP system during the last
measurement period.
Number
Calls in other states:
Indicates the number of tRFC
calls of this type that were in
intermediary states such as
HOLD, WCONFIRM, SYSLOAD
etc during the last
measurement period.
Number
Tracking these calls become important when
typical tRFC issues are encountered.
The detailed diagnosis of this emasure if
enabled lists the details for these calls using
which you can figure out any abnormal/error
states.
Long waiting calls:
Indicates the number of tRFC
calls of this type that were
stuck in any state beyond the
time specified against the
longwaitingCutOff parameter
while configuring this test.
Number
tRFC calls can get stuck in certain states due
to various reasons such as insufficient errors
or intermediate errors, communication issues
etc. Such calls need to be either manually
processed or an appropriate report can be
configured to process any known issues.
Use the detailed diagnosis of this measure for
further analysis of such calls.
2.6.6 Internet Communication Manager Test
The Internet Communication Manager (ICM) facilitates communication between SAP system(s) and the internet using
the HTTP, HTTPS, and SMTP protocols. Requests received from the internet are forwarded to SAP system for
processing via the ICM. Likewise, the ICM also sends SAP requests to the internet, gets the feedback and transfers it
to the SAP system.
The ICM is implemented as an independent process and is started and monitored by the dispatcher. The ICM process
uses a pool of worker threads to parallel process the load. This is why, if a sudden/consistent slow down is noticed in
a SAP system’s interactons with the internet, the first place administrators need to check for inconsistencies is this
thread pool. The absence of adequate threads in the pool can significantly impair the ICM’s ability to uniformly
distribute the request load across threads, thereby causing one/more threads be ove-utilized; ultimately, this will
result in a slowdown! Besides erratic thread pool usage, the sudden unavailability of the ICM and over-utilization of
ICM connections can also cause disturbances in a SAP system’s internet communications. To ensure that such
anomalies are promptly captured and corrected, administrators should keep an eye on the accessibility of the ICM, its
thread pool usage, and availability of ICM connections. This is where the Internet Communication Manager test helps!
This test periodically checks the availability, thread pool usage, and connection utilization of the ICM, and promptly
reports the non-availability of the ICM, abnormal usage of worker threads by the ICM, and the over-utilization of ICM
connections. This way, the test leads administrators to the probable causes for the breaks / slowness in the
communication between the SAP system and the internet.
M O N I T O R I N G T H E S A P A B A P I N S T A N C E
130
Purpose
Periodically checks the availability, thread pool usage, and connection utilization of the ICM, and
promptly reports the non-availability of the ICM, abnormal usage of worker threads by the ICM,
and the over-utilization of ICM connections
Target of the
test
A SAP R/3 server
Agent
deploying the
test
An internal/remote agent

M O N I T O R I N G T H E S A P A B A P I N S T A N C E
131
Configurable
parameters for
the test
1. TEST PERIOD - How often should the test be executed
2. HOST - Host name of the server for which the test is to be configured
3. PORTNO - Enter the port to which the specified HOST listens
4. CLIENTNAME – Specify the ID of the client system that is connecting to the R/3 server. To
view a list of client IDs to choose from, follow the procedure discussed in Page 14.
5. SAPUSER - Provide a valid user name for logging into the SAP R/3 server. In order to
enable the eG Enterprise suite to effectively monitor SAP, the name of a SAPUSER with
either of the following profiles need to be specified: S_A.SYSTEM (super administrator) or
SAP_ALL (all authorizations for SAP).
6. PASSWORD - The password of the specified SAPUSER.
7. CONFIRMPASSWORD - Confirm the password by retyping it here.
8. SYSNO - An indicator of the TCP/IP port at which the SAP server listens. For example, for a
server that listens at port 3200, the SYSNO will be '00'. Similarly, if the SAP server port is
3201, the SYSNO will have to be specified as '01'. Therefore, in the SYSNO text box
specify the system number of the SAP server with which the specified client communicates.
9. ROUTER - If the SAP client with the specified CLIENTNAME exists in a network external to
the SAP server, then a router will be used to enable the server-client communication. In
such a case, specify the IP of the router in the ROUTER text box. If both the client and the
server exist in the same network, then specify 'none' against the ROUTER text box.
10. INSTANCENAME - Specify the name of the SAP R/3 instance to be monitored. To view the
complete list of instances to choose from, do the follow the procedure discussed in Page 17
of this document.
11. TIMEOUT - Indicate the duration (in seconds) for which this test should wait for a response
from the SAP R/3 server. By default, this is set to 120 seconds.
12. JCO VERSION – The eG agent uses the SAP JCO library to connect to the SAP ABAP
system and pull out metrics. To enable the eG agent to make this connection and query the
metrics, you need to specify the version of the SAP JCO library that the agent needs to use.
For instance, to instruct the eG agent to use JCO v2.1.19, it would suffice if you specify the
‘major version number’ alone against JCO VERSION – in the case of this example, this will
be
2.x
.
13. DD FREQUENCY - Refers to the frequency with which detailed diagnosis measures are to
be generated for this test. The default is
1:1
. This indicates that, by default, detailed
measures will be generated every time this test runs, and also every time the test detects a
problem. You can modify this frequency, if you so desire. Also, if you intend to disable the
detailed diagnosis capability for this test, you can do so by specifying
none
against DD
FREQUENCY.
M O N I T O R I N G T H E S A P A B A P I N S T A N C E
132
14. DETAILED DIAGNOSIS - To make diagnosis more efficient and accurate, the eG
Enterprise suite embeds an optional detailed diagnostic capability. With this capability, the
eG agents can be configured to run detailed, more elaborate tests as and when specific
problems are detected. To enable the detailed diagnosis capability of this test for a
particular server, choose the On option. To disable the capability, click on the Off option.
The option to selectively enable/disable the detailed diagnosis capability will be available
only if the following conditions are fulfilled:
The eG manager license should allow the detailed diagnosis capability
Both the normal and abnormal frequencies configured for the detailed diagnosis
measures should not be 0.
Outputs of the
test
One set of results for the SAP ABAP instance being monitored
Measurements
made by the
test
Measurement
Measurement
Unit
Interpretation
Is available ?:
Indicates whether/not the
ICM is running.
This measure reports the value
Yes
if the ICM
is running, and
No
if the ICM is not running.
The numeric values that correspond to the
above-mentioned measure values are as
follows:
Measure Value
Numeric Value
Yes
100
No
0
Note:
By default, the test reports the above-
mentioned Measure Values to indicate
whether/not the ICM is available. However, in
the graph of this measure, the same is
represented using the numeric equivalents
only.
If the value of this measure is
No
, then it
indicates that the HTTP/HTTPS/SMTP
communication to the SAP ABAP insitance is
disrupted.
Current threads:
Indicates the number of
threads that were currently
created from the pool for
processing requests.
Number
A high value denotes a high level of activity
on the ICM.

M O N I T O R I N G T H E S A P A B A P I N S T A N C E
133
Free threads:
Indicates the number of
threads that can be created
from the pool for processing
requests.
Number
Thread utilization:
Indicates the percentage of
maximum threads (in pool)
that have been created
currently for processing
requests.
Percent
A value close to 100% denotes over-usage of
threads. You may then have to increase the
maximum threads in pool configuration to
allow more threads to be created for
processing requests, so that processing
bottlenecks can be eliminated.
Percentage waiting
threads:
Indicates the percentage of
maximum threads (in pool) to
that are currently waiting for
data to be processed..
Percent
Threads waiting for data from network or
application server / server response / client
response are classified as waiting threads.
Threads waiting for a long time result in
sustained increase in waiting threads and are
indicative of a generic network / application
server issue.
Number of requests in
queue:
Indicates the number of
requests waiting for free ICM
threads.
Number
A consistent rise in this value could indicate a
potential overload condition, typically caused
by insufficient threads in pool. You may
hence have to resize the pool to prevent
requests from queuing up.
Request queue utilization:
Indicates the percentage of
total requests that are in
queue currently.
Percent
A value close to 100% is a cause for concern,
as it indicates that almost all requests are
being queued. This again points to a load-
balancing irregularity, probably caused by the
lack of adequate threads in the pool.
Connections used:
Indicates the number of
currently open connections.
Number
The number of simulatenously open
connections and their sockets can be
deduced from this measure.
Connection utilization:
Indicates the percentage of
currently open connections.
Percent
Each request can create multiple connections.
This measure therefore helps to gauge the
level activity at the ICM (web dispatcher), so
that the system load can be observed and the
relevant profile parameters can be tuned
accordingly. For instance, a value close to
100% for this measure, may mandate that
the
icm/max_conn
parameter be increased,
so that enough connections are always
available.

M O N I T O R I N G T H E S A P A B A P I N S T A N C E
134
Inactive services:
Indicates the number of
inactive ICM services.
Number
The detailed diagnosis of this measure
provides details of the inactive services.
These details include the service name, keep
alive connection status, backend processing
timeout, port, hostname and whether/not
external bindings are used.
2.7 The SAP Service Layer
The tests depicted by Figure 2.21 help administrators to find quick and accurate answers to the following questions:
Are all R/3 sub-systems functioning smoothly, or has any sub-system reported errors? If
so, how many errors were reported?
Is the Dialog service taking too long a time to respond to requests? If so, where does the
maximum delay take place - during network transfer or in the queue or during GUI call-
back or at the database end?
Is the SAP R/3 server available? What is the connection time?
Are too many users logged on to the SAP R/3 system? If so, who are they and what are
the client activities they are logged into?

M O N I T O R I N G T H E S A P A B A P I N S T A N C E
135
Figure 2.21: The tests associated with the SAP Service layer
2.7.1 Batch Inputs Test
Batch input is one of the primary ways in which data can be transferred into the SAP ABAP System. Batch input is
used for bulk data transfers and not for near real-time data transfers.
Typical uses of batch input include the one-time import of data from a legacy system into a newly installed SAP ABAP
System. Another typical use is for periodic (hourly, daily...) transfers of data from external systems or legacy systems
that are still in use into SAP ABAP, where all enterprise data is consolidated.
A batch input session is a set of one or more calls to transactions along with the data to be processed by the
transactions. The system normally executes the transactions in a session non-interactively, allowing rapid entry of
bulk data into an SAP ABAP System.
Administrators should periodically check whether/not the batch input sessions have completed successfully. If bulk
transfers into the SAP ABAP system via these sessions is interrupted, then administrators should be able to promptly
capture the errors in sessions, instantly initiate error analysis, and rapidly correct the problem. The Batch Inputs test
enables administrators to perform all this and more! This test monitors the batch input sessions, promptly detects
errors in sessions, and accurately points administrators to those sessions where errors have occurred. In addition,

M O N I T O R I N G T H E S A P A B A P I N S T A N C E
136
the test periodically measures the load on the SAP ABAP system by reporting the number of created and running
sessions, and in the process, warns administrators of probable overload conditions.
Purpose
Monitors the batch input sessions, promptly detects errors in sessions, and accurately points
administrators to those sessions where errors have occurred; also, periodically measures the
load on the SAP ABAP system by reporting the number of created and running sessions, and in
the process, warns administrators of probable overload conditions
Target of the
test
A SAP R/3 server
Agent
deploying the
test
An internal/remote agent

M O N I T O R I N G T H E S A P A B A P I N S T A N C E
137
Configurable
parameters for
the test
1. TEST PERIOD - How often should the test be executed
2. HOST - Host name of the server for which the test is to be configured
3. PORTNO - Enter the port to which the specified HOST listens
4. CLIENTNAME – Specify the ID of the client system that is connecting to the R/3 server. To
view a list of client IDs to choose from, follow the procedure discussed in Page 14.
5. SAPUSER - Provide a valid user name for logging into the SAP R/3 server. In order to
enable the eG Enterprise suite to effectively monitor SAP, the name of a SAPUSER with
either of the following profiles need to be specified: S_A.SYSTEM (super administrator) or
SAP_ALL (all authorizations for SAP).
6. PASSWORD - The password of the specified SAPUSER.
7. CONFIRMPASSWORD - Confirm the password by retyping it here.
8. SYSNO - An indicator of the TCP/IP port at which the SAP server listens. For example, for a
server that listens at port 3200, the SYSNO will be '00'. Similarly, if the SAP server port is
3201, the SYSNO will have to be specified as '01'. Therefore, in the SYSNO text box
specify the system number of the SAP server with which the specified client communicates.
9. ROUTER - If the SAP client with the specified CLIENTNAME exists in a network external to
the SAP server, then a router will be used to enable the server-client communication. In
such a case, specify the IP of the router in the ROUTER text box. If both the client and the
server exist in the same network, then specify 'none' against the ROUTER text box.
10. INSTANCENAME - Specify the name of the SAP R/3 instance to be monitored. To view the
complete list of instances to choose from, do the follow the procedure discussed in Page 17
of this document.
11. TIMEOUT - Indicate the duration (in seconds) for which this test should wait for a response
from the SAP R/3 server. By default, this is set to 120 seconds.
12. JCO VERSION – The eG agent uses the SAP JCO library to connect to the SAP ABAP
system and pull out metrics. To enable the eG agent to make this connection and query the
metrics, you need to specify the version of the SAP JCO library that the agent needs to use.
For instance, to instruct the eG agent to use JCO v2.1.19, it would suffice if you specify the
‘major version number’ alone against JCO VERSION – in the case of this example, this will
be
2.x
.
13. DD FREQUENCY - Refers to the frequency with which detailed diagnosis measures are to
be generated for this test. The default is
1:1
. This indicates that, by default, detailed
measures will be generated every time this test runs, and also every time the test detects a
problem. You can modify this frequency, if you so desire. Also, if you intend to disable the
detailed diagnosis capability for this test, you can do so by specifying
none
against DD
FREQUENCY.
M O N I T O R I N G T H E S A P A B A P I N S T A N C E
138
14. DETAILED DIAGNOSIS - To make diagnosis more efficient and accurate, the eG
Enterprise suite embeds an optional detailed diagnostic capability. With this capability, the
eG agents can be configured to run detailed, more elaborate tests as and when specific
problems are detected. To enable the detailed diagnosis capability of this test for a
particular server, choose the On option. To disable the capability, click on the Off option.
The option to selectively enable/disable the detailed diagnosis capability will be available
only if the following conditions are fulfilled:
The eG manager license should allow the detailed diagnosis capability
Both the normal and abnormal frequencies configured for the detailed diagnosis
measures should not be 0.
Outputs of the
test
One set of results for the SAP ABAP instance being monitored
Measurements
made by the
test
Measurement
Measurement
Unit
Interpretation
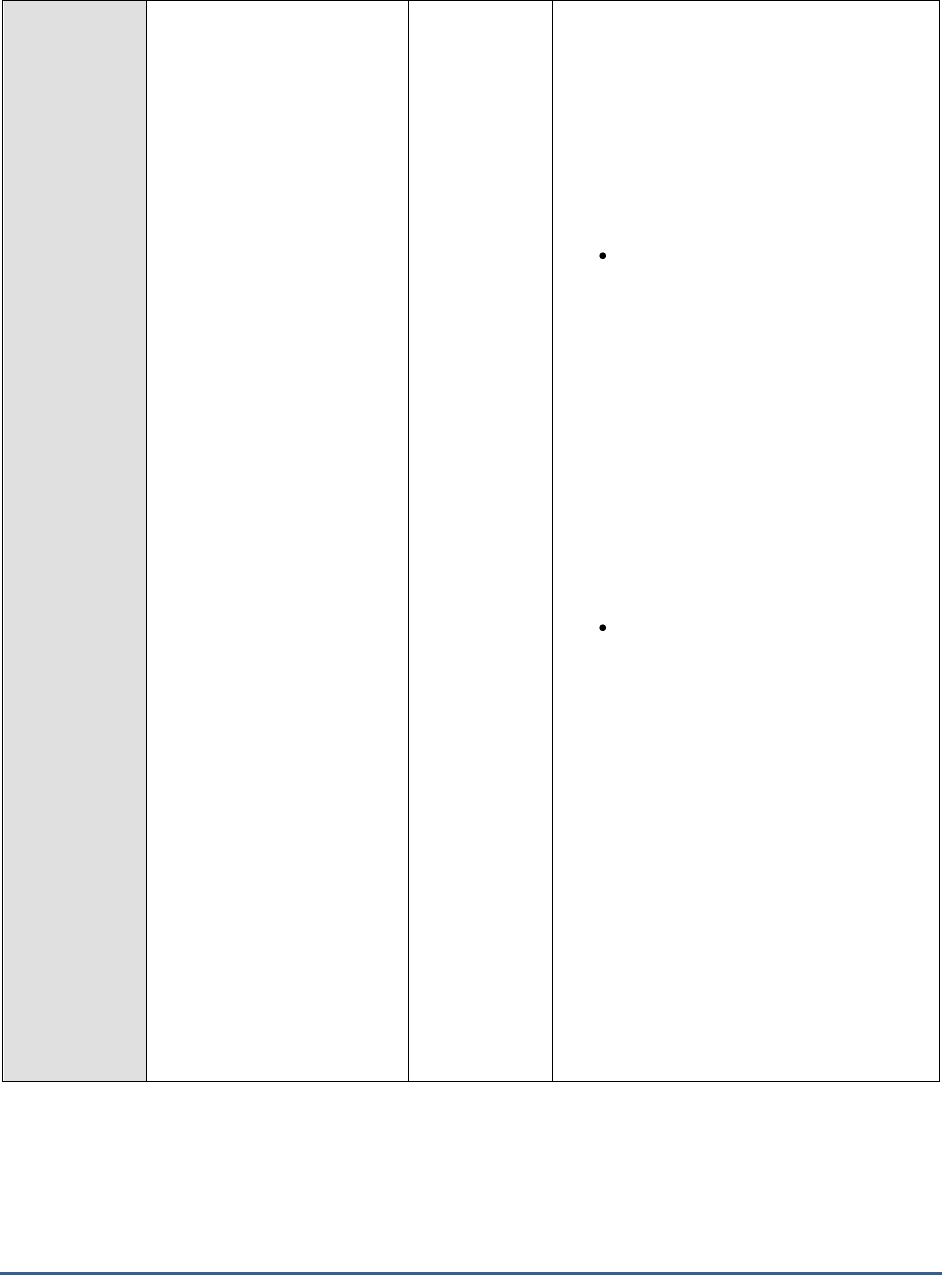
M O N I T O R I N G T H E S A P A B A P I N S T A N C E
139
Error sessions:
Indicates the current number
of batch input sessions with
errors.
Number
Ideally, the value of this measure should be
0. A non-zero value indicates that
transactions in one/more sessions ended in
errors. A transaction contains an error if it
issues a message of type E (error) or type A
(abnormal termination). In such
situations, the system administrator must
analyze the error.
Most errors fall into one of two categories:
Required data is missing from the
batch-input session or invalid data
has been included in the session.
Possible external causes of this type
of problem include errors in the data
conversion program or the presence
of unexpected types of data or
incorrect data in the legacy
database. Causes for this type of
problem within R/3 include incorrect
or incomplete customizing in an
application. For example, a legacy
data type may not have been
foreseen in the check table entries
made in application customizing.
Technical/programming problems. A
batch input session enters data by
running R/3 transactions non-
interactively. A typical technical or
programming problem is therefore
incorrect identification of one of the
data fields in a transaction. Or the
conversion program may not fill a
required data field or may have
provided invalid values.
You can use the detailed diagnosis of
this measure to know which batch input
sessions encountered what type of
errors.
To correct transactions with errors, the
system administrator or the responsible
department can interactively correct and
reprocess the transactions.
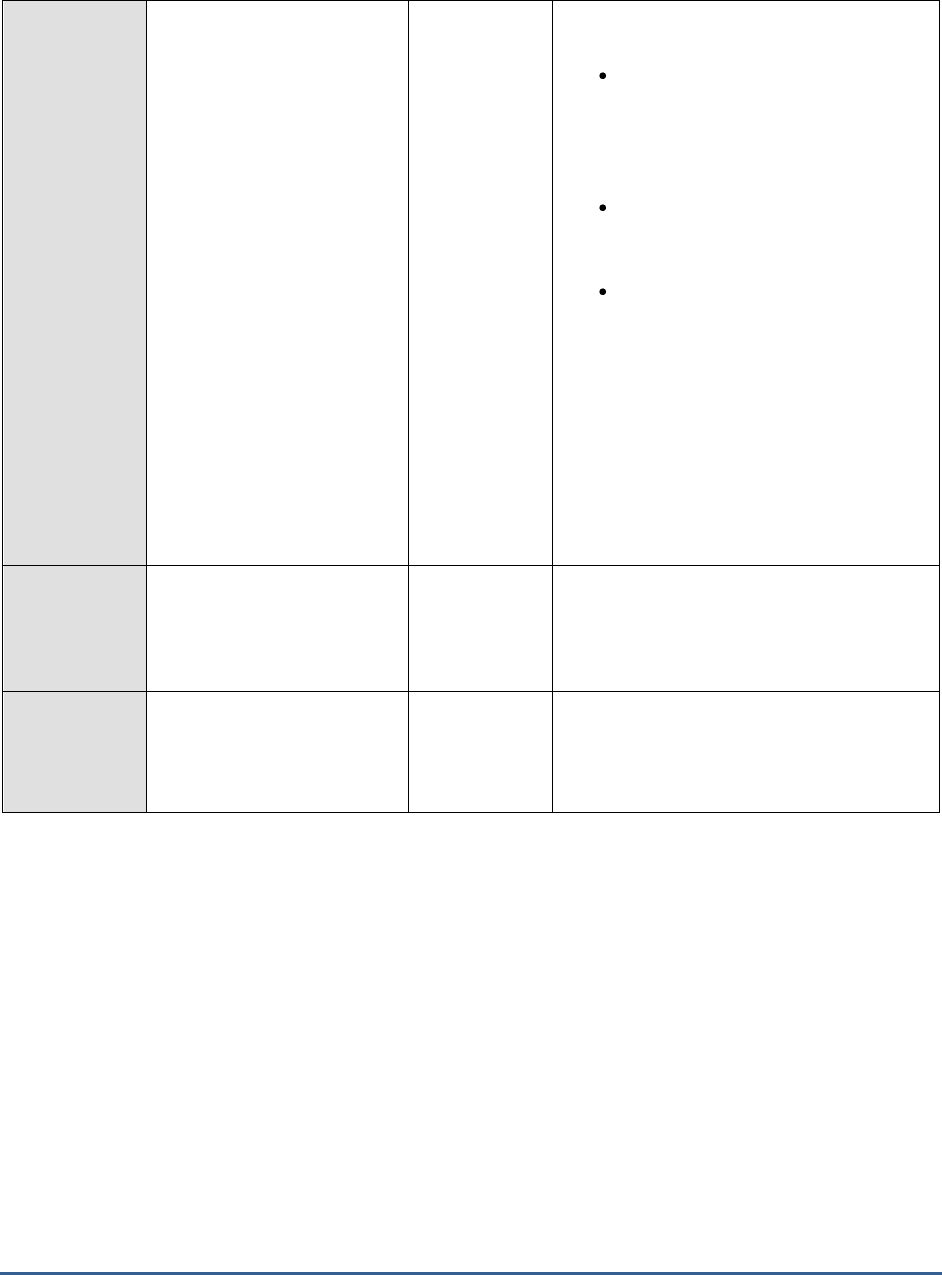
M O N I T O R I N G T H E S A P A B A P I N S T A N C E
140
Background sessions:
Indicates the current
number of batch input
sessions running in the
background.
Number
The data in a batch input session can be
processed in one of the three modes:
Process/foreground: Runs the
session in the foreground,
displaying every screen and field.
If you change a screen in this
option, the process halts.
Display errors only: Runs the
session in the foreground,
displaying only errors.
Background: Runs the session in
the background.
The
Background sessions
measure reports
the number of sessions currently running in
the background mode. Since sessions are
typically run in this mode to execute the data
transfer or test its performance, you can use
the
Background sessions
measure as an
indicator of the number of data transfer
sessions the SAP ABAP system can handle at
a given point in time.
Inprocess sessions:
Indicates the number of
batch input sessions that are
currently running.
Number
This is a good indicator of the current batch
input session load on the SAP ABAP system.
Sessions being created:
Indicates the number of
batch input sessions
being created.
Number
M O N I T O R I N G T H E S A P A B A P I N S T A N C E
141
2.7.2 Event linkages Test
The type linkage describes the assignment of a receiver function module and a receiver type to a particular
combination of
object type
and
event
.
A type linkage must be created if the system is always to react to an event of a particular object type. The type
linkages are evaluated at runtime by the event manager.
The event receiver should define a type linkage using a function module provided.
Type linkages are client-dependent and are written automatically into a Customizing transport request if the client is
configured (in table T000 ) for changes to be recorded automatically. All entries are then transported including
activation indicators.
In the case of client copy, you should ensure that the type linkages are copied into the target client, but are always
deactivated in the target client. The activation indicator of each individual type linkage is only copied with client copy
if explicitly requested (parameter option for copying tables of class A).
The event manager begins the evaluation of the active type linkages when it is notified of the ID of a created event.
For event handling to take place, either the event created and its triggering object type or the event created and a
supertype of the triggering object type must be entered for the type linkage.
An appropriate workflow is always started as a reaction to an event of a particular object type. Whenever workflow
start is delayed or there is a sudden decrease in the number of workflows that are started, then the administrators
may need to analyze the real cause behind such delays! Ususally such delays are caused when the event linkages are
inactive and when errors are detected in the event linkages. Therefore it becomes essential to monitor the event
linkages and keep a constant vigil on the number of inactive linkages and the number of linkages with errors. The
Event linkages test helps you in this regard.
This test monitors the event linkges and helps you figure out how many linkages are available on the server and how
many are currently active/inactive on the server. In addition, this test helps the administrators identify the number of
event linkages with errors and figure out the real reason behind such errors.
Purpose
Monitors the event linkges and helps you figure out how many linkages are available
on the server and how many are currently active and inactive on the server. In
addition, this test helps the administrators identify the number of event linkages with
errors and figure out the real reason behind such errors.
Target of the
test
A SAP R/3 server
Agent
deploying the
test
An internal/remote agent
Configurable
parameters for
the test
1. TEST PERIOD - How often should the test be executed
2. HOST - Host name of the server for which the test is to be configured
3. PORTNO - Enter the port to which the specified HOST listens
4. CLIENTNAME – Specify the ID of the client system that is connecting to the R/3 server. To
view a list of client IDs to choose from, follow the procedure discussed in Page 14.

M O N I T O R I N G T H E S A P A B A P I N S T A N C E
142
5. SAPUSER - Provide a valid user name for logging into the SAP R/3 server. In order to
enable the eG Enterprise suite to effectively monitor SAP, the name of a SAPUSER with
either of the following profiles need to be specified: S_A.SYSTEM (super administrator) or
SAP_ALL (all authorizations for SAP).
6. PASSWORD - The password of the specified SAPUSER.
7. CONFIRMPASSWORD - Confirm the password by retyping it here.
8. SYSNO - An indicator of the TCP/IP port at which the SAP server listens. For example, for a
server that listens at port 3200, the SYSNO will be '00'. Similarly, if the SAP server port is
3201, the SYSNO will have to be specified as '01'. Therefore, in the SYSNO text box
specify the system number of the SAP server with which the specified client communicates.
9. ROUTER - If the SAP client with the specified CLIENTNAME exists in a network external to
the SAP server, then a router will be used to enable the server-client communication. In
such a case, specify the IP of the router in the ROUTER text box. If both the client and the
server exist in the same network, then specify 'none' against the ROUTER text box.
10. INSTANCENAME - Specify the name of the SAP R/3 instance to be monitored. To view the
complete list of instances to choose from, follow the procedure discussed in Page 17 of this
document.
11. JCOVERSION - The eG agent uses the SAP JCO library to connect to the SAP ABAP system
and pull out metrics. To enable the eG agent to make this connection and query the
metrics, you need to specify the version of the SAP JCO library that the agent needs to use.
For instance, to instruct the eG agent to use JCO v2.1.19, it would suffice if you specify the
‘major version number’ alone against JCO VERSION – in the case of this example, this will
be
2.x
.
12. TIMEOUT - Indicate the duration (in seconds) for which this test should wait for a response
from the SAP R/3 server. By default, this is set to 120 seconds.
13. DD FREQUENCY - Refers to the frequency with which detailed diagnosis measures are to
be generated for this test. The default is 1:1. This indicates that, by default, detailed
measures will be generated every time this test runs, and also every time the test detects a
problem. You can modify this frequency, if you so desire. Also, if you intend to disable the
detailed diagnosis capability for this test, you can do so by specifying none against dd
frequency.
14. DETAILED DIAGNOSIS - To make diagnosis more efficient and accurate, the eG
Enterprise suite embeds an optional detailed diagnostic capability. With this capability, the
eG agents can be configured to run detailed, more elaborate tests as and when specific
problems are detected. To enable the detailed diagnosis capability of this test for a
particular server, choose the On option. To disable the capability, click on the Off option.
The option to selectively enable/disable the detailed diagnosis capability will be available
only if the following conditions are fulfilled:
o The eG manager license should allow the detailed diagnosis capability
o Both the normal and abnormal frequencies configured for the detailed diagnosis
measures should not be 0.

M O N I T O R I N G T H E S A P A B A P I N S T A N C E
143
Outputs of the
test
One set of results for every SAP R/3 server being monitored
Measurements
made by the
test
Measurement
Measurement
Unit
Interpretation
Total linkages:
Indicates the number of type
linkages defined on the
server.
Number
Active linkages:
Indicates the type linkages
that are currently activated
on the server.
Number
Inactive linkages:
Indicates the number of type
linkages that are currently
inactive on the server.
Number
The event rerceivers will respond to events
only when the type linkages are active.
The detailed diagnosis of this measure if
enabled, lists the linkage details such as the
Client, Business object, event description,
receiver type, receiver function modules,
error linkage etc.
Percentage of linkages
that are inactive:
Indicates the percentage of
type linkages that were
inactive.
Percent
A low value is desired for this measure.
Error linkages:
Indicates the number of type
linkages with errors.
Number
Receivers will immediately respond to events
only if the event linkage is active is without
any errors. Active linkages with errors result
in the event being queued with error status
and these linkages have to be reprocessed
manually, if needed.
Ideally, the value of this measure should be
zero. If the value of this measure is
abnormally high, then it indicates that there
are too many errors in the linkages which
eventually results in the delay in processing
and lead to a delayed response to the events
by the receivers.
The detailed diagnosis of this measure if
enabled, lists the corresponding type linkage
details such as Client, Business object type,
event description, receiver type, receiver
function modules, error linkage etc.
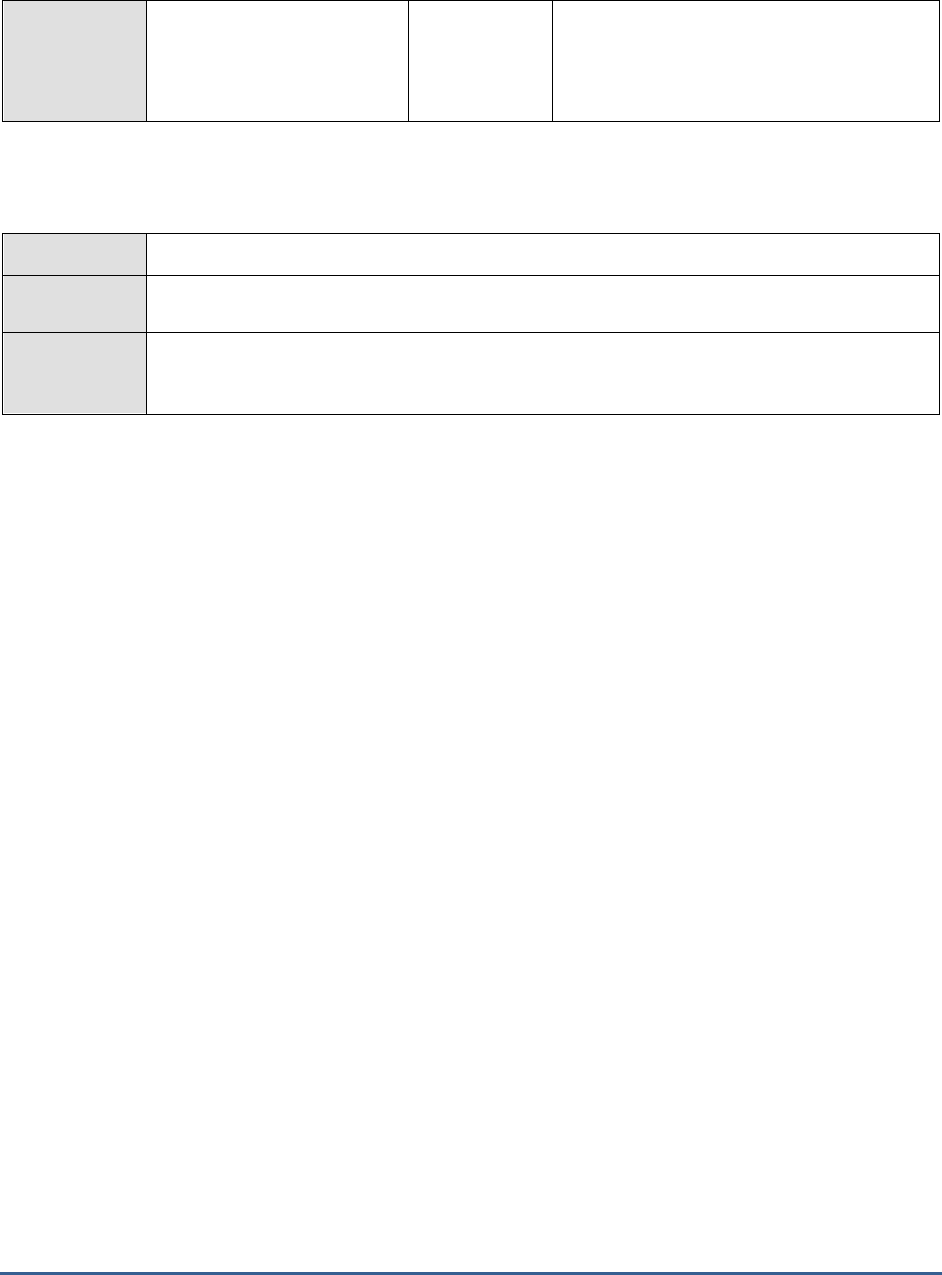
M O N I T O R I N G T H E S A P A B A P I N S T A N C E
144
Percentage of linkages
with errors:
Indicates the percentage of
type linkages with errors.
Number
A high value for this measure is a cause of
concern.
2.7.3 R3 Dumps Test
This test reports the occurrence of ABAP short dumps.
Purpose
Reports the occurrence of ABAP short dumps
Target of the
test
A SAP R/3 server
Agent
deploying the
test
An internal/remote agent

M O N I T O R I N G T H E S A P A B A P I N S T A N C E
145
Configurable
parameters for
the test
1. TEST PERIOD - How often should the test be executed
2. HOST - Host name of the server for which the test is to be configured
3. PORTNO - Enter the port to which the specified HOST listens
4. CLIENTNAME – Specify the ID of the client system that is connecting to the R/3 server. To
view a list of client IDs to choose from, follow the procedure discussed in Page 14.
5. SAPUSER - Provide a valid user name for logging into the SAP R/3 server. In order to
enable the eG Enterprise suite to effectively monitor SAP, the name of a SAPUSER with
either of the following profiles need to be specified: S_A.SYSTEM (super administrator) or
SAP_ALL (all authorizations for SAP).
6. PASSWORD - The password of the specified SAPUSER.
7. CONFIRMPASSWORD - Confirm the password by retyping it here.
8. SYSNO - An indicator of the TCP/IP port at which the SAP server listens. For example, for a
server that listens at port 3200, the SYSNO will be '00'. Similarly, if the SAP server port is
3201, the SYSNO will have to be specified as '01'. Therefore, in the SYSNO text box
specify the system number of the SAP server with which the specified client communicates.
9. ROUTER - If the SAP client with the specified CLIENTNAME exists in a network external
to the SAP server, then a router will be used to enable the server-client communication. In
such a case, specify the IP of the router in the ROUTER text box. If both the client and the
server exist in the same network, then specify 'none' against the ROUTER text box.
10. INSTANCENAME - Specify the name of the SAP R/3 instance to be monitored. To view the
complete list of instances to choose from, do the follow the procedure discussed in Page 17
of this document.
11. TIMEOUT - Indicate the duration (in seconds) for which this test should wait for a response
from the SAP R/3 server. By default, this is set to 120 seconds.
12. JCOVERSION - The eG agent uses the SAP JCO library to connect to the SAP ABAP system
and pull out metrics. To enable the eG agent to make this connection and query the
metrics, you need to specify the version of the SAP JCO library that the agent needs to use.
For instance, to instruct the eG agent to use JCO v2.1.19, it would suffice if you specify the
‘major version number’ alone against JCO VERSION – in the case of this example, this will
be
2.x
.
13. ISPASSIVE – If the value chosen is YES, then the server under consideration is a passive
server in a SAP R/3 cluster. No alerts will be generated if the server is not running.
Measures will be reported as “Not applicable” by the agent if the server is not up.
14. DETAILED DIAGNOSIS - To make diagnosis more efficient and accurate, the eG
Enterprise suite embeds an optional detailed diagnostic capability. With this capability, the
eG agents can be configured to run detailed, more elaborate tests as and when specific
problems are detected. To enable the detailed diagnosis capability of this test for a
particular server, choose the On option. To disable the capability, click on the Off option.
The option to selectively enable/disable the detailed diagnosis capability will be available
only if the following conditions are fulfilled:
o The eG manager license should allow the detailed diagnosis capability
o Both the normal and abnormal frequencies configured for the detailed diagnosis
measures should not be 0.
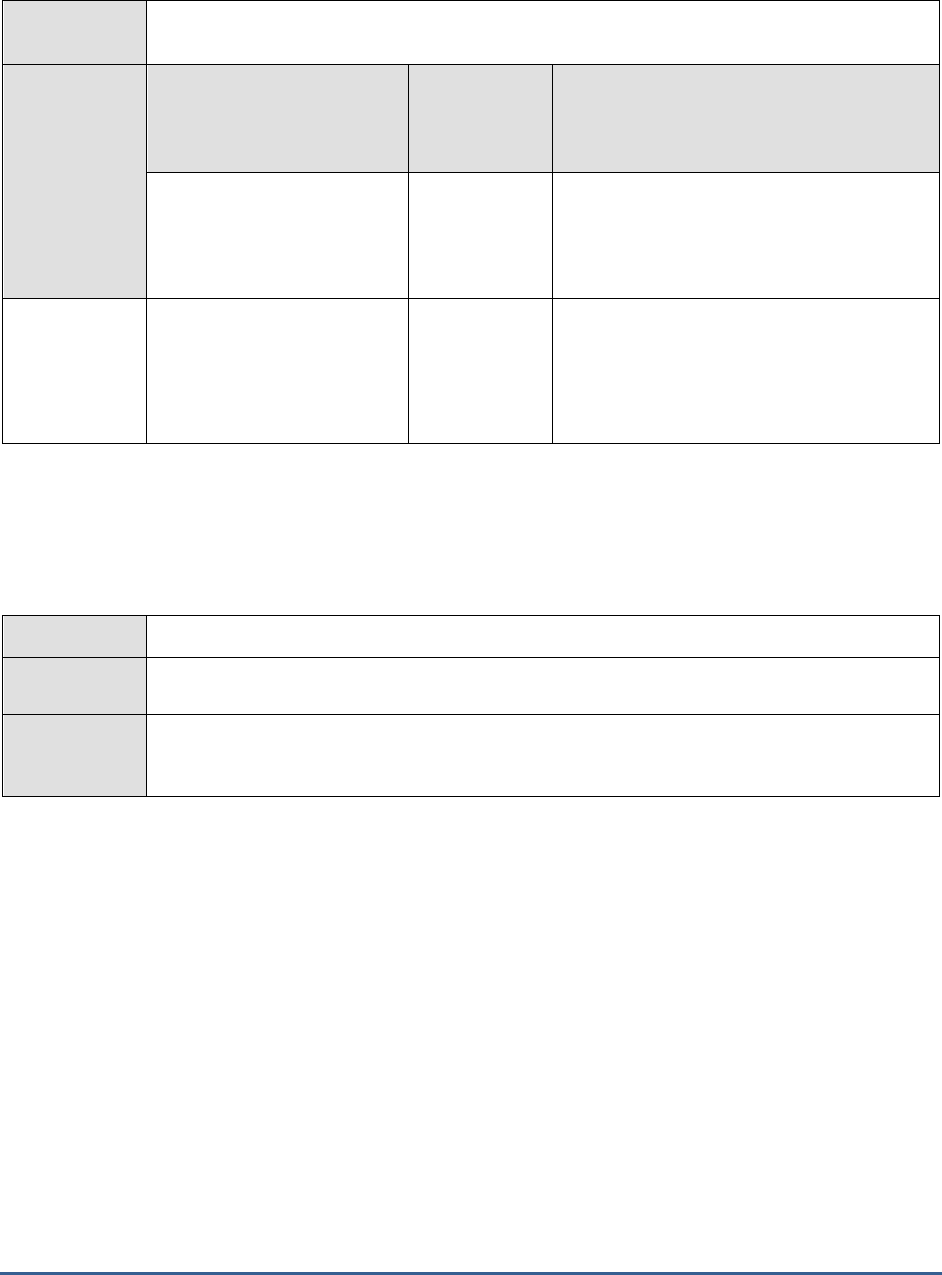
M O N I T O R I N G T H E S A P A B A P I N S T A N C E
146
Outputs of the
test
One set of results for the SAP R/3 server being monitored
Measurements
made by the
test
Measurement
Measurement
Unit
Interpretation
Total short dumps:
The total number of ABAP
short dumps that have
occurred.
Number
New short dumps:
The number of ABAP short
dumps that have occurred
during the last measurement
period
Number
2.7.4 R3 Status Messages Test
The different SAP R/3 sub-systems report the status of different activities carried out. This test indicates whether
each sub-system's activities are successfully carried out or not.
Purpose
Indicates whether each sub-system's activities are successfully carried out or not
Target of the
test
A SAP R/3 server
Agent
deploying the
test
An internal/remote agent

M O N I T O R I N G T H E S A P A B A P I N S T A N C E
147
Configurable
parameters for
the test
1. TEST PERIOD - How often should the test be executed
2. HOST - Host name of the server for which the test is to be configured
3. PORTNO - Enter the port to which the specified HOST listens
4. CLIENTNAME – Specify the ID of the client system that is connecting to the R/3 server. To
view a list of client IDs to choose from, follow the procedure discussed in Page 14.
5. SAPUSER - Provide a valid user name for logging into the SAP R/3 server. In order to
enable the eG Enterprise suite to effectively monitor SAP, the name of a SAPUSER with
either of the following profiles need to be specified: S_A.SYSTEM (super administrator) or
SAP_ALL (all authorizations for SAP).
6. PASSWORD - The password of the specified SAPUSER.
7. CONFIRMPASSWORD - Confirm the password by retyping it here.
8. SYSNO - An indicator of the TCP/IP port at which the SAP server listens. For example, for a
server that listens at port 3200, the SYSNO will be '00'. Similarly, if the SAP server port is
3201, the SYSNO will have to be specified as '01'. Therefore, in the SYSNO text box
specify the system number of the SAP server with which the specified client communicates.
9. ROUTER - If the SAP client with the specified CLIENTNAME exists in a network external to
the SAP server, then a router will be used to enable the server-client communication. In
such a case, specify the IP of the router in the ROUTER text box. If both the client and
the server exist in the same network, then specify 'none' against the ROUTER text box.
10. INSTANCENAME - Specify the name of the SAP R/3 instance to be monitored. To view the
complete list of instances to choose from, do the follow the procedure discussed in Page 17
of this document.
11. TIMEOUT - Indicate the duration (in seconds) for which this test should wait for a response
from the SAP R/3 server. By default, this is set to 120 seconds.
12. JCO VERSION - The eG agent uses the SAP JCO library to connect to the SAP ABAP system
and pull out metrics. To enable the eG agent to make this connection and query the
metrics, you need to specify the version of the SAP JCO library that the agent needs to
use. For instance, to instruct the eG agent to use JCO v2.1.19, it would suffice if you
specify the ‘major version number’ alone against JCO VERSION – in the case of this
example, this will be
2.x
.
13. ISPASSIVE – If the value chosen is YES, then the server under consideration is a passive
server in a SAP R/3 cluster. No alerts will be generated if the server is not running.
Measures will be reported as “Not applicable” by the agent if the server is not up.
14. DETAILED DIAGNOSIS - To make diagnosis more efficient and accurate, the eG
Enterprise suite embeds an optional detailed diagnostic capability. With this capability, the
eG agents can be configured to run detailed, more elaborate tests as and when specific
problems are detected. To enable the detailed diagnosis capability of this test for a
particular server, choose the On option. To disable the capability, click on the Off option.
The option to selectively enable/disable the detailed diagnosis capability will be available
only if the following conditions are fulfilled:
o The eG manager license should allow the detailed diagnosis capability
o Both the normal and abnormal frequencies configured for the detailed diagnosis
measures should not be 0.
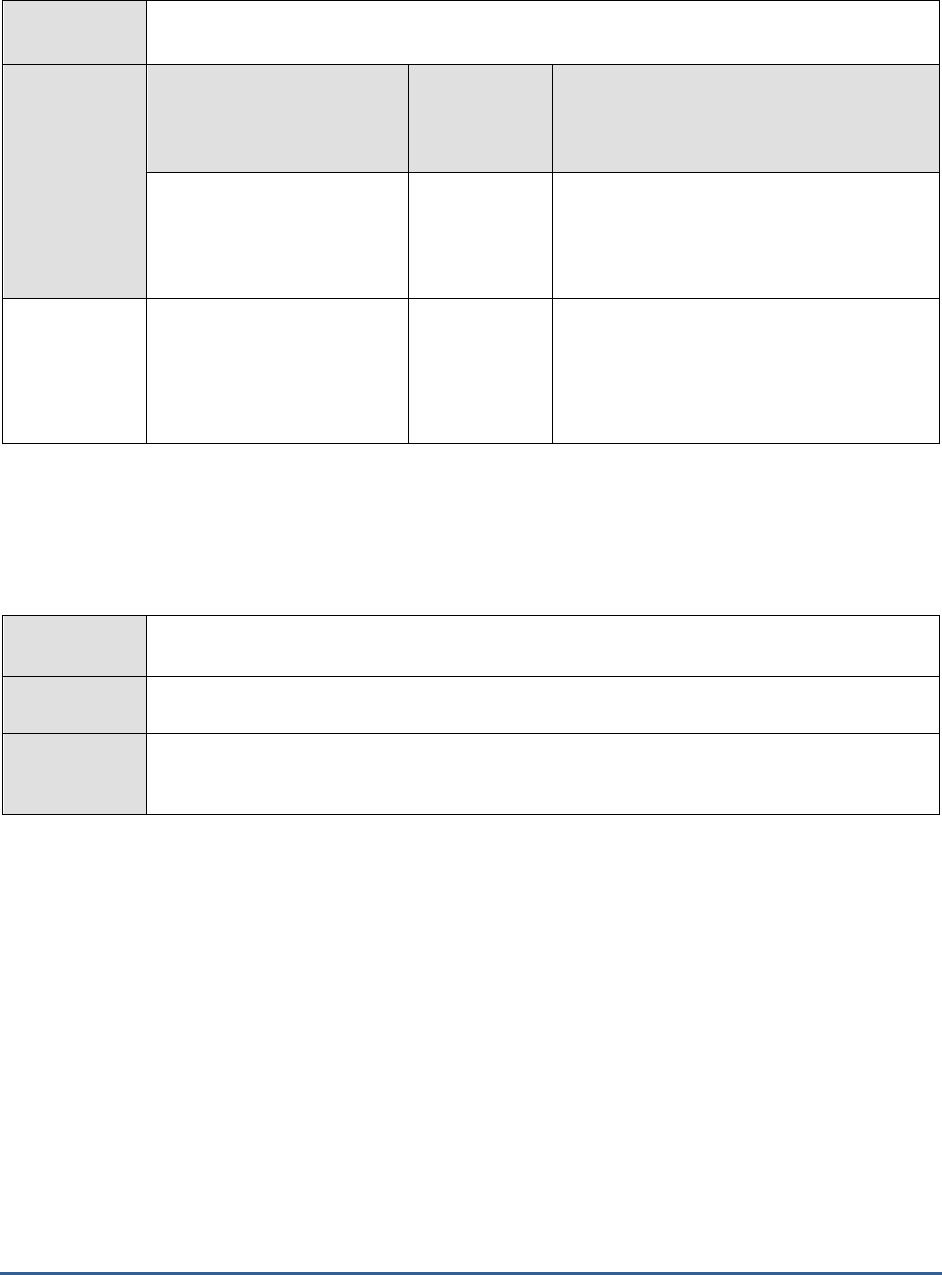
M O N I T O R I N G T H E S A P A B A P I N S T A N C E
148
Outputs of the
test
One set of results for every SAP R/3 sub-system being monitored
Measurements
made by the
test
Measurement
Measurement
Unit
Interpretation
Total messages:
The total number of error
messages present in R/3's
sub-system.
Number
New messages:
The number of error
messages that were newly
generated in the R/3's sub-
systems.
Number
2.7.5 Dialog Response Test
This test monitors the responses sent by the Dialog service, and returns key performance metrics pertaining to the
responses.
Purpose
Monitors the responses sent by the Dialog service, and returns key performance metrics
pertaining to the responses
Target of the
test
A SAP R/3 server
Agent
deploying the
test
An internal/remote agent
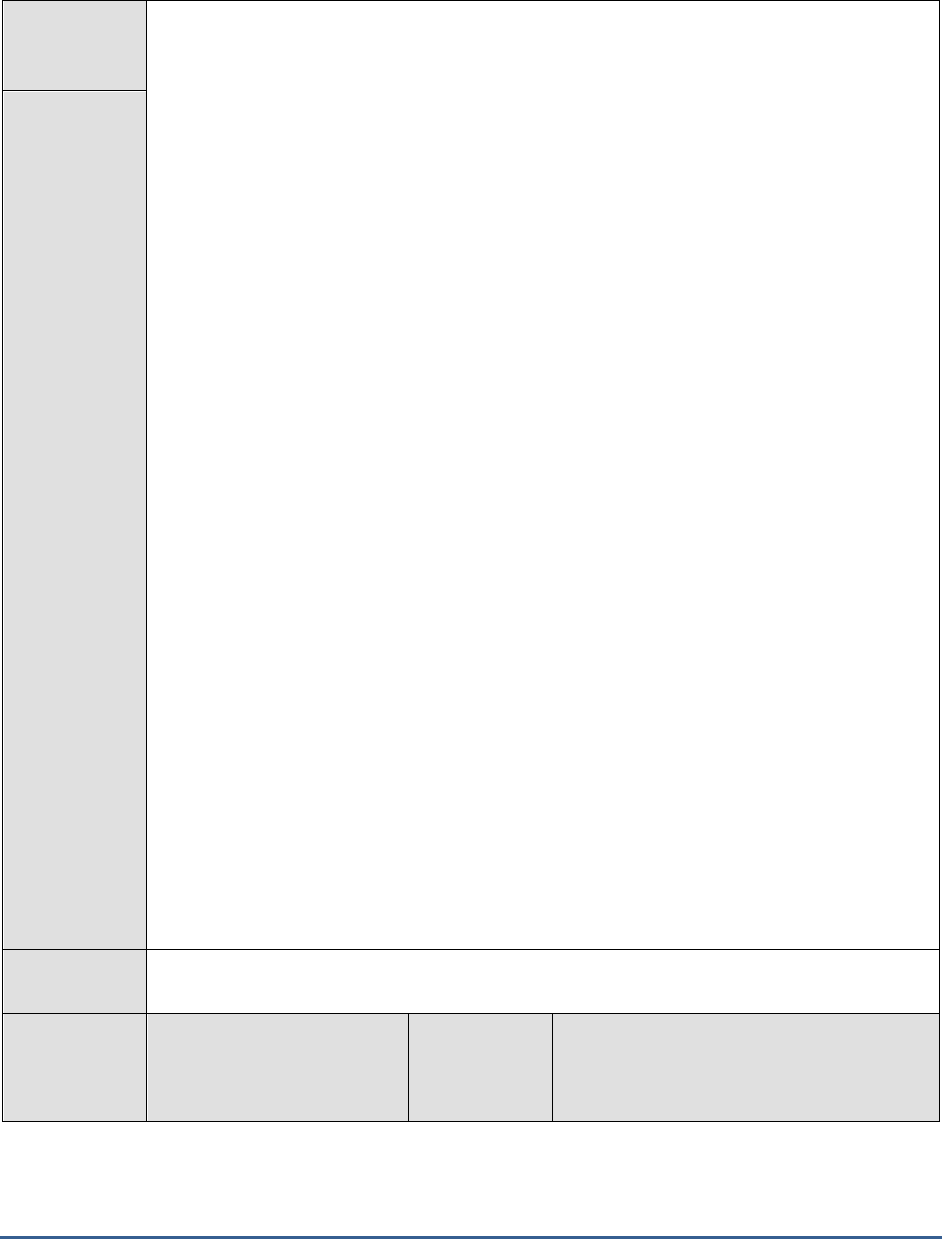
M O N I T O R I N G T H E S A P A B A P I N S T A N C E
149
Configurable
parameters for
the test
1. TEST PERIOD - How often should the test be executed
2. HOST - Host name of the server for which the test is to be configured
3. PORTNO - Enter the port to which the specified HOST listens
4. CLIENTNAME – Specify the ID of the client system that is connecting to the R/3 server. To
view a list of client IDs to choose from, follow the procedure discussed in Page 14.
5. SAPUSER - Provide a valid user name for logging into the SAP R/3 server. In order to
enable the eG Enterprise suite to effectively monitor SAP, the name of a SAPUSER with
either of the following profiles need to be specified: S_A.SYSTEM (super administrator) or
SAP_ALL (all authorizations for SAP). \
6. PASSWORD - The password of the specified SAPUSER.
7. CONFIRMPASSWORD - Confirm the password by retyping it here.
8. SYSNO - An indicator of the TCP/IP port at which the SAP server listens. For example, for a
server that listens at port 3200, the SYSNO will be '00'. Similarly, if the SAP server port is
3201, the SYSNO will have to be specified as '01'. Therefore, in the SYSNO text box
specify the system number of the SAP server with which the specified client communicates.
9. ROUTER - If the SAP client with the specified CLIENTNAME exists in a network external
to the SAP server, then a router will be used to enable the server-client communication. In
such a case, specify the IP of the router in the ROUTER text box. If both the client and the
server exist in the same network, then specify 'none' against the ROUTER text box.
10. INSTANCENAME - Specify the name of the SAP R/3 instance to be monitored. To view the
complete list of instances to choose from, do the follow the procedure discussed in Page 17
of this document.
11. TIMEOUT - Indicate the duration (in seconds) for which this test should wait for a response
from the SAP R/3 server. By default, this is set to 120 seconds.
12. JCO VERSION - The eG agent uses the SAP JCO library to connect to the SAP ABAP
system and pull out metrics. To enable the eG agent to make this connection and query the
metrics, you need to specify the version of the SAP JCO library that the agent needs to use.
For instance, to instruct the eG agent to use JCO v2.1.19, it would suffice if you specify the
‘major version number’ alone against JCO VERSION – in the case of this example, this will
be
2.x
.
13. ISPASSIVE – If the value chosen is YES, then the server under consideration is a passive
server in a SAP R/3 cluster. No alerts will be generated if the server is not running.
Measures will be reported as “Not applicable” by the agent if the server is not up.
Outputs of the
test
One set of results for every SAP R/3 server being monitored
Measurements
made by the
test
Measurement
Measurement
Unit
Interpretation

M O N I T O R I N G T H E S A P A B A P I N S T A N C E
150
Total response time for a
dialog step:
The average time that the
user waits at the front end for
his or her request to be
processed. It is the sum of
the Dialog process time,
Network transfer time, Queue
time and GUI Callback time.
Secs
If the user response time increases, while the
standard response time remains stable, it
means that the problem must be at the front
end or in the connection to the application
server.
Network transfer time for
a dialog step:
The time taken by the
network for the first data
transfer between the front
end and the application
server and during the last
data transfer from the
application server to the front
end.
Secs
The value of this measure does not include
round trips.
Queue time for dialog
process:
The average wait time in the
dispatcher wait queue.
Secs
With a normal workload, there should always
be free dialog work processes available. In
such a case, the wait time will only be a few
milliseconds.
GUI callback time:
The average length of time
that a work process waits for
the front end during the
communication between the
application server and the
front end.
Secs
Dialog process time:
The total time that is required
for processing a SAP R/3
dialog step, including the
database processing time.
Secs
Check the CPU performance, system paging,
dialog work processes, and database
performance for any performance lag in the
dialog process time.
Load generation time:
The average load generation
time for source texts,
graphical user interfaces and
screen information from the
database.
Secs
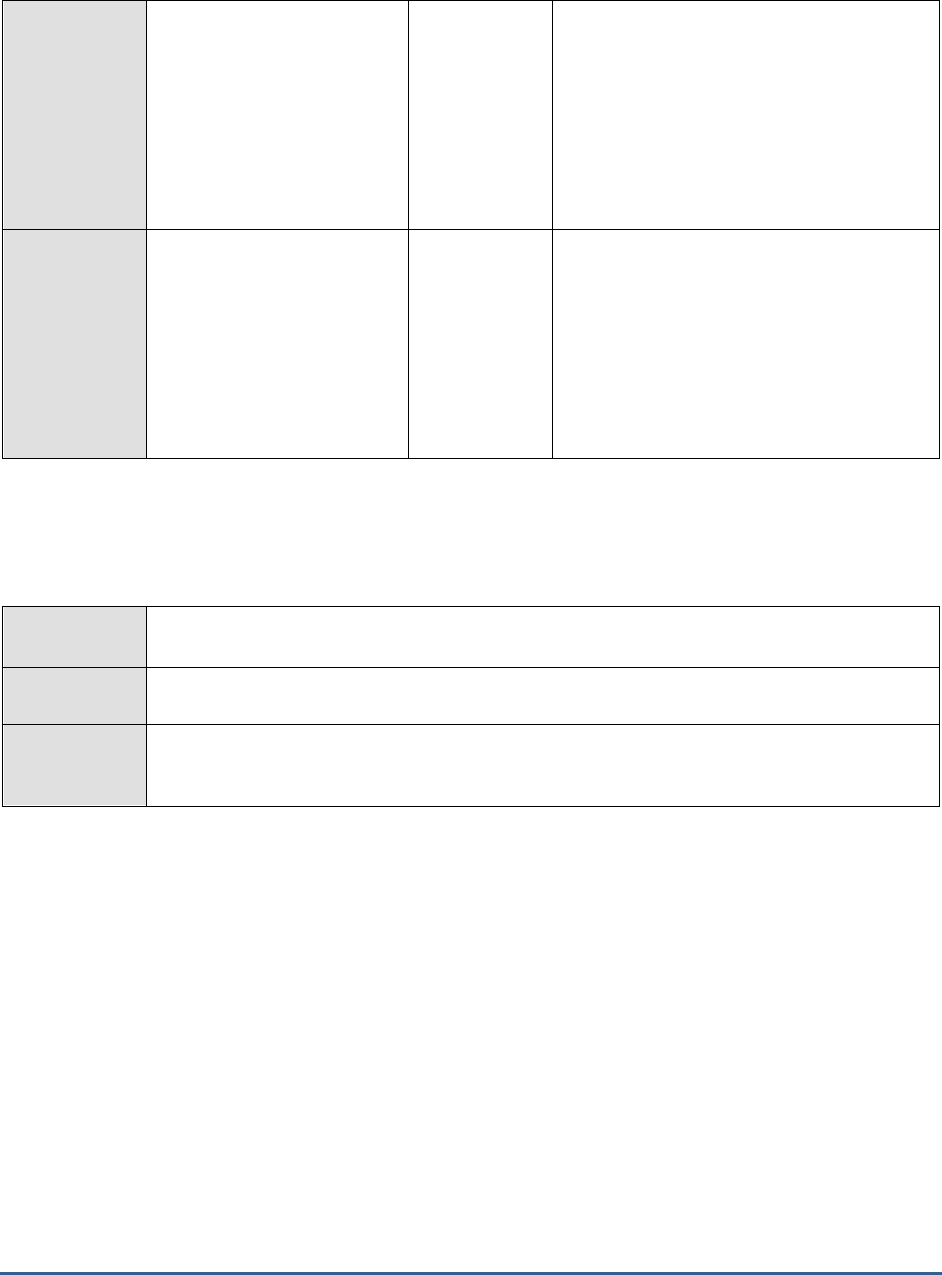
M O N I T O R I N G T H E S A P A B A P I N S T A N C E
151
Database response time
for the dialog step:
The average time for
processing logical database
requests.
Secs
Read requests can either be sent to the
database buffers or to the fast local SAP
buffers. The efficiency of the buffers, the
required number of requests as well as a
large number of database change requests
affect the total access time. The database
access time also takes into account the db
server, CPU performance as well as network
transfer times.
Dialog std response time:
The time taken for a standard
transaction that simulates the
normal workload of a
transaction by accessing data
on the database and
executing a series of ABAP
function modules.
Secs
If the dialog response time is deteriorating
consistently, while the standard response
time remains stable, check the number of
users logged on. If there are only a small
number of users, the use of very resource-
intensive transactions by one user can, in
extreme cases, significantly increase the
response time. If this is the case, there is
often no serious performance problem.
2.7.6 R3 Connection Test
This test emulates a client access to the SAP R/3 server, and reports the server availability and connect time.
Purpose
Emulates a client access to the SAP R/3 server, and reports the server availability and connect
time.
Target of the
test
A SAP R/3 server
Agent
deploying the
test
An internal/remote agent

M O N I T O R I N G T H E S A P A B A P I N S T A N C E
152
Configurable
parameters for
the test
1. TEST PERIOD - How often should the test be executed
2. HOST - Host name of the server for which the test is to be configured
3. PORTNO - Enter the port to which the specified HOST listens
4. CLIENTNAME – Specify the ID of the client system that is connecting to the R/3 server. To
view a list of client IDs to choose from, follow the procedure discussed in Page 14.
5. SAPUSER - Provide a valid user name for logging into the SAP R/3 server. In order to
enable the eG Enterprise suite to effectively monitor SAP, the name of a SAPUSER with
either of the following profiles need to be specified: S_A.SYSTEM (super administrator) or
SAP_ALL (all authorizations for SAP).
6. PASSWORD - The password of the specified SAPUSER.
7. CONFIRMPASSWORD - Confirm the password by retyping it here.
8. SYSNO - An indicator of the TCP/IP port at which the SAP server listens. For example, for a
server that listens at port 3200, the SYSNO will be '00'. Similarly, if the SAP server port is
3201, the SYSNO will have to be specified as '01'. Therefore, in the SYSNO text box
specify the system number of the SAP server with which the specified client communicates.
9. ROUTER - If the SAP client with the specified CLIENTNAME exists in a network external
to the SAP server, then a router will be used to enable the server-client communication. In
such a case, specify the IP of the router in the ROUTER text box. If both the client and the
server exist in the same network, then specify 'none' against the ROUTER text box.
10. INSTANCENAME - Specify the name of the SAP R/3 instance to be monitored. To view the
complete list of instances to choose from, do the follow the procedure discussed in Page 17
of this document.
11. TIMEOUT - Indicate the duration (in seconds) for which this test should wait for a response
from the SAP R/3 server. By default, this is set to 120 seconds.
12. JCOVERSION - The eG agent uses the SAP JCO library to connect to the SAP ABAP system
and pull out metrics. To enable the eG agent to make this connection and query the
metrics, you need to specify the version of the SAP JCO library that the agent needs to use.
For instance, to instruct the eG agent to use JCO v2.1.19, it would suffice if you specify the
‘major version number’ alone against JCO VERSION – in the case of this example, this will
be
2.x
.
13. ISPASSIVE – If the value chosen is YES, then the server under consideration is a passive
server in a SAP R/3 cluster. No alerts will be generated if the server is not running.
Measures will be reported as “Not applicable” by the agent if the server is not up.
Outputs of the
test
One set of results for every SAP R/3 server being monitored
Measurements
made by the
test
Measurement
Measurement
Unit
Interpretation
SAP R/3 server
availability:
Whether the SAP server is
available or not.
Percent
The value 0 for this measure indicates that
the server is not available. The value 100
indicates server availability.
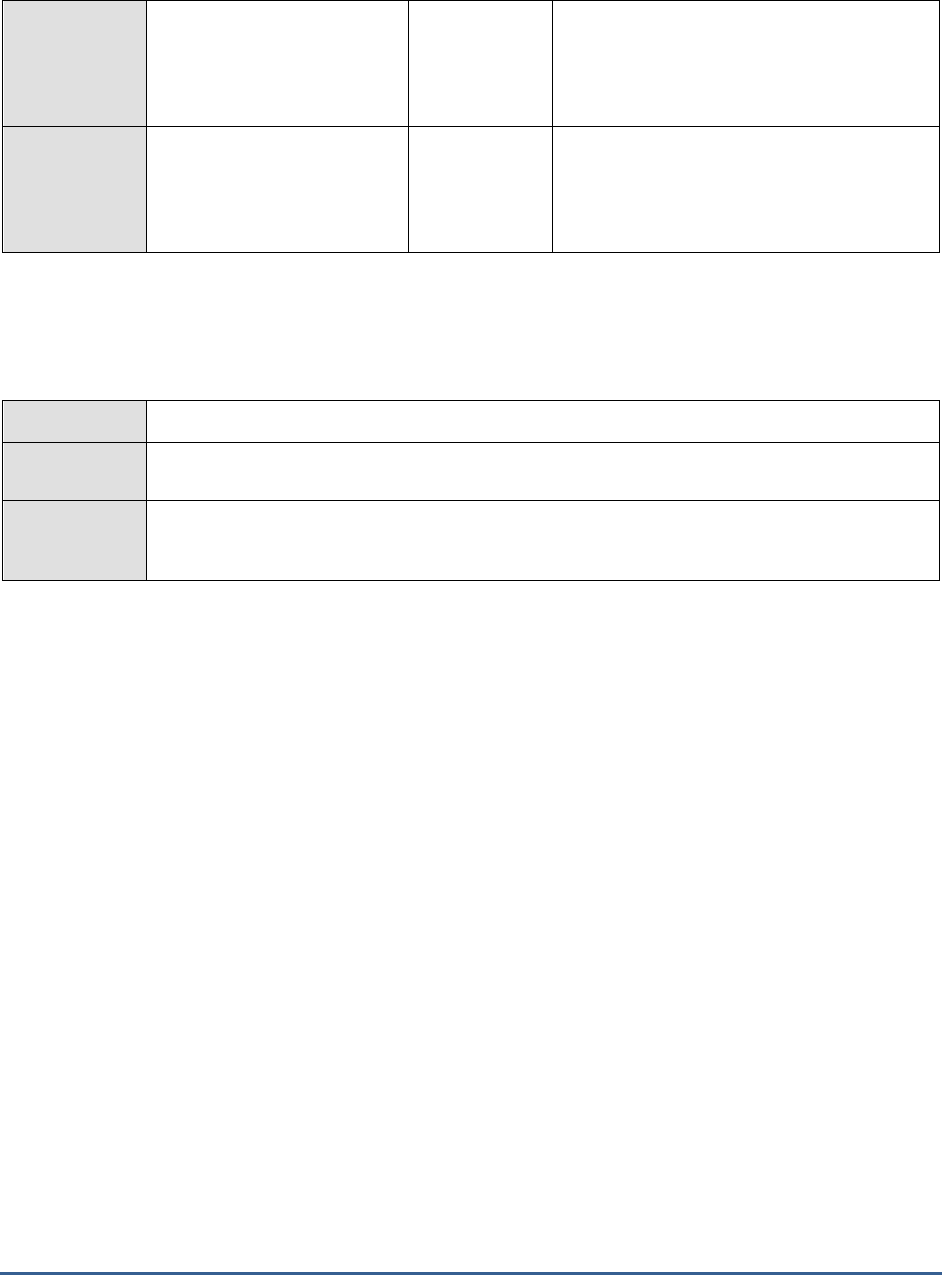
M O N I T O R I N G T H E S A P A B A P I N S T A N C E
153
Connect time:
Time taken for the SAP client
to connect to the SAP server.
Secs
Command execution time:
Time taken by the server to
execute a command.
Secs
2.7.7 R3 Users Test
This test displays the number of users logged on to various client activities of the R/3 server.
Purpose
Displays the number of users logged on to various client activities of the R/3 server
Target of the
test
A SAP R/3 server
Agent
deploying the
test
An internal/remote agent

M O N I T O R I N G T H E S A P A B A P I N S T A N C E
154
Configurable
parameters for
the test
1. TEST PERIOD - How often should the test be executed
2. HOST - Host name of the server for which the test is to be configured
3. PORTNO - Enter the port to which the specified HOST listens
4. CLIENTNAME – Specify the ID of the client system that is connecting to the R/3 server. To
view a list of client IDs to choose from, follow the procedure discussed in Page 14.
5. SAPUSER - Provide a valid user name for logging into the SAP R/3 server. In order to
enable the eG Enterprise suite to effectively monitor SAP, the name of a SAPUSER with
either of the following profiles need to be specified: S_A.SYSTEM (super administrator) or
SAP_ALL (all authorizations for SAP).
6. PASSWORD - The password of the specified SAPUSER.
7. CONFIRMPASSWORD - Confirm the password by retyping it here.
8. SYSNO - An indicator of the TCP/IP port at which the SAP server listens. For example, for a
server that listens at port 3200, the SYSNO will be '00'. Similarly, if the SAP server port is
3201, the SYSNO will have to be specified as '01'. Therefore, in the SYSNO text box
specify the system number of the SAP server with which the specified client communicates.
9. ROUTER - If the SAP client with the specified CLIENTNAME exists in a network external
to the SAP server, then a router will be used to enable the server-client communication. In
such a case, specify the IP of the router in the ROUTER text box. If both the client and the
server exist in the same network, then specify 'none' against the ROUTER text box.
10. INSTANCENAME - Specify the name of the SAP R/3 instance to be monitored. To view the
complete list of instances to choose from, do the follow the procedure discussed in Page 17
of this document.
11. TIMEOUT - Indicate the duration (in seconds) for which this test should wait for a response
from the SAP R/3 server. By default, this is set to 120 seconds.
12. JCOVERSION - The eG agent uses the SAP JCO library to connect to the SAP ABAP system
and pull out metrics. To enable the eG agent to make this connection and query the
metrics, you need to specify the version of the SAP JCO library that the agent needs to use.
For instance, to instruct the eG agent to use JCO v2.1.19, it would suffice if you specify the
‘major version number’ alone against JCO VERSION – in the case of this example, this will
be
2.x
.
13. ISPASSIVE – If the value chosen is YES, then the server under consideration is a passive
server in a SAP R/3 cluster. No alerts will be generated if the server is not running.
Measures will be reported as “Not applicable” by the agent if the server is not up.
14. DETAILED DIAGNOSIS - To make diagnosis more efficient and accurate, the eG
Enterprise suite embeds an optional detailed diagnostic capability. With this capability, the
eG agents can be configured to run detailed, more elaborate tests as and when specific
problems are detected. To enable the detailed diagnosis capability of this test for a
particular server, choose the On option. To disable the capability, click on the Off option.
The option to selectively enable/disable the detailed diagnosis capability will be available
only if the following conditions are fulfilled:
o The eG manager license should allow the detailed diagnosis capability
o Both the normal and abnormal frequencies configured for the detailed diagnosis
measures should not be 0.
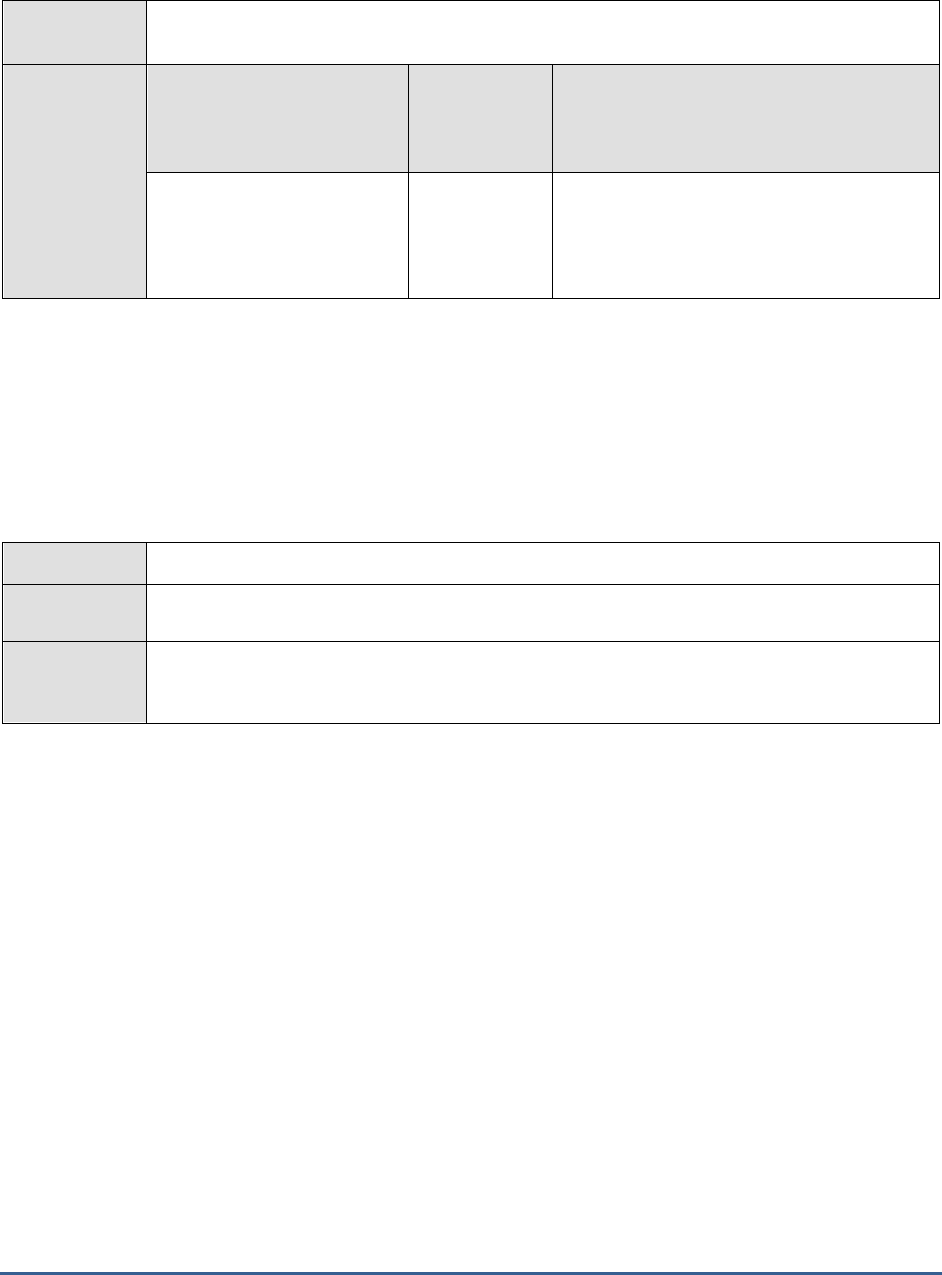
M O N I T O R I N G T H E S A P A B A P I N S T A N C E
155
Outputs of the
test
One set of results for every SAP R/3 sub-system being monitored
Measurements
made by the
test
Measurement
Measurement
Unit
Interpretation
Current users:
The number of users logged
on to various client activities
of the R/3 server.
Number
The detailed diagnosis of this measure, if
enabled, provides the details of the currently
logged in users.
2.7.8 R3 Log Test
The R3 Log test monitors the SAP R/3 server's log files for specific error patterns. This test is disabled by default.
This test is disabled by default. To enable the test, go to the ENABLE / DISABLE TESTS page using the menu sequence
: Agents -> Tests -> Enable/Disable, pick
SAP R/3
as the Component type, set
Performance
as the Test type, choose
this test from the DISABLED TESTS list, and click on the >> button to move the test to the ENABLED TESTS list. Finally,
click the Update button.
Purpose
Monitors the SAP R/3 server's log files for specific error patterns
Target of the
test
Log files of the SAP R/3 server
Agent
deploying the
test
An internal agent

M O N I T O R I N G T H E S A P A B A P I N S T A N C E
156
Configurable
parameters for
the test
1. TEST PERIOD - How often should the test be executed
2. HOST - The host for which the test is to be configured.
3. PORT – The port at which the server listens
4. ALERTFILE - Specify the path to the SAP R/3 server log file to be monitored. For eg.,
/usr/saplog/slog.log
. Multiple log file paths can be provided as a comma-separated list - eg.,
/user/john/sapalerts.log,/tmp/log/slog01.log
.
Also, instead of a specific log file path, the path to the directory containing log files can be
provided - eg.,
/user/logs
. This ensures that eG monitors the most recent log files in the
specified directory. Specific log file name patterns can also be specified. For example, to
monitor the latest log files with names containing the string 'slogs', the parameter
specification can be,
/tmp/usr/*slogs*
. Here, '*' indicates leading/trailing spaces (as the
case may be). In this case, the eG agent first enumerates all the log files in the specified
path that match the given pattern, and then picks only the latest log file from the result set
for monitoring.
The eG monitor interface will report one set of measurements for every configured path.
You can also configure the path in the following format:
Name@logfilepath
. Here,
Name
represents the display name of the path being configured. Accordingly, the parameter
specification for the 'slogs' example discussed above can be:
slogs@/tmp/usr/*slogs*
. In
this case, the display name 'slogs' will alone be displayed as descriptors of the test.
Every time this test is executed, the eG agent verifies the following:
c. Whether any changes have occurred in the size and/or timestamp of the log
files that were monitoring during the last measurement period;
d. Whether any new log files (that match the ALERTFILE specification) have been
newly added since the last measurement period;
If a few lines have been added to a log file that was monitored previously, then the eG
agent monitors the additions to that log file, and then proceeds to monitor newer log files
(if any). If an older log file has been overwritten, then, the eG agent monitors this log file
completely, and then proceeds to monitor the newer log files (if any).
5. SEARCHPATTERN - Enter the specific patterns of alerts to be monitored. The pattern
should be in the following format:
<PatternName>:<Pattern>
, where
<PatternName>
is
the pattern name that will be displayed in the monitor interface and
<Pattern>
is an
expression of the form - *expr* or expr or *expr or expr*, etc. A leading '*' signifies any
number of leading characters, while a trailing '*' signifies any number of trailing characters.
For example, say you specify SAP:*SAPSYS* in the SEARCHPATTERN text box. This
indicates that "SAP" is the pattern name to be displayed in the monitor interface.
"*SAPSYS*" indicates that the test will monitor only those lines in the R/3 server log which
embed the term "SAPSYS". A single pattern may also be of the form e1+e2, where +
signifies an OR condition. That is, the PatternName is matched if either e1 is true or e2 is
true.

M O N I T O R I N G T H E S A P A B A P I N S T A N C E
157
Multiple search patterns can be specified as a comma-separated list. For example:
SAP:*SAPSYS*,SAPAL:*DDIC*.
If the ALERTFILE specification is of the format
Name@logfilepath
, then the descriptor for
this test in the eG monitor interface will be of the format:
Name:PatternName
. On the other
hand, if the ALERTFILE specification consists only of a comma-separated list of log file
paths, then the descriptors will be of the format:
LogFilePath:PatternName
.
If you want all the messages in a log file to be monitored, then your specification would be:
<PatternName>:*
.
6. LINES - Specify two numbers in the format x:y. This means that when a line in the alert
file matches a particular pattern, then x lines before the matched line and y lines after the
matched line will be reported in the detail diagnosis output (in addition to the matched
line). The default value here is 0:0. Multiple entries can be provided as a comma-separated
list.
If you give 1:1 as the value for LINES, then this value will be applied to all the patterns
specified in the SEARCHPATTERN field. If you give 0:0,1:1 as the value for LINES and if
the corresponding value in the SEARCHPATTERN filed is like
SAP:*SAPSYS*,SAPAL:*DDIC* then:
0:0 will be applied to SAP:*SAPSYS* pattern
1:1 will be applied to SAPAL:*DDIC* pattern
7. EXCLUDEPATTERN - Provide a comma-separated list of patterns to be excluded from
monitoring in the EXCLUDEPATTERN text box. For example
*critical*,*exception*
. By
default, this parameter is set to 'none'.
8. UNIQUEMATCH - By default, the UNIQUEMATCH parameter is set to FALSE, indicating
that, by default, the test checks every line in the log file for the existence of each of the
configured SEARCHPATTERNS. By setting this parameter to TRUE, you can instruct the
test to ignore a line and move to the next as soon as a match for one of the configured
patterns is found in that line. For example, assume that
Pattern1:*fatal*,Pattern2:*error*
is
the SEARCHPATTERN that has been configured. If UNIQUEMATCH is set to FALSE,
then the test will read every line in the log file completely to check for the existence of
messages embedding the strings 'fatal' and 'error'. If both the patterns are detected in the
same line, then the number of matches will be incremented by 2. On the other hand, if
UNIQUEMATCH is set to TRUE, then the test will read a line only until a match for one of
the configured patterns is found and not both. This means that even if the strings 'fatal' and
'error' follow one another in the same line, the test will consider only the first match and not
the next. The match count in this case will therefore be incremented by only 1.

M O N I T O R I N G T H E S A P A B A P I N S T A N C E
158
9. ROTATINGFILE - This flag governs the display of descriptors for this test in the eG
monitoring console.
If this flag is set to true and the ALERTFILE text box contains the full path to a specific
(log/text) file, then, the descriptors of this test will be displayed in the following format:
Directory_containing_monitored_file:<SearchPattern>
. For instance, if the ALERTFILE
parameter is set to
c:\eGurkha\logs\syslog.txt
, and ROTATINGFILE is set to true, then,
your descriptor will be of the following format:
c:\eGurkha\logs:<SearchPattern>
. On the
other hand, if the ROTATINGFILE flag had been set to false, then the descriptors will be of
the following format:
<FileName>:<SearchPattern>
- i.e.,
syslog.txt:<SearchPattern>
in
the case of the example above.
If this flag is set to true and the ALERTFILE parameter is set to the directory containing log
files, then, the descriptors of this test will be displayed in the format:
Configured_directory_path:<SearchPattern>.
For instance, if the ALERTFILE parameter is
set to
c:\eGurkha\logs
, and ROTATINGFILE is set to true, then, your descriptor will be:
c:\eGurkha\logs:<SearchPattern>
. On the other hand, if the ROTATINGFILE parameter
had been set to false, then the descriptors will be of the following format:
Configured_directory:<SearchPattern>
- i.e.,
logs:<SearchPattern>
in the case of the
example above.
If this flag is set to true and the ALERTFILE parameter is set to a specific file pattern,
then, the descriptors of this test will be of the following format:
<FilePattern>:<SearchPattern>
. For instance, if the ALERTFILE parameter is set to
c:\eGurkha\logs\*sys*
, and ROTATINGFILE is set to true, then, your descriptor will be:
*sys*:<SearchPattern>
. In this case, the descriptor format will not change even if the
ROTATINGFILE flag status is changed.
10. DD FREQUENCY - Refers to the frequency with which detailed diagnosis measures are to
be generated for this test. The default is 1:1. This indicates that, by default, detailed
measures will be generated every time this test runs, and also every time the test detects a
problem. You can modify this frequency, if you so desire. Also, if you intend to disable the
detailed diagnosis capability for this test, you can do so by specifying none against dd
frequency.
11. ISPASSIVE – If the value chosen is YES, then the server under consideration is a passive
server in a SAP R/3 cluster. No alerts will be generated if the server is not running.
Measures will be reported as “Not applicable” by the agent if the server is not up.
12. DETAILED DIAGNOSIS - To make diagnosis more efficient and accurate, the eG
Enterprise suite embeds an optional detailed diagnostic capability. With this capability, the
eG agents can be configured to run detailed, more elaborate tests as and when specific
problems are detected. To enable the detailed diagnosis capability of this test for a
particular server, choose the On option. To disable the capability, click on the Off option.
The option to selectively enable/disable the detailed diagnosis capability will be available
only if the following conditions are fulfilled:
The eG manager license should allow the detailed diagnosis capability
Both the normal and abnormal frequencies configured for the detailed diagnosis
measures should not be 0.
Outputs of the
test
One set of results for every SEARCHPATTERN
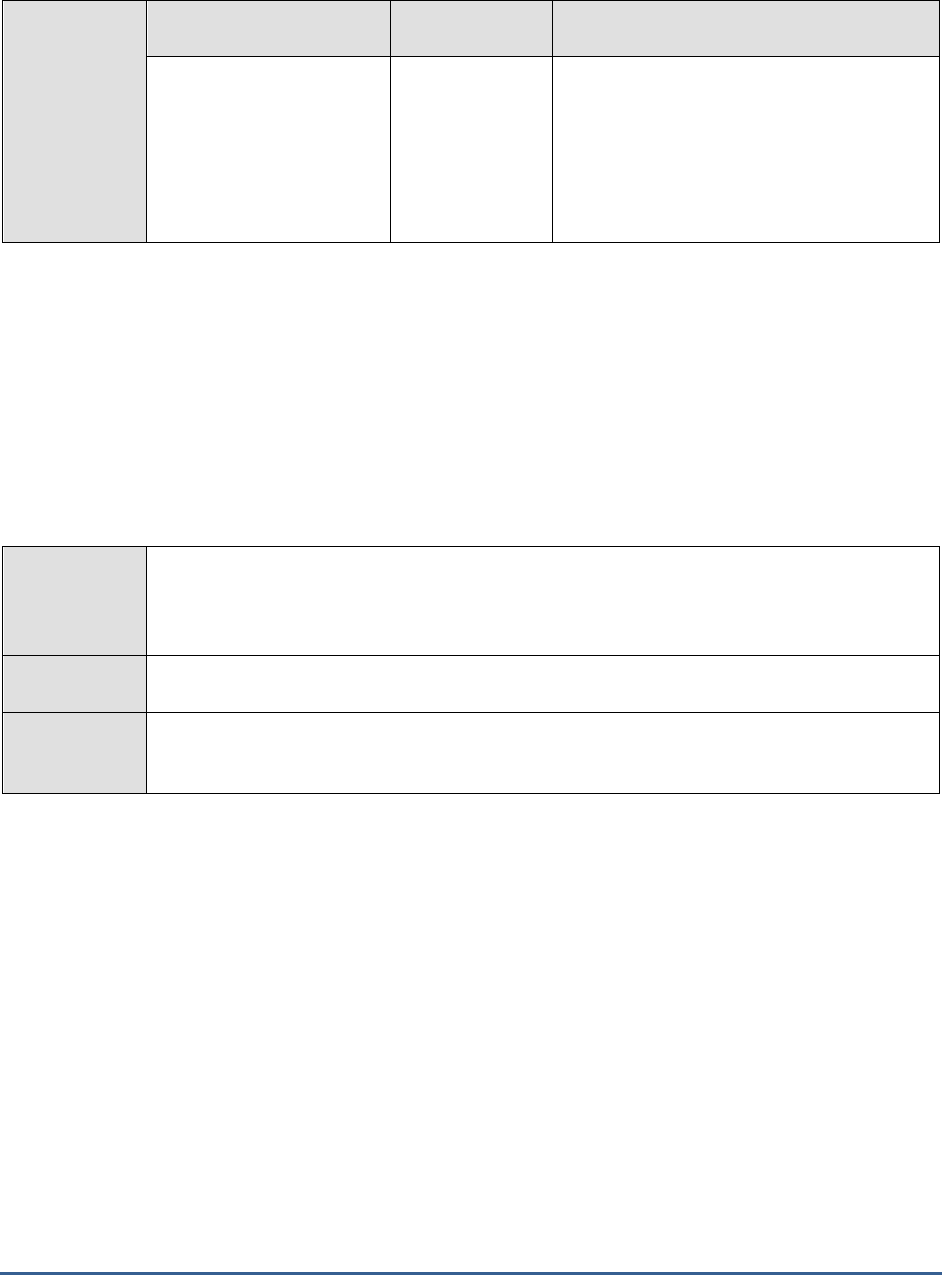
M O N I T O R I N G T H E S A P A B A P I N S T A N C E
159
Measurements
made by the
test
Measurement
Measurement
Unit
Interpretation
Number of messages:
Indicates the number of
messages of the configured
patterns that were added
to the SAP R/3 server logs
when the test was last
executed.
Number
The value of this measure is a clear indicator
of the number of “new” alerts that have
come into the monitored logs.
2.7.9 Syslog errors Test
The SysLog aka “System Logging” is a text file where selected events and problems within a SAP ABAP instance are
generally logged.
This test monitors the syslog file and for each event type logged into the file, this test reports the numerical statistics
of the total number of messages logged, the messages that were entered due to transaction problems, application
server and memory related isssues. In addition, this test reports the error messages and the warings that were
entered. This way, administrators may identify the event type that is more error prone and take remedial measures
to rectify the same before any severe issue crop up!.
Purpose
Monitors the syslog file and for each event type logged into the file, this test reports the
numerical statistics of the total number of messages logged, the messages that were entered
due to transaction problems, application server and memory related isssues. In addition, this
test reports the error messages and the warings that were entered
Target of the
test
A SAP R/3 server
Agent
deploying the
test
An internal/remote agent

M O N I T O R I N G T H E S A P A B A P I N S T A N C E
160
Configurable
parameters for
the test
1. TEST PERIOD - How often should the test be executed
2. HOST - Host name of the server for which the test is to be configured
3. PORTNO - Enter the port to which the specified HOST listens
4. CLIENTNAME – Specify the ID of the client system that is connecting to the R/3 server. To
view a list of client IDs to choose from, follow the procedure discussed in Page 14.
5. SAPUSER - Provide a valid user name for logging into the SAP R/3 server. In order to
enable the eG Enterprise suite to effectively monitor SAP, the name of a SAPUSER with
either of the following profiles need to be specified: S_A.SYSTEM (super administrator) or
SAP_ALL (all authorizations for SAP).
6. PASSWORD - The password of the specified SAPUSER.
7. CONFIRMPASSWORD - Confirm the password by retyping it here.
8. SYSNO - An indicator of the TCP/IP port at which the SAP server listens. For example, for a
server that listens at port 3200, the SYSNO will be '00'. Similarly, if the SAP server port is
3201, the SYSNO will have to be specified as '01'. Therefore, in the SYSNO text box
specify the system number of the SAP server with which the specified client communicates.
9. ROUTER - If the SAP client with the specified CLIENTNAME exists in a network external to
the SAP server, then a router will be used to enable the server-client communication. In
such a case, specify the IP of the router in the ROUTER text box. If both the client and the
server exist in the same network, then specify 'none' against the ROUTER text box.
10. INSTANCENAME - Specify the name of the SAP R/3 instance to be monitored. To view the
complete list of instances to choose from, do the follow the procedure discussed in Page 17
of this document.
11. TIMEOUT - Indicate the duration (in seconds) for which this test should wait for a response
from the SAP R/3 server. By default, this is set to 120 seconds.
12. ISPASSIVE – If the value chosen is YES, then the server under consideration is a passive
server in a SAP R/3 cluster. No alerts will be generated if the server is not running.
Measures will be reported as “Not applicable” by the agent if the server is not up.
13. JCO VERSION – Here, specify the major version of the JCO library that has been deployed
on the eG agent that is communicating with the SAP server. The value of this version is
either 2.x or 3.x where x relates to any of the minor releases.
14. CUSTOMPATTERNS – Specify a comma separated list of custom patterns for which this
test should report metrics for. You can specify the patterns in the
PatternName:Patternstring
format. However, the
PatternName
is optional. If the
PatternName
is specified, then this
PatternName
is displayed as the descriptor of this test in
the eG monitor interface. If the
PatternName
is not specified, then the
PatternString
alone is
specified as the descriptor of this test. By default,
none
will be displayed against this
parameter.
15. SHOWALERTSONLY – By default, this test monitors all the syslog messages logged in the
syslog file. If you wish to monitor only those syslog messages for which alerts were
generated in the SAP ABAP server instance, then set this flag to Yes.

M O N I T O R I N G T H E S A P A B A P I N S T A N C E
161
16. SEVERITYCUTOFF – By default, each syslog message is mapped to a severity value.
Specify a severity value against this text box beyond which all syslog messages are included
in the scope of montoiring. By default, the value of this parameter is
49
.
17. DETAILED DIAGNOSIS - To make diagnosis more efficient and accurate, the eG
Enterprise suite embeds an optional detailed diagnostic capability. With this capability, the
eG agents can be configured to run detailed, more elaborate tests as and when specific
problems are detected. To enable the detailed diagnosis capability of this test for a
particular server, choose the On option. To disable the capability, click on the Off option.
The option to selectively enable/disable the detailed diagnosis capability will be available
only if the following conditions are fulfilled:
o The eG manager license should allow the detailed diagnosis capability
o Both the normal and abnormal frequencies configured for the detailed diagnosis
measures should not be 0.
Outputs of the
test
One set of results for every SAP R/3 server being monitored
Measurements
made by the
test
Measurement
Measurement
Unit
Interpretation
Transaction problems:
Indicates the number of
messages of this type entered
in the syslog file with
transaction problems during
the last measurement period.
Number
Transaction problems indicate problems while
invoking transaction codes.
The detailed diagnosis of this measure if
enabled, lists the details such as the user
executing the Tcode, the client, the terminal
logged in by the user, program that is
currently executing, timestamp of the problem
message, severity and alert message and the
actual problem message.
Warnings:
Indicates the number of
warning messages of this
type that were entered in the
syslog file during the last
measurement period.
Number
The detailed diagnosis of this measure if
enabled, lists the details such as the user
executing the Tcode, the client, the terminal
logged in by the user, program that is
currently executing, timestamp of the problem
message, severity and alert message and the
actual problem message.
Dumps messages:
Indicates the number of
dump messages of this type
that were entered in the
syslog file during the last
measurement period.
Number
The detailed diagnosis of this measure if
enabled, lists the details such as the user
executing the Tcode, the client, the terminal
logged in by the user, program that is
currently executing, timestamp of the problem
message, severity and alert message and the
actual problem message.

M O N I T O R I N G T H E S A P A B A P I N S T A N C E
162
AS problems:
Indicates the number of
application server problem
messages of this type that
were entered in the syslog
file during the last
measurement period.
Number
Use these messages to trace problems that
occurred when the application server was
operated.
The detailed diagnosis of this measure if
enabled, lists the details such as the user
executing the Tcode, the client, the terminal
logged in by the user, program that is
currently executing, timestamp of the problem
message, severity and alert message and the
actual problem message.
Memory messages:
Indicates the total number of
memory related messages of
this type that were entered in
the syslog file during the last
measurement period.
Number
Use these messages to identify memory
related issues with the SAP ABAP instance.
The detailed diagnosis of this measure if
enabled, lists the details such as the user
executing the Tcode, the client, the terminal
logged in by the user, program that is
currently executing, timestamp of the problem
message, severity and alert message and the
actual problem message.
Error messages:
Indicates the error messages
of this type that were entered
ni the syslog file during the
last measurement period.
Number
The detailed diagnosis of this measure if
enabled, lists the name of the user executing
the Tcode, the client, the terminal logged in
by the user, Program that is currently
executing, Timestamp, severity and alert
message and the actual problem message.
Total issues:
Indicates the total number of
messages of this type
available in the syslog file
during the last measurement
period.
Number
This measure is a good indicator of the issues
occurring on the SAP instance.
The value of this measure is cumulative of
the
Transaction problems
,
Warnings
, Dumps
messages, AS problems, Memory messages
and Error messages measures.
2.7.10 TemSe Test
TemSe is the SAP store location for temporary sequential data. When the Temse are grows rapidly, it becomes
tedious for the adminsitrators to locate what exactly caused the growth of the Temse area and which Temse object
contributed to this abnormal growth? Use the Temse test to figure out the answers to such questions.
This test reports the rate at which each Temse object was created due to spool requests, background jobs and
activity in the HR module. In addition, this test reports how well the data is copied to the Temse object. This way,
administrators may figure out the Temse object that occupied more space and the Temse object that was created
the most.
Purpose
Monitors the functioning of the spool system, and reports the extent of its utilization, the length
of the wait queues, etc.
Target of the
test
A SAP R/3 server
Agent
deploying the
An internal/remote agent

M O N I T O R I N G T H E S A P A B A P I N S T A N C E
163
test
Configurable
parameters for
the test
1. TEST PERIOD - How often should the test be executed
2. HOST - Host name of the server for which the test is to be configured
3. PORTNO - Enter the port to which the specified HOST listens
4. CLIENTNAME – Specify the ID of the client system that is connecting to the R/3 server. To
view a list of client IDs to choose from, follow the procedure discussed in Page 14.
5. SAPUSER - Provide a valid user name for logging into the SAP R/3 server. In order to
enable the eG Enterprise suite to effectively monitor SAP, the name of a SAPUSER with
either of the following profiles need to be specified: S_A.SYSTEM (super administrator) or
SAP_ALL (all authorizations for SAP).
6. PASSWORD - The password of the specified SAPUSER.
7. CONFIRMPASSWORD - Confirm the password by retyping it here.
8. SYSNO - An indicator of the TCP/IP port at which the SAP server listens. For example, for a
server that listens at port 3200, the SYSNO will be '00'. Similarly, if the SAP server port is
3201, the SYSNO will have to be specified as '01'. Therefore, in the SYSNO text box
specify the system number of the SAP server with which the specified client communicates.
9. ROUTER - If the SAP client with the specified CLIENTNAME exists in a network external to
the SAP server, then a router will be used to enable the server-client communication. In
such a case, specify the IP of the router in the ROUTER text box. If both the client and the
server exist in the same network, then specify 'none' against the ROUTER text box.
10. INSTANCENAME - Specify the name of the SAP R/3 instance to be monitored. To view the
complete list of instances to choose from, do the follow the procedure discussed in Page 17
of this document.
11. TIMEOUT - Indicate the duration (in seconds) for which this test should wait for a response
from the SAP R/3 server. By default, this is set to 120 seconds.
12. ISPASSIVE – If the value chosen is YES, then the server under consideration is a passive
server in a SAP R/3 cluster. No alerts will be generated if the server is not running.
Measures will be reported as “Not applicable” by the agent if the server is not up.
13. JCOVERSION –The eG agent uses the SAP JCO library to connect to the SAP ABAP system
and pull out metrics. To enable the eG agent to make this connection and query the
metrics, you need to specify the version of the SAP JCO library that the agent needs to use.
For instance, to instruct the eG agent to use JCO v2.1.19, it would suffice if you specify the
‘major version number’ alone against JCO VERSION – in the case of this example, this will
be
2.x.
Outputs of the
test
One set of results for each Temse object of the SAP R/3 server being monitored
Measurements
made by the
test
Measurement
Measurement
Unit
Interpretation

M O N I T O R I N G T H E S A P A B A P I N S T A N C E
164
Total TemSe creation
rate:
Indicates the rate at which
this Temse object was
created during the last
measurement period.
Parts/sec
This measure is a good indicator of the rate
at which the Temse data has grown. If the
value of this measure is high, administrators
can consider reorganizing/provisioning the
TemSe data accordingly.
TemSe creation rate for
spool requests:
Indicates the rate at which
this Temse object was
created due to spool requests
during the last measurement
period.
Parts/sec
This measure is a good indicator of the
growth in the Temse area due to
spool/printing requests.
TemSe creation rate for
jobs:
Indicates the rate at which
this Temse object was
created due to background
jobs during the last
measurement period.
Parts/sec
HR TemSe creation rate:
Indicates the rate at which
this Temse object was
created during the last
measurement period due to
the activity in the HR module
of the SAP ABAP instance.
Parts/sec
TemSe data rate:
Indicates the rate at which
data was copied to the Temse
area of this Temse object
during the last measurement
period.
MB/sec
This measure can also be used for
provisioning/reorganization of the TemSe
space and also helps in detecting TemSe
issues created due to causes like huge spool
requests, overutilization by background jobs
etc.,
2.7.11 CTS Monitor Test
Change and Transport System (CTS) is the tool provided by SAP for the creation, documentation and distribution of
changes within a system landscape.
Using this test, administrators may figure out the number of requests that were created, how many of those requests
were successful and how many succeeded with errors. In addition, you may figure out how many transport requests
were partially successful and how many requests encountered critical errors. This way, administrators may figure out
how well the transport requests were processed and the exact cause behind the error prone requests.
Purpose
Helps you figure out the number of requests that were created, how many of those requests
were successful and how many succeeded with errors. In addition, you may figure out how
many transport requests were partially successful and how many requests encountered critical
errors
M O N I T O R I N G T H E S A P A B A P I N S T A N C E
165
Target of the
test
A SAP R/3 server
Agent
deploying the
test
An internal/remote agent
Configurable
parameters for
the test
1. TEST PERIOD - How often should the test be executed
2. HOST - Host name of the server for which the test is to be configured
3. PORTNO - Enter the port to which the specified HOST listens
4. CLIENTNAME – Specify the ID of the client system that is connecting to the R/3 server. To
view a list of client IDs to choose from, follow the procedure discussed in Page 14.
5. SAPUSER - Provide a valid user name for logging into the SAP R/3 server. In order to
enable the eG Enterprise suite to effectively monitor SAP, the name of a SAPUSER with
either of the following profiles need to be specified: S_A.SYSTEM (super administrator) or
SAP_ALL (all authorizations for SAP).
6. PASSWORD - The password of the specified SAPUSER.
7. CONFIRMPASSWORD - Confirm the password by retyping it here.
8. SYSNO - An indicator of the TCP/IP port at which the SAP server listens. For example, for a
server that listens at port 3200, the SYSNO will be '00'. Similarly, if the SAP server port is
3201, the SYSNO will have to be specified as '01'. Therefore, in the SYSNO text box
specify the system number of the SAP server with which the specified client communicates.
9. ROUTER - If the SAP client with the specified CLIENTNAME exists in a network external to
the SAP server, then a router will be used to enable the server-client communication. In
such a case, specify the IP of the router in the ROUTER text box. If both the client and the
server exist in the same network, then specify 'none' against the ROUTER text box.
10. INSTANCENAME - Specify the name of the SAP R/3 instance to be monitored. To view the
complete list of instances to choose from, do the follow the procedure discussed in Page 17
of this document.
11. TIMEOUT - Indicate the duration (in seconds) for which this test should wait for a response
from the SAP R/3 server. By default, this is set to 120 seconds.
12. JCO VERSION – The eG agent uses the SAP JCO library to connect to the SAP ABAP
system and pull out metrics. To enable the eG agent to make this connection and query the
metrics, you need to specify the version of the SAP JCO library that the agent needs to use.
For instance, to instruct the eG agent to use JCO v2.1.19, it would suffice if you specify the
‘major version number’ alone against JCO VERSION – in the case of this example, this will
be
2.x.
13. DD FREQUENCY - Refers to the frequency with which detailed diagnosis measures are to
be generated for this test. The default is 1:1. This indicates that, by default, detailed
measures will be generated every time this test runs, and also every time the test detects a
problem. You can modify this frequency, if you so desire. Also, if you intend to disable the
detailed diagnosis capability for this test, you can do so by specifying none against dd
frequency.

M O N I T O R I N G T H E S A P A B A P I N S T A N C E
166
14. DETAILED DIAGNOSIS - To make diagnosis more efficient and accurate, the eG
Enterprise suite embeds an optional detailed diagnostic capability. With this capability, the
eG agents can be configured to run detailed, more elaborate tests as and when specific
problems are detected. To enable the detailed diagnosis capability of this test for a
particular server, choose the On option. To disable the capability, click on the Off option.
The option to selectively enable/disable the detailed diagnosis capability will be available
only if the following conditions are fulfilled:
o The eG manager license should allow the detailed diagnosis capability
o Both the normal and abnormal frequencies configured for the detailed diagnosis
measures should not be 0.
Outputs of the
test
One set of results for every SAP R/3 server being monitored
Measurements
made by the
test
Measurement
Measurement
Unit
Interpretation
Total exports:
Indicates the total number of
requests that were created
during the last measurement
period.
Number
Successful exports:
Indicates the number of
transport requests that were
successful during the last
measurement period.
Number
The TPALOG return code for these requests
is 0000.
Succeeded with warnings:
Indicates the number of
transport requests that
succeeded with warnings
during the last measurement
period.
Number
The TPALOG return code for these requests
is 0004. Warnings could be innocuous as in
regular warnings issued when the transport
request involves object deletion.
Nevertheless, these warnings need to be
checked.
Partial successes:
Indicates the number of
transport requests that were
partially successful during the
last measurement period.
Parts/sec
The TPALOG return code for these requests
is 0008. These errors need to be analyzed
and corrected. Examples of such errors
include original/repaired objects not being
overwritten. Detailed diagnosis for this
measure provides details of these requests
such as : Request timestamp, Request
number, target system, source client,
transport step, project number, transport user
and transport admin.
M O N I T O R I N G T H E S A P A B A P I N S T A N C E
167
Percentage of partial
successes:
Indicates the percentage of
transport requests that were
partially successful during the
last measurement period.
Percent
The TPALOG return code for these requests
is 0008. Typically these errors arise due to
transport request configuration as opposed to
a transport system error.
Critical errors:
Indicates the number of
transport requests with
critical errors during the last
measurement period.
Number
The TPALOG return code for these requests
is 0012 or higher. These errors usually arise
due to some serious error in the transport
system and hence tend to impact a majority
of the transport requests.
The detailed diagnosis of this emsaure if
enabled lists the details of these requests
such as Request timestamp, Request
number, target system, source client,
transport step, project number, transport user
and transport admin.
Percentage of critical
errors:
Indicates the percentage of
transport requests with
critical errors during the last
measurement period.
Percent
The TPALOG return code for these requests
is 0012 or higher. These errors tend to
correspond to the overall availability of the
transport system.
2.7.12 New alerts in the last measure period
Every SAP solution is bundled with a monitoring architecture, and alerts form a central element of this architecture.
They quickly and reliably report errors – such as values exceeding or falling below a particular threshold value or that
a SAP component has been inactive for a defined period of time. These alerts are displayed in the Alert Monitor - this
is a central tool that facilitates efficient administration and monitoring of distributed SAP solutions.
An alert is uniquely assigned to one monitoring tree element (MTE) in the Alert Monitor. A set of monitoring tree
elements (MTEs) that are arranged in a hierarchical structure becomes a Monitor. These Monitors can be grouped to
form a Monitor Set.
The alerts contain a status indicator with a color and a numerical value. Yellow means a warning, red means a
problem, green means normal, and the numerical value shows the severity of the reported error.
Using APIs provided by SAP, this test pulls out useful statistics related to SAP R/3 alerts from the AlertMonitor.
Besides reporting the total number of alerts generated on every Monitor that is configured, the test also reveals the
number of alerts in various states (red, yellow, green, etc.). You can even optionally generate detailed measures to
view additional alert information such as the alert description and its severity. This way, the eG monitoring console
serves as a single, central platform that displays the details of the open and completed alerts related to a monitored
SAP R/3 server.
Purpose
Reports useful statistics related to SAP R/3 alerts
Target of the
test
A SAP R/3 server

M O N I T O R I N G T H E S A P A B A P I N S T A N C E
168
Agent
deploying the
test
An internal/remote agent
Configurable
parameters for
the test
1. TEST PERIOD - How often should the test be executed
2. HOST - Host name of the server for which the test is to be configured
3. PORT - Enter the port to which the specified HOST listens
4. CLIENTNAME – Specify the ID of the client system that is connecting to the R/3 server. To
view a list of client IDs to choose from, follow the procedure discussed in Page 14.
5. SAPUSER - Provide a valid user name for logging into the SAP R/3 server. In order to
enable the eG Enterprise suite to effectively monitor SAP, the name of a SAPUSER with
either of the following profiles need to be specified: S_A.SYSTEM (super administrator) or
SAP_ALL (all authorizations for SAP).
6. PASSWORD - The password of the specified SAPUSER.
7. CONFIRMPASSWORD - Confirm the password by retyping it here.
8. SYSNO - An indicator of the TCP/IP port at which the SAP server listens. For example, for a
server that listens at port 3200, the SYSNO will be '00'. Similarly, if the SAP server port is
3201, the SYSNO will have to be specified as '01'. Therefore, in the SYSNO text box
specify the system number of the SAP server with which the specified client communicates.
9. INSTANCENAME - Specify the name of the SAP R/3 instance to be monitored. To view the
complete list of instances to choose from, do the follow the procedure discussed in Page 17
of this document.
10. JCO VERSION – The eG agent uses the SAP JCO library to connect to the SAP ABAP
system and pull out metrics. To enable the eG agent to make this connection and query the
metrics, you need to specify the version of the SAP JCO library that the agent needs to use.
For instance, to instruct the eG agent to use JCO v2.1.19, it would suffice if you specify the
‘major version number’ alone against JCO VERSION – in the case of this example, this will
be
2.x.
11. ROUTER - If the SAP client with the specified CLIENTNAME exists in a network external to
the SAP server, then a router will be used to enable the server-client communication. In
such a case, specify the IP of the router in the ROUTER text box. If both the client and the
server exist in the same network, then specify 'none' against the ROUTER text box.
12. SETS - Provide a comma-separated list of monitor sets for which performance attributes
are to be monitored. For example:
SAP CCMS Monitor Templates,Monitor Collection for
Certification
13. MONITORS - Provide a comma-separated list of monitors under the configured monitor
SETS for which performance attributes are to be monitored. While specifying the list of
MONITORS, make sure that you specify them in the same order as that of your monitor
SETS specification. For instance, the first monitor in your MONITORS list should belong to
the first monitor set in your SETS specification, and so on. This implies that if your SETS
specification reads as follows -
SAP CCMS Monitor Templates,Monitor Collection for
Certification
- then the first monitor in your MONITORS specification should belong to the
SAP CCMS
Monitor Templates
set and the second monitor should belong to the
Monitor
Collection for Certification
set. In this case, your MONITORS specification may read as
follows:
Dialog Overview,Test Monitor Syslog
.
M O N I T O R I N G T H E S A P A B A P I N S T A N C E
169
If you want to include more than one monitor from a particular monitor set in your
MONITORS specification, then make sure that you repeat that monitor set’s name as many
times in your SETS specification.
While configuring the SETS and MONITORS , you may want to know the exact names
of the monitors and monitor sets that form part of your specification. To determine this,
follow the procedure discussed in Page 176 of this document.
14. XMI AUDIT LEVEL - The XMI interface is a general framework for the CCMS external
system management interfaces. This interface contains essential function modules and
structures that coordinate connections between external system management tools and
individual CCMS interfaces, and writes messages in the R/3 XMI log on behalf of the
external tool. The XMI log is a table containing English message texts. The messages can
have various degrees of detail. The audit level determines the degree of detail to which
messages in the XMI log are written - i.e., whether the message should always be logged,
or is simply a message which supplies further detail (higher detail degree). The XMI log
contains messages from external tools and also messages which arise in SMAPI functions.
To indicate to the test the degree of detail to which messages from the eG agent are to be
written in the XMI log, you need to specify the XMI AUDIT LEVEL. By default, this
parameter is set to
0
, which indicates that all calls that modify the database are to be
logged. The other values this parameter can take and their implications are discussed
below:
o 1: Logs all calls that modify the database and error
messages
o 2: Logs all calls that read from the database, modify the
database, and error messages
o 3: Logs all calls and all messages (full trace)
15. TIMEOUT - Indicate the duration (in seconds) for which this test should wait for a response
from the SAP R/3 server. By default, this is set to 120 seconds.
16. DETAILED DIAGNOSIS - To make diagnosis more efficient and accurate, the eG
Enterprise suite embeds an optional detailed diagnostic capability. With this capability, the
eG agents can be configured to run detailed, more elaborate tests as and when specific
problems are detected. To enable the detailed diagnosis capability of this test for a
particular server, choose the On option. To disable the capability, click on the Off option.
The option to selectively enable/disable the detailed diagnosis capability will be available
only if the following conditions are fulfilled:
o The eG manager license should allow the detailed diagnosis capability
o Both the normal and abnormal frequencies configured for the detailed diagnosis
measures should not be 0.
Outputs of the
test
One set of results for every configured Monitor
Measurements
made by the
test
Measurement
Measurement
Unit
Interpretation

M O N I T O R I N G T H E S A P A B A P I N S T A N C E
170
Total number of alerts:
Indicates the total number of
alerts that have occurred for
this monitor since the last
measurement period.
Number
The detailed diagnosis of this measure,
if enabled, provides the complete
details of all the alerts associated with
the corresponding monitor. The details
include: Date, Time, System, Context,
Object Name, Short Name, Status,
Importance and Alert Text.
Alternatively, you can navigate to the
Components -> SAP -> Alerts
to selectively
view the alerts related to specific monitor
sets or monitors, alerts of a specific status, or
alerts generated during a given period.
Number of red alerts:
Indicates the number of
errors or critical status
messages that have occurred
for this monitor since the last
measurement period.
Number
To view the alerts and rectify them
instantly, you can navigate to the
Components -> SAP -> Alerts
page in the eG
monitoring console.
Number of yellow alerts:
Indicates the number of
warning alerts that have
occurred for this monitor
since the last measurement
period.
Number
To view the alerts and rectify them instantly,
you can navigate to the
Components -> SAP
-> Alerts
page in the eG monitoring console.
Number of green alerts:
Indicates the number of
events or components that
were running normally since
the last measurement period.
Number
It is also possible to generate messages
for green “alerts” and react to them
correspondingly. Green alerts of this
type do not indicate error situations,
but are intended as all-clears or explicit
messages that an action was
successful.
You can activate green alerts in the
Alert Monitor for performance attributes
and status attributes. Behavior in the
case of performance attributes is as
follows:
e. A green alert is generated
if the current status is yellow or
red and the next report sets the
current status to green.
f. No green alert is generated
if the current status is already
green.
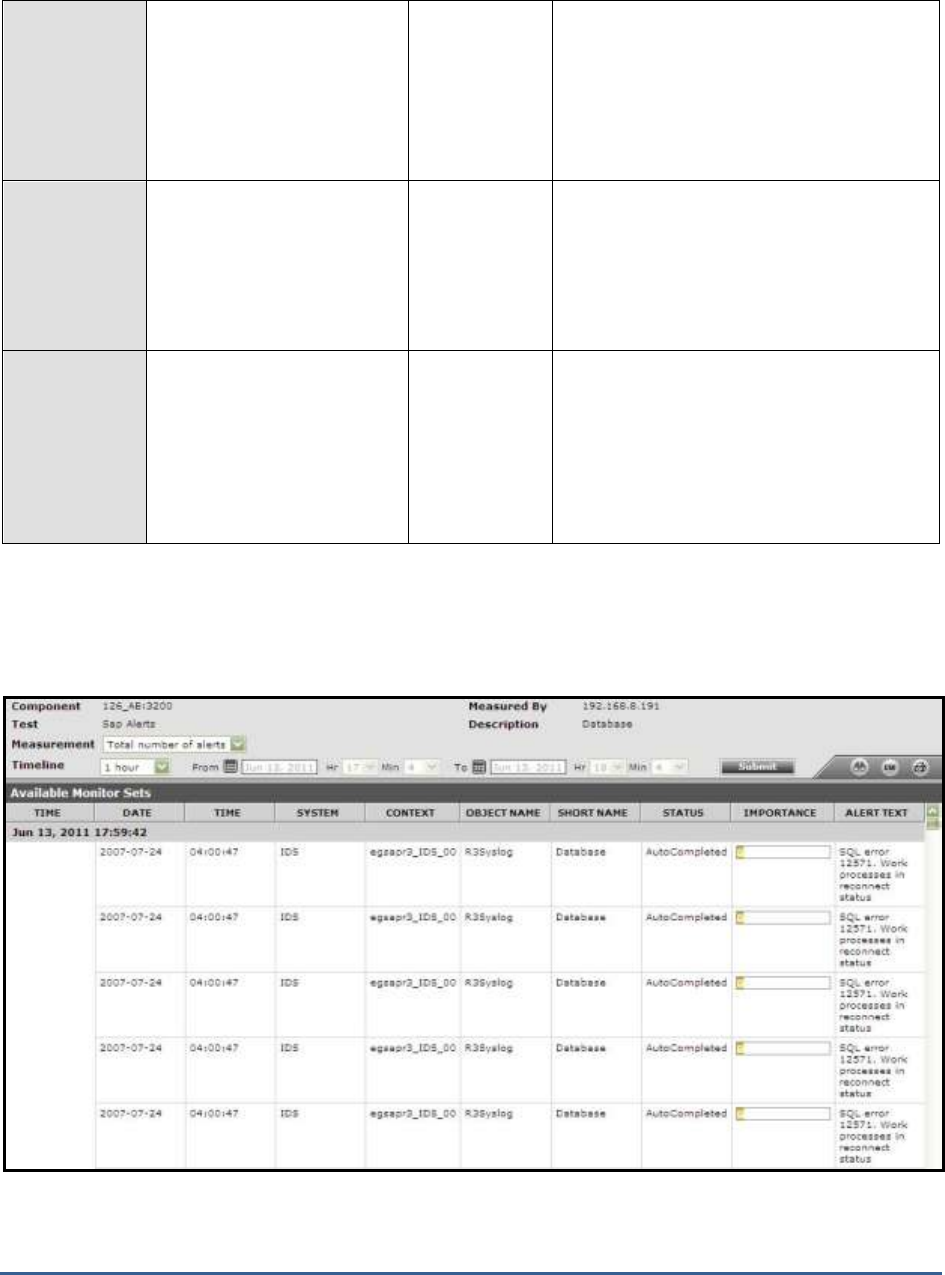
M O N I T O R I N G T H E S A P A B A P I N S T A N C E
171
Number of active alerts:
Indicates the number of
alerts that are active since
the last measurement period.
Number
An abnormally high value could indicate that
the SAP R/3 component is problem-prone.
You may want to navigate to the
Components -> SAP -> Alerts
page in the eG
monitoring console to take a closer look at
the active alerts, and decide on a course of
action.
Number of completed
alerts:
Indicates the number of
alerts that were rectified
manually since the last
measurement period.
Number
To zoom into the completed alerts, you can
navigate to the
Components -> SAP -> Alerts
page in the eG monitoring console.
Number of autocompleted
alerts:
Indicates the number of
alerts that were rectified
automatically by this SAP R/3
system since the last
measurement period.
Number
To zoom into the auto-completed alerts, you
can navigate to the
Components -> SAP ->
Alerts
page in the eG monitoring console.
The detailed diagnosis of the
Total number of alerts
measure provides the complete details of the alerts generated
on a configured monitor. The details include: Date, Time, System, Context, Object Name, Short Name, Status,
Importance and Alert Text.
Figure 5.1: The detailed diagnosis of the Total number of alerts measure
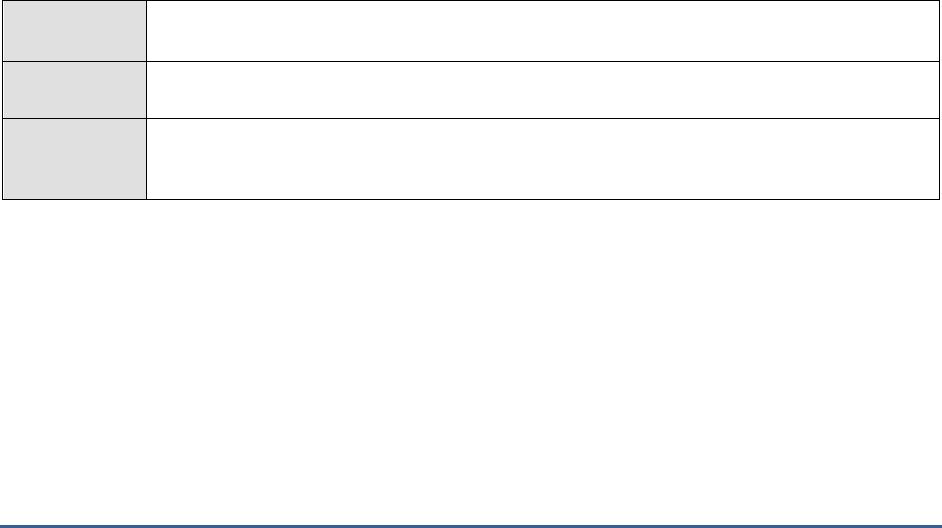
M O N I T O R I N G T H E S A P A B A P I N S T A N C E
172
2.7.13 Performance Attributes for Monitors
A monitoring object represents a component of the IT environment that is to be monitored, such as the CPU of a
server, the dialog system, or background processing. Monitoring attributes are values, statuses, or texts that are
reported to this object, such as the CPU utilization, or the average response time in the dialog system. A monitoring
attribute can be assigned an alert. The selection of the monitoring objects is performed using the data suppliers that
exist for all areas of system management.
Monitoring objects and their attributes are displayed in the alert monitoring tree as individual nodes in a hierarchical
tree. If the data reported to the monitoring architecture exceeds or falls below the defined alert threshold values, an
alert is triggered in the corresponding monitoring tree element.
There are five different types of monitoring attributes:
Performance attribute
Status attribute
Heartbeat attribute
Log attribute
Text attribute
The Performance attribute collects and averages performance values that have been reported to the monitoring
architecture. If these values violate the set threshold values, an alert is generated.
To know the count of performance attributes associated with specific monitors, and to instantly isolate attributes on
which alerts were generated, use the Performance Attributes in Monitors test.
This test is disabled by default. To enable the test, go to the ENABLE / DISABLE TESTS page using the menu sequence
: Agents -> Tests -> Enable/Disable, pick
SAP R/3
as the Component type, set
Performance
as the Test type, choose
this test from the DISABLED TESTS list, and click on the >> button to move the test to the ENABLED TESTS list. Finally,
click the Update button.
Purpose
Reports the count of performance attributes associated with specific monitors, and helps isolate
attributes on which alerts were generated
Target of the
test
A SAP R/3 server
Agent
deploying the
test
An internal/remote agent

M O N I T O R I N G T H E S A P A B A P I N S T A N C E
173
Configurable
parameters for
the test
1. TEST PERIOD - How often should the test be executed
2. HOST - Host name of the server for which the test is to be configured
3. PORT - Enter the port to which the specified HOST listens
4. CLIENTNAME – Specify the ID of the client system that is connecting to the R/3 server. To
view a list of client IDs to choose from, follow the procedure discussed in Page 14.
5. SAPUSER - Provide a valid user name for logging into the SAP R/3 server. In order to
enable the eG Enterprise suite to effectively monitor SAP, the name of a SAPUSER with
either of the following profiles need to be specified: S_A.SYSTEM (super administrator) or
SAP_ALL (all authorizations for SAP).
6. PASSWORD - The password of the specified SAPUSER.
7. CONFIRMPASSWORD - Confirm the password by retyping it here.
8. SYSNO - An indicator of the TCP/IP port at which the SAP server listens. For example, for a
server that listens at port 3200, the SYSNO will be '00'. Similarly, if the SAP server port is
3201, the SYSNO will have to be specified as '01'. Therefore, in the SYSNO text box
specify the system number of the SAP server with which the specified client communicates.
9. ROUTER - If the SAP client with the specified CLIENTNAME exists in a network external to
the SAP server, then a router will be used to enable the server-client communication. In
such a case, specify the IP of the router in the ROUTER text box. If both the client and the
server exist in the same network, then specify 'none' against the ROUTER text box.
10. INSTANCENAME - Specify the name of the SAP R/3 instance to be monitored. To view the
complete list of instances to choose from, do the follow the procedure discussed in Page 17
of this document.
11. JCO VERSION – The eG agent uses the SAP JCO library to connect to the SAP ABAP
system and pull out metrics. To enable the eG agent to make this connection and query the
metrics, you need to specify the version of the SAP JCO library that the agent needs to use.
For instance, to instruct the eG agent to use JCO v2.1.19, it would suffice if you specify the
‘major version number’ alone against JCO VERSION – in the case of this example, this will
be
2.x.
12. SETS - Provide a comma-separated list of monitor sets for which performance attributes
are to be monitored. For example:
SAP CCMS Monitor Templates,Monitor Collection for
Certification
13. MONITORS - Provide a comma-separated list of monitors under the configured monitor
SETS for which performance attributes are to be monitored. While specifying the list of
MONITORS, make sure that you specify them in the same order as that of your monitor
SETS specification. For instance, the first monitor in your MONITORS list should belong to
the first monitor set in your SETS specification, and so on. This implies that if your SETS
specification reads as follows -
SAP CCMS Monitor Templates,Monitor Collection for
Certification
- then the first monitor in your MONITORS specification should belong to the
SAP CCMS
Monitor Templates
set and the second monitor should belong to the
Monitor
Collection for Certification
set. In this case, your MONITORS specification may read as
follows:
Dialog Overview,Test Monitor Syslog
.
If you want to include more than one monitor from a particular monitor set in your
MONITORS specification, then make sure that you repeat that monitor set’s name as many
times in your SETS specification.
While configuring the SETS and MONITORS , you may want to know the exact names of
the monitors and monitor sets that form part of your specification. To determine this, follow
the procedure discussed in Page 176 of this document.

M O N I T O R I N G T H E S A P A B A P I N S T A N C E
174
14. XMI AUDIT LEVEL - The XMI interface is a general framework for the CCMS external
system management interfaces. This interface contains essential function modules and
structures that coordinate connections between external system management tools and
individual CCMS interfaces, and writes messages in the R/3 XMI log on behalf of the
external tool. The XMI log is a table containing English message texts. The messages can
have various degrees of detail. The audit level determines the degree of detail to which
messages in the XMI log are written - i.e., whether the message should always be logged,
or is simply a message which supplies further detail (higher detail degree). The XMI log
contains messages from external tools and also messages which arise in SMAPI functions.
To indicate to the test the degree of detail to which messages from the eG agent are to be
written in the XMI log, you need to specify the XMI AUDIT LEVEL. By default, this
parameter is set to
0
, which indicates that all calls that modify the database are to be
logged. The other values this parameter can take and their implications are discussed
below:
o 1: Logs all calls that modify the database and error
messages
o 2: Logs all calls that read from the database, modify the
database, and error messages
o 3: Logs all calls and all messages (full trace)
15. TIMEOUT - Indicate the duration (in seconds) for which this test should wait for a response
from the SAP R/3 server. By default, this is set to 120 seconds.
16. DETAILED DIAGNOSIS - To make diagnosis more efficient and accurate, the eG
Enterprise suite embeds an optional detailed diagnostic capability. With this capability, the
eG agents can be configured to run detailed, more elaborate tests as and when specific
problems are detected. To enable the detailed diagnosis capability of this test for a
particular server, choose the On option. To disable the capability, click on the Off option.
The option to selectively enable/disable the detailed diagnosis capability will be available
only if the following conditions are fulfilled:
o The eG manager license should allow the detailed diagnosis capability
o Both the normal and abnormal frequencies configured for the detailed diagnosis
measures should not be 0.
Outputs of the
test
One set of results for every configured Monitor
Measurements
made by the
test
Measurement
Measurement
Unit
Interpretation

M O N I T O R I N G T H E S A P A B A P I N S T A N C E
175
Total number of
performance attributes:
Indicates the total number of
Performance attributes
available for this monitor.
Number
A monitoring tree depicts the hierarchy
of monitoring objects within a monitor
and the various attributes exposed by
the monitoring objects. The monitoring
tree depicted by the detailed diagnosis
page of this measure shows only the
Performance attributes within the
monitoring objects. Within the tree, the
Performance attributes are indicated in
a tabular format. The table contains an
entry for each Performance attribute
exposed by the monitoring object with
details such as the Attribute Name,
Current Value of the attribute (with
units), Importance and the actual
Timestamp of the Current Value shown.
The Importance value is a combination
of the status and severity of the most
significant active alert associated with
this Performance attribute. The Status
of this performance attribute is
represented using the unique color code
as mentioned above. The severity of a
given status is indicated by a number
between 0 and 255, with higher
severity values being more important
than the lower ones.
The monitoring tree is identical to the
alert monitoring tree in SAP CCMS Alert
Monitor and its individual nodes can be
expanded and contracted.
Number of red
performance attributes:
Indicates the number of
errors or critical status
messages that have been
issued for this monitor.
Number
A high value for this measure indicates
that too many performance attributes
of a given monitor have encountered
critical errors. To view these
performance attributes, use the Alerts
page that appears when the
Components ->
SAP -> Alerts
menu sequence is followed in
the eG monitoring console.
Number of yellow
performance attributes:
Indicates the number of
warning messages that have
been issued for this monitor.
Number
A high value for this measure indicates that
too many performance attributes of a given
monitor have encountered warnings. To view
these performance attributes, use the Alerts
page that appears when the
Components ->
SAP -> Alerts
menu sequence is followed in
the eG monitoring console.
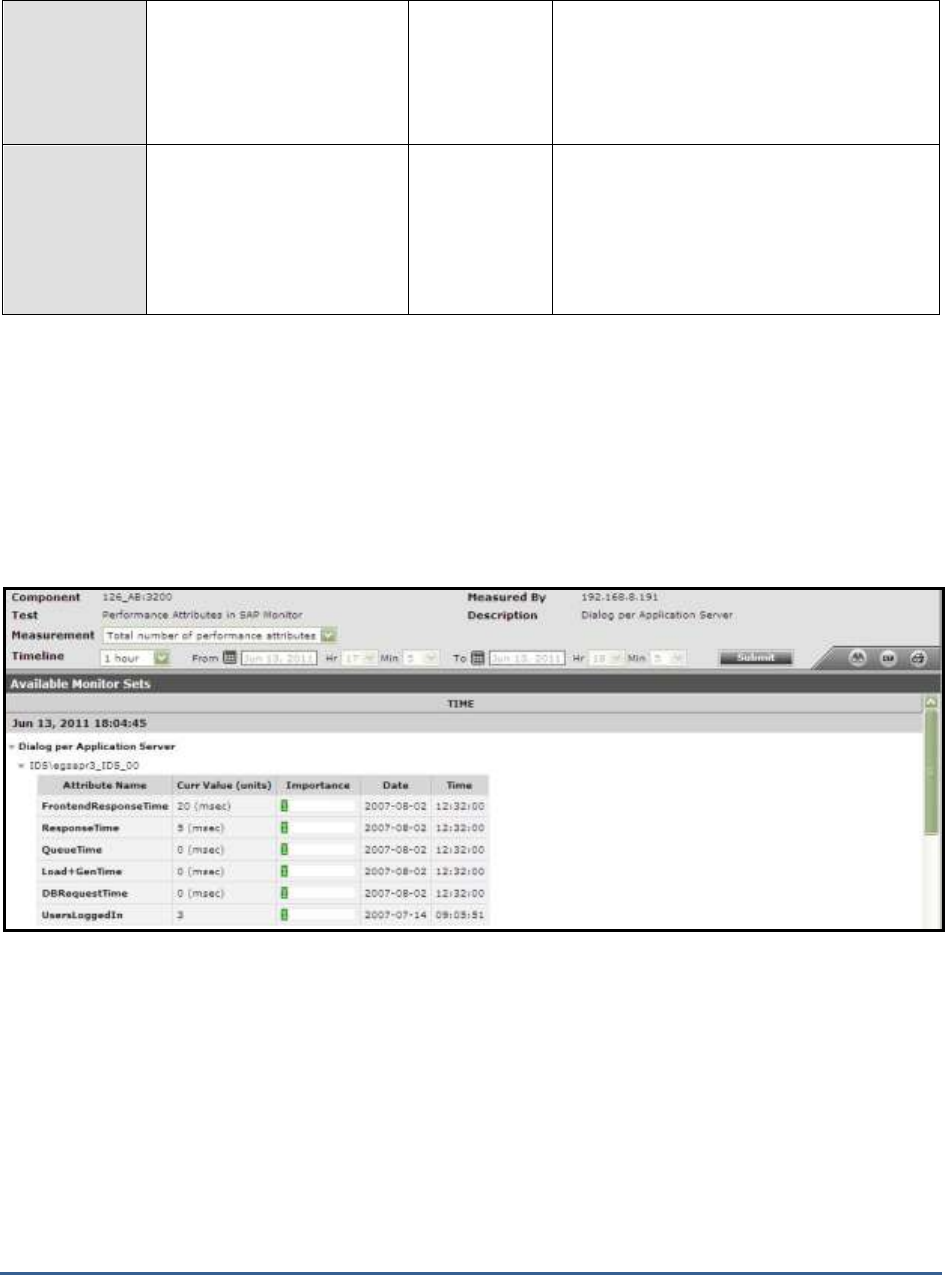
M O N I T O R I N G T H E S A P A B A P I N S T A N C E
176
Number of green
performance attributes:
Indicates the number of
successful events for this
monitor.
Number
Number of inactive
peformance attributes:
Indicates the number of
Performance attributes for
this monitor that currently do
not have any data.
Number
The monitoring tree depicted by the detailed diagnosis page of the
Total number of performance attributes
measure
shows only the Performance attributes within the monitoring objects. Within the tree, the Performance attributes are
indicated in a tabular format. The table contains an entry for each Performance attribute exposed by the monitoring
object with details such as the Attribute Name, Current Value of the attribute (with units), Importance and the actual
Timestamp of the Current Value shown. The Importance value is a combination of the status and severity of the
most significant active alert associated with this Performance attribute. The Status of this performance attribute is
represented using the unique color code as mentioned above. The severity of a given status is indicated by a number
between 0 and 255, with higher severity values being more important than the lower ones.
Figure 2.22: The detailed diagnosis of the Total number of performance attributes measure
While configuring the MONITOR DETAILS , you may want to know the exact names of the monitors and monitor
sets that form part of your specification. To determine this, do the following:
1. Open the SAP Logon tool using the
Start -> Programs -> SAP Front End -> SAP Logon
menu sequence.
2. Pick a system from Figure 2.23 that appears, and click on the Logon button therein to connect to the chosen
sysem.
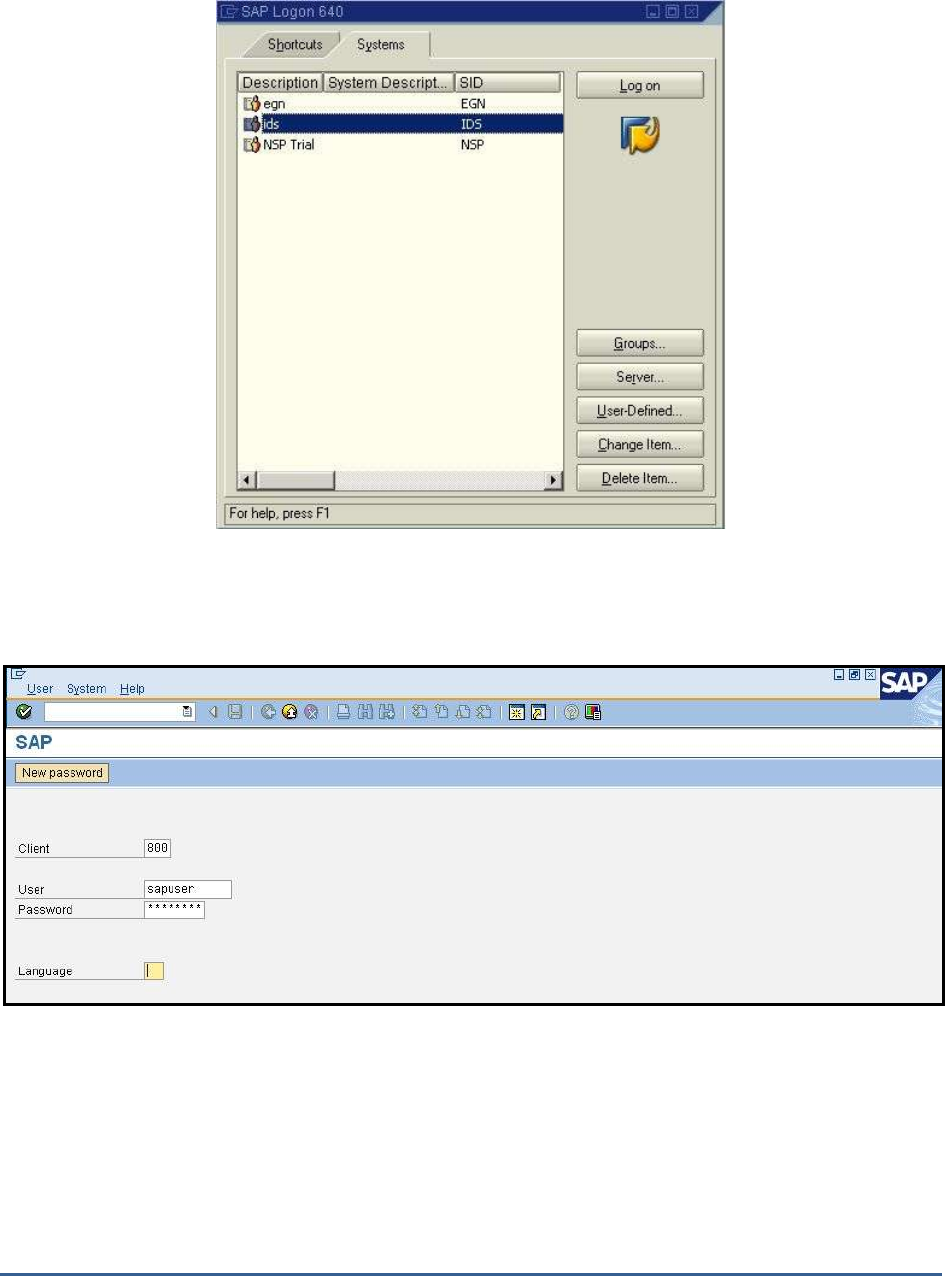
M O N I T O R I N G T H E S A P A B A P I N S T A N C E
177
Figure 2.23: Selecting a system to login to
3. Then, login to the chosen system by providing the required Client, User, and Password credentials. Once the
Password is provided, press the Enter key on your keyboard to login (see Figure 2.24).
Figure 2.24: Logging into the chosen system
4. Upon logging in successfully, the SAP Easy Access interface will appear (see Figure 2.25). In the tree-structure
in the left panel of the interface, follow the node sequence,
SAP Menu -> Tools -> CCMS -> Control/Monitoring
.
Then, double-click on the
RZ20-CCMS Monitor Sets
sub-node under the
Control/Monitoring
node.
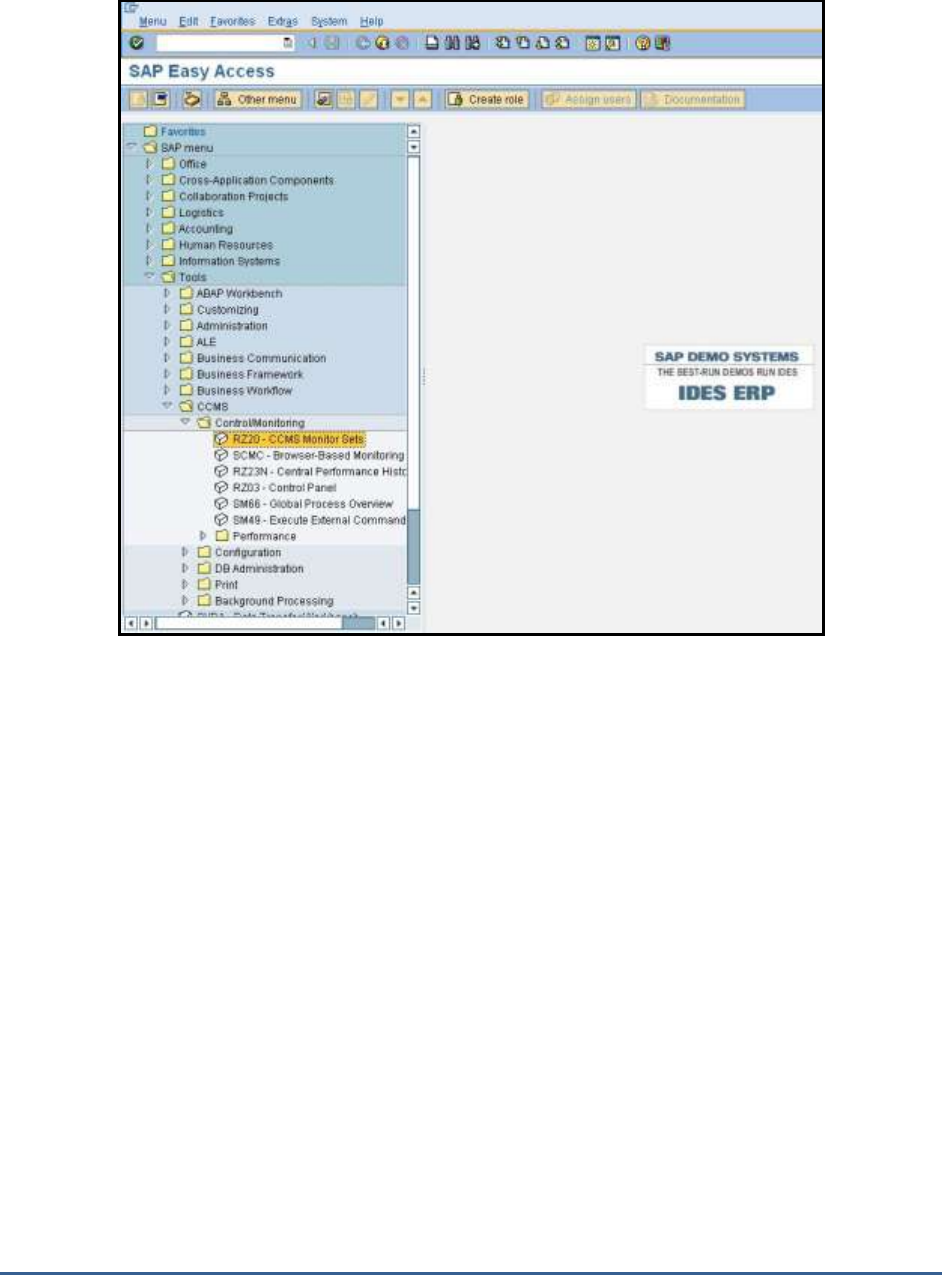
M O N I T O R I N G T H E S A P A B A P I N S T A N C E
178
Figure 2.25: Double-clicking on the CCMS Monitor Sets sub-node
5. This will invoke Figure 2.26, where the complete list of monitor sets will be displayed. Expand a monitor set to
view the monitors within. Use these details to configure the
monitor set:monitors
in the MONITOR DETAILS
text box.
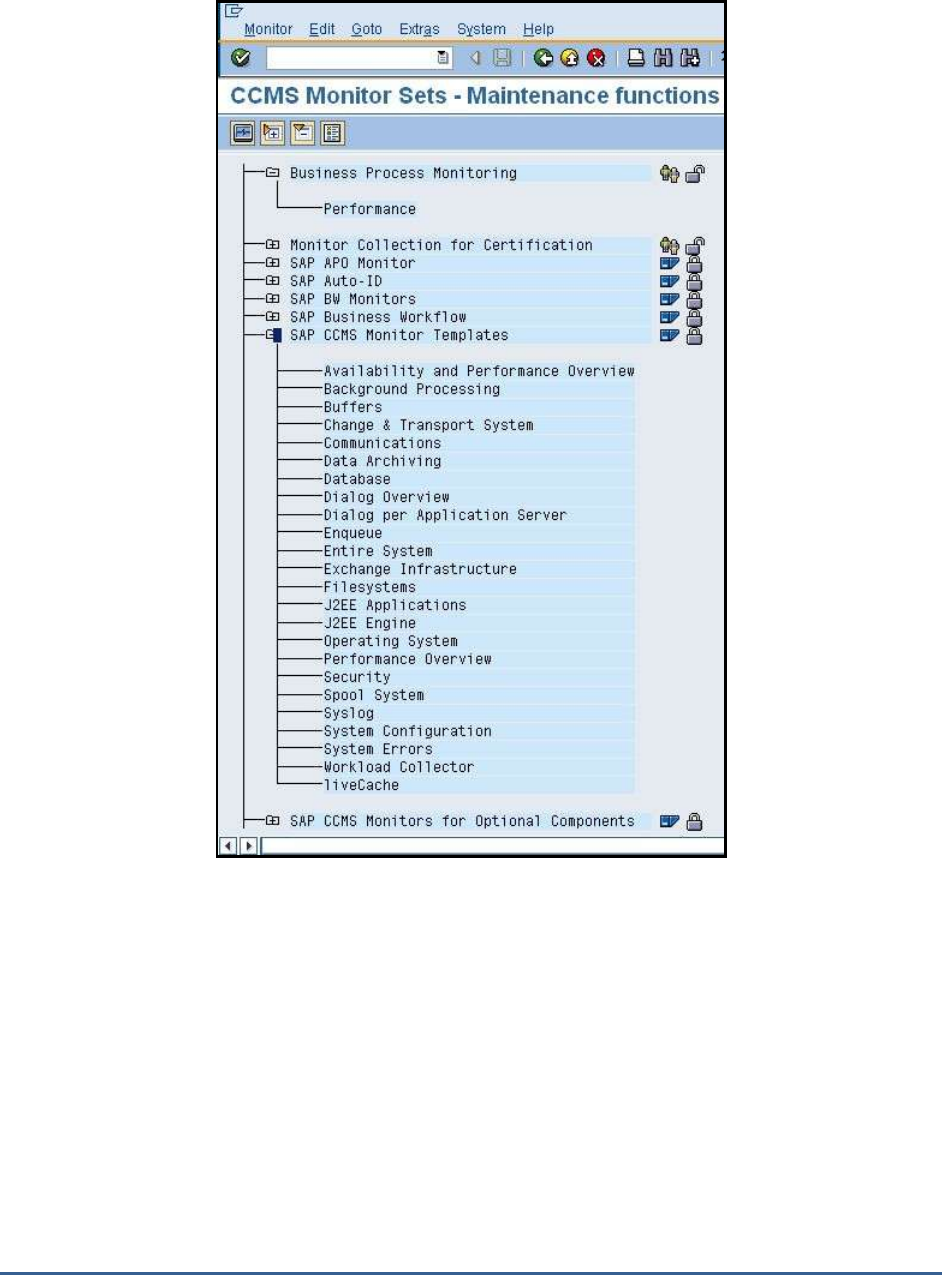
M O N I T O R I N G T H E S A P A B A P I N S T A N C E
179
Figure 2.26: Viewing the monitor sets and monitors
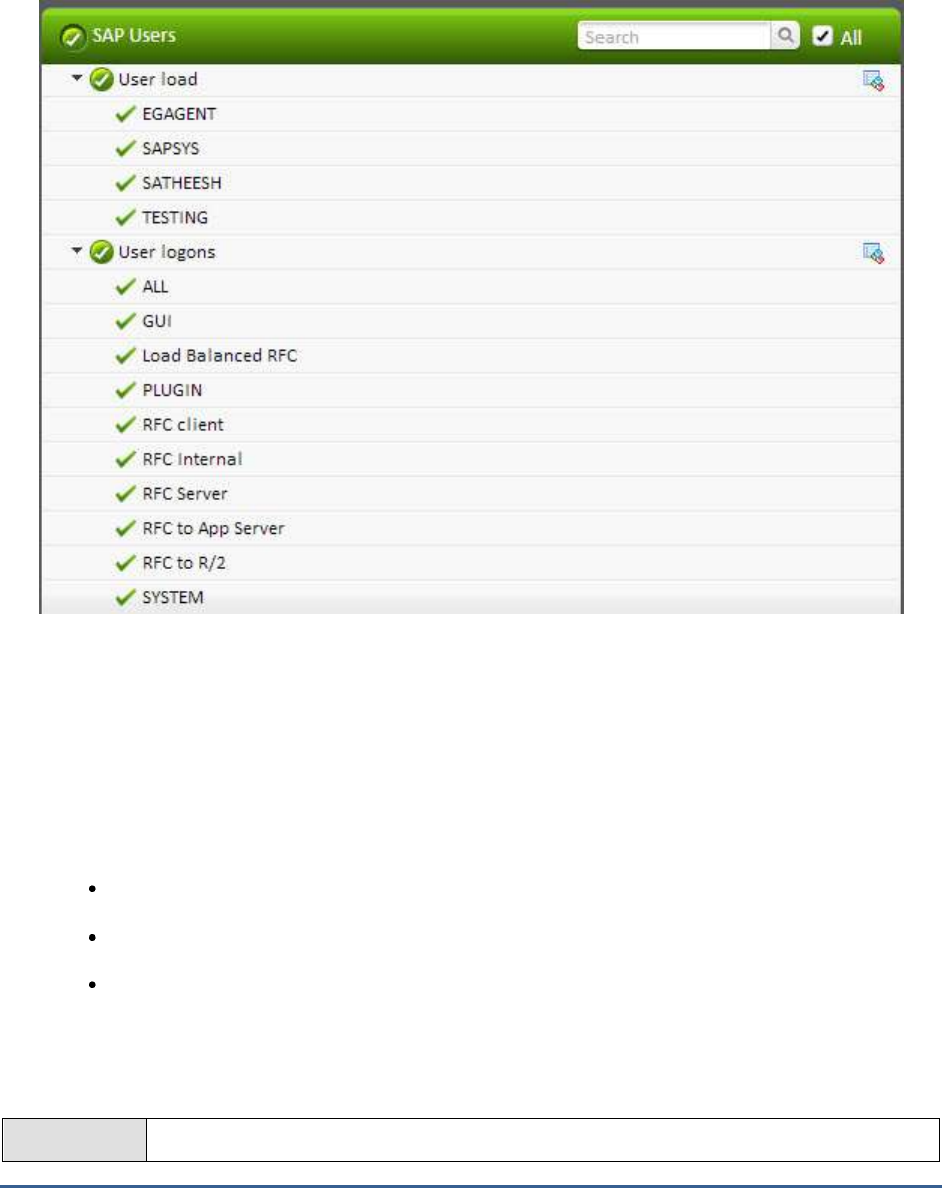
M O N I T O R I N G T H E S A P A B A P I N S T A N C E
180
2.8 The SAP Users Layer
Figure 2.27: The tests mapped to the SAP Users layer
2.8.1 User Load Test
When a user complains that the SAP ABAP system is taking too long to process his/her requests, administrators may
want to closely observe the interactions between that user and the SAP system, identify processing bottlenecks (if
any), and accurately determine where the bottleneck has occurred. The User Load test enables administrators
effectively and efficiently perform this user experience analysis! This test monitors the transactions of every user to
the SAP ABAP system and reports the following:
Which user is executing resource-intensive transactions on the ABAP system?
Which user is overloading the system?
Which user is experiencing slowness when running transactions on the system? Where did this delay
occur? – in the dispatcher queue? when loading/generating objects? when rolling-in/rolling out user
contexts? in the database? when performing enqueue operations? or when waiting for RFC calls to
complete?
Purpose
Monitors the transactions of every user to the SAP ABAP system and reports the following:

M O N I T O R I N G T H E S A P A B A P I N S T A N C E
181
Which user is executing resource-intensive transactions on the ABAP system?
Which user is overloading the system?
Which user is experiencing slowness when running transactions on the system?
Where did this delay occur? – in the dispatcher queue? when loading/generating
objects? when rolling-in/rolling out user contexts? in the database? when
performing enqueue operations? or when waiting for RFC calls to complete?
Target of the
test
A SAP R/3 server
Agent
deploying the
test
An internal/remote agent

M O N I T O R I N G T H E S A P A B A P I N S T A N C E
182
Configurable
parameters for
the test
1. TEST PERIOD - How often should the test be executed
2. HOST - Host name of the server for which the test is to be configured
3. PORTNO - Enter the port to which the specified HOST listens
4. CLIENTNAME – Specify the ID of the client system that is connecting to the R/3 server. To
view a list of client IDs to choose from, follow the procedure discussed in Page 14.
5. SAPUSER - Provide a valid user name for logging into the SAP R/3 server. In order to
enable the eG Enterprise suite to effectively monitor SAP, the name of a SAPUSER with
either of the following profiles need to be specified: S_A.SYSTEM (super administrator) or
SAP_ALL (all authorizations for SAP).
6. PASSWORD - The password of the specified SAPUSER.
7. CONFIRMPASSWORD - Confirm the password by retyping it here.
8. SYSNO - An indicator of the TCP/IP port at which the SAP server listens. For example, for a
server that listens at port 3200, the SYSNO will be '00'. Similarly, if the SAP server port is
3201, the SYSNO will have to be specified as '01'. Therefore, in the SYSNO text box
specify the system number of the SAP server with which the specified client communicates.
9. ROUTER - If the SAP client with the specified CLIENTNAME exists in a network external to
the SAP server, then a router will be used to enable the server-client communication. In
such a case, specify the IP of the router in the ROUTER text box. If both the client and the
server exist in the same network, then specify 'none' against the ROUTER text box.
10. INSTANCENAME - Specify the name of the SAP R/3 instance to be monitored. To view the
complete list of instances to choose from, do the follow the procedure discussed in Page 17
of this document.
11. TIMEOUT - Indicate the duration (in seconds) for which this test should wait for a response
from the SAP R/3 server. By default, this is set to 120 seconds.
12. JCO VERSION – The eG agent uses the SAP JCO library to connect to the SAP ABAP
system and pull out metrics. To enable the eG agent to make this connection and query the
metrics, you need to specify the version of the SAP JCO library that the agent needs to use.
For instance, to instruct the eG agent to use JCO v2.1.19, it would suffice if you specify the
‘major version number’ alone against JCO VERSION – in the case of this example, this will
be
2.x
.
13. MAXIMUM STEPS – To report workload metrics, the eG agent will have to typically analyze
numerous dialog steps of activity on the SAP ABAP system. To reduce the stress on the eG
agent, you can limit the number of dialog steps the eG agent needs to process in order to
make a fair assessment of the workload and the processing ability of the ABAP system. This
limit can be specified against MAXIMUM STEPS. By default, this limit is set to 5000.
14. INCLUDE TCODES – By default, this test monitors only those transactions that were
invoked in the last measurement period. However, if you want a few critical transactions to
be monitored all the time – i.e., regardless of their status (whether they were invoked or
not) in the last measurement period – then, you can provide a comma-separated list of the
transaction codes of such transactions against INCLUDE TCODES.
15. ISPASSIVE – If the value chosen is YES, then the server under consideration is a passive
server in a SAP R/3 cluster. No alerts will be generated if the server is not running.
Measures will be reported as “Not applicable” by the agent if the server is not up.
M O N I T O R I N G T H E S A P A B A P I N S T A N C E
183
16. DETAILED DIAGNOSIS - To make diagnosis more efficient and accurate, the eG
Enterprise suite embeds an optional detailed diagnostic capability. With this capability, the
eG agents can be configured to run detailed, more elaborate tests as and when specific
problems are detected. To enable the detailed diagnosis capability of this test for a
particular server, choose the On option. To disable the capability, click on the Off option.
The option to selectively enable/disable the detailed diagnosis capability will be available
only if the following conditions are fulfilled:
The eG manager license should allow the detailed diagnosis capability
Both the normal and abnormal frequencies configured for the detailed diagnosis
measures should not be 0.
Outputs of the
test
One set of results for every transaction handled by the SAP AS ABAP instance being monitored
Measurements
made by the
test
Measurement
Measurement
Unit
Interpretation
Activity:
Indicates the rate of steps
executed for this user’s
transactions in the last
measurement period.
Steps/Sec
This is a good indicator of the workload
imposed by a user on the SAP ABAP instance.
You can compare the value of this measure
across users to know which transaction is
generating the maximum load.
CPU utilization:
Indicates the percentage of
CPU resources utilized by this
user’s transactions.
Percent
Compare the value of this measure across
users to know which user is using the
maximum CPU and is probably causing a CPU
contention on the system. You may then
want to observe how this user has been
using CPU over time and figure out whether
the CPU usage of that user remains
consistently high; if so, it could mean that
that transactions executed by that user
require more processing power to execute.
You may then want to consider resizing the
SAP ABAP system with more CPU resources.
M O N I T O R I N G T H E S A P A B A P I N S T A N C E
184
Total memory:
Indicates the total memory
used by the transactions of
this user during the last
measurement period.
MB
This measure is the sum total of the roll
memory, extended memory, and heap
memory used by a process.
By comparing the value of this measure
across users, you can accurately identify that
user who is consuming the maximum
memory. If the memory usage of this user
has been abnormally high consistently, it
could indicate that the user is typically
running memory-intensive transactions and
requires more memory resources for proper
execution. You should then figure out how
much memory and of what type should be
allocated to the task. For this, you may want
to determine which memory type was being
used the highest over time – is it heap
memory? Roll memory? Or extended
memory. The values of the
PRIV mode heap
memory
and the
Extended memory
metrics
will help administrators figure this out.
You can also use the detailed diagnosis of
this measure to identify the top 3 memory-
consuming steps of a particular transaction.
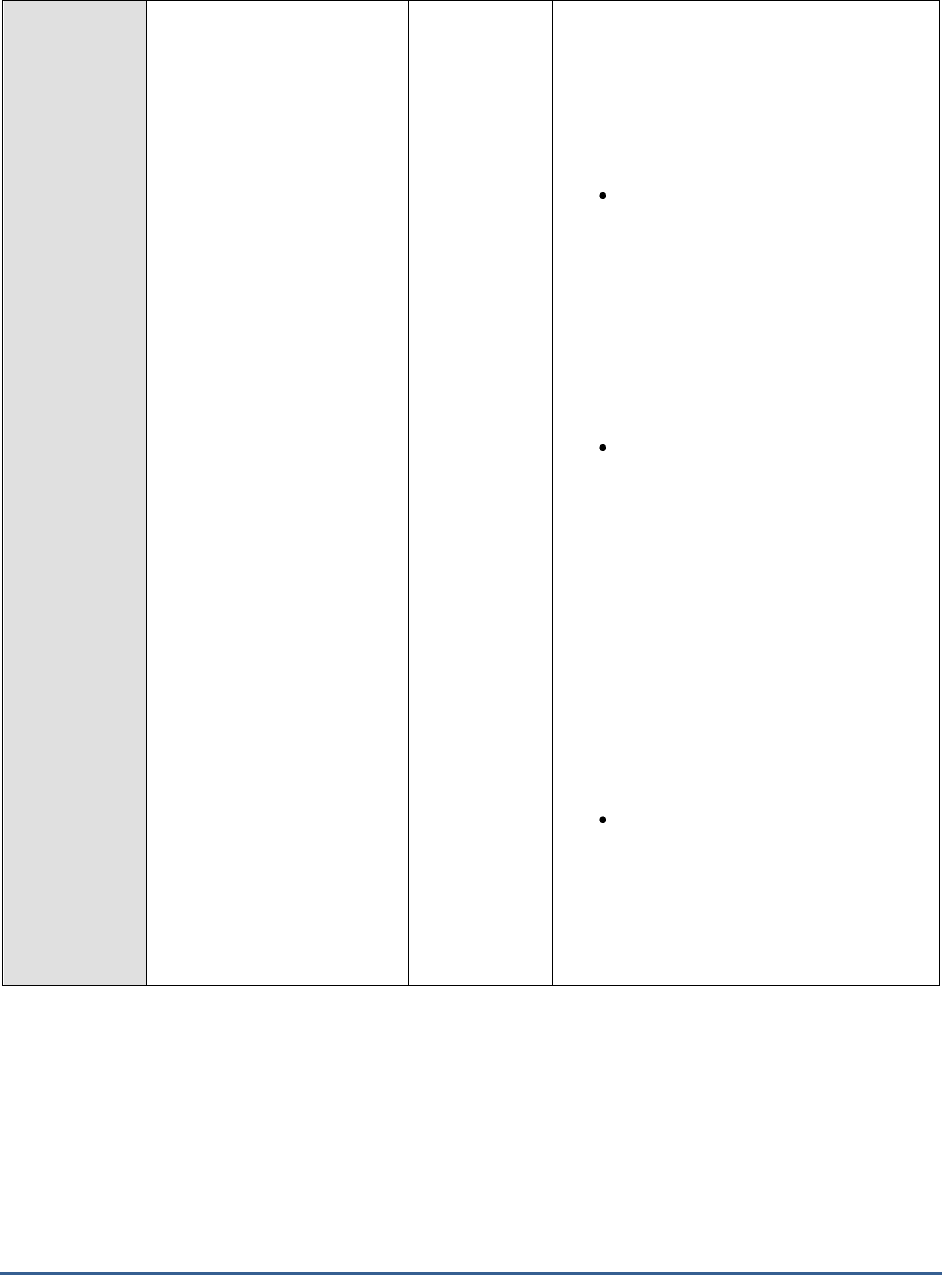
M O N I T O R I N G T H E S A P A B A P I N S T A N C E
185
PRIV mode heap memory:
Indicates the maximum
PRIV mode heap memory
consumed by transactions
of this user in the last
measure period.
MB
SAP’s memory management system assigns
memory to a work process. The order in
which a work process is assigned the memory
type depends on the work process type,
either dialog or non-dialog), and the
underlying operating system. Some of the
memory types are as follows:
Roll area: The roll area memory is
used for the initial memory assigned
to a user context, and (if available)
for additional memory if the
expanded memory is full. The roll
area consists of 2 segments. The
first segment is assigned to the work
process first as memory. If this is
used up, the work process has more
memory assigned to it.
Extended memory: Each ABAP work
process has a part reserved in its
virtual address space for extended
memory. The majority of the user
context is stored in the extended
memory. You can map the extended
memory from the common resource
onto any work process, and after
onto another process on the same
address in the virtual address space.
This is important if you work with
pointers in the ABAP program. The
value of the
Extended memory
measure indicates how each user is
using this memory type.
Private memory: If a dialog work
process has used up the roll area
assigned to it and the extended
memory, private memory is
assigned to the work process. The
work process goes into PRIV mode
(private). Other processes cannot

M O N I T O R I N G T H E S A P A B A P I N S T A N C E
186
use private (heap) memory. After
releasing the assigned memory, the
operating system still considers the
(virtual) memory as being occupied
by the allocating process.
A consistent increase in the value of
the
PRIV mode heap memory
measure for a user therefore
indicates that transactions of that
user are continuously using up all
the roll area and extended memory,
and are being forced to reach out to
the private memory. This could
mean that the user transactions are
memory-intensive. If too many
transactions are found to be using
PRIV heap memory, it could mean
that the work processes are sized
with insufficient roll area and
extended memory. You may hence
want to allocate more roll area and
extended memory to make sure that
private memory usage is minimal.
Extended memory:
Indicates the maximum
extended memory used
by transactions of this
user in the last measure
period.
MB
Work process restarts:
Indicates the number of
work process restarts
caused by transactions of
this user in the last
measure period.
Number
One of the common reasons for work process
restarts is excessive usage of private
memory. The work process, if it has used a
lot of private memory, is restarted when the
user context is terminated and the local
memory is returned. The restart makes the
local memory available again for other
processes.
Regardless of what caused it, work process
restarts are performance-impacting and need
to be kept at a minimum.

M O N I T O R I N G T H E S A P A B A P I N S T A N C E
187
Maximum response time
of a step:
Indicates the maximum
response time of the
transaction steps of this user
in the last measurement
period.
Secs
An SAP transaction normally extends over
several transaction steps. During these steps,
data such as variables, internal tables, and
screen lists are built up and stored in the
main memory of the application server.
This measure compares the response time of
all the transactions executed by a user in the
last measurement period and reports the
highest response time.
Use the detailed diagnosis of this measure to
identify the top 3 transactions executed by
this user with highest response times. This
leads you to the probable cause for delay in
the execution of this transaction in the last
five minutes. Apart from the response time
break up, the report and CUA programs that
were running are also shown as part of
detailed diagnosis.
Total response time:
Indicates the total response
time per transaction of this
user within the last measure
period.
Seconds/transa
ction
This measure includes the response time
taken at the server and the round trip times.
Ideally, the value of this measure should be
low. High values are indicative of poor
responsiveness.
Compare the value of this measure across
users to identify the user who is experiencing
the maximum slowness. To know the reason
for the delay, you can compare the value of
the
GUI time, GUI Net time, Server response
time, Processing time, Dispatcher wait time,
Load and generation time, Roll time,
Database request time, Lock time, and RFC
time
measures for that transaction. This will
accurately pinpoint where the user
transactions spent maximum time – in the
dispatcher queue? at the server end? in
processing? when loading objects? when
rolling in user contexts? when performing
database operations? when performing
enqueue operations? Or in waiting for RFC
calls?
You can also use the detailed diagnosis of
this measure to view the details of the top 3
transaction invocations that were least
responsive.

M O N I T O R I N G T H E S A P A B A P I N S T A N C E
188
GUI time:
Indicates the average time
taken for round trip
communication steps
between client and server in
between a transaction of
this user.
Secons/transac
tion
If the values of these measures are
excessive, check that the hardware
requirements for the presentation server are
met and that the network between the
application servers and the presentation
servers is not experiencing shortages or slow
traffic.
GUI Net time:
Indicates the average front
end net time taken for the
first and last steps of
transactions of this user.
Seconds/transa
ction
Server response time:
Indicates the average
response time of a
transaction of this user at
the server end.
Seconds/transa
ction
In the event of a processing slowdown, you
can compare the value of this measure with
other response time measures reported by
this test to understand where the processing
bottleneck lies.
Processing time:
Indicates the average time
taken to process a
transaction of this user.
Secons/transac
tion
A high value for this measure may indicate
that ABAP programs are very complex and
the work processes spend a large amount of
time interpreting what is to be done.
The processing time of transactions executed
by the dialog work process for instance
should be below twice the CPU time.
Dispatcher wait time:
Indicates the average time
that the transactions of
this user spent waiting for a
free work process at the
dispatcher.
Seconds/transa
ction
When the dispatcher receives a processing
request, it looks for a free SAP work process
of the required type and then sends the
request to this work process, which begins
the work. If all SAP work processes of the
required type are busy when the request
initially reaches the dispatcher, the request is
placed in the dispatcher queue. In the
dispatcher queue, the request waits until a
work process of the required type is free. As
soon as a work process is free, the
dispatcher sends the request to it. This time
the request spends in the dispatcher queue is
indicated as the dispatcher wait time.
For the transactions of the dialog work
process for instance, the value of this
measure should be less than 10% of the
value of the
Total response time
measure.
Higher values are indicative of performance
problems. One common cause of such
performance problems may be insufficient
work processes.

M O N I T O R I N G T H E S A P A B A P I N S T A N C E
189
Load and generation time:
Indicates the average time
spent for a transaction of
this user for loading and
generation.
Seconds/transa
ction
All ABAP programs and screens that are
required but not yet available in the
application server buffers must be loaded or
generated. The time it takes to do this is
indicated as load and generation time.
Loading a program also entails accessing
database tables that store the ABAP
programs.
Typically, for the transactions of the dialog
work process, the load time per step should
not be greater than 50 ms.
High values could indicate problems with
memory configuration, small buffer sizes,
wrong parameter settings or a CPU
bottleneck.

M O N I T O R I N G T H E S A P A B A P I N S T A N C E
190
Roll time:
Indicates the average time
spent by a transaction of
this user for rolling in user
contexts and when waiting
for roll out.
Secs
AN SAP transaction normally extends over
several transaction steps. During these steps,
data such as variables, internal tables, and
screen lists are built up and stored in the
main memory of the application server. This
data is known as user context. Different
transaction steps are normally processed by
different dialog work processes. At the
beginning of a transaction step, the user
context is made available to the appropriate
work process.This procedure is called roll-in.
Roll-out on the other hand saves the current
user-context data to virtual memory at the
conclusion of a transaction step. The time a
transaction step waited in the roll-area is
called
roll wait t
ime.
The value of this measure is the sum total of
roll-in time and roll wait time.
A high value for this measure indicates that
the user transaction is either taking too long
to roll in user contexts or is waiting too long
in the roll-area for a roll-out to occur. Since a
user context is moved out of the local
memory of a work process and moved into
the roll buffer during the roll-in process,
improperly sized roll buffers can cause
slowdowns in this process. Lack of adequate
space in the extended memory can also
contribute to a slowdown when rolling in user
contexts.
Possible causes for high roll wait times may
be due to having all work processes in the
target system occupied. It is very important
to configure the instances properly, especially
when they are designed to handle RFC
communication.

M O N I T O R I N G T H E S A P A B A P I N S T A N C E
191
Database request time:
Indicates the average time
spent by transactions of this
user for performing database
operations such as selects,
inserts, updates, deletes and
commits.
Secons/transac
tion
When data is read or changed in the dataase,
the time required is known as Database
request time. This time is measured from the
moment the database request is sent to the
database server and runs until the moment
the data is returned to the application server.
Ideally, for the transactions of the dialog
work process, the value of this measure
should be 40% of the total response time.
Many factors can cause worrysome spikes in
this value. This could be problems in the
database such as expensive SQL statement
or wrong parameter settings in the database
level. In addition, issues in network
connectivity between the application server
and the database can also adversely impact
this value. This is because, the
Database
request time
not only includes the time
required by the database to produce the
requested data, but also the time required for
network transfer of that data. In addition, I/O
contentions experienced by the physical disks
can also affect this time.
Lock time:
Indicates the average time
spent performing enqueue
operations for a transaction
of this user.
Seconds/Trans
action
The enqueue service allows SAP ABAP
applications to lock data so that only they can
use it. Locking the data prevents parallel
changes to the same data, which would lead
to data inconsistency.
The
Lock time
measure reports the time from
sending an enqueue request to the SAP
enqueue server to the receipt of the results.
For the transactions of the dialog work
process for example, the
Lock time
should be
less than 5 ms. Any value higher than that
would represent a problem that might affect
system stability. Network problems can also
increase the value of this measure.

M O N I T O R I N G T H E S A P A B A P I N S T A N C E
192
RFC time:
Indicates the average time
spent waiting for RFC calls to
get executed in a
transaction of this user.
Secons/Transa
ction
The value of this measure includes
CPIC
(Common Programming Interface
Communication) time
as well. CPIC is
typically used by the SAP system for
program-to-program communication.
An increase in RFC time can increase
roll wait
time
considerably. When synchronous RFCs
are called, the work process executes a roll
out and may have to wait for the
end of the RFC in the roll area, even if the
dialog step is not yet completed. In the roll
area, RFC server programs can also wait for
other RFCs sent to them. The time a
transaction step waited in the roll-area is
called
roll wait t
ime.
The absence of adequate work processes can
cause the RFC time and consequently, the
roll wait time to increase. Besides ensuring
that the SAP ABAP system is sized with
sufficient work processes, you can also set
the following parameters properly to better
balance RFC load:
rdisp/rfc_max_comm_entries: This
specifies the maximum number of
communications in an instance. No
more dialog work processes will be
given to the program calling the
target system after this number is
reached.
rdisp/rfc_min_wait_dia_wp: This
specifies the number of work
processes to be always available for
online users.
2.8.2 User logons Test
By tracking the user logins to the SAP ABAP system, administrators can understand how actively the system is being
used and accordingly plan the capacity of the system. In addition, failed login attempts can also be isolated, thus
turning the spotlight on unauthorized accesses and malicious attacks. This is why, eG Enterprise periodically executes
the User Logons test. For every type of login, this test reports the number of users who are logged in, measures the
activity levels of the users, and reports login failures. This way, the test indicates how well the ABAP system is being
utilized, proactively reveals a consistent rise in user activity on the system, and pre-emptively points to dubious login
attempts.

M O N I T O R I N G T H E S A P A B A P I N S T A N C E
193
Purpose
For every type of login, this test reports the number of users who are logged in, measures the
activity levels of the users, and reports login failures
Target of the
test
A SAP R/3 server
Agent
deploying the
test
An internal/remote agent
Configurable
parameters for
the test
1. TEST PERIOD - How often should the test be executed
2. HOST - Host name of the server for which the test is to be configured
3. PORTNO - Enter the port to which the specified HOST listens
4. CLIENTNAME – Specify the ID of the client system that is connecting to the R/3 server. To
view a list of client IDs to choose from, follow the procedure discussed in Page 14.
5. SAPUSER - Provide a valid user name for logging into the SAP R/3 server. In order to
enable the eG Enterprise suite to effectively monitor SAP, the name of a SAPUSER with
either of the following profiles need to be specified: S_A.SYSTEM (super administrator) or
SAP_ALL (all authorizations for SAP).
6. PASSWORD - The password of the specified SAPUSER.
7. CONFIRMPASSWORD - Confirm the password by retyping it here.
8. SYSNO - An indicator of the TCP/IP port at which the SAP server listens. For example, for a
server that listens at port 3200, the SYSNO will be '00'. Similarly, if the SAP server port is
3201, the SYSNO will have to be specified as '01'. Therefore, in the SYSNO text box
specify the system number of the SAP server with which the specified client communicates.
9. ROUTER - If the SAP client with the specified CLIENTNAME exists in a network external to
the SAP server, then a router will be used to enable the server-client communication. In
such a case, specify the IP of the router in the ROUTER text box. If both the client and the
server exist in the same network, then specify 'none' against the ROUTER text box.
10. INSTANCENAME - Specify the name of the SAP R/3 instance to be monitored. To view the
complete list of instances to choose from, do the follow the procedure discussed in Page 17
of this document.
11. TIMEOUT - Indicate the duration (in seconds) for which this test should wait for a response
from the SAP R/3 server. By default, this is set to 120 seconds.
12. JCO VERSION – The eG agent uses the SAP JCO library to connect to the SAP ABAP
system and pull out metrics. To enable the eG agent to make this connection and query the
metrics, you need to specify the version of the SAP JCO library that the agent needs to use.
For instance, to instruct the eG agent to use JCO v2.1.19, it would suffice if you specify the
‘major version number’ alone against JCO VERSION – in the case of this example, this will
be
2.x
.
13. CUTOFFMINS – Specify the duration of inactivity of a user, beyond which that user will be
considered as inactive. Such users will be automatically excluded from the
Active users
count and the value of the
Percentage active users
measure.
14. ISPASSIVE – If the value chosen is YES, then the server under consideration is a passive
server in a SAP R/3 cluster. No alerts will be generated if the server is not running.
Measures will be reported as “Not applicable” by the agent if the server is not up.
M O N I T O R I N G T H E S A P A B A P I N S T A N C E
194
15. DD FREQUENCY - Refers to the frequency with which detailed diagnosis measures are to
be generated for this test. The default is
1:1
. This indicates that, by default, detailed
measures will be generated every time this test runs, and also every time the test detects a
problem. You can modify this frequency, if you so desire. Also, if you intend to disable the
detailed diagnosis capability for this test, you can do so by specifying
none
against DD
FREQUENCY.
16. DETAILED DIAGNOSIS - To make diagnosis more efficient and accurate, the eG
Enterprise suite embeds an optional detailed diagnostic capability. With this capability, the
eG agents can be configured to run detailed, more elaborate tests as and when specific
problems are detected. To enable the detailed diagnosis capability of this test for a
particular server, choose the On option. To disable the capability, click on the Off option.
The option to selectively enable/disable the detailed diagnosis capability will be available
only if the following conditions are fulfilled:
The eG manager license should allow the detailed diagnosis capability
Both the normal and abnormal frequencies configured for the detailed diagnosis
measures should not be 0.
Outputs of the
test
One set of results for every user login type - GUI, PLUGIN, SYSTEM and various RFC subtypes
such as RFC client, RFC Internal, RFC Server, RFC to App Server, RFC to R/2. One set of
summary measures for all types
Measurements
made by the
test
Measurement
Measurement
Unit
Interpretation
Logged in users:
Indicates the number of users
of this type who are currently
logged in.
Number
This is a good indicator of the current
workload imposed on the SAP ABAP instance.
You can compare the value of this measure
across login types to know which type of
login contributed to the maximum load.
Active users:
Indicates the number of
users of this login type
who created some activity
in the instance during the
last measure period.
Number
A high value of this measure is indicative of
high level of user activity on the ABAP
instance. In the event of an overload, you cn
compare the value of this measure across
login types to know which type of login is
generating the maximum activity on the
instance.
Percentage active users:
Indicates the percentage of
logged in users of this type
who are currently active.
Percent
Number of failed logins:
Indicates the number of
logins of this type that failed.
Number
Ideally, the value of this measure should be
low. If this value is abnormally high, you can
use the detailed diagnosis of this measure to
know which logins failed and investigate why.
Note that the value of this measure does not
include the number of logins that failed due to
incorrect password.

M O N I T O R I N G T H E S A P A B A P I N S T A N C E
195
New users:
Indicates the number of users
of this login type who logged
in during the last
measurement period.
Number
Logouts:
Indicates the number of users
of this login type who have
successfully logged out in the
last measure period.
Number
The detailed diagnosis of this measure shows
the activity summary of the logged out user
such as name, hostname, login time, duration
in minutes etc.
External sessions:
Indicates the total number of
external sessions created for
this login type.
Number
When user logs on to SAP ABAP system, the
system creates a new terminal session called
external session. In general, each user can
open up to six windows in a single SAP GUI
session. Each of these windows corresponds
to an external session on the application
server with its own area of shared memory.
Internal sessions:
Indicates the total number of
internal sessions created for
this login type.
Number
Internal sessions are automatically created by
the ABAP system when navigating through
transactions. Internal sessions are like
navigation levels when performing system
functions.. A maximum of 9 internal sessions
can be created.
The internal session has a memory area that
contains the ABAP program and its associated
data. Internal sessions proportionately
increase the memory consumption of its
parent external session. High average
number of internal sessions results in higher
memory consumption for the same number
of external sessions.
2.9 Viewing the SAP Alerts
The eG monitoring console provides a dedicated interface for selectively viewing the history of alerts related to
managed SAP R/3 components. With the help of this interface, administrators can at-a-glance infer the number,
nature, status, and severity of issues encountered by the SAP R/3 environment, currently and in the past. This
information will enable administrators to understand how problem-prone their SAP environment has been over time,
study problem patterns, isolate recurring problems (if any), and arrive at effective solutions.
Moreover, active alerts awaiting manual completion can be effortlessly identified using this interface, and such alerts
can also be closed by employing a simple sequence of mouse-clicks on this interface.
To access this interface, follow the menu sequence,
Components -> SAP -> Alerts
in the eG monitoring console.
Figure 2.28 will then appear.

M O N I T O R I N G T H E S A P A B A P I N S T A N C E
196
Figure 2.28: The SAP Alerts page with the filter criteria
In this page, do the following:
1. To view the SAP alerts related to a particular SAP R/3 component, select a Component.
2. Once a Component is selected, the Monitor Sets list will be populated with the monitor sets that currently exist
for the selected component. To view the alerts for specific monitor sets, pick them from the Monitor Sets list.
3. The monitors that are available within the chosen monitor sets will be populated automatically in the Monitors
list. Select the monitors of your choice from this list.
4. Use the Filter By list to filter your alerts based on their current status. The options available here are as follows:
g. Active: Pick this criterion to view the currently active alerts pertaining to the selected monitor
sets and the monitors.
h. Done: This criterion is selected to view the list of alerts that were completed by the
administrator.
i. Auto Completed: You can select this option to view the list of alerts that were completed
automatically by the SAP system.
j. All: Select this option to view all alerts related to the chosen monitors, regardless of their
status.
5. Then, from the Timeline list box, select the time period for which you wish to view the alerts. The timeline
options available are as follows:
k. To view all the alerts that were generated by the SAP R/3 system since startup, select the All
option from the Timeline list box.
l. If you wish to view the alerts that were prevalent for a short period during the last 24 hours,
pick the Last X Minutes option. This will invoke the Hr and Min list boxes using which you can
specify a particular time period for which you wish to view the alerts.
m. By picking the Any option, you will be allowed to select the date/time range from the list boxes
that appear next to the Timeline option.
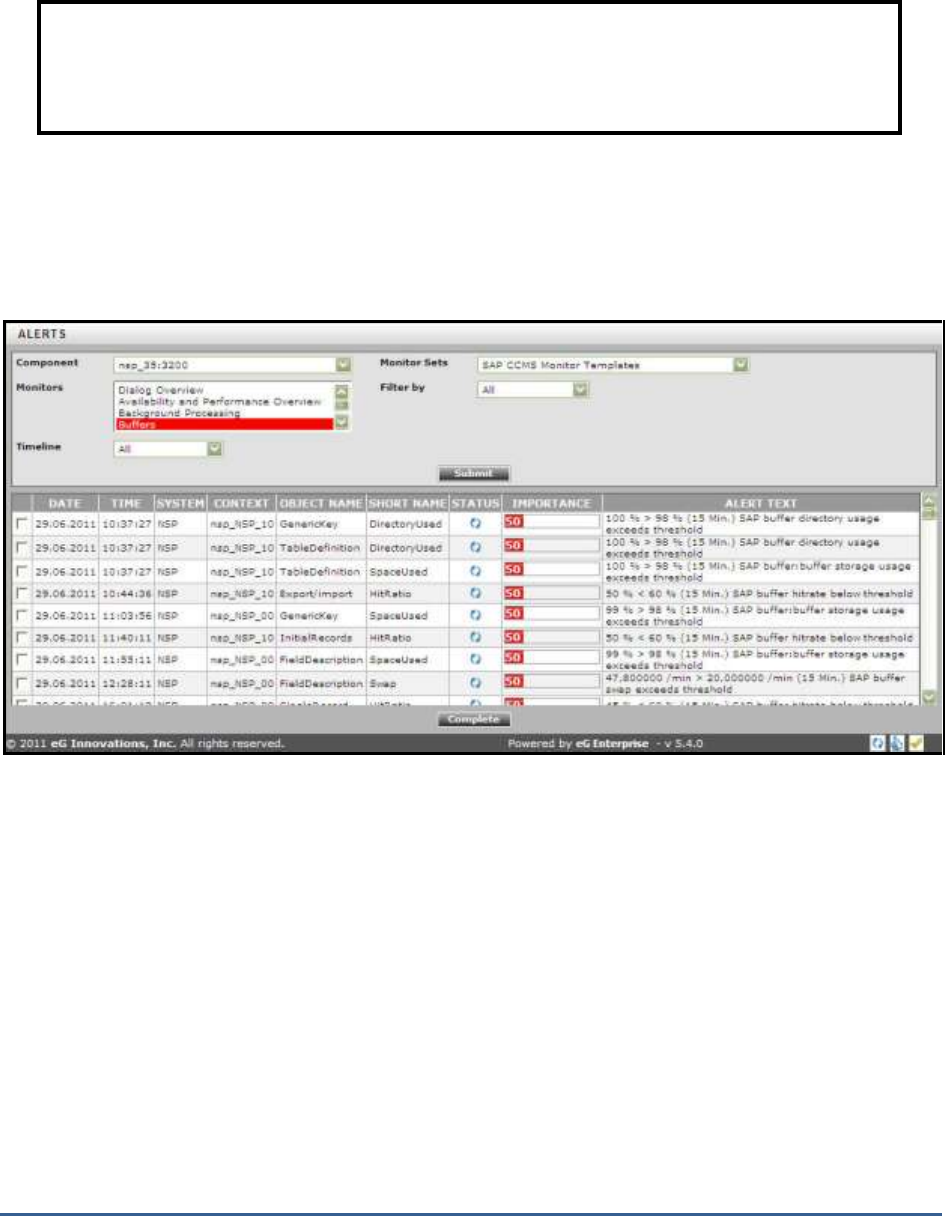
M O N I T O R I N G T H E S A P A B A P I N S T A N C E
197
6. Finally, click the Submit button to view the list of alerts that fulfill the selected criteria.
7. If the Filter by option was set to All, then all alerts related to chosen monitor sets and monitors will appear,
regardless of status (see Figure 2.29).
Figure 2.29: The SAP Alerts page displaying all alerts, regardless of status
8. On the other hand, if you had chosen the Active alerts from the Filter by list, then only the currently active alerts
will appear.
Note:
The date/time range provided as part of the Any Timeline specification will pertain to the time zone of
the SAP USER configured for the New alerts in the last measurement period test.

M O N I T O R I N G T H E S A P A B A P I N S T A N C E
198
Figure 2.30: The SAP Alerts page displaying only the active alerts
9. Regardless of the Filter by option chosen, the details displayed for each alert include the Date, Time, System (the
name of the SAP R/3 system), Context (the instance on which this alert has occurred), Object Name and Short
Name (the name of the monitoring object and its corresponding attribute that is responsible for this alert). Also,
in the Status column, the status of each alert will be indicated using symbols. In other words, the symbol will
be displayed to represent an
Active
alert. Likewise, the symbol represents the alerts that were
Auto
Completed
by the SAP R/3 system and the symbol represents that the alerts were completed i.e.,
Done
by the
administrator. Besides status, an alert is also accompanied by 'importance' indicators. The importance of an alert
is represented by a color coding and a severity value ranging from
0 to 255
, encrypted on the color. A red color
in the Importance column indicates that the alert is critical and a yellow color in the Importance column indicates
that this is a warning alert. An elaborate description of alert will be available in the Alert text column. The alerts
displayed in this page are sorted in the order and sequence specified below:
n. ascending order of the monitors chosen from the Monitors list box in Figure 2.30
o. ascending order of status code (active/done/auto-completed),
p. descending order of severity values (most severe alerts appear first)
q. ascending order of alert time stamps
r. ascending order of the ID of the alert (note that the alarm ID will not be displayed in the
Figure 2.30, and is maintained internally by the eG Enterprise system; this will be however
used for the sorting purposes).
10. Active alerts can also be completed on-the-fly, using this page. For this purpose, simply select the check box
corresponding to an active alert, and click the Complete button below (see Figure 2.30)
Note:
The DATE and TIME displayed for every alert in this page will pertain to the time zone of the SAP USER
configured for the New alerts in the last measure period test.
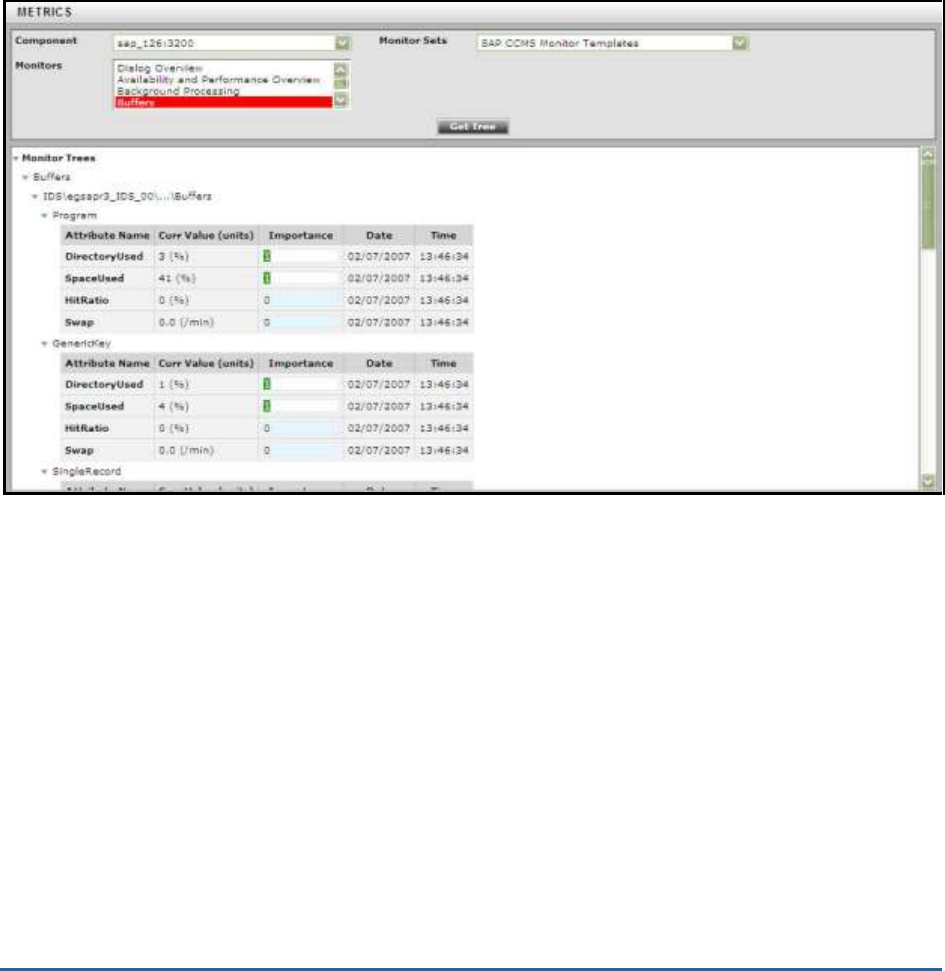
M O N I T O R I N G T H E S A P A B A P I N S T A N C E
199
2.10 Viewing the Performance Attribute Tree
The Performance Attribute tree (see Figure 2.22) discussed earlier in this chapter allowed you to view all
the performance attributes that are associated with a specific monitor only. However, if you are
looking for a more flexible interface, which allows you to choose from all monitor sets configured for a
SAP R/3 server, pick one/more monitors of interest to you, and view all the attributes associated with
all chosen monitors, then, you will have to use the METRICS page (see Figure 2.31) offered by the eG
monitoring console. To access this page, follow the
Components -> SAP -> Metrics
menu sequence.
Figure 2.31: The Metrics page
To use this page, do the following:
1. Select the SAP R/3 Component of interest to you.
2. All the Monitor Sets configured for the chosen server will then populate the Monitor Sets list. Pick a monitor set
from this list.
3. The Monitors list will then display all the monitors associated with the chosen Monitor Set. Select one/more
monitors from this list, and click the Get Tree button.
4. An attribute tree providing the details of all the attributes of the chosen monitors will then appear, as depicted
by Figure 2.31 above. Within the tree, the Performance attributes will be displayed in a tabular format. The
table contains an entry for each Performance attribute exposed by the monitoring object with details such as
the Attribute Name, Current Value of the attribute (with units), Importance and the actual Timestamp of the
Current Value shown. The Importance value is a combination of the status and severity of the most significant
active alert associated with this Performance attribute. The Status of this performance attribute is represented
using a unique color code. The severity of a given status is indicated by a number between 0 and 255, with
higher severity values being more important than the lower ones.

M O N I T O R I N G T H E I N T E R N E T T R A N S A C T I O N S E R V E R ( I T S )
200
Monitoring the Internet
Transaction Server (ITS)
The Internet Transaction Server is the platform-independent, browser-based SAP client that typically comprises of
two components: a WGate component, and an AGate component. The WGate component is a CGI program that runs
within a web server (Apache). This component interfaces between the web server and the AGate component, and
facilitates the transmission of requests from the web server and HTML responses from the AGate component.
The AGate component, on the other hand, performs the following functions:
Sends the requests received from the WGate component to the SAP application server
Receives ‘Screen’ from the application server
Formats ‘Screen’ into HTML using an HTML Template file and style sheets
Sends the formatted page to WGate
As the SAP ITS serves as an interface between the users and the SAP application server, any
performance slowdown or non-availability that the SAP ITS experiences can negatively impact the user
interaction with the SAP environment. If such an outcome is to be prevented, then both the AGate and
WGate components of SAP ITS need to be kept under constant observation.
To monitor the WGate component, eG Enterprise recommends the following steps:
Configure a web site on the web server hosting the WGate component
While configuring the transactions to be monitored, ensure that the URL
*/wgate/*
is
included in the PAGES TO BE INCLUDED list.
As for the AGate component, eG Enterprise prescribes a unique
AGate
monitoring model to monitor the load
on the component and the user accesses to it (see Figure 3.1).
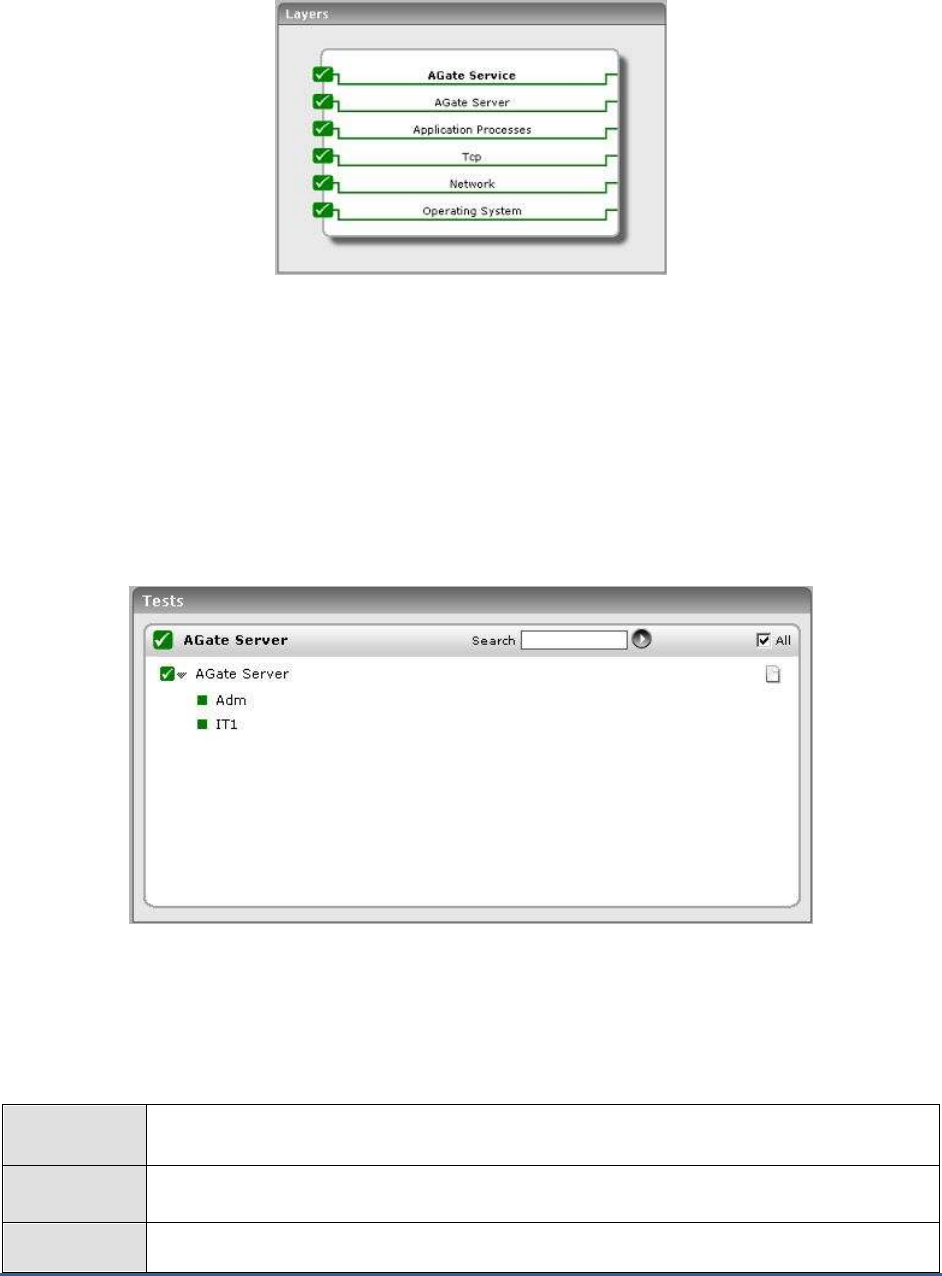
M O N I T O R I N G T H E I N T E R N E T T R A N S A C T I O N S E R V E R ( I T S )
201
Figure 3.1: The layer model of the AGate component of ITS
The sections to come discuss each of top 2 layers of Figure 3.1. For details on the remaining layers, please refer to
the
Monitoring Unix and Windows Servers
document.
3.1 The AGate Server layer
The AgateServer test associated with the AGate Server layer measures the session load on the AGate component,
and reveals whether/not the component has adequate threads to handle the load.
Figure 3.2: The tests associated with the AGate Server layer
3.1.1 AGate Server Test
The AGateServerTest reports performance statistics pertaining to the AGate component of the Internet Transaction
Server (ITS).
Purpose
Reports performance statistics pertaining to the AGate component of the Internet Transaction
Server (ITS)
Target of the
test
The AGate Component of ITS
Agent
deploying the
An internal agent
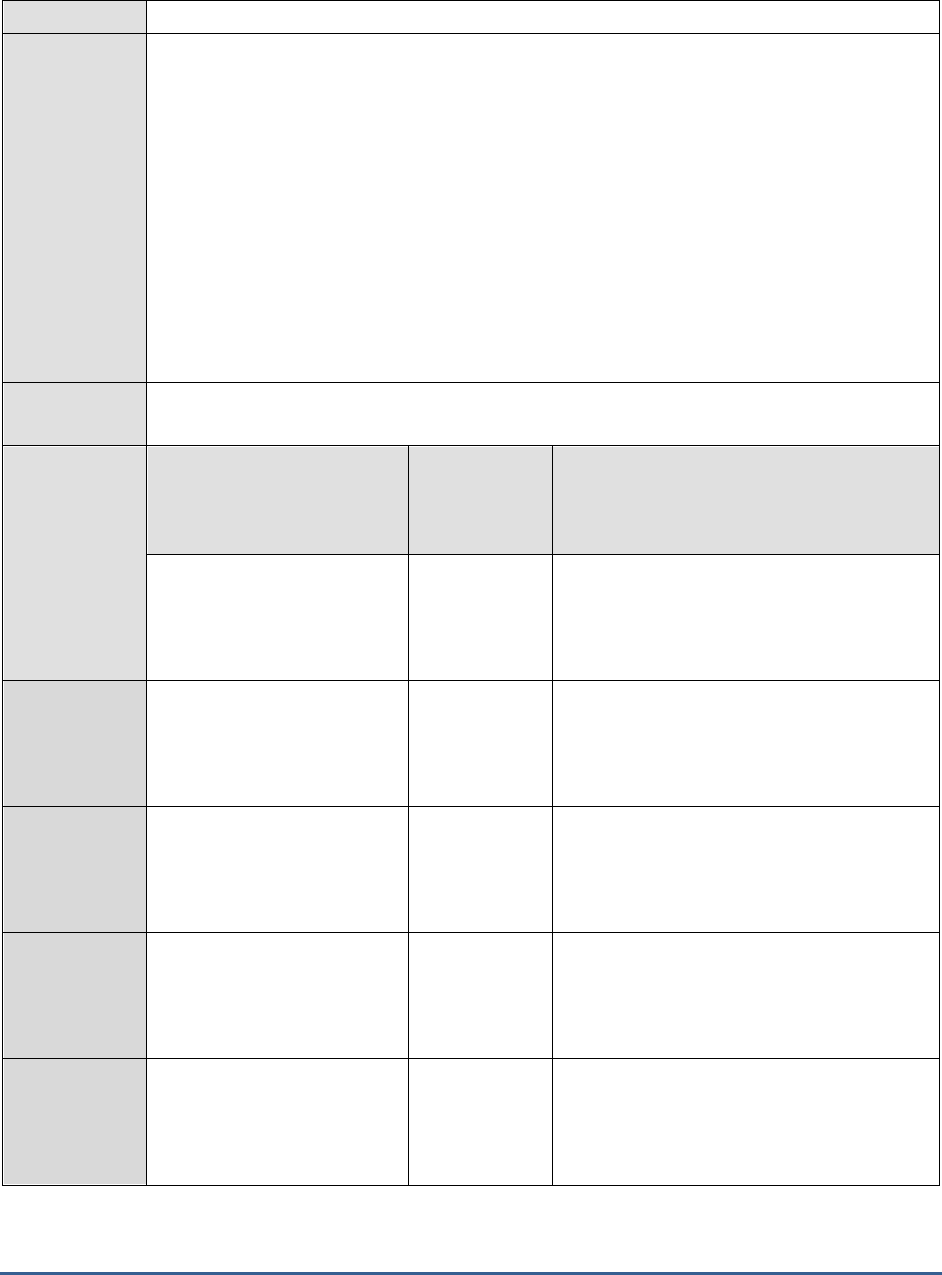
M O N I T O R I N G T H E I N T E R N E T T R A N S A C T I O N S E R V E R ( I T S )
202
test
Configurable
parameters for
the test
1. TEST PERIOD - How often should the test be executed
2. HOST - Host name of the server for which the test is to be configured
3. LOGFILEPATH - This test extracts the performance metrics from the
performance.log
file
present in the
{ITS_INSTALL_DIR}\6.20\{Directory corresponding to the ITS instance}\logs
directory. Therefore, in the LOGFILEPATH text box, provide the full path to the
performance.log
file in the following format:
{Instance Name}={Path to the log file}
. For
example, if the log file for an instance named 'ADM' is to be monitored, and ITS is installed
in the C:\Program Files\SAP\ITS directory, then the LOGFILEPATH specification should be
as follows:
ADM=c:\Progra~1\SAP\ITS\6.20\ADM\logs\performance.log
. To monitor the
performance.log files associated with multiple instances, provide the LOGFILEPATH as a
comma-separated list. For example,
ADM=c:\Progra~1\SAP\ITS\6.20\ADM\logs\performance.log,ITS1=c:\Progra~1\SAP\ITS\6.
20\ITS1\logs\performance.log
.
Outputs of the
test
One set of results for every ITS instance being monitored
Measurements
made by the
test
Measurement
Measurement
Unit
Interpretation
Current sessions:
Indicates the number of
sessions that are currently
active.
Number
Free sessions:
Indicates the number of free
sessions.
Number
Sessions usage:
Indicates the percentage
utilization of sessions.
Percent
Active worker threads:
Indicates the worker threads
that are currently active.
Number
Free worker threads:
Indicates the number of free
worker threads.
Number
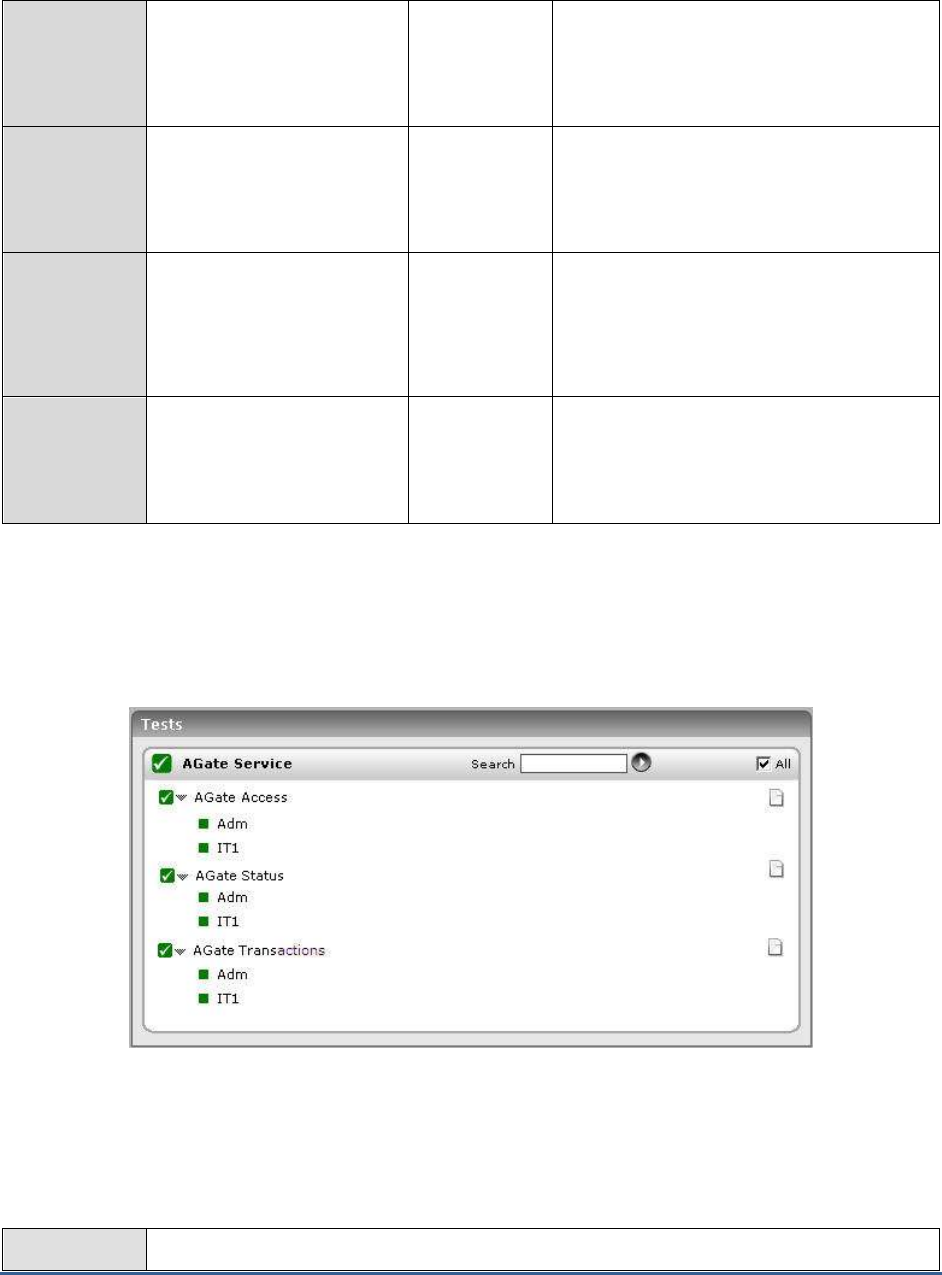
M O N I T O R I N G T H E I N T E R N E T T R A N S A C T I O N S E R V E R ( I T S )
203
Worker threads usage:
Indicates the percentage
usage of worker threads.
Percent
Hit rate:
Indicates the rate at which
the AGate component was
hit.
Hits/Sec
Turnaround time:
Indicates the total time taken
by a client request to reach
the AGate component and a
response received from it.
Secs
Hits:
Indicates the number of hits
at an AGate component.
Number
3.2 The AGate Service Layer
The tests associated with the AGate Service layer extract critical access statistics from the AGate component.
Figure 3.3: The tests associated with the AGate Service layer
3.2.1 AGate Access Test
The AgateAccess test reports the number of successful logins to the AGate component of the Internet Transaction
Server (ITS).
Purpose
Reports the number of successful logins to the AGate component of the Internet Transaction
M O N I T O R I N G T H E I N T E R N E T T R A N S A C T I O N S E R V E R ( I T S )
204
Server (ITS).
Target of the
test
The AGate Component of ITS
Agent
deploying the
test
An internal agent
Configurable
parameters for
the test
1. TEST PERIOD - How often should the test be executed
2. HOST - Host name of the server for which the test is to be configured
3. LOGFILEPATH - This test extracts the performance metrics from the
access.log
file
present in the
{ITS_INSTALL_DIR}\6.20\{Directory corresponding to the ITS instance}\logs
directory. Therefore, in the LOGFILEPATH text box, provide the full path to the
access.log
file in the following format:
{Instance Name}={Path to the log file}
. For example, if the log
file for an instance named 'ADM' is to be monitored, and ITS is installed in the C:\Program
Files\SAP\ITS directory, then the LOGFILEPATH specification should be as follows:
ADM=c:\Progra~1\SAP\ITS\6.20\ADM\logs\access.log
. To monitor the access.log files
associated with multiple instances, provide the LOGFILEPATH as a comma-separated list.
For example,
ADM=c:\Progra~1\SAP\ITS\6.20\ADM\logs\access.log,ITS1=c:\Progra~1\SAP\ITS\6.20\ITS
1\logs\access.log
.
Outputs of the
test
One set of results for every ITS instance being monitored
Measurements
made by the
test
Measurement
Measurement
Unit
Interpretation
Access count:
Indicates the number of
times the AGate component
was successfully accessed.
Number
3.2.2 AGate Status Test
The AgateStatus test reports whether any errors occurred in the AGate component during the last measurement
period.
Purpose
Reports whether any errors occurred in the AGate component during the last measurement
period
Target of the
test
The AGate Component of ITS
Agent
deploying the
test
An internal agent
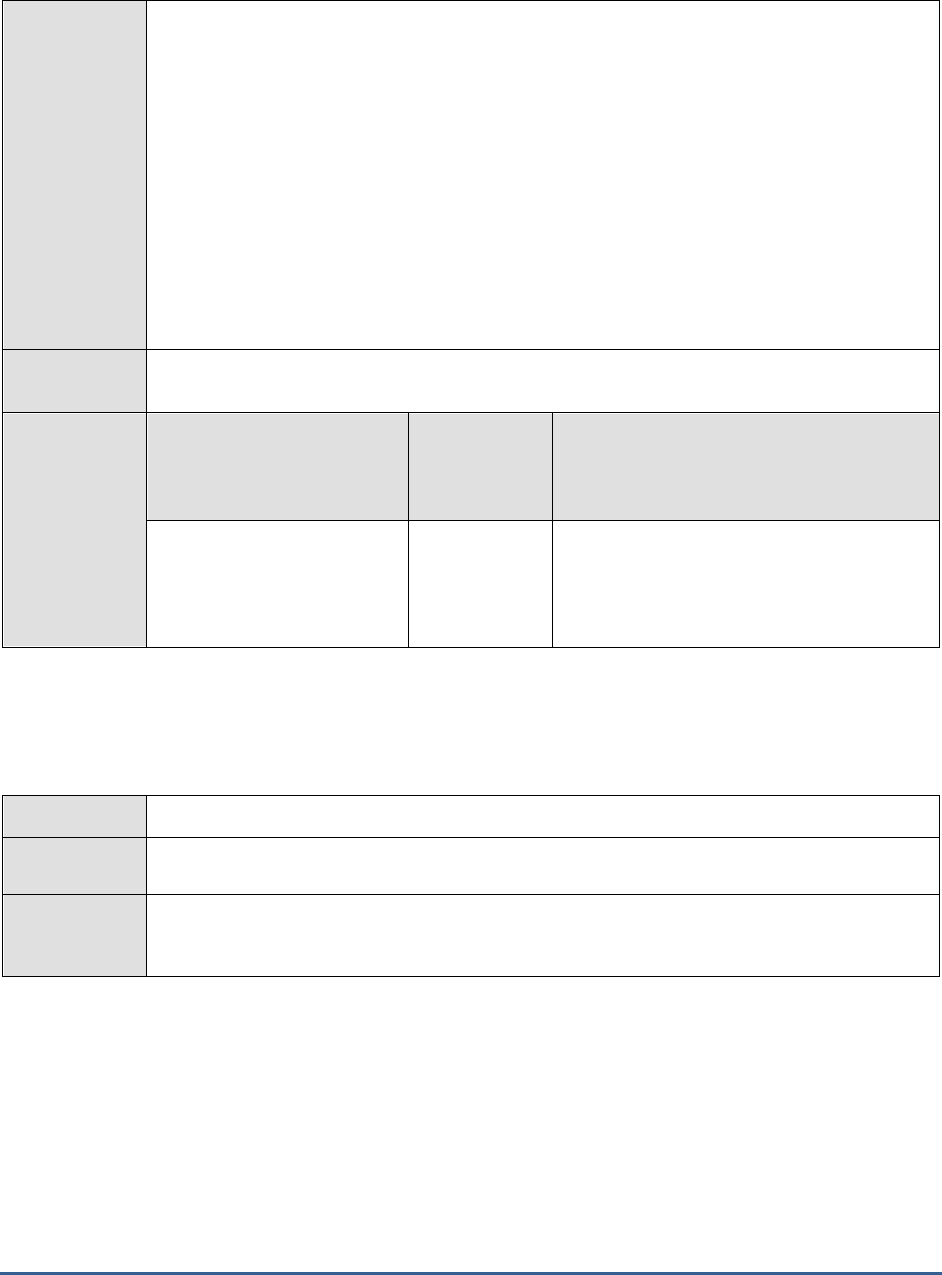
M O N I T O R I N G T H E I N T E R N E T T R A N S A C T I O N S E R V E R ( I T S )
205
Configurable
parameters for
the test
1. TEST PERIOD - How often should the test be executed
2. HOST - Host name of the server for which the test is to be configured
3. LOGFILEPATH - This test extracts the performance metrics from the
diagnostics.log
file
present in the
{ITS_INSTALL_DIR}\6.20\{Directory corresponding to the ITS instance}\logs
directory. Therefore, in the LOGFILEPATH text box, provide the full path to the
diagnostics.log
file in the following format:
{Instance Name}={Path to the log file}
. For
example, if the log file for an instance named 'ADM' is to be monitored, and ITS is installed
in the C:\Program Files\SAP\ITS directory, then the LOGFILEPATH specification should be
as follows:
ADM=c:\Progra~1\SAP\ITS\6.20\ADM\logs\diagnostics.log
. To monitor the
diagnostics.log files associated with multiple instances, provide the LOGFILEPATH as a
comma-separated list. For example,
ADM=c:\Progra~1\SAP\ITS\6.20\ADM\logs\diagnostics.log,ITS1=c:\Progra~1\SAP\ITS\6.20
\ITS1\logs\diagnostics.log
.
Outputs of the
test
One set of results for every ITS instance being monitored
Measurements
made by the
test
Measurement
Measurement
Unit
Interpretation
Message count:
Indicates the number of
diagnostic messages.
Number
These are always failure messages.
3.2.3 AGate Transactions Test
The AgateTrans test monitors the access requests serviced by the ITS instance.
Purpose
Monitors the access requests serviced by the ITS instance
Target of the
test
The AGate Component of ITS
Agent
deploying the
test
An internal agent
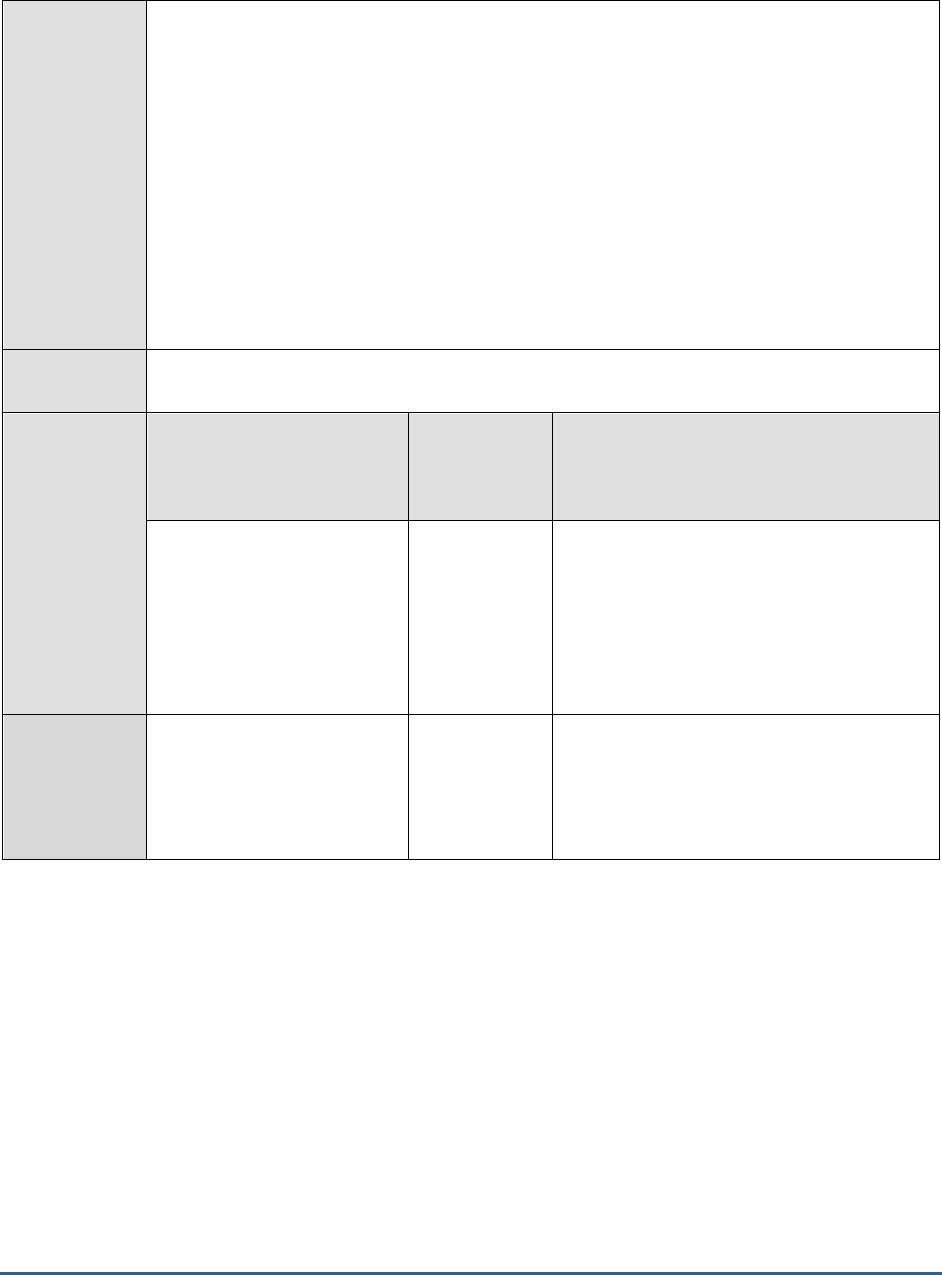
M O N I T O R I N G T H E I N T E R N E T T R A N S A C T I O N S E R V E R ( I T S )
206
Configurable
parameters for
the test
1. TEST PERIOD - How often should the test be executed
2. HOST - Host name of the server for which the test is to be configured
3. LOGFILEPATH - This test extracts the performance metrics from the
loadstat.log
file
present in the
{ITS_INSTALL_DIR}\6.20\{Directory corresponding to the ITS instance}\logs
directory. Therefore, in the LOGFILEPATH text box, provide the full path to the
loadstat.log
file in the following format:
{Instance Name}={Path to the log file}
. For
example, if the log file for an instance named 'ADM' is to be monitored, and ITS is installed
in the C:\Program Files\SAP\ITS directory, then the LOGFILEPATH specification should be
as follows:
ADM=c:\Progra~1\SAP\ITS\6.20\ADM\logs\loadstat.log
. To monitor the
loadstat.log files associated with multiple instances, provide the LOGFILEPATH as a
comma-separated list. For example,
ADM=c:\Progra~1\SAP\ITS\6.20\ADM\logs\loadstat.log,ITS1=c:\Progra~1\SAP\ITS\6.20\IT
S1\logs\loadstat.log
.
Outputs of the
test
One set of results for every ITS instance being monitored
Measurements
made by the
test
Measurement
Measurement
Unit
Interpretation
AGate instances:
Every ITS instance could
consist of multiple AGate
instances. This measure
returns the number of AGate
instances in every monitored
ITS instance.
Number
Web transactions:
The number of web accesses
(including incorrect accesses)
that were serviced by the
AGate instances
Number
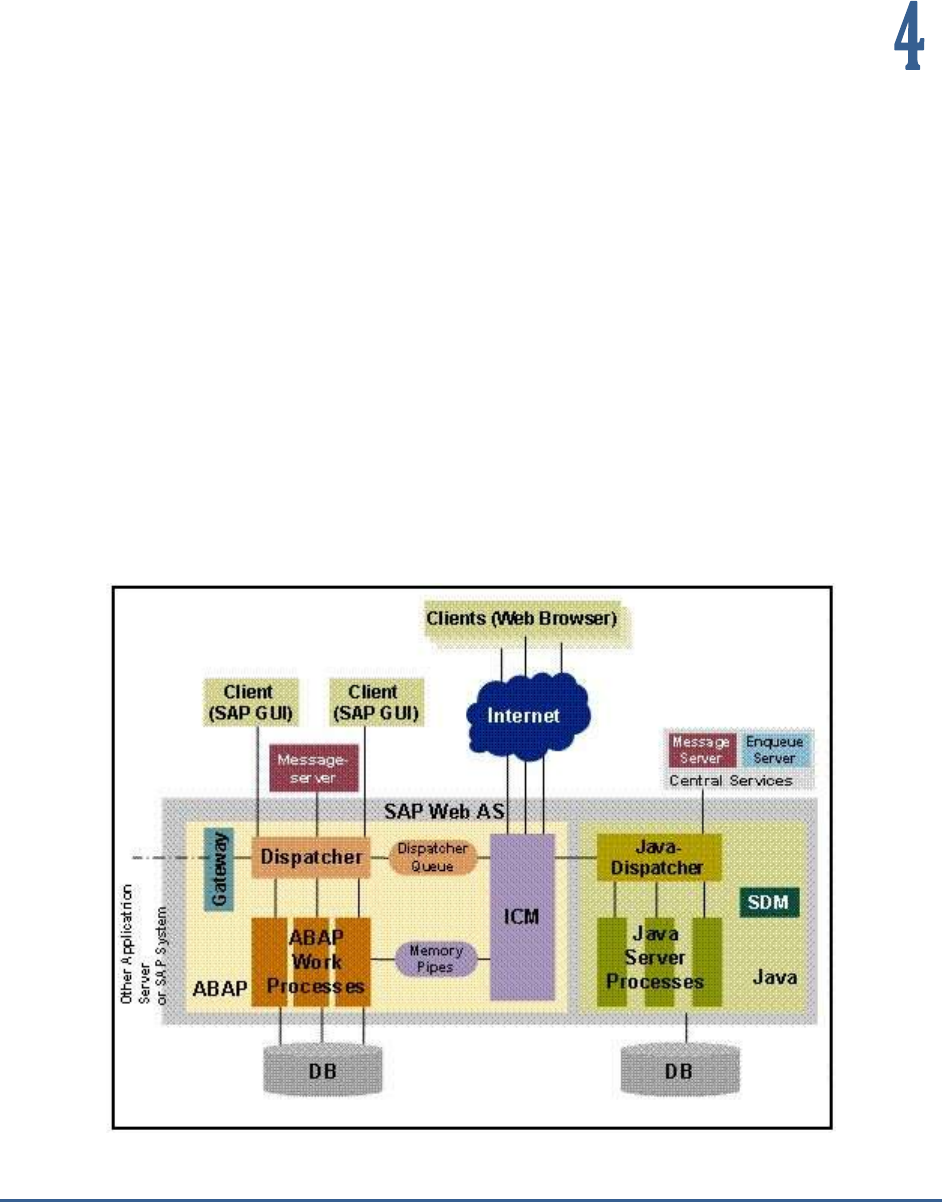
M O N I T O R I N G T H E S A P W E B A P P L I C A T I O N S E R V E R
207
Monitoring the SAP Web
Application Server
The SAP Web Application Server (Web AS) is the web services infrastructure for all current versions of SAP R/3
Enterprise, and SAP xApps, mySAP solutions and any SAP J2EE-based application. It is also the underlying technology
for SAP Enterprise Portal, SAP Business Information Warehouse, and SAP Exchange Infrastructure, and a key
component in the SAP Enterprise Services Architecture and SAP NetWeaver. Therefore, managing the SAP Web AS is
crucial for ensuring business continuity in the SAP environment.
The graphic below shows the components of the Web Application Server (see Figure 4.1).
Figure 4.1: The SAP Web AS Architecture
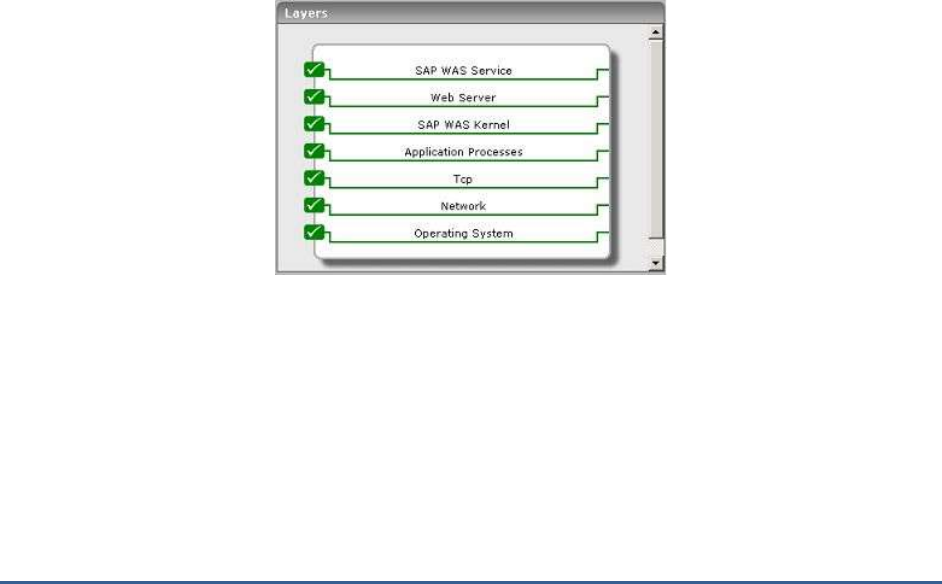
M O N I T O R I N G T H E S A P W E B A P P L I C A T I O N S E R V E R
208
The components and their tasks are described below:
The Internet Communication Manager (ICM) sets up the connection to the Internet. It can
process both server and client Web requests. It supports the protocols HTTP, HTTPS, and
SMTP. The SAP Web AS can behave as a Web server or as a Web client .
The dispatcher distributes the requests to the work processes. If all the processes are
occupied the requests are stored in the dispatcher queue.
The ABAP work process executes the ABAP code.
The SAP Gateway makes the RFC interface between the SAP instances available (within an
SAP System and beyond system boundaries).
The message server exchanges messages and balances the load in the SAP System.
In the Java component of the SAP Web AS there are the components Java Dispatcher,
Server Process, and Software Deployment Manager. The Java dispatcher receives the
client request and forwards it to the server process with the lowest capacity usage. If
there is already a connection to the client, the request goes to the server process that
processes this client. The server processes actually execute the J2EE application. The
Software Deployment Manager (SDM) is a tool with which you can manage and deploy
software packages (Software Deployment Archives (SDAs) and Software Component
Archives (SCAs)) that you receive from SAP.
The eG Enterprise suite embeds a specialized monitoring model for the SAP Web AS (see Figure 4.2), using which the
performance of the critical services and components of the server can be tracked, issues affecting server-
performance captured at their infancy, and the root-cause of the issues promptly traced and treated before it
adversely impacts the transaction of business in the SAP environment.
Figure 4.2: The layer model of the SAP Web AS
Every layer depicted by Figure 4.2 is associated with a series of tests, each of which seeks to answer the following
questions related to the performance of the SAP Web AS:
Are the thread managers of the SAP Web AS making optimum use of the threads in the
pool?
Are direct database accesses kept at a minimum?
What type of connection requests are received by the SAP Web AS? How well does the
server handle these requests?
How is the memory usage of the Java objects managed by the SAP Web AS?

M O N I T O R I N G T H E S A P W E B A P P L I C A T I O N S E R V E R
209
Is the server cache been utilized effectively?
Were any HTTP connections terminated abnormally by the SAP Web AS?
Has the SAP Web AS been sized adequately to handle both the present and future logs?
Has sufficient memory been allocated to the JVM?
Have any new bean instances been added/removed from a bean pool? What are they?
Are there any invalid user sessions on the SAP Web AS?
How often do transaction rollbacks occur on the SAP Web AS?
Are too many transactions/sessions getting timed out?
Is the P4 connection to the server available? How quickly was the connection established?
Is the web server component on the SAP Web AS accessible? What is its response time?
Since the last 4 layers of Figure 4.2 have been dealt with to a great extent in the
Monitoring Unix and Windows
Servers
document, the sections to come will discuss the first 3 layers only.
4.1 The SAP WAS Kernel Layer
The eG agents use JMX to obtain critical performance metrics from the SAP Web AS. At the SAP WAS Kernel layer, the
agents execute a wide range of Kernel tests (see Figure 4.3) that extract performance statistics pertaining to the
J2EE Engine managers such as:
the Application Thread manager
the Configuration manager
the Connections Manipulator Manager
the Pool manager
the Threads manager

M O N I T O R I N G T H E S A P W E B A P P L I C A T I O N S E R V E R
210
Figure 4.3: The tests associated with the SAP WAS Kernel layer
4.1.1 Kernel Config Test
The Kernel Config test monitors the Configuration Manager's interactions with the database. The Configuration
Manager enables J2EE Engine modules to store and access data from a relational database management system
(RDBMS). It provides properties for configuring a database connection.
Purpose
Monitors the Configuration Manager's interactions with the database
Target of the
test
The SAP Web AS
Agent
deploying the
test
An internal agent

M O N I T O R I N G T H E S A P W E B A P P L I C A T I O N S E R V E R
211
Configurable
parameters for
the test
1. TEST PERIOD - How often should the test be executed
2. HOST - Host name of the server for which the test is to be configured
3. PORT - The port number to which the server is listening
4. USERNAME - This test connects to a specific SAP web application server instance, and
extracts critical metrics from it. Therefore, in the USERNAME text box, provide a valid
j2ee admin user name which the test should use for connecting to the server instance.
5. PASSWORD - Provide the PASSWORD that corresponds to the specified USERNAME.
6. CONFIRM PASSWORD - Confirm the password by retyping it in the CONFIRM
PASSWORD box.
7. INSTANCENAME - Provide the application server instance to which the test should
connect. For example, if you specify
tpp
here, then the test will use the login credentials
(USERNAME and PASSWORD) provided here to connect to an instance named
TPP
,
which is incidentally the central instance of the SAP web application server. To know the
available server instances, use the Programs -> SAP Management Console menu sequence
on the application server host, and open the SAP Management Console. In the tree-
structure in the left pane of the console, you will find a SAP Systems node. When you
expand the SAP Systems node, the available server instances will appear as its sub-nodes.
Any one of the displayed instance names can be specified in the INSTANCENAME text
box.
8. CONNECTORPORT - This test uses the P4 protocol for connecting to the SAP web
application server. Therefore, the port at which the P4 protocol listens needs to be
specified as the CONNECTORPORT. The default port number of the P4 protocol is 50004.
However, if the P4 protocol listens at a different port in your environment, then specify the
exact port number here. To know the P4 protocol port, first open the adminCFG.properties
file in the
{SAP_WAS_HOME_DIR}\usr\sap\TPP\DVEBMGS00\j2ee\admin\classes
directory.
The value specified against the LOGIN_PORT parameter in that file, is the P4 protocol port.

M O N I T O R I N G T H E S A P W E B A P P L I C A T I O N S E R V E R
212
9. DISPATCHERID - This test reports a set of metrics for the Java dispatcher that receives
client requests. To enable this reporting, specify the cluster ID of the Java dispatcher that
needs to be monitored. To know the cluster ID of the dispatcher, follow the steps
discussed in Section 4.1.1.1 of this document.
10. SERVERIDS - Typically, the Java dispatcher distributes the client requests it receives to
the server processes executing on the Java component of the SAP Web AS for processing.
To monitor specific server processes, specify a comma-separated list of the cluster IDs of
these server processes in the SERVERIDS text box. To know the cluster IDs of the server
processes, follow the procedure detailed in Section 4.1.1.1 of this document.
Providing a comma-separated list of server process cluster IDs will ensure that
these cluster IDs alone appear as the descriptors of the test. If need be, you
can have server process name-cluster ID pairs appear as the test descriptors.
To achieve this, the specification in the SERVERIDS text box should be of the
following format: Server process name:Cluster ID of the server process. For
example, if the cluster ID of a server process named Server0 is 12621850,
then you can specify the SERVERID in the format:
Server0:12621850
.
Outputs of the
test
One set of results each for the Dispatcher and each of the configured server processes of the
SAP Web AS
Measurements
made by the
test
Measurement
Measurement
Unit
Interpretation
Commit duration:
Indicates the time taken for a
commit to take place for data
storage in the last
measurement period.
Secs
Locked exception ratio:
Indicates the number of
database lock exceptions that
occurred for every database
access in the last
measurement period.
Exceptions/Db
_tries
Cache hit rate:
Indicates the percentage of
time data was retrieved from
the database cache in the last
measurement period.
Percent
Ideally, the ratio of cache hits to database
accesses should be high, as direct database
accesses are expensive operations.
Db read ratio:
Indicates the number of
database reads that occurred
for every database access in
the last measurement period.
Reads/Db_tries

M O N I T O R I N G T H E S A P W E B A P P L I C A T I O N S E R V E R
213
Db write ratio:
Indicates the number of
database writes that occurred
for every database access in
the last measurement period.
Writes/Db_trie
s
4.1.1.1 Configuring the DISPATCHERID and SERVERID ParameterS
This test reports a set of metrics for the Java dispatcher that receives client requests. To enable this reporting, you
need to specify the cluster ID of the Java dispatcher that needs to be monitored in the DISPATCHERID text box of
the test configuration page.
Typically, the Java dispatcher distributes the client requests it receives to the server processes executing on the Java
component of the SAP Web AS for processing. To monitor specific server processes, you need to specify a comma-
separated list of the cluster IDs of these server processes in the SERVERIDS text box.
To know the cluster ID of the dispatcher and the server process, you can use any of the following broad
methodologies:
s. Using the J2EE Engine Visual Administrator tool
t. Using SAP's Web Application through the browser
u. Using the Properties file for instances in the SAP installation
The sections that come will discuss each of these methodologies in detail.
4.1.1.1.1 Determining the DISPATCHERID and SERVERID using the Visual
Administrator Tool
If the Visual Administrator Tool is available in your environment, then follow the steps below to figure out the cluster
ID of the dispatcher:
1. Start the J2EE Engine Visual Administrator tool by executing the command
{SAP_WAS_HOME_DIR}\usr\sap\TPP\DVEBMGS00\j2ee\admin\go.bat
at the command prompt, if you use a
Windows
platform. If you use a
Unix
platform, execute the command
{SAP_WAS_HOME_DIR}\usr\sap\TPP\DVEBMGS00\j2ee\admin\go
at the command prompt.
2. Login to the J2EE Engine Visual Administrator using a valid user name and password.
3. Proceed to the Global Configuration tab that appears in the left panel of the Visual Administrator.
4. Upon clicking on the Dispatcher node, the information pertaining to that dispatcher will appear in the right
panel.
5. Pick the cluster ID that is displayed in that panel and specify in the DISPATCHERID text box.
Likewise, if the Visual Administrator Tool is available in your environment, then follow the steps below to figure out
the cluster ID of the server process:
1. Start the J2EE Engine Visual Administrator tool by executing the command
{SAP_WAS_HOME_DIR}\usr\sap\TPP\DVEBMGS00\j2ee\admin\go.bat
at the command prompt, if you use a
Windows
platform. If you use a
Unix
platform, execute the command
{SAP_WAS_HOME_DIR}\usr\sap\TPP\DVEBMGS00\j2ee\admin\go
at the command prompt.
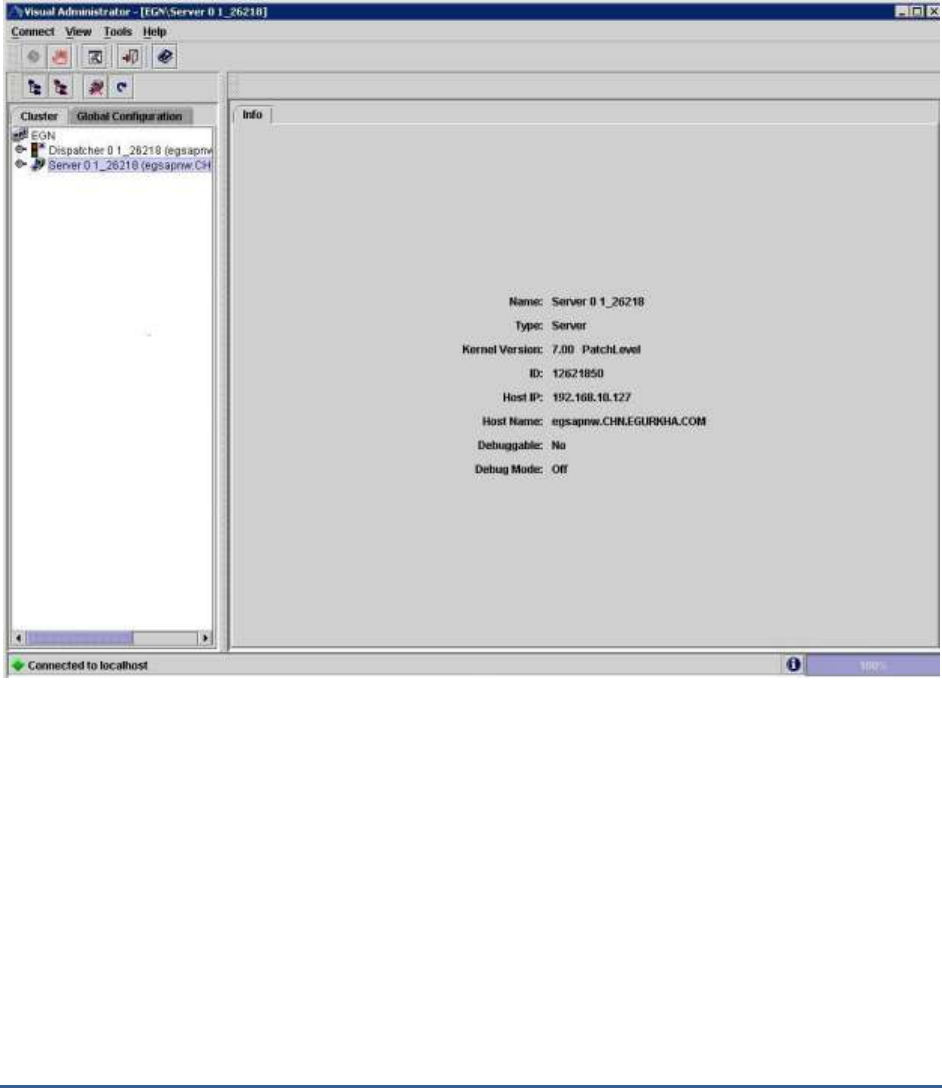
M O N I T O R I N G T H E S A P W E B A P P L I C A T I O N S E R V E R
214
2. Login to the J2EE Engine Visual Administrator using a valid user name and password.
3. Proceed to the Global Configuration tab that appears in the left panel of the Visual Administrator.
4. A list of servers will appear in the left panel of the Visual Administrator. Upon clicking on a particular Server
node, the information pertaining to that server process, including its name and cluster ID, will appear in the right
panel.
Figure 4.4: Determining the name and cluster ID of a server process
5. This way, you can determine the Name and cluster ID of each of the servers to be monitored. To configure the
tests to report metrics for each cluster ID alone, specify these cluster IDs as a comma-separated list in the
SERVERIDS text box. To configure the tests to report metrics for each server process name - cluster ID
pair,
then provide a comma-separated list of server process Names and cluster IDs in the format:
Server process
name:Cluster ID
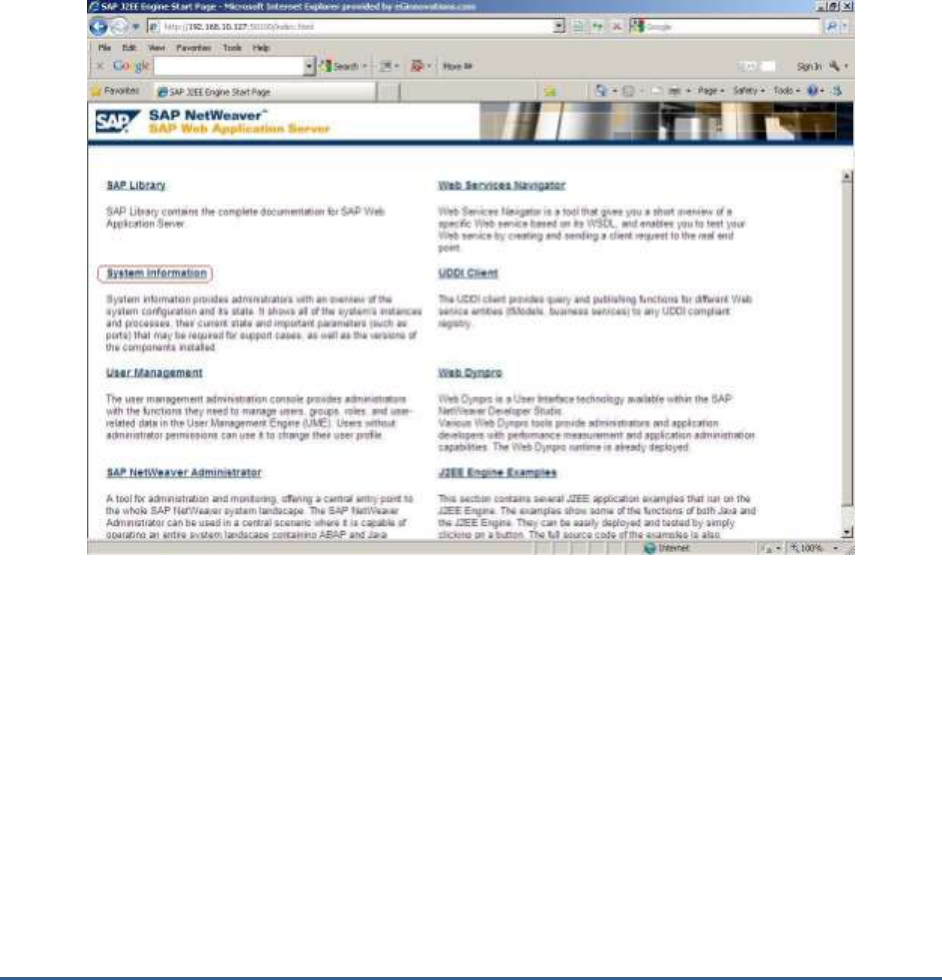
M O N I T O R I N G T H E S A P W E B A P P L I C A T I O N S E R V E R
215
4.1.1.1.2 Determining the DISPATCHERID and SERVERID using the SAP's Web
Application
To determine the cluster ID of a dispatcher and server through SAP's Web Application, do the following:
1. Connect to SAP's Web Application using the URL: http://<Hostname_or_IPaddress_of_SAP_system>:<HTTP_port>/
For instance, your URL can be: http://192.168.10.127:50100l
2. Figure 4.5 will then appear. Click on the System Information link indicated by Figure 4.5.
Figure 4.5: The SAP Web Application Server
3. In the login pop-up that then appears, provide the credentials for accessing the system information, and click the
OK button therein.
4. Upon providing valid login credentials, Figure 4.6 will appear, displaying the necessary system information. The
Dispatcher ID and Server ID indicated by Figure 4.6 can be used to configure the DISPATCHERID and
SERVERID test parameters respectively.

M O N I T O R I N G T H E S A P W E B A P P L I C A T I O N S E R V E R
216
Figure 4.6: The page showing a dispatcher ID and server ID
4.1.1.1.3 Determining the DISPATCHERID and SERVERID using the Properties file
You can use the instance.properties file in the SAP system to determine the dispatcher ID and server process ID to
be used for configuring the SAP Netweaver tests. For this, follow the steps given below:
1. The instance.properties file can be found in the following directory in a SAP system installed on Windows:
<SAP_INSTALL_DIR>\usr\sap\<SYSTEM NAME>\DVEBMGS[NN]\j2ee\cluster
Here, <SYSTEM NAME> refers to the 3-letter system name, and DVEBMGS[NN] indicates the corresponding number
(example: DVEBMGS01)
2. The instance.properties file contains the properties for the various instances (cluster elements) in the WAS server
(see Figure 4.7).
Dispatcher ID
Server ID
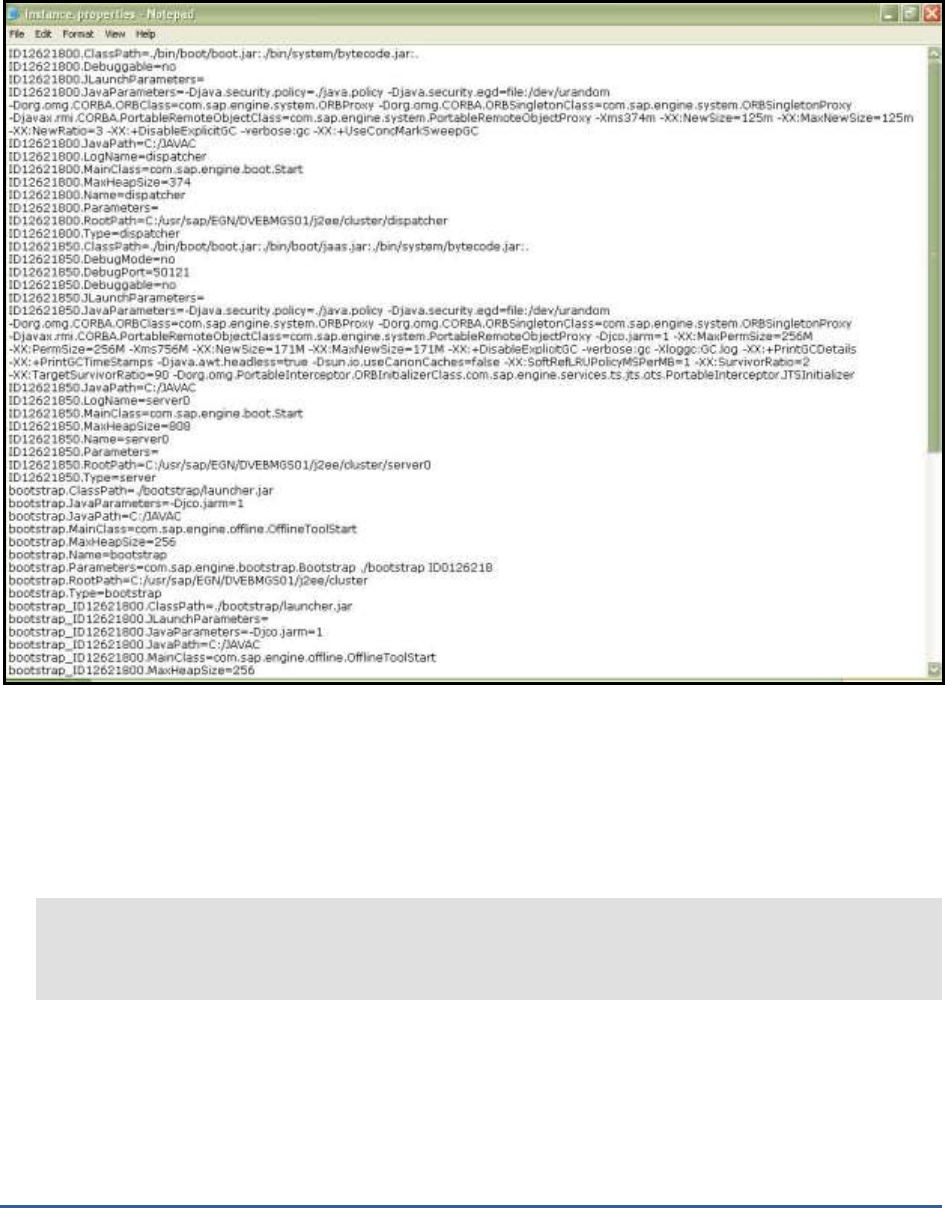
M O N I T O R I N G T H E S A P W E B A P P L I C A T I O N S E R V E R
217
Figure 4.7: The instance.properties file
3. As you can see, in Figure 4.7, each property of each instance is identified by the cluster element ID and the
property name in the following format :
4. ID[cluster element ID].<property name>=<property value>
5.
For example, take the case of the following (non-contiguous) entries in the instance.properties file:
ID12621800.Name=dispatcher
....
....
....
ID12621850.Name=server0
In the first entry, Name is the <property name>, dispatcher is the <property value>, and 12621800 is the <cluster
element ID>.
Likewise, in the second entry, Name is the <property name>, server0 is the <property value>, and 12621850 is the
<cluster element ID>.
While the Name property and its corresponding <property value> tells us whether a cluster element is a
dispatcher or server, the <cluster element ID> indicates the ID of the dispatcher or server (as the case may be).

M O N I T O R I N G T H E S A P W E B A P P L I C A T I O N S E R V E R
218
In the case of the entries above, 12621800 is the dispatcher ID and 12621850 is the ID of the server, server0.
During test configuration, you will have to provide these two IDs against the DISPATCHERID and SERVERID
parameters respectively.
4.1.2 Application Threads Test
The J2EE Engine thread system is responsible for handling system and client threads. It comprises of two managers
– Thread Manager and Application Thread Manager. The Application Threads test monitors the Application Thread
Manager of the SAP Web Application server, which supplies the threads in which the client applications' source code
is executed. This manager provides a set of properties for starting and managing client threads in the Java Virtual
Machine. When a client request comes, the system tries to find a free thread in the Application Thread Manager and
to start the execution of the request. If no free thread is available, the thread system buffers the request in a request
queue. By buffering the threads and using them again, the system achieves better performance than using normal
Java thread system without buffering. The Application Thread Manager runs only on server processes.
Purpose
Monitors the Application Thread Manager of the SAP Web Application server, which supplies the
threads in which the client applications' source code is executed
Target of the
test
The SAP Web AS
Agent
deploying the
test
An internal agent

M O N I T O R I N G T H E S A P W E B A P P L I C A T I O N S E R V E R
219
Configurable
parameters for
the test
1. TEST PERIOD - How often should the test be executed
2. HOST - Host name of the server for which the test is to be configured
3. PORT - The port number to which the server is listening
4. USERNAME - This test connects to a specific SAP web application server instance, and
extracts critical metrics from it. Therefore, in the USERNAME text box, provide a valid j2ee
admin user name which the test should use for connecting to the server instance.
5. PASSWORD - Provide the PASSWORD that corresponds to the specified USERNAME.
6. CONFIRM PASSWORD - Confirm the password by retyping it in the CONFIRM
PASSWORD box.
7. INSTANCENAME - Provide the application server instance to which the test should
connect. For example, if you specify
tpp
here, then the test will use the login credentials
(USERNAME and PASSWORD) provided here to connect to an instance named
TPP
,
which is incidentally the central instance of the SAP web application server. To know the
available server instances, use the Programs -> SAP Management Console menu sequence
on the application server host, and open the SAP Management Console. In the tree-
structure in the left pane of the console, you will find a SAP Systems node. When you
expand the SAP Systems node, the available server instances will appear as its sub-nodes.
Any one of the displayed instance names can be specified in the INSTANCENAME text
box.
8. CONNECTORPORT - This test uses the P4 protocol for connecting to the SAP web
application server. Therefore, the port at which the P4 protocol listens needs to be specified
as the CONNECTORPORT. The default port number of the P4 protocol is 50004. However,
if the P4 protocol listens at a different port in your environment, then specify the exact port
number here. To know the P4 protocol port, first open the adminCFG.properties file in the
{SAP_WAS_HOME_DIR}\usr\sap\TPP\DVEBMGS00\j2ee\admin\classes
directory. The value
specified against the LOGIN_PORT parameter in that file, is the P4 protocol port.

M O N I T O R I N G T H E S A P W E B A P P L I C A T I O N S E R V E R
220
9. DISPATCHERID - This test reports a set of metrics for the Java dispatcher that receives
client requests. To enable this reporting, specify the cluster ID of the Java dispatcher that
needs to be monitored. To know the cluster ID of the dispatcher, follow the steps discussed
in Section 4.1.1.1 of this document.
10. SERVERIDS - Typically, the Java dispatcher distributes the client requests it receives to the
server processes executing on the Java component of the SAP Web AS for processing. To
monitor specific server processes, specify a comma-separated list of the cluster IDs of these
server processes in the SERVERIDS text box. To know the cluster IDs of the server
processes, follow the procedure detailed in Section 4.1.1.1 of this document.
Providing a comma-separated list of server process cluster IDs will ensure that
these cluster IDs alone appear as the descriptors of the test. If need be, you can
have server process name-cluster ID pairs appear as the test descriptors. To
achieve this, the specification in the SERVERIDS text box should be of the
following format: Server process name:Cluster ID of the server process. For
example, if the cluster ID of a server process named Server0 is 12621850, then
you can specify the SERVERID in the format:
Server0:12621850
.
Outputs of the
test
One set of results each for the Dispatcher and each of the configured server processes of the
SAP Web AS
Measurements
made by the
test
Measurement
Measurement
Unit
Interpretation
Active threads:
Indicates the number of
threads from the thread pool
which are currently executing
a runnable task.
Number
This measure serves as a good indicator of
the server workload.
Current pool size:
Indicates the number of
threads that are currently in
the thread pool.
Number
Threadpool usage:
Indicates the percentage of
threads in the thread pool
that are being currently
utilized.
Percent
If the value of this measure is high, it could
indicate a heavy server workload.
Waiting tasks:
Indicates the number of tasks
waiting for threads, so as to
begin execution.
Number
M O N I T O R I N G T H E S A P W E B A P P L I C A T I O N S E R V E R
221
Tasks queue size:
Indicates the capacity of the
request queue where the
tasks waiting for execution
are stored.
Number
Task queue overflow:
Indicates the number of tasks
waiting to be placed in the
request queue, in the event
that the request queue is full.
Number
If the value of this measure increases
consistently, it could indicate a processing
bottleneck.
4.1.3 Cluster Connections Test
The Cluster Connections test monitors the SAP J2EE engine's Connections Manipulator Manager, which manages the
client connections to the cluster by providing a set of properties for managing the pools where the TCP connection
objects are stored. The Connections Manipulator Manager runs on dispatchers only.
Purpose
Monitors the SAP J2EE engine's Connections Manipulator Manager, which manages the client
connections to the cluster by providing a set of properties for managing the pools where the
TCP connection objects are stored
Target of the
test
The SAP Web AS
Agent
deploying the
test
An internal agent

M O N I T O R I N G T H E S A P W E B A P P L I C A T I O N S E R V E R
222
Configurable
parameters for
the test
1. TEST PERIOD - How often should the test be executed
2. HOST - Host name of the server for which the test is to be configured
3. PORT - The port number to which the server is listening
4. USERNAME - This test connects to a specific SAP web application server instance, and
extracts critical metrics from it. Therefore, in the USERNAME text box, provide a valid j2ee
admin user name which the test should use for connecting to the server instance.
5. PASSWORD - Provide the PASSWORD that corresponds to the specified USERNAME.
6. CONFIRM PASSWORD - Confirm the password by retyping it in the CONFIRM
PASSWORD box.
7. INSTANCENAME - Provide the application server instance to which the test should
connect. For example, if you specify
tpp
here, then the test will use the login credentials
(USERNAME and PASSWORD) provided here to connect to an instance named
TPP
,
which is incidentally the central instance of the SAP web application server. To know the
available server instances, use the Programs -> SAP Management Console menu sequence
on the application server host, and open the SAP Management Console. In the tree-
structure in the left pane of the console, you will find a SAP Systems node. When you
expand the SAP Systems node, the available server instances will appear as its sub-nodes.
Any one of the displayed instance names can be specified in the INSTANCENAME text
box.
8. CONNECTORPORT - This test uses the P4 protocol for connecting to the SAP web
application server. Therefore, the port at which the P4 protocol listens needs to be specified
as the CONNECTORPORT. The default port number of the P4 protocol is 50004. However,
if the P4 protocol listens at a different port in your environment, then specify the exact port
number here. To know the P4 protocol port, first open the adminCFG.properties file in the
{SAP_WAS_HOME_DIR}\usr\sap\TPP\DVEBMGS00\j2ee\admin\classes
directory. The value
specified against the LOGIN_PORT parameter in that file, is the P4 protocol port.

M O N I T O R I N G T H E S A P W E B A P P L I C A T I O N S E R V E R
223
9. DISPATCHERID - This test reports a set of metrics for the Java dispatcher that receives
client requests. To enable this reporting, specify the cluster ID of the Java dispatcher that
needs to be monitored. To know the cluster ID of the dispatcher, follow the steps discussed
in Section 4.1.1.1 of this document.
10. SERVERIDS - Typically, the Java dispatcher distributes the client requests it receives to the
server processes executing on the Java component of the SAP Web AS for processing. To
monitor specific server processes, specify a comma-separated list of the cluster IDs of these
server processes in the SERVERIDS text box. To know the cluster IDs of the server
processes, follow the procedure detailed in Section 4.1.1.1 of this document.
Providing a comma-separated list of server process cluster IDs will ensure that these
cluster IDs alone appear as the descriptors of the test. If need be, you can have server
process name-cluster ID pairs appear as the test descriptors. To achieve this, the
specification in the SERVERIDS text box should be of the following format:
Server process
name:Cluster ID of the server process
. For example, if the cluster ID of a server process
named
Server0
is
12621850
, then you can specify the SERVERID in the format:
Server0:12621850
.
Outputs of the
test
One set of results each for the Dispatcher and each of the configured server processes of the
SAP Web AS
Measurements
made by the
test
Measurement
Measurement
Unit
Interpretation
Current pool size:
Indicates the current size of
the TCP connections pool.
Percent
HTTP connections:
Indicates the number of TCP
connections in the pool that
are currently been utilized for
servicing HTTP requests.
Number
P4 connections:
Indicates the number of TCP
connections in the pool that
are currently been utilized for
servicing P4 requests.
Number
IIOP connections:
Indicates the number of TCP
connections in the pool that
are currently been utilized for
servicing IIOP requests.
Number
M O N I T O R I N G T H E S A P W E B A P P L I C A T I O N S E R V E R
224
Unrecognized
connections:
Indicates the number of TCP
connections in the pool that
are currently being utilized for
servicing requests of an
unknown kind.
Number
4.1.4 Pool Data Aggregate Test
The Pool Data Aggregate test reports metrics pertaining to the J2EE Engine Pool Manager, which facilitates the
centralized creation and reuse of byte arrays.
Purpose
Reports metrics pertaining to the J2EE Engine Pool Manager, which facilitates the centralized
creation and reuse of byte arrays
Target of the
test
The SAP Web AS
Agent
deploying the
test
An internal agent

M O N I T O R I N G T H E S A P W E B A P P L I C A T I O N S E R V E R
225
Configurable
parameters for
the test
1. TEST PERIOD - How often should the test be executed
2. HOST - Host name of the server for which the test is to be configured
3. PORT - The port number to which the server is listening
4. USERNAME - This test connects to a specific SAP web application server instance, and
extracts critical metrics from it. Therefore, in the USERNAME text box, provide a valid j2ee
admin user name which the test should use for connecting to the server instance.
5. PASSWORD - Provide the PASSWORD that corresponds to the specified USERNAME.
6. CONFIRM PASSWORD - Confirm the password by retyping it in the CONFIRM
PASSWORD box.
7. INSTANCENAME - Provide the application server instance to which the test should
connect. For example, if you specify
tpp
here, then the test will use the login credentials
(USERNAME and PASSWORD) provided here to connect to an instance named
TPP
,
which is incidentally the central instance of the SAP web application server. To know the
available server instances, use the Programs -> SAP Management Console menu sequence
on the application server host, and open the SAP Management Console. In the tree-
structure in the left pane of the console, you will find a SAP Systems node. When you
expand the SAP Systems node, the available server instances will appear as its sub-nodes.
Any one of the displayed instance names can be specified in the INSTANCENAME text
box.
8. CONNECTORPORT - This test uses the P4 protocol for connecting to the SAP web
application server. Therefore, the port at which the P4 protocol listens needs to be specified
as the CONNECTORPORT. The default port number of the P4 protocol is 50004. However,
if the P4 protocol listens at a different port in your environment, then specify the exact port
number here. To know the P4 protocol port, first open the adminCFG.properties file in the
{SAP_WAS_HOME_DIR}\usr\sap\TPP\DVEBMGS00\j2ee\admin\classes
directory. The value
specified against the LOGIN_PORT parameter in that file, is the P4 protocol port.
M O N I T O R I N G T H E S A P W E B A P P L I C A T I O N S E R V E R
226
9. DISPATCHERID - This test reports a set of metrics for the Java dispatcher that receives
client requests. To enable this reporting, specify the cluster ID of the Java dispatcher that
needs to be monitored. To know the cluster ID of the dispatcher, follow the steps discussed
in Section 4.1.1.1 of this document.
10. SERVERIDS - Typically, the Java dispatcher distributes the client requests it receives to the
server processes executing on the Java component of the SAP Web AS for processing. To
monitor specific server processes, specify a comma-separated list of the cluster IDs of these
server processes in the SERVERIDS text box. To know the cluster IDs of the server
processes, follow the procedure detailed in Section 4.1.1.1 of this document.
Providing a comma-separated list of server process cluster IDs will ensure that
these cluster IDs alone appear as the descriptors of the test. If need be, you can
have server process name-cluster ID pairs appear as the test descriptors. To
achieve this, the specification in the SERVERIDS text box should be of the
following format: Server process name:Cluster ID of the server process. For
example, if the cluster ID of a server process named Server0 is 12621850, then
you can specify the SERVERID in the format:
Server0:12621850
.
Outputs of the
test
One set of results each for the Dispatcher and each of the configured server processes of the
SAP Web AS
Measurements
made by the
test
Measurement
Measurement
Unit
Interpretation
Pool memory allocated:
Indicates the total memory
that is allocated by the Pool
Manager to the Java objects
that it manages.
MB
Pool memory used:
Indicates the total memory
that is used by the Java
objects managed by the Pool
Manager.
MB
4.1.5 System Threads Test
The J2EE Engine thread system is responsible for handling system and client threads. It comprises two managers –
Thread Manager and Application Thread Manager. The System Threads test monitors the health of the Thread
Manager, which supplies the threads in which SAP J2EE Engine system operations are executed. This manager
provides a set of properties for starting and managing system threads. This thread pool is for system activities such
as making backup, background optimizations for load/store data, and so on. The logic in the system thread manager
is similar to the application logic – the system uses a queue for system requests if a free thread is not available.
Purpose
Monitors the health of the Thread Manager, which supplies the threads in which SAP J2EE
Engine system operations are executed

M O N I T O R I N G T H E S A P W E B A P P L I C A T I O N S E R V E R
227
Target of the
test
The SAP Web AS
Agent
deploying the
test
An internal agent
Configurable
parameters for
the test
1. TEST PERIOD - How often should the test be executed
2. HOST - Host name of the server for which the test is to be configured
3. PORT - The port number to which the server is listening
4. USERNAME - This test connects to a specific SAP web application server instance, and
extracts critical metrics from it. Therefore, in the USERNAME text box, provide a valid j2ee
admin user name which the test should use for connecting to the server instance.
5. PASSWORD - Provide the PASSWORD that corresponds to the specified USERNAME.
6. CONFIRM PASSWORD - Confirm the password by retyping it in the CONFIRM
PASSWORD box.
7. INSTANCENAME - Provide the application server instance to which the test should
connect. For example, if you specify
tpp
here, then the test will use the login credentials
(USERNAME and PASSWORD) provided here to connect to an instance named
TPP
,
which is incidentally the central instance of the SAP web application server. To know the
available server instances, use the Programs -> SAP Management Console menu sequence
on the application server host, and open the SAP Management Console. In the tree-
structure in the left pane of the console, you will find a SAP Systems node. When you
expand the SAP Systems node, the available server instances will appear as its sub-nodes.
Any one of the displayed instance names can be specified in the INSTANCENAME text
box.
8. CONNECTORPORT - This test uses the P4 protocol for connecting to the SAP web
application server. Therefore, the port at which the P4 protocol listens needs to be specified
as the CONNECTORPORT. The default port number of the P4 protocol is 50004. However,
if the P4 protocol listens at a different port in your environment, then specify the exact port
number here. To know the P4 protocol port, first open the adminCFG.properties file in the
{SAP_WAS_HOME_DIR}\usr\sap\TPP\DVEBMGS00\j2ee\admin\classes
directory. The value
specified against the LOGIN_PORT parameter in that file, is the P4 protocol port.

M O N I T O R I N G T H E S A P W E B A P P L I C A T I O N S E R V E R
228
9. DISPATCHERID - This test reports a set of metrics for the Java dispatcher that receives
client requests. To enable this reporting, specify the cluster ID of the Java dispatcher that
needs to be monitored. To know the cluster ID of the dispatcher, follow the steps discussed
in Section 4.1.1.1 of this document.
10. SERVERIDS - Typically, the Java dispatcher distributes the client requests it receives to the
server processes executing on the Java component of the SAP Web AS for processing. To
monitor specific server processes, specify a comma-separated list of the cluster IDs of these
server processes in the SERVERIDS text box. To know the cluster IDs of the server
processes, follow the procedure detailed in Section 4.1.1.1 of this document.
Providing a comma-separated list of server process cluster IDs will ensure that
these cluster IDs alone appear as the descriptors of the test. If need be, you can
have server process name-cluster ID pairs appear as the test descriptors. To
achieve this, the specification in the SERVERIDS text box should be of the
following format: Server process name:Cluster ID of the server process. For
example, if the cluster ID of a server process named Server0 is 12621850, then
you can specify the SERVERID in the format:
Server0:12621850
.
Outputs of the
test
One set of results each for the Dispatcher and each of the configured server processes of the
SAP Web AS
Measurements
made by the
test
Measurement
Measurement
Unit
Interpretation
Active threads:
Indicates the number of
threads from the thread pool
which are currently executing
a runnable task.
Number
This measure serves as a good indicator of
the server workload.
Current pool size:
Indicates the number of
threads that are currently in
the thread pool.
Number
Threadpool usage:
Indicates the percentage of
threads in the thread pool
that are being currently
utilized.
Percent
If the value of this measure is high, it could
indicate a heavy server workload.
Tasks waiting:
Indicates the number of tasks
waiting for threads, so as to
begin execution.
Number
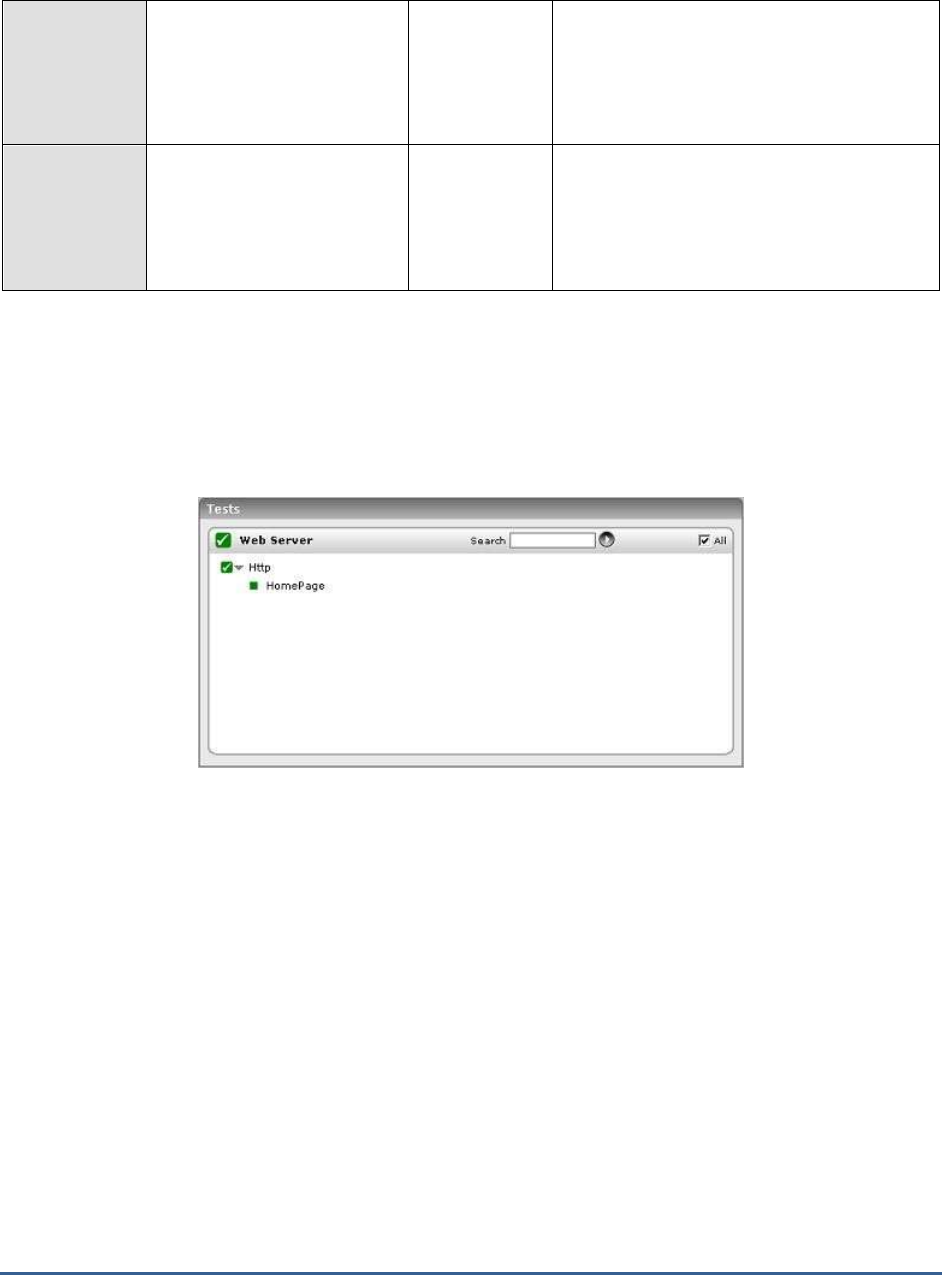
M O N I T O R I N G T H E S A P W E B A P P L I C A T I O N S E R V E R
229
Tasks queue size:
Indicates the capacity of the
request queue where the
tasks waiting for execution
are stored.
Number
Tasks queue overflow:
Indicates the number of tasks
waiting to be placed in the
request queue, in the event
that the request queue is full.
Number
If the value of this measure increases
consistently, it could indicate a processing
bottleneck.
4.2 The Web Server Layer
An external Http test executes on this layer (see Figure 4.8), which emulates a user access to the web server
component of the SAP Web AS, and reports the web server's availability and responsiveness.
Figure 4.8: The test executing on the Web Server layer
Since the Http test has already been dealt with in
Monitoring Web Servers
document, let us focus on the SAP WAS
Service layer.
4.3 The SAP WAS Service Layer
The tests mapped to the SAP WAS Service (see Figure 4.9) layer extract critical performance metrics relating to the
services running on a SAP Web AS, where each service performs an application function.

M O N I T O R I N G T H E S A P W E B A P P L I C A T I O N S E R V E R
230
Figure 4.9: The tests associated with the SAP WAS Service layer
4.3.1 MBeans Cache Test
The MBeansCache test monitors the accesses to the MBeans cache, where the MBeans are created and administered
by the JMX Adapter Service. The JMX Adapter Service manages the configuration and lifecycle of the MBeanServer
and provides access to it for applications, services, and libraries.

M O N I T O R I N G T H E S A P W E B A P P L I C A T I O N S E R V E R
231
Purpose
Monitors the accesses to the MBeans cache, where the MBeans are created and administered by
the JMX Adapter Service
Target of the
test
The SAP Web AS
Agent
deploying the
test
An internal agent
Configurable
parameters for
the test
1. TEST PERIOD - How often should the test be executed
2. HOST - Host name of the server for which the test is to be configured
3. PORT - The port number to which the server is listening
4. USERNAME - This test connects to a specific SAP web application server instance, and
extracts critical metrics from it. Therefore, in the USERNAME text box, provide a valid j2ee
admin user name which the test should use for connecting to the server instance.
5. PASSWORD - Provide the PASSWORD that corresponds to the specified USERNAME.
6. CONFIRM PASSWORD - Confirm the password by retyping it in the CONFIRM
PASSWORD box.
7. INSTANCENAME - Provide the application server instance to which the test should
connect. For example, if you specify
tpp
here, then the test will use the login credentials
(USERNAME and PASSWORD) provided here to connect to an instance named
TPP
,
which is incidentally the central instance of the SAP web application server. To know the
available server instances, use the Programs -> SAP Management Console menu sequence
on the application server host, and open the SAP Management Console. In the tree-
structure in the left pane of the console, you will find a SAP Systems node. When you
expand the SAP Systems node, the available server instances will appear as its sub-nodes.
Any one of the displayed instance names can be specified in the INSTANCENAME text
box.
8. CONNECTORPORT - This test uses the P4 protocol for connecting to the SAP web
application server. Therefore, the port at which the P4 protocol listens needs to be specified
as the CONNECTORPORT. The default port number of the P4 protocol is 50004. However,
if the P4 protocol listens at a different port in your environment, then specify the exact port
number here. To know the P4 protocol port, first open the adminCFG.properties file in the
{SAP_WAS_HOME_DIR}\usr\sap\TPP\DVEBMGS00\j2ee\admin\classes
directory. The value
specified against the LOGIN_PORT parameter in that file, is the P4 protocol port.
M O N I T O R I N G T H E S A P W E B A P P L I C A T I O N S E R V E R
232
9. DISPATCHERID - This test reports a set of metrics for the Java dispatcher that receives
client requests. To enable this reporting, specify the cluster ID of the Java dispatcher that
needs to be monitored. To know the cluster ID of the dispatcher, follow the steps discussed
in Section 4.1.1.1 of this document.
10. SERVERIDS - Typically, the Java dispatcher distributes the client requests it receives to the
server processes executing on the Java component of the SAP Web AS for processing. To
monitor specific server processes, specify a comma-separated list of the cluster IDs of these
server processes in the SERVERIDS text box. To know the cluster IDs of the server
processes, follow the procedure detailed in Section 4.1.1.1 of this document.
Providing a comma-separated list of server process cluster IDs will ensure that
these cluster IDs alone appear as the descriptors of the test. If need be, you can
have server process name-cluster ID pairs appear as the test descriptors. To
achieve this, the specification in the SERVERIDS text box should be of the
following format: Server process name:Cluster ID of the server process. For
example, if the cluster ID of a server process named Server0 is 12621850, then
you can specify the SERVERID in the format:
Server0:12621850
.
Outputs of the
test
One set of results each for the Dispatcher and each of the configured server processes of the
SAP Web AS
Measurements
made by the
test
Measurement
Measurement
Unit
Interpretation
Cache hit rate:
Indicates the ratio of the
number of cache hits to the
total number of accesses to
the MBeanServer.
Hits/tries
Ideally, this ratio should be high. Direct
server accesses are expensive operations,
and hence need to be kept at the minimum.
4.3.2 HTTP Connections Test
The HTTP Provider Service represents a server socket that listens for client HTTP connections on the J2EE Engine. It
takes care of parsing the URL of the incoming HTTP requests, dispatching them to the correct J2EE Engine’s module
for processing, and returning the generated responses back to the client. The HTTP Connections test monitors the
HTTP Provider Service and reports key statistics pertaining to client HTTP connections on the J2EE engine.
Purpose
Monitors the HTTP Provider Service and reports key statistics pertaining to client HTTP
connections on the J2EE engine
Target of the
test
The SAP Web AS
Agent
deploying the
test
An internal agent

M O N I T O R I N G T H E S A P W E B A P P L I C A T I O N S E R V E R
233
Configurable
parameters for
the test
1. TEST PERIOD - How often should the test be executed
2. HOST - Host name of the server for which the test is to be configured
3. PORT - The port number to which the server is listening
4. USERNAME - This test connects to a specific SAP web application server instance, and
extracts critical metrics from it. Therefore, in the USERNAME text box, provide a valid j2ee
admin user name which the test should use for connecting to the server instance.
5. PASSWORD - Provide the PASSWORD that corresponds to the specified USERNAME.
6. CONFIRM PASSWORD - Confirm the password by retyping it in the CONFIRM
PASSWORD box.
7. INSTANCENAME - Provide the application server instance to which the test should
connect. For example, if you specify
tpp
here, then the test will use the login credentials
(USERNAME and PASSWORD) provided here to connect to an instance named
TPP
,
which is incidentally the central instance of the SAP web application server. To know the
available server instances, use the Programs -> SAP Management Console menu sequence
on the application server host, and open the SAP Management Console. In the tree-
structure in the left pane of the console, you will find a SAP Systems node. When you
expand the SAP Systems node, the available server instances will appear as its sub-nodes.
Any one of the displayed instance names can be specified in the INSTANCENAME text
box.
8. CONNECTORPORT - This test uses the P4 protocol for connecting to the SAP web
application server. Therefore, the port at which the P4 protocol listens needs to be specified
as the CONNECTORPORT. The default port number of the P4 protocol is 50004. However,
if the P4 protocol listens at a different port in your environment, then specify the exact port
number here. To know the P4 protocol port, first open the adminCFG.properties file in the
{SAP_WAS_HOME_DIR}\usr\sap\TPP\DVEBMGS00\j2ee\admin\classes
directory. The value
specified against the LOGIN_PORT parameter in that file, is the P4 protocol port.

M O N I T O R I N G T H E S A P W E B A P P L I C A T I O N S E R V E R
234
9. DISPATCHERID - This test reports a set of metrics for the Java dispatcher that receives
client requests. To enable this reporting, specify the cluster ID of the Java dispatcher that
needs to be monitored. To know the cluster ID of the dispatcher, follow the steps discussed
in Section 4.1.1.1 of this document.
10. SERVERIDS - Typically, the Java dispatcher distributes the client requests it receives to the
server processes executing on the Java component of the SAP Web AS for processing. To
monitor specific server processes, specify a comma-separated list of the cluster IDs of these
server processes in the SERVERIDS text box. To know the cluster IDs of the server
processes, follow the procedure detailed in Section 4.1.1.1 of this document.
Providing a comma-separated list of server process cluster IDs will ensure that
these cluster IDs alone appear as the descriptors of the test. If need be, you can
have server process name-cluster ID pairs appear as the test descriptors. To
achieve this, the specification in the SERVERIDS text box should be of the
following format: Server process name:Cluster ID of the server process. For
example, if the cluster ID of a server process named Server0 is 12621850, then
you can specify the SERVERID in the format:
Server0:12621850
.
Outputs of the
test
One set of results each for the Dispatcher and each of the configured server processes of the
SAP Web AS
Measurements
made by the
test
Measurement
Measurement
Unit
Interpretation
New requests:
Indicates the number of
HTTP requests newly
received from client since the
last measurement period.
Number
Connections keep alive:
Indicates the number of TCP
connections that are currently
open.
Number
Under HTTP 1.0, if the browser supports
keep-alive, it adds an additional header to
the request: "Connection: Keep-Alive". Then,
when the server receives this request and
generates a response, it also adds a header
to the response: "Connection: Keep-Alive".
Following this, the connection is NOT
dropped, but is instead kept open. When the
client sends another request, it uses the
same connection. This will continue until
either the client or the server decides that the
conversation is over, and one of them drops
the connection. Under HTTP 1.1, all
connections are kept alive by default, unless
stated otherwise with the following header:
"Connection: close". The "Connection: Keep-
Alive" header no longer has any meaning
because of this.

M O N I T O R I N G T H E S A P W E B A P P L I C A T I O N S E R V E R
235
Connections closed by
client:
Indicates the number of TCP
connections that have been
closed by the client since the
last measurement period.
Number
Connections closed by
server:
Indicates the number of TCP
connections closed by the
server since the last
measurement period.
Number
When the server closes a TCP connection, it
could be a normal connection timeout or an
abnormal termination. In case of the latter,
the reasons for the abnormal connection loss
will have to be investigated.
4.3.3 HTTP Requests Test
The HTTP Provider Service represents a server socket that listens for client HTTP connections on the J2EE Engine. It
takes care of parsing the URL of the incoming HTTP requests, dispatching them to the correct J2EE Engine’s module
for processing, and returning the generated responses back to the client. The HTTP Requests test monitors how well
the HTTP Provider Service responds to the HTTP connection requests received from clients.
Purpose
Monitors how well the HTTP Provider Service responds to the HTTP connection requests
received from clients
Target of the
test
The SAP Web AS
Agent
deploying the
test
An internal agent

M O N I T O R I N G T H E S A P W E B A P P L I C A T I O N S E R V E R
236
Configurable
parameters for
the test
1. TEST PERIOD - How often should the test be executed
2. HOST - Host name of the server for which the test is to be configured
3. PORT - The port number to which the server is listening
4. USERNAME - This test connects to a specific SAP web application server instance, and
extracts critical metrics from it. Therefore, in the USERNAME text box, provide a valid j2ee
admin user name which the test should use for connecting to the server instance.
5. PASSWORD - Provide the PASSWORD that corresponds to the specified USERNAME.
6. CONFIRM PASSWORD - Confirm the password by retyping it in the CONFIRM
PASSWORD box.
7. INSTANCENAME - Provide the application server instance to which the test should
connect. For example, if you specify
tpp
here, then the test will use the login credentials
(USERNAME and PASSWORD) provided here to connect to an instance named
TPP
,
which is incidentally the central instance of the SAP web application server. To know the
available server instances, use the Programs -> SAP Management Console menu sequence
on the application server host, and open the SAP Management Console. In the tree-
structure in the left pane of the console, you will find a SAP Systems node. When you
expand the SAP Systems node, the available server instances will appear as its sub-nodes.
Any one of the displayed instance names can be specified in the INSTANCENAME text
box.
8. CONNECTORPORT - This test uses the P4 protocol for connecting to the SAP web
application server. Therefore, the port at which the P4 protocol listens needs to be specified
as the CONNECTORPORT. The default port number of the P4 protocol is 50004. However,
if the P4 protocol listens at a different port in your environment, then specify the exact port
number here. To know the P4 protocol port, first open the adminCFG.properties file in the
{SAP_WAS_HOME_DIR}\usr\sap\TPP\DVEBMGS00\j2ee\admin\classes
directory. The value
specified against the LOGIN_PORT parameter in that file, is the P4 protocol port.
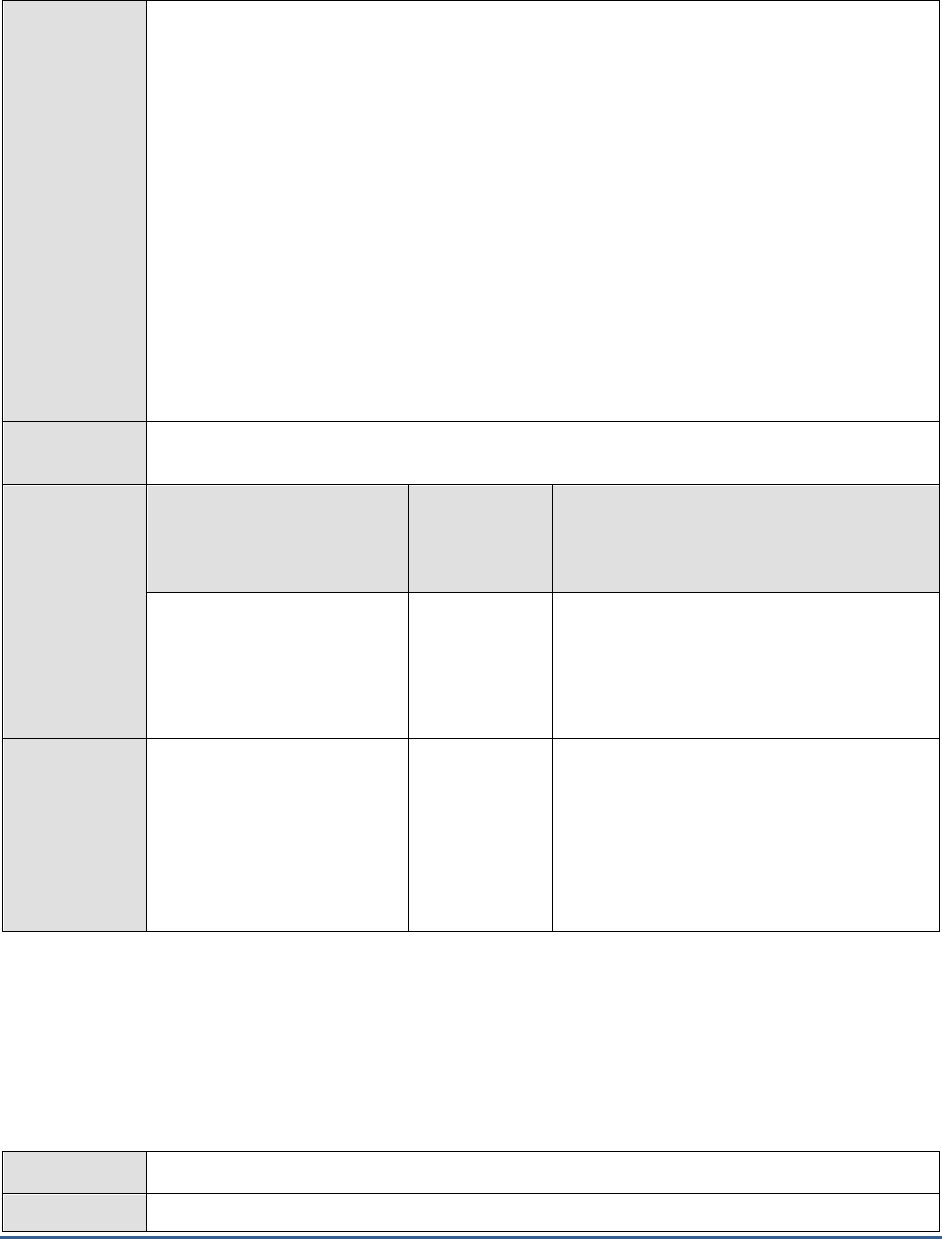
M O N I T O R I N G T H E S A P W E B A P P L I C A T I O N S E R V E R
237
9. DISPATCHERID - This test reports a set of metrics for the Java dispatcher that receives
client requests. To enable this reporting, specify the cluster ID of the Java dispatcher that
needs to be monitored. To know the cluster ID of the dispatcher, follow the steps discussed
in Section 4.1.1.1 of this document.
10. SERVERIDS - Typically, the Java dispatcher distributes the client requests it receives to the
server processes executing on the Java component of the SAP Web AS for processing. To
monitor specific server processes, specify a comma-separated list of the cluster IDs of these
server processes in the SERVERIDS text box. To know the cluster IDs of the server
processes, follow the procedure detailed in Section 4.1.1.1 of this document.
Providing a comma-separated list of server process cluster IDs will ensure that
these cluster IDs alone appear as the descriptors of the test. If need be, you can
have server process name-cluster ID pairs appear as the test descriptors. To
achieve this, the specification in the SERVERIDS text box should be of the
following format: Server process name:Cluster ID of the server process. For
example, if the cluster ID of a server process named Server0 is 12621850, then
you can specify the SERVERID in the format:
Server0:12621850
.
Outputs of the
test
One set of results each for the Dispatcher and each of the configured server processes of the
SAP Web AS
Measurements
made by the
test
Measurement
Measurement
Unit
Interpretation
New HTTP requests:
Indicates the number of
HTTP requests received by
the server since the last
measurement period.
Number
Responses from cache:
Indicates the number of
times the server has retrieved
information from the cache to
respond to HTTP requests
from clients, since the last
measurement period.
Number
Ideally, this value should be high.
4.3.4 JMX Notify Queue Test
The JMX Notification Service is responsible for the distribution of the MBeanServer notifications throughout the
cluster. MBeanServer notifications inform all the clients within the cluster about recently registered MBeans and the
removal of MBeans from the MBeanServer. The JmxNotifyQueue test reports metrics that indicate how well the JMX
Notification Service performs.
Purpose
Reports metrics that indicate how well the JMX Notification Service performs
Target of the
The SAP Web AS

M O N I T O R I N G T H E S A P W E B A P P L I C A T I O N S E R V E R
238
test
Agent
deploying the
test
An internal agent
Configurable
parameters for
the test
1. TEST PERIOD - How often should the test be executed
2. HOST - Host name of the server for which the test is to be configured
3. PORT - The port number to which the server is listening
4. USERNAME - This test connects to a specific SAP web application server instance, and
extracts critical metrics from it. Therefore, in the USERNAME text box, provide a valid j2ee
admin user name which the test should use for connecting to the server instance.
5. PASSWORD - Provide the PASSWORD that corresponds to the specified USERNAME.
6. CONFIRM PASSWORD - Confirm the password by retyping it in the CONFIRM
PASSWORD box.
7. INSTANCENAME - Provide the application server instance to which the test should
connect. For example, if you specify
tpp
here, then the test will use the login credentials
(USERNAME and PASSWORD) provided here to connect to an instance named
TPP
,
which is incidentally the central instance of the SAP web application server. To know the
available server instances, use the Programs -> SAP Management Console menu sequence
on the application server host, and open the SAP Management Console. In the tree-
structure in the left pane of the console, you will find a SAP Systems node. When you
expand the SAP Systems node, the available server instances will appear as its sub-nodes.
Any one of the displayed instance names can be specified in the INSTANCENAME text
box.
8. CONNECTORPORT - This test uses the P4 protocol for connecting to the SAP web
application server. Therefore, the port at which the P4 protocol listens needs to be specified
as the CONNECTORPORT. The default port number of the P4 protocol is 50004. However,
if the P4 protocol listens at a different port in your environment, then specify the exact port
number here. To know the P4 protocol port, first open the adminCFG.properties file in the
{SAP_WAS_HOME_DIR}\usr\sap\TPP\DVEBMGS00\j2ee\admin\classes
directory. The value
specified against the LOGIN_PORT parameter in that file, is the P4 protocol port.
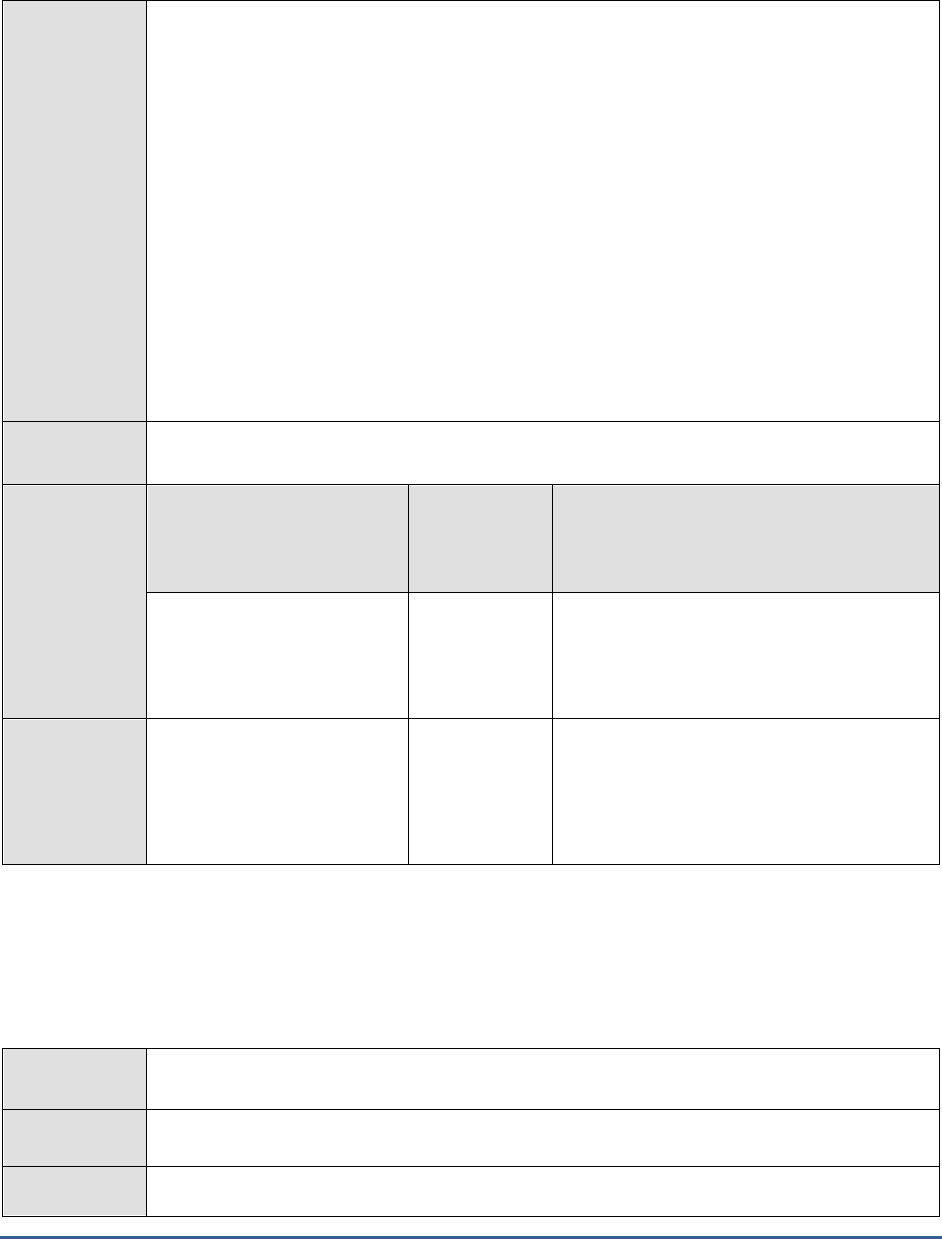
M O N I T O R I N G T H E S A P W E B A P P L I C A T I O N S E R V E R
239
9. DISPATCHERID - This test reports a set of metrics for the Java dispatcher that receives
client requests. To enable this reporting, specify the cluster ID of the Java dispatcher that
needs to be monitored. To know the cluster ID of the dispatcher, follow the steps discussed
in Section 4.1.1.1 of this document.
10. SERVERIDS - Typically, the Java dispatcher distributes the client requests it receives to the
server processes executing on the Java component of the SAP Web AS for processing. To
monitor specific server processes, specify a comma-separated list of the cluster IDs of these
server processes in the SERVERIDS text box. To know the cluster IDs of the server
processes, follow the procedure detailed in Section 4.1.1.1 of this document.
Providing a comma-separated list of server process cluster IDs will ensure that
these cluster IDs alone appear as the descriptors of the test. If need be, you can
have server process name-cluster ID pairs appear as the test descriptors. To
achieve this, the specification in the SERVERIDS text box should be of the
following format: Server process name:Cluster ID of the server process. For
example, if the cluster ID of a server process named Server0 is 12621850, then
you can specify the SERVERID in the format:
Server0:12621850
.
Outputs of the
test
One set of results each for the Dispatcher and each of the configured server processes of the
SAP Web AS
Measurements
made by the
test
Measurement
Measurement
Unit
Interpretation
Active threads:
Indicates the number of
threads that are currently
processing JMX notifications.
Number
Queue size:
Indicates the number of
notifications currently in
queue, waiting to be sent to
clients.
Number
If the value of this measure increases
consistently, it could indicate a
processing/delivery bottleneck.
4.3.5 Log Config Test
Using the Log Configurator service runtime available in the Visual Administrator, one can manage the logging and
tracing configurations of the J2EE Engine components and of the deployed applications. The LogConfig test monitors
this service to indicate whether the SAP web application server has been adequately configured to handle both its
present and future logs.
Purpose
Monitors this service to indicate whether the SAP web application server has been adequately
configured to handle both its present and future logs
Target of the
test
The SAP Web AS
Agent
deploying the
An internal agent

M O N I T O R I N G T H E S A P W E B A P P L I C A T I O N S E R V E R
240
test
Configurable
parameters for
the test
1. TEST PERIOD - How often should the test be executed
2. HOST - Host name of the server for which the test is to be configured
3. PORT - The port number to which the server is listening
4. USERNAME - This test connects to a specific SAP web application server instance, and
extracts critical metrics from it. Therefore, in the USERNAME text box, provide a valid j2ee
admin user name which the test should use for connecting to the server instance.
5. PASSWORD - Provide the PASSWORD that corresponds to the specified USERNAME.
6. CONFIRM PASSWORD - Confirm the password by retyping it in the CONFIRM
PASSWORD box.
7. INSTANCENAME - Provide the application server instance to which the test should
connect. For example, if you specify
tpp
here, then the test will use the login credentials
(USERNAME and PASSWORD) provided here to connect to an instance named
TPP
,
which is incidentally the central instance of the SAP web application server. To know the
available server instances, use the Programs -> SAP Management Console menu sequence
on the application server host, and open the SAP Management Console. In the tree-
structure in the left pane of the console, you will find a SAP Systems node. When you
expand the SAP Systems node, the available server instances will appear as its sub-nodes.
Any one of the displayed instance names can be specified in the INSTANCENAME text
box.
8. CONNECTORPORT - This test uses the P4 protocol for connecting to the SAP web
application server. Therefore, the port at which the P4 protocol listens needs to be specified
as the CONNECTORPORT. The default port number of the P4 protocol is 50004. However,
if the P4 protocol listens at a different port in your environment, then specify the exact port
number here. To know the P4 protocol port, first open the adminCFG.properties file in the
{SAP_WAS_HOME_DIR}\usr\sap\TPP\DVEBMGS00\j2ee\admin\classes
directory. The value
specified against the LOGIN_PORT parameter in that file, is the P4 protocol port.

M O N I T O R I N G T H E S A P W E B A P P L I C A T I O N S E R V E R
241
9. DISPATCHERID - This test reports a set of metrics for the Java dispatcher that receives
client requests. To enable this reporting, specify the cluster ID of the Java dispatcher that
needs to be monitored. To know the cluster ID of the dispatcher, follow the steps discussed
in Section 4.1.1.1 of this document.
10. SERVERIDS - Typically, the Java dispatcher distributes the client requests it receives to the
server processes executing on the Java component of the SAP Web AS for processing. To
monitor specific server processes, specify a comma-separated list of the cluster IDs of these
server processes in the SERVERIDS text box. To know the cluster IDs of the server
processes, follow the procedure detailed in Section 4.1.1.1 of this document.
Providing a comma-separated list of server process cluster IDs will ensure that
these cluster IDs alone appear as the descriptors of the test. If need be, you can
have server process name-cluster ID pairs appear as the test descriptors. To
achieve this, the specification in the SERVERIDS text box should be of the
following format: Server process name:Cluster ID of the server process. For
example, if the cluster ID of a server process named Server0 is 12621850, then
you can specify the SERVERID in the format:
Server0:12621850
.
Outputs of the
test
One set of results each for the Dispatcher and each of the configured server processes of the
SAP Web AS
Measurements
made by the
test
Measurement
Measurement
Unit
Interpretation
Archives size:
Indicates the total size of all
log and trace archives.
MB
Log files size:
Indicates the total size of all
log and trace files excluding
archives.
MB
4.3.6 MBeans Register Test
The MBeansRegisterTest monitors the process of the registration of MBeans with the MBeanServer.
Purpose
Monitors the process of the registration of MBeans with the MBeanServer
Target of the
test
The SAP Web AS
Agent
deploying the
test
An internal agent

M O N I T O R I N G T H E S A P W E B A P P L I C A T I O N S E R V E R
242
Configurable
parameters for
the test
1. TEST PERIOD - How often should the test be executed
2. HOST - Host name of the server for which the test is to be configured
3. PORT - The port number to which the server is listening
4. USERNAME - This test connects to a specific SAP web application server instance, and
extracts critical metrics from it. Therefore, in the USERNAME text box, provide a valid j2ee
admin user name which the test should use for connecting to the server instance.
5. PASSWORD - Provide the PASSWORD that corresponds to the specified USERNAME.
6. CONFIRM PASSWORD - Confirm the password by retyping it in the CONFIRM
PASSWORD box.
7. INSTANCENAME - Provide the application server instance to which the test should
connect. For example, if you specify
tpp
here, then the test will use the login credentials
(USERNAME and PASSWORD) provided here to connect to an instance named
TPP
,
which is incidentally the central instance of the SAP web application server. To know the
available server instances, use the Programs -> SAP Management Console menu sequence
on the application server host, and open the SAP Management Console. In the tree-
structure in the left pane of the console, you will find a SAP Systems node. When you
expand the SAP Systems node, the available server instances will appear as its sub-nodes.
Any one of the displayed instance names can be specified in the INSTANCENAME text
box.
8. CONNECTORPORT - This test uses the P4 protocol for connecting to the SAP web
application server. Therefore, the port at which the P4 protocol listens needs to be specified
as the CONNECTORPORT. The default port number of the P4 protocol is 50004. However,
if the P4 protocol listens at a different port in your environment, then specify the exact port
number here. To know the P4 protocol port, first open the adminCFG.properties file in the
{SAP_WAS_HOME_DIR}\usr\sap\TPP\DVEBMGS00\j2ee\admin\classes
directory. The value
specified against the LOGIN_PORT parameter in that file, is the P4 protocol port.
9. DISPATCHERID - This test reports a set of metrics for the Java dispatcher that receives
client requests. To enable this reporting, specify the cluster ID of the Java dispatcher that
needs to be monitored. To know the cluster ID of the dispatcher, follow the steps discussed
in Page 213 of this document.
10. SERVERIDS - Typically, the Java dispatcher distributes the client requests it receives to the
server processes executing on the Java component of the SAP Web AS for processing. To
monitor specific server processes, specify a comma-separated list of the cluster IDs of these
server processes in the SERVERIDS text box. To know the cluster IDs of the server
processes, follow the procedure detailed in Page 218 of this document.
11. Providing a comma-separated list of server process cluster IDs will ensure that these cluster
IDs alone appear as the descriptors of the test. If need be, you can have server process
name-cluster ID pairs appear as the test descriptors. To achieve this, the specification in
the SERVERIDS text box should be of the following format:
Server process name:Cluster
ID of the server process
. For example, if the cluster ID of a server process named
Server0
is
12621850
, then you can specify the SERVERID in the format:
Server0:12621850
.
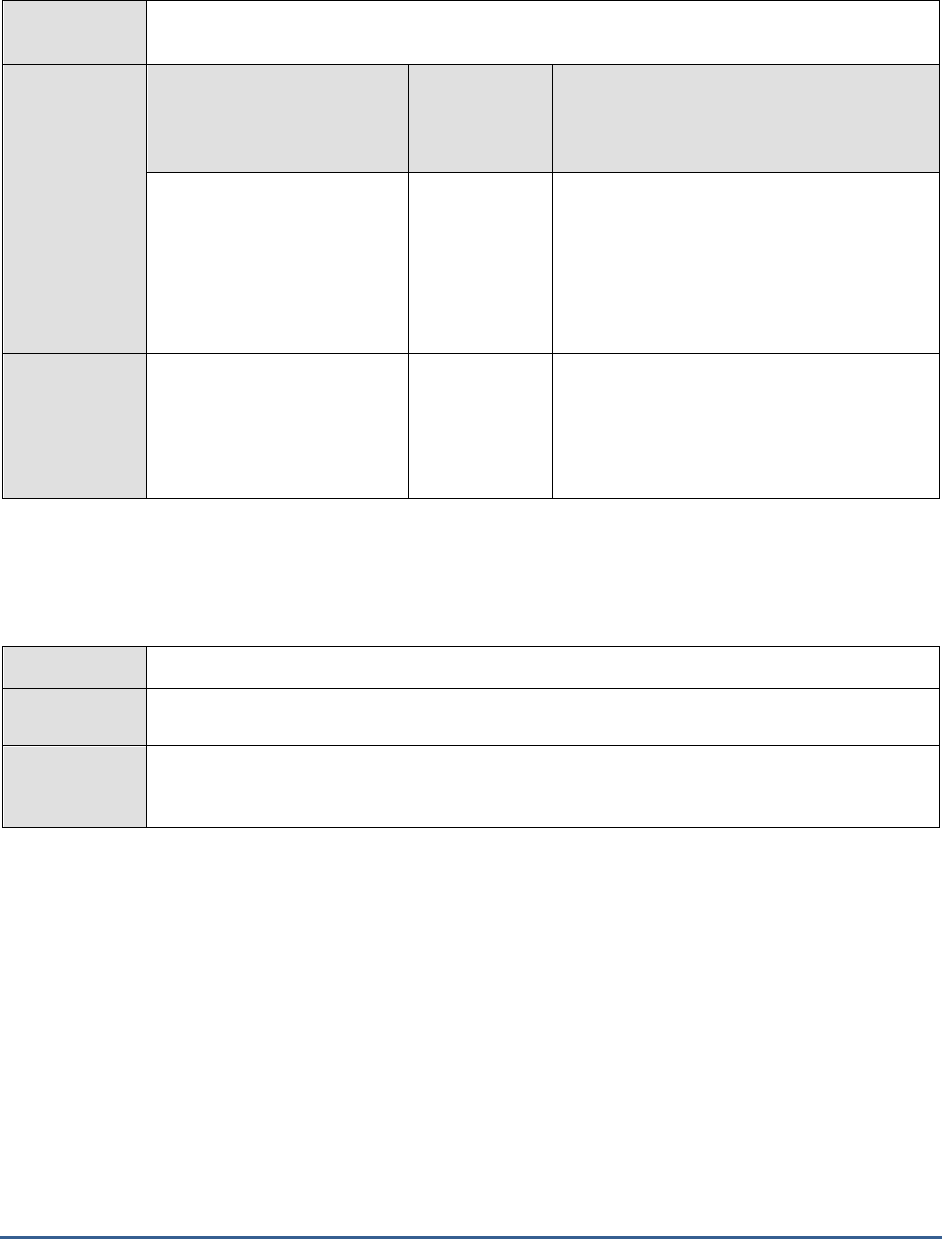
M O N I T O R I N G T H E S A P W E B A P P L I C A T I O N S E R V E R
243
Outputs of the
test
One set of results each for the Dispatcher and each of the configured server processes of the
SAP Web AS
Measurements
made by the
test
Measurement
Measurement
Unit
Interpretation
Notify listeners:
Indicates the number of
notification listeners
registered with the
MBeanServer since the last
measurement period.
Number
Adding a listener for
MBeanServerNotifications
causes the
MBeanServer to send a broadcast message
for each MBean that is (un)registered.
Therefore, avoid it whenever possible and do
not forget to unregister the listener if you no
longer require notification.
Mbeans registered:
Indicates the number of
Mbeans registered with the
MBeanServer since the last
measurement period.
Number
4.3.7 P4 Connections Test
The P4Connections test reveals the availability and responsiveness of the P4 connection to the SAP Web AS.
Purpose
Reports the availability and responsiveness of the P4 connection to the SAP Web AS
Target of the
test
The SAP Web AS
Agent
deploying the
test
An internal agent
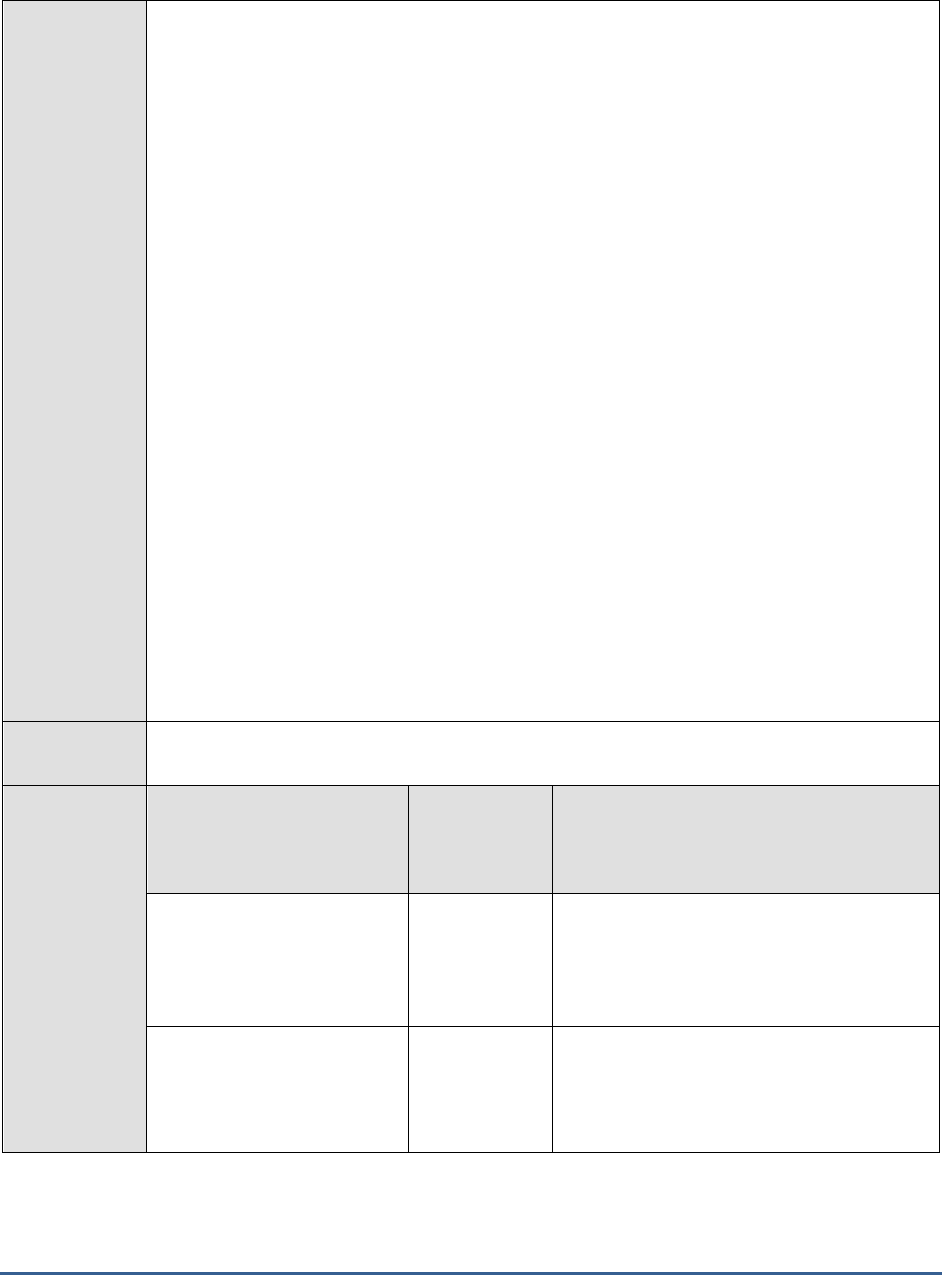
M O N I T O R I N G T H E S A P W E B A P P L I C A T I O N S E R V E R
244
Configurable
parameters for
the test
1. TEST PERIOD - How often should the test be executed
2. HOST - Host name of the server for which the test is to be configured
3. PORT - The port number to which the server is listening
4. USERNAME - This test connects to a specific SAP web application server instance, and
extracts critical metrics from it. Therefore, in the USERNAME text box, provide a valid j2ee
admin user name which the test should use for connecting to the server instance.
5. PASSWORD - Provide the PASSWORD that corresponds to the specified USERNAME.
6. CONFIRM PASSWORD - Confirm the password by retyping it in the CONFIRM
PASSWORD box.
7. INSTANCENAME - Provide the application server instance to which the test should
connect. For example, if you specify
tpp
here, then the test will use the login credentials
(USERNAME and PASSWORD) provided here to connect to an instance named
TPP
,
which is incidentally the central instance of the SAP web application server. To know the
available server instances, use the Programs -> SAP Management Console menu sequence
on the application server host, and open the SAP Management Console. In the tree-
structure in the left pane of the console, you will find a SAP Systems node. When you
expand the SAP Systems node, the available server instances will appear as its sub-nodes.
Any one of the displayed instance names can be specified in the INSTANCENAME text
box.
8. CONNECTORPORT - This test uses the P4 protocol for connecting to the SAP web
application server. Therefore, the port at which the P4 protocol listens needs to be specified
as the CONNECTORPORT. The default port number of the P4 protocol is 50004. However,
if the P4 protocol listens at a different port in your environment, then specify the exact port
number here. To know the P4 protocol port, first open the adminCFG.properties file in the
{SAP_WAS_HOME_DIR}\usr\sap\TPP\DVEBMGS00\j2ee\admin\classes
directory. The value
specified against the LOGIN_PORT parameter in that file, is the P4 protocol port.
Outputs of the
test
One set of results each for every SAP Web AS monitored
Measurements
made by the
test
Measurement
Measurement
Unit
Interpretation
Availability:
Indicates whether the P4
connection is available or not.
Percent
If the value of this measure is 100, it
indicates that the P4 connection is available.
The value 0, on the other hand, is indicative
of the non-availability of the P4 connection to
the server.
Response time:
Indicates the responsiveness
(in seconds) of the P4
protocol.
Secs
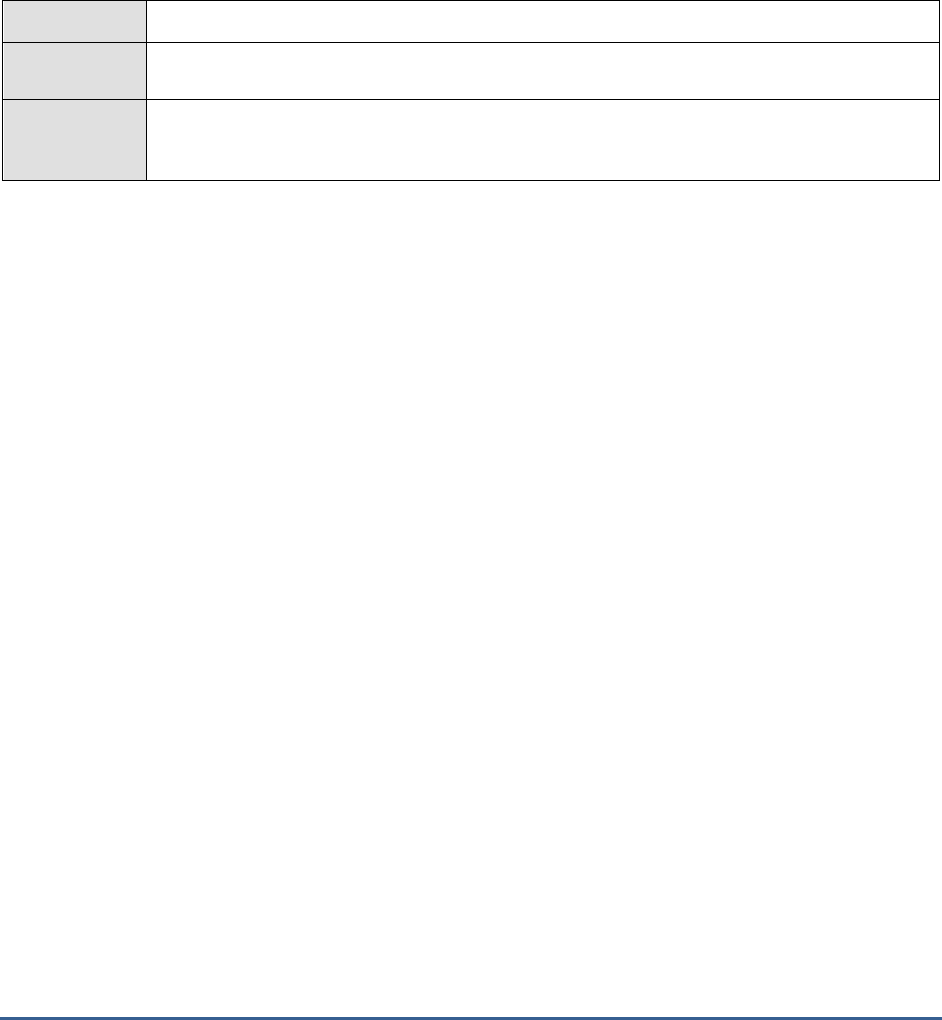
M O N I T O R I N G T H E S A P W E B A P P L I C A T I O N S E R V E R
245
4.3.8 P4 Usage Test
The P4Usage test measures the capability of the P4 Provider Service in handling P4 requests. The P4 Provider Service
provides functions for the communication of remote objects over the P4 protocol on the J2EE Engine. It also provides
functions for communication support generation. The P4 Provider Service consists of two parts. One of the parts runs
on the Java dispatcher. It accepts requests from the remote clients and has the responsibility to dispatch them to the
appropriate cluster element, where the implementation of the remote object resides. For the purpose, the P4
Provider Service uses the J2EE Engine Load Balancing System. The second part of the P4 Provider Service runs on
the server processes. This part contains the implementation of the P4RemoteObject broker and is responsible for
executing methods on the implementation of the remote object and returning the results.
Purpose
Measures the capability of the P4 Provider Service in handling P4 requests
Target of the
test
The SAP Web AS
Agent
deploying the
test
An internal agent

M O N I T O R I N G T H E S A P W E B A P P L I C A T I O N S E R V E R
246
Configurable
parameters for
the test
1. TEST PERIOD - How often should the test be executed
2. HOST - Host name of the server for which the test is to be configured
3. PORT - The port number to which the server is listening
4. USERNAME - This test connects to a specific SAP web application server instance, and
extracts critical metrics from it. Therefore, in the USERNAME text box, provide a valid j2ee
admin user name which the test should use for connecting to the server instance.
5. PASSWORD - Provide the PASSWORD that corresponds to the specified USERNAME.
6. CONFIRM PASSWORD - Confirm the password by retyping it in the CONFIRM
PASSWORD box.
7. INSTANCENAME - Provide the application server instance to which the test should
connect. For example, if you specify
tpp
here, then the test will use the login credentials
(USERNAME and PASSWORD) provided here to connect to an instance named
TPP
,
which is incidentally the central instance of the SAP web application server. To know the
available server instances, use the Programs -> SAP Management Console menu sequence
on the application server host, and open the SAP Management Console. In the tree-
structure in the left pane of the console, you will find a SAP Systems node. When you
expand the SAP Systems node, the available server instances will appear as its sub-nodes.
Any one of the displayed instance names can be specified in the INSTANCENAME text
box.
8. CONNECTORPORT - This test uses the P4 protocol for connecting to the SAP web
application server. Therefore, the port at which the P4 protocol listens needs to be specified
as the CONNECTORPORT. The default port number of the P4 protocol is 50004. However,
if the P4 protocol listens at a different port in your environment, then specify the exact port
number here. To know the P4 protocol port, first open the adminCFG.properties file in the
{SAP_WAS_HOME_DIR}\usr\sap\TPP\DVEBMGS00\j2ee\admin\classes
directory. The value
specified against the LOGIN_PORT parameter in that file, is the P4 protocol port.
9. DISPATCHERID - This test reports a set of metrics for the Java dispatcher that receives
client requests. To enable this reporting, specify the cluster ID of the Java dispatcher that
needs to be monitored. To know the cluster ID of the dispatcher, follow the steps discussed
in Section 4.1.1.1 of this document.
10. SERVERIDS - Typically, the Java dispatcher distributes the client requests it receives to the
server processes executing on the Java component of the SAP Web AS for processing. To
monitor specific server processes, specify a comma-separated list of the cluster IDs of these
server processes in the SERVERIDS text box. To know the cluster IDs of the server
processes, follow the procedure detailed in Section 4.1.1.1 of this document.
11. Providing a comma-separated list of server process cluster IDs will ensure that these cluster
IDs alone appear as the descriptors of the test. If need be, you can have server process
name-cluster ID pairs appear as the test descriptors. To achieve this, the specification in
the SERVERIDS text box should be of the following format:
Server process name:Cluster
ID of the server process
. For example, if the cluster ID of a server process named
Server0
is
12621850
, then you can specify the SERVERID in the format:
Server0:12621850
.
Outputs of the
test
One set of results each for the Dispatcher and each of the configured server processes of the
SAP Web AS
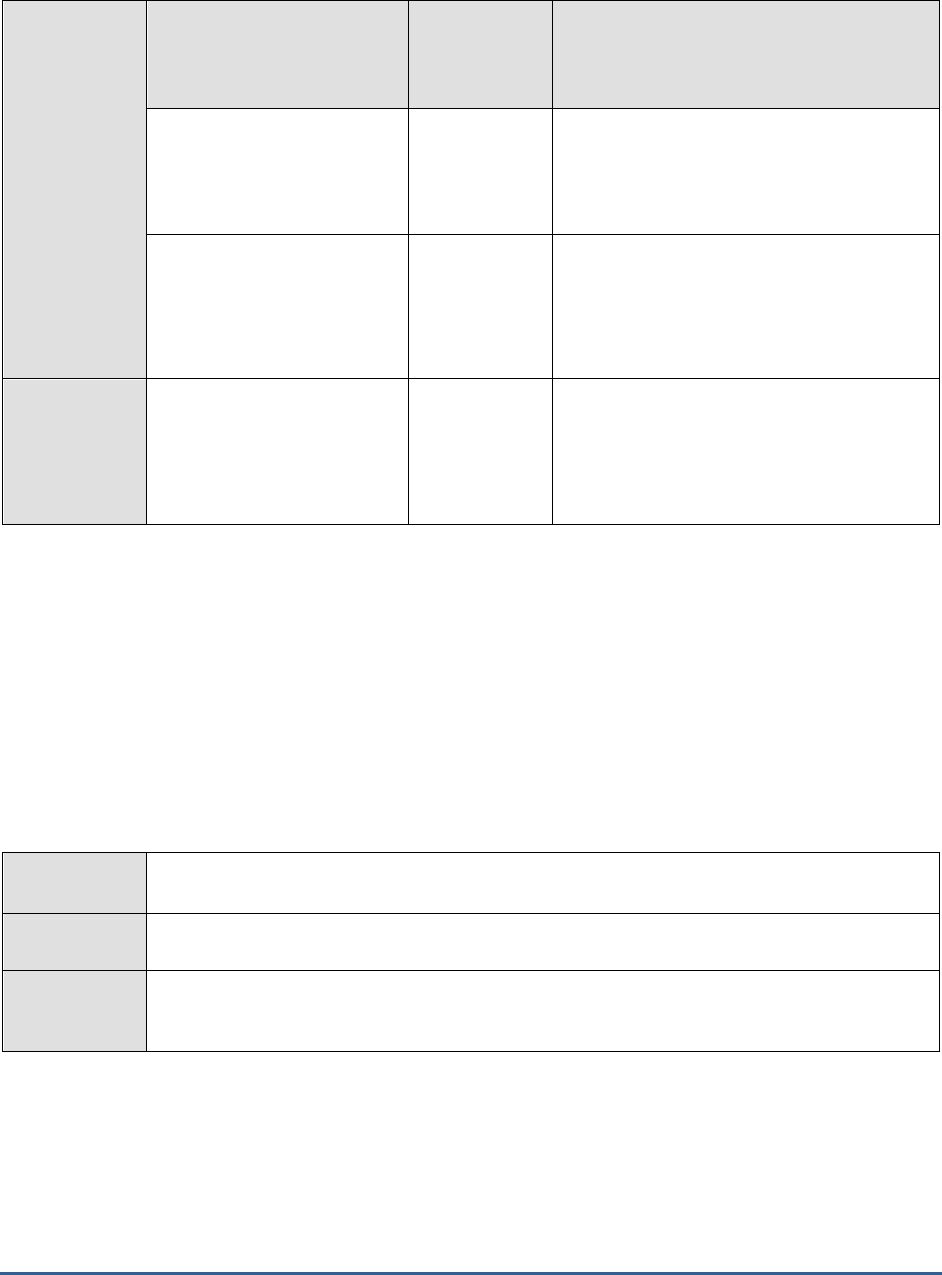
M O N I T O R I N G T H E S A P W E B A P P L I C A T I O N S E R V E R
247
Measurements
made by the
test
Measurement
Measurement
Unit
Interpretation
Remote objects:
Indicates the number of
remote objects handled by
the P4 Provider Service.
Number
P4 requests:
Indicates the number of P4
requests received from
remote clients since the last
measurement period.
Number
Failed requests:
Indicates the number of P4
requests which have failed
since the last measurement
period.
Number
4.3.9 Sap WAS Beans Test
The SapWasBeans test measures the efficiency with which the EJB Container Service manages the enterprise bean
instances deployed on the server. The EJB Container provides all the services that are required by an EJB application,
such as transaction and security management, clustering, persistence, network distribution of remote clients, scalable
management of resources, and so on.
If too many EJBs have been deployed on the server, then managing the individual EJBs could become a cumbersome
task. In such a case, you can use the eG administrative interface to group EJBs and manage the groups, instead. To
create an EJB group, you will need to click on the Click here hyperlink displayed above the parameters of the
SapWasBeans test. By default, eG Enterprise system monitors only those beans that are part of a group.
Purpose
Measures the efficiency with which the EJB Container Service manages the enterprise bean
instances deployed on the server
Target of the
test
The SAP Web AS
Agent
deploying the
test
An internal agent

M O N I T O R I N G T H E S A P W E B A P P L I C A T I O N S E R V E R
248
Configurable
parameters for
the test
1. TEST PERIOD - How often should the test be executed
2. HOST - Host name of the server for which the test is to be configured
3. PORT - The port number to which the server is listening
4. USERNAME - This test connects to a specific SAP web application server instance, and
extracts critical metrics from it. Therefore, in the USERNAME text box, provide a valid j2ee
admin user name which the test should use for connecting to the server instance.
5. PASSWORD - Provide the PASSWORD that corresponds to the specified USERNAME.
6. CONFIRM PASSWORD - Confirm the password by retyping it in the CONFIRM
PASSWORD box.
7. INSTANCENAME - Provide the application server instance to which the test should
connect. For example, if you specify
tpp
here, then the test will use the login credentials
(USERNAME and PASSWORD) provided here to connect to an instance named
TPP
,
which is incidentally the central instance of the SAP web application server. To know the
available server instances, use the Programs -> SAP Management Console menu sequence
on the application server host, and open the SAP Management Console. In the tree-
structure in the left pane of the console, you will find a SAP Systems node. When you
expand the SAP Systems node, the available server instances will appear as its sub-nodes.
Any one of the displayed instance names can be specified in the INSTANCENAME text
box.
8. CONNECTORPORT - This test uses the P4 protocol for connecting to the SAP web
application server. Therefore, the port at which the P4 protocol listens needs to be specified
as the CONNECTORPORT. The default port number of the P4 protocol is 50004. However,
if the P4 protocol listens at a different port in your environment, then specify the exact port
number here. To know the P4 protocol port, first open the adminCFG.properties file in the
{SAP_WAS_HOME_DIR}\usr\sap\TPP\DVEBMGS00\j2ee\admin\classes
directory. The value
specified against the LOGIN_PORT parameter in that file, is the P4 protocol port.
9. AUTODISCOVERY – By default, the eG Enterprise suite allows administrators to configure
bean groups using the eG administrative interface, and reports metrics pertaining to every
group so created. Accordingly, by default, AUTODISCOVERY is set to NO. If you want
beans to be discovered and monitored automatically, then select the YES option against
AUTODISCOVERY. When this is done, the eG agent automatically discovers all the beans
on the SAP web application server, and reports one set of measures for every bean hosted
on the server.
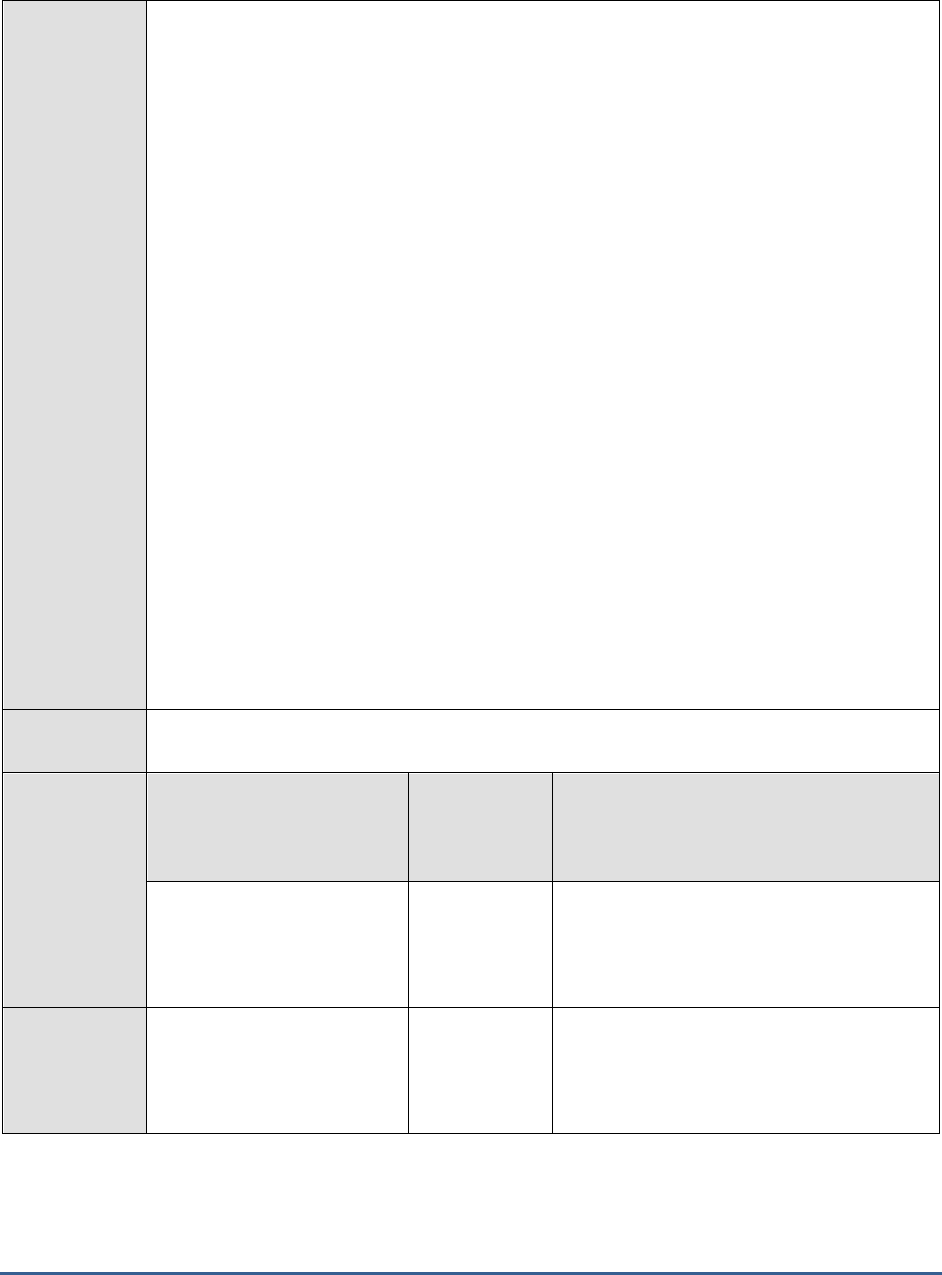
M O N I T O R I N G T H E S A P W E B A P P L I C A T I O N S E R V E R
249
10. DISPATCHERID - This test reports a set of metrics for the Java dispatcher that receives
client requests. To enable this reporting, specify the cluster ID of the Java dispatcher that
needs to be monitored. To know the cluster ID of the dispatcher, follow the steps discussed
in Section 4.1.1.1 of this document.
11. SERVERIDS - Typically, the Java dispatcher distributes the client requests it receives to the
server processes executing on the Java component of the SAP Web AS for processing. To
monitor specific server processes, specify a comma-separated list of the cluster IDs of these
server processes in the SERVERIDS text box. To know the cluster IDs of the server
processes, follow the procedure detailed in Section 4.1.1.1 of this document.
Providing a comma-separated list of server process cluster IDs will ensure that
these cluster IDs alone appear as the descriptors of the test. If need be, you can
have server process name-cluster ID pairs appear as the test descriptors. To
achieve this, the specification in the SERVERIDS text box should be of the
following format: Server process name:Cluster ID of the server process. For
example, if the cluster ID of a server process named Server0 is 12621850, then
you can specify the SERVERID in the format:
Server0:12621850
.
12. DETAILED DIAGNOSIS - To make diagnosis more efficient and accurate, the eG
Enterprise suite embeds an optional detailed diagnostic capability. With this capability, the
eG agents can be configured to run detailed, more elaborate tests as and when specific
problems are detected. To enable the detailed diagnosis capability of this test for a
particular server, choose the On option. To disable the capability, click on the Off option.
The option to selectively enable/disable the detailed diagnosis capability will be
available only if the following conditions are fulfilled:
v. The eG manager license should allow the detailed diagnosis capability
W. Both the normal and abnormal frequencies configured for the detailed diagnosis
measures should not be 0.
Outputs of the
test
One set of results for every configured EJB group
Measurements
made by the
test
Measurement
Measurement
Unit
Interpretation
Bean creations:
Indicates the number of
times a bean has been
created.
Number
The detailed diagnosis of this measure, if
enabled, provides an individual bean-wise
breakup of the current pool size, and the
number of additions and removals.
Bean removals:
Indicates the number of
times a bean has been
removed.
Number

M O N I T O R I N G T H E S A P W E B A P P L I C A T I O N S E R V E R
250
Current pool size:
Indicates the number of bean
instances provided by this
pool, which are currently
used by the application or are
stored in the pool.
Number
Bean activations:
Indicates the number of
times a bean instance has
been activated since the last
measurement period.
Number
Bean passivations:
Indicates the number of
times a bean instance has
been passivated or
deactivated since the last
measurement period.
Number
Active sessions:
Indicates the number of bean
sessions that are currently
active.
Number
Passive sessions:
Indicates the number of bean
sessions that are currently
passive.
Number
Completed sessions:
Indicates the number of bean
sessions that have been
completed since the last
measurement period.
Number
Bean stores:
Indicates the number of
entity bean instances that
were stored in the database
since the last measurement
period.
Number
Bean loads:
Indicates the number of
entity bean instances that
were loaded to the EJB
container from the database
since the last measurement
period.
Number

M O N I T O R I N G T H E S A P W E B A P P L I C A T I O N S E R V E R
251
4.3.10 Sap WAS Memory Test
The SapWasMemoryTest reports the memory usage metrics revealed by the Memory Info Service. This service is
responsible for keeping track of the memory that is used internally by the JVM of the owner cluster element. The
service provides a set of properties for managing memory usage levels.
Purpose
Reports the memory usage metrics revealed by the Memory Info Service
Target of the
test
The SAP Web AS
Agent
deploying the
test
An internal agent
Configurable
parameters for
the test
1. TEST PERIOD - How often should the test be executed
2. HOST - Host name of the server for which the test is to be configured
3. PORT - The port number to which the server is listening
4. USERNAME - This test connects to a specific SAP web application server instance, and
extracts critical metrics from it. Therefore, in the USERNAME text box, provide a valid j2ee
admin user name which the test should use for connecting to the server instance.
5. PASSWORD - Provide the PASSWORD that corresponds to the specified USERNAME.
6. CONFIRM PASSWORD - Confirm the password by retyping it in the CONFIRM
PASSWORD box.
7. INSTANCENAME - Provide the application server instance to which the test should
connect. For example, if you specify
tpp
here, then the test will use the login credentials
(USERNAME and PASSWORD) provided here to connect to an instance named
TPP
,
which is incidentally the central instance of the SAP web application server. To know the
available server instances, use the Programs -> SAP Management Console menu sequence
on the application server host, and open the SAP Management Console. In the tree-
structure in the left pane of the console, you will find a SAP Systems node. When you
expand the SAP Systems node, the available server instances will appear as its sub-nodes.
Any one of the displayed instance names can be specified in the INSTANCENAME text
box.
8. CONNECTORPORT - This test uses the P4 protocol for connecting to the SAP web
application server. Therefore, the port at which the P4 protocol listens needs to be specified
as the CONNECTORPORT. The default port number of the P4 protocol is 50004. However,
if the P4 protocol listens at a different port in your environment, then specify the exact port
number here. To know the P4 protocol port, first open the adminCFG.properties file in the
{SAP_WAS_HOME_DIR}\usr\sap\TPP\DVEBMGS00\j2ee\admin\classes
directory. The value
specified against the LOGIN_PORT parameter in that file, is the P4 protocol port.

M O N I T O R I N G T H E S A P W E B A P P L I C A T I O N S E R V E R
252
9. DISPATCHERID - This test reports a set of metrics for the Java dispatcher that receives
client requests. To enable this reporting, specify the cluster ID of the Java dispatcher that
needs to be monitored. To know the cluster ID of the dispatcher, follow the steps discussed
in Section 4.1.1.1 of this document.
10. SERVERIDS - Typically, the Java dispatcher distributes the client requests it receives to the
server processes executing on the Java component of the SAP Web AS for processing. To
monitor specific server processes, specify a comma-separated list of the cluster IDs of these
server processes in the SERVERIDS text box. To know the cluster IDs of the server
processes, follow the procedure detailed in Section 4.1.1.1 of this document.
Providing a comma-separated list of server process cluster IDs will ensure that
these cluster IDs alone appear as the descriptors of the test. If need be, you can
have server process name-cluster ID pairs appear as the test descriptors. To
achieve this, the specification in the SERVERIDS text box should be of the
following format: Server process name:Cluster ID of the server process. For
example, if the cluster ID of a server process named Server0 is 12621850, then
you can specify the SERVERID in the format:
Server0:12621850
.
Outputs of the
test
One set of results each for the Dispatcher and each of the configured server processes of the
SAP Web AS
Measurements
made by the
test
Measurement
Measurement
Unit
Interpretation
Memory used:
Indicates the memory that
has been currently utilized by
the JVM.
MB
Memory allocated:
Indicates the amount of
memory that has been
allocated to the JVM.
MB
Memory available:
Indicates the amount of
memory that is currently
available.
MB
If this value is very low or is decreasing
consistently, it could be a cause for concern.
You might then consider allocating more
memory to the JVM of the owner cluster
element.
4.3.11 Sap WAS Sessions Test
The SapWasSessions test reports metrics pertaining to user sessions on the SAP web application server as revealed
by the Security Provider service. This service enables the management of the security policy and the authentication
and authorization mechanisms on the system, monitors user sessions, and restricts access to the resources or the
applications deployed on the J2EE Engine.

M O N I T O R I N G T H E S A P W E B A P P L I C A T I O N S E R V E R
253
Purpose
Reports metrics pertaining to user sessions on the SAP web application server as revealed by the
Security Provider service
Target of the
test
The SAP Web AS
Agent
deploying the
test
An internal agent
Configurable
parameters for
the test
1. TEST PERIOD - How often should the test be executed
2. HOST - Host name of the server for which the test is to be configured
3. PORT - The port number to which the server is listening
4. USERNAME - This test connects to a specific SAP web application server instance, and
extracts critical metrics from it. Therefore, in the USERNAME text box, provide a valid j2ee
admin user name which the test should use for connecting to the server instance.
5. PASSWORD - Provide the PASSWORD that corresponds to the specified USERNAME.
6. CONFIRM PASSWORD - Confirm the password by retyping it in the CONFIRM
PASSWORD box.
7. INSTANCENAME - Provide the application server instance to which the test should
connect. For example, if you specify
tpp
here, then the test will use the login credentials
(USERNAME and PASSWORD) provided here to connect to an instance named
TPP
,
which is incidentally the central instance of the SAP web application server. To know the
available server instances, use the Programs -> SAP Management Console menu sequence
on the application server host, and open the SAP Management Console. In the tree-
structure in the left pane of the console, you will find a SAP Systems node. When you
expand the SAP Systems node, the available server instances will appear as its sub-nodes.
Any one of the displayed instance names can be specified in the INSTANCENAME text
box.
8. CONNECTORPORT - This test uses the P4 protocol for connecting to the SAP web
application server. Therefore, the port at which the P4 protocol listens needs to be specified
as the CONNECTORPORT. The default port number of the P4 protocol is 50004. However,
if the P4 protocol listens at a different port in your environment, then specify the exact port
number here. To know the P4 protocol port, first open the adminCFG.properties file in the
{SAP_WAS_HOME_DIR}\usr\sap\TPP\DVEBMGS00\j2ee\admin\classes
directory. The value
specified against the LOGIN_PORT parameter in that file, is the P4 protocol port.

M O N I T O R I N G T H E S A P W E B A P P L I C A T I O N S E R V E R
254
9. DISPATCHERID - This test reports a set of metrics for the Java dispatcher that receives
client requests. To enable this reporting, specify the cluster ID of the Java dispatcher that
needs to be monitored. To know the cluster ID of the dispatcher, follow the steps discussed
in Section 4.1.1.1 of this document.
10. SERVERIDS - Typically, the Java dispatcher distributes the client requests it receives to the
server processes executing on the Java component of the SAP Web AS for processing. To
monitor specific server processes, specify a comma-separated list of the cluster IDs of these
server processes in the SERVERIDS text box. To know the cluster IDs of the server
processes, follow the procedure detailed in Section 4.1.1.1 of this document.
Providing a comma-separated list of server process cluster IDs will ensure that
these cluster IDs alone appear as the descriptors of the test. If need be, you can
have server process name-cluster ID pairs appear as the test descriptors. To
achieve this, the specification in the SERVERIDS text box should be of the
following format: Server process name:Cluster ID of the server process. For
example, if the cluster ID of a server process named Server0 is 12621850, then
you can specify the SERVERID in the format:
Server0:12621850
.
Outputs of the
test
One set of results each for the Dispatcher and each of the configured server processes of the
SAP Web AS
Measurements
made by the
test
Measurement
Measurement
Unit
Interpretation
Failed logon attempts:
Indicates the number of
unsuccessful logon attempts
since the last measurement
period.
Number
New sessions:
Indicates the number of
sessions that have newly
opened since the last
measurement period.
Number
Active sessions:
Indicates the number of
currently active sessions.
Number
Invalid sessions:
Indicates the number of
invalid sessions since the last
measurement period.
Number
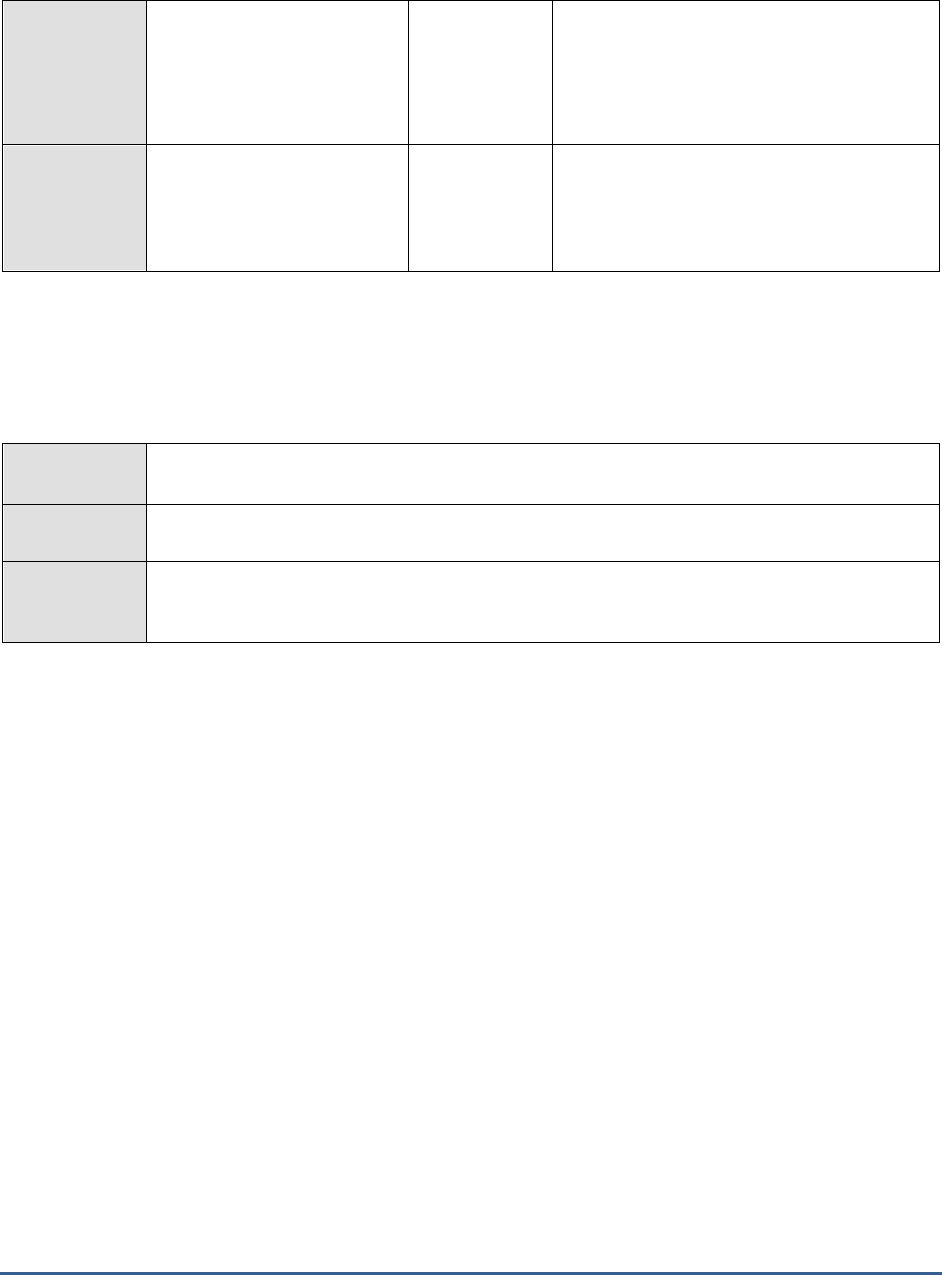
M O N I T O R I N G T H E S A P W E B A P P L I C A T I O N S E R V E R
255
Logged off sessions:
Indicates the number of
sessions users logged out of
since the last measurement
period.
Number
Timed out sessions:
Indicates the number of
sessions that timed out.
Number
If the value of this measure is very high, then
consider resetting the TIMEOUT period for
user sessions.
4.3.12 Sap WAS Transactions Test
The Sap WAS Transactions test monitors the transactions to the SAP web application server, and reports key
statistics pertaining to the transactions.
Purpose
Monitors the transactions to the SAP web application server, and reports key statistics pertaining
to the transactions
Target of the
test
The SAP Web AS
Agent
deploying the
test
An internal agent

M O N I T O R I N G T H E S A P W E B A P P L I C A T I O N S E R V E R
256
Configurable
parameters for
the test
1. TEST PERIOD - How often should the test be executed
2. HOST - Host name of the server for which the test is to be configured
3. PORT - The port number to which the server is listening
4. USERNAME - This test connects to a specific SAP web application server instance, and
extracts critical metrics from it. Therefore, in the USERNAME text box, provide a valid j2ee
admin user name which the test should use for connecting to the server instance.
5. PASSWORD - Provide the PASSWORD that corresponds to the specified USERNAME.
6. CONFIRM PASSWORD - Confirm the password by retyping it in the CONFIRM
PASSWORD box.
7. INSTANCENAME - Provide the application server instance to which the test should
connect. For example, if you specify
tpp
here, then the test will use the login credentials
(USERNAME and PASSWORD) provided here to connect to an instance named
TPP
,
which is incidentally the central instance of the SAP web application server. To know the
available server instances, use the Programs -> SAP Management Console menu sequence
on the application server host, and open the SAP Management Console. In the tree-
structure in the left pane of the console, you will find a SAP Systems node. When you
expand the SAP Systems node, the available server instances will appear as its sub-nodes.
Any one of the displayed instance names can be specified in the INSTANCENAME text
box.
8. CONNECTORPORT - This test uses the P4 protocol for connecting to the SAP web
application server. Therefore, the port at which the P4 protocol listens needs to be specified
as the CONNECTORPORT. The default port number of the P4 protocol is 50004. However,
if the P4 protocol listens at a different port in your environment, then specify the exact port
number here. To know the P4 protocol port, first open the adminCFG.properties file in the
{SAP_WAS_HOME_DIR}\usr\sap\TPP\DVEBMGS00\j2ee\admin\classes
directory. The value
specified against the LOGIN_PORT parameter in that file, is the P4 protocol port.
9. DISPATCHERID - This test reports a set of metrics for the Java dispatcher that receives
client requests. To enable this reporting, specify the cluster ID of the Java dispatcher that
needs to be monitored. To know the cluster ID of the dispatcher, follow the steps discussed
in Section 4.1.1.1 of this document.
10. SERVERIDS - Typically, the Java dispatcher distributes the client requests it receives to the
server processes executing on the Java component of the SAP Web AS for processing. To
monitor specific server processes, specify a comma-separated list of the cluster IDs of these
server processes in the SERVERIDS text box. To know the cluster IDs of the server
processes, follow the procedure detailed in Section 4.1.1.1 of this document.
Providing a comma-separated list of server process cluster IDs will ensure that
these cluster IDs alone appear as the descriptors of the test. If need be, you can
have server process name-cluster ID pairs appear as the test descriptors. To
achieve this, the specification in the SERVERIDS text box should be of the
following format: Server process name:Cluster ID of the server process. For
example, if the cluster ID of a server process named Server0 is 12621850, then
you can specify the SERVERID in the format:
Server0:12621850
.
Outputs of the
test
One set of results each for the Dispatcher and each of the configured server processes of the
SAP Web AS
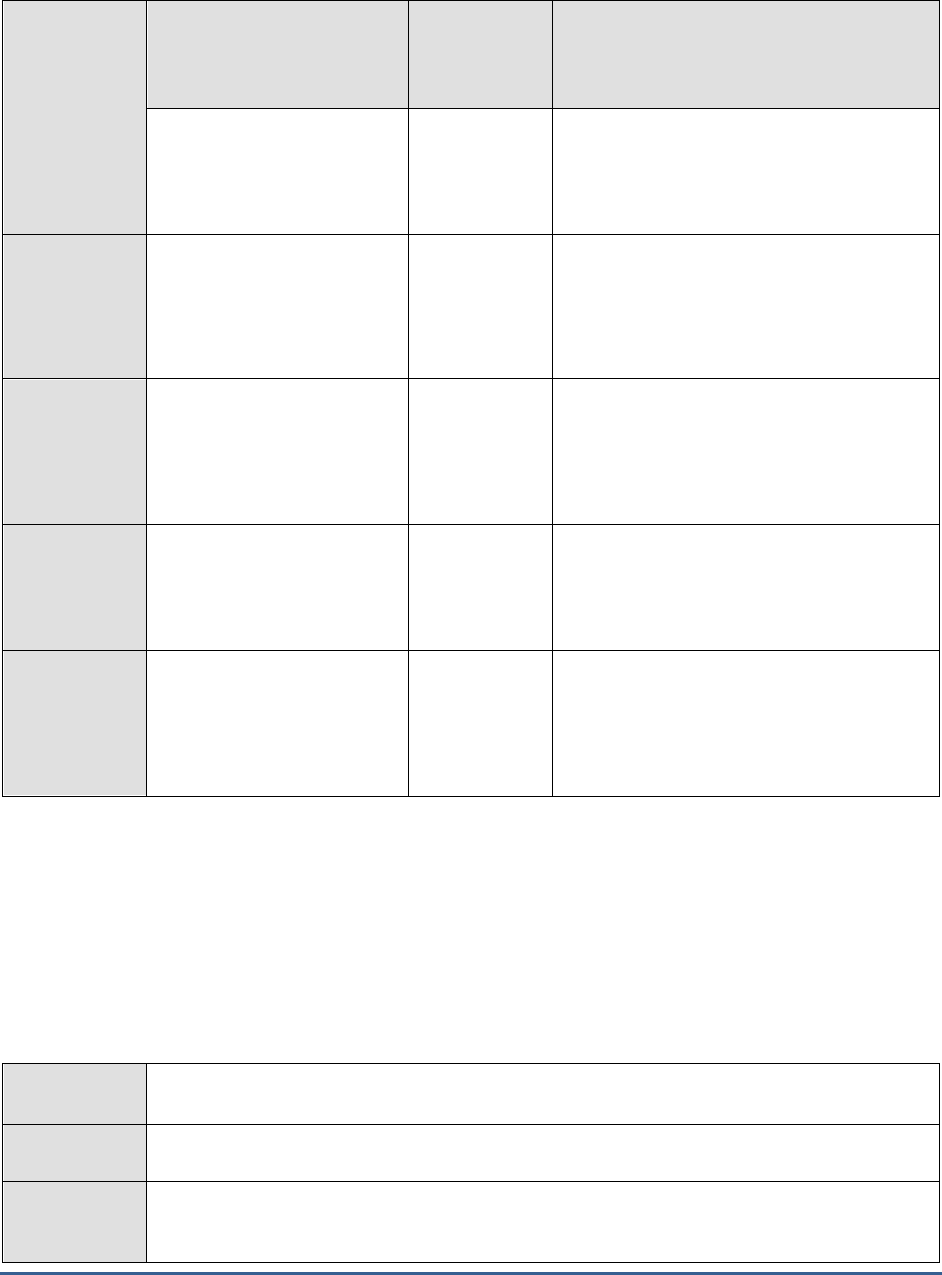
M O N I T O R I N G T H E S A P W E B A P P L I C A T I O N S E R V E R
257
Measurements
made by the
test
Measurement
Measurement
Unit
Interpretation
Active transactions:
Indicates the number of
transactions that are
currently active.
Number
Commit transactions:
Indicates the number of
transactions that have been
committed since the last
measurement period.
Number
Rollback transactions:
Indicates the number of
transactions that have been
rolled back since the last
measurement period.
Number
Ideally, there should be fewer rollbacks
happening, as rollbacks are costly operations
on the database.
Suspend transactions:
Indicates the number of
suspended transactions since
the last measurement period.
Number
Timedout transactions:
Indicates the number of
transactions that have timed
out since the last
measurement period.
Number
If the value of this measure is very high, then
consider resetting the TIMEOUT period for
transactions.
4.3.13 Timeouts Test
The Timeouts test monitors the Timeout service, which provides an open structure for registering numerous listeners
willing to perform time-base actions. This service is a non-distributed system for scheduling tasks for future execution
in a background thread. A special Timeout object represents each task. If you want to reuse a particular thread, you
can specify a timeout after which the same thread can be reused. The Timeout Service is used by other J2EE Engine
services that need to receive events at particular intervals. The service can be used for accomplishing regular
operations – checking the module status, logging information about the current load, and so on.
Purpose
Monitors the Timeout service, which provides an open structure for registering numerous
listeners willing to perform time-base actions
Target of the
test
The SAP Web AS
Agent
deploying the
test
An internal agent

M O N I T O R I N G T H E S A P W E B A P P L I C A T I O N S E R V E R
258
Configurable
parameters for
the test
1. TEST PERIOD - How often should the test be executed
2. HOST - Host name of the server for which the test is to be configured
3. PORT - The port number to which the server is listening
4. USERNAME - This test connects to a specific SAP web application server instance, and
extracts critical metrics from it. Therefore, in the USERNAME text box, provide a valid j2ee
admin user name which the test should use for connecting to the server instance.
5. PASSWORD - Provide the PASSWORD that corresponds to the specified USERNAME.
6. CONFIRM PASSWORD - Confirm the password by retyping it in the CONFIRM
PASSWORD box.
7. INSTANCENAME - Provide the application server instance to which the test should
connect. For example, if you specify
tpp
here, then the test will use the login credentials
(USERNAME and PASSWORD) provided here to connect to an instance named
TPP
,
which is incidentally the central instance of the SAP web application server. To know the
available server instances, use the Programs -> SAP Management Console menu sequence
on the application server host, and open the SAP Management Console. In the tree-
structure in the left pane of the console, you will find a SAP Systems node. When you
expand the SAP Systems node, the available server instances will appear as its sub-nodes.
Any one of the displayed instance names can be specified in the INSTANCENAME text
box.
8. CONNECTORPORT - This test uses the P4 protocol for connecting to the SAP web
application server. Therefore, the port at which the P4 protocol listens needs to be specified
as the CONNECTORPORT. The default port number of the P4 protocol is 50004. However,
if the P4 protocol listens at a different port in your environment, then specify the exact port
number here. To know the P4 protocol port, first open the adminCFG.properties file in the
{SAP_WAS_HOME_DIR}\usr\sap\TPP\DVEBMGS00\j2ee\admin\classes
directory. The value
specified against the LOGIN_PORT parameter in that file, is the P4 protocol port.
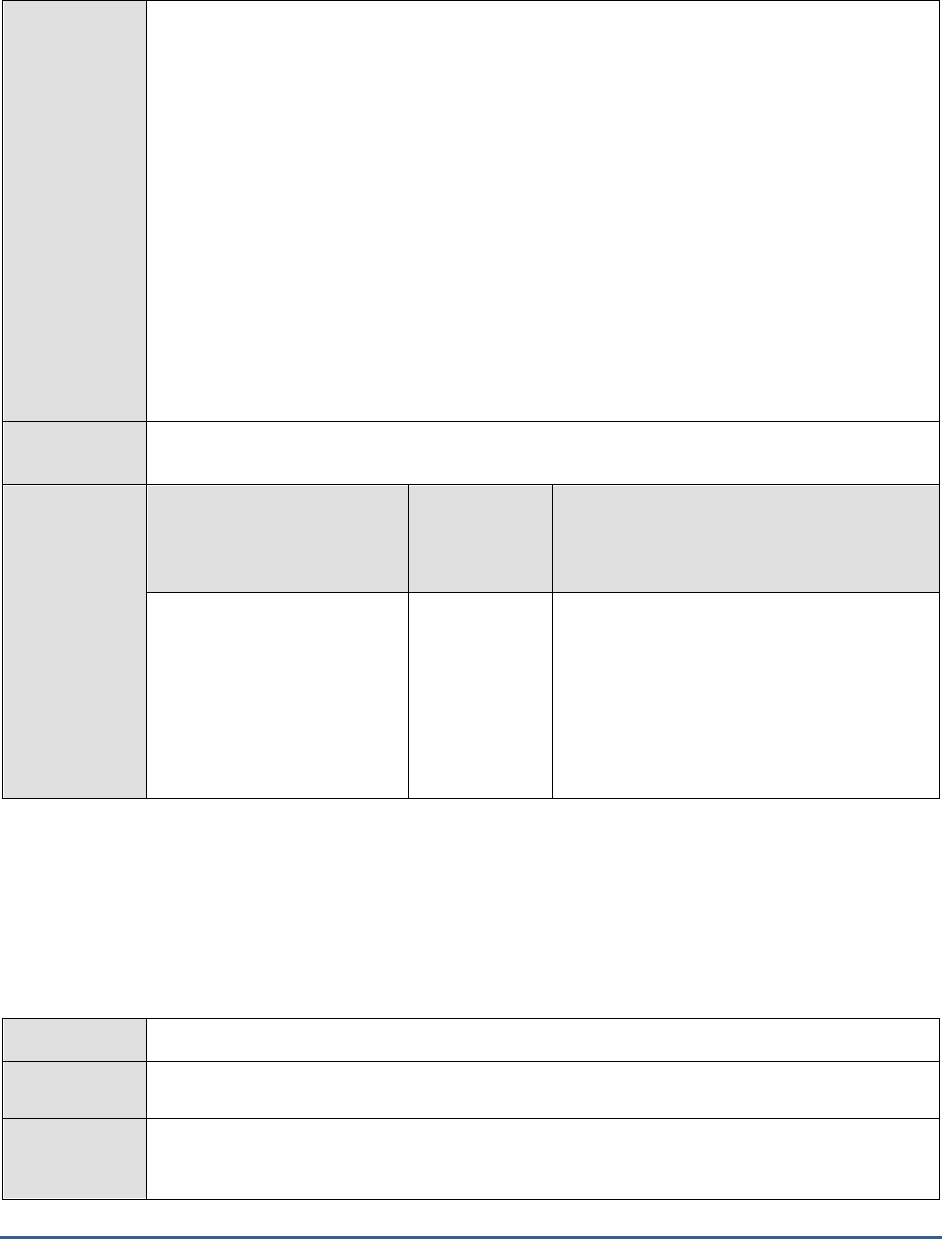
M O N I T O R I N G T H E S A P W E B A P P L I C A T I O N S E R V E R
259
9. DISPATCHERID - This test reports a set of metrics for the Java dispatcher that receives
client requests. To enable this reporting, specify the cluster ID of the Java dispatcher that
needs to be monitored. To know the cluster ID of the dispatcher, follow the steps discussed
in Section 4.1.1.1 of this document.
10. SERVERIDS - Typically, the Java dispatcher distributes the client requests it receives to the
server processes executing on the Java component of the SAP Web AS for processing. To
monitor specific server processes, specify a comma-separated list of the cluster IDs of these
server processes in the SERVERIDS text box. To know the cluster IDs of the server
processes, follow the procedure detailed in Section 4.1.1.1 of this document.
Providing a comma-separated list of server process cluster IDs will ensure that
these cluster IDs alone appear as the descriptors of the test. If need be, you can
have server process name-cluster ID pairs appear as the test descriptors. To
achieve this, the specification in the SERVERIDS text box should be of the
following format: Server process name:Cluster ID of the server process. For
example, if the cluster ID of a server process named Server0 is 12621850, then
you can specify the SERVERID in the format:
Server0:12621850
.
Outputs of the
test
One set of results each for the Dispatcher and each of the configured server processes of the
SAP Web AS
Measurements
made by the
test
Measurement
Measurement
Unit
Interpretation
Timeout rate:
Indicates the count of
timeout events received by a
J2EE Engine service per
minute.
Timeouts/min
If the timeout value set for the Timeout
objects is high, then the value of this
measure will be low. Since the Timeout
Service optimizes thread utilization by
running multiple application tasks
simultaneously, it would be good practice to
create more Timeout objects and set a low
timeout value for the objects.
4.3.14 WasJndiRegistry Test
The WasJndiRegistryTest monitors the JNDI Registry Service, which provides a way by which names are associated
with objects, and objects are found based on their names. It provides a set of properties for specifying the number of
trials for locking an object in a database, for assigning communication protocols to be used by this service, and for
specifying the method of the lookup process. The JNDI Registry runs on server processes only.
Purpose
Monitors the JNDI Registry Service
Target of the
test
The SAP Web AS
Agent
deploying the
test
An internal agent

M O N I T O R I N G T H E S A P W E B A P P L I C A T I O N S E R V E R
260
Configurable
parameters for
the test
1. TEST PERIOD - How often should the test be executed
2. HOST - Host name of the server for which the test is to be configured
3. PORT - The port number to which the server is listening
4. USERNAME - This test connects to a specific SAP web application server instance, and
extracts critical metrics from it. Therefore, in the USERNAME text box, provide a valid j2ee
admin user name which the test should use for connecting to the server instance.
5. PASSWORD - Provide the PASSWORD that corresponds to the specified USERNAME.
6. CONFIRM PASSWORD - Confirm the password by retyping it in the CONFIRM
PASSWORD box.
7. INSTANCENAME - Provide the application server instance to which the test should
connect. For example, if you specify
tpp
here, then the test will use the login credentials
(USERNAME and PASSWORD) provided here to connect to an instance named
TPP
,
which is incidentally the central instance of the SAP web application server. To know the
available server instances, use the Programs -> SAP Management Console menu sequence
on the application server host, and open the SAP Management Console. In the tree-
structure in the left pane of the console, you will find a SAP Systems node. When you
expand the SAP Systems node, the available server instances will appear as its sub-nodes.
Any one of the displayed instance names can be specified in the INSTANCENAME text
box.
8. CONNECTORPORT - This test uses the P4 protocol for connecting to the SAP web
application server. Therefore, the port at which the P4 protocol listens needs to be specified
as the CONNECTORPORT. The default port number of the P4 protocol is 50004. However,
if the P4 protocol listens at a different port in your environment, then specify the exact port
number here. To know the P4 protocol port, first open the adminCFG.properties file in the
{SAP_WAS_HOME_DIR}\usr\sap\TPP\DVEBMGS00\j2ee\admin\classes
directory. The value
specified against the LOGIN_PORT parameter in that file, is the P4 protocol port.
9. DISPATCHERID - This test reports a set of metrics for the Java dispatcher that receives
client requests. To enable this reporting, specify the cluster ID of the Java dispatcher that
needs to be monitored. To know the cluster ID of the dispatcher, follow the steps discussed
in Section 4.1.1.1 of this document.
10. SERVERIDS - Typically, the Java dispatcher distributes the client requests it receives to the
server processes executing on the Java component of the SAP Web AS for processing. To
monitor specific server processes, specify a comma-separated list of the cluster IDs of these
server processes in the SERVERIDS text box. To know the cluster IDs of the server
processes, follow the procedure detailed in Section 4.1.1.1 of this document.
Providing a comma-separated list of server process cluster IDs will ensure that
these cluster IDs alone appear as the descriptors of the test. If need be, you can
have server process name-cluster ID pairs appear as the test descriptors. To
achieve this, the specification in the SERVERIDS text box should be of the
following format: Server process name:Cluster ID of the server process. For
example, if the cluster ID of a server process named Server0 is 12621850, then
you can specify the SERVERID in the format:
Server0:12621850
.
Outputs of the
test
One set of results each for the Dispatcher and each of the configured server processes of the
SAP Web AS
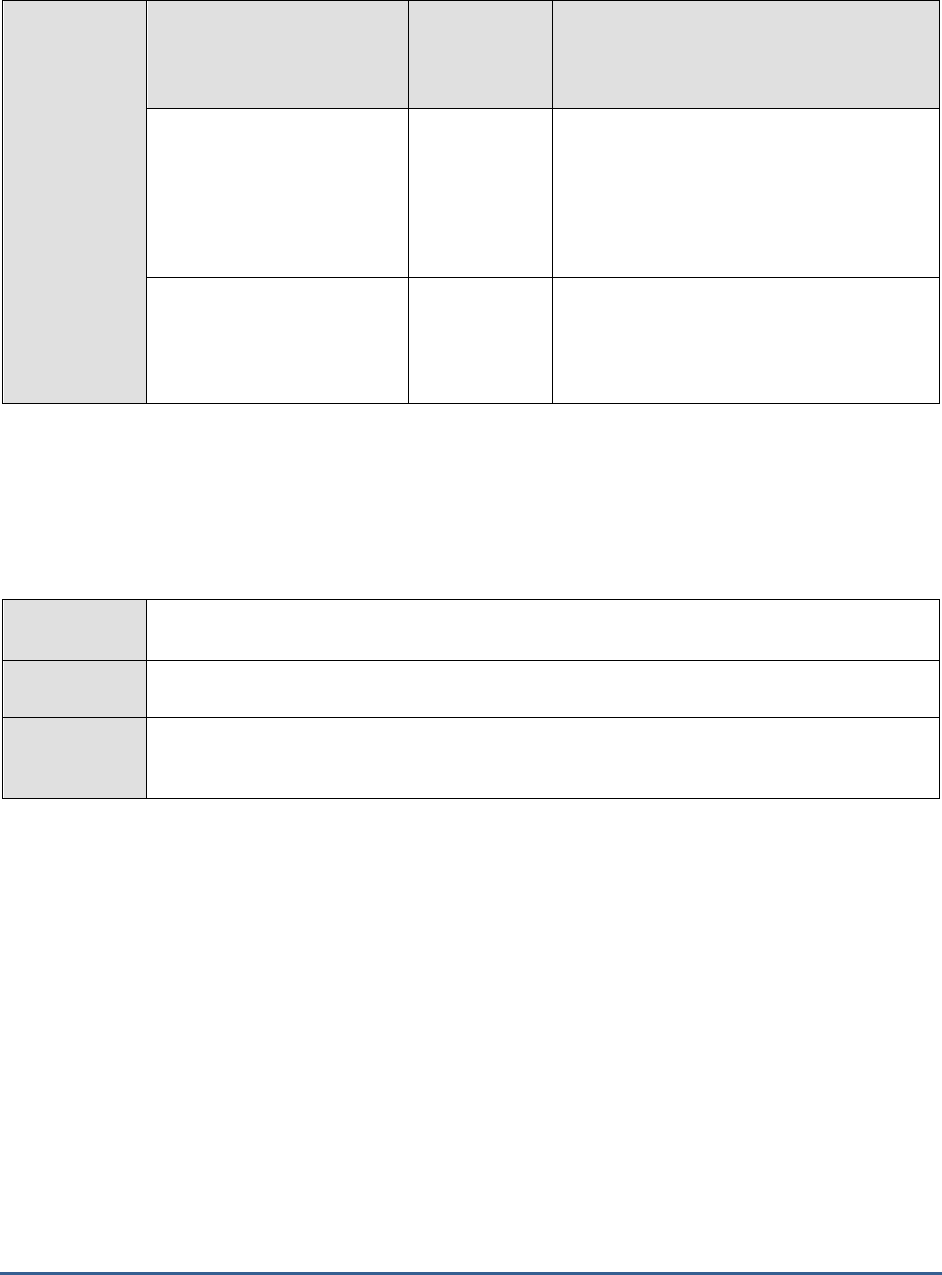
M O N I T O R I N G T H E S A P W E B A P P L I C A T I O N S E R V E R
261
Measurements
made by the
test
Measurement
Measurement
Unit
Interpretation
Bound objects:
Indicates the total number of
objects that are bound in the
naming tree, including the
serializable and non-
serializable objects.
Number
This measure gives an idea about the
application runtime.
Byte array cache size:
Indicates the size of the byte
array cache.
MB
4.3.15 WebContainer Test
The WebContainer test monitors the functions of the Web Container Service, which manages J2EE Web components
across a cluster environment, generates dynamic responses, and so on. This service enables the life cycle of Web
applications to be managed. It also helps developing and running session- and security-aware Web applications.
Purpose
Monitors the functions of the Web Container Service, which manages J2EE Web components
across a cluster environment, generates dynamic responses, and so on.
Target of the
test
The SAP Web AS
Agent
deploying the
test
An internal agent

M O N I T O R I N G T H E S A P W E B A P P L I C A T I O N S E R V E R
262
Configurable
parameters for
the test
1. TEST PERIOD - How often should the test be executed
2. HOST - Host name of the server for which the test is to be configured
3. PORT - The port number to which the server is listening
4. USERNAME - This test connects to a specific SAP web application server instance, and
extracts critical metrics from it. Therefore, in the USERNAME text box, provide a valid j2ee
admin user name which the test should use for connecting to the server instance.
5. PASSWORD - Provide the PASSWORD that corresponds to the specified USERNAME.
6. CONFIRM PASSWORD - Confirm the password by retyping it in the CONFIRM
PASSWORD box.
7. INSTANCENAME - Provide the application server instance to which the test should
connect. For example, if you specify
tpp
here, then the test will use the login credentials
(USERNAME and PASSWORD) provided here to connect to an instance named
TPP
,
which is incidentally the central instance of the SAP web application server. To know the
available server instances, use the Programs -> SAP Management Console menu sequence
on the application server host, and open the SAP Management Console. In the tree-
structure in the left pane of the console, you will find a SAP Systems node. When you
expand the SAP Systems node, the available server instances will appear as its sub-nodes.
Any one of the displayed instance names can be specified in the INSTANCENAME text
box.
8. CONNECTORPORT - This test uses the P4 protocol for connecting to the SAP web
application server. Therefore, the port at which the P4 protocol listens needs to be specified
as the CONNECTORPORT. The default port number of the P4 protocol is 50004. However,
if the P4 protocol listens at a different port in your environment, then specify the exact port
number here. To know the P4 protocol port, first open the adminCFG.properties file in the
{SAP_WAS_HOME_DIR}\usr\sap\TPP\DVEBMGS00\j2ee\admin\classes
directory. The value
specified against the LOGIN_PORT parameter in that file, is the P4 protocol port.

M O N I T O R I N G T H E S A P W E B A P P L I C A T I O N S E R V E R
263
9. DISPATCHERID - This test reports a set of metrics for the Java dispatcher that receives
client requests. To enable this reporting, specify the cluster ID of the Java dispatcher that
needs to be monitored. To know the cluster ID of the dispatcher, follow the steps discussed
in Section 4.1.1.1 of this document.
10. SERVERIDS - Typically, the Java dispatcher distributes the client requests it receives to the
server processes executing on the Java component of the SAP Web AS for processing. To
monitor specific server processes, specify a comma-separated list of the cluster IDs of these
server processes in the SERVERIDS text box. To know the cluster IDs of the server
processes, follow the procedure detailed in Section 4.1.1.1 of this document.
Providing a comma-separated list of server process cluster IDs will ensure that
these cluster IDs alone appear as the descriptors of the test. If need be, you can
have server process name-cluster ID pairs appear as the test descriptors. To
achieve this, the specification in the SERVERIDS text box should be of the
following format: Server process name:Cluster ID of the server process. For
example, if the cluster ID of a server process named Server0 is 12621850, then
you can specify the SERVERID in the format:
Server0:12621850
.
Outputs of the
test
One set of results each for the Dispatcher and each of the configured server processes of the
SAP Web AS
Measurements
made by the
test
Measurement
Measurement
Unit
Interpretation
New requests:
Indicates the number of
requests newly received by
the Web Container Service
since the last measurement
period.
Number
Current http sessions:
Indicates the number of
HTTP sessions that are
currently valid.
Number
Current secure sessions:
Indicates the number of valid
security sessions currently
created for HTTP clients.
Number
Invalid http sessions:
Indicates the number of
HTTP sessions invalidated by
application since the last
measurement period.
Number
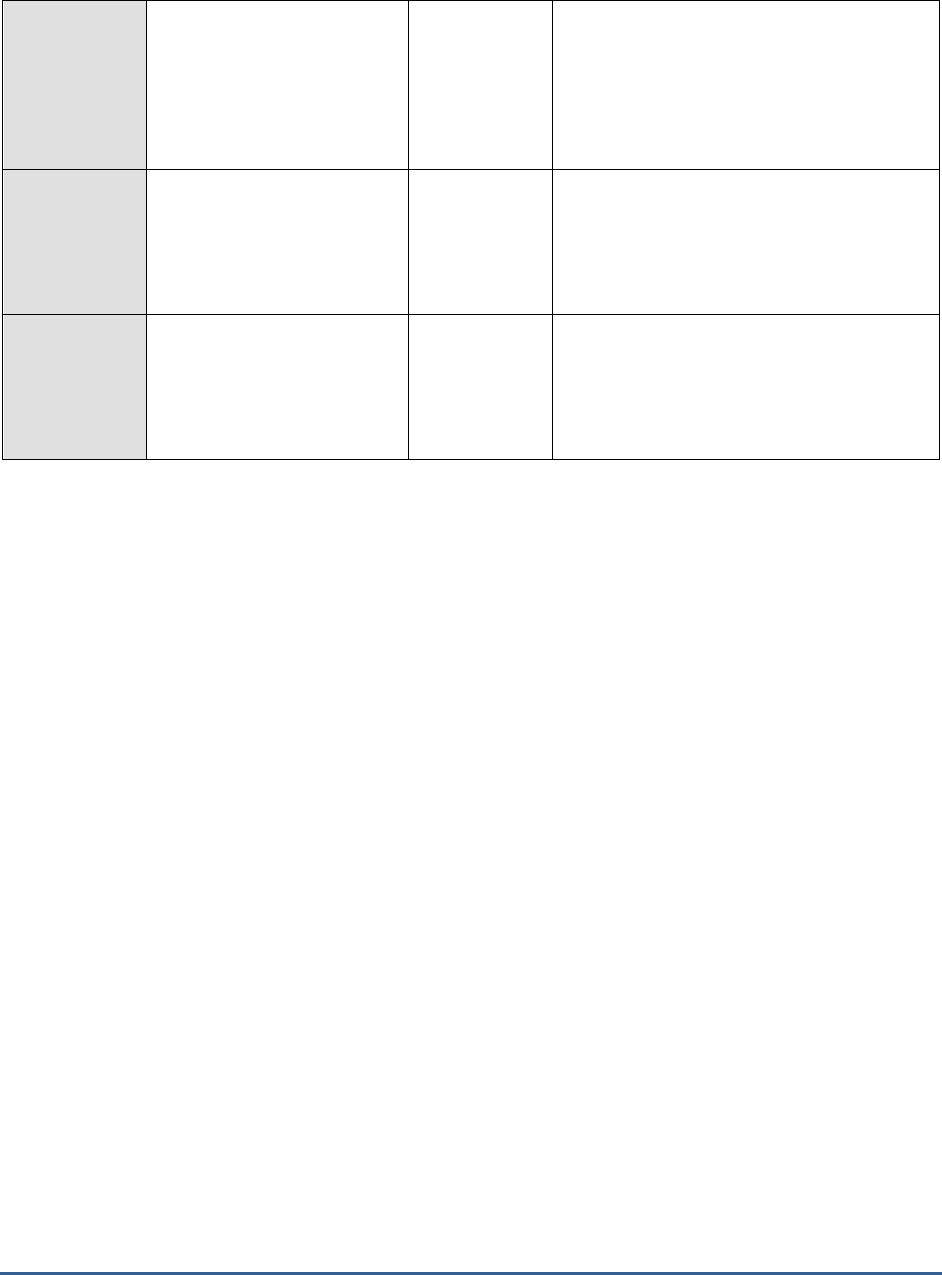
M O N I T O R I N G T H E S A P W E B A P P L I C A T I O N S E R V E R
264
Invalid secure sessions:
Indicates the number of
security sessions which have
been invalidated by
application since the last
measurement period.
Number
Timeout http sessions:
Indicates the number of
HTTP sessions which have
timed out since the last
measurement period.
Number
Timeout secure sessions:
Indicates the number of
secure sessions which have
timed out since the last
measurement period.
Number

M O N I T O R I N G M A X D B
265
Monitoring MaxDB
MySQL MaxDB is a mature and reliable database system that effortlessly handles heavy-duty transactions related to
OLTP. As MaxDB embeds special capabilities to handle all SAP applications, in-depth monitoring of MaxDB is
necessary to ensure the continuous availability and good health of the SAP environment.
The eG Enterprise suite offers a specialized monitoring model (see Figure 5.2) for the MaxDB server using which the
following queries can be effectively answered:
Is a connection to the database available?
Is the OMS heap been excessively utilized?
Is there enough free space in the data area for permanent data, or is the temporary data
occupying a large portion of it?
Have locks been held for too long a time? Are deadlocks and lock collisions kept at a
minimum?
Is the log area been used excessively, or are log backups carried out frequently?
What type of QUERY statements are most often executed on the database? How long does
the database server take to execute a simple load query?
Are many transaction rollbacks happening?
Does the server handle all I/O requests to it promptly, or are there too many requests
pending processing?
Are all caches adequately sized? Are there excessive cache misses?

M O N I T O R I N G M A X D B
266
Figure 5.2: Layer model of a MaxDB server
The eG agent on MaxDB executes a wide variety of tests on the server to assess its health. Typically, these tests
connect to a database on the MaxDB server as a SYSDBA, access certain key system tables on the database, and pull
out critical performance statistics pertaining to the MaxDB server from the system tables. Every layer of Figure 5.2
above is associated with one/more of these tests.
The sections to come will discuss each of the top 4 layers of Figure 5.2 in more detail. The other layers have been
dealt with extensively in the
Monitoring Unix and Windows Servers
document.
5.1 The MAXDB Net Layer
Using the Db Connection test associated with it (see Figure 5.3), the MAXDB Net layer measures the availability and
responsiveness of the MaxDB server.
Note:
Before monitoring the MaxDB server, do the following:
Connect to the URL: http://dev.mysql.com/downloads/
Scroll down the page that appears next to view a section titled, MaxDB by MySQL - - SAP R/3
Cerfified.
In that section, click on the hyperlink representing the latest version of MaxDB.
Scroll down the page that appears next to view the list of downloads available for the latest
version. From the list, download the JDBC Driver Binary to the local host.
A file named sapdbc-<version>.jar gets downloaded.
Next, copy the sapdbc-<version>.jar file to the /opt/egurkha/lib directory.
Once copied, rename the sapdbc-<version>.jar file to sapdbc.jar.
Restart the eG agent.
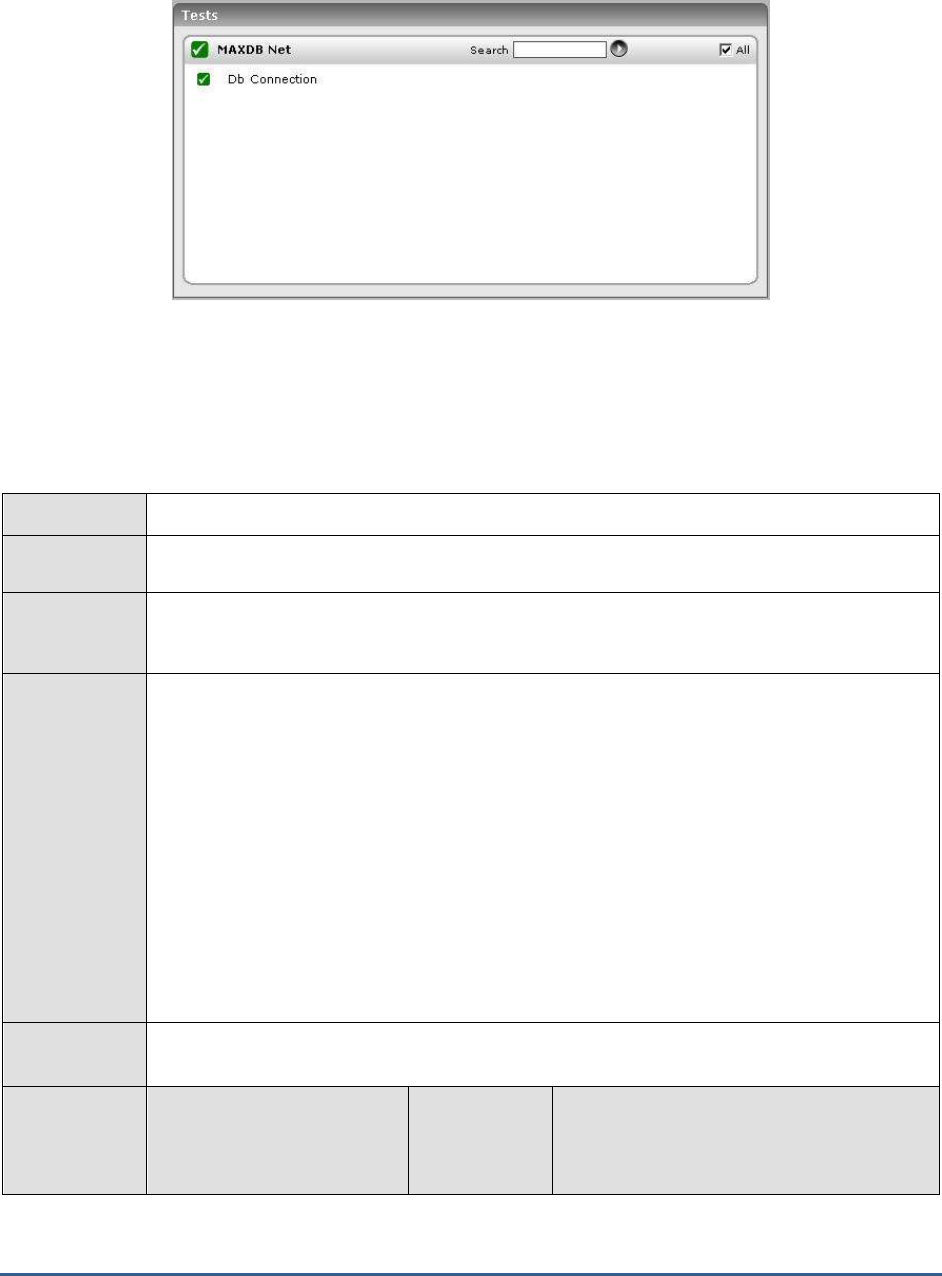
M O N I T O R I N G M A X D B
267
Figure 5.3: The test associated with the MAXDB Net layer
5.1.1 Db Connection Test
The Db Connection test measures the availability and responsiveness of the MaxDB server.
Purpose
Measures the availability and responsiveness of the MaxDB server
Target of the
test
The MaxDB server
Agent
deploying the
test
An internal agent
Configurable
parameters for
the test
1. TEST PERIOD - How often should the test be executed
2. HOST - Host name of the server for which the test is to be configured
3. PORT - The port number to which the server is listening
4. DATABASENAME - The test connects to a database on MaxDB and extracts performance
statistics from the system tables in the database. Therefore, provide the name of a
database in the DATABASENAME text box.
5. USERNAME - Since users with the SYSDBA privilege alone are allowed access to system
tables, specify the name of such a user against USERNAME.
6. PASSWORD - Provide the PASSWORD that corresponds to the specified USERNAME.
7. CONFIRM PASSWORD - Confirm the password by retyping it in the CONFIRM
PASSWORD box.
Outputs of the
test
One set of results for the MaxDB server being monitored
Measurements
made by the
test
Measurement
Measurement
Unit
Interpretation
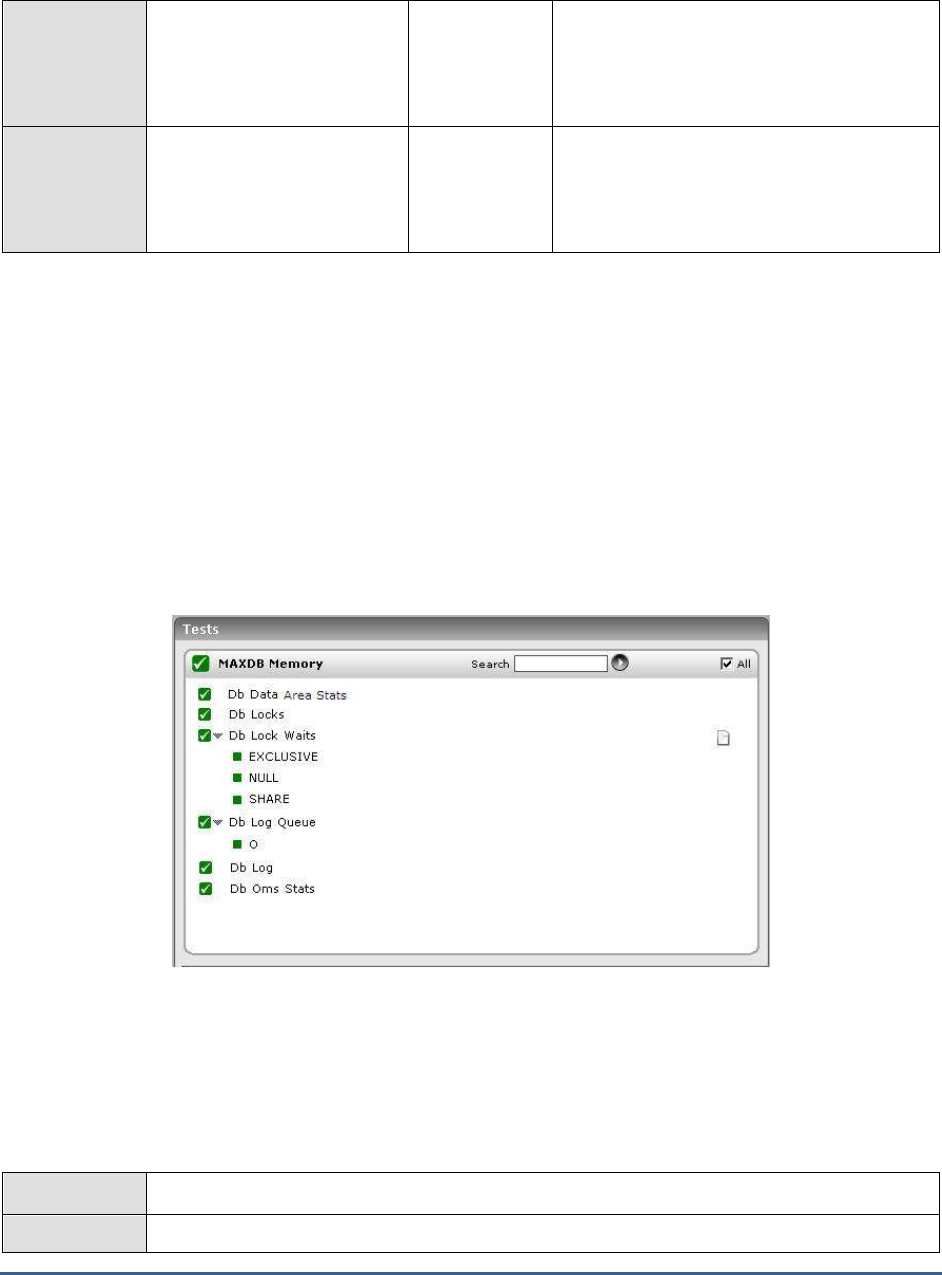
M O N I T O R I N G M A X D B
268
Database availability:
Indicates whether the
database connection is
available or not.
Percent
The value 100 indicates availability, the value
0 indicates non-availability.
Response time:
Indicates the time taken to
execute a simple load
database query.
Secs
A sudden increase in response time is
indicative of a bottleneck at the database
server.
5.2 The MAXDB Memory Layer
The tests associated with the MAXDB Memory layer help determine the following:
Whether the data area has been adequately sized or not
Whether the locking mechanism is functioning smootly on the database server
Whether log queues are overloaded with log entries
Whether adequate memory is available in the log area
How well the SAP liveCache manages objects
Figure 5.4: The tests associated with the MAXDB Memory layer
5.2.1 Db Data Area Stats Test
All data volumes in a database instance are known collectively as the data area. The data area contains, amongst
other things, the application data, the database catalog and the undo log entries of the database instance. This test
monitors the usage of the data area.
Purpose
Monitors the usage of the data area
Target of the
The MaxDB server
M O N I T O R I N G M A X D B
269
test
Agent
deploying the
test
An internal agent
Configurable
parameters for
the test
1. TEST PERIOD - How often should the test be executed
2. HOST - Host name of the server for which the test is to be configured
3. PORT - The port number to which the server is listening
4. DATABASENAME - The test connects to a database on MaxDB and extracts performance
statistics from the system tables in the database. Therefore, provide the name of a
database in the DATABASENAME text box.
5. USERNAME - Since users with the SYSDBA privilege alone are allowed access to system
tables, specify the name of such a user against USERNAME.
6. PASSWORD - Provide the PASSWORD that corresponds to the specified USERNAME.
7. CONFIRM PASSWORD - Confirm the password by retyping it in the CONFIRM
PASSWORD box.
Outputs of the
test
One set of results for the MaxDB server being monitored
Measurements
made by the
test
Measurement
Measurement
Unit
Interpretation
Usable size:
Indicates the data area that is
currently available for data.
MB
There must also always be sufficient space in
the data area to hold all the data that is
created during database operations.
Therefore, ideally, this value should be high.
Used size:
Indicates the memory in data
area that is currently used for
data.
MB
Data area usage:
Indicates the percentage of
memory in the data area that
is actually used for data.
Percent
Ideally, this value should not be very high.
Data on volume:
Indicates the amount of data
that has been written to the
data area, currently.
MB
M O N I T O R I N G M A X D B
270
Data not on volume:
Indicates the amount of
permanent data that has to
be written to the data area at
the next savepoint.
MB
Pagers (which are tasks in the user kernel
thread) write the data from the data cache to
the data area for each savepoint. If a lot of
data was changed and the pagers would
have to write many pages at the next
savepoint, then the pagers write data from
the data cache to the data area before the
next savepoint.
Permanent size used:
Indicates the data area that is
currently used for permanent
data.
MB
Temporary size used:
Indicates the data area that is
currently used for temporary
data.
MB
A large proportion of temporary data
indicates large amounts of (buffer) result
sets. If the value of this measure is high,
then find the statement that is causing large
amounts of (buffer) result sets to be created,
and check the access strategies for this
statement.
5.2.2 Db Locks Test
Multiple transactions can access the same database object, such as a table, at the same time. To isolate the
transactions from one another, the database system sets locks for database objects. The Db Locks test monitors the
locking activity on MaxDB.
Purpose
Monitors the locking activity on MaxDB
Target of the
test
The MaxDB server
Agent
deploying the
test
An internal agent
Configurable
parameters for
the test
1. TEST PERIOD - How often should the test be executed
2. HOST - Host name of the server for which the test is to be configured
3. PORT - The port number to which the server is listening
4. DATABASENAME - The test connects to a database on MaxDB and extracts performance
statistics from the system tables in the database. Therefore, provide the name of a
database in the DATABASENAME text box.
5. USERNAME - Since users with the SYSDBA privilege alone are allowed access to system
tables, specify the name of such a user against USERNAME.
6. PASSWORD - Provide the PASSWORD that corresponds to the specified USERNAME.
7. CONFIRM PASSWORD - Confirm the password by retyping it in the CONFIRM
PASSWORD box.

M O N I T O R I N G M A X D B
271
Outputs of the
test
One set of results for the MaxDB server being monitored
Measurements
made by the
test
Measurement
Measurement
Unit
Interpretation
Num locks:
Indicates the number of locks
currently in the database.
Number
A consistent increase in the value of this
measure indicates a contention for locks.
Transaction holding locks:
Indicates the number of
transactions to which locks
have been assigned,
currently.
Number
Transaction request locks:
Indicates the number of
transactions requesting locks
in the last measurement
period.
Number
Num oms locks:
Indicates the number of OMS
locks currently in the
database.
Number
Deadlock rate:
Indicates the rate of
deadlocks
Deadlocks/Sec
A deadlock may arise due to various
situations including bad design of queries and
deficient coding practices. A deadlock is a
situation where both/all the lock requestors
are in a mutual or a multi-way tie. Any
deadlocks are detrimental to database
application performance.

M O N I T O R I N G M A X D B
272
Collision rate:
Indicates the rate of lock
collisions.
Collisions/Sec
A lock collision occurs when tasks running in
different threads attempt to access a global
storage area in parallel. The synchronization
required for this often leads to an increased
collision rate. Generally, the risk of collision
rises with the number of processors used
(MAXCPU general database parameter). In
multiprocessor systems, you should therefore
check whether the database system can fulfill
the needs of the applications with fewer
CPUs. If high collision rates occur in
multiprocessor central systems (database
system and application running on the same
computer), check whether the computer’s
CPU is overloaded, and whether the database
threads are blocked by other applications. In
this case, the database threads that contain
user tasks should receive REAL TIME
PRIORITY from the operating system. To
avoid operating system blocks however, the
value of MAXCPU must be at least one lower
than the number of actual CPUs. If the high
collision rates occur in the DATAn, SPLITn or
TREEn regions, increase the values of both
the general database parameter CACHE_SIZE
and the special database parameters
_DATA_CACHE_RGNS and _TREE_RGNS. If
the high collision rates occur in the TRACE or
BUFWRTR regions, then activate the
database trace temporarily for
troubleshooting only.
Note:
One exception to this in liveCache instances
is high collision rates in the OMSVDIR and
CNSTVIEW regions. This is normal for certain
actions, such as a simultaneous CIF queue
transfer.
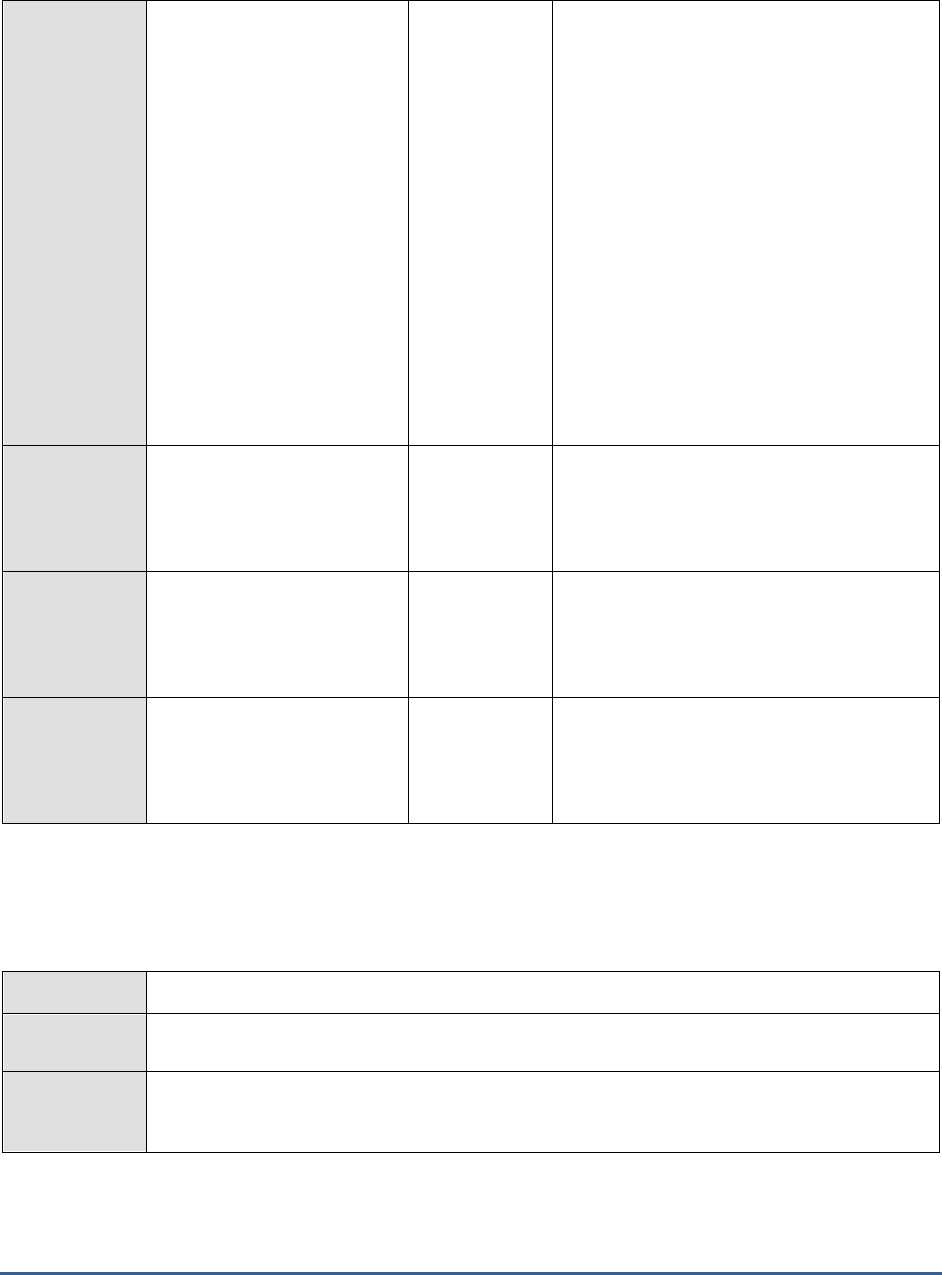
M O N I T O R I N G M A X D B
273
Escalation rate:
Indicates the rate of
escalations.
Escalations/Sec
Escalations show the total number of rows
locked by a single user session. If more than
a certain percentage of the rows of a table
are locked by a single user session, then the
database system locks the entire table. You
can specify the maximum number of possible
row locks in the lock list in the general
database parameter MAXLOCKS. The
database system attempts to convert the row
lock to a table lock if a task holds more than
0.1*MAXLOCKS row locks in a table. If too
many escalations occur, increase the
parameter value. Whether escalations lead to
problems depends strongly on the application
in question. If escalations occur, check the
application to see whether you can split any
change transactions that lock a lot of rows
into several individual transactions.
Row locks:
Indicates the rate of row
locks.
Locks/Sec
A consistent increase in the value of this
measure could indicate a probable escalation.
Table locks:
Indicates the rate of table
locks.
Locks/Sec
Request timeouts:
Indicates the rate at which
lock requests exceeded the
timeout value.
Timeouts/Sec
If the value of this measure is high, you
might want to reset the REQUEST_TIMEOUT
value.
5.2.3 Db Lock Waits Test
The Db Lock Waits test reports the number of requests that are awaiting locks.
Purpose
Reports the number of requests that are awaiting locks
Target of the
test
The MaxDB server
Agent
deploying the
test
An internal agent
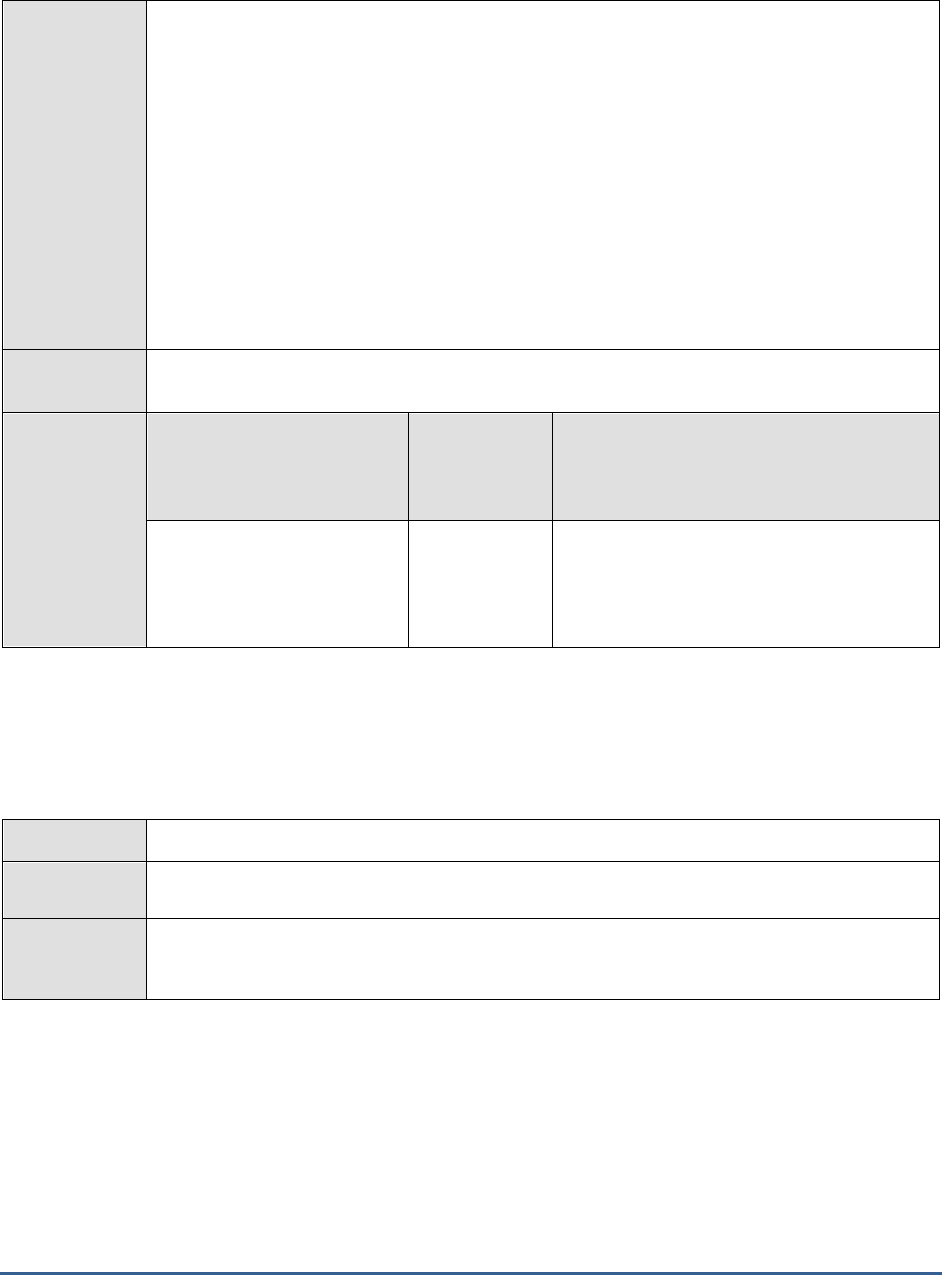
M O N I T O R I N G M A X D B
274
Configurable
parameters for
the test
1. TEST PERIOD - How often should the test be executed
2. HOST - Host name of the server for which the test is to be configured
3. PORT - The port number to which the server is listening
4. DATABASENAME - The test connects to a database on MaxDB and extracts performance
statistics from the system tables in the database. Therefore, provide the name of a
database in the DATABASENAME text box.
5. USERNAME - Since users with the SYSDBA privilege alone are allowed access to system
tables, specify the name of such a user against USERNAME.
6. PASSWORD - Provide the PASSWORD that corresponds to the specified USERNAME.
7. CONFIRM PASSWORD - Confirm the password by retyping it in the CONFIRM
PASSWORD box.
Outputs of the
test
One set of results for every lock type operational on the MaxDB server being monitored
Measurements
made by the
test
Measurement
Measurement
Unit
Interpretation
Lock waits:
Indicates the number of lock
waits currently in the
database.
Number
Lock waits can be caused by transactions that
take too long to execute. Long wait times can
also occur when various applications want to
lock the same object.
5.2.4 Db Log Queue Test
The log queue is the main memory area, in which redo log entries from the transactions are stored. The Db Log
Queue test monitors the usage of the log queue.
Purpose
Monitors the usage of the log queue
Target of the
test
The MaxDB server
Agent
deploying the
test
An internal agent

M O N I T O R I N G M A X D B
275
Configurable
parameters for
the test
1. TEST PERIOD - How often should the test be executed
2. HOST - Host name of the server for which the test is to be configured
3. PORT - The port number to which the server is listening
4. DATABASENAME - The test connects to a database on MaxDB and extracts performance
statistics from the system tables in the database. Therefore, provide the name of a
database in the DATABASENAME text box.
5. USERNAME - Since users with the SYSDBA privilege alone are allowed access to system
tables, specify the name of such a user against USERNAME.
6. PASSWORD - Provide the PASSWORD that corresponds to the specified USERNAME.
7. CONFIRM PASSWORD - Confirm the password by retyping it in the CONFIRM
PASSWORD box.
Outputs of the
test
One set of results for every log queue on the MaxDB server being monitored
Measurements
made by the
test
Measurement
Measurement
Unit
Interpretation
Queue max used:
Indicates the maximum
number of transactions
written to the log queue.
Number
Log entries inserted:
Indicates the number of log
entries inserted into the
queue in the last
measurement period.
Number
Queue overflow:
Indicates the number of wait
situations that arose due to
log queue overflows in the
last measurement period.
Number
If the log queue becomes full before log
pages are written to the log area, then a log
queue overflow occurs. If the value of this
measure keeps increasing, you might want to
consider altering the log queue size by
resetting the LOG_IO_QUEUE parameter.
Group commits:
Indicates the number of log
pages whose writing was
waited for by more than one
transaction, in the last
measurement period.
Number
Log queue transactions:
Indicates the number of
transactions waiting to write
in the log queue in the last
measurement period.
Number
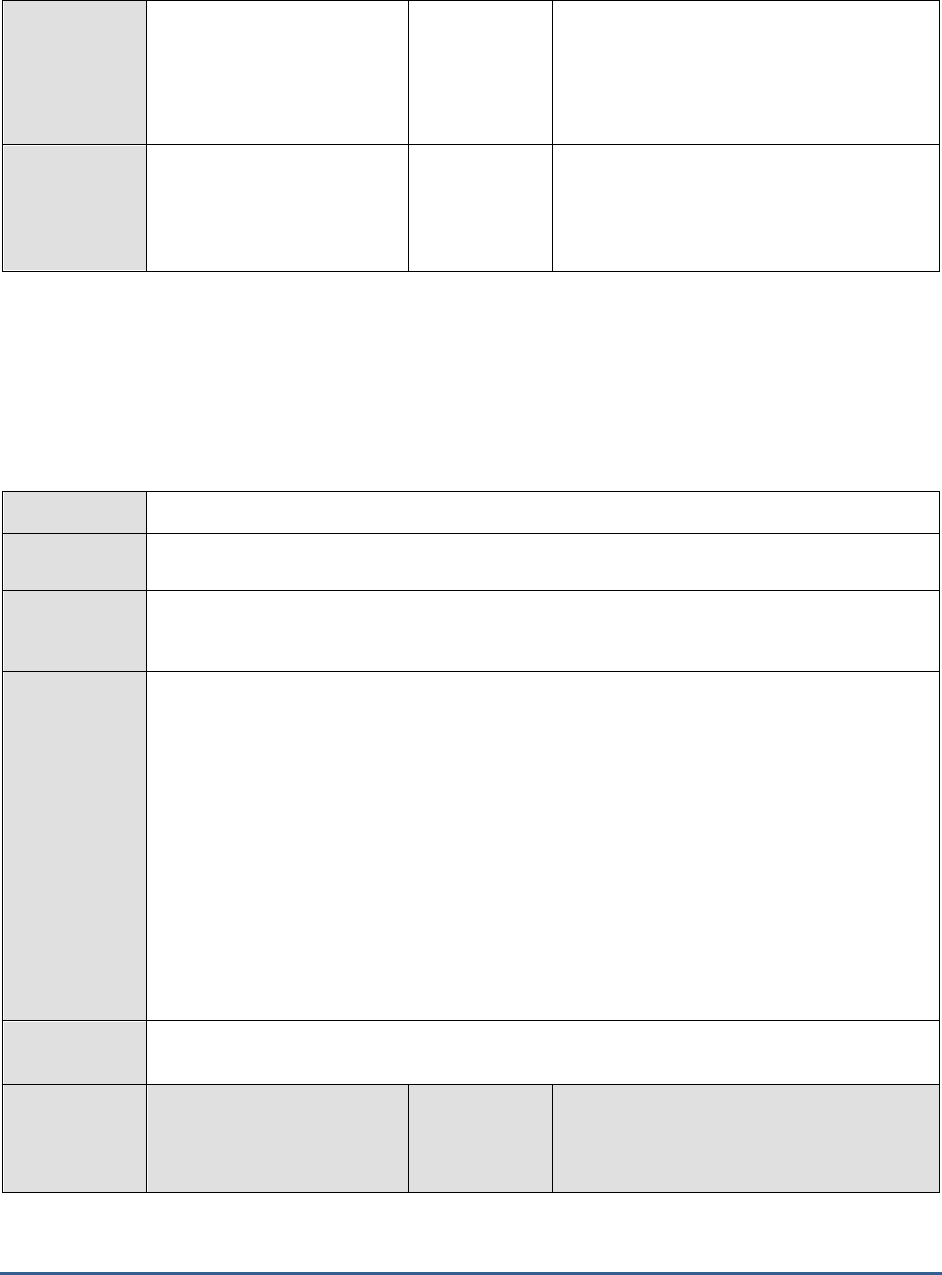
M O N I T O R I N G M A X D B
276
Max waits per page:
Indicates the maximum
number of transactions that
simultaneously waited for the
same page to be written.
Number
A high value of this measure could cause
undue delays in transaction execution.
Physical write rate:
Indicates the rate at which
log pages were written to the
log area.
Writes/Sec
5.2.5 Db Log Test
All log volumes in a database instance are known collectively as the log area. The database system writes the redo
log entries of transactions in the log segments of the log area. Redo log entries are needed, amongst other things,
for restoring a consistent database instance state after a restart or a system breakdown. The Db Log test monitors
the usage of the log area.
Purpose
Monitors the usage of the log area
Target of the
test
The MaxDB server
Agent
deploying the
test
An internal agent
Configurable
parameters for
the test
1. TEST PERIOD - How often should the test be executed
2. HOST - Host name of the server for which the test is to be configured
3. PORT - The port number to which the server is listening
4. DATABASENAME - The test connects to a database on MaxDB and extracts performance
statistics from the system tables in the database. Therefore, provide the name of a
database in the DATABASENAME text box.
5. USERNAME - Since users with the SYSDBA privilege alone are allowed access to system
tables, specify the name of such a user against USERNAME.
6. PASSWORD - Provide the PASSWORD that corresponds to the specified USERNAME.
7. CONFIRM PASSWORD - Confirm the password by retyping it in the CONFIRM
PASSWORD box.
Outputs of the
test
One set of results for the MaxDB server being monitored
Measurements
made by the
test
Measurement
Measurement
Unit
Interpretation

M O N I T O R I N G M A X D B
277
Total log memory:
Indicates the current size of
the log area.
MB
Log memory used:
Indicates the size of the log
area currently utilized.
MB
If the value of this measure grows
dangerously close to the value of the
Total_log_memory measure, it indicates that
the log area is fast becoming full. This
indicates a probable problem condition, as a
full log area causes the database to shut
down. To avoid this, it is recommended that
you carry out log backups at regular
intervals, because the database system
cannot overwrite the segments in the log
area until after a successful log backup.
Percentage of log area
used:
Indicates the percentage of
the log area utilized.
Percent
If the value of this measure grows
dangerously close to 100%, it indicates that
the log area is fast becoming full. This
indicates a probable problem condition, as a
full log area causes the database to shut
down. To avoid this, it is recommended that
you carry out log backups at regular
intervals, because the database system
cannot overwrite the segments in the log
area until after a successful log backup.
Transaction rate:
Indicates the rate of
transactions to the log area.
Trans/Sec
Write transaction rate:
Indicates the rate of write
transactions to the log area.
Trans/Sec
Percentage of write
transactions:
Indicates the percentage of
write transactions to the log
area.
Percent
This measure is a good indicator of the level
of activity on the log area.
Log queues:
Indicates the current number
of log queues.
Number
Queue size:
Indicates the size of the log
queue.
MB
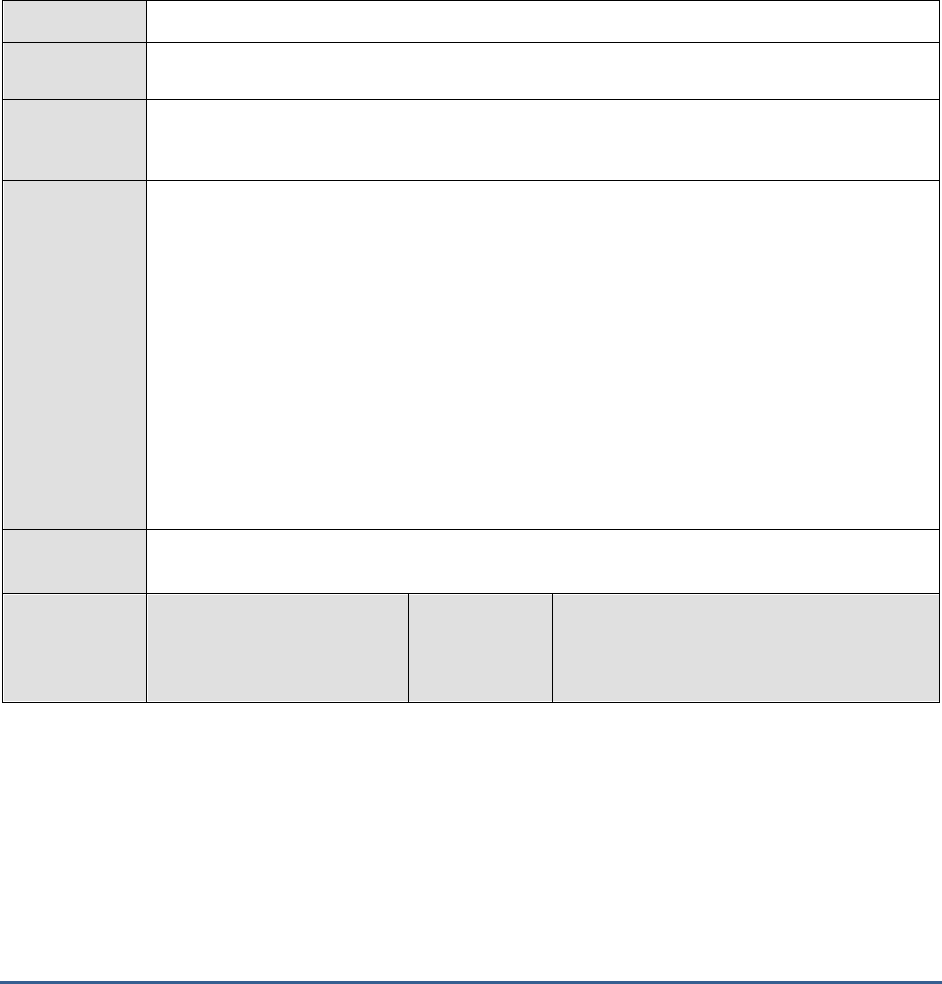
M O N I T O R I N G M A X D B
278
5.2.6 Db Oms Stats Test
Object management system (OMS) is a type of data management. Only SAP liveCache database instances use OMS.
SAP liveCache is an enhancement of the MaxDB relational database system. In SAP liveCache, the actual data
structures and data streams (such as networks and relationships) can be mapped more easily and effectively. A large
part of the data in a SAP liveCache database instance is managed in objects. This object data is called OMS data.
OMS data is managed in containers that are assigned to precisely one persistent C++ class of the object type, and is
edited in the OMS intermediate layer. The OMS data pages are in the data cache. The Db Oms Stats test measures
how well the SAP liveCache manages objects using OMS.
Purpose
Measures how well the SAP liveCache manages objects using OMS
Target of the
test
The MaxDB server
Agent
deploying the
test
An internal agent
Configurable
parameters for
the test
1. TEST PERIOD - How often should the test be executed
2. HOST - Host name of the server for which the test is to be configured
3. PORT - The port number to which the server is listening
4. DATABASENAME - The test connects to a database on MaxDB and extracts performance
statistics from the system tables in the database. Therefore, provide the name of a
database in the DATABASENAME text box.
5. USERNAME - Since users with the SYSDBA privilege alone are allowed access to system
tables, specify the name of such a user against USERNAME.
6. PASSWORD - Provide the PASSWORD that corresponds to the specified USERNAME.
7. CONFIRM PASSWORD - Confirm the password by retyping it in the CONFIRM
PASSWORD box.
Outputs of the
test
One set of results for every liveCache object on the MaxDB server being monitored
Measurements
made by the
test
Measurement
Measurement
Unit
Interpretation

M O N I T O R I N G M A X D B
279
Heap used:
Indicates the liveCache
memory that is been used
currently.
MB
The memory requirements in the OMS heap
are very high for the running DB procedures.
If the memory utilization in the OMS heap
reaches 100% of its limit, there is the risk of
errors in the DB procedures (Out of Memory
Exceptions), or that OMS version data is
swapped from the OMS heap to the global
data cache (OMS version is unloaded). It is
recommended that you configure the general
database parameter CACHE_SIZE and the
liveCache parameter OMS_HEAP_LIMIT in
such a way that it prevents swapping at the
operating system level and errors in DB
procedures.
Reserved size:
Indicates the memory
managed by the allocator.
MB
Memory allocation rate:
Indicates the number of
memory allocations per
second.
Allocations/Sec
A higher rate indicates higher and faster
memory utilization.
Memory release rate:
Indicates the number of
memory releases per second.
Releases/Sec
Spinlock rate:
When a requested lock is not
available, then the process
will spin and try again to
acquire the lock. This is
known as a Spinlock. This
measure indicates the
number of attempts that
were made per second to
acquire a spinlock.
Attempts/Sec
A consistent increase in this rate indicates
that some locks have been held for too long a
time.
Collision rate:
Indicates the rate at which
attempts to get a spinlock
failed.
Collisions/Sec

M O N I T O R I N G M A X D B
280
Spinloop rate:
Indicates the rate at which
attempts were made to
acquire a spinlock without
prior release of the CPU.
Attempts/Sec
Yieldloop rate:
Indicates the rate at which
attempts were made to
acquire a spinlock after prior
release of the CPU.
Attempts/Sec
Errors rate:
Indicates the rate at which
errors were detected and
automatically corrected.
Errors/Sec
5.3 The MAXDB Cache Layer
The utilization of the data cache and the I/O buffer cache is monitored using the tests mapped to the MAXDB Cache
layer (see Figure 5.5).
Figure 5.5: The tests associated with the MAXDB Cache layer
5.3.1 Db Data Cache Test
The Db Data Cache test monitors the usage of the data cache on MaxDB. The data cache contains the last read- or
write-accessed pages of the data volumes. It is shared by all simultaneously active users.
Purpose
Monitors the usage of the data cache on MaxDB
Target of the
test
The MaxDB server
Agent
deploying the
An internal agent
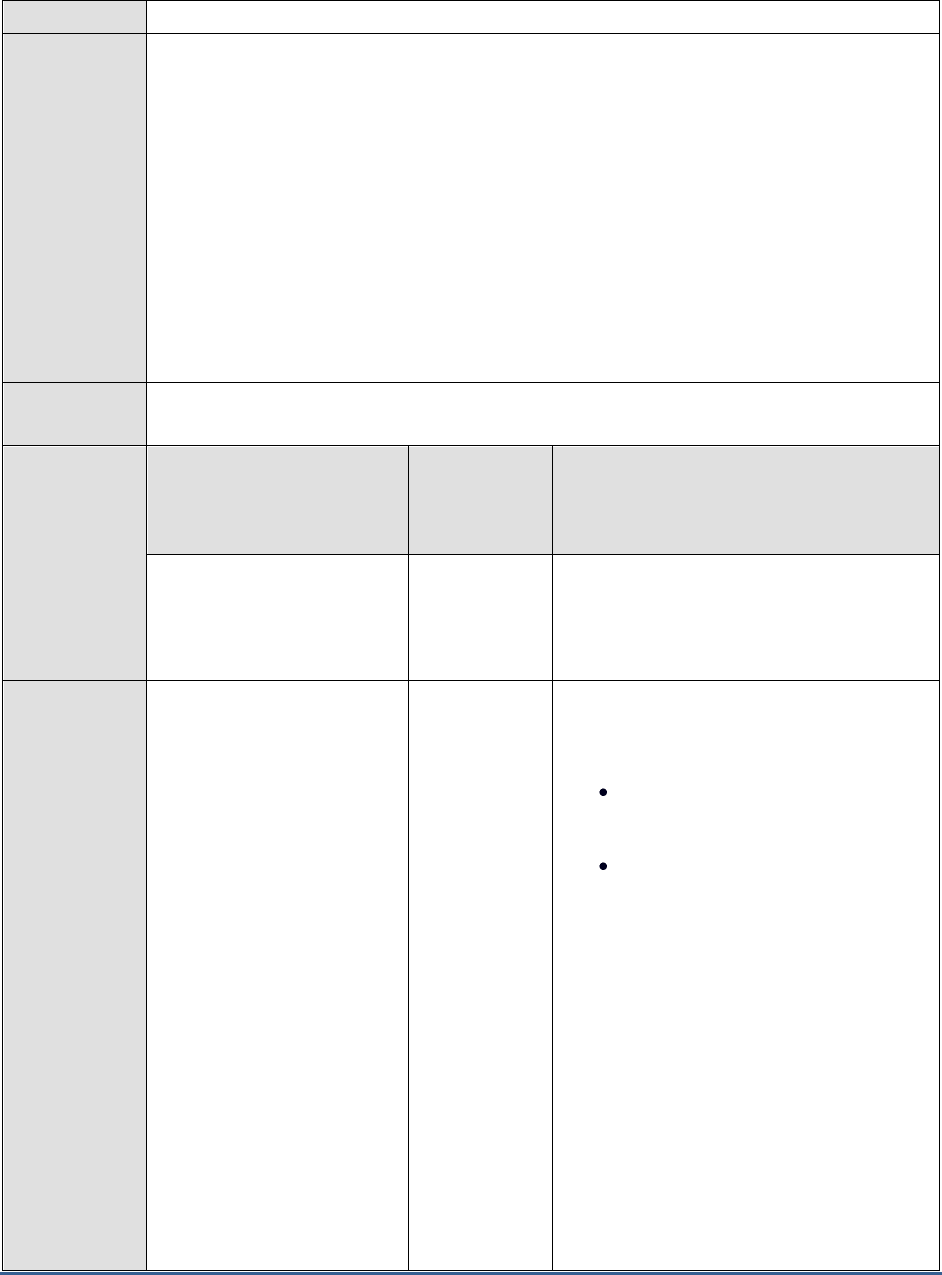
M O N I T O R I N G M A X D B
281
test
Configurable
parameters for
the test
1. TEST PERIOD - How often should the test be executed
2. HOST - Host name of the server for which the test is to be configured
3. PORT - The port number to which the server is listening
4. DATABASENAME - The test connects to a database on MaxDB and extracts performance
statistics from the system tables in the database. Therefore, provide the name of a
database in the DATABASENAME text box.
5. USERNAME - Since users with the SYSDBA privilege alone are allowed access to system
tables, specify the name of such a user against USERNAME.
6. PASSWORD - Provide the PASSWORD that corresponds to the specified USERNAME.
7. CONFIRM PASSWORD - Confirm the password by retyping it in the CONFIRM
PASSWORD box.
Outputs of the
test
One set of results for the MaxDB server being monitored
Measurements
made by the
test
Measurement
Measurement
Unit
Interpretation
Data cache hit ratio:
Indicates the percentage of
successful accesses to the
data cache.
Percent
A high hit rate of at least 98% is
recommended for the data cache. If the hit
rate is low, consider changing the size of the
data cache.
Cache usable size:
Indicates the current size of
the data cache.
MB
The size of the data cache has the following
effect on the performance of the database
system:
A large data cache makes a
high hit rate possible.
If the data cache is too large for
a small main memory, this can
lead to operating system
swapping with a very high level
of I/O activity.
However, since the data cache is dynamically
dimensioned by the database system, you
cannot configure the size of the data cache
directly, but can only influence it implicitly by
configuring the I/O buffer cache. The
database system takes the pages required for
the data cache from the I/O buffer cache. If
the other I/O buffer cache user, the
converter, grows in size, the database system
decreases the size of the data cache, if
necessary.
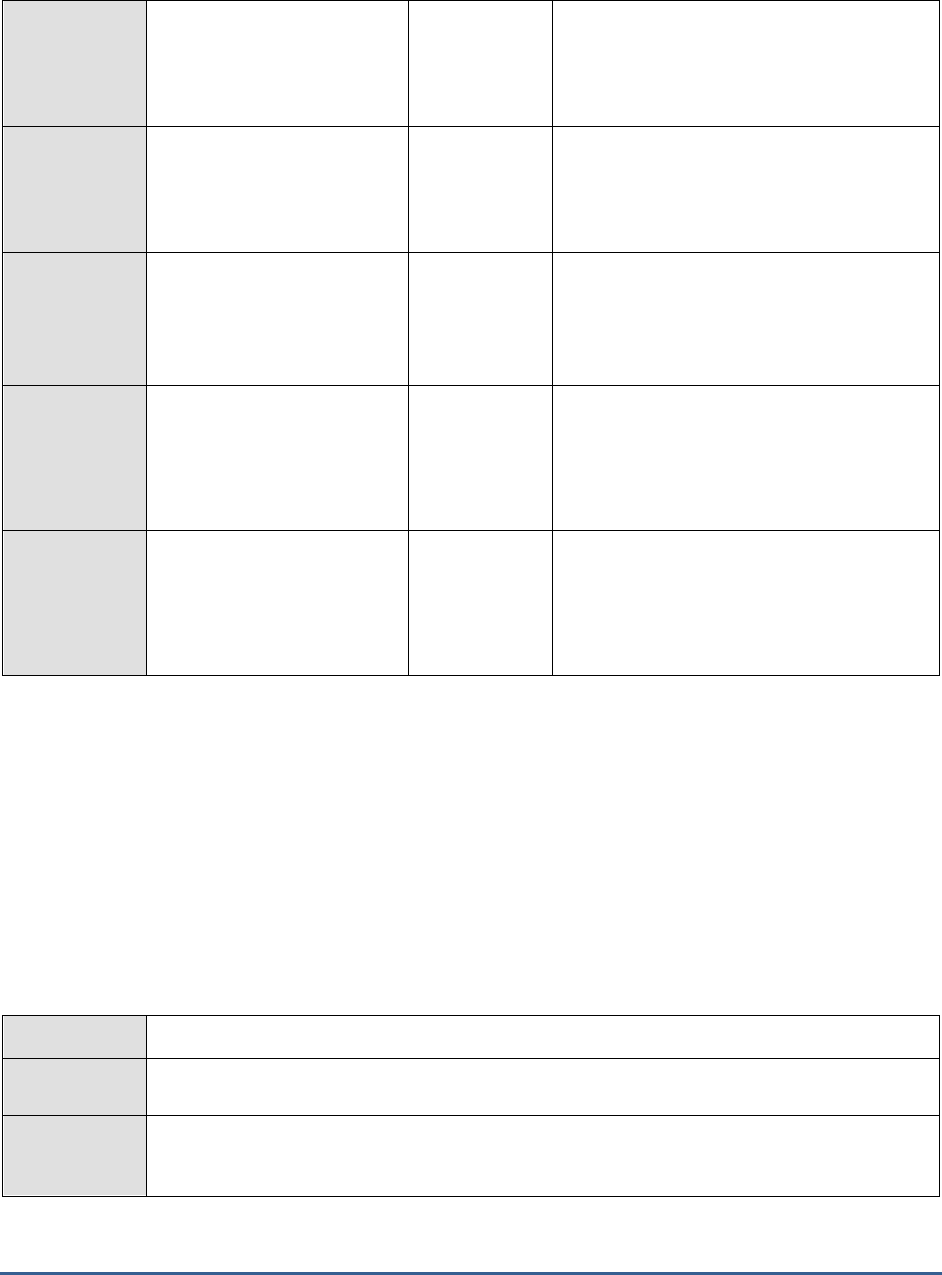
M O N I T O R I N G M A X D B
282
Cache used size:
Indicates the currently
utilized portion of the data
cache.
MB
If converter cache or catalog cache run out of
space, the data cache is used; so, it is
recommended that you increase the overall
cache size.
Percent of data cache
used:
Indicates the percentage of
the cache that is utilized.
Percent
If converter cache or catalog cache run out of
space, the data cache is used; so, it is
recommended that you increase the overall
cache size.
Oms data size:
Indicates the size of the data
cache that is currently used
for storing OMS data.
MB
Since the data in an SAP liveCache database
instance consists mainly of OMS data, you
should configure the data cache for SAP
liveCache database instances to be large
enough to store all the OMS data, if possible.
History data size:
Indicates the size of the data
cache required for consistent
reads and transactions
management.
MB
SQL data size:
Indicates the size of the data
cache not required either for
OMS data or consistent reads
and transaction management.
MB
5.3.2 Db I/O Cache Test
The Db I/O Cache test monitors the I/O Buffer Cache on the MaxDB server. The database system uses the I/O buffer
cache to manage all of the main memory that is available for I/O operations. The converter and the data cache are
the most important main memory consumers that the database system manages in the I/O buffer cache. The
converter is where the database system keeps information about which logical page number is saved at what
physical position (MaxDB block address). When the database system fails to find a page number in the data cache, it
searches for the page number in the converter and uses this to calculate the physical position of the data page in the
data volumes. If the converter grows while the database is running, and requires more pages, the database system
gives it more pages from the I/O buffer cache. If no more pages are available there, data is displaced from the data
cache and made available to the converter.
Purpose
Monitors the I/O Buffer Cache on the MaxDB server
Target of the
test
The MaxDB server
Agent
deploying the
test
An internal agent
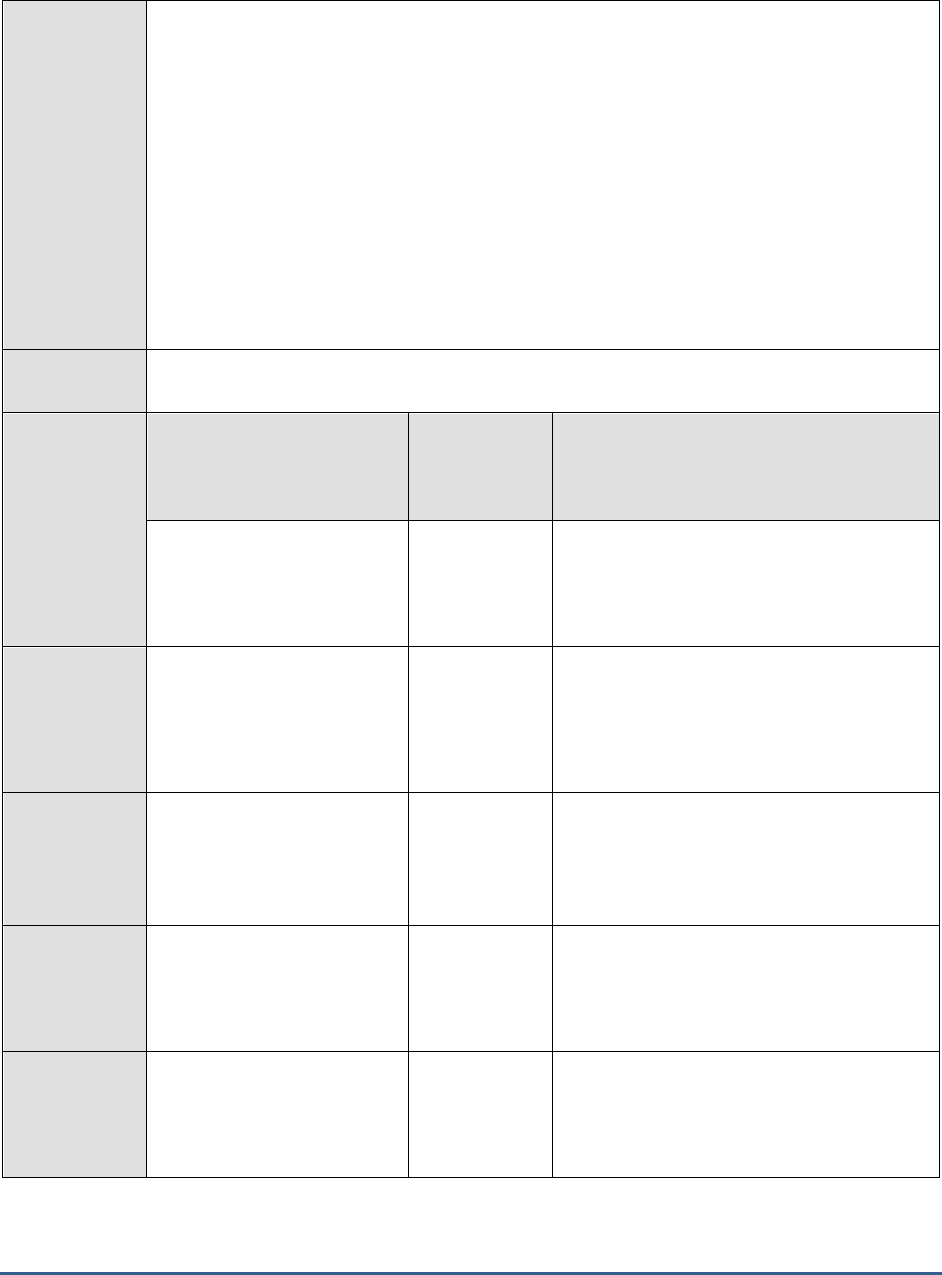
M O N I T O R I N G M A X D B
283
Configurable
parameters for
the test
1. TEST PERIOD - How often should the test be executed
2. HOST - Host name of the server for which the test is to be configured
3. PORT - The port number to which the server is listening
4. DATABASENAME - The test connects to a database on MaxDB and extracts performance
statistics from the system tables in the database. Therefore, provide the name of a
database in the DATABASENAME text box.
5. USERNAME - Since users with the SYSDBA privilege alone are allowed access to system
tables, specify the name of such a user against USERNAME.
6. PASSWORD - Provide the PASSWORD that corresponds to the specified USERNAME.
7. CONFIRM PASSWORD - Confirm the password by retyping it in the CONFIRM
PASSWORD box.
Outputs of the
test
One set of results for the MaxDB server being monitored
Measurements
made by the
test
Measurement
Measurement
Unit
Interpretation
Total I/O cache size:
Indicates the current size of
the I/O buffer cache.
MB
Data cache size:
Indicates the portion of the
I/O buffer cache that is
currently utilized by the data
cache.
MB
A high value of this measure is imperative to
ensure a high data cache hit rate. If the value
of this measure is very low, it is
recommended that you reset the
CACHE_SIZE parameter.
Percent data cache:
Indicates the percentage of
the I/O buffer cache used by
the data cache.
Percent
A high value of this measure is imperative to
ensure a high data cache hit rate. If the value
of this measure is very low, it is
recommended that you reset the
CACHE_SIZE parameter.
Converter size:
Indicates the space in the I/O
buffer cache currently used
by the converter.
MB
Percent coverter size:
Indicates the percentage of
the I/O buffer cache used by
the converter.
Percent
If the value of this measure falls, data is
displaced from the data cache and made
available to the converter.

M O N I T O R I N G M A X D B
284
IO mgmt size:
Indicates the current size of
the I/O management.
MB
File directory size:
Indicates the space currently
used by the file directories.
MB
Restart record size:
Indicates the space currently
used by restart records that
store all information that the
database system requires to
restart the database instance.
MB
Block allocator size:
Indicates the amount of
memory currently used by
block allocators.
MB
Unused size:
Indicates the free space in
the I/O buffer cache.
MB
Ideally, this value should be high. A very low
value of this measure indicates the need to
reset the CACHE_SIZE.
5.4 The MAXDB Service Layer
Using the tests associated with the MAXDB Service layer (see Figure 5.6), you can monitor the following:
How well the database session caches are utilized
The SQL statements and transactions executing on the MaxDB server
The request processing capability of the MaxDB server
The different types of queries that are executed on the server
The active sessions on the database server
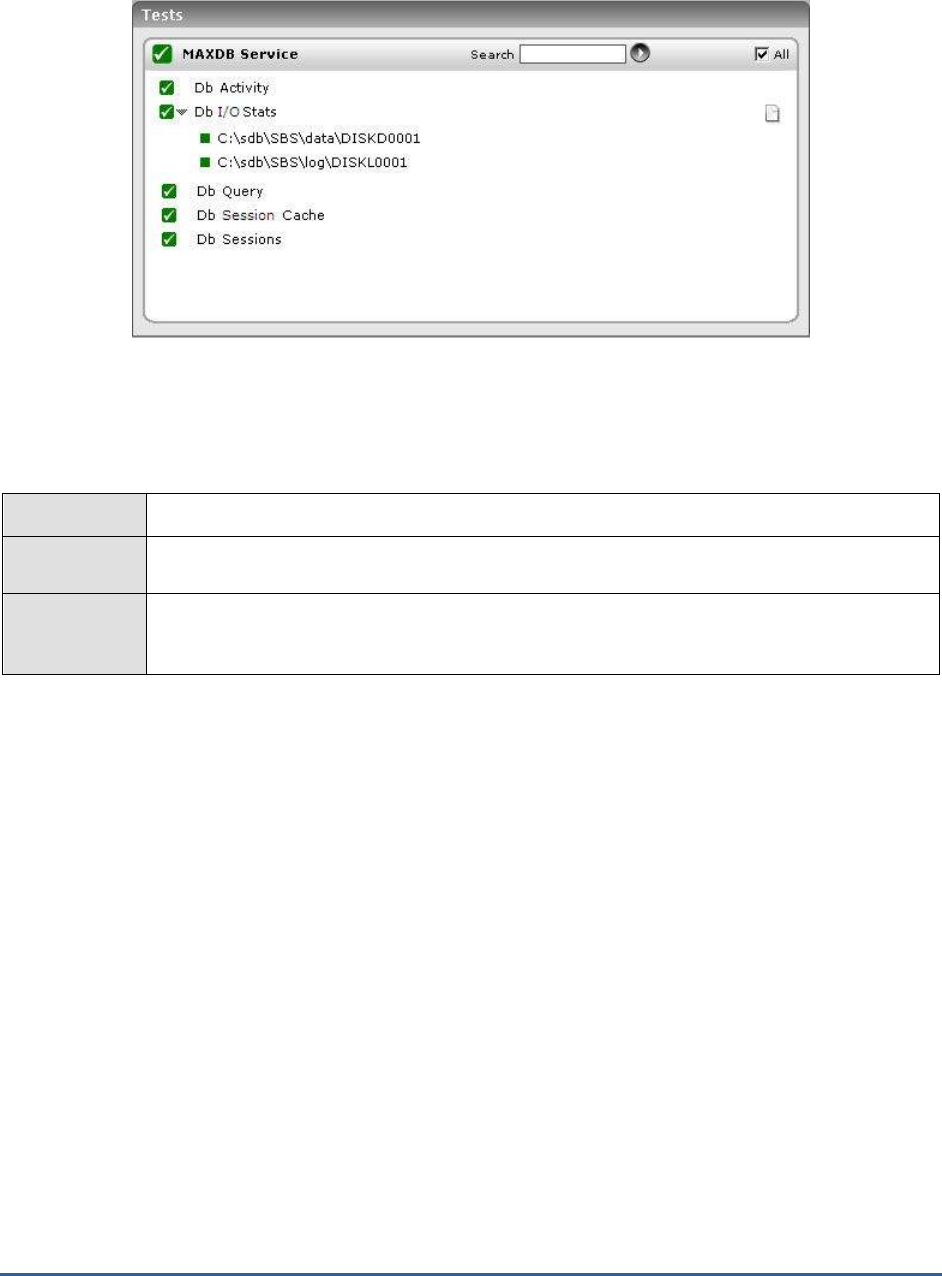
M O N I T O R I N G M A X D B
285
Figure 5.6: The tests associated with the MAXDB Service
5.4.1 Db Session Cache Test
The Db Session Cache test reveals whether the database session cache has been effectively utilized or not.
Purpose
Reveals whether the database session cache has been effectively utilized or not
Target of the
test
The MaxDB server
Agent
deploying the
test
An internal agent
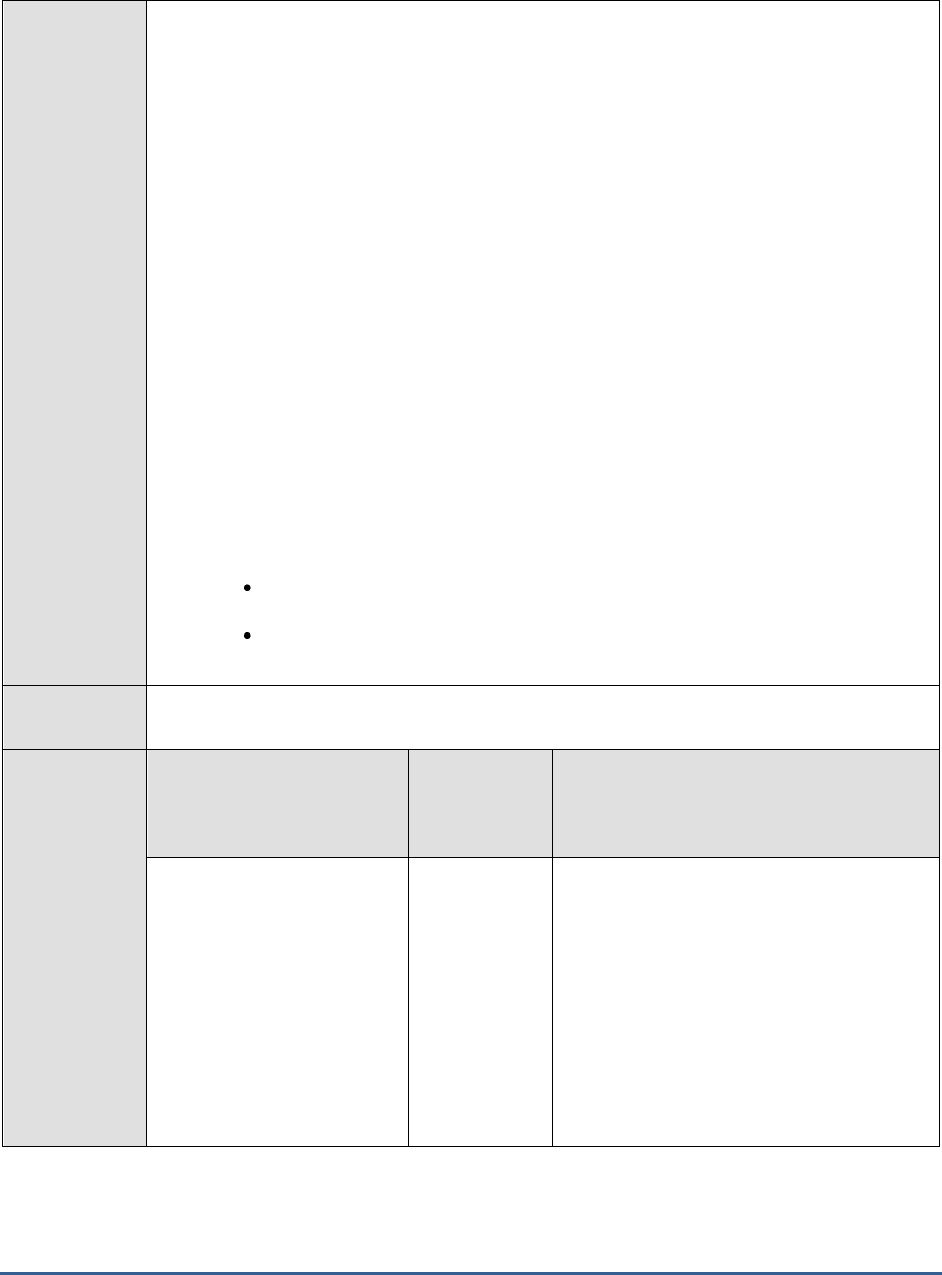
M O N I T O R I N G M A X D B
286
Configurable
parameters for
the test
1. TEST PERIOD - How often should the test be executed
2. HOST - Host name of the server for which the test is to be configured
3. PORT - The port number to which the server is listening
4. DATABASENAME - The test connects to a database on MaxDB and extracts performance
statistics from the system tables in the database. Therefore, provide the name of a
database in the DATABASENAME text box.
5. USERNAME - Since users with the SYSDBA privilege alone are allowed access to system
tables, specify the name of such a user against USERNAME.
6. PASSWORD - Provide the PASSWORD that corresponds to the specified USERNAME.
7. CONFIRM PASSWORD - Confirm the password by retyping it in the CONFIRM
PASSWORD box.
8. DETAILED DIAGNOSIS - To make diagnosis more efficient and accurate, the eG
Enterprise system embeds an optional detailed diagnostic capability. With this capability,
the eG agents can be configured to run detailed, more elaborate tests as and when specific
problems are detected. To enable the detailed diagnosis capability of this test for a
particular server, choose the On option against DETAILED DIAGNOSIS. To disable the
capability, click on the Off option.
The option to selectively enabled/disable the detailed diagnosis capability will be available
only if the following conditions are fulfilled:
The eG manager license should allow the detailed diagnosis capability
Both the bad and normal frequencies configured for the detailed diagnosis
measures should not be 0.
Outputs of the
test
One set of results for the MaxDB server being monitored
Measurements
made by the
test
Measurement
Measurement
Unit
Interpretation
Cache hits:
Indicates the percentage of
total database sessions that
were accessed from the
cache.
Percent
If the value of this measure is over 85%, it is
a sign of good health. Values lesser than
85% might warrant a change in the cache
size using the CAT_CACHE_SUPPLY
parameter.
The detailed diagnosis of this measure, if
enabled, provides a list of session IDs, the
number of attempts made to access each
session, the number of times every listed
session was successfully accessed from the
cache, and the hit rate.
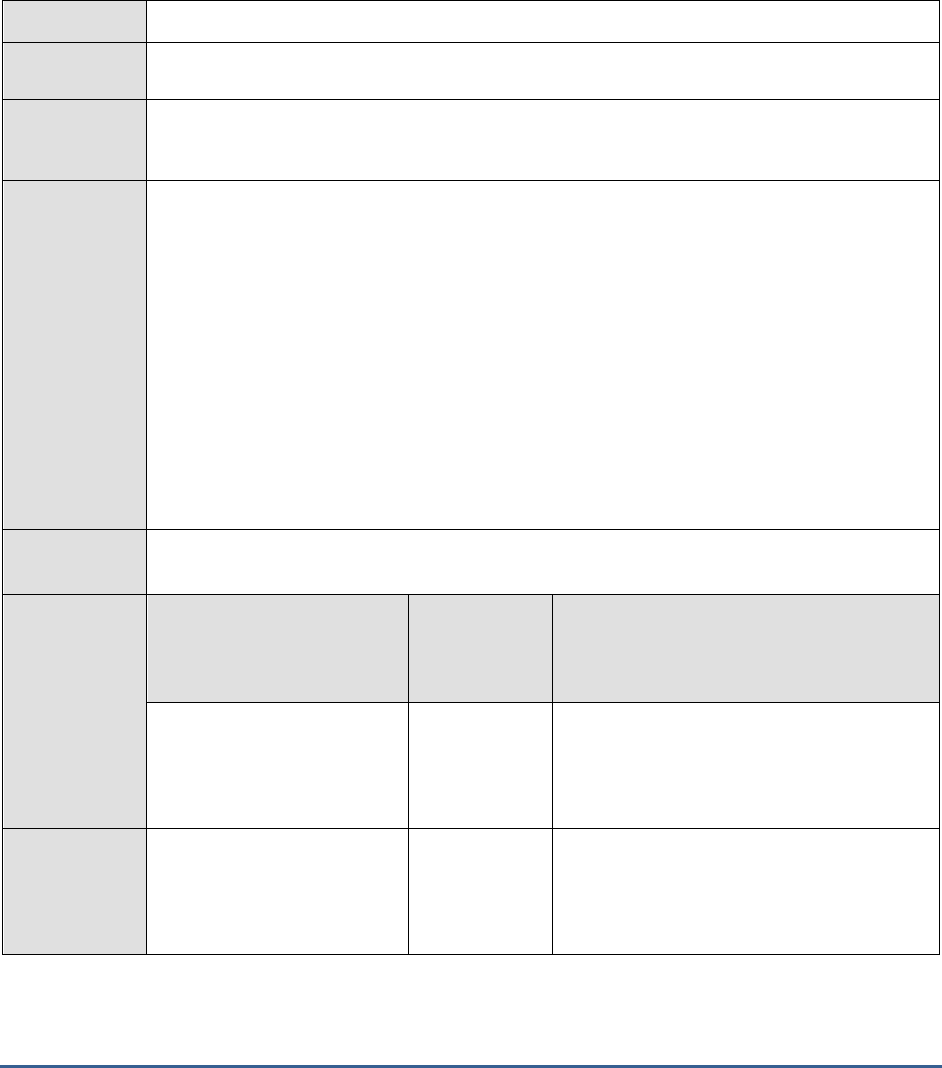
M O N I T O R I N G M A X D B
287
5.4.2 Db Activity Test
A transaction is a sequence of SQL statements that are handled by the database system as a unit, in the sense that
any modifications made to the database by the SQL statements are either all reflected in the state of the database,
or else none of the database modifications are retained. Among other things, the transaction management functions
of a database system make sure that parallel transactions from multiple database sessions are processed correctly,
and that they deliver the same results as if the transactions were processed sequentially. The Db Activity test reports
statistics pertaining to the transactions executing on MaxDB.
Purpose
Reports statistics pertaining to the transactions executing on MaxDB
Target of the
test
The MaxDB server
Agent
deploying the
test
An internal agent
Configurable
parameters for
the test
1. TEST PERIOD - How often should the test be executed
2. HOST - Host name of the server for which the test is to be configured
3. PORT - The port number to which the server is listening
4. DATABASENAME - The test connects to a database on MaxDB and extracts performance
statistics from the system tables in the database. Therefore, provide the name of a
database in the DATABASENAME text box.
5. USERNAME - Since users with the SYSDBA privilege alone are allowed access to system
tables, specify the name of such a user against USERNAME.
6. PASSWORD - Provide the PASSWORD that corresponds to the specified USERNAME.
7. CONFIRM PASSWORD - Confirm the password by retyping it in the CONFIRM
PASSWORD box.
Outputs of the
test
One set of results for the MaxDB server being monitored
Measurements
made by the
test
Measurement
Measurement
Unit
Interpretation
Sql command rate:
Indicates the rate at which
SQL statements were
executed.
Commands/Se
c
Sql parsing rate:
Indicates the rate at which
SQL statements were parsed.
Parses/Sec
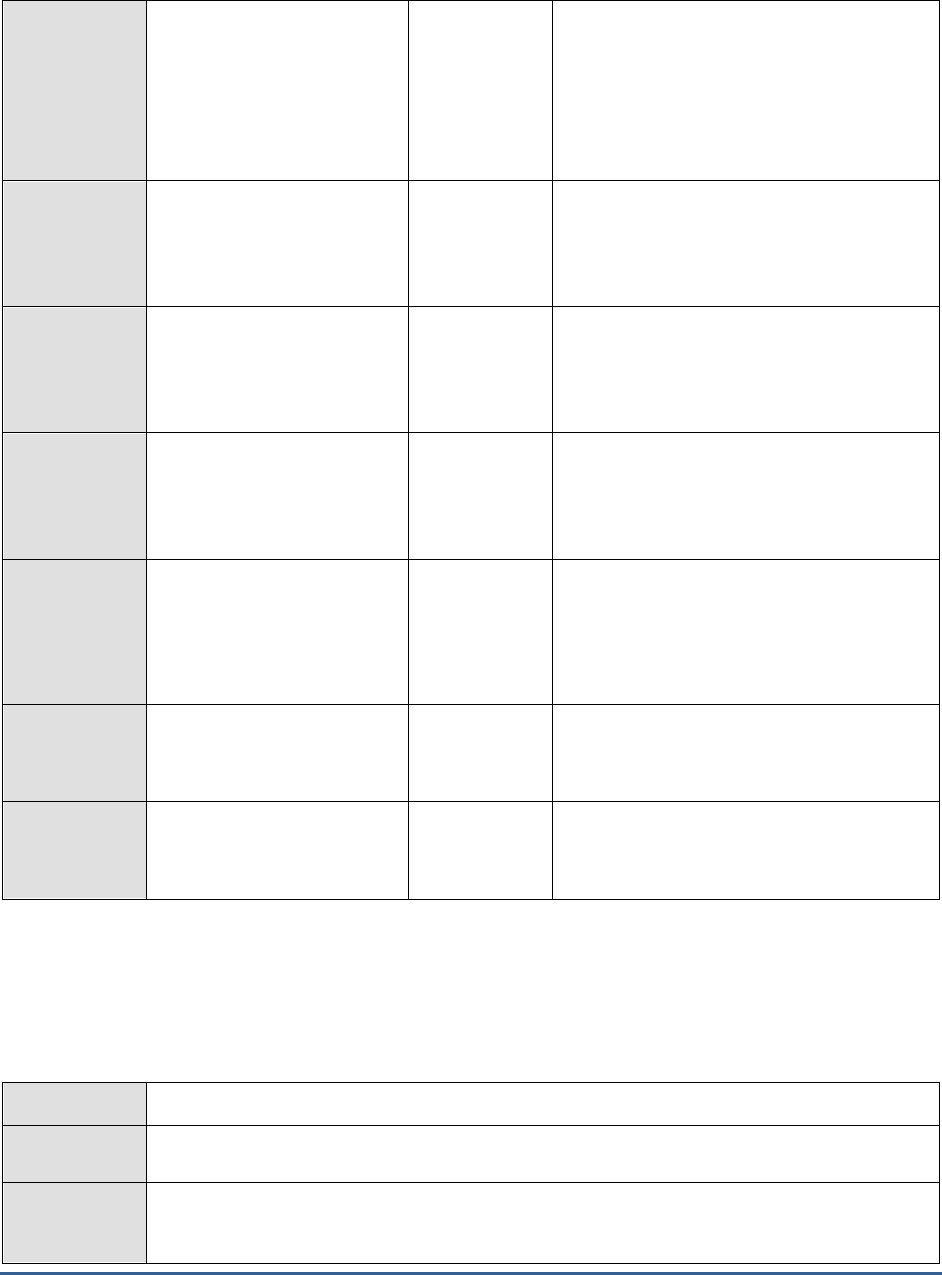
M O N I T O R I N G M A X D B
288
Parsed sql execurtion
rate:
Indicates the rate at which
parsed SQL statements were
executed.
Executions/Sec
A high level of parse activity when the
database is running can indicate a missing
statement cache implementation in your
application, or a deactivated parse info cache
in the JDBC interface. A high level of parse
activity is normal when programs or program
components are started for the first time.
Transaction commits:
Indicates the rate at which
transactions were committed.
Commits/Sec
Transaction rollbacks:
Indicates the rate at which
transactions were rolled back.
Rollbacks/Sec
Ideally, there should be few user rollbacks
happening, since rollbacks are costly
operations on the database.
Rollbacks:
Indicates the percentage of
rollbacks.
Percent
Ideally, there should be few user rollbacks
happening, since rollbacks are costly
operations on the database.
Memory sort rate:
Indicates the rate at which
sorting operations were
performed on the main
memory to build indexes.
Sorts/Sec
Table scans:
Indicates the rate of table
scans.
Scans/Sec
A high value of table scans is an indicator
that the queries do not use indexes at all or
use indexes with low selectivity.
Index scan rate:
Indicates the rate of index
scans.
Scans/Sec
5.4.3 Db I/O Stats Test
The Db I/O Stats test indicates how efficiently MaxDB handles read/write requests to the database.
Purpose
Indicates how efficiently MaxDB handles read/write requests to the database
Target of the
test
The MaxDB server
Agent
deploying the
test
An internal agent
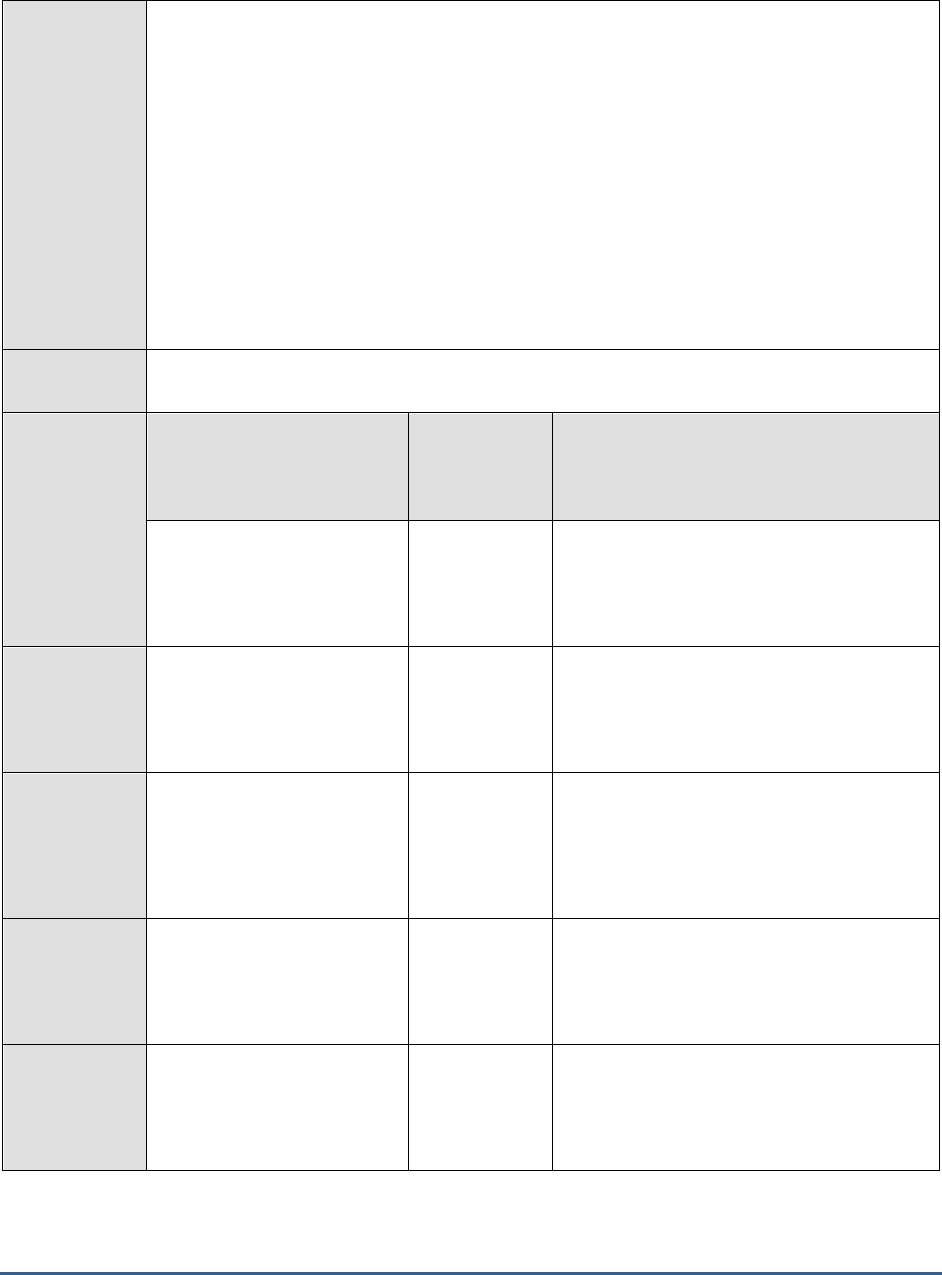
M O N I T O R I N G M A X D B
289
Configurable
parameters for
the test
1. TEST PERIOD - How often should the test be executed
2. HOST - Host name of the server for which the test is to be configured
3. PORT - The port number to which the server is listening
4. DATABASENAME - The test connects to a database on MaxDB and extracts performance
statistics from the system tables in the database. Therefore, provide the name of a
database in the DATABASENAME text box.
5. USERNAME - Since users with the SYSDBA privilege alone are allowed access to system
tables, specify the name of such a user against USERNAME.
6. PASSWORD - Provide the PASSWORD that corresponds to the specified USERNAME.
7. CONFIRM PASSWORD - Confirm the password by retyping it in the CONFIRM
PASSWORD box.
Outputs of the
test
One set of results for every data volume and log volume on the MaxDB server being monitored
Measurements
made by the
test
Measurement
Measurement
Unit
Interpretation
Database read rate:
Indicates the rate at which
database reads were
performed.
Reads/Sec
Page read operations:
Indicates the rate at which
page reads were performed.
Pages/Sec
Database read time:
Indicates the time taken by
the database to perform read
operations in the last
measurement period.
Secs
A high value of this measure indicates a
reading bottleneck.
Database write rate:
Indicates the rate at which
data is written to the
database.
Writes/Sec
Page write operations:
Indicates the rate at which
page writes were performed.
Pages/Sec
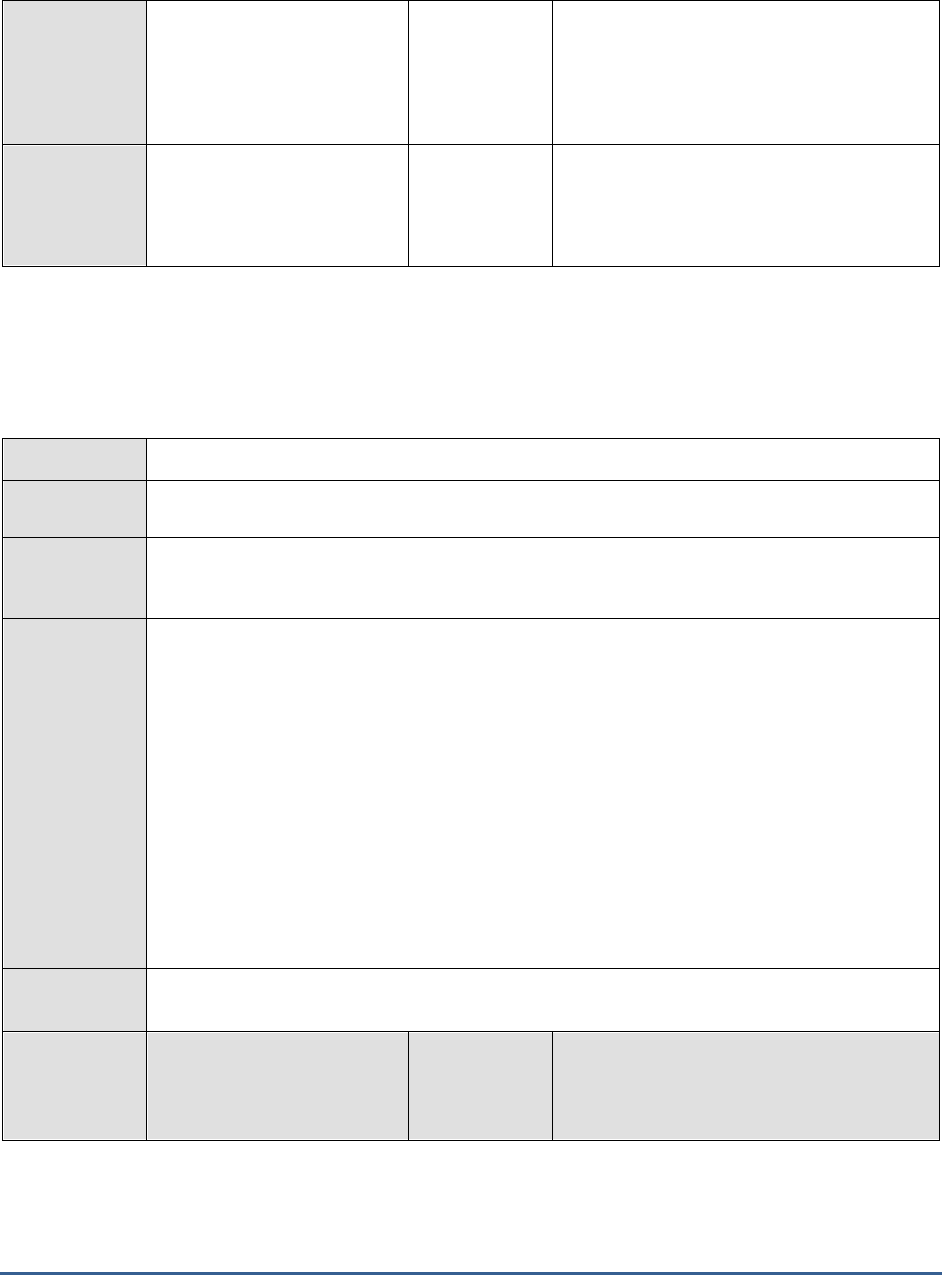
M O N I T O R I N G M A X D B
290
Database write time:
Indicates the time taken by
the database to perform write
operations in the last
measurement period.
Secs
A high value of this measure indicates a
writing bottleneck.
Pending I/O operations:
Indicates the number of IO
operations still to be
completed.
Number
If the value of this measure keeps increasing,
it is indicative of a processing bottleneck.
5.4.4 Db Query Test
A QUERY statement specifies a result table that can be ordered. The Db Query test monitors the different types of
QUERY statements that are executed on the MaxDB database.
Purpose
Monitors the different types of QUERY statements that are executed on the MaxDB database
Target of the
test
The MaxDB server
Agent
deploying the
test
An internal agent
Configurable
parameters for
the test
1. TEST PERIOD - How often should the test be executed
2. HOST - Host name of the server for which the test is to be configured
3. PORT - The port number to which the server is listening
4. DATABASENAME - The test connects to a database on MaxDB and extracts performance
statistics from the system tables in the database. Therefore, provide the name of a
database in the DATABASENAME text box.
5. USERNAME - Since users with the SYSDBA privilege alone are allowed access to system
tables, specify the name of such a user against USERNAME.
6. PASSWORD - Provide the PASSWORD that corresponds to the specified USERNAME.
7. CONFIRM PASSWORD - Confirm the password by retyping it in the CONFIRM
PASSWORD box.
Outputs of the
test
One set of results for the MaxDB server being monitored
Measurements
made by the
test
Measurement
Measurement
Unit
Interpretation

M O N I T O R I N G M A X D B
291
Create statements:
Indicates the number of
CREATE statements that were
executed in the last
measurement period.
Number
Alter statements:
Indicates the number of
ALTER statements that were
executed in the last
measurement period.
Number
Drop statements:
Indicates the number of
DROP statements that were
executed in the last
measurement period.
Number
Insert statements:
Indicates the number of
INSERT statements that were
executed in the last
measurement period.
Number
Insert row statements:
Indicates the number of rows
inserted in the last
measurement period.
Number
Update statements:
Indicates the number of
UPDATE statements that
were executed in the last
measurement period.
Number
Update row statements:
Indicates the number of rows
that were updated in the last
measurement period.
Number
Delete statements:
Indicates the number of
DELETE statements that were
executed in the last
measurement period.
Number
Delete row statements:
Indicates the number of rows
that were deleted in the last
measurement period.
Number
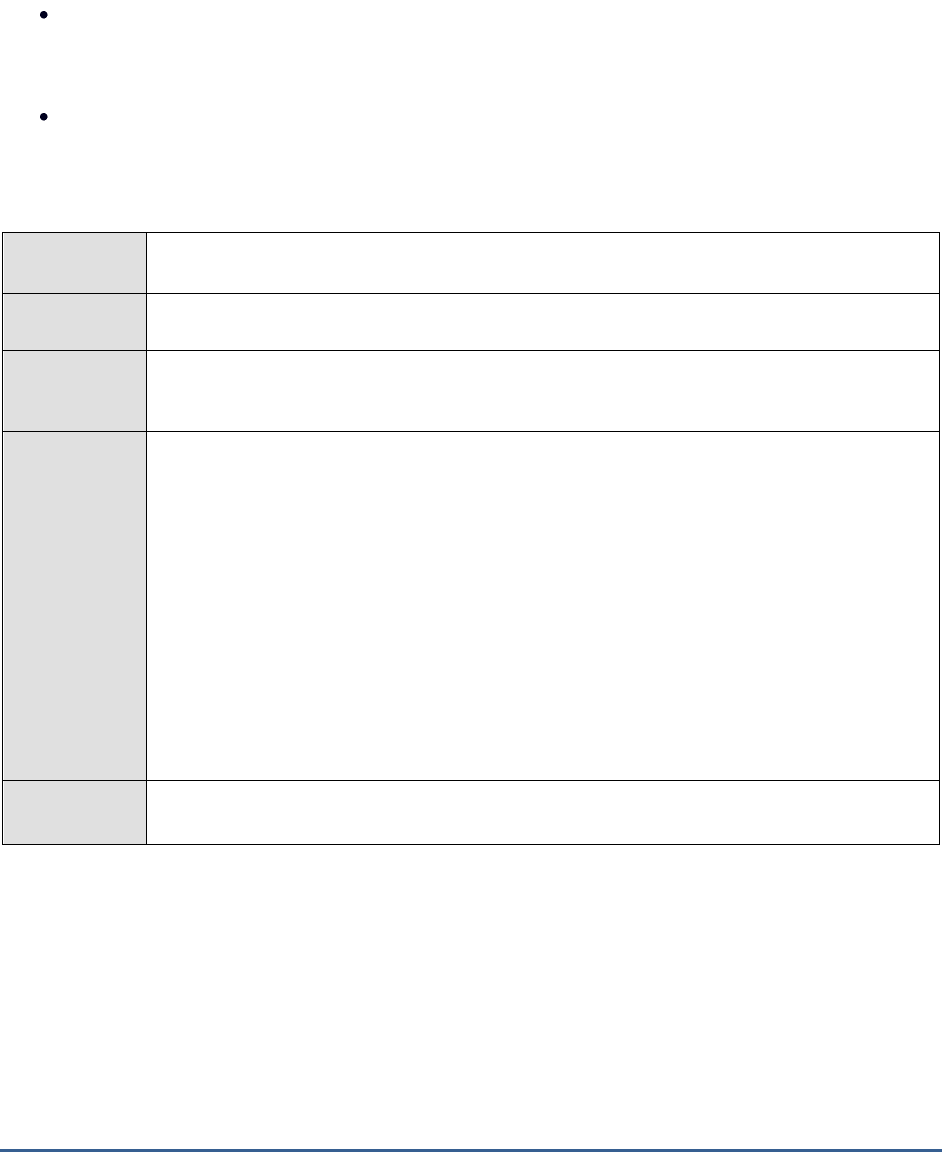
M O N I T O R I N G M A X D B
292
5.4.5 Db Sessions Test
To work with a database instance, to make data queries or to manage the database instance, you have to open a
database session. This can happen as follows:
The user logs on to the database instance with a user name and password, thus opening a
database session. Later, the database session is terminated explicitly by the user or closed
implicitly when the timeout value is exceeded.
A database tool implicitly opens a database session and then closes it again later.
The Db Sessions test reveals the level of activity on the MaxDB server by reporting the number of active database
sessions.
Purpose
Reveals the level of activity on the MaxDB server by reporting the number of active database
sessions
Target of the
test
The MaxDB server
Agent
deploying the
test
An internal agent
Configurable
parameters for
the test
1. TEST PERIOD - How often should the test be executed
2. HOST - Host name of the server for which the test is to be configured
3. PORT - The port number to which the server is listening
4. DATABASENAME - The test connects to a database on MaxDB and extracts performance
statistics from the system tables in the database. Therefore, provide the name of a
database in the DATABASENAME text box.
5. USERNAME - Since users with the SYSDBA privilege alone are allowed access to system
tables, specify the name of such a user against USERNAME.
6. PASSWORD - Provide the PASSWORD that corresponds to the specified USERNAME.
7. CONFIRM PASSWORD - Confirm the password by retyping it in the CONFIRM
PASSWORD box.
Outputs of the
test
One set of results for the MaxDB server being monitored

M O N I T O R I N G M A X D B
293
Measurements
made by the
test
Measurement
Measurement
Unit
Interpretation
Number of sessions:
Indicates the number of
currently active database
sessions.
Number
This measure is a good indicator of the
workload on the database server.

C O N C L U S I O N
294
Conclusion
This document has described in detail the monitoring paradigm used and the measurement capabilities of the eG
Enterprise suite of products with respect to SAP Environments. For details of how to administer and use the eG
Enterprise suite of products, refer to the user manuals.
We will be adding new measurement capabilities into the future versions of the eG Enterprise suite. If you can
identify new capabilities that you would like us to incorporate in the eG Enterprise suite of products, please contact
support@eginnovations.com. We look forward to your support and cooperation. Any feedback regarding this manual
or any other aspects of the eG Enterprise suite can be forwarded to feedback@eginnovations.com.
