Performance Tuning Guide Mule 3.8.x Resource
User Manual:
Open the PDF directly: View PDF ![]() .
.
Page Count: 41
- Performance Tuning Guide
- 1. Introduction
- 2. Goals and Design Considerations
- 3. Mule Application Design
- 4. The Java Virtual Machine and Garbage Collection
- 5. Tunables
- 6. Sample Configuration Files
- References

Performance Tuning Guide
Performance Tuning Guide
Q3 2017 for Mule 3.8.x
This Tuning Guide provides a set of recommendations from MuleSoft experts on how to tune
applications running on Mule 3.8.x1 for optimal performance. The document first provides
context as to why and when performance tuning matters, before outlining methodologies and
discussing best practices. Examples are mentioned throughout the report, and can be explored
in greater detail with information found in the References section.
1Starting Mule 3.8.0 Runtime, API Gateway Runtime is unified with core Mule runtime.
1

Performance Tuning Guide
1. Introduction
1.1. Overview
The structure of this document roughly follows the performance tuning process. After
addressing important preliminaries like requirement specification, the next step is to dive into
application design. Runtime environment settings also contribute to performance. That includes
configurations for the application, Mule, the runtime engine for MuleSoft’s Anypoint Platform,
and the virtual machine.
Section 2, “Goals and Design Considerations” gives a background for any type of performance
testing on Mule or another type of application. Also will help you set your goals during the
performance test and development.
Section 3, “Mule Application Design” focuses on optimizing the application and its components.
The section contains a number of general recommendations about synchronicity, variable
scope, payload format, and so forth. There is also discussion of how to efficiently accomplish
particular tasks. For example, implementing HTTP connections.
Section 4, “The Java Virtual Machine and Garbage Collection” discusses virtual machine
settings that greatly affect different aspects of performance. Depending on use case goals, one
method of garbage collection may be preferable to others. Heap size can also be configured to
maximize performance.
Section 5, “Tunables” emphasizes two kinds of adjustment. First, application-specific
configurations can help with performance, like setting the right logging options. Such
modifications are not part of the application design process despite being application-specific.
Second, Mule itself may be configured to enhance application performance.
Section 6, “Sample Configuration Files” contains examples of files discussed throughout
this document. One can see, for instance, how logging settings are adjusted in
log42j.properties or how to set the garbage collection method in wrapper.conf .
Reviewing these complete and reusable examples helps tie all the concepts learned here and
highlights interdependencies and correlation between tunables, knowing where these files are
makes tuning Mule applications a lot easier.
2
Performance Tuning Guide
1.2. Preliminaries
When Performance Matters
Performance always matters. An application and its environment should be designed with
performance in mind. The application, the server it runs on, the database it communicates with,
the network it communicates over; all of these elements should be performant. Creating an
efficient, elegant mechanism is not only important for a business, but also for the engineers
maintaining the system, as a well tuned app is more stable under expected load and makes a
better use of available resources.
Although true, perhaps that is not the answer one is looking for. When does performance
matter? The question is too broad. The following discussion helps clarify the question and how
to answer it.
Good applications and protocols should work well on a variety of systems. In contrast,
performance testing and tuning have system-dependent components. For instance, an
application can be tuned to balance throughput versus response time in ways that are mutually
exclusive. So out-of-the-box settings may not strike the perfect balance that yields optimal
performance for a given use case.
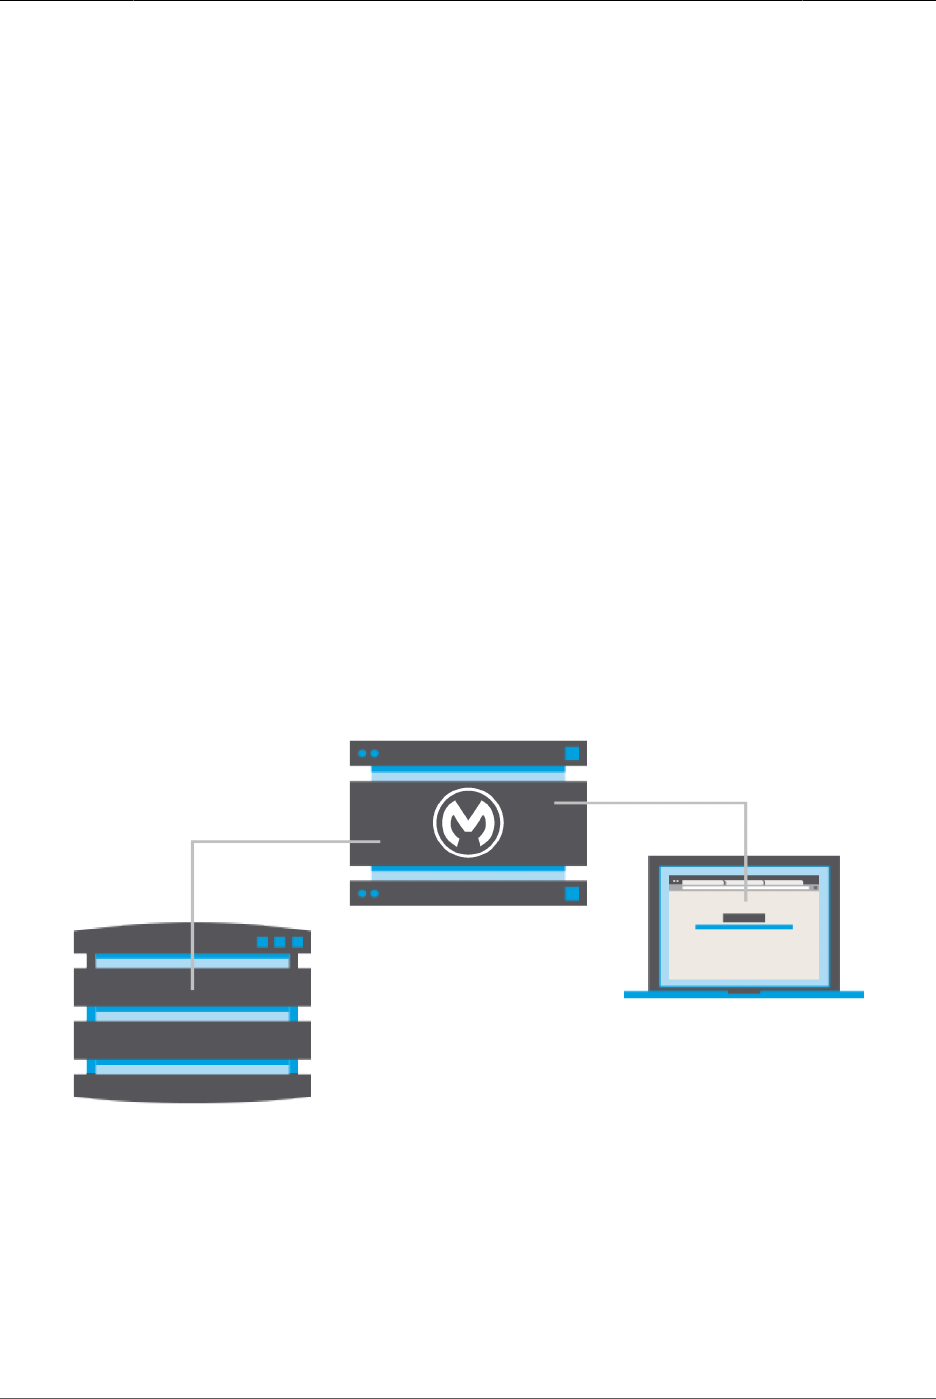
Figure 1. Parts of an Interdependent System
The figure depicts a relatively simple environment. A user’s node interacts with a Mule node,
which is also connected to a database. Each node runs a salient application: Mule, perhaps
Firefox for the user, and MySQL. Those applications run on operating systems. Each node’s
software in turn runs on particular hardware. And then there is the network connection. Observe
3

Performance Tuning Guide
that even this simple system has many components that can affect important performance
metrics.
When is performance tuning worthwhile for a particular use case?
For deploying a Mule application, the best question is whether or not a particular case warrants
extra calibration. Here, "particular case" refers to the application running in a given production
environment. Are higher throughput or lower response time important? Is it infeasible or
unhelpful to throw more hardware at the problem? If so, then performance tuning is the way to
go.
Goals of This Document
The main goal of this document is to help users of Anypoint Platform get the most out of
their applications. In addition to discussing Mule tuning, this guide pays some attention to
other factors that can affect Mule application performance. Examples include packaging data,
networking, and database configuration.
While it is often useful to optimize one’s database, this is not a guide for tuning particular
database systems. There is no detailed treatment of MySQL here. Likewise for other items that
Mule applications may interact with. Some information about MySQL, for instance, is given here
and references are included for interested readers.
This guide is about designing and optimizing Mule applications running on Mule, the runtime
engine for MuleSoft’s Anypoint Platform. Performance monitoring and analysis are related topics
that play an important role. The discussion includes some best practices collected from the field.
Interested readers may find helpful references in the footnotes.
Audience
This document is written with a technical audience in mind. But one does not have to be a
performance expert to implement performance tuning. The recommendations given here are
typically simple. For instance, just modify an attribute or change a setting in a configuration file.
There are also best-practice suggestions. Using them throughout the design process can help
prevent unnecessary bottlenecks.
Readers unfamiliar with a topic can find additional explanation through
references given in the footnotes. Section 6, “Sample Configuration Files” may
also help contextualize some discussions.
4

Performance Tuning Guide
Bottlenecks happen, despite good intentions. When they do, it can be helpful to call upon on-
site performance experts. Performance engineers can help identify performance bottlenecks
and determine which settings might improve performance.
5

Performance Tuning Guide
2. Goals and Design Considerations
2.1. Getting Started
To-Do Before Tuning
Here are a few questions to ask before tuning. Performance tuning requires affirmative answers
for (1) and (2), plus a concise response to (3).
1. Does the application function as expected?
2. Is the testing environment stable?
3. How does the application need to be tuned? Is the goal to increase throughput or
decrease response time?
Donald Knuth maintained that "premature optimization is the root of all evil".2
Make sure the application runs properly before tuning it.
Performance Tuning Process Overview
1. Design Phase Tuning
a. Tune Mule’s flows.
b. Tune Mule’s configuration settings.
2. Runtime Environment Tuning
a. Tune the Java Virtual Machine (JVM).
b. Tune the garbage collection (GC) mechanism.
3. Operating System Tuning
a. Tune the ulimit.
b. Tune the TCP/IP stack.
Use an iterative approach when tuning. Make one change at a time, retest, and check the
results.
2See [Knuth_Structured].
6
Performance Tuning Guide
It may be tempting to apply several changes at once. That hasty approach leads
to difficulties linking causes with effects. Doing one change at a time makes it
apparent how each modification affects performance.
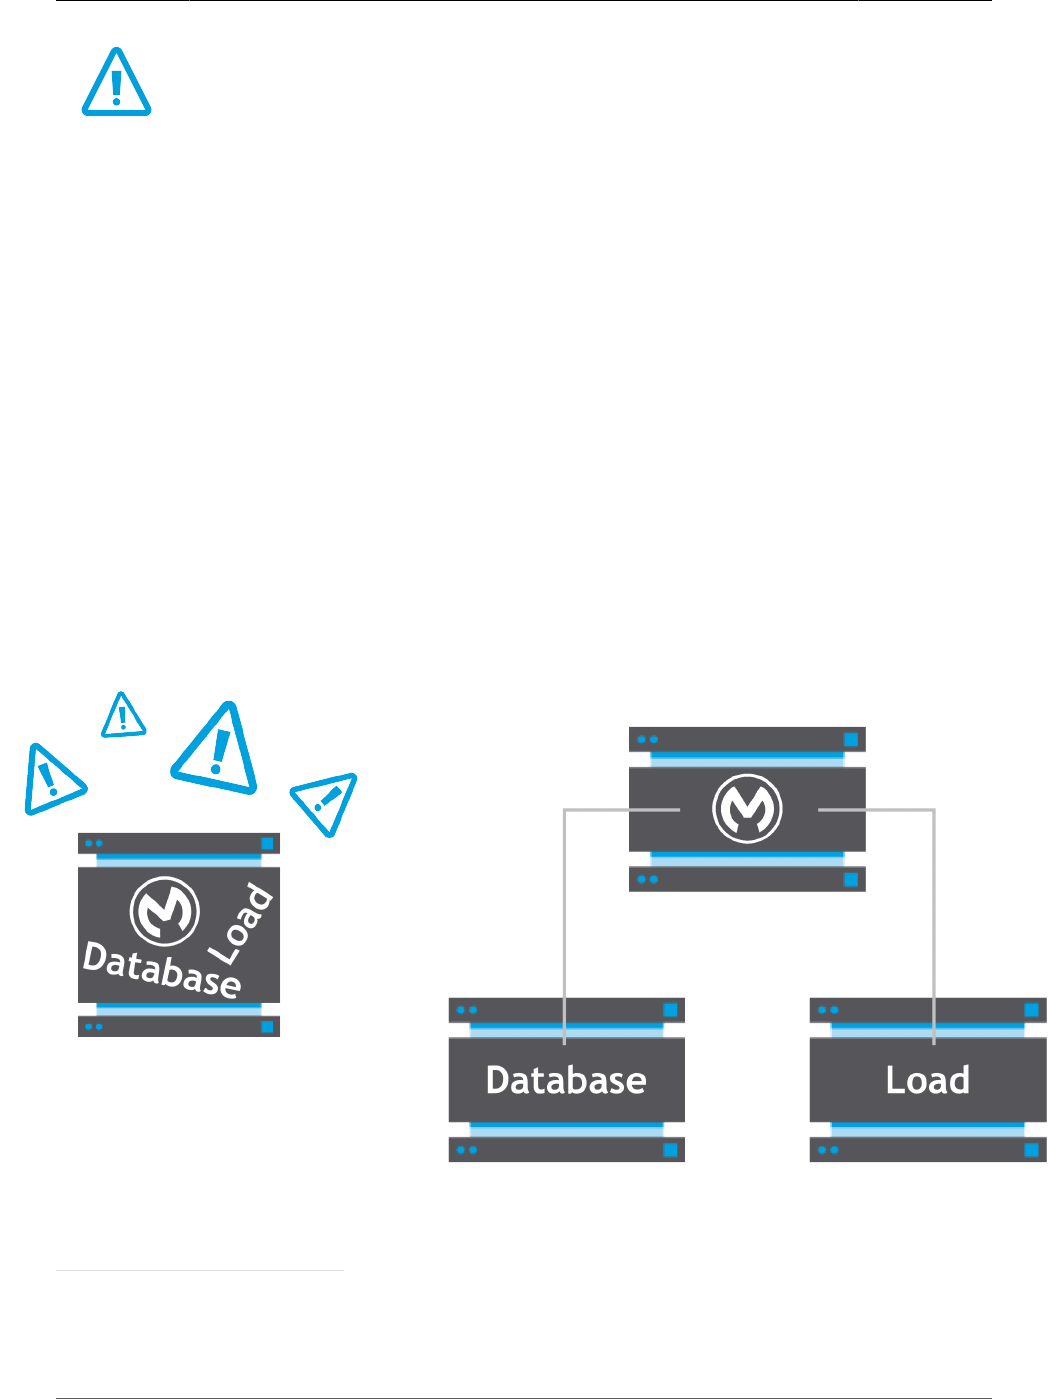
Performance Testing Best Practices
Use a Controlled Environment
Repeatability is crucial to running performance tests. The testing environment must be
controlled and stable. To help ensure stability, use:
• A dedicated host to prevent other running processes from interfering with Mule and the
application
• A wired, stable network
• Separate hosts to run other dependent services 3
• Separate hosts for running load client tools 4
Figure 2. Separate Hosts Avoid Interference
3E.g., MySQL, ActiveMQ, other backend services
4E.g., Apache Bench, JMeter
7

Performance Tuning Guide
A dedicated VM on shared hardware is not controlled, a similar environment
should be used or it must be the only VM running in the server.
Use Representative Workloads
Representative workloads mimic the customer use cases in the real world. The planning of the
workload usually includes analysis of the payloads and user behaviors.
Payloads can be designed to vary realistically in terms of size, type, and complexity. Its arrival
rate can also be adjusted to imitate actual customer behavior by introducing think time in the
load test tool. For testing proxy scenarios, artificial latency may also need to be added to the
back-end service.
Clarify Requirements and Goals
It is important to specify the performance criteria for an application’s use case. Here, use case
refers to an application running in an environment to achieve particular goals. Different types of
requirements lead to different configurations. For example, use cases emphasizing throughput
should utilize parallel mark-and-sweep (MS garbage collection (GC. Cases focusing on
response time may prefer concurrent MS (CMS. Those GC techniques are themselves tuned
differently. As such, a case cannot be tuned until after performance requirements are defined.
Here are some questions that may help clarify requirements:
1. What are the expected average and peak workloads?5
2. Is the use case emphasis on throughput or response time?
3. What is the minimum acceptable throughput?
4. What is the maximum acceptable response time?
Choose the Right Tools
The components used for testing can make a big difference. Ideally, tests should use the same
items as are being tested. For instance, suppose some tests are designed to represent a
5Specify the nature of the input as well as the number of inputs.
8

Performance Tuning Guide
system using a MySQL database. Then clearly those tests should use a MySQL database with
the same setup.
The load driver is an important part of the test, although typically not part of that which is
tested. There are many enterprise and open source load test tools in the market with different
implementations such as single-threaded, multi-threaded, non-blocking, etc. Each one has their
own advantages and disadvantages depending on the scenario. The general rule of thumb is to
choose one that is most performant and suitable for the specific use case, then stick to it for
consistent comparisons. The performance team at MuleSoft uses Apache JMeter and API
Bench for most tests.
Also, it is important to configure the load test tools. For instance, we have a customer using HP
LoadRunner with dated TLS version, and ran into bad performance when testing against
HTTPS endpoint.
2.2. Performance Goals
This section provides more information about the common performance requirements and
goals. The use case and corresponding performance criteria lead to particular tunables:
adjustments that can enhance the performance of the use case. Readers are invited to choose
their own adventures.
High Throughput
Throughput is a measure of transactions per unit time, usually seconds (tps. The most
common metrics are mean and median throughput. One might also focus on minimum expected
throughput or other factors.
Focus on throughput when handling a large volume of transactions is a high priority. Suppose
there is an application that just takes purchase information, transforms it, and inserts it into a
database. Assume that response times do not affect user experience in this case (the operation
is post-purchase. In such cases, it may not matter if the application has latency spikes. The
most important aspect of performance is throughput.
Most of the tips discussed in this document can help maximize throughput. Here are a couple of
additional tips. First, be sure to use persistent HTTP connections. See the section called “HTTP
Keep-Alive”. Second, use the default garbage collection method rather than Concurrent Mark-
and-Sweep. See the section called “Parallel GC”.
9

Performance Tuning Guide
Low Latency
Latency (also referred as the response time is a measure of response time, typically expressed
in milliseconds (ms. Insofar as latency is a concern, latency spikes (the extreme outliers could
impact the average, so it is a good idea to express latency as top percentile. For instance, if the
95th percentile latency is 1000 ms, then 95% of transactions are done in 1000 ms.
Latency spikes are unacceptable for some applications. If latency spikes affect user
experiences, users may become frustrated. Perhaps, for instance, a user submits a purchase
and is left to wait for a few seconds for confirmation. More extreme cases in which latency
spikes are unacceptable are scenarios with real-time demands. So use cases involving real-
time demands or user wait times may prioritize low latency.
Several portions of this text have tips that can help minimize latency. To start, see Section 3.2,
“HTTP Connections”. Also you can enable Concurrent Mark-and-Sweep for garbage collection.
See the section called “CMS GC (Concurrent-Mark-Sweep”. It is also a good idea to
understand when to use synchronous or asynchronous processing. See the section called
“Asynchronous Processing”. To take advantage of the Scatter-Gather message processor, see
Section 5.1, “Scatter-Gather”.
High Concurrency
Concurrency is a measure of the number of users or transactions at a given moment.
Concurrency is sometimes either ignored in favor of or confused with throughput. The two are
distinct and there are cases in which concurrency deserves more attention.
Take, for example, any widely used social networking website. Assuming it has 100 million
users, the concurrency requirement would be very high in order to support all users connecting
to the website at the same time. While it is important to maintain high throughput in general, the
expectation of throughput is actually not as high in this case - because a user that is logged in is
likely to take time to read and think before acting.
In this scenario, the performance test setup should take the user’s think-time into consideration.
Also pay attention to the system limits of resources such as the number of file handles and ports
available, on the machines under test and the machines running the load clients. Regarding
load clients, it is important to choose one that could support high concurrency, and ensure it is
configured to use the most optimal HTTP(S connection implementation. A non-thread based,
non-blocking client such as API Bench is recommended because it is lightweight with a small
footprint and has lower resource contention overhead.
10

Performance Tuning Guide
The usual rule for increasing concurrency is to increase the relevant thread pools. For more
information on concurrency, see the section called “HTTP Keep-Alive” and Section 5.2, “Batch”.
Remember to use streaming with batch module to maximize concurrency.
Ability to Handle Large Messages
For specificity, a large message is one that is at least 1 MB. When designing applications that
deal with large messages, it is good to consider potential problems. Such issues can include
transferring, caching, storing, and processing large messages. Large messages play a role in a
wide variety of use cases; for instance, when transferring customer data, images, sound files, or
videos.
In general, it is important to keep data moving and not let large messages clog the flow. This
may be done by either processing independent data in parallel or by distributing data throughout
the flow.
Three tricks for handling the most common use cases involving large messages are splitting,
streaming, and chunking. Some data can be split for parallel processing. This technique is well-
suited for data consisting of parts that can be processed independently. For instance, a data
file containing many customer records. Streaming data are processed as they come in, without
waiting for the entire message to arrive. Chunking handles data in groups, but not necessarily
in parallel. One common case in which it helps to handle data in chunks is when inserting into a
database. Inserting a hundred rows at once is much faster than inserting the rows serially.
What a mess! Indeed, there are a lot of factors to consider. The upshot is that Mule makes it
easy to set parameters, especially for users of Anypoint Studio. Categorizing use cases and
knowing what to look out for in each type is also helpful.
For large messages, be sure to stream data whenever possible. Mechanisms like Scatter-
Gather and Batch are helpful for many use cases. See Section 5.1, “Scatter-Gather” and
Section 5.2, “Batch”, respectively. Finally, it may be necessary to tune the heap to accommodate
large messages. See Section 4.2, “Heap Size”.
11

Performance Tuning Guide
3. Mule Application Design
This section focuses on application design. Considerations like elegance and sustainability tend
to contribute to performance. There are also performance-specific factors that enhance the
design process. Integrating performance from the ground up maximizes performance metrics,
like throughput, while minimizing the overhead caused by hunting and calibrating later.
To optimize the design process, MuleSoft offers an Architecture and Design Review to clients.
The service is cost-effective, engaging, and convenient. 6
3.1. General Recommendations
Session Variables
For applications with many endpoints, prefer fewer and smaller session variables over many or
large ones.7 The session scope is serialized and deserialized every time a message crosses
an endpoint, even a VM endpoint. So if an application has a lot of endpoints, it will involve many
serializations/deserializations. Using fewer and smaller session variables helps minimize this
overhead.
Payload format
When it comes to performance, not all formats are equal. Some payload formats allow faster
access to data than others. Bean payloads tend to be the fastest for Mule applications. So if it is
a viable option given other considerations, create payloads in Java objects.
Data Extraction
Mule Expression Language (MEL) can be used to extract data from messages.8 In terms of
performance, allowing MEL to extract data can be preferable to using a scripting language.
Scripting languages are dynamically typed. Some are even interpreted at runtime. Those factors
can generate overhead that may degrade performance.
6See [Mulesoft_Architecture_and_Design_Review] for more information.
7See [MuleSoft_Message_Structure] for a description of session variables. [Bonillo_Mule_Scope] contains additional
discussion and examples.
8See [MuleSoft_MEL] for more information on MEL.
12

Performance Tuning Guide
For XML extractions, XPATH is another great option. Since XPATH expressions
are compiled at startup, it performs better than scripting.
3.2. HTTP Connections
HTTP connections9 are ripe for tuning since they often handle sub-message throughput and
payloads.
HTTP Inbound Connections
Non-blocking processing strategy
In Mule 3.7 and API Gateway 2.0, a new non-blocking processing strategy was introduced to
yield the best out-of-the-box performance especially for the bare proxy use case. It has a low
and stable memory resource footprint and is enabled by default on the mule proxy application
generated from Anypoint API Manager to run in the API Gateway runtime. The following
configuration enables the non-blocking processing strategy.
<configuration defaultProcessingStrategy="non-blocking" />
The throughput of the non-blocking strategy also slightly outperforms the blocking processing
strategy when there is high latency at the backend service.
The current blocking strategy
Regardless of blocking or non-blocking processing strategy, for any HTTP inbound connections
HTTP listener is generally recommended over HTTP inbound endpoint and JETTY endpoint.
The non-blocking nature of HTTP listener uses dedicated threads to receive the socket
connection, then hand off the message to the threads executing the rest of the synchronous
flow. Since HTTP listener does not use a thread-per-client model like the HTTP endpoint, it can
sustain a higher throughput over higher concurrency, less memory overhead, and perform better
than JETTY.
9As of Mule 3.6 and newer, the HTTP and HTTPS endpoint-based connectors and transports have been replaced by a
single HTTP operation-based connector which supports HTTPS. See [MuleSoft_HTTP_Connector] for more information.
13

Performance Tuning Guide
By default, the number of acceptor threads is the same as the number of CPU cores. This
configuration receives connections very fast. Those connections are passed to a worker thread
for processing. For HTTP Inbound, the default value for maxThreadsActive is 128. That is
typically sufficient, although it is possible to tune the value.
The key parameter to tune here is maxThreadsActive .
<http:listener-config name="HTTP" host="0.0.0.0" port="8081">
<http:worker-threading-profile maxThreadsIdle="8" maxThreadsActive="200"/>
</http:listener-config>
The worker threads will be the ones that will process the whole flow
synchronously. The default threading profile doesn't apply to the flows that
use the HTTP Connector listener, so instead of running the default 16 threads
per flow, the flow will use all the threads set in the profile.
HTTP Outbound Connections
Out of the box, the HTTP requester has sendTCPNoDelay=true and other performance-
optimizing settings active. Adjustments should only be necessary in special circumstances.
One such scenario involves high-performance applications on multi-core systems that the HTTP
requester may utilize more threads than default threading profile. If the backend service is not
responsive enough, the waiting threads can then lead to spikes in message latency, lower CPU
utilization, and thus decreased throughput. To accommodate this scenario, one can configure
the maxConnections in the HTTP requester, limiting the amount of outgoing connections. For
instance:
<http:request-config maxConnections="20" name="requestConfig" host="0.0.0.0"
port="8081" />
The default value is unlimited: "-1" . There is typically no need to modify this
parameter unless in the special cases where performance needs to be tuned.
HTTP Keep-Alive
"Keep-alive" refers to the persistence of a connection. Mule uses HTTP-persistent connections
by default. Persistent connections are only disabled under the following circumstances:
14

Performance Tuning Guide
1. HTTP 1.0 client is used when hitting the HTTP listener without the keep-alive header.
2. The usePersistentConnections attribute has been set to false .10
It is usually a good idea to use persistent connections. That goes not just for Mule, but also for
performance testing applications like Apache JMeter, Load Runner and Apache Bench (also
make sure the performance testing application is using the latest HTTP or TLS libraries and
implementation.)11
HTTPS
When a request is sent in HTTPS for secured data transmit, it first establishes a secure
connection with network handshake, then the data is sent over the secured connection,
encrypted, and will be decrypted with ciphers.
In today’s world of fast networks and high computing power with efficient ciphers, the overhead
of SSL usually isn’t very noticeable. Benchmarks were done on CloudHub, the fully managed
and fully hosted PaaS for Anypoint Platform, to measure the performance difference between
HTTP and HTTPS requests. The results showed that the average response times for HTTPS
requests are only about 0.2 to 0.4ms more than HTTP requests.
If a custom nginx load-balancing is used and there are requirements for strong ciphers,
it is necessary to use the Nginx+ MuleSoft edition which supports proxy_keepalive and
proxy_ssl_session_cache for better performance. These two properties aren’t supported in the
open source Nginx version. 12
Also, it is very important that the load test tool uses an updated and optimal SSL library for
sending requests over SSL. The latest TLS version as of this writing is 1.2. It is recommended
for all users to use TLS 1.1/1.2. Using an older version could lead to significant vulnerabilities
and poorer performance due to the cipher inefficiency.
HTTP Streaming
Streaming is introduced as an optional feature for HTTP Connector starting Mule 3.8.5
release. Large payloads (each file is >10% of the heap size) can be handled without causing
OutOfMemory error and the processing can start as the streams arrive. To enable streaming,
10The section called "Child Elements of <connector…>" in [MuleSoft_HTTP_Transport] contains an example in which
keepAlive flag is set.
11See [Apache_JMeter] and [Apache_Bench] for more details on the performance testing applications.
12The MuleSoft team has worked with Nginx team to get a custom version of Nginx+ which has performance fixes
discovered by us.
15

Performance Tuning Guide
you can set “mule.http.streamResponse” to true in system property and the response buffer size
can be customized by setting “mule.http.responseBufferSize” to the bytes desired (Default is
10240, 10KB).
By design, it is mandatory to consume the stream. Considering users might not be consuming
request streams in their existing apps, the streaming feature is turned off by default. It is
recommended for users who need to process big HTTP response to enable the streaming
feature in a blocking way (to avoid potential deadlock issues) and migrate to 3.8.5 instead of
applying patch.
3.3. Messaging
Java Message Service
JMS Connection Pooling
Using the caching-connection-factory allows the caching of JMS sessions and producers
for a single non-XA JMS connection. Since Mule 3.6, this caching is on by default. A connection
factory can be manually designated through the connectionFactory-ref attribute. Use that
element as the connection factory in the JMS connector. Then use sessionCacheSize to
adjust the size of the JMS cached connection pool.13 Here is an example of the context:
<spring:bean name="jmsVendorConnectionFactory" class="com.vendor.ConnectionFactory">
...
</spring:bean>
<jms:caching-connection-factory name="cachingConnectionFactory"
connectionFactory-ref="connectionFactory" sessionCacheSize="50" />
<jms:connector name="jmsConnector" connectionFactory-ref="cachingConnectionFactory" /
>
JMS Server
If the application uses JMS with ActiveMQ as the message broker, consider disabling message
persistence during the load tests. Doing so may alleviate IO bound concerns and increase
ActiveMQ performance. Similar adjustments can be applied to other JMS brokers as well.
13See [MuleSoft_JMS_Transport] for more details.
16

Performance Tuning Guide
To disable message persistence, edit <ACTIVEMQ_HOME>/conf/activemq.xml as follows:
<broker xmlns="http://activemq.apache.org/schema/core" brokerName="localhost"
dataDirectory="${activemq.data}" persistent="false" >
In a situation where the consumer of the queue is as fast as the producer, the producer flow-
control feature in ActiveMQ can be disabled to allow messages to be enqueued as fast as
possible.14
Consumers
Messages are consumed by subscribing to a queue or topic. When a message arrives to the
broker, it will notify the topic’s subscribers that they have a message to consume.
Defining the number of consumers will impact the application’s performance. That is because
the application will be able to consume more than one message at a time per subscriber, thus
processing more messages at the same time (if needed).
JMS Configuration
To configure the number of consumers, set the numberOfConsumers property:
<jms:activemq-connector name="JMS"
connectionFactory-ref="cachingConnectionFactory"
specification="1.1"
validateConnections="true"
maxRedelivery="-1"
numberOfConsumers="4"/>
AMQP Configuration
JMS subscribers are called "channels" in the AMQP connector. They are configured with the
property numberOfChannels . It is possible to have more than the default four channels. Adjust
the number of channels as follows:
<amqp:connector name="amqpAutoAckLocalhostConnector"
14See Producer Flow Control [http://activemq.apache.org/producer-flow-control.html] for more information about flow-
control.
17

Performance Tuning Guide
virtualHost="my-vhost"
username="my-user"
password="my-pwd"
activeDeclarationsOnly="true"
numberOfChannels="200"/>
3.4. Flow References
Flow references are a pleasantly direct way to enable flow communication within an application.
Flow references are preferred for communications between flows than VM endpoints. Flow
references inject messages into the target flow without intermediate steps. Although the
VM connector is an in-memory protocol. It emulates transport semantics that serialize and
deserialize parts of messages. The phenomenon is especially notable in the Session scope. As
such, flow references are superior to VM endpoints for the purpose of inter-flow communication
because the former avoid unnecessary overhead generated by serialization and deserialization.
18

Performance Tuning Guide
4. The Java Virtual Machine and Garbage Collection
The Java Virtual Machine (JVM) and garbage collection (GC) can be tuned to make an
application more efficient. This section focuses on basic JVM and GC tunables that yield the
maximum performance and stability.
JVM and GC flags can be set for Mule in wrapper.conf .15 Flags are indicated where
appropriate in the discussion to follow. Section 6, “Sample Configuration Files” provides
additional context and information.
4.1. Different JVMs
It is easy to get passionate about a particular Java Virtual Machine (JVM) or garbage collection
(GC) method. JRockit versus HotSpot, parallel mark-and-sweep (MS) versus G1.16 The fact of
the matter is that there is no versus. Which JVM/GC is best depends on the use case and
associated criteria.
MuleSoft uses HotSpot, the standard Oracle JVM. HotSpot is well-supported and easy to
customize for a variety of purposes. MuleSoft’s performance testing emphasizes throughput,
and thus parallel GC. HotSpot is also easy to optimize for response time. The tips in the
following sections show how to calibrate HotSpot for throughput or response time.
4.2. Heap Size
Designate the initial and maximum heap sizes to be the same value. This can be done by
setting MaxMetaspaceSize=MetaspaceSize and MaxNewSize=NewSize .17 Doing so can avoid
the need for the JVM to dynamically allocate additional memory during runtime. The flags are
set in wrapper.conf . Section 6, “Sample Configuration Files” provides the context in which
these and other flags are designated.
e.g.
wrapper.java.additional.16=-XX:NewSize=1365m
15See [Oracle_HotSpot_Options] for a list of typical options for Oracle HotSpot.
16For synopsis, see [Oracle_HotSpot], [Oracle_JRockit], and [Oracle_G1]. For a discussion of GC tuning for HotSpot,
including parallel MS, see [Oracle_HotSpot_GC_Tuning].
17Java 8 does not have a PermGen. PermSize option was deprecated in JDK 8, and superseded by the
MetaspaceSize option.
19

Performance Tuning Guide
wrapper.java.additional.17=-XX:MaxNewSize=1365m
wrapper.java.additional.18=-XX:MetaspaceSize=256m
wrapper.java.additional.19=-XX:MaxMetaspaceSize=256m
wrapper.java.additional.20=-Xms=2048m
wrapper.java.additional.21=-Xmx=2048m
There are at least two reasons why such dynamic reallocation can hinder performance. First,
the JVM performs a major GC for each heap resize. A full GC stops all threads for a period
of time. That holds even when using concurrent mark-and-sweep (CMS). World-stopping
should always be minimized, other things being equal. This is especially crucial for applications
prioritizing low response times.
Dynamic heap resizing creates a second worry when memory is tight. Suppose the JVM
increases its heap size during runtime and the system does not have enough free memory
pages readily available. As a result, some pages for a kernel-chosen process might be swapped
out to disk. The circumstance would incur slowdown due to increased disk IO.
4.3. Garbage Collection
HotSpot is equipped with three canonical garbage collection (GC) mechanisms. These are
serial, parallel, and concurrent mark-and-sweep (CMS).18 Garbage First (G1) has recently been
added to the list.19 The JVM uses parallel GC by default on machines with 2 or more physical
processors and 2 or more GB of physical memory.
This document emphasizes parallel GC and CMS.
18See [Oracle_HotSpot_GC_Tuning].
19See [Oracle_G1].
20
Performance Tuning Guide
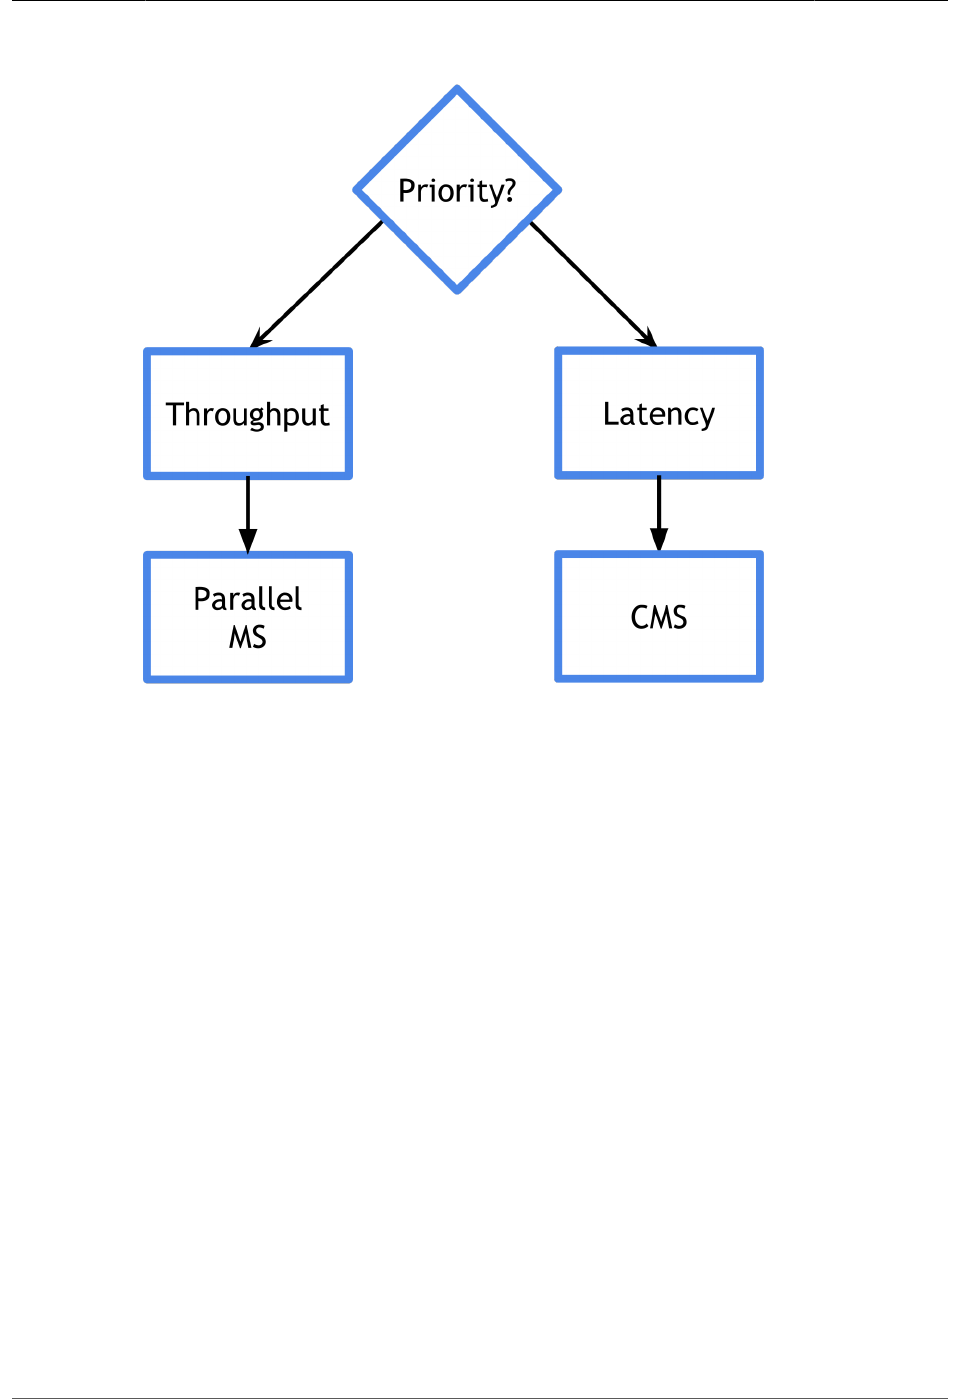
Figure 3. GC Selection
Parallel GC
Parallel GC is the default garbage collection algorithm in HotSpot JVM. When triggered, it uses
multiple threads to scan, move and collect the unreachable objects in the heap.
CMS GC (Concurrent-Mark-Sweep)
Concurrent mark-and-sweep (CMS) GC is designed to reduce application pauses by running
most of the cleaning phases concurrently with the application threads, hence it offers more
control over the stall time which affects the application response time.
Here is an example demonstrating how to set the JVM to use CMS, plus other options. Set the
following in Mule’s wrapper.conf file. Section 6, “Sample Configuration Files” gives additional
context in which the flags are set.
21

Performance Tuning Guide
wrapper.java.additional.22=-XX:+UseConcMarkSweepGC
wrapper.java.additional.23=-XX:CMSInitiatingOccupancyFraction=65
wrapper.java.additional.24=-XX:UseCMSInitiatingOccupancyOnly
The flag -XX:CMSInitiatingOccupancyFraction designates a percentage of the total heap
usage. When that percentage is reached, the JVM will trigger a CMS GC. A value of 40 to
70 typically suffices for applications running on Mule. If the value is too low, it could result in
excessive, premature collections. It is usually recommend to start at a relatively higher value for
-XX:CMSInitiatingOccupancyFraction and decrease it as needed to optimize for the fewest CMS
events for the best performance.
Specify -XX:+UseCMSInitiatingOccupancyOnly when designating -XX:
+CMSInitiatingOccupancyFraction . Otherwise, the JVM attempts to dynamically adjust the value
for -XX:+CMSInitiatingOccupancyFraction. A changing value is undesirable in most production
scenarios. That is because dynamic adjustment is based on statistical analysis that may not
reliably account for load spikes.
4.4. Additional JVM Flags
GC logging
GC logging is a good idea for performance tests. The GC log, once enabled, provides
extremely valuable information about the activities in the heap and how they affect the runtime
performance. GC logging tends to have little overhead for disk IO.
Here is an example of how to enable various aspects of GC logging. Add these configurations to
Mule’s wrapper.conf file. Section 6, “Sample Configuration Files” provides additional context,
if needed.
wrapper.java.additional.4=-XX:+PrintGCApplicationStoppedTime
wrapper.java.additional.5=-XX:+PrintGCDetails
wrapper.java.additional.6=-XX:+PrintGCDateStamps
wrapper.java.additional.7=-XX:+PrintTenuringDistribution
wrapper.java.additional.8=-XX:ErrorFile=%MULE_HOME%/logs/err.log
wrapper.java.additional.9=-Xloggc:%MULE_HOME%/logs/gc.log
wrapper.java.additional.10=-XX:+HeapDumpOnOutOfMemoryError
The value of N in wrapper.java.addition.N above should not conflict with
the surrounding incremental numbers in Mule’s wrapper.conf file.
22

Performance Tuning Guide
5. Tunables
5.1. Scatter-Gather
The routing message processor Scatter-Gather sends a request message to multiple targets
concurrently. It collects the responses from all routes and aggregates them into a single
message.
Scatter-Gather replaces the All message processor, which is deprecated as of Mule 3.5.0. Note
that, unlike All, Scatter-Gather executes routes concurrently instead of sequentially. Parallel
execution of routes can greatly increase the efficiency of your application and provides more
information than sequential processing.
For a more thorough discussion of Scatter-Gather, including examples, refer to migration
details20 .
Where should Scatter-Gather be used?
The Scatter-Gather module should be used whenever the following conditions are met:
1. There are two or more independent data operations with a single source.
2. The results of the operations are combined, perhaps to make some decision.
Example app:
<scatter-gather timeout="5000">
<custom-aggregation-strategy
class="org.myproject.CheapestFlightAggregationStrategy" />
<flow-ref name="flightBroker1" />
<flow-ref name="flightBroker2" />
<flow-ref name="flightBroker3" />
</scatter-gather>
It is possible to use the module as the All processor (sequential processing), but
may cause impact on throughput. Enable it with the doThreading attribute.
20 https://docs.mulesoft.com/mule-user-guide/v/3.8/scatter-gather
23

Performance Tuning Guide
Tuning for performance
Scatter-Gather’s default threading profile is designed to work in most scenarios. The Scatter-
Gather component is typically configured with between three to six routes. It is also possible to
define a custom threading profile for the Scatter-Gather component.
Scatter-Gather’s threading profile is specific to the Scatter-Gather router and does not define
the threading profile for your whole Mule application; however, threads started by each Scatter-
Gather router are shared across all messages passing through the flow. This means that a high
number of threads configured in Scatter-Gather does not necessarily guarantee that enough
processing power will be available to meet the requirements for all messages. For example,
suppose two messages arrive two milliseconds apart from each other at a Scatter-Gather
component with 20 routes and 20 threads. The first message will have access to the 20 threads
and will execute promptly whereas the second message will have high latency while it waits for
the first message to release these threads.
Ultimately, the optimum threading profile depends on each application. For most scenarios,
MuleSoft recommends that the number of threads in Scatter-Gather should be the result of the
number of routes multiplied by the value of maxThreadsActive for the flow where Scatter-Gather
resides.
Threading Profile Rule: SC_Threads = SC_Routes * Flow_Threads
SC_Threads = maxThreadsActive in Scatter-Gather component
SC_Routes = number of routes in Scatter-Gather component
Flow_Threads = maxThreadsActive in the flow
However, in some scenarios the above recommendation could result in a large number of
threads which would consume a lot of memory and processing power. It may be necessary
to conduct experiments in order to find the optimum tuning point, i.e. the exact point at which
parallelism provides maximum gain before starting to become a bottleneck.
5.2. Batch
Mule possesses the ability to process messages in batches. Within an application, you can
initiate a batch job which is a block of code that splits large messages into individual records,
performs actions upon each record, then reports on the results and potentially pushes the
processed output to other systems or queues.
24

Performance Tuning Guide
A batch job contains one or more batch steps which, in turn, contain any number of message
processors that act upon records as they move through the batch job. During batch processing,
you can use record-level variables (recordVars) and Mule Expression Language (MEL)
expressions to enrich, route or otherwise act upon records.
A batch job executes when triggered by either a batch executor in a Mule flow or a message
source in a batch-accepting input; when triggered, Mule creates a new batch job instance.
When all records have passed through all batch steps, the batch job instance ends and the
batch job result is summarized in a report to indicate which records succeeded and which failed
during processing.
See Batch Processing Reference21 for more information.
Where should Batch be used?
Batch functionality is particularly useful when working with streaming input or when engineering
"near real-time" data integration between SaaS applications.
For example, batch processing is particularly useful when working with the following scenarios:
• Integrating data sets, small or large, streaming or not, to parallel processing records.
• Synchronizing data sets between business applications, such as syncing contacts between
NetSuite and Salesforce, and causing "near real-time" data integration.
• Extracting, transforming and loading (ETL) information into a target system, such as
uploading data from a flat file (CSV) to Hadoop.
• Handling large quantities of incoming data from an API into a legacy system.
In case of a failure of the system, crash of the OS, hardware, or others, batch
ensures resilience and zero message loss. On restart it will continue to process
the ones left behind and finish successfully (if possible).
Tuning for performance
Performing DataWeave transformations in batch processing phases
Most scenarios need to transform and aggregate data to communicate with different system
or style needs. When doing so, choosing where and how to do them is crucial. Performing
21 https://docs.mulesoft.com/mule-user-guide/v/3.8/batch-processing-reference
25

Performance Tuning Guide
DataWeave transformations is very expensive if done one record at a time. Unless mandatory,
the transformation should always happen in the input phase. Under special scenarios,
DataWeave can be used in the commit block, but never use it in a step, otherwise performance
will be severely diminished.
Batch Configuration
•Batch block size: By default, the batch block size is set to 100. It was a good balancing
point between performance and working memory requirement based on our analysis across
a set of representative batch use cases with various record sizes. However, the optimal
value for each application depends on its use case. For example, when the number of
records being processed is very small, say a job with only 200 records, the default block
size 100 will result in only 2 records being processed in parallel at any given time. In another
situation where batch is used to process very large payloads such as images, the 100 block
size puts a heavy toll on the working memory requirements. Decreasing the block size will
help in the above two cases. On the contrary, when a job has millions of records and small
payloads, a larger block size could provide a huge performance boost. The "Batch Block
Size" property can be configured for the batch job. If you believe that in your particular case,
a custom size is best suited, make sure to run comparative tests with different values to find
the optimum size in your use case.
•Threading profile: As any parallel processing module, a thread pool is used to manage
record processing. By default there are 16 batch worker threads. This is good for most
applications, but having big commit phases and using external services may cause
unnecessary waiting time. Under such circumstances, it can be optimal to devote more
threads to record processing. To do this, configure the 'batch:threading-profile'.
<batch:job name="job">
<batch:threading-profile poolExhaustedAction="WAIT" maxThreadsActive="32" />
<batch:input>
....
</batch:input>
<batch:process-records>
<batch:step name="first step">
....
</batch:step>
....
<batch:step name="last step">
....
</batch:step>
26

Performance Tuning Guide
</batch:process-records>
<batch:on-complete>
....
</batch:on-complete>
</batch:job>
</mule>
Only use WAIT as the exhausted action, several tests have shown that not
doing so leads to performance degradation due to the distinctive batch
threading pool behavior.
Having more threads processing may cause a bottleneck in external services
and also failures if the service is throttled somehow.
•Batch commit phase: At the end of a step, the commit phase can collect N records for
processing in the processor chain. This allows you to do bulk inserts or uploads, which
provides better performance than individually inserting or uploading those records. This
number of records, N, is configurable and may be determined using the average record size
and service (Salesforce, Database, etc.). For instance,
<batch:step name="batch step">
.....
<batch:commit size="200">
<sfdc:create config-ref="Salesforce" type="Lead">
<sfdc:objects ref="#[payload]"/>
</sfdc:create>
</batch:commit>
</batch:step>
Instead of size, streaming may be configured. However, streaming could reduce
performance as two additional queues are used per streaming commit. Use
streaming only when necessary such as generating reports.
System Resources
Since Batch was designed to work with millions of records, they need to be stored in a
persistent storage queue. In loading phase, the entire dataset is persisted to disk to ensure
resilience of the information that is meant to be processed. Mule queues and schedules batch
records in blocks of 100 records (default) to improve efficiency when reading and storing. This
lessens the amount of I/O requests and improves an operation’s load.
27

Performance Tuning Guide
In Batch’s processing stage, the blocks of 100 records are loaded into memory (heap) for
concurrent processing with 16 threads by default, which means moving 1600 records from
persistent storage into RAM. Therefore, the larger your records and their quantity, the more
available memory you need for batch processing.
You can change the amount of threads per job in the threading-profile element.
We can get an estimate of the needed memory resolving this equation:
BatchMemmoryConsumption = AvgRecordSize * ThreadingProfile(16) *
BatchBlockSize(100) + TotalCommitMemmoryConsumption
CommitMemmoryConsumption = if (streamingEnabled) then { 0 } else { CommitSize *
AvgRecordSize }
Where the TotalCommitMemmoryConsumption is the sum of all the
CommitsMemmoryConsumptions.
The heap is also used by other mule objects. Therefore, when doing estimation of the raw
dataset in memory, it is best to not exceed 60% of total heap size. It is advised to use the default
JVM parallel GC instead of CMS because we want to avoid fragmented memory pages.
Processing Time
The estimated total time for the batch job to process the records is:
TotalTime = TotalRecords / [ ThreadingProfile * AvgProcessingTimePerRecord ]
The AvgProcessingTimePerRecord is hard to measure due to persistence, commit phase and
services variability. You can get an estimate by inverting this equation after running an example
job with your configuration.
You may also want to measure the loading time. In this case there is no concurrency, so it is just
the transformation time after getting the data set and loading it into batch. This time is driven by
transformation latency, as stated before, enabling DataWeave’s streaming capability is a must to
transform and persist the records continuously instead of sequentially.
28

Performance Tuning Guide
5.3. Clustering and High Availability
A cluster is a set of Mule instances that acts as a unit. In other words, a cluster is a virtual server
composed of multiple nodes. The servers in a cluster communicate and share information
through a distributed shared memory grid. This means that the data is replicated across
memory in different physical machines.
Clustering Mule servers ensures high system availability. For additional details, check out
documentation22 .
Tuning for Performance
If high performance is the primary goal (over reliability), it is possible to configure a Mule
cluster or an individual application for maximum performance using a performance profile.
Implementing the performance profile for specific applications within a cluster can maximize
the scalability of deployments, even when deploying applications with different performance
and reliability requirements in the same cluster. Implementing the performance profile at the
container level applies it to all applications within that container. Application-level configuration
overrides container-level configuration.
Setting the performance profile has two effects:
• It disables distributed queues, using local queues instead to prevent data serialization/
deserialization and distribution in the shared data grid.
• It implements the object store without backups, to avoid replication.
To configure the performance profile at the container level, add the following to either mule-
cluster.properties, the system properties from the command line, or wrapper.conf:
mule.cluster.storeprofile=performance
To configure the performance profile at the individual application level, add the profile inside a
configuration wrapper, as shown below.
Performance Store Profile
<mule>
<configuration>
<cluster:cluster-config>
22 https://docs.mulesoft.com/mule-user-guide/v/3.8/mule-high-availability-ha-clusters
29

Performance Tuning Guide
<cluster:performance-store-profile/>
</cluster:cluster-config>
</configuration>
</mule>
Remember that application-level configuration overrides container-level configuration. To
configure the container for high performance but make one or more individual applications
within that container prioritize reliability, include the following code in those applications:
Reliable Store Profile
<mule>
<configuration>
<cluster:cluster-config>
<cluster:reliable-store-profile/>
</cluster:cluster-config>
</configuration>
</mule>
Persistent caches in a cluster are not actually persistent. If the whole cluster is
shut down, the cached information will disappear.
5.4. Threading Profile
A Mule application is a collaboration of a set of flows. Conceptually, messages are processed by
flows in three stages:
1. Message receipt by the inbound connector
2. Message processing
3. Message transmission an outbound connector
Stage 1 always comes first. Stages 2 and 3 can be interleaved, since a flow can intermix
message processors and outbound endpoints.
Tuning performance in Mule involves analyzing and improving these three stages for each flow.
Start by applying the same tuning approach to all flows and then further customize the tuning for
each flow as needed.
Each request that comes into Mule is processed on its own thread. A connector’s receiver has
a thread pool with a certain number of threads available to process requests on the inbound
endpoints that use that connector.
30

Performance Tuning Guide
Keep in mind that Mule can send messages asynchronously or synchronously. Messages are
processed asynchronously, unless one of the following is true:
• The flow uses a synchronous processing strategy
• The flow takes part in a transaction
• The inbound endpoint which received the message uses the request-response message
exchange pattern
Synchronous Processing
In this scenario, the same thread is used to carry the message all the way through Mule. As
the message is processed, if it needs to be sent to an outbound endpoint, one of the following
applies:
• If the outbound endpoint is one-way, the message is sent using the same thread. Once it
has been sent, the thread resumes processing the same message. It does not wait for the
message to be received by the remote endpoint.
• If the outbound endpoint is request-response, the flow thread sends the message to the
outbound endpoint and waits for the response. When the response arrives, the flow threads
resumes by processing the response.
This configuration should be used in low latency scenarios as it will avoid delays
in context switching. However, fewer messages may be processed if there are
delays in the flow given that the amount of threads will limit throughput.
Asynchronous Processing
Now the receiver thread is used only to place the message on a staged event-driven
architecture (SEDA) queue, at which point the message is transferred to a flow thread, and
the receiver thread is released back into the receiver thread pool so it can carry another
message. As the message is processed, if it needs to be sent to an outbound endpoint, one of
the following applies:
• If the outbound endpoint is one-way, the message is copied and the copy processed by
a dispatcher thread, while the flow thread continues processing the original message in
parallel.
31

Performance Tuning Guide
• If the outbound endpoint is request-response, the flow thread sends the message to the
outbound endpoint and waits for the response. When the response arrives, the flow thread
resumes by processing the response.
To optimize throughput when using slow services, remember that there should
not be more receiver threads than flow threads or a bottleneck may slow down
the application.
Thread Pools
A thread pool is a collection of available threads. There is a separate thread pool for each
receiver, a flow (shared by all the message processors in that flow), and a dispatcher.
The threading profile specifies how the thread pools behave in Mule. One can specify a
separate threading profile for each receiver thread pool, flow thread pool, and dispatcher thread
pool.
The detailed calculating methods and tuning options can be found in this documentation23 . The
Calculating Threads section describes methodologies for determining what the setting should
be, whereas the Threading Profile Configuration Reference section describes the options that
can set for each threading profile.
In general, the formula is:
Concurrent user requests = maxThreadsActive + maxBufferSize`
Where maxThreadsActive specifies the number of threads in the thread pool running
concurrently and maxBufferSize defines the maximum number of requests that are buffered in
the queue for threads to be released.
New threads are created until reaching minThreads. After that, a request
is buffered until maxBufferSize requests are queued. Then new threads
are created until maxThreads is reached. Incorrect combinations of thread
configurations and maxBufferSize values can cause outages with no
apparent cause. Stress tests should be used to find and validate appropriate
configurations.
23 https://docs.mulesoft.com/mule-user-guide/v/3.8/tuning-performance
32

Performance Tuning Guide
Defining Thread Pools
This guide is intended for tuning one flow at a time, this can be achieved by defining the default
threading profile, which will modify inbound, flow and outbound profiles.
• The following items are good to know:
◦ Application average load or concurrent requests of clients.
◦ Expected latency.
◦ Maximum latency.
For starter, run the flow with one thread and synchronous mode (if possible) This will reflect the
minimum latency that could be achieved. If the minimum latency is unacceptable, more threads
will not help. Try different transports, transformers and strategies to resolve the problem.
Next, test the application with the required load and slowly increase the thread pool until
achieving the highest throughput or latency starts to degrade.
If there is no target load try a broad number of possibilities slowly scaling till overpassing the
usual load. Also when having a target load checking with a higher one will ensure that the
system can handle a peak load.
5.5. Custom Serializers
Prior to Mule 3.7, Mule relied on the plain old Java serialization to store objects in files or to
replicate them through a Mule cluster. Starting Mule 3.7, Kryo Serializer and the Serialization
API decouple Mule and its extensions from the actual serialization mechanism to be used,
making it configurable as a custom serializer.
• Mule serializes an object whenever:
◦ it is read from or written to a persistent ObjectStore
◦ it is read from or written to a persistent VM or JMS queue
◦ it is distributed in a Mule cluster
◦ it is read from or written to a file
Changing the serialization mechanism for these tasks can greatly improve functionality and
performance.
33

Performance Tuning Guide
To configure a custom serializer, please see Improving Performance with the Kryo Serializer24 .
Kryo Serializer
Mule provides the implementation of ObjectSerializer which relies on the Kryo framework. Kryo
provides:
• Better performance - Kryo is much faster than Java serialization.
• Support for a wider range of Java types - Kryo is not bounded by most of the limitations that
Java serialization imposes, like requiring to implement the Serializable interface, having a
default constructor, etc
• Support for compression - You can use either Deflate or GZip compression algorithms
The Kryo namespace configures this serializer:
<mule>
<kryo:serializer name = "kryo" />
<configuration defaultObjectSerializer-ref = "kryo" />
</mule>
The configuration sets the default serializer to a Kryo based one. Additionally, you can also
configure compression as:
<kryo:serializer name = "noCompression" compressionMode = "NONE" />
<kryo:serializer name = "deflate" compressionMode = "DEFLATE" />
<kryo:serializer name = "gzip" compressionMode = "GZIP" />
You should try each type of compression on your own application, but as a rule of thumb, we
recommend using the default config in general cases (noCompression/NONE) and DEFLATE in
HA scenarios (Mule Cluster).
5.6. Logging
INFO and DEBUG logging can be very helpful for testing. That holds almost ubiquitously for
functional testing. Performance tests can benefit from logging, too.
24 https://docs.mulesoft.com/mule-user-guide/v/3.8/improving-performance-with-the-kryo-serializer
34

Performance Tuning Guide
Mule 3.x runtime uses the asynchronous Log4j2. 25 Log4j 2 tends to be very efficient in contrast
to its synchronous predecessor. Asynchronous logging doesn’t impact on CPU or memory
performance, but it still uses the disk space and time. To reclaim them, set log levels to WARN .
You can configure what gets logged, where it gets logged, and how by editing a configuration
file from your Studio project ( <Mule Installation Directory>/conf/log4j2.xml or in
your standalone Mule server’s $MULE_HOME directory (navigate to <MULE_HOME>/apps/
<APP_NAME>/classes .26 Section 6, “Sample Configuration Files” provides an example.
Placing log42j.properties into <MULE_HOME>/conf applies logging settings
to Mule broadly. If an app configuration is set explicitly, it will use the custom
configuration instead of the default one.
Apply caution when logging parts of messages, especially the payload. Logging messages can
bypass streaming and incur significant disk IO for large payloads.
25See [Apache_Log4j_2].
26See [MuleSoft_Logging] for more information on how to configure logging.
35

Performance Tuning Guide
6. Sample Configuration Files
6.1. log4j2.xml
The log4j2.xml file is placed in <MULE_HOME>/apps/<APP_NAME>/classes . The file may
be created if it does not exist. To apply settings to Mule broadly, modify log4j2.xml in
<MULE_HOME>/conf .
Default Asynchronous
<?xml version="1.0" encoding="UTF-8"?>
<Configuration>
<Appenders>
<Console name="Console" target="SYSTEM_OUT">
<PatternLayout pattern="%-5p %d [%t] %c: %m%n"/>
</Console>
# Every log to System Out will be redirected to the mule.log or
# mule_ee.log by the wrapper, if you want to log to a different
# file you should set your own Appender:
#
# <RollingFile name="RollingFile" fileName="logs/app.log" filePattern="logs/app-
%d{MM-dd-yyyy}.log"
# ignoreExceptions="false">
# <PatternLayout pattern="%-5p %d [%t] %c: %m%n"/>
# <TimeBasedTriggeringPolicy />
# </RollingFile>
</Appenders>
<Loggers>
################################################
# You can set custom log levels per-package here
################################################
<!-- CXF is used heavily by Mule for web services -->
<AsyncLogger name="org.apache.cxf" level="WARN"/>
<!-- Apache Commons tend to make a lot of noise which can clutter the log-->
36

Performance Tuning Guide
<AsyncLogger name="org.apache" level="WARN"/>
<!-- Reduce startup noise -->
<AsyncLogger name="org.springframework.beans.factory" level="WARN"/>
<!-- Mule classes -->
<AsyncLogger name="org.mule" level="INFO"/>
<AsyncLogger name="com.mulesoft" level="INFO"/>
<!-- Reduce DM verbosity -->
<AsyncLogger name="org.jetel" level="WARN"/>
<AsyncLogger name="Tracking" level="WARN"/>
# Default log level
<AsyncRoot level="INFO">
<AppenderRef ref="Console"/>
</AsyncRoot>
</Loggers>
</Configuration>
Synchronous configuration
You can also define the loggers to be synchronous (this will impact negatively on the
performance as the same thread will be waiting and writing on disk). This may be required for
certain applications.
<?xml version="1.0" encoding="UTF-8"?>
<Configuration>
<Appenders>
<Console name="Console" target="SYSTEM_OUT">
<PatternLayout pattern="%-5p %d [%t] %c: %m%n"/>
</Console>
# Every log to System Out will be redirected to the mule.log or
# mule_ee.log by the wrapper, if you want to log to a different
# file you should set your own Appender:
#
# <RollingFile name="RollingFile" fileName="logs/app.log" filePattern="logs/app-
%d{MM-dd-yyyy}.log"
# ignoreExceptions="false">
# <PatternLayout pattern="%-5p %d [%t] %c: %m%n"/>
# <TimeBasedTriggeringPolicy />
# </RollingFile>
37

Performance Tuning Guide
</Appenders>
<Loggers>
################################################
# You can set custom log levels per-package here
################################################
<!-- CXF is used heavily by Mule for web services -->
<Logger name="org.apache.cxf" level="WARN"/>
<!-- Apache Commons tend to make a lot of noise which can clutter the log-->
<Logger name="org.apache" level="WARN"/>
<!-- Reduce startup noise -->
<Logger name="org.springframework.beans.factory" level="WARN"/>
<!-- Mule classes -->
<Logger name="org.mule" level="INFO"/>
<Logger name="com.mulesoft" level="INFO"/>
<!-- Reduce DM verbosity -->
<Logger name="org.jetel" level="WARN"/>
<Logger name="Tracking" level="WARN"/>
# Default log level
<Root level="INFO">
<AppenderRef ref="Console"/>
</Root>
</Loggers>
</Configuration>
Hybrid logging
It is possible to have multiple logging styles, you can even log errors synchronously and the
debug level asynchronously, providing easy access to problems. But keeping performance in
mind, logging should always be asynchronous.
This configuration is very basic and Mule oriented, please check Log4J2
documentation for detailed Appenders reference, you may find very interesting
ones as jdbc, jms and other detailed and well-documented configurations.
38

Performance Tuning Guide
6.2. wrapper.conf
The wrapper.conf file is located in <MULE_HOME>/conf . To enable GC log, please add the
following.
...
# Enable verbose GC flags
wrapper.java.additional.15=-XX:+PrintGCApplicationStoppedTime
wrapper.java.additional.16=-XX:+PrintGCDetails
wrapper.java.additional.17=-XX:+PrintGCDateStamps
wrapper.java.additional.18=-XX:+PrintTenuringDistribution
wrapper.java.additional.19=-Xloggc:%MULE_HOME%/logs/gc.log
...
39

Performance Tuning Guide
References
[Apache_Bench] Apache Software Foundation. "ab - Apache HTTP server benchmarking tool."
http://httpd.apache.org/docs/current/programs/ab.html Accessed 2017-6-22.
[Apache_JMeter] Apache Software Foundation. "Apache JMeter." http://jmeter.apache.org/
Accessed 2017-06-22
[Apache_Log4j_2] Apache Software Foundation. "Apache Log4j 2." http://logging.apache.org/
log4j/2.x/ Accessed 2017-06-22.
[Bonillo_Mule_Scope] Bonillo, Victor. "Mule School: The MuleMessage, Property Scopes
and Variables." https://blogs.mulesoft.com/dev/anypoint-platform-dev/mule-school-the-
mulemessage-property-scopes-and-variables/ Published 2012-11-26, accessed 2017-06-22.
[Eclipse_Jetty] Eclipse. "Servlet Engine and Http Server." http://www.eclipse.org/jetty/ Accessed
2017-06-22.
[Knuth_Structured] Knuth, Donald E. "Structured Programming with Go To Statements."
Computing Surveys. Vol. 6, No. 4. Association of Computing Machinery, Inc. 1974.
[Mulesoft_Architecture_and_Design_Review] MuleSoft’s Services offerings: https://
www.mulesoft.com/support-and-services/consulting Accessed 2017-06-22.
[MuleSoft_Flow_Processing] MuleSoft. "Flow Processing Strategies." https://docs.mulesoft.com/
mule-user-guide/v/3.8/flow-processing-strategies Accessed 2017-06-22.
[MuleSoft_HTTP_Connector] MuleSoft. "HTTP Connector." https://docs.mulesoft.com/mule-
user-guide/v/3.8/http-connector Accessed 2017-06-22.
[MuleSoft_HTTP_Transport] MuleSoft. "HTTP Transport Reference." https://docs.mulesoft.com/
mule-user-guide/v/3.8/deprecated-http-transport-reference Accessed 2017-06-22.
[MuleSoft_JMS_Transport] MuleSoft. "JMS Transport Reference." https://docs.mulesoft.com/
mule-user-guide/v/3.8/jms-transport-reference Accessed 2017-06-22.
[MuleSoft_Logging] MuleSoft. "Logging Configurations in Mule." https://docs.mulesoft.com/
mule-user-guide/v/3.8/logging-in-mule Accessed 2017-06-22.
[MuleSoft_MEL] MuleSoft. "Mule Expression Langauge (MEL)." https://docs.mulesoft.com/mule-
user-guide/v/3.8/mule-expression-language-mel Accessed 2017-06-22.
[MuleSoft_Message_Structure] MuleSoft. "Mule Message Structure." https://docs.mulesoft.com/
mule-user-guide/v/3.8/mule-message-structure Accessed 2017-06-22.
40

Performance Tuning Guide
[Nagle_Algorithm] Nagle, John. "Congestion Control in IP/TCP Internetworks." RFC 896. 1984.
[O_HARA_AMQP] O’Hara, J. "Toward a commodity enterprise middleware." Acm Queue 5 (4):
48–55 http://dl.acm.org/citation.cfm?doid=1255421.1255424
[Oracle_HotSpot] Oracle. "Java SE HotSpot at a Glance." http://www.oracle.com/technetwork/
java/javase/tech/index-jsp-136373.html Accessed 2017-06-22.
[Oracle_HotSpot_GC_Tuning] Oracle. "Java Platform, Standard Edition HotSpot Virtual Machine
Garbage Collection Tuning Guide." http://docs.oracle.com/javase/8/docs/technotes/guides/vm/
gctuning/index.html Accessed 2017-06-22.
[Oracle_HotSpot_Options] Oracle. "Java HotSpot VM Options." http://docs.oracle.com/javase/8/
docs/technotes/tools/unix/java.html Accessed 2017-06-22.
[Oracle_JRockit] Oracle. "Oracle JRockit." http://www.oracle.com/technetwork/middleware/
jrockit/overview/index.html Accessed 2017-06-22.
[Oracle_G1] Oracle. "The Garbage-First Garbage Collector." http://www.oracle.com/technetwork/
java/javase/tech/g1-intro-jsp-135488.html Accessed 2017-06-22.
41
