NCReport Definitive Guide En
User Manual:
Open the PDF directly: View PDF ![]() .
.
Page Count: 161 [warning: Documents this large are best viewed by clicking the View PDF Link!]
- I Introduction
- II Getting started
- Step by step creating a simple report
- Beginning a new report
- Setting up page options
- Adding a data source
- Assigning data source to the detail section
- Using Geometric Editor
- Designing page header section
- Designing Detail section
- Designing page footer section
- Testing report in the Designer
- Advanced steps
- Final testing the report
- Integrating NCReport in Qt applications
- Step by step creating a simple report
- III NCReport Designer
- IV Advanced functions
- Parameters
- Expressions
- Script editor
- Zones
- Dynamic data driven size and position
- Dynamic data driven shape style
- Text Document printout mode
- Data Relation System
- Double pass mode
- Multi language reports
- Cross-Tab tables
- Conditional formatting
- Sub-Report Iteration
- Printing QTableView
- Sending report via e-mail
- General TEXT output
- V Using NCReport API
- VI Specification
- Index
NCReport Definitive Guide
Norbert Szabo
January 17, 2017

NCReport Definitive Guide
by Norbert Szabo
Copyright © 2017 Norbert Szabo
This document is essentially a comprehensive user documentation about NCReport Reporting System. It also
contains installation instructions, tutorials and information about the contents of the distribution.
While every precaution has been taken in the preparation of this documentation, the publisher and author
assume no responsibility for errors or omissions, or for damages resulting from the use of the information
contained herein.
ii
Contents
I Introduction 1
1 About NCReport 9
1.1 AShortNCReportHistory.......................................... 9
1.2 HowNCReportworks ............................................ 9
1.3 AboutreportdefinitionXMLfile ...................................... 10
1.4 Coordinatesystemmeasurement...................................... 10
2 Install 11
2.1 InstallingNCReport ............................................. 11
2.1.1 Requirements............................................. 11
2.1.2 Install Binary package on Linux . . . . . . . . . . . . . . . . . . . . . . . . . . . . . . . . . . 11
2.1.3 Install (commercial) source package under Linux . . . . . . . . . . . . . . . . . . . . . . . . 12
2.1.4 Install binary package on Windows . . . . . . . . . . . . . . . . . . . . . . . . . . . . . . . . 12
2.1.5 Install (commercial) source package under Windows . . . . . . . . . . . . . . . . . . . . . . 12
2.2 Contents of the installation directory . . . . . . . . . . . . . . . . . . . . . . . . . . . . . . . . . . . . 12
2.3 Acknowledgements.............................................. 13
II Getting started 15
3 Step by step creating a simple report 19
3.1 Beginninganewreport............................................ 19
3.2 Settinguppageoptions ........................................... 19
3.3 Addingadatasource............................................. 20
3.4 Assigning data source to the detail section . . . . . . . . . . . . . . . . . . . . . . . . . . . . . . . . . 22
3.5 UsingGeometricEditor ........................................... 23
3.6 Designingpageheadersection ....................................... 23
3.6.1 AddingLabels ............................................ 23
3.6.2 Resizesection............................................. 24
3.6.3 Drawingaline ............................................ 24
3.7 DesigningDetailsection ........................................... 25
3.7.1 AddingFields............................................. 25
3.8 Designingpagefootersection........................................ 26
3.8.1 AddingSystemvariablefields ................................... 26
3.8.2 Addingpagenumberfield ..................................... 26
3.8.3 Addingapplicationinfofield.................................... 27
3.8.4 Resizesection............................................. 27
3.9 TestingreportintheDesigner........................................ 27
3.10Advancedsteps ................................................ 28
3.10.1 Adding a variable for summary . . . . . . . . . . . . . . . . . . . . . . . . . . . . . . . . . . 28
3.10.2 Definingagroup ........................................... 29
3.10.3 Adding summary field to group footer . . . . . . . . . . . . . . . . . . . . . . . . . . . . . . 30
3.11Finaltestingthereport ............................................ 31
3.12 Integrating NCReport in Qt applications . . . . . . . . . . . . . . . . . . . . . . . . . . . . . . . . . . 32
3.12.1 Adding NCReport library to the project . . . . . . . . . . . . . . . . . . . . . . . . . . . . . . 32
3.12.2 InitializingNCReportclass ..................................... 33
3.12.3 SettingtheReport’ssource ..................................... 33
3.12.4 Addingparameters.......................................... 33
3.12.5 RunningtheReport ......................................... 34
3.12.6 Errorhandling ............................................ 34
3.12.7 DeletingReportobject........................................ 34
iii

CONTENTS
III NCReport Designer 37
4 Getting Started with Designer 41
4.1 LaunchingDesigner ............................................. 41
4.2 TheUserInterface............................................... 41
4.3 Designer’sMainWindow .......................................... 42
4.4 Geometryeditor................................................ 42
4.5 DataSourceTree................................................ 43
4.5.1 Adding a Field using the Data Source Tree . . . . . . . . . . . . . . . . . . . . . . . . . . . . 43
4.6 FieldExpressionBuilder........................................... 43
4.6.1 Expression Builder Dialog Controls . . . . . . . . . . . . . . . . . . . . . . . . . . . . . . . . 44
4.6.2 LogicalOperationButtons...................................... 44
5 Designing a report 45
5.1 Beginninganewreport............................................ 45
5.2 Reportsections ................................................ 46
5.2.1 Detail.................................................. 46
5.2.2 Pageheader.............................................. 47
5.2.3 Pagefooter .............................................. 47
5.2.4 Reportheader............................................. 47
5.2.5 Reportfooter ............................................. 47
5.3 Settinguppageandreportoptions..................................... 47
5.4 Addingdatasources ............................................. 48
5.5 Assigning data source to the Detail . . . . . . . . . . . . . . . . . . . . . . . . . . . . . . . . . . . . . 50
5.6 Addingreportitems ............................................. 51
5.6.1 AddingheadingLabels ....................................... 52
5.6.2 AddingLine.............................................. 53
5.6.3 AddingFields............................................. 53
5.6.4 AddingVariablesfortotals ..................................... 56
5.6.5 Addinggrouptodetail........................................ 57
5.6.6 Addingtotalvariablefield...................................... 58
5.6.7 Otheritems .............................................. 59
5.6.8 Adjustmentandformatting..................................... 59
5.7 Connecting to database from Designer . . . . . . . . . . . . . . . . . . . . . . . . . . . . . . . . . . . 59
5.8 Runningthereport .............................................. 60
IV Advanced functions 63
6 Parameters 67
6.1 Parametersyntax ............................................... 67
6.2 TestingParameters .............................................. 67
7 Expressions 69
7.1 ScriptExpressions............................................... 69
7.2 TemplateExpressions............................................. 69
7.3 Usingreferencesinexpressions....................................... 69
7.4 Referencesintemplates............................................ 69
7.5 Referenceexamples.............................................. 70
7.6 FieldExpression................................................ 70
7.7 PrintWhenExpressions ........................................... 71
7.7.1 Testing Print when expression . . . . . . . . . . . . . . . . . . . . . . . . . . . . . . . . . . . 72
7.8 TemplatesinFieldsandTexts ........................................ 72
7.9 DataSourceFunctions ............................................ 72
7.9.1 Data Source related (meta) functions . . . . . . . . . . . . . . . . . . . . . . . . . . . . . . . . 72
7.9.2 Data Source Column related (Value) functions . . . . . . . . . . . . . . . . . . . . . . . . . . 73
8 Script editor 75
9 Zones 77
iv

CONTENTS
10 Dynamic data driven size and position 79
11 Dynamic data driven shape style 81
12 Text Document printout mode 83
12.1Stepsofusage ................................................. 83
13 Data Relation System 85
13.1Definingaparentdatasource ........................................ 86
13.2Definingchilddatasources ......................................... 86
13.3Settingupthedetailsection ......................................... 87
13.4Designingthereport ............................................. 87
13.5Changesin2.13version ........................................... 89
14 Double pass mode 91
14.1Settingdoublepassmode .......................................... 91
14.2 Example using of pagecount variable................................... 91
15 Multi language reports 93
15.1Definelanguages ............................................... 93
15.2 Adding translations to Fields and Labels . . . . . . . . . . . . . . . . . . . . . . . . . . . . . . . . . . 93
15.3Usingthecurrentlanguage ......................................... 94
16 Cross-Tab tables 95
16.1Tablestructure................................................. 95
16.2Usingcross-tableinDesigner ........................................ 96
16.3Tablelevelproperties............................................. 97
16.4Celllevelproperties.............................................. 98
17 Conditional formatting 101
17.1StyleTagSymbols...............................................101
17.2EditstylecodeinDesigner..........................................102
17.3Defaultstyle..................................................102
18 Sub-Report Iteration 103
18.1Sub-Reportdatasource............................................103
18.2Referencetomasterdatasource.......................................103
19 Printing QTableView 105
19.1AddingTableViewitem ...........................................105
19.2Settingtheobjectreferences .........................................106
19.3Example ....................................................106
20 Sending report via e-mail 109
20.1E-mailsendingexample ...........................................109
21 General TEXT output 111
21.1Texttemplatemanagertags .........................................111
21.2Examples....................................................111
V Using NCReport API 113
22 Library integration 117
22.1Settingupyourprojectfile..........................................117
22.2InitializeNCReportclass...........................................117
22.2.1 Includedirectives...........................................117
22.2.2 CreatingNCReportclass.......................................118
22.3ConnectingtoSQLdatabase.........................................118
22.4SettingtheReport’ssource..........................................118
v

CONTENTS
23 Running the Report 119
23.1RunningtheReportbyOneStep ......................................119
23.2 Running the Report in customized mode . . . . . . . . . . . . . . . . . . . . . . . . . . . . . . . . . 119
23.2.1 InitializingReport’sOutput.....................................119
23.2.2 RunningtheReport .........................................120
23.2.3 PreviewingReport ..........................................120
VI Specification 123
24 Data sources 127
24.1SQLdatasource................................................127
24.1.1 XMLsyntax..............................................127
24.1.2 Tagproperties.............................................127
24.2Textdatasource................................................128
24.2.1 XMLsyntax..............................................128
24.2.2 Tagproperties.............................................128
24.3XMLdatasource ...............................................128
24.3.1 XMLsyntax..............................................129
24.3.2 Tagproperties.............................................129
24.4Stringlistdatasource.............................................129
24.4.1 XMLsyntax..............................................130
24.4.2 Tagproperties.............................................130
24.5Itemmodeldatasource............................................130
24.5.1 XMLsyntax..............................................130
24.5.2 Tagproperties.............................................130
24.6Customdatasource..............................................130
25 Report sections 131
25.1Pageheader ..................................................131
25.1.1 XMLsyntax..............................................131
25.1.2 Tagproperties.............................................131
25.2Pagefooter...................................................131
25.2.1 XMLsyntax..............................................131
25.2.2 Tagproperties.............................................132
25.3Reportheader .................................................132
25.3.1 XMLsyntax..............................................132
25.3.2 Tagproperties.............................................132
25.4Reportfooter..................................................132
25.4.1 XMLsyntax..............................................132
25.4.2 Tagproperties.............................................132
25.5Details .....................................................132
25.5.1 XMLsyntax..............................................133
25.5.2 Tagproperties.............................................133
25.6Groupsections.................................................133
25.6.1 XMLsyntax..............................................133
25.6.2 Tagproperties.............................................134
25.6.3 Groupheader.............................................134
25.6.3.1 XMLsyntax.........................................134
25.6.3.2 Tagproperties .......................................134
25.6.4 Groupfooter .............................................134
25.6.4.1 XMLsyntax.........................................134
25.6.4.2 Tagproperties .......................................134
vi

CONTENTS
26 Application Data 135
26.1ReportParameters ..............................................135
26.2Variables ....................................................135
26.3SystemVariables ...............................................135
26.4Expressions ..................................................136
26.4.1 Referencesinexpressions ......................................136
26.4.2 Using script expression in field: . . . . . . . . . . . . . . . . . . . . . . . . . . . . . . . . . . . 137
26.5DataTemplates ................................................137
26.5.1 Referencesintemplates .......................................137
26.5.2 Example of using template text in field . . . . . . . . . . . . . . . . . . . . . . . . . . . . . . 137
27 Section items 139
27.1Textlabel....................................................139
27.1.1 XMLsyntax..............................................139
27.1.2 Tagproperties.............................................139
27.2Field ......................................................140
27.2.1 XMLsyntax..............................................140
27.2.2 Tagproperties.............................................140
27.3HTMLText...................................................141
27.3.1 XMLsyntax..............................................141
27.3.2 Tagproperties.............................................141
27.4Line.......................................................142
27.4.1 XMLsyntax..............................................142
27.4.2 Tagproperties.............................................142
27.5Rectangle....................................................143
27.5.1 XMLsyntax..............................................143
27.5.2 Tagproperties.............................................143
27.6EllipseorCircle ................................................144
27.6.1 XMLsyntax..............................................144
27.6.2 Properties ...............................................144
27.7Image......................................................145
27.7.1 XMLsyntax..............................................145
27.7.2 Tagproperties.............................................145
27.8Barcode.....................................................146
27.8.1 XMLsyntax..............................................146
27.8.2 Tagproperties.............................................146
27.9CustomGraphitem..............................................146
27.9.1 XMLsyntax..............................................147
27.9.2 Tagproperties.............................................147
Index 149
vii
List of Figures
1 About NCReport
1.1 StructureofNCReport ............................................ 10
3 Step by step creating a simple report
3.1 AnewemptyreportinDesigner ...................................... 19
3.2 Pagesettingsdialog.............................................. 20
3.3 Datasourcetypesdialog........................................... 21
3.4 Data source setting dialog (This is an SQL data source example) . . . . . . . . . . . . . . . . . . . . 21
3.5 Detailsettingsdialog............................................. 23
3.6 Labeldialog .................................................. 24
3.7 Labelsasheaders ............................................... 24
3.8 PageHeaderwithlabelsandline...................................... 25
3.9 Fieldpropertiesdialog ............................................ 25
3.10 Field properties dialog - numeric data . . . . . . . . . . . . . . . . . . . . . . . . . . . . . . . . . . . 26
3.11 Product list example report in Designer . . . . . . . . . . . . . . . . . . . . . . . . . . . . . . . . . . 26
3.12PagenumberSystemVariable........................................ 27
3.13Reportexamplewithpagefooter ...................................... 27
3.14RunreportfromDesigner .......................................... 28
3.15 Test report print preview example . . . . . . . . . . . . . . . . . . . . . . . . . . . . . . . . . . . . . 28
3.16Variabledialog................................................. 29
3.17Groupsettingsdialog............................................. 30
3.18Groupinthereport.............................................. 30
3.19Variablefield.................................................. 31
3.20Reportexamplewithgroup ......................................... 31
3.21Reportfinalprintpreview .......................................... 32
4 Getting Started with Designer
4.1 NCReportDesignerdesktop......................................... 42
4.2 Geometryeditor................................................ 43
4.3 DataSourceTreeWidget........................................... 43
4.4 ExpressionBuilderDialog .......................................... 44
5 Designing a report
5.1 Newreport................................................... 46
5.2 Pagesettingsdialog.............................................. 48
5.3 datasourcetypesdialog ........................................... 49
5.4 SQLdatasource................................................ 50
5.5 Detaildialog.................................................. 51
5.6 Labeldialog .................................................. 52
5.7 Addinglabels ................................................. 53
5.8 Addingline .................................................. 53
5.9 Fielddialog .................................................. 54
5.10Fielddialog-numericdata ......................................... 56
5.11Detailssectionwithfields .......................................... 56
5.12Variabledialog................................................. 57
5.13Groupdialog.................................................. 58
5.14Reportisready ................................................ 59
5.15SQLconnectiondialog ............................................ 60
5.16Runreportdialog............................................... 61
5.17Previewoutput-page1 ........................................... 61
ix

LIST OF FIGURES LIST OF FIGURES
5.18Previewoutput-page2 ........................................... 62
6 Parameters
6.1 Testingparameter-preview......................................... 68
7 Expressions
7.1 Fieldexpressionexample........................................... 71
7.2 Resultoffieldexpression........................................... 71
7.3 Print only when expression is true condition . . . . . . . . . . . . . . . . . . . . . . . . . . . . . . . 72
8 Script editor
8.1 ExpressionBuilderDialog .......................................... 75
9 Zones
9.1 ZoneIDinpropertydialog.......................................... 77
9.2 ZonesinDesignmode ............................................ 77
10 Dynamic data driven size and position
10.1 Dynamic position and size settings . . . . . . . . . . . . . . . . . . . . . . . . . . . . . . . . . . . . . 79
11 Dynamic data driven shape style
11.1Dynamicstylesettings ............................................ 81
13 Data Relation System
13.1Datarelation.................................................. 86
13.2 Sub-query report example in Designer . . . . . . . . . . . . . . . . . . . . . . . . . . . . . . . . . . . 88
13.3 Result of a sub-query report example . . . . . . . . . . . . . . . . . . . . . . . . . . . . . . . . . . . . 89
16 Cross-Tab tables
16.1 ......................................................... 95
16.2Tablerows ................................................... 95
16.3Tablecolumns................................................. 96
16.4Cellstructure ................................................. 96
16.5Cross-tabinDesigner............................................. 97
16.6Cross-tabSettingsDialog........................................... 97
16.7Cellsettings .................................................. 99
17 Conditional formatting
17.1 .........................................................102
19 Printing QTableView
19.1TableViewIteminDesigner.........................................105
19.2TableViewIteminDesigner.........................................106
19.3QTableViewwidget..............................................107
19.4 QTableView table in print preview . . . . . . . . . . . . . . . . . . . . . . . . . . . . . . . . . . . . . 107
x
List of Tables
5 Designing a report
5.1 Fieldcolumnformulas ............................................ 55
7 Expressions
7.1 Referencesinexpressions .......................................... 70
17 Conditional formatting
17.1Dynamicstyletagsymbols..........................................101
21 General TEXT output
21.1Texttemplatetags...............................................112
xi
Part I
Introduction
1

Preface and installation
3
Preface
What is report generator?
A report generator is a computer program whose purpose is to take data from a data source such as a database,
XML stream, text or a spreadsheet, and use it to produce a printed document in a format which satisfies a
particular human readership.
About NCReport
NCReport is a report generator, report writer application, report engine library with GUI designer primarily for
Qt applications, though it is by no means limited to Qt environment. The software tool enables applications to
print data driven reports, tables, lists, rich text documents or even any paginated graphical contents from one or
more data sources. The system consists of at least two parts: Report engine and designer GUI application. The
report engine is also available as command line executable. The report engine can be used and integrated into
any Qt applications independently. NCReport has already been used and integrated by a growing community
of commercial users and professionals.
Features
NCReport provides the following features and functions:
• XML report template
• Native GUI report designer
• Several types of datasources: SQL database, Text, QAbstractItemModel, QStringList, Custom subclassed
data source
• Supported output formats: Printer, Postscript, PDF, SVG, Text, HTML, Image
• Native Text/HTML output by an additional template
• Fast internal preview window
• Internal or external SQL database connection
• Report elements: Label, Field, HTML text, Line, Rectangle, Ellipse, Images, Barcode and Custom item for
graphs or any QPainter based customized contents
• Parameters from application side
• Multiple details in one report
• Cross tabulation tables
• Page header/footer
• Report header/footer
• Unlimited level of groups with group headers, footers, aggregate functions: SUM, COUNT, AVG, STD,
MIN, MAX
5

PREFACE WHY USE NCREPORT
• Variables for aggregate functions, system variables
• Images: static, file, data source or http based. File name can also be fetched from data source
• Complete Html document printing mode for multi-page rich text documents (QTextDocument with Qt
supported Html subsets)
• Barcode rendering with at least 50 types of available barcodes thanks to the Zint barcode library. Barcode
data can be feed from any data sources
• Script expressions for fields and texts and logical conditions
• Show or hide items and sections by logical contitions
• Conditional Field or Label formatting
• Numeric, date data formatting
• Full Qt4/Qt5 compatibility
• Native multi-platform supports thanks to Qt.
• And much more...
Why use NCReport
Present software applications often use various data sources and SQL databases. In most cases they must have
the ability of printing or representing data in several output formats therefore they must be able to generate
reports. Data-center application’s report generation function is almost always a required feature. If you want to
make your application to be able to do this, NCReport is a great choice. NCReport project contains thousands
of development hours and it maintained continuously. If this reporting tool is integrated into your application,
you will save huge amount of development time and you don’t need to develop any printing function for your
application. This is true primarily for softwares written by Qt toolkit. Another goal that this system is fully
portable native C++ multi-platform solution.
About this Documentation
This book is designed to be the clear, concise, normal reference to the NCReport reporting software. This we
can use as the official documentation for NCReport.
We hope to answer, definitively, all the questions you might have about all the elements, features and entities
in NCReport. In particular, we cover the following subjects:
• The general nature of NCReport. We quickly get you up to speed on how the pieces fit together.
• How to create NCReport reports. Where should you start and what should you do?
• Understanding all of the report elements. Each element is extensively documented, including the intended
semantics and the purpose of all its attributes. An example of proper usage is given for every element.
• How to run NCReport reports. After you’ve created one, what do you do with it?
• How to integrate NCReport library into a Qt application.
Getting this Documentation
If you want to hold this book in your hand and flip through its pages, unfortunately it is not yet possible
unless you print it for yourself. You can also get this book in electronic form, as PDF, from our web site:
ncreportsoftware.com/doc
6

PREFACE GETTING EXAMPLES FROM THIS ...
Getting Examples from This Documentation
All of the examples are included on our web site. You can get the most up-to-date information about this
documentation from our web site: ncreportsoftware.com
Request for Comments
Please help us improve future editions of this book by reporting any errors, inaccuracies, bugs, misleading or
confusing statements, and plain old typos that you find. An online errata list is maintained at tracker.ncreport.org
Email your bug reports and comments us to support@ncreportsoftware.com
7
Chapter 1
About NCReport
This chapter provides an overview of NCReport, starting with its history. It includes a description of NCReport
v2.12 - v2.20. or above.
1.1 A Short NCReport History
NCReport’s history is more than 15 years old. The project has been started in 2002 as a joint project of a Qt3
application and later the tool become a unique GPL project. The reason why the system was started to plan the
urgent needs of data printing as a very missing function in Qt/C++ programming environment. In 2007 the full
project has been rewritten into a new commercial project by following the well formatted fully object oriented
design concept. This version was named 2.0 version.
1.2 How NCReport works
What does NCReport do exactly? In few words NCReport generates ready to print documents from raw data by
a template. As a first step an XML report definition as a template must be existed. This is a template of the report
engine that describes what content must exactly render and how should it look like, where the data come from
and so on. This report definition can come from local or remote file or from SQL database depending on what
report source was defined. Report source manager is a part of the report engine that handles and loads report
definition from it’s origin. The report designer application as a separated GUI application designed for creating
report XML definitions. When running a report first the report engine parses report definition and opens the
specified data sources. If SQL data source is defined a valid SQL database connection must be established first
(in case of non built-in database connection is defined) After the data sources successfully opened, the report
engine begins to process data row by row according to the specified data source assigned to the first detail
section. While report is processing, the report director manages the rendering of different section bands and the
items inside. The result can be rendered intto the specified output: printer, print preview, postscript, PDF, SVG,
Image, HTML, Text
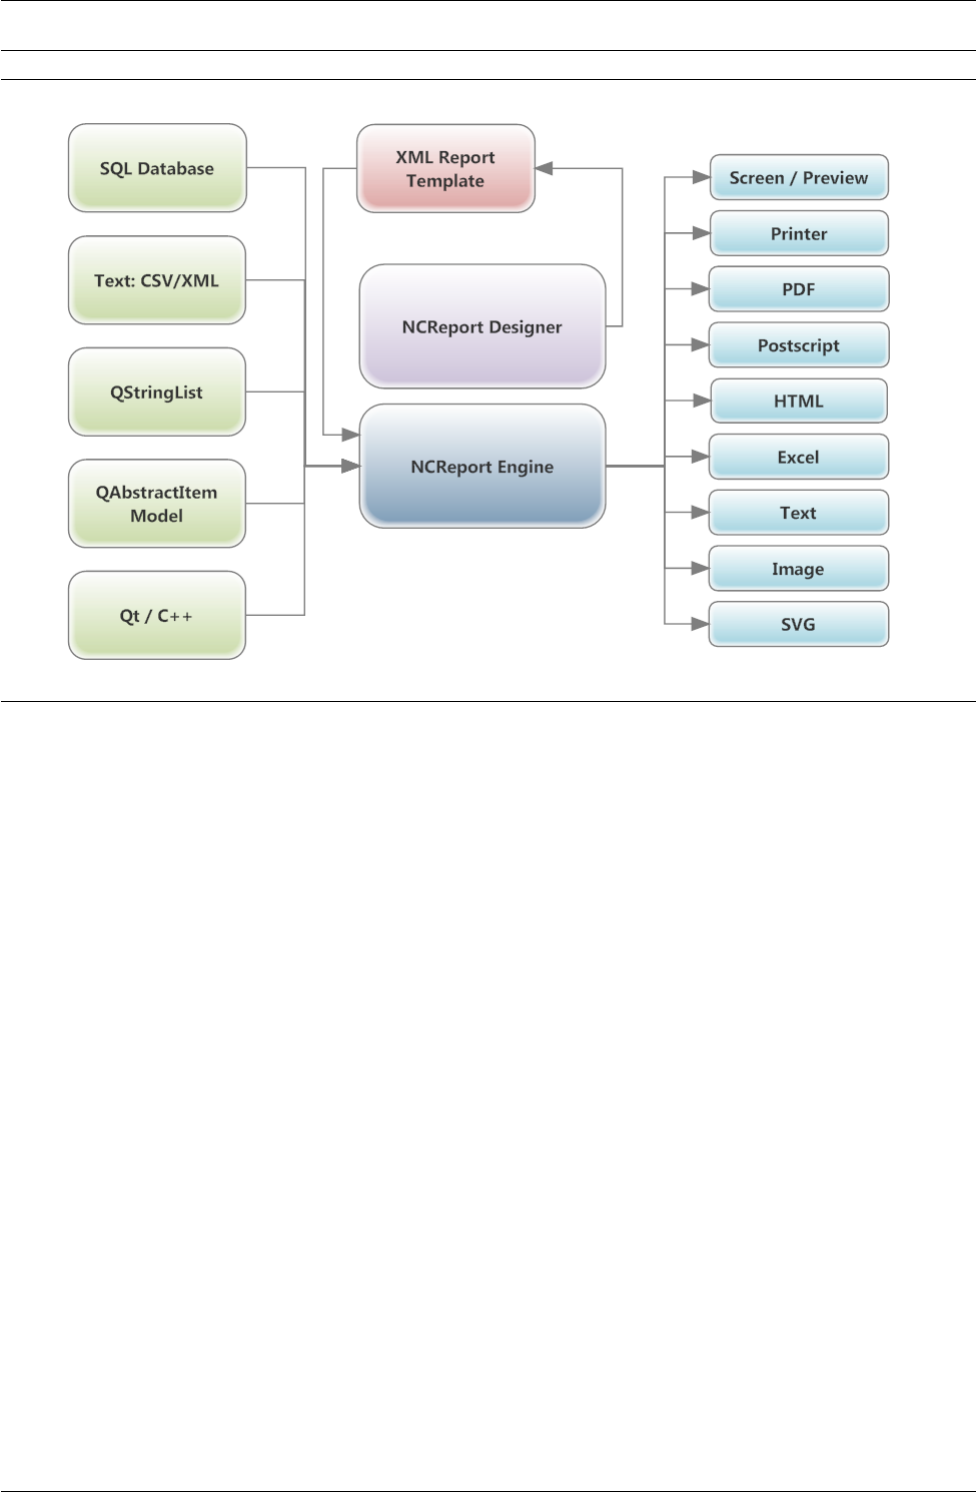
The following diagram illustrates how the report generator works in general.
9
CHAPTER 1. ABOUT NCREPORT 1.3. ABOUT REPORT DEFINITION XML FILE
Figure 1.1 Structure of NCReport
1.3 About report definition XML file
NCReport uses Extensible Markup Language (XML) format for report definition. This is a universal standard
file format, which simplifies also the human reading and processing the report definition templates.
1.4 Coordinate system measurement
NCReport’s report definition XML files contain the position and size information in metric measurement. The
position and size values are stored in millimeters, so to modify the report element geometry in XML structure
is easy even without the designer tool.
10

Chapter 2
Install
2.1 Installing NCReport
2.1.1 Requirements
• Linux or any Unix like operation systems or Microsoft Windows™ or MacOS 10.4 or above.
• At least 512Mb of memory and a 1GHz CPU.
• 40Mb of free disk space
NCReport is officially supported on Windows 2000/XP/Vista, on Linux >=2.6 and on MacOSX >=10.4. It is
also possible to use it on other platforms that are supported by Qt but with limited or without support from us.
NCReport has been tested with:
• Qt4.5-Qt5.7 under Windows 7/XP/Vista
• Qt4.5-Qt5.7 under Linux (Ubuntu 10.04, 12.04)
• Qt4.7-Qt5.7 MacOSX 10.6-10.x
• Qt4.8 Raspberry Pi
2.1.2 Install Binary package on Linux
1. Make sure that the appropriate Qt version binaries are already installed on your Linux system. The re-
quired version is specified in the downloaded package.
2. Unpack the NCReport Linux distribution to any directory you want: (i.e ncreport)
$ cd ncreport
tar -xzvf ncreport2.x.x.tar.gz
$ cd ncreport/bin
3. NCReport binary files are intended to be used directly from the ncreport2.x.x/bin directory. That is,
you can start NCReport binaries by simply executing:
To start the report designer:
$ ./NCReportDesigner
To start the command line report engine:
$ ./ncreport
After that, you may want to add ncreport2.x.x/bin/ to your $PATH.
11

CHAPTER 2. INSTALL 2.2. CONTENTS OF THE INSTALLATION ...
2.1.3 Install (commercial) source package under Linux
1. Make sure that GCC/G++ c++ compiler and the appropriate version of Qt development environment is
already installed on your Linux system. In addition, you need to be compiled/installed appropriate Qt’s
database drivers. Example reports mostly use QMYSQL and QSQLITE database drivers.
2. Unpack the NCReport Linux source package inside any directory you want:
$ cd directory
$ tar -xzvf ncreport2.x.x.tar.gz
$ cd NCReport2.x.x
$ qmake
$ make
3. To start NCReport binary files just do the same as it’s written in previous section.
2.1.4 Install binary package on Windows
1. It is strongly recommended to download and install one of the auto install setup.exe files. (NCReport_
2.x.x_Windows.exe,NCReport_2.x.x_Windows_MinGW.exe)
2. Just simply run the setup executable file and follow the setup wizard instructions.
3. To start NCReport Designer use the Start menu
2.1.5 Install (commercial) source package 1under Windows
1. Make sure that a Windows™ C++ development environment is already installed on your Windows sys-
tem. If you use Open Source version of Qt, the GNU MinGW compiler is contained in the Qt SDK.Current
example shows the compiling procedure using Microsoft Visual C++ compiler
2. Make sure that the appropriate version of Qt development environment is already installed on your Win-
dows system. In addition, you need to be compiled/installed appropriate Qt’s database drivers. Example
reports are mostly use QMYSQL and QSQLITE database drivers.
3. Simply unpack the downloaded ncreport2.x.x.zip or .tar.gz or .7z source package. Use a tool like
WinZip,7-Zip or Info-Zip 2to unzip the NCReport distribution inside any directory you want:
mkdir ncreport
cd ncreport
unzip ncreport2.x.x_src.zip
qmake
nmake
2.2 Contents of the installation directory
/bin Contains the NCReport executable files
/doc Contains the User Guide and API documentation in html format
/sql Contains the sql script files are required for some of example reports
/reports Contains the sample reports for demonstrating NCReport features
/lib Contains the binary library files (Unix/Linux only)
/testdata Contains test files for demonstration purposes. defaulttestdata.xml file is used by Designer
application for storing test parametersdata. If want to use it, please copy this file to /bin directory before
starting NCReportDesigner.
1For license holders only
2Note that Windows XP has built-in support for .zip archives.
12

CHAPTER 2. INSTALL 2.3. ACKNOWLEDGEMENTS
/i18n Contains internationalization files.
/images Contains image files for a sql_productlist_with_dynimages_demo.xml test report
/src Contains the source codes of NCReport system. The binary package contains only the source of demo and
sample applications. The full source code is available for commercial license holders only.
2.3 Acknowledgements
On Windows, NCReport installer .exe is built using Inno Setup by Jordan Russell’s software. We defintely
recommend this excellent and free-to-use tool.
13
Part II
Getting started
15

This part is intended to provide a quick introduction to using NCReport system. If you’re already familiar
with using the tool, you only need to skim this chapter. To work with NCReport, you need to understand a few
basic concepts of structured editing in general, and NCReport, in particular. That’s covered here. You also need
some concrete experience with the way a NCReport report definition is structured. That’s covered in the next
chapter.
17
Chapter 3
Step by step creating a simple report
At the very beginning we go through the first basic steps of creating a simple report with the report designer
application. In our example we build a plain product price list report grouped by product category.
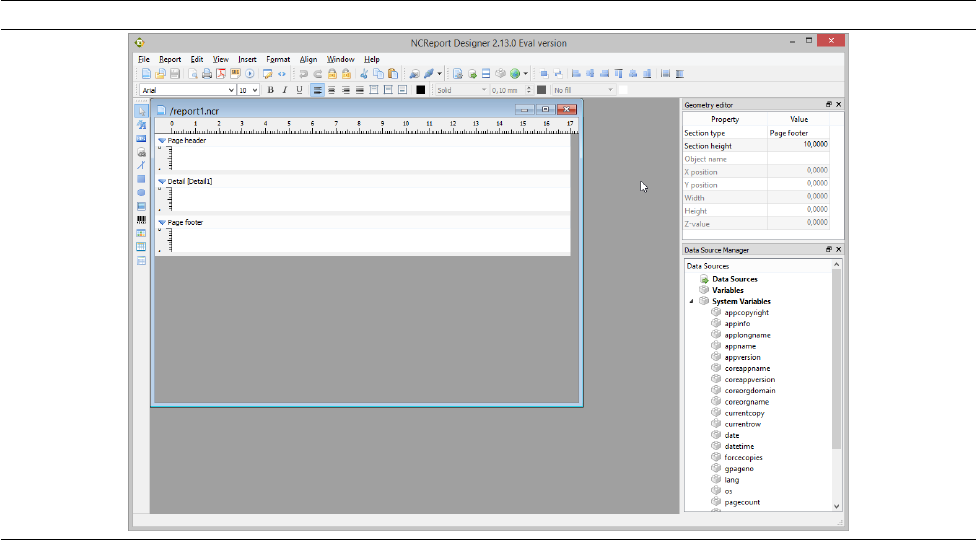
3.1 Beginning a new report
Open the report designer GUI application and let’s begin a new report by clicking New tool bar button or use
File →New menu.
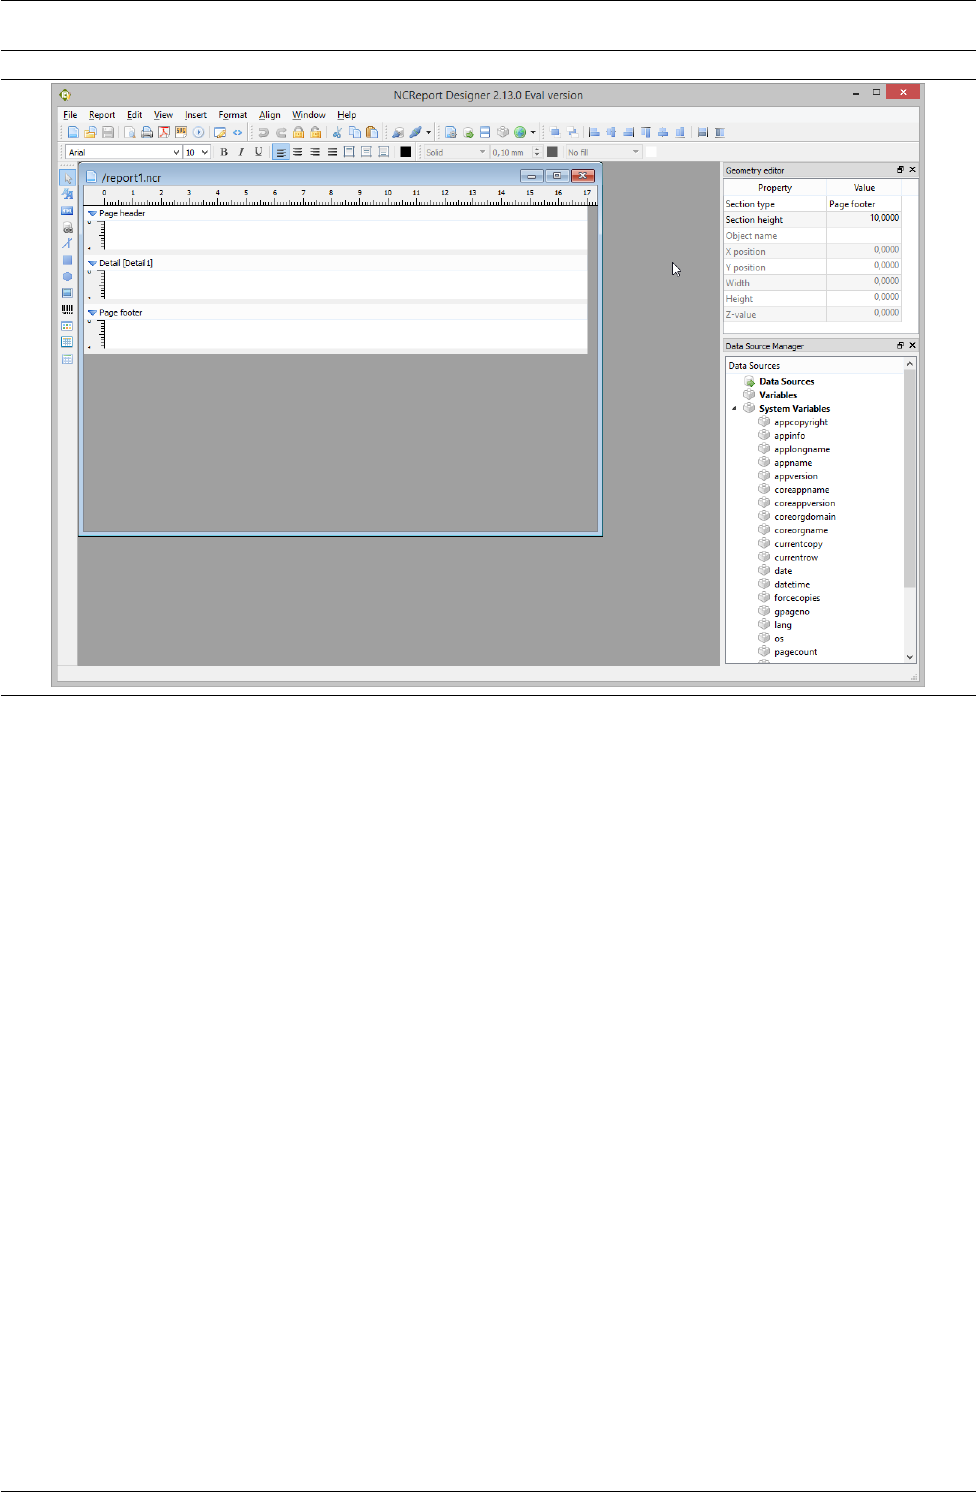
Figure 3.1 A new empty report in Designer
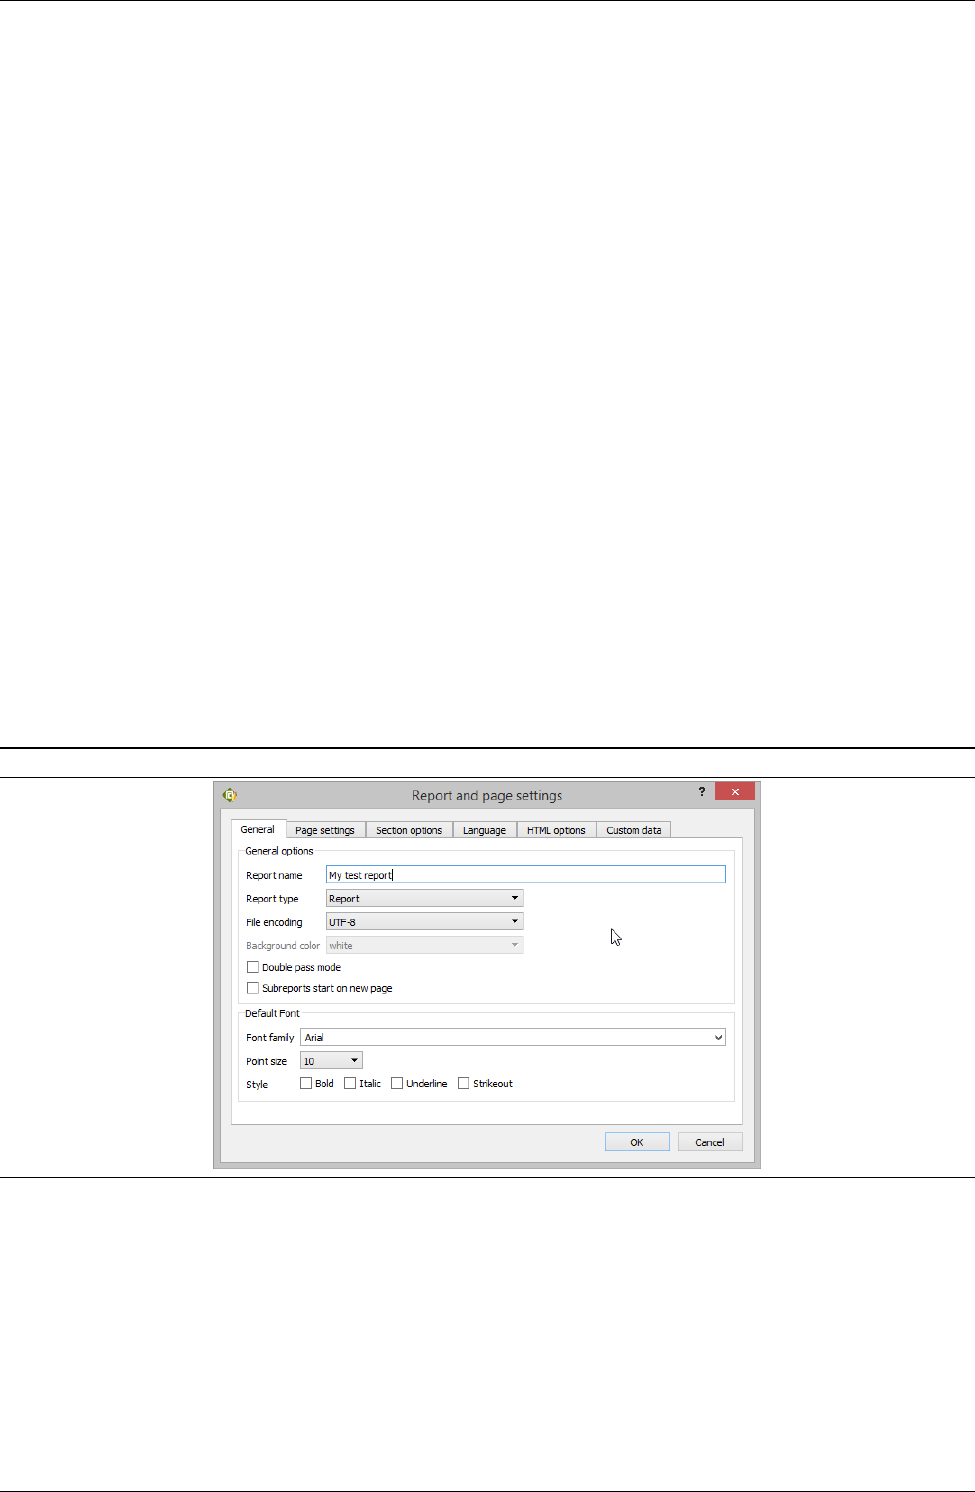
3.2 Setting up page options
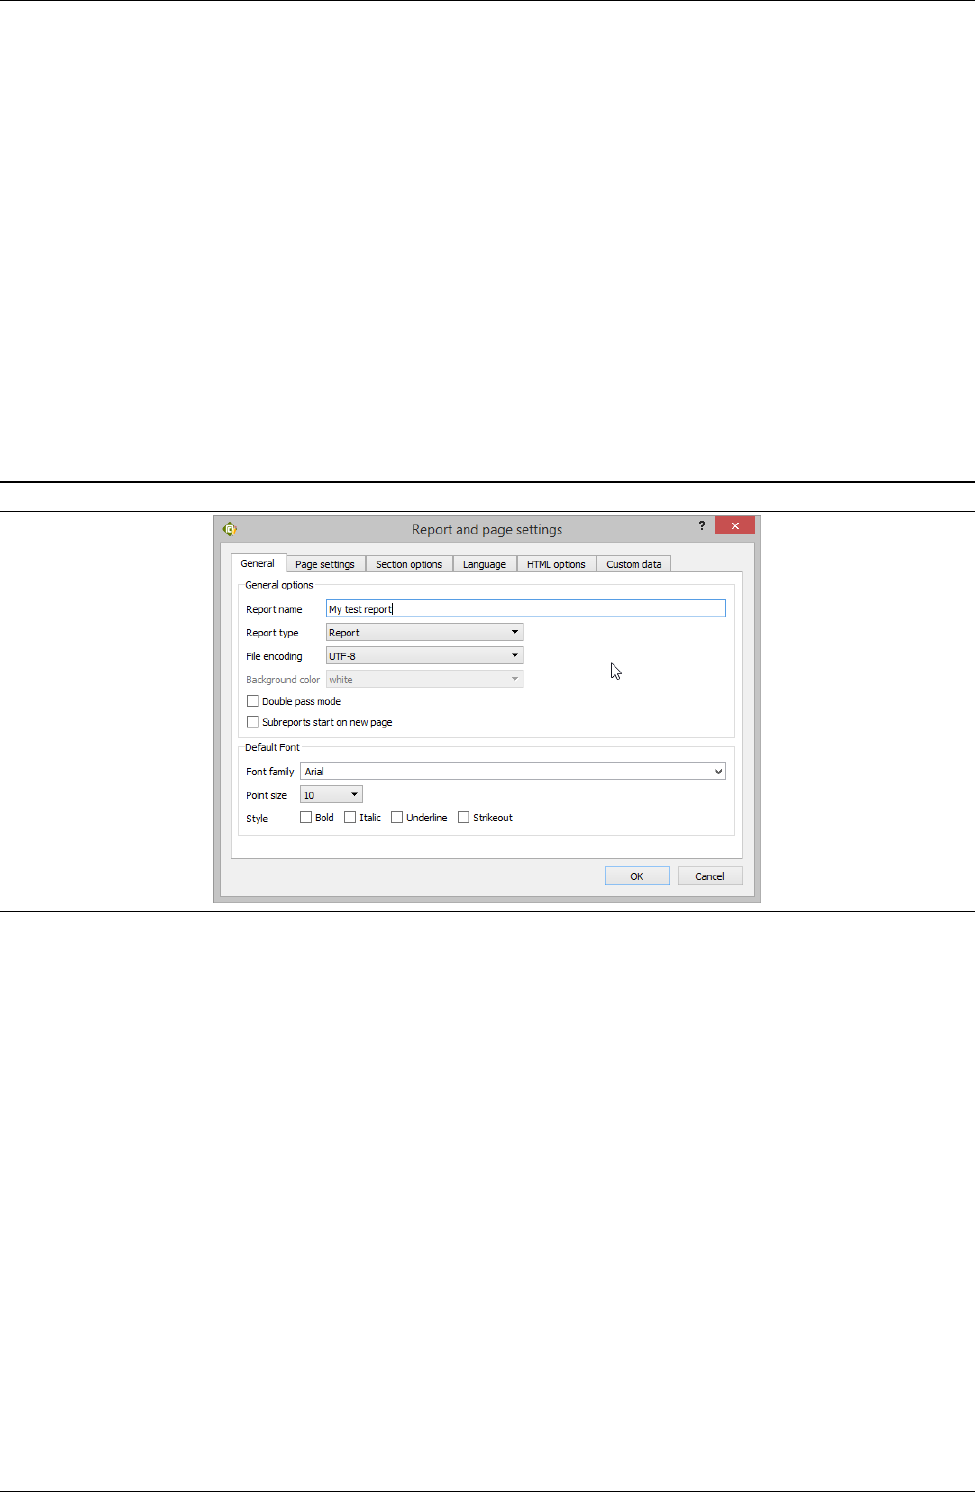
Page options of the current report can be specified in Report and Page settings dialog. Open the Report menu
and select Report and Page options... menu. In the report page settings dialog you can specify the following
options:
Report name Type the name of the report. It’s just an informative option, it’s not used by report generator.
Report type There are two type of reports available. Report represents a normal report, Text document is a
limited report mode. In this mode the report can contain HTML text items only. The generated report will
be a paginated rich text document.
19
CHAPTER 3. STEP BY STEP CREATING A ... 3.3. ADDING A DATA SOURCE
File encoding The encoding of the XML file. When user opens or saves the report definition file, this will be
the default encoding. In most cases UTF-8 fulfills the requirements, but for special international characters
you can choose any specified encoding.
Default font The font name and size are basically used for the text labels and fields in the whole report. Unique
object settings may overwrite this option.
Page size The size of the page. The size names are listed in the combo box and their names are the standard
size names. Currently the standard page sizes are supported.
Background color The background color of the report. This option currently is unused.
Header and footer settings The check boxes can be used to enable or disable page header/footer and report
header/footer. To alter the height of these sections you may use spin boxes corresponding to their check
boxes. You can also change these height properties by mouse dragging or by geometry editor
Margins margin properties represent the top, bottom, left and right margins of the page in millimeters. To alter
the margin values just use the spin boxes.
Orientation This radio button option represents the orientation of the page, Portrait or Landscape orientation
can be selected.
Specify the page’s properties by this example and click OK button for saving data source settings. We add
the report’s name only, other default properties we don’t change.
Figure 3.2 Page settings dialog
3.3 Adding a data source
First, you see an empty new report that contains a page header, a detail and a page footer sections by default.
Before starting to add report items we define the data source that represents a definition where the data will
come from. In our example the data source is a Text.
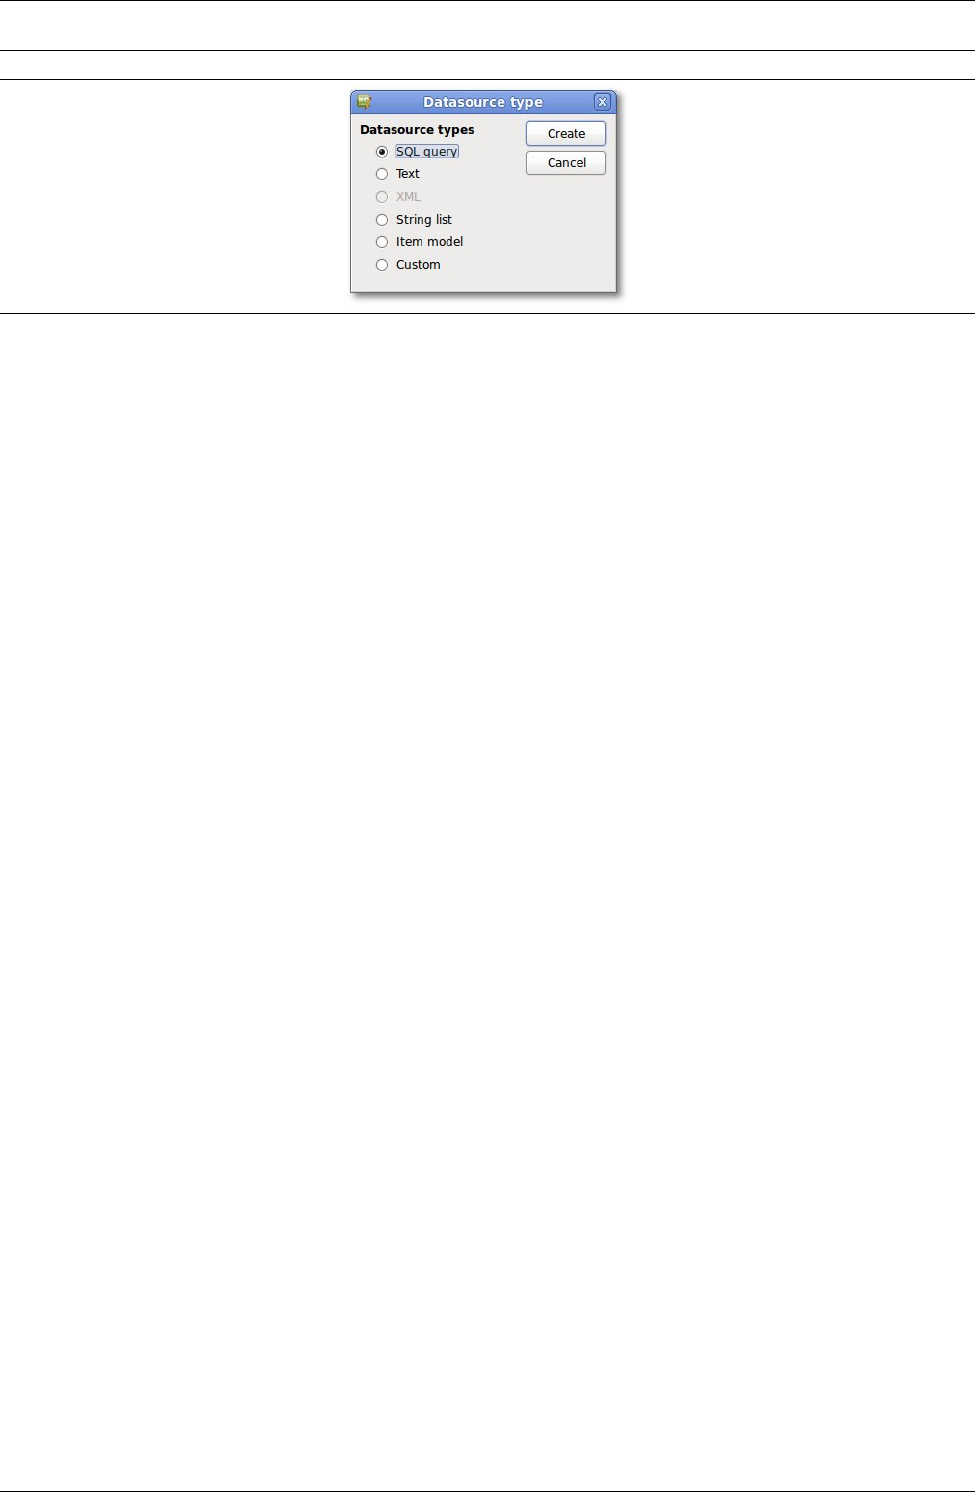
To specify a data source in your report open the Report menu and select Data sources... menu item. Then
appears a dialog on you can add and or remove data sources. To add a new data source click the Add button in
dialog and then select the Text data source type from the list of available data source types.
20
CHAPTER 3. STEP BY STEP CREATING A ... 3.3. ADDING A DATA SOURCE
Figure 3.3 Data source types dialog
Choosing Create button opens the data source dialog and adds the selected type of data source. In the data
source dialog you can specify all data source settings.
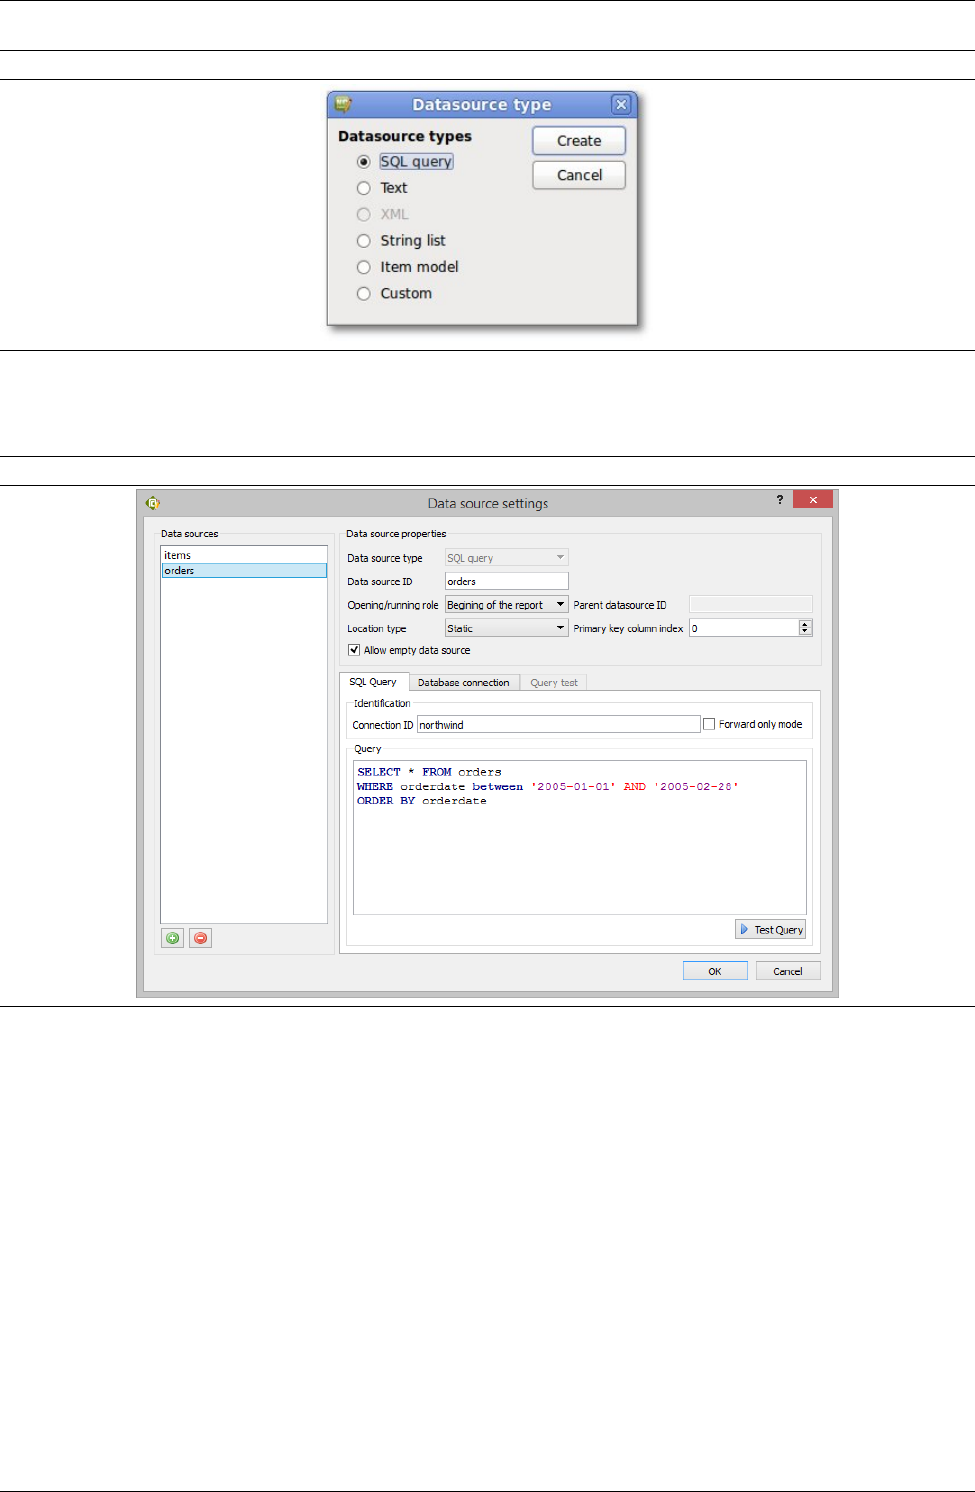
Figure 3.4 Data source setting dialog (This is an SQL data source example)
In our example in the data source dialog the following properties we will specify:
Data source ID This ID is important for assigning data source to a detail section. You can use this ID in all
expressions and data source reference.
Data source type The type of the data source you’ve already chosen before.
Location type Location type is a property that describes where the data can be found. In this report we will use
static Text which is a statically typed or pasted text. The text will be stored in the report.
Because we chose static data source, we have to insert a static text data into the Static Text area. In our
example we create a simple product list included the following columns:
• type as 0. column
• product name as 1. column
• product code as 2. column
• available as 3. column
21
CHAPTER 3. STEP BY STEP CREATING A ... 3.4. ASSIGNING DATA SOURCE TO THE ...
• weight as 4. column
• price as 5. column
The semicolon separated static data:
A;Magnetometer;D54/78;1;0.778;15.6
A;Pressostat CMR;M542;0;2.547;30
B;Oil pump Merin;CT-784;1;1.510;17
B;Hydraulic pump;RF-800;1;3.981;58
B;Erling o-ring;577874;0;2.887;49
C;Hydraulic cup;HC55;0;0.435;39
C;Ballistic rocket;BV01;1;1.260;157.9
C;Wheel WRRT56;Q185/70;1;25.554;199.0
The data columns are identified by col0, col1, col2, col3, col4, col5 identifier. Alternatively
you can use the column numbers only but the first alternative is recommended.
TIP
To make the column identification easier with text data source we can use column names. Text
data source can have a column name row, this is the first row if we enable First row as column
header option.
For example: type;productname;code;available;weight;price
In our example the col0-col5 column names are used. We specify the other text data source options:
Column delimiter Text data columns can be separated by the column delimiters specified in the combo box.
We select semicolon as column delimiter.
Encoding The text data encoding name. UTF-8 is good choice in most cases.
First row as column header When this option is enabled the first row of the text data is considered as a column
name definition. In our example we enable this as we defined the columns at the 1st row.
After specifying the data source properties by this example and click OK to save the data source settings.
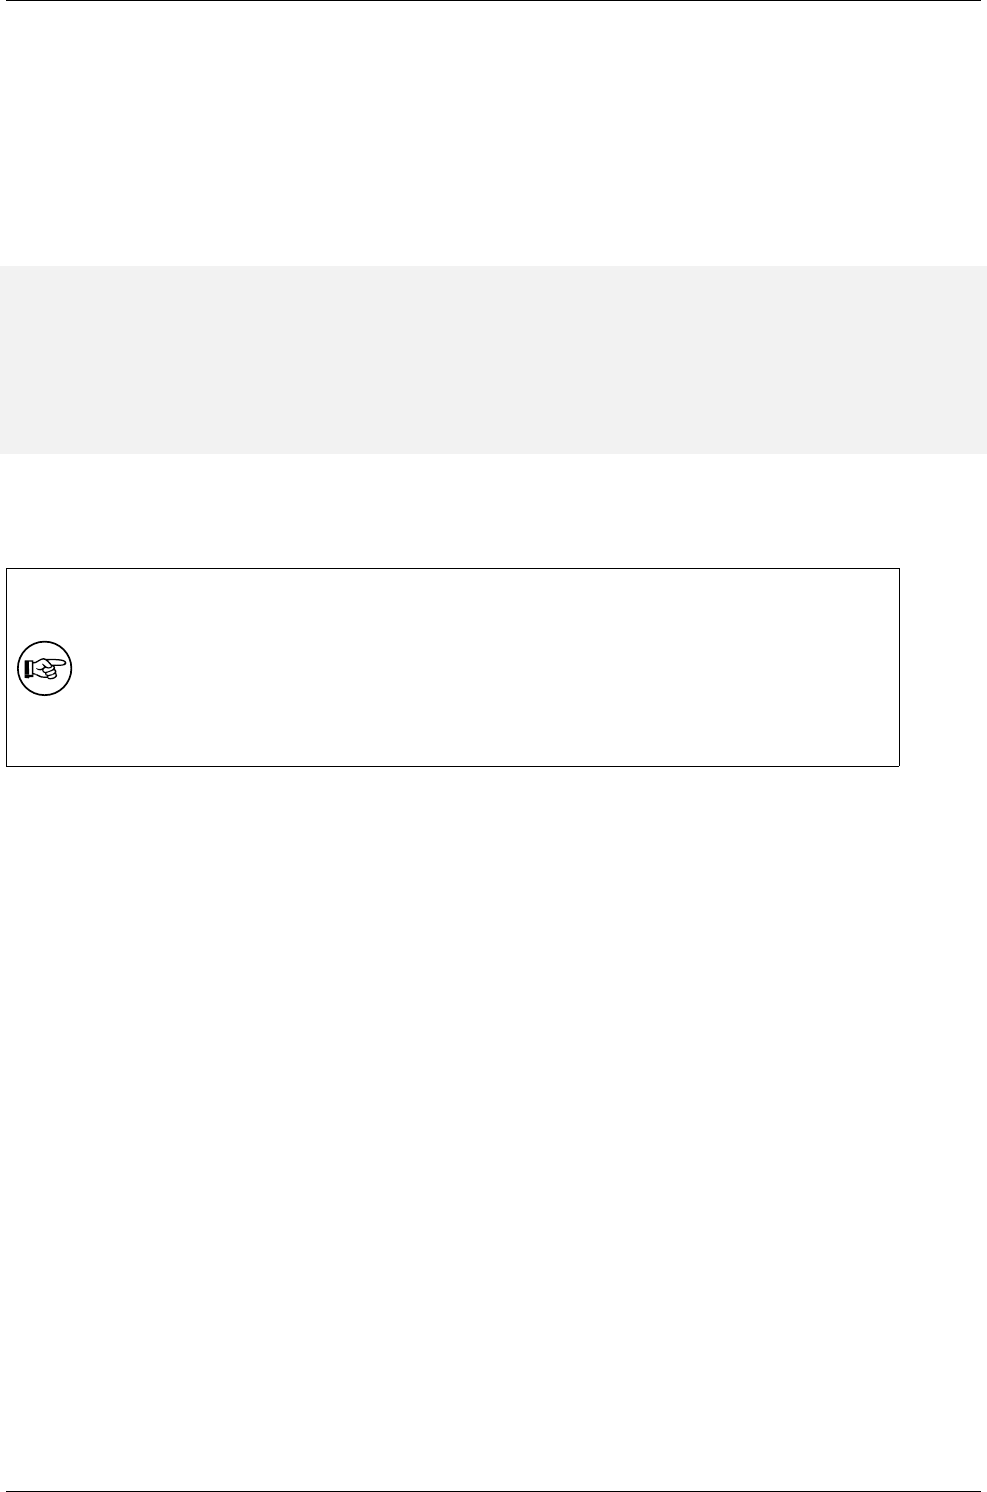
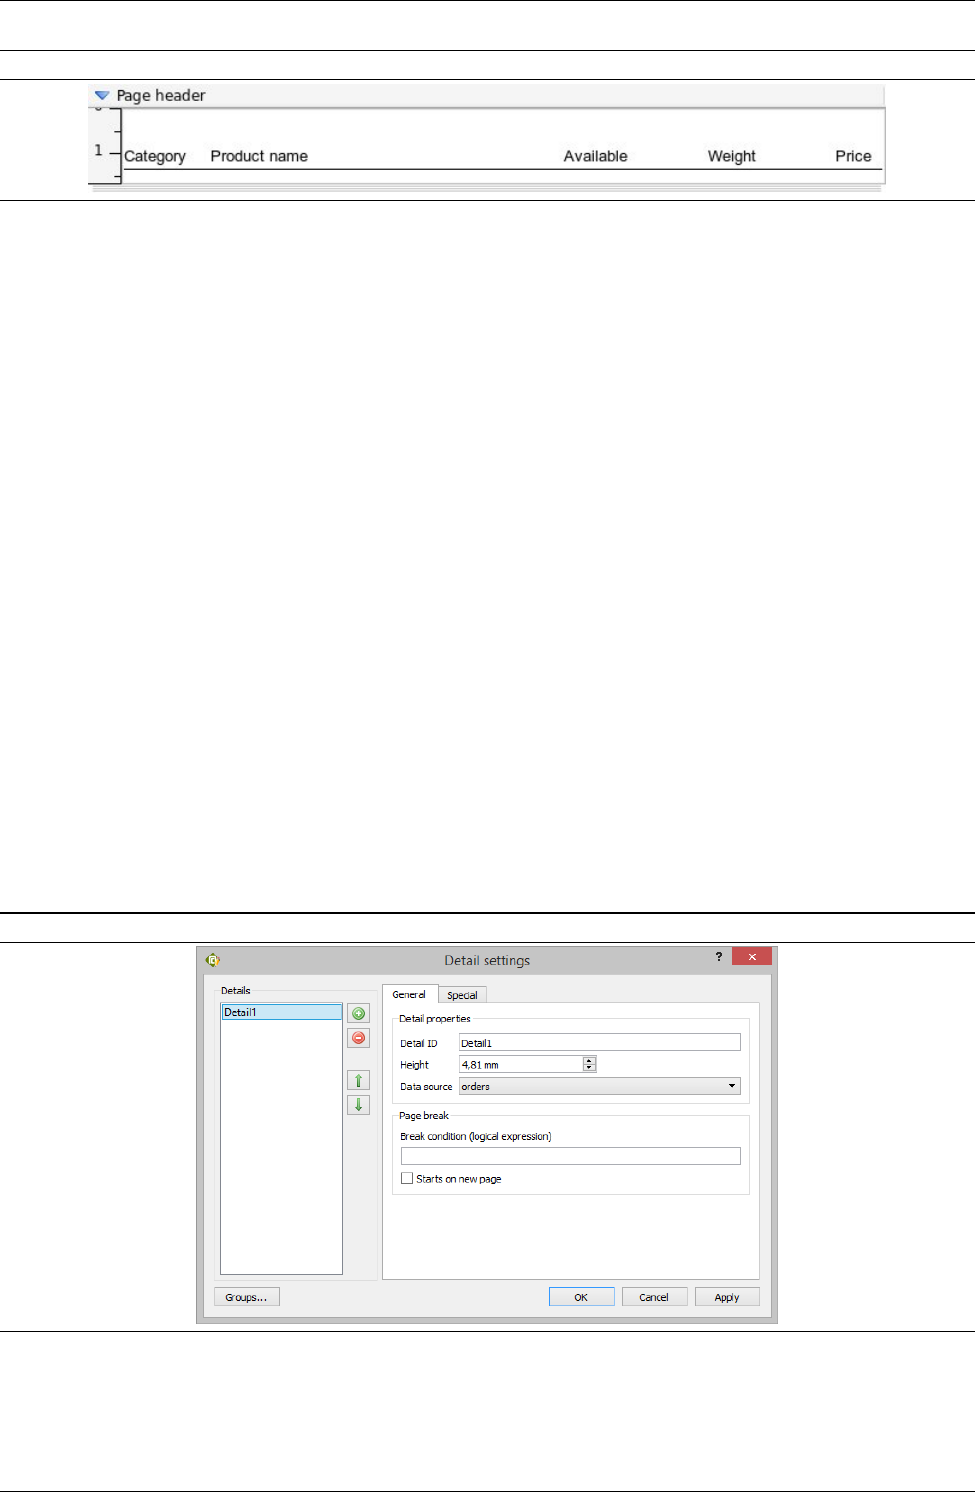
3.4 Assigning data source to the detail section
To assign the data source we defined before, open the Report menu and select Details and grouping... menu
item, then appears a dialog on you can manage the detail sections of the report. A default detail ID is Detail1,
you may change it to whatever ID you want. Select the previously defined data source from data source combo
box.
22
CHAPTER 3. STEP BY STEP CREATING A ... 3.5. USING GEOMETRIC EDITOR
Figure 3.5 Detail settings dialog
Click OK button to apply detail settings.
3.5 Using Geometric Editor
Geometry editor is a small property tool window in designer for showing or editing the position and size of
objects in focus. To enable/disableGeometry editor just use View menu and enable/disable Geometry editor
menu item. Then the tool window will appear in the right side. The current objects or sections are always
activated by a mouse click. You can type the numeric size or position values into the spin boxes. Any changes
made to the object’s properties cause it to be updated immediately.
3.6 Designing page header section
Page headers is used to contain page headings. First, we will add column titles as labels to page header section.
Labels are simple texts. Label items are used to display descriptive information on a report, such as titles,
headings, etc. Labels are static items, their value never change.
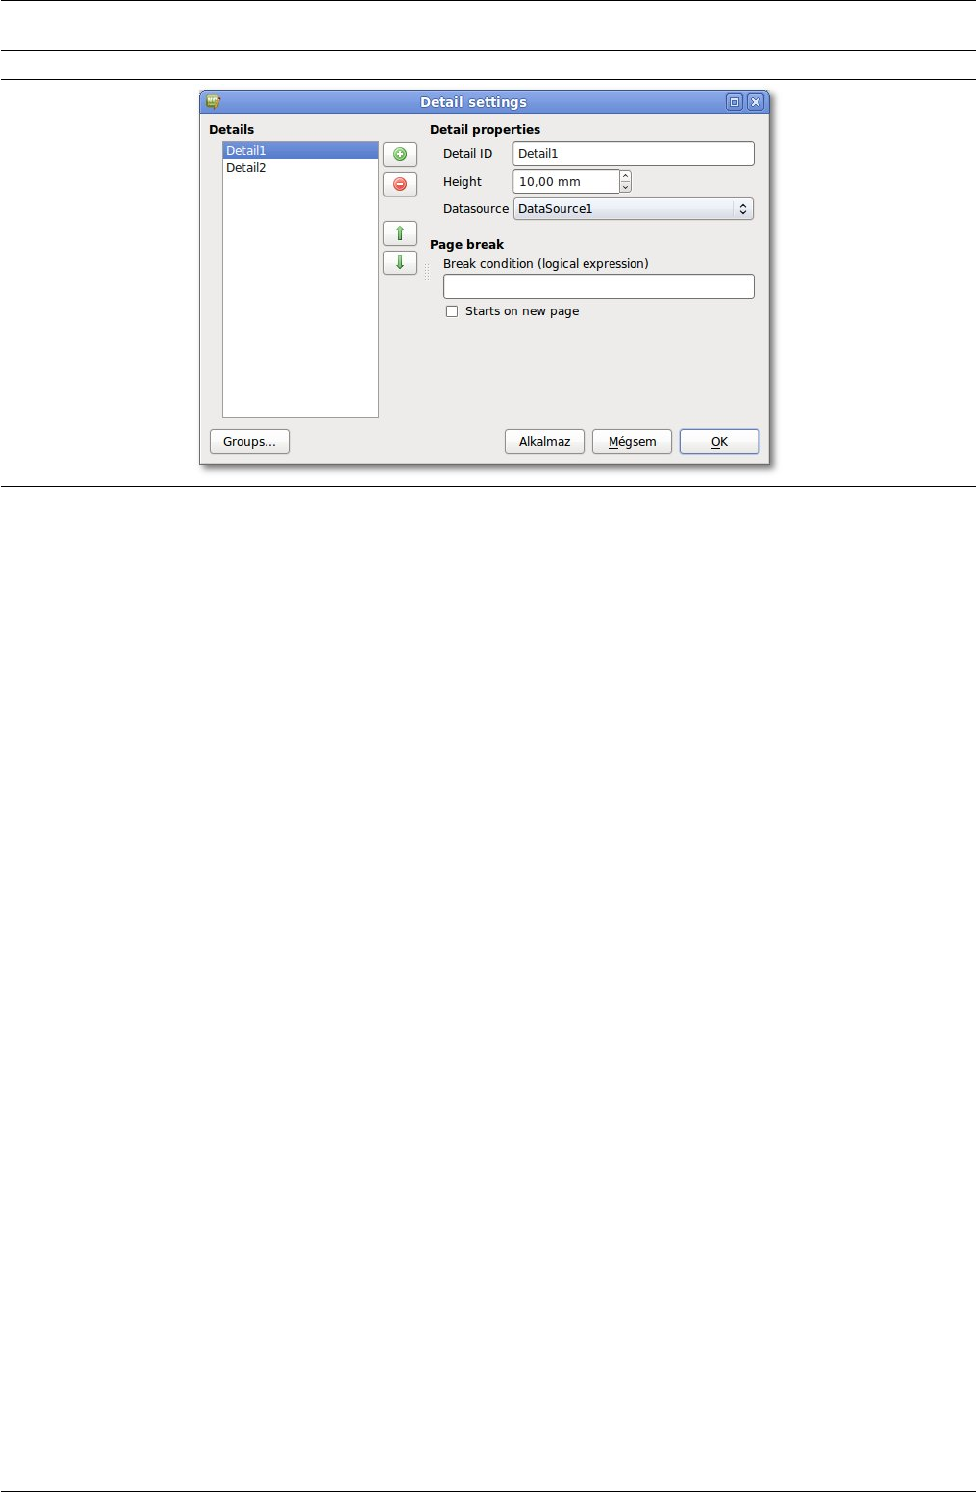
3.6.1 Adding Labels
Select the Label tool button or menu item in Tools menu. After that the cursor changes to a cross beam, then
click in the page header of the report definition where you want the Label to be located. Doing so will create the
Label object in that section and opens the Label settings dialog.
23
CHAPTER 3. STEP BY STEP CREATING A ... 3.6. DESIGNING PAGE HEADER SECTION
Figure 3.6 Label dialog
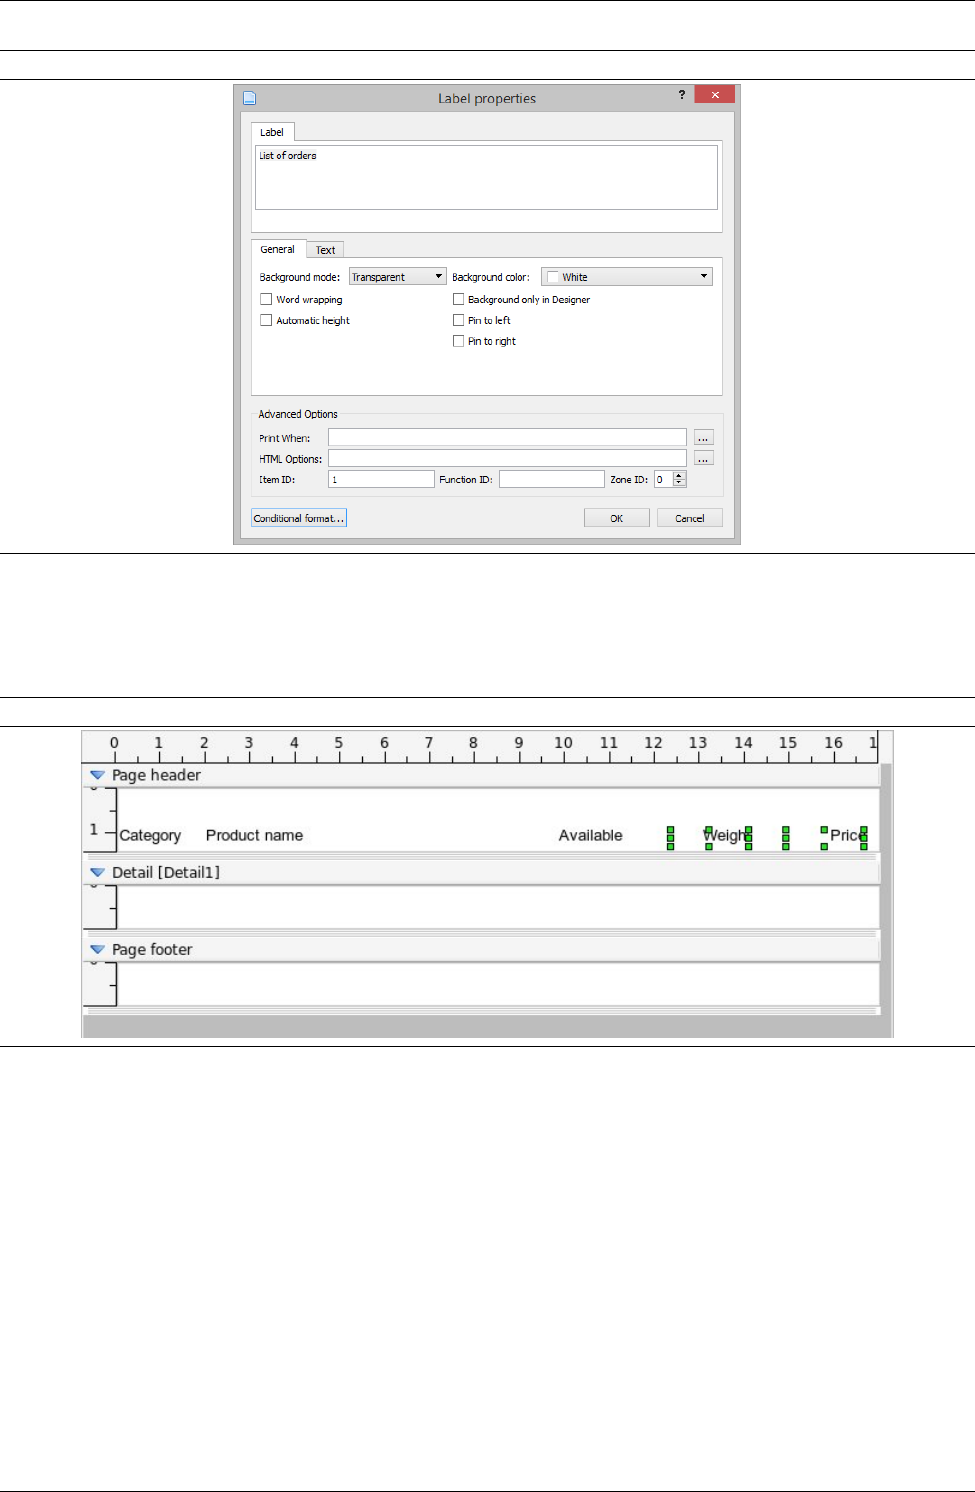
Add labels to page header for column titles and move them to positions by example. Then select "Weight"
and "Price" (multiple selecting is available) and align them right by clicking Right alignment tool button.
Figure 3.7 Labels as headers
3.6.2 Resize section
Increase the height of page header section by dragging the resizer bar at the bottom of the section. Another way
for resizing to type Section height value in Geometry editor.
3.6.3 Drawing a line
To underline the labels, let’s draw a Line by selecting the Line button in the tool bar or menu item in Tools
menu. After that the cursor changes to a cross beam, then click in the section of the report definition where you
want the line to be started and simply drag the line to the end position. To move the line just drag and drop by
left mouse button.
24
CHAPTER 3. STEP BY STEP CREATING A ... 3.7. DESIGNING DETAIL SECTION
Figure 3.8 Page Header with labels and line
3.7 Designing Detail section
The core information in a report is displayed in its Detail section. This section is the most important section of
the report since it contains the row by row data from the data source.
3.7.1 Adding Fields
Select the Field tool button or menu item in Tools menu. After that the cursor changes to a cross beam, then
click in the detail section where you want the Field to be located. Doing so will create the Field object in that
section and opens the Field settings dialog.
The following properties must be specified:
Field source type The combo box contains the possible sources from where the field can pull data.
Field column/expression This property represents the name of the data column from where field’s value is
loaded from.
For identifying data columns specify:
• the name of SQL column when using SQL data source
• the number of column 0,1,2...n or col0,col1,col2...coln when using StringList, Item-
Model, StringParameter, Text data source.
Data type The field’s base data type. The following data types are supported: Text,Numeric,Date,Boolean
The field’s property dialog of the 1st column field:
Figure 3.9 Field properties dialog
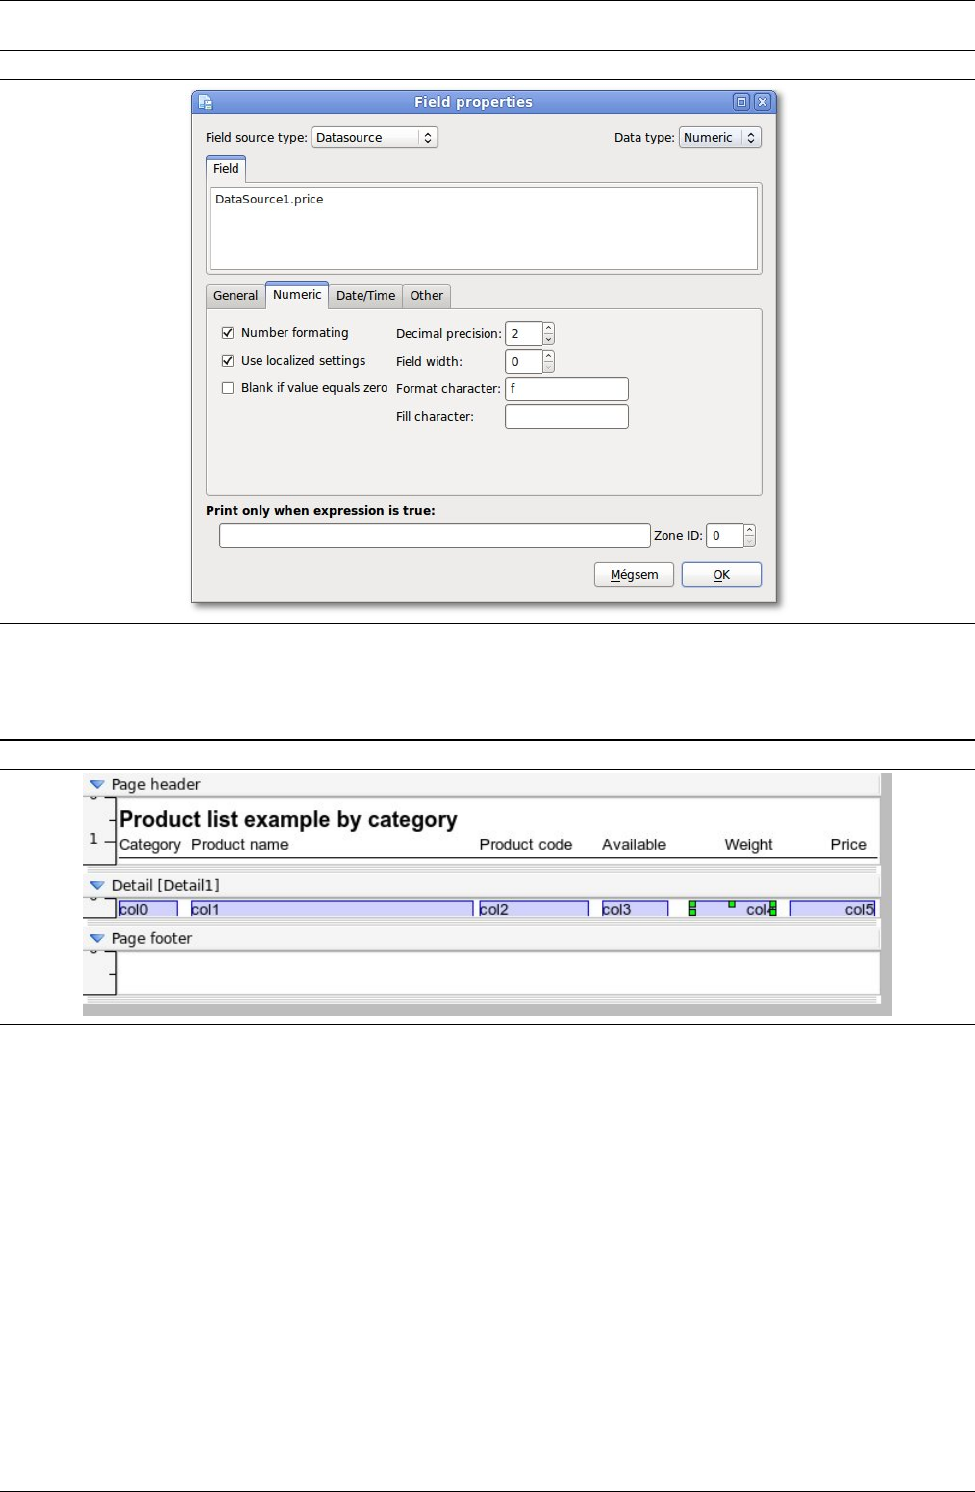
Add Fields to Detail and move them to positions by example. Field column names are: col0, col1,
col2, col3, col4, col5 (alternative naming: 0, 1, 2, 3, 4, 5) Select col4 and col5 field item and
align them right by clicking Right alignment tool button. After, in the field’s dialog set Data type to Numeric
and use the Numeric tab page to set number formatting properties.
25
CHAPTER 3. STEP BY STEP CREATING A ... 3.8. DESIGNING PAGE FOOTER SECTION
Figure 3.10 Field properties dialog - numeric data
Resize the detail section to 4.5 mm height. After also a title label added to the page header section and
formatted, the report should look like this:
Figure 3.11 Product list example report in Designer
3.8 Designing page footer section
Page footer is usually used to display informations such as number of the page. In our example we only add
two system variable fields: Application info and the current page number.
3.8.1 Adding System variable fields
Select the Field tool button or menu item in Tools menu. After that the cursor changes to a cross beam, then
click in the detail section where you want the Field to be located. Doing so will create the Field object in that
section and opens the Field settings dialog.
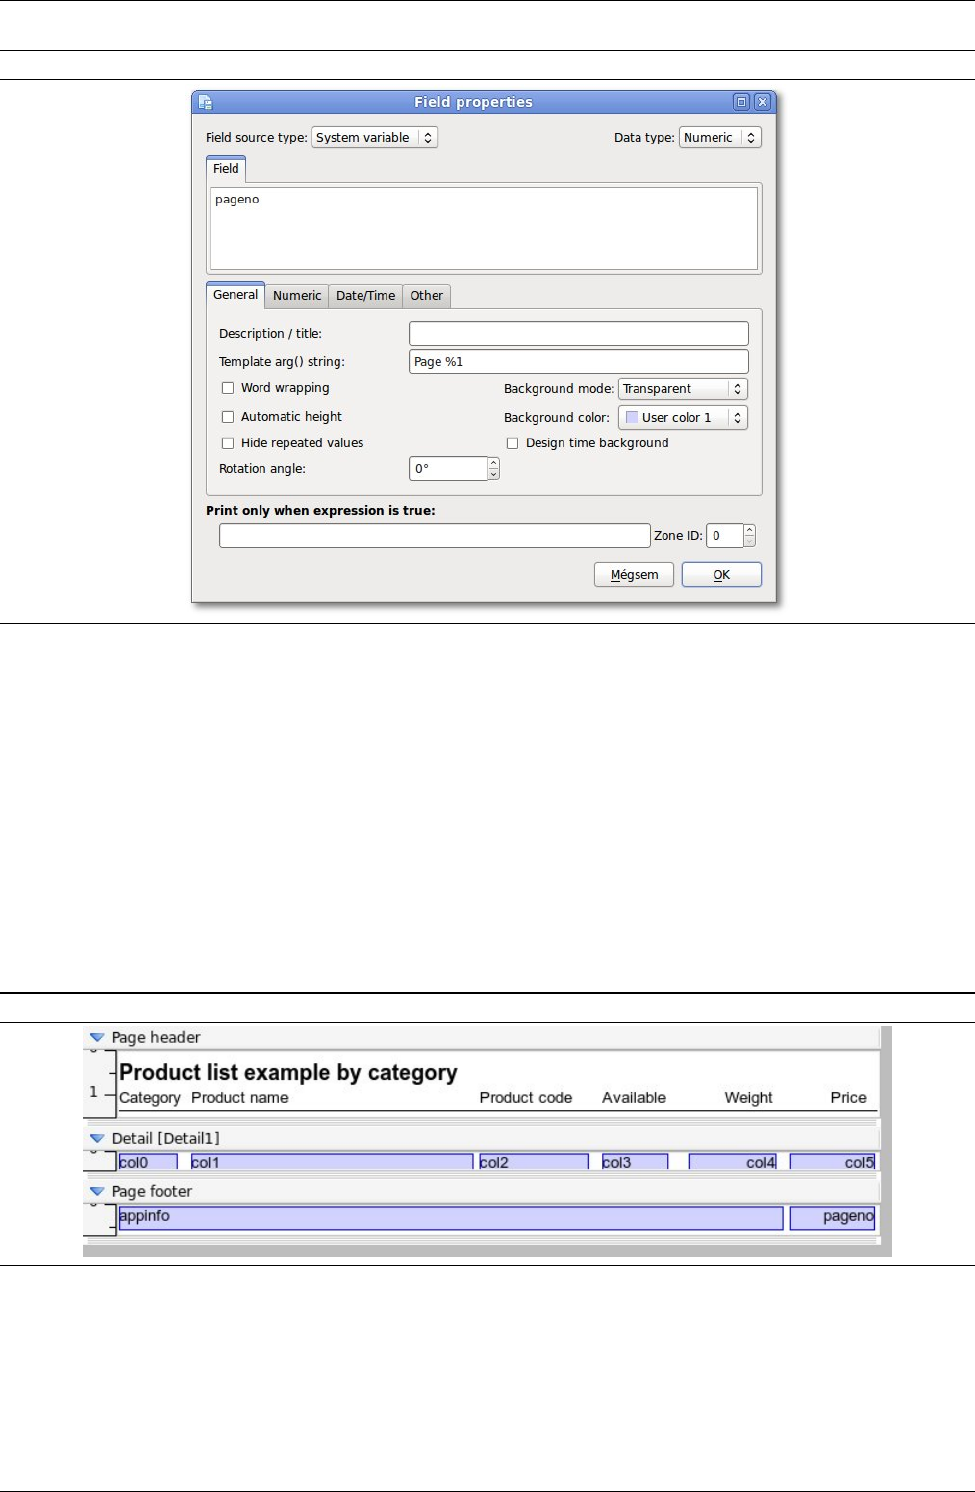
3.8.2 Adding page number field
Specify the field’s properties by this example:
26
CHAPTER 3. STEP BY STEP CREATING A ... 3.9. TESTING REPORT IN THE DESIGNER
Figure 3.12 Page number System Variable
3.8.3 Adding application info field
Add again a new field to page footer and specify the field’s properties by this, similar to the previous:
Field source type: System variable Field column expression: appinfo
3.8.4 Resize section
Derease the height of page footer section by dragging the resizer bar at the bottom of the section. Another way
for resizing to type Section height value in Geometry editor.
After setting the alignments and moved fields to the right positions, the report should look like this:
Figure 3.13 Report example with page footer
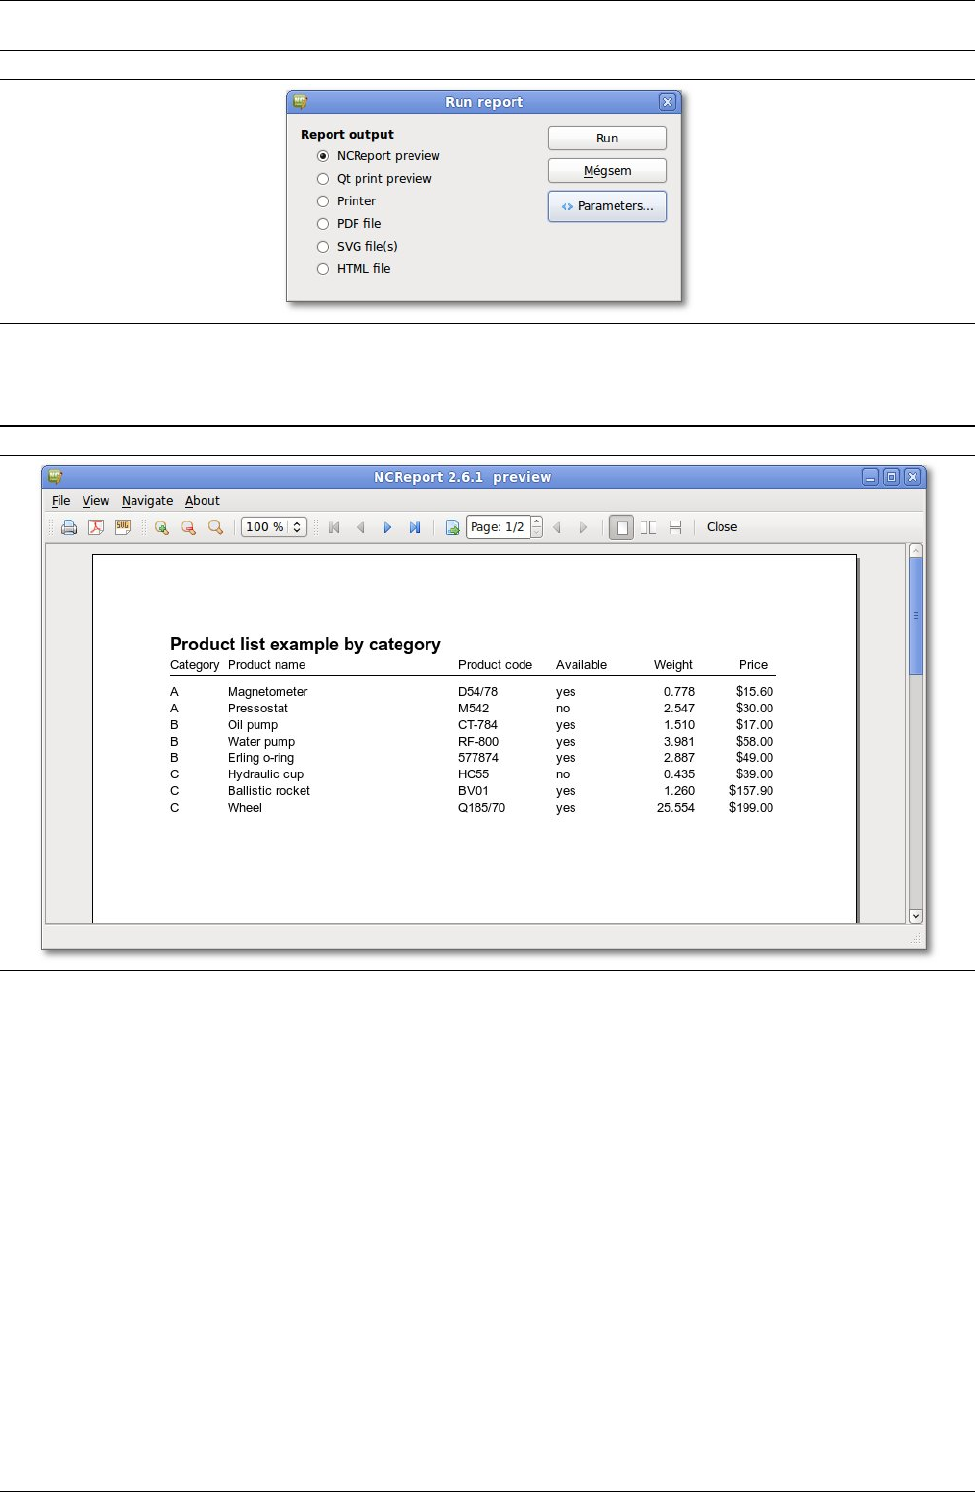
3.9 Testing report in the Designer
Our sample report now is ready for testing. To run report from designer there are at least two ways: Select
Report/Run report... menu and after the report runner dialog appears you can choose the report’s output. To
start running report just click OK button.
27
CHAPTER 3. STEP BY STEP CREATING A ... 3.10. ADVANCED STEPS
Figure 3.14 Run report from Designer
For fast preview just select Report/Run report to preview... menu and then the Designer will run report to
print preview immediately. In this state the preview of our example report appears like this:
Figure 3.15 Test report print preview example
3.10 Advanced steps
The following section describes how to use some advanced feature of NCReport. We will define a group and
after we will add summary variables to our example report.
3.10.1 Adding a variable for summary
Variables are special numeric items used for providing counts and totals. Each of them have name, function
type, data type, and have an assigned data source column the variable based on. To add a variable open the
Report menu and select Variables... menu item. Then appears a dialog on you can manage variables.
The following options are available for variables:
Variable ID The name/ID of the variable
Variable expression The data source column name the variable is based on
Function type The function type of the variable. Supported function types: Sum, Count
Reset scope Specifies the scope after report engine resets the variable. Group level resets also must be set by
group settings dialog.
28
CHAPTER 3. STEP BY STEP CREATING A ... 3.10. ADVANCED STEPS
Initial value Initial value of the variable
Let’s create a var0 which will summarize col4 column. (weight) It provides variable to summarize col4
values in ’Group’ Reset scope. Specify the field’s properties by this example:
Figure 3.16 Variable dialog
To apply settings click OK button on Variable dialog.
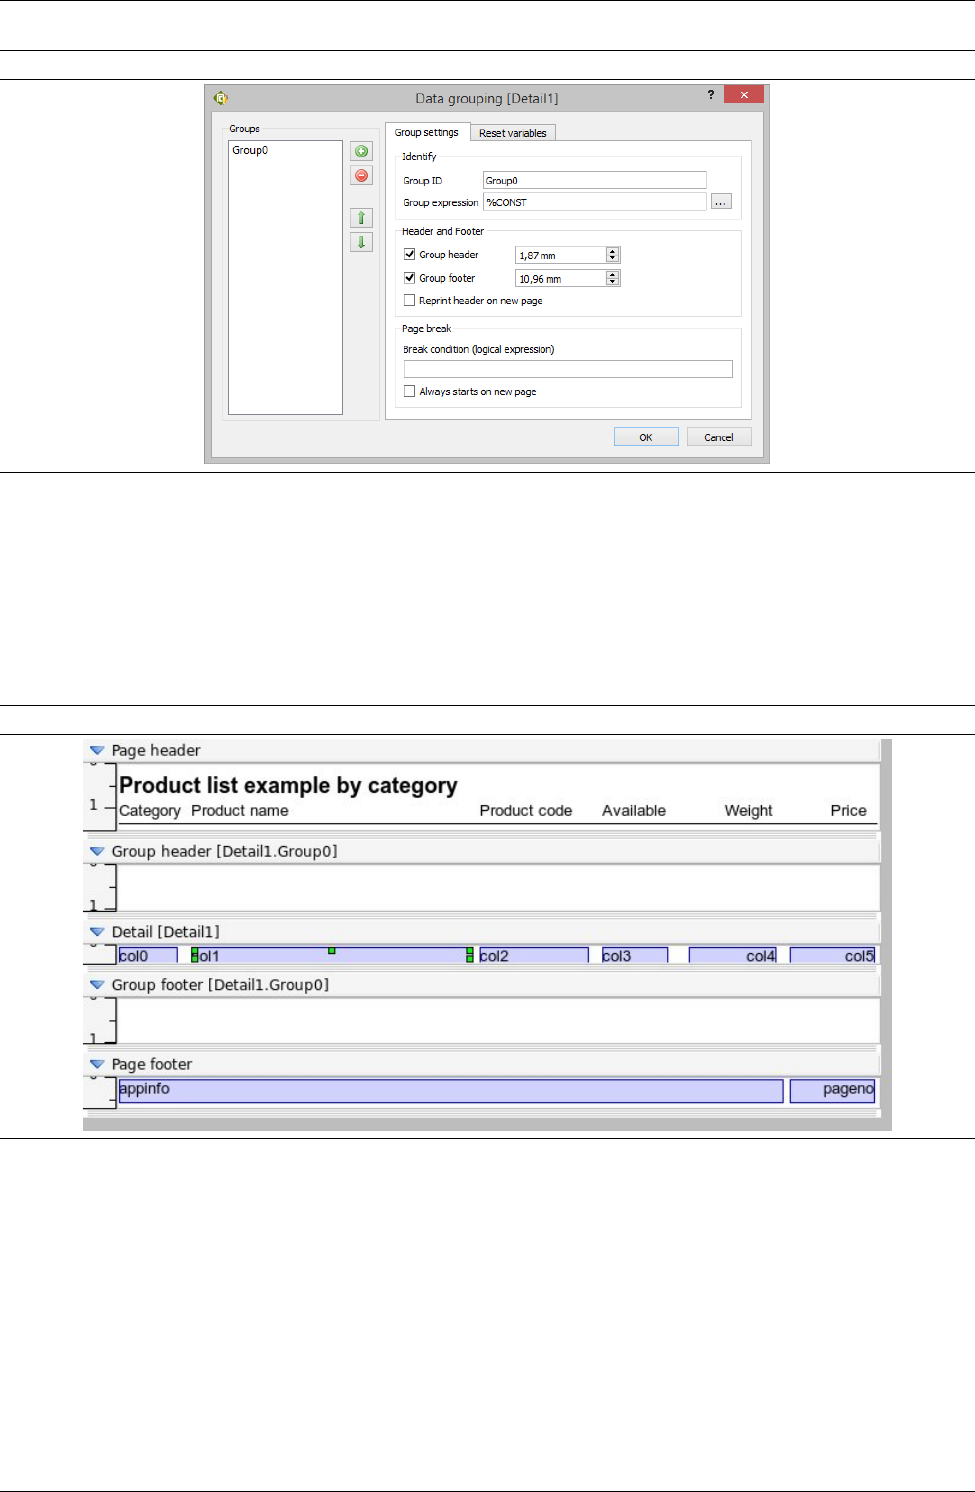
3.10.2 Defining a group
Reports often require summary data by band. In our example we will add weight summary by product category
to report. First, open the Report menu and select Details and grouping... menu item, then appears a dialog
on you may manage the detail sections and groups of the detail. Select "Detail1" detail and click the Data
grouping... button, then the Group settings dialog will appear. The following properties are available for a
group:
Group ID The name/ID of the group for identification purposes
Group expression The name of the data source column the group is based on.
Header and Footer To enable or disable group header and footer, check on or off the specified check box. To set
initial height of these sections you can use spin boxes near the check boxes.
Reset variables This list contains the ’Group’ scope variables. You can specify which variable the report gener-
ator has to reset when a group level run out.
We want the grouping to be based on col0 column (product category column). Specify the field’s properties
by this example:
29
CHAPTER 3. STEP BY STEP CREATING A ... 3.10. ADVANCED STEPS
Figure 3.17 Group settings dialog
To apply settings click OK button on Group dialog and then click OK button on Detail dialog. After doing
so group header and footer of the detail will appear.
Figure 3.18 Group in the report
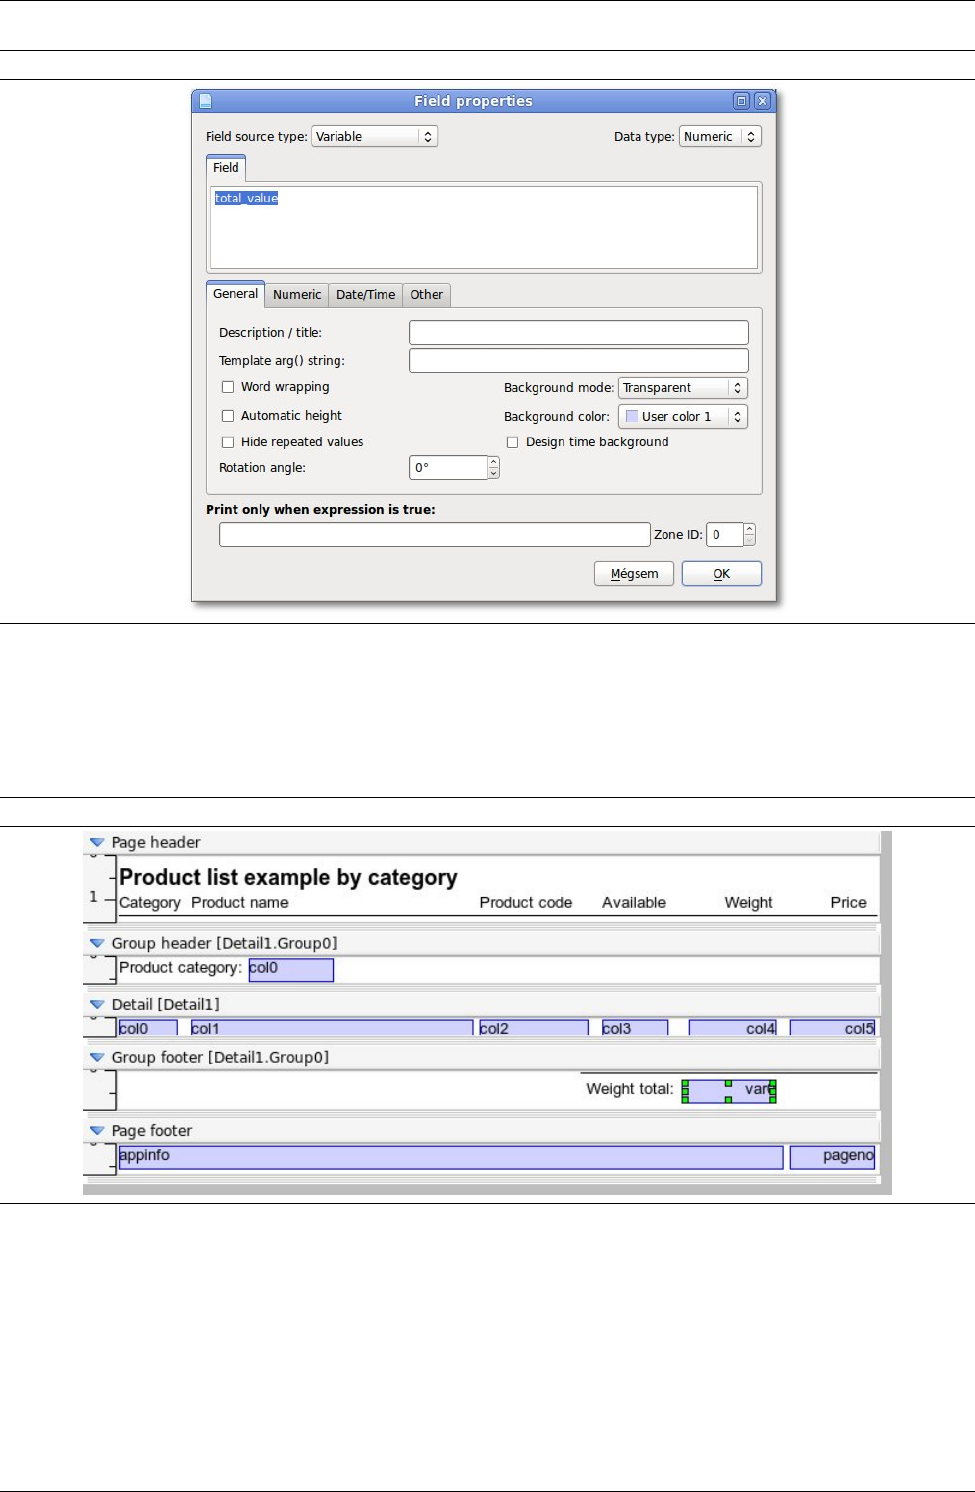
3.10.3 Adding summary field to group footer
To add a Field based on var0 variable just add again a new field to group footer and specify the field’s properties
by example:
30
CHAPTER 3. STEP BY STEP CREATING A ... 3.11. FINAL TESTING THE REPORT
Figure 3.19 Variable field
After adding variable field and some labels and a line to group header and footer our report should look
like this:
Figure 3.20 Report example with group
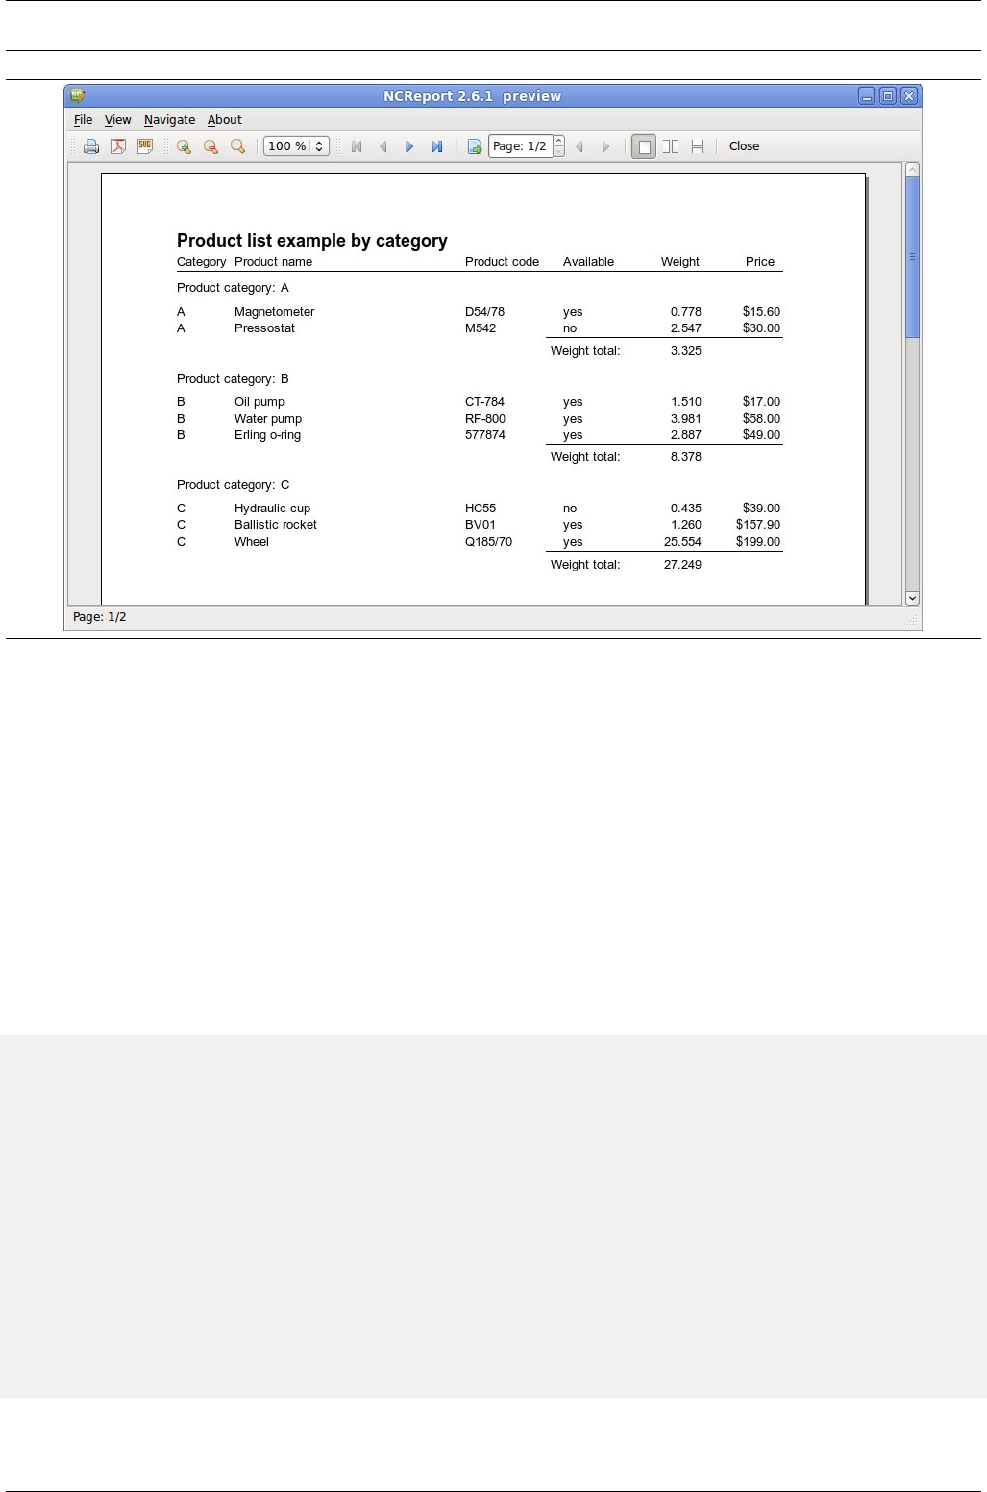
3.11 Final testing the report
Now we are ready! For preview testing just select again Report/Run report to preview... menu and then the
Designer will run our report to print preview. In this state the preview of our example report appears like this:
31
CHAPTER 3. STEP BY STEP CREATING A ... 3.12. INTEGRATING NCREPORT IN QT ...
Figure 3.21 Report final print preview
And yeah! We have created a simple one level group report. In the next step we will describe how to run
this report from your application.
3.12 Integrating NCReport in Qt applications
3.12.1 Adding NCReport library to the project
For using NCReport from your application, first you have to integrate NCReport into your application project.
There are at least two different ways to do this:
Static including the source codes
Shared library mode
QT += core gui
greaterThan(QT_MAJOR_VERSION, 4): QT += widgets printsupport
TARGET = MySimpleDemo
TEMPLATE = app
SOURCES += main.cpp
win32:CONFIG(release, debug|release) : LIBS += -L$$PWD/../ncreport/lib/ -lNCReport2
else:win32:CONFIG(debug, debug|release): LIBS += -L$$PWD/../ncreport/lib/ - ←-
lNCReportDebug2
unix:CONFIG(release, debug|release) : LIBS += -L/usr/local/lib/ncreport -lNCReport
else:unix:CONFIG(debug, debug|release): LIBS += -L/usr/local/lib/ncreport - ←-
lNCReportDebug
INCLUDEPATH += $$PWD/../ncreport/includes
32
CHAPTER 3. STEP BY STEP CREATING A ... 3.12. INTEGRATING NCREPORT IN QT ...
WARNING
Check the library and include path and use the correct paths from your environment. be sure that
you link the debug version library in debug mode and the release version in release mode!
For more informations see the Qt documentation in qmake manual at chapter Declaring Other Libraries.
TIP
Use Qt designer’s Add library... menu to add NCReport library to your project.
3.12.2 Initializing NCReport class
This step shows you how to initialize NCReport class.
Includes. First we have to add includes. To include the definitions of the module’s classes, use the following
includes:
#include "ncreport.h"
#include "ncreportoutput.h"
#include "ncreportpreviewoutput.h"
#include "ncreportpreviewwindow.h"
Creating NCReport class. We create the report class just like as another QObject based class:
NCReport *report = new NCReport();
If NCReport object has been created earlier and passed as a parameter, you should inititalize the report by
calling reset() method:
report->reset();
//or
report->reset(true);
NCReport::reset() function will delete all object references, and makes report engine able to run a report
again. If parameter is set TRUE, also report parameters, added data sources such as QStringLists, custom items
will be deleted.
3.12.3 Setting the Report’s source
Report source means the way of NCReport handles XML report definitions. Report definitions may opened
from a file - in most cases it is suitable, but also it can be loaded from an SQL database’s table. In our example
we apply File as report source:
report->setReportFile( fileName );
This code is equivalent with this code:
report->setReportSource( NCReportSource::File );
report->reportSource()->setFileName( fileName );
3.12.4 Adding parameters
To add a parameter to NCReport use addParameter method. The parameter ID is a string, the value is a QVariant
object.
report->addParameter( "id", QVariant("value") );
You can use the same for the different data types:
33
CHAPTER 3. STEP BY STEP CREATING A ... 3.12. INTEGRATING NCREPORT IN QT ...
report->addParameter( "par1","String Parameter" );
report->addParameter( "par2", 5.687 );
report->addParameter( "par3", 1024 );
report->addParameter( "par4", QDate::currentDate() );
3.12.5 Running the Report
Now we are ready to run the Report to different outputs. Doing so just use one of runReportTo... functions.
Running report to printer
report->runReportToPrinter();
Running report to PDF
QString fileName("mypdffile.pdf");
report->runReportToPDF( fileName );
Running report to Print Preview
report->runReportToPreview();
If you run report to preview, result will be stored in an NCReportPreviewOutput object. Report engine
does not run the preview form automatically. After the report engine successfully done we need to initialize an
NCReportPreviewWindow object for previewing. Before doing so we check if a report error occurred.
if ( !report->hasError() ) {
NCReportPreviewWindow *pv = new NCReportPreviewWindow();
pv->setOutput( (NCReportPreviewOutput*)report->output() );
pv->setWindowModality( Qt::ApplicationModal );
pv->setAttribute( Qt::WA_DeleteOnClose );
pv->setReport( report ); // sets the report objects
pv->exec();
}else {
QMessageBox::warning( tr("Error"), report->lastErrorMsg() );
}
To get the current output use NCReport::output() function.
WARNING
When you run report to preview the report output object won’t be deleted by NCReport. When the
NCReportPreviewWindow object is destroyed, output is deleted automaticaly by it’s destruc-
tor.
3.12.6 Error handling
To catch occurrent errors you can use the following functions:
bool error = report->hasError();
QString errormsg = report->lastErrorMsg();
3.12.7 Deleting Report object
After report running action you may delete the report object. When NCReport object is deleted all child objects
are also deleted.
delete report;
34

CHAPTER 3. STEP BY STEP CREATING A ... 3.12. INTEGRATING NCREPORT IN QT ...
WARNING
Don’t delete NCReport object if NCReportPreviewWindow object still exists. If you want to
use report object again without deleting just use NCReport::reset() function.
35
Part III
NCReport Designer
37

NCReport Designer is a GUI application for designing and testing report files. It allows you to create and
design the report templates for NCReport instead of writing the XML file manually with a text editor.
39
Chapter 4
Getting Started with Designer
This chapter covers the fundamental steps that most users will take when creating reports with NCReport
Designer. We will introduce the main features of the tool by creating a simple report that we can use with
NCReport engine.
4.1 Launching Designer
The way that you launch NCReport Designer depends on your platform:
• On Windows, click the Start button, open the Programs submenu, open the NCReport2 submenu, and
click NCReport Designer.
• On Unix or Linux, you may find a NCReport Designer icon on the desktop background or in the desktop
start menu under the NCReport submenu. You can launch Designer from this icon. Alternatively, you can
enter ./NCReportDesigner in a terminal window in NCReport/bin directory
• On MacOSX, double click on NCReport Designer in the Finder.
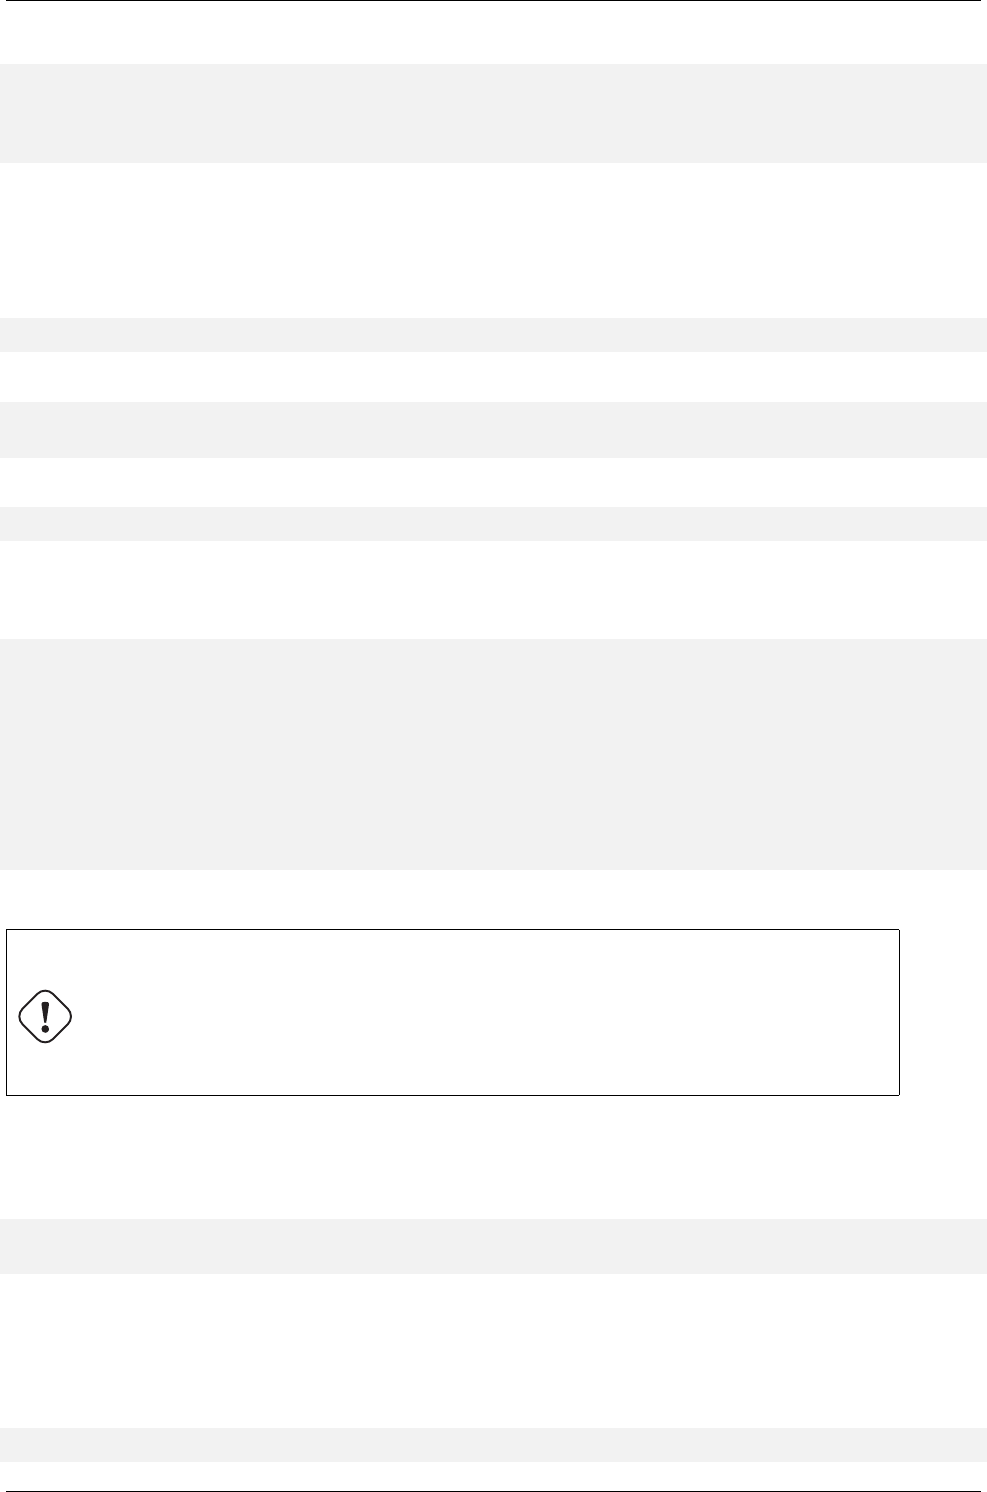
4.2 The User Interface
NCReport Designer’s user interface is built as any standard multi-window user interface. The main window
consists of a menu bar, a tool bar, and a geometry editor for editing the position and size of objects. Geometry
editor can be enabled or disabled by clicking on View/Geometry editor checkbox menu.
41
CHAPTER 4. GETTING STARTED WITH DESIGNER 4.3. DESIGNER’S MAIN WINDOW
Figure 4.1 NCReport Designer desktop
4.3 Designer’s Main Window
The menu bar provides all the standard actions for opening and saving report files, managing report sections,
using the clipboard, and so on. The tool bar displays common actions that are used when editing a report. These
are also available via the main menu. File menu provides the file operation actions, Report menu contains the
report and it’s sections settings that belong to the current/active report. View menu displays the specified items
can be enabled or disabled in MDI area. The Tool menu provides common report objects that are used to build
a report. The Align menu holds the alignment actions for the specified report items can be aligned. With the
Window menu you can manage the windows are opened concurrently.
Most features of NCReport Designer are accessible via the menu bar or the tool bar. Some features are also
available through context menus that can be opened over the report sections. On most platforms, the right
mouse button is used to open context menus.
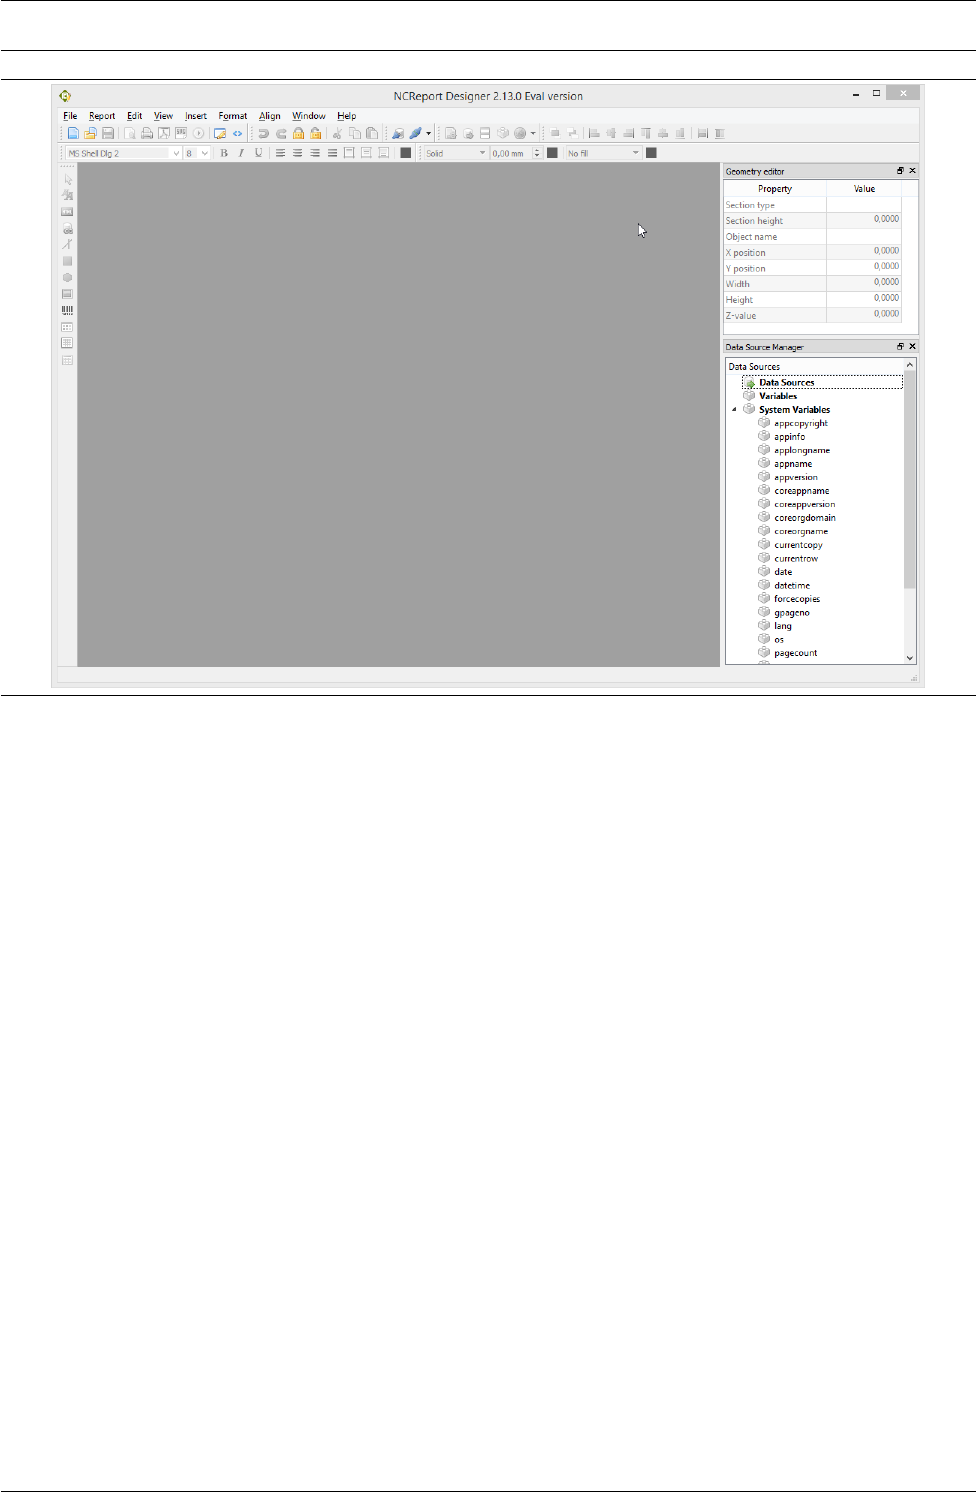
4.4 Geometry editor
Geometry editor is a tool window can be enabled by View/Geometry menu. This window displays the position
and size informations of the current report section or object. The current objects or sections are always activated
by a mouse click. You can type the numeric size or position values into the spin boxes. Any changes made to
the object’s properties cause it to be updated immediately.
42
CHAPTER 4. GETTING STARTED WITH DESIGNER 4.5. DATA SOURCE TREE
Figure 4.2 Geometry editor
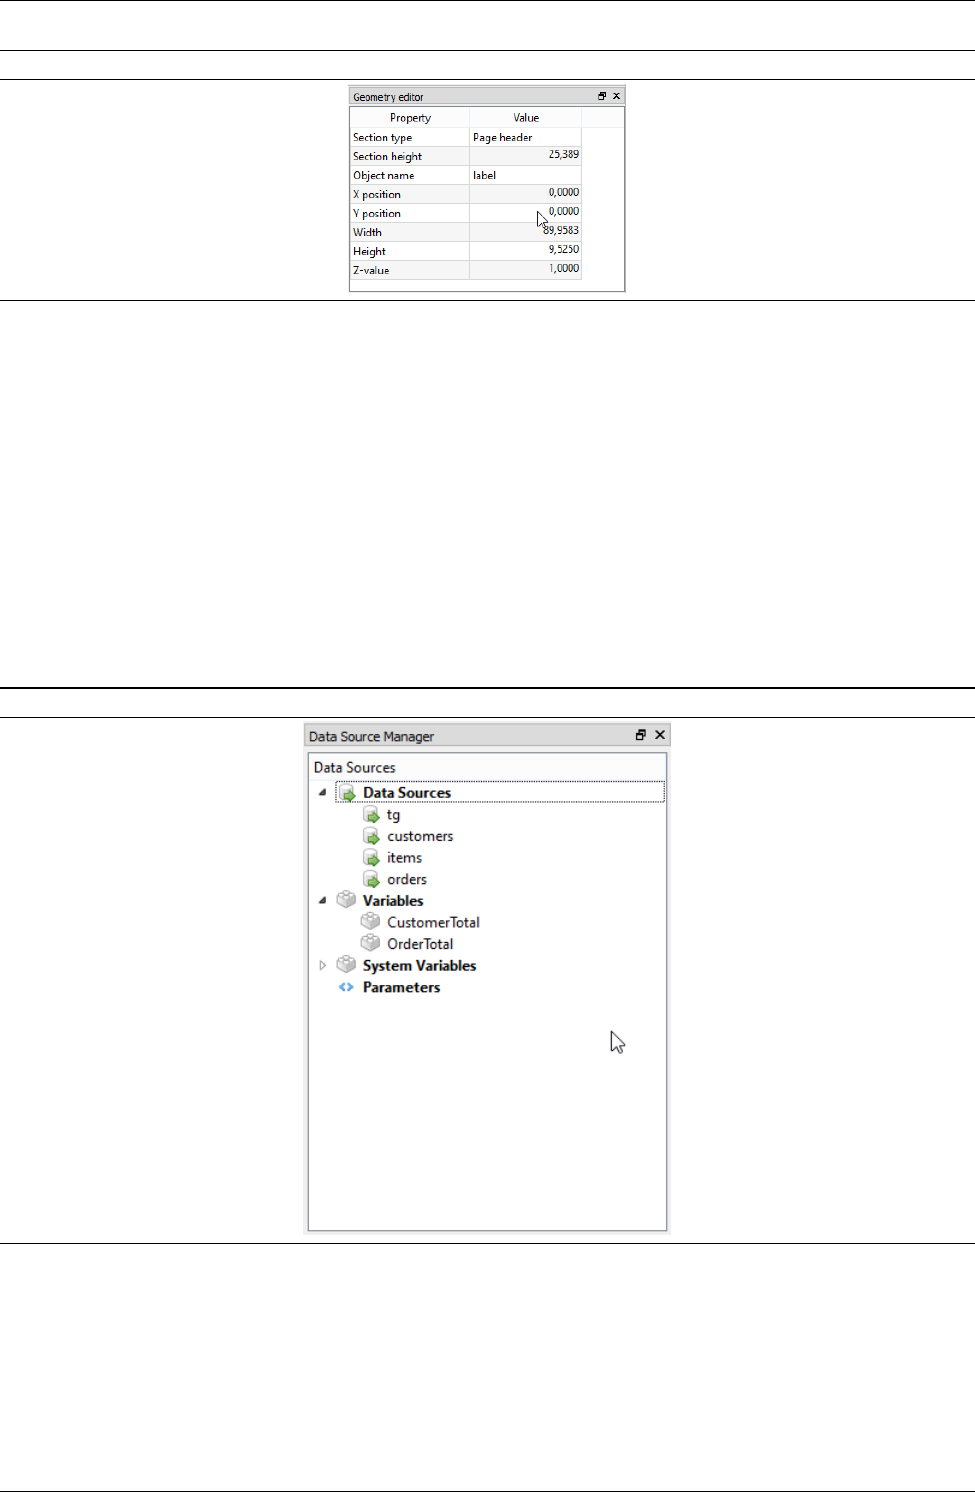
4.5 Data Source Tree
Data Source Tree (or data source manager) is a dock window widget in the main designer desktop. The widget
helps to add fields to the report very easily by a simple drag and drop action. The data source tree is updated
when you add or modify a data source in the report. Therefore it is recommended to start the report building
with defining the data source first. If the data columns are available at design time they will appear in the
widget under the appropriate data source item.
4.5.1 Adding a Field using the Data Source Tree
To add a field to any report section just drag the selected column and drop onto the section at the position
whatever you want. The Field item will be created at the drop position. Note that mouse pointer target position
is considered.
Figure 4.3 Data Source Tree Widget
4.6 Field Expression Builder
When you work with Field items you get a useful helper tool for creating the correct Field expression. You find
the Expression builder button in the Filed settings dialog labeled Build Expression... and besides the Print When
logical expression editor controls. You can choose the combo boxes to select the desired expression and you can
add it by simple clicking on the small add buttons. Then the expression will be inserted into the text area at the
cursor position. Depending on what type of expression you insert the expression builder will apply the correct
43
CHAPTER 4. GETTING STARTED WITH DESIGNER 4.6. FIELD EXPRESSION BUILDER
syntax. You have also the data source tree in the dialog that can be used for the same purpose if you just simply
select a Data Source column, a Parameter or a Variable. Double clicking on the appropriate item will insert it
from the data source tree.
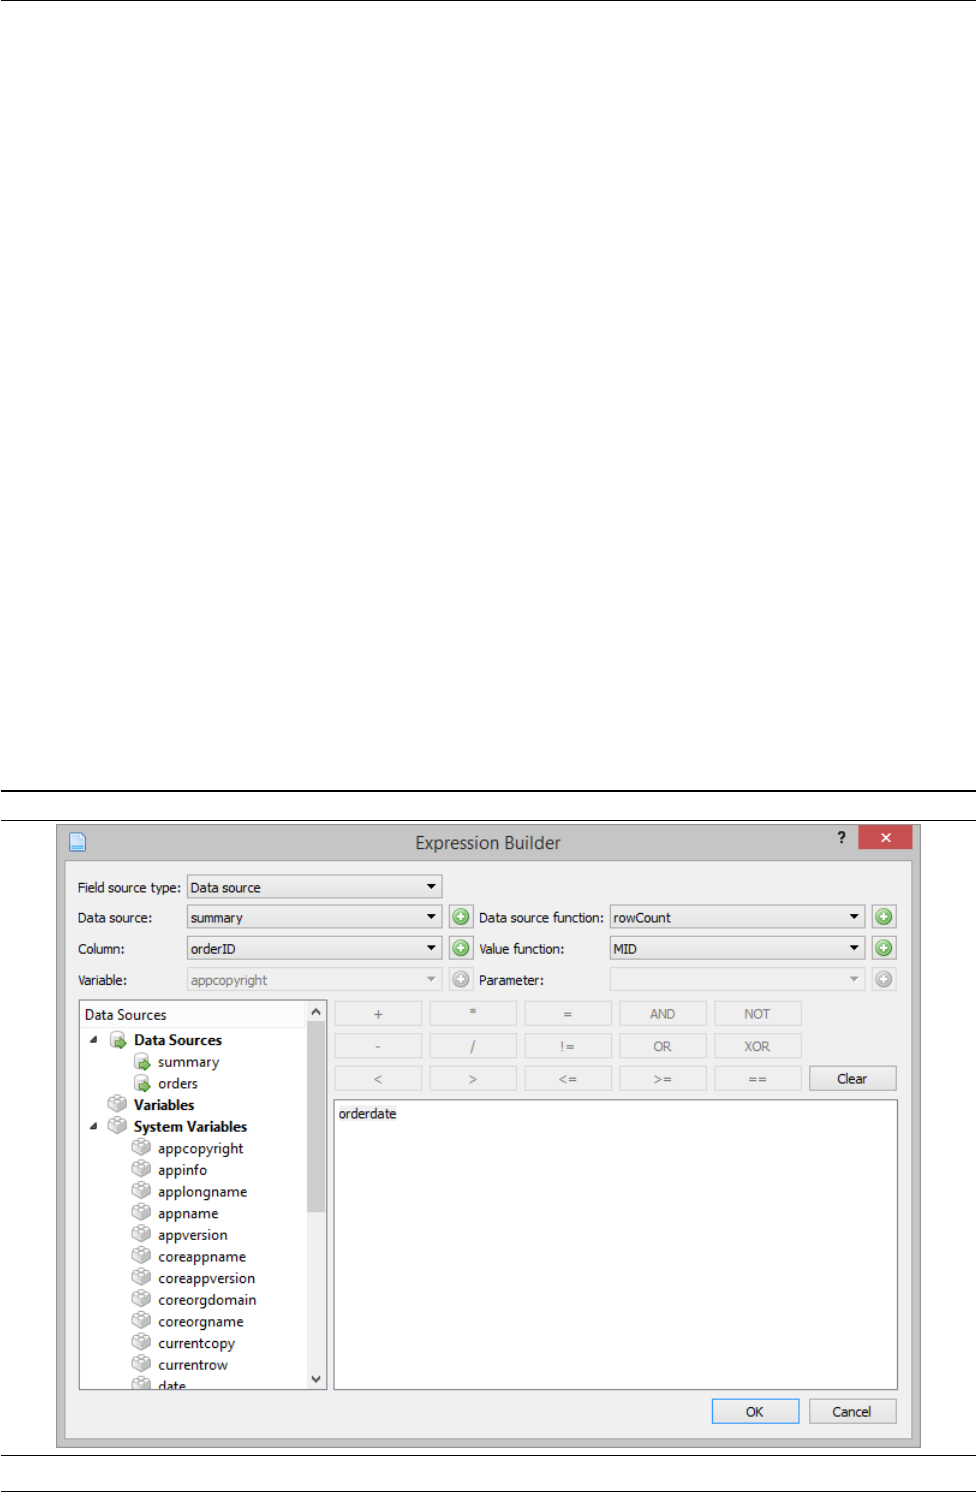
4.6.1 Expression Builder Dialog Controls
The following description helps to understand what combo box widgets are found on the dialog and what they
are good for.
Field source type You can select the field source type. This is what to do first. The source type will determine
what other controls will be available.
Data source Selects the data source from all available data sources of the report. To add a data source click on
the add item beside the widget.
Column Selects the data source column. To add a data column click on the add item beside the widget.
Variable You can select here all available variables including the system variables. To add a variable click on
the add item beside the widget.
Data source function You can select the available data source level functions here. To add a function expression
click on the add item beside the widget.
Value function You can select the available data source value functions here. To add a function expression click
on the add item beside the widget.
Parameter You can select the design time defined parameters here. To add a parameter click on the add item
beside the widget.
4.6.2 Logical Operation Buttons
You find also logical operation buttons on the dialog that boosts editing of a script or a logical expression. When
you click on a button it will insert the named logical operation into the text area.
Figure 4.4 Expression Builder Dialog
44
Chapter 5
Designing a report
In this chapter we will look at the main steps that users will take when creating new report with NCReport
Designer. Usually, creating a new report will involve various activities:
• Deciding what kind of report structure we need
• Deciding what data sources to use
• Defining the data sources
• Adding the report sections are needed
• Deciding what items/objects to use in the different sections.
• Composing the user interface by adding report objects to the report sections.
• Connecting to SQL data source if needed
• Testing the report
Users may find that they prefer to perform these activities in a different order, However, we present each
of the activities in the above order, and leave it up to the user to find the approach that suits them best. To
demonstrate the processes used to create a new report, we will take a look at the steps needed to create a simple
report with NCReport Designer. We use a report that engages SQL database data source to illustrate certain
features of the tool.
5.1 Beginning a new report
By clicking the New menu or tool opens a new instance of a report. Select this tool button or menu to begin a
new report definition. By default the new empty report contains page header, a detail and a page footer sections.
45
CHAPTER 5. DESIGNING A REPORT 5.2. REPORT SECTIONS
Figure 5.1 New report
5.2 Report sections
Report sections are the representations of the function specific areas inside the report. Reports are builded
from sections. They are often a recurring areas such as detail, header or footer. The most important section is
called Detail since details can contain the fields are changed row by row. Each sections can contain all kinds of
report items. Item’s coordinates are always relative to their parent section. One report can contain the following
sections: Report header, report footer, page headers, page footers, group headers and footers and details
To change the height of a section just drag the bottom resizer bar under the section area and resize to the size
you want or type the height value in millimeter at Geometry editor’s spinbox if that is enabled. To activate the
current section just click onto the empty area of a section
5.2.1 Detail
The core information in a report is displayed in its Detail section. This section is the most important section
of the report since it contains the row by row data from the data source. Detail section have the following
characteristics:
• Generally print in the middle of a page (between headers and footers)
• Always contain the core information for a report
• Display multiple rows of data returned by a data source
• The detail sections generally contains fields.
• Multiple independent details are allowed in one report, each detail after the other
• All of details are assigned to one specified data source
46

CHAPTER 5. DESIGNING A REPORT 5.3. SETTING UP PAGE AND REPORT OPTIONS
5.2.2 Page header
Page headers is used to contain page headings. Page headers have the following characteristics:
• Always print at the top of a page
• Always contain the first information printed on a page
• Only display one (current) row of data returned by a data source
• Only one allowed per page
In most cases you need page header in reports. To add or remove page header select Report/Page options...
menu, then appears a dialog on you can set the page options of the current report. To enable or disable page
header just use Page header check box.
5.2.3 Page footer
Page Footer are commonly used to close the pages. Page footers have the following characteristics:
• Always print at the bottom of a page
• Only display one (current) row of data returned by a data source
• Only one allowed per page
Page footer is usually used to display informations such as number of the page, report titles and so on. In
most cases you need page footer in reports. To enable or disable page footer just use Page footer check box in
Report/Page options... menu.
5.2.4 Report header
Report header is a section used to contain report headings. Report header has the following characteristics:
• Always printed after the page header
• Report header is printed only once at the begining of the report
• Displays only one (current) row of data returned by a data source
To enable or disable report header use Report header check box in Page options dialog can be activated by
opening Report menu and selecting Page Options...
5.2.5 Report footer
Report footer is a section commonly used to close the report. Report footer has the following characteristics:
• Always printed before the page footer at the end of the report
• Only display one (current) row of data returned by a data source
• Only one allowed per report
To enable or disable report footer use Report foter check box in Page options dialog can be activated by
opening Report menu and selecting Page Options...
5.3 Setting up page and report options
Page options of the current report can be specified in Page options dialog. Open the Report menu and select
Page options.... In the report page settings dialog you can specify the following options:
Report name Type the name of the report. It’s just an informative option, it’s not used by report generator.
File encoding The encoding of the XML file. When user opens or saves the report definition file, this will be
the default encoding. In most cases UTF-8 encoding suit the requirements, but for special international
characters you may choose the specified encoding.
47
CHAPTER 5. DESIGNING A REPORT 5.4. ADDING DATA SOURCES
Page size The size of the page. The size names are listed in the combobox and their names are the standard size
names. Currently the standard page sizes are supported.
Default font The font name and size are basically used for the text labels and fields in the whole report. Each
object may change this option.
Background color The background color of the report. This option currently is not used.
Header and footer settings The check boxes can be used to enable or disable page header/footer and report
header/footer. To alter the height of theese sections you may use spin boxes corresponding to their check
boxes. You can also change these height properties by mouse dragging or by geometry editor
Margins margin properties represent the top, bottom, left and right margins of the page in millimeters. To alter
the margin values just use the spin boxes.
Orientation This radio button option represents the orientation of the page, Portrait or Landscape orientation
can be selected
Figure 5.2 Page settings dialog
The following buttons are available for apply or cancel settings:
•OK Select to apply your settings.
•Cancel Closes the screen without saving any changes, returning you to the designer desktop.
Specify the report page properties by using Page options dialog and validate the settings by clicking the OK
button.
5.4 Adding data sources
At the very beginning we have to decide what data source(s) we will use in the report. Since the report generator
builds a printable representation of data from a data source, at least one data source must be defined in the
report. Data may be fetched from an SQL query using Qt’s database SQL database connection drivers or from
other sources that don’t require SQL connection, such as text, string list or custom defined data source. One
report can contain multiple data sources and each details can be connected to one selected data source. Often a
data source is not assigned to any of detail, in this case you can use these kind of unassigned data sources as a
one (first) row/record source of data. See the details later.
To specify a data source to your report open the Report menu and select data sources... menu item. Then
appears a dialog on you can add and remove data sources. To add a new data source click the Add button and
then select the data source type from the list of available data soure types.
48
CHAPTER 5. DESIGNING A REPORT 5.4. ADDING DATA SOURCES
Figure 5.3 data source types dialog
In our example we choose SQL query data source type. After you click OK button a new SQL query data
source will be added to the list in dialog panel. Then you can specify the data source options. The following
properties are available for data sources:
data source ID. This string property is very important for identification purposes. You can refer to the data
source by this ID string.
data source type The type of the data source you’ve chosen before. It is cannot be changed after the data source
added to the list
Location type Location type is a property that describes where the data or the sql query can be found, inside
the report file or inside an external file. It’s value may be: Static, File, HTTP, FTP, Parameter. HTTP and
FTP type currently is not supported for SQL queries. For the different type of data sources it means a bit
different. For SQL query the Static location type is suitable, it means that SQL query will be saved statically
into the report file. Parameter type provides that the data is added to NCReport by NCReportParamer.
For example a QString Text or an SQL query can be added as parameter to NCReport depending on the
data source type.
File name/URL In case non Static location type is selected, here you can specify the name of the file that contains
data. (URL address currently is not supported.)
Connection ID This string property represents the ID of an SQL database connection. This name just the same
ID that is used in QSqlDatabase::addDatabase() function for identifying database connection. When you
add database connection in your application before running report, this connection name you should
specify.
Use external connection If you want to make available the SQL data source to use it’s own database connection,
you may enable this checkbox. After, the external connection panel becomes enabled and you can specify
the required properties of sql connection: hostname, database, username, password, port (optional).
SQL query This text area in which you can edit the sql query expression. Almost every cases it is a SELECT.
..FROM expression applying the SQL syntax of the specified database. Only one sql query is allowed for
the data source. SQL expression can contain Parameters, see later.
49
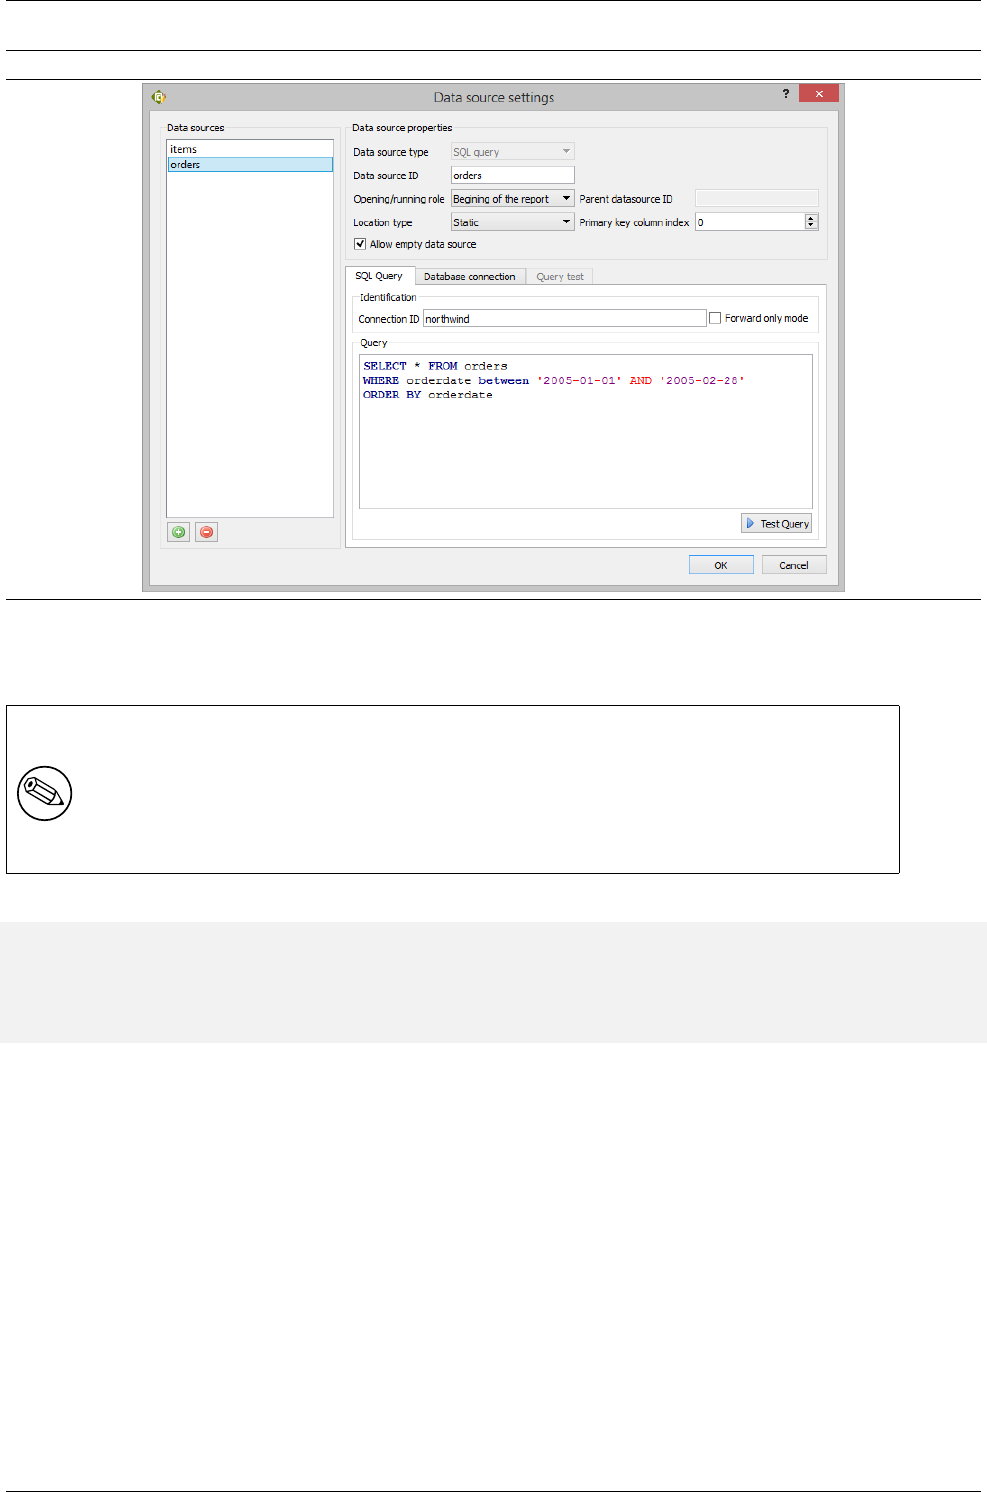
CHAPTER 5. DESIGNING A REPORT 5.5. ASSIGNING DATA SOURCE TO THE DETAIL
Figure 5.4 SQL data source
In our example we set the data source ID to data source1 (the default name) and choose Static location type.
We name the Connection ID Con0. After the SQL query must be specified.
NOTE
This example requires a running MySQL database server with existing northwind database and
tables. For generating sample database and tables SQL script file is attached with NCReport
project
Let’s use this simple query:
SELECT ProductID, ProductName, QuantityPerUnit, UnitPrice,
QuantityPerUnit*UnitPrice as value
FROM products
WHERE ProductID>20
ORDER BY ProductName
The following buttons are available for apply or cancel settings:
•OK Select to apply your data source settings.
•Cancel Closes the screen without saving any changes, returning you to the designer desktop.
Validate the data source settings by clicking the OK button.
5.5 Assigning data source to the Detail
To assign the data source we defined before, open the Report menu and select Details and grouping... menu item,
then appears a dialog on you may manage the detail sections of the report. A default Detail1 named detail is
already defined. You can rename it to the name you want if you change Detail ID. Select the previously defined
data source from data source combo box. The combo box contains all of defined data sources. This option must
be specified for working of the report.
50
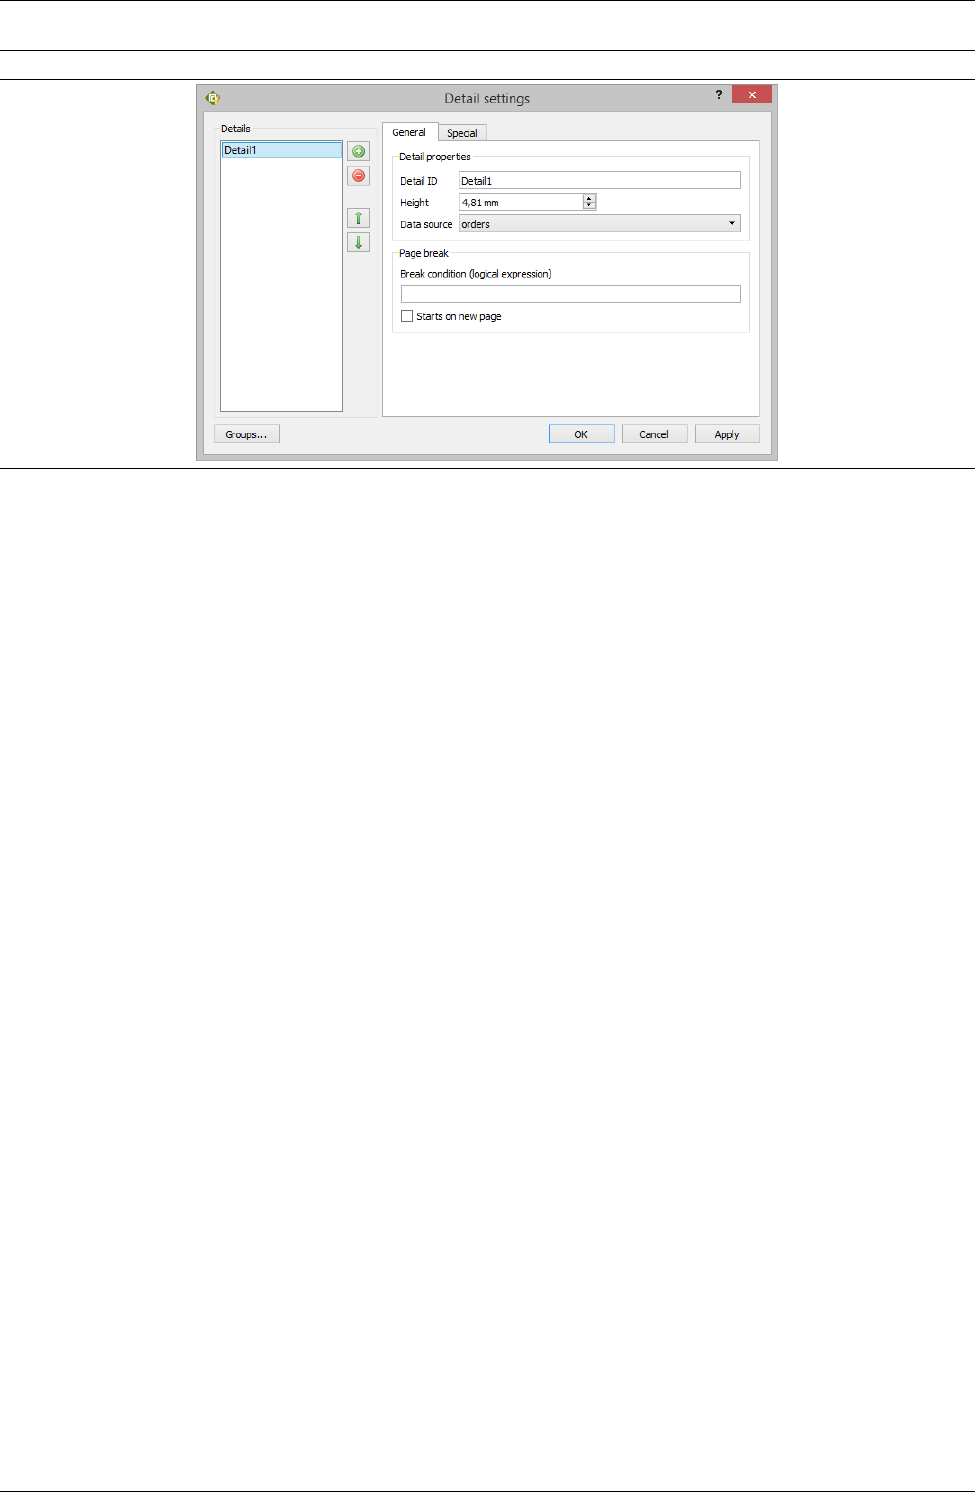
CHAPTER 5. DESIGNING A REPORT 5.6. ADDING REPORT ITEMS
Figure 5.5 Detail dialog
Here we summarize the options of Detail dialog:
Detail ID The name of the detail section.
Height Height of the detail section in millimeters. To alter the height of theese sections you may use this spin
box. You can also change the height by mouse dragging or by geometry editor
data source data source name assigned to the detail. Previously defined data sources can be selected in the
combo box
Data grouping By clicking this button the group management dialog of the corresponding detail can be opened.
You can add more details by Add button or remove existing detail by Remove button. One detail section must
be existed, so it does not construe to remove the only one detail.
The following buttons are available for apply or cancel settings:
•OK Select to apply your settings.
•Cancel Closes the screen without saving any changes, returning you to the designer desktop.
Validate the detail settings by clicking the OK button.
5.6 Adding report items
After we defined the data source and specified the report options now we can design the report by adding items
to the specified sections. The Tools menu or the tool bar displays report items that can be used when designing
a report. Let’s summarize the various report items of NCReport:
Text label The Label represents simple text or label items. Label items are used to display descriptive infor-
mation on a report definition, such as titles, headings, etc. Labels are static item, it’s values don’t change
when rendering the report.
Field The Field is the matter of report items. It represents the data Field objects. By data type Fields may be
text, numeric and date. Field items are used for pulling dynamically generated data into a report from the
specified data source such as database the report generator uses. For example, a Field item may be used
to present SQL data, variables and parameters. NCReport handles data formatting for the different type
of fields like numbers or texts.
Line The Line option enables you to create Line items. In general, Line items are used for drawing vertical,
horizontal lines for headings, underlining titles or so on. Lines are defined by it’s start and the end point
coordinates
Rectangle The Rectangle enables you to create Rectangle items. Rectangles are usually used for drawing boxes
or borders around a specified area. Rectangle makes easier the box drawings instead of drawing four
lines.
51
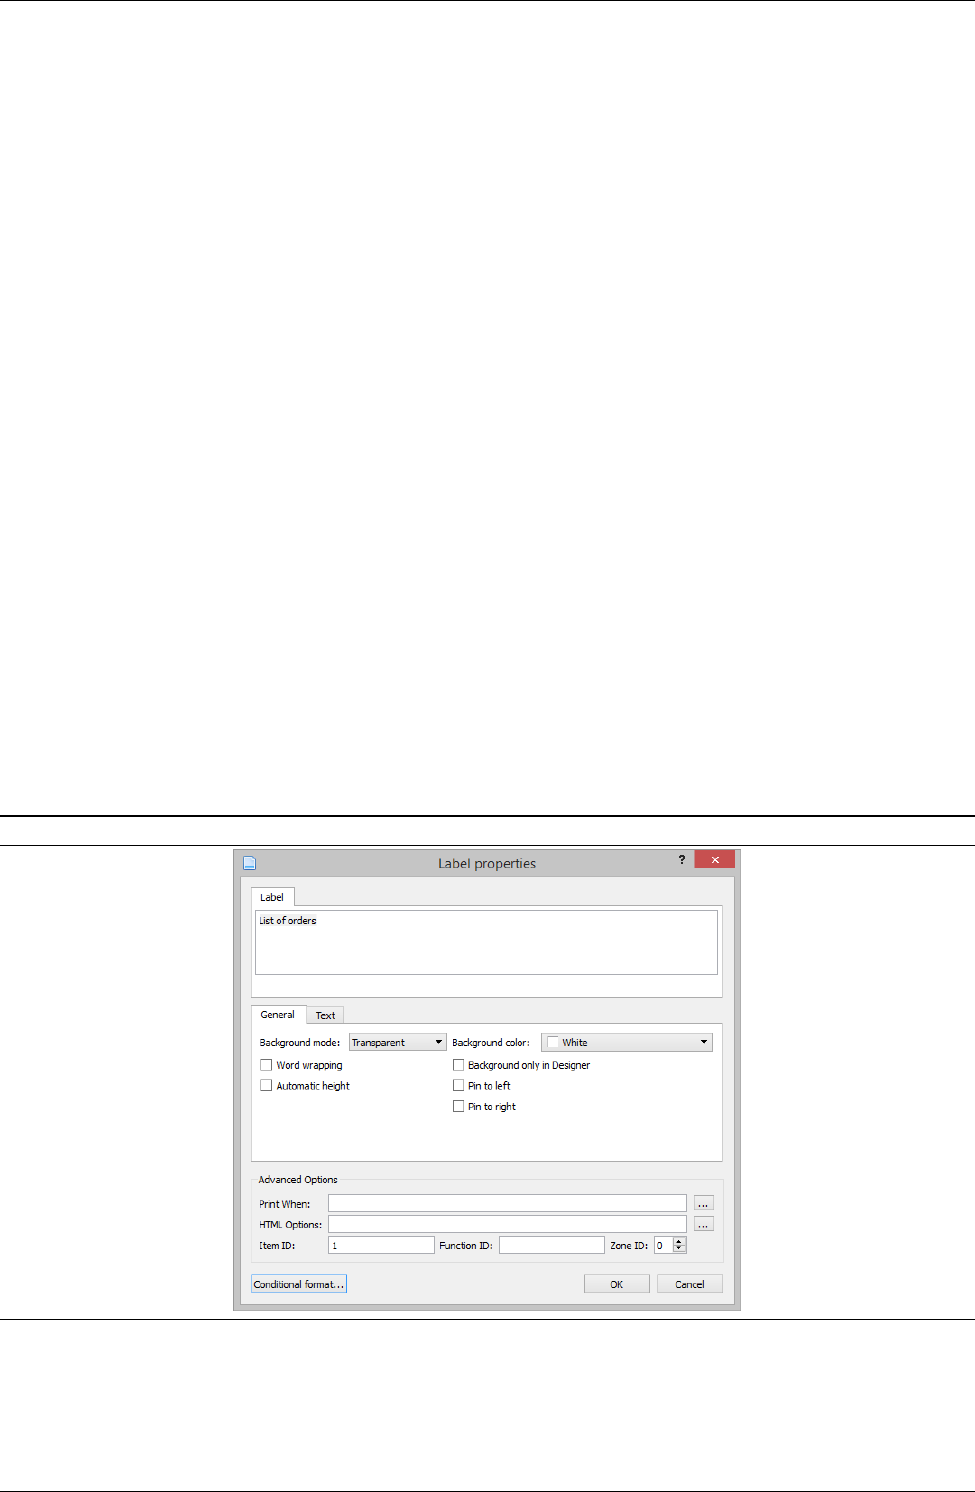
CHAPTER 5. DESIGNING A REPORT 5.6. ADDING REPORT ITEMS
Ellipse The Ellipse item enables you to create circle or ellipse in report. Ellipses are mostly used for drawing
charts or borders around a text.
Image The Image option enables you to create Image items. Image items are used to insert either static or
dynamic into a report definition. Static images such as a company logo often displayed in the Report
Header can be loaded from a static file or from report definition. Dynamic images can be loaded from the
specified SQL data source.
Barcode The Barcode option enables you to create barcodes. Currently the EAN13 code format is supported.
Barcodes might be either static or dynamic items similar to images. Static barcodes read it’s value from
the report definition, dynamic barcodes are loaded from the specified data source.
Custom item / Graph Graph/Custom item is a special member of NCReport items. This option enables you to
render special, custom defined contents in reports. The typical field of application is using this feature for
rendering graphs or such contents.
5.6.1 Adding heading Labels
First let’s add the labels that represent the column header of data rows. To create a new Label object, first select
the Label tool button or menu item in Tools menu. After that the cursor changes to a cross beam, then click in the
section of the report definition where you want the Label to be located. (i.e. we add label to the report header.)
Doing so will create the Label object in that section and opens the Object settings dialog. On the dialog you may
then set the Label object’s properties.
The following options are available for labels:
Text Just enter here the text of the label
Automatic word wrapping If this check box is enabled the text will be wrapped fitting to it’s size.
Print when expression This is a logical expression which enables you to define when the Label object is shown
or not. See the details later.
Figure 5.6 Label dialog
The following buttons are available for apply or cancel settings:
•OK Select to apply your label settings.
•Cancel Closes the screen without saving any changes, returning you to the designer desktop.
52
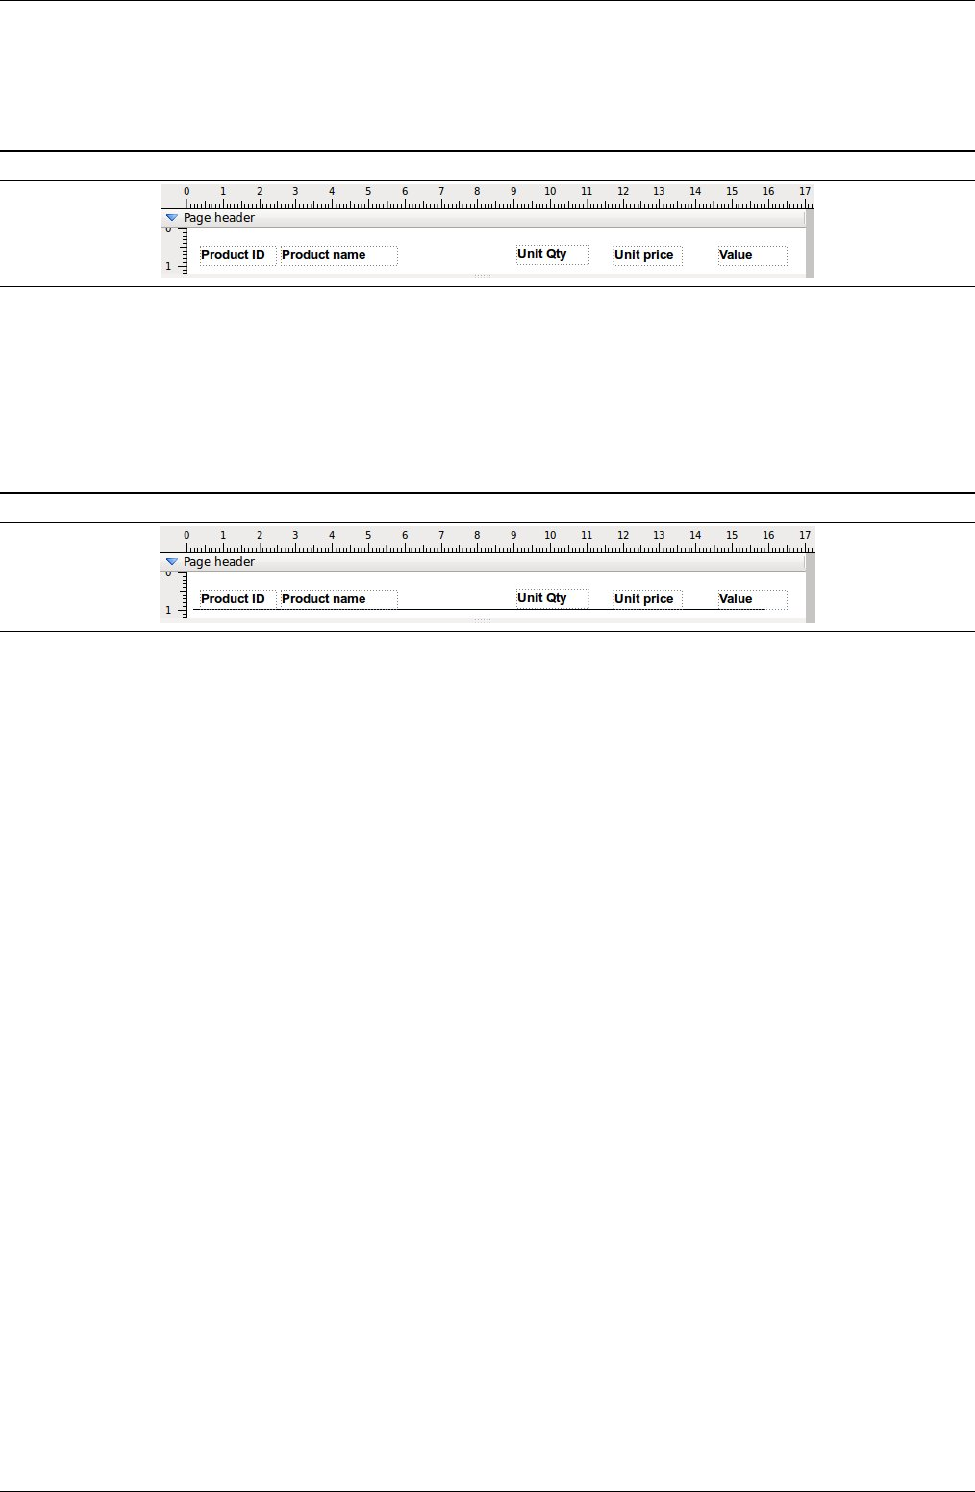
CHAPTER 5. DESIGNING A REPORT 5.6. ADDING REPORT ITEMS
Add the following labels to the Page Header: Product ID, Product name, Unit Qty, Unit price, Value and
move them by drag and drop to the place you want to be located. To move the added Label just drag (select) it
with left mouse button and drop it to the location you want. To delete a Label, select it and press Delete button
Figure 5.7 Adding labels
5.6.2 Adding Line
To create a new Line object select the Line button in the tool bar or menu item in Tools menu. After that the
cursor changes to a cross beam, then click in the section of the report definition where you want the line to be
started and simply drag the line to the end position. To move the added line just drag (select) it with left mouse
button and drop it to the location you want. To delete the line just select it and press Delete button
Figure 5.8 Adding line
To open the line properties dialog just double click on the line, on the dialog you may then set the object’s
properties. In the dialog you are presented with the following options are available:
Print when expression This is a logical expression which enables you to define when the Line object is shown
or not. See the details later.
5.6.3 Adding Fields
Now we have to add the most important items to the report. Field objects contain dynamic information retrieved
from a data source, parameter or a variable. To create a new Field object, first select the Field tool button or the
menu item in Tools menu. After that the cursor changes to a cross beam, then click in the section onto you want
the Field to be located. This section is in generally the Detail section. Doing so will create the Field object in
the specified section at that position and opens the Field property dialog. On the dialog you may then set the
Field’s properties.
The following options are available for fields:
Field source type The combo box contains the possible sources from where the field can pull data. Field’s data
can be loaded form the following sources: data source, Parameter, Variable, System variable, Expression.
About various source types you can find informations in NCReport specification.
Field column/expression This property represents the name of the data column from where field’s value are
pulled. When SQL query data source is used by the field, this name equals the corresponding SQL column
name included in SQL query. When other data sources such as Text, this value is often the number of the
data column.
Data type The field’s base data type. The following data types are supported: Text, Numeric, Date, Boolean
Automatic word wrapping If this check box is enabled the field will be wrapped fitting to it’s size.
QString::arg() expression This is a string expression with %1 symbol for the same purpose what QString("S
tring %1").arg(value) code does. The field’s value will be embedded into this expression.
Call function This feature currently is unavailable.
Lookup class name This feature currently is unavailable.
53
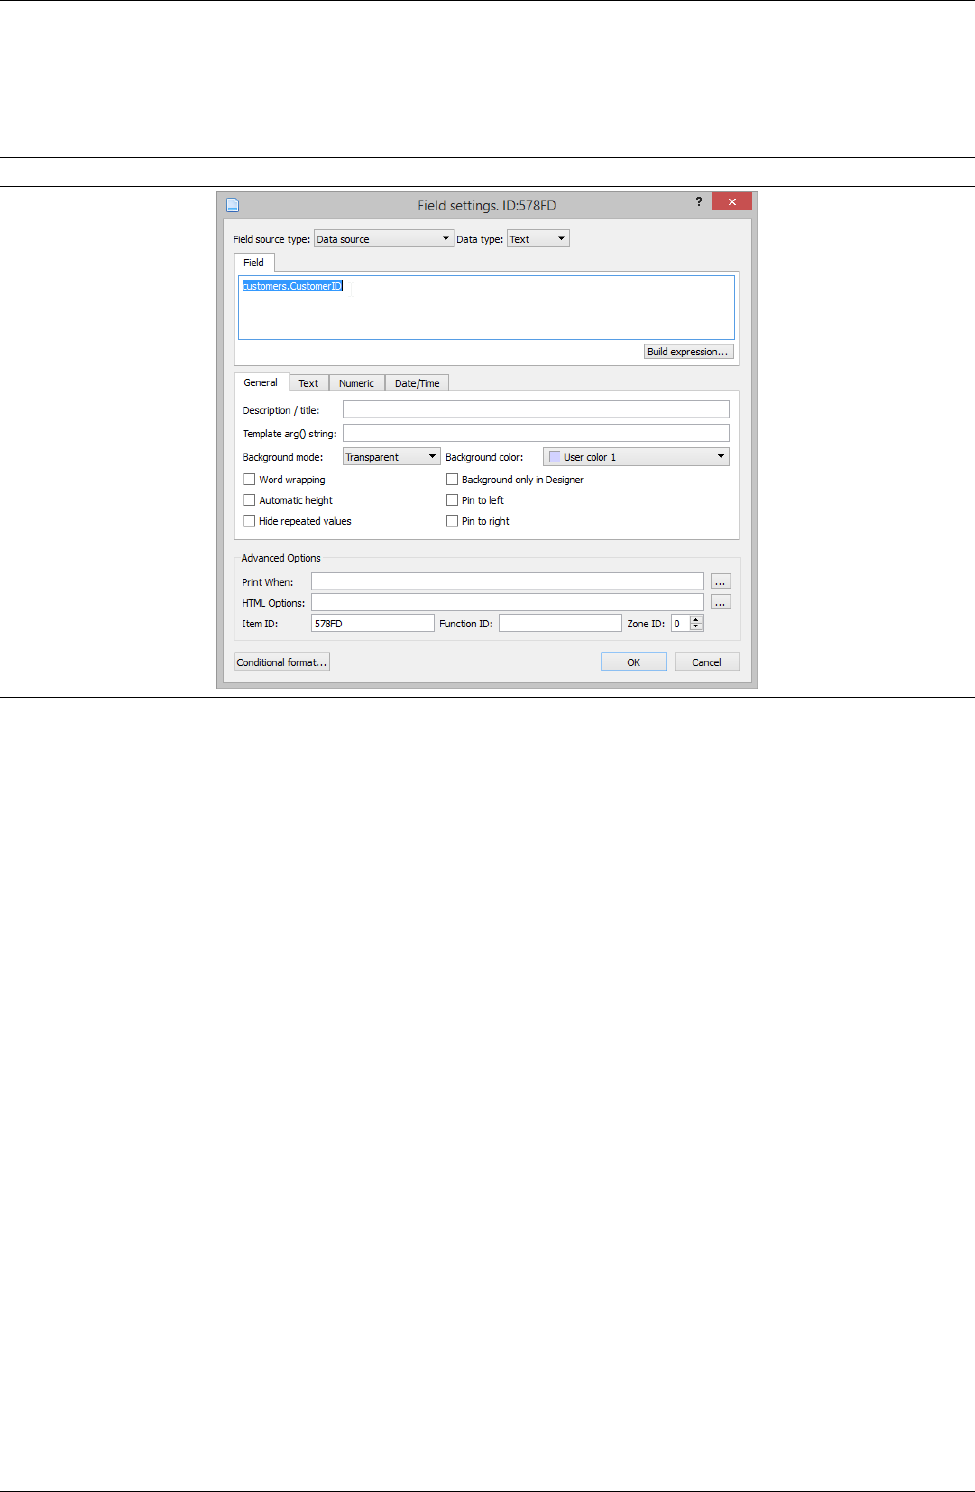
CHAPTER 5. DESIGNING A REPORT 5.6. ADDING REPORT ITEMS
Print when expression This is a logical expression which enables you to define when the Field is shown or not.
See the details later.
Figure 5.9 Field dialog
The following table summarizes the various formulas you can specify in fields as field column expression.
The formula depends on what field source type you use.
Some properties are available for different data types only. They are located on separated tab widgets within
the dialog. The following additive options are available for numeric fields:
Number formating: If this option is checked, the number formating will be turned on
Use localized settings If this option is checked, the report engine will use localized number formats by the
current application’s QLocale settings.
Blank if value equals zero If this option is checked, the field’s current value will not appear when it’s value
equals zero.
Decimal precision The number of digits after the decimal point.
Field width Width of number in digits. Specifies the minimum amount of space that a is padded to and filled
with the character fillChar. A positive value will produce right-aligned text, whereas a negative value will
produce left-aligned text.
Format character This one digit option specifies the format code for numbers. Possibly values are: e,E,f. With
e, E and f, precision is the number of digits after the decimal point. With ’g’ and ’G’, precision is the
maximum number of significant digits. Used by QString::arg( double a, int fieldWidth =
0, char format =’g’, int precision =-1, const QChar fillChar) function.
Fill character specifies the character the numeric value is filled with when formating. See QString::arg() fillChar
parameter.
54
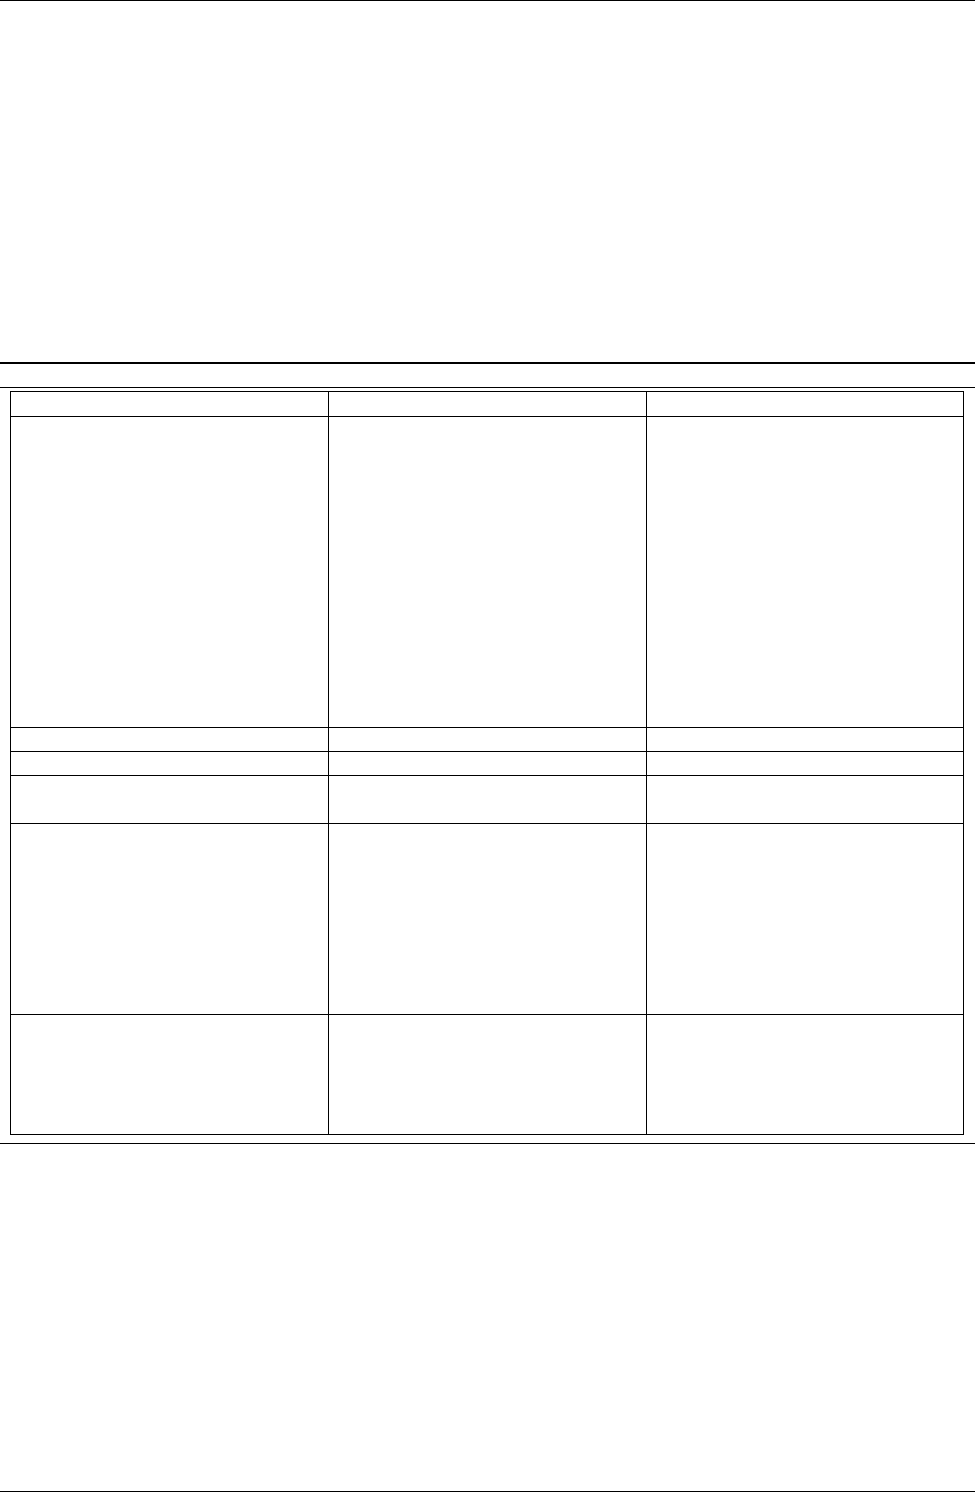
CHAPTER 5. DESIGNING A REPORT 5.6. ADDING REPORT ITEMS
Table 5.1 Field column formulas
Filed source type Field column formula Description
Data Source [data sourceID.]column
The column equals a valid SQL
column name in your SQL query.
If data sourceID is specified, the
report engine will assign the
named data source by this ID. If
you don’t specify data sourceID,
the default (currently processing)
data source is interpreted you
have assigned before to the
detail.
The Data Source references can
contain also functions. Read
more in chapter Expressions.
Parameter parameterName The name/ID of the parameter
Variable variableName The name/ID of the variable
System variable variableName The name/ID of the system
variable.
Expression expression
You can use even a complex
script expression for the field.
Both data source data,
Parameters, Variables can be
used in expressions. For more
informations about expressions
see the Using expressions
chapter.
Template template expression
Template is a simple substitution
of report items such as data
source data, parameter or
variable. All of them are joined
into one string.
55
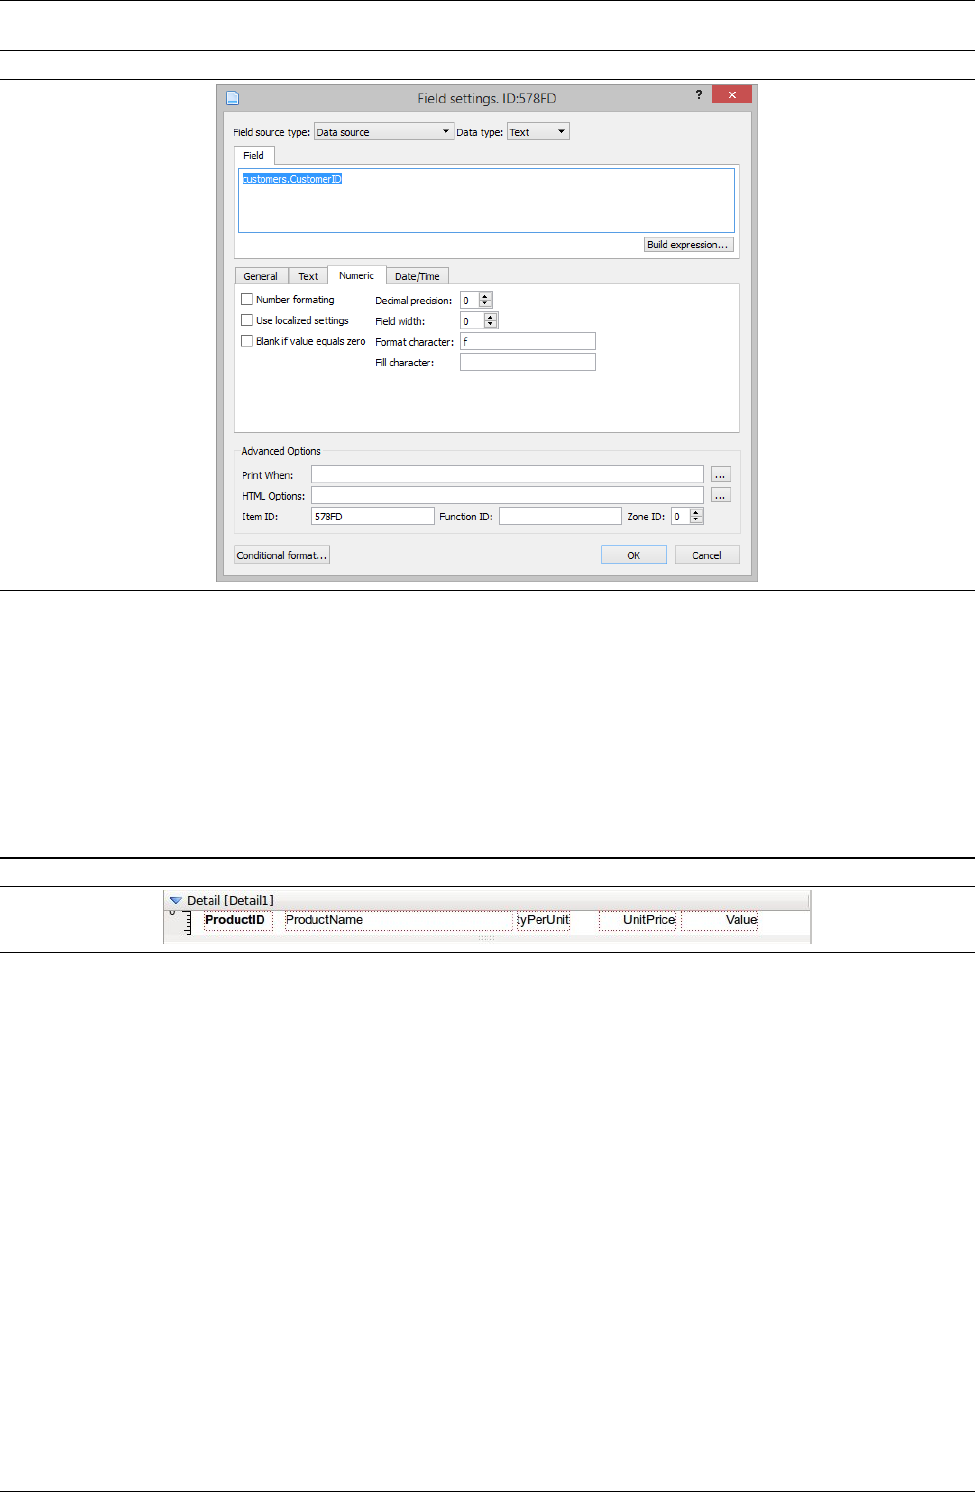
CHAPTER 5. DESIGNING A REPORT 5.6. ADDING REPORT ITEMS
Figure 5.10 Field dialog - numeric data
The following buttons are available for apply or cancel settings:
•OK Select to apply your field settings.
•Cancel Closes the screen without saving any changes, returning you to the designer desktop.
To continue our instance report, add the following (four) fields to the detail section. Use the following
names and data types in field column expression: ProductID (Numeric), ProductName (Text), QuantityPerUnit
(Numeric), UnitPrice (Numeric), Value (Numeric)
Figure 5.11 Details section with fields
5.6.4 Adding Variables for totals
Before we add variable field to the report, let’s see the handling of variables in NCReport. Variables are special
items used for providing counts and totals. Each of the variables have name, function type, data type, and
have an assigned data source column the variable based on. To add a variable open the Report menu and select
Variables... menu item. Then appears a dialog on you can manage variables.
The following options are available for variables:
Variable ID The name/ID of the variable.
Variable expression This property represents the name of the data column from where variable’s value is
pulled from.
Function type The function type of the variable. Supported function types: Sum, Count Count: The COUNT
type of variable will increment by 1 for every detail row. Sum: The SUM (summary) variable will summa-
rize the value of the specified data column returned by the field
Reset scope If this check box is enabled the field will be wrapped fitting to it’s size.
Initial value Initial value of the Variable
56
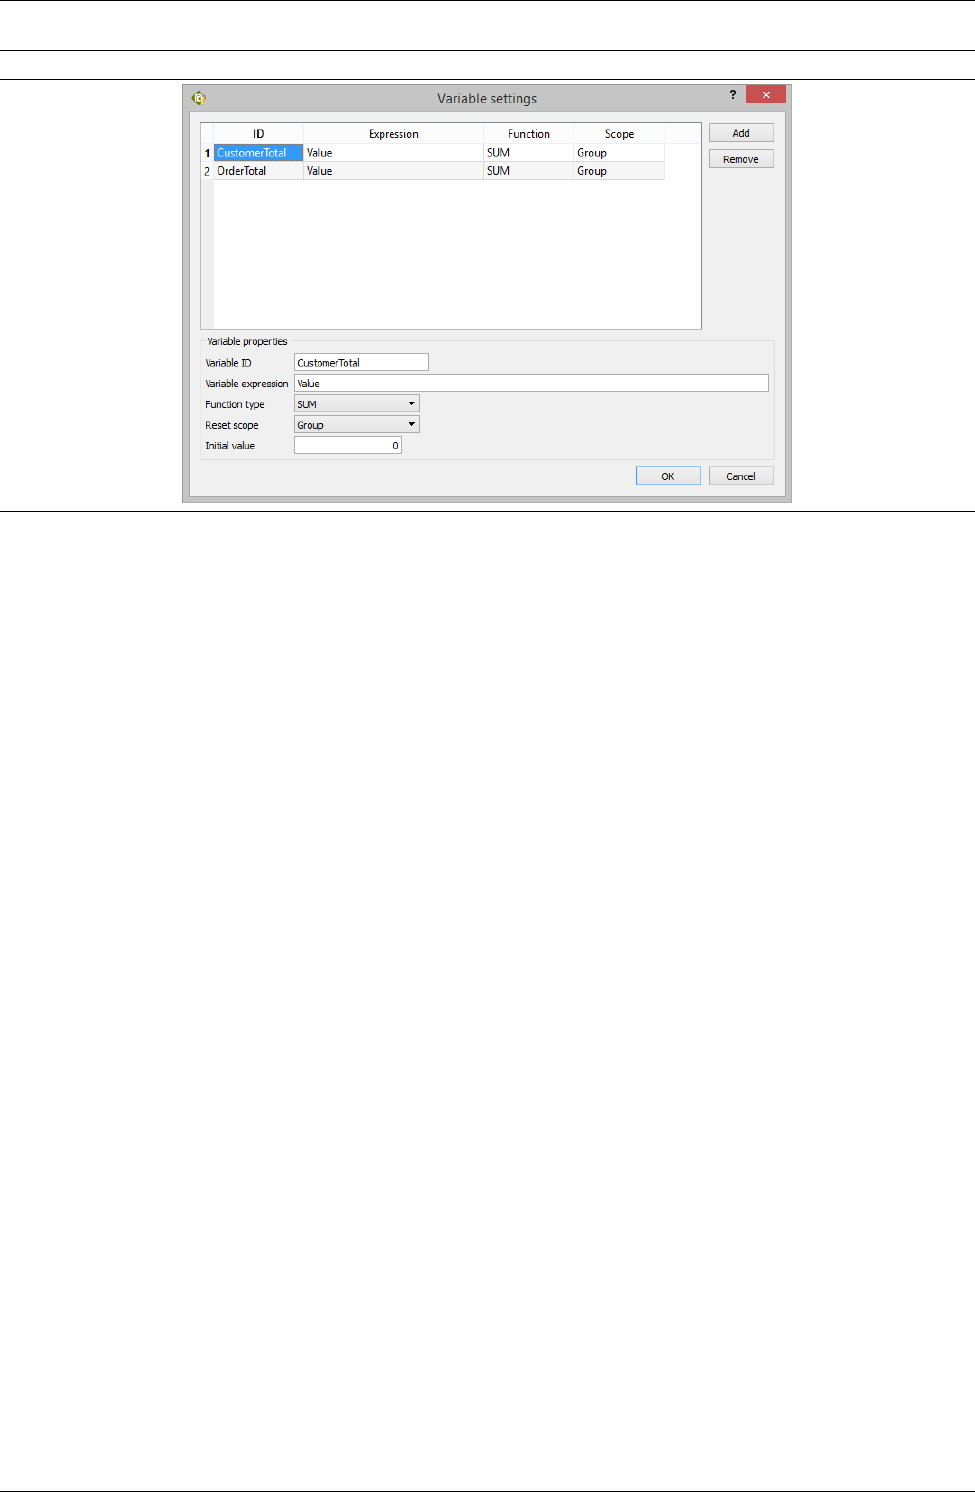
CHAPTER 5. DESIGNING A REPORT 5.6. ADDING REPORT ITEMS
Figure 5.12 Variable dialog
The variables added to report are shown in the variable list view. Clicking on the list items the selected item
becomes active. To delete the selected item just select the Remove button. The following buttons are available in
the dialog:
Add Adds a new variable and enable the variable options to edit. Remove: Deletes the variable selected from
the list
•OK Select to save your variable settings.
•Cancel Closes the dialog without saving any changes, returning you to the designer desktop.
Add a new variable by clicking the Add button and then specify the options by followings: Variable ID:
total_value, Variable expression: value, Function type: SUM, Reset scope: Group
To add total first, we should add a new group to the detail. In the next section we explain how to use the
grouping feature.
5.6.5 Adding group to detail
While most reports can be defined using a single Detail section having multiple columns and rows of data,
others - just like our example report - require summary data, totals as subtotals. For reports requiring summary
data, NCReport supports Group sections. Group sections have the following characteristics:
• Always associated with a Detail section
• Defined by Group Headers and Group Footers
• Group Headers always print above it’s Detail section
• Group Footers always print below it’s Detail section
• Reference database column on which Group Headers and Group Footers will break
• Force new Group Header each time the value of the referenced column changes
• Force a new Group Footer each time the value of the referenced column changes
• Unlimited level of groups allowed
In the group dialog the groups added to the report are shown in the order you have added. The added group
sections will appear in the designer after you applied the group settings. Groups are structured hierarchically.
The first group will be the primary level of group, the second one is the second level and so on.
To add a new group to the detail, open the Report menu and select Details and grouping.... Then the Detail
settings dialog will appear. Select the Detail1 detail in the list, then to open the grouping dialog click on Data
57
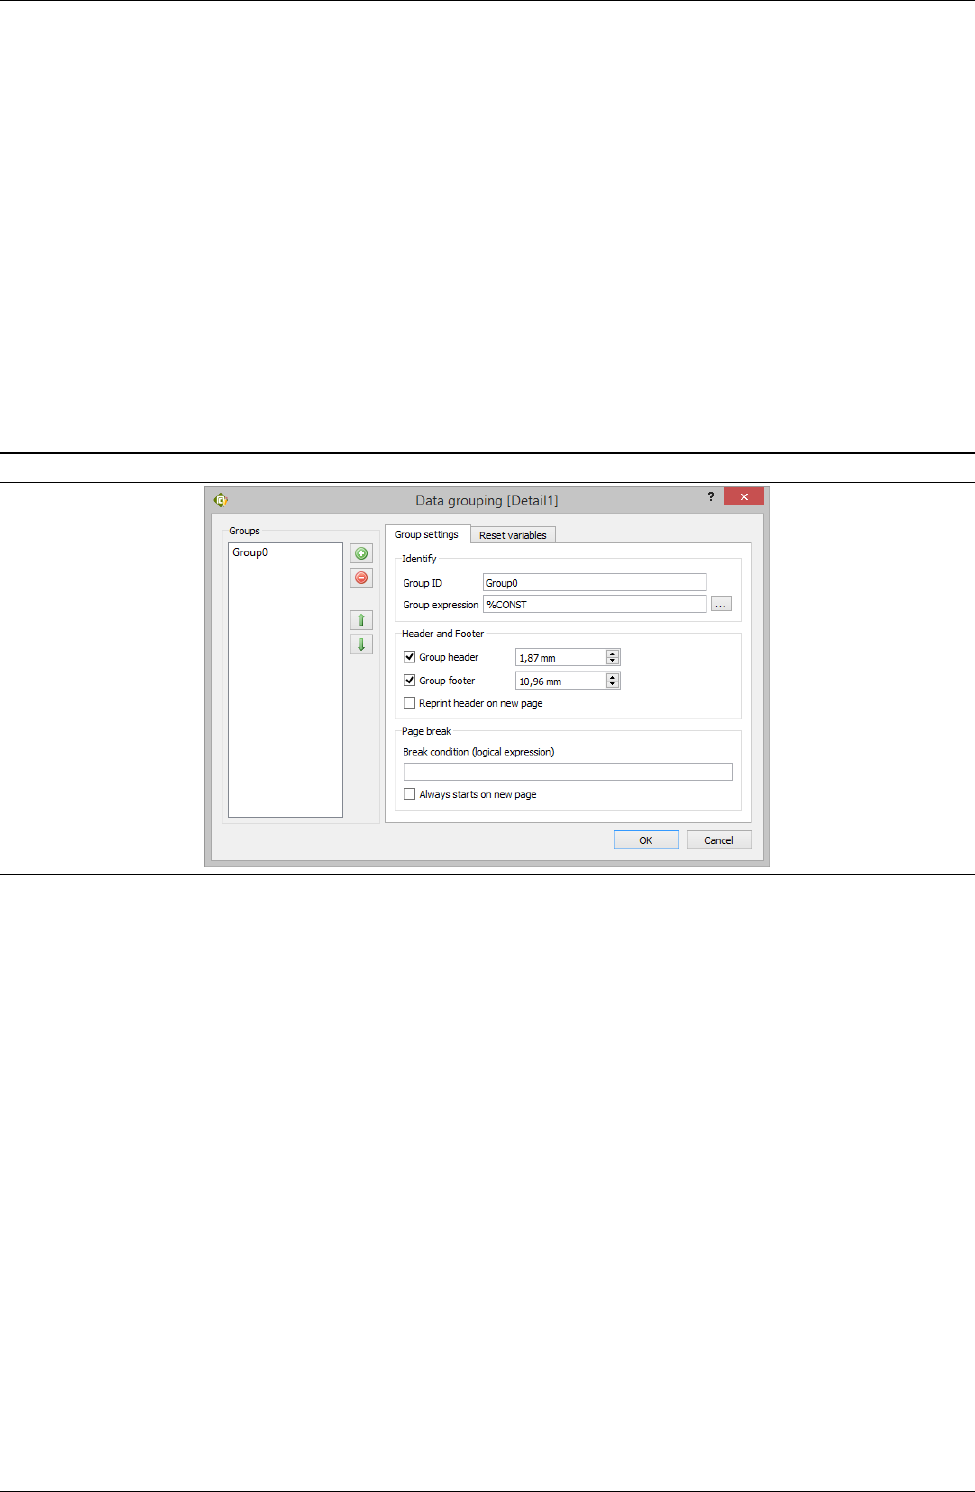
CHAPTER 5. DESIGNING A REPORT 5.6. ADDING REPORT ITEMS
grouping... button. The Group settings dialog appeared, always belongs to the previously selected detail. To
add a new group click on the Add button.
The following additive options are available for a group:
Group ID The name/ID of the group for identification purposes
Group expression The name of the data source column the group is based on. If the value of this referenced
column changes, the group breaks. Also constant values such as 0 or 1 can be used as group expression.
Then the group will never break just ends. This could be very useful for end-total fields.
Header and Footer To enable or disable group header and footer, check on or off the specified check box. To set
initial height of these sections you can use spin boxes near the check boxes.
Reset variables This list contains the variable names are available to reset when the group ends. The variables
that have Report reset scope status are visible only in the list.
Figure 5.13 Group dialog
The groups added to a detail appear in the group list. Clicking on the list items the selected item becomes
active. To delete the selected group just select the Remove button. The following buttons are available in the
dialog:
•Add Adds a group and enables the group options to edit.
•Remove Removes the group selected from the list
•OK Select to save your group settings.
•Cancel Closes the dialog without saving any changes, returning you to the Detail settings dialog.
So, let’s add a new group with the following specification: Group ID: Group0, Group expression: 0, Show
group header and footer, Reset total_value variable. After you select OK button, the new group sections (header
and footer) will appear in report document. Close also the Detail settings dialog by clickink OK button.
5.6.6 Adding total variable field
Now we have a defined group with header and footer. Group footers in general a sections are usable for showing
totals and subtotals. Let’s add a new field to the report footer with the following parameters:
Field source type: Variable, Field column: total_value, Data type: Numeric
Now we have got almost all of fields we need. What we have to do also is just adding some missing lines,
labels and adjusting the report.
58
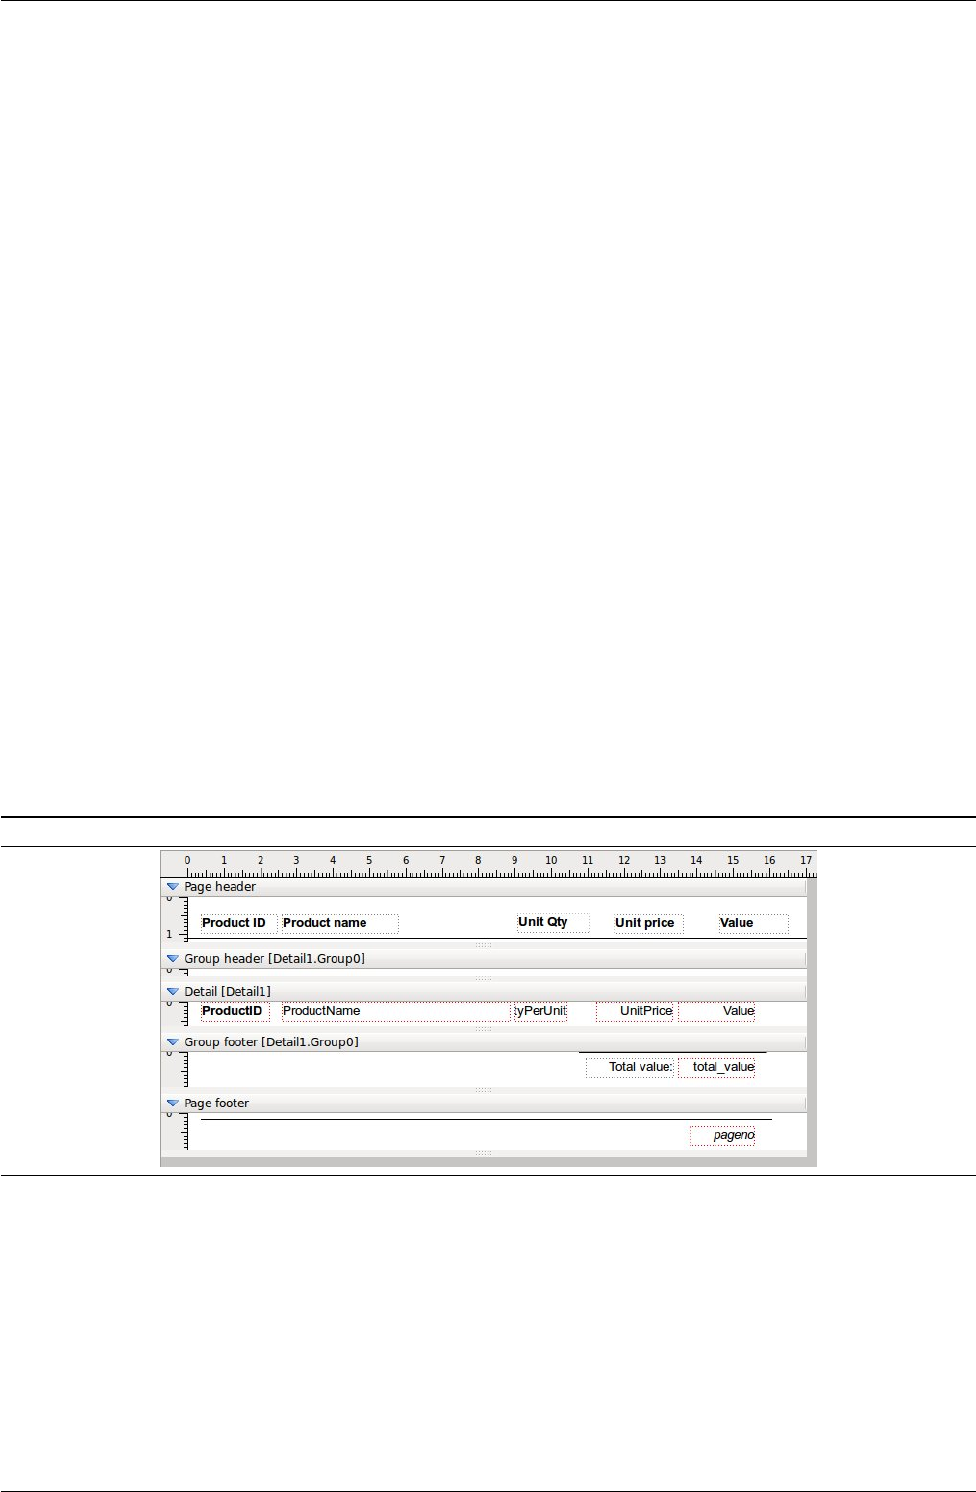
CHAPTER 5. DESIGNING A REPORT 5.7. CONNECTING TO DATABASE FROM ...
5.6.7 Other items
We summarize the tasks below:
• Add a Total value: Label to the report footer section near the total field.
• Add a Line above the totals.
• Move the items adjusted to the appropriate columns.
• Add a Line to the Page footer similar to the line in the Page header
• Add a Field to the Page footer: Field source type: System variable, Field column: pageno, Data type:
Numeric, QString::arg() expression: Page: %1
5.6.8 Adjustment and formatting
To finish the report now we can format and adjust the items. Here are tasks you should also do:
• Adjust the height of the sections for the fitting size by mouse dragging the base line of section or by
geometry editor. The height of the detail is important, since it is often recured many times.
• Select the labels in Page header and set the font weight to bold by clicking the Bold tool button in tool bar.
Item multi-selection may used.
• Select ProductID field in Detail section and set its font weight to bold.
• Select and align right all of numeric fields to right by clicking the Align right tool button in tool bar.
• Set the number format options for numeric fields: Number formating: on, Decimal precision: 2
• Set also Use localized settings on for value and total_value fields
Save the report. Now you should get something similar this:
Figure 5.14 Report is ready
5.7 Connecting to database from Designer
NCReport Designer now enables you to test the report from inside the designer. Since this report requires inter-
nal MySQL database connection, first we should connect to "northwind" database. SQL database connections
can be managed by the Connection manager within the designer application. Open the Report menu and then
select SQL connection manager... After the Connection manager dialog will appear. By this dialog you can add
one or more SQL connections.
The following options are available for connections:
Database driver The appropriate SQL database driver.
59
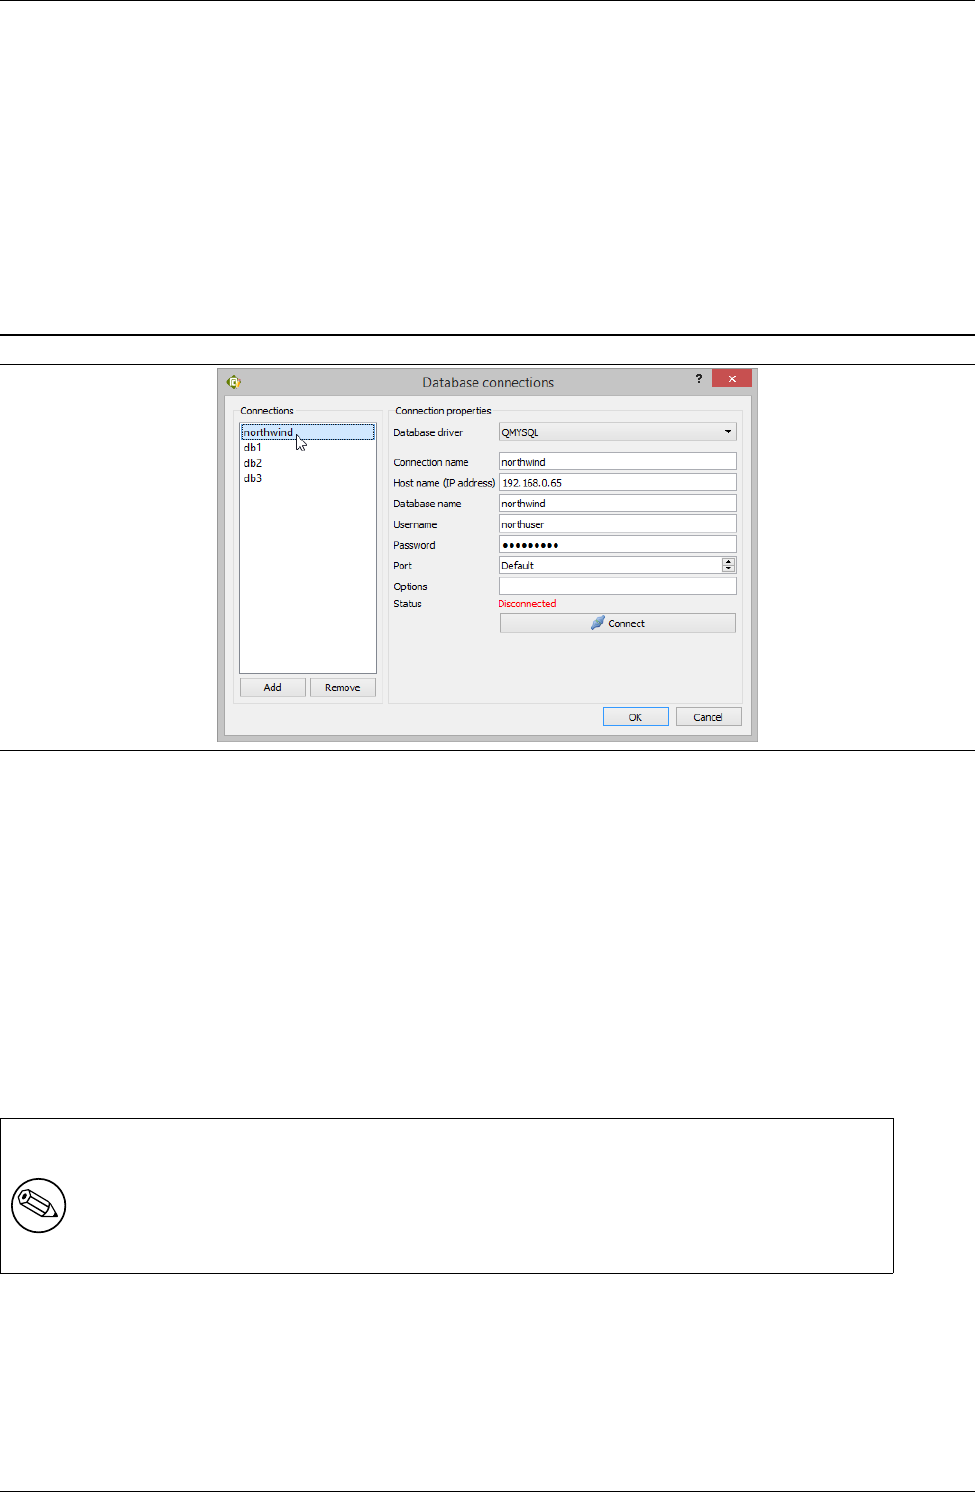
CHAPTER 5. DESIGNING A REPORT 5.8. RUNNING THE REPORT
Connection name The name of the database connection. Qt uses this name in addDatabase(...) function. For
identifying the corresponding connection this value have to be specified.
Host name Name or IP address of host
Database name Name of the database
Username Connection’s user name
Password Connection’s password
Port Connection’s port number. If empty, the default port is used in connection.
Figure 5.15 SQL connection dialog
•Connect Tries to establish the connection
•Add Adds a new connection and enables the options to edit
•Remove Removes the connection selected from the list
•OK Select to save your connection settings.
•Cancel Closes the dialog without saving any changes, returning you to the desktop.
After you specified connection parameters to the added connection use the Connect button to establish
connection. If the connection is succeeded then your report is ready to run. Before running the report we
rename our connection to northwind and then also our data source’s connection name must be renamed to
northwind. Doing so just open again the data sources... dialog and then rename the connection ID to northwind
too
NOTE
You don’t need any SQL connection if you use non SQL data source in your report, for example
Text, Stringlist or other data source
5.8 Running the report
For running report from the Designer window open Report menu and select Run report... menu item. Then
the report runner dialog will appear. You may add and remove parameters by Add/Remove buttons. About
parameters in example see the next section. Select the output where you want the report to go to and then start
the report by clicking OK button
60
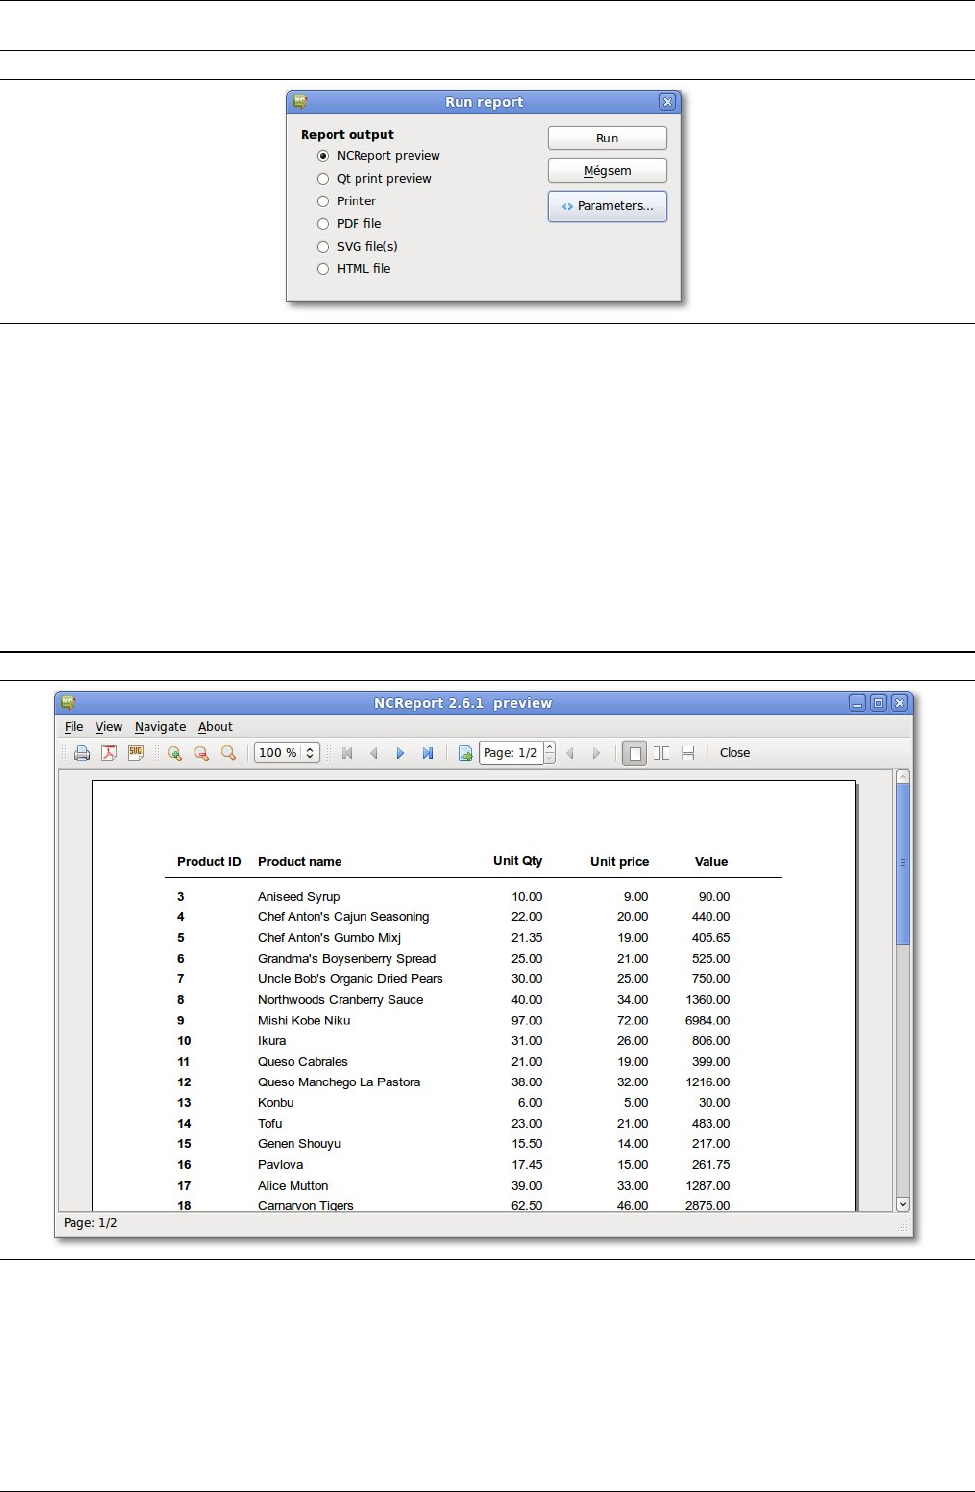
CHAPTER 5. DESIGNING A REPORT 5.8. RUNNING THE REPORT
Figure 5.16 Run report dialog
Running the report to Preview window now you should see something similar:
Figure 5.17 Preview output - page 1
And the second page:
61
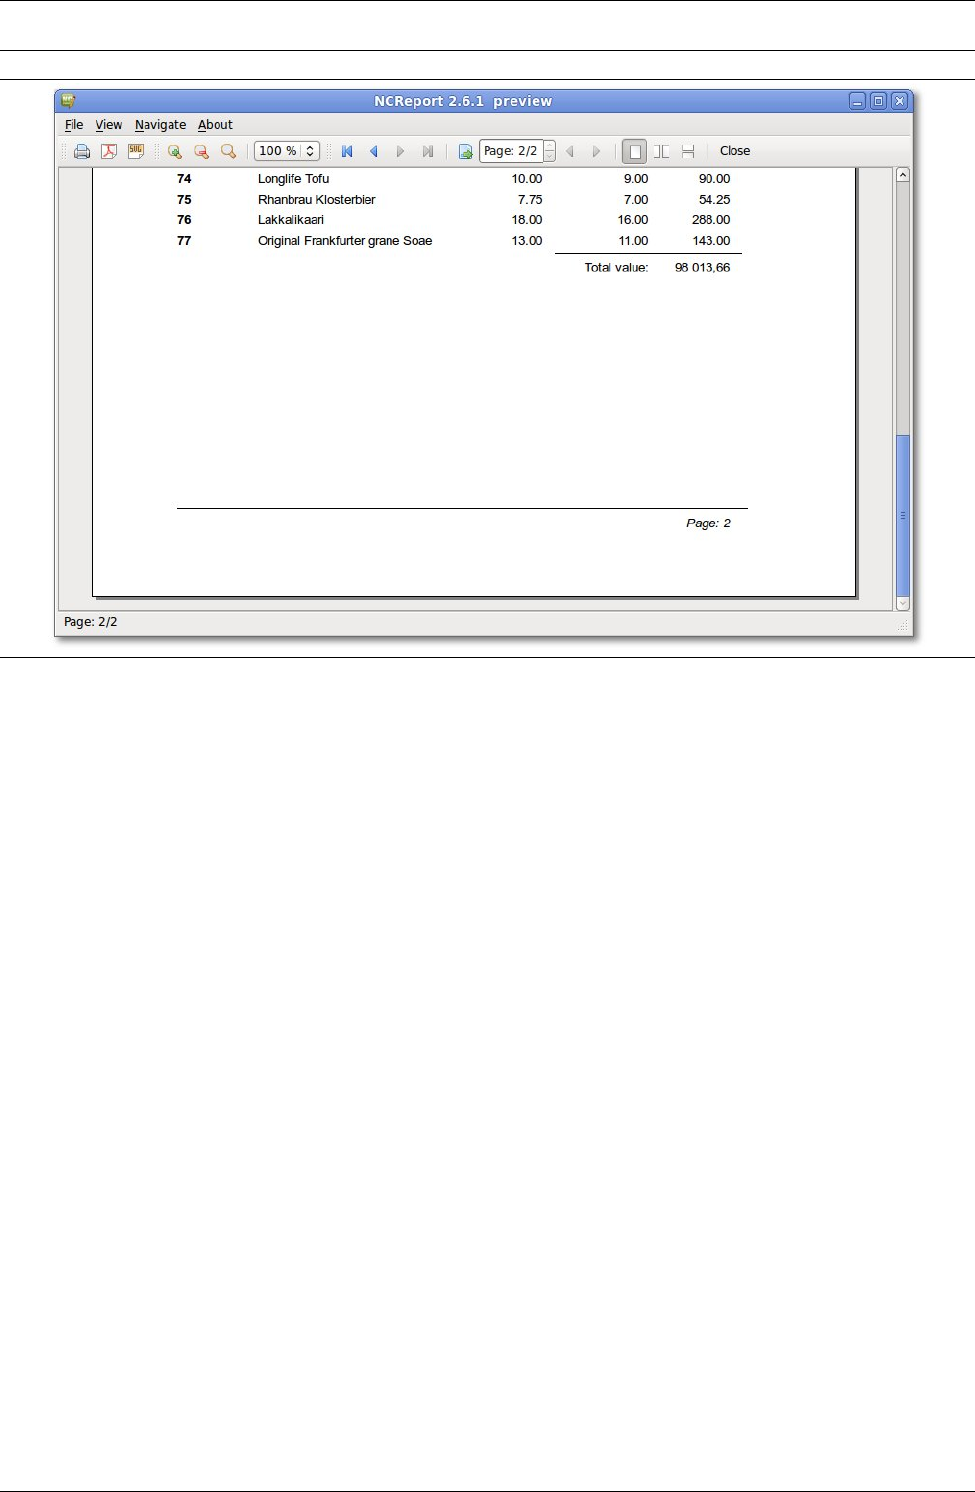
CHAPTER 5. DESIGNING A REPORT 5.8. RUNNING THE REPORT
Figure 5.18 Preview output - page 2
62
Part IV
Advanced functions
63

To create more complex, professional reports we need even more features and functions. The following
section describes about these important advanced functions of the NCReport reporting system.
65

Chapter 6
Parameters
Parameters are data that obtained from outside of the report generator. The application that calls NCReport
object passes informations as parameter to NCReport class by NCReport::addParameter(...) method.
Parameters are evaluated within SQL queries and script expressions. Field objects also may have a parameter
data source type, so they can be presented as data in the report. Parameters mostly used in SQL queries and
expressions.
6.1 Parameter syntax
For example if you want to embed a parameter into the query or an expression use this syntax:
$P{parameterID}
Example of using parameter in sql query:
SELECT productId, productName FROM db.products WHERE primaryKey=$P{parameterID}
6.2 Testing Parameters
Our last sample report uses SQL data source and we defined a static SQL query in it. In most cases it’s not
suitable because usually we have to influence and change the content of SQL queries for i.e. filtering or for
similar purposes. Parameters are very handy to do this. To modify our SQL query open the Report menu and
select Report/Data sources... menu item. Modify the SQL query of our connection by the following:
SELECT ProductID, ProductName,
QuantityPerUnit, UnitPrice, QuantityPerUnit*UnitPrice as value
FROM products
WHERE ProductID > $P{prodID}
ORDER BY ProductName
After we have to add a Parameter with prodID ID/name to NCReport otherwise the query will throw an
error. NCReport Designer has a test runner dialog with parameter adding feature. To open the runner dialog
select the Run report... menu item from Report menu. To add a new Parameter just click Add button and then
specify it’s name to prodID and the value to a code what you want. We specify the value to 70. After running
the report to Preview we get the following result:
67
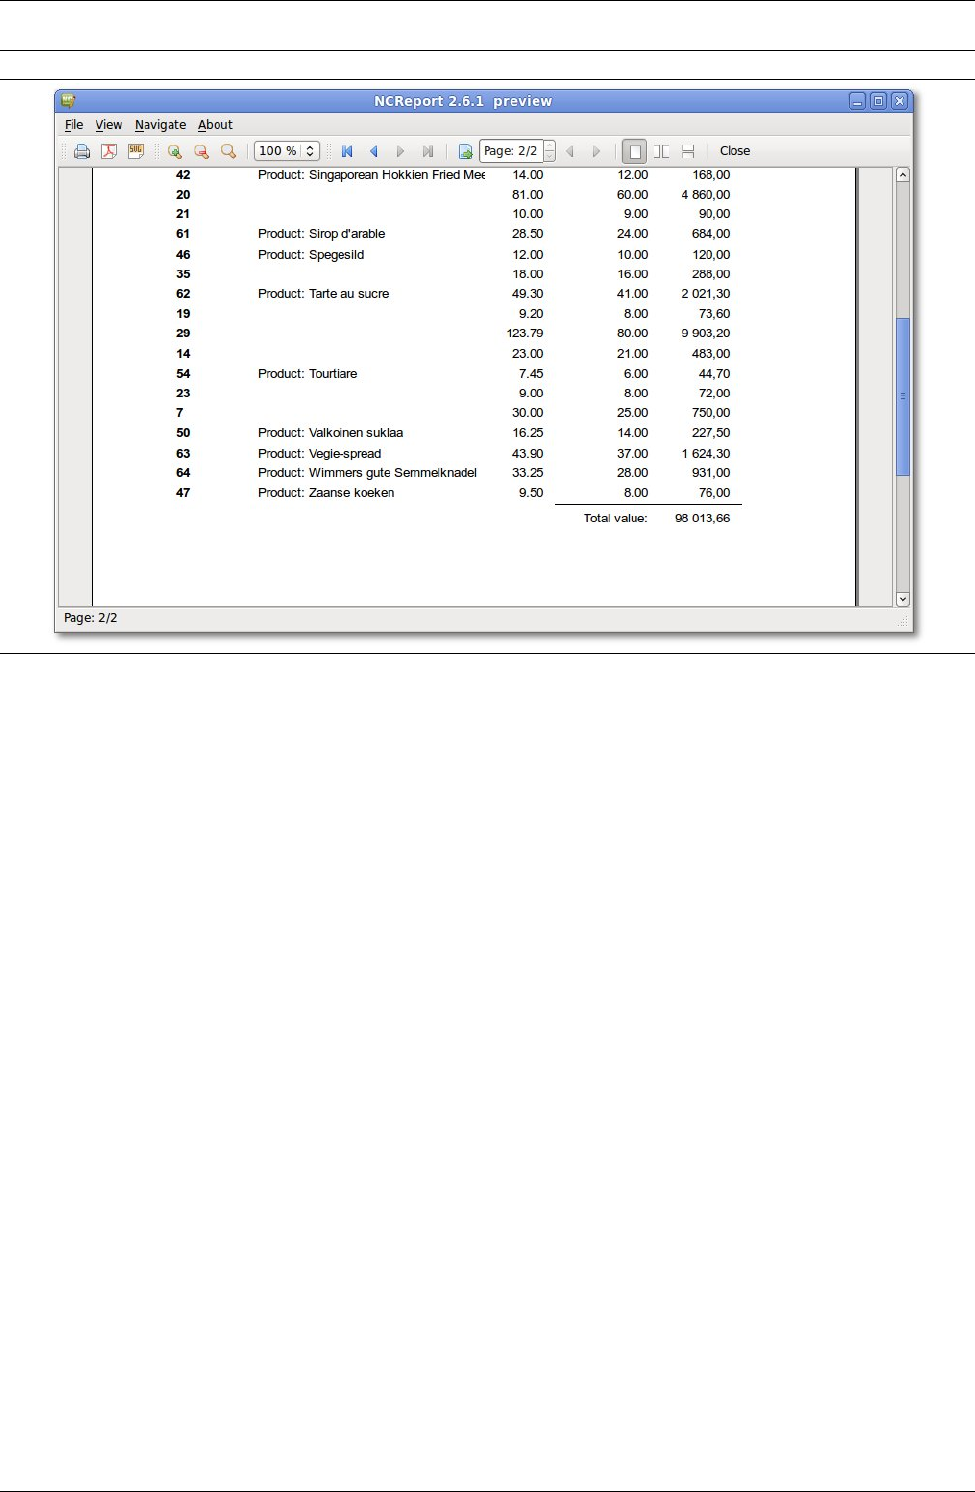
CHAPTER 6. PARAMETERS 6.2. TESTING PARAMETERS
Figure 6.1 Testing parameter - preview
In all reports the Parameters are always evaluated within the SQL queries, scripts and PrintWhen expres-
sions
68

Chapter 7
Expressions
Reports can contain special formulas is called exression. Expression is string in which data references can be
inserted. Expression can be script or a simple text template.
7.1 Script Expressions
NCReport since 2.0 version can handle script expressions using Qt Script module the new powerful feature of
Qt 4.3. Qt Script is based on the ECMAScript scripting language, as defined in standard ECMA-262. Fields
can even contain script codes instead of a simple data source column, parameter or variable. In this case the
report engine evaluates the specified script code each time when the fields are refreshed. Report items can also
have "Print only when expression is true" (short name: printWhen) property. Print when expressions are script
expressions too but they must always return boolean result. To use script expression in fields you have to set
Expression field source type in the Field property dialog.
7.2 Template Expressions
Templates are simple strings including data source, parameter or variable references only. A template string
cannot contain script function, but only data references.
7.3 Using references in expressions
Expressions can contain the following references: Data source data, Parameter, Variable, Field result. When
expressions are evaluated the references always replaced with their current value. The syntax formats of the
references are the following:
NOTE
If a script expression contains any inserted reference with string/text type, quote marks are needed
at the beginning and the end of the token.
For example: "$D{ds.lastname}"=="Smith"
You don’t need quote marks for numeric or boolean values, for example $D{price}==750.0
is correct formula
7.4 References in templates
Template (Section 7.8) is a text where you can simply embed any data reference without using script formulas.
Templates can be used in fields as a source type or in rich texts if template mode is on.
Example of using data references in templates:
69
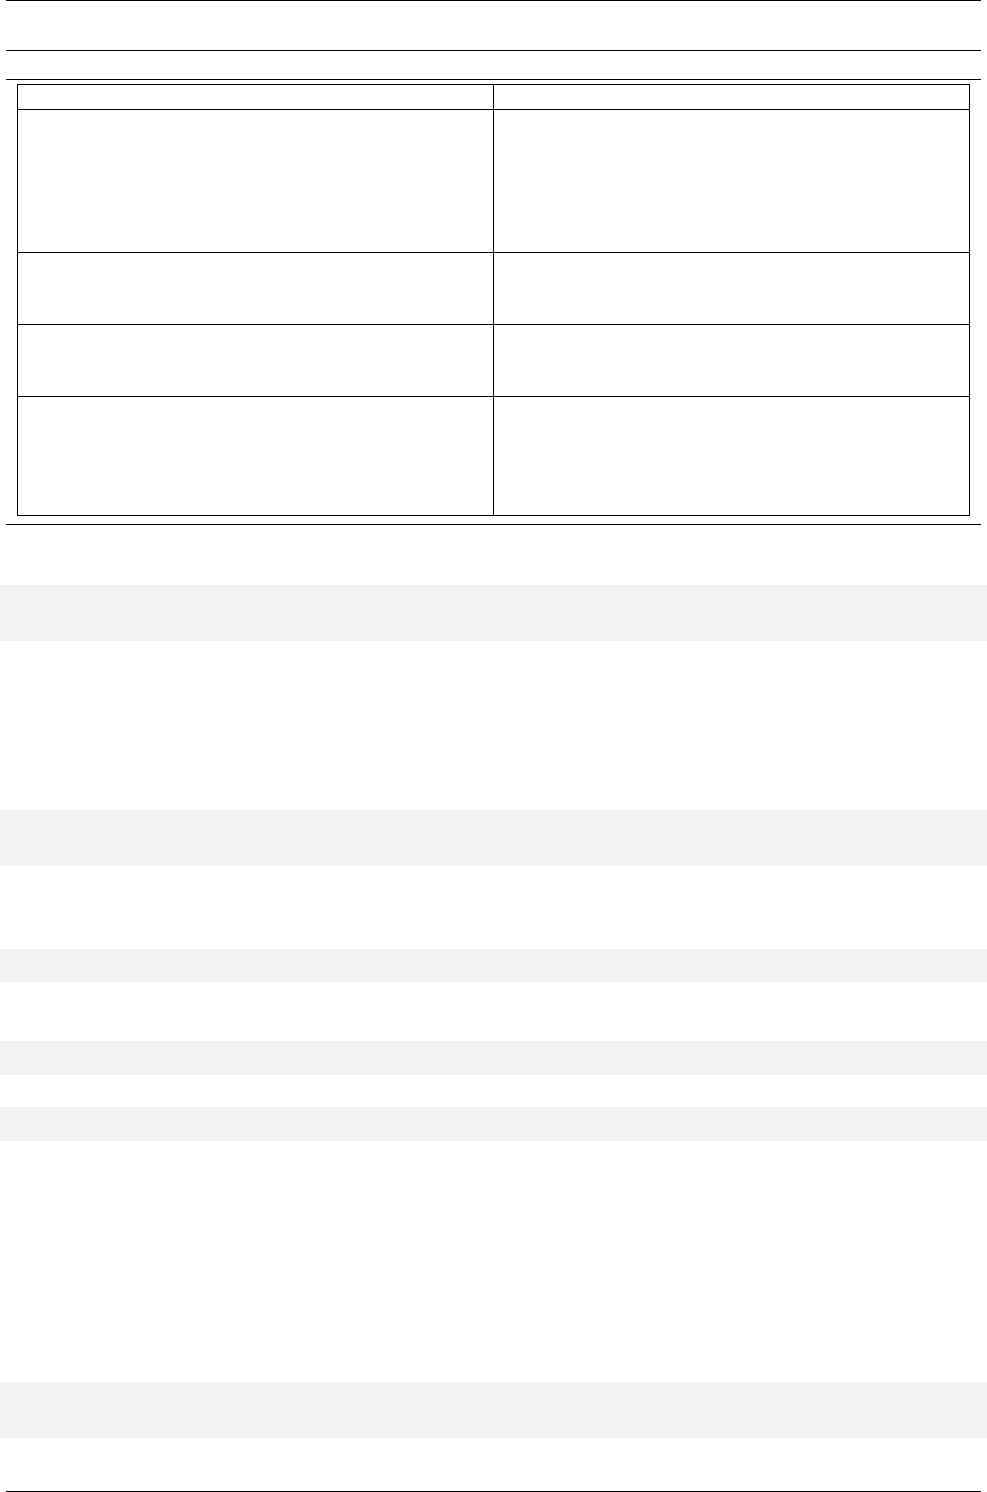
CHAPTER 7. EXPRESSIONS 7.5. REFERENCE EXAMPLES
Table 7.1 References in expressions
Syntax Description
$D{[datasourceID.]column}
Data source column reference. Returns the current
value of the data source column from the current
data row/record. If datasourceID is not
specified the default current data source (what is
assigned to the current detail) is considered.
$P{parameterID}
Parameter reference. Returns the value of the
parameter by name/ID
$V{variableID}
Variable reference. Returns the current value of the
variable by name/ID.
$F{fieldID}
Field reference. Returns the current display value
of the specified Field. FieldID is the auto generated
but editable ID value of the field generated first
when it’s added to a section.
First name: $D{datasource1.firstname} Last name: $D{datasource1.lastname} Date from: $P ←-
{date_from}
7.5 Reference examples
Example of using script expression in fields
"$D{datasource1.productName}"+" first string "+"
second string "+"$P{parametername}"
Example of using script expression as "Print only when expression is true" property. The expression must
return logical value.
$D{productPrice}<1500
Example of using data references in templates:
Date period: $D{ds.datefrom} - $D{ds.dateto}
Dear $D{ds.firstname} $D{ds.lastname},
7.6 Field Expression
Now we try out how expressions are working with Fields. We use our last report example. Let’s open the
report in the designer and select the productName Field in the detail section. Open the Field properties dialog
by double clicking on the field item. Change the Field source type to Expression and then the Field column
expression we modify to the following script expression:
if ($D{ProductID}>40) "Product:
"+"$D{ProductName}"; else "";
70
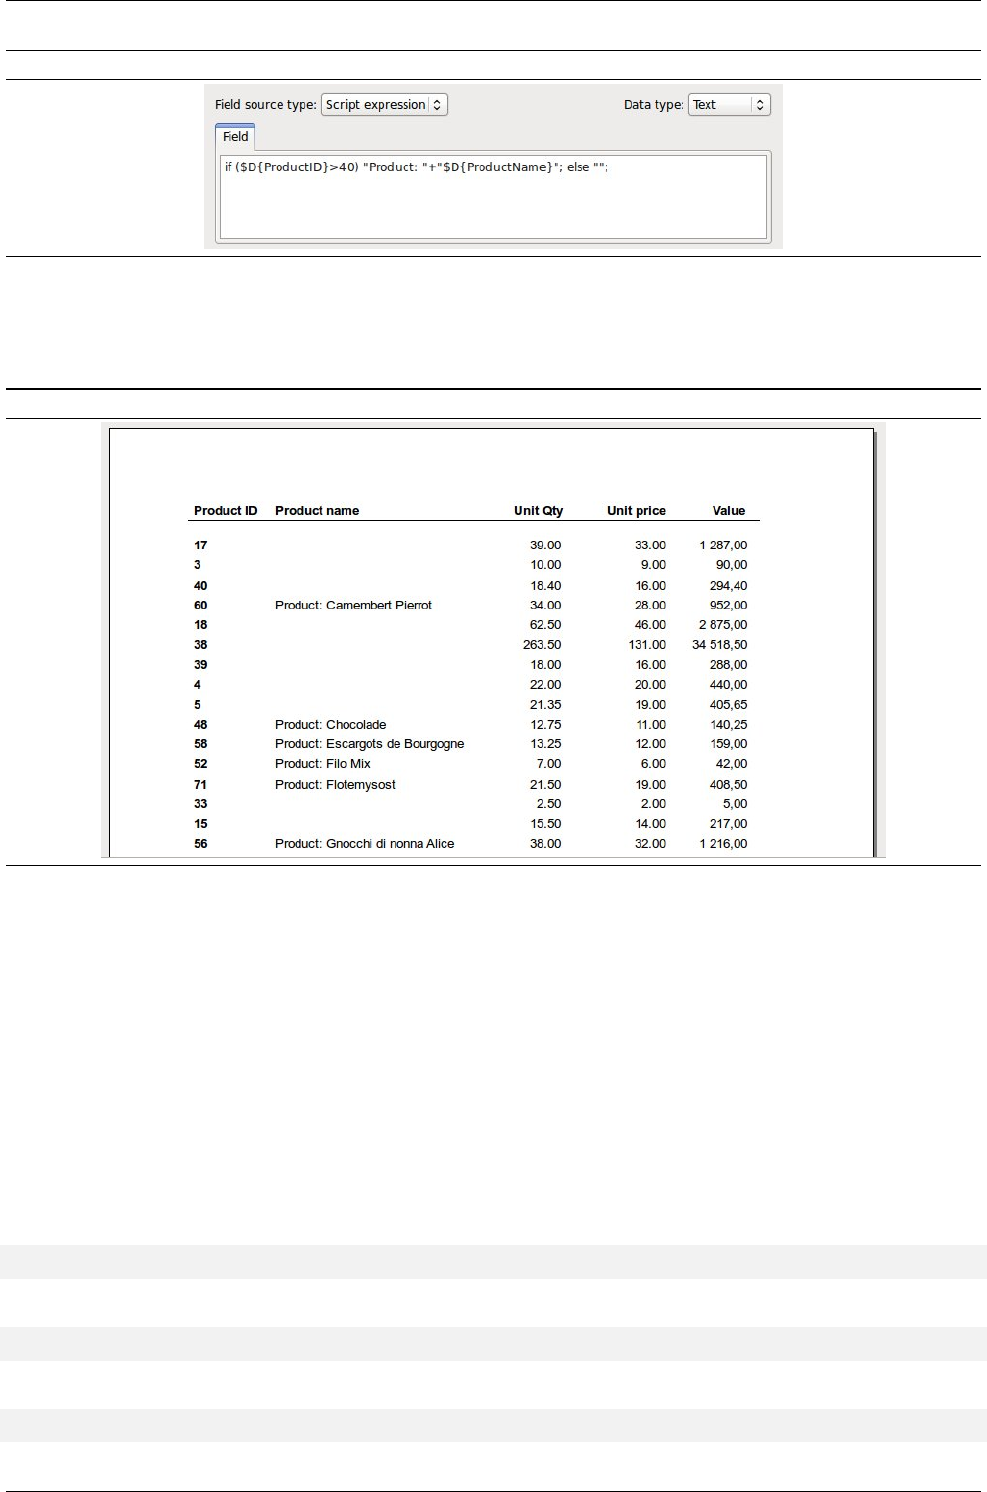
CHAPTER 7. EXPRESSIONS 7.7. PRINT WHEN EXPRESSIONS
Figure 7.1 Field expression example
In this case the report engine first replaces the references in the code and then evaluates the script code before
each rendering action. Close the dialog by clicking OK button and then save the report. Now we just run report
to preview window. Let’s see the result:
Figure 7.2 Result of field expression
This example is spectacular but not the most effective way of using expressions. In most cases when you use
expressions in fields you don’t need too complex code. If you need a condition by your field should be visible
or not, we recommend to use "Print only when expression is true" feature instead. We test this feature in the
next section.
7.7 Print When Expressions
This is always a logical script expression that returns true or false. It is considered only if defined for a specified
item or a section. When the PrintWhen expression is set the specified item (or section) will be printed ONLY
WHEN the expression returns true. As usual the expression can contain any data source, parameter or variable
reference.
Examples:
Hide an item when DataSource1.intcolumn data source value is less than 10:
$D{DataSource1.intcolumn}>=10
A boolean column print When example:
$D{DataSource1.boolcolumn}
Your item appears when DataSource1.stringcolumn is not empty:
"$D{DataSource1.stringcolumn}">""
71
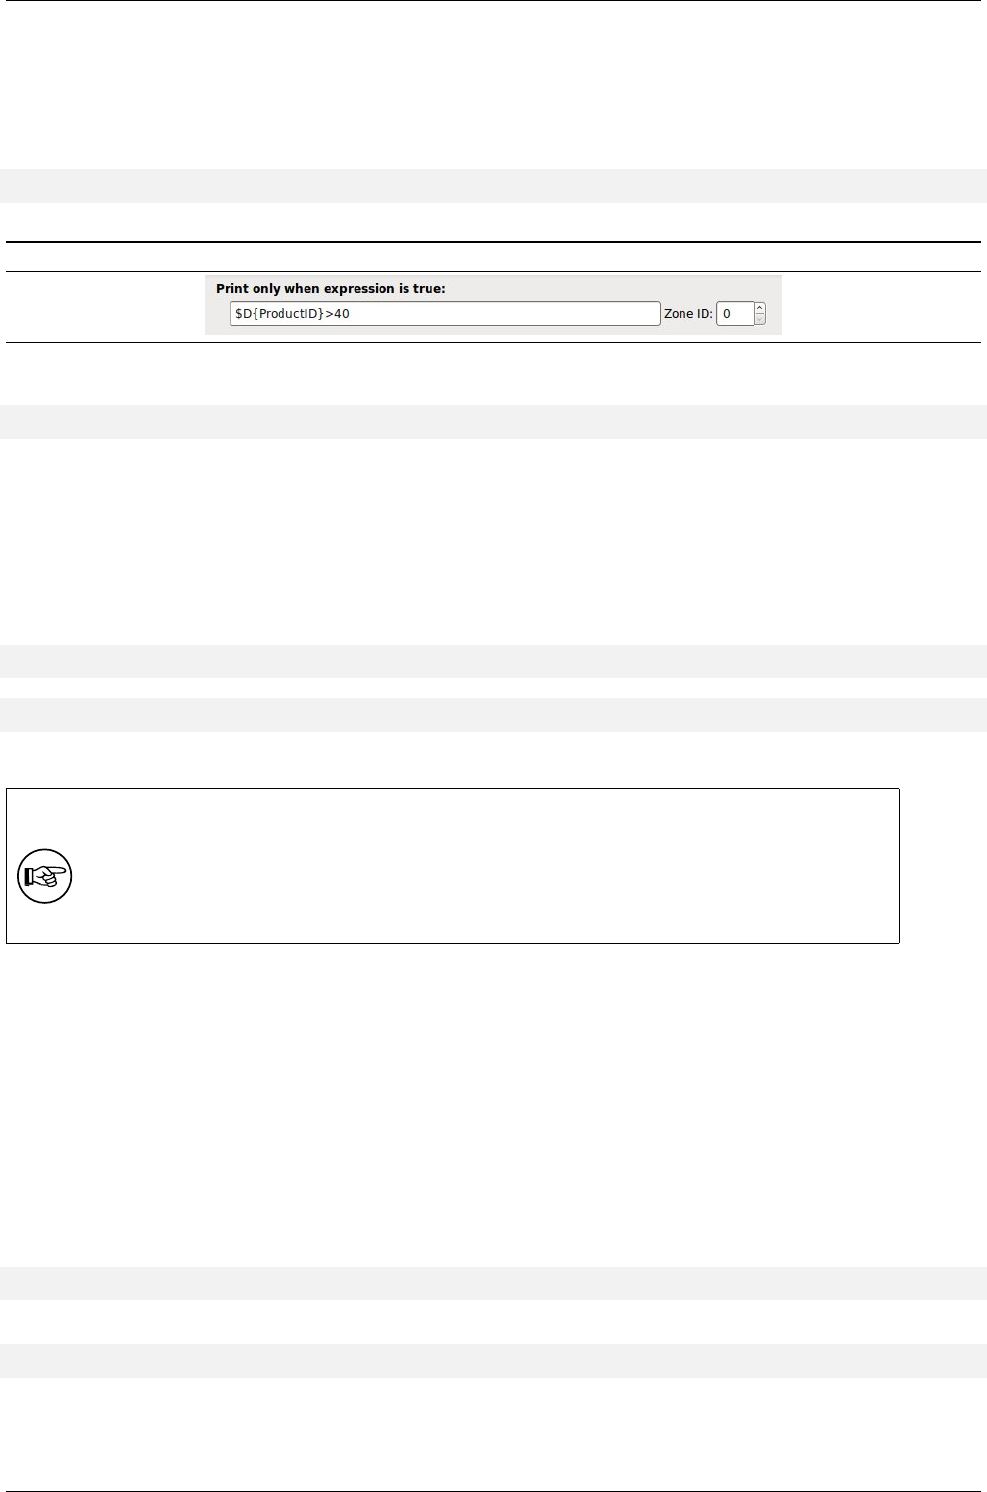
CHAPTER 7. EXPRESSIONS 7.8. TEMPLATES IN FIELDS AND TEXTS
7.7.1 Testing Print when expression
So, print when script expressions are codes that return boolean result. They often called as logical expressions.
To test it just open the Field properties dialog by double clicking on the same field item. Type the following
code to Print when logical expression:
$D{ProductID}>40
Figure 7.3 Print only when expression is true condition
Then modify the previous Field column expression by the following:
"Product: "+"$D{ProductName}"
After you validate the settings and save the report run the report again. We have to get the same result.
7.8 Templates in Fields and Texts
Templates are special expressions when the data references are simply included in a text. They are not a script
hence you cannot use script language elements but simple data source, parameter and variable references only.
For example:
Customer name: $D{ds1.name} Address: $D{ds1.address}
Interval: $P{datefrom} - $P{dateto}
TIP
Template expressions are faster than script expressions because it requires no evaluation but a
simple insertion only.
To use a template select the Template data source type in a field or a text item.
7.9 Data Source Functions
Field expressions can contain some simple function references. These functions helps to apply basic operations
on data or getting meta information from data sources. The functions can be data source level and data column
level functions. The function name you may insert after the data source ID or the column ID depending on the
function. It is separated by a dot character.
7.9.1 Data Source related (meta) functions
A data source function syntax:
DataSourceId.function()
In scripts or templates:
$D{DataSourceId.function()}
rowCount() Returns the number of rows of the data source.
Example:
72

CHAPTER 7. EXPRESSIONS 7.9. DATA SOURCE FUNCTIONS
products.rowCount() or $D{products.rowCount()}
isAvailable() Returns the isAvailable() method result of the data source class.
Example:
products.isAvailable() or $D{products.rowCount()}
isValid() Returns the isValid() method result of the data source class.
Example:
products.isValid() or $D{products.isValid()}
isEmpty() Returns true if the data source has no data record.
Example:
products.isEmpty() or $D{products.isEmpty()}
isNotEmpty() Returns true if the data source has at least 1 data record.
Example:
products.isNotEmpty() or $D{products.isNotEmpty()}
update() Forces the update() function on the data source. This can be useful if you may want to manually
update a user defined data source. This function use carefully.
Example:
products.update() or $D{products.update()}
7.9.2 Data Source Column related (Value) functions
The data source column functions are introduced for helping some basic text operation.
The data source column function syntax:
DataSourceId.column.function()
In a Detail section when using the assigned data source:
column.function()
In scripts or templates:
$D{DataSourceId.column.function()}
In a Detail section when using the assigned data source:
$D{column.function()}
MID(n,m) Returns a string that contains n characters of this string, starting at the specified m position index.
Example:
DataSource1.firstname.MID(2,5) or $D{DataSource1.firstname.MID(2,5)}
LEFT(n) Returns a substring that contains the n leftmost characters of the string. Example:
DataSource1.firstname.LEFT(3) or $D{DataSource1.firstname.LEFT(3)}
RIGHT(n) Returns the isValid() method result of the data source class. Example:
DataSource1.firstname.RIGHT(2) or $D{DataSource1.firstname.RIGHT(2)}
USERFUNC() Executes the NCReportDataSource::getUserFunctionValue(value, arguments) method
and returns its value. You may want to use it a custom implemented data source. Example:
DataSource1.lastname.USERFUNC() or $D{DataSource1.lastname.USERFUNC()}
73
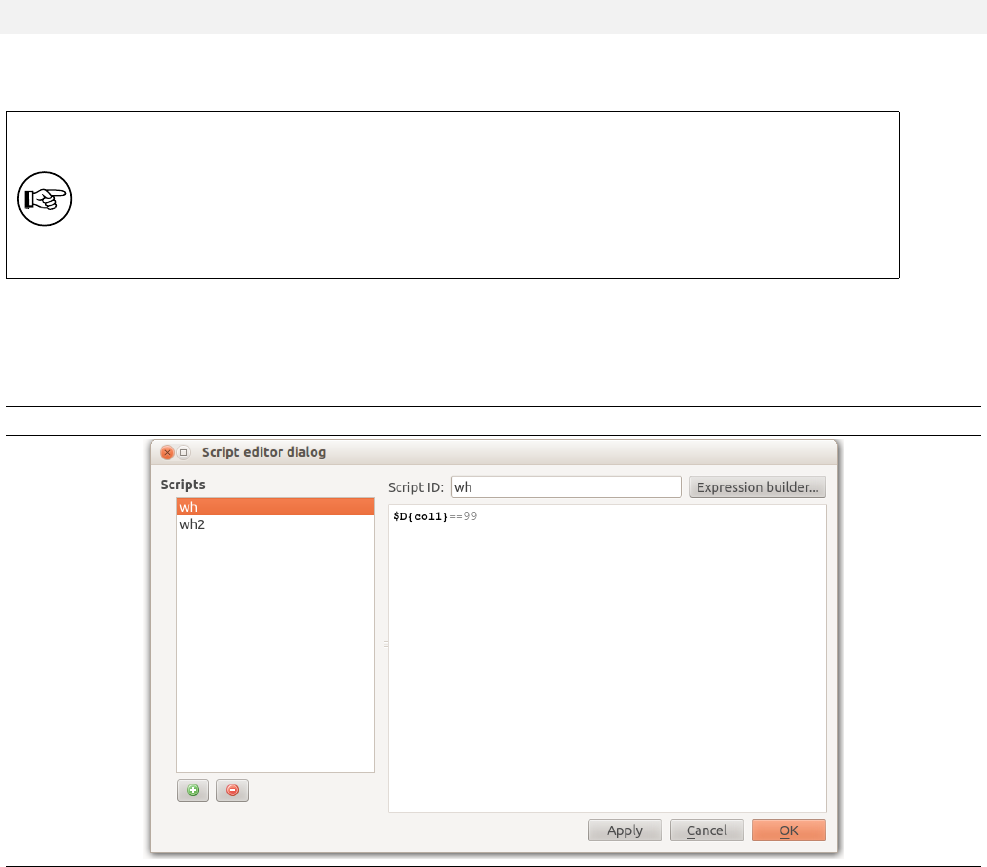
Chapter 8
Script editor
This function provides ability of storing predefined custom script functions within the report. The goal of
storing scripts in the report is to avoid duplicating script codes assigned to the report items or anywhere in the
report’s scope. For example it can be used efficiently for print when expressions.
To reference the script anywhere in the report use the following token:
$S{scriptId}
Where scriptId the id you assigned to the script.
TIP
Use predefined scripts when you have to define complex code or if you need a script expression
more than once in a report. This is a typical occasion of multiple using the same "print when"
expression
To define your scripts in the designer open the Report →Scripts... menu item. (The equivalent tool button
you find on the toolbar.) Then appears a dialog on you can add, edit and remove scripts. To add a new script
click the Add button and type the script id. To remove a script choose Remove. If you want to use the expression
builder select Expression builder... to open the expression builder dialog.
Figure 8.1 Expression Builder Dialog
Script ID The script identifier. When you call the script anywhere in the report you can assign with this ID. For
example: $S{myscript1}
75

CHAPTER 8. SCRIPT EDITOR
Script definition Insert your code here. You can use any report data reference in the code by the usual rules of
NCReport data reference.
The following buttons are available for apply or cancel settings:
•Apply Select to apply your settings without closing the dialog.
•OK Select to apply your settings and closing the dialog.
•Cancel Closes the editor without saving any changes, returning you to the designer desktop.
76
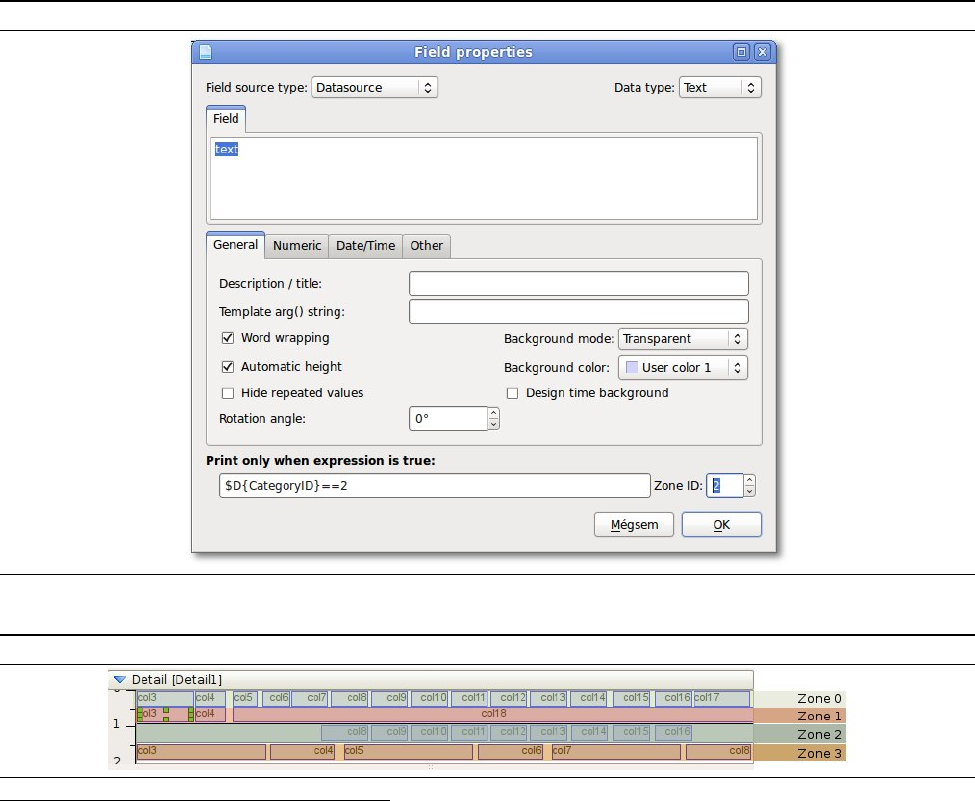
Chapter 9
Zones
Zones are virtual bands within a report section. The function is available in all section types except the page
footer. All items can have a specified Zone ID. Items with the same zone id, just like a group, represent a
horizontal zone as a virtual band inside the section. When the section’s automatic height option is enabled, the
report engine will process the rendering of zones in order by zone ID sequentially, one after another. If a content
of a zone is empty for example because the printWhen expression of all items in the zone return false, then the
zone won’t be printed and the section will be shrunken. The rendering order of zones matches the order of zone
IDs. 1
To set the Zone ID of a report item use the item property dialogs.
Figure 9.1 Zone ID in property dialog
Figure 9.2 Zones in Design mode
1Zone fuction is available since version 2.2.0
77

CHAPTER 9. ZONES
NOTE
Zones are not visible in design mode. The specified region is determined by only the zone IDs of
the report items
78
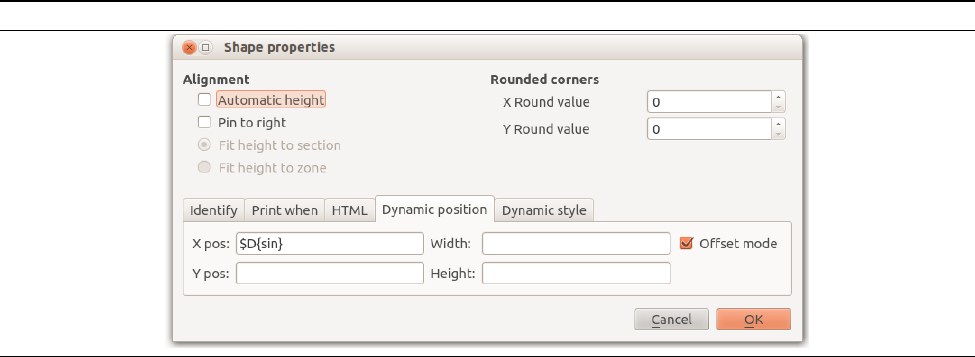
Chapter 10
Dynamic data driven size and position
This feature makes it easy for you to manage the position and the size of the report items dynamically, driven
by a data source, parameter or a variable or even a script expression.
For example it is possible to define the x, y coordinates of objects in the data source, then the positions will
be managed by data source. If you want to show graphical objects such as bar, line, you can even use them for
generating vertical charts.
To set the item’s dynamic position and size management in designer open any report item’s setting dialog
by double clicking on a report item. Then appears the item settings dialog. Choose the Dynamic position tab
of the bottom side property panel.
Figure 10.1 Dynamic position and size settings
You can set the following properties. If you leave an option empty - this is the default - the setting is turned
off and not considered. The values are always counted in millimeter and relative to their container band’s
coordinate system.
X pos The source of item’s x position.
Y pos The source of item’s y position.
Width The source of item’s width.
Height The source of item’s height
Offset mode If this option is enabled then the positions are relative to the original static position, otherwise
they are explicit values.
79
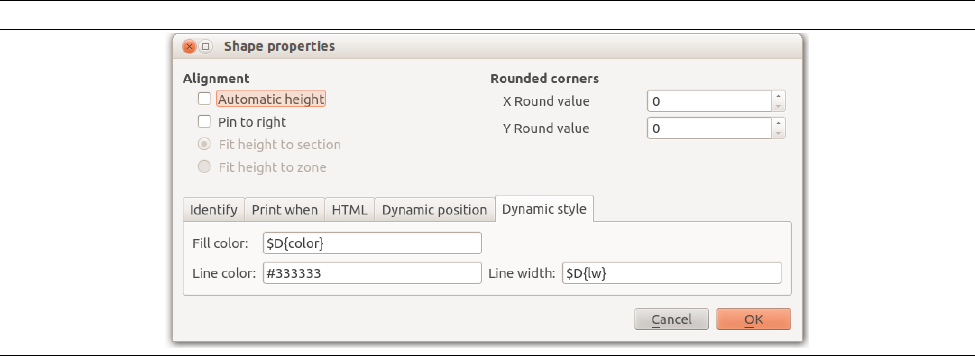
Chapter 11
Dynamic data driven shape style
The shapes like line, rectangle, ellipse can also have dynamic style. It is possible for you to manage the line
width, line color and background color dynamically, driven by a data source, parameter or a variable or even a
script expression.
To set the shape item’s dynamic style in designer open any shape item’s setting dialog by double clicking
on an existing item. Then appears the item settings dialog. Choose the Dynamic style tab of the bottom side
property panel.
Figure 11.1 Dynamic style settings
You can set the following properties. If you leave an option empty - this is the default - the setting is turned
off and not considered. The width is counted in millimeter.
Fill color The source of item’s background/fill color.
Line color The source of item’s line color.
Line width The source of item’s line width.
81
Chapter 12
Text Document printout mode
TextDocument mode feature allows to render and print multi-page QTextDocument based rich texts. The
text source may be a file or any data source, so the text can be static and dynamic or even a template. In this
mode you can use only a page header, page footer and one or more detail in the report definition. The result
will be a paginated, printer-ready text document. In TextDocument mode the pagecount system variable is
automatically available
12.1 Steps of usage
To create a text document printout report use the Designer application
• In Designer select the Report →Page options menu. Then the report page settings dialog will appear. Set
the Report type combobox to Text document
• Add a text report item into (the only one) Detail section. Set the text’s properties by using its property
dialog. The text may come from any source as usual.
• Design the report’s page header and footer (Not required)
NOTE
In this mode only one detail section within one text item is supported. The horizontal position and
the width of the text item are followed when rendering.
Example 12.1 Text Document printout report
To see how it’s working try textdocument_printout.xml demo report. It prints a long Qt class documen-
tation HTML file.
83

Chapter 13
Data Relation System
This feature is also named as Sub-Query or Sub-Data Source system
Database systems almost always have master/detail data relation between tables. When defining reports
for a typical kind of documents such as invoices, orders etc. there are at least one header and a related detail
data is used which are linked via primary and foreign key. The goal of the data relation system that child data
sources are updated runtime row by row driven by a parent data source. This works by an ID column which is
the primary key of the parent and the foreign key of the child. The data source relation is very useful option for
SQL data sources where the data are fetched from database tables via SQL command and for Item Model data
sources as well where you can manage the data source content from code.
NOTE
The data source relation system currently works for SQL data source and Item Model data source
only. Other data source types are not supported by this feature, expect the Item model data
source.
The following example shows a 3 level parent/child structure.
85
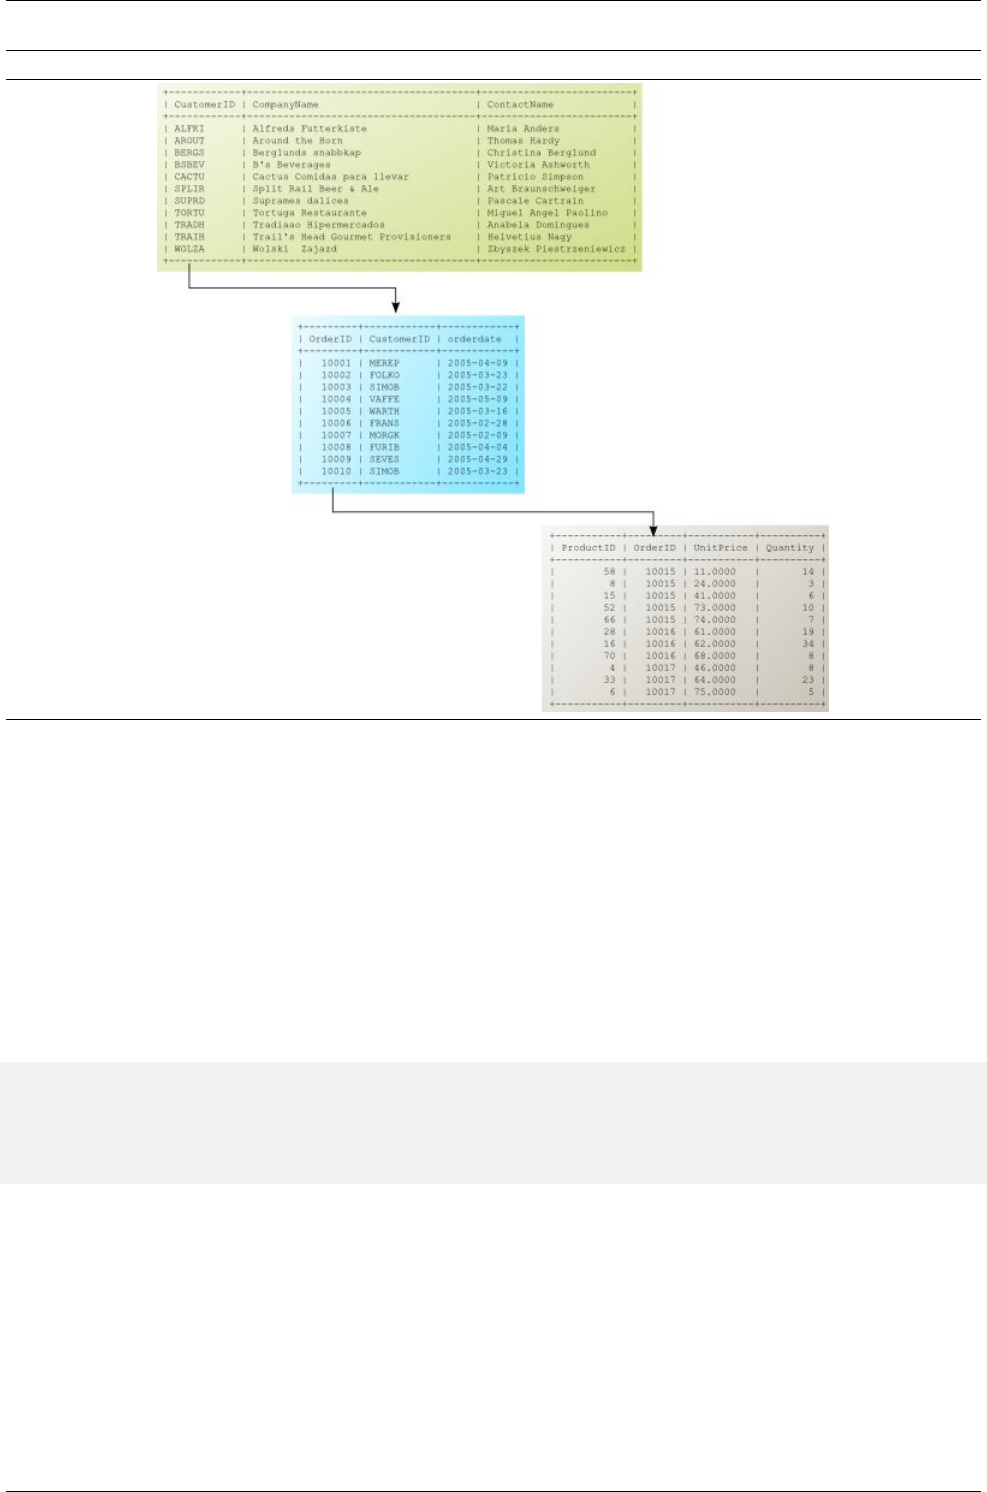
CHAPTER 13. DATA RELATION SYSTEM 13.1. DEFINING A PARENT DATA SOURCE
Figure 13.1 Data relation
In the the next section you can overview how to define the data sources of master/detail relation. We will
create a three level data source relation in the following example.
13.1 Defining a parent data source
You can add the master data source in Data Source settings Dialog. In the Designer select Report →Data
sources... and add a new SQL data source. Set the Opening role to Beginning of the report. It means that the
query will be executed only once at the beginning of the report. Type the data source ID, set the connection
properties and edit the SQL query in the SQL editor text box.
This is our example master query that queries the customers:
SELECT customers.CustomerID, customers.CompanyName, customers.CompanyName
FROM orders
INNER JOIN customers ON orders.CustomerID=customers.ContactName
WHERE OrderDate between ’2005-03-01’ and ’2005-03-31’
GROUP BY CustomerID
13.2 Defining child data sources
At the same (Data source) dialog we have to add two more data sources within the parent/child structure.
Doing the first one add a new SQL data source again. Set the Opening role to Child datasource (subquery). It
means that the query will be executed repetitively every time when the next master record is processed. Type
the data source ID, set the connection properties in the SQL connection tab. After type the Parent datasource id
which is the ID of previously defined parent data source. (customers)
86
CHAPTER 13. DATA RELATION SYSTEM 13.3. SETTING UP THE DETAIL SECTION
WARNING
The Parent datasource id is case sensitive. It must be equal to the already existed parent data
source ID
Edit the SQL query in the sql editor text box. This is the 1st child query, it queries the order headers between
a date period and is related to a customer:
SELECT OrderID,CustomerID,EmployeeID,OrderDate,ShipName
FROM orders
WHERE CustomerID=’$D{customers.CustomerID}’
AND OrderDate between ’2005-03-01’ and ’2005-03-31’
ORDER BY OrderID
As here can be seen, the data relation is managed by a data reference expression: $D{customers.Custom
erID} We have to insert the key value of parent data source into the SQL command.
After comes the second child data source. This is the third level of the relation. Set the Opening role to Child
data source (sub-query) too and type the Parent data source id which is the ID of its parent data source (orders).
Edit the SQL query in the SQL editor text box. This query retrieves order items are related to a specified order
ID:
SELECT OrderID, orderitems.UnitPrice, Quantity, Itemno,
products.productname, orderitems.UnitPrice*Quantity as Value
FROM orderitems INNER JOIN products ON orderitems.productID = products.productID
WHERE OrderID=$D{orders.OrderID}
ORDER BY Itemno
At this level the data relation is managed by the following data reference expression: $D{orders.Order
ID} Accordingly the parent key will always be evaluated and the query is executed when the parent key change
occurs. (When its parent row is changed by report processor)
13.3 Setting up the detail section
In this step we have to assign the appropriate data source to the Detail section. Doing that open Report →Details
and grouping... menu (or the tool button on the toolbar), then appears the Detail section properties dialog. Select
the previously defined data source which is the highest parent level in hierarchy, in our example: customers.
NOTE
When defining a sub-query, always the highest level parent query should be assigned to the actual
Detail section. This because the report engine handles data source relation by iterating on all child
level data source records automatically.
WARNING
One parent data source can have only one child at the same time. Multiple children in one level is
not supported at the moment!
13.4 Designing the report
After we defined the data sources and assigned them to the Detail we have to add the appropriate groups also
to the Detail by using Data grouping... button. As usual each data source level is related to a group level.
87
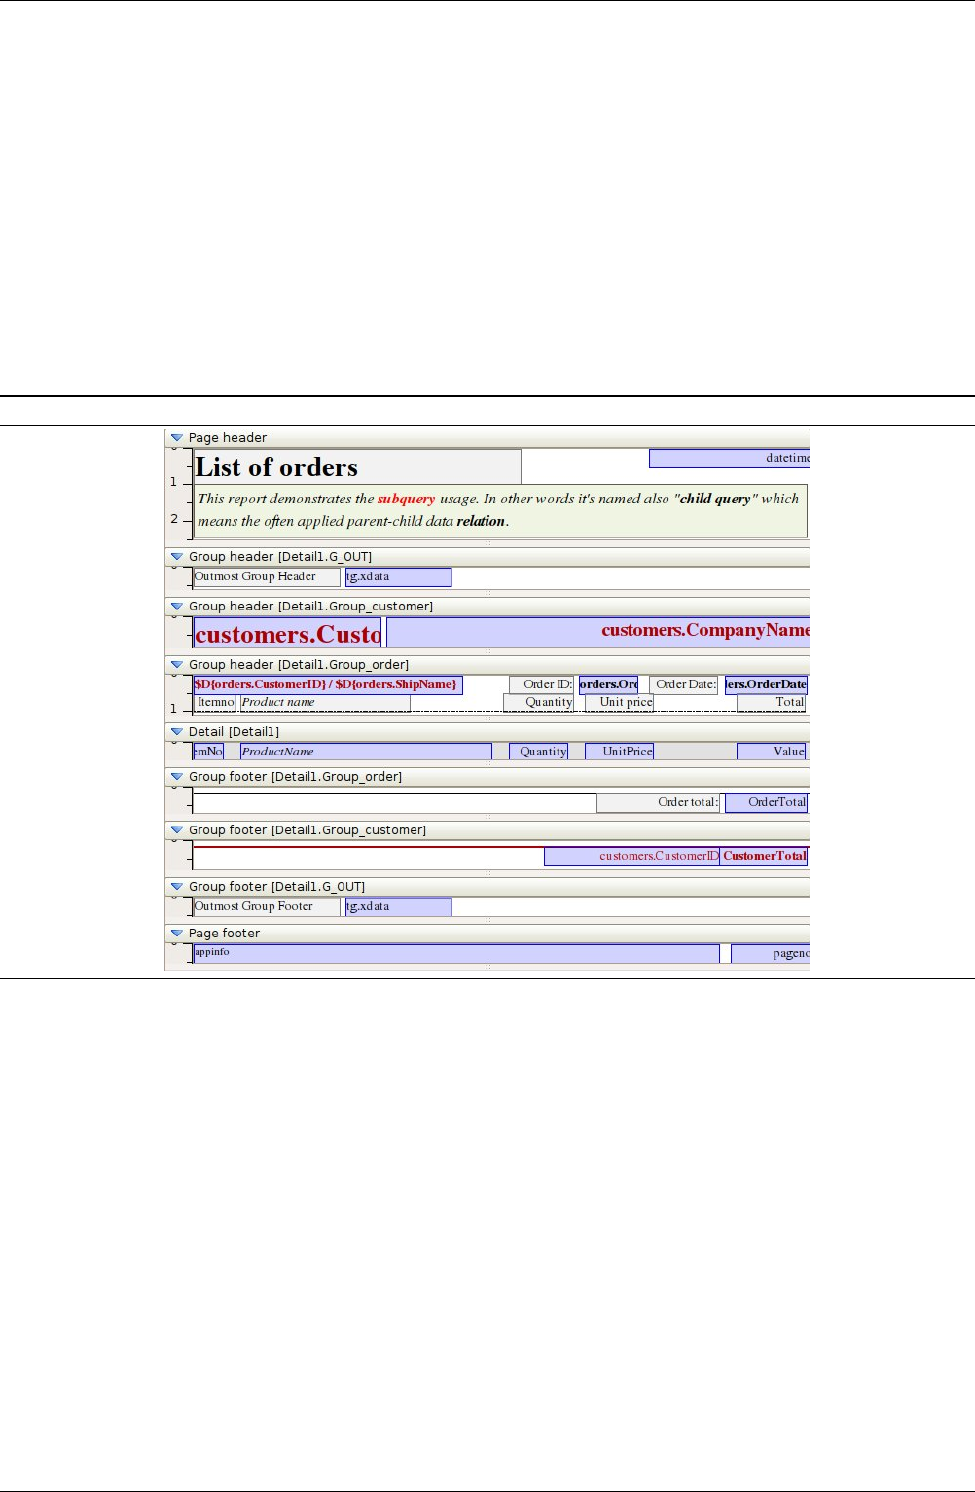
CHAPTER 13. DATA RELATION SYSTEM 13.4. DESIGNING THE REPORT
Add the other report sections and report items and set the alignments. The following figure appears the
ready to run report. (The name of this example report file: list_of_orders_complex.xml)
Figure 13.2 Sub-query report example in Designer
The report preview result of our example looks like this: (The name of this example report file: list_of_
orders_complex.xml)
88
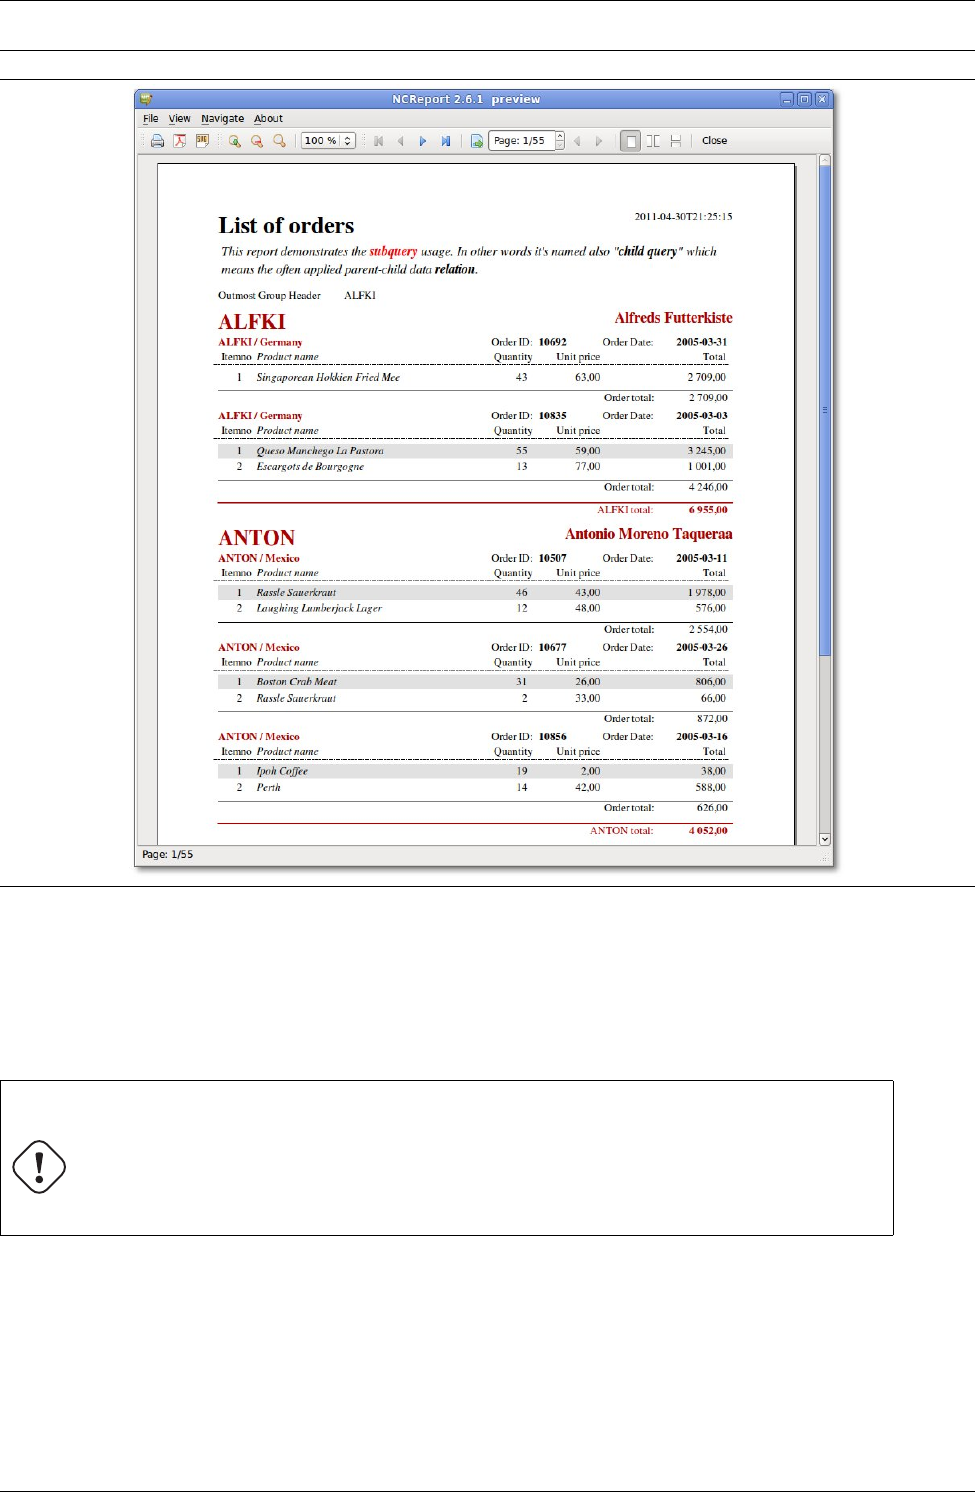
CHAPTER 13. DATA RELATION SYSTEM 13.5. CHANGES IN 2.13 VERSION
Figure 13.3 Result of a sub-query report example
13.5 Changes in 2.13 version
Data Source Relations has been extended from version 2.13. This is now much better supported general feature.
The function has been extended to Item Models. The reports that is created by the old sub-query/relation
system are not compatible anymore with the new version of data source relation function.
WARNING
The reports that uses sub-query function and created in previous version of NCReport, must be
upgraded. This function is not compatible with the old report versions.
Changes in the function: (you have to change this in old reports)
• The detail’s data source must be the root parent data source
• All fields and expressions must have its data source identifier i.e: datasource.column
To use the new data source relation system follow these rules:
• A data source relation can be defined by simply set "child data source" and giving the parent data source
id. (as usual)
89

CHAPTER 13. DATA RELATION SYSTEM 13.5. CHANGES IN 2.13 VERSION
• 1 parent can have only 1 child (1 to many relation)
• You can specify the primary key column index. If a primary key column is defined for the parent data
source, you can use {PK} or {ID} expression in the child data source query. (This is useful only in SQL data
sources)
• If you assign a data source relation to a detail section always set the root parent data source to the detail.
In earlier version we had to set the last child data source, but it is outdated in 2.13.
• Use dataSourceUpdateRequest(const QString dataSourceID, const QString foreignK
eyValue); signal to handle data source updates.
• Use !$D{datasource.isEmpty()} print when expression of a detail section to hide the empty children
data
90
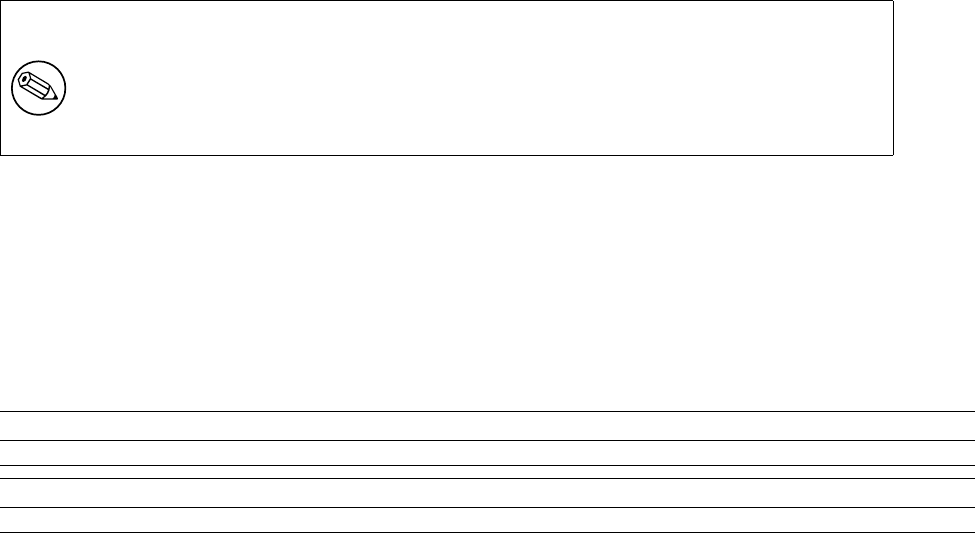
Chapter 14
Double pass mode
Double pass mode is a report option that influences the running mode of report engine. When double pass
mode is enabled the report is executed two times - this two running cycle is called primary (test) and secondary
(real) pass. When the two pass mode is necessary? In normal (1 pass) mode the report generator simply runs
the report without anticipatory counting and calculations such as determining the total page numbers.
NOTE
The pagecount system variable always returns zero in 1 pass (normal) mode. If the pageco
unt system variable is needed you have to enable the double pass mode option.
14.1 Setting double pass mode
The double pass option is part of the report options are saved into the report definition. To enable or disable
this option in Designer select ReportReport and Page Options... To read more: Section 5.3.
14.2 Example using of pagecount variable
Use $V{pagecount} expression as field in expression or template mode ore use in text in expression mode
Example 14.1 Expression mode example
$V{pagecount}
Example 14.2 Template mode example
Page $V{pagenum} of $V{pagecount}
91
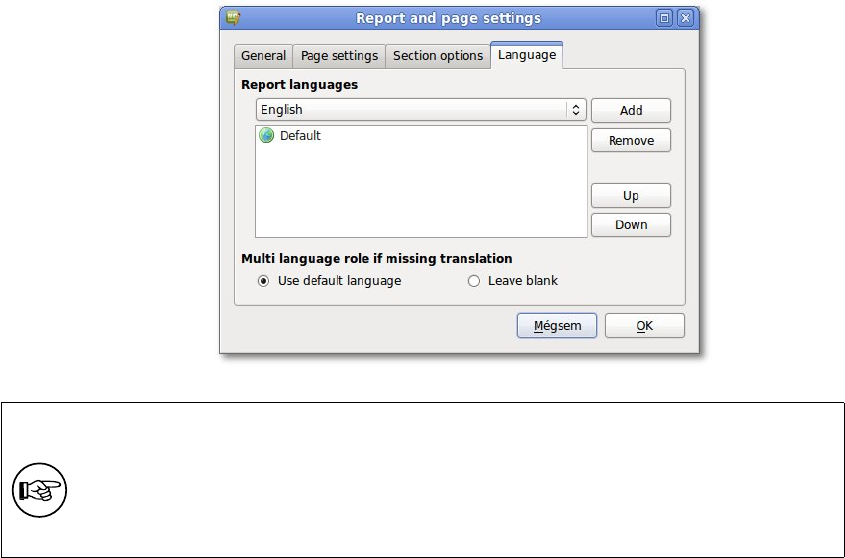
Chapter 15
Multi language reports
Since version 2.5 reports have ability to be multiple lingual. This is an important aspect of international ap-
plications. The goal of this feature that fields and labels can store more than one texts according to previously
defined languages.
15.1 Define languages
1. To set up languages use Report and page settings menu and choose Language tab in the dialog.
2. To add more languages select the language from combo box and add to language list using Add button
TIP
Leave the Default language first in the list. This represents the original language of the
report.
3. Set the Multi language role. If not all labels or fields are translated and the current language translation is
missing, two options can be chosen. In order to choose Use default language the default text will appear
otherwise the label or field will not be printed (This is the Leave blank option)
15.2 Adding translations to Fields and Labels
Insert a Field or Label item as usual. The property dialog appears with tabs of each language that was defined
previously. Type the translations to the appropriate language tab control. Empty translation tab means a missing
translation.
93
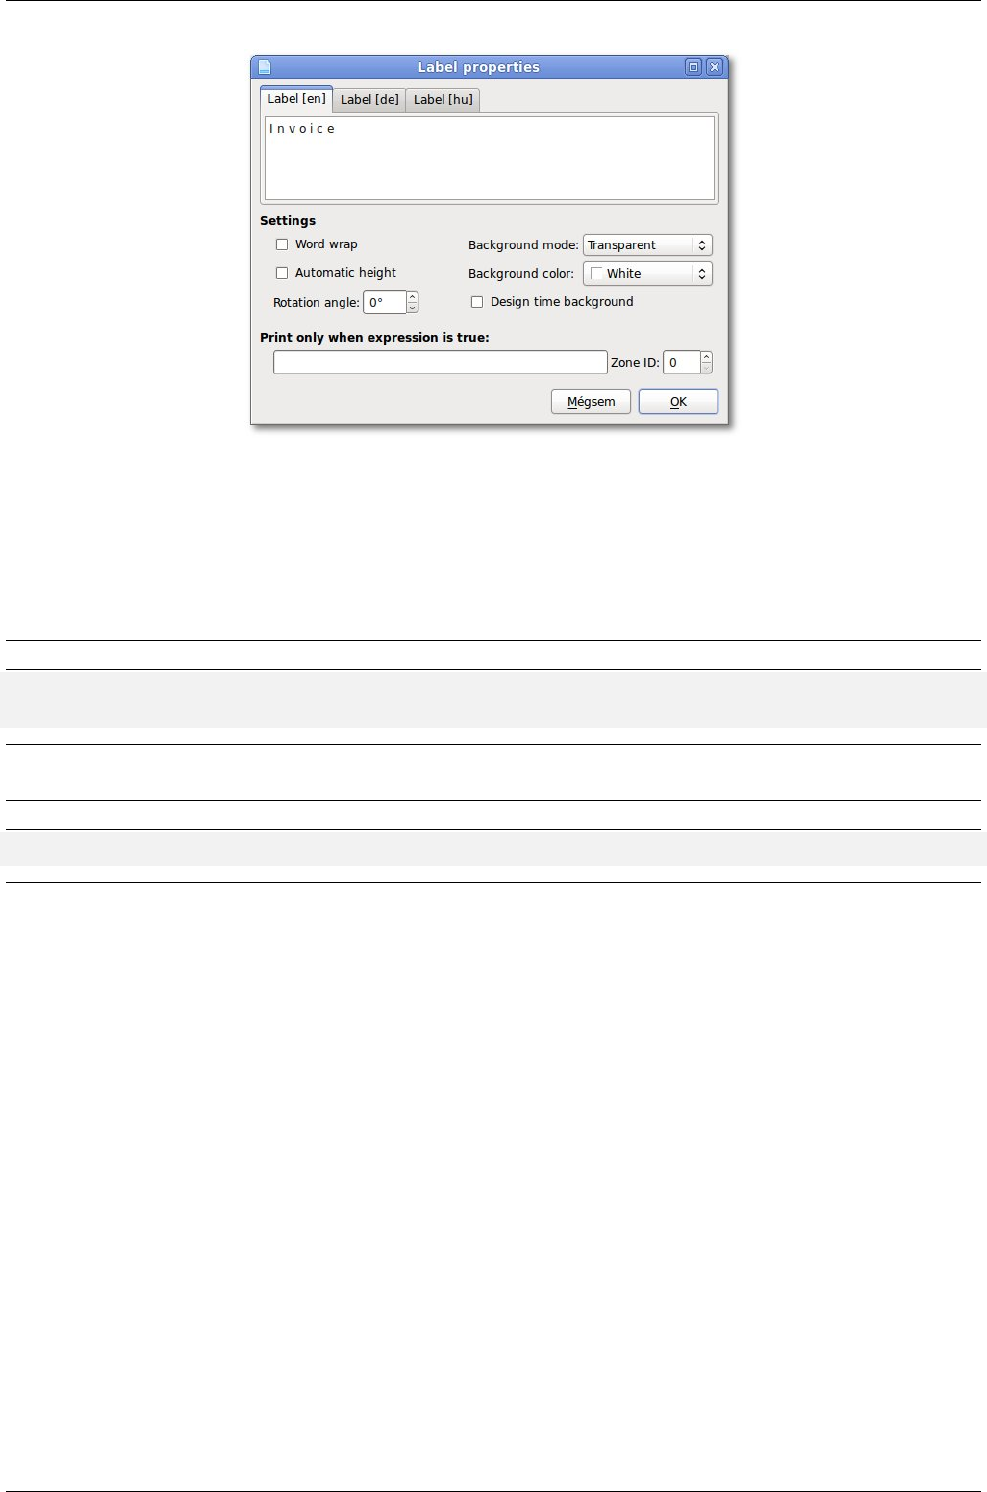
CHAPTER 15. MULTI LANGUAGE REPORTS 15.3. USING THE CURRENT LANGUAGE
15.3 Using the current language
The current language of the report can be set both in design mode and in running mode. In Designer select
Report language from the Report menu or the Languages tool button from the toolbar and select the language
what you want from the submenu
To set the language from application code use setCurrentLanguage( const QString & langcode
)function where langcode is the international two letter language code.
Example 15.1 Setting up the language
NCReport*report = new NCReport(parent);
report->setLanguage("de");
To set the language from console running mode use -l command line parameter the international two letter
language code.
Example 15.2 Setting up the current language from command line
ncreport -f report.xml -o pdf -of report.pdf -l de
94
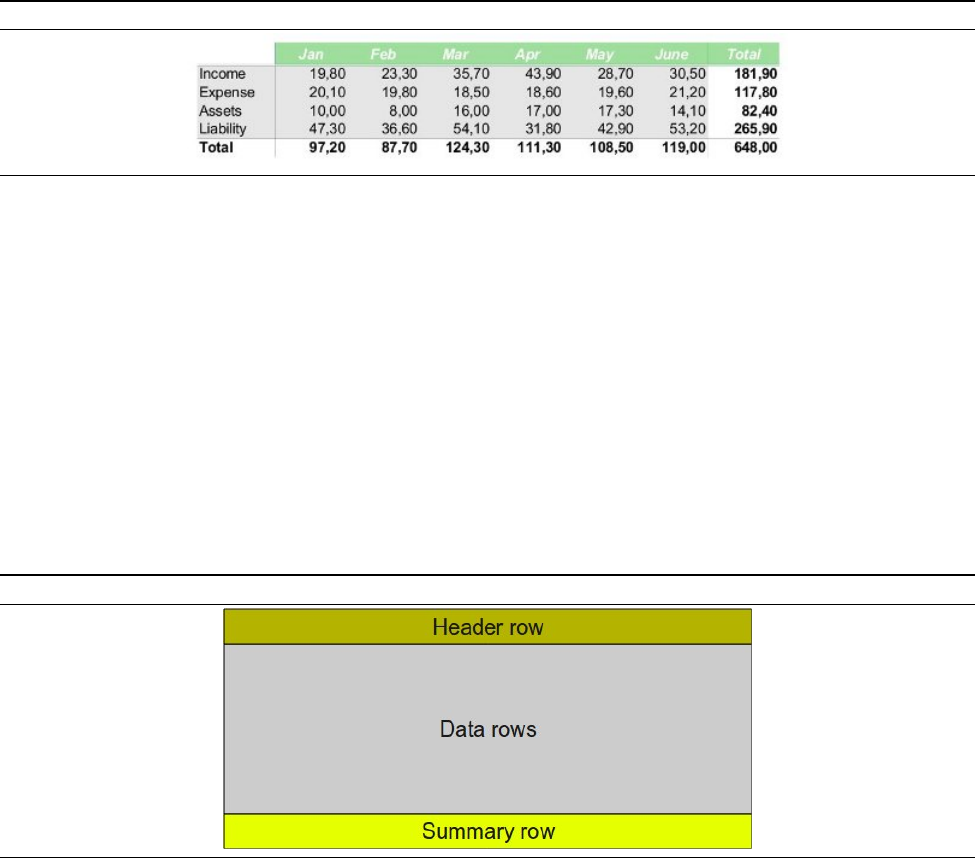
Chapter 16
Cross-Tab tables
Reports are often contain tables or data in table style layout. Sometimes it is necessary to rotate results so that
columns are presented horizontally and rows are presented vertically. This is sometimes known as creating a
PivotTable®, creating a cross-tab report, or rotating data. In cross tab tables the data source records are repre-
sented as horizontal columns and the cross-tab rows are printed as data source columns. Tables often contain
horizontal and/or vertical summarization as well.
Figure 16.1
Cross-table has a unique data source assigned. In the report a unique data source is needed to be defined for
the table. When report generator renders cross tables they have the following behave:
• Expandable horizontally: If table is wider than the space to right it should be continued in a new table
below. Table columns are represented as data source records
• Expandable vertically: Vertically enlargement: each row represents a data column from the specified data
source - it can break to multiple pages
16.1 Table structure
Cross-tables are built from cells. Each cell has its own function depending on were it is located. The first level
function elements of tables are the rows and columns. The following two figures show the cross-tab row and
column structure with their named function.
Figure 16.2 Table rows
Vertical table sections: Header row, data rows, summary row.
95
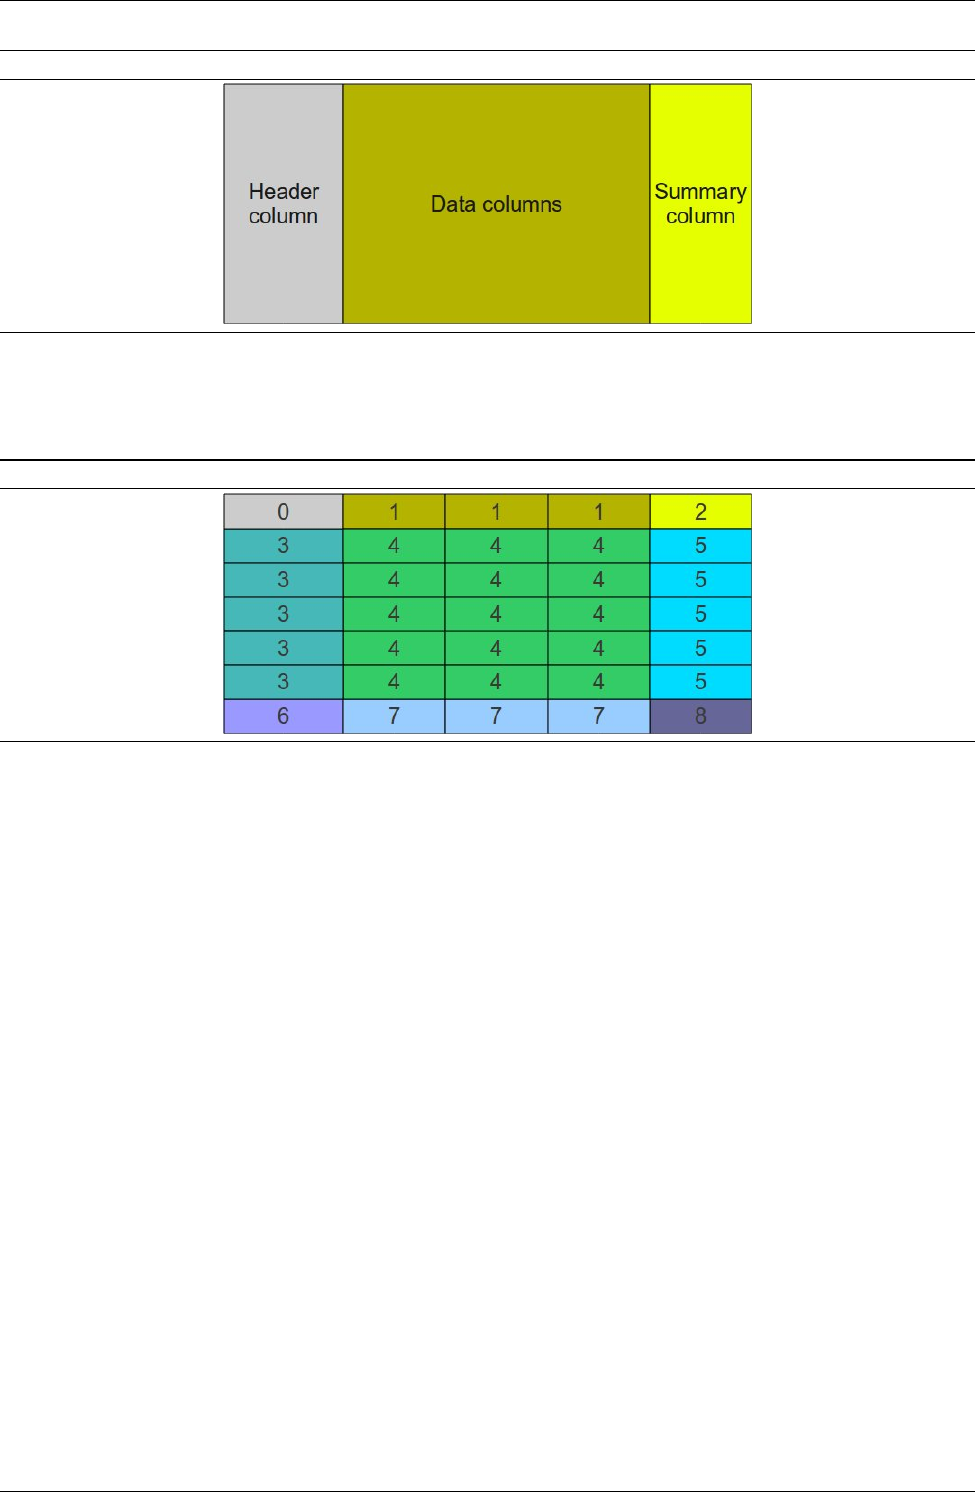
CHAPTER 16. CROSS-TAB TABLES 16.2. USING CROSS-TABLE IN DESIGNER
Figure 16.3 Table columns
Horizontal table sections: header column, data columns, summary column.
The following figure represents the cell structure of cross-tables:
Figure 16.4 Cell structure
• 0: corner header
• 1: column header
• 2: side summary header
• 3: row header
• 4: data
• 5: side summary data
• 6: bottom summary header
• 7: bottom summary data
• 8: cross summary data
16.2 Using cross-table in Designer
To add a cross-tab to a report select Cross table item from toolbar or from Insert menu To create a new Cross-
table object, first select the Cross tab tool button or the menu item in Tools menu. After that the cursor changes
to a cross beam, then click in the section into you want the table to be located. The recommended section is
generally the Detail section.
96
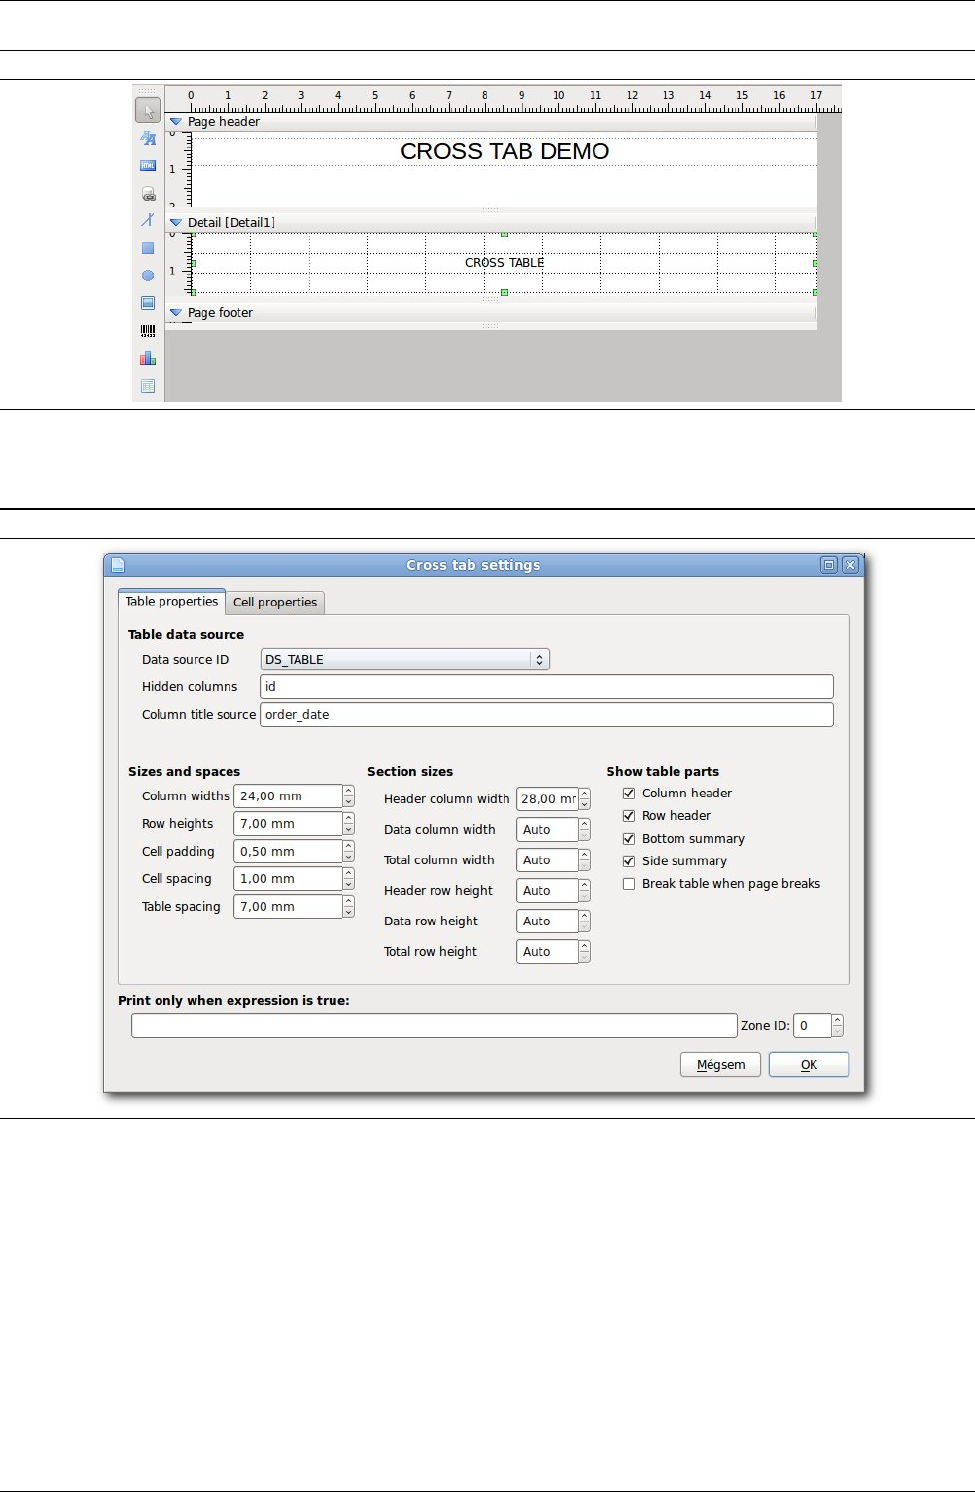
CHAPTER 16. CROSS-TAB TABLES 16.3. TABLE LEVEL PROPERTIES
Figure 16.5 Cross-tab in Designer
Doing so will create a new Cross tab object in the selected section at position you have clicked and opens the
Cross table property dialog. On the dialog you can set all table’s properties.
Figure 16.6 Cross-tab Settings Dialog
The property dialog is devided to the following tabs: Table properties and Cell properties As usual you
find the Print only when expression at the bottom of dialog. If a logical expression is defined, the table will
be shown or hidden, depending on the result of the expression. The following paragraps describe the table’s
properties:
16.3 Table level properties
TABLE DATA SOURCE
The group box represents the data source related options.
Data source ID ID of the defined data source which is related to the table. The selected data source should be
unique that is independent from the data source of any detail because cross tables has own data process-
ing.
97

CHAPTER 16. CROSS-TAB TABLES 16.4. CELL LEVEL PROPERTIES
Hidden columns Comma separated list of valid data source columns we don’t want to show in the table. These
data columns of course are existed in data source definition.
Column title source Data column ID of column header titles. If not specified, the column numbers appear.
SIZES AND SPACES
This group box represents the general sizes of cross-tab table elements.
Column widths General width of columns
Row heights General height of table rows
Cell padding Gap size inside of the cells. This is equal to internal cell margin
Cell spacing Spacing size between the cells
Table spacing Spacing between the tables when cross-tab is multi line. Table is broken to multi line when wider
than a page.
SECTION SIZES
This group box represents the sizes of cross-tab table sections. To read more about table sections look at the
table structure. The following options contains the size of specified table part.
Header column width Width of the header (left/first) column
Data column width Width of data columns
Total column width Width of total/summary column. Mostly this is last, rightmost column.
Header row height Height of the header (first) row.
Data row height Height of the data rows
Total row height Height of the total/bottom summary row. Mostly this is the last row of the table.
SHOW TABLE PARTS
This group box represents the switches with you can enable or disable the specified table part.
Column header To show or hide column header
Row header To show or hide row header
Bottom summary To show or hide summary row
Side summary To show or hide side summary column
Break table when page breaks If this option is enabled the table can break within its rows when the page
breaks. To avoid table breaking disable this option.
16.4 Cell level properties
The cell properties are related to the specified cells. The cell names are represented by their function. To read
more about cell structures look at the table structure.
98
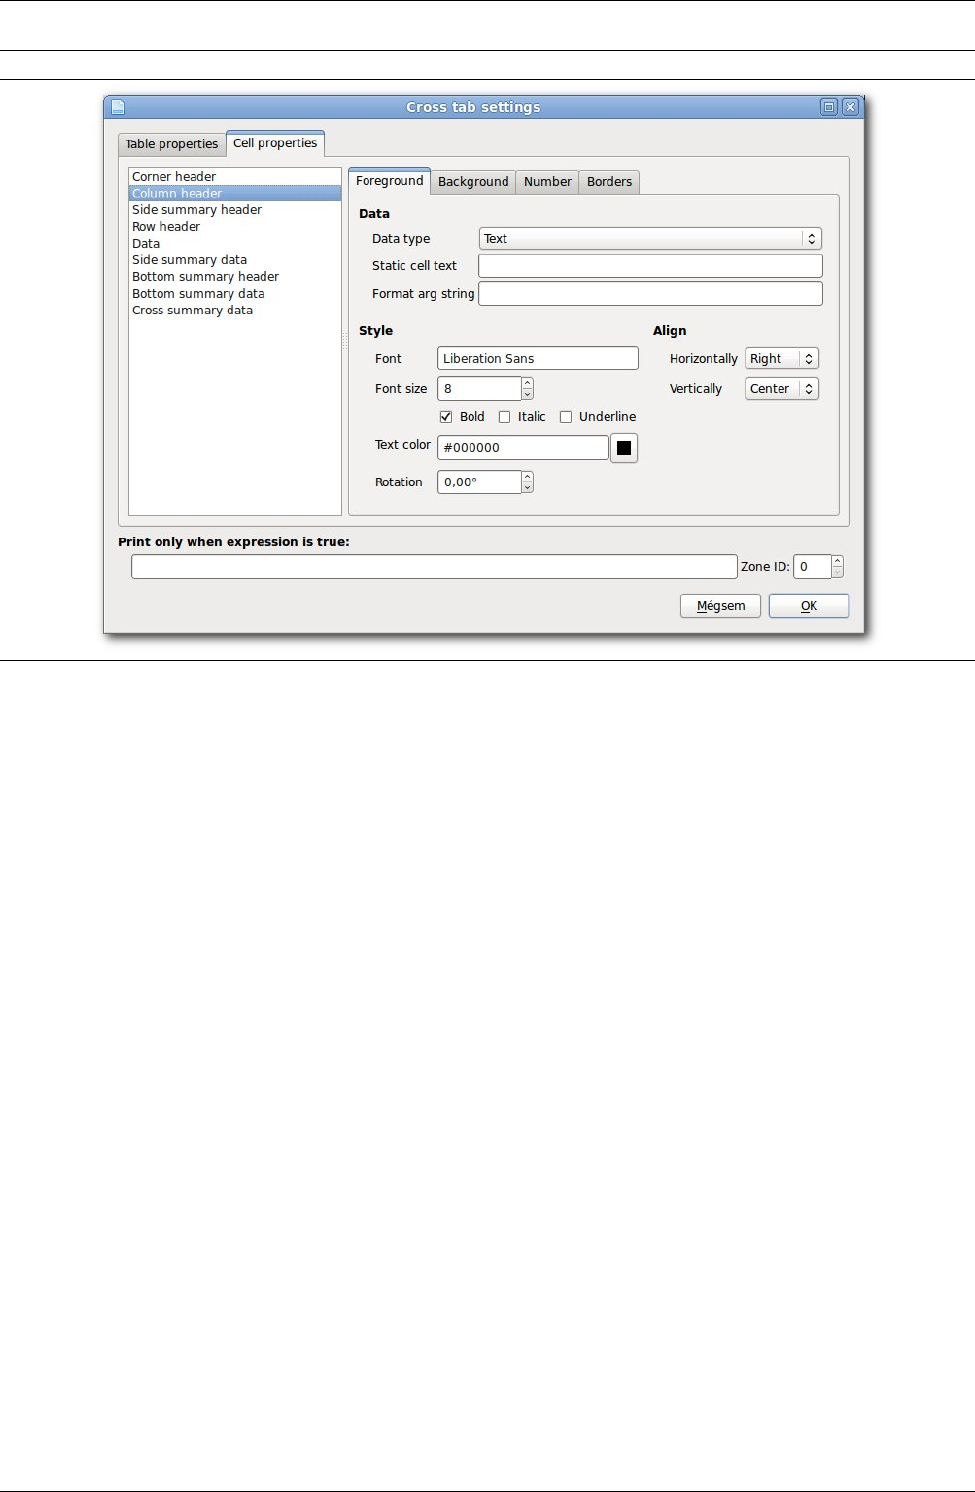
CHAPTER 16. CROSS-TAB TABLES 16.4. CELL LEVEL PROPERTIES
Figure 16.7 Cell settings
99
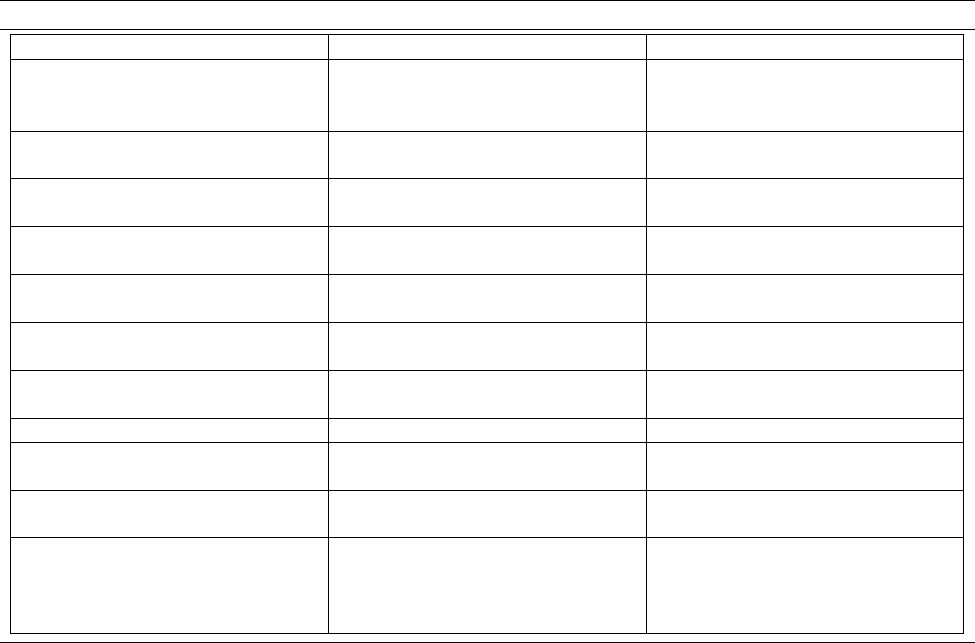
Chapter 17
Conditional formatting
This function allows to use dynamic, data-driven text styles in reports depending on current value of any data
source columns, parameters, variables or even script expressions. This runtime formatting option is available
for Labels or Fields only. HTML texts can be dynamically formatted by embedding dynamic tags within HTML
code.
Format definition is a code text with style tag symbols and expressions similar to generic CSS style code.
Style tag and its value/expression are divided by colon. Each row represents one style definition. Script expres-
sions have to enclose into curly braces.
17.1 Style Tag Symbols
The following style tag symbols can be used in format code. Multiple style tags are allowed in the code.
Table 17.1 Dynamic style tag symbols
Tag symbol Description Examples
color: Text foreground color
color:#ff0000 color:$D{ds.color}
color:{if($D{ds.price}>500)
"#ff0000";}
background-color: Text background color background-color:#ff0000
background-color:$D{ds.bgcolor}
font-family: Font family name font-family:Arial
font-family::$D{ds.font}
font-bold: Font bold on/off font-bold:true
font-bold:$D{ds.isBold}
font-italic: Font italic on/off font-italic:true
font-italic:$D{ds.isItalic}
font-weight: Font weight integer value.
Higher value results bolder text.
font-weight:50
font-weight:$D{ds.fweight}
font-underline: Font underline on/off font-underline:true font-
underline:$D{ds.isUnderline}
font-size: Font size in points. Integer value. font-size:12 font-size:$D{ds.size}
font-strikeout: Font strikeout on/off font-strikeout:true
font-strikeout:$D{ds.fstrikeout}
letter-spacing: Text letter spacing value. Greater
value results bigger spacing
letter-spacing:1.5 letter-
spacing:$D{ds.letterspacing}
capitalization:
Rendering option for text font
applies to. Integer value from
0-4. Equals QFont::Capitalization
enumeration property
capitalization:$D{ds.cap}
101
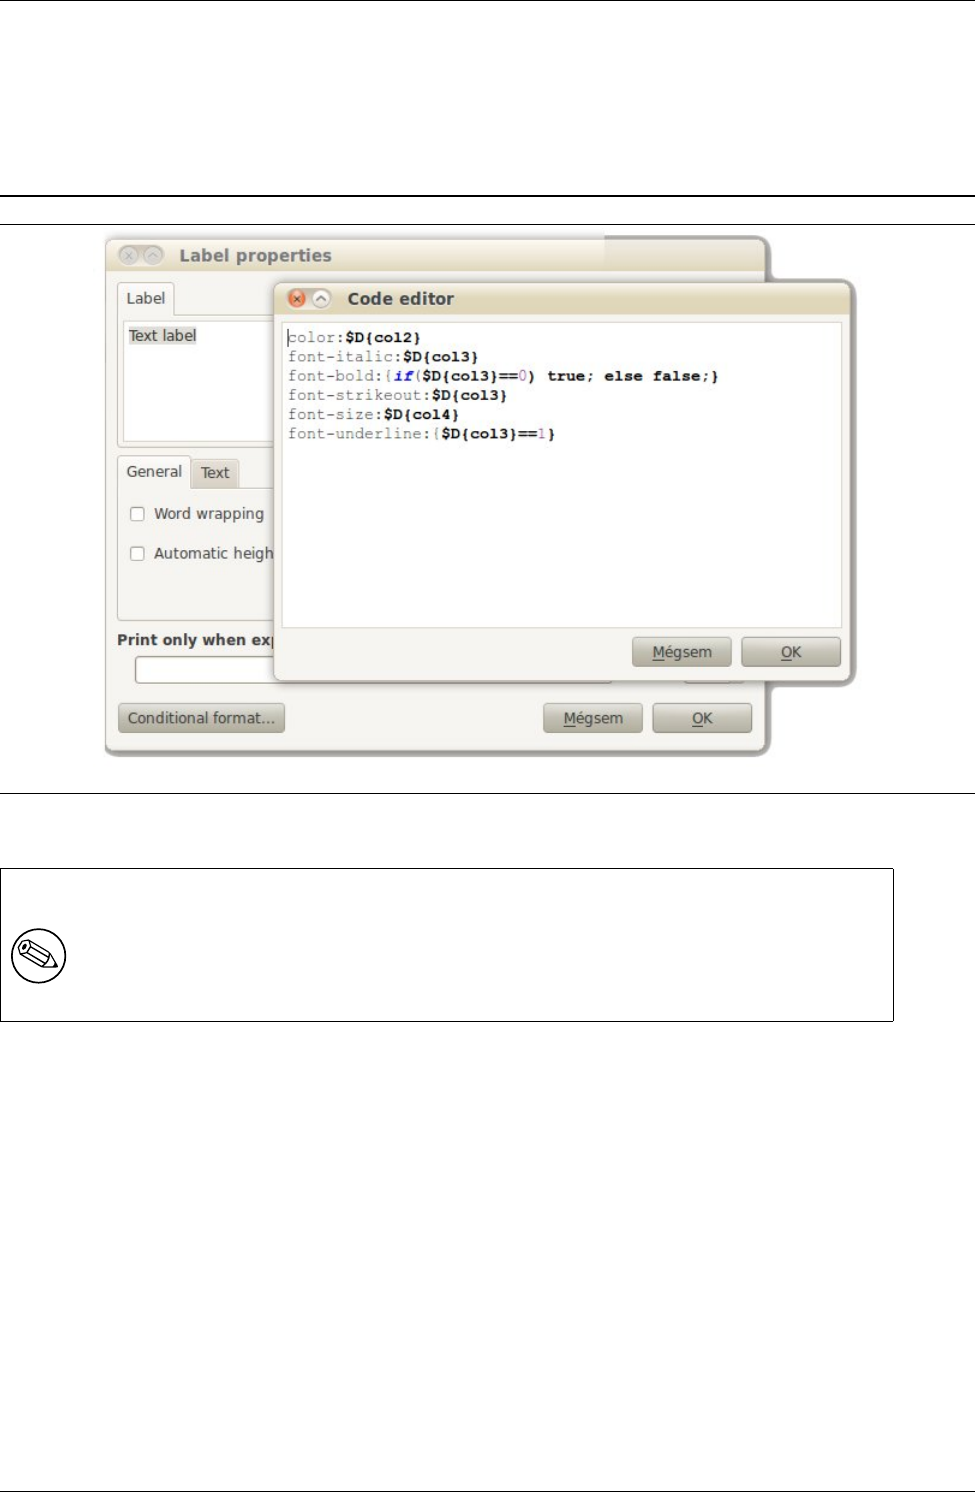
CHAPTER 17. CONDITIONAL FORMATTING 17.2. EDIT STYLE CODE IN DESIGNER
17.2 Edit style code in Designer
To define a conditional text formatting of a Label or a Field click on the Conditional formatting... button at the
bottom of the item property dialog. Then the conditional format code dialog will appear. Type or paste the
format code by keeping the syntax rules. Click OK to save the code
Figure 17.1
NOTE
Style tag and its corresponding value should be in one line! Multiple lines of style definitions are
not evaluated.
17.3 Default style
In order to using a condition (script or data) that returns empty value, the default style formatting option is
applied. The default style settings are what you set statically in the report as usual.
102
Chapter 18
Sub-Report Iteration
The feature called ’sub-report’ means here when whole report process is repeated by traversing through a dedi-
cated data source. This is similar to the ’classic sub-report’ model but supports only 1 level. This function is very
useful when a complex report or a multi detail report has to be repeated by processing different data records.
The function uses a dedicated ’parent’ data source as a repeation source.
Sub-Report function is a great opportunity for creating simple one-to-many relation reports.
18.1 Sub-Report data source
To set the data source on which the iteration based, you have to add a data source to the report as usual. Set the
Opening role to Sub-Report iteration
18.2 Reference to master data source
You can place any reference to master data source in the SQL data source queries. For example:
SELECT product.name, product.code WHERE id=$D{master.id}
For non SQL data sources such as Item Model data source it is possible to use the SIGNAL/SLOT mecha-
nism. Use the following signal of NCReport object:
signals:
void dataSourceUpdateRequest(const QString& dataSourceID, const QString& data);
NOTE
All data sources are updated repeatedly when a sub-report cycle begins, after the last cycle fin-
ished, except the master data source. The function is similar to a parent/child relation
103
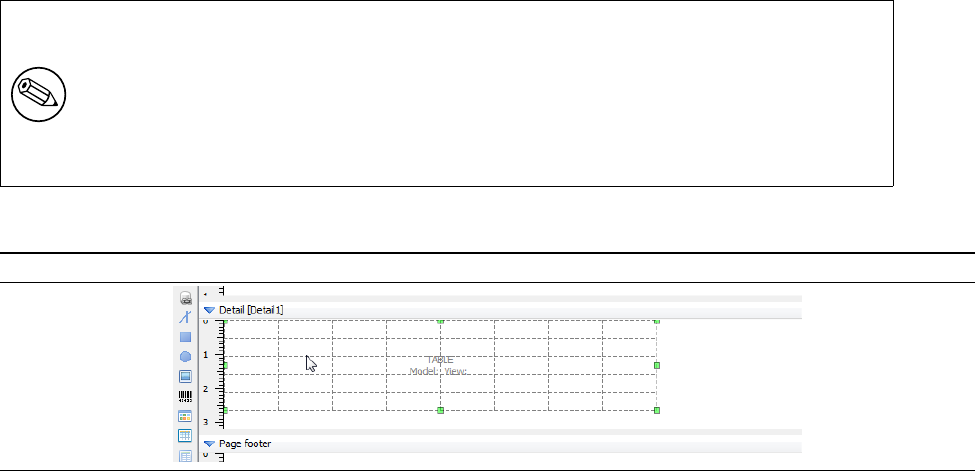
Chapter 19
Printing QTableView
Table View item is a report item destined to rendering QTableView tables with full WYSWYG print support. The
function is aimed to print the tables in the same rate as the existed QTableView screen widget. The table view
item should follow the formats of the original QTableView widget. The cells gets display outlook information
from the table’s item model. Some basic table settings such as header background, line type, line color, etc. are
currently fixed.
19.1 Adding TableView item
In Designer to add a TableView item into a section select the Table View tool button or menu item from Tools
menu. After the cursor changes to a cross beam click in the section where you want the item to be located. The
Table View item is created and its settings dialog appears.
NOTE
It is strongly recommended to add Table View to a Detail section, not into the headers or footers.
Since the table may fill the available space both horizontally and vertically, no other report items
should add to this section. The table view has its own data source assignment so it is independent
from the data source of the detail which should be unique and should have 1 (dummy) record.
Figure 19.1 Table View Item in Designer
Specify the same ID values in the Table View settings dialog that you will apply when setting the table view
and the model from code. The report engine will identify the objects by the specified IDs.
105
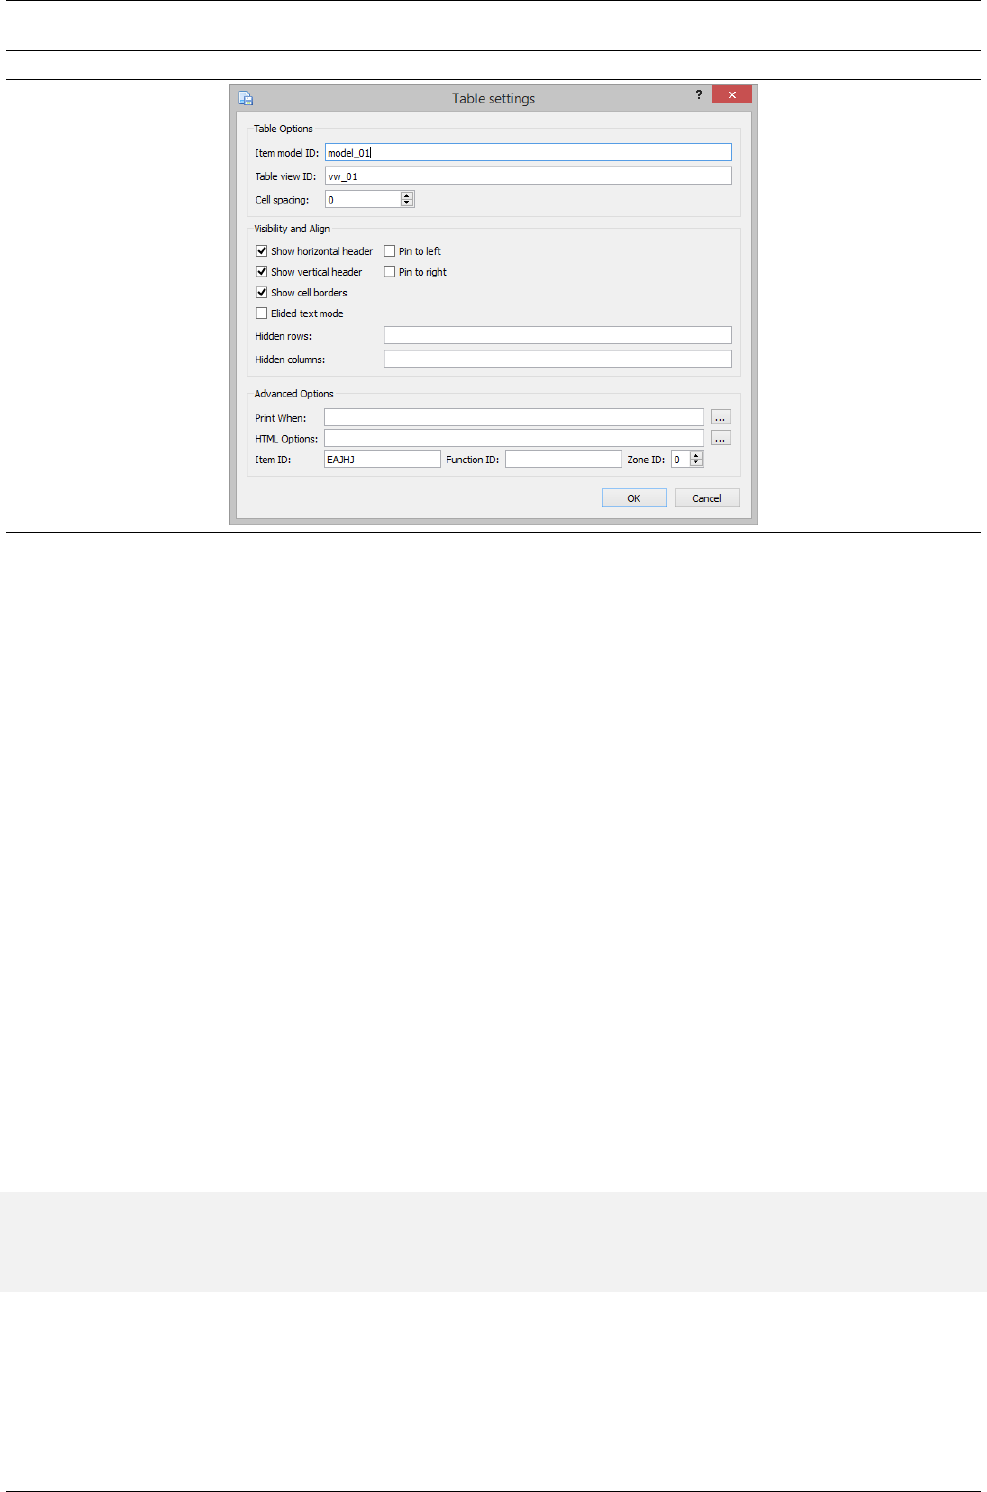
CHAPTER 19. PRINTING QTABLEVIEW 19.2. SETTING THE OBJECT REFERENCES
Figure 19.2 Table View Item in Designer
The dialog options are as follows:
Item Model ID Identifies the model object pointer related to the QTableView.
Table View ID Identifies the QTableView object pointer you want to render.
Cell spacing Spacing value for cells. Has no affect.
Show horizontal header If enabled then the horizontal table header will appear.
Show vertical header If enabled then the vertical table header will appear.
Elided text mode When this option is enabled the multi-line texts will not be rendered, but partially the first
line only with three dots.
Pin to left The table will automatically be adjusted to the left margin.
Pin to right The table will automatically be adjusted to the right margin.
19.2 Setting the object references
Use the following API functions for defining the QTableView object and its model for NCReport. You have to
set the appropriate IDs to identify the objects. This because it is possible to assign multiple object pointers to
NCReport. You don’t need this in design time but only when running the report.
NCReport*report = new NCReport( this );
...
report->addTableView( ui->tableView, "myView");
report->addItemModel(ui->tableView->model(), "myModel");
19.3 Example
The following example shows how a printed QTableView widget looks like on the screen. The table is filled
with test data and even images.
106
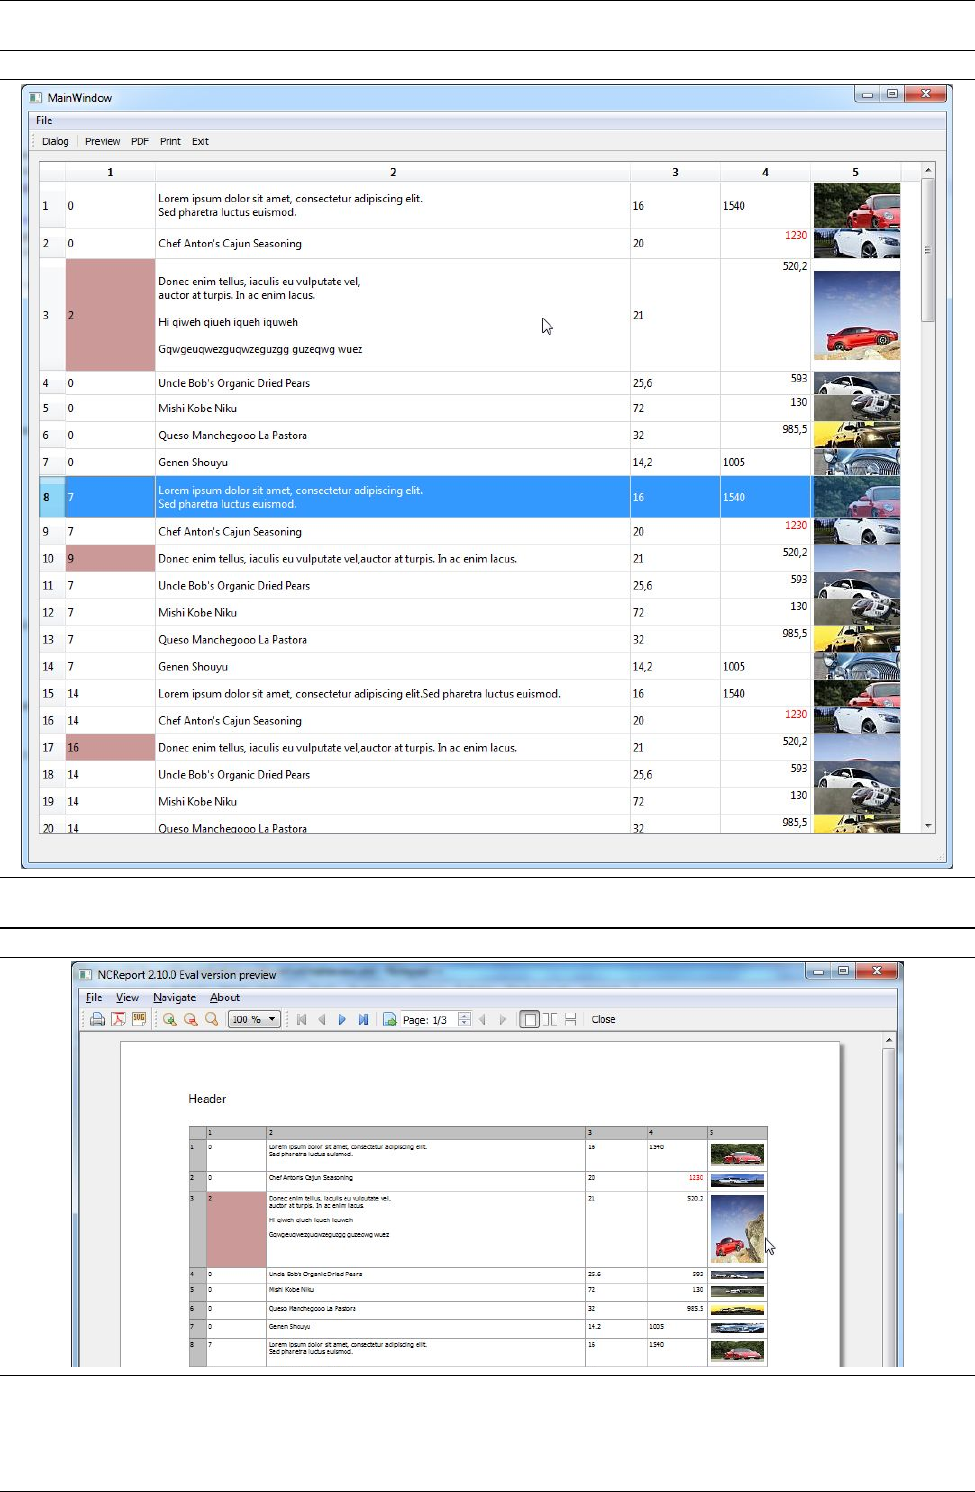
CHAPTER 19. PRINTING QTABLEVIEW 19.3. EXAMPLE
Figure 19.3 QTableView widget
Figure 19.4 QTableView table in print preview
107

Chapter 20
Sending report via e-mail
From version 2.10 there is a new class that provides you to send e-mail from your application. The class is
named LMailSender. Also it is possible to run report into PDF file and one step sending via e-mail by
calling NCReport::runReportToPDFSendMail(const QString &filename, LMailSender *mailS
ender) method. An existing LMailSender object must be prepared before calling this function. The detailed
class information you find in API documentation.
20.1 E-mail sending example
The following example shows how the LMailSender should be used and how the attachments are added.
LMailSender mail;
mail.setSmtpServer("mail.mailserver.com");
//mail.setPort(465);
//mail.setSsl(true);
mail.setLogin("user@mailserver.com","xyz123");
mail.setSubject("Test Email");
mail.setBody("Hello!\nThis is a test report. How are you?");
mail.setFrom("me@myself.com");
mail.setFromName("Albert Einstein");
// Recipient
QStringList listTo;
listTo << "myfriend@anywhere.com";
mail.setTo( listTo );
QFile file("c:/Documents/report_result1.pdf");
if (file.open(QFile::ReadOnly))
mail.setAttachment("report_result1.pdf", file.readAll());
QFile file2("c:/Documents/report_result2.html");
if (file2.open(QFile::ReadOnly))
mail.setAttachment("report_result2.html", file2.readAll());
if ( !mail.send() )
qDebug("Mail error: %s",qPrintable(mail.lastError()));
Example of running report to PDF and sending via e-mail:
LMailSender mail;
mail.setSmtpServer("mail.mailserver.com");
mail.setLogin("user@mailserver.com","xyz123");
mail.setSubject("Test Email");
mail.setBody("Hello!\nThis is a test report. How are you?");
mail.setFrom("me@myself.com");
mail.setFromName("Albert Einstein");
109

CHAPTER 20. SENDING REPORT VIA E-MAIL 20.1. E-MAIL SENDING EXAMPLE
NCReport*report = new NCReport();
...
report->runReportToPDFSendMail("myreport.pdf", mail);
...
110
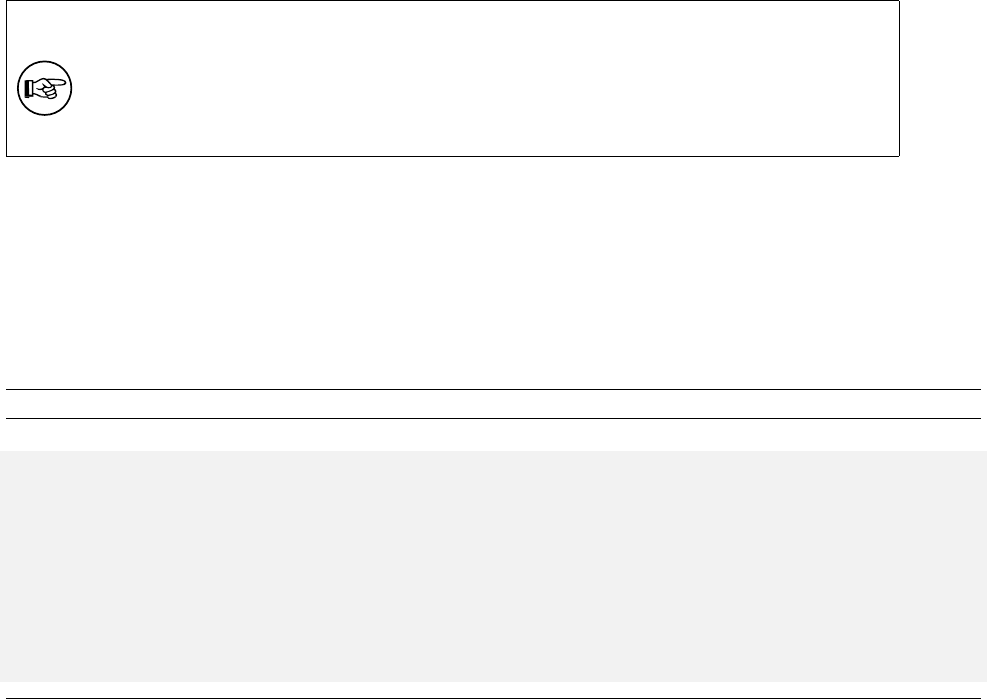
Chapter 21
General TEXT output
Text output is a very powerful feature in NCReport. The function provides the ability of generating various
kind of text outputs like HTML, XML, Plain text, etc. Text Output requires an additinal template to be existed.
Before running a report you have to specify the text template file as well.
TIP
TEXT output is generated very fast, because data is processed and substituted directly into the
text template without any graphical rendering.
21.1 Text template manager tags
The following manager keywords/tags are available when you create a text template. Each start and end tags
represents a specified section. Tags are enclosed in standard HTML comment tokens, according to HTML
21.2 Examples
Example 21.1 TEXT output template example
The following example shows how a typical usage of text template
<!-- BEGIN {DH} -->
SIMPLE TEXT REPORT OUTPUT
<!-- END -->
<!-- BEGIN {PH} -->
Customer ID Name Address
-----------------------------------------------
<!-- END -->
<!-- BEGIN {D.Detail1} -->
$D{custid} $D{custname} $D{address}
<!-- END -->
111
CHAPTER 21. GENERAL TEXT OUTPUT 21.2. EXAMPLES
Table 21.1 Text template tags
Tag keyword Description
<!--BEGIN {DH} -->
Document header begins. Document means the
current text output. For example the HTML header
part.
<!--END --> Section ends
<!--BEGIN {DF} --> Document footer begins. For example the HTML
document footer part.
<!--END --> Section ends
<!--BEGIN {PH} --> Page header section begins.
<!--END --> Section ends
<!--BEGIN {PF} --> Page footer section begins.
<!--END --> Section ends
<!--BEGIN {RF} --> Report header section begins.
<!--END --> Section ends
<!--BEGIN {RF} --> Report footer section begins.
<!--END --> Section ends
<!--BEGIN {D.DetailID} --> Detail section begins. Section is identified by
DetailID
<!--END --> Section ends
<!--BEGIN {GH.DetailID.GroupID} --> >Group header section begins. Section is identified
by both DetailID and GroupID
<!--END --> Section ends
<!--BEGIN {GF.DetailID.GroupID} --> >Group footer section begins. Section is identified
by both DetailID and GroupID
<!--END --> Section ends
112
Part V
Using NCReport API
113

This part shows you how to create an NCReport object and how to use it from your C++/Qt application. As
we described earlier NCReport system consists of two parts: Report renderer library and a report designer GUI
application. Of course the report engine can be used separately from Designer.
115

Chapter 22
Library integration
If you want to call NCReport from your application, first you have to integrate NCReport in your Qt application
project. There are more options for you to do this:
• Static integration: To add the whole sources to your project and build it together with your application.
• To use NCReport engine as shared library. For using NCReport library like other libraries in your project
you need to specify them in your project file. For more informations see the Qt documentation in qmake
manual at chapter Declaring Other Libraries. If you use Qt Creator development environment, adding
NCReport library to your project is very simple with the right click menu on the project tree.
• Statically linking NCReport library to your project. For more informations see the Qt documentation in
qmake manual at chapter Declaring Other Libraries
22.1 Setting up your project file
You have to add to your .pro file at least the following lines:
NCREPORT_LIBPATH = /home/ncreport/lib
CONFIG(release, debug|release) {
win32|win64: LIBS += -L$$NCREPORT_LIBPATH -lNCReport2
unix:!macx: LIBS += -L$$NCREPORT_LIBPATH -lNCReport
else:macx: LIBS += -framework NCReport
}
CONFIG(debug, debug|release) {
win32|win64: LIBS += -L$$NCREPORT_LIBPATH -lNCReportDebug2
unix:!macx: LIBS += -L$$NCREPORT_LIBPATH -lNCReportDebug
else:macx: LIBS += -framework NCReportDebug
}
INCLUDEPATH += /home/ncreport/include
...
22.2 Initialize NCReport class
This section covers the fundamental steps that most users should take when creating and using NCReport class.
We present each of the activities in the suggested order.
22.2.1 Include directives
To include the definitions of the module’s classes, use the following directive:
#include "ncreport.h"
#include "ncreportoutput.h"
#include "ncreportpreviewoutput.h"
#include "ncreportpreviewwindow.h"
117
CHAPTER 22. LIBRARY INTEGRATION 22.3. CONNECTING TO SQL DATABASE
22.2.2 Creating NCReport class
Create the report class just like as another QObject based class:
NCReport *report = new NCReport();
If the class has created earlier and passed as a parameter to your method in which you use the report object
you should inititalize the report by calling reset() method:
report->reset();
You dont’t need using reset() if the report object is declared immediately before using it.
22.3 Connecting to SQL database
SQL connection is required only when your data source uses internal database connection. In other words
Internal connection menas an already existing database connection which is established before running the
report. On the other hand reports can also use external (defined in the report / built-in) connection as well.
Other data sources don’t require db connection.
This example code shows a typical SQL database connection with error handling:
QSqlDatabase defaultDB = QSqlDatabase::addDatabase("QMYSQL","myconn" );
if ( !defaultDB.isValid() ) {
QMessageBox::warning( 0, "Report error", QObject::tr("Could not load database ←-
driver.") );
delete report;
return;
}
defaultDB.setHostName( "host" );
defaultDB.setDatabaseName( "database" );
defaultDB.setUserName( "user" );
defaultDB.setPassword( "password" );
if ( !defaultDB.open() ) {
QMessageBox::warning( 0, "Report error", QObject::tr("Cannot open database:
")+defaultDB.lastError().databaseText() );
return;
}
22.4 Setting the Report’s source
Report source means the way of NCReport handles XML report definitions, in other words the source of report
definition XML data. Report definitions may opened from a file - in most cases it is suitable, but it can be loaded
also from an SQL database’s table. For informations of configuring and using the different report sources see ...
In current example we apply File as report source:
report->setReportFile( fileName );
This code is equivalent with this code:
report->setReportSource( NCReportSource::File );
report->reportSource()->setFileName( fileName );
118

Chapter 23
Running the Report
Now we are ready to run the Report and catch the error message if an error occurs. There are at least two ways
to start running the report engine.
23.1 Running the Report by One Step
This running mode is the most simple but with less custom configuration is available.
// run report to printer
bool result = report->runReportToPrinter(1, true, parent);
// run report to pdf file
bool result = report->runReportToPDF( "file.pdf" );
// run report to svg files
bool result = report->runReportToSVG( "file.svg" );
// run report to preview output
bool result = report->runReportToPreview();
// run report to QPrintPreview dialog
bool result = report->runReportToQtPreview();
By this way, if we want to preview the report we also have to create and show NCReportPreviewWindow
. See the next section.
23.2 Running the Report in customized mode
This running report mode allows more flexible configuration. First we have to initialize the output object, after
the report is ready to run.
23.2.1 Initializing Report’s Output
The next issue is to create and specify the report’s output. As rendering target, NCReport applies a class derived
from NCReportOutput base class. There are pre-defined classes for the mostly used outputs: NCReportPrin
terOutput ,NCReportPreviewOutput ,NCReportPdfOutput . To define the specified output use a code
similar to this:
NCReportOutput *output=0;
if ( rbPreview->isChecked() ) {
output = new NCReportPreviewOutput();
output->setAutoDelete( FALSE );
report->setOutput( output );
}else if ( rbPrinter->isChecked() ) {
output = new NCReportPrinterOutput();
output->setCopies(1);
output->setShowPrintDialog(TRUE);
report->setOutput( output );
119
CHAPTER 23. RUNNING THE REPORT 23.2. RUNNING THE REPORT IN CUSTOMIZED ...
}else if ( rbPdf->isChecked() ) {
QString fileName = QFileDialog::getSaveFileName(this, tr("Save PDF File"),
"report.pdf", tr("Pdf files (*.pdf)"));
if ( fileName.isEmpty() ) {
delete report;
return;
}else {
output = new NCReportPdfOutput();
output->setFileName( fileName );
report->setOutput( output );
}
23.2.2 Running the Report
Now we are ready to run the Report and catch the error message if an error occures:
QApplication::setOverrideCursor(QCursor(Qt::WaitCursor));
report->runReport();
bool error = report->hasError();
QString err = report->lastErrorMsg();
QApplication::restoreOverrideCursor();
23.2.3 Previewing Report
If we specified NCReportPreviewOutput as report’s output, it does not run the preview form automatically.
After the report engine succesfully done we need to inititalize an NCReportPreviewWindow*object for pre-
viewing. The following code shows the way of doing this. It is suggested to catch the error first, before running
preview dialog.:
if ( error )
QMessageBox::information( 0, "Riport error", err );
else {
if ( rbPreview->isChecked() ) {
//-----------------------------
// PRINT PREVIEW
//-----------------------------
NCReportPreviewWindow *pv = new NCReportPreviewWindow();
pv->setReport( report );
pv->setOutput( (NCReportPreviewOutput*)output );
pv->setWindowModality(Qt::ApplicationModal );
pv->setAttribute( Qt::WA_DeleteOnClose );
pv->exec();
}
}
WARNING
We must not delete the output object after we added to the NCReportPreviewWindow object. The
preview window will delete its output object when destroys.
120

CHAPTER 23. RUNNING THE REPORT 23.2. RUNNING THE REPORT IN CUSTOMIZED ...
TIP
For the best performance (quality) we should not delete NCReport object until we close preview
dialog. Add the report object to the preview object by setReport( NCReport*). If it’s
done the printing from preview will result the original printout quality, since it will run report again
instead of printing the lower quality preview pages.
Since 2.8.4 version it’s possible to show the preview widget in dialog mode, just like QDialog. NCReportPre-
viewMainWindow::exec() function shows the preview window and keeps application event loop while preview.
This is good when you use a locally defined report object, because the report object will not be deleted until user
closes the preview window.
121
Part VI
Specification
123

This document is essentially a specification of NCReport Reporting System XML template structure. This is
a brief documentation of XML report definition.
125

Chapter 24
Data sources
Since the report generator builds a printable representation of data from a data source, the the data source is one
of the most important requirement of the system. Data may come from an SQL query using Qt’s database SQL
database connection drivers or from other sources such as text, XML, string list, item model or custom defined
data source. One report can contain multiple data sources and each details can be connected to a specified data
source. Rarely a data source is not assigned to any detail, in this case the initial (first) record data of the data
source is evaluated. These one row data sources are very useful when you want a report-wide available data or
you want 1 row detail sections.
24.1 SQL data source
SQL queries are commonly used data sources of NCReport. It requires SQL database connection using Qt’s
database driver plugins. Database connection might be internal or external. With internal - which is the default
- connection a valid database connection must be established by the application uses NCReport before running
the report. External connection parameters must be specified if we want to use external connection. External
connection is established by the report engine at the beginnig of the report runtime.
24.1.1 XML syntax
<datasource>[SQL query]</datasource>
<datasource>[query filename]</datasource>
24.1.2 Tag properties
id data source ID. Identification name of the data source. Details are assigned to data source by this ID.
type Specifies the data source type. Equals SQL for SQL data sources. Possible values are: SQL,txt,xml,lis
t,model,custom
source The source of the data source definition. Depending on this option the SQL query is stored and read
from the report definition or from a specified file. Possibly values are: static,file,parameter
connection Specifies the SQL database connection handling method. Possibly values are: internal,exter
nal With internal (the default) connection a valid database connection must be established by the appli-
cation uses NCReport before running the report. If external connection is specified, the report generator
connects to the database when opening the data source. If this occurs the host,database,user,pass
word,port possible connection parameters are used.
connID The database connection’s name that is used when the QSQLDatabase::addDatabase(...) method
is called in the report engine. This ID is required for running SQL query which is assigned to the data
source
parentID If the data source is a sub-item of a parent data source (sub-query system) then this ID equals to the
ID of parent data source. Valid for SQL data sources only
127

CHAPTER 24. DATA SOURCES 24.2. TEXT DATA SOURCE
driver The name of the Qt’s SQL database driver. The possible values are: QDB2, QIBASE, QMYSQL, QOCI,
QODBC, QPSQL, QSQLITE2, QSQLITE, QTDS
host Host name for SQL database connection. Used only when external connection is defined.
database Database name for SQL database connection. Used only when external connection is defined.
user Host name for SQL database connection. Used only when external connection is defined.
password Password for SQL database connection. Used only when external connection is defined.
port Port number for SQL database connection. Used only when external connection is defined.
24.2 Text data source
Texts, text files, are able to be as a data source for NCReport. The data columns of a text are usually delimited
by tab or other delimiter character. Even it’s possible to avoid SQL database connection when using this kind of
data source. It’s necessary to set the delimiter type, this delimiter separates the columns and each row represents
a data record. Text data sources can be static, stored in XML definition or can be a file
24.2.1 XML syntax
<data source>[static text]</data source>
<data source>[filename]</data source>
24.2.2 Tag properties
id data source ID. Identification name of the data source. Details are assigned to data source by this ID.
type Specifies the data source type. Equals txt for text data sources.
source The source of the data source definition. Depending on this option the text is stored and read from the
report definition or from a specified file. Possibly values are: static,file
24.3 XML data source
Extensible Markup Language (XML) format is also can be a data source for NCReport. If using xml data source
you don’t need SQL database connection. Currently the XML data source works with a pre-defined XML struc-
ture only. Nice opportunity that also parameters can be stored within the XML data source.
The following example shows how the data structure should look like
Example 24.1 Exmple XML structure
<?xml version="1.0" encoding="UTF-8"?>
<!DOCTYPE NCReport-Data>
<NCReportData>
<parameters>
<d type="string" id="TransactionNumber">02236412</d>
<d type="string" id="ContactFirstName">Peter</d>
<d type="string" id="ContactLastName">Gilmore</d>
<d type="string" id="ContactEmail">nobody@company.com</d>
<d type="string" id="ReportDate">2012-12-21 10:00:00.000</d>
<d type="string" id="HeaderComments">Lorem ipsum dolor sit amet, consectetur ←-
adipisicing elit, sed do eiusmod tempor incididunt ut labore et dolore magna aliqua ←-
. Ut enim ad minim veniam, quis nostrud exercitation ullamco laboris nisi ut ←-
aliquip ex ea commodo consequat. Duis aute irure dolor in reprehenderit in ←-
voluptate velit esse cillum dolore eu fugiat nulla pariatur. Excepteur sint ←-
occaecat cupidatat non proident, sunt in culpa qui officia deserunt mollit anim id ←-
est laborum.</d>
<d type="date" id="PrintedDate">2012-12-21</d>
<d type="numeric" id="TotalAmount">618.50</d>
128

CHAPTER 24. DATA SOURCES 24.4. STRING LIST DATA SOURCE
<d type="numeric" id="TaxAmount">0</d>
</parameters>
<datasources>
<datasource id="xmlds1">
<columns>
<column type="string">ProductNumber</column>
<column type="string">ProductName</column>
<column type="string">Comments</column>
<column type="string">VATNumber</column>
<column type="string">Description</column>
<column type="boolean">IsValid</column>
<column type="string">Currency</column>
<column type="numeric">NetPrice</column>
<column type="numeric">Quantity</column>
<column type="string">QuantityUnit</column>
</columns>
<row>
<d>CK02214</d>
<d>Computer Monitor</d>
<d></d>
<d>26540114</d>
<d></d>
<d>1</d>
<d>EUR</d>
<d>290.00</d>
<d>2</d>
<d>pcs</d>
</row>
<row>
<d>BLKD5541</d>
<d>Wireless Keyboard PC-887</d>
<d></d>
<d>3221444</d>
<d></d>
<d>1</d>
<d>EUR</d>
<d>38.50</d>
<d>1</d>
<d>pcs</d>
</row>
</datasource>
</datasources>
</NCReportData>
24.3.1 XML syntax
<datasource>[static xml text]</datasource>
<datasource>[xml filename]</datasource>
24.3.2 Tag properties
id data source ID. Identification name of the data source. Details are assigned to data source by this ID.
type Specifies the data source type. Equals xml for XML data sources.
24.4 String list data source
It’s possible to use also QStringList as data source for NCReport. Before running report, a QStringList must be
assigned to the specified data source and also is necessary to set a delimiter character for separating columns in
each list item that represents a data record.
129

CHAPTER 24. DATA SOURCES 24.5. ITEM MODEL DATA SOURCE
24.4.1 XML syntax
<data source></data source>
24.4.2 Tag properties
id data source ID. Identification name of the data source. Details are assigned to data source by this ID.
listID ID of the list. This identification name specifies the id of the QStringList added to NCReport.
type Specifies the data source type. Equals list for string list data sources.
24.5 Item model data source
Qt’s item model classes provide a generic model for storing custom data. For example QStandardItemModel
can be used as a repository for standard Qt data types. It is one of the Model/View Classes and is part of Qt’s
model/view framework. It’s possible to use item models as data source for NCReport. Before running report, a
QAbstractItemModel based class must be implemented and assigned to the report engine as specified data
source.
24.5.1 XML syntax
<data source></data source>
24.5.2 Tag properties
id data source ID. Identification name of the data source. Details are assigned to data source by this ID.
modelID ID of the model. This identification name specifies the id of the Model added to NCReport.
type Specifies the data source type. Equals model for item model data sources.
24.6 Custom data source
Often data is stored in special repository such as lists, arrays etc. You can build your custom data source
class derived from NCReportdata source base class. It is an abstract class - you just have to implement the
required methods.
130

Chapter 25
Report sections
Report sections are the representations of the function specific areas inside the report. The whole report is
builded from sections. They are often a recurring areas such as detail, headers and footers. The most important
section is called Detail since details can contain the fields are changed row by row. Each sections can contain all
kinds of report items. Item’s coordinates are always relative to it’s parent section. One report can contain the
following sections:
Report header, report footer, page headers, page footers, group headers and footers and details
25.1 Page header
Page headers is used to contain page headings. Page headers have the following characteristics:
• Always print at the top of a page
• Always contain the first information printed on a page
• Only display one (current) row of data returned by a data source
• Only one allowed per page
25.1.1 XML syntax
<pageheader>...</pageheader>
25.1.2 Tag properties
height The height of the page header section in millimeters
25.2 Page footer
Page Footer are commonly used to close the pages. Page footers have the following characteristics:
• Always print at the bottom of a page
• Only display one (current) row of data returned by a data source
• Only one allowed per page
• Page footer is usually used to display informations like number of the page, report titles and so on.
25.2.1 XML syntax
<pagefooter>...</pagefooter>
131

CHAPTER 25. REPORT SECTIONS 25.3. REPORT HEADER
25.2.2 Tag properties
height The height of the page footer section in millimeters
25.3 Report header
Report header is used to contain report headings. Report header has the following characteristics:
• Always printed after the page header
• Report header is printed only once at the begining of the report
• Displays only one (current) row of data returned by a data source
25.3.1 XML syntax
<reportheader>...</reportheader>
25.3.2 Tag properties
height The height of the report header section in millimeters
25.4 Report footer
Report footer is commonly used to close the report. Report footer has the following characteristics:
• Always printed before the page footer at the end of the report
• Only display one (current) row of data returned by a data source
• Only one allowed per report
25.4.1 XML syntax
<reportfooter>...</reportfooter>
25.4.2 Tag properties
height The height of the report footer section in millimeters
25.5 Details
The core information in a report is displayed in its Detail section. This section is the most important part of the
report since it contains the row by row data from the data source Detail section have the following issues:
• Generally print in the middle of a page
• Always contain the core information for a report
• Display multiple rows of data returned by a data source
• The detail sections generally contains fields or dynamic objects.
• Multiple independent details are allowed in one report, each detail after the other
• Each detail is assigned to one specified data source
132

CHAPTER 25. REPORT SECTIONS 25.6. GROUP SECTIONS
25.5.1 XML syntax
<detail>...</detail>
Structure:
<details>
<detail>
<items>...</items>
<groups>...</groups>
</detail>
<detail>
<items>...</items>
<groups>...</groups>
</detail>
...
</details>
25.5.2 Tag properties
id Name/ID of the detail for identification purpuses
height The height of the group header section in millimeters
data source The data source name/id the detail section is assigned to
25.6 Group sections
While most reports can be defined using a single Detail section having multiple columns and rows of data,
others require summary data - such as subtotals. For reports requiring summary data, the report writer supports
Group sections. Group sections have the following characteristics:
• Always associated with a Detail section
• Defined by Group Headers and Group Footers
• Group Headers always print above it’s Detail section
• Group Footers always print below it’s Detail section
• Reference database column on which Group Headers and Group Footers will break
• Force new Group Header each time the value of the referenced column changes
• Force a new Group Footer each time the value of the referenced column changes
• Unlimited level of groups allowed
The groups added to XML definition are shown in the order you have added. They are structured hierar-
chically. The first group will be the primary level of group, the second one is the second level and so on. The
added group sections will appear in the designer after you applied the group settings.
25.6.1 XML syntax
<groups>
<group>
<groupheader>...</groupheader>
<groupfooter>...</groupfooter>
</group>
</groups>
133

CHAPTER 25. REPORT SECTIONS 25.6. GROUP SECTIONS
25.6.2 Tag properties
id Identification label for naming the group
groupExp Group expression or data source column. Specifies the name of the data source column on which
Group Headers and Group Footers will break. The expression also can be a constant value, in this case the
detail row won’t break. The constant group expression: %CONST
resetVariables The variable list appears the existed variables in the report. Just select the items represent the
variables will be reset when the current group ends. Selecting the specified variables is very useful when
for example you want to reset a total or a count variable.
reprintHeader Item’s Y coordinate in millimeter within the current section.
25.6.3 Group header
Group headers are used to contain group heading items such as column head titles or so on. They are always
printed above it’s Detail section. A new Group Header is forced each time the value of the referenced column
changes.
25.6.3.1 XML syntax
<groupheader>...items...</groupheader>
25.6.3.2 Tag properties
height The height of the group header section in millimeters
25.6.4 Group footer
Group footers are used to contain group footing items such as totals, subtotals. They are always printed below
it’s Detail section. A new Group Footer is forced each time the value of the referenced column changes.
25.6.4.1 XML syntax
<groupfooter>...items...</groupfooter>
25.6.4.2 Tag properties
height The height of the group footer section in millimeters
134

Chapter 26
Application Data
Reports can use data from application side. One of the most important interface between from application to
the report is using parameters. Also there are internal data which can be used in reports: variables and system
variables. NCReport also provides a way to combine muiltiple data into one by applying expressions.
26.1 Report Parameters
Parameters are data pulled from outside of the report generator. The application that calls NCReport object
passes informations as parameter to NCReport class by addParameter(...) method. Parameters are evalu-
ated within SQL queries and fields or script expressions. Field objects may have a parameter data source type,
so they can be presented as data in the report. Parameters mostly used in queries. If you want to embed a
parameter into the query or an expression use this syntax:
$P{parametername}
Example of using parameter in SQL query:
SELECT productId, productName FROM db.products WHERE primaryKey=$P{parametername}
26.2 Variables
Variables are specific items of the report. Variables are special fields used for providing counts and totals. Each
of the variables have name, function type, data type, and have an assigned data source column the variable
based on. We will explain what the different function types mean:
Count The COUNT type of variable will increment by 1 for every row returned by a query.
Sum The SUM (summary) variable will summarize the value of the specified data source column. It requires
numeric field type. To embed a parameter into an expression use this syntax:
$V{variablename}
26.3 System Variables
System variables are special variables that provide some report system informations such as page number,
current date/time etc. for fields Names of available system variables are:
pageno Returns the current page number
pagecount Returns the count of total pages of the report. Works only for Text document printout mode.
forcecopies Returns the number of total force copies
currentcopy Returns the current number of force copy
135

CHAPTER 26. APPLICATION DATA 26.4. EXPRESSIONS
currentrow Returns the current detail row number
date Returns the current date
time Returns the current time
datetime Returns the timestamp
appname Returns the name of this application
applongname Returns the long name of this application
appinfo Returns the full info string of this application
appversion Returns the version of this application
appcopyright Returns the copyright info of this application
qtversion Returns the Qt version
os Returns the operation system
For variable fields or to embed a parameter into an expression use this syntax:
$V{systemvariablename}
26.4 Expressions
NCReport since 2.0 version handles script expressions using Qt Script the new powerful feature of Qt 4.3. Qt
Script is based on the ECMAScript scripting language, as defined in standard ECMA-262. Fields and group
expressions may are script codes instead of data source column. The report engine evaluates the specified script
code in each time when fields are refreshed. Report items can have printWhen property. They are also script
expressions that return boolean result. To use script expression in fields the ftype="exp" field property must
be specified.
26.4.1 References in expressions
Expressions can contain and evaluate references such as
• data source data
• parameter
• variable
The references are always replaced to their current value before the exression is evaluated. The syntax of
referneces are the following:
$D{[data source.]column[,n]} data source column reference. Returns the current value of the data source col-
umn from the current row/record. If [data source.] is not specified the current data source (assigned
to the current detail) is interpreted.
If nis specified then first, the data source will be positioned to nth. record. Works only if the ::seek(
int ) method is defined in the appropriate data source class.
$P{paramatername} Parameter reference. Returns the value of the parameter by name/ID
$V{variablename} Variable reference. Returns the current value of the variable by name/ID.
136
CHAPTER 26. APPLICATION DATA 26.5. DATA TEMPLATES
26.4.2 Using script expression in field:
"$D{db.productName}"+" "+"some string"+"$P{parametername}"
Using script expression in printWhen property
$D{price}<1500
NOTE
Quotation mark in expressions is required only if a string data are applied. Otherwise (i.e for
number) the quotation mark is not neccessary.
26.5 Data Templates
Data template or text template provides an option to combine more data into one string. It has more advantages
over using expressions: more simple and faster. In few words a template is a simple string with embedded data
references.
26.5.1 References in templates
Data templates can contain references such as
• data source data
• parameter
• variable
Before the template expression is printed the included references are replaced with their current value. The
syntax of referneces are the same as in expressions.
26.5.2 Example of using template text in field
Name: $D{db.firstname} $D{db.lastname} Address: $D{db.address}
NOTE
Quotation mark is not required in templates
137

Chapter 27
Section items
Report items are the elements within section. Report items can be found always in a specified section. This
chapter is a brief documentation of the items NCReport provides.
27.1 Text label
The Label represents simple text or label items. Label items are used to display descriptive information on a
report definition, such as titles, headings, etc. Labels are static item, it’s values don’t change when rendering
the report.
27.1.1 XML syntax
<label>Text label...</label>
27.1.2 Tag properties
id Identification number for internal purpuses (temporarily not used)
posX Item’s X coordinate in millimeter within the current section.
posY Item’s Y coordinate in millimeter within the current section.
width Label’s width in millimeter.
height Label’s height in millimeter.
resource Resource of the label. Not used for labels since they are always static.
fontName Font style/face name
fontSize Font size in points.
fontWeight Font weight. Possible values are: bold,demibold
alignmentH Label’s horizontal alignment. Possible values: left,right,center
alignmentV Label’s vertical alignment. Possible values: top,center,bottom
forecolor The foreground color of the label in #RRGGBB format
zValue This integer number specifies Z-order value of the item. This value decides the stacking order of sibling
(neighboring) items.
printWhen This logical script expression specifies the item’s visibility. If this expression is not empty, the report
engine evaluates it each time before rendering. If the logical expression returns true (or 1) the item is
shown, otherwise the item is hidden.
139

CHAPTER 27. SECTION ITEMS 27.2. FIELD
27.2 Field
The Field is the matter of report items. It represents the data Field objects. By data type Fields may be text,
numeric and date. Field items are used for pulling dynamically generated data into a report from the specified
data source such as database the report generator uses. For example, a Field item may be used to present SQL
data, variables and parameters. NCReport handles data formatting for the different type of fields like numbers
or texts.
27.2.1 XML syntax
<field>[data sourcename.]column</field>
<field>[expression]</field>
<field>[parametername]</field>
<field>[variablename]</field>
<field>[system variablename]</field>
27.2.2 Tag properties
id Identification number for internal purpuses (temporarily not used)
type The field’s base data type. The following data types are handled:
•txt Text data
•num Numeric data. All numeric formatting options are valid only when this option is set
•date Date data. The date formattiong options are valid for date type data only
•bool Boolean data. It’s value might be Yes/True or Not/False
ftype This property represents what kind of field source expression is used by the field. Field’s value are pulled
from the specified source is set by this property. The possible sources are:
•ds/SQL The field gets data from the default or the specified data source
•par The field gets data from the specified parameter
•var The field gets data from the specified variable
•sys The field gets data from the specified system variable
•exp The field evaluates the script expression and it’s result will be rendered
posX Item’s X coordinate in millimeter within the current section.
posY Item’s Y coordinate in millimeter within the current section.
width Field’s width in millimeter.
height Field’s height in millimeter.
resource Not used for fields since they are always dynamic.
fontName Font style/face name
fontSize Font size in points.
fontWeight Font weight. Possible values are: bold, demibold
alignmentH Field’s horizontal alignment. Possible values: left, right, center
alignmentV Field’s vertical alignment. Possible values: top, center, bottom
forecolor The foreground color of the field in #RRGGBB format
formatting If the field’s data type is numeric, this option tells the report engine if number formatting is turned
on or off. The possible values are: true,false
140

CHAPTER 27. SECTION ITEMS 27.3. HTML TEXT
numwidth Width of number in digits. The fieldWidth value specifies the minimum amount of space that a is
padded to and filled with the character fillChar. A positive value will produce right-aligned text, whereas
a negative value will produce left-aligned text. Works only when the number formatting is turned on
format This one digit option specifies the format code for numbers. Possibly values are: e,E,f. With e,E and
f, precision is the number of digits after the decimal point. With ’g’ and ’G’, precision is the maximum
number of significant digits. Used by QString::arg( double a, int fieldWidth =0, char f
ormat =’g’, int precision =-1, const QChar & fillChar) function.
precision The number of digits after the decimal point for numeric data.
fillchar The numwidth value specifies the minimum amount of space that a is padded to and filled with the
character fillchar. A positive value will produce right-aligned text, whereas a negative value will produce
left-aligned text.
callFunction Specifies the Field level custom function is called when the field is evaluated. Not used currently.
lookupClass Similar to callFunction. Temporarely is not used.
dateFormat Date formatting expression. This expression uses the same format QDate::fromString() uses.
Works only when the field’s type is date
localized Specifies if localization is turned on or off. Works for numeric data only. The possible values are:
true, false
blankifzero If true, If the field’s value equals zero, the field will not be displayed.
arg This expression specifies the QString::arg(...) string of field’s value to be replaced or formatted. The
field gets a copy of this string where a replaces the first occurrence of %1. The ’%’ can be followed by an
’L’, in which case the sequence is replaced with a localized representation of a. The conversion uses the
default locale, set by QLocale::setDefault(). If no default locale was specified, the "C" locale is used.
zValue This integer number specifies Z-order value of the item. This value decides the stacking order of sibling
(neighboring) items.
printWhen This logical script expression specifies the item’s visibility. If this expression is not empty, the report
engine evaluates it each time before rendering. If the logical expression returns true (or 1) the item is
shown, otherwise the item is hidden.
27.3 HTML Text
HTML Text represents the rich texts in Html format.
27.3.1 XML syntax
<text>Static (encoded) Html text</text>
<text>[data source].column</text>
<text>[filename]</text>
27.3.2 Tag properties
id Identification number for internal purpuses (temporarily not used)
posX Item’s X coordinate in millimeter within the current section.
posY Item’s Y coordinate in millimeter within the current section.
width width in millimeter.
height height in millimeter.
resource Resource of the text. Not used for labels since they are always static.
141

CHAPTER 27. SECTION ITEMS 27.4. LINE
fontName Font style/face name. Effects only if system settings is enabled.
fontSize Font size in points. Effects only if system settings is enabled.
fontWeight Font weight. Possible values are: bold,demibold Effects only if system settings is enabled.
forecolor The foreground color of the label in #RRGGBB format. Effects only if system settings is enabled.
zValue This integer number specifies Z-order value of the item. This value decides the stacking order of sibling
(neighboring) items.
printWhen This logical script expression specifies the item’s visibility. If this expression is not empty, the report
engine evaluates it each time before rendering. If the logical expression returns true (or 1) the item is
shown, otherwise the item is hidden.
27.4 Line
The Line option enables you to create Line items. In general, Line items are used for drawing vertical, horizontal
lines for headings, underlining titles or so on. Lines are defined by it’s start and the end point coordinates
27.4.1 XML syntax
<line></line>
27.4.2 Tag properties
id Identification number for internal purpuses (temporarily not used)
lineStyle Specifies the line drawing style of the item. Possible values are:
•solid Solid line
•dash Dashed line
•dot Dotted line
•dashdot Dash+dotted line
•dashdotdot Dash+dot+dot line
•nopen No line painted. Unavailable for lines
fromX X coordinate of the start point of line in millimeters within the current section.
fromY Y coordinate of the start point of line in millimeters within the current section.
toX X coordinate of the end point of line in millimeters within the current section.
toY Y coordinate of the end point of line in millimeters within the current section.
resource Not used for lines since they are always static.
lineWidth The width of the line in millimeters
lineColor The color of the line in #RRGGBB format
zValue This integer number specifies Z-order value of the item. This value decides the stacking order of sibling
(neighboring) items.
printWhen This logical script expression specifies the item’s visibility. If this expression is not empty, the report
engine evaluates it each time before rendering. If the logical expression returns true (or 1) the item is
shown, otherwise the item is hidden.
142

CHAPTER 27. SECTION ITEMS 27.5. RECTANGLE
27.5 Rectangle
The Rectangle enables you to create Rectangle items. Rectangles are usually used for drawing boxes or borders
around a specified area. Rectangle makes easier the box drawings instead of drawing four lines.
27.5.1 XML syntax
<rectangle></rectangle>
27.5.2 Tag properties
id Identification number for internal purpuses (temporarily not used)
lineStyle Specifies the line drawing style of the rectangle. Possible values are:
•solid Solid line
•dash Dashed line
•dot Dotted line
•dashdot Dash+dotted line
•dashdotdot Dash+dot+dot line
•nopen No line painted. The rectange is rendered without outline
fillStyle Specifies the fill style or painting brush of the rectangle. Possible values are:
•no Rectangle is not filled.
•solid Solid fill
•dense1 Extremely dense brush pattern fill
•dense2 Very dense brush pattern fill
•dense3 Somewhat dense brush pattern fill
•dense4 Half dense brush pattern fill
•dense5 Half dense brush pattern fill
•dense6 Somewhat sparse brush pattern fill
•dense7 Very sparse brush pattern fill
•hor Horizontal lines pattern fill
•ver Vertical lines pattern fill
•cross Cross lines pattern fill
•bdiag Backward diagonal lines pattern fill
•fdiag Foreward diagonal lines pattern fill
•diagcross Crossing diagonal lines pattern fill
posX Rectangle’s X coordinate in millimeters within the current section.
posY Rectangle’s Y coordinate in millimeters within the current section.
width Rectangle’s width in millimeters.
height Rectangle’s height in millimeters.
resource Not used for rectangles since they are always static.
lineWidth The width of the outline in millimeters
lineColor The color of the rectangle’s outline in #RRGGBB format
fillColor The fill color of the rectangle in #RRGGBB format
143

CHAPTER 27. SECTION ITEMS 27.6. ELLIPSE OR CIRCLE
zValue This integer number specifies Z-order value of the item. This value decides the stacking order of sibling
(neighboring) items.
printWhen This logical script expression specifies the item’s visibility. If this expression is not empty, the report
engine evaluates it each time before rendering. If the logical expression returns true (or 1) the item is
shown, otherwise the item is hidden.
27.6 Ellipse or Circle
The ellipse provides to create Rectangle items. Ellipses are usually used for drawing diagrams or borders
around a specified area.
27.6.1 XML syntax
<ellipse></ellipse>
27.6.2 Properties
id Identification number for internal purpuses (temporarily not used)
lineStyle Specifies the line drawing style of the ellipse. Possible values are:
•solid Solid line
•dash Dashed line
•dot Dotted line
•dashdot Dash+dotted line
•dashdotdot Dash+dot+dot line
•nopen No line painted. The rectange is rendered without outline
fillStyle Specifies the fill style or painting brush of the ellipse. Possible values are:
•no Rectangle is not filled.
•solid Solid fill
•dense1 Extremely dense brush pattern fill
•dense2 Very dense brush pattern fill
•dense3 Somewhat dense brush pattern fill
•dense4 Half dense brush pattern fill
•dense5 Half dense brush pattern fill
•dense6 Somewhat sparse brush pattern fill
•dense7 Very sparse brush pattern fill
•hor Horizontal lines pattern fill
•ver Vertical lines pattern fill
•cross Cross lines pattern fill
•bdiag Backward diagonal lines pattern fill
•fdiag Foreward diagonal lines pattern fill
•diagcross Crossing diagonal lines pattern fill
posX Rectangle’s X coordinate in millimeters within the current section.
posY Rectangle’s Y coordinate in millimeters within the current section.
width Rectangle’s width in millimeters.
144

CHAPTER 27. SECTION ITEMS 27.7. IMAGE
height Rectangle’s height in millimeters.
resource Not used for rectangles since they are always static.
lineWidth The width of the outline in millimeters
lineColor The color of the rectangle’s outline in #RRGGBB format
fillColor The fill color of the rectangle in #RRGGBB format
zValue This integer number specifies Z-order value of the item. This value decides the stacking order of sibling
(neighboring) items.
printWhen This logical script expression specifies the item’s visibility. If this expression is not empty, the report
engine evaluates it each time before rendering. If the logical expression returns true (or 1) the item is
shown, otherwise the item is hidden.
27.7 Image
The Image option enables you to create Image items. Image items are used to insert either static or dynamic into
a report definition. Static images such as a company logo often displayed in the Report Header can be loaded
from a static file or from report definition. Dynamic images can be loaded from the specified SQL data source.
27.7.1 XML syntax
<image>[image in Base64 encoded format]</image>
<image>[image file name]</image>
<image>[data source.]column</image>
27.7.2 Tag properties
id Identification number for internal purpuses (temporarily not used)
resource Specifies the resource of the image item. Possible values are:
•static Image is loaded from report definition. The image must be saved into XML definition in
Base64 encoded format
•data source Image is loaded from data source (SQL database)
•fileImage is loaded from the specified file. File might be with full path or reative to the program’s
directory
posX Image’s X coordinate in millimeters within the current section.
posY Image’s Y coordinate in millimeters within the current section.
width Image’s width in millimeters.
height Image’s height in millimeters.
scaling Logical option that specifies the image if is scaled or not. Possible values: true,false
aspectRatio If scaling option is switched on, this property specifies the scaling method. Possible values:
•ignore The size of image is scaled freely. The aspect ratio is not preserved.
•keep The size is scaled to a rectangle as large as possible inside a given rectangle, preserving the
aspect ratio.
•expand The size is scaled to a rectangle as small as possible outside a given rectangle, preserving the
aspect ratio.
zValue This integer number specifies Z-order value of the item. This value decides the stacking order of sibling
(neighboring) items.
printWhen This logical script expression specifies the item’s visibility. If this expression is not empty, the report
engine evaluates it each time before rendering. If the logical expression returns true (or 1) the item is
shown, otherwise the item is hidden.
145

CHAPTER 27. SECTION ITEMS 27.8. BARCODE
27.8 Barcode
The Barcode option enables you to create barcodes. Currently the EAN13 code format is supported. Barcodes
might be either static or dynamic items similar to images. Static barcodes read it’s value from the report defini-
tion, dynamic barcodes are loaded from the specified data source.
27.8.1 XML syntax
<barcode>[code]</barcode>
<barcode>[data source.]column</barcode>
27.8.2 Tag properties
id Identification number for internal purpuses (temporarily not used)
resource Specifies the resource of the barcode item. Possible values are:
•static Barcode is loaded from report definition. The barcode’s code must be specified in XML
definition
•data source Barcode is loaded from data source
posX Barcode’s X coordinate in millimeters within the current section.
posY Barcode’s Y coordinate in millimeters within the current section.
width Barcode’s width in millimeters.
height Barcode’s height in millimeters.
barcodeType The type name of the barcode. Possible values: EAN13
showCode The logical property specifies if the code is shown under the barcode or not. Possible values: true,
false
sizeFactor This integer property specifies the zooming factor of the barcode when it is rendering. This property
is very useful when we print barcodes to a high resolution device such as printer. (Suggested value=10)
fontSize The font size of the barcode’s text in points.
zValue This integer number specifies Z-order value of the item. This value decides the stacking order of sibling
(neighboring) items.
printWhen This logical script expression specifies the item’s visibility. If this expression is not empty, the report
engine evaluates it each time before rendering. If the logical expression returns true (or 1) the item is
shown, otherwise the item is hidden.
27.9 Custom Graph item
Graph/Custom item is a special member of NCReport items. This option enables you to render special, custom
defined contents in reports. The typical field of application is using this feature for rendering graphs or such
contents. For using this feature you need to do the followings:
• Add a Graph (Custom) item into your report in the designer and specify the size and the location of this
object.
• Set the class ID of the specified item
• If need, add a static item definition for the object. If you set it’s resource to data source and fill out the data
source column, this information will come from the specified data source column.
146

CHAPTER 27. SECTION ITEMS 27.9. CUSTOM GRAPH ITEM
• Derive the NCReportAbstractItemRendering class implementing it’s paintItem method. You may
’stick’ this class to your graph or any kind of rendering class by multiple inheritance. The paintItem
method gets the following parameters:
–QPainter*painter this is the painter pointer.
–NCReportOutput*output the output object pointer.
–const QRectF& rect the rectangle of the object in the specified output. The geometry of the
rectangle is depending on the output’s resolution.
–const QString& itemdata item definition information comes from data source or report defini-
tion for custom purpuses.
• Set the string ID of your class for identification by setID(...) method.
• Create your custom rendering object (it must to be derived from NCReportAbstractItemRendering
class) and add it to NCReport object by using addItemRenderingClass(...) method.
27.9.1 XML syntax
<graph></graph>
27.9.2 Tag properties
id Identification number for internal purpuses (temporarily not used)
classID Class ID text for custom item class identification
resourceSpecifies the resource of the graph item. Possible values are:
•static Graph definition is loaded from report definition. The definition text must be existed in
XML definition
•data source Graph definition text is loaded from data source
posX Graph’s X coordinate in millimeters within the current section.
posY Graph’s Y coordinate in millimeters within the current section.
width Graph’s width in millimeters.
height Graph’s height in millimeters.
zValue This integer number specifies Z-order value of the item. This value decides the stacking order of sibling
(neighboring) items.
printWhen This logical script expression specifies the item’s visibility. If this expression is not empty, the report
engine evaluates it each time before rendering. If the logical expression returns true (or 1) the item is
shown, otherwise the item is hidden.
147
