Standards Related To Prognostics And Health Management (PHM) For Manufacturing 8012 NIST.IR.8012
User Manual: 8012
Open the PDF directly: View PDF ![]() .
.
Page Count: 48


This publication is available free of charge from http://dx.doi.org/10.6028/NIST.IR.8012
NISTIR 8012
Standards Related to Prognostics and
Health Management (PHM) for
Manufacturing
Gregory W. Vogl
Brian A. Weiss
M. Alkan Donmez
Intelligent Systems Division
Engineering Laboratory
This publication is available free of charge from:
http://dx.doi.org/10.6028/NIST.IR.8012
June 2014
U.S. Department of Commerce
Penny Pritzker, Secretary
National Institute of Standards and Technology
Willie May, Acting Under Secretary of Commerce for Standards and Technology and Director
This publication is available free of charge from http://dx.doi.org/10.6028/NIST.IR.8012
Abstract
Prognostics and health management (PHM) technologies reduce burdensome maintenance tasks of
products or processes through diagnostic and prognostic activities. These activities provide actionable
information that enable intelligent decision‐making for improved performance, safety, reliability, and
maintainability. However, standards for PHM system development, data collection and analysis
techniques, data management, system training, and software interoperability appear to be partly
lacking. The National Institute of Standards and Technology1 (NIST) conducted a survey of PHM‐related
standards to determine the industries and needs addressed by such standards, the extent of these
standards, and any similarities as well as potential gaps among the documents. Standards from various
national and international organizations are summarized, including those from the Air Transport
Association (ATA), the International Electrotechnical Commission (IEC), the International Organization
for Standardization (ISO), the Society of Automotive Engineers (SAE), and the United States Army (US
Army). Finally, recommendations are offered for the development of future PHM‐related standards.
Keywords: diagnostics; health management; maintenance; manufacturing; monitoring; PHM;
prognostics; standards
1 Certain commercial equipment, instruments, or materials are identified in this document in order to adequately describe the implementation
of the methodology. Such identification does not imply recommendation or endorsement by the National Institute of Standards and
Technology, nor does it imply that the materials or equipment identified are necessarily the best available for the purpose.
ii
This publication is available free of charge from http://dx.doi.org/10.6028/NIST.IR.8012
1. Introduction
1.1. Prognostics and Health Management (PHM) Basics
Prognostics and health management (PHM) systems and technologies enable maintenance action on
products and processes based on need, determined by the current system condition via diagnostic
analyses or the expected future condition through prognostic methods. PHM techniques are in contrast
to the use of schedules where maintenance is conducted on specific time limits [1]. PHM aims to reduce
burdensome maintenance tasks while increasing the availability, safety, and cost effectiveness for the
products and processes to which it is applied. Therefore, PHM is enabled through data collection,
diagnostics, and prognostics as well as usage monitoring.
PHM is a diverse, interdisciplinary field with evolving needs that is applicable to numerous domains,
such as manufacturing, automotive, and aerospace industries [2]. PHM is a broad concept that includes
prognostics, diagnostics, and condition‐based monitoring. Specifically, PHM covers maintenance,
logistics, and mission planning from both preventative and reactive approaches to monitor, schedule,
and optimize asset management. The goal of PHM is to extend useful life, reduce unplanned
maintenance events, and optimize availability and sustainment while reducing lifecycle costs of either
products or processes. Specific PHM technologies are aimed at providing decision support; the output
from a PHM system is actionable information that supports decision‐making for improved performance,
safety, reliability, and maintainability of the monitored product or process.
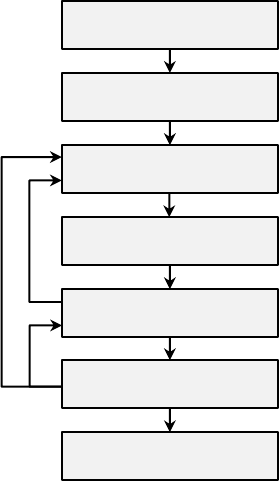
Figure 1 shows a flowchart of the general process of PHM system development. PHM system
development begins with cost and dependability analyses to determine the components to monitor. The
data management system is then initialized for collection, processing, visualization, and archiving of the
maintenance data. Once the measurement techniques are established, the diagnostic and prognostic
approaches are developed and tested to ensure that the desired goals are achieved. Finally, personnel
are trained during the iterative process of system validation and verification before final system
deployment.
1
This publication is available free of charge from http://dx.doi.org/10.6028/NIST.IR.8012
PHM System Design Begins
Cost Benefit Analysis
and Dependability Analysis
Data Requirements and
Management
Measurement Techniques
Diagnostics and Prognostics
PHM Testing and Training
PHM System Deployment
Figure 1. General PHM system development process.
1.2. PHM Needs and Challenges
PHM is dependent on data collection and processing for maintenance‐related components or
subsystems, so standards about data acquisition and processing are needed to influence the
requirements for PHM systems development [1]. Standards for PHM are needed to address the lack of
standardized terms, the lack of visibility, uniformity, and consistency of the PHM methods and tools, the
need for compatibility and interoperability of PHM technology, and the needs for guidance in the
practical use and development of PHM techniques [3].
Another goal of PHM is the comprehensive tracking of the performance and operational history of
specific components; that is, components with serial numbers. The U.S. Army desires the capability of
such a PHM system, but current obstacles include the lack of quality control, data management,
software interoperability, and systematic serialization. These data‐centric capabilities will enable the
collection, transmission, storage, processing, and visibility of data within and among PHM systems [1].
Kalgren et al. [4] presented terminology and associated definitions for PHM that have been used for
mechanical, structural, and propulsion technologies in an attempt to address this situation and to aid in
the general application of PHM. For example, PHM was defined along with concepts like the gray‐scale
health index (from 0 to 1) for diagnostics and remaining useful life (RUL) for prognostics [4].
The creation of PHM systems is still difficult due to the inter‐related tasks of design engineering, systems
engineering, logistics, and user training [1]; no consistent methodology exists for assessing both the
technical and economic benefits of PHM methods. Standardizing a specific set of data signal processing
methods for PHM is perhaps ineffective, because each application requires diagnostic and prognostic
techniques tailored to specific needs [1]. Roemer et al. [5] developed software for assessing the
2
This publication is available free of charge from http://dx.doi.org/10.6028/NIST.IR.8012
performance and effectiveness of PHM technologies being developed for a specific aircraft to help
determine the effectiveness of PHM systems.
Despite the inconsistency of PHM methods, a prognostic approach should at least yield the predicted
time of failure or degradation and its associated confidence interval. The assessment of failure or
degradation requires performance metrics ranging from those for detection (to determine the system
state) and isolation (to identify a root cause fault or failure mode) to prognosis (to determine remaining
useful life) [5].
The development of PHM systems can be challenging due to the typical iterative process to result in a
reliable system with effective data collection and analysis, even if the performance metrics are known.
For example, the determination of performance thresholds for diagnostics or prognostics is a result of
the analysis of various data sets, which would come from either seeded fault testing, accelerated
mission testing, or actual field data in which known parameters are monitored and correlated with the
progression of failure [5]. However, such data sets are typically expensive to acquire and represent less
than 10% of the data sets required for performing the comprehensive verification and validation (V&V)
needed for PHM systems [5].
1.3. NIST PHM Efforts
In summary, PHM systems need to be developed and tested before implementation to enable improved
decision‐making for performance, safety, reliability, and maintainability of products and processes.
However, standards appear to be lacking for PHM system development, data collection and analysis
techniques, data management, system training, and software interoperability. National measurement
institutes such as the United States’ National Institute of Standards and Technology (NIST) may help to
serve a role in the development of such standards. The first step is to identify the existing pertinent
standards, which is a purpose of this document.
3
This publication is available free of charge from http://dx.doi.org/10.6028/NIST.IR.8012
2. Published Standards
Personnel from NIST conducted a survey of PHM‐related standards to determine the industries and
needs addressed by such standards and any similarities as well as potential gaps among the documents.
Table 1 categorizes the various standards related to PHM for manufacturing products and processes
according to general topics based on the PHM process steps seen in Figure 1: ‘Overview’, ‘Dependability
analysis’, ‘Measurement techniques’, ‘Diagnostics and Prognostics’, ‘Data management’, ‘Training’, and
‘Applications’. If a standard has an ‘X’ mark in a corresponding general topic column in Table 1, then that
standard is largely applicable within that category. Some of the standards outline broad approaches for
PHM (marked in the ‘Overview’ category) or are specific in guidance for PHM within a given application
(marked in the ‘Applications’ category). Other standards focus on dependability analysis, measurement
techniques, diagnostics and/or prognostics, PHM data management, or training related to maintenance
of dependability systems, as denoted by the ‘X’ marks in Table 1. This list of standards is not exhaustive,
yet it is comprehensive enough for those in the manufacturing fields.
Table 1. Standards related to PHM for manufacturing.
Organization
Committee/
Subcommittee Standard
Year
Issued Title
Overview
Dependability analysis
Measurement techniques
Diagnostics and Prognostics
Data management
Training
Applications
ATA MSG ATA MSG‐3 2013 MSG‐3: Operator/Manufacturer Scheduled
Maintenance Development, Volume 1 – Fixed Wing
Aircraft
X X
IEC 56 IEC 61703 2001 Mathematical expressions for reliability, availability,
maintainability and maintenance support terms X
ISO TC 108/SC 5 ISO 13372 2012 Condition monitoring and diagnostics of machines –
Vocabulary X
ISO TC 108/SC 5 ISO 17359 2011 Condition monitoring and diagnostics of machines −
General guidelines X
SAE E‐32 ARP1587B 2007 Aircraft Gas Turbine Engine Health Management
System Guide X X
US Army Aviation
Engineering
ADS‐79C‐HDBK 2012 Aeronautical Design Standard Handbook for Condition
Based Maintenance Systems for US Army Aircraft X X X X
IEC 56 IEC 60300‐3‐1 2003 Dependability management
–
Part 3‐1: Application
guide – Analysis techniques for dependability – Guide
on methodology
X
IEC 56 IEC 60300‐3‐3 2004 Dependability management
–
Part 3‐3: Application
guide – Life cycle costing X
IEC 56 IEC 60812 2006 Analysis techniques for system reliability
–
Procedure
for failure mode and effects analysis (FMEA) X
IEC 56 IEC 61025 2006 Fault tree analysis (FTA) X
IEC 56 IEC 61165 2006 Application of Markov techniques X
SAE AQPIC J1739 2009 Potential Failure Mode and Effects Analysis in Design
(Design FMEA), Potential Failure Mode and Effects
Analysis in Manufacturing and Assembly Processes
(Process FMEA)
X
SAE G‐11r ARP5580 2001 Recommended Failure Modes and Effects Analysis
(FMEA) Practices for Non‐Automobile Applications X
ISO/IEC JTC 1/SC 7 ISO/IEC 15909‐1 2004 Software and system engineering − High‐level Petri
nets − Part 1: Concepts, definiƟons and graphical X
4

This publication is available free of charge from http://dx.doi.org/10.6028/NIST.IR.8012
notation
ISO/IEC JTC 1/SC 7 ISO/IEC 15909‐2 2011 Software and system engineering − High‐level Petri
nets−Part 2: Transfer format X
ISO TC 108/SC 2 ISO 13373‐1 2002 Condition monitoring and diagnostics of machines −
Vibration condition monitoring − Part 1: General
procedures
X
ISO TC 108/SC 2 ISO 13373‐2 2005 Condition monitoring and diagnostics of machines −
Vibration condition monitoring − Part 2: Processing,
analysis and presentation of vibration data
X
ISO TC 108/SC 5 ISO 18434‐1 2008 Condition monitoring and diagnostics of machines –
Thermography – Part 1: General procedures X
ISO TC 108/SC 5 ISO 20958 2013 Condition monitoring and diagnostics of machine
systems – Electrical signature analysis of three‐phase
induction motors
X
ISO TC 108/SC 5 ISO 22096 2007 Condition monitoring and diagnostics of machines –
Acoustic emission X
ISO TC 108/SC 5 ISO 29821‐1 2011 Condition monitoring and diagnostics of machines –
Ultrasound – Part 1: General guidelines X
ISO TC 108/SC 5 ISO 13379‐1 2012 Condition monitoring and diagnostics of machines −
Data interpretation and diagnostics techniques− Part
1: General guidelines
X
ISO TC 108/SC 5 ISO 13381‐1 2004 Condition monitoring and diagnostics of machines −
Prognostics−Part 1: General guidelines X
SAE E‐32 AIR5871 2008 Prognostics for Gas Turbine Engines X X
ISO TC 184/SC 4 ISO 15531‐1 2004 Industrial automation systems and integration
–
Industrial manufacturing management data – Part 1:
General overview
X
ISO TC 184/SC 4 ISO 15531‐42 2005 Industrial automation systems and integration
–
Industrial manufacturing management data – Part 42:
Time Model
X
ISO TC 184/SC 4 ISO 15531‐43 2006 Industrial automation systems and integration
–
Industrial manufacturing management data – Part 43:
Manufacturing flow management data: Data model
for flow monitoring and manufacturing data exchange
X
ISO TC 184/SC 4 ISO 15531‐44 2010 Industrial automation systems and integration
–
Industrial manufacturing management data – Part 44:
Information modelling for shop floor data acquisition
X
ISO TC 184/SC 4 ISO 15926‐1 2004 Industrial automation systems and integration −
Integration of life‐cycle data for process plants
including oil and gas production facilities − Part 1:
Overview and fundamental principles
X
ISO TC 184/SC 4 ISO 15926‐2 2003 Industrial automation systems and integration −
Integration of life‐cycle data for process plants
including oil and gas production facilities − Part 2:
Data model
X
ISO TC 108/SC 5 ISO 13374‐1 2003 Condition monitoring and diagnostics of machines −
Data processing, communication and presentation −
Part 1: General guidelines
X
ISO TC 108/SC 5 ISO 13374‐2 2007 Condition monitoring and diagnostics of machines −
Data processing, communication and presentation −
Part 2: Data processing
X
ISO TC 108/SC 5 ISO 13374‐3 2012 Condition monitoring and diagnostics of machines −
Data processing, communication and presentation −
Part 3: Communication
X
ISO TC 184/SC 5 ISO 18435‐1 2009 Industrial automation systems and integration
–
Diagnostics, capability assessment and maintenance
applications integration – Part 1: Overview and
general requirements
X
ISO TC 184/SC 5 ISO 18435‐2 2012 Industrial automation systems and integration −
Diagnostics, capability assessment and maintenance
applications integration − Part 2: DescripƟons and
definitions of application domain matrix elements
X
ISO TC 108/SC 5 ISO 18436‐1 2012 Condition monitoring and diagnostics of machines –
Requirements for qualification and assessment of X
5

This publication is available free of charge from http://dx.doi.org/10.6028/NIST.IR.8012
personnel
–
Part 1: Requirements for assessment
bodies and the assessment process
ISO TC 108/SC 5 ISO 18436‐2 2003 Condition monitoring and diagnostics of machines –
Requirements for training and certification of
personnel – Part 2: Vibration condition monitoring
and diagnostics
X
ISO TC 108/SC 5 ISO 18436‐3 2012 Condition monitoring and diagnostics of machines –
Requirements for qualification and assessment of
personnel – Part 3: Requirements for training bodies
and the training process
X
ISO TC 108/SC 5 ISO 18436‐4 2008 Condition monitoring and diagnostics of machines –
Requirements for qualification and assessment of
personnel – Part 4: Field lubricant analysis
X
ISO TC 108/SC 5 ISO 18436‐5 2012 Condition monitoring and diagnostics of machines –
Requirements for qualification and assessment of
personnel – Part 5: Lubricant laboratory
technician/analyst
X
ISO TC 108/SC 5 ISO 18436‐6 2008 Condition monitoring and diagnostics of machines –
Requirements for qualification and assessment of
personnel – Part 6: Acoustic emission
X
ISO TC 108/SC 5 ISO 18436‐7 2008 Condition monitoring and diagnostics of machines –
Requirements for qualification and assessment of
personnel – Part 7: Thermography
X
ISO TC 108/SC 5 ISO 18436‐8 2013 Condition monitoring and diagnostics of machines –
Requirements for qualification and assessment of
personnel – Part 8: Ultrasound
X
These standards were developed by various national and international organizations: the Air Transport
Association (ATA), the International Electrotechnical Commission (IEC), the International Organization
for Standardization (ISO), the Society of Automotive Engineers (SAE), and the United States Army
(US Army). Specifically, each standard is developed within a technical committee (TC) or subcommittee
(SC) of each organization, composed of various experts from industry, government, and academia. The
committee that produces each standard is listed in Table 1 for reference purposes.
For example, four subcommittees within ISO are responsible for the associated standards in Table 1:
TC 108/SC 2, TC 108/SC 5, TC 184/SC 4, and TC 184/SC 5. The ISO/TC 108/SC 5 group (members from 33
countries [6]) is tasked with the development of standards related to condition monitoring and
diagnostics of machine systems in which physical parameters are periodically or continuously sensed for
the support of machine maintenance decisions [7]. The Acoustical Society of America is accredited by
the American National Standards Institute (ANSI) to organize and manage the U.S. Technical Advisory
Group (TAG) that gives U.S. stakeholders (including NIST) a voice in ISO/TC 108 standards development.
While TC 108/SC 5 relates to the condition monitoring and diagnostics of machine systems, TC 108/SC 2
deals specifically with the measurement and evaluation of mechanical vibration and shock for machines,
vehicles, and structures, and ISO/TC 184 is scoped with the standardization of automation systems and
their integration within manufacturing [8]. As such, ISO/TC 184/SC 4 (covering ’industrial data‘) has
numerous standards dealing with the management of industrial manufacturing data.
In the following subsections, the various standards seen in Table 1 are outlined according to their main
associated category.
2.1. Overview
6
This publication is available free of charge from http://dx.doi.org/10.6028/NIST.IR.8012
Standards with general guidance about the creation of PHM systems are indicated under the ‘Overview’
category within Table 1. Such standards are a natural starting point during the creation of PHM systems,
because these documents outline the factors influencing condition monitoring and provide guidance for
the monitoring of components and/or sub‐systems.
As the parent document of a group of standards that cover condition monitoring and diagnostics,
ISO 17359 [9] was developed by ISO/TC 108/SC 5 (“Condition monitoring and diagnostics of machines”)
to provide the general procedures for setting up a condition monitoring program for all machines, e.g.,
the generic approaches to setting alarm criteria and carrying out diagnosis and prognosis.
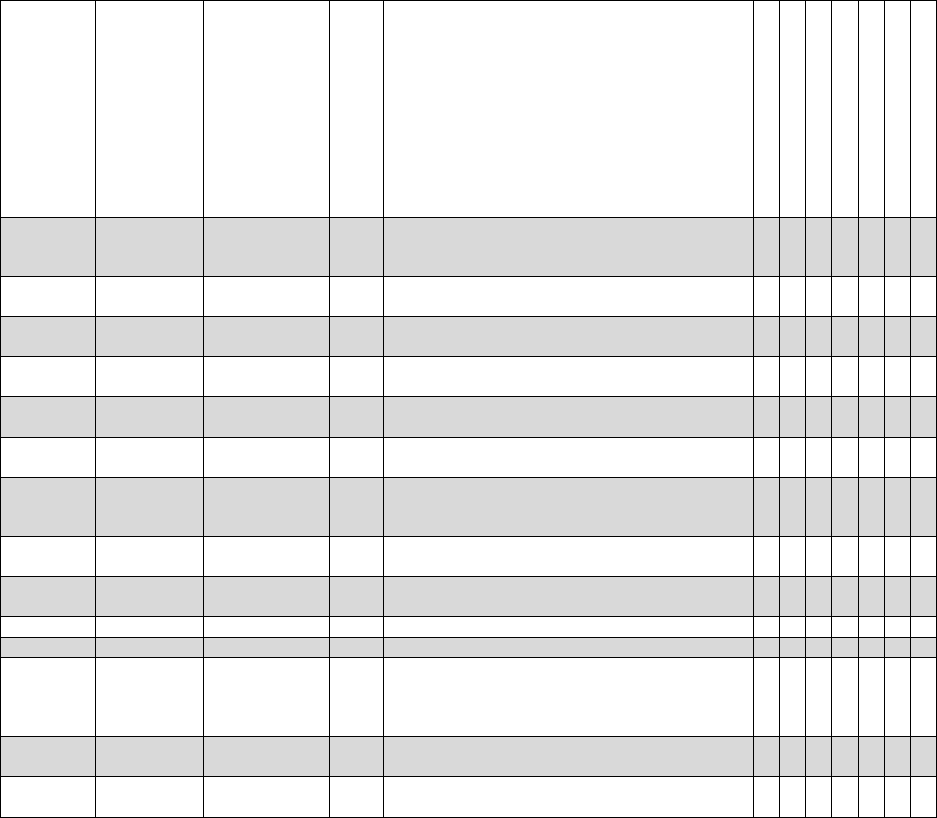
ISO 17359 outlines the condition monitoring procedure for a general manufacturing process (see Figure
2), factors influencing condition monitoring, a list of issues affecting equipment criticality (e.g., cost of
machine down‐time, replacement cost), and a table of condition monitoring parameters (such as
temperature, pressure, and vibration) for various machine types. ISO 17359 also presents multiple
examples of tables showing the correlation of possible faults (e.g., air inlet blockage, seal leakage, and
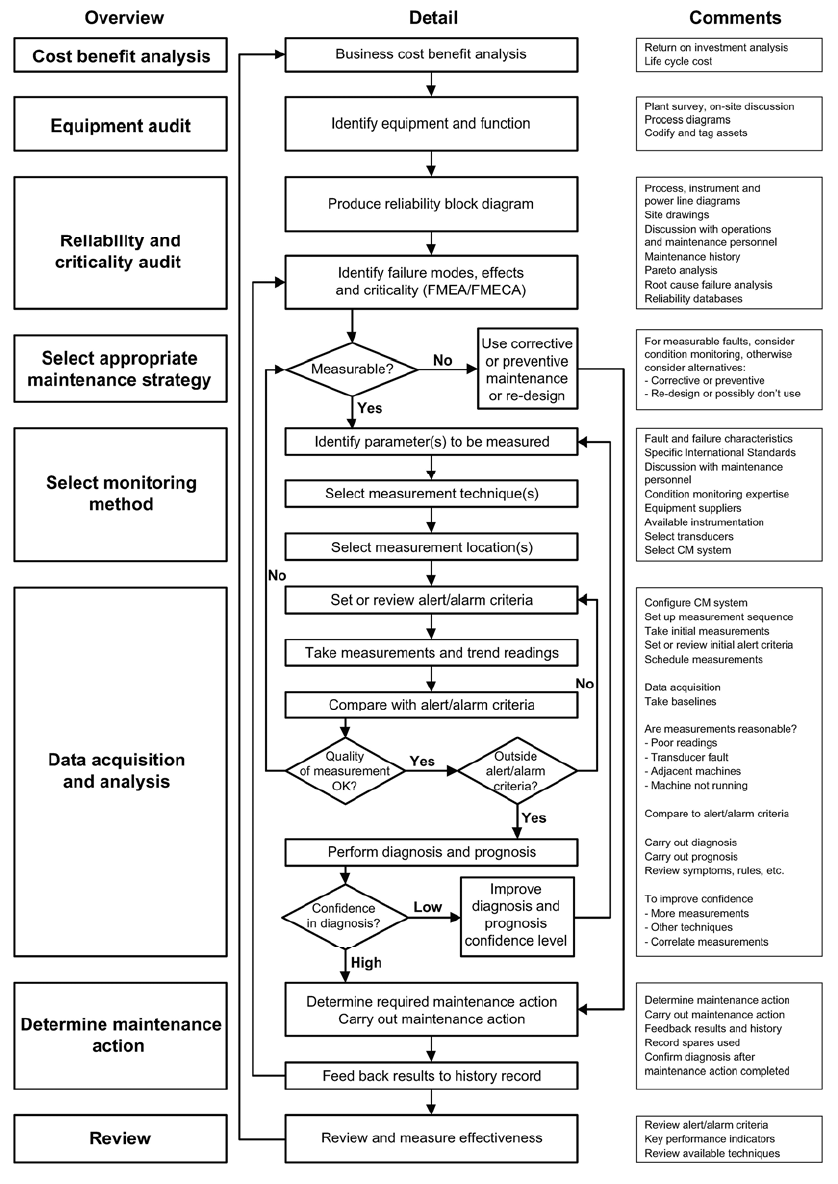
unbalance) with symptoms or parameter changes. Furthermore, ISO 17359 shows an example of a
typical form for recording monitoring information, as seen in Figure 3.
7
This publication is available free of charge from http://dx.doi.org/10.6028/NIST.IR.8012
Figure 2. Condition monitoring procedure flowchart from ISO 17359 [9]. [This excerpt is taken from ISO
17359:2011, Figure 1 on page 2, with the permission of ANSI on behalf of ISO. (c) ISO 2014‐ All rights
reserved].
8
This publication is available free of charge from http://dx.doi.org/10.6028/NIST.IR.8012
Figure 3. Form for recording typical machine details from ISO 17359 [9]. [This excerpt is taken from ISO
17359:2011, Table C.1 on page 21, with the permission of ANSI on behalf of ISO. (c) ISO 2014‐ All rights
reserved].
Another standard that provides guidance for PHM systems development is MSG‐3, a document titled
“Operator/Manufacturer Scheduled Maintenance Development.” The Maintenance Steering Group
9
This publication is available free of charge from http://dx.doi.org/10.6028/NIST.IR.8012
(MSG) of the Air Transport Association (ATA) developed MSG‐3, which is used for developing
maintenance plans for aircraft, engines, and systems [10]. MSG‐3 is used by Industry Steering
Committees (ISCs), comprised of aircraft, engine, propeller, and appliance manufacturers, for the
development of minimum initial maintenance requirements for all new or derivative aircraft in the
United States. Each ISC‐generated document for an aircraft is then approved by the Federal Aviation
Administration (FAA) before the aircraft enters service. MSG‐3 is a top‐down approach to determine the
consequences (safety, operational, and economic) of failure, starting at the system level and working
down to the component level [11]. Failure effects are divided into five categories, and if the
consequences of failure cannot be mitigated, then redesign becomes necessary. For example, the MSG‐
3 process led to mandatory design changes for the Boeing 787‐8’s in‐flight control and lightning/HIRF
(High‐Intensity Radiated Field) protection systems. Furthermore, the MSG‐3 methodology helps improve
safety while reducing maintenance‐related costs up to 30 percent. In fact, MSG‐3 improves previous
approaches that led to unnecessary maintenance tasks and potential supplemental failures [11].
Similar in scope to the standards just described, an Aeronautical Design Standard (ADS) Handbook
(HDBK), ADS‐79C‐HDBK, was developed by the U.S. Army to describe the Army’s condition‐based
maintenance (CBM) system for military aircraft systems [1]. CBM is the preferred maintenance approach
for Army aircraft systems, yet ADS‐79C‐HDBK is broad enough for application in other industries to be
included in the ‘Overview’ category of Table 1. The document provides guidance and standards for use
by all Department of Defense (DoD) agencies in the development of CBM data acquisition, signal
processing software, and data management. Furthermore, ADS‐79C‐HDBK is in the spirit of the previous
use of reliability centered maintenance (RCM) methods by the DoD to avoid the consequences of
material failure. Failure mode, effects, and criticality analysis (FMECA) identifies where CBM should be
utilized, but RCM is used to determine the most appropriate failure management strategy. Additionally,
ADS‐79C‐HDBK is supported by the Machinery Information Management Open Standards Alliance
(MIMOSA), a United States association of industry and government, and follows the information flow
structure detailed in the ISO 13374 series [1]. Even though CBM systems can be valued for increasing the
dependability of mission‐oriented systems, the Army does not intend to make missions dependent upon
such systems, because missions must proceed even if CBM systems are inoperative [1]. For example,
adding sensors with associated signal processing to legacy aircraft can increase the overall system
reliability as long as the hardware is not mission‐critical. However, years of work may be needed to
achieve in‐flight PHM via field tests with faults [1].
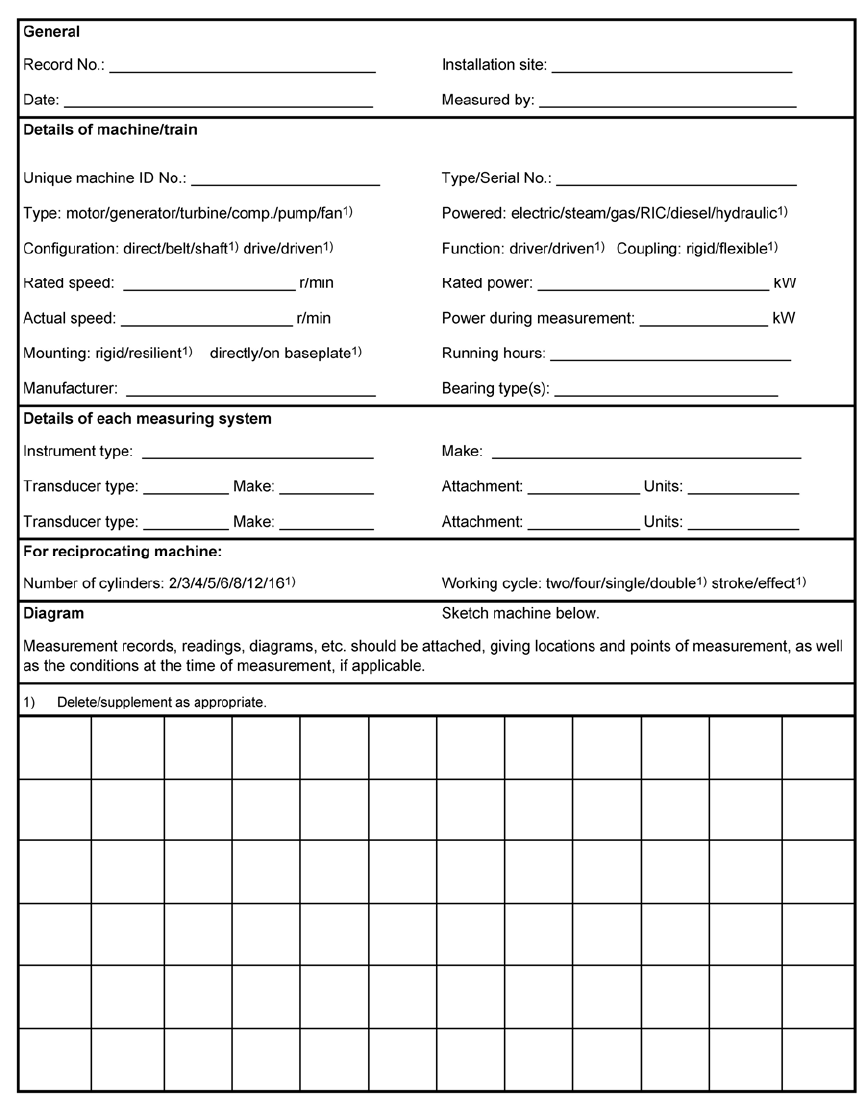
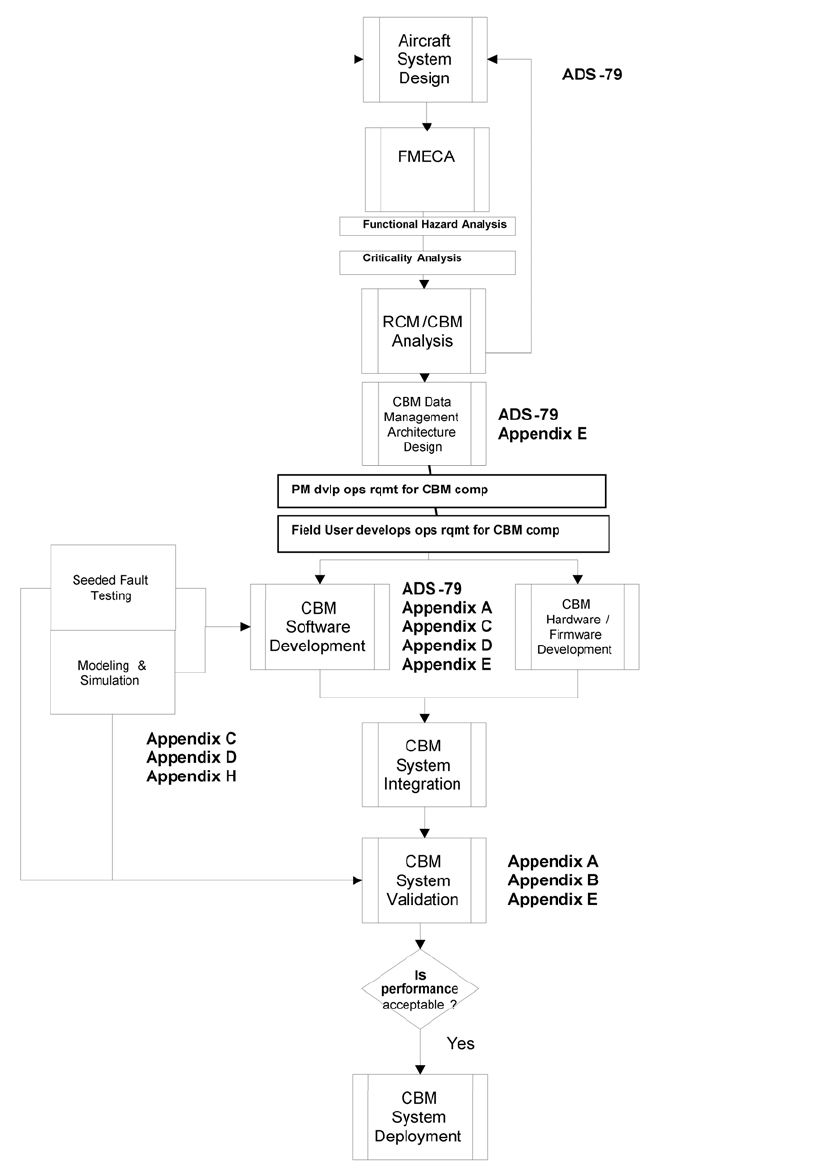
ADS‐79C‐HDBK describes the elements of a CBM system architecture with technical considerations for
Army aviation in twelve separate appendices (e.g., fatigue life management, flight test validation,
vibration based diagnostics, and data integrity). ADS‐79C‐HDBK defines CBM‐related terms
(‘airworthiness’, ‘critical safety item’, ‘exceedance’, etc.) and assists in the development of CBM systems
for both legacy and new aircraft. As seen in Figure 4, the appendices of ADS‐79C‐HDBK are used to help
developers to identify components to maintain, plan for data acquisition, perform fault testing, design
the software and hardware elements, and validate CBM algorithms.
10
This publication is available free of charge from http://dx.doi.org/10.6028/NIST.IR.8012
Figure 4. CBM development for new acquisition from ADS‐79C‐HDBK [1]. [This excerpt is taken from
ADS‐79C‐HDBK, Figure 4 on page 31, with the permission of the Aviation Engineering Directorate of the
U.S. Army].
11
This publication is available free of charge from http://dx.doi.org/10.6028/NIST.IR.8012
2.2. Dependability Analysis
As discussed in Section 2.1, one aspect of the creation of PHM systems is the determination of what
components or subsystems should be redesigned, changed, or monitored. In general, a dependability
analysis involves the identification of the reliability, availability, and maintainability of the entire system,
its subsystems, and its components [12]. An essential part of system design is the definition of
dependability requirements for subsystems, so the most effective system architecture can be
determined. Only manufacturing process design changes can improve the inherent dependability
performance measures [12]. Such changes should occur sooner rather than later, necessitating the
dependability analysis in the early phases of PHM system development, as seen in the upper portion of
the flowchart in Figure 4.
Various methods exist to identify the failure modes of the system, and experts in the dependability and
system engineering field should select the most applicable method early in the program development.
For example, bottom‐up (elements) methods are used to identify the failure modes at the component
level, which are then used to determine the corresponding effect on higher‐level system performance.
Top‐down (functional) methods are used to identify undesirable system operations by starting from the
highest level of interest (the top event) and proceeding to successively lower levels [12]. Usually
bottom‐up methods are more straightforward in application, while top‐down methods require more
thought and are hence more prone to errors. Bottom‐up dependability analysis methods include event
tree analysis, failure mode and effects analysis (FMEA), and hazard and operability study (HAZOP), while
top‐down methods includes fault tree analysis (FTA), Markov analysis, Petri net analysis, and reliability
block diagrams (RBD).
IEC 60300‐3‐1 gives a general overview of the common dependability analysis techniques, including fault
tree analysis, Markov analysis, Petri net analysis, and stress‐strength analysis [12]. IEC 60300‐3‐1
presents tables outlining the general applicability and characteristics of each method (see Figure 5) as
well as concise summaries of each method (including benefits, limitations, and examples) in a separate
informative annex. The methods can be categorized according to their purpose of either fault avoidance
(e.g., stress‐strength analysis), architectural analysis and dependability allocation (bottom‐up methods,
such as FMEA, or top‐down methods, such as FTA), or estimation of measures for basic events (such as
failure rate prediction). However, IEC 60300‐3‐1 states that no single dependability analysis method is
sufficiently comprehensive, such that composite approaches have been used in practice [12]. Ultimately,
analysis based on either a hardware (bottom‐up), functional (top‐down), or combination approach
should be used to assess high risk items and provide corrective actions [13].
12

This publication is available free of charge from http://dx.doi.org/10.6028/NIST.IR.8012
Figure 5. Characteristics of various dependability analysis methods from IEC 60300‐3‐1 [12]. [Copyright
© 2003 IEC Geneva, Switzerland. www.iec.ch].
To support the quantification of dependability, the IEC technical committee 56 (Dependability)
developed IEC 61703 to provide the mathematical expressions for reliability, availability, maintainability,
and other maintenance terms [14]. The expressions are grouped into classes for various items: non‐
repaired items, repaired items with zero time to restoration, and repaired items with non‐zero time to
13
This publication is available free of charge from http://dx.doi.org/10.6028/NIST.IR.8012
restoration. Numerous equations are provided in IEC 61703 for the generic case of an exponentially
distributed time to failure.
While IEC 61703 and IEC 60300‐3‐1 contain overviews of various dependability expressions and analysis
methods, other standards focus on guidance for use of a particular analysis method, whether bottom‐up
or top‐down. The following subsections summarize those particular standards indicated under the
‘Dependability analysis’ category within Table 1.
2.2.1. Bottom‐Up Methods
2.2.1.1. FMEA and FMECA
Failure modes and effects analysis (FMEA) is a formal and systematic approach to identify potential
failure modes of a system along with their causes and immediate and final effects on system
performance [15] through the usage of information about failure (“What has failed?”) and its effects
(“What are the consequences?”) [16]. It is advantageous to perform FMEA early in the development of a
product or process so that failure modes can be eliminated or mitigated as cost effectively as possible.
FMEA can be used to identify failures (hardware, software, human performance) and improve reliability
and maintainability via information for the development of diagnostic and maintenance procedures. The
process begins with a hierarchical decomposition of the system and is followed by an analysis beginning
with lowest level elements (bottom‐up approach) [15].
FMEA has been modified for various purposes; failure modes, effects and criticality analysis (FMECA) is
an extension of FMEA that uses a metric called criticality to rank the severity of failure modes [15] as
well as the probability of each failure mode [16]. FMECA is composed of two steps (FMEA and criticality
analysis (CA)) to determine the effect of each failure on system operation by identifying single failure
points and ranking each failure according to its severity. FMECA is essential during conceptual design
through development of a system to identify all failure modes, especially the catastrophic ones, so that
they can be eliminated or minimized through redesign [13]. The over‐arching goal of FMECA is to
support the design‐making process, like all dependability analyses.
FMEA can also be applied to manufacturing and assembly processes, in which it is called process FMEA
(PFMEA). PFMEA enables engineers to identify unacceptable effects of failure modes (such as those for
part binding, cracking etc.). Engineers then develop manufacturing control plans as well as “document
the rationale behind process changes to guide development of future manufacturing and assembly
processes” [16]. PFMEA usually leads to cost improvements [15].
One standard concerning FMEA and FMECA is MIL‐P‐1629, which was issued by the U.S. military in 1949.
In 1980, the U.S. Department of Defense issued a revision as MIL‐STD‐1629A. This standard establishes
requirements and procedures for performing a systematic FMECA for each functional or hardware
failure related to mission success, personnel and system safety, system performance, maintainability,
and maintenance requirements. Specifically, MIL‐STD‐1629A provides a functional block diagram
example, a reliability block diagram example, an equation to calculate failure mode criticality, and
FMEA, CA, and FMECA worksheet formats [13].
14
This publication is available free of charge from http://dx.doi.org/10.6028/NIST.IR.8012
MIL‐STD‐1629A was partially revised in 1984 but canceled in 1998. At that time, the DoD was
transitioning to utilize more commercial products and practices. The Defense Standards Improvement
Council (DSIC) was created to oversee the standardization reform process. Consequently, the foreword
to SAE ARP5580 (‘Recommended Failure Mode and Effects Analysis (FMEA) Practices for Non‐
Automobile Applications’) from SAE’s G‐11r Reliability Committee recognizes SAE ARP5580 as essentially
an update of MIL‐STD‐1629A based on input from industry, Government, and academia [16].
SAE ARP5580 describes the procedure for how to perform FMEA. This procedure includes a basic
methodology for the three FMEA classifications related to how the failure modes are postulated:
functional FMEA (at the conceptual design level), interface FMEA (before the detailed design of the
interconnected subsystems), and detailed FMEA (performed when detailed designs are available) [16].
SAE ARP5580 can be used to assess the reliability of systems with increasing impact when FMEA is
performed at increasing levels of detail during development of hardware or software. FMEA can
continue throughout the entire life of a program, from conceptual design to maintenance [16]. The
FMEA process itself can be improved, and SAE ARP5580 states that possible improvements to FMEA are
the inclusion of timing effects, including simultaneous failure modes and their delayed consequences.
SAE ARP5580 provides many definitions of key terms (e.g., ‘allocation’, ‘criticality’, and ‘fault tree’) and
other items typically included within FMEA. SAE ARP5580 provides ground rules (with an example),
numbering conventions for functional FMEA to describe systems according to a hierarchy (subsystems,
components, software, etc.) with well‐defined inputs and outputs, and examples of severity
classifications for military, aerospace, and automobile industries. SAE ARP5580 also gives failure mode
probability equations and an example of qualitative probability intervals for the automobile industry.
An integrator must create an overall system FMEA, which may require a standardized worksheet format
for FMEA information [16].
Even though FMEA has been useful to identify, rank, and mitigate potential failure modes in the
automobile industry since the late 1960s, a growing need developed for changes in failure mode ranking
criteria and the risk priority number (RPN) [17]. Hence, SAE J1739 was revised in 2009 as a basis for the
development of an effective design FMEA (DFMEA) and a FMEA for manufacturing and assembly
processes (PFMEA) [17]. Based on references (e.g., SAE ARP5580 and IEC 60812) and input from original
equipment manufacturers (OEMs) and their suppliers, SAE J1739 was revised to include current terms,
requirements, ranking charts, and worksheets for the identification and mitigation of failure mode risks.
Examples are given for a block or boundary diagram (for DFMEA), a process flow diagram (for PFMEA),
and design and process FMEA worksheets related to the auto industry. Also, suggestions are given in
tabulated form for design and process FMEA severity (S) evaluation criteria as well as those for
occurrence (O) and detection (D) evaluation criteria. Even though the RPN is defined as the product S ൈ
O ൈ D, SAE J1739 warns that this number, which ranges from 1 to 1000, should not be used as the sole
metric for risk evaluation via thresholding. Finally, the document has various examples of lists of items
to consider for inputs (e.g., warranty, recalls), outputs (such as high‐severity failure modes, action plans
for design, and worksheets), design controls, functions, requirements, and failure modes for the FMEA
process [17].
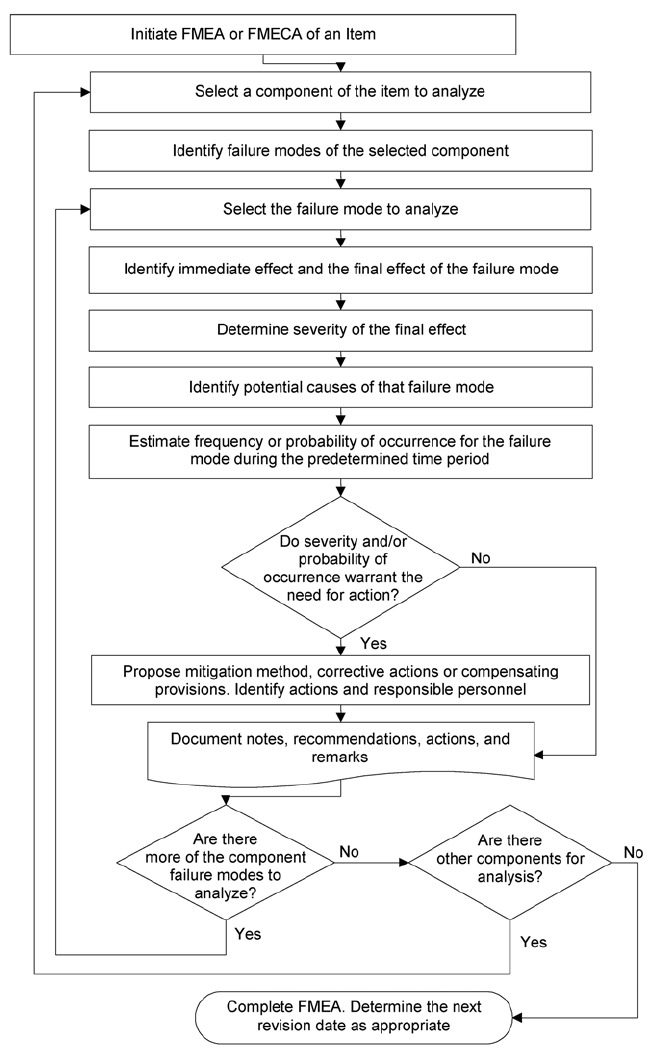
Another standard that gives guidance to produce successful FMEA and FMECA is IEC 60812, which was
developed by the IEC technical committee 56 (Dependability) [15]. IEC 61025 (‘Fault tree analysis (FTA)’)
and IEC 61078 (‘Analysis techniques for dependability – Reliability block diagram method’) are
normative references for IEC 60812. IEC 60812 is a standard that provides steps, terms, criticality
measures (potential risk, risk priority number, criticality matrix), failure modes, basic principles,
15
This publication is available free of charge from http://dx.doi.org/10.6028/NIST.IR.8012
procedures, and examples for FMEA and FMECA. Figure 6 shows a flowchart of the general FMEA
process. IEC 60812 advises that while FMECA may be a very cost‐effective method for assessing failure
risks, a probability risk analysis (PRA) is preferable to a FMECA; FMECA should not be the only basis for
judging risks, especially since risk priority numbers have deficiencies such as inadequate scaling, as
discussed in SAE J1739. FMEA has limitations in that it is difficult and tedious to apply to complex
systems with multiple functions [15].
Figure 6. FMEA flowchart from IEC 60812 [15]. [Copyright © 2006 IEC Geneva, Switzerland www.iec.ch].
16
This publication is available free of charge from http://dx.doi.org/10.6028/NIST.IR.8012
2.2.2. Top‐Down Methods
As discussed in the previous section, FMEA/FMECA is a widely used analysis method for dependability.
FMEA, as an inductive (bottom‐up) method of analysis, is mainly used to complement other approaches
such as fault tree analysis (FTA), a deductive (top‐down) method. IEC 60812 states that it may be
difficult to decide whether an inductive or deductive approach should be used at the design stage [15].
However, a deductive approach such as FTA is generally preferred over FMEA for industrial systems
where the levels of risk are identified. FMEA is more applicable for systems with components related by
mainly series failure logic, while FTA is generally preferred for systems with multiple failure modes and
complex failure logic and redundancy [15].
2.2.2.1. Fault Tree Analysis (FTA)
FTA is a technique that is helpful in overcoming the current limitations of FMEA [16]. FTA is a deductive
method used to determine the causes that can lead to the occurrence of a defined outcome, called the
‘top event’ [18]. FTA achieves this goal through use of a fault tree, such as the one shown in Figure 7. A
fault tree is a graphical representation of how faults or events interact to possibly cause the top event.
Construction proceeds down the tree, continually approaching the desired lower level of mechanism
and mode. The lowest possible level contains the primary (bottom) events, the individual causes of
potential failures or faults [18]. Thus, FTA identifies potential problems caused by design, operational
stresses, and flaws in product manufacturing processes. Hence, fault trees should be developed early
during system design and continue throughout the development of a product [18]. Fault trees are used
in multiple industries, such as in automotive, nuclear, and manufacturing plants.
17
This publication is available free of charge from http://dx.doi.org/10.6028/NIST.IR.8012
Figure 7. Explanation of terms used in fault tree analysis from IEC 61025 [18]. [Copyright © 2006 IEC
Geneva, Switzerland. www.iec.ch].
In contrast to other reliability analyses, FTA includes only those events and their interactions that
contribute to the occurrence of the top event. In fact, several differences exist among FTA and FMEA.
First, FTA is a top‐down approach, while FMEA is a bottom‐up approach. Second, FTA accomplishes
single and multiple failure analysis via the interaction between faults or events representing failure
modes. These interactions are not possible in a regular FMEA. Third, FTA is a method for causal analysis
of undesirable events, while FMEA is a method for identification of basic events or hazards [18].
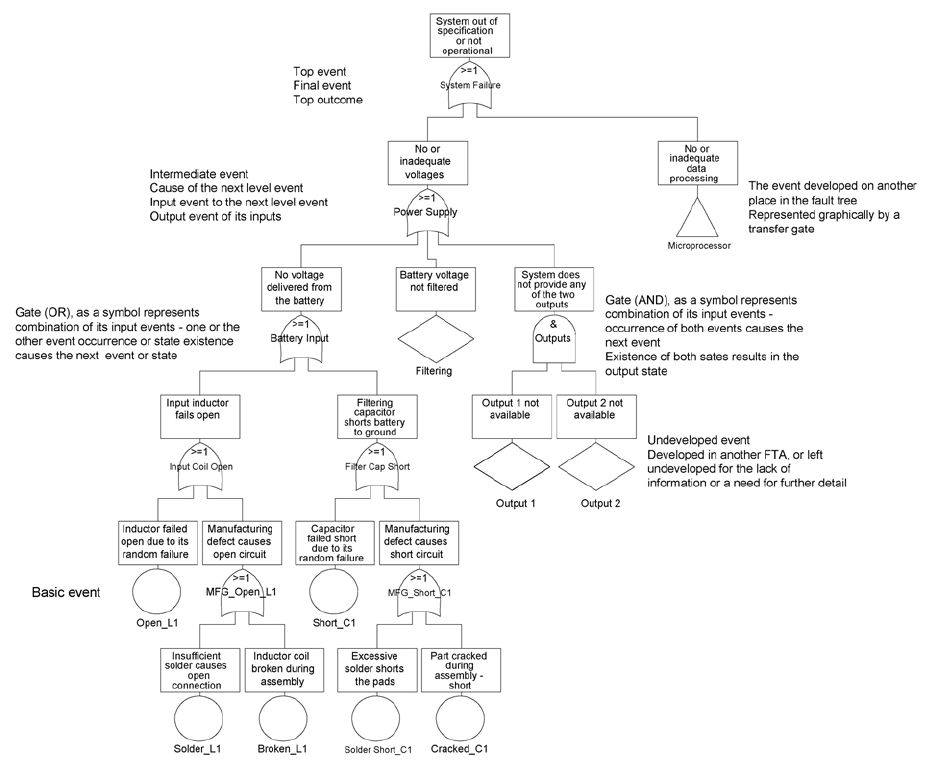
To enable the use of fault tree analysis, the IEC technical committee 56 developed IEC 61025, which
addresses the two approaches to FTA: a qualitative or logical approach (Method A), used largely in the
nuclear industry, and a quantitative or numerical approach (Method B) that results in a quantitative
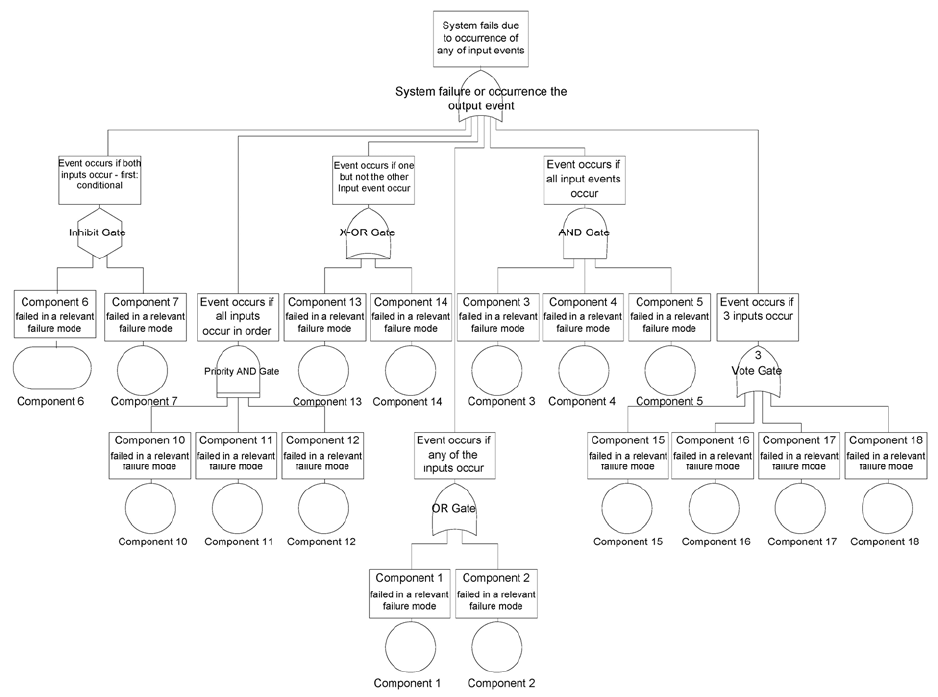
probability of the occurrence of a top event within manufacturing and other industries [18]. IEC 61025
describes FTA with its definitions (e.g., ‘top event’, ‘gate’, and ‘event’), steps (fault tree construction,
analysis, reporting, etc.), and fault tree symbols (for static and dynamics gates). Figure 8 shows a fault
tree with different gate types such as ‘AND’ and ‘OR.’
18
This publication is available free of charge from http://dx.doi.org/10.6028/NIST.IR.8012
Figure 8. Example of fault tree showing various types of gates from IEC 61025 [18]. [Copyright © 2006
IEC Geneva, Switzerland. www.iec.ch].
FTA can be extended to complex systems with fault trees created for separate but linked events, with
these fault trees subsequently combined. IEC 61025 provides the mathematics for reliability of series
and parallel (redundant) systems, which uses probabilistic data at the component level from reliability
or actual field test data to determine the probability of the occurrence of the ‘top event’. Proper
mathematical treatment includes ‘disjointing’, a series of algebraic operations that ensures that the
common branch (or common‐cause failure) is included only once in the ‘top event’ probability
calculations [18].
2.2.2.2. Markov Analysis
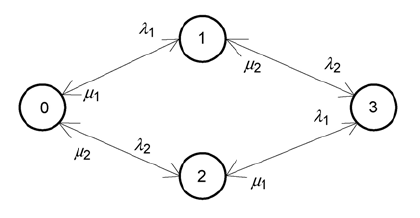
Markov analysis is another method to determine the dependability and safety of systems. The IEC
technical committee 56 produced IEC 61165, a standard that gives an overview of the Markov
technique [19]. Markov techniques use state transition diagrams to represent the temporal behavior of
a system, which is a connected number of elements, each of which has only one of two states: up or
down. An example of such a diagram is shown in Figure 9. The entire system transitions from one state
to another as the system elements fail or are restored according to defined failure and restoration rates.
Each state in Figure 9 is represented by a circled number, and transitions are represented by arrows
with failure rates (ߣଵ, ߣଶ, etc.) or restoration rates (ߤଵ, ߤଶ, etc.).
19
This publication is available free of charge from http://dx.doi.org/10.6028/NIST.IR.8012
Figure 9. Example state transition diagram used for Markov techniques from IEC 61165 [19]. [Copyright
© 2006 IEC Geneva, Switzerland. www.iec.ch].
Markov techniques are especially useful for the analysis of redundant systems. One advantage is that
maintenance strategies can be modeled with Markov techniques, while other techniques such as fault
tree analysis (FTA) and reliability block diagrams (RBDs) do not account for complex maintenance
strategies. The flexibility of Markov techniques is offset by their complexity with the increasing number
of system states. Another limitation of Markov techniques is that Markov models are memory‐less; that
is, system behavior depends only on the system state and not on the way the system arrived at the
state [19].
IEC 61165 uses symbols from IEC 60050 (‘International Electrotechnical Vocabulary’) but defines other
fundamental terminology (e.g., ‘up state’ and ‘down state’), symbols (circles, rectangles, etc.), and
mathematical techniques (e.g., via ordinary differential equations and Laplace transforms) for the
homogeneous Markov technique, in which the state transition rates are assumed to be time‐
independent [19]. IEC 61165 shows that the differences between the expressions for reliability,
maintainability, and availability arise from the different state transition diagrams used to create the
equations.
2.2.2.3. Petri Net Analysis
Since their creation in 1962, Petri nets have been used to describe, design, and maintain a wide range of
systems and processes in industries including aerospace, banking, manufacturing systems, and nuclear
power systems [20]. Petri nets are a rigorous method to mathematically describe processes based on
basic set theory [21]. Petri nets allow prototypes and processes to be tested at the earliest and cheapest
design stage, thus saving time for testing and maintenance while potentially increasing reliability [20].
Furthermore, Petri nets can be used to generate the Markov models discussed in Section 2.2.2.2. Petri
nets are typically used to describe complex interactions more easily than Markov models because Petri
models require far fewer elements [12].
In the 1980s, Petri nets were extended to high‐level Petri nets (HLPNs) to model discrete‐event systems.
HLPNs were also used to advance the use of Petri nets for complex systems, analogous to the use of
high‐level programming languages to overcome challenges with assembly languages. High‐level Petri net
graphs (HLPNGs) are used to model systems in a graphical form, allowing the visualization of the flow of
system data and controls. Such a graphical form of HLPNs is more user‐friendly for industry in that
operators can visualize the data flow represented by the basic equations [20].
20
This publication is available free of charge from http://dx.doi.org/10.6028/NIST.IR.8012
ISO/IEC 15909‐1 is a standard developed by SC 7 (‘Software and system engineering’) of JTC 1
(‘Information technology’), a Joint Technical Committee (JTC) composed of ISO and IEC members, to aid
the use of HLPNs and facilitate the development of Petri net software tools [20]. Specifically,
ISO/IEC 15909‐1 defines a mathematical semantic model, an abstract mathematical syntax for
annotations, and a graphical notation for high‐level Petri nets [20]. Several levels exist for conformance
to the standard, depending upon the high‐level class and supporting syntax chosen by the user of
ISO/IEC 15909‐1.
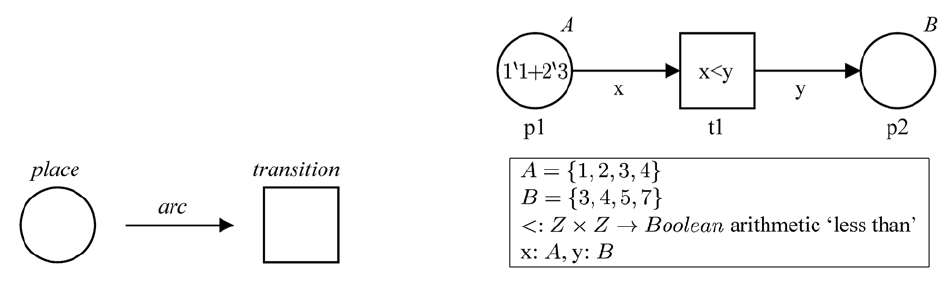
ISO/IEC 15909‐1 defines terms (such as ‘arc’, ‘multiset’, ‘Petri net’, ‘token’, ‘transition’, etc.) and
mathematical conventions needed for high‐level Petri nets and provides the formal concepts of marking,
enabling, and transition rules needed for HLPNGs. As seen in Figure 10, a place (a set, a collection of
objects) is graphically represented by a circle or an ellipse, while a transition (an action) is graphically
represented by a rectangle in HLPNGs. Arcs (one‐directional connections of nodes, of places and
transitions) are represented by arrows, as seen in Figure 10 [20]. Utilizing these basic conventions, users
of ISO/IEC 15909‐1 can create HLPNGs that represent complex processes within manufacturing and
other industries.
Figure 10. (Left) Graphic conventions for, and (right) an example of, high‐level Petri net graphs from
ISO/IEC 15909‐1 [20]. [These excerpts are taken from ISO/IEC 15909‐1:2004, (left) Figure D.1 on page 28
and (right) Figure 1 on page 10, with the permission of ANSI on behalf of ISO. (c) ISO 2014‐ All rights
reserved].
Collectively, ISO/IEC 15909 is a series of standards to support high‐level Petri nets. ISO/IEC 15909‐1
provides the mathematical definition of HLPNs, known as the semantic model, as well as its graphical
form, HLPNGs. In a complementary manner, ISO/IEC 15909‐2 defines the transfer format, the Petri Net
Markup Language (PNML), to support the exchange of HLPNs [22]. The basic level of conformance to
ISO/IEC 15909‐2 is the use of the PNML Core Model, which is a meta model based on a unified modeling
language (UML) that defines the core concepts and structure of Petri nets. The mapping of these
concepts to Extensible Markup Language (XML) syntax is also covered within the standard. Furthermore,
these concepts are not related to the mathematical concepts standardized in ISO/IEC 15909‐1, but
rather related only to the graphical representation and structure of Petri nets to ensure that the
appearance of Petri nets is similar in different software. Therefore, ISO/IEC 15909‐2 was written as a
reference for current and future developers of Petri net tools; ISO/IEC 15909‐1 is semantic in nature,
covering ‘types’ and ‘functions’, while ISO/IEC 15909‐2 is syntactic in nature, covering the counterparts
of ‘sorts’ and ‘operators’.
21
This publication is available free of charge from http://dx.doi.org/10.6028/NIST.IR.8012
2.2.3. Life Cycle Costing
As previously discussed, decisions are made during the design and manufacturing of products that affect
their performance, safety, reliability, and maintainability [23]. However, those same decisions also
impact, and are motivated by, the life cycle cost (LCC) of the products. LCC is the sum of the estimated
price, ownership, and disposal costs. Life cycle costing (economic analysis to determine the partial or
entire life cycle costs of a product) should also be applied to optimize a product’s design in addition to
the more technical dependability approaches. Due to the use of integrated logistics within maintenance
systems, trade‐off analyses during PHM deployment should include the potential improvements from
inventory and labor costs.
IEC 60300‐3‐3 was prepared by the IEC technical committee 56 (Dependability) to address the costs
associated with the dependability of products [23]. The process of life cycle costing involves the
generation of a LCC model, a structure containing the mathematical expressions for the LCC costs.
Accordingly, IEC 60300‐3‐3 contains examples of LLC models, in which the cost elements may be created
by engineering, analogous, or parametric cost methods. The purpose of the analysis is to determine the
cost elements whose relative contributions exceed predefined thresholds. However, the confidence of
life cost costing depends on the assumptions and availability of data, so the process should be well‐
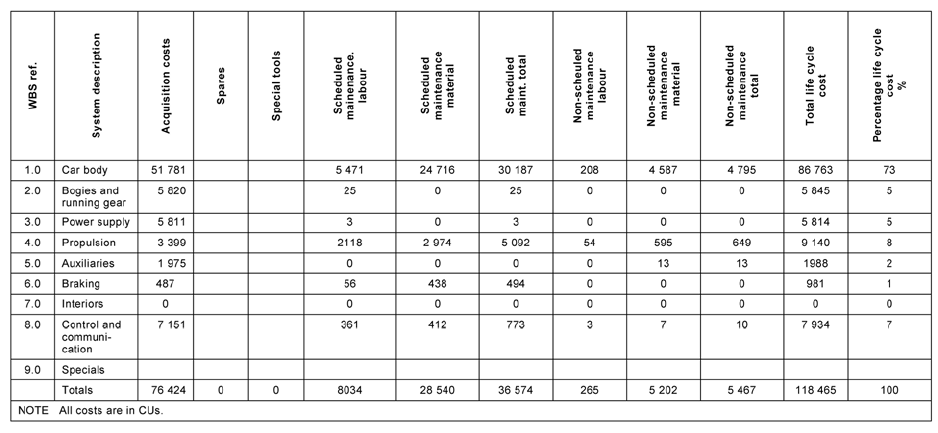
documented and structured. For example, Figure 11 shows a summary of a structured breakdown of life
cycle costs. Furthermore, IEC 60300‐3‐3 touches upon the implications of opportunity costs, inflation,
and taxation on the life cycle costing process [23].
Figure 11. Life cycle cost summary by product breakdown structure from IEC 60300‐3‐3 [23]. [Copyright
© 2004 IEC Geneva, Switzerland. www.iec.ch].
2.3. Measurement Techniques
Dependability analysis, whether top‐down or bottom‐up or some combination thereof, is used to
identify the failure modes of the system and help manufacturers to determine which risks should be
mitigated or eliminated. If a failure mode must exist, being unavoidable for system operation, then the
22
This publication is available free of charge from http://dx.doi.org/10.6028/NIST.IR.8012
failure mode may be monitored or predicted via diagnostics and prognostics with sensors and
established measurement and analysis techniques. The system designer must be aware of the various
measurement techniques and their preferred uses based on the accepted experience of others.
Several standards contain explicit guidelines on the use of measurement techniques for PHM. This
section summarizes those particular standards indicated under the ‘Measurement techniques’ category
within Table 1. However, due to the detailed nature and variety of measurement techniques, this
document mentions these standards in a broad manner. This section mainly covers the information
within these standards that are relatively general in scope and application for manufacturing.
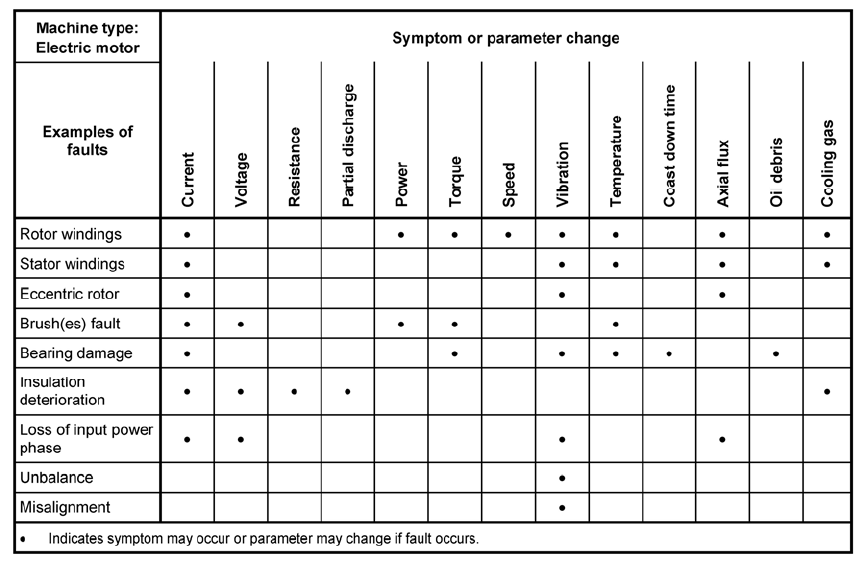
For example, Annex B of ISO 17359 contains nine tables of guidance for measurement techniques for
various systems, including generators, fans, engines, and pumps [9]. Figure 12 is one such example,
showing possible faults for an electric motor and the associated measureable symptoms. For example,
Figure 12 shows that the bearing unbalance affects the vibration directly, but only impacts the other
detectable symptoms tangentially. Such tables are essential for understanding the basic physical
consequences of system faults to aid in the selection and positioning of sensors. Similarly, Annex D of
ISO 13379‐1 relates measurement techniques and numerous diagnostic models in tabular form, as seen
in Figure 13. The combination of the information from ISO 17359 and ISO 13379‐1 helps both novices
and experts in PHM to determine the measurement types and associated diagnostic techniques for a
given system fault. For example, a bearing unbalance could be detected via vibration monitoring
(according to Figure 12) and analyzed via a subsequent data‐driven statistical method (according to
Figure 13).
Figure 12. Example of faults and their measureable symptoms from ISO 17359 [9]. [This excerpt is taken
from ISO 17359:2011, Table B.2 on page 13, with the permission of ANSI on behalf of ISO. (c) ISO 2014‐
All rights reserved].
23
This publication is available free of charge from http://dx.doi.org/10.6028/NIST.IR.8012
Figure 13. Measurement techniques for various diagnostics models from ISO 13379‐1 [24]. [This excerpt
is taken from ISO 13379‐1:2012, Annex D on page 26, with the permission of ANSI on behalf of ISO.
(c) ISO 2014‐ All rights reserved].
As seen in Table 1, other standards are more specific in their guidance for the use of numerous
measurement techniques: ISO 13373‐1 and ISO 13373‐2 are useful for vibration monitoring, ISO 18434‐1
for thermography, ISO 20958 for analysis of electrical motor signatures, ISO 22096 for acoustic emission
monitoring, and ISO 29821‐1 for ultrasound monitoring. These standards guide the application of
sensors based on conditions such as data requirements and analysis techniques. This document
mentions these standards for thoroughness and recommends that these standards be utilized, when
applicable, for the development of measurement techniques used within PHM systems.
2.4. Diagnostics and Prognostics
Diagnostics is the determination of the current condition of a component or system, and prognostics is
the predictive ability of future performance degradation and expected failures [25]. Both diagnostics
and prognostics require data collection and analysis to enable decision making by system managers.
Accordingly, the standards described in the previous sections about dependability analyses (‘why’ and
‘what’ to measure) and measurement techniques (‘how’ to measure) enable the measurements used for
diagnostics and prognostics, which support decisions that reduce costs, improve safety, and optimize
maintenance scheduling. The entire process of machine condition monitoring can be categorized into
five distinct phases: problem detection, diagnostics, prognostics, recommendation of actions, and post‐
mortems [26].
The following subsections summarize those particular standards indicated under the ‘Diagnostics and
Prognostics’ category within Table 1. As seen in the table, the number of existing standards with general
focuses on diagnostics and prognostics is fairly limited; this section is fairly short yet comprehensive.
24
This publication is available free of charge from http://dx.doi.org/10.6028/NIST.IR.8012
2.4.1. Diagnostics
One recently‐published standard aids the diagnostics of general PHM processes; ISO 13379‐1 was
created to aid the condition monitoring of industrial machines including turbines, compressors, pumps,
generators, electrical motors, blowers, gearboxes, and fans [24]. ISO 13379‐1, which was prepared
under SC 5 (Condition monitoring and diagnostics of machines) of ISO/TC 108 (Mechanical vibration,
shock and condition monitoring), outlines the condition monitoring and diagnostics cycle into a
preparatory design phase and a usage phase. As mentioned in Section 2.3, the standard addresses the
connection of measurement techniques to diagnostic approaches [24]. However, ISO 13379‐1 mainly
outlines the nine generic steps for diagnostics, of which the first four (steps 1 to 4) are satisfied by FMEA
or FMECA as outlined in IEC 60812. The last seven steps (steps 3 to 9) are followed using the FMSA
(failure mode symptoms analysis) methodology outlined in ISO 13379‐1, which is essentially a
modification of a FMECA process that focuses on the selection of the most appropriate detection and
monitoring techniques and strategies. The process results in a monitoring priority number (MPN) for
each failure mode. The MPN is the product of four numbers representing the confidence (each rated
from 1 to 5) of detection, severity, diagnosis, and prognosis for the given failure mode. The highest MPN
value indicates the most suitable technique for detection, diagnostics, and prognostics of the associated
failure mode [24].
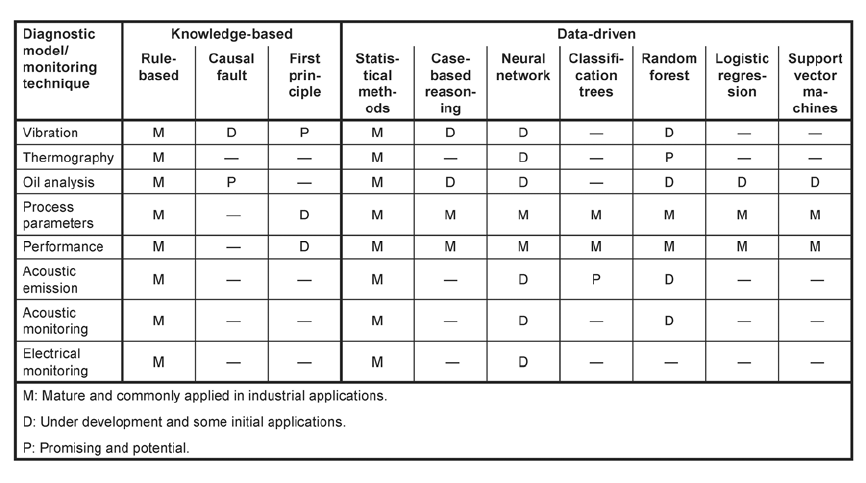
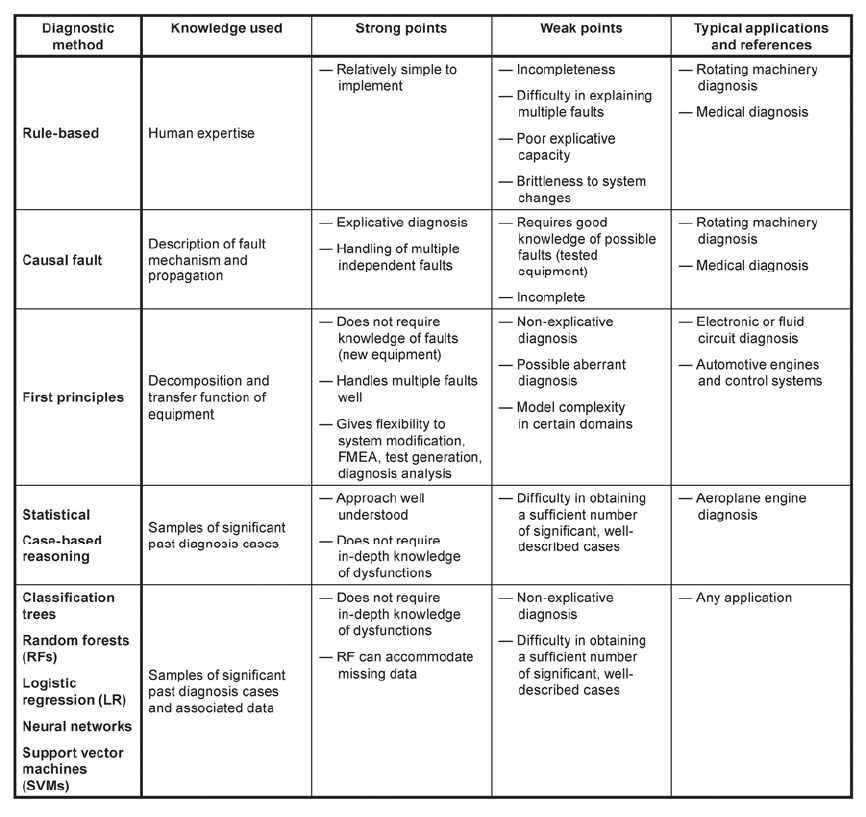
ISO 13379‐1 also outlines the data‐driven diagnostic approaches (e.g., neural network, logistic
regression, and support vector machine) and the knowledge‐based diagnostic approaches (e.g., causal
tree and first principles), comparing their strengths and weaknesses, as seen in Figure 14. Based on such
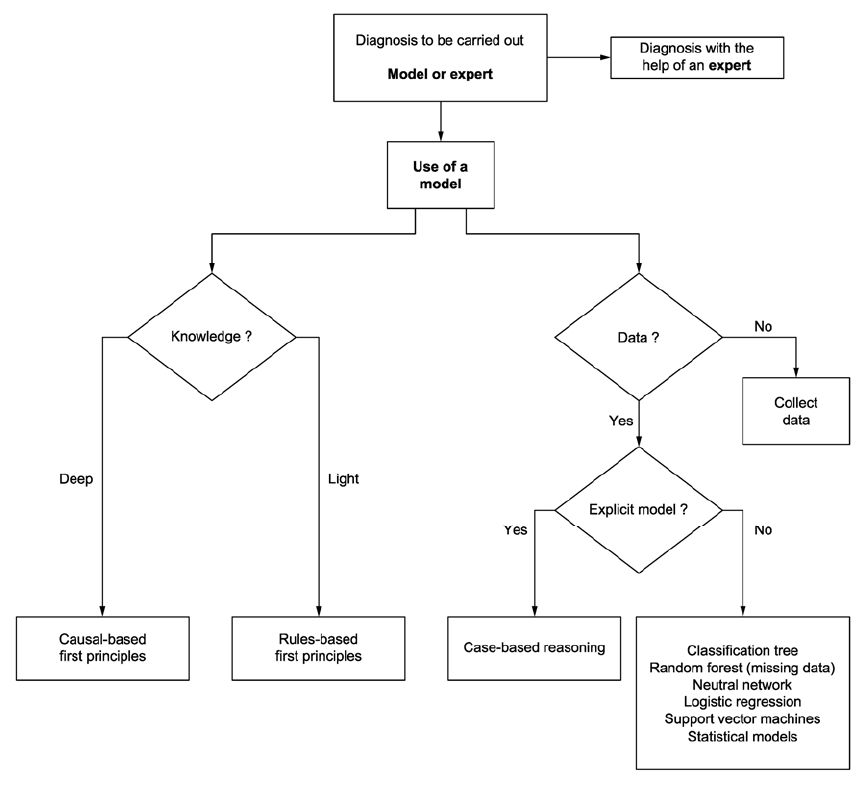
a comparison, Figure 15 shows a convenient flow chart for choosing a diagnostic model. The decision is
based on the model type, whether knowledge‐based or data‐driven, and the relative strength of the
information. The last step in the diagnostic process is a formal diagnostic report, such as an example
given in Annex E of ISO 13379‐1, which includes information about the event, its diagnosis, symptoms,
failure modes, and recommendations for corrective action and fault avoidance.
25
This publication is available free of charge from http://dx.doi.org/10.6028/NIST.IR.8012
Figure 14. Comparison of diagnostic models from ISO 13379‐1 [24]. [This excerpt is taken from
ISO 13379‐1:2012, Annex C on page 25, with the permission of ANSI on behalf of ISO. (c) ISO 2014‐ All
rights reserved].
26
This publication is available free of charge from http://dx.doi.org/10.6028/NIST.IR.8012
Figure 15. Diagnostic model decision flowchart from ISO 13379‐1 [24]. [This excerpt is taken from
ISO 13379‐1:2012, Figure 2 on page 10, with the permission of ANSI on behalf of ISO. (c) ISO 2014‐ All
rights reserved].
2.4.2. Prognostics
Other standards are needed to provide guidance for prognostics, because there is currently no precise
procedure or standard methodology. Fault prognostics require prior knowledge of the probable failure
modes, the anticipated future activities of the machine, and the relationships between failure modes
and operating conditions [26]. Because prognostics are focused on future predictions, the prognosis
needs to consider future failure modes, operating conditions, and maintenance actions. These
requirements are not necessarily obvious because such information may be based on experience or
difficult to predict or quantify. As analytical damage models are introduced and computing power
increases, the ability to predict faults is conceivable if the set of parameter values that represent
initiation criteria are known for a given set of conditions [26].
27
This publication is available free of charge from http://dx.doi.org/10.6028/NIST.IR.8012
To facilitate the development of prognostics within general PHM processes, ISO 13381‐1 outlines
general guidelines, approaches, and concepts for prognostics [26]. ISO 13381‐1 uses ISO 13372 [27]
(‘Condition monitoring and diagnostics of machines – Vocabulary’) and ISO 17359 (see Section 2.1) as
normative references. Also, terms such as prognosis (an estimation of time to failure and associated
risk), confidence level, root cause, and estimated time to failure (ETTF) are defined in ISO 13381‐1.
ISO 13381‐1 also outlines the four basic phases of prognosis: pre‐processing, existing failure mode
prognosis, future failure mode prognosis, and post‐action prognosis. ISO 13381‐1 states that the trip set
point used for thresholding to prevent damage or failure is a parameter value, normally determined
from standards, manufacturers’ guidelines, and experience. Other thresholds, such as alert and alarm
limits, are set at values below the trip set point to initiate maintenance. Once a fault has been detected
based on a failure mode behavior model (FMECA, FTA, etc.), the estimated time to failure (ETTF) needs
to be determined by expert opinion and/or empirical methods [26].
2.5. Data Management
Monitoring the condition of machines is not an easy task because the integration of various PHM
software is typically not ‘plug‐and‐play’ [28]. Dependability data must be collected, processed, and
managed for diagnostic and prognostic purposes of the given system. Ideally, the raw data, its processed
forms, and dependability decisions, based on the data, would be stored in a fashion presentable in
support of various activities (e.g., data mining purposes for the advancement of PHM in other systems).
Consequently, several standards exist for the purpose of guiding the management of PHM data and,
hence, the integration of various PHM software via the transfer of standardized data formats. This
section summarizes those particular standards indicated under the ‘Data management’ category within
Table 1.
ISO 13374‐1 was created by ISO/TC 108/SC 5 to provide the basic requirements for open software
specifications to facilitate the transfer of data among various condition monitoring software, regardless
of platform or hardware protocols [28]. ISO 13374‐1 establishes the general guidelines, while later parts
of ISO 13374 address the specific software requirements for data processing, communication, and
processing. One of these general guidelines is the requirement of an ‘open machine condition
monitoring information schema architecture as an underlying framework’ [28]. Vendor‐independent
XML schema and protocols can be used for the network exchange of PHM information. In accordance
with ISO 13374, the Machinery Information Management Open Systems Alliance (MIMOSA) published a
conceptual schema called the Common Relational Information Schema (CRIS) in Adobe PDF, Microsoft
Word, and XML schema forms. The CRIS has been used in the condition monitoring industry to
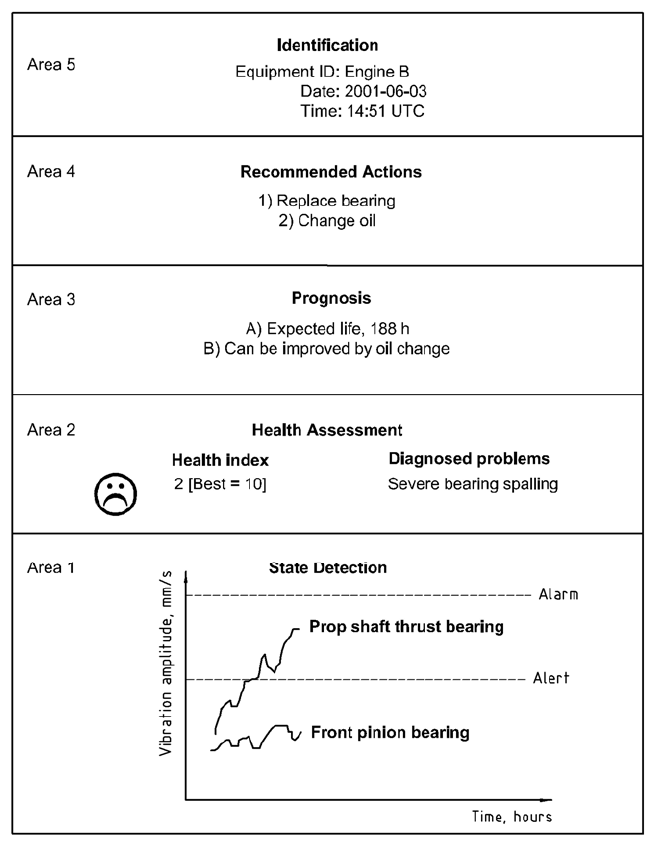
communicate and integrate information from many systems [29]. Ultimately, to facilitate maintenance
decisions by qualified personnel, information would be displayed through use of machine identification,
recommended actions, prognosis, health assessment, and pertinent data, as seen in Figure 16.
28
This publication is available free of charge from http://dx.doi.org/10.6028/NIST.IR.8012
Figure 16. Example of an aircraft engine display for condition monitoring from ISO 13374‐1 [28]. [This
excerpt is taken from ISO 13374‐1:2003, Figure 3 on page 12, with the permission of ANSI on behalf of
ISO. (c) ISO 2014‐ All rights reserved].
ISO 13374‐2 provides requirements for a reference information model and a reference processing model
for an open condition monitoring and diagnostics (CM&D) architecture [30]. In other words, ISO 13374‐2
provides details of the methodology and requirements for data processing within CM&D systems. ISO
13374‐2 describes the required content for the five layers (1 – semantic definitions, 2 – a non‐
proprietary conceptual information model or ‘schema’, 3 – implementation data model, 4 – reference
data library, and 5 – data document definitions) of the open CM&D information architecture, which
describes all the data objects, types, relationships, etc. for a given system [30]. Finally, ISO 13374‐2
provides an informative annex about the UML, XML, and Middleware services.
MIMOSA publishes an open CM&D information specification known as the MIMOSA Open Systems
Architecture for Enterprise Application Integration (OSA‐EAI™), which is compliant with the
requirements outlined in ISO 13374‐1 and ISO 13374‐2 and free for download [31]. Such an open CM&D
29
This publication is available free of charge from http://dx.doi.org/10.6028/NIST.IR.8012
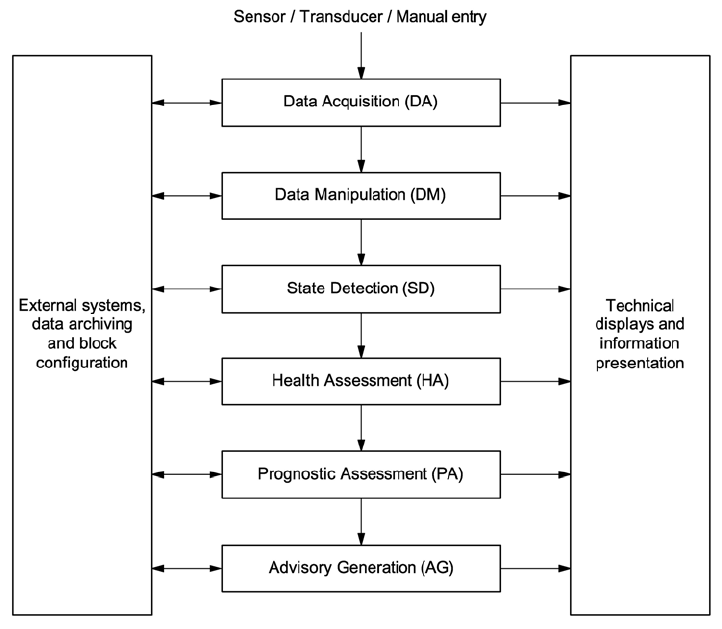
processing architecture specification uses the processing architecture seen in Figure 17. This processing
architecture processes and transforms basic data into actionable information. ISO 13374‐2 details the
input and outputs of each of the six processing blocks from Data Acquisition (DA) to Advisory Generation
(AG). MIMOSA also publishes an open CM&D specification known as the MIMOSA Open Systems
Architecture for Condition Based Maintenance (OSA‐CBM™), which is based on OSA‐EAI™ as well as on
ISO/IEC 14750 for the processing blocks, enabling integration of systems from various suppliers [30]. The
MIMOSA interface standard does not impose a structure on the components that comprise a MIMOSA
compliant system. This lack of structure allows complete encapsulation of proprietary algorithms and
software, and is a key enabler to prognostic module implementation [32]. Furthermore, MIMOSA
developed various whitepapers, including one on the condition of CBM [33] and another on condition‐
based operations for manufacturing [34].
Figure 17. Data processing block diagram for open CM&D information architecture from ISO 13374‐
2 [30]. [This excerpt is taken from ISO 13374‐2:2007, Figure 2 on page 5, with the permission of ANSI on
behalf of ISO. (c) ISO 2014‐ All rights reserved].
The third part of ISO 13374, ISO 13374‐3, defines the communication requirements for any open CM&D
systems to aid the interoperability of such systems [35]. The technologies and software used by the
data‐oriented processing blocks (DA, DM, and SD) often vary from those used by the analysis‐oriented
processing blocks (HA, PA, and AG) seen in Figure 17. ISO 13374‐3 states that a UML model, compliant
with ISO/IEC 19501, shall support the open CM&D data‐processing communications. ISO 13374‐3
defines the block processing methods and interface types that should be utilized by each data‐
processing block defined in ISO 13374‐2. Also, based on IEC/DIS 62264‐5, ISO 13374‐3 contains an
30
This publication is available free of charge from http://dx.doi.org/10.6028/NIST.IR.8012
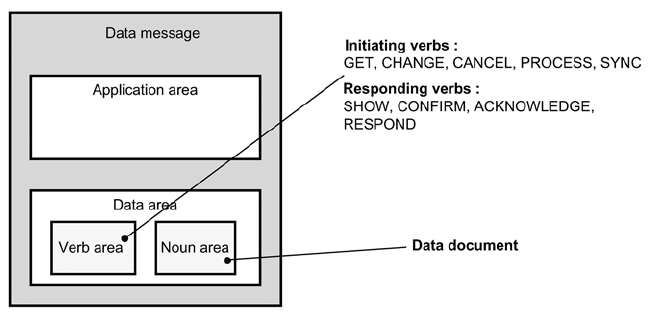
informative annex of an open CM&D information architecture with the message structure seen in Figure
18.
Figure 18. Message structure, compliant with IEC/DIS 62264‐5, from ISO 13374‐3 [35]. [Grayscale
version. This excerpt is taken from ISO 13374‐3:2012, Figure A.1 on page 10, with the permission of ANSI
on behalf of ISO. (c) ISO 2014‐ All rights reserved].
The ISO 13374 standard series applies to systems including process plants, and the cross‐organizational
nature of the plant information necessitates a robust data management structure with efficient
integration. Accordingly, information related to the engineering, construction, and operation of process
plants must be managed and utilized by owners, operators, contractors, and regulators during the life of
a plant [36]. These process plants operate in various industries, including oil and gas, power generation,
chemical manufacturing, pharmaceuticals, and food. In order to facilitate the integration of process
plant life‐cycle data, ISO 15926‐1 [36] was prepared by ISO/TC 184/SC 4 for the representation of
process plant life‐cycle information via a data model with consistent context for data definitions.
ISO 15926 complements other standards for industrial data management, including ISO 10303‐11 that
specifies the ’EXPRESS’ data modeling language for product data representation and exchange [37].
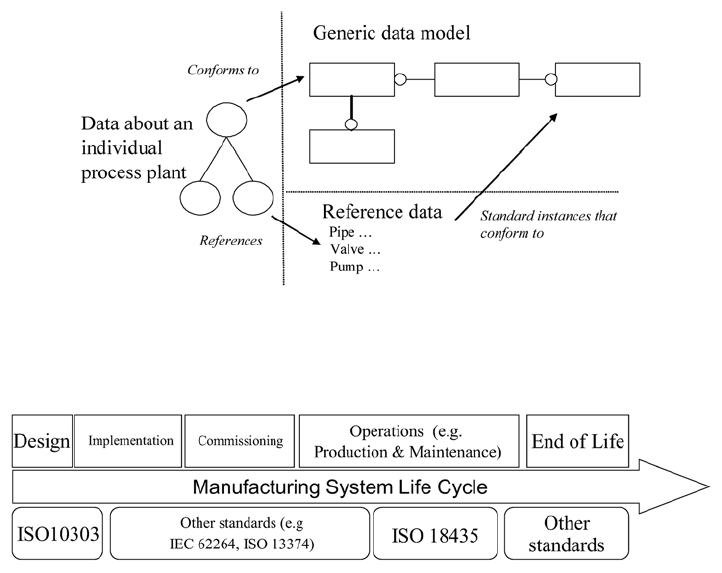
The information architecture outlined in ISO 15926‐1 is seen in Figure 19 and was designed such that
conceptual and reference data may be represented concisely without the need for duplication.
ISO 15926‐2 [38] specifies a conceptual data model used within the architecture outlined in Figure 19.
An information system conforming to this architecture should provide an application programming
interface (API) with operations following the guidance in ISO 15926‐1.
Other standards apply to data management needs within manufacturing enterprises. In a manufacturing
enterprise, a properly integrated asset management system should provide critical information to
improve the productivity of the existing manufacturing assets, which is increasingly possible as digital
signal processing has become more mature. The main focus of the ISO 18435 standards series is to
describe the integration requirements that manufacturing assets and resources need to support
operations and maintenance within a manufacturing system’s lifecycle, as seen in Figure 20 [39]. In
ISO 18435, the functions and interfaces that gather information about process, equipment, operators,
materials, etc. (related to various diagnostics for asset management) are based on the definitions and
concepts from other standards, such as IEC 62264, ISO 15745, ISO 13374, MIMOSA OSA‐CBM, and
MIMOSA OSA‐EAI [39]. By utilizing the general tools outlined in ISO 18435, system integrators can
reduce the time to develop diagnostics and maintenance solutions. Use of ISO 18435 will help
manufacturers to realize optimized performance, costs, safety, and environmental compatibility [39].
31
This publication is available free of charge from http://dx.doi.org/10.6028/NIST.IR.8012
Figure 19. Information architecture from ISO 15926‐1:2004 [36]. [This excerpt is taken from ISO 15926‐
1:2004, Figure 2 on page 7, with the permission of ANSI on behalf of ISO. (c) ISO 2014 ‐ All rights
reserved].
Figure 20. Scope of ISO 18435 in the lifecycle of a manufacturing system from ISO 18435‐1 [39]. [This
excerpt is taken from ISO 18435‐1:2009, Figure 1 on page vi, with the permission of ANSI on behalf of
ISO. (c) ISO 2014‐ All rights reserved].
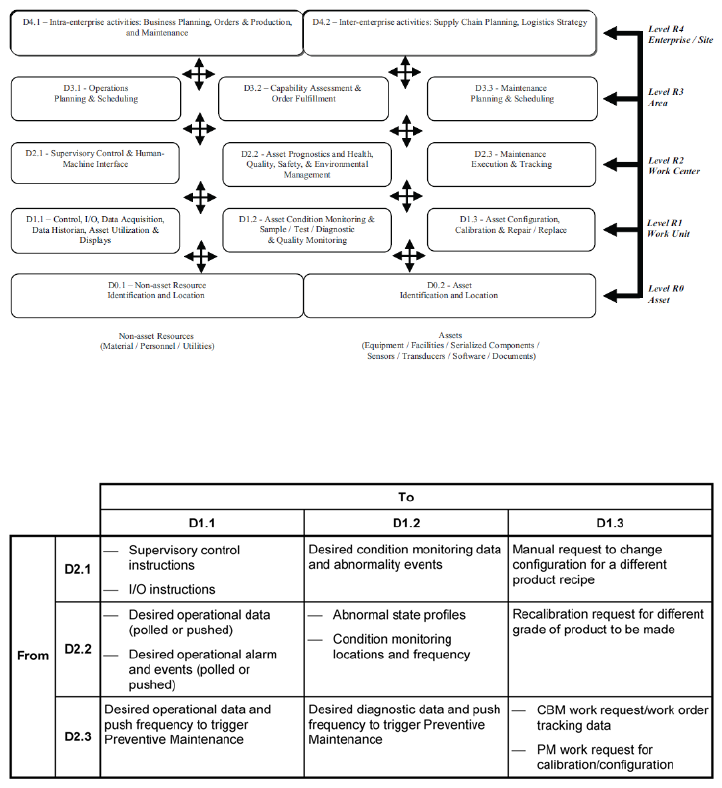
ISO 18435‐1 gives an overview of the elements and rules of an integration modeling method to describe
a manufacturing application’s requirements for integration of an automation application with other
applications, e.g., diagnostics, prognostics, capability assessment, and maintenance applications with
production and control applications [39]. The method is based upon the Application Domain Integration
Diagram (ADID), as seen in Figure 21, which facilitates the transfer of information among various
application domains of the manufacturing process. The domains involve the integration of information
including the processing blocks of ISO 13374, such as the Data Monitoring block or the State Detection
block. ISO 18435‐1 defines terms (e.g., ‘integration’ and ‘interaction’) and provides examples of
exchanged information among domains (e.g., see Figure 22).
32
This publication is available free of charge from http://dx.doi.org/10.6028/NIST.IR.8012
Figure 21. Application Domain Integration Diagram from ISO 18435‐1 [39]. [This excerpt is taken from
ISO 18435‐1:2009, Figure 5 on page 7, with the permission of ANSI on behalf of ISO. (c) ISO 2014‐ All
rights reserved].
Figure 22. Items exchanged from domains at Level 2 to domains at Level 1 from ISO 18435‐1 [39]. [This
excerpt is taken from ISO 18435‐1:2009, Table A.6 on page 18, with the permission of ANSI on behalf of
ISO. (c) ISO 2014‐ All rights reserved].
ISO 18435‐2 helps to enable the interoperability of manufacturing resources, which can achieve
compatibility among interfaces via ISO 15745 templates. This interoperability results in an integrated
system for the flow of material, information, and energy, which is needed for diagnostic and prognostic
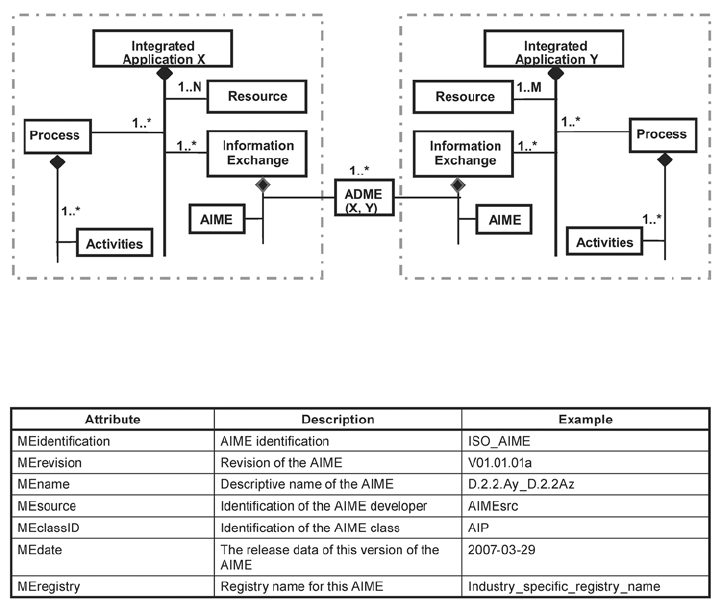
processes within PHM systems. ISO 18435‐2 defines the application interaction matrix element (AIME)
and application domain matrix element (ADME) structures and relationships, including the steps to
construct an ADME for support by a set of AIMEs [40]. An AIME represents a set of capabilities provided
by a set of manufacturing resources of an application. An ADME is a means to model the information
exchanges between applications, being constructed from interoperability profiles referenced in AIMEs.
For example, Figure 23 shows an ADME linking two conceptual AIMEs. ISO 18435‐2 outlines the XML
schema for the headers and bodies that comprise AIMEs and ADMEs. AIME bodies consist of context
and conveyance sections, and ADME bodies consist of context, conveyance, and content sections. Figure
24 shows an example of the attributes, but ISO 18435‐2 also contains formal definitions of the
ADME/AIME schemas in informative annexes [40].
33
This publication is available free of charge from http://dx.doi.org/10.6028/NIST.IR.8012
Figure 23. Interoperability of applications from ISO 18435‐2 [40]. [This excerpt is taken from ISO 18435‐
2:2012, Figure 4 on page 3, with the permission of ANSI on behalf of ISO. (c) ISO 2014 ‐ All rights
reserved].
Figure 24. AIME template header attributes from ISO 18435‐2 [40]. [This excerpt is taken from ISO
18435‐2:2012, Table 1 on page 5, with the permission of ANSI on behalf of ISO. (c) ISO 2014‐ All rights
reserved].
Other industrial data management standards can be broadly applied to PHM systems. IEEE 1232‐2010
(AI‐ESTATE) is utilized for data exchange in test and diagnostic environments [41], and ISO 15531‐
44:2010 provides data models for use by any software to manage and improve manufacturing [42]. ISO
15531‐44:2010 addresses the modeling of data (quantitative or qualitative) collected from data
acquisition systems at the control level (level 2 of IEC 62264‐1) to be stored at the manufacturing
management level (level 3 of IEC 62264‐1) and processed further at this level for any management
purpose. The standard provides data models that are able to be used by any software to manage and
improve manufacturing. Normative references include other parts of ISO 15531 (parts 1, 31, 32, 42, and
43), ISO 10303‐11, ISO 13584‐1, and ISO 13584‐24.
2.6. Training
Before the implementation of PHM systems, personnel should be trained to use such systems, and
certain standards guide the requirements needed for training processes. Specifically, ISO 18436 includes
requirements for the qualification and assessment of personnel for condition monitoring and
diagnostics systems for machines [43]. The series covers general requirements and guidance for training
related to measurements of vibration (part 2), field lubricants (parts 4 and 5), acoustic emission (part 6),
thermography (part 7), and ultrasound (part 8). This document does not focus on these training‐related
standards since the emphasis of this standards survey is on PHM system development, methodologies
and metrics.
34
This publication is available free of charge from http://dx.doi.org/10.6028/NIST.IR.8012
2.7. Applications
The previous sections describing the elements of PHM system development and implementation may be
applied to various manufacturing products and processes. The standards mentioned in this document
are organized fairly independently of industry, in order to reveal any common ground among existing
standards while inspiring the usage of standards across disciplines. Certain standards contain significant
guidance for PHM systems within only specific industries, as indicated under the ‘Applications’ category
within Table 1.
2.7.1. Aerospace Industry
The Society of Automotive Engineers (SAE) is a U.S.‐based association for engineering professionals in
various industries, particularly transportation (automotive, aircraft, etc.). SAE has developed thousands
of Aerospace Standards including Aerospace Information Reports (AIRs) and Aerospace Recommended
Practices (ARPs). AIRs and ARPs are documents that give dimensional design or performance
recommendations for standard engineering practices [44]. Some of these documents provide guidance
for PHM systems of aircraft and their components.
One vital component to monitor is the aircraft engine. Engine health management (EHM) is defined as
the “general discipline or techniques for detection, accommodation, diagnosis and prognosis of
degradation or failure of an engine system, piece of equipment, component or subassembly and offering
a maintenance action or decision support to address the degradation” [45]. EHM systems are part of an
integrated vehicle health management (IVHM) system. If EHM can provide sufficient prognostics, then
maintenance support can tailor their efforts to reduce the logistic footprint. EHM generally includes
warning systems in order to mitigate failures during the ‘fault to failure progression’, but future systems
might include anomaly detection and advanced monitoring and analysis for vibration, turbine blade
performance, and oil health [45].
Because EHM is becoming more important for optimizing aircraft utilization, SAE ARP1587B was written
as a guide for aircraft gas turbine EHM for use by commercial and government operators, aircraft
manufacturers, engine producers, and equipment suppliers. Under the E‐32 Aerospace Propulsion
Systems Health Management Technical Committee, SAE ARP1587 was introduced in 1981 and revised as
version A in 1993. This standard was further revised as version B in 2007, which was subsequently
reaffirmed in 2013 [46]. SAE ARP1587B gives a top‐level view of Engine Health Management (EHM),
addressing benefits and capabilities while providing examples and possible design options.
SAE ARP1587B describes EHM terminology (e.g., ‘failure’, ‘fault’, and ‘life’) and the four essential
elements of an EHM system (symptomatics, diagnostics, prognostics, and prescriptive action). Because
prescriptive action can be taken at different levels, SAE ARP1587B separates prognostics into three
predictions based upon time scale: ‘near‐horizon prognostics’ (up to two weeks), ‘mid‐horizon
prognostics’ (between two weeks and two months), and ‘far‐horizon prognostics’ (greater than two
months). Other referenced SAE documents provide detailed implementation steps and procedures for
EHM.
EHM is basically an information exchange process that supports the prescriptive action decisions made
by engine maintenance and design personnel for improved reliability, logistics, efficiency, costs, and
35
This publication is available free of charge from http://dx.doi.org/10.6028/NIST.IR.8012
safety [45]. An EHM system should be reliable, valid (see SAE AIR5120 for guidance), and continuously
improved and upgraded. However, retrofitting an EHM sensor on an in‐service aircraft is usually too
costly compared to its benefits (see SAE AIR4176 for cost/benefit analysis guidance) [45]. Nonetheless,
advancements in technology and computation capabilities are making automation of EHM more cost‐
effective for new designs. Current EHM concerns include system architecture, data/information
interfaces, system integration, data security, and regulatory requirements [45].
Health management for military aircraft is improving due to advances in sensors (for detecting oil debris,
vibration, etc.), model‐based PHM (on‐board models for real‐time health estimation), and logistics (e.g.,
real‐time data exchange). The Joint Strike Fighter (F‐35) is such an example, because it is built around
on‐board failure diagnostics and prognostics with real‐time communication to the logistics
infrastructure for immediate corrective action [45]. Therefore, when an F‐35 returns from a mission, it
may be met at the airfield with needed maintenance for an efficient turnaround, serving the ultimate
goal of PHM (delivering true condition‐based maintenance capability) [45].
The increasing interest in gas turbine prognostics led to SAE AIR5871, which addresses the foundation of
prognostics for engine health monitoring [25]. Prognosis depends on fault isolation and diagnosis, and as
such, SAE AIR5871 delineates prognostics between condition prognostics (to forecast remaining useful
life based on identified degradation) and failure prognostics (if the identified fault affects component
life) [25]. SAE AIR5871 summarizes the five leading data‐driven and model‐based analytical approaches:
1 – experience‐based prognostics (simplest approach that uses failure or inspection data), 2 –
evolutionary prognostics (works well for system level degradation), 3 – feature progression and AI‐based
prognostics (includes trained neural networks), 4 – state estimator prognostics (used to track and
smooth the features related to failure prediction), and 5 – physics‐based prognostics (traditional
approach that uses comprehensive modeling). SAE AIR5871 also outlines prognostic examples for a gas
turbine blade failure mode (due to fatigue) and gas turbine performance degradation (due to fouling).
Finally, SAE AIR5871 states that current research in prognostics is focused on improving the
understanding of the physics of failure progression as well as the “logical and quantitative rationale for
specifying prognostic system performance”, which relies on the interaction between PHM providers and
users [25].
2.7.2. Energy Industry
In 2013, the International Atomic Energy Agency (IAEA) produced a document (NP‐T‐3.14) focused on
PHM for nuclear power plants [47]. More than 50 people (see pp. 135‐136 of Ref. [47]) contributed to
drafting and reviewing the final document. The document is comprehensive in its definitions and
approaches for PHM of nuclear power plants. However, the background information and details for
PHM measurement and analysis are applicable to other industrial processes and hence worthy of
attention for PHM developers in other industries.
36

This publication is available free of charge from http://dx.doi.org/10.6028/NIST.IR.8012
3. Current Standards Development
New standards and revisions to existing standards related to PHM are currently under development.
Table 2 categorizes these developing standards for manufacturing according to the general topics used
throughout this document.
Table 2. Standards under development related to PHM for manufacturing.
Organization
Committee/
Subcommittee Standard
1st Edition
/ Revision? Title
Overview
Dependability analysis
Measurement techniques
Diagnostics and Prognostics
Data management
Training
Applications
SAE G‐11r ARP6204 1st Edition Condition Based Maintenance (CBM)
Recommended Practices X
IEEE RS P1856 1st Edition Standard Framework for Prognostics and Health
Management of Electronic Systems X
ISO/IEC JTC 1/SC 7 ISO/IEC
15909‐3
1st Edition Software and system engineering − High‐level
Petri nets−Part 3: Petri Net Extensions X
ISO TC 108/SC 5 ISO 13379‐2 1st Edition Condition monitoring and diagnostics of
machines− Data interpretaƟon and diagnosƟcs
techniques−Part 1: General guidelines
X
ISO TC 108/SC 5 ISO 13381‐1 Revision Condition monitoring and diagnostics of
machines − Prognostics − Part 1: General
guidelines
X
ISO TC 108/SC 5 ISO 18129 1st Edition Condition monitoring and diagnostics of
machines − Approaches for performance
diagnosis
X
ISO TC 184/SC 5 ISO 22400‐1 1st Edition Manufacturing operations management − Key
performance indicators − Part 1: Overview,
concepts and terminology
X
ISO TC 184/SC 5 ISO 22400‐2 1st Edition Manufacturing operations management − Key
performance indicators− Part 2: DefiniƟons and
descriptions of KPIs
X
ISO TC 184/SC 5 ISO 18435‐3 1st Edition Industrial automation systems and integration
–
Diagnostics, capability assessment and
maintenance applications integration – Part 3:
Applications integration description method
X
The following sections provide additional details about these developing standards, organized according
to the topics in Table 2.
3.1. Overview
Currently, SAE is developing SAE ARP6204, a standard for “Condition Based Maintenance (CBM)
Recommended Practices,” under the G‐11r Reliability Committee [48]. The scope of the document is to
outline a path for an organization to implement a CBM approach to maintenance, including practices
regarding both CBM design and field equipment support [48]. The G‐11r Reliability Committee has
benchmarked the CBM framework and performance specifications and is developing a formal
application specification [49].
37
This publication is available free of charge from http://dx.doi.org/10.6028/NIST.IR.8012
Another broad standard under development by the Institute of Electrical and Electronics Engineers
(IEEE) is IEEE P1856 ‐ “Standard Framework for Prognostics and Health Management of Electronic
Systems” [50]. In 2012, the IEEE Standards Board approved the new standard development project to
produce IEEE P1856, which is sponsored by the Reliability Society (IEEE‐RS) [51]. The working group
meets regularly to prepare a draft for ballot in 2014 [51]. Even though this standard is being developed
by IEEE, the intent is for it to have broad applicability in mechanical structures, civil structures, nuclear
technology, and aeronautics [52].
3.2. Dependability Analysis
The first edition of ISO/IEC 15909‐3 is under development by ISO/IEC JTC 1/SC 7 to aid the use of high‐
level Petri nets [53]. ISO/IEC 15909‐3, expected to be the last part of the ISO/IEC 15909 series, will
address the techniques for modularity and extensions of high‐level Petri nets for dependability analysis
of PHM systems.
3.3. Diagnostics and Prognostics
ISO 13379‐2 (‘Data‐driven applications’) will aid the condition monitoring of industrial machines via
diagnostics and is currently in the committee draft stage within ISO/TC 108/SC 5. Also, ISO 13381‐1 is
now at the committee draft stage while being updated to advance prognostics within PHM systems.
Furthermore, within the same subcommittee, a new standard, ISO 18129, is in the draft international
stage to address ‘approaches for performance diagnosis‘ [54].
Several standards are also being developed to guide the creation and measurements of key
performance indicators (KPIs). KPIs are the most useful measures for monitoring and evaluating the
performance of a production‐oriented enterprise to help industries meet their performance targets in
an intelligent manner [55]. KPIs are important for understanding and improving manufacturing plant
performance in terms of waste elimination and goal achievement [56]. The most difficult plants to
operate are network‐structured plants with multiple products. KPIs are one of the potential support
tools for continuous improvement of these challenging plant operations [55]. The set of KPIs at the
highest levels should be used as target values for selecting the plant floor measures. The alignment of
measurements and KPIs with the business operations is a partial reflection of the quality of the
enterprise integration [55]. However, KPIs alone are not sufficient; warning and action limits are often
necessary to help detect process trends, and information from industrial and control systems about
process, equipment, operator, and materials can be effective as feedback for improving the productivity
of manufacturing resources [56]. Hence, KPIs are serviced by effective PHM systems, so standards
related to KPIs could easily influence the diagnostic and prognostic aspects of PHM systems.
ISO 22400 is a series of standards under development by ISO/TC 184/SC 5 to guide the creation,
computation, measurement, utilization, and maturation of KPIs within the manufacturing operations
management (MOM) domain [55]. The intent of the ISO 22400 series is to allow the broadest use of the
KPI definition across the various industries and markets by factory managers, management software
suppliers (e.g., involving PHM data management), engineers, and others involved in manufacturing.
The working draft (WD) of the first standard in the series, ISO/WD 22400‐1, presents a framework for
defining, composing, and utilizing KPIs for all types of industries (for batch, continuous, and discrete
38
This publication is available free of charge from http://dx.doi.org/10.6028/NIST.IR.8012
processes) based upon data from the process control domain (Levels 1‐2 according to IEC 62264‐1 [57])
for use in the MOM domain (Level 3) as well as the business domain (Level 4). ISO/WD 22400‐1 is
focused on internal processes (enterprise‐to‐plant processes) in contrast to external processes
(including the life cycle process and product support). Specifically, ISO/WD 22400‐1 defines the criteria
for KPIs (a KPI should be ‘aligned’, ‘quantifiable’, ‘actionable’, etc.), the information it should contain
(‘name’, ‘description’, ‘formula’, etc.), the types of KPIs (‘ratio’, ‘utilization’, ‘rate’, etc.), and the KPI
model that includes its relationships and dependencies of KPIs on one another.
The working draft of the second standard in the series, ISO/WD 22400‐2, defines the KPIs that reside at
Level 3, the MOM domain, in contrast to KPIs that reside at Level 4, which are related to economic,
business, logistic, and financial factors [56]. ISO/WD 22400‐2 defines over 25 KPIs that are currently in
use and related to work units, such as ‘worker efficiency’, ‘allocation ratio’, and ‘throughput rate.’ Each
KPI is based on the tabular structure set forth in ISO/WD 22400‐1. The ‘formula’ for each KPI is a
function of up to 30 various ‘elements’ or indicators related to time, logistics, quality, performance, and
maintenance. Examples include actual production time (PT), scrap quantity (SQ), and upper specification
limit (USL). Other KPIs, such as the overall equipment effectiveness (OEE) index (OEE Index =
Availability ൈ Effectiveness ൈ Quality ratio), may be a function of other KPIs. For each KPI,
ISO/WD 22400‐2 shows the associated ‘effect model diagram’, which is a visual representation of how
the KPI relates to the manufacturing process.
3.4. Data Management
Future improvements to ATA MSG‐3 [10], used for developing maintenance plans for aircraft, engines,
and systems, will involve an existing data format specification known as ATA SPEC2000, a
comprehensive set of e‐Business specifications, products, and services that help to overcome the supply
chain challenges in the aircraft industry [58]. ATA SPEC2000 helps aircraft manufacturers with
information exchange in order to have statistically significant data for optimizing and developing
maintenance programs.
3.5. Professional Societies
In addition to ISO, IEC, and other professional societies that help develop PHM standards, the PHM
Society is now supporting the development of standards, methods, and metrics in PHM for the further
development of PHM as an engineering discipline [2]. The PHM Society held their first standards panel
at their 2012 conference in Minneapolis, Minnesota, USA. Invited speakers were from SAEB
International, standards organizations, National Aeronautics and Space Administration (NASA), General
Electric (GE), U.S. Army, NRG Energy, Penn State, and Georgia Tech. The need for PHM standards was
identified due to various reasons, including the lack of standardized terms used in PHM, the lack of
visibility, uniformity, and consistency of the PHM methods and tools, the need for compatibility and
interoperability of PHM technology, and the needs for guidance in the practical use and development of
PHM techniques [3].
39
This publication is available free of charge from http://dx.doi.org/10.6028/NIST.IR.8012
4. Summary and Conclusions
The National Institute of Standards and Technology (NIST) conducted a survey of PHM‐related standards
to determine the industries and needs addressed by such standards, the extent of these standards, and
any similarities as well as potential gaps among the documents. Over fifty (50) existing or developing
standards from various national and international organizations were identified and summarized. This
effort revealed that standards exist that are related to all aspects of the development of prognostics and
health management systems: general overview, dependability analysis, measurement techniques,
diagnostic analysis, prognostic analysis, data management, economics, performance metrics, and
personnel training. Some standards were focused on providing guidance for specific applications, yet
still broad enough for general application across industries. Other standards were more focused on a
specific product or process within a target industry.
Based on the lessons learned from the PHM‐related standards categorized according to topics in Table 1
and Table 2, recommendations can be made for the development of future PHM standards. It should be
noted that the following suggestions are not necessarily comprehensive and are subject to change based
on the changing needs and priorities of industry:
The ‘overview’ standards are relatively thorough and therefore overlap significantly, but each
provides important and unique guidance. The standards could be updated and harmonized by
the respective organizations to provide better consolidation among the separate standards,
providing for a more generally approved PHM process across disciplines.
The ‘dependability analysis’ standards are thorough with respect to mathematical methodology,
but could be extended to include treatments including economic and business influences.
Perhaps the key performance indicator standards being developed for manufacturing could be
combined with a dependability method to provide a bridge of guidance between design and
business decisions.
The ‘measurement techniques’ standards, being based in large part on the use of existing sensor
technology, are not a hurdle for the development of PHM systems.
The ‘diagnostics and prognostics’ standards are lacking, as previously stated, due in part to the
difficult nature of reliable diagnostics and prognostics techniques across various industries.
However, the existing standards are still valuable for industry. Collaborations among PHM
experts are recommended for the generation of additional standards for diagnostics and
prognostics.
The ‘data management’ standards appear to be thorough and consistent among each other,
providing generic structures for PHM data and control flow. Real‐life test cases within
manufacturing could be reported in future editions of these standards.
40
This publication is available free of charge from http://dx.doi.org/10.6028/NIST.IR.8012
Acknowledgments
The authors thank the American National Standards Institute (ANSI), on behalf of the International
Organization for Standardization (ISO), and the United States Army for permission to reproduce
information from their standards. Additionally, the authors thank the International Electrotechnical
Commission (IEC) for permission to reproduce information from its International Standard IEC 60300‐3‐1
ed.2.0 (2003), IEC 60812 ed.2.0 (2006), IEC 61025 ed.2.0 (2006), IEC 61165 ed.2.0 (2006) and IEC 60300‐
3‐3 ed.2.0 (2004). All such extracts are copyright of IEC, Geneva, Switzerland. All rights reserved. Further
information on the IEC is available from www.iec.ch. IEC has no responsibility for the placement and
context in which the extracts and contents are reproduced by the authors, nor is IEC in any way
responsible for the other content or accuracy therein.
41

This publication is available free of charge from http://dx.doi.org/10.6028/NIST.IR.8012
References
[1] United States Army, "ADS‐79C‐HDBK ‐ Aeronautical Design Standard Handbook for Condition
Based Maintenance Systems for US Army Aircraft," ed, 2012.
[2] J. Bird and G. Shao, "A View of Standards for Prognostics and Health Management,"
International Journal of Prognostics and Health Management, 2013.
[3] Sony Mathew. (2012). PHM Standards ‐ IEEE PHM Standard. Available:
https://www.phmsociety.org/sites/phmsociety.org/files/PHM%20Society%20Standards%20Res
earch%20Panel_IEEE%20PHM.pdf
[4] P. W. Kalgren, C. S. Byington, M. J. Roemer, and M. J. Watson, "Defining PHM, a lexical evolution
of maintenance and logistics," in 2006 IEEE AUTOTESTCON‐ IEEE Systems Readiness Technology
Conference, Anaheim, CA, United states, 2007, pp. 353‐358.
[5] M. J. Roemer, J. Dzakowic, R. F. Orsagh, C. S. Byington, and G. Vachtsevanos, "Validation and
verification of prognostic and health management technologies," in 2005 IEEE Aerospace
Conference, Big Sky, MT, United states, 2005.
[6] S. B. Blaeser. (2012). The PHM Society’s role as a member of the ANSI‐Accredited US TAG to
ISO/TC 108/SC 5 Condition monitoring and diagnostics of machine systems. Available:
https://www.phmsociety.org/sites/phmsociety.org/files/ISO%20PHM%20Society%20presentati
on.pdf
[7] International Organization for Standardization (ISO). (2013). ISO/TC 108/SC 5 Condition
monitoring and diagnostics of machine systems. Available:
http://www.iso.org/iso/home/standards_development/list_of_iso_technical_committees/iso_t
echnical_committee.htm?commid=51538
[8] International Organization for Standardization (ISO). (2013). ISO/TC 184 Automation systems
and integration. Available:
http://www.iso.org/iso/home/standards_development/list_of_iso_technical_committees/iso_t
echnical_committee.htm?commid=54110
[9] International Organization for Standardization (ISO), "ISO 17359:2011 ‐ Condition monitoring
and diagnostics of machines−General guidelines," ed, 2011.
[10] Air Transport Association of America, "MSG‐3: Operator/Manufacturer Scheduled Maintenance
Development, Volume 1 – Fixed Wing Aircraft," ed, 2013.
[11] C. Adams. (2009) Understanding MSG‐3. Aviation Today. Available:
http://www.aviationtoday.com/am/repairstations/Understanding‐MSG‐3_33062.html
[12] International Electrotechnical Commission, "IEC 60300‐3‐1‐ Dependability management – Part
3‐1: Application guide – Analysis techniques for dependability – Guide on methodology," ed,
2003.
[13] United States Department of Defense, "MIL‐STD‐1629A ‐ Procedures for performing a failure
mode, effects and criticality analysis," ed, 1980.
[14] International Electrotechnical Commission, "IEC 61703‐ Mathematical expressions for reliability,
availability, maintainability and maintenance support terms," ed, 2001.
[15] International Electrotechnical Commission, "IEC 60812 ‐ Analysis techniques for system
reliability – Procedure for failure mode and effects analysis (FMEA)," ed, 2006.
[16] SAE International, "ARP5580 ‐ Recommended Failure Modes and Effects Analysis (FMEA)
Practices for Non‐Automobile Applications," ed, 2001.
[17] SAE International, "J1739‐ Potential Failure Mode and Effects Analysis in Design (Design FMEA),
Potential Failure Mode and Effects Analysis in Manufacturing and Assembly Processes (Process
FMEA)," ed, 2009.
42

This publication is available free of charge from http://dx.doi.org/10.6028/NIST.IR.8012
[18] International Electrotechnical Commission, "IEC 61025‐ Fault tree analysis (FTA)," ed, 2006.
[19] International Electrotechnical Commission, "IEC 61165‐ Application of Markov techniques," ed,
2006.
[20] International Organization for Standardization (ISO) and International Electrotechnical
Commission (IEC), "ISO/IEC 15909‐1:2004‐ Software and system engineering− High‐level Petri
nets− Part 1: Concepts, definiƟons and graphical notation," ed, 2004.
[21] J. K. Truss, Discrete Mathematics for Computer Scientists, 2nd ed.: Addison‐Wesley, 1998.
[22] International Organization for Standardization (ISO) and International Electrotechnical
Commission (IEC), "ISO/IEC 15909‐2:2011‐ Software and system engineering− High‐level Petri
nets− Part 2: Transfer format," ed, 2011.
[23] International Electrotechnical Commission, "IEC 60300‐3‐3‐ Dependability management – Part
3‐3: Application guide – Life cycle costing," ed, 2004.
[24] International Organization for Standardization (ISO), "ISO 13379‐1:2012‐ Condition monitoring
and diagnostics of machines− Data interpretaƟon and diagnosƟcs techniques− Part 1: General
guidelines," ed, 2012.
[25] SAE International, "AIR5871‐ Prognostics for Gas Turbine Engines," ed, 2008.
[26] International Organization for Standardization (ISO), "ISO 13381‐1:2004‐ Condition monitoring
and diagnostics of machines−PrognosƟcs−Part 1: General guidelines," ed, 2004.
[27] International Organization for Standardization (ISO), "ISO 13372:2012 ‐ Condition monitoring
and diagnostics of machines−Vocabulary," ed, 2012.
[28] International Organization for Standardization (ISO), "ISO 13374‐1:2003‐ Condition monitoring
and diagnostics of machines − Data processing, communication and presentation − Part 1:
General guidelines," ed, 2003.
[29] MIMOSA. (2006). MIMOSA's Open System Architecture for Enterprise Application Integration
(OSA‐EAI) Technical Architecture Summary Available:
http://www.mimosa.org/sites/default/files/TechDocs/OSA‐
EAI_Technical_Architecture_Summary_Dec_2006.pdf
[30] International Organization for Standardization (ISO), "ISO 13374‐2:2007‐ Condition monitoring
and diagnostics of machines− Data processing, communicaƟon and presentaƟon− Part 2: Data
processing," ed, 2007.
[31] MIMOSA. (2013). MIMOSA's Open System Architecture for Enterprise Application Integration
(OSA‐EAI). Available: http://www.mimosa.org/?q=node/300
[32] C. S. Byington, M. J. Roemer, G. J. Kacprzymki, and T. Galie, "Prognostic enhancements to
diagnostic systems for improved condition‐based maintenance," in 2002 IEEE Aerospace
Conference, Big Sky, MT, United states, 2002, pp. 2815‐2824.
[33] C. Staller, "Condition Based Maintenance – What is the condition of Condition Based
Maintenance?," ed. MIMOSA, 2013.
[34] MIMOSA, "Condition Based Operations for Manufacturing," ed, 2004.
[35] International Organization for Standardization (ISO), "ISO 13374‐3:2012‐ Condition monitoring
and diagnostics of machines − Data processing, communicaƟon and presentaƟon − Part 3:
Communication," ed, 2012.
[36] International Organization for Standardization (ISO), "ISO 15926‐1:2004‐ Industrial automation
systems and integration− IntegraƟon of life‐cycle data for process plants including oil and gas
production facilities−Part 1: Overview and fundamental principles," ed, 2004.
[37] International Organization for Standardization (ISO), "ISO 10303‐11:2004‐ Industrial automation
systems and integration − Product data representaƟon and exchange − Part 11: DescripƟon
methods: The EXPRESS language reference manual," ed, 2004.
43

This publication is available free of charge from http://dx.doi.org/10.6028/NIST.IR.8012
[38] International Organization for Standardization (ISO), "ISO 15926‐2:2003‐ Industrial automation
systems and integration− IntegraƟon of life‐cycle data for process plants including oil and gas
production facilities−Part 2: Data model," ed, 2003.
[39] International Organization for Standardization (ISO), "ISO 18435‐1:2009‐ Industrial automation
systems and integration − DiagnosƟcs, capability assessment and maintenance applicaƟons
integration− Part 1: Overview and general requirements," ed, 2009.
[40] International Organization for Standardization (ISO), "ISO 18435‐2:2012‐ Industrial automation
systems and integration − DiagnosƟcs, capability assessment and maintenance applicaƟons
integration − Part 2: DescripƟons and definiƟons of applicaƟon domain matrix elements," ed,
2012.
[41] IEEE Standards Association, "1232‐2010‐ IEEE Standard for Artificial Intelligence Exchange and
Service Tie to All Test Environments (AI‐ESTATE)," ed, 2010.
[42] International Organization for Standardization (ISO), "ISO 15531‐44:2010‐ Industrial automation
systems and integration − Industrial manufacturing management data −Part 44: InformaƟon
modelling for shop floor data acquisition," ed, 2010.
[43] International Organization for Standardization (ISO), "ISO 18436‐1:2012‐ Condition monitoring
and diagnostics of machines − Requirements for qualificaƟon and assessment of personnel −
Part 1: Requirements for assessment bodies and the assessment process," ed, 2012.
[44] SAE Digital Library. (2013). SAE Aerospace Standards (AS). Available:
http://www.saedigitallibrary.org/content/standards/sae‐aerospace‐standards/
[45] SAE International, "ARP1587B‐ Aircraft Gas Turbine Engine Health Management System Guide,"
ed, 2007.
[46] SAE International. (2013). Aircraft Gas Turbine Engine Health Management System Guide.
Available: http://standards.sae.org/arp1587b/
[47] International Atomic Energy Agency (IAEA), "NP‐T‐3.14‐ Advanced Surveillance, Diagnostic and
Prognostic Techniques in Monitoring Structures, Systems and Components in Nuclear Power
Plants," 2013.
[48] SAE International. (2013). Condition Based Maintenance (CBM) Recommended Practices.
Available: http://standards.sae.org/wip/arp6204/
[49] Y. Zhou, J. Bo, and T. Wei, "A review of current prognostics and health management system
related standards," Chemical Engineering Transactions, vol. 33, pp. 277‐282, 2013.
[50] IEEE Standards Association. (2013). P1856 ‐ Standard Framework for Prognostics and Health
Management of Electronic Systems. Available:
http://standards.ieee.org/develop/project/1856.html
[51] IEEE Reliability Society. (2014). IEEE Standards Development. Available: http://rs.ieee.org/ieee‐
standards‐development.html
[52] The Center for Advanced Life Cycle Engineering (CALCE). (2013). CALCE PHM News ‐ August
2013. Available: http://www.prognostics.umd.edu/WhatsNew/2013/calce‐phm‐aug2013.html
[53] International Organization for Standardization (ISO) and International Electrotechnical
Commission (IEC), "ISO/IEC CD 15909‐3‐ Software and system engineering − High‐level Petri
nets− Part 3: Petri Net Extensions," ed, 2014.
[54] International Organization for Standardization (ISO), "ISO/DIS 18129‐ Condition monitoring and
diagnostics of machines−Approaches for performance diagnosis," ed, 2014.
[55] International Organization for Standardization (ISO), "ISO/WD 22400‐1‐ Manufacturing
operations management − Key performance indicators − Part 1: Overview, concepts and
terminology," ed, 2013.
44

This publication is available free of charge from http://dx.doi.org/10.6028/NIST.IR.8012
[56] International Organization for Standardization (ISO), "ISO/WD 22400‐2‐ Manufacturing
operations management− Key performance indicators− Part 2: DefiniƟons and descriptions of
KPIs," ed, 2013.
[57] International Electrotechnical Commission, "IEC 62264‐1‐ Enterprise‐control system integration
−Part 1: Models and terminology," ed, 2003.
[58] Air Transport Association of America. (2012). SPEC2000. Available: http://www.spec2000.com/
45
