NTOP User Guide
User Manual:
Open the PDF directly: View PDF ![]() .
.
Page Count: 76
- Preface
- What is ntopng
- Licensing
- How to start ntopng
- The ntopng Configuration File
- Running ntopng as a Daemon
- Daemon Configuration File
- Automatic Daemon Startup on Boot
- Daemon Control
- Running ntopng on Windows
- Specify Monitored Interfaces
- Execution as a Windows Service
- Command Line Options
- The ntopng Web GUI
- Home Menu
- About ntopng
- ntop Blog
- Report an Issue
- Dashboard
- Dashboard
- Dashboard in the Community Version
- Dashboard in the Professional Version
- Report
- Flows
- Application
- Layer-4 Protocol (L4 Proto)
- Client
- Server
- Duration
- Breakdown
- Actual Throughput
- Total Bytes
- Info
- Hosts
- All Hosts
- Host Pools
- Networks
- Autonomous Systems
- Countries
- Operating Systems
- HTTP Servers (Local)
- Top Hosts (Local)
- Geo Map
- Tree Map
- Local Flow Matrix
- Host Details
- Home
- Traffic
- Packets
- Ports
- Peers
- Protocols
- DNS
- HTTP
- Flows
- SMNP
- Talkers
- Geography
- Alerts Configuration
- Statistics
- Interfaces
- Home
- Packets
- Protocols
- ICMP
- ARP
- Statistics
- Traffic Profiles (Professional Version)
- Settings
- Host Pools
- Packet Dump
- ntopng Settings
- Manage Users
- Preferences
- Export Data
- Administration
- Alerts
- Host Search
- Advanced ntopng Features
- Physical Interfaces Aggregation: Interface Views
- Traffic Profiles
- Realtime Profiles
- Historical Profiles Statistics
- Bridging and Traffic Policing
- 2+1 Bridging Mode
- 1+1 Bridging Mode
- The Bridge Details Page
- Traffic Policing
- Captive Portal
- Flows Dump
- MySQL
- ElasticSearch
- Logstash
- Additional ntopng Features

ntopng™
High-Speed Web-based Traffic Analysis and Flow Collection
User Guide
Version 3.2
December 2017
© 2002-17
Page of 1 76

Index
Preface 4 .......................................................................................................................................................
What is ntopng 4 ..........................................................................................................................................
Licensing 4 ................................................................................................................................................
How to start ntopng 4 ..................................................................................................................................
The ntopng Configuration File 5 ..............................................................................................................
Running ntopng as a Daemon 6 ............................................................................................................
Daemon Configuration File 6 ..............................................................................................................
Automatic Daemon Startup on Boot 6 ...............................................................................................
Daemon Control 6 ...............................................................................................................................
Running ntopng on Windows 8 ..............................................................................................................
Specify Monitored Interfaces 8 ...........................................................................................................
Execution as a Windows Service 9 .....................................................................................................
Command Line Options 11 ...........................................................................................................................
The ntopng Web GUI 16 ...............................................................................................................................
Home Menu 17 .........................................................................................................................................
About ntopng 18 ...................................................................................................................................
ntop Blog 19 ..........................................................................................................................................
Report an Issue 19 ................................................................................................................................
Dashboard 19 .......................................................................................................................................
Dashboard 20 ..........................................................................................................................................
Dashboard in the Community Version 20 ........................................................................................
Dashboard in the Professional Version 25 ........................................................................................
Report 25 ...................................................................................................................................................
Flows 29
Application 29 ......................................................................................................................................
Layer-4 Protocol (L4 Proto) 30 ..............................................................................................................
Client 30 ................................................................................................................................................
Server 30 ...............................................................................................................................................
Duration 30 ...........................................................................................................................................
Breakdown 30 ......................................................................................................................................
Actual Throughput 30 ..........................................................................................................................
Total Bytes 30 .......................................................................................................................................
Info 30 ...................................................................................................................................................
Hosts 32
All Hosts 32 ...........................................................................................................................................
Host Pools 33 .......................................................................................................................................
Networks 34 .........................................................................................................................................
Autonomous Systems 35 ....................................................................................................................
Countries 35 .........................................................................................................................................
Operating Systems 35 .........................................................................................................................
HTTP Servers (Local) 36 ........................................................................................................................
Top Hosts (Local) 36 .............................................................................................................................
Geo Map 37 ..........................................................................................................................................
Tree Map 37 .........................................................................................................................................
Local Flow Matrix 38 ............................................................................................................................
Host Details 39 .........................................................................................................................................
Home 39 .............................................................................................................................................
Traffic 40 ...............................................................................................................................................
Packets 41 .............................................................................................................................................
Page of 2 76

Ports 42 .................................................................................................................................................
Peers 43 ................................................................................................................................................
Protocols 44 ..........................................................................................................................................
DNS 45 ..................................................................................................................................................
HTTP 46 .................................................................................................................................................
Flows 47 ................................................................................................................................................
SMNP 47 ...............................................................................................................................................
Talkers 48 .............................................................................................................................................
Geography 48 .....................................................................................................................................
Alerts Configuration 49 ......................................................................................................................
Statistics 50 .........................................................................................................................................
Interfaces 51 ..............................................................................................................................................
Home 52 ..............................................................................................................................................
Packets 52 ............................................................................................................................................
Protocols 52 ..........................................................................................................................................
ICMP 53 .................................................................................................................................................
ARP 54 ...................................................................................................................................................
Statistics 54 .........................................................................................................................................
Traffic Profiles (Professional Version) 56 ..........................................................................................
Settings 56 ...........................................................................................................................................
Host Pools 57 .......................................................................................................................................
Packet Dump 58 .................................................................................................................................
ntopng Settings 59 .................................................................................................................................
Manage Users 59 ................................................................................................................................
Preferences 59 .....................................................................................................................................
Export Data 59 ......................................................................................................................................
Administration 60 ....................................................................................................................................
Alerts 60 ..................................................................................................................................................
Host Search 60 .........................................................................................................................................
Advanced ntopng Features 61 ....................................................................................................................
Physical Interfaces Aggregation: Interface Views 61 ............................................................................
Traffic Profiles 62 ......................................................................................................................................
Realtime Profiles 62 .............................................................................................................................
Historical Profiles Statistics 63 .............................................................................................................
Bridging and Traffic Policing 64 ..............................................................................................................
2+1 Bridging Mode 65 .........................................................................................................................
1+1 Bridging Mode 65 ..........................................................................................................................
The Bridge Details Page 66 .................................................................................................................
Traffic Policing 67 .................................................................................................................................
Captive Portal 69 ..................................................................................................................................
Flows Dump 73 .........................................................................................................................................
MySQL 73 ..............................................................................................................................................
ElasticSearch 74 ...................................................................................................................................
Logstash 75 .........................................................................................................................................
Additional ntopng Features 76...............................................................................................................
Page of 3 76

Preface
By reading this book, you will learn how to install ntopng, how to use the basic elements of the graphical
user interface (such as menu bars) and what’s behind some of the cool features that are not always
obvious at first sight. It will hopefully guide you around some common problems that frequently appear
for new (and sometimes even advanced) users of ntopng.
What is ntopng
Ntopng is a passive network monitoring tool focused on flows and statistics that can be obtained from the
traffic captured by the server.
Licensing
Binary ntopng instances require a per-server license that is released according to the EULA (End User
License Agreement). Each license is perpetual (i.e. it does not expire) and it allows to install updates for
one year since purchase/license issue. This means that a license generated on 1/1/2017 will be able to
activate new versions of the software until 1/1/2018. If you want to install new versions of the software
release after that date, you need to renew the maintenance or avoid further updating the software. For
source-based ntopng you can refer to the GPL-v3 License.
ntopng licenses are generated using the orderId and email you provided when the license has been
purchased on https://shop.ntop.org/. The licenses are generated at https://shop.ntop.org/mkntopng.
Note: if you are using a VM or you plan to move licenses often, and you have installed the software on a
server with Internet access, you can add --online-license-check to the application command line
(example: ntopng -i eth0 --online-license-check) so that at startup the license is validated against the
license database. The --online-license-check option also supports http proxy setting the http_proxy
environment variable (example: export http_proxy=http://<ip>:<port>).
How to start ntopng
Ntopng can be started from the command line of your favorite Linux, Unix and Windows system. Services
control panel are also supported in Windows. When starting ntopng it is possible to modify its behavior by
customizing one or more of the several optional settings available, using either the command line, or
grouping them in a configuration file used and start ntopng with it.
ntopng <configuration file path>
ntopng <command line options>
Section “Command Line Options” of this guide thoroughly discuss any available option.
Page of 4 76

The ntopng Configuration File
Command line options can be grouped in a plain text file, that is typically named ntopng.conf. Note
that any name is acceptable except when ntopng is run as a daemon in which case ntopng.conf file
name must be used.
Options in the configuration file must be reported one per line. Comment lines are accepted as well and
have to be prefixed with the ‘#’ sign. Option name and option value must be separated by the ‘=‘ sign.
The latter sign is necessary even for options that doesn’t require a value. For example, to disable interface
promiscuous mode, one would use --no-promisc when starting ntopng directly from the command
line or would add a line --no-promisc= in the configuration file when starting ntopng as a daemon.
An example of a configuration file is the following
$ cat /etc/ntopng/ntopng.conf
-G=/var/tmp/ntopng.pid
--daemon=
# Listen on localhost:3000 only
--http-port=:3000
# Use prefix due to nginx proxy
--http-prefix="/ntopng"
# Everybody's admin
#--disable-login=1
# Do not resolve any names
--dns-mode=3
# Limit memory usage
--max-num-flows=200000
--max-num-hosts=250000
--sticky-hosts=none
# Dump flows to MySQL
--dump-flows=mysql;localhost;ntopng;flows;ntopng;xxx
#--verbose
Page of 5 76

Running ntopng as a Daemon
Ntopng can be run in daemon mode on unix systems and optionally be run automatically on
system startup. Daemon execution and status are controlled using the script
/etc/init.d/ntopng
The script is installed automatically on unix systems as it is part of any standard ntopng
installation procedure.
Systems that support systemd use systemctl to control daemon execution an status.
Daemon Configuration File
Ntopng configuration file is required when running it as a daemon. The configuration file has to
be named ntopng.conf and must be placed under
/etc/ntopng/
The interested reader can find above and example of a configuration file. A default configuration
file is created by default when installing ntopng from any binary package.
Automatic Daemon Startup on Boot
In order to launch ntopng daemon automatically on system startup, an empty file
ntopng.start must be created in the same directory of the configuration files. Therefore, the
directory will contain both the configuration and the startup files
root@devel:/etc/ntopng# ls -lha
total 28K
drwxr-xr-x 2 root root 4.0K Mar 17 15:44 .
drwxr-xr-x 117 root root 12K Mar 11 12:16 ..
-rw-r--r-- 1 root root 211 Mar 15 17:54 ntopng.conf
-rw-r--r-- 1 root root 0 Mar 17 15:44 ntopng.start
The existence of the ntopng.start file is no longer required on systems that have systemd.
On those systems, automatic ntopng daemon startup is controlled by enabling/disabling the
ntopng service as
systemctl enable ntopng
systemctl disable ntopng
Daemon Control
ntopng daemon is controlled with the script /etc/init.d/ntopng. The script accepts
different options. Calling the script without options yields the following brief help
deri@devel 204> sudo /etc/init.d/ntopng
Page of 6 76

Usage: /etc/init.d/ntopng {start|force-start|stop|restart|status}
On unix systems that support systemd, the demon can only be controlled with systemctl. All
the standard options are accepted. The options and the usage of the daemon control script is
discussed below.
start
This option is used to start the ntopng daemon
deri@devel 204> /etc/init.d/ntopng start
* Starting ntopng
...done.
On unix systems with systemd the daemon is started as
deri@devel 204> systemctl start ntopng
force-start
Equivalent to start. Not available on unix systems with systemd.
stop
This option is used to stop an ntopng daemon instance. For example
deri@devel 204> /etc/init.d/ntopng stop
* Stopping ntopng
...done.
To stop the daemon on a unix system with systemd use
deri@devel 204> systemctl stop ntopng
restart
This option causes the restart of a daemon associated to a given interface, e.g.,
deri@devel 204> /etc/init.d/ntopng restart
* Stopping ntopng
* Starting ntopng
...done.
To restart the daemon on a unix system type
deri@devel 204> systemctl restart ntopng
status
This options prints the status of a daemon associated to a given interface, e.g.,
deri@devel 204> /etc/init.d/ntopng status
ntopng running as 5623
To print the status of the ntopng daemon on a unix system with systemd type
deri@devel 204> systemctl status ntopng
Page of 7 76

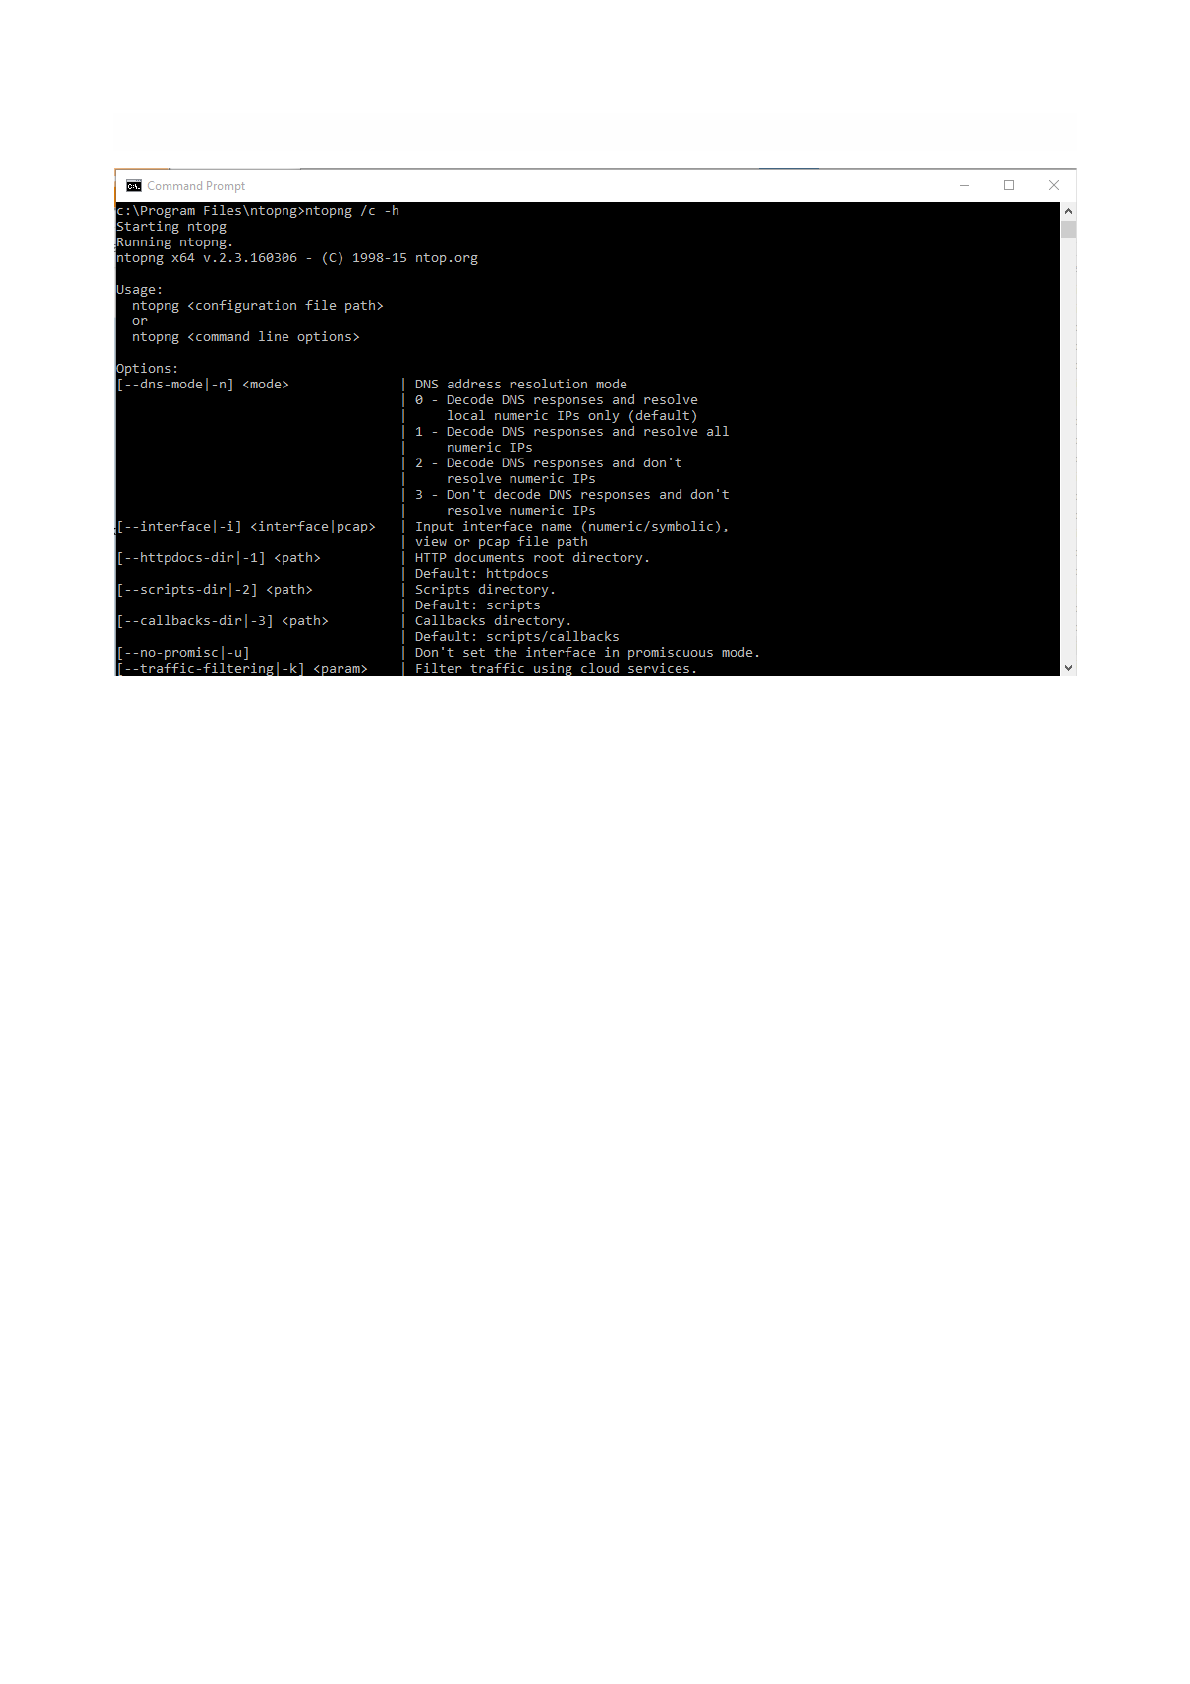
Running ntopng on Windows
Ntopng can be run either as service or as application (i.e. you can start it from cmd.exe). The ntopng
installer registers the service and automatically starts is as shown below.
In order to interact with ntopng from the command line, fire up a Windows Commands Promt and
navigate to the ntopng installation directory. You may need to execute the commands promo with
Administrator privileges. Commands are issued after a /c that stands for “console”. For example to display
the inline help it suffices to run
ntopng /c -h
Specify Monitored Interfaces
As network interfaces on Windows can have long names, a numeric index is associated to the interface in
order to ease the ntopng configuration. The association interface name and index is shown in the inline
help.
c:\Program Files\ntopng>ntopng /c -h
Starting ntopg
Running ntopng.
ntopng x64 v.2.3.160306 - (C) 1998-15 ntop.org
Page of 8 76
The Windows Services Manager
[…]
Available interfaces (-i <interface index>):
1. Intel(R) PRO/1000 MT Desktop Adapter
{8EDDEFE3-D6DB-4F9B-9EDF-FBC0BFF67F3C}
[…]
In the above example the network adapter Intel(R) PRO/1000 MT Desktop is associated with index 1. To
select this adapter ntopng needs to be started with –i 1 option.
Execution as a Windows Service
Windows services are started and stopped using the Services application part of the Windows
administrative tools. When ntopng is used as service, command line options need to be specified at
service registration and can be modified only by removing and re-adding the service. The ntopng installer
registers ntopng as a service with the default options. The default registered service options can be
changed using these commands:
ntopng /r Remove the service
ntopng /i <new set of options> Install the service with
the specified options.
Page of 9 76
The Windows Command Promt

In a Commands Promt:
c:\Program Files\ntopng>ntopng /r
ntopng removed.
c:\Program Files\ntopng>ntopng /i -i 1
ntopng installed.
NOTE: the default password for the 'admin' user has been set to 'admin'.
c:\Program Files\ntopng>!
Page of 10 76

Command Line Options
Ntopng supports a large number of command line parameters. To see what they are, simply enter the
command ntopng -h and the help information should be printed:
$ ./ntopng --help
Usage:
ntopng <configuration file path>
or
ntopng <command line options>
Options:
[--dns-mode|-n] <mode> | DNS address resolution mode
| 0 - Decode DNS responses and resolve
| local numeric IPs only (default)
| 1 - Decode DNS responses and resolve all
| numeric IPs
| 2 - Decode DNS responses and don't
| resolve numeric IPs
| 3 - Don't decode DNS responses and don't
| resolve numeric IPs
[--interface|-i] <interface|pcap> | Input interface name (numeric/symbolic),
| view or pcap file path
[--data-dir|-d] <path> | Data directory (must be writable).
| Default: /var/tmp/ntopng
[--install-dir|-t] <path> | Set the installation directory to <dir>.
| Should be set when installing ntopng
| under custom directories
[--daemon|-e] | Daemonize ntopng
[--httpdocs-dir|-1] <path> | HTTP documents root directory.
| Default: httpdocs
[--scripts-dir|-2] <path> | Scripts directory.
| Default: scripts
[--callbacks-dir|-3] <path> | Callbacks directory.
| Default: scripts/callbacks
[--no-promisc|-u] | Don't set the interface in promiscuous mode.
[--traffic-filtering|-k] <param> | Filter traffic using cloud services.
| (default: disabled). Available options:
| httpbl:<api_key> See README.httpbl
[--http-port|-w] <[addr:]port> | HTTP. Set to 0 to disable http server.
| Addr can be any valid ipv4 (e.g., 192.168.1.1)
| or ipv6 (e.g., [3ffe:2a00:100:7031::1]) address.
| Surround ipv6 addresses with square brackets.
| Prepend a ':' without addr before the port
| to listen on the loopback address.
| Default port: 3000
| Examples:
| -w :3000
| -w 192.168.1.1:3001
| -w [3ffe:2a00:100:7031::1]:3002
[--https-port|-W] <[:]https port> | HTTPS. See usage of -w above. Default: 3001
[--local-networks|-m] <local nets> | Local nets list (default: 192.168.1.0/24)
| (e.g. -m "192.168.0.0/24,172.16.0.0/16")
[--ndpi-protocols|-p] <file>.protos | Specify a nDPI protocol file
| (eg. protos.txt)
[--redis|-r] <fmt> | Redis connection. <fmt> is [h[:port[:pwd]]][@db-id]
| db-id is the id. of the redis database (default 0).
| h is the host that is running Redis (default
| localhost), optionally followed by a ':'-separated
| port. A password can be specified after
| the port when Redis authentication is required.
| By default password authentication is disabled.
| Examples:
| -r @2
| -r 129.168.1.3
| -r 129.168.1.3:6379@3
| -r 129.168.1.3:6379:nt0pngPwD@0
Page of 11 76

[--core-affinity|-g] <cpu core ids> | Bind the capture/processing threads to
| specific CPU cores (specified as a comma-
| separated list)
[--user|-U] <sys user> | Run ntopng with the specified user
| instead of nobody
[--dont-change-user|-s] | Do not change user (debug only)
[--shutdown-when-done] | Terminate when a pcap has been read (debug only)
[--zmq-encrypt-pwd] <pwd> | Encrypt the ZMQ data using the specified password
[--disable-autologout|-q] | Disable web interface logout for inactivity
[--disable-login|-l] <mode> | Disable user login authentication:
| 0 - Disable login only for localhost
| 1 - Disable login only for all hosts
[--max-num-flows|-X] <num> | Max number of active flows
| (default: 131072)
[--max-num-hosts|-x] <num> | Max number of active hosts
| (default: 65536)
[--users-file|-u] <path> | Users configuration file path
| Default: ntopng-users.conf
[--pid|-G] <path> | Pid file path
[--packet-filter|-B] <filter> | Ingress packet filter (BPF filter)
[--dump-flows|-F] <mode> | Dump expired flows. Mode:
| es Dump in ElasticSearch database
| Format:
| es;<idx>;<idx name>;<es URL>;<http auth>
|
| logstash Dump in LogStash collection engine
| Format:
| logstash;<host>;<proto>;<port>
| Example:
| logstash;localhost;tcp;5510
|
| mysql Dump in MySQL database
| Format:
| mysql;<host|socket>;<db>;<table name>;<user>;<pw>
[--export-flows|-I] <endpoint> | Export flows using the specified endpoint.
[--dump-hosts|-D] <mode> | Dump hosts policy (default: none).
| Values:
| all - Dump all hosts
| local - Dump only local hosts
| remote - Dump only remote hosts
| none - Do not dump any host
[--sticky-hosts|-S] <mode> | Don't flush hosts (default: none).
| Values:
| all - Keep all hosts in memory
| local - Keep only local hosts
| remote - Keep only remote hosts
| none - Flush hosts when idle
--hw-timestamp-mode <mode> | Enable hw timestamping/stripping.
| Supported TS modes are:
| apcon - Timestamped packets by apcon.com
| hardware devices
| ixia - Timestamped packets by ixiacom.com
| hardware devices
| vss - Timestamped packets by vssmonitoring.com
| hardware devices
--capture-direction | Specify packet capture direction
| 0=RX+TX (default), 1=RX only, 2=TX only
--online-license-check | Check license online
[--enable-taps|-T] | Enable tap interfaces used to dump traffic
[--enable-flow-activity] | Enable local hosts flow activities
[--http-prefix|-Z] <prefix> | HTTP prefix to be prepended to URLs. This is
| useful when using ntopng behind a proxy.
[--instance-name|-N] <name> | Assign an identifier to the ntopng instance.
[--community] | Start ntopng in community edition (debug only).
[--check-license] | Check if the license is valid.
[--check-maintenance] | Check until maintenance is included in the license.
[--verbose|-v] <level> | Verbose tracing [ 0 (min) .. 2 (normal) .. 6
(debug) ]
[--version|-V] | Print version and quit
--print-ndpi-protocols | Print the nDPI protocols recognized di ntopng
--simulate-vlans | Simulate VLAN traffic (debug only)
Page of 12 76

[--help|-h] | Help
Available interfaces (-i <interface index>):
1. ntopng0
2. enp9s0f1
3. eno1
4. br1
5. any
6. lo
7. enp8s0
8. enp9s0f0
9. enp4s0
10. enp5s0
11. docker0
12. enp9s0f2
13. enp9s0f3
14. nflog
15. nfqueue
16. usbmon1
17. usbmon2
18. usbmon3
19. usbmon4
Some of the most important parameters are briefly discussed here.
[--redis|-r] <redis host[:port][@db-id]>
Ntopng uses Redis as a backend database to store user configuration and preferences. Redis must be
started before ntopng. By default the location is localhost but this can be changed by specifying host and
port where Redis is listening. During startup procedure the connection to a remote Redis database is
shown as (<Timestamp>: Successfully connected to Redis 127.0.0.1:6379@0. In case the
connection can’t be established, the following error occurs (<Timestamp> ERROR: ntopng requires
redis server to be up and running). In case multiple ntopng instances use same Redis server is it
important, to prevent data from being overwritten, to specify the “@db-id” (where db-id is a number > 0)
string to reserve a single Redis database to every ntopng instance.
[—interface|-i] <interface|pcap>
At the end of the help information there a list of all available interfaces. The user can select one or more
interfaces from the list so that ntopng will treat them as monitored interfaces. Any traffic flowing though
monitored interfaces will be seen and processed by ntopng. On Windows systems you will specify the
interface number (i.e. -i 1). On Linux / Unix use the interface name. A monitoring session using multiple
interfaces can be set up as follows:
ntopng -i eth0 -i eth1
The following is also allowed:
ntopng -i eth0,eth1
To specify a zmq interface (that allows to visualise remotely-collected flows by nProbe and cento) you
should add a n interface like this:
ntopng -i tcp://<endpoint ip>/
An example of ntopng and nprobe communication is
nprobe -i eth0 -n none --zmq tcp://*:5556
ntopng -i tcp://<nprobe host ip>:5556
Page of 13 76

It is also possible to operate ntopng in collector mode and nProbe in probe mode (this can be useful for
example when nProbe is behind a NAT) as follows (note the trailing c after the collection port)
nprobe -i eth0 -n none --zmq-probe-mode --zmq tcp://*:5556
ntopng -i tcp://<nprobe host ip>:5556c
Ntopng is also able to compute statistics based on pcap traffic files:
ntopng -i /tmp/traffic.pcap
[--http-prefix|-Z] <prefix>
Network admins who want to monitor their network, may want to map ntopng web interface using a
reverse proxy. The main issue with reverse proxying is that the ‘/‘ URI should not be mapped to the
ntopng base. Customizable prefixes for the ntopng base can be chosen using the http-prefix option.
Generally speaking, when the http-prefix is used, ntopng web interface is accessible by pointing the
browser at http://<host>:<port>/<prefix>/
For example, ntopng web interface can be accessed at http://localhost:3000/myntopng if it is executed
as
ntopng -Z /myntopng
Using Apache, one would achieve the same behavior with the following http proxypass directives:
ProxyPass /myntopng/ http://192.168.100.3:3000/myntopng/
ProxyPassReverse /myntopng/ http://192.168.100.3:3000/myntopng/
[--dns-mode|-n] <mode>
This option controls the behavior of the name resolution done by ntopng. User can specify whether to use
full resolution, local- or remote-only, or even no resolution at all.
[--data-dir|-d] <path>
Ntopng uses a data directory to store several kinds of information. Most of the historical information
related to hosts and applications is stored in this directory. Historical information includes round robin
database (RRD) files for each application/host.
[--local-networks|-m] <local nets>
Ntopng characterizes networks in two categories, namely local and remote. Consequently, also hosts are
characterized in either local or remote hosts. Every host that belongs to a local network is local. Similarly,
every host that belongs to a remote network is remote.
Local networks are ‘special’ for ntopng. Indeed, it stores much more information (e.g., layer-7 protocols) for
local networks if compared to their remote counterparts. However, additional information comes at the
cost of extra memory and space used. Therefore, although a user would virtually want to mark all
possible networks as local, in practice he/she will have to find a good tradeoff.
Page of 14 76
Local networks can be specified as a comma separated list of IPv4 (IPv6) addresses and subnet masks.
For example to mark three networks as local ntopng can be executed as follows:
ntopng -local-networks="192.168.2.0/24,10.0.0.0/8,8.8.8.0/24"
In the ntopng web interface, local networks and hosts are displayed with green colors while remote
networks and hosts hosts with gray colors. Extra information will be available in the contextual menus for
local networks.
[—disable-login|-l]
By default ntopng uses authentication method to access the web GUI. Authentication can be disabled by
adding the option disable-login to the startup parameters. In this case any user who access the web
interface has administrator privileges.
As mentioned above, a configuration file can be used in order to start ntopng. All the command line
options can be reported in the configuration file, one per line. Options must be separated from their
values using a ‘=‘ sign. Comment lines starting with a ‘#’ sign are allowed as well.
Warning
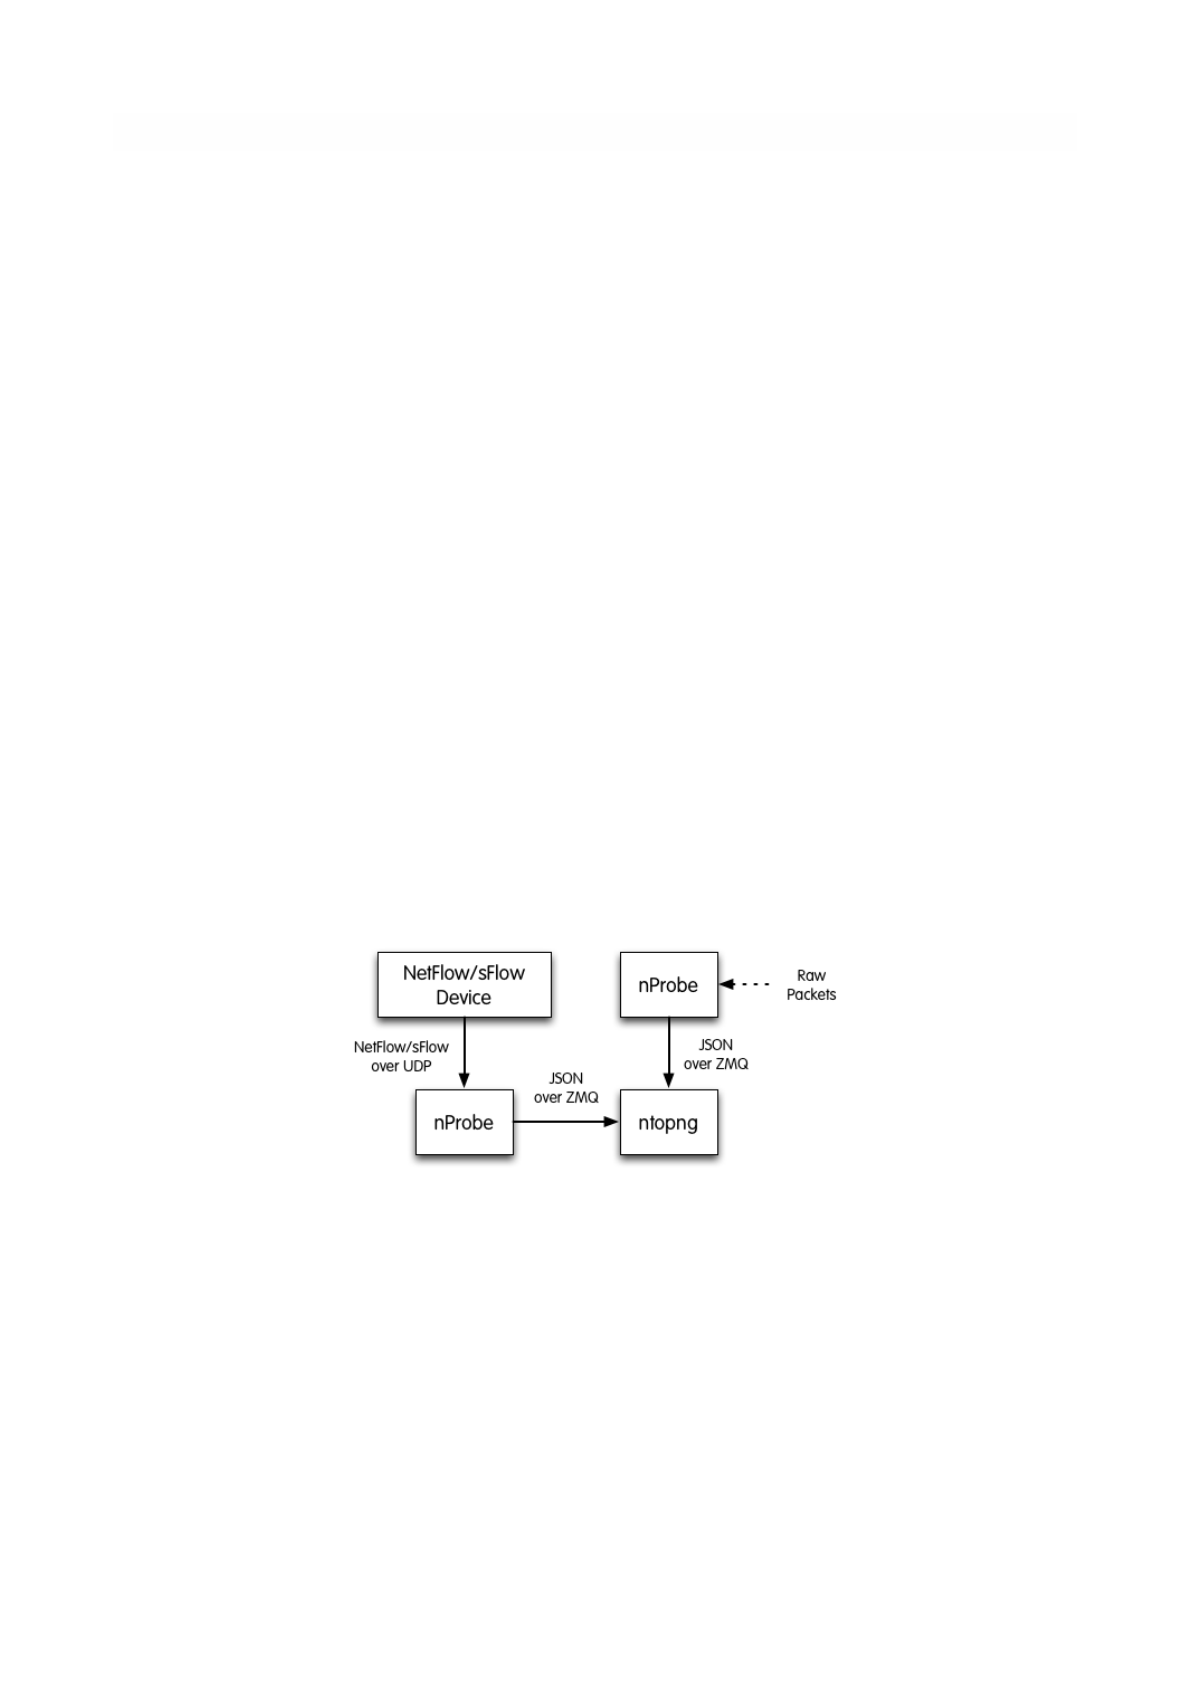
Unlike its predecessor, ntopng is not itself a Netflow collector. It can act as Netflow collector
combined with nProbe. To perform this connection start nProbe with the “--zmq” parameter and
point ntopng interface parameter to the nProbe zmq endpoint. Using this configuration give the
admin the possibility to use ntopng as collector GUI to display data either from nProbe captured
traffic and Netflow enabled devices as displayed in the following picture.
"
Figure 1 - ntopng/nprobe setup
Keep in mind that even if logically nProbe is a ntopng client, the session starts the other way
around (ntopng connects to nprobe endpoint), hence in case of firewalled connection, the flow is
initiated by ntopng
Page of 15 76

The ntopng Web GUI
After ntopng has started you can view the GUI. By default, the GUI can be accessed from any web
browser at http://<ntopng IP>:3000/. A different port can be specified as a command line option during
ntopng startup. The first page that always pops out contains the login form — provided that the user has
not decided to turn authentication off during startup.
The default login is
During the first access, a prompt will require the user to change the default password.
Administrator privileges are granted to user ‘admin’.
If an unauthenticated user attempts to access a specific ntopng URL, the system will redirect the browser
to the login page and then, upon successful authentication, to the requested resource.
Ntopng GUI web pages have a common structure the user will soon be familiar with. The pages are
mostly composed of a top toolbar, some body content, and a ‘dashboard’ footer.
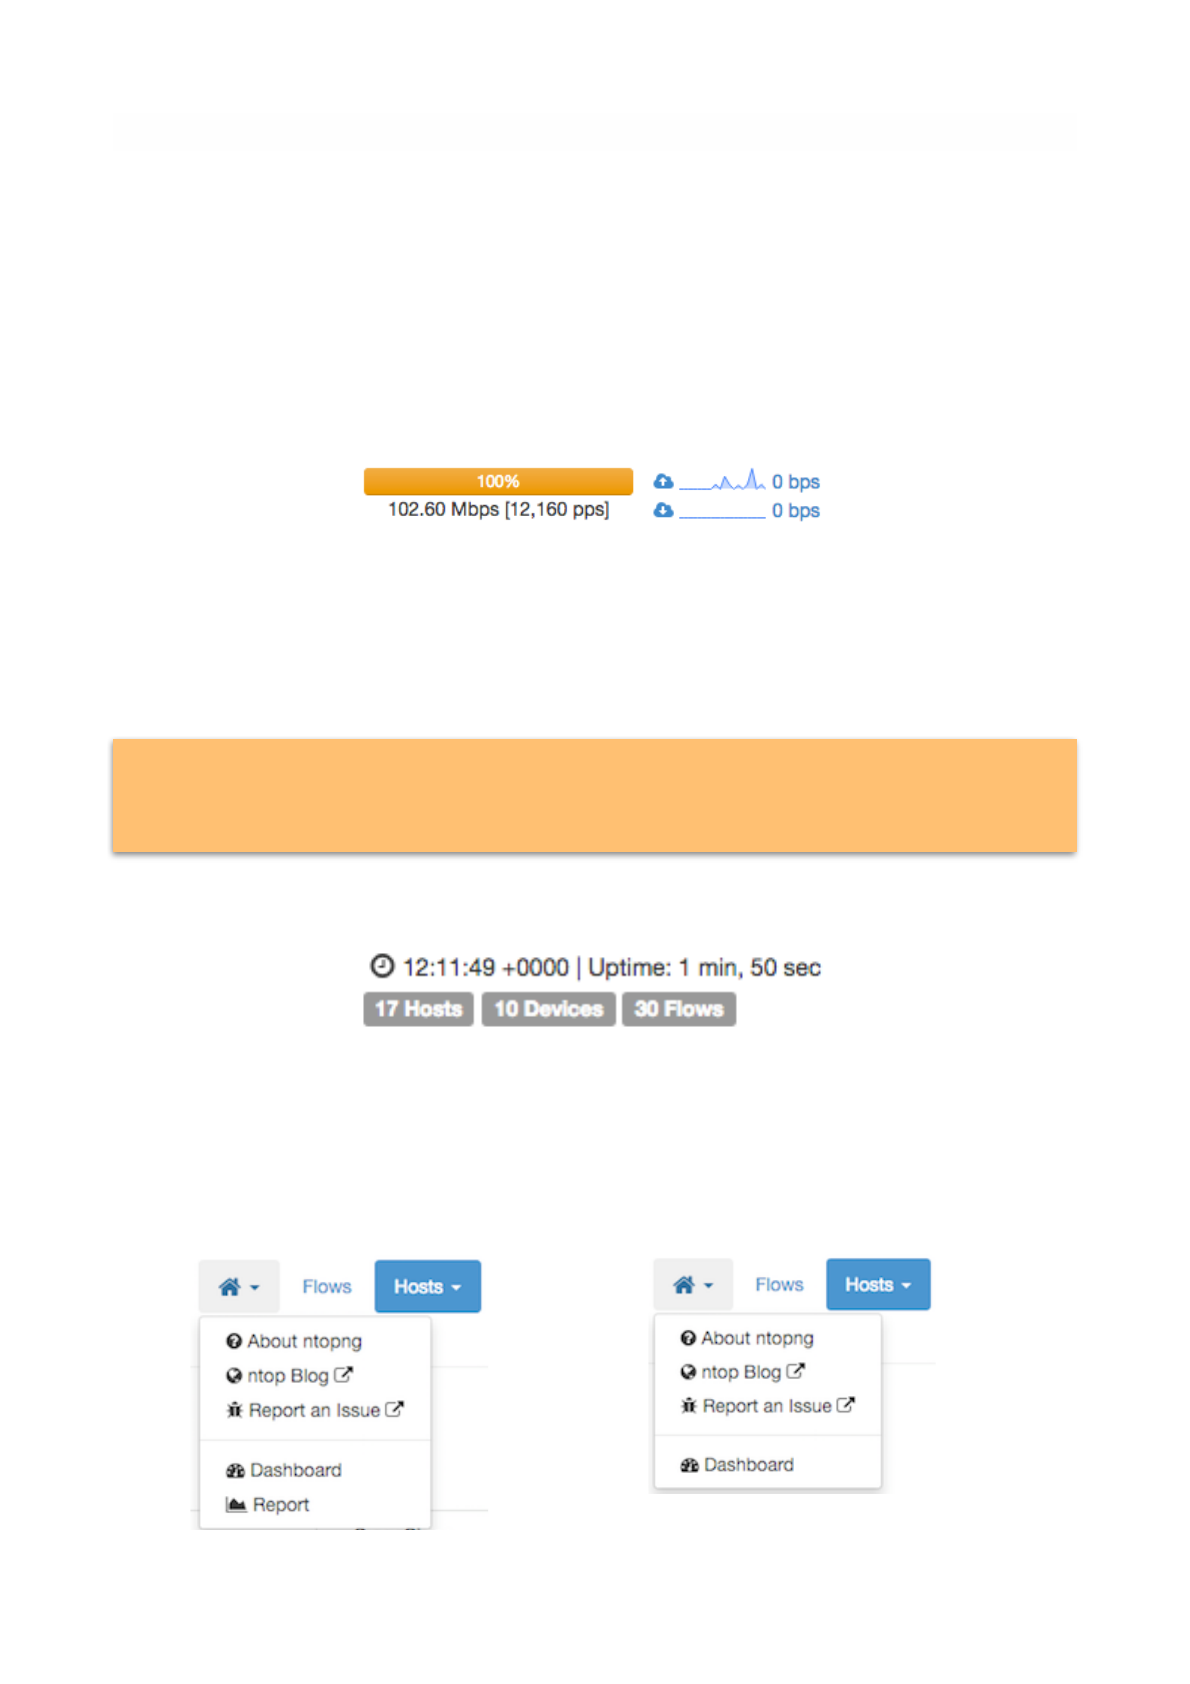
The main toolbar appears as follows.
username
admin
password
admin
Page of 16 76
The Login Page
The Header Bar
The items list are Home, Flows, Hosts, Protocols, Interfaces, Setting, Logout, and Search Host. An extra
item Alert pops out when some alerts fired in reaction of user configuration.
In the left part of the footer, ntopng summarizes some information such as logged-in user, monitored
interfaces, and used version (Community or Professional).
In the center it is shown a gauge which provides the bandwidth saturation level for monitored interfaces.
The same information is also reported as a function of time in two dynamic graphs, for upstream and
downstream traffic, respectively.
Finally, in the right side of the footer there is the uptime information, direct links to current Alerts (if any),
Hosts, Layer-2 Devices, and Flows counters monitored by ntopng.
Home Menu
Four items belong to the Home menu. An additional entry ‘Report’ is available in the Professional version.
Page of 17 76
Gauge scale is calculated according to physical interfaces features. It is not always possible to
determine maximum nominal interfaces speed. For this reason, scale can me manually
configured simply by clicking on the gauge. Changes will be automatically saved to persistent
storage.
Professional Version Home
Menu
Community Version Home Menu
The Center of the Footer Bar
The Right Side of the Footer Bar
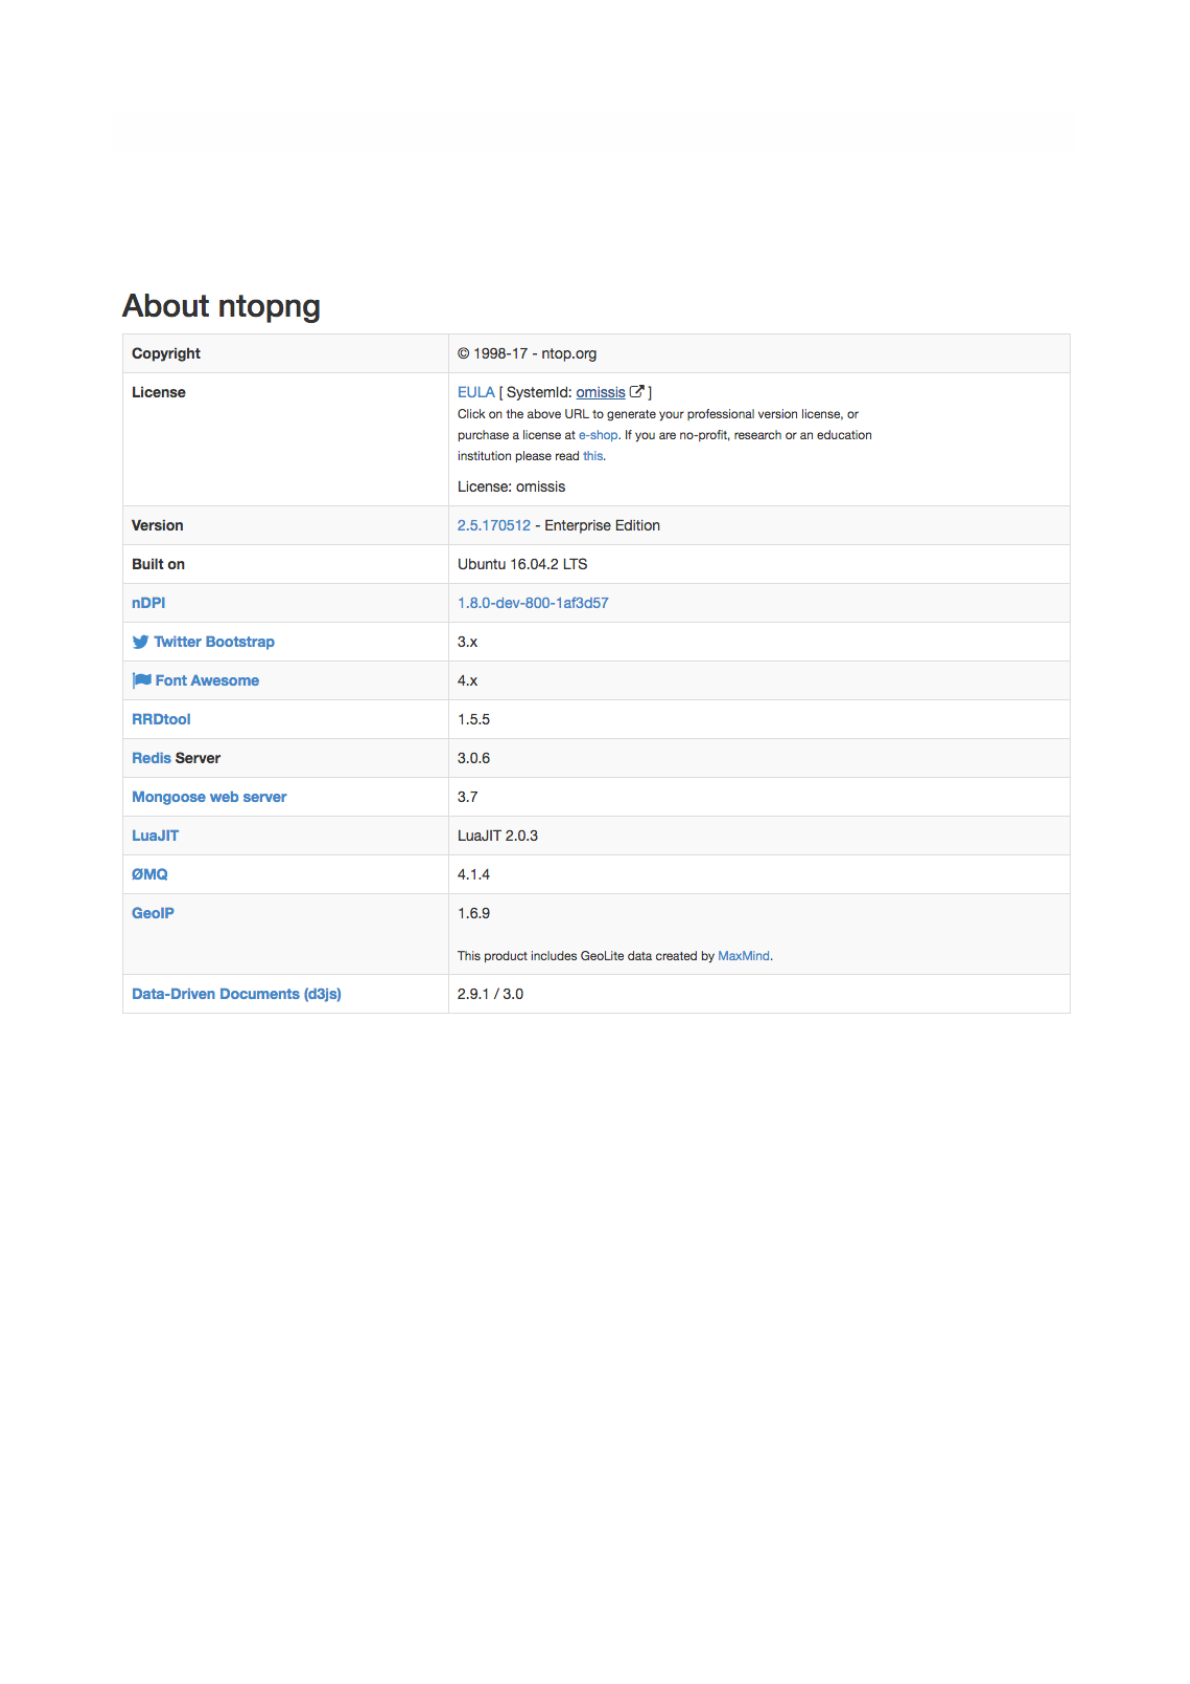
About ntopng
Shows information about ntopng Version, Platform, Currently Logged User, Uptime value and some
details related to its internals.
The ‘About ntopng’ Page
The upgrade from Community to Professional Version can be done by clicking on the system ID. The
browser will be redirected to the ntop shop to generate a valid license. The generated id should be save
in the appropriate field in “License” field.
Page of 18 76

ntop Blog
is a link to http://www.ntop.org/blog/ page where some useful information of tricks can be found.
Report an Issue
is a link to https://github.com/ntop/ntopng/issues page where you can report specific bug you
discovered.
Dashboard
Provides a shortcut to default dashboard page of ntopng. The dashboard is discussed in greater detail in
the following section.
Page of 19 76
Dashboard
Dashboard is a dynamic page and provides an updated snapshot of the current traffic for the selected
interface or interface view being monitored by ntopng. Community and Professional version have two
different dashboards.
Dashboard in the Community Version
The dashboard provides information about Talkers, Hosts, Ports, Applications, ASNs, and Senders.
Information can be selected from the top menu. Each item is discussed below.
Talkers
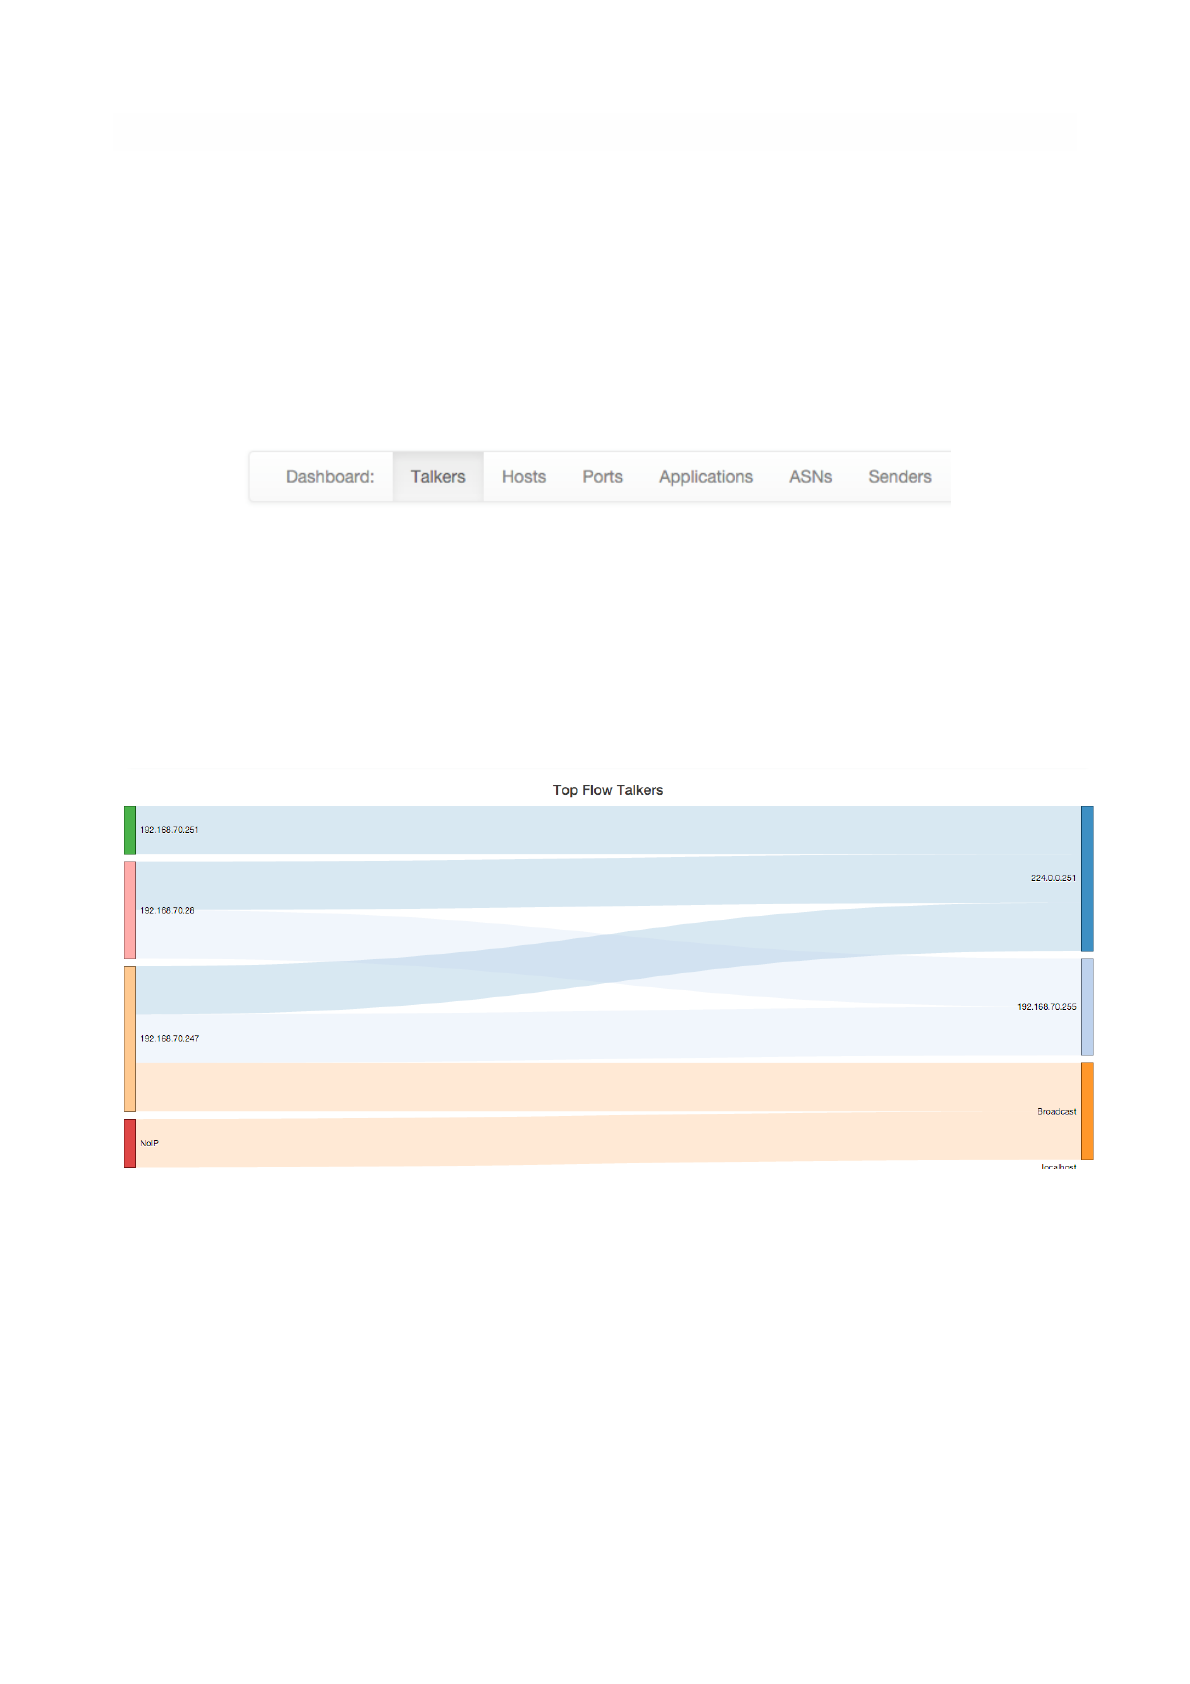
The default dashboard page is a Sankey diagram of Top Flow Talkers
The Sankey diagram displays hosts currently active on the monitored interface or interface view. Host
pairs are joined together by colored bars representing flows. The client host is always placed in the left
edge of the bar. Similarly, the server is placed on the right. Bar width is proportional to the amount of
traffic exchanged. The wider the bar, the higher the traffic exchanged between the corresponding pair of
hosts.
By default, the diagram is updated every 5 seconds. Refresh frequency can be set or disabled from the
dropdown menu shown right below the diagram.
Host and flow information shown in the Sankey is interactive. Indeed, both host names (IP addresses) as
well as flows are clickable.
Page of 20 76
The Sankey Diagram of Top Flow Talkers
The Top Menu for the Dashboard

A double-click on any host name redirects the user the ‘Host Details’ page, that contains a great deal of
host-related information. This page will be discussed later in the manual.
Similarly, a double-click on any bar representing a flow redirects the user to the ‘Hosts Comparison’ page.
Hosts can be pairwise compared in terms of Applications, Layer-4 Protocols, and Ports. A pie chart of
exchanged traffic can be shown as well.
Below is shown an Application comparison between two hosts. The diagram shows that both hosts on
the left have used DNS services (on the right). It is also possible to visually spot behaviors and trends. For
example it is possible to see that jake.unipi.it is much more prone to use Google’s DNS than the other
host.
Page of 21 76
Diagram Refresh Settings
Pairwise Host Comparison
Hosts
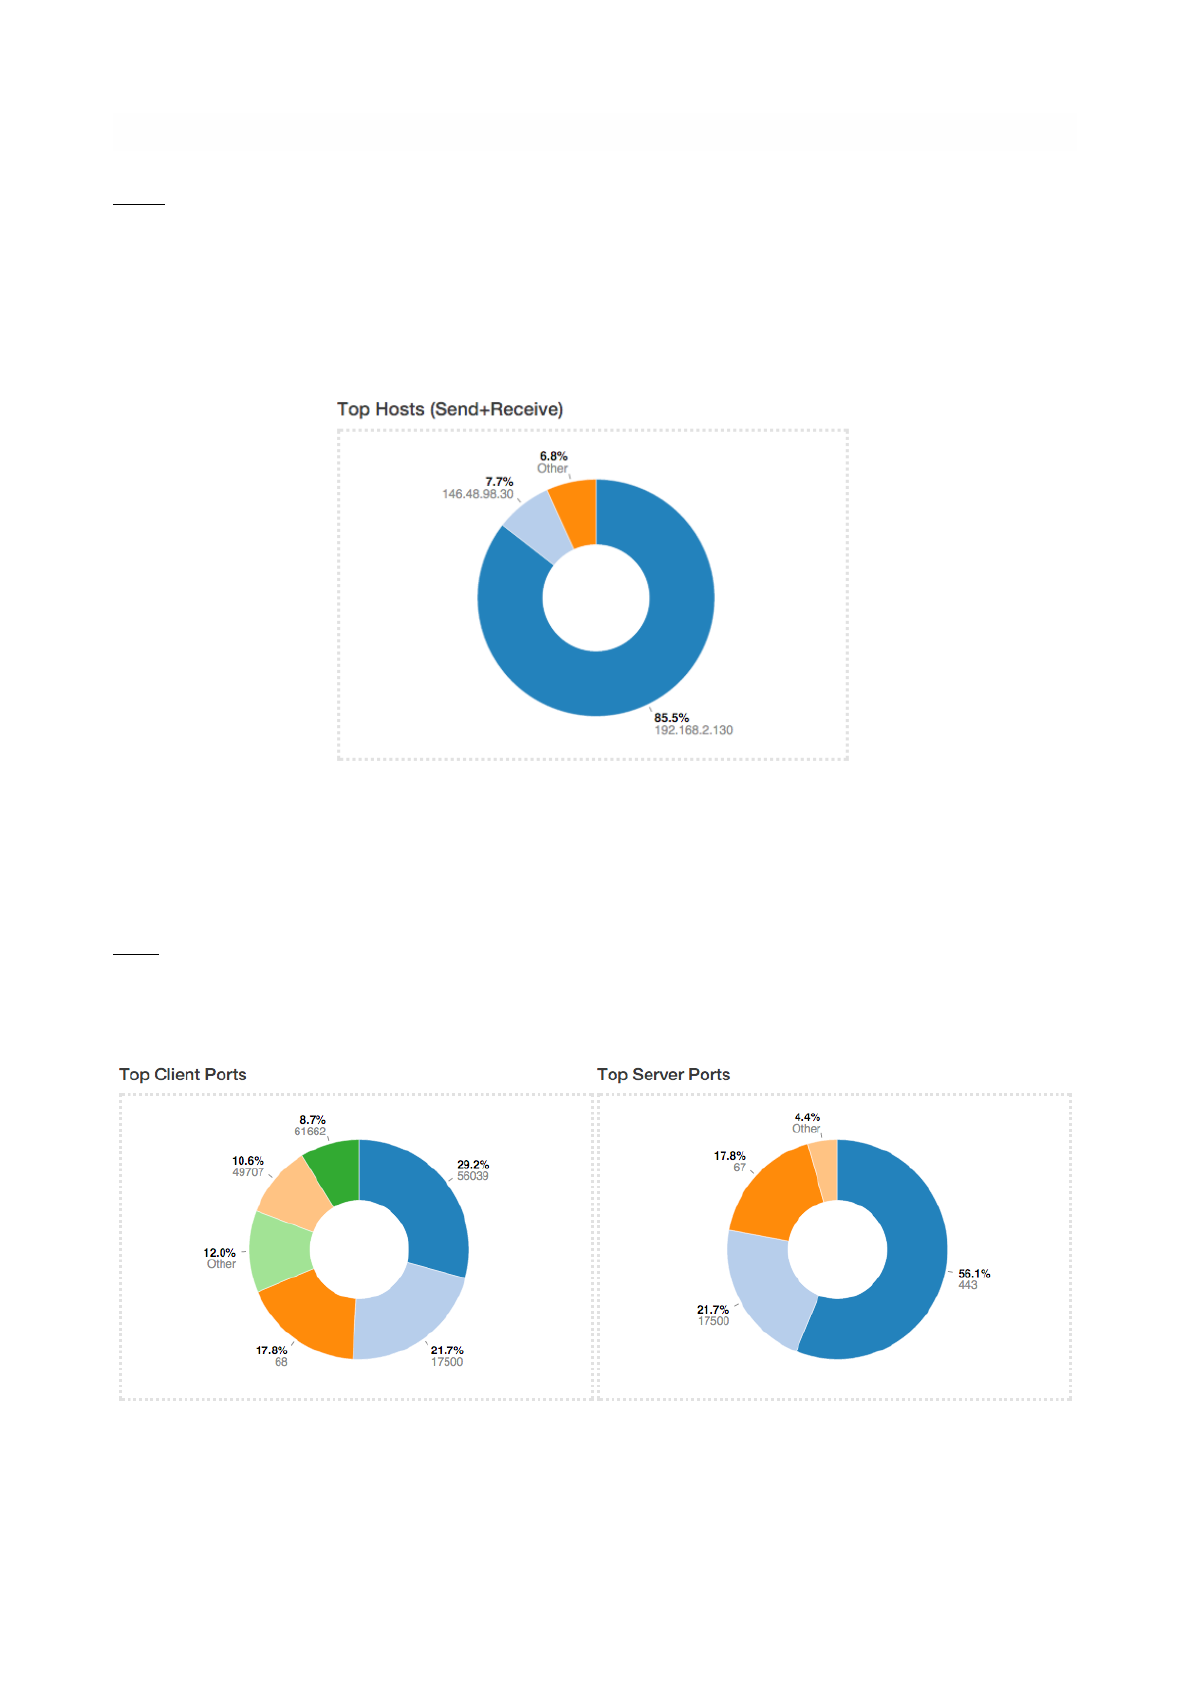
Hosts View provides a pie chart representation of the captured traffic. Aggregation is done on a per-host
basis. Similarly to the Sankey Diagram discussed above, any host name (or non-resolved IP address)
shown can be double-clicked to visit the corresponding ‘Host Details’ page.
The pie chart is refreshed automatically.
Ports
Ports view provides two separated pie charts with the most used ports, both for clients and for servers.
Each pie chart provides statistics for client ports and server ports.
Pie Chart of Top Client and Server Ports
Page of 22 76
Pie Chart of Top Hosts
Any port number shown can be double-clicked to visit the ‘Active Flows’ page. This page lists all
the currently active flows such that client or server port matches the one clicked.
Applications
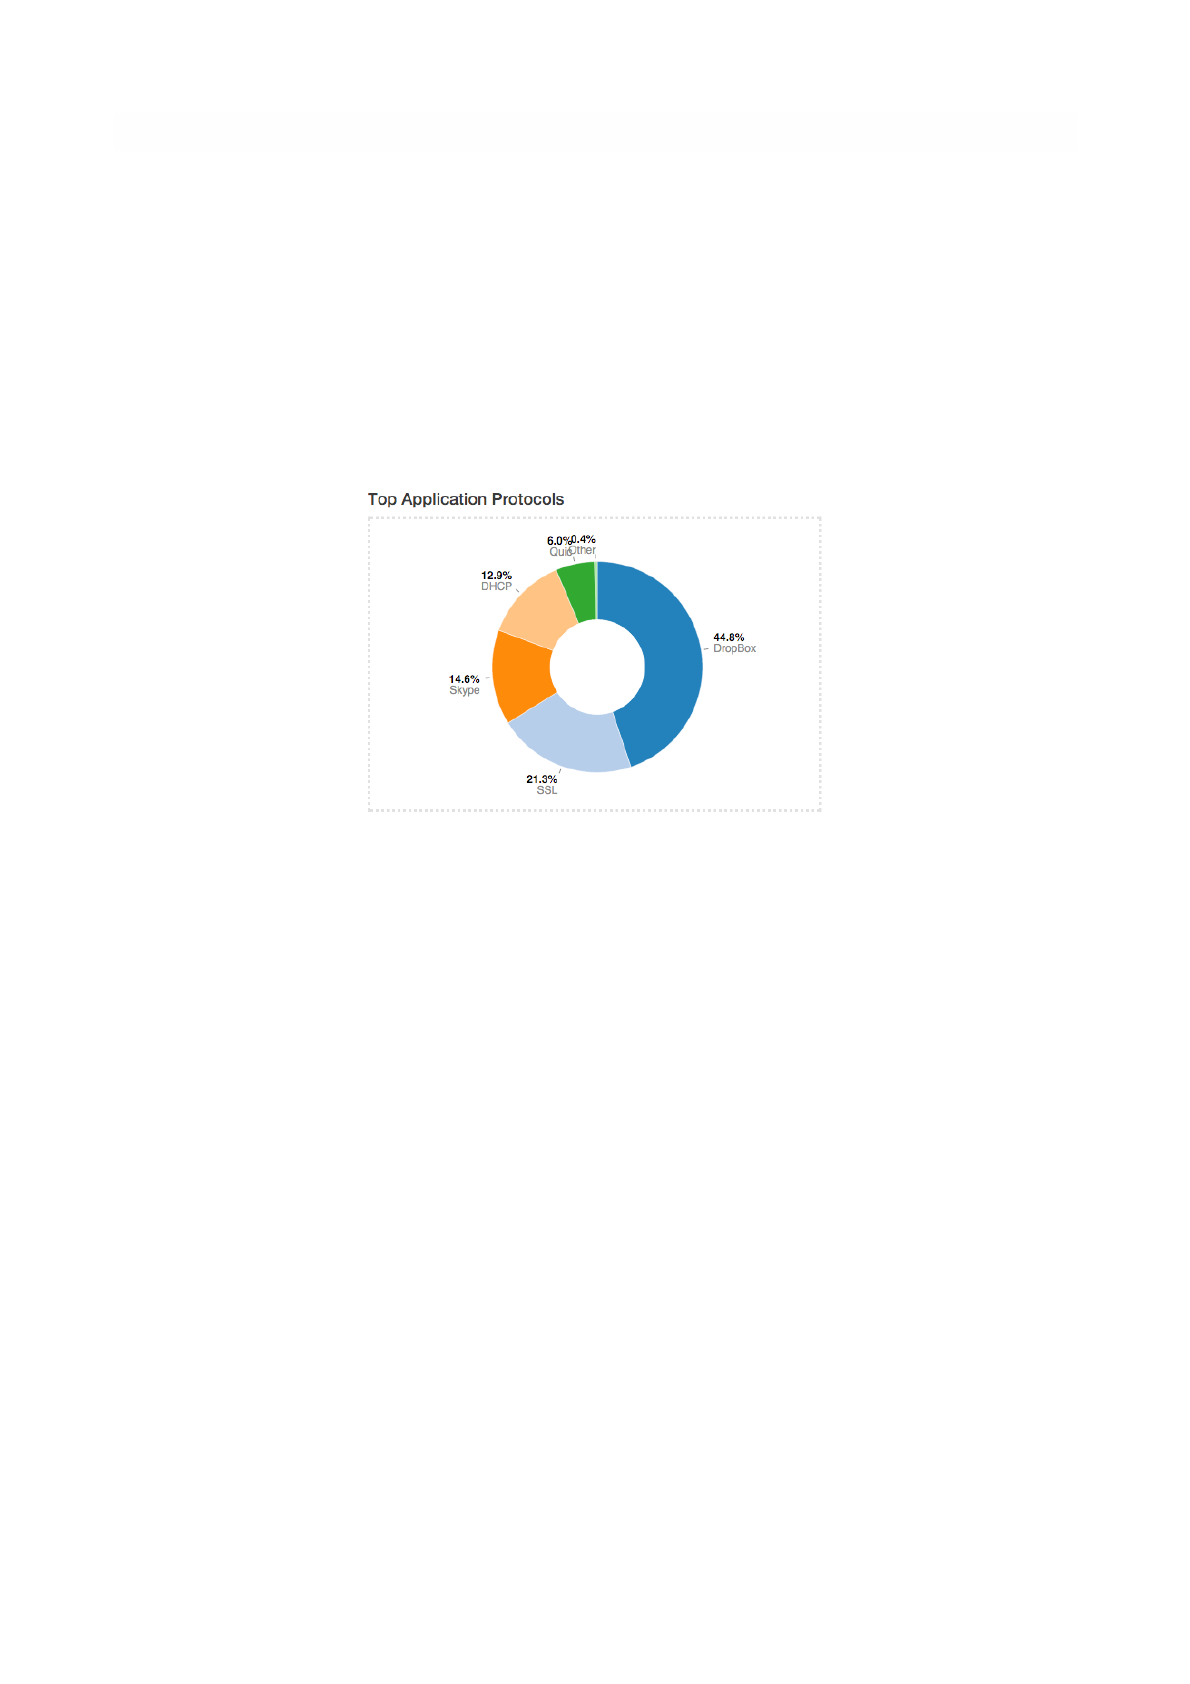
Application View provides another pie chart that represents a view of the bandwidth usage divided per
application protocol. Protocol identification is done through ntopn nDPI engine. Protocols that cannot be
identified are marked as Unknown.
Pie Chart of Top Applications
In the same manner as for previous view, application names are clickable to be redirected to a page with
more detailed information on application.
Page of 23 76
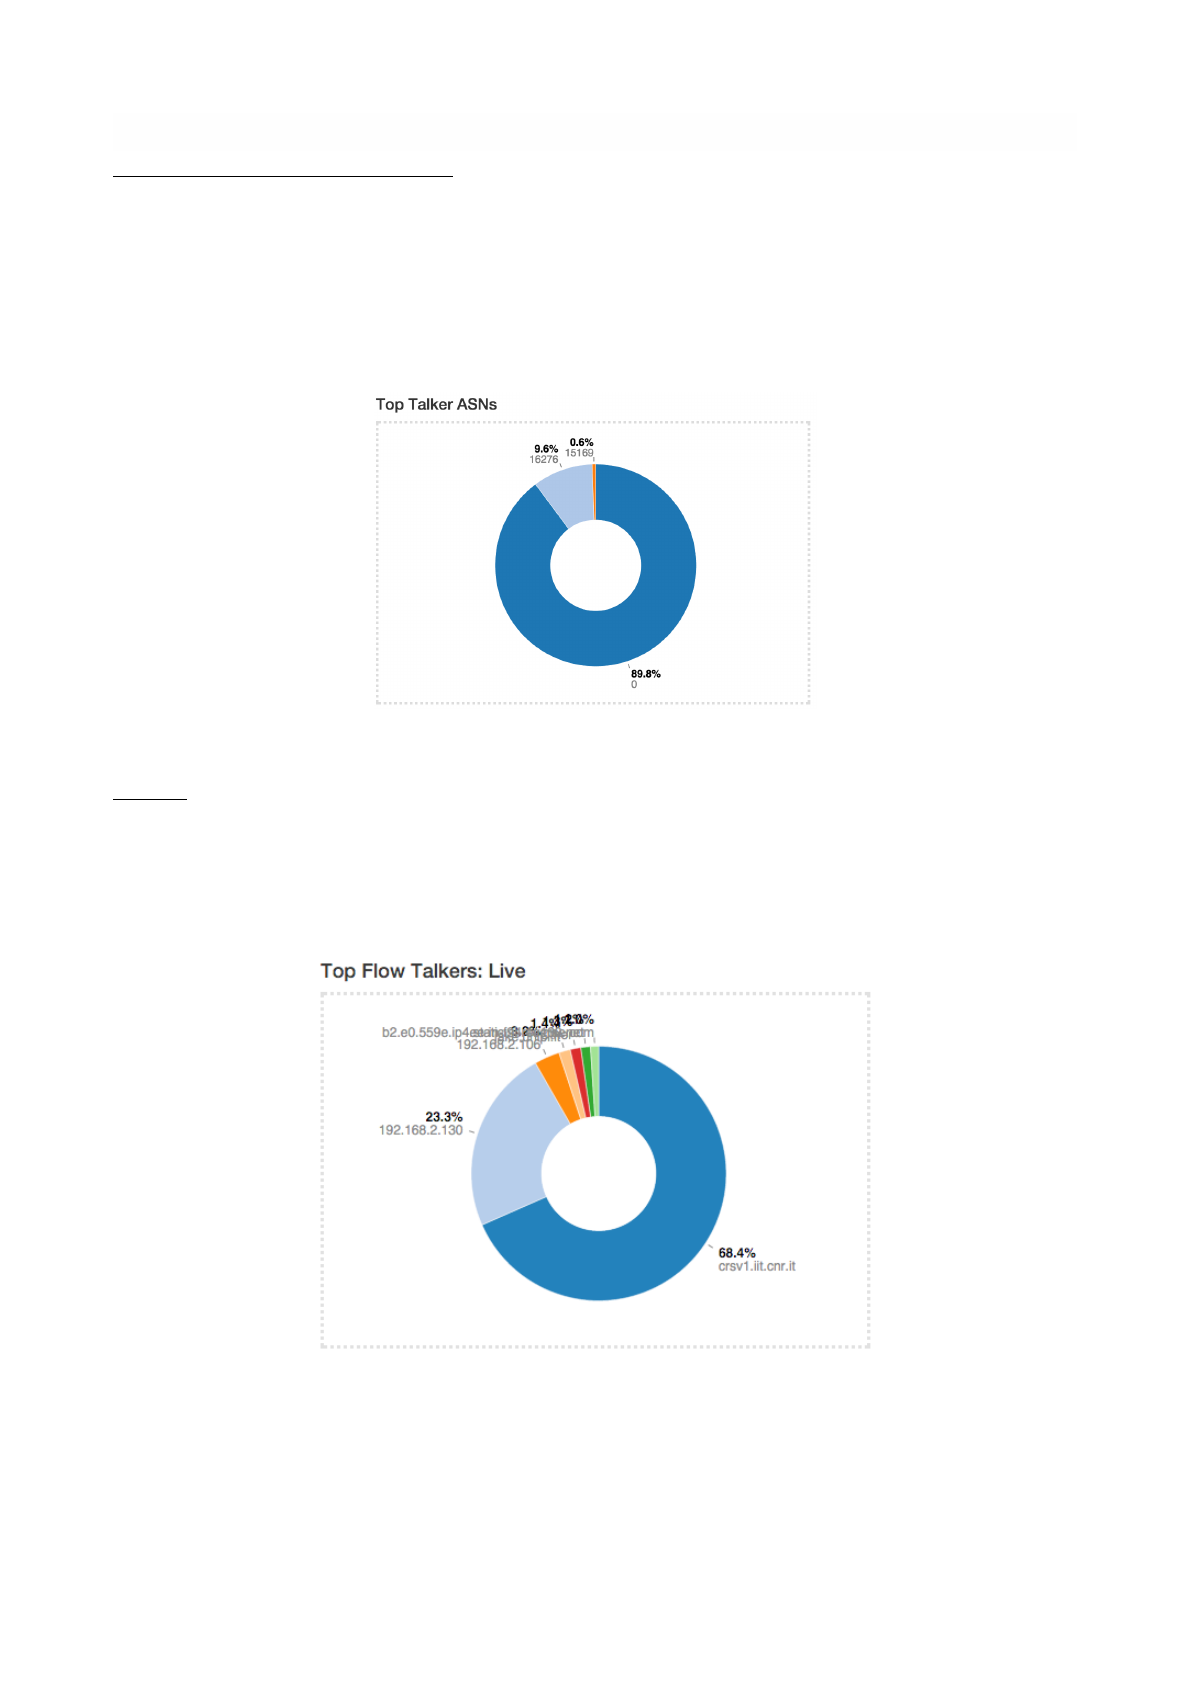
Autonomous System Numbers (ASNs)
ASNs view provides a pie chart representation of the traffic grouped by Autonomous System (AS). An AS is
either a single network or a group of networks, controlled by a network administrator on behalf of a single
administrative entity (such as a university, a business enterprise, or a business division). An AS is also
sometimes referred to as a routing domain. A globally unique number called an Autonomous System
Number (ASN) is assigned to each AS.
"
Pie Chart of Top ASNs
Senders
Senders view provides a pie chart representation of top flow senders currently active. This graph shows
the percentage of traffic being sent by endpoints either on local or remote networks.
"
Page of 24 76
Pie Chart of Top Senders
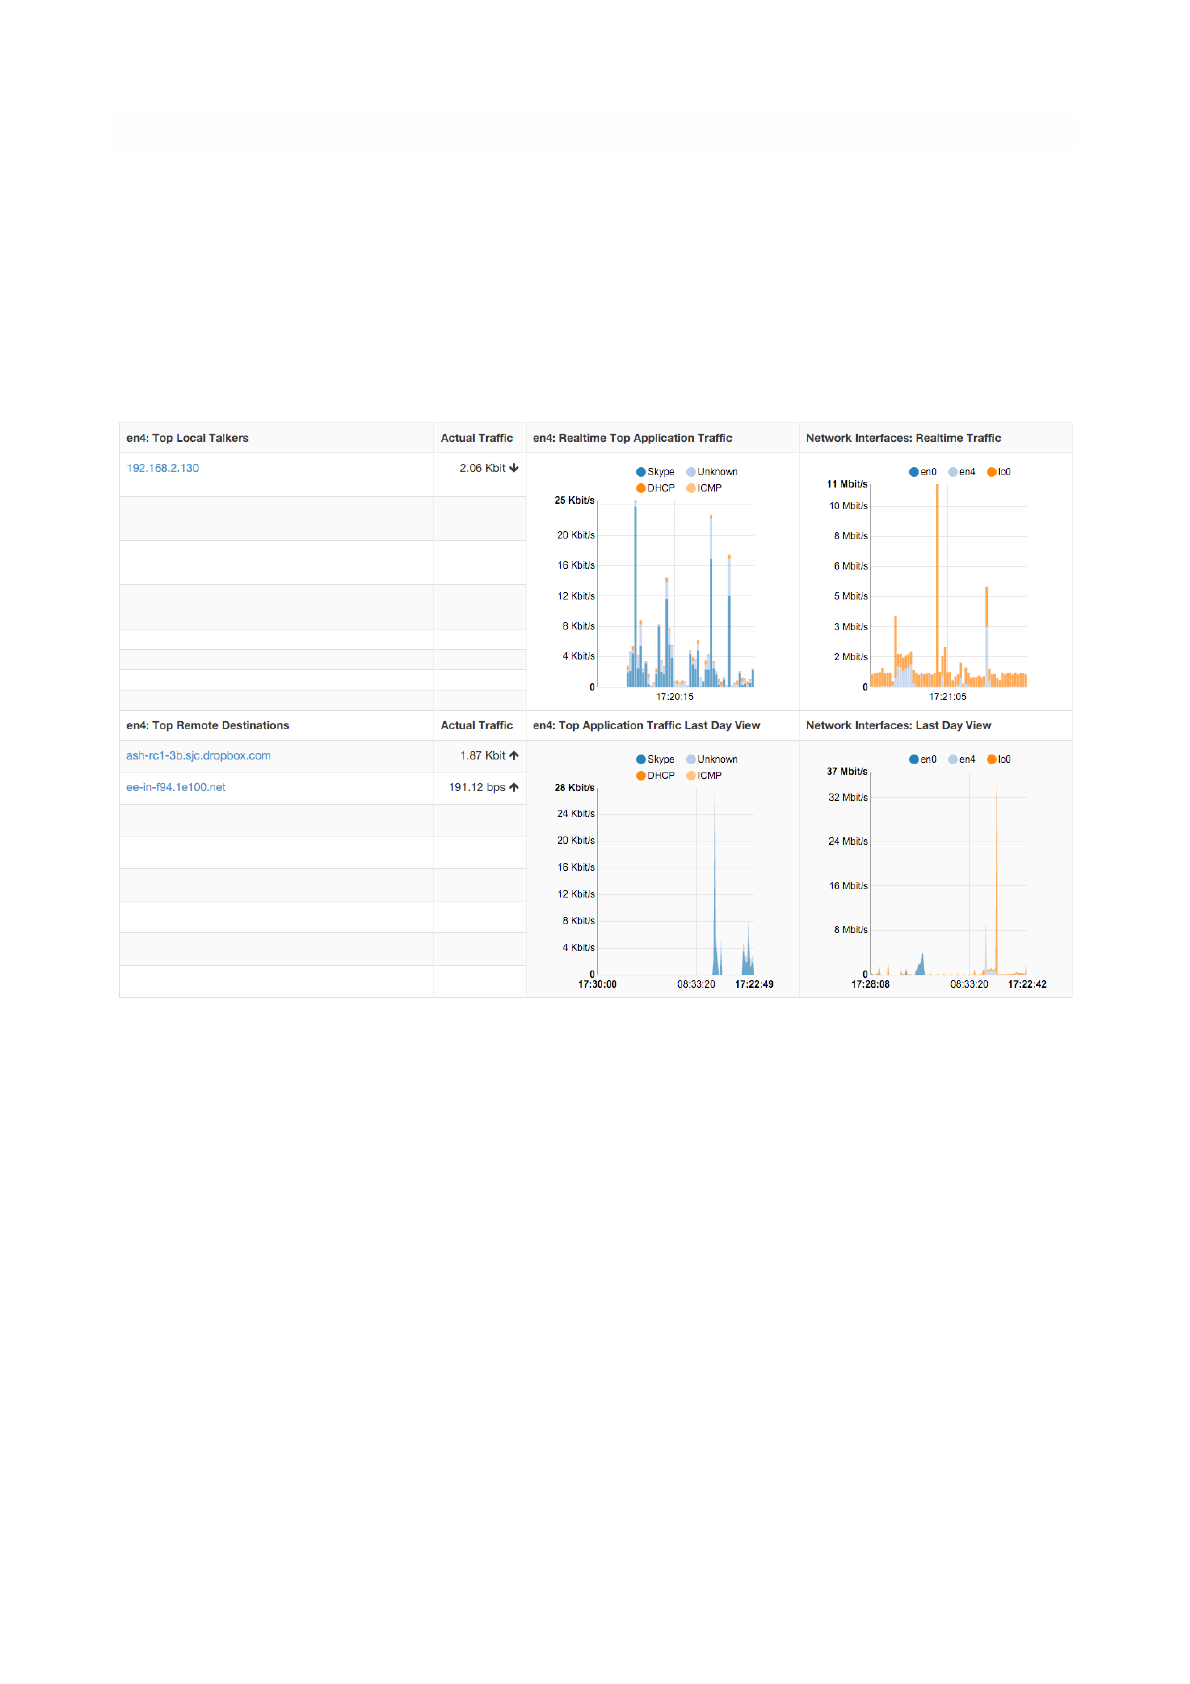
Dashboard in the Professional Version
The dashboard in the professional version provides a great deal of information, including realtime traffic —
both per monitored interface and per application — top local talkers and top destinations. The dashboard
is refreshed dynamically. Tables and chars are kept updated by ntopng.
The right part of the dashboard displays realtime and last-day charts of Top Applications and Network
Traffic. In case a network interface view is selected, then network traffic is shown on a per physical-
interface basis. Items shown in each chart can be dynamically toggled simply by clicking on the
corresponding coloured dot in the chart key.
The left part of the dashboard shows tables of realtime Top Local Talkers and Top Remote Destinations,
including the amount of traffic exchanged.
Top Local Talkers are hosts, belonging to local networks, that are exchanging the highest traffic volumes.
Similarly, Top Remote Destinations are hosts, belonging to remote networks, that are currently exchanging
the highest traffic volumes.
Next to each Actual Traffic value there is an arrow that point up or down that indicates whether the traffic
for such host has increased/decreased since the last web page update.
Each host show can be clicked to access its ‘Host Details’ page. Next to a host you can find a badge
enclosing a number: it indicates how many virtual HTTP servers the host features.
Report
The Professional version of ntopng allows to generate custom traffic reports for one or more interfaces
monitored. Report page, reachable from the dropdown home menu in the main toolbar, presents the
user with multiple configuration options
Page of 25 76
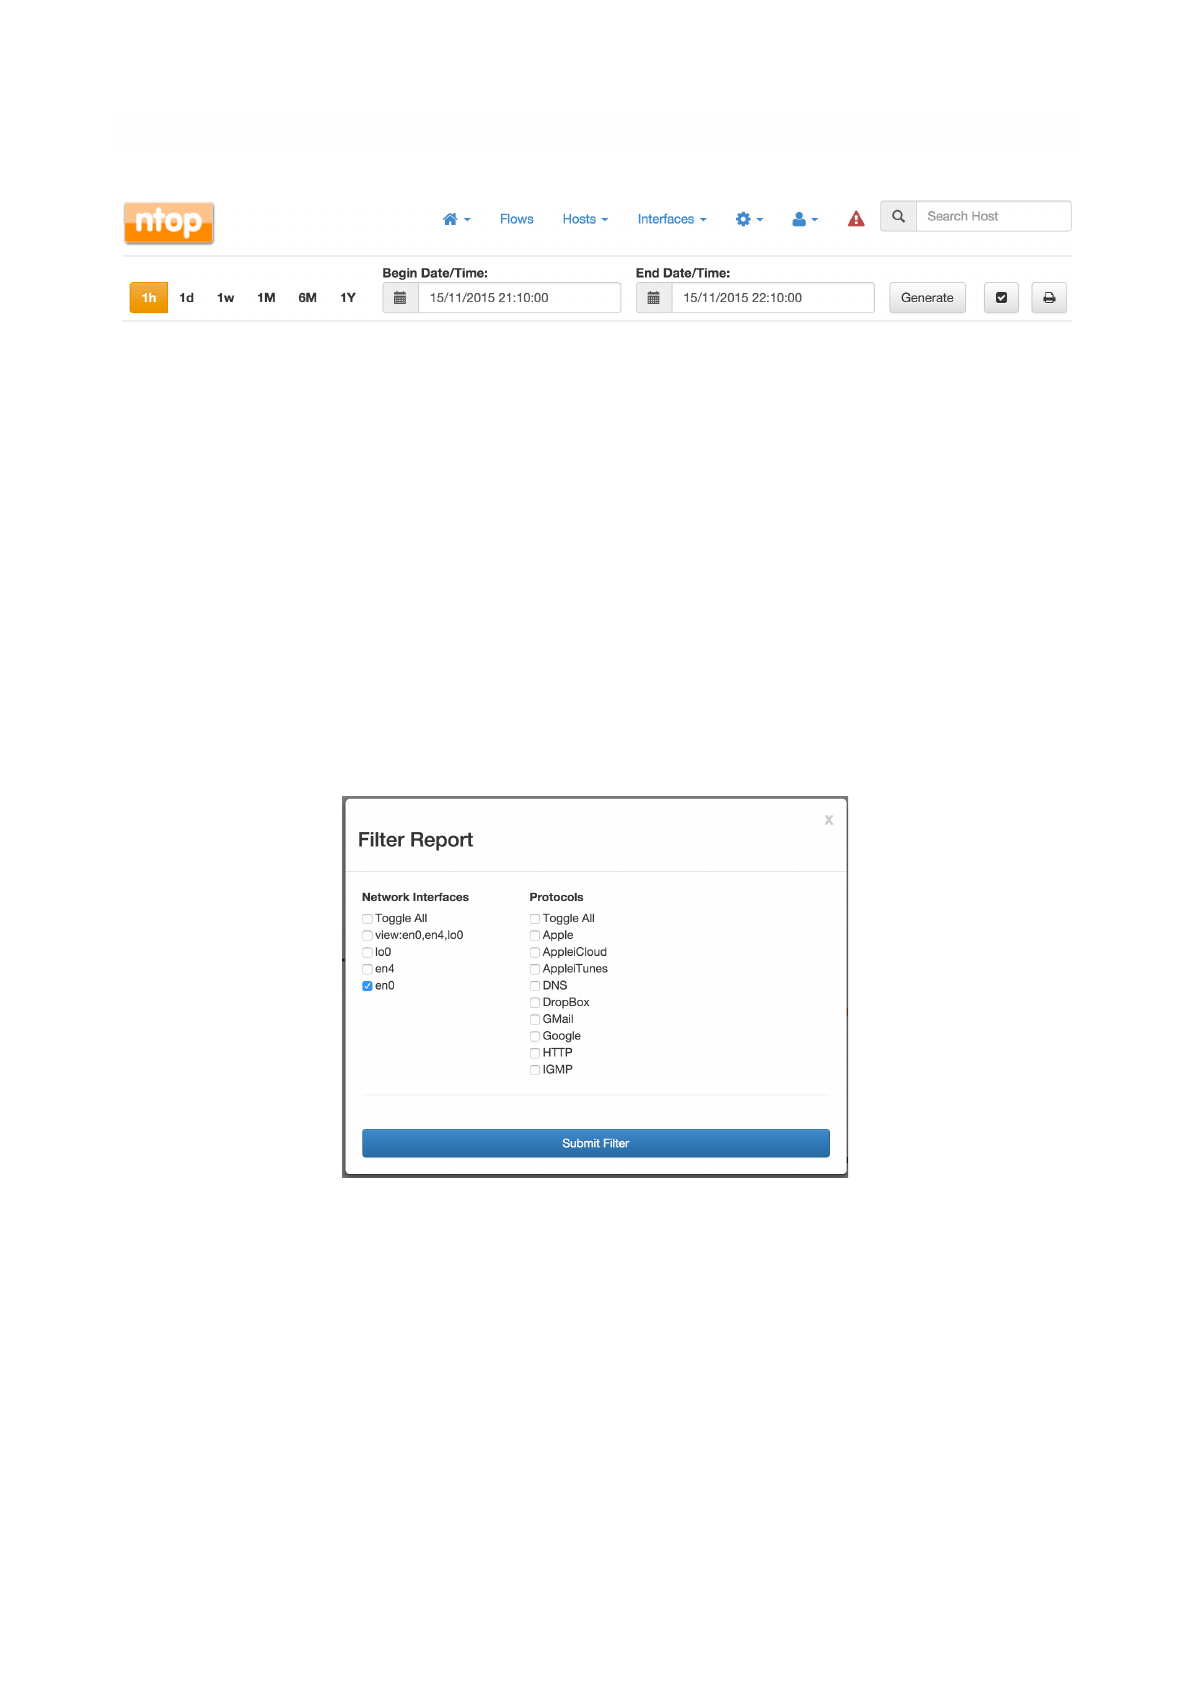
Fixed-width temporal intervals are available on the left. They are 1h (one hour), 1d (one day), 1w (one
week), 1M (one month), 6M (six months), and 1Y (one year). A click on any of those intervals produces an
automatic report that spans a time range that starts at the present and that goes backwards in time until
the clicked interval is reached.
Exact temporal intervals can be chosen using the two dropdown date time pickers in the center. The first
and the second pickers are used to specify the start and the end of a custom report, respectively. Once
dates and times have been chosen, the report is obtained by clicking on ‘Generate’.
The small checkbox icon right of the ‘Generate’ button allows to select one or more of the available
monitored interfaces, as well as application protocols of interest. Clicking on it yields the following overlaid
menu
Report Filter Overlay
Finally, the rightmost icon generates a printer-friendly report ready to be printed.
Reports contain charts of monitored interfaces overall traffic, local versus remote traffic, local networks
traffic, as well as the traffic grouped by:
• Application Protocols (e.g., HTTPS, Skype)
• Countries
• Local Hosts (hosts belonging to local networks) and Remote Hosts (hosts belonging to remote
networks)
• Local Operating Systems
• Autonomous Systems
Page of 26 76
The Top of the Report Page

In the remainder of this section are screenshots of reported information discussed above.
"
Report - Network Interfaces and Traffic
"
Report - Top Networks and Applications
Page of 27 76
Report - Monitored Network Interfaces Summary
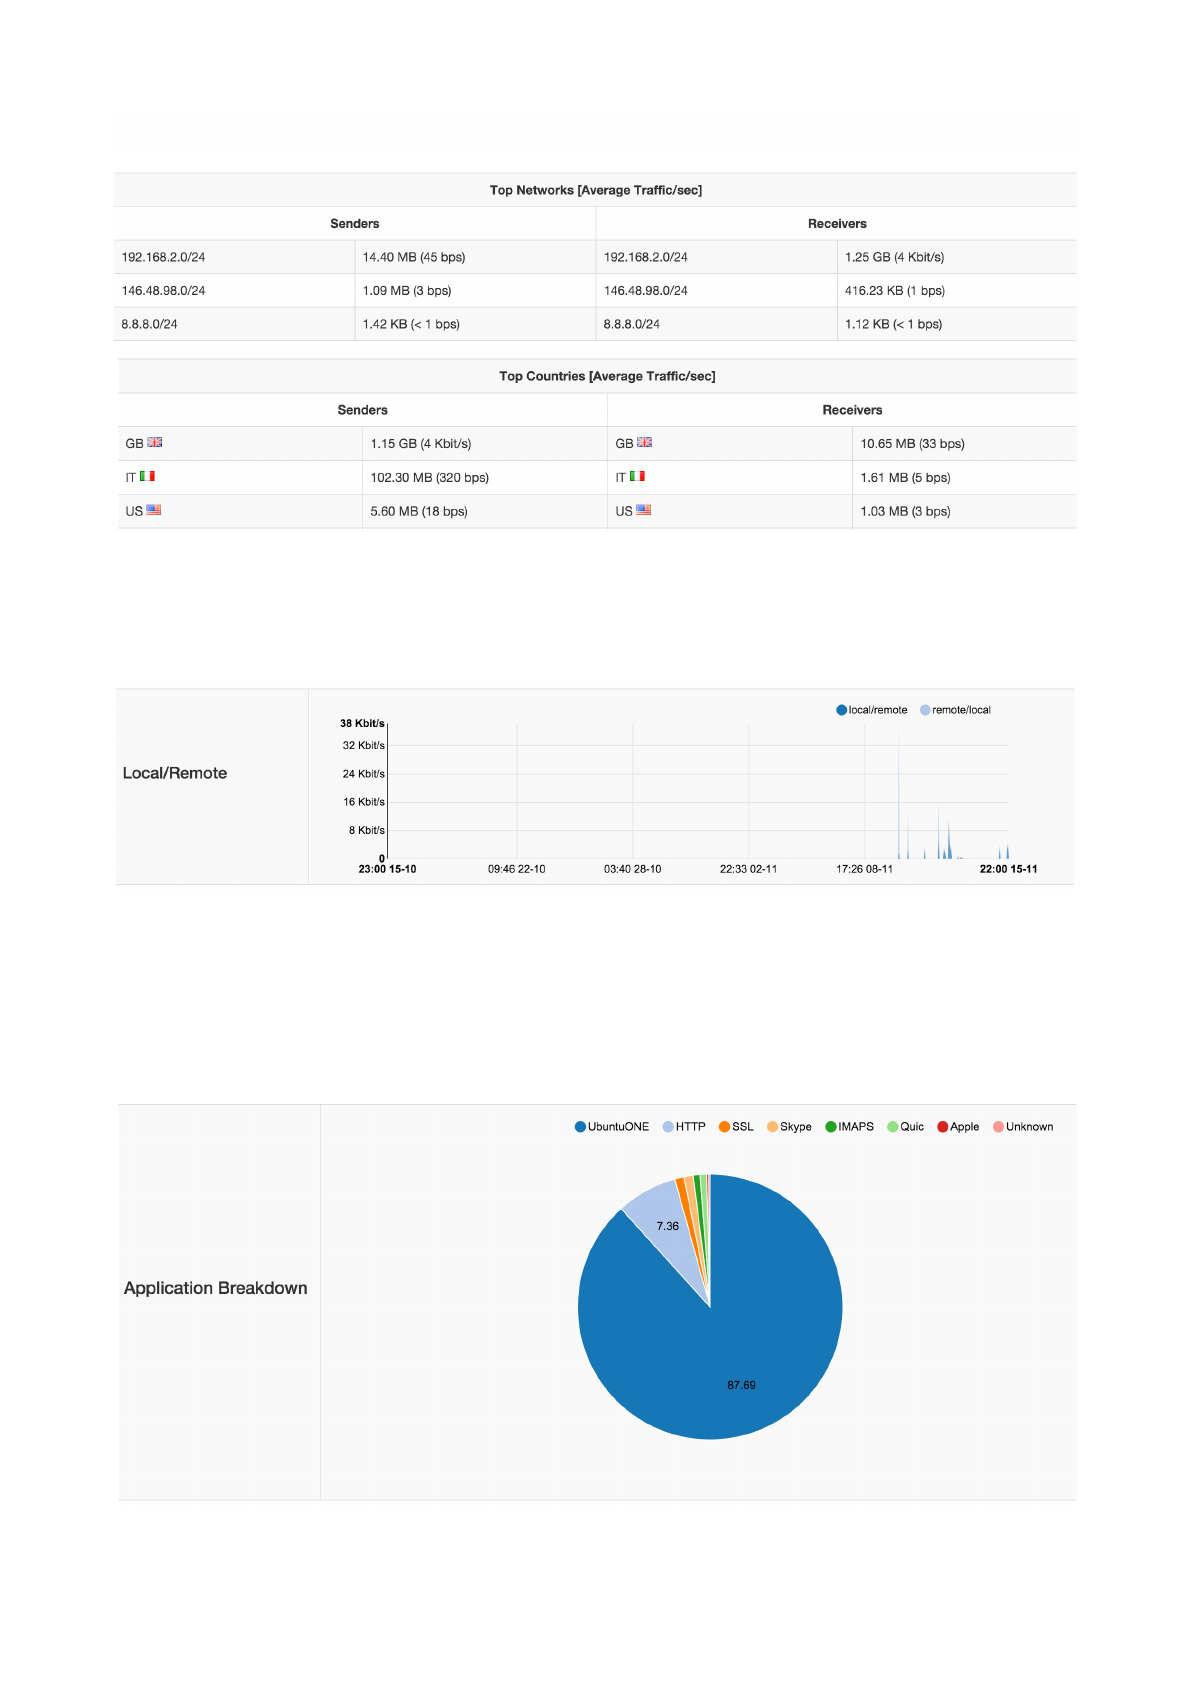
!
Page of 28 76
Report - Local to Remote and Remote to Local Traffic
Report - Application Breakdown
Report - Top Countries
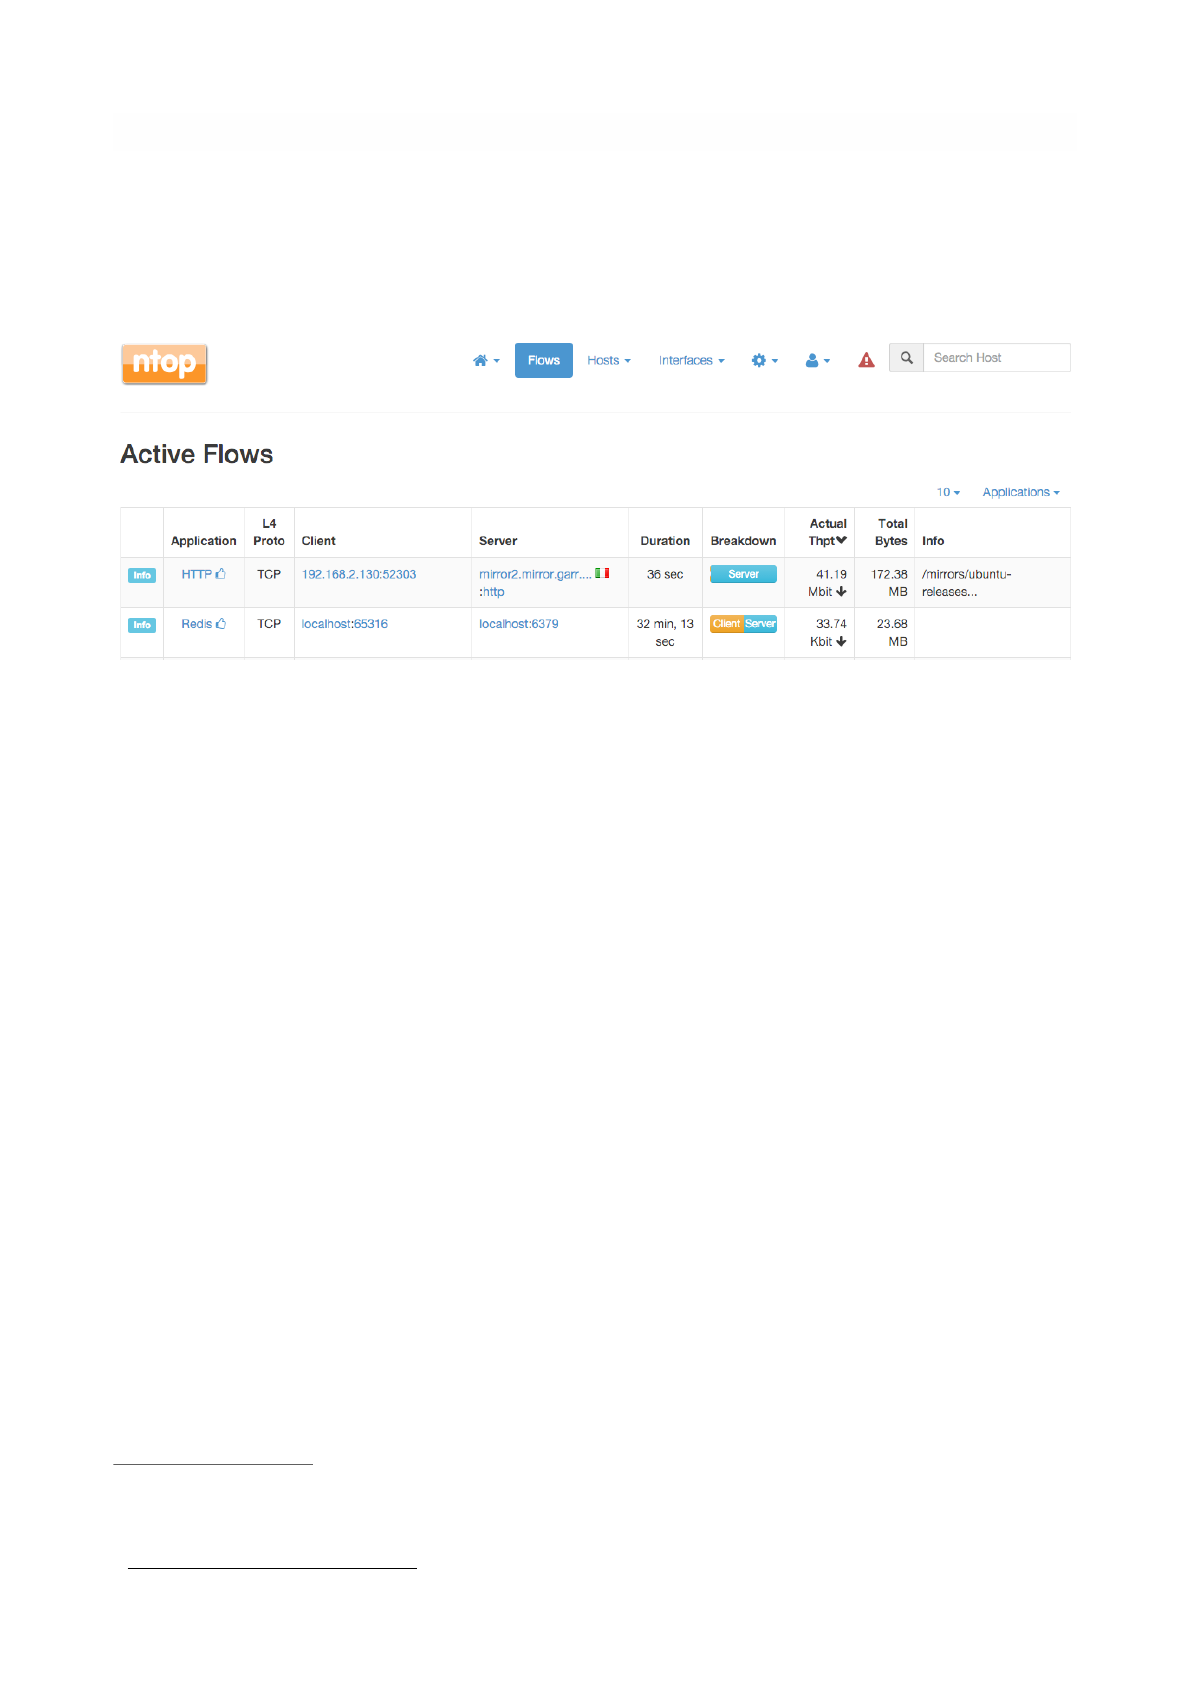
Flows
The ‘Flows’ entry in the top toolbar can be selected to visualize realtime traffic information on the currently
active flows. A flow can be thought of as a logical, bi-directional communication channel between two
hosts . Multiple simultaneous flows can exist between the same pair of hosts.
1
Flows are uniquely identified via a 5-tuple composed of:
• Source and destination IP address
• Source and destination port
• Layer-4 protocol
Each flow is shown as a row entry in the flows table. Flows are sortable by application using the rightmost
dropdown menu at the top right edge of the table. Similarly, the other dropdown menu enables the user
to choose the number of flows displayed on each page.
Flows have multiple information fields, namely, Application, Layer-4 Protocol, Client and Server hosts,
Duration, Client and Server Breakdown, Current Throughput, Total Bytes, and Additional Information.
Information fields are briefly discussed below.
Application
Application is the Layer-7 program which is exchanging data through the flow. This is the piece of
software that lays closest to the end user. Examples of Applications are Skype, Redis, HTTP, and Bit
Torrent. Layer-7 applications are detected by the NTOP opensource Deep Packet Inspection (DPI) engine
named nDPI . In case application detection fails, ntopng marks the flow as ‘Unknown’. If the detection
2
succeeds, the application name and a thumb up (down) is shown if the application is deemed to be good
(bad).
Application name can be clicked to see all hosts generating traffic for the application.
Actually, flows may also exist between a host and a multicast group, as well as a broadcast
1
domain.
https://github.com/ntop/nDPI
2
Page of 29 76
Active Flows Page

Layer-4 Protocol (L4 Proto)
The layer-4 protocol is the one used at the transport level. Most common transport protocol are the
reliable Transmission Control Protocol (TCP) and the best-effort User Datagram Protocol (UDP).
Client
This field contains host and port information regarding the client endpoint of the flow. An host is
considered a client if it is the initiator of the flow. Information is shown as host:port and both information
are clickable. If the host has a public IP address, ntopng also shows the country flag for that client . A blue
3
flag is drawn when the host is the ntopng host.
Server
Similarly to the client, this field contains information regarding the server endpoint of the flow. An host is
considered a server if it is not the initiator of the flow. We refer the reader to the previous paragraph for a
detailed description.
Duration
This is the amount of time that has elapsed since the flow was opened by the client.
Breakdown
Flows are bi-directional, in the sense that traffic flows both from the server to the client and from the client
to the server. This coloured bar gives and indication on the amount of traffic exchanged in each of the two
directions. Client to server traffic in shown in orange, while server to client in blue.
Actual Throughput
The throughput is computed periodically (the refresh time is a few seconds)
Total Bytes
The amount of traffic exchanged thought the flow. This total value is the sum of traffic exchanged in each
of the two directions (client to server and server to client).
Info
Extra information nDPI is able to extract from the detected flow is made available in this field. This field
may include urls, traffic profiles (in the Professional Version), contents of DNS requests, and so on.
These data are based on MaxMind databases.
3
Page of 30 76
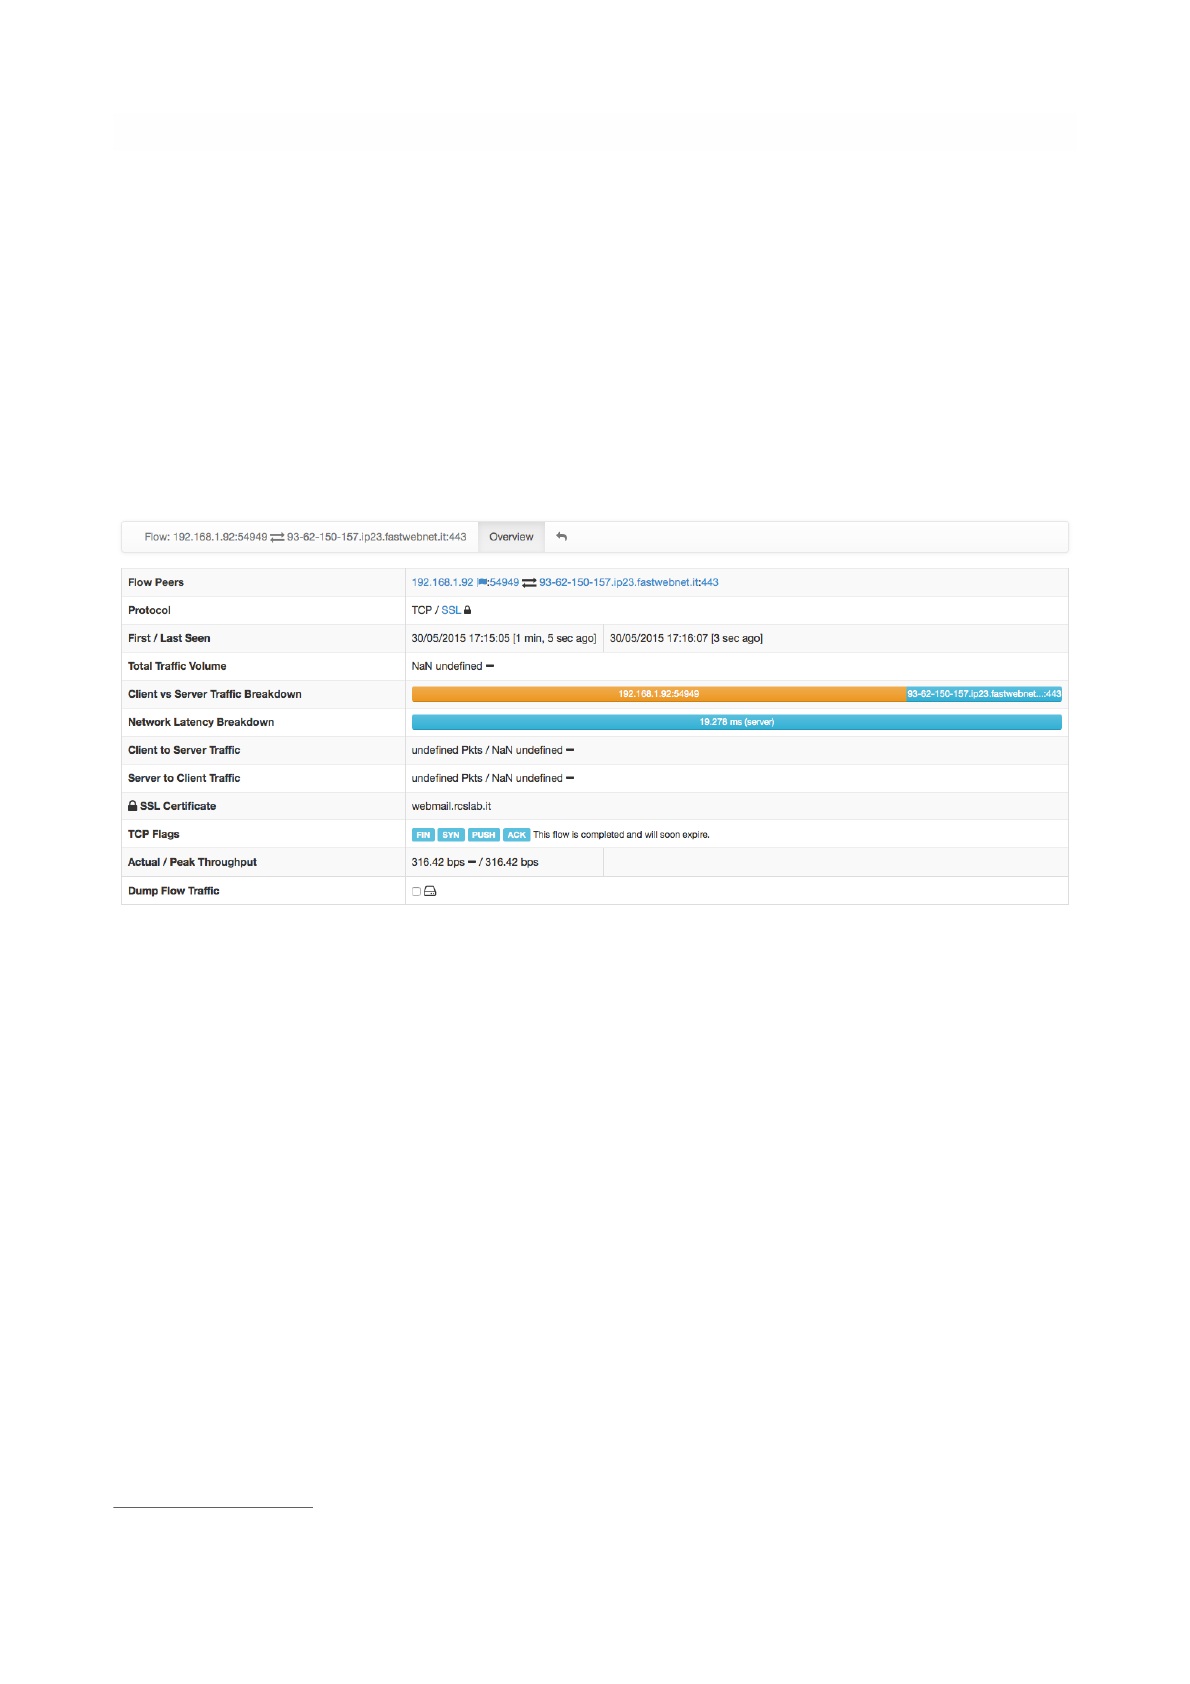
The leftmost column Info has a button that redirects the user to a page containing detailed flow
information. Values in the Flow Details page are dynamically updated every second. Detailed information
include
• First / Last Seen
• Total Traffic Volume and Trend
4
• Client / Server Traffic Breakdown
• Packets and Bytes sent in each flow direction
• Protocol flags, if L4 protocol is TCP
• SSL Certificate
• Throughput
• Flow traffic dump to persistent storage.
Flow Details Page
Increasing trend is shown with an arrow that points upwards. Stable trend is shown with a dash.
4
Decreasing trend is show with as arrow that points downwards.
Page of 31 76

Hosts
Hosts is a dropdown menu always reachable from the top toolbar that contains a bunch of links to host-
related information pages. The dropdown is as follows
Host-related information pages available have the following content
•Hosts page shows all hosts seen
•Networks page lists all networks — both local and remote — any seen host belongs to
•Host Pools page has the list of the defined Host Pools
•Autonomous Systems page presents all Autonomous Systems (AS) any seen host belongs to
•Countries page shows hosts countries based on the information provided by MaxMind databases
•Operating Systems page lists all host operating systems that have been detected. Detection is done
using passive fingerprinting techniques
•HTTP Servers (Local) page shows monitored HTTP servers, limited to local hosts only
•Top Hosts Traffic page presents traffic of top hosts in order to typology selected;
•Geo Map page lays out hosts in a geographic map to give visual insights into the geographical
locations of seen hosts
•Tree Map page shows a tree representation of the monitored environment
•Local Matrix page displays a matrix representation of local systems
All Hosts
All hosts that have been seen monitoring network interfaces are show here. Column headers can be
clicked to sort results in descending (ascending) order of the clicked header. Additional sort options are
available in the top right corner of the table.
The table shown has several columns, including
Page of 32 76
The Hosts Dropdown Menu
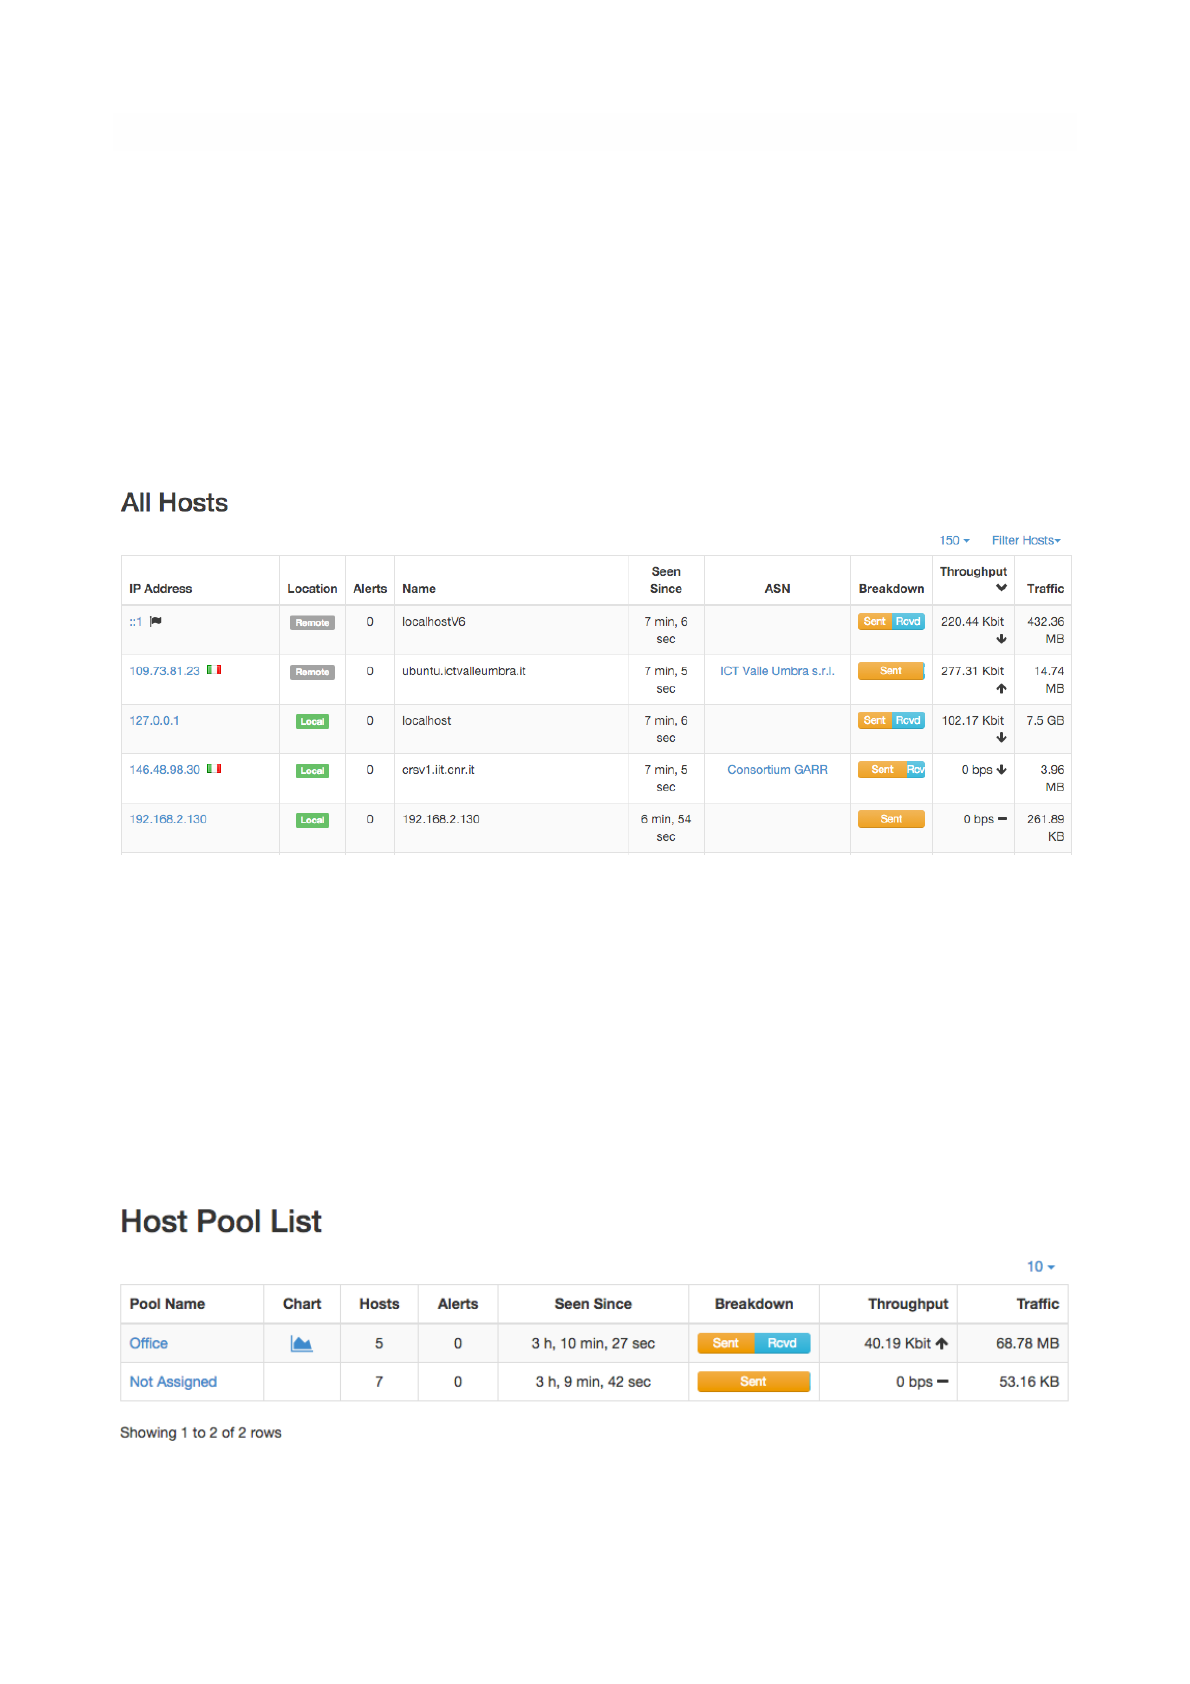
• IP address, with optional country flag and OS logo (if detected)
• Location, either Local (the host belongs to a local network) or Remote (the host belongs to a remote
network) — please note that this is not a geographical location
• Alerts, with the number of alerts associated to the host
• Name, having the resolved hostname (or a custom name, if set in any Host Details page)
• Seen Since, with the amount of time it has lapsed since the first packet sent/received by the host has
been observed
• ASN, with the AS number (if available)
• Breakdown, showing a bar that gives visual insights in the use of both traffic directions
• Throughput, with the overall actual throughput of the host
• Traffic, with the total traffic exchanged by the host
Any host can be clicked to be redirected to its ‘Host Details’ page, which is discussed below.
Host Pools
Host Pools are logical groups of hosts that are described in detail in the “Network Interfaces" section of
this document. This page show the list of defined and currently active Host Pools.
Page of 33 76
The All Hosts Page
The Host Pools List Hosts Page
Each row of the table shows, for each pool, the following information:
• The Pool Name as defined by the user during Host Pool creation
• A Chart icon to access historical pool traffic timeseries. Historical pool traffic charts must be enabled
from the preferences page and are a feature that is only supported in the Professional version.
• The number of active hosts in the pool
• The number of alerts detected as the sum of host alerts for each host in the pool
• Seen Since, with the amount of time it has lapsed since the first packet sent/received by any of the
hosts in the pool has been observed
• Breakdown, showing a bar that gives visual insights in the use of both pool traffic directions
• Throughput, with the overall actual throughput of the pool
• Traffic, with the total traffic exchanged by the pool
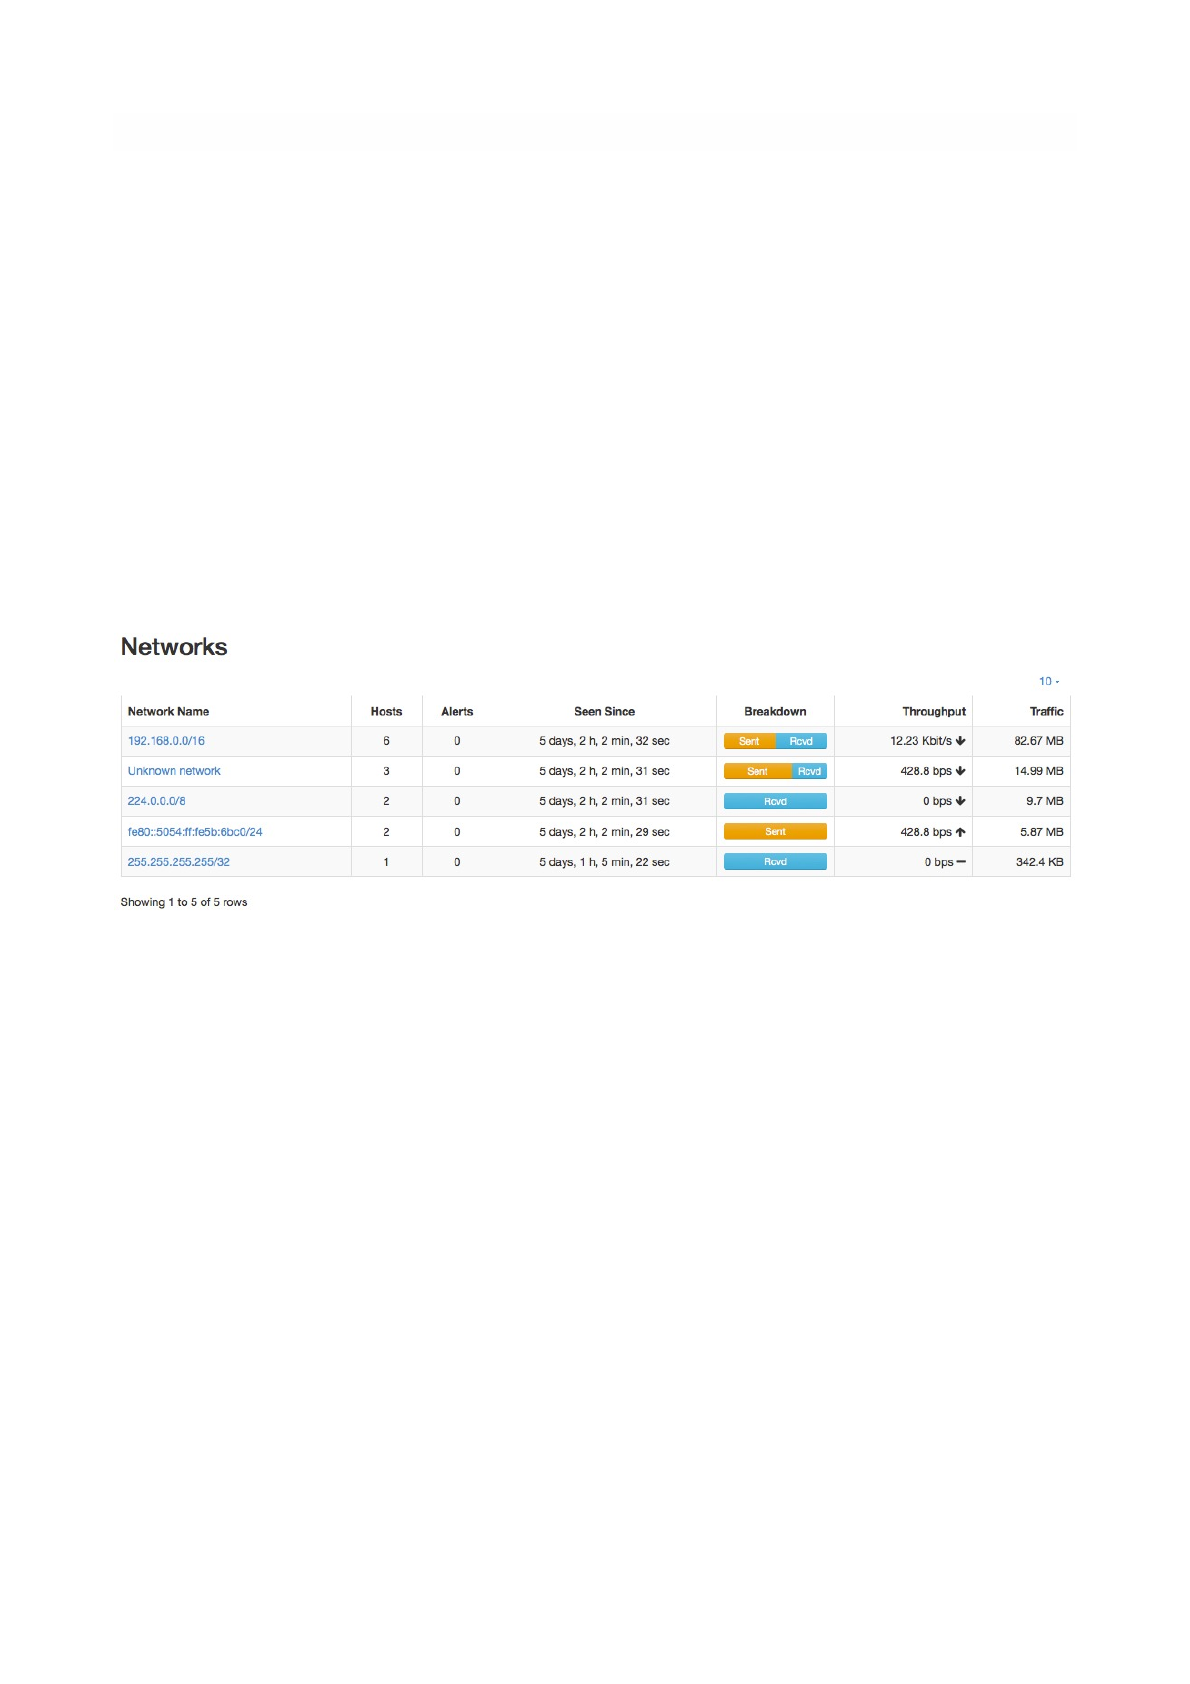
Networks
Networks shows all networks discovered by ntopng.
For each network discovered ntopng provides the number of hosts, alerts triggered, date of discovery,
breakdown, throughput and traffic. Network names can be clicked to display the hosts lists inside the
network selected.
Page of 34 76
The Networks Summary Page

Autonomous Systems
Autonomous Systems shows all autonomous systems discovered by ntopng.
Ntopng uses a Maxmind database to gather information about Autonomous Systems (AS) and based on
this it groups hosts belonging to the same AS. AS number 0 contains all hosts having private IP addresses.
Countries
Countries page provides all countries discovered by ntopng. Any country can be clicked to be redirected to
a page containing the full list of hosts localised in that country.
Operating Systems
Operating Systems page shows a list of all OS detected by ntopng. OSes can be clicked to see the detailed
list of hosts.
Page of 35 76
The Hosts Countries Summary Page
The Hosts Operating Systems Summary Page
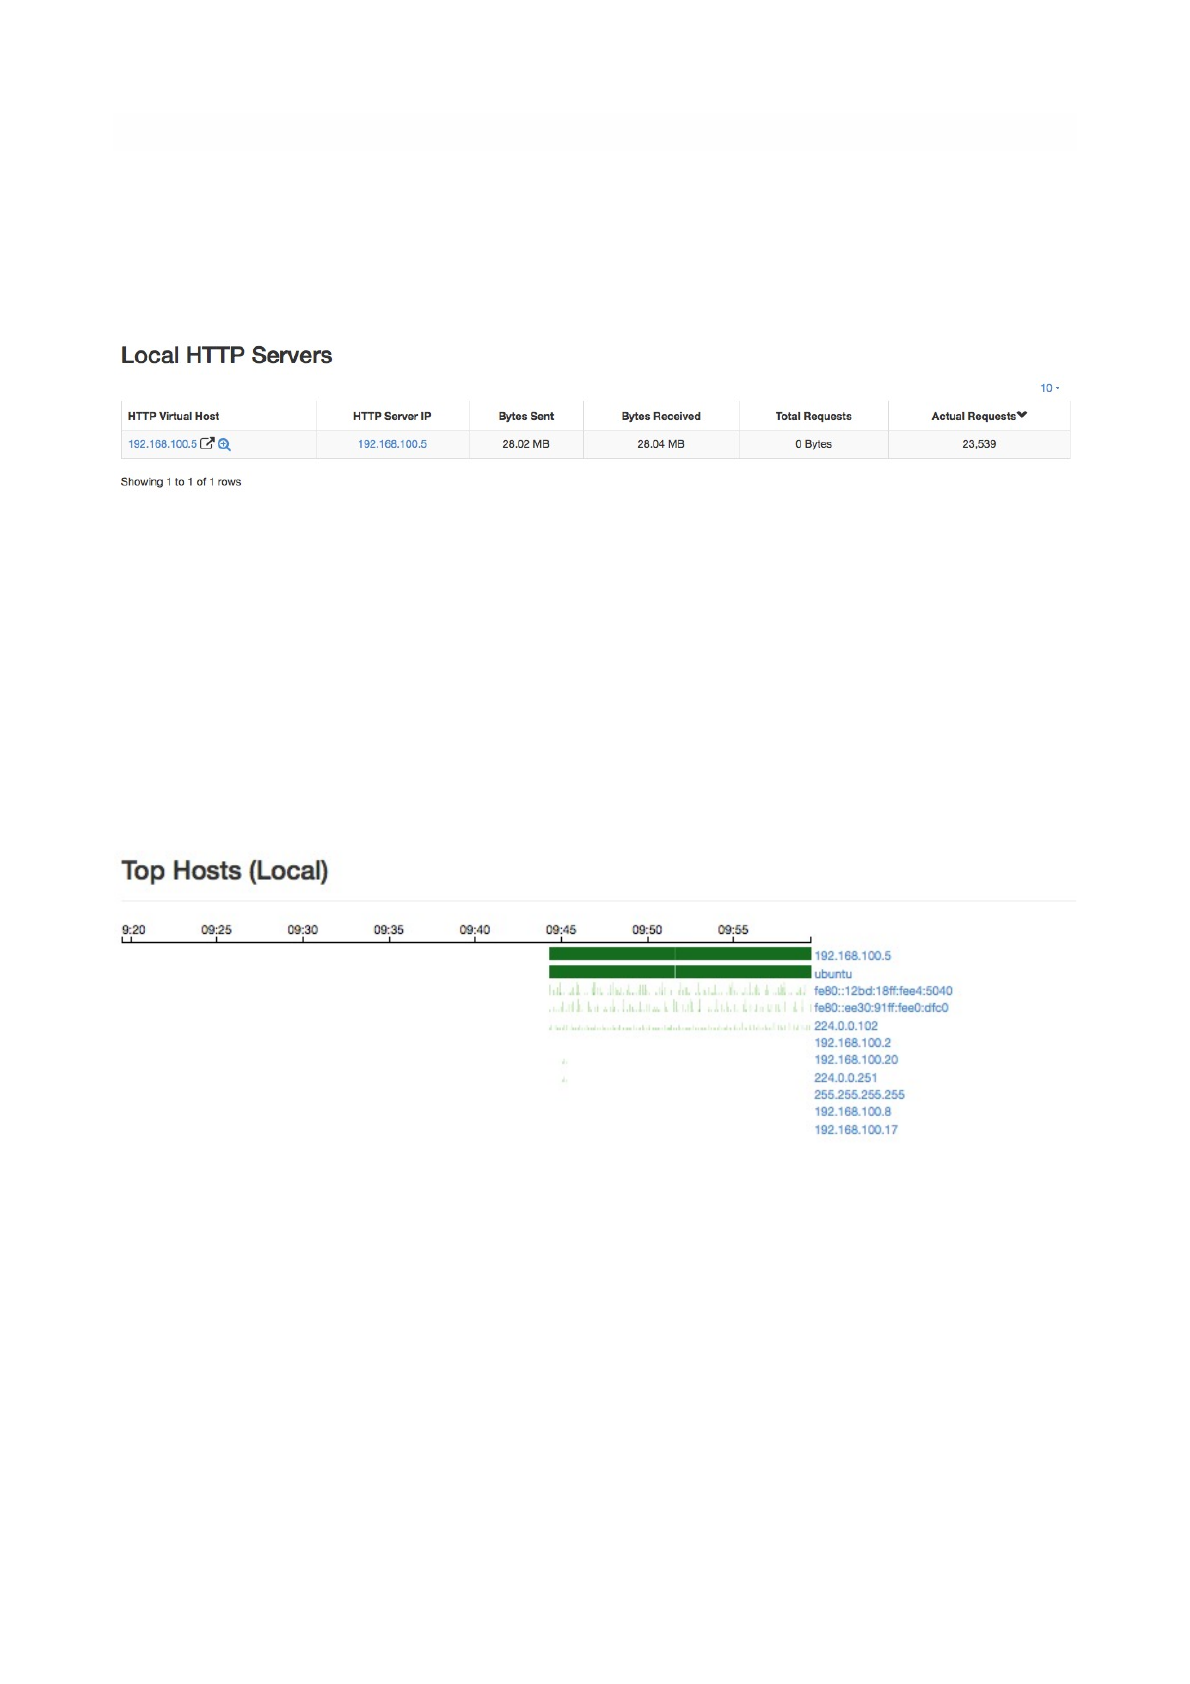
HTTP Servers (Local)
HTTP Servers page lists all local HTTP Servers. Multiple distinct virtual hosts may refer to the same HTTP
server IP, which is specified in the second column. Additional information such as bytes sent and received
are available for each HTTP virtual host. By clicking on the magnifying lens icon near to the HTTP virtual
host, it is possible to display all active flows involving it.
Top Hosts (Local)
Top hosts page provides hosts activity on time basis. The page should be kept open in order to allow the
graph to dynamical update itself with real-time freshly collected data for each host. The time axis is
divided in 5-minute bars and goes backwards in time in a right-to-left fashion, starting from the present.
Page of 36 76
The Local HTTP Servers Summary Page
The Top Hosts Summary Page
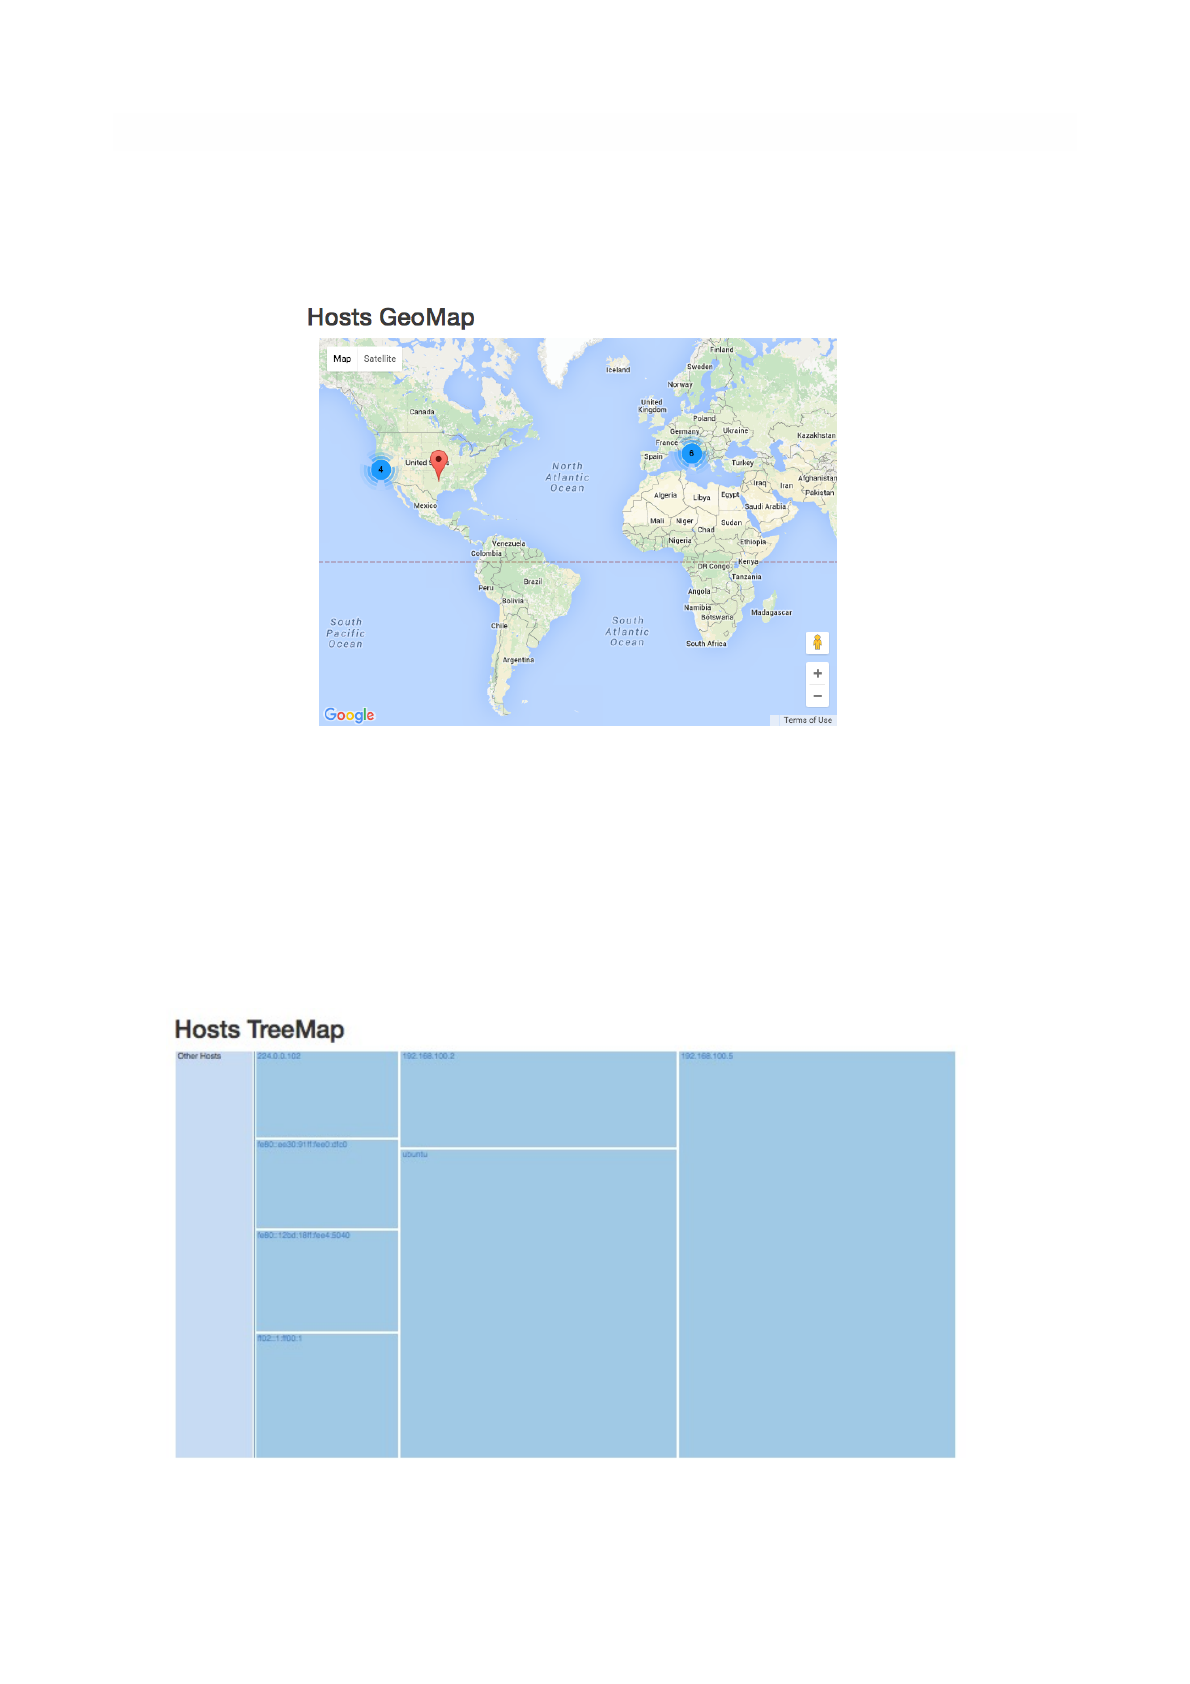
Geo Map
The Hosts Geo Map page provides world map where hosts are arranged according to their
geographical position.
Tree Map
This page provides a tree map of all monitored hosts. By clicking on hosts it is possible to visit the
corresponding ‘Host Details’ page.
Page of 37 76
The Hosts Tree Map Summary Page
The Hosts Geo Map Summary Page
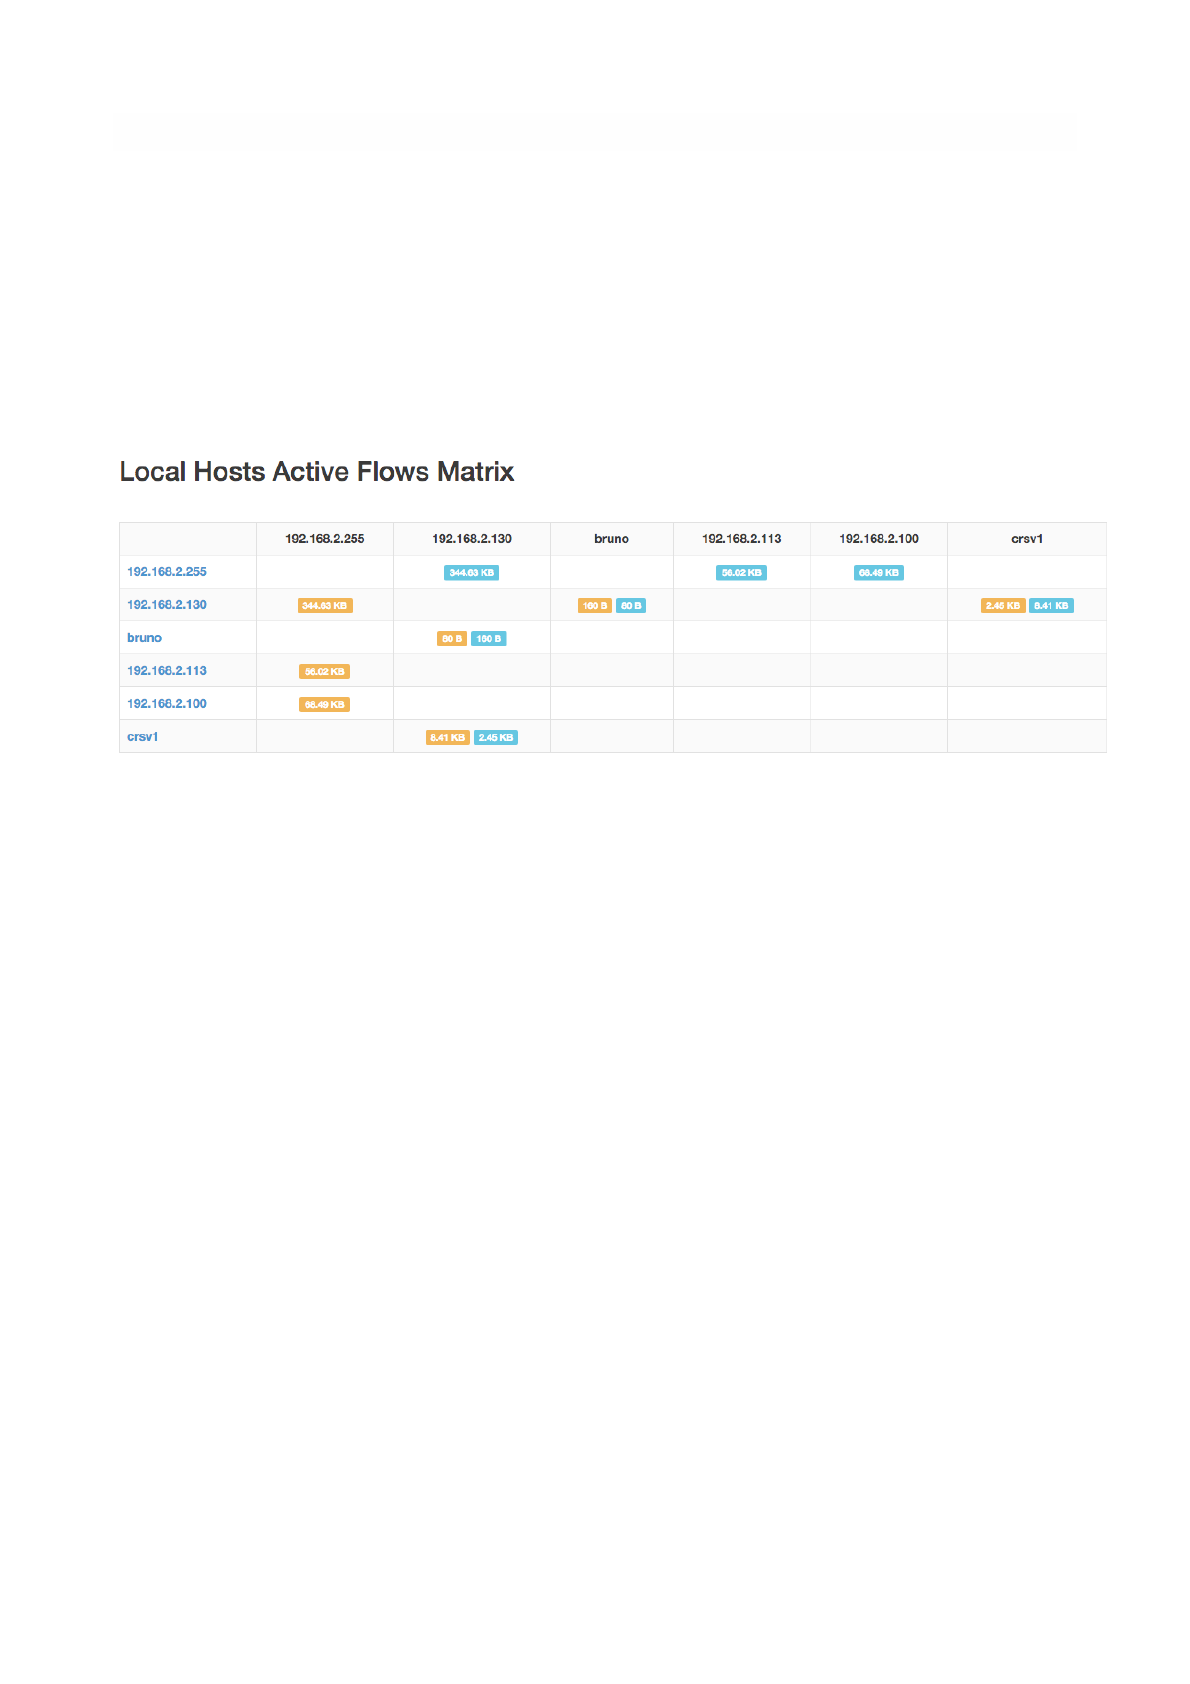
Local Flow Matrix
Local Hosts Active Flows Matrix page visualises a matrix of local hosts versus local hosts. Each cell
contains the amount of traffic exchanged between every pair of hosts. Since flows are bi-directional, up to
two values can be indicated in each cell.
Page of 38 76
The Active Flows Matrix Page
Host Details
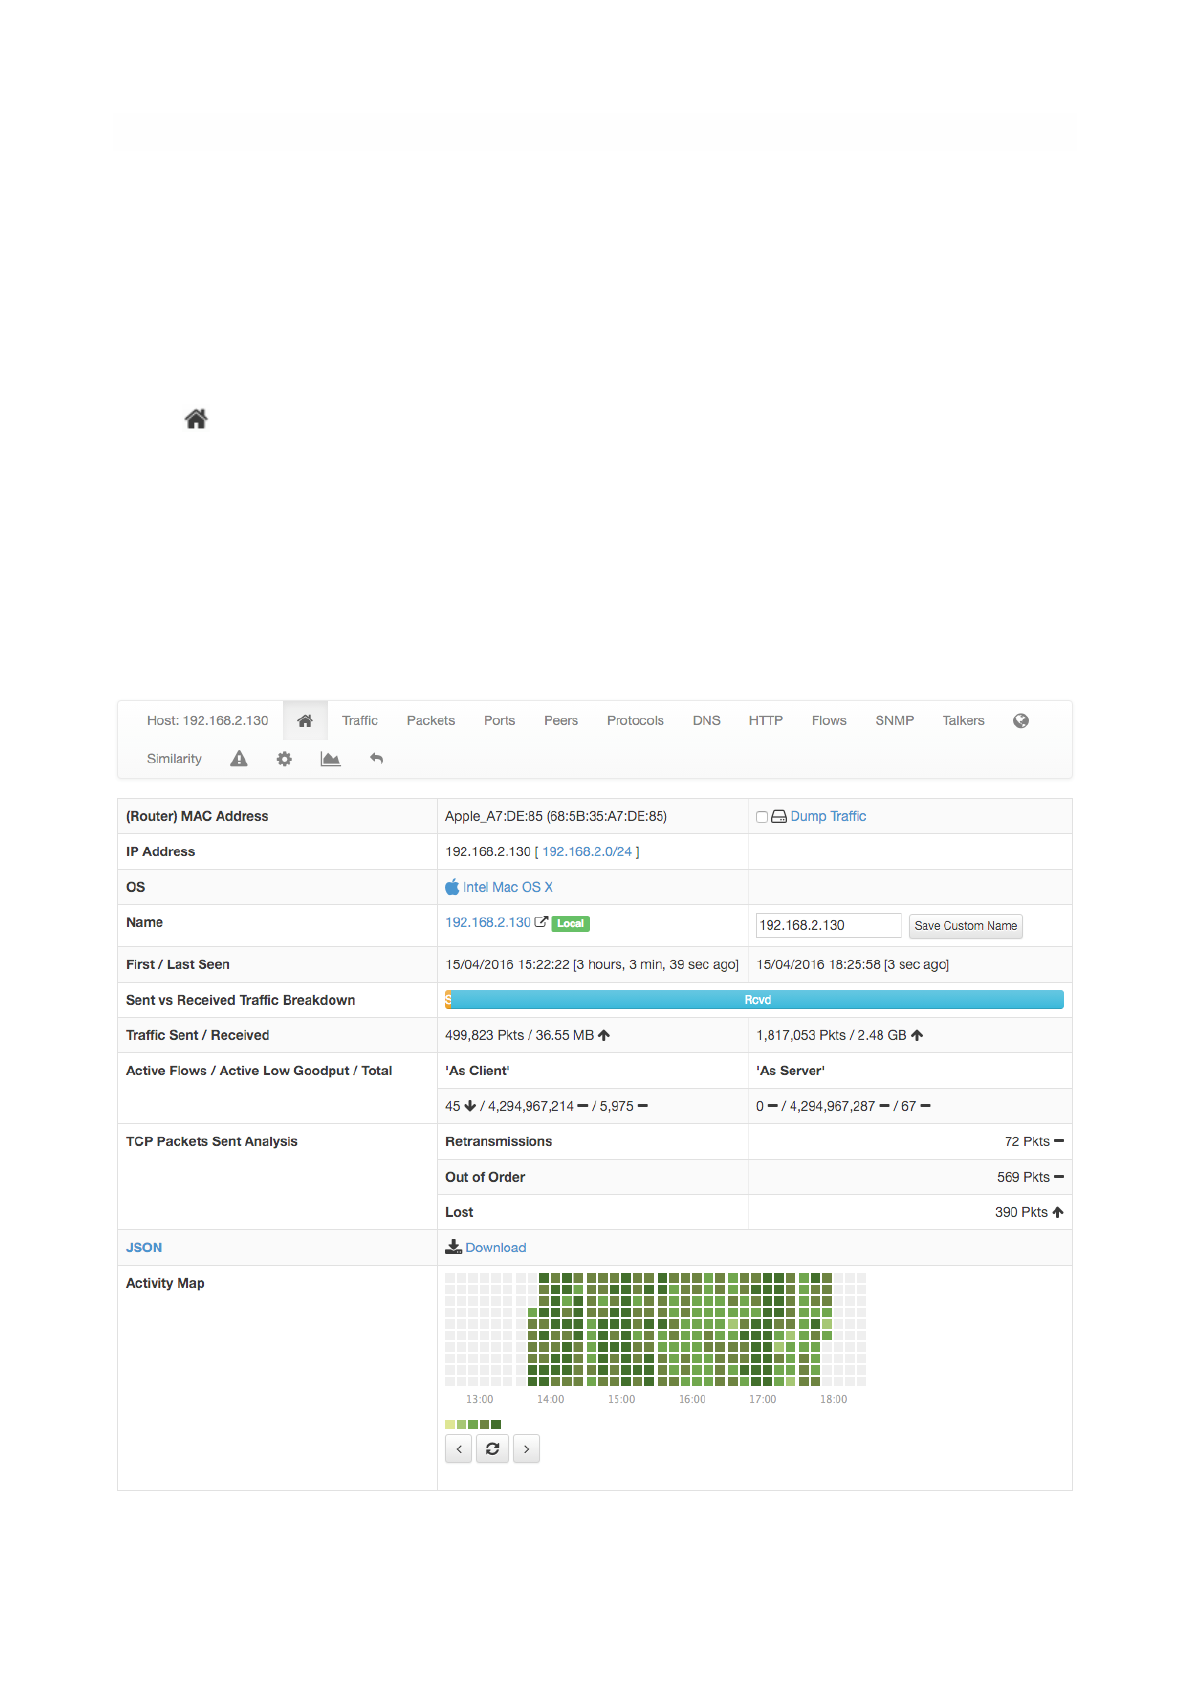
Host Details page is as follows.
A contextual menu with labels and badges appears right below the top toolbar. Menu entries are
dynamic, hence, some of them may not always be present.
Menu entries are discussed below.
Home
Home is the default view of the Host Details page and provides detailed information including host MAC
Address (or the last router MAC address if the host is remote), IP Address (with network mask if detected),
a toggle to activate/deactivate alerts for the host, a checkbox to enable packet dump for the specific host,
symbolic hostname (or IP address), location (local or remote), date and time of first and last packet seen
for the host, traffic breakdown, amount of traffic packets received/sent, number of flows as client/server
host. All of this information is also available in JSON format by clicking on the ‘Download’ link. The heat
map provides the Activity Map for each host. Each box represents one minute of traffic. By default, Activity
Map shows the last six hours, but it is possible to set a different timeframe using the controls.
Page of 39 76
The Home View of the Host Details Page

Traffic
The Traffic Page provides Layer-4 protocol statistics for the host. A pie chart showing L-4 protocol
breakdown is show at the top of page. A table with detailed statistics is shown below the chart.
Page of 40 76
The Traffic View of the Host Details Page
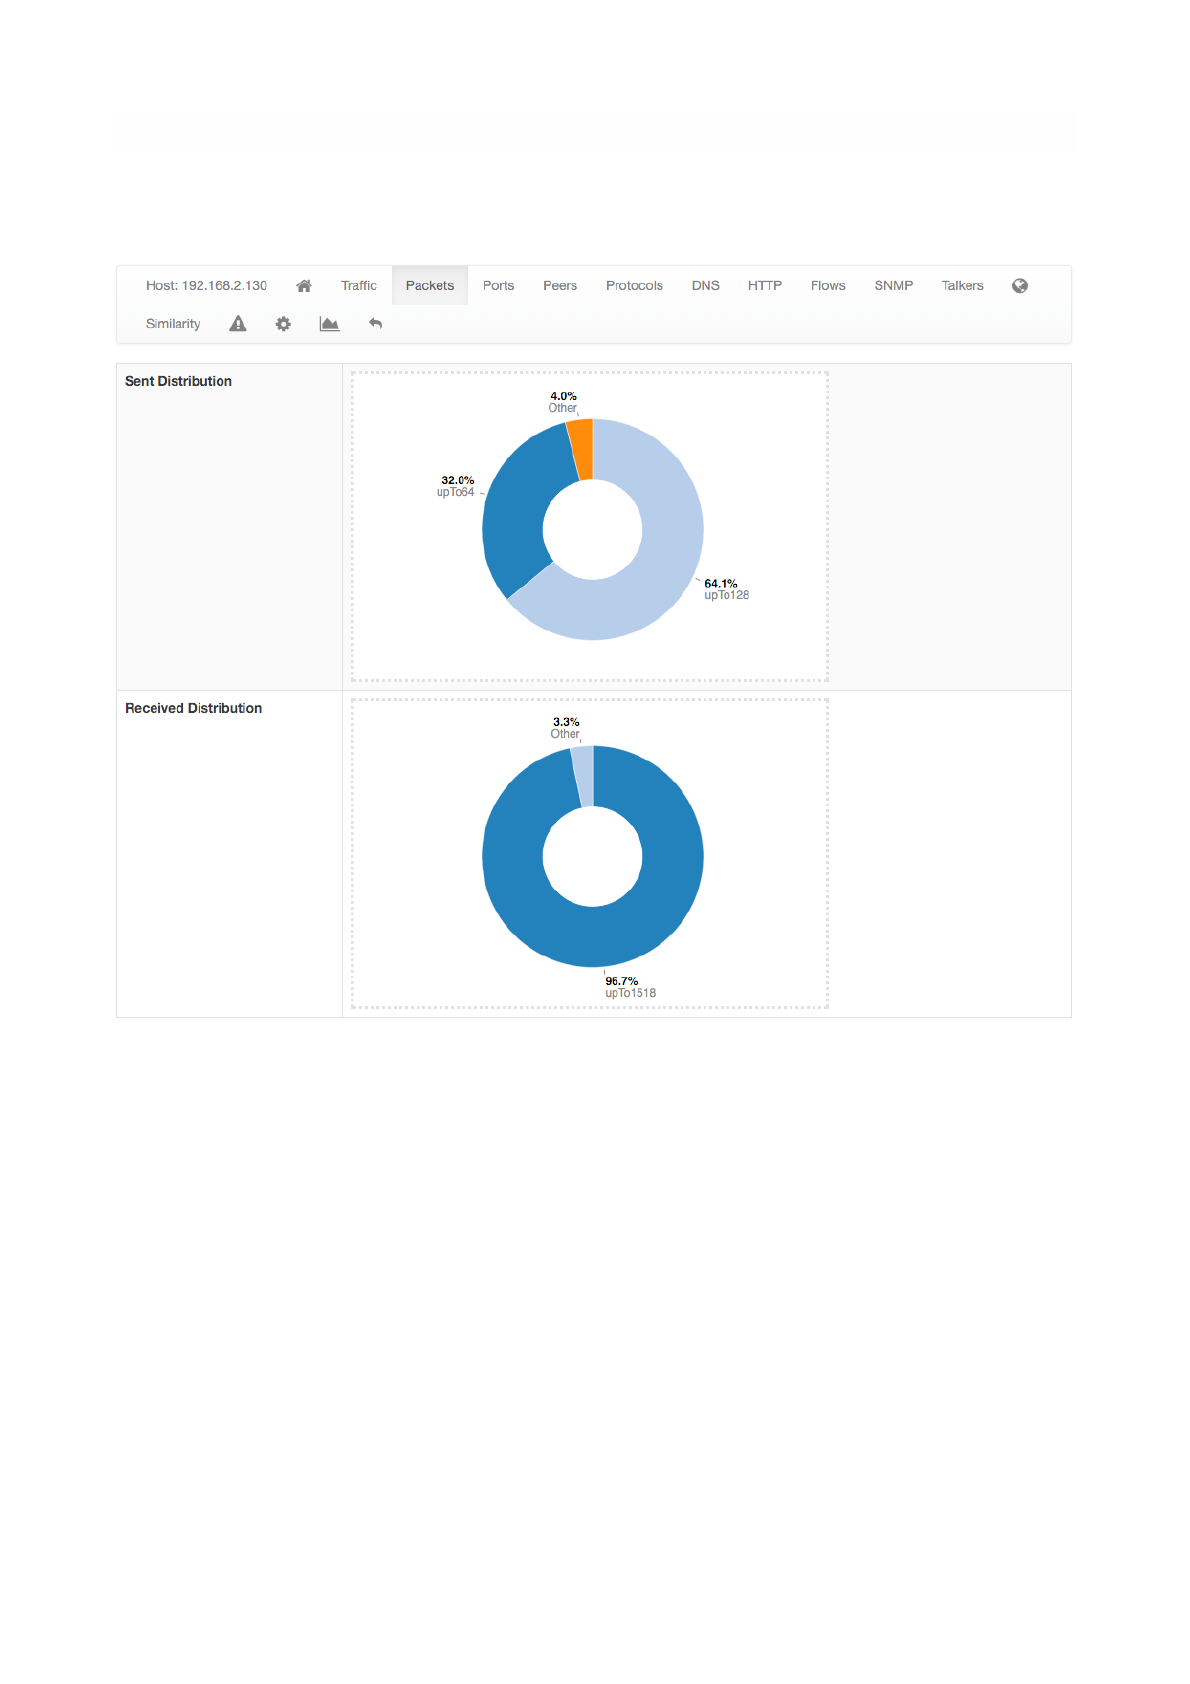
Packets
Packets page provides pie charts with packet size distribution, both for sent and received packets.
Page of 41 76
The Packets View of the Host Details
Ports
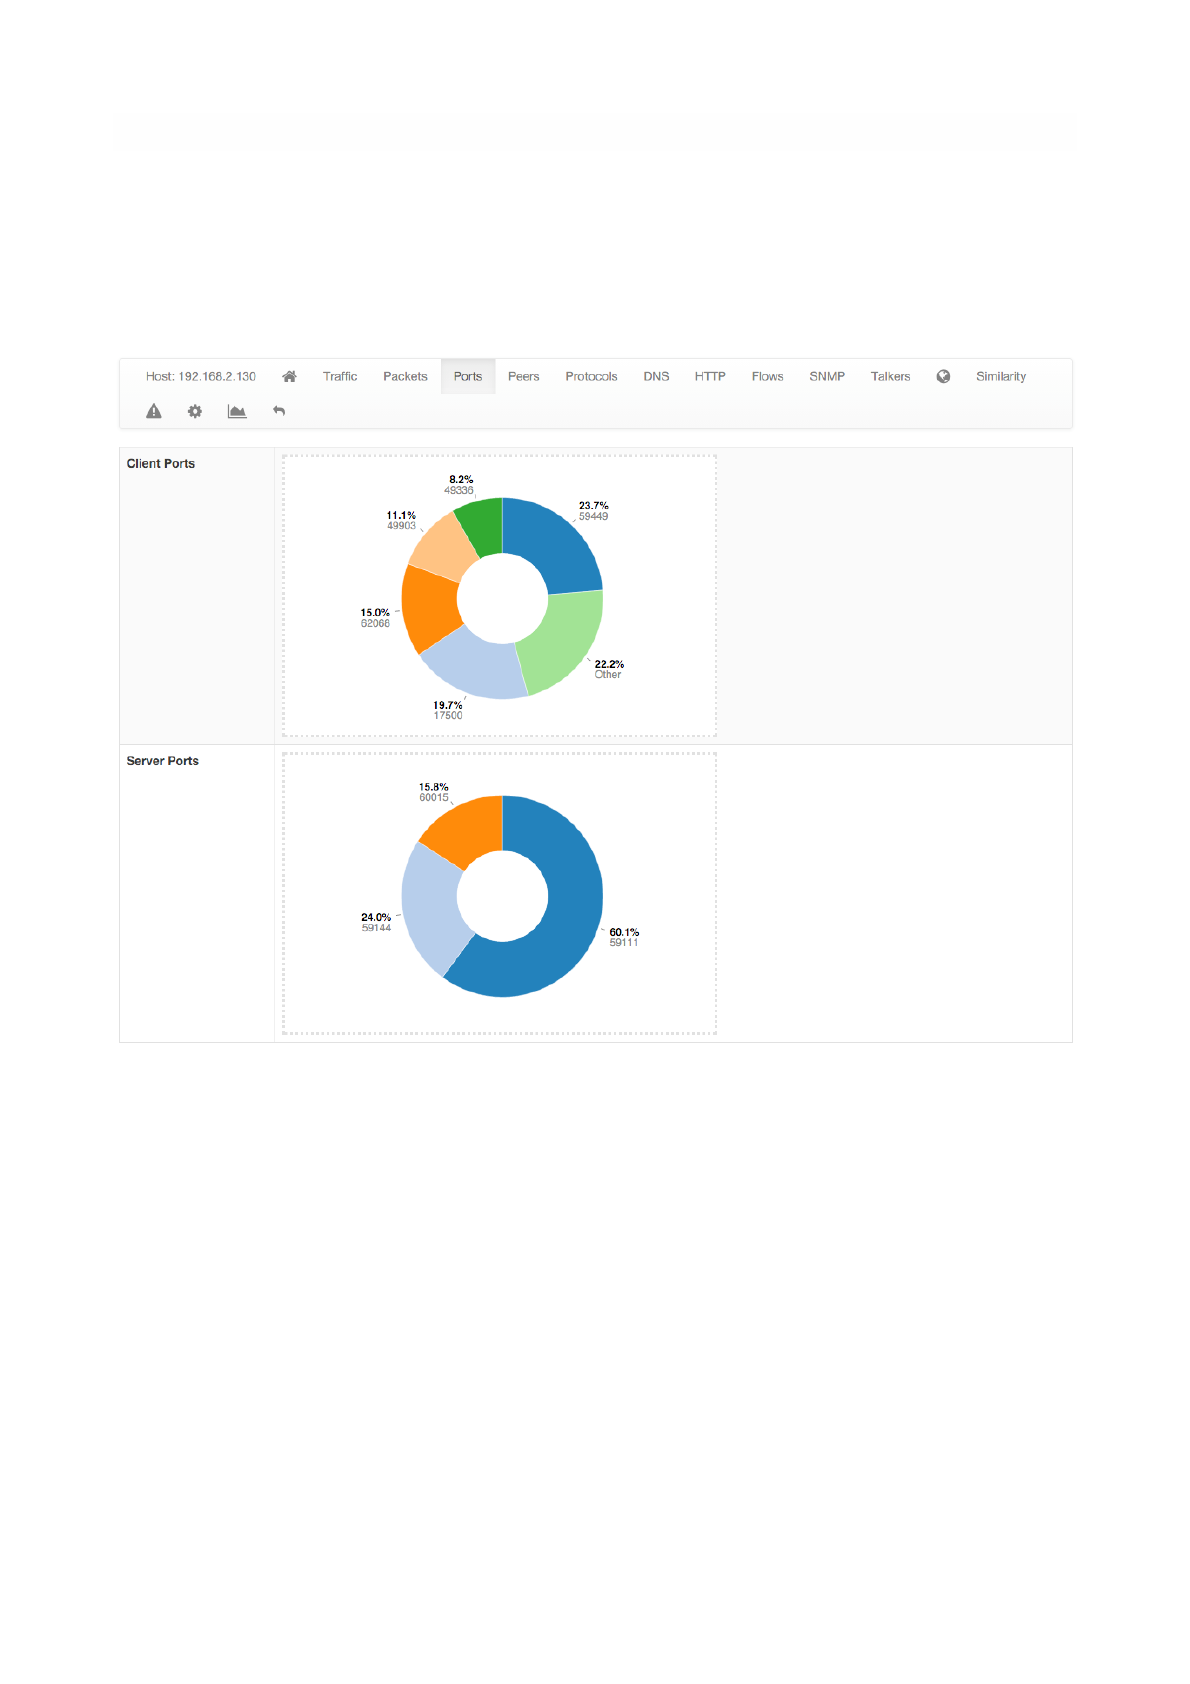
Ports page provides pie charts with traffic statistics grouped by port. A chart is available for client ports
and another one is available for server ports.
!
Page of 42 76
The Ports View of the Host Details Page
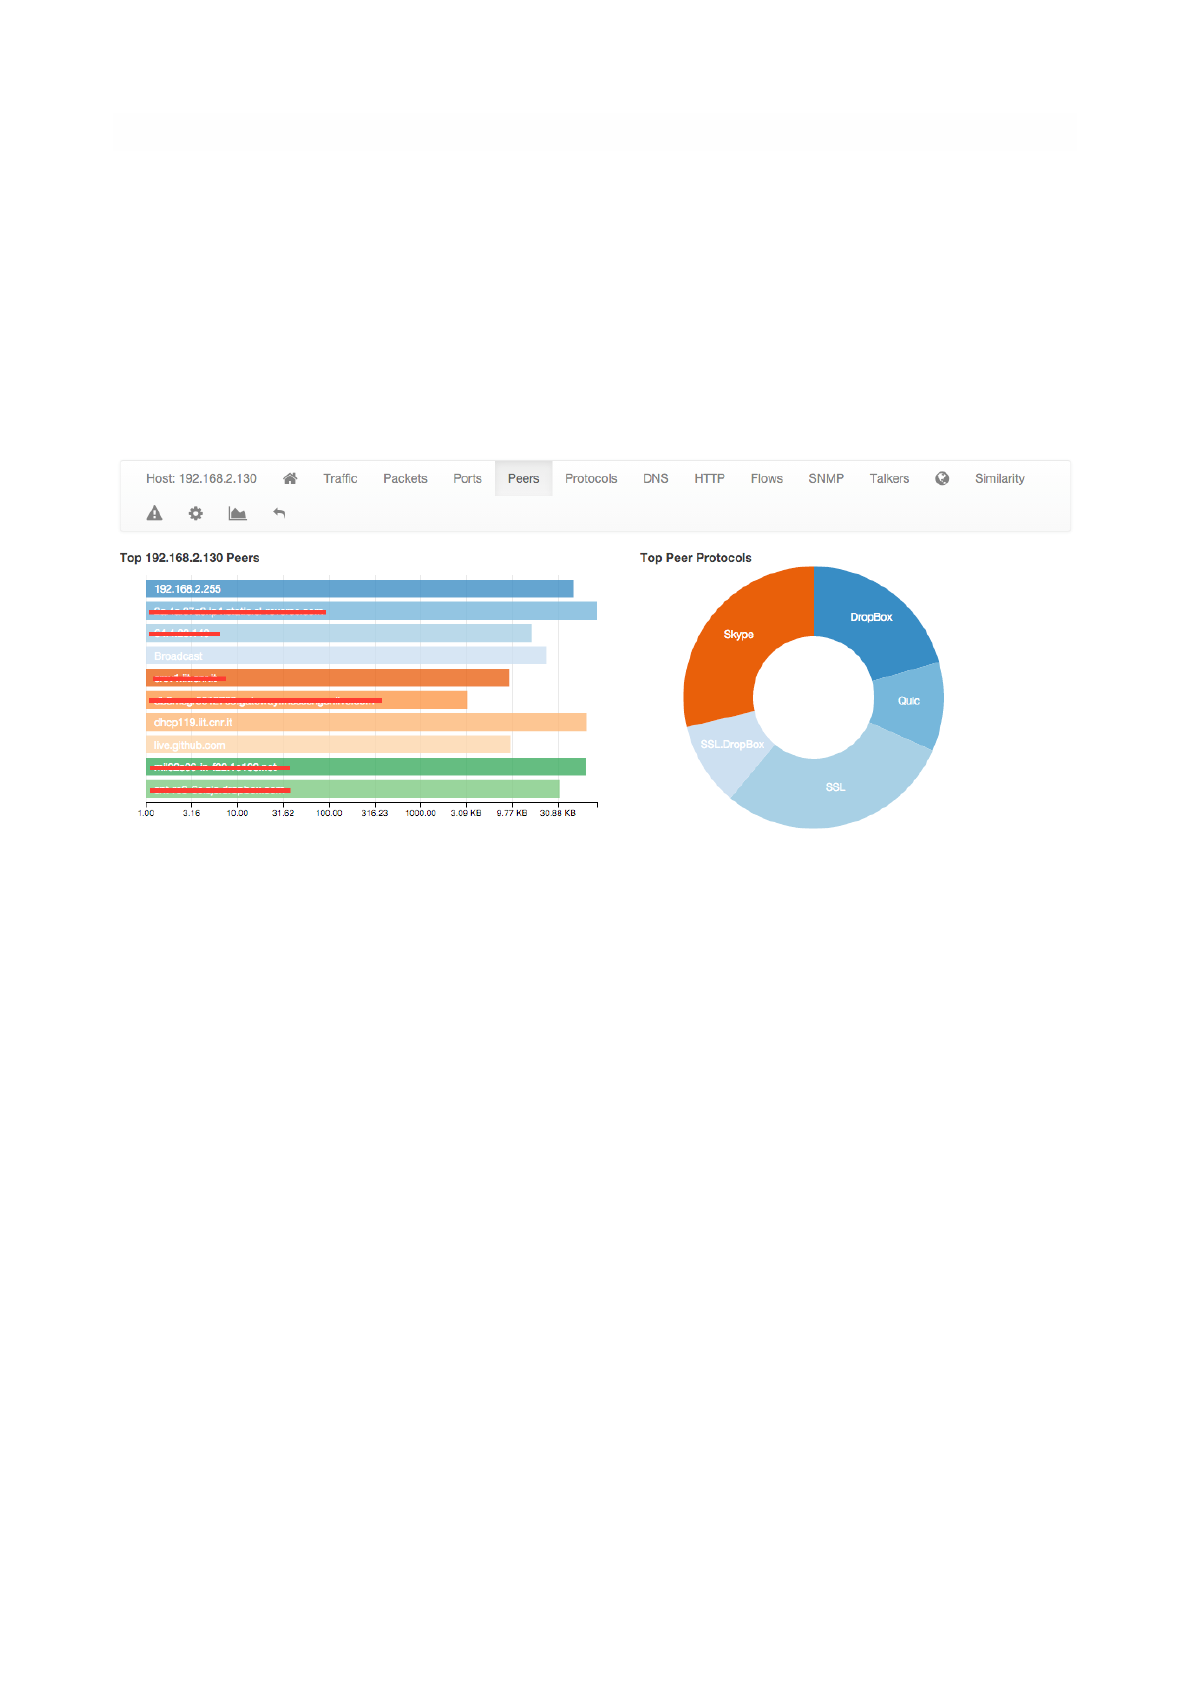
Peers
Peers page presents a graphical overview of top contacted peers and top protocols used. In the following
screenshot some hosts are struck-through intentionally for privacy reasons. A table with top application
per peer is shown below the graphical overview. Every information is clickable to allow the user to drill
down and find insights.
!
Page of 43 76
The Peers View of the Host Details Page
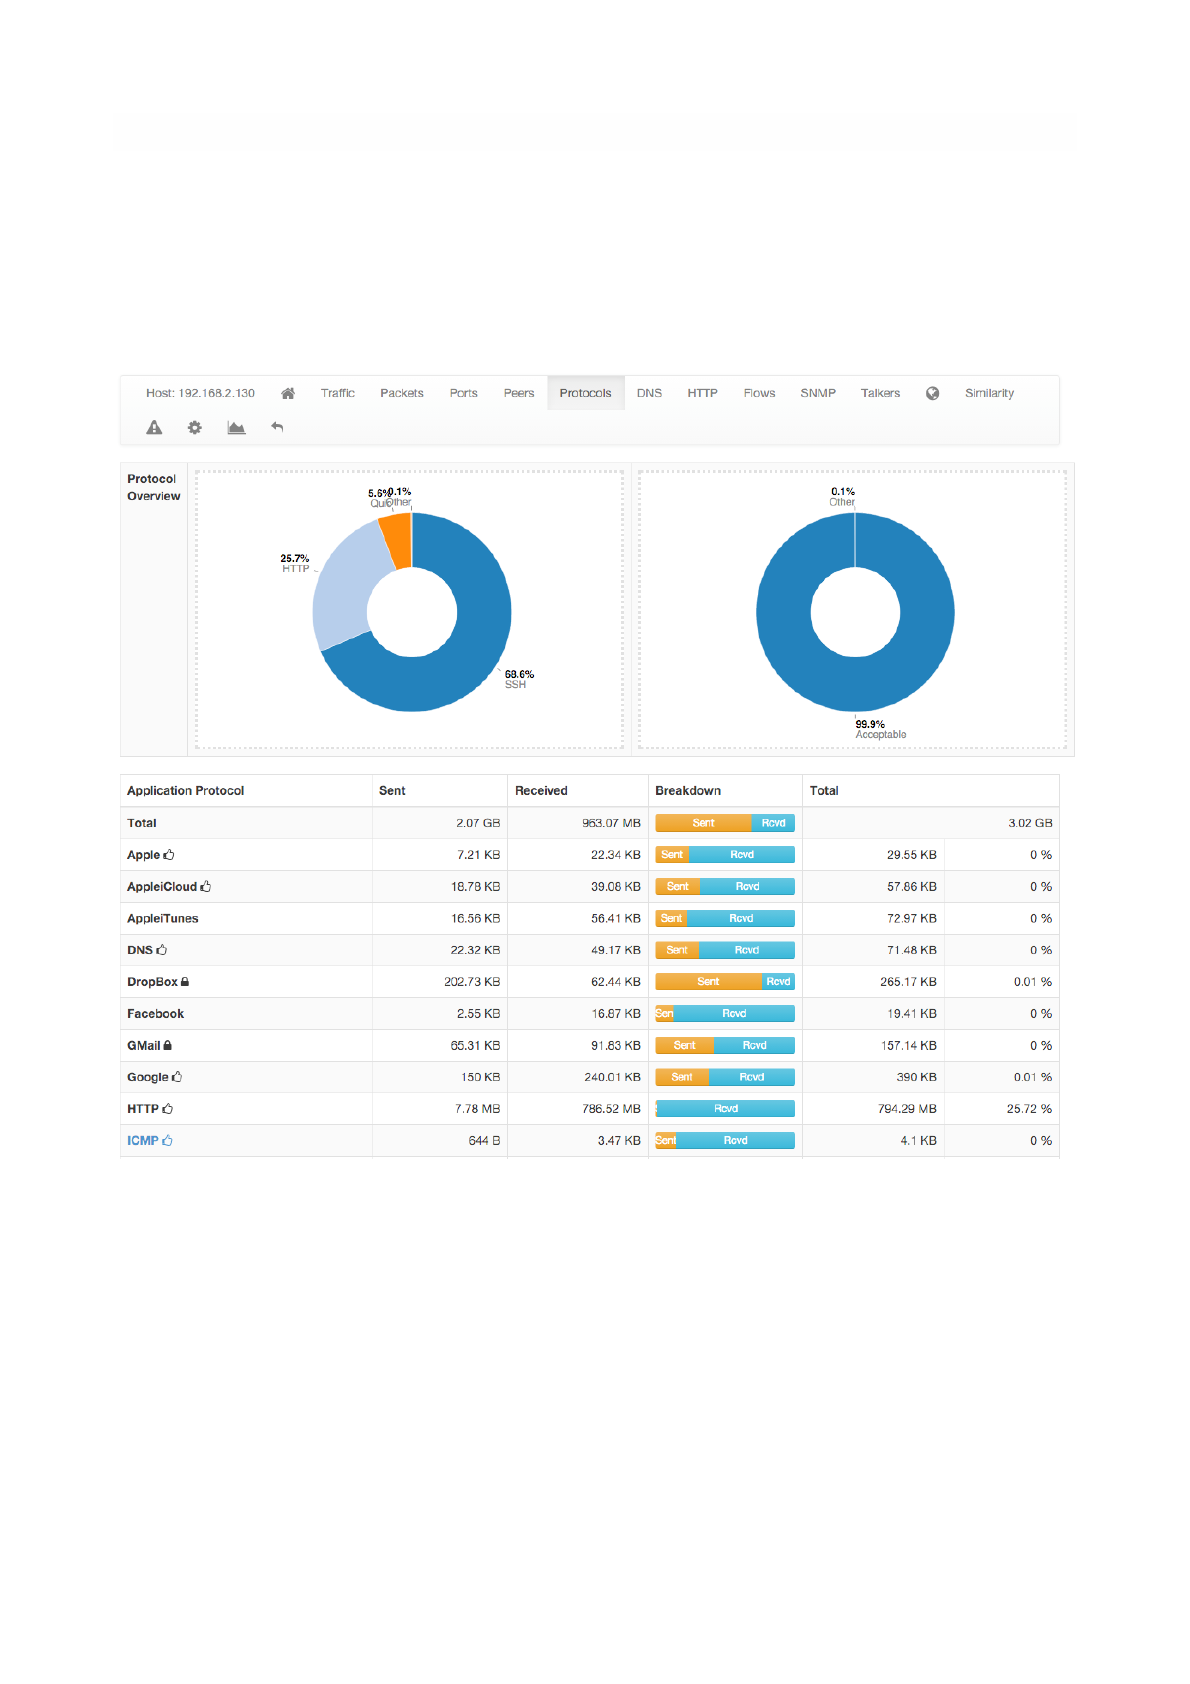
Protocols
Using the DPI information, this page provides in pie chart and tabular format the amount of traffic divided
by application. An additional pie chart provides a statistics about protocol type. A click on the protocol
name redirects the user to the page with detailed statistics about the selected protocol.
Page of 44 76
The Protocols View of the Host Details Page
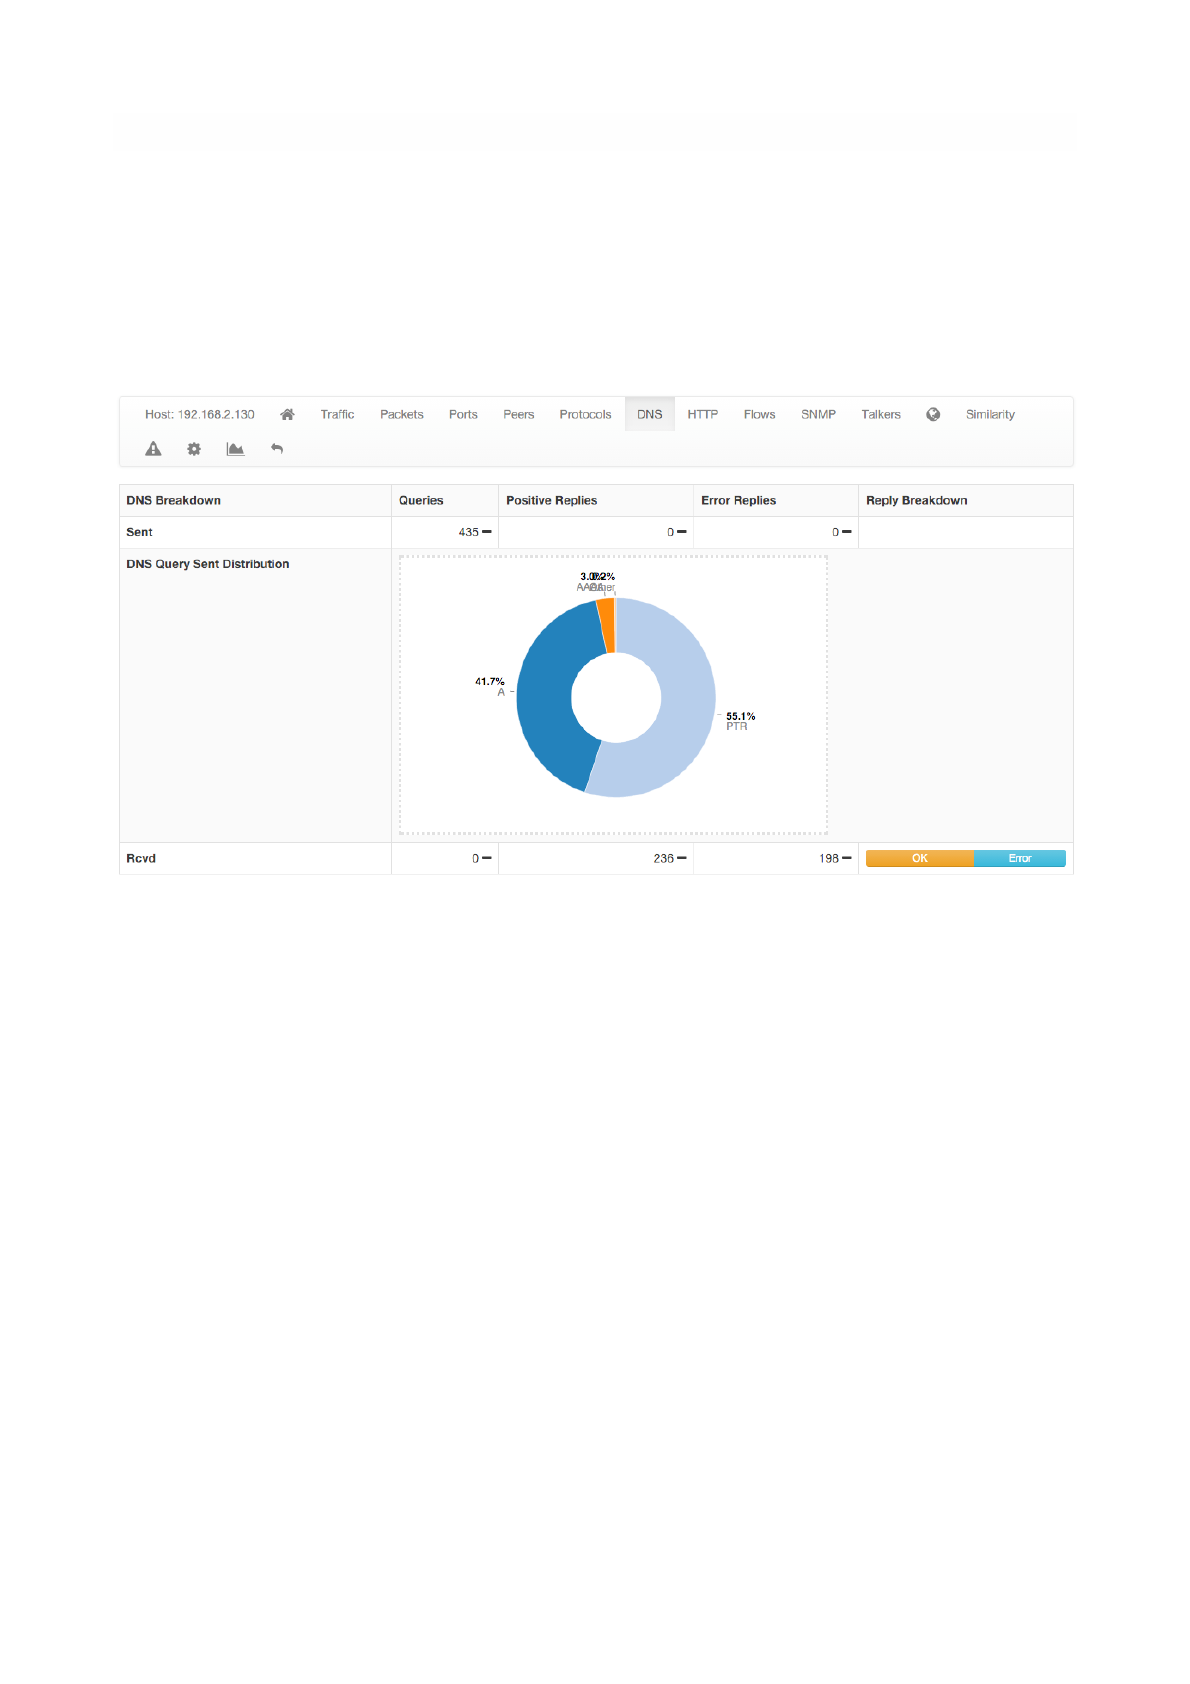
DNS
The chart and the table displayed on this page report DNS statistics, such as the number of queries, their
type (e.g., A, AAAA, PTR, and so on), and possible errors.
$
Page of 45 76
The DNS View of the Host Details Page
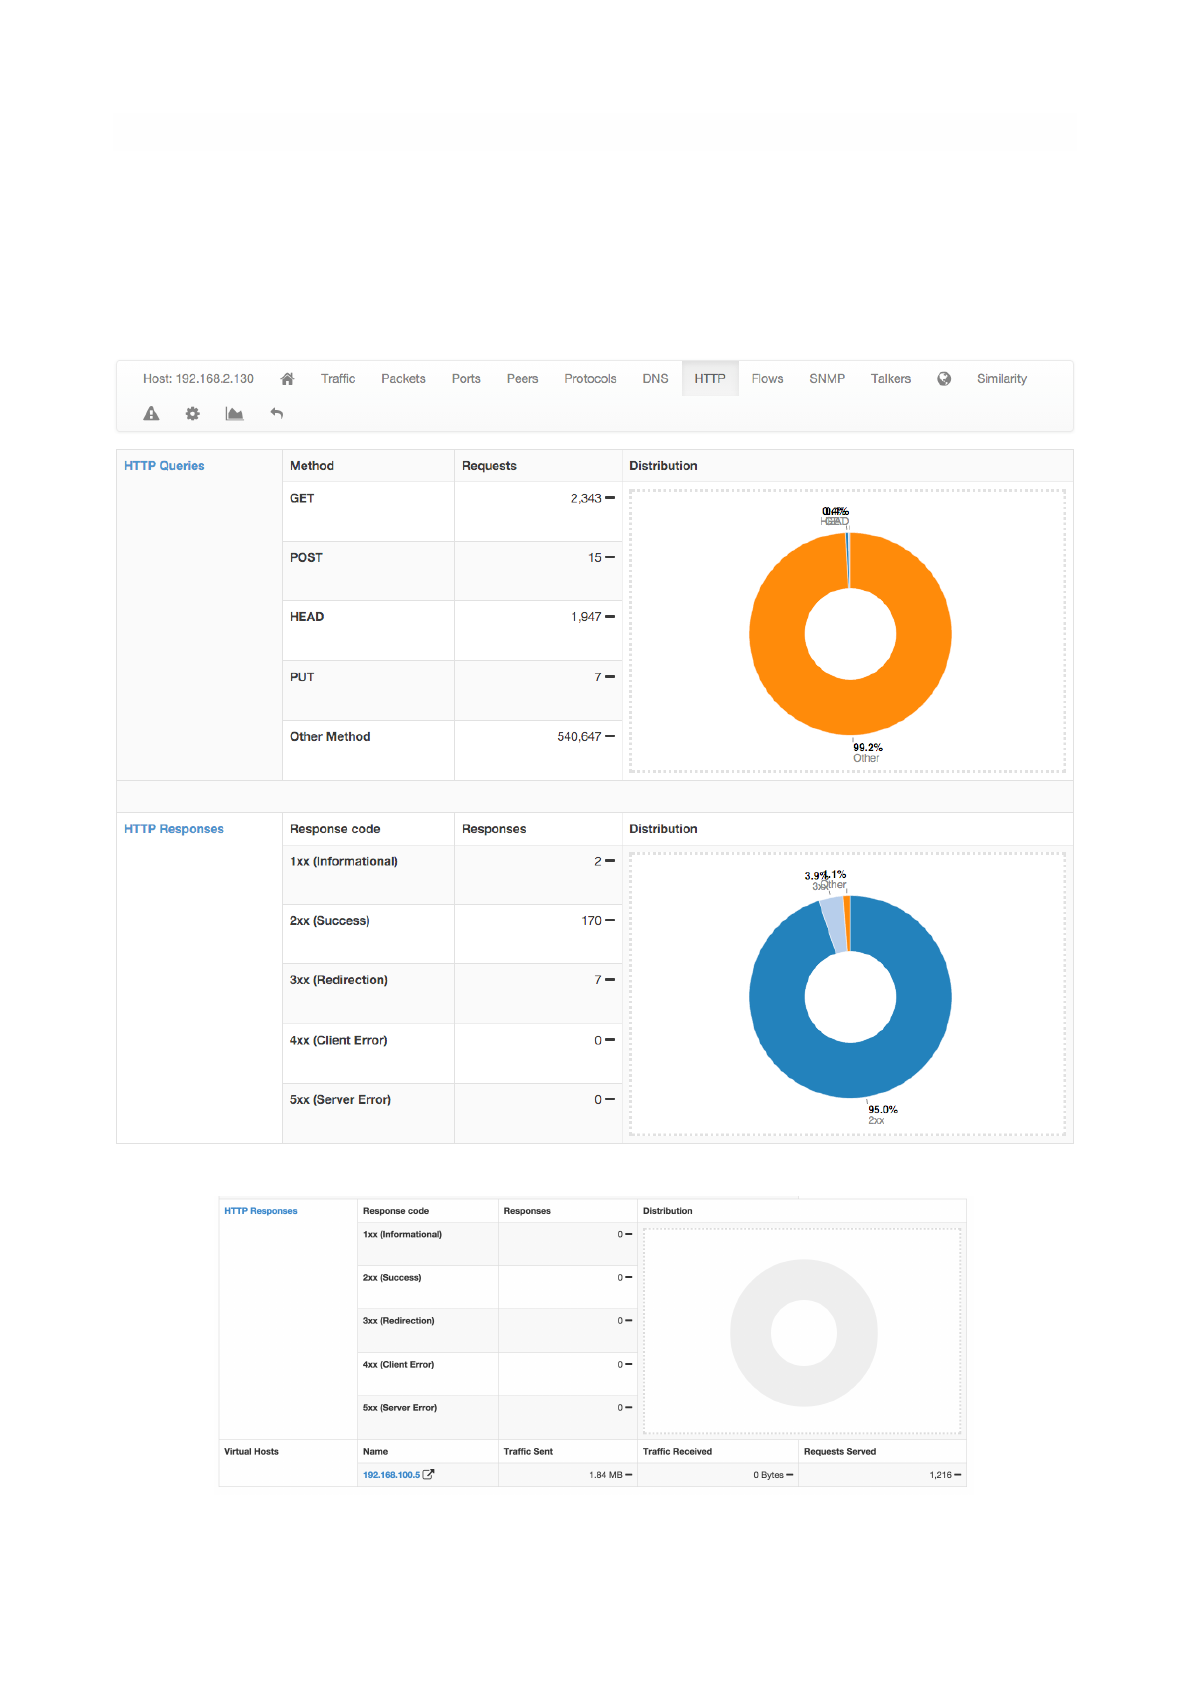
HTTP
This page provides information about the HTTP protocol in terms of requests done and responses
received for each HTTP method, together with response codes. Counters are provided both as tables and
pie charts. In the case of virtual host being detected, a badge with the number of virtual hosts detected for
Page of 46 76
The HTTP View of the Host Details Page
The HTTP View of the Host Details Page with Virtual Hosts
the same IP address is displayed in the host bar and an entry for each virtual server is displayed in a
virtual server table.
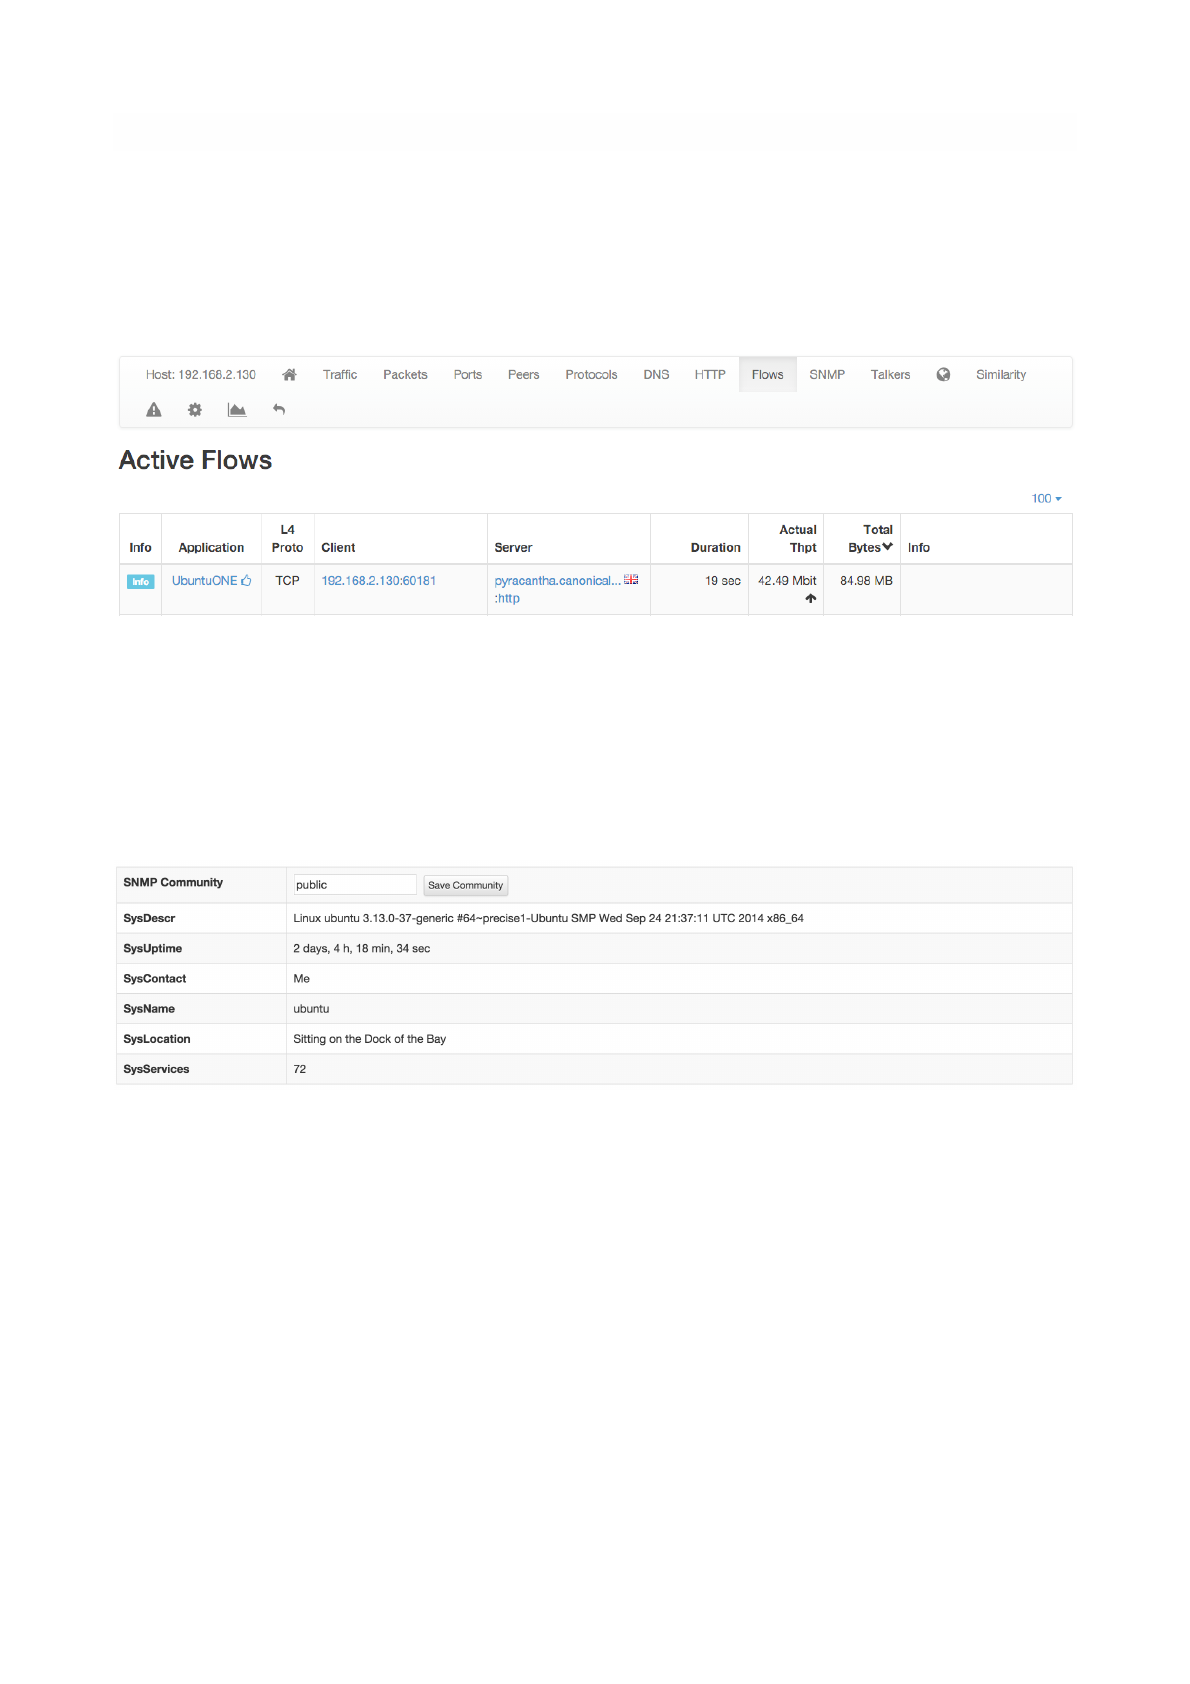
Flows
Flows page lists all active flows that have the selected host as an endpoint. A section of this manual
discuss in greater detail the statistics shown for flows.
SMNP
SMNP page provides SNMP information for the selected host with all the standard SNMP traffic metrics.
Page of 47 76
The Flows View of the Host Details Page
The SMNP View of the Host Details Page
Talkers
Talkers page provides top talkers having active flows with selected host. Similarly to the Community
edition dashboard, top talkers are laid out in a Sankey Diagram.
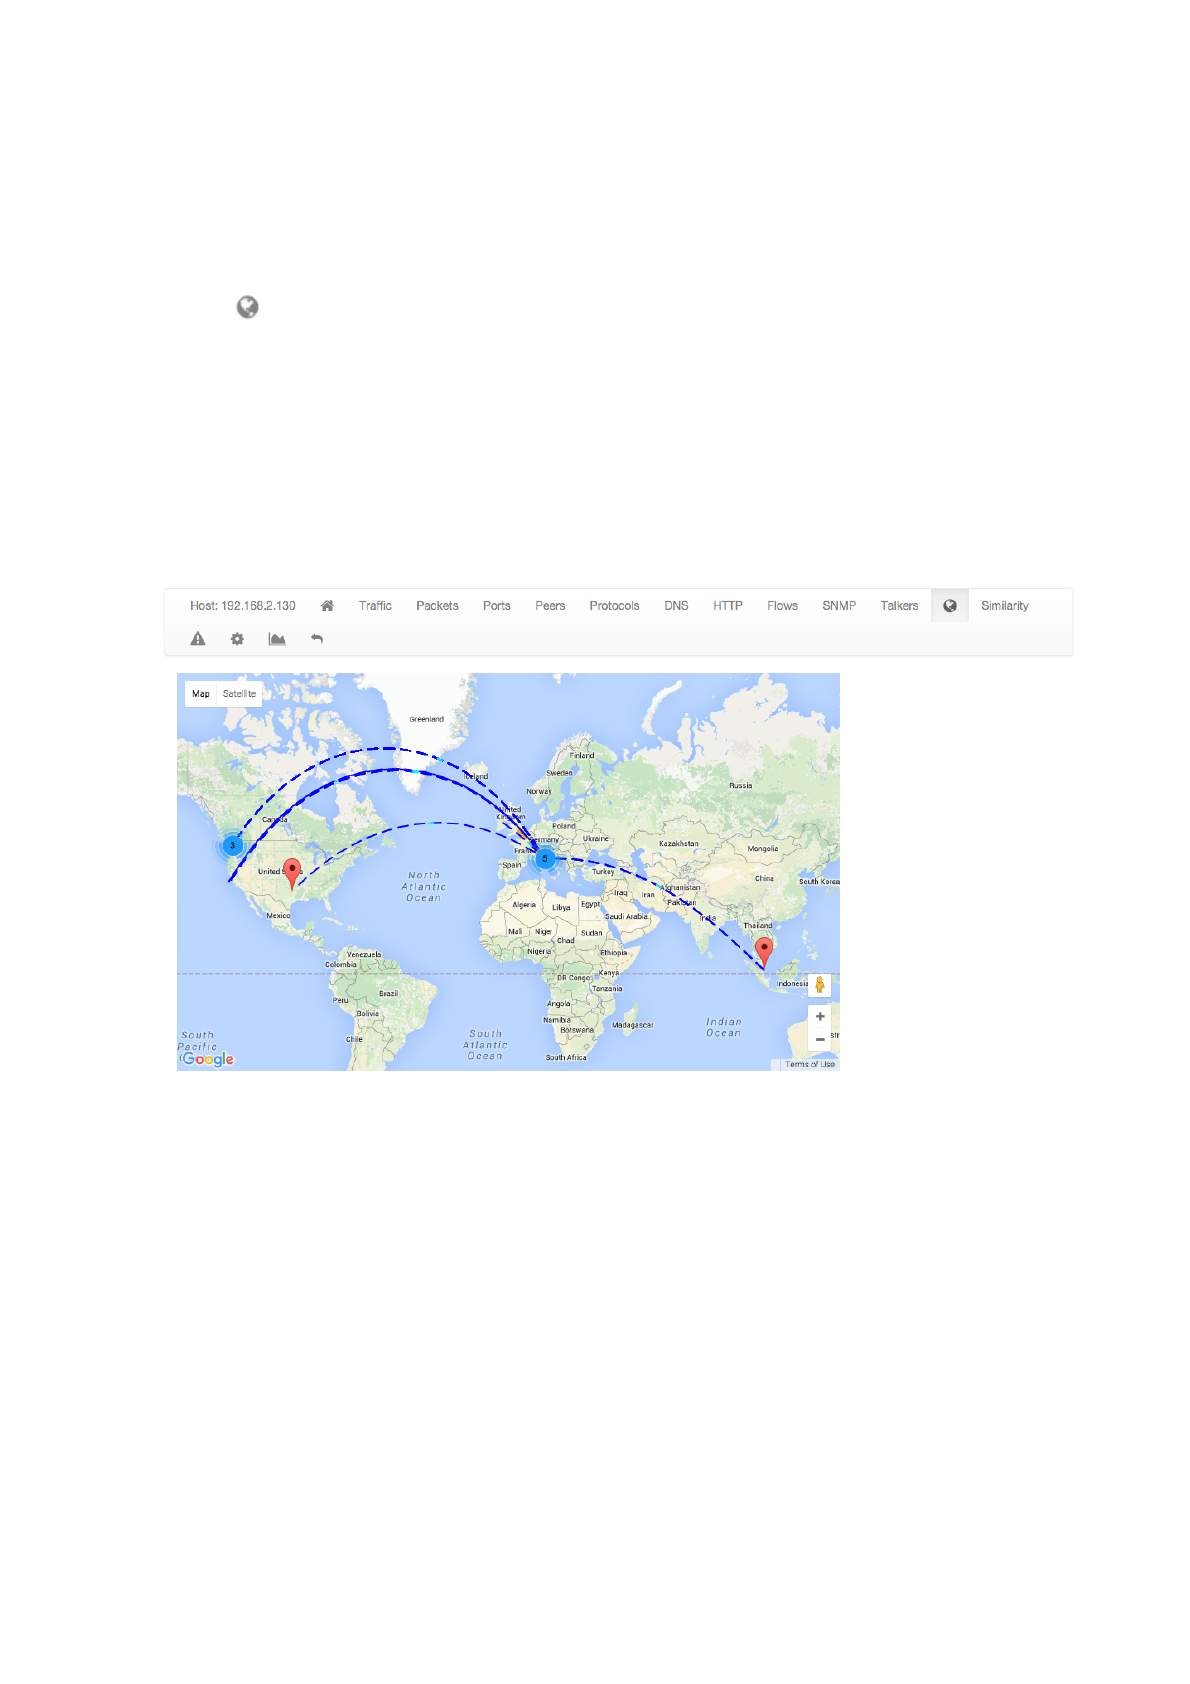
Geography !
Geography page provides an interactive map that shows the selected hosts, its flows, and its
peers."
$
Page of 48 76
The Geography View of the Host Details Page
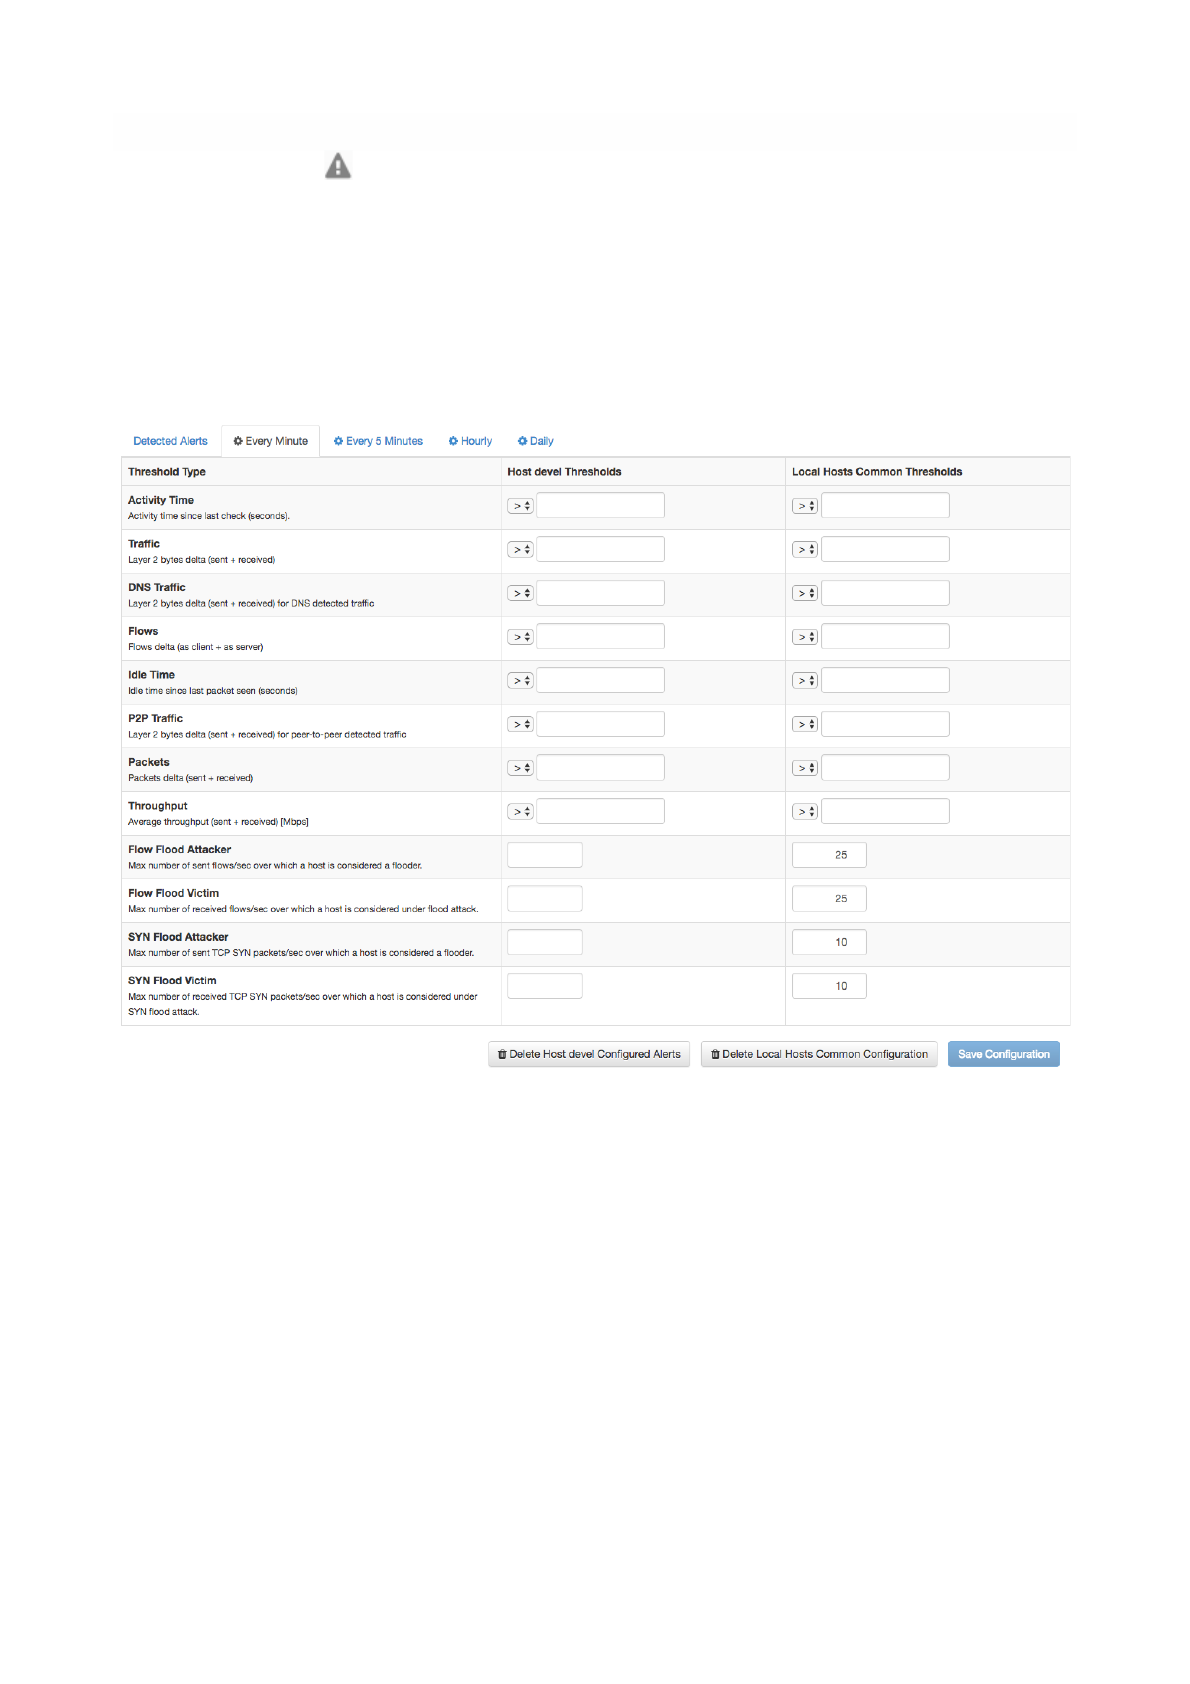
Alerts Configuration !
Alerts Configuration page enables the user to set custom thresholds on multiple metrics, and to trigger
alerts based on those thresholds. Alerts can be armed, among other metrics, per total bytes, DNS traffic,
P2P traffic or packets, in a fixed time interval. Available time intervals are 1 and 5 minutes, 60 minutes,
and 1 day. Two columns are available for configuration. The first affects only the selected local host,
whereas the second affects all local hosts.
Page of 49 76
The Alerts View of the Host Details Page
Statistics
Statistics page provides historical traffic statistics for the selected host. The user can choose to filter
statistics on a protocol basis and display data in several formats (e.g., bytes, packets, flows, and so on).
Page of 50 76
The Statistics View of the Host Details Page
The Dropdown menu in The Statistics View of the Host Details Page
Interfaces
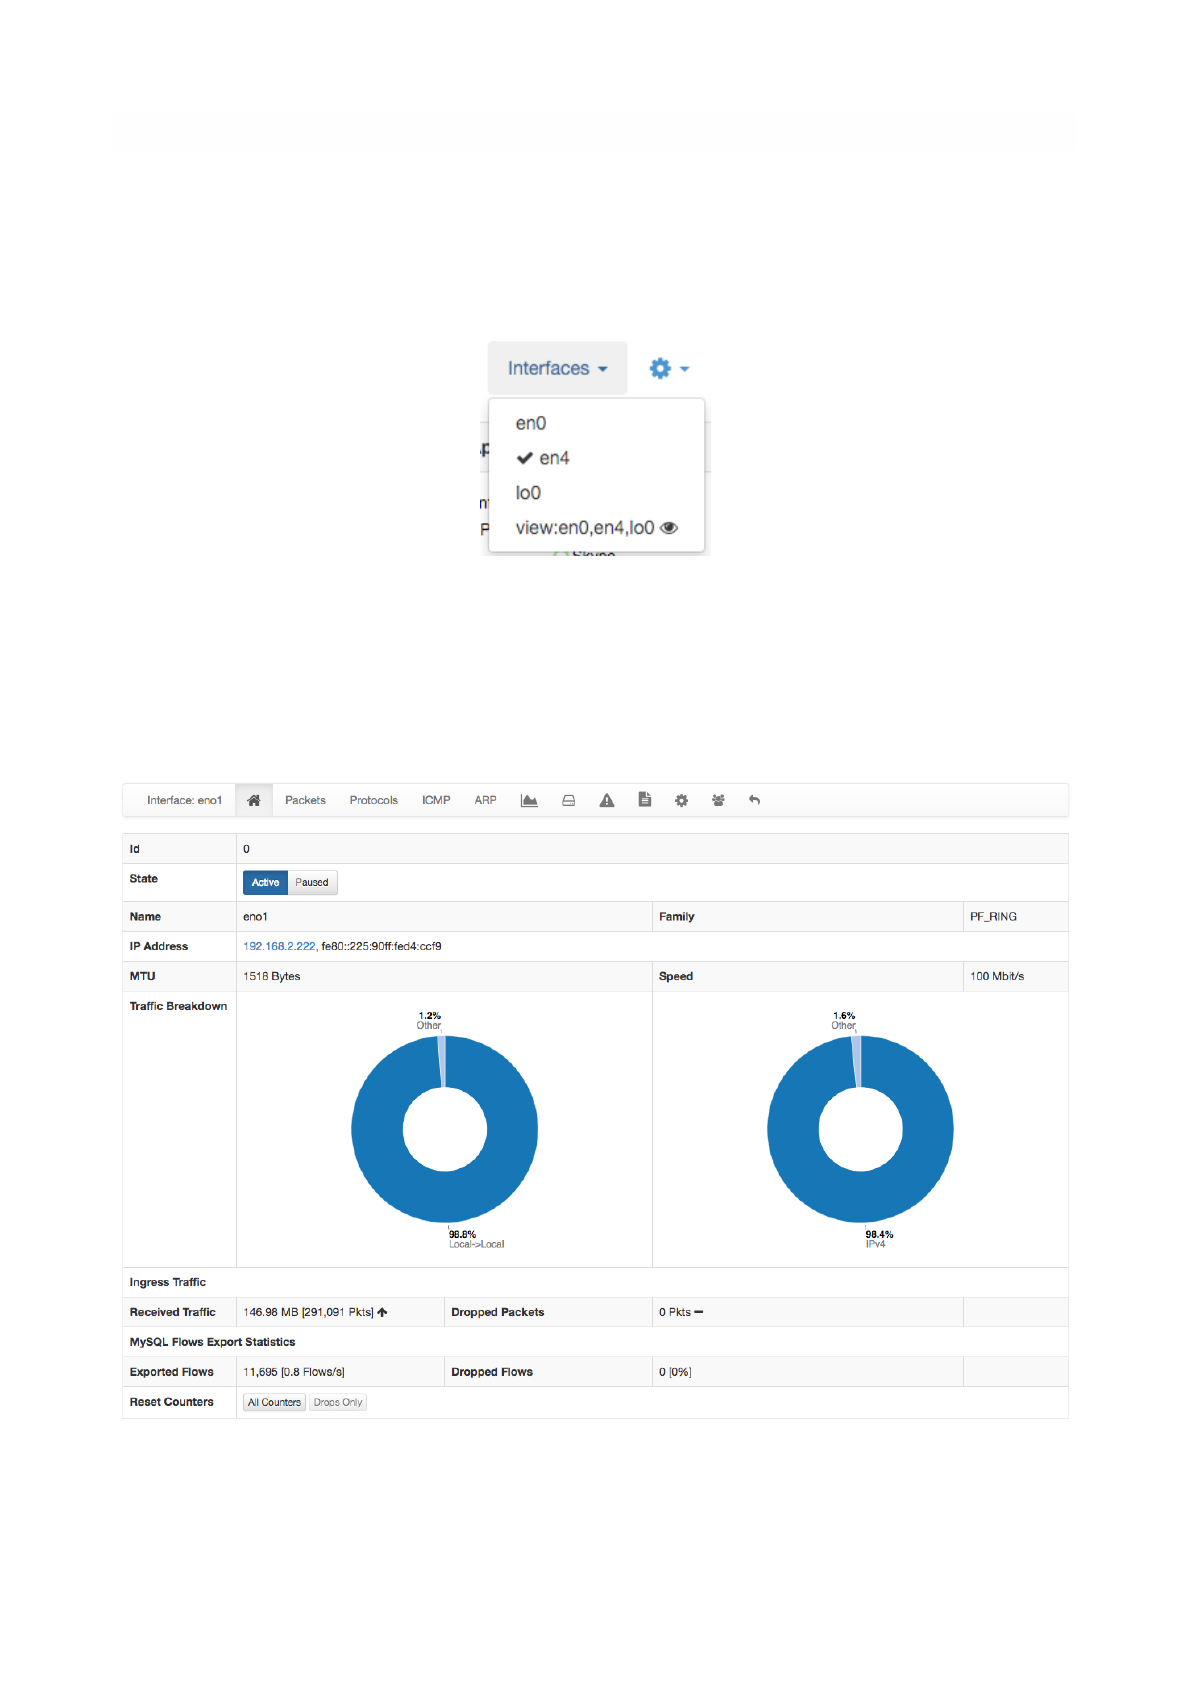
The Interfaces dropdown menu entry in the top toolbar contains lists all the interfaces that are currently
monitored by ntopng. Among all interfaces listed, one has a check mark that indicates the interface is
currently selected. Every data and information shown in ntopng web GUI relates to the currently selected
interface. Any interface listed can be selected simply by clicking on its name.
The dropdown menu is only used to switch between selected interfaces, it is also used to actually see
interface traffic statistics. Interface traffic statistics can be accessed by clicking on the currently selected
Page of 51 76
The Interfaces Dropdown Menu
The Home View of the Interface Details Page

interface. A contextual menu with multiple options and badges appear right below the top toolbar. Menu
entries are discussed below.
Home
In the Home page it is possible to view general interface information, such as Id (a unique integer
identifier ntopng assigns to each monitored interface), family (e.g., pcap), and the overall traffic counters in
bytes. It is possible to customise the interface name just by writing a custom name into the Name textbook
and clicking on “Save Name”. Interface monitoring can be temporarily paused from the ‘State’ toggle
buttons.
Packets
Packets page shows a pie chart of packets size distribution.
Protocols
Protocols page provides three pie charts and a specific table with nDPI-detected protocols for the selected
interface.
In the two top pie charts ntopng shows the application distribution and its categorisation. The bottom pie
chart shows nDPI-detected applications for currently active flows. All labels are clickable and point to
detailed statistics pages. Belo pie charts there is a list of protocols detected with the corresponding total
traffic, both in absolute terms and as a percentage of the total traffic.
By selecting any Application Protocol, it is possible to display a statistics page with temporal charts for that
protocol. Similarly, by clicking on the magnifying lens icon, it is possible to display all active flows for that
protocol.!
Page of 52 76
The Packets View of the Interface Details Page
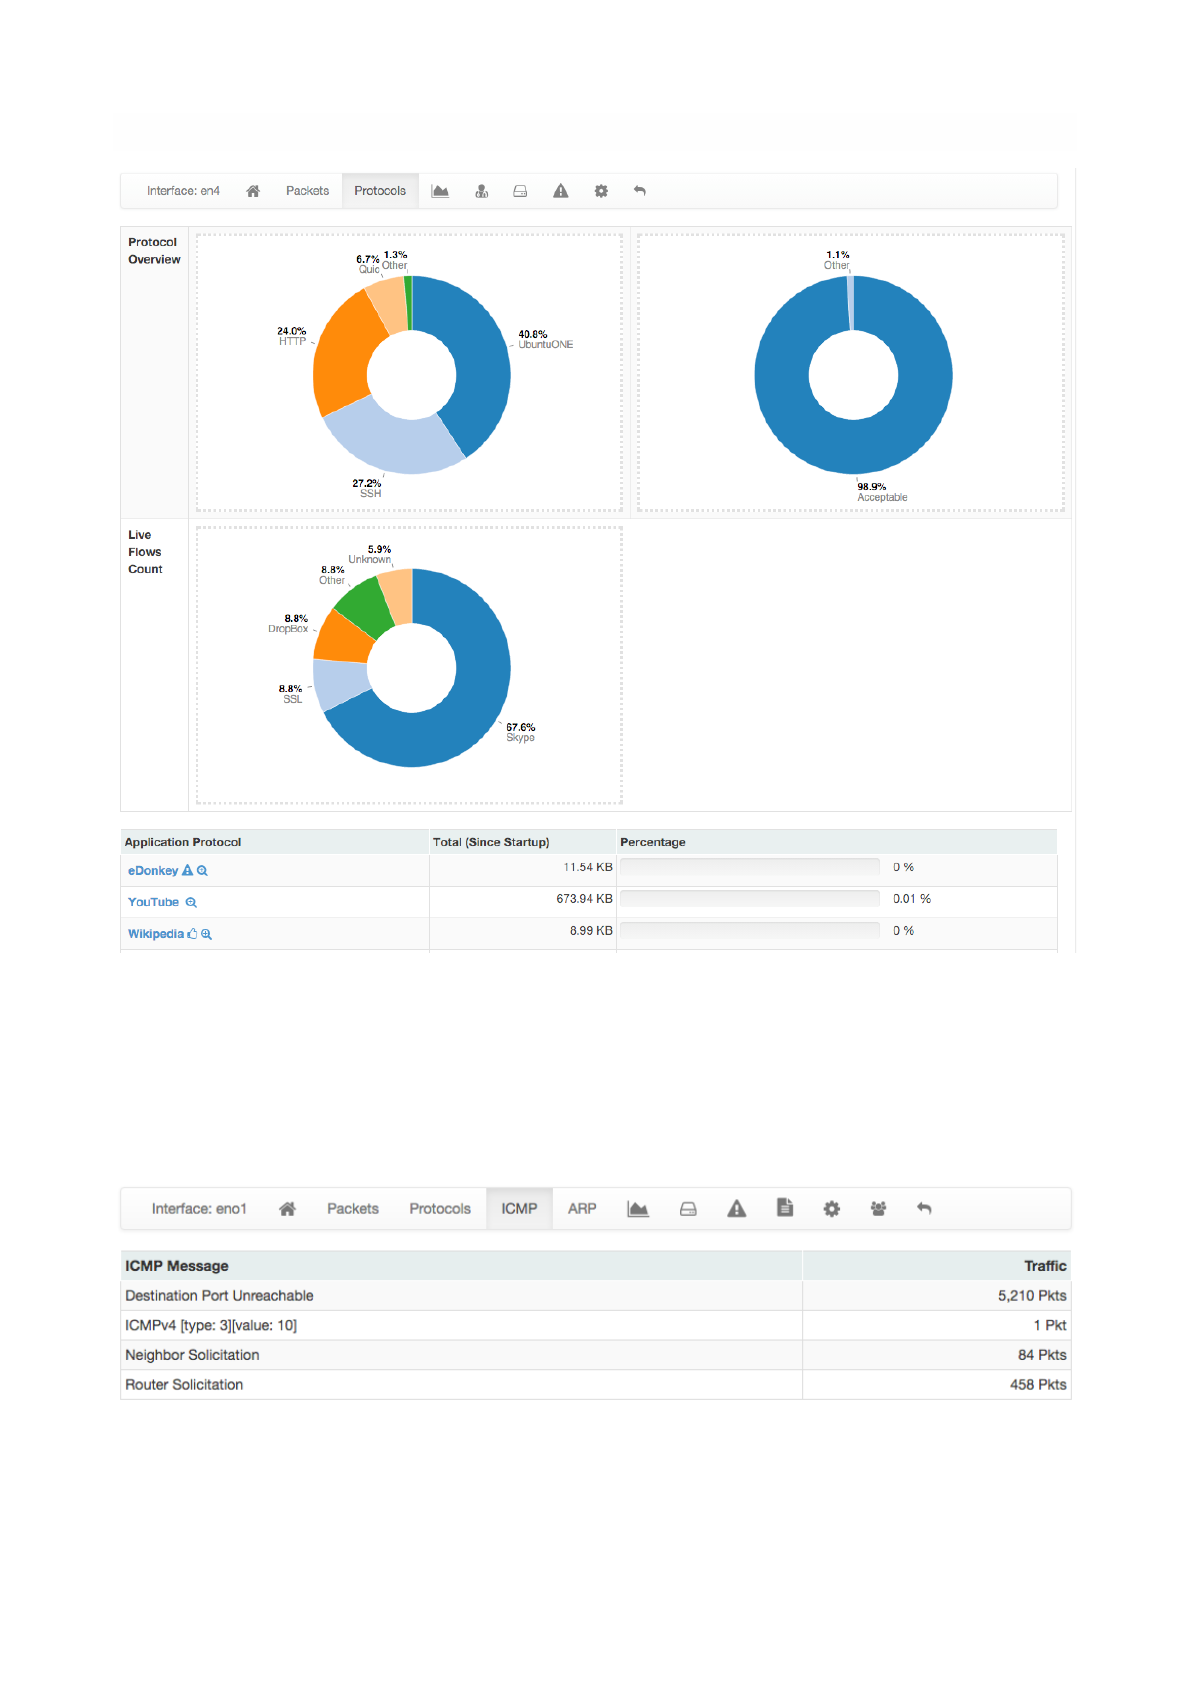
ICMP
ICMP page shows overall interface ICMP statistics.
Page of 53 76
The Protocols View of the Interface Details Page
The ICMP View of the Interface Details Page
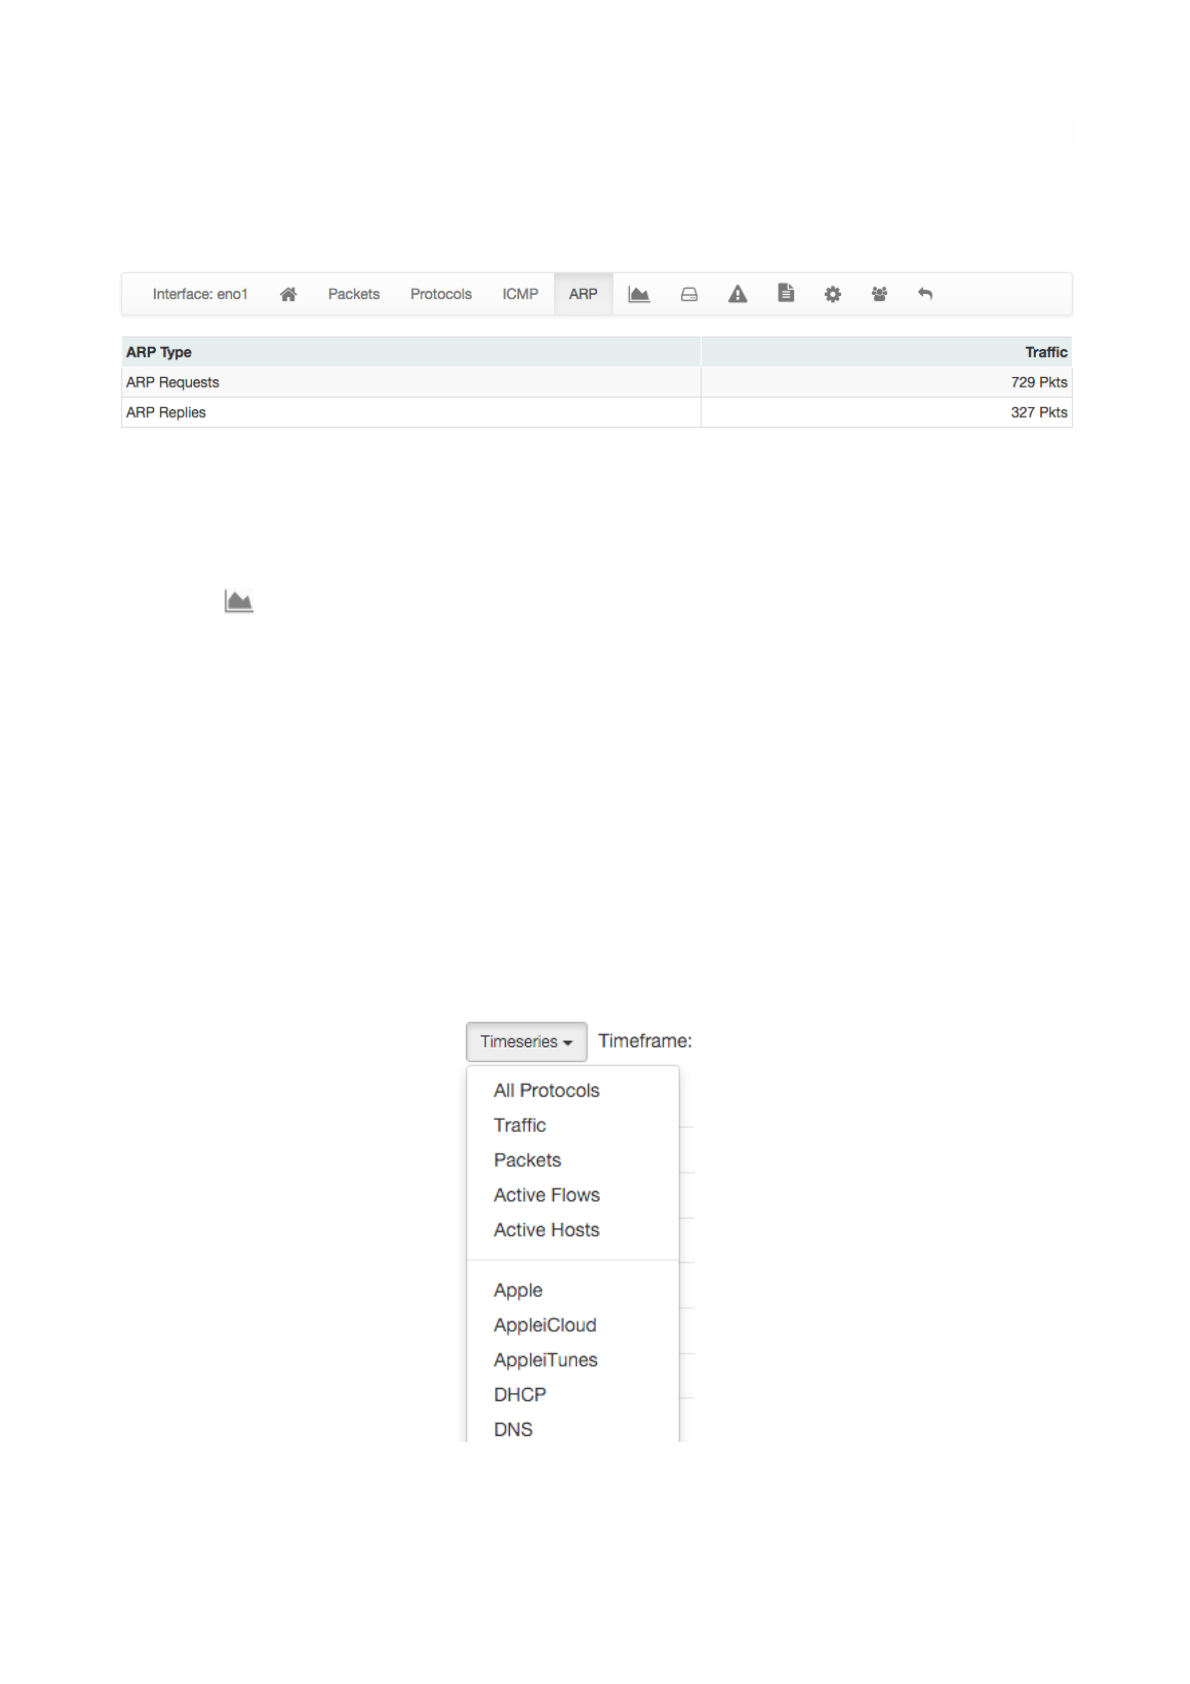
ARP
The Address Resolution Protocol (ARP) page highlights the number of ARP requests and replies seen.
Statistics
Statistics page provides historical traffic statistics for the selected interface. The user can choose to filter
statistics on a protocol basis and display data in several formats (e.g., bytes, packets, flows, and so on). In
the Professional Version of ntopng, traffic for interface views in shown as stacked per physical interface.
Physical interface visualisation can be toggled by clicking on the coloured dot just left of interface name.
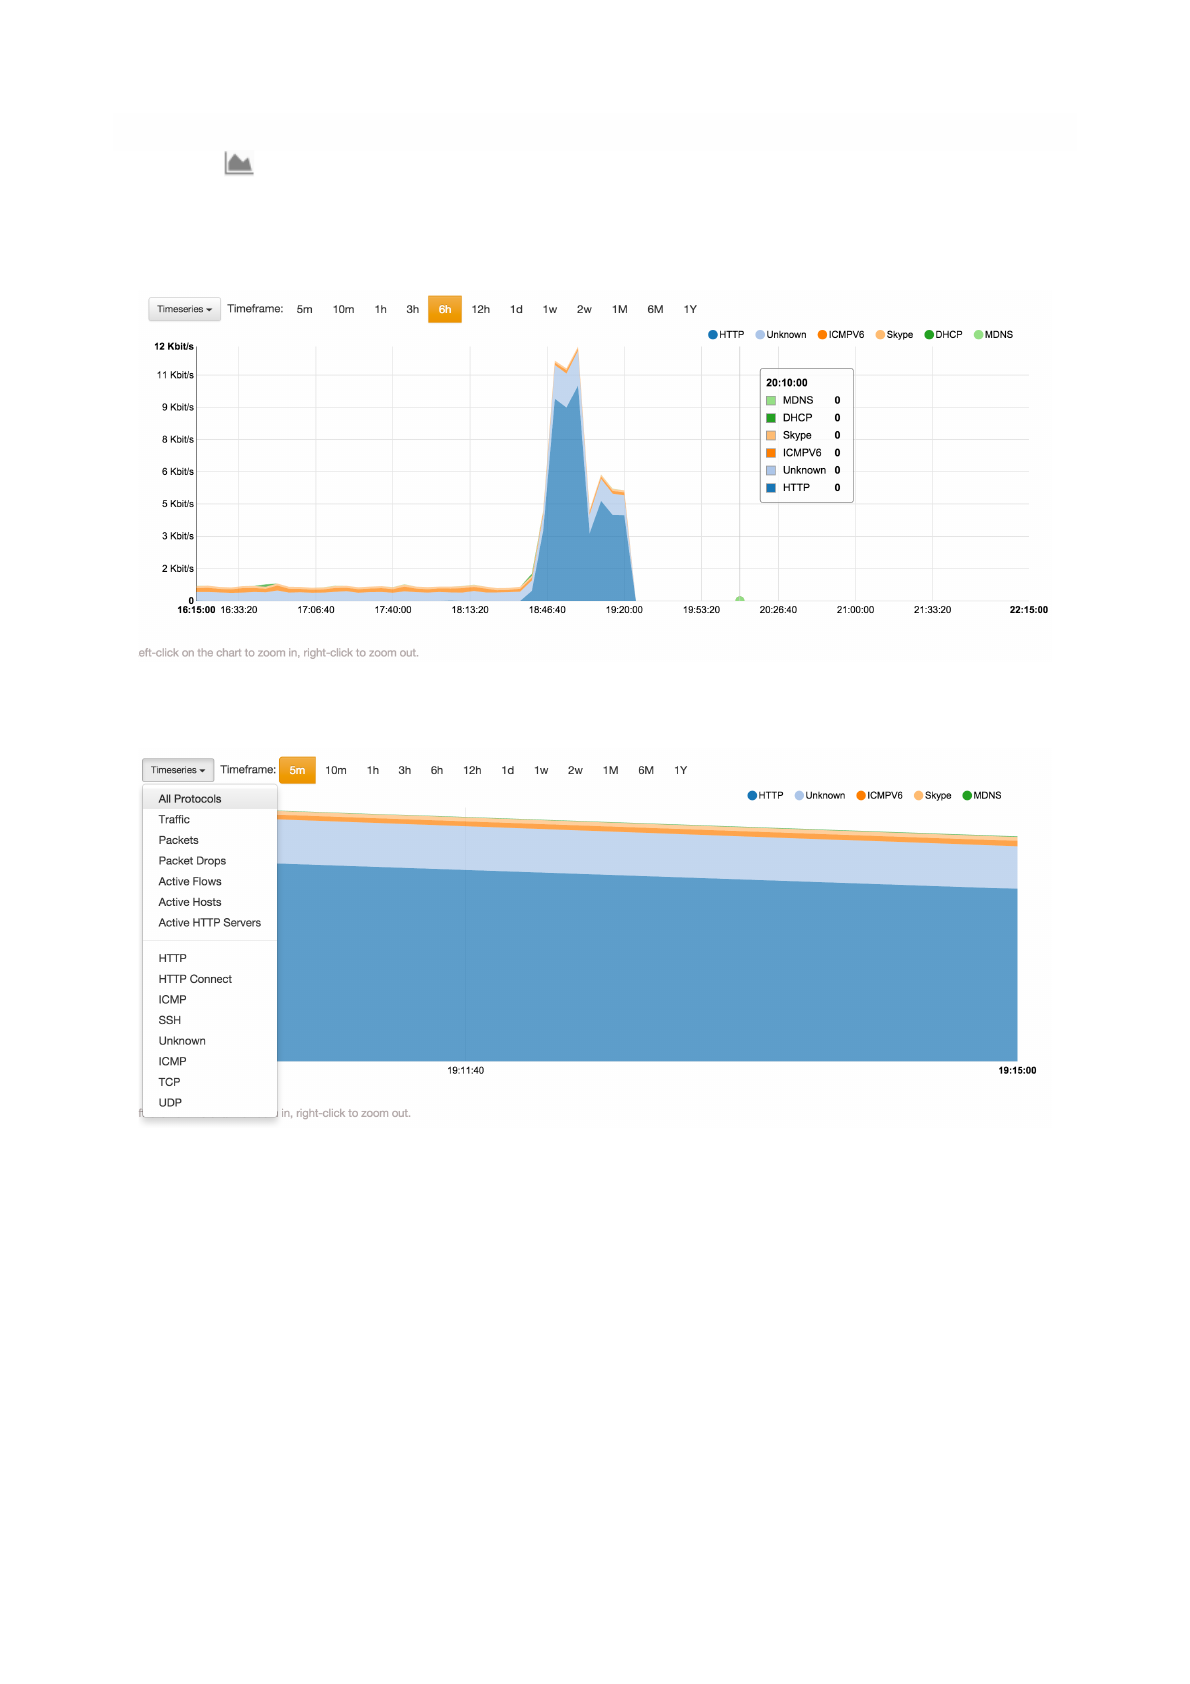
The time series span can be adjusted by selecting values from 5 minutes up to 1 year. Moreover, drill-
down is possible by clicking on the time series itself. Every click zooms the chart in, centering the time
series around the clicked point.
In addition, time series shown can be chosen via the dropdown menu labelled ‘Time series’. For example,
it is possible to visualise all or just one protocol, traffic, packets, active hosts and flows, and so on. Ntopng
is VLAN aware, hence if several VLANs are detected, traffic is accounted also on a VLAN basis.
Page of 54 76
The Dropdown Time Series Menu in the
Statistics View of the Interface Details Page
The ARP View of the Interface Details Page
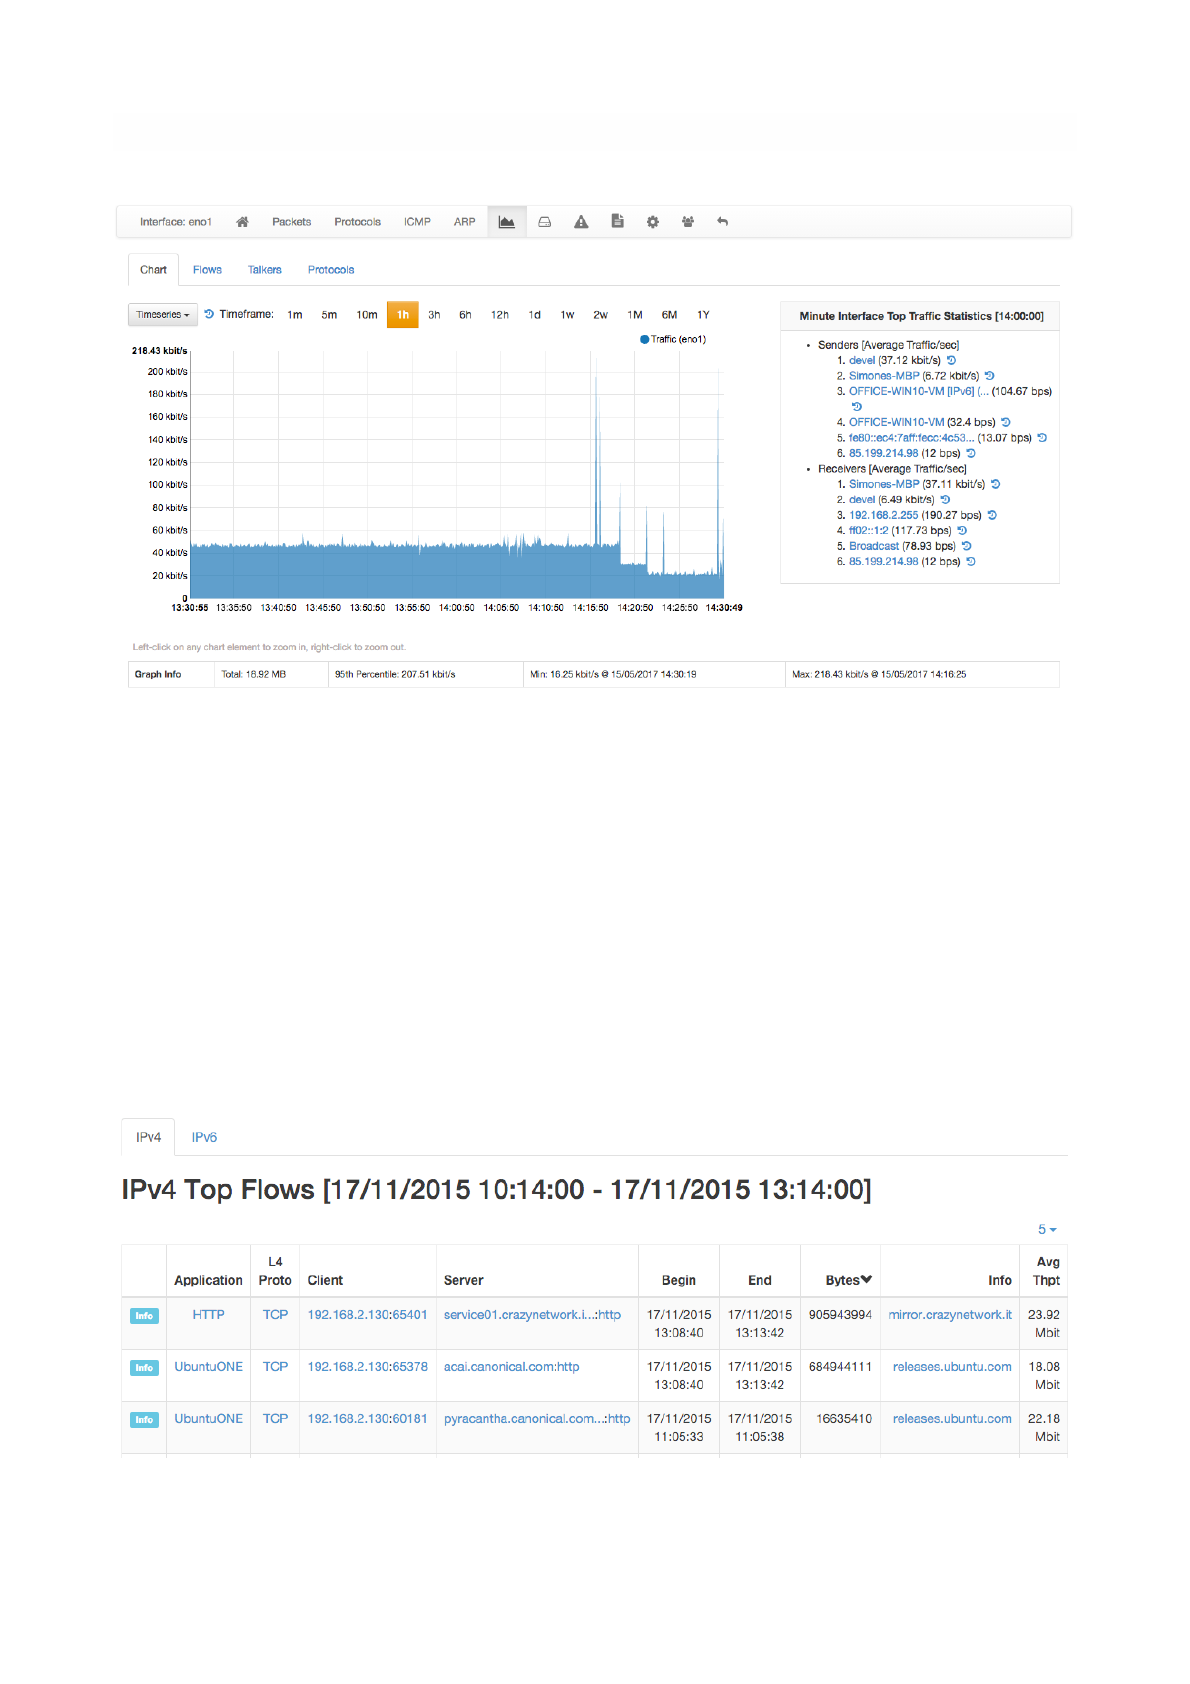
Historical interface minute top talkers are shown on the right of the page, and get refreshed automatically
when the mouse moves over the chart.
An historical “Flows” tab is present next to the “Chart” when ntopng is started with the -F switch. This
historical table shows flows data that have been recorded and dumped during the selected observation
period. The Professional/Enterprise version of ntopng also feature two extra tabs, namely, “Talkers” and
“Protocols” to drill down historical data by talkers and application protocols.
Page of 55 76
The Historical Flows Table of the Interface Details Page Statistics View
The Statistics View of the Interface Details
Page (Professional Version)
Traffic Profiles (Professional Version)
See later in this manual for more information.
Settings !
The settings page allow the configuration of several interface properties.
Custom Name
Is a label used to identify the interface.
Interface Speed
The speed of the interface expressed in Mbps. Typically, ntopng is able to properly determine this speed
automatically.
Realtime Stats Refresh Rate
Amount of time between two consecutive refreshes of dashboard and footer charts. Useful for example
when using ntopng in combination with nProbe to collect remote NetFlow of sFlow.
Scaling Factor
A constant used to up-scale interface traffic. This is useful when ntopng is processing sampled traffic.
Page of 56 76
The Settings View of the Interface Details Page
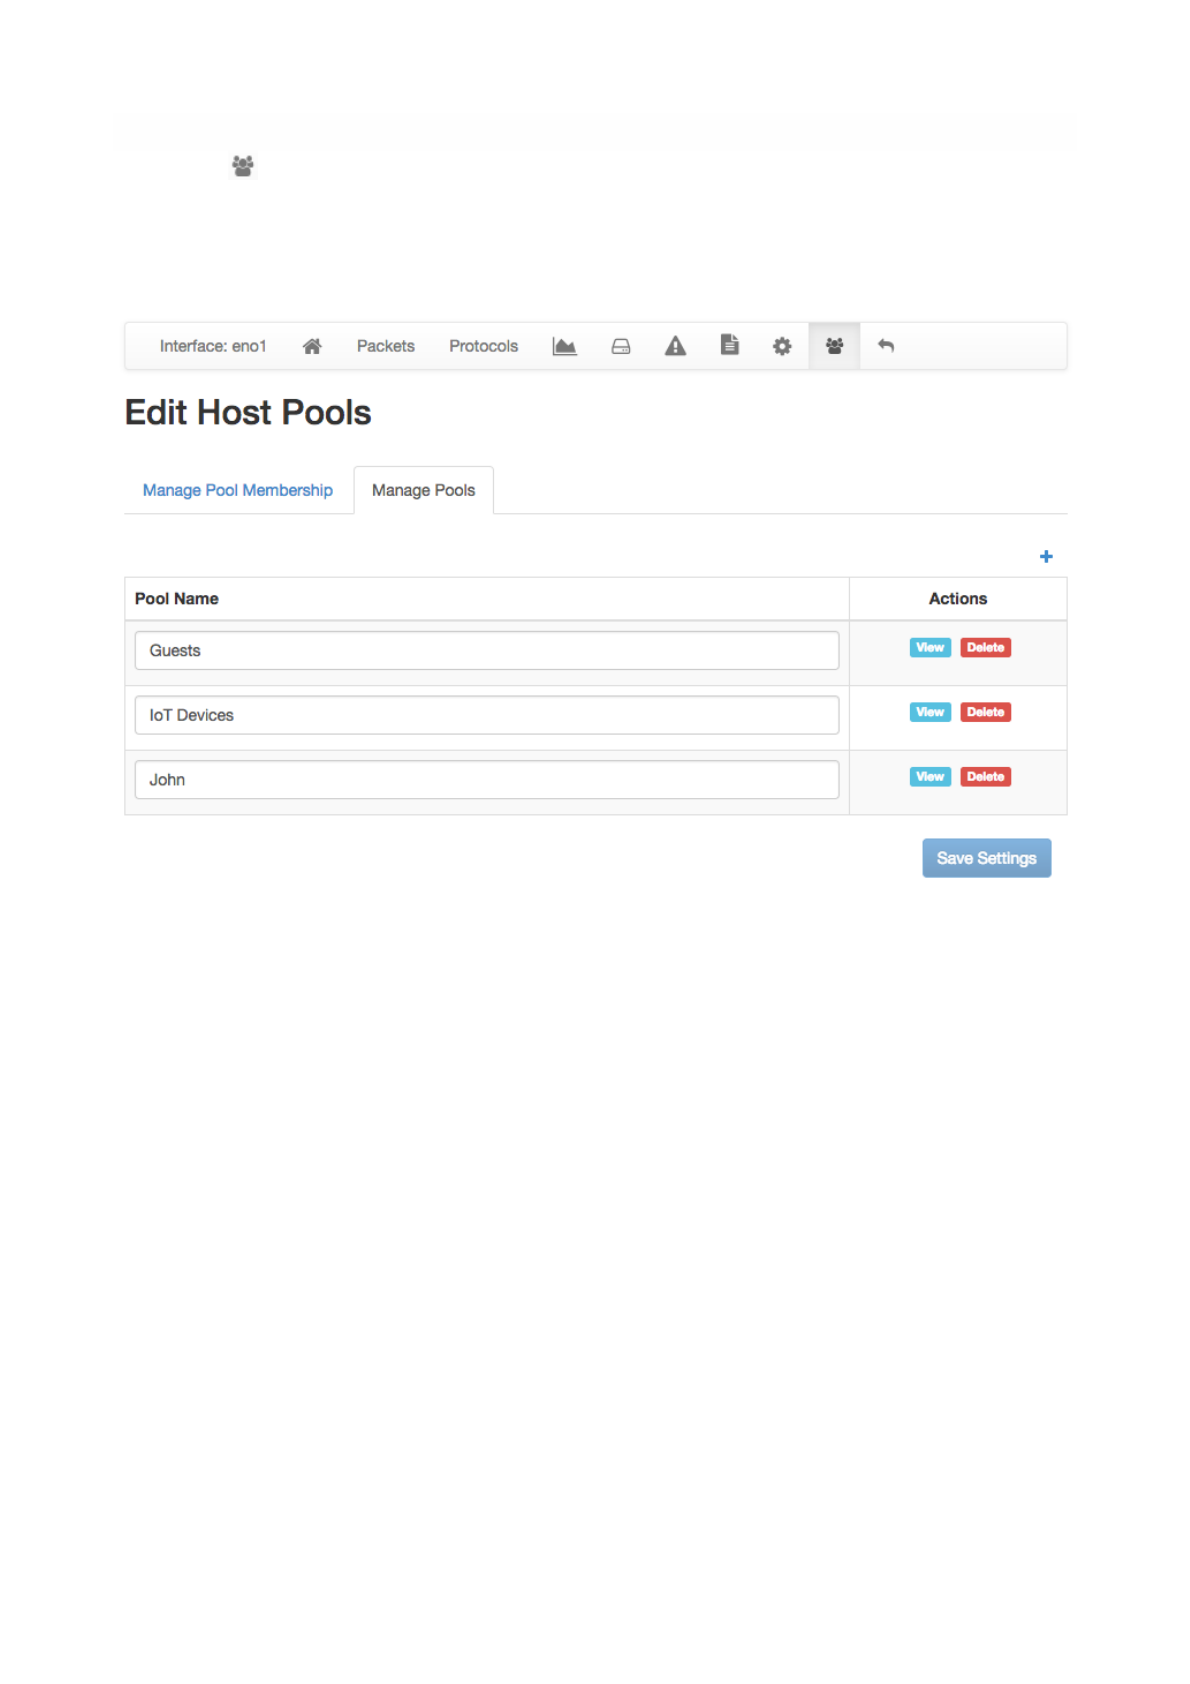
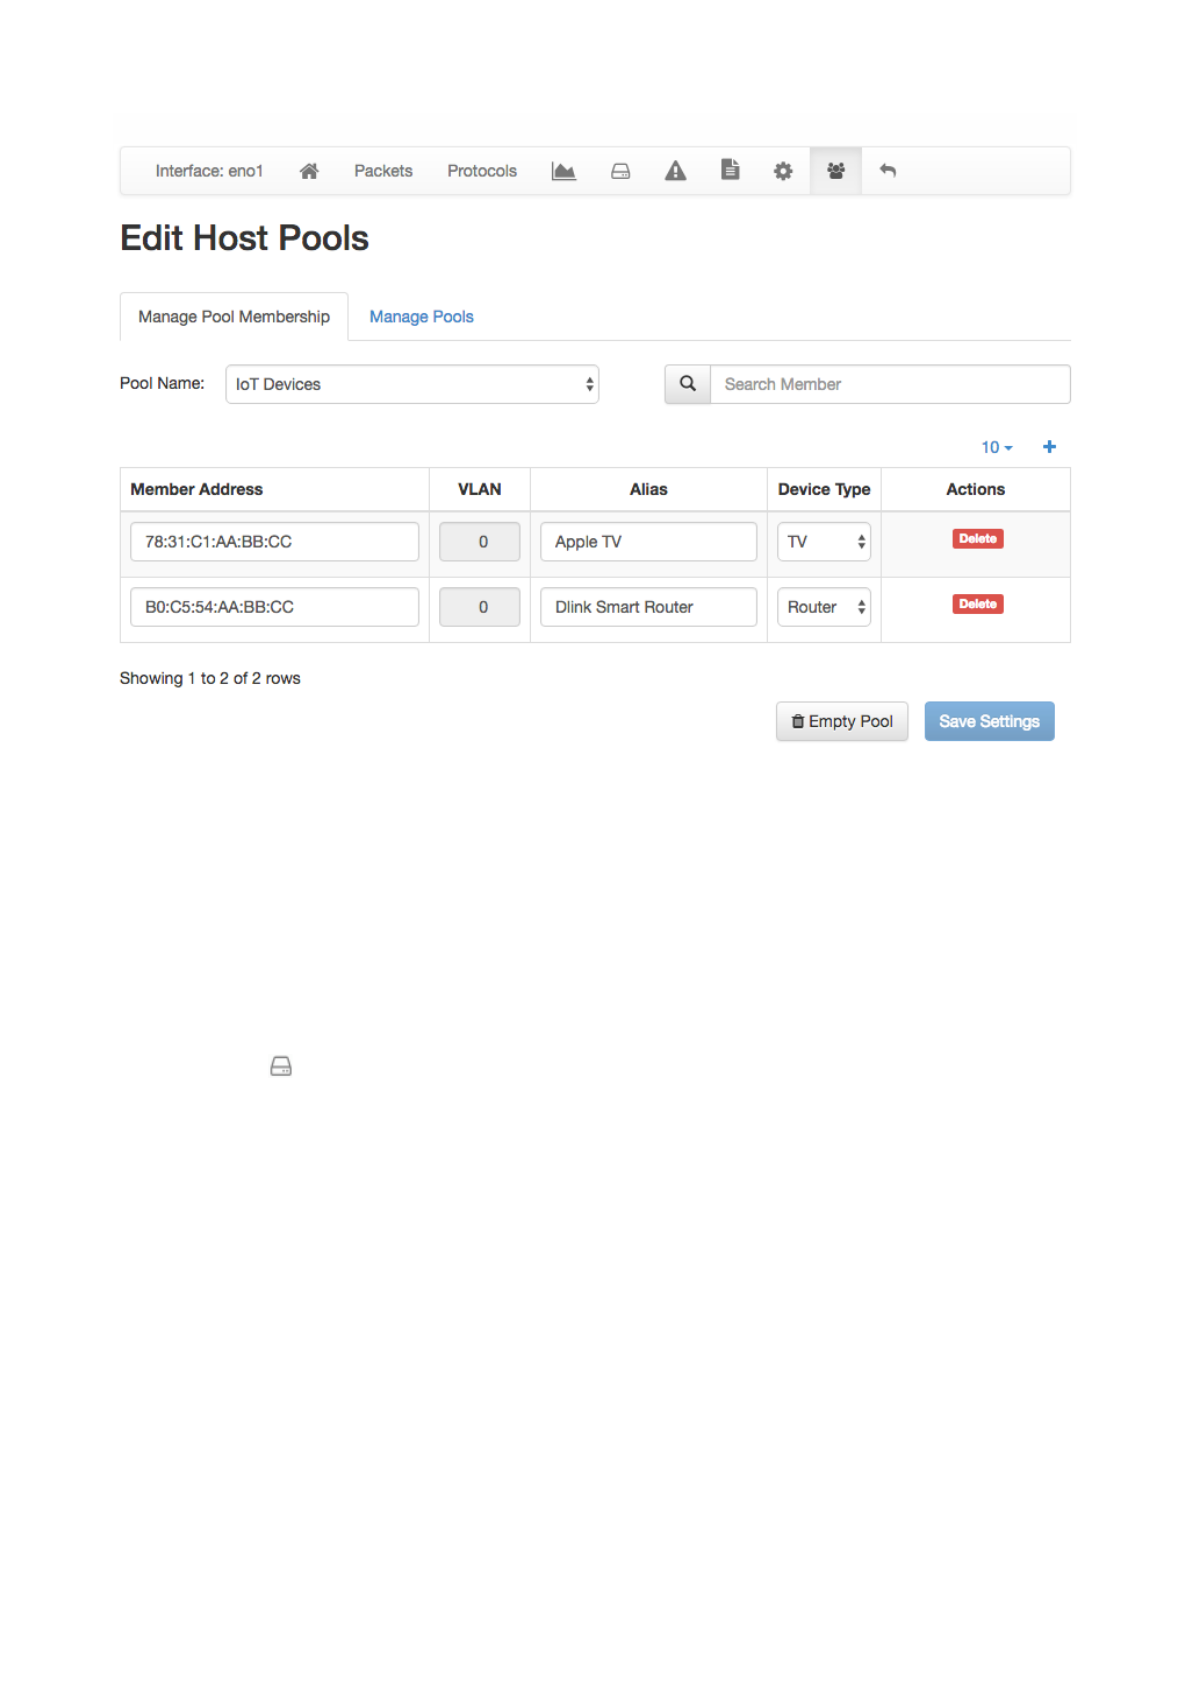
Host Pools !
Host pools are logical groups of hosts. Pools are added using the “plus” button in the “Manage Pools” tab
of the Host Pools page.
Once an Host Pool is created, it is possible to add members to it. Host Pool members are added using the
“plus” button in the “Manage Pool Membership” tab of the Host Pools page.
Each pool member can be a:
•Layer 2 device (specified with a Mac Address)
•Layer 3 host (specified with an IPv4/IPv6 Address and, optionally, a VLAN)
•Layer 3 network (specified with an IPv4/IPv6 network in CIDR format and, optionally, a VLAN)
An “Alias” can be associated to each pool member to ease the its identification. Typically, one would
assign a mnemonic label as member alias (e.g., “John’s iPhone” or “Smart TV”). A “Device Type” can be
associated to each member as well. Devices types are used to categorise members on the basis of the
device type (e.g., TV, Camera, Smartphone).
The following image shows an “IoT Devices” Host Pool with two members, namely a smart tv and a router.
A view of every host pool is accessible from the “Hosts” menu, entry “Host Pools” as discussed earlier in
this document. The view shows live pool information (e.g., overall pool throughput) and provides access to
the historical pool traffic timeseries (Professional version) as well as to the currently active pool members.
Page of 57 76
The Edit Host Pools “Manage Pools” of the Interface Details Page
Host pools can also be used to enforce traffic policies (e.g, block YouTube traffic for the “John” pool and
limit Facebook traffic at 1 Mbps for the “Guests” pool). This feature is only available when ntopng is used
inline and is a feature only available in the professional version. ntopng inline is described in the
“Advanced ntopng Features” of this document.
Packet Dump
This page allows you to save to disk selected packets that match various criteria.
Page of 58 76
The Edit Host Pools “Manage Pool Membership” of the Interface Details Page

ntopng Settings !
The Runtime settings can be configured using the dropdown gear menu in the top toolbar.
Manage Users
Manage Users menu gives access to ntopng users administration. Ntopng is a multi-user system that
handles multiple simultaneous active sessions. Ntopng users can have the role of Administrators or
standard users.
Password and other preferences such as role and allowed networks can be changed by clicking on
button Manage, which causes a new window to pop out
Preferences
Preferences menu entry enables the user to change runtime configurations. A thorough help is reported
below every preference directly into ntopng web GUI.
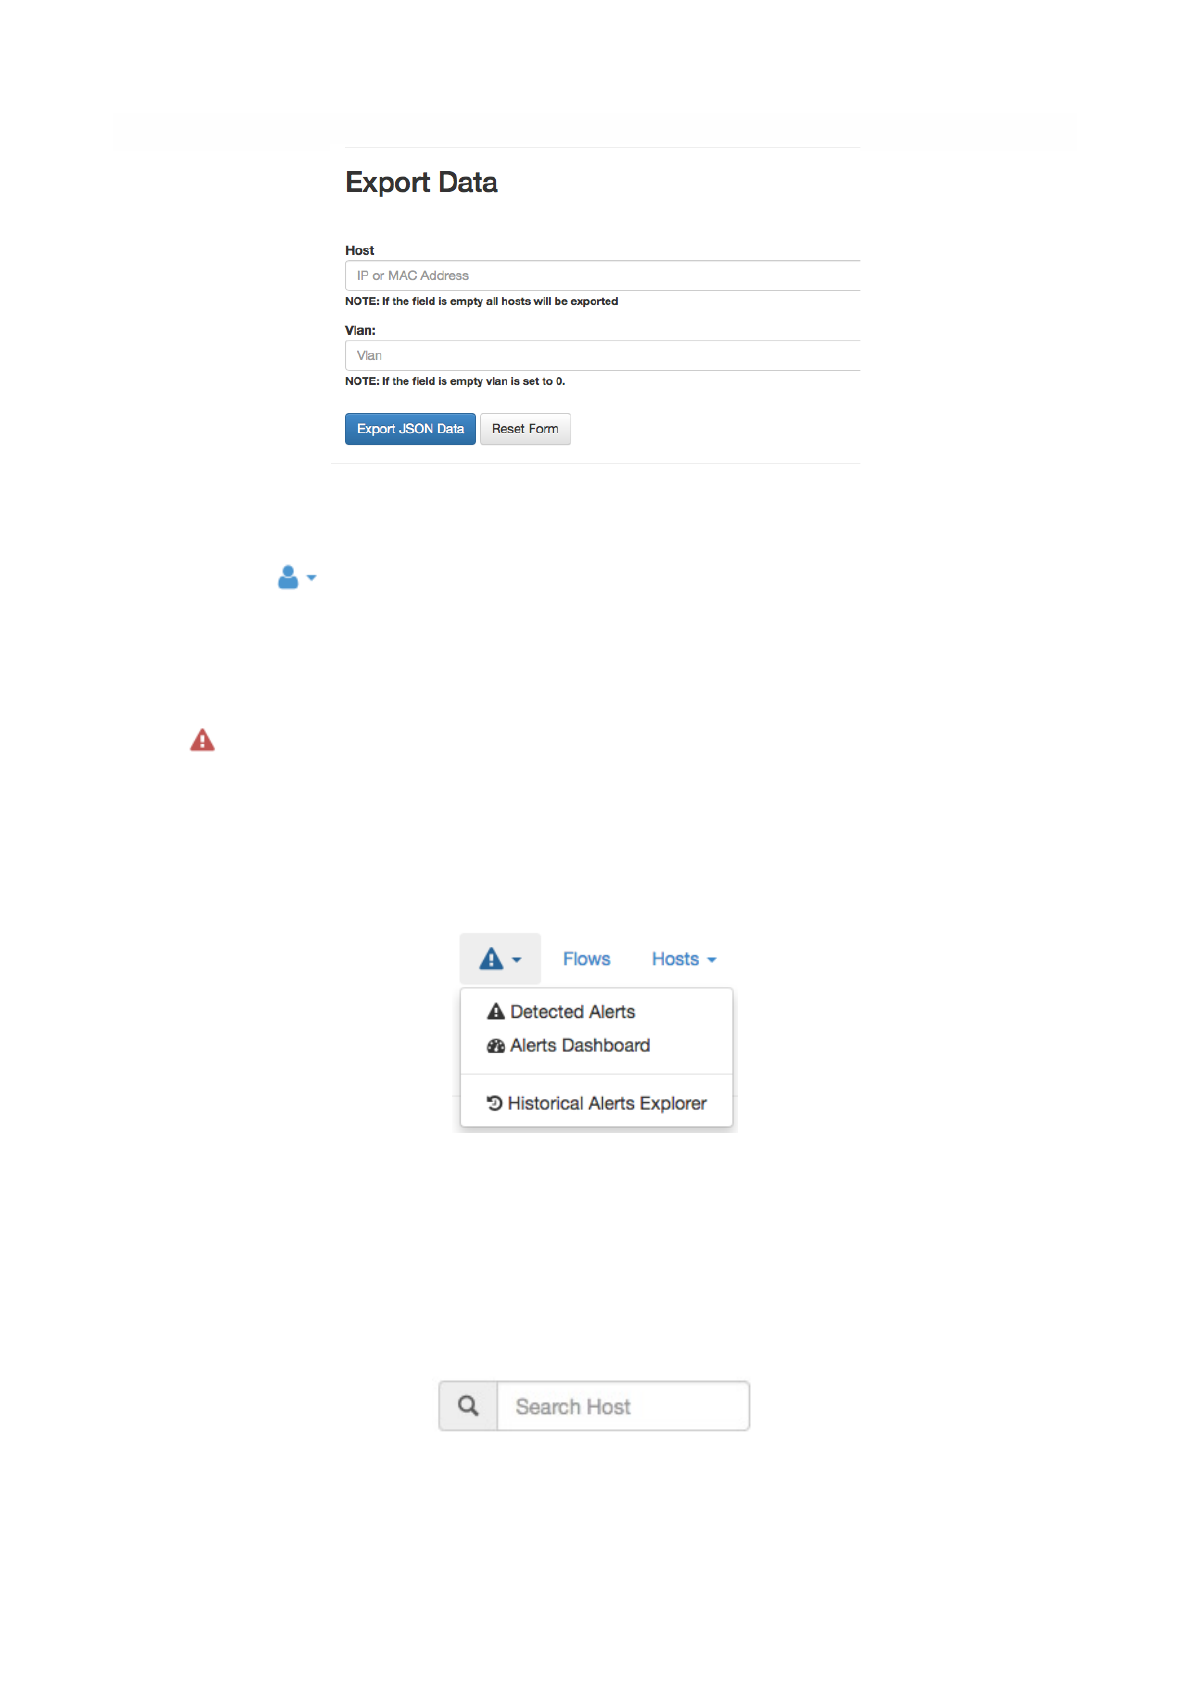
Export Data
Ntopng is able to export monitored hosts information. It allows to export data in JSON format giving the
user the ability to include ntopng information in a user created GUI.
Page of 59 76
The Dropdown Settings Menu in the Top Toolbar
The Manage Users Settings Page
Administration !
This menu entry contains a logout button to disconnect the used from the ntopng GUI.
Alerts !
The Alerts Menu opens a page with the list of alerts that was fired. This icon is hidden if no alerts was
triggered or after purge operation. Each row in the Alerts page presents an alert detected by ntopng with
information such as Date, Severity, Type and Description.
Host Search
This box allows to display all information about a specific host. Dynamic auto completion enables users to
check whether the searched host appears in the list while typing.!
Page of 60 76
The Search Box
The Export Data Page
The Alerts Page
Advanced ntopng Features
Advanced ntopng features such as logical interface aggregation and bridging are described in this
section.
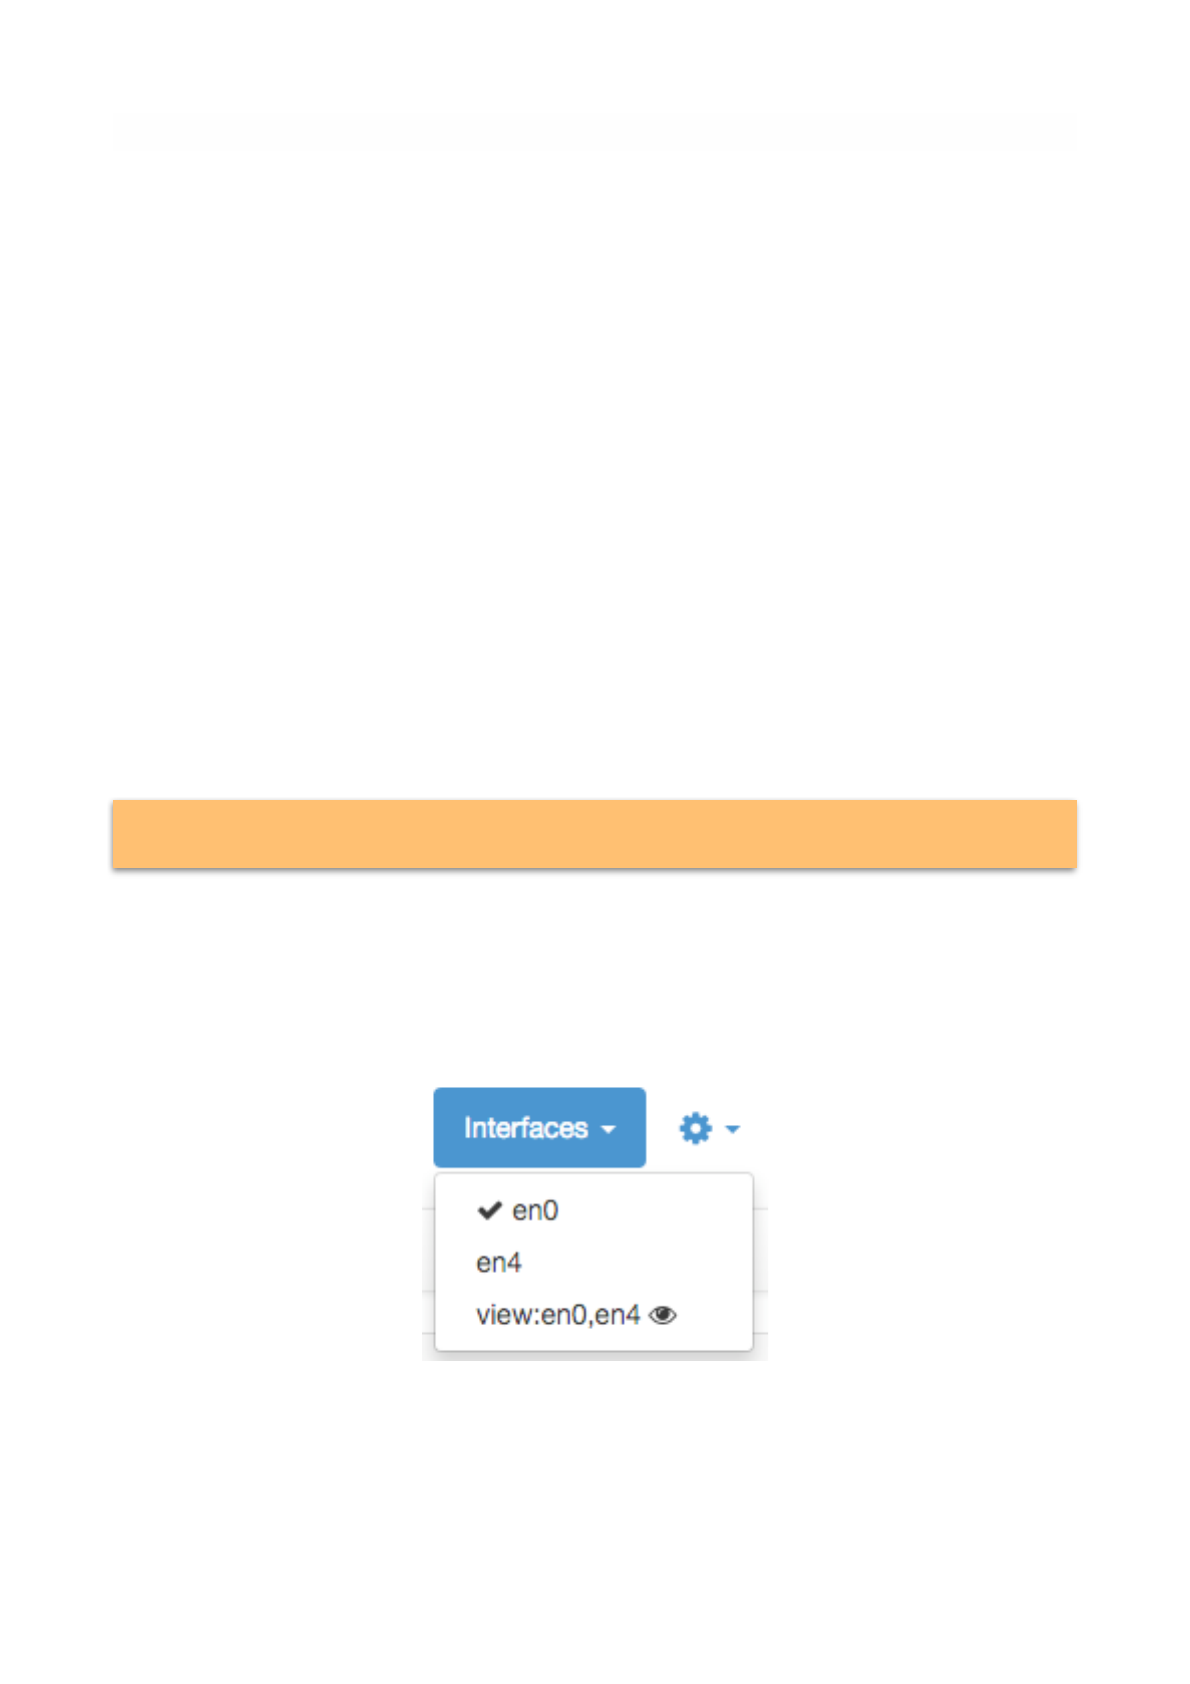
Physical Interfaces Aggregation: Interface Views
Ntopng can aggregate two or more physical interfaces into logical units, the so called Interface Views.
Interface views are seen and treated in the web GUI as if they were real interfaces. In the background,
ntopng collects statistics and traffic for every physical interface underlying an interface view, and reduce
these multi-source stream of information into a single logical aggregate.
Interface views are specified via command line (or configuration file), using the same -i modified that is
used for physical interfaces. An extra view: string must be added right after the -i modifier to tell ntopng
that it is going to read a view. Physical interfaces must be indicated in a comma separated list that follows
the view: string.
For example an interface view that merges physical interfaces en0 and en4 can be created using the
following syntax
ntopng -i en0 -i en4 -i view:en0,en4
Upon successful startup, ntopng shows, in the top toolbar ‘Interfaces’ menu, the interface view together
with other physical interfaces. An eye is show next to each view, which can be clicked and selected as if it
was a physical interface.
Page of 61 76
Interfaces that are part of a view must also be specified separately as physical interfaces. This
means that you cannot omit the -i en0 -i en4 from the example above.
The Interfaces Dropdown Menu in the Top Toolbar
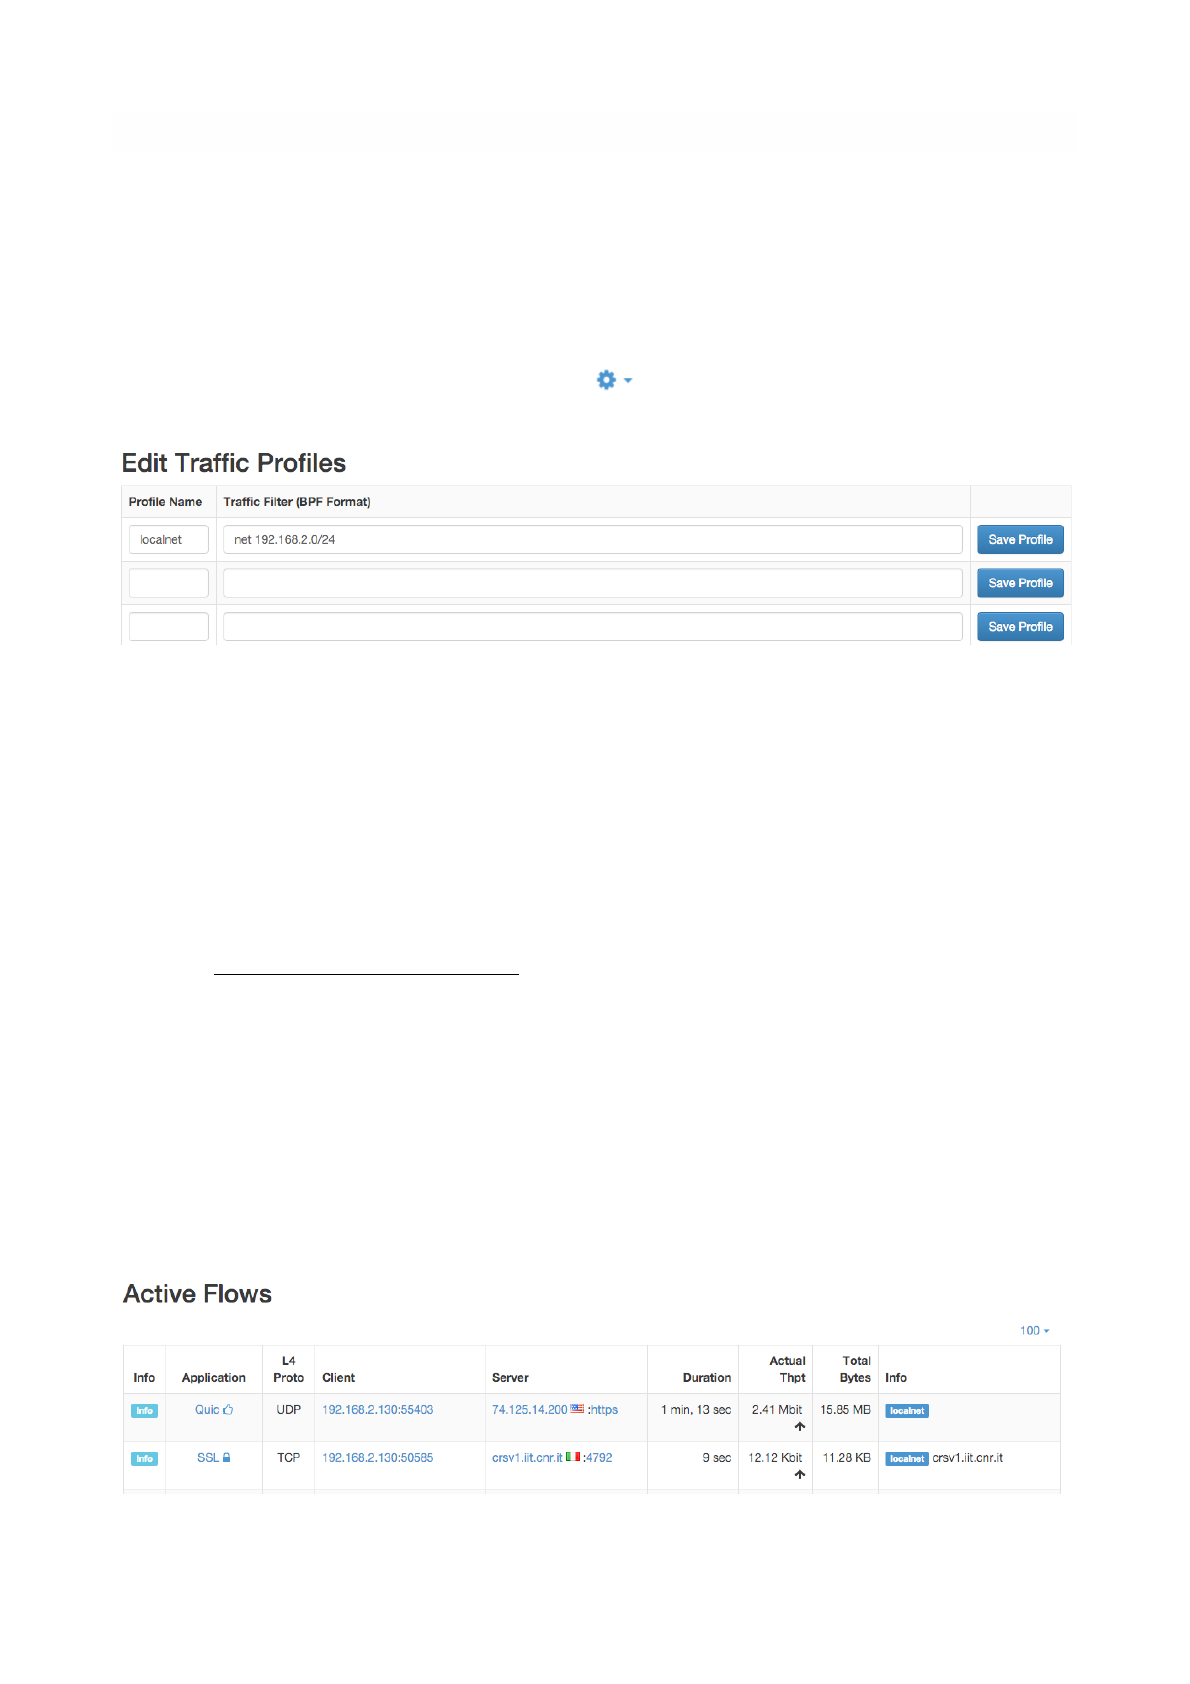
Traffic Profiles
Traffic profiles allow the user to define logical aggregations of traffic. Examples of logical aggregates of
traffic include ‘TCP traffic flowing from local network 192.160.1.0/24 to host 10.0.0.1’, ‘Facebook traffic
originating at host 192.168.10.20’, and so on.
Traffic Profiles are a feature that is only available in the Professional Version of ntopng.
Profiles can be set and configured via the dropdown ! menu in the top toolbar.
In the screenshot above, ntopng has been configured with a profile that logically includes any kind of
traffic having source and/or destination hosts within the private network 192.168.2.0/24.
Profiles must be expressed using the Berkeley Packet Filter (BPF) syntax. Filters will be parsed and syntax
will be checked every time thew ‘Save Profile’ button is hit. Errors are raised when the syntax is not BPF
compliant. A thorough discussion of the BPF falls outside the scope of this work. The interested reader is
referred to http://biot.com/capstats/bpf.html for a detailed description of the syntax.
Realtime Profiles
Profiles are fine grained and potentially apply to every flow detected. Real time flows and their assigned
profiles can be seen using the ‘Flows’ menu entry in the top toolbar. Similarly, profiles can be seen on a
host basis by selecting the tab ‘Flows’ from the contextual Host Details menu.
A blue badge labelled with profile name will appear in the rightmost column ‘Info’ of every profiled flow.
In the example below are shown two currently active flows for host 192.168.2.130, that match the defined
localnet profile.
Page of 62 76
The Edit Traffic Profiles Page
Traffic Profiles in the Active Flows Page
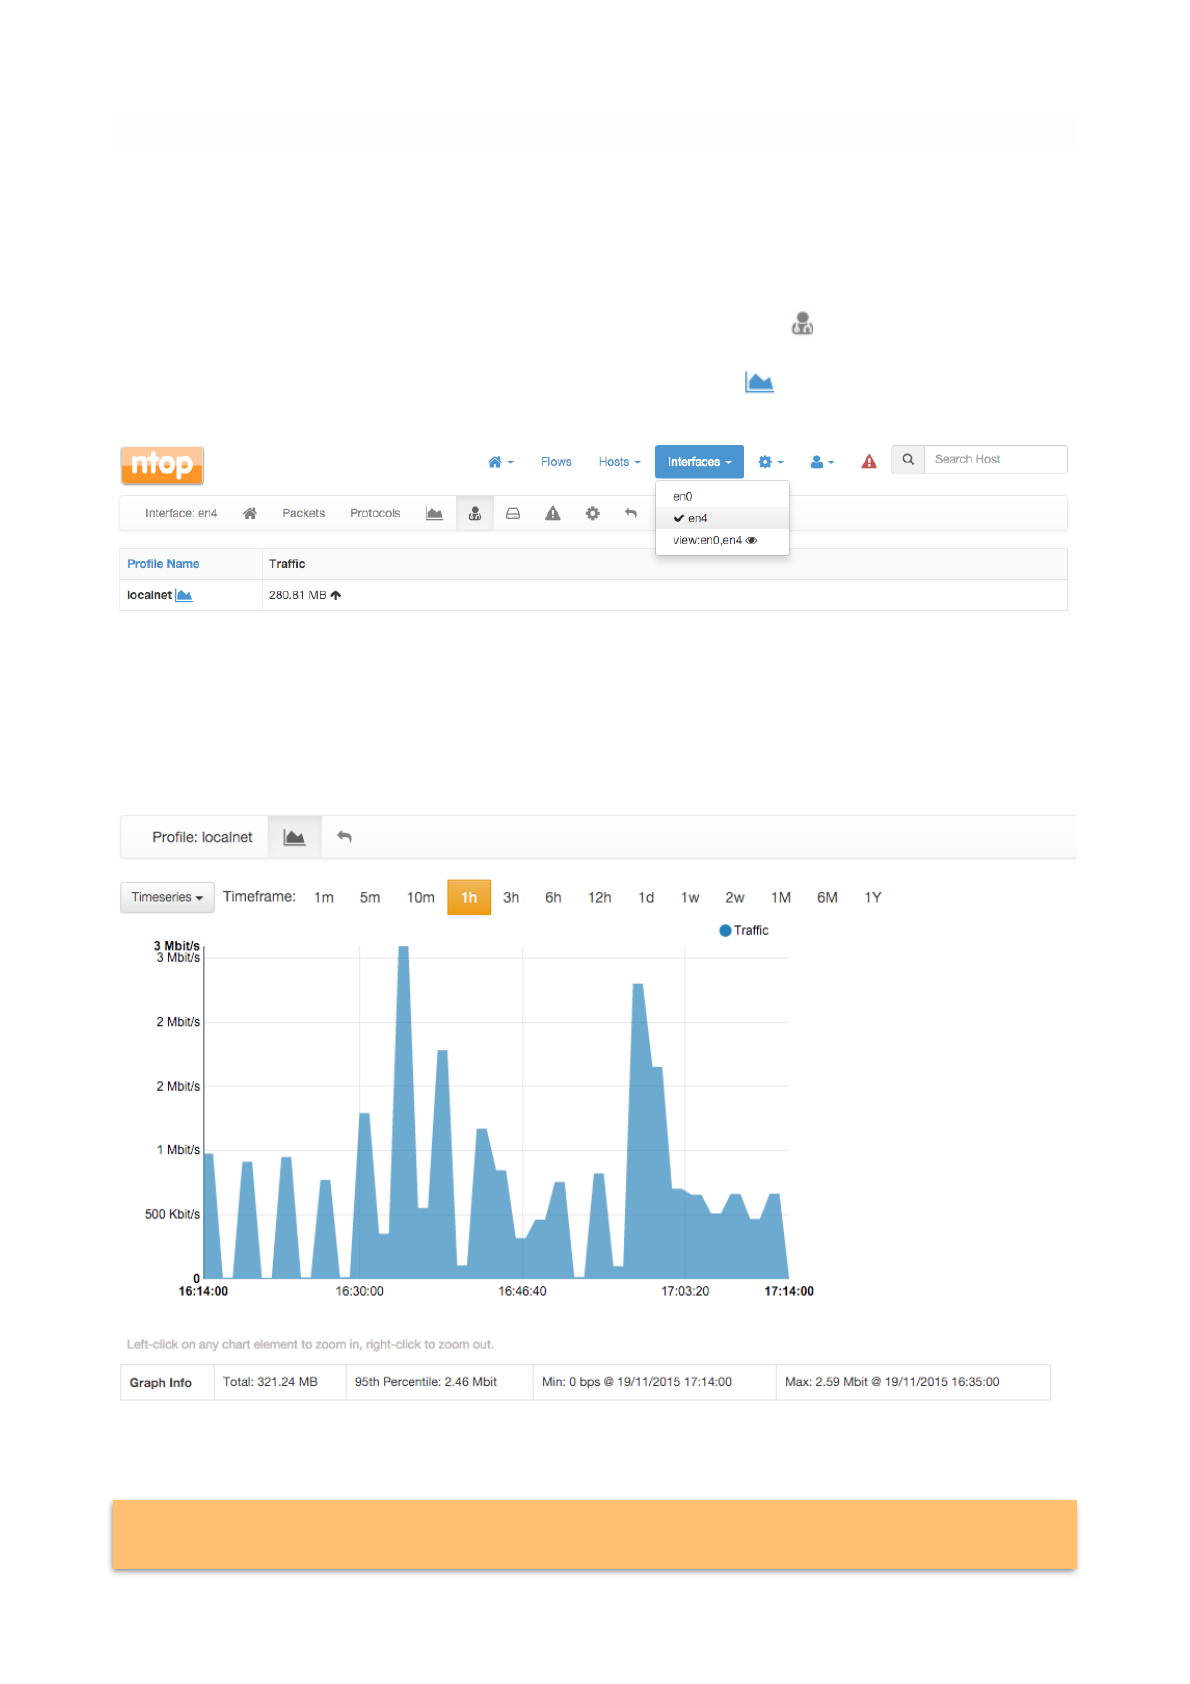
Historical Profiles Statistics
Profiles are not only available in realtime. Their traffic statistics are sampled every minute and stored in
RRDs. Similarly, if ntopng was started with the -F modifier, flows will be exported to MySQL or ElasticSearch
together with their profiles. Historical charts and tables are available in the ‘Profile Details’ page,
reachable from the ‘Interface’ contextual toolbar. By clicking on the doctor ! icon, it is possible to see the
full list of profiles detected for the selected interface, together with their traffic and throughput trend. Profile
Details page can be opened for each profile simply by clicking on the ! icon.
Profile Details page shows historical profile traffic. An optional table with historical flow details — for flows
matching the selected profile — is shown below the chart if ntopng was started with the -F modifier.
Page of 63 76
Presently, no overlapping profiles are handled. This means that when a flow matches more than
one traffic profile, it will be assigned to one profile only in a non-predictable way.
The Traffic Profiles Summary Page
The Traffic Profile Details Page

Bridging and Traffic Policing
The Professional version of ntopng can operate as an active traffic monitor. In this mode, ntopng is not
only able to see what is flowing in the network, it is also able to shape and apply filtering policies to traffic
flows. Policies can be applied to limit the bandwidth of logical groups of hosts named Host Pools. The
bandwidth is limited by means of rules that can be defined for every Layer 7 Application protocol (e.g.,
block WhatsApp and YouTube) as well as for every Layer 7 Application category (e.g., limit Peer-2-Peer to 1
Mbps maximum).
Host pools are described in detail in the “Hosts” section of this document. In the remainder of this section it
is discussed how to properly use ntopng in bridge mode, and how to set policies and apply them to host
pools.
When used inline ntopng becomes totally transparent. For this reason there is no need to set particular IP
addresses or change any other network setup such as the DNS address or the gateway IP. In this mode,
ntopng bridges the traffic of two network interfaces.
Let’s assume the network layout is the following:
In order to policy the traffic ntopng must be placed between the Wan/Internet gateway and the Switch as
depicted below.
Page of 64 76
NIC 2
NIC 1
Realtime
Monitoring
Wan/Internet
Gateway
Switch
PC1
PC2
Wan/Internet
Gateway
Switch
PC1
PC2

Specifically, there are two possible setups for the use of ntopng inline when operating in the configuration
described above, namely:
• 1+1 where a NIC is used to reach the ntopng host and 1 NIC is used to reach the Internet.
• 2+1 where two NICs are used to connect the Switch to the internet gateway and a third NIC is used for
the management of the ntopng host.
2+1 Bridging Mode
In this setup one management NIC is used to access the ntopng host, and two additional interfaces are
use for bridging traffic. In other words, three separate NICs are used, one to manage ntopng, and two to
create a Bump-In-The-Wire between the Switch and the Internet gateway.
Let’s assume that a bridge has to be created between the Switch and the Internet gateway using
interfaces eth3 and eth4, and ntopng can be reached from a third management (mgt) interface that is
neither eth3 nor eth4.
The proper way to start ntopng in this case is
ntopng -i bridge:eth3,eth4
1+1 Bridging Mode
In this setup the management of the ntopng host is done through one of the interfaces that actually bridge
the traffic between the Internet gateway and the Switch. A third interface is not required in this setup.
However, some initial configuration is required before starting ntopng.
Specifically, one of the two interfaces must be associated to a Linux bridge (that should not be confused
with the bridge operated by ntopng).
Let’s assume that ntopng has to operate inline between interfaces eth0 and wlan0, so that eth0 is
connected towards a Switch or an Internet gateway, and clients connect to the network through interface
wlan0. this is the typical case of a Raspberry PI but, more in general, the configuration apply to any
device that has at most two interfaces available for bridging.
Page of 65 76
Wan/Internet
Gateway
Switch
eth3
eth4
mgt

To properly operate in 1+1 mode, eth0 must be added to a linux bridge before firing up ntopng. This is
accomplished by editing file /etc/network/interfaces as follows:
# cat /etc/network/interfaces
auto eth0
iface eth0 inet manual
up ifconfig eth0 up
auto br0
iface br0 inet dhcp
bridge_ports eth0
bridge stp off
bridge_maxwait 0
bridge_fd 0
allow-hotplug wlan0
iface wlan0 inet manual
wpa-conf /etc/wpa_supplicant/wpa_supplicant.conf
Once the networking service has been restated and the configuration specified has taken effect, one can
start ntopng by specifying br0 as one of the interfaces:
ntopng -i bridge:br0,wlan0
The Bridge Details Page
Upon successful startup, regardless of the chosen bridge mode, ntopng will show bridging status and
information in the bridged Interface Details page, reachable from the ‘Interfaces’ top toolbar menu.
Bridge information is given for each direction at the bottom of the page. An additional entry “Traffic
Policing” to configure the bridge policies will appear in the contextual interface menu.
Page of 66 76
Wan/Internet
Gateway
eth0
wlan0
PC1
PC2
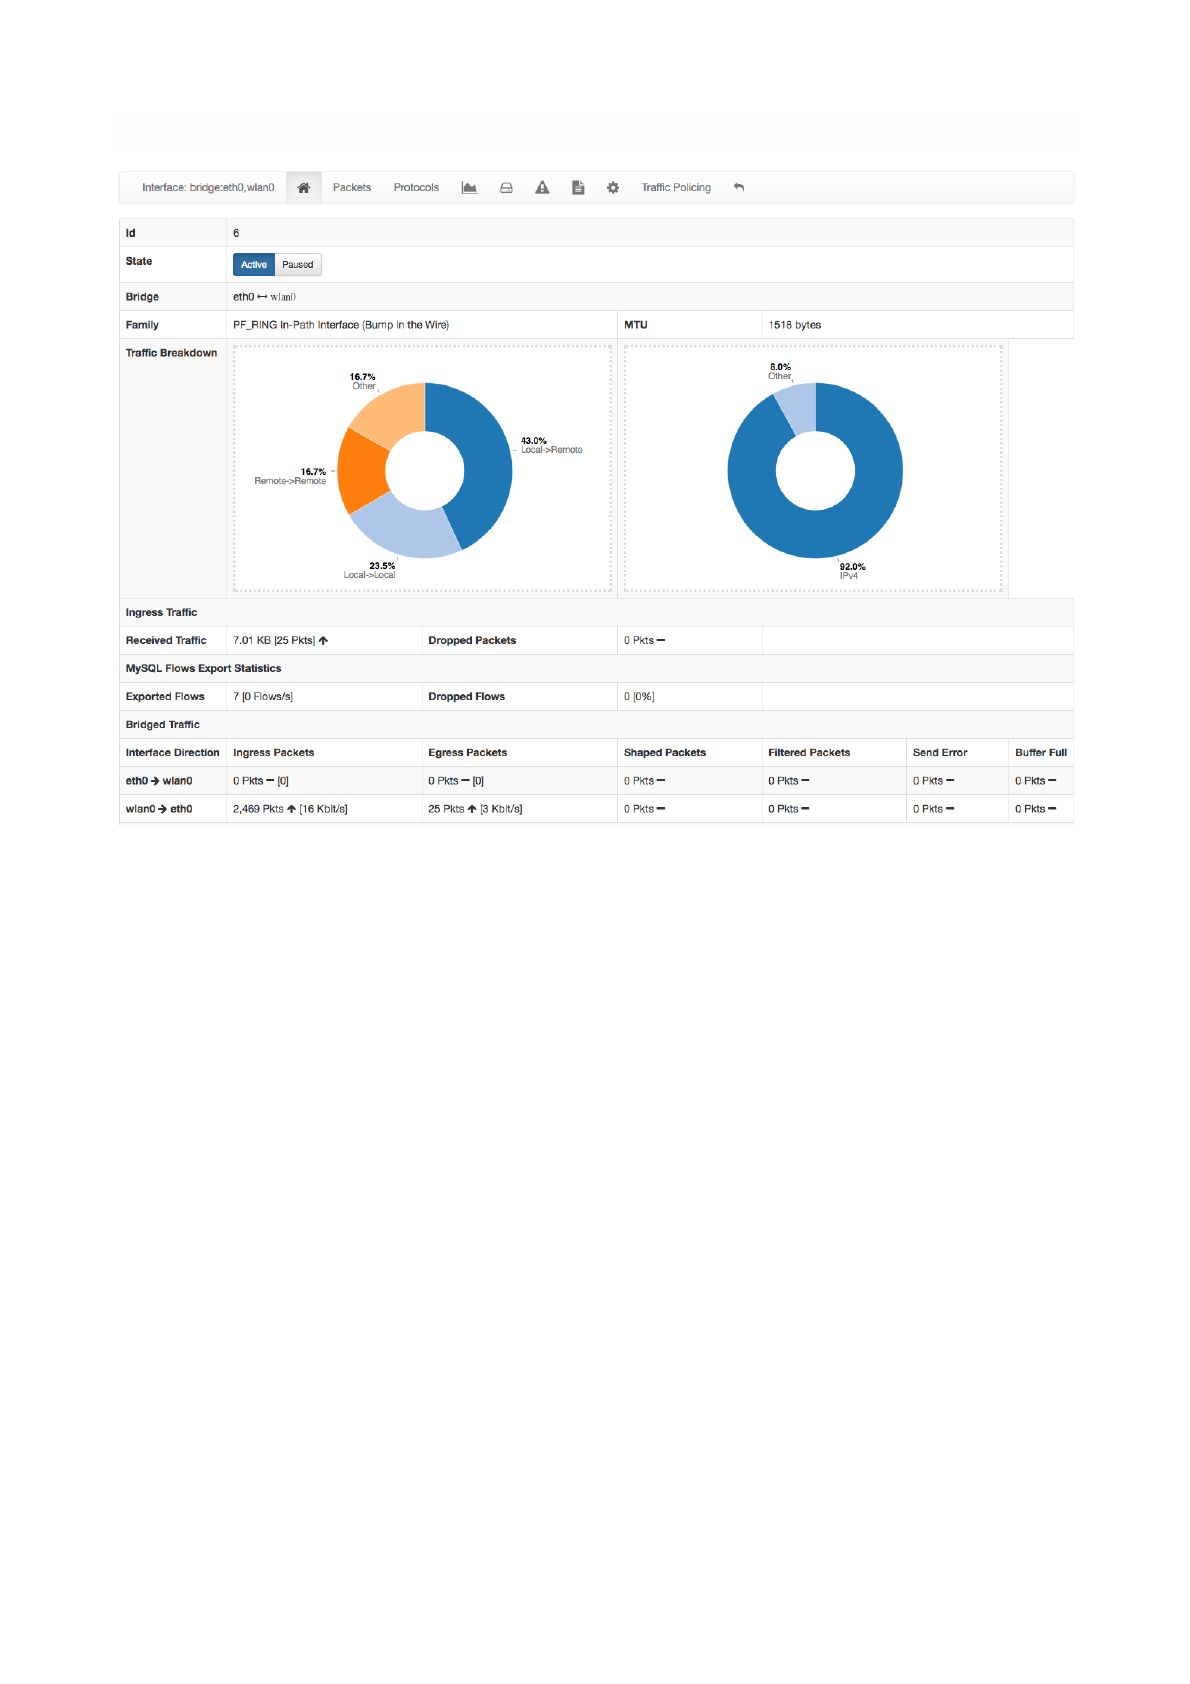
Traffic Policing
Once ntopng operates inline, it is ready to enforce policies. As anticipated above, policies apply
independently to every defined Host Pool. A policy is a pair of rules that can be specified for single Layer 7
application protocols as well as for aggregated Layer 7 application protocol categories:
• The first rule controls the traffic that originates from the Host Pool;
• The second rule controls the traffic that is destined to the Host Pool.
A rule, that can also be referred to as a shaper, is just a rate that poses an upper bound to the volume of
traffic per second. Two default shapers exists and are immutable, namely:
•No Limit: that doesn’t cap the volume of traffic per second;
•Drop All Traffic: that doesn’t allow any volume of traffic to flow.
Custom shapers can be set from the “Bandwidth Manager” tab of the “Traffic Policing” Interface page. For
example, in the picture below there is a custom 2 Mbps shaper defined in addition to the “No Limit” and
“Drop All Traffic” shapers. The column “Applied To”, next to the “Max Rate” one, lists all the Host Pools that
are currently using each shaper. A shaper can be shared between multiple Host Pools. In that case, also
the cap will be enforced globally among all the pools that are sharing it. In the picture, the “No Limit”
shaper with Id 0 is shared between pools “Guests” and “Office”, and is also used by any other host that
Page of 67 76
The Bridged Interface Page
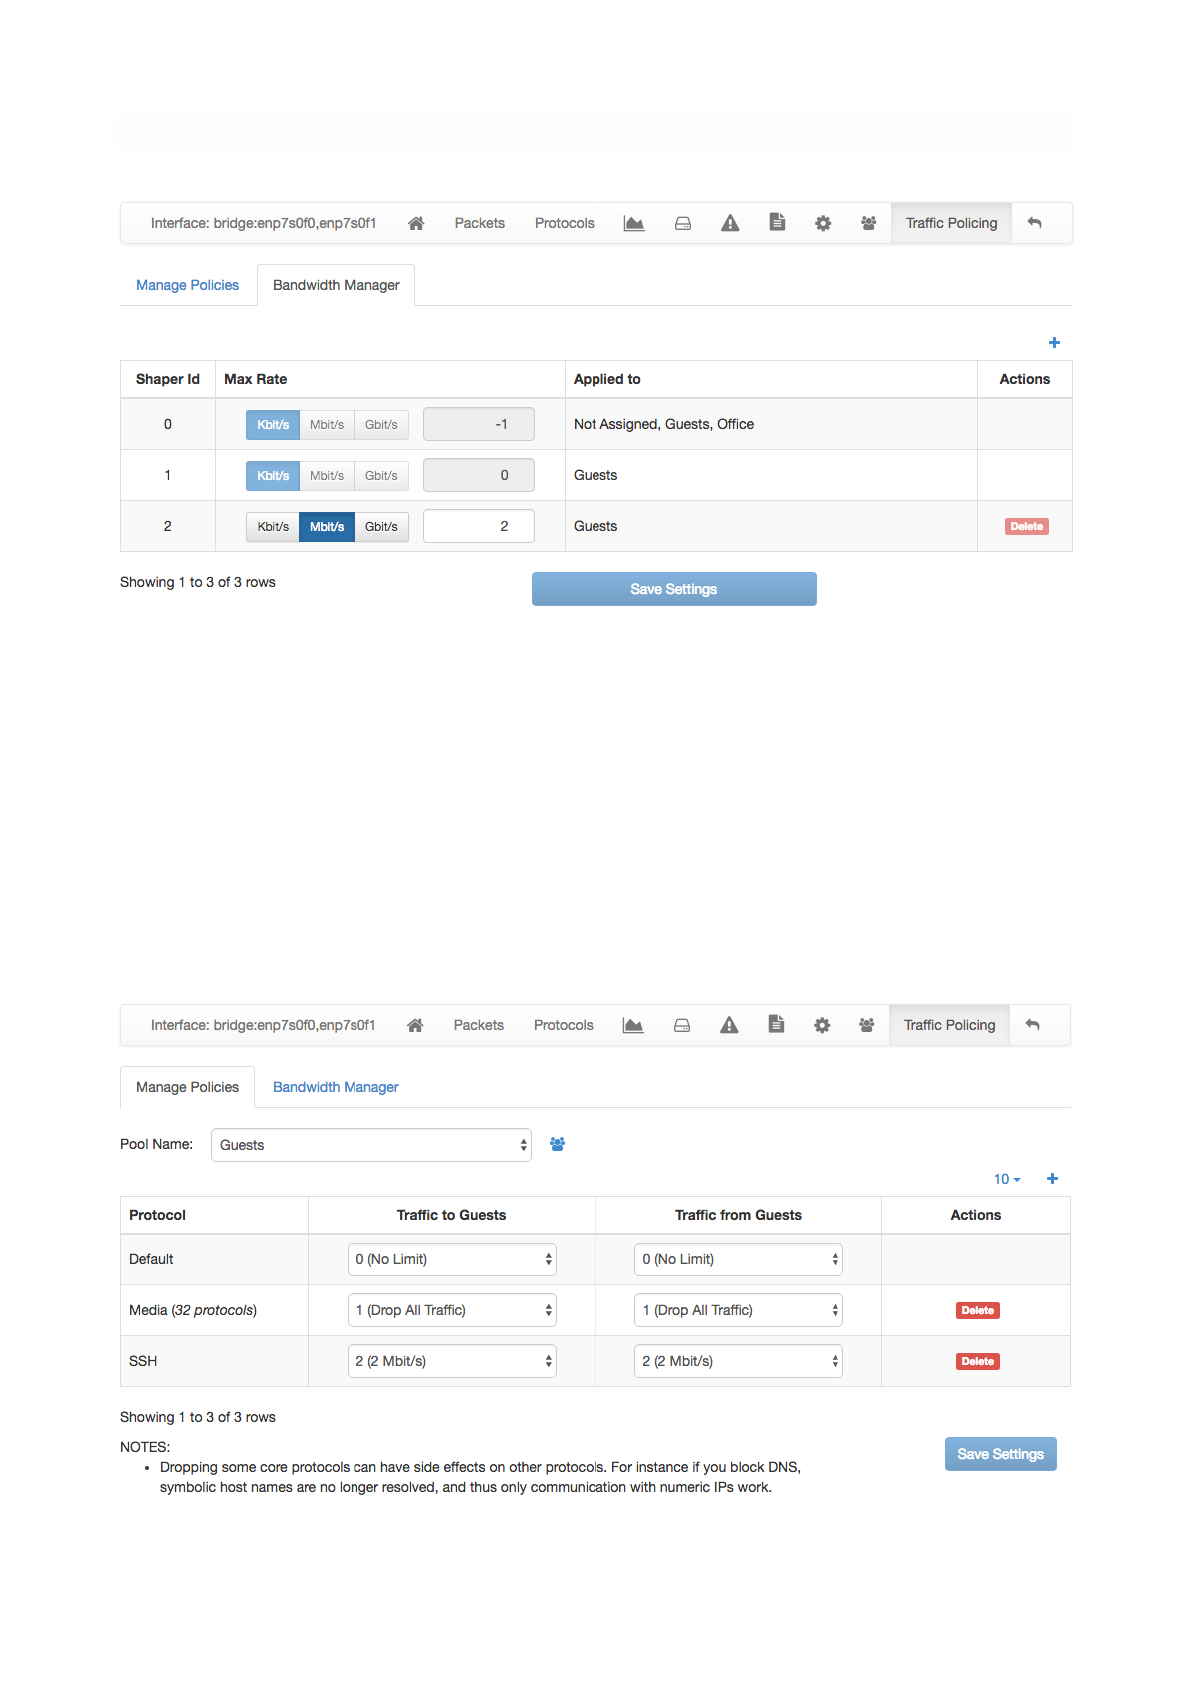
has no host pool associated. The “Drop All Traffic” shaper is used only by pool “Guests” as well as the 2
Mbps shaper identified with id 2.
Once the shapers are defined, they can be actually applied as policies to the Host Pools from the tab
“Manage Policies”. In the picture below, Host Pool “Guests” has policies defined for:
• A Layer 7 application protocol category “Media”;
• A Layer 7 application protocol category “SSH”.
Page of 68 76
The Traffic Policing “Bandwidth Manager” tab of the bridged Interface Details Page
The Traffic Policing “Manage Policies” tab of the bridged Interface Details Page

Application category “Media” groups together 32 different application protocols (including YouTube and
many other common audio/video streaming protocols), whereas application protocol “SSH” only apply to
Secured Shell traffic.
“Media” category is subject to the “Drop All Traffic” shaper both for the traffic that is destined to hosts in the
pool and for the traffic that originates from the pool. In other words, no “Media” application protocol can
be done by the pool “Guests”. Similarly, “SSH” protocol is subject to the 2 Mbps shaper in both the
directions, i.e., from hosts the pool and to hosts in the pool. This means that there is an overall limit to
2Mbps for the SSH traffic of the pool.
When the traffic of the pool is neither “SSH” nor it falls in the “Media” category, then it is subject to the
“Default” policy, which has the “No Limit” shaper in both direction. Therefore, hosts in the pool “Guests” are
free to use the network without limit provided that they do application protocols that are not in the “Media”
category and are not “SSH”.
Captive Portal
When operating inline, ntopng can also provide a Captive Portal functionality. This feature, only available
in the Enterprise Version, is used to authenticate legitimate users and bind them to the correct Host Pool.
The authentication takes place directly on the users’ devices by means of a login page that is prompted
right after the user has joined the network.
To enable the Captive Portal, ntopng must be started in inline according to one of the two configurations
described above. In addition, an extra option -w port1,port2 must be used to tell ntopng to use
port1 and port2 to authenticate Captive Portal users and to administer ntopng, respectively. If both the
conditions are satisfied, ntopng will show an entry in the “Preferences page” that can be used to enable
the captive portal.
Page of 69 76
The Traffic Bridging Captive Portal toggle in the Preferences Page
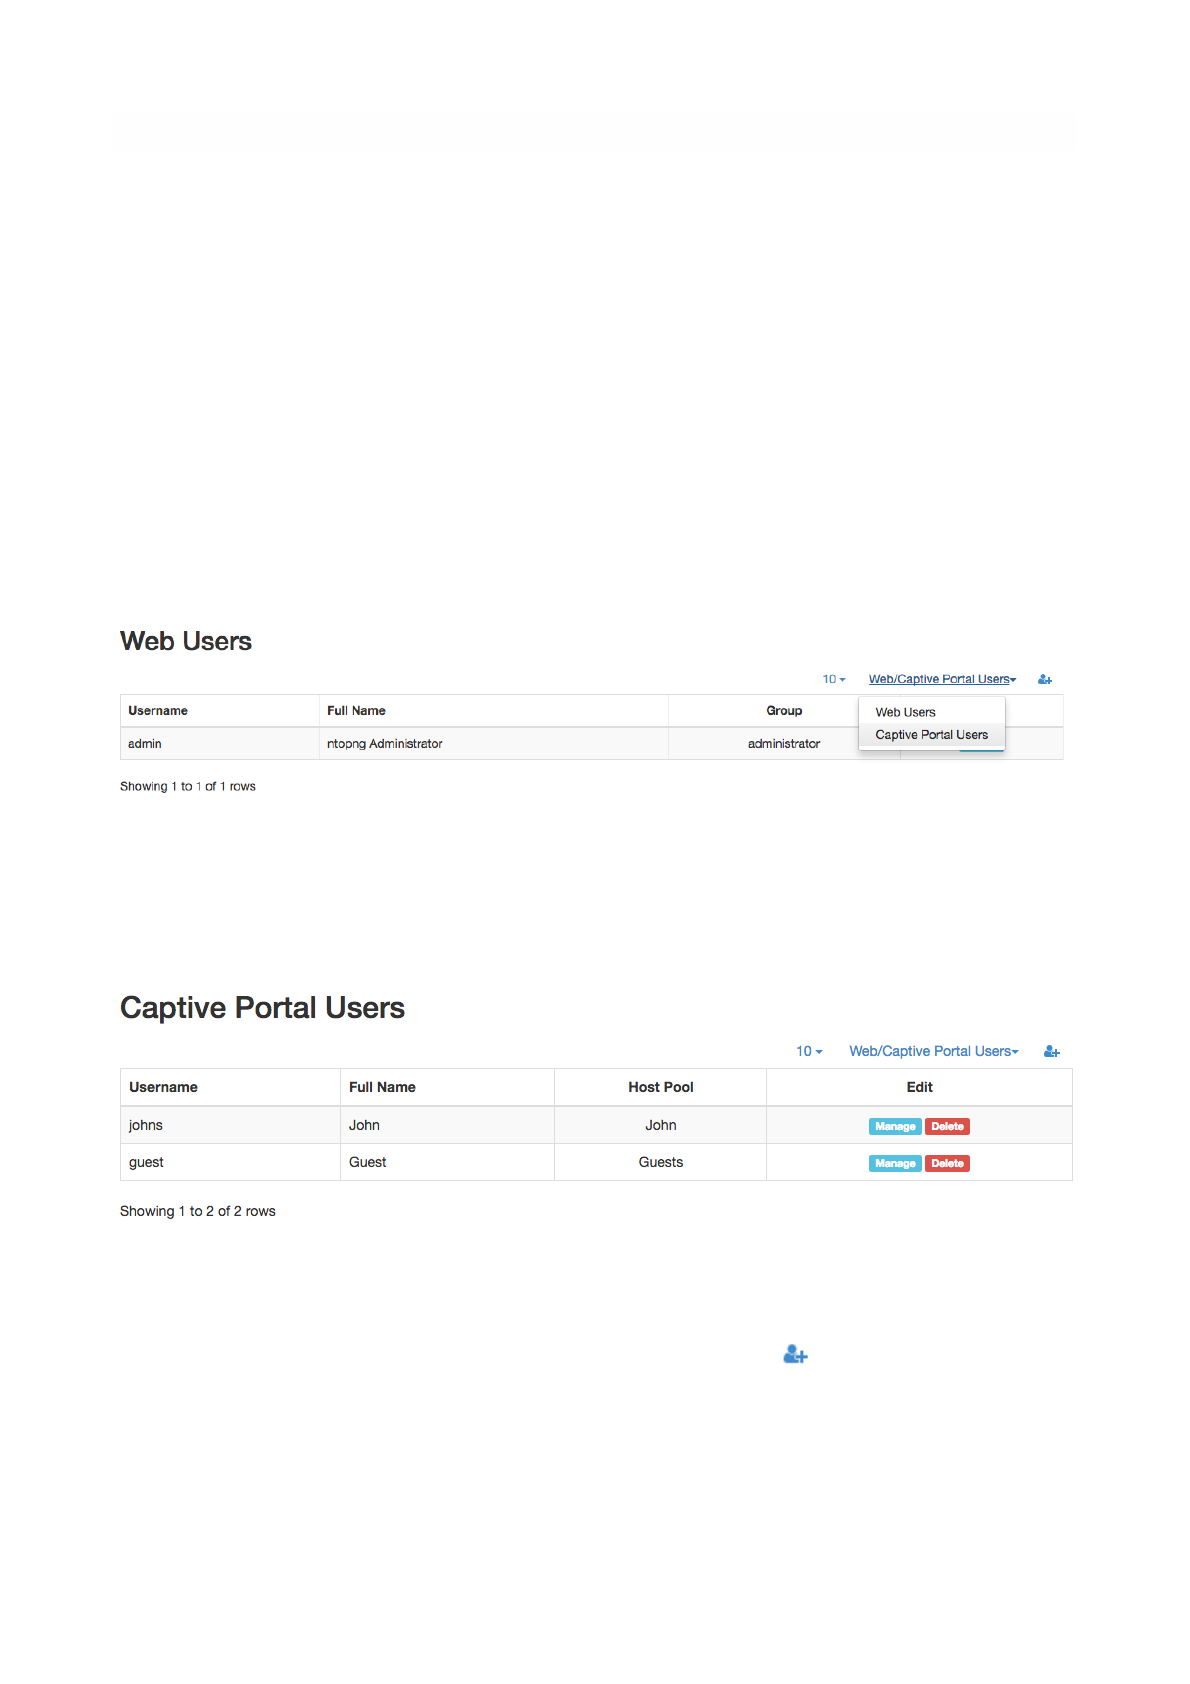
When the captive portal is enabled, traffic will be bridged only for “known” hosts, i.e, for hosts whose
users successfully authenticated to the portal using their Captive Portal credentials.
Captive Portal users and their credentials must be created by an ntopng administrator. Captive Portal
users are different from standard ntopng users as they are not meant to be used for accessing the ntopng
web interface but just for authenticating on the captive portal and using the network. The idea is to create
a Captive Portal user for a human, or create generic users such as guest or anonymous.
The creation of Captive Portal users is done using the “Manage Users” menu entry of the Settings menu.
An extra dropdown “Web/Captive portal users” appear on the right of the page and allows an ntopng
administrator to browse, manage, and create both Web and Captive Portal users. To create a Captive
Portal user, an ntopng administrator has to select the corresponding entry from the dropdown menu.
This will bring the administrator to the list of currently defined Captive Portal Users.
The Captive Portal user creation form is accessible by clicking on the icon ! and has the following fields:
•Username: the name that will be used during the Captive Portal login
•Password and Confirm Password: to authenticate, along with the username, to the Captive Portal
•Full Name: an optional string that can be associated to the current user to better identify it
•Host Pool: the host pool that will be automatically bound to any device that authenticates with the
current user
Page of 70 76
The Captive Portal Users dropdown menu
The Captive Portal Users list

•Authentication Lifetime: The amount of time a user can stay logged in before having to re-
authenticate to the Captive Portal. Lifetime can be unlimited or can expire after a specified amount of
time. Expiration is intended to be per-device, that is, if multiple logins occur from separate devices
(think to multiple users that authenticate with the same “guest” account at different points in time), then
each device will have its own expiration independently from the other.
Following is a picture that demonstrates how to create a “guest” Captive Portal user so that devices that
authenticate with “guest” will be automatically and perpetually associated to pool “Guests”.
Once the Captive Portal is enabled and users are created, new devices that join the network will be
presented with a login screen so that users having valid credential will be able to authenticate and obtain
network access.
Authenticating to the captive portal is not used just to enable network access, but to bind assets to people.
For example if John owns a phone, a tablet and a laptop, if he authenticates to the Captive Portal using
his credentials, any device he is using will be automatically bound to John. The glue that makes possible
this binging is the Captive Portal user that is the same, as John is always the same person, regardless of
Page of 71 76
The Captive Portal User creation form

which device he is using. In this way it is possible to forget identifying computers and start thinking in
terms of humans.
The list of active, successfully authenticated devices is available from the “Host Pools” entry of the “Hosts”
menu, as if they were normal, manually added pool members. The label specified in the network access
page will be shown as well.
Page of 72 76
The Captive Portal Network Access Page
Flows Dump
Ntopng can dump expired flow information either to a MySQL database or ElasticSearch. Ntopng is
instructed to dump expired flows to MySQL via the -F startup modifier.
MySQL
To dump expired flows to MySQL ntopng requires the -F modifier followed by a string in the following
format
mysql;<host|socket>;<dbname>;<table name>;<user>;<pw>
The string has 6 semi-colon separated fields
•mysql tells ntopng to dump flows to MySQL
•<host|socket> is the host (or the socket) of a running MySQL instance that will receive expired
flows
•<dbname> specify the name of the MySQL database to use. If the database does not exist, ntopng
will create it.
•<table name> specify the prefix of MySQL table names to use. Presently the prefix is always
defaulted to flows.
•<user>;<pw> are the credential of a MySQL user that has privileges to create, select and update
tables on <dbname>.
Ntopng creates two database tables. Tables are named flowsv4 and flowsv6 that are used to store
IPv4 and IPv6 flows, respectively.
Page of 73 76
A MySQL Table with Dumped Flows

ElasticSearch
Elasticsearch is an Open-Source real-time search and analytics engine with a powerful RESTful API built on
top of Apache Lucene. Ntopng can connect to an external Elasticsearch cluster as client using the Bulk
insert API for JSON mapped indexing.
Elasticsearch is designed for quickly and dynamically analyzing or searching through large amounts of
data and thus is ideal for flows generated by ntopng, enabling users and integrators to create a virtually
infinite number and variety of statistics using Kibana.
To learn more about Elasticsearch visit: https://www.elastic.co/guide.
To dump expired flows to Elasticsearch ntopng requires the -F modifier followed by a string in the
following format:
es;<idx type>;<idx name>;<es URL>;<http auth>
The string has 5 semi-colon separated fields
• es instructs ntopng to dump flows to Elasticsearch
• <idx type> “_type” to use in exported documents
• <idx name> index to use for exported documents [ accepts strftime() format ]
• <es URL> URL of Elasticsearch Bulk API [ ie: http://127.0.0.1:9200/bulk]
• <http auth> Basic HTTP Authentication [ username:password ]
Example:
es;ntopng;ntopng-%Y.%m.%d;http://localhost:9200/_bulk;
Definitions:
Indexes are like ‘databases’ in a RDBMS terms. An index is a logical namespace which maps to one or
more primary shards and can have zero or more replica shards distributed across nodes of a cluster.
Index mapping defines the multiple supported types.
Mapping is required for Elasticsearch to correctly interpret all fields produced by ntopng, specifically those
containing IP and Geo Location data. This is achieved by using a mapping template for ntop types,
automatically inserted by the application at startup. Note this action requires full admin rights on the
cluster in order to be performed successfully.
Ntopng will create Indexes and Mapping automatically on startup with no action required.
Each time the index name changes, a new Index is created. By default, ntopng creates one daily index
(i.e.: ntopng-2015.11.21). Index types can be used to differentiate instances.
Data Rotation:
The official Curator tool from Elastic can be used to manage and rotate Indexes created by ntopng
according to the user preferences and requirements.
Page of 74 76

Logstash
Logstash is an open source, server-side data processing pipeline that ingests data from a multitude of
sources simultaneously, transforms it, and then sends it to a downstream 'stash' such as ElasticSearch.
Ntopng can connect to a Logstash instance and send monitored flows to that instance.
To dump expired flows to Logstash ntopng requires the -F modifier followed by a string in the following
format:
logstash;<host>;<proto>;<port>
The string has 4 semi-colon separated fields
• logstash instructs ntopng to dump flows to Logstash
• <host> contains the name or IP address of the host that is running Logstash
• <proto> specifies the protocol (e.g., tcp) to be used for the flow export
• <port> indicates the port on which the Logstash process is listening
Example:
logstash;localhost;tcp;5510
An handy video-tutorial that shows how to send monitored flows to Logstash is available at https://
youtu.be/tluAUEeqkCk
!
Page of 75 76

Additional ntopng Features
Ntopng has several additional features that fall outside the scope of this user guide. New features are
always under active development and include
•Ability to work in inline mode and enforce traffic and layer-7 protocols
•Embedded-Systems aware including Raspberry Pi and Ubiquity Networks
Please stay tuned and follow the ntop blog (http://blog.ntop.org) for all the latest news or visit the ntop
Github page at http://github.com/ntop.
Page of 76 76
