Nanosurf Operating Instructions (Naio) Naio AFM
User Manual:
Open the PDF directly: View PDF ![]() .
.
Page Count: 258 [warning: Documents this large are best viewed by clicking the View PDF Link!]
- Table of contents
- INTRODUCTION TO THE INSTRUMENT
- The NaioAFM
- Installing the NaioAFM
- Preparing for measurement
- A first measurement
- Improving measurement quality
- Finishing measurements
- SOFTWARE REFERENCE
- The user interface
- Operating modes
- Positioning
- Imaging
- Spectroscopy
- Lithography
- Working with documents
- Options and settings
- Quick reference
- APPENDICES
Nanosurf NaioAFM
Operating Instructions
for
Naio Control Software
Version 3.6
“NANOSURF” AND THE NANOSURF LOGO ARE TRADEMARKS OF NANOSURF AG,
REGISTERED AND/OR OTHERWISE PROTECTED IN VARIOUS COUNTRIES.
COPYRIGHT © NOVEMBER 2015, NANOSURF AG, SWITZERLAND.
OPERATING INSTRUCTIONS V3.6R0, BT05386-22.

Table of contents

4
PART A: INTRODUCTION TO THE INSTRUMENT
CHAPTER 1: The NaioAFM 15
1.1: Introduction.............................................................................................. 16
1.2: Components of the system...................................................................... 16
1.2.1: Contents of the tool set ..................................................................................17
1.3: Connectors, indicators and controls ....................................................... 18
CHAPTER 2: Installing the NaioAFM 21
2.1: Installing the Naio control software ....................................................... 22
2.1.1: Preparation..........................................................................................................22
2.1.2: Installation...........................................................................................................22
2.2: Installing the hardware............................................................................ 23
CHAPTER 3: Preparing for measurement 25
3.1: Introduction.............................................................................................. 26
3.2: Initializing the NaioAFM system ............................................................ 26
3.3: Installing the cantilever ........................................................................... 27
3.3.1: Selecting a cantilever ......................................................................................28
3.3.2: Inserting a cantilever in the scan head.....................................................29
3.4: Installing the sample................................................................................ 32
3.4.1: Preparing the sample ......................................................................................32
3.4.2: Nanosurf samples .............................................................................................33
3.4.3: Mounting a sample ..........................................................................................35
CHAPTER 4: A first measurement 39
4.1: Introduction.............................................................................................. 40
4.1.1: Entering and changing parameter values ...............................................40
4.2: Preparing the instrument ........................................................................ 41
4.3: Approaching the sample ......................................................................... 42
4.3.1: Fine approach using the motorized approach stage...........................42
4.3.2: Automatic final approach ..............................................................................44
4.4: Starting a measurement .......................................................................... 46
4.5: Selecting a measurement area................................................................ 47
4.6: Storing the measurement........................................................................ 48
4.7: Creating a basic report............................................................................. 49
4.8: Running the microscope simulation....................................................... 49
4.9: Further options......................................................................................... 50
Table of contents
5
CHAPTER 5: Improving measurement quality 51
5.1: Removing interfering signals.................................................................. 52
5.1.1: Mechanical vibrations.....................................................................................52
5.1.2: Electrical interference......................................................................................52
5.1.3: Infrared and other light sources..................................................................53
5.2: Adjusting the measurement plane ......................................................... 53
5.3: Judging tip quality ................................................................................... 56
CHAPTER 6: Finishing measurements 59
6.1: Finishing scanning ................................................................................... 60
6.2: Turning off the instrument ...................................................................... 60
6.3: Storing the instrument ............................................................................ 61
PART B: SOFTWARE REFERENCE
CHAPTER 7: The user interface 65
7.1: General concept and layout..................................................................... 66
7.2: Workspace................................................................................................. 67
7.3: Operating windows.................................................................................. 68
7.3.1: Entering and changing parameter values ...............................................69
7.4: Document space ....................................................................................... 70
7.5: Panels ........................................................................................................ 71
7.6: Ribbon ....................................................................................................... 73
7.7: Status bar .................................................................................................. 74
7.8: View tab..................................................................................................... 75
7.8.1: Workspace group..............................................................................................75
7.8.2: Panels group.......................................................................................................75
7.8.3: Window group ...................................................................................................76
7.9: SPM parameters dialog............................................................................ 76
CHAPTER 8: Operating modes 79
8.1: Introduction.............................................................................................. 80
8.2: Acquisition tab ......................................................................................... 80
8.2.1: Preparation group ............................................................................................80
8.3: Static force mode...................................................................................... 81
8.4: Dynamic force mode ................................................................................ 82
8.5: Phase contrast mode................................................................................ 82
8.6: Force modulation mode........................................................................... 84
8.7: Spreading resistance mode..................................................................... 85
6
8.8: SPM parameters dialog............................................................................ 86
8.8.1: Operating mode page.....................................................................................86
8.8.2: Z-controller page ..............................................................................................88
8.8.3: SPM System page..............................................................................................90
8.9: Cantilever Browser dialog ....................................................................... 91
8.9.1: Cantilever Editor dialog ..................................................................................92
8.10: Vibration frequency search dialog.......................................................... 94
8.10.1: General concept................................................................................................94
8.10.2: Automated vibration frequency search....................................................95
8.10.3: Manual sweep controls...................................................................................96
8.10.4: Auto Frequency Config dialog .....................................................................98
CHAPTER 9: Positioning 101
9.1: Introduction............................................................................................. 102
9.2: Video panel .............................................................................................. 102
9.2.1: Digital video camera display........................................................................102
9.2.2: Illumination section ........................................................................................105
9.2.3: Digital video properties dialog ...................................................................105
9.3: Online panel............................................................................................. 107
9.3.1: Scan position section .....................................................................................107
9.3.2: Master image section .....................................................................................108
9.3.3: Illumination section ........................................................................................109
9.4: Acquisition tab ........................................................................................ 109
9.4.1: Approach group...............................................................................................109
9.5: SPM parameters dialog........................................................................... 110
9.5.1: Approach page .................................................................................................110
CHAPTER 10: Imaging 113
10.1: Introduction............................................................................................. 114
10.2: Imaging wizard........................................................................................ 115
10.3: Imaging parameters area ....................................................................... 117
10.4: Imaging toolbar....................................................................................... 120
10.5: Acquisition tab ........................................................................................ 122
10.5.1: Imaging group..................................................................................................122
10.5.2: Scripting group.................................................................................................123
10.6: SPM parameters dialog........................................................................... 124
10.6.1: Imaging page ....................................................................................................124
CHAPTER 11: Spectroscopy 129
11.1: Introduction............................................................................................. 130
7
11.2: Spectroscopy wizard............................................................................... 133
11.2.1: Force–distance..................................................................................................134
11.2.2: Amplitude–Distance / Phase–Distance ...................................................138
11.2.3: Tip current–Distance ......................................................................................139
11.2.4: Tip current–Tip voltage..................................................................................140
11.3: Spectroscopy parameters area............................................................... 142
11.4: Spectroscopy toolbar.............................................................................. 143
11.4.1: Tools Status for Line spectroscopy ............................................................144
11.4.2: Tools Status for Grid spectroscopy ............................................................145
11.5: Acquisition tab ........................................................................................ 145
11.5.1: Spectroscopy group........................................................................................145
11.6: SPM parameters dialog........................................................................... 146
11.6.1: Spectroscopy page..........................................................................................146
11.6.2: Spectroscopy page (standard level)..........................................................147
11.6.3: Spectroscopy page (advanced level)........................................................150
CHAPTER 12: Lithography 153
12.1: Introduction............................................................................................. 154
12.2: Performing lithography.......................................................................... 155
12.3: Lithography parameters area................................................................. 156
12.3.1: Vector Graphic Import dialog......................................................................159
12.3.2: Pixel Graphic Import dialog .........................................................................161
12.3.3: Layer Editor dialog...........................................................................................164
12.3.4: Object Editor dialog........................................................................................166
12.4: Acquisition tab ........................................................................................ 167
12.4.1: Lithography group ..........................................................................................167
12.5: Lithography toolbar................................................................................ 168
12.6: Lithography preview............................................................................... 169
12.7: SPM parameters dialog........................................................................... 170
12.7.1: Lithography page ............................................................................................170
CHAPTER 13: Working with documents 173
13.1: Introduction............................................................................................. 174
13.2: Data info panel ........................................................................................ 174
13.2.1: Data info toolbar..............................................................................................175
13.3: Charts ....................................................................................................... 175
13.3.1: Working with multiple charts......................................................................177
13.3.2: Chart Properties dialog..................................................................................178
8
13.4: Gallery panel............................................................................................ 186
13.4.1: History file mask...............................................................................................187
13.4.2: Image list.............................................................................................................187
13.4.3: Gallery toolbar ..................................................................................................187
13.4.4: Mask editor dialog...........................................................................................188
13.4.5: File Rename dialog ..........................................................................................190
13.5: Analysis tab.............................................................................................. 191
13.5.1: Measure group..................................................................................................192
13.5.2: Correction group..............................................................................................194
13.5.3: Roughness group.............................................................................................196
13.5.4: Filter group.........................................................................................................198
13.5.5: Tools group ........................................................................................................200
13.5.6: Report group .....................................................................................................201
13.5.7: Scripting group.................................................................................................203
13.6: Tool panel................................................................................................. 203
13.7: File menu.................................................................................................. 205
CHAPTER 14: Options and settings 209
14.1: File menu.................................................................................................. 210
14.1.1: Options dialog ..................................................................................................212
14.2: Settings tab.............................................................................................. 218
14.2.1: Scan head group..............................................................................................219
14.2.2: Hardware group ...............................................................................................219
14.2.3: Service group ....................................................................................................220
14.3: Scan head selector dialog....................................................................... 220
14.4: Scan head calibration editor dialog....................................................... 221
14.4.1: Scan Axis .............................................................................................................222
14.4.2: I/O Signals...........................................................................................................223
14.5: Scan Axis Correction dialog.................................................................... 225
14.6: Scan Head Diagnostics dialog ................................................................ 225
14.6.1: Dialog for AFM scan heads...........................................................................226
14.7: Controller configuration dialog ............................................................. 226
14.8: SPM parameters dialog........................................................................... 229
14.8.1: Probe/tip page..................................................................................................229
CHAPTER 15: Quick reference 231
PART C: APPENDICES
CHAPTER 16: Maintenance 235
16.1: Introduction............................................................................................. 236
16.2: The NaioAFM scan head.......................................................................... 236
16.3: The NaioAFM exterior ............................................................................. 236
9
CHAPTER 17: Problems and solutions 237
17.1: Introduction............................................................................................. 238
17.2: Software and driver problems ............................................................... 238
17.2.1: No connection to microscope.....................................................................238
17.2.2: USB Port error....................................................................................................238
17.2.3: Driver problems................................................................................................239
17.3: AFM measurement problems ................................................................. 241
17.3.1: Laser fail...............................................................................................................241
17.3.2: Automatic final approach fails ....................................................................242
17.3.3: Image quality suddenly deteriorates........................................................242
17.4: Nanosurf support .................................................................................... 243
17.4.1: Self help...............................................................................................................243
17.4.2: Assistance ...........................................................................................................244
17.5: About dialog ............................................................................................ 245
CHAPTER 18: AFM theory 247
18.1: Scanning probe microscopy ................................................................... 248
18.2: The NaioAFM............................................................................................ 249
CHAPTER 19: Technical data 251
19.1: Introduction............................................................................................. 252
19.2: The NaioAFM............................................................................................ 252
19.2.1: Specifications and features ..........................................................................252
19.2.2: Dimensions ........................................................................................................254
19.2.3: Cantilever requirements and considerations.........................................254
19.2.4: Compatible Options and Accessories.......................................................256
10
About this Manual
For your convenience, this manual has been divided into three separate parts:
PART A: INTRODUCTION TO THE INSTRUMENT will familiarize you with the Nanosurf NaioAFM
system, and will explain how to set up your system and operate it on a daily basis. Among
other things, it will also describes how to set up basic experiments and how to generally
improve measurement quality. Part A starts with Chapter 1: The NaioAFM (page 15) and
ends with Chapter 6: Finishing measurements (page 59).
PART B: SOFTWARE REFERENCE is a reference for the software that comes with the NaioAFM
system. It starts with Chapter 7: The user interface (page 65) and ends with Chapter 16: Quick
reference (page 283). Its content applies to the Nanosurf Naio control software version 3.6.
If you are using newer software versions, download the latest manual from the Nanosurf
support pages or refer to the “SPM software version history.pdf” file that came with the
newer software. For more information on the Nanosurf Report software, refer to the online
help included with this optional software.
PART C: APPENDICES contains information that you will use less frequently, such as general
maintenance and troubleshooting. It starts with Chapter 16: Maintenance (page 235) and
ends with Chapter 19: Technical data (page 251).
11

PART A:
INTRODUCTION TO THE
INSTRUMENT

CHAPTER 1:
The NaioAFM
0
0
CHAPTER 1: THE NAIOAFM
16
The Nanosurf NaioAFM system is an atomic force microscope that can measure the
topography and several other properties of a sample with nanometer resolution. These
measurements are performed, displayed, and evaluated using the Nanosurf Naio control
software.
The content of the system and the function of its major components are described in this
chapter. Detailed technical specifications and system features can be found in Chapter 19:
Technical data (page 251).
Several other Nanosurf products can be used in conjunction with the NaioAFM:
•NaioAFM Side View Camera.
• Naio Advanced Modes Option: package that enables Spreading Resistance Operating
mode, Force Modulation Operating mode, Advanced Spectroscopy modes, and
Advanced Lithography modes.
• Nanosurf Report: software for simple automatic evaluation and report generation of
SPM measurements.
• Nanosurf Analysis: software for detailed analysis of SPM measurements.
• The Nanosurf Isostage: a highly compact active vibration isolation table.
This section describes the parts that may be delivered with an NaioAFM system. The
contents of delivery can vary from system to system, depending on which parts were
ordered. To find out which parts are included in your system, refer to the delivery note
shipped with your system. Verify that the package contains the following components:
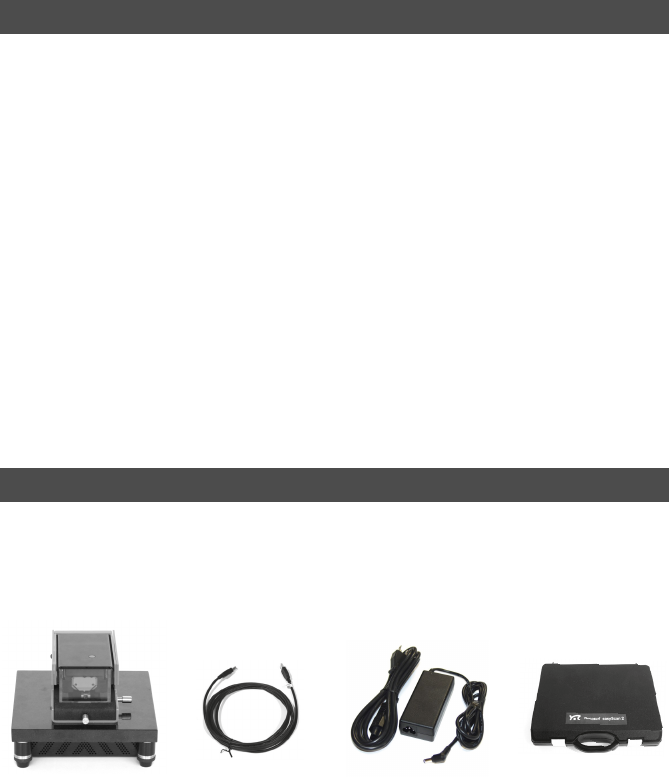
1. The NaioAFM system.
2. USB cable.
3. Mains cable (for power supply).
4. Power supply.
1.1: Introduction
1.2: Components of the system
Figure 1-1: Components. The NaioAFM system
13524
COMPONENTS OF THE SYSTEM
17
5. NaioAFM tool set. The items contained in the NaioAFM tool set are described in the
next section.
6. NaioAFM side view camera (option; not shown).
7. The NaioAFM installation CD (not shown): Contains product software and calibration
files, as well as PDF files of all relevant manuals, application notes and technical notes.
8. A calibration certificate for your system (not shown).
9. This NaioAFM Operating Instructions manual (not shown).
10. AFM extended sample kit (option; not shown): comes with a set of 10 samples and
description of experiments.
11. Naio Advanced Modes Option certificate of purchase with Activation key printed on it
(option,; not shown; comes with Naio Advanced Mode Option).
12. Instrument case (not shown).
Please keep the original packaging material (at least until the end of the warranty period),
so that it may be used for transport at a later date, if necessary. For information on how to
store, transport, or send in the instrument for repairs, see Section 6.3: Storing the instrument
(page 61).
The content of the tool set depends on the modules and options included in your order. It
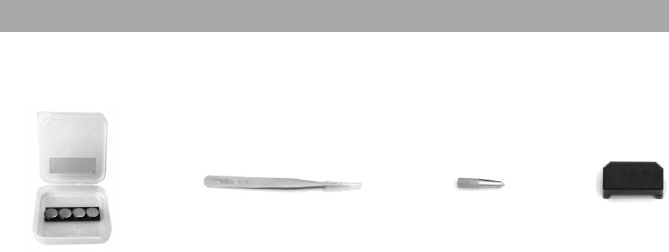
may contain any of the following items:
1. Set of 4 steel sample discs.
2. Cantilever tweezers: (103A CA).
3. Cantilever insertion tool (usually mounted in the DropStop).
4. DropStop.
5. Samples (option; not shown). Possible combinations are:
a. AFM large scan sample kit (grid: 10 μm / 100 nm, CD ROM piece).
b. AFM high resolution sample kit (grid: 660 nm, graphite (HOPG) sample on sample
support).
1.2.1: Contents of the tool set
Figure 1-2: Contents of the tool set
234
1

CHAPTER 1: THE NAIOAFM
18
c. Two calibration samples (grid: 10 μm / 100 nm, grid: 660 nm).
6. AFM calibration samples kit (option; not shown) with three calibration samples (grid:
10 μm / 100 nm, grid: 660 nm, flatness sample).
7. Set of 10 static mode cantilevers (option; not shown).
8. Set of 10 dynamic mode cantilevers (option; not shown).
9. USB dongle for Nanosurf Report or SPIP software (option).
Use this section to discover the function and location of key parts of the NaioAFM system,
as referred to throughout this manual.
Vibration isolation table
Granite table that (through its weight) helps eliminate environmental vibrations that would
otherwise disturb sample measurements.
Vibration isolation feet
Rubber, spring-mounted feet that further isolate the NaioAFM system from mechanically
transmitted vibrations.
Controller housing
Black, metallic housing that shields and protects the NaioAFM control electronics mounted
directly underneath the vibration isolation table.
Power LED
Lights up blue when the system is powered on.
Scan head housing
Orange, metallic housing encompassing the scan head and providing a hinge-function for
the scan head cover and scanner shield.
Scan head cover
Black, metallic part underneath which the scan head is mounted. Offers a flip-over function
for accessing the scan head and the sample stage. Also contains the Side View Optics.
Side view lens
Allows observation of the tip–sample distance during approach (by eye or via optional side
view camera).
Sample stage
XY-positioning table that allows the sample to be positioned with respect to the cantilever.
Allows selection of the measurement area of interest.
Positioning screws
Used to change the position of the sample stage (and thus of your sample).
1.3: Connectors, indicators and controls
CONNECTORS, INDICATORS AND CONTROLS
19
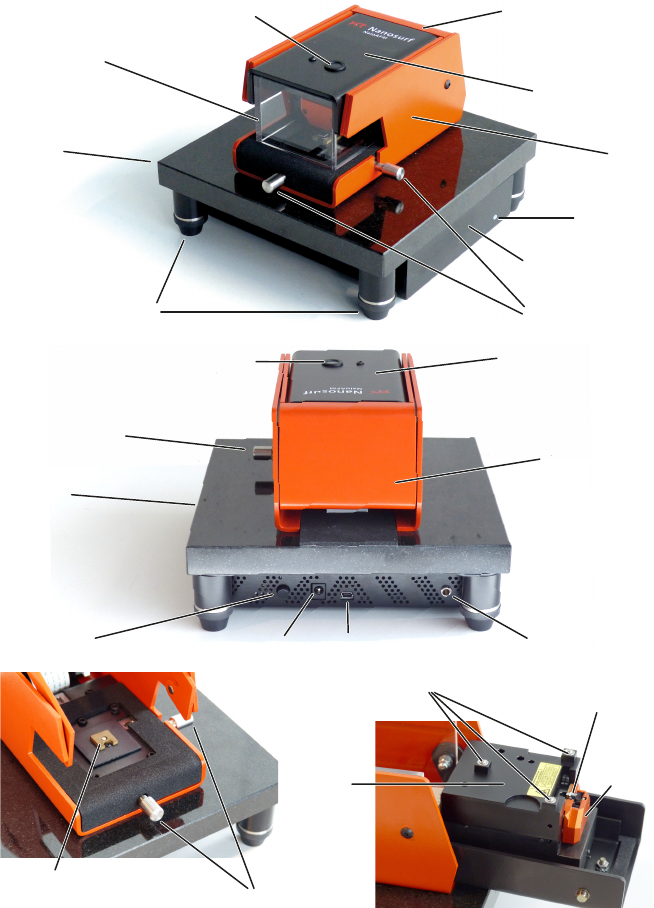
Figure 1-3: Parts of the system.
Vibration
Isolation
Table
Power LED
Positioning ScrewsVibration Isolation Feet
Scan Shield
Scan Head Cover
Locking HandleSide View Lens
Controller Housing
Scan
Head
Housing
Vibration
Isolation
Table
Power Button
Positioning Screw
Locking Handle
Side View Lens Scan Head Cover
Power Connector Mini-USB Connector Ground Connector
Sample Stage
with Magnet
Cantilever and
Cantilever Holder Spring
Scan Head Feet
Positioning Screws
Scan
Head
Approach
Stage
Scan
Head
CHAPTER 1: THE NAIOAFM
20
Scan shield
A partly metallic, partly plexi-glass cover that protects measurements from air flow and (to
a lesser extent) acoustic disturbances.
Locking handle
Locks the NaioAFM system for Measurement. Only when the system is properly closed with
the locking handle can measurements be performed.
Scan head
Contains all electronic and mechanical components necessary for scanning and cantilever
deflection detection.
Scan head feet
Used to reproducibly and stably position the scan head with respect to the sample.
Approach stage
Motorized part of the scan head that brings the cantilever into contact with the sample.
Power button
Used to turn the NaioAFM system on or off.
Power connector
Used to connect the power supply.
USB connector
Used to connect the NaioAFM system to a personal computer.
Ground connector
Used to connect the electrical ground of the NaioAFM system to that of other equipment.

CHAPTER 2:
Installing the
NaioAFM
0
0
CHAPTER 2: INSTALLING THE NAIOAFM
22
Before installation, the following steps need to be performed:
1Make sure the computer to be used meets the minimal computer requirements, as
described in Chapter 19: Technical data under Operating system/PC requirements (page
253).
2Make sure none of the NaioAFM system’s hardware is connected to the computer (this
includes the optional (USB) NaioAFM Side View ).
3Turn on the computer and start Windows.
4Log on with Administrator privileges.
To initiate the installation procedure:
1Insert the Naio Installation CD into the CD drive of the computer.
In most cases, the Autorun CD Menu program will open automatically. Depending on
your Autoplay settings, however, it is also possible that the Autoplay window opens,
or that nothing happens at all. In these cases:
>Click “Run CD_Start.exe” in the Autoplay window, or manually open the Naio
Installation CD and start the program “CD_Start.exe”.
2.1: Installing the Naio control software
2.1.1: Preparation
Important
Do not run any other programs while installing the NaioAFM software.
2.1.2: Installation
Important
The Naio Installation CD contains calibration information (.hed, .stagex files) specific to
your instrument! Therefore, always store (a backup copy of ) the CD delivered with the
instrument in a safe place.

INSTALLING THE HARDWARE
23
2Click the “Install Naio software” button.
The CD Menu program now launches the software setup program, which will start
installation of all components required to run the Nanosurf Naio software.
In Windows Vista/7, the User Account Control (UAC) dialog may pop up after clicking
the “Install Naio software” button, displaying the text “An unidentified program wants
access to your computer”. If the name of the program being displayed is “Setup.exe”:
>Click the “Allow” button.
After the software setup program has started:
1Click “Next” in each of the “Welcome”, “Select Destination Folder”, and “Select Start
Menu Folder” windows that sequentially appear, accepting the default choices in all
dialogs.
2When the “Ready to install” window appears, click on the “Install” button.
The setup program now performs its tasks without any further user interaction.
Depending on the configuration of your computer, a reboot may be required at the
end of the software installation process. If this is the case, the setup program will
inform you of this, and will provide you with the opportunity to do so.
This completes the driver and control software installation procedure. If you wish to use the
Lithography features of the NaioAFM software and want to design your own vector
graphics for import into the lithography module, you can opt to install the LayoutEditor
software by clicking the “Install CAD Program” button in the CD Menu program. This will
launch the LayoutEditor installation program, which will guide you through the CAD
program setup. Likewise, if you wish to use the Gwyddion program for advanced
measurement analysis, you may also opt to install it now. Otherwise, you can exit by
clicking the “Exit” button and continue with Section 2.2: Installing the hardware.
1Connect the NaioAFM to the power supply
2.2: Installing the hardware
Important
• Make sure your mains power connection is protected against excess voltage surges.
• Place the instrument on a stable support in a location that has a low level of building
vibrations, acoustic noise, electrical fields, and air currents.
• If the vibration isolation of your setup proves to be insufficient for your measurement
purposes, you can use an active vibration isolation table such as the Nanosurf
Isostage. Refer to the respective manuals for installation instructions.
CHAPTER 2: INSTALLING THE NAIOAFM
24
2Connect the NaioAFM to the computer on which the Naio control software was
installed (see Section 2.1: Installing the Naio control software) using the supplied USB
cable (Figure 1-1: Components (page 16), item 2).
A popup balloon appears in the Windows notification area, stating that new hardware
devices have been found and drivers are being installed. This can take quite some time
(20 seconds or more). Please be patient! After successful installation, the popup
balloon indicates that the installation has finished and devices are now ready for use.
3If you own a NaioAFM side view camera, connect it to a USB port on your computer.
On Windows 7 computers, a popup balloon may display the message “Problem
installing driver”. If this happens, disconnect and reconnect the video camera once
more. Hardware recognition will now complete successfully.
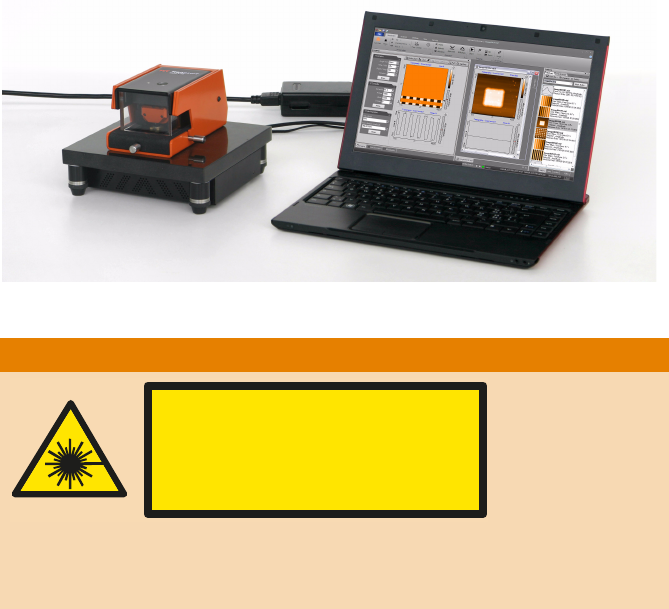
Figure 2-1: Measurement setup. Complete NaioAFM system with personal computer.
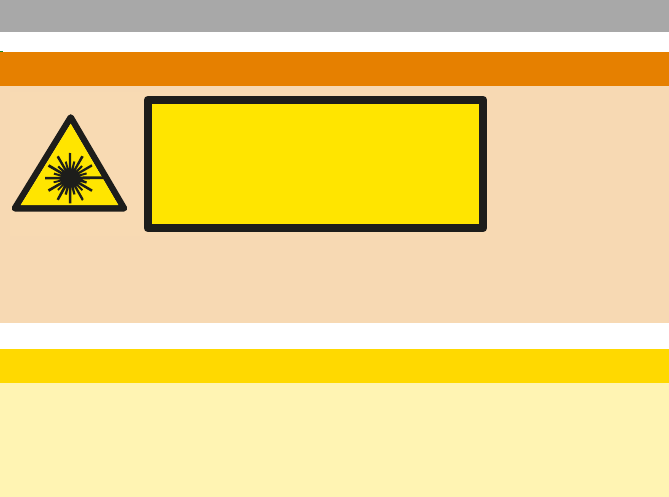
! WARNING
Always close the DropStop before inspecting or mounting a cantilever, or before
inspecting the alignment chip, especially when using optical instruments (magnifiers)
for the inspection.
LASER RADIATION (650nm)
DO NOT STARE INTO THE BEAM
OR VIEW DIRECTLY WITH OPTICAL
INSTRUMENTS (MAGNIFIERS)
CLASS 2M LASER PRODUCT

CHAPTER 3:
Preparing for
measurement
0
0
CHAPTER 3: PREPARING FOR MEASUREMENT
26
Once the system has been set up (see Chapter 2: Installing the NaioAFM (page 21)), the
instrument and the sample have to be prepared for measurement. The preparation consists
of three steps: Initializing the NaioAFM system, Installing the cantilever, and Installing the
sample.
To initialize the NaioAFM system:
1Make sure that the NaioAFM system is connected to the mains power and to the USB
port of the control computer.
2Turn on the power of the NaioAFM system by pressing the power button at the back
of the controller housing.
A blue power LED on the side of the system will light up.
3Start the Naio control software on the control computer.
Now a message “Controller startup in progress” is displayed on the computer screen.
When initialization is completed, a message “Starting system” is briefly displayed on
the computer screen.
4In the Preparation group of the Acquisition tab you will see the currently selected
perating mode and cantilever type.
5Determine which operating mode you wish to use.
Refer to Chapter 6: Operating modes (page 66) for detailed properties of the modes
available.
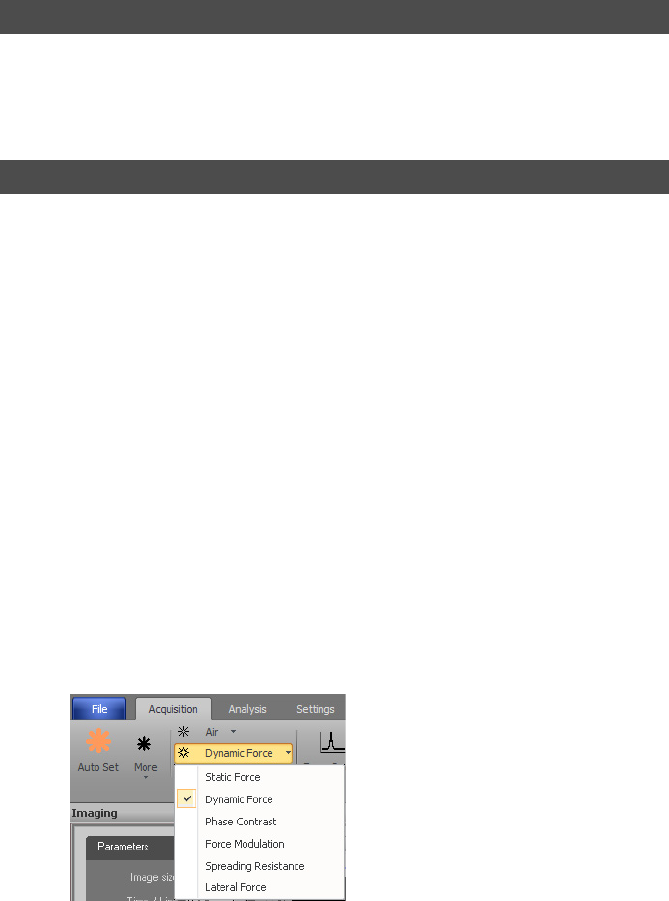
To change the operating mode:
>Select the desired operating mode from the Operating mode drop-down menu by
clicking the currently selected operating mode:
3.1: Introduction
3.2: Initializing the NaioAFM system
INSTALLING THE CANTILEVER
27
6Determine which cantilever type you wish to use.
The cantilever most suited for your measurements will depend on the selected the
selected operating mode, and on your sample.
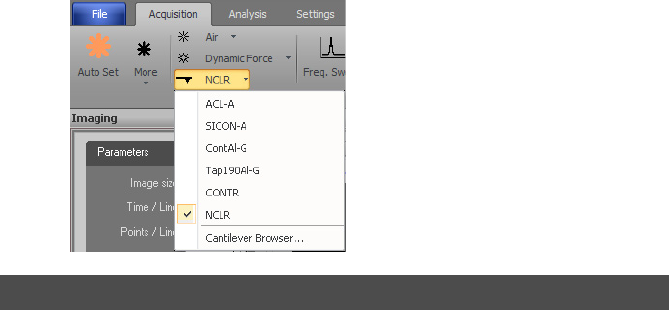
To change the cantilever type:
>Select the desired cantilever type from the Cantilever selector drop-down menu by
clicking the currently selected cantilever type:
To maximize ease of use, the NaioAFM is designed in such a way that the cantilever can be
quickly installed and removed without having to re-adjust the cantilever deflection
detection system. The quick cantilever installation is possible because the scan head
contains a self-alignment system. This alignment system consists of structures on the
alignment chip and matching grooves in the cantilever chip. The alignment system
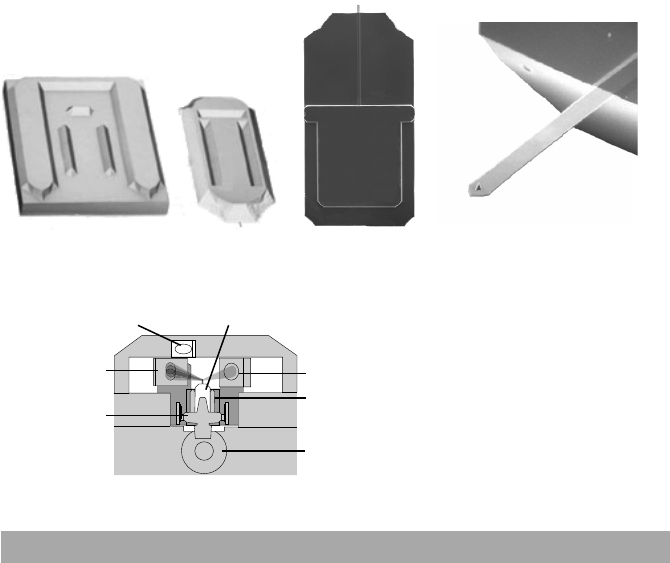
positions the cantilever with micrometer accuracy (see Figure 3-1: Cantilever, left). This
accuracy is only guaranteed when the cantilever and the mounting chip are absolutely
clean. Installation of the cantilever should therefore still be carried out with great care. The
quality of measurements depends strongly on the accuracy of the cantilever installation.
3.3: Installing the cantilever
CHAPTER 3: PREPARING FOR MEASUREMENT
28
Stiffer and shorter cantilevers (e.g. NCLR [Nanoworld] or Tap190Al-G [BudgetSensors]) are
generally used for the Dynamic force mode. More flexible and longer cantilevers (e.g.
XYCONTR [Nanoworld] or ContAl-G [BudgetSensors]) are generally used for the Static force
mode.
To change to a different cantilever type:
>In the Preparation group of the Acquisition tab, select the desired cantilever type from
the Cantilever selector drop-down menu by clicking the currently selected cantilever
type.
For each cantilever type, data is stored. This data is used to calculate:
• Force data and setpoint from cantilever deflection.
• Frequency search range for dynamic mode setup.
If the wrong cantilever type is selected, these calculations will most likely produce incorrect
results.
Figure 3-1: Cantilever. (Left) Alignment system. (Center) Cantilever chip viewed from the top. (Right)
Cantilever, 450 μm long, 50 μm wide with integrated tip.
Figure 3-2: Cantilever deflection detection system
3.3.1: Selecting a cantilever
Sample illumination
P
hotodetector Laser
Cantilever
holder spring
Cantilever
Alignment chip
Hole for cantileve
r
insertion tool
INSTALLING THE CANTILEVER
29
In addition to this, the selected cantilever type is used in the Data info panel of a
measurment to show what cantilever was used for that particular measurement.
If the cantilever type is not available in the list, select the last list entry ("Cantilever
Browser...") and refer to Section 8.9: Cantilever Browser dialog (page 91) on how to create a
new cantilever type in the software.
If the NaioAFM is locked (i.e. closed for measurement), you have to unlock it first:
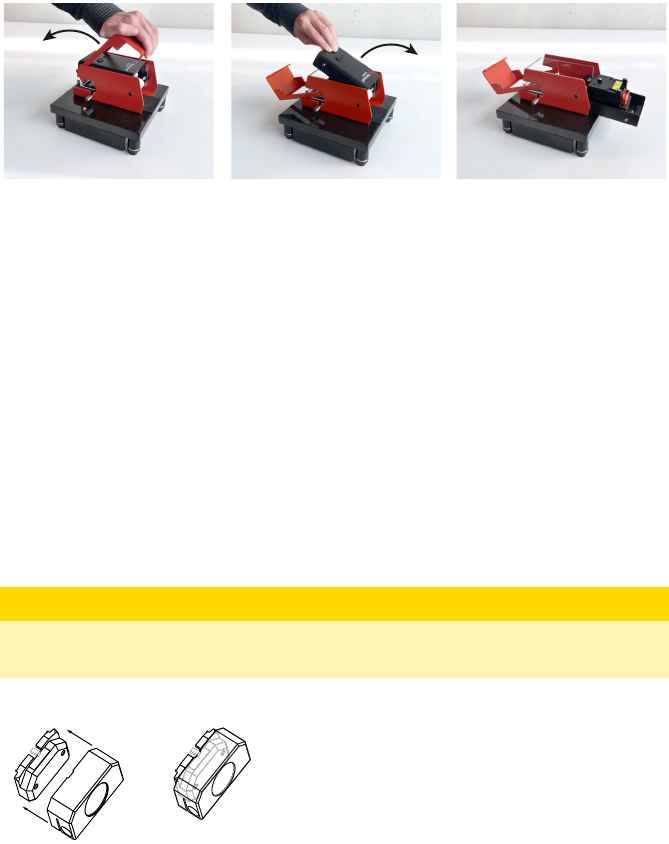
>Grab the NaioAFM’s locking handle and pull it over to the other side (see Figure 3-3:
Unlocking and opening the NaioAFM scan head, Left).
To remove the old cantilever:
1Put the scan head upside-down by flipping over the scan head cover (see Figure 3-3:
Unlocking and opening the NaioAFM scan head, Center and Right).
At this point, the sample illumination light will turn off and the approach stage of the
scan head will move to its “Home” position, retracting the cantilever as far as possible.
This is a safety precaution to avoid crashing of the new cantilever into the sample
surface once the scan head cover is closed again. You can manually abort or shorten
3.3.2: Inserting a cantilever in the scan head
! WARNING
Always close the DropStop before inspecting or mounting a cantilever, or before
inspecting the alignment chip, especially when using optical instruments (magnifiers)
for the inspection.
CAUTION
• Nothing should ever touch the cantilever. The cantilever tip may get damaged or the
cantilever may break off otherwise.
• The Cantilever Holder Spring is very delicate. NEVER overstretch it! It will become bent
and unusable otherwise!
LASER RADIATION (650nm)
DO NOT STARE INTO THE BEAM
OR VIEW DIRECTLY WITH OPTICAL
INSTRUMENTS (MAGNIFIERS)
CLASS 2M LASER PRODUCT
CHAPTER 3: PREPARING FOR MEASUREMENT
30
the retraction process by clicking the “Stop” button in the Naio control software (see
also Home (page 109)), although this is only recommended for experienced users.
2Remove the Cantilever Insertion Tool from the DropStop.
3Place the DropStop on the scan head (see Figure 3-4: Placing the DropStop).
The laser beam is now blocked by the DropStop. As a consequence, the Probe Status
light in the Naio Control software will now blink red.
4Place the cantilever insertion tool (Figure 1-2: Contents of the tool set (page 17), item 3)
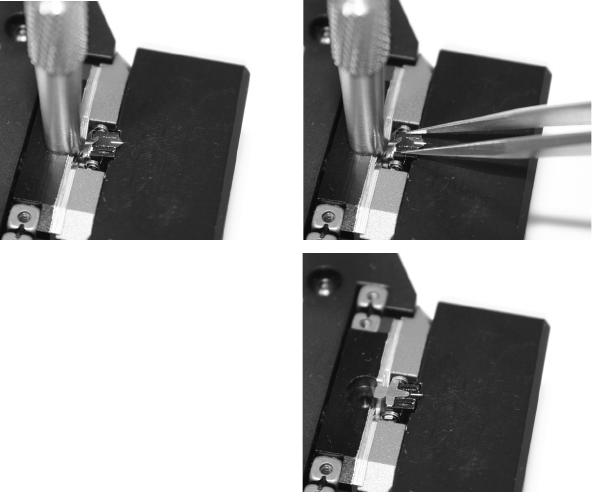
into the hole behind the alignment chip (Figure 3-5: Mounting the cantilever, top left).
The Cantilever Holder Spring opens.
5Use the Cantilever Tweezers (figure Figure 1-2: Contents of the tool set (page 17), item 2)
to remove the old cantilever from the instrument (Figure 3-5: Mounting the cantilever,
top right).
Figure 3-3: Unlocking and opening the NaioAFM scan head. (Left) Unlocking. (Middle) Opening.
(Right) Ready for cantilever exchange.
CAUTION
Always store and ship the scan head with a cantilever installed. If you fail to do so, the
cantilever holder spring may damage the alignment chip structure.
Figure 3-4: Placing the DropStop
INSTALLING THE CANTILEVER
31
To insert the new cantilever:
1Take the new cantilever out of its box with the cantilever tweezers.
2Place the cantilever carefully on the alignment chip in the scan head (Figure 3-5:
Mounting the cantilever, top right).
3Verify that the cantilever does not move with respect to the alignment chip by
carefully tapping on it with the tweezers.
If the cantilever does move, it is probably not inserted correctly. Refer to Figure 3-6:
Cantilever alignment for correct alignment and examples of incorrect alignment.
4Gently pull the cantilever insertion tool out of the hole.
The Cantilever Holder Spring closes and holds the cantilever chip tightly in position
(Figure 3-5: Mounting the cantilever, bottom right).
Figure 3-5: Mounting the cantilever. (top left) inserting the cantilever insertion tool, (top right)
inserting/removing the cantilever, (bottom right) correctly inserted cantilever.
CHAPTER 3: PREPARING FOR MEASUREMENT
32
5Remove the DropStop.
The laser beam is now unblocked, and the Probe Status light in the Naio Control
software should now stop blinking red. If this is not the case refer to Section 17.3.1:
Laser fail (page 241).
The NaioAFM can be used to examine any material with a surface roughness that does not
exceed the height range of the scanning tip. Nevertheless, the choice and preparation of
the surface can influence the surface–tip interaction. Examples of influencing factors are
excess moisture, dust, grease or other contaminations of the sample surface. Because of
this, some samples need special preparation to clean their surface. Generally, however, only
clean your samples if this is absolutely required, and be sure to clean very carefully in order
not to harm the sample surface.
If the surface is dusty, try to measure on a clean area between the dust. Although it is
possible to blow away coarse particles with dry, oil-free air, small particles generally stick
quite strongly to the surface and cannot be easily removed this way. Also note that bottled,
pressurized air is generally dry, but pressurized air from an in-house supply is generally not.
In this case an oil filter should be installed. Blowing away dust by breath is not advisable,
because it too is not dry, and the risk of contaminating the sample even further is very high.
When the sample surface is contaminated with solid matter or substances that can be
dissolved, the surface should be cleaned with a solvent. Suitable solvents are distilled or
demineralized water, alcohol or acetone, depending on the nature of the contaminant. The
solvent should always be highly pure in order to prevent accumulation of impurities
contained within the solvent on the sample surface. When the sample is very dirty, it should
be cleaned several times to completely remove partially dissolved and redeposited
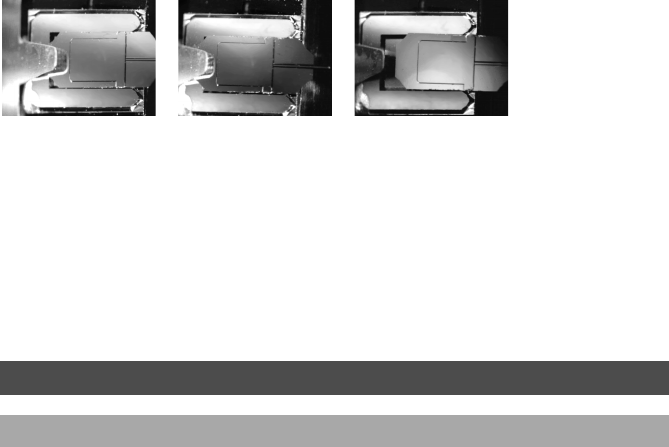
Figure 3-6: Cantilever alignment. (Left) Correct: the mirrored environment shows a reflection that is
continuous over the cantilever and the alignment chip, and small triangular gaps can be seen between
the edges of the alignment chip and the corners of the cantilever chip. (Center & right) Incorrect: the
mirrored environment shows a reflection that is different on the cantilever and on the alignment chip,
and no nice triangular gaps can be discerned.
3.4: Installing the sample
3.4.1: Preparing the sample
INSTALLING THE SAMPLE
33
contaminants. Delicate samples, which would suffer from such a treatment, can
alternatively be cleaned in an ultrasonic bath.
Nanosurf delivers optional samples, which are usually packed in the AFM tool set. These
samples are briefly described here. Further samples are available in the AFM Extended
Sample Kit, which contains its own sample description.
All samples should be stored in their respective boxes. This way, it should not be necessary
to clean them. Cleaning of the samples is generally not advisable (unless indicated below),
because their surfaces are often rather delicate.
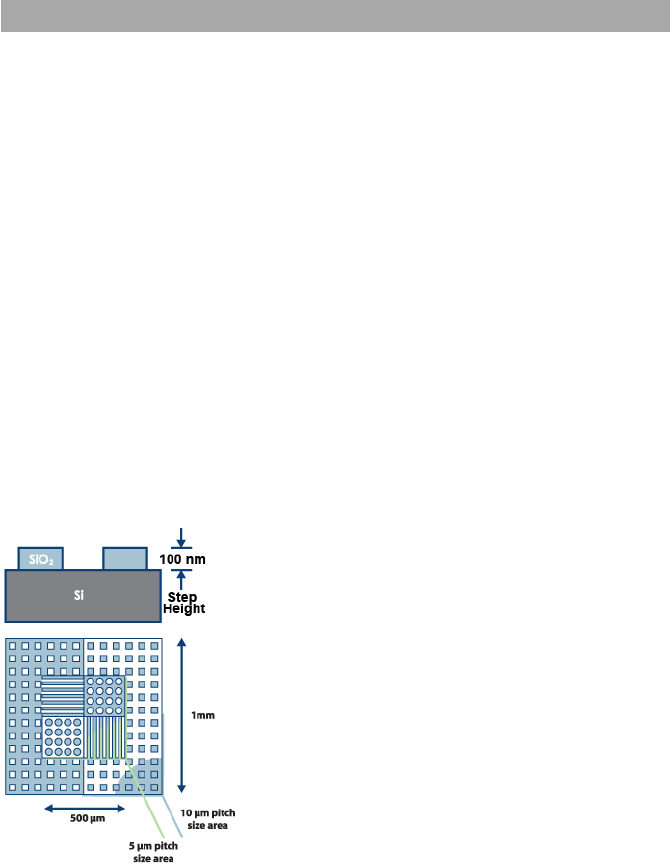
Grid HS-100MG
The grid HS-100MG features silicon dioxide structure arrays on a 5 mm × 5 mm silicon chip.
The calibration area is situated in the center of the chip. It is easy to locate this area optically.
The structure step height is in the range of 100 nm. The exact value for each chip is
indicated on the box label. Arrays of structures with different shape and pitch are
integrated on the chip. The larger square (1 mm × 1 mm) contains square pillars and holes
with a 10-μm pitch. The smaller square (500×500 μm) contains circular pillars and holes as
well as lines in the X- and Y-direction with a 5-μm pitch.
Aside from Z-axis calibration, this design also allows X- and Y-axis calibration for larrge
range scanners (in the 70- to 110-μm range).
The HS-100MG chip is glued onto a 12-mm metal disc using a high-quality electrically-
conductive epoxy resin and it is ready for use as shipped.
3.4.2: Nanosurf samples
CHAPTER 3: PREPARING FOR MEASUREMENT
34
Sample specifications:
Flatness sample
The Flatness sample is a polished silicon sample. It can be used for testing the Flatness of
the scanned plane.
Sample specifications:
CD-ROM piece
Sample for demonstrating the AFM imaging. The CD sample is a piece from a CD, without
any coating applied to it.
Sample specifications:
Graphite (HOPG) on sample support
This sample can be used for STM as well as AFM measurements. In high resolution AFM
measurements, the atomic steps of the graphite surface can be seen. Conductivity
variations can be observed in spreading resistance mode.
Size: 5 mm × 5 mm
Material: Silicon
Step height: Approx. 100 nm
Geometry: – Square holes and pillars with a 10-μm pitch arranged in a 1 mm × 1 mm
square
– Circular pillars and holes, plus lines in the x- and y-direction, with a 5-μm
pitch arranged in a 500 μm × 500 μm square
Size: 5 mm × 5 mm
Material: Silicon
Thickness: Approx. 320 μm
Material: Polycarbonate
Structure: 100 nm deep pits arranged in tracks that are spaced 1.6 μm apart.
INSTALLING THE SAMPLE
35
Sample specifications:
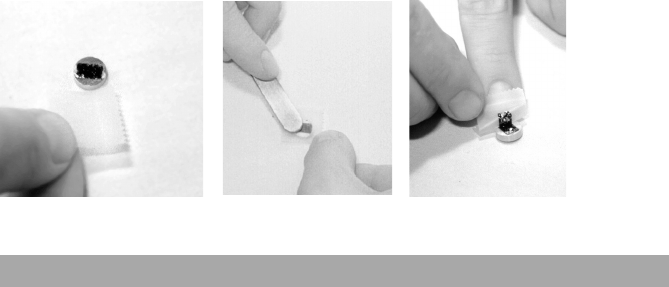
The surface of the graphite sample can be cleaned when it is very dirty or uneven. Due to
the layered structure of graphite this can easily be done using a piece of adhesive tape
(Figure 3-7: Cleaving graphite):
1Put the sample on the table using a pair of tweezers.
2Stick a piece of adhesive tape gently to the graphite and then pull it off again.
The topmost layer of the sample should stick to the tape.
3Remove any loose flakes with the tweezers.
The graphite sample is now ready for use and should not be touched anymore.
Samples should be mounted on steel discs with a maximum diameter of 12 mm. They can
either be attached more permanently by using glue or double-sided adhesive tape, or be
mounted temporarily using the method described below. The sample disc can then be
easily placed on the NaioAFM sample stage, where it is securely held in place by a magnet.
To mount a sample onto the steel disc:
1Put a double-sided adhesive tape on the frontside of a Post-it® note, so that it is on the
opposite side of the sticky part.
2Cut off all parts of the note that do not have adhesive tape on it.
3Fix the tape-side of the prepared note to the steel disc.
Size: 5 mm × 5 mm
Material: Highly Oriented Pyrolytic Graphite (HOPG)
Sample support: Magnetic Steel disc, galvanized with Nickel.
Figure 3-7: Cleaving graphite
3.4.3: Mounting a sample
CHAPTER 3: PREPARING FOR MEASUREMENT
36
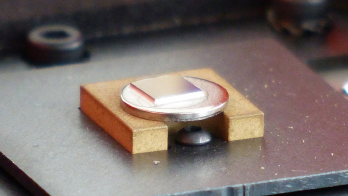
4Put the sample on the sticky side of the Post-it® note, and press on it lightly.
The result should resemble Figure 3-8: Sample mounted on a steel disc and placed on the
NaioAFM sample stage.
5Remove the scan head and place the sample holder on top of the sample plate.
It is recommended to always connect the sample holder to the ground connector on
the scan head using the ground cable.
6Place the scan head back onto the Sample Stage, but be sure to keep a safe distance
between the cantilever and the sample surface. If necessary, adjust the tip–sample
distance via the leveling screws before placing back the scan head.
To mount the sample onto the NaioAFM sample stage:
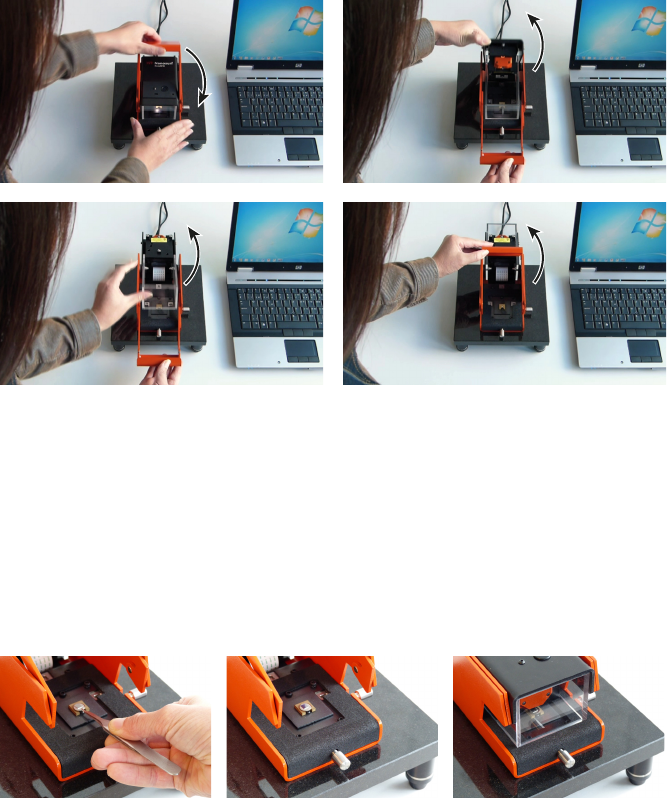
1Unlock the NaioAFM by flipping over the locking handle (see Figure 3-9: Opening the
NaioAFM for full access to the sample stage, Step 1).
2Flip over the scan head cover and scan head (see Figure 3-9, step 2).
At this point, the sample illumination light will turn off and the approach stage of the
scan head will move to its “Home” position (similar to pressing the “Home” button in
the Approach section of the Naio control software’s the Acquisition tab; see Home
(page 109)), retracting the cantilever to its upper-most position. This is a safety
precaution to avoid crashing of the cantilever into the newly-placed sample’s surface
once the scan head is closed again. You can manually abort or shorten the retraction
process by clicking the “Stop” button in the Naio control software, although this is not
recommended for the sample placement process described here.
3Flip over the scan shield (see Figure 3-9, step 3).
4Optionally flip back the locking handle to further increase accessibility of the sample
stage (see Figure 3-9, step 4).
Figure 3-8: Sample mounted on a steel disc and placed on the NaioAFM sample stage.
INSTALLING THE SAMPLE
37
5Place the steel sample disc onto the sample stage using tweezers (see Figure 3-10:
Placing a sample, left).
The sample will be held in place by the magnet that is located in the center of the
sample stage (see Figure 3-10, center).
6Close the NaioAFM system again by following all steps above in reversed order (see
Figure 3-10, right).
Figure 3-9: Opening the NaioAFM for full access to the sample stage. Step 1: Flip the locking
handle all the way to the front. Step 2: Flip the scan head cover (and scan head) all the way to the back.
Step 3: Flip the scan shield all the way to the back. Step 4: Optionally flip back the locking handle again.
Figure 3-10: Placing a sample. Left: Use the tweezers to place the sample onto the sample stage.
Center: Sample is held in place by the magnet of the sample stage. Right: NaioAFM closed for
measurement.
12
334

CHAPTER 3: PREPARING FOR MEASUREMENT
38
CAUTION
Only when the system is fully closed with the locking handle pressed down should the
NaioAFM be used for measurement! The locking handle makes sure that the scan head
is decoupled from the scan head cover and securely positioned onto the scan head feet
via a strong cover-mounted spring. Only when this is the case can a reliable sample
approach and subsequent sample measurement take place.

CHAPTER 4:
A first measurement
0
0
CHAPTER 4: A FIRST MEASUREMENT
40
In this chapter, step-by-step instructions are given to operate the microscope and to
perform a simple measurement. More detailed explanations of the software and of the
system can be found elsewhere in this manual. If you are not familiar with the Naio control
software, first read Chapter 7: The user interface (page 65) and the chapters directly
thereafter, or try using the Naio control software in microscope simulation mode (see
Section 4.8: Running the microscope simulation).
When using the Nanosurf NaioAFM and the Naio control software, you may from time to
time need to change or enter parameter values. These can be found in the parameter
sections of the Operating windows and in various dialogs.
To change a parameter or enter a value:
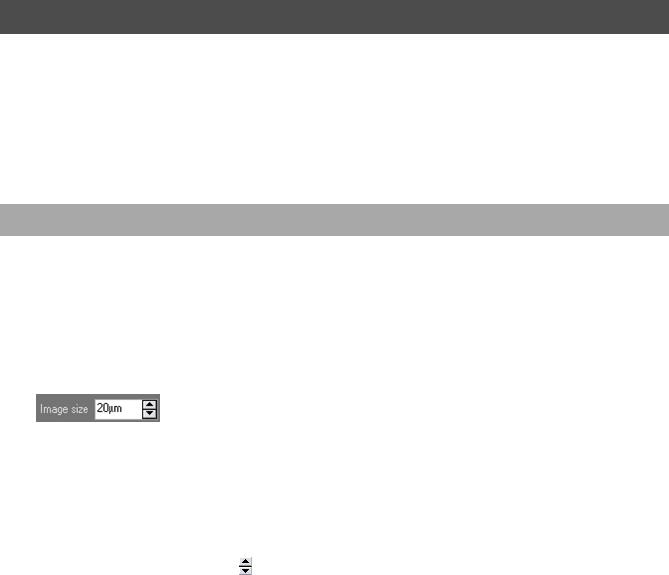
1Activate the parameter by clicking inside the (white) parameter edit box:
2In case of a drop-down menu selection list, change the selection using the mouse or
the up and down arrows on the keyboard. In case of a numerical value, use one of the
following methods:
• Use the up and down arrow keys on the keyboard to increase or decrease its value.
The new value is automatically used after one second.
• Click the arrow buttons next to the parameter value with the mouse pointer.
Normally, the parameter value is changed by a small amount (usually in the range of
1–10%). Some edit boxes are doubling or dividing the parameter value by two (e.g.
the “points/line” parameter). The new value is automatically used after one second.
• Enter the new value using the keyboard. The entered value is applied upon pressing
the “Enter” or “Return” key, or by activating another input. The entered value is
discarded upon pressing the “Esc” key. The unit prefix can be changed by typing one
of the following keyboard keys:
4.1: Introduction
4.1.1: Entering and changing parameter values
f = femto space bar = no prefix
p=pico k =kilo
n = nano M (shift-m) = mega
u = micro G (shift-g) = giga
m = milli T (shift-t) = tera
PREPARING THE INSTRUMENT
41
Sometimes the program will change an entered value to a slightly different value. This
happens when the desired value is outside the digitization range of the Naio controller, for
example due to resolution or timing limits. In such cases, the desired value is automatically
changed to the nearest possible value.
Prepare the instrument as follows (see Chapter 3: Preparing for measurement (page 25) for
more detailed instructions):
1If you want to perform dynamic measurements, install an NCLR type cantilever.
Otherwise install a XYCONTR type cantilever.
2Install one of the samples from the Nanosurf AFM basic sample kit or calibration
sample kit. Preferably, install the 10 μm calibration grid when using a 70-μm or 110-μm
scan head, and the 660 nm Calibration grid when using a 10-μm scan head.
The measurement examples shown here were made with the 10 μm calibration grid.
To make sure that the configuration is correct:
>Open File menu >> Parameters >> Load parameter settings and load the file
“Default_AFM.par” from the folder that holds the default Naio configurations.
Usually this is “C:\Program Files\Nanosurf Naio\Config”.
Examples
• If the basic unit is volts, type “m” to change to millivolts.
• Type the space bar for volts
• Type “u” for microvolts.
4.2: Preparing the instrument
Important
• Never touch the cantilever or the surface of the sample! Good results rely heavily on a
correct treatment of the tip and the sample.
• Avoid exposing the system to direct light while measuring. This could influence the
cantilever deflection detection system and reduce the quality of the measurement.

CHAPTER 4: A FIRST MEASUREMENT
42
To start measuring, the cantilever tip must come within a fraction of a nanometer of the
sample without touching it with too much force. To achieve this, a very careful and sensitive
approach of the cantilever is required. This delicate operation is carried out in two steps:
10. Fine approach using the motorized approach stage
11. Automatic final approach
The color of the Status light shows the current status of the approach:
– Orange/yellow
Normal state during approach: the Z-scanner is fully extended toward the sample.
–Red
The approach has gone too far: the tip was driven into the sample, and the Z-scanner is
fully retracted from the sample. In this case, the tip is probably damaged and you will
have to install a new cantilever again.
– Green
The approach has finished successfully: the Z-scanner is within the measuring range.
To prepare for the approach process:
>Select the Acquisition tab
The controls for positioning the cantilever with respect to the sample are located in the
Approach group.
During the approach steps described in the following sections, use the side view of the
cantilever to judge the distance between tip and sample surface:
>If the NaioAFM Side View Camera is installed, select “Side view” in the Video panel
located in the Info pane (see Section 9.2: Video panel (page 102)).
If the NaioAFM Side View Camera is not installed, use the side view lens of the scan
head to observe the sample instead.
In this step, the tip is brought as close to the sample surface as possible, without touching
it. The closer the two are together, the less time the Automatic final approach takes.
1Observe the distance between tip and sample in side view.
4.3: Approaching the sample
4.3.1: Fine approach using the motorized approach stage
APPROACHING THE SAMPLE
43
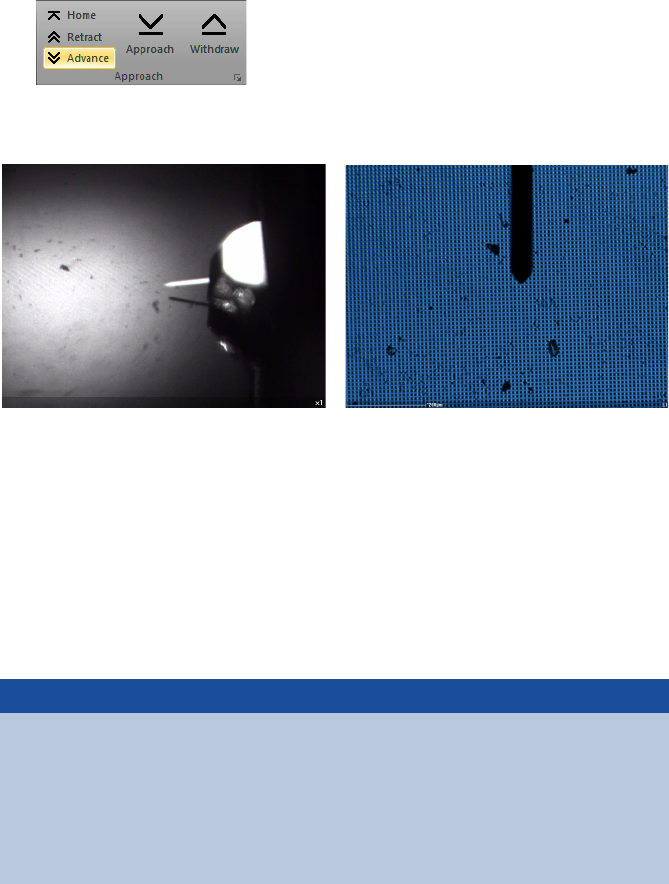
2While observing the tip–sample distance, click and hold the “Advance” button in the
Approach group of the Acquisition tab until the tip is close enough to the sample:
The tip should not come closer to the sample than a few times the cantilever width
(see Figure 4-1: View of the cantilever and sample after fine approach, left).
Now that the sample is in focus, the top view image can be used to find a suitable location
to measure on. In top view, the sample is seen from a direction perpendicular to its surface
(see Figure 4-1: View of the cantilever and sample after fine approach, right).
To use the top view:
1Select Top view in the Video panel (see Section 9.2: Video panel (page 102)).
2If necessary, move the sample by turning the positioning screws of the sample stage
to find a suitable location that is free of dust particles.
Figure 4-1: View of the cantilever and sample after fine approach. (Left) Side view, (Right) Top
view.
Important
• After turning any of the positioning screws in a certain direction to adjust the sample
position, always turn it back half a turn in the opposite direction once you are satisfied
with respective X- or Y-position: The position of the sample won’t change before at
least a full turn is made, but this “half-a-turn-back” procedure does ensure that the
sample table is decoupled from the respective positioning screw, thus reducing
vibrations otherwise transmitted through the positioning screws.
• Make sure to always perform this procedure for both of the positioning screws.
CHAPTER 4: A FIRST MEASUREMENT
44
In this last step, the tip automatically approaches the sample until a given Setpoint is
reached. Before starting the automatic approach, select the desired operating mode and
cantilever type. To do this:
>In the Preparation group of the Acquisition tab, select an operating mode and
cantilever type that match the cantilever installed.
In dynamic force mode, the instrument will automatically determine the vibration
frequency to be used during imaging. To determine the optimal frequency, the controller
performs a coarse and a fine frequency sweep in which the cantilever vibration amplitude
(and — in phase contrast mode — also the phase) are recorded as a function of excitation
frequency. It is instructive to see both frequency sweep measurements in all detail at least
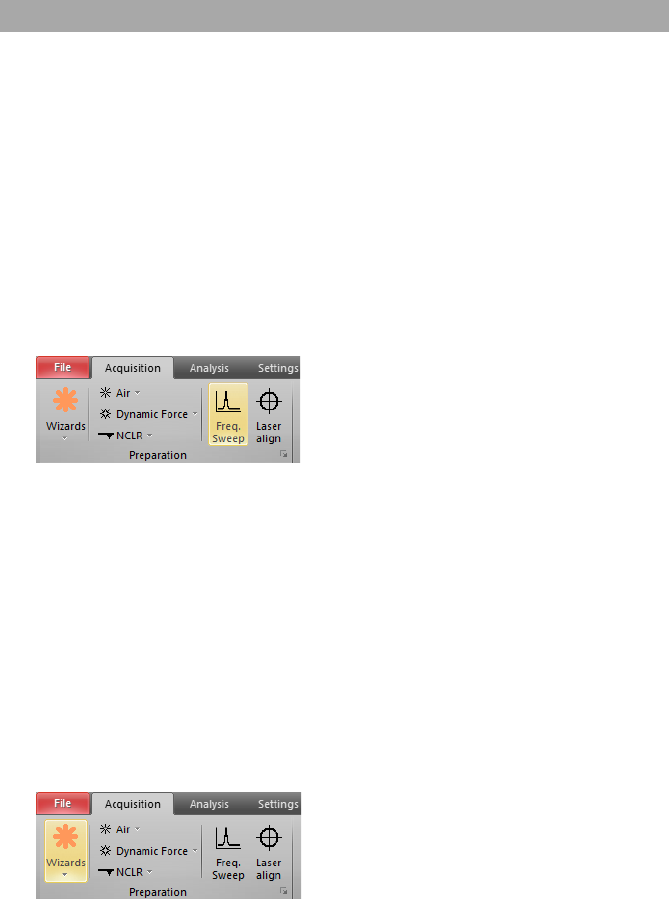
once. To do this, it is possible to manually perform the frequency sweeps:
1In the Preparation group of the Acquisition tab, click the Freq. sweep button:
The Vibration frequency search dialog now opens (see Section 8.10: Vibration frequency
search dialog (page 94) for details).
2Click the Auto frequency set button.
The Naio control software now sets appropriate values for the coarse and fine sweeps
and performs these sweeps. The fine sweep will overwrite the data of the coarse
sweep in the charts displayed in the Vibration frequency search dialog. To see the results
of the individual sweeps:
>Press the Coarse sweep and Fine sweep buttons sequentially.
Before final approach of the sample, it is necessary to set the scanning and feedback
parameters of the control software to suitable initial values. The easiest way to do this is to
use the imaging wizard:
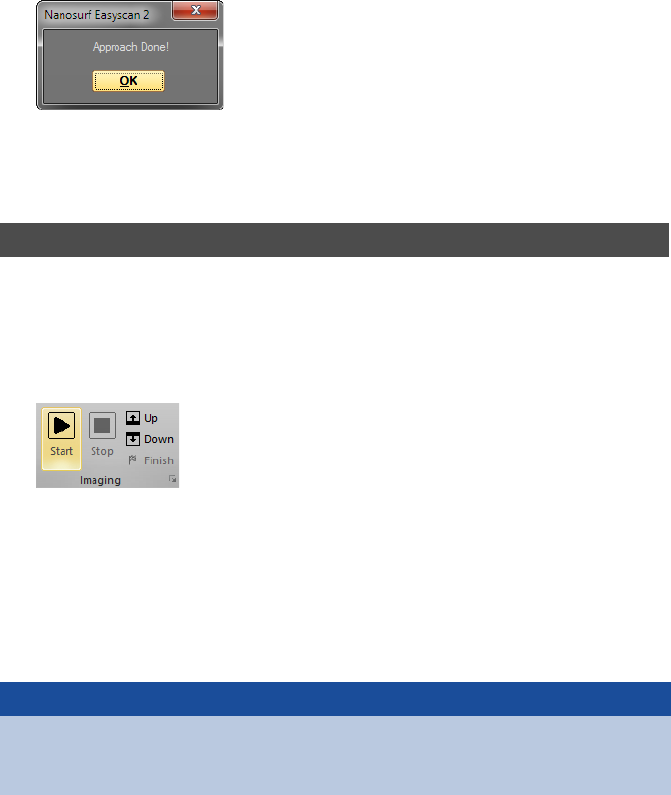
1In the Preparation group of the Acquisition tab, click the Wizards button:
4.3.2: Automatic final approach

APPROACHING THE SAMPLE
45
2Select Imaging from the drop-down selection menu.
A dialog will pop up, which will ask you some basic questions about your sample and
your measurement needs.
3Answer the questions of the imaging wizard to the best of your knowledge.
For descriptions of the features of standard Nanosurf samples refer to Section 3.4.2:
Nanosurf samples (page 33).
Now that the initial software settings have been given suitable values, you need to name
the measurement series (see Section 13.4.1: History file mask (page 187)). Each completed
measurement (scan/image) will be temporarily saved (automatically) in the history folder
under this name, with index numbers (or, optionally, date and time attributes) added to
identify the individual measurements. It is best to enter the measurement series’ name
now, since the control software will (by default) start measuring as soon as the final
approach is done. It is also strongly recommended to move all relevant measurements to a
new folder when you are finished, since the files in the history folder will be overwritten
over time (see Max. history files (page 264)).
To set the measurement series name:
1Activate the Gallery panel (see Section 13.4: Gallery panel (page 186)) in the info pane.
2Click the History tab at the top of the Gallery panel with the mouse.
3In the entry box at the top of the panel, enter a name by hand or use the Mask editor
dialog (see Section 13.4.4: Mask editor dialog (page 188)) to create the name mask.
If no [INDEX] attribute is explicitly added to the name mask, it will be automatically
applied to the end of the file name so that individual measurements can be stored and
distinguished.
The automated final approach can now be started. To do this:
1In the Approach group of the Acquisition tab, click the Approach button:
The cantilever is moved towards the sample via the approach stage, with the Z-
controller turned on. This movement continues until the Z-controller error becomes
zero. From this point onward, the distance between sample and tip is maintained
CHAPTER 4: A FIRST MEASUREMENT
46
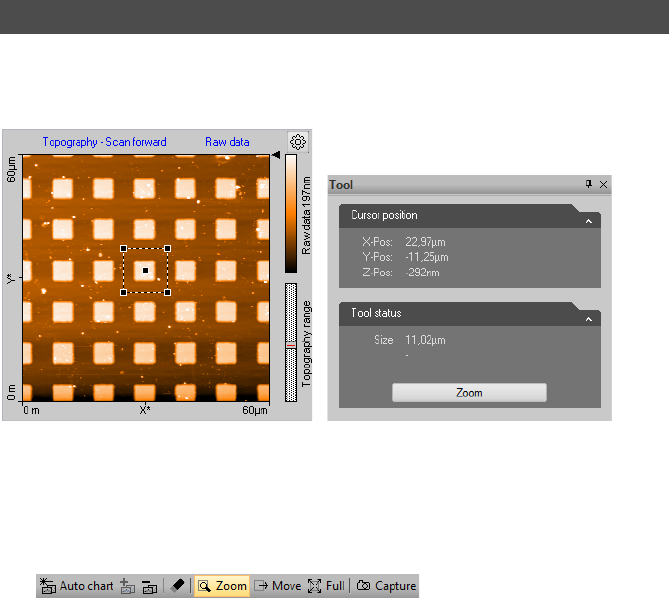
automatically by the electronics. The probe status light changes to a constant green,
and a message “Approach done” appears:
2Click the “OK” button.
If the automatic final approach fails, refer to Section 17.3: AFM measurement problems (page
241) for the further steps to take.
Now that the tip–sample interaction defined by Setpoint has been established between tip
and sample, measurements can start. By default, the control software is set to automatically
start measuring after the automatic approach. If this is not the case:
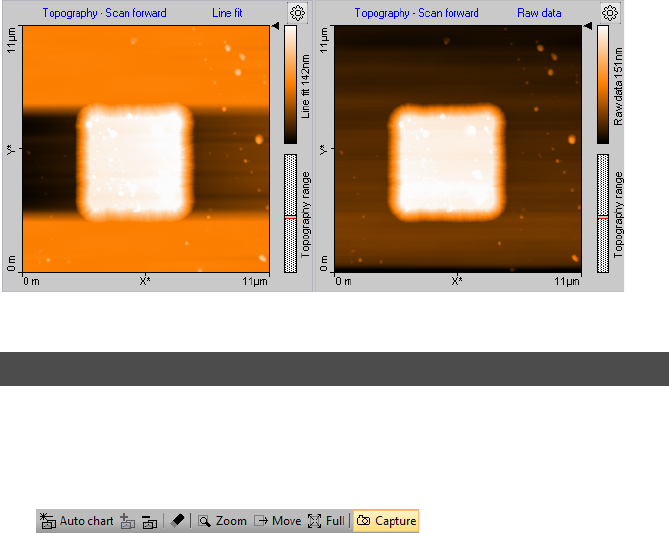
>Start measurements manually by clicking the Start button in the Imaging group of the
Acquisition tab:
Two representations of the ongoing measurement are now drawn in the graph area of the
the Imaging window. One representation is a color coded height image (topography) called
a Color map. The other is a plot of height as a function of X* position called a Line graph.
With the default settings, the software automatically adjusts the contrast of the Color map,
and height range of the Line graph to the data that have been measured.
To judge the imaging quality, watch the displays until at least one fourth of the
measurement has been completed.
When a measurement contains large disturbances, or no two scan lines are similar, stop
measuring and reduce or eliminate the disturbances. To do this:
4.4: Starting a measurement
Important
Measurements on the micrometer/nanometer scale are very sensitive to environment
influences. Direct light or fast movements — causing air flow and temperature
variations near the scan head — can influence and disturb the measurement.
SELECTING A MEASUREMENT AREA
47
>Click the Stop button in the Imaging group of the Acquisition tab and follow the
instructions in Chapter 17: Problems and solutions (page 237):
If you were able to prepare your measurement so that the scan line in the Line graph
reproduces stably, the Color map should look similar to the one shown below when the
measurement has finished.
To zoom in to an interesting part of the measurement:
1Activate the Color map by clicking on it.
2Click the Zoom button in the Imaging toolbar:
The mouse pointer becomes pen-shaped when moving over the color map.
3Click on one corner of the region to be selected using the left mouse button, and keep
the button pressed.
4Drag the mouse to the other corner of the region.
The size and the position of the square are shown in the Tool panel of the info pane.
5Release the mouse button when the size of the square covers approximately one
period of the grid.
4.5: Selecting a measurement area
Figure 4-2: Zooming in on an overview measurement
CHAPTER 4: A FIRST MEASUREMENT
48
6Confirm the selection by double clicking the color map graph using the left mouse
button. Now the selection is enlarged to the whole display size. You can abort the
zoom function by clicking the Zoom button again.
The microscope will now start measuring a single grid period. Once the measurement is
completed, you should get an image such as the one in Figure 4-3: Zoomed measurement,
left. The depression in the sample surface to the sides of the structure is due to the Line fit
data filter used. To remove it, click on Line fit and select the data filter Raw data from the
drop-down menu. The chart will now look like Figure 4-3: Zoomed measurement, right.
By default, each completed measurement is automatically stored (temporarily) on your
computer so that it can be used later. Additionally, you can also take snapshots of
measurements still in progress. To do this:
>Click the Capture button in the Imaging toolbar:
The current measurement is immediately stored and will show up in the History page
of the Gallery panel, together with all other finished/stored measurements (see Section
13.4: Gallery panel (page 186) for details). In addition, the captured document will
remain open in the document space of the Naio control software.
Measurement documents in the temporary History folder (see page 264) should always be
moved to a new location for permanent storage when you are done measuring. For details
on how to do this, see Save as (page 187). Measurement documents thus permanently
stored can always be loaded with the Naio control software (or with the optional Nanosurf
Figure 4-3: Zoomed measurement. (Left) With line subtraction. (Right) Without line subtraction.
4.6: Storing the measurement
CREATING A BASIC REPORT
49
Report or Nanosurf Analysis software packages) for later viewing, analysis, and printing. A
brief introduction on how to create a basic report using the Report software is given below.
For more detailed information on starting and using the Report software, see Section 22.2:
Creating a report (page 452), or refer to the Nanosurf Report online help.
The optional Nanosurf Report software can be used to evaluate measurements, and to
create consistent and visually appealing reports. Here, we will just briefly explain how to
start the software and create a basic report.
To create a basic report of a completed measurement:
1Open a measurement from the Gallery panel.
2In the Report group of the Analysis tab, click the Report button.
The Nanosurf Report software will now launch, import the currently open
measurement, and evaluate the data using the default template.
The Naio control software can be started without having the microscope connected to
your computer in order to explore the Naio system (measurements and software) without
danger of damaging the instrument or the cantilever. In simulation mode, most functions
of the real microscope are emulated. The sample is replaced by a mathematical description
of a surface.
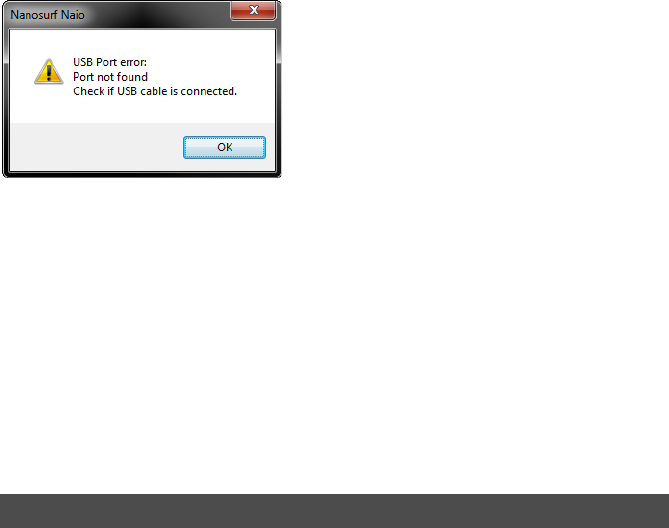
When the Naio control software is started without a microscope connected to your
computer, the following dialog appears:
4.7: Creating a basic report
Important
After a fresh installation of the Report software, the Report software has to be run at least
once before it can be automatically started from within the Naio control software. To run
the Report software for the first time, select it from the Microsoft Windows “Start” menu.
4.8: Running the microscope simulation
CHAPTER 4: A FIRST MEASUREMENT
50
>Click “OK”.
The status bar will now display the text “Simulation”.
You can also switch to simulation mode with the microscope connected:
>In the Hardware group of the Settings tab, click the Simulation button.
The Simulation button will now be highlighted and the status bar will display the text
“Simulation”.
To exit the microscope simulation mode:
>In the Hardware group of the Settings tab, click the Simulation button again.
The highlighting of the Simulation button will now disappear, and the status bar will
display the text “Online”.
From this point on, there are several things that can be done. Please refer to the respective
chapters for detailed instructions:
• Performing a new measurement on another sample by repeating the instructions given
in Chapter 3: Preparing for measurement and Chapter 4: A first measurement with the new
sample.
• Improving measurement quality, as described in Chapter 5: Improving measurement
quality (page 51).
• Performing a different type of measurement by choosing a different operating mode, as
described in Chapter 6: Operating modes (page 66).
• Finishing measurements, turning off the instrument, and/or storing the instrument, as
described in Chapter 6: Finishing measurements (page 59).
4.9: Further options

CHAPTER 5:
Improving
measurement quality
0
0

CHAPTER 5: IMPROVING MEASUREMENT QUALITY
52
Interfering signals can be recognized because they have a fixed frequency throughout the
image. Thus, they are manifested by straight lines that run throughout the entire image.
Possible interference sources are:
• Mechanical vibrations from machines or heavy transformers in direct vicinity (e.g.
pumps; see Section 5.1.1: Mechanical vibrations).
• Electrical interference (in the electronics, or in electrical forces of the tip–sample
interaction; see Section 5.1.2: Electrical interference).
• Infrared and other light sources (light bulbs, sample illumination in an inverted
microscope; see Section 5.1.3: Infrared and other light sources).
Measure the frequency of the vibrations to find out if the interference is due to mechanical
vibrations. You can use the optional Gwyddion software for this (see last paragraph of
Section 2.1.2: Installation (page 22) for instructions on how to install this software). Such
vibrations have a frequency that is (a multiple of) the rotation frequency of the source. This
frequency is usually not a multiple of the local mains frequency, and may vary slightly over
time. Try the following to find out if the interfering signal is due to mechanical vibrations:
1If possible, turn off all rotating machines (i.e. pumps) in the room.
2Move the system to an entirely different location.
If mechanical vibrations are the cause of the interference, either improve the isolation of
the vibrating machines, or improve the isolation of the instrument by using an active
vibration isolation table (e.g. the optional Nanosurf Isostage or halcyonics_i4.
Electrical interference may be caused by interference in the electronics, or by electrostatic
forces acting between the tip and the sample. These interferences usually have a frequency
that is a multiple of the local mains frequency (50 or 60 Hz). Try the following in order to
reduce the influence of electrical interference:
1Connect the instrument to the mains power supply using sockets with line filters and
surge protection.
2Use the Ground connector on the NaioAFM to ground the system.
3Remove interfering electromagnetic field sources, such cathode ray tube displays,
loudspeakers, etc.
5.1: Removing interfering signals
5.1.1: Mechanical vibrations
5.1.2: Electrical interference

ADJUSTING THE MEASUREMENT PLANE
53
Infrared and other light sources can influence the cantilever deflection detection system.
This problem is especially severe when measuring in the Static Force mode. Try the
following in order to reduce the influence of infrared light sources:
1Turn off the light.
2Shield the instrument from external light sources.
Ideally, the sample surface and the XY-plane of the scanner run parallel to each other. In
most cases, however, the sample plane is tilted with respect to the XY-plane of the scanner.
In this case, the sample cross section in the X* measurement direction has a certain slope.
The line graph in Figure 5-1: Unadjusted slope is an example.
This slope depends on the direction of the X* direction and therefore on the rotation of the
measurement, as shown in Figure 5-2: Sample and measurement orientation before slope
adjustment.
This slope is undesirable for several reasons:
• It makes it difficult to see small details on the sample surface, because the Mean fit, Line
fit, or higher order filters cannot be used properly.
• The Z-controller functions less accurately, because it continuously has to compensate for
the sample slope.
After approach, the measurement plane should therefore be adjusted electronically. This
can either be done automatically or manually. Both procedures are described below.
5.1.3: Infrared and other light sources
5.2: Adjusting the measurement plane
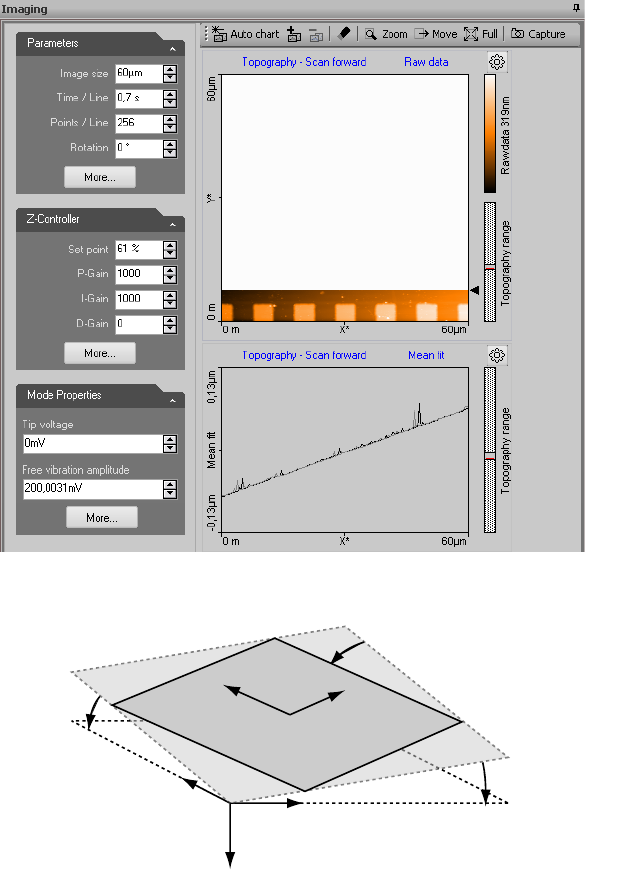
CHAPTER 5: IMPROVING MEASUREMENT QUALITY
54
Figure 5-1: Unadjusted slope. Measurement with improperly set X*-slope.
Figure 5-2: Sample and measurement orientation before slope adjustment
X
Y
Z, Z*
Scanner XY-plane
'X-Slope' ang
le
'
Y-Slope'
angle
'Rotation'
angle
Measurement plane
Image area
X*
Y*
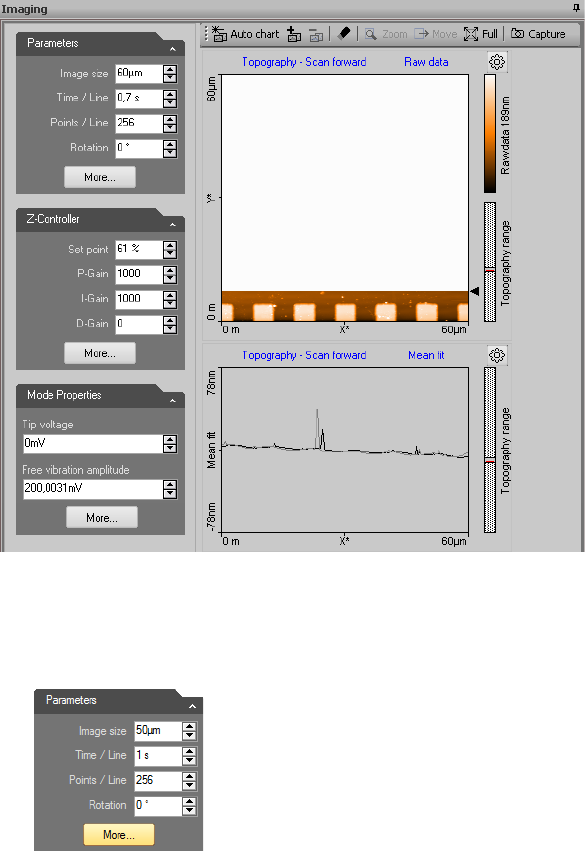
ADJUSTING THE MEASUREMENT PLANE
55
To automatically adjust the measurement plane once:
1In the Imaging parameters section of the Imaging parameters area, click the More
button:
The SPM parameters dialog will now open on the Imaging page. This dialog contains all
possible parameters and settings that influence the behavior of your Nanosurf
NaioAFM system (see also Section 7.9: SPM parameters dialog (page 76)).
Figure 5-3: Adjusted slope. Measurement with properly set X*-slope.
CHAPTER 5: IMPROVING MEASUREMENT QUALITY
56
2Click the Adjust slope button:
The Naio control software will automatically perform a slope determination procedure
similar to the manual procedure described below and will enter the slope angles into
the Slope X and Slope Y parameters.
To automatically adjust the measurement plane before each measurement:
>Check the Auto slope checkbox next to the Adjust slope button.
To manually adjust the measurement plane:
1Measure the slope for X in the Line graph using the Measure angle tool (see Section
13.5.1: Measure group (page 192)).
Use a single click instead of dragging the first line to create a horizontal line and
measure the angle relative to the X*-Axis.
2Enter the result of the angle determination as Slope X (see Imaging Options (page 125))
and fine-tune its value until the X-axis of the scan line lies parallel to the X-axis of the
sample.
3Set Rotation to 90° to scan along the Y-direction of the scanner.
4If the scan line in Y-direction is not horizontal, perform the same procedure as
described for correction of the slope in X but now for Y.
5Set Rotation back to 0°.
The scanner scans in X-direction again.
When all prerequisites for measurement are optimal, the measurement quality mainly
depends on the quality of the tip. A good tip quality is essential for high quality images and
high resolution.
When the image quality deteriorates dramatically during a previously good measurement,
the tip has most probably picked up some material from the sample. As a result, the image
Important
If the sample surface contains large jumps or steps in height, the line fitting procedure
used to determine the slope in X- and Y-direction may not deliver the best possible
results. In such cases it is recommended to perform a manual slope adjustment as
described below.
5.3: Judging tip quality
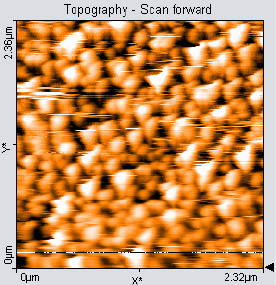
JUDGING TIP QUALITY
57
in the color map charts consist of uncorrelated lines or the image appear blurred (see
Chapter 5: Measurement containing tip artifacts). In such cases:
>Follow the suggestions in Section 17.3.3: Image quality suddenly deteriorates (page 242).
If these do not help, the cantilever should be replaced.
When all peaks in the image have the same, usually triangular shape, the sharp end of the
tip may have broken off. The measured structure reflects the shape of the tip rather than
that of the sample and is called a tip artefact. In such cases:
>Replace the cantilever.
Figure 5-4: Measurement containing tip artifacts
CHAPTER 5: IMPROVING MEASUREMENT QUALITY
58

CHAPTER 6:
Finishing
measurements
0
0
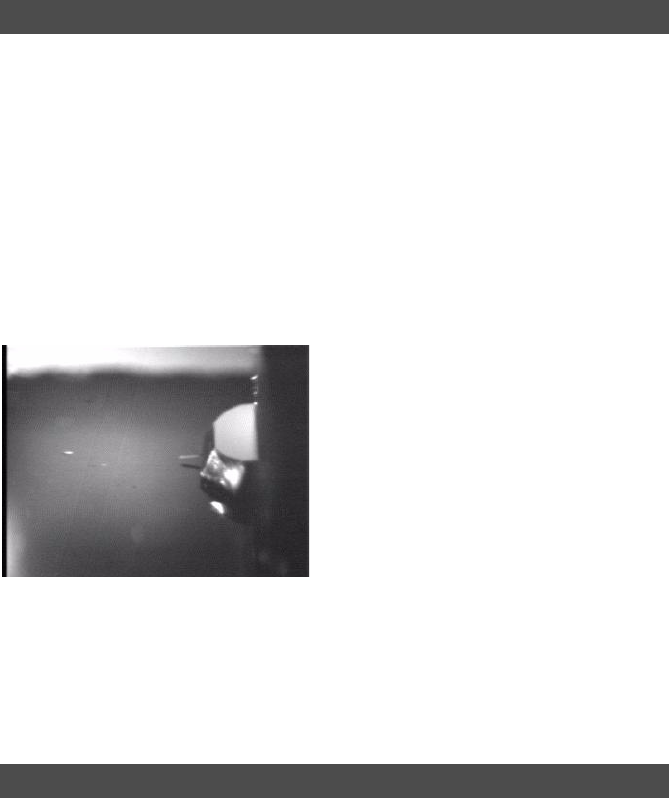
CHAPTER 6: FINISHING MEASUREMENTS
60
Once you are done measuring:
1In the Imaging group of the Acquisition tab, click the Stop button to stop measuring.
2If the NaioAFM Side View is installed, activate “Side view” in the Video panel (see
Section 9.2: Video panel (page 102)).
If the NaioAFM Side View is not installed, use the side view lens of the scan head to
observe the sample instead.
3Retract the cantilever to a safe distance from the sample by clicking and holding the
Retract button in the Approach group of the Acquisition tab until the tip–sample
distance is at least as large as shown in Figure 6-1: Side view of the cantilever after
retracting or by clicking the Home button and waiting for the automatic full retraction
process to finish.
4Open the NaioAFM as described in Section 3.4.3: Mounting a sample (page 35).
5Remove the sample from the sample stage.
6Close the NaioAFM.
To turn off the instrument:
1Finish as described in Section 6.1: Finishing scanning
2Select the measurements that you want to keep in the History page of the Gallery
panell and save them in a new folder (see Save as (page 187)).
6.1: Finishing scanning
Figure 6-1: Side view of the cantilever after retracting. Minimal distance required for safe removal
of the scan head and sample.
6.2: Turning off the instrument
STORING THE INSTRUMENT
61
3Exit the Naio control software.
4Turn off the power by pushing the power button at the back of the NaioAFM (see
Figure 1-3: Parts of the system (page 19)).
If you are not using the instrument for an extended period of time, if you have to transport
it, or if you send it in for repairs, put the instrument in the original packaging material or
instrument case.
1Turn off the instrument as described in Section 6.2: Turning off the instrument, and
remove all cables.
2Leave the cantilever in the scan head, or replace it with an old one.
3Pack all components in the original Nanosurf packaging material or instrument case,
as shown in Figure 6-2: Packing.
Important
Always store the NaioAFM with a(n old) cantilever installed. This will prevent dust from
gathering on the alignment chip, and will protect the alignment chip against damage.
6.3: Storing the instrument
Important
Before transport, always put the instrument in the original Nanosurf packaging material
or instrument case.
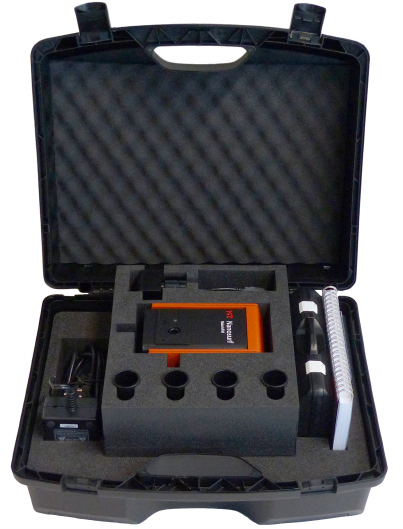
CHAPTER 6: FINISHING MEASUREMENTS
62
Figure 6-2: Packing. The NaioAFM system packed in its instrument case. Shown here is the NaioAFM
system with optional NaioAFM Side View Camera and Isostage Adapter Set.

PART B:
SOFTWARE REFERENCE

CHAPTER 7:
The user interface
0
0
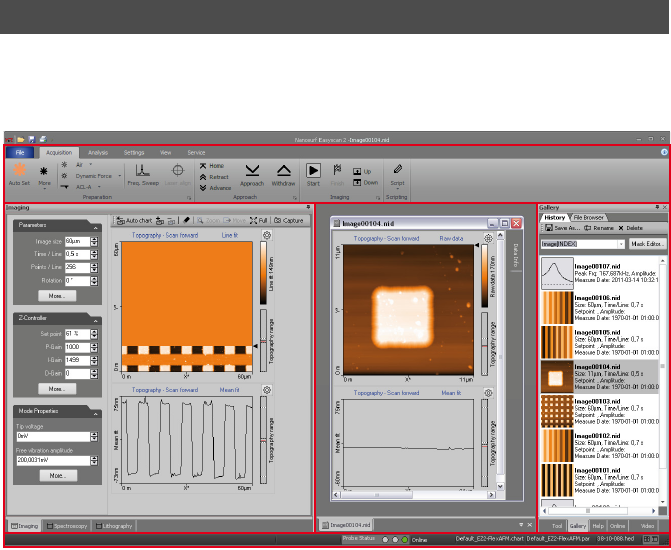
CHAPTER 7: THE USER INTERFACE
66
The Naio control software provides all functions to operate the microscope during imaging
of surfaces and more advanced operating modes. It also provides data analysis functions
for post-processing of measurement data.
The main control software window (also referred to as Workspace) consists of five major
areas:
1. Acquisition pane. contains the so-called operating windows (see Section 7.3: Operating
windows), which are used to acquire and display ongoing measurements.
2. Document space; used for displaying and analyzing previously stored measurement
documents.
3. Info pane. contains several stacked panels (see Section 7.5: Panels) and is used to group
a diverse array of functionality and information.
4. Ribbon; used to access all action functions.
5. Status bar; used to display system status and further information.
Additionally, there is the SPM parameters dialog (page 76), accessed via the More buttons
or launcher icons, which gives access to parameters that are not available in the ribbon or
the operating windows.
7.1: General concept and layout
Figure 7-1: The main window in “Normal” workspace mode
1
12
23
3
4
4
5
5
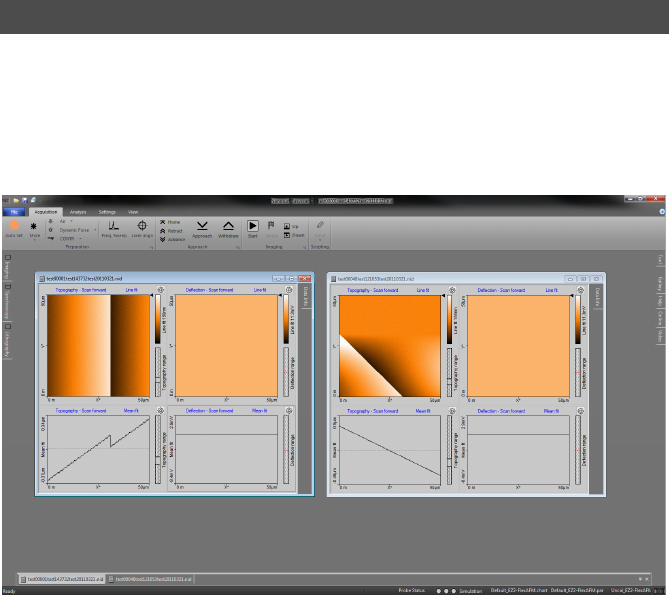
WORKSPACE
67
With the Naio control software, measurement of newly acquired data and analysis of
already stored data can be performed in parallel. Since these tasks are partly performed in
different workspace areas, the use of a high resolution monitor (or multiple monitors) is
recommended to do this most efficiently. To offer a similar functionality on systems with
limited screen resolution, the user can switch between a Normal (see Figure 7-1) and a
Documents mode (see Figure 7-2).
In Normal workspace mode, the emphasis lies on the Acquisition pane and the Info pane.
The inside border of the two panes can be dragged by the mouse to adjust their individual
widths to your needs. The room reserved for Document space, on the other hand, is rather
limited (see Figure 7-1: The main window in “Normal” workspace mode). This mode is most
suited for measurements.
In Documents workspace mode, the Document space is maximized while the Acquisition
pane and Info pane are minimized to the left and right side of the main window,
respectively (see Figure 7-2: The main window in “Document” workspace mode). The various
window and panel titles are shown in tabs so that you can still open them when needed. A
click or a mouse-over on one of these tabs will cause the respective window or panel to
slide out automatically, so that you can work on it. It will automatically minimize again
when you are done. This mode is most suited for analyzing stored measurement data.
7.2: Workspace
Figure 7-2: The main window in “Document” workspace mode
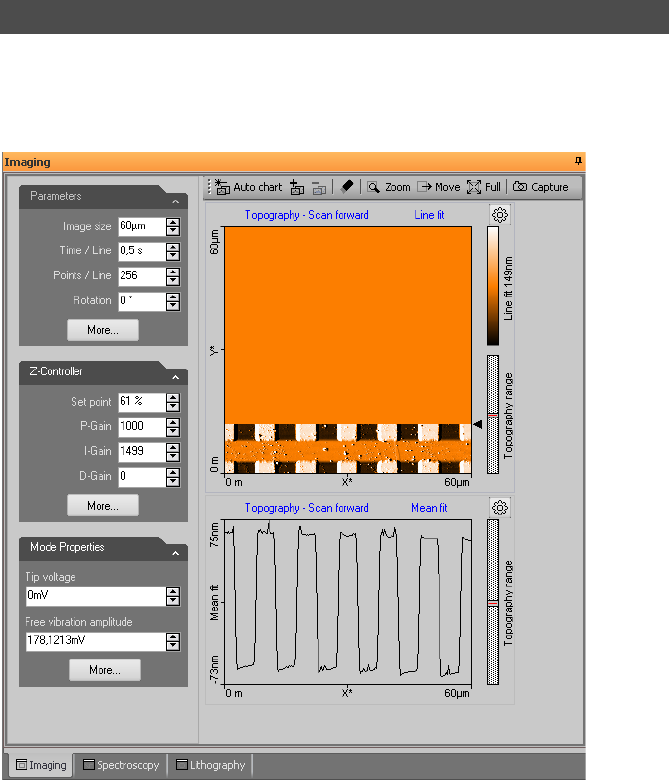
CHAPTER 7: THE USER INTERFACE
68
Operating windows are used to perform specific operations with the microscope. The
operating windows are grouped together in the Acquisition pane and can be accessed by
clicking the respective tab at the bottom of the pane. The operations themselves are
usually controlled using the action buttons of the Ribbon.
7.3: Operating windows
Figure 7-3: Elements of operating windows. Shown here is the imaging window, with the
parameter area on the left, the chart area on the right, and the imaging toolbar on top. Clicking the
tabs at the bottom of the peasurement pane switches between the operating windows.
OPERATING WINDOWS
69
The operating windows are:
•The Imaging window; used for generating images of a sample (for details see Chapter 10:
Imaging (page 113)).
•The Spectroscopy window; used for measuring various “A as a function of B” curves at
certain sample locations, such as force–distance curves or current-voltage curves (for
details see Chapter 11: Spectroscopy (page 129)).
•The Lithography window; used for performing lithography on the current scan area (for
details see Chapter 12: Lithography (page 153)).
All operating windows contain three distinct elements, which are described in Figure 7-3:
Elements of operating windows and in the next chapters:
1. The parameter area, where the main parameters influencing the current measurement
are grouped into different sections.
2. The chart area, where one or more charts, showing different aspects/signals of the
current measurement, are being displayed.
3. The chart toolbar, where several functions that directly influence the current
measurement (or the way its displayed) are located.
Parameter values can be found in the parameter sections of the operating windows and in
special dialogs (such as the SPM parameters dialog (page 76)). Depending on your
measurement (or optimization thereof), you may from time to time need to make changes
there.
To change a parameter or enter a value:
1Activate the parameter by clicking inside the (white) parameter edit box:
2In case of a drop-down menu selection list, change the selection using the mouse or
the up and down arrows on the keyboard. In case of a numerical value, use one of the
following methods:
• Use the up and down arrow keys on the keyboard to increase or decrease its value.
The new value is automatically used after one second.
• Click the arrow buttons next to the parameter value with the mouse pointer.
Normally, the parameter value is changed by a small amount (usually in the range of
1–10%). Some edit boxes are doubling or dividing the parameter value by two (e.g.
the “points/line” parameter). The new value is automatically used after one second.
• Enter the new value using the keyboard. The entered value is applied upon pressing
the “Enter” or “Return” key, or by activating another input. The entered value is
7.3.1: Entering and changing parameter values
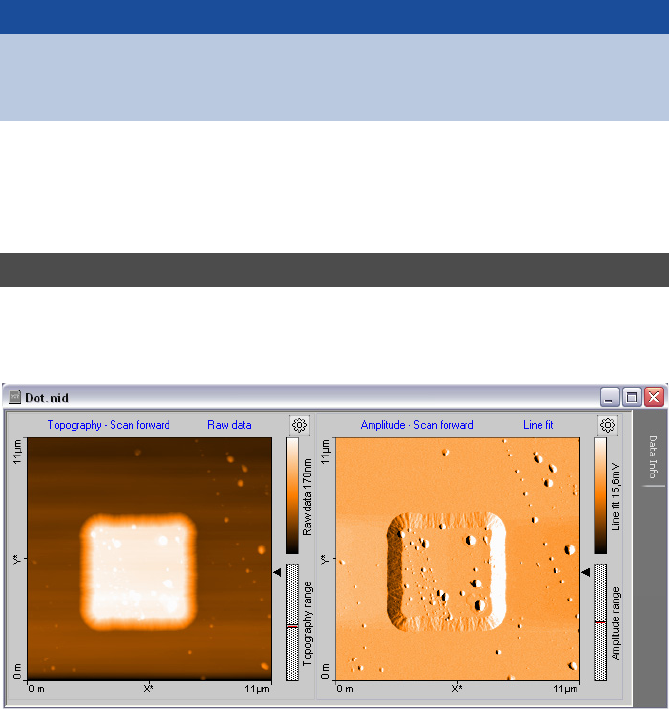
CHAPTER 7: THE USER INTERFACE
70
discarded upon pressing the “Esc” key. The unit prefix can be changed by typing one
of the following keyboard keys:
Sometimes the program will change an entered value to a slightly different value. This
happens when the desired value is outside the digitization range of the Naio controller, for
example due to resolution or timing limits. In such cases, the desired value is automatically
changed to the nearest possible value.
In the document space, stored measurements can be displayed for evaluation and analysis.
Each measurement is contained within its own document window. These windows can be
arranged in document space to your liking.
f = femto space bar = no prefix
p=pico k =kilo
n = nano M (shift-m) = mega
u = micro G (shift-g) = giga
m = milli T (shift-t) = tera
Examples
• If the basic unit is volts, type “m” to change to millivolts.
• Type the space bar for volts
• Type “u” for microvolts.
7.4: Document space
Figure 7-4: Example of a measurement document window
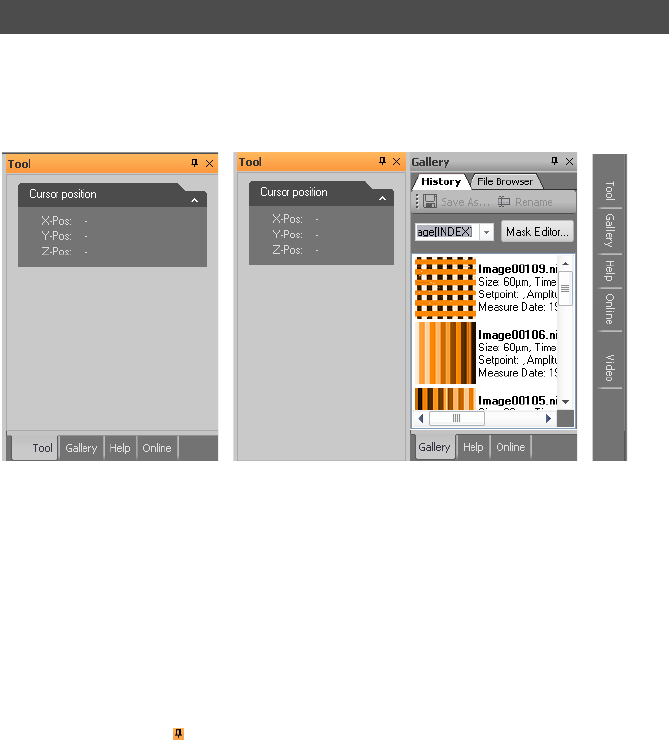
PANELS
71
By default, all measurements are automatically stored (temporarily) during imaging and
spectroscopy. They can be opened at all times from the Gallery panel (see Section 13.4:
Gallery panel (page 186)), but should be moved to a new folder for permanent storage as
soon as you have finished measuring (see Save as (page 187)).
Everything related to documents is described in more detail in Chapter 13: Working with
documents (page 173).
In the panels of the Info pane, the control software provides additional information that can
be useful to the user. These panels are normally docked to the info pane and are stacked to
save space. The panels have several features, however, that allow you to arrange them in a
way that is most efficient for your application (see Figure 7-5: Arranging panels).
To separate a panel and dock it individually to the side of/below another panel that is
already docked to this window, drag its title bar to the desired position using the mouse
cursor.
To add a control panel to a stack, drag either its title bar or its label to either the title bar or
labels of the stack. To remove a panel from a stack, drag its label away from the stack.
When panels are stacked, their title labels are displayed on the bottom of the info pane. To
move a control panel to the top of the stack, click its tab.
With the “pin” button ( ) in the tile bar of the individual panel or the Info pane, the auto
hide feature is controlled. If “unpinned”, the panel or the Info pane minimizes to the right
7.5: Panels
Figure 7-5: Arranging panels. (Left) Stacked panels. (Center) Separated panel that is docked to a
stack. (Right) Panels that are minimized in “Document” mode.
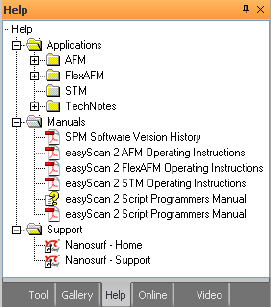
CHAPTER 7: THE USER INTERFACE
72
border of the main window and only the panel titles are visible (similar to the Documents
workspace mode, but now only for the panel/Info pane and not for the Acquisition pane). A
mouse hover over (or click on) a title tab will slide this panel into view.
It is possible to scroll the content of a control panel up and down, when it is too small to
display all the parameters it contains. To do this, move the mouse cursor over an area where
it changes to a four pointed arrow. Then, drag the content up and down with the mouse.
Tool
The Tool panel contains the results of the various analysis tools available to you during and
after measurement, displays the current mouse position during selections, and displays the
size of those selections (e.g. during zooming). The Tool panel is described in more detail in
Section 13.6: Tool panel (page 203).
Gallery
The Gallery panel displays a list of stored measurements for quick opening (viewing and
analysis). A file browser is also integrated for general file management tasks. The Gallery
panel is described in more detail in Section 13.4: Gallery panel (page 186).
Help
The Help panel provides quick access to PDF versions of the user manuals belonging to
your system, to relevant application notes and technical notes, and to online sources of
information (direct links to the Nanosurf website).

RIBBON
73
Online
The Online panel provides you with an overview of the current scan range within the
maximum range the scanner is capable of (Scan position section), a master image that can
be used as a reference for multiple zoomed scans on different points of interest (Master
image section) and a simple illumination control (Illumination section). The Online panel is
described in more detail in Section 9.3: Online panel (page 107).
Video
The Video panel with its top and side view of cantilever and sample is particularly useful
during sample positioning and approach (see also Section 4.3: Approaching the sample
(page 42)). The elements and usage of the Video panel is described in Section 9.2: Video
panel (page 102).
The Ribbon provides quick access to all major actions and commands by organizing them
in tabs according to their usage. Each tab is further divided into several functionally
relevant groups.
File menu
The File menu contains commands to open, save and print measurements. Other files such
as those containing parameter settings or chart properties can be loaded or saved here as
well. The File menu also provides data export functions. General program settings are
configured through the Options dialog, which is opened by clicking the Options button of
the File menu. The basic functions of the File menu are described in Section 13.7: File menu
(page 205). Its more advanced functions are explained in Section 15.1: File menu (page 258).
Acquisition tab
Guides you through the measurement process. There are groups of buttons for
measurement preparation, sample approach and the measurement itself. The Preparation
group and the Approach group have a fixed content and are described in Chapter 8:
Operating modes (page 79) and Chapter 9: Positioning (page 101), respectively. The content
of the other groups varies with the selected measurement window (Imaging, Spectroscopy
7.6: Ribbon
Figure 7-6: The Ribbon.
CHAPTER 7: THE USER INTERFACE
74
or Lithography) and is therefore described in the respective chapters. At the bottom right
of some of the Acquisition tab groups, the Dialog Launcher icon ( ) can be found. It
provides access to the SPM parameters dialog (page 76).
Analysis tab
Contains measurement data functions for extracting information from your measurements
(e.g. step height or roughness). It also provides functions to permanently modify your
image data (e.g. backplane removal or noise filtering). All of these functions are described
in Section 13.5: Analysis tab (page 191).
Settings tab
Contains functions to configure the microscope controller hardware and calibrating the
scan head. It is described in Section 15.2: Settings tab (page 265)
View tab
Provides access to the workspace modes Normal and Documents (see Section 7.4: Document
space and Section 7.8.1: Workspace group), the panels of the Info pane, and document
window arrangement options. Since it has a great impact on the overall look of the user
interface of the Naio control software, it is described in this chapter (see Section 7.8: View
tab).
The status bar displays relevant microscope information and the loaded settings (see Figure
7-7: The status bar). It contains the following elements:
1. Help text information about the current menu button or latest error messages
2. Status signal of the Z-feedback controller (red: in upper limit positions; orange: in
lower limit position; green: tip in normal feedback contact with sample).
3. Software status: “Online” or “Simulation” (depends on the presence or absence of a
scan head, and/or on user choice).
4. Currently loaded file (“.chart”) used for chart settings.
5. Currently loaded file (“.par”) used for parameter settings.
6. Currently loaded scan head calibration file (“.hed”).
7. Buttons to access the Normal and Documents workspace view.
7.7: Status bar
1 2 3 4 5 6 7
Figure 7-7: The status bar. Numbers in this figure correspond to those in the list below.
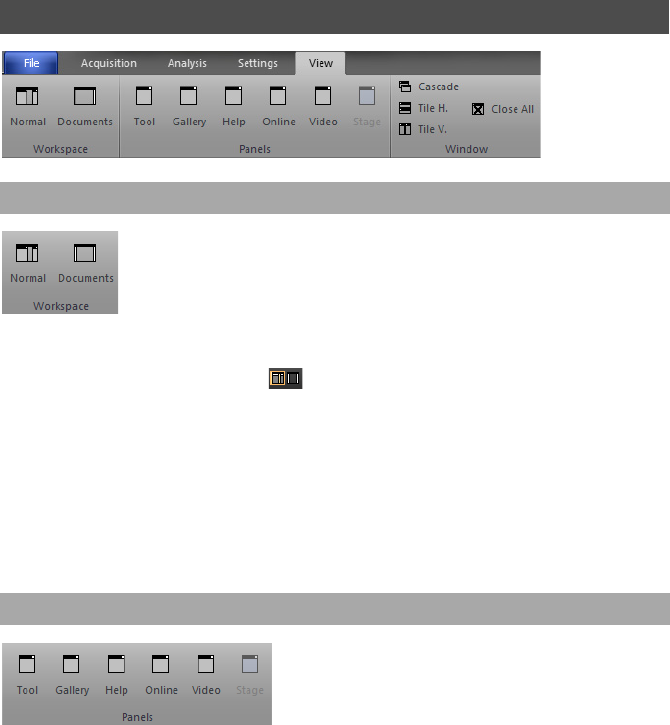
VIEW TAB
75
The Workspace group of the View tab gives you the ability to switch between the two
workspace modes Normal and Documents. To switch, click on either of the buttons, or on
the corresponding smaller buttons ( ) on the right-hand side of the status bar (see also
Section 7.7: Status bar). With these smaller buttons you don't even need to switch to the
View tab while measuring.
Normal
The optimal workspace choice during measurements.
Documents
The best choice for viewing or analysis of stored documents (see Chapter 13: Working with
documents (page 173)).
The buttons of the Panels group have the same function as the tabs at the bottom of the
info pane (i.e., to bring the respective panel to the top of the Info pane). If the panel was
undocked from the Info pane (see Section 7.5: Panels) and subsequently closed (i.e., no
longer visible as panel or tab), it will re-appear by pressing its button in the Panels group.
7.8: View tab
7.8.1: Workspace group
7.8.2: Panels group
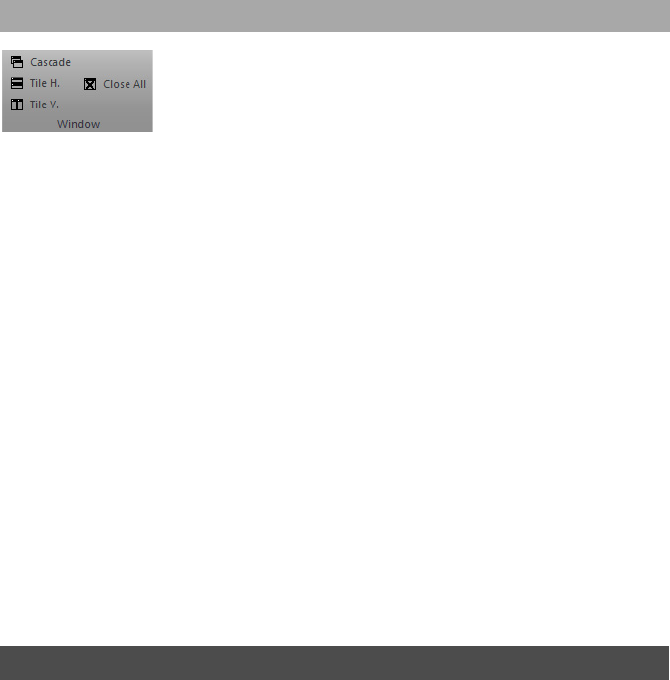
CHAPTER 7: THE USER INTERFACE
76
The Window group provides you with tools to arrange open measurement documents in
different ways or quickly close them all.
Cascade
Open document windows are stacked on top of each other and slightly offset with respect
to each other so that individual windows can be easily accessed. Width and position of the
windows is optimized by the control software.
Tile H.
Tiles the open document windows horizontally, so that individual measurements can be
easily compared. Width of the document windows is maximized. Height is evenly
distributed over the available document space.
Tile V.
Tiles the open document windows vertically, so that individual measurements can be easily
compared. Height of the document windows is maximized. Width is evenly distributed
over the available document space.
Close all
Closes all open document windows. If unsaved data exists, you will be asked to save it.
Windows
Allows you to directly select an open document window from a drop-down list, or to create
a new windows for the currently active document.
While not directly visible upon starting the Nanosurf Naio control software, the SPM
parameters dialog is essential for controlling many advanced parameters during
measuring. The dialog is opened by clicking the “More” button that can be found in many
of the parameter sections of the acquisition panels. It can stay open during all operations
to provide the advanced user with a permanent and detailed control over all measurement
parameters.
7.8.3: Window group
7.9: SPM parameters dialog
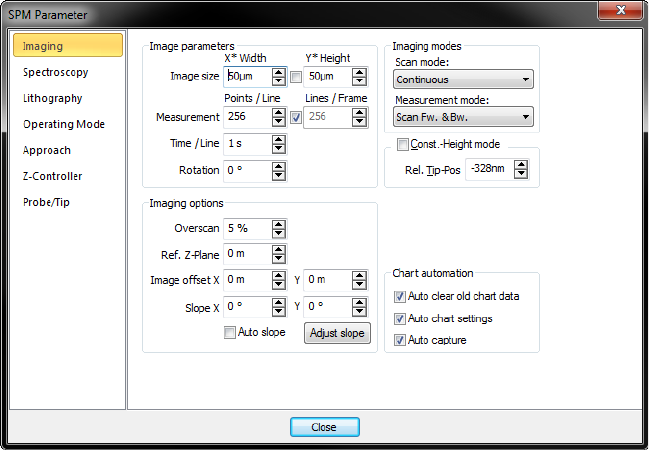
SPM PARAMETERS DIALOG
77
The SPM parameters dialog contains several (sub)pages:
• Imaging (see Section 10.6.1: Imaging page (page 124))
• Spectroscopy (see Section 11.6.1: Spectroscopy page (page 146))
• Lithography (see Section 12.7.1: Lithography page (page 170))
• Operating mode (see Section 8.8.1: Operating mode page (page 86))
• Approach (see Section 9.5.1: Approach page (page 110))
• Z-Controller (see Section 8.8.2: Z-controller page (page 88))
• Probe/tip (see Section 15.8.2: Probe/tip page (page 277)
• SPM System (see Section 8.8.3: SPM System page (page 90))
For a detailed description of all available functions and settings, see the respective manual
pages.
CHAPTER 7: THE USER INTERFACE
78

CHAPTER 8:
Operating modes
0
0
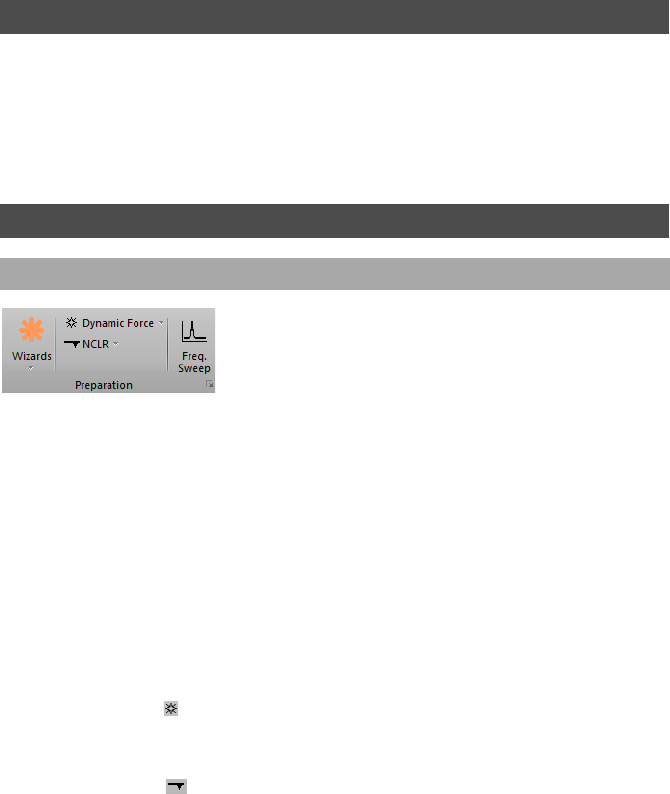
CHAPTER 8: OPERATING MODES
80
This chapter instructs you on how to use the Static force mode, Dynamic force mode, Phase
contrast mode. The latter two modes require the Naio Advanced Modes Option to be
activated using the corresponding access code (see Section Access code (page
264)).Operating modes can be selected in the Preparation group of the Acquisition tab.
Appropriate parameters can either be set manually or via one of the wizards. These
possibilities are explained in Section 8.2.1: Preparation group.
Wizards
The Wizards button opens up various parameter preparation wizards (select the
appropriate one from the drop-down menu). Available options are:
–Imaging
Prepares imaging parameters based on the currently selected operating mode, your
sample description, and your imaging requirements (as provided in the imaging wizard
dialog screens).
–Spectroscopy
Quickly set parameters for spectroscopy measurements on a sample (see Section 11.2:
Spectroscopy wizard (page 133) for further details).
Operating mode
This drop-down box ( ) allows selection of the operating mode used for measuring (see
Section 8.4: Dynamic force mode and onward).
Cantilever selector
This drop-down box ( ) allows the selection of the mounted cantilever in case of AFM
scan heads. The last entry in the list, “Cantilever Browser…”, opens the Cantilever Browser
dialog, which allows you to edit existing or define new cantilever types (see Section 8.9:
Cantilever Browser dialog (page 91)).
8.1: Introduction
8.2: Acquisition tab
8.2.1: Preparation group

STATIC FORCE MODE
81
Freq. sweep
This button opens the Vibration frequency search dialog. In this dialog, amplitude versus
frequency plots can be measured and the operating frequency for dynamic modes can be
set manually. In “Air” environment, setting of the vibration frequency is normally
performed fully automatically, without user intervention. In “Liquid” environment, the
Vibration frequency search dialog opens after the control software determined a suitable
vibration frequency. You need to fine adjust and confirm the selected resonance frequency
prior to approach. For more details about this dialog see Section 8.10: Vibration frequency
search dialog (page 94).
Launcher icon
More advanced settings are available through the Dialog Launcher icon ( ) at the bottom
right corner of the Preparation group, which opens up the SPM parameters dialog on the
Operating Mode page (see Section 8.8.1: Operating mode page (page 86)).
In the static force mode, the “static” deflection of the cantilever is used as the error signal
for the Z-controller. The setpoint in Newton is calculated by multiplying the deflection with
the spring constant of the selected cantilever. In order to minimize tip/sample wear, the
force setpoint should be made as small as possible. In some cases, even a negative setpoint
(i.e. an adhesive force) may work, but when the tip momentarily loses contact with the
sample due to some disturbance, the Z-controller will always fully retract the cantilever
from the sample. Moreover, working in this range may cause image artifacts due to
instabilities in the tip–sample contact.
Both the force modulation mode and the spreading resistance mode are an extension of
the static force mode (see Section 8.6: Force modulation mode and Section 8.7: Spreading
resistance mode, respectively).
The procedure for a first static force mode measurement is almost identical to the
procedure described for the dynamic force mode in Chapter 4: A first measurement (page
39). In contrast to the description given there, however, do the following:
1Select a cantilever suitable for static force mode (e.g. CONTR).
2Install the cantilever as described in Section 3.3: Installing the cantilever (page 27).
3Select this cantilever type in the Preparation group of the Acquisition tab.
4Select the static force mode in this group as well.
5Set the force Setpoint in the Z-controller section of the Imaging window.
For a more detailed description of the parameters that can be set, refer to Section 8.8.2: Z-
controller page (page 88).
8.3: Static force mode

CHAPTER 8: OPERATING MODES
82
In the dynamic force mode, changes in the dynamic behavior of the cantilever are detected
by measuring changes in its vibration amplitude when it is excited with a sinusoidal signal
with a frequency close to the free resonance frequency of the cantilever. When the
cantilever tip comes close to the sample surface, this vibration amplitude will generally go
down. Thus the Setpoint is the percentage of the vibration amplitude that remains when
the cantilever is close to the sample surface compared to the vibration amplitude when the
cantilever is far away from the surface. A small percentage means a big reduction, and a
large percentage means a small reduction. To minimize tip/sample wear, the Setpoint
should be set as large as possible. However, when the Set-point becomes too large, the Z-
controller may not be able to optimally follow the sample surface, and artifacts may occur
due to instabilities in the cantilever vibration.
The procedure for a first dynamic force mode measurement is described for the dynamic
force mode in Chapter 4: A first measurement (page 39). For more information on how the
vibration amplitude and frequency are set, refer to Section 8.8.1: Operating mode page and
Section 8.10: Vibration frequency search dialog.
The phase contrast mode is an extension of the dynamic force mode. Therefore, the same
cantilevers can be used as for dynamic force mode. In addition to the vibration amplitude,
the phase shift between the cantilever vibration and a reference signal is measured. This
phase shift changes when the resonance characteristic of the cantilever changes due to
changes in the tip–sample interaction. Thus, the phase contrast mode can be used to
produce material contrast when there is a significant difference in the tip sample
interaction of these materials. This section gives a brief description of how to operate the
NaioAFM in phase contrast mode. For a more detailed description of the parameters that
can be, refer to section Section 8.8.1: Operating mode page (page 86).
The phase contrast mode can also be used to do Magnetic and Electrostatic Force
Microscopy. For more information on how to do Magnetic Force Microscopy, refer to
technical note TN00031 – Magnetic Force Microscopy, which can be downloaded from the
support section of the Nanosurf website.
Phase measurement
In phase contrast mode, the phase of the measured cantilever vibration is compared to the
phase of a reference sine wave. The phase comparison is performed by multiplying the
measured vibration signal with the reference. The measured phase, φmeasured , is the output
8.4: Dynamic force mode
8.5: Phase contrast mode

PHASE CONTRAST MODE
83
of this multiplication, and is related to the actual phase shift between the measured
vibration and the excitation sine wave, φactual , according to the following equation:
φmeasured = 90° sin ( φactual – φreference ) ,
where φreference is a reference phase that can be set by the user. This has two important
consequences:
1. The measured phase shift lies between –90° and +90°; phase shifts outside this range
are folded back into the –90° to +90° range. The measurement does not distinguish
between phase φ and phase φ + 180°.
2. The phase shift measurement becomes less sensitive when the phase approaches
+90° and –90°.
Note that the phase of the cantilever vibration changes by 180° symmetrically around its
resonance frequency. This phase shift only fits into the –90° to +90° range when the
reference phase is set in such a way that it is zero at the resonance frequency. However, the
operating frequency is generally set to be different from the resonance frequency. In such
cases, the reference phase is automatically set in such a way that the phase shift is zero at
the operating frequency. Thus, part of the frequency spectrum of the phase shift will be
folded back into the –90° to +90° range (Figure 8-1: Phase shift folded back).
Operating the NaioAFM in phase contrast mode
To operate the NaioAFM in phase contrast mode:
>Select the Phase contrast mode in the Preparation group of the Acquisition tab.
A new color map and line chart for the phase data will automatically be added to the
chart area. If necessary, you can increase the size of the acquisition pane to make room
for the new charts.
Figure 8-1: Phase shift folded back. Frequency spectrum with phase shift folded back over the +90°
limit.

CHAPTER 8: OPERATING MODES
84
After approach, the reference phase is usually set automatically in such a way that the
average phase shift lies in the center of the measurement range. To re-adjust the phase
shift:
>Click the Freq. sweep button in the Preparation group of the Acquisition tab.
If you do not want the reference phase to be set automatically:
1Open the SPM parameters dialog by clicking the More button in the Mode properties
section of the Imaging window.
2Uncheck the reference phase Auto set checkbox.
3Enter the reference phase manually using the Reference phase input box.
The force modulation mode is an extension of the static force mode. The static force acting
on the cantilever is still used to produce a topography image of the sample.
Simultaneously, the cantilever is excited and the resulting vibration amplitude measured.
The vibration amplitude depends on the drive amplitude, the stiffness of the cantilever
and, most importantly, the stiffness of the tip–sample contact. Thus, the force modulation
mode can be used to produce material contrast when there is a significant difference in the
stiffness of the tip–sample contact of these materials. This section gives a brief description
of how to operate the NaioAFM in force modulation mode. For a more detailed description
of the parameters that you can set, refer to Section 8.8.1: Operating mode page (page 86).
To operate the NaioAFM in force modulation mode:
1Select a cantilever that has a spring constant that is suitable for the sample stiffness
that you expect.
Good results were obtained with LFMR-type cantilevers. The FMR type cantilever,
which is explicitly sold for force modulation mode measurements, cannot be used due
to its insufficient width.
2Install the cantilever as described in Section 3.3: Installing the cantilever (page 27).
3In the Preparation group of the Acquisition tab, select the Force modulation operating
mode.
4In the Z-controller section of the Imaging window, verify the force Setpoint.
5In the Preparation group of the Acquisition tab, click the “Freq. seep” button.
6Click the “Auto frequency set” button to measure the frequency characteristic of the
cantilever.
8.6: Force modulation mode
SPREADING RESISTANCE MODE
85
7Make a note of the cantilever resonance frequency from the sweep chart and set
“Vibration frequency” to this value.
8Set “Vibration amplitude” to the desired modulation amplitude.
9Increase the vibration amplitude if no proper Force Modulation signal can be
measured.
The spreading resistance mode is an extension of the static force mode. The static force
acting on the cantilever is used to produce a topography image of the sample.
Simultaneously, changes in the spreading resistance from the cantilever tip to a ground
contact on a sample can be imaged by measuring changes in tip current while a fixed
voltage is applied to the tip. This section gives a brief description of how to operate the
NaioAFM in spreading resistance mode. For a more detailed description of the parameters
that you can set, refer to Section 8.8.1: Operating mode page (page 86).
To operate the NaioAFM in the spreading resistance mode:
1Electrically connect the sample to the Ground connector on the NaioAFM (Figure 1-3:
Parts of the system (page 19)) via a 100 kOhm resistor in order to prevent damage to
the tip due to an excessive current.
For best results, the sample should be electrically isolated except for the connection
mentioned above.
2Select a suitable cantilever:
• CDT-NCLR should be used for samples where a high force is needed to penetrate a
surface oxide layer.
• CONT-PtIr cantilevers can be used on delicate samples. The applied voltage should
be small, because high currents may cause the conducting layer on the tip to
evaporate. Also, applied forces should be very small to prevent damage to the
conducting layer.
• NCL-PtIr cantilevers could be used in combination with non-contact topography
measurements, but damage to the tip is likely.
8.7: Spreading resistance mode
Important
• Standard XYCONTR cantilevers cannot be used due to the surface oxide on the tip, and
the semiconducting contact between the tip and the sample.
• EFM cantilevers cannot be used for static force mode measurements, due to their
insufficient width.
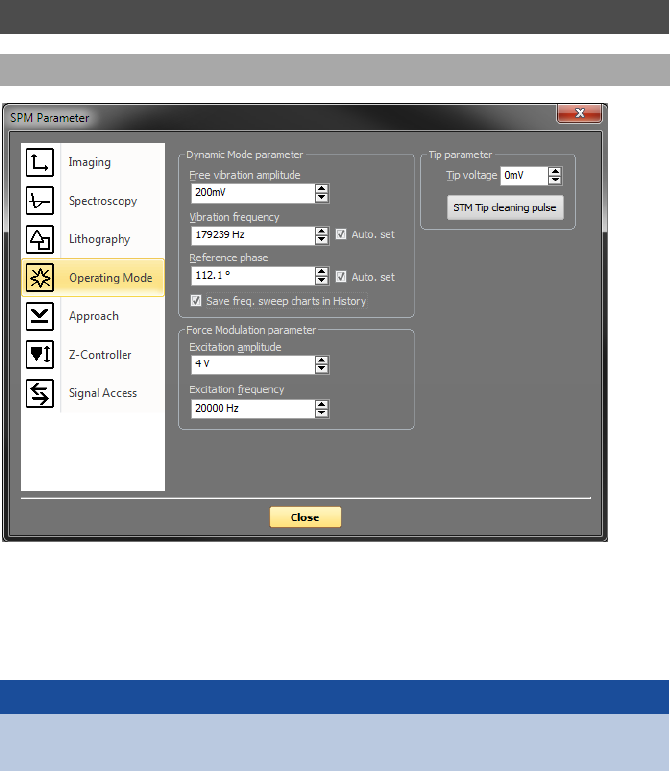
CHAPTER 8: OPERATING MODES
86
3Install the cantilever as described in Section 3.3: Installing the cantilever (page 27).
4In the preparation group of the acquisition tab, select the spreading resistance
operating mode.
5In the Z-controller section of the imaging window, verify the setpoint.
6In the mode properties section, set the tip voltage to your requirements.
Tip Parameter
Tip Voltage
This parameter defines the potential to be applied to the tip. The voltage that can be used
lies between -10 V and +10 V.
8.8: SPM parameters dialog
8.8.1: Operating mode page
Important
With AFM systems the sample has to be electrically connected to the instrument chassis
ground for accurate measurements.
SPM PARAMETERS DIALOG
87
Dynamic mode parameters
These parameters determine the cantilever vibration measurement for dynamic mode
topography and phase contrast mode.
Free vibration amplitude
The desired reference amplitude of the cantilever vibration. The cantilever vibrates at this
amplitude when it is far away from the sample. The excitation strength is adjusted so that
this vibration amplitude is reached.
Vibration frequency
The frequency at which the cantilever vibrates during the measurement. This frequency
can be set automatically as described at the start of this section by enabling the Auto set
check box (see below).
Auto set
When Auto set is enabled, the Vibration frequency is automatically set. Immediately at
activation and each time an approach is started. When Auto set is disabled, the frequency
can be set manually, either by directly changing its value in the control box, or by using the
Vibration Frequency Determination dialog (see Section 8.10: Vibration frequency search
dialog (page 94)).
Reference phase
The reference phase for the detected cantilever vibration. Changing the reference phase
changes the offset of the phase signal. The phase reference can be automatically set so that
the phase signal is zero by enabling the Auto set check box.
Auto set
When Auto set is enabled the phase reference is automatically set after finishing the
approach.
Auto capture frequency sweep
When checked, this option will cause the software to automatically save the frequency
sweep graphs as an .NID file.
Force Modulation parameters
Excitation amplitude
The amplitude of the sensor excitation during a force modulation mode measurement.
Excitation frequency
The frequency of the sensor excitation during a force modulation mode measurement.
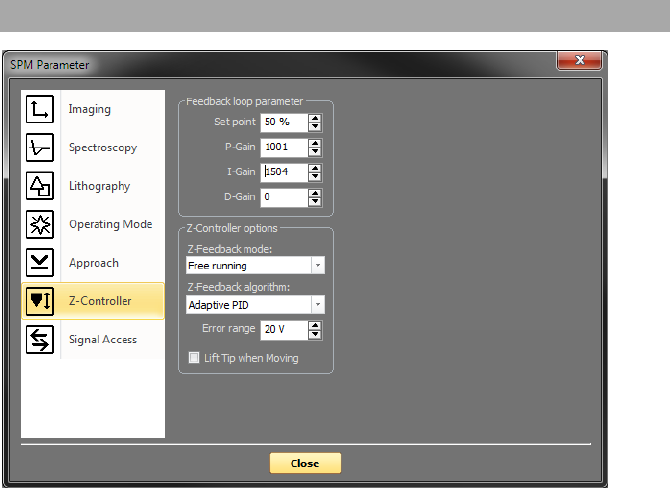
CHAPTER 8: OPERATING MODES
88
Feedback loop parameter
Setpoint
The working point for the Z-controller.Depending on the operating mode, this is the
cantilever deflection (Static Force mode) or relative cantilever vibration amplitude
(dynamic force mode). In the later case, the set amplitude is relative to the operating
amplitude, set in the Mode properties section. For example, when a Setpoint of 70% is
used, the Z-controller will move the tip closer to the sample until the vibration amplitude
has decreased to 70% of the vibration amplitude far away from the sample.
P-Gain
The strength of the Z-controller reaction that is proportional to the error signal. Increasing
the P-Gain decreases the error signal.
I-Gain
The strength of the Z-controller reaction that is proportional to the integral of the error
signal. Increasing the I-Gain decreases the error signal over time. It is the least sensitive to
noise, and usually the dominant contributor to the topography measurement.
8.8.2: Z-controller page

SPM PARAMETERS DIALOG
89
D-Gain
The strength of the Z-controller reaction that is proportional to the derivative of the error
signal. Increasing the D-Gain decreases fast changes in the error signal, but also amplifies
high frequency noise.
Z-controller options
Z-feedback mode
The following modes are available:
– Free running
The Z-controller is active.
– Freeze
The Z-controller is not active, the scanner remains in its current Z-position.
– Clear
The Z-controller is not active, the scanner is moved to the “Ref. Z Plane”, set in the
Imaging page of the SPM parameters dialog. The Probe Status Light will blink green as
long as the Z-controller is deactivated.
Z-Feedback algorithm
The following algorithms are available:
–Standard PID
A standard PID controller is used for Z-Feedback.
–Adaptive PID
A standard PID controller is used for Z-feedback. In addition, the bandwidth of the
Topography measurement is adapted to the number of measured points per second. The
adaptive PID controller thus reduces noise in the measurement. However, topography
changes that happen faster than the time between two measured points are also lost.
This makes it more difficult to detect vibrations due to instability of the feedback loop.
These vibrations remain visible in the Current, Amplitude, or Deflection signal, however,
so always monitor these signals when optimizing Z-controller settings, especially when
using the Adaptive PID.
Error Range
The range of the error signal used to control the Z-Position. The error signal is the difference
between the signal used for topography feedback and the current Setpoint. When the
value of “Error Range” is reduced, the resolution of the error signal is increased.
CAUTION
The tip may be damaged when the Z-controller is not active during scanning. This will
happen when Ref. Z Plane is much lower than the current position of the tip, or when
the scan range contains large height differences.
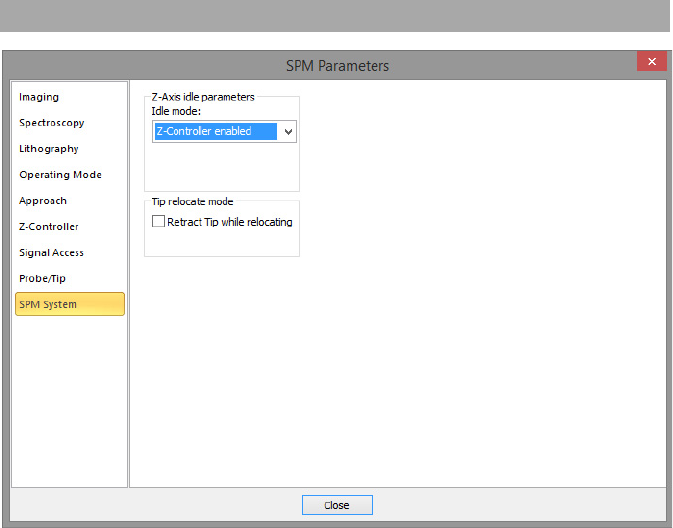
CHAPTER 8: OPERATING MODES
90
Various settings that control the general behavior of the scanning system, independent of
operating mode and measurement mode, are set here. One important setting is the system
behavior when it is when it is idle (not performing any measurement or approaching).
Z-axis idle parameters
Idle mode
Determines what the Z-controller does when not busy with Imaging, Spectroscopy,
Lithography or Approach.
– Z-Controller enabled
The tip stays at the surface
–Retract tip
The tip is fully retracted
– Keep last Z-pos
The tip does not move (better not used when the tip is on the surface, but can be used
when a spectroscopy measurement ends away from the surface)
8.8.3: SPM System page
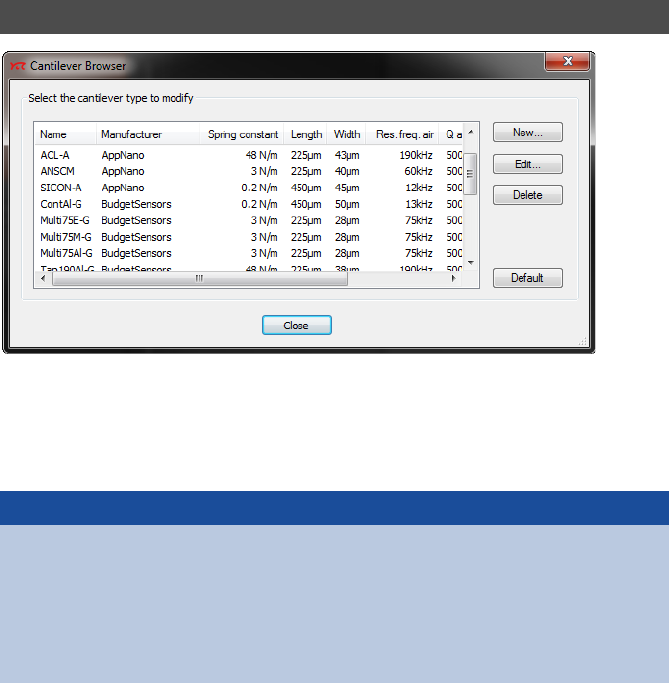
CANTILEVER BROWSER DIALOG
91
Tip Relocate mode
Retract Tip while relocating
When this check box is activated, the tip moves to the fully retracted state when moving in
XY. Activate this checkbox when there is danger of damaging the tip or sample when
moving
Do not activate this checkbox when measuring very flat samples; moving the full Z-range
may cause some drift or creep that could disturb the sample surface.
The Cantilever Browser dialog displays the list of stored cantilever types in the database of
the Naio control software. In this database, many cantilevers of different manufactures are
saved with their typical physical properties. The Cantilever Browser dialog is opened via the
drop-down menu entry “Cantilever browser” of the “cantilever” button in the Preparation
group of the Acquisition tab.
8.9: Cantilever Browser dialog
Important
• Many commercial cantilever types are compatible with the NaioAFM scan head, but
there are some requirements with regard to light reflection and alignment that must
be met (see Section 19.2.3: Cantilever requirements and considerations (page 254)).
• Never put a grooveless cantilever in the AFM. The cantilever would damage the
alignment chip. In addition, the cantilever will probably not be in the focal plane of
the laser beam, thereby causing large interferences.
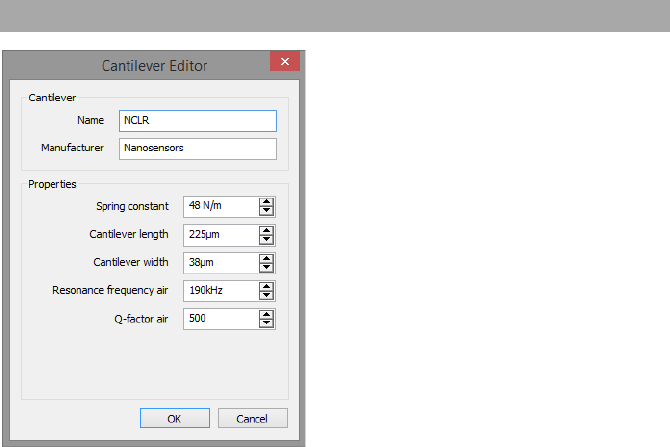
CHAPTER 8: OPERATING MODES
92
New
Opens the Cantilever Editor dialog for a new cantilever type. You can create new cantilever
types that are not defined in the default configuration. See section x.1 The Cantilever Editor
Edit
Opens the “Cantilever Editor” dialog to modify the currently selected cantilever type. See
section x.1 The Cantilever Editor
Delete
Deletes the currently selected cantilever type.
Default
Sets all known cantilevers types back to their default factory settings. It also restores
deleted known cantilevers. After a software update, new known cantilevers are added. User
defined cantilevers are always kept as defined.
The Cantilever Editor dialog allows and editing of existing cantilever types and the creation
of new cantilever types that are not defined in the default configuration.
8.9.1: Cantilever Editor dialog

CANTILEVER BROWSER DIALOG
93
Cantilever
Name
Name of the cantilever type. This name appears in the Cantilever type drop-down menu in
the Preparation group of the Acquisition tab. The list is sorted by the manufacturer's name.
Manufacturer
Name of the cantilever manufacturer.
Properties
Spring constant
When the cantilever type in the cantilever type drop-down menu is changed, this value is
entered in the respective field in the Probe/Tip page of the SPM parameters dialog (see
Section 15.8.2: Probe/tip page (page 277)).
Cantilever length
The nominal length of this cantilever type.
Cantilever width
The mean width of this cantilever type.
Resonance frequency air
The nominal resonance frequency of the cantilever type in air or in liquid measurement
environment. This frequency is used for calculation of the automatic coarse frequency
sweep search range (see Section 8.10: Vibration frequency search dialog (page 94)).
Q-factor air
The quality factor of the cantilever resonance in air. The higher the number, the sharper the
peak. By default, this number is 500 in air and 5 in liquid. The quality factor is used for
calculation of the automatic fine frequency sweep search range (see Section 8.10: Vibration
frequency search dialog (page 94)).
Important
The deflection calibration value of the current scan head calibration file is used to
calculate the force:
Force [N] = Spring Constant [N/m] * Deflection [m]
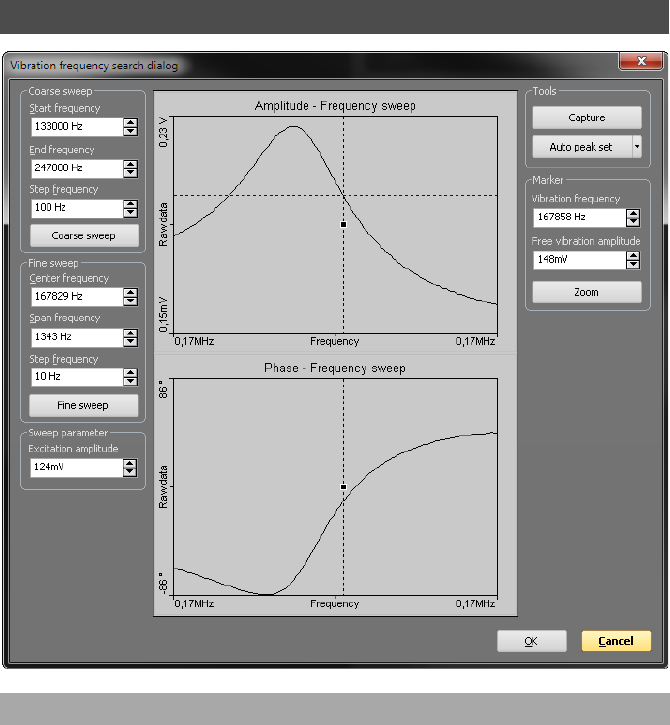
CHAPTER 8: OPERATING MODES
94
The Vibration Frequency Search dialog provides all functionality to view, search and
change the vibration frequency used by the dynamic measurement modes. It is opened by
clicking the “Freq. Sweep” button in the Preparation group of the Acquisition tab. When
opened, the previous frequency sweep is shown. If no previous sweep was performed, the
charts are empty.
To find the cantilevers best operation frequency the control software measures a so called
Bode-Plot. This Bode-plot displays the cantilevers amplitude and phase response versus
excitation frequency. Based on this Bode-plot, the Naio control software is able to
8.10: Vibration frequency search dialog
8.10.1: General concept

VIBRATION FREQUENCY SEARCH DIALOG
95
automatically detect the cantilever resonance peak and adjust the operating frequency
accordingly. In some cases (mostly in Liquid environment) it is necessary for the user to
adjust the operating frequency manually (based on the Bode-plot result), because the
automatic algorithm is not able to find the right frequency peak.
For recording the Bode-plot, the Naio control software tunes the cantilever excitation from
a start frequency slowly up to a higher frequency. During this tuning (or sweeping) the
cantilevers amplitude and phase response is measured and saved. The result is plotted in
an Amplitude and a Phase versus Frequency chart. The Excitation amplitude is held
constant during the sweep. Therefore, any change in detector amplitude and phase signal
is a result of cantilever response.
Resonance frequencies vary greatly between cantilevers, depending on the cantilever’s
respective physical properties. Cantilever manufacturers provide information on the
resonance frequency range of each cantilever type. The Naio control software therefore has
a built-in database of commonly used cantilevers. Other cantilever can be manually added
by the user (see Section 8.9: Cantilever Browser dialog (page 91)). Based on this database
information, the control software selects the frequency sweep range.
After a coarse and a fine sweep, the optimal operating frequency is chosen close to the
resonance frequency of the cantilever.
Tools
Auto frequency set
A click to this button starts an automated vibration frequency peak search and
optimization procedure. This procedure consists of four phases:
1. First a coarse frequency sweep based on the database information of the currently
selected cantilever is performed. The frequency range of this sweep is shown in the
coarse sweep section.
2. Based on the best frequency peak found in this coarse sweep a narrow band fine
sweep is done. The frequency peak and sweep range used for the fine sweep is shown
in the fine sweep section.
3. Based on the amplitude reduction settings (accessed by choosing “Config” from the
“Auto frequency set” buttons drop-down menu) the optimal vibration frequency is
Important
The Phase measurement and chart plot is performed only if a Mode Extension Module
is installed in the NaioAFM controller. The Phase is always measured, independent on
the selected operating mode.
8.10.2: Automated vibration frequency search

CHAPTER 8: OPERATING MODES
96
selected and the excitation amplitude tuned to get the desired free vibration
amplitude at this frequency.
4. After the amplitude tuning, a final fine sweep is performed with the new excitation
amplitude.
At the end of the procedure, the new operating frequency is shown by the marker (both
graphically and in numbers). Additionally, the “excitation amplitude” parameter shows the
amplitude required to obtain the desired free vibration amplitude.
The user may now just leave the dialog and accept the new frequency using the “OK”
button, reset to previous values with the “Cancel” button, do manual adjustment with the
marker, or change amplitude settings and/or customize frequency sweep ranges through
use of the edit boxes and action buttons.
Capture
Stores a copy of the current Bode-plot in the History page of the Gallery panel. The data is
stored as a new measurement and remains open in the Document space of the Naio control
software.
Config
Selected from the “Auto frequency set” button’s drop-down menu, this menu option opens
the Auto frequency config dialog (see Section 8.10.4: Auto Frequency Config dialog (page
98)).
Marker
The marker represents the currently selected frequency. It is shown as a dotted vertical line
in the amplitude and phase chart. The corresponding “Vibration frequency” and “Free
vibration amplitude” values (see below) are shown as automatically updating numbers in
the Vibration frequency and Free vibration amplitude edit boxes as well.
To move the marker by mouse, click and hold the line's handle (small black box in the center
of the line) and move it around. The vibration frequency is updated immediately during the
movement. At release of the marker the amplitude is measured and drawn as a horizontal
line in the amplitude chart and its value is displayed in the Free vibration amplitude edit
box.
To use the currently shown frequency as the new vibration frequency, leave the dialog with
the “OK” button.
Vibration frequency
This parameter shows the frequency at the marker's position. It is used as the actual
vibration frequency during operation of the microscope in the Dynamic operating modes.
The value of this frequency can be changed manually by typing in the desired value, by
8.10.3: Manual sweep controls
VIBRATION FREQUENCY SEARCH DIALOG
97
using the arrow keys beside the parameter field, or by dragging the frequency marker line
in the charts as described above.
Free vibration amplitude
This parameter shows the actual amplitude at the current marker frequency. If the user
enters a new value, the excitation amplitude is adjusted to obtain a free cantilever
amplitude with this new value. A new frequency sweep is immediately performed and its
results displayed. If the desired amplitude could not be set, an error dialog is shown.
Zoom
A click on this button starts a new frequency sweep with a smaller frequency range than
currently displayed in the charts. The center of the sweep is at the markers position. The
new sweep range and center position is shown in the Fine sweep parameter section.
Coarse sweep
Start / End Frequency
These parameters defines the sweep range of a coarse frequency sweep. This range is
normally set large enough to search for the initial resonance peak. “Auto frequency set”
sets these parameters to the range found in the Cantilever database for the currently
selected cantilever.
Step Frequency
This parameter defines the frequency steps used during the sweep. Therefore, the number
of data points of the sweep is defined as:
Datapoint = (End – Start) / Step + 1.
Typical step sizes during a coarse sweep are 100 Hz or more.
Coarse sweep
The “Coarse sweep” button performs a coarse frequency sweep according to the coarse
sweep parameters entered (see above).
Fine sweep
Center / Span Frequency
These parameters defines the sweep range of a fine frequency sweep. The range is
normally smaller than the coarse sweep range. “Auto frequency set” sets the center
frequency to the resonance peak found during the coarse sweep. The span is set according
to the quality factor found in the Cantilever database for the currently selected cantilever.
Span defines the start and end frequencies for the fine sweep as follows:
Start = Center – (Span / 2)
End = Center + (Span / 2)

CHAPTER 8: OPERATING MODES
98
Step Frequency
This parameter defines the frequency steps used during the sweep. Therefore, the number
of data points of the sweep is defined as:
Datapoints = (End – Start) / Step.
Typical steps are 10 Hz or less.
Fine sweep
The “Fine sweep” button starts a fine frequency sweep according to the fine sweep
parameters entered (see above).
Sweep parameter section
Excitation amplitude
This parameter defines the used excitation amplitude during the sweep. If the user enters
a new value a new frequency sweep is immediately performed and its results displayed.
The “Auto frequency set” sets this value to a predefined value according to the scan head
calibration file settings and the currently selected environment parameter.
Auto frequency parameters
Amplitude reduction
This parameter defines the final position of the automated operating frequency search.
Normally, the operating frequency is not at the resonance peak but somewhere beside it.
“Auto frequency set” adjusts the free vibration frequency in such a way that the cantilever
vibration amplitude is smaller than the vibration amplitude at the resonance frequency as
defined by this parameter:
AmplitudeVibr. freq. = AmplitudeRes. freq. × (1 – Amplitude reduction/100)
8.10.4: Auto Frequency Config dialog
VIBRATION FREQUENCY SEARCH DIALOG
99
Use upper side band
When checked, the vibration frequency is set to a frequency higher than the resonance
frequency. When unchecked, the vibration frequency is set to a frequency lower than the
resonance frequency.
CHAPTER 8: OPERATING MODES
100

CHAPTER 9:
Positioning
0
0
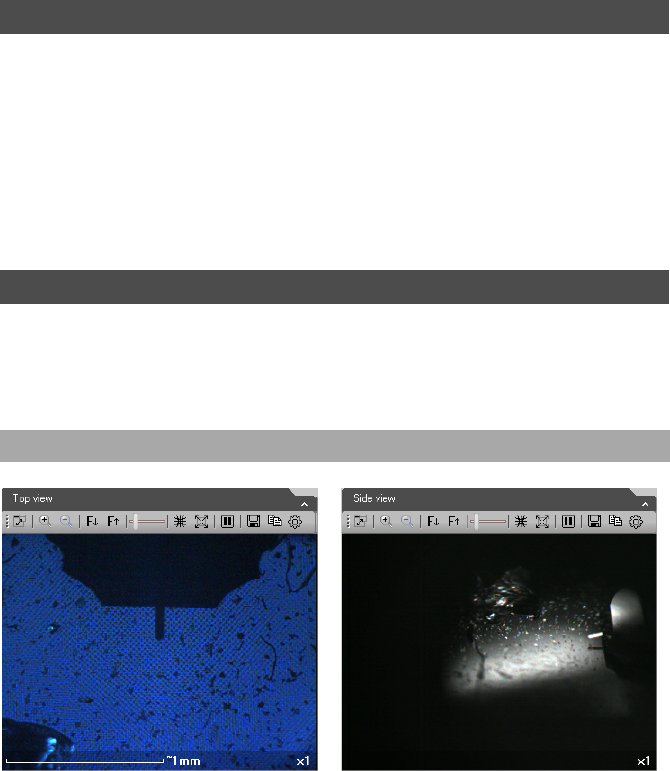
CHAPTER 9: POSITIONING
102
Positioning of the sample with respect to the tip is a prerequisite for starting any
measurement. This process consists of two distinct steps:
1. An area of interest has to be found and positioned directly underneath the tip before
an approach and subsequent measurement can be initiated. Several panels of the Info
pane can be of assistance here. They are explained in Section 9.2: Video panel and
Section 9.3: Online panel.
2. The tip has to approach the sample until a given setpoint is reached. The approach
process is controlled through the Approach group of the Ribbon’s Acquisition tab (see
Section 9.4.1: Approach group).
The Video panel displays the available video signals. Each of the graphical sections used for
video display contains a toolbar with control options to adjust the display properties of the
respective video signal. The settings for each of these controls is stored independently for
each video signal (i.e. different parameters can be set for both top and side view).
If your system is equipped with the additional NaioAFM side view camera, the two camera
views (top and side view) can be displayed simultaneously in the Video panel. The video
signal and its display can be influenced by the controls in the Digital video camera toolbar
(see below).
9.1: Introduction
9.2: Video panel
9.2.1: Digital video camera display
Figure 9-1: Digital video signal in the video panel. (Left) Top view. (Right) Side view.
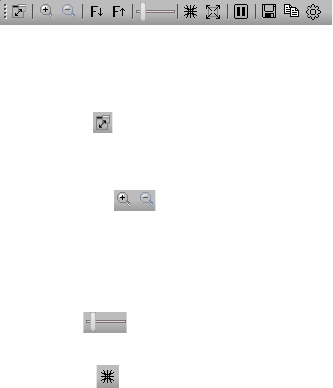
VIDEO PANEL
103
Digital video camera toolbar
Some of the buttons on the video camera toolbar described here (such as zoom, focus and
properties) are only available with video sources that support these features.
Show window
This button ( ) allows you to switch between display of the video signal in a section of the
Video panel and display of the video signal in a separate window.
Zoom in / zoom out
These buttons ( ) allow you to zoom in or out digitally (by binning of pixels). The zoom
area is always in the center of the image. The number of pixels displayed is kept constant.
Therefore, the video rate is independent of the zoom factor. The current zoom factor is
displayed in an overlay at the bottom of the video image.
Gain
This slider ( ) regulates the amount of gain applied to the video signal.
Anti-moiré
This button ( ) ensures that the ratio between the number of camera pixels and video
display pixels is always a whole number. This prevents moiré patterns from occurring in the
video image. The moiré effect is mostly visible on samples with regular structures like grids
or lines if this option is not enabled. When the anti-moiré mode is active, the button is
highlighted. Clicking the highlighted button will deactivate the anti-moiré mode and will
cancel the button’s highlighting.
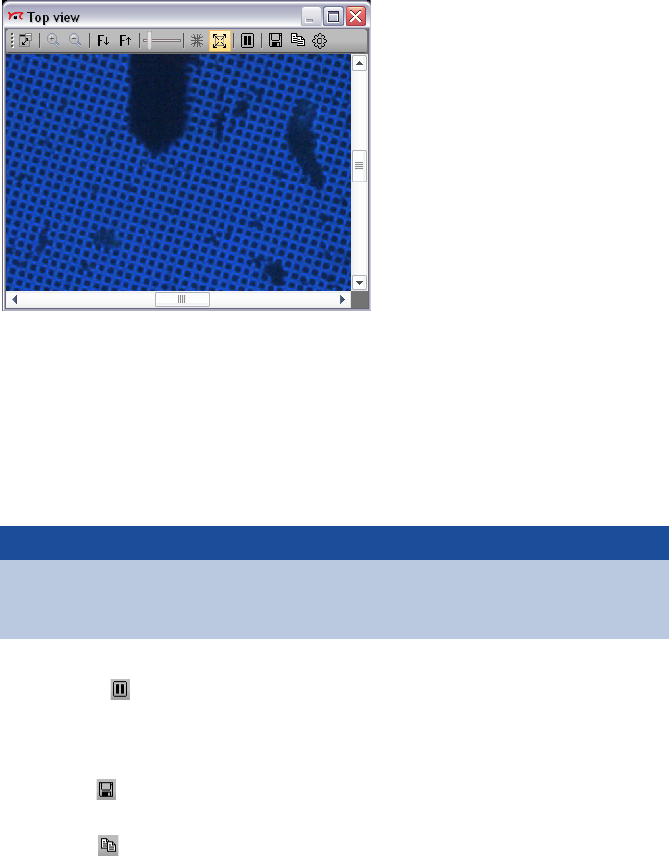
CHAPTER 9: POSITIONING
104
High-resolution mode
This button forces the video display to show all camera pixels on the display one-to-one.
No Zoom is available in this mode. If the video display’s pixel size is lower than the camera’s,
scroll bars are automatically shown on the borders of the video display. This mode is only
useful in a large separate window (e.g. on a second LCD monitor) when you need to see a
sample in full detail.
When the high-resolution mode is active, the button is highlighted. Clicking the
highlighted button will deactivate the high-resolution mode and will cancel the button’s
highlighting.
Pause
If this button ( ) is activated, the video image update is stopped and the frozen image
(last frame received) is shown continuously. A second click on this button restarts the real
time video display.
Save as
This button ( ) allows you to save the current video image as a JPG file.
Copy
This button ( ) allows you to copies the current video image to the Windows clipboard
for pasting into other applications.
Important
In high-resolution mode the amount of (video pixel) data that needs to be transferred
over the USB connection is huge. As a result, the video frame rate typically drops below
5 Hz and a high-performance PC is required to keep the system stable.
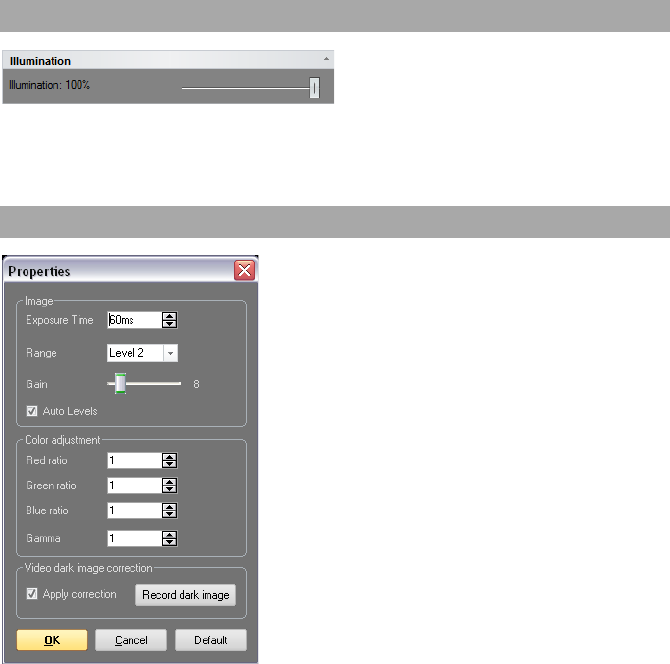
VIDEO PANEL
105
Video properties
This button opens the Digital video properties dialog. See Section 9.2.3: Digital video
properties dialog for details.
The Illumination section of the Video panel contains an illumination slider that controls the
intensity of the sample illumination LED. It may be used to adjust the amount of light on
the sample, thereby optimizing the video image.
This dialog is only available with the FlexAFM camera, the NaniteAFM, camera and the
NaioAFM Topview camera. Other cameras may support their own configuration dialogs,
which you can access by right clicking on the video image. These dialogs are not
documented here.
The Digital video properties dialog can be accessed via the Digital video camera toolbar or
the video display’s context menu. The properties accessible through this dialog directly
influence the respective camera's behavior at the camera driver level.
9.2.2: Illumination section
9.2.3: Digital video properties dialog
CHAPTER 9: POSITIONING
106
Image
Exposure time
Adjusts the exposure time (time to record one image frame) for the respective video
camera. Changing this setting allows the camera to cope with very bright or very dark
sample illumination conditions, or to fine-tune the predefined illumination condition
ranges (see Range below).
Range
Allows the selection of different illumination ranges (levels) for quick adjustment of the
video camera to the current sample illumination conditions. Lower level numbers are
suitable for lower illumination conditions.
Gain
Identical to the Gain slider in the Digital video camera toolbar (page 103), which adjusts the
amount of gain applied to the video signal.
Auto levels
When checked, this option automatically adjusts the camera data to fill the dynamic range
of the video display (similar to the Auto set option for the Chart data range (see Section
13.3.2: Chart Properties dialog (page 178)). Using this option will automatically give you a
good quality image. You will find that changing the other image parameters while this
option is checked (within limits) hardly has an effect on the video display anymore.
Color adjustment
Red ratio
Adjusts the relative amount of red color information in the RGB color mix for each pixel. Not
available for the (monochrome) side view.
Green ratio
Adjusts the relative amount of green color information in the RGB color mix for each pixel.
Not available for the (monochrome) side view.
Blue ratio
Adjusts the relative amount of blue color information in the RGB color mix for each pixel.
Not available for the (monochrome) side view.
Gamma
Adjusts the midpoint of the video image’s dynamic range. Adjusting this setting can be
beneficial for images that show too low or too high contrast. In such cases, increase or
decrease the gamma setting, respectively.
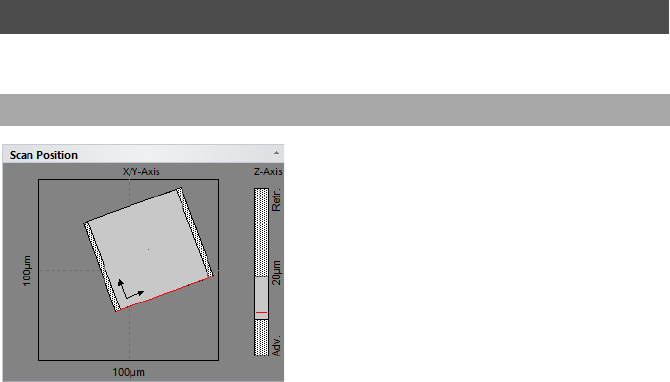
ONLINE PANEL
107
Video dark image correction
At higher gains levels, digital cameras tend to exhibit differences in intensity for individual
image pixels, making some pixels stand out unfavorably from the rest. Applying the Video
dark image correction (on by default) will remove any such pixels from the video display.
This is done by using a so-called “dark image” as a reference. The Naio control software will
attempt to record this dark image the first time it is started. This process is silent. If
successful, the Apply correction checkbox (see below) will be available in the Digital video
properties dialog. If the ambient light is too high, however, the process will fail, and the
Apply correction checkbox will be grayed out. To activate the checkbox, it will be necessary
to record the dark image manually by clicking the Record dark image button. If the light
levels are still too high, you will be advised to cover the instrument or darken the room.
Apply correction
Applies the dark image correction.
Record dark image
Records the dark image for video correction. Each time this button is clicked, the previous
dark image reference will be overwritten.
The Online panel displays scan area information and various other data.
The Scan position section displays information about the maximum scan area (scan head
range), the current measurement area, and the tip position.
The left side of the section shows the maximum scan range of the scan head (outer square
and numbers) and the currently set image size (inner square). The dotted bars to the left
9.3: Online panel
9.3.1: Scan position section
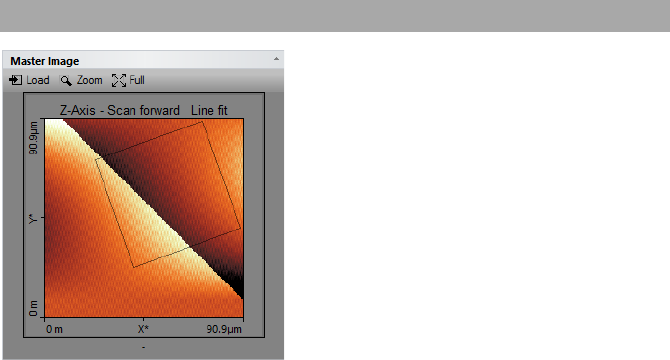
CHAPTER 9: POSITIONING
108
and right of the inner square represent the Overscan area (see Section 10.6.1: Imaging page
(page 124)).
The red line in the inner square represents the currently measured scan line during
imaging. The two arrows represent the orientation of the axes of the image coordinate
system. The small dot in the center of the image square represents the Image offset X/Y and
Rotation point (see Section 10.6.1: Imaging page (page 124)).
The dotted bar on the right side of the Scan position section represents the maximum Z-
range (bar and numbers), the used range for the current measurement (gray box) and the
actual Z-position (average of the current scan line) of the tip (red line).
The Master image section displays a topography measurement, which can be used as a
reference for comparison with other measurements, or as an overview image for multiple
(zoomed) measurements on several points of interest. The Master image section starts out
blank. A reference image has to be loaded manually. When this is done, a box with a black
outline will show the current measurement area inside the reference/overview image.
Load
This button loads the current topography image of the active operating window into the
Master image section.
Zoom
This button allows you to select a new scan area size and position inside the Master image
section (within the loaded image). After selecting the Zoom button, the user draws a zoom
frame in the chart area. To select the new scan area, double-click within the selection area.
A right mouse click aborts the zoom operation.
9.3.2: Master image section
ACQUISITION TAB
109
Full
This button sets the current scan size back to the full scan range, similar to the Full button
in the Imaging toolbar of the Imaging window (see Full (page 122)).
With the illumination slider in the Illumination section, the intensity of the sample
illumination LED is controlled. This slider is only present in the Online panel when no video
camera is present in your system. When a camera is present, this slider automatically moves
to the Video panel (see also Section 9.2.2: Illumination section).
The buttons of the Approach group control the position of the approach stage that has
been selected by the Approach mode setting (page 111).
Home
Increases the tip–sample distance to its maximum value to ensure that the maximum
motorized approach range is available during final automatic approach. When the Home
button has been pressed, it changes to a Stop button that can be used to abort the full
retraction process.
Stop
Aborts the full retraction process and changes the Stop button back to the Home button.
Retract
Increases the tip–sample distance at maximum speed until the button is released.
Advance
Decreases the tip–sample distance at maximum speed until the button is released.
Approach
Starts the automatic approach. During automatic approach, the tip–sample distance is
decreased until the Setpoint (set in the Z-controller section) is reached, or until the
9.3.3: Illumination section
9.4: Acquisition tab
9.4.1: Approach group
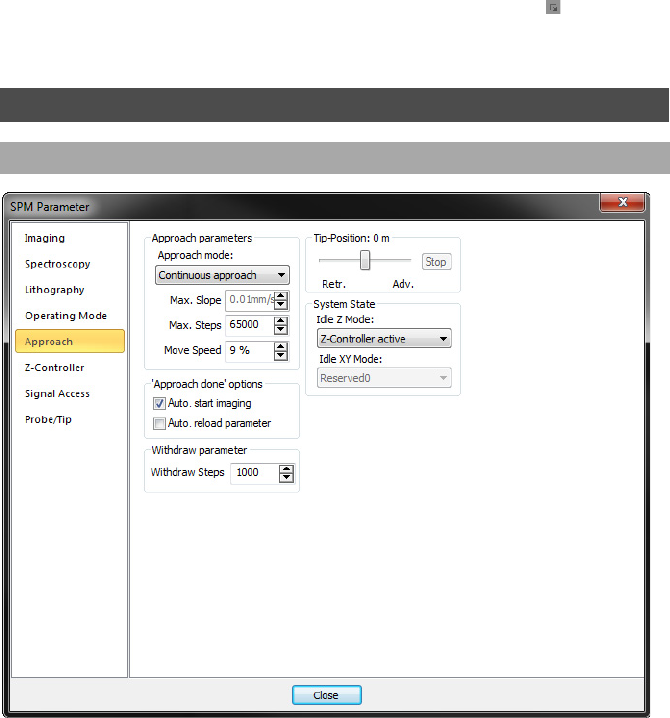
CHAPTER 9: POSITIONING
110
maximum number of approach steps is reached (see Section 9.5.1: Approach page (page
110)). During the approach process, the Approach button changes to a Stop button that can
be used to abort the approach process.
Stop
Aborts the approach process and changes the Stop button back to the Approach button.
Withdraw
Increases the tip–sample distance with approach speed settings.
Launcher icon
More advanced settings are available through the “dialog launcher” icon ( at the bottom
right corner of the Approach group), which opens up the SPM parameters dialog on the
Approach page (see Section 9.5.1: Approach page).
9.5: SPM parameters dialog
9.5.1: Approach page
SPM PARAMETERS DIALOG
111
Approach parameters
Approach mode
For AFM scan heads, two approach options are available:
– Continuous approach
Approach with a continuous and slow motorized stage movement until surface contact
point is reached. Z-Axis stays at Tip-position during approach (see page 112). This is the
default approach method, and was the only method available in the Nanosurf Naio
control software before version 3.
– Step-by-step approach
Approach is performed by moving the motorized stage quickly over a distance that is
smaller than the scanner’s Z-range. During the movement of the motorized stage, the tip
is fully retracted. When the motorized movement is finished, the scanner extends the tip
along the Z-axis to probe for the sample surface. The approach is considered done when
the Setpoint (defined in the Z-controller page of the SPM parameters dialog, or in the Z-
controller section of the Imaging parameters area of the Imaging window) has been
reached. If it is not reached within the Z-range of the scanner, the tip is again fully
retracted and the next motorized step is performed. This process of “step-and-probe” is
repeated until the Setpoint has been reached (and approach is done). The Step-by-step
approach is more “gentle” to tip and sample and should be considered for very sharp tips
and/or very soft samples. In general, it does however take more time than the Continuous
approach.
Max. slope
This parameter defines the speed of extending the Z-axis. It is only available in Step-by-step
approach mode. Slower speeds help to preserve sharp tips.
Max. steps
This parameter defines the maximal duration of an automatic approach:
•In Continuous approach mode it defines the maximum time.
•In Step-by-step approach mode it defines the maximum number of cycles.
Move speed
This parameter defines the move speed during automatic approach and withdraw:
•In Continuous approach mode this value should be small. If the approach is too fast, the
tip or the sample surface can be damaged. On the other hand, the motor will not move
when the move speed is too small.
•In Step-by-step approach mode this value should be around full speed. Lower values help
to stop in the Z-range of the scanner. On the other hand the approach time increases.
CHAPTER 9: POSITIONING
112
Approach done options
Auto start imaging
When selected, the system automatically starts imaging after a successful approach.
Scanning automatically stops the approach motor is moved.
Withdraw parameter
Withdraw steps
The number of steps to use for withdrawing the tip from the sample (see Withdraw (page
110)).
Tip-position
This value determines the Z-Position of the scanner when the approach motor stops. When
the Tip-Position is changed when the tip is already approached to the sample, the motor
will move the approach stage so, that the Z-Position of the tip becomes equal to the set Z-
Position. When a high resolution scanner is used, the Tip-Position before approach is set to
approximately +500 nm (advanced) by default. This compensates for the residual motion
of the approach stage that occurs after the approach motor has stopped.

CHAPTER 10:
Imaging
0
0

CHAPTER 10: IMAGING
114
Imaging measurements of the sample are controlled using the Imaging window. This
chapter describes all elements of the Imaging window in detail. For procedures describing
a basic measurements, refer to Chapter 4: A first measurement (page 39). For details on how
to use the charts see Section 13.3: Charts (page 175). For advanced imaging settings see
Section 10.6.1: Imaging page.
The Imaging window is contained within the Acquisition pane and can be opened by
clicking the Imaging tab at the bottom of the Acquisition pane. The largest part of the
Imaging window consists of a number of charts that display the data from the ongoing
measurement: the chart area. The Imaging window can display as many charts as required.
Scroll bars will appear automatically as soon as the content is larger than the window can
accommodate. By default, two charts groups are displayed: 2 color maps of the sample and
their corresponding line graphs. Usually, these show topography on the left and another
measurement signal on the right (e.g. deflection), depending on the current operating
mode. For more information on adding and changing charts, which basically works the
same for charts in operating windows and in stored measurement documents, see Chapter
13: Working with documents (page 173).
The parameter area on the left side of the Imaging window, the so-called Imaging
parameters area, is organized in 3 sections: the Imaging parameters section, Z-controller
section and the Mode properties section. These sections are an integral part of the Imaging
window and represent the most commonly used parameters for the currently selected
operating mode. Possible parameters in these sections are described in Section 10.3:
Imaging parameters area. Advanced parameters can be accessed via the More button in
each section, which will open the SPM parameters dialog on the respective page (see
Section 7.9: SPM parameters dialog (page 76)).
At the top, the Imaging window contains a toolbar with commands to control the imaging
process: the Imaging toolbar. It is described in Section 10.4: Imaging toolbar.
Apart from the necessary settings, several actions have to be performed before being able
to image a sample. These are accessed via the Acquisition tab of the Ribbon, the elements
of which are described in detail in Section 10.5: Acquisition tab.
Before and during imaging, several panels of the info pane provide additional information
for your reference. The relevant panels for positioning and imaging are explained in Section
9.2: Video panel (page 102) and Section 9.3: Online panel (page 107). A description of the
other panels is found elsewhere in this manual. Please refer to the Chapter 16: Quick
reference (page 283) to locate them.
10.1: Introduction
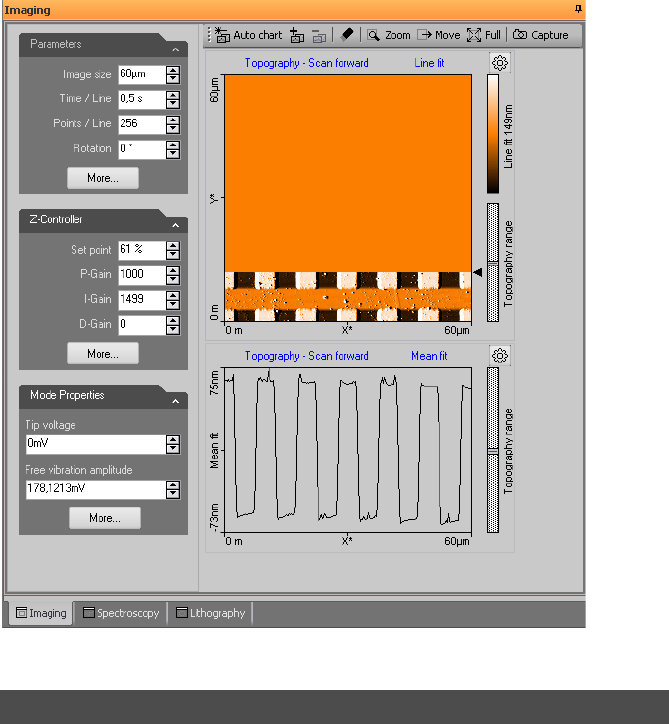
IMAGING WIZARD
115
The Imaging wizard helps you to quickly setup the imaging parameters for an imaging
experiment, based on the your sample description and imaging requirements. It can be
activated by clicking the Imaging wizard button of the Imaging parameters area (see
below).
The Imaging wizard will display the following dialogs:
Figure 10-1: Imaging window
10.2: Imaging wizard
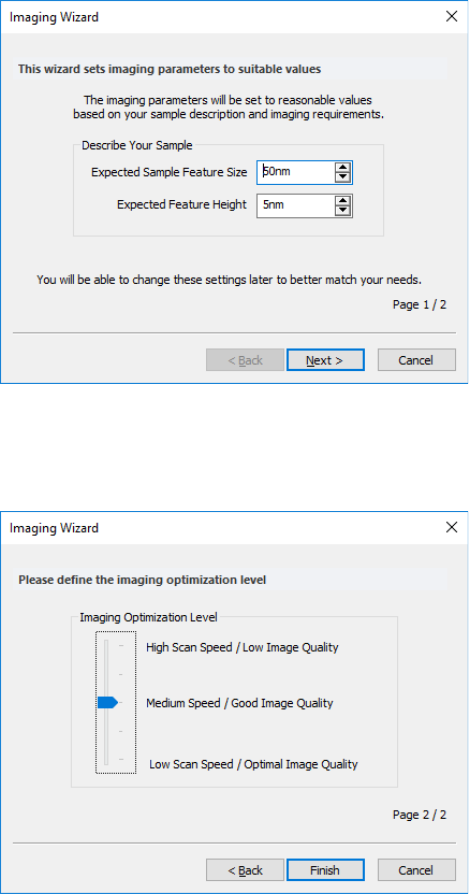
CHAPTER 10: IMAGING
116
Expected Sample Feature Size
Provide a rough estimate of the sample structure dimensions.
Expected Feature Height
Provide a rough estimate of the sample structure height.
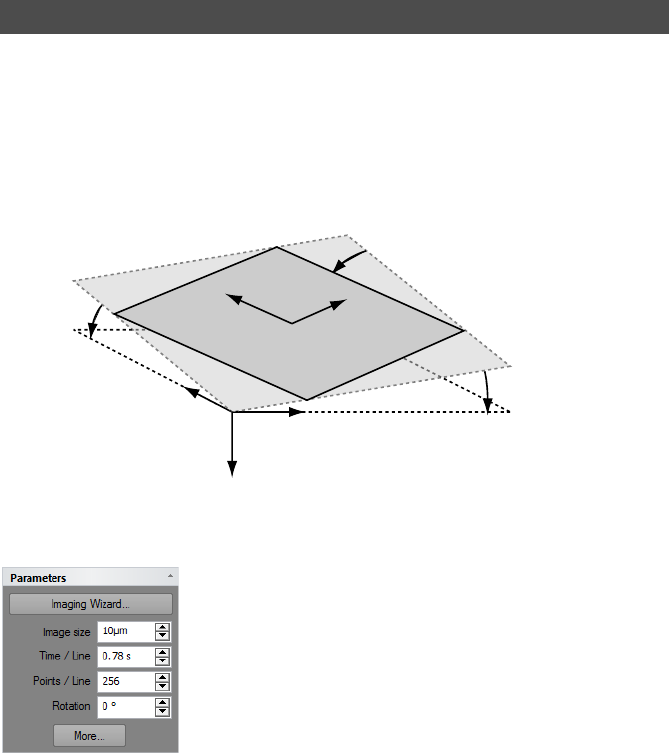
IMAGING PARAMETERS AREA
117
Image Optimization level
Select the kind of imaging you want to perform.
The imaging settings use two coordinate systems: the scanner coordinate system and the
measurement image coordinate system. To separate the two systems, the image axes are
denoted by an asterisk (i.e. X*, Y*). The relation between the two coordinate systems is
determined by various parameters in the Imaging parameters area. The effect of these
parameters is illustrated in Figure 10-2: Coordinate systems. In the Naio control software, a
‘live’ schematical illustration is displayed for the active imaging settings in the Scan position
section of the Online panel of the info pane (see Section 9.3: Online panel (page 107)).
Imaging parameters section
Imaging wizard
This button starts the Imaging wizard that helps you set resonable imaging parameters for
your sample (see also page 115).
10.3: Imaging parameters area
Figure 10-2: Coordinate systems
X
Y
Z, Z*
Scanner XY-plane
'X-Slope' angle
'Y-Slope'
angle
'Rotation'
angle
Measurement plane
Image area
X*
Y*
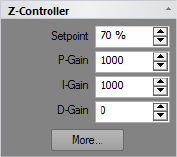
CHAPTER 10: IMAGING
118
Image size
Defines the image size in both the X* and Y* direction. The size is doubled or halved when
the arrows next to the edit box are used.
Time / Line
The time needed to acquire a single data line. The time needed for the entire image is
displayed in the status bar.
Points / Line
The number of measured data points per line. It also sets the number of lines to the same
value.
Rotation
The angle between the X-direction of the scanner and the X* direction of the measurement
(Figure 15-2: Coordinate systems). Note that with the NaioAFM the maximum scan range is
obtained at 45° rotation.
More
Opens up the SPM parameters dialog on the Imaging page for more advanced parameters
(see Section 10.6.1: Imaging page).
Z-controller section
During imaging, the tip–sample interaction is kept constant through the Z-controller. The
Z-controller is a standard PID controller as is shown in Figure 10-3: Z-controller.
Setpoint
The working point for the Z-controller. Depending on the operating mode, this is the
cantilever deflection (static force mode) or relative cantilever vibration amplitude (dynamic
force mode). In the later case, the set amplitude is relative to the operating amplitude, set
in the Mode properties section. For example, when a Setpoint of 70% is used, the Z-
controller will move the tip closer to the sample until the vibration amplitude has
decreased to 70% of the vibration amplitude far away from the sample.
P-Gain
The strength of the Z-controller reaction that is proportional to the error signal. Increasing
the P-Gain decreases the error signal.
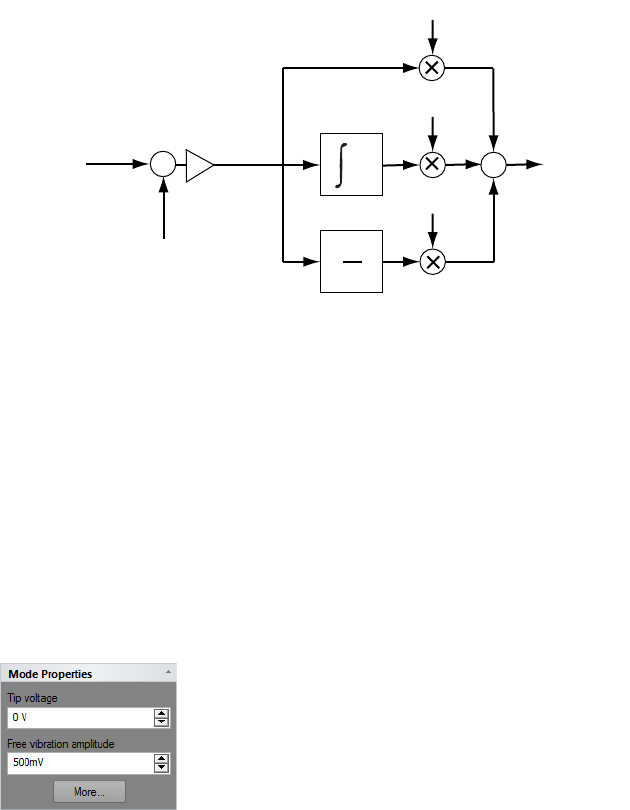
IMAGING PARAMETERS AREA
119
I-Gain
The strength of the Z-controller reaction that is proportional to the integral of the error
signal. Increasing the I-Gain decreases the error signal over time. It is the least sensitive to
noise, and usually the dominant contributor to the topography measurement.
D-Gain
The strength of the Z-controller reaction that is proportional to the derivative of the error
signal. Increasing the D-Gain decreases fast changes in the error signal, but also amplifies
high frequency noise.
More
Opens the SPM parameters dialog on the “Z-controller” page for more advanced
parameters (see Section 8.8.2: Z-controller page (page 88)).
Mode properties section
Tip Voltage
This parameter defines the potential to be applied to the tip. The voltage that can be used
lies between -10V and +10V.
Figure 10-3: Z-controller
Set point
Topography
Error
Signal
+
-
+
Control Signal
(Tip Current,
Deflection,
Amplitude, ...) 1..16x
Error
Range
P-Gain
D-Gain
I-Gain
dt
d
dt
+
+
CHAPTER 10: IMAGING
120
Free vibration amplitude
The desired reference amplitude of the cantilever vibration. The cantilever vibrates at this
amplitude when it is far away from the sample. The excitation strength is adjusted so that
this vibration amplitude is reached.
More
Opens up the SPM parameters dialog on the “Operating mode” page for more advanced
parameters (see Section 8.8.1: Operating mode page (page 86).
Auto chart
Using this button, the control software displays all meaningful charts for the currently
selected operating mode. The actual number of charts varies depending on the mode.
“+” and “–”
With these buttons you can add and remove chart groups, respectively, but not more than
minimally makes sense. There will always be a chart group left. Conversely, you can't add
more chart groups than the Auto tool would display. You can however still remove or add
charts manually (See 13.7 Working with charts)
Clear old chart data
Deletes chart data from a previous measurement. Old chart data can be deleted at all times,
regardless of whether a measurement is running or not.
Zoom
Selects an area that is to be measured in more detail. The size and area of the selected zoom
area is displayed in the Tool Results panel.
The zoom area is defined by two opposite corners of the area. Pressing the left mouse
button at the first corner and holding it down while moving the mouse pointer to the other
corner will create a zoom area of user-defined size. Alternatively, an area that has a third of
the current measurement size and a center at the current mouse pointer position is defined
with a single mouse click at the desired zoom position.
The area defined by the marker can be resized by dragging one of its corners, or moved to
a new position by dragging its center point.
Important
With AFM scan heads the sample has to be electrically connected to the instrument’s
chassis ground for accurate measurements.
10.4: Imaging toolbar
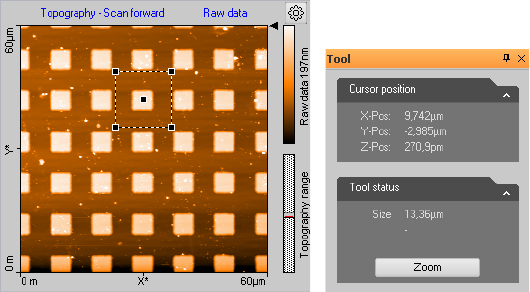
IMAGING TOOLBAR
121
To accept the new zoom area:
>Double-click the chart with the left mouse button, or click the “Zoom” button in the
Tool Results panel.
This action modifies the parameters “Image size”, “Image offset X” and “Image offset Y”
in the Imaging page of the SPM parameters dialog accordingly (see Section 10.6.1:
Imaging page).
To abort the zoom function
>Click Zoom again, or use the right mouse button to select “Abort” in the context menu.
Move
The “Move” button moves the position of the imaged area. An interesting corner can thus
be moved to the center of the measurement. The Tool Results panel numerically displays
the change in position.
The change in position is indicated by an arrow. The start of the arrow is defined by the
mouse cursor position where the left mouse button is pressed; the end of the arrow by the
position where the button is released. With a single click of the left mouse button an arrow
ending in the center of the measurement is drawn. The direction of the arrow can be
adjusted by dragging its end markers. It can be moved by dragging the center marker.
The image is moved by double clicking, or clicking the “Move” button in the Tool Results
panel. To abort the Move function, click the Move-Button again or click the right mouse
button and select “Abort” in the context menu.
Figure 10-4: Zooming. (Left) The Zoom tool area marker. (Right) The Zoom tool information in the
Tool panel of the Info pane.
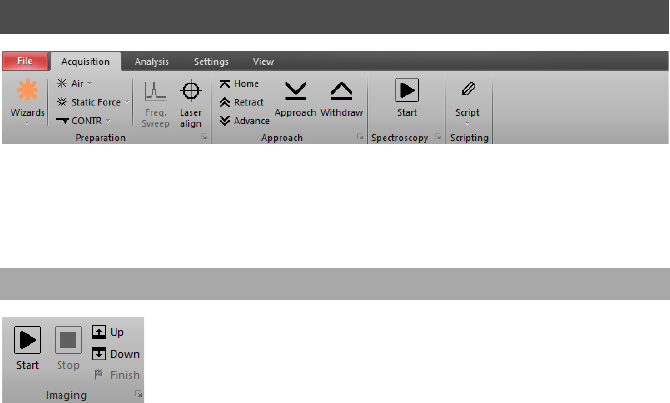
CHAPTER 10: IMAGING
122
Full
The Full button returns the parameters Scan range to the largest possible values, and “X-
Offset” and “Y-Offset” to zero (see Section 10.6.1: Imaging page).
Capture
With the “Capture” button, you can immediately copy the current measurement to the
History page of the Gallery panel without waiting for the scan to be completed (see also
Section 13.4: Gallery panel (page 186)). It is stored as a new document and remains open in
the Document space of the Naio control software.
The Acquisition tab of the Ribbon contains several groups that are important for the
imaging of samples. While the Preparation group is explained in Section 8.2.1: Preparation
group (page 80) and the Approach group is explained in Section 9.4.1: Approach group
(page 109), the Imaging and Scripting groups are described here.
Start
Clicking this button starts a measurement and changes the button to a Pause button.
Pause
Clicking this button pauses the measurement and changes the button to a Resume button.
Z-controller feedback remains active during the pause phase.
Resume
Clicking this button will resume the measurement and changes the button back to the
Pause button again.
Stop
Clicking this button stops a measurement as soon as the current scan line is finished. It can
be clicked during measurement as well as during a pause phase.
10.5: Acquisition tab
10.5.1: Imaging group
ACQUISITION TAB
123
Up / Down
Starts a single measurement or restarts an ongoing measurement from the selected
scanning direction. With the “Up” button the image is scanned from bottom to top. With
the “Down” button it is scanned from top to bottom.
Finish
Selecting Finish will set the Finish flag, which will not abort the measurement directly, but
will do so when the measurement is finished. Deselecting (i.e., clicking it again) will disable
the Finish flag so that the measurement will no longer stop automatically when it is
finished. The Finish button is highlighted when it is flagged.
Launcher icon
More advanced settings are available through the dialog launcher” icon ( at the bottom
right corner of the Preparation group), which opens up the SPM parameters dialog on the
Imaging page (see Section 10.6.1: Imaging page).
The scripting interface is an optional component for creating user defined scripts (software
components) to add new features or automating tasks. For details, see “Help Panel” >>
“Manuals” >> “Script Programmer’s Manual”.
Script
This button opens the Script editor dialog. In this dialog, a script source code can be loaded,
edited, saved and run directly.
The script button drop-down menu
Accessed by clicking the arrow head at the bottom part of the Script button. In this drop-
down list, scripts from the standard scripting folder are displayed and can be started by
selecting the corresponding menu item. The menu item's name is equal to the script’s
name without the script extension (*.vbs) and is sorted alphabetically. The standard folder
is configured through the Scripting acquisition and Analysis file paths (accessed via “File”
>> “Options” >> “Scripting” (see Scripting (page 262)).
10.5.2: Scripting group
Important
The Scripting Interface is a purchase option and has to be activated using the s page (see
Access code (page 264) of the Options dialog.
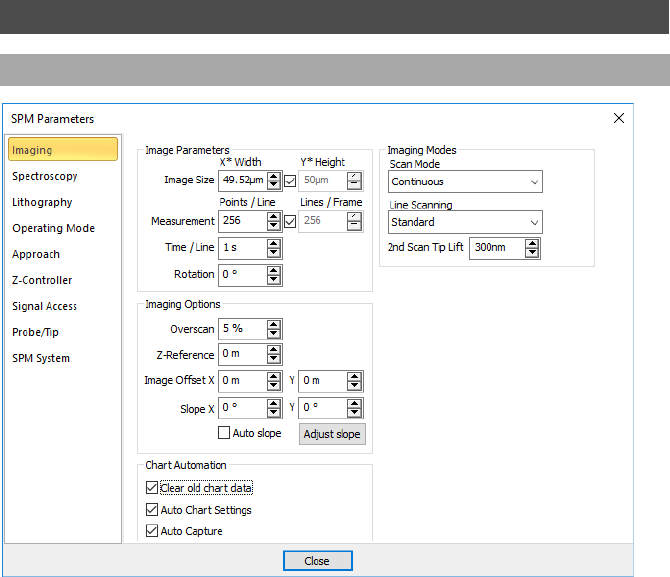
CHAPTER 10: IMAGING
124
At the bottom of the drop-down menu, the “Run from File…” menu item is displayed. It
allows selection and execution of a script file anywhere on your harddisk (or other storage
media). With the selection of this menu item, a file open dialog is displayed and a script file
can be manually selected. This script file is executed directly after “Open” is selected.
Image Parameters
Image Size
The image size in X*-direction and the image size in Y*-direction. When the Check-box is
active, the image Height is always identical to the Image width.
Measurements
The number of measured data points and data lines in an image. When the Check-box is
active, the number of Lines is always equal to the number of Points / Line.
10.6: SPM parameters dialog
10.6.1: Imaging page
SPM PARAMETERS DIALOG
125
Time / Line
The time needed to acquire a data line. The time needed for the entire image is displayed
in the status bar.
Rotation
The angle between the X-direction of the scanner and the X* direction of the measurement
(Figure 15-2: Coordinate systems). Note that with the NaioAFM the maximum scan range is
obtained at 45° rotation.
Imaging Options
Overscan
The “Overscan” determines how much the effective scan range is increased relative to the
image width. This will eliminate edge effects caused by the reversal of the scanning motion
by not recording or displaying them in the measurement image. Disadvantages of using
Overscan are that the maximum scan range is reduced, the tip moves slightly faster over
the sample with the same “Time/Line” setting, and the tip may hit large features outside the
measured image.
Ref. Z-Plane
The height of the reference plane. This height reference is used when the Z-controller
output is cleared, and when the Z-position is not modulated relative to the current surface
position during spectroscopy measurements.
The reference plane for the image can be aligned to the surface of the sample using the
slope parameters (see Figure 5-2: Sample and measurement orientation before slope
adjustment (page 54) or Figure 10-2: Coordinate systems (page 117)).
Image offset X/Y
The center position of the measured area.
Slope X
A positive value rotates the image plane around the Y-axis counterclockwise.
Slope Y
A positive value rotates the image plane around the X-axis counterclockwise.
The center position of the measured area can be changed by typing its position as well as
by using the Move tool in the Imaging toolbar. The zero position corresponds to the center
position of the scanner.
Adjust slope
The “Adjust slope” button will cause the control software to set appropriate values for X-
and Y-slope by performing two single line scans (one in X- and one in Y-direction) and
determining the respective slopes via line fitting, thus electronically compensating for
these measurement plane slopes (see Section 5.2: Adjusting the measurement plane (page
53) for details).
CHAPTER 10: IMAGING
126
Auto slope
Automatically performs the same action as the “Adjust slope” button does. It adjusts the
slopes with each new “Start” of imaging.
Imaging Modes
Scan Mode
This parameter defines how the images are acquired and displayed:
–Continuous
The acquisition direction is reversed after each scan: from bottom to top and vice versa.
–Cont.Up
The acquisition direction is always from bottom to top.
–Cont.Down
The acquisition direction is always from top to bottom.
Line Scanning
This parameter defines how each imaging line is acquired and stored (for details see Figure
10-5: Available Line Scanning options (page 127) and a description of the available options
below):
–Standard
The Z-controller is enabled during both forward and backward scan.
–Dual scan
The first (forward and backward) scan is made as in the standard setting, but then a
second scan is made with the Z-controller disabled. This setting is the most precise, and
gives the largest amount of information, but it is also half as fast as the other dual modes.
–Interlaced
The Z-controller is enabled in the forward scan, and disabled in the backward scan. Thus
the data acquisition time is reduced compared to Dual scan but forward scan data
cannot be compared to backward scan data to judge controller performance. This
setting is twice as fast as Dual scan, but it is not possible to compare forward and
backward scan to optimize feedback settings.
– Second scan only
The Z-controller is only enabled before the start of each scan using the standard settings.
During the scan, the 2nd Scan Parameters are used. This setting is the fastest, and has the
lowest tip wear, because the measurement can be made faster as the tip does not need
to follow topography. However, correlation of second scan data with topography is much
less precise.
2nd Scan Tip Lift
This parameter sets the height of the start of the second scan compared to the height of
the start of the first scan. Positive values move the tip further away from the sample. For a
procedure on how to determine the tip lift, please refer to technote “TN00031 – Operating
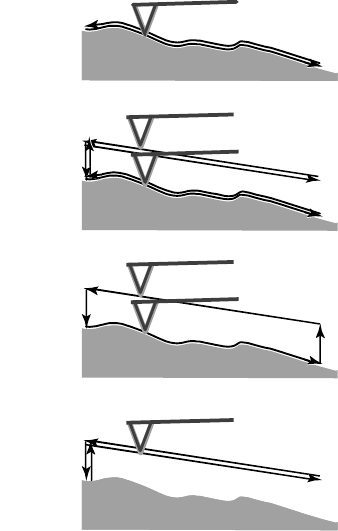
SPM PARAMETERS DIALOG
127
Nanosurf AFMs in MFM mode”, which can be found in the “Technote” section of the Help
panel.
Chart automation
Auto clear old chart data
Automatically clear the chart data from a measurement when a measurement is restarted
(either when a scan is restarted manually, or when a previous scan has finished and
measurement recommences as determined by the scan mode (see Scan Mode (page 126).
Auto chart settings
If checked, the chart arrangement is automatically updated (see also Auto chart (page 120)).
Auto capture
If checked, all measurements are automatically stored in the history Gallery. If unchecked,
you have to click the “Capture” button in the Imaging tool bar to manually save your
measurement data.
Figure 10-5: Available Line Scanning options
sample
"1" Find sur
f
ace
2
sample
2
1
sample
2
1
sample
Dual Scan
Standard
Interlaced
Second
scan only
CHAPTER 10: IMAGING
128

CHAPTER 11:
Spectroscopy
0
0
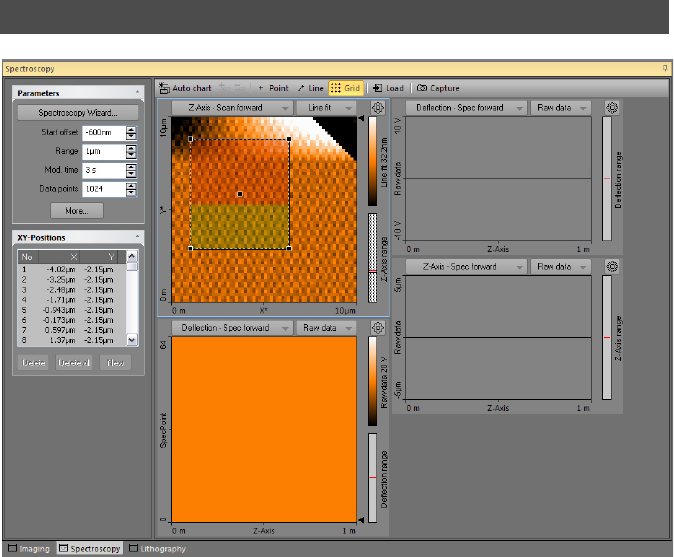
CHAPTER 11: SPECTROSCOPY
130
Spectroscopic measurements are performed in the Spectroscopy window, which is opened
by clicking the Spectroscopy tab in the Acquisition pane. The Spectroscopy window
contains the Spectroscopy toolbar, with commands that control the spectroscopy
processes, and the spectroscopy parameters area, with parameters that determine how the
spectroscopy measurement is performed.
The Spectroscopy window also contains a number of charts that display the data from a
previous imaging measurement and the data from the ongoing spectroscopic
measurement. The Spectroscopy window can display as many charts as the size of the
window can accommodate. It is recommended to display at least two charts, one Color
map of a previous Topography measurement of the area where the spectroscopy
measurement is performed, and one Line graph of the current spectroscopy measurement.
For more information on adding and changing charts see Section 13.3: Charts (page 175).
In general, a spectroscopic measurement is a measurement of an input signal as a function
of a modulated output. Common spectroscopic measurement types are:
Figure 11-1: Spectroscopy window
11.1: Introduction
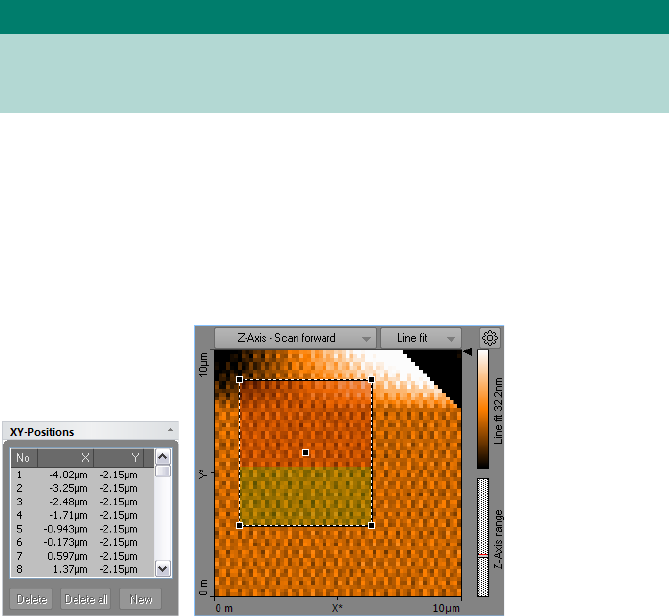
INTRODUCTION
131
• Force–Distance curves in AFM static, spreading resistance, and lateral force operating
modes
• Amplitude–Distance or Phase–Distance curves in AFM dynamic operating modes
• Tip Current– Tip Voltage curves in AFM and STM operating modes
The XY-Position section of the spectroscopy parameters area stores a list of points where
such measurements are to be performed. To define these positions, the “Point”, “Line” or
“Grid” tools in the Spectroscopy toolbar help you to define these positions graphically by
using the mouse. Alternatively, individual positions can also be defined manually by
entering their X and Y coordinates in the XY-Position dialog, opened by clicking the “New”
button in the XY-Position section (also see New (page 143)). The positions in the list are also
shown in the color map chart of the surface (see Figure 11-2: Example of a multiple position
measurement using the Grid tool).
Tip
Use the Spectroscopy wizard (“Wizards” >> ”Spectroscopy”) to quickly prepare
spectroscopy parameters. The wizard can prepare appropriate parameters for all
common spectroscopy modes.
Figure 11-2: Example of a multiple position measurement using the Grid tool. ((Left) List of
coordinates. (Right) Grid area as shown on the sample surface. Measured points are tinted yellow;
unmeasured points are tinted red.

CHAPTER 11: SPECTROSCOPY
132
When using the graphical tools Line and Grid to define the measurement positions, the
Tool status field in the Tool reseults panel needs to be used to define the number of
measurement positions.
For any spectroscopy measurement, two basic modulation method types exist:
– “Fixed length” modulation
This type of modulation has a fixed start and end value. It is freely available with the
Standard spectroscopy level (see Section 11.6.2: Spectroscopy page (standard level)).
– “Stop by value” modulation
This type of modulation has a fixed speed from a start value until a certain measurement
value is reached. This type of spectroscopy is only available with the Advanced
spectroscopy level (see Section 11.6.3: Spectroscopy page (advanced level)).
Important
In the spectroscopy toolbar, the Naio control software has three graphical tools to define
positions using the mouse. Use these graphical tools to easily define X/Y-positions:
(also see Section 11.4: Spectroscopy toolbar (page 143))
Individual points created using any method can be easily repositioned by dragging the
respective circle to its new position in the Topography overview chart.
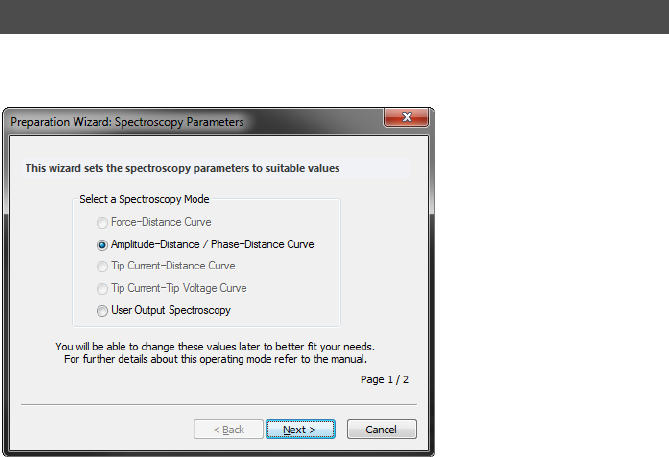
SPECTROSCOPY WIZARD
133
The Spectroscopy Wizard helps you to setup the spectroscopy parameters for a
spectroscopy experiment:
The wizard will set all spectroscopy parameters, modes, and settings to reasonable values,
so that the desired spectroscopy function is well prepared for almost all cases. The wizard
takes overall system settings (e.g Cantilever type, Z- Feedback Setpoint, Free Vibration
Amplitude, etc.) into account when it calculates the parameters it proposes as default
values.
The Spectroscopy wizard takes you through a two-step process:
1. Select the spectroscopy mode you wish to perform.
2. Accept or change the proposed parameters.
After clicking the “Finish” button, the Wizard sets all spectroscopy parameters. These can
be viewed in the Spectroscopy page of the SPM parameters dialog (see Section 11.6.1:
Spectroscopy page) and may be adjusted at any time to better fit your needs.
If already approached to the surface, you are ready to start the Spectroscopy by clicking the
“Start” button in the Spectroscopy group of the Acquisition ribbon (see Section 11.5.1:
Spectroscopy group). If no X/Y-Position is defined, spectroscopy will be performed in the
center of the image, respecting the selected XY-offset in the imaging parameters.
11.2: Spectroscopy wizard

CHAPTER 11: SPECTROSCOPY
134
6.1.1
The Force–Distance curve is a spectroscopy mode where the cantilever is moved while the
deflection signal is measured. With Force–Distance spectroscopy, the typical snap-in and
release effect of the tip–sample interaction can be measured. Additionally, the cantilever
spring constant and the system’s deflection sensitivity can be precisely calibrated (see
Section 15.8.2: Probe/tip page (page 277)).
A “fixed length” modulation can be safely performed with the Standard Spectroscopy level
when the tip starts at the surface (and the Z-position of the surface is therefore already
known) and is subsequently moved away to a retracted position and then back again.
A “stop by value” modulation can only be performed with the Advanced Spectroscopy level
since only there the it is possible to enter an appropriate stop value. Here it is also possible
to start from a retracted position and then move towards the surface until a given Stop
criterion is reached and to retract again afterwards.
A “fixed length” Force–Distance spectroscopy experiment is typically divided into 4 distinct
phases (see Figure 11-3, Left):
1. Tip is approached (i.e. in contact with the surface).
2. Move the tip to a defined position (Range) above the surface while measuring the
deflection signal (and any other input signals that the current measurement mode
may allow). This is called the “Forward Modulation phase”.
3. Move the tip back to the surface while measuring deflection (and any other input
signals). This is the “Backward Modulation phase”. Its duration is the same as during the
forward phase. The direction is opposite to that of the forward phase.
4. Remain approached (keep Z-controller active). If more spectroscopy measurements
are to be performed, move to the next measurement (XY) position (also with active Z-
feedback).
A “stop by value” Force–Distance spectroscopy experiment is typically divided into 8
distinct phases (see Figure 11-3, Right):
1. Start from a (fully) retracted Z-position.
Important
• A disabled spectroscopy mode means that this mode is not available for the currently
selected operating mode. “Amplitude–Distance curve”, for example, is only possible in
dynamic force or phase contrast operating mode and not in static force” operating
mode.
• A disabled parameter means that it is only available when the advanced spectroscopy
level has been activated by a correct (see Access code (page 264)).
11.2.1: Force–distance
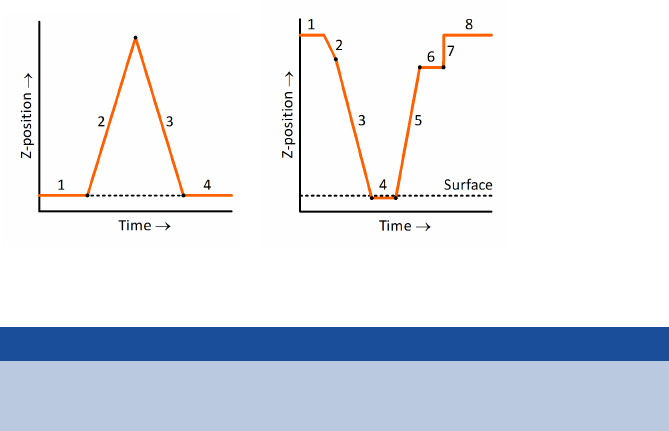
SPECTROSCOPY WIZARD
135
2. Move the tip to a defined position above the surface (start offset).
3. Move the tip toward the surface and measure the deflection signal (and any other
input signals that the current measurement mode may allow). This is called the
“Forward Modulation phase”.
4. Stop at a defined deflection value (Fwd Stop value) and maintain this Z-position for a
certain amount of time. This is called the “Fwd pause phase”. During the pause phase,
data is still being recorded, but may have a different sample rate.
5. Move the tip away from the sample to a defined position while measuring deflection
(and/or other input signals). This is the “Backward Modulation phase”.
6. Stop at a defined deflection value (Bwd Stop value) and maintain this position for a
certain amount of time, again while recording data. This is the “Bwd pause phase”.
7. Change the modulation signal back to its initial value.
8. If more spectroscopy measurements are to be performed, move to the next
measurement (XY) position.
Figure 11-3: Typical phases of Force–Distance curves. (Left) Fixed length (standard) modulation.
(Right) Stop by value (advanced) modulation.
Important
• Force–Distance Curve is available in all Static force operating modes.
• Cantilevers with low spring constants are typically used.
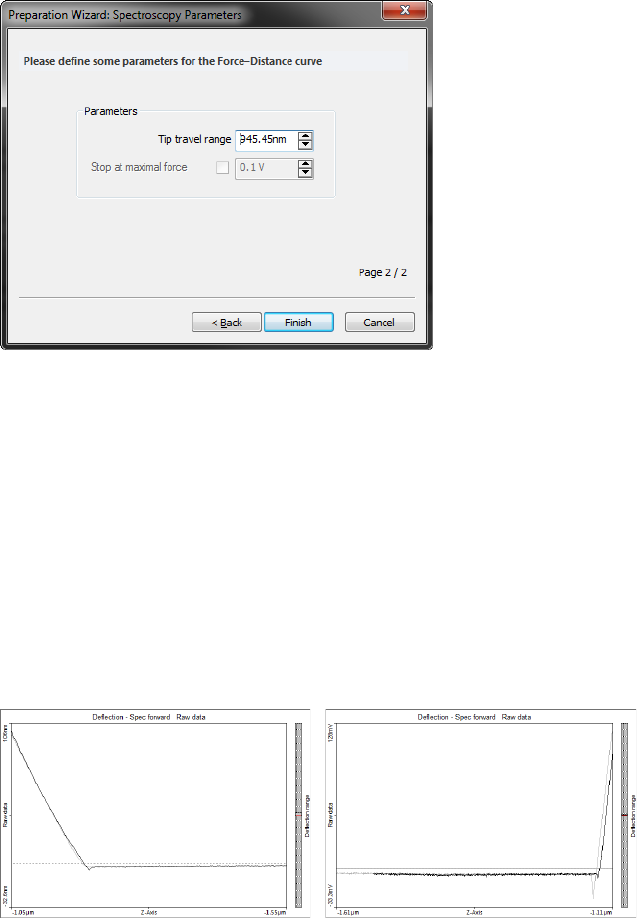
CHAPTER 11: SPECTROSCOPY
136
Parameters
Tip travel range
Defines the range of the desired tip movement toward/away from the sample during
measurement. In fixed length modulation, this parameter sets the actual forward and
backward travel ranges. In stop by value modulation, this parameter sets the maximum
travel ranges (if not shortened by the respective stop values).
Stop value
If checked, the forward spectroscopy stops its forward movement as soon as the defined
deflection value is reached. This parameter is only available when advanced spectroscopy
has been activated via the proper access key.
Results
Typical measurement results will look as follows (Left: fixed length; Right: stop by value):
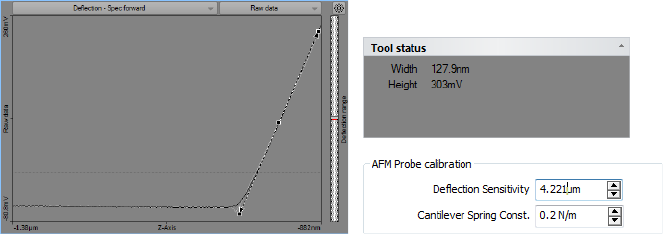
SPECTROSCOPY WIZARD
137
Usage
Force–Distance curves can be easily analyzed in the Nanosurf Naio control software to
reveal the system’s deflection sensitivity (see below). These can then be entered into the
respective fields on the Probe/Tip page of the SPM parameters dialog (see Section 15.8.2:
Probe/tip page (page 277)) and allow the software to correctly express measurement data
(voltage) as height information (e.g. in nm). If the cantilever spring constant has been
determined and entered in the corresponding field on the Probe/Tip page as well, the
software can also accurately express measurement data as Force (in Newton).
To perform a calibration:
1Record a Force—Distance curve as described above.
2Use the Measure Length tool (see Measure length (page 192)) on the Ribbon’s Analysis
and draw a line on the descending or ascending part of the force curve (see Figure 11-
4: Deflection sensitivity calibration, Left).
3From the numbers shown in the Tool status area of the Tool panel of the Info pane
(Figure 11-4: Deflection sensitivity calibration, Top right), divide Height by Width to
obtain the slope in V/m. In the example shown in Figure 11-4, the slope calculates to
303 mV / 127.9 nm = 2369038 V/m.
4To obtain the Deflection sensitivity, divide 10 V (the scale of the AFM detector) by the
slope. In the example shown in Figure 11-4, this corresponds to 4.221×10⁻⁶ m.
5Enter this number in the Detector Sensitivity field of the Probe/Tip page of the SPM
parameters dialog. In the example shown, 4.221 μm has to be entered (see Figure 11-
4: Deflection sensitivity calibration, Bottom right).
Figure 11-4: Deflection sensitivity calibration.
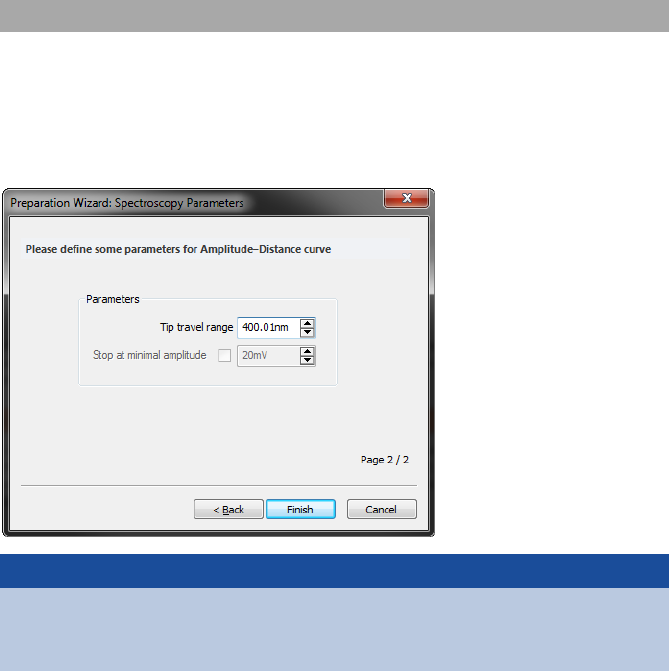
CHAPTER 11: SPECTROSCOPY
138
6.1.2
The Amplitude–Distance / Phase Distance curve is a spectroscopy mode where the
cantilever is moved while the amplitude or phase signal is being recorded. With this
modulation, the typical amplitude reduction or phase shift effect due to the increasing tip–
sample interaction can be measured (see Results (page 139)). Note that while both
amplitude and phase signal can be recorded simultaneously, only the amplitude signal can
be used as Stop value in Advanced Spectroscopy mode.
Parameters
Tip travel range
Defines the range of the tip movement.during the forward and backward phases of the
spectroscopy measurement.
Stop value
If checked, the forward spectroscopy stops its forward movement as soon as a defined
reduced amplitude value is reached. This parameter is only available when advanced
spectroscopy has been activated via the proper access key.
11.2.2: Amplitude–Distance / Phase–Distance
Important
• Amplitude–distance / phase–distance curve is only available in dynamic force or
phase contrast operating mode.
• Cantilevers with high spring constants are typically used.
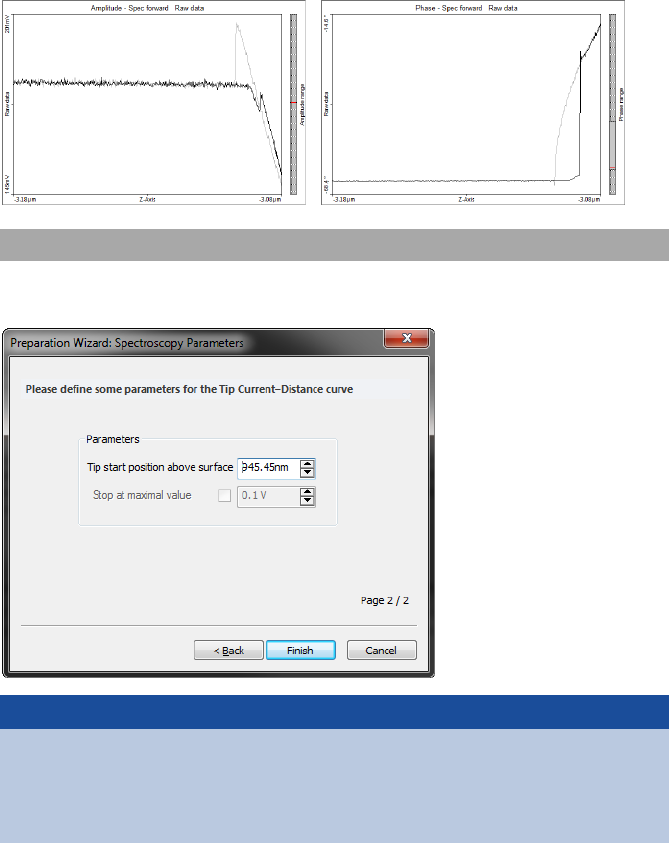
SPECTROSCOPY WIZARD
139
Results
Typical measurement results will look as follows (Left: Amplitude; Right: Phase):
6.1.3
The Tip current–Distance curve is a spectroscopy mode where tip current is measured
while the tip is moved.
11.2.3: Tip current–Distance
Important
• The Tip current–Distance curve is only available in in the AFM “Spreading resistance”
operating mode.
• AFM users must electrically connect the sample to the ground connector on the scan
head to apply a tip–sample voltage difference.
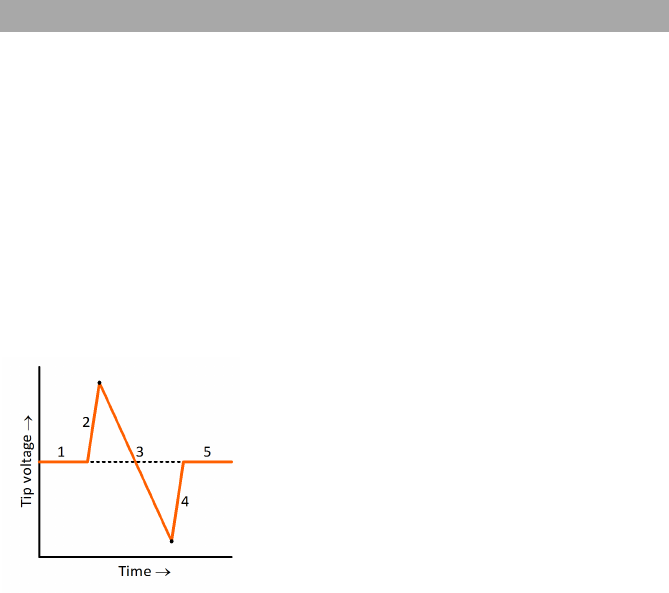
CHAPTER 11: SPECTROSCOPY
140
Parameters
Tip travel range
Defines the range of the desired tip movement toward the sample during the forward
measurement phase.
Stop value
If checked, the forward spectroscopy stops its forward movement as soon as a defined
value is reached. In AFM spreading resistance mode, the stop value does not correspond to
a tip current, but (as with Force–Distance measurements) corresponds to a defined
deflection signal. The tip current is measured as a separate channel in spreading resistance
mode.
6.1.4
The Tip current–Tip voltage curve is a spectroscopy mode where the tip is not moved, but
where the tip voltage is changed instead. During this voltage change, the tip current signal
is measured.
A Tip current–Tip voltage spectroscopy experiment is typically divided into 5 distinct
phases (see Figure 11-5, Left):
1. Tip voltage is at a resting potential (e.g. 0 V).
2. Tip voltage is set to a positive value (e.g. +5 V).
3. Tip voltage is slowly set to a negative voltage (e.g. –5 V) while the Tip current is being
measured.
4. Tip voltage is returned to its resting potential.
5. Tip voltage remains at this potential. If more spectroscopy measurements are to be
performed, move to the next measurement (XY) position.
11.2.4: Tip current–Tip voltage
Figure 11-5: Typical Tip Current–Tip Voltage curve. Dotted line represents resting potential.
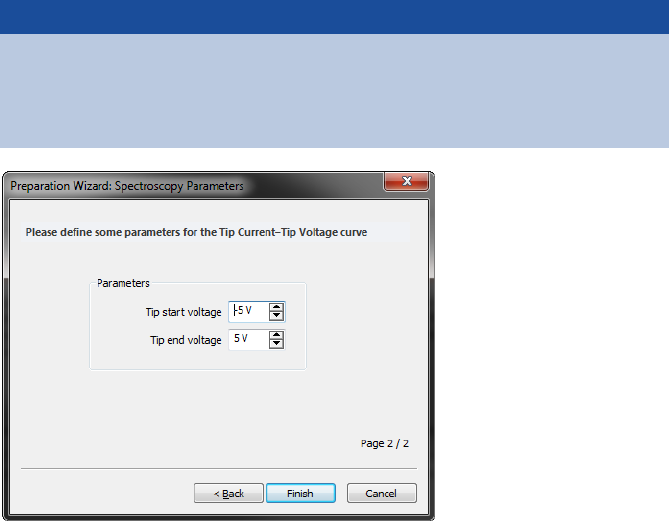
SPECTROSCOPY WIZARD
141
Parameters
Tip start voltage
Defines the start point of the voltage scan.
Tip end voltage
Defines the end point of the voltage scan.
Important
• The Tip current–Tip voltage curve is only available in the AFM “Spreading resistance”
operating mode.
• AFM users must electrically connect the sample to the ground connector on the scan
head to apply a tip–sample voltage difference.
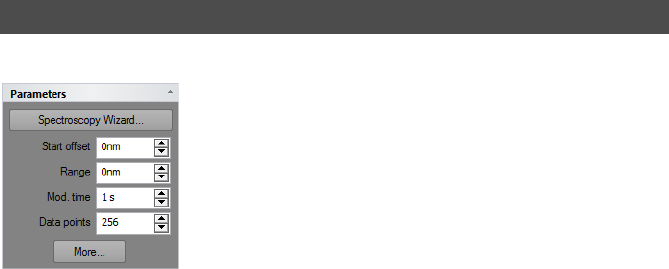
CHAPTER 11: SPECTROSCOPY
142
Parameters section
Spectroscopy wizard
This button starts the spectroscopy wizard (see Section 11.2: Spectroscopy wizard (page 133)
for details).
Start offset
The starting point for the spectroscopy modulation
Range
The range over which the modulated output is changed. The “Spec forward” data is
measured from the “Start offset” value until “Start offset” + “Range”. “Spec backward” data
is measured in the opposite direction. The “Spec forward” data is always measured before
the “Spec backward” data. For spectroscopy as a function of distance (Z-axis modulation),
more negative values are further away from the sample whereas more positive values go
towards (or even into) the sample.
Mod. time
The time used to change the modulated output from its the start to end value.
Data points
The number of data points measured while the modulation output is changed. The data
points are equally distributed over the modulation range.
“More” button
Opens up the SPM parameters dialog on the Spectroscopy page for more advanced
parameter settings (see Section 11.6.1: Spectroscopy page (page 146)).
11.3: Spectroscopy parameters area
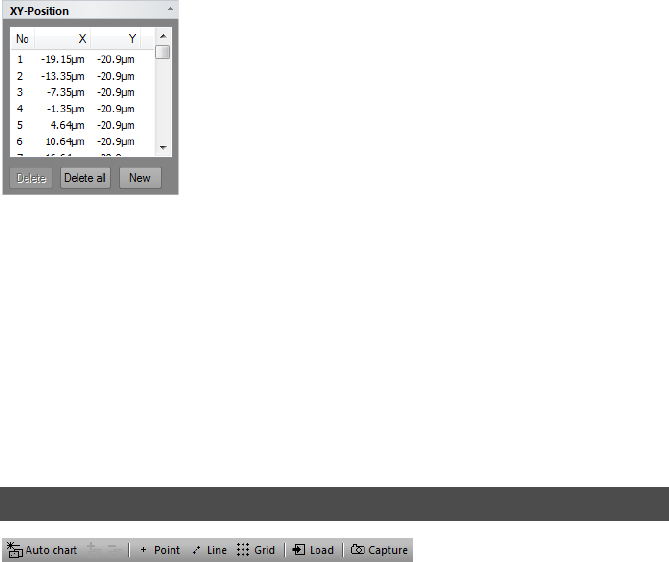
SPECTROSCOPY TOOLBAR
143
XY-Position section
The Position section lists the positions to be used for spectroscopy measurements. The list
can be populated using tools from the Spectroscopy toolbar or by adding individual
positions using the “New” button (see below). Any position on this list can be moved to a
new location by using the mouse to drag the corresponding circle in the overview chart.
Delete
Removes the currently selected measurement position from the list.
Delete all
Removes all measurement positions from the list.
New
Opens up a dialog to add a new XY-coordinate for Spectroscopy measurement.
Auto chart
Using this button, the control software displays all meaningful charts for the currently
selected operating mode. The actual number of charts varies depending on the mode.
“+” and “–”
With these buttons you can add or remove chart groups, respectively, but not more than
what minimally makes sense. There will always be a chart group left. Conversely, you can't
add more chart groups than the Auto tool would display. You can however still remove or
add charts manually (See Section 13.3.1: Working with multiple charts (page 177)).
Point
Activates the single point spectroscopy mode. It defines the position of the spectroscopy
measurement by mouse. Click in the topography Color Map chart at the position where the
spectroscopy measurement should take place. A small white circle appears at this position.
The positions coordinate is transferred to list in the XY-Position section.
11.4: Spectroscopy toolbar

CHAPTER 11: SPECTROSCOPY
144
Line
Activates the line spectroscopy mode. Defines the start and end position of the
spectroscopy measurement by mouse. Click and hold the left mouse button in the
topography Color Map chart at the position where the spectroscopy measurement should
start. Move the mouse to the end position and release the left mouse button. A line with
measurement positions is overlaid on the Color map. The position coordinates are
transferred to the XY-Position section of the Spectroscopy parameters area.
Grid
Activates the grid spectroscopy mode. Defines opposite corners of a rectangular grid of
spectroscopy measurements by mouse. Click and hold the left mouse button down while
dragging from one corner of the grid to the opposite corner. Releasing the mouse button
will overlay the grid’s measurement positions on the topography view.
Load
Fills the Topography Color Map chart in the Spectroscopy window with the current
measurement of the Imaging window. Selection of “point”, “line”, or “grid” measurement
positions can be performed in this chart.
Capture
A click on “Capture” saves the current spectroscopy measurement data to the History page
of the Gallery panel, even when the measurement(s) have not been completed yet. The
spectroscopy data are stored as a new document and remain open in the Document space
of the Naio control software.
Length
The length of the selected line.
Sequence points
Allows setting the number of data points in the line. The total number of positions is limited
to 64 in the basic spectroscopy version.
Set
Updates the XY positions according to the new settings.
11.4.1: Tools Status for Line spectroscopy
ACQUISITION TAB
145
Start X, Y
The coordinate of the first point.
Width
The size of the grid in the fast scan direction.
Height
The size of the grid in the slow scan direction.
Placement
Avaialable options are:
– At point:
The corners of the drawn grid are the measurement locations. The distance between
points along a line equals Width/(Points–1). Choose this setting when the measurement
resultfor each point should represent the results at exactly that location.
– Cell center:
The grid is divided in Points × Line rectangles, the measurement position is in
the center of the rectangle. The distance between points along a line is Width / Points.
Choose this setting when the measurement result is seen as representative for the area
around the measurement location.
Points, Lines
The number of points (in the fast direction) and lines (in the slow direction) of the grid. The
total number of positions is limited to 64 in the basic spectroscopy version.
During spectroscopy, all groups of the Acquisition tab are identical to those during imaging
of the sample, with exception of the Imaging group, which is replaced by the Spectroscopy
group.
Start
Clicking Start starts a spectroscopy measurement sequence.
11.4.2: Tools Status for Grid spectroscopy
11.5: Acquisition tab
11.5.1: Spectroscopy group

CHAPTER 11: SPECTROSCOPY
146
Stop
Clicking Stop aborts the measurement sequence as soon as the current modulation period
is finished.
Launcher icon
More advanced settings are available through the Launcher icon ( at the bottom right
corner of the Spectroscopy group), which opens up the SPM parameters dialog on the
Spectroscopy page (see below).
The Spectroscopy page of the SPM parameters dialog contains all parameters relevant for
performing spectroscopy measurements. Two levels of parameter complexity are
distinguished and can be selected at the top of the Spectroscopy page:
– Standard Spectroscopy
In this level, Spectroscopy works in fixed-length modulation mode and without pause
phases. Forward and Backward phases will always have the same absolute range. This
mode serves the most common spectroscopy needs and is easy to operate. For details
see Section 11.6.2: Spectroscopy page (standard level).
– Advanced Spectroscopy
In this level, the “Stop by value” modulation modes is also supported and many more
parameters for each phase are available. For details see Section 11.6.3: Spectroscopy page
(advanced level). This level is only available when it has been unlocked with a valid access
key (see Access code (page 264).
11.6: SPM parameters dialog
11.6.1: Spectroscopy page
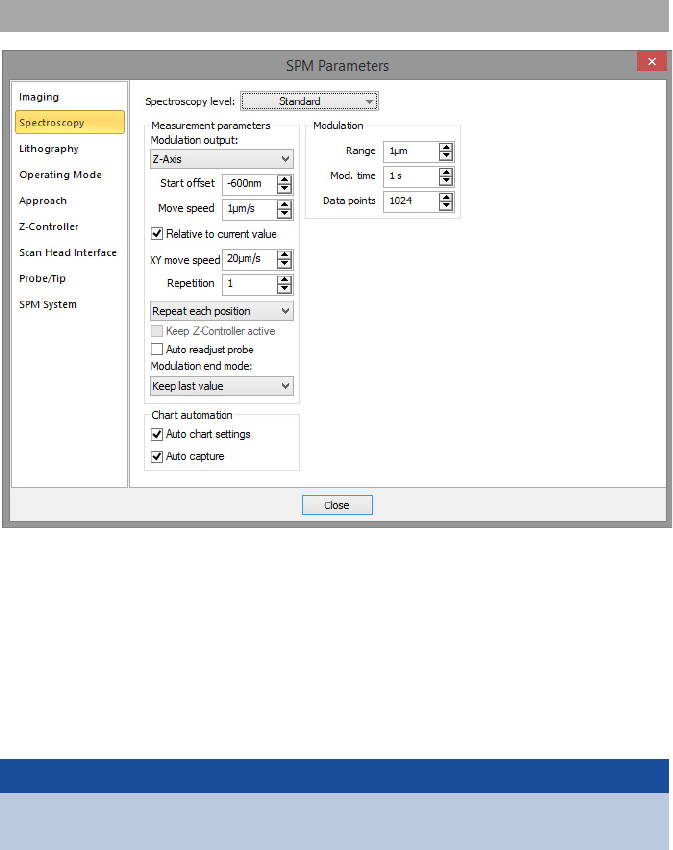
SPM PARAMETERS DIALOG
147
Measurement parameters group
Modulation Output
This parameter defines the output signal used to drive the spectroscopy (horizontal axis in
the resulting spectroscopy graph). All possible signals (vertical axis in the spectroscopy
graph) are recorded while this modulation output signal is changing its value from Start
(“Start offset”) to End (“Start offset” + “Range”). The number of available modulated
outputs depends on the scan head and the number of installed modules. Possible values
are: “Z-Axis”, “Tip Potential” and the names of the User Outputs.
Start Offset
Defines the absolute or relative start value of the modulated output signal during a new
modulation.
11.6.2: Spectroscopy page (standard level)
Important
In Z-Axis modulation mode, positive values mean closer/into to the surface, while
negative values are away from the surface.
CHAPTER 11: SPECTROSCOPY
148
Relative to current value
If checked, the start offset value is used as a value relative to the current value. If unchecked
the Start Offset is used as an absolute value for the start of a new modulation. In case of Z-
Axis modulation, the last known surface position is used as reference point. This means that
if the tip was at some point retracted after approach, it still uses the Z-height at which
contact was established.
XY move speed
The speed at which the scanner moves from one point to the next during line and grid
spectroscopy measurements.
Repetition
This value defines the number of times a modulation measurement is repeated. Each
measurement is stored individually.
Measurement order
Determines in what order data is acquired and what data is contained in a single file.
Available options are:
– Repeat position list
This first measures each position of the grid/line, saves the results to a file, and then
repeat this process Repetition times. This setting is useful when you want to measure
repetitions of a whole grid).
– Repeat each position
This repeats the measurement on the first point Repetition times, saves the results to a
file, and then goes on to the next point. This setting is useful when you want to measure
single positions multiple times, for example for statistics.
Repeat position list / Repeat each position
Determines how the repetitions are performed: either the entire XY-position list is repeated
as a whole, or each position within the list is repeated before going to the next
measurement position within the list.
Keep Z-controller active
When checked, the Z-controller will continue to change the Z-position to keep the tip–
sample interaction constant. This option is not available when the Modulated output is set
to Z-Axis. This setting can for example be used to measure Tip current as a function of
applied voltage while keeping the tip–sample force constant. If unchecked, the Z-Axis is
kept at its last value prior to the start of the modulation.
Auto readjust probe
If checked, the offset of the probe signal is readjusted prior to each modulation. With this
readjustment, changes of the probe’s properties over time (e.g. temperature-induced drift)
can be compensated.
SPM PARAMETERS DIALOG
149
Modulation End Mode
While moving from one X/Y-Position to the next, this parameter defines the tip’s Z-Axis
behavior. “Keep last Z-Pos” deactivates Z-feedback while moving and keeps the Z-Axis at
the last Z-height. This selection is recommended for positive Range values (in particular
during Advanced spectroscopy). “Z-controller active” activates the feedback during the
movement; the surface is tracked. This selection is recommended for negative Range
values.
Modulation
Range
This value defines the range over which the output value is changed during the forward
modulation phase, starting from Start Offset. The range can be positive or negative (also
see Important (page 147)). The backward modulation automatically follows the reverse
direction range. After both (fwd/bwd) modulation phases, the modulation output will be
at the Start offset value again.
Mod. time
This value defines the time used to move over the range set by the Range parameter during
both modulation phases.
Data points
This value defines the number of data points that will be measured during each
modulation phase. The data points are equally distributed over the complete modulation
range.
Chart automation
Auto chart settings
If checked, the chart arrangement is automatically updated (see also Auto chart (page 143)).
Auto Capture
If checked, all spectroscopy measurements are automatically stored in the history Gallery.
If unchecked, you have to click the “Capture” button in the Spectroscopy tool bar to
manually save your measurement data.
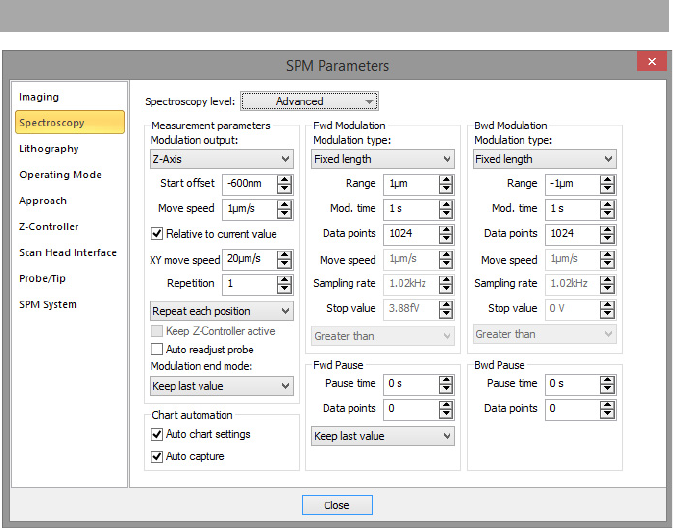
CHAPTER 11: SPECTROSCOPY
150
The advanced level of the Spectroscopy page of the SPM parameters dialog provides much
more control over Spectroscopy experiments than the standard level. In addition to the
parameters described in Section 11.6.2: Spectroscopy page (standard level), the advanced
level Spectroscopy page contains the following elements:
Fwd Modulation / Bwd Modulation
Modulation Type
In “Fixed Length” the modulation phase is exactly defined by Range, Mod. Time and Data
points. All measurements (repetitions, different positions) will have the same length. In
“Stop by value” this is not the case; only maximum values are given. Since the input channel
used for feedback during imaging (e.g. deflection or amplitude) is used to stop each
modulation phase at a preset point (see Stop Value (page 151)), the lengths of each
modulation phase (for each repetition, different position) will most likely be different.
Range
In “Fixed length” modulation, this value defines the change of the output value during the
modulation phase. For forward modulation it starts from Start offset. The range can be
11.6.3: Spectroscopy page (advanced level)
SPM PARAMETERS DIALOG
151
positive or negative (also see Important (page 147)). For the backward modulation it starts
from the last value of the forward pause phase and with its own Range settings. Therefore,
the modulation output value at the end of the backward modulation phase can be
different from the start value of the forward phase. In “Stop by value” modulation, this field
shows a maximum value, calculated from the Data points, Move speed, and Sampling rate
parameters (see below).
Mod. time
In “Fixed length” modulation, this value defines the time used to move over the modulation
range during the respective modulation phase. In “Stop by value” modulation, this field
shows a maximum value, calculated from the Data points and Sampling rate parameters
(see below).
Data points
This value defines how many data points will be measured during the respective
modulation phase. Data points will be equally distributed over the entire modulation
range. In “Fixed length” modulation, the number of data points are exactly defined by this
value. In “Stop by value” modulation, this is the maximum is number of datapoints that will
be recorded.
Move speed
In “Stop by value” modulation, this value defines the speed at which the modulation
output is changed. The move speed can be positive or negative (also see Important (page
147)). For the backward modulation it can have a different value than for the forward
modulation. Therefore the modulation output value at the end of the backward
modulation phase can be different from the start value (Start offset). In “Fixed length”
modulation mode, this value is calculated from the Range and Mod. time parameters (see
above).
Sampling rate
In ”Stop by value” modulation, this value (in Hz) defines the number of data points
measured per second during the respective modulation phase. In “Fixed length”
modulation, this value is calculated form the Data points and Mod. time parameters.
Stop Value
In “Stop by value” modulation, this value defines the abort criterion that has to be reached
in order to stop the respective modulation phase. The signal which is monitored is the Z-
controller input signal (e.g. deflection or amplitude) and depends on the selected
operating mode. The value may be positive or negative. In “Fixed length” modulation mode
the value shown here has no meaning.
Stop Mode
If “Greater than” is selected the modulation is stopped if the measured value is more
positive than “Stop value”. If “Less than” is selected the measured value has to be more
CHAPTER 11: SPECTROSCOPY
152
negative. For Z-Axis modulations, “Greater than” should be selected for Static operating
modes and “Less than” for Dynamic operating modes.
Fwd Pause / Bwd Pause
Pause time
This value defines the waiting time after the respective modulation phase before the next
phase is initiated.
Data Points
This value defines the number of data points that will be recorded during the respective
pause phase. The number of data point recorded during a pause phase can be different
from the number of data points recorded during the respective modulation phase. If set to
zero, the respective Pause time will be automatically set to zero as well (and vice-versa).
Z-Axis Pause Mode
In “Z-Axis Modulation” Mode (see Modulation Output (page 147)), it is possible to select the
Pause-Phase behavior via this selector. With “Keep last Z-Pos” it maintains the final value of
the modulation phase. With “Z-controller active” it activates Z-controller feedback during
the pause; the surface is tracked.

CHAPTER 12:
Lithography
0
0
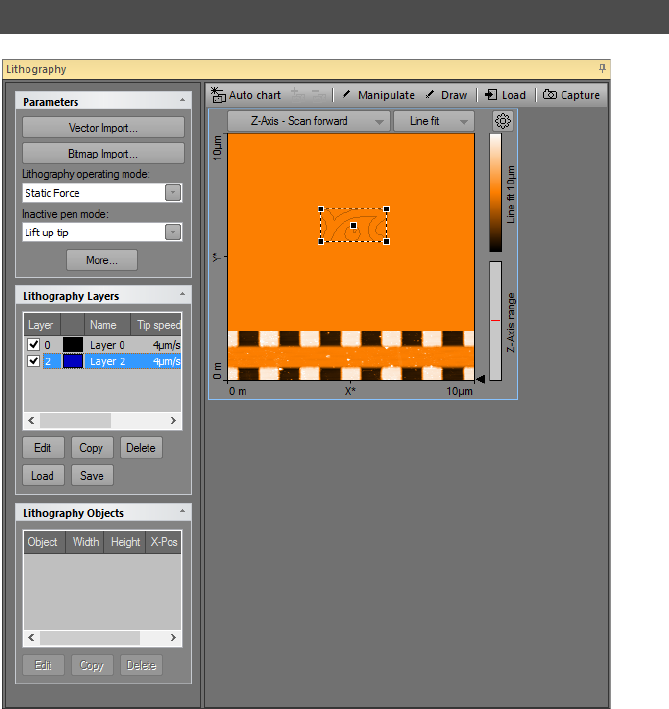
CHAPTER 12: LITHOGRAPHY
154
In the context of Scanning Probe Microscopy (SPM), Lithography is the process of
modifying a sample surface with the goal of creating a pattern on that surface with the SPM
tip. In the Nanosurf Naio control software, this is accomplished in the Lithography window.
The Lithography window is opened by clicking the Lithography tab in the Acquisition pane.
The Lithography window contains the Lithography toolbar, with commands that control
lithography-related processes, and the lithography parameters area, with parameters that
determine how the Lithography is performed.
Figure 12-1: Lithography window
12.1: Introduction

PERFORMING LITHOGRAPHY
155
By default, the Lithography window also contains the Lithography Preview display (see
Section 12.6: Lithography preview (page 169)) and a Color map chart of the current
Topography measurement. The Lithography window can however display more charts,
should this be desirable. For more information on adding and changing charts, see Section
13.3.1: Working with multiple charts (page 177).
Lithography can be performed provided that suitable samples, tips, and lithography
parameters are used. Depending on the operating mode and operating parameters used
during the Lithography process, the surface modifications fall into two distinct categories:
1. Mechanical surface modification through “scratching”, “indenting” (both Static Force
mode), or through “hammering” (dynamic force mode). This type of modification
require higher tip-sample interactions than normally used during imaging to
mechanically transfer the desired pattern into the sample surface. The width and
depth of the scratches or indentations made mainly depend on the force exerted on
the cantilever tip and on the tip’s shape.
2. Electrochemical surface modification through voltage-dependent surface reactions.
This type of modification requires a voltage difference between sample and tip, and
will add molecules to the surface (e.g. through oxidation). The width and height of the
oxidative surface modifications depend on the relative humidity of the ambient air, on
the strength of the electric field, and on the tip speed.
A typical lithography process is performed as follows:
1. The sample surface is imaged to identify an area that is suitable for transfer of a
pattern. Suitable areas should preferentially be flat and dust-free.
2. The Lithography window is opened and the “Load” button of the Lithography toolbar
is clicked to import the imaged sample surface.
3. A pattern that was previously designed is imported. Suitable sources for patterns can
either be (multi-layered) vector graphics files (GDS II, DXF, CIF, OAS, OASIS) or (multi-
color/grayscale) pixel graphics files (BMP, DIB, GIF, TIFF, PNG, JPEG). After import of a
vector or pixel graphics file, the pattern is referred to as a “Lithography object” in the
Lithography window.
Important
Lithography of objects drawn by hand and direct manipulation of the tip is available as
standard functionality. Import of vector or pixel graphics files to be used as patterns in
the lithography process requires the licensed Naio Advanced Modes Option. For
information on how to activate the Naio Advanced Modes Option, refer to Access code
(page 264).
12.2: Performing lithography
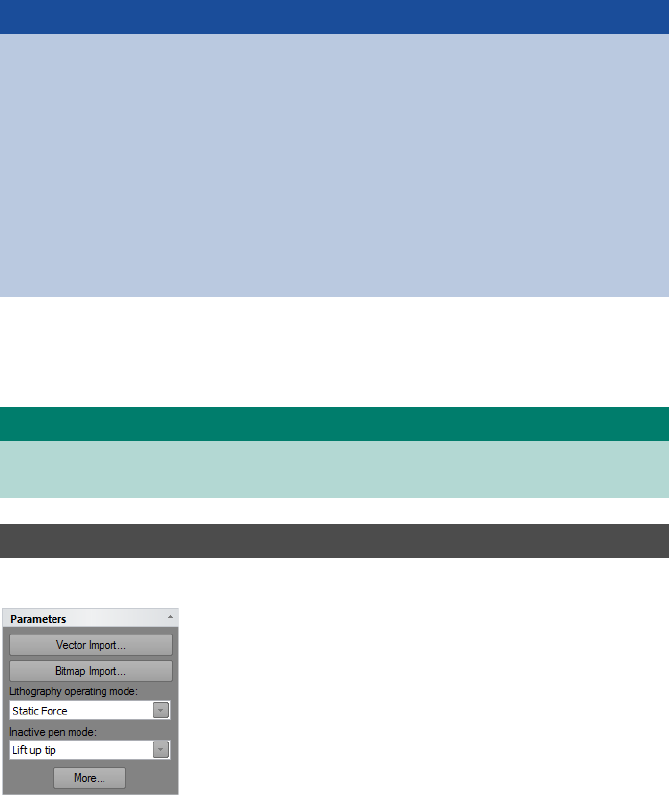
CHAPTER 12: LITHOGRAPHY
156
4. The imported object is positioned and scaled to fit the target area.
5. The Lithography sequence is executed.
6. The sample surface is re-imaged to view the Lithography results.
Parameters section
Vector import
Opens the Vector Graphic Import dialog for importing vector graphics based lithography
data (see page 159).
Important
• In case of vector-based objects, multiple lithography objects may be present (e.g.
through sequential import) and used for lithography. In case of pixel-based objects,
only one pixel-based object can be present at any given time (other objects will be
deleted upon import).
• A separate CAD program called “LayoutEditor” is included on the installation CD to
create suitable GDS vector graphics (Newest version of LayoutEditor; http://
layout.sourceforge.net). Pixel graphics files can be created or edited in any pixel-
based image editor like the Windows Paint.
• As an alternative to designing the lithography pattern in a vector or pixel graphics file
and then importing it into the lithography software, a freehand drawing mode is
available in the Lithography window.
Tip
As alternatives to step 3–5, you can also use the Direct Tip Manipulation or Free Drawing
modes.
12.3: Lithography parameters area
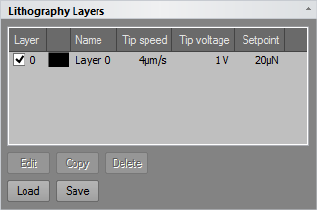
LITHOGRAPHY PARAMETERS AREA
157
Bitmap import
Opens the Pixel Graphic Import dialog for importing bitmap graphics based lithography
data (see page 161).
Lithography operating mode
Used to select the operating mode during lithography operation. The following options are
available:
– Static force
–Dynamic force
Inactive pen mode
Action to be performed when the tip is moving from one end point to a new start point, in
case the end point and start point are not the same. The following options are available:
– Lift up tip
Only lift the tip (upper position of the Z-actuator of the scan head). No feedback will be
performed by the Z-controller during travel to the new start point.
–Standard operating mode
Switch the Z-controller operating mode back to the one selected in the “Operating mode
panel” during imaging. All values such as Tip speed, Tip voltage, Setpoint etc. will
temporarily chance back to the values used for imaging. The Z-controller will be active
during travel to the new start point.
“More” button
Opens up the SPM parameters dialog on the “Lithography” page (see Section 12.7.1:
Lithography page).
Lithography Layers section
Layer list
Lists all layers that are present in the objects shown in the Lithography Objects list. Layer 0
is always present, even if no lithography objects exists, and may be used to set the default
Lithography parameter values (see Parameters (page 162) in Section 12.3.2: Pixel Graphic
Import dialog for details).
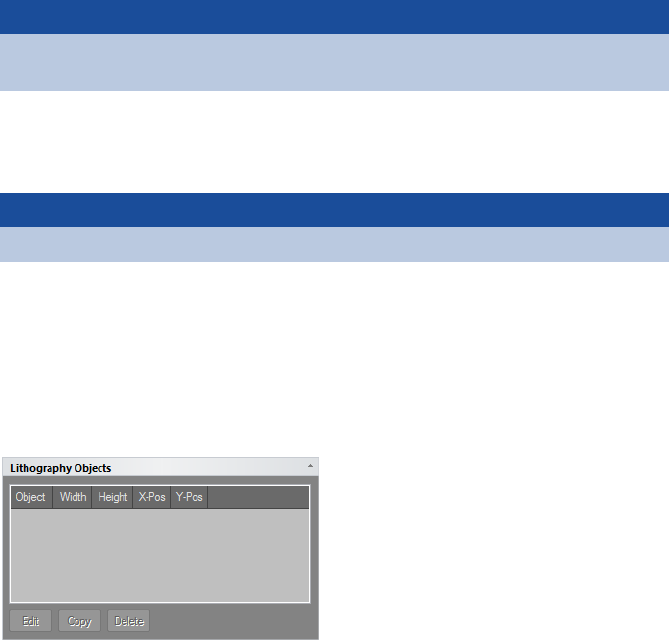
CHAPTER 12: LITHOGRAPHY
158
Edit
Edit will open the Layer Editor dialog to edit the selected layer.
Copy
Copy will open the Layer Editor dialog (see Section 12.3.3: Layer Editor dialog) to edit the
selected layer before copying it. When changes have been made (if any) and the “OK”
button is clicked, a new layer is generated.
Delete
Used to delete a layer. Delete will open a warning dialog to confirm the deletion of the
selected layer.
Load
Load a predefined layer list “.lld”. Layers that are needed to display the current objects that
are not part of the loaded list will be created.
Save
Save all the layers to a layer list file “.lld”.
Lithography Objects section
Contains a list of all available Lithography objects. Objects may be selected or deselected
by checking or unchecking the checkbox. If the object is unchecked it will not be used for
a lithography session.
Important
Upon creation of a new layer, the layer number will be incremented to the next available
layer number. If a total of 256 layers is reached, no more layers can be added.
Important
Only layers currently not assigned to any object can be deleted.
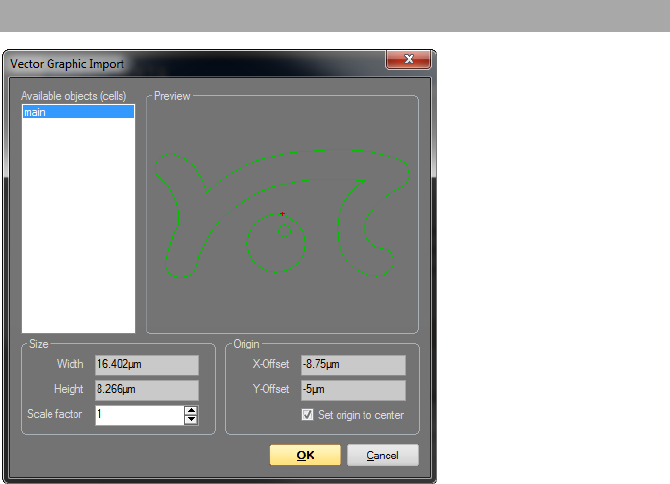
LITHOGRAPHY PARAMETERS AREA
159
Edit
Edit will open the Object Editor dialog to edit the selected object (see Section 12.3.4: Object
Editor dialog (page 166)).
Copy
Copy will open the Object Editor dialog to edit the selected object before copying it.
Delete
Delete will delete the selected object. A warning dialog will appear for confirmation of this
action.
The Vector Graphic Import dialog appears after clicking the “Import Vector” button and
selecting a valid GDS II file. It can be used to select the object (cell) of the GDS II file to
import. Size and origin of the resulting lithography object can be set during import using
the Size and Origin fields (see description below), or after import using the Object Editor
(see Section 17.3.2: The Object Editor dialog (page 191) for details).
Available objects (cells)
Contains a list with all valid objects (cells) of the selected GDS II file. Selecting an object will
results in the respective object being displayed in the preview area of the Vector Graphic
12.3.1: Vector Graphic Import dialog
CHAPTER 12: LITHOGRAPHY
160
Import dialog, and will cause the selected object to be imported when the “OK” button is
clicked. Objects can only be imported one at a time. Clicking the “Cancel” button will abort
the import process.
Preview
A graphical area that displays the selected object in the available objects list (see above).
The red cross (if visible) indicates the position of the object's origin.
Size
Width / Height
Displays width and height of the selected object (cell).
Scale factor
The factor by which the selected object (cell) will be scaled. A scale factor of 1 corresponds
to the original object size. If the scale factor is changed manually, the object's width and
height will be recalculated and displayed automatically.
Origin
X-Offset / Y-Offset
The X-Offset and the Y-Offset of the origin of the selected object (cell).
Set origin to center
When enabled, the origin of the object (cell) will be set to the center of the rectangle that
encloses the object. When disabled, the origin will remain at the position that is defined in
the object.
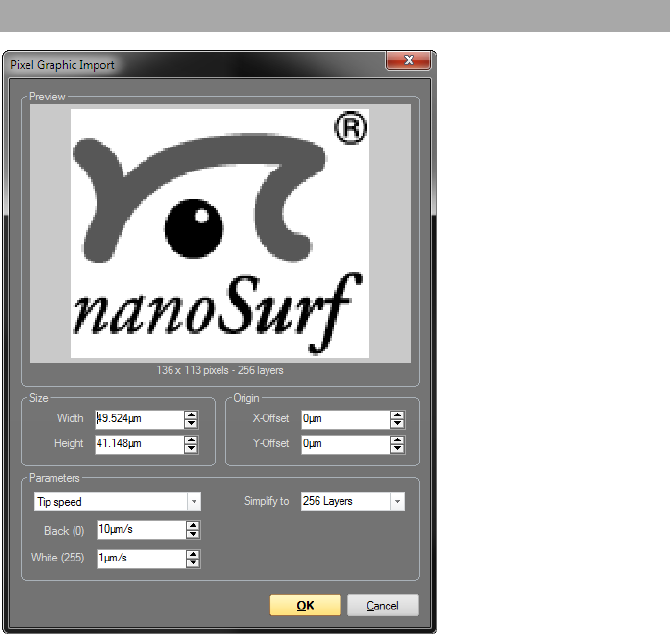
LITHOGRAPHY PARAMETERS AREA
161
The Pixel Graphic Import dialog appears after clicking and selecting a supported pixel
graphics file, and can be used to specify how such a file is converted to a lithography object.
All images are first converted to an 8-bit grayscale (256 levels). Each set of pixels with the
same grayscale value will correspond to a separate layer in the resulting lithography object.
Layers will only be generated for those grayscale values that are actually occupied. In
addition, the number of layers can be reduced upon import (see Simplify to (page 186)).
For each layer, individual lithography parameters can be set. One of these lithography
parameters can be automatically varied upon import, by using the grayscale values of the
imported pixel graphics file to define the selected parameter's range (see Parameters
below). All parameters can of course always be modified manually after import (see Section
17.3.1: The Layer Editor dialog (page 188)).
12.3.2: Pixel Graphic Import dialog

CHAPTER 12: LITHOGRAPHY
162
Preview
Graphical area that displays the selected pixel graphics file and information about the file.
Size
Width / Height
The width and the height of the lithography object resulting from the Pixel Graphic import.
The default settings for width and height are taken from the dimensions of the current
color topography map of the Lithography window. The pixel graphic is automatically
resized to fit into the area defined by these dimensions while maintain its aspect ratio. It is
at this point however possible to change the automatically calculated size manually. If the
width is changed manually, the height is recalculated to keep the aspect ratio. If the height
is changed manually, the width is not recalculated.
Origin
X-Offset / Y-Offset
By default the origin is in the center of the pixel graphic. By manually changing X-Offset and
Y-Offset, the origin may be moved to a different position.
Parameters
This area allows selection of the lithography parameter that will be automatically varied,
based on the different grayscale values of the imported pixel graphics file. The parameter
values for the black and white pixels of the imported pixel graphic can be set, after which
the parameter values corresponding to any in-between grayscale values are interpolated.
All values and settings in the parameters section are stored when the dialog is closed. They
will be automatically used the next time the dialog is opened.
From the drop-down list box, one of the following parameters may be selected for
automatic calculation:
– Tip speed
–Tip voltage
– Static force setpoint
Important
Since it is only possible to select one automatically adjusted lithography parameter per
import, the other parameters must be set elsewhere. This is achieved by setting the
Layer 0 parameters before import. The values entered here will be used as default values
for all imported layers, except for the parameter that was explicitly selected in the Pixel
Graphics Import dialog.

LITHOGRAPHY PARAMETERS AREA
163
– Dynamic force setpoint
– Dynamic force amplitude
Black / White
Used to enter the parameter values for black and white pixel values, which form the basis
for the interpolation of the in-between color/grayscale pixel values.
Simplify to
Select the number of layers the imported pixel graphics file should be simplified to.
Selecting the number of layers to be identical to the number of grayscale values in the pixel
graphics file will results in no simplification taking place. In all other cases, simplifications
are performed through binning of layers.
Example
Setting the automatically adjusted Lithography parameter to “Static Force Setpoint”,
and Black (layer 0) and White (layer 3) to 25 μN and 10 μN, respectively, will result in:
• Layer 0 (black pixel layer) having a Static Force Setpoint of 25 μN
• Layer 1 (gray pixel layer 1) having a Static Force Setpoint of 20 μN
• Layer 2 (gray pixel layer 2) having a Static Force Setpoint of 15 μN
• Layer 3 (white pixel layer) having a Static Force Setpoint of 10 μN.
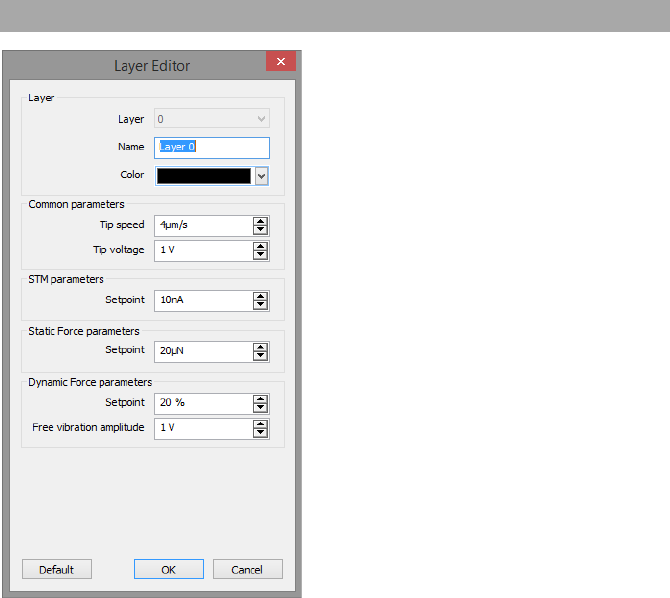
CHAPTER 12: LITHOGRAPHY
164
The Layer Editor sets the controller parameter values to be used during lithography.
Layer
Layer
Displays the selected layer’s number.
Name
Displays and allows editing of the selected layer’s name.
Color
Allows selection of the layer color for display of the layer elements in the Topography chart
of the Lithography window.
12.3.3: Layer Editor dialog
LITHOGRAPHY PARAMETERS AREA
165
Common parameters
Tip speed
Determines the drawing speed during lithography,
Tip voltage
Determines the voltage set to the tip during oxidative Lithography.
STM parameters
Setpoint
Used to set the tunnelling current Setpoint of the Z-controller during STM Lithography. This
setting has no effect during AFM Lithography.
Static force parameters
Setpoint
Used to set the force Setpoint of a lithography sequence performed in the Static Force AFM
mode.
Dynamic force parameters
Setpoint
Used to set the amplitude Setpoint of a lithography sequence performed in dynamic force
AFM mode.
Free vibration amplitude
Used to set the Free vibration amplitude of a lithography sequence performed in dynamic
mode.
“Default” button
Loads the default Lithography parameter values.
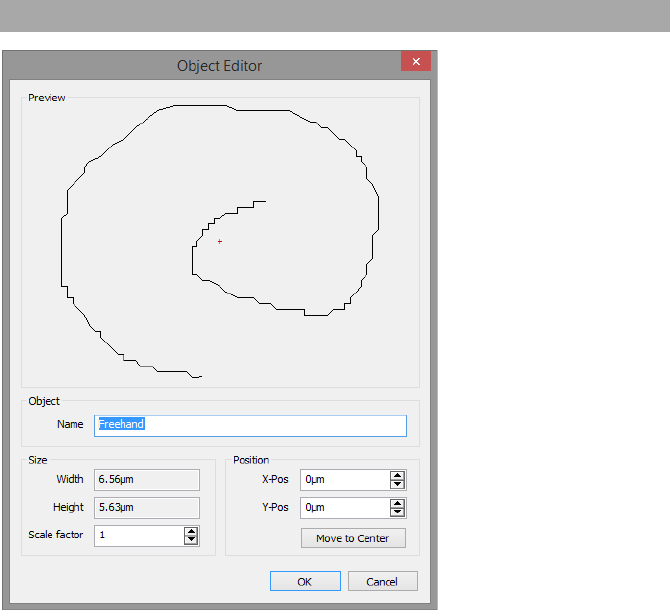
CHAPTER 12: LITHOGRAPHY
166
Preview
Graphical area that provides a preview of the selected Lithography object. The red cross (if
visible) indicates the origin position of the object.
Object
Name
The name that is used to describe the object. Default names are generated during import,
based on the GDS II object names or on the pixel graphic filename, but may be edited here
afterwards.
12.3.4: Object Editor dialog
ACQUISITION TAB
167
Size
Width/Height
Displays the width and the height of the object.
Scale factor
The factor by which the object can be scaled. If the scale factor is changed, the width and
the height will be automatically recalculated. Scale factor 1 represents the original size.
Position
X-Pos/Y-Pos
The X-Pos and the Y-Pos may be used to move the object within the space of the
topography map.
Move to Center
Moves the origin on the selected object back to the center of the topography map.
During Lithography, all groups of the Acquisition tab are identical to those during imaging
of the sample, with the exception of the Imaging group, which is replaced by the
Lithography group.
Start
Starts the lithography sequence and changes to “Measuring” until the lithography
sequence is finished.
Stop
Aborts the lithography sequence.
Rescan
Starts a single image measurement and changes to “Stop” until a full image has been
scanned. The image is scanned from the bottom to top. Clicking “Stop” aborts the
measurement.
12.4: Acquisition tab
12.4.1: Lithography group
CHAPTER 12: LITHOGRAPHY
168
Launcher icon
The Lithography parameters can also be accessed through the “Dialog Launcher” icon (
at the bottom right corner of the Lithography group), which opens up the SPM parameters
dialog on the Lithography page (see Section 12.7.1: Lithography page.
Auto chart
Using this button, the control software displays all meaningful charts for the currently
selected operating mode. The actual number of charts varies depending on the mode.
“+” and “–”
With these buttons you can add and remove chart groups, respectively, but not more than
minimally makes sense. There will always be a chart group left. Conversely, you can't add
more chart groups than the Auto chart tool would display. You can however still remove or
add charts manually (See 13.7 Working with charts).
Manipulate
Starts the direct tip manipulation mode. It is now possible to control the movement of the
tip by moving the mouse around the topography color map chart. When the left mouse
button is held down, lithography will be performed with the lithography operating mode
set in the lithography parameters section, and with the parameters set in Layer 0 (the Tip
speed setting is ignored). When the left mouse button is released, the tip will go to the
inactive pen mode set in the lithography parameters section and will not move until the
left mouse button is pressed again. Dragging the mouse slowly will produce smoother lines
than dragging it fast.
Draw
Starts the free hand drawing mode. A shape can now be drawn in the topography color
map chart by clicking and holding the left mouse button. A shape can only consist of a
single line. Repeating the above will erase the previous drawing. Double clicking the
drawing will save it to the lithography object list. The drawn shape can be executed by a
click on “Start” in the Acquisition tab.
Important
When performing imaging from within the lithography window, be sure to set valid
imaging parameters in the imaging and Z-controller sections of the imaging parameters
area.
12.5: Lithography toolbar
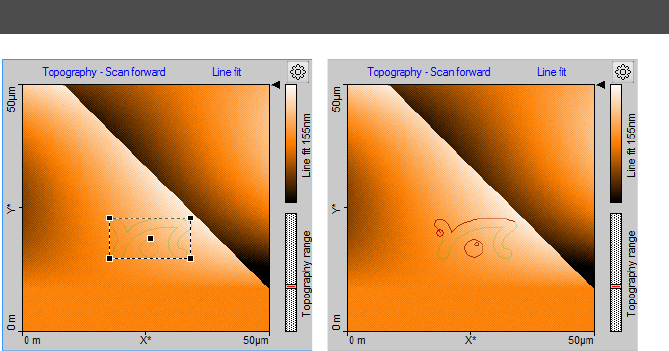
LITHOGRAPHY PREVIEW
169
Load
Loads the Topography image from the Imaging window into the Lithography Topography
chart.
Capture
This button captures the measurement currently displayed in the “Lithography window” to
the History page of the Gallery panel. If clicked during a measurement, a copy is generated
as soon as the measurement in progress is finished. The capture process is cancelled by
clicking second time. The captured measurement is stored as a new document and remains
open in the Document space of the Naio control software.
The Lithography Topography chart is the only chart present in the Chart area of the
Lithography window (Figure 12-2: Lithography preview, left). It displays the topography
image of the sample surface to be used for lithography (after the Topography information
has been loaded via the “Load” button of the Lithography toolbar (see Load (page 158)) and
the superimposed preview images of the Lithography objects (when these have been
loaded and selected; see Vector import or Bitmap import (page 157)).
Before running a lithography sequence, a box with the size and content of the selected
lithography object is superimposed on the surface map. When selecting the center of the
box with the mouse, the corresponding object can be moved around the scan area to
reposition it. The new object location (X-Pos and Y-Pos) is however only transferred to the
object's properties (as displayed in the Lithography Objects list, and graphically shown on
the Topography chart) when the selection box is double-clicked after repositioning. If it is
12.6: Lithography preview
Figure 12-2: Lithography preview. (Left) Before the Lithography sequence has been started. (Right)
While the Lithography sequence is running.
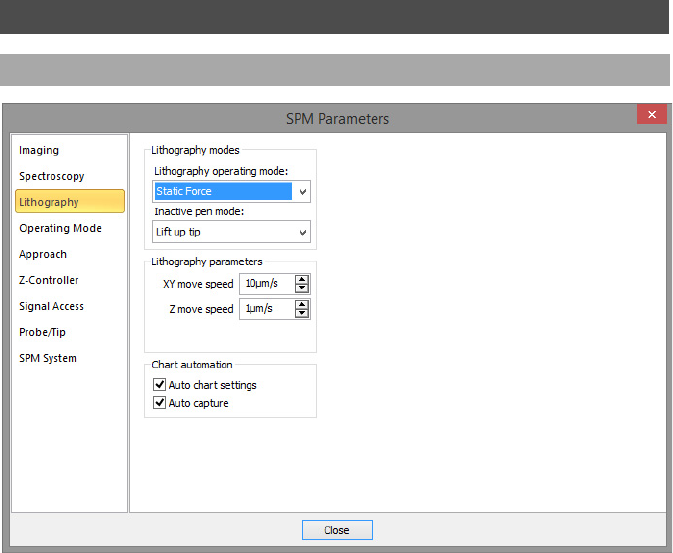
CHAPTER 12: LITHOGRAPHY
170
not, any changes made are not implemented. Position of an object (and in addition its size)
can also be modified by editing the respective parameters for the selected object inside the
Lithography Object Editor dialog (see Section 12.3.4: Object Editor dialog (page 166)).
When a lithography sequence is started, the selection box will disappear, while a red circle
and a darker red trace line will be drawn on the Lithography object preview to provide a
live progress report on the Lithography drawing process (see Figure 12-2: Lithography
preview (page 169), right). After a lithography sequence has been completed, the red line
and circle will remain visible until a new lithography sequence is started.
Lithography modes
Lithography operating mode
Used to select the operating mode during lithography operation. The following options are
available:
– Static force
–Dynamic force
12.7: SPM parameters dialog
12.7.1: Lithography page
SPM PARAMETERS DIALOG
171
Inactive pen mode
Action to be performed when the tip is moving from one end point to a new start point, in
case the end point and start point are not the same. The following options are available:
– Lift up tip
Only lift the tip (upper position of the Z-actuator of the scan head). No feedback will be
performed by the Z-controller during travel to the new start point.
–Standard operating mode
Switch the Z-controller operating mode back to the one selected in the “Operating mode
panel” during imaging. All values such as Tip speed, Tip voltage, Setpoint etc. will
temporarily chance back to the values used for imaging. The Z-controller will be active
during travel to the new start point.
Lithography parameters
XY move speed
The speed at which the tip moves laterally.
Z move speed
The speed at which the tip moves in the Z-direction.
Lift tip abs. Z pos
The Z-position the tip lifts up to during Z modulation lithography.
Chart automation
Auto chart settings
If checked, the chart arrangement is automatically updated (see also Auto chart settings
(page 171)).
Auto Capture
If checked, all Lithography measurements are automatically stored in the history Gallery. If
unchecked, you have to click the “Capture” button in the Lithography tool bar to manually
save your measurement data.
CHAPTER 12: LITHOGRAPHY
172

CHAPTER 13:
Working with
documents
0
0
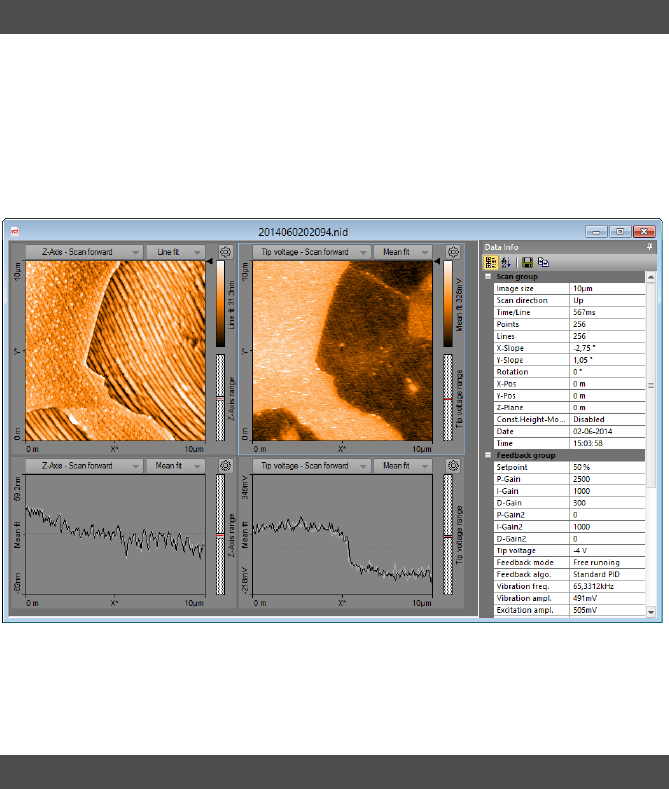
CHAPTER 13: WORKING WITH DOCUMENTS
174
When working with the Nanosurf Naio control software, all finished measurements (a full
image was recorded) will be temporarily stored according to the file name mask you
specified in the Gallery panel (see Section 13.4: Gallery panel). These measurement
documents can be opened and displayed in the document area of the Naio control
software’s workspace (see Section 7.1: General concept and layout (page 66) and Section 7.4:
Document space (page 70)). It is strongly recommended to permanently store relevant
documents to a new folder (see Save as (page 187) in Section 13.4.3: Gallery toolbar).
Charts and the Data info panel together display all available measurement information.
The Data info panel (minimized by default, but expanded upon hovering of the mouse
cursor over the data info tab on the right side of the measurement document window)
displays measurement settings and the hardware used during the measurement. Its
content is self-explanatory and will therefore not be discussed in this manual.
13.1: Introduction
Figure 13-1: Measurement document. Typical measurement window with the Data Info panel
expanded (see Figure 7-4: Example of a measurement document window (page 70) for a window with a
minimized Data Info panel).
13.2: Data info panel
CHARTS
175
Just like the panels of the Info pane, the Data info panel can be “pinned” and “unpinned” to
disable or enable the auto-hide function of the panel (see Section 7.5: Panels (page 71)). It
cannot be undocked from the document window, however.
The Data info panel also contains a small toolbar (see Section 13.2.1: Data info toolbar),
which allows you to customize the presentation of the data and offers ways to export it.
Categorized
The “Categorized” button ( ) will group the data entries for the measurement document
by category. This is the default display method of the Data Info panel.
Alphabetical
The “Alphabetical” button ( ) will sort the data entries for the measurement document
alphabetically.
Save
The “Save” button ( ) will save the information in the Data Info panel to file. Possible
formats are text (.TXT) and comma separated values (.CSV) files.
Copy to Clipboard
The “Copy to Clipboard” button ( ) will copy the entries of the Data Info panel to the
Windows clipboard for easy pasting into other applications.
Charts provide a graphical display of the measured data. Charts occur in measurement
document windows, in operating windows, and in various other windows and dialogs. You
can adjust them to your needs and liking. How to do this is explained in this section. This
information is valid for charts in stored measurement documents as well as for ongoing
measurements in one of the operating windows (Imaging, Spectroscopy, and Lithography).
A chart consists of a graphical representation of the measured data itself and elements that
provide additional information. There are three basic chart types: Line graph, color map
and 3D view (see Figure 13-2: Elements of a chart, items 1–3).
Chart titles
The title elements of each chart display the signal name and the background line filtering
type that are used. A click on each of these titles opens a drop-down menu with other
possible signals or filters:
13.2.1: Data info toolbar
13.3: Charts
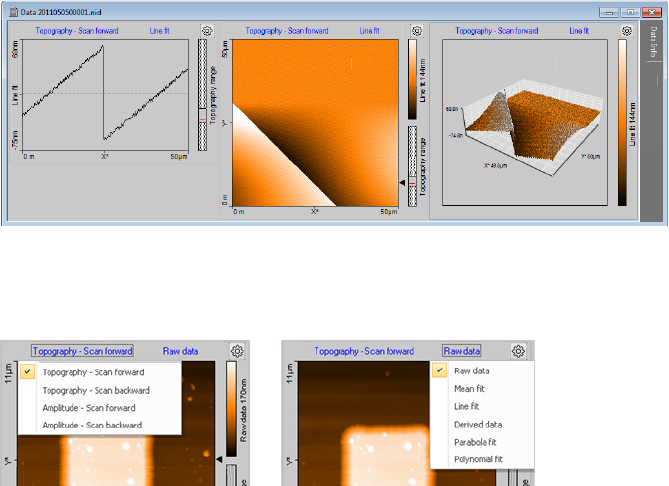
CHAPTER 13: WORKING WITH DOCUMENTS
176
Changing the titles will change the content of the chart.
Color scales
The Color scale (Figure 13-2: Elements of a chart, item 5) shows which measured signal level
is mapped to which color. The color mapping can be changed using the Color Palette
dialog (see Section Color Palette (page 261)) .
Data range indicator
The Data range indicator (Figure 13-2: Elements of a chart, item 6) shows the Z-range of the
scan head and of the values occupied by the measured data, and the current scan line
height.
Hovering with the mouse cursor over the Color scale or Data range indicator of a color map
chart opens a height histogram graph and two range selectors:
Figure 13-2: Elements of a chart. (1) Line graph. (2) Color map. (3) 3D view. (4) Data Info panel (see
Section 13.2: Data info panel). (5) Color scale for data Z-range. (6) Data range indicator, with scan head
Z-range as dotted box, data Z-range as solid gray box and current scan line height as red line. (7) Line
selection arrow. (8) “Chart Properties” button.
1
1
2
2
2
2
3
3
4
4
5
5
5
5
5
6
6
6
6
6
7
7
7
7
7
8
8
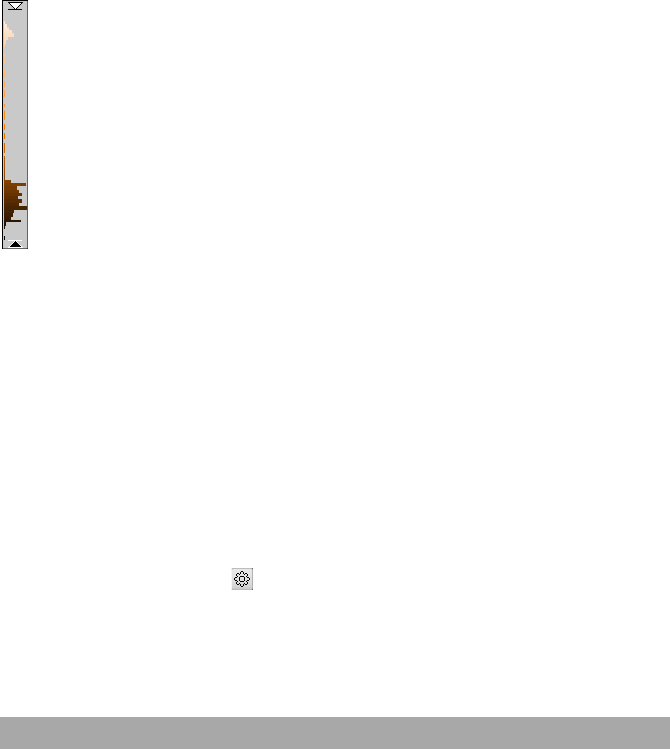
CHARTS
177
This histogram displays the current height distribution of the measurement data and the
used color range. With the top and bottom range selectors, the color bar range can be
adjusted to the actual height distribution of the measurement data. Changing these range
settings changes the “Center” and “Span” parameters of the Chart Properties dialog (see
Section 13.3.2: Chart Properties dialog) and immediately updates the color display of the
data in the chart.
Line selection arrow
With the Line selection arrow (Figure 13-2: Elements of a chart, item 7) the shown data line
on line charts displaying the same signal can be changed by holding down the left mouse
button over the arrow and move the mouse up or down.
Chart properties
The “Chart Properties” button ( ; Figure 13-2: Elements of a chart, item 8) opens the Chart
Properties dialog. This dialog is the center of all chart parameters and is described in more
detail in Section 13.3.2: Chart Properties dialog.
Most chart settings can also be accessed from a context menu, which is opened by right-
clicking a chart.
In some windows, multiple charts can be displayed and configured by the user at anytime
(e.g. in the Imaging window or a Document window). The same signal can be displayed in
different styles (e.g Line Graph and Color map) and / or multiple signals can be shown side
by side (e.g. Topography and Phase Signal).
Adding or removing a chart, or setting chart parameters is all performed in the Chart
Properties dialog (see Section 13.3.2: Chart Properties dialog). When opened, the settings
displayed in the Chart Properties dialog refer to the currently selected chart. This (active)
13.3.1: Working with multiple charts
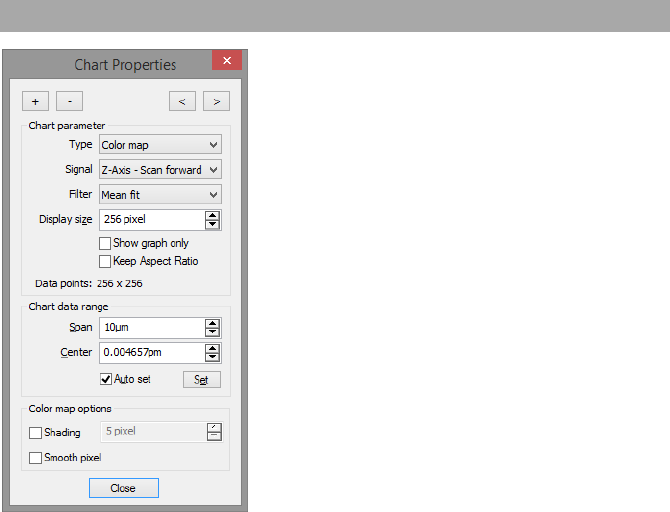
CHAPTER 13: WORKING WITH DOCUMENTS
178
chart is indicated by a thin blue line around the chart area. A chart is activated by clicking
on it with the mouse cursor anywhere in the chart area.
Arrangement of the charts is performed automatically by the control software based on
the size of the window and based on the order in which the charts were generated/added.
If the window is to small to display all charts, scrollbars are displayed at the border of the
window.
Short cuts to add and remove charts are found in the chart context menu. Select “Create
new chart” or “Delete current chart” from the menu list. It is also possible to use the “Insert”
or “Delete” key of your computer’s keyboard for this task. In all Operating windows, “Add
Chart“ and “Remove Chart” buttons (“+” and “–”) can be found in the respective
measurement toolbar.
The Charts Properties dialog is used to set all chart properties that influence data display
by the respective chart. It may be kept open at all times if many parameters have to be set
for different charts.
Some parameters are chart type specific. They are therefore displayed at the bottom of the
Chart Properties dialog in a separate group.
13.3.2: Chart Properties dialog
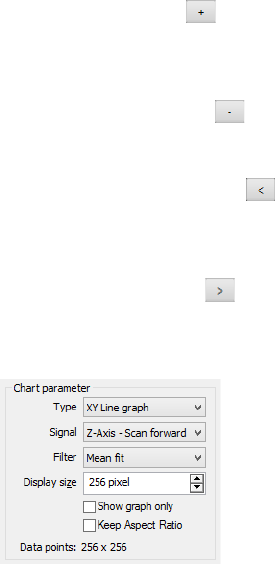
CHARTS
179
Add chart
The “Add Chart” button ( ) creates a copy of the currently selected or active chart and
adds it to the active window in last position.
Remove chart
The “Remove Chart” button ( ) removes the currently active chart.
Previous chart
The “Previous Chart” button ( ) activates the previous chart and updates the
parameters displayed in the Chart Properties dialog to those of that chart.
Next chart
The “Next Chart” button ( ) activates the next chart and updates the parameters
displayed in the Chart Properties dialog to those of that chart.
Chart parameters
Type
Selects the chart type to be used for display of the measurement data:
– Line graph
Data is displayed as a Line graph where the signal channel is plotted as a function of the
modulated signal (Scanner X*-position Z-Axis out, time). Points outside the range of the
scanner are displayed in red. The line being displayed is selected by dragging the Line
selection arrow in a Color map (see Line selection arrow (page 177)). In ongoing
measurements (e.g. during imaging) the position of the Line selection arrow is updated
automatically and corresponds to the last measured scan line (but even here it is possible
to select a different line for view in a line graph by dragging/holding the Line selection
arrow in a different location).
– Color map
Z-height data is encoded using a color scale and displayed 2-dimensionally.
CHAPTER 13: WORKING WITH DOCUMENTS
180
–3D view
Data is shown in a 3-dimensional representation in parallel perspective. Color
information (such as implemented in the Color map) is maintained.
–XY Line Graph
Data is displayed as a Line graph where the vertical plot position is determined by the
signal channel and the horizontal plot position is determined by a second signal that was
measured at the same time, with the modulated signal as invisible, independent
parameter. This graph is mainly used to display spectroscopy data. It can for example
show how the measured signals depend on the position measured by a Z-sensor.
Mathematically, the XY Line graph is a parametric curve where the modulated signal
(Scanner X*-position Z-Axis out, time, point number) is the independent parameter and
two dependent signals determine the X and the Y coordinates of the plotted points.
Signal
Selects the dependent signal that is plotted in the chart (in line charts in the vertical
direction). The available signals depend on the operating mode (selected or used) and the
status of the User inputs.
Filter
Selects the line filter method. The control software applies this filter to the data selected in
Signal (see directly above) before displaying it (see Figure 13-3: Data filter types). No
modification of the original measurement data occurs (selecting another filter is always
possible). It is possible to use a filter with an XY Line graph, but the filter will only fit the
Signal channel as a function of the modulated parameter; the second, X-data channel is not
used for the fit. Available data filters are:
–Raw data
No data processing.
–Mean fit
Calculates the mean value of each line of data points and subtracts this number from the
raw measurement data for each data point of that line.
–Line fit
Calculates the first order least squares fit (mean value and slope) for each line of data
points and subtracts the fitted values from the raw measurement data for each data
point of that line.
–Derived data
Calculates the difference between two consecutive data points (derivative) and displays
this instead of the raw image data.
– Parabola fit
Calculates the second order least squares fit for each line of data points and subtracts the
fitted values from the raw measurement data for each data point of that line.
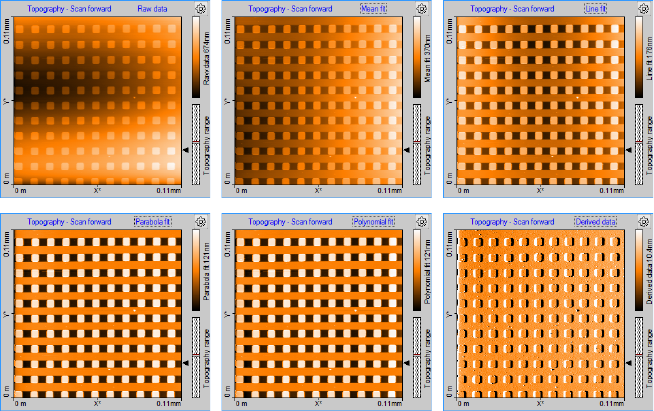
CHARTS
181
–Polynomial fit
Calculates the fourth order least squares fit for each line of data points and subtracts the
fitted values from the raw measurement data for each data point of that line.
Display size
The size of the chart in pixels.
Show graph only
When unchecked (default), the axis labels, color and range scales, and titles are displayed
alongside the graph. When checked, they are hidden.
Keep Aspect ratio
When checked, the axis in the color map are drawn in their correct size-relation (according
to their value and unit). When unchecked (default), the size of the display is always a square
and data pixels are stretched if necessary.
Figure 13-3: Data filter types. The same measurement data displayed using the available filters. A
defective area on a calibration grid is shown here to illustrate the effect of the filters.
CHAPTER 13: WORKING WITH DOCUMENTS
182
Chart data range
Span
The span that corresponds to the chart’s displayed Z-range. Increasing Span decreases
feature contrast and vice-versa. The current span is displayed next to the color scale in color
maps, or can be inferred from the Z-axis labels in Line graphs and 3D views.
Center
The signal value that corresponds to the center of the “Span” parameter.
Set button
Sets the Min and Max value so that all signal values of the current line graph fit in the
Horizontal range. Mostly used when “Auto set” is off.
Auto set
The set function is performed every time when the line graph data changes. When
checked, the software will set the Min and Max values each time the chart is automatically
scaled.
Line graph options
Show reverse line
When checked, the reverse scan data is drawn in gray (see Figure 13-4: Show reverse line
option. It allows comparison of the forward and reverse measurements data. Whether or
not this data is available depends on the measurement mode used during the acquisition
of the data (see Line Scanning (page 126).
X-Axis Min
Defines at what value the horizontal axis starts. Can be used to zoom in or out to a specific
data range.
X-Axis Max
Defines at what value the horizontal axis ends. Can be used to zoom or out to a specific data
range.
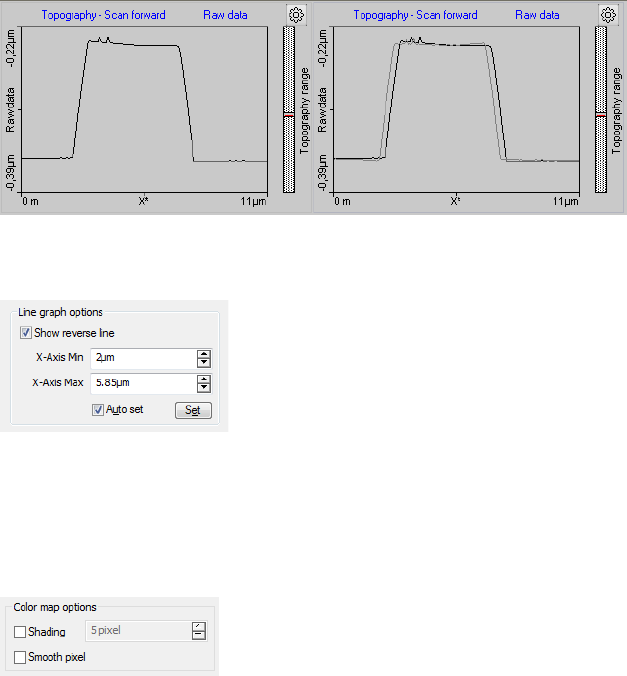
CHARTS
183
XY line graph options
Signal
The signal that determines the horizontal position of the plotted points.
All other parameters are identical to the ones described for the Line graph options (page
182).
Color map options
Shading
When checked, the color map creates the impression of a 3-dimensional surface which is
lighted from the left. This is achieved by combining the topography with its derivative. The
number of pixels in the edit box defines the amplification of the derivative add on.
Smooth pixel
When checked, the screen edge rendering of individual data pixels is smoothed with their
neighboring pixels. Alternative data pixels are drawn as individual squares. This smoothing
shows the most effect when the display size is larger that the number of measured of data
points (e.g. a 256×256 measurement displayed at 512×512 pixels).
Figure 13-4: Show reverse line option. (Left) Reverse line disabled. (Right) Reverse line enabled.
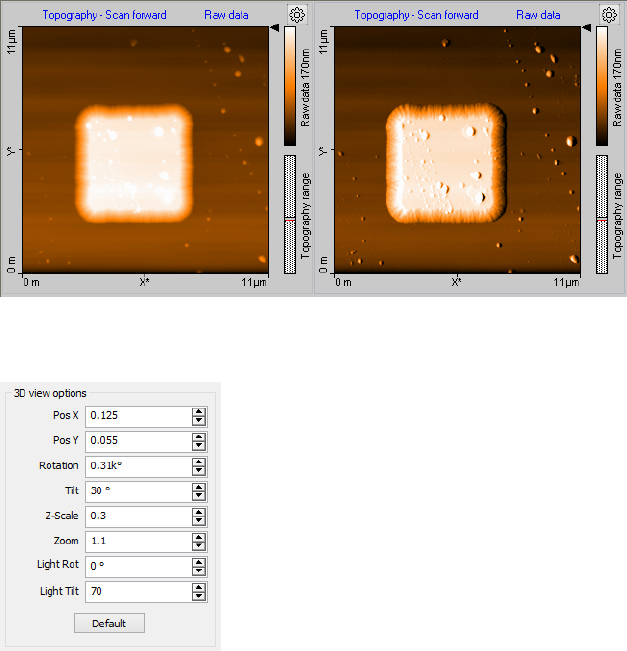
CHAPTER 13: WORKING WITH DOCUMENTS
184
3D View options
Pos X, Pos Y
Defines the center position of the 3D plot inside the chart area.
Rotation
Defines the z-axis rotation of the 3D plot relative to the view point.
Tilt
Defines the off-plane angle of the 3D plot.
Z-Scale
Defines a Z-axis ‘stretch’ factor. Use this e.g. to enlarge surface details.
Zoom
Defines the magnification of the 3D plot.
Figure 13-5: Shading option. (Left) Shading disabled. (Right) Five-pixel shading enabled.
CHARTS
185
Light Rot
Defines the rotation angle of the light source relative to the Z-axis (360°)
Light Tilt
Defines the off-plane angle of the light source. The lowest value (0°) corresponds to
“sunset” lighting, the highest value (90°) corresponds to mid-day lighting at the equator.
Default
The “Default” button resets all 3D parameters to their default values.
Keyboard and Mouse short cuts
Always click and hold the left mouse button on the 3D view chart while moving around the
mouse to change the 3D view. The surface is reduced in feature complexity once the left
mouse button is pressed to speed up redrawing on the screen. The surface will return to full
detail once the mouse button is released.
Press the following additional keys/buttons to determine which chart property is changed:
– Surface rotation
Mouse left/right
–Surface tilt
Mouse up/down.
– Size displayed surface
“Ctrl”- key + mouse up/down
– Surface position
“Shift”-key + mouse up/down/left/right
– Z-scale magnification
Left mouse button + right mouse button + mouse up/down
– Light source direction
“Shift” + ”Ctrl”-key + mouse left/right
– Light source height
“Shift” + ”Ctrl”-key + mouse up/down
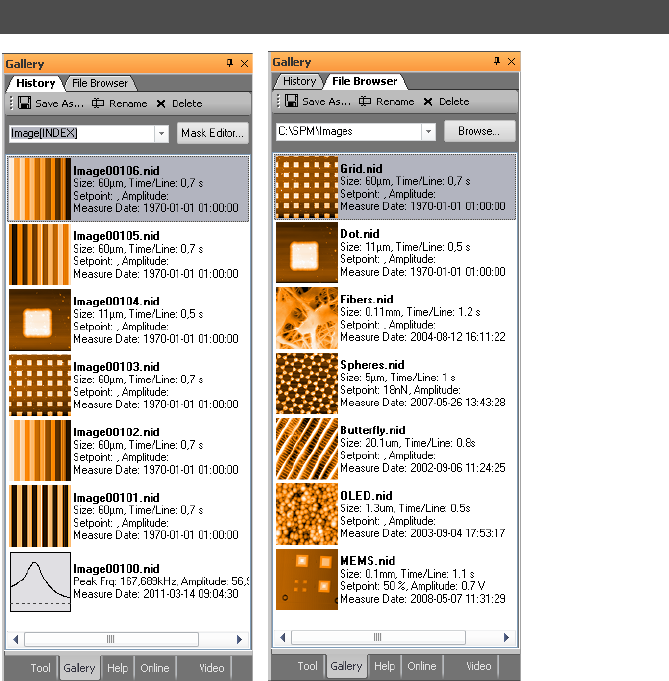
CHAPTER 13: WORKING WITH DOCUMENTS
186
The Gallery Panel displays lists of thumbnails representing previous measurements for
quick access to those documents. It contains two pages (accessed via tabs):
1. History
2. File browser
The History page, with the temporarily (automatically) stored measurements (for details on
how to change the default History folder and the maximum number of files to be stored
see Gallery settings (page 264)). The File browser page contains measurements from a user-
selected folder (e.g. containing older measurements that were previously moved there).
The various elements of the Gallery panel are described in the next sections.
13.4: Gallery panel
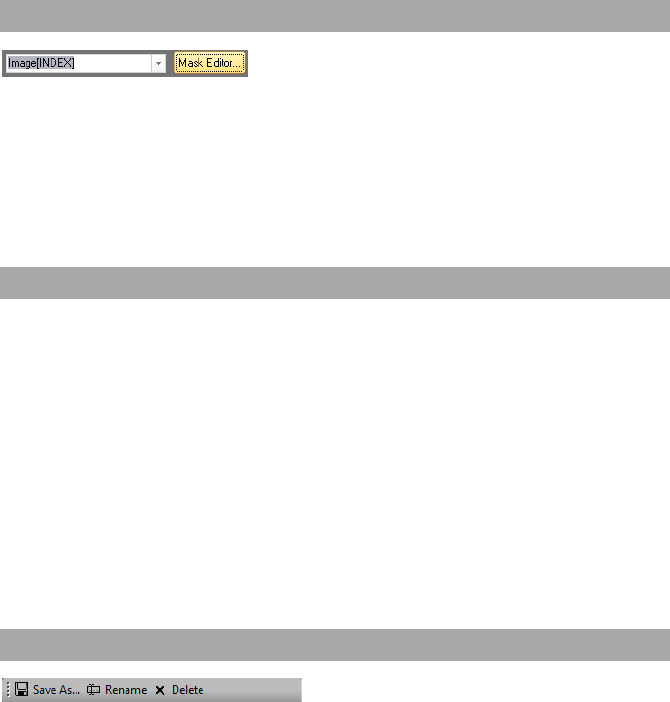
GALLERY PANEL
187
The temporary (automatic) storage of new measurements uses a File mask to create new
file names each time a new measurement has to be saved. This mask can contain normal
text, but also special variables like index number or date and time stamps. You may enter a
new mask directly into the edit field in the History page, select an old mask from the drop-
down menu, or define a new mask with the help of the Mask Editor dialog (see Section
13.4.4: Mask editor dialog), which is opened by clicking the “Mask Editor” button next to the
edit box.
In the image list the stored measurement are shown. Each measurement is displayed as a
thumbnail image of the measurement, together with some information about the
measurement and measurement document.
The following mouse operations are possible inside the image list:
–Double-click
Opens the respective measurement in the document space.
– Single left mouse click
Selects the respective measurement and removes all other selections.
– “Ctrl” key + left mouse click
Adds individual selections to the current selections.
– “Shift” key + left mouse click
Selects all measurements from the last selection to the new selection.
The Gallery toolbar is present in both the “History” and “File Browser” pages. It performs
similar functions in both pages.
Save as
Selected measurements can be saved to a new location with this button.
If only a single measurement is selected a standard Windows “Save” Dialog is shown. Here
you select the new location and the new file name.
If multiple measurements are selected a “Folder” dialog is shown, which allows you to
select (or create) the folder that all selected files are to be copied to. It is strongly
13.4.1: History file mask
13.4.2: Image list
13.4.3: Gallery toolbar
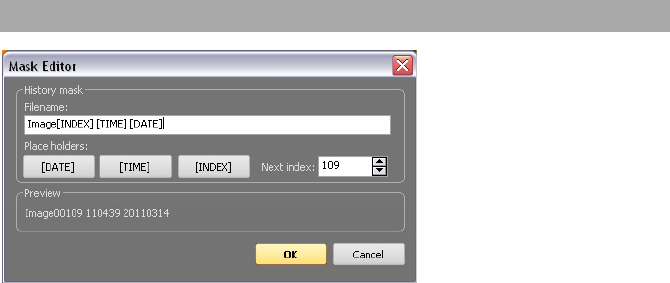
CHAPTER 13: WORKING WITH DOCUMENTS
188
recommended to do this for files in temporary storage of the History folder that you want
to keep, because they may be overwritten as soon as the maximum number of files in the
History folder is reached (see Section Gallery settings (page 264)
Rename
Single or multiple measurements can be renamed by clicking the “Rename” button. It will
open the File Rename dialog (see Section 13.4.5: File Rename dialog), which allows you to
specify a mask for the new file names.
Delete
Single or multiple measurements can be deleted by clicking this button.
The Mask Editor dialog assists you in the creation of file name masks.
History mask
Filename
A file name mask is the template that is used to generate the file names for documents that
are automatically stored (temporarily) during measurement. A file mask consists of
standard text entered by the user and of variables for software-generated text or numbers
(either specified by the user or added automatically).
Mask variables
Mask variables can be entered as specific words surrounded by square brackets. The
following variables are defined in the Naio control software:
–[INDEX]
This variable represents a number that is automatically incremented each time a new
filename is created. The index number is 5 digits in length and filled with zeros for
missing digits. The next index number that will be used is shown in the “Next Index” field.
13.4.4: Mask editor dialog

GALLERY PANEL
189
–[TIME]
This variable represents the actual time of file name creation. It is formatted with two
digit numbers for the hours, minutes and seconds (HHMMSS). This time format is used
regardless of the Regional Settings of the Windows operating system.
–[DATE]
This variable represents the date of the day the file was created (i.e., the day the
measurement was performed). It contains four digit numbers for the year and two digit
numbers for month and day (YYYYMMDD). This date format is used regardless of the
Regional Settings of the Windows operating system.
To quickly insert a Mask variable at the current cursor position in the mask edit box, click
the corresponding button.
Next Index
This entry field defines the next index number to be used. By default this value is identical
to the highest number present in the History files, increased by one.
Preview
The filename that will be used for the next measurement document to be saved (as
specified by your entries) is shown here.
Important
If no Mask variable is used, an index is automatically added to the text string defined in
the filename mask.
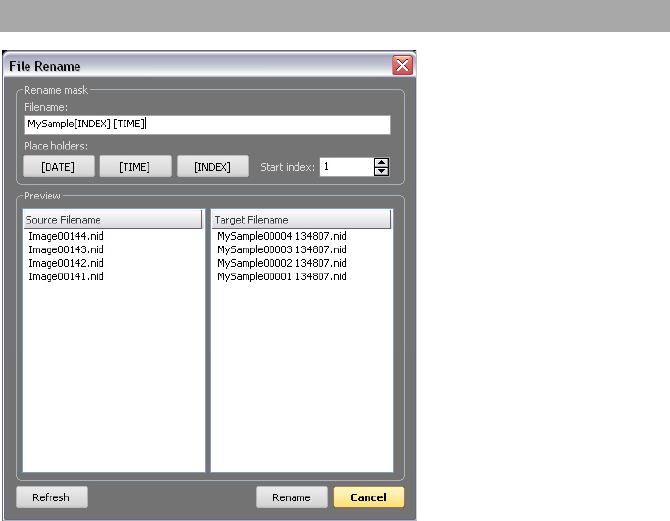
CHAPTER 13: WORKING WITH DOCUMENTS
190
The File Rename dialog is used to rename (or move) multiple files using a Rename mask
(see below). The dialog is opened by clicking the “Rename” button in the Gallery panel. To
rename a file or multiple files, the Rename mask can be defined here following the same
principles as for the History mask. A preview of the new filenames is shown in the preview
section.
Rename mask
See History mask (page 188).
Preview
Source Filename
The left column of the Preview section shows the original filename(s).
Target Filename
The right column of the preview section shows what the filename(s) will be after pressing
the “Rename” button.
13.4.5: File Rename dialog
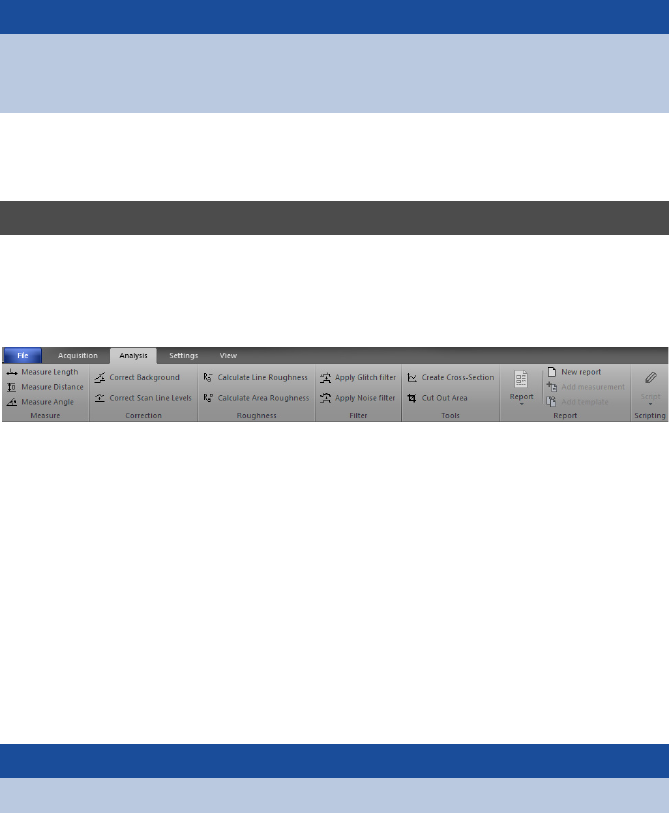
ANALYSIS TAB
191
Refresh
This button updates the preview list.
Rename
This button renames the selected files.
Cancel
This button closes the dialog without renaming the files.
Measurement data can of course not only be displayed in charts, it can be analyzed as well.
The control software has several tools that allow quick numerical evaluation and
modification of chart data in Operating or document windows. These tools are accessible
through the various groups of the Analysis tab.
All of these tools can also be used while a measurement is still being acquired.
To use a quick evaluation tool:
1Click on the chart that you want to evaluate to activate it.
2Select the desired tool using one of the following approaches:
• Click on one of the tool buttons in the Analysis tab.
• Select the tool from the Chart’s context menu (right-click on the chart).
3Define the evaluation. The procedure to define the evaluation is different for each tool.
Details can be found in the tool-specific instructions below.
When a tool has been selected, the Tool panel (see Section 13.6: Tool panel) moves to the
top of the panel stack of the Info pane.
Important
If no unique filename(s) would result from the specified Rename mask, an index is
automatically added to the files. If this still does not result in unique filenames, the text
“Copy of” is added to each filename as often as is required to make it unique.
13.5: Analysis tab
Important
Depending on the selected chart type, some tools may be unavailable.
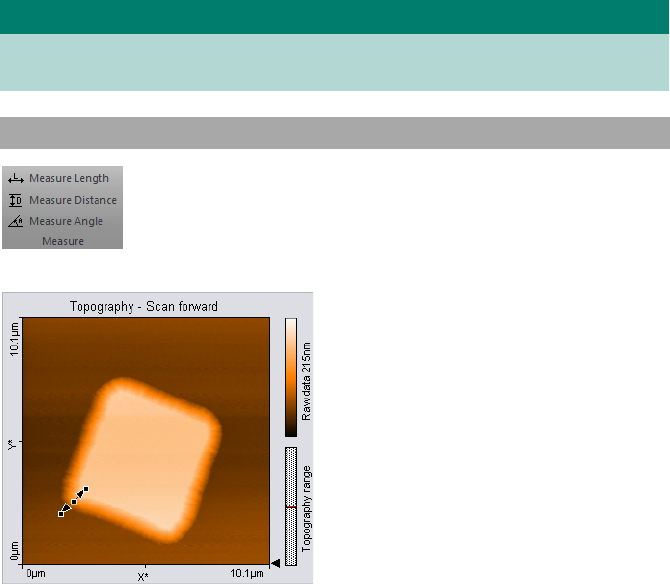
CHAPTER 13: WORKING WITH DOCUMENTS
192
To stop using a tool:
> Select another tool, select the same tool a second time, or select “Abort” in the Chart’s
context menu.
Measure length
Calculates the distance and signal difference between two points. Graphically, a line with
arrowheads on each end represents the selection marker. The line is defined by drawing a
line on the measurement chart. The first point is positioned by moving the mouse cursor
to the desired location and clicking and holding the left mouse button. The second point
is positioned when the mouse button is released. When the mouse is not moved between
clicking and releasing, an line parallel to the X*-axis is drawn.
The direction and length of the selection marker can be adjusted by dragging the end
markers. The line can be moved as a whole by dragging the center marker.
The Tool status section of the Tool panel displays the calculated “Length”, “DeltaZ”, “Width”
and “Height”. This data will also be stored in the “Tool” data category of the Data Info panel
Tip
For more elaborate evaluations, the optional Nanosurf Analysis or Nanosurf Report
software can be used.
13.5.1: Measure group
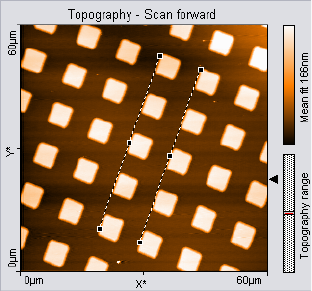
ANALYSIS TAB
193
(see Section 13.2: Data info panel) for the respective measurement document as long as the
tool is active when the document is stored. For more information on the data in the Tool
status section (see Tool status section (page 203)).
Measure distance
Calculates the distance between two parallel lines. The parallel lines are defined by drawing
them in the chart. The first point of the first line is defined by the mouse cursor position
where the left mouse button is clicked, the second point by the position where the button
is released. When the mouse is not moved between clicking and releasing, a line parallel to
the X*axis is drawn. After releasing the mouse button, a second parallel line sticks to the
mouse cursor, that is released by clicking its desired position. The direction of the parallel
lines can be adjusted by dragging their end markers; they can be moved by dragging the
center marker.
The Tool status section of the Tool panel displays the calculated distance. The distance
value only depends on the cursor positions, it does not on depend the displayed data
values. The distance data will also be stored in the “Tool” data category of the Data Info
panel (see Section 13.2: Data info panel) for the respective measurement document as long
as the tool is active when the document is stored. For more information on the data in the
Tool status section (see Tool status section (page 203)).
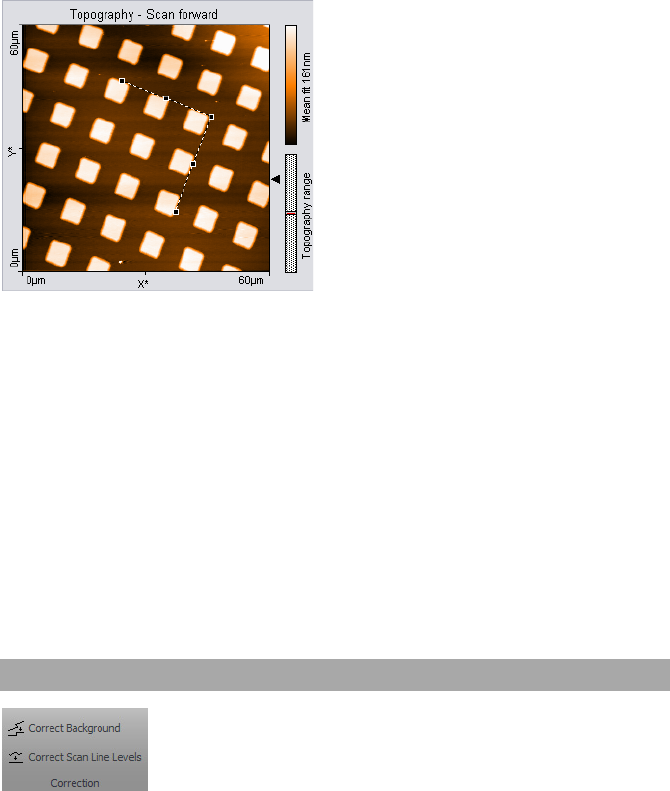
CHAPTER 13: WORKING WITH DOCUMENTS
194
Measure angle
Calculates the angle between two lines. In Line graph-type displays, this tool can only be
used when the chart displays data that has the unit “meters”.
The two lines are defined by drawing them in the chart. The first point of the first line is
defined by the mouse cursor position where the left mouse button is clicked, the second
point by the position where the button is released. When the mouse is not moved between
clicking and releasing, a line parallel to the X*-axis is drawn. After releasing the mouse
button, the end of the second line sticks to the mouse pointer. The end is released by
clicking its desired position. The angle can be changed by dragging the line end point
markers or the corner mark; it can be moved by dragging the line center markers.
The Tool status section of the Tool panel displays the calculated angle. This data will also be
stored in the “Tool” data category of the Data Info panel (see Section 13.2: Data info panel)
for the respective measurement document as long as the tool is active when the document
is stored. For more information on the data in the Tool status section (see Tool status section
(page 203)).
In contrast to the evaluation tools of the Measure and Roughness groups, the tools of the
Correction group (and also those of the Filter group (see Filter group (page 198)) actually
change measurement data. This is done in a copy of the original measurement document,
though, so you won’t lose any data and will always be able to access the original
measurement data in addition to the corrected or filtered data.
13.5.2: Correction group
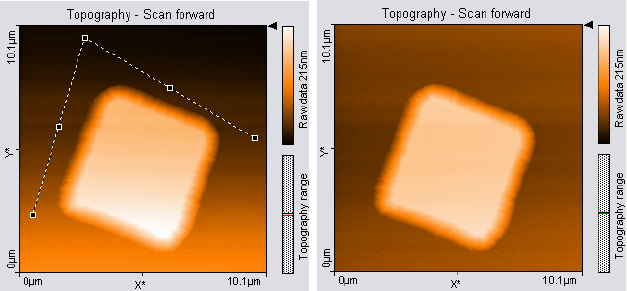
ANALYSIS TAB
195
Correct background
Removes the effect of an ill-aligned scan plane when the line filter options (see Filter (page
180)) do not give satisfactory results. This may be the case when the scan lines in different
parts of the measurement have a different average height. An example of such a
measurement is shown in Figure 13-6: Correct Background.
To use the tool, select three points that should be on the same height. This is done in the
same way as with the angle tool (see Measure Angle (page 339)). The selected points
become the end points of the selection marker.
After clicking the “Execute” button in the Tool status section of the Tool panel, a copy of the
original measurement document is made and the plane that is defined by the selection
maker is subtracted from the measurement data in the newly created document. To get
useful results, the Data filter option for the corrected image in the new document will be
automatically set to “Raw data”.
Correct scan line levels
Removes the effect of drift when the line filter options (see Filter (page 180)) do not give
satisfactory results. This may occur when the scan lines in different parts of the
measurement have a different average height. An example of such a measurement is
shown in Figure 13-7: Correct scan line levels.
To use the tool, draw a line through points that should have the same height in the same
way as with the Measure Length tool.
After clicking the “Execute” button in the Tool status section of the Tool panel, a copy of the
original measurement document is made and the average level of each scan line in the
newly created document is adjusted so that all points along the drawn line have the same
Figure 13-6: Correct Background. (Left) Uncorrected image; the end points of the selection marker
have been moved to points that should have the same height. (Right) Corrected image.
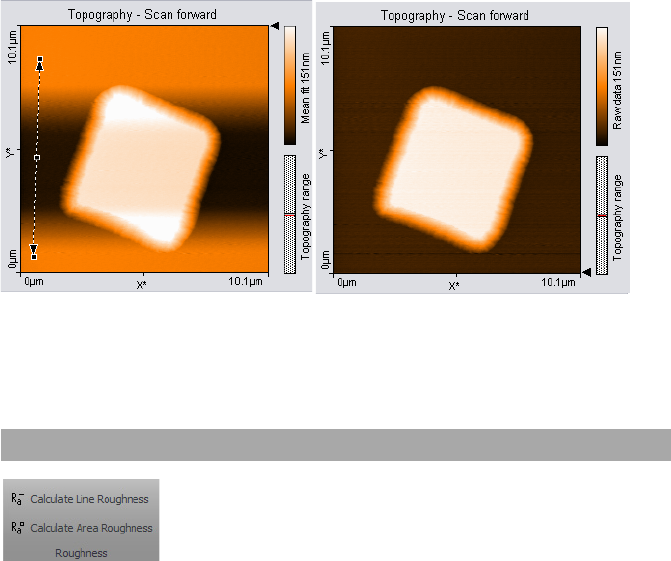
CHAPTER 13: WORKING WITH DOCUMENTS
196
height. To get useful results, the Data filter option for the corrected image in the new
document will be automatically set to “Raw data”.
Calculate line roughness
Calculates several roughness parameters from the data at points along a selected line. The
line is selected in the same way as with the Measure length tool (see Measure length (page
192).
Figure 13-7: Correct scan line levels. (Left) Uncorrected image with a selection marker through
points that should be at the same height. (Right) Corrected image
13.5.3: Roughness group
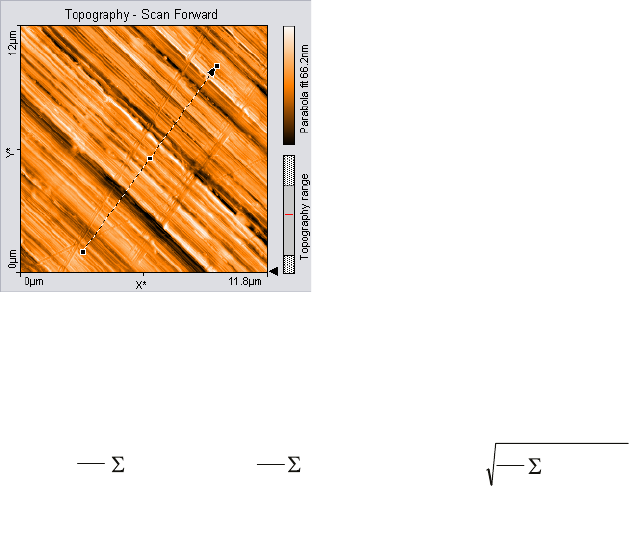
ANALYSIS TAB
197
The Tool status section of the Tool panel displays the calculated “Length” and “DeltaZ” of
the selected area.
The Tool result section displays the roughness values that are calculated from the data
according to the following formulas:
The roughness values depend on the line filter option (see Filter (page 180)) that is applied
to the chart, because they are calculated from the filtered data.
Clicking the “Store” button in the Tool result section stores the roughness values in the
“Roughness” data category of the Data Info panel for the active measurement document.
Calculate area roughness
Calculates several roughness parameters from the data points in a selected area.
The area is selected in the same way as with the Cut out Area tool.
The Tool status section of the Tool Results panel displays the calculated Size or Width and
Height of the selected area. For more information on the Tool status section, see The Tool
status section (page 207).
The Tool result section displays the roughness values that are calculated from the data
according to the following formulas:
The Roughness Average, Ra
| – Rm))(|
1
0=
N-1
l
l
xz
N
Ra =
The Peak Height, Rp
Rp = highest value – Rm
The Valley depth, Rv
Rv = lowest value – Rm
The Mean Value, Rm
0=
N-1
l
)(
1
l
x
z
N
Rm =
The Root Mean Square, Rq
The Peak-Valley Height, R
y
Sy = Sp– S
v
0=
N-1
l
2
– Rm))((
1
l
xz
N
Rq =
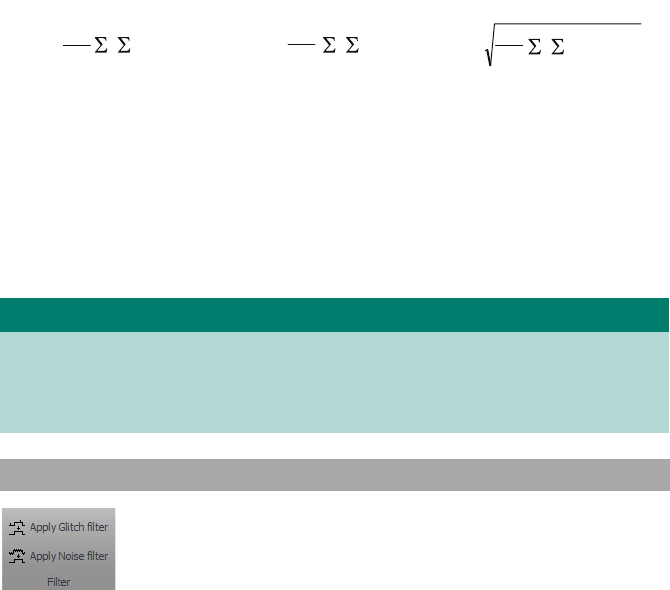
CHAPTER 13: WORKING WITH DOCUMENTS
198
The roughness values depend on the Data filter that is applied to the chart, because they
values are calculated from the filtered data. More information on data filters is provided in
Section 18.2: The Chart bar under Data filter (page 199).
Clicking the “Store” button in the Tool result section stores the roughness values in the
“Roughness” data category of the Data Info panel for the active measurement document.
Glitch filter
The Glitch Filter removes the effect of small defects in the image such as single short
glitches in the scan. Compared to the Noise Filter (see below), it has the advantage of not
reducing resolution on step edges. The glitch filter is implemented as a Median filter on a
3×3 pixel matrix.
To apply the filter, activate the color map chart that is to be filtered, then click the “Glitch
Filter” button. A new Measurement document with the filtered data is created.
Noise filter
The Noise filter removes high frequency noise from the image, but applying the filter will
also decrease the resolution of the image. The Noise Filter is implemented as a convolution
with a 3×3 pixel Gaussian kernel function.
Tip
The Area Roughness tool can be used to determine the mean height difference between
two plateaus with more accuracy than with the “Measure Distance” tool. To determine
the mean height difference, select an area on each plateau, and calculate the difference
between their Sm-values.
13.5.4: Filter group
The Roughness Average, S
a
The Valley depth, S
v
S
v
= lowest value
|
),(
|
1
00==
M-1
k
N-1
l
lk
yxz
MN
S
a
=
The Mean Value, S
m
The Peak Height, S
p
S
p
= highest value
00==
M-1
k
N-1
l
),
(
1
lk
y
x
z
MN
S
m
=
The Root Mean Square, S
q
The Peak-Valley Height, S
y
S
y
= S
p
- S
v
00==
M-1
k
N-1
l
2
)),((
1
lk
yxz
MN
S
q
=
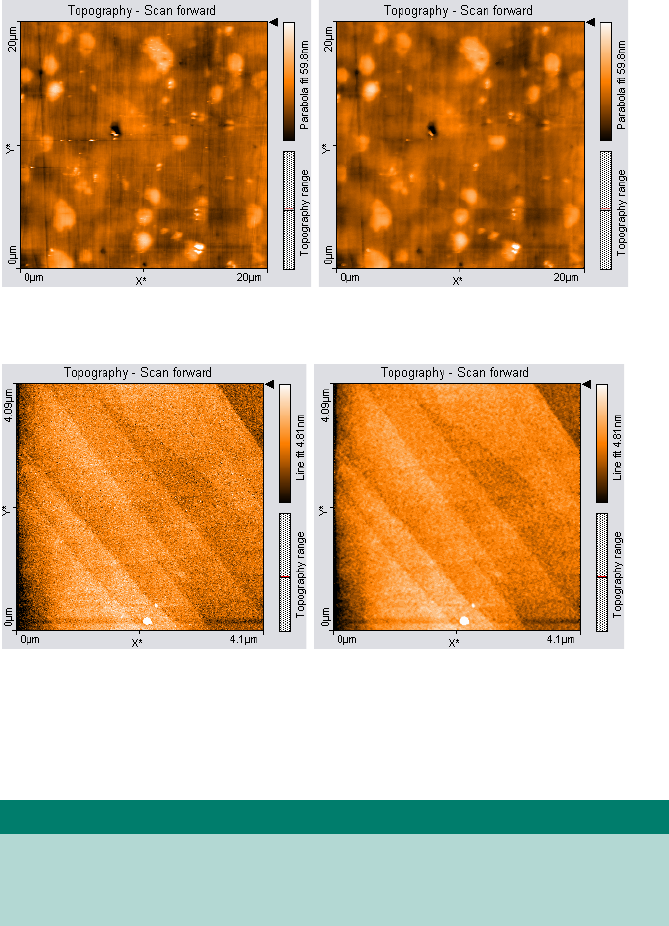
ANALYSIS TAB
199
To apply the filter, activate the color map chart that is to be filtered, then click the “Noise
Filter” button in the Tools bar. A new measurement document with the filtered data is
created.
Figure 13-8: Glitch Filter. (Left) Unfiltered image with some glitches where the tip lost contact with
the sample. (Right) Corrected image.
Figure 13-9: Noise Filter. (Left) Noisy (unfiltered) image of a measurement on HOPG. (Right) Filtered
image
Tip
• Filters are especially useful for improving the appearance of 3D views.
• Applying filters may changes the result of the other tools. This may result in incorrect
results, e.g. when evaluating sample roughness.
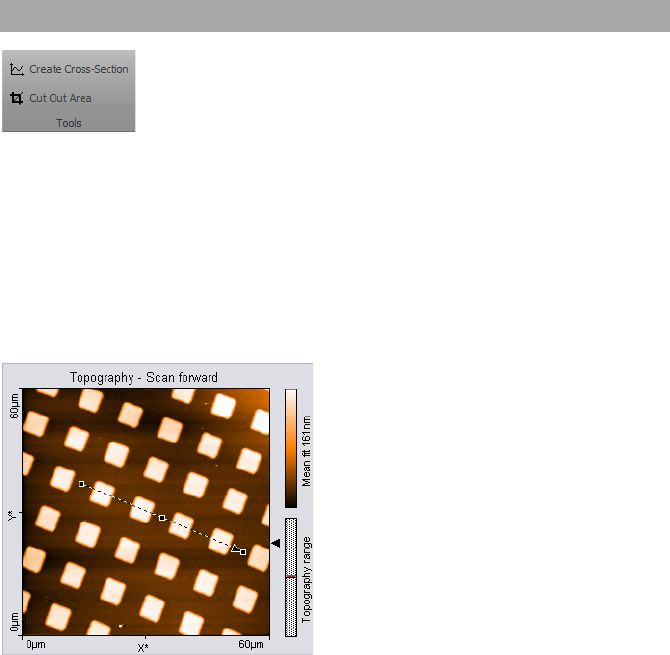
CHAPTER 13: WORKING WITH DOCUMENTS
200
Create cross-section
Creates a new measurement document containing a line cross-section of a Color map or
Line View display.
The line is defined by drawing a selection arrow. The arrow points toward the forward
direction of the line. The start of the arrow is defined by the mouse cursor position where
the left mouse button is clicked, the end of the arrow by the position where the button is
released. When the mouse is not moved between clicking and releasing, an arrow ending
in the center of the measurement is drawn. The direction of the arrow can be adjusted by
dragging its end markers; it can be moved by dragging the center marker.
Double-clicking the graph, or clicking the “Cut out line”-button in the Tool status section of
the Tool panel creates a new document that contains the line section.
The Tool chart section of the Tool Results panel displays a preview chart of the selected line.
The Tool status section of the Tool Results panel displays the calculated “Length” and
“DeltaZ” of the selected line. For more information on the data in the Tool status section
(see Tool status section (page 203)).
Cut out area
Creates a new measurement document containing a subsection of an existing
measurement.
13.5.5: Tools group
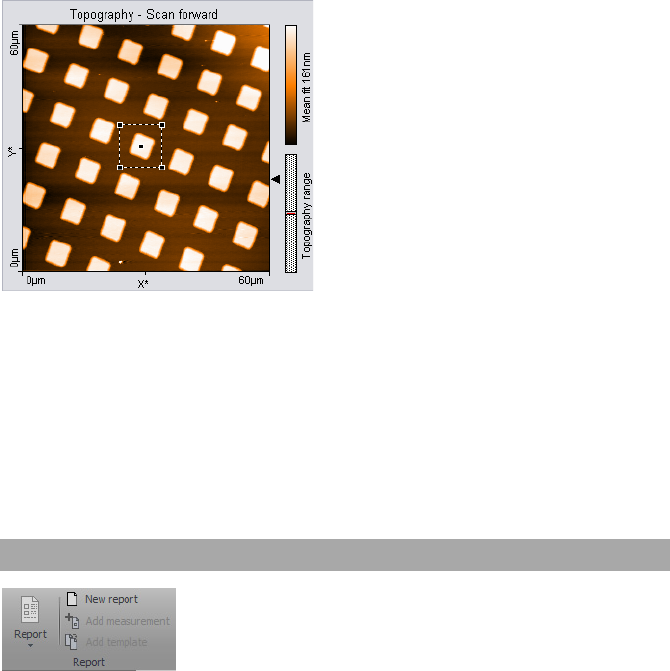
ANALYSIS TAB
201
One corner of the area is defined by the mouse cursor position where the left mouse button
is clicked, the opposite corner by the position where the button is released. When the
mouse is not moved between clicking and releasing, an area is defined that has a size of
33% of the current measurement, and is centered on the clicked location.
Once an area is defined, it can be resized by dragging one of its corners, and moved as a
whole by dragging its center point.
Pressing the “Shift” key while dragging a corner defines a non-square (i.e. rectangular) area.
Double-clicking the graph, or clicking the “Cut out area” button in the Tool Results panel
creates a new measurement document that contains the selected area.
The Tool status section of the Tool Results panel displays the calculated “Size” or “Width”
and “Height” of the selected area. For more information on the data in the Tool status
section (see Tool status section (page 203)).
The Nanosurf Report software offers a powerful and extensive set of analysis functions.
Complex analyses can be created interactively, and then displayed and printed in visually
appealing reports. These reports can then be used as templates to consistently apply the
same analysis to other measurements.
13.5.6: Report group
CHAPTER 13: WORKING WITH DOCUMENTS
202
Report
The “Report” button starts the Report software (if installed) from within the Naio control
software:
When a measurement is opened by the Report software, it will import all measurement
channels that are displayed in the current measurement document. By default, a Basic
Report is generated. Other Report styles can be chosen from the “Report” button’s drop-
down-menu:
This drop-down menu lists templates stored in a template folder. The Menu Item's name is
equal to the template name without the extension (*.mnt) and is sorted alphabetically. This
standard folder is configured by the Report Template File path (see Reporting (page 263)).
New report
An empty report is opened.
Add measurement
The currently active measurement is added to the currently opened report.
Apply template
Opens a dialog that allows you to select a template that is applied to the currently active
measurement. If selected, a menu item the template is applied to the current selected
measurement document.
Important
After a fresh installation of the Report software, the Report software has to be run at
least one time before you can automatically start it from the Naio control software. To
run the Report software for the first time, select it from the Windows “Start” menu.
Important
If you do not save the measurement in the control software, but only save the report, the
data in measurement channels that were not displayed is lost.
A measurement document should only display those channels that are used in a
template. When a template is applied to a measurement document that displays
different, or a different number of measurement channels than the template uses, the
results may not be correct.
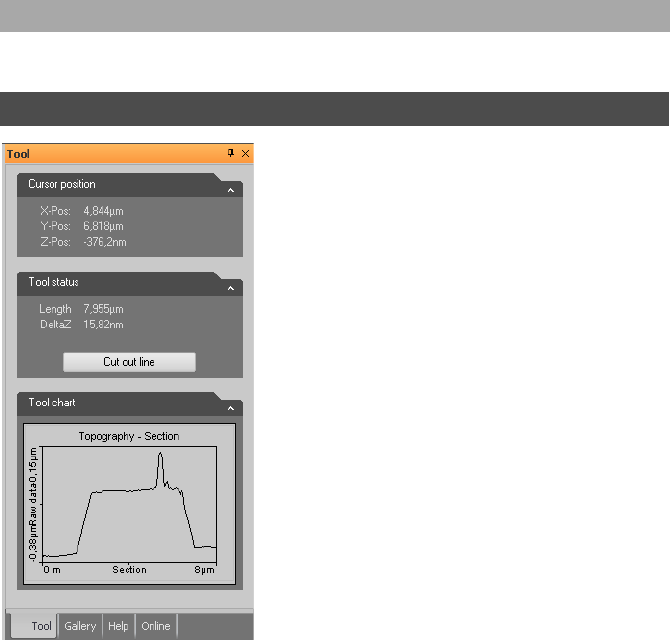
TOOL PANEL
203
Please refer to Section 10.5.2: Scripting group (page 123).
The Tool panel of the Info pane displays varying information, which depends on the tool
currently selected in the Analysis tab.
Cursor Position section
This section is always visible. It displays the mouse cursor position in the physical units of
the selected chart.
Tool status section
This sections appears when a tool is being used. It displays the evaluation result of the
currently active tool.
13.5.7: Scripting group
13.6: Tool panel
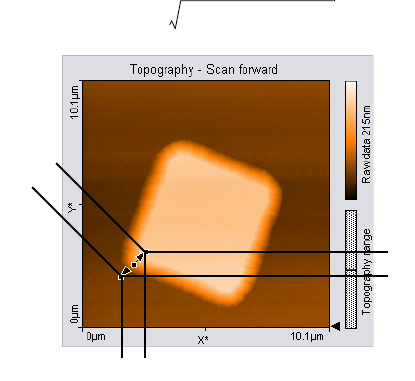
CHAPTER 13: WORKING WITH DOCUMENTS
204
The tools that require drawing a selection marker to define the evaluation have some
common parameters that are described here. The other parameters are described in the
sections that describe the respective tool (see above).
Length
The length of the selection marker in the plane of the chart. “Length” is related to the
evaluation results “Width” and “Height” (see below) according to the formula:
In a Color map chart, length is calculated in the XY-Plane. In a Line graph chart, length is
calculated in the XZ-Plane.
“Length” is not displayed when “Width” and “Height” are of different physical units (e.g. in
Amplitude Spectroscopy, where the X-Axis is given in [m] and the Z-Axis in [V]).
Width, Height
The “Width” and “Height” of the measurement tool in the chart, calculated in the chart
plane.
DeltaZ
The difference between the “Z-Pos” values at both ends of the selection marker.
In a Color map chart, “DeltaZ” is the difference in the (filtered) sample height between the
start and the end point.
Length Width2Height2
+=
Width
Height
L
ength
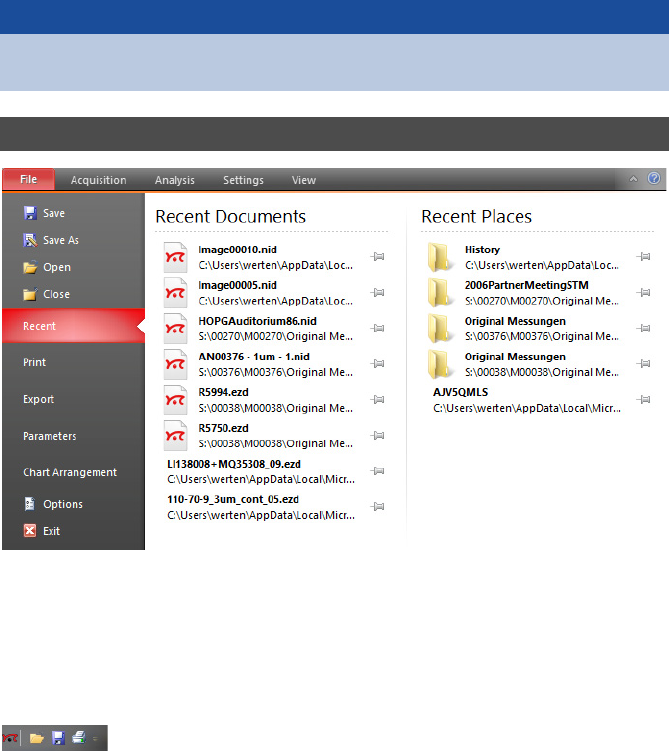
FILE MENU
205
The File menu is accessed by clicking the “File” tab at the left side of the Ribbon. It provides
access to software related settings and options (see Section 15.1.1: Options dialog (page
259)), but also to basic file operations such as such as opening, storing and printing of
measurements (explained below). The latter functions can also be performed using the
Quick access toolbar (see below) that is located directly above the file menu.
Quick access toolbar
By default, this customizable toolbar contains small icons to Open, Save and Print
documents. The content of the quick acces toolbar can be changed via the Quick access
toolbar page of the Options dialog (see page 212).
Open
Launches a system “File open” dialog for opening Nanosurf “.nid” or “.ezd” (Easyscan 1) files.
It is possible to select more than one file at once by using the “Shift” and/or “Ctrl” keys.
Important
The calculated values of “Length”, “Width” and “Height” only depend on the cursor
positions, they do not depend on the displayed data values.
13.7: File menu
CHAPTER 13: WORKING WITH DOCUMENTS
206
Selected files will open in document windows, which contains a chart area and a data info
panel. There is no Imaging toolbar like there is for ongoing measurements in the Imaging
window. You can however still customize the charts through a context menu, which opens
through a right-click.
The data info Panel displays all significant parameters were used for the measurement. For
more information on Measurement document functionality, see Section 13.1: Introduction.
Save
Saves the currently open measurement document in Nanosurf image data format (file
extension “.nid”) under its current name.
Save as
Save the currently open measurement document under a new name.
Close
Closes the currently active document, but not the Naio control software. If you have
unsaved data in the current document, you will be asked to save it.
Export
Exports either the active chart or the whole active measurement document for use in other
programs or image-processing software. Available data types for documents are tagged
image file format (.tif), portable network graphics (.png), Windows bitmap (.bmp), 16 bit
data file (.dat), and plot file (.plt). For Charts, additional available data types are comma
separated z values (.csv), and (X,Y,Z)points (.csv).
When the data is exported using the function “Export” >> “Current document as”, every
Chart in the measurement document is stored in the export file consecutively. In the binary
format, the blocks of data from each Chart are stored directly one behind the other. In the
“ASCII” text format the blocks of data for each Chart are separated by two empty lines.
Tagged image file format (.tif), portable network graphics (.png), and Windows
bitmap (.bmp)
All of these image file formats are suitable for inclusion of images in electronic documents,
e.g. in Word, PowerPoint or image-processing software. The exact image as seen on the
computer screen will be saved in the exported file (similar to a screenshot of the respective
chart).
Data file 16Bit (.dat)
A binary data file that can be processed in data processing software. This “binary” data
format only contains the measured data. The data is stored consecutively, line by line
upwards, as 16-bit values (–32768 to +32767). Before being stored, the data is processed
FILE MENU
207
using the settings chosen in the Correction and Filter groups of the Analysis tab (see Section
13.5: Analysis tab for details).
Plotfile ASCII (.plt)
This is an “ASCII” text format which contains the measured data as well as a small header
with a description of the scan. A plotfile can be used for detailed data analysis by various
mathematical software packages such as MathLab, or for plotting by software such as
GnuPlot. Before being stored, the data is processed using the settings chosen in the
Correction and Filter groups of the Analysis tab (see Section 13.5: Analysis tab for details).
If “Line graph” is selected as “Display” in the “Chart bar”, only the visualized lines will be
stored. Each data point is stored as a pair of floating point numbers on a separate line. The
number pairs are separated by a blank character (SPACE).
If any other chart type is selected, all measured values are stored. All values in a data line
are stored on a separate line in the text file. An empty line is inserted after every data line.
The data lines are stored from the bottom to the top. A small header at the beginning of the
first data line contains the names of the channel and frame, as well as X-, Y-, and Z-ranges
with their physical units.
Comma separated z values (.csv)
This format stores all the measured data in a chart, as a matrix of floating point numbers in
ASCII format separated by a “comma” and “SPACE” character. This enables easy data
exchange with commonly used spread sheet and database applications.
(X, Y, Z)-Points (.csv)
This format stores the coordinates of all measured points in a chart as a list of floating point
number pairs. For Line graphs, only X and Z points are exported.
Print
Prints the currently selected measurement document together with the values shown in
the Data Info panel. The Print option also provides a graphical preview of document that
will be printed.
Exit
With exit you can close the Naio control software. If you exit the program while still having
unsaved data, you will be asked to save it.
CHAPTER 13: WORKING WITH DOCUMENTS
208

CHAPTER 14:
Options and settings
0
0
CHAPTER 14: OPTIONS AND SETTINGS
210
The File menu is accessed by clicking the file tab at the left side of the Ribbon. It provides
access to basic file operations such as such as opening, storing and printing of
measurements (explained in Section 13.7: File menu (page 205)), but also to some software
related settings and options (explained below).
Parameters
All measurement parameters are stored in a configuration file with the extension “.par”.
When the Naio control software is started, default values are loaded from a file that is
selected in the Controller configuration dialog (Section 14.7: Controller configuration
dialog). Functions for storing and retrieving parameters are accessed via the application
button.
Load parameter settings
Loads a previously saved parameter file.
Save parameter settings
Saves the parameters to the currently selected parameter file. The name of this file is
indicated in the status bar at the bottom of the main window.
Save as parameter settings
Saves the parameters under a new file name.
14.1: File menu
FILE MENU
211
Chart arrangement
The chart arrangement of the Imaging and Spectroscopy windows is stored in a
configuration file with the extension “.chart”. When the Naio control software is started, a
default arrangement is loaded from a file that is selected in the controller configuration
dialog (Section 14.7: Controller configuration dialog). Functions for storing and retrieving the
chart arrangement are accessed via the application button.
Load chart arrangements
Loads a previously saved chart file.
Save chart arrangements
Saves the chart arrangement to the currently selected chart file. The name of this file is
indicated in the status bar at the bottom of the main window.
Save as chart arrangements
Saves the chart arrangement under a new file name.
Options
The Options button opens the Options dialog (see below), which configures various general
control software settings.
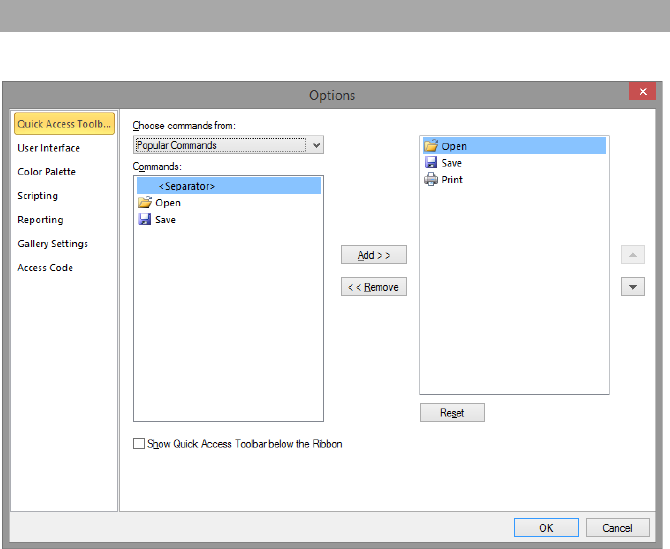
CHAPTER 14: OPTIONS AND SETTINGS
212
Quick access toolbar
Allows changes to the content of the Quick Access toolbar (see Quick access toolbar (page
205)). This process is very similar to that in the Microsoft Office applications and is therefore
not explained in this manual. You are free to try it out and can always use the “Reset” button
to reload standard settings.
14.1.1: Options dialog
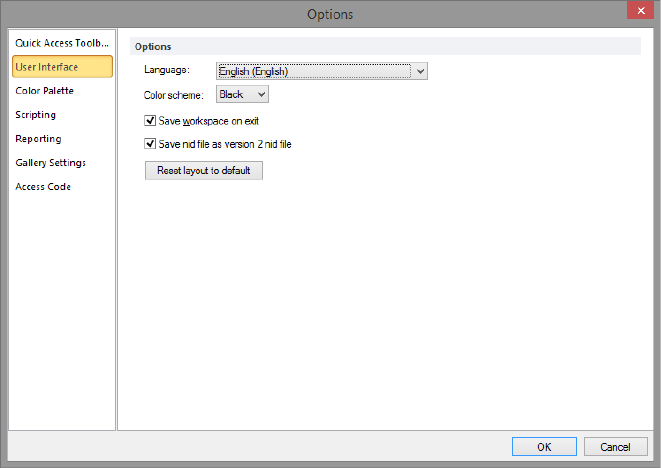
FILE MENU
213
User Interface
Language
Specifies the Naio control software language.
Color scheme
Select between black (default), silver, and blue coloring of the user interface.
Save workspace on exit
When checked, the workspace settings are automatically saved to the system registry
when the control software is closed (see also Parameters and Chart arrangement (page
211)).
Save nid file as version 2 nid file
Saves a document in the older version 2 file format. Activate this option when you need to
be able to import .NID files in older data evaluation software packages such as Nanosurf
Report version 5 and older or SPIP 5 and older. Users of report version 6 and newer or SPIP
6 and newer should update to the latest version of their software package, if there is any
trouble to read new files. This setting has no effect on most spectroscopy measurements,
as they must be saved in a newer file format version.
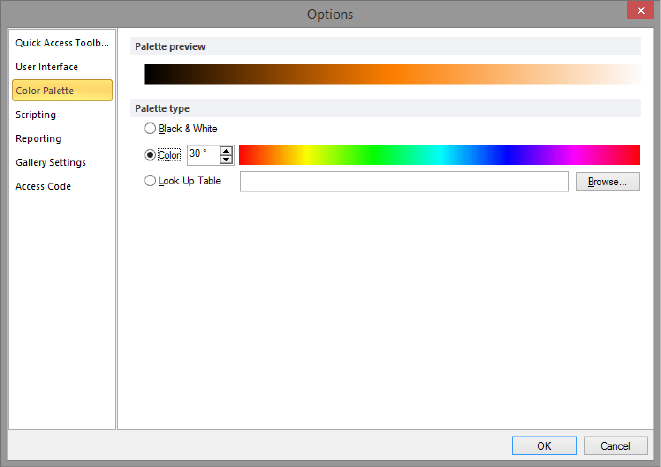
CHAPTER 14: OPTIONS AND SETTINGS
214
Reset layout to default
Sets the layout to default settings. Especially when changing the monitor configuration, it
may happen that some dialogs and panels are "displayed" off-screen. In this case, you
cannot see the dialog, and it may seem that the software stopped working. If this happens,
press the "Esc" key to exit the invisible dialog, and activate this button.
Color Palette
The color palette dialog is reached via the menu item “Options” >> “Config Color palette”.
The color palette is used to map the display range of the measured values to a color. Three
different palette types are available:
–Black&White
The color map is a linear gray scale.
– Color
The color selection uses the HSB-color model where the color (H) is set in ° value. The
color is selected by entering a number or by clicking a color in the color bar.
– Look Up Table
A user definable palette (with max 256 color entries) can be selected. This palette is
stored in a “.lut” file that contains an ASCII table with RGB color values. A different look up
table can be selected by clicking the “Browse” button.
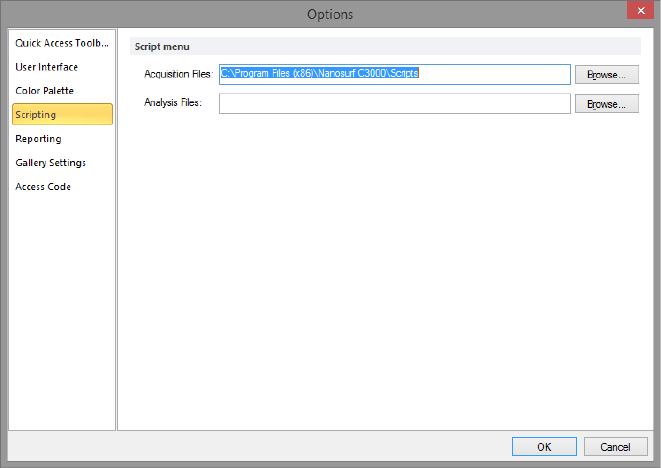
FILE MENU
215
Scripting
Allows you to set the search paths for the acquisition and analysis scripts that are displayed
in the Scripting group of the Acquisition tab and Analysis tab, respectively.
Scripts can be organized in subfolders inside each of the “Script” folders, which are
displayed as submenus in the control software. These submenus are displayed before
individual scripts in the Script drop-down menu.
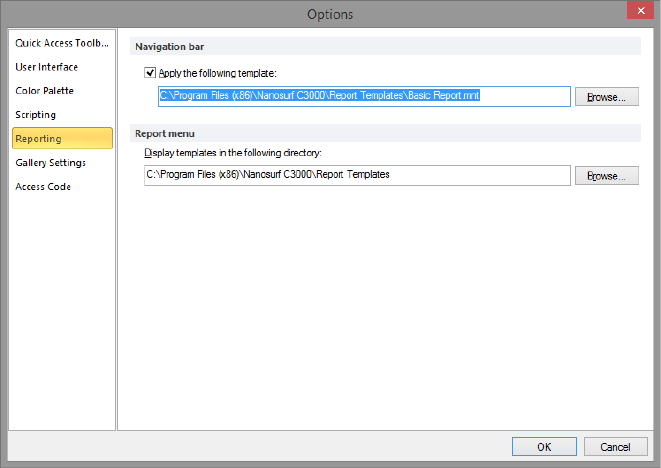
CHAPTER 14: OPTIONS AND SETTINGS
216
Reporting
Used to configure the behavior of the Report button in the Report group of the Analysis tab
(page 191).
Apply the following template
When enabled, automatically applies the template specified in the box below. You can
search for a template using the “Browse” button.
Display templates in the following folder
As with the locations of the scripting files (see Scripting (page 215)), the content of the
specified folder is displayed as choices in the Report drop-down menu.
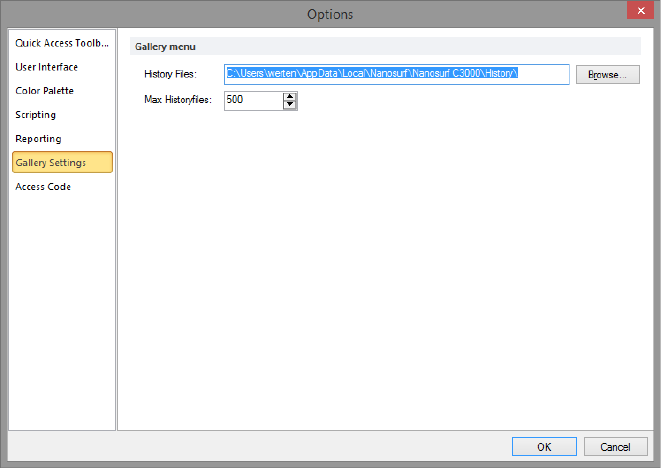
FILE MENU
217
Gallery settings
History folder
Sets the folder where the temporarily (automatically) stored measurements (which are
listed in the Gallery panel of the Info pane) are stored.
Max. history files
Sets the maximum number of files to keep in the above folder. When the maximum is
reached, the oldest measurement will be deleted from the History folder to allow the latest
measurement to be saved.
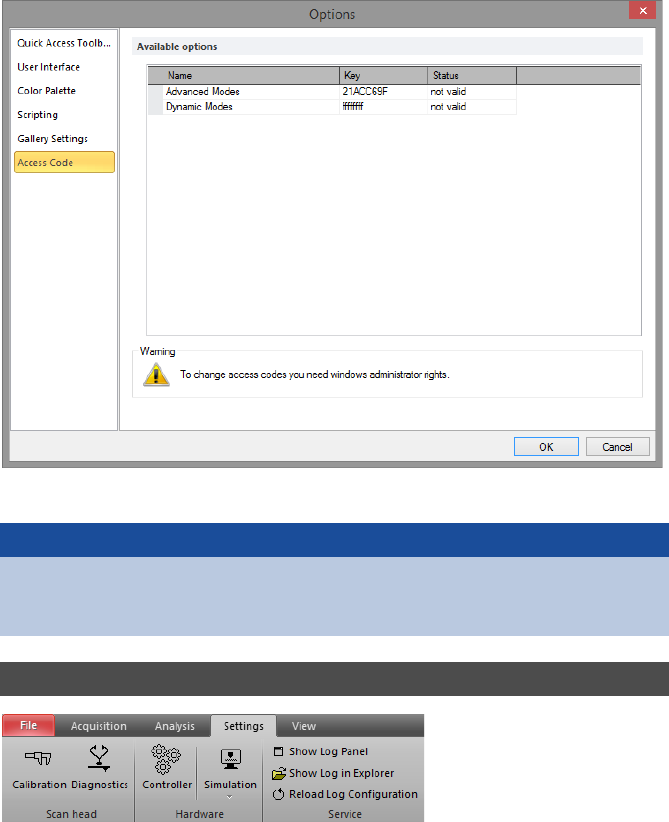
CHAPTER 14: OPTIONS AND SETTINGS
218
Access code
Used to enter the access codes for additional (optional) software modules.
Provides access to many hardware related settings.
Important
If you receive the warning “To change access codes you need Windows administrator
rights”, please restart the control software with the “Run as Administrator” option from
the Windows Explorer context menu.
14.2: Settings tab
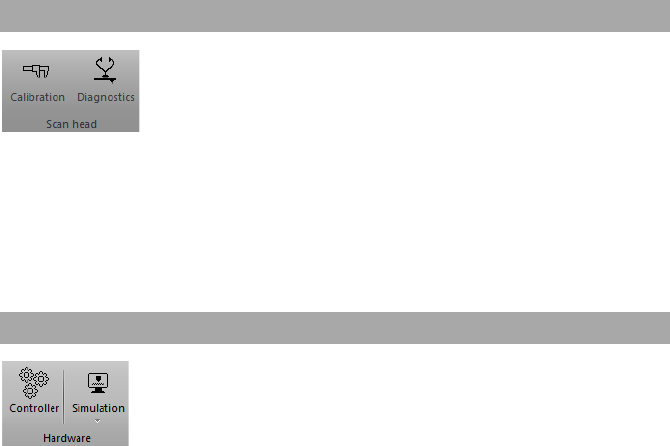
SETTINGS TAB
219
Calibration
This button opens the Scan head selector dialog to load, save or edit a scan head calibration
file. For more details, see Section 14.3: Scan head selector dialog.
Diagnosis
This button opens the Scan Head Diagnostics dialog where the actual health state of the
scan head can be seen. For more details, see Section 14.6: Scan Head Diagnostics dialog.
Controller
Opens the Controller configuration dialog where different hardware related settings can be
defined. It defines communications port, video driver settings, start up parameter and
others. For more details, see Section 14.7: Controller configuration dialog (page 226).
Simulation
Check or uncheck the Simulation button to enter or exit the control software’s microscope
simulation mode. Once the simulation mode is active, the status bar of the control software
displays the text “Simulation”. Otherwise, this field displays the text “Online”.
The drop-down menu selects the scan heads to simulate:
–NaioSTM
–NaioAFM
In microscope simulation mode, many functions of the microscope are performed on a
mathematically generated surface. Thus, software functionality and acquisition
procedures can be practised without danger of harming the instrument.
14.2.1: Scan head group
14.2.2: Hardware group
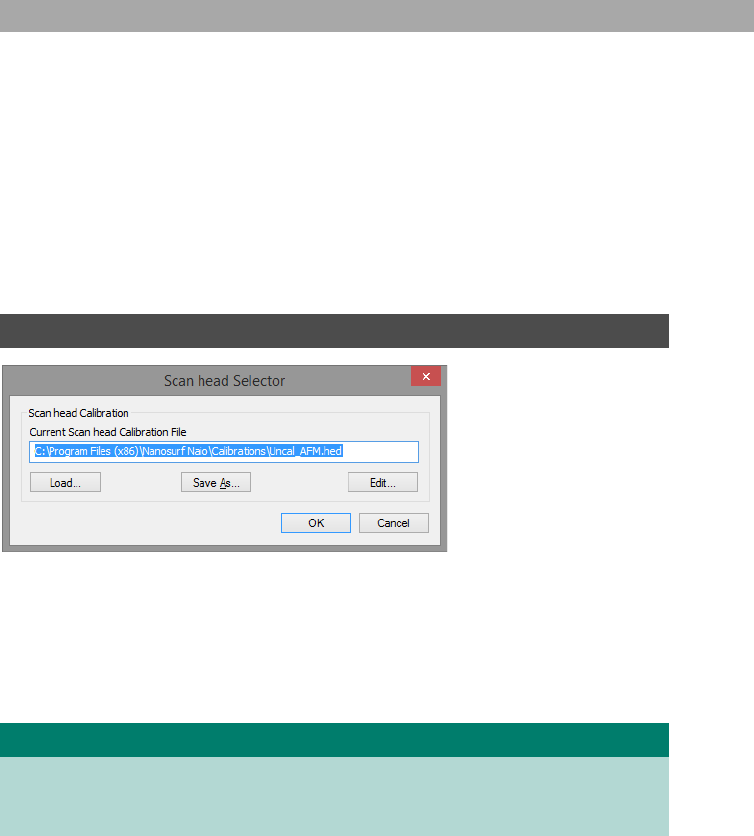
CHAPTER 14: OPTIONS AND SETTINGS
220
Show Log panel
Opens the log panel to show detailed messages about what the control software is doing.
This information will be helpful for service personnel. Use the Marker button to mark a
specific action or event in the log.
Show Log in Explorer
Opens the directory where the log files are stored. If the system had a problem, you can
send the newest files from this directory to your local sales partner, together with an error
description and — if applicable — a measurement that shows the problems.
Reload log configuration
Restarts the log system with the current configuration from file.
The Scan head selector dialog is used to load, save or edit scan head calibration files. These
files store all calibration values specific to a certain scan head. The Scan head selector dialog
is opened via the Calibration button in the Scan head group of the Settings tab.
The exact configuration of each scan head is stored in a file with a filename that
corresponds to the serial number of that particular scan head, with the extension “.hed”.
The currently loaded scan head calibration file is displayed in the status bar.
14.2.3: Service group
14.3: Scan head selector dialog
Tip
The specific scan head calibration file(s) for each customer is automatically copied and
selected as default during the installation of the control software from the installation
CD. It can be found in the “Calibrations” subfolder of your installation path.

SCAN HEAD CALIBRATION EDITOR DIALOG
221
Load
Loads a different scan head calibration file.
Save as
Saves the current scan head calibration file with a different name.
Edit
Edit the currently loaded scan head calibration file using the Scan Head Calibration Editor
dialog (see Section 14.4: Scan head calibration editor dialog). Always save a backup copy of
the original scan head calibration files by clicking 'Save As' first.
Through this dialog, the calibration of all standard Inputs and Outputs can be configured
individually for a particular scan head.
Important
When you change a scan head, you have to load the correct configuration file too. If you
do not, scan ranges and other important calibration settings are incorrect and the scan
head may not operate properly.
14.4: Scan head calibration editor dialog
CAUTION
Changes to these settings should be performed with great care. False settings can lead
to false interpretation of the data and incorrect operation of the controller.
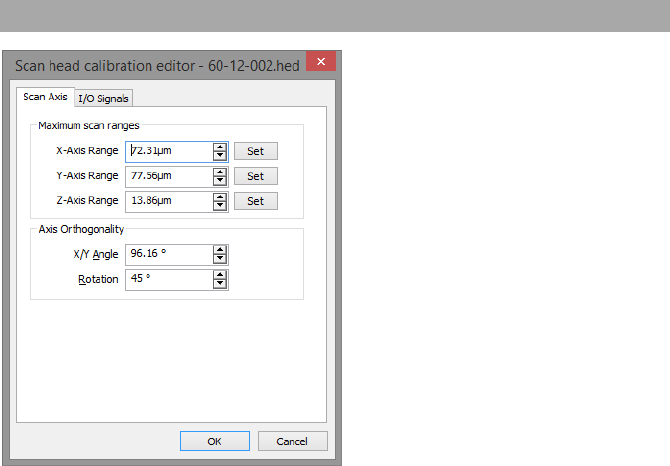
CHAPTER 14: OPTIONS AND SETTINGS
222
Maximum scan ranges
X/Y/Z-Axis Range
The calibration values of each of the scanner axes. The calibration values are given as the
maximum motion range of the scanner (Overscan is set to 0% and X/Y Angle set to 90° and
the Axis Orthogonality Rotation of 0° [or a multiply of 90°]).
Set
The Set buttons open the Scan Axis Correction dialog (page 225).
X/Y/Z-Axis Sensor
If the scan head has position sensors to measure the absolute axis positions, the calibration
values are set here.
Axis Orthogonality
The X- and Y-Axes of the scanner are generally not perfectly orthogonal, and their
orientation with respect to the scanner housing may vary. The controller corrects these
errors by adding/subtracting some of the X scanner command signal to the Y scanner
command signal and vice versa.
14.4.1: Scan Axis
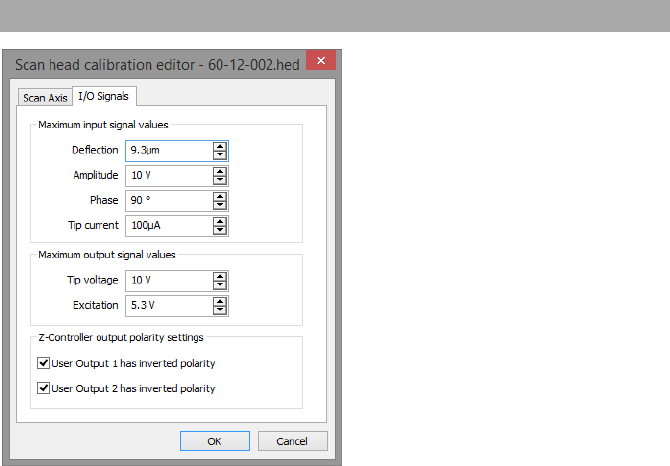
SCAN HEAD CALIBRATION EDITOR DIALOG
223
X/Y Angle
The angle between then the X- and Y-axis of the scanner hardware. The control software
uses this value to correct the scan command signals such that the scan axes are orthogonal.
Rotation
The angle between the X-axis of the scanner and the X-axis of the microscope body (see
Figure 18-3: Scanner coordinate system (page 250)). The control software uses this value to
correct the scan command signals in such a way that the scan axis is parallel to the X-axis
of the microscope body.
Maximum input signal values
Deflection
The calibration of the cantilever deflection signal. This calibration value is used to convert
the AFM Detector Signal or the STM preamplifier signal (both in Volts) to physical units.
14.4.2: I/O Signals

CHAPTER 14: OPTIONS AND SETTINGS
224
Amplitude
The calibration value of the cantilever vibration amplitude signal.
Phase
The calibration value of the cantilever vibration phase shift signal.
Tip current
The calibration value of the controllers internal Tip current preamplifier sensitivity.
Maximum output signal values
Tip voltage
The calibration value of the Tip voltage setting.
Excitation
The calibration value of the Amplitude of the signal that is used to excite the cantilever in
dynamic force operating modes.
Z-controller output polarity settings
Determines the output o fUser outputs 1 and 2. These values should normally not be
changed.
Important
Deflection sensitivity depends on laser alignment and cantilever length. Since 2013, this
deflection sensitivity calibration is by definition the deflection sensitivity of a static
mode, 440-μm long, 50-μm wide cantilever with the laser aligned at the end of the
cantilever (measured with an XYCONTR cantilever). When using other cantilevers or
older scan heads, the deflection in m and the force in N will not be correct, and should
be calibrated.
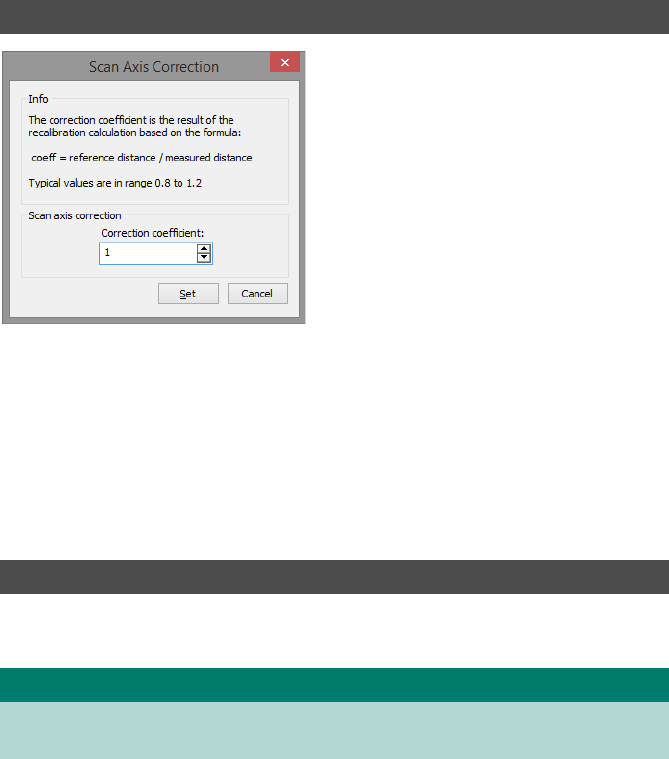
SCAN AXIS CORRECTION DIALOG
225
This dialog can be used to correct the scan range by entering a correction factor based on
a measured distance and a known real distance.
This correction factor could for example be determined by evaluating the height
information in a measurement of a calibration grid with known properties.
Scan axis correction
Correction coefficient
The scan range is multiplied with this number when the “Set” button is clicked.
The Scan Head Diagnostics dialog displays the current status of the scan head. It is opened
by clicking the “Diagnostics” button in scan head group of the Settings tab.
14.5: Scan Axis Correction dialog
14.6: Scan Head Diagnostics dialog
Tip
The Scan Head Diagnostics dialog cannot be accessed once the tip has been
approached to the sample. In this case, retract the tip first.
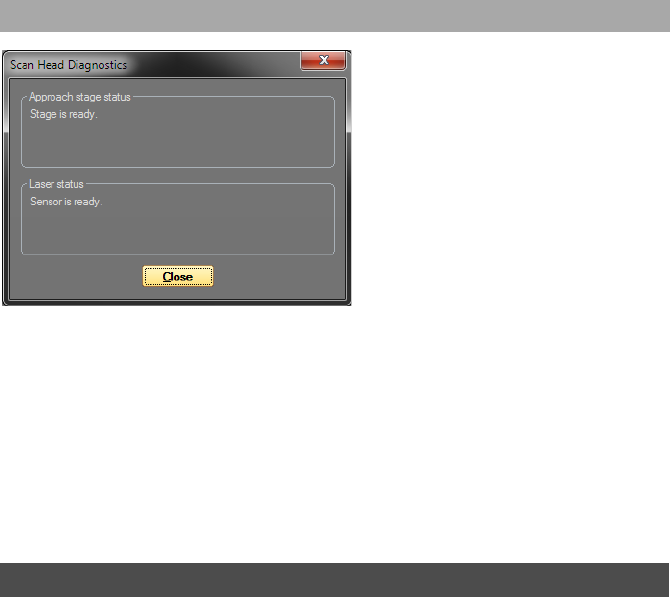
CHAPTER 14: OPTIONS AND SETTINGS
226
Approach stage status
Status about the motorized approach stage is shown here.
Laser Status
Status about the laser / detector system is shown here.
If the Status light on the NaioAFM controller in the Naio control software is blinking red,
more detailed information about the failure is displayed here (see also Section 17.3.1: Laser
fail (page 241)).
?
With this dialog some controller hardware related settings can be configured. On a
correctly installed system, it should not be necessary to change these settings manually.
The Controller configuration dialog is opened via the “Controller” button in the Hardware
group of the Settings tab.
14.6.1: Dialog for AFM scan heads
14.7: Controller configuration dialog
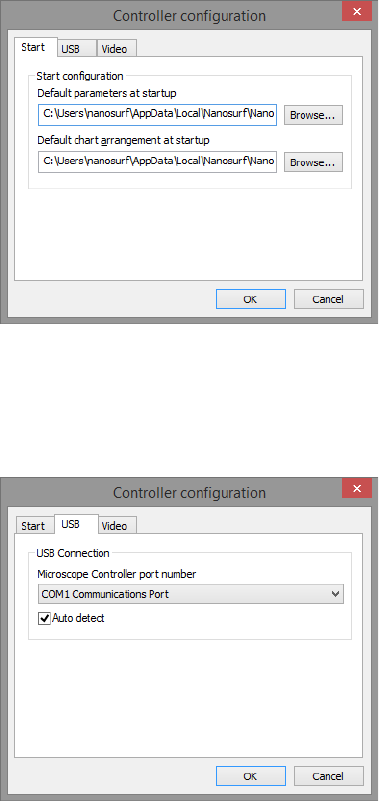
CONTROLLER CONFIGURATION DIALOG
227
Start configuration
The parameter and chart arrangement files that are loaded when the Naio control software
starts. Each Windows user has his/her own set of these two files a personal “Local Settings”
folder. Therefore, each windows user can configure the control software to his/her own
personal preferences without any consequences for other users.
USB Connection
The NaioAFM controller uses a virtual serial port that is connected to the USB port. The
number of this virtual serial port should be the same as the one shown in your the windows
device manager dialog.
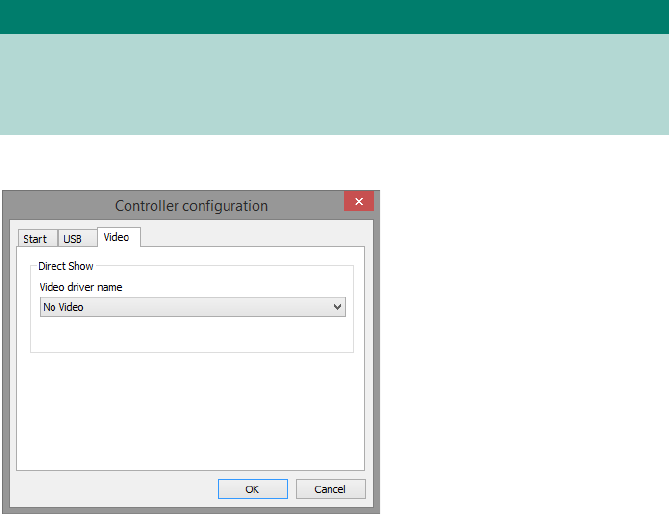
CHAPTER 14: OPTIONS AND SETTINGS
228
Activate “Auto detect” to let the control software search for the right COM port at each
program start. This is highly recommended, because Windows assigns individual COM port
numbers to different USB connectors. With auto detect, you will be able to plug in the USB
cable to different ports.
Video signal
Allows selection of an additional video source to be shown in the video panel. The driver
of the optional sideview camera is selected here.
Select “No video” in the list if you wish to completely suppress the video display.
Tip
If the port number is set to “No controller (simulation only)” and “Auto detect” is
switched off, the control software will always start in simulation mode. This could be
useful if the software will be used mainly for analysis and is installed on a PC without
microscope hardware.
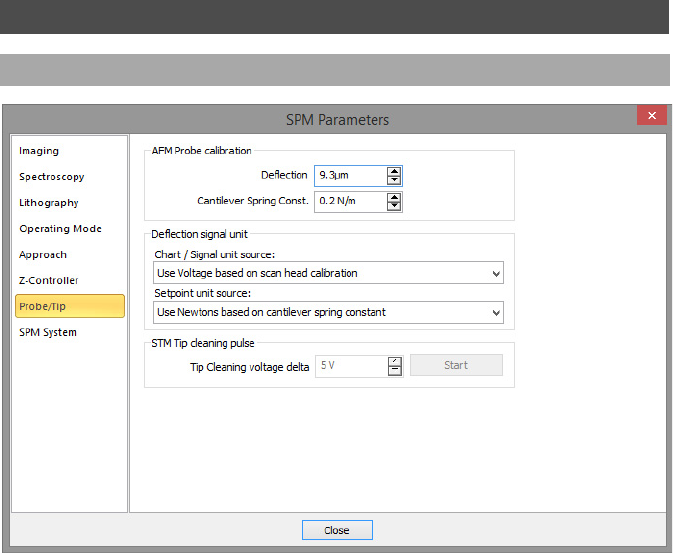
SPM PARAMETERS DIALOG
229
AFM probe calibration
Deflection
This parameter should be set to the maximum cantilever deflection that can be acquired.
The Sensitivity in m/V is equal to maximum Deflection / 10.V. The maximum deflection
depends on the cantilever type and the position of the laser on the cantilever. The
maximum deflection decrease (sensitivity increases) with cantilever length and with the
distance between the laser spot and the fixed end of the cantilever.
A default value of Deflection is loaded when the scan head calibration file is loaded. This
value is only correct for CONTR or XYCONTR cantilevers, depending on when the scan head
was calibrated.
If you use a different cantilever than the default calibration (C3000 , or a different laser
alignment), you should re-determine this value using deflection versus distance
spectroscopy.
14.8: SPM parameters dialog
14.8.1: Probe/tip page
CHAPTER 14: OPTIONS AND SETTINGS
230
Cantilever spring const.
This value defines the spring constant of the selected cantilever, as used by the Naio control
software for internal calculations. Its default value is taken from the currently selected
cantilever’s database entry (see Section 8.9: Cantilever Browser dialog (page 91)). Each time
a new cantilever is selected, this value is overwritten to the default value of the newly
selected cantilever. This default value may be not precise enough for very accurate force
measurements. In such cases, you may overwrite it by a measured value (e.g. a calculated
spring constant, based on a mechanical cantilever model and the resonance of the
cantilever; refer to technical note TN00865 Determining the Cantilever Spring Constant
from its Spectrum for other options to calibrate the spring constant).
Deflection signal unit
For all Static Force operating modes, it is possible to select different deflection signal units
to be used for display in Charts/Signal values, and as used for the Setpoint. Three choices
are available for each:
– Use meters based on head calibration
The deflection of the cantilever is displayed in meters. This is the default setting for Chart.
– Use Newtons based on mounted cantilever's spring constant
The deflection of the cantilever is displayed in Newtons in all charts. This is particularly
useful for recording Force–Distance curves with the Spectroscopy Window. This is the
default settings for SetPoint.
– Use meters based on head calibration
The deflection of the cantilever is displayed in Volt.

CHAPTER 15:
Quick reference

232
Dialogs
About ............................................................... 245
Auto Frequency Config ................................98
Cantilever Browser .........................................91
Cantilever Editor .............................................92
Chart Properties ........................................... 178
Controller Configuration .......................... 226
Digital Video Properties ............................ 105
File Rename ................................................... 190
Imaging Wizard ...................................115, 116
Layer Editor .................................................... 164
Mask Editor .................................................... 188
Object Editor ................................................. 166
Options ............................................................ 212
Pixel Graphic Import ................................... 161
Scan Axis Correction ................................... 225
Scan Head Calibration ............................... 221
Scan Head Diagnosis .................................. 225
Scan Head Selector ..................................... 220
Spectroscopy Wizard ................................. 133
SPM Parameters ..............................................76
Vector Graphic Import ............................... 159
Vibration Frequency Search .......................94
Operating windows
Imaging ........................................................... 113
Lithography ................................................... 153
Spectroscopy ................................................ 129
Panels
Data Info ......................................................... 174
Gallery .............................................................. 186
Imaging ........................................................... 117
Online .............................................................. 107
Spectroscopy ................................................ 142
Video ................................................................ 102
Ribbon tabs/groups
Acquisition ..................................................... 122
Approach ............................................... 109
Imaging .................................................. 122
Lithography .......................................... 167
Preparation ..............................................80
Scripting .................................................123
Analysis ............................................................191
Correction ..............................................194
Filter .........................................................198
Measure ..................................................192
Report .....................................................201
Roughness .............................................196
Tools ........................................................200
File ........................................................... 205, 210
Chart arrangement ............................211
Exit ...........................................................207
Export ......................................................206
Open ........................................................205
Options ...................................................211
Parameters ............................................210
Print/Print preview .............................207
Save/Save as .........................................206
Settings ...........................................................218
Hardware ...............................................219
Scan Head ..............................................219
View .................................................................... 75
Panels ........................................................ 75
Window .................................................... 76
Workspace ............................................... 75
Toolbars
Data Info ..........................................................175
Digital Video Camera ..................................103
Gallery ..............................................................187
Imaging ...........................................................120
Lithography ...................................................168
Quick Access ..................................................205
Spectroscopy .................................................143
Quick reference

PART C:
APPENDICES

CHAPTER 16:
Maintenance
0
0

CHAPTER 16: MAINTENANCE
236
To ensure fault-free operation of the microscope, the maintenance instructions below have
to be observed.
It is important to keep the open parts of the scan head clean. Therefore, always close the
NaioAFM system and store it in a dust-free and dry environment when it is not in use. If
exposed to moisture (high humidity) over a prolonged period, corrosion will occur.
To clean the alignment chip when it has become dirty:
>Blow away dust using dry, oil-free air or use a soft brush.
To clean the exterior of the NaioAFM system:
>Use a soft cloth, lightly moistened with a mild detergent solution. Do not use any
abrasive pads or solvents like alcohol or spirits.
16.1: Introduction
16.2: The NaioAFM scan head
CAUTION
When using a (compressed gas) air duster to clean the alignment chip on the NaioAFM
scan head, be sure to place the DropStop and to only gently blow over the alignment
chip rather than fully onto it. A failure to do so will results in strong air currents inside the
scan head that could damage sensitive wires belonging to the scan head electronics!
16.3: The NaioAFM exterior

CHAPTER 17:
Problems and
solutions
0
0
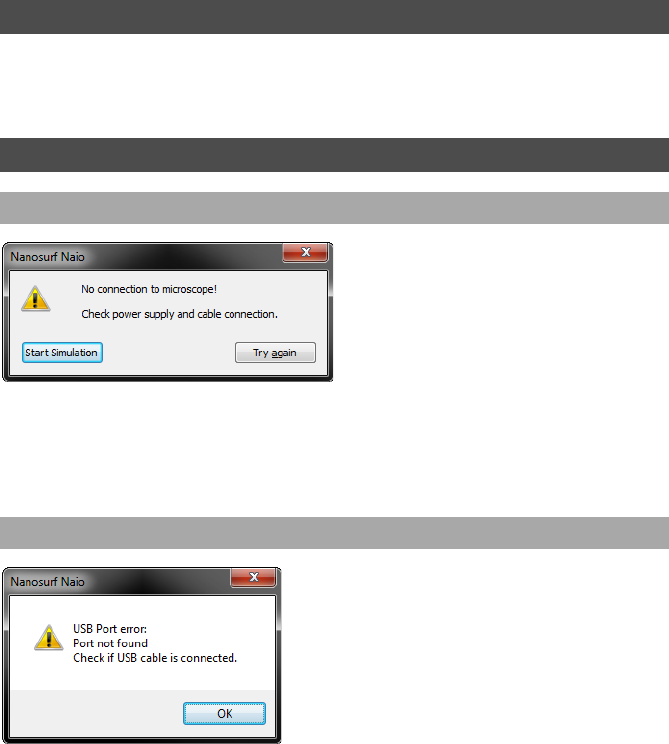
CHAPTER 17: PROBLEMS AND SOLUTIONS
238
The problems described here can occur during normal operation of the microscope. If the
suggested course of action does not solve the problem, or the problem is not described
here, refer to Section 17.4: Nanosurf support (page 243).
This error message appears when the Naio software is waiting for an answer from the
controller. Most likely, the NaioAFM is not connected to the mains power, or it is not turned
on. In this case the power LED on the side of the NaioAFM is off. To fix this problem:
>Check the connections and the power switch.
The USB serial converter is not available. The USB cable is not properly connected. To fix this
problem:
1Check if the a second copy of the Naio control software is already running and
occupying the USB port.
2Check that the USB cable is properly connected.
17.1: Introduction
17.2: Software and driver problems
17.2.1: No connection to microscope
17.2.2: USB Port error

SOFTWARE AND DRIVER PROBLEMS
239
If this does not solve the problem, check if there is a driver problem with the USB Serial
port/USB Serial converter drivers, as described in the next section.
If you have trouble connecting to the controller, or if the video image in the positioning
window is not available, it is possible that one of the drivers of your instrument is causing
problems, for example because the installation did not work, or the installation of some
other hardware is in conflict with the drivers of the NaioAFM. In order to solve driver
problems:
1Check for driver updates on the Nanosurf Support web site.
2Insert the installation CD for your instrument.
3Log in with Administrator privileges.
The device manager can then be opened to view and correct any driver problems:
1Open the windows menu “Start” >> “Control Panel”.
The control panel now opens.
2Select “Large icons” or “Small icons” if “View by” is set to “Categories”.
3Double-click the “Device Manager” icon.
The device manager now opens.
When the device manager opens and your controller is connected to your computer, you
may see the drivers shown in Figure 17-1: Device manager (information may vary depending
on the configuration of your system).
If there are problems with any of these drivers, or a wrong driver is installed, you can try to
do the following to fix this:
1Double click on the driver.
Properties dialog for the device now opens.
2Select the “Driver”-tab.
3Click the “Update Driver”-button
Windows will now ask you where to look for the driver.
4Instruct windows to manually search for the driver files on the Installation CD.
17.2.3: Driver problems
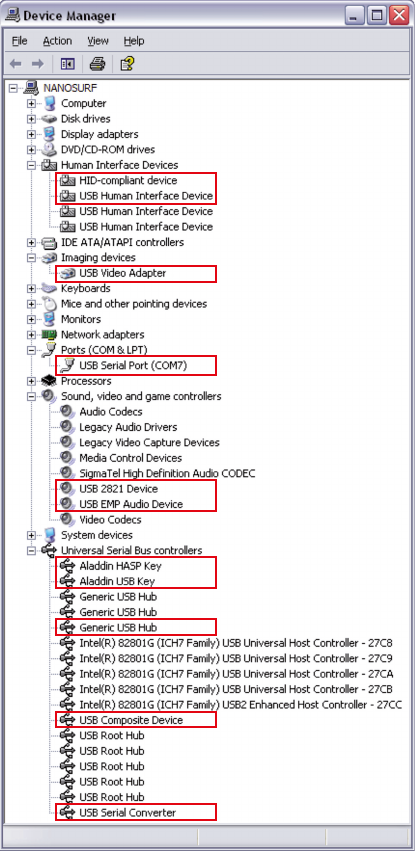
CHAPTER 17: PROBLEMS AND SOLUTIONS
240
Figure 17-1: Device manager. The drivers that may be installed on your system when your controller
is connected to the computer.
Nanosurf Analysis (SPIP) dongle
Framemaker grabber driver
for Video Module v1
USB to Serial converter (part 1)
Framemaker grabber driver
for Video Module v2 (part 1)
Nanosurf Report dongle
USB Hub
Framemaker grabber driver
for Video Module v2 (part 2)
USB to Serial converter (part 2)
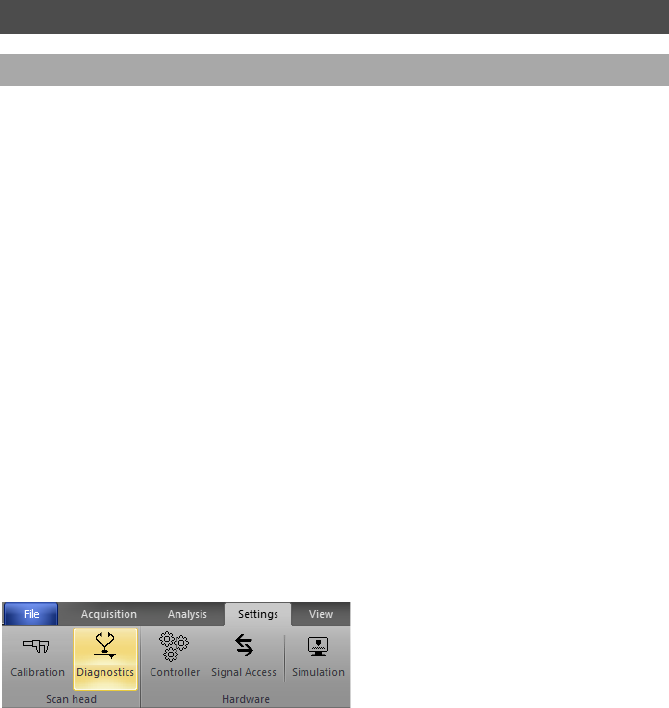
AFM MEASUREMENT PROBLEMS
241
Laser fail will occur when an insufficient amount of light reaches the detector of the
cantilever deflection detection system. This can either be due to the DropStop still being
closed or to a misaligned cantilever.
If the dropStop is still present:
>Remove it.
To check for a misaligned cantilever:
1Open the scan compartment.
2Make sure that the cantilever is lying perfectly in the alignment chip (for details, see
Figure 3-6: Cantilever alignment (page 32)).
If the cantilever is not well-aligned, there may be dust between the cantilever and
alignment chip. To correct this:
ARemove the cantilever as described in Section 3.3: Installing the cantilever (page
27).
BBlow away dust from the alignment chip and the back side of the cantilever using
dry, oil-free air. Mount the cantilever again.
For further details on the status of the laser detection system, open the Scan Head
Diagnostics dialog:
1In the Scan Head group of the Settings tab, click the “Diagnostics” button:
The Scan Head Diagnostics dialog now opens.
2Check the laser efficiency and position on the photodiode detector.
In some rare cases, the blinking of the Probe Status light may be caused by light from
external sources reaching the photodiode detector. If this is the case:
>Turn off/down the external light source, or shield the scan head from its influence.
17.3: AFM measurement problems
17.3.1: Laser fail

CHAPTER 17: PROBLEMS AND SOLUTIONS
242
If the automatic approach fails, the Setpoint may either be too high, or the distance
between tip and sample is larger than the maximum automatic approach range of the scan
head. To solve these issues, try the procedures below (if necessary, try each and/or both
procedures repeatedly until the automatic final approach is successful).
To check for a low Setpoint, repeat the approach as follows:
1In the Approach group of the Acquisition tab, click the “Home” button to fully retract
the cantilever.
2Decrease the Setpoint by 5-10% (see Z-controller section (page 118)) and Section 4.1.1:
Entering and changing parameter values (page 40) for details on how to do this).
3Repeat the automatic final approach as described in Section 4.3.2: Automatic final
approach (page 44).
To check for a large tip–sample distance, repeat the approach as follows:
1In the Approach group of the Acquisition tab, click the “Home” button to fully retract
the cantilever.
2While watching the side view of the cantilever, manually approach a bit further by
pressing the “Advance” button.
3Repeat the automatic final approach as described in Section 4.3.2: Automatic final
approach (page 44).
If both of these procedures do not solve the problem, check the status of the cantilever
deflection detection system (Section 15.6: Scan Head Diagnostics dialog (page 270)) or try
installing another cantilever.
Tip picks up material
When a scan line suddenly starts reproducing badly, the tip may have picked up some
particles.
To get rid of these particles, follow the procedure below until the image quality improves:
1Continue measuring for a while (1–2 images), as the tip may eventually lose these
particles again.
2In the Approach group of the Acquisition tab, click the “Withdraw” button to retract
the cantilever, and then perform a new approach.
17.3.2: Automatic final approach fails
17.3.3: Image quality suddenly deteriorates

NANOSURF SUPPORT
243
3Try to induce changes in the tip end:
AWhile measuring, increase the force “Setpoint”, or decrease the amplitude
“Setpoint” in the Z-Controller section of the Imaging window.
BRestore the Setpoint to its old value when the contrast improves, or if nothing
happens after scanning several lines.
4Change the cantilever if no improvement occurs after following the steps above.
Setpoint drift
When part of the scan line in the Line graph is drawn red, the tip has moved to its maximum
or minimum Z-position. This should also be visible in the range display on the right hand
side of the graph. The tip will move to its maximum Z-position when it has lost contact with
the sample. To correct this:
1In the Static Force based modes, increase the force Setpoint, in the dynamic force
based modes, reduce the amplitude Setpoint.
2If this does not help, retract and re-approach the tip.
The fastest way to solve a problem is often to solve it yourself. If the previously suggested
actions did not help, or the problem is not described here, refer to the Nanosurf support
pages:
1Open www.Nanosurf.com.
2Click on “Company” and “Support”.
3Enter the login and password combination that you received upon registering.
4Select the NaioAFM link.
5If the problem is software related, try to upgrade to the latest version and/or read the
“SPM software version history.pdf” file to see if the problem was solved. For the
solution to other problems, refer to the frequently asked questions (FAQ).
If your instrument has not been registered yet, you will first have to register to receive a
password.
17.4: Nanosurf support
17.4.1: Self help
CHAPTER 17: PROBLEMS AND SOLUTIONS
244
If the standard solutions are not sufficient, contact your local distributor for help. In order
to resolve the problem as fast as possible, please provide as much information as possible,
such as:
• A detailed description of what happened before the problem occurred. For example:
“When I click the ‘Approach’ button, then quickly click abort, the controller will not react
to anything I do anymore. This only happens when measuring in dynamic force mode.”
• If an error message was displayed: The exact text of the message, or at least the start of
the message.
• The serial number of your scan head and/or controller.
• A description of the computer hardware and software on which the control software is
running: computer brand, type (laptop or desktop), operating system, software version
etc.
• Original Nanosurf image data (.nid) files that show the problem, rather than bitmap
screen shots, because these files contain all the settings that were used to make them.
• Parameter (.par) files with the instrument settings that were used when the problem
occurred.
• Script files, if the problem occurs during the operation of a script.
17.4.2: Assistance
IMPORANT
Sending “.vbs” scripts by e-mail often does not work, because these files are usually
blocked as a security measure. To successfully e-mail a script, you may either:
• Add the script text to the body of the e-mail.
• Change the extension of the script file to “.txt” and attach it to the e-mail.
• Compress the script file to a “.zip” archive and attach it to the e-mail.
ABOUT DIALOG
245
The About dialog displays information that may be useful for diagnostics when you have
problems with your instrument. The About dialog is opened by clicking the “Information”
button on the upper right corner of the program window, just below the “close window”
button:
The About dialog contains the following information:
• The version number of the control software.
• The serial number of the controller (when the microscope simulation is active, the serial
number “0xx-00-000” is displayed).
• The version number of the firmware that is running on the controller.
• The version number of all modules built into the controller.
• The version number of all installed software options.
• Contact information for getting more support.
17.5: About dialog
CHAPTER 17: PROBLEMS AND SOLUTIONS
246

CHAPTER 18:
AFM theory
0
0
CHAPTER 18: AFM THEORY
248
The NaioAFM is an atomic force microscope, which is part of the family of scanning probe
microscopes. With the first scanning probe microscope, the scanning tunneling
microscope (STM), it became possible to look into the fascinating world of atoms. The STM
was developed by Gerd Binnig and Heinrich Rohrer in the early ’80s at the IBM research
laboratory in Rüschlikon, Switzerland. For this revolutionary innovation, Binnig and Rohrer
were awarded the Nobel prize in Physics in 1986.
However, the STM technique is restricted to electrically conducting surfaces. An extension
of this technique, called the Atomic Force Microscopy (AFM), was developed by Gerd
Binnig, Calvin Quate and Christoph Gerber. The AFM also allowed insulating materials to be
analyzed. Both the AFM and the STM microscopy techniques work without optical focusing
elements. Instead, a small sharp probing tip is scanned very closely across the sample
surface. The distance between the tip and the sample surface is so small that atomic-range
forces act between them. In an AFM, a tip is attached to the end of a cantilever in order to
measure these forces. The force acting on the tip can then be determined by detecting the
deflection of this cantilever (see Figure 18-1: Cantilever).
The measurement of the cantilever deflection can be used to control the tip–surface
distance on an atomic scale. Thus, enormous resolution can be achieved, so that even the
atomic arrangement of surfaces can be probed. This measurement is a so-called static
operating mode, in which the static deflection of the cantilever is used. Generally, the
forces acting on the tip will cause it to snap onto the sample, which result in an effective,
nanometer-range flattening of the tip, and friction and stiction between the tip and the
sample.
To circumvent the aforementioned problems, the so-called dynamic force microscopy
modes can be used, as was pointed out by the AFM inventors. In these modes, the
cantilever vibrates during the operation. In the dynamic modes, changes in the free
18.1: Scanning probe microscopy
Figure 18-1: Cantilever. 228 μm long micro-fabricated silicon cantilever with integrated tip.
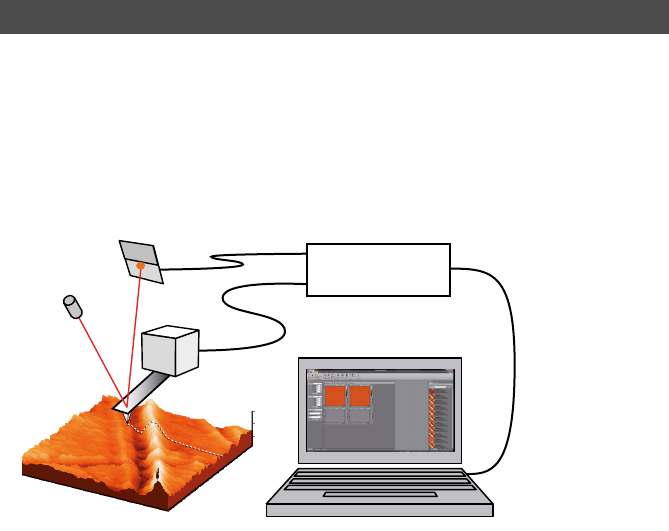
THE NAIOAFM
249
resonance frequency and the damping of the cantilever vibration caused by the forces
between the tip and the cantilever can be measured and used to regulate the tip–sample
distance.
To achieve atomic resolution, ultra-clean and flat surfaces prepared in highly sophisticated
vacuum systems are needed. Nevertheless, measurements in air can give useful results for
many technically relevant surfaces. In this manual, the use of the dynamic modes in air on
such surfaces is described.
The NaioAFM is an AFM that can be used in both static and dynamic operating modes . The
AFM cantilever is a microfabricated cantilever with an integrated tip mounted on a
cantilever holder chip.
When the sensor tip comes in contact with the sample, a repulsive force that increases with
decreasing tip–sample distance acts on it. In the static force operating mode, the bend of
the cantilever, due to the force acting on its tip, is measured using a cantilever deflection
detection system.
In dynamic operating modes, the cantilever is excited using a piezo element. This piezo is
oscillated with a fixed amplitude at an operating frequency close to the free resonance
frequency of the cantilever. The repulsive force acting on the tip will increase the resonance
frequency of the cantilever. This will cause the vibration amplitude of the cantilever to
decrease. The vibration of the cantilever is also detected using the cantilever deflection
detection system.
18.2: The NaioAFM
Figure 18-2: SPM system. Cantilever with deflection detection system scanning the sample. The
sample is visualized on a computer with installed scan software, which also directs the scan itself.
Control
electronics
XY
Z
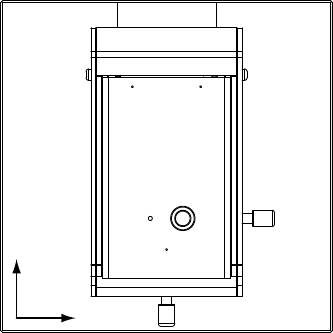
CHAPTER 18: AFM THEORY
250
The measured laser beam deflection or cantilever vibration amplitude can now be used as
an input for a feedback loop that keeps the tip–sample interaction constant by changing
the tip height. The output of this feedback loop thus corresponds to the local sample
height.
An image of the surface is made by scanning over the sample surface in the X and Y
direction. The sample structure image is now obtained by recording the output of the
height control loop as a function of the tip position. The direction of the X- and Y-axes of
the scanner is shown in Figure 18-3: Scanner coordinate system. The scanner axes may not
be the same as the measurement axes, when the measurement is rotated, or the
measurement plane is tilted. Therefore, the image X- and Y-axes are denoted by an asterisk
to avoid confusion (i.e. X*, Y*).
Figure 18-3: Scanner coordinate system
X
Y

CHAPTER 19:
Technical data
0
0
0
CHAPTER 19: TECHNICAL DATA
252
The specifications given in this chapter represent typical values of the Nanosurf NaioAFM
system. The exact specifications of all components belonging to your system are given on
the calibration certificate delivered with the instrument.
19.1: Introduction
19.2: The NaioAFM
19.2.1: Specifications and features
NaioAFM Specifications and Features
Max. scan range / scan height (resolution) (1) 70 μm (1.0 nm) / 14 μm (0.2 nm)
Static / Dynamic RMS Z-noise typ. 0.4 nm (max. 0.8 nm) / typ. 0.3 nm (max.
0.8 nm)
Max. sample size / height 12 mm / 3.5 mm
Max. sample stage positioning range 12 mm travel in each direction (6 mm from
center to all sides)
Top view camera
3×3 mm FOV, 4× digital zoom, 2 μm optical
resolution, 2048×1536 pixels, in-axis LED
illumination
Side view observation
5×5 mm FOV, variable LED illumination
(with optional side view camera:
2×2 mm FOV, 1280×1024 pixels)
Approach 4 mm linear motor, continuous or step-by-
step approach
Imaging modes Static Force, Dynamic Force, Phase
Contrast, MFM, EFM
Advanced imaging modes (2) Spreading Resistance, Force Modulation
Spectroscopy modes Force–Distance, Amplitude–Distance,
Voltage–Distance
Advanced spectroscopy modes (2) Current–Voltage, Stop by end value, Fwd &
Bwd pause
(1) Manufacturing tolerances are ±10%
(2) Naio Advanced Modes Option required
Cantilevers used in conjunction with the NaioAFM should have the following properties: (i) Grooves that are
compatible with the alignment chip used by Applied Nanostructures, BudgetSensors, NanoSensors, NanoWorld,
and VISTAprobes, (ii) a nominal length of 225 μm or more, and a width of 40 μm or more, (iii) a coating on the
backside of the cantilever that reflects (infra)red light.
THE NAIOAFM
253
Lithography modes Static Force, Dynamic Force, Oxidation
Advanced lithography modes (2) Draw and load CAD vector graphics, Bitmap
images
Remote control/add-ons (2)
Windows scripting interface: compatible
with LabView, C#, Visual Basic, MatLab, and
other software...
Operating system/PC requirements
Windows XP/Vista/7 (32/64-bit), 1280x1024
pixels screen resolution, Core2 CPU, 4 GB
RAM, 1 free USB 2.0 port
Tip voltage ±10 V (in 5 mV steps)
Tip current measurement (2) ± 100 μA (3 nA resolution)
Dynamic frequency range 15–500 kHz (0.1 Hz resolution)
Phase contrast range ± 90° (0.05° resolution)
Phase reference range 0–360°
Size (LWH) / Weight / Power 204×204×160 mm / 6.5 kg / 100–240 VAC
(30 W)
NaioAFM Specifications and Features (Forts.)
(1) Manufacturing tolerances are ±10%
(2) Naio Advanced Modes Option required
Cantilevers used in conjunction with the NaioAFM should have the following properties: (i) Grooves that are
compatible with the alignment chip used by Applied Nanostructures, BudgetSensors, NanoSensors, NanoWorld,
and VISTAprobes, (ii) a nominal length of 225 μm or more, and a width of 40 μm or more, (iii) a coating on the
backside of the cantilever that reflects (infra)red light.
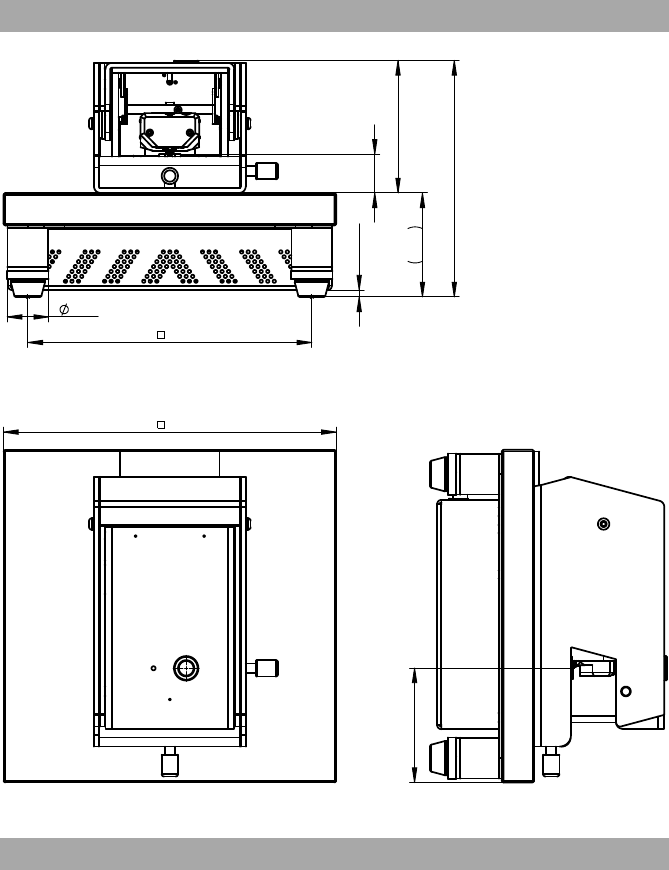
CHAPTER 19: TECHNICAL DATA
254
Many commercial cantilever types are compatible with the NaioAFM scan head, but there
are some requirements with regard to Light reflection and Alignment that must be met (see
19.2.2: Dimensions
Figure 19-1: The Nanosurf NaioAFM. Front view. All dimensions in mm.
Figure 19-2: The Nanosurf NaioAFM. Top and side view. All dimensions in mm.
19.2.3: Cantilever requirements and considerations
4.3 max.
23.7
81.2
63.8
145
25.4
174
204
70.2

THE NAIOAFM
255
below). If the cantilever type that you wish to use does not meet these requirements,
please contact your local distributor or Nanosurf Support to see if a similar, compatible
cantilever can be found.
Light reflection
Reflective coating
The cantilever should have reflective coating to prevent optical interference between light
reflected from the cantilever and light reflected from the sample.
Width
The top width should be 40 μm or more (please distinguish between mean width specified
by most manufacturers and the actual top width of trapezoid-shaped cantilevers).
Alignment
Alignment grooves
The used cantilever must have alignment grooves (available from Applied Nanostructures,
Budgetsensors NanoSensors, NanoWorld, TeamNanotec Aspire, VISTAprobes)
Tip position
The scan head should always have the tip aligned to the same position. Cantilever
manufacturers have used two alignment strategies: to keep the tip-end of the cantilever
aligned or to keep the fixed end of the cantilever aligned. For 220-μm long cantilevers, both
strategies will work. Applied Nanostructures (and Team Nanotec Aspire) cantilevers always
have tip-alignment. Nanosensors and Nanoworld cantilevers only have tip alignment for
XY-type series.
Without XY alignment, cantilevers longer than 220 μm will work, but with the deflection
range increased by a factor 1.5. Shorter cantilever will not work, because the laser will not
hit the cantilever.
Resonance frequency
Scan head sensitivity slowly decreases at frequencies above 100 kHz, thus the use of
cantilevers with resonance frequencies above 200 kHz becomes impractical.
Important
Never put a grooveless cantilever in the AFM. The cantilever would damage the
alignment chip. In addition, the cantilever will probably not be in the focal plane of the
laser beam, thereby causing large interferences.
CHAPTER 19: TECHNICAL DATA
256
NaioAFM Side View Camera
Allows convenient display of the side view in the Naio control software, alongside the
already integrated top view.
Naio Advanced Modes Option
Adds advanced imaging modes, advanced spectroscopy modes, advanced lithography
modes, and remote controls/add-ons to your NaioAFM system (see Section 19.2.1:
Specifications and features).
C3000 signal I/O option
Clock input
• Input for an external digital clock
(10 MHz, ±1 V)
• Synchronization of internal Lock-In,
PLL, function generators
Analog inputs • 2 user inputs for imaging and spectroscopy
Analog outputs • 2 user outputs for spectroscopy modulation,
Z-control, etc.
Digital sync • 2 digital outputs for synchronization
Table 19-1: C3000 signal I/O option
C3000 stage control option
Drivers • Direct control for all supported stage
controllers
Manual move • Via buttons in the C3000 control software
Batch manager • Automated movement via position list and
scripts
Table 19-2: C3000 stage control option
C3000 PFM work package
Extends the advanced modes option with the Piezoresponse force microscopy (PFM)
mode through a special user interface. In addition to the standard signals, amplitude and
phase of the piezo response signal can be measured during imaging and spectroscopy
Table 19-3: C3000 PFM work package
19.2.4: Compatible Options and Accessories
THE NAIOAFM
257
Isostage Adapters for Naio
Allow the NaioAFM to be effectively mounted onto the Nanosurf Isostage, thus providing
optimal vibration isolation.
AFM Extended Sample Kit
Provides 10 samples from various disciplines for AFM courses and classes.
CHAPTER 19: TECHNICAL DATA
258