New User Guide
User Manual:
Open the PDF directly: View PDF ![]() .
.
Page Count: 10
Welcome to the RCE!
This is the system that we use to store all datasets used by the team, as well as providing
computing resources for analysis of secure health data.
Basic Rules:
● Do your work in a place the rest of the team can see! This is important to make sure that
all of our team’s work is reproducible, and to make it easier for people to help you if you
need help.
● The RCE’s computing resources should be used for computations involving secure
health data only. Our work is resource intensive, and research on health data can only
be done on the RCE, while other clusters, such as Odyssey, are available for work with
less stringent security requirements.
● Wherever possible, try to avoid duplicating data. We have a large amount of storage
available on the RCE, but it’s important to ensure that we use it as efficiently as possible.
How do I use the RCE? Where do I find the team’s folders?
The most user friendly method of accessing the RCE is using the NoMachine virtual desktop
interface. The RCE documentation page provides a very solid set of instructions for accessing
the system. All of the following instructions assume that the RCE is being accessed via
NoMachine. The link to these instructions are here.
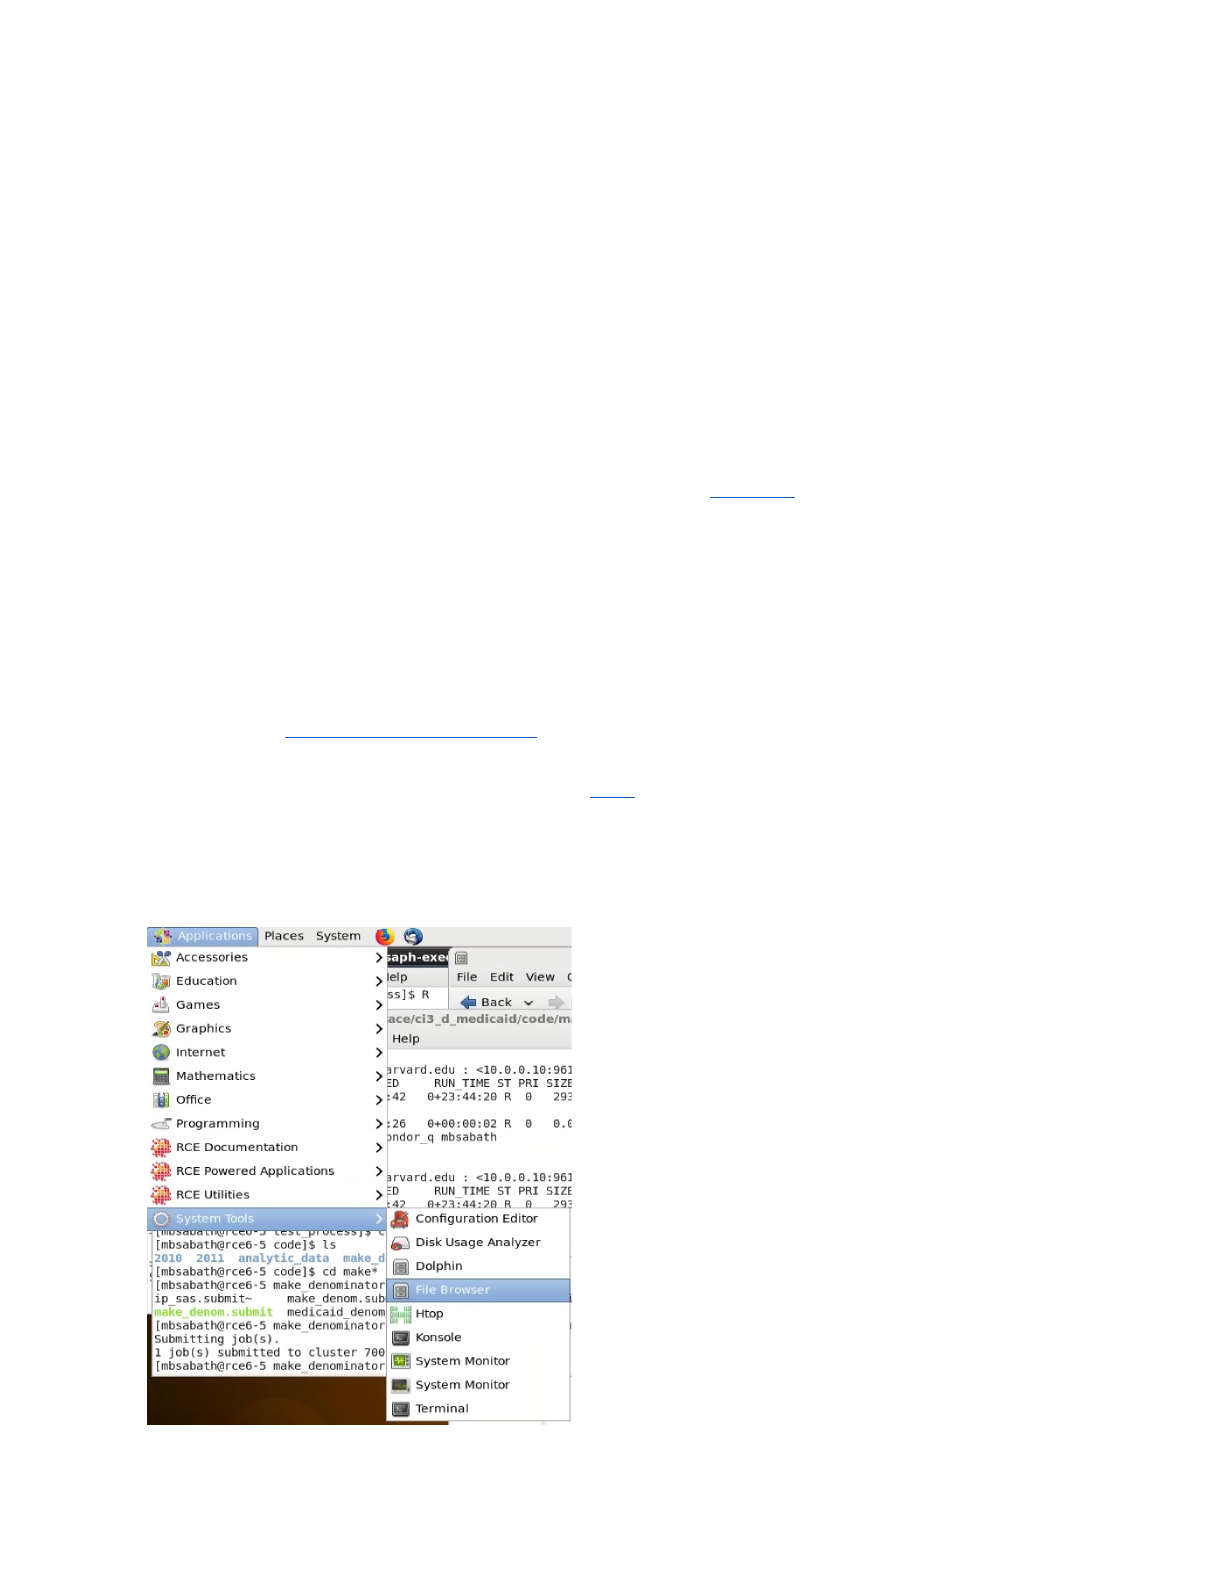
The easiest way to browse across folders on the RCE is to make use of the file browser, the
best method to access the browser is shown below:
Accessing the File Browser
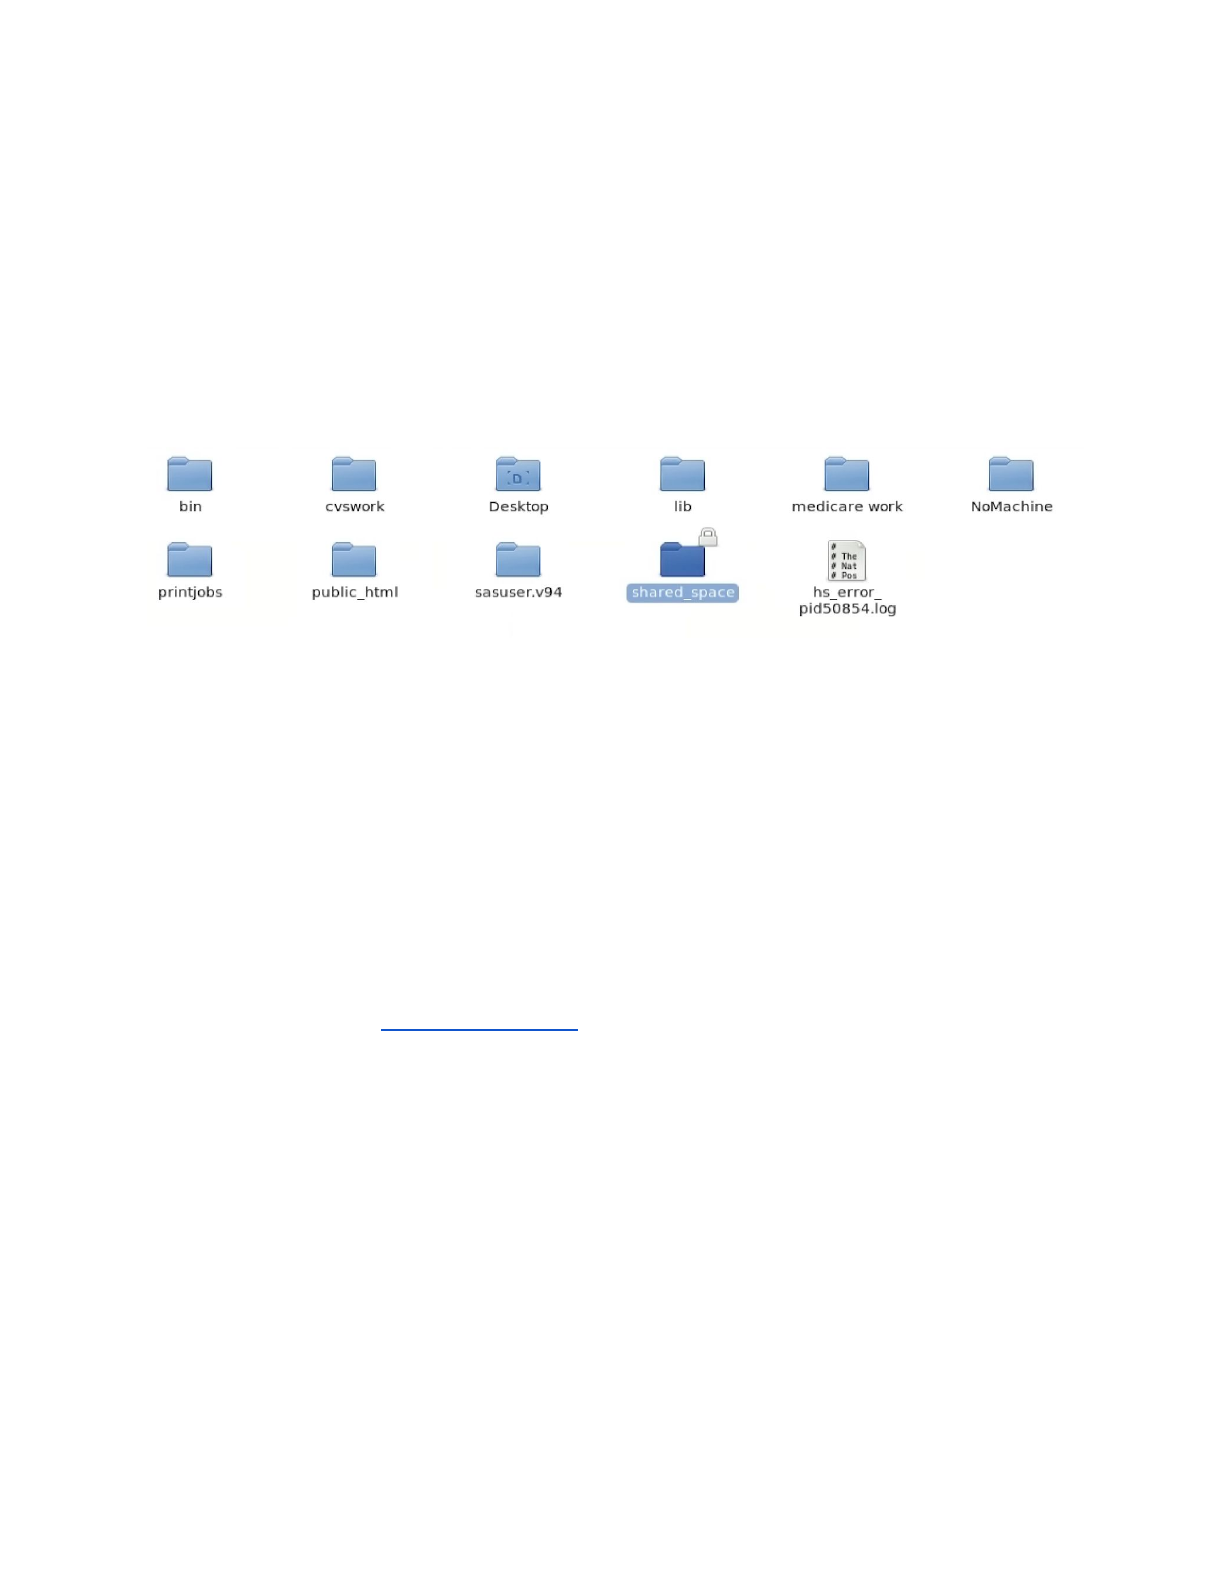
All shared folders of interest are contained in the shared_space, found in a user’s home
directory:
The location of the shared_space
All of the folders shared among the team are in a folder in your home directory called
“shared_space”. Every shared folder you’re allowed to access is located in that folder. If you
can see it, you’re allowed to access it. All folders mentioned in the rest of this document can be
found there unless otherwise specified. One thing you’ll notice is that all of our folders start with
“ci3”. This is because the storage they are on is certified for level 3 data (such as the medicare
and medicaid data we use on the team). If a folder is in your shared space, but doesn’t have the
ci3 prefix, it is not secure and should not be used to store Medicare data.
The RCE allows for R Studio to be run in an interactive way, but running code in batch mode is
a best practice. See the Running Batch Jobs section for details.There are examples of batch
scripts located in ci3_analysis/batch_job_templates.
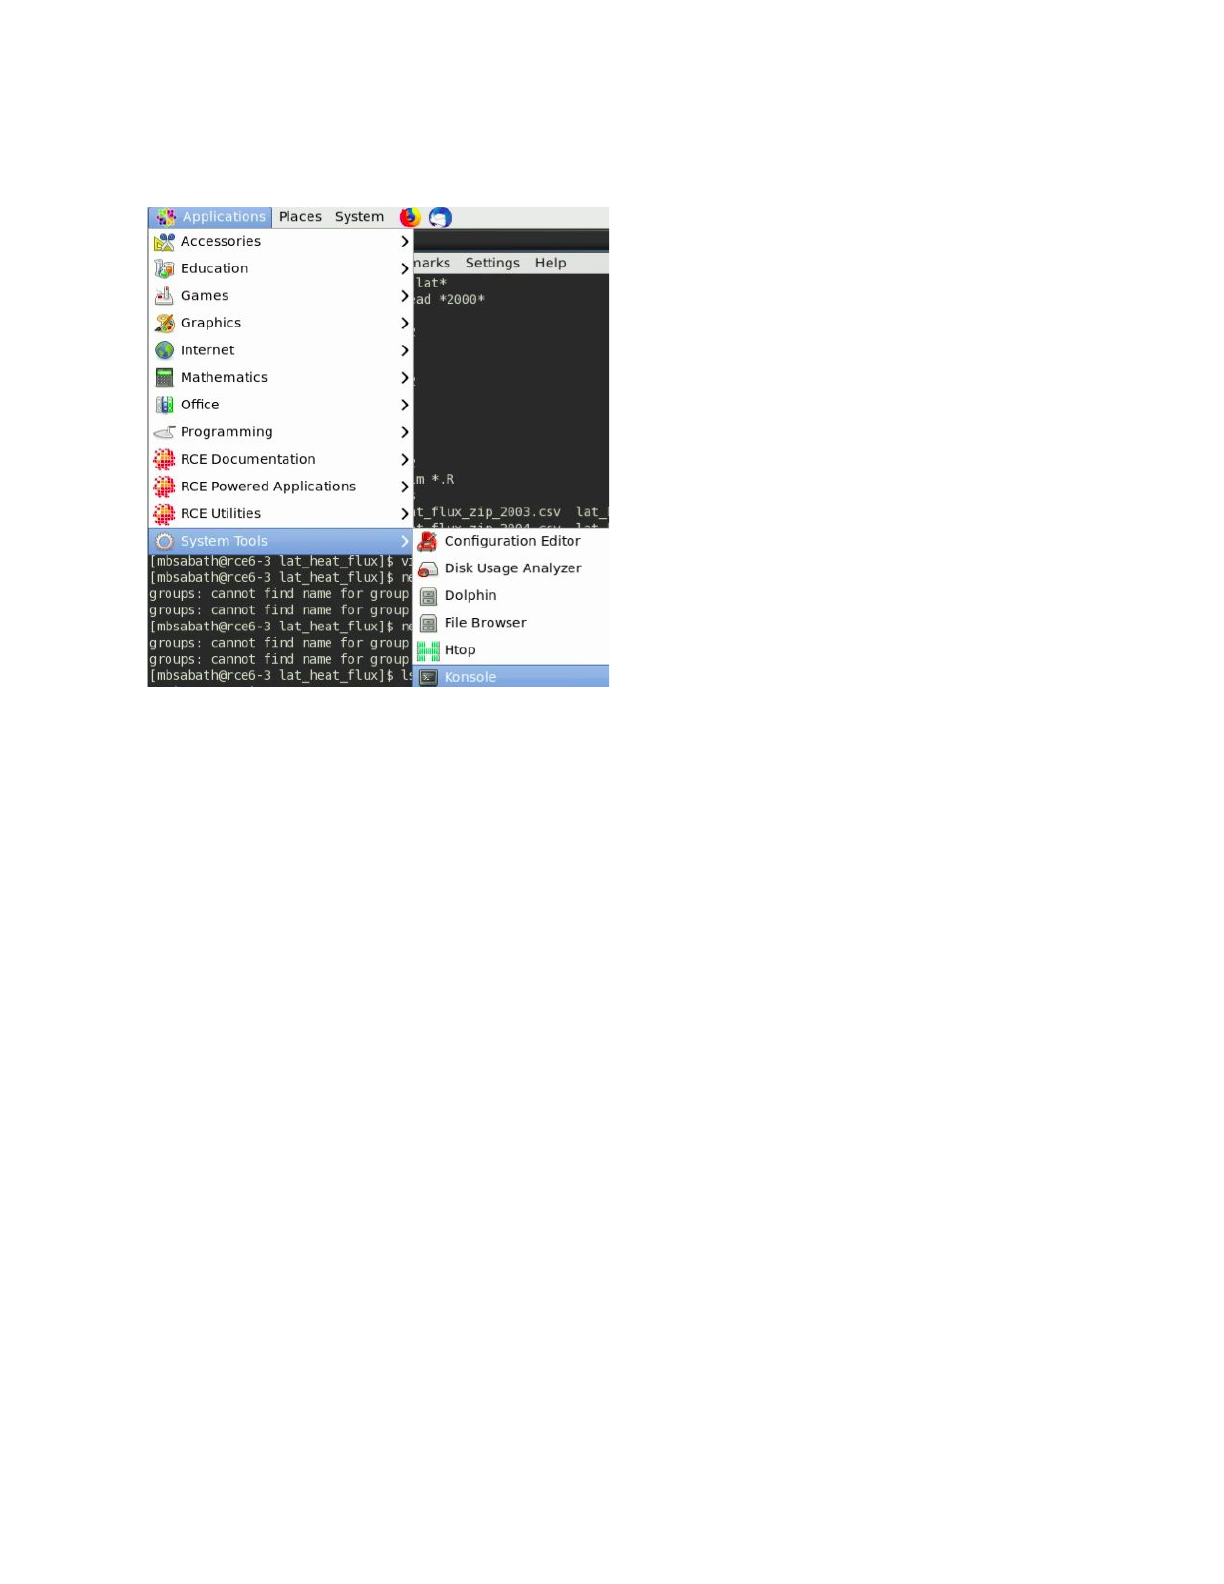
Some tools can only be used via the RCE terminal. To access the command line select the
following option on the No Machine menu:
I want to start a new project? Where should I go?
The folder ci3_analysis was created to hold all of the projects on the team. At the time that this
is being written, there are already a large number of projects in the directory, and that number is
only going to go up. All members of the team have permission to create new project directories.
Because of this, it’s very important to be disciplined about how we document the project
directories.
Here are some basic guidelines for what each directory in analysis should have:
● A clear purpose. Each directory should be devoted to a single analysis project.
Directories shouldn’t serve as a top level directory to hold the personal files of a single
user.
● An short, descriptive name. This should describe what is being analyzed in the project,
and should try to avoid having your name. It’s important for the team to have more
descriptive names so that people in the future can make better use of past research
done by the team.
● A readme file containing the name and email address of the owner, a detailed
description of the project, and the time period that work was being carried out. This file
should also describe the contents of the directory, especially code and data files.
I’m Looking for _____ Data, where can I find it?

This document contains a short summary of the data available to the team. This spreadsheet
contains a more detailed list of the datasets used by the team. There are tabs for each of the
three categories of data (exposure, confounder/census, and health information). Exposure and
confounders are organized by specific variable, while the health data lists individual whole
datasets.
To use these shared datasets in your analysis while not copying them to your personal folder,
please be sure to specify the whole path to these datasets in your code.
I’m looking for Medicare/Medicaid Data:
Medicare and Medicaid Data is stored in the ci3_health_data folder. The following is an example
of the structure that is used to store analytic datasets used by the team. If John Doe requested
a dataset containing Medicare cardiovascular hospitalizations from 2010-2011 it would be
stored at the following path:
ci3_health_data/medicare/cvd/2010_2011/doe
In this path, the following are the meanings of each part of the path, this is the structure followed
by all datasets in the ci3_health_data folder:
Ci3_health_data – parent directory
Medicare – data source
Cvd – condition of study
2010_2011 – years covered by data
Doe – lastname of original data requester
Commonly used datasets include:
The data used by Qian Di et al in their paper published in the NEJM:
With Exposure and confounder data merged in:
ci3_health_data/medicare/mortality/2000_2012/exposure
_merged/denominator_1999_2013_merge.csv
Only health data:
ci3_health_data/medicare/mortality/2000_2012/unmerged
_data/denominator_1999_2013.csv
The data used by Qian Di et al in their paper published in JAMA:
ci3_health_data/medicare/case_crossover_merged/AllDat
a_Lag6_G100.rds
A common problem people run into when receiving datasets from Yun (our team’s data
manager) is that they treat the column ‘zipcode_r’ as a normal zip code. This is the individuals
zipcode reversed in order to help provide additional protection for the identity of individuals. If
you find yourself trying to match values on zip codes but getting a number of missing values this
may be due to trying to match reversed and unreversed zip codes.
I’m looking for PM2.5/NO2/Ozone/Other Pollutant Data:

Exposure data (such as PM, Ozone, Temperature, etc.) data is all stored in the ci3_exposure
directory. The data there is organized first by pollution type (pm2.5, ozone, NO2) then by
geographic scope (The entire US, New England, Only at monitors), then by time resolution
(daily or annual), then by geographical resolution (At 1km x 1km grid points or aggregated to
zipcodes). Where applicable, we have predictions generated by multiple teams (typically either
by Qian Di or by Randall Martin’s team. See the spreadsheet linked above for a more complete
listing of what is available.
The most commonly used data within the team is Qian Di’s PM2.5 predictions, aggregated to
zipcodes from their original 1km x 1km grids. The most recent iteration of these are located at
ci3_exposure/pm25/whole_us/annual/zipcode/qd_predictions_ensemble/are
a_weighted. There is a value for each zipcode for each year present in this dataset.
I’m looking for data from the census/on BMI/on smoking rates/other similar data:
Data such as this, which may not be at the individual level, is located in the
‘ci3_confounders’ directory. Much of this data is sourced from published US census results
and other public data sources. For example, in ci3_confounders/business_analyst,
we have prepared versions of the business analyst dataset prepared by ESRI. In that directory
we have a script (ci3_confounders/business_analyst/extract_ba.R) that can be
used to extract variables from the dataset that is spread out across a number of directories.
When using that script please be sure to copy it to your own personal directory before changing
it. We also have an excel spreadsheet listing all of the variables available in the business
analyst dataset
(ci3_confounders/business_analyst/Business_Analyst_census_data_code_b
ook_v1.xlsx). We’ve also created a dataset containing all census variables used in Qian Di
et. al’s analysts currently available in the business analyst dataset located at
(ci3_confounders/data_for_analysis/prepped_census/).
I want to run code on the RCE
Using RCE Resources
Our group has exclusive use of two servers with 64 cores and 500GB of memory each on the
RCE, in addition to the cluster resources available to all users. That sounds like a lot (and it is),
but it is frequently difficult for users to get access to the resources that they need to run their
analysis. This is largely due to the typical computing needs of our team. The usual job involves
a single core (since R cannot easily be run in parallel) and a large block of memory (typically
200-300GB). This means that despite our large amount of resources, only a couple people can
simultaneously perform analysis at a time.

This can be eased through working to parallelize analyses, but often our groups analysis cannot
be split into smaller chunks. To help ensure that we use our resources as efficiently as we have
decided that our team will use the RCE exclusively for health data analysis (as that can only be
performed on the RCE). All other analysis requiring significant computing resources should be
done on the Odyssey cluster.
Users with the team also frequently run their analysis using interactive R studio jobs on the
RCE. Being able to use Rstudio with the resources of the RCE is a powerful tool; however, it
often leads to the resources of the team being used inefficiently. People leave jobs open while
not running analysis leading to 100s of GBs of memory sitting idle while also being unable to be
used by other members of the team. Our recommendation is to use Rstudio for prototyping
analysis on small versions of your data and then use batch jobs to run full scale analysis.
Running Batch Jobs
The RCE provides access to batch nodes
, a cluster of many computers. The batch nodes are
good for jobs will run for a long time, and for groups of very similar jobs (e.g., simulations where
a number of parameters are varied).
Running jobs on the batch nodes is somewhat more complicated than running interactive jobs
on the RCE. The main access points are two command line
programs, condor_submit_util and
condor_submit. Here we’ll focus on writing simple submit files and submitting them with
condor_submit. For more details on automatically generating and submitting using
condor_submit_util refer to the main RCE batch job documentation.
This text below is an example of what a standard batch job submit file should look like:
# Universe whould always be 'vanilla'. This line MUST be
#included in your submit file, exactly as shown below.
Universe = vanilla
# The following arguments are _optional_. If included
# they are used to specify the requirements for the
# submission.
request_cpus = 1
request_disk = 4GB
request_memory = 4GB
# Enter the path to the program you wish to run.
# The default runs the R program. To run another
# program just change '/user/local/bin/R' to the
# path to the program you want to run. For example,
# to run Stata set Executable to '/usr/local/bin/stata'.
Executable = /usr/local/bin/R

# Specify any arguments you want to pass to the executable.
Arguments = --no-save --no-restore --slave
# Specify the relative path to the input file (if any). If you
# are using R this should be your R script. If you are using
# Stata this should be your do file.
input = example.R
# Specify where to output any results printed by your program.
output = output/out.$(Process)
# Specify where to save any errors returned by your program.
error = output/error.$(Process)
# Specify where to save the log file.
Log = output/log
# Enter the number of processes to request. This should
# always be the last part of your submit file.
Queue 10
This submit file instructs the scheduler to request 10 nodes (Queue 10), start R2 on each one
(Executable = /usr/local/bin/R), run the code in example.R (input = example.R), write the output
to files named out.0 – out.9 in the output folder (output = output/out.$(Process)), write any errors
to files named out.0 – out.9 in the output folder (error = output/error.$(Process)), and write a log
file in the output folder (Log = output/log). Each of the 10 requested nodes must be able to
provide at least one cpu (request_cpus = 1), four Gb of disk space (request_disk = 4GB) and
four Gb of memory (request_memory = 4GB).
The elements included in the submit file template above should be sufficient for most jobs. You
can download this submit file template and modify it to suit your needs. For a complete
description of the Condor submit file syntax, including less commonly used elements not
described here refer to the official documentation.
For additional details on running multiple jobs in parallel, working example scripts, and for a
more indepth look at the information provided here, please look at the documentation here.
In order to get results from a batch job, there are two options. First, you can save results (saved
models or data frames or other objects) that are small enough to be loaded and prepared in a
standard size (<16GB of memory) job either as RDS files (for generic options) or csv files (for
data frames). Plots can also be output to image files and saved in the course of a job. For other
results just seeking a number, results can be printed using a print statement and read off of the
designated output file.
Checking on Running Jobs
To see what active jobs you have running, you can enter the command “condor_q <your user
name>”. This will list the job number and status of all jobs you have running or submitted. This
can be used to track whether or not your batch jobs are running.
You cannot directly monitor jobs running in batch mode. However, output is updated in real time
as the job runs. Therefore to check on the progress of a job as it runs, you can include print
statements in your code, which will place output in the designated output
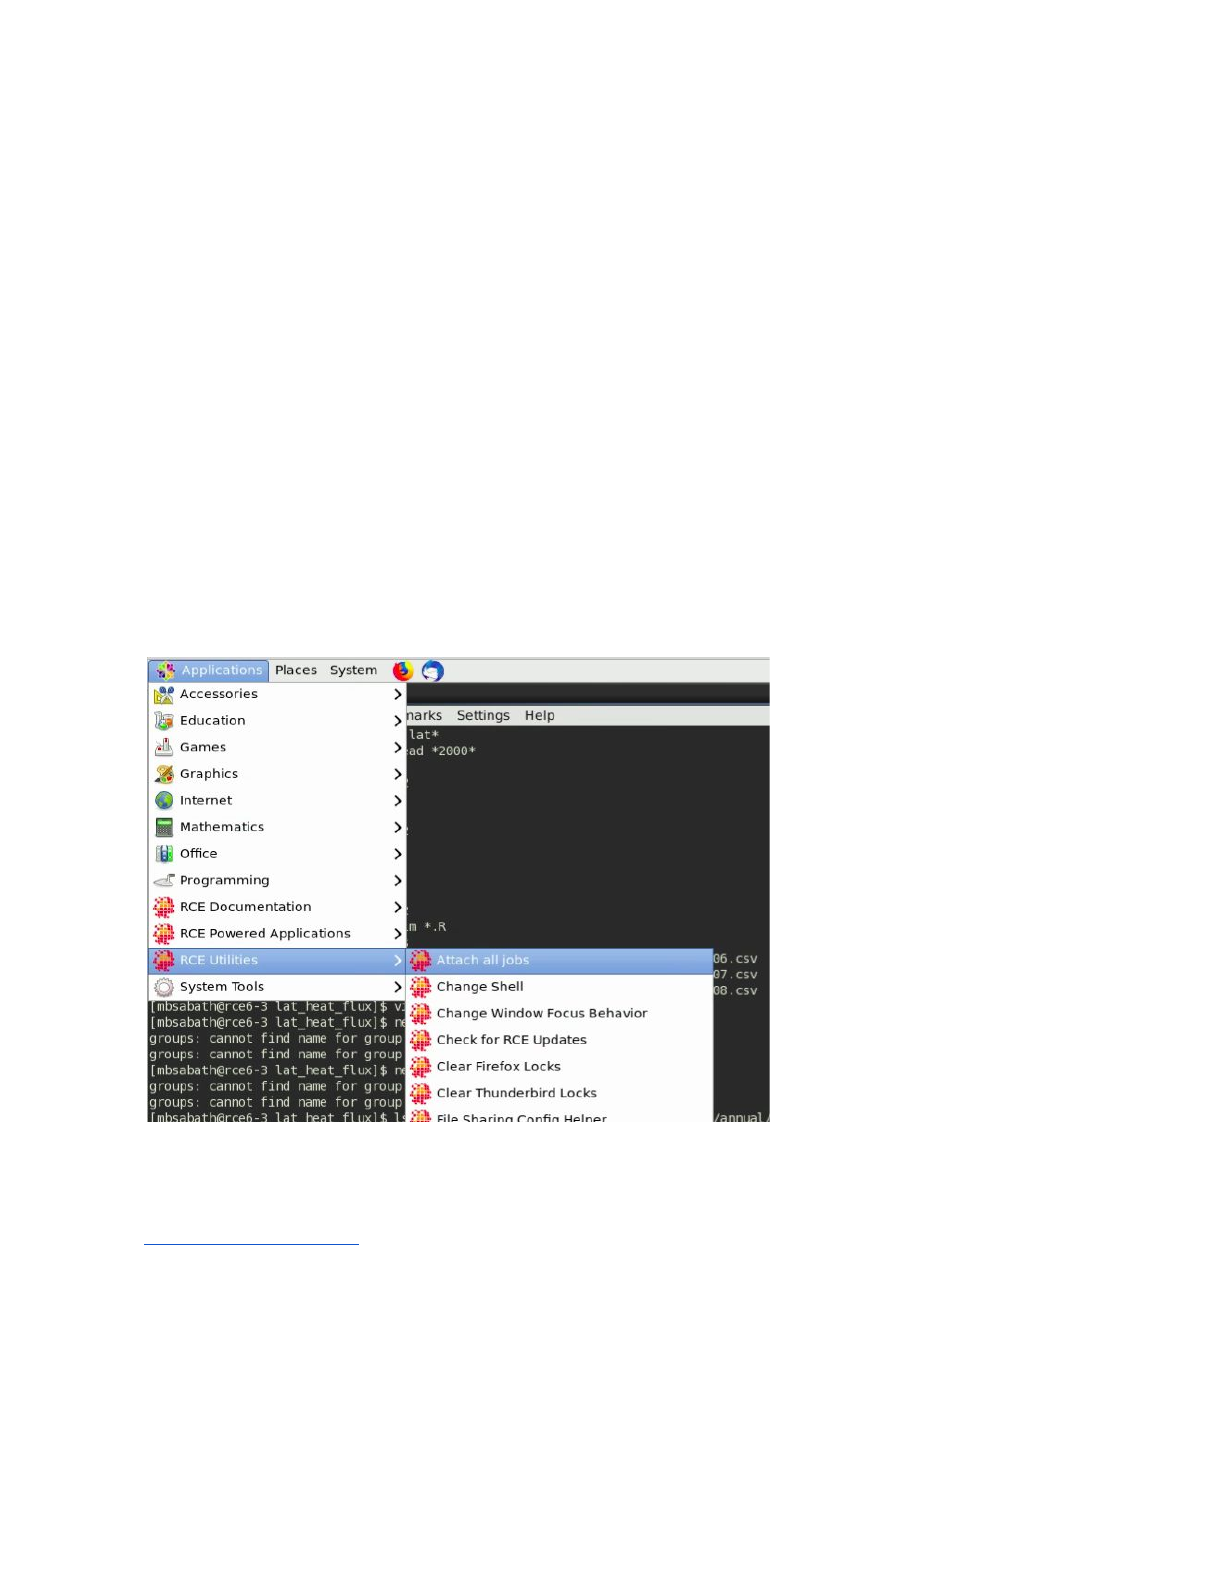
Attach all jobs
Occasionally, you will have had a interactive job running that no longer appears on your no
machine desktop. However, when you run condor_q, the job appears to still be running. This
occurs when a job has become detached from your session, which can happen for a number of
primarily maintenance related reasons. To regain access to the job, either to continue the work
or to end it, you can use the “attach all jobs” routine accessible via the menu here:
Condor_rm
In order to end a batch job early, or an interactive job that is not responding, you can use the
condor_rm command. The link has more detailed documentation on how to handle errors with it,
but the basic application involves using condor_q to identify the job number of the job you wish
to cancel, then using “condor_rm <job number>” to end the job.
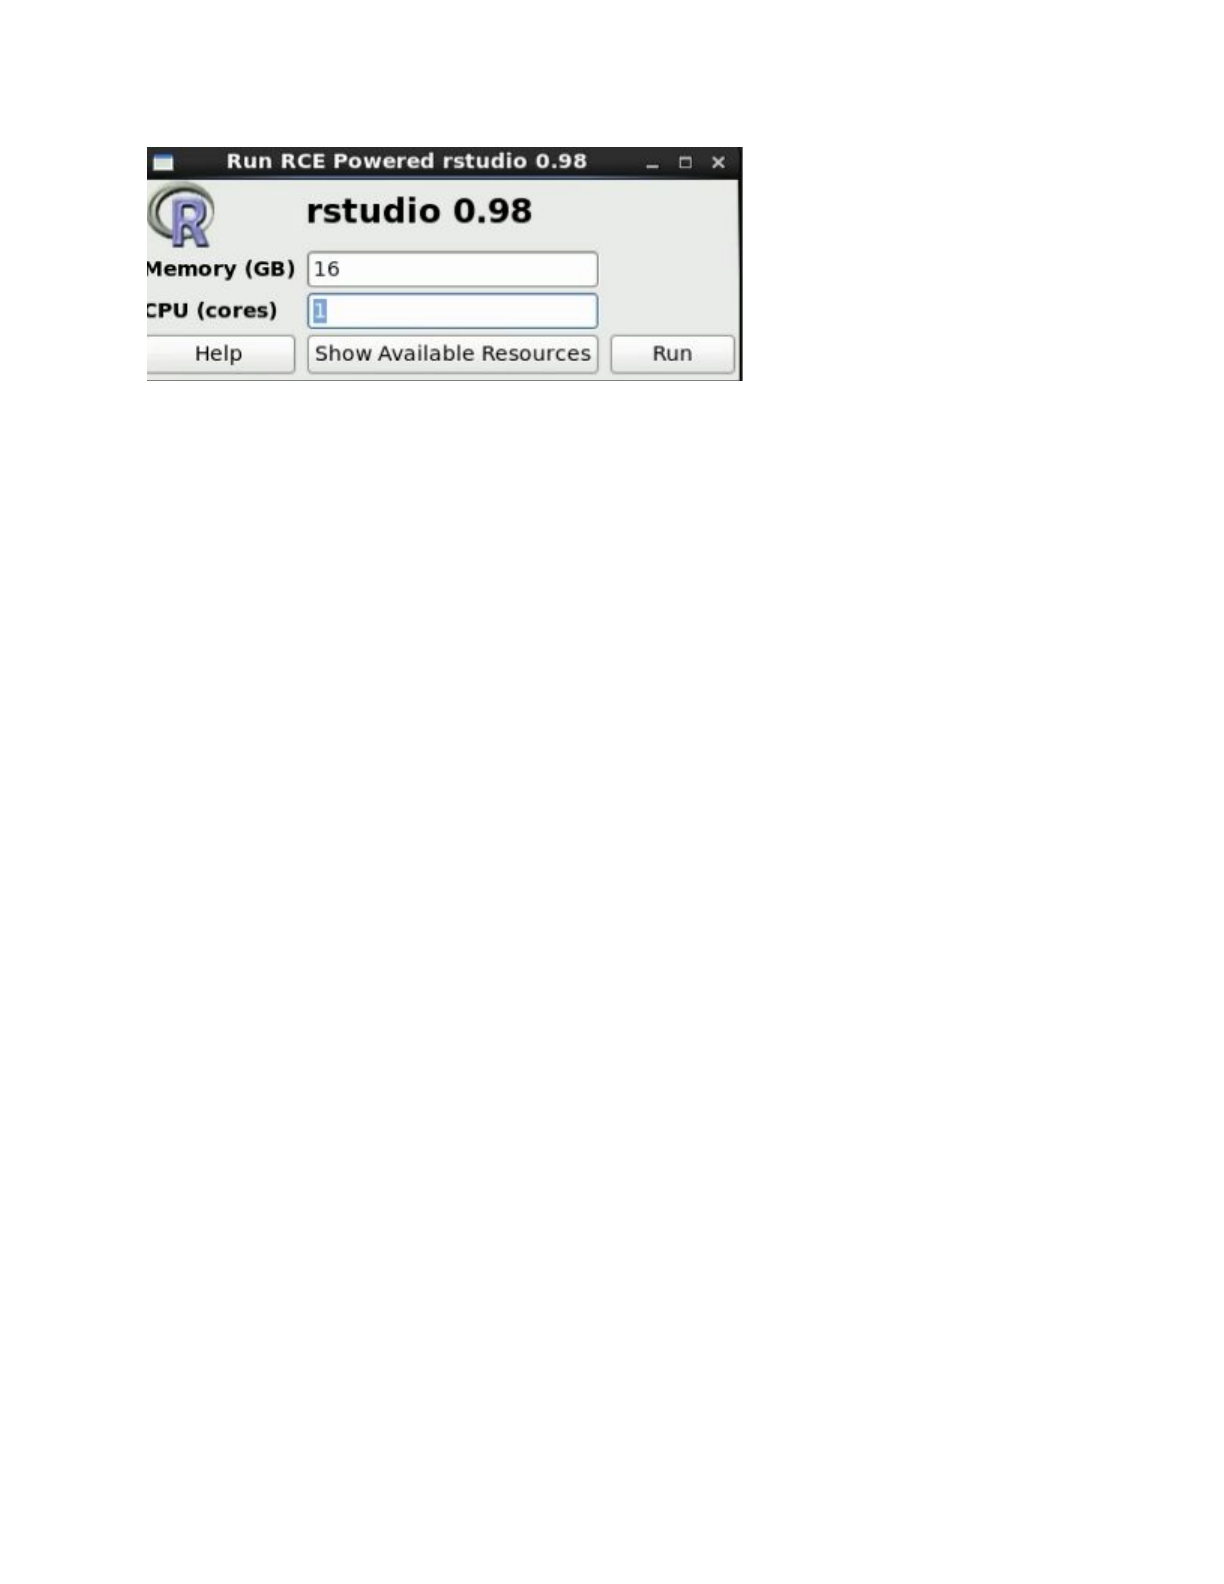
Running Interactive Jobs
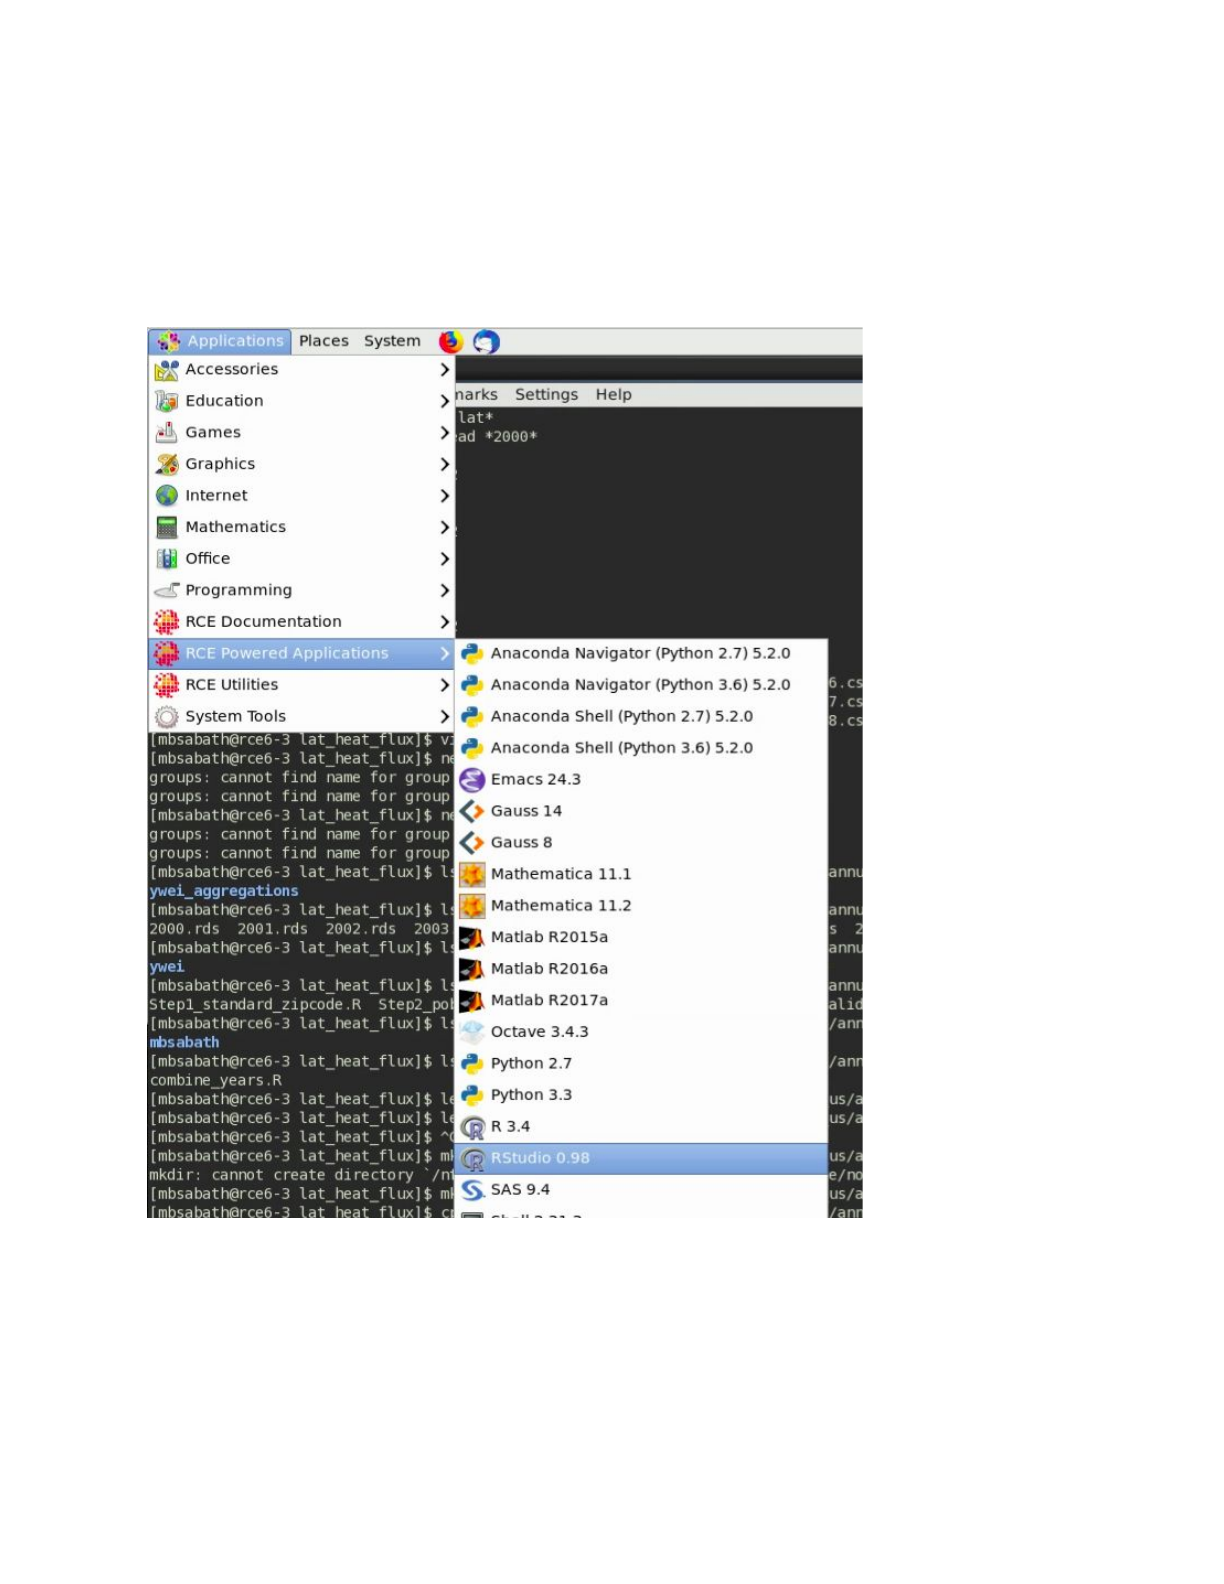
In order to run an interactive job, select one of the applications listed under ‘RCE Powered
Applications’ in the dropdown menu pictured in the screenshot below. Rstuidio (shown in the
image) is one of the most common applications used interactively within our team, but the shell
option (which opens a terminal with access to computational resources) is also useful for a
number of applications as well.
After selecting an application, you will be prompted to request the resources you need for your
job. Please select the minimum amount of resources you need to successfully complete your
work to allow other people to work at the same time.