Next Generation Sequencing Of Pooled Samples: Guideline For Variants’ Filtering Samples Guide
User Manual:
Open the PDF directly: View PDF ![]() .
.
Page Count: 9
- Next Generation Sequencing of Pooled Samples: Guideline for Variants’ Filtering
- Results and Discussion
- Sequencing results.
- Variant Call.
- Public database annotations.
- Comparison with 1000genomes and ExAC.
- Validation of Pool-seq AF: comparison with Immunochip SNP-array.
- Sequencing errors and rare alleles.
- Filtering guideline using Kolmogorov-Smirnov (KS) test: Quality Filter (QF).
- Minimum Percentage of reads Filter (MPF) as an alternative filter.
- Getting the best out of two filters.
- Validation of filters.
- Possible applications of filtering guideline.
- Conclusions
- Methods
- Pooling and sequencing of target-regions.
- Bioinformatic pipeline.
- Variant call using CRISP and variant annotations.
- Comparison with Immunochip SNP-array.
- AF calculation and AF with MPF filter.
- Kolmogorov-Smirnov (KS) test.
- Comparison with individual sequencing variants of one of the pools.
- Analysis tools.
- Acknowledgements
- Author Contributions
- Figure 1. (a) Allele Frequency distribution of all variants.
- Figure 2. Comparison of poolAF with AF of 1000genomes.
- Figure 3. Pool sequencing AF vs.
- Figure 4. QUAL(ity) score distribution of all variants.
- Figure 5. Density distributions of QUAL(ity) scores of variants found in public databases (in.
- Table 1. Summary of comparison of Pool-seq variants with variants obtained from individual sequencing of the same pool (before and after filtering).
- Results and Discussion

1
Scientific RepoRts | 6:33735 | DOI: 10.1038/srep33735
www.nature.com/scientificreports
Next Generation Sequencing of
Pooled Samples: Guideline for
Variants’ Filtering
Santosh Anand1,2,*,#, Eleonora Mangano1,*, Nadia Barizzone3,4,*, Roberta Bordoni1,
Melissa Sorosina5, Ferdinando Clarelli5, Lucia Corrado3,4, Filippo Martinelli Boneschi5,6,†,
Sandra D’Alfonso3,4,† & Gianluca De Bellis1,†
Sequencing large number of individuals, which is often needed for population genetics studies, is
still economically challenging despite falling costs of Next Generation Sequencing (NGS). Pool-seq
is an alternative cost- and time-eective option in which DNA from several individuals is pooled for
sequencing. However, pooling of DNA creates new problems and challenges for accurate variant call
and allele frequency (AF) estimation. In particular, sequencing errors confound with the alleles present
at low frequency in the pools possibly giving rise to false positive variants. We sequenced 996 individuals
in 83 pools (12 individuals/pool) in a targeted re-sequencing experiment. We show that Pool-seq AFs are
robust and reliable by comparing them with public variant databases and in-house SNP-genotyping data
of individual subjects of pools. Furthermore, we propose a simple ltering guideline for the removal of
spurious variants based on the Kolmogorov-Smirnov statistical test. We experimentally validated our
lters by comparing Pool-seq to individual sequencing data showing that the lters remove most of the
false variants while retaining majority of true variants. The proposed guideline is fairly generic in nature
and could be easily applied in other Pool-seq experiments.
Population genetics studies and epidemiological studies on the genetics of multifactorial diseases require
sequencing a large number of genomes at high coverage. is is mandatory both in order to reach sucient power
for case-control analysis and to compare the patterns of genetic variations across populations. Despite substantial
reduction in the cost of NGS in recent years, sequencing a large number of individual genomes at high cover-
age is still economically challenging. An alternative cost-eective approach is to sequence DNA from pools of
individuals (Pool-seq), which has other benets like needing less DNA from each single individual and reducing
overall work and time of sequencing experiments. Pooling allows even small labs to carry out population genetics
studies, which are otherwise impossible due to exorbitant costs. However, pooling of DNA creates new problems
and complexity in data analysis. One of the most challenging problems of Pool-seq is to correctly identify rare
variants (allele frequency, AF < 0.01), as sequencing errors confound with the alleles present at low frequencies in
the pools. Rare variants are not only abundant in population but also have potential functional roles1,2. Hundreds
of Genome Wide Association Studies (GWAS) targeting common variants explain only a fraction of genetic
heritability in complex diseases3. is implies that we need to look beyond “common disease/common variant
(CD/CV)” hypothesis and genetic burden of many rare variants of small eect size with high penetrance might
play key roles in explaining missing heritability of complex diseases4,5. us accurate determination of rare
variants is extremely important in genetic disease research.
One of the key interests of population genetics study is the information about polymorphic sites and corre-
sponding AF of variant alleles in the population. e power of many genetic analyses depends upon accurate
1Institute for Biomedical Technologies, National Research Council, Segrate (MI), Italy. 2Department of Science and
Technology, University of Sannio, Benevento, Italy. 3Interdisciplinary Research Center of Autoimmune Diseases
IRCAD, University of Eastern Piedmont, Novara, Italy. 4Department of Health Sciences, University of Eastern
Piedmont, Novara, Italy. 5Laboratory of Human Genetics of Neurological Disorders, Institute of Experimental
Neurology (INSPE), Division of Neuroscience, San Raffaele Scientific Institute, Milan, Italy. 6Department of
Neurology, Division of Neuroscience, Scientic Institute San Raaele, Milan, Italy. #Present address: Department
of Genetic Medicine and Development (GEDEV), University of Geneva Medical School, 1 Rue Michel-Servet, Geneva
1211, Switzerland. *These authors contributed equally to this work. †These authors jointly supervised this work.
Correspondence and requests for materials should be addressed to S.A. (email: santosh.anand@itb.cnr.it)
Received: 04 November 2015
Accepted: 30 August 2016
Published: 27 September 2016
OPEN
www.nature.com/scientificreports/
2
Scientific RepoRts | 6:33735 | DOI: 10.1038/srep33735
determination of AFs of variants. In principle, Pool-seq should give more robust estimate of AF due to the larger
sample size, which allows decreasing the overall variance of the estimated AF6. is hypothesis is well supported
by mathematical models under the assumption that there are no sequencing errors and each individual con-
tributes equal amount of DNA to the pools7–9. However, in reality the sequencing errors are appreciable10,11 and
achieving equimolar concentration of each individual’s DNA in the pools is also somewhat dicult, which makes
it worthwhile to verify the accuracy of AFs in Pool-seq experiments.
In the present study, involving targeted re-sequencing of 996 individuals in 83 pools, we show that Pool-seq
can be used to accurately estimate AFs of variant alleles. By comparing Pool-seq with several public variant data-
bases and SNP-array data of individuals constituting the pools, we show that the Pool-seq AFs are robust and
reliable. We also provide general ltering guideline in order to remove spurious variants due to sequencing errors.
We individually sequenced and identied variants for all subjects of a single pool and compared them with the
results of Pool-seq, showing that the proposed lters provide a low rate of false positive and false negative variants,
thus proving the utility and ecacy of the lters.
Results and Discussion
Sequencing results. We sequenced 84 pools (12 individuals per pool) on Illumina GaIIx sequencer aer
multiplexing six pools per lane following targeted capture of the genomic regions of interest (totaling 1.9 Mb).
Aer demultiplexing, reads from each pool were tested for quality in terms of duplicate level and mapping ability
in the target regions. One of the pools did not pass the Quality Control (QC), thus it was re-sequenced without
success and was consequently discarded from any further analysis.
e overall sequencing performance is shown in Supplementary Table S1. We generated 13.96 millions reads
per pool on average. Aer duplicate removal (average 5.97%), we got an average of 13.71 millions reads mapped
on the human genome. On average, the mean depth was 351.9× with more than 85% of the targeted regions
covered by NGS reads in each pool. Supplementary Fig. S1 shows the distribution of coverage for all pools. On
average, 75% (range 70 to 80%) of the target regions are covered at least 50× and 69% are covered at least 100× . In
order to quickly appreciate the sequencing quality issues concerning samples, we plotted the number of total and
mapped reads (Supplementary Fig. S2) as well as mean depth and coverage (Supplementary Fig. S3) for all pools.
As a general comment, a fairly homogeneous behavior in terms of sequencing was found.
Variant Call. We have used the Pool-seq variant caller CRISP12 [Comprehensive Read analysis for
Identication of Single Nucleotide Polymorphisms (SNPs) from Pooled sequencing] for the identication of the
variants. CRISP is able to identify both rare as well as common variants from pooled NGS data. It has shown rea-
sonably low false positive and false negative rates of variants on real data sets12,13. CRISP applies a sophisticated set
of techniques to distinguish between false variants coming from sequencing errors compared to those from real
variant alleles. In particular, CRISP analyzes the entire set of reads across all pools that cover any particular var-
iant position, and gathers various signals in multiple steps to distinguish sequencing errors from real variants12.
CRISP called a total of 29736 variants in our data out of which 27529 were single nucleotide variants (SNVs)
and 2207 were insertions and deletions (INDELs). INDELs represent a challenging issue for any variant calling
soware and we decided to focus our attention only on SNVs. Only 23651 SNVs passed all ltering imposed
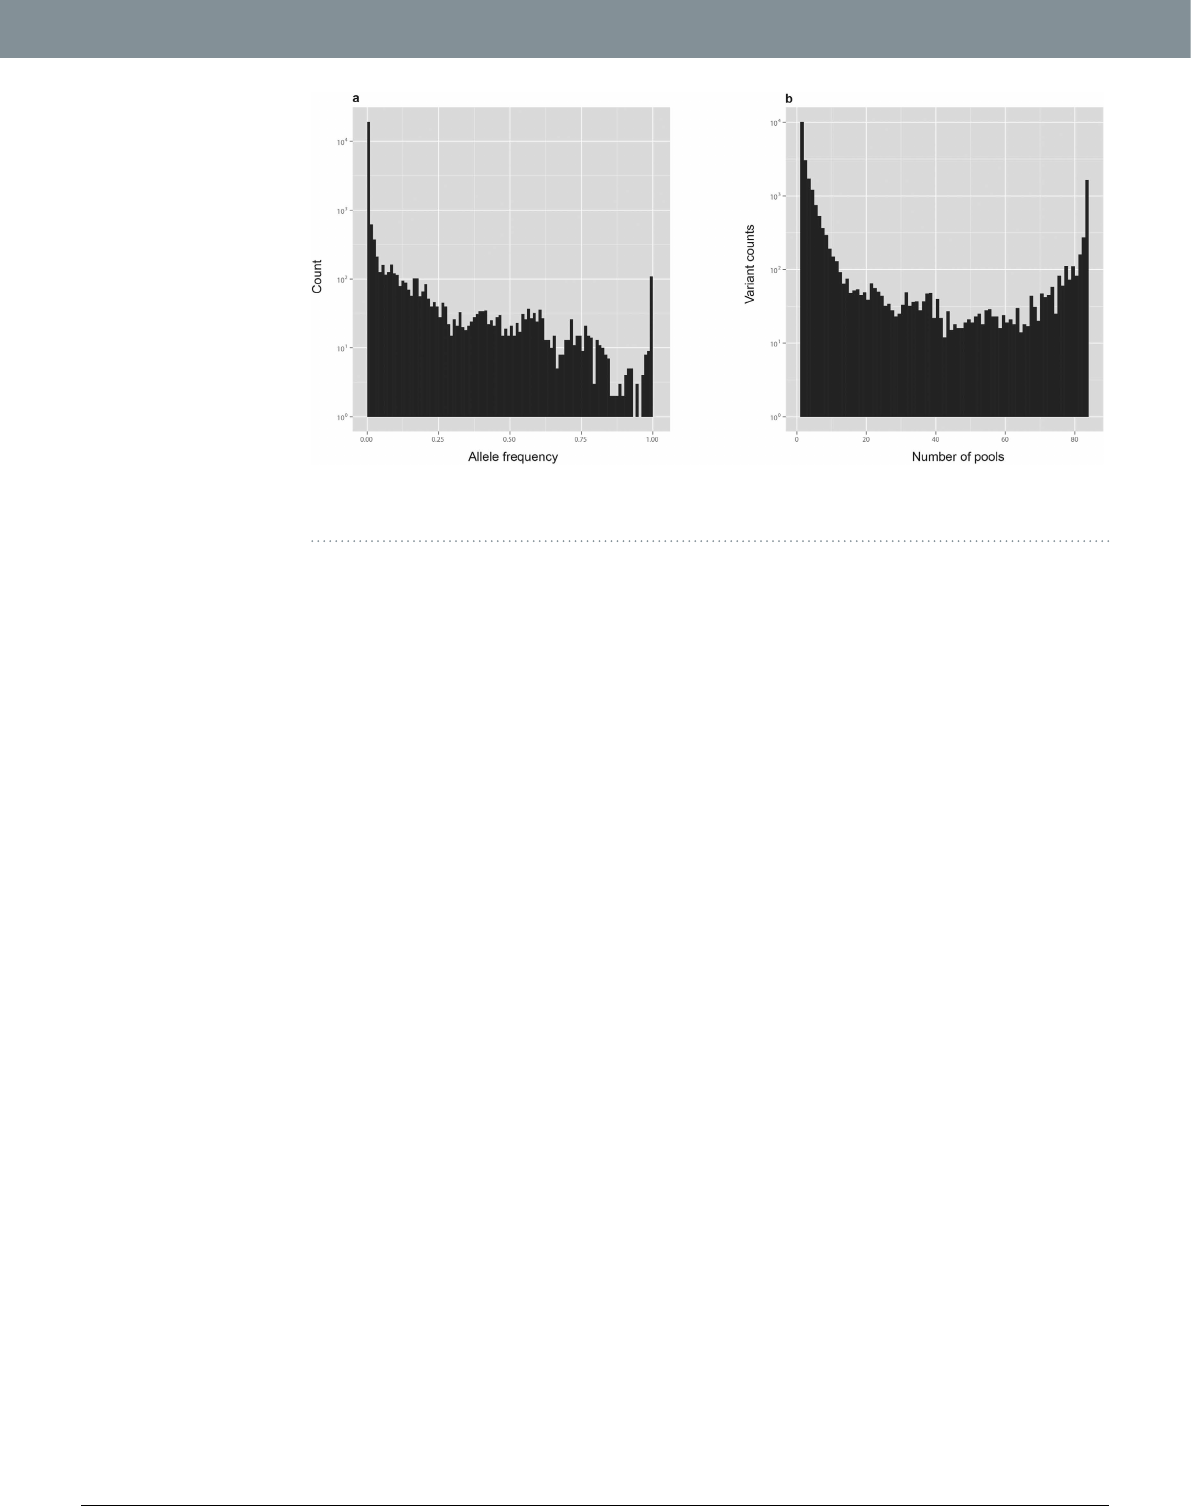
by CRISP (e.g. low-depth, strand-bias etc.). Figure1(a) shows the allele frequency (AF) distribution of all
SNVs. Most variants (N = 19139, 80.92%) can be classied as rare, showing AF below 0.01. Many of the SNVs
(N = 10111, 42.75%) are found in only one pool, and they may be private rare variants (present in only one
individual of that pool) [Fig.1(b)]. ese are expected results since rare variants are abundant in population1,2
and their chances of detection increase with increasing sequencing depth and number of individuals sequenced.
However, they could also derive from sequencing errors.
Figure 1. (a) Allele Frequency distribution of all variants. (b) Distribution of variants according to the number
of pools in which they are found.
www.nature.com/scientificreports/
3
Scientific RepoRts | 6:33735 | DOI: 10.1038/srep33735
Public database annotations. 9204 out of 23651 SNVs were found in 1000Genomes database14 con-
sidering all populations of 1000Genomes (1000Genomes_ALL), of which 7068 were found considering the
European population (1000Genomes_EUR) only. 10280 variants were found in dbSNP15, 1669 in ExAC16 (Exome
Aggregation Consortium) database and 1111 in ESP17 (Exome Sequencing Project) database. Overall, we found
12991 (54.93%) “novel” variants not found in any of the 1000genomes, dbSNP, ExAC or ESP database. Almost all
of them (n = 12780, 98.38%) are rare variants (AF < 0.01) (Supplementary Fig. S4).
Comparison with 1000genomes and ExAC. Estimation of population AF is susceptible to sampling
errors, especially if the number of samples is low. e advantage of pooling is that the variance due to sampling
error can be greatly reduced by choosing a fairly large pool size. ere are reports showing that the accuracy of
AF-estimation in Pool-seq is comparable to, if not better than, that of individual sequencing13,18,19. To ascertain
the accuracy of AF in our experiment, we compared it with public databases and with AF got from individual
genotyping using SNP-array, as explained in the following sections.
e number of individuals in our samples (12 individuals/pool * 83 pools = 996 individuals) is comparable
to that of 1000genomes database. We compared Pool-seq AF (poolAF) with AF of 1000Genomes_EUR popu-
lation. For 7068 SNVs for which 1000genomes_EUR frequency was available, there is an excellent correlation
between poolAF and 1000genomes_EUR AF (R2 = 0.980; Supplementary Fig. S5). e dierence between poolAF
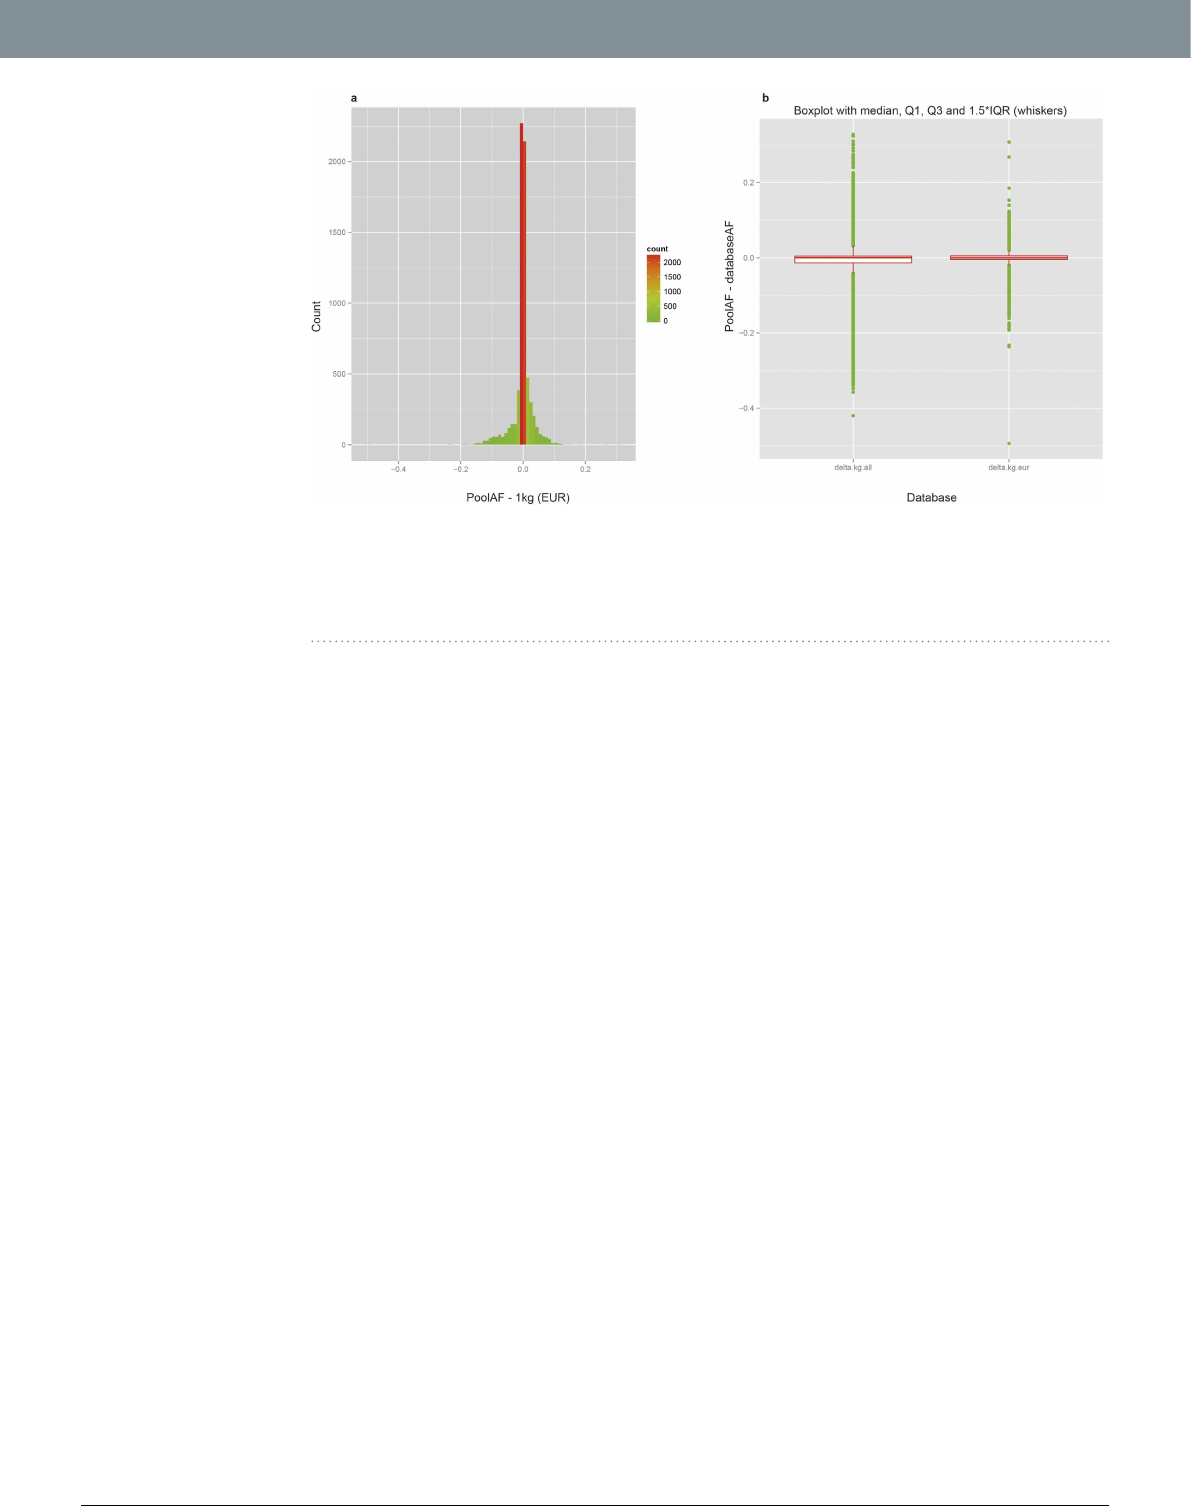
and 1000genome_EUR AF shows a very tight distribution centred at zero [median = 0; Inter Quartile Range,
IQR = 0.01; Fig.2(a)]. Considering the fact that our pools are composed of Italian subjects, the overall similarity
between poolAF and 1000Genomes AF is higher for 1000genomes_EUR population than 1000genomes_ALL
population as expected (R2_EUR = 0.980 vs. R2_ALL = 0.922; Supplementary Fig. S5). is is also proved by the
fact that the distribution of dierences between poolAF and 1000Genomes AF shows smaller IQR and a much
lesser spread of data for comparison with 1000genomes_EUR population than 1000genomes_ALL population
[Fig.2(b)]. In a stratied analysis for rare and common variants separately, we further show that the relative dif-
ferences (absolute delta/AF) are small for either of the groups of variants (Supplementary Fig. S6).
Our targeted region is composed of both exonic and inter or intra genic regions. For 1669 variants in exonic
regions we were able to run the above comparison with ExAC16 database, which is much larger (60,706 unre-
lated individuals) and hence more robust. e concordance is again excellent between poolAF and ExAC AF
(R2 = 0.970; Supplementary Fig. S7). erefore, taking advantage of publicly available variant databases reporting
allele frequency, we are able to demonstrate the close similarity between our data and those collected from pop-
ulations of similar or larger size.
Validation of Pool-seq AF: comparison with Immunochip SNP-array. e subjects of 50 pools (out
of total 83) for a total of 600 individuals have been each genotyped individually using Illumina’s Immunochip20–22
SNP-genotyping platform. e Immunochip platform tested 1535 variants covered in our targeted sequencing,
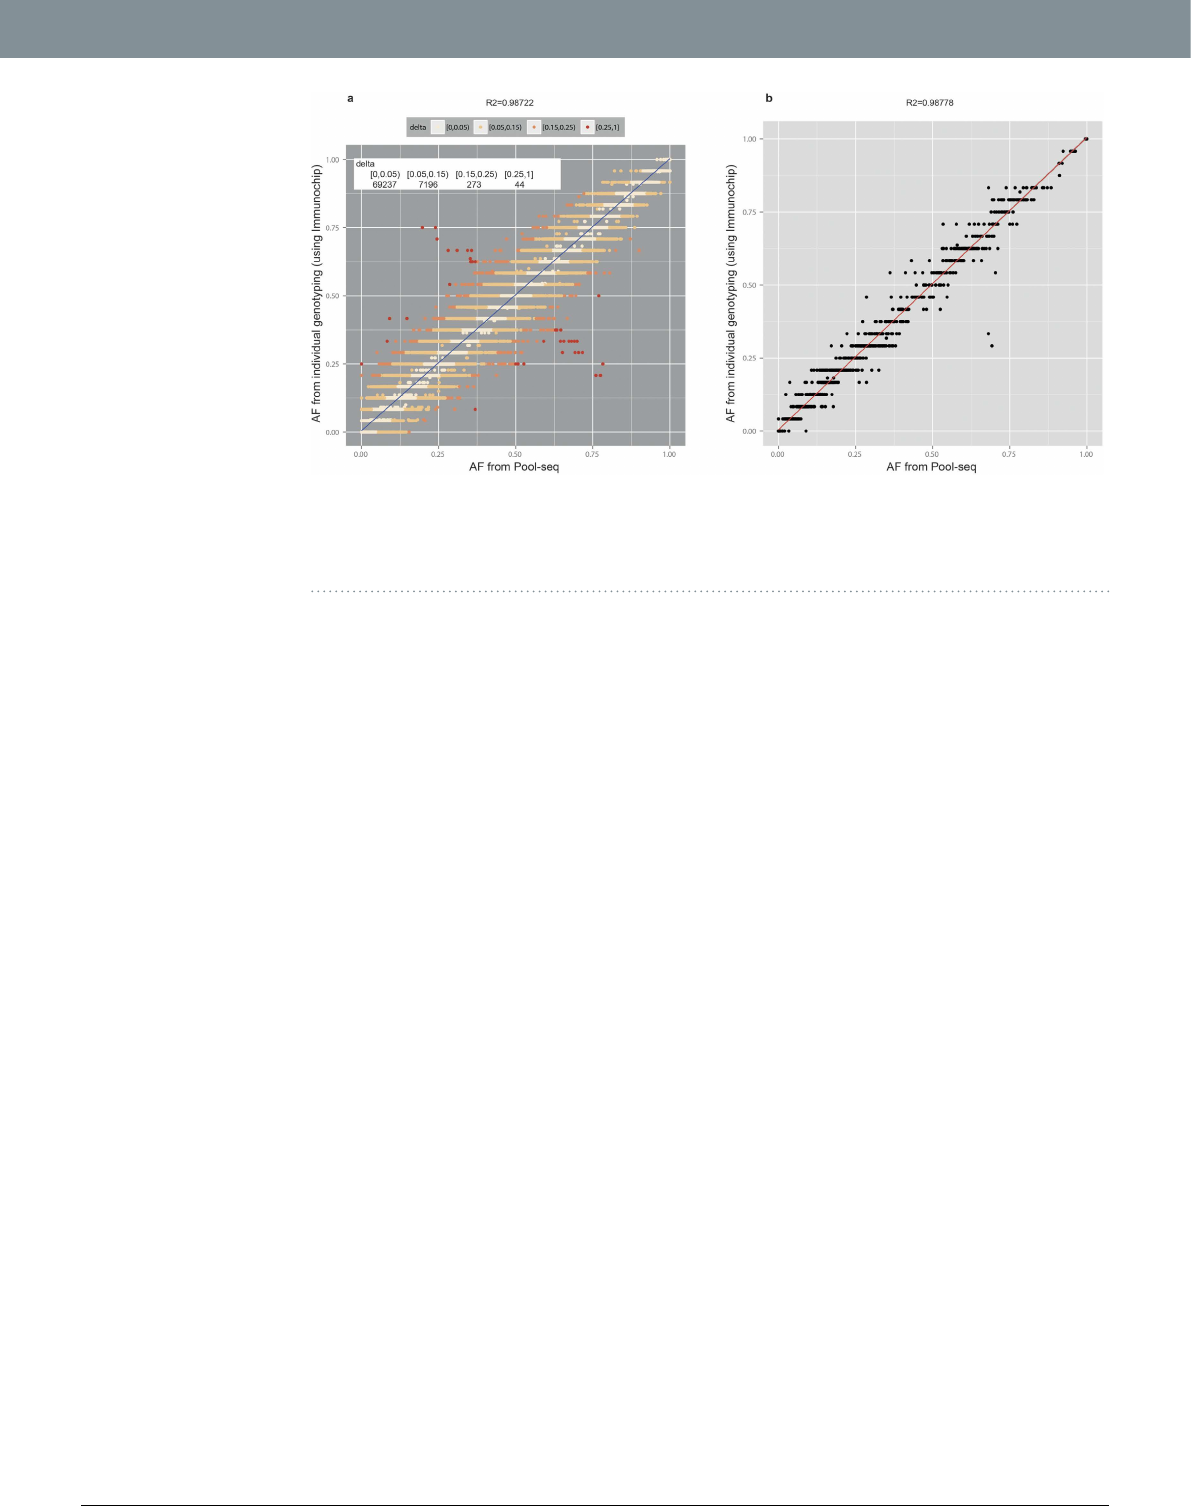
for which a comparison was possible between the two platforms. AFs obtained from Pool-seq show an excel-
lent correlation (R2 = 0.987) with AFs obtained from individual genotyping, with majority of the AF-pairs
(N = 69237, 90.32%) diering by < 0.05 (~1 varied chromosome out of total 24 autosomes) between two sets
[Fig.3(a)]. e relative dierences (absolute delta/AF) are also small both for common as well as rare variants
(Supplementary Fig. S8). In addition, the pool-by-pool correlation was very high: the mean correlation for all
Figure 2. Comparison of poolAF with AF of 1000genomes. (a) Histogram of dierences between poolAF
and 1000genomes European population [1 kg(EUR)]. Minimum: − 0.494;1st Quartile: 0.005; Median: 0.000;
Mean: − 0.002; 3rd Quartile: 0.005; Maximum: 0.308. (b) Boxplot of dierences: Le panel 1000genomes_ALL
(delta.kg.all) and Right panel 1000genomes_EUR (delta.kg.eur). e overall similarity between poolAF and
1000Genomes is higher for 1000genomes_EUR population as shown by smaller IQR and lesser spread of data.
www.nature.com/scientificreports/
4
Scientific RepoRts | 6:33735 | DOI: 10.1038/srep33735
pools was 0.987 ± 0.001 [Fig.3(b)]. ese results further show that the estimation of AF in Pool-seq is reliable
and robust.
Sequencing errors and rare alleles. Although the previous observations suggest an overall accuracy in
variant calls of known variants owing to the availability of reference public datasets and Immunochip SNP-array
data of individual subjects, the same cannot be stated for “novel” rare variants that represent the vast majority of
our calls. False rare variants are the most challenging problem of Pool-seq, as sequencing errors confound with
alleles present at low frequencies, possibly generating many false positives. NGS technologies are not completely
error-free with sequencers showing varying degree of error rates10,11. In individual sequencing, it is easy to correct
for small sequencing errors as the alternative allele can take only a few discrete values (e.g. the AF of an allele in
a diploid organism can only be: 0 = not present; 0.5 = heterozygous; or 1 = homozygous). However, if n diploid
organisms are pooled for sequencing, the possible AFs can take any value from the set {0, 1, 2, … .., 2n − 1, 2n}/(2n).
For large pool-size AF can take many possible values making it dicult to correct for small deviations in AF due
to sequencing errors. Consequently, this could strongly aect AF in the low frequency range making it dicult to
discriminate “real” rare variants from background noise caused by sequencing errors. erefore, proper ltering
approach has to be devised in order to remove false positive variants.
Filtering guideline using Kolmogorov-Smirnov (KS) test: Quality Filter (QF). CRISP generates
a quality score for each variant by considering several parameters using a sophisticated multi-step algorithm12.
Considering our entire SNV dataset, the resulting quality score (QUAL) values span a large range, from 20 to
over 1 million, distributed as shown in Fig.4. Around 29% (N = 6862) of the variants have a “low” (QUAL < 100)
quality score (Fig.4) and almost all of them are rare variants (AF < 0.01; Supplementary Fig. S9). However, not all
rare variants (N = 19139) have low quality values, actually spanning from 20 to 11080 (Supplementary Fig. S10).
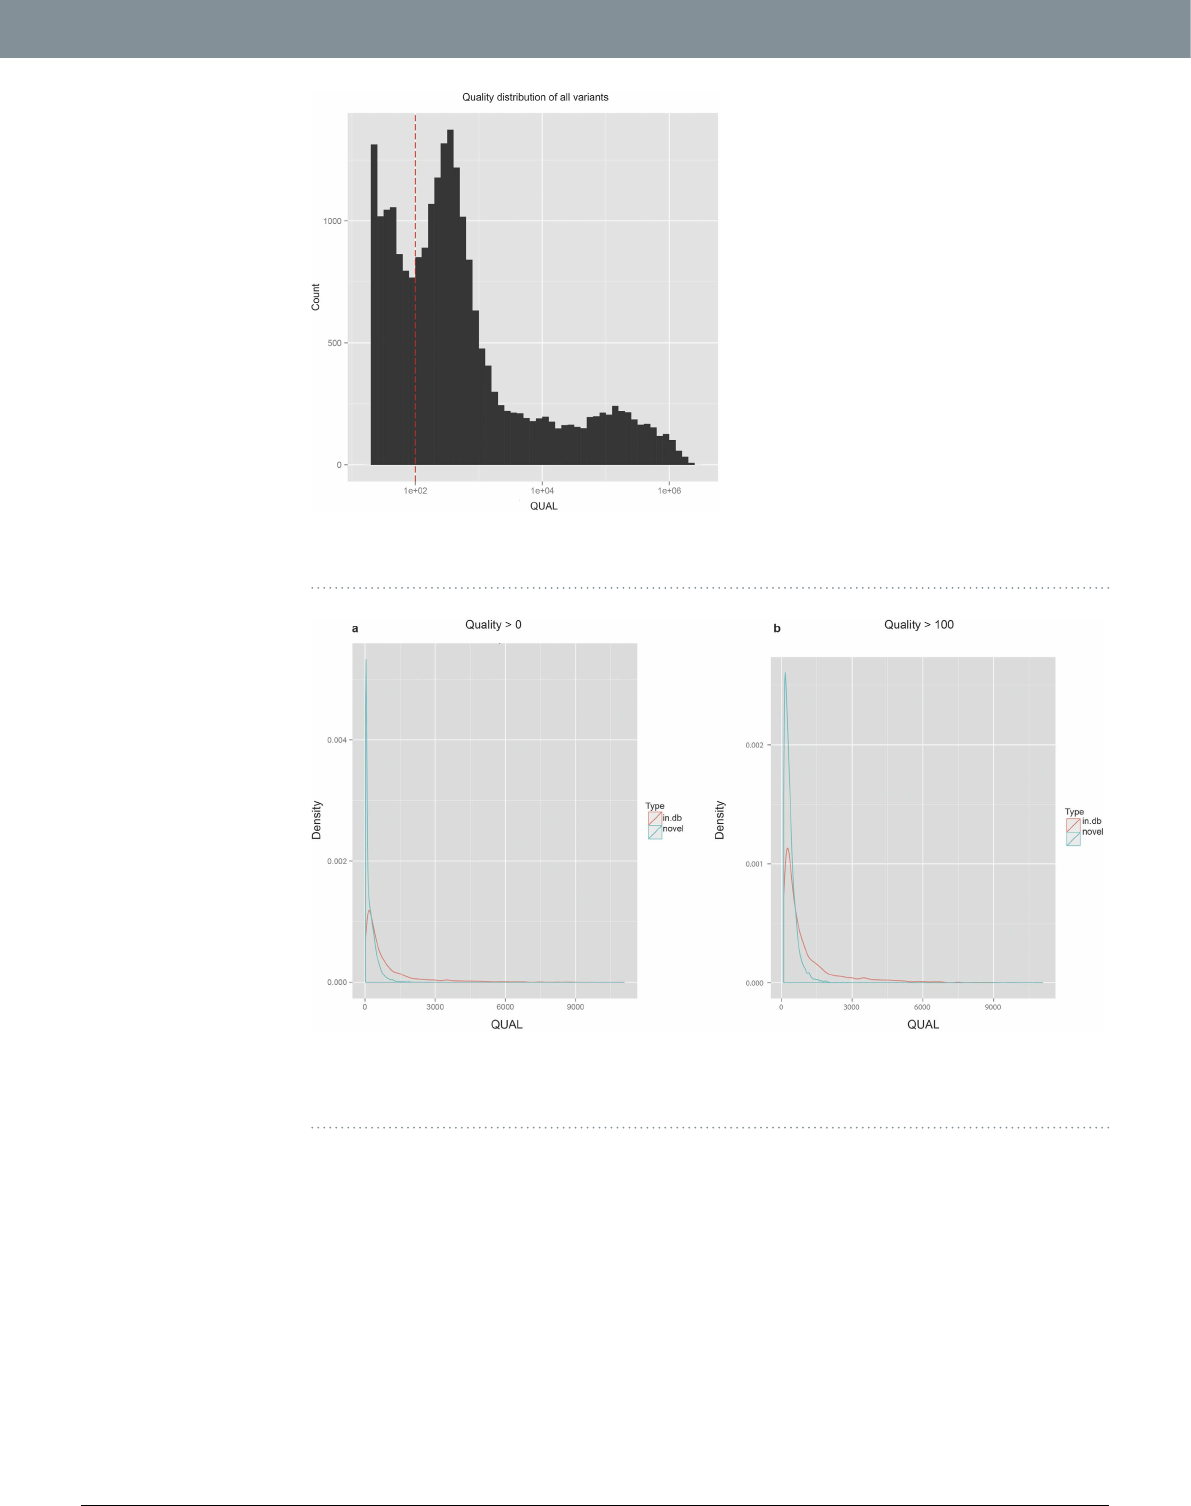
Comparing the distribution of quality for the rare variants reported in any of the 1000genomes, dbSNP, ExAC
or ESP database (N in.db = 6359) with those not annotated in any public database (N novel = 12780), we found
a disproportionate number of lower quality variants in the novel rare variant category [Fig.5(a)]. However, we
expect these two distributions to be similar because the presence or absence of variants in public database and the
quality score of variant calls are completely independent parameters.
e above considerations would suggest to apply a quality based ltering, which is a very common way to
remove false positive calls23,24. Indeed, applying an ad-hoc QUALITY lter of 100 (i.e. QUAL > 100) would make
those distributions qualitatively more similar [Fig.5(b)], at the cost of losing 11.92% (N = 758) of the annotated
variants and 47.97% (N = 6130) of the novel ones. Assuming that annotated variants are somewhat “real” as they
have been found in other databases, we would not like to lose a lot of them. So, in order to set the quality cuto
value in an objective manner, we used Kolmogorov-Smirnov (KS) test, which measures the similarity between
two distributions. e D-statistics (Dstat, 0 ≤ Dstat ≤ 1) of KS-test gives a quantitative measure of the similarity
between the two distributions being compared; lower values indicate more similar distributions. We ran KS-tests
for “in.db” and “novel” categories at dierent quality cut-o thresholds, from 20 to 200 in steps of 1, and found
that the Dstat is minimum (Dstatmin = 0.3114) for QUAL threshold of 74 (Supplementary Fig. S11). Only 7.69%
(N = 489) of the annotated variants, but 42% (N = 5368) of the novel variants are removed at this Quality Filter.
Minimum Percentage of reads Filter (MPF) as an alternative lter. Our pools are composed of 12
individuals (24 autosomes), therefore, the “ideal” lower detection limit for variant alleles in individual pools is
1/24 (AF = ~0.04). Considering that CRISP calls a variant with minimum of 4 variant reads, at high coverage a
Figure 3. Pool sequencing AF vs. AF obtained from individual genotyping by ImmunoChip SNP-array.
(a) Correlation scatterplot. e points are colour coded according to the absolute dierence (delta) between the
two frequencies; the number of points for corresponding ranges of delta is shown in top le inset. (b) Pool-by-
pool correlation. A representative scatter plot for one of the pools (12 individuals) for 1535 SNVs is shown.
www.nature.com/scientificreports/
5
Scientific RepoRts | 6:33735 | DOI: 10.1038/srep33735
variant could be called by CRISP even if the number of variant reads is well below the theoretical threshold of 4%,
possibly generating spurious variants resulting from sequencing noise. To remove these kinds of false variants
due to possible sequencing errors, we recalculated the AFs in individual pools by introducing a threshold on
the minimum % of reads of alternative alleles, from 0% to 5% in steps of 0.1% (see methods). We then applied
the KS-test for “in.db” and “novel” categories as before at dierent MPF cut-o thresholds, and found that for
threshold = 2.6%, the Dstat is minimum (Dstatmin = 0.3062) (Supplementary Fig. S12). Only 4.96% (N = 316)
of the annotated variants, but 38.74% (N = 4951) of the novel variants are removed at this minimum percentage
lter (MPF).
Getting the best out of two lters. e Quality Filter (QF) and the Minimum Percentage Filter (MPF) act
at dierent levels: QF removes a variant altogether from all of the pools if its quality is below threshold whereas MPF
removes variants from only those pools where variant allele read count is below a minimum percentage of total reads.
However, they do similar jobs of removing spurious variants, which is clear from the fact that using either of them makes
the two distributions more similar as evidenced by lower Dstat values of KS-tests. In fact, it is striking that by using either
of them, the minimum Dstat achieved is similar: 0.3062 for MPF vs. 0.3114 for QF. Also, the remaining variants aer
Figure 4. QUAL(ity) score distribution of all variants. e dashed red vertical line denotes the ad-hoc
threshold of low-quality (QUAL = 100).
Figure 5. Density distributions of QUAL(ity) scores of variants found in public databases (in.db), and
those not found in any database (novel). (a) Distributions for all variants (QUAL > 0) (b) Distribution for
variants having QUAL > 100.

www.nature.com/scientificreports/
6
Scientific RepoRts | 6:33735 | DOI: 10.1038/srep33735
applying either lter overlap substantially (N_MPF = 13873; N_QF = 13283, N_common = 12311). is suggests that
a robust way to select the bona-de variants is to take those that are present in both of them (intersection of the two
sets). is gives a Dstat of 0.309 for KS-test, which is close to the minimum Dstat of either of the two lters QF or MPF.
Validation of lters. To ascertain the accuracy and ecacy of our lters, we individually sequenced all the
subjects of one of the pools that contained relatively high number of rare variants before ltering. We then called
the variants in all these individual samples constituting the pool using the standard GATK25 caller and compared
them with the variants called by Pool-seq. Assuming individual variants as true, the unltered Pool-seq data shows
a high rate of false positive (FPR = 53.97%, Table1). Applying both MPF and QF lters on all the variants gives a
reasonable false positive rate (FPR) of 6.67%, while the percentage of true positive variants retained are 96.39%.
e ecacy of lters is better for common variants than rare variants (Table1). Nevertheless, the lters are able to
remove the vast majority of false variants in either case while retaining majority of true positive variants.
Possible applications of ltering guideline. e guideline proposed here to determine cut-o values of
lters is fairly generic and easy to apply. Essentially, it requires comparing the distributions of Qualities (or pos-
sibly other suitable discriminant) of “in.db” and “novel” class of variants for various lters, which can be done by
any standard statistical package. We have used the function “ks.test()” implemented in R26 for it. In our case, we
found that both QF and MPF are needed to clean the data. However, in other situations and depending on a dif-
ferent variant caller or dierent composition of pools, it might be possible that just one lter is sucient enough,
or a completely new combination of two or more lters is required. e important point we would like to empha-
size here is that using this method gives us the opportunity to determine the cut-o values of lters objectively,
which is surely a frustrating task. Moreover, this idea can be conceptually applied to even individual sequencing
when a high number of false positive variants are suspected, as this method or guideline does not really depend
on the fact that the variants are called in pools.
Conclusions
Pool-seq can be successfully used as a cost-eective alternative to individual sequencing for population genetics stud-
ies. We have shown that the estimation of AF in Pool-seq is robust and reliable even with a modest pool-size of 126,7.
Sequencing noises might give rise to many spurious rare variants in Pool-seq and proper care should be taken to remove
them before doing any kind of association studies involving rare variants. Our proposed ltering guideline using known
variants as a reference in order to lter false positive variants is eective in removing spurious variants. is method
could be adopted in similar studies of Pool-seq or even in individual sequencing to lter false positive variants.
Methods
Pooling and sequencing of target-regions. e target regions (total 1.9 Mb) are either whole genomic
segments (17 regions) or only the coding part of genes (72 genes). DNA was collected from voluntary Italian
subjects (41% male, 59% female), excluding any of Sardinian origin, and was pooled as 12 individuals/pool in 84
pools. e target regions were captured using Agilent SureSelect target enrichment method. e DNA quantity has
been properly balanced in each pool in order to equally represent each genome. Aer the fragmentation of each
DNA pool using the Covaris shearing system (Covaris inc., Massachusetts, USA), the ligation to specic paired-
end adaptors, the preparation of amplied libraries and their hybridization to capture probes were performed. e
enriched libraries were then subjected to Illumina protocols for cluster generation and massive sequencing. Paired-
end multiplexed sequencing was performed on the Illumina GaIIx platform (Illumina, San Diego, CA), combining
6 pools tagged with dierent index sequences in each lane and producing 2 × 85 bp read lengths. At QC step, some
samples were found to be not covered and/or sequenced properly and they were repeated for sequencing.
is study was approved by the ethics committees of San Raaele Hospital (Milan, Italy) and AOU Maggiore
della Carità (Novara, Italy). Sample and clinical information were collected aer obtaining a written informed
Variant Type Filters Applied
Pool-seq
variants
TP
variants
TP variants
retained FPR
ALL Variants
Original Variants 8195 3772 100.00 53.97
Aer MPF & QF
Filters 3896 3636 96.39 6.67
Common Variants
Original Variants 3911 3406 100.00 12.91
Aer MPF & QF
Filters 3566 3326 97.65 6.73
Rare Variants Original Variants 4284 366 100.00 91.46
Both MPF and QF 330 310 84.70 6.06
Table 1. Summary of comparison of Pool-seq variants with variants obtained from individual sequencing
of the same pool (before and aer ltering). Original Variants = Original number of variants without any
lter. MPF = Minimum Percentage Filter; QF = Quality Filter. Pool-seq variants = number of variants called
by CRISP in this pool. True Positive (TP) variants = Number of pool-seq variants conrmed by individual
sequencing. TP variants retained = % of TP variants retained aer applying the respective lters. False Positive
Rate (FPR) = Rate of False positive variants in respective data (before or aer lters). See methods for details
about TP and FPR calculations.

www.nature.com/scientificreports/
7
Scientific RepoRts | 6:33735 | DOI: 10.1038/srep33735
consent from all subjects in accordance with the approved guidelines. e experiments and other methods were
carried out in accordance with the approved guidelines.
Bioinformatic pipeline. Supplementary Fig. S13 shows a schematic overview of the bioinformatic pipeline.
Briey, the raw-reads are rst checked for QC using FastQC27. e QC-checked paired end (PE) reads of each
pool were mapped to NCBI human reference genome (build GRCh37) using BWA28 (v0.7.5a-r405). e mapping
was done allowing for maximum 3 mismatches and with other default parameters of BWA. Using samtools29, we
then remove the duplicate reads due to PCR amplication during library preparation. For each pool, we retain
only high quality (HQ) alignments in sorted BAM les (HQ-BAM) by ltering out unmapped reads and those
alignments with mapping quality (MAPQ) less than 15. ese high quality alignments (HQ-BAMs) are then
checked for overall mapping statistics (mapping-QC) by an in-house script. e detailed mapping statistics for
each pool is reported in Supplementary Figs S2 and S3. ere were three cases where the mapping-QC report
suggested a very low mean depth or coverage of target regions. For those cases, the sequencing experiment was
repeated. One of the pools could not pass the QC even aer repeated sequencing and consequently was removed
from any further analysis. All the HQ-BAMs passing the QC are ready now for variant calling.
Variant call using CRISP and variant annotations. We have used CRISP12 (v27122013) as the variant
caller. CRISP takes as input the BAM les (HQ-BAMs in our case) of individual pools and the reference human
genome in standard FASTA format. To call the variants only in the targeted regions, it also requires the coordinate
of targeted regions in UCSC BED-le format30. CRISP was run with all the default parameters, which are somewhat
less stringent. is was deliberately done so as not to loose any potential variant due to the stringent parameters.
CRISP reports the variants in a VCF-le. We have used ANNOVAR31 to annotate the variants. 1000g2014sep
version of Annovar table was used for 1000Genomes AFs, which is based on the data of phase III (2013.05) align-
ment. e Annovar table versions for other AF annotations are as follows – dbSNP: avsnp142 (v.2014.12.28); ESP:
esp6500siv2 (v.2014.12.22); and ExAC: exac03 (v.2015.11.29).
Comparison with Immunochip SNP-array. e subjects of 51 pools (out of total 83) had been each
genotyped individually using Illumina’s Immunochip SNP-genotyping platform20–22. ere were 1535 genomic
positions common in targeted sequencing and Immunochip, for which a comparison was made between two
platforms. e pool-by-pool correlation plot suggested that one sample (pool) had a low correlation (R2 = 0.872)
compared to all other pools (mean R2 = 0.987 ± 0.001), for which it was dropped from the overall correlation
analysis. e coecient of determination R2, which is numerically equal to the square of Pearson correlation
coecient, was obtained using lm() function of R26 and plotting was done using ggplot2 library of R. e R2 for
all the 51 pools have been reported in Supplementary Table S2.
AF calculation and AF with MPF lter. e allele frequencies have been calculated as the average AF of
all the pools. e AF in individual pools has been calculated as the fraction of total number of reads supporting
the alternative allele.
e AFs using minimum percentage lter (MPF) have been calculated like this: for any pool having alternative
allele (ALT) reads less than threshold = th% value, its ALT reads value has been reset to 0 (assuming it as sequenc-
ing error). We then re-calculate the AFs of variants for dierent values of thresholds from the set th = {0.1, 0.2,
0.3, … ., 4.7, 4.8, 4.9, 5.0}%.
Kolmogorov-Smirnov (KS) test. e KS-test was used to compare the distributions of quality scores of
two classes of variants, namely, variants present in any public database (in.db) and “novel” variants. e advantage
of using KS-test is that it is a non-parametric test; hence, it does not require or assume any information about the
types of distributions compared. e function ks.test() from standard implementation of R26 was used for it. e
D-statistics (0 ≤ Dstat ≤ 1) of KS-test gives a quantitative measure of the dierences between the two distribu-
tions; lower values indicate more similar distributions.
Comparison with individual sequencing variants of one of the pools. e subjects of one of the pools
were each sequenced individually using exactly the same procedure of capture and sequencing as followed for the
pools. e pool for individual sequencing was selected based on a very high number of rare variants and a very
good mean depth. e variants in the individual samples of that pool were called together using GATK25 (using
HaplotypeCaller in GVCF mode), following the developers’ recommendations and default parameters. We then
compared these variants with CRISP variants in that pool. e various comparison parameters are calculated as
follows:
=
=
.
=.
=
=
=∗.
‑
‑
‑‑ ‑
Pool seqvariantsVariantscalledinthisparticularpool by CRISP
True Positive (TP) variants ThoseCRISP Pool seqvariantswhich were also
calledbyGATKusing individual sequencing
TP variants retained %ofTruepositivevariantsretainedafter applying successive filters
FPRFalse Positive Rate
%offalse positive in data
((#Pool seq#TP)/#Pool seq) 100

www.nature.com/scientificreports/
8
Scientific RepoRts | 6:33735 | DOI: 10.1038/srep33735
Analysis tools. e analyses were done using statistical programming language R26 and custom Unix shell
scripts. A series of custom R-scripts were written to do the comparison of AF with public databases and with
Immunochip, to nd the correlation of AF with Immunochip, to nd the AF aer applying QF and MPF, to run
the KS-tests etc. e scripts are available upon request. Plotting was done using ggplot2 library of R.
e mean values are shown as mean ± standard error of mean (s.e.m.), unless specied otherwise.
References
1. Tennessen, J. A. et al. Evolution and functional impact of rare coding variation from deep sequencing of human exomes. Science 337,
64–69 (2012).
2. Nelson, M. . et al. An abundance of rare functional variants in 202 drug target genes sequenced in 14,002 people. Science 337,
100–104 (2012).
3. Par, J. H. et al. Estimation of eect size distribution from genome-wide association studies and implications for future discoveries.
Nat Genet 42, 570–575 (2010).
4. Gorlov, I. P., Gorlova, O. Y., Frazier, M. L., Spitz, M. . & Amos, C. I. Evolutionary evidence of the eect of rare variants on disease
etiology. Clin Genet 79, 199–206 (2011).
5. Manolio, T. A. et al. Finding the missing heritability of complex diseases. Nature 461, 747–753 (2009).
6. Schlotterer, C., Tobler, ., oer, . & Nolte, V. Sequencing pools of individuals - mining genome-wide polymorphism data without
big funding. Nat ev Genet 15, 749–763 (2014).
7. Gautier, M. et al. Estimation of population allele frequencies from next-generation sequencing data: pool-versus individual-based
genotyping. Mol Ecol 22, 3766–3779 (2013).
8. Futschi, A. & Schlotterer, C. e next generation of molecular marers from massively parallel sequencing of pooled DNA samples.
Genetics 186, 207–218 (2010).
9. Cutler, D. J. & Jensen, J. D. To pool, or not to pool? Genetics 186, 41–43 (2010).
10. Loman, N. J. et al. Performance comparison of benchtop high-throughput sequencing platforms. Nat Biotechnol 30, 434–439 (2012).
11. Junemann, S. et al. Updating benchtop sequencing performance comparison. Nat Biotechnol 31, 294–296 (2013).
12. Bansal, V. A statistical method for the detection of variants from next-generation resequencing of DNA pools. Bioinformatics 26,
i318–i324 (2010).
13. Bansal, V., Tewhey, ., Leproust, E. M. & Schor, N. J. Ecient and cost eective population resequencing by pooling and in-
solution hybridization. PLoS One 6, e18353 (2011).
14. McVean, G. A. et al. An integrated map of genetic variation from 1,092 human genomes. Nature 491, 56–65 (2012).
15. NCBI-NLM. Database of Single Nucleotide Polymorphisms (dbSNP), http://www.ncbi.nlm.nih.gov/SNP/ (2015).
16. Institute, B. Exome Aggregation Consortium (ExAC), exac.broadinstitute.org (2015).
17. Fu, W. et al. Analysis of 6,515 exomes reveals the recent origin of most human protein-coding variants. Nature 493, 216–220
(2013).
18. ivas, M. A. et al. Deep resequencing of GWAS loci identies independent rare variants associated with inammatory bowel disease.
Nat Genet 43, 1066–1073 (2011).
19. ellstab, C., Zoller, S., Tedder, A., Gugerli, F. & Fischer, M. C. Validation of SNP allele frequencies determined by pooled next-
generation sequencing in natural populations of a non-model plant species. PLoS One 8, e80422 (2013).
20. IMSGC et al. Analysis of immune-related loci identifies 48 new susceptibility variants for multiple sclerosis. Nat Genet 45,
1353–1360 (2013).
21. Cortes, A. & Brown, M. A. Promise and pitfalls of the Immunochip. Arthritis es er 13, 101 (2011).
22. Pares, M., Cortes, A., van Heel, D. A. & Brown, M. A. Genetic insights into common pathways and complex relationships among
immune-mediated diseases. Nat ev Genet 14, 661–673 (2013).
23. Li, H. Towards Better Understanding of Artifacts in Variant Calling from High-Coverage Samples. ArXiv e-prints 1404, 929, http://
adsabs.harvard.edu/abs/2014arXiv1404.0929L%3E (2014).
24. Carson, A. . et al. Eective ltering strategies to improve data quality from population-based whole exome sequencing studies.
BMC Bioinformatics 15, 125 (2014).
25. DePristo, M. A. et al. A framewor for variation discovery and genotyping using next-generation DNA sequencing data. Nat Genet
43, 491–498 (2011).
26. . Core Team. : A Language and Environment for Statistical Computing, http://www.-project.org/ (2013).
27. Andrews, S. FastQC: A quality control tool for high throughput sequence data, http://www.bioinformatics.babraham.ac.u/projects/
fastqc/ (2015).
28. Li, H. & Durbin, . Fast and accurate short read alignment with Burrows-Wheeler transform. Bioinformatics 25, 1754–1760 (2009).
29. Li, H. et al. e Sequence Alignment/Map format and SAMtools. Bioinformatics 25, 2078–2079 (2009).
30. UCSC. BED format - UCSC FAQs on Data File Formats, http://genome.ucsc.edu/FAQ/FAQformat.html - format1 (2015).
31. Wang, ., Li, M. & Haonarson, H. ANNOVA: functional annotation of genetic variants from high-throughput sequencing data.
Nucleic Acids es 38, e164 (2010).
Acknowledgements
is work was supported by a grant from the Italian Foundation for Multiple Sclerosis [FISM grant 2011/R/14].
We also acknowledge the help provided by Vikas Bansal, the author of CRISP soware, in setting up and clearing
doubts regarding the soware.
Author Contributions
S.A. designed the methods and implemented the bioinformatic and analysis pipeline. E.M., N.B., F.C. and L.C.
did the bioinformatic analyses. N.B., L.C. and M.S. prepared the pools. R.B. and M.S. performed the sequencing
experiments. G.D.B., S.D.A. and F.M.B. conceived the project. S.A., G.D.B., S.D.A. and F.M.B. wrote the
manuscript. All authors read and approved the nal manuscript.
Additional Information
Supplementary information accompanies this paper at http://www.nature.com/srep
Competing nancial interests: e authors declare no competing nancial interests.
How to cite this article: Anand, S. et al. Next Generation Sequencing of Pooled Samples: Guideline for Variants’
Filtering. Sci. Rep. 6, 33735; doi: 10.1038/srep33735 (2016).

www.nature.com/scientificreports/
9
Scientific RepoRts | 6:33735 | DOI: 10.1038/srep33735
is work is licensed under a Creative Commons Attribution 4.0 International License. e images
or other third party material in this article are included in the article’s Creative Commons license,
unless indicated otherwise in the credit line; if the material is not included under the Creative Commons license,
users will need to obtain permission from the license holder to reproduce the material. To view a copy of this
license, visit http://creativecommons.org/licenses/by/4.0/
© e Author(s) 2016
