Debug Manual Non Stop
User Manual:
Open the PDF directly: View PDF ![]() .
.
Page Count: 274 [warning: Documents this large are best viewed by clicking the View PDF Link!]
- What’s New in This Manual
- About This Manual
- 1 Introduction
- Execution Modes on TNS/R Systems
- What User Access Is Required for Debugging
- How to Make a Process Enter Debug
- How to Select Debug as the Debugger
- Why a Process Enters Debug
- How to Determine Process State on a Trap or Signal
- Ending a Debug Session
- What Appears in the Debug Header Message
- How to Use Debug
- How Debug Breakpoints Work
- 2 Using Debug on TNS/R Processors
- 3 Debug Command Overview
- 4 Debug Commands
- Command Summary
- A Command
- AMAP Command
- B Command
- BASE Command
- BM Command
- C Command
- CM Command
- D Command
- DJ Command
- DN Command
- EX[IT] Command
- F[ILES] Command
- FC Command
- FN Command
- FNL Command
- FREEZE Command
- HALT Command
- H[ELP] Command
- I Command
- IH Command (TNS/R Native and OSS Processes)
- INSPECT Command
- LMAP Command
- M Command
- MH Command (TNS/R Native and OSS Processes)
- P[AUSE] Command
- PMAP Command (Accelerated Programs)
- PRV Command
- R Command
- S[TOP] Command
- T Command
- V Command
- VQ Command
- VQA Command
- = Command
- ? Command
- A Error Messages
- B ASCII Character Set
- C Command Syntax Summary
- Register Syntax
- Expression Syntax
- Address Syntax
- A Command
- AMAP Command
- B Command
- BASE Command
- BM Command
- C Command
- CM Command
- D Command
- DJ Command
- DN Command
- EX[IT] Command
- F[ILES] Command
- FC Command
- FN Command
- FNL Command
- FREEZE Command
- HALT Command
- H[ELP] Command
- I Command
- IH Command
- INSPECT Command
- LMAP Command
- M Command
- MH Command
- Output-Device Syntax
- P[AUSE] Command
- PMAP Command
- PRV Command
- R Command
- S[TOP] Command
- T Command
- V Command
- VQ Command
- VQA Command
- = Command
- ? Command
- D Session Boundaries
- E Correspondence Between Debug and Inspect Commands
- F Sample Debug Sessions
- Glossary
- Index

Debug Manual
Abstract
This manual describes the Guardian debug facility (Debug) on HP NonStop™ systems.
Product Version
G07
Supported Release Version Updates (RVUs)
This publication supports G06.06 and all subsequent G-series RVUs until otherwise
indicated by its replacement publication.
Part Number Published
421921-003 January 2006

Document History
Part Number Product Version Published
132505 G02 May 1997
141852 G06.03 December 1998
421921-001 G07 August 1999
421921-002 G07 September 2003
421921-003 G07 January 2006

Hewlett-Packard Company—421921-003
i
Debug Manual
Glossary Index Examples Figures Tables
What’s New in This Manual xi
Manual Information xi
New and Changed Information xi
About This Manual xiii
Who Should Use This Manual xiii
How to Use This Manual xiv
Related Reading xv
Notation Conventions xvi
1. Introduction
Execution Modes on TNS/R Systems 1-1
What User Access Is Required for Debugging 1-2
How to Make a Process Enter Debug 1-2
Using the RUND Command 1-2
Invoking Debug From TACL for a Process 1-3
Calling Debug From a Process 1-4
Entering a Breakpoint in a Process 1-5
Running Debug From the OSS Shell 1-6
How to Select Debug as the Debugger 1-6
Why a Process Enters Debug 1-7
How to Determine Process State on a Trap or Signal 1-7
Ending a Debug Session 1-10
What Appears in the Debug Header Message 1-10
Header Message Format 1-10
Header Message Information 1-12
How to Use Debug 1-13
Example of Debug Use 1-13
Debugging on a Remote Node 1-13
Necessary Compiler Listing 1-14
How Debug Breakpoints Work 1-14
Example of a Code Breakpoint 1-14

Contents
Debug Manual—421921-003
ii
1. Introduction (continued)
1. Introduction (continued)
Example of a Memory-Access Breakpoint 1-15
Debug/Program Execution Environment 1-16
2. Using Debug on TNS/R Processors
TNS/R Memory Addressing 2-1
Execution Options 2-3
Running Native Program Files 2-3
Running TNS Program Files 2-4
Running Accelerated Program Files 2-4
Considerations in Using the Accelerator 2-4
Types of Processes 2-5
TNS and RISC Execution Correspondence (Accelerated Mode) 2-5
Breakpoints 2-5
Setting TNS Breakpoints 2-6
Setting RISC Breakpoints 2-7
Rules About RISC Breakpoints 2-7
Considerations for Memory-Access Breakpoints 2-8
TNS/R Registers 2-10
TNS and TNS/R Register Correspondence 2-12
3. Debug Command Overview
Types of Debug Commands 3-1
Breakpoint Commands 3-1
Display Commands 3-3
Modify Commands 3-4
Environment Commands 3-5
Privileged Commands 3-5
Miscellaneous Commands 3-6
Multiple Commands on a Line 3-6
Command Structure 3-6
Capitalization in Commands 3-7
Default Commands 3-7
Notation for Privileged Commands 3-7
Register Syntax 3-7
Expression Syntax 3-9
Address Syntax 3-12

Contents
Debug Manual—421921-003
iii
4. Debug Commands
4. Debug Commands
Command Summary 4-1
A Command 4-3
AMAP Command 4-6
B Command 4-7
Set Unconditional Code Breakpoint 4-7
Set Conditional Code Breakpoint 4-11
Set Trace Code Breakpoint 4-13
Set Execute Code Breakpoint 4-15
Display Breakpoints 4-16
BASE Command 4-22
BM Command 4-24
Set Unconditional Memory-Access Breakpoint 4-24
Set Conditional Memory-Access Breakpoint 4-26
Set Trace Memory-Access Breakpoint 4-29
Set Execute Memory-Access Breakpoint 4-31
C Command 4-32
CM Command 4-33
D Command 4-33
Display Register Contents 4-36
DJ Command 4-40
DN Command 4-41
EX[IT] Command 4-45
F[ILES] Command 4-46
FC Command 4-47
FN Command 4-48
FNL Command 4-49
FREEZE Command 4-50
HALT Command 4-51
H[ELP] Command 4-51
I Command 4-52
IH Command (TNS/R Native and OSS Processes) 4-54
INSPECT Command 4-55
LMAP Command 4-57
M Command 4-58
Modify Variables 4-58
Modify Register Contents 4-59
MH Command (TNS/R Native and OSS Processes) 4-62
P[AUSE] Command 4-63

Contents
Debug Manual—421921-003
iv
4. Debug Commands (continued)
4. Debug Commands (continued)
PMAP Command (Accelerated Programs) 4-64
PRV Command 4-65
R Command 4-66
S[TOP] Command 4-67
T Command 4-68
V Command 4-71
VQ Command 4-72
VQA Command 4-73
= Command 4-73
? Command 4-75
A. Error Messages
1A-1
2A-1
3A-1
4A-1
7A-2
8A-2
9A-2
11 A-2
13 A-3
14 A-3
15 A-4
16 A-4
17 A-4
18 A-4
19 A-5
20 A-5
21 A-5
22 A-5
23 A-6
24 A-6
25 A-6
26 A-6
27 A-7
28 A-7
29 A-7
30 A-7

Contents
Debug Manual—421921-003
v
A. Error Messages (continued)
A. Error Messages (continued)
31 A-7
32 A-8
33 A-8
34 A-8
35 A-8
36 A-9
37 A-9
38 A-9
39 A-9
40 A-10
41 A-10
42 A-10
43 A-10
44 A-11
45 A-11
46 A-11
47 A-11
48 A-12
49 A-12
50 A-12
51 A-12
52 A-13
53 A-13
54 A-13
55 A-13
56 A-14
57 A-14
58 A-14
59 A-14
60 A-15
61 A-15
62 A-15
63 A-15
64 A-16
65 A-16
66 A-16
67 A-16
68 A-17

Contents
Debug Manual—421921-003
vi
A. Error Messages (continued)
A. Error Messages (continued)
69 A-17
70 A-17
71 A-17
72 A-18
73 A-18
74 A-18
75 A-18
76 A-19
77 A-19
78 A-19
79 A-19
80 A-20
81 A-20
82 A-20
83 A-20
84 A-21
85 A-21
86 A-21
87 A-21
88 A-22
89 A-22
90 A-22
91 A-22
92 A-23
93 A-23
94 A-23
95 A-23
96 A-24
97 A-24
98 A-24
99 A-24
100 A-25
101 A-25
102 A-25
103 A-26
104 A-26
105 A-26

Contents
Debug Manual—421921-003
vii
B. ASCII Character Set
B. ASCII Character Set
C. Command Syntax Summary
Register Syntax C-1
Expression Syntax C-2
Address Syntax C-2
A Command C-3
AMAP Command C-3
B Command C-3
Set Unconditional Code Breakpoint C-3
Set Conditional Code Breakpoint C-4
Set Trace Code Breakpoint C-4
Set Execute Code Breakpoint C-4
Display Breakpoints C-4
BASE Command C-4
BM Command C-5
Set Unconditional Memory-Access Breakpoint C-5
Set Conditional Memory-Access Breakpoint C-5
Set Trace Memory-Access Breakpoint C-5
Set Execute Memory-Access Breakpoint C-6
C Command C-6
CM Command C-6
D Command C-6
Display Variables C-6
Display Register Contents C-7
DJ Command C-7
DN Command C-7
EX[IT] Command C-7
F[ILES] Command C-7
FC Command C-8
FN Command C-8
FNL Command C-8
FREEZE Command C-8
HALT Command C-8
H[ELP] Command C-8
I Command C-8
IH Command C-9
INSPECT Command C-9
LMAP Command C-9

Contents
Debug Manual—421921-003
viii
C. Command Syntax Summary (continued)
C. Command Syntax Summary (continued)
M Command C-9
Modify Variables C-9
Modify Register Contents C-9
MH Command C-9
Output-Device Syntax C-9
P[AUSE] Command C-10
PMAP Command C-10
PRV Command C-10
R Command C-10
S[TOP] Command C-11
T Command C-11
V Command C-11
VQ Command C-11
VQA Command C-11
= Command C-12
? Command C-12
D. Session Boundaries
E. Correspondence Between Debug and Inspect Commands
F. Sample Debug Sessions
Overview of Example Program F-1
TNS Program Example F-3
Accelerated Program Example F-23
Native Program Example F-28
Privileged Commands F-49
Glossary
Index
Examples
Example F-1. Example Source Code for SDEMO1 F-2
Example F-2. TNS Example Compiled Listing F-4
Example F-3. pTAL Compiled Listing F-28
Example F-4. noft Listing of pTAL Program F-30

Contents
Debug Manual—421921-003
ix
Figures
Figures
Figure 1-1. Environment Register (TNS Environment) 1-9
Figure 1-2. Debugging a Remote Process 1-14
Figure 1-3. Debug/User Process Diagram 1-16
Figure 1-4. Debug Displaying and Accepting Data 1-17
Figure 2-1. Diagram of TNS/R Memory 2-2
Figure 2-2. How TNS Breakpoints Can Correspond to RISC Breakpoints 2-6
Figure 2-3. How RISC Breakpoints Correspond to TNS Instructions 2-7
Figure D-1. Scope of Debug Commands’ Effects D-2
Tables
Table 1-1. Map of TNS/R Native Signals to Traps 1-8
Table 2-1. TNS Register Implementation Summary 2-12
Table 2-2. TNS/R Register Use Summary 2-13
Table 3-1. Breakpoint Commands 3-2
Table 3-2. Display Commands 3-3
Table 3-3. Modify Commands 3-4
Table 3-4. Debug Environment Commands 3-5
Table 3-5. Privileged Commands 3-5
Table 3-6. Process Control Commands 3-6
Table 4-1. Debug Command Summary 4-1
Table D-1. Nonprivileged Command Persistence (With Scope of a Process) D-1
Table D-2. Privileged Command Persistence (With Scope of the Processor) D-3
Table E-1. Correspondence Between Debug and Inspect Commands E-1

Debug Manual—421921-003
xi
What’s New in This Manual
Manual Information
Debug Manual
Abstract
This manual describes the Guardian debug facility (Debug) on HP NonStop™ systems.
Product Version
G07
Supported Release Version Updates (RVUs)
This publication supports G06.06 and all subsequent G-series RVUs until otherwise
indicated by its replacement publication.
Document History
New and Changed Information
Changes in the G06.28 manual:
•Added these new error messages:
°102 on page A-25
°103 on page A-26
°104 on page A-26
°105 on page A-26
•Removed references to the obsolete commands, DT and ET, from Table D-2 on
page D-3.
•Rebranded the terminology in the manual.
Part Number Published
421921-003 January 2006
Part Number Product Version Published
132505 G02 May 1997
141852 G06.03 December 1998
421921-001 G07 August 1999
421921-002 G07 September 2003
421921-003 G07 January 2006

What’s New in This Manual
Debug Manual—421921-003
xii
Changes in the G06.21 Manual
Changes in the G06.21 Manual
•Since product names are changing over time, this publication might contain both
HP and Compaq product names
•Product names in graphic representations are consistent with the current product
interface
•Updated B Command on page 4-7 to describe global breakpoints under the ALL
option
•Updated Considerations on page 4-8 with information regarding specification and
instances of global breakpoints
•Updated Considerations on page 4-25 with information regarding processor halt
code %6005
•Updated the D command under Considerations on page 4-35 to distinguish
between the D N address and the DN address
•Added the "SIG_IGN" system-supplied signal action to MH Command (TNS/R
Native and OSS Processes) on page 4-62
•Added the D option to = Command on page 4-73
•Updated the ? command Examples on page 4-75

Debug Manual—421921-003
xiii
About This Manual
This manual describes the features and use of the Guardian debug facility, Debug.
This version of Debug runs on HP NonStop Series/RISC (TNS/R) processors. TNS/R
processors are based on reduced instruction-set computing (RISC) technology.
This version of the HP NonStop operating system also supports execution of programs
written for the HP NonStop Series (TNS) processor environment, although TNS
processors are no longer supported. TNS processors were based on complex
instruction-set computing (CISC) technology.
Who Should Use This Manual
Debug is a low-level debugging tool. It is intended to be used by system and
application programmers.
To use this product, you must be familiar with the Transaction Application Language
(TAL) or another programming language, such as pTAL, C, C++, COBOL, or Pascal.
You must also be familiar with system hardware registers and addressing modes.
A high-level symbolic debugger, the Inspect product, is also provided by HP. Many
people find it more convenient to use a symbolic debugger than a low-level debugger,
because a symbolic debugger allows you to use the names of the symbols in your
program rather than the addresses and registers that the compiler assigned. You might
consider using the Inspect debugger if it is possible to do so. Using the Inspect
debugger, however, requires that the Inspect monitor process (IMON) be running on
the node. If you prefer a symbolic debugger, refer to the Inspect Manual.
Debug is a part of the operating system and is always available. Debug is required for
debugging address spaces that the Inspect debugger cannot debug, such as:
•Monitor process
•Memory manager
•$SYSTEM disk process

About This Manual
Debug Manual—421921-003
xiv
How to Use This Manual
How to Use This Manual
The organization of this manual:
Section Description
Section 1, Introduction Introduces and discusses how to make your process
enter Debug, what happens once your process enters
Debug, and how Debug breakpoints work.
Section 2, Using Debug on
TNS/R Processors Describes Debug use on TNS/R processors. It includes
descriptions of TNS/R memory addressing, execution
options, breakpoints on TNS/R processors, TNS/R
registers, and correspondence between TNS/R and
TNS environment registers.
Section 3, Debug Command
Overview Provides an overview of the Debug commands. It
introduces all the commands, and describes the
structure of the commands. It also discusses the
register syntax, expression syntax, and address syntax
for Debug commands.
Section 4, Debug Commands Describes and explains the syntax for each of the
Debug commands. In addition, this section explains
how to set, clear, and display breakpoints. It also
explains how to display and modify the contents of
variables and registers.
Appendix A, Error Messages Describes the Debug error messages.
Appendix B, ASCII Character Set Describes the ASCII character set.
Appendix C, Command Syntax
Summary Provides a summary of the Debug command syntax.
Appendix D, Session Boundaries Discusses Debug session boundaries; how particular
Debug commands affect subsequent Debug sessions
for the same process; and, for privileged debugging,
how commands affect debugging on a processor.
Appendix E, Correspondence
Between Debug and Inspect
Commands
Shows the correspondence of Debug commands to
Inspect low-level commands.
Appendix F, Sample Debug
Sessions Provides interactive sample programs that might be
useful to the user.
Glossary Defines terms used in the manual.

About This Manual
Debug Manual—421921-003
xv
Related Reading
Related Reading
While using this manual, you might need to refer to some of the manuals described
below. The following paragraphs provide a complete list of the manuals.
System Procedure Manuals
These manuals contain information related to Guardian procedure calls:
•Guardian Procedure Calls Reference Manual
•Guardian Procedure Errors and Messages Manual
Programming Tools Manuals
These manuals describe tools used in program development:
•nld Manual
•noft Manual
•Binder Manual
•Inspect Manual
Server Description Manual
The NonStop S-Series Server Description Manual provides a description of the system
architecture.
Manual About The Command Interface
The TACL Reference Manual provides information related to the command interface.
Open System Services (OSS) Manuals
These manuals provide information regarding programming for the HP NonStop Open
System Services (OSS) environment:
•Open System Services Programmer’s Guide
•Open System Services Library Calls Reference Manual
•Open System Services System Calls Reference Manual
Language Reference Manuals
These manuals provide information regarding system programming and running
applications on TNS/R processors:
•Guardian Programmer’s Guide provides information about system programming.

About This Manual
Debug Manual—421921-003
xvi
Notation Conventions
•Accelerator Manual provides information regarding programming and running
applications on TNS/R processors.
These manuals provide more information regarding specific source languages:
•C/C++ Programmer's Guide
•COBOL Manual for TNS and TNS/R Programs
•TAL Programmer’s Guide
•TAL Reference Manual
•pTAL Conversion Guide
•pTAL Reference Manual
Notation Conventions
Hypertext Links
Blue underline is used to indicate a hypertext link within text. By clicking a passage of
text with a blue underline, you are taken to the location described. For example:
This requirement is described under Backup DAM Volumes and Physical Disk
Drives on page 3-2.
General Syntax Notation
This list summarizes the notation conventions for syntax presentation in this manual.
UPPERCASE LETTERS. Uppercase letters indicate keywords and reserved words. Type
these items exactly as shown. Items not enclosed in brackets are required. For
example:
MAXATTACH
lowercase italic letters. Lowercase italic letters indicate variable items that you supply.
Items not enclosed in brackets are required. For example:
file-name
computer type. Computer type letters within text indicate C and Open System Services
(OSS) keywords and reserved words. Type these items exactly as shown. Items not
enclosed in brackets are required. For example:
myfile.c
italic computer type. Italic computer type letters within text indicate C and Open
System Services (OSS) variable items that you supply. Items not enclosed in brackets
are required. For example:
pathname
About This Manual
Debug Manual—421921-003
xvii
General Syntax Notation
[ ] Brackets. Brackets enclose optional syntax items. For example:
TERM [\system-name.]$terminal-name
INT[ERRUPTS]
A group of items enclosed in brackets is a list from which you can choose one item or
none. The items in the list can be arranged either vertically, with aligned brackets on
each side of the list, or horizontally, enclosed in a pair of brackets and separated by
vertical lines. For example:
FC [ num ]
[ -num ]
[ text ]
K [ X | D ] address
{ } Braces. A group of items enclosed in braces is a list from which you are required to
choose one item. The items in the list can be arranged either vertically, with aligned
braces on each side of the list, or horizontally, enclosed in a pair of braces and
separated by vertical lines. For example:
LISTOPENS PROCESS { $appl-mgr-name }
{ $process-name }
ALLOWSU { ON | OFF }
| Vertical Line. A vertical line separates alternatives in a horizontal list that is enclosed in
brackets or braces. For example:
INSPECT { OFF | ON | SAVEABEND }
… Ellipsis. An ellipsis immediately following a pair of brackets or braces indicates that you
can repeat the enclosed sequence of syntax items any number of times. For example:
M address [ , new-value ]…
[ - ] {0|1|2|3|4|5|6|7|8|9}…
An ellipsis immediately following a single syntax item indicates that you can repeat that
syntax item any number of times. For example:
"s-char…"
Punctuation. Parentheses, commas, semicolons, and other symbols not previously
described must be typed as shown. For example:
error := NEXTFILENAME ( file-name ) ;
LISTOPENS SU $process-name.#su-name
Quotation marks around a symbol such as a bracket or brace indicate the symbol is a
required character that you must type as shown. For example:
"[" repetition-constant-list "]"
About This Manual
Debug Manual—421921-003
xviii
Notation for Messages
Item Spacing. Spaces shown between items are required unless one of the items is a
punctuation symbol such as a parenthesis or a comma. For example:
CALL STEPMOM ( process-id ) ;
If there is no space between two items, spaces are not permitted. In this example, no
spaces are permitted between the period and any other items:
$process-name.#su-name
Line Spacing. If the syntax of a command is too long to fit on a single line, each
continuation line is indented three spaces and is separated from the preceding line by
a blank line. This spacing distinguishes items in a continuation line from items in a
vertical list of selections. For example:
ALTER [ / OUT file-spec / ] LINE
[ , attribute-spec ]…
!i and !o. In procedure calls, the !i notation follows an input parameter (one that passes data
to the called procedure); the !o notation follows an output parameter (one that returns
data to the calling program). For example:
CALL CHECKRESIZESEGMENT ( segment-id !i
, error ) ; !o
!i,o. In procedure calls, the !i,o notation follows an input/output parameter (one that both
passes data to the called procedure and returns data to the calling program). For
example:
error := COMPRESSEDIT ( filenum ) ; !i,o
!i:i. In procedure calls, the !i:i notation follows an input string parameter that has a
corresponding parameter specifying the length of the string in bytes. For example:
error := FILENAME_COMPARE_ ( filename1:length !i:i
, filename2:length ) ; !i:i
!o:i. In procedure calls, the !o:i notation follows an output buffer parameter that has a
corresponding input parameter specifying the maximum length of the output buffer in
bytes. For example:
error := FILE_GETINFO_ ( filenum !i
, [ filename:maxlen ] ) ; !o:i
Notation for Messages
This list summarizes the notation conventions for the presentation of displayed
messages in this manual.
About This Manual
Debug Manual—421921-003
xix
Notation for Messages
Bold Text. Bold text in an example indicates user input typed at the terminal. For example:
ENTER RUN CODE
?123
CODE RECEIVED: 123.00
The user must press the Return key after typing the input.
Nonitalic text. Nonitalic letters, numbers, and punctuation indicate text that is displayed or
returned exactly as shown. For example:
Backup Up.
lowercase italic letters. Lowercase italic letters indicate variable items whose values are
displayed or returned. For example:
p-register
process-name
[ ] Brackets. Brackets enclose items that are sometimes, but not always, displayed. For
example:
Event number = number [ Subject = first-subject-value ]
A group of items enclosed in brackets is a list of all possible items that can be
displayed, of which one or none might actually be displayed. The items in the list can
be arranged either vertically, with aligned brackets on each side of the list, or
horizontally, enclosed in a pair of brackets and separated by vertical lines. For
example:
proc-name trapped [ in SQL | in SQL file system ]
{ } Braces. A group of items enclosed in braces is a list of all possible items that can be
displayed, of which one is actually displayed. The items in the list can be arranged
either vertically, with aligned braces on each side of the list, or horizontally, enclosed in
a pair of braces and separated by vertical lines. For example:
obj-type obj-name state changed to state, caused by
{ Object | Operator | Service }
process-name State changed from old-objstate to objstate
{ Operator Request. }
{ Unknown. }
| Vertical Line. A vertical line separates alternatives in a horizontal list that is enclosed in
brackets or braces. For example:
Transfer status: { OK | Failed }

About This Manual
Debug Manual—421921-003
xx
Notation for Management Programming Interfaces
% Percent Sign. A percent sign precedes a number that is not in decimal notation. The
% notation precedes an octal number. The %B notation precedes a binary number.
The %H notation precedes a hexadecimal number. For example:
%005400
%B101111
%H2F
P=%p-register E=%e-register
Notation for Management Programming Interfaces
This list summarizes the notation conventions used in the boxed descriptions of
programmatic commands, event messages, and error lists in this manual.
UPPERCASE LETTERS. Uppercase letters indicate names from definition files. Type these
names exactly as shown. For example:
ZCOM-TKN-SUBJ-SERV
lowercase letters. Words in lowercase letters are words that are part of the notation,
including Data Definition Language (DDL) keywords. For example:
token-type
!r. The !r notation following a token or field name indicates that the token or field is
required. For example:
ZCOM-TKN-OBJNAME token-type ZSPI-TYP-STRING. !r
!o. The !o notation following a token or field name indicates that the token or field is
optional. For example:
ZSPI-TKN-MANAGER token-type ZSPI-TYP-FNAME32. !o
Change Bar Notation
Change bars are used to indicate substantive differences between this manual and its
preceding version. Change bars are vertical rules placed in the right margin of changed
portions of text, figures, tables, examples, and so on. Change bars highlight new or
revised information. For example:
The message types specified in the REPORT clause are different in the COBOL
environment and the Common Run-Time Environment (CRE).
The CRE has many new message types and some new message type codes for
old message types. In the CRE, the message type SYSTEM includes all messages
except LOGICAL-CLOSE and LOGICAL-OPEN.

Debug Manual—421921-003
1-1
1Introduction
The Guardian debug facility (Debug) provides a tool for interactively debugging a
running process. Using Debug, you can designate certain program code or memory
locations as breakpoints. When these breakpoints are executed or accessed in the
specified way (read, write, or change), your process enters the debug state.
While a process is in the debug state, you can interactively display and modify the
contents of the process’s variables, display and modify the contents of the process’s
registers, and set other breakpoints.
Debug is a low-level debugging facility. To use Debug, you should have a thorough
understanding of the system hardware registers and the system addressing scheme.
Refer to the server description manual appropriate for the system at your site.
These topics are covered in this section:
•Execution Modes on TNS/R Systems
•What User Access Is Required for Debugging on page 1-2
•How to Make a Process Enter Debug on page 1-2
•How to Select Debug as the Debugger on page 1-6
•Why a Process Enters Debug on page 1-7
•How to Determine Process State on a Trap or Signal on page 1-7
•Ending a Debug Session on page 1-10
•What Appears in the Debug Header Message on page 1-10
•How to Use Debug on page 1-13
•How Debug Breakpoints Work on page 1-14
Execution Modes on TNS/R Systems
TNS/R systems can execute TNS/R native code, TNS code, and accelerated code.
User processes run in all of these modes.
Native code is produced by a TNS/R native compiler and consists entirely of RISC
instructions that have been optimized to take full advantage of the RISC architecture.
TNS code executes on RISC processors by millicode emulation.
Accelerated code is produced by the Accelerator, a program that processes a TNS
object file to run more efficiently on a TNS/R processor. An accelerated object file
consists of RISC instructions generated by the Accelerator as well as the original TNS
instructions.

Introduction
Debug Manual—421921-003
1-2
What User Access Is Required for Debugging
A TNS/R native process is a process that is initiated by executing a native program,
which contains native code. A TNS process is a process that is initiated by executing a
TNS or accelerated program, which contains TNS or accelerated object code.
Debug can be used with either type of process and with any of these execution modes.
Functionally, Debug is the same for all of these cases, although there are minor
differences in syntax, input and output formats, and so on. These differences are
noted throughout the manual.
What User Access Is Required for Debugging
To debug a program, you must have both read and execute access to the file for that
program. To debug code in the user library, you must also have read and execute
access to that user library file. To debug system code or any privileged code, you
must be executing under the local super ID (255, 255) and issue the PRV ON
command.
How to Make a Process Enter Debug
There are six ways to force a process into the debug state:
•Using the RUND Command (or the TACL run option DEBUG)
•Invoking Debug From TACL for a Process on page 1-3
•Calling Debug From a Process on page 1-4
•Entering a Breakpoint in a Process on page 1-5
•Running Debug From the OSS Shell on page 1-6
Using the RUND Command
Running a program with the command interpreter RUND (run Debug) command
causes the process to enter the debug state before the first instruction of the main
procedure is executed.
Example:
10> RUND myprog
Using the TACL run option DEBUG is equivalent to using the RUND command. The
following example uses the run option DEBUG and also requests a system-assigned
name.

Introduction
Debug Manual—421921-003
1-3
Invoking Debug From TACL for a Process
PROCESS_LAUNCH_ Procedure
You can run the debugger (Inspect or Debug) on a new process by passing the debug
option bits to the PROCESS_LAUNCH_ procedure as a field in a structure, as
illustrated in this example:
<initialize structure PARMS>
. .
PARMS.NAME_OPTIONS := 2; ! Requests a system-assigned name.
PARMS.DEBUG_OPTIONS.<12> := 1; ! Debug at first instruction.
PARMS.DEBUG_OPTIONS.<14> := 1; ! Use debugger set in next bit.
PARMS.DEBUG_OPTIONS.<15> := 0; ! Selects Debug as the debugger.
ERROR := PROCESS_LAUNCH_ ( PARMS, ERROR_DETAIL );
Invoking Debug From TACL for a Process
Run a program that you want to debug through the command interpreter, in this case
the HP Tandem Advanced Command Language (TACL). While the program is
executing, press the BREAK key to wake up the TACL process; the program continues
executing. TACL returns to the command-input mode. At this point, either from the
original terminal or at another terminal, find the processor number and process
identification number (PIN) of the process (the executing program you want to debug)
by using the TACL command STATUS:
STATUS *, TERM ! from the same terminal
STATUS *, USER ! from another terminal
Then enter this command indicating the process you want to debug:
DEBUG | DEBUGNOW
specifies that the Debug facility is to start debugging the selected process. If you
do not specify a process, Debug starts debugging the process most recently
started by the TACL process if that process still exists.
DEBUG causes the specified process to enter the debug state at the next
instruction executing in unprivileged state. If the process is executing in privileged
state, it will enter debug when it next returns to unprivileged execution.
DEBUGNOW causes the specified process to enter the debug state at the next
instruction, which might be in the privileged state. DEBUGNOW can be invoked
only by the local super ID (255, 255).
Standard security requirements are applied to the user of DEBUG. A process
executing an ordinary (unlicensed) program can be put into debug state by the
user that created it, by the supervisor of that group, or by the super ID. The user
placing the process into debug must be at least as local as the one creating the
process. A process running from a program that requires licensing (one that
{ DEBUG | DEBUGNOW } [ cpu,pin | process-name ]
[,TERM [[\sys-name.]$terminal-name .[#qualifier ]]]
Introduction
Debug Manual—421921-003
1-4
Calling Debug From a Process
contains CALLABLE or PRIV procedures) can be put into debug state only by the
local super ID.
If a process is created privileged, it will never run unprivileged, so DEBUG would
be ineffective; therefore, DEBUG is rejected for an initially privileged process. Use
DEBUGNOW instead.
cpu,pin
is the processor in which the program to be debugged is executing and its process
identification number.
process-name
is the process name of the program to be debugged. If you use the process-name
form, the primary process of a process pair enters the debug state.
TERM [[\sys-name.]$terminal-name [.#qualifier ]]
TERM specifies the new home terminal of the process being debugged. If you omit
TERM, Debug prompts appear on the original home terminal of the process. If you
specify TERM but omit the terminal name, Debug uses the terminal from which you
just entered this command. You must include the \sys-name if the new home
terminal is connected to a system other than the current default system.
Example:
(BREAK key pressed)
20> STATUS *,TERM
Process Pri PFR %WT Userid Program file Hometerm
$Z159 1,152 123 R 000 9,215 $VOL1.SV1.POBJ $T1
.
.
21> DEBUG 1,152
DEBUG $PC=0x7000D820
106,01,00152-
Calling Debug From a Process
Programs can include explicit calls to a debug facility. This method is quite useful for
finding elusive error conditions. The procedures that call a debug facility invoke either
Debug or the Inspect debugger depending on which debugger has been previously
selected. These procedures can invoke the debug state for the current process or the
designated process. The procedures are:
•DEBUG procedure, which invokes Debug for the current process
•PROCESS_DEBUG_ procedure, which can invoke Debug for either the current
process or the called process
•DEBUGPROCESS procedure, which invokes Debug for the specified process

Introduction
Debug Manual—421921-003
1-5
Entering a Breakpoint in a Process
DEBUG Procedure
The DEBUG procedure causes the current process to enter the debug state at the call
to Debug.
Example:
IF < THEN CALL DEBUG;
PROCESS_DEBUG_ Procedure
The PROCESS_DEBUG_ procedure can cause either the current process or the called
process to enter the debug state at the call.
Example of invoking Debug for the current process:
IF < THEN CALL PROCESS_DEBUG_ ; ! without parameters
Example of invoking Debug for another process identified by process handle:
ERROR := PROCESS_DEBUG_ ( PROCESSHANDLE, TERMINAL:LENGTH );
A now parameter in the PROCESS_DEBUG_ procedure immediately invokes the
debug state. To use the now parameter, the calling process must be executing under
the local super ID. The now parameter is required for debugging a system process,
including an input/output process (IOP). The same security considerations apply to the
use of PROCESS_DEBUG_ as to the use of the TACL DEBUG | DEBUGNOW
command.
DEBUGPROCESS Procedure
The DEBUGPROCESS procedure invokes debugging of the process specified by the
process-id parameter. The process-id can be in either a timestamp format or a
local or remote named format.
Example:
CALL DEBUGPROCESS (PROCESS-ID, ERROR );
A now parameter in the DEBUGPROCESS procedure immediately invokes the debug
state for the specified process. To use the now parameter, the calling process must be
executing under the local super ID (255, 255). The now parameter is required for
debugging a system process, including an input/output process (IOP).
Entering a Breakpoint in a Process
To have a process enter the debug state at a particular code location, set a code
breakpoint by using the B command when the process is in the debug state. Or, for a
memory location, set a memory-access breakpoint by using the BM command. After
Note. Using PROCESS_DEBUG_ to cause the current process to enter the debug state may
give unexpected results. To avoid any uncertainty, use DEBUG to cause the current process to
enter the debug state.

Introduction
Debug Manual—421921-003
1-6
Running Debug From the OSS Shell
setting the breakpoint, resume execution. Debug prompts when the code location is
executed or the memory location is accessed:
Example of a code breakpoint:
106,06,00125-B 0x700003B0 ! Set RISC breakpoint at 0x700003B0
N: 0x700003B0 INS: ADDIU sp,sp,-24
106,06,00125-R ! Resume execution.
DEBUG P=%700003B0, E=%000207 UC.%00-BREAKPOINT- ($PC=0x700003B0)
106,06,00125- ! Awaiting input in debug state.
Running Debug From the OSS Shell
You can use Debug in the Open System Services (OSS) environment. When running
a program from the OSS shell, you can cause it to enter the debug state before the
first instruction of the main procedure is executed. This example causes the program
ossprog to enter the debug state with Debug as the debugger:
$ run -debug -inspect=off ossprog
If the command line in the preceding example said -inspect=on, and if the program
ossprog were compiled with SYMBOLS ON, then Inspect would be the debugger.
When either of those two conditions are not satisfied, Debug is the debugger.
How to Select Debug as the Debugger
Debug is the default debugger; however, commands can set the Inspect debugger as
the default debugger. If the Inspect debugger has been set as the default for a
process, any new process created by the old process also uses the Inspect debugger
unless the procedure creating the new process explicitly overrides using the Inspect
debugger.
The following list indicates commands or procedures you can use to invoke process
execution to ensure that Debug is the default debugger for a Guardian process. These
methods are listed in the order of precedence, with the highest precedence first. For
example, a process started with method 1 would override debugger selection
potentially set in the process’s program object file by method 3.
1. Specify Debug as the debugger in the PROCESS_LAUNCH_ procedure. For
information on using this procedure, see the Guardian Procedure Calls Reference
Manual.
2. In a RUND command to run your program through the command interpreter,
specify INSPECT OFF. Also, in a RUND command, do not specify either the
INSPECT or SAVEABEND parameters. (Either of these parameters selects the
Inspect debugger.) For information on the RUND command, see the TACL
Reference Manual.
This RUND command is equivalent to method 1 above, because it is a method of
creating a new process.

Introduction
Debug Manual—421921-003
1-7
Why a Process Enters Debug
3. When linking the program object file, specify the nld or Binder command
SET INSPECT OFF. Note that the command SET SAVEABEND ON also sets
INSPECT ON. You might want to ensure that the command
SET SAVEABEND OFF is also specified. If the program object file has already
been created, you can accomplish the same thing by specifying the nld or Binder
commands CHANGE INSPECT OFF and CHANGE SAVEABEND OFF for the file.
For more information on nld commands, see the nld Manual and the noft Manual.
For more information on Binder commands, see the Binder Manual. For more
information on compiler directives, see the reference manual for the particular
compiler.
Why a Process Enters Debug
There are several reasons a process might unexpectedly enter Debug by default:
•The process tried to call an undefined external procedure.
•The process called the DEBUG procedure.
•Another process specified the process in a call to the DEBUGPROCESS or
PROCESS_DEBUG_ procedure.
•In the case of a TNS/R native process, the process received a signal and either the
installed signal action was SIG_DEBUG or a user-supplied signal handler invoked
Debug.
•In the case of a TNS/R native process that previously had been in the debug state,
the installed signal action is SIG_DFL and the process received a signal for which
the SIG_DFL action is normally process termination. For such a process, the
SIG_DFL action for these signals becomes invocation of Debug. (This applies to
all native signals and to most OSS signals.)
•In the case of a TNS process, a trap occurred and the process had previously
neither specified its own trap-handling mechanism nor disabled traps by a call to
the ARMTRAP procedure.
How to Determine Process State on a Trap or
Signal
If a TNS process enters Debug because a trap occurred, Debug automatically displays
the number of the trap. The trap numbers that can be displayed are:
Trap Number Trap Condition (page 1 of 2)
0 Illegal address reference
1 Instruction failure
2 Arithmetic overflow
3 Stack overflow

Introduction
Debug Manual—421921-003
1-8
How to Determine Process State on a Trap or Signal
If a TNS/R native or OSS process enters Debug because it has received a signal,
Debug automatically displays the name of the signal. Table 1-1 shows the TNS/R
native signals and how they correspond to trap conditions in a TNS process. Additional
signals are supported by Open System Services (OSS). For more information about
OSS signals, see the signal(4) topic in the reference page, either online or in the Open
System Services System Calls Reference Manual.
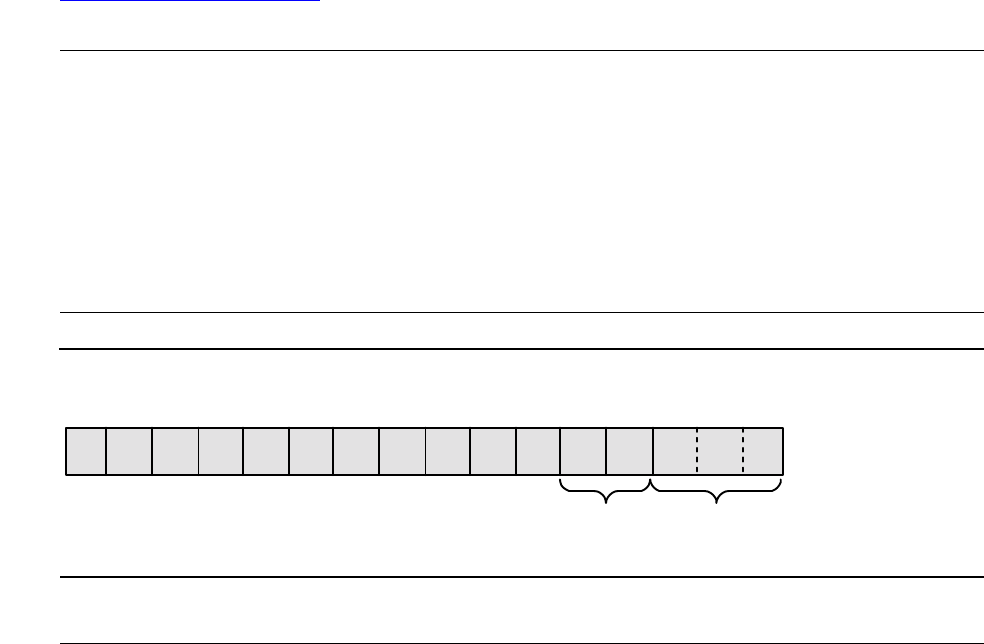
You can determine the TNS/R register settings (native mode) or the S, P, ENV, and L
register settings (TNS or accelerated mode) at the time of the trap by displaying the
register contents. Use the D command to display the contents of the TNS/R or TNS
environment registers and to display the space identifier. The meanings of the various
bits and the format of the Environment (ENV) register are illustrated in Figure 1-1 on
page 1-9.
For more information about TNS/R registers, see Section 2, Using Debug on TNS/R
Processors. For more information about space identifiers, see What Appears in the
4 Process loop-timer timeout
5 D-series limit does not fit into a C-series interface
8 (Under very unusual circumstances, a signal is delivered to a TNS
process and appears as a trap 8.)
11 Memory manager read error
12 No memory available
13 Uncorrectable memory error. Note that this error should not occur
because the millicode will halt the processor.
Table 1-1. Map of TNS/R Native Signals to Traps
Signal Name Description Trap Number
SIGABRT Abnormal termination (8)
SIGILL Invalid hardware instruction 1
SIGFPE Arithmetic overflow 2
SIGLIMIT Limits exceeded 5
SIGMEMERR Uncorrectable memory error 13
SIGMEMMGR Memory manager disk read
error 11
SIGNOMEM No memory available 12
SIGSEGV Invalid memory reference 0
SIGSTK Stack overflow 3
SIGTIMEOUT Process loop timeout 4
Trap Number Trap Condition (page 2 of 2)
Introduction
Debug Manual—421921-003
1-9
How to Determine Process State on a Trap or Signal
Debug Header Message on page 1-10. For more information about space identifiers,
see the appropriate server description manual for the processor that you are using.
Note. You cannot resume a process that entered Debug either because it received a
nondeferrable signal or because a synchronous trap occurred. A signal is nondeferrable if it
was generated by the system because the process cannot continue executing the instruction
stream. The only traps from which you can resume are the looptimer trap and the arithmetic
overflow trap, provided that the T and V bits are not both set in the ENV register.
Resuming from any of these nonresumable situations causes the process to be terminated
with the same Guardian Stop message or OSS wait status as would have been generated had
the signal or trap terminated the process without entering Debug. For additional information
about signals and traps, refer to Guardian Programmer’s Guide.
Figure 1-1. Environment Register (TNS Environment)
Field Description Bits Values
LS Library space ENV.<4> 0 = Code space
1 = Library space
PRIV Privileged ENV.<5> 0 = Nonprivileged
1 = Privileged
DS Data space ENV.<6> 0 = User
1 = System
CS Code space ENV.<7> 0 = User
1 = System
T Trap enable ENV.<8> 0 = Disable
1 = Enable
K Carry bit ENV.<9> 1 = Carry
V Overflow ENV.<10> 0 = No overflow
1 = Overflow
N Negative or numeric condition ENV.<11> See CC
Z Zero or alphabetic ENV.<12> See CC
CC Condition code ENV.<11:12> 10 < CCL (numeric)
01 = CCE (alpha)
00 > CCG (special)
RP Register stack pointer ENV.<13:15>
1514135
PRIV
4
LS
6
DS
7
CS
8
T
9
K
10
V
12
Z
11
N
RP
CC
VST0101.vsd

Introduction
Debug Manual—421921-003
1-10
Ending a Debug Session
Ending a Debug Session
Two commands are provided for ending a Debug session: the STOP command and
the EXIT command.
•The STOP command stops execution of the current process and deletes it.
•The EXIT command clears all breakpoints and resumes execution of the current
process.
What Appears in the Debug Header Message
When a process enters Debug, regardless of the reason, Debug opens the home
terminal. If Debug cannot open the home terminal, the process stops unless it cannot
stop, in which case, it continues.
When Debug opens the home terminal, it prints a header message on the terminal.
The header message displays the current values of the P or PC and the ENV registers,
the current space identifier, and information as to why your process entered Debug.
These examples illustrate different Debug header messages:
DEBUG P=%001025, E=%000017, UC.%00 ! Gives current values of
101,01,00012- ! TNS environment P and ENV
! registers and space identifier.
DEBUG P=%037175, E=%000017, UC.%03 - TRAP #03 -!Process entered
Debug
099,00,00039- ! when it encountered
! a stack overflow.
Header Message Format
The format of the header message appears in the box below; the element descriptions
follow:
DEBUG {P=P-register, E=ENV-register, space-identifier}[ info
]
{PC=32-bit-address }
sys,cpu,pin [cmd]-

Introduction
Debug Manual—421921-003
1-11
Header Message Format
The elements reported in the Debug header message are explained as follows:
P-register is the 16-bit octal current value (P register) of the program
counter for TNS or accelerated mode. Typically, this is where a
breakpoint was specified.
32-bit-
address
is the 32-bit hexadecimal current value (PC register) of the
program counter for native mode. Typically, this is where a
breakpoint was specified.
ENV-register is the current value in octal of the TNS environment ENV
register. For more information on register field descriptions, see
Figure 1-1 on page 1-9. In native mode, only the PRIV and DS
fields are valid.
space-
identifier
is one of these values:
UCr
SRL
SCr
SLr
UC.segment-num
UL.segment-num
SC.segment-num
SL.segment-num
The space-identifier defines the current code segment. UC
indicates that the code segment is within the user code space.
Within a user code space there can be up to 32 segments of
code.
SRL indicates that the code is within one of the TNS/R native
shared run-time library code spaces.
SC indicates that the code segment is within the system code
space. SL indicates that the code segment is within the system
library space.
An r indicates that the segment is within the code space for
native object code. (UC with no r and no segment-num appears
in some displays and is equivalent to UCr.) For a process in TNS
or accelerated mode, the segment-num appears instead of an r
and defines the particular code segment. SRL always refers to a
space for native object code.
For more information about space identifiers, see the server
description manual appropriate for your system.
[ info ] is the header message; it is described in the next subsection.

Introduction
Debug Manual—421921-003
1-12
Header Message Information
Header Message Information
These messages appear (as info) in the header to indicate why your process entered
Debug:
- (no further information in the header message)
One of the following occurred: a call to Debug, a call to an undefined external
procedure, a Debug command entered through the command interpreter, a RUND
command, or a memory-access breakpoint taken while executing system code. In
the latter case, a message precedes the prompt.
-BREAKPOINT-
The process encountered a code breakpoint.
-MEMORY ACCESS BREAKPOINT-
The process encountered a memory-access breakpoint.
-MEMORY ACCESS BREAKPOINT- (WHILE IN SYSTEM CODE)
The process encountered a memory-access breakpoint while in system code. The
Debug prompt occurs when execution exits system code.
-MEMORY ACCESS BREAKPOINT- (WHILE IN LIBRARY CODE)
The process encountered a memory-access breakpoint while in system library
code. The Debug prompt occurs when execution exits the system library code.
- RISC BREAKPOINT ($PC= 0x704205E0) -
The process encountered a RISC breakpoint.
- SIGNAL signal-name -
The process received a signal, identified by signal-name, and the signal action
in effect is SIG_DEBUG.
sys,cpu,pin
[cmd]is the Debug prompt.
The value of sys is the node (system) number in decimal
(assigned during SYSGEN).
The value of cpu is the number, in decimal, of the processor
module where the process is executing.
The value of pin is the five-digit process identification number,
in decimal, of the process.
The value of cmd is a Debug command. If the Debug command
appears at the prompt, you can press RETURN to continue
executing the command.

Introduction
Debug Manual—421921-003
1-13
How to Use Debug
- TRAP #nn -
The process encountered a trap, number nn, and no trap handler was specified for
the process.
How to Use Debug
Once your process enters Debug, use the commands in Section 4, Debug Commands,
to find out what is happening. You use Debug interactively by entering the Debug
commands at the process’ home terminal.
With Debug it is possible to establish one or more breakpoints, to display and modify
the contents of variables, and to display and modify the contents of specified registers.
It is also possible to trace and display stack markers, to calculate the value of
expressions, and to redirect the Debug display to an output device.
Example of Debug Use
The following sample Debug session shows commands that display and modify the
contents of a memory location, set a breakpoint, and resume program execution. The
commands entered by the user are in bold so you can distinguish them from the Debug
output.
DEBUG P=%001025, E=%000017, UC.%00 ! Debug header message.
106,01,00012-D 14,2 ! Display 2 words starting at user data loc. %14.
000014: 020040 020040
106,01,00012-M 14,0 ! Modify user data loc. %14 by storing 0.
106,01,00012-B 1027 ! Set breakpoint at %001027
! in current code segment.
ADDR: UC.%00, %001027 INS: %127001
106,01,00012-R ! Resume program execution.
Program execution resumes.
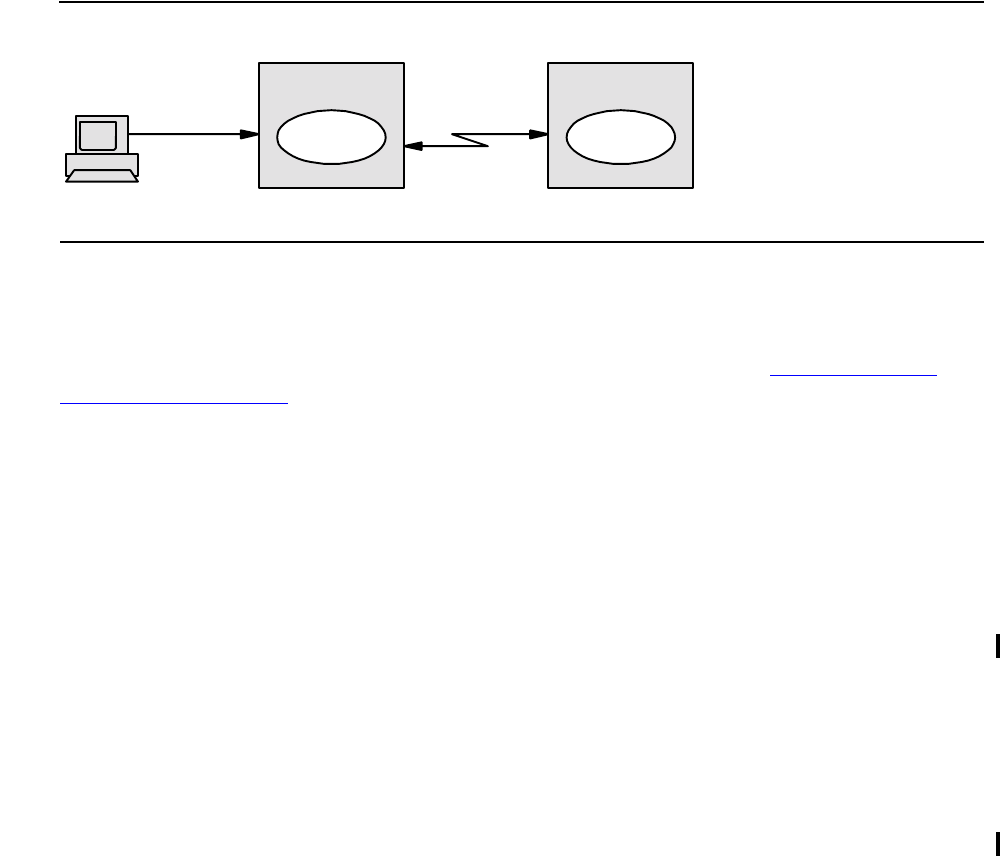
Debugging on a Remote Node
Debug allows debugging from a remote node for two nodes connected in a network.
From the terminal on your node, you can run a process on another node and debug it,
or a process can be run or a new process started with a home terminal specified on
another node. Debugging on a remote node is illustrated in Figure 1-2 on page 1-14.
Note. Unless you specify otherwise (either in the command itself or by using a BASE
command), numeric values input to or output by Debug are in hexadecimal representation for
commands referencing RISC addresses and in octal for commands referencing TNS
addresses, except for the Debug prompt, where sys, cpu, and pin are in decimal.
Introduction
Debug Manual—421921-003
1-14
Necessary Compiler Listing
Example:
RUND \sysb.$vol3.subv4.oprog / NAME $pro1 /
To debug remotely, you use the same commands discussed under How to Make a
Process Enter Debug on page 1-2. Specifically, the commands and procedures are:
Necessary Compiler Listing
To debug a program, you need a compiler listing of the program. As your
source-language compiler permits, you should specify these compiler directives:
Programmers familiar with the machine instructions might find a listing of the
instruction codes helpful. These source-language compiler directives enable the listing
of instruction codes:
How Debug Breakpoints Work
A breakpoint is a location (or “point”) in your program where you want to suspend
execution so that you can then examine and perhaps modify the program’s state.
Example of a Code Breakpoint
For a code breakpoint, you specify a location in the code area where you want the
process to enter the debug state just before execution of that code. The operating
Figure 1-2. Debugging a Remote Process
Commands RUND and DEBUG entered from the command interpreter
Procedures PROCESS_LAUNCH_, PROCESS_DEBUG_, and
DEBUGPROCESS
?LIST Lists the source program and enables other listings
?MAP Specifies maps of the identifiers used in the source program
?LMAP* Specifies a map of procedure entry points
?CODE Lists instruction codes in octal for entire procedures
?ICODE Lists instruction code mnemonics for entire procedures
?INNERLIST Lists instruction code after each statement
VST0102.vsd
$PRO1
Home
Terminal
$HT
\SYSA \SYSB

Introduction
Debug Manual—421921-003
1-15
Example of a Memory-Access Breakpoint
system replaces the instruction in the specified location with a breakpoint instruction
and stores the replaced instruction in a breakpoint table. No instructions are moved
except when breakpoints are set and cleared.
Example of a Memory-Access Breakpoint
In addition to code breakpoints, the operating system allows memory-access
breakpoints (one for each process). When you specify a memory-access breakpoint,
you also specify the type of access that triggers the breakpoint. The actual types
available depend on the processor, but possible types are:
•Read access
•Write access
•Read/Write access
•Change access
When you set a memory-access breakpoint, Debug assigns the address of the
memory-access breakpoint location to a special processor register during execution of
the process that set the breakpoint. If this location is accessed in the specified way, the
processor hardware causes an interrupt that invokes the Debug procedure.
On a memory-access breakpoint, the invocation of Debug is delayed if it occurs within
privileged code and the user is not privileged. For instance, suppose a user process
calls a system library procedure and a memory-access breakpoint occurs during
execution of privileged system code. Because the user is not permitted to debug
privileged code (unless the PRV ON command has been successfully issued),
invocation of Debug is deferred until the process is no longer executing privileged
code. At the point where control is returned to Debug, if the process is still executing in
either the system code or the system library space, Debug cannot modify code in that
space (either directly or indirectly, by setting a breakpoint). Full use of nonprivileged
Debug commands resumes when control is returned to Debug while the process is
executing in the user program.
For other anomalies, see Considerations for Memory-Access Breakpoints on page 2-8.

Introduction
Debug Manual—421921-003
1-16
Debug/Program Execution Environment
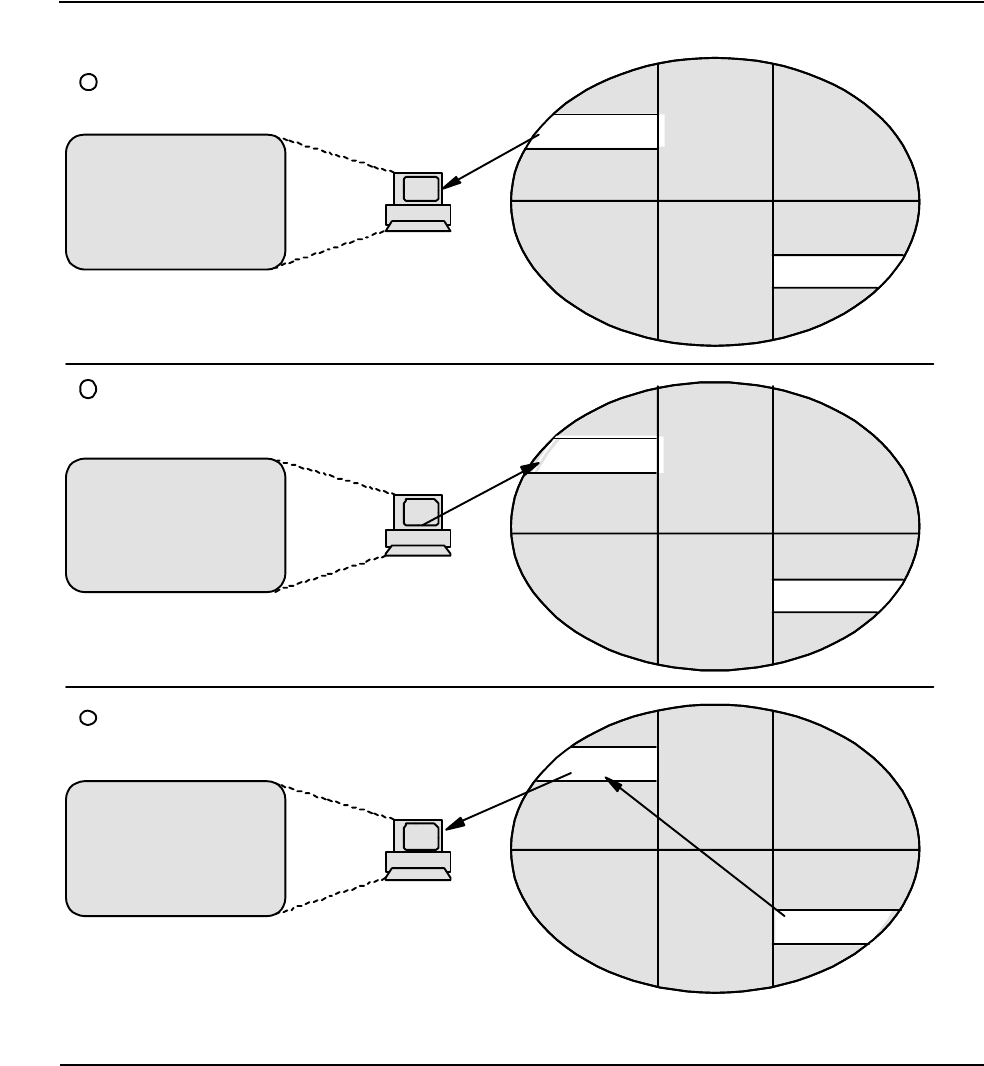
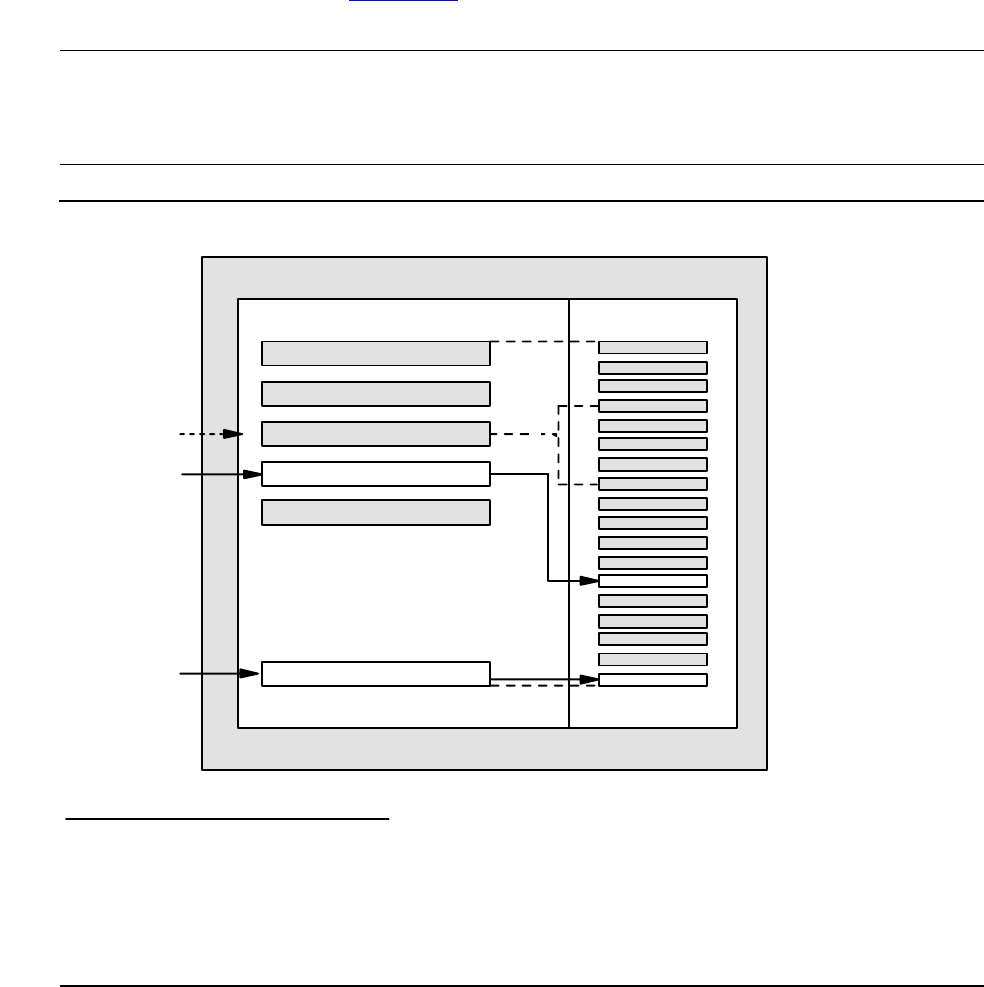
Debug/Program Execution Environment
Debug executes in a private environment with its own stack; it does not use the
environment of the procedure from which it was invoked. Debug does not use any
processor registers of the process being debugged, so all registers are available to the
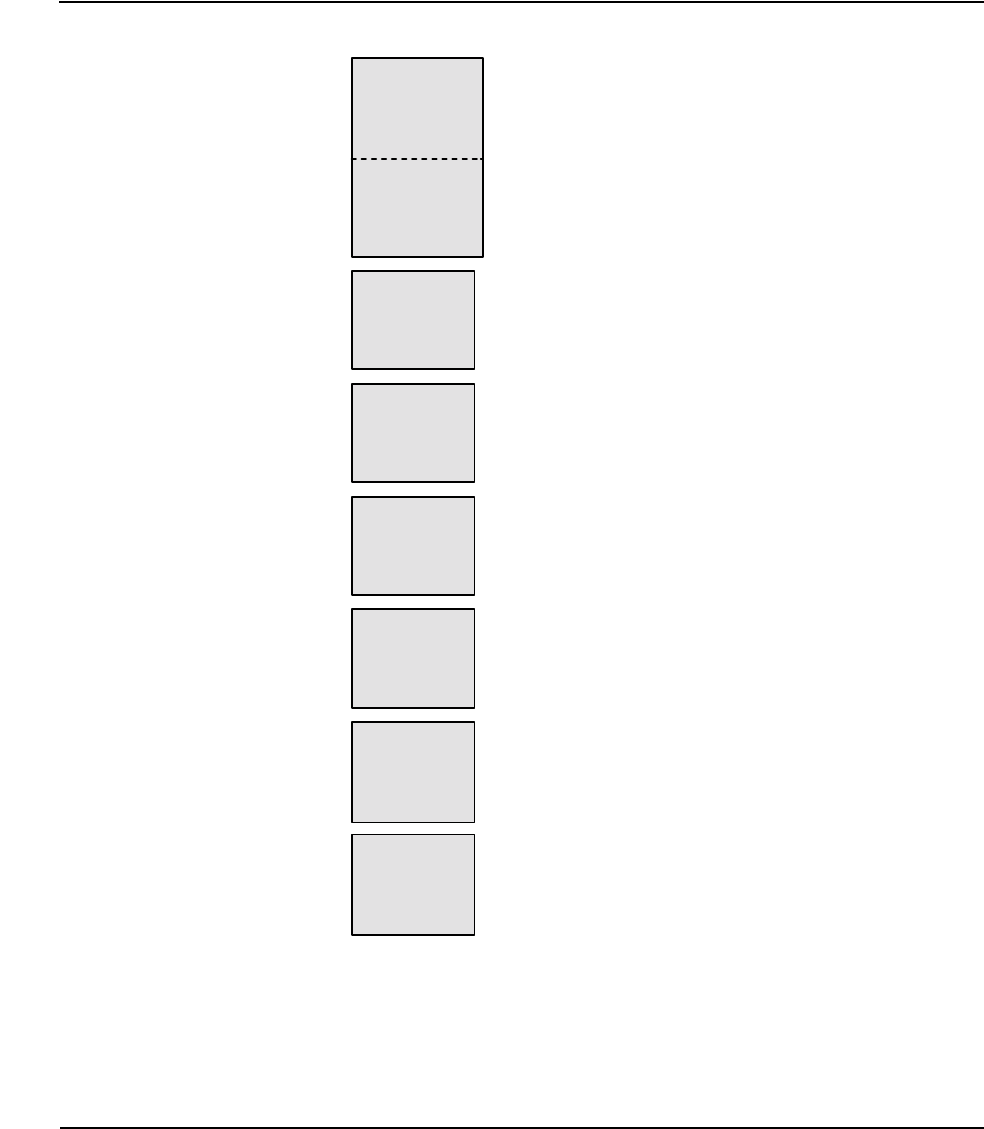
user program. Debug runs as part of the original user process executing out of the
system code portion of the process, as illustrated in Figure 1-3. Debug data is stored
outside the user data area.
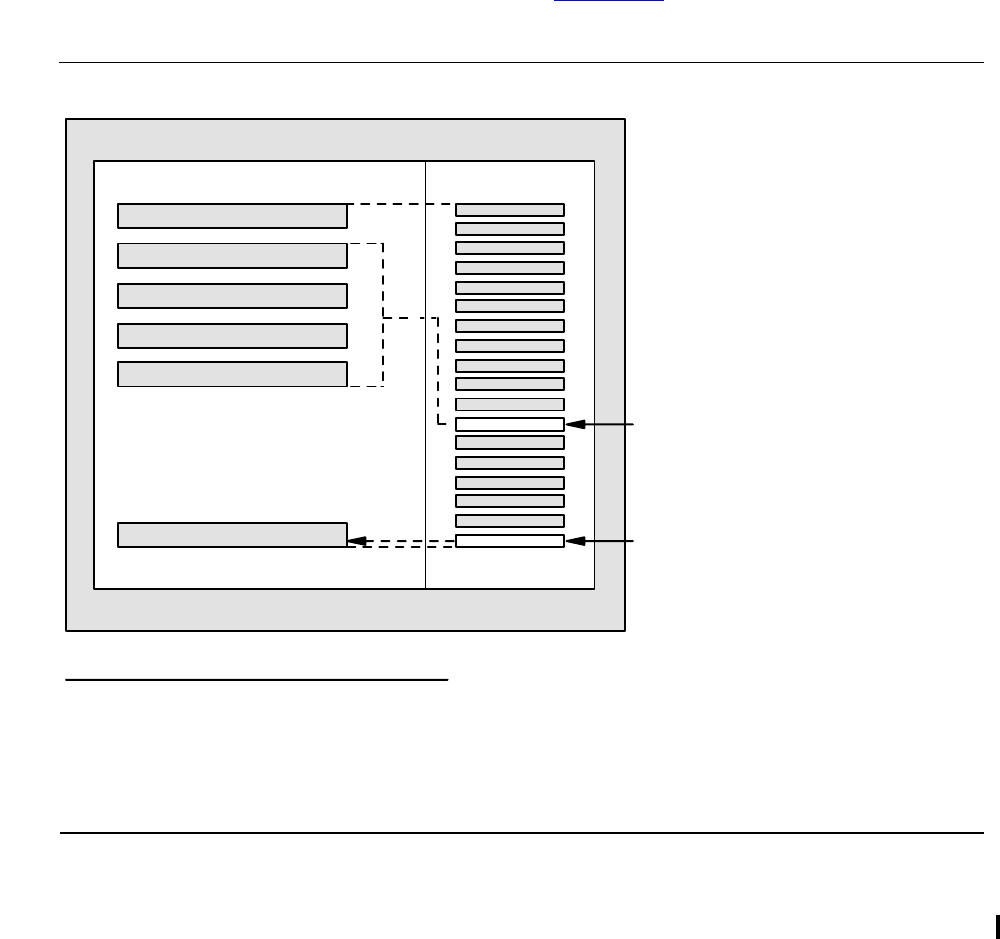
In a process being debugged, Debug displays output to the terminal and accepts input
from the terminal as illustrated in Figure 1-4 on page 1-17. Panel 1 illustrates control
going to a terminal at an assumed breakpoint. Then Debug requests input. Panel 2
illustrates a request to Debug to display data at location 100. Panel 3 illustrates Debug
reading the location and returning the information, which is the value 25, to the
terminal.
When several processes run the same program file in the same processor module,
they share the code area. If a breakpoint is set in shared code using the default
breakpoint mode, only the process that set the breakpoint enters the debug state when
it executes or accesses the breakpoint location. If you are debugging in privileged
mode, you can direct all processes to break at that location by specifying ALL when
setting the breakpoint.
When a privileged memory-access breakpoint is set with the ALL attribute specified
(for example, BM0,r,ALL), every other memory-access breakpoint in that processor is
inhibited. The other breakpoints return to use when the privileged ALL breakpoint is
cleared. Only one ALL memory-access breakpoint is allowed per processor.
Figure 1-3. Debug/User Process Diagram
VST0103.vsd
System Code System Library System Data
User Code User Library User Data
Debug
User Process
Debug Data

Debug Manual—421921-003
2-1
2
Using Debug on TNS/R Processors
When debugging on HP NonStop Series/RISC (TNS/R) processors in native mode,
Debug provides information about the RISC state of the process so that you can debug
at the RISC instruction level when necessary. Program execution in native mode
consists entirely of RISC instructions and TNS/R register use.
When debugging programs in TNS or accelerated mode, you do not need to know the
TNS/R architecture, except for some low-level debugging. You do, however, need to
understand the HP NonStop Series (TNS) environment. Debug provides TNS
breakpoints and information on the TNS environment registers.
For your convenience, this section provides an overview of information that you need
to debug programs at the RISC instruction level. This section discusses these topics:
•TNS/R Memory Addressing on page 2-1
•Execution Options on page 2-3
•TNS and RISC Execution Correspondence (Accelerated Mode) on page 2-5
•Breakpoints on page 2-5
•TNS/R Registers on page 2-10
•TNS and TNS/R Register Correspondence on page 2-12
For debugging at the RISC instruction level, you are assumed to be familiar with the
TNS/R machine architecture, which is described in the NonStop S-Series Server
Description Manual.
TNS/R Memory Addressing
TNS/R memory is accessible through Debug with 32-bit addresses. Memory
accessible while debugging in nonprivileged mode is:
•User code space (0x70000000 through 0x71FFFFFF)
•User library space (0x72000000 through 0x73FFFFFF)
While debugging in privileged mode, access to the system library space and system
code space are permitted. Address ranges for the different code areas are illustrated in
Figure 2-1 on page 2-2.
Hexadecimal is the default numeric base for 32-bit TNS/R addresses to be displayed
by Debug or entered as input in Debug statements.
Using Debug on TNS/R Processors
Debug Manual—421921-003
2-2
TNS/R Memory Addressing
Figure 2-1. Diagram of TNS/R Memory
Native User Code; TNS
or
Accelerated User Library
Native
System Code
UCr or UL TNS Code 0x72000000 through 0x723FFFFF
0x72400000
0x72400000 + header-len
through 0x73FFFFFF
SL
TNS or Accelerated System
Library
TNS Code 0x7A000000 through 0x7A3FFFFF
0x7A400000
0x7A400000 + header-len
through 0x7BFFFFFF
SCr
SLr
ULr
SC
TNS or Accelerated
System Code
TNS Code 0x80000000 through 0x803FFFFF
0x80400000
0x80400000 + header-len
through 0x807FFFFF
Millicode
UCr or UC TNS Code
Accelerator Header
Accelerated Code
0x70000000 through 0x703FFFFF
0x70400000
0x70400000 + header-len
through 0x71FFFFFF
Native, TNS, or Accelerated User
Code
0x72000000
0x 73FFFFF
F
0x7A000000
0x7BFFFFFF
0x7C000000
0x7DFFFFFF
0x74000000
0x79000000
0x80000000
0x7E000000
0x7FFFFFFF
0x807FFFFF
0x80800000
0x81FFFFF
0x70000000
0x 71FFFFF
F
Native
User Library
Native
System Library
Accelerator Header
Accelerated Code
Accelerator Header
Accelerated Code
Accelerator Header
Accelerated Code
SRL Space 0x74000000 through 0x79FFFFFF
VST0201.vsd

Using Debug on TNS/R Processors
Debug Manual—421921-003
2-3
Execution Options
Execution Options
Three modes of execution are possible on a TNS/R system: TNS mode, accelerated
mode, and native mode.
Much of the code in software products supplied by HP for TNS/R systems has been
produced by TNS/R native compilers. Users can also use native compilers to produce
their own native TNS/R code. For more information, see the C/C++ Programmer's
Guide and the pTAL Programmer’s Guide. Native code consists of RISC instructions
that have been optimized to fully exploit the RISC architecture. Program files
containing such code are called native program files.
Programs produced by compilers that are not TNS/R native compilers also execute on
TNS/R systems. Such programs contain TNS object code. Program files containing
TNS object code are called TNS program files.
For most TNS program files, you can significantly improve performance by processing
them with the Accelerator to make use of performance features of the RISC instruction
set.
The Accelerator processes a standard TNS object file and augments that file by adding
the equivalent RISC instructions. TNS object files that have been optimized by the
Accelerator are called accelerated object files, or accelerated program files if they
include a main procedure.
Running accelerated program files can significantly improve performance over simply
running TNS program files directly on the TNS/R processor. The Accelerator, however,
provides optimization options that can affect debugging the program.
The following paragraphs provide an overview of execution options and describe how
two Accelerator options affect debugging. For more information on using the
Accelerator, see the Accelerator Manual.
Running Native Program Files
Debugging a native program is similar to debugging the RISC portions of an
accelerated program, but you should be aware of a few differences.
•Most addresses in native mode must be expressed in 32-bit address form. For
example, to set a breakpoint in native code, you must use the 32-bit address form
to specify the breakpoint address:
248,01,012-B 0x70451210
•Because of differences in stack layout and contents between native mode and
TNS or accelerated mode, the method of specifying a particular stack frame to
begin a stack trace differs. For more information on displaying a stack trace, see
the description of the T Command on page 4-68.

Using Debug on TNS/R Processors
Debug Manual—421921-003
2-4
Running TNS Program Files
•In native mode, local variables are sometimes cached in registers. Attempting to
modify a local variable or use it for a purpose such as setting a memory-access
breakpoint can have unexpected results.
•In highly optimized native object code, parameter values are sometimes cached in
registers, making their exact location unpredictable.
•The PMAP command is not valid in native mode.
•In native mode, the D register commands display only TNS/R registers.
Running TNS Program Files
TNS program files generated by compilers and the Binder execute with their TNS
instruction set because execution is facilitated by millicode. Millicode is assembled
program code, consisting of RISC instructions, that implements various TNS low-level
functions. Such functions include, but are not limited to, exception handlers, real-time
translation routines, and the library of routines that implements the TNS instruction set
(the equivalent of microcode in other processors).
TNS program files executed on TNS/R processors by the use of millicode in this way
are said to be in “TNS execution mode.”
Running Accelerated Program Files
The Accelerator provides two options that affect optimization and debugging:
•ProcDebug
•StmtDebug
By default, the Accelerator optimizes programs across source-code statement
boundaries to optimize procedure execution (that is, the ProcDebug option is on). The
ProcDebug option generates RISC instructions that do not follow TNS statement
boundaries, therefore producing optimized RISC instruction sequence.
The Accelerator also provides the StmtDebug option, which generates RISC
instructions that optimize only within the code produced for any one source-code
statement. The resulting code might not be as optimized as code generated by the
ProcDebug option, but in this way you can debug individual TNS statements.
Considerations in Using the Accelerator
Consider these points when debugging accelerated programs.
•It is recommended that programs be compiled with SYMBOLS ON before they are
accelerated, because the Accelerator can generate more efficient code with the
information resulting from the SYMBOLS ON option.
•In rare cases, accelerated programs can have portions that are executed in TNS
execution mode and portions that are executed in accelerated execution mode.

Using Debug on TNS/R Processors
Debug Manual—421921-003
2-5
Types of Processes
Portions executed in TNS execution mode result both from explicit instructions to
the Accelerator not to optimize portions of code and from TNS instructions that the
Accelerator cannot optimize.
Portions executed in accelerated execution mode consist of statements and
procedures that were optimized by the Accelerator.
Types of Processes
A process that is initiated by executing a native program is called a TNS/R native
process. A native process executes in the native operating environment of the TNS/R
processor.
A process that is initiated by executing a TNS or accelerated program is called a TNS
process. A TNS process executes in an emulated TNS operating environment.
TNS and RISC Execution Correspondence
(Accelerated Mode)
In accelerated program files, there are two types of execution points where you can
depend on exact correspondence between TNS and RISC states. These are:
•Memory-exact point: A point in an accelerated program where memory (but not
necessarily the registers) is in a known state and contains exactly the values it
would if the program had been running on a TNS processor. The memory,
however, might have already been loaded in registers, so setting breakpoints to
modify memory at these points might not achieve the desired results.
Most statement boundaries are memory-exact points, and complex statements
might contain several such points: at each function call, privileged instruction, and
embedded assignment.
•Register-exact point: A point in an accelerated program where both memory and
registers are in a known state that is equivalent to the state the program would be
in if it had been running on a TNS processor.
In accelerated execution mode, register-exact points occur at procedure calls and
returns, and on entering and leaving accelerated execution mode.
The Debug PMAP command displays corresponding TNS and RISC code and marks
memory-exact (>) and register-exact (@) points in the display.
The Debug D* command displays corresponding TNS and TNS/R register values.
Breakpoints
In accelerated program files, there are typically multiple RISC instructions per TNS
instruction; therefore, any mapping from a breakpoint at a RISC instruction to a TNS
Using Debug on TNS/R Processors
Debug Manual—421921-003
2-6
Setting TNS Breakpoints
instruction would be approximate. Also, multiple RISC breakpoints could map to a
single TNS instruction.
Breakpoint correspondence is illustrated in the following set of figures.
Setting TNS Breakpoints
Setting any allowable TNS breakpoint causes a corresponding breakpoint in the RISC
code. You set a TNS breakpoint by using a B command that includes a reference to a
TNS address (for example, a UC address). The PMAP command shows the allowable
TNS location with > or @ characters. How TNS breakpoints correspond to RISC
breakpoints is illustrated in Figure 2-2, which shows setting breakpoints in the user
code area.
Note. TNS breakpoints can be set only at memory-exact or register-exact points because a
corresponding RISC breakpoint can also be set. Some TNS breakpoints cannot be set at
other points because there is no corresponding RISC instruction, as illustrated in the figure
below with the double slash (//) symbol.
Figure 2-2. How TNS Breakpoints Can Correspond to RISC Breakpoints
B UC. n
+nnn
User Code Area for ProcA
B UC. n +nnn specifies a TNS breakpoint
Register-Exact Point
TNS Instructions RISC Instructions
Register-Exact PointB UC. n
+nnn
Memory-Exact Point
B UC. n
+nnn
// //
Legend
VST0202.vsd
Using Debug on TNS/R Processors
Debug Manual—421921-003
2-7
Setting RISC Breakpoints
Setting RISC Breakpoints
A RISC breakpoint is allowed on any valid RISC address. A RISC breakpoint in
accelerated code does not cause a corresponding TNS breakpoint to be set even
though a corresponding TNS instruction might exist. You set a RISC breakpoint by
using a B command that includes the 32-bit address mode. How RISC breakpoints
correspond to TNS instructions is illustrated in Figure 2-3, which shows setting
breakpoints in the accelerated user code area.
Rules About RISC Breakpoints
These rules about breakpoints apply to accelerated programs:
•A breakpoint set on a TNS instruction also sets a breakpoint in the generated RISC
instruction.
•Whether a TNS or RISC breakpoint is actually accessed depends on whether a
process is executing in TNS or accelerated execution mode. A TNS breakpoint
occurs in TNS execution mode; a RISC breakpoint occurs in accelerated execution
mode.
Figure 2-3. How RISC Breakpoints Correspond to TNS Instructions
BN 0x70 nnnnnn
BN 0x70 nnnnnn
User Code Area for ProcA
BN 0x70 nnnnnn specifies a RISC breakpoint
Register-Exact Point
TNS Instructions RISC Instructions
//
Register-Exact Point
Legend
VST0203.vsd

Using Debug on TNS/R Processors
Debug Manual—421921-003
2-8
Considerations for Memory-Access Breakpoints
•Setting a RISC breakpoint at any valid RISC address is allowed; however, only at
register-exact points are both TNS/R memory and registers consistent with the
TNS state.
•Setting a RISC breakpoint does not cause a TNS breakpoint even if there happens
to be a corresponding TNS instruction. If you set a RISC breakpoint, it is assumed
that you want to debug in the RISC state.
•Avoid modifying memory at memory-exact points; instead, you should modify
memory only at register-exact points when debugging in accelerated execution
mode.
•Modify register values only at register-exact points when debugging in accelerated
execution mode.
Considerations for Memory-Access Breakpoints
Execution of additional instructions might affect the value of the memory location at the
breakpoint and the value of the P-register.
The TNS P or the TNS/R $PC register contains the address of the next instruction to
be executed. Conventionally, the contents of the P-register are incremented by one at
the beginning of instruction execution so that, nominally, instructions are fetched (and
executed) from ascending memory locations. Typically, the value of the P or $PC
register that can be displayed at the breakpoint is one greater than the instruction that
caused the breakpoint.
In Accelerated Execution Mode
In accelerated code, several more TNS instructions can be executed between the
instruction that causes the breakpoint and the instruction where the breakpoint occurs.
When debugging accelerated code, consider this:
•Read-access memory-access breakpoints do not occur if the Accelerator has
optimized the read from memory. This occurs when the Accelerator keeps the
value in a register.
Differences Between Code and Memory-Access Breakpoints
When a code breakpoint is on an instruction that causes a memory-access breakpoint,
the code breakpoint is reported first, then memory access-breakpoint is reported after
resuming the program. The following examples show the results when there is only a
memory-access breakpoint set and the results when a code breakpoint is placed on an
instruction that produces a memory-access breakpoint.

Using Debug on TNS/R Processors
Debug Manual—421921-003
2-9
Considerations for Memory-Access Breakpoints
TNS Example
This code sequence will be used to show the results of the interaction between
memory-access breakpoints and code breakpoints, in TNS mode:
The following example shows the program hitting a memory-access breakpoint. The
displayed P address is one instruction address past the address of the instruction that
caused the memory-access breakpoint. The memory-access breakpoint was triggered
by the STOR instruction at %76.
The displayed $PC address is from the millicode used to emulate the TNS instructions.
The following example shows the results of having a code breakpoint on the instruction
that will cause the memory-access breakpoint. First the code breakpoint is reported;
the memory-access breakpoint is reported after resuming the program.
Native Example
This code sequence shows the results of the interaction between memory-access
breakpoints and code breakpoints, in native mode:
The following example shows the program hitting a memory-access breakpoint. The
displayed $PC address is one instruction address past the address of the instruction
050,03,00009-i %74,4
%000074: LADR L+004 LLS 01 STOR L+035 LDI +000
050,03,00009-bm l+35 , w
XA: 0x0000005E MAB: W (DATA SEG)
050,03,00009-r
DEBUG P=%000077, E=%000207, UC.%00-MEMORY ACCESS BREAKPOINT-
MEMORY ACCESS BREAKPOINT OCCURRED AT $PC=0x7E004A60
050,03,00014-bm l+35, w
XA: 0x0000005E MAB: W (DATA SEG)
050,03,00014-b %76
ADDR: UC.%00,%000076 INS: %044435 SEG: %020740
INS: STOR L+035
050,03,00014-r
DEBUG P=%000076, E=%000200, UC.%00-BREAKPOINT-
050,03,00014-r
DEBUG P=%000077, E=%000207, UC.%00-MEMORY ACCESS BREAKPOINT-
MEMORY ACCESS BREAKPOINT OCCURRED AT $PC=0x7E004A60
050,03,00270-i 0x70000438, #4
70000438: ADDIU t0,sp,128 SW t0,120(sp) ADDIU t1,gp,-32750
70000444: SW t1,176(sp)

Using Debug on TNS/R Processors
Debug Manual—421921-003
2-10
TNS/R Registers
that caused the memory-access breakpoint. The memory-access breakpoint was
triggered by the store word (SW) instruction at 0x7000043C.
This example shows the results from putting a breakpoint on a code location that
causes a memory-access breakpoint:
Observe that the first $PC address ($PC=0x7FF00E20), after executing the second R
command in the above example, is outside the range of the program. But the second
displayed $PC address ($PC=0x7000043C) is the location of the instruction that
caused the memory-access breakpoint, not the location of the next instruction as
shown previously. This is the result of resuming the program from the code breakpoint.
TNS/R Registers
Debug displays the values of the TNS/R hardware registers. The TNS/R registers
include the 32 general-purpose registers $00 through $31, the arithmetic HI/LO
registers, the program counter $PC, and the IEEE floating-point registers.
The TNS/R registers are:
050,03,00270-bm $sp+#120, w
N: 0x4FFFFEA8 MAB: W
050,03,00270-r
DEBUG $PC=0x70000440 -MEMORY ACCESS BREAKPOINT-
MEMORY ACCESS BREAKPOINT OCCURRED AT $PC=0x70000440
050,03,00269-bm $SP + #120, w
N: 0x4FFFFEA8 MAB: W
050,03,00269-b 0x7000043c
N: 0x7000043C INS: 0xAFA80078
INS: SW t0,120(sp)
050,03,00269-r
DEBUG $PC=0x7000043C -RISC BREAKPOINT ($PC: 0x7000043C)-
050,03,00269-r
DEBUG $PC=0x7FF00E20 -MEMORY ACCESS BREAKPOINT-
MEMORY ACCESS BREAKPOINT OCCURRED AT $PC=0x7000043C
$00 Hard wired to the value 0
$01 through $31 General-purpose registers
$HI, $LO Arithmetic high and low registers
$PC TNS/R program counter
$F00 through
$F31 IEEE floating-point general purpose registers
$FCR31 IEEE floating-point status/control register

Using Debug on TNS/R Processors
Debug Manual—421921-003
2-11
TNS/R Registers
Alias names for registers $01 through $31 and $F00 through $F09 appear in this list:
In TNS and accelerated modes, registers $01 through $10 contain temporary values
for various operations. Registers $13 through $25 and $28 through $30 maintain TNS
state information. For many registers, use depends on the execution mode: TNS
mode, accelerated mode, or native mode. A summary of how TNS/R registers are
used with the three execution modes is listed in Table 2-2 on page 2-13.
Note that Debug never reports valid contents for registers $26 and $27, which are
reserved for use by low-level millicode.
Also note that floating-point registers are available only on native programs where
floating-point instructions have been executed. Floating-point registers $F00 through
$F09 can be entered as $F0 through $F9. Floating-point registers $F10 through $F31
and $FCR31 have no alias names.
Register Alias Register Alias
$00
$01 $AT $16 $S0
$02 $V0 $17 $S1
$03 $V1 $18 $S2
$04 $A0 $19 $S3
$05 $A1 $20 $S4
$06 $A2 $21 $S5
$07 $A3 $22 $S6
$08 $T0 $23 $S7
$09 $T1 $24 $T8
$10 $T2 $25 $T9
$11 $T3 $26 $K0
$12 $T4 $27 $K1
$13 $T5 $28 $GP
$14 $T6 $29 $SP
$15 $T7 $30 $S8 or $FP
$31 $RA
$F00 $F0 $F05 $F5
$F01 $F1 $F06 $F6
$F02 $F2 $F07 $F7
$F03 $F3 $F08 $F8
$F04 $F4 $F09 $F9

Using Debug on TNS/R Processors
Debug Manual—421921-003
2-12
TNS and TNS/R Register Correspondence
TNS and TNS/R Register Correspondence
TNS/R processors maintain many of the TNS environment hardware and program
registers. The location and contents of TNS environment registers might vary
depending on the registers involved and the state of the process when Debug was
entered.
Table 2-1 lists TNS environment registers and corresponding TNS/R implementation.
Table 2-2 on page 2-13 provides a summary of how TNS/R registers are used with
native, TNS, and accelerated execution modes.
Table 2-1. TNS Register Implementation Summary
TNS
Register TNS/R Implementation
S S register (stack pointer) is maintained in register $29 (alias $SP). The value
is exact in TNS execution mode but approximate in accelerated execution
mode, except at register-exact points. The value is a 32-bit byte address
equivalent to the TNS S register value.
P The P-register is inferred from the TNS/R PC register (program counter) in
accelerated execution mode; it is retained in the PX register in TNS execution
mode.
ENV The ENV register is maintained in several different TNS/R registers and data
locations. The bits from left to right are implemented as follows:
< 0:15>Unused; must be 0
<16:19>Reserved; must be 0
<20>LS; 1 if executing in user library
<21>PRIV; valid only if privileged
<22>DS; 1 if executing TNS interrupt handler; valid only if privileged
<23>CS; 1 if executing in TNS execution mode in system library
<24>T; 1 if TNS arithmetic overflow traps are enabled
<25>Undefined; see K register ($14, alias $T6)
<26>V;1 if TNS arithmetic overflow occurred
<27:31>CSPACEINDEX; set #0 through 31 within current code file
L L register (frame pointer) is maintained in TNS/R register $30 (alias $S8 or
$FP). The value always contains a 32-bit byte address equivalent to the TNS
L register value.
CSPACEID This is maintained in fields LS, CS, and CSPACEINDEX of ENV.
R0,R1,...R7 TNS register stack pointers are maintained in registers $16 through $23 (alias
$S0 through $S7) in accelerated execution mode; values in accelerated
execution mode are equal to the TNS register values only at register-exact
points.
Also, in TNS execution mode, register $22 (alias $S6) contains an extended
address pointing to the register stack array that holds the TNS registers R0
through R7.

Using Debug on TNS/R Processors
Debug Manual—421921-003
2-13
TNS and TNS/R Register Correspondence
Table 2-2. TNS/R Register Use Summary (page 1 of 2)
Register Alias
Native
Execution
Mode TNS Execution Mode Accelerated
Execution Mode
$00 Zero constant Zero constant Zero constant
$01 $AT Assembler
temporary Temporary Temporary
$02, $03 $V0, $V1 Function values Temporary Temporary
$04..$07 $A0..$A3 Arguments Temporary Temporary
$08..$10 $T0..$T2 Temporary Temporary Temporary
$11 $T3 Temporary Rj_Ptr (executor
variable) Temporary
$12 $T4 Temporary Arg (executor variable) Temporary
$13 $T5 Temporary Iword (executor
variable) RA2 register
$14 $T6 Temporary K (carry bit) K (carry bit)
$15 $T7 Temporary CC (condition code; <0,
=0, >0) CC (condition
code)
$16 $S0 Saved variables Do_Next R0
$17 $S1 Saved variables (spare) R1
$18 $S2 Saved variables Extended address in
read-only memory of
instruction decode
tables
R2
$19 $S3 Saved variables SG_Ptr. Extended
absolute address in
Kseg0 of system global
(SG) data segment
R3
$20 $S4 Saved variables RP wrap base (address
of R0) R4
$21 $S5 Saved variables Cur_Cseg. Current
code segment as an
extended 32-bit address
(can be UC, UL, SC, or
SL)
R5
$22 $S6 Saved variables RPX. Extended
address pointing into
register stack array
holding TNS registers
R0 through R7
R6

Using Debug on TNS/R Processors
Debug Manual—421921-003
2-14
TNS and TNS/R Register Correspondence
$23 $S7 Saved variables PX. Extended address
in user space of next
TNS instruction half
word in current TNS
code segment
R7
$24 $T8 Temporary UC_CSeg. User code
segment as an
extended 32-bit address
UC_Cseg. User
code segment as
an extended 32-bit
address
$25 $T9 Temporary ENV. Environment
register in stack-marker
format
ENV.
Environment
register in stack-
marker format
$26, $27 $K0, $K1 Reserved for
kernel Reserved for kernel --
$28 $GP Global pointer RMap. Extended
address of current TNS
code segment’s return
map
RMap. Extended
address of
current TNS code
segment’s return
map
$29 $SP Stack pointer SX. S register value as
an extended 32-bit
address
SX. S register
value as an
extended 32-bit
address
$30 $S8/$FP Saved variables LX. L register value as
an extended 32-bit
address
LX. L register
value as an
extended 32-bit
address
$31 $RA Return address Temporary Temporary
$F00..$F31 When floating-
point instructions
have been used.
$F00 through
$F19 are
temporary
registers and
$F20 through
$F31 are saved
registers.
$FCR31 When floating-
point instructions
have been used
Table 2-2. TNS/R Register Use Summary (page 2 of 2)
Register Alias
Native
Execution
Mode TNS Execution Mode Accelerated
Execution Mode

Using Debug on TNS/R Processors
Debug Manual—421921-003
2-15
TNS and TNS/R Register Correspondence
The bits and the decoding for the $FCR31 register are as follows:
Bit Meaning
<7> FS: 0 or 1 When the FS bit is set, denormalized results are flushed to 0.
<8> C: 0 or 1 The C bit is set to 1 if the condition is true, and the bit is cleared to
0 if the condition is false.
<14:19>: CAUSE The CAUSE bits reflect the results of the most recently executed
instruction. They identify the exceptions raised by the last
floating-point operation and raise an interrupt or exception if the
corresponding ENABLE bit is set. If more than one exception
occurs on a single instruction, each appropriate bit is set. Note that
the CAUSE bits are managed by the NonStop operating system,
the user code has no access to them.
<20:24>: ENABLE A floating-point exception is generated any time a CAUSE bit and
the corresponding ENABLE bit are set. A floating-point operation
that sets an enabled CAUSE bit forces an immediate exception.
<25:29>: FLAGS The FLAG bits are cumulative and indicate that an exception was
raised by an operation that was executed after the FLAG bits were
explicitly reset. The FLAG bits are set to 1 if an IEEE 754
exception is raised; otherwise, they remain unchanged. A bit in the
FLAG field is set only if the corresponding exception condition
occurs and the corresponding trap is disabled.
<30:31>: Round Mode These bits specify the rounding mode that the floating-point unit
(FPU) uses for all floating-point operations.

Debug Manual—421921-003
3-1
3Debug Command Overview
This section introduces all of the Debug commands (by functional groups), explains the
structure of the commands, and shows the primary relationships between the
commands. For more information on how to use the Debug commands, see Section 4,
Debug Commands
Types of Debug Commands
The commands in Table 3-2 through 3-7 are grouped according to the various types of
Debug commands:
•Breakpoint Commands
•Display Commands on page 3-3
•Modify Commands on page 3-4
•Environment Commands on page 3-5
•Privileged Commands on page 3-5
•Miscellaneous Commands on page 3-6
This grouping is useful in that it indicates some of the relationships between the
commands. For example, the code breakpoint commands consist of the B and C
commands. The B command sets code breakpoints, and the C command clears them.
Breakpoint Commands
There are two subgroups of breakpoint commands: code and memory-access.
Table 3-1 on page 3-2 gives an overview of these commands.
A code breakpoint is a designated location in the code area that, when executed,
causes the process to enter the debug state. The code breakpoint commands consist
of the B and C commands.
A memory-access breakpoint is a designated location in memory that, when accessed
in the specified way (read, write, write/read, or change), causes the process to enter
the debug state. The operating system allows only one memory-access breakpoint for
each process. The memory-access breakpoint commands consist of the BM and CM
commands.

Debug Command Overview
Debug Manual—421921-003
3-2
Breakpoint Commands
Table 3-1. Breakpoint Commands
Command Meaning Function Description
B Break Set unconditional code
breakpoint The process enters the debug state
when the breakpoint location is
executed.
Set conditional code
breakpoint Depending on the value of a specified
variable, the process enters the debug
state. The variable is checked when
the breakpoint location is executed.
Set trace code
breakpoint Debug lists the contents of specified
variables when the breakpoint location
is executed, then Debug resumes the
process.
Set execute code
breakpoint Debug executes a specified string of
Debug commands when the
breakpoint location is executed.
Display breakpoints Debug displays all currently set code
and memory-access breakpoints for
the process being debugged.
BM Break on
memory Set unconditional
memory-access
breakpoint
The process enters the debug state
when the breakpoint location is
accessed or modified.
Set conditional
memory-access
breakpoint
The process enters the debug state
depending on the value of a specified
variable. The variable is checked
when the breakpoint location is
accessed or modified.
Set trace memory-
access breakpoint Debug lists the contents of specified
variables when the breakpoint location
is accessed or modified, then Debug
resumes the process.
Set execute memory-
access breakpoint Debug executes a specified string of
Debug commands when the
breakpoint location is accessed or
modified.
C Clear Clear breakpoint Debug clears one or all code
breakpoints.
CM Clear
memory
breakpoint
Clear memory-access
breakpoint Debug clears the memory-access
breakpoint for the process being
debugged.

Debug Command Overview
Debug Manual—421921-003
3-3
Display Commands
Display Commands
The display commands are listed and described in Table 3-2 on page 3-3. In addition
to these commands, the B command (a code breakpoint command) also displays all
code and memory-access breakpoints for the process being debugged.
Table 3-2. Display Commands (page 1 of 2)
Command Meaning Function Description
A ASCII Display data in ASCII Displays the contents of specified
variables in ASCII representation.
AMAP Address
Map Displays address
attribute information Converts 16-bit address to 32-bit
address, if necessary. It also displays
attribute values of the address.
D Display Display data in
numeric representation Displays the contents of specified
variables in numeric representation.
Display register
contents in numeric
representation
Displays the contents of a specified
register in numeric representation.
Display space identifier
in numeric
representation
Displays the space identifier of the
current code segment in numeric
representation.
DJ Display
jump
buffer
Display jump buffer
contents Displays the contents of a specified
jump buffer in register format.
DN Display Display memory (32-bit
addresses) Displays memory in multiple formats:
ASCII, RISC or TNS instruction code,
or various numeric formats.
F[ILES] Files Display file name and
error information Displays file name and latest file error
number associated with an open file,
or displays all files opened by the
process.
FN Find
number Memory search Searches memory to find a 16-bit
number.
FNL Find
number
long
Memory search Searches memory to find a 32-bit
number.
I Instruction
code Display data in
instruction-code format Displays the contents of specified
variables as instruction code.
IH Info
handler Display information
about signal handlers Displays information about the actions
taken by a process when it receives
various signals.
LMAP List map Map a code address Displays the name of the procedure,
the offset from the base of the
procedure, and the code space, where
a specified address lies.

Debug Command Overview
Debug Manual—421921-003
3-4
Modify Commands
Modify Commands
The modify commands are listed in Table 3-3.
PMAP Print code
map Display corresponding
blocks of TNS and
RISC code
Displays the contents of specified
memory as TNS code and
corresponding RISC code for
accelerated programs.
T Trace Trace stack markers Displays key attributes of the
process’s stack frames (procedure
activations), up to ten at a time.
= Equal Compute a value Computes and displays the value of
an expression in decimal,
hexadecimal, octal, binary, ASCII, or
instruction code. Translates and
displays an expression as both forms
of the ENV register: the hardware
ENV register and the stack marker
ENV register.
Table 3-3. Modify Commands
Command Meaning Function Description
M Modify Modify data Modifies the contents of specified
variables.
Modify register
contents Modifies the contents of a specified
register.
Modify space identifier Modifies the current space identifier in
order to cause a different code segment
to become the current code segment.
MH Modify
handling Modify signal handling Modifies signal handling by associating a
new signal handler or signal action with
a signal.
Note. You can change the current location of a process running in TNS or accelerated mode
by modifying the value of the P register. If the process is a multiple-segment process, you must
also change the space identifier. You change the space identifier in order to change the
location of the process to a different code segment. It is also possible to change the current
location of a process running in native mode, but doing so requires knowledge of native mode
internals and is beyond the scope of this manual.
Table 3-2. Display Commands (page 2 of 2)
Command Meaning Function Description

Debug Command Overview
Debug Manual—421921-003
3-5
Environment Commands
Environment Commands
The environment commands are listed in Table 3-4.
Privileged Commands
Table 3-5 contains commands for privileged users only. Privileged commands are
those permitted only if they have been enabled by use of the PRV ON command. To
successfully issue the PRV ON command, the process being debugged must be
executing under the local super ID. (Privileged debugging is distinct from the privileged
state of process execution, which permits a process to perform privileged operations
that are normally permitted only to the operating system.)
The privileged commands include those that have address parameters to:
•Access data and code in the kernel address space.
•Plant code breakpoints in code containing PRIV or CALLABLE procedures,
including licensed UC, UL, UCr, SRLs, or system code and library.
•Modify code.
Table 3-4. Debug Environment Commands
Command Meaning Function Description
BASE Numeric
base Set numeric base Sets numeric base for input to Debug,
output displays by Debug, or both.
VQ Vector Q
segment Change selectable
segment Changes the selectable segment currently
viewed by the debugger.
VQA Vector
QA
segment
Set selectable
segment to absolute
segment
Set the current selectable data segment to
the specified absolute segment number.
? Segment Display code
segment and
selectable data
segment information
Displays space identifier for current code
segment, displays segment ID for current
selectable data segment brought into use
by USESEGMENT or SEGMENT_USE_,
and displays segment ID for current
selectable data segment brought into use
by Debug VQ command.
Table 3-5. Privileged Commands (page 1 of 2)
Command Meaning Description
FREEZE Freeze Disables the processor and asserts a freeze on other
processors.
HALT Halt Halts the processor.

Debug Command Overview
Debug Manual—421921-003
3-6
Miscellaneous Commands
Miscellaneous Commands
Miscellaneous Debug commands are listed in Table 3-6.
Multiple Commands on a Line
Debug allows multiple commands on a line, each separated by a semicolon (;). This
feature allows you to enter very sophisticated and powerful command lines while
debugging.
Command Structure
Most of the Debug commands have one function and one syntax definition. However,
the A, B, BM, D, and M commands have more than one function. For these
commands, each function has its own definition and its own syntax.
For example, the B command has five functions: set unconditional code breakpoint, set
conditional code breakpoint, set trace code breakpoint, set execute code breakpoint,
and display code and memory-access breakpoints. Although all of these functions deal
with setting breakpoints, each function has a unique description and a unique syntax.
PRV Privileged Enables or disables the use of privileged commands.
V Vector Allows access to other address spaces.
VQA Vector Sets the current selectable data segment to the specified
absolute segment number.
Table 3-6. Process Control Commands
Command Meaning Description
FC Fix
command Fix Debug command. Allows you to edit the last Debug
command that you entered.
EX[IT] Exit Exits the Debug session.
H[ELP] Help Displays requested help information about a Debug command,
variable, or all help topics.
INSPECT Run
Inspect Switches to the Inspect debugger.
P[AUSE] Pause Pauses (suspends) the process for a specified time.
R Resume Resumes program execution (leaves the debug state).
S[TOP] Stop Stops process execution.
Table 3-5. Privileged Commands (page 2 of 2)
Command Meaning Description

Debug Command Overview
Debug Manual—421921-003
3-7
Capitalization in Commands
Capitalization in Commands
Note that uppercase and lowercase letters are interchangeable in Debug commands.
The syntax shows keywords in uppercase letters.
Default Commands
Certain Debug commands have defaults. A default for a command is a variant of the
command that is executed when you simply press RETURN at the Debug prompt
without actually entering the command. Default commands are valid only when certain
conditions exist. Whenever a default command would be a valid entry, the command
name appears in the Debug prompt. For example:
251,06,00024 (FN)-
This prompt signifies that if you press RETURN, the default version of the FN
command is executed. Note that you can also enter other commands when Debug
displays this prompt.
More information about default commands is given in the descriptions of the
commands that have defaults.
Table 3-1 on page 3-2 through Table 3-5 on page 3-5, list the function or functions of
each command and give a brief description of each function.
Notation for Privileged Commands
Underlined keywords or characters in command syntax are available to privileged
users only. Keywords or characters that are not underlined are available to both
privileged and nonprivileged users.
Register Syntax
Several Debug commands have register names as parameters or registers specified in
expressions. The form of a register specification is:
register
represents the contents of a processor register for that process. It can be either a
TNS/R register or a TNS environment register.
A TNS/R register is one of the following:
{ $00 | $01 | ... | $31 }
{ $HI | $LO }
{ $PC }
{ $F00 | $F01 | ... | $F31 }
{ $FCR31 }

Debug Command Overview
Debug Manual—421921-003
3-8
Register Syntax
Alias names for registers $01 through $31 and $F00 through $F09 appear in the
following list. For more information, see TNS/R Registers on page 2-10
A TNS environment register is one of these:
{ S | P | E | L | SP }
{ R0 | R1 | ... | R7 }
{ RA | RB | ... | RH }
Register Alias Register Alias
$00
$01 $AT $16 $S0
$02 $V0 $17 $S1
$03 $V1 $18 $S2
$04 $A0 $19 $S3
$05 $A1 $20 $S4
$06 $A2 $21 $S5
$07 $A3 $22 $S6
$08 $T0 $23 $S7
$09 $T1 $24 $T8
$10 $T2 $25 $T9
$11 $T3 $26 $K0
$12 $T4 $27 $K1
$13 $T5 $28 $GP
$14 $T6 $29 $SP
$15 $T7 $30 $S8 or $FP
$31 $RA
$F00 $F0 $F05 $F5
$F01 $F1 $F06 $F6
$F02 $F2 $F07 $F7
$F03 $F3 $F08 $F8
$F04 $F4 $F09 $F9
Sspecifies the S register.
Pspecifies the P register.
Especifies the ENV register.
Lspecifies the L register.
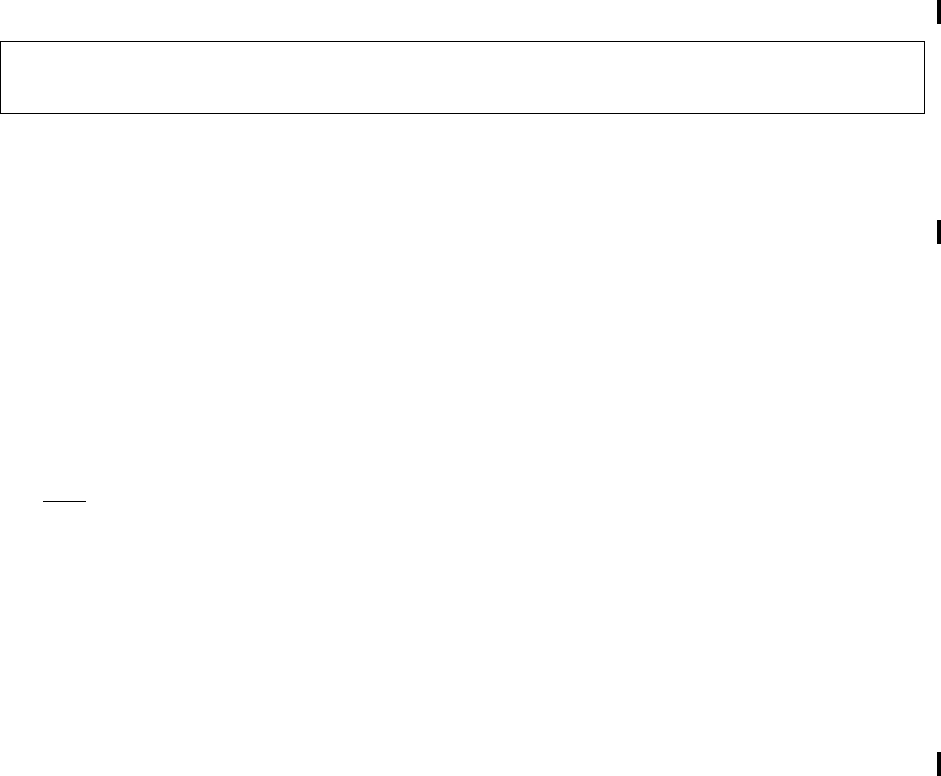
Debug Command Overview
Debug Manual—421921-003
3-9
Expression Syntax
Expression Syntax
Several Debug commands have address and count parameters that are supplied in the
form of an expression. An expression can represent a 16-bit integer, a 32-bit integer, or
ASCII characters.
The format of an expression:
The term parameter is of the form:
value [ op value ]...
The value parameter has one of these forms:
( expression )
is an expression in parentheses to be treated as a single value.
'c1[c2[c3[c4]]]’
is an apostrophe followed by 1 through 4 ASCII characters, c1, c2, c3, c4
and a trailing apostrophe.
PCB expression
represents the address of the specified PCB. The expression parameter is a
value that indicates the number of the PCB. PCB is allowed only in privileged
mode.
number[.number]
is an integer value to be treated as a 16-bit word or a 32-bit word. It represents
a 32-bit word if [.number] is present or if number is too large to be represented
in a 16-bit word.
The format of the number parameter:
[ + | - | % | # | %H | 0X ] integer
The value of number is negative if - is present and positive if - is absent.
The + is an optional unary plus.
SP specifies the space identifier.
R0 through R7 specify one of the registers in the register stack.
RA through RH is an alternative specification for the eight stack
registers, where RA is the current top of stack, RB is the
next one down, and so forth.
term [ { + } term ]...
{ - }

Debug Command Overview
Debug Manual—421921-003
3-10
Expression Syntax
The other prefixes affect the interpretation of number as follows:
register
represents the contents of one of the processor registers for that process; see
Register Syntax on page 3-7.
K [ X | D ] address
is a value that allows memory-based variables in its calculation.
op
is one of these arithmetic operators:
These operators have the same precedence. The order of execution is left to right.
To control order, you can use parentheses.
Considerations
•Debug evaluates a particular expression at the time you enter the command
containing that expression.
•A register’s value is the contents of that register at the time you enter the
command that references it.
•Extended addressing and N addresses use 32-bit addresses.
•A 32-bit address can be entered as a value that cannot be represented in 16 bits or
high-word.low-word. The 32-bit value is preferred to the high-word.low-
word form.
%represents an octal number; octal is the default numeric base
except for the DN command and N address mode.
#represents a decimal number.
%H |0X represents a hexadecimal number.
Kgets the contents of the specified address.
Xloads a 16-bit word from the specified address with sign extension.
Dloads a 32-bit word from the specified address.
address is the specified 16-bit address. For the format, see Address Syntax
on page 3-12.
*Unsigned multiply
/Unsigned divide
<< Left shift (unsigned 32-bit shift)
>> Right shift (unsigned 32-bit shift)

Debug Command Overview
Debug Manual—421921-003
3-11
Expression Syntax
If a command requires a 16-bit expression, the evaluated expression must be
represented in 16 bits. A syntax error occurs if the evaluated expression cannot be
represented in 16 bits.
If the command allows a 32-bit expression, the evaluated expression is always 32
bits long, with the sign extended into the high-order word. However, when a 32-bit
word expression is displayed with the = command, it is always shown as a 16-bit
word value if it can be expressed in 16-bit word.
•The default numeric base in expressions is octal, except for the DN command and
N address mode, where the default base is hexadecimal.
•The BASE command overrides the default numeric base.
•In a value notation of the form number.number, the notation for the numeric base
of the input value is not required in both halves of the value notation. For example,
suppose that you are entering a decimal value but the default base is octal: the
base notation # is required only in the first half of the value, but it is allowed in both
halves. Both of these forms are equivalent:
#8.#823
#8.823
Examples
Expression
#27
'AB'
'A'
4*3+2
4*(3+2)
177777/2
-(177777/2)
-1
-1.0
2.1000
(2.1000)<<1
%h23
%h8009.3000
%h8009.%h3000
$T8 ! Contents of TNS/R register $T8
$PC+4 ! Contents of TNS/R register $PC plus 4
R1 ! Contents of TNS register 1
L-2 ! Contents of TNS register L minus 2
R1.R0 ! Contents of TNS registers 0 and 1
175,07,00068-D L+3 ! Display L+3 (that is, display contents
000003: %000033 ! of word addressed by the sum of the
! contents of TNS register L plus 3)

Debug Command Overview
Debug Manual—421921-003
3-12
Address Syntax
Address Syntax
Many Debug commands require you to specify an address. The syntax for an address
is as follows:
32-bit-address
defines the 32-bit address where the code or data is located.
TNS-style
defines the code or data segment address for TNS users. The syntax for the TNS-
style address is as follows:
address-mode
defines the code or data segment where the address is located. The value of
address-mode can be one of the following:
UC[.segment-num, ]
indicates that the address is in the TNS user code space. The segment-num
parameter defines the particular code segment within the user code space.
The value of segment-num must be in the valid range, which (in octal) is 0
through %37. If you omit segment-num, Debug uses 0.
UL[.segment-num, ]
indicates that the address is in the TNS user library space. The segment-num
parameter defines the particular library code segment within the user library
space. The value of segment-num must be in the valid range, which (in octal)
is 0 through %37. If you omit segment-num, Debug uses 0.
SC[.segment-num, ]
indicates that the address is in the TNS system code space. SC is allowed only
in privileged mode. The segment-num defines the particular code segment
within the system code space. If you omit segment-num, Debug uses 5.
The value of segment-num must be in the range 5 through %37 (octal).
SL[.segment-num, ]
indicates that the address is in the TNS system library space. SL is allowed
only in privileged mode. The segment-num parameter defines the particular
[ 32-bit-address ] | [ TNS-style ] | [ Q-mode ] | [ N-mode
]
[ address-mode ] offset [ indirection-type [ index ] ]
Debug Command Overview
Debug Manual—421921-003
3-13
Address Syntax
code segment within the system code space. If you omit segment-num,
Debug uses 0.
The value of segment-num must be in the range 0 through %37 (octal).
UD[,]
indicates that the address is in the user data segment.
offset
is an expression giving the address, relative to the indicated address-mode.
indirection-type
specifies that the address is to be used as an indirect address. The value of
indirection-type must be one of the following:
index
is an expression to be used as an offset from the base address. The index
parameter is a byte offset if prefix is N or if indirection-type is S, SX,
or SG; otherwise, index is 16-bit word offset.
Q-mode
indicates that the address is in the current selectable data segment. Q indicates an
address within the currently assigned selectable segment. The syntax for Q-mode
is as follows:
Q offset [ indirection-type [index ] ]
See the definitions of offset, indirection-type, and index above.
Cindicates an address in the current TNS code segment (user code
space or user library space).
Lindicates an L-relative address (procedure parameters or local
variables) in the user data segment.
Sindicates an S-relative address (subprocedure parameters or sublocal
variables) in the user data segment.
Gindicates a system-global relative address in the system data segment.
G is allowed only in privileged mode.
Iuse the indirect address as a word address.
Suse the indirect address as a byte address.
IX use the indirect address as an extended word address.
SX use the indirect address as an extended byte address or as a 32-bit
address.
IG use the indirect address as a system global word address; this type is
allowed only in privileged mode.
SG use the indirect address as a system global byte address; this type is
allowed only in privileged mode.
Debug Command Overview
Debug Manual—421921-003
3-14
Address Syntax
N-mode
Indicates that the user is in a 32-bit address mode.
Considerations
•If you omit address-mode and if offset is a 16-bit word expression, Debug
assumes one of two address modes depending on where address appears. If
address appears in a B, C, or I command, omitting address-mode causes
Debug to use a C-relative code address in the current TNS code segment (same
as C address-mode).
°If address appears in a D, A, FN, or M command, omitting address-mode
causes Debug to use a G-relative address in the TNS user data segment.
•If you omit address-mode and if offset is a 32-bit expression, Debug assumes
extended addressing.
•To indicate an address in a flat segment, use N-mode address and specify a 32-bit
RISC address in the flat segment range as returned by the ALLOCATESEGMENT
or SEGMENT_ALLOCATE_ procedure call.
•When using UC and UD as a default, the user needs to take the following into
consideration:
°If the command deals with code, UC is assumed as the default.
°If the command deals with data, UD is assumed as the default.
•Direct addressing versus indirect addressing
There are two basic forms of the display command: the direct form and the indirect
form. The direct form is used to display direct variables, value parameters,
contents of pointers, and the addresses in reference parameters. The indirect form
is used to display indirect variables (arrays), objects of pointers, and the values of
reference parameters.
Using the Direct Form
In the following example, the programmer wants to display the contents of some
global variables. The first action is to refer to the map of global identifiers located at
the end of the compiler listing:
DB^BUF VARIABLE INT G+010 INDIRECT
DB^COUNTREAD VARIABLE INT G+011 DIRECT
DB^ERRCNT VARIABLE INT G+007 DIRECT
NUse N mode to indicate addresses in native or accelerated code, RISC
stacks, native globals and heap areas, flat segments or the currently in-use
selectable segment, or anywhere 32-bit addressing is convenient.
In nonprivileged mode, you can specify addresses in user space, 0 through
0x7FFFFFFF. (Not all of these addresses are valid in any process
environment, and some ranges are reserved for privileged access.)
In privileged mode, you can specify all available addresses.

Debug Command Overview
Debug Manual—421921-003
3-15
Address Syntax
To display the contents of the direct variable DB^COUNTREAD, this display
command is entered:
106,01,00012-D 11 ! Display user global location %11
Debug displays the following:
000011: %000310
To display the contents of the pointer variable DB^BUF, this display command is
entered:
106,01,00012-D 10 ! Display global location %10
Debug displays the following:
000010: %000116 ! A word address
To display the FNUM value parameter of a procedure, the procedure’s map of
identifiers is referred to:
ERRCNT VARIABLE INT L-004 INDIRECT
ERRORNUM VARIABLE INT L-003 INDIRECT
FNUM VARIABLE INT L-005 DIRECT
Then this display command is entered:
215,00,00035-D L-5 ! Display L-relative location -5
Debug displays the following:
000370: %000002
Using the Indirect Form
To display the contents of an indirect array, the indirect form of the display
command is used.
For example, to display the first element of DB^BUF, the relative-address I form of
the display command is entered:
215,00,00035-D 10I ! Display indirect, using user global location %10
Debug uses location G[%10] as the indirect address of the location to be
displayed. The following is displayed:
000116: %063162
As another example, suppose the programmer wants to display in character form
20 words of the indirect array DB^BUF, starting with word [20]. This requires use of
the indirect, indexed form of the display command. This command is entered:
215,00,00035-A 10I #20,#20
Debug calculates the address of the first word to be displayed by adding 20 to the
address value of G[%10]. Twenty words are displayed, in character form, starting
at the calculated location:
000142: .12. .34. .5 . .gr. .ap. .e . .la. .ne.
000152: . . . . . . . . . . . . . . . .
000162: . . . . . . . .
Displaying the contents of an indirect byte array requires that the indirect byte
address be converted to its word equivalent. This is accomplished by using the
indirection type S in the address for the display command.

Debug Command Overview
Debug Manual—421921-003
3-16
Address Syntax
For example, to display (in character form) %20 bytes pointed to by the string
pointer SDB^BUF,
.
SDB^BUF VARIABLE STRING G+020 INDIRECT
.
this command is entered:
215,00,0003500-A20S,10
000116: .fr. .ed. . . . . . . . . . . . .
This converts the string address to a word address and displays %10 words
starting at that location ( G[%116] ).
•Displaying Variables in Extended Data Segments
The command syntax for displaying variables in extended data segments
(selectable segments or flat segments) is similar to that for setting breakpoints in
extended data segments.
To display data in a flat segment, use the N address mode to display a 32-bit RISC
address within the flat segment range. You can obtain the address of a flat
segment within your program by using the ALLOCATESEGMENT or
SEGMENT_ALLOCATE_ procedure call. For example, assuming 0x42000A6F is
an address within a flat segment, this command displays the contents of the word
at that address:
106,05,00134-DN 0x42000A6F
42000A6F: 0x0000007E
Addresses in selectable segments can be expressed in a number of ways.
For example, suppose that, as in the third example in Set Unconditional Code
Breakpoint on page 4-7, the programmer has allocated a selectable segment by
using either the ALLOCATESEGMENT or SEGMENT_ALLOCATE_ procedure,
giving it segment ID 10. Again suppose that the segment has not been brought into
use by a call to either USESEGMENT or SEGMENT_USE_, and that no other
segment is in use. This time, rather than set a breakpoint, the programmer wants
to display the contents of word 80 of that segment. First a VQ command is needed:
215,00,00035-VQ#10
215,00,00035-
Then this command displays the contents of the 16-bit word 80:
215,00,00035-DQ#80
%000080: %177777
The same location could be displayed using extended addressing, with any of
these commands:
d 100 + #80<<1
d 2000000 + #80*2
d 2000000 + #160
d 2000240
d 10240
d 10#160

Debug Manual—421921-003
4-1
4Debug Commands
This section describes Debug commands. Table 4-1 summarizes all of the available
Debug commands. Then the descriptions of each command are written on the
subsequent pages.
Command Summary
Table 4-1 summarizes the Debug commands. Note that some commands are available
only to privileged users. These commands are indicated with a check (√ ) in Table 4-1.
Table 4-1. Debug Command Summary (page 1 of 2)
Command Priv
Only Purpose Page
A Command Display data in ASCII 4-3
AMAP Command Provide information about an address 4-6
B Command Set code breakpoint, and display code
and memory-access breakpoints 4-7
BASE Command Set numeric base for input, output, or
both 4-22
BM Command Set memory-access breakpoint 4-24
C Command Clear code breakpoint 4-32
CM Command Clear memory-access breakpoint 4-33
D Command Display data, registers, and space
identifier in numeric formats 4-33
DJ Command Display jump buffer contents in register
format 4-40
DN Command Display memory contents in a specified
format 4-41
EX[IT] Command Exit the Debug session and resume
process execution 4-45
F[ILES] Command Display file name, file number, and error
information for open files 4-46
FC Command Correct or change Debug command 4-47
FN Command Search memory to find a particular 16-bit
number 4-48
FNL Command Search memory to find a particular 32-bit
number 4-49
FREEZE
Command √Disable processors 4-50
HALT Command √Halt a processor 4-51

Debug Commands
Debug Manual—421921-003
4-2
Command Summary
H[ELP] Command Display help information about Debug
commands 4-51
I Command Display data as instruction code 4-52
IH Command
(TNS/R Native and
OSS Processes)
Display information about signal handling 4-54
INSPECT
Command Transfer control to the Inspect debugger 4-55
LMAP Command Display the name of the procedure, and
the offset from the base of the
procedure, where a specified address
lies
4-57
M Command Modify data, registers, or space identifier 4-58
MH Command
(TNS/R Native and
OSS Processes)
Modify signal handling 4-62
P[AUSE]
Command Pause (suspend) process for specified
period 4-63
PMAP Command
(Accelerated
Programs)
Print corresponding blocks of
accelerated code 4-64
PRV Command Enable or disable privileged debugging 4-65
R Command Resume process execution 4-66
S[TOP] Command Stop process execution 4-67
T Command Display a stack-marker traceback or
procedure-name traceback 4-68
V Command √Enable access to other address spaces 4-71
VQ Command Change selectable data segment
currently viewed by Debug 4-72
VQA Command √Set the current selectable data segment
to the specified absolute segment
number
4-73
= Command Compute and display value of an
expression 4-73
? Command Display identifiers for the current code
segment and for the selectable data
segment that is currently in use
4-75
Table 4-1. Debug Command Summary (page 2 of 2)
Command Priv
Only Purpose Page

Debug Commands
Debug Manual—421921-003
4-3
A Command
A Command
The A command displays the contents of a process’ variables in ASCII representation.
The syntax for this command:
address
is the address of the first character to be displayed. For more information, see
Address Syntax on page 3-12.
length
specifies the number of 16-bit words to be displayed by Debug and must be one of
the following:
count
is an expression designating the number of 16-bit words to be displayed.
T entry-size * num-entries
specifies that the display is to be in table format. The entry-size *
num-entries parameter is an expression specifying the number of 16-bit
words to be displayed. The display consists of num-entries blocks, each
block consisting of entry-size words.
If you omit length, one 16-bit word is displayed.
data-display-format
specifies the format options in which data is displayed. The data-display-
format has this format:
{ B | B1 | C | B2 | S | B4 | L }
[OUT] output-dev
specifies where the display is directed. Debug output can be directed to an output
device, a process, or a spooler collector. Debug output cannot be directed to a disk
file. If you omit output-dev, Debug assumes the home terminal.
output-dev has these formats:
A address [ , length ] [, data-display-format ]
[ , [ OUT ] output-dev ]
B|B1|C display data in character format.
B2|S display characters in 2-byte groups representing a 16-bit word. This
is the default format option.
B4|L display characters in 4-byte groups representing a 32-bit word.
Debug Commands
Debug Manual—421921-003
4-4
A Command
Syntax for a device other than a disk:
[ node.]{device-name[.qualifier ]}
{ldev-number }
Syntax for a named process:
[ node.]process-name[:seq-no][.qual-1[.qual-2] ]
Syntax for an unnamed process:
[ node.]$:cpu:pin:seq-no
For syntax descriptions of these process and device names, see the Guardian
Procedure Calls Reference Manual.
Debug Commands
Debug Manual—421921-003
4-5
A Command
Examples
050,03,00009-a %62/2
%000031: 'ab'
050,03,00009-a %62/2, #40/2
%000031: 'ab' 'cd' 'ef' 'go' 'me' ' d' 'at' 'a.'
%000041: '..' '..' '..' '..' '..' '..' '..' '..'
%000051: '..' '..' '..' '..'
050,03,00009-a L+3s, #40/2, b
%000031:abcdefgome data.........................
050,03,00009-a L3s, #40/2, b2
%000031: 'ab' 'cd' 'ef' 'go' 'me' ' d' 'at' 'a.'
%000041: '..' '..' '..' '..' '..' '..' '..' '..'
%000051: '..' '..' '..' '..'
050,03,00009-a L3s, #40/2, b4
%000031: 'ab.cd' 'ef.go' 'me. d' 'at.a.' '.....' '.....' '.....' '.....'
%000051: '.....' '.....'
050,03,00009-A Q #40/2, T5*4
%000024: '.a' 'bc' 'de' 'fg' '..'
%000031: '..' '..' '..' '..' '..'
%000036: '..' '..' '..' '..' '..'
%000043: '..' '..' '..' '..' '..'
050,03,00009-a n 0x00080029, T5*4, c
00080028:.abcdefg..
00080032:..........
0008003C:..........
00080046:..........
050,03,00009-A L+4sx, T5*4, L
%000024: '.a.bc' 'de.fg' '.....' '.....' '.....'
%000036: '.....' '.....' '.....' '.....' '.....'
050,03,00009-
Debug Commands
Debug Manual—421921-003
4-6
AMAP Command
AMAP Command
The AMAP command provides information about a specified address in 32-bit form.
This information is displayed when you use the AMAP command:
•KIND, which specifies the address mode (UC, UL, SC, or SL) and the execution
mode (TNS, AXCEL, native, or unknown).
•ATTRIBUTE, which specifies one or more of the following: resident, read only,
code, SRL, enter vector, priv to read, priv to write, priv to break, is zero page, and
none.
The syntax for the AMAP command is as follows:
address
specifies the user input address. For more information about addressing, see
Address Syntax on page 3-12.
Examples
050,03,00272-amap 0x7C369070
Address: 0x7C369070
Address location attribute: 0x0B678000
Kind = 0x000B: SL (NATIVE)
Attributes: Read Only, Code, Priv to Read, Priv To Write,
Priv to Break
AMAP address

Debug Commands
Debug Manual—421921-003
4-7
B Command
B Command
The B command sets code breakpoints and displays code and memory-access
breakpoints. The B command has five functions:
•Set Unconditional Code Breakpoint on page 4-7
•Set Conditional Code Breakpoint on page 4-11
•Set Trace Code Breakpoint on page 4-13
•Set Execute Code Breakpoint on page 4-15
•Display Breakpoints on page 4-16
Each function is defined by a unique syntax. Each function and its syntax is described
in the following pages.
Set Unconditional Code Breakpoint
The B command can set an unconditional code breakpoint. An unconditional code
breakpoint causes the process to enter the debug state each time the breakpoint
location is executed. The unconditional form of the B command is:
address
is the code address where the breakpoint is to occur. For more information, see
Address Syntax on page 3-12. The address mode must follow these guidelines:
•Use UC, UL, SC, SL, and C address modes for TNS code.
•Use 32-bit extended address or N address mode for native or accelerated
code.
•You must be privileged to set a breakpoint in protected code areas, which
include:
°All system code: SC, SL, SCr, SLr
°Code anywhere in a UC, UL, UCr, or SRL space that contains PRIV or
CALLABLE procedures
•To set a breakpoint in a UC, UL or SRL space, you must have read access to
the object file for that library.
B address [, ALL ]

Debug Commands
Debug Manual—421921-003
4-8
Set Unconditional Code Breakpoint
ALL
indicates that the breakpoint applies to all processes in the processor executing
the code being debugged. The ALL option is allowed only in privileged mode. A
global breakpoint (this is, a breakpoint set with the ALL option) is delivered to any
process that executes the code location that is breakpointed. A private breakpoint
(without the ALL option) is delivered only to the process that created the
breakpoint.
Considerations
•When you set a breakpoint, Debug displays information describing this breakpoint.
For more information on the information displayed, see Display Breakpoints on
page 4-16.
•When debugging accelerated programs, you can set breakpoints in TNS code only
on instructions that are register-exact points or memory-exact points. These points
are marked in displays by the I and PMAP commands. For more information, see
Section 2, Using Debug on TNS/R Processors.
•A global breakpoint is associated with a particular memory object, regardless of
any process. The breakpoint persists as long as the containing memory object
exists; the breakpoint disappears when the memory object is deleted. By contrast,
a private breakpoint is associated with a particular memory object within a
particular process; the breakpoint disappears when the object disappears or the
process terminates.
°A global breakpoint in system code, or in a system library, persists until the
processor is reloaded.
°A global breakpoint in a public SRL or public DLL persists as long as that SRL
or DLL persists. The breakpoint disappears if the SRL is untitled or the
processor is reloaded.
°A global breakpoint in user code, a user library, private SRL, or private DLL
persists as long as at least one process is executing that code, library, SRL, or
DLL. The breakpoint disappears when no process is executing that code,
library, SRL, or DLL.
°A global breakpoint in an OSS shared memory object persists as long as the
object persists.

Debug Commands
Debug Manual—421921-003
4-9
Set Unconditional Code Breakpoint
Examples
215,01,00012-b 4+16
215,01,00012-b ul.2, 10+42
215,01,00012-b uc.1, 2047
215,01,00012-B 226+30
215,01,00012-B C 226+30 ! Equivalent to the preceding command
248,02,00022-B SL.2, 23243+332 ! Break in system library segment 2
! at the instruction at
! address %23243+332
248,02,00022-B 0X70023FE4 ! Break in user code at RISC
! address 0x70023FE4 (native mode)
The following example uses the I command to display user code to determine a
register-exact point (marked with an @ sign) at which to set a breakpoint. The
subsequent B command sets a breakpoint at offset %215 in user code.
244,00,00084-I UC.0,207, 20
000207: STOR L+026 > LADR L+023,I LADR L+003 LADR L+027,I
000213: PUSH 722 XCAL 003 @ STRP 7 LDI +001
000217: LDD L+001 LADR L+003 LDI +000 LDI +016
000223: PUSH 755 XCAL 000 @ STOR L+017 > LDI -001
244,00,00084-B UC.0, 215
@ ADDR: UC.%00, %000215 INS: %000107
Examples of Setting Unconditional Code Breakpoints
Appendix F, Sample Debug Sessions provides examples that illustrate setting
unconditional code breakpoints in a procedure and a subprocedure written in TAL
(TNS mode). The following example shows the setting of unconditional code
breakpoints in a function written in C (native mode).
In a C Function (Native Mode). Suppose the programmer wants a process to enter
the debug state at line 115 of this example:

Debug Commands
Debug Manual—421921-003
4-10
Set Unconditional Code Breakpoint
101 int getloc(void)
102 {
103 int loc_num, i_val, tm, *row;
.
.
115 if (i_val == loc_num)
116 return nextloc (row, loc_num);
In a native program, the address of the base of a function or procedure can be
determined using the noft utility. After noft has been started and the name of the
object file has been provided, the function getloc is specified with the listproc
command:
noft> listproc getloc
This command causes noft to display the base address of the function getloc.
Procedure : # Address
getloc : 2 0x70000448
The address displayed is then supplied as input to the dumpaddress command. This
command causes noft to display disassembled native code starting at the beginning of
getloc for forty 32-bit words:
noft> dumpaddress 0x70000448 for 40 words
The resulting display includes the RISC code associated with source line 115. (The
source line number is multiplied by 1000 in the display.)
Procedure Src Line Address Long Word Instructions
----------------------------------------------------------------
--
.
[getloc 115000] 0x700004a4 0x8fae008c lw t6,0x8c(sp)
[getloc 115000] 0x700004a8 0x8faf0088 lw t7,0x88(sp)
[getloc 115000] 0x700004ac 0x0000000000 nop
[getloc 115000] 0x700004b0 0x15cf0009 bne t6,t7,0x700004d8
[getloc 115000] 0x700004b4 0x0000000000 nop
.
The display shows the first instruction associated with line 115 to be at 0x700004A4. A
breakpoint is placed at that location:
106,06,00125-B 0x700004A4 ! (set breakpoint)
N: 0x700004A4 INS: LW t6,140(sp)
106,06,00125-R ! (resume)
The process enters the debug state each time the instruction at RISC address
0x700004A4 is executed.
DEBUG PC=0x700004A4 -RISC BREAKPOINT ($PC:0x700004A4)-
Note. In optimized code, instructions might be rearranged in the object file. Where possible,
noft indicates this by a “+” or “-” in the dumpaddress display. In highly optimized code, you
might have to rely on your own judgment to decide where a breakpoint is appropriate.

Debug Commands
Debug Manual—421921-003
4-11
Set Conditional Code Breakpoint
For more information about how to use the noft utility, see the nld Manual and the noft
Manual.
Set Conditional Code Breakpoint
The B command can set a conditional code breakpoint. A conditional code breakpoint
causes a process to enter the debug state when both the breakpoint location is
executed and a specified variable matches a predetermined condition. The conditional
form of the B command is:
address
is the code address where the breakpoint is to occur. For more information, see
Address Syntax on page 3-12. The address mode must follow the same guidelines
as those stated earlier in this section for specifying the code address when setting
an unconditional code breakpoint.
test-address
is the address of the variable to be tested. The syntax for test-address is the
same as the Address Syntax on page 3-12, but it is limited to only data locations
and the Q-mode syntax is not allowed. If test-address is an N mode address,
test-address refers to a 32-bit variable.
register
is a processor register. For more information, see Register Syntax on page 3-7.
For a TNS process, when registers R0 through R7 are specified, the values in the
registers are evaluated when the breakpoint is executed. Other registers are
evaluated to a memory location pointed by the registers when the breakpoint is
executed.
For a TNS/R process, any register except the floating-point registers can be used.
mask
is an expression. The mask parameter is logically ANDed with the value of the
register parameter or the value pointed to by the test-address parameter
and the constant parameter before the condition is tested. The comparison
values are treated as signed values. The value for mask is 32 bits if a TNS/R
register or an N mode test-address value is used; otherwise, the value is 16
bits.
B address
{, {test-address |register} [& mask] op constant[, ALL ]}
{ [, ALL ] , {test-address | register}[& mask]
op constant }

Debug Commands
Debug Manual—421921-003
4-12
Set Conditional Code Breakpoint
If you omit mask, Debug uses -1 (0xFFFF for a 16-bit constant or 0xFFFFFFFF
for a 32-bit constant).
op
is a relational operator and must be one of the following:
constant
is an expression. The value is 32 bits if a TNS/R register or an N-mode
test-address is used; otherwise, it is 16 bits.
ALL
specifies an attribute for the breakpoint only if you are debugging in privileged
mode as described under the PRV command. For more information, see Set
Unconditional Code Breakpoint on page 4-7.
Considerations
•When you set a breakpoint, Debug displays information describing this breakpoint.
For a description of the information displayed, see Display Breakpoints on
page 4-16.
•When debugging accelerated programs, you can set breakpoints in TNS code only
on instructions that are register-exact or memory-exact points. These points are
marked in displays by the I and PMAP commands. For more information, see
Rules About RISC Breakpoints on page 2-7.
•When the N-mode address form is used for the test-address, mask, and
constant refer to a 32-bit value. Otherwise, a 16-bit value is assumed.
•When TNS/R register is used, mask and constant refer to 32-bit values. For
TNS register, a 16-bit value is assumed.
•If a Q-mode address is required for test-address, the Q-mode address can be
converted to a 32-bit address with the AMAP command if the program has a
selectable segment in use. For example, to obtain the address location of the 10th
16-bit word of the selectable segment, enter the command AMAP Q#10. The
result, 0x00080014, can be entered for the test-address value. Alternatively,
the byte address offset can be added to 0x00080000 to get the test-address
value in a selectable segment.
<break if the variable is less than constant. This operator does a
signed comparison.
>break if the variable is greater than constant. This operator does
a signed comparison.
=break if the variable is equal to constant.
# | <> break if the variable is not equal to constant.

Debug Commands
Debug Manual—421921-003
4-13
Set Trace Code Breakpoint
Examples
106,03,00040-B 100 + 117, L + 14 > 500
106,03,00040-B UC.2, 526, L+3 = 0
106,03,00040-B C, 2I, R4 <> 1
106,03,00040-B UL.1, 325, L+5 > 3
248,00,00045-B N 0x70450F1C, $T2 & 0xF000FFFF < 0x17
! Break in RISC code if the 32-bit value in $T2 logically
! ANDed with the mask value is less than 0x17.
Examples of Setting Conditional Code Breakpoints
The address where the breakpoint is located is determined in the same manner as
previously described in Set Unconditional Code Breakpoint on page 4-7. For examples,
see Appendix F, Sample Debug Sessions.
Set Trace Code Breakpoint
The B command can set a trace code breakpoint. A trace code breakpoint causes
Debug to list the contents of one or more registers or memory locations each time the
breakpoint location is executed. The trace form of the B command is:
address
is the code address where the breakpoint is to occur. For more information, see
Address Syntax on page 3-12. The address mode must follow the same guidelines
as those stated earlier in this section for specifying the code address when setting
an unconditional code breakpoint. The address parameter is limited to code
locations only.
register
is a processor register. For more information, see Register Syntax on page 3-7.
For a TNS process, when registers R0 through R7 are specified, the values in the
registers are evaluated when the breakpoint is executed. Other registers are
evaluated to a memory location pointed by the registers when the breakpoint is
executed.
For a TNS/R process, any register except the floating-point registers can be used.
start-address
is the address of the first variable to be listed. The syntax for start-address is
the same as the Address Syntax on page 3-12, but it is limited to only data
B address {, {register | start-address} ? count [, ALL ] }
{ [, ALL ], {register | start-address} ? count }

Debug Commands
Debug Manual—421921-003
4-14
Set Trace Code Breakpoint
locations and the Q-mode syntax is not allowed. If start-address is an N mode
address, start-address refers to a 32-bit variable.
?
means list.
count
is an expression indicating the number of 16-bit words to be displayed. The value
is stored in 32 bits if a TNS/R register or N-mode start-address is used;
otherwise, it is stored in 16 bits. If count is stored in 32 bits, only the value in the
lower-order 16 bits are used to determine the number of 16-bit words to be
displayed.
If a TNS stack register R0 through R7 is specified, the value for count has to be 1
in order to display the 16-bit contents of the register. To display a range of the
stack registers, enter the starting register and count values. For example, to
display all eight stack registers, enter R0?#8.
If a TNS/R register is specified, the value for count has to be 2 in order to display
the 32-bit contents of register as two 16-bit values. To display a range of the
TNS/R registers, enter the starting register and count values. For example, to
display all 32 registers, enter $00?#64.
ALL
For more information on the description of this option, see Set Unconditional Code
Breakpoint on page 4-7.
Considerations
•Debug displays this header each time the breakpoint location is executed:
°TNS and accelerated modes
TRACE code-address, space-identifier
This header gives the address where the break occurred. In TNS or
accelerated mode, code-address is a C-relative address, which gives the
address of the break relative to the identified TNS code segment. An r in the
space-identifier, instead of a segment index, indicates native code; that
is, SCr, SLr, and so forth. (UC appearing without a segment index is
equivalent to UCr.)
°RISC
TRACE $PC=code-address
In native mode, code-address is a 32-bit hexadecimal value.

Debug Commands
Debug Manual—421921-003
4-15
Set Execute Code Breakpoint
•When you set a breakpoint, Debug displays information describing this breakpoint.
For a description of the information displayed, see Display Breakpoints on
page 4-16.
•When debugging accelerated programs, you can set breakpoints in TNS code only
on instructions that are register-exact points or memory-exact points.These points
are marked in displays by the I and PMAP commands. For more information, see
Section 2, Using Debug on TNS/R Processors.
Examples
106,01,00012-B 4+52, 5?10
106,01,00012-B UC.2, 423, 3?10
106,01,00012-B UL.1, 5+23, 40?3
248,01,00012-B N 0X70451210, 0x2323 ? 0x100
Example of Setting a Trace Code Breakpoint
The address where the breakpoint is located is determined in the same manner as
previously described in Set Unconditional Code Breakpoint on page 4-7. For more
information on an example of setting a trace code breakpoint, see Appendix F, Sample
Debug Sessions.
Set Execute Code Breakpoint
The B command can set an execute code breakpoint. An execute code breakpoint
causes Debug to execute a specified string of Debug commands when the breakpoint
location itself is executed.
After executing the specified command string, Debug prompts for additional Debug
commands, unless the specified command string contains an R (resume) command.
The execute form of the B command is:
address
is the code address where the breakpoint is to be placed. For more information,
see Address Syntax on page 3-12. The address mode must follow the same
guidelines as those stated earlier in this section for specifying the code address
when setting an unconditional code breakpoint.
command-string
is a string of Debug commands separated by semicolons (;) that is saved when
you enter the breakpoint and executed when the breakpoint is executed. The
string of Debug commands is not examined for syntax errors until it is executed.
B address {, ( command-string ) [, ALL ] }
{ [, ALL], ( command-string ) }

Debug Commands
Debug Manual—421921-003
4-16
Display Breakpoints
ALL
For the description of this option, see Set Unconditional Code Breakpoint on
page 4-7 under the B command.
Considerations
When debugging accelerated programs, you can set breakpoints in TNS code only on
instructions that are register-exact or memory-exact points. These points are marked in
displays by the I and PMAP commands. For more information, see Rules About RISC
Breakpoints on page 2-7.
Examples
106,04,00192-b 5 + 3, (d; t; r)
106,04,00192-b uc.2, 100+2, (d;t;r)
248,04,00092-B N 0X7002D058, (D;T;R)
Display Breakpoints
The B command can display currently set breakpoints for the process being debugged.
In addition, as each breakpoint is set, Debug displays information describing
that breakpoint.
The display breakpoints form of the B command is:
B [ * ]
Considerations
For more information on how Debug displays the breakpoint information, see the
display formats described on the following pages.
*displays RISC breakpoints set as a result of setting TNS breakpoints in an
accelerated program. Without the asterisk (*), only breakpoints explicitly set in a
B or BM command are displayed.

Debug Commands
Debug Manual—421921-003
4-17
Display Breakpoints
Format of the Code Breakpoint Display
Debug displays TNS and native code breakpoints in this form:
TNS code breakpoint:
Native code breakpoint:
[@ | >] code-segment, addr-16 INS: instr SEG:memory-seg
[PIN: { <pin-num> | ALL }
]
INS: mnemonic-instr
[ condition ]
[ trace ]
[ command-string ]
[^--] N: addr-32 INS: instr-32
INS: mnemonic-instr-32
[ condition ]
[ trace ]
[ command-string ]
>(greater-than sign) denotes a memory-exact point, for
accelerated programs only.
@(commercial at sign) denotes a register-exact point, for
accelerated programs only.
code-segment defines the TNS code segment where the breakpoint is set.
Segments are:
UC.segment-num ! in user code space
UL.segment-num ! in user library space
SC.segment-num ! in system code space (privileged only)
SL.segment-num ! in system library space (privileged only)
Characters appearing in the display before UC, UL, SC, or SL
indicate that the breakpoint is set on corresponding TNS and
RISC instructions as follows:
addr-16 is the 16-bit word address where the breakpoint is set. This
address is within the specified code segment.
instr is the octal value of the instruction at the address defined by
code-segment, addr-16. This value is the value of the
instruction at the time the breakpoint was set. While the
breakpoint is set, the content of code-segment, addr-16 is a
BPT (TNS) instruction (000451).
SEG is the segment in memory where the breakpoint is set.
memory-seg the memory segment.
Debug Commands
Debug Manual—421921-003
4-18
Display Breakpoints
The displays for condition, trace, and command-string are described separately
later in this section.
Example
This is an example, in TNS breakpoint format, of what is displayed by Debug in
response to the B command:
050,03,00013-B UC.0,%5
ADDR: UC.%00,%000005 INS: %002035 SEG: %020737
INS: ADDS +035
This is an example of a display for a breakpoint on a TNS instruction in a program that
was accelerated and, therefore, has RISC instructions. Debug sets a breakpoint in the
RISC instruction that corresponds to the TNS instruction.
050,03,00032-b
@ ADDR: UC.%00,%000005 INS: %002035 SEG: %020737
INS: ADDS +035
050,03,00032-b *
@ ADDR: UC.%00,%000005 INS: %002035 SEG: %020737
INS: ADDS +035
^--N: 0x7042001C INS: 0x27BD004E
INS: ADDIU sp,sp,78
This is an example of the display for a breakpoint in native format:
050,03,00266-B 0x70000390 + (#3 * #4)
N: 0x7000039C INS: 0x00002025
INS: OR a0,$0,$0
pin-num is the PIN number, available only on privileged mode.
mnemonic-
instr is the mnemonic decode of the instr binary value.
^-- indicates that the displayed output is RISC corresponding to a
previous TNS breakpoint. This is shown only with the B*
command.
Nindicates that the breakpoint is in RISC code.
addr-32 is the 32-bit address in RISC code where the breakpoint is set.
instr-32 is the RISC instruction at the address addr-32, which was
replaced by the RISC instruction BREAK.
mnemonic-
nstr-32 is the mnemonic RISC decode of the instr-32 binary value.

Debug Commands
Debug Manual—421921-003
4-19
Display Breakpoints
Format of the Memory-Access Breakpoint Display
Debug displays memory-access (MAB) breakpoints in this form:
{XA: | N:} mab-addr [ - ] MAB: access ( seg-type )
[PIN: { <pin-num> | ALL } ]
[ condition ]
[ trace ]
[ command-string ]
{XA: |
N: } XA is a 32-bit extended address given when the MAB is on a data
location. N is given when the MAB is on a RISC stack location or a
code location. A MAB can be put on a TNS code location only in
privileged mode.
mab-addr indicates the 32-bit absolute address where the memory-access
breakpoint is set.
-indicates that this memory-access breakpoint is inhibited.
When a privileged memory-access breakpoint is set with the ALL
option specified, the memory-access breakpoints for all other
processes are inhibited and “-” appears in the display.
When the privileged ALL breakpoint is cleared, the memory-access
breakpoints for all of the other processes return to use and “-” no
longer appears in the display.
access indicates the type of memory access that triggers the breakpoint
and can be one of these access types:
R ! Break on a read access.
RW ! Break on a read/write access.
W ! Break on a write access.
C ! Break on change access.
seg-type indicates the type of segment that mab-addr points into. Segment
types are:
DATA SEG ! current data segment, in octal (TNS only)
Q segment-id ! selectable segment, in octal
UC.segment-num ! in user code space, in octal (TNS)
UL.segment-num ! in user library space, in octal (TNS)
SC.segment-num ! in system code space, in octal (TNS and PRV
only)
SL.segment-num ! in system library space, in octal TNS and PRV
only)
PIN: {
<pin-num>
ALL}
For more information, see Format of the Code Breakpoint Display
on page 4-17.

Debug Commands
Debug Manual—421921-003
4-20
Display Breakpoints
The displays for condition, trace, and command-string are described
separately later in this section.
Example
For memory-access breakpoint examples, see Appendix F, Sample Debug Sessions.
Format of the Conditional Breakpoint Display
For a conditional breakpoint (code or memory-access), Debug displays the conditional
information under the normal breakpoint information. The condition parameter is
displayed in one of these two forms:
The 32-bit display form:
The 16-bit display form:
{register | test-address } & mask {< } constant
{> }
{= }
{# }
register is one of the TNS/R registers.
test-address is a 32-bit address.
mask is an expression as defined under Set Conditional Code
Breakpoint on page 4-11.
<, >, =, # is less than, greater than, equal, and not equal, respectively.
constant is an expression as defined under Set Conditional Code
Breakpoint on page 4-11.
{register |test-address } [ {I} [index] ]& mask {< } constant
[ {IX} ] {> }
[ {IG} ] {= }
{# }
register is one of the TNS stack registers (R0 through R7) as described
under Register Syntax on page 3-7.
test-address is a 16-bit address or a 32-bit address.
I, IX, IG is integer indirect, integer extended indirect, and integer indirect
global, respectively. These indirect types can be used with 16-
bit addresses only.

Debug Commands
Debug Manual—421921-003
4-21
Display Breakpoints
Example
For conditional breakpoint examples, see Appendix F, Sample Debug Sessions.
Format of the Trace Breakpoint Display
For a trace breakpoint (code or memory-access), displays the trace information under
the normal breakpoint information. The trace parameter is displayed in one of these
two forms:
The 32-bit display form:
The 16-bit display form:
index is an offset from the base address. This can be used with 16-bit
addresses only.
mask is an expression as defined under Set Conditional Code
Breakpoint on page 4-11.
constant is an expression as defined under Set Conditional Code
Breakpoint on page 4-11..
{register | start-address } ? count
register is one of the TNS/R registers.
start-address is a 32-bit address.
?is the trace indicator.
count is the number of 16-bit words to be displayed. The value of
count can be either 16 bits or 32 bits. If it is 32 bits, only the
lower 16 bits are used for the number of 16-bit words to display.
{ register | start-address }[ { I } [index] ] ? count
{ IX }
{ GX }
register is one of the TNS/R stack registers (R0 through R7) as
described under Register Syntax on page 3-7.
start-address is a 16-bit address or a 32-bit address.
I, IX, GX is integer indirect, integer extended indirect, and integer
indirect global. These indirect types can be used with 16-bit
addresses only.

Debug Commands
Debug Manual—421921-003
4-22
BASE Command
Example
For trace breakpoint examples, see Appendix F, Sample Debug Sessions.
Format of the Command-String Display
For an execute mode breakpoint (code or memory-access), Debug displays the value
of command-string that was entered with the breakpoint.The command-string
parameter is displayed in this form:
BASE Command
The BASE command changes the default base for numeric values displayed by Debug
and accepted by Debug as command input. The form of the BASE command is:
STANDARD | S
Generally, input and output base defaults are determined by each command:
•Hexadecimal for the DN command and commands that use the N-address
mode.
•Octal for most other commands.
The default base is STANDARD for both the IN and OUT options.
OCTAL | O
specifies that octal is the base for input or displayed numeric values.
DECIMAL | D
specifies that decimal is the base for input or displayed numeric values.
HEXADECIMAL | H
specifies that hexadecimal is the base for input or displayed numeric values.
index is an offset from the base address. It can be used with 16-bit
addresses only.
?is the trace indicator.
count is the number of 16-bit words to be displayed.
( command-string )
BASE [ STANDARD | S ] [ IN | I ]
[ OCTAL | O ] [ OUT | O ]
[ DECIMAL | D ]
[ HEXADECIMAL | H ]

Debug Commands
Debug Manual—421921-003
4-23
BASE Command
IN | I
changes the base only for numeric values being entered.
OUT | O
changes the base only for numeric values being displayed.
Considerations
•If the command omits both IN and OUT, the command affects both values being
entered and values displayed.
•Once issued, the BASE command is in effect until either you enter another BASE
command that overrides a previous command or the process terminates.
•The command BASE, with no options, cancels any previous BASE command and
sets standard defaults for both input and output.
•The ? command displays the current settings for BASE.
•The N address mode is not affected by the BASE command.
•The BASE command has no effect on these displays:
°The sys,cpu,pin parameters in Debug’s prompt, which are decimal
°User code and user library segment numbers, and system code and system
library segment numbers, which are octal
Examples
This command series changes the base on input and output to hexadecimal, decimal,
and octal for arithmetic with the = command.
215,05,00069-BASE H; = 7000/2 ! Hexadecimal
= 0x3800 %0034000 #14336 ‘8.’
215,05,00069-BASE D; = 7000/2 ! Decimal
= #003500 %006654 0x0DAC ‘..’
215,05,00069-BASE; = 7000/2 ! Octal (the default)
= %003400 #01792 0x0700 ‘..’
This command displays the contents of TNS environment register R0. The default
base for output is octal.
215,05,00069-D R0
*REG* %002377
This command series changes the base for output to hexadecimal and displays the
contents of R0 again.
215,05,00069-BASE H O; D R0
*REG* 0x04FF

Debug Commands
Debug Manual—421921-003
4-24
BM Command
This command series changes the base for output to decimal and displays the
contents of R0 again.
215,05,00069-BASE D O; D R0
*REG* #01279
This command series changes the base for output to the standard value, which is octal
for the TNS state, and displays the contents of R0 again.
215,05,00069-BASE S O; D R0
*REG* %002377
For more examples of the BASE command, see Appendix F, Sample Debug Sessions.
BM Command
The BM command sets memory-access breakpoints. The BM command has four
functions:
•Set unconditional memory-access breakpoint
•Set conditional memory-access breakpoint
•Set trace memory-access breakpoint
•Set execute memory-access breakpoint
Each function is defined by a unique syntax. Each function and its syntax is described
on the following pages.
Set Unconditional Memory-Access Breakpoint
The BM command can set an unconditional memory-access breakpoint. An
unconditional memory-access breakpoint causes the process to enter the debug state
each time the breakpoint location is accessed in the specified manner (reading, writing,
or changing). The unconditional form of the BM command is:
address
is the address where the breakpoint is to occur. For more information, see Address
Syntax on page 3-12.
BM address , access [, ALL ]

Debug Commands
Debug Manual—421921-003
4-25
Set Unconditional Memory-Access Breakpoint
access
indicates the type of memory access that triggers the breakpoint.
ALL
specifies a privileged attribute for the memory-access breakpoint. ALL specifies
that the breakpoint applies to all processes in the processor executing the process
being debugged. The ALL option is allowed only if you are debugging in privileged
mode as described under the PRV command.
Considerations
•Only one memory-access breakpoint can be set for each process.
•If a privileged memory-access breakpoint is set with the ALL option specified, all
other memory-access breakpoints set for processes in the same processor are
inhibited. When the privileged breakpoint with the ALL option is cleared, the other
breakpoints return to use.
•When you set a breakpoint, Debug displays information describing this breakpoint.
For a description of the information displayed, see “Display Breakpoints” under the
B command.
•If a memory-access breakpoint was planted during a nonprivileged debugging
session and is triggered by the execution of privileged code, control is not returned
to Debug until the process is no longer executing privileged code. At the point
where control is returned to Debug, if the process is still executing in either the
system code or the system library space, you are not allowed to modify code in
that space (either directly or indirectly, by setting a code breakpoint). If you want to
return to a procedure that was called earlier and that is not in system code or
system library, you can execute a T command and set a breakpoint at a location
based on the activation record of that procedure as shown in the stack trace.
If the memory-access breakpoint was planted during a privileged debugging
session, control passes to debug immediately.
•For a conditional breakpoint, the system attempts to evaluate the condition as soon
as the memory access is detected. However, that evaluation occurs in a restricted
environment in which absent pages cannot be made present. If the condition
requires accessing an absent page, the condition is tentatively deemed to be “true”
RBreak on a read access
R
WBreak on a read/write access
W
RBreak on a read/write access; equivalent to RW
WBreak on a write access
CBreak on a change access

Debug Commands
Debug Manual—421921-003
4-26
Set Conditional Memory-Access Breakpoint
and control is passed to Debug in the normal way. If the triggering code is
privileged but the breakpoint was not, the process continues to run until it exits to
unprivileged code. At that point, Debug is entered and evaluates the condition. The
condition might be different at that time, if the condition variable was modified by
the code executed in the meantime. (This issue is not a concern if the condition
variable is the same as the location being watched for the breakpoint or if it lies in
the same memory page.)
•A read-access memory-access breakpoint will not occur in an accelerated program
if the Accelerator has optimized the read from memory. This occurs when the
Accelerator keeps the value in a register.
•If a global memory access breakpoint, to break on write access, is planted in priv
mode, and a code breakpoint is then planted at the same address as the memory
access breakpoint, trying to install (write) the code breakpoint will trigger the
memory access breakpoint that was set previously. Since a priv Memory Access
Breakpoint is taken immediately, this causes the program to drop into Lobug seen
as halt %6005. A privileged user can resume out of Lobug.
Examples
215,01,00012-BM L2,W
215,01,00012-BM Q (2.1000)<<1,R W
215,01,00012-BM UC.1, L+3, W
215,01,00012-BM UL.3, 4+23, R
Set Conditional Memory-Access Breakpoint
The BM command can set a conditional memory-access breakpoint. A conditional
memory-access breakpoint causes the process to enter the debug state when both the
breakpoint location is accessed in the specified manner and a specified variable
matches a predetermined condition. The conditional form of the BM command is:
address
is the address where the breakpoint is to occur. For more information, see Address
Syntax on page 3-12.
BM address , access
{, {test-address | register }[& mask] op constant[, ALL ]}
{ [, ALL ] {test-address | register } [& mask]op constant}

Debug Commands
Debug Manual—421921-003
4-27
Set Conditional Memory-Access Breakpoint
access
indicates the type of memory access that triggers the breakpoint.Valid options
depend on the type of processor you are using, as noted in the following list:
register
is a processor register. For more information on this parameter, see Register
Syntax on page 3-7.
For a TNS process, when registers R0 through R7 are specified, the values in the
registers are evaluated when the breakpoint is executed. Other registers are
evaluated to a memory location pointed to by the registers when the breakpoint is
executed.
For a TNS/R process, any register except the floating-point registers can be used.
test-address
is the address of the variable to be compared with constant. The syntax for
test-address is the same as the syntax for Address Syntax on page 3-12.
However, test-address is limited to data locations only (it cannot access UC,
UL, SC, SL, and C). For more information, see Address Syntax on page 3-12. If
address is an N-mode address, test-address refers to a 32-bit variable.
mask
is an expression. The mask parameter is logically ANDed with the value of the
register parameter or the value pointed to by test-address and constant
before the condition is tested. The comparison values are treated as signed
values. The value for mask is 32 bits if a TNS/R register or an N-mode test-
address value is used; otherwise, the value is 16 bits.
If you omit mask, Debug uses -1 (0xFFFF for a 16-bit constant or 0xFFFFFFFF
for a 32-bit constant).
op
is a relational operator and must be one of the following:
RBreak on a read access
RW Break on a read/write access
WR Break on a read/write access; equivalent to RW
WBreak on a write access
< break if the variable is less than constant. This operator does a
signed comparison.

Debug Commands
Debug Manual—421921-003
4-28
Set Conditional Memory-Access Breakpoint
constant
is an expression. The value is 16 bits unless address is an N mode address, in
which case the value will be 32 bits.
ALL
For the description of this option, see Set Unconditional Memory-Access Breakpoint on
page 4-24.
Considerations
•For information about setting an unconditional memory-access breakpoint, see
Considerations on page 4-25.
•Change access is not allowed with conditional memory-access breakpoint.
Examples
099,01,00012-BM L2, W, R0 5 & 11 <> 0
099,01,00012-BM UC.2, 4+3, W, L+2 > 5
099,01,00012-BM UL.1, 20I, R, R5=0
099,01,00012-BM $sp+#44, w, $a1 <> 0x80020004
For more examples of setting conditional memory-access breakpoints, see
Appendix F, Sample Debug Sessions.
> break if the variable is greater than constant. This operator does a
signed comparison.
= break if the variable is equal to constant.
# | <> break if the variable is not equal to constant.

Debug Commands
Debug Manual—421921-003
4-29
Set Trace Memory-Access Breakpoint
Set Trace Memory-Access Breakpoint
The BM command can set a trace memory-access breakpoint. A trace memory-access
breakpoint causes Debug to list the contents of specified variables each time the
breakpoint location is accessed in the specified manner. The trace form of the BM
command is:
address
is the address where the breakpoint is to occur. For more information, see Address
Syntax on page 3-12.
access
indicates the type of memory access that triggers the breakpoint. Valid options
depend on the type of processor you are using, as noted in list:
register
is a processor register. For more information, see Set Trace Code Breakpoint on
page 4-13 for description of this parameter.
start-address
is the address of the first variable to be listed. The syntax for start-address is
the same as the Address Syntax on page 3-12, limited to data locations only.
?
means list.
count
is a 16-bit expression representing the number of 16-bit words to be listed.
ALL
For more information, see Set Unconditional Memory-Access Breakpoint on page 4-24
for the description of this option.
BM address , access
{, {register | start-address } ? count [, ALL ] }
{ [ , ALL ] {register | start-address } ? count }
RBreak on a read access
RW Break on a read/write access
WR Break on a read/write access; equivalent to RW
WBreak on a write access

Debug Commands
Debug Manual—421921-003
4-30
Set Trace Memory-Access Breakpoint
Considerations
•Change access is not allowed with trace memory-access breakpoint.
•Debug displays this header each time the breakpoint location is accessed in the
specified manner:
°TNS and accelerated modes
TRACE code-address, space-identifier
This header gives the address where the break occurred. In TNS or
accelerated mode, code-address is a C-relative address, which gives the
address of the break relative to the identified code segment. An r in the
space-identifier, in place of the segment index, indicates native code;
that is, SCr, SLr, and so forth. (UC appearing without a segment index is
equivalent to UCr.)
°RISC mode
TRACE $PC=code-address
In native mode, code-address is a 32-bit hexadecimal value.
•For infromation about setting an unconditional memory-access breakpoint, see
Considerations on page 4-25.
Examples
106,01,00012-BM L2, W, (2.1000)<<1 ? #16
106,01,00012-BM UC.2, 524, W, L+3 ? 6
106,01,00012-BM C 200, R, R0 ? 10
106,01,00012-BM 0x00080030, w, $a1 ? 2
For more example for strace memory-access breakpoint, see Appendix F, Sample
Debug Sessions.

Debug Commands
Debug Manual—421921-003
4-31
Set Execute Memory-Access Breakpoint
Set Execute Memory-Access Breakpoint
The BM command can set an execute memory-access breakpoint. An execute
memory-access breakpoint causes Debug to execute a specified string of Debug
commands when the breakpoint location itself is accessed in the specified manner.
After executing the specified command string, Debug prompts for additional Debug
commands, unless the specified command string contains an R (resume) command.
The execute form of the BM command is:
address
is the address where the breakpoint is to occur. For more information, see Address
Syntax on page 3-12.
indicates the type of memory access that triggers the breakpoint. Valid options
depend on the type of processor you are using, as noted in this list:
command-string
is a string of Debug commands separated by semicolons (;) that is saved when
you enter the breakpoint and is executed when the breakpoint is executed. The
string of Debug commands is not examined for syntax errors until it is executed.
ALL
For more information on this option, see Set Unconditional Memory-Access Breakpoint
on page 4-24.
Considerations
•For more information on setting an unconditional memory-access breakpoint, see
Considerations on page 4-25.
•Change access is not allowed with execute memory-access breakpoint.
BM address , access
{, ( command-string ) [, ALL ] }
{ [ , ALL ] ( command-string ) }
RBreak on a read access
RW Break on a read/write access
WR Break on a read/write access; equivalent to RW
WBreak on a write access

Debug Commands
Debug Manual—421921-003
4-32
C Command
Examples
100,01,00011-BM L+2, R, (D; T; R)
100,01,00011-BM UC.2, 400, W, (D;T;R)
100,01,00011-BM SC.0, 2342, W, (D;T;R)
248,02,00067-BM 0x4FFFFEFC, R, (D;T;R)
C Command
The C command clears one or all code breakpoints (unconditional, conditional, trace,
and execute). The form of the C command is:
address
is the code address of the breakpoint to be cleared. For more information, see
Address Syntax on page 3-12. Any address mode used to set a code breakpoint
may be used to clear one. Any code breakpoint can be cleared without privilege,
even if privilege was required to set it.
Address value 0 clears all code breakpoints for the current process but does not
affect breakpoints set with the ALL option; privilege is not required.
Address value -1 clears all code breakpoints set in this processor, including those
set in and for other processes and those set with the ALL option; this value is valid
only if you are debugging in privileged mode.
If you omit address, Debug clears the current breakpoint.
Examples
106,01,00012-C 527+215 ! Clears the breakpoint at %000744.
106,01,00012-C UC.2,325 ! Clears breakpoint in user code segment 2.
106,01,00012-C0 ! Clears all breakpoints in the current process.
106,01,00012-C -1 ! Clears all breakpoints in the processor.
248,02,00012-C 0x7045FEF0 ! Clears the breakpoint in RISC code.
C [ address ]
[ * | 0 ]
[ -1 ]
* clears all breakpoints for the current process; this is equivalent to specifying
the address value 0.
Debug Commands
Debug Manual—421921-003
4-33
CM Command
CM Command
The CM command clears the memory-access breakpoint for the process being
debugged. The form of the CM command is:
ALL
clears the memory-access breakpoint with the ALL option specified. You can
specify ALL only if you are debugging in privileged mode as described under the
PRV command.
Example
106,01,00012-CM
D Command
The D command displays numeric data. The default format is octal, but the format can
be specified by the mode option or by the BASE command.
address
is the address of the first variable to be displayed. For more information, see
Address Syntax on page 3-12.
length
specifies the number of words to be displayed by Debug and must be one of the
following:
count
is an expression designating the number of 16-bit words to be displayed.
T entry-size * num-entries
specifies that the display is to be in table format. The entry-size * num-
entries parameter is an expression specifying the number of 16-bit words to
be displayed. The display consists of num-entries blocks, each block
consisting of entry-size words.
If you omit length, one 16-bit word is displayed.
CM [ , ALL ]
D address [ , length ] [ , data-display-format ]
[ , [ OUT ] output-dev ] [ : d-base ]

Debug Commands
Debug Manual—421921-003
4-34
D Command
data-display-format
specifies the format options in which data is displayed. The data-display-
format has this format:
{ B | B1 | C | B2 | S | B4 | L }
[OUT] output-dev
specifies where the display is directed. Debug output can be directed to an output
device, a process, or a spooler collector. Debug output cannot be directed to a disk
file. If you omit output-dev, Debug assumes the home terminal.
output-dev has these formats.
Syntax for a device other than a disk:
[ node.]{device-name[.qualifier ] }
{ldev-number }
Syntax for a named process:
[ node.]process-name[:seq-no][.qual-1[.qual-2] ]
Syntax for an unnamed process:
[ node.]$:cpu:pin:seq-no
For syntax descriptions of these process and device names, see the Guardian
Procedure Calls Reference Manual.
d-base
specifies the display base. The d-base parameter has this format:
{ % | # | D | H | O }
These format options have these meanings:
If you omit d-base, the default is octal unless the BASE command was used to
specify a different default output base.
B|B1|C Display data in character format.
B2|S Display data in 16-bit word format. These are the default format
options.
B4|L Display data in 32-bit format.
%|O displays numeric information in octal.
#|D displays numeric information in decimal.
Hdisplays numeric information in hexadecimal.
Debug Commands
Debug Manual—421921-003
4-35
D Command
Considerations
•The D N address (with space between the letters) is not the same as the DN
address. The D command is used to display data in 16-bit word groups, while the
DN command has different syntax and is issued to display data in 32-bit word
groups.
•For displaying data in ASCII, use the A command.
•For displaying data in machine instruction, use the I command.
Examples
050,03,00009-d L+3
%000026: %000062
050,03,00009-d %000062/2, #20
%000031: %060542 %061544 %062546 %063557 %066545 %020144 %060564 %060415
%000041: %005000 %000000 %000000 %000000 %000000 %000000 %000000 %000000
%000051: %000000 %000000 %000000 %000000
050,03,00009-D L3S, #40/2 , b :h
%000031: 61 62 63 64 65 66 67 6F 6D 65 20 64 61 74 61 0D
%000041: 0A 00 00 00 00 00 00 00 00 00 00 00 00 00 00 00
%000051: 00 00 00 00 00 00 00 00
050,03,00009-D L3s, #40/2, b4 :h
%000031: 0x61626364 0x6566676F 0x6D652064 0x6174610D 0x0A000000
%000043: 0x00000000 0x00000000 0x00000000 0x00000000 0x00000000
050,03,00009-d Q #40/2, T5*4, c :h
%000024: 00 61 62 63 64 65 66 67 00 0000
%000031: 00 00 00 00 00 00 00 00 00 0000
%000036: 00 00 00 00 00 00 00 00 00 0000
%000043: 00 00 00 00 00 00 00 00 00 00
050,03,00009-d L+4sx, T5*4, l :h
%000024: 0x00616263 0x64656667 0x00000000 0x00000000 0x00000000
%000036: 0x00000000 0x00000000 0x00000000 0x00000000 0x00000000
050,03,00009-D n 0x00080029, T5*4, s :h
00080028: 0x0061 0x6263 0x6465 0x6667 0x0000
00080032: 0x0000 0x0000 0x0000 0x0000 0x0000
0008003C: 0x0000 0x0000 0x0000 0x0000 0x0000
00080046: 0x0000 0x0000 0x0000 0x0000 0x0000
050,03,00009-

Debug Commands
Debug Manual—421921-003
4-36
Display Register Contents
Display Register Contents
The D command can display registers. The display-register form of this command is:
register
represents the contents of one of the processor registers for the process. For more
information, see Register Syntax on page 3-7.
If you omit register, Debug displays the current values of the TNS/R registers
when in native mode, and the TNS environment registers when in TNS or
accelerated mode. In addition, Debug displays the space identifier of the current
code segment.
These notes apply to TNS environment registers:
This note applies to TNS/R registers:
[OUT] output-dev
specifies where the display is directed. Debug output can be directed to an output
device, a process, or a spooler collector. Debug output cannot be directed to a disk
file. If you omit output-dev, Debug assumes the home terminal.
The output-dev parameter has these formats:
D [ register ] [ , [ OUT ] output-dev ]
[ * ]
Especifies the ENV register. When asked to display the ENV register,
Debug translates the meaning of its contents.
SP specifies the space identifier of the current code segment.
*displays all registers, including TNS/R registers and TNS environment
registers when the process is an accelerated mode.
Without the asterisk (*), only TNS/R registers are displayed in native
process; only TNS environment registers are displayed in TNS or
accelerated mode.
$F00 through $F31 and $FCR31 specify the IEEE floating-point registers.
These registers are available only after a
program has executed floating-point
instructions. When specified to display the
$FCR31 register, Debug translates the
meaning of the bits for the register. For more
information, see TNS/R Registers on
page 2-10.
Debug Commands
Debug Manual—421921-003
4-37
Display Register Contents
Syntax for a device other than a disk:
[ node.]{device-name[.qualifier ] }
{ldev-number }
Syntax for a named process:
[ node.]process-name[:seq-no][.qual-1[.qual-2] ]
Syntax for an unnamed process:
[ node.]$:cpu:pin:seq-no
For syntax descriptions of these process and device names, see the Guardian
Procedure Calls Reference Manual.
Examples Specific to Debugging in TNS
EXECUTION MODE = TNS
050,03,00020-d *
S=%000060 P=%000177 E=%000207 L=%000023 SP=UC.%00
ENV IS: T CCG RP7
EXAMPLE_FILL_ARRAY + %000073
*REG* %000010 %000055 %000000 %000066 %000000 %000000 %000140 %000166
050,03,00020-d e
ENV IS: T CCG RP7
050,03,00020-d sp
SPACEID: UC.%00
050,03,00020-d r7
*REG*: %000166

Debug Commands
Debug Manual—421921-003
4-38
Display Register Contents
Examples Specific to Debugging in Accelerated Mode
050,03,00023-d *
*** WARNING: TNS STATE MAY NOT BE WHERE YOU THINK IT IS ***
S=%000060 P=%000177 E=%000307 L=%000023 SP=UC.%00
ENV IS: TK CCG RP7
EXAMPLE_FILL_ARRAY + %000073
*REG* %177000 %177767 %000062 %000021 %000005 %000050 %000140 %000166
EXECUTION MODE = ACCELERATED
$PC: 0x7042023C $HI: 0x000016C2 $LO: 0x0DA329FC
$00: $00: 0x00000000 $AT: 0x00000001 $V0: 0x7E000000 $V1: 0x00000000
$04: $A0: 0x0008002E $A1: 0x00000037 $A2: 0x00000000 $A3: 0x00000000
$08: $T0: 0x00000061 $T1: 0x00000005 $T2: 0x00000001 $T3: 0x70420220
$12: $T4: 0x00000037 $T5: 0x8006FC14 $T6: 0xFFFFFFFF $T7: 0x00050000
$16: $S0: 0xFFFFFE00 $S1: 0xFFFFFFF7 $S2: 0x00000032 $S3: 0x00000011
$20: $S4: 0x00000005 $S5: 0x00000028 $S6: 0x00000060 $S7: 0x00000076
$24: $T8: 0x70000000 $T9: 0x00000080 $K0: 0xA713A713 $K1: 0xA713A713
$28: $GP: 0x70400A00 $SP: 0x00000060 $S8: 0x00000026 $RA: 0x7042023C
050,03,00023-d e
*** WARNING: TNS STATE MAY NOT BE WHERE YOU THINK IT IS ***
ENV IS: TK CCG RP7
050,03,00023-d sp
*** WARNING: TNS STATE MAY NOT BE WHERE YOU THINK IT IS ***
SPACEID: UC.%00
050,03,00023-d $SP
*REG*: 0x00000060
050,03,00023-d r7
*** WARNING: TNS STATE MAY NOT BE WHERE YOU THINK IT IS ***
*REG*: %000166
Note. D SP and D $SP refer to two different registers.

Debug Commands
Debug Manual—421921-003
4-39
Display Register Contents
Example Specific to Debugging in Native Mode
EXECUTION MODE = NATIVE
050,03,00267-d *
$PC: 0x70000568 $HI: 0x00000D38 $LO: 0x221FC20C
$00: $00: 0x00000000 $AT: 0x00000001 $V0: 0x00000000 $V1: 0x00000000
$04: $A0: 0x00080030 $A1: 0x4FFFFEBB $A2: 0x00000000 $A3: 0x00000000
$08: $T0: 0x00000067 $T1: 0x00000007 $T2: 0x00000001 $T3: 0x00000007
$12: $T4: 0x4FFFFEBB $T5: 0x00004003 $T6: 0xFFFFFFFF $T7: 0x80C27F00
$16: $S0: 0x00000000 $S1: 0xFFFFFFFF $S2: 0xFFFFFFFF $S3: 0xFFFFFFFF
$20: $S4: 0xFFFFFFFF $S5: 0xFFFFFFFF $S6: 0xFFFFFFFF $S7: 0xFFFFFFFF
$24: $T8: 0x00000000 $T9: 0xC40014EC $K0: 0xA713A713 $K1: 0xA713A713
$28: $GP: 0x08007FF0 $SP: 0x4FFFFE68 $S8: 0xFFFFFFFF $RA: 0x7000066C
050,03,00267-d $GP
*REG*: 0x08007FF0
050,03,00267-d $pc
*REG*: 0x70000568
If a program has executed IEEE floating-point instructions, the D or D * command can
be used to display the floating-point registers as this example shows:
050,03,00269-d *
EXECUTION MODE = NATIVE
$PC: 0x70001A0C $HI: 0x00000000 $LO: 0x00000000
$00: $00: 0x00000000 $AT: 0x70000018 $V0: 0x00000005 $V1: 0x00000000
$04: $A0: 0x00000000 $A1: 0x01000000 $A2: 0x4FFFFEBC $A3: 0x08006063
$08: $T0: 0xFEFFFFFF $T1: 0x47E00000 $T2: 0x0000000E $T3: 0x40000000
$12: $T4: 0x47F00000 $T5: 0x40000000 $T6: 0x00000000 $T7: 0x47F00000
$16: $S0: 0x4FFFFEBC $S1: 0x00000080 $S2: 0x4FFFFEBC $S3: 0xFFFFFFFF
$20: $S4: 0xFFFFFFFF $S5: 0xFFFFFFFF $S6: 0xFFFFFFFF $S7: 0xFFFFFFFF
$24: $T8: 0x7F800000 $T9: 0x70001864 $K0: 0xA702A702 $K1: 0xA702A702
$28: $GP: 0x08008180 $SP: 0x4FFFFE58 $S8: 0xFFFFFFFF $RA: 0x70001A08
$FCR31: 0x00005014
FS=0 C=0 CAUSE=OI FLAGS=OI Round Mode=0=RN
$F01.$F00: 0x40000000.00000000 $F03.$F02 0x40000000.00000000
$F05.$F04: 0x47E00000.00000000 $F07.$F06 0x40000000.00000000
$F09.$F08: 0x47F00000.00000000 $F11.$F10 0x40000000.00000000
$F13.$F12: 0x40280000.00000000 $F15.$F14 0xFFFFFFFF.FFFFFFFF
$F17.$F16: 0x47F00000.00000000 $F19.$F18 0x7FF00000.7F800000
$F21.$F20: 0xFFFFFFFF.FFFFFFFF $F23.$F22 0xFFFFFFFF.FFFFFFFF
$F25.$F24: 0xFFFFFFFF.FFFFFFFF $F27.$F26 0xFFFFFFFF.FFFFFFFF
$F29.$F28: 0xFFFFFFFF.FFFFFFFF $F31.$F30 0xFFFFFFFF.FFFFFFFF

Debug Commands
Debug Manual—421921-003
4-40
DJ Command
DJ Command
The DJ command displays the contents of a specified jump buffer in register format.
The form of the DJ command is:
32-bit-address
is the RISC address of a jump buffer.
Considerations
•The DJ command causes a subset of the TNS/R registers to be displayed.
Registers that are not saved in the jump buffer are not displayed.
•The default numeric base for the DJ command is hexadecimal.
•A jump buffer is used for saving the context of a process. For more information
about jump buffers and their use, refer to the descriptions of the SETJMP_,
LONGJMP_, SIGSETJMP_, and SIGLONGJMP_ procedures in the Guardian
Procedure Calls Reference Manual.
Example
245,02,00033-DJ 0x80001920
$s0: 0xFFFFFFFF
$s1: 0xFFFFFFFF
$s2: 0xFFFFFFFF
$s3: 0xFFFFFFFF
$s4: 0xFFFFFFFF
$s5: 0xFFFFFFFF
$s6: 0xFFFFFFFF
$s7: 0xFFFFFFFF
$s8: 0xFFFFFFFF
$sp: 0x4FFFFE98
$gp: 0x08009610
$ra: 0x700003E8
DJ 32-bit-address

Debug Commands
Debug Manual—421921-003
4-41
DN Command
DN Command
The DN command displays memory contents in multiple formats: namely, ASCII, RISC
instruction code, TNS instruction code, binary, octal, decimal, or hexadecimal. The DN
command parameters specify this information:
•Address, or the beginning address, of the memory that Debug should display
•Count of the items to be displayed and the format you are using to enter the count
•Display format that Debug should use to display the memory contents
The syntax of the DN command is:
32-bit-address
is the RISC address, or beginning RISC address, of the memory to be displayed.
count-format has this form:
{ FOR | , }
specifies that instructions for count-format follow in the command. You
must begin the count-format with a FOR or a comma (,). A count format
and a display format can appear in either order in a DN command.
count
is an expression specifying the number of 32-bit items to be displayed. The
default base for count is hexadecimal.
count-size
specifies the number of bytes in the count unit. The format of count-size is:
{ B1 | B2 | B3 | B4 }
B1 specifies 1 byte, B2 specifies 2 bytes, and so forth. The default size is B4.
The number of bytes that Debug will display is count times count-size.
BY columns
specifies the number of items to be displayed in a row. This option allows you
to control the number of columns for data displayed in a table format. Valid
numbers are integers beginning with 1. If the number of items fills a line of
output, Debug automatically wraps the displayed line.
DN 32-bit-address [ count-format ] [ display-format ]
{ FOR | , } count [ count-size ] [ BY columns ]

Debug Commands
Debug Manual—421921-003
4-42
DN Command
If you omit BY columns, Debug determines the number of items to display on
a line.
display-format has this form:
{ IN| : }
specifies that the display-format (output) follow in the command. You must
begin display-format with an IN or a colon (:). In a DN command, a
count-format specification and a display-format specification can
appear in either order.
[ S | U ]
specifies signed or unsigned displays for octal and decimal numbers. In a
signed (S) display for a negative value, a minus sign (-) precedes the value. In
an unsigned (U) display, no sign appears. This option is ignored with other
numeric bases. The default specification is U.
display-type
specifies the format of the display. The format of display-type is:
{ A }
{ I }
{ R | N }
{ T }
{ B | %B }
{ O | %O | % }
{ D | %D | # }
{ H | %H | X }
The descriptions of these formats are:
{ IN| : } [ S | U ] display-type [ display-size ]
Adisplays ASCII code.
Iauto-select instruction decoding based on a process type.
R | N displays RISC instruction code.
Tdisplays TNS instruction code.
B | %B displays information in binary.
O | %O | % displays information in octal.
D | %D | # displays information in decimal.
H | %H | X displays information in hexadecimal.

Debug Commands
Debug Manual—421921-003
4-43
DN Command
The default format is determined by a preceding BASE command If no BASE
command has been entered, the default format is H, which displays 32 bits (4
bytes).
display-size
indicates the number of bytes in the displayed item. Valid sizes are integer
values of 1 through 4.
The default display sizes for the display types are as follows:
Considerations
•Use this command to display memory using 32-bit addresses. DN is especially
convenient for displaying 32-bit data. It is suitable for data in both flat and
selectable data segments, as well as data in RISC program globals and stacks,
and RISC code.
•The D command (with or without the N address mode) and the DN command can
be used in TNS, accelerated, or native processes.
•The command displays information to the home terminal for the Debug process.
•The entered address does not need to fill 32 bits, but Debug treats it as if it were
32 bits long. For example, the address “DN 1234” is valid, but in RISC execution
mode, Debug assumes that its value is 0x00001234. The default input base is
hexadecimal.
•The default base is hexadecimal for all components of the command. You can
override the default base by using a prefix as described in Expression Syntax on
page 3-9. The applicable prefixes are:
•The default base is hexadecimal. You can override the default base by setting the
display format in the DN command.
Format Display Type Size in Bytes
AASCII 2
R RISC instruction code 4
T TNS instruction code 2
BBinary 1
OOctal 2
DDecimal 2
H Hexadecimal 4
% for octal
# for decimal

Debug Commands
Debug Manual—421921-003
4-44
DN Command
•All displays contain the full display address along the left-hand side of the display.
For example, the output from the command “DN $SP, 10” is formatted as follows:
4FFFFA78: 0x08000680 0x70011D94 0x00000004 0xFFFFFFF7
4FFFFA88: 0x00000000 0x00000000 0x4FFFFB30 0x7C260D48
4FFFFA98: 0x00000000 0x00000000 0x08000680 0x50000000
4FFFFAA8: 0x00000004 0x00000000 0x4FFFFB40 0x00000000
•It is your responsibility to ensure the compatibility of the count format with the
display format. If count-size exceeds display-size, Debug truncates the
memory displayed to the display size. If display-size exceeds count-size,
Debug displays memory up to count-size.
•Display addresses do not need to be aligned on 16-bit or 32-bit boundaries. A
display command displays the address given in the stated format correctly
independent of the byte alignment of the address.
Examples
This command displays eight hexadecimal values. The display-size is the default
size, which is 4 bytes.
248,06,024-DN 0x70000, #8
70000000: 0x004C004C 0x137219A9 0x2CEF3457 0x349C94B0
70000010: 0x39F73AB3 0x3B683E90 0x3F8E3FCB 0x40814140
This command displays eight hexadecimal two-byte values:
248,06,024-DN 0x70000, #8 B2
70000000: 0x004C004C 0x137219A9 0x2CEF3457 0x349C94B0
This command displays eight hexadecimal two-byte values, two bytes at a time:
248,06,024-DN 0x70000, #8 B2 IN H 2
70000000: 0x004C 0x004C 0x1372 0x19A9
70000008: 0x2CEF 0x3457 0x349C 0x94B0
This command is equivalent to the preceding command but uses different options:
48,06,024-DN 0x70000, #8 B2:H 2
70000000: 0x004C 0x004C 0x1372 0x19A9
70000008: 0x2CEF 0x3457 0x349C 0x94B0
This command displays eight two-byte octal values, with four values to a column:
48,06,024-DN 0x70000, #8 B2 BY 4:O 2
70000000: 0x000114 0x000114 0x011562 0x014651
70000008 0x026357 0x032127 0x032234 0x112260
This command displays eight hexadecimal values, with three values to a row:
248,06,024-DN 0x70000, #8 BY 3
70000000: 0x004C004C 0x137219A9 0x2CEF3457

Debug Commands
Debug Manual—421921-003
4-45
EX[IT] Command
7000000C: 0x349C94B0 0x39F73AB3 0x3B683E90
70000018: 0x3F8E3FCB 0x40814140
This command displays eight RISC instructions:
248,06,024-DN 0x70000, #8 : R
70000000: SYSCALL BEQ k1,s2,0x700006 SLTIU ....
7000000C: ORI gp,a0,0x34B0 XORI s7,t7,0x3AB3 XORI ....
70000018: LUI t6,0x3FCB MTC0 at,8
This command displays the same memory locations as nonsensical TNS instructions:
248,06,024-DN 0x70000, #8 : T
70000000: STAR 4 STAR 4 BOX +162,5
70000006: BAZ -127 COMW 357 LDX G+127,6
7000000C: LDX G+234,6 LDX G+260,6 NSTO S-027
70000012: NSTO G+263,5 NSTO L+150,5 NSTO G+220,7
70000018: NSTO G+016,7 NSTO L-013,7 LOAD G+201
7000001E: LOAD L+100
EX[IT] Command
The EXIT (or EX) command exits a debug session. The form of the EXIT command is:
Considerations
•You typically enter an EXIT command when you are finished debugging and want
to continue executing the process. When you enter this command, Debug performs
various cleanup functions, including the following:
°It clears all breakpoints for the current process.
°It resumes execution of the process.
If you then reenter Debug, the default base for numeric input and output is set back
to the standard base (hexadecimal for TNS/R registers and addresses, octal for
TNS environment registers and addresses).
•You cannot resume a process that entered Debug either because it received a
nondeferrable signal or because a synchronous trap occurred. A signal is
nondeferrable if it was generated by the system because the process cannot
continue executing the instruction stream. The only traps from which you can
resume are the looptimer trap and the arithmetic overflow trap, provided that the T
and V bits are not both set in the ENV register.
•If you enter an EXIT command on a nonresumable process, the process is deleted
after Debug exits with the same Guardian Stop message or OSS wait status as
would have been generated had the signal or trap terminated the process without
entering Debug.
EX[IT]

Debug Commands
Debug Manual—421921-003
4-46
F[ILES] Command
F[ILES] Command
The FILES (or F) command displays the file name and the latest file-management error
number associated with an open file. The form of the FILES command is:
file-number
is a 16-bit word expression representing the file number returned from the open
operation on the file whose information is to be displayed.
The value -1 causes Debug to display the error associated with the last open,
create, purge, or AWAITIO operation that failed.
If you omit file-number, Debug displays the file number and other information
for all of the process’s open files.
The FILES command displays the file information in this form:
F[ILES] [ file-number ]
[ file-number ] { file-name } error [ suberror ]
{?file-name }
{ ??? }
file-number is displayed in decimal only for currently open files. The file
number is displayed only if you enter the FILES command
without file-number (to display all files).
File number -1 denotes the current error and detail information,
which appears in the first line in the display.
file-name is displayed as a fully qualified external file name for file names
available to Debug.
?file-name a question mark displayed in front of the file name indicates that
the current name is unavailable. The displayed name is the
originally opened name, which can occur, for example, if a
remote disk file is open and the network goes down.
??? is displayed if the file name is not available to Debug.
error is displayed in decimal as a 6-digit signed integer.
suberror is a detail error value displayed in decimal only for values other
than zero.

Debug Commands
Debug Manual—421921-003
4-47
FC Command
Examples
106,00,00030-F 4
\SYS1.$SYSTEM.SYS50.OSIMAGE #-00006
106,00,00031-F
# -1 ??? # 00014
#001 \SYS1.$DATA.INFO.NAMES #-00008 00001
#004 \SYS1.$SYSTEM.SYS50.OSIMAGE #-00024
#005 \SYS1.$:15:122:1263433 # 00000
#006 ?\SYS2.$TRAMP.TEST.FILE # 00210
FC Command
The FC command alters the last Debug command that was entered. The form of the
FC command is:
When you enter the FC command, Debug displays the last command line and prompts
you for an “editing template.” Enter the editing template under the line just displayed.
Debug then displays the command line in its new state, and Debug again permits you
to enter an editing template. When you are finished editing, press RETURN at the
prompt, and Debug automatically reexecutes the command.
To indicate the type of editing to be performed, there are three subcommands that you
can enter in the editing template:
In addition, replacement is implied if a subcommand begins with any nonblank
character other than R, I, or D.
The FC command is implemented in other software. For more information about the
FC command, refer to the TACL Reference Manual.
FC
Subcommand Description
R Replace (followed by a replacement string)
I Insert (followed by an insertion string)
DDelete

Debug Commands
Debug Manual—421921-003
4-48
FN Command
FN Command
The FN command searches memory to find a particular number. The FN command
starts at a specified address and searches memory until one of the following occurs:
•A 16-bit word is reached whose contents logically ANDed with mask, and it equals
the result of value logically ANDed with mask.
•A 16-bit word address ending in 17 binary zeros is reached.
The form of the FN command is:
address
is the address at which the FN command starts to search memory. The address
parameter must be on an even byte boundary. For more information, see Address
Syntax on page 3-12.
value
is any expression that evaluates to a valid 16-bit number.
mask
is any expression that evaluates to a valid 16-bit number.
Considerations
•If you omit value and mask, the FN command uses the value and mask
specified by the previous FN command but starts searching at the newly specified
address.
•If you omit address, value, and mask, the FN command uses the value and
mask specified by the previous FN command and starts searching at the address
where the previous FN command terminated.
•The FN command has a default that provides a shorthand way of finding repeated
occurrences of a value. If you execute an FN command and a match is found,
Debug responds with the standard prompt followed by (FN). For example:
251,06,024-(FN)-
If you then press RETURN, the effect is the same as entering an FN command
with no parameters; that is, Debug continues searching for the same value starting
at the address where the previous FN command terminated. You can continue
pressing RETURN in this manner until the Debug prompt does not contain (FN)
(indicating that no match was found).
•Two possible uses for this command are finding data structures with particular
values and finding code that has moved slightly because of a minor change.
FN [ address [ , value ] [ & mask ] ]

Debug Commands
Debug Manual—421921-003
4-49
FNL Command
Examples
106,00,00014-FN UC.1, 1, 3 & 2
106,00,00014-FN 5, 23 & 2
248,01,00023-FN N 0x80020000, 0x33 ! Find the number 0x33 starting at
! the specified RISC address.
FNL Command
The FNL command searches memory to find a 32-bit number. The FNL command
starts at a specified address and searches memory until one of the following occurs:
•A word is reached whose contents logically ANDed with mask, and it equals the
result of value logically ANDed with mask.
•A byte address ending in 17 binary zeros is reached.
The form of the FNL command is:
address
is the address at which the FNL command starts to search memory. The address
parameter must be on an even byte boundary. For more information, see Address
Syntax on page 3-12.
value
is any expression that evaluates to a valid 32-bit number.
mask
is any expression that evaluates to a valid 32-bit number.
Considerations
•The FNL command has a default that provides a shorthand way of finding repeated
occurrences of a value. If you execute an FNL command and a match is found,
Debug responds with the standard prompt followed by (FNL). For example:
251,06,00024-(FNL)
If you then press RETURN, the effect is the same as entering an FNL command
with no parameters; that is, Debug continues searching for the same value starting
at the address where the previous FNL command terminated. You can continue
pressing RETURN in this manner until the Debug prompt does not contain (FNL)
(indicating that no match was found).
FNL [ address [ , value ] [ & mask ] ]

Debug Commands
Debug Manual—421921-003
4-50
FREEZE Command
•Two possible uses for this command are finding data structures with particular
values and finding code that has moved slightly because of a minor change.
If you omit value and mask, the FNL command uses the value and mask specified
by the previous FNL command but starts searching at the newly specified address.
•If you omit address, value, and mask, the FNL command uses the value and
mask specified by the previous FNL command and starts searching at the address
where the previous FNL command terminated.
Examples
The following shows the search for a 32-bit word starting with string 45. The mask
indicates that we are to ignore the contents of the lower 16 bits of the 32-bit word as
well as the lower 16 bits of our search pattern.
050,03,00272-fnl q, '45xx' & 0xffff0000
0008002C: 0x34353637
For more FNL Command examples, see Appendix F, Sample Debug Sessions.
FREEZE Command
The FREEZE command disables the processor and asserts a freeze on other
processors that have freeze enabled. The form of the FREEZE command is:
Considerations
•The FREEZE command is allowed only if you are debugging in privileged mode as
described under the PRV command.
•Once a processor is frozen, a service provider can use the service processor (SP)
to examine the current processor and another frozen processor.
Example
245,02,00033-FREEZE ! Freezes the current processor, 02 in this example,
! and asserts a freeze on other processors.
FREEZE

Debug Commands
Debug Manual—421921-003
4-51
HALT Command
HALT Command
The HALT command halts the processor. The form of the HALT command is:
Considerations
•The HALT command is allowed only if you are debugging in privileged mode as
described under the PRV command.
•Any running processors will declare the halted processor as being down.
•Once a processor is halted, a service provider can use the service processor (SP)
to examine the processor.
Example
245,02,00033-HALT ! Halts the current processor, 02 in this example.
H[ELP] Command
The HELP (or H) command displays help information about Debug commands. The
form of the HELP command is:
debug-command
specifies the command whose syntax Debug is to display.
<variable-item>
specifies a variable item whose syntax Debug is to display. A variable item
represents an item that you supply in a Debug command. The values you can
specify for variable-item might vary depending on the release of Debug that
you are using.
The variable-item parameter must be enclosed in angle brackets.
You can specify either debug-command or <variable-item>, but not both. If you
omit both debug-command and <variable-item>, Debug displays all the available
Debug commands and variables. Privileged Debug commands and options appear
only if you are debugging in privileged mode as described under the PRV command.
HALT
H[ELP] [ debug-command ]
[ <variable-item> ]

Debug Commands
Debug Manual—421921-003
4-52
I Command
Considerations
The HELP command is not available if the priority of the process being debugged is
greater than or equal to the priority of the memory manager.
I Command
The I command displays instruction code. The default instruction set depends on the
process type, but the instruction set can be specified by the mode parameter. The
display syntax of this command is as follows:
address
is the address of the first variable to be displayed. For more information, see
Address Syntax on page 3-12.
length
specifies the number of instructions to be displayed by Debug.
[OUT] output-dev
specifies where the display is directed. Debug output can be directed to an output
device, a process, or a spooler collector. Debug output cannot be directed to a disk
file. If you omit output-dev, Debug assumes the home terminal.
The output-dev parameter has these formats.
Syntax for a device other than a disk:
[ node.]{device-name[.qualifier ] }
{ldev-number }
Syntax for a named process:
[ node.]process-name[:seq-no][.qual-1[.qual-2] ]
Syntax for an unnamed process:
[ node.]$:cpu:pin:seq-no
For syntax descriptions of these process and device names, see the Guardian
Procedure Calls Reference Manual.
mode
specifies the instruction set options. The mode parameter has this format:
{ T | N | R }
I address [ , length ]
[ , [ OUT ] output-dev ] [ : mode ]

Debug Commands
Debug Manual—421921-003
4-53
I Command
These format options have these meanings:
If you omit mode, the default is based on the address that is currently being used.
Considerations
For an accelerated program, the I command displays the specified address area in
TNS instruction code and marks points of correspondence between TNS and RISC
instructions as follows:
•A commercial at sign (@) marks a register-exact point.
•A greater-than sign (>) marks a memory-exact point.
These points are the TNS environment P register values on which you can set
breakpoints. For more information on these points, see TNS and RISC Execution
Correspondence (Accelerated Mode) on page 2-5.
Examples From a TNS Program
050,03,00013-I %104
%000104: ADDS +002
050,03,00013-I %104, #10
%000104: ADDS +002 LADR L+006 LLS 01 PUSH 700
%000110: ADDS +032 LOAD L-003 PUSH 700 ADDS +006
%000114: LDLI +200 LDI -007
050,03,00013-I Q #40/2, 5 :r
00080028: SUBU t4,v1,at UNKNOWN 64000000 NOP
00080034: NOP NOP
050,03,00013-
Example From an Accelerated Program
050,03,00014-I %104, #10
%000104: @ ADDS +002 LADR L+006 LLS 01 PUSH 700
%000110: ADDS +032 LOAD L-003 PUSH 700 ADDS +006
%000114: > LDLI +200 LDI -007
050,03,00014-
Tdisplays TNS instruction code.
Ndisplays RISC instruction code.
Rdisplays RISC instruction code.

Debug Commands
Debug Manual—421921-003
4-54
IH Command (TNS/R Native and OSS Processes)
Examples From a Native Program
050,03,00267-I 0x70000464
70000464: ADDIU sp,sp,-128
050,03,00267-I $pc - (4*4), 4
70000558: LW s0,52(sp) LW s1,56(sp) LW ra,60(sp)
70000564: NOP
050,03,00267-I Q #40/2, 6 :t
%000024: ADRA 1 LDD G+143,5 LDD G+145,6 LDD G+147,7
%000030: NOP NOP
050,03,00267-
IH Command (TNS/R Native and OSS
Processes)
The IH command displays information about signal handling for all signals or for a
specified signal. The form of the IH command is:
signal-name
specifies a signal for which signal-handling information is to be displayed. The
TNS/R native signals are:
{ SIGSEGV | SIGILL | SIGFPE | SIGABRT }
{ SIGSTK | SIGLIMIT | SIGMEMMGR | SIGNOMEM }
{ SIGMEMERR | SIGTIMEOUT }
Additional signals are supported by Open System Services (see Considerations
below). If signal-name is not specified, information is displayed for all signals,
including both TNS/R native signals and OSS signals.
Considerations
•Because only TNS/R native or OSS processes can have signal handlers, the IH
command is allowed only on such processes. For more information on signals,
refer to the description of the SIGACTION_INIT_ procedure in the Guardian
Procedure Calls Reference Manual.
•Open System Services supports additional signals that can be specified for
signal-name. For more information about OSS signals, OSS users can refer to
the signal(4) topic in the reference page, either online or in the Open System
Services System Calls Reference Manual.
•The first column of the IH command display shows the name of each signal for
which information is provided.
IH [ signal-name ]

Debug Commands
Debug Manual—421921-003
4-55
INSPECT Command
The second column shows a “P” if the signal handler for that signal is privileged or
“N” if the signal handler is nonprivileged.
The third column shows the starting address of each signal handler.
The fourth and fifth columns show the mask values that indicate which signals to
block when each signal handler is executing. (Only the lower 64 bits are displayed
of the 128 bits that are available; the upper 64 bits are reserved.)
The sixth column shows the flags fields that modify the behavior of each signal
handler.
Example
245,02,00033-IH ! Display signal handling information for all the signals
Signal Priv/Non Handler Mask[0:31] Mask[32:63] Flags
SIGHUP N 0xFFFC0000 0x00000000 0x00000000 0x00000000
SIGINT N 0xFFFC0000 0x00000000 0x00000000 0x00000000
SIGQUIT N 0xFFFC0000 0x00000000 0x00000000 0x00000000
SIGILL N 0x70002204 0x00000000 0x00000000 0x00000000
SIGURG N 0xFFFC0001 0x00000000 0x00000000 0x00000000
SIGABRT N 0xFFFC0000 0x00000000 0x00000000 0x00000000
SIGIO N 0xFFFC0001 0x00000000 0x00000000 0x00000000
SIGFPE N 0x70002204 0x00000000 0x00000000 0x00000000
SIGKILL N 0xFFFC0000 0x00000000 0x00000000 0x00000000
SIGSEGV N 0x70002204 0x00000000 0x00000000 0x00000000
SIGPIPE N 0xFFFC0000 0x00000000 0x00000000 0x00000000
SIGALRM N 0xFFFC0000 0x00000000 0x00000000 0x00000000
SIGTERM N 0xFFFC0000 0x00000000 0x00000000 0x00000000
SIGUSR1 N 0xFFFC0000 0x00000000 0x00000000 0x00000000
SIGUSR2 N 0xFFFC0000 0x00000000 0x00000000 0x00000000
SIGCHLD N 0xFFFC0001 0x00000000 0x00000000 0x00000000
SIGRECV N 0xFFFC0001 0x00000000 0x00000000 0x00000000
SIGSTOP N 0xFFFC0000 0x00000000 0x00000000 0x00000000
SIGTSTP N 0xFFFC0000 0x00000000 0x00000000 0x00000000
SIGMEMERR N 0x70002204 0x00000000 0x00000000 0x00000000
SIGSTK N 0x70002204 0x00000000 0x00000000 0x00000000
SIGTIMEOUT N 0x70002204 0x00000000 0x00000000 0x00000000
SIGLIMIT N 0x70002204 0x00000000 0x00000000 0x00000000
SIGCONT N 0xFFFC0001 0x00000000 0x00000000 0x00000000
SIGTTIN N 0xFFFC0000 0x00000000 0x00000000 0x00000000
SIGTTOU N 0xFFFC0000 0x00000000 0x00000000 0x00000000
SIGABEND N 0xFFFC0000 0x00000000 0x00000000 0x00000000
INSPECT Command
The INSPECT command starts the Inspect debugger from Debug. The form of the
INSPECT command is
INSPECT

Debug Commands
Debug Manual—421921-003
4-56
INSPECT Command
Considerations for Switching From Debug to Inspect
•The Inspect debugger updates its breakpoint list upon being invoked from Debug.
•Privileged breakpoints are added only if the Inspect debugger has SET PRIV
MODE ON. For this to happen, you must have (1) been in the Inspect debugger
and entered the SET PRIV MODE ON command, (2) invoked Debug, entered the
PRV command, and set breakpoints, and (3) reinvoked the Inspect debugger.
•Conditional breakpoints set by Debug are always evaluated conditionally,
regardless of whether you are using the Inspect debugger or Debug.
•The Inspect LIST BREAKPOINTS command lists information about breakpoints set
in Debug. If the breakpoint has attributes not allowed for Inspect breakpoints (for
example, it is a conditional breakpoint that uses a mask), the Inspect debugger
lists the breakpoint type as one of the following:
Code DEBUG
Data DEBUG
The breakpoint description can include this information:
CONDITIONAL ! Conditional Debug breakpoint
ALL PROCESSES ! Applies to all processes
PRIV ! Set by Debug in privileged mode
•The Inspect debugger does not list Debug breakpoints if the command:
•Includes the AS COMMANDS option
•Is the FB command
Considerations for Switching From Inspect to Debug
•To switch from the Inspect debugger back to Debug, use the SELECT
DEBUGGER DEBUG command.
•From the Inspect debugger, you can invoke Debug only on object programs that
are in the hold state. You cannot use Debug on Pathway Screen COBOL
programs.
•Conditional breakpoints that were set by using the Inspect debugger are reported
unconditionally in Debug.
•If you invoke Debug from within the Inspect debugger and the process being
debugged terminates, control returns to the Inspect debugger. The Inspect session
terminates if there are no other processes being debugged; otherwise, the Inspect
debugger resets the current program and issues a prompt.
Caution. When returning control to the Inspect debugger after you have used Debug to set “all
process” breakpoints in system code and system library spaces, a deadlock can occur if the
Inspect component process DMON calls the procedure in which you set a breakpoint.
Debug Commands
Debug Manual—421921-003
4-57
LMAP Command
•If you invoke Debug from an Inspect process being used to debug multiple
processes, there is a possibility of both the Inspect process and Debug competing
to control the terminal. You might consider using either the Inspect or Debug pause
command to eliminate the contention.
•If the Inspect debugger is used to set breakpoints on STOP or ABEND, the Inspect
debugger reports the event even if the event occurs when Debug is being used to
debug the process.
•If PRV ON occurred earlier in Debug or SET PRIV MODE ON occurred earlier in
Inspect, you do not need to reissue PRV ON to Debug.
Example
This command switches from Debug to the Inspect debugger.
244,02,00033-INSPECT
INSPECT - Symbolic Debugger - ...
244,02,00033 MYPROG #MYPROC^MAIN.#29004(SMYPROG)
-MYPROG-
.
.
.
-MYPROG- SELECT DEBUGGER DEBUG ! Go back to Debug.
DEBUG P=%000236, E=%000207, UC.%00
244,02,00033-
LMAP Command
The LMAP command displays the name of the procedure, the offset from the base of
the procedure, and the code space, where a specified address lies. The form of the
LMAP command is:
address
is the address that is to be translated to a procedure name plus offset. For more
information, see Address Syntax on page 3-12.
Considerations
•If you use the V command to vector to another process (V is a privileged
command), LMAP works only for global code areas (SC, SL, SCr, SLr); local code
addresses in the program of the target process are rejected.
•The LMAP command displays nothing if the address is outside any procedure or if
no name is available.
•The offset is displayed only if it is nonzero.
LMAP address

Debug Commands
Debug Manual—421921-003
4-58
M Command
•The LMAP command is not available when the process in Debug is one that does
not allow page faults.
Examples
243,01,00282-lmap sl.7,24137 ! an address in SL.07
EMTEXT + %17226 (SL.07)
243,01,00282-lmap n 0x7a0e50be ! same location as a 32-bit address
EMTEXT + %17226 (SL.07)
243,01,00282-lmap n 0x7A6CDBAC ! an address in accelerated code
EMSTEXT + %17226 (acc SL.07)
243,01,00071-lmap n 0x700015ac ! an address in a native program
PROGRAM + 0x5EC (UCr)
242,01,00040-lmap n 0x76068130 ! an address in a native SRL
printf (SRL ZCRTLSRL)
M Command
The M command has these functions:
•To modify the contents of a process’s variable
•To modify the contents of one of a process’s registers, or to modify the space
identifier of the current code segment
Each function is defined by a unique syntax. Each function and its syntax is described
on the following pages.
Modify Variables
The M command can modify the contents of a process’s variables. The modify-variable
form of the M command is:
address
is the address of the first variable to be modified. For more information, see
Address Syntax on page 3-12. The only address modes allowed while in
nonprivileged mode are L, S, Q, and N. All address modes are allowed for a
process while in privileged mode.
new-value
is a 16-bit word expression representing the new contents of the modified
variables. A series of more than one new-value separated by commas modifies
consecutive ascending memory locations. A 16-bit word is used for new-value
M address [ , new-value ] ...

Debug Commands
Debug Manual—421921-003
4-59
Modify Register Contents
unless an N-mode address is used, in which case a 32-bit word is used for new-
value.
If you omit new-value, Debug prompts for a 16-bit word expression to represent
the new contents of the variable. The prompt is of the form:
address
is the address of the word to be modified.
current-value
is the current value of the indicated variable.
You can enter one value at the prompt. If you enter a value, Debug prompts for a
value for the next consecutive location. If you enter a blank, current-value is
unchanged and Debug prompts for a value for the next location. If you enter
nothing, current-value is unchanged and Debug returns to its command-
input mode.
Considerations
When N addressing mode is used, the current-value displayed and the new-
value received are 32-bit numbers; the default base is hexadecimal.
Examples
106,01,00012-m L-3I,1,2,3
248,01,00023-M N 0X80020000, 0, 0, 0, 0 ! Change four 32-bit
! values to 0.
For more examples that use the M command, see Appendix F, Sample Debug
Sessions.
Modify Register Contents
The M command can modify the contents of one of a process’s registers. The modify-
register form of the M command is:
register
represents one of the registers for that process; see Register Syntax on page 3-7.
address: current-value <-
M register [ , new-value ]

Debug Commands
Debug Manual—421921-003
4-60
Modify Register Contents
new-value
is a 16-bit word expression representing the new contents of the designated
register. The new-value parameter is a space identifier if you specify SP for
register.
If register is a TNS/R register, new-value is a 32-bit value and you enter new-
value in hexadecimal.
If you omit new-value, Debug prompts for a 16-bit word expression to represent
the new contents of the register. The prompt is of the form:
register
is the register to be modified.
current-value
is the current value of the indicated register.
You can enter one value at the prompt.
When you specify SP for register, new-value is of the form:
{ UC[.segment-num ] }
{ UL[.segment-num ] }
{ SC[.segment-num ] }
{ SL[.segment-num ] }
segment-num
defines the particular library code segment within the user code or user library
space, and it must be an octal number identifying any allowed segment. If you
omit segment-num, Debug uses 0.
register: current-value <-
U
Cindicates the user code space.
U
Lindicates the user library space.
S
Cindicates the system code space (valid only in privileged mode).
S
Lindicates the system code space (valid only in privileged mode).
Debug Commands
Debug Manual—421921-003
4-61
Modify Register Contents
Considerations
•When you want to change the current location of a process running in TNS or
accelerated mode, you modify the value of the P register. If the process is a
multiple-segment process, you must also change the space identifier. You change
the space identifier in order to change the location of the process to a different
code segment.
(It is also possible to change the current location of a process running in native
mode, but doing so requires knowledge of native mode internals and is beyond the
scope of this manual.)
•In the TNS environment, ENV.<0:7> cannot be modified by specifying E for the
register parameter, except in privileged mode. However, in nonprivileged mode,
Debug does allow you to modify ENV.<4> and ENV.<7> by specifying SP for the
register parameter.
The LS (ENV.<4>) and CS (ENV.<7>) fields in the ENV register must agree with
the UC, UL, SC, and SL fields in the space identifier. Therefore, to modify
ENV.<4> or ENV.<7>, set new-value for the SP register parameter as follows:
Note that a nonprivileged user cannot set CS to 1, which would be system code or
system library.
•When modifying the bit values of the $FCR31 register, the modification is made to
the local copy maintained by Debug. Although you can display the modified value
of the register, the copy that is placed in the original $FCR31 register when the
program resumes might be different than the modified value. Bits cannot be set in
undefined fields of the register, and the value of the CAUSE field cannot be
modified. Applying only selected bit fields reduces program failure when the
program is resumed.
new-value changes ENV.<4> to changes ENV.<7> to
UC 0 0
UL 1 0
SC (priv mode only) 0 1
SL (priv mode only) 1 1

Debug Commands
Debug Manual—421921-003
4-62
MH Command (TNS/R Native and OSS Processes)
Examples
147,01,00029-MR0
*REG*: %000031 <- 0
147,01,00033- M SP
SPACEID: UL.2 <- UC.00
147,01,00033- M SP,UC ! Defaults to UC.00
248,01,00033-M $V0, -1 ! Set register $V0 to -1.
248,02,00022-M $T0 ! Change register $T0 to the value
0x70452312.
*REG*: 0x00000EF0 <- 0x70452312
MH Command (TNS/R Native and OSS
Processes)
The MH command can modify signal handling by specifying a new signal handler or
signal action for a specified signal. The form of the MH command is:
signal-name
specifies the signal for which signal handling is to be modified. The TNS/R native
signals are:
{ SIGSEGV | SIGILL | SIGFPE | SIGABRT }
{ SIGSTK | SIGLIMIT | SIGMEMMGR | SIGNOMEM }
{ SIGMEMERR | SIGTIMEOUT }
Additional signals are supported by Open System Services. For more information,
see Considerations on page 4-62.
sigaction
specifies one of the system-supplied signal actions:
{ SIG_DFL | SIG_ABORT | SIG_DEBUG | SIG_IGN }
32-bit-address
is the RISC address of a user-supplied signal handler.
Considerations
•Because only TNS/R native and OSS processes can have signal handlers, the MH
command is allowed only on such processes. For more information on signals,
refer to the description of the SIGACTION_INIT_ procedure in the Guardian
Procedure Calls Reference Manual.
MH signal-name , { sigaction | 32-bit-address }

Debug Commands
Debug Manual—421921-003
4-63
P[AUSE] Command
•Open System Services supports additional signals that can be specified for
signal-name. For more information about OSS signals, OSS users can refer to
the signal(4) topic in the reference page, either online or in the Open System
Services System Calls Reference Manual.
•A user-written procedure must meet certain requirements to function as a signal
handler. For more information on how to write a signal handler, refer to the
description of the SIGACTION_INIT_ procedure in the Guardian Procedure Calls
Reference Manual.
•If you are running Debug as the super ID (255, 25), a signal handler that you install
with the MH command might or might not be capable of executing in privileged
mode depending on whether the signal handler it replaced was capable of
executing in privileged mode. The level of privilege will be unchanged. If you are
not running Debug as the super ID, you can install only a nonprivileged signal
handler.
•You can use the IH command to verify that the new signal handler or handler
action is in effect after installing it with the MH command.
Examples
In this example, the MH command is used to specify a signal handler for the signal
SIGFPE and then, for verification, the IH command is used to display signal-handling
information for the same signal.
243,04,00019-MH SIGFPE, oxh00030000
243,04,00019-IH SIGFPE
Signal Priv/Non Handler Mask[0:31] Mask[32:63] Flags
SIGFPE N 0x00030000 0x00000000 0x098700A1 0x000816E4
P[AUSE] Command
The PAUSE (or P) command momentarily suspends process execution. This
command is particularly useful when you are simultaneously debugging several
processes at the same terminal. The form of the PAUSE command is:
pause-time
is an expression that specifies the length of time, in 0.01-second units, that the
process is to pause for.
Example
119,01,00012-P #1000 ! Pauses the process (01,012) for 10 seconds.
P[AUSE] pause-time

Debug Commands
Debug Manual—421921-003
4-64
PMAP Command (Accelerated Programs)
PMAP Command (Accelerated Programs)
The PMAP command prints corresponding blocks of TNS and RISC instruction code.
The form of the PMAP command is:
address
is a code address. For more information, see Address Syntax on page 3-12. The
address-mode parameters allowed for a code address are as follows:
•UC, UL, SL, and C address modes are allowed while in nonprivileged mode.
N address mode is also allowed for addresses in any native code space and
for addresses in accelerated code spaces UC, UL, and SL.
•Any address mode appropriate for the processor is allowed while in privileged
mode.
count
is an expression representing the number of instructions to be displayed. Valid
values for count are integers. Debug displays the minimum number of blocks of
instructions that includes the count number of instructions.
[OUT] output-dev
specifies where the display is directed. Debug output can be directed to an output
device, a process, or a spooler collector. Debug output cannot be directed to a disk
file. If you omit output-dev, Debug assumes the home terminal.
output-dev has these formats.
Syntax for a device other than a disk:
[ node.]{device-name[.qualifier ] }
{ldev-number }
Syntax for a named process:
[ node.]process-name[:seq-no][.qual-1[.qual-2] ]
Syntax for an unnamed process:
[ node.]$:cpu:pin:seq-no
•For syntax descriptions of these process and device names, see the Guardian
Procedure Calls Reference Manual.
Considerations
•The PMAP command is allowed only on TNS or RISC code in accelerated program
areas.
PMAP address [ , count ] [ , [ OUT ] output-dev ]
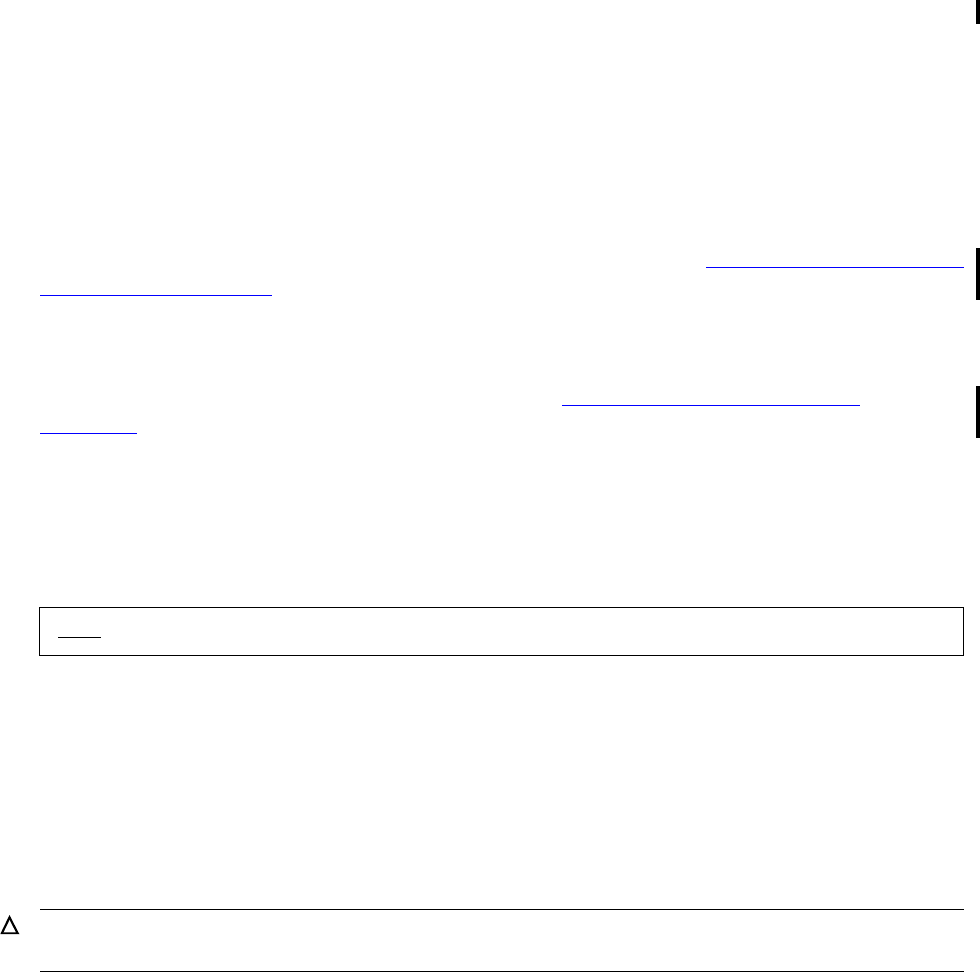
Debug Commands
Debug Manual—421921-003
4-65
PRV Command
•If the name you specify for output-dev happens to match a register name, a
syntax error might result. To avoid any possibility of ambiguity, include the keyword
OUT before output-dev, which informs Debug that the name refers to an output
device. For example, suppose a printer is named $S1, which is also the name of a
TNS/R register. Specifying OUT $S1 on the PMAP command tells Debug that $S1
is an output device.
PMAP Display Format
The PMAP command displays the specified address area in TNS instruction code
followed by RISC instruction code. These conventions apply to the display:
•RISC addresses are represented in hexadecimal.
•TNS addresses are represented in octal.
•A commercial at sign (@) marks a register-exact point.
•A greater-than sign (>) marks a memory-exact point.
Register-exact and memory-exact points are the TNS P register values on which you
can set breakpoints. For more information on these points, see Section 2, Using Debug
on TNS/R Processors.
Examples
For examples that use the PMAP command, see Appendix F, Sample Debug
Sessions.
PRV Command
The PRV command enables or disables privileged debugging commands.The form of
the PRV command is:
ON
specifies that privileged debugging commands be enabled.
OFF
specifies that privileged debugging commands be disabled.
If you do not specify either ON or OFF, ON is the default.
PRV [ ON | OFF ]
Caution. Use privileged commands with extreme caution, because they allow you to perform
operations that could halt the system.
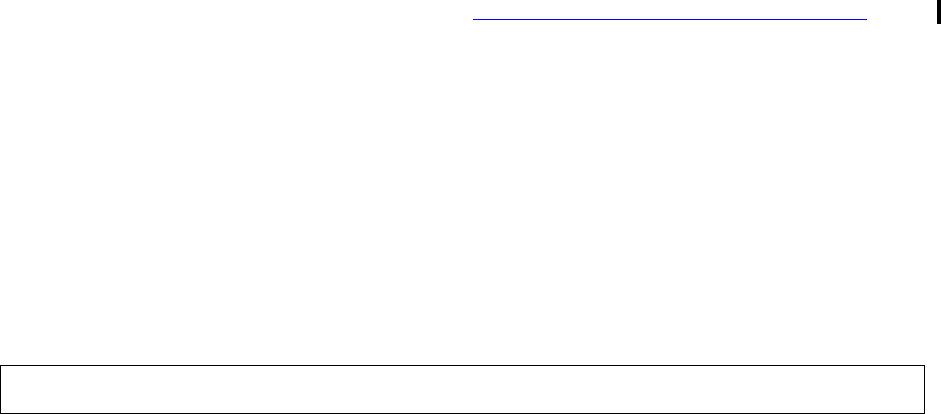
Debug Commands
Debug Manual—421921-003
4-66
R Command
Considerations
•The PRV ON command requires that the process you are debugging be executing
under the local super ID (255, 155). After you specify the PRV ON command, you
can enter any of the privileged commands or options.
•Privileged debugging is never available automatically. Before using the privileged
Debug commands and options, you must always issue the PRV ON command; the
security subsystem then decides whether you have the proper access to be
granted privileged debugging. The only exception is where a process falls into a
debugging session that is already privileged because of an earlier PRV ON
command from Debug (or a SET PRIV MODE ON command from Inspect) during
the life of the process.
•The privileged Debug commands are:
°The FREEZE, HALT, PRV, V, and VQA commands
°Access data and code in the kernel address space (Kseg0 and Kseg2).
°Plant code breakpoints in code containing PRIV or CALLABLE procedures,
including licensed UC, UL, UCr, SRLs, or system code and library.
°Commands that modify user code.
Example
For examples that use the R command, see Appendix F, Sample Debug Sessions.
R Command
The R command causes the application process to leave the debug state and resume
execution.
You can specify a conditional resume. For a conditional resume, Debug executes the
R command only if the specified relation between the two expressions is true. A
conditional resume is particularly useful to include in a command string on an execute
code breakpoint or execute memory-access breakpoint.
The form of the R command is:
expression-1
is a 16-bit word expression.
R [ expression-1 op expression-2 ]

Debug Commands
Debug Manual—421921-003
4-67
S[TOP] Command
op
is one of these operators:
expression-2
is a 16-bit word expression.
Considerations
•You cannot resume a process that entered Debug either because it received a
nondeferrable signal or because a synchronous trap occurred. A signal is
nondeferrable if it was generated by the system because the process cannot
continue executing the instruction stream. The only traps from which you can
resume are the looptimer trap and the arithmetic overflow trap, provided that the T
and V bits are not both set in the ENV register.
If you enter an R command on a nonresumable process, the process is deleted
after Debug exits with the same Guardian Stop message or OSS wait status as
would have been generated had the signal or trap terminated the process without
entering Debug.
Example
This command sets an execute memory-access breakpoint at offset %42 with two
conditional resume requests:
100,02,00033-BM 42, (R K17 < 12; R R0 < 54;)
S[TOP] Command
The STOP (or S) command deletes an application process. The form of the STOP
command is:
<resume if expression-1 is less than expression-2. This operator
does an unsigned comparison.
>resume if expression-1 is greater than expression-2. This
operator does an unsigned comparison.
=resume if expression-1 is equal to expression-2.
<> resume if expression-1 is not equal to expression-2.
S[TOP]
Note. The process deletion is treated as a normal deletion (for example, a system message -5
is sent to the creator of the deleted process).

Debug Commands
Debug Manual—421921-003
4-68
T Command
T Command
The T command traces back and displays the contents of up to 10 stack markers,
starting from the current stack marker or a designated stack marker. The T command
can either report the procedure names or translate the PC register (native mode) or the
ENV register (TNS or accelerated mode) in each stack marker. The form of the
T command is:
options
gives Debug the conditions to assume when starting the trace. The options
parameter is a list of one or more of the following, separated by commas:
[register [=]] expression
tells Debug to start the trace as though the specified register had the specified
value. If the register is a 16-bit register, only the low-order 16 bits of the
expression are used. You can include as many [register [=]] expression
specifications as are necessary to indicate where to start the trace. You can
omit register = , in which case Debug assumes the L register.
MODE { N[ATIVE] | T[NS] | A[CCELERATED] }
specifies the execution mode that Debug is to assume when starting the stack
trace. If you omit this option, Debug assumes the execution mode of the
current process.
AT expression
specifies the address of a word on the stack whose content is a native code
address. Debug assumes that this word is the return address stored by a
procedure, and attempts to begin the trace with the stack frame of that
procedure.
J 32-bit-address
specifies that the stack trace start from the context saved in a jump buffer. The
32-bit-address parameter is the RISC address of the jump buffer.
T [ & ] [ N ] [ options ] [ , [ OUT ] output-dev ]
&specifies that Debug is to begin the display with the frame immediately following
the last frame displayed. You can use this option to display successive blocks of
frames.
Nspecifies that Debug is to display a trace of procedure names rather than the
translated ENV or PC registers.

Debug Commands
Debug Manual—421921-003
4-69
T Command
[OUT] output-dev
specifies where the display is directed. Debug output can be directed to an output
device, a process, or a spooler collector. Debug output cannot be directed to a disk
file. If you omit output-dev, Debug assumes the home terminal.
The output-dev parameter has these formats.
Syntax for a device other than a disk:
[ node.]{device-name[.qualifier ] }
{ldev-number }
Syntax for a named process:
[ node.]process-name[:seq-no][.qual-1[.qual-2] ]
[ node.]$:cpu:pin:seq-no
For syntax descriptions of these process and device names, see the Guardian
Procedure Calls Reference Manual.
Considerations
•If the process being debugged contains threads, Debug displays a stack trace for
only the thread currently in effect.
•If the name you specify for output-dev happens to match a register name, a
syntax error might result. To avoid any possibility of ambiguity, include the keyword
OUT before output-dev, which informs Debug that the name refers to an output
device. For example, suppose a printer is named $S1, which is also the name of a
TNS/R register. Specifying OUT $S1 on the T command tells Debug that $S1 is an
output device.
•In a stack trace displayed by the T command, the top line represents the most
recently called procedure, the second line represents the next most recently called
procedure, and so on. For example, in the following trace, PROMPT called
CHECKRECEIVE.
%004251: %002223 E=%000000 L=%004072 CHECKRECEIVE + %000250
%004070: %006163 E=%000000 L=%003634 PROMPT + %001064
•There are two ways to start a stack trace at a particular stack frame in native
mode. One way is to indicate where the frame is and which procedure built the
frame. Do this by including the appropriate register = expression
specifications in the T command. For example:
T$RA 0x70302304, $30 0xFFFFFFFF
An alternate and easier way is to examine the stack for a value that is likely to be a
RISC PC address (that is, a value that addresses the SCr, SLr, UCr, or SRL code
space) and provide the address of that value as the expression for the AT
parameter.

Debug Commands
Debug Manual—421921-003
4-70
T Command
•The T command has a default that provides a shorthand way of displaying
successive blocks of stack frames. If you execute a T command and the
subsequent Debug prompt ends with (T)-, this indicates that additional stack
frames remain to be displayed. For example:
149,06,00024 (T)-
You can display the remaining stack frames simply by pressing RETURN. This
executes a default command of the form
T & options
where options are the options you specified for the previous T command.
Executing this default command displays the next block of stack frames. You can
continue pressing RETURN until all stack frames have been displayed (the Debug
prompt no longer contains (T)-).
•This routine displays a stack frame of any type. The format depends upon the
information available, including the emulation mode, TNS P, and RISC pc address.
The output line holds this form:
addr pc Virtual frame ptr id
addr pc E L id
addr P E L id
where:
addr is the location of the source of the data (16 or 32 bits), or empty;
pc is the RISC pc (32 bits);
P is the TNS P (16 bits);
E is the TNS environment (stack-marker form, 16 bits);
L is the TNS L (16 bits);
id is the procedure name and offset if requested and available, or the code space
location.
The standard base is hexadecimal for 32-bit data and octal for 16-bit data.
•A stack trace may include both TNS/R native mode stack frames and TNS or
accelerated mode stack frames. If so, a blank line indicates each change of
execution mode.
•RISC stack frame addresses grow from larger to smaller addresses. TNS stack
frame addresses grow from smaller to larger addresses.
•When the N option is specified, Debug displays both the procedure name and the
offset into the procedure.
•The N option format does not work when you are debugging these processes:
•Monitor process.

Debug Commands
Debug Manual—421921-003
4-71
V Command
•A disk process whose object code resides on the disk being debugged,
typically $SYSTEM.
•The N option format always works for user processes and system input/output
processes (IOPs) other than those mentioned in the preceding list.
Examples
For examples that use the T command, see Appendix F, Sample Debug Sessions.
V Command
The V command enables you to access address spaces of other processes. The items
affected are the current code, current data, registers, and the Q segment. The Q
segment is the current selectable segment as viewed by Debug. The form of the V
command is:
expression-16
is the PIN of the desired process. If you omit expression-16, the current PIN
reverts to the one in use when the process entered Debug.
Particular V command values have meaning as follows:
V [ expression-16 ]
Vreturns to the current process’s values.
V -1 sets values as follows:
code = 5 (system code)
data = 1 (system global data)
Q = undefined
V pin sets values as follows:
code = pin’s code
data = pin’s data
Q = pin’s current in-use segment
registers = pin’s registers

Debug Commands
Debug Manual—421921-003
4-72
VQ Command
Considerations
•You can specify V only if you are debugging in privileged mode.
•If you use the V command to switch Debug’s view to another process, you cannot
then enter Inspect commands for that process; an attempt to do so produces an
error message.
Example
This example makes Debug’s current view the state of PIN 23 in processor 2 and then
sets a breakpoint in the process:
245,02,00033-V #23
245,02,00033-B 0x7000DE88
VQ Command
The VQ command changes the segment ID for the current selectable data segment (as
viewed by Debug). The form of the VQ command is:
expression-16
is the segment ID of the segment that is to be the current selectable data segment
(Q segment). If you omit expression-16, the current segment ID reverts to the
one in use when the process entered Debug.
Considerations
•The VQ command affects only the current segment ID as viewed during
debugging. It does not change the current segment ID seen by the program itself.
The segment ID seen by the program is the result of a previous call to either the
USESEGMENT or SEGMENT_USE_ procedure.
•If the specified segment ID is not allocated, an error occurs.
Example
106,01,00012-VQ 2
VQ [ expression-16 ]

Debug Commands
Debug Manual—421921-003
4-73
VQA Command
VQA Command
The VQA command sets the current selectable data segment to the specified absolute
segment number. The syntax of the VQA command is:
expression-16
is the specified segment ID of the segment that is to be the current selectable data
segment (Q segment). If you omit expression-16, the current segment ID
reverts to the one in use when the process entered Debug.
Considerations
•The VQA command affects only the current segment ID as viewed during
debugging. It does not change the current segment ID seen by the program itself.
•If the specified segment ID is not allocated, an error occurs.
Example
050,03,00266-vqa #1024
= Command
The = command computes and displays the value of an expression. This value can be
displayed in octal, decimal, hexadecimal, binary, ASCII, RISC instruction code, or TNS
instruction code.
The = command can also translate and display an expression as both forms of the
TNS environment ENV register: the hardware ENV register and the stack marker ENV
register.
The form of the = command is:
VQA [ expression-16 ]
= expression [ : [ A ] ]
[ B ]
[ D ]
[ E ]
[ H ]
[ N ]
[ O ]
[ R ]
[ T ]
[ # ]
[ % ]

Debug Commands
Debug Manual—421921-003
4-74
= Command
A, B, D, E, H, N, O, R, T, #, and %
specify the base in which Debug is to display the computed value
If you do not supply a base notation or do not reset the default numeric base with
the BASE command, Debug assumes octal.
Considerations
•When a 32-bit word expression is displayed with the = command, it is shown as
a 16-bit word value whenever possible; that is, the high-order word is dropped if it
is merely a sign extension (0 or 177777).
Examples
For more information on the examples that use the = command, see Appendix F,
Sample Debug Sessions.
Adenotes ASCII.
Bdenotes binary.
Ddenotes decimal.
Etranslates and displays expression as both the hardware ENV register
and the stack marker ENV register.
Hdenotes hexadecimal.
Ndenotes RISC instruction code.
Odenotes octal.
Rdenotes RISC instruction code.
Tdenotes TNS instruction code.
#denotes decimal.
%denotes octal.
Debug Commands
Debug Manual—421921-003
4-75
? Command
? Command
The ? command displays the following:
•The space identifier for the current code segment.
•Either the segment ID for the current selectable data segment that was brought
into use when the process being debugged called USESEGMENT or
SEGMENT_USE_, or the segment ID last specified by you in a Debug VQ
command.
The segment ID is in octal.
The VQ command does not change the process segment ID that resulted from the
process’s last call to USESEGMENT or SEGMENT_USE_. When the process
resumes execution, it uses this segment ID.
If no selectable data segment exists, the word NONE appears.
•The current specified base of input and output.
•The current home terminal.
•The current PRV setting.
The form of the ? command is:
Examples
254,03,00012-prv on
254,03,00012-?
BASE SEGMENTS: SYSTEM DATA = %000001
SYSTEM CODE = %000005
SYSTEM LIB = %020400
USER DATA = %020777
V PIN = 014 (#012)
USE SEGMENT ID = NONE
BASE STANDARD IN
BASE STANDARD OUT
TERM \RAMBLER.$ZTN00.#PTYRVSD
PRV = ON
?

Debug Manual—421921-003
A-1
AError Messages
This appendix lists the error messages that can occur when you enter a Debug
command.
1
Cause. The code breakpoint table is full. The new breakpoint cannot be entered.
Effect. The command is not executed.
Recovery. Clear an existing breakpoint to provide space in the table, then try again.
2
Cause. The command, as entered, has invalid syntax, or the command is allowed only
in privileged mode and the debugging session is in nonprivileged mode.
Effect. The command is not executed.
Recovery. Correct the command, and try again. For a privileged mode command, if
you are the super ID (255,255), enter the PRV command and try again.
3
Cause. An error occurred on an input-output request. The value of error-number is
the decimal number of the file-system error that occurred.
Effect. None.
Recovery. See the file-system errors in the Guardian Procedure Errors and Messages
Manual for corrective action. For example, the error “?14” (file-system error 14) reports
that a specified device does not exist on the particular system.
4
Cause. A breakpoint is already set at the specified location, or a memory-access
breakpoint is already set. The new breakpoint cannot be entered.
Effect. None.
Recovery. Informational message only; no corrective action is needed.
The breakpoint table is full.
Trace routine encountered a syntax error.
?error-number
Breakpoint already exists.

Error Messages
Debug Manual—421921-003
A-2
7
7
Cause. The PRV ON command must be executed in order to use a privileged
command.
Effect. The command is not executed.
Recovery. Enter the PRV ON command and try again.
8
Cause. The command attempts to set a breakpoint with a command string, but Debug
requires system buffer space that is not available.
Effect. The command is not executed.
Recovery. There is no corrective action possible for the entered command. If
possible, try to debug your process on a different processor. Otherwise, enter the
break (B) or break memory (BM) command without the command string.
9
Cause. The specified command requested Debug to convert a number that will
overflow 32 bits or to perform an arithmetic operation that will overflow the available
space.
Effect. The command is not executed.
Recovery. Correct the command so that no overflow occurs, and try again.
11
Cause. The trace (T) command encountered an error while attempting to analyze the
stack.
Effect. The command might or might not display some output information.
Recovery. Contact your service provider with all the necessary information to
reproduce the problem.
PRV ON is required to perform command.
Could not get memory to hold break information.
An arithmetic overflow occurred while computing the address.
FRAME number, number

Error Messages
Debug Manual—421921-003
A-3
13
13
Cause. An error occurred while attempting to display information pointed at by the
COMPADRS field of the breakpoint table. The reason is provided with the error
message, which can be one of the following:
Effect. Break information cannot be displayed.
Recovery. Try to fix the problem for the stated reason by clearing the breakpoint and
retrying the command. If retrying fails, contact your service provider with the
description of the problem.
14
Cause. The address was within the extended data segment or selectable segment,
but the address type was not being used in the process that is being debugged.
Effect. None.
Recovery. Check the program to make sure that it is using a data segment at this
point in the program. Also, check that you are debugging the correct program.
Internal error: Cannot access COMPADRS <reason>.
OK Occurs as an informational message only.
Bad PIN The specified PIN number is invalid.
Address not valid The specified address is invalid.
Unsupported The specified Debug version is not supported by the memory
manager.
KSEG1 address
given Address specified in KSEG1 form is not valid.
REGSAVE required REGSAVE is required to qualify the address for the specified
address.
Out of bounds Read or write went beyond the limits of the allocated
memory.
Illegal Access Read or write access is illegal.
Cannot Access An unrecoverable error occurred while attempting to access
memory.
Address is in a relative data segment, but the program or the VQ command is
not using the segment.

Error Messages
Debug Manual—421921-003
A-4
15
15
Cause. Internal error occurred indicating that Debug cannot decode 1-byte
instructions.
Effect. None.
Recovery. This error should not occur. If it does, contact your service provider with
the description of the problem.
16
Cause. The PIN that is being debugged has a higher priority than the memory
manager. The code that is needed to process the command might need to be swapped
into memory, which cannot be done under these conditions.
Effect. The command is not executed.
Recovery. Depending on the command being used, it might be necessary to display
the raw data and decode it on a different process or try the command on a different
process.
17
Cause. A string terminator was not specified. String can be 1, 2, 3, or 4 bytes long.
Effect. None.
Recovery. Make sure that the missing string terminator is specified and try again.
18
Cause. A matching closing parenthesis was not found.
Effect. The command is not executed.
Recovery. Enter a closing parenthesis and try again.
Internal error: Cannot decode 1-byte long instructions.
Page fault is not allowed for this PIN. Cannot execute command.
String terminator (‘) is missing.
Missing closing parenthesis.

Error Messages
Debug Manual—421921-003
A-5
19
19
Cause. The specified PIN is not valid. You did not specify the correct address, or the
PIN is in a different processor than where you are debugging.
Effect. The command is not executed.
Recovery. Verify that the PIN is in the processor where you are debugging, or make
sure that the address is correct.
20
Cause. The specified number was greater than what the command expected.
Effect. The command is not executed.
Recovery. Specify a value that can fit in a 16-bit word and try again.
21
Cause. Either an incorrect syntax was provided or the end of a command was
expected.
Effect. The command is not executed.
Recovery. Look over the syntax for the command in the help line and make sure that
you provide the correct syntax.
22
Cause. An attempt was made to specify an output device that is the same as the one
that is currently being used.
Effect. The command is not executed.
Recovery. Make sure that the specified output device is not the same as the terminal
device that is currently being used.
Invalid PIN.
Specified number is greater than 0xFFFF.
Incorrect syntax or end of command expected.
Internal error: current output device matches new output device.

Error Messages
Debug Manual—421921-003
A-6
23
23
Cause. The specified output device was invalid.
Effect. The command is not executed.
Recovery. Specify a valid output device and try again.
24
Cause. The name of the output device was not found, or the name was identified as a
disk device.
Effect. The command is not executed.
Recovery. Make sure that an output device is specified and that it is not a disk device.
25
Cause. A comma ( , ) needs to be specified after the space ID and before the offset.
Effect. The command is not executed.
Recovery. Specify the comma and try again.
26
Cause. The specified space ID is larger than the number of spaces available in the
code file. The code file has a maximum of 31 spaces (decimal).
Effect. The command is not executed.
Recovery. Check the number of code spaces in the listing of the code file. (The space
number is usually specified in octal.) Make sure that the number is not larger than what
is available for use.
Specified device name is invalid.
Output device is missing or output is directed to disk.
Comma (,) expected.
Space ID number is too large.

Error Messages
Debug Manual—421921-003
A-7
27
27
Cause. The given address requires a valid PIN.
Effect. The command is not executed.
Recovery. Make sure that the address relates to the correct PIN.
28
Cause. The specified SC address was not valid.
Effect. The command is not executed.
Recovery. Specify a valid SC address and try again.
29
Cause. The program is native, but the specified address is in TNS format.
Effect. The command is not executed.
Recovery. Specify the address for a native program and try again.
30
Cause. A form other than direct or indirect extended string was specified. The only
address forms for a native program are direct and indirect extended string.
Effect. The command is not executed.
Recovery. Check how address is used in the program. If the address is an extended
address, then only SX is allowed for a native program.
31
Cause. An unrecognized indirect address type was encountered.
Effect. The command is not executed.
Recovery. Contact your service provider with description of the encountered problem.
Address requires valid PIN.
SC address is invalid.
TNS-style segment specified for native program.
Only direct and SX allowed for native program.
Internal error: ADDRESS_CREATE_.

Error Messages
Debug Manual—421921-003
A-8
32
32
Cause. The program is not an accelerated program.
Effect. The command is not executed.
Recovery. Do not use the PMAP command unless the program is accelerated.
33
Cause. While attempting to execute the PMAP command, an address that was
beyond the end of the accelerated code was found. More information might have been
provided before this error occurred.
Effect. The command is not executed.
Recovery. Change the starting PMAP address or reduce the count value, and try
again.
34
Cause. Could not find the starting address of the TNS code in the accelerated
program.
Effect. The command is not executed.
Recovery. Check the specified address to the PMAP command.
35
Cause. Could not find the ending address of the TNS code in the accelerated
program.
Effect. The command either is not executed or it might be partially executed.
Recovery. The count value of the PMAP command might be beyond the end of the
code. Reduce the count value and try again.
Start of accelerated code location is not found.
End of accelerated code location is not found.
Start of TNS code location is not found.
End of TNS code location is not found.

Error Messages
Debug Manual—421921-003
A-9
36
36
Cause. An attempt to use a RISC code address to find a TNS address in the
accelerated program has failed, because the address does not point to a TNS code
location.
Effect. The command is not executed.
Recovery. Make sure that the address assigned to the PMAP command is valid and
try again.
37
Cause. The count value was not valid for the specified command.
Effect. The command is not executed.
Recovery. Check the specified count value and make sure that it does not exceed the
limit. Generally, the maximum count value is 3767 or 16383 (decimal) for most
commands.
38
Cause. The output base value for the DN command was invalid. You must specify one
of the following as an output base value: A, B, D, H, I, O, R, or T.
Effect. The command is not executed.
Recovery. Specify one of the listed output base values and try again.
39
Cause. The specified number, after the output base of the DN command, must be 1,
2, 3, or 4.
Effect. The command is not executed.
Recovery. Specify one of the option numbers and try again.
Start of TNS code location is invalid.
Invalid count.
Invalid output base.
Display size must be 1, 2, 3, or 4.

Error Messages
Debug Manual—421921-003
A-10
40
40
Cause. The space needed to display the information for the DN command was larger
than the space available.
Effect. The command is not executed.
Recovery. Contact your service provider with the description of the problem.
41
Cause. The PMAP command cannot be used on native code.
Effect. The command is not executed.
Recovery. Do not use the PMAP command on native code.
42
Cause. The LMAP command cannot be used on some processes. The code
necessary to process the command might need to be swapped.
Effect. The command is not executed.
Recovery. If the address is not in process where the code space is located, vector to
the correct PIN and then enter the command.
43
Cause. The LMAP command initialization failed for the given address.
Effect. The command is not executed.
Recovery. Check the address assigned to the LMAP command. If the address is not
valid, make sure that you specify a valid address. If the address is valid, contact your
service provider.
Internal error: DUMP_NATIVE_COMMAND.
PMAP address is not TNS or accelerated code.
Address and PIN combination is invalid.
LMAP command initialization failed.

Error Messages
Debug Manual—421921-003
A-11
44
44
Cause. The HIST_FORMAT_ function returned an internal error when the LMAP
command was used.
Effect. The command either might not be executed or it might be partially executed.
Recovery. Check the address assigned to the LMAP command. If the address is not
valid, make sure that you specify a valid address. If the address is valid, contact your
service provider.
45
Cause. Debug encountered an error when attempting to turn off the privileged mode.
Effect. The command is not executed.
Recovery. Check the PRV setting with the? command; it might already be set to OFF.
46
Cause. Debug was not able to turn on the privileged mode. You must be the super ID
(255, 255) in order to use the privileged mode.
Effect. The command is not executed.
Recovery. If you are a privileged user, log on the system as the super ID (255,255)
and try the PRV ON command again.
47
Cause. One of the possible values was not specified.
Effect. The command is not executed.
Recovery. Specify one of the values listed in the message text and try again.
Internal error: HIST_FORMAT_ error:error-number.
Unsuccessful turning OFF of PRV.
Unsuccessful turning ON of PRV.
Expecting one of the following: =, <>, <, >, or ?.

Error Messages
Debug Manual—421921-003
A-12
48
48
Cause. Debug could not access memory. See error message 13 for the list of
reasons.
Effect. The command is not executed.
Recovery. Check the address in the specified command to make sure that it is valid.
Make sure that the PIN still exists.
49
Cause. The FN command stops every time it reaches a byte address where the low-
order 17 bits are zero.
Effect. The command stops searching.
Recovery. To continue the search in the next unitary segment, enter the FN command
with the given 32-bit address.
50
Cause. The FN command stopped searching at the indicated address for the given
reason (see error message 13 for the list of reasons). This error normally occurs when
the end of the allocated memory is reached.
Effect. The executed command cannot go beyond the indicated address.
Recovery. Specify new values for the FN command or enter some other Debug
command that you want.
51
Cause. The FNL command stops every time it reaches a byte address where the low-
order 17 bits are zero.
Effect. The command stops searching.
Recovery. To continue the search in the next unitary segment, specify the FNL
command with the given 32-bit address.
Error accessing memory: reason.
FN reached address boundry. To continue, enter the following address:
address.
FN stopped searching at the following address: address, reason.
FNL reached address boundry. To continue, enter the following address:
address.

Error Messages
Debug Manual—421921-003
A-13
52
52
Cause. The FNL command stopped searching at the indicated address for the given
reason (see error message 13 for the list of reasons). This normally occurs when the
end of the allocated memory for the program is reached.
Effect. The executed command cannot go beyond the indicated address.
Recovery. Specify new values for the FNL command or enter some other Debug
command that you want.
53
Cause. The specified absolute-segment number for the VQA command was larger
than the number of absolute segments.
Effect. The command is not executed.
Recovery. Make sure that the specified absolute-segment number is within the range
of the VQA command.
54
Cause. The specified absolute-segment number for the VQA command cannot be
used.
Effect. The command is not executed.
Recovery. Contact your service provider with the description of the problem.
55
Cause. The VQ command cannot restore the original segment that was being used by
the program.
Effect. The command might or might not be executed.
Recovery. Check the current user segment syntax with the ? command. If you had not
specified the correct value, specify a correct value for the user segment and try again.
If the user segment value you specified is correct, contact your service provider with
the description of the problem.
FNL stopped searching at the following address: address, reason.
Absolute-segment number is too large.
Cannot use absolute-segment number.
Cannot restore user segment.

Error Messages
Debug Manual—421921-003
A-14
56
56
Cause. The VQ command attempted to restore the current segment indicated in the
PCB of the vectored PIN, but the attempt failed.
Effect. The command might or might not be executed.
Recovery. Check the current user segment syntax with the ? command. If you had not
specified the correct value, specify a correct value for the user segment and try again.
If the user segment value you specified is correct, contact your service provider with
the description of the problem.
57
Cause. The specified segment number in the VQ command was greater than the last
valid segment ID, or the specified segment ID is accessible only through privileged
mode.
Effect. The command is not executed.
Recovery. Make sure that the segment number you specified is not greater than the
segment ID. If the segment number is correctly specified, then make sure that you are
in privileged mode.
58
Cause. The VQ command could not access the segment number.
Effect. The command is not executed.
Recovery. Make sure that the specified segment number has been allocated by the
program.
59
Cause. The F command did not find a valid process file segment (PFS).
Effect. The command is not executed.
Recovery. The process might not have PFS allocated for the current PIN at this point
of process startup. This error can also indicate that Debug or some other part of the
operating system has a problem. If this problem persists, contact your service provider.
Cannot restore current segment in vectored PIN.
Segment number is invalid or requires PRV ON.
Cannot use segment.
Invalid PFS.

Error Messages
Debug Manual—421921-003
A-15
60
60
Cause. You did not indicate whether a memory-access breakpoint was a READ,
READ-WRITE, WRITE, or change (C) breakpoint.
Effect. The command is not executed.
Recovery. Specify one of the valid memory access types listed in the message text
and retry the command.
61
Cause. The memory manager indicated that the specified address is not a code
location.
Effect. The command is not executed.
Recovery. Make sure that specified address is in the code space (verify the address
with the AMAP command, if necessary).
62
Cause. Either command strings are not allowed or one had been specified previously.
Effect. The command is not executed.
Recovery. Do not use command strings when the change (C) access type is specified
with the BM command.
63
Cause. You specified a combination of options for the BM command that is not
allowed.
Effect. The command is not executed.
Recovery. Do not use conditions or trace breakpoint when the C access type is
specified with the BM command.
Invalid MAB access type. Expecting R, RW, W, or C.
Address is not in code location.
Command string is not allowed or was specified previously.
Condition or trace breakpoint is not allowed.

Error Messages
Debug Manual—421921-003
A-16
64
64
Cause. An extended address was specified for the trace or condition clause on a
breakpoint. The IX, IG, and I options cannot be used with an extended address.
Effect. The command is not executed.
Recovery. If an extended address must be used, use SX to allow indexing.
65
Cause. When attempting to set a memory access breakpoint (MAB), the page was not
found, and a page fault is not allowed on a process.
Effect. None.
Recovery. Use the C command to clear the MAB, if necessary. Make sure that the
memory manager has sufficiently high priority. Check the code to see if code
breakpoint can be set instead of MAB.
66
Cause. An attempted was made to set a TNS breakpoint in an accelerated program. A
TNS breakpoint can be set only at a memory-exact or a register-exact point.
Effect. The command is not executed.
Recovery. Use the PMAP command to find the appropriate TNS locations or set
breakpoint in the accelerated RISC code.
67
Cause. An attempt was made to clear a memory-access breakpoint using the C
command.
Effect. The command is not executed.
Recovery. Use the CM command to clear the MAB.
IX, IG, and I are not allowed for extended address.
Memory is absent and page fault is not allowed.
Cannot set TNS breakpoint at this location because there is no corresponding
RISC breakpoint. Use the PMAP command to find matching RISC location near
this TNS location.
CM command required to clear MAB.

Error Messages
Debug Manual—421921-003
A-17
68
68
Cause. An attempt was made to clear a breakpoint using the C command, but no
code address was specified. The C command without an address can be used only if
the current program location is at a breakpoint.
Effect. The command is not executed.
Recovery. Specify an address to the C command, or use some other option available
in the C command syntax.
69
Cause. The specified address to the C command could not be found in the breakpoint
table.
Effect. The command is not executed.
Recovery. Use the B or B* command to see the contents of the breakpoint table.
70
Cause. The specified output base was not acceptable for the indicated command. The
acceptable base set for the equal (=) command are as follows: A, B, H, E, N, O, R, T,
#, and %. Other commands have more restricted sets. For more information on the
description of the Debug commands, see Debug Commands on page 4-1.
Effect. The command is not executed.
Recovery. Specify the appropriate base and try again.
71
Cause. The specified value for the = command did not fit into 16 bits. Converting a
value to E register requires the value to fit in 16 bits.
Effect. The command is not executed.
Recovery. Make sure that the value that you specified fits into 16 bits.
Need code address to find and clear breakpoint.
Breakpoint matching address not found.
Invalid conversion base.
Base E not allowed when value cannot be stored in 16-bits.

Error Messages
Debug Manual—421921-003
A-18
72
72
Cause. Multiple commas were found. The syntax is meaningless.
Effect. The specified command is not executed.
Recovery. Fix the syntax and try again.
73
Cause. The display-format was specified more than once, or the specified syntax was
invalid.
Effect. The command is not executed.
Recovery. Fix the command and try again.
74
Cause. A valid display-format value was not specified.
Effect. The command is not executed.
Recovery. Specify one of the valid display-format values listed in the message text
and try again.
75
Cause. Either more than one count value was specified or the syntax was invalid.
Effect. The command is not executed.
Recovery. Check the syntax, and make the necessary corrections and try again.
Multiple commas (,,) found.
Multiple display-format found or syntax is invalid.
Expected display-format of B, B1, B2, B4, C, S, or L.
Count value appears more than once or syntax is invalid.

Error Messages
Debug Manual—421921-003
A-19
76
76
Cause. One of the possible base values was not specified.
Effect. The command is not executed.
Recovery. Specify one of the possible output base values listed in the message text
and try again.
77
Cause. One of the specified values (T, N, or R) was not specified.
Effect. The command is not executed.
Recovery. To override the I command’s base value, specify T for TNS instructions,
and N or R for RISC instructions.
78
Cause. The specified signal name did not match any of the known signals.
Effect. The command is not executed.
Recovery. Check the signal names that are available using the IH command without
parameters.
79
Cause. The attempt to access information about the signal failed.
Effect. The command is not executed.
Recovery. Check the syntax of the command that you are using. If the syntax is
correctly specified, contact your service provider with the description of the problem.
Expected %, #, D, H, or O.
Expected T, N, or R.
Invalid signal name.
Attempt to get signal information failed.

Error Messages
Debug Manual—421921-003
A-20
80
80
Cause. One of the expected options was not specified when using the MH command.
Effect. The command is not executed.
Recovery. Make sure that one of the options in the message text is specified and try
again.
81
Cause. An attempt to modify signal information failed.
Effect. The command is not executed.
Recovery. Check the syntax to make sure that it is correct. Also, make sure that the
PIN is correct. If this error persists, contact your service provider.
82
Cause. You attempted to modify registers while vectored to another process.
Effect. The command is not executed.
Recovery. You must be debugging the same PIN you started with in order to change
register values. See the #DEBUGPROCESS command in the TACL Reference Manual
to start debugging a process that is already active.
83
Cause. The specified space ID was out of range. Space IDs are limited to the range 0
through 31(decimal).
Effect. The command is not executed.
Recovery. Check the number you specified. Specify the numeric prefix (%, #, or 0X),
if necessary.
Expected SIG_DFL, SIG_ABORT, SIG_DEBUG, or SIG_IGN.
Attempt to modify signal information failed.
Cannot change another process’s registers.
Space ID must be 0 through 31 (decimal).

Error Messages
Debug Manual—421921-003
A-21
84
84
Cause. You attempted to modify an address location that might be a code location or
the address might not be resident.
Effect. The command is not executed.
Recovery. If you want to modify this address, you must debug the process directly,
not vector to it. See the #DEBUGPROCESS command in the TACL Reference Manual
to start debugging a process directly. You can get more information about the address
with the AMAP command.
85
Cause. You specified a command that was either invalid or required privileged mode.
Effect. The command is not executed.
Recovery. If you know the command you specified is valid, check to see if it is a
privileged command. If it is a privileged command, first issue the PRV ON command,
then specify the command you want to use. You must be the super ID (255,255) in
order to access the privileged commands.
86
Cause. An attempt to create an address for a selectable segment was made, but there
is no selectable segment in use.
Effect. The command is not executed.
Recovery. The program must allocate a selectable segment before attempting to
create an address for it.
87
Cause. The attempt to set a TNS register on a native program failed.
Effect. The command is not executed.
Recovery. Make sure that your are specifying the correct register name for the
program type.
Cannot modify V PIN memory.
Command is either invalid or requires PRV ON.
Attempting to create an address for selectable segment when no selectable
segments are in use.
TNS or accelerated program required.

Error Messages
Debug Manual—421921-003
A-22
88
88
Cause. The specified code segment number was out of range.
Effect. The command is not executed.
Recovery. Make sure that you specify a segment number that is within the range.
89
Cause. An internal error occurred for a native program.
Effect. The command is not executed.
Recovery. Contact your service provider with the description of the encountered
problem.
90
Cause. An unknown emulation mode error occurred.
Effect. The command is not executed.
Recovery. Contact your service provider with the description of the encountered
problem.
91
Cause. The PMAP command encountered an error indicating that the starting value
for the TNS address was zero.
Effect. The command might be partially executed.
Recovery. Make sure that the specified address is correct and try again.
Code segment number is out of range.
Internal error: CHANGE_T16R.
Internal error: CHANGE_T9.
TNS starting address is zero.

Error Messages
Debug Manual—421921-003
A-23
92
92
Cause. The PMAP command encountered an error indicating that ending-value of the
TNS address was zero.
Effect. The command might be partially executed.
Recovery. Make sure that the address and the length specified for the PMAP
command are correct.
93
Cause. You attempted to use an Inspect command while vectored to another PIN.
Effect. None.
Recovery. If you want to use Inspect commands, you must vector back to the PIN
where you started from by entering the V command with no parameters.
94
Cause. The attempt to switch to the Inspect debugger failed.
Effect. None.
Recovery. Make sure that DMON is running in the processor where you are working.
95
Cause. The BASE command indicated that the user did not specify one of the
expected options (standard, octal, decimal, hexadecimal, S, O, D, or H).
Effect. The specified command is not executed.
Recovery. Specify one of the given options and try again.
TNS ending address is zero.
Cannot access Inspect while vectored to another PIN.
Attempt to switch to Inspect failed.
Expecting: standard, octal, decimal, hexadecimal, S, O, D, or H.

Error Messages
Debug Manual—421921-003
A-24
96
96
Cause. The BASE command asked whether the specified base was for an input or for
an output.
Effect. The specified command is not executed.
Recovery. Indicate whether the base is an input or an output.
97
Cause. The DJ command encountered an error while attempting to process the
information in the jump buffer that is pointed to by the specified address.
Effect. The specified command is not performed.
Recovery. Specify an appropriate address and try again.
98
Cause. The specified TNS address for the BREAK command pointed to word 0 or
word 1 of the procedure entry table.
Effect. The command is not executed.
Recovery. Make sure that you have specified the correct address for the break (B)
command.
99
Cause. You attempted to use the OSP option, which is not available on this version of
Debug.
Effect. The command is not executed.
Recovery. Try the command without the OSP option.
Expecting: In, Out, I, or O.
Bad information in jump buffer.
TNS address pointed to PEP area.
OSP is not a supported option.

Error Messages
Debug Manual—421921-003
A-25
100
100
Cause. The command referenced a floating-point register, but either the PIN does not
use IEEE floating-point instructions or an IEEE floating-point instruction is not executed
at this point in the program.
Effect. The command is not executed.
Recovery. If you think the program at this PIN uses IEEE floating-point instructions,
you might need to delay the command until an IEEE floating-point instruction is
executed and the IEEE floating-point usage flag is enabled in the program control
block (PCB).
101
Cause. An IEEE floating-point register was referenced in the specified command
syntax. Unlike the general purpose registers $00 through $31, IEEE floating-point
register values cannot be used in the syntax of some commands, because Debug can
handle only 32-bit integer expressions and it cannot determine if the specified IEEE
floating-point register is used as a 32-bit integer.
Effect. The command is not executed.
Recovery. If you need the contents of the IEEE floating-point registers, first display
the value of the register and then use this value with the command syntax. Note that
the register value must be an integer that can be expressed in 32-bit form.
102
Cause. The command tried to set a Memory Access Breakpoint at a location where a
code breakpoint either exists in same process or in all processes in same processor.
Effect. The command is not executed.
Recovery. Try the command after removing the existing code breakpoint at the same
location.
PIN does not use IEEE floating point.
IEEE floating-point registers cannot be used here.
Cannot set the Memory Access Breakpoint at this address as a code breakpoint
already exists at given location.
Error Messages
Debug Manual—421921-003
A-26
103
103
Cause. The command tried to set a code breakpoint at a location where a Memory
Access Breakpoint either exists in same process or in all processes in same processor.
Effect. The command is not executed.
Recovery. Try the command after removing the existing Memory Access Breakpoint
at the same location.
104
Cause. The command tried to set an all process Memory Access Breakpoint at a
location where a code breakpoint either exists in same process or in all processes in
same processor.
Effect. The command is not executed.
Recovery. Try the command after removing the existing code breakpoint at the same
location.
105
Cause. The command tried to set an all process code breakpoint at a location where a
Memory Access Breakpoint either exists in same process or in all processes in same
processor.
Effect. The command is not executed.
Recovery. Try the command after removing the existing Memory Access Breakpoint
at the same location.
Cannot set the code breakpoint at this address as Memory Access Breakpoint
already exists at given location.
Cannot set the Memory Access Breakpoint in all processes at this address as a
code breakpoint already exists at given location.
Cannot set the code breakpoint in all processes at this address as Memory
Access Breakpoint already exists at given location.

Debug Manual—421921-003
B-1
BASCII Character Set
Char Octal Hex Dec Meaning Ordinal
Left Right
NUL 000000 000000 0 0 Null 1
SOH 000400 000001 1 1 Start of heading 2
STX 001000 000002 2 2 Start of text 3
ETX 001400 000003 3 3 End of text 4
EOT 002000 000004 4 4 End of transmission 5
ENQ 002400 000005 5 5 Enquiry 6
ACK 003000 000006 6 6 Acknowledge 7
BEL 003400 000007 7 7 Bell 8
BS 004000 000010 8 8 Backspace 9
HT 004400 000011 9 9 Horizontal tabulation 10
LF 005000 000012 A 10 Line feed 11
VT 005400 000013 B 11 Vertical tabulation 12
FF 006000 000014 C 12 Form feed 13
CR 006400 000015 D 13 Carriage return 14
SO 007000 000016 E 14 Shift out 15
SI 007400 000017 F 15 Shift in 16
DLE 010000 000020 10 16 Data link escape 17
DC1 010400 000021 11 17 Device control 1 18
DC2 011000 000022 12 18 Device control 2 19
DC3 011400 000023 13 19 Device control 3 20
DC4 012000 000024 14 20 Device control 4 21
NAK 012400 000025 15 21 Negative acknowledge 22
SYN 013000 000026 16 22 Synchronous idle 23
ETB 013400 000027 17 23 End of transmission block 24
CAN 014000 000030 18 24 Cancel 25
EM 014400 000031 19 25 End of medium 26
SUB 015000 000032 1A 26 Substitute 27
ESC 015400 000033 1B 27 Escape 28
FS 016000 000034 1C 28 File separator 29
GS 016400 000035 1D 29 Group separator 30
RS 017000 000036 1E 30 Record separator 31
US 017400 000037 1F 31 Unit separator 32
ASCII Character Set
Debug Manual—421921-003
B-2
SP 020000 000040 20 32 Space 33
! 020400 000041 21 33 Exclamation point 34
" 021000 000042 22 34 Quotation mark 35
# 021400 000043 23 35 Number sign 36
$ 022000 000044 24 36 Dollar sign 37
% 022400 000045 25 37 Percent sign 38
& 023000 000046 26 38 Ampersand 39
' 023400 000047 27 39 Apostrophe 40
( 024000 000050 28 40 Opening parenthesis 41
) 024400 000051 29 41 Closing parenthesis 42
* 025000 000052 2A 42 Asterisk 43
+ 025400 000053 2B 43 Plus 44
, 026000 000054 2C 44 Comma 45
- 026400 000055 2D 45 Hyphen (minus) 46
. 027000 000056 2E 46 Period (decimal point) 47
/ 027400 000057 2F 47 Right slash 48
0 030000 000060 30 48 Zero 49
1 030400 000061 31 49 One 50
2 031000 000062 32 50 Two 51
3 031400 000063 33 51 Three 52
4 032000 000064 34 52 Four 53
5 032400 000065 35 53 Five 54
6 033000 000066 36 54 Six 55
7 033400 000067 37 55 Seven 56
8 034000 000070 38 56 Eight 57
9 034400 000071 39 57 Nine 58
: 035000 000072 3A 58 Colon 59
; 035400 000073 3B 59 Semicolon 60
< 036000 000074 3C 60 Less than 61
= 036400 000075 3D 61 Equals 62
> 037000 000076 3E 62 Greater than 63
? 037400 000077 3F 63 Question mark 64
@ 040000 000100 40 64 Commercial at sign 65
A 040400 000101 41 65 Uppercase A 66
B 041000 000102 42 66 Uppercase B 67
Char Octal Hex Dec Meaning Ordinal
Left Right
ASCII Character Set
Debug Manual—421921-003
B-3
C 041400 000103 43 67 Uppercase C 68
D 042000 000104 44 68 Uppercase D 69
E 042400 000105 45 69 Uppercase E 70
F 043000 000106 46 70 Uppercase F 71
G 043400 000107 47 71 Uppercase G 72
H 044000 000110 48 72 Uppercase H 73
I 044400 000111 49 73 Uppercase I 74
J 045000 000112 4A 74 Uppercase J 75
K 045400 000113 4B 75 Uppercase K 76
L 046000 000114 4C 76 Uppercase L 77
M 046400 000115 4D 77 Uppercase M 78
N 047000 000116 4E 78 Uppercase N 79
O 047400 000117 4F 79 Uppercase O 80
P 050000 000120 50 80 Uppercase P 81
Q 050400 000121 51 81 Uppercase Q 82
R 051000 000122 52 82 Uppercase R 83
S 051400 000123 53 83 Uppercase S 84
T 052000 000124 54 84 Uppercase T 85
U 052400 000125 55 85 Uppercase U 86
V 053000 000126 56 86 Uppercase V 87
W 053400 000127 57 87 Uppercase W 88
X 054000 000130 58 88 Uppercase X 89
Y 054400 000131 59 89 Uppercase Y 90
Z 055000 000132 5A 90 Uppercase Z 91
[ 055400 000133 5B 91 Opening bracket 92
\ 056000 000134 5C 92 Back slash 93
] 056400 000135 5D 93 Closing bracket 94
^ 057000 000136 5E 94 Circumflex 95
_ 057400 000137 5F 95 Underscore 96
` 060000 000140 60 96 Grave accent 97
a 060400 000141 61 97 Lowercase a 98
b 061000 000142 62 98 Lowercase b 99
c 061400 000143 63 99 Lowercase c 100
d 062000 000144 64 100 Lowercase d 101
e 062400 000145 65 101 Lowercase e 102
Char Octal Hex Dec Meaning Ordinal
Left Right
ASCII Character Set
Debug Manual—421921-003
B-4
f 063000 000146 66 102 Lowercase f 103
g 063400 000147 67 103 Lowercase g 104
h 064000 000150 68 104 Lowercase h 105
i 064400 000151 69 105 Lowercase i 106
j 065000 000152 6A 106 Lowercase j 107
k 065400 000153 6B 107 Lowercase k 108
l 066000 000154 6C 108 Lowercase l 109
m 066400 000155 6D 109 Lowercase m 110
n 067000 000156 6E 110 Lowercase n 111
o 067400 000157 6F 111 Lowercase o 112
p 070000 000160 70 112 Lowercase p 113
q 070400 000161 71 113 Lowercase q 114
r 071000 000162 72 114 Lowercase r 115
s 071400 000163 73 115 Lowercase s 116
t 072000 000164 74 116 Lowercase t 117
u 072400 000165 75 117 Lowercase u 118
v 073000 000166 76 118 Lowercase v 119
w 073400 000167 77 119 Lowercase w 120
x 074000 000170 78 120 Lowercase x 121
y 074400 000171 79 121 Lowercase y 122
z 075000 000172 7A 122 Lowercase z 123
{ 075400 000173 7B 123 Opening brace 124
| 076000 000174 7C 124 Vertical line 125
} 076400 000175 7D 125 Closing brace 126
~ 077000 000176 7E 126 Tilde 127
DEL 077400 000177 7F 127 Delete 128
Char Octal Hex Dec Meaning Ordinal
Left Right
Debug Manual—421921-003
C-1
CCommand Syntax Summary
Register Syntax
The register parameter can be either a TNS/R register or a TNS environment
register. A TNS/R register has one of these formats:
{ $00| $01 | ... | $31 }
{ $HI | $LO }
{ $PC }
{ $F00| $F01 | ... | $F31 }
{ $FCR31 }
Alias names are also valid for registers $01 through $31and $F00 through $F09 as
follows:
register
Register Alias Register Alias
$00
$01 $AT $16 $S0
$02 $V0 $17 $S1
$03 $V1 $18 $S2
$04 $A0 $19 $S3
$05 $A1 $20 $S4
$06 $A2 $21 $S5
$07 $A3 $22 $S6
$08 $T0 $23 $S7
$09 $T1 $24 $T8
$10 $T2 $25 $T9
$11 $T3 $26 $K0
$12 $T4 $27 $K1
$13 $T5 $28 $GP
$14 $T6 $29 $SP
$15 $T7 $30 $S8 or $FP
$31 $RA
$F00 $F0 $F05 $F5
$F01 $F1 $F06 $F6
$F02 $F2 $F07 $F7
$F03 $F3 $F08 $F8
$F04 $F4 $F09 $F9
Command Syntax Summary
Debug Manual—421921-003
C-2
Expression Syntax
A TNS environment register has one of these formats:
{ S | P | E | L | SP }
{ R0 | R1 | ... | R7 }
{ RA | RB | ... | RH }
Expression Syntax
The term parameters is of the form:
value [ op value ]...
The value parameter has one of these forms:
( expression )
'c1[c2[c3[c4]]]’
PCB expression ! privileged mode only
number[.number]
K [ X | D ] address
The number parameter has one of these two forms:
[ + | - | % | # | %H | 0X ] integer
register
The value of op is one of these arithmetic operators:
*
/
<<
>>
Address Syntax
The TNS-style address has this format:
The address-mode parameter has one of these values:
UC[.segment-num, ]
UL[.segment-num, ]
SC[.segment-num, ] ! privileged mode only
SL[.segment-num, ] ! privileged mode only
UD[,]
C
L
S
term [ { + } term ]...
{ - }
[ 32-bit-address ] | [ TNS-style ] | [ Q-mode ] | [ N-mode ]
[ address-mode ] offset [ indirection-type [ index ] ]
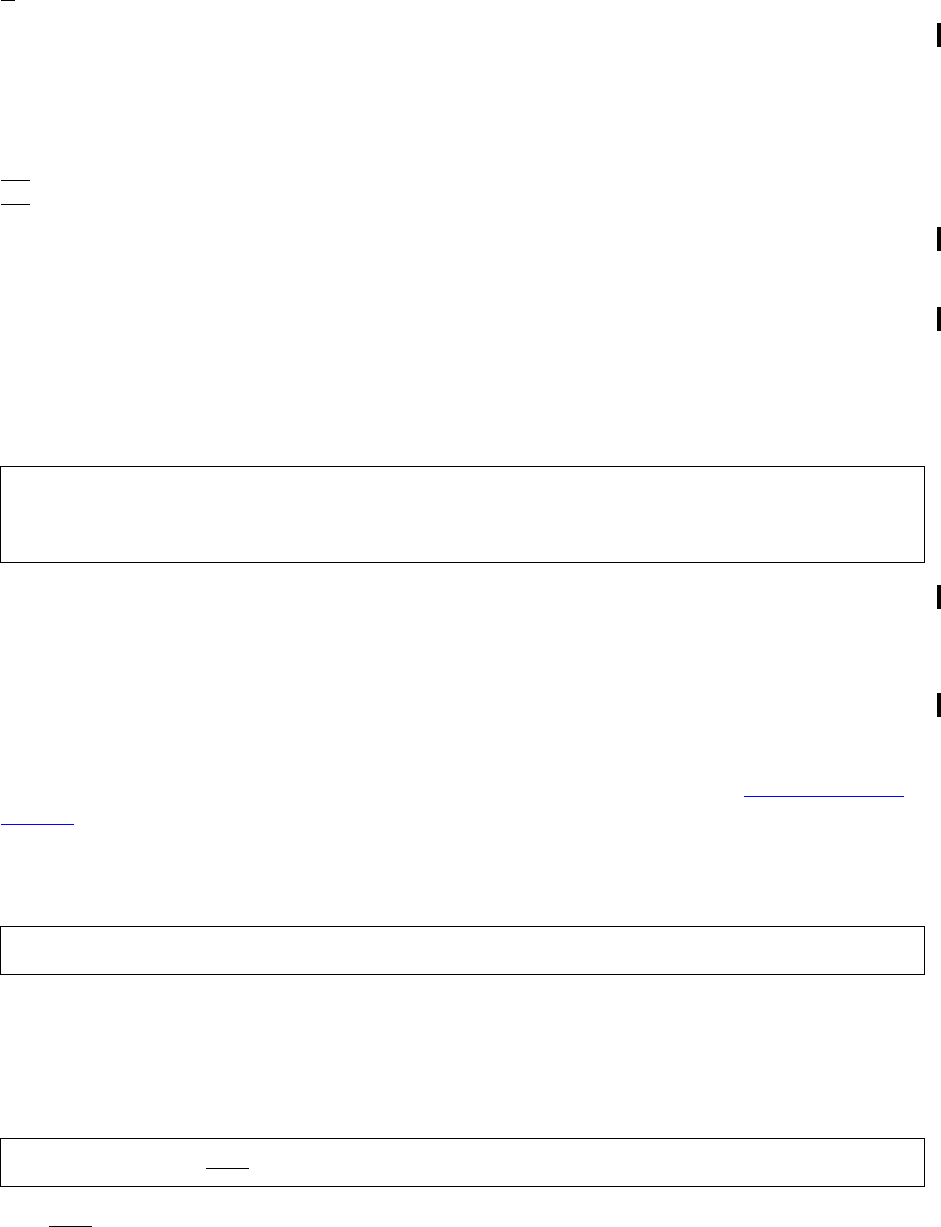
Command Syntax Summary
Debug Manual—421921-003
C-3
A Command
Q
G ! privileged mode only
The indirection-type parameter has one of these values:
I
S
IX
SX
IG ! privileged mode only
SG ! privileged mode only
The Q-mode address has these format:
offset [indirection-type ]
The N-mode address has this format:
N
A Command
The length parameter has one of these two forms:
count
T entry-size * num-entries
The data-display-format parameter has this format:
{ B | B1 | C | B2 | S | B4 | L }
The output-dev parameter is described later in this appendix under Output-Device
Syntax.
AMAP Command
B Command
Set Unconditional Code Breakpoint
The ALL option is allowed only in privileged mode.
A address [ , length ] [ , data-display-format ]
[ , [ OUT ] output-dev ]
AMAP address
B address [, ALL ]

Command Syntax Summary
Debug Manual—421921-003
C-4
Set Conditional Code Breakpoint
Set Conditional Code Breakpoint
op is:
{ < | > | = | <> }
The ALL option is allowed only in privileged mode.
Set Trace Code Breakpoint
The ALL option is allowed only in privileged mode.
Set Execute Code Breakpoint
The ALL option is allowed only in privileged mode.
Display Breakpoints
BASE Command
B address
{, {register |start-address }[& mask] op constant [, ALL] }
{ [, ALL] , {register |start-address }[& mask] op constant }
B address {, {register |start-address } ? count [, ALL ] }
{ [ , ALL ] {register |start-address }? count }
B address {, ( command-string ) [, ALL ] }
{ [, ALL ] ( command-string ) }
B [ * ]
BASE [ STANDARD | S ] [ IN | I ]
[ OCTAL | O ] [ OUT | O ]
[ DECIMAL | D ]
[ HEXADECIMAL | H ]

Command Syntax Summary
Debug Manual—421921-003
C-5
BM Command
BM Command
Set Unconditional Memory-Access Breakpoint
access is:
R
RW
WR
W
C
The ALL option is allowed only in privileged mode.
Set Conditional Memory-Access Breakpoint
The value of access is one of the following:
R
RW
WR
W
The op parameter has this format:
{ < | > | = | <> }
The ALL option is allowed only in privileged mode.
Set Trace Memory-Access Breakpoint
The value of access is one of the following:
R
RW
WR
W
The ALL option is allowed only in privileged mode.
BM address , access [, ALL ]
BM address , access
{, {register | start-address }[& mask] op constant [, ALL ]}
{ [, ALL ] {register | start-address }[& mask] op constant }
BM address , access
{, {register | start-address } ? count [, ALL ] }
{ [, ALL ] {register | start-address } ? count }

Command Syntax Summary
Debug Manual—421921-003
C-6
Set Execute Memory-Access Breakpoint
Set Execute Memory-Access Breakpoint
The value of access is one of the following:
R
RW
WR
W
The ALL option is allowed only in privileged mode.
C Command
CM Command
D Command
Display Variables
The length parameter has one of these two formats:
count
T entry-size * num-entries
The data-display-format parameter has this format:
{ B | B1 | C | B2 | S | B4 | L }
The output-dev parameter is described later in this appendix under Output-Device
Syntax on page C-9.
d-base has this format:
{ % | # | D | H | O }
BM address , access
{, ( command-string ) [, ALL ] }
{ [, ALL ] ( command-string ) }
C [ address ]
[ * | 0 ]
[ -1 ]
CM [ , ALL ]
D address [ , length ] [ , data-display-format ]
[ , [ OUT ] output-dev ] [ : d-base ]
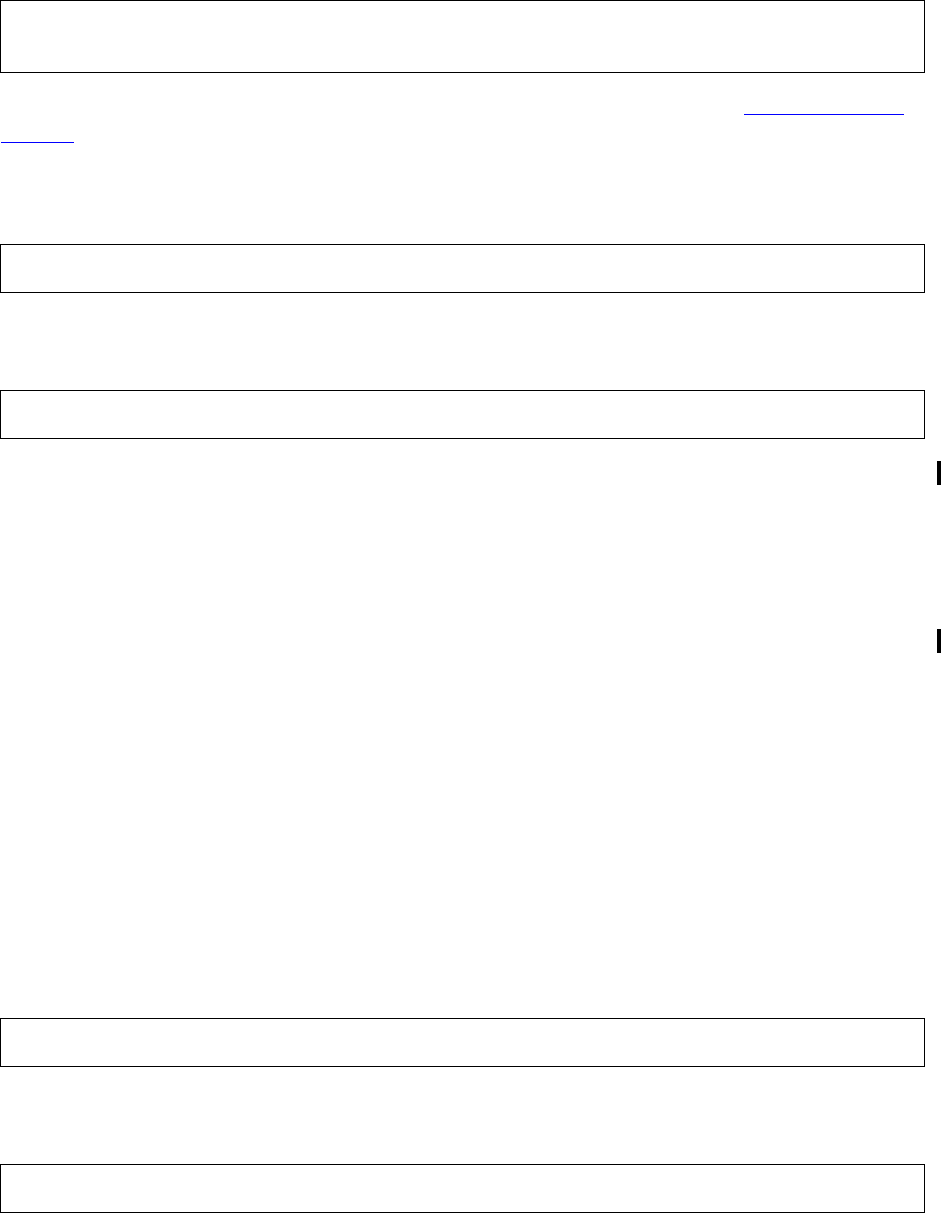
Command Syntax Summary
Debug Manual—421921-003
C-7
Display Register Contents
Display Register Contents
The output-dev parameter is described later in this appendix under Output-Device
Syntax on page C-9.
DJ Command
DN Command
The count-format parameter has this format:
{ FOR | , } count [ count-size ] [ BY columns ]
The value of count-size is one of the following:
{ B1 | B2 | B3 | B4 }
The display-format parameter has this format:
{ IN | : } [ S | U ] display-type [ display-size ]
The value of display-type is one of the following:
{ A }
{ I }
{ T }
{ B | %B }
{ O | %O | % }
{ D | %D | # }
{ H | %H | X }
EX[IT] Command
F[ILES] Command
D [ register ] [ , [ OUT ] output-dev ]
[ * ]
DJ 32-bit-address
DN 32-bit-address [ count-format ] [ display-format ]
EX[IT]
F[ILES] [ file-number ]
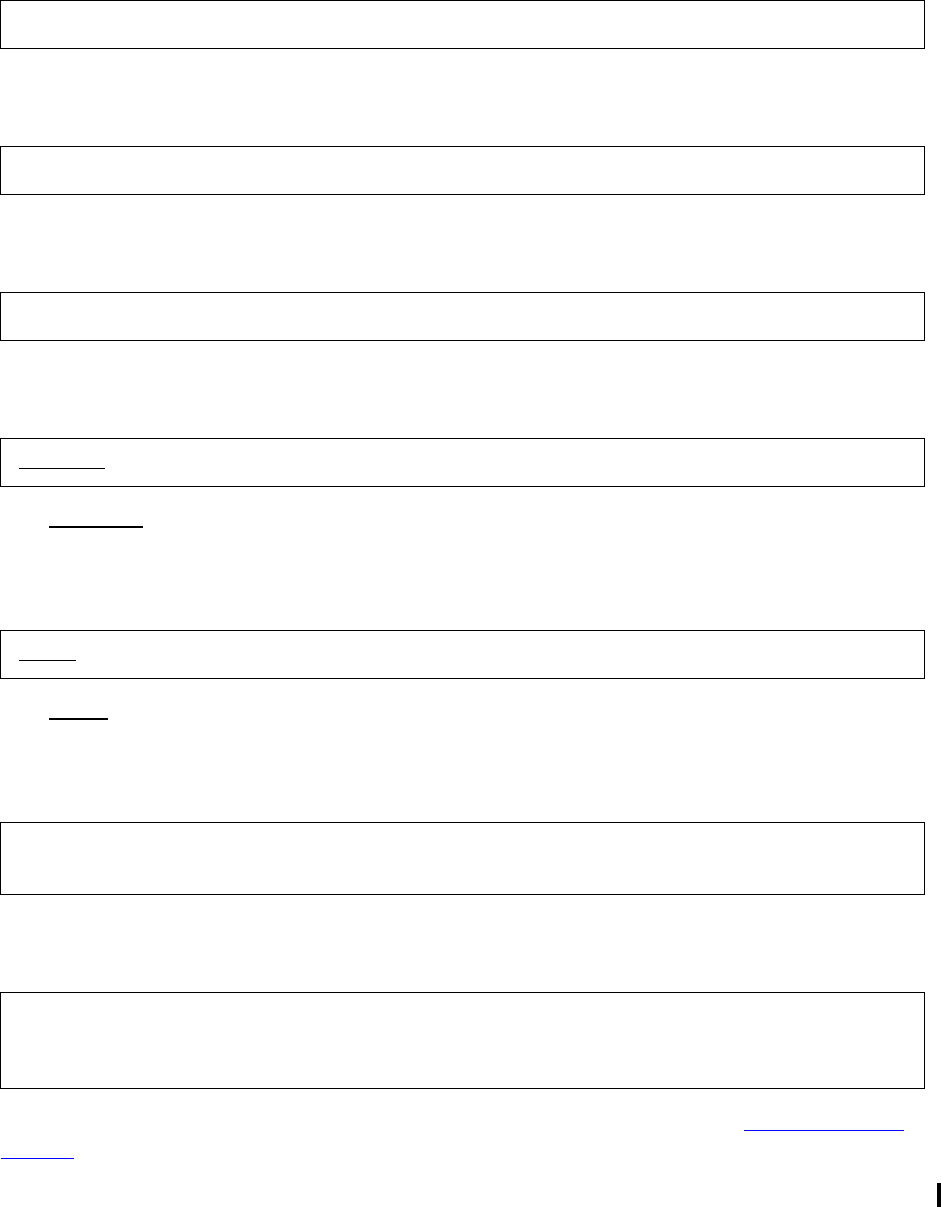
Command Syntax Summary
Debug Manual—421921-003
C-8
FC Command
FC Command
FN Command
FNL Command
FREEZE Command
The FREEZE command is allowed only in privileged mode.
HALT Command
The HALT command is allowed only in privileged mode.
H[ELP] Command
I Command
The output-dev parameter is described later in this appendix under Output-Device
Syntax on page C-9.
The mode parameter has this format:
{ T | N | R }
FC
FN [ address [ , value ] [ & mask ] ]
FNL [ address [ , value ] [ & mask ] ]
FREEZE
HALT
H[ELP] [ debug-command ]
[ variable-item ]
I address [ , length ]
[ , [ OUT ] output-dev ] [ : mode ]
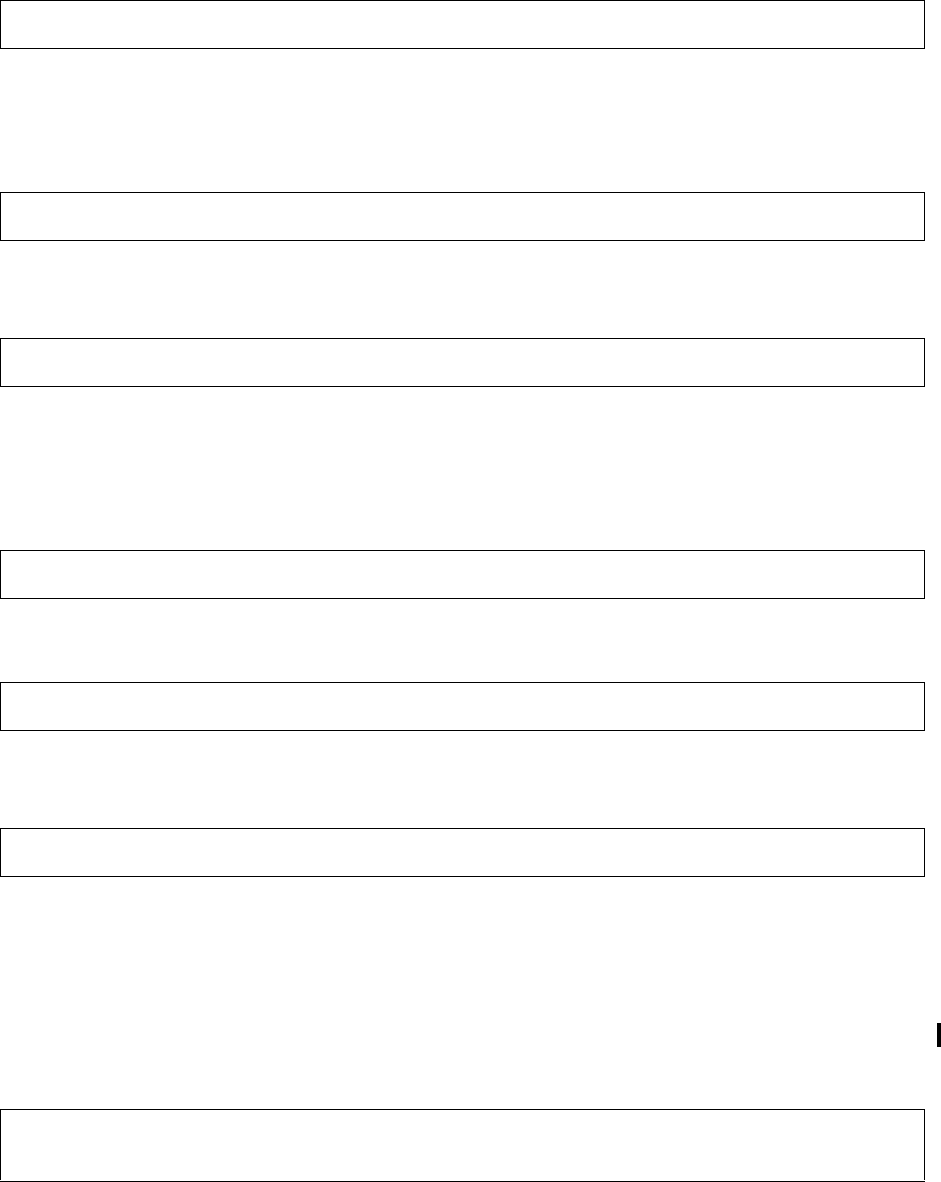
Command Syntax Summary
Debug Manual—421921-003
C-9
IH Command
IH Command
The IH command is allowed only on native processes.
INSPECT Command
LMAP Command
M Command
Modify Variables
Modify Register Contents
MH Command
The MH command is allowed only on native processes.
Output-Device Syntax
The output-dev parameter has these formats.
Syntax for a device other than a disk is:
IH [ signal-name ]
INSPECT
LMAP address
M address [ , new-value ] ...
M register [ , new-value ]
MH signal-name , { sigaction | 32-bit-address }
[ node.]{device-name[.qualifier ] }
{ldev-number }
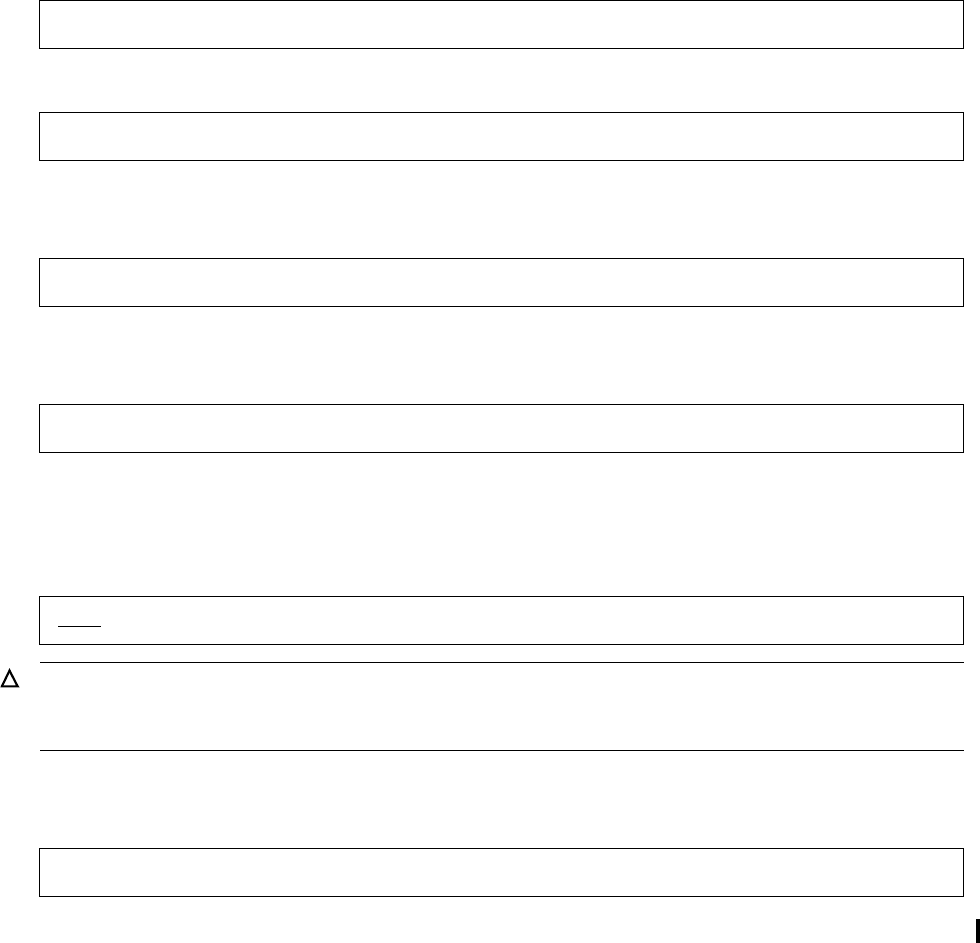
Command Syntax Summary
Debug Manual—421921-003
C-10
P[AUSE] Command
Syntax for a named process is:
Syntax for an unnamed process is:
P[AUSE] Command
PMAP Command
The PMAP command is allowed only on accelerated programs.
PRV Command
R Command
The op parameter has this format:
{ < | > | = | <> }
[ node.]process-name[:seq-no][.qual-1[.qual-2] ]
[ node.]$:cpu:pin:seq-no
P[AUSE] pause-time
PMAP address [ , count ] [ , [ OUT ] output-dev ]
PRV [ ON | OFF ]
Caution. Use privileged commands with extreme caution, because they allow you to perform
operations that could halt the system. Note that only the local super ID (255, 255) is allowed to
use the PRV ON command.
R [ expression-1 op expression-2 ]
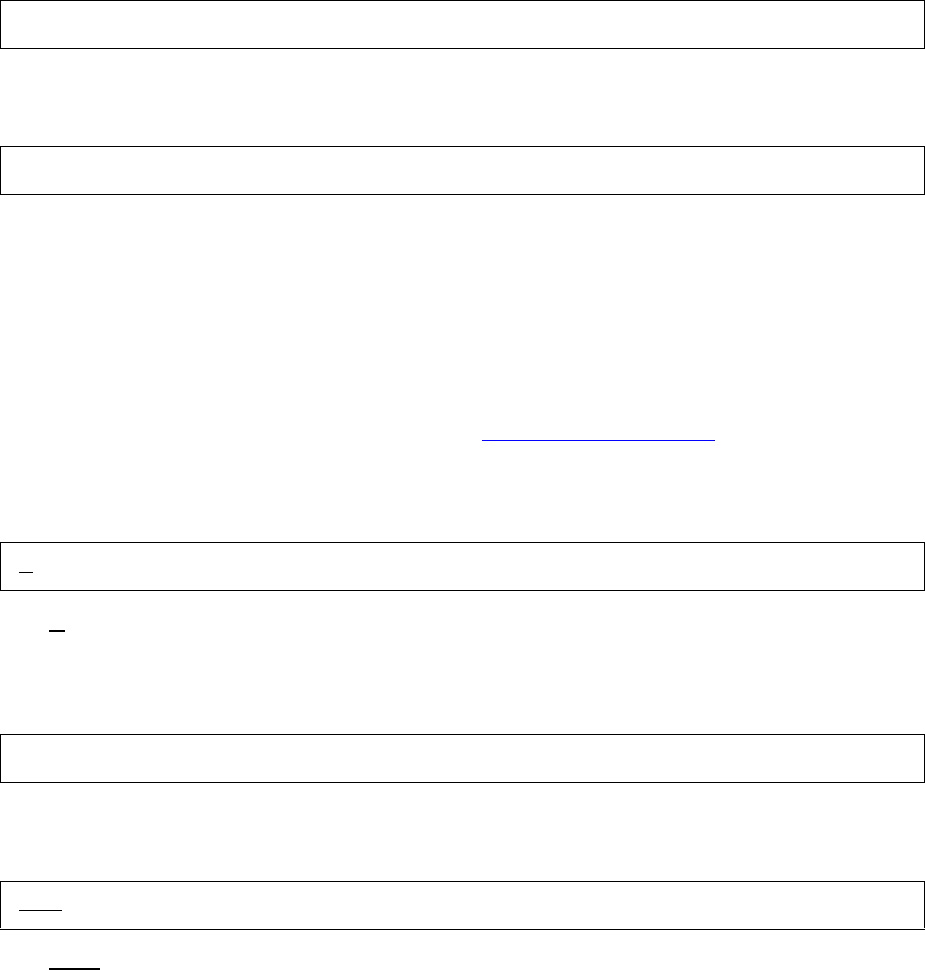
Command Syntax Summary
Debug Manual—421921-003
C-11
S[TOP] Command
S[TOP] Command
T Command
The options parameter is one or more of the following, separated by commas:
[register [=]] expression
MODE { N[ATIVE] | T[NS] | A[CCELERATED] }
AT expression
J 32-bit-address
The output-dev parameter is described in Output-Device Syntax on page C-9.
V Command
The V command is allowed only in privileged mode.
VQ Command
VQA Command
The VQA command is allowed only in privileged mode.
S[TOP]
T [ & ] [ N ] [ options ] [ , [ OUT ] output-dev ]
V [ QA ] [ expression-16 ]
VQ [ expression-16 ]
VQA [ expression-16 ]


Debug Manual—421921-003
D-1
DSession Boundaries
Typically, a Debug session begins when Debug is invoked for a process and the
Debug prompt is displayed on the process’s home terminal. Typically, the session ends
when you leave Debug (EXIT command), resume process execution (R command), or
stop the process (S command). Most Debug commands affect only the current
debugging session. The effects of certain commands, however, cross session
boundaries.
For example if your current Debug session is the result of setting a breakpoint in a
previous session, this current session can inherit options set in the previous session.
The effects of nonprivileged Debug commands can persist as long as the process
being debugged executes. They cannot affect another process.
Privileged commands, however, can affect a whole processor and can persist even if
the particular process being debugged goes away.
The possible scope of Debug commands, both nonprivileged and privileged, is
illustrated in Figure D-1 on page D-2.
Command persistence of nonprivileged commands is summarized in Table D-1. The
table is based on the assumption that you do not issue a command to override or
cancel the particular commands.
Table D-1. Nonprivileged Command Persistence (With Scope of a Process)
Command Resume
Command
Creates
a New
Process Process
Stops/Abends Canceling
Command
BASE Retained Retained * Canceled BASE
B (code breakpoint) Retained Retained * Canceled C
BM (memory-
access breakpoint) Retained Retained * Canceled CM; inhibited
by a BM ALL
privileged
command
* The commands are retained for the old process. No commands from debugging the old process are inherited
by the new process.
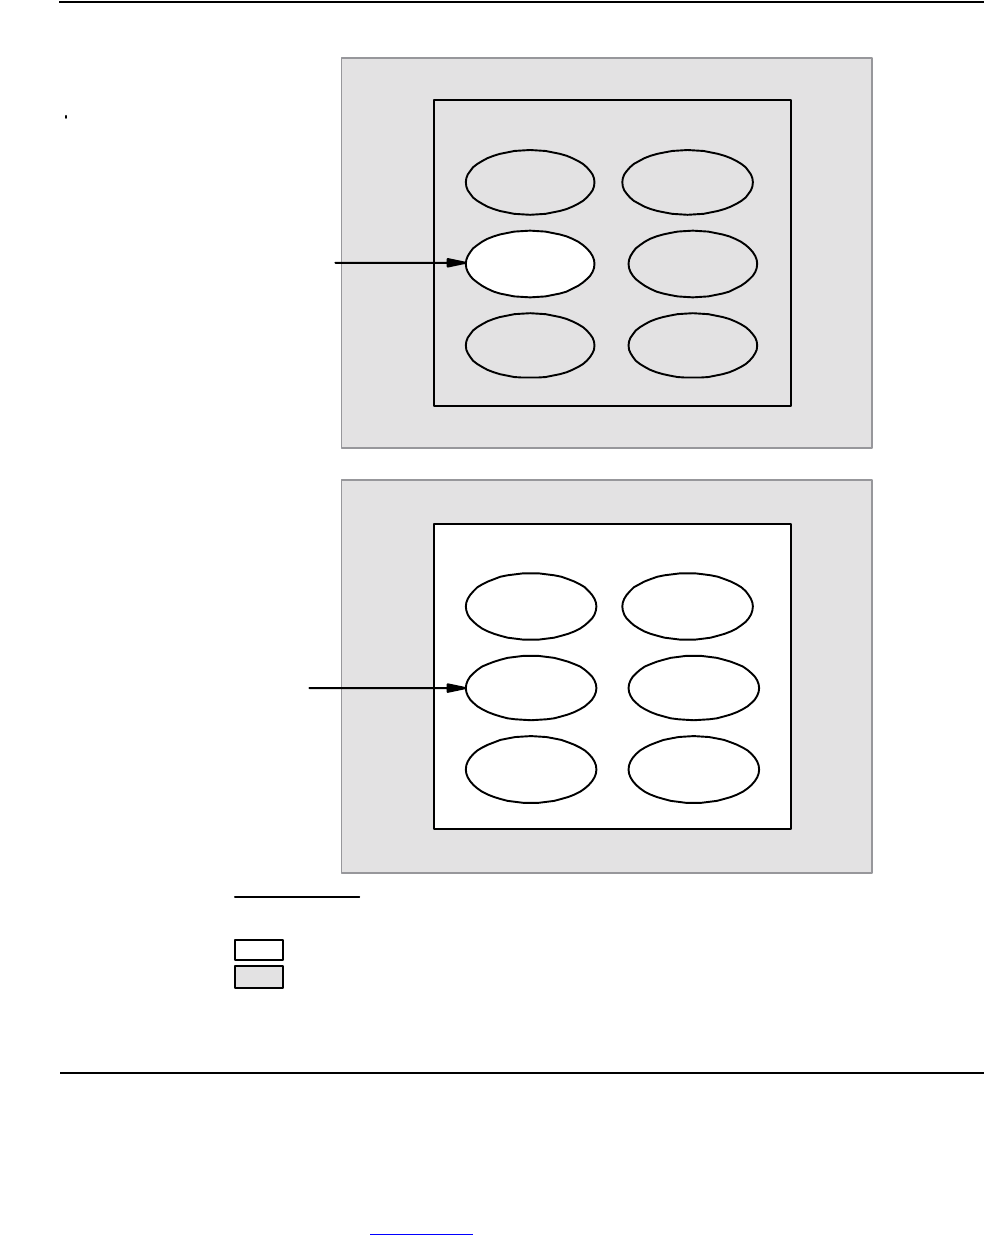
Session Boundaries
Debug Manual—421921-003
D-2
If you issue privileged commands (described under the PRV command), commands
are effective for the processor. The particular process you are debugging can go away,
but the command persists. The commands can be canceled during the privileged
debugging of any process in the processor. Command persistence of privileged
commands is summarized in Table D-2 on page D-3.
Figure D-1. Scope of Debug Commands’ Effects
Node
CPUn
ProcessNonprivileged
Debug
Commands
Node
CPUn
Process
Privileged
Debug
Commands
Process
Process
Process
Process
Process
Legend
Can be affected by commands issued in a Debug session
Cannot be affected by commands issued in a Debug session
VSTD101.vsd

Session Boundaries
Debug Manual—421921-003
D-3
Table D-2. Privileged Command Persistence (With Scope of the Processor)
Command Resume
Command Process
Stops/Abends Canceling Operation
PRV Retained Canceled N / A
B ... ALL
(code
breakpoint)
Retained Retained C –1 command; memory or code
space cleared
BM ... ALL
(memory-access
breakpoint)
Retained Retained CM ALL; memory or code space
cleared
FREEZE * N / A N / A Lobug R (resume) command or
reload the processor
HALT N / A N / A Lobug command that starts
processor or reloads the
processor
* The FREEZE command can affect other processors in a system, depending on switch settings made
through the Remote Console Process (RCP).
Note. Invoking and debugging in the Inspect debugger and returning to Debug has no effect
on session-inherited attributes. Debug retains the effects of the previous commands issued in
the Debug environment. Debug commands do not affect the Inspect debugger. Privilege mode
set in the Inspect debugger is retained in Debug. For more information on using the Inspect
debugger, see the INSPECT command description in Section 4, Debug Commands and the
Inspect Reference Manual.

Debug Manual—421921-003
E-1
E
Correspondence Between Debug
and Inspect Commands
Table E-1 shows the correspondence of Debug commands to Inspect low-level
commands. The low-level Inspect debugger also supports high-level Inspect
commands. For more information about Inspect commands, see the Inspect Manual.
Table E-1. Correspondence Between Debug and Inspect
Commands (page 1 of 2)
Debug Command Low-Level Inspect
Command Command Description for Debug and
Low-Level Inspect
A A Display data or registers in ASCII
AMAP — Provide information about an address
B B Set code breakpoint
BASE SET RADIX Set numeric base for input, output, or both
BM BM Set memory-access breakpoint
C C Clear code breakpoint
CM CM Clear memory-access breakpoint
D D Display data or registers in a specified
numeric format
DJ — Display jump buffer contents in register
format
DN — Display memory in the specified format
EX[IT] — Exit the debug session
F[ILES] F File status query
FC FC Edit or repeat command
FN FN Search memory for 16-bit number
FNL — Search memory for 32-bit number
FREEZE — Disable the processor and assert a freeze on
other processors
H[ELP] HELP Display commands
HALT — Halt a processor
I I Display data or registers in RISC code or
TNS code
IH — Display information about signal handling
INSPECT SELECT
DEBUGGER DEBUG Switch from Inspect to Debug or from Debug
to Inspect

Correspondence Between Debug and Inspect
Commands
Debug Manual—421921-003
E-2
Debug Command Low-Level Inspect
Command Command Description for Debug and
Low-Level Inspect
LMAP — Display procedure name and offset that
corresponds to a specified address
M M Modify data and registers
MH — Modify signal handling
P[AUSE] P Pause program execution
PMAP ICODE Display TNS and RISC instruction code
PRV SET PRIV MODE Enable or disable privileged debugging
R R Resume program execution
S[TOP] S Stop the current program
T T Trace stack markers
V — Enable access to another address space
VQ VQ Change selectable segment
VQA — Set the current selectable data segment to
absolute segment number
? ? Display segment ID (code and data)
= = Compute a value
Table E-1. Correspondence Between Debug and Inspect
Commands (page 2 of 2)

Debug Manual—421921-003
F-1
FSample Debug Sessions
This section of the manual provides step-by-step demonstrations of using Debug
commands for debugging TNS, accelerated, and native programs. For more
information on TNS programs, accelerated programs, and native programs, see
Section 2, Using Debug on TNS/R Processors in this manual.
We provide the source listing (Example F-1 on page F-2), which can be compiled with
either a TAL or pTAL compiler. We also provide TNS and native program listings.
When going through the examples, you should refer to the compiled listings; otherwise,
the examples will not make much sense to you.
Overview of Example Program
The first few lines of the source code listing show declarations of various procedures.
For more information about these procedures, see the Guardian Procedure Calls
Reference Manual. Following the procedure declarations, there are three global
variables, INT MY_TERMNUM, INT array PROCESS_HANDLE, and an extended
STRING pointer SP that is initialized to starting address of 2000000 (octal).
Following the global variables, there is the EXAMPLE_INIT procedure, which has a set
of local variables and some code that uses some of the procedure declared at the
beginning of the program. The code manipulates both local and global variables. Note
that the EXAMPLE_INIT procedure opens a terminal file. We will write data to and read
data from this file to demonstrate the use of various Debug commands.
The EXAMPLE_FILL_ARRAY procedure takes a single parameter. This procedure
also has some local variables and code. The code manipulates global and local
variables. This procedure reads and writes the terminal opened by the EXAMPLE_INIT
procedure.
Finally, we have the EXAMPLE_MAIN procedure, which is declared as the MAIN of the
program. This procedure calls the EXAMPLE_INIT procedure, allocates memory
segments, then calls the EXAMPLE_FILL_ARRAY procedure several times, passing in
a different memory segment number on each call.
Example Program Page
TNS Program Example F-3
Accelerated Program Example F-23
Native Program Example F-28
Privileged Commands F-49

Sample Debug Sessions
Debug Manual—421921-003
F-2
Overview of Example Program
Example F-1. Example Source Code for SDEMO1
7.01 ?NOLIST, SOURCE $system.system.extdecs (DEBUG, FILE_OPEN_,
7.11 ? INITIALIZER, PROCESS_GETINFO_, PROCESSHANDLE_NULLIT_,
7.111 ? SEGMENT_ALLOCATE_, SEGMENT_USE_, WRITEREADX)
8 ?LIST
8.1 INT my_termnum;
8.101 INT process_handle [0:9];
8.11 STRING .EXT sp := %2000000D;
8.22 PROC example_init;
8.23 BEGIN
8.3 INT error_init;
8.301 INT .EXT handle_ptr;
8.302 STRING hometerm [0:47];
8.304 INT hometerm_len;
8.305 STRING .hometerm_ptr;
8.307 INITIALIZER; ! external system procedure
8.308 error_init := PROCESSHANDLE_NULLIT_ (process_handle);
8.31 error_init := PROCESS_GETINFO_ (process_handle,
8.311 !fname:max!, !fname-len!, !priority!,
8.312 !mom!, hometerm:48, hometerm_len);
8.313 error_init := FILE_OPEN_ (hometerm:hometerm_len, my_termnum);
8.317 IF error_init <> 0 THEN
8.32 DEBUG;
8.34 @hometerm_ptr := @hometerm [0];
8.341 @handle_ptr := $WADDR_TO_EXTADDR (@process_handle [0]);
8.35 END; -- example_init
9 PROC example_fill_array (array_num);
9.01 INT array_num;
9.1 BEGIN
9.101 INT count_read;
9.11 INT error_fill_array;
9.111 STRING .in_out_msg [0:47];
9.112 STRING .EXT segment_ptr;
9.114 error_fill_array := SEGMENT_USE_ (array_num);
9.12 IF error_fill_array <> 0 THEN
9.121 DEBUG;
9.122 sp [0] := array_num;
9.123 @segment_ptr := @sp [41];
9.124 in_out_msg [0] ':=' "enter some data" & %h0D0A; -- CR LF
9.13 WRITEREADX (my_termnum, in_out_msg, 17, 48, count_read);
9.14 segment_ptr ':=' in_out_msg [0] FOR count_read bytes;
9.2 END; -- example_fill_array
9.3 PROC example_main MAIN;
10 BEGIN
11.02 INT error_main;
11.03 INT error_detail;
12 example_init;
12.007 error_main := SEGMENT_ALLOCATE_ (1, 131064D, !filename;len!,
error_detail);
12.02 IF error_main <> 0 THEN
12.021 DEBUG;
12.022 error_main := SEGMENT_ALLOCATE_ (2, 131064D, !filename;len!,
error_detail);
12.03 IF error_main <> 0 THEN
12.031 DEBUG;
12.032 error_main := SEGMENT_ALLOCATE_ (17, 258000D, !filename;len!,
error_detail);
12.04 IF error_main <> 0 THEN
12.05 DEBUG;
12.2 example_fill_array (1);
12.3 example_fill_array (2);
13 example_fill_array (17);

Sample Debug Sessions
Debug Manual—421921-003
F-3
TNS Program Example
14 END; -- example_maim
TNS Program Example
Example F-2 on page F-4 is a TNS program, obtained by compiling the source code
(Example F-1 on page F-2) with TAL. Before we demonstrate the use of the Debug
commands, we first need to compile this program to obtain an object file. The TAL
compiler command entered is as follows:
TAL /IN sdemo1, OUT $S.#ldemo1/ demo1; OPTIMIZE 0, LIST, NOINSPECT
OPTIMIZE 0 is used to make debugging easier. It forces intermediate results into
memory instead of being held in the registers. While this makes debugging easier, it
also results in slower code execution. For more information about using other
OPTIMIZE values, refer to the TAL Reference Manual.
The following is the TNS example program that we will use to demonstrate the use of
various Debug commands.
The TNS example program does not do much, but it has enough function to illustrate
the use of most of the Debug commands.
The listing below shows the output of the TAL compiler and BINSERV, the binder.
Observe these three parts of the listing:
•The 6-digit column shown on the left side of each procedure gives the relative
offset, in octal, for the first instruction of the line.
•The register addresses of variables declared in the procedure are shown at the
end of the procedure.
•The ENTRY POINT MAP shown at the end of the listing gives the base address for
each procedure. If you don't have the program listing you can use the binder LMAP
command to show information (for example, BIND LMAP FROM demo1).
Note. If you try these examples, there might be some differences between your output
information and ours. These differences might be caused by changes to the program,
changes to the compiler, the program running on a different system and processor,
process number, and having a different terminal name. The following is the object file
listing of the source program in Example F-1 on page F-2, minus some of the output
information that is not relevant to our discussion.

Sample Debug Sessions
Debug Manual—421921-003
F-4
TNS Program Example
Example F-2. TNS Example Compiled Listing
? optimize 0, list, noinspect
7.01 000000 0 0 ?NOLIST, SOURCE $system.system.extdecs (DEBUG, FILE_OPEN_,
8.1 000000 0 0 INT my_termnum;
8.101 000000 0 0 INT process_handle [0:9];
8.11 000000 0 0 STRING .EXT sp := %2000000D;
8.22 000000 0 0 PROC example_init;
8.23 000000 1 0 BEGIN
8.3 000000 1 1 INT error_init;
8.301 000000 1 1 INT .EXT handle_ptr;
8.302 000000 1 1 STRING hometerm [0:47];
8.304 000000 1 1 INT hometerm_len;
8.305 000000 1 1 STRING .hometerm_ptr;
8.307 000000 1 1 INITIALIZER; ! external system procedure
8.308 000007 1 1 error_init := PROCESSHANDLE_NULLIT_ (process_handle);
8.31 000017 1 1 error_init := PROCESS_GETINFO_ (process_handle,
8.311 000017 1 1 !fname:max!, !fname-len!, !priority!,
8.312 000017 1 1 !mom!, hometerm:48, hometerm_len);
8.313 000045 1 1 error_init := FILE_OPEN_ (hometerm:hometerm_len,
my_termnum);
8.317 000063 1 1 IF error_init <> 0 THEN
8.32 000066 1 1 DEBUG;
8.34 000067 1 1 @hometerm_ptr := @hometerm [0];
8.341 000072 1 1 @handle_ptr := $WADDR_TO_EXTADDR (@process_handle [0]);
8.35 000076 1 1 END; -- example_init
ERROR_INIT Variable INT Direct L+001
HANDLE_PTR Variable INT EXT Pointer L+002
HOMETERM Variable STRING Direct L+004
HOMETERM_LEN Variable INT Direct L+034
HOMETERM_PTR Variable STRING Indirect L+035
8.4 000000 0 0
9. 000000 0 0 PROC example_fill_array (array_num);
9.01 000000 1 0 INT array_num;
9.1 000000 1 0 BEGIN
9.101 000000 1 1 INT count_read;
9.11 000000 1 1 INT error_fill_array;
9.111 000000 1 1 STRING .in_out_msg [0:47];
9.112 000000 1 1 STRING .EXT segment_ptr;
9.114 000000 1 1 error_fill_array := SEGMENT_USE_ (array_num);
9.12 000015 1 1 IF error_fill_array <> 0 THEN
9.121 000020 1 1 DEBUG;
9.122 000021 1 1 sp [0] := array_num;
9.123 000024 1 1 @segment_ptr := @sp [41];
9.124 000031 1 1 in_out_msg [0] ':=' "enter some data" & %h0D0A; -- CR LF
9.13 000050 1 1 WRITEREADX (my_termnum, in_out_msg, 17, 48, count_read);
9.14 000066 1 1 segment_ptr ':=' in_out_msg [0] FOR count_read bytes;
9.2 000073 1 1 END; -- example_fill_array
ARRAY_NUM Variable INT Direct L-003
COUNT_READ Variable INT Direct L+001
ERROR_FILL_ARRAY Variable INT Direct L+002
IN_OUT_MSG Variable STRING Indirect L+003
SEGMENT_PTR Variable STRING EXT Pointer L+004
9.21 000000 0 0
9.3 000000 0 0 PROC example_main MAIN;
10. 000000 1 0 BEGIN
11.02 000000 1 1 INT error_main;
11.03 000000 1 1 INT error_detail;
12. 000000 1 1 example_init;
12.007 error_main := SEGMENT_ALLOCATE_ (1, 131064D, !filename;len!,
error_detail);

Sample Debug Sessions
Debug Manual—421921-003
F-5
TNS Program Example
12.02 000021 1 1 IF error_main <> 0 THEN
12.021 000024 1 1 DEBUG;
12.022 error_main := SEGMENT_ALLOCATE_ (2, 131064D, !filename;len!,
error_detail);
12.03 000044 1 1 IF error_main <> 0 THEN
12.031 000047 1 1 DEBUG;
12.032 error_main := SEGMENT_ALLOCATE_ (17, 258000D, !filename;len!,
error_detail);
12.04 000070 1 1 IF error_main <> 0 THEN
12.05 000073 1 1 DEBUG;
12.2 000074 1 1 example_fill_array (1);
12.3 000077 1 1 example_fill_array (2);
13. 000102 1 1 example_fill_array (17);
14. 000105 1 1 END; -- example_maim
ERROR_DETAIL Variable INT Direct L+002
ERROR_MAIN Variable INT Direct L+001
GLOBAL MAP
DEBUG Proc External
EXAMPLE_FILL_ARRAY Proc %000000
EXAMPLE_INIT Proc %000000
EXAMPLE_MAIN Proc %000000
FILE_OPEN_ Proc INT External
INITIALIZER Proc INT External
MY_TERMNUM Variable INT Direct
#GLOBAL+000
PROCESSHANDLE_NULLIT_ Proc INT External
PROCESS_GETINFO_ Proc INT External
PROCESS_HANDLE Variable INT Direct
#GLOBAL+001
SEGMENT_ALLOCATE_ Proc INT External
SEGMENT_USE_ Proc INT External
SP Variable STRING EXT Pointer
#GLOBAL+013
WRITEREADX Proc External
LOAD MAPS
ENTRY POINT MAP BY NAME FOR FILE: \NODE.demo1
SP PEP BASE LIMIT ENTRY ATTRS NAME DATE TIME
00 003 000104 000210 000104 EXAMPLE_FILL_ARRAY 1998-07-08 14:53
00 002 000005 000103 000005 EXAMPLE_INIT 1998-07-08 14:53
00 004 000211 000320 000211 M EXAMPLE_MAIN 1998-07-08 14:53
LOAD MAPS
DATA BLOCK MAP BY NAME FOR FILE: \NODE.demo1
BASE LIMIT TYPE MODE NAME DATE TIME
000000 000014 COMMON WORD #GLOBAL 1998-07-08 14:53
To start debugging the program in Example F-2 on page F-4, enter RUND demo1. If
the program starts in Inspect, then it was not compiled with the compiler directives
shown. To switch to Debug, enter the Inspect command SELECT DEBUGGER
DEBUG. This output is displayed:
DEBUG P=%000211, E=%000207, UC.%00
Break command
The first Debug command that we are going to demonstrate is the break (B) command.
To look at the before and after result that occurs when running the EXAMPLE_INIT
procedure of our sample program, we put a breakpoint at the beginning and at the end
of the procedure. From the ENTRY POINT MAP (Example F-2 on page F-4), we find
that the EXAMPLE_INIT procedure starts at SP 0 and ENTRY 5 (octal).
Sample Debug Sessions
Debug Manual—421921-003
F-6
TNS Program Example
Thus, we enter UC.0,%5 at the prompt, which gives us the breakpoint at the beginning
of EXAMPLE_INIT procedure:
Selecting a location near the end of the EXAMPLE_INIT procedure, we find that
relative offset 76 (octal) is near the end of the procedure. Thus, adding 76 (octal) to
the starting location gives us the ending breakpoint location of the procedure.
We resume the program and get to the first breakpoint as follows:
LMAP Command
The P value indicates that we have hit the breakpoint at the beginning of the
EXAMPLE_INIT procedure. You can confirm this by passing the P register to the
LMAP command as follows:
Displaying Variable Values
We can look at the before contents of the program’s global variable MY_TERMNUM,
located at the program’s GLOBAL + 0, and the EXAMPLE_INIT procedure variables
HOMETERM_LEN and HOMETERM. HOMETERM_LEN and HOMETERM are
located at L + 34 and L + 4 (octal), respectively. (See the object program listing in
Example F-2 on page F-4.) We use the D command for displaying numeric variables
and the A command for displaying string variables,
We used #48/2 for the length of the A command based on the declaration of the
HOMETERM array. The array was declared as [0:47], which is 48 (decimal) bytes long.
050,03,00013-B UC.0,%5
ADDR: UC.%00,%000005 INS: %002035 SEG: %020737
INS: ADDS +035
Note. The octal prefix, %, is used in our examples to emphasize the numeric base of the
numbers shown.
050,03,00013-B UC.0,%5+%76
ADDR: UC.%00,%000103 INS: %125003 SEG: %020737
INS: EXIT 03
050,03,00013-R
DEBUG P=%000005, E=%000207, UC.%00-BREAKPOINT-
050,03,00013-LMAP P
EXAMPLE_INIT (UC.00)
050,03,00013-D UD,%0
%000000: %000000
050,03,00013-D L%34
%000056: %000000
050,03,00013-A L%4, #48/2, B
%000026................................................

Sample Debug Sessions
Debug Manual—421921-003
F-7
TNS Program Example
For the A command, the length in is 16-bit words. Thus, we divide 48 by 2 to get 2
bytes per 16-bit word. We also use the B display format to group the output into bytes
rather than using the 16-bit words default.
Checking for Open Files
We check for opened files using the find (F) command. We find that there is no
opened file at this point in our example.
We advance to the breakpoint at the end of the EXAMPLE_INIT procedure using the
resume (R) command and verifying our location with the LMAP command. The result:
We can look at the various data locations using the A and D commands, to see the
changes to the variables after we hit the end breakpoint.
We used the value found for HOMETERM_LEN variable, located at L%34, for the
length of the A command. We round up the result to the next even number before
dividing by 2; otherwise, you can lose a byte of information. We also specified the
output to display in byte-form instead of 16-bit word-form by using the B option.
(Options C or B1 could also have been used.)
If we again check for open files by entering the F command, we find that file number 1
is opened. The name of the file matches the file name we saw at the HOMETERM
variable with the A command, above.
Output Display Conversion
Here, we illustrate how to convert from octal to decimal for displaying output data. The
default output for the D command is octal. We can change the output display using the
d-base option. (Use HELP D and HELP d-base for syntax information.) We will look at
the contents of the program’s global PROCESS_HANDLE array in the default form and
in the decimal form. The PROCESS_HANDLE array starts at the program’s global
050,03,00013-F
# -1 ??? # 00000
050,03,00013-R
DEBUG P=%000103, E=%000217, UC.%00-BREAKPOINT-
050,03,00013-LMAP P
EXAMPLE_INIT + %76 (UC.00)
050,03,00013-D UD,%0
%000000: %000001
050,03,00013-D L%34
%000056: %000023
050,03,00013-A L%4, %24/2, B
%000024:\M5.$ZTN00.#PTAZJAC.
050,03,00013-F
# -1 ??? # 00000
#001 \M5.$ZTN00.#PTAZJAC # 00000

Sample Debug Sessions
Debug Manual—421921-003
F-8
TNS Program Example
address 1 and is 10 16-bit words long. For information about how we obtained these
numbers, see Example F-2 on page F-4. Here, we omit UD for the address because
UD is the default option for the D command. The commands entered and the outputs
displayed:
Using Extended Addressing
At this point in the EXAMPLE_INIT procedure, the local extended integer pointer,
HANDLE_PTR, located at L + 2, has been set to the program’s global array,
PROCESS_HANDLE, starting at UD + 1. We can display the information in
PROCESS_HANDLE using two methods: reading the pointer address stored at L+2
and L+3 and then using that address to display the information in
PROCESS_HANDLE, or we can use the extended integer indirect clause in the
address part of the D command.
When displaying the extended pointer, we will set the display format to group in 4
bytes, thus using B4. For the second part of the display, we need to divide the
extended pointer value by 2 because extended pointers are byte-aligned and the
address specified to the D command must be word aligned when referencing the user
data area. Both methods are shown here:
BASE Command
Most Debug commands have default base for numeric input and output. The default
input can be overridden by prefixing the number with the appropriate numeric prefix (%
for octal, # for decimal, or 0x or %h for hexadecimal). The default output of some
Debug commands can be changed with an output base as was shown in the previous
050,03,00013-d 1, #10
%000001: %000400 %000000 %000003 %000015 %000000 %000000 %000014 %130212
%000011: %000000 %000062
050,03,00013-d 1, #10 :d
%000001: #00256 #00000 #00003 #00013 #00000 #00000 #00012 #45194
%000011: #00000 #00050
Note. Because Debug is not case-sensitive, you can use lowercase or uppercase letters when
entering Debug commands.
050,03,00013-D L+%2, %2 , B4 :h
%000024: 0x00000002
050,03,00013-d 0x00000002 /2, #10 :D
%000001: #00256 #00000 #00003 #00013 #00000 #00000 #00012 #45194
%000011: #00000 #00050
050,03,00013-D L+%2IX, #10 :D
%000001: #00256 #00000 #00003 #00013 #00000 #00000 #00012 #45194
%000011: #00000 #00050

Sample Debug Sessions
Debug Manual—421921-003
F-9
TNS Program Example
D example. The following specifies the output value to be a decimal for the D
command.
? Command
We use the ? command to see the current setting of the base:
We change the base for the output from decimal to standard and use the ? command
to check the result:
B Command (Continued)
In the above examples, we used the EXAMPLE_INIT procedure to demonstrate some
of the Debug commands. We will now set breakpoints in the EXAMPLE_MAIN
procedure in order to demonstrate other Debug commands.
We stop the program after segments 1 and 2 are allocated at offsets 21 and 44 (octal),
respectively, in the main procedure EXAMPLE_MAIN.
Under the ENTRY POINT MAP in Example F-2 on page F-4, the EXAMPLE_MAIN
procedure starts at 211 (octal). When we enter the breakpoint, we do not need to
qualify the address with the segment, because the breakpoint is in the segment we are
currently in. So instead of entering UC.0, %211+%21, we can enter %211+%21. One
way to enter the address of breakpoints is by specifying the base address and its offset
with the command, which emphasizes the relative offset in the procedure. Another way
050,03,00013-BASE DECIMAL OUT
050,03,00013-d 1, #10
#00001: #00256 #00000 #00003 #00013 #00000 #00000 #00012 #45194
#00009: #00000 #00050
Note. Both of the address output and the data output are displayed in decimal format.
Contrast this with the :D option in the example, where only the data output changes base.
050,03,00013-?
USE SEGMENT ID = NONE
BASE STANDARD IN
BASE DECIMAL OUT
TERM \M5.$ZTN00.#PTAZJAC
PRV = OFF
050,03,00013-BASE STANDARD OUT
050,03,00013-?
USE SEGMENT ID = NONE
BASE STANDARD IN
BASE STANDARD OUT
TERM \M5.$ZTN00.#PTAZJAC
PRV = OFF

Sample Debug Sessions
Debug Manual—421921-003
F-10
TNS Program Example
is to enter the sum of the offset and the base %255 (44 + 211), as shown in the
example below. After entering the breakpoints we resume to the location.
Modify Command
Here, we demonstrate the use of the modify (M) command. At this point in our
example, we simulate an error returned from a call to the SEGMENT_ALLOCATE_
procedure by modifying the value in the ERROR_MAIN variable, located at L 1, to
have a nonzero value. First we display the location for ERROR_MAIN, then modify
the location.
We resume to see the call to Debug. We display the value in the ERROR_MAIN
variable in an octal format (default) and in a decimal format. We then resume to the
next breakpoint.
Again, we simulate an error returned from the call to the SEGMENT_ALLOCATE_
procedure by modifying the value in the ERROR_MAIN variable to have a nonzero
value. This time we use the M command interactively:
050,03,00013-B %211+%21
ADDR: UC.%00,%000232 INS: %040401 SEG: %020737
INS: LOAD L+001
050,03,00013-B %255
ADDR: UC.%00,%000255 INS: %040401 SEG: %020737
INS: LOAD L+001
050,03,00013-R
DEBUG P=%000232, E=%000217, UC.%00-BREAKPOINT-
050,03,00013-D L 1
%000016: %000000
050,03,00013-M L 1, -1
Note. A call to Debug produces a different message at the stop than when we hit a
breakpoint.
050,03,00013-R
DEBUG P=%000236, E=%000227, UC.%00
050,03,00013-D L 1
%000016: %177777
050,03,00013-D L 1 :D
%000016: #65535
050,03,00013-R
DEBUG P=%000255, E=%000217, UC.%00-BREAKPOINT-
50,03,00013-M L 1
%000016: %000000 <- 4
%000017: %000000 <-
050,03,00013-R
DEBUG P=%000261, E=%000207, UC.%00
Sample Debug Sessions
Debug Manual—421921-003
F-11
TNS Program Example
Clearing Breakpoints with *
The following example demonstrates clearing breakpoints using * with the C command.
First, we use the B command to view all the breakpoints we have set in the
EXAMPLE_MAIN procedure. We then clear the breakpoints using the C * command
and show that they are gone.
Trace Command
In the following example, we use the EXAMPLE_FILL_ARRAY procedure to illustrate
the use of the trace (T) command, and the use of the N option with the T command.
We first set breakpoints at the beginning and near the end of the procedure and
resume to the first breakpoint. After reaching the breakpoint, we use the T and TN
commands to trace the stack and show the names.
050,03,00013-B
ADDR: UC.%00,%000005 INS: %002035 SEG: %020737
INS: ADDS +035
ADDR: UC.%00,%000103 INS: %125003 SEG: %020737
INS: EXIT 03
ADDR: UC.%00,%000232 INS: %040401 SEG: %020737
INS: LOAD L+001
ADDR: UC.%00,%000255 INS: %040401 SEG: %020737
INS: LOAD L+001
050,03,00013-C *
050,03,00013-B
050,03,00013-B %104
ADDR: UC.%00,%000104 INS: %002002 SEG: %020737
INS: ADDS +002
050,03,00013-b %104+%73
ADDR: UC.%00,%000177 INS: %125004 SEG: %020737
INS: EXIT 04
050,03,00013-r
DEBUG P=%000104, E=%000207, UC.%00-BREAKPOINT-
050,03,00011-t
%000104 E=%000200 L=%000023 ENV: T UC.%00
%000021:%000310 E=%000200 L=%000015 ENV: T UC.%00
050,03,00013-tn
%000104 E=%000200 L=%000023 EXAMPLE_FILL_ARRAY + %000000
000021: %000310 E=%000200 L=%000015 EXAMPLE_MAIN + %000077
Sample Debug Sessions
Debug Manual—421921-003
F-12
TNS Program Example
Clearing Breakpoint of Current Location
If the program is stopped at a code breakpoint, you need to specify only the C
command to clear the breakpoint. We look at the breakpoints both before and after this
operation.
? Command
The EXAMPLE_FILL_ARRAY procedure makes one of the previously allocated
segments available for the program use. We can see the current segment being used
with the ? command by displaying the ARRAY_NUM parameter at location L-3.
When we resume the program, it puts data segment 1 in use, then prompts us for
some data. We enter "abcdefg". The program puts the input data in a local buffer, then
moves it to the data segment. At this point, we arrive at the breakpoint that is at the
end of the procedure. Using the ? command, we can see that segment 1 is being used.
050,03,00013-b
ADDR: UC.%00,%000104 INS: %002002 SEG: %020737
INS: ADDS +002
ADDR: UC.%00,%000177 INS: %125004 SEG: %020737
INS: EXIT 04
050,03,00013-c
050,03,00013-b
ADDR: UC.%00,%000177 INS: %125004 SEG: %020737
INS: EXIT 04
050,03,00013-?
USE SEGMENT ID = NONE
BASE STANDARD IN
BASE STANDARD OUT
TERM \M5.$ZTN00.#PTAZJAC
PRV = OFF
050,03,00013-d l-3
%000020: %000001
050,03,00013-r
enter some data
abcdefg
DEBUG P=%000177, E=%000207, UC.%00-BREAKPOINT-
050,03,00013-?
USE SEGMENT ID = %000001
BASE STANDARD IN
BASE STANDARD OUT
TERM \M5.$ZTN00.#PTAZJAC
PRV = OFF

Sample Debug Sessions
Debug Manual—421921-003
F-13
TNS Program Example
Displaying String Output
The local buffer, IN_OUT_MSG, is an indirect string. This means that we need to use
the pointer at L 3 to find the address of the data, divide it by 2 to convert from a string
address to a word address, then display the information. We can do this in one step or
two steps by using the indirect form as shown below:
Displaying Data Using Q Address
We can display some data in the selectable segment using the Q address mode. The
extended indirect pointer, SP, is used to store the ARRAY_NUM in location 0 of the
selectable segment. We can separate the characters by using the C grouping option
and hexadecimal output format.
We can also see the results of moving the procedure's buffer into the selectable
segment. Because the data is stored at byte offset 41, we need to round down to the
previous even byte (40). We then divide by 2 to convert to a 16-bit word address offset.
050,03,00013-d l 3
%000026: %000062
050,03,00013-a %62/2, #8/2, c
%000031:abcdefgo
050,03,00013-a l3s, #8/2, c
%000031:abcdefgo
Note. The last character returned is an "o," because we use the same buffer for input and
output. The "o" is from the word "some" in our prompt string "enter some data." An additional
item to note about the above example: The address 62 (octal) returned from the D L 3
command is in the user data (UD) area. We could have entered the A command as A
UD,%62/2, #8/2,C to obtain the same result. In other words, if a space qualifier is not specified
for the A or D command, UD is assumed.
050,03,00013-d q0, c :h
%000000: 01 00
050,03,00013-a q #40/2, #10/2, c
%000024:.abcdefg..

Sample Debug Sessions
Debug Manual—421921-003
F-14
TNS Program Example
Displaying Data Using Extended Address
The EXAMPLE_FILL_ARRAY procedure does not update the extended indirect pointer
SP located at the program’s global 12, so it is pointing to the beginning of the
selectable segment. We can repeat the A and D commands above, using SP as a
string extended address.
In this case, because the S indirection type indicates a string (byte), index is a byte
offset, which eliminates the need of dividing the address by 2. Instead of using the a q
#40/2, #10/2, c command in the above example, we can also enter it as: a
ud,12sx#40,#10/2,c.
The EXAMPLE_FILL_ARRAY procedure has a local extended string pointer,
SEGMENT_PTR, located at L 4. The pointer is set to offset 41 of SP. We can repeat
the A commands above, using SEGMENT_PTR.
We resume the program so that it stops the next time we reach the end of
EXAMPLE_FILL_ARRAY procedure. The ? command shows us which segment is in
use.
050,03,00013-d 12ix, c :h
%000000: 01 00
050,03,00013-a 12sx + #40, #10/2, c
%000024:.abcdefg..
Note. For the A command, we are using this address form:
offset [indirection-type [index]].
050,03,00013-a L4sx, #10/2, c
%000024:.abcdefg..
050,03,00013-r
enter some data
tuvwxyz
DEBUG P=%000174, E=%000207, UC.%00-BREAKPOINT-
050,03,00013-?
USE SEGMENT ID = %000002
BASE STANDARD IN
BASE STANDARD OUT
TERM \M5.$ZTN00.#PTAZJAC
PRV = OFF

Sample Debug Sessions
Debug Manual—421921-003
F-15
TNS Program Example
VQ Command
The ? command above shows that segment ID 2 is in use. The VQ command allows us
to switch to any segment available to the program. In this example, we first use the VQ
command to switch to segment 1, which had the “abcdefg” data inserted the last time
the EXAMPLE_FILL_ARRAY procedure was called. We then modify the data at
location 0x2ff0 in the segment to demonstrate the FN command.
FN Command
We can use the FN command to find the location of a 16-bit word that matches a
value. The value must be aligned on an even-byte address boundary. The "abcdefg"
we entered earlier was placed into the selectable segment 1 starting on an odd byte
(41), so we start looking for the "bc" part of the character segment, which starts at an
even byte. We have also modified the selectable segment with "bc" at offset 0x2ff0,
which is an even address.
Pressing return on the (FN) prompt caused the FN command to continue searching.
After the second return, we encountered the end of the selectable segment and an
error was reported. Note that the addresses are given in octal word offsets, followed by
the contents of the 16-bit word.
050,03,00013-vq 1
050,03,00013-?
USE SEGMENT ID = %000001
BASE STANDARD IN
BASE STANDARD OUT
TERM \M5.$ZTN00.#PTAZJAC
PRV = OFF
050,03,00013-m q 0x2ff0,'bc'
050,03,00013-fn q 0, 'bc'
%000025: 0x6263
050,03,00013 (FN)-
%027760: 0x6263
050,03,00013 (FN)-
DEBUG error 50: FN stopped searching at the following address:
0x0009FFF8
Address not valid
Sample Debug Sessions
Debug Manual—421921-003
F-16
TNS Program Example
= Command
In the following example, we show how the = command complements other Debug
commands. In this case, we show that the output octal address specified in the FN
command, can be specified with the = command to convert the octal address to a
hexadecimal address. When we specify the address to the = command, note that it is
the same one used in the modify command. If we specify the data found at the location
to the = command, we find "bc," the characters entered in the FN command above.
If we want to find a specific bit pattern and are not interested in the other bits, we can
use the mask. In the following example we look for a "c" in the second byte of the 16-
bit word and ignore the other bits.
Note below that the "x" of the “xc” is ignored. The 0x62, (binary "b") is also ignored
when finding the match to our search.
We resume the program and enter a different data pattern from what is contained in
segments 1 and 2. The selectable segment 17 is longer than segment 1 or 2. We use
this to show some variations on the commands.
050,03,00013-=%027760
= %027760 #12272 0x2FF0 '/.'
050,03,00013-= 0x6263
= %061143 #25187 0x6263 'bc'
050,03,00013-fn q 0, 'xc' & 0x00ff
%000025: 0x6263
050,03,00013 (FN)-
%027760: 0x6263
050,03,00013 (FN)-
050,03,00013-r
enter some data
0123456789
DEBUG P=%000177, E=%000207, UC.%00-BREAKPOINT-
050,03,00013-?
USE SEGMENT ID = %000021
BASE STANDARD IN
BASE STANDARD OUT
TERM \M5.$ZTN00.#PTAZJAC
PRV = OFF

Sample Debug Sessions
Debug Manual—421921-003
F-17
TNS Program Example
AMAP Command
If the N prefix is used with an address, the address must be in a 32-bit form. The N
prefix also changes the formatting of the output display for some Debug commands. In
this example, we use the AMAP command to convert the Q address to a 32-bit
address and use the converted address for the A command.
DN Command
The following shows the use of the DN command:
Modify Data Using 32-bit address
For the next example we modify a 32-bit word in the selectable segment. We use the
M command with an N address prefix to do the 32-bit operation.
050,03,00013-amap q #40/2
Address: 0x00080028
Kind = 0x0013: Unknown
Attributes: none
050,03,00013-a n 0x00080028, #10, c
00080028:.0123456789.........
Note. Adding the N prefix to the A command changed the output display to decimal byte
address.
050,03,00013-dn 0x00080028, #10 :a
00080028: ..012. .3456. .789.. ......
00080038: ...... ...... ...... ......
00080048: ...... ......
Note. The DN command is not the same as D N (with space between the letters). For more
information about the differences between the DN and D N commands, refer to Section 4,
Debug Commands, of this manual.
050,03,00013-amap q #140000
Address: 0x000A22E0
Kind = 0x0013: Unknown
Attributes: none
050,03,00013-m n 0x000A22E0
0x000A22E0 : 0x00000000 <- '3456'
0x000A22E4 : 0x00000000 <-

Sample Debug Sessions
Debug Manual—421921-003
F-18
TNS Program Example
FNL Command
We use the FNL command to find data in 32-bit form. Because the value we are
searching for is 32-bit, the specified address must be aligned on a even 4-byte
boundary (last digit must be hexadecimal 0, 4, 8, or C).
We can also look for a specific pattern within the 32-bit word while ignoring the other
bits. We use the FNL command with a mask to look only for the bit pattern 0x3435 in
the second and third byte of the word.
Stopping the Program
Before we move to the examples we are going to demonstrate below, we must first
stop the program using the STOP command.
050,03,00013-fnl q0, '3456'
0008002C: 0x33343536
050,03,00013 (FNL)-
** DEBUG error 51: FNL reached address boundary. To continue, enter the following
address:
0x000A0000
050,03,00013-FNL 0x000A0000
000A22E0: 0x33343536
050,03,00013 (FNL)-
** DEBUG error 52: FNL stopped searching at the following address:
0x000BEFD0
Address not valid
Note. The output addresses for the FNL command are hexadecimal byte addresses. The FNL
command stops the search at either the end of the segment or when the low-order 17 bits of
the address are zero. If the address boundary is reached, it is necessary to restart only the
command with the address. The value to search for is the same as the last search.
050,03,00013-FNL q0, 0x00343500 & 0x00ffff00
0008002C: 0x33343536
050,03,00013 (FNL)-

Sample Debug Sessions
Debug Manual—421921-003
F-19
TNS Program Example
Additional Breakpoint Options
Next, we demonstrate some variations on the B and BM commands. We run the object
file in Example F-2 on page F-4 several times to show the various options with the B
and BM commands. The first example will show the breakpoint tracing.
We put a breakpoint near the beginning of the EXAMPLE_FILL_ARRAY procedure
and show the content of the ARRAY_NUM parameter. We also put a breakpoint at the
end of EXAMPLE_FILL_ARRAY and show the data in the selectable segment at a 40-
byte offset for 16 bytes.
In order to ensure that the output values are within the scope of the procedure we are
debugging, we need to make sure that the address reference in the trace clause is
evaluated within the context of the procedure. So, we put a breakpoint after the stack
has been set up and resume to the breakpoint. First we look at the code to find an
appropriate location at put the breakpoint. In this case, this location is right after the
stack has been set up and initialized.
We then clear the breakpoint and put in another breakpoint with the trace clause.
050,03,00009-i %104, 20
%000104: ADDS +002 LADR L+006 LLS 01 PUSH 700
%000110: ADDS +032 LOAD L-003 PUSH 700 ADDS +006
%000114: LDLI +200 LDI -007 PUSH 711 XCAL 006
%000120: STOR L+002 LOAD L+002 CMPI +000 BEQL +001
050,03,00009-b %117
ADDR: UC.%00,%000117 INS: %127006 SEG: %020707
INS: XCAL 006
050,03,00009-r
DEBUG P=%000117, E=%000227, UC.%00-BREAKPOINT-
050,03,00009-c
050,03,00009-b %117, l-3 ? 1
ADDR: UC.%00,%000117 INS: %127006 SEG: %020707
INS: XCAL 006
L %177775 ? %000001
050,03,00009-b %104+%73, n 0x00080028 ? #16/2
ADDR: UC.%00,%000177 INS: %125004 SEG: %020707
INS: EXIT 04
N 0x00080028 ? 0x00000008

Sample Debug Sessions
Debug Manual—421921-003
F-20
TNS Program Example
We resume the program and enter some data at the prompt. Observe that the value of
ARRAY_NUM is shown as we enter the procedure, and the selectable segment is
shown as the procedure ends.
Conditional Breakpoint
The next example shows a conditional breakpoint. We stop at a code breakpoint in
EXAMPLE_FILL_ARRAY when parameter ARRAY_NUM is greater than 16. We first
run the object code in Example F-2 on page F-4: RUND demo1.
050,03,00009-r
TRACE 0x004F , UC.%00
0x0010: 0x0001
enter some data
abcdefg
TRACE 0x007F , UC.%00
0x0014: 0x0061 0x6263 0x6465 0x6667 0x0000 0x0000 0x0000 0x0000
TRACE 0x004F , UC.%00
0x0010: 0x0002
enter some data
hijklmnop
TRACE 0x007F , UC.%00
0x0014: 0x0068 0x696A 0x6B6C 0x6D6E 0x6F70 0x0000 0x0000 0x0000
TRACE 0x004F , UC.%00
0x0010: 0x0011
enter some data
uvwxyz0123
TRACE 0x007F , UC.%00
0x0014: 0x0075 0x7677 0x7879 0x7A30 0x3132 0x3300 0x0000 0x0000
050,03,00010-b %117
ADDR: UC.%00,%000117 INS: %127006 SEG: %020707
INS: XCAL 006
050,03,00010-r
DEBUG P=%000117, E=%000227, UC.%00-BREAKPOINT-
050,03,00010-c
050,03,00010-b %117, L-3 > #16
ADDR: UC.%00,%000117 INS: %127006 SEG: %020707
INS: XCAL 006
L %177775 & %177777 > %000020
050,03,00010-r
enter some data
abcdefg
enter some data
lmnopqrst
DEBUG P=%000117, E=%000227, UC.%00-BREAKPOINT-
050,03,00010-d L-3 :d
%000020: #00017

Sample Debug Sessions
Debug Manual—421921-003
F-21
TNS Program Example
Execute Breakpoint
The next example shows the execute breakpoint using the BM command. We first run
the object code: RUND demo1.
We put a memory-access breakpoint on the first word of data pointed to by the
IN_OUT_MESSAGE pointer in the EXAMPLE_FILL_ARRAY procedure. We stop at
the beginning of the procedure and look at the value of the IN_OUT_MESSAGE
pointer.
The pointer has not been set at this point in the program. We put a breakpoint a few
instructions ahead and look at the pointer again.
Now the stack has been set up, so there is a value in the pointer. Remember that this
is a string pointer, so the value is a byte offset into the UD area. Because we no longer
need the code breakpoints, we clear them. We use the BM command to set a memory-
access breakpoint. We also use the command-string option to make an execute
breakpoint.
Because we are using an indirect variable, we need to be at a location where the
pointer has been established. For information about indirect addressing, see Section 3,
Debug Command Overview. Thus the address of 0x00000032 shown in the output for
the BM command is in the user data segment (UD). Whenever the location is written,
we execute the LMAP command, the A command, and resume.
050,03,00027-b %104
ADDR: UC.%00,%000104 INS: %002002 SEG: %020737
INS: ADDS +002
050,03,00027-r
DEBUG P=%000104, E=%000207, UC.%00-BREAKPOINT-
050,03,00027-d l3
%000026: %000000
050,03,00027-b %104+%15
ADDR: UC.%00,%000121 INS: %040402 SEG: %020737
INS: LOAD L+002
050,03,00027-r
DEBUG P=%000121, E=%000217, UC.%00-BREAKPOINT-
050,03,00027-d L3
%000026: %000062
050,03,00027-c *
050,03,00027-bm L3s, w, (lmap p;a L3s, #40/2, c;r)
XA: 0x00000032 MAB: W (DATA SEG)
(LMAP P;A L3S, #40/2, C;R)

Sample Debug Sessions
Debug Manual—421921-003
F-22
TNS Program Example
Resuming gives us these outputs:
050,03,00027-r
DEBUG P=%000145, E=%000202, UC.%00-MEMORY ACCESS BREAKPOINT-
MEMORY ACCESS BREAKPOINT OCCURRED AT $PC=0x7E007EE4
EXAMPLE_FILL_ARRAY + %41 (UC.00)
%000031:eN00.#PTAZJA............................
DEBUG P=%000145, E=%000202, UC.%00-MEMORY ACCESS BREAKPOINT-
MEMORY ACCESS BREAKPOINT OCCURRED AT $PC=0x7E007EF0
EXAMPLE_FILL_ARRAY + %41 (UC.00)
%000031:en00.#PTAZJA............................
enter some data
abcdefg
DEBUG P=%000171, E=%000317, UC.%00-MEMORY ACCESS BREAKPOINT-
MEMORY ACCESS BREAKPOINT OCCURRED AT $PC=0x7E007EF0
EXAMPLE_FILL_ARRAY + %65 (UC.00)
%000031:abcdefgome data.........................
DEBUG P=%000145, E=%000202, UC.%00-MEMORY ACCESS BREAKPOINT-
MEMORY ACCESS BREAKPOINT OCCURRED AT $PC=0x7E007EE4
EXAMPLE_FILL_ARRAY + %41 (UC.00)
%000031:ebcdefgome data.........................
DEBUG P=%000145, E=%000202, UC.%00-MEMORY ACCESS BREAKPOINT-
MEMORY ACCESS BREAKPOINT OCCURRED AT $PC=0x7E007EF0
EXAMPLE_FILL_ARRAY + %41 (UC.00)
%000031:encdefgome data.........................
enter some data
uvwxyz
DEBUG P=%000171, E=%000317, UC.%00-MEMORY ACCESS BREAKPOINT-
MEMORY ACCESS BREAKPOINT OCCURRED AT $PC=0x7E007EF0
EXAMPLE_FILL_ARRAY + %65 (UC.00)
%000031:uvwxyzsome data.........................
DEBUG P=%000145, E=%000202, UC.%00-MEMORY ACCESS BREAKPOINT-
MEMORY ACCESS BREAKPOINT OCCURRED AT $PC=0x7E007EE4
EXAMPLE_FILL_ARRAY + %41 (UC.00)
%000031:evwxyzsome data.........................
DEBUG P=%000145, E=%000202, UC.%00-MEMORY ACCESS BREAKPOINT-
MEMORY ACCESS BREAKPOINT OCCURRED AT $PC=0x7E007EF0
EXAMPLE_FILL_ARRAY + %41 (UC.00)
%000031:enwxyzsome data.........................
enter some data
0123456789
DEBUG P=%000171, E=%000317, UC.%00-MEMORY ACCESS BREAKPOINT-
MEMORY ACCESS BREAKPOINT OCCURRED AT $PC=0x7E007EF0
EXAMPLE_FILL_ARRAY + %65 (UC.00)
%000031:0123456789 data.........................
Note. There is already some text in the data area of the first breakpoint. This procedure is
reusing some of the data area the EXAMPLE_INIT procedure used in previous examples.
Thus, if we had entered our breakpoint at the beginning of the program as "bm n 0x32, w," we
would have stopped in the EXAMPLE_INIT and EXAMPLE_FILL_ARRAY procedures.

Sample Debug Sessions
Debug Manual—421921-003
F-23
Accelerated Program Example
The memory-access breakpoint is triggered when anything is written to the 16-bit word.
In this case, we get two interrupts at EXAMPLE_FILL_ARRAY + %41: one when the
"e" is put into the word, and another when the "n" is put into the word. This double
interrupt is true only when the code putting the data in the memory location is doing
byte operations and the code is not PRIV. The next break happens after the data is
entered. In the second case, the data is transferred in the PRIV system procedure, so
the breakpoint is reported after the end of the PRIV procedure.
Accelerated Program Example
Debugging accelerated programs is similar to debugging TNS programs, with some
differences between the two. In this subsection, we discuss the differences between
TNS and accelerated programs.
To generate an accelerated object file, we use the demo1 program in Example F-2 on
page F-4 and get an accelerated program as follows:
AXCEL demo1,ademo1. Because the ademo1 object file does not have significant
information, the listing is not provided here. For more information about using the
Accelerator refer to the Accelerator Manual.
Break Command
We run the ademo1 object file and put a breakpoint at EXAMPLE_INIT procedure.
When we specify the B command in an accelerated program, we are actually entering
two breakpoints, one in TNS code and another in RISC code.
Using of the B command to insert a TNS code breakpoint and using the B* command
to insert a RISC code breakpoint:
RUND ademo1
DEBUG P=%000211, E=%000207, UC.%00
050,03,00032-b %5
@ ADDR: UC.%00,%000005 INS: %002035 SEG: %020737
INS: ADDS +035
050,03,00032-r
DEBUG P=%000005, E=%000207, UC.%00-BREAKPOINT-
050,03,00032-b ! TNS breakpoint
@ ADDR: UC.%00,%000005 INS: %002035 SEG: %020737
INS: ADDS +035
050,03,00032-b * ! RISC breakpoint
@ ADDR: UC.%00,%000005 INS: %002035 SEG: %020737
INS: ADDS +035
^--N: 0x7042001C INS: 0x27BD004E
INS: ADDIU sp,sp,78

Sample Debug Sessions
Debug Manual—421921-003
F-24
Accelerated Program Example
PMAP Command
We can enter TNS code breakpoints only at memory-exact and register-exact points.
If we enter the PMAP command at a TNS location, we get a set of RISC code output
that corresponds to the set of TNS code that performs the same functions.
Below, the output shows that TNS address %5 is a register-exact point, which
corresponds to RISC address 0x7042001C. (Note that 0x is omitted on the address
output because of space constraints.)
The TNS code and RISC code locations currently have breakpoints. We can see the
instructions that were in the original code by entering the B * command or by clearing
the breakpoints with the C command and entering the PMAP command again.
We are allowed to set TNS code breakpoints only at locations that are register-exact or
memory-exact. To see other TNS locations where we are allowed to set breakpoints,
we can specify the address and the length with the PMAP command, as shown in this
example:
Observe that TNS address %7 is a memory-exact point and that TNS address %13 is
the next register-exact point.
050,03,00032-pmap %05
%000005: @ BPT ADDS +010
7042001C: BREAK INSPECT RISC LUI at,0x7FFF ADD $0,sp,at
050,03,00032-c
050,03,00032-pmap %05
%000005: @ ADDS +035 ADDS +010
7042001C: ADDIU sp,sp,78 LUI at,0x7FFF ADD $0,sp,at
050,03,00032-pmap %5 , #14
%000005: @ ADDS +035 ADDS +010
7042001C: ADDIU sp,sp,78 LUI at,0x7FFF ADD $0,sp,at
%000007: > LDI +000 LDI -010 PUSH 711 XCAL 002
70420028: LI s1,-8 SH $0,-2(sp) SH s1,0(sp)
70420034: JAL 0x7A5D91F0 LI a0,11
%000013: @ STRP 7 LDI +000 LADR G+001 DLLS 01
%000017: LDLI +300 LDI -002 PUSH 733 XCAL 003
7042003C: LI s0,2 LI s2,-16384 LI s3,-2
70420048: ADDIU sp,sp,8 SWL s0,-6(sp) SWR s0,-3(sp)
70420054: SH s2,-2(sp) SH s3,0(sp) JAL 0x7C2CB64C
70420060: LI a0,19

Sample Debug Sessions
Debug Manual—421921-003
F-25
Accelerated Program Example
We set a breakpoint at the next register-exact point and display the registers, as
follows:
This example shows that an error occurs if an attempt is made to set a TNS code
breakpoint at a location that is not a memory-exact or register-exact point. To resolve
the error, use the PMAP command to find a matching RISC location near the TNS
location.
You can set a breakpoint on any RISC code location. Below, we set a code breakpoint
and resume the program. When it gets to the breakpoint, we display the registers.
050,03,00032-b %13
@ ADDR: UC.%00,%000013 INS: %000107 SEG: %020737
INS: STRP 7
050,03,00032-r
DEBUG P=%000013, E=%000317, UC.%00-BREAKPOINT-
050,03,00032-d *
S=%000057 P=%000013 E=%000317 L=%000022 SP=UC.%00
ENV IS: TK CCE RP7
EXAMPLE_INIT + %000006
*REG* %000000 %104010 %000002 %177630 %177440 %000031 %002404 %002412
EXECUTION MODE = ACCELERATED
$PC: 0x7042003C $HI: 0x0000246F $LO: 0x8881FC7E
$00: $00: 0x00000000 $AT: 0x70000000 $V0: 0x7E000000 $V1: 0x00000000
$04: $A0: 0x0000257D $A1: 0x00000000 $A2: 0x0000000B $A3: 0x80022438
$08: $T0: 0x7042003C $T1: 0x7042003C $T2: 0x70400000 $T3: 0x70400000
$12: $T4: 0x0000FD13 $T5: 0x8006FC14 $T6: 0xFFFFFFFF $T7: 0x00000000
$16: $S0: 0x00000000 $S1: 0x7A5D8808 $S2: 0x00000002 $S3: 0xFFFFFF98
$20: $S4: 0xC5FFFF20 $S5: 0x00000019 $S6: 0x00000504 $S7: 0x0000050A
$24: $T8: 0x70000000 $T9: 0x00000080 $K0: 0xA713A713 $K1: 0xA713A713
$28: $GP: 0x70400A00 $SP: 0x0000005E $S8: 0x00000024 $RA: 0x7A5D9A2C
050,03,00032-b %17
DEBUG error 66: Cannot set TNS breakpoint at this location because there is no
corresponding RISC breakpoint.
050,03,00032-b 0x7042004c
N: 0x7042004C INS: 0xABB0FFFA
INS: SWL s0,-6(sp)
050,03,00032-r
DEBUG P=%000013, E=%000317, UC.%00-RISC BREAKPOINT ($PC: 0x7042004C)-
050,03,00032-d *
Sample Debug Sessions
Debug Manual—421921-003
F-26
Accelerated Program Example
Because we are not at a register-exact point, the displayed registers issued a warning
message. The warning message indicates that the TNS registers might not contain the
correct values at this point of the program. If we need to find a memory-exact or
register-exact location near this RISC location, we can specify the RISC location to the
PMAP command.
Note that the RISC register $PC is specified to the PMAP command. For an
accelerated program, the RISC registers can be used in expressions to commands.
Next, we clear the breakpoints and set a breakpoint on the next memory-exact point.
Before resuming, we use the LMAP command to find the address of the routine to
which the JAL instruction is jumping.
*** WARNING: TNS STATE MAY NOT BE WHERE YOU THINK IT IS ***
S=%000063 P=%000013 E=%000317 L=%000022 SP=UC.%00
ENV IS: TK CCE RP7
EXAMPLE_INIT + %000006
*REG* %000002 %104010 %140000 %177776 %177440 %000031 %002404 %002412
EXECUTION MODE = ACCELERATED
$PC: 0x7042004C $HI: 0x0000246F $LO: 0x8881FC7E
$00: $00: 0x00000000 $AT: 0x70000000 $V0: 0x7E000000 $V1: 0x00000000
$04: $A0: 0x0000257D $A1: 0x00000000 $A2: 0x0000000B $A3: 0x80022438
$08: $T0: 0x7042003C $T1: 0x7042003C $T2: 0x70400000 $T3: 0x70400000
$12: $T4: 0x0000FD13 $T5: 0x8006FC14 $T6: 0xFFFFFFFF $T7: 0x00000000
$16: $S0: 0x00000002 $S1: 0x7A5D8808 $S2: 0xFFFFC000 $S3: 0xFFFFFFFE
$20: $S4: 0xC5FFFF20 $S5: 0x00000019 $S6: 0x00000504 $S7: 0x0000050A
$24: $T8: 0x70000000 $T9: 0x00000080 $K0: 0xA713A713 $K1: 0xA713A713
$28: $GP: 0x70400A00 $SP: 0x00000066 $S8: 0x00000024 $RA: 0x7A5D9A2C
050,03,00032-pmap $pc , 7
%000013: @ BPT LDI +000 LADR G+001 DLLS 01
%000017: LDLI +300 LDI -002 PUSH 733 XCAL 003
7042003C: BREAK INSPECT RISC LI s2,-16384 LI s3,-2
70420048: ADDIU sp,sp,8 BREAK INSPECT RISC SWR s0,-3(sp)
70420054: SH s2,-2(sp) SH s3,0(sp) JAL 0x7C2CB64C
70420060: LI a0,19
%000023: @ STOR L+001
70420064: SH s0,2(fp)
050,03,00032-c *
050,03,00032-b %23
@ ADDR: UC.%00,%000023 INS: %044401 SEG: %020737
INS: STOR L+001
050,03,00032-lmap 0x7C2CB64C
$PROCESSHANDLE_NULLIT_ (SLr)
050,03,00032-r
DEBUG P=%000023, E=%000217, UC.%00-BREAKPOINT-
Sample Debug Sessions
Debug Manual—421921-003
F-27
Accelerated Program Example
This time the PROCESS_HANDLE array starting the program GLOBAL +1 should be
initialized with nulls. We can confirm this by displaying the information:
STOP Command
We stop the program by entering the STOP command.
050,03,00032-d 1, #10:H
%000001: 0xFFFF 0xFFFF 0xFFFF 0xFFFF 0xFFFF 0xFFFF 0xFFFF 0xFFFF
%000011: 0xFFFF 0xFFFF

Sample Debug Sessions
Debug Manual—421921-003
F-28
Native Program Example
Native Program Example
To show the use of Debug commands on a program compiled with a native compiler,
we compiled the sample program in Example F-1 on page F-2 with pTAL as follows:
Example F-3. pTAL Compiled Listing
PTAL /IN demo1, OUT $S.#ldemo1/ tdemo1; optimize 0
Copyright (c) 1992-1995, Tandem Computers Incorporated
Directives = ?OPTIMIZE 0
Source file: [1] \node.ndemo1 1998-07-08 14:53:11
7.010 0 0 ?NOLIST, SOURCE $system.system.extdecs (DEBUG, FILE_OPEN_,
8.100 0 0 INT my_termnum;
8.101 0 0 INT process_handle [0:9];
8.110 0 0 STRING .EXT sp := %2000000D;
8.220 1 0 PROC example_init;
8.230 1 1 BEGIN
8.300 1 1 INT error_init;
8.301 1 1 INT .EXT handle_ptr;
8.302 1 1 STRING hometerm [0:47];
8.304 1 1 INT hometerm_len;
8.305 1 1 STRING .hometerm_ptr;
8.307 1 1 INITIALIZER; ! external system procedure
8.308 1 1 error_init := PROCESSHANDLE_NULLIT_ (process_handle);
8.310 1 1 error_init := PROCESS_GETINFO_ (process_handle,
8.311 1 1 !fname:max!, !fname-len!, !priority!,
8.312 1 1 !mom!, hometerm:48, hometerm_len);
8.313 1 1 error_init := FILE_OPEN_ (hometerm:hometerm_len, my_termnum);
8.317 1 1 IF error_init <> 0 THEN
8.320 1 1 DEBUG;
8.340 1 1 @hometerm_ptr := @hometerm [0];
8.341 1 1 @handle_ptr := $WADDR_TO_EXTADDR (@process_handle [0]);
8.350 1 1 END; -- example_init
ERROR_INIT INT(16)
%HB6 %H2 LOCAL VARIABLE
HANDLE_PTR INT(16) EXT POINTER
%HB0 %H4 LOCAL VARIABLE
HOMETERM STRING [0:47]
%H80 %H30 LOCAL VARIABLE
HOMETERM_LEN INT(16)
%H7E %H2 LOCAL VARIABLE
HOMETERM_PTR STRING POINTER
%H78 %H4 LOCAL VARIABLE
9. 1 0 PROC example_fill_array (array_num);
9.010 1 0 INT array_num;
9.100 1 1 BEGIN
9.101 1 1 INT count_read;
9.110 1 1 INT error_fill_array;
9.111 1 1 STRING .in_out_msg [0:47];
9.112 1 1 STRING .EXT segment_ptr;
9.114 1 1 error_fill_array := SEGMENT_USE_ (array_num);
9.120 1 1 IF error_fill_array <> 0 THEN
9.121 1 1 DEBUG;
9.122 1 1 sp [0] := array_num;
9.123 1 1 @segment_ptr := @sp [41];
9.124 1 1 in_out_msg [0] ‘:=’ “enter some data” & %h0D0A; -- CR LF
9.130 1 1 WRITEREADX (my_termnum, in_out_msg, 17, 48, count_read);
9.140 1 1 segment_ptr ‘:=’ in_out_msg [0] FOR count_read bytes;
9.200 1 1 END; -- example_fill_array
ARRAY_NUM INT(16)
%H82 %H2 LOCAL PARAMETER
COUNT_READ INT(16)
%H7E %H2 LOCAL VARIABLE
ERROR_FILL_ARRAY INT(16)
%H7C %H2 LOCAL VARIABLE
IN_OUT_MSG STRING [0:47]
%H4C %H30 LOCAL VARIABLE

Sample Debug Sessions
Debug Manual—421921-003
F-29
Native Program Example
SEGMENT_PTR STRING EXT POINTER
%H48 %H4 LOCAL VARIABLE
9.300 1 0 PROC example_main MAIN;
10. 1 1 BEGIN
11.020 1 1 INT error_main;
11.030 1 1 INT error_detail;
12. 1 1 example_init;
12.007 1 error_main := SEGMENT_ALLOCATE_ (1, 131064D, !filename;len!,
error_detail);
12.020 1 1 IF error_main <> 0 THEN
12.021 1 1 DEBUG;
12.022 1 error_main := SEGMENT_ALLOCATE_ (2, 131064D, !filename;len!,
error_detail);
12.030 1 1 IF error_main <> 0 THEN
12.031 1 1 DEBUG;
12.032 1 error_main := SEGMENT_ALLOCATE_ (17, 258000D, !filename;len!,
error_detail);
12.040 1 1 IF error_main <> 0 THEN
12.050 1 1 DEBUG;
12.200 1 1 example_fill_array (1);
12.300 1 1 example_fill_array (2);
13. 1 1 example_fill_array (17);
14. 1 1 END; -- example_maim
ERROR_DETAIL INT(16)
%H44 %H2 LOCAL VARIABLE
ERROR_MAIN INT(16)
%H46 %H2 LOCAL VARIABLE
Global Map
MY_TERMNUM INT(16)
%H0 %H2 _GLOBAL
PROCESS_HANDLE INT(16) [0:9]
%H2 %H14 _GLOBAL
SP STRING EXT POINTER
%H18 %H4 _GLOBAL
To make the program executable, we must also run NLD on the compiled object to
create an executable object. We use this command:
NLD tdemo1 -o ndemo1 -set inspect off -s
We also need to get some address information about various procedures from the
noft listing. For more information about using noft, see the nld Manual and the noft
Manual. For our example, we specify noft commands as follows:
NOFT out $s.#lndemo1;f ndemo1; lp * d

Sample Debug Sessions
Debug Manual—421921-003
F-30
Native Program Example
Example F-4. noft Listing of pTAL Program
Out File : $s.#lnexp1
Object File : $NATIV1.CRGMAN.nexp1
File Format : ELF
Scope : (none)
Case : Sensitive
******** List of Procedures ********
Number : 2
Name : EXAMPLE_INIT
Address : 0x70000390
Size : 212 bytes
Subprocedure : No
Visibility : External
Optimization Level : (unknown)
Parent Procedure : (none)
Source File : Source name stripped
Number : 3
Name : EXAMPLE_FILL_ARRAY
Address : 0x70000464
Size : 268 bytes
Subprocedure : No
Visibility : External
Optimization Level : (unknown)
Parent Procedure : (none)
Source File : Source name stripped
Number : 4
Name : EXAMPLE_MAIN
Address : 0x70000570
Size : 320 bytes
Subprocedure : No
Visibility : External
Optimization Level : (unknown)
Parent Procedure : (none)
Source File : Source name stripped
Break Command
Here, we demonstrate breakpoints using the EXAMPLE_INIT procedure in our native
program in Example F-3 on page F-28. In the following example, we demonstrate
issuing breakpoints at the global scope of our program. Later, we will demonstrate
breakpoints within a local procedure.
To start debugging the native program example, we enter the following command. (If
the program starts in Inspect, enter the SELECT DEBUGGER DEBUG to access
Debug.)
For this example, we look at the before and after results that occur as a result of
executing the EXAMPLE_INIT procedure. We put a breakpoint near the beginning and
near the end of the procedure. (This is similar to what we did for the TNS example.)
From the noft listing in Example F-4, we find that EXAMPLE_INIT starts at
0x70000390. We put a breakpoint three instructions after the beginning breakpoint so
that the stack can be set up. Each instruction is 4 bytes long. We use the B command
to specify the first breakpoint.
RUND ndemo1
DEBUG $PC=0x70000570
050,03,00266-B 0x70000390 + (#3 * #4)
N: 0x7000039C INS: 0x00002025
INS: OR a0,$0,$0
Sample Debug Sessions
Debug Manual—421921-003
F-31
Native Program Example
Selecting a location near the end of the EXAMPLE_INIT procedure in our noft listing,
we see that EXAMPLE_INIT is 212 (decimal) bytes long. To make sure we that get to
the end of the procedure we want to work with, rather than a procedure that precedes
it, it is important that we find the starting address of the instruction that is second from
the end of the procedure. We ensure the correct location by subtracting 8 bytes (2 * 4)
from the length of the procedure. To find the ending address of EXAMPLE_INIT, we
add 8 to its beginning address. The following shows this formula:
We resume the program and let it hit the first breakpoint.
LMAP Command
The $PC value shows that we have hit the breakpoint at the beginning of
EXAMPLE_INIT, but we can confirm this using the LMAP command. We pass the
$PC register to the LMAP command.
Displaying Variable Values
We can look at the content of program’s global variable MY_TERMNUM located a
program _GLOBAL + 0, and the procedure variables HOMETERM_LEN and
HOMETERM located at stack + %H7E and stack + %H80, respectively. Note that
hexadecimal numbers can be entered with the numeric prefix %H or 0X. Also note that
_GLOBAL has the address 0x08000000. We will see this address when we look at the
HANDLE_PTR variable in the EXAMPLE_INIT procedure, later in the example.
We used %H30/2 for the length of the A command based on the declaration in the
listing. The array was declared as [0:47], which is 48 (decimal) bytes long. For the A
command, the length is the number of 16-bit words. Because there are 2 bytes per
16-bit word, we divide the length by 2. We also use the B display format to group the
output into bytes rather than the default of 16-bit words.
050,03,00266-B 0x70000390 + (#212 - #8)
N: 0x7000045C INS: 0x03E00008
INS: JR ra
050,03,00266-R
DEBUG $PC=0x7000039C -RISC BREAKPOINT ($PC: 0x7000039C)-
050,03,00266-LMAP $PC
EXAMPLE_INIT + 0xC (UCr)
050,03,00266-D N 0x08000000, 1 :H
08000000: 0x0000
050,03,00266-D N $SP + %H7E , 1:D
4FFFFEAE: #00000
050,03,00266-A N $SP + %H80, %h30/2, B
4FFFFEB0:................................................
Sample Debug Sessions
Debug Manual—421921-003
F-32
Native Program Example
Checking for Open Files
We check for open files using the find (F) command. We find that there is no open file
at this point in our example.
We advance to the breakpoint at the end of the EXAMPLE_INIT procedure using the
resume command, and verify our location with the LMAP command:
N-address Mode
We look at the various data locations again:
We used the value found for HOMETERM_LEN at $SP + %H7E for the length of the A
command. We rounded the result up to the next even number before dividing by 2. We
also specified the output to be displayed in byte-form instead of 16-bit word-form. (The
letters C or B1 could have been used instead of B for the same result.)
In executing the above commands, we used the N-address mode. This is a common
practice with native programs, because they use 32 bit-words and hexadecimal values
more often than TNS or accelerated programs.
DN Command
Many programmers prefer to use the DN command for displaying output information.
For working with 32-bit operations, the 32-bit byte-form is used (programmers do not
need to convert from 16-bit word-form). Also, twice as much information is displayed
and hexadecimal is the default display format. In the following example, we display the
variables discussed above using the DN command.
050,03,00266-F
# -1 ??? # 00000
050,03,00266-R
DEBUG $PC=0x7000045C -RISC BREAKPOINT ($PC: 0x7000045C)-
050,03,00266-LMAP $PC
EXAMPLE_INIT + 0xCC (UCr)
050,03,00266-D N 0x08000000, 1 :H
08000000: 0x0001
050,03,00266-D N $SP + %H7E , 1:D
4FFFFEAE: #00019
050,03,00266-A N $SP + %H80, #20/2, B
4FFFFEB0:\M5.$ZTN00.#PTUGRB0.
Sample Debug Sessions
Debug Manual—421921-003
F-33
Native Program Example
The length is the number of 32-bit words to display. The :H 2 part of the first command
below breaks the output into two-byte hexadecimal groups. The :D part of the second
command breaks the output into two-byte decimal groups.
We again check for open files. This time file number 1 is opened with the name shown
with the A command and the DN :A command.
FC Command
The default output for the DN command is hexadecimal. We can change the output
using the base option. (Use HELP DN for syntax information.) Below, we use the FC
command to change the command. We can look at the contents of the program’s
global variable PROCESS_HANDLE array in the default form and in decimal form. The
PROCESS_HANDLE array starts at program _GLOBAL address 2 and is five 32-bit
words long.
At this point in the procedure, the local extended integer pointer, HANDLE_PTR,
located at $SP + %HB0, is set to the program’s global array, PROCESS_HANDLE,
starting at _GLOBAL + 2. Thus, we know the address for _GLOBAL is 0x08000002.
050,03,00266-DN 0x08000000, 1 :H 2
08000000: 0x0001 0x0100
050,03,00266-DN $SP + %H7E, 1:D
4FFFFEAE: #00019 #23629
050,03,00266-DN $sp + %h80, #20/4 :A
4FFFFEB0: .\M5.. .$ZTN. .00.#. .PTUG.
4FFFFEC0: .RB0..
050,03,00266-F
# -1 ??? # 00000
#001 \M5.$ZTN00.#PTUGRB0 # 00000
050,03,00266-DN 0x08000000 + %H2, #5
08000002: 0x01000000 0x0003010A 0x00000000 0x000BDB4C
08000012: 0x00000032
050,03,00266-FC
DN 0x08000000 + %H2, #5
............. :D
DN 0x08000000 + %H2, #5 :D
.............
08000002: #00256 #00000 #00003 #00266 #00000 #00000 #00011 #56140
08000012: #00000 #00050

Sample Debug Sessions
Debug Manual—421921-003
F-34
Native Program Example
We can display the information in PROCESS_HANDLE by using two steps: reading
the pointer address stored at $SP + %HB0 and then using that address to display the
information in PROCESS_HANDLE. Alternatively, we can use the extended string
indirect-clause in the address part of the display command. The following shows both
methods:
= Command
We can use the = command to see a value in various bases. For example, if we take
the value of the fourth 16-bit word of the PROCESS_HANDLE array and use it in the =
command, we get the following:
We stop the program after segments 1and 2 have been allocated in the main
procedure of EXAMPLE_MAIN. We see from the noft listing that the procedure starts
at 0x70000570 and is 320 (decimal) bytes long.
I Command
We need to analyze the code to see where to put the breakpoints. Note that the
decoding instruction uses decimal numbers frequently. We can assume that unless the
number is prefixed with a 0x, it is a decimal number when it appears in the decoding
instruction.
050,03,00266-DN $SP + %HB0
4FFFFEE0: 0x08000002
050,03,00266-DN 0x08000002, #5 :D
08000002: #00256 #00000 #00003 #00266 #00000 #00000 #00011 #56140
08000012: #00000 #00050 0x000B 0xDB4C
050,03,00266-DN ($SP + %HB0)SX, #5:D
08000002: #00256 #00000 #00003 #00266 #00000 #00000 #00011 #56140
08000012: #00000 #00050
050,03,00266-= #00266
= %000412 #00266 0x010A '..'

Sample Debug Sessions
Debug Manual—421921-003
F-35
Native Program Example
LMAP Command (Continued)
Note that address 0x7000057C contains a JAL. The address points to the
EXAMPLE_INIT procedure. We can see this using the LMAP command:
After the NOP in the delay slot, we see the parameters being set up for the next JAL.
The SEGMENT_ALLOCATE_ procedure can accept a variable number of parameters;
register A0 is a mask indicating which parameters are being passed. Some of the
parameters are passed in registers and others are passed on the stack. Register A1
contains the segment number and A2, the length. The pointer to ERROR_DETAIL,
$SP + 68, is stored at $SP + 20. So, for the first call to SEGMENT_ALLOCATE_, we
see this sequence of output:
The results from SEGMENT_ALLOCATE_ are stored in ERROR_MAIN, at $SP + 70,
the result is also put in register T7 and compared against the zero constant in register
$0. If the results are not equal, we fall into the next JAL, which is the call to Debug.
The following shows this sequence:
050,03,00266-I 0x70000570, (#320 / 4)
70000570: ADDIU sp,sp,-72 SW ra,60(sp) SW s0,56(sp)
7000057C: JAL 0x70000390 NOP LUI a0,0xC800
70000588: LI a1,1 LUI a2,0x1
70000590: ORI a2,a2,0xFFF8 ADDIU t6,sp,68 SW t6,20(sp)
7000059C: SW $0,44(sp) JAL 0x7F8051A8 NOP
700005A8: OR s0,v0,$0 SH s0,70(sp)
700005B0: LH t7,70(sp) NOP BEQ t7,$0,0x700005D0
700005BC: NOP JAL 0x7C369070 NOP
700005C8: BEQ $0,$0,0x700005D0 NOP
700005D0: LUI a0,0xC800 LI a1,2 LUI a2,0x1
700005DC: ORI a2,a2,0xFFF8 ADDIU t8,sp,68 SW t8,20(sp)
700005E8: JAL 0x7F8051A8 NOP
700005F0: OR s0,v0,$0 SH s0,70(sp) LH t9,70(sp)
700005FC: NOP BEQ t9,$0,0x70000618 NOP
70000608: JAL 0x7C369070 NOP
70000610: BEQ $0,$0,0x70000618 NOP LUI a0,0xC800
7000061C: LI a1,17 LUI a2,0x3 ORI a2,a2,0xEFD0
70000628: ADDIU t0,sp,68 SW t0,20(sp)
70000630: JAL 0x7F8051A8 NOP OR s0,v0,$0
7000063C: SH s0,70(sp) LH t1,70(sp) NOP
70000648: BEQ t1,$0,0x70000660 NOP
70000650: JAL 0x7C369070 NOP BEQ $0,$0,0x70000660
7000065C: NOP LI a0,1 JAL 0x70000464
70000668: NOP LI a0,2
70000670: JAL 0x70000464 NOP LI a0,17
7000067C: JAL 0x70000464 NOP OR a0,$0,$0
70000688: JAL 0x7F808C98 NOP
70000690: BEQ $0,$0,0x70000698 NOP LW s0,56(sp)
7000069C: LW ra,60(sp) NOP JR ra
700006A8: ADDIU sp,sp,72 NOP
050,03,00266-LMAP 0x70000390
EXAMPLE_INIT (UCr)
7000057C: LUI a0,0xC800
70000588: LI a1,1 LUI a2,0x1
70000590: ORI a2,a2,0xFFF8 ADDIU t6,sp,68 SW t6,20(sp)
7000059C: SW $0,44(sp) JAL 0x7F8051A8 NOP
700005A8: OR s0,v0,$0 SH s0,70(sp)
700005B0: LH t7,70(sp) NOP BEQ t7,$0,0x700005D0
700005BC: NOP JAL 0x7C369070 NOP

Sample Debug Sessions
Debug Manual—421921-003
F-36
Native Program Example
We can confirm that the JAL in the above sequence is a call to Debug by using the
LMAP command:
This does not work all the time. For example, the call to SEGMENT_ALLOCATE_ goes
through a gateway to provide a protection layer between PRIV and non-PRIV code.
Gateway and millicode addresses cannot be interpreted by the LMAP command. The
following is the address for SEGMENT_ALLOCATE_ shown in an earlier code
sequence. Below, we show the information the AMAP command provides about the
address:
Break Command (Continued)
Below, we put a breakpoint after the first call to SEGMENT_ALLOCATE_ and after the
second call to SEGMENT_ALLOCATE_:
At the first location, we stopped just as the ERROR_MAIN value at $SP + 70 was
about to be loaded into register T7. In the second case, the value was already loaded
in register T9 and we are about to branch based on the content in this register. We
resume to the first location.
DN Command (Continued)
At this point in our example, we simulate an error returned from the call to
SEGMENT_ALLOCATE_ by modifying the value in ERROR_MAIN at $SP + 70 to
Note. If a compiler optimization level other than 0 is used, it is unlikely that the return value
from SEGMENT_ALLOCATE_ would be stored in memory. It would probably just be kept in a
register.
050,03,00266-LMAP 0x7C369070
DEBUG (SLr)
050,03,00266-LMAP 0x7F8051A8
050,03,00266-AMAP 0x7F8051A8
Address: 0x7F8051A8
Kind = 0x000B: SL (NATIVE)
Attributes: Read Only, Code, Entry Vector, Priv To Write
050,03,00266-B 0x700005B0
N: 0x700005B0 INS: 0x87AF0046
INS: LH t7,70(sp)
050,03,00266-B 0x70000600
N: 0x70000600 INS: 0x13200005
INS: BEQ t9,$0,0x70000618
050,03,00266-R
DEBUG $PC=0x700005B0 -RISC BREAKPOINT ($PC: 0x700005B0)-
Sample Debug Sessions
Debug Manual—421921-003
F-37
Native Program Example
have a nonzero value. First we display the location, then we modify the location.
Finally, we display the location again.
The ERROR_MAIN variable is 2 bytes or 16 bits out of a 32-bit word. The first
command we used was the DN command to display the 32-bit word as two 16-bit
words. The second display we used is the D command with the N-address option to
show one 16-bit word. We used the M command without the N-address option to
assign a 16-bit value to the word. We could have also used the M command with the
N-address option, but we would have needed to keep the value of the lower 16 bits of
the 32-bit word unchanged, by entering their value. In that case, the command we
would have entered is M N $SP + #70, 0xFFFF0000.
We resume and see the call to Debug, then resume to the next breakpoint. The call to
Debug produces a different message at the stop than when we hit a breakpoint.
Modifying Register Contents
We simulate an error returned from the call to SEGMENT_ALLOCATE_ by modifying
the value used in the branch instruction to have a nonzero value. This time we use the
modify command to change the register interactively. First, we display the current code
location, clear the break at the location, and see the instruction at the location. Then
we modify the value, display the register, and resume.
050,03,00266-DN $SP + #70 :H 2
4FFFFF2E: 0x0000 0x0000
050,03,00266-D N $SP + #70
4FFFFF2E: 0x0000
050,03,00266-M $SP + #70, -#1
050,03,00266-DN $SP + #70 :H
4FFFFF2E: 0xFFFF0000
050,03,00266-R
DEBUG $PC=0x700005C8
050,03,00266-R
DEBUG $PC=0x70000600 -RISC BREAKPOINT ($PC: 0x70000600)-
050,03,00266-I $PC
70000600: BREAK INSPECT RISC
050,03,00266-C $PC
050,03,00266-I $PC
70000600: BEQ t9,$0,0x70000618
050,03,00266-M $T9
*REG*: 0x00000000 <- 4
050,03,00266-D $T9
*REG*: 0x00000004
050,03,00266-R
DEBUG $PC=0x70000610

Sample Debug Sessions
Debug Manual—421921-003
F-38
Native Program Example
Clearing Breakpoints
We view all the remaining breakpoints we have set, clear them, then show that they
are gone:
Setting Breakpoints Within a Procedure
In our first native code breakpoint example, we use the EXAMPLE_INIT procedure to
emphasize debugging more on a global scope. The following example uses, the
EXAMPLE_FILL_ARRAY procedure to emphasize debugging on a narrower (local)
scope. In this example we demonstrate the B command as well as other Debug
commands that we did not use with the EXAMPLE_INIT procedure.
I Command
We set breakpoints near the beginning and near the end of EXAMPLE_FILL_ARRAY
procedure and resume to the first breakpoint. From our noft listing, we find that the
procedure starts at 0x70000464 and is 268 bytes long. If we look at the first few
instructions of the procedure, we observe:
The first five instructions set up the stack for the EXAMPLE_FILL_ARRAY procedure.
The instruction at 0x70000478 sets up the parameters for JAL at 0x70000484. This
JAL is the call to the SEGMENT_USE_ procedure.
B Command
We put the beginning breakpoint at 0x70000478 and the end breakpoint at the second
instruction from the end of the procedure.
050,03,00266-B
N: 0x7000039C INS: 0x00002025
INS: OR a0,$0,$0
N: 0x7000045C INS: 0x03E00008
INS: JR ra
N: 0x700005B0 INS: 0x87AF0046
INS: LH t7,70(sp)
050,03,00266-C *
050,03,00266-B
050,03,00266-I 0x70000464, #10
70000464: ADDIU sp,sp,-128 SW ra,60(sp) SW a0,128(sp)
70000470: SW s1,56(sp) SW s0,52(sp) LUI a0,0x8000
7000047C: LH a1,130(sp) SW $0,44(sp)
70000484: JAL 0x7F805228 NOP
050,03,00266-B 0x70000478
N: 0x70000478 INS: 0x3C048000
INS: LUI a0,0x8000
050,03,00266-B 0x70000464 + #268 - (4 * 2)
N: 0x70000568 INS: 0x03E00008
INS: JR ra
Sample Debug Sessions
Debug Manual—421921-003
F-39
Native Program Example
T Command
We resume the program. After reaching the breakpoint, we use the T and TN
commands to trace the stack and show the names:
Clear Breakpoint at the Current Location
If the program is stopped at a code breakpoint, you need to specify only the C
command to clear the breakpoint. We will look at the breakpoints before and after this
operation.
The EXAMPLE_FILL_ARRAY procedure uses one of the previously allocated
segments. We can see the current segment in use with the ? command and display the
ARRAY_NUM parameter at $SP + %h82. Note that ARRAY_NUM is only 2 bytes long.
The :d part of the command caused the 32-bit word to break into two 16-bit words.
When we resume the program, it puts data segment 1 into use, then prompts us for
some data. We enter "abcdefg". The program places the input data in a local buffer,
then moves it to the data segment. At this point of our example, we arrive at the
050,03,00266-t
DEBUG $PC=0x70000478 -RISC BREAKPOINT ($PC: 0x70000478)-
050,03,00266-t
0x70000478 VFP=0x4FFFFEE8 UCr
0x4FFFFE9C: 0x7000066C VFP=0x4FFFFF30 UCr
050,03,00266-tn
0x70000478 VFP=0x4FFFFEE8 EXAMPLE_FILL_ARRAY + 0x14
0x4FFFFE9C: 0x7000066C VFP=0x4FFFFF30 EXAMPLE_MAIN + 0xFC
050,03,00266-b
N: 0x70000478 INS: 0x3C048000
INS: LUI a0,0x8000
N: 0x70000568 INS: 0x03E00008
INS: JR ra
050,03,00266-c
050,03,00266-b
N: 0x70000568 INS: 0x03E00008
INS: JR ra
050,03,00266-?
USE SEGMENT ID = NONE
BASE STANDARD IN
BASE STANDARD OUT
TERM \M5.$ZTN00.#PTUGRB0
PRV = OFF
050,03,00266-DN $sp+ %h82, 1 :d
4FFFFEEA: #00001 #00000
Sample Debug Sessions
Debug Manual—421921-003
F-40
Native Program Example
breakpoint that is at the end of the procedure. Using the ? command, we see that
segment 1 is being used.
Displaying Data Using Q Address
We can display some data in the selectable segment using the Q-address mode. The
extended indirect pointer, SP, was used to store the ARRAY_NUM in location 0 of the
selectable segment. We can separate the characters by using the C grouping option
and the hexadecimal output format.
We can also see the results of moving the procedure's buffer into the selectable
segment. Because the data was stored at byte offset 41, we need to round down to the
previous even byte (40). We then divide the offset 40 by 2 to convert to a 16-bit word
address.
Displaying Output in Hexadecimal
Note that the output address, for the commands we used above, is given as 16-bit
word offsets in octal. To see the hexadecimal byte offset, we can use the DN
command. However, we need to first get the 32-bit address of the selectable segment.
AMAP Command
We use the AMAP command to get the 32-bit address of the selectable segment.
050,03,00266-r
enter some data
abcdefg
DEBUG $PC=0x70000568 -RISC BREAKPOINT ($PC: 0x70000568)-
050,03,00267-?
USE SEGMENT ID = %000001
BASE STANDARD IN
BASE STANDARD OUT
TERM \M5.$ZTN00.#PTUGRB0
PRV = OFF
050,03,00266-d q 0, c :h
%000000: 01 00
050,03,00266-a q #40/2, #12/2, c
%000024:.abcdefg....
050,03,00266-AMAP Q
Address: 0x00080000
Kind = 0x0013: Unknown
Attributes: none

Sample Debug Sessions
Debug Manual—421921-003
F-41
Native Program Example
DN Command
Then display the information shown under the “Displaying Data Using Q Address”
using the DN command.
Using DN Command with Extended String Address
The EXAMPLE_FILL_ARRAY procedure does not update the extended indirect pointer
SP located at program _GLOBAL + %H18, so it is pointing to the beginning of the
selectable segment. We can repeat the DN commands above, using SP as an string
extended address.
The EXAMPLE_FILL_ARRAY procedure has a local extended string pointer,
SEGMENT_PTR, located at $SP + %h48. The pointer is set to offset 41 of SP. We can
repeat the above commands, using the location for the SEGMENT_PTR pointer.
We resume the program so it stops the next time we reach the end of the
EXAMPLE_FILL_ARRAY procedure. The ? command shows the segment that
iscurrently being used.
050,03,00266-DN 0x00080000, 1 : h 1
00080000: 0x01 0x00 0x00 0x00
050,03,00266-DN 0x00080000 + #40, #12/4 :a
00080028: ..abc. .defg. ......
Note. The DN command we are using has this address form: offset [indirection-type [index]].
50,03,00266-DN 0x08000000 + %h18sx, 1 :h 1
00080000: 0x01 0x00 0x00 0x00
050,03,00266-DN 0x08000000 + %h18sx#40, #12/4 :a
00080028: ..abc. .defg. ......
050,03,00266-DN $SP +%h48sx, #12/4 :a
00080029: .abcd. .efg.. ......
050,03,00266-r
enter some data
tuvwxyz
DEBUG $PC=0x70000568 -RISC BREAKPOINT ($PC: 0x70000568)-
050,03,00266-?
USE SEGMENT ID = %000002
BASE STANDARD IN
BASE STANDARD OUT
TERM \M5.$ZTN00.#PTUGRB0
PRV = OFF

Sample Debug Sessions
Debug Manual—421921-003
F-42
Native Program Example
VQ Command
We switch to another selectable segment with the VQ command and modify the data in
the segment in preparation to demonstrate the FN command.
FN Command
We can use the FN command to find the location of a 16-bit word that matches a
value. The value must be aligned on an even byte boundary. The "abcdefg" data we
entered was placed into the selectable segment 1 starting on an odd byte (41), so we
start by looking for a "bc," which is the first character starting on an even byte. We also
modified the selectable segment with an "bc" at offset 0x2ff0, which is an even
address.
Pressing return at the (FN) prompt causes the FN command to continue searching.
After the second return, we encounter the end of the selectable segment, and an error
is reported.
To find out the byte address in hexadecimal form, we can use the AMAP command to
convert the Q-address into a 32-bit address and use the = command to add in the 16-
bit offset. Furthermore, we enter the data found at the location to the = command and
find that the value equals "bc."
050,03,00266-vq 1
050,03,00266-?
USE SEGMENT ID = %000001
BASE STANDARD IN
BASE STANDARD OUT
TERM \M5.$ZTN00.#PTUGRB0
PRV = OFF
050,03,00266- M Q 0x2ff0, 'bc'
050,03,00266-FN Q 0, 'bc'
%000025: 0x6263
050,03,00266 (FN)-
%027760: 0x6263
050,03,00266 (FN)-
** DEBUG error 50: FN stopped searching at the following address: 0x0009FFF8
Address not valid
Note. The FN command specifies the output address offset for 16-bit words in octal.
050,03,00266-AMAP Q 0
Address: 0x00080000
Kind = 0x0013: Unknown
Attributes: none
050,03,00266-= 0x00080000 + (%000025 * 2)
Sample Debug Sessions
Debug Manual—421921-003
F-43
Native Program Example
Finding Bit Patterns
If we want to find a bit pattern and do not care what is in the other bits, we can use
masking. In the following example, we look for a "c" in the second byte of the 16-bit
word and ignore the other bits. The "x" is the value we were looking for, and the 0x62,
"b", was ignored when finding the match.
We resume the program again and enter a different data pattern from what is
contained in segments 1 and 2. The selectable segment 17 is longer than segment 1
or segment 2. We use this to show some variations on the commands.
For the next example, we modify a 32-bit word in the selectable segment. We use the
modify command with an N-address prefix to do the 32-bit operation.
= %00002000052 #524330 0x0008002A '...*'
050,03,00266-= 0x6263
= %061143 #25187 0x6263 'bc'
050,03,00266-fn q 0, 'xc' & 0x00ff
%000025: 0x6263
050,03,00266 (FN)-
%027760: 0x6263
050,03,00266 (FN)-
050,03,00266-r
enter some data
0123456789
DEBUG $PC=0x70000568 -RISC BREAKPOINT ($PC: 0x70000568)-
050,03,00266-?
USE SEGMENT ID = %000021
BASE STANDARD IN
BASE STANDARD OUT
TERM \M5.$ZTN00.#PTUGRB0
PRV = OFF
050,03,00266-AMAP Q #140000
Address: 0x000A22E0
Kind = 0x0013: Unknown
Attributes: none
050,03,00266-m n 0x000A22E0
0x000A22E0 : 0x00000000 <- '3456'
0x000A22E4 : 0x00000000 <-
Sample Debug Sessions
Debug Manual—421921-003
F-44
Native Program Example
FNL Command
We use the FNL command to find the 32-bit data. The value is 32-bit, so the address
given must be aligned on an even quad byte.
The FNL and FN commands stop the search either at the end of the segment or when
the low-order 17 bits of the address are zero. If the address boundary is reached, it is
only necessary to restart the command with the address. The value to search for will
be the same as for the last search.
Searching for Specific Bit Patterns
We can look for a specific pattern within the 32-bit word, while ignoring the other bits.
In this example, we use the FNL command with a mask to look only for the bit pattern
0x3435 in the second and third byte of the word:
STOP Command
Before we move to the rest of the native program examples, we enter the STOP
command to stop the program.
Additional Breakpoint Options
In the following examples, we demonstrate some variations on the B and BM
commands by running the Example F-3, pTAL Compiled Listing several times.
050,03,00266-FNL Q 0 , '3456'
0008002C: 0x33343536
050,03,00266 (FNL)-
** DEBUG error 51: FNL reached address boundary. To continue, enter the
following address:
0x000A0000
050,03,00266-fnl 0x000A0000
000A22E0: 0x33343536
050,03,00266 (FNL)-
** DEBUG error 52: FNL stopped searching at the following address:
0x000BEFD0
Address not valid
Note. The output addresses for the FNL command are hexadecimal byte addresses.
050,03,00266-FNL q0, 0x00343500 & 0x00ffff00
0008002C: 0x33343536
050,03,00266 (FNL)-
Sample Debug Sessions
Debug Manual—421921-003
F-45
Native Program Example
Tracing Breakpoint
Here, we demonstrate the breakpoint tracing capability. First, we run the program as
follows: RUND ndemo1. We then set the base output to hexadecimal to make the
outputs more familiar for native code programmers.
Conditional Breakpoint
The next example shows the conditional breakpoint. We stop a code breakpoint in the
EXAMPLE_FILL_ARRAY procedure when the ARRAY_NUM parameter is greater than
16. (Note that the third call to the EXAMPLE_FILL_ARRAY procedure is 17 in the
native object code listing above.) We put a breakpoint in the EXAMPLE_FILL_ARRAY
DEBUG $PC=0x70000570
050,03,00265-base hex out
050,03,00265-b 0x70000478
N: 0x70000478 INS: 0x3C048000
INS: LUI a0,0x8000
050,03,00265-r
DEBUG $PC=0x70000478 -RISC BREAKPOINT ($PC: 0x70000478)-
050,03,00265-c
050,03,00265-= $SP + %h82
= %11777777352 #1342177002 0x4FFFFEEA 'O...'
050,03,00265-b 0x70000478, N 0x4FFFFEEA ? 1
N: 0x70000478 INS: 0x3C048000
INS: LUI a0,0x8000
N 0x4FFFFEEA ? 0x00000001
050,03,00265-b 0x70000464 + #268 - (4 * 2), N 0x00080028 ? #16/2
N: 0x70000568 INS: 0x03E00008
INS: JR ra
N 0x00080028 ? 0x00000008
050,03,00265-r
TRACE $PC=0x70000478
4FFFFEEA: 0x0001
enter some data
abcdefg
TRACE $PC=0x70000568
00080028: 0x0061 0x6263 0x6465 0x6667 0x0000 0x0000 0x0000 0x0000
TRACE $PC=0x70000478
4FFFFEEA: 0x0002
enter some data
hijklmnop
TRACE $PC=0x70000568
00080028: 0x0068 0x696A 0x6B6C 0x6D6E 0x6F70 0x0000 0x0000 0x0000
TRACE $PC=0x70000478
4FFFFEEA: 0x0011
enter some data
uvwxyz0123
TRACE $PC=0x70000568
00080028: 0x0075 0x7677 0x7879 0x7A30 0x3132 0x3300 0x0000 0x0000
Sample Debug Sessions
Debug Manual—421921-003
F-46
Native Program Example
procedure after the SP register has been set up, so that we point to the correct location
for ARRAY_NUM. First we run the program as follows: RUND ndemo1.
The ARRAY_NUM variable is a 16-bit (2 bytes long) number, so we enter the condition
address as a 32-bit address without an N prefix. If we want to have a conditional
breakpoint on a 32-bit number, we would prefix the conditional address with the N.
Execute Breakpoint
The next example shows the execute breakpoint using the BM command. First we run
the pTAL compiled listing: RUND ondemo1.
We put a memory-access breakpoint on the first 16-bit word of data pointed to in the
IN_OUT_MESSAGE array of the EXAMPLE_FILL_ARRAY procedure. We stop near
the beginning of EXAMPLE_FILL_ARRAY and look at the data in IN_OUT_MESSAGE.
The data in the current location is junk, left on the stack from the EXAMPIL_INIT
procedure that we used in previous examples.
050,03,00267-b 0x70000478
N: 0x70000478 INS: 0x3C048000
INS: LUI a0,0x8000
050,03,00267-r
DEBUG $PC=0x70000478 -RISC BREAKPOINT ($PC: 0x70000478)-
050,03,00267-c
050,03,00267-b 0x70000478, 0x4FFFFEEA > #16
N: 0x70000478 INS: 0x3C048000
INS: LUI a0,0x8000
%047777.177352 & %177777 > %000020
050,03,00267-r
enter some data
abcdefg
enter some data
lmnopqrst
DEBUG $PC=0x70000478 -RISC BREAKPOINT ($PC: 0x70000478)-
050,03,00267-dn $sp+%h82 :d
4FFFFEEA: #00017 #00000
050,03,00269-b 0x70000478
N: 0x70000478 INS: 0x3C048000
INS: LUI a0,0x8000
050,03,00269-r
DEBUG $PC=0x70000478 -RISC BREAKPOINT ($PC: 0x70000478)-
050,03,00269-dn $SP + %H4c, %h30/4 :a
4FFFFEB4: .$ZTN. .00.#. .PTK9. .AAB..
4FFFFEC4: ...... ...... ...... ......
4FFFFED4: ...... ...... ...... ......
Sample Debug Sessions
Debug Manual—421921-003
F-47
Native Program Example
Next, we clear the code breakpoint and add a memory-access breakpoint on the data.
We include a command string to make the breakpoint an execute breakpoint.
050,03,00269-bm $SP + %H4c, w, (TN; dn $SP + %H4c, %h30/4 :a; R)
N: 0x4FFFFEB4 MAB: W (TN; DN $SP + %H4C, %H30/4 :A; R)
050,03,00269-r
DEBUG $PC=0x7E007EE4 -MEMORY ACCESS BREAKPOINT-
MEMORY ACCESS BREAKPOINT OCCURRED AT $PC=0x7E007EE4
7E00.7EE4 4FFF.FE68 Mil
7000.04EC 4FFF.FEE8 EXAMPLE_FILL_ARRAY + 0x88
4FFF.FE9C: 7000.066C 4FFF.FF30 EXAMPLE_MAIN + 0xFC
4FFFFEB4: .eZTN. .00.#. .PTK9. .AAB..
4FFFFEC4: ...... ...... ...... ......
4FFFFED4: ...... ...... ...... ......
DEBUG $PC=0x7E007EF0 -MEMORY ACCESS BREAKPOINT-
MEMORY ACCESS BREAKPOINT OCCURRED AT $PC=0x7E007EF0
7E00.7EF0 4FFF.FE68 Mil
7000.04EC 4FFF.FEE8 EXAMPLE_FILL_ARRAY + 0x88
4FFF.FE9C: 7000.066C 4FFF.FF30 EXAMPLE_MAIN + 0xFC
4FFFFEB4: .enTN. .00.#. .PTK9. .AAB..
4FFFFEC4: ...... ...... ...... ......
4FFFFED4: ...... ...... ...... ......
enter some data
abcdefg
DEBUG $PC=0x70000530 -MEMORY ACCESS BREAKPOINT-
MEMORY ACCESS BREAKPOINT OCCURRED AT $PC=0x7E007EF0
7000.0532 4FFF.FEE8 EXAMPLE_FILL_ARRAY + 0xCE
4FFF.FE9C: 7000.066C 4FFF.FF30 EXAMPLE_MAIN + 0xFC
4FFFFEB4: .abcd. .efgo. .me d. .ata..
4FFFFEC4: ...... ...... ...... ......
4FFFFED4: ...... ...... ...... ......
DEBUG $PC=0x7E007EE4 -MEMORY ACCESS BREAKPOINT-
MEMORY ACCESS BREAKPOINT OCCURRED AT $PC=0x7E007EE4
7E00.7EE4 4FFF.FE68 Mil
7000.04EC 4FFF.FEE8 EXAMPLE_FILL_ARRAY + 0x88
4FFF.FE9C: 7000.0678 4FFF.FF30 EXAMPLE_MAIN + 0x108
4FFFFEB4: .ebcd. .efgo. .me d. .ata..
4FFFFEC4: ...... ...... ...... ......
4FFFFED4: ...... ...... ...... ......
DEBUG $PC=0x7E007EF0 -MEMORY ACCESS BREAKPOINT-
MEMORY ACCESS BREAKPOINT OCCURRED AT $PC=0x7E007EF0
7E00.7EF0 4FFF.FE68 Mil
7000.04EC 4FFF.FEE8 EXAMPLE_FILL_ARRAY + 0x88
4FFF.FE9C: 7000.0678 4FFF.FF30 EXAMPLE_MAIN + 0x108
4FFFFEB4: .encd. .efgo. .me d. .ata..
4FFFFEC4: ...... ...... ...... ......
4FFFFED4: ...... ...... ...... ......
enter some data
uvwxyz
DEBUG $PC=0x70000530 -MEMORY ACCESS BREAKPOINT-
MEMORY ACCESS BREAKPOINT OCCURRED AT $PC=0x7E007EF0
7000.0532 4FFF.FEE8 EXAMPLE_FILL_ARRAY + 0xCE
4FFF.FE9C: 7000.0678 4FFF.FF30 EXAMPLE_MAIN + 0x108
4FFFFEB4: .uvwx. .yzso. .me d. .ata..
4FFFFEC4: ...... ...... ...... ......
4FFFFED4: ...... ...... ...... ......
Sample Debug Sessions
Debug Manual—421921-003
F-48
Native Program Example
Note that at the first breakpoint, there is already some text in the data area. This
procedure is reusing some of the data area that the EXAMPLE_INIT procedure used.
Thus, if we had entered our breakpoint at the beginning of the program as "bm n
0x4FFFFEB4, w," we would have stopped in the EXAMPLE_INIT and
EXAMPLE_FILL_ARRAY procedures.
The memory-access breakpoint is triggered when anything is written to the 16-bit word.
In this case, we get two interrupts: one when the "e" is put into the word, and another
when the "n" is put into the word. This double interrupt is true only when the code
placing the data in the memory location is doing byte operations and the code is not
PRV. The next break happens after the data is entered. In second case, the data is
transferred in the PRV system procedure so the breakpoint is reported after the end of
the PRV procedure. In the following subsection, we discuss privileged commands.
DEBUG $PC=0x7E007EE4 -MEMORY ACCESS BREAKPOINT-
MEMORY ACCESS BREAKPOINT OCCURRED AT $PC=0x7E007EE4
7E00.7EE4 4FFF.FE68 Mil
7000.04EC 4FFF.FEE8 EXAMPLE_FILL_ARRAY + 0x88
4FFF.FE9C: 7000.0684 4FFF.FF30 EXAMPLE_MAIN + 0x114
4FFFFEB4: .evwx. .yzso. .me d. .ata..
4FFFFEC4: ...... ...... ...... ......
4FFFFED4: ...... ...... ...... ......
DEBUG $PC=0x7E007EF0 -MEMORY ACCESS BREAKPOINT-
MEMORY ACCESS BREAKPOINT OCCURRED AT $PC=0x7E007EF0
7E00.7EF0 4FFF.FE68 Mil
7000.04EC 4FFF.FEE8 EXAMPLE_FILL_ARRAY + 0x88
4FFF.FE9C: 7000.0684 4FFF.FF30 EXAMPLE_MAIN + 0x114
4FFFFEB4: .enwx. .yzso. .me d. .ata..
4FFFFEC4: ...... ...... ...... ......
4FFFFED4: ...... ...... ...... ......
enter some data
0123456789
DEBUG $PC=0x70000530 -MEMORY ACCESS BREAKPOINT-
MEMORY ACCESS BREAKPOINT OCCURRED AT $PC=0x7E007EF0
7000.0532 4FFF.FEE8 EXAMPLE_FILL_ARRAY + 0xCE
4FFF.FE9C: 7000.0684 4FFF.FF30 EXAMPLE_MAIN + 0x114
4FFFFEB4: .0123. .4567. .89 d. .ata..
4FFFFEC4: ...... ...... ...... ......
4FFFFED4: ...... ...... ...... ......
Sample Debug Sessions
Debug Manual—421921-003
F-49
Privileged Commands
Privileged Commands
Certain commands and addresses are restricted unless PRV has been turned ON.
This is allowed only when the user is the super ID (255, 255). In order to run the
following commands, you need to be the super ID. Use Debug commands on another
program running in the same processor. The environment to run Debug can be
chosen arbitrarily. For our example program, we used the File Utility Program (FUP). If
you are debugging in Inspect, enter the command SELECT DEBUGGER DEBUG to
access Debug.
Using G-address Mode to Access Data
The G-address mode allows access to data in the system’s global area. Attempting to
use the G-address mode when you are not a privileged user results in an error.
$DATA06 CRGTT 9> fup /cpu 3, debug/
INSPECT - Symbolic Debugger - T9673D40 - (30SEP97) System \M5
Copyright Tandem Computers Incorporated 1983, 1985-1997
INSPECT
050,03,00010 FUP #FUP^MAIN + %0I _FUP_select debugger debug
DEBUG P=%120301, E=%000207, UC.%00
050,03,00010-D G 123I, T#8*#12 :h
** DEBUG error 7: PRV ON is required to perform command.
050,03,00010-?
USE SEGMENT ID = %002000
BASE STANDARD IN
BASE STANDARD OUT
TERM \M5.$ZTN00.#PTYX5AA
PRV = OFF
050,03,00010-PRV ON
050,03,00010-?
BASE SEGMENTS: SYSTEM DATA = %000001
SYSTEM CODE = %000005
SYSTEM LIB = %020400
USER DATA = %020754
USER CODE = %020736
V PIN = 012 (#010)

Sample Debug Sessions
Debug Manual—421921-003
F-50
Privileged Commands
The current setting of PRV can be viewed with the ? command. Also, when PRV is set,
additional segments are shown.
Address Range Limitation
Certain address ranges are not allowed for a command when PRV is set to OFF.
Following are two examples of this:
Finding information in the process control block (PCB) involves accessing addresses
that require the privileged mode to be turned on (the use of the PRV or PRV ON
USE SEGMENT ID = %002000
BASE STANDARD IN
BASE STANDARD OUT
TERM \M5.$ZTN00.#PTYX5AA
PRV = ON
050,03,00010-D G 123I, T#8*#12 :h
%155457: 0xFFFF 0x0000 0x0000 0x0000 0x0000 0x0000 0x0000 0x0000
%155467: 0x0000 0x0000 0x0000 0x0000 0x0000 0x0000 0x0000 0x0000
%155477: 0x0000 0x0000 0x0000 0x0000 0x0000 0x0000 0xFFFF 0x0000
%155507: 0xFFFF 0x0000 0x0000 0x0000 0x0000 0x0000 0x0000 0x0000
%155517: 0x0000 0x0000 0x0000 0x0000 0x0000 0x0000 0x0000 0x0000
%155527: 0x0000 0x0000 0x0000 0x0000 0x0000 0x0000 0xFFFF 0x0000
%155537: 0xFFFF 0x0000 0x0000 0x0000 0x0000 0x0000 0x0000 0x0000
%155547: 0x0000 0x0000 0x0000 0x0000 0x0000 0x0000 0x0000 0x0000
%155557: 0x0000 0x0000 0x0000 0x0000 0x0000 0x0000 0xFFFF 0x0000
%155567: 0xFFFF 0x0000 0x0000 0x0000 0x0000 0x0000 0x0000 0x0000
%155577: 0x0000 0x0000 0x0000 0x0000 0x0000 0x0000 0x0000 0x0000
%155607: 0x0000 0x0000 0x0000 0x0000 0x0000 0x0000 0xFFFF 0x0000
050,03,00010-amap G 123I
** DEBUG error 7: PRV ON is required to perform command.
050,03,00010-PRV
050,03,00010-amap G 123I
Address: 0x8003B65E
Kind = 0x0013: Unknown
Attributes: Priv To Read, Priv To Write
050,03,00010-PRV OFF
050,03,00010-DN 0x8003B65E, #24 by 4 :h
** DEBUG error 7: PRV ON is required to perform command.
050,03,00010-prv on
050,03,00010-DN 0x8003B65E, #24 by 4 :h
8003B65E: 0xFFFF0000 0x00000000 0x00000000 0x00000000
8003B66E: 0x00000000 0x00000000 0x00000000 0x00000000
8003B67E: 0x00000000 0x00000000 0x00000000 0xFFFF0000
8003B68E: 0xFFFF0000 0x00000000 0x00000000 0x00000000
8003B69E: 0x00000000 0x00000000 0x00000000 0x00000000
8003B6AE: 0x00000000 0x00000000 0x00000000 0xFFFF0000
Note. To turn PRV mode on, we can enter only PRV, not PRV ON. For the remainder of the
example, we use only PRV.

Sample Debug Sessions
Debug Manual—421921-003
F-51
Privileged Commands
commands). If we want to look at information in another PIN's PCB, or our own, we
can use the PCB option on the D command.
In this example, we are looking at the PCB for PIN 265, starting at byte offset 8 for two
16-bit words. Byte 8 has the starting priority, and byte 9 has the current priority. Bytes
10 and 11 make up a 16-bit word that contains the PIN. Note that the PIN matches the
one we entered.
We have the example program running as PIN 265 in the same processor. The
program has a breakpoint at the end of the EXAMPLE_FILL_ARRAY procedure. First,
we look at the breakpoint table.
With the privileged mode enabled, we can see breakpoints to all the processes. Thus,
while running PIN 10, we also see PIN 265's breakpoint.
V Command
We can use the V command to view and manipulate information for another PIN. In
this example, we vector to PIN 265. We use the ? command to see the environment
before and after the V command has been entered.
050,03,00010-D PCB #265 + #8, 2 :h
80C26F28: 0xA8A8 0x0109
050,03,00010-= %ha8
= %000250 #00168 0x00A8 '..'
050,03,00010-= 0x0109
= %000411 #00265 0x0109 '..'
050,03,00010-B
N: 0x70000568 INS: 0x03E00008 PIN: #00265
INS: JR ra
050,03,00010-?
BASE SEGMENTS: SYSTEM DATA = %000001
SYSTEM CODE = %000005
SYSTEM LIB = %020400
USER DATA = %020754
USER CODE = %020736
V PIN = 012 (#010)
USE SEGMENT ID = %002000
BASE STANDARD IN
BASE STANDARD OUT
TERM \M5.$ZTN00.#PTYX5AA
PRV = ON
050,03,00010-V #265
Sample Debug Sessions
Debug Manual—421921-003
F-52
Privileged Commands
We can display information in PIN 265's _GLOBAL data as follows:
As we saw in the examples above, the program is currently using selectable segment
2. We can use various Debug commands to see the contents of the selectable
segments:
Code Breakpoints
We can use commands such as M or FNL on the program we have vectored to. We
can also place code breakpoints. The following shows the code before and after the
breakpoint is placed near the beginning of the EXAMPLE_FILL_ARRAY procedure.
050,03,00010-?
BASE SEGMENTS: SYSTEM DATA = %000001
SYSTEM CODE = %000005
SYSTEM LIB = %020400
V PIN = 411 (#265)
USE SEGMENT ID = %000002
BASE STANDARD IN
BASE STANDARD OUT
TERM \M5.$ZTN00.#PTYX5AA
PRV = ON
050,03,00010-DN 0x08000002, %h14/4 :D
08000002: #00256 #00000 #00003 #00265 #00000 #00000 #00011 #43155
08000012: #00000 #00050
050,03,00010-vq 1
050,03,00010-D Q 0, 1,b:d
%000000: 001 000
050,03,00010-vq 2
050,03,00010-D Q 0, 1,b:d
%000000: 002 000
050,03,00010-vq #17
050,03,00010-D Q 0, 1,b:d
%000000: 000 000
050,03,00010-i %h70000464, 10
70000464: ADDIU sp,sp,-128 SW ra,60(sp) SW a0,128(sp)
70000470: SW s1,56(sp) SW s0,52(sp) LUI a0,0x8000
7000047C: LH a1,130(sp) SW $0,44(sp)
70000484: JAL 0x7F805228 NOP OR s0,v0,$0
70000490: SH s0,124(sp) LH t6,124(sp) NOP
7000049C: BEQ t6,$0,0x700004B4 NOP
050,03,00010-b %h70000478
N: 0x70000478 INS: 0x3C048000 PIN: #00265
INS: LUI a0,0x8000
050,03,00010-i %h70000464, 10
70000464: ADDIU sp,sp,-128 SW ra,60(sp) SW a0,128(sp)
70000470: SW s1,56(sp) SW s0,52(sp) BREAK INSPECT RISC
7000047C: LH a1,130(sp) SW $0,44(sp)
70000484: JAL 0x7F805228 NOP OR s0,v0,$0
70000490: SH s0,124(sp) LH t6,124(sp) NOP
7000049C: BEQ t6,$0,0x700004B4 NOP

Sample Debug Sessions
Debug Manual—421921-003
F-53
Privileged Commands
While in privileged mode, it is possible to clear all the breakpoints set on all the
processes in a processor.
In this example, we first use the V command to go back to our own process and show
the environment with the ? command. Then we show the breakpoint table before and
after the C -1 command.
STOP Command
We stop the program by entering the STOP command.
050,03,00010-V
050,03,00010-?
BASE SEGMENTS: SYSTEM DATA = %000001
SYSTEM CODE = %000005
SYSTEM LIB = %020400
USER DATA = %020754
USER CODE = %020736
V PIN = 012 (#010)
USE SEGMENT ID = NONE
BASE STANDARD IN
BASE STANDARD OUT
TERM \M5.$ZTN00.#PTYX5AA
PRV = ON
050,03,00010-B
N: 0x70000568 INS: 0x03E00008 PIN: #00265
INS: JR ra
N: 0x70000478 INS: 0x3C048000 PIN: #00265
INS: LUI a0,0x8000
050,03,00010-C -1
050,03,00010-B

Debug Manual—421921-003
Glossary-1
Glossary
This glossary defines technical terms related to the design of the operating system, to
HP system architecture, and to the Debug facility. The following definitions should help
you interpret the information on using Debug.
absolute extended address. An address that can be used, when the processor module is
in privileged mode, to access any byte of virtual memory in the processor module.
accelerate. To use the Accelerator program to generate an accelerated object file.
accelerated mode. The operational environment in which Accelerator-generated RISC
instructions execute.
accelerated object code. The RISC instructions that result from processing a TNS object
file with the Accelerator.
accelerated object file. The object file that results from processing a TNS object file with
the Accelerator. An accelerated object file contains the original TNS object code, the
accelerated object code and related address map tables, and any binder and symbol
information from the original TNS object file.
Accelerator. A program that processes a TNS object file and produces an accelerated
object file. Most TNS object code that has been accelerated runs faster on TNS/R
processors than TNS object code that has not been accelerated.
breakpoint. A location in a program at which execution is suspended so that you can
examine and modify the program’s state. A breakpoint can occur just before the
execution of a specific instruction (instruction breakpoint), or it can occur when a
specific memory location is accessed in a specified way (memory-access breakpoint).
A TNS breakpoint is an instruction breakpoint within a sequence of TNS instructions. A
RISC breakpoint is an instruction breakpoint within a sequence of RISC instructions. In
accelerated code, a TNS breakpoint can be placed only at a memory-exact point or at
a register-exact point; Debug sets a corresponding RISC breakpoint.
byte. A group of eight consecutive bits; the smallest addressable unit of memory.
C-series system. A system that is running a C-release version of the HP NonStop
operating system.
central processing unit (CPU). Traditionally, the main data processing unit of a computer.
A HP system has multiple cooperating processors rather than a single processor, and
processors are sometimes loosely called processors.
CISC. See complex instruction-set computing (CISC).
code image. The part of an object file that contains the machine instructions that make up
procedures in one or more code segments.

Glossary
Debug Manual—421921-003
Glossary-2
code segment
code segment. A segment that contains program instructions to be executed plus related
information. Code segments cannot be altered by an application program; therefore,
they are read from disk but are never written back to disk.
complex instruction-set computing (CISC). A processor architecture based on a large
instruction set, characterized by numerous addressing modes, multicycle machine
instructions, and many special-purpose instructions. Contrast with reduced instruction-
set computing (RISC).
converted process. An executing program that was written to take advantage of at least
one feature of D-series systems. Contrast with unconverted process.
CPU. See central processing unit (CPU).
creation process ID. See process ID.
CRTPID. See process ID.
current selectable data segment. The selectable data segment that is being accessed by
a process. A process specifies the current selectable data segment by calling the
SEGMENT_USE_ or USESEGMENT procedure. Debug can put another segment in
use if a VQ command is issued.
D-series system. A system that is running a D00.00 or later version of the HP NonStop
operating system.
data segment. A type of segment whose logical pages contain information to be processed
by the instructions in the related code segment.
extended data segment. An area of virtual memory used to contain data. An extended data
segment is allocated with contiguous addresses and is treated programmatically as a
single object. The two types of extended data segments are selectable segments and
flat segments. Extended data segments are allocated by the ALLOCATESEGMENT or
SEGMENT_ALLOCATE_ Guardian procedure.
file number. An integer that represents a particular instance of an open of a file. A file
number is returned by an open procedure and is used in all subsequent input-output
procedures to refer to the file. Internally, the file number is an index into the file table.
file system. A set of operating system procedures and data structures that provides for
communication between a process and a file, which can be a disk file, a device other
than a disk, or another process.
flat segment. An extended data segment that has a distinct range of relative addresses
within the environment for the current process. Contrast with selectable segment.
Guardian. An environment available for interactive or programmatic use with the HP
NonStop operating system. Processes that run in the Guardian environment use the
Guardian system procedure calls as their application program interface; interactive

Glossary
Debug Manual—421921-003
Glossary-3
high PIN
users of the Guardian environment use the HP Tandem Advanced Command
Language (TACL) or another HP product’s command interpreter. Contrast with Open
System Services (OSS).
high PIN. A process identification number (PIN) in the range 256 or higher.
Home Terminal. )þ(1) The terminal from which a process is started. (2)þThe terminal from
which the ENFORM command is entered. (3)þThe terminal whose name is returned by
a call to the MYTERM procedure, or the name returned in the hometerm parameter of
the PROCESS_GETINFO_ procedure.
HP NonStop operating system. The operating system for HP NonStop systems.
HP NonStop Series (TNS). HP computers that support the HP NonStop operating system
and that are based on complex instruction-set computing (CISC) technology. TNS
processors implement the TNS instruction set. Contrast with HP NonStop Series/RISC
(TNS/R).
HP NonStop Series/RISC (TNS/R). HP computers that support the HP NonStop operating
system and that are based on reduced instruction-set computing (RISC) technology.
TNS/R processors implement the RISC instruction set and are upwardly compatible
with the TNS system-level architecture. TNS/R processors include the NSR-L and
NSR-N processors. Contrast with HP NonStop Series (TNS).
Lobug. A low-level debugger available to service providers.
low PIN. A process identification number (PIN) in the range 0 through 254.
memory-exact point. A location in an accelerated program at which the values in memory
(but not necessarily in the register stack) are the same as they would be if the program
were running on a TNS processor. Most source statement boundaries are memory-
exact points. Complex statements might contain several such points: at each function
call, privileged instruction, and embedded assignment. Contrast with register-exact
point.
memory manager. A system process that manages physical memory in a
processor module.
message system. A set of operating system procedures and data structures that handles
the mechanics of exchanging messages between processes.
millicode. RISC instructions that implement various TNS low-level functions such
as exception handling, real-time translation routines, and library routines that
implement the TNS instruction set. Millicode is functionally equivalent to
TNS microcode.
module. A physical grouping of procedures and data structures.

Glossary
Debug Manual—421921-003
Glossary-4
monitor
monitor. A system process that performs housekeeping tasks and creates and deletes
processes in its processor module.
named process. A process to which a process name was assigned when the process was
created. Contrast with unnamed process.
native-compiled RISC instructions. See RISC instructions.
native mode. See TNS/R native mode.
native object code. See TNS/R native object code
native object file. See TNS/R native object file.
native process. See TNS/R native process.
native signal. See TNS/R native signal.”
network. Two or more nodes linked together for intersystem communication.
node. A system of one or more processors. Although the term is meaningful only when
more than one system is linked into a network, the design of HP systems for operation
in networks makes this term preferable to “system” in many contexts.
node name. The portion of a file name that identifies the system through which the file can
be accessed.
node number. The internal identifier for the node on which file access occurs.
NonStop Open System Services (OSS). An application programmatic interface (API) to
the HP NonStop operating system and associated tools and utilities. See to Open
System Services (OSS) for a more complete definition.
NSR-L processor. The NonStop System RISC Model L processor (NSR-L processor) is the
first HP NonStop Series/RISC processor.
object file. A file, generated by a compiler or binder, that contains machine instructions and
other information needed to construct the code spaces and initial data for a process.
The file may be a complete program that is ready for immediate execution, or it may be
incomplete and require binding with other object files before execution.
Open System Services (OSS). An open system environment available for interactive or
programmatic use with the HP NonStop operating system. Processes that run in the
OSS environment use the OSS application program interface; interactive users of the
OSS environment use the OSS shell for their command interpreter. Contrast with
Guardian.
OSS. See Open System Services (OSS).

Glossary
Debug Manual—421921-003
Glossary-5
OSS signal
OSS signal. A signal model defined in the POSIX.1 specification and available to TNS
processes and TNS/R native processes in the OSS environment. OSS signals can be
sent between processes.
PFS. See process file segment (PFS).
physical memory. The semiconductor memory that is part of every processor module.
PIN. See process identification number (PIN).
privileged mode. 1. The state in which privileged debugging commands are enabled. The
right to use Debug’s privileged commands must be acquired by using the PRV ON
command and does not depend on whether the process is executing privileged code.
To acquire privileged debugging rights, the process being debugged must be executing
under the local super ID (255, 255). 2. A process state that permits a process to
perform privileged operations. Normally, only the operating system executes in
privileged mode for such operations as sending data over an interprocessor bus,
initiating input-output operations, calling privileged procedures, and accessing system
tables.
ProcDebug. An Accelerator option that directs the Accelerator to perform optimization
across statement boundaries. This option typically produces faster-executing code
than the StmtDebug option, but debugging the program might be more difficult
because it might not be possible to set a breakpoint at some statement boundaries.
ProcDebug is the Accelerator default action. Contrast with StmtDebug.
process. An instance of execution of a program.
process file name. A file name that identifies a process.
process file segment (PFS). An extended data segment that is automatically allocated to
every process and contains operating system data structures such as file-system data
structures and memory-management pool data structures.
process handle. A D-series 20-byte data structure that identifies a named or unnamed
process in the network. A process handle identifies an individual process; thus, each
process of a process pair has a unique process handle.
process ID. A system structure that serves as an address of a process. The structure
contains a processor number, process identification number (PIN), creation timestamp
or process name, and system number (optional). It is sometimes called a creation
timestamp process ID (CRTPID).
process identification number (PIN). An unsigned integer that identifies a process in a
processor module. Internally, a PIN is used as an index into the process control block
(PCB) table.
process name. A name that can be assigned to a process when the process is created.
A process name uniquely identifies a process or process pair in a system.

Glossary
Debug Manual—421921-003
Glossary-6
program
program. A set of instructions that a computer is capable of executing.
program file. An executable object file. See to object file.
reduced instruction-set computing (RISC). A processor architecture based on a relatively
small and simple instruction set, a large number of general-purpose registers, and an
optimized instruction pipeline that supports high-performance instruction execution.
Contrast with complex instruction-set computing (CISC).
register-exact point. A location in an accelerated program at which the values in both
memory and the register stack are the same as they would be if the program were
running on a TNS processor. Register-exact points are also memory-exact points.
Contrast with memory-exact point.
relative extended address. An address that can be used when the processor module is in
privileged or nonprivileged mode to access the user code, user library, and user data
spaces of the process. A relative extended address can also be used in privileged
mode to access the system code, system library, and system data spaces of the
process.
RISC. See reduced instruction-set computing (RISC).
RISC instructions. Register-oriented 32-bit machine instructions that are directly executed
on TNS/R processors. RISC instructions execute only on TNS/R systems, not on TNS
systems. Contrast with TNS instructions.
selectable segment. An extended data segment that shares the same relative address
space with all other selectable segments allocated by a process (and therefore does
not have a distinct range of relative addresses within the current environment).
Contrast with flat segment.
signal. A means by which a native or OSS process can be notified of or affected by an
event occurring in the system. Some signals are used to notify a process when certain
errors occur that prevent it from continuing execution of the current code stream. See
also TNS/R native signal and OSS signal. Contrast with trap.
signal handler. A procedure that is executed when a signal is received by a process.
StmtDebug. An Accelerator option that directs the Accelerator to optimize instructions only
within the code produced for any one statement. Instructions are not optimized across
statements. This option typically produces less-optimized code than the ProcDebug
option. However, debugging is easier than with the ProcDebug option because the
beginning of every statement in the source program is a memory-exact point. Contrast
with ProcDebug.
super ID. The user ID that permits unrestricted access to the system. On Guardian
systems, it is user number 255,255; on OSS systems, it is the root user.

Glossary
Debug Manual—421921-003
Glossary-7
synthetic process ID
synthetic process ID. An identifier that might allow an unconverted server process to
communicate with a high-PIN requester process. A synthetic process ID has a PIN
of 255.
system. All the processors, memory, controllers, peripheral devices, and related
components that are directly connected together by buses and interface wiring to form
a cooperative processing unit.
system name. The identifier for the node on which file access occurs.
system number. The internal identifier for the node on which file access occurs.
system process. A process whose primary purpose is to manage system resources rather
than to solve a user’s problem. A system process is essential to a system-provided
service. Failure of a system process often causes the processor module to fail. Most
system processes are automatically created when the processor module is cold
loaded. Contrast with user process.
TNS. See HP NonStop Series (TNS).
TNS instructions. Stack-oriented, 16-bit instructions defined as part of the TNS
environment. On TNS systems, TNS instructions are implemented by microcode; on
TNS/R systems, TNS instructions are implemented by millicode routines or by
translation to an equivalent sequence of RISC instructions. Contrast with RISC
instructions.
TNS mode. The operational environment in which TNS instructions execute.
TNS object code. The TNS instructions that result from processing source code with a TNS
language compiler. TNS object code executes on both TNS and TNS/R systems.
TNS or accelerated mode. The operational environments in which either TNS instructions
or Accelerator-generated RISC instructions execute. Contrast with TNS/R native mode.
TNS/R. See HP NonStop Series/RISC (TNS/R).
TNS/R native mode. The operational environment in which native-compiled RISC
instructions execute.
TNS/R native object code. The RISC instructions that result from processing program
source code with a TNS/R native compiler. TNS/R native object code executes only on
TNS/R systems, not on TNS systems.
TNS/R native object file. A file created by a TNS/R native compiler that contains RISC
instructions and other information needed to construct the code spaces and the initial
data for a TNS/R native process.
TNS/R native process. A process initiated by executing a TNS/R native object file.

Glossary
Debug Manual—421921-003
Glossary-8
TNS/R native signal
TNS/R native signal. A signal model available to TNS/R native processes in the Guardian
and OSS environments. TNS/R native signals are used for error exception handling.
trap. A software mechanism that stops program execution and holds the cause of a
processing problem. In TNS Guardian processes, traps occur as the result of errors
that prevent the continued execution of the code stream. Contrast with signal.
trap handler. A location in a program where execution begins if a trap occurs. A process
can specify a trap handler by a call to the ARMTRAP procedure.
unconverted process. A process that does not take advantage of the extended features of
D-series systems. Contrast with converted process.
unnamed process. A process to which a process name was not assigned when the
process was created. Contrast with named process.
user process. A process whose primary purpose is to solve a user’s problem. A user
process is not essential to the availability of a processor module. A user process is
created only when the user explicitly creates it. Contrast with system process.

Debug Manual—421921-003
Index-1
Index
Numbers
16-bit expression
syntax 3-9/3-11
V command 4-71
VQ command 4-72
VQA command 4-73
32-bit address
DJ command 4-40
DN command 4-41
format in expressions 3-10
syntax 3-14
T command 4-68
32-bit expression syntax 3-9/3-11
A
A3-1
A command 3-3, 4-3/4-4
A display option
DN command 4-42
= command 4-73
Abnormal termination signal 1-8
Absolute extended address 4-19,
Glossary-1
Absolute segment number 4-71
Accelerated program file 2-4
Accelerator 2-3/2-4
Accepting data, illustration 1-17
Access for debugging 1-2
Access types, BM command 4-25, 4-27,
4-29, 4-31
Accessing other address spaces 4-71
Address
32-bit address 3-12
absolute extended 4-19
byte offset 3-13
displaying procedure containing 4-57
expression syntax for 3-10
Address (continued)
extended addressing 3-10
indirection types 3-13
N address mode 3-14
N mode address 3-10
N-mode address 3-14
Q-mode address 3-13
syntax 3-12
TNS-style address 3-12
TNS/R memory 2-1
trace events 4-68
Address reference trap 1-7
Alias register names 3-8
ALL attribute
B command 4-8
BM command 4-25
processor limit 1-16
ALL option, CM command 4-33
AMAP command 3-3, 4-6
Arithmetic overflow signal 1-8
Arithmetic overflow trap 1-7
ARMTRAP procedure 1-7
ASCII character set B-1/B-4
ASCII characters in expression syntax 3-9
ASCII representation
DN command 4-42
= command 4-73
Authority for debugging 1-2
B
B command
description 3-1
displaying all breakpoints 4-16/4-22
persistence
nonprivileged D-1
privileged D-2

Index
Debug Manual—421921-003
Index-2
B
B command (continued)
setting breakpoints
conditional code
breakpoint 4-11/4-13
execute code breakpoint 4-15/4-16
trace code breakpoint 4-13/4-15
unconditional code
breakpoint 4-7/4-10
B display option
DN command 4-42
= command 4-73
B1 to B4 options, DN command 4-41
Base address 3-13
BASE command 3-5
persistence D-1
syntax 4-22/4-24
Base notation for expressions 3-9
Base representation
setting 4-22
= command 4-73
Binary representation
DN command 4-42
= command 4-73
BM command 3-1, 4-24/4-32
persistence
nonprivileged D-1
persistence, privileged D-2
setting breakpoints
conditional memory-access
breakpoint 4-26/4-28
execute memory-access
breakpoint 4-31/4-32
trace memory-access
breakpoint 4-29/4-32
unconditional memory-access
breakpoint 4-24/4-26
BREAK key 1-3
Breakpoint
attribute
B command 4-12, 4-14, 4-16
BM command 4-25, 4-28, 4-29,
4-31
Breakpoint (continued)
defined 1-14
displaying all 4-16
entering 1-5
example of code breakpoint 1-14
header messages 1-12
Inspect 4-56
reported in Inspect 4-56
setting on TNS/R processors 2-5/2-10
Breakpoint display format
code breakpoint 4-17
command string 4-22
conditional 4-20
memory-access 4-19
trace 4-21
Breakpoint, code
clearing 4-32
commands 3-1
Debug header message 1-12
display format 4-17
display format for conditional 4-20
displaying permissible locations 4-53,
4-65
persistence
nonprivileged D-1
privileged D-2
setting
conditional 4-11/4-13
execute 4-15/4-16
trace 4-13/4-15
unconditional 4-7/4-10
Breakpoint, memory-access
clearing 4-33
commands 3-1
Debug header message 1-12
display format 4-19
display format for conditional 4-20
overview example 1-15

Index
Debug Manual—421921-003
Index-3
C
Breakpoint, memory-access (continued)
persistence
nonprivileged D-1
privileged D-2
setting conditional 4-26/4-28
setting execute 4-31/4-32
setting trace 4-29/4-32
setting unconditional 4-24/4-26
BY option, DN command 4-41
Byte address, using S indirection type 3-13
Byte offset, using index 3-13
Bytes, displaying, DN command 4-41
C
C command 3-1, 4-32
C memory access 2-8, 4-25
Callable procedure 4-65
Calling
Debug 1-4
undefined external procedure 1-7
Capitalization in commands 3-7
Carry bit 1-9
Change (C) memory access 2-8, 4-25
Changing
current code segment 4-71
current selectable data segment 4-71
register contents 4-59/4-62
signal handling 4-62/4-63
variables 4-58
Character set listing B-1/B-4
Characters, in expressions 3-9
Clearing
code breakpoint 4-32
memory-access breakpoint 4-33
CM command 3-1, 4-33
CODE compiler directive 1-14
Code image
defined Glossary-1
Code location to enter Debug 1-5
Code segment
displaying 4-36
displaying current 4-75
setting current 4-71
Code space
ENV register 1-9
Column display 4-33, 4-41
Command interpreter 1-3
Command string
B command 4-15
BM command 4-31
breakpoint display format 4-22
Commands
A command 4-3
AMAP command 4-6
B command 4-7
BASE command 4-22
BM command 4-24
C command 4-32
CM command 4-33
D command 4-33
DJ command 4-40
DN command 4-41
EXIT command 4-45
F command 4-46
FC command 4-47
FN command 4-48
FNL command 4-49
FREEZE command 4-50
HALT command 4-51
HELP command 4-51
help display 4-51
I command 4-52
IH command 4-54
INSPECT command 4-55
line format 3-6
LMAP command 4-57
M command 4-58
MH command 4-62

Index
Debug Manual—421921-003
Index-4
D
Commands (continued)
notation 3-7
overview 3-1
PAUSE command 4-63
persistence, nonprivileged D-1
persistence, privileged D-2
PMAP command 4-64
privileged 4-65
PRV command 4-65
R command 4-66
scope, nonprivileged D-1
scope, privileged D-1
STOP command 4-67
structure 3-6
summary
breakpoint 3-1
convenience 3-5
display 3-3
memory-access breakpoint 3-1
modify 3-4
privileged 3-5
process control 3-6
syntax summary C-1/C-12
T command 4-68
V command 4-71
VQ command 4-72
VQA command 4-73
= command 4-73
? command 4-75
Compiler directives 1-14
Computing an expression 4-73/4-74
Condition code 1-9
Conditional code breakpoint
clearing 4-32
display format 4-20
setting 4-11/4-13
Conditional memory-access breakpoint
display format 4-20
setting 4-26/4-28
Considerations 4-8
Constant
B command 4-12
BM command 4-28
breakpoint display format 4-20
Control evaluation order 3-10
Control process commands 3-6
Convenience commands 3-5
Count
A command 4-3
B command 4-14
BM command 4-29
breakpoint display format 4-21
D command 4-33
DN command 4-41
PMAP command 4-64
Count size 4-41
CSPACEID, TNS/R implementation 2-12
Current code segment
changing 3-4
display 4-36
setting 4-71
? command 4-75
Current code segment changing 4-61
Current selectable data
segment 4-71/4-72, Glossary-2
D
D address in expressions 3-10
D command 3-3, 4-33/4-39
displaying registers 4-36
displaying space identifier 4-36/4-39
D display option, DN command 4-42
D option, BASE command 4-22
Data segment Glossary-2
Data space, in ENV register 1-9
Debug
command overview 3-1
commands 4-1/4-75
convenience commands 3-5

Index
Debug Manual—421921-003
Index-5
E
Debug (continued)
DEBUG command 1-3
DEBUGNOW command 1-3
execution environment 1-16
how to use 1-13
interactive use, illustration 1-17
native mode 2-1
prompt 1-12
selecting as debugger 1-6
session 1-13, D-1
state 1-1
using on TNS/R processors 2-1/2-14
DEBUG procedure 1-5
Debugging options
DEBUGPROCESS procedure 1-5
PROCESS_DEBUG_ procedure 1-5
DEBUGPROCESS procedure 1-5
DECIMAL option, BASE command 4-22
Decimal representation
BASE command 4-22
D command 4-34
DN command 4-42
= command 4-73
Default entry to Debug state 1-7
Default numeric representation 3-9
Deleting FC command option 4-47
Device, in output device syntax 4-4, 4-34,
4-37, 4-52, 4-64, 4-69
Direct variables, displaying 3-14
Directives, source-language compiler 1-14
Disabling processor 4-50
Display
ASCII representation, DN
command 4-41
breakpoints 4-16/4-22
code breakpoint 4-17
command string 4-22
commands 3-3
conditional code breakpoint 4-20
data, illustration 1-17
Display (continued)
expression value 4-73
file names 4-46
help 4-51
instruction code, DN command 4-41
jump buffer contents 4-40
memory, DN command 4-41/4-45
memory-access breakpoint 4-19
numeric representation, DN
command 4-41
registers 4-36
space identifier 4-36, 4-75
TNS and RISC instruction
code 4-64/4-65
trace breakpoint 4-21
variables
DN command 4-41/4-45
I command 4-52/4-54
trace 4-13/4-15
display mode, D command 4-34
display option
DN command 4-42
= command 4-73
Display size, DN command 4-43
Division 3-10
DJ command 3-3, 4-40
DN command 3-3, 4-41/4-45
Doubleword expression
D address 3-10
syntax 3-9
= command 4-74
DT command
persistence D-2
D-series limit in C-series interface trap 1-7
E
E display option 4-73
E register
D command 4-36
syntax 3-8

Index
Debug Manual—421921-003
Index-6
F
E register (continued)
TNS/R implementation 2-12
Ending a debug session 1-10
Entering debug state 1-2, 1-7/1-13, 1-15
ENV register
D command 4-36
Debug message header 1-10
illustration 1-9
privileged bit 4-65
syntax 3-8
TNS/R implementation 2-12
tracing 4-68
= command 4-73
Erroneous arithmetic operation signal 1-8
Error messages A-1/A-25
ET command
persistence D-2
Evaluation order 3-10
Execute access for debugging 1-2
Execute code breakpoint
clearing 4-32
setting 4-15/4-16
Execute memory-access
breakpoint 4-31/4-32
Execution
environment, illustrated 1-16
pause 4-63
suspend 1-14
TNS/R options 2-3
EXIT command 3-6, 4-45
Exiting Debug
and resuming process execution 4-66
and terminating the process 4-67
clearing breakpoints and resuming
process execution 4-45
Explicit call to Debug 1-4
Expression
compute and display 4-73/4-74
examples 3-11
syntax 3-9/3-11
Extended addressing
definition 3-10
display format 4-19, 4-20, 4-21
example of memory 3-16
Extended data segment, addressing 3-16
Extended word address indirection
type 3-13
External procedure 1-7
F
F command 3-3, 4-46
FC command 3-6, 4-47
File
display error numbers 4-46
display names 4-46
number Glossary-2
system Glossary-2
FILES command 3-3, 4-46
Flat segment, addressing 3-16
FN command 3-3, 4-48
FNL command 3-3, 4-49
FOR option, DN command 4-41
FREEZE command 3-5, 4-50
persistence D-2
Function level breakpoint (native mode C),
example 4-9
G
General-purpose registers 3-8
Guardian Glossary-2
H
H command 3-6, 4-51
H display mode, D command 4-34
H display option
DN command 4-42
= command 4-73
H option, BASE command 4-22

Index
Debug Manual—421921-003
Index-7
I
HALT command
description 3-5, 4-51
persistence D-2
Hardware environment register 1-9
Header message 1-10/1-13
HELP command 3-6
syntax 4-51
HEXADECIMAL option, BASE
command 4-22
Hexadecimal representation
BASE command 4-22
D command 4-34
DN command 4-42
expression syntax 3-9
= command 4-73
High word 3-10
Hold state 4-56
Home terminal
Debug header message 1-10
specifying 1-4
How to use Debug 1-13
HP NonStop operating system Glossary-3
HP NonStop Series Glossary-3
HP NonStop Series/RISC Glossary-3
I
I command 3-3, 4-52/4-54
I display mode, I command 4-52
I display option
DN command 4-42
= command 4-73
I indirection type 3-13
I option
BASE command 4-23
FC command 4-47
ICODE compiler directive 1-14
IG indirection type 3-13
IH command 3-3, 4-54
Illegal address reference trap 1-7
IN option
BASE command 4-23
DN command 4-42
Index
address syntax 3-13
breakpoint display 4-20
Indirect variables, displaying 3-15
Indirection type 3-13
Information message 1-10/1-13
Initiating debug state 1-7/1-13
INNERLIST compiler directive 1-14
Input, default numeric representation
for 1-13
Input/output process (IOP), debugging 1-5
Insert string 4-47
INSPECT command 3-6, 4-55/4-57
Inspect, SET INSPECT OFF 1-6
Instruction code
display for TNS and RISC 4-64/4-65
DN command 4-41, 4-42
mode on I command 4-52
= command 4-73
Instruction failure signal 1-8
Instruction failure trap 1-7
Integer, in expressions 3-9
Interactive debugging 1-13, 1-16
Invalid hardware instruction signal 1-8
Invalid memory reference signal 1-8
Invoking 1-3
Invoking Debug from Inspect 4-56
Invoking Inspect from Debug 4-56/4-57
IX indirection type 3-13
J
Jump buffer, displaying contents of 4-40
K
K address in expressions 3-10

Index
Debug Manual—421921-003
Index-8
L
L
L register
D command 4-36
syntax 3-8
TNS/R implementation 2-12
Leaving Debug 1-10, 4-45
Left shift operator 3-10
Library space, in ENV register 1-9
Licensed procedure 4-65
Limitations, notation in syntax 3-7
Limits exceeded signal 1-8
Line with multiple commands 3-6
LIST compiler directive 1-14
LMAP command 3-3
Load from an address 3-10
Lobug Glossary-3
Looptimeout signal 1-8
Low word 3-10
Lowercase letters in commands 3-7
Low-level debugging 1-1
M
M command 3-4, 4-58/4-62
modify register contents 4-59/4-62
modify variables 4-58/4-59
MAP compiler directive 1-14
Mask
B command 4-11
BM command 4-27
breakpoint display format 4-20
FN command 4-48
FNL command 4-49
Memory
access types 4-25, 4-27, 4-29, 4-31
addressing for TNS/R processors 2-1
displaying, DN command 4-41/4-45
search 4-48, 4-49
signal conditions 1-8
trap conditions 1-7
Memory manager Glossary-3
Memory manager disk read error signal 1-8
Memory manager read error trap 1-7
Memory-exact point
breakpoint display 4-18
description 2-5
I command 4-53
PMAP command 4-65
setting breakpoints 2-8
Message header 1-10/1-13
Message system Glossary-3
Messages, Debug error A-1/A-25
MH command 3-4, 4-62/4-63
Millicode 2-4
Mode, in D command 4-34
Mode, in I command 4-52
Modifying
commands 3-4
register contents 2-7, 4-59/4-62
signal handling 4-62/4-63
TNS memory 2-7
TNS/R memory 2-7
variables 4-58/4-59
Module Glossary-3
Monitor Glossary-4
Multiple commands
executed 4-15, 4-31
on a command line 3-6
Multiplication 3-10
N
N3-14
N address mode
address syntax 3-14
B command display 4-18
N option, T command 4-68
Native mode 1-1, 2-3
Native mode debugging 2-1, 2-3
Native processes 1-2, 2-5
New process, creating 1-3

Index
Debug Manual—421921-003
Index-9
O
No memory available signal 1-8
No memory available trap 1-7
Node name, in output-device syntax 4-4,
4-34, 4-37, 4-52, 4-64, 4-69
Node number, in Debug prompt 1-12, 4-23
noft utility, example 4-9/4-10
NonStop Open System
Services Glossary-4
Number
expression syntax 3-9
finding in memory 4-48, 4-49
signed/unsigned 4-42
Numeric representation
default 1-13, 3-9
displaying default base 4-75
expression syntax 3-9
in expressions 3-11
setting the base 4-22/4-24
= command 4-73/4-74
O
O display option, DN command 4-42
O option, BASE command 4-22, 4-23
Object code
optimization 2-4
TNS 2-3
TNS/R native 2-3
OCTAL option, BASE command 4-22
Octal representation
BASE command 4-22
D command 4-34
DN command 4-42
expression syntax 3-9
= command 4-73
Offset in address syntax 3-13
Open files 4-46
Open System Services 1-6, Glossary-4
Operator
arithmetic 3-10
Operator (continued)
relational
B command 4-12
BM command 4-27
R command 4-67
Optimization options 2-4
OSS signal Glossary-5
OUT option, BASE command 4-23
Output device
A command 4-3
D command 4-34, 4-36
I command 4-52
PMAP command 4-64
T command 4-69
Output, default numeric representation
for 1-13
Overflow
arithmetic overflow signal 1-8
arithmetic overflow trap 1-7
ENV register 1-9
stack overflow signal 1-8
stack overflow trap 1-7
Overview
Debug commands 3-1
P
P command 3-6, 4-63
P register
Debug header message 1-10
modifying 3-4, 4-61
syntax 3-8
TNS/R implementation 2-12
Parentheses 3-10
PAUSE command 3-6, 4-63
Pausing 4-63
PCB in expression 3-9
PFS Glossary-5
Physical memory Glossary-5

Index
Debug Manual—421921-003
Index-10
P
PIN
DEBUG command 1-4
DEBUGNOW command 1-4
defined Glossary-5
in Debug prompt 1-12, 4-23
output-device syntax 4-4, 4-34, 4-37,
4-52, 4-64, 4-69
V command 4-71
PMAP command 3-3, 4-64/4-65
Print map 4-64/4-65
Privileged bit
ENV register 1-9
TNS/R implementation 2-12
Privileged commands 3-5
Privileged mode
authority 1-2
breakpoint attribute
B command 4-12, 4-14, 4-16
BM command 4-25, 4-28, 4-29,
4-31
defined Glossary-5
description 4-65
Inspect 4-56
started in Inspect 4-56
ProcDebug option 2-4
Procedure
ARMTRAP 1-7
callable 4-65
calling undefined external 1-7
DEBUG 1-5
DEBUGPROCESS 1-5
licensed 4-65
optimization 2-4
privileged 4-65
PROCESS_DEBUG_ 1-5
PROCESS_LAUNCH_ 1-3
tracing 4-68
Process
executing with Debug 1-16
file name Glossary-5
See also File names
ID Glossary-5
name Glossary-5
output destination 4-3, 4-34, 4-36,
4-52, 4-64, 4-69
output device syntax 4-4, 4-34, 4-37,
4-52, 4-64, 4-69
privileged mode 4-65
resuming execution 4-66
state, determining 1-7/1-9
stopping 4-67
suspending execution 1-14, 4-63
Process control commands 3-6
Process file segment
See PFS
Process identification number
See PIN
Process looptimeout signal 1-8
Process loop-timer timeout trap 1-7
Process name
DEBUG command 1-4
DEBUGNOW command 1-4
output device syntax 4-4, 4-34, 4-37,
4-52, 4-64, 4-69
system-assigned 1-2
Processor
clear privileged memory-access
breakpoint 4-33
DEBUG command 1-4
DEBUGNOW command 1-4
freeze 4-50
halt 4-51
in Debug prompt 1-12, 4-23
output-device syntax 4-4, 4-34, 4-37,
4-52, 4-64, 4-69
set privileged code breakpoint 4-8
set privileged memory-access
breakpoint 4-25

Index
Debug Manual—421921-003
Index-11
Q
Processor (continued)
TNS/R processors and Debug
use 2-1/2-14
TNS/R registers 2-12
Process-ID parameter 1-5
PROCESS_DEBUG_ procedure 1-5
PROCESS_LAUNCH_ procedure 1-3
Program
optimization of 2-4
suspending execution 1-14, 4-63
Program compiler directives 1-14
Program file 2-3, 2-4
Prompt 1-12
PRV command 3-5, 4-65
persistence D-2
Q
Q segment 4-71
QA option, V command 4-71
R
R command 3-6, 4-66
R display mode, I command 4-52
R display option, = command 4-73
R memory access 4-25, 4-27, 4-29, 4-31
R option, FC command 4-47
R0 to R7 registers
D command 4-36
syntax 3-8
TNS/R implementation 2-12
RA to RH registers 3-8
Read access for debugging 1-2
Read (R) memory access 4-25, 4-27, 4-29,
4-31
Read/write (RW or WR) memory
access 4-25, 4-27, 4-29, 4-31
Register
breakpoint display format 4-20
displaying 4-36
expression syntax 3-10
Register (continued)
modifying contents 4-59/4-62
stack register syntax 3-7
syntax 3-7
TNS implementation in TNS/R 2-12
TNS/R processors 2-12
Register-exact point
breakpoint display 4-18
description 2-5
I command 4-53
PMAP command 4-65
setting breakpoints 2-8
Relational operators
B command 4-12
BM command 4-27
R command 4-67
Relative extended address Glossary-6
Remote node, debugging on a 1-13
Replace string, FC command 4-47
Resuming execution
example 1-5
R command 4-66
Right shift 3-10
RISC breakpoint header message 1-12
RISC instruction code
DN command 4-42
PMAP command 4-64/4-65
= command 4-73
RUND command 1-2, 1-14
Running Debug 1-3
Running program files 2-4
RW memory access 4-25, 4-27, 4-29, 4-31
S
S command 3-6, 4-67
S indirection type 3-13
S option
BASE command 4-22
DN command 4-42

Index
Debug Manual—421921-003
Index-12
S
S register
D command 4-36
syntax 3-8
TNS/R implementation 2-12
Saveabend file 1-6
Segment, memory-access breakpoint
display format 4-19
SEGMENT_USE_ procedure 4-72, 4-73,
4-75
Selectable data segment
addressing 3-16
setting current 4-71, 4-72, 4-73
Sequence number, in output-device
syntax 4-4, 4-34, 4-37, 4-52, 4-64
Sequence number, in Syntax for an
unnamed process 4-69
Session 1-13
Setting breakpoints
at memory-exact points 2-8
conditional code 4-11/4-13
conditional memory-access 4-26/4-28
current extended segment 4-72, 4-73
execute code 4-15/4-16
execute memory-access 4-31/4-32
on TNS/R processors 2-5/2-10
trace code 4-13/4-15
trace memory-access 4-29/4-32
unconditional code 4-7/4-10
unconditional memory-
access 4-24/4-26
SG indirection type 3-13
Shift operation 3-10
Signal
conditions 1-8
defined Glossary-6
entering Debug 1-7
Signal handler
defined Glossary-6
specifying 4-62/4-63
Signal handling
modifying 4-62/4-63
obtaining information about 4-54
Signal header message 1-12
Single-word expression syntax 3-9
Source-language compiler directives 1-14
SP register
D command 4-36
syntax 3-8
Space identifier
D command 4-36
Debug header message 1-10
modifying 3-4, 4-61
Spooler collector 4-3, 4-34, 4-36, 4-52,
4-64, 4-69
Stack marker ENV register, displaying 4-73
Stack overflow signal 1-8
Stack overflow trap 1-7
Stack register syntax 3-8
STANDARD option, BASE command 4-22
Start address
B command 4-13
BM command 4-29
breakpoint display format 4-21
Statement optimization 2-4
StmtDebug option 2-4
STOP command 3-6, 4-67
Stopping
the process being debugged 4-67
Super ID 1-2, 1-3, 1-5, 3-5, 4-65
defined Glossary-6
Suspending execution
P command 4-63
with breakpoints 1-14
Switching debuggers 4-56/4-57
SX indirection type 3-13
SYMBOLS compiler directive 2-4
Syntax summary C-1/C-12

Index
Debug Manual—421921-003
Index-13
T
System code
Debug header message 1-10
participating in execution
environment 1-16
segment number 4-23
space for TNS/R processors 2-1
System global byte address, SG indirection
type 3-13
System library
Debug header message 1-10
segment number 4-23
System name
defined Glossary-7
in output-device syntax 4-4, 4-34, 4-37,
4-52, 4-64, 4-69
System number
defined Glossary-7
in Debug prompt 1-12, 4-23
System process Glossary-7
debugging 1-3, 1-5
System-assigned process name 1-2
T
T command 3-3, 4-68
T display mode, I command 4-52
T display option
DN command 4-42
= command 4-73
Table 3-5
Table-formatted display 4-33, 4-41
TACL, DEBUG run option 1-2
TERM option 1-4
Terminating application process 4-67
Test address
B command 4-11
BM command 4-27
breakpoint display format 4-20
Three 2-3
Timeout, process looptimeout signal 1-8
TNS Glossary-3
TNS environment registers 3-8
TNS instruction code
DN command 4-42
PMAP command 4-64/4-65
= command 4-73
TNS processes 1-2, 2-5
TNS program file, running 2-3
TNS registers emulated in TNS/R
registers 2-12
TNS/R Glossary-3
TNS/R memory
displaying 4-41
organization 2-1
TNS/R native mode 1-1
TNS/R native processes 1-2, 2-5
TNS/R native program file 2-4
TNS/R native signal
defined Glossary-8
TNS/R processors and Debug use 2-1/2-14
TNS/R registers 3-8
description 2-10
D* command 4-36
Trace 3-5, 4-68
Trace breakpoint display format 4-21
Trace code breakpoint
clearing 4-32
setting 4-13/4-15
Trace memory-access
breakpoint 4-29/4-32
Trap
conditions 1-7
defined Glossary-8
enable bit 1-9
entering Debug 1-7
Trap handler Glossary-8
Trap header message 1-12
Types of Debug commands 3-1
U
U option, DN command 4-42

Index
Debug Manual—421921-003
Index-14
V
Unconditional code breakpoint
clearing 4-32
setting 4-7/4-10
Unconditional memory-access
breakpoint 4-24/4-26
Uncorrectable memory error signal 1-8
Uncorrectable memory error trap 1-7
Uppercase letters in commands 3-7
User code
Debug header message 1-10
segment number 4-23
space for TNS/R processors 2-1, 2-6
User library
Debug header message 1-10
segment number 4-23
space for TNS/R processors 2-1
User process
defined Glossary-8
executing with Debug 1-16
USESEGMENT procedure 4-72, 4-73, 4-75
V
V command 3-5, 4-71
Variables
modifying 4-58/4-59
tracing contents 4-13/4-15
VQ command 3-5, 4-72
VQA command 3-5, 4-73
W
W memory access 4-25, 4-27, 4-29, 4-31
Word address, using I indirection type 3-13
WR memory access 4-25, 4-27, 4-29, 4-31
Write (W) memory access 4-25, 4-27, 4-29,
4-31
X
X address in expressions 3-10
X display option, DN command 4-42
Special Characters
$0 register 2-10, 3-8
$1 to $31 registers 2-10, 3-8
$HI register 2-10, 3-8
$LO register 2-10, 3-8
$PC register 2-10, 3-8
% display mode, D command 4-34
% display option
DN command 4-42
= command 4-73
% in expressions 3-9
%B display option, DN command 4-42
%D display option, DN command 4-42
%H display option, DN command 4-42
%H in expressions 3-9
%O display option, DN command 4-42
& option, T command 4-68
() in expressions 3-10
* arithmetic operator 3-10
* option
B command 4-16
C command 4-32
D command 4-36
+ in expressions 3-9
, option, DN command 4-41
- in expressions 3-9
/ arithmetic operator 3-10
: option, DN command 4-42
; string separator
B command 4-15
BM command 4-31
command line 3-6
< relational operator
B command 4-12
BM command 4-27
R command 4-67
<< left shift operator 3-10
<> relational operator
B command 4-12
BM command 4-28

Index
Debug Manual—421921-003
Index-15
Special Characters
R command 4-67
= command 3-4, 4-73
= relational operator
B command 4-12
BM command 4-28
R command 4-67
> display symbol for memory-exact
point 4-18, 4-53, 4-65
> relational operator
B command 4-12
BM command 4-27
R command 4-67
>> right shift operator 3-10
? command 3-5, 4-75
? option
B command 4-14
BM command 4-29
@ display symbol for register-exact
point 4-18, 4-53, 4-65
