PL360 Noreco 2013 ENG
User Manual: PL360
Open the PDF directly: View PDF ![]() .
.
Page Count: 85

ANNUAL REPORT
2013

5 Key figures
6Management team
8License portfolio
12 Annual statement of reserves
18 Noreco Group
20 Corporate Governance
30 Board of Directors
33 Directors report
45 Consolidated statement
of comprehensive income
46 Consolidated statement
of financial positions
48 Consolidated statement
of changes in equity
50 Consolidated statement
of cash flows
53 Notes
136 Statutory accounts Norwegian
Energy Company ASA
164 Auditor’s Report
166 Statement of compliance
167 Glossary
CONTENT
Norwegian Energy Company ASA
Verksgata 1A
P.O. Box 550 Sentrum
4003 Stavanger
Norway
www.noreco.com
Idé og design:

4 Noreco Annual report 2013 Noreco Annual report 2013 5
(NOK million) 2013 2012 2011 2010
Income statement
Revenue 894 832 1 616 2 146
EBITDA (440) (817) (997) 699
EBIT (1 969) (1 508) (1 914) 61
Result before tax (1 954) (1 994) (2 381) (424)
Net result (1 008) (593) (1 442) 5
Net cash flow from
operations 1 476 905 1 294 731
Balance sheet
Non-current assets 4 797 5 411 6 809 9 611
Current assets 1 408 2 515 2 055 3 002
Total assets 6 205 7 926 8 864 12 613
Equity 1 750 2 028 2 428 3 675
Liability 4 455 5 898 6 436 8 938
Total equity and liabilities 6 205 7 926 8 864 12 613
6 Noreco Annual report 2013 Noreco Annual report 2013 7
MANAGEMENT TEAM
2013
Svein Arild
Killingland (58)
Stavanger
CEO
Joined Noreco in May 2013.
Killingland has 30 years experience
predominantly within oil and gas
upstream activity. Killingland has
previously held positions in Statoil,
Revus Energy and Wintershall,
predominantly within upstream oil
and gas business development and
management, as well as a position
as Senior Partner in HitecVision
(2010-12). Killingland holds a degree
in Economics and Management from
the Norwegian School of Economics
and Business Administration.
Ørjan Gjerde (44)
Stavanger
CFO
Ørjan Gjerde joined Noreco in March
2012, and has since 1996 been
CFO in several companies such as
IKM Gruppen AS, Proserv Group
AS and Skanem AS. Gjerde has
extensive experience from financial
and operational restructuring,
strategy and business development,
mergers, acquisitions and establish-
ments, as well as directorships in
IKM Gruppen AS, Rig Management
Norway AS, Wellcon AS (-chairman),
and Cyviz AS (chairman and
co-founder). Gjerde is a State
authorised public accountant and
graduated from Norwegian School
of Economics in 1995.
Øyvind Sørbø (46)
Stavanger
Vice President Commercial
Joined Noreco in September
2006. Has worked in the oil and
gas industry since 1993, and
held positions in Amoco and BP
within finance, economic analysis,
commercial operations and
business development. Held
several commercial responsibilities
within BP, including the role of
Commercial Advisor for their
producing assets. In Noreco,
Sørbø has held positions as
Sr. Commercial Advisor and
Business Development Manager.
Øyvind Sørbø holds a BA (Hons)
degree in Economics and Finance
from the University of Strathclyde
Scotland.
Lars Fosvold (52)
Stavanger
Vice President Exploration
Joined Noreco in December 2005.
Has worked in the oil and gas
industry since 1986 in Norway
and internationally. Has held
various specialist and leading
geoscience positions in the total
value chain from exploration to
development and production with
several major oil companies. Holds
a BSc (Hons) in Applied Geology
from the University of Strathclyde
in Scotland.
8 Noreco Annual report 2013
23
39
31
5
6
29
13
20
4
6808
6510
6511
6206
6408
6200
220
36
35
34 37
38
27
26
25 28
29
20
19 21 22
14
13
12
11
17 18
15
16
15
24
16 17 18 19
7
6
5
1
78 9 10 11 12
23
89
25 26 27
30 31 32
3433 35 36
1
222
221
218
219 6201 6202 6203 6204
6205
6301
6300 6302 6303 6204 6305 6306 6307
64026401 6403 6404
6405
6406 6407
65026501 6503 6504 6505 6506 6507
6508 6509
66026601 6603 6604 6605 6606 6607
6608 6609 6610
6703 6704
6705 6706 6707
6708 6709
6809
6710
6810
217
216
209
210 211
208
214
213
206
205
203
201
202
204
223
23
30
7029
7030
7031
7020
7021
7022
7019
7018
7017
7016
7120
7121
7122
7119
7118
7117
7116
7123
7124
7125
7126
7127 7128
7129
7130
7131
7220
7221
7222
7223
7224
7225 7226
7227
7228
7229
7230
7231
7219
7218
7217
7216
7215
7320
7321
7322
7323
7324
7325 7326
7327
7328
7329
7330
7331
7318
7317
7316
7315
7319
7422
7423
7424
7425
7426
7427
7428
7429
7420
7421
7419
7418
7417
7416
7415
66°
67°
68°
70°15
71°
72°
73°
74°
65°
0°
1W°
2W°
3W°
4W°
5W°
6W°
2E°
1E°
3E° 4E°
5E° 6E° 7E° 8E°
9E°
10E°
11E°
24°E
26°E
28°E
22E°
20°E
18°E
16°E
63°
62°
61°
60°
59°
58°
58°
56°
64°
65°
1E°
0°
1W° 2E° 3E° 5E° 6E° 7E° 8E° 10E°
9E° 11E° 12E° 13E°
4E°
PL606
PL490
PL492
PL701
PL646
PL484
PL599
PL639
PL519
N O RW AY
U K
PL620
4/95
Nini
16/98
Cecilie
1/90 &
7/86
Lulita
9/06
Gita
9/95
Maja
N O RW AY
DENMARK
PL018DS
PL616
P1666
PL006C
SE Tor
PL274
Oselvar
PL274CS
P1768
PL048D
Enoch
P1114
Huntington
PL360
7/86
Amalie
P2032
P1989
P1889
P2003
P2026
P2009
P1934
PL761
PL762
PL755
PL744S
PL748
Updated 3rd Februar 2014
DM # 19297
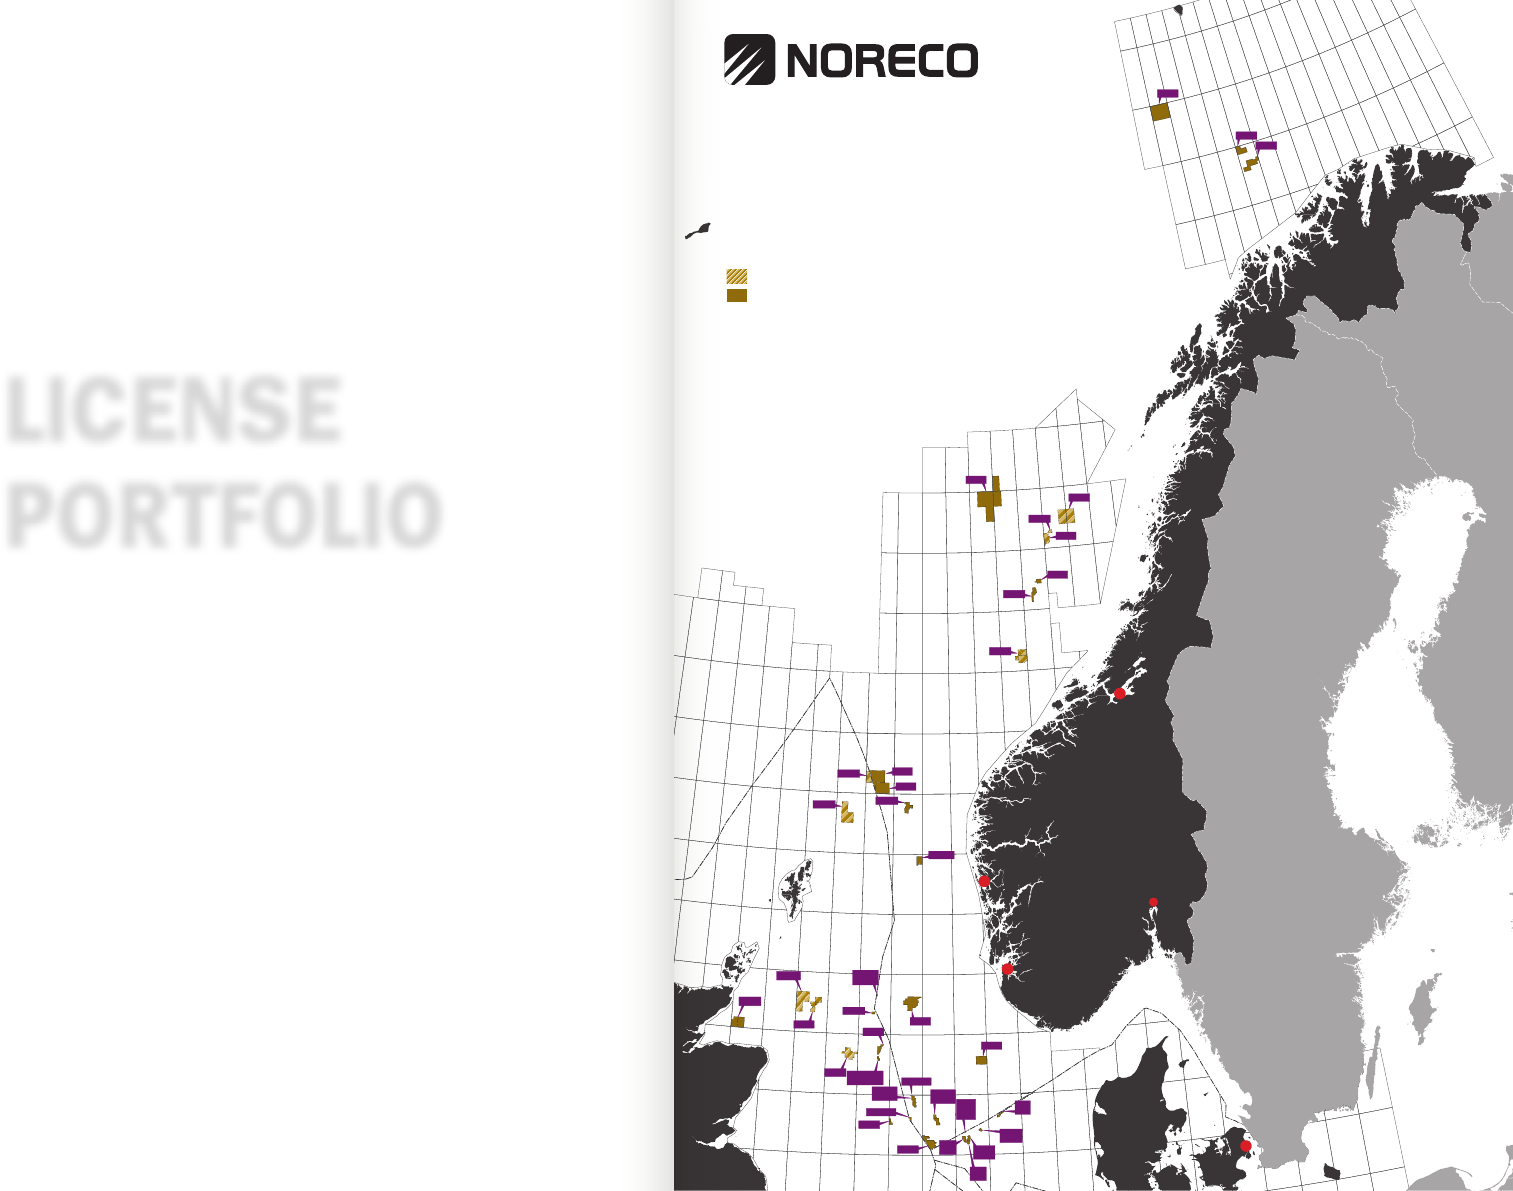
NORECO operator
NORECO partner
Shetland
Bjørnøya
NORWAY
UK
SWEDEN
FINLAND
DENMARK
Oslo
Trondheim
Stavanger
Bergen
Copenhagen
NORECO License Portfolio
0 250 km
LICENSE
PORTFOLIO
NORECO License Portfolio

10 Noreco Annual report 2013 Noreco Annual report 2013 11
12 Noreco Annual report 2013 Noreco Annual report 2013 13
ANNUAL STATEMENT
OF RESERVES
2013
Noreco’s classification of reserves follows
the SPE/WPC/AAPG/SPEE Petroleum
Resources Management System (SPE-
PRMS) published in 2007. The system
is a recognised resource classification
system in accordance with the Oslo Stock
Exchange Circular 1/2013 “Revised listing
and disclosure requirements for oil and
natural gas companies”.
The SPE-PRMS uses “reserves”, “contingent
resources” and “prospective resources”
to classify hydrocarbon resources of
varying technical maturity and commercial
viability. The maturity within each class is
also described to help guide classification
of a given asset.
Details of SPE-PRMS can be found here:
http://www.spe.org/industry/reserves/
prms.php
RESERVES
In this document Noreco reports the
company’s reserves, estimated by Noreco
in accordance with the SPE-PRMS
standard. Economic limit tests have been
performed based on a market forward
oil price as of end 2013 as well as the
company’s best assumptions of future
operating costs.
In addition, Noreco uses an external
company (DeGolyer and MacNaughton)
to perform an independent reserves
analysis. Both the in-house and the
independent reserves estimation follow
SPE-PRMS.
As per 31 December 2013, Noreco has
reserves in seven fields. Further informa-
tion about the fields is available on
Noreco’s homepage www.noreco.com.
Noreco’s reserves overview is shown in
Table 1 and 2. The division is as suggested
in Oslo Børs Circular 1/2013 Annex III, and
the SPE PRMS reserves categories used
is shown in brackets.
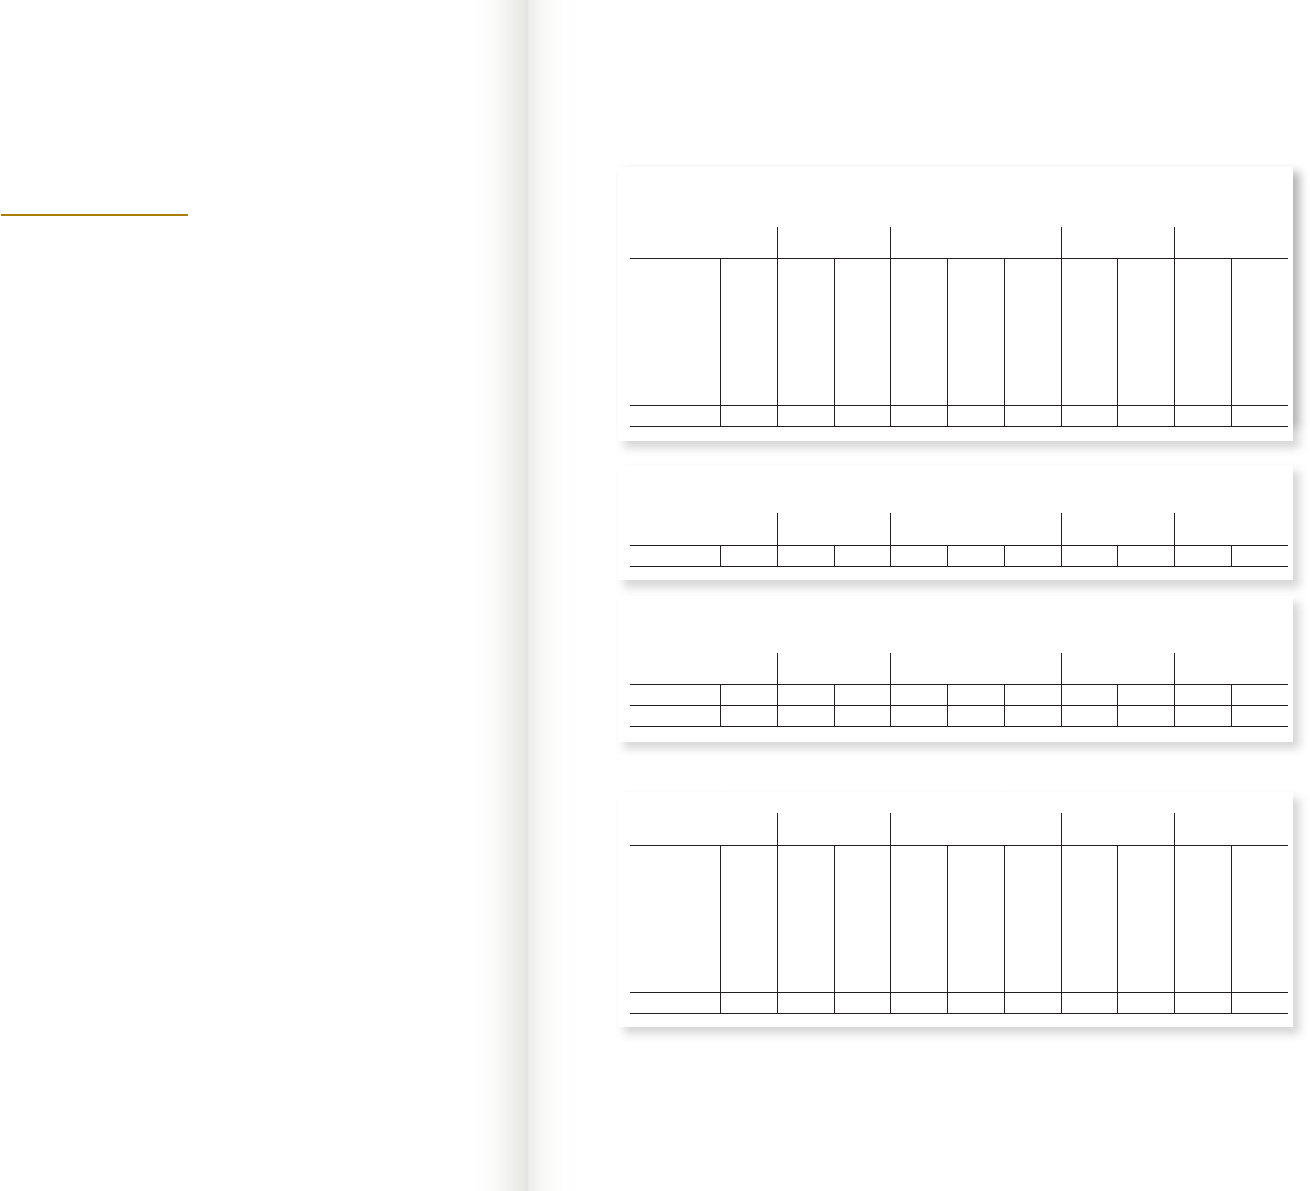
Table 1: Noreco reserves by asset
Developed Assets (on production) as of 31.12.2013
1P 2P
Liquids
(mill bbl)
Gas
(bscf)
mill
boe
Interest
%
Net mill
boe
Liquids
(mill bbl)
Gas
(bscf)
mill
boe
Interest
%
Net mill
boe
Nini 0.9 0.0 0.9 30.0 0.3 2.1 0.0 2.1 30.0 0.6
Nini East 2.6 0.0 2.6 30.0 0.8 6.5 0.0 6.5 30.0 2.0
Cecilie 0.0 0.0 0.0 61.0 0.0 1.5 0.0 1.5 61.0 0.9
Lulita 0.8 3.0 1.3 28.2 0.4 0.9 3.7 1.6 28.2 0.5
Enoch 1.7 0.0 1.7 4.4 0.1 2.3 0.0 2.3 4.4 0.1
Oselvar 7.4 18.2 10.7 15.0 1.6 13.2 53.6 22.8 15.0 3.4
Huntington 22.1 10.7 24.0 20.0 4.8 35.4 21.1 39.2 20.0 7.8
Total 7.9 15.3
Under development (approved for development) as of 31.12.2013
1P 2P
Liquids
(mill bbl)
Gas
(bscf)
mill
boe
Interest
%
Net mill
boe
Liquids
(mill bbl)
Gas
(bscf)
mill
boe
Interest
%
Net mill
boe
Total 0.0 0.0
Non-developed assets (justified for development) as of 31.12.2013
1P 2P
Liquids
(mill bbl)
Gas
(bscf)
mill
boe
Interest
%
Net mill
boe
Liquids
(mill bbl)
Gas
(bscf)
mill
boe
Interest
%
Net mill
boe
Nini East 0.0 0.0 0.0 30.0 0.0 1.2 0.0 1.2 30.0 0.3
Total 0.0 0.3
Total reserves as of 31.12.2013
1P 2P
Liquids
(mill bbl)
Gas
(bscf)
mill
boe
Interest
%
Net mill
boe
Liquids
(mill bbl)
Gas
(bscf)
mill
boe
Interest
%
Net mill
boe
Nini 0.9 0.0 0.9 30.0 0.3 2.1 0.0 2.1 30.0 0.6
Nini East 2.6 0.0 2.6 30.0 0.8 7.7 0.0 7.7 30.0 2.3
Cecilie 0.0 0.0 0.0 61.0 0.0 1.5 0.0 1.5 61.0 0.9
Lulita 0.8 3.0 1.3 28.2 0.4 0.9 3.7 1.6 28.2 0.5
Enoch 1.7 0.0 1.7 4.4 0.1 2.3 0.0 2.3 4.4 0.1
Oselvar 7.4 18.2 10.7 15.0 1.6 13.2 53.6 22.8 15.0 3.4
Huntington 22.1 10.7 24.0 20.0 4.8 35.4 21.1 39.2 20.0 7.8
Total 7.9 15.6

14 Noreco Annual report 2013 Noreco Annual report 2013 15
For conversion between gas volumes (scf)
and oil equivalents (boe), Noreco has
used 5600 scf equals 1 boa.
The Nini, Nini East and Cecilie reserves
are all produced via the Siri platform.
Nini, DCS, operated by Dong Energy,
Noreco 30 percent
The reserves assessment of the Nini field
is based on decline analysis of the
producing wells. Reserves are approxi-
mately 40% lower than last year after
accounting for the 2013 production due
to well performance.
Nini East, DCS, operated by Dong Energy,
Noreco 30 percent
The reserves assessment of Nini East is
based on detailed reservoir modelling.
The reserves for a new production well are
included in the Justified for Development
category. Reserves are approximately 2%
higher than last year after accounting for
the 2013 production.
Oselvar, NCS, operated by Dong Energy,
Noreco 15 percent
The Oselvar field was put on production
14th April 2012. The reserves assessment
of the Oselvar field is based on new reservoir
modelling and recent production history.
The production level so far has been lower
than expected, and work is ongoing to find
the reason for the weak production and to
identify possible improvement measures.
The 2P reserves are approximately 55%
lower than last year after accounting for
the 2013 production.
Huntington Forties, UKCS, operated
by E.ON Exploration and Production,
Noreco 20 percent
The Huntington field was put on production
12th April 2013 about half a year after the
production vessel (FPSO) Voyageur Spirit
was installed on the field. Noreco’s
reserve estimate of the Huntington Forties
reservoir is based on the company’s own
reservoir modelling, the new development
wells together with recent production
history. The 2P reserves on Huntington
have been kept unchanged.
CONTINGENT AND PROSPECTIVE
RESOURCES
Noreco’s contingent resources are from
discoveries in various stages of maturation
towards development on the Norwegian
Danish and UK continental shelves.
In accordance with guidelines from Oslo
Stock Exchange, Noreco does not quantify
contingent resources in this ASR.
For a description and overview of our
contingent resources, reference is made
to Noreco’s homepage www.noreco.com.
MANAGEMENT’S DISCUSSION
AND ANALYSIS
The reported reserve estimates are based
on standard industry practices and
methodology such as decline analysis,
reservoir modelling and geological and
geophysical analysis. The evaluations
and assessments have been performed
by engineers with extensive industry
experience, and the methodology and
results have been quality controlled as
part of the company’s internal reserves
estimation procedures. The 2P reserves
estimate represents the expected
outcome for the fields based on the
performance observed to date, the
company’s understanding of the fields
and the planned activities in the licenses.
A third party independent assessment
has been performed by DeGolyer and
MacNaughton on all of Noreco’s fields
categorised as reserves. The assessment
is based on input data provided by
Noreco, as well as full access to subsur-
face data and license documentation.
DeGolyer and MacNaughton performed
an independent review of reserves on this
basis. The independent review concludes
with a reserves estimate that is ten
percent higher than Noreco’s overall 2P
estimate and hence serves as a verifica-
tion of the Noreco reserves estimate.
The information included herein may
contain certain forward-looking statements
that address activities, events or
developments that Noreco expects,
projects, believes or anticipates will or
may occur in the future. These state-
ments are based on various assumptions
made by Noreco, which are beyond its
control and are subject to certain additional
Cecilie, DCS, operated by Dong Energy,
Noreco 61 percent
The reserves for the Cecilie field are
based on decline analysis of existing
wells. The reserves are decreased by
approximately 25% compared with last
year.
Lulita, DCS, operated by Maersk Oil
& Gas, Noreco 28.2 percent
The 2P reserves for the Lulita field are
based on decline analysis. The Lulita field
is produced with a single well and there
is potential for infill drilling (sidetrack).
New seismic is being interpreted to
address future possibilities. However,
no firm plan exists and consequently
there are no undeveloped reserves
booked for Lulita. Reserves are un-
changed since last year.
Enoch, NCS, operated by Talisman,
Noreco 4.36 percent
The Enoch field is produced with a single
well, but the field has been shut down in
2013. The 2P reserves have been kept
unchanged.
Reserves development
Net mill boe Developed assets
(on production)
Under development
(approved for
development)
Non-developed assets
(justified for
development
Total
1P 2P 1P 2P 1P 2P 1P 2P
Balance as of 31.12.2012 6.4 13.1 5.3 8.8 0.0 0.0 11.7 21.9
Production (1.5) (1.5) - - - - (1.5) (1.5)
Aquisitions/disposals - - - - - - - -
Extensions and discoveries - - - - - - - -
New developments 5.3 8.5 (5.3) (8.8) 0.0 0.3 0.0 0.0
Revisions of previous estimates (2.3) (4.7) 0.0 0.0 0.0 0.0 (2.3) (4.7)
Balance as of 31.12.2013 7.9 15.3 0.0 0.0 0.0 0.3 7.9 15.6
Table 2: Noreco reserves development
16 Noreco Annual report 2013 Noreco Annual report 2013 17
risks and uncertainties. As a result
of these factors, actual events may
differ materially from those indicated
in or implied by such forward-looking
statements.
The 2P reserve estimate for the Noreco
portfolio is 15.6 million barrels of oil
equivalents (boe) compared to 21.9
million boe in the year end 2012 reserves
statement. This decrease is mainly
a result of Oselvar write downs and
Noreco’s production of 1.5 million boe
in 2013.
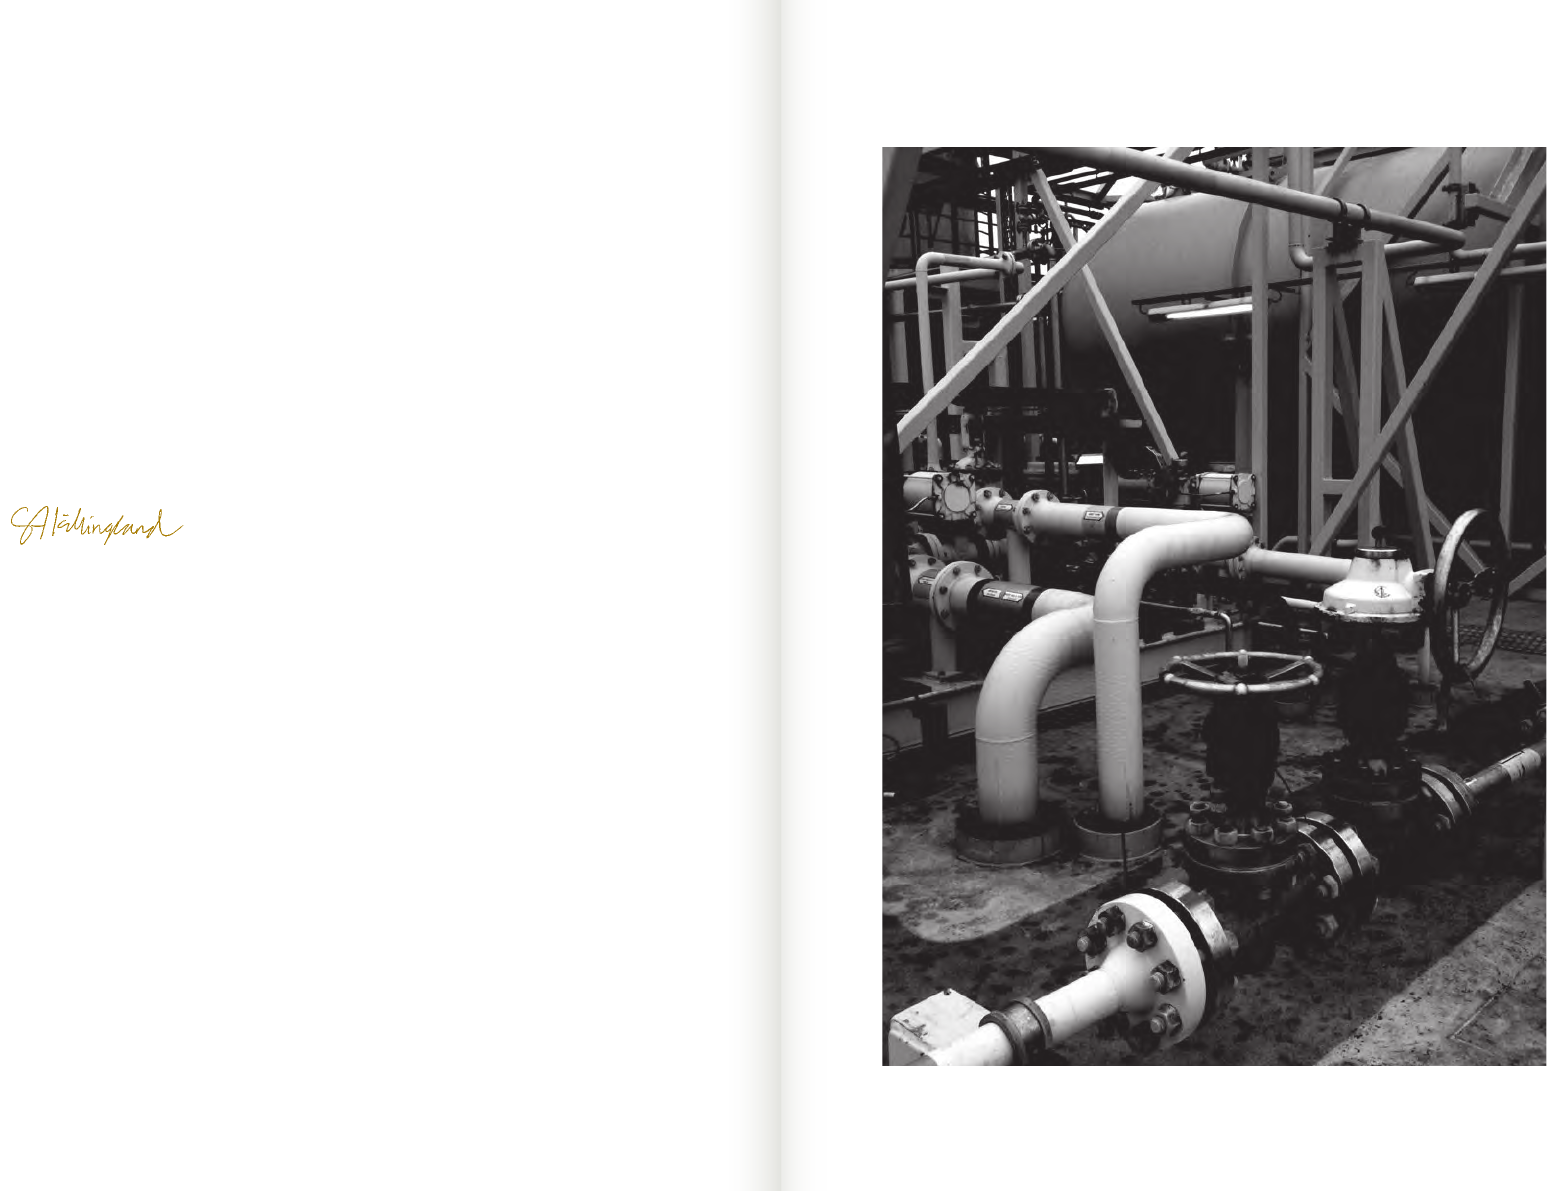
Svein Arild Killingland
CEO, Noreco

18 Noreco Annual report 2013 Noreco Annual report 2013 19
Norwegian Energy Company ASA*
Noreco Petroleum
(UK) Ltd
Altinex ASA
Noreco Denmark A/S Noreco Norway AS
• Enoch 4.36 %
• Oselvar 15 %
• All NO exploration activity
Noreco Oil
Denmark A/S
• Nini 30 %
• Cecilie 37 %
• Lulita 19.452 %
• All DK exploration activity
Noreco Petroleum
Denmark A/S
• Cecilie 24 %
• Lulita 8.751 %
Noreco Oil
(UK) Ltd
• Huntington 20 %
Norwegian Energy
Company (UK) Ltd
• All UK exploration activity
NORECO GROUP
2013
NORECO
GROUP
* All companies 100 % controlled by parent

20 Noreco Annual report 2013 Noreco Annual report 2013 21
Implementation and reporting on
corporate governance
Noreco is committed to maintain a high
standard of corporate governance and
believe that effective corporate govern-
ance is essential to its success.
Noreco’s board and management shall
endeavour to exercise a corporate
governance policy built on Norwegian
corporate law, and that follows the
Norwegian Code of Practice for Corporate
Governance of 23 October 2012 (with
correction of 21 December 2012)
(hereinafter the ”Code”), However, as of
the date of this annual report, Noreco is
not in full compliance with the Code.
Noreco deviates from the Code on the
following matters:
• not all members of the Board of
Directors (the “Board”), all members of
the nomination committee or the auditor
will normally attend the general meeting;
This is because of the number of board
members, and in order to carry out the
General Meetings in an efficient manner.
It is Noreco’s aim that at least one of
the board members are present at
the General Meetings, that one of the
members of the nomination committee
are present in the event that an election
is on the agenda, and that the auditor
is present when the General Meetings
discusses the annual accounts, or other
matters in which the auditor’s presence
may be useful.
• The company’s nomination committee
consists of three members, whereof the
chairman, Tom Henning Slethei, together
with close associates own 90 000
shares in Noreco. Ole Rettedal is the
CEO of IKM Industri-Invest AS which owns
18.19 per cent of the shares in Noreco.
Ole Rettedal himself owns together with
other close associates 0.23 per cent of
the shares in Noreco. The final member,
Morten Garman, lawyer and partner in
Gram, Hambro & Garman law firm, is
independent of both shareholders,
the Board and executive management.
The Board has the overall responsibility
for corporate governance in Noreco and
ensures that The Company implements
sound corporate governance. The Board
has established a remuneration and
corporate governance committee
consisting of three of the members of
the Board. This committee reviews and
assesses Noreco’s corporate governance
policies and procedures on a regular
basis, and recommends any proposed
changes to the Board for approval.
The Board has defined Noreco’s basic
corporate values, and its ethical guide-
lines and guidelines for corporate social
responsibility are in accordance with
these values. Further information on
and an English translation of the Code
are available on www.ncgb.no.
The Public Limited Liability Companies Act
(hereinafter the “PLCA”) and the Securities
Trading Act are available in unofficial
English translations on http://www.
oslobors.no/ob_eng/Oslo-Boers/
Regulations/Acts.
Noreco’s business and main strategy
Noreco has grown from being a small
privately owned E&P company into a
publicly owned independent E&P company
listed on Oslo Stock Exchange. From
inception, The Company has combined
strong commercial principles with a
long-term growth perspective. Confidence
in Noreco and its businesses is essential
for Noreco’s competitiveness and value
creation.
In accordance with Noreco’s Articles of
Association section 3, “The business of
Noreco is exploration, production and sale
related to oil and gas activities. Noreco
will obtain participating interests in
production licenses by participating in
license rounds and through acquisition
of participating interests”.
Noreco’s vision is to be one of the leading
independent oil and gas companies
whose activities are focused in the North
Sea area (Norway, Denmark and United
Kingdom). The Company provides value
creation for all its shareholders by building
an optimised portfolio of exploration,
development and production assets.
To achieve its vision, Noreco is actively
participating in exploration rounds and
asset activity, as well as building on core
areas were Noreco has the understanding
and knowledge to develop unique value
creating options for The Company and its
shareholders. Further, Noreco endeavours
to create values in the core areas through
competence and commitment to generate
activity and take calculated risk.
Noreco’s employees, and their compe-
tence and commitment to succeed, are
at the centre of The Company’s strategy.
Noreco will ensure that The Company has
and maintains competitive competence
in all key disciplines, and that it has the
necessary capacity to both deliver value
creation on Noreco’s assets and sustain-
able growth in portfolio and capability.
Noreco believes that its integrity and
standards are critical to Noreco’s
sustainability and value as a company,
and that success is both about achieving
the right results and delivering in the
right way.
Noreco’s business decisions and actions
are made in accordance with the following
values:
• Being a good corporate citizen
• Caring for Noreco’s people and the
environment
• Developing Noreco’s people and
competence
• Committing to competitive performance
• Conducting its business with integrity
and honesty
Noreco’s ethical guidelines and the
guidelines on corporate social responsi-
bility (CSR) are based on the values
mentioned above. The CSR statement
as approved by the board 14 March 2011
is to be found on Noreco’s website,
http://www.noreco.com/en/About-us/CSR/
Noreco is aware of the effect our business
has on society. The basic principles for
corporate social responsibility that The
CORPORATE GOVERNANCE

22 Noreco Annual report 2013 Noreco Annual report 2013 23
Company will follow are outlined in our
policy for corporate social responsibility.
Equity and dividends
After the refinancing of the Company in
the autumn of 2013, Noreco’s equity is
considered to be adequate to Noreco’s
objectives, strategies and risk profile.
Noreco has not previously paid any
dividends, and it does not expect to pay
ordinary dividends to its shareholders in
the near future. However, the Company
aims over time to give shareholders a
competitive return on capital relative to
the underlying risk. Any future dividend
payment will be subject to determination
based on Noreco’s results and other
factors the Board finds relevant.
Any proposal by the Board concerning
dividends must be approved by Noreco’s
shareholders at the General Meeting. Thus,
Noreco’s policy concerning dividends is
predictable and corresponding with its
objectives, strategies and risk profile.
Presently, the General Meeting has
granted the Board with the authority to
increase the share capital of Noreco by
issuance of up to 4 608 998 shares to
be utilised in connection with the incentive
scheme for the group’s employees.
The proxy is valid until 1 June 2014.
Equal treatment of shareholders
Noreco only has one class of shares and
each share carries one vote at the general
meetings of the company.
In case of deviations from existing
shareholders preferential rights at share
capital increases and the reasons would
be publicised in a stock exchange report
linked to the capital increase.
Transactions regarding the company’s
own shares
For the time being, Noreco is not
authorised by the general meeting to
acquire own shares. Noreco’s transactions
of its own shares would be conducted on
the stock exchange or by other way of
procedure at the stock exchange value.
In case of limited liquidity in the share,
the requirement on equal treatment would
nevertheless be upheld by other way of
appropriate procedure.
Transactions with close associates
There have not been any other transaction
of significance with closely related parties
during 2013.
If Noreco should enter into a not immate-
rial transaction with any of its associated
parties within The Company or with
companies in which a Director or leading
employee of Noreco or close associates
of these have a direct or indirect vested
interest, those concerned shall immedi-
ately notify the Board. Any such transac-
tion must be approved by the CEO and the
Board, and where required also as soon
as possible be publicly disclosed to the
market.
If a transaction, which is not immaterial,
is entered into between Noreco and
shareholders, a shareholder’s parent
company, member of the Board, member
of the executive management or close
associates of such parties, or related
companies with minority shareholders, the
Board will, where deemed necessary, seek
to arrange an independent valuation to be
obtained from an independent third party,
unless the General Meeting shall consider
the matter pursuant to the provisions of
the PLCA.
Freely negotiable shares
The Noreco shares are freely negotiable
and the Articles of Association do not
impose any restriction on the transfer
of shares. The Company is listed on the
Oslo Stock Exchange.
General Meetings
The General Meeting is Noreco’s supreme
corporate body. The Board strives to
ensure that the General Meeting is
an effective forum for communication
between the Board and the shareholders.
Therefore, Noreco encourages all
shareholders to exercise their right
to participate in the general meetings.
The Annual General Meeting will normally
be held in April or May each year.
The calling notice will be distributed to all
shareholders no later than 21 days before
a general meeting, cf. Noreco’s Articles
of Association section 10. However, the
Company also has the opportunity to call
a general meeting with a 14 days’ notice
period.
Noreco endeavours in general to make
the detailed support information, the
resolutions to be considered at the
General Meeting and the nomination
committee’s recommendations and report,
available on the Company’s website no
later than on the date of the distribution
of the notice of the general meeting. The
resolutions and the supporting information
distributed are sufficiently detailed and
comprehensive to allow shareholders to
form a view on all matters to be consid-
ered at the meeting.
The calling notice includes a reference to
Noreco’s website where the notice calling
the meeting and other supporting
documents are made available. As the
supporting documents are made accessi-
ble for the shareholders on Noreco’s
web-pages, the documents will normally
not be enclosed in the calling notice sent
to the shareholders, cf. Noreco’s Articles
of Association section 13. Further,
the right for shareholders to propose
resolutions in respect of matters to
be dealt with by the general meeting
will be described on the website.
As the right for shareholders to propose
resolutions is described on Noreco’s
website, it is not specifically included in
the calling notice. According to Noreco’s
Articles of Association section 9,
shareholders must give written notice
to Noreco of their intention to attend the
General Meeting by the date stated in the
calling notice, which date must be at least
two working days before the General Meet-
ing. Shareholders, who are unable to be
present, are encouraged to participate by
proxy, and a person who will be available
to vote on behalf of shareholders as their
proxy will be nominated. Such proxy which
allows separate voting instructions to be
given for each matter to be considered
by the meeting and for each of the
candidates nominated for election is
enclosed in the calling notice. To the
extent necessary, members of the Board,
the Nomination Committee and the
auditor will strive to be present at the
General Meeting.
Noreco will endeavour to arrange elections
in such manners that the general meeting
may vote separately for each candidate
nominated for election to the Company’s
corporate bodies. The Board decides
the agenda for the General Meeting.

24 Noreco Annual report 2013 Noreco Annual report 2013 25
However, the main agenda items are
determined by the requirements of
the PLCA and requirements in Noreco’s
Articles of Association. The chairman of
the Board shall chair the General Meeting,
if the Board has not decided to appoint
an independent chairperson.
The Board may decide to allow electronic
participation in general meetings, and will
consider this before each general
meeting.
Nomination Committee
The Nomination Committee consists of
three members elected by the General
Meeting. An extraordinary general meeting
was held on 4 February 2014, where Tom
Henning Slethei (chairman), Ole Rettedal
and Morten Garman were elected as
members of the Nomination Committee.
Tom Henning Slethei owns together with
close associates 90 000 shares in
Noreco. Ole Rettedal is the CEO of IKM
Industri-Invest AS which owns 18.19 per
cent of the shares in Noreco, and Ole
Rettedal himself owns together with close
associates 0.23 per cent of the shares in
Noreco. Morten Garman is independent of
the board and management. The service
shall be two years unless the General
Meeting determines that the service
period shall be shorter, cf. Noreco’s
Articles of Association section 7.
The Articles of Association state that:
“the Nomination Committee shall prepare
a motion for the Annual General Meeting
relating to:
• Election of members of the Board and
the chairperson of the Board.
• Election of the members of the Nomina-
tion Committee and the chairperson of
the Committee.
• The remuneration of the Directors and
the members of the Nomination
Committee.
• Any amendments of the Nomination
Committee’s Mandate and Charter”.
The tasks of the Nomination Committee
are further described in Noreco’s
Nomination Committee guidelines.
The committee had 4 meetings in 2013.
Board candidates are selected considering
the competence, experience, capacity
and diversity of each individual and the
Group as a whole. Its recommendations
will normally be explained. The nomination
committee also proposes the remunera-
tion of the directors to the General
Meeting, reflecting the responsibility,
competence, time and complexity of
the work involved.
The remuneration shall be a fixed amount,
which does not depend on results or
involve options. The General Meeting
makes the final decision as to the
remuneration.
Corporate assembly
Noreco does not have a corporate
assembly as it is not required to.
The Board: Composition and
Independence
The Board is organised in accordance with
the PLCA and the Articles of Association,
and the Board currently exists of five
members, whereof two are women.
The current shareholder elected directors
were appointed at the General Meeting
held on 4 February 2014.
Two directors and four deputies, all
representing the employees of Noreco,
were elected during 2012 as
representatives for the employees. The
chairman of the Board is elected by the
General Meeting.
The directors are elected for a two-year
period, cf. PLCA section 6-6, unless the
General Meeting decides otherwise. This
period of service is not deviated in
Noreco’s Articles of Association.
All the directors elected by the sharehold-
ers have a wide experience and represent
both industry specific and professional
expertise from national and international
companies. Further information on each
director is available on www.noreco.com/
about_us/board.
In Noreco’s opinion, all the shareholder
elected directors are independent of the
Company’s executive management and
material business contacts.
Employee elected directors and deputies
have options to buy or subscribe for
shares in the company. The Company
has not issued any option to buy or
subscribe for shares to shareholder
elected directors.
The work of the Board
In 2013 the Board held 29 board
meetings. During 2013, an average of
6 directors participated in the board
meetings.
The Board has the overall and ultimate
responsibility for the management of
Noreco and for supervising its day-to-day
management and activities in general.
Their main duties are to develop Noreco’s
strategy and monitor its implementation.
The Board also exercises supervision
responsibilities to ensure that the
Company manages its business and
assets in a prudent and satisfactory
manner, and that an appropriate level
of internal control and risk management
systems is upheld.
In accordance with the provisions of the
PLCA, the terms of reference for the Board
are set out in a formal mandate that
includes specific rules on the work of the
board and decision-making. The chairman
of the Board is responsible for ensuring
that the work of the Board is carried out
in an effective and proper manner in
accordance with the relevant legislation.
The Board annually prepares a work plan
for the upcoming year especially empha-
sizing their objectives, strategies and
implementation.
The Board issues a mandate for the work
of the CEO. There is a clear division of
responsibilities between the Board and
the executive personnel. The CEO is
responsible for the operational manage-
ment of the Group and reports to the
Board on a regular basis.
The Board is informed of Noreco’s
financial position and ensures adequate
control of the Company’s activities,
accounts and asset management.
The Board receives monthly reports on
the Company’s commercial and financial
status. Noreco also follows the timetable
laid down by the Oslo Stock Exchange
concerning publication of interim and
annual reports.
The Board has established an audit
committee consisting of two members
elected by and among the Board.

26 Noreco Annual report 2013 Noreco Annual report 2013 27
Hilde Drønen (Chairperson) and Marika
Svãrdström are currently the members of
the committee. In addition, Noreco’s CFO
and group finance manager attend the
audit committee meetings. The Board has
resolved a charter stating the purpose
and responsibilities of the committee.
According to the audit committee charter,
the audit committee shall, inter alia, act
as preparatory body in connection with the
supervisory role of the Board with respect
to financial control and review and external
audit of Noreco’s financial statements and
propose to the Board, who then propose
to the General Meeting, the election of
the independent auditor of Noreco.
Further, a remuneration and corporate
governance committee has been estab-
lished. The committee consists of three
members elected by and among the
Board. The committee’s purpose and
responsibilities are stated in a charter
approved by the Board. David Gair, Morten
Garman and Erik Henriksen are presently
the members of the committee.
The remuneration and corporate govern-
ance committee charter states, inter
alia, that the remuneration and corporate
governance committee shall act as
preparatory body in connection with the
supervisory role of the Board with respect
to remuneration compensation and other
benefits, of Noreco’s CEO and other senior
executives and make proposals for long-term
incentive schemes applicable to Noreco’s
CEO and other senior executives.
The Board carries out an annual evalua-
tion of its own work, competence and
performance. A similar evaluation of the
CEO is also carried out annually. Further,
the Board carries out an annual risk- and
internal control review evaluating inter alia
Noreco’s reporting routines, monitoring,
internal audit functions and the Company’s
ability to cope with a variety of potential
changes.
In order to ensure a more independent
consideration of matters of a material
character in which the chairman of the
board is, or has been, personally involved,
the board’s consideration of such matters
should be chaired by some other member
of the board.
Risk management and internal control
The Noreco management system covers
all areas of operation of the Company.
The system is divided into four levels and
is described in the Noreco Management
Manual.
Level 1 describes Noreco’s vision and
values, level 2 is the management
documents and level 3 general require-
ments in work processes, flow diagrams
and procedures and 4 contains supporting
documentation (e.g. guidelines).
Management documents for risk manage-
ment, internal control and financial
reporting are covered in level 2 in the
management system. Noreco’s risk
management process covers all types
of risks, opportunities and threats. The
financial manual describes how financial
management and reporting is performed
in Noreco.
The Board carries out an annual review
of Noreco’s main areas of business and
its internal control system. Noreco’s
management conduct day-to-day follow-up
of financial management and reporting.
The Board’s audit committee assesses
the integrity of Noreco’s accounts, and
prepares for the board items related to
financial review and control and external
audit of accounts.
Non-conformances are systematically
followed up and corrective measures
initiated. The internal control systems
encompass Noreco’s corporate values,
ethical guidelines and guidelines for
corporate social responsibility.
It is the Boards opinion that the CEO has
ensured that the principal accounting
processes for the company, hereunder
reporting to official authorities, are in
accordance with laws and regulations,
and that the administration of assets are
taken care of in a reassuring manner.
Remuneration of the Board
The Nomination Committee proposes the
remuneration of the directors. The General
Meeting approves the remuneration to the
directors and reflects the responsibility,
qualifications, time commitment and the
complexity of their tasks and Noreco in
general. The remuneration of the directors
is not linked to Noreco’s performance.
Noreco has not granted share options to
the directors elected by the shareholders.
The remuneration to the directors is
included in the notes to the annual
accounts.
No directors elected by the shareholders
have assumed special tasks for Noreco
beyond what is described in this docu-
ment, and no such director has received
any compensation from Noreco other than
ordinary Board remuneration.
Remuneration of the executive personnel
The remuneration committee reviews and
advises on proposals made by the CEO
with regard to the remuneration payable
to executive personnel, and presents
it to the Board.
The remuneration payable to executive
personnel is determined on the basis of
competence, experience and achieved
results. The performance-related remuner-
ation to the executive personnel is subject
to an absolute limit. The Board prepares
guidelines concerning remuneration and
presents these for the General Meeting in
accordance with the PLCA and the Code.
The executive personnel, as well as other
employees, have performance-related
bonus programs. Further information
is included in the notes to the annual
accounts.
An incentive scheme for the executive
personnel and other employees, under
which options exercisable into ordinary
shares in the Company are granted, has
been approved by the shareholders in
an Extraordinary General Meeting held
14 January 2008.
Information and communications
Noreco will on a regular basis keep
shareholders and investors informed
about commercial and financial develop-
ment and performance. Such information
will also be made available on the
Company’s website simultaneously with
the informing of shareholders. Noreco is
committed to ensuring that the partici-
pants in the stock market receive the
same information at the same time.

28 Noreco Annual report 2013 Noreco Annual report 2013 29
Hence, key value drivers and risks
will be disclosed through Cision on
www.newsweb.no as soon as it becomes
known to the Board and the executive
management. There are special rules
related to publishing of drilling results.
The annual financial report is distributed
to the shareholders before the General
Meeting. Quarterly earnings releases are
published within two months following the
end of the quarter. Presentations of the
Quarterly earnings are communicated
directly via the internet. Noreco publishes
an annual financial calendar which can
be consulted on the Oslo Stock Exchange
web site, through news agencies and
on the Company`s website.
The Board performs the financial and
other reporting and their contact with
shareholders outside the General Meeting
with basis in the requirement for open-
ness and equal treatment for all partici-
pants in the market, and in line with its
internal guidelines for Noreco’s contact
with shareholders other than through
general meetings.
Noreco strives to ensure that the
information provided in announcements
to the market, reports, presentations and
meetings at all times will give the correct
picture of the Company’s current position
in all relevant matters.
Take-Overs
Noreco’s Articles of Association do not
contain any restrictions, limitations or
defence mechanisms on acquiring
Noreco’s shares.
In accordance with the Securities Trading
Act and the Code, the Board has prepared
internal guidelines for the event of a
take-over bid.
In the event of a take-over bid, the Board
will, in accordance with its overall
responsibility for corporate governance,
act for the benefit of all shareholders.
The Board will not seek to hinder, obstruct
or complicate takeover bids for Noreco’s
activities or shares unless there are
particular reasons for this. The Board
is responsible for making sure that the
requirement on equal treatment in regards
to the shareholders is upheld and that
they have received sufficient information
to decide upon any possible offer.
In case of offering for the shares in the
Company, the board shall not use granted
authorities or other initiatives with the
purpose of complicating the carrying out
of the offer unless such action was
approved by the General Meeting.
If an offer is made for the shares of
Noreco, the Board will make a recommen-
dation on whether the shareholders
should or should not accept the offer.
The Board will consider arranging a
valuation from an independent expert
which includes an explanation.
The Company shall only enter into
agreements containing limitations on
acquiring other offerings on the shares
when this is clearly in the best interest
of the Company and the shareholders.
The same principles shall apply on
agreements regarding break fee to the
offering party should the offer not finally
be accepted. Any break fee shall normally
be limited to the costs incurred on the
offering party deriving from making the
offer.
Agreements of significance for the markets
assessment of the offer between the
Company and the offering party shall be
made public simultaneously with the offer
being made public.
Transactions which in reality mean a
transfer of all of the Company’s business
to a third party must be resolved by the
General Meeting.
Auditor
Year-end accounts are audited. The audit
committee receives a report from the
auditor after year-end audits for the year
concerned, and the auditor presents to
the audit committee a review of Noreco’s
internal control procedures.
Annually, the auditor presents to the
Board a review of Noreco’s internal control
procedures. The auditor participates in
the meetings of the Board that deal with
annual accounts. The Board regularly
reviews the relationship to ensure that
the auditor is fulfilling an independent and
satisfactory control function. The Board
reports the remuneration of the auditor
at the General Meeting for the approval
of the shareholders.
The Board strives to meet with the auditor
at least once a year at which neither
the chief executive officer nor any other
member of the executive management
are present.
The Board has established guidelines
in respect of the use of the auditor by
Noreco’s executive management for
services other than the audit.

30 Noreco Annual report 2013 Noreco Annual report 2013 31
Morten Garman (67)
Chairman
Garman is an attorney-at-law, and
has wide experience as counsel
in most areas of business law,
including comprehensive assis-
tance in financing. He works with
stock exchange and securities
law, corporate law, international
law, contract law, transport law,
litigation in construction and
offshore contracts, and he also
acts as an arbitrator in disputes
within these areas.
Morten Garman has comprehen-
sive board experience and holds
directorships in large Norwegian
corporations and foreign compa-
nies with international activities.
David Gair (61)
Board member
Gair has an international petro-
leum engineering background,
and years of experience from
executive E&P leadership and
M&A delivery in BP and Royal Bank
of Canada. Gair is a chartered
engineer from the Institute of
Petroleum, and holds a Bsc (Hons)
in Industrial Chemistry from
Kingston University.
BOARD OF DIRECTORS
2013
Hilde Drønen (52)
Board member
Hilde Drønen is currently the CFO
in DOF ASA (since 2004), and has
extensive experience from the
offshore sector. She has previously
worked as the Finance Director in
Bergen Yards AS (2003-2004) and
Group Controller for the Møgster
Group (1995-2003). She holds a
Master degree from the Norwegian
School of Management (BI) and
legal course from Universitetet
i Bergen (UIB). Mrs Drønen is and
has been represented in several
Boards of Directors, including
DOF Subsea AS (since 2005),
Sevan Marine ASA (2006-2010)
and Tide ASA (2005-2010).
Marika Svärdström (48)
Board member
Marika Svärdström is an advisor
to Sabaro Investments Ltd.
She holds an MBA from IMD in
Switzerland and a M.Sc. in Energy
technology from Lund Institute of
Technology in Sweden. Svärdström
has 20 years of international and
commercial experience in industries
including financial services, the
energy sector and telecom/IT.
Previous roles include member
of the executive management team
at Skandiabank (Switzerland) AG
and leadership positions within
product and services innovation,
strategy and marketing at GE Capital
and Vattenfall AB, among others.
She has lived and worked in
Switzerland, Hong Kong, UK,
France and Sweden.
Erik Henriksen (56)
Board member
Erik Henriksen is an advisor to
Sabaro Investments Limited. He has
a diploma in International Shipping
from London School of Foreign Trade.
Henriksen has been a founder,
developer and investor in various
companies over the last 30 years
including Telecomputing ASA,
Intelecom ASA, Discoverer ASA,
Tanker Navigation ASA (all companies
have been listed at the Oslo Stock
Exchange) as well as many private
companies including Trader Navigation
(UK) Limited. Earlier in his career
he worked for F.H. Lorentzen & Co.,
Oslo, Stolt-Nielsen Group (Oslo
and the US), R.S. Platou (Oslo and
Hawaii) and was in charge of a
joint venture company between
R.S.Platou and the Erling Lorentzen
Group in Rio de Janeiro, Brazil.
Noreco Annual report 2013 3332 Noreco Annual report 2013
Noreco Noreco is a Norwegian exploration
and production company engaged in the
exploitation, development, and acquisition
of oil and gas fields. The company’s vision
is to be a leading independent company
in the North Sea area.
The company’s strategy is focused on
the exploration for oil and gas. Successful
exploration provides the basis for value
creation which may be realised either
through asset sales or development
and production.
Noreco’s activities are located in Norway,
Denmark and the UK, with offices in
Stavanger (head office) and Lyngby
outside Copenhagen.
The company’s vision, values and strategy
are described on the company website
www.noreco.com. The company’s social
responsibility (http://www.noreco.com/en/
About-us/CSR/) and guiding principles for
corporate governance are also documented
there. These policies are reflected in more
detailed governing documents, proce-
dures and routines and are the basis for
all day-to-day corporate activities. These
policies are available for all employees
in the internal management system.
Exploration
In 2013 Noreco continued to exercise its
exploration strategy which is designed
to increase value creation through the
identification, evaluation and drilling of
exploration prospects. Criteria such as
chance of discovery and potential
commercial attractiveness have been
further emphasised, and the company
has concentrated its exploration activities
in selected key areas where the company
has specific technical competence and
experience.
In 2013 Noreco completed drilling five
exploration wells. Two wells did not
encounter hydrocarbons. In two wells,
the reservoir interval was of poorer quality
than expected, and the discoveries were
deemed non-commercial. The last well
was spudded in the third quarter and was
drilled on the Gohta prospect located in
the Lundin operated PL492 licence in
the Barents Sea. Resources are currently
estimated to be between 111 and 232
mmboe, and plans are now in place to
drill an appraisal well in 2014. Noreco
has a 20% working interest in the license.
Noreco has continued to mature and
manage its portfolio of exploration
licences. As part of this process,
numerous licences have been relin-
quished as material prospectivity could
not be confirmed, and new licences have
been acquired through licensing rounds.
Two new licences were acquired as part of
the APA 2012 awards (PL701 & PL591B),
and six new licences were obtained
through the UK 27th Licensing Round
(P1934, P1989, P2003, P2009, P2026,
& P2032). The APA licensing rounds in
Norway give Noreco continued access
to prospectivity in well-understood and
DIRECTORS REPORT
Hilde Alexandersen (47)
Employee elected board
representative
Hilde Alexandersen has 19 years
of experience from the oil and gas
industry. She has a Master of
Science degree in geology from
the University of Bergen. Prior to
joining Noreco in 2007, she has
held various subsurface positions
in ConocoPhillips and has
experience from exploration,
operations and producing assets.
Alexandersen currently holds a
position as a Sr.Geologist within
Noreco’s Developments team.
Bård Arve Lærum (44)
Employee elected board
representative
Lærum has more than 15 years
experience from the industry. He
joined Noreco in 2007. He worked
11 years in various positions
within subsurface, projects and
commercial in BP prior to joining
Noreco. He holds a Master of
Science degree in Petroleum
Technology from University of
Stavanger, Norway. Lærum is
currently holding the position
as Subsurface Manager in Noreco.

34 Noreco Annual report 2013 Noreco Annual report 2013 35
gas export restrictions, and poor weather
conditions. At the time of this report,
the production has stabilised around
the expected plateau level.
Financial position
In October 2013, it became evident that
Noreco’s financial challenges were critical.
Sustained production problems at
Huntington, the continued shutdown
of Danish fields, and a demand for a
guarantee for the abandonment obligation
in Denmark led the banks in the reserves
based lending (RBL) consortium to not
approve a continuance of the previously
approved waivers. Furthermore, the banks
prevented Noreco from transferring cash
from the Danish subsidiaries to the parent
company in order to pay the current
operating expenses and interest.
As a consequence, Noreco was projected
to run out of cash by mid-November,
and the company would have been
unable to pay current obligations. On this
basis, the board deemed it necessary
to immediately initiate a significant
financial restructuring.
After pre-sounding with the major
shareholders and bondholders, Noreco
presented a proposal for refinancing on
21 October 2013. The proposal called
for the issuance of new equity and the
restructuring of all bonds. The proposed
bond structure had lower interest rates
and a maturity profile that better reflected
the expected future cash flows of the
Group.
In the fourth quarter 2013 and January
2014, Noreco raised NOK 530 million in
new equity through a private placement
and a subsequent repair offering for the
Company’s shareholders with less than
1 million shares. Simultaneously, the
company received a significant tax refund,
the bond debt was restructured, and the
RBL facility was paid off in full. The effects
of this refinancing are reflected in the
company’s income statement and balance
sheet at year-end 2013 with the exception
of the subsequent repair offering, which
totalled NOK 100 million. The restructuring
of the bonds resulted in a gain of NOK
523 million which is recorded in the
financial accounts.
The Group maintains two credit facilities
which enable some degree of flexibility
in the funding structure.
The production levels developed positively
during 2014. The Huntington field has
stable production, and the Nini field in Siri
fairway has resumed production via the
previously discussed temporary solution.
As long as the company does not
experience any long-term or unexpected
production challenges, the financing of
the operations, servicing of debt and
further investments for the Group will be
secured through the available liquidity,
cash flows from operations and active
portfolio management.
In 2012 the company initiated a reorgani-
sation of the group structure in order
to provide for more efficient operations.
The reorganisation is partly completed,
and the parent company Noreco ASA is
now a pure holding company with all
operational activities being executed in
its wholly owned subsidiaries.
Financial results for 2013 Total revenues
for 2013 amounted to NOK 894 million, up
from NOK 832 million the previous year.
mature plays. Noreco was awarded five
licences in the APA 2013, two of these
as operator.
During 2013 Dong Energy, as operator
of the Danish licence 7/86 containing the
Amalie discovery, proposed to relinquish
the licences on the grounds that the
resource potential of the Amalie discovery
did not justify further appraisal. In addition,
part of the Danish licence 9/06 was
relinquished, thus reducing the net
resources to Noreco related to the
Gita discovery.
Production and developments
Noreco’s production in 2013 averaged
4 099 barrels of oil equivalents per day
(boepd). This was significantly lower than
expected, mainly due to a delayed
production start at the Huntington field
and the shutdown of the Siri production
facilities in summer 2013.
The Nini (which consists of Nini and Nini
East) and Cecilie fields on the Danish
continental shelf recorded good productivity
during the first half of 2013. However,
in periods of adverse weather conditions,
operational restrictions impacted regularity
at the host platform.
In July 2013, cracks were discovered in
the caisson on the Siri platform. This led
to a complete production shut down and
de-manning of the platform. During the
autumn of 2013, a number of actions
were taken to re-establish production. In
December 2013, the relevant authorities
granted approval to restart production
using a temporary solution of transferring
the stabilised crude directly to a tanker.
At the time of this report, production from
Nini is 2 000-3 000 boepd net to Noreco.
As a consequence of the pressure
build-up after the extended shutdown,
production was higher immediately
following start-up. In the coming months,
production performance is expected to
stabilise at lower levels. Production on
Cecilie is expected to resume during the
second quarter of 2014.
The operator has started a large repair
project on the Siri Platform. This work is
planned completed in the third quarter
2014 and is important to securing stable
production from the satellite fields in the
future.
The Oselvar field came on stream in April
2012, and production has been consider-
ably lower than anticipated in the plan for
development and operation. In November
2013, the operator submitted a revised
plan for further development of the field.
It was concluded that the risk attached
to a new well was too high and that it is
not possible to achieve the previously
expected output levels. New reserve
estimates for the field were calculated
on this basis. The reserve estimates on
31 December 2012 were 7.7 million boe
(2p). Revised reserve estimates per 30
September 2013 were 3.23 million boe.
At the Huntington field, significant delays
occurred in connection with upgrading the
floating production and storage platform
(FPSO) Voyageur Spirit. As a result of the
delays, installation was postponed into
the winter season which caused further
delays due to weather conditions. On 12
April 2013, production eventually started,
but output was considerably lower than
planned. Reduced output continued
through 2013 due to challenges with
the processing facilities on the FPSO,

36 Noreco Annual report 2013 Noreco Annual report 2013 37
company’s overall UK tax asset over the
next couple of years. The effective tax rate
for 2013 is 48 percent compared to 70
percent for 2012. The reduction is mainly
due to write-downs of goodwill which have
no tax impact and write-downs of the
Danish assets where the tax rate is 25
percent.
The net result for 2013 was a loss of
NOK 1 008 million, compared to a loss
of NOK 593 million the previous year.
Net cash flow from operations in 2013
amounted to NOK 1 476 million, up from
NOK 905 million in 2012. The difference
between cash flow from operations and
the result before tax is mainly caused by
significant write-downs, the gain related to
the restructuring, and expensed explora-
tion expenditures which were previously
capitalised and classified as investment
activity in the cash flow statement.
Net cash flow used in investing activities
in 2013 was NOK 1 031 million compared
to NOK 1 136 in 2012. Noreco estab-
lished a security (escrow) account
amounting to NOK 570 million (equalling
minimum DKK 500 million) to be used
for abandonment obligations in Denmark.
The cash flow in 2012 was driven by high
exploration activity and investments in the
development of the Oselvar and Hunting-
ton fields.
Cash flow from financing activities in 2013
was a net cash outflow of NOK 626 million
compared to a net cash inflow of NOK 143
million in 2012. Significant cash inflows
are related to issue of the NOR09 bond
and draw-downs on the exploration loan
facility. Significant cash outflows are
related to payments of interest for the
entire debt portfolio as well as the
repayment of the RBL loan in Denmark
and the current portion of the exploration
loan.
Interest bearing debt, excluding explora-
tion loans, had a book value of NOK 2 480
million (principal amount of NOK 3 102
million) at the end of 2013, compared to
NOK 3 311 million (principal amount of
NOK 3 401 million) at the end of the
previous year. The book value of the
Group’s exploration loan amounted to NOK
333 million at the end of 2013, compared
to NOK 573 million at the end of 2012.
Total interest bearing debt had a book
value of 2 813 million, of which NOK 874
million is classified as current liabilities.
See further information in note 23 to the
group accounts.
Total cash and cash equivalents was NOK
403 million at the end of 2013, compared
to NOK 584 million at the end of 2012.
Please see description of covenants
in the section for the going concern
assumption. Undrawn availability under
the company’s overdraft facility in Noreco
Oil Denmark A/S amounted to NOK 18
million.
On 31 December 2013, Norwegian Energy
Company ASA had restricted cash of
NOK 570 million set aside as security for
covering the abandonment obligation in
Denmark or repayment to bondholders.
In February 2014, an agreement was
reached with Dong and RWE whereby
Noreco agreed to transfer DKK 445 million
to an escrow account pledged in favour
of DONG and RWE. The excess amount
of DKK 55 million was offered to the
bondholders and is expected to be paid in
June 2014. The repayment will reduce the
Exploration and evaluation expenses were
NOK 666 million, down from NOK 1,188
million in 2012. For 2013, an expense
of previously capitalised suspended wells
(Amalie) of NOK 255 million was recog-
nised. Included in 2012, an expense of
previously capitalised suspended wells
of NOK 397 million was recognised.
Write-downs amounted to NOK 1 211
million in 2013 compared to NOK 421
million in 2012. The write-down in 2013
is partly related to the Oselvar field which
has not produced as expected since it
came on-stream in the second quarter
2012 and the reserve estimates have
been significantly reduced compared
to prior estimates. As a consequence,
total write-downs of NOK 388 million were
recorded in 2013. Further, the fields in
Denmark have been shutdown for the
entire second half of 2013. Due to the
production challenges, an expected
increase in future production expenses
and the lower estimated production
regularity, write-downs of NOK 484 million
have been recognised during 2013.
In addition, goodwill was written down
by NOK 350 million, of which NOK 218
million relates to activities in the UK and
NOK 116 million relates to activities in
Denmark. Write-downs of goodwill related
to the UK are due to updated expecta-
tions for regularity and revised estimates
for the production costs of operating the
Huntington field. The goodwill related to
the UK is also supported by the Fulmar
section of the Huntington licence. As a
consequence of updated market values
for comparable non-developed discoveries
on the UK continental shelf, an adjust-
ment to the valuation of the Fulmar
section contributed to a portion of the
goodwill write-down. The write-down in
Denmark was due to the issues at the Siri
platform, and the updated estimates for
future operational costs related to Danish
production. Write-downs of goodwill
amounted to NOK 118 million in 2012.
The net operating result (EBIT) for 2013
was a loss of NOK 1 969 million,
compared to a loss of NOK 1 508 million
in 2012.
Net financial items was a gain of NOK 15
million in 2013, compared to a loss of
NOK 486 million in 2012. A gain of NOK
523 million relating to the restructuring
of the bonds has been included in net
financial items for 2013. The restructuring
was accounted for as an extinguishment
of debt in accordance with IFRS as the
terms of the new bond agreements were
substantially different from the terms of
the old bond agreements. The new loans
are recognised in the balance sheet at
market value at the time of the agree-
ments. As a consequence, a gain on
settlement of the old debt was recog-
nised. The gain is net of transaction costs
related to the restructuring of the old
bonds amounting to NOK 47 million.
See further information in note 23.
The Company’s ordinary result before tax
(EBT) was a loss of NOK 1 954 million,
compared to a loss of NOK 1 994 million
in 2012.
Tax income for 2013 was NOK 947 million
compared to NOK 1 401 million in 2012.
The tax income in 2012 was higher than
2013 as a consequence of high explora-
tion activity in Norway and the capitalisa-
tion of tax assets in the UK. Going
forward, income from the Huntington
production is expected to utilise the

38 Noreco Annual report 2013 Noreco Annual report 2013 39
Both the Norwegian and British market for
oil and gas assets was somewhat less
active than in 2012. As part of the work
with portfolio management and rationali-
sation of assets, Noreco was involved in
three license transactions as part of its
active portfolio management and
rationalisation of assets. There still seems
to be a substantial interest in high quality
producing fields while market activity for
exploration licenses seems to be some-
what low. It has proven difficult to achieve
the desired adjustments in ownership
interests through the traditional farm-out
processes.
Financial risk
Noreco’s most significant risk factors
are related to oil prices, exploration
success, production interruption, currency
exchange rates and ability to service debt.
Almost all of the Group’s debt has a fixed
interest rate. Risk connected with interest
rate changes is thereby limited.
Financial risk management is performed
by a central finance and accounting
function, and it is the goal of the risk
management to minimise the possible
negative impact on the company’s
financial results. Financial derivative
instruments are used when appropriate
to mitigate certain risk exposures.
All of the company’s bond debt has a
fixed interest rate, and the interest rate
risk is considered low. More information
on the management of financial risk can
be found in the notes to the financial
statements.
Production of oil and gas is the company’s
main earnings driver. The operation of
production installations is exposed to
risks of interruptions and delays due to
technical problems or other unforeseen
events. Production of oil and gas is also
associated with the risk of wells not
delivering the anticipated production,
the risk of it becoming more expensive to
operate the fields than anticipated, or the
risk of long-term production interruptions.
Noreco’s production is also concentrated
in a limited number of fields.
Such risks are reduced by continued
focus on reservoir understanding and
on the technical integrity of production
facilities. In addition, the company has
an extensive insurance package covering
physical damage to installations, loss of
well control, liability, pollution, removal
of debris and business interruption.
The five-month production shutdown on
the Siri platform in 2009 was an example
of such a risk, causing both a loss of
production and repair costs. Noreco has
filed insurance claims to cover the loss
of production income and the costs of
the temporary solution which allowed
production to be resumed. The company
has not yet received any compensation
related to these insurance claims.
The process has taken more time than
anticipated due to the technical complex-
ity of the claim. The total claim exceeds
NOK 2 billion, of which NOK 359 million
is recognised as a current receivable at
31 December 2013. Based on technical
documentation containing third party
evaluations and the insurance agree-
ments, the company remains firm that
the booked claim is covered and will be
settled during the next twelve months.
Thus, the receivable is classified as a
current receivable. The USD amount is
unchanged from 31 December 2012.
first bond maturity of loan NOR06, NOR10
and NOR11 pro rata according to the face
value of the gross principal amount of the
loans.
Noreco has one reporting segment:
exploration and production. In order to
provide users with better insight into the
company’s activities, additional informa-
tion about each field is provided in the
annual statement of reserves. In addition,
geographical information is disclosed in
note 5 to the consolidated financial
statements.
The going concern assumption Pursuant
to the Norwegian Accounting Act section
3-3a, the Board confirms that the
requirements of the going concern
assumption are met and that the annual
accounts have been prepared on that
basis. The financial solidity and the
Company’s cash position are considered
satisfactory for the planned activity level
in 2014. However, the company is
dependent on production from Huntington
and the other fields during 2014 to be
able to meet the future obligations.
The company’s own cash forecast indicate
that liquidity will be sufficient in the next
12 months, but there is a risk that
headroom for the covenant can be tight
after the bond maturity in December 2014
if production conditions are not in line
with expectations. The covenant implies
that the Group shall at all times have a
minimum of NOK 100 million in free cash.
The forecasts are based on a number
of assumptions pertaining to future
operating conditions, market conditions
and the timing of certain events. If the
trend through 2014 differs negatively from
the forecasted development, it may be
necessary for the company to implement
extraordinary measures to ensure
fulfilment of the loan terms and ensure
sufficient liquidity to meet current
obligations and debt maturities. In the
Board’s view, several such extraordinary
and doable measures have already been
identified and can be implemented if
necessary. In the Board’s view, the annual
accounts give a true and fair view of the
company’s assets and liabilities, financial
position and results. The Board is not
aware of any factors that materially affect
the assessment of the company’s
position as of 31 December 2013, or
the results for 2013, other than those
presented in this report or that otherwise
follow from the financial statements.
The market
The oil market remained strong and stable
in 2013. Noreco’s average realised oil
price was USD 108 per barrel compared
to USD 111 per barrel for the previous
year. The oil price has continued at similar
levels into 2014. The company’s average
realised price for all products was
USD 102 (NOK 598) per boe for 2013
compared to USD 106 (NOK 618) per
boe for the previous year.
The Board believes that market conditions
as they are now will continue to support
high oil prices. High oil prices drive profits
for the oil producers, support high
valuation of oil and gas resources, and
stimulate increased activity both within
exploration and field developments.
However, this is reflected in increased
competition for attractive exploration
acreage, a tighter market for specialists
and oil services, and consequently
increasing cost levels for bringing new
oil to the market.

40 Noreco Annual report 2013 Noreco Annual report 2013 41
The employees are also actively engaged
in being part of the HSEQ culture.
Noreco actively follows up the HSEQ work
in all its licences. This mainly involves
management follow-up of HSEQ in the
licence control committees and inspec-
tions on the facilities. Noreco keeps
statistics and overviews of HSEQ incidents
in addition to follow-up plans for the
activities.
Exploration, development and production
of oil and gas may cause emissions to the
sea and air. Noreco’s operations are in
accordance with all regulatory require-
ments, and there were no breaches of
these requirements in 2013. Noreco did
not operate any exploration wells in 2013.
Personnel resources and working
environment
Noreco’s employees are essential to value
creation in the company.
At the end of 2013, the company had 54
employees, whereof 43 are in Norway and
11 are in Denmark. Two employees in the
resignation period are not included in
these numbers.
Noreco has a diverse workforce with a
total of nine nationalities represented:
Norwegian, Danish, British, Irish, Pakistani,
Polish, South African, Turkish and Mexican.
The company’s Board of directors consists
of three women and four men, whereof
two women and three men were elected
by shareholders.
At the end of 2013, 43 percent of the
employees were women compared to 39
percent in 2012, 35 percent in 2011 and
33 percent in 2010. It is a goal to maintain
a good gender balance in the workforce.
Number of employees
Employees’ Gender Employees’ Nationality Employees’ Location
NorwayNorwegian
T o p
Management
Prodution
Finance,
Commercial
& Support
Exploration
4
27
8
17
56
Total
Female DenmarkDanish
Male
Other
Noreco has withdrawn the standstill agree-
ment with the insurance companies and
has invited them to negotiations regarding
a settlement. Negotiations are still ongoing,
but have not yet led to a satisfactory
solution for the case. As such, Noreco
filed the writ to the Danish courts on
14 February 2014. Negotiations continue
in parallel with the legal process. See also
note 2.9 for a description of the Group’s
applicable accounting principles, and note
4.2 b) regarding the necessary judgmental
assessments.
Noreco is involved in capital-intensive
exploration and development projects.
The funding of these activities primarily
comes from three sources: cash flow from
operations, proceeds from asset sales,
and external financing through debt or
equity. The company is continuously
working with portfolio management to
balance these sources.
Health, environment and safety
Noreco puts emphasis on everyone
performing company activities in line with
good business integrity and with respect
for people and the environment. The
Board believes that this is a key condition
for creating value over time in a very
demanding business. The company’s
vision for health, environment, safety and
quality (HSEQ) is zero accidents, zero
unwanted incidents, and zero long-term
impact on the environment. The company
seeks to protect people, the environment
and its assets through involvement and to
improve HSEQ in all aspects of our
business.
One of the company goals in the HSEQ
programme is to achieve compliance and
business improvements by further
development and use of the management
system. To fulfil this goal, the company
has performed a number of activities
during 2013, whereby the process owners
and process responsibles have been
trained in the use of the management
system. In addition, Noreco has continued
developing and creating new work
processes and verified its management
system according to the ISO 14001
standard. Another goal in the HSEQ
programme is to continue efforts to
prevent major accidents through system-
atic risk management in all decisions that
the company makes. To fulfil this goal,
the company has performed an extensive
training programme for all members of the
emergency preparedness organisation.
In addition, risk management courses
have been offered to all employees, and
risks have been evaluated for all of the
company’s producing fields. Noreco is
also promoting exchange of experience
by engaging in close dialogue with the rest
of the industry.
To fulfil the goal of strengthening the
robustness, health and individual
development and performance, Noreco
has introduced a competence mapping
module in its management system.
In addition, the company has completed
a safety day for all employees and their
families, and all employees have been
offered follow up from our physiotherapist
through development of a health profile.
All employees are encouraged to engage
in physical activity.
The employees are key to achieving the
company’s goals and visions within HSEQ.
The company’s HSEQ management is
integrated in the overall management
system, which is regularly updated.
42 Noreco Annual report 2013 Noreco Annual report 2013 43
Noreco held its Annual General meeting
in May 2013. In addition, an extraordinary
general meeting was held in November
2013 where it was resolved to reduce
the share capital, carry out a private
placement by issuance of a temporary
new class of shares, grant a proxy to
the Board to carry out a repair issue,
and grant the Board a proxy to issue one
or several convertible loans.
In January 2014, the company again
received a request to convene an
extraordinary general meeting to elect
the shareholder representatives to the
Board. Such general meeting was held on
5 February 2014. The following directors
were elected: Morten Garman (chair),
Hilde Drønen, Marika Svärdström, Erik
Henriksen and David Gair. Directors
elected by and among company employ-
ees, Hilde Alexandersen and Bård Arve
Lærum, were not up for election.
Further information on corporate govern-
ance in Noreco can be found in a
separate chapter on corporate govern-
ance in this annual report.
Ownership
There are no restrictions on the transfer
of shares in Noreco. The company
currently has approximately 5 860
shareholders, and approximately 67
percent of the shares are held by
Norwegian residents.
A full conversion of the convertible bond
issued in December 2013 will result in an
issue of 1 223 million new shares. This
new equity from the convertible bonds will
then represent 17.8 percent of the share
capital. If the interest is paid-in-kind
instead of cash, a conversion of the entire
convertible bond after five years will result
in the issuance of 1 490 million shares.
This new equity will then represent 20.9
percent of the issued share capital at that
time. This information assumes that there
are no other issuances of new shares in
the period.
Norwegian Energy Company ASA
In 2013, the parent company was a pure
holding company, and the operating
expenses mainly consisted of shareholder
costs and payroll expenses. In addition,
a write-down was made of the sharehold-
ing in Altinex ASA of NOK 444 million.
Among others, this write-down reflects the
produc-tion and other impairments related
to the underlying fields of Altinex ASA’s
subsidiaries. The effect related to the
refinancing of the company’s bond debt
is recognised directly within equity, and
amounts to NOK 501 million after tax.
This differs from the accounting policy for
the Group and follows prevailing guidance
of the Norwegian Accounting Act and
accounting standards and practices
generally accepted in Norway (N-GAAP).
For comments on financial risk and
market conditions and statement
regarding going concern, please see
other parts of this annual report. These
comments are also valid for the parent
company.
Allocations
The result for the year for Norwegian
Energy Company ASA in 2013 was a loss
of NOK 844 million. The board proposes
the following allocations:
NOK million
Allocated from other equity 527
Covered by other paid-in capital 318
Total appropriation 844
For the whole company, four of the middle
management positions are occupied by
women. This is the same level as in 2012
and 2011. There are an equal number of
female and male employees on the work
environment committee (WEC).
Noreco has a highly educated staff, where
39 percent of the organisation holds a
bachelor degree, 54 percent holds a
master degree and 7 percent holds a PhD.
Noreco pays equal salaries and gives equal
compensation for positions at the same
level, regardless of gender, ethnicity, religion
or disabilities. Women are slightly under-
represented in management positions
compared to the company’s overall gender
mix. This causes the average salary in the
company to be lower for women than for men.
According to annual work environment
surveys, Noreco has a good working
environment. Sick leave in Noreco
remains low and was 1.5 percent in 2013
versus 2 percent in 2012 and 2.5 percent
in 2011. Given the company’s challenging
financial situation, special emphasis was
put on keeping employees well informed
about the developments at all times.
Feedback has been positive.
The management’s compensation is
described in the notes to the annual
accounts.
Research and development
Noreco collaborates with several research
institutions to increase the understanding
of a number of complex challenges within
the oil and gas industry’s upstream
segment. The company has no particular
plans to participate in the commercialisa-
tion of these efforts.
Corporate governance
The Board is focused on maintaining a
high standard on corporate governance
and believes that this is essential to
ensure the success of the company’s
vision and ambitions for value creation
for the shareholders.
The Board and management strive to
live up to the corporate governance in
accordance with the Norwegian Code
of Practice for Corporate Governance.
Corporate governance in Noreco is based
on equal treatment of all shareholders
through the activity that the Board and
General Assembly practice. In total, 29
board meetings were held in 2013.
The activities of the Board have been
focused on promoting value creation in
the company’s portfolio, strengthening the
company’s financial position and further
developing the company strategy.
In February 2013, the company received
a request to convene an extraordinary
general meeting from shareholder Sabaro
Investments Limited with the purpose of
electing a chairman and members of the
Board. The extraordinary general meeting
was held on March 22, 2013. The Compa-
ny’s nomination committee recommended
in this context that the number of share-
holder elected Board members be reduced
from seven to five. Ståle Kyllingstad
(Chairman), Hilde Drønen, Eimund
Nygaard, Erik Henriksen (new) and Marika
Svärdström (new) were elected as new
Board members. Erik Henriksen and
Marika Svärdström resigned as Board
members in August 2013.

Noreco Annual report 2013 4544 Noreco Annual report 2013
Note 1 to 32 are an integral part of these consolidated financial statements.
CONSOLIDATED STATEMENT
OF COMPREHENSIVE INCOME
for the year ended 31 December
(All figures in NOK million) Note 2013 2012
Revenue 5,6 894 832
Production expenses (430) (244)
Exploration and evaluation expenses 7,27 (666) (1 188)
Payroll expenses 8,21,25 (127) (134)
Other operating expenses 9(95) (114)
Other (losses)/ gains 10 (15) 32
Total operating expenses (1 333) (1 649)
Operating results before depreciation and amortisation (440) (817)
Depreciation 12,31 (319) (269)
Write-downs 11,12 (1 211) (421)
Net operating result (1 969) (1 508)
Financial income 13 570 76
Financial expenses 13 (556) (562)
Net financial items 15 (486)
Result before tax (1 954) (1 994)
Income tax benefit 14 947 1 401
Net result for the year (1 008) (593)
Other comprehensive income (net of tax):
Items not to be reclassified to profit or loss in subsequent periods
Remeasurement of defined benefit pension plans 21 0 3
Total 0 3
Items to be reclassified to profit or loss in subsequent periods
Cash flow hedge 18 7 (11)
Discontinued cash flow hedge 18 4 -
Currency translation adjustment 264 (201)
Total 274 (212)
Total other comprehensive result for the year (net of tax) 274 (209)
Total comprehensive result for the year (net of tax) (733) (802)
Earnings per share (NOK 1)
Basic 15 (1.49) (2.26)
Dilluted 15 (1.49) (2.26)
Outlook
After a successful refinancing including
restructuring of all outstanding bond debt,
down payment of the reserve based lending
facility and two successful share issues,
Noreco has established a significantly better
financial foundation. However, the compa-
ny’s liquidity position going forward will
be heavily dependent on production from
Huntington and the other fields developing
as expected. Deviations in the oil price
and the exchange rate between USD
and NOK from the present levels will also
impact the company’s liquidity position.
With the Huntington field on stream,
Noreco’s production capacity has more
than doubled, and the field’s plateau
production level at above 6 400 boepd
net to Noreco has been confirmed.
Experience has shown that field uptime
can be impacted by events outside the
company’s control, for instance by bad
weather and restrictions in the British
Central Area Transmission System (CATS)
gas grid on the UK continental shelf.
In Denmark, the operator is planning to
repair the Siri platform in the third quarter
2014. A temporary solution is in place
for the Nini and Cecilie fields; however,
this is exposed to weather conditions.
Production irregularity is, therefore,
expected until the final repairs at the Siri
platform are completed. Production at
Nini restarted in early February. Production
at Cecilie is expected to resume in the
second quarter 2014 after completion
of necessary repair and maintenance
work at the processing facility on the Siri
platform. The Enoch field was expected
to be back on stream during the second
quarter, but this now appears to be
uncertain and delays are expected
In Norway, the Oselvar and Lulita fields
restarted in October 2013. They have
both produced well since start up.
Noreco’s drilling programme for 2014
comprises three confirmed wells. Drilling
at the Verdande licences has been
somewhat delayed due to rig availability
but is expected to spud in the beginning
of the second quarter 2014. The appraisal
well currently being planned at Gohta in
the second quarter is very important to
determining the potential of this discovery.
The Xana well in Denmark is expected to
start in October 2014.
Noreco continuously works on optimising
the license portfolio to reflect the
company’s desired equity level and
risk-reward balance, while running the
company within an acceptable financial
framework. The newly issued awards in
the APA 2013 demonstrate the company’s
commitment to the development of a
value-creating licence portfolio.
Approved by the board 25 March 2014
(Translation made for information purposes only.)
Erik Henriksen
Board member
Hilde Alexandersen
Employee elected
board representative
David Gair
Board member
Bård Arve Lærum
Employee elected
board representative
Svein Arild Killingland
CEO
Morten Garman
Chairman
Hilde Drønen
Board member
Marika Svärdström
Board member

46 Noreco Annual report 2013 Noreco Annual report 2013 47
(All figures in NOK million) Note 31.12.13 31.12.12 01.01.12
Non-current assets
License and capitalised exploration expenditures 11,27 743 819 1 250
Goodwill 11 174 497 656
Deferred tax assets 14 293 105 610
Property, plant and equipment 12,27 3 087 3 991 4 297
Restricted cash 17,19 500 - -
Total non-current assets 4 797 5 411 6 813
Current assets
Tax refund 14 378 1 339 506
Derivatives 18,19 1 7 27
Trade receivables and other current assets 16,19 551 564 834
Restricted cash 17,19 74 20 17
Bank deposits, cash and cash equivalents 17,19 403 584 671
Total current assets 1 408 2 515 2 055
Total assets 6 205 7 926 8 868
(All figures in NOK million) Note 31.12.13 31.12.12 01.01.12
Equity
Share capital 20 466 1 097 756
Other equity 20,25 1 284 931 1 671
Total equity 1 750 2 028 2 427
Non-current liabilities
Deferred tax 14 953 1 245 1 991
Pension liabilities 21 - 7 16
Asset retirement obligations 22 327 323 298
Bond loan 19,23,26 1 939 -2 318
Other interest bearing debt 19,23,26 0243 293
Total non-current liabilities 3 220 1 818 4 916
Current liabilities
Bond loan 19,23,26 541 2 779 643
Other interest bearing debt 19,23,26 333 862 421
Derivatives 18,19 411 -
Tax payable 14 13 51 180
Trade payables and other current liabilities 19,24 343 376 281
Total current liabilities 1 235 4 080 1 526
Total liabilities 4 455 5 898 6 441
Total equity and liabilities 6 205 7 926 8 868
Stavanger 25 March 2014
(Translation made for information purposes only.)
Erik Henriksen
Board member
Hilde Alexandersen
Employee Representative
David Gair
Board member
Bård Arve Lærum
Employee Representative
Svein Arild Killingland
CEO
Morten Garman
Chairman
Hilde Drønen
Board member
Marika Svärdström
Board member
Note 1 to 32 are an integral part of these consolidated financial statements. Note 1 to 32 are an integral part of these consolidated financial statements.
CONSOLIDATED STATEMENT
OF FINANCIAL POSITIONS
as of 31 December
48 Noreco Annual report 2013 Noreco Annual report 2013 49
Note 1 to 32 are an integral part of these consolidated financial statements. Note 1 to 32 are an integral part of these consolidated financial statements.
CONSOLIDATED STATEMENT
OF CHANGES IN EQUITY
for the year ended 31 December
(All figures in NOK million)
2012 Note
Share
capital
Currency
translation
fund
Hedging
reserve
Other
equity
Total
equity
Equity at 01.01.2012 756 138 0 1 534 2 428
Retrospective adoption of
of IAS19R adjustment 21 (1) (1)
Equity at 01.01.2012 756 138 0 1 533 2 427
Net result for 2012 - - - (593) (593)
Comprehensive income/(loss) for the period (net of cash)
Currency translation adjustments - (201) - - (201)
Remeasurement of defined benefit
pension plans 21 3 3
Cash flow hedge 18 - - (11) -(11)
Total comprehensive income(loss) for 2012 - (201) (11) (590) (802)
Total transactions with owners for the period
Proceeds from share issued 20 341 - - 66 407
Issue cost - - - (18) (18)
Share-based incentive program 25 - - - 14 14
Total transactions with owner for the period 341 - - 62 403
Equity at 31.12.2012 1 097 (64) (11) 1 005 2 028
(All figures in NOK million)
2013 Note
Share
capital
Currency
translation
fund
Hedging
reserve
Other
equity
Total
equity
Equity at 01.01.2013 1 097 (64) (11) 1 005 2 028
Net result for 2013 (1 008) (1 008)
Comprehensive income/(loss) for the period (net of tax)
Currency translation adjustments - 264 - - 264
Cash flow hedge 18 - - 7 - 7
Discontinued cash flow hedge 18 - - 4 - 4
Total comprehensive income(loss) for 2013 - 264 11 (1 008) (733)
Transactions with owners for the period
Proceeds from share issued 20 437 - - 2 439
Issue cost - - - (13) (13)
Capital reduction 20 (1 068) - - 1 068 -
Equity component of convertible bond 23,2 - - - 16 16
Share-based incentive program 25 - - - 13 13
Total transactions with owners
for the period (631) - - 1 086 455
Equity at 31.12.2013 466 200 -1 084 1 750

50 Noreco Annual report 2013 Noreco Annual report 2013 51
Note 1 to 32 are an integral part of these consolidated financial statements. Note 1 to 32 are an integral part of these consolidated financial statements.
CONSOLIDATED STATEMENT
OF CASH FLOWS
for the year ended 31 December
(All figures in NOK million) Note 2013 2012
Net result for the period (1 008) (593)
Income tax benefit 14 (947) (1 401)
Adjustments to reconcile net result before tax to net cash flows
from operating activities:
Tax paid (64) (166)
Tax refunded 14 1 351 516
Depreciation 12 319 269
Write-downs and reversal of write-downs 11,12 1 211 421
Expensed exploration expenditures previously capitalised 11 556 995
Share-based payments expenses 25 13 14
(Gain) / loss on sale of licenses 10 0 (54)
Impact from termination of defined benefit pension plan 21 (7) 0
Loss related to discontinued cash flow hedge 18 4 0
Unrealised loss / (gain) related to financial instruments 5 20
Gain on extinguishment of debt 13,23 (569) 0
Paid/received interests and borrowing cost - net 431 384
Interests received 28 24
Effect of changes in exchange rates (net foreign exchange loss) 13 13 7
Loss on repurchase of bonds 13 3 0
Amortisation of borrowing costs 13 82 48
Accreation expense related to asset retirement obligations 22 25 27
Changes in working capital
Changes in trade receivables 33 39
Changes in trade payables 20 3
Changes in other current balance sheet items (24) 352
Net cash flow from operations 1 476 905
(All figures in NOK million) Note 2013 2012
Cash flows from investing activities
Purchase of tangible assets 12 (49) (486)
Purchase of intangible assets 11 (412) (649)
Establishment of security account for abandonment obligation
in Denmark 17 (570) 0
Net cash flow used in investment activities (1 031) (1 136)
Cash flow from financing activities
Issue of share capital 439 407
Paid issue cost (4) (18)
Proceeds from issuance of bonds 23 300 500
Proceeds from utilisation of exploration facility 23 345 597
Proceeds from utilisation of reserve based facility/owner 0 456
Repayment of bonds 0 (649)
Repayment of exploration facility 23 (573) (454)
Repayment of reserve based facility 23 (581) (228)
Repurchase own bonds (50) 0
Paid borrowing costs 13 (61) (62)
Interest paid (440) (407)
Net cash flow from (used) in financing activities (626) 143
Net change in cash and cash equivalents (181) (87)
Cash and cash equivalents at the beginning of the year 17 584 671
Cash and cash equivalents at end of the year 17 403 584

NotesNotes
52 Noreco Annual report 2013 Noreco Annual report 2013 53
8
NOTES
16
32

NotesNotes
54 Noreco Annual report 2013 Noreco Annual report 2013 55
1 General information
Norwegian Energy Company ASA (“Noreco”, “the Company” or “the Group”) is a public limited company regis-
tered in Norway, with headquarters in Stavanger (Verksgata 1A, 4003 Stavanger). The Company has subsidiaries
in Norway, Denmark and the United Kingdom. The Company’s objectives are exploration and production of
crude oil and natural gas.
The Company is listed on the Oslo Stock Exchange.
The consolidated financial statements for 2013 were approved by the Board of Directors on 25 March 2014.
2 Summary of significant accounting policies
The principal accounting policies applied in the preparation of these consolidated financial statements are set
out below. These policies have been consistently applied to all the years presented, unless otherwise stated.
2.1 Basis of preparation
The consolidated financial statements of Norwegian Energy Company ASA (Noreco ASA) have been prepared in
accordance with International Financial Reporting Standards (IFRS) and interpretations from the IFRS interpretation
committee (IFRIC), as endorsed by the EU. The Group does also provide information which is obligated in accordance
with the Norwegian Accounting Act and associated N-GAAP standards.
The preparation of financial statements in accordance with IFRS requires the use of certain critical accounting esti-
mates. It also requires management to exercise its judgement in the process of applying the Group’s accounting
policies. The areas involving a higher degree of judgement or complexity, or areas where assumptions and estima-
tes are significant to the consolidated financial statements are disclosed in note 4.
In accordance with the Norwegian Accounting Act, section 3-3a, the Board of Directors confirms that the consolida-
ted financial statements have been prepared under the assumption of going concern and that this is the basis for
the preparation of the financial statements. The financial solidity and the Company’s cash position at 31 December
2013 was considered satisfactory in regards of the planned activity level in 2014. However, the Company is highly
dependent on production from Huntington and the other fields during 2014 to be able to meet the future obliga-
tions. See note 3.1 for further details relating to liquidity risk.
The Board of Directors is of the opinion that the consolidated financial statements give a true and fair view of the
Company’s assets, debt, financial position and financial results. The Board of Directors is not aware of any factors
that materially affect the assessment of the Company’s position as of 31 December, 2013, besides what is disclo-
sed in the Director’s report and the financial statements.
The subtotals and totals in some of the tables may not equal the sum of the amounts shown due to rounding.
2.1.1 Changes in accounting policies and disclosures
a) New and amended standards adopted by the group
The following standards have been adopted by the Group for the first time for the financial year beginning on or
after 1 January 2013 and have a material impact on the Group:
IAS 1 Financial statement presentation
Amendment to IAS 1 is regarding other comprehensive income. The main change resulting from these amendments
is a requirement for entities to Group items presented in ‘other comprehensive income’ (OCI) on the basis of
whether they are potentially re-classifiable to profit or loss subsequently (reclassification adjustments).
IAS 19 Employee benefits
IAS 19 was revised in June 2011. The changes on the Group’s accounting policies has been as follows: all estimate
deviations are reported in ‘other comprehensive income’ as they occur (no corridor), to immediately recognise all
past service costs; and to replace interest cost and expected return on plan assets with a net interest amount that
is calculated by applying the discount rate to the net defined benefit liability (asset). See note 21 for the impact on
the financial statements.
IFRS 13 Fair value measurement
IFRS 13 defines fair value when the term is used in IFRS, gives a general description of how fair value should be
determined under IFRS, and defines which additional information needs to be given when fair value is used. The
standard does not extend the scope of accounting to fair value, but gives guidance on how it should be applied
where its use is already required or permitted by other standards within IFRSs. The Group applies fair value as a
measurement criteria for certain assets and liabilities. Application of IFRS 13 has not materially impacted the fair
value measurements of the Group. Additional disclosures, where required, are provided in the individual notes rela-
ting to the assets and liabilities whose fair values were determined. The fair value hierarchy is provided in note 19.
IAS 36 Impairment of assets
Amendments to IAS 36 relate to the recoverable amount disclosures for non-financial assets. This amendment
removed certain disclosures of the recoverable amount of CGUs which had been included in IAS 36 by the issue
of IFRS 13. The amendment is not mandatory for the Group until 1 January 2014; however, the Group has decided
to early adopt the amendment as of 1 January 2013.
b) New standards and interpretations not yet adopted
A number of new standards and amendments to standards and interpretations are effective for annual periods
beginning after 1 January 2014, and have not been applied in preparing these consolidated financial statements.
IFRS 9 Financial instrument; Classification and measurement
IFRS 9 addresses the classification, measurement and recognition of financial assets and financial liabilities.
IFRS 9 was issued in November 2009 and October 2010. It replaces the parts of IAS 39 that relate to the classifi-
cation and measurement of financial instruments. IFRS 9 requires financial assets to be classified into two measu-
rement categories: those measured at fair value and those measured at amortised cost. The determination is
made at initial recognition. The classification depends on the entity’s business model for managing its financial
instruments and the contractual cash flow characteristics of the instrument. For financial liabilities, the standard
retains most of the IAS 39 requirements. The main change is that, in cases where the fair value option is taken for
financial liabilities, the part of a fair value change due to an entity’s own credit risk is recorded in other comprehen-
sive income rather than the income statement, unless this creates an accounting mismatch.
The effective date of IFRS 9 was 1 January 2015. The effective date has been postponed and a new date is yet to
be specified. The Company will adopt the standard in the first annual period beginning on or after the mandatory

NotesNotes
56 Noreco Annual report 2013 Noreco Annual report 2013 57
Notes
effective date (once specified). The Group is yet to assess IFRS 9’s full impact and the Group will also consider the
impact of the remaining phases of IFRS 9 when completed by the Board.
IFRS 10 Consolidated Financial Statements, IAS 27 Separate Financial Statement
IFRS 10 replaces the portion of IAS 27 “Consolidated and Separate Financial Statements” that addresses the acco-
unting for consolidated financial statements.
IFRS 10 builds on existing principles by identifying the concept of control as the determining factor in whether an
entity should be included within the consolidated financial statements of the parent company. The standard provi-
des additional guidance to assist in the determination of control where this is difficult to assess. The change is
effective from 1 January 2014. Currently all subsidiaries are included in the Group accounts and are wholly owned
and the standard will not lead to significant changes in entities deemed to be controlled by Noreco.
IFRS 11 Joint Arrangements
IFRS 11, ‘Joint arrangements’ focuses on the rights and obligations of the parties to the arrangement rather than
its legal form. There are two types of joint arrangements: joint operations and joint ventures. Joint operations arise
where the investors have rights to the assets and obligations for the liabilities of an arrangement. A joint operator
accounts for its share of the assets, liabilities, revenue and expenses. Joint ventures arise where the investors have
rights to the net assets of the arrangement; joint ventures are accounted for under the equity method. Proportional
consolidation of joint arrangements is no longer permitted. The Group has not identified significant entities or acti-
vities within the scope of IFRS 11 that will be accounted for differently under the new standard. Those of The Group’s
license activities that are within the scope of the standard will be accounted for in a manner similar to proportionate
consolidation. The change is effective from 1 January 2014.
IFRS 12 Disclosures of interests in other entities
IFRS 12 includes the disclosure requirements for all forms of interests in other entities, including joint arrange-
ments, associates, structured entities and other off balance sheet vehicles. The new standard will require a number
of new disclosures, but has no impact on the Group’s financial position or performance. The change is effective
from 1 January 2014.
There are no other IFRSs or IFRIC interpretations that are not yet effective that would be expected to have a material
impact on the Group.
2.2 Consolidation
a) Subsidiaries
Subsidiaries are all entities over which the Group has the power to govern the financial and operating policies
generally accompanying a shareholding of more than one half of the voting rights. The existence and effect of
potential voting rights that are currently exercisable or convertible are considered when assessing whether the
Group controls another entity.
The Group also assesses existence of control where it does not have more than 50 percent of the voting power
but is able to govern the financial and operating policies by virtue of de-facto control. De-facto control may
arise in circumstances where voting rights are spread amongst a large number of owners who are not realisti-
cally able to organise their votes. In assessing de-facto control, the fact that the Group can elect the Board of
Directors they want is given decisive weighting. As of 31 December 2013, all consolidated subsidiaries are
100 percent controlled by the parent company, Norwegian Energy Company ASA.
Subsidiaries are fully consolidated from the date on which control is transferred to the Group. They are de-
consolidated from the date that control ceases.
The Group applies the acquisition method to account for business combinations. The consideration transferred
for the acquisition of a subsidiary is the fair values of the assets transferred, the liabilities incurred to the for-
mer owners of the acquiree and the equity interests issued by the Group. The consideration transferred
includes the fair value of any asset or liability resulting from a contingent consideration arrangement.
Identifiable assets acquired and liabilities and contingent liabilities assumed in a business combination are
measured initially at their fair values at the acquisition date.
Acquisition-related costs are expensed as incurred.
If the business combination is achieved in stages, the acquisition date carrying value of the acquirer’s previ-
ously held equity interest in the acquiree is re-measured to fair value at the acquisition date; any gains or
losses arising from such re-measurement are recognised in profit or loss.
Goodwill is initially measured as the excess of the aggregate of the consideration transferred and the fair value
of non-controlling interest over the net identifiable assets acquired and liabilities assumed. If this considera-
tion is lower than the fair value of the net assets of the subsidiary acquired, the difference is recognised in
profit or loss.
Inter-company transactions, balances, income and expenses on transactions between Group companies are
eliminated. Profits and losses resulting from intercompany transactions that are recognised in assets are also
eliminated. Accounting policies of subsidiaries have been changed where necessary to ensure consistency
with the policies adopted by the Group.
b) Disposal of subsidiaries
When the Group ceases to have control any retained interest in the entity is re-measured to its fair value at
the date when control is lost, with the change in carrying amount recognised in profit or loss. The fair value is
the initial carrying amount for the purposes of subsequently accounting for the retained interest as an associ-
ate, joint venture or financial asset. In addition, any amounts previously recognised in other comprehensive
income in respect of that entity are accounted for as if the Group had directly disposed of the related assets
or liabilities. This may mean that amounts previously recognised in other comprehensive income are reclassi-
fied to profit or loss.
c) Interest in jointly controlled assets
A jointly controlled asset is a contractual agreement between two or more parties regarding a financial activity
under joint control. The Group has ownership in licenses that are not separate legal companies. All of these
are related to licenses on the Norwegian, Danish and UK continental shelf. The Company recognises invest-
ments in jointly controlled assets (oil and gas licenses) by applying the proportionate consolidation method by
accounting for its share in the assets income, cost, assets, debt and cash flow in the respective line items in
the Company’s financial statements.
2.3 Segment reporting
The Group’s segments were established on the basis of the most appropriate distribution of resource and
result measurement. Segment reporting is regularly evaluated by the Company management. Operating seg-
ments are reported in a manner consistent with the internal reporting provided to the chief operating decision-
maker. The chief operating decision-maker, who is responsible for allocating resources and assessing perfor-
mance of the operating segments, has been identified as the Chief Executive Officer (CEO). In 2012 and 2013,
The Group had one reporting segment: Exploration and production. Geography is important for the Group, and
consequently, information about countries in which the Company operates has been disclosed in the segment
note. Information about reserves is given in a separate report.

NotesNotes
58 Noreco Annual report 2013 Noreco Annual report 2013 59
2.4 Foreign currency translation
a) Functional and presentation currency
Items included in the financial statements of each of the Group’s entities are measured using the currency of
the primary economic environment in which the entity operates (‘the functional currency’). The consolidated
financial statements are presented in Norwegian Kroner (NOK), which is the Group’s presentation currency and
the parent company’s functional currency.
b) Transactions and balances
Foreign currency transactions are translated into the functional currency using the exchange rates prevailing
at the dates of the transactions or valuation where items are re-measured.
Foreign exchange gains and losses are recognised in the income statement as other financial income or other
financial expenses.
c) Group companies
The results and financial position of all the Group entities (none of which has the currency of a hyper-inflation-
ary economy) that have a functional currency different from the presentation currency are translated into the
presentation currency as follows:
I) assets and liabilities for each balance sheet presented are translated at the closing rate at the date of
that balance sheet;
II income and expenses for each income statement are translated at the average quarterly exchange rates
(unless this average is not a reasonable approximation of the cumulative effect of the rates prevailing on
the transaction dates, in which case income and expenses are translated at the rate on the dates of the
transactions)
III) All currency translation adjustments are recognised in other comprehensive income.
Goodwill and fair value adjustments arising on the acquisition of a foreign entity are treated as assets and
liabilities of the foreign entity and translated at the closing rate. Currency translation adjustments arising are
recognised in other comprehensive income.
2.5 Property, plant and equipment
Property, plant and equipment include production facilities, assets under construction and machinery and
equipment. Items of property, plant and equipment are measured at cost, less accumulated depreciation and
accumulated impairment losses. Cost includes purchase price or construction cost and any costs directly
attributable to bringing the assets to a working condition for their intended use, including capitalised borrowing
expenses incurred up until the time the asset is ready to be put into operation.
For property, plant and equipment where asset retirement obligations for decommissioning and dismantling
are recognised as a liability, this value will be added to acquisition cost for the respective assets. Borrowing
costs that are not directly attributable to the acquisition, construction or production of a qualifying asset are
recognised in the income statement using the effective interest method.
When parts of an item of property, plant and equipment have different useful lives, they are accounted for as
separate items (major components) of property, plant and equipment and depreciated separately.
Subsequent costs are included in the asset’s carrying amount or recognised as a separate asset, as appropri-
ate, only when it is probable that future economic benefits associated with the item will flow to the Group and
the cost of the item can be measured reliably. The carrying amount of the replaced part is derecognised. All
other repairs and maintenance are charged to the income statement during the financial period in which they
are incurred.
Gain or loss from sale of property, plant and equipment, which is calculated as the difference between the
sales consideration and the carrying amount, is reported in the income statement under other (losses)/gains.
(See also Note 2.6 a) regarding goodwill.)
Expenses related to drilling and equipment for exploration wells where proven and probable reserves are dis-
covered are capitalised and depreciated using the unit-of-production (UoP) method based on the proven and
probable reserves expected to be produced from the well. Development cost related to construction, installa-
tion and completion of infrastructural facilities such at platforms, pipelines and drilling of production wells, are
capitalised as producing oil and gas fields. They are depreciated using the unit-of-production method based
on the proven and probable developed reserves expected to be recovered from the area for the economic
lifetime of the field. For fields where the oil share of the reserves constitutes the most significant part of the
value, the capitalised cost is depreciated based on produced barrels of oil. This gives a more correct matching
of expenses and revenue than using all produced oil equivalents. If realisation of the probable reserves
demands further future investments, these are added to the basis of depreciation.
Acquired assets used for extraction and production of petroleum deposits, including license rights, are depre-
ciated using the unit-of-production method based on proven and probable reserves.
Historical cost price for other assets is depreciated over the estimated useful economic life of the asset, using
the straight line method.
The estimated useful lives are as follows:
- Office equipment and fixtures: 3-5 years
Assets under construction are not depreciated until the asset is put into operation.
Depreciation methods, useful lives, residual values and reserves are reviewed at each reporting date and
adjusted if appropriate.
2.5.1 Property, plant and equipment available for sale
Property, plant and equipment are classified as held for sale when their carrying amount is to be recovered
principally through a sale transaction and a sale is considered highly probable. They are measured at the lower
of carrying amount and the fair value less costs of disposal.

NotesNotes
60 Noreco Annual report 2013 Noreco Annual report 2013 61
2.6 Intangible assets
a) Goodwill
Goodwill arises on the acquisition of business and represents the excess of the consideration transferred over
The Group’s interest in net fair value of the net identifiable assets, liabilities and contingent liabilities of the
acquiree. Subsequently, goodwill is measured at historical cost with deduction for accumulated write-downs.
Goodwill is not amortised.
Goodwill impairment tests are performed annually or more frequently if events or changes in circumstances
indicate a potential impairment. The carrying value of goodwill is compared to the recoverable amount, which
is the higher of value in use and the fair value less costs to sell. Any impairment is recognised immediately
as an expense and is not subsequently reversed.
Goodwill is allocated for each business combination to cash generating units on the level management moni-
tor the specific investment.
In connection with divestment of assets, gain or loss is calculated by settling all carrying balances related to
the realised asset and comparing this with the agreed consideration adjusted for any pro/contra settlement.
In cases where the sold asset forms a part of a cash generating unit to which goodwill is allocated, goodwill
is allocated to the sold asset based on the relative share of fair value which forms part of the specific cash
generating unit for goodwill. This method is used unless the Company can demonstrate that another method
better reflects the goodwill related with the sold asset.
b) License and capitalised exploration expenditures
Exploration costs are accounted for in accordance with the successful effort method. This means that all explo-
ration costs including pre-operating costs (seismic acquisitions, seismic studies, internal man hours, etc.) are
expensed as incurred. Exceptions are costs related to acquisition of licenses and drilling of exploration wells.
Exploratory wells are accounted for as follows:
- Costs of exploratory wells which result in proven reserves remain capitalised, but reclassified to property,
plant and equipment when the development plan is approved and initiated.
- Costs of dry exploratory wells and wells where proven reserves were not found are expensed in the income
statement when sufficient information to complete the assessment has been gathered.
- Cost of exploration wells are temporarily capitalised until a determination is made as to whether the well has
found proven reserves or not. In the period before proven reserves are determined and any development
begins, the following two conditions must be met:
- The well has found a sufficient quantity of reserves to justify its completion as a producing well, if appro-
priate, assuming that the required capital expenditures are made;
- The Group is making sufficient progress assessing the reserves and the economic and operating viability
of the project. This progress is evaluated on the basis of indicators such as:
- Whether additional exploration works are under way or firmly planned, and/or there is nearby exploration
activity which is expected to contribute to development of the Group’s discoveries (wells, seismic or
significant studies),
- Whether costs are being incurred for development studies,
- Whether the Group is waiting for governmental or other third-party authorization of a proposed project,
- Whether the Group is waiting for availability of capacity on an existing transport or processing facility to
be able to produce the existing discovery, and
- Whether there is a common understanding among the partners to wait with further progress for a spe-
cific discovery until an on-going development project is on-stream.
Costs of exploration wells not meeting these conditions are charged to expense on the line item for explora-
tion expenses.
When acquiring shares in exploration licenses (“farm-in” agreements) where the agreement is to cover a share
of the sellers (“farmor”) cost, these expenses are charged in the same manner as own exploration expenses
in the income statement.
For similar sales of assets in exploration licenses (farm-out agreements), the Group will normally surrender
parts of a license given that the buyer (“farmee”) carries some defined cost.
The seller does not recognise any gain/loss but treats the cost as a cost reduction as cost occurs.
In those cases where the carry period starts before the accounting date of the agreement, a profit/loss cal-
culation may be necessary.
Unitisation that occurs when licenses or parts of licenses are merged normally does not require any account-
ing. If the new distribution of interest shares constitutes any cash payment, or the Company receives cash,
such compensation will be adjusted towards the recognised asset. If there is a subsequent redetermination,
such event will normally not require any accounting, as long as cash settlement is not necessary to settle the
new distribution.
If the field where unitisation or redetermination occurs is in the production phase, the accounts will be cor-
rected for items in the income statement that are altered in connection with the determination of the new
ownership structure.
2.7 Impairment of non-financial assets
a) Unit of account
The Group applies each prospect, discovery, or field as unit of account for allocation of profit or loss and
balance sheet items.
When performing impairment testing of license and capitalised exploration expenses and production facilities,
each prospect, discovery, or field is tested separately as long as they are not defined to be part of a larger
cash generating unit.
To be able to group exploration and evaluation assets into one cash-generating unit, they should normally be
planned to be part of a joint development, or it is planned and likely that a new discovery can be tied back to
another of the Group’s fields.
Developed fields producing from the same offshore installation are treated as one joint cash generating unit.
The size of a cash-generating unit can not be larger than an operational segment.
Goodwill is tested for impairment at the same level in which the goodwill is allocated. The Group’s goodwill,
which has its background from the acquisition of Altinex ASA in 2007, is allocated to the following cash gen-
erating units: Norway, Denmark, and United Kingdom (UK). Only assets and business which were a part of the
acquisition are included in these cash-generating units.
b) Impairment testing
Intangible assets with an indefinite useful life are not subject to amortisation and are tested annually for
impairment. Property, plant and equipment subject to amortisation are reviewed for impairment whenever

NotesNotes
62 Noreco Annual report 2013 Noreco Annual report 2013 63
events or changes in circumstances indicate that the carrying amount may not be recoverable. An impairment
loss is recognised for the amount by which the asset’s carrying amount exceeds its recoverable amount. The
recoverable amount is the higher of an asset’s fair value less costs of disposal and value in use. For the pur-
poses of assessing impairment, assets are grouped at the lowest levels for which there are separately iden-
tifiable cash flows (cash-generating units). Non-financial assets other than goodwill that suffered impairment
are reviewed for possible reversal of the impairment at each reporting date.
2.8 Financial instruments
2.8.1 Classification
The Group classifies financial assets in the following categories: Financial assets at fair value through profit or
loss and loans and receivables. The classification depends on the purpose of the asset. Management deter-
mines the classification of its financial assets at initial recognition.
a) Financial assets at fair value through profit or loss
Financial assets at fair value through profit or loss are financial assets held for trading. A financial asset is
classified in this category if acquired principally for the purpose of selling in the short term. Derivatives are also
categorised as available-for-sale unless they are designated as hedges. Assets in this category are classified as
current assets if expected to be settled within 12 months, otherwise they are classified as non-current.
b) Loans and receivables
Loans and receivables are non-derivative financial assets with fixed or determinable payments that are not
quoted in an active market. They are included in current assets, except for maturities greater than 12 months
after the end of the reporting period. These are classified as non-current assets. The Group’s loans and
receivables comprise ‘trade and other receivables’, “restricted cash” and ‘cash and cash equivalents’ in the
balance sheet (notes 2.11 and 2.12).
2.8.2 Recognition and measurement
Regular purchases and sales of financial assets are recognised on the trade-date – the date on which the
Group commits to purchase or sell the asset. Investments are initially recognised at fair value plus transaction
costs for all financial assets not carried at fair value through profit or loss. Financial assets carried at fair value
through profit or loss, are initially recognised at fair value, and transaction costs are expensed in the income
statement. Financial assets are derecognised when the rights to receive cash flows from the investments have
expired or have been transferred and the Group has transferred substantially all risks and rewards of owner-
ship. Available-for-sale financial assets and financial assets at fair value through profit or loss are subsequently
carried at fair value. Loans and receivables are subsequently carried at amortised cost using the effective
interest method.
Gains or losses arising from changes in the fair value of the ‘financial assets at fair value through profit or
loss’ category are presented in the income statement within ‘Other (losses)/gains’ in the period in which they
arise.
2.9 Impairment of financial assets
a) Assets carried at amortised cost
The Group assesses whether there is objective evidence that a financial asset or group of financial assets is impai-
red at the end of each reporting period. A financial asset or a group of financial assets is impaired and impairment
losses are incurred only if there is objective evidence of impairment as a result of one or more events that occurred
after the initial recognition of the asset (a ‘loss event’) and that loss event (or events) has an impact on the esti-
mated future cash flows of the financial asset or group of financial assets that can be reliably estimated.
Evidence of impairment may include indications that the debtors or a group of debtors is experiencing significant
financial difficulty, default or delinquency in interest or principal payments, the probability that they will enter bank-
ruptcy or other financial reorganisation, and where observable data indicate that there is a measurable decrease in
the estimated future cash flows, such as changes in arrears or economic conditions that correlate with defaults.
For the loans and receivables category, the amount of the loss is measured as the difference between the asset’s
carrying amount and the present value of estimated future cash flows (excluding future credit losses that have not
been incurred) discounted at the financial asset’s original effective interest rate. The carrying amount of the asset
is reduced and the amount of the loss is recognised in the consolidated income statement. If a loan or held-to-
maturity investment has a variable interest rate, the discount rate for measuring any impairment loss is the current
effective interest rate determined under the contract. As a practical expedient, the Group may measure impairment
on the basis of an instrument’s fair value using an observable market price.
If, in a subsequent period, the amount of the impairment loss decreases and the decrease can be related
objectively to an event occurring after the impairment was recognised (such as an improvement in the debtor’s
credit rating), the reversal of the previously recognised impairment loss is recognised in the consolidated
income statement.
2.10 Derivative financial instruments and hedging acitivites
Derivatives are initially recognised at fair value on the date a derivative contract is entered into and are sub-
sequently re-measured at their fair value. The method of recognising the resulting gain or loss depends on
whether the derivative is designated as a hedging instrument, and if so, the nature of the item being hedged.
The Group designates certain derivatives as either:
a) hedges of the fair value of recognised assets or liabilities or a firm commitment (fair value hedge);
b) hedges of a particular risk associated with a recognised asset or liability or a highly probable forecast trans-
action (cash flow hedge)
At the inception of the transaction, the Group documents the relationship between hedging instruments and
hedged items, as well as its risk management objectives and strategy for undertaking various hedging trans-
actions. The Group also documents its assessment, both at hedge inception and on an on-going basis, of
whether the derivatives that are used in hedging transactions are highly effective in offsetting changes in fair
values or cash flows of hedged items.
The fair values of various derivative instruments used for hedging purposes are shown in note 19. Movements
on the hedging reserve in other comprehensive income are described in note 18. Fair value of a hedging deriva-
tive is classified as current asset or liability, as long as there is not a material part of the value that relates to a
hedge item which matures later then 12 months. Trading derivatives are classified as a current asset or liability.

NotesNotes
64 Noreco Annual report 2013 Noreco Annual report 2013 65
Cash flow hedge
The effective portion of changes in the fair value of derivatives that are designated and qualify as cash flow
hedges is recognised in other comprehensive income. The gain or loss relating to the ineffective portion is
recognised immediately in the income statement within ‘Other gains/(losses)’.
Amounts accumulated in other comprehensive income are reclassified to profit or loss in the periods when
the hedged item affects profit or loss (for instance, when the forecast sale that is hedged takes place).
The gain or loss relating to the effective portion of interest rate swaps hedging variable rate borrowings
is recognised in the income statement within ‘finance expenses’. Gain or loss related to the ineffective part
is recognised as “Other gains (/losses)”.
When a hedging instrument expires, or is sold, or no longer meets the criteria for hedge accounting, any gain
or loss accumulated in other comprehensive income at that time remains within other comprehensive income
and is recognised when the forecast transaction is ultimately recognised in the income statement. If a forecast
transaction is no longer expected to occur, the cumulative gain or loss that was reported in other comprehen-
sive income is immediately transferred to the income statement within Other gains/(losses).
The Group has no derivatives designated for cash flow hedging as of 31 December 2013.
2.11 Trade receivables
Trade receivables are amounts due from customers for merchandise sold or services performed in the ordinary
course of business. If collection is expected in one year or less (or in the normal operating cycle of the busi-
ness if longer), they are classified as current assets. If not, they are presented as non-current assets.
Trade receivables are recognised initially at fair value and subsequently measured at amortised cost using the
effective interest method, less provision for impairment.
2.12 Cash and cash equivalents
Cash and cash equivalents includes cash, bank deposits and short term liquid placements, that immediately
and with insignificant share price risk can be converted to known cash amounts and with a remaining maturity
less than three months from the date of acquisition. In the consolidated balance sheet, bank overdrafts are
shown within borrowings in current liabilities.
2.13 Over/under lifting of hydrocarbons
Over lifting of hydrocarbons is presented as current liabilities, under lifting of hydrocarbons is presented as cur-
rent receivables. The value of over lifting or under lifting is measured at the estimated sales value, less estimated
sales costs. Over lifting and under lifting of hydrocarbons are presented at gross value. Over/under lift positions
at the balance sheet date, are expected to be settled within 12 months from the balance sheet date.
For the accounts, the items are treated as financial instruments at fair value through profit or loss. The item
is considered to be a financial instrument as the over/under lift position will be settled in cash at the end of
the fields’ life time or when the license is sold or returned.
2.14 Share capital and share premium
Ordinary shares are classified as equity. Costs directly attributable to the issue of new shares or option shares
are recognised as a deduction from equity, net of any tax effects.
2.15 Trade payables
Trade payables are obligations to pay for goods or services that have been acquired in the ordinary course of busi-
ness from suppliers. Trade payables are classified as current liabilities if payment is due within one year or less
(or in the normal operating cycle of the business if longer). If not, they are presented as non-current liabilities.
Trade payables are measured at fair value at first time recognition. Subsequent measurements are considered
trade payables at amortised cost when using effective interest rate.
2.16 Borrowings
Borrowings are recognised initially at fair value, net of transaction costs incurred. Borrowings are subsequently
carried at amortised cost; any difference between the proceeds (net of transaction costs) and the redemption value
is recognised in the income statement over the period of the borrowings using the effective interest method.
Borrowings are classified as non-current if contractual maturity is more than 12 months from the balance sheet
date. If the Group is in breach with any covenants on the balance sheet date, and a waiver has not been
approved before or on the balance sheet date with 12 months duration or more after the balance sheet date,
the loan is classified as current even if expected maturity is longer than 12 months after the balance sheet
date. If the breach which results in any reclassification is related to a loan with cross-default terms in the loan
agreement, all loans with the same cross-default terms are reclassified.
Fees paid on the establishment of loan facilities are recognised as transaction costs of the loan to the extent
that it is probable that some or all of the facility will be drawn down. In this case, the fee is deferred until the
draw-down occurs. To the extent there is no evidence that it is probable that some or all of the facility will be
drawn down, the fee is capitalised as a prepayment for liquidity services and amortised over the period of the
facility to which it relates.
Gains or losses arising from repurchases of the Group’s bond debt are recognized as financial income or finan-
cial expense. The gain or loss is calculated as the difference between the fair value paid at the time of the
repurchase and the amortised cost.
A financial liability is derecognised when the obligation under the liability is discharged or cancelled, or when
the contractual obligation expires. When an existing financial liability is replaced by another from the same
lender on substantially different terms, or the terms of an existing liability are substantially modified, the
exchange or modification is treated as the de-recognition of the original liability and the recognition of a new
liability. The difference in the respective carrying amounts is recognised in the statement of comprehensive
income as a gain or loss under financial items. Transaction costs incurred during this process are treated as
a cost of the settlement of the old debt and included in the gain or loss calculation.
Borrowings are classified as current liabilities unless the Group has an unconditional right to defer settlement
of the liability for at least 12 months after the end of the reporting period.

NotesNotes
66 Noreco Annual report 2013 Noreco Annual report 2013 67
2.17 Borrowing costs
General and specific borrowing costs directly attributable to the acquisition, construction or production of qualifying
assets, which are assets that necessarily take a substantial period of time to get ready for their intended use or
sale, are added to the cost of those assets, until such time as the assets are substantially ready for their intended
use or sale.
Investment income earned on the temporary investment of specific borrowings pending their expenditure on qualify-
ing assets is deducted from the borrowing costs eligible for capitalisation.
All other borrowing costs are recognised in profit or loss in the period in which they incur.
2.18 Compound financial instruments
Compound financial instruments issued by the Group comprise convertible notes that can be converted to share
capital at the option of the holder, and the number of shares to be issued does not vary with changes in their fair
value.
The liability component of a compound financial instrument is recognised initially at the fair value of a similar liability
that does not have an equity conversion option. The equity component is recognised initially as the difference bet-
ween the fair value of the compound financial instrument as a whole and the fair value of the liability component.
Any directly attributable transaction costs are allocated to the liability and equity components in proportion to their
initial carrying amounts.Subsequent to initial recognition, the liability component of a compound financial instrument
is measured at amortised cost using the effective interest method. The equity component of a compound financial
instrument is not re-measured subsequent to initial recognition.
2.19 Current and deferred income tax
The tax expense for the period comprises current tax, tax impact from refund of exploration expenses and deferred
tax. Income tax is recognised in the income statement, except items related to business combination, or items
recognised in other comprehensive income.
Income tax expenses consists of the expected payable tax or tax receivable for the expenses for the period are
calculated based on the expected payable tax applicable to the expected total annual earnings, changes in defer-
red tax and corrections for changes from previous years. Tax is calculated using tax rates enacted or substantively
enacted at the reporting date. Current tax payable also includes any tax liability arising from the declaration of divi-
dends. Deferred tax is recognised in respect of temporary differences between the carrying amounts of assets and
liabilities for accounting purposes and tax purposes.
Deferred tax is not recognised for:
– temporary differences on the initial recognition of assets or liabilities in a transaction that is not a business com-
bination and that affects neither accounting nor taxable profit or loss;
– temporary differences related to investments in subsidiaries and jointly controlled entities to the extent that it is
probable that they will not reverse in the foreseeable future,
– taxable temporary differences arising on the initial recognition of goodwill
A deferred tax asset is recognised to the extent that it is probable that the deferred tax asset will be utilised.
Any capitalised deferred tax asset is reduced if it is no longer probable that the tax asset will be realised. Deferred
tax and deferred tax asset is calculated with basis in expected future nominal tax rate for the companies where the
temporary difference has occurred.
Companies engaged in petroleum production and pipeline transportation on the Norwegian continental shelf are
subject to a special petroleum tax on profits derived from these activities. The special petroleum tax is currently
levied at 50 percent. The special tax is applied to relevant income in addition to the standard 28 percent income
tax, resulting in a 78 percent marginal tax rate on income subject to petroleum tax. The standard income tax rate
is changed to 27 percent from 1 January 2014. The special petroleum tax rate is changed to 51 percent at the
same time, leaving the marginal tax rate on income subject to petroleum tax unchanged. As of 31 December 2013,
the deferred tax and deferred tax an asset relating to onshore activity in Norway is calculated with a tax rate of 27
percent as a consequence of the change in tax rates.
The basis for computing the special petroleum tax is the same as for income subject to ordinary income tax, except
that onshore losses are not deductible against the special petroleum tax, and a tax-free allowance, or uplift, is
granted at 5.5 percent per year. The uplift is computed on the basis of the original capitalised cost of offshore pro-
duction installations. The uplift may be deducted from taxable income for a period of four years, starting in the year
in which the capital expenditures are incurred. Uplift benefit is recorded when the deduction is included in the cur-
rent year tax return and impacts taxes payable. Unused uplift may be carried forward indefinitely. In accordance with
the Norwegian Petroleum Taxation Act, sale of oil is taxed according to norm price. In the consolidated financial
statements, the difference between norm price and actual obtained price are treated as a permanent difference.
Losses carry forward are calculated with a fixed interest rate per year. For 2013, this interest rate is 1.5 percent.
(2012: 1.5 percent)
Interest expenses on interest-bearing debts are distributed between onshore and offshore activities. The tax allo-
wance for the offshore debt interests are calculated as interest expense multiplied by 50 percent of the ratio bet-
ween the tax value of the offshore asset and average interest-bearing debt. The remaining net financial expenses
are allocated to onshore. Net finance costs onshore can be transferred to the continental shelf (28 percent, 27
percent from 1 January 2014), ref. the Norwegian Petroleum Taxation Act §3d. If interest expense is to related par-
ties and net interest expense exceeds NOK 5 million, they can not be deducted for the amount that exceeds 30
percent of ordinary income, adjusted for interest and tax depreciation. This rule applies from 2014, but the compa-
nies covered by the Norwegian Petroleum Taxation Act § 3 d are as of today exempt. The interest limitation rule will
have limited impact on the Group.
The Norwegian Petroleum Taxation Act also regulates the access to demand payment of the tax value of losses that
occur from exploration activity on the Norwegian Continental Shelf. For fiscal losses in Group companies that under-
take exploration activity on the Norwegian continental shelf, the Company applies for a refund of the tax amount for
such a loss. The receivable that then occurs is recognised as short term claim for the current assets, under the
line “Tax receivable”. If a business liable for special tax is discontinued, and a loss has not been covered, the
Company may claim payment from the Norwegian government of the tax value of its uncovered losses, ref. the
Norwegian Petroleum Taxation Act §3c. The tax refund will be determined by the authorities, and will be received at
the end of the year following the year of discontinuance of petroleum activity in the parent company.
In the UK, oil and gas companies are subject to a company tax of 30 percent, in addition to a 32 percent special
tax related to exploration and production activities on the UK Continental Shelf. Investments can be deducted 100
percent in the year the investment is made. Losses can be utilised indefinitely for entities which have commenced
“trading”. For entities at a pre-trading stage the losses can be carried forward in six years, and the losses give an
annual markup of 10 percent (6 percent prior to 2012), for up to six years. Finance cost is deducted in the company
tax, not the special tax.
In Denmark the maximum marginal tax rate for oil and gas companies is 78 percent, whereof 25 percent is related
to ordinary company tax. At the current oil price level, the Danish subsidiaries will not be in a position where they
have to pay the extra petroleum tax. The current tax rate for the Danish companies is 25 percent.

NotesNotes
68 Noreco Annual report 2013 Noreco Annual report 2013 69
On the 20 December 2013, “Folketinget” (the Danish government) concluded that with effect from 1 January 2014
hydrocarbon taxes in Denmark will be harmonised. The main changes are a reduction in the special hydrocarbon
tax rate from 70 percent to 52 percent with a marginal tax rate of 64 percent, the 5 percent duty on oil production
is cancelled, and the hydrocarbon allowances are reduced from 25 percent annually for 10 years to 5 percent annu-
ally for 6 years. The Groups assessment is that the suggested changes will not have a negative impact on the Group
accounts, and the current tax rate for the Danish companies will remain 25 percent.
2.20 Pensions
The Group has had both defined benefit and defined contribution plans valid up to 12 G during the reporting
period. The pension arrangement is financed through payments to an insurance company.
Employees in the Norwegian companies within the Group have had a collective (secured) pension arrangement
up until 31 December 2013. The arrangement was defined as a benefit plan. From 31 December 2013, the
pension agreements for all Norwegian employees have been changed to defined contribution plans; and as of
the balance sheet date, the Group has no liability relating to defined benefit plan arrangements. In Denmark,
the Group has a defined contribution plan.
a) Defined contribution plan
With a defined contribution plan, the Company pays contributions to an insurance company. After the contri-
bution has been made, the Company has no legal or constructive obligations to pay further contributions. The
contribution is recognised as payroll expenses. Prepaid contributions are reflected as an asset (pension fund)
to the degree the contribution can be refunded or will reduce future payments.
b) Defined benefit plan
A defined benefit plan is a pension scheme which is not a defined contribution plan. A defined benefit plan is a
pension scheme which defines a pension payment which an employee will receive at pension age. The pension
payments are normally dependent on one or more factors such as age, number of years in the Company, and salary.
The commitment relating to the defined benefit plan on the balance sheet is the present value of the defined bene-
fit obligation at the balance sheet date less fair value of the plan assets (amount paid to an insurance company),
adjusted for unrecognised estimation deviations and unrecognised expenses related to pension vesting for previous
periods.
The defined benefit obligation is calculated annually by independent actuaries using the projected unit credit
method. The present value of the defined benefit obligation is determined by discounting the estimated future
cash outflows using a discount rate based on bonds with priority (OMF) on the balance sheet date which have
maturity dates that coincide with the Group’s pension obligations.
Actuarial gains and losses arising from experience adjustments and changes in actuarial assumptions are
charged or credited to equity in other comprehensive income in the period in which they arise.
Past-service costs are recognised immediately in income.
c) Bonus plans
The Group recognises a liability and an expense for bonuses based on an estimate that takes into considera-
tion the performance of the Company compared to board approved performance objectives for the period. The
Group recognises a provision where contractually obliged or where there is a past practice that has created a
constructive obligation.
2.21 Share-based payments
The Group operates a number of equity-settled, share-based compensation plans, under which the entity recei-
ves services from employees as consideration for equity instruments (options) of the Group. The fair value of
the employee services received in exchange for the grant of the options is recognised as an expense. The total
amount to be expensed is determined by reference to the fair value of the options granted:
Fair value:
– including any market performance conditions
– excludes the impact of any service and non-market performance vesting conditions (for example, profitability,
sales growth targets and remaining an employee of the entity over a specified time period)
Non-market performance and service conditions are included in assumptions about the number of options that
are expected to vest. The total expense is recognised over the vesting period (which is the period over which
all of the specified vesting conditions are to be satisfied).
At the end of each reporting period, the Group revises its estimates of the number of options that are expec-
ted to vest based on the non-market vesting conditions. It recognises the impact of the revision to original
estimates, if any, in the income statement, with a corresponding adjustment to equity.
When the options are exercised, the Company issues new shares. The proceeds received net of any directly
attributable transaction costs are credited to share capital (nominal value) and share premium.
The social security contributions payable in connection with the grant of the share options is considered an
integral part of the grant itself, and the charge will be treated as a cash-settled transaction.
2.22 Provisions
Provisions are recognised when the Company has a present obligation (legal or constructive) arising from a
past event, and it is probable (more likely than not) that it will result in an outflow from the entity of resources
embodying economic benefits, and that a reliable estimate can be made of the amount of the obligation.
Provisions are measured at the present value of the expenditures expected to be required to settle the obli-
gation using a pre-tax rate that reflects current market assessments of the time value of money and the risks
specific to the obligation. The increase in the provision due to passage of time is recognised as interest
expense.
2.22.1 Asset retirement obligations
Provisions reflect the estimated cost of decommissioning and removal of wells and production facilities used
for the production of hydrocarbons. Asset retirement obligations are measured at net present value of the
anticipated future cost (estimated based on current day costs inflated). The liability is calculated on the basis
of current removal requirements and is discounted to present value using a risk-free rate adjusted for credit
risk. Liabilities are recognised when they arise and are adjusted continually in accordance with changes in
requirements, price levels etc. When a decommissioning liability is recognised or the estimate changes, a cor-
responding amount is recorded to increase or decrease the related asset and is depreciated in line with the
asset. Increase in the provision as a result of the time value of money is recognised in the income statement
as a financial expense.

NotesNotes
70 Noreco Annual report 2013 Noreco Annual report 2013 71
2.23 Contingent liabilities and assets
Contingent liabilities are defined as:
– possible obligations that arise from past events, whose existence depends on uncertain future events.
– present obligations which have not been recognised because it is not probable that they will result in a
payment.
– the amount of the obligation cannot be measured with sufficient reliability.
Specific mention of material contingent liabilities is disclosed, with the exception of contingent liabilities where
the possibility of an outflow of resources embodying economic benefits is remote.
Contingent assets are not recognised in the financial statements, but are disclosed if there is a certain pro-
bability that a benefit will accrue to the Group.
2.24 Revenue recognition
Revenue from the production of oil, gas and NGL (hydrocarbons) is recognised depending on the Group’s share
of production in the separate licenses the Group is part of, independently of whether the produced oil and gas
has been sold (the entitlement method). Over/under lifting of hydrocarbons as a consequence of the entitle-
ment method is valued to estimated sale value minus estimated sales costs on the reporting date. Over/under
lifting occurs when the Group has lifted and sold more or less hydrocarbons from a producing field than what
the Group is entitled to at the lift time. See note 2.13 for description of accounting for over/under lifting of
hydrocarbons in the balance sheet.
2.25 Production cost
Production cost is costs that are directly attached to production of hydrocarbons, e.g. cost for operating and
maintaining production facilities and installations. Costs mainly consist of man-hours, insurance, processing
costs, environmental fees, transport costs etc.
2.26 Interest income
Interest income is recognised using the effective interest method. When a loan and receivable is impaired, the
Group reduces the carrying amount to its recoverable amount, being the estimated future cash flow discounted
at the original effective interest rate of the instrument, and continues unwinding the discount as interest income.
Interest income on impaired loan and receivables is recognised using the original effective interest rate.
2.27 Leases
Leases in which a significant portion of the risks and rewards of ownership are retained by the lessor are clas-
sified as operating leases. Payments made under operating leases (net of any incentives received from the
lessor) are charged to the income statement on a straight-line basis over the period of the lease.
2.28 Consolidated statement of cash flow
The consolidated statement of cash flow is prepared according to the indirect method. See note 2.12 for the
definition of “Cash and cash equivalents”.
2.29 Subsequent events
a) Generally about subsequent events
Events that take place between the end of the reporting period and the issuing of the quarterly or annual acco-
unts, will be considered if the event is of such a nature that it gives new information about items that were
present on the balance sheet date.
b) Treatment of information about dry/non-commercial wells after the end of the reporting period
The Group expenses recognised drilling costs related to a well if it becomes evident in the period after the
reporting period and leading up to the publication of the quarterly or annual report, that the on-going drilling
has not identified a commercial discovery.
The same principle applies if new information clarifies the commercial assessment related to a previously drilled
prospect, where the commerciality assessment was not completed at the completion of the drilling operation.
3 Financial risk management
3.1 Financial risk factors
The Group’s activities expose it to a variety of financial risks through the use of various types of financial instru-
ments. The Group uses bank loans and bonds to finance its operations and any investments in new busines-
ses. In connection with the day to day business, financial instruments, such as bank deposits, trade receiva-
bles and payables, and other short term liabilities which arise directly from its operations, are utilised. The
Group also enters into derivative transactions as options, swap agreements and forward contracts. The pur-
pose is to hedge the certain items in the balance sheet or cash flows.
The main financial risks arising from the Group’s activities are market, liquidity risk and credit risk.
Market risk
Market risk is the risk that the fair value of future cash flows of a financial instrument will fluctuate because
of changes in the market prices. Market risk comprises three types of risk: foreign currency risk, price risk and
interest rate risk. Financial instruments affected by market risk include loans and borrowings, deposits, trade
receivables, trade payables, accrued liabilities and derivative financial instruments.
(a) Foreign currency risk
The Group is composed of businesses with various functional currencies in USD, GBP and NOK. The Group is
exposed to foreign exchange risk for series of payments in other currencies than the functional currency,

Noreco Annual report 2013 73
NotesNotes
mainly related to the ratio between NOK and USD, DKK and USD, and GBP and NOK. The Group’s policy is to
hedge significant items in currencies other than its functional currency against exchange rate fluctuations. This
ensures that vital cash flow such as tax is hedged using forward exchange contracts. In addition, income in
other currency is continuously converted to functional currency. There were no outstanding foreign currency
derivatives at year end. The Group’s balance sheet includes also significant assets and liabilities which is
recorded in other currencies then the Group’s presentation currency. As such the Group’s equity is sensitive
to changes in foreign exchange rates, especially the rate between NOK and USD. See Note 16 Trade receiva-
bles and other receivables, Note 17 Restricted cash, bank deposits, cash and cash equivalents, Note 18
Derivative financial instruments, Note 23 Borrowings and Note 24 Trade payable and other current liabilities.
A decrease of the average exchange rate and the closing rate of USD, GBP and DKK with 5 percent would have
the following impact on income statement and equity:
NOK million USD GBP DKK
Revenue (45) 0 0
Total operating expenses 34 914
Net income for the year 37 214
Equity (118) (12) 14
With a similar increase of the exchange rates it would impact the figures equity with the opposite sign.
(b) Price risk
Price risk – The main risk the Company is exposed to, with regards to its incoming cash flow, is related to the develop-
ment of the oil and gas prices. The Group have for a little share of the future production entered into put options spe-
cifying a price floor for the pricing of a bulk of the Company’s oil production. The options entitle a right, but not an
obligation, to sell oil at a specified minimum price. If the market price of oil exceeds the strike price of the options,
which currently is USD 70, the options are not exercised and the Group sells at market price. Hedge accounting has
not been applied when accounting for the oil price derivatives; see Note 18 Derivative financial instruments.
In 2013 The Group realised an average oil price of USD 101.8 per barrel of oil equivalents. If the realised average
price had been 5 percent lower (USD 96.7), the revenue would have been reduced with NOK 45 million.
(c) Interest rate risk
Loans with floating interest rate represent an interest risk for the Group’s future cash flow. Loans with fixed
interest rate expose the Group to risk (premium/discount) associated with changes in the market interest rate.
The Group has a total of NOK 3 447 million (2012: NOK 3 712 million) in interest-bearing debt (nominal value),
of which NOK 945 million (2012: NOK 1 862 million) is short-term debt. Of the Group’s debt, NOK 3 102 mil-
lion (2012: NOK 1 825 million) are loans with a fixed interest rate. The remaining, NOK 345 million (2012: NOK
2 149 million), are loans with a floating interest rate. The exploration loan is the only loan with a floating inte-
rest at 31 December 2013. For further information about the Group’s interest-bearing debt, see Note 23.
The Group had also secured a fixed interest rate for the bond loans with a floating interest rate in 2012, see
specification regarding these interest swap agreements in Note 18 Derivative financial instruments.
All bank deposits (NOK 978 million) are at floating interest rates. See note 17 Restricted cash, bank deposits,
cash and cash equivalents for further information about bank deposits.
At the end of the reporting period and as a result of the refinancing process, all long term loans have a fixed
interest rate. As a consequence, the Group considers the risk exposure to changes in market interest to be
at an acceptable level.
During 2013 the interest expenses related to the exploration loan amounted to NOK 32 million including amor-
tisation of borrowing cost. The interest terms for the loan is 3 month NIBOR + a 2.5 percent margin. The
average NIBOR in 2013 were 1.70 percent, and an increase of 10 percent to 1.87 percent would increase the
interest expenses related to exploration loan with NOK 1 million.
Liquidity risk
Management of liquidity risk implies maintaining a sufficient buffer of cash and cash equivalents and the availability
of funding through overdraft and revolving credit facilities. The Group has a business model that includes active
management of its asset portfolio. This entails among other factors that The Group should be able to attend the
entire process from when the license is in the exploration phase to the delivery of a plan for development and ope-
rations with subsequent investments and production. The Group will simultaneously assess each license in order
to optimise the value for the Group either through divestment or continued participation in the license. During 2013,
the management has continued the work to align the Group’s debt maturity profile to the expected cash flows from
operations. The refinancing was completed during the fourth quarter 2013, and was a result of these efforts and
the developments in 2013 that did not turn out as expected at the beginning of the year.
The financial solidity and the Company’s cash position at 31 December 2013 was considered satisfactory in
regards of the planned activity level in 2014. However, the Company is highly dependent on production from
Huntington and the other fields during 2014 to be able to meet the future obligations.
The Company’s cash forecast indicates that liquidity will be sufficient in the next 12 months, but there is a
risk that headroom in regard of the covenant can be tight after the bond maturity in December 2014 given an
unchanged asset portfolio. The covenant implies that the group shall at all times have a minimum of NOK 100
million in free cash. The forecasts are based on a number of assumptions concerning future operating condi-
tions, market conditions and the timing of certain events. If the trend through 2014 differ negatively from fore-
casted development, it may be necessary for the Company to implement certain extraordinary measures to
ensure fulfilment of loan terms and ensure sufficient liquidity to meet current obligations and debt maturities.
The Group has two credit facilities which secure some degree of flexibility in the funding structure. This, along
with available liquidity, cash flow from operations and active portfolio management provides the basis for that
the Group has secured financing of the operations and further investments. See note 17 Restricted cash, bank
deposits, cash and cash equivalents Note 23 Borrowings and Note 29 Operating leases.
Credit risk
The Groups most significant credit risk arises principally from recognised receivables and insurance arrange-
ments related to the Group’s operation. The credit risk arising from the production of oil, gas and NGL is con-
sidered limited, as sales are to major oil companies with considerable financial resources. The counterparty
in derivatives and insurance related issues are large international banks and insurance companies whose
credit risk is considered low. The Group is entitled to a tax refund from the Norwegian tax authorities in accor-
dance with the Norwegian Petroleum Taxation Act relating to exploration expenditures on Norwegian exploration
licenses. The credit risk relating to the refund is considered low.
The maximum credit risk can be summarised as follows:
Maximum credit risk
(NOK million) Note 2013 2012
Non-current assets
Restricted cash 17,19 500 -
Total 500 -
Current assets
Tax refund 14 378 1 339
Derivatives 18,19 1 7
Trade receivables and other current receivables 16 551 564
Restricted cash 17,19 74 20
Bank deposits, cash and cash equivalents 17,19 403 584
Total 1 407 2 514
Maximum credit risk 1 907 2 514

NotesNotes
74 Noreco Annual report 2013 Noreco Annual report 2013 75
3.2 Capital risk management
The Group’s objectives when managing capital are to safeguard the Group’s ability to continue as a going con-
cern in order to provide returns for shareholders and benefits for other stakeholders and to maintain an opti-
mal capital structure to reduce the cost of capital.
The Group manages its capital structure in relation to the risk. The management of the capital structure invol-
ves active monitoring and making adjustments to the financing instruments in parallel with changes in econo-
mic conditions and the risk characteristics of the underlying assets. In order to maintain or adjust the capital
structure, the Group may refinance its debt, buy or issue new shares or debt instruments, or divest assets. No
changes were made in the objectives, policies or processes during the years ended 31 December 2012 and 31
December 2013.
The Group monitors the debt with the basis of cash flows, equity ratio and the gearing ratio.
See further information regarding borrowings and covenants in Note 23.
3.3 Fair value estimation
The Group has certain financial instruments carried at fair value. The different levels have been defined as follows:
Level 1: Quoted prices (unadjusted) in active markets for identical assets and liabilities
The fair value of financial instruments traded in active markets is based on quoted market prices at the balance
sheet date. A market is regarded as active if quoted prices are readily and regularly available from an exchange,
dealer, broker, industry group, pricing service, or regulatory agency, and those prices represent actual and regularly
occurring market transactions on an arm’s length basis.
Level 2: Inputs other than quoted prices included within level 1 that are observable for the assets or
liability, either directly or indirectly
The fair value of financial instruments that are not traded in an active market (for example, over-the-counter deriva-
tives) is determined by using valuation techniques. These valuation techniques maximise the use of observable
market data where it is available and rely as little as possible on entity specific estimates. If all significant inputs
required to fair value an instrument are observable, the instrument is included in level 2. If one or more of the sig-
nificant inputs is not based on observable market data, the instrument is included in Level 3.
Level 3: Inputs for other assets or liabilities that are not based on observable market data
Other techniques, such as discounted cash flow analysis, are used to determine fair value for the financial instru-
ments included in this level.
See Note 19 for fair value hierarchy and further information.
4 Critical accounting estimates and judgements
Estimates and judgements are continually evaluated and are based on historical experience and other factors,
including expectations of future events that are believed to be reasonable under the circumstances.
4.1 Critical accounting estimates and assumptions
The Group makes estimates and assumptions concerning the future. The resulting accounting estimates will, by
definition, rarely equal the related actual results. The estimates and assumptions that have a significant risk of
causing a material adjustment to the carrying amounts of assets and liabilities within the next financial year are
addressed below.
a) Estimated impairment of goodwill
Goodwill impairment tests are performed annually or more frequently if events or changes in circumstances indicate
a potential impairment in accordance with the accounting policy stated in note 2.6. The recoverable amounts of
cash-generating units have been determined based on value-in-use calculations. These calculations require the use
of estimates (Note 11). An impairment charge of NOK 350 million arose during 2013 (2012: NOK 118 million), dis-
tributed with NOK 218 million for the cash generating unit for UK, NOK 116 million for Denmark and NOK 17 million
for Norway. This resulted in the carrying amount for these countries being written down to its recoverable amount.
If the estimated oil price at 31 December 2013 was reduced by 5 percent this would cause a further impairment
of goodwill of NOK 76 million. If the applied discount rate after tax for these cash generating units was increased
by 1 percent (from 10 to 11 percent), this would cause a further impairment of goodwill of NOK 17 million.
b) Estimated recoverable amount on intangible assets
The Group’s intangible assets with an indefinite lifespan will be subject to annual impairment testing. The Group’s
activities are largely affected by changes in hydrocarbon prices and changes in currency rates for USD. A decline in
oil price will affect the Group’s cash flow significantly. Expectations for future oil price are also an important factor
when assessments are made regarding whether discoveries are financially viable. Further, the oil price also affects
the Company’s exploration activity.
c) Estimated recoverable amount on property, plant and equipment
The Group performs impairment testing on property, plant and equipment whenever events or changes in circums-
tances indicate that the carrying amount may not be recoverable, ref. Note 2.7. Recoverable amount from cash
generating units are determined through calculations of value-in-use. These calculations require the use of estima-
tes (Note 12). There was a net loss on impairment during 2013 of NOK 860 million (2012: NOK 303 million). This
caused the carrying value of certain assets to be written down to their recoverable amount. See information regar-
ding sensitivity related to the impairment test in note 12.
d) Estimated reserves and resources – accounting impact
Proven and probable reserves are used to calculate production volumes related to amortisation. Reserve estimates
are also used for testing of license-related assets for write down. Changes to reserve estimates can, for instance,
be caused by changes to price and cost estimates. Changes in production profile can occur as a result of new
information about the reservoir. Future changes in proven and probable oil and gas reserves can have a significant
impact on amortisation, timing of decommissioning, including testing license-related assets for write down. This can
have a significant negative or positive impact on the operating result as a consequence of increased or reduced
amortisation, or reversal of previously recognised write down.
NotesNotes
76 Noreco Annual report 2013 Noreco Annual report 2013 77
e) Estimated value of financial assets
For every reporting date, an assessment is made on whether objective evidence is present that financial assets or
groups of financial assets should be written down . The Group, in conjunction with its partners, has an insurance
claim where the expected settlement is estimated in connection with the impairment test in accordance to IAS 39.
f) Income tax
All figures reported in the income statement and balance sheet are based on The Group’s tax calculations, and
should be regarded as estimates until the tax for the year has been settled. Norwegian tax authorities can be of a
different opinion than the Company with regards to what constitutes exploration cost and continental shelf defici-
ency in accordance with the Petroleum Taxation Act. See also Note 14.
g) Asset retirement obligation
Production of oil and gas is subject to statutory requirements relating to decommissioning and removal obligation
once production has ceased. Provisions to cover these future decommissioning and removal expenditures must be
recognised at the time the statutory requirement arises. The costs will often incur some time in the future, and
there is significant uncertainty attached to the scale and complexity of the decommissioning and removal involved.
Estimated future costs (estimated based on current costs inflated) are based on known decommissioning and
removal technology, expected future price levels, and the expected future decommissioning and removal date, dis-
counted to net present value using a risk-free rate adjusted for credit risk. Changes in one or more of these factors
could result in major changes in the decommissioning and removal liabilities.
4.2 Critical judgements in applying the entity’s
accounting policies
a) Assessment of progress and possible development alternatives for the Company’s non-developed assets.
When performing impairment tests of intangible assets, progress is assessed in accordance with the policy stated
in Note 2.6. This determination requires judgement. The Group’s intention and plans are stated as basis, so far as
there is no information indicating that the majority of partners in the licenses will not be able to support The Group’s
intentions and plans.
b) Impairment testing of financial assets (short-term receivable)
The Group follows the guidance of IAS 39 to determine impairment of receivables recognised in accordance with
amortised cost. This determination requires significant judgement. The Group has a receivable due from the
company’s insurance companies, and the judgement used as basis for the Company’s impairment test include a
number of technical and legally complex conditions. See Note 16 for further information.
c) Method for valuation of intangible assets
In relation to impairment testing of intangible assets, different valuation methods, adjusted to the available informa-
tion available for the different assets, are used. A significant degree of judgement is used to determine the appro-
priate method, which is dependant on maturity, geographical location, available budgets, taxation regulations etc.
Changes in methods will in certain cases have a significant impact on the valuation used as basis for the Company’s
recorded values.
d) Resource and reserve estimates
Estimates of oil and gas reserves are prepared by internal experts in line with industry standards. The estimates
are based both on The Group’s judgement assessments and information from the operators. In addition, the most
significant volumes are verified by an independent third party. Proven and probable oil and gas reserves include the
estimated amounts of crude oil, natural gas and condensates that geological and technical data reasonably deter-
mine to be extractable from known reservoirs and under existing financial and operational conditions per the date
the estimate is prepared.
5 Segment information
The Group’s activities are entirely related to exploration and development of oil, gas and NGL. The Group’s
activities are considered to have a homogenous risk and rate of return before tax and are therefore considered
as one operating segment, see note 2 Significant Accounting Policies.
Noreco has activities in Norway, Denmark and UK. See note 2.3 for additional information on segment reporting.
Assets and liabilities are reflecting balance sheet items for the Group entities in their respective countries.
Excess value is allocated to the units expected to gain advantages by the acquisition. Investments in subsi-
diaries, loans, receivables and payables between the companies are included in segment assets and liabili-
ties. These are eliminated in the consolidated balance sheet.
GEOGRAPHICAL INFORMATION 2013
(NOK million) Norway Denmark UK
Inter-
company Group
Condensed Income statement
Total revenue 106 384 404 - 894
Total operating expenses (490) (536) (308) - (1 333)
Depreciations (30) (102) (187) -(319)
Write-downs and reversal of write-downs (393) (600) (218) -(1 211)
Net operating result (807) (854) (308) -(1 969)
Net financial items 80 (8) (57) -15
Result before tax (728) (862) (365) -(1 954)
Income tax benefit 592 186 169 -947
Net result for the period (135) (676) (196) -(1 008)
Condensed statement of financial position
License and capitalised exploration expenses 148 18 577 -743
Goodwill (0) 43 131 - 174
Property, plant and equipment 382 299 2 405 -3 087
Other assets 1 696 1 324 529 (1 347) 2 201
Total assets 2 226 1 685 3 642 (1 347) 6 205
Total liabilities 2 930 914 1 958 (1 347) 4 455
Capital expenditure
Capital expenditures production facilities 114 (0) -14
Capital expenditures asset under construction - - 36 -36
Capital expenditures explorations and evaluations 293 16 103 -412
Total capital expenditure 293 29 139 -461
NotesNotes
78 Noreco Annual report 2013 Noreco Annual report 2013 79
GEOGRAPHICAL INFORMATION 2012
(NOK million) Norway Denmark UK
Inter-
company Group
Condensed Income statement
Total revenue 116 715 - - 832
Total operating expenses (1 030) (406) (213) - (1 649)
Depreciations (40) (229) - - (269)
Write-downs and reversal of write-downs (338) -(83) -(421)
Net operating result (1 292) 80 (296) -(1 508)
Net financial items (383) (45) (62) 4(486)
Result before tax (1 675) 35 (358) 4(1 994)
Income tax benefit 1 083 (10) 328 -1 401
Net result for the period (592) 25 (30) 4(593)
Condensed statement of financial position
License and capitalised exploration expenses 27 240 552 -819
Goodwill 17 154 326 -497
Property, plant and equipment 821 912 2 259 -3 991
Other assets 2 278 1 628 430 (1 717) 2 619
Total assets 3 143 2 933 3 566 (1 717) 7 926
Total liabilities 3 743 1 594 2 275 (1 715) 5 898
Capital expenditure
Capital expenditures production facilities 111 20 - - 131
Capital expenditures asset under construction 101 -254 -355
Capital expenditures explorations and evaluations 524 66 59 -649
Total capital expenditure 736 86 314 -1 136
6 Revenue
(NOK million) 2013 2012
Sale of oil 828 799
Sale of gas and NGL 65 33
Total revenue 894 832
Revenue by customer 2013 2012
Shell 51.2 % 86.6 %
BP 15.4 % 11.4 %
Exxon 13.3 % 0.0 %
Other - each less than 10 % 20.1 % 2.0 %
Total 100.0 % 100.0 %
7 Exploration and evaluation expenses
(NOK million) 2013 2012
Acquisition of seismic data, analysis and general G&G costs (95) (113)
Exploration wells capitalised in previous years (311) (416)
Dry exploration wells this period (244) (579)
Other exploration and evaluation costs (15) (80)
Total exploration and evaluation costs (666) (1 188)
8 Personell expenses and remuneration
Personell expenses consist of the following:
(NOK million) 2013 2012
Salaries (107) (120)
Social security tax (15) (16)
Pensions costs (note 21) (4) (14)
Costs relating to share-based payments (note 25) (13) (11)
Other personell expenses (3) (3)
Personnel expenses charged to operated licenses 15 30
Total personell expenses (127) (134)
Average number of man-years 2013 2012
Norway 54 61
Denmark 11 12
Total 65 75
NotesNotes
80 Noreco Annual report 2013 Noreco Annual report 2013 81
(NOK 1 000)
Senior executives
Svein Arild Killingland (6)
CEO
-1 972 -121 416 2 509 -1 500 000
Einar Gjelsvik (7)
CEO
-2 173 1 815 136 527 4 651 - -
Ørjan Gjerde
CFO
-2 211 111 147 259 2 728 514 867 1 000 000
Lars Fosvold
VP, Exploration
-1 991 171 206 930 3 298 291 169 766 536 2 000 000
John Bogen (8)
COO, VP Dev. & Production
-1 896 163 209 902 3 170 135 941 656 571
Kjetil Bakken (9)
VP, Strategy & Investor Relations
-1 792 340 147 223 2 502 - -
Øyvind Sørbø (10)
VP, Commercial
-1 704 164 178 494 2 540 193 483 337 007 1 160 570
Board of directors
Ståle Kyllingstad (11)
Chairman of the Board
302 - - - - 302 1 029 470 893 -
Ole Melberg
Deputy chairman
51 - - - - 51 260 048 -
Eimund Nygaard (12)
Board member
201 - - - - 201 27 701 514 -
Shona Grant
Board member
45 - - - - 45 20 000 -
Mona Iren Kolnes
Board member
45 - - - - 45 30 000 -
Arnstein Wigestrand
Board member
90 - - - - 90 87 027 -
Hilde Drønen
Board member 402
- - - - 402 40 000 -
Erik Henriksen
Board member 168
- - - - 168 1 515 354 828 -21 000 000
Ingrid Marika Svärdström
Board member 168
- - - - 168 - -
Bård Arve Lærum
Board member
employee elected
151
1 482 117 170 327 2 247 119 167 305 215 800 000
Hilde Alexandersen
Board member
employee elected
151
1 402 120 182 318 2 173 116 301 288 639 850 000
Total compensation 2013
1 774 16 623 3 001 1 495 4 396 27 289 2 574 115 371
2 868 835
28 310 570
Total compensation 2012
2 235 17 094 3 450 1 636 1 417 25 832
Director’s fees
Bonus
Remuneration
Pension
(1)
Other remuneration
(2)
Total compensation
(4) Number of options
(3) Number of shares
(5) Shares purchased in 2014
Compensation to key management for 2013 (1) Other remuneration include pension exceeding 12G, telephone, broadband and other minor remunera-
tions
(2) All figures stated regarding salary and other compensation based on full year 2013. Not just part of the
year that person held a position with reporting requirement
(3) The number of shares owned by key management is allocated between private shareholding and share-
holding through companies controlled by key management. Number of shares owned as of 31 December
2013
(4) The number of options includes bonus shares according to the Company’s incentive arrangement
(5) On 21 January 2014 the repair share issue related to the refinancing in the fourth quarter 2013 was paid
out to the Company (ref. note 32). On the repair key management received shares. In addtion to the sha-
res listed in the table the employee elected deputies were allocated the following shares:
Kenneth Brix received 40 302 shares and holds 47 021 shares after the allocation
Liselotte Vibeke Kiørboe received 268 842 shares and holds 313 662 shares after the allocation
Anne Hellvik Kvadsheim received 492 713 shares and holds 492 713 shares after the allocation
Erik Borg received 158 853 shares and holds 197 972 shares after the allocation
(6) Svein Arild Killingland was appointed CEO from 13 May 2013 replacing Einar Gjelsvik
(7) Total compensation for Einar Gjelsvik includes NOK 3.2 million in redundancy payments
(8) John Bogen left the Company on 31 January 2014
(9) Kjetil Bakken left the Company on 31 January 2014
(10) Øyvind Sørbø was appointed VP Commercial from 15 October 2013
(11) Ståle Kyllingstad own shares through the company IKM Industri-Invest AS
(12) Eimund Nygaard is CEO in Lyse Energi AS which is the owner of the shares
The arrangement is applicable if the Company enters into a merger or an acquisition and the person concerned
has to resign from his/her position.
The Company has not issued any loans or acted as a guarantor for directors or management.
Director’s fees
The annual remuneration to board members is decided on by the Shareholder’s Meeting. Current benefits are;
The Chairman of the Board receives an annual remuneration of NOK 300 000 The other shareholder elected
members of the board receive NOK 400 000 (non local) and NOK 200 000 (local). The remuneration is paid
quarterly. None of the Board’s members have entered into any agreement to provide services to the Company
except for services following their duty as Board members.
The Board is not part of the Group’s option program.
Employee elected board representatives receive an annual remuneration of NOK 150 000. Deputy board mem-
bers receive remuneration of NOK 5 000 per meeting they attend. The remuneration is paid quarterly.
In addition to the above, Board members are reimbursed for travel expenses and other expenses in connection
with company related activities.

NotesNotes
82 Noreco Annual report 2013 Noreco Annual report 2013 83
Board of Directors’ Statement on Remuneration to the CEO and the Executive Officers
In accordance with §6-16a of the Norwegian Public Limited Liability Companies Act, the Board of Directors of
Norwegian Energy Company ASA (“Noreco” or the “Company”) has prepared a statement related to the deter-
mination of salary and other benefits for the CEO and other executive officers. The guidelines set out below
for the CEO and other executive officers’ salary and other benefits, for the coming fiscal year, will be presented
to the shareholders for their advisory vote at the Annual General Meeting 25 April 2014.
Noreco is a Norwegian E&P company, and its activities are focused in the North Sea area (mainly Norway,
Denmark and United Kingdom). Noreco’s employment base is international. The total compensation package
for the CEO and other executive officers shall therefore be competitive both within the Norwegian labour market
and internationally. Both the level of total compensation and the structure of the compensation package for
the CEO and other executive officers shall be such that it may attract and retain highly qualified international
managers. This will require the use of several different instruments and measures also meant to provide incen-
tives for enhanced performance and to ensure common goals and interest between the shareholders and
management.
The current remuneration package for the CEO and other executive officers includes fixed elements and varia-
ble elements. The fixed elements consist of a base salary and other benefits. Other benefits include free
mobile phone and similar benefits. The fixed elements also include life, accident and sickness insurance in
accordance with normal practice in the oil industry and a pension plan for all the employees, including the
executive officers and the CEO.
The variable elements consist of an annual bonus scheme, a deferred bonus and participation in a share
option program.
The level of the cash bonus is determined by the Board based on the Company’s performance. The cash bonus
will as a principle be limited to a maximum payment of 40 % of the base salary, but can be deviated from
under extraordinary circumstances. The CEO can receive a cash bonus of maximum 100% of the base salary.
The employees, including the executive officers and the CEO, will have the opportunity to purchase Noreco
shares equal to a maximum of 50 % of the bonus (pre tax) at the time of the bonus payment (deferred bonus).
Employees, who retain such shares for two years and are still employed by Noreco at that time, will be eligible
for an award of additional matching shares on a one-for-one basis.
The CEO has an employment agreement under which he is entitled to receive a severance payment equal to
12 months’ base salary in addition to salary in the termination period if the employment is terminated.
Other members of the group management have an arrangement of 12 months’ severance payment after ter-
mination of employment if the Company is de-listed, enters into a merger or an acquisition and the person
concerned is not offered an equivalent position in the new company.
The Annual General Meeting of shareholders held on 8 May 2013 resolved that the Board of Directors was
authorised to increase share capital by up to NOK 21.7 million by one or several issues of up to a total of 7
million shares each with a nominal value of NOK 3.10. This authorisation could only be used for issuing new
shares in relation to employee incentive schemes existing at any time for employees in the Group. The man-
date expires on 1 June 2014. The mandate has been utilised once, when 2 391 002 shares were issued in
February 2014 as part of the bonus scheme. The remaining mandate is 4 608 998 shares.
In 2014, the Board has at the date of this annual report decided to maintain the current share options pro-
gram, which has a maximum allocation limit of 40% of base salary for all employees, 80% for management
team members and 100% for the CEO. The board has for 2014 granted all employees the maximum number
of share options in accordance with the program as previously approved, contingent on approval by the General
Meeting in 2014. The strike price for these options will be determined by applying the volume weighed average
trading price for the week prior to the General meeting 2014. Full allocation according to this program will
result in issue of approx. 156 million options (based on an estimated strike price of 0.19). This represents a
dilution of 2.75% for existing shareholders, provided no issuance of shares in the mean-time. The Board pro-
poses that the options program continues on the same principles as applied and described above. The options
arrangement provide for cash settlement in the event of inability to settle with issuance of new shares.
Other variable elements of remuneration may be used or other special supplementary payment may be awar-
ded than those mentioned above if this is considered appropriate in order to attract and/or retain a manager.
There have been no deviations from the guidelines described above in 2013.
Remuneration of the CEO and other executive officers will be evaluated regularly by the Remuneration and
Corporate Governance Committee and the Board of Directors to ensure that salaries and other benefits are
kept, at all times, within the above guidelines and principles.
NotesNotes
84 Noreco Annual report 2013 Noreco Annual report 2013 85
(1) Other remuneration include pension exceeding 12G, telephone, broadband and other minor remunera-
tions
(2) The number of options includes bonus shares according to the Company’s incentive arrangement.
Awarded options in 2013 are included.
(3) Ørjan Gjerde CFO joined 1st of March 2012. Erik Borg hold the Acting CFO position from 1 January 2012
until March 2012
(4) John Bogen was appointed COO & VP HSE from the 16 of January 2013 replacing Ellen S. Brattland
(5) From 16 of January 2013 the Investor Relations function was no longer part of the executive management
team.
(6) Lotte Kiørboe was an employee elected board representative until October 2012
(7) Hilde Alexandersen replaced Lotte Kiørboe as employee elected board representative from October
2012
(8) The number of shares owned by key management is allocated between private shareholding and share-
holding through companies controlled by key management. Number of shares owned as of 31 December
2012
(9) Ståle Kyllingstad own shares through the company IKM Industri-Invest AS
(10) Eimund Nygaard is CEO in Lyse Energi AS which is the owner of the shares
(11) All figures stated regarding salary and other compensation based on full year 2012. Not only part of the
year that person held a position with reporting requirement
Compensation to key management for 2012
(NOK 1 000)
Senior executives
Einar Gjelsvik
CEO
-2 715 575 159 455 3 904 204 459 1 371 041 53 072
Ørjan Gjerde (3)
CFO
-1 366 261 113 187 1 928 109 181 528 351 13 484
Erik Borg (11)
Deputy CFO
-1 354 263 150 248 2 016 23 445 330 957 15 674
Ellen S. Bratland (4)
COO, VP Dev. & Production
-1 982 416 203 40 2 640 88 579 353 579 118 832
Lars Fosvold
VP, Exploration
-1 955 418 224 36 2 633 129 794 792 255 161 375
John Bogen (4)
VP, Commercial
-1 845 398 192 41 2 475 115 219 673 904 120 722
Kjetil Bakken (5)
VP, Strategy & Investor Relations
-1 780 346 135 222 2 483 101 624 441 943 19 245
Board of directors
Ståle Kyllingstad (9)
Chairman of the Board
300 - - - - 300 34 484 809 -4 566 424
Ole Melberg
Deputy chairman
225 - - - - 225 260 048 -
Eimund Nygaard (10)
Board member
200 - - - - 200 27 701 514 -
Shona Grant
Board member
200 - - - - 200 20 000 -
Mona Iren Kolnes
Board member
200 - - - - 200 30 000 -
Arnstein Wigestrand
Board member
400 - - - - 400 87 027 -
Hilde Drønen
Board member 400
- - - - 400 40 000 -
Lotte Kiørboe (6)
Board member
employee elected 135
1 241 186 138 123 1 823 29 679 282 977 15 141
Bård Arve Lærum
Board member
employee elected 150
1 465 297 155 31 2 098 69 769 326 758 49 398
Hilde Alexandersen (7)
Board member
employee elected 25
1 391 290 167 34 1 907 62 881 313 977 53 420
Total compensation 2012
2 235 17 094 3 450 1 636 1 417 25 832 63 558 028
5 415 742
5 187 417
Director’s fees
Bonus
Remuneration
Pension
(1)
Other remuneration
(11)
Total compensation
(2) Number of options
(8) Number of shares
Shares purchased in 2013
NotesNotes
86 Noreco Annual report 2013 Noreco Annual report 2013 87
9 Other operating expenses
Specification of other operating expenses
(NOK million) 2013 2012
Lease expenses (11) (13)
IT expenses (27) (27)
Travel expenses (5) (6)
General and administrative costs (5) (6)
Consultant fees (49) (73)
Other operating expenses (2) (3)
Other operating expenses charged to own operated licenses 513
Total other operating expenses (95) (114)
Auditor’s fees (ex. VAT)
(NOK million) 2013 2012
Auditor's fees (2) (2)
Other assurance service (0) (1)
Other non-audit assistance (2) (2)
Total audit fees (5) (5)
10 Other (losses) / gains
(NOK million) 2013 2012
Change in value, put options (11) (23)
Loss on discontinued cash flow hedge (ref note 18,19.2) (4) -
Gain /(loss) on sale of assets (0) 54
Total other (losses) / gains (15) 32
(Loss) / gain per divestment Accounting date 2013 2012
Rau 22.05.12 -23
Romeo (farm-out) 31.12.12 -32
Total - 54
All figures are stated before tax effects associated with the divestments.
11 Intangible fixed assets
Intangible fixed assets on 31 December 2013
(NOK milion)
License and capitalised
exploration expenses Goodwill Total
Acquisition costs 31 December 2012 944 947 1 891
Presentation adjustment (126) -(126)
Aquisition costs 1 December 2013 819 947 1 766
Additions 412 -412
Expensed exploration expenditures previously
capitalised (556) -(556)
Currency translation adjustment 68 78 146
Acquisition costs 31 December 2013 743 1 025 1 768
Accumulated depreciation and write-downs
Acquisition costs 31 December 2012 126 451 576
Presentation adjustment (126) -(126)
Accumulated depreciation and write-downs
1 December 2013
-451 451
Depreciations ---
Write-downs -350 350
Currency translation adjustment -51 51
Accumulated depreciation and write-downs
31 December 2013 - 852 852
Book value 31 December 2013 743 174 917
Intangible fixed assets on 31 December 2012
(NOK milion)
License and capitalised
exploration expenses Goodwill Total
Acquisition costs 1 December 2012 1 376 1 012 2 387
Additions 649 -649
Expensed exploration expenditures previously
capitalised
(995) -(995)
Disposals (11) -(11)
Currency translation adjustment (74) (64) (138)
Acquisition costs 31 December 2012 944 947 1 892
Accumulated depreciation and write-downs
Accumulated depreciation and write-downs
1 January 1012
126 355 481
Write-downs -118 118
Currency translation adjustment -(23) (23)
Accumulated depreciation and write-downs
31 December 2012 126 451 576
Book value 31 December 2012 819 497 1 316

NotesNotes
88 Noreco Annual report 2013 Noreco Annual report 2013 89
Goodwill is allocated to the Group’s cash-generating units identified in connection with the acquisitions the
goodwill relates to. Goodwill is allocated to three cash generating units: Norway, Denmark and United Kingdom.
In connection with the impairment test of goodwill, only assets with background from the Altinex acquisition in
2007 are included
Overview of Goodwill per cash generating unit
(NOK million) Currency Exchange rate
Cost price in
local currency
Date of
acquiring
Book value
as of 31.12
Altinex Norway NOK 1.00 232 01.07.07 (0)
Altinex UK USD 6.08 120 01.07.07 131
Altinex Denmark USD 6.08 42 01.07.07 43
Total goodwill (NOK) 174
Impairment test of intangible assets
In accordance with the Group’s accounting policies, an impairment test for the Group’s goodwill and capitalised
exploration expenses has been carried out at 31.12.2013. The impairment tests are carried out by the company
and are based on expected cash flows from relevant reserves and resources (value-in-use). For licenses which
still are considered to be in an exploration phase, an average price multiple based on several analyst estimates,
or average multiple of observed market transactions has been applied (fair value less costs of disposal).
The impairment calculations are based on the following assumptions:
2013 2012
Discount rate (after tax) 10.0 percent 9.0 percent
Inflation 2.0 percent 2.0 percent
Cash flow After tax After tax
Prognosis period (1) Estimated life time of the oil field Estimated life time of the oil field
Reserves/resources (2) I
nternal estimated resources and
reserves as of 31 December 2013
I
nternal estimated resources and
reserves as of 31 December 2012
Oil price (3)
Forward curve for oil price for the
period 2014-2016. From 2017 the
oil price is adjusted for inflation.
Forward curve for oil price for the
period 2013-2019. From 2020 the
oil price is adjusted for inflation.
Currency rates
Average forward-rate for the period
2014-2017. From 2018 the eve-
rage rate for 2017 is used.
Average forward-rate for the period
2013-2016. From 2017 the eve-
rage rate for 2016 is used.
(1) In estimating the recoverable amount for fields, an estimation period corresponding to the lifetime of the
individual field is used. This is because the production profiles, investment costs, abandonment provisions,
and timing for abandonment significantly affect the value of future cash flows and can be reasonably esti-
mated over the total lifetime of the oil fields.
(2) As a basic rule the Company’s own resource estimates are applied for impairment testing. Reserves for
the producing fields are annually verified by an independent party. For the resources applied for impairment
testing of intangible assets the company performs an assessment to identify any deviations from resource
estimates from the partners in the licenses. If any deviations are identified, an estimate which place greater
emphasis on information from other partners and other external sources are applied.
(3) Forward curve for Brent blend from accessible market data is applied for forecasting of expected revenue
from sale of oil. Gas, NGL, and condensate prices are derived using the oil price based on expected correla-
tion. Revenue for each field is adjusted for the quality of the product. For fields that Noreco have contractual
price, such prices are applied when calculating the future cash flows.
Result from impairment test of goodwill on 31 December 2013
Goodwill associated with the business in Norway, included in the Group in connection with the acquisition of Altinex
ASA in 2007 was written down to zero in 2013. The Lupin prospect in PL360 was the last asset from the acquisition
that defended the goodwill in Norway. The well was drilled in Q1 2013 and resulted in a dry well. There are other
possible prospects in the PL360 license, but the Group has considered it appropriate to write-down the remaining
goodwill for the Norwegian Altinex business, which amounted to NOK 17 million on 31 December 2012.
Goodwill associated with the business in Denmark is written down by NOK 116 million. The write-down is due to
challenges with the Siri-platform which the Cecilie and Nini field are tied into and changes in estimates for future
operating expenditures related to the Danish production. The remaining goodwill associated with the business in
Denmark amounts to NOK 43 million on 31 December 2013.
Goodwill associated with the business in United Kingdom is written down by NOK 218 million during 2013. The
write-down is due to updated expectations for the Huntington regularity, production and operating expenditures for
the next years, and the fact that the valuation of the Huntington-license is impacted by a reduced value on Fulmar
due to updated information regarding the market value of comparable non-developed discoveries on the British
continental shelf. The remaining goodwill associated with the business in the United Kingdom amounts to NOK 131
million on 31 December 2013.
Result from impairment test of License and capitalised exploration expenses as of 31 December 2013
During the year a number of impairment tests of the intangible assets have been performed. Based on consi-
deration of progress, new information from evaluation work, relinquishment of licenses, and other commerciality
analyses regarding Noreco’s suspended wells, it has been concluded that the Amalie discovery in Denmark is
amortised/written off in 2013. Recent technical work by the operator and Noreco on the discovery has shown
that there is basis for increasing the volume estimates; however, the operator has decided that they will not
pursue a development of this discovery. The write-off of Amalie contributes with extra exploration expense which
amounted to NOK 255 million pre tax and NOK 191 million post tax.
License P1650 with the Crazy Horse-prospect in United Kingdom has been relinquished after Noreco has decided
not to drill the well. Capitalised expenditures related to drilling preparations were written off during 2013 and
amounted to NOK 16 million pre tax and NOK 6 million post tax.
The other expensed capitalised exploration costs in 2013 are related to exploration wells which were drilled in
2013 and concluded to be dry, and some expenses related to wells drilled in previous years where the final
expenditures have been changed due to license audits etc. The main items relate to PL360 Lupin (NOK 50 million
pre tax and NOK 11 million post tax) and PL453 Ogna (NOK 96 million pre tax and NOK 21 million post tax) in
Norway, and P1658 Scotney (NOK 120 million pre tax and NOK 46 million post tax) in the United Kingdom. Other
expenses amounted to NOK 18 million pre tax.
In total these expenses amount to NOK 556 million pre tax (NOK 378 million post tax). They are presented as
exploration expenses in the statement of comprehensive income (tax impact is included in the line items for
income tax benefit).
The remaining assets with capitalised exploration and evaluation expenditures have a recoverable amount that
exceeds the book value at the level that the assets are tested for impairment. The main assets are P1114
Huntington Fulmar (NOK 576 million) and PL492 Gohta (NOK 134 million).
NotesNotes
90 Noreco Annual report 2013 Noreco Annual report 2013 91
Huntington Fulmar is included in a combined cash generating unit for the Huntington license which also includes
the producing field Huntington Forties when performing the impairment test.
See further information in note 2.6. b), 2.7 and 4.2 a) regarding the Group’s accounting principles for these
assets, and description of the judgmental assessments that is required.
Sensitivities related to the impairment test
Goodwill
The impairment tests performed during 2013 showed that the carrying amount of goodwill exceeded the
recoverable amount for Norway, Denmark and UK. After the impairments, the book value of UK goodwill at 31
December 2013 is equal to the recoverable amount for the UK cash generating unit. The book value of Danish
goodwill at 31 December 2013 is below the recoverable amount. The headroom in the Danish cash-generating
unit for impairment test of goodwill amounts to NOK 19 million at 31 December 2013.
The most sensitive assumptions used in the calculations are the resource and reserve estimates, regularity
for the Group’s producing fields, discount rate, foreign exchange rates and oil price. A negative change in the
oil price with 5 percent will impact the recoverable amount for the Group’s total goodwill by NOK 76 million. An
increase of the discount rate to 11 percent will impact the recoverable amount for the Group’s total goodwill
by NOK 17 million. A 10 percent negative change in the expected regularity for the Group’s producing fields will
impact the recoverable amount for the Group’s total goodwill by NOK 80 million. Sensitivity for the resource and
reserve assumptions and foreign exchange rates is approximately the same as the sensitivity for change in oil
price. If all negative effects should be applicable at the same time, the maximum exposure for goodwill write-down
is equal to the book value of the goodwill amounting to NOK 174 million.
Licenses and capitalised exploration expenditures
Related to the impairment test of the assets classified as Licenses and capitalised exploration expenditures,
the most sensitive assumption is the assessment of commerciality. During 2014 an appraisal well with a new
target in the Gohta discovery is expected to clarify if the size of the discovery exceeds commercial thresholds.
If the results from the well show that the discovery will not be economically viable, the capitalised expenditures
incurred during 2013 must be written off. These expenditures amount to NOK 134 million pre tax and NOK 29
million post tax.
The company’s plan and intention is to develop the Jurassic discovery in the Huntington-license on the British
continental shelf (Huntington Fulmar). There is currently an ongoing project in the partnership which is evaluating
all alternative development solutions of the discovery. In a potential scenario where the partnership concludes
not to continue the work with a development, it will require a write-off of the book value which amounts to
NOK 576 million pre tax and NOK 240 million post tax. The amount is based on the foreign exchange rate at
31 December 2013.
12 Property, plant and equipment
Property, plant and equipment on 31 December 2013
Asset under
construction
Production
facilities
Office
equipment
and fixtures Total
(NOK million)
Acquisition costs 31 December 2 257 2 633 44 893
Presentation adjustment -251 -251
Acquisition costs 1 January 2013 2 257 2 884 45 144
Additions 36 14 -49
Capitalised interest ----
Transferred from Asset Under Construction
to Production Facilities (2 448) 2 448 - -
Revaluation abandonment assets 46 (91) -(45)
Disposal - - - -
Currency translation adjustment 109 260 0369
Acquisition costs 31 December 2013 - 5 514 4 5 518
Accumulated depreciation
Accumulated depreciation and write-
downs 31 December 2012 - 899 4902
Presentation adjustment - 251 -251
Accumulated depreciation and write-
downs 1 Januar 2013 - 1 150 41 153
Depreciation - 319 -319
Disposals - ---
Write-downs - 917 - 917
Reversal of write-downs - (57) (57)
Currency translation adjustment - 98 099
Accumulated depreciation and write-
downs 31 December 2013
- 2 427 4 2 431
Book value 31 December 2013 - 3 087 0 3 087
Economic life N/A N/A 3–5 years
Depreciation plan N/A UoP Straight line

NotesNotes
92 Noreco Annual report 2013 Noreco Annual report 2013 93
Property, plant and equipment on 31 December 2012
Asset under
construction
Production
facilities
Office
equipment
and fixtures Total
(NOK million)
Acquisition costs 1 January 2012 3 053 1 607 84 668
Additions 355 131 -486
Capitalised interest 11 - - 11
Transferred from Asset Under Construction
to Production Facilities (976) 976 - -
Revaluation abandonment assets -12 -12
Disposal - - (4) (4)
Currency translation adjustment (186) (94) -(280)
Acquisition costs 31 December 2012 2 257 2 632 4 4 893
Accumulated depreciation
Accumulated depreciation and write-
downs 1 January 2012 - 363 8371
Depreciation - 269 -269
Disposals - -(4) (4)
Write-downs - 303 - 303
Currency translation adjustment - (37) -(37)
Accumulated depreciation and write-
downs 31 December 2012
- 898 4 902
Book value 31 December 2012 2 257 1 734 - 3 991
Economic life N/A N/A 3–5 years
Depreciation plan N/A UoP Straight line
Impairment test of property, plant and equipment
The impairment tests are carried out by the company and are based on expected cash flows from the Group’s
producing fields (Value-in-use).
Main assumptions applied for the impairment test on 31 December
2013 2012
Discount rate (after tax) 10.0 percent 9.0 percent
Inflation 2.0 percent 2.0 percent
Cash flow After tax After tax
Prognosis period (1)
Estimated life time of the oil/gas field Estimated life time of the oil/gas field
Reserves/resources (2) Internal estimated reserves as of
31 December 2013
Internal estimated reserves as of
31 December 2012
Oil price (3)
Forward curve for oil price for the
period 2014-2016. From 2017 the
oil price is adjusted for inflation.
Forward curve for oil price for the
period 2013-2019. From 2020 the
oil price is adjusted for inflation.
Currency rates
Average forward-rate for the period
2014-2017. From 2018 the eve-
rage rate for 2017 is used.
Average forward-rate for the period
2013-2016. From 2017 the eve-
rage rate for 2016 is used.
(1) In estimating the recoverable amount for fields, an estimation period corresponding to the lifetime of the
individual field is used. This is because the production profiles and investment costs significantly affect the
value of future cash flows and can be reasonably estimated over the total lifetime of the oil fields.
(2) The Company’s reserve estimates are applied for impairment testing. The reserves are annually verified by
an independent party. See further information in note 31.
(3) Forward curve for Brent blend from accessible market data is applied for forecasting of expected revenue from
sale of oil. Gas, NGL, and condensate prices are derived using the oil price based on historical correlation.
Revenue for each field is adjusted for the quality of the product. For some fields, Noreco has entered into
fixed price agreements, and such prices are applied for those fields when calculating the future cash flows.
Result from impairment test as of 31 December 2013
The Oselvar field in Norway has not delivered as expected since it came on stream in the second quarter 2012.
In the license-partnership, work with rebuilding a reservoir model to assess what can be done to improve the
production from the field has been conducted. Based on this new work, the operator communicated an updated
reserve estimate, which was significantly lower than the previous estimate. Noreco has applied this estimate for
the assessment of the reserves that are applied for impairment testing purposes. Due to this, write-downs of total
NOK 388 million pre tax (NOK 104 million post tax) have been charged to the income statement during 2013.
For the Norwegian field Enoch, previously recognised write-downs of NOK 12 million pre tax (NOK 3 million post tax)
have been reversed. The reversal is related to the fact that expenditures that in previous impairment tests were
included in the future cash flows are now paid in connection with conducted work on the field at the end of 2013.
It is expected that the field will start producing again during the first half of 2014.
The fields in Denmark, which are producing through the Siri-platform (Nini and Cecilie), have been shut-in for the
entire second half of 2013. As a consequence of the challenges with these fields, expected higher future production
expenses and lower regularity the first year, write-downs of totally NOK 484 million pre tax (NOK 363 million post
tax) has been made during 2013.
Sensitivities related to the impairment test of assets which are carried at recoverable amount
Book value of Oselvar, Enoch and Siri fairway are equal to the recoverable amount by the end of the year, and
change in the assumptions may require future write-downs. The write-downs can be fully or partially reversed if
new information results in increased recoverable amounts.
The calculated values are most sensitive to changes in the reserve estimates, regularity for the Group’s producing
fields, discount rate, foreign exchange rates and oil price. The table below shows the sensitivities for the Group’s
assets carried at recoverable amont values (before tax).
Change of calculated value (before tax) if:
NOK million
Discount rate is
changed to 11 percent
Oilprice reduced with
5 percent
Regularity reduced
with 10 percent
Siri Fairway (Nini and Cecilie) (7) (77) (15)
Enoch -(2) (2)
Oselvar (19) (24) (19)
Sensitivity for the reserve assumptions and foreign exchange rates is approximately the same as the sensitivity
for change in oil price.
NotesNotes
94 Noreco Annual report 2013 Noreco Annual report 2013 95
13 Financial income and expenses
(NOK million) 2013 2012
Financial income
Interest income 24 24
Gain on extinguishment of debt (note 23) 523 -
Foreign exchange rate 22 51
Other financial income 1 1
Total financial income 570 76
Financial expenses
Interest expense from bond loans (407) (365)
Interest expense from reserve based loan (33) (39)
Interest expense from exploration loan (32) (42)
Interest expenses current liabilities (3) (8)
Capitalised interest expenses - 11
Accretion expense related to asset retirement obligations (ref note 22) (25) (27)
Loss on repurchase of bond (3) -
Foreign exchane losses (36) (59)
Other financial expenses (17) (34)
Total financial expenses (556) (562)
Net financial items 15 (486)
Cash flow details relating to financial income and expenses
Amortisation
Amortisation of borrowing costs included in interest expenses 82 48
Paid borrowing cost
Incurred borrowing cost (95) (62)
Unpaid borrowing cost at year end 34 0
Paid borrowing cost for the period (61) (62)
14 Tax
Income tax benefit
(NOK million) 2013 2012
Tax payable (17) (75)
Tax refundable 378 1 350
Change in deferred tax/-deferred tax asset 511 (22)
Deferred tax asset previosly not recognised 74 150
Change regarding previous years 2 (1)
Change in tax rates 2
Other items (4) (0)
Income tax benefit 947 1 401
Domestic income tax benefit 592 1 097
Foreign income tax benefit 354 304
Tax expense relating to other comprehensive income
(NOK million) 2013 2012
Remeasurement of defined benefit pension plans (1) (11)
Cash flow hedge - -
Discontinued cash flow hedge - -
Currency translation adjustment - -
Total tax expense on other comprehensive income (1) (11)
Reconciliation of nominal to actual tax rate:
(NOK million) 2013 % 2012 %
Income (loss) before tax (1 954) (1 994)
Calculated 28% tax on profit before tax 547 28 % 558 28 %
Adjustment of calculated tax in foreign subsidiaries
in relation to 28% tax (28) (1) % 10 %
Petroleum tax 498 25 % 690 35 %
Tax effect of:
Recognised change deferred tax from previous years 74 4 % 124 6 %
Effect of change in tax rate 2 0 % -0 %
Permanent differences (134) (7) % (85) (4) %
Other items (12) (1) % 112 6 %
Income tax benefit 947 48 % 1 401 70 %
NotesNotes
96 Noreco Annual report 2013 Noreco Annual report 2013 97
Tax refund
Noreco Norway AS is the only entity with exploration activity in Norway during 2013. In 2012 Norwegian Energy
Company ASA was the only entity with exploration activity in Norway.
Basis for tax refund for exploration expenses
(NOK million) 2013 2012
Loss before tax in Norwegian exploration company (804) (1 390)
Financial items (onshore) 78 379
Permanent differences 0 4
Change in temporary differences (ex. financial items) (108) 154
Onshore expenses 0 24
Non- exploration expenses - offshore 350 38
Basis for exploration tax refund 78 % (485) (792)
Calculated exploration refund 378 618
Tax refund related to discontinuing of petroleum activity in Norwegian Energy Company ASA
(NOK million) 2013 2012
Offshore lossess carry forward 28 % -(2 408)
Offshore lossess carry forward 50 % -(94)
Calculated tax refund regarding discontinuing of petroleum activity - 721
Total calculated tax refund 378 1 339
On 31 December 2012, Norwegian Energy Company ASA completed the transfer of its petroleum activity to
Noreco Norway AS, with the effect that from the expiry of the same date, all related assets, contracts and per-
sonnel have been transferred to this subsidiary. Noreco Norway AS thereby became owner of all of the Group’s
licenses on the Norwegian continental shelf. The ultimate parent company, Norwegian Energy Company ASA,
has thereby discontinued its direct petroleum activities, and as such, it claimed payment from the Norwegian
government for the tax value of its uncovered losses pursuant to Norwegian Petroleum Taxation Act section 3(c)
(4). Tax refund for 2012 of NOK 1 351 million was received in December 2013.
Tax payable
Tax payable relates to the group’s enteties in Denmark and UK. The amounts payable on December 31 were:
(NOK million) 2013 2012
Tax payable other countries 13 51
Deferred tax and deferred tax asset:
(NOK million) 2013 2012
Net operating loss deductable (1 979) (703)
Fixed assets 2 392 2 888
Current assets 177 197
Liabilities 615 (84)
Other (226) (294)
Basis of deferred tax/deferred tax asset 979 2 003
Net deferred tax/deferred tax asset 660 1 125
Unrecognised deferred tax asset - 8
Deferred tax/deferred tax asset recognised 660 1 134
Recognised deferred tax asset (1) 293 105
Recognised deferred tax (2) 953 1 245
Recognised deferred tax asset domestic 288 52
Recognised deferred tax asset foreign 553
Recognised deferred tax domestic 24 0
Recognised deferred tax foreign 930 1 245
Net deferred tax/deferred tax asset 660 1 140
(1) Deferred tax asset relates to Norwegian and Danish tax jurisdiction.
(2) Deferred tax related to special offshore tax in Norwegian tax legislation, deferred tax in foreign subsidiaries
and deferred tax related to identified excess values on acquisition date.
There is a net deferred tax position relating to the UK companies. The position consists of deferred tax relating to
temporary differences partly offset by a deferred tax on tax loss carry forward. The recognition of the deferred tax
assets is based on the expectation that sufficient taxable income will be available through future taxable income
in the UK. Planned restructuring of Noreco’s business in the UK is included in such assessment in accordance
with IAS 12.36.(d).
Deferred tax asset and deferred tax liability are presented net for each jurisdiction and tax regime, where our
legal entities have, or are expected to have, a legally enforceable right to offset current tax assets against cur-
rent tax liabilities, and the deferred tax assets and the deferred tax liabilities relate to income taxes levied by
the same taxation authority.
Deferred tax asset in 2012 has been adjusted to reflect changes relating to IAS 19R. See note 21 for details.
All figures reported in the income statement and the balance sheet are based on Noreco’s tax calculations, and
should be considered as estimates until the final tax return is settled for each specific year.
NotesNotes
98 Noreco Annual report 2013 Noreco Annual report 2013 99
Net operating loss deductable - expiry dates
NOK million 2013
Unlimited (1 559)
Expires:
2014 (3)
2015 (3)
2016 (17)
2017 (34)
2018 (70)
2019 (96)
2020 (197)
Sum (1 979)
Tax losses that expires in accordance with the table is relating to Norwegian Energy Company (UK) Limited
(UK) Limited.
15 Earnings per share
Earnings per share are calculated by dividing the profit attributable to shareholders by the weighted average
number of ordinary shares in issue during the year.
(NOK million) 2013 2012
Net loss attributable to ordinary shareholders (1 008) (593)
Shares issued 1 January 353 831 111 243 842 914
Shares issued during the year 4 302 262 971 109 988 197
Shares issued on 31 December 4 656 094 082 353 831 111
Weighted average number of ordinary shares 674 891 644 262 426 363
Earnings per share (NOK 1)
Earnings per share (1.49) (2.26)
Diluted earnings per share (1.49) (2.26)
The Company has implemented an option program which includes all employees in the Group. In addition,
employees are granted bonus shares, which will give right to new matching shares after a vesting period. See
more information regarding the possible number of new shares in note 25.
Further, the Company has issued a convertible bond that can be converted into shares. See further information
in note 23.
In accordance with IAS 33, any dilution effect caused by share options or covertible bonds is not shown in the
consolidated statement of comprehensive income since conversion to ordinary shares would have reduced the
loss and improved the result per share.
In 2014 1 002 391 002 new shares have been issued, ref. note 32. These will impact the future calculations
of earnings per share.
NotesNotes
100 Noreco Annual report 2013 Noreco Annual report 2013 101
16 Trade receivables and other current receivables
(NOK million) 2013 2012
Tax receivables 15 0
Trade receivables* 106 139
Receivables from operators relating to joint venture licenses* 43 40
Underlift of oil/NGL 1)* 17 38
Prepayments 2 0
Other receivables (ref note 28)* 368 346
Total other current receivables 551 564
* See note 19 for fair value disclosures
(1) Specification of underlift oil/NGL (*) boe USD/boe
Value
(NOK million)
Underlift oil 26 815 104.67 17
Underlift NGL 443 20.71 0
Total underlift 27 258 103.31 17
(*) Underlift and overlift oil and NGL from the different fields is presented as gross amounts. For specification of
overlift, see note 24 Trade Payables and other Payables.
Current receivables in currency
(NOK million) 2013 2012
NOK 34 41
DKK 35 4
USD 472 466
GBP 10 53
EUR 0 0
Total 551 564
Receivables are valued at amortised cost. An impairment loss in respect of a financial asset measured at amor-
tised cost is calculated as the difference between its carrying amount and the present value of the estimated
future cash flows discounted at the asset’s original effective interest rate. Fair value is not considered to diverge
from booked amount.
The Group’s trade receivables are mainly consisting of receivables related to sales of hydrocarbons. The debtors
are large established oil companies and the credit risk is considered to be low. The Group has not realised any
losses on receivables in 2013 and 2012.
Receivables in USD are mainly in subsidiaries which have USD as their functional currency. The Company has
not hedged receivables against fluctuations in currency. The Company has operating costs in different currencies
and receivables will hedge trade payables and other current liabilities in different currencies. The Company has
not used hedge accounting in such instances.
Ageing analysis of trade receivables and other short term receivables
31 December 2013 Past due
(NOK million) Total
Not
past due
> 30
days
30-60
days
61-90
days
91-120
days
> 120
days
Tax receivables 15 15 -----
Trade receivables 106 102 4 - - 0 1
Receivables from ope-
rators relating to joint
venture of oil/NGL
43 43 -----
Underlift of oil/NGL 17 17 -----
Prepayments 22-----
Other receivables 368 6----363
Total 551 184 4 - - 0 363
Ageing analysis of trade receivables and other short term receivables
31 December 2012 Past due
(NOK million) Total
Not
past due
> 30
days
30-60
days
61-90
days
91-120
days
> 120
days
Tax receivables - -------
Trade receivables 139 139 -----
Receivables from ope-
rators relating to joint
venture of oil/NGL
40 38 10001
Underlift of oil/NGL 38 38 -----
Prepayments 00-----
Other receivables 346 5----341
Total 564 221 1000342
NotesNotes
102 Noreco Annual report 2013 Noreco Annual report 2013 103
17 Restricted cash, bank deposits,
cash and cash equivalents
Specification of restricted cash, bank deposits, cash and cash equivalents
(NOK million) 2013 2012
Non-current assets
500 0
Restriced cash pledged as security for abandonment obligaion in Denmark (1)
Current assets
Restricted cash which can only be used for collateral for abandonment obliga-
tion or repayments to bondholder:
70 0
Other restriced cash and bank deposits 4 20
Total restricted cash 74 20
Unrestricted cash, bank deposits and cash equivalents 403 584
Total bank deposits 978 604
(1) Norwegian Energy Company ASA maintains a Debt Service Reserve Account which will be used as security
for covering the abandonment obligation in Denmark related to the Cecilie and Nini fields (DKK 500 million).
In February 2014 an agreement was reached with Dong & RWE where Noreco agreed to transfer DKK 445
million to an escrow account that is pledged in favor of DONG and RWE.
There is a general liquidity requirement of minimum NOK 100 million at Noreco group level in accordance with
the covenants for the bond loans. See note 23.5.
Cash held in different currency
2013 2012
(NOK million) Amount in currency NOK Amount in currency NOK
NOK 913 913 381 381
DKK 10 11 5 5
USD 8 47 34 188
EUR - - 0 2
GBP 1 7 3 28
Total 978 604
There are no differences between fair value and carrying amount for cash at bank.
Overdraft facilities
On 31 December 2013
(NOK million)
Facility amount
in currency NOK Used Unused Available (1)
NOK (Exploration loan facility in
Noreco Norway AS) 1 240 1 240 345 895 -
USD (overdraft facility in Noreco Oil
Denmark AS)
3 18 - 18 18
Total 1 258 345 913 18
Unrestriced cash and cash equivalents 403
Accessible liquidity
on 31 December 2013 422
(1) The basis for utilisation of the exploration loan facility is 70 percent of exploration losses which are entitled
for 78 percent tax refund from the Norwegian tax authorities. On 31 December 2013 the available amount
was fully utilised based on incurred exploration costs which will covered by refund for 2013.
On 31 December 2012
(NOK million)
Facility amount
in currency NOK Used Unused Available
NOK (exploration loan) 573 573 573 - -
USD (overdraft facility in Noreco Oil
Denmark AS)
3 17 5 11 11
USD (reserve based lending facilities)
108 603 551 52 52
Total 1 192 1 129 63 63
Unrestriced cash and cash equivalents 584
Accessible liquidity
on 31 December 2012 647
NotesNotes
104 Noreco Annual report 2013 Noreco Annual report 2013 105
18 Derivative financial instruments
Financial derivatives entered into to hedge future cash flows:
Commodity derivatives
The Group has a strategy to hedge some of the future oil sale against fluctuations in the sales price. This is
done by buying put options for part of the estimated oil production. These options give the company a right, but
not an obligation, to sell oil at a minimum price at USD 70 per barrel. For accounting purposes, these options
are classified as derivatives held for trade and are measured at fair value through profit or loss.
On 31 December 2013 the Group has the following option contracts:
Cost
(USD million)
Book value
(USD million)
Book value /
Fair value
(NOK million)
Options expiring in 2014 2 0.07 0
Options expiring in 2015 1 0.16 1
Total book value options contracts 30.23 1
On 31 December 2012 the Group had the following option contracts:
Cost
(USD million)
Book value
(USD million)
Book value /
Fair value
(NOK million)
Options expiring in 2013 3 0.3 2
Options expiring in 2014 2 1 6
Total book value options contracts 5 1.3 7
Interest rate swap agreements
The Group has entered into interest rate swap agreements to secure a fixed interest for most of the Group’s
loans with floating interest prior to the refinancing (Note 23). The agreements match the critical terms of the
loan agreements, and as such, hedge accounting is applied. The interest rate swap agreements are carried
at fair value in the balance sheet, and the effective part of the change in fair value is recognised in the other
coprehensive income. Ineffectiveness is recognised through ordinary profit or loss.
Change in fair value of the hedging instruments which is recognised through other comprehensive income
during 2013 amounts to NOK 7 million. The hedge accounting for the interest rate swap agreements ceased
in December 2013 as the underlying debt was refinanced. As a consequence all impacts in other comprehen-
sive income relating to hedge accounting were reclassified to Other (losses)/ gains in the income statements.
A total amount of NOK 4 million was reclassified (ref. note 10). The remaining interest swap agreement is car-
ried at fair value thourgh ordinary profit and loss.
On 31 December 2013, the remaining instrument had the following terms:
Derivate held for trading: Notional principal Receive Pay Maturity
Fair value
31.12.13
Interest rate swap 325 NOK 3M NIBOR 2.58 % 27.04.16 (4)
Total book value of interest rate swaps (4)
On 31 December 2012, the Group had the following interest:
Hedged interest payments for: Notional principal Receive Pay Maturity
Fair value
31.12.12
NOR05 700 NOK 3M NIBOR 2.525 % 06.12.13 (5)
NOR07 325 NOK(1) 3M NIBOR 2.58 % 27.04.16 (5)
Reserve-based loan facility (RBL) 170 USD(1) 3M LIBOR 1.82 % 31.12.13 (1)
Total book value of interest rate swaps (11)
(1) The notional amounts is agreed to be adjusted in line with the repayments schedule of the hedge loan.
Change in fair value of the hedging instruments which is recognised through other comprehensive income
during 2012 amounts to NOK 11 million.

NotesNotes
106 Noreco Annual report 2013 Noreco Annual report 2013 107
19 Financial instruments
19.1 Fair value hierarchy
The table below analyses financial instruments carried at fair value, by valuation method. The different levels have
been defined as follows (se also note 3.3)
Level 1 - Quoted prices (unadjusted) in active markets for identical assets or liabilities
Level 2 - Inputs other than quoted prices included within level 1 that are observable for the asset or liability,
either directly or indirectly.
Level 3 - Inputs for the asset or liability that are not based on observable market data.
On 31 December 2013
(NOK million) Level 1 Level 2 Level 3 Total
Assets
Recurring fair value measurements of assets
Financial assets at fair value through profit or loss
- Trading derivatives 1 1
- Underlift of oil (ref. note 16) 17 17
Total - 19 - 19
Liabilities
Recurring fair value measuremenst of liabilities
Financial liabilities at fair value through profit or loss
- Interest rate swap agreements (ref. note 18) (1) 4 4
- Overlift of oil (ref. note 2) 16 16
Total - 20 - 20
Liabilities for which fair values are disclosed
Bonds (current and non-current, ref. note 23.1) 2 481 2 481
Total - 2 481 - 2 481
(1) In Q4 2013 the hedging relationship for the interest rate swap agreement was broken when the related bond
agreement was refinanced and the terms for interest payments were changed from being a floating interest
(NIBOR + margin), to fixed interest. Hence, the derivative contract is reclassified from “Derivatives used for
hedging” to “Financial instruments at fair value through profit or loss”.
There have been no transfers between any levels during the period.
On 31 December 2012
(NOK million) Level 1 Level 2 Level 3 Total
Assets
Financial assets at fair value through profit or loss
- Trading derivatives 7 7
- Underlift of oil 38 38
Total assets - 45 - 45
Liabilities
Derivatives used for hedging
- Interest rate swap agreements 11 11
Financial liabilities at fair value through profit or loss
- Overlift of oil 45 45
Total - 56 - 56
The fair value of financial instruments that are not traded in an active market is determined by using valuation
techniques. These valuation techniques maximise the use of observable market data where it is available and
rely as little as possible on entity specific estimates. If all significant inputs required to fair value an instrument
are observable, the instrument is included in level 2.
The fair value of the instruments in level 2 is collected from external finance institutions.
NotesNotes
108 Noreco Annual report 2013 Noreco Annual report 2013 109
19.2 Financial instruments by category
On 31 December 2013
(NOK million)
Loans and
receivables
Assets at fair
value through
profit or loss Total
Assets
Derivatives -11
Trade receivables and other current assets 527 17 544
Bank deposits, cash and cash equivalents 978 0978
Total 1 505 19 1 523
(NOK million)
Other financial
liabilities at
amortised cost
Liabilities at fair
value through
profit or loss Total
Liabilities
Bond loan 2 481 2 481
Other interest bearing debt 333 333
Derivatives (1) 4 4
Trade payables and other
current liabilities 294 16 310
Total 3 107 20 3 127
(1) In December 2013 the hedging relationship for the interest rate swap agreement was broken when the
related bond agreement was refinanced and the terms for interest payments were changed from being
a floating interest (NIBOR + margin), to fixed interest. Hence, the derivative contract is reclassified from
“Derivatives used for hedging” to “Financial instruments at fair value through profit or loss”.
On 31 December 2012
(NOK million)
Loans and
receivables
Assets at fair
value through
profit or loss Total
Assets
Derivatives -77
Trade receivables and other current assets 526 38 564
Bank deposits, cash and cash equivalents 604 0604
Total 1 130 45 1 175
(NOK million)
Derivatives used for
hedging
Other financial
liabilities at
amortised cost
Liabilities at fair
value through
profit or loss Total
Liabilities
Bond loan -2 779 -2 779
Other interest bearing debt -1 105 -1 105
Derivatives 11 - - 11
Trade payables and other current
liabilities -331 45 379
Total 11 4 215 45 4 271
NotesNotes
110 Noreco Annual report 2013 Noreco Annual report 2013 111
19.3 Financial instruments - Fair values
Set out below is a comparison of the carrying amounts and fair value of financial instruments:
On 31 December 2013
(NOK million) Carrying amount Fair value
Financial assets
Derivatives (ref. note 18) 1 1
Trade receivables and other current assets (ref. note 16) (1) 534 534
Restricted cash, bank deposits, cash and cash equivalents (ref. note 17) (1) 978 978
Total 1 513 1 513
Financial liabilities
Bonds (current and non-current, ref note 23.1) 2 481 2 481
Other interest bearing debt (ret. note 23.1) 333 333
Derivatives (ref. note 18) 4 4
Trade payables and other current liabilities (ref. note 24) (1) 310 310
Total 3 127 3 127
(1) The carrying amount is a reasonable approximation of fair value, hence the items are not included in the fair
value hierarchy as the information is not required.
On 31 December 2012
(NOK million) Carrying amount Fair value
Financial assets
Derivatives (ref. note 18) 7 7
Trade receivables and other current assets (ref. note 16) (1) 564 564
Restricted cash, bank deposits, cash and cash equivalents (ref. note 17) (1) 604 604
Total 1 175 1 175
Financial liabilities
Bonds (ref note 23) 2 779 2 853
Other interest bearing debt (ret. note 23) 1 105 1 105
Derivatives (ref. note 18) 11 11
Trade payables and other current liabilities (ref. note 24) (1) 376 376
Total 4 271 4 345
(1) The carrying amount is a reasonable approximation of fair value, hence the items are not included in the fair
value hierarchy as the information in not required.
20 Share capital
2013 2012
Ordinary shares 4 656 094 082 353 831 111
Total shares 4 656 094 082 353 831 111
Fair value (NOK 1) 0.10 3.10
The Group does not own any of its parent company shares. All shares have equal rights.
Changes in number of shares and share capital:
(NOK million) No. of shares Share Capital
Share capital on 1 January 2012 243 842 914 756
Share issue November 2012 108 108 108 335
Repair share issue November 2012 1 038 010 3
Share issue employees 842 079 3
Share capital on 31 December 2012 353 831 111 1 097
Share capital on 1 January 2013 353 831 111 1 097
Share issue employees on 14 January 2013 1 814 206 6
Share issue employees on 18 March 2013 448 778 1
Share issue on 4 December 2013 4 299 999 987 430
Capital reduction on 31 December 2013 (1 068)
Share capital on 31 December 2013 4 656 094 082 466
Changes in 2013
On 14 January 2013 Noreco, issues 1 814 206 employee incentive scheme shares.
On 18 March 2013, Noreco issued 448 778 new shares to its employees in connection with bonus reward for
2012.
On 4 December 2013, Noreco issued 138 709 677 A-shares at par value NOK 3.10. The A-shares were auto-
matically converted to ordinary shares simultaneously with the completion of the share capital reduction
through a reduction of nominal value from NOK 3.10 to NOK 0.10, through a share split in which each of the
A-shares was split and converted to 31 ordinary shares of totally 4 299 999 987 ordinary shares.
The share share capital reduction was formally approved on 31 December 2013 after the creditor period resul-
ting in a reduction of share capital of NOK 1 068 million.
Changes in 2014
On 21 January 2014, the repair share issue related to the refinancing in the fourth quarter 2013 was received
by the Company.
On 14 February 2014, Noreco issued new shares as part of its employee incentive scheme. Following regis-
tration of the share capital increase the total number of shares issued in Noreco are 5 658 485 084, each
with a nominal value of NOK 0.10. See note 32 for further information.
NotesNotes
112 Noreco Annual report 2013 Noreco Annual report 2013 113
Existing mandates
The Board of Directors was in 2013 granted a mandate by the General Meeting to issue up to 7 000 000
shares to the employees. The mandate expires on 1 June 2014. The mandate has been utilised once, when
2 391 002 shares were issued in February 2014 as part of the bonus scheme. The remaining mandate is
4 608 998 shares.
The above-mentioned mandates replace all previously granted mandates relating to the issuing of shares.
Overview of shareholders on 12 March 2014:
Name Shareholding Ownership share Voting share
SABARO INVESTMENTS 1 536 354 828 27.15 % 27.15 %
IKM INDUSTRI-INVEST 1 029 470 893 18.19 % 18.19 %
MP PENSJON PK 204 516 300 3.61 % 3.61 %
OM Holding AS 159 615 900 2.82 % 2.82 %
ALTO HOLDING AS 90 000 000 1.59 % 1.59 %
CITIBANK, N.A. S/A IF SKADEFORSAKRI 56 608 700 1.00 % 1.00 %
VERDIPAPIRFONDET DNB 50 748 746 0.90 % 0.90 %
AWILCO INVEST AS 49 999 900 0.88 % 0.88 %
BD TRADING AS 41 850 000 0.74 % 0.74 %
CARE HOLDING AS 41 850 000 0.74 % 0.74 %
JFH FINANS AS 40 000 000 0.71 % 0.71 %
Goldman Sachs 36 998 500 0.65 % 0.65 %
IMPORTER AS 34 000 000 0.60 % 0.60 %
NORDNET PENSJONSFORS 30 396 101 0.54 % 0.54 %
LYSE ENERGI AS 27 701 514 0.49 % 0.49 %
NORDNET BANK AB 26 568 509 0.47 % 0.47 %
ANKO INVEST AS 26 183 000 0.46 % 0.46 %
HAMNINGBERG HOLDING 26 000 000 0.46 % 0.46 %
MORGAN STANLEY & CO 21 488 755 0.38 % 0.38 %
PEDERSEN ATLE SANDVIK 20 682 852 0.37 % 0.37 %
Total 3 551 034 498 62.8 % 62,8 %
Other owners (ownership <0.37 %) 2 107 450 586 37.2 % 37.2 %
Total number of shares
on 12 March 2014 5 658 485 084 100 % 100 %
21 Post-employment benefits
Defined benefit plan
Up until 31 December 2013, employees in certain of the Norwegian companies had a defined benefit plan in
a life assurance company. The plan comprises 56 persons as of 31 December 2012. The remainder of the
employees are covered through a defined contribution plan. On 31 December 2013 the defined benefit plans
were changed to defined contribution plans, and as a consequence the Group does not have a pension liabi-
lity in the balance sheet on 31 December 2013.
The Norwegian Companies are obliged to have occupational pension in accordance with the Norwegian act
related to mandatory occupational pension. All companies meet the Norwegian requirements for mandatory
occupational pension (”obligatorisk tjenestepensjon).
Changes to IAS 19 Employee benefits - impacts on the financial statements
Effective as of 1 January 2013, Noreco has utilised IAS 19 Benefits to employees (June 2011) (”IAS 19R”) and
altered the basis for calculation of pension liabilities and pension costs. The company has previously applied
the ”corridor” method for accounting of unamortised estimate deviations. The corridor method is no longer
allowed and, in accordance with IAS 19R, all estimate deviations are to be recognised under other compre-
hensive income (OCI). The corridor on 1 January 2012, which amounted to NOK 5.3 million, has been reset to
zero. Pension liabilities increased correspondingly from NOK 10.3 million to NOK 15.6 million on 1 January
2012, whereas the equity was reduced by NOK 1.2 million (after tax).
Return on pension plan assets was previously calculated on the basis of a long-term expected return on the
pension plan assets. Due to the application of IAS 19R, the net interest cost of the period is now calculated
by applying the discount rate applicable to the liability at the start of the period on the net liability. Thus, the
net interest cost comprises interest on the liability and return on the pension plan assets, both calculated with
the discount rate. Changes in net pension liabilities due to premium payments and pension benefits are taken
into consideration. The difference between actual return on the pension plan assets and the recognised return
is recognised against the OCI on an ongoing basis. The pension cost in 2012, recognised in accordance with
the prior principles, amounted to NOK 14.8 million.
As a consequence of the altered principle for handling of unamortised estimate deviations and calculation of
net interest cost, the recognised pension cost increased to NOK 15.0 million, whereas an estimate deviation
in the amount of NOK 2.9 million was charged to other comprehensive income. The pension liability on 31
December 2012 decreased from NOK 15 million to NOK 7.1 million. IAS 19 R has been applied retrospectively,
and the corresponding figures have been changed.
NotesNotes
114 Noreco Annual report 2013 Noreco Annual report 2013 115
The adoption impact and retrospective adoption had the following impact on the comprehensive income for
2012, and the opening and closing statement of financial positions for 2012:
(NOK million) 2012
Consolidated statement of comprehensive income
Payroll expenses -
Remeasurement of defined benefit pension plans 3
Consolidated statement of financial positions 31.12.12 01.01.12
Deferred tax asset (6) 4
Other equity 2 (1)
Pension obligation (8) 5
During 2013 and prior to cancellation of the defined benefit plan, a net actuarial gain of NOK 1 million
was charged to other comprehensive income.
Changes to the employee pension plans - cancellation of the defined benefit plan and impacts on
the financial statements
Early in December 2013, employees were informed that the Group’s defined benefit plans were
cancelled and replaced by defined contribution plans. Upon cancellation, a net settlment gain of NOK
7 million (including social security tax) reduced the current year pension cost. The current year pension
cost including the settlement amounted to NOK 4 million.
During 2013 total payments of NOK 10 million were made to the plan (2012: NOK 9 million).
Pension costs related to the company’s defined contribution plan amounts to NOK 1 million for 2013.
For 2012 the corresponding costs were NOK 1 million.
22 Asset retirement obligations
Specification of asset retirement obligations
(NOK million) 2013 2012
Balance on 1 January 323 298
Provisions made during the year (45) 17
Accreation expense – present value calculator 25 27
Currency translation 24 (18)
Provision made for asset retirement obligations on 31 December 327 323
Provisions made for asset retirement obligations includes the future expected costs (esimtated based on current
day costs inflated) for close-down and removal of oil equipment and production facilities used in hydrocarbon
activities. The estimated future provision is discounted using a risk-free rate adjusted for credit risk of 9 percent,
which represent the Group’s expected average alternative borrowing interest, to calculate the net present value
of the obligation. Inflation is assumed to be 2 percent.
Expected maturity
(NOK million) 2013 2012
1-5 years 5 12
6-10 years 104 300
over 10 years 218 10
Provision made for asset retirement obligations on 31 December 327 323
NotesNotes
116 Noreco Annual report 2013 Noreco Annual report 2013 117
23 Borrowings
23.1 Summary of borrowings
2013 2012
(NOK million) Note
Principal
amount
Book
value
Principal
amount
Book
value
Non-current debt
Bond loan NOR06 23.3 500 402 --
Bond loan NOR10 1st Lien 23.3 899 829 --
Bond loan NOR10 2nd Lien 23.3 736 502 --
Bond loan NOR12 Convertible 23.3, 23.5 367 206 --
Total non-current bonds 2 502 1 939 - -
Reserve-based loan 23.4 - - 262 243
Total non-current other
interest bearing debt - - 262 243
Current debt
Bond loan NOR04 (1) 23.3 - - 1 250 1 222
Bond loan NOR05 23.3 - - 700 682
Bond loan NOR06 (1) 23.3 100 80 275 267
Bond loan NOR07 (1) 23.3 - - 325 315
Bond loan NOR08 23.3 - - 300 293
Bond loan NOR10 1st Lien 23.3 500 461 - -
Total current bonds 600 541 2 850 2 779
Exploration loan 23.4 345 333 573 573
Reserve-based loan 23.4 - - 289 289
Total non-current other
interest bearing debt 345 333 862 862
Total borrowings 3 447 2 813 3 974 3 884
(1) In the statement of financial positions on 31 December 2012 and in one or more of the quarters in 2013 the
long term portion of the bond loans NOR04, NOR06 and NOR07 was classified as current liabilites as IAS 1.75
demands such classification if a borrower is in breach with the loan agreement on the balance sheet date and
has not prior to the balance sheet date obtained waiver with 12 months duration from the balance sheet date.
23.2 The refinancing
On 21 October 2013 the Company announced a proposed comprehensive refinancing of all its bond loans total-
ling around NOK 3.1 billion, resulting in a new bond structure in combination with a private placement of new
shares. The purpose of the transactions was to strengthen the financial position for further development of the
Group.
The importance of a full refinancing of the Company became evident by a series of events: Sustained production
problems at Huntington and continued shut-down of Danish fields, combined with a demand from the partners
in the Nini and Cecilie licenses for a guarantee for the abandonment obligation in Denmark. As the Group had a
high yield credit rating, the partners could not accept a parent company guarantee. Therefore, the guarantee was
required to be cash collateral or a bank guarantee. This led the banks behind the reserve based lending facility
(the ”RBL”) to not approve a continuance of the previously approved waivers. Further, the RBL-banks decided to
reduce the Group’s borrowing limit from approx. NOK 420 million (USD 69.9 million) to approx. NOK 150 million
(USD 25 million) from 15 October 2013.
Furthermore the banks disallowed Noreco to transfer cash from the Danish subsidiaries to the parent Company
in order to cover current operating expenses and interest. In total, the result of this was that the parent Company
and the Norwegian operations would run out of cash by mid-November 2013, and would be unable to pay current
obligations, both operational costs and financial costs. In other words the liquidity changes in the Company were
in aggregate due to delayed revenues, lack of new loans, withdrawn credit and the fact that the Company had to
have cash available for the guarantee in relation to the abandonment obligations. The board considered it neces-
sary to immediately initiate a significant financial restructuring.
The Refinancing resulted in the bond loans outstanding being replaced (through amendments or roll-overs) with
certain new bonds issued as follows:
– NOK 1 399 million 3 year Senior Secured Callable Bond Issue (6.0 per cent interest) with security in the Hun-
tington and producing Danish assets;
– NOK 600 million 4 year Senior Secured Callable Bond Issue (6.5 per cent interest) with security in the Oselvar
assets and in addition a second lien security in the Huntington and producing Danish assets;
– NOK 736 million 5.5 year Second Lien Callable Bond Issue (6.75 per cent interest) with second lien security in
the Huntington and producing Danish assets pari passu with the Oselvar bond; and
– NOK 367 million 5 year Senior Convertible Bond Issue (4 per cent PIK interest (”payment in kind”);
The Refinancing was implemented in conjunction with and subject to completion of the Private Placement. Both
the Private Placement and the Refinancing Proposal were mutually conditional on each other. The Refinancing
Proposal also assumed the full repayment of Noreco’s existing RBL facilities.
All the new bonds are subject to the same covenants. The covenants are customary in the Norwegian high yield
bond market. A general liquidity requirement in the amount of NOK 100 million at Group level applies, as well as
incurrence based covenants on significant asset disposals and new financial indebtedness, which are only permit-
ted if the Group gearing ratio (net interest-bearing debt to EBITDAX, with the X only relating to exploration activity
on the Norwegian continental shelf) is less than 3.5 x.
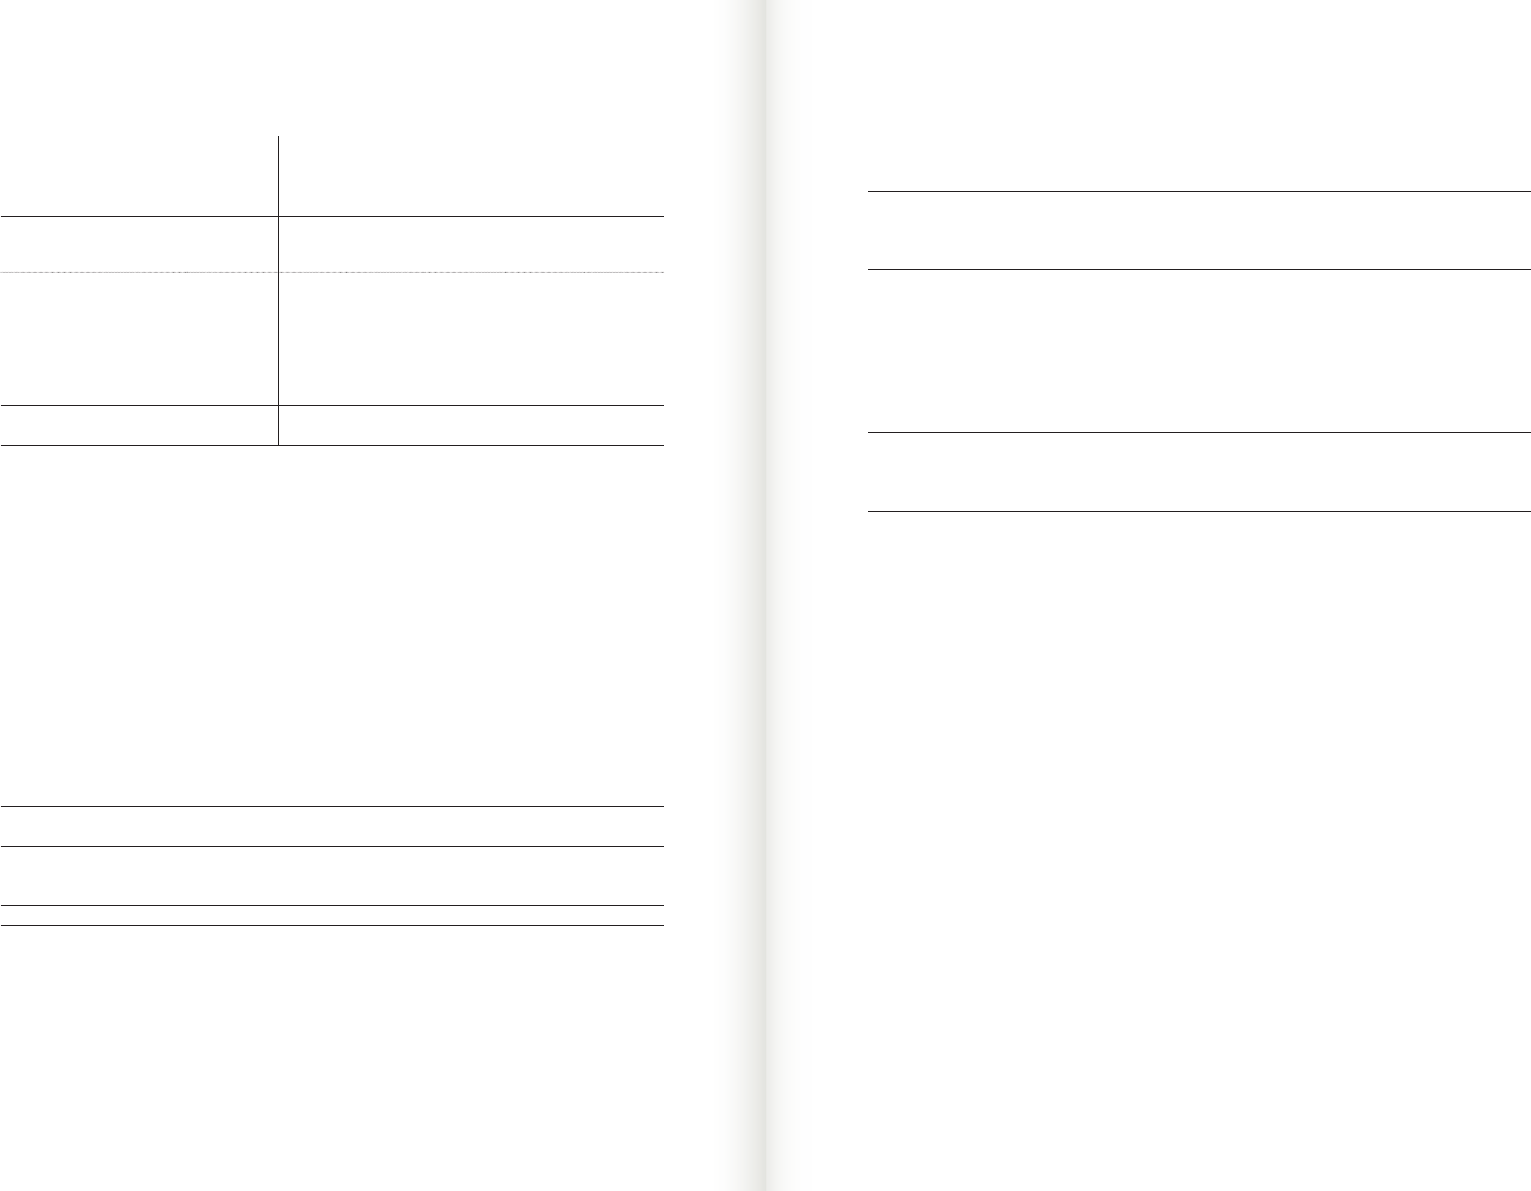
NotesNotes
118 Noreco Annual report 2013 Noreco Annual report 2013 119
(NOK million)
Principal
amount
(of bonds
before
refinancing)
1st lien
secured
Oselvar
Bond
1st lien
Secured
Huntington
and
Denmark
Bond
2nd Lien
Bond
(Huntington
and
Denmark)
Unsecured
Convertible
Bond
Total
principal
amount
refinanced
bonds
Bond loans
Ticker (new bond loans) NOR06 NOR10 NOR11 NOR12
Bond loan NOR04 1 220 100 %
Bond loan NOR05 699 14.0 % 57.4 % 28.6 %
Bond loan NOR06 275 100 %
Bond loan NOR07 325 100 %
Bond loan NOR08 284 14.0 % 57.4 % 28.6 %
Bond loan NOR09 300 14.0 % 57.5 % 28.6 %
Total bonds at the time
of refinancing 3 102 600 1 399 736 367 3 102
Extinguishment of debt and calculation of gain
Due to substantial modification of terms, the refinancing has been accounted for as extinguishment of debt. The
old bonds were derecognised in December 2013, and the new bond structure was recognised as new borrowings.
The convertible bond includes both a liability component and an equity component. The value of the liability com-
ponent has been determined using a comparable loan with no conversion features. The equity component is the
residual between the fair value of the bond at the time of the listing of the bond agreement, and the calculated
value of the liability component. The difference between the book value of the old bonds at the date of derecog-
nition (9 December 2013), and the fair value of the new loans has been recorded in the income statement as a
gain extinguishment within the financial items.
Transaction costs incurred in the process is treated as costs of the settlement of the old debt and is included in
the gain calculation. Total transactions costs relating to the financing amount to NOK 47 million.
Specification of gain on extinguishment of debt
(NOK million) 2013
Book value of old bonds on the time of derecognition: 3 058
Fair value of new bonds at initial recognition 2 489
Difference 569
Transaction cost (47)
Net gain on extinguishment 523
The equity component of the convertible bonds has been calculated to NOK 16 million and has been accounted
for as an increase of equity.
Measurement for initial recognition
The following fair values were observed and are applied for the new bonds at initial recognition:
NOR 06 - Oselvar 1. lien bond 80 %
NOR 10 - Huntington and Danish assets 1. lien 92 %
NOR 11 - Huntington and Danish assets 2. lien 68 %
NOR 12 - Unsecured convertible bond 60 %
The fair values are based on executed transactions and buy and sell orders in the period after the issue of the
bonds at 9 December 2013. Reference is made to note 19 for the fair value hierarchy.
Yield for amortisation of effective interest
The difference between the par value and the fair value at the initial recognition will be included in future interest
expenses as part of the effective interest. The yield for the new loans for accounting purposes are listed below:
NOR 06 - Oselvar 1. lien bond 16.1 %
NOR 10 - Huntington and Danish assets 1. lien 11.1 %
NOR 11 - Huntington and Danish assets 2. lien 17.0 %
NOR 12 - Unsecured convertible bond 17.0 %
23.3 Details on borrowing
Details on borrowings outstanding on 31 December 2013
NOR06 1st lien Secured Oselvar Bond
The bond was entered into in December 2013 with at face value of NOK 600 million and a final maturity date of
9 December 2017 (4 years after the original issue date). The bond holds a fixed interest rate of 6,5% with semi
annual interest payments. The first interest payment is due on 9 June 2014.
Upon the occurence of a change of control event, the bondholders have the right to require the issuer to redeem
its bonds (a ”put option”) at a price of 101% of par value plus accrued interest.
Norco may redeem the bonds in whole or in parts (”call option”) at 105% in 2014, 103.5% in 2015, 102.5% in
2016 and 101% in 2017. Cross default clauses exist.
The loan is listed on the Oslo Stock Exchange with the ticker NOR06.
NOR10 1st lien Secured Huntington and Denmark Bond
The bond was entered into in December 2013 with at face value of NOK 1 399 million and a final maturity date of
9 December 2016 (3 years after the original issue date). The bond holds a fixed interest rate of 6.0% with semi
annual interest payments. The first interest payment is due on 9 June 2014.
Upon the occurence of a change of control event, the bondholders have the right to require the issuer to redeem
its bonds (a ”put option”) at a price of 101% of par value plus accrued interest.

NotesNotes
120 Noreco Annual report 2013 Noreco Annual report 2013 121
Norco may redeem the bonds in whole or in parts (”call option”) at 105% in 2014, 103% in 2015 and 101% in
2016. Cross default clauses exist.
The loan is listed on the Oslo Stock Exchange with the ticker NOR10.
NOR11 2nd Lien Bond (Huntington and Denmark)
The bond was entered into in December 2013 with a face value of NOK 736 million and a final maturity date of
9 June 2019 (5.5 years after the original issue date and reduced from the initially agreed maturity date of 9 De-
cember 2020 as commented on below). The bond holds a fixed interest rate of 6.75% with semi annual interest
payments. The first interest payment is due on 9 June 2014.
Upon the occurence of a change of control event, the bondholders have the right to require the issuer to redeem
its bonds (a ”put option”) at a price of 101% of par value plus accrued interest.
Noreco may redeem the bonds in whole or in parts (”call option”) at 105% until 2016, 104% in 2017, 103% in
2018, 102% in 2019 and 101% in 2020. In connection with the execution of the refinancing, Noreco announced
a commitment to early redeem the remaining loan at 9 June 2019, and pay 102% of the principal amount as
described as the redemption fee above. This change was amended to the loan agreement during February 2014.
Cross default clauses exist.
The loan is listed on the Oslo Stock Exchange with the ticker NOR11.
NOR12 Unsecured Convertible Bond
The bond was entered into in December 2013 with a face value of NOK 367 million and a final maturity date of
9 December 2018 (5 years after the original issue date). The bond holds a fixed interest rate of 4.0% with semi
annual interest payments. The first interest payment is due on 9 June 2014. Such interest payments to be paid
in kind or cash interest at the Company’s discretion. Covertible bonds issued and paid in kind interest shall have
the same rights as the original convertible bonds. If interests are paid in kind the interest amount will be added
to the loan balance.
Each bondholder may exercise one or more of the conversion rights at a price of NOK 0.30 per common share at
any time during the exercise period. The exercise period means the period commencing on the issue date and
ending on 9 December 2018 or, in the event of a new board resolution persuant to an extended authorisation by
the Issuer’s general meeting, to (but not including) the maturity date.
Upon the occurence of a change of control event, the bondholders have the right to require the issuer to redeem
its bonds (a ”put option”) at a price of 101% of par value plus accrued interest or convert its bonds at a convertion
price per common share of the issuer in accordance with a formula defined in the bond agreement.
At any time three (3) years after the issue date, Noreco shall have the right (issuer soft call option”) to redeem
all or some of the bonds at 100% in 2017 and 2018, subject to 120% parity check based on 20/30 last trading
days. Cross default clauses exist
The loan is listed on the Oslo Stock Exchange with the ticker NOR12.
Exploration loan Noreco Norway AS
The exploration loan was issued on 19 March 2013 with a principal amount of NOK 1 240 million. Amount out-
standing at 31 December 2013 is NOK 345 million. The loan holds interest rate of NIBOR 3 months plus 2.5%
margin with quarterly interest payments. A full repayment of the loan is due in December the year after drawdown.
Change of control of Noreco and delisting leads to mandatory repayment. Cross default clauses exist.
Details on borrowings outstanding on 31 December 2012 and changes in 2013 prior to the refinancing
NOR04 Senior secured callable bond
The bond loan was entered into in November 2009 with a face value of NOK 1 250 million. During 2011 the
company repurchased NOK 71 million of the bond. In 2012 these repurchased bonds have been resold. The bor-
rowing cost is capitalised initially and amortised over the term of the loan. The interest was a fixed coupon rate
set at 12.90% annually. Interests was paid in arrears quarterly. Remaining amortisation on 31 December 2012
was NOK 28.225 million. The loan was listed on the Oslo Stock Exchange with the ticker NOR04 and was issued
against pledged collateral.
The company could redeem the bond loan at the following rates; November 2013 – rate 105 and November
2014 – rate 103.
The loan had the following two financial conditions; The Group should maintain an equity to capital employed ratio
of minimum 25 % and the Group should maintain a gearing-ratio of less than 5.0. During 2012 the gearing ratio
exceeded the threshold, but a waiver was agreed with the bondholders until the end of Q1 2013, as such the
Group was not in breach of the conditions of the loan agreement at the balance sheet date.
NOR05 Senior unsecured bond
The bond loan was entered into in November 2010 with a face value of NOK 700 million. During 2011 the com-
pany repurchased NOK 129 million of the bond. In 2012 these repurchased bonds were resold. The borrowing
cost was capitalised initially and amortised over the term of the loan. The interest rate was NIBOR 3 months + a
margin of 8.00%. Interests were paid in arrears quarterly. Remaining amortisation on 31 December 2012 was NOK
17.520 million. The loan was listed on Oslo Stock Exchange with the ticker NOR05.
NOR06 Senior secured callable bond
The bond loan was entered into in April 2011 with a face value of NOK 275 million. The borrowing cost was
capitalised initially and amortised over the term of the loan. The interest was a fixed coupon rate set at 10.25%
annually. Interests were paid in arrears quarterly. Remaining amortisation on 31 December 2012 was NOK 8.233
million. The loan was listed on the Oslo Stock Exchange with the ticker NOR06 and the loan was issued against
pledged collateral.
NOR07 Senior secured callable bond
The bond loan was entered into in April 2011 with a face value of NOK 325 million. The borrowing cost was
capitalised initially and amortised over the term of the loan. The interest rate was NIBOR 3 months + a margin
of 6.0%. Interests were paid in arrears quarterly. Remaining amortisation on 31 December 2012 was NOK 9.730
million. The loan was listed on the Oslo Stock Exchange with the ticker NOR07 and the loan was issued against
pledged collateral.
NOR08 Senior unsecured bond
The bond loan was entered into in October 2012 with a face value of NOK 300 million. The borrowing cost was
capitalised initially and amortised over the term of the loan. The interest rate was a fixed coupon rate set at
12,9%. Interests was paid in arrears quarterly. Remaining amortisation on 31 December 2012 was NOK 6.872
million. The loan was listed on the Oslo Stock Exchange with the ticker NOR08.
NOR09 Senior unsecured bond
On 13 February 2013 Noreco contemplated issue of an unsecured bond of NOK 300 million. The bond’s maturity
date was February 2016 and carried an interest of 10.5 percent. The funds were made available from 1 April
2013.
NotesNotes
122 Noreco Annual report 2013 Noreco Annual report 2013 123
Reserve based lending facility Noreco Oil Denmark A/S (”RBL”)
The reserve-based loan was recognised at amortised cost. The banks made a commitment to a maximum frame
of USD 140 million at the end of 2012 and then a gradual reduction to USD 0 in January 2015 when the loan
would expire. Available loan facility as of 31 December 2012 was USD 108.3 million and the loan drawn up as
of 31 December 2012 was USD 99.0 million. Available loan facility was regulated quarterly and was based upon
expected reserve base, costs and oil price. The loan had a floating rate of LIBOR + a margin between 2.50% p.a
and 3.50 % p.a. The first due date for interest was 28 February 2013. The margin was dependent upon how
much of the facility which was drawn up. The loan had financial covenants relating to liquidity ratio and debt ratio
and was secured with mortgage in shares in the Group as well as major assets. The loan terms also included a
requirement to hedge a part of future oil production for two years ahead.
The interest rate margin changed pending the use of the loan facility. The interest rate margin varied between
2.5 % and 3.5 %.
On 31 December 2012 the estimated downpayment was as follows: 2013 - USD 52.0 million, 2014 - USD 38.0
million and 2015 USD 9.0 million. Remaining amortisation was USD 3 million.
Exploration loan facility - Norwegain Energy Company ASA
The exploration loan was entered into in February 2008, with a facility amount of NOK 1 550 million. The borrower
was Norwegian Energy Company ASA and the facility could be utilised untill 31 December 2012. The tax refund
balance was pledged as security for the loan. The balance on 31 December 2012 was due in December 2013,
after the tax refund was received. The loan carried a floating interest of NIBOR + a margin of 2.5% p.a. First due
date for interests is 2. April 2014. A new exploration loan was entered into by Noreco Norway AS.
23.4 Covenants
Covenants relating to interest bearing debt outstanding on 31 December 2013
All the New Bonds shall be subject to the same covenants. The covenants are in line with what is considered
customary in the Norwegian high yield bond market. A general liquidity requirement in the amount of NOK 100
million at Noreco group level apply, as well as incurrence based covenants on significant asset disposals and new
financial indebtedness, which are only permitted if the Group gearing ratio (net interest-bearing debt to EBITDAX,
with the X only relating to exploration activity on the Norwegian continental shelf) is less than 3.5 x.
Custumary events of default exist for the exploration loan, hereunder material adverse change, and in addition fail
to claim refund that the borrower is entitled to under the Petroleum Tax Act relating to exploration costs financed
under the agreement.
The Group is in compliance with the covenants on 31 December 2013.
Covenants relating to interest bearing debt outstanding at 31 December 2012
The bond loans had the following two financial covenants; The Group shall maintain an equity ratio of minimum
25 % and a gearing-ratio of less than 5.0. Equity ratio was defined as the book equity of the group divided with
total assets.
During 2012 and 2013 the gearing ratio exceeded this threshold, but a waiver was agreed with the bondholders.
However, the obtained waivers did not have a duration of at least 12 months from the balance sheet date.
In the statement of financial positions on 31 December 2012 and in one or more of the quarters in 2013 the long
term portion of the bond loans NOR04, NOR06 and NOR07 were therefore classified as current liabilites as IAS 1.75
demands such classification if a borrower is in breach with the loan agreement on the balance sheet date and has
not prior to the balance sheet date obtained waiver with 12 months duration from the balance sheet date.
23.5 Convertible bond loan
Liability component of convertible loan
(NOK million) 2013 2012
Book value as initial recognition (1) 204 349
Conversion -(222)
Repurchase of bonds -(46)
Interest expense 3118
Paid/accrued interest (1) (63)
Amortisation of establishment costs - 36
Repayment at maturity -(173)
Liability component 31 December 206 -
(1) Dilution if the convertible bonds is converted
Following the new share issue in December of NOK 430 million (Note 20) and the subsequent repair issue of
NOK 100 million, a full conversion of the convertible bond will result in an issue of 1 223 million new shares.
This new equity from the convertible bonds will then represent 17.8 percent of the share capital. If the interest
is paid-in-kind instead of cash, a conversion of the entire convertible bond after five years will result in issue
of 1 490 million shares. This new equity will then represent 20.9 percent of the issued share capital at that
time. This information does not assume any other issue of new shares in the period.
The Group did not have any convertible bond loans outstanding on 31 December 2012.
23.6 Payment structure
Payment structure loans (NOK million):
Year NOR06 NOR10 NOR11 NOR12
Exploration
loan (1)
Total
2013
Total
2012
2013 - 1 862
2014 100 500 345 945 1 642
2015 100 500 600 230
2016 150 399 549 240
2017 250 100 350 -
2018 (2) 200 447 647 -
2019 445 445 -
Total 600 1 399 745 447 345 3 536 3 974
(1) The exploration loan will be repaid once the tax refund on exploration expenses has been received.
(2) In 2018 the repayment of the convertible bond is included with NOK 447 million which will be the principal
amount of this bond if all interests are paid in kind.
NotesNotes
124 Noreco Annual report 2013 Noreco Annual report 2013 125
Interest payments (NOK million):
Year NOR06 NOR10 NOR11 NOR12
Exploration
loan (3)
Total
2013
Total
2012
Interest rate 6.50 % 6.00 % 6.75 % 4.00 % 4.19 %
2013 - 364
2014 39 84 50 14 188 222
2015 33 54 50 - 137 58
2016 26 24 50 - 100 43
2017 16 - 50 - 67 -
2018 - - 44 - 44
2019 - - 30 - 30 -
Total 114 162 275 - 14 565 687
(3) Interest rate terms are NIBOR 3 months plus 2.5% margin. NIBOR 3 months of 1.69% has been used in the
calculation. The interest amounts included interest for all debt as of 31 December 2013.
23.7 Assets pledged as security for interest bearing debt
Specification of assets pledged as securites
(NOK million) 2013 2012
Collateralised debt (net book value)
Bond loans (current and non current part, ref. note 23.1) 2 275 1 804
Reserve based loan (ref. note 23.1) -532
Exploration loan (ref. note 23.1) 333 573
Total collateralised debt 2 608 2 909
Capitalised value in the consolidated accounts of assets pledged
as securities
License and capitalised exploration expenditures 743 527
Property, plant and equipment 3 087 3 984
Tax receivable 378 618
Cash at bank -196
Total capitalised value 4 208 5 325
Specification of assets pledged as securities per bond/loan:
Bond loan NOR10 1st Lien (1)
License and capitalised exploration expenditures 595 -
Property, plant and equipment 2 705 -
Total 3 300 -
(NOK million) 2013 2012
Bond loan NOR06 (2)
Property, plant and equipment 382 -
Total 382 -
Bond Loan NOR11 2nd Lien (3)
The bond holds a second ranking security as descibed in the footnote.
Exploration loan (4)
License and capitalised exploration expenditures 148 27
Tax receivable 378 618
Total 526 645
(1) The Bond loan NOR10 1st lien is secured with pledge in licenses owned by Noreco Oil Denmark A/S (the com-
pany holds the title to a number of assets in Denmark, including the producing Nini, Lulita and Cecilie assets),
licenses owned by Noreco Petroleum Denmark A/S (the company is a holder of licenses in Denmark, such as
the Cecilie and Lulita fields) and licenses in Noreco Oil (UK) Ltd (the Huntington field on UK sector) and also
the project agreements relating to these licenses. Further the bond is secured with pledge in the earnings
accounts relating to Noreco Oil Denmark AS, Noreco Petroleum Denmark AS and Noreco Oil (UK) Ltd, Noreco
Oil (UK) Ltd’s goodwill and uncalled capital and the company’s property, assets, rights and revenues (present
and future). In addtion to guarantees, intra group loans held by the three above mentioned companies and
the shares in Noreco Oil Denmark A/S, Noreco Oil (UK) Ltd and Noreco Petroleum Denmark A/S. Book value of
the shares in Noreco Oil Denmark A/S is USD 197 million, Noreco Oil (UK) Ltd USD 25 million, and in Noreco
Petroleum Denmark A/S USD 5 million.
(2) The bond loan NOR06 is secured with pledge in licenses owned by Noreco Norway AS (the company holds
all of the Group’s Norwegian licenses, including the Oselvar and Enoch producing assets), project proceeds
relating to the Oselvar license, insurance proceeds directly deriving from any damage to equipment and/or
property in respect of the Oselvar license and Norwegian law on-demand guarantees issued by Noreco Norway
AS. Further intra group loans made by Noreco Norway AS, the Noreco Norway earnings account are pledged as
security for the loan in addtion to the shares in Noreco Norway AS. The shares in Noreco Norway AS is held by
Altinex ASA and has a book value of NOK 819 million at 31 December 2013. The loan has in addition second
lien security in the same assets with substantially the same terms as the Bond loan NOR10.
(3) The bond loan NOR11 is also secured with second lien security in the same assets with substantially the
same terms as the Bond loan NOR10.
(4) The exploration loan is secured with pledge in the tax refund balance related to Norwegian exploration activity
and all Norwegian exploration licenses.
Bond loan NOR04 outstanding on 31 December 2012
The parent company’s investment in Altinex ASA and Noreco Petroleum (UK) ltd was pledged as security for the
NOR04 bond. The shares had a book value of NOK 2.8 billion as of 31 December 2012. The Danish holding
company, Noreco Denmark A/S (prev. Geopard AS) had pledged the shares in Noreco Oil Denmark A/S, and its
investments in Noreco Petroleum Denmark A/S and Noreco Oil UK Ltd. The investments in Noreco Oil Denmark
A/S had a book value of NOK 1.1 billion as of 31 December 2012.
NotesNotes
126 Noreco Annual report 2013 Noreco Annual report 2013 127
24 Trade payables and other payables
(NOK million 2013 2012
Trade payable* 58 29
Liabilities to operators relating to joint venture licenses* 190 186
Overlift of oil 1)* 16 45
Accrued interest 11 52
Employee bonus/salary accruals 33 33
Public duties payable* 8 8
Other current liabilities* 27 24
Total trade payable and other payables 343 376
* See note 19 for value disclosures
(1) Specification of overlift oil boe USD/boe
Value
(NOK million)
Overlift oil 24 772 107.12 16
Overlift NGL - - -
Total 27 772 107.12 16
Overlift and underlift of oil and NGL is presented net. For details of underlift, see note 16 Receivables.
Trade and other payables held in currency
(NOK million) 2013 2012
NOK 114 134
DKK 22 21
USD 122 102
GBP 84 119
Total 343 376
Debt is valued at amortised cost. Fair value is not considered to diverge from booked amount.
Payables in USD are mainly related to companies which have USD as functional currency. The Company has
covered its USD requirements, cf. note 16 Trade Receivables and other current assets and note 17 Cash and
Cash Equivalents. Payables in DKK are entirely in companies with USD as functional currency. For currencies in
which the Company has income, the revenue generating cash flows will hedge the Company’s payables in cor-
responding currency. The Company has not used hedge accounting in such situations.
Ageing analysis of trade payables and other current liabilities
31 December 2013 Due
(NOK million) Total
Not
past due
> 30
days
30-60
days
61-90
days
91-120
days
> 120
days
Trade payable 58 38 18 1 0 - 1
Liabilities to operators
relating to joint
venture licenses
190 190 -----
Overlift of oil (1) 16 16 -----
Accrued interest 11 11 -----
Employee bonus/
salary accruals 33 33 -----
Public duties payable 88-----
Other current
liabilities 27 27 -----
Total 343 324 18 1 0 - 1
Ageing analysis of trade payables and other current liabilities
31 December 2012 Due
(NOK million) Total
Not
past due
> 30
days
30-60
days
61-90
days
91-120
days
> 120
days
Trade payable 29 26 0---1
Liabilities to operators
relating to joint ven-
ture licenses
186 186 -----
Overlift of oil (1) 45 45 -----
Accrued interest 52 52 -----
Employee bonus/
salary accruals 33 33 -----
Public duties payable 88-----
Other current
liabilities 24 24 -----
Total 376 375 0---1
NotesNotes
128 Noreco Annual report 2013 Noreco Annual report 2013 129
25 Share-based compensation
The Group has an option program established in January 2008. The purpose of the program is to establish a
long-term incentive program for employees.
Share options are granted annually by the Board. The options will be fully acquired after three years and expire
after five years. The options will according to plan be settled when the shares are issued.
In addition, the Group has an agreement where employees have an option to purchase shares equivalent to
up to 50% of their bonus at the payment date. Employees who retain these shares for two years, and are still
employed in Noreco by the expiration of the two-year period, will be granted an option to receive additional shares
at a one-to-one basis.
Fair value of the option is calculated by external advisors using the Black and Scholes Merton option pricing
model. Inputs to the option pricing modeI is for instance grant date, exercise price, expected exercise date,
volatility and risk free rate.
Historic volatility in the Noreco shares has been used to estimate volatility. The share price for the first 12
months after listing on the stock exchange has been left out of the estimation, as the share price usually has an
abnormal volatility in the initial phase, before stabilizing. Fair value of the options is measured at the grant date
and is expensed linearly over the contribution time. The cost is booked in the company of the employee.
Social security tax:
Social security tax is booked progressively at the reporting intervals if the share price is higher than the exercise
price. There is no social security tax for the Danish subsidiaries.
There has been no accrual for social security tax in 2013 or 2012 as the share price is lower than the exercise
price.
Outstanding share options and bonus shares
Total share options and bonus shares outstanding as at 1 Janurary 2012 5 328 172
Share options granted in 2012 4 279 387
Bonus shares granted in 2012 -
Share options forfeited in 2012 (515 382)
Bonus shares forfeited in 2012 (128 181)
Outstanding at 31 December 2012 8 963 996
Share options granted in 2013 8 297 299
Bonus shares granted in 2013 448 778
Share options forfeited in 2013 (4 675 126)
Bonus shares forfeited in 2013 (229 560)
Outstanding at 31 December 2013 12 805 387
Grants Exercise price
Outstanding
share options
and bonus shares
at 31.12.2013
Average
remaining
Contractual term
Weighted
average
exercise price
Granted bonus shares in 2013 0.00 387 167 1.17 -
Share options programme 2009 11.01 1 126 912 0.17 11.01
Share options programme 2010 17.00 630 596 1.17 17.00
Share options programme 2011 14.85 1 167 910 2.26 14.85
Share options programme 2012 8.04 2 806 129 3.19 8.04
Share options programme 2013 4.11 6 686 673 4.18 4.11
Total 12 805 387 3.20 7.07
Effect of outstanding options in financial statements:
(NOK million) 2013 2012
Personal expenses 13 14
Summary of assumptions and indata for valuation of the options programme:
2013 2012
Share price at grant date (NOK) 3.90 8.04
Volatility 60.0 % 64.2 %
Expected life span options (year) 4 4
Risk free interest 1.55 % 1.8 %
Fair value at grant date (NOK) 2.31 4.13

Notes
130 Noreco Annual report 2013
Notes
26 Guarantees
Overview of issued guarantees on 31 December 2013
The parent company of the Group Norwegian Energy Company ASA (””Noreco””) has issued a parent company
guarantee on behalf of its subsidiary Norwegian Energy Company UK Ltd and Noreco Oil (UK) Limited. Noreco
guarantees that, if any sums become payable by Norwegian Energy Company UK Ltd or by Noreco Oil (UK) Limited
to the UK Secretary of State under the terms of the license and the company does not repay those sums on first
demand, Noreco shall pay to the UK Secretary of State on demand an amount equal to all such sums.
On 6 December 2007, Noreco issued a parent company guarantee to the Danish Ministry of Climate, Energy and
Building on behalf of its subsidiary Noreco Oil Denmark A/S and Noreco Petroleum Denmark A/S.
As a part of the transfer agreement signed 22 July 2011 for the sale of the Siri Field to DONG E&P A/S, Norwegian
Energy Company ASA issued a parent company guarantee in favour of Dong guaranteeing as primary obligor (in
Danish: som selvskyldnerkautionist) and not only as surety the fulfilment of any of the seller’s obligations under
the agreement. It is reasonable to believe that there will be no claims made against the guarantee although
formally there is no limitation period which means that usual 3 year prescription period as applicable under
Danish law will apply.
On 11 July 2011, the Norwegain Energy Company ASA issued a parent company guarantee in connection with
establishment of a USD 3 million overdraft facility in Nordea. The debitor is Noreco Oil Denmark A/S
On 31 December 2012, Norwegain Energy Company ASA issued a parent company guarantee on behalf of its
subsidiary Noreco Norway AS. Noreco guarantees that, if any sums become payable by Noreco Norway AS to
the Norwegian Secretary of State under the terms of the licenses and the company does not repay those sums
on first demand, Norwegain Energy Company ASA shall pay to the Norwegian Secretary of State on demand an
amount equal to all such sums.
On 19 March 2013, the Norwegain Energy Company ASA issued a parent company guarantee in connection with
establishment of a NOK 1,240 million exploration loan facility in Sparebank 1 - SR Bank. The debitor is Noreco
Norway AS.
On 6 December 2013, several subsidiaries in the Noreco group entered into Co-debitor guarantees related to
the refinancing of outstanding bonds at that time. These are unconditional and irrevocable Norwegian law on-
demand guarantee from the Guarantor securing the Obligor’s obligations when they have become due under the
Bond Agreement and any other Finance Document, including interest, cost and expenses, with payment by the
Guarantor to be made within 10 Business Days of any demand, such Guarantees to be qualified as required by
Danish law with respect to any Danish Guarantor.
27 Interest in jointly controlled assets
Interest in jointly controlled assets are included in the accounts by the gross method (partly consolidation),
based on the equity. The Group holds the following license equities on 31 December 2013:
License Country Field Equity
PL006C Norway 15.0 %
PL018DS Norway 13.3 %
PL048D Norway Enoch* 21.8 %
PL274 Norway Oselvar 15.0 %
PL274CS Norway 15.0 %
PL360 Norway 15.0 %
PL414 Norway 20.0 %
PL414B Norway 20.0 %
PL453S Norway 25.0 %
PL484 (O) Norway 30.0 %
PL490 Norway 20.0 %
PL492 Norway 20.0 %
PL519 Norway 20.0 %
PL591 Norway 40.0 %
PL591B Norway 40.0 %
PL599 Norway 20.0 %
PL606 Norway 40.0 %
PL616 Norway 20.0 %
PL620 Norway 25.0 %
PL624 Norway 15.0 %
PL634 Norway 30.0 %
PL639 Norway 15.0 %
PL646 Norway 20.0 %
PL701 (O) Norway 40.0 %
1/90 Denmark Lulita 28.2 %
16/98 Denmark Cecilie 61.0 %
4/95 Denmark Nini 30.0 %
7/86 Denmark 56.4 %
9/06 Denmark 12.0 %
9/95 Denmark 20.1 %
P1114 United Kingdom Huntington 20.0 %
P1666 United Kingdom 10.0 %
P1768 (O) United Kingdom 54.0 %
P1889 United Kingdom 22.5 %
P1934 (O) United Kingdom 100.0 %
P1989 (O) United Kingdom 50.0 %
P2003 United Kingdom 50.0 %
P2009 (O) United Kingdom 100.0 %
P2026 United Kingdom 50.0 %
P2032 (O) United Kingdom 15.0 %
(O) = A Group company is the operator
*The Enoch field located in the license PL048D is a separate joint venture in which Noreco participates with 4.36
percent equity interest
In connection with the granting of new licenses for exploration and production of oil and gas or when a PDO
is approved, the participants are obliged to fulfill certain commitments. Such commitments could be to drill a
number of wells, conduct seismic surveys or other commitments.
NotesNotes
132 Noreco Annual report 2013 Noreco Annual report 2013 133
28 Contingencies and commitments
Contingent assets
Zidane contingent payment
As part of the disposal of PL435 (the Zidane discovery), Noreco is entiteled to a contingent payment when a PDO
for the Zidane 2 discovey is approved by authorities. The payment will be linked to the volumes submitted in the
PDO. The contingent payment is not recognised in the accounts on 31 December 2013.
Insurance payments - Loss of production income (LOPI) etc.
The Group has several insurance claims related to production shut-ins of the fields Siri, Oselvar and Enoch which
are currently being evaluated by the insurance companies. Except for certain parts of the Siri claim which is not
considered a contingent asset, these items are not recognised in the accounts.
The Company continues to progress an insurance claim which is related to the damages to the Siri platform
that were discovered in 2009. This has taken more time than anticipated due to the technical complexity of
the claim. The total claim exceeds NOK 2 billion, of which NOK 359 million (USD 59 million) is recognised as a
current receivable on 31 December 2013. This amount relates to costs incurred to prevent further damage, and
loss of production income in 2009/2010. Based on technical documentation containing third party evaluations
and the insurance agreements, the Company remains firm that the booked claim is covered and will be settled
during the next twelve months. Thus the receivable is classified as a current receivable. The USD amount is
unchanged from 31 December 2012. Noreco has withdrawn the standstill agreement with the insurance com-
panies and has invited to negotiations regarding a settlement. Negotiations are still ongoing, but have so far not
led to a satisfactory solution for the case. As such Noreco filed the writ to the Danish courts on 14 February
2014. Negotiations continue in parallel with the legal process. See also note 2.9 for a description of the Group’s
applicable accounting principles, and note 4.2 b) regarding the necessary judgmental assessments.
Contingent liabilities
Huntington startup OPEX
The operator of the Huntington field has still not reached a final agreement with Teekay, the owner of the FPSO,
regarding some costs related to the startup phase of the field, which Teekay are claiming. The dispute is mainly
related to charter fees and certain operational costs for the period since commencement of production in April
2013 until August 2013. Both Noreco and the operator have not recognised a provision for these un-concluded
costs which amounts to maximum NOK 46 million (net Noreco share). Both parties are of the opinion that these
costs should not be paid in accordance with the current agreements .
Brage sale and abandonment guarantee
The Group sold its participating interest (12.2575 percent) in the Brage Unit to Core Energy AS in 2011, causing
a potential statutory liability with respect to Core Energy AS’ share of the decommissioning cost related to the
Brage installations, wells and other infrastructure which existed at the completion date of that license sale. The
liability materialises if Core Energy AS, as the primary obligor, fails to settle its liability for such decommissioning
costs. The Noreco Group could claim recourse from Core Energy AS.
Apart from the issues discussed above, the Group is not involved in claims from public authorities, legal claims
or arbitrations that could have a significant impact on the Company’s financial position or results.
Other commitments
At year end 2013 the Noreco group had the following commitments relating to exploration and production
wells for the year 2014-2016:
(NOK million) Number of wells Amount
Commitments exploration wells
Commitments exploration wells, Norwegian Continental Shelf 2267
Commitments exploration wells, UK Continental Shelf 128
Commitments exploration wells, Danish Continental Shelf 192
Total commitments exploration wells 4 387
Commitments production wells
Commitments production wells, Danish Continental Shelf 1 75
Total commitments production wells 1 75
Total commitments 5 462
The investment in producing wells is related to the drilling of an in-fill well on license 4/95 in Denmark. See further
information regarding subseqent events in note 32.
At year end Noreco did not have any well commitments for 2017 and beyond.
When purchasing a share of a license, the purchase price may consist of an obligation to carry certain of seller’s
costs in respect of seller’s retained license share (”Carry agreement”). Such an agreement obliges the purchaser
to pay the seller’s share of exploration and/or development costs, up to an agreed after-tax limit. Such agre-
ements are an alternative to cash settlement. At year end 2013, the company had entered six such agreements
(2012: four such agreements). All these agreements are related to the exploration licenses in UK.
NotesNotes
134 Noreco Annual report 2013 Noreco Annual report 2013 135
29 Operating leases
Operating leases
(NOK million)
Annual lease costs related to lease agreements
accounted for as operating leases 2013 2012
Office 15 13
Other (1) 43 9
Future minimum lease payments under non-cancellable
lease agreements 2013 2012
2013 -94
2014 107 103
2015 96 88
2016 86 82
2017 83 80
>2017 23 79
Total 394 526
(1) ”Other” is mainly relating to operational assets associated with the Huntington license. The FPSO (floating
production unit) Voyager Spirit is contracted to the Huntington field in which Noreco has a share through its
subsidiary Noreco Oil UK Ltd. The leasing contract is valid 5 years from 2013 (with options for extension).
30 Related party transactions
The Noreco Group did not have any transactions with any related parties during 2013 or 2012. Director’s fee
paid to shareholders and remuneration to management is descibed in Note 8.
31 Supplementary oil and gas information (unaudited)
The Group has reported oil, gas and NGL reserves according to the guidelines given in the Stock Exchange cir-
cular no. 1/2013. The report is included as a separate section in the annual report, see the section on annual
statement of reserves.
32 Subsequent events
On 21 January 2014, the repair share issue related to the refinancing in the fourth quarter 2013 was paid out
to the Company. The share issue was oversubscribed and new share capital amounts to NOK 100 million. 1 000
000 000 new shares were issued, and the total shares issued for the Company after this was 5 656 094 082.
On 4 February 2014, the operator of the Nini license in Denmark informed Noreco that the work related to the
new production well NB5 will be postponed, and will not be drilled in the first half of 2014 as planned. It is
expected that the well will be drilled in 2015. This information changes the projected cash flows related to the
Nini field, and the impairment test is adjusted for this. The reversal of previously recognised write-downs were
decreased by NOK 18 million related to this new information.
On 14 February 2014, Noreco issued 2 391 002 new shares at a price of NOK 0.14403 per share as part of
its employee incentive scheme. Following registration of the share capital increase, the total number of shares
issued in Noreco are 5 658 485 084, each with a nominal value of NOK 0.10.
On 19 February 2014, Noreco signed an agreement with Dong & RWE where Noreco agreed to transfer DKK 445
million to an escrow account that is pledged in favor of DONG and RWE. The escrow account will be the security
for abandonment obligation related to the Nini and Cecilie fields.
On 19 February 2014, Noreco became official participant in five new licenses on Norwegian continental shelf,
which was offered to the Company in the license round for 2013. The licenses PL761 and PL762 were awarded
to Noreco as the operator, while Noreco will be a partner in the licenses PL744S, PL748 and PL755.
136 Noreco Annual report 2013 Noreco Annual report 2013 137
STATUTORY
ACCOUNTS
2013
NORWEGIAN ENERGY COMPANY ASA
(PARENT COMPANY)
CONTENT
STATUTORY ACCOUNTS FOR NORWEGIAN ENERGY COMPANY ASA
Income statement
Balance sheet
Cash flow statement
Note 1 Accounting principles
Note 2 Investments in subsidiaries
Note 3 Restricted bank deposits
Note 4 Borrowings
Note 5 Current liabilities
Note 6 Derivatives
Note 7 Guarantees
Note 8 Shareholders’ equity
Note 9 Share capital and shareholder information
Note 10 Share-based compensation
Note 11 Payroll expenses, number of employees, remunerations, etc
Note 12 Tax
Note 13 Exploration expenses
Note 14 Other operating expenses and audit fees
Note 15 Related-party transactions
Note 16 Subsequent events
138 Noreco Annual report 2013 Noreco Annual report 2013 139
(All figures in NOK million) Note 2013 2012
ASSETS
Non-current assets
Financial non-current assets
Investments in subsidiaries 23 039 3 036
Loan to group companies 7,15 867 972
Restricted cash 3500 -
Total financial non-current assets 4 406 4 008
Total non-current assets 4 406 4 008
Current assets
Receivables
Accounts receivable -10
Tax refund 12 -1 339
Receivables from group companies 15 -10
Other current receivables 2 1
Total receivables 2 1 360
Financial current assets
Restricted cash 370 9
Bank deposits, cash and cash equivalents 329 365
Total financial current assets 399 374
Total current assets 401 1 734
Total assets 4 807 5 741
BALANCE SHEET
on 31 December
INCOME STATEMENT
for the year ended 31 December
(All figures in NOK million) Note 2013 2012
Revenue 15 - -
Total revenues - -
Exploration and evaluation expenses 13 -(825)
Personell expenses 10,11,15 (20) (100)
Other operating expenses 14 (13) (78)
Total operating expenses (33) (1 003)
Net operating result (33) (1 003)
Income from subsidiaries 2 2 10
Interest received from group companies 72 72
Interest income 23 19
Other financial income 127
Write-down of financial assets 2(444) (859)
Interest expenses to group companies (14) (47)
Interest expenses (432) (408)
Other financial expense (20) (46)
Net financial items (811) (1 233)
Result before tax (844) (2 236)
Income tax benefit/(expense) 12 -871
Net result for the year (844) (1 364)
Appropriation:
Allocated to/(from) other equity 8(527) 184
Covered with other paid-in capital 8(318) (14)
Covered by share premium 8 - (1 534)
Total appropriation (844) (1 364)
140 Noreco Annual report 2013 Noreco Annual report 2013 141
(All figures in NOK million) Note 2013 2012
EQUITY AND LIABILITIES
Equity
Paid in equity
Share capital 8,9 466 1 097
Share premium fund 81 007 1 018
Other paid-in capital 8764 -
Total paid in equity 2 237 2 115
Retained earnings
Other equity 8--
Total retained earnings - -
Total equity 2 237 2 115
Liabilities
Provisions
Deferred tax 12 24 -
Total provisions 24 -
BALANCE SHEET
as on 31 December
(All figures in NOK million) Note 2013 2012
Other non-current liabilities
Bond loans 41 939 1 804
Other interest bearing debt to group companies 15 0157
Total other non-current liabilities 1 939 1 961
Current liabilities
Bond loans 4541 976
Other interest bearing debt 4 0 573
Trade payables 42 8
Public duties payable 0 7
Debt to group companies 15 7 0
Other current liabilities 517 102
Total current liabilities 608 1 665
Total liabilities 2 571 3 627
Total equity and liabilities 4 807 5 741
Stavanger 25 March 2014
(Translation made for information purposes only.)
Erik Henriksen
Board member
Hilde Alexandersen
Employee Representative
David Gair
Board member
Bård Arve Lærum
Employee Representative
Svein Arild Killingland
CEO
Morten Garman
Chairman
Hilde Drønen
Board member
Marika Svärdström
Board member

Notes
Noreco Annual report 2013 143142 Noreco Annual report 2013
(All figures in NOK million) Note 2013 2012
Net result for the year (844) (1 364)
Income tax benefit/(expense) -(871)
Adjustments to reconcile result before tax to net
cash flows from operating activities:
Tax paid (11) -
Tax refunded 12 1 351 516
Depreciation and writedowns 2444 859
Write-downs dry wells - 649
Share-based payments 10 -10
Loss related to discontinued cash flow hedge 4 -
Unrealised loss/(gain) related to financial instruments 5 -
Loss on repurchase of bonds 3 -
Amortisation of borrowing expenses 62 34
Paid/received interests - net 366 361
Received interests 28 19
Change in working capital
Changes in accounts receivable 10 74
Changes in trade payables (9) (10)
Changes in other current balance sheet items (84) 35
Net cash flow from operations 1 325 309
CASH FLOW STATEMENT
for the year ended 31 December
(All figures in NOK million) Note 2013 2012
Cash flows from investment activities
Purchase of intangible assets - (506)
Purchase of shares in subsidiaries (0) (93)
Establishment of security account for abandonment obligation
in Denmark 3(570) -
Net cash flow used in investing activities (570) (599)
Cash flows from financing activities
Issue of share capital 8439 407
Paid issue cost (4) (18)
Proceeds from issue of long term debt 4300 500
Repayment of bonds - (649)
Proceeds from utilisation of exploration facility -597
Repayment of exploration facility 4(573) (454)
Change in loans from group companies (151) 312
Changes in loans to group companies (318) (95)
Repurchase own bonds (50) -
Interest paid (394) (380)
Paid borrowing cost (40) (58)
Net cash flow from (used in) financing activities (791) 162
Net change in cash and cash equivalents (36) (128)
Cash and cash equivalents at start of the year 364 492
Cash and cash equivalents at end of the year 329 364

NotesNotes
144 Noreco Annual report 2013 Noreco Annual report 2013 145
1 Accounting principles
The annual accounts for Norwegian Energy Company ASA (”Noreco” or ”the company”) have been prepared
in compliance with the Norwegian Accounting Act (”accounting act”) and accounting principles generally accep-
ted in Norway (”NGAAP”) as of 31 December 2013.
Use of estimates
The preparation of financial statements in compliance with the Accounting Act requires the use of estimates.
The application of the company’s accounting principles also require management to apply judgment. Areas,
which to a great extent contain such judgments, a high degree of complexity, or areas in which assumptions
and estimates are significant for the financial statements, are described in the notes.
Revenues
Income from sale of services are recognised at fair value of the consideration, net after deduction of VAT.
Services are recognised in proportion to the work performed.
Classification of balance sheet items
Assets intended for long term ownership or use have been classified as fixed assets. Receivables are clas-
sified as current assets if they are to be repaid within one year after the transaction date. Similar criteria apply
for liabilities. First year’s installment on long term liabilities and long term receivables are classified as current
liabilities and assets.
For interest bearing debt where the company is required to be in compliance with financial covenants, the
loans are classified as current liabilities if Noreco is in breach with the covenants to that extent that the loan
would be payable on the demand of the creditor. If a waiver is agreed with the creditor prior to approval of
these financial statements, the classification is carried forward in accordance with the payment schedule of
the initial borrowing agreement.
Investments in subsidiaries
For investments in subsidiaries, the cost method is applied. The cost price is increased when funds are added
through capital increases or when group contributions are made to subsidiaries. Dividends received are initially
taken as income. Dividends exceeding the portion of retained profit after the aquisition are reflected as a
reduction in costprice. Dividend/group contribution from subsidiaries are reflected in the same year as the
subsidiary makes a provision for the amount.
Asset impairments
Impairment tests are carried out if there is indication that the carrying amount of an asset exceeds the esti-
mated recoverable amount. The test is performed on the lowest level of fixed assets at which independent
cashflows can be identified. If the carrying amount is higher than both the fair value less cost to sell and reco-
verable amount (net present value of future use/ownership), the asset is written down to the highest of fair
value less cost of disposal and the recoverable amount.
Previous impairment charges are reversed in later periods if the conditions causing the write-down are no lon-
ger present.
Debtors
Trade debtors are recognised in the balance sheet after provision for bad debts. The bad debt provision is
made on basis of an individual assessment of each debtor and an additional provision is made for other deb-
tors to cover expected losses. Significant financial problems at the customers, the likelihood that the customer
will become bankrupt or experience financial restructuring and postponements and insufficient payments, are
considered indicators that the debtors should be written down.
Other debtors, both current and long term, are recognised at the lower of nominal and net realisable value.
Net realisable value is the present value of estimated future payments. When the effect of a writedown is
insignificant for accounting purposes this is, however, not carried out. Provisions for bad debts are valued the
same way as for trade debtors.
Foreign currencies
Assets and liabilities in foreign currencies are valued at the exchange rate on the balance sheet date.
Exchange gains and losses relating to sales and purchases in foreign currencies are recognised as other finan-
cial income and other financial expenses.
Derivatives
Noreco enters into interest rate swap agreements to secure a fixed interest rate on the company’s loans with
floating interest rate when considered necessary. The accounting rules for cash flow hedging are applied for
these instruments. The derivatives are carried at fair value at the time of initial recognition, and recognised at
fair value on each following reporting dates. The change in fair value is recognised in the equity as long as the
hedge is effective. Ineffectiveness is recognised as other financial items in the income statement.
When a hedging instrument expires, or is sold, or no longer meets the criteria for hedge accounting, any gain
or loss accumulated in equity at that time remains within equity and is recognised when the forecast transac-
tion is ultimately recognised in the income statement. If a forecast transaction is no longer expected to occur,
the cumulative gain or loss that was reported in equity is immediately transferred to the income statement
within ‘other operating expenses’.
As of 31 December 2013 the major part of the company’s debt have fixed interests rates. See note 6 for
details.
Recognised unrealised loss is classified as current liabilities, unrealised gain is classified as current receivables.
Bonds and other debt to financial institutions
Borrowings are recognised at fair value when the loan is granted with deduction for transaction expenses. For
the following periods, the loans are carried at amortised cost by applying the effective interest method. The
difference between received facility amount (less transaction expenses) and the final settlement amount is
expenses in the income statement during the lifetime of the loan as part of the effective interest cost.
Compound financial instruments issued by the company comprise convertible notes that can be converted to
share capital at the option of the holder, and the number of shares to be issued does not vary with changes
in their fair value.
The liability component of a compound financial instrument is recognised initially at the fair value of a similar
liability that does not have an equity conversion option. The equity component is recognised initially as the
difference between the fair value of the compound financial instrument as a whole and the fair value of the
liability component. Any directly attributable transaction costs are allocated to the liability and equity compo-
nents in proportion to their initial carrying amounts. Subsequent to initial recognition, the liability component
of a compound financial instrument is measured at amortised cost using the effective interest method. The
equity component of a compound financial instrument is not re-measured subsequent to initial recognition.
Gains or losses arising from repurchases of the company’s bond debt are recognized as financial income or
financial expense. The gain or loss is calculated as the difference between the fair value paid at the time of
the repurchase and the amortised cost.
NotesNotes
146 Noreco Annual report 2013 Noreco Annual report 2013 147
The Company’s bond debt was restructured in December 2013. See note 4.2 for description of the applied
accounting princples.
Borrowings are classified as current liabilities unless the company has an unconditional right to defer settle-
ment of the liability for at least 12 months after the end of the reporting period.
Other liabilities
Liabilities, with the exception of certain liability provisions, are recognised in the balance sheet at nominal
amount.
Taxes
The tax in the income statement includes payable taxes for the period, refundable tax and changes in defer-
red tax. Deferred tax is calculated at relevant tax rates on the basis of the temporary differences which exist
between accounting and tax values, and any carryforward losses for tax purposes at the year-end. Tax enhan-
cing or tax reducing temporary differences, which are reversed or may be reversed in the same period, have
been eliminated. The disclosure of deferred tax benefits on net tax reducing differences which have not been
eliminated, and carryforward losses, is based on estimated future earnings. Deferred tax and tax benefits
which may be shown in the balance sheet are presented net.
Tax reduction on group contributions given and tax on group contribution received, recorded as a reduction of
cost price or taken directly to equity, are recorded directly against tax in the balance sheet (offset against
payable taxes if the group contribution has affected payable taxes, and offset against deferred taxes if the
group contribution has affected deferred taxes).
Deferred tax is reflected at nominal value.
Cash flow statement
The cash flow statement has been prepared according to the indirect method. Cash and cash equivalents
include cash, bank deposits, and other short term investments which immediately and with minimal exchange
risk can be converted into known cash amounts, with due date less than three months from purchase date.
2 Investment in subsidiaries
Investments in subsidiaries are booked according to the cost method.
(NOK million)
Subsidiaries Location
Ownership/
voting right
Equity
31.12.13
Net income
2013 Book value
Altinex ASA Stavanger 100 % 1 210 (14) 2 410
Norwegian Energy Company UK Ltd Great Britain 100 % 236 (17) 285
Noreco Petroleum UK Ltd Great Britain 100 % 374 27 344
Book value 31 December 2013 3 039
The investment in Altinex ASA has been written down by NOK 444 million in 2013 (NOK 859 million in 2012).
The write-down relates to impairment of assets controlled by Altinex ASA. The impairment relates to reduced
reserves for producing fields as a result of production in 2013 and revised estimates on future production, not
satisfactory progress on previously capitalised discoveries, relinquished licenses and change in currency rates.
The write-downs can be fully or partly reversed should the recoverable amount of the business owned by Altinex
ASA be strengthened.
Norwegian Energy Company ASA has received NOK 2 million as group contribution from Altinex ASA for the
financial year 2013.
3 Restricted bank deposits
(NOK million) 2013 2012
Deposit office rental - 2
Withheld employee taxes - 7
Restricted cash pledged as security for abandonment obligation in Denmark (1) 500 -
Restricted cash which can only be used for collateral for abandonment obligation
or repayments to bondholders 70 -
Total restricted bank deposits 570 9
(1) Norwegian Energy Company ASA maintains a Debt Service Reserve Account which will be used as security
for covering the abandonment obligation in Denmark related to the Cecilie and Nini field (DKK 500 million).
In February 2014 an agreement was reached with Dong & RWE where Noreco agreed to transfer DKK 445
million to an escrow account that is pledged in favor of DONG and RWE.
NotesNotes
148 Noreco Annual report 2013 Noreco Annual report 2013 149
4 Borrowings
4.1 Summary of borrowings
(NOK million) 2013 2012
Non-current debt
Bond loan NOR04 - 1 222
Bond loan NOR06 402 267
Bond loan NOR07 -315
Bond loan NOR10 1st Lien 829 -
Bond Loan NOR11 2nd Lien 502 -
Bond Loan NOR12 Convertible 206 -
Total 1 939 1 804
Current debt
Bond loan NOR05 -682
Bond loan NOR06 80
Bond loan NOR08 -293
Bond loan NOR10 1st Lien 461 -
Exploration loan -573
Total 541 1 548
Total borrowings 2 481 3 352
4.2 The Refinancing
Refinancing of debt and calculation of impact from refinancing
The Company’s bond debt was restructured in December 2013. Due to substantial modification of terms the
refinancing has been accounted for as a partly remission of debt. The old bonds were derecognised in
December 2013 and the new bond structure was recognised as new borrowings at fair value at the time of
issue, in a accordance with the transaction principle. The convertible bond includes both a liability component
and an equity component. The value of the liability component has been determined using a comparable loan
with no conversion features. The equity component is the residual between the fair value of the bond, and the
calculated value of the liability component.
The refinancing process was completed as a consequence of the company’s financial distress and lack of
ability to pay current liabilities. Impact relating to the difference between the book value of the old bonds at
the date of derecognition (9 December 2013), and the fair value of the new loans, is for accounting purposes
considered remission of debt. In accordance with NGAAP guidance, the impact from the refinancing should
therefore be recognised directly through equity. Any tax impacts resulting from the refinancing is also recogni-
sed directly in equity.
Transaction costs of NOK 47 million incurred in the process is treated as costs relating to settlement of the
old debt and is included in the calculation.
Specification of the equity impact due to the refinancing
(NOK million) 2013
Book value of old bonds on the time of derecognition: 3 058
Fair value of new bonds at time of issue 2 489
Difference 569
Transaction cost (47)
Equity component of convertible bond 16
Tax impact 22
Impact from refinancing (net of tax) 517
See note 23.2 to the Group Annual Report for further details relating to the refinancing.
4.3 Covenants
Covenants relating to interest bearing debt outstanding on 31 December 2013
All the New Bonds shall be subject to the same covenants. The covenants are in line with what is considered
customary in the Norwegian high yield bond market. A general liquidity requirement in the amount of NOK 100
million at Noreco group level apply, as well as incurrence based covenants on significant asset disposals and
new financial indebtedness, which are only permitted if the Noreco group gearing ratio (net interest-bearing
debt to EBITDAX, with the X only relating to exploration activity on the Norwegian continental shelf) is less than
3.5 x. The Group is in compliance with the covenants on 31 December 2013.
Covenants relating to interest bearing debt outstanding on 31 December 2012
The bond loans had the following two financial covenants: The group shall maintain an equity ratio of minimum
25 percent. And the group shall maintain a gearing-ratio of less than 5.0. Equity ratio was defined as the book
equity of the group divided with total assets.
During 2012 and 2013 the gearing ratio exceeded this threshold, and a waiver was agreed with the bondhol-
ders. N--GAAP does not contain the same rules which required the reclassification of NOR04, NOR06 and
NOR07 as short-term liabilities in the consolidated financial statements in accordance with IFRS. See note 23
to the Group Annual Report for additional information.
NotesNotes
150 Noreco Annual report 2013 Noreco Annual report 2013 151
4.4 Payment structure
Repayment structure - all interest bearing debt on 31 December
Year (NOK million) NOR06 NOR10 NOR11 NOR12 2013 2012
2013 - 1 573
2014 100 500 600 1 430
2015 100 500 600 180
2016 150 399 549 240
2017 250 100 350 -
2018 200 447 647 -
2019 445 445 -
Total 600 1 399 745 447 3 191 3 423
Repayment amounts are stated at their principal amount. In 2018 the repayment of the convertible bond is
included with NOK 447 million which will be the principal amount of this bond if all interests are paid in kind.
Average interest - external financing
(NOK million) 2013 2012
Interest cost (432) (408)
Average interest bearing debt 2 916 3 367
Average interest for all interest bearing debt 14.82 % 12.11 %
The interest cost includes all arrangement fees and other borrowing cost that are included in the calculation
of the effective interest.
The interest rates for the bond loans are fixed over the term of the bond.
4.5 Assets pledged as security for interest bearing debt
Specification of assets pledged as securities as of 31 December
(NOK million) 2013 2012
Collateralised debt (book value)
Bond loans (1) 2 275 1 804
Exploration loan -573
Total collateralised debt 2 275 2 376
Capitalised value in the consolidated accounts of assets pledged as securities
Shares in subsidiaries (1) 2 695 2 841
Tax receivable -618
Total capitalised value 2 695 3 459
(1) The Bond loan NOR10 1st lien is secured with pledge in licenses owned by Noreco Oil Denmark A/S (the com-
pany holds the title to a number of assets in Denmark, including the producing Nini, Nini East, Lulita and Cecilie
assets), licenses owned by Noreco Petroleum Denmark A/S (the company is a holder of licenses in Denmark,
such as the Cecilie and Lulita fields and the Amalie discovery) and licenses in Noreco Oil (UK) Ltd (the Huntington
field on UK sector) and also the project agreements relating to these licenses. Further the bond is secured with
pledge in the earnings accounts relating to Noreco Oil Denmark AS, Noreco Petroleum Denmark AS and Noreco
Oil (UK) Ltd, Noreco Oil (UK) Ltd’s goodwill and uncalled capital and the company’s property, assets, rights and
revenues (present and future). In addition to guarantees, intra group loans held by the three above mentioned
companies and the shares in Noreco Oil Denmark A/S, Noreco Oil (UK) Ltd and Noreco Petroleum Denmark A/S.
Book value of the shares in Noreco Oil Denmark A/S is USD 197 million, Noreco Oil (UK) Ltd USD 25 million,
and in Noreco Petroleum Denmark A/S USD 5 million.
The bond loan NOR06 is secured with pledge in licenses owned by Noreco Norway AS (the company holds all of the
Group’s Norwegian licenses, including the Oselvar and Enoch producing assets), project proceeds relating to the
Oselvar license, insurance proceeds directly deriving from any damage to equipment and/or property in respect of
the Oselvar license and Norwegian law on-demand guarantees issued by Noreco Norway AS. Further intra group
loans made by Noreco Norway AS, the Noreco Norway earnings account are pledged as security for the loan in
addtion to the shares in Noreco Norway AS. The shares in Noreco Norway AS is held by Altinex ASA and has a book
value of NOK 819 million at 31 December 2013. The loan has in addition second lien security in the same assets
with substantially the same terms as the Bond loan NOR10.
The bond loan NOR11 is also secured with second lien security in the same assets with substantially the same
terms as the Bond loan NOR10.
Bond loan NOR04 outstanding on 31 December 2012
The parent company’s investments in Altinex ASA and Noreco Petroleum (UK) ltd are pledged as security for the
NOR04 bond. The shares have a book value of NOK 2.8 billion on 31 December 2012. The Danish holding company,
Noreco Denmark A/S (prev. Geopard AS) has pledged the shares in Noreco Oil Denmark A/S, and its investments
in Noreco Petroleum Denmark A/S and Noreco Oil UK Ltd. The investments in Noreco Oil Denmark A/S had a book
value of NOK 1.1 billion on 31 December 2012.
See Note 23 to the Group Annual Report for additional details on the outstanding loans.
NotesNotes
152 Noreco Annual report 2013 Noreco Annual report 2013 153
5 Current liabilities
(NOK million) 2013 2012
Liabilities to operators relating to joint venture licenses -12
Derivatives (ref. note 6) 410
Accrued interest 10 47
Outstanding salaries/bonuses 130
Other current liabilities 2 4
Total other current liabilities 17 102
6 Derivatives
In 2012 the Company had entered into interest rate swap agreements to secure a fixed interest for most of
the company’s loans with floating interest. The agreements match the critical terms of the loan agreements,
as such hedge accounting is applied. The interest rate swap agreements are carried at fair value in the balance
sheet, and the effective part of the change in fair value is recognised within equity. Ineffectiveness is recogni-
sed through ordinary profit or loss.
Change in fair value of the hedging instruments which is recognised through equity during 2013 amount to NOK
5 million. The hedge accounting for the interest rate swaps agreements ceased in 2013 as the underlying debt
were refinanced. As a consequence, all impacts in equity relating to hedge accounting were reclassified from
equity to other operating expenses in the income statements. A total amount of NOK 4 million was reclassified
(ref. note 8). The remaining interest swap agreement is carried at fair value thourgh ordinary profit and loss.
As of 31 December 2013 the Company holds the following interest rate swap agreements
Derivatives held for trading
(NOK million)
Notional
principal Receive Pay Maturity
Fair value
31.12.13
NOR07 325 NOK (1) 3M NIBOR 2.58 % 27.04.16 (4)
Total book value (4)
As of 31 December 2012 the Company held the following interest rate swap agreements
Derivatives held for trading
(NOK million)
Notional
principal Receive Pay Maturity
Fair value
31.12.12
NOR07 700 NOK 3M NIBOR 2.53 % 06.12.13 (5)
NOR07 325 NOK (1) 3M NIBOR 2.58 % 27.04.16 (5)
Total book value (10)
(1) The notional amounts is agreed to be adjusted in line with the repayments schedule of the hedge loan.
Change in fair value of the hedging instruments not recognised through profit or loss amounts to a loss of NOK 10
million on 31 December 2012. The fair value of the swap agreements are collected from the Company’s bank and
is based on the present value of the future net settlements calculated with the market’s expectation of development
in the interest level.
7 Guarantees
Overview of issued guarantees on 31 December 2013
The parent company of the Group Norwegian Energy Company ASA has issued a parent company guarantee
on behalf of its subsidiary Norwegian Energy Company UK Ltd and Noreco Oil (UK) Limited. Noreco guarantees
that, if any sums become payable by Norwegian Energy Company UK Ltd or by Noreco Oil (UK) Limited to the
UK Secretary of State under the terms of the license and the company does not repay those sums on first
demand, Noreco shall pay to the UK Secretary of State on demand an amount equal to all such sums.
On 6 December 2007, Norwegian Energy Company ASA issued a parent company guarantee to the Danish
Ministry of Climate, Energy and Building on behalf of its subsidiary Noreco Oil Denmark A/S and Noreco
Petroleum Denmark A/S.
As a part of the transfer agreement signed 22 July 2011 for the sale of the Siri Field to DONG E&P A/S
Norwegian Energy Company ASA issued a parent company guarantee in favour of Dong guaranteeing as primary
obligor (in Danish: som selvskyldnerkautionist) and not only as surety the fulfilment of any of the seller’s obli-
gations under the agreement. It is reasonable to believe that there will be no claims made against the gua-
rantee although formally there is no limitation period which means that usual 3 year prescription period as
applicable under Danish law will apply.
On 11 July 2011 the Norwegian Energy Company ASA issued a parent company guarantee in connection with
establishment of a USD 3 million overdraft facility in Nordea. The debitor is Noreco Oil Denmark A/S
On 31 December 2012, Norwegian Energy Company ASA issued a parent company guarantee on behalf of its
subsidiary Noreco Norway AS. Noreco guarantees that, if any sums become payable by Noreco Norway AS to
the Norwegian Secretary of State under the terms of the licenses and the company does not repay those sums
on first demand, Noreco shall pay to the Norwegian Secretary of State on demand an amount equal to all such
sums.
On 19 March 2013 the Norwegian Energy Company ASA issued a parent company guarantee in connection with
establishment of a NOK 1 240 million exploration loan facility in SR-Bank. The debitor is Noreco Norway AS.
See also note 16 for information regarding guarantees issued in 2014.
NotesNotes
154 Noreco Annual report 2013 Noreco Annual report 2013 155
8 Shareholders’ equity
Changes in equity
(NOK million)
Share
capital
Share
premium
reserve
Other
paid-in
equity
Other
equity Total
Equity 31 December 2012 1 097 1 018 - - 2 115
Proceeds from share issued 437 2439
Share issue cost - (13) (13)
Capital reduction (1) (1 068) 1 068 -
Impact from refinancing (net of tax)
(ref note 4.2) - 517 517
Options cost 13 13
Change in fair value of hedging instruments 5 5
Discontinued cash flow hedge 4 4
Appropriation of loss for the year (318) (527) (844)
Equity 31 December 2013 466 1 007 764 - 2 237
(1) The capital reduction was approved by an extraordinary general meeting 15 November 2013 and was finally
executed at 31 December 2013 when the notice period for the creditors were expired. The capital decrea-
se was registered at the Company register at 3 January 2014.
9 Share capital and shareholder information
2013 2012
Ordinary shares 4 656 094 082 353 831 111
Total shares 4 656 094 082 353 831 111
Par value (NOK 1) 0.10 3.10
The Group does not own any of its parent company shares. All shares have equal rights.
Changes in number of shares and share capital:
(NOK million) No. of shares Share Capital
Share capital on 1 January 2012 243 842 914 756
Share issue November 2012 108 108 108 335
Repair share issue November 2012 1 038 010 3
Share issue employees 842 079 3
Share capital on 31 December 2012 353 831 111 1 097
(NOK million) No. of shares Share Capital
Share capital on 1 January 2013 353 831 111 1 097
Share issue employees on 14 January 2013 1 814 206 6
Share issue employees on 18 March 2013 448 778 1
Share issue on 4 December 2013 4 299 999 987 430
Capital reduction on 31 December 2013 - (1 068)
Share capital on 31 December 2013 4 656 094 082 466
Changes in 2013
On 14 January 2014 Noreco issued 1 814 206 employee incentive scheme shares.
On 18 March 2013 Noreco issued 448 778 new shares to its employees in connection with bonus reward for 2012.
On 4 December 2013 Noreco issued 138 709 677 A-shares at par value NOK 3.10. The A-shares was automa-
tically converted to ordinary shares simultaneously with the completion of the share capital reduction through
a reduction of nominal value from NOK 3.10 to NOK 0.10, through a share split in which each of the A-shares
were split and converted to 31 ordinary shares of totally 4 299 999 987 ordinary shares.
The share capital reduction was formally approved on 31 December 2013 after the creditor period resulting in
a reduction of share capital of NOK 1 068 million.
Changes in 2014
On 21 January 2014 the repair share issue related to the refinancing in the fourth quarter 2013 was paid out
to the Company.
On 14 February 2014 Noreco issued new shares as part of its employee incentive scheme. Following registra-
tion of the share capital increase the total number of shares issued in Noreco are 5 658 485 084, each with
a nominal value of NOK 0.10. See note 16 for further information.
Existing mandates
In 2013 the Board of Directors was granted a mandate by the General Meeting to issue up to 7 000 000 shares
to the employees. The mandate expires on 1 June 2014. The mandate has been utilised once, when 2 391 002 shares
were issued in February 2014 as part of the bonus scheme. The remaining mandate is 4 608 998 shares.
The above-mentioned mandates replace all previously granted mandates relating to the issuing of shares.
Overview of shareholders at 12 March 2014:
Name Shareholding Ownership share
SABARO INVESTMENTS 1 536 354 828 27.15 %
IKM INDUSTRI-INVEST 1 029 470 893 18.19 %
MP PENSJON PK 204 516 300 3.61 %
OM Holding AS 159 615 900 2.82 %
ALTO HOLDING AS 90 000 000 1.59 %
CITIBANK, N.A. S/A IF SKADEFORSAKRI 56 608 700 1.00 %
VERDIPAPIRFONDET DNB 50 748 746 0.90 %
AWILCO INVEST AS 49 999 900 0.88 %
BD TRADING AS 41 850 000 0.74 %
CARE HOLDING AS 41 850 000 0.74 %
JFH FINANS AS 40 000 000 0.71 %
Goldman Sachs 36 998 500 0.65 %
IMPORTER AS 34 000 000 0.60 %
NORDNET PENSJONSFORS 30 396 101 0.54 %
LYSE ENERGI AS 27 701 514 0.49 %
NORDNET BANK AB 26 568 509 0.47 %
ANKO INVEST AS 26 183 000 0.46 %
HAMNINGBERG HOLDING 26 000 000 0.46 %
MORGAN STANLEY & CO 21 488 755 0.38 %
PEDERSEN ATLE SANDVIK 20 682 852 0.37 %
Total 3 551 034 498 62.76 %
Other owners (ownership <0.37 %) 2 107 450 586 37.24 %
Total number of shares 5 658 485 084 100 %
NotesNotes
156 Noreco Annual report 2013 Noreco Annual report 2013 157
10 Share-based compensation
The Group has an option programme established in January 2008. The principles in this programme were
approved by the extraordinary general meeting in January 2008. The purpose of the programme is to establish
a long-term incentive programme for employees.
Share options are granted annually by the Board. The options will be fully acquired after three years and expire
after five years. The options will according to plan be settled when the shares are issued.
In addition, the Group has an agreement where employees have an option to purchase shares equivalent to
up to 50 percent of their bonus at the payment date. Employees who retain these shares for two years, and
are still employed in Noreco by the expiration of the two-year period, will be granted an option to receive addi-
tional shares at a one-to-one basis.
Fair value of the option is calculated by external advisors using the Black and Scholes Merton option pricing
model. Inputs to the option pricing modelI is for instance grant date, exercise price, expected exercise date,
volatility and risk free rate.
Historic volatility in the Noreco shares has been used to estimate volatility. The share price for the first 12
months after listing on the stock exchange has been left out of the estimation, as the share price usually has
an abnormal volatility in the initial phase, before stabilizing. Fair value of the options is measured at the grant
date and is expensed linearly over the contribution time. The cost is booked in the company of the employee.
Outstanding share options and bonus shares
Total share options and bonus shares outstanding on 1 January 2012 5 328 172
Share options granted in 2012 4 279 387
Bonus shares granted in 2012 -
Share options forfeited in 2012 (515 382)
Bonus shares forfeited in 2012 (128 181)
Outstanding on 31 December 2012 8 963 996
Share options granted in 2013 8 297 299
Bonus shares granted in 2013 448 778
Share options forfeited in 2013 (4 675 126)
Bonus shares forfeited in 2013 (229 560)
Outstanding on 31 December 2013 12 805 387
By the end of 2013 and 2012 no employees with share options were employed in Norwegian Energy Company ASA.
Grants Exercise price
Outstanding
share options and
bonus shares
at 31.12.13
Average
remaining
Contractual
term
Weighted
average
exercise price
Granted bonus shares in 2013 0.00 387 167 1.17 -
Share options programme 2008 33.00 - - -
Share options programme 2009 11.01 1 126 912 0.17 11.01
Share options programme 2010 17.00 630 596 1.17 17.00
Share options programme 2011 14.85 1 167 910 2.26 14.85
Share options programme 2012 8.04 2 806 129 3.19 8.04
Share options programme 2013 4.11 6 686 673 4.18 4.11
Total 12 805 387 3.20 7.07
Effect of outstanding options in financial statements:
(NOK million) 2013 2012
Personal expenses 010
As there are no employees in the Company and all employees in the plan are employeed in subsidiaries of the
Company, options costs related to the employees in the plan are allocated to the company where they are
employeed. As a consequence, there are no share based payment expenses in the income statement for
2013. In 2012 the expense amounted to NOK 10 million in the parent company (see note 15 for details on
sale of business). In the annual report for Norwegian Energy Company ASA, the cost is debited investments in
shares and credited other paid-in equity. The total equity effect of the share options programme was NOK 13.1
million for 2013 against NOK 13.3 million in 2012.
Social security tax
Social security tax is booked progressively at the reporting intervals if the share price is higher than the exer-
cise price. The social security tax is recorded together with the expense in the company where the employees
are employeed.
Summary of assumptions and data for valuation of the options programme:
(NOK million) 2013 2012
Share price at grant date (NOK) 3.90 8,04
Volatility 60.0 % 64.2 %
Expected life span options (year) 4 4
Risk free interest 1.55 % 1.8 %
Fair value at grant date (NOK) 2.31 4.13
NotesNotes
158 Noreco Annual report 2013 Noreco Annual report 2013 159
11 Payroll expenses, number of employees,
remunerations, etc
Payroll expenses
(NOK million) 2013 2012
Salaries (1) (107)
Social security tax (0) (16)
Pensions costs -(14)
Costs relating to share-based payments -(10)
Salaries from other group companies (19) 22
Other personell expenses (0) (2)
Manhours sold to own operated licenses -27
Total (20) (100)
Average number of man-years 0 61
See note 8 in the Group Annual Report for further information on compensation to key management and the board
of directors etc.
12 Tax
Income tax
(NOK million) 2013 2012
Tax refundable -1 350
Changes in deferred tax -51
Changes in deferred tax benefit -(525)
Changes in deferred tax benefit - not recognised - -
Changes regarding previuos years -(4)
Effect of change in tax rate - -
Income tax expense (benefit) - 871
The company does not have any income tax relating to the ordinary activity in 2013. Impacts from the refinancing
has been recognised in equity, net of any related tax effects. See note 4.2 for additional information.
Basis for tax refund:
(NOK million) 2013 2012
Result before tax -2 236
Financial items -(379)
Permanent differences -(850)
Changes in temporary differences (exclusing financial
items) -(154)
Onshore expenses -(24)
Non exploration expenses - Offshore -(38)
Basis for refund - 78 % -792
Tax refund - 618
Discontinuation of E&P activity:
(NOK million) 2013 2012
Loss carry forward - 28 % offshore -2 408
Loss carry forward - 50 % offshore -94
Refund related to discontinuing E&P activity - 721
Total tax refund - 1 339
On 31 December 2012, Norwegian Energy Company ASA completed the planned and previous announced trans-
fer of its petroleum activity to Noreco Norway AS, with the effect that from the expiry of the same date, all related
assets, contracts and personnel have been transferred to this subsidiary. Noreco Norway AS thereby became
owner of all the group’s licenses on the Norwegian continental shelf. The ultimate parent company, Norwegian
Energy Company ASA, has thereby discontinued its direct petroleum activities, and as such, it has claimed pay-
ment from the Norwegian government for the tax value of its uncovered losses pursuant to Norwegian Petroleum
Taxation Act section 3(c)(4). Tax refund for 2012 of NOK 1 351 million was received in December 2013.
NotesNotes
160 Noreco Annual report 2013 Noreco Annual report 2013 161
Reconsiliation of nominal to actual tax rate:
(NOK million) 2013 2012
Result before tax (844) (2 236)
Tax portion of income (loss) before tax - 28 % (236) 559
Tax portion of income (loss) before tax - 50 % -1 118
Sum calculated tax expense (236) 1 677
Tax free portion from sale of non-current assets / transactions before tax - -
Effect of financial items -(197)
Permanent differences 121 (633)
Changes in deferred tax benefit - not previously recognised 118 -
Other items (3) 25
Income tax benefit (0) 871
Deferred tax and deferred tax assets:
(NOK million) 2013 2012
Net operating loss deductible 530 91
Fixed assets - -
Curren assets 4 -
Liabilities (622) (61)
Basis of deferred tax / deferred tax asset (88) 30
Net deferred tax / (deferred tax asset) (2013: 27%, 2012: 28%) 24 (8)
Unrecognised deferred tax asset 8
Deferrd tax / (deferred tax asset) recognised 24 -
Recognised deferred tax asset - -
Recognised deferred tax asset 2 4 -
13 Exploration expenses
(NOK million) 2013 2012
Acquisition of seismic data, analysis and general G&G costs -(102)
Exploration wells capitalised in previous years -(139)
Dry exploration wells this period -(510)
Other exploration and evaluation costs -(74)
Total exploration and evaluation expenses - (825)
14 Other operating expenses and audit fees
Specification of other operating expenses
(NOK million) 2013 2012
Lease expenses -(12)
IT expenses 0(22)
Travel expenses (0) (4)
General and administrative costs (0) (4)
Consultant fees (7) (44)
Other operating expenses (2) (3)
Other operating expenses charged to own operated licenses -12
Loss on discontinued hedge (4) -
Loss on sale of assets -(1)
Total other operating expenses (13) (78)
Expensed audit fee
(NOK million) 2013 2012
Statutory audit (incl. technical assistance with financial statements) (2) (1)
Other assurance services (0) (1)
Other assistance (2) (1)
Total audit fees (4) (3)
VAT is not included in the audit fee.
NotesNotes
162 Noreco Annual report 2013 Noreco Annual report 2013 163
15 Related party transactions
Transactions with group companies
(NOK million) 2013 2012
a) Sales of services -34
b) Purchases of services 19 9
c) Sale of assets -614
Interest income and interest expenses to group companies are presented seperately in the income statement.
Services are charged between group companies at an hourly rate which corresponds to similar rates between
independent parties. The revenue is registered as a cost reduction since operationally it is considered cost
sharing.
Balances with group companies
Balances with group companies are stated on the face of the balance sheet and are all related to 100 percent
controlled subsidiaries.
Remuneration to executives
Remuneration to executives is disclosed in note 8 to the Group annual report.
Sale of assets
With effect from end of the day 31 December 2012 all licenses, personell and other activities in Norwegian
Energy Company ASA were sold to the subsidiary Noreco Norway AS. The consideration of NOK 614 million
is based on arms length principles. Statement in accordance with Norwegian Private Public Limited Liability
Companies Act §3-8 is prepared. Noreco Norway AS is a 100% owned subsidiary of Altinex ASA which is a 100
percent owned subsidiary of Norwegian Energy Company ASA.
In addition to rights, personell and other oil and gas activity the transactions included the following licenses.
License Equity License Equity
PL 006C 15.0 % PL 520 50.0 %
PL048C 21.8 % PL 525 100.0 %
PL 360 15.0 % PL 563 20.0 %
PL 360B 15.0 % PL 591 40.0 %
PL 385 20.0 % PL 599 20.0 %
PL 414 20.0 % PL 606 40.0 %
PL 414B 20.0 % PL 616 20.0 %
PL 440S 12.0 % PL 620 25.0 %
PL 453S 25.0 % PL 621 25.0 %
PL 471 30.0 % PL 624 15.0 %
PL 484 40.0 % PL 634 30.0 %
PL 490 20.0 % PL 639 15.0 %
PL 492 20.0 % PL 646 20.0 %
PL 519 20.0 %
The sale has been settled by establishment of an agreement of seller’s credit.
For accounting purposes, the transfer is not treated as a ’transaction’ and consequently the difference between
consideration and book value of net sold assets is not a realised gain. The difference (continuity difference) is
treated as an adjustment of the book value of the shares investment in Altinex ASA. Choice of accounting method
for the transfer is based on an assessment of sellers ownership of buyer, who is the actual decision maker and
that the total assets sold are considered to be a business.
16 Subsequent events
On 21 January 2014 the repair share issue related to the refinancing in the fourth quarter 2013 was paid out
to the Company. The share issue was oversubscribed and new share capital amounts to NOK 100 million.
1 000 000 000 new shares were issued, and the total shares issued for the Company after this was 5 656
094 082.
On 14 February 2014 Noreco issued 2 391 002 new shares at a price of NOK 0.14403 per share as part of
its employee incentive scheme. Following registration of the share capital increase the total number of shares
issued in Noreco are 5 658 485 084, each with a nominal value of NOK 0.10.
On 19 February 2014 Noreco signed an agreement with Dong & RWE where Noreco agreed to transfer DKK
445 million to an escrow account that is pledged in favor of DONG and RWE. The escrow account will be the
security for abandonment obligation related to the Nini and Cecilie fields.
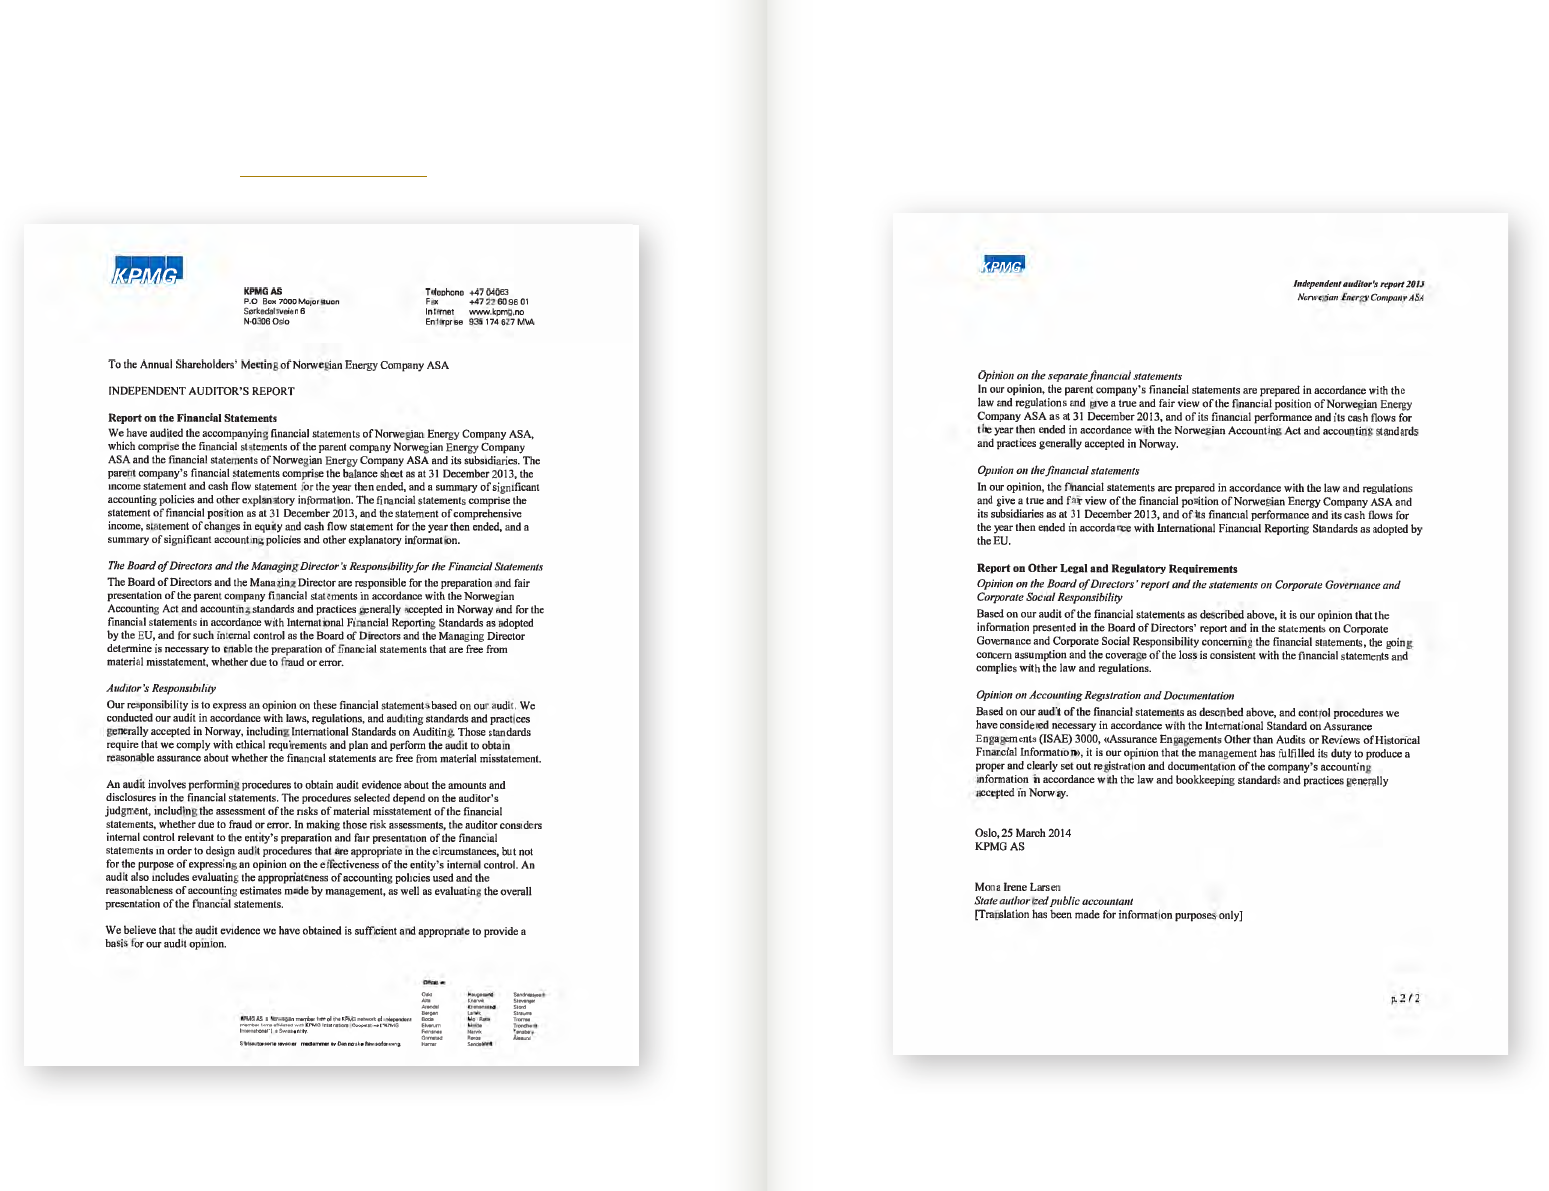
164 Noreco Annual report 2013 Noreco Annual report 2013 165
AUDITOR’S REPORT

Noreco Annual report 2013 167166 Noreco Annual report 2013
Today, the Board of Directors, the Chief Executive Officer and the Chief Financial Officer
reviewed and approved the Board of Directors’ Report and the Norwegian Energy Company
ASA consolidated and separate annual financial statements as of 31 December 2013.
To the best of our knowledge, we confirm that:
•
the Norwegian Energy Company ASA consolidated annual financial statements for 2013
have been prepared in accordance with IFRSs and IFRICs as adopted by the European
Union (EU), and additional Norwegian disclosure requirements in the Norwegian Accounting
Act, and that
•
the financial statements for Norwegian Energy Company ASA have been prepared in
accordance with the Norwegian Accounting Act and Norwegian Accounting Standards, and
•
that the Board of Directors Report for the group and the Parent company is in accordance
with the requirements in the Norwegian Accounting Act and Norwegian Accounting
•
Standard no 16, and
•
that the information presented in the financial statements gives a true and fair view of the
Company’s and the Group’s assets, liabilities, financial position and results for the period
viewed in their entirety, and
•
that the Board of Directors’ report gives a true and fair view of the development, performance,
financial position, principle risks and uncertainties of the Company and the Group.
GLOSSARY
APA Awards in Predefined Areas, system for awarding production licenses in mature areas
of the Norwegian Continental Shelf
Appraisal well A well drilled to determine the physical extent and reseves
bbl Barrel, volume unit corresponding to 159 liters
boe Barrel of Oil Equivalents, used as a standard unit measure for oil and natural gas
boepd Barrels of oil per day
Code Norwegian Code of Practice for Corporate Governance
DCS Danish Continental Shelf
Exploration well A well in an unproven area or prospect, may also be known as a wildcat well
HSE Health, Safety and Environment
IFRS International Financial Reporting Standards
License Permit granted to an oil company from the government of a country to explore
for and produce oil and gas
mmboe Million barrels of oil equivalent
NCS Norwegian Continental Shelf
NOK Norwegian kroner
Noreco Norwegian Energy Company ASA
Operator The oil company responsible for carrying out the daily operations of a production
license on behalf of the other licensees
Oslo Børs Oslo Stock Exchange
PDO Plan for Development and Operation, Norwegian term for the formal plan for developing
and operating a field
PL Production License
R&D Research & Development
Spudding Initiation of drilling operations
UKCS UK Continental Shelf
Unrisked Potential volumes before applying a risk factor
Upstream Segment of the oil industry that cover the exploration, development, production
and transport of oil and gas prior to refining
USD US Dollar
Working interest The percentage interest ownership a company has in a license
STATEMENT
OF COMPLIANCE
Board and management confirmation
25 March 2014
(Translation made for information purposes only.)
Erik Henriksen
Board member
Hilde Alexandersen
Employee Representative
David Gair
Board member
Bård Arve Lærum
Employee Representative
Svein Arild Killingland
CEO
Morten Garman
Chairman
Hilde Drønen
Board member
Marika Svärdström
Board member

168 Noreco Annual report 2013
