OECD Manual Measuring The Digital Economy
User Manual:
Open the PDF directly: View PDF ![]() .
.
Page Count: 161 [warning: Documents this large are best viewed by clicking the View PDF Link!]
- 1ere
- Final Combined
- 001
- 002
- DSTI 2014 (eng)--BaT241014--eBook
- Foreword
- Acknowledgements
- Table of Contents
- Reader’s Guide
- Executive Summary
- A MEASUREMENT AGENDA FOR THE DIGITAL ECONOMY
- Chapter 1 THE DIGITAL ECONOMY TODAY
- Figure 1. Internet usage trends in the OECD and differences by country (top panel) and by age group
- Figure 2. Trends in broadband speed across the OECD, Q4 2009-13
- Figure 3. Wikipedia monthly page views on mobile platforms, by language, 2010-13
- Figure 4. The progress of smartphones, 2010-13
- Figure 5. Average data storage cost for consumers, 1998-2012
- Figure 6. Data mining-related scientific articles, 1995-2014
- Figure 7. R&D intensity and contribution to total BERD by industry in the OECD, 2011
- Figure 8. Methods to stimulate creativity across 22 European countries in information industries vs
- Figure 9. ICT uptake among process and organisational innovators and non-innovators in 13 European c
- Figure 10. Patents on M2M, data analytics and 3D printing technologies, 2004-14
- Figure 11. Cost of genome sequencing, 2001-14
- Figure 12. The relative size of information industries in the OECD, 2000 and 2012
- Figure 13. Apparent labour productivity levels, information industries vs. total economy, 2012
- Figure 14. OECD shares in global exports of ICT goods and in underlying value added, 2000 and 2009
- Figure 15. Performance trends of top 250 ICT firms, 2000-13
- Figure 16. Venture capital investment in the United States, by industry, 1995-2012
- Figure 17. The dynamics of ICT sector employment in the OECD, 1995-2012
- Figure 18. The dynamics of ICT-related occupations in OECD countries, 2003-13
- Figure 19. Computer use at work in OECD countries, by level of sophistication, 2012
- Figure 20. Participation in e-commerce by individuals and enterprises, 2007-08 and 2012-13
- Notes
- References
- Chapter 2 INVESTING IN SMART INFRASTRUCTURE
- 2.1 Broadband penetration
- 2.2 Mobile data communication
- 2.3 The growth of the Internet
- 2.4 Toward higher speed
- 2.5 Prices for connectivity
- 2.6 ICT devices and applications
- 2.7 E-commerce across borders
- 2.8 Security
- Use of security methods for authentication/identification and the protection of data by enterprises,
- Businesses having encountered IT security problems, attacks resulting in denial-of-service, by size,
- Distributed denial-of-service attacks originating from or targeting each geographical area, April 20
- 2.9 Perceiving security and privacy threats
- 2.10 Improving the evidence base for online security and privacy
- Notes
- References
- Chapter 3 EMPOWERING SOCIETY
- Chapter 4 UNLEASHING INNOVATION
- Chapter 5 DELIVERING GROWTH AND JOBS
- Data sources
- List of Figures
- 999
- 4eme
Consult this publication on line at http://dx.doi.org/10.1787/9789264221796-en.
This work is published on the OECD iLibrary, which gathers all OECD books, periodicals and statistical databases.
Visit www.oecd-ilibrary.org for more information.
Measuring the Digital Economy
A NEW PERSPECTIVE
The growing role of the digital economy in daily life has heightened demand for new data and measurement
tools. Internationally comparable and timely statistics combined with robust cross-country analyses are crucial
to strengthen the evidence base for digital economy policy making, particularly in a context of rapid change.
Measuring the Digital Economy: A New Perspective presents indicators traditionally used to monitor the
information society and complements them with experimental indicators that provide insight into areas of
policy interest. The key objectives of this publication are to highlight measurement gaps and propose actions
to advance the measurement agenda.
Contents
• A measurement agenda for the digital economy
• The digital economy today
• Investing in smart infrastructure
• Empowering society
• Unleashing creativity and innovation
• Delivering growth and jobs
For more information about the OECD’s work on measurement and analysis of the digital economy,
see www.oecd.org/sti/measuring-the-digital-economy.htm.
Measuring the Digital Economy A NEW PERSPECTIVE
Measuring the
Digital Economy
A NEW PERSPECTIVE
ISBN 978-92-64-21130-8
93 2014 02 1 P 9HSTCQE*cbbdai+
932014021Cov.indd 1 29-Sep-2014 11:28:11 AM

Measuring the
Digital Economy
A NEW PERSPECTIVE

This work is published under the responsibility of the Secretary-General of the OECD. The
opinions expressed and arguments employed herein do not necessarily reflect the official
views of OECD member countries.
This document and any map included herein are without prejudice to the status of or
sovereignty over any territory, to the delimitation of international frontiers and boundaries
and to the name of any territory, city or area.
ISBN 978-92-64-21130-8 (print)
ISBN 978-92-64-22179-6 (PDF)
The statistical data for Israel are supplied by and under the responsibility of the relevant Israeli authorities. The use
of such data by the OECD is without prejudice to the status of the Golan Heights, East Jerusalem and Israeli
settlements in the West Bank under the terms of international law.
Photo credits: Cover © echo3005/Shutterstock.com.
Corrigenda to OECD publications may be found on line at: www.oecd.org/about/publishing/corrigenda.htm.
© OECD 2014
You can copy, download or print OECD content for your own use, and you can include excerpts from OECD publications, databases and
multimedia products in your own documents, presentations, blogs, websites and teaching materials, provided that suitable
acknowledgment of the source and copyright owner is given. All requests for public or commercial use and translation rights should be
submitted to rights@oecd.org. Requests for permission to photocopy portions of this material for public or commercial use shall be
addressed directly to the Copyright Clearance Center (CCC) at info@copyright.com or the Centre français d’exploitation du droit de copie
(CFC) at contact@cfcopies.com.
Please cite this publication as:
OECD (2014), Measuring the Digital Economy: A New Perspective, OECD Publishing.
http://dx.doi.org/10.1787/9789264221796-en

FOREWORD FOREWORD
MEASURING THE DIGITAL ECONOMY: A NEW PERSPECTIVE © OECD 2014 3
Foreword
Sound measurement is crucial for policy making. It helps policy makers to evaluate the
efciency of their actions and to reinforce the accountability of public interventions.
Thedemand for new data and measurement tools is particularly high in the case of the
digital economy, because of its growing role in everyday life and the fast pace of change.
Measuring the Digital Economy: A New Perspective selects indicators traditionally used to
monitor the information society and complements them with experimental indicators that
provide insight into areas of policy interest. Key objectives of the report are to highlight
measurement gaps and propose actions to advance the measurement agenda.
Objectives and scope
Measuring the Digital Economy addresses the use of ICTs and the Internet at work in relation
to the economy and society. It is designed to be a point of reference with respect to
currently available statistics, and to mark progress towards the development of relevant
new indicators on a broad range of issues. The aim is to:
• Review the current set of internationally comparable ICT indicators in light of OECD
policy priorities in the area of the digital economy, as formulated in the 2008 Seoul
Ministerial Declaration and the 2011 High-Level Meeting on the Internet Economy;
• Exploit the potential of existing ofcial statistics and experiment with new metrics;
• Identify data gaps and foreground the measurement agenda; and
• Discuss the data infrastructure needed to measure ICT diffusion and impacts, including
tools for the analysis of large datasets.
Structure
A Measurement Agenda For The Digital Economy
Based on the OECD’s expertise in the development of ICT indicators, this section summarises
the main weaknesses of the current measurement framework and identies a number of key
areas for action with a view to establishing a forward-looking international measurement
agenda. The target audience of this section encompasses policy makers in search of sound
evidence to support decisions, the broader research community in the area of ICTs, and
statisticians involved in production of ICT data. This section of the publication builds on
the following parts but it is placed at the beginning to bring discussion of a long-term
strategy for measurement of the digital economy closer to the heart of policy making.
The Digital Economy Today (C 1)
Chapter 1 sets the stage by pinpointing the evolving features of the digital economy and
society. The target audience includes experts as well as the more general public (i.e. any
person interested in obtaining a broader picture and key trends). The chapter highlights
features such as the rise of mobile broadband access and applications; the increased offer
of cloud computing services; the development of “smart” applications and associated
sensor-based networks and machine-to-machine (M2M) communications; the rise of big
data analytics; the role of ICT in innovation and the performance of ICT industries during
the recent economic crisis.
Thematic Chapters (C 2, 3, 4, 5)
The second section of the publication consists of four thematic chapters, which aim to
reect priorities for government action in the ICT area. They cover topics ranging from
infrastructure availability to openness and participation in the Internet economy, cyber

FOREWORD
MEASURING THE DIGITAL ECONOMY: A NEW PERSPECTIVE © OECD 20144
security and privacy, protection and empowerment of consumers and citizens, and
innovation and sustainability. These thematic chapters map existing indicators against
current digital economy policy issues as reected in the OECD Internet Policy Principles, as
well as in the overarching objective to foster the role of ICT in promoting growth and jobs:
Chapter 2: Investing in smart infrastructure
Chapter 3: Empowering society
Chapter 4: Unleashing creativity and innovation
Chapter 5: Delivering growth and jobs
The target audience for the thematic chapters includes policy analysts with a certain level
of sophistication in the use of indicators, as well as those engaged in producing indicators
for policy making. The chapters also include a few “Gap Pages” that make a case for the
development of new statistics in areas that lack high-quality, internationally comparable
indicators. The “Gap Pages” discuss user needs, highlight the measurement challenges and
propose ways forward:
• Improving the evidence base for online security and privacy (in chapter 2);
• Children online (in chapter 3);
• ICT and health (in chapter 3);
• Unleashing the potential of micro-data (in chapter 4); and
• Measuring quality in communication services (in chapter 5).

ACKNOWLEDGEMENTS ACKNOWLEDGEMENTS
MEASURING THE DIGITAL ECONOMY: A NEW PERSPECTIVE © OECD 2014 5
Acknowledgements
Measuring the Digital Economy: A New Perspective was prepared under the overall guidance
of Alessandra Colecchia by Andrea de Panizza, Elif Köksal-Oudot, Vincenzo Spiezia, Pierre
Montagnier, Pedro Herrera-Gimenez (Economic Analysis and Statistics Division, EAS),
Cristina Serra-Vallejo and Frédéric Bourassa (Digital Economy Policy Division, DEP) of the
OECD Directorate for Science, Technology and Innovation (DSTI).
Several colleagues made available their respective areas of expertise: Brigitte Acoca,
Peter Avery, Rudolf van der Berg, Laurent Bernat, Anne Carblanc, Augustín Díaz-Pinés,
Michael Donohue, Aaron Martin, Hajime Oiso, Sam Paltridge, Taewon Park, Elettra Ronchi
and Christian Reimsbach-Kounatze of the Digital Economy Policy Division (DEP), as well
as other colleagues in DSTI and different OECD Directorates, namely Nadim Ahmad,
Laudeline Auriol, Francesco Avvisati, Francesca Borgonovi, Agnès Cimper, Hélène Dernis,
Fernando Galindo-Rueda, Corinne Heckmann, Mariarosa Lunati, Valentine Millot, Dirk Pilat,
Gueram Sargsyan, Mariagrazia Squicciarini, David Valenciano, Fabien Verger, Colin Webb,
Andrew Wyckoff and Belen Zinni.
The time and help granted by delegates of the Working Party on Measurement and Analysis
of the Digital Economy (WPMADE) and their colleagues at the Committee on the Digital
Economy Policy (CDEP) have been instrumental in the development of this publication.
This collaborative effort would not have been possible without the help and dedication of
all. We hope to build on this experiment and on the longer-term measurement agenda to
further improve the evidence base for digital economy policy.

TABLE OF CONTENTS TABLE OF CONTENTS
MEASURING THE DIGITAL ECONOMY: A NEW PERSPECTIVE © OECD 2014 7
Table of Contents
Foreword ....................................................................................................................................................................................................... 3
Acknowledgements ........................................................................................................................................................................... 5
Reader’s Guide ........................................................................................................................................................................................ 9
Executive Summary ........................................................................................................................................................................... 13
A MEASUREMENT AGENDA FOR THE DIGITAL ECONOMY ....................................................................... 17
References ...................................................................................................................................................................................... 23
Chapter 1 THE DIGITAL ECONOMY TODAY .............................................................................................................. 25
Notes.................................................................................................................................................................................................... 44
References ...................................................................................................................................................................................... 47
Chapter 2 INVESTING IN SMART INFRASTRUCTURE .................................................................................... 49
2.1 Broadband penetration ......................................................................................................................................... 50
2.2 Mobile data communication ............................................................................................................................ 52
2.3 The growth of the Internet ................................................................................................................................ 54
2.4 Toward higher speed ............................................................................................................................................... 56
2.5 Prices for connectivity ........................................................................................................................................... 58
2.6 ICT devices and applications .......................................................................................................................... 60
2.7 E-commerce across borders ............................................................................................................................. 62
2.8 Security ................................................................................................................................................................................ 64
2.9 Perceiving security and privacy threats ................................................................................................ 66
2.10 Improving the evidence base for online security and privacy ........................................ 68
Notes.................................................................................................................................................................................................... 70
References ...................................................................................................................................................................................... 73
Chapter 3 EMPOWERING SOCIETY ................................................................................................................................... 75
3.1 Internet users ................................................................................................................................................................. 76
3.2 Online activities ........................................................................................................................................................... 78
3.3 User sophistication ................................................................................................................................................... 80
3.4 Digital natives ................................................................................................................................................................ 82
3.5 Children online ............................................................................................................................................................. 84
3.6 ICTs in education ........................................................................................................................................................ 86
3.7 ICT skills in the workplace ................................................................................................................................ 88
3.8 E-consumers .................................................................................................................................................................... 90
3.9 Content without borders ..................................................................................................................................... 92
3.10 E-government use ...................................................................................................................................................... 94
3.11 ICT and health ............................................................................................................................................................... 96
Notes.................................................................................................................................................................................................... 98
References ...................................................................................................................................................................................... 103
Chapter 4 UNLEASHING INNOVATION ......................................................................................................................... 105
4.1 ICT and R&D .................................................................................................................................................................... 106
4.2 Innovation in ICT industries ............................................................................................................................ 108
4.3 E-business .......................................................................................................................................................................... 110
4.4 Unleashing the potential of micro-data ............................................................................................... 112
4.5 ICT patents ....................................................................................................................................................................... 114
4.6 ICT designs ....................................................................................................................................................................... 116

TABLE OF CONTENTS
MEASURING THE DIGITAL ECONOMY: A NEW PERSPECTIVE © OECD 20148
4.7 ICT trademarks ............................................................................................................................................................. 118
4.8 Knowledge diffusion ............................................................................................................................................... 120
Notes.................................................................................................................................................................................................... 122
References ...................................................................................................................................................................................... 125
Chapter 5 DELIVERING GROWTH AND JOBS ........................................................................................................... 127
5.1 ICT investment ............................................................................................................................................................. 128
5.2 ICT business dynamics ......................................................................................................................................... 130
5.3 ICT value added ........................................................................................................................................................... 132
5.4 Labour productivity in information industries .............................................................................. 134
5.5 Measuring quality in communication services ............................................................................. 136
5.6 E-commerce ..................................................................................................................................................................... 138
5.7 Human capital in ICT.............................................................................................................................................. 140
5.8 ICT jobs and jobs in the ICT sector ............................................................................................................ 142
5.9 Trade competitiveness and GVCs ............................................................................................................... 144
Notes.................................................................................................................................................................................................... 146
References ...................................................................................................................................................................................... 149
Data sources .............................................................................................................................................................................................. 151
List of Figures ........................................................................................................................................................................................... 153
Look for the StatLinks2at the bottom of the tables or graphs in this book.
To download the matching Excel® spreadsheet, just type the link into your
Internet browser, starting with the http://dx.doi.org prex, or click on the link from
the e-book edition.
Follow OECD Publications on:
This book has...
StatLinks2
A service that delivers Excel
®
les from the printed page!
http://twitter.com/OECD_Pubs
http://www.facebook.com/OECDPublications
http://www.linkedin.com/groups/OECD-Publications-4645871
http://www.youtube.com/oecdilibrary
http://www.oecd.org/oecddirect/
OECD
Alerts

READER’S GUIDE READER’S GUIDE
MEASURING THE DIGITAL ECONOMY: A NEW PERSPECTIVE © OECD 2014 9
Reader’s Guide
Acronyms
ADE Automated data exchange
ANACOM National Communication Authority of Portugal
(Autoridade Nacional de Comunicações)
AS Autonomous system
ASN Autonomous system number
BERD Business enterprise expenditure on research and development
BLS Bureau of Labor Statistics
B2B Business-to-business
B2C Business-to-consumer
B2G Business-to-government
ccTLD Country code top-level domain
CDN Content distribution network
CDSS Clinical decision support system
CERT Computer emergency response team
CIS Community Innovation Survey
CSIRT Computer security incident response team
C2C Consumer-to-consumer
DDOS Distributed denial-of-service
DNS Domain name system
DOS Denial-of-service
DSL Digital subscriber line
EDI Electronic data interchange
EHR Electronic health record
ERP Enterprise resource planning
ESS European Statistical System
EU European Union
FCC Federal Communications Commission
FTE Full-time equivalent
FTTH Fibre to the home
GDP Gross domestic product
Gbit Gigabyte
gTLD Generic top-level domain
HDD Hard disk drive
HTTP Hypertext Transfer Protocol
ICT Information and communication technology
IDS Intrusion detection system
GFCF Gross xed capital formation
GPS Global positioning system
IaaS Infrastructure as a service
IC3 Internet Crime Complaint Center
ICIO Inter-Country Input-Output
IP Internet Protocol
IPC International Patent Classication
IPv4 Internet Protocol version 4

READER’S GUIDE
MEASURING THE DIGITAL ECONOMY: A NEW PERSPECTIVE © OECD 201410
ISC Internet Systems Consortium
ISCED International Standard Classication of Education
ISCO International Standard Classication of Occupations
ISIC International Standard Industrial Classication
ISP Internet service provider
IT Information technology
ITU International Telecommunication Union
JST Japan Science and Technology Agency
KISA Korean Internet & Security Agency
LAN Local area network
LTE Long term evolution
Mbit Megabyte
MHGE Medium and high-growth enterprise
MNE Multinational enterprise
MOOC Massive open online course
M2M Machine-to-machine
NAT Network address translation
NFC Near eld communication
NIC Network information centre
NSF National Science Foundation
NSO National statistical ofce
OFCOM Ofce of Communications
OHIM Ofce for Harmonization in the Internal Market
PaaS Platform as a service
PCT Patent Cooperation Treaty
PPP Purchasing power parity
R&D Research and development
RCA Revealed comparative advantage
RCD Registered Community Design
RFID Radio frequency identication
RIR Regional Internet registry
SaaS Software as a service
SCM Supply chain management
SIM Subscriber identity module
S&T Science and technology
SME Small and medium-sized enterprise
SMS Short message service
SNA System of National Accounts
SSD Solid-state drive
USD United States dollar
USPTO United States Patent and Trademark Ofce
VC Venture capital
VoIP Voice over Internet Protocol
Wi-Fi Wireless delity
WIPO World Intellectual Property Organization

READER’S GUIDE READER’S GUIDE
MEASURING THE DIGITAL ECONOMY: A NEW PERSPECTIVE © OECD 2014 11
Abbreviations
For most of the charts, this publication uses ISO codes for countries or economies.
AUS Australia
AUT Austria
BEL Belgium
BRA Brazil
CAN Canada
CHE Switzerland
CHL Chile
CHN People’s Republic of China
COL Colombia
CRI Costa Rica
CZE Czech Republic
DEU Germany
DNK Denmark
ESP Spain
EST Estonia
FIN Finland
FRA France
GBR United Kingdom
GRC Greece
HKG Hong Kong, China
HRV Croatia
HUN Hungary
IDN Indonesia
IND India
IRL Ireland
ISL Iceland
ISR Israel
ITA Italy
JPN Japan
KOR Korea
LUX Luxembourg
LVA Latvia
MEX Mexico
MYS Malaysia
NLD Netherlands
NOR Norway
NZL New Zealand
PAN Panama
PHL Philippines
POL Poland
PRT Portugal
ROU Romania
RUS Russian Federation
SAU Saudi Arabia
SGP Singapore
SVK Slovak Republic
SVN Slovenia
SWE Sweden
THA Thailand
TUR Turkey
TWN Chinese Taipei
UKR Ukraine
USA United States
VGB Virgin Islands (British)
ZAF South Africa
Country groupings
BRIICS Brazil, the Russian Federation, India, Indonesia, China and South Africa.
EU28 European Union
OECD Australia, Austria, Belgium, Canada, Chile, the Czech Republic, Denmark,
Estonia, Finland, France, Germany, Greece, Hungary, Iceland, Ireland, Israel,
Italy, Japan, Korea, Luxembourg, Mexico, the Netherlands, New Zealand,
Norway, Poland, Portugal, the Slovak Republic, Slovenia, Spain, Sweden,
Switzerland, Turkey, the United Kingdom and the United States.
ROW Rest of the world
WLD World

EXECUTIVE SUMMARY EXECUTIVE SUMMARY
MEASURING THE DIGITAL ECONOMY: A NEW PERSPECTIVE © OECD 2014 13
Executive Summary
With lacklustre growth across much of the globe, monitoring and understanding the role
of ICTs and the Internet in the broader economy is a priority. Measuring the Digital Economy
maps existing indicators against digital economy policy issues, identies gaps in the
measurement framework, assesses progress, and proposes a forward-looking international
measurement agenda.
ICTs have triggered deep changes in economies and societies
The number of Internet users in OECD countries increased from fewer than 60% of adults
in 2005 to about 80% in 2013, reaching 95% among young people, with large differences
across and within countries. In 2013, more than 90% of individuals accessed the Internet
in Luxembourg, the Netherlands, the Nordic countries, and Switzerland against 60% or less
inGreece, Italy, Mexico and Turkey. The gap between Internet uptake among the elderly
and the younger population generally remained high in the lagging countries compared to
the leaders.
Fifteen-year-olds in the OECD spend about 3hours on the Internet on a typical weekday
and more than 70% use the Internet at school. In OECD countries, 62% of Internet users
participate in social networks and 35% use e-government services. About half of individuals
in OECD countries purchase goods and services online, and almost 20%inDenmark, Korea,
Sweden and the UnitedKingdom use a mobile device to do so.
In 2012-13, 77% of enterprises in the OECD area had a website or home page and 21% sold
their products electronically. Over 80% of enterprises used e-government services.
Technological developments are feeding further penetration
Higher speed Internet, lower unit prices and smart devices have favoured new and more
data-intensive applications. Wireless broadband subscriptions in the OECD area increased
over twofold in just four years: by December 2013, almost 3 out of 4 individuals in the OECD
area had a mobile wireless broadband subscription.
Mobile broadband is also widely available in many emerging and less developed countries.
In sub-Saharan Africa, for example, subscriptions grew from 14million in 2010 to 117million
in 2013.
In less than two years, the number of pages viewed from mobile devices and tablets is
estimated to have risen from 15% to over 30% of total. In 2013, over 75% of active Facebook
users connected via a mobile device.
International differences in speed and prices remain signicant, however, even among
OECD countries. In December 2013, the share of high-speed broadband subscribers (above
10Mbit/s) ranged from over 70% to under 2% across OECD countries. Depending on country,
smartphone users in the OECD may pay up to seven times more for a comparable basket
of mobile services.
ICTs are fostering innovations across industries and sciences
ICT-producing industries, together with publishing, digital media and content industries,
accounted for about one-quarter of total OECD business expenditure on R&D (BERD) in
2011. In 2014, patents in ICT-related technologies accounted for a third of all applications
to main patent ofces. In the last ten years, the share of data mining in total patents
more than tripled, and the share of machine-to-machine (M2M) communication patents
increased sixtimes.

EXECUTIVE SUMMARY
MEASURING THE DIGITAL ECONOMY: A NEW PERSPECTIVE © OECD 201414
Many emergent technologies rely on innovations in ICTs. In the OECD countries, about
25% of ICT patents also belong to non-ICT areas. For example the deployment of second-
generation genome sequencing techniques with embedded data-mining algorithms
resulted in the cost per human-like genome sequence dropping from a million to a
thousand dollars in just ve years (2009-14).
The digital economy has been resilient in the crisis
In 2012, information industries accounted for about 6% of total value added, around 4% of
total employment and 12% of total xed investment in the OECD area. Labour productivity
in the information economy sector is about 60% higher than in the total economy.
The ICT sector outperformed the rest of the economy in terms of net business population
growth between 2009 and 2012 and involved relatively high shares of medium and
high-growth rms. New ICT enterprises have also higher survival rates than their counter-
parts in manufacturing and services.
The crisis does not seem to have signicantly affected the revenues of the world’s top-250
ICT rms. However, they have substantially reduced their R&D expenditures compared to
the beginning of the decade, perhaps due to the shift from manufacturing to services.
Over 2000-12, computers and peripherals fell from almost 38% to under 30% of world ICT
exports, while the share of communication equipment and consumer electronics grew
from 26% to almost 35%. Over the same period, China’s share in global ICT exports grew
from 4.4% to above 30%. However, in terms of value added, China’s share was only 17%
since it has to import a signicant amount of intermediate goods and services.
Employment creation has been sluggish
Despite the dynamism of the sector, employment in ICT industries never regained the 2001
peak of 4.1% of total employment and remained just below 3.8% in 2012. These sluggish
employment dynamics reected the downsizing of manufacturing and telecom services
and the growth of IT services. Yet ICT industries account for less than half of ICT-related
occupations in OECD countries.
From 2003 to 2013, employment in ICT occupations grew by 25% or more in Australia and
Canada, about 15% in the United States, and 16% to 30% in OECD countries in Europe,
performing better than total employment through the crisis. Yet, several studies highlight
the potentially disruptive effects of ICTs on employment, given the progress in automation
and machine learning.
New skills for workers, rms and users are required
While the use of ICTs at work is generalised, over 60% of the EU labour force reported their
computer skills as insufcient to apply for a new job, rising to over 80% of people with low
education compared to below 40% of those with a tertiary education. ICT industries employ
on average 30% of business sector researchers, but only 3% of OECD tertiary graduates
attained a degree in computer sciences in 2012.
The Internet has opened up new opportunities for education and training. In 2013, 9.3%
of Internet users followed an online course in the 30 OECD countries for which data are
available, and hundreds of universities now propose online programmes and massive open
online courses (MOOCs).
Security skills also need to be improved. Security is cited as the main reason for not buying
online by over one-third of Internet users in the EuropeanUnion. However, in 2013 only about
one-third of Internet users in the EuropeanUnion had ever changed the security settings
of their browsers. Similarly, in 2010 only 9% of adult Internet users in the EuropeanUnion
used a parental control or web-ltering software to protect their children online.

EXECUTIVE SUMMARY EXECUTIVE SUMMARY
MEASURING THE DIGITAL ECONOMY: A NEW PERSPECTIVE © OECD 2014 15
New statistical tools are needed to measure the digital economy
While existing statistics measure the diffusion of ICTs, they are less able to keep up with
new and rapidly evolving technologies and usage by individuals and rms. A forward-
looking international measurement agenda should bebuilt around six areas:
• Improve the measurement of ICT investment and its link to macroeconomic performance;
• Dene and measure skill needs for the digital economy;
• Develop metrics to monitor issues of security, privacy and consumer protection;
• Promote the measurement of ICT for social goals and the impact of the digital economy
on society;
• Invest in a comprehensive, high-quality data infrastructure for measuring impacts; and
• Build a statistical quality framework suited to exploiting the Internet as a data source.

MEASURING THE DIGITAL ECONOMY: A NEW PERSPECTIVE © OECD 2014 17
A MEASUREMENT AGENDA
FOR THE DIGITAL ECONOMY

MEASURING THE DIGITAL ECONOMY: A NEW PERSPECTIVE © OECD 201418
A MEASUREMENT AGENDA FOR THE DIGITAL ECONOMY A MEASUREMENT AGENDA FOR THE DIGITAL ECONOMY
THE DIGITAL ECONOMY: TOWARDS A MEASUREMENT AGENDA
Measuring the Digital Economy: A New Perspective maps existing indicators drawn from a wide range of areas
including education, innovation, entrepreneurship and economic outcomes against current digital economy
policy issues, as reected in the OECD Internet Policy Principles OECD (2011b). By doing so, it identies gaps in
the current measurement framework and assesses progress made by some initiatives towards lling these gaps.
Theoverarching objective of Measuring the Digital Economy is to advance the measurement agenda, including in
areas highlighted by the OECD in its broadband metric checklist (see Box1), so as to better monitor the pervasive
role of ICTs and theInternet in the broader economy and their contributions to delivering jobs and growth.
This is a challenge. As the OECD and the broader international community develop international policy guidelines
on the protection of personal data, children or consumers online, and address issues of cybersecurity, a key
question concerns the extent to which existing metrics and measurement tools provide an evidence base to allow
analysis of these policies and their impact across countries.1
The near ubiquitous diffusion of information and communication technologies has led to their convergence
with other technologies such as biotechnologies and nanotechnologies, which in turn have led to innovations in
advanced manufacturing, health care, environmental protection and other applications. The growing interdiscipli-
nary nature of these technologies underscores the need for a consistent measurement framework.
For centuries, technological developments have made old skills obsolete and led to the demand for new skill sets.
ICTs are at the forefront of this transition today and are generating policy interest about new skills needs and
methods to develop these skills. This debate has raised a number of questions: What measures best capture the
range of skills consumers and workers need? Is it possible to dene such ICT skills based on existing metrics and
statistics? Does the use of ICTs improve learning and educational outcomes? To what extent does education play
a role in shaping the skills of future ICT users in the workplace and everyday life?
The digital economy extends beyond businesses and markets – it includes individuals, communities and societies.
This broader conception encompasses new themes such as the rapid growth of social networks and free and rapid
access to social media and other user-created content. This gives rise to a wide range of policy issues including
cyber bullying, the right to have one’s past forgotten and Internet “addiction”, as well as on-going concerns about
the protection of children online and persistent digital divides. The majority of current ICT metrics focus on the
role of ICTs in business performance and fall short in terms of measuring the social impacts of ICTs and their
contributions to social outcomes.
Finally, measuring the digital economy and understanding the various dimensions of its impact often means
improving measurement of the “traditional” economy. For example, price deators for goods and services must be
adjusted to reect changes in quality induced by ICTs so as to permit measurement of changes in key aggregate
statistics, such as productivity, and to assess the contribution of ICTs to overall economic performance.2
To understand the structural impact of ICTs and the changing nature of competition in the digital economy,
it is important to consider price differentials between goods and services sold online versus ofine, as well as
measures of price dispersion across producers using the same distribution method. Furthermore, addressing the
challenge of measuring and valuing outputs is essential in order to identify the impacts of ICTs in service sector
industries where they play a key role.
In the short term, the challenge is to make statistical systems more exible and responsive to the introduction of
new and rapidly evolving concepts driven by ICTs. A number of options exist such as experimenting with satellite
accounts, exploiting the potential of existing micro-data, adding questions to existing surveys, periodically augment-
ing existing surveys with topic-specic modules or developing short turnaround surveys to meet special needs.
Experimental and exible approaches could be developed to meet the specic priorities and resources of countries.
1. The OECD Model Surveys on ICT Access and Usage by Households and Individuals and ICT Usage by Businesses were revised in 2014 to improve
measurement in the areas of cybersecurity and privacy, notably the economics of personal data and security, prevention measures and incident
response. The OECD is also working to improve the international comparability of data generated by Computer Security Incidents Response Teams
(CSIRTs) (see 2.10). Theoverall objective of the work is to develop statistical denitions for a set of indicators (e.g.budget, personnel, skills and
co-operation, along with specic kinds of incidents) that national CSIRTs could report on a voluntary basis, in addition to suggestions for CSIRTs to
better leverage existing data, such as from third-party institutions, for statistical purposes.
2. In particular, the OECD is looking at the feasibility of hedonic prices as an approach to measuring quality changes in communication services
across countries (see 5.5).

MEASURING THE DIGITAL ECONOMY: A NEW PERSPECTIVE © OECD 2014 19
A MEASUREMENT AGENDA FOR THE DIGITAL ECONOMY A MEASUREMENT AGENDA FOR THE DIGITAL ECONOMY
Good co-ordination will help prevent geographically fragmented research efforts and ensure that the international
community takes up the results of successful experimentation by countries (OECD, 2011a).
Box 1. • Key messages from the OECD Broadband Checklist3
• Develop a broadband denition by speed tier that reects national specicities, to be implemented in
data collection.
• Measure the deployment of broadband networks, including by exploring metrics based on interactive
Internet mapping.
• Improve the measurement of ICT investment, including investment in broadband infrastructure.
• Develop a harmonised methodology to measure broadband performance metrics, such as broadband
speed delivered directly to consumers’ routers.
• Review and update broadband competition metrics such as market shares.
• Improve indicators of mobile broadband uptake via subscription data, use by individuals and businesses
as measured in ICT use surveys, data from mobile operators/regulators on connections, trafc and usage
patterns, and other data from industry stakeholders.
• Improve the collection of mobile broadband supply-side metrics in terms of coverage, capacity, speed and
competition based on data from service providers.
• Develop new approaches to measuring broadband service prices including, in the longer term, work on
hedonic deators for different broadband services bundles.
• Explore the reliability of using Internet-based statistics to develop timely metrics for trafc-ow data or
use of the Web.
• Exploit available micro-data and linking of micro-databases for new indicators on the demand side,
including intensity and sophistication of ICT usage and in particular broadband.
• Review the OECD Model Surveys on ICT usage by households/individuals and by businesses to provide
a richer set of data for analysis of impacts, including on ICT-enabled innovation and the role of ICTs for
social outcomes such as health and education.
• Build on existing initiatives to measure the effect of the Internet on business practices and public
administration, using automated data mining where possible.
• Build on existing OECD productivity measures to improve the underlying statistics for ICT and content
industries.
• Consider over the longer term the possibility of integrating broadband investment and prices within
National Accounts frameworks or satellite accounts, so as to enable analysis of the impact of broadband
on productivity at the macro level.
Source: OECD, summary based on OECD (2012a).
3. In recent years the OECD has organised several technical workshops and debated at length emerging issues in metrics under the aegis of the
Committee on Digital Economy Policy (CDEP) and its Working Parties. This led to the identication of some points for action which are summarised
in the document DSTI/ICCP(2012)7. Some of these actions have already been implemented. For example, the WPCISP (Working Party on Communi-
cation Infrastructure and Service Policy) has adopted an international denition of broadband by speed tiers (OECD, 2012a) and has initiated work
in the area of Internet mapping (see www.oecd.org/sti/broadband/broadbandmapping.htm) and speed tests (see www.oecd.org/sti/broadband/
speed-tests.htm). The WPIIS (Working Party on Indicators for the Information Society), now the WPMADE (Working Party on Measurement and
Analysis of the Digital Economy), has just completed a major revision of its Model Surveys on ICT Access and Usage by Households and Individuals
(OECD, 2014a) and ICT Usage by Businesses (OECD, 2014b) to take into account, among others, some of the priorities highlighted in the broadband
metrics checklist, including the denition of speed tiers (256Kbit/s to less than 1.5/2Mbit/s; 1.5/2Mbit/s to less than 10Mbit/s; 10Mbit/s to less
than 25/30Mbit/s; 25/30Mbit/s to less than 100Mbit/s; 100Mbit/s to less than 1Gbit/s; and 1Gbit/s and above).
In the long term, the challenge for the statistical community is to redesign surveys to address the relevant unit
of analysis. As ICTs and the Internet become basic infrastructure for business and society, it will be increasingly
difcult to measure the digital economy as distinct from the overall economy. This is due in part to the fact that
the Internet enables the creation of non-physical organisations and exible outsourcing of business activities,
within existing sectors of activity and across locations, thus blurring the boundaries between rms and markets
and between work and social life. A higher level of granularity in data will therefore be needed to measure how
businesses and individuals use ICTs on a continuous basis from any location for any type of activity (Lehr, 2012).

MEASURING THE DIGITAL ECONOMY: A NEW PERSPECTIVE © OECD 201420
A MEASUREMENT AGENDA FOR THE DIGITAL ECONOMY A MEASUREMENT AGENDA FOR THE DIGITAL ECONOMY
The exploitation of ofcial statistics at the “micro” level (enterprise/establishment/organisation, worker,
household/individual) and the use of administrative data will need to become the norm, and existing data collec-
tions will need to be reviewed to maximise data-linking opportunities for research and analysis.4 This will mean
nding ways to provide researchers with access to micro-data while responding to concerns about condentiality.
The envisaged measurement framework will have to be developed and implemented gradually with the involvement
of stakeholders outside the statistical community. Policy makers in co-operation with other stakeholders will need to
dene user needs. Researchers will have to analyse the data, ascertain impacts, and help to develop the appropriate
metrics and data infrastructures. Engagement with organisations, businesses, universities and the public sector
will be indispensable, as the statistical system can only collect what can feasibly be measured inside organisations.
Attention must be paid to minimising the reporting burden by carefully selecting questions, exploiting other ofcial
and administrative data, and making use of new sources of data generated through the use of ICTs.
The OECD Internet Policy Making Principles call on the international community to promote the digital economy and
to develop stakeholder capacity to bring publicly available, reliable data into the policy making process. Thetask
of Measuring the Digital Economy is to propose indicators that can inform policy making in this area, as well as
to offer a fresh perspective by highlighting new data sources, gaps and measurement challenges. The following
paragraphs present key messages and actions to advance the measurement agenda for the digital economy.
Action 1
Improve the measurement of ICT investment including broadband investment and its link to macroeconomic
performance
ICTs need to be implemented in business processes together with other assets to drive performance, and need
to be analysed in the broader context of their contribution to aggregate jobs and economic performance. To this
end, business and individual surveys on ICTs need to be reviewed regularly to take into account the role of ICTs, in
particular broadband, as enablers of innovation and contributors to business performance and consumer welfare.
ICT survey and administrative data need to be aligned with aggregate economic measures to allow the integration
of ICTs within the System of National Accounts (SNA).
The business, statistical and research communities are encouraged to:
• Improve measurement of ICT investment and internationally comparable deators for hardware, software and
communication infrastructure, including the pricing of broadband services bundles;
• Measure and value digitised data as an intangible asset, and analyse its contribution to productivity and
business performance;
• Review regularly the measurement framework for ICT usage to identify and prioritise areas for survey design
and re-design in line with on-going developments and policy priorities.
Action 2
Dene and measure skills needs for the digital economy
The development of the digital economy and its applications, such as “big data” analytics, cloud computing and
mobile applications, may raise demand for new skills, leading to skills shortages in the short term. At work,
shortage of ICT programmers may be compounded by managerial challenges to the development of new business
models, new organisational structures and new working methods. Among users, the capacity to search among
a myriad of mobile applications or protect against digital security risks is increasing demand for new types of
skills. Traditionally, ofcial statistics have used educational attainment or occupational categories as a proxy for
skills, but this approach seems too narrow to address the issue of demand for new skills. More could be gained by
exploiting and harmonising nely detailed national surveys on tasks and skills,5 and by working with the business
community to dene new metrics for skill shortages.
4. The OECD, for instance, has pioneered a distributed approach to micro-data analysis, where the Organisation provides a common research
framework and researchers from different countries run the analysis on their own country’s micro-data. The OECD has also developed a micro-data
lab, which compiles and links large-scale non-condential administrative and commercial datasets at the micro level (see 4.4).
5. Such as the Occupational Information Network (O*NET) in the United States, the UK Skills Surveys (UKSS), the Canadian Essential Skills
program (ES) or the German Qualication and Career Surveys (carried out by the Federal Institute for Vocational Education and Training - BIBB).

MEASURING THE DIGITAL ECONOMY: A NEW PERSPECTIVE © OECD 2014 21
A MEASUREMENT AGENDA FOR THE DIGITAL ECONOMY A MEASUREMENT AGENDA FOR THE DIGITAL ECONOMY
6. See 3.5 for the measurement challenges related to the activity and protection of children online.
7. This survey is an important outcome of a multi-stakeholder initiative launched by the OECD in 2010 to improve the availability and quality of
health ICT data and guide measurement efforts (see 3.11).
The business, statistical and research communities are encouraged to:
• Exploit the potential of existing public and private statistics on skills, occupations and industry classications,
and to promote the harmonisation of existing national sources on tasks and skills;
• Better exploit existing cross-country surveys (e.g.the European Survey of Working Conditions and the OECD’s
Programme for the International Assessment of Adult Competencies), and promote the linking of datasets
containing information on skills, jobs and activities at the individual level;
• Improve access and use of private online vacancy datasets (e.g. Help Wanted Online by the United States
Conference Board) to measure vacancies in ICT-related occupations, their duration and rate of lling;
• Promote the harmonisation of national programmes currently in place in several OECD countries to assess skills
supply and forecast skills demand.
Action 3
Develop metrics to monitor issues of security, privacy and consumer protection
Management of security and privacy risk online has become a key policy issue as individuals, businesses and
governments shift large parts of their daily activities to the Internet. The analytical framework developed by the
OECD to classify statistics and empirical data related to security and privacy risk highlights the potential for better
indicators in this area, building on an underexploited wealth of empirical data (OECD, 2012b). While some aspects
are currently being developed, such as the harmonisation of statistics from CSIRTs (Computer Security Incidents
Response Team), others need to be explored further.
Statistical information related to online security and privacy risks relies either on self-reporting (e.g.in response
to a survey or assistance sought from a CSIRT) or on Internet-based data, (e.g.malware activities recorded by
a rewall). Measures based on self-reporting suffer from the drawback that not all incidents are identied in
a comparable manner or reported because victims are often reluctant to expose their reputation when facing
privacy and security incidents. Internet-based data is less susceptible to these issues, but its utility is limited
because of restricted coverage of Internet activities as well as multiple security aspects and privacy risks.
A number of steps can be undertaken to address these shortcomings and improve measurement in the areas of
online security and privacy risk, and consumer protection.
The statistical community, regulators and other stakeholders, such as CSIRTs and Internet intermediaries, are
invited to work together and with relevant partners to:
• Test and improve the privacy and security modules in the ICT Users Surveys by Individuals and by Businesses
to increase the quality and rate of response;
• Develop guidance for CSIRTs to produce and report internationally comparable statistics;
• Develop new indicators on the various factors and dimensions of security and privacy risk (including threats,
vulnerabilities, incidents, impact, prevention, response), building on the above-mentioned analytical framework;
• Promote a statistical and regulatory framework for Internet-based data on online security and privacy risk, as
well as consumer protection (see Action5 below).
Action 4
Promote measurement of ICTs for social goals and impacts of the digital economy on society
The current measurement framework focuses on the role of ICTs in economic performance. It has limited capacity
to measure the extent to which new ICTs can help address social goals, such as those associated with health,
ageing population or climate change.
Governments as well as statistical and research communities are encouraged to:
• Develop new statistical tools including self-perceptions surveys to monitor the impact of ICT use by adult
individuals and children6;
• Promote wider implementation of the OECD Model Survey on the Adoption and Use of ICTs in the Health Sector7

MEASURING THE DIGITAL ECONOMY: A NEW PERSPECTIVE © OECD 201422
A MEASUREMENT AGENDA FOR THE DIGITAL ECONOMY A MEASUREMENT AGENDA FOR THE DIGITAL ECONOMY
and build on existing medical surveys of hospitals, practitioners and patients to improve measurement of
theeffects of e-health;
• Develop the ICT model usage surveys to improve measurement of consumer trust and behaviour in the digital
economy;
• Improve measurement of the impact of ICTs on the environment by enhancing statistical linkages among
ICT-use surveys, consumer expenditure surveys, supply-use tables and industry-level data.
Action 5
Invest in a comprehensive, high-quality data infrastructure for measuring impacts
The rst and best evidence of economic impacts is likely to come from micro-data (data about rms, workers
or consumers) before it shows up in macro-data. To date, measurement has focused mostly on access to and
adoption of ICTs. Since economic effects arise as a consequence of ICT usage, the statistical infrastructure in most
OECD economies, which details adoption behaviour across rms, households, individuals and their characteristics,
provides a good basis for analysing impacts.
It is important to be able to link together existing datasets and exploit the potential of existing administrative
records. This can improve understanding and reduce respondent burden. For example, the ability to link ICT
surveys to datasets (surveys or administrative data) containing information on skills, jobs and activities at the
individual level can substantially improve empirical research on the impacts of ICTs on jobs and skills. The linking
of ICT surveys to business registers and innovation surveys can help to improve understanding of the role of ICTs
in driving innovation and business performance.
Governments and statistical and research communities are encouraged to:
• Promote the exploitation of ofcial statistics at the “micro” level (enterprise, establishment, organisation,
worker, household/individual);
• Explore the statistical potential of administrative records;
• Review existing data collections to maximise data-linking opportunities for research;
• Improve the research community’s access to this infrastructure while ensuring data condentiality.
Action 6
Build a statistical quality framework suited to the Internet as a data source
Given the pace of technological change it is understandable that institutions collecting economic data tend to
fall
behind in measuring the magnitude and scope of ICT impacts on the economy. However, ICTs are themselves
generating enormous ows of information at an unprecedented pace. Statistical information is no exception to
this trend. ICTs have
reduced the complexity and costs of collection, storage and treatment of data. Furthermore,
Internet trafc ows and Web-based data provide a timely source of information on economic and social activities
across the digital economy.
While offering great opportunities for statistics, Internet-based data also raise a number of issues regarding
statistical quality, security, privacy and costs. Addressing these issues requires a signicant range of expertise.
National Statistical Ofces (NSOs), regulators, Internet Service Providers (ISPs) and the Internet community at
large are invited to work together to:
• Develop international statistical standards for the collection of Internet-based data (e.g. sampling) and the
development of statistical indicators (e.g.treatment of Web search results);
• Assess alternative models of co-operation among businesses, Internet intermediaries and NSOs for the collection
and treatment of Internet-based data;
• Promote the emergence of a regulatory framework for the collection and treatment of Internet-based data,
based on consensus among regulators, Internet intermediaries and the Internet technical community;
• Explore technical and regulatory solutions to preserve user security and privacy in the collection and use of
Internet-based data.

MEASURING THE DIGITAL ECONOMY: A NEW PERSPECTIVE © OECD 2014 23
A MEASUREMENT AGENDA FOR THE DIGITAL ECONOMY A MEASUREMENT AGENDA FOR THE DIGITAL ECONOMY
References
Lehr, W. (2012), “Measuring the Internet: The Data Challenge”, OECD Digital Economy Papers, No. 194, OECD Publishing.
Doi: http://dx.doi.org/10.1787/5k9bhk5fzvzx-en.
OECD (2014a), “The OECD Model Survey on ICT Access and Usage by Households and Individuals”, Working Party on
Measurement and Analysis of the Digital Economy, DSTI/ICCP/IIS(2013)1/FINAL, OECD, Paris.
OECD (2014b), “The OECD Model Survey on ICT Usage by Businesses”, Working Party on Measurement and Analysis of
the Digital Economy, DSTI/ICCP/IIS(2013)2/FINAL, OECD, Paris.
OECD (2012a), OECD Workshop on Broadband Metrics: Summary of Recommendations, OECD Workshop on Broadband
Metrics, London, 14-15 June, www.oecd.org/site/stibrdbd.
OECD (2012b), “Improving the Evidence Base for Information Security and Privacy Policies: Understanding the
Opportunities and Challenges related to Measuring Information Security, Privacy and the Protection of Children
Online”, OECD Digital Economy Papers, No.214, OECD Publishing. Doi: http://dx.doi.org/10.1787/5k4dq3rkb19n-en.
OECD (2011a), Measuring Innovation: A New Perspective, OECD Publishing. Doi: http://dx.doi.org/10.1787/9789264059474-en.
OECD (2011b), Recommendation of the Council on Principles for Internet Policy Making, acts.oecd.org/Instruments/
ShowInstrumentView.aspx?InstrumentID=270.
References

MEASURING THE DIGITAL ECONOMY: A NEW PERSPECTIVE © OECD 2014 25
Chapter 1
THE DIGITAL ECONOMY TODAY

MEASURING THE DIGITAL ECONOMY: A NEW PERSPECTIVE © OECD 201426
1. THE DIGITAL ECONOMY TODAY 1. THE DIGITAL ECONOMY TODAY
THE DIGITAL ECONOMY TODAY
Mobility, cloud computing, social networking, sensor-nets and big data analytics are some of the most important
trends in the digital economy today. Collectively these trends are making possible the future of “smart everything”
(i.e. grids, homes, business processes, energy, healthcare, transport and government), as well as empowering
businesses, consumers and society at large.
These new and future applications rely on the widespread availability of xed and wireless broadband networks to
meet the growing demands of economies and societies with a concomitant rise in the number of devices connected
over theInternet. In the OECD area, the number of connected devices in households is projected to increase from
an estimated 1.7billion today to 14billion by 2022 (OECD, 2013a).
Collection of data will be facilitated by the expansion of machine-to-machine (M2M) communications with large-
scale processing delivered by “cloud computing” services. New data analytics will be able to process and analyse
large volumes of data, frequently termed “big data”. These phenomena together form the “building blocks of smart
networks”. Thenumbers of devices, data and elements involved in smart networks are orders of magnitude larger
than in previous periods (OECD, 2013a).
The pace at which ICT applications are evolving poses particular challenges for measuring the digital economy.
Todate, measurement has focused on the availability and adoption of ICT technologies, in particular Internet
access. However, as the Internet evolves and becomes basic infrastructure, and the simple “adoption” of ICTs
saturates, metrics for specic (more sophisticated) applications become increasingly relevant (Lehr, 2012).
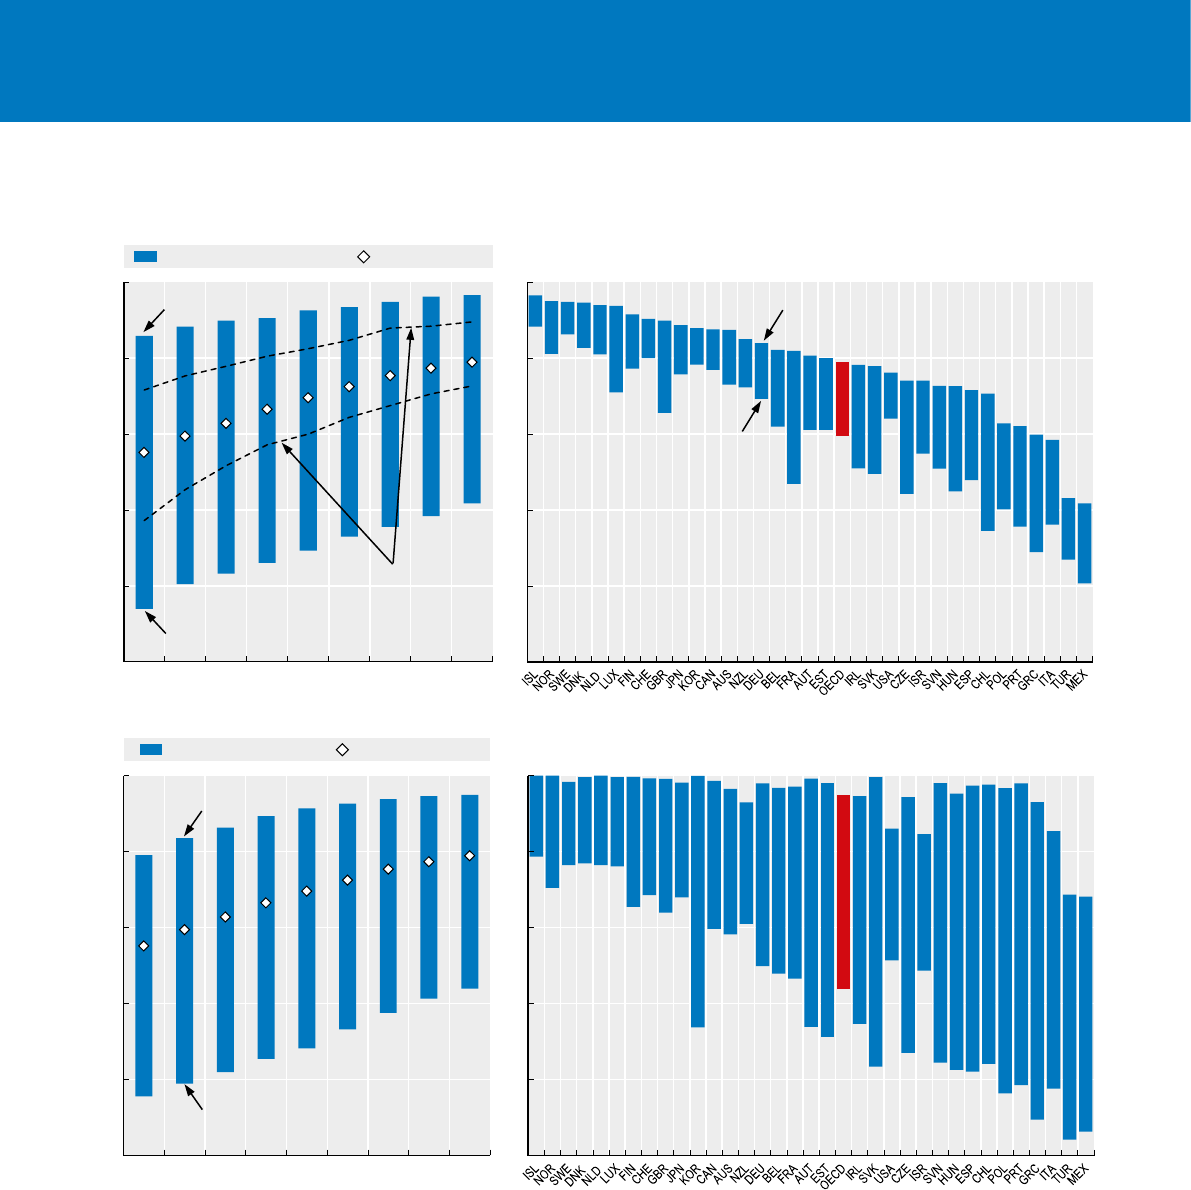
On average about 80% of 16-74 year-olds in OECD countries were Internet users in
2013, compared with less than 60% in 2005. Differences among countries and among
individuals are still large (Figure 1). Internet users are 90% and above of the adult
population in Luxembourg, the Netherlands, the Nordic countries and Switzerland
but less than 60% in Greece, Italy, Mexico and Turkey. These differences are wider for
older generations. Over 75% of 55-74 year-olds in Denmark, Iceland, Luxembourg,
the Netherlands and Sweden reported using the Internet against less than 10% in
Mexico and Turkey.
Education appears to be a much more relevant factor for older people than for younger
people. Usage rates for 55-74 year-olds with tertiary education are generally in line with
those of the overall population, and in leading countries approach that of 16-24 year-olds.
However, these gaps are closing steadily. At the bottom of the OECD range, Mexico
currently has an Internet penetration rate of 40%, while nearly half of all elderly people
in the OECD are now online. The near future will see a further narrowing of these gaps
as technology continues to reduce the cost of online access and as today’s “digital
natives” become adults.
Towards
universal diffusion
of the Internet
MEASURING THE DIGITAL ECONOMY: A NEW PERSPECTIVE © OECD 2014 27
1. THE DIGITAL ECONOMY TODAY 1. THE DIGITAL ECONOMY TODAY
Figure 1. Internet usage trends in the OECD and differences by country (top panel)
and by age groups (bottom panel), 2005-13
Inter country gap: Percentages of 16-74 year-olds; Age gap: 16-24 vs. 65-74 year-olds
0
20
40
60
80
100
2005 2006 2007 2008 2009 2010 2011 2012 2013
%Age gap (percentage points) Average (all individuals)
65-74 year-olds
16-24 year-olds
0
20
40
60
80
100
2005 2006 2007 2008 2009 2010 2011 2012 2013
%Inter-country gap (percentage points) Average (all countries)
Lowest ranking country
Highest ranking country
1st and 3rd quartiles
(The values for half of the countries
are between the two lines)
0
20
40
60
80
100
%By country age gap, 2013
0
20
40
60
80
100
%By country change between 2006 and 2013
2006
2013
Source: OECD computations based on OECD, ICT Database and Eurostat, Information Society Statistics, July 2014. See chapter notes.
1 2 http://dx.doi.org/10.1787/888933147770
MEASURING THE DIGITAL ECONOMY: A NEW PERSPECTIVE © OECD 201428
1. THE DIGITAL ECONOMY TODAY 1. THE DIGITAL ECONOMY TODAY
Source: OECD computations based on Akamai, The State of the Internet, various years, May 2014. See chapter notes.
1 2 http://dx.doi.org/10.1787/888933147787
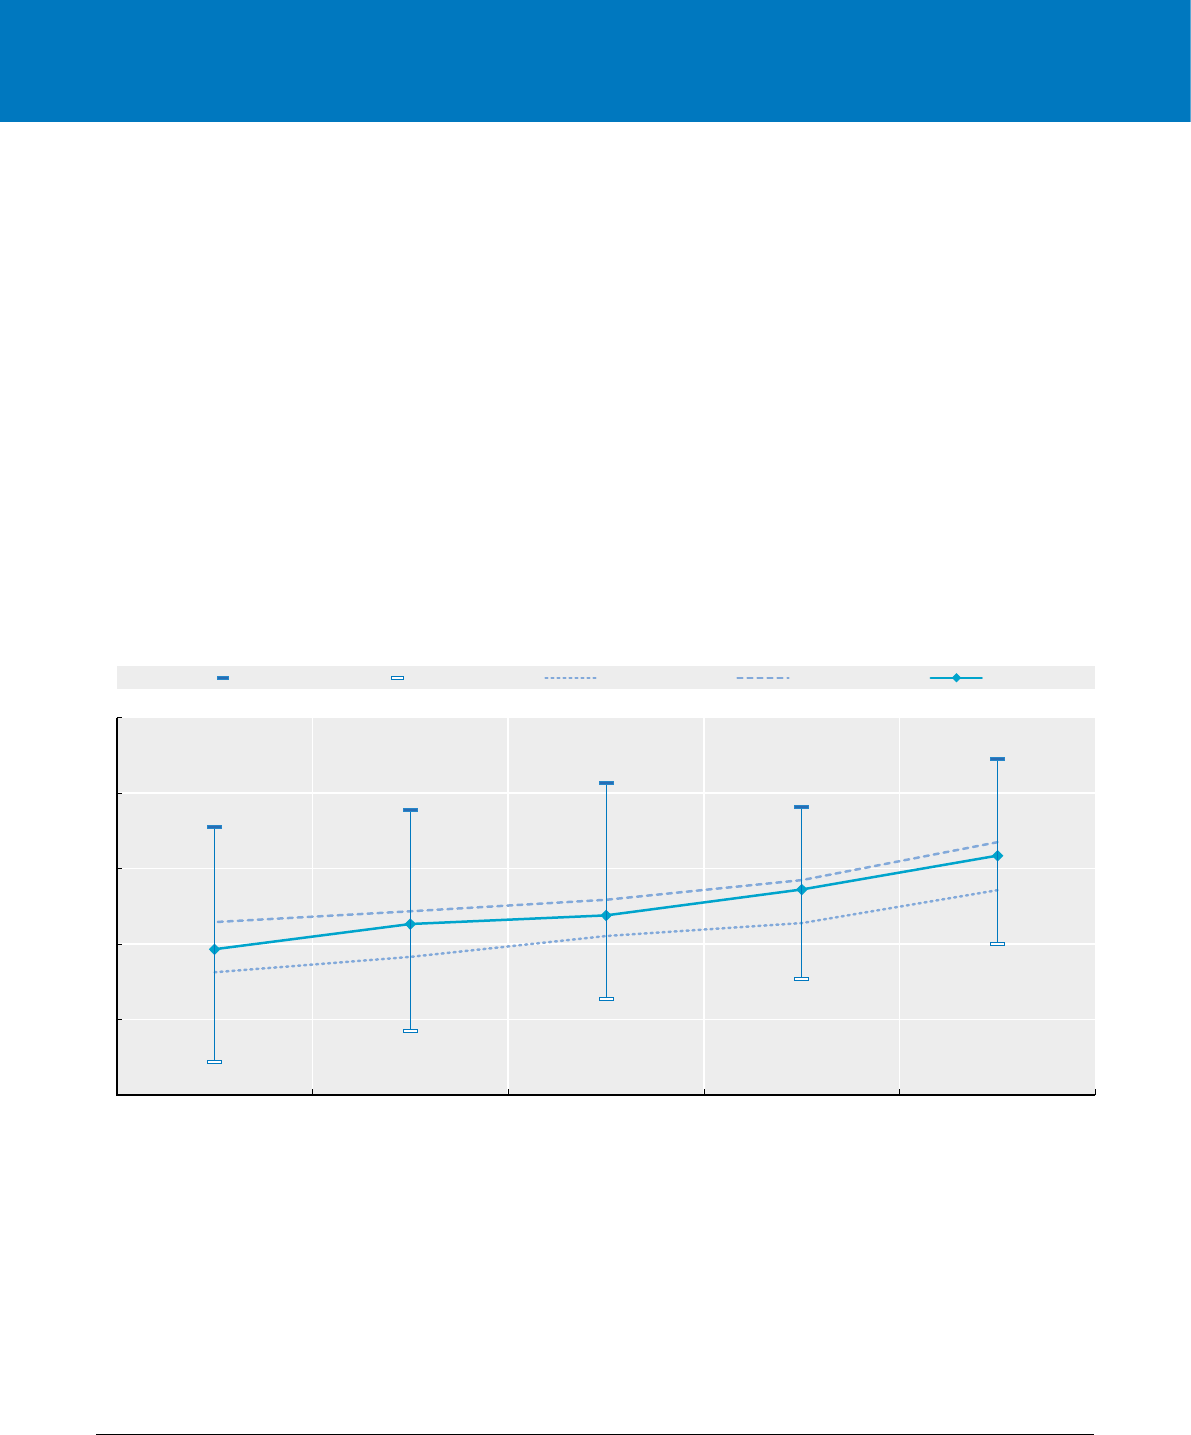
Figure 2. Trends in broadband speed across the OECD, Q4 2009-13
Average download speed in Mbit/s, All technologies combined
1
2
4
8
16
32
Q4 2013Q4 2012Q4 2011Q4 2010Q4 2009
Mbit/s
Highest Lowest 1st quartile 3rd quartile Median
The explosion
of mobile broadband
access…
Increasing Internet uptake has greatly beneted from the development of mobile infra-
structures and falling access prices. Wireless broadband subscriptions in the OECD
increased over twofold in just four years, from about 250million to 850million between
2008 and the rst half of 2013. Mobile broadband connectivity is also widely available
in many emerging and less developed countries, enabling these economies to make
substantial increases in Internet access. For example, in sub-Saharan Africa mobile
broadband subscriptions grew from 14million to 117million between 2010 and 2013,
and are estimated to exceed 170million in 2014.1
Despite the broad diversity in prices and quality of xed and mobile broadband services
across the OECD, average broadband speeds have risen. Fully reliable datasets for wired
and wireless broadband are not yet available across the OECD (see 2.1 and 2.2). However,
according to data recorded by a major Content Distribution Network (CDN), speeds
increased from about 1.5Mbit/s to 4Mbit/s over a four-year period in Mexico, the OECD
country at the bottom of the range, while Korea, the country at the top of the range,
enjoys speeds in 2013 that are about ve times faster (22Mbit/s) (Figure2).
1. International Telecommunication Union (ITU), World Telecommunication/ICT Indicators Database (www.itu.int/en/ITU-D/Statistics/Documents/
statistics/2014/ITU_Key_2005-2014_ICT_data.xls).
… and related
applications
Progress in the quality of mobile broadband and the massive spread of Wi-Fi over xed
networks has allowed mobile devices to expand the array of applications used over
the Internet, affecting the everyday life of millions of users across the OECD. Inless
than two years, the number of pages viewed from mobile devices, on a sample of
3million websites monitored by Statcounter (gs.statcounter.com, June 2014), rose from
11.7% to 24.3%worldwide, and from about 15% to more than 30% when tablets are included.
MEASURING THE DIGITAL ECONOMY: A NEW PERSPECTIVE © OECD 2014 29
1. THE DIGITAL ECONOMY TODAY 1. THE DIGITAL ECONOMY TODAY
Source: OECD computations based on data from Wikimedia Foundation Statistics, stats.wikimedia.org, June 2014.
1 2 http://dx.doi.org/10.1787/888933147790
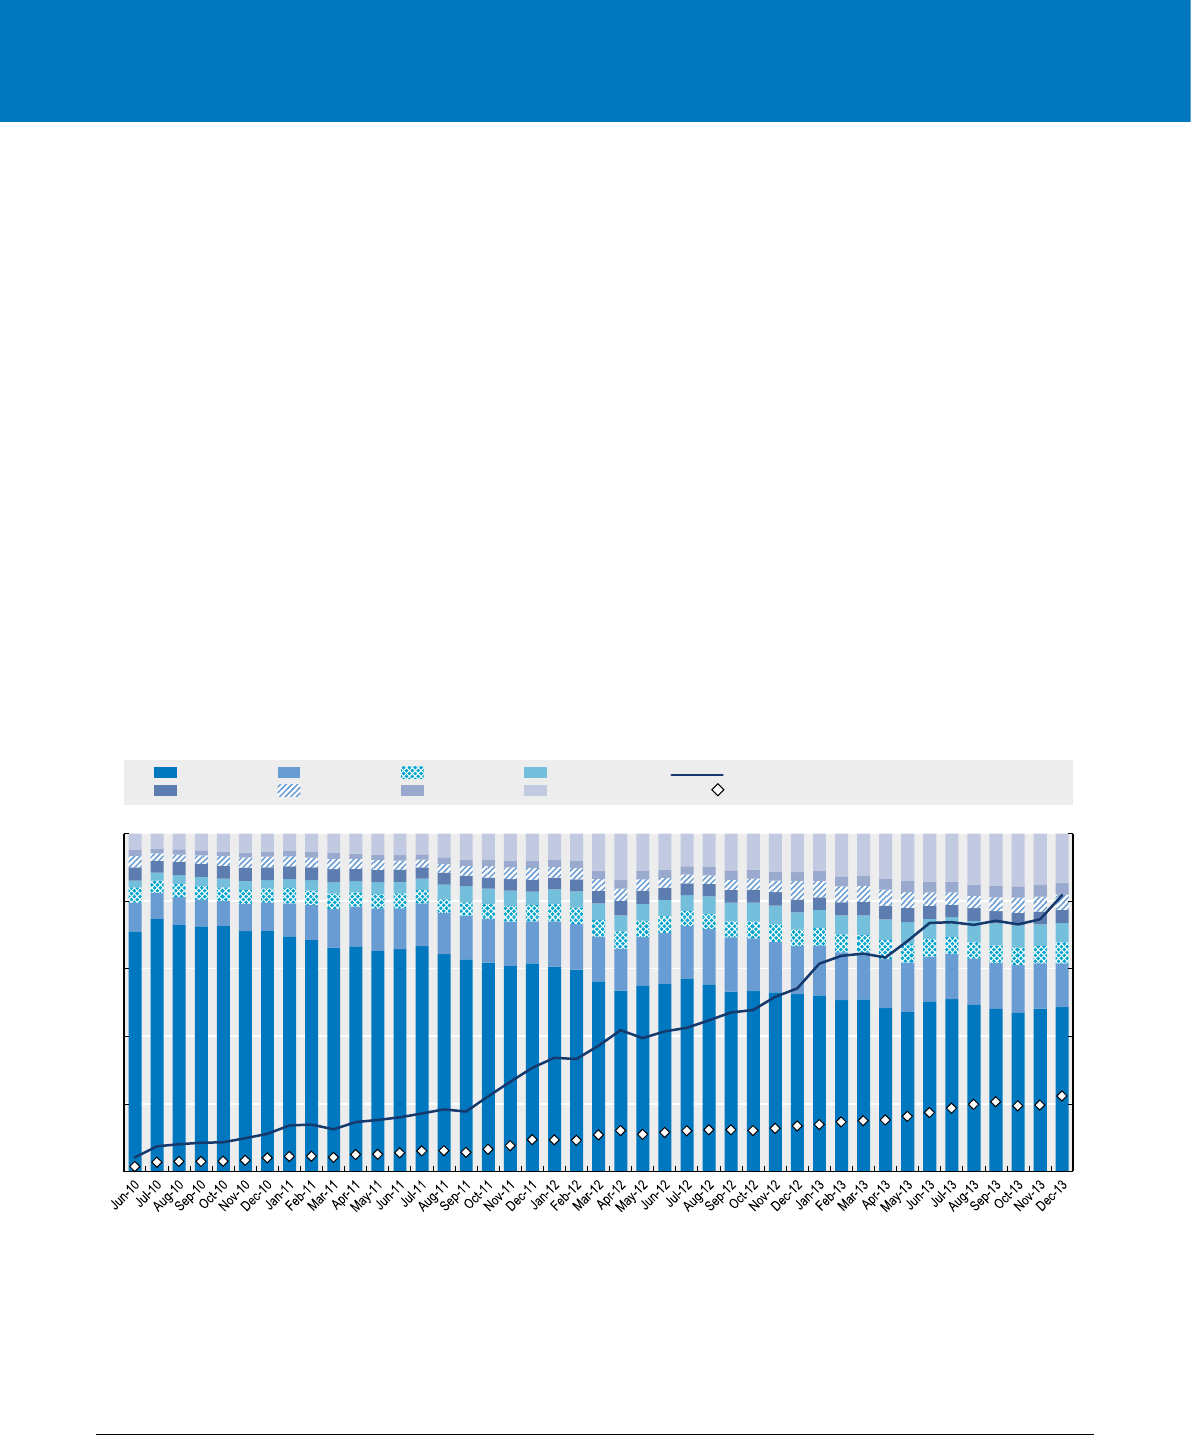
Figure 3. Wikipedia monthly page views on mobile platforms, by language, 2010-13
Percentages (left-hand scale), number in billions (right-hand scale)
0
1
2
3
4
5
0
20
40
60
80
100
Billions
%
English
French
Japanese
Russian
German
Italian
Spanish
Other languages Views on mobile platforms as a percentage of total views
Total views on mobile platforms (right-hand scale)
2. In March 2014, Facebook claimed to have 802million active users a day, 609million of which connect via a mobile device. It is worth noting that
these gures do not portray mobile-only users.
The use of mobile devices is proportionally greater where xed broadband deployment
is scarce: for example, in Africa and Asia page views by mobiles and tablets increased
from about 15% and 20% respectively in 2012, to about 40% in 2014. In Europe, North
America and Oceania, where the development of both xed and mobile infrastructures
is more advanced and average income comparatively high, there has been a signicant
rise in the use of tablets, which now account for up to 10% of web page views.
The same page-view metrics can be applied to individual websites. Wikimedia, the not-
for-prot corporation managing Wikipedia, publishes this information on a monthly
basis. Worldwide gures for Wikipedia show 20billion page views per month, making it
one of the top ten most visited websites across nearly all OECD countries. Page views on
handheld device platforms (tablet and smartphone) grew from about 1billion per month
at the beginning of 2011 to more than 4billion per month at the end of 2013, accounting
for about 20% of total page views. Much of this growth came from views of pages in
languages other than English (Figure3).
The development of mobile usage affects the ICT economy in different ways, sometimes
displacing other segments in ICT markets. For instance, active Facebook users connecting
to the social network with a mobile passed from 28% of all users at the end of 2009 to
over 75% at the end of 2013, while the revenue Facebook declared from mobile adver-
tising rose from 13% of total revenues in 2012 to 40% in 2013.2

MEASURING THE DIGITAL ECONOMY: A NEW PERSPECTIVE © OECD 201430
1. THE DIGITAL ECONOMY TODAY 1. THE DIGITAL ECONOMY TODAY
The integration
of functionality
in devices and
thegrowth of apps
with increasing
performance
Devices are becoming increasingly powerful and affordable (Figure4). Mobile phones now
have signicant computing power and functionality, with cameras and music players as
standard, and a wide range of available applications. Smartphones now employ touch-
screen technology and include location and speed sensors, as well as an array of other
sensors to improve the user experience.5 Wi-Fi and Bluetooth connectivity for data
transmission is also standard, while RFID transponders allowing near eld communica-
tion (NFC) for mobile payments are also likely to see an increase in use.
Innovations in the pipeline include sensors for monitoring air pollution, ambient conditions
(via UV light sensors) and health diagnostic tools – from microscopes to heartbeat,
pressure and temperature sensors – that would ideally allow for constant monitoring of
physical conditions, including from remote locations. The integration of new functionality
and information has also given birth to a smartphone and tablet ecosystem comprising
an extensive array of new software applications for mobile operating systems, commonly
known as “apps”.6 The growing ubiquity of these applications has also drawn attention to
the importance of effective protection of personal information.
3. Estimates combine different forecasts of private sources, including IHC-technology (press.ihs.com/press-release/design-supply-chain/cloud-
related-spending-businesses-triple-2011-2017), IDC (www.idc.com/getdoc.jsp?containerId=prUS24298013), Gartner (Forrester Research report
quoted in blog.trendmicro.com/forrester-cloud-market-to-hit-240-billion-by-2020/#.U9fM6ygvjl8).
4. Among sources claiming potential savings in this order of magnitude, see for instance the recent report by Computer Economics (www.computer-
economics.com/custom.cfm?name=postPaymentGateway.cfm&id=1931).
5. These typically include a global positioning system (GPS) chip and a magnetometer/digital compass for orientation, often complemented by a barometer
for altitude. These are accompanied by sensors for measuring movement and angular rotation (accelerometers and gyroscopes), with light sensors to
adapt to visibility conditions while saving battery power, and proximity sensors to avoid accidental hitting of the touchscreen when in free hands mode.
6. The contraction “app” for software application predates the introduction of mobile apps, but is now mostly used in reference to them. In general,
an app (mobile app) is a lightweight software that either aids browsing (i.e. it facilitates interaction with a commercial website by hosting some of
the information on the device) or allows for specic functionalities (e.g.gaming or use of tools embedded in the device to offer functions such as
speed measurement).
The progression
of cloud computing
The development of communication infrastructures is opening the market to an array
of new business processes, among which cloud computing (i.e.the centralised provision
of IT infrastructures and software to end users over a network) is considered one of
the most promising applications. Cloud computing is becoming a more viable alterna-
tive for storage and computing capability with the provision of infrastructure as a service
(Iaas) offers and, increasingly, software as a service (Saas) and platform as a service (Paas)
– the latter incorporating the other two. The appeal for businesses is potential exibility
and effectiveness. Cloud services are a substitute for investment and offer seamless
scalability and pay as you use contracts that can lead to a reduction in personnel costs.
Private source forecasts of market size for these different areas are far from consistent
and ought to be considered as indicative only. These estimates suggest an increase in
the global cloud market from about USD120-150billion in 2013 to USD200-250billion
in 2017.3 SaaS is predicted to account for about 15% of this total value with the private
cloud (where infrastructure is dedicated to the customer) forecast to be the leading type
of architecture.
Ofcial statistics on cloud computing, while still scattered, largely conrm that adoption
is spreading rapidly, in particular among larger enterprises. For example, 54% of larger
Canadian businesses in 2012 used cloud services against 28% of businesses with less than
50 employees. The 2012 share of large companies using cloud solutions was almost 30%
in Korea and 36.4% in Japan, up from 28.7% a year earlier. Comparable information in this
area will be available in early 2015 for countries under the European Statistical System
(ESS), with a special module on the use of cloud services by enterprises incorporated in
the 2014 survey. Broader availability of information will permit monitoring of the growth
in cloud services and analysis of its drivers and impacts on rm performance. Atpresent,
private sector estimates report around 10-20% savings on IT costs for businesses using
cloud services, although such data ought to be considered with caution.4
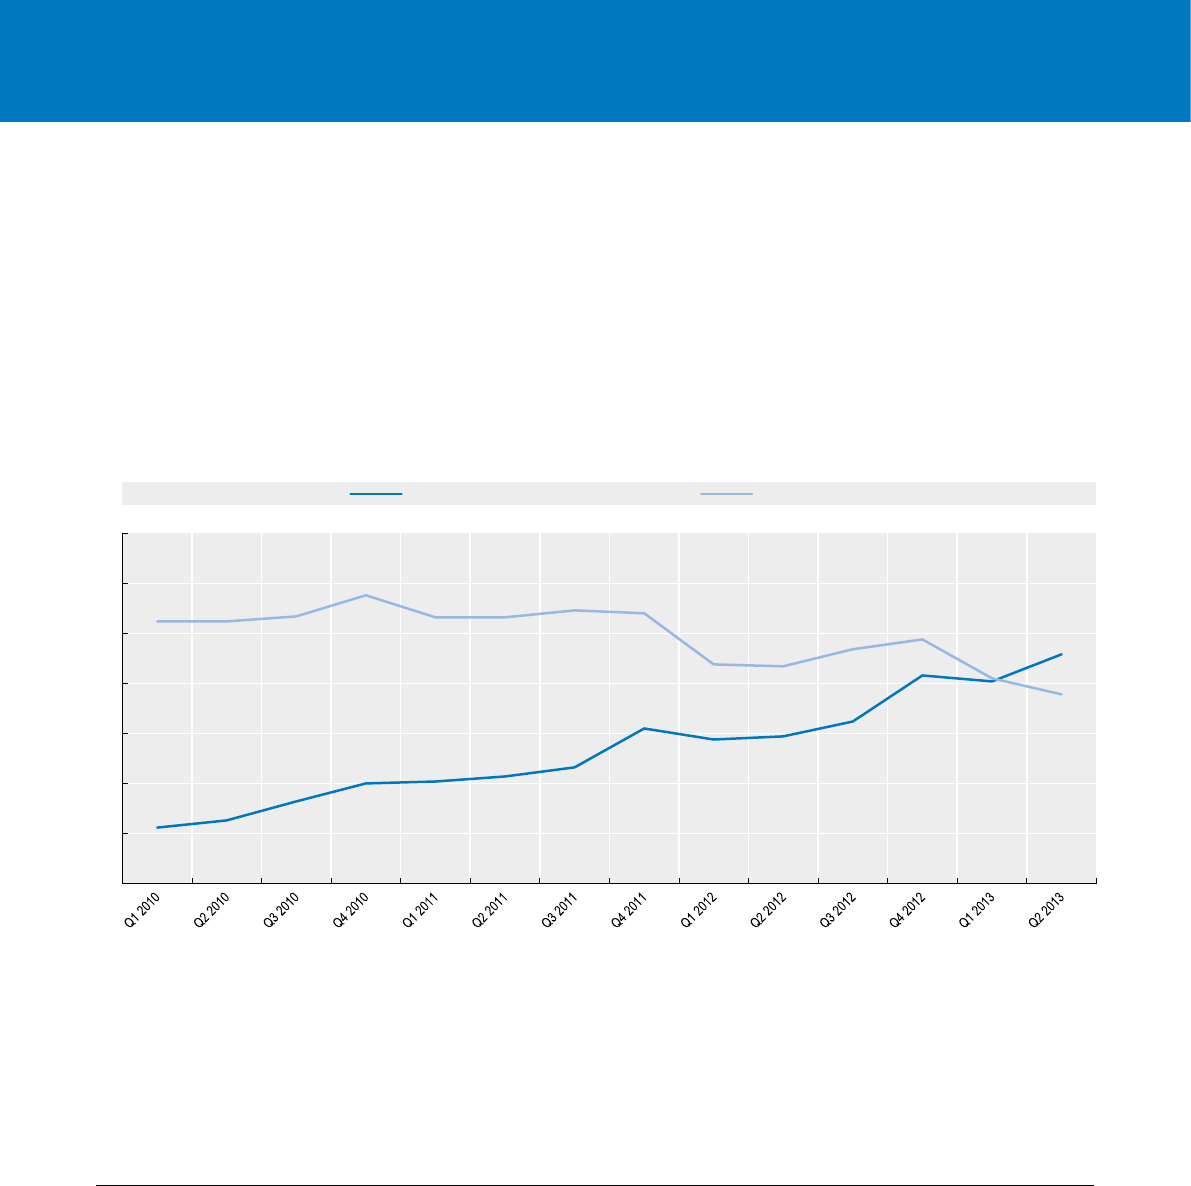
MEASURING THE DIGITAL ECONOMY: A NEW PERSPECTIVE © OECD 2014 31
1. THE DIGITAL ECONOMY TODAY 1. THE DIGITAL ECONOMY TODAY
The Android platform currently boasts the highest number of available applications.
Apps in the Android market grew almost 60% in the year to May 2014, reaching about
1.2million units. Of these, 1million are (in principle) available for “free”, while 200000
are paid.7 The size of the world mobile (and tablets) market for apps can be estimated
at around USD20-25billion dollars in 2013, with strong growth perspectives. Sales and
employment forecasts related to apps are highly diverse and sensitive to underlying
methodology.8
Source: ABI research, based on information from the 14 largest mobile producers, July 2014. See chapter notes.
1 2 http://dx.doi.org/10.1787/888933147808
Figure 4. The progress of smartphones, 2010-13
Quarterly global shipping trends
0
50
100
150
200
250
300
350
Millions
Smartphones Other mobile phones
7. It must be stressed that many free-to-download apps might charge a fee for usage or upgrade. Also, in comparing these gures with those from
Apple, it should be noted that the latter exert a somehow tighter control on the publication of apps for its devices, such that almost 20% of apps
available on the Android market are identied as “low quality” (either useless or harmful) and are thus candidates for removal from the platform.
8. Corporate apps create value for developers even when free to users. Most banks, newspapers and commercial chains produce them for almost all
popular operating systems (or platforms) to attract customers and increase their delity. However, these represent only a fraction of the apps being
developed. The majority of apps make little or no money with only a few going viral and making a prot. Hence, a signicant part of the market for
apps functions essentially as a lottery. This is made possible by the low investment required to develop and distribute a single app, while the lack
of interoperability between platforms multiplies the total number of apps. From the consumer’s perspective, moving from one platform to another
(or owning devices with different operating systems) implies an extra cost, potentially “locking in” customers to platforms.
A study released in the last quarter of 2012 by the Canadian Information and Communications Technology Council (ICTC, 2012), extrapolating
national data based on information from both direct (including ofcial survey) and indirect sources, put the world market for apps at about
USD23billion in 2012, including about USD4billion from advertisement revenue. Portioresearch.com in their Mobile Applications Futures 2013-2017
placed it at USD20 billion in 2013, corresponding to about 82billion downloads during the year. Gartner and ABI Research placed it at USD26billion
and USD27billion, respectively, the former forecasting growth of up to USD77billion in 2017. With respect to employment, a study commissioned
by TechNet in 2012 (Mandel, 2012) estimates just above 300000jobs for the United States, of which half comprised technicians (the ICTC study for
Canada comes to a similar share). These are then inated to almost half a million counting for indirect employment with a 1.5 multiplier.

MEASURING THE DIGITAL ECONOMY: A NEW PERSPECTIVE © OECD 201432
1. THE DIGITAL ECONOMY TODAY 1. THE DIGITAL ECONOMY TODAY
9. Data analytics consists of the use of data mining and similar exploratory techniques to support decisions. One well-known example is that of
targeted online advertising, which uses results from individual proling based on information on websites visited by means of cookies or other
devices. There are several denitions of big data, which refer to the volume, variety and other aspects of information, as well as to techniques and
tools (including parallel computing) to treat such large unstructured datasets.
10. The UK innovation agency (NESTA) undertook a survey, followed by a modular study on enterprises using data analytics, whose more advanced
results are published in Bakshi etal. (2014a) with respect to the impact on rm performance, and in Bakshi etal. (2014b) with respect to the type
of human resources used and activities performed. For an overview of these and other empirical works, see OECD (2015). With a view to gathering
more robust and comparable evidence in this eld, the OECD also introduced an experimental module on data analytics in the 2014 revision of its
Model Survey on ICT Usage by Businesses.
11. For example, the US National Science Foundation (NSF) and the Japan Science and Technology Agency (JST) are currently working on a joint
programme to optimise the use of big data and massive computing in disaster management. JST-NSF (2014) provides a preliminary assessment,
which served as a basis for the collaborative research programme. A synopsis of the latter is available at www.nsf.gov/funding/pgm_summ.
jsp?pims_id=505035.
12. In healthcare, data analytics can lead to improvements in the quality and effectiveness of treatments while saving resources. The availability
of personal health records can help to diagnose conditions and identify and ne tune the most effective treatments with respect to individual
patients, as well as providing insights into co-morbidities and risk factors. Data analytics solutions are already embedded in some clinical decision
support system software (CDSS) – a key application of articial intelligence in medicine. The OECD is also promoting an international action to
leverage big data with respect to Alzheimer’s disease.
13. See www.oecd.org/health/dementia.htm. The Citizen Science Projects promoted by Zooniverse (www.zooniverse.org) provide some examples of
the use of big data-combined distributed participation.
The emergence
of big data analytics
and its potential
applications
Higher speed Internet, lower unit prices and smart devices have favoured deployment,
access and use of new and more data-intensive applications. Cisco estimates an increase
in the yearly growth rate of data trafc of about 20%, from 70 exabyte (EB = 1billion
Gigabytes or 1 trillion [i.e.10006] bytes) per month in 2014 to about 120EB in 2017, with
the share of mobile trafc growing from 4% to more than 9%. Though this is a signicant
increase, the growth rate is considerably lower than that of the previous period.
Potential applications of data analytics techniques to treat this increasing wealth of infor-
mation are also being advertised to the general public, and popularised as “big data”.9
The declining cost of data storage and processing have facilitated the collection of large
data volumes and the adoption of data analytics. Cost decline in data storage is illus-
trated by the average cost per gigabyte of consumer hard disk drives (HDDs), which
dropped from USD 56 in 1998 to USD 0.05 in 2012, an average decline of almost 40%
a year (Figure 5). With new generation storage technologies such as solid-state drives
(SSDs), thedecline in costs per gigabyte was even faster (51% over 2007-12).
“Big data” solutions such as Hadoop are used primarily by enterprises in the ICT sector,
but their applications extend to the whole economy. Studies in this eld draw mainly on
anecdotal information, although more structured evidence is accumulating.10 Societal
applications are even wider, ranging from disaster management11 to healthcare appli-
cations.12 Data analytics can also be a driver for innovation in a number of scientic
areas (see Figure 11 below concerning genome sequencing) and is used increasingly
in collaborative and crowd-based projects.13 Exploiting the potential of big data also
requires access to specic skills, in terms of new analytical techniques such as parallel
processing or visualisation tools. In many cases, the transition also requires changes in
the organisational practices of both enterprises and institutions, as well as the develop-
ment of rules for data storage and exchange (e.g. health records).
Reliable information on the development and market value of emerging applications is
still limited. Consequently, other approaches may be better suited to tracking develop-
ment at this early stage.
Bibliometric and patent analysis may offer a better proxy of scientic progress in this
area. A text search performed on one of the largest repository of scientic publications
shows that data mining-related articles doubled their weight during the last decade
(Figure 6).
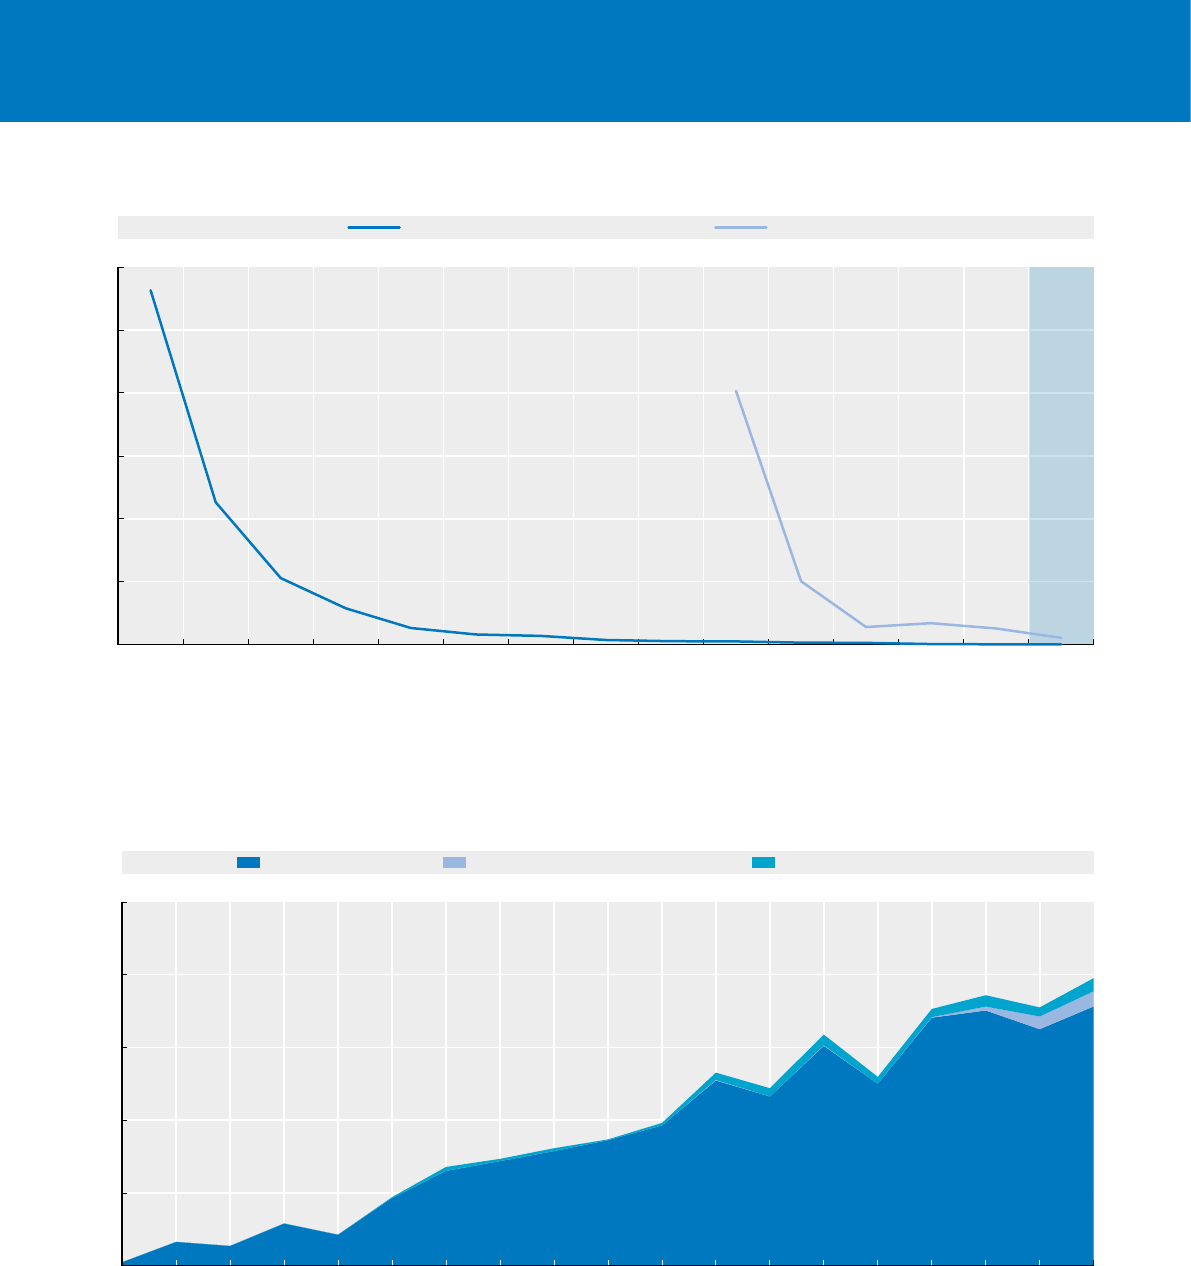
MEASURING THE DIGITAL ECONOMY: A NEW PERSPECTIVE © OECD 2014 33
1. THE DIGITAL ECONOMY TODAY 1. THE DIGITAL ECONOMY TODAY
Source: OECD, based on Royal Pingdom blog, December 2011. See chapter notes.
1 2 http://dx.doi.org/10.1787/888933147819
Figure 5. Average data storage cost for consumers, 1998-2012
Per Gbit
0
10
20
30
40
50
60
1998 1999 2000 2001 2002 2003 2004 2005 2006 2007 2008 2009 2010 2011 2012
USD
Hard disk drives Solid-state drives
Estimated
value
Source: OECD computations based on on ScienceDirect repository, www.sciencedirect.com, July 2014.
1 2 http://dx.doi.org/10.1787/888933147825
Figure 6. Data mining-related scientic articles, 1995-2014
Per thousand articles
0
0.5
1
1.5
2
2.5
‰
Data mining Big data (excluding data mining) Text mining (excluding data mining)
1996 1997 1998 1999 2000 2001 2002 2003 2004 2005 2006 2007 2008 2009 2010 2011 2012 2013 2014
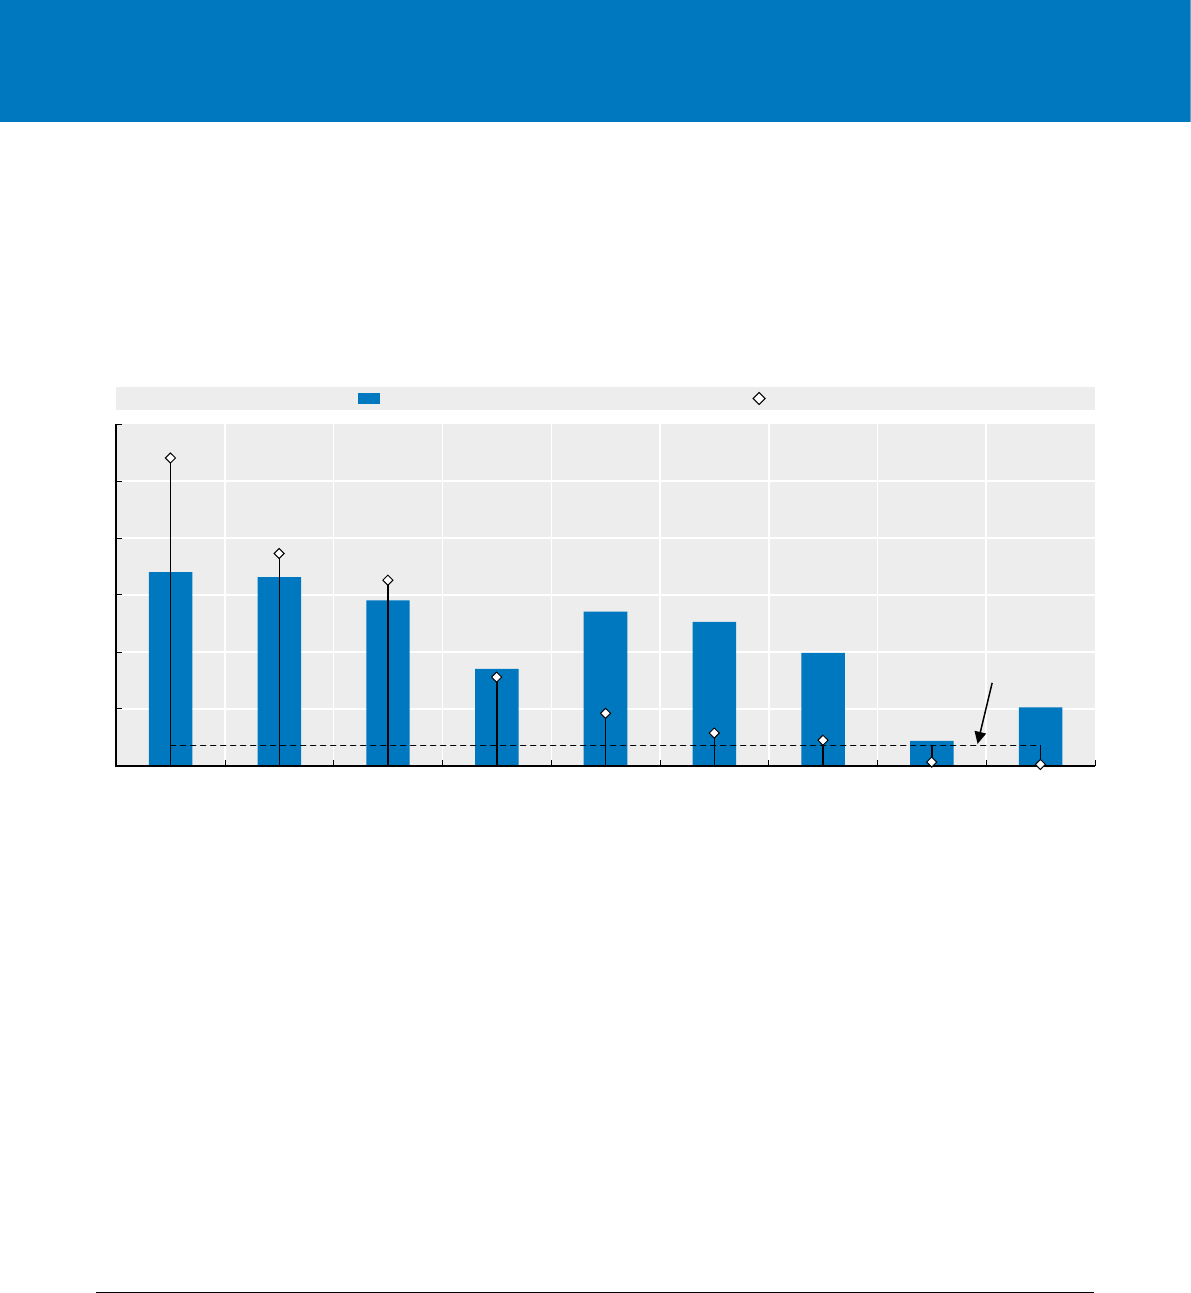
MEASURING THE DIGITAL ECONOMY: A NEW PERSPECTIVE © OECD 201434
1. THE DIGITAL ECONOMY TODAY 1. THE DIGITAL ECONOMY TODAY
… innovation
practices and
performance
Innovative businesses generally use innovative practices and foster creativity in the
workplace through a variety of methods. Innovation surveys measure some of these
practices, which include brainstorming, forming multidisciplinary or cross-functional
teams, providing nancial or other incentives to workers for developing new ideas, and
encouraging job mobility within the organisation.
Innovators in information industries, both in manufacturing and information services,
have a higher than average propensity to successfully adopt all of these practices (Figure8).
Firm-level data on ICT usage and innovation reveal that enterprises introducing product,
process or organisational innovations are more likely to adopt key ICT applications than
non-innovators.15 As ICT uptake becomes generalised, as in the case of broadband use
and website presence, the difference between the two groups tends to disappear, while
it remains sizeable for the practice of e-commerce and the use of Enterprise Resource
Planning (ERP) software tools in business processes (Figure9).
14. The OECD in 2007 dened the information economy sector (see OECD, 2011) as the aggregate combining ICT and digital media and content
industries. Here these are all referred as information industries. This aggregate includes ISIC Rev.4 Division 26 (Manufacture of computer, electronic
and optical products) and Section J (Information and communication services), consisting of Divisions 58-60 (Publishing and broadcasting
industries), 61 (Telecommunications) and 62-63 (Computer programming and information services). ICT trade and repair activities (in Groups 465
and 951) are also included, but are not considered here due to issues of data availability.
15. This evidence was gathered by the Eurostat project ESSLait (ESSnet on Linking of Microdata to Analyse ICT Impact), nalised in 2013
(see Eurostat, 2013). Fourteen countries participated in the project overall: Austria, Denmark, Finland, France, Germany, Ireland, Italy, Luxembourg,
the Netherlands, Norway, Poland, Slovenia, Sweden and the United Kingdom. In 2014, Australia and Canada will publish indicators comparable to
those produced within this project. The evidence presented refers to all project countries pooled, except Germany, for which it was not possible to
link ICT usage and innovation micro-data.
Source: OECD estimates based on OECD, ANBERD Database, www.oecd.org/sti/anberd, June 2014. See chapter notes.
1 2 http://dx.doi.org/10.1787/888933147838
Figure 7. R&D intensity and contribution to total BERD by industry in the OECD, 2011
R&D expenditure as a percentage of value added and of total BERD
0
5
10
15
20
25
30
ICT manufacturing Transport
equipment
Chemicals and
pharmaceuticals
Machinery and
electrical equipment
Information and
communication
services
S&T and
professional
services
Other manufacturing Other industries Other services
%Shares of total BERD R&D intensity
All industries R&D intensity = 1.8%
Information
industries lead
in innovation
activities…
ICTs play a key role in today’s innovation activities. While innovators tend to be more
intensive users of ICTs, businesses in the information economy sector14 are leading across
all types of innovation activities, especially but not only those related to R&D. Indeed,
the ICT sector is among the most R&D intensive and, combined with publishing, digital
media and content industries, accounts for about one-quarter of total OECD business
expenditure on research and development (BERD) (Figure7).
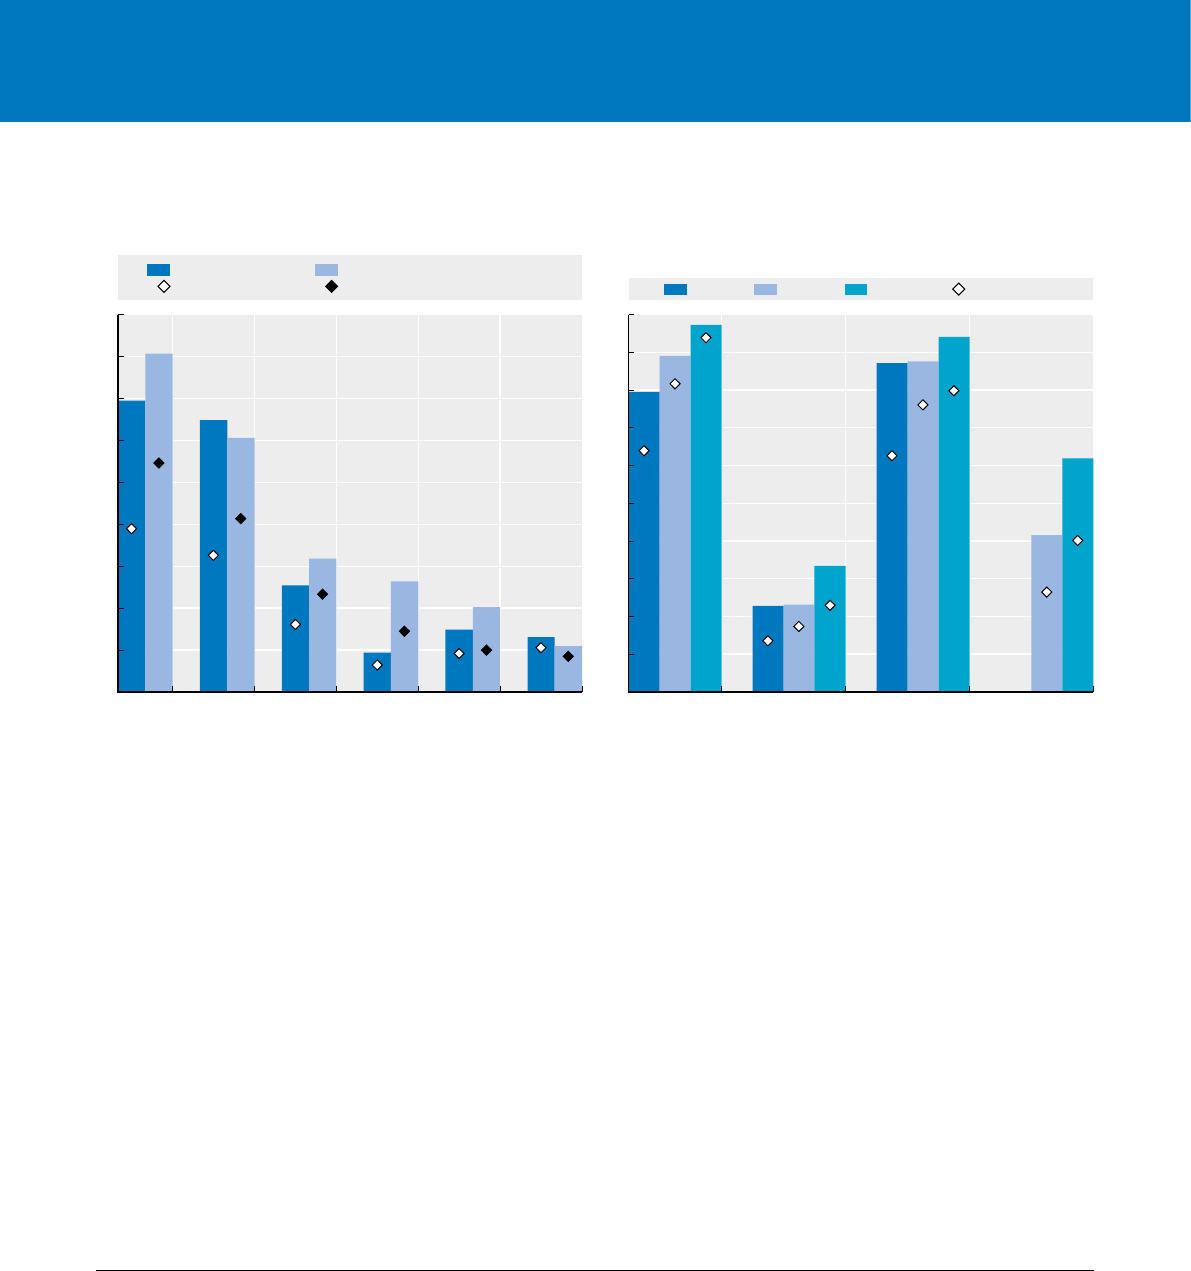
MEASURING THE DIGITAL ECONOMY: A NEW PERSPECTIVE © OECD 2014 35
1. THE DIGITAL ECONOMY TODAY 1. THE DIGITAL ECONOMY TODAY
ICTs are driving
the next wave
of innovation
Today, patents in ICT-related technology classes account for about one-third of all applica-
tions to main patent ofces. Keyword text searches on international patent lings to the
World Intellectual Property Organization (WIPO), for example, provide insights into the
relative importance and dynamics of inventive activity in emerging areas like data mining,
3D-printing and M2M communication (Figure10).16 All three of these technology areas,
while still minor in patenting activity, show an upward trend in terms of weight in the
total number of patents led, particularly in the case ofM2M.17
Many of the emergent technology groupings owe a debt to ICT-related technologies
which are blending with other technologies to create innovations that are “in silico”.
In the OECD, about 25% of inventions attributed to an ICT-related technology class
by patent examiners are also labelled under other (non-ICT) technology areas (OECD,
2013b).18 Genome sequencing is a noticeable example of the application of ICTs to other
elds. The deployment of second-generation sequencing techniques with embedded
data-mining algorithms has resulted in a spectacular fall in cost in the three years to
mid-2011, from USD1million to about USD10000 per human-like genome, and a further
decrease to less than USD5000 in early 2014 (Figure11).
16. This technique represents a more effective tool than class analysis when applications cannot be clearly attributed to one or few classes only,
and/or when these also encompass other types of applications. Text string searches were performed on the abstract and claim areas of the le,
which are generally considered to be a good compromise between full description (too broad) and title (too narrow) searches. Multiple strings were
used jointly for each item to address possible differences in wording (e.g. 3D printing, 3D print, 3D printer, etc.).
17. The spike observed for 2014 should be considered with caution, as it is based on partial information.
18. The acceleration in the development of patented technologies, or patent “burst”, corresponds to periods (i.e.years) characterised by a persistent
increase in the number of patents applied for in a certain technology eld. The intensity of the burst reects the pace at which the acceleration
occurs. Technology bursts are identied at the 4-digit level of the International Patent Classication (IPC). Accelerations in co-developments are
detected by looking at the application patterns and bursts of all possible pairs of 4-digit IPC classes contained in patent documents. Top patent
bursts are selected by comparing the intensity of the accelerations observed. Technology areas are identied on the basis of content analysis of
the IPC classes considered.
Source: OECD computations based on Eurostat, Community Innovation
Survey (2010), June 2014. See chapter notes.
1 2 http://dx.doi.org/10.1787/888933147849
Source: OECD based on the EU ESSLAIT project Micro Moments
Database, June 2014. See chapter notes.
1 2 http://dx.doi.org/10.1787/888933147857
Figure 8. Methods to stimulate creativity
across 22 European countries in information industries
vs. other sectors, 2010
Percentage of innovators by method and industry
Figure 9. ICT uptake among process and organisational
innovators and non-innovators in 13 European countries,
2004, 2008 and 2010
Percentage shares of adopters of selected technologies
10
15
20
25
30
35
40
45
50
55
Brainstorm Multi-team Training Non-financial
incentives
Financial
incentives
Job rotation
%
ICT manufacturing Information and communication services
Total manufacturing Total services
0
10
20
30
40
50
60
70
80
90
100
Broadband E-sales Website ERP
%2004 2008 2010 Non-innovators
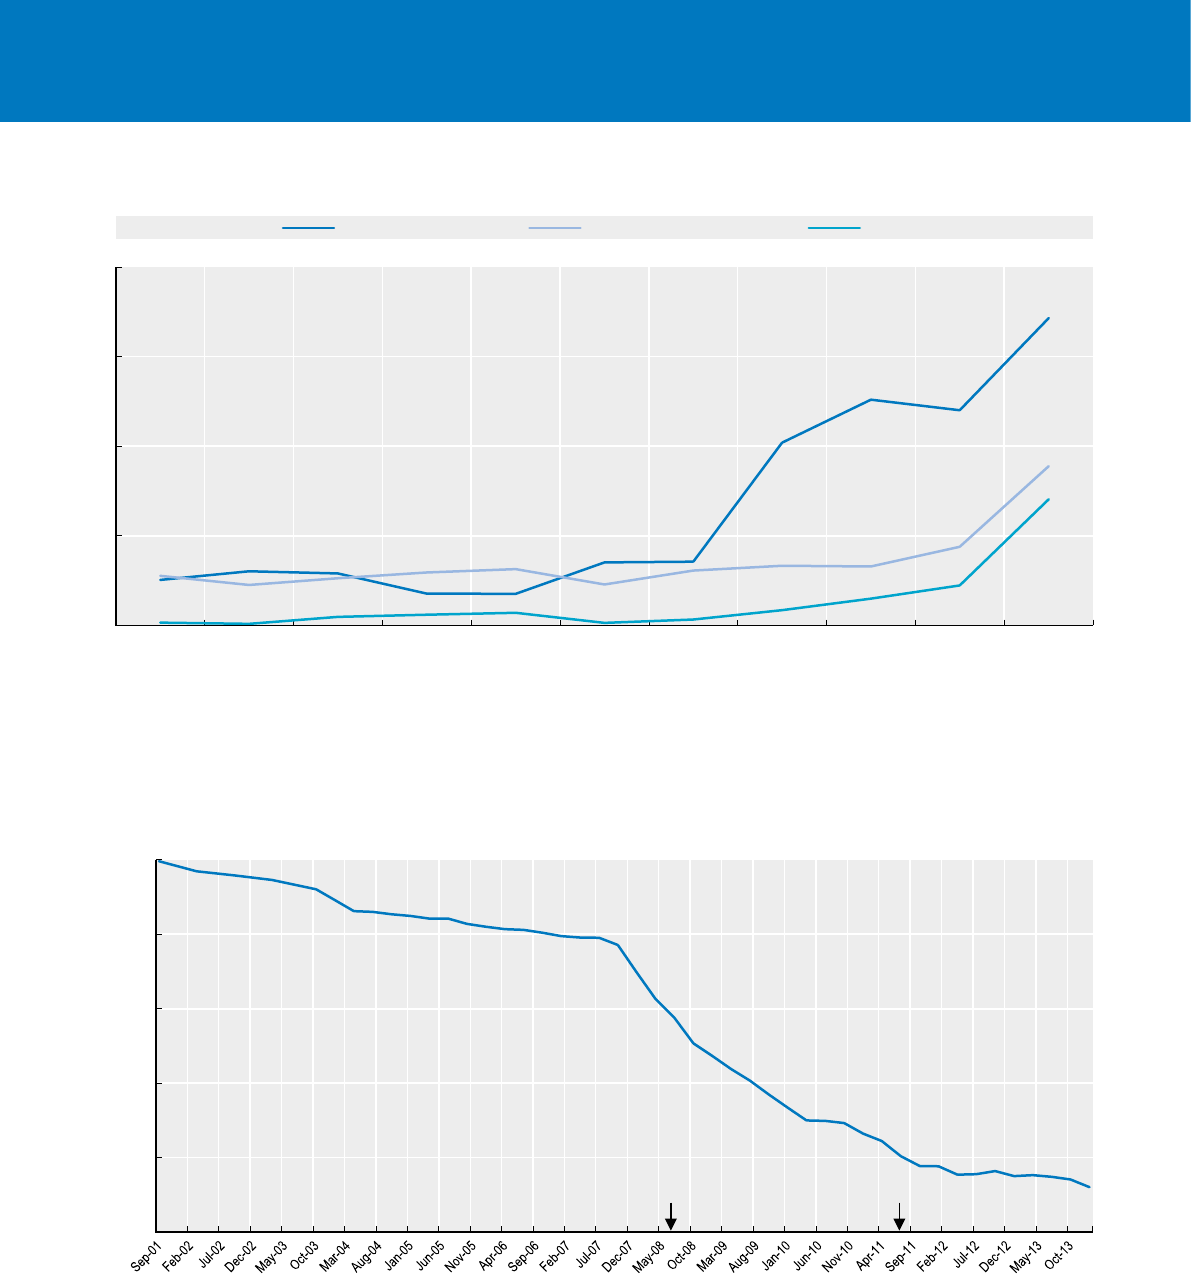
MEASURING THE DIGITAL ECONOMY: A NEW PERSPECTIVE © OECD 201436
1. THE DIGITAL ECONOMY TODAY 1. THE DIGITAL ECONOMY TODAY
Source: OECD computations based on WIPO Patentscope Database, patentscope.wipo.int, May 2014. See chapter notes.
1 2 http://dx.doi.org/10.1787/888933147865
Figure 10. Patents on M2M, data analytics and 3D printing technologies, 2004-14
Per million PCT patent applications including selected text strings in abstracts or claims
0
50
100
150
200
Per million
M2M Data mining 3D printing
2004 2005 2006 2007 2008 2009 2010 2011 2012 2013 2014
Source: OECD on NHGRI, Genome Sequencing Program (GSP), www.genome.gov/sequencingcosts, July 2014.
1 2 http://dx.doi.org/10.1787/888933147871
Figure 11. Cost of genome sequencing, 2001-14
Cost per genome, logarithmic scale
1
10
100
1000
10000
100000
USD current
1 million USD 10 000 USD
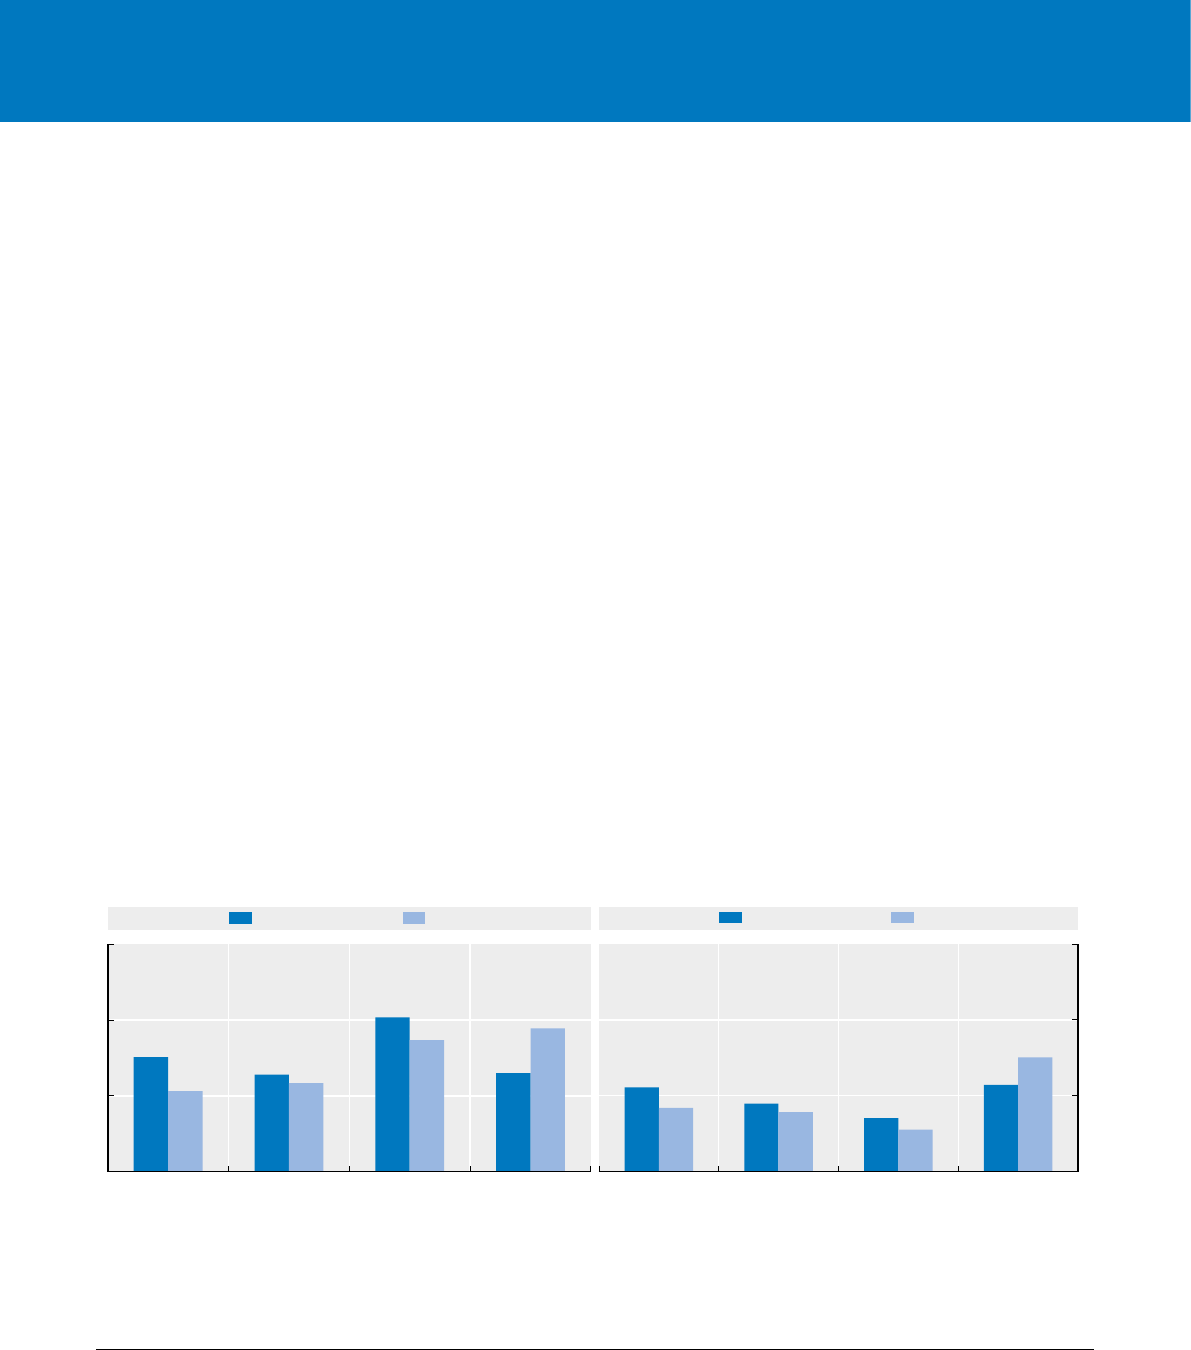
MEASURING THE DIGITAL ECONOMY: A NEW PERSPECTIVE © OECD 2014 37
1. THE DIGITAL ECONOMY TODAY 1. THE DIGITAL ECONOMY TODAY
Source: OECD estimates based on OECD, STAN, ISIC Rev.4 Database, www.oecd.org/sti/stan and Eurostat, National Accounts Statistics, June 2014.
See chapter notes.
1 2 http://dx.doi.org/10.1787/888933147889
Figure 12. The relative size of information industries in the OECD, 2000 and 2012
Percentage points of total value added and employment, simple average
0
1
2
3
Computer, electronic
and optical products
Publishing, audiovisual
and broadcasting
activities
Telecommunications IT and other
information services
%
Value added
2000 2012
0
1
2
3
Computer, electronic
and optical products
Publishing, audiovisual
and broadcasting
activities
Telecommunications IT and other
information services
Employment
2000 2012 %
The weight
of the Information
economy sector
and ICTs in
theeconomy
While the role of ICTs in science has become pervasive and demand for products from
the information industries has increased signicantly over the last decade, the aggregate
weight of these activities declined slightly in the average of OECD economies, to little
less of 6% of total value added and 3.7-3.8% of employment. This was accompanied by an
important shift in the composition of the sector. IT services increased their share due to
rising demand for applications and management of IT infrastructure, while ICT manu-
facturing and, to a lesser extent, Telecommunication services saw their importance
diminish as production shifted to other (mostly non-OECD) economies, and unit prices
fell as a result of productivity growth and increased competition (Figure12). Indeed,
information industries have maintained a lead in labour productivity (see5.4). For all
OECD countries for which data are available, this gure is higher than the productivity
level for the total economy and in the majority is also higher than the OECD average
total economy level (Figure13).
These changes are also reected in the dynamics of international trade. From 2000 to
2012, China’s share in global ICT exports grew from 4.4% to over 30%, partly owing to the
shifting of production offshore, amounting to a tenfold increase in USD terms. TheOECD
area in 2009 accounted for 55% of global ICT exports, or 63% when calculated in value
added terms. This measure takes into account the share of imported intermediate
inputs embodied in a country’s exports and provides a new perspective on the interna-
tional fragmentation of production.19 By both measures the OECD area’s relative share
has declined in the last decade, by 18 and 17 percentage points, respectively (Figure14).
Between 2000 and 2012 there was also a major shift in world trade and consumption
patterns. The share of computers and peripherals in world exports fell from almost 38%
to less than 30%, while the combined share of communication equipment and consumer
electronics grew from 26% to almost 35%.
19. The international fragmentation of production has expanded rapidly in the last two decades and production processes in many economies
have specialised in specic tasks and activities. To understand this development it is not enough to compare direct imports to measures of
domestic production. A producer that imports components may also purchase components from domestic providers that, in turn, use interme-
diate imports in their production processes. Moreover, imports may contain elements produced in the domestic economy. The OECD-WTO Trade
in Value Added (TiVA) Database, developed in response to demand from policy makers, offers new insights on international trade patterns and
dynamics. For example, indicators of the foreign value added content of exports reveal the extent to which countries have become more dependent
on imports from a greater number of countries in order to maintain or improve their export performance (see OECD, 2013b).
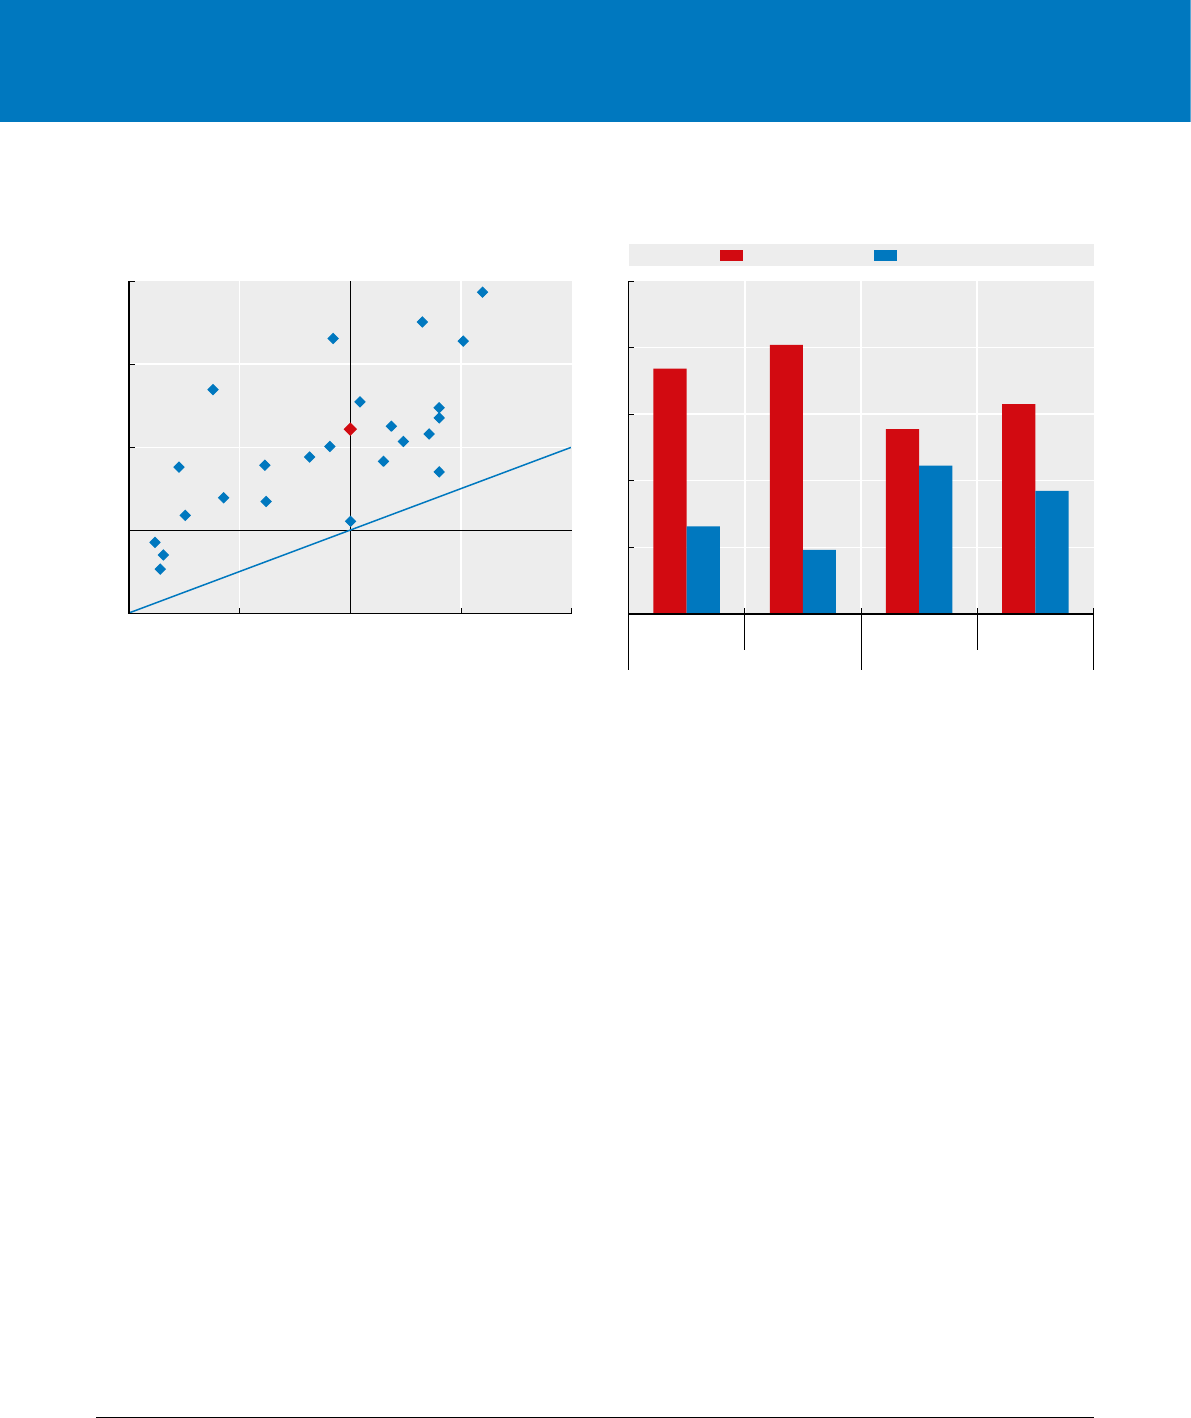
MEASURING THE DIGITAL ECONOMY: A NEW PERSPECTIVE © OECD 201438
1. THE DIGITAL ECONOMY TODAY 1. THE DIGITAL ECONOMY TODAY
Top ICT players
and new entrants
The recent crisis does not appear to have signicantly affected the income or revenues
of the major ICT players (the top 250 ICT rms monitored by the OECD).20 However,
on aggregate, companies belonging to this group have substantially reduced R&D
expenditures compared to the beginning of the decade – perhaps due to the shift from
manufacturing to services. When the “dot-com bubble” burst in 2000-01, these
rms experienced negative incomes which did not return to 2000 levels until 2004.
Incontrast, during the last crisis income fell by 30% in 2008 only, but recovered imme-
diately afterwards. Employment dynamics were more sluggish: after a fall in 2002-03,
employment returned to its 2000 level in 2008 and continued to grow steadily thereafter.
R&D spending, however, decreased only marginally in the aftermath of the dot-com
bubble but never returned to pre-crisis growth rates. As a result, in 2013 R&D spending
in current USD remained below the 2000 level (Figure15).
The ICT sector is extremely vital in terms of enterprise creation with new enterprises
exhibiting higher survival rates than their counterparts in manufacturing and services.
Between 2009 and 2012, net business population growth in the ICT sector was about 4.5%
on average as compared to 1% in the business economy overall (see 5.2).
20. Enterprises in the “top 250” group mainly operate in activities such as manufacturing of telecom equipment and chipsets in hardware,
pre-packaged software for ofce applications, search engines and social networks. For more information on the methodology used to compute the
variables on top 250 ICT rms, see OECD (2012).
Source: OECD estimates based on OECD, STAN, ISIC Rev.4 Database,
www.oecd.org/sti/stan and Eurostat, National Accounts Statistics,
May 2014. See chapter notes.
1 2 http://dx.doi.org/10.1787/888933147890
Source: OECD, Inter-Country Input-Output (ICIO) Database, May 2013.
1 2 http://dx.doi.org/10.1787/888933147908
Figure 13. Apparent labour productivity levels,
information industries vs. total economy, 2012
OECD total economy level = 100
Figure 14. OECD shares in global exports of ICT goods
and in underlying value added, 2000 and 2009
Percentage shares of world totals
GRC
PRT
CAN
IRL
USA
CZE
ESP
JPN
BEL
SVK
POL
OECD
GBR ITA
SWE
HUN
SVN
FRA
NLD
CHE
EST
DEU
AUT DNK
FIN
50
100
150
200
250
50 75 100 125 150
Total economy
Information industries = Total economy
Information industries
0
20
40
60
80
100
Gross exports Domestic value added
in foreign final demand
Gross exports Domestic value added
in foreign final demand
2000 2009
%OECD Rest of the World
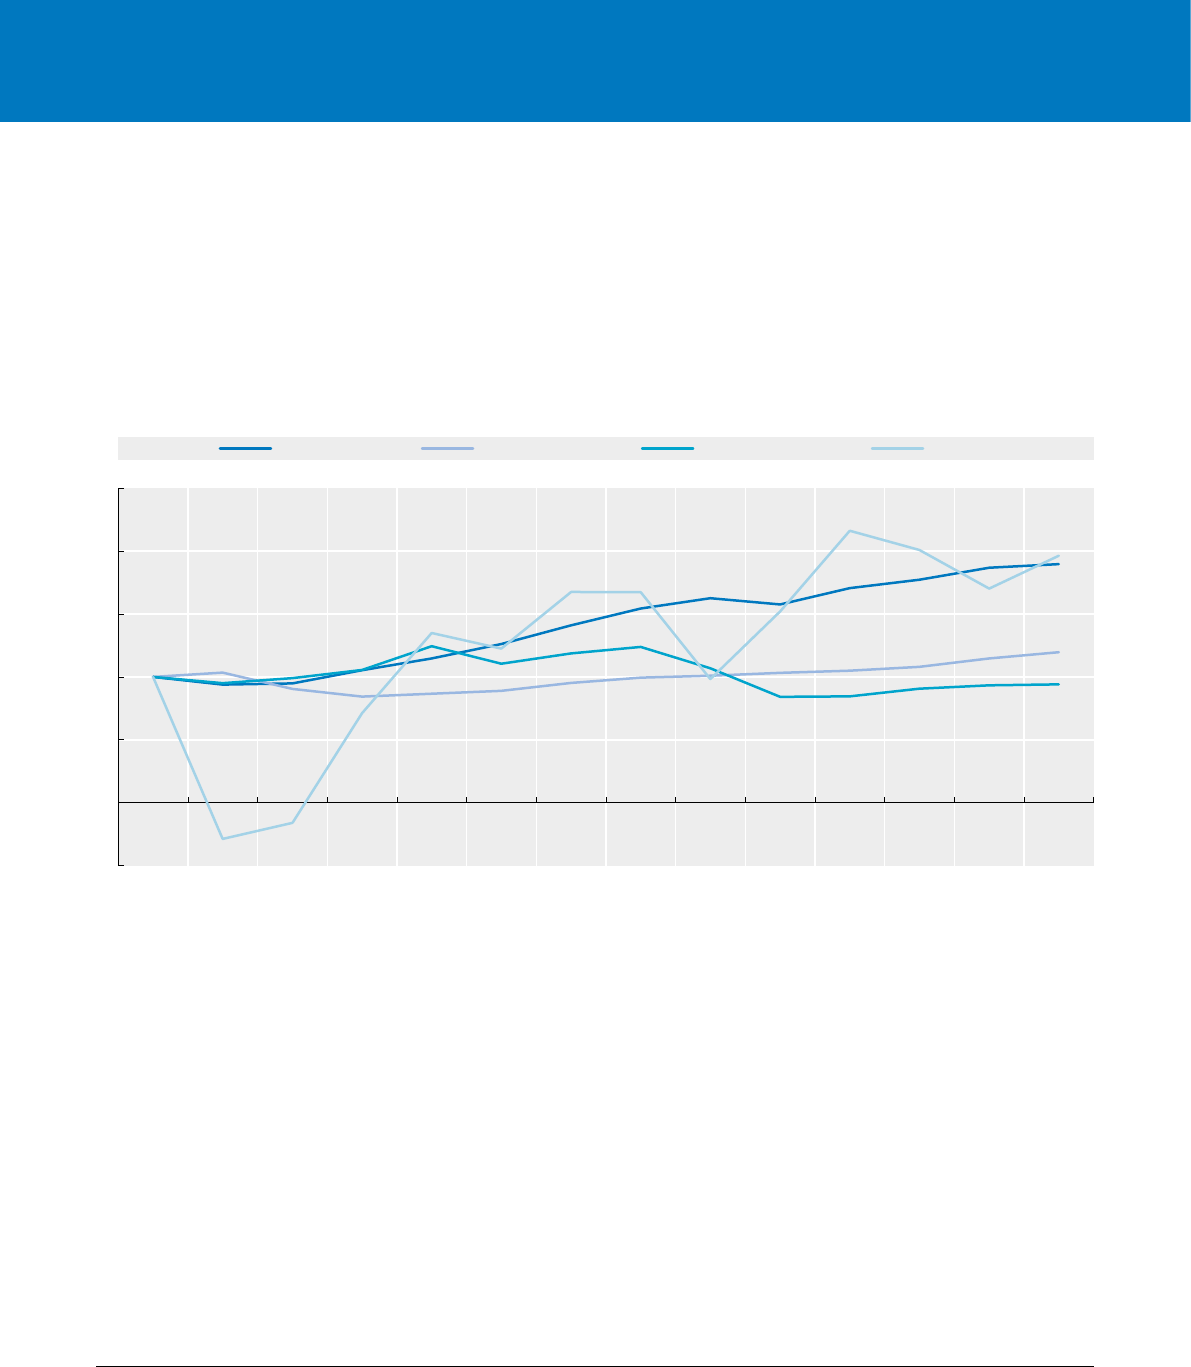
MEASURING THE DIGITAL ECONOMY: A NEW PERSPECTIVE © OECD 2014 39
1. THE DIGITAL ECONOMY TODAY 1. THE DIGITAL ECONOMY TODAY
21. Although ICT businesses remain at the forefront in terms of capacity to attract VC, this considerably reduced in size and overall importance
following the 2000 peak, when total VC investment reached over USD100billion and information industries (ICT and media) accounted for the
large majority of total VC in major economic areas (European data ranging from almost 30% of the United States value in 2008 to about 15% in 2012).
Therecent crisis impacted only marginally on VC overall size. However, VC investment failed to recover fully during the last decade. ICT industries,
in particular, have progressively lost ground, decreasing to half their former total to about USD10billion in 2009, recovering marginally in the years
to 2012. In the meanwhile, an important shift towards IT services occurred (Figure 17).
Promising start-ups attract funds from venture capitalists and in recent decades
thelargest share of this funding has gone to ICT industries. The dynamics of venture
capital (VC) in the United States – leading by far in terms of the size of VC market and
ICT industries’ share in VC investment ows – provide an insight into the expansion
and collapse of the dot-com bubble, and also highlight the shift towards funding for IT
services companies (Figure16).21
Source: OECD computations based on annual reports, SEC lings and market nancials, May 2014. See chapter notes.
1 2 http://dx.doi.org/10.1787/888933147915
Figure 15. Performance trends of top 250 ICT rms, 2000-13
Revenue, employment, R&D spending and net income
-50
0
50
100
150
200
250
2000 2001 2002 2003 2004 2005 2006 2007 2008 2009 2010 2011 2012 2013
Index 2000 = 100
Revenue Employment R&D spending Net income
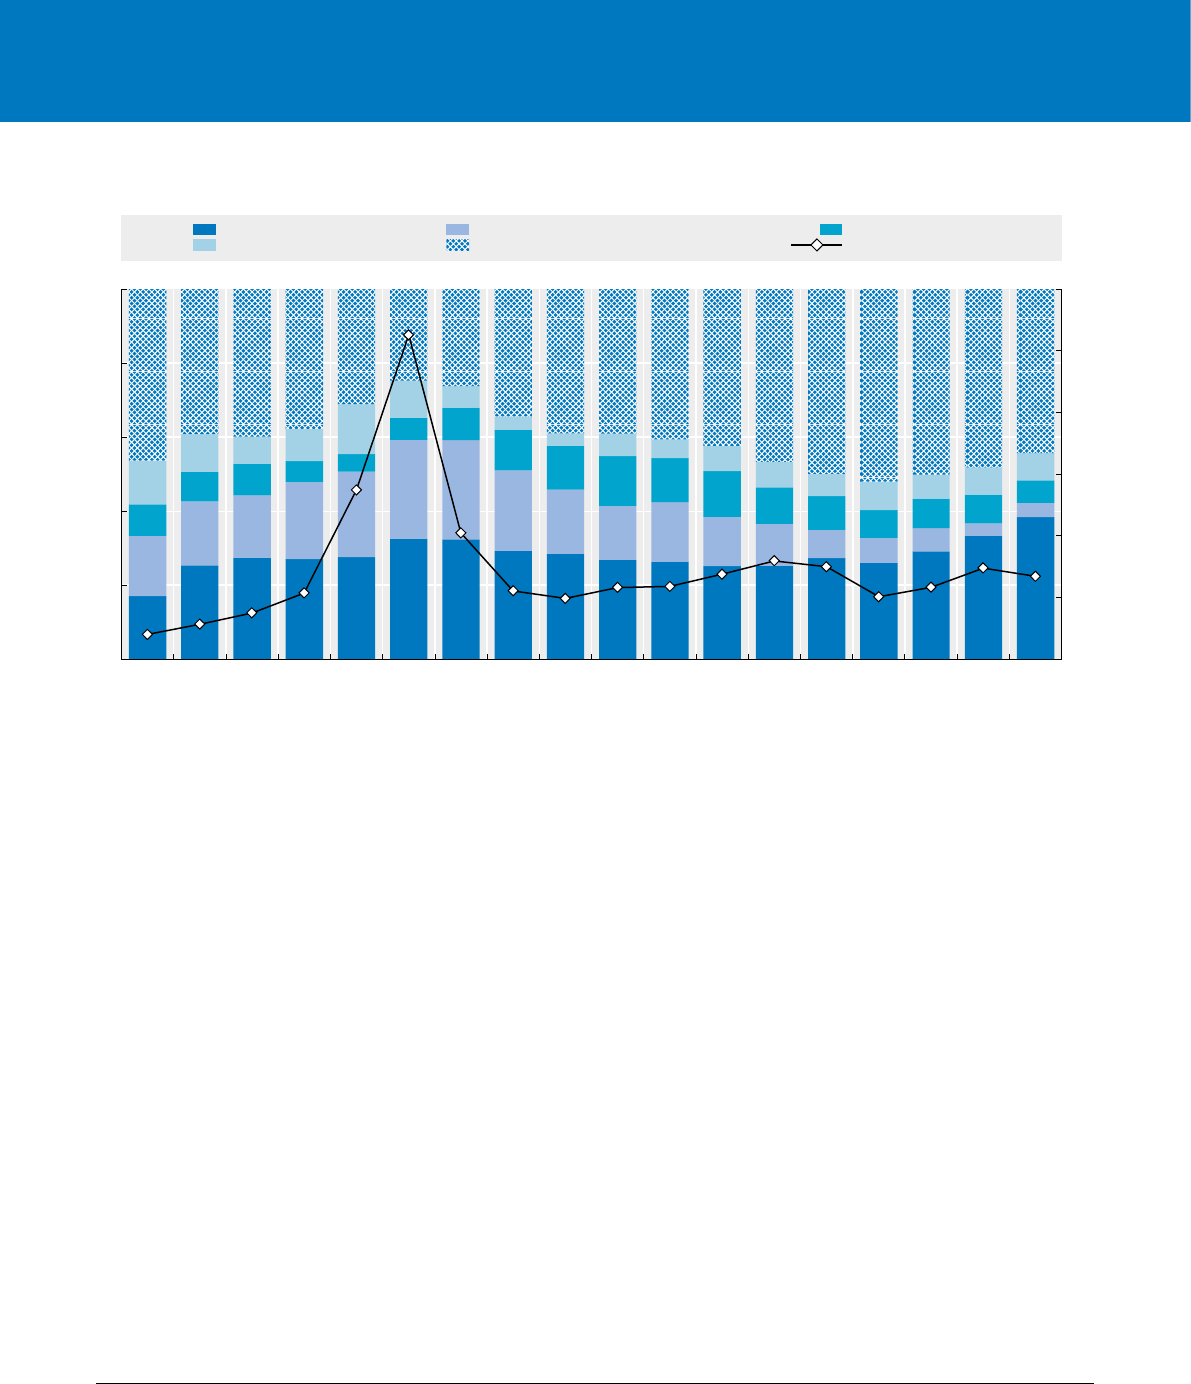
MEASURING THE DIGITAL ECONOMY: A NEW PERSPECTIVE © OECD 201440
1. THE DIGITAL ECONOMY TODAY 1. THE DIGITAL ECONOMY TODAY
ICT employment… Between 1995 and 2012, ICT sector employment in the OECD area increased by 10%,
against about 8% for total employment, thus marginally increasing its share from 3.7%
to 3.8% of total employment. This increase is the result of very wide uctuations, with
employment in ICT industries growing at higher rates than the whole economy during
business cycle upturns, but also suffering more pronounced downswings. The fall in ICT
employment during the 2008-09 crisis was less pronounced and shorter in duration than
the drop following the dot-com bubble burst of 2001, while the subsequent recovery was
steadier than for total employment. However, employment in the ICT-producing sector
never regained the 2001 peak of 5.8% of total employment, and currently sits at just
above 3.7% (Figure17).
These employment trends reect the downsizing of manufacturing and telecom services
and the dynamism of IT services in more recent years (see5.8). However, employment
in ICT industries does not accurately reect the importance of ICT-related employment
in the economy, nor can it reect the generalised diffusion of ICTs in the workplace and
underlying skill needs.
Today, ICT-related occupations account for only about half of total employment in
ICT industries. However, such jobs have now spread throughout the economy with
the majority of ICT-related jobs now found outside the ICT sector. From 2003 to 2013,
employment in ICT occupations grew 25% or more in Australia and Canada, about 15%
in the United States, and between 16% and 30% for 25 European OECD countries,22
performing better than total employment through the crisis (Figure18). On the other
hand, several studies highlight the potentially disruptive effects of ICTs on employment
across most occupations throughout the economy, given progresses in machine learning.
22. In these countries, namely Austria, Belgium, the Czech Republic, Denmark, Estonia, Finland, France, Germany, Greece, Hungary, Iceland,
Ireland, Italy, Luxembourg, the Netherlands, Norway, Poland, Portugal, the SlovakRepublic, Slovenia, Spain, Sweden, Switzerland, Turkey and
theUnitedKingdom, amajor break in series occurred in 2011, due to the adoption of the new ISCO-08 classication. The lowest rate resulted from
the break in the series, and likely represents an underestimation. The highest rate corresponds to the transposition of the old series dynamics on
the values of the new series, assuming that no changes occurred between 2010 and 2011.
Source: OECD on PricewaterhouseCoopers/National Venture Capital Association MoneyTree™ Report based on Thomson Reuters data, July 2014.
1 2 http://dx.doi.org/10.1787/888933147920
Figure 16. Venture capital investment in the United States, by industry, 1995-2012
Percentage shares (left-hand scale) and total in USD billions (right-hand scale)
0
20
40
60
80
100
120
0
20
40
60
80
100
1995 1996 1997 1998 1999 2000 2001 2002 2003 2004 2005 2006 2007 2008 2009 2010 2011 2012
USD billions%
IT services and software Telecommunications, networking and equipment Computers and electronics
Media and entertainment All other industries Total (right-hand scale)
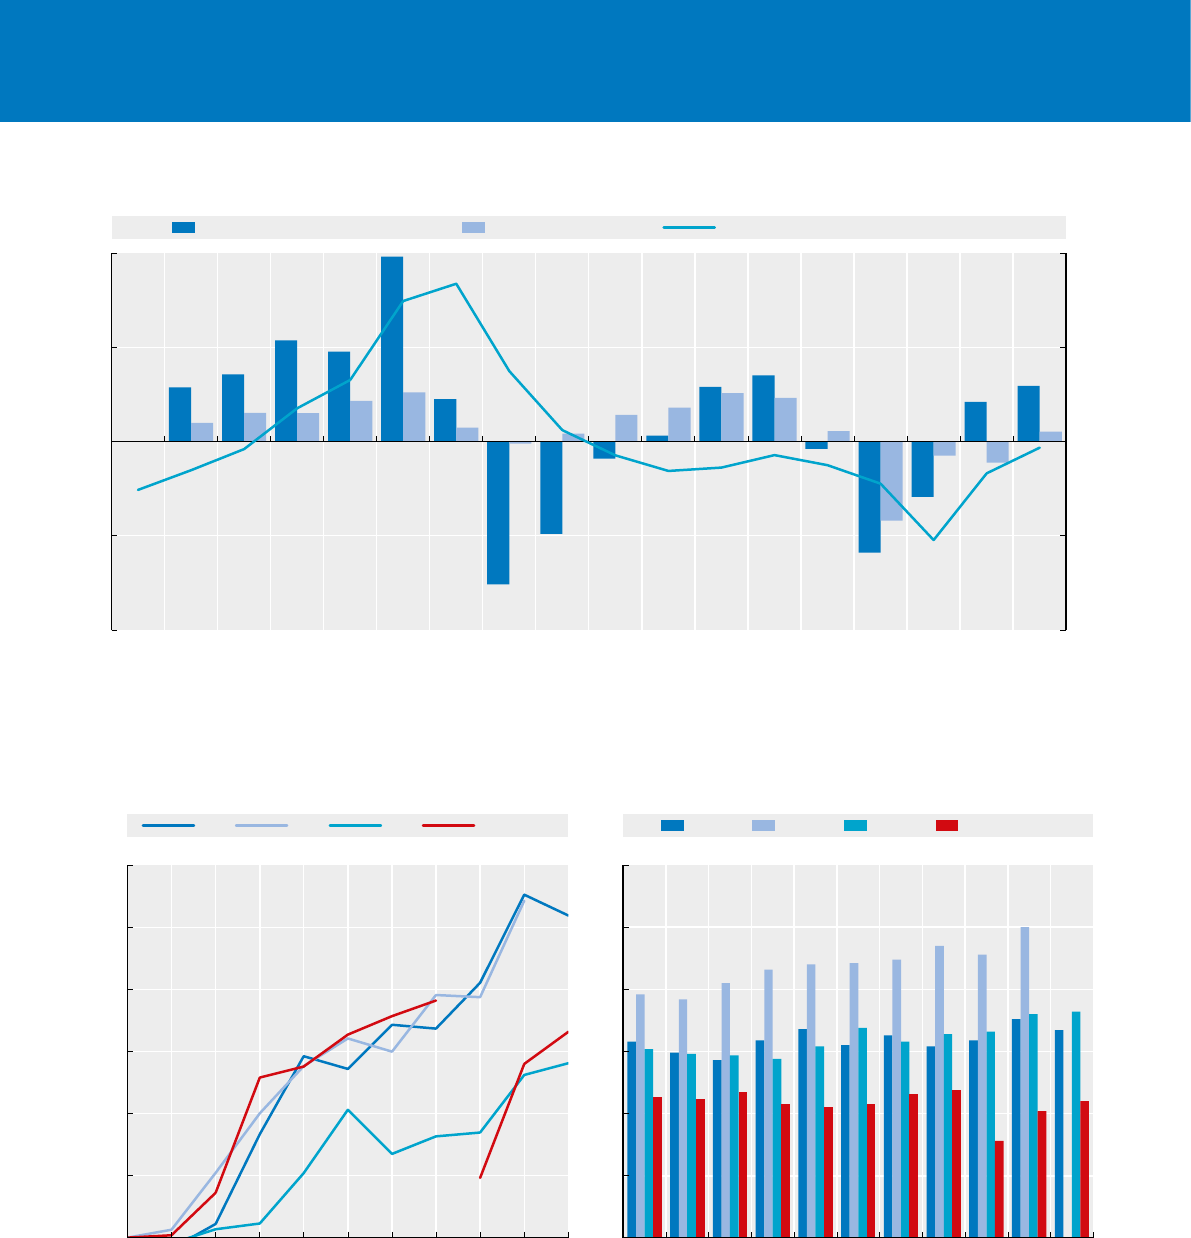
MEASURING THE DIGITAL ECONOMY: A NEW PERSPECTIVE © OECD 2014 41
1. THE DIGITAL ECONOMY TODAY 1. THE DIGITAL ECONOMY TODAY
Source: OECD estimates based on OECD, STAN, ISIC Rev.4 Database, www.oecd.org/sti/stan and Eurostat National Accounts Statistics, July 2014.
See chapter notes.
1 2 http://dx.doi.org/10.1787/888933147936
Figure 17. The dynamics of ICT sector employment in the OECD, 1995-2012
Annual growth rate (left-hand scale) and percentage share on total employment (right-hand scale)
3.4
3.6
3.8
4.0
4.2
-6
-3
0
3
6
1995 1996 1997 1998 1999 2000 2001 2002 2003 2004 2005 2006 2007 2008 2009 2010 2011 2012
%% Employment growth in the ICT sector Total employment growth Employment share of the ICT sector (right-hand scale)
Source: OECD computations based on Australian, Canadian and European labour force surveys and United States Current Population Survey, June
2014. See chapter notes.
1 2 http://dx.doi.org/10.1787/888933147943
Figure 18. The dynamics of ICT-related occupations in OECD countries, 2003-13
Index numbers (left-hand panel) and percentage shares in total employment (right-hand panel)
100
105
110
115
120
125
130
2003 2004 2005 2006 2007 2008 2009 2010 2011 2012 2013
AUS CAN USA OECD-Europe
Index 2003 = 100
2.0
2.5
3.0
3.5
4.0
4.5
5.0
2003 2004 2005 2006 2007 2008 2009 2010 2011 2012 2013
%
AUS CAN USA OECD-Europe
… and the spread
of ICT skills across
professions
The new OECD PIAAC survey results for 21 countries reveal that about 45% of workers
require a moderate to complex (advanced user to programming) level of ICT interaction
for their work (Figure19), with country-level values ranging from almost 60% of workers
in Sweden to about 30% in Poland. Conversely, on average only 30% of workers did not
use computers on the job. These shares range from 17% in Norway to 50% in Italy.
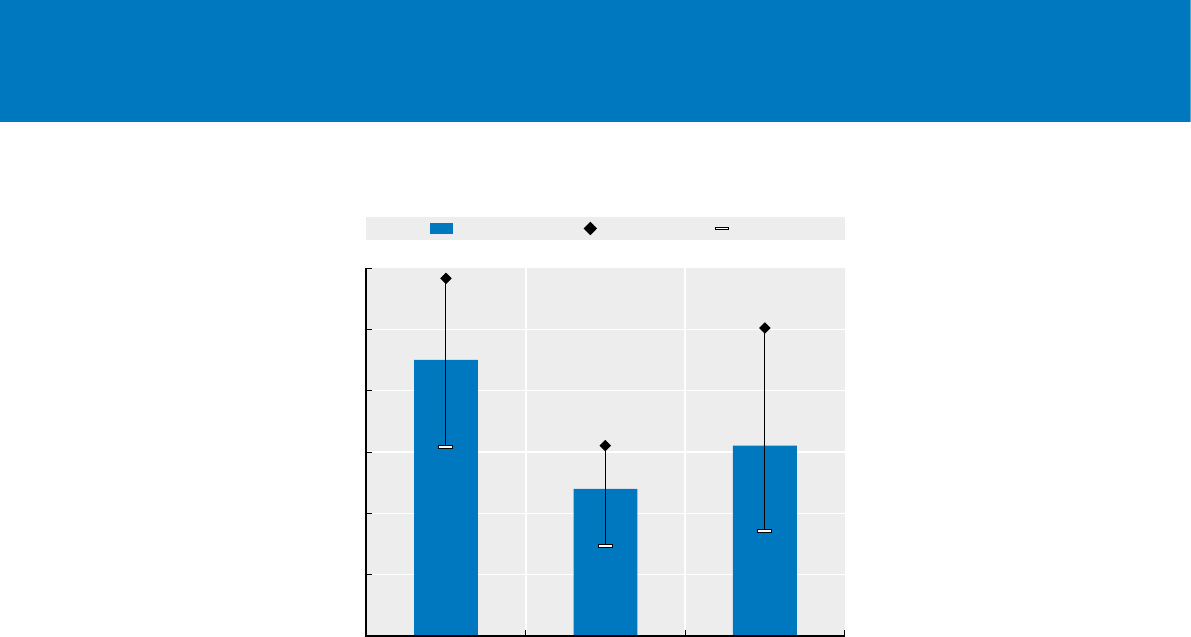
MEASURING THE DIGITAL ECONOMY: A NEW PERSPECTIVE © OECD 201442
1. THE DIGITAL ECONOMY TODAY 1. THE DIGITAL ECONOMY TODAY
The spread
of E-commerce
ICT skills are also vital for individuals to participate in and benet from e-commerce
transactions. Between 2007 and 2013, online purchases by individuals increased from
about 31% to almost 50% of the adult OECD population, although for some countries this
gure stands at 10% (Figure20); recently individual purchases via mobile phones also
started being recorded in many countries (see 3.8). Progress for enterprises has been less
striking: in 2012, only 21% of OECD enterprises with ten or more persons were engaged in
e-sales, representing a slight increase of about 5 percentage points since 2008, as a result
of lower e-commerce propensity rates for smaller businesses in most countries (see5.6).
Developments in e-commerce and m-commerce bring gains in consumer welfare
and business opportunities, but also pose new challenges. In particular, intermediary
(brokering) service platforms provide customers with easy access to a wide variety of
sellers via and SMEs with an opportunity to increase their market reach. Conversely,
such brokers might restrain choice for consumers, while these developments challenge
operators in traditional distribution channels. In some cases, traditional businesses may
be displaced by online services (e.g.bookshops) or nd their margins eroded by these
intermediaries (e.g.hotels), whose commissions benet from the oligopolistic nature of
the information-search market.
Skills gaps
and opportunities
for training
While the use of ICTs at work is now generalised, more than 60% of adults in the EU
countries assessed their ICT skills as being below the level required to nd or change
ajob. Across all countries, this gap is inversely related to the educational attainment of
individuals, with an average rate below 40% for those with a tertiary education, and over
80%for low-educated respondents (see3.7). However, the Internet has opened up new
opportunities for education and training in all elds, including ICTs. In 2012-13, across
30OECDcountries, on average about 9.5% of individuals reported having followed an
online course in the previous quarter (see3.6). This educational channel is now reaching
maturity with hundreds of universities proposing online programmes, and massive
open online courses (MOOCs) ourishing within and outside established educational
institutions, in many cases making (often high-quality) training and education freely
accessible worldwide.
Source: OECD, PIAAC Database, July 2014.
1 2 http://dx.doi.org/10.1787/888933147958
Figure 19. Computer use at work in OECD countries, by level of sophistication, 2012
Percentage shares of all workers
NLD
SWE
ITA
ESP
SVK
NOR
0
10
20
30
40
50
60
Moderate or complex Straightforward No computer use at work
%
Average Highest Lowest
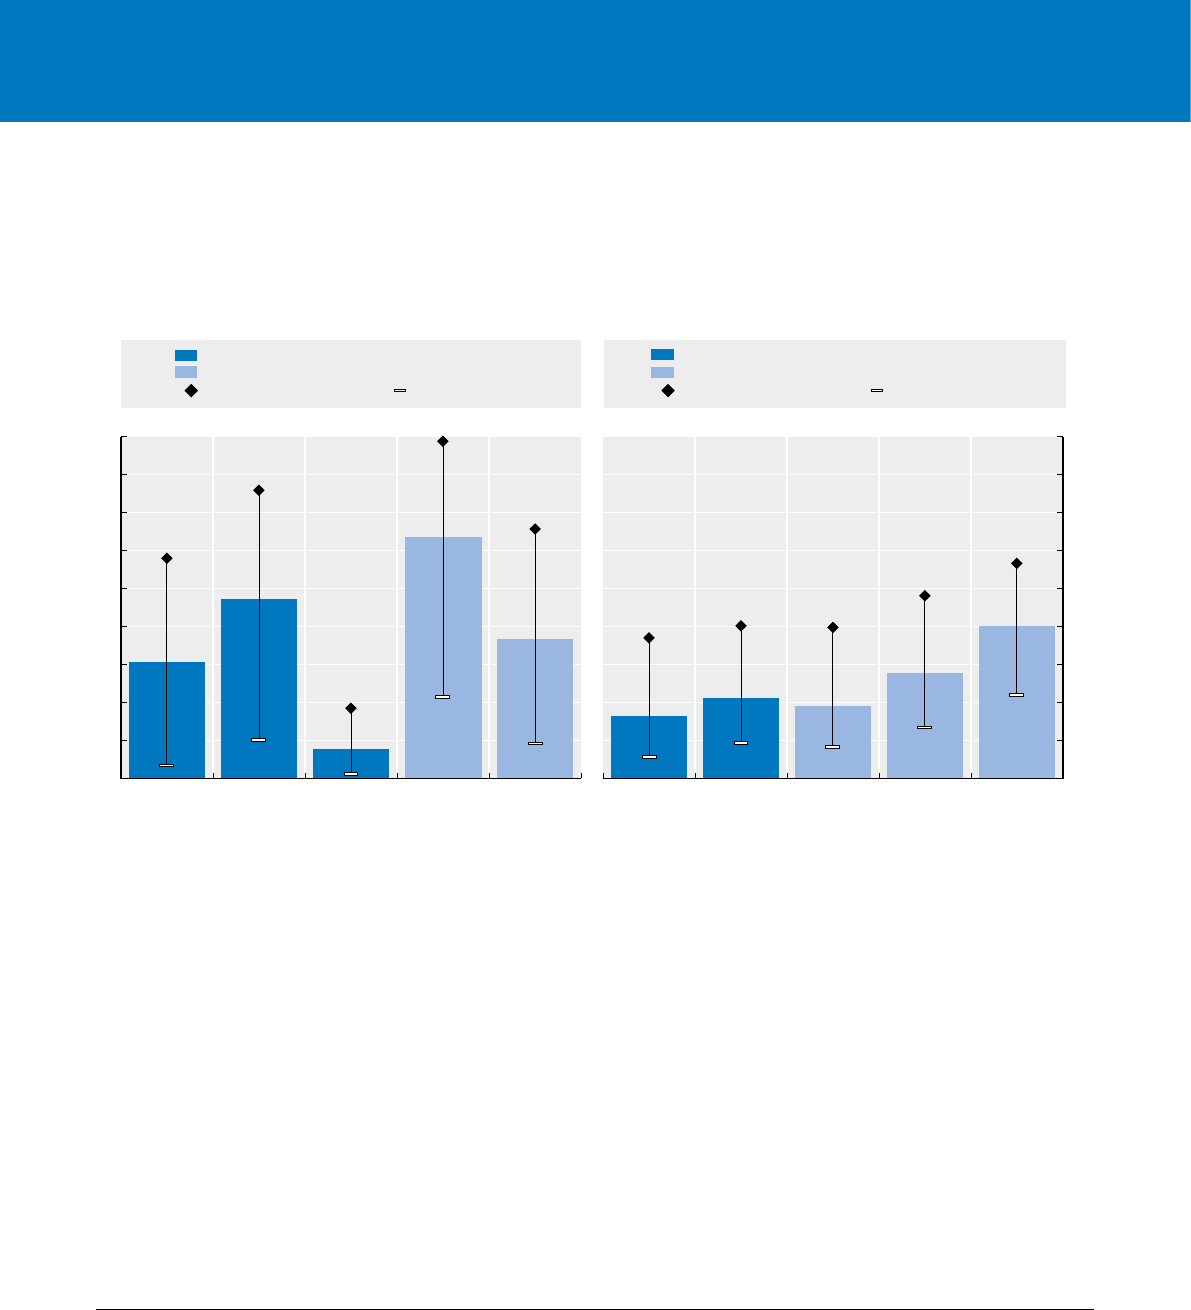
MEASURING THE DIGITAL ECONOMY: A NEW PERSPECTIVE © OECD 2014 43
1. THE DIGITAL ECONOMY TODAY 1. THE DIGITAL ECONOMY TODAY
But security, privacy
and consumer
protection also need
to be improved
Online transactions by nal consumers (especially cross-border transactions) and
e-payments or mobile payments pose a number of issues for consumer protection.
Thelatest cybercrime report by Symantec put the overall cost for consumers at more
than USD110billion in 2013 (out of which almost one-quarter stems from the cost of
repairs) and set the total number of victims at almost 400million.23
These estimates do not include business and ought to be considered with caution, as
public sources on complaints result in much smaller gures.24 The most recent, albeit
outdated, data available on the use of ICT security facilities by businesses show that
awareness is generalised, but that the implementation of facilities depends strongly on
the size of operations (see2.8).
While security issues are high on the policy agenda, the production of reliable statistics
will require further work of data collection and harmonisation, making it a key topic for
the measurement agenda.
23. The Norton Report (go.symantec.com/norton-report-2013) is based on data collected in 24 countries: Australia, Brazil, Canada, China, Colombia,
Denmark, France, Germany, India, Italy, Japan, Mexico, the Netherlands, NewZealand, Poland, the Russian Federation, SaudiArabia, Singapore,
SouthAfrica, Sweden, Turkey, the UnitedArabEmirates, the UnitedKingdom and the UnitedStates. The costs include money lost due to credit card
theft as well as estimates on expenses for restoring of devices and information loss.
24. In the UnitedStates, 33% of the 2.1million complaints led at the Federal Trade Commission in 2013 (up 43% from 2010) stemmed from an
initial email contact, and 15% from visiting websites (Federal Trade Commission, 2014). More specically, in 2013 the Internet Crime Complaint
Center (IC3) recorded less than 300 hundred thousand complaints (slightly down from previous years), corresponding to certied losses of over
USD100000, totalling almost USD800million, and representing a 26% growth over the previous year. Note that IC3 receives a small number of
complaints also from countries other than the UnitedStates.
Source: OECD, ICT Database; Eurostat, Information Society Statistics and national sources, July 2014. See chapter notes.
1 2 http://dx.doi.org/10.1787/888933147963
Figure 20. Participation in e-commerce by individuals and enterprises, 2007-08 and 2012-13
Individuals who ordered goods or services online, by age (left-hand panel) and enterprises engaged in sales via e-commerce,
by employment size (right-hand panel), averages
Top 3 countries Bottom 3 countries
NOR, DNK, NLD
DNK, GBR, NLD
GBR, USA, DEU
0
10
20
30
40
50
60
70
80
90
2007 2013 Via handheld
devices (2012)
25-44 year-olds
(2013)
65-74 year-olds
(2013)
%
As a percentage of all individuals
As a percentage of Internet users
GBR, KOR, SWE
GBR, DEU, DNK
NZL, AUS, CHE NZL, AUS, CHE
ISL, NZL, IRL
NZL, DNK, ISL
0
10
20
30
40
50
60
70
80
90
2008 2012 10-49
(2012)
50-249
(2012)
250+
(2012)
%
As a percentage of all enterprises
As a percentage of enterprises in each employment size class
NZL, NOR, CHE
Top 3 countries Bottom 3 countries
Statistical information on consumer and operator behaviour and on the impacts of
online markets is still scarce, and requires improvement in geographic coverage and
representativeness to assess the costs and benets in this area.

MEASURING THE DIGITAL ECONOMY: A NEW PERSPECTIVE © OECD 201444
1. THE DIGITAL ECONOMY TODAY 1. THE DIGITAL ECONOMY TODAY
Notes
Figure 1. Internet usage trends in the OECD and differences by country (top panel) and by age groups
(bottom panel), 2005-13
Data exclude Chile and Israel.
For 16-24 and 65-74 year-olds, data exclude Japan and the United States.
For country-specic notes, see 3.1 in Chapter 3.
Figure 2. Trends in broadband speed across the OECD, Q4 2009-13
Akamai measures the broadband speed through the amount of time required to download various les from their
servers, averaging all technologies and locations.
Figure 4. The progress of smartphones, 2010-13
Data are extracted from www.ercewireless.com/europe/special-reports/analyzing-worlds-14-biggest-handset-
makers-q2-2013.
Figure 5. Average data storage cost for consumers, 1998-2012
Data for 1998-2011 are based on average prices of consumer-oriented drives (171 HDDs and 101 SSDs) from
M.Komorowski (www.mkomo.com/cost-per-gigabyte), AnandTech (www.anandtech.com/tag/storage) and Tom’s
Hardware (www.tomshardware.com). The price estimate for SSD in2012 is based on DeCarlo (2011) referring to
Gartner.
Figure 7. R&D intensity and contribution to total BERD by industry in the OECD, 2011
The OECD has recently undertaken an analysis to establish a new classication of economic activities on the basis
of R&D intensity.
Data refer to Austria, Belgium, Canada, the Czech Republic, Denmark, Finland, France, Germany, Hungary, Italy,
Japan, Korea, the Netherlands, Norway, Poland, Portugal, the SlovakRepublic, Slovenia, Spain, the UnitedKingdom
and the UnitedStates.
“Other industries” include Agriculture, ISIC Rev.4 Divisions 01-03 (A); Mining, 05-09 (B); Utilities, 35-39 (D and E) and
Construction, 41-43 (F).
Israel
“The statistical data for Israel are supplied by and under the responsibility of the relevant Israeli authorities
or third party. The use of such data by the OECD is without prejudice to the status of the Golan Heights, East
Jerusalem and Israeli settlements in the West Bank under the terms of international law.
“It should be noted that statistical data on Israeli patents and trademarks are supplied by the patent and
trademark ofces of the relevant countries.”
Notes

MEASURING THE DIGITAL ECONOMY: A NEW PERSPECTIVE © OECD 2014 45
1. THE DIGITAL ECONOMY TODAY 1. THE DIGITAL ECONOMY TODAY
Notes
Figure 8. Methods to stimulate creativity across 22 European countries in information industries vs. other
sectors, 2010
Data refer to Belgium, Bulgaria, Croatia, the Czech Republic, Estonia, Finland, France, Hungary, Ireland, Italy,
Lithuania, Luxembourg, Netherlands, Norway, Poland, Romania, Serbia, the Slovak Republic, Slovenia, Sweden
and Turkey.
For Estonia, Finland and Luxembourg, Information and communication services aggregates are OECD estimates
based on ISIC Rev.4 SectionJ, excluding J59-60. For Ireland, this aggregate includes Information services only (and
excludes Publishing and Telecommunications) and for Turkey it includes telecommunication services only.
Variables cover brainstorming sessions, multidisciplinary or cross-functional work teams, training of employees
on how to develop new ideas or creativity, nancial and non-nancial incentives for employees to develop new
ideas, and job rotation of staff. All the above cases refer to “successful methods to stimulate creativity”.
Figure 9. ICT uptake among process and organisational innovators and non-innovators in 13 European
countries, 2004, 2008 and 2010
The gure shows simple averages for all reporting countries across reference years in which the Community
Innovation Survey (CIS) and the Community Survey on ICT Usage in Enterprises were performed.
Data refer to Austria, Denmark, Finland, France, Ireland, Italy, Luxembourg, the Netherlands, Norway, Poland,
Slovenia, Sweden and theUnitedKingdom.
Cell values for each variable are reweighted to represent the business structure by employment size in each country.
Data for ERP in 2010 are limited to Finland, France and Luxembourg.
Figure 10. Patents on M2M, data analytics and 3D printing technologies, 2004-14
Patent abstracts and/or claims were searched for the following:
M2M: “machine to machine” or “M2M”;
Data mining: “data mining” or “big data” or “data analytics”;
3D printing: “3D printer” or “3D printing”.
For 2014, coverage is limited to the available data as of 31 May.
Figure 12. The relative size of information industries in the OECD, 2000 and 2012
Data refer to 2008 for Japan, to 2009 for Canada, to 2010 for Switzerland, and to 2011 for Germany, Greece,
Luxembourg, Poland, Portugal, Sweden, the United Kingdom and the United States.
Figure 13. Apparent labour productivity levels, information industries vs. total economy, 2012
Data refer to 2008 for Japan, to 2009 for Canada, to 2010 for Switzerland, and to 2011 for Germany, Greece,
Luxembourg, Poland, Portugal, Sweden, the UnitedKingdom and the UnitedStates.
Apparent labour productivity is dened as value added per person employed.
Figure 15. Performance trends of top 250 ICT rms, 2000-13
Indicators are based on averages for those rms reporting in 2000-13. Values for 2013 are estimated based on
interim reports where annual reports were not available.
Figure 17. The dynamics of ICT sector employment in the OECD, 1995-2012
The gure includes data for Australia, Austria, Canada, the CzechRepublic, Denmark, Estonia, Finland, France,
Germany, Greece, Hungary, Ireland, Italy, Japan, Luxembourg, the Netherlands, Norway, Poland, Portugal,
theSlovakRepublic, Slovenia, Spain, Sweden, Switzerland, theUnitedKingdom and the UnitedStates with partial
coverage for some countries (e.g. Canada, 1998 to 2010).

MEASURING THE DIGITAL ECONOMY: A NEW PERSPECTIVE © OECD 201446
1. THE DIGITAL ECONOMY TODAY 1. THE DIGITAL ECONOMY TODAY
Notes
Figure 18. The dynamics of ICT-related occupations in OECD countries, 2003-13
The OECD-Europe aggregate includes Austria, Belgium, the CzechRepublic, Denmark, Estonia, Finland, France,
Germany, Greece, Hungary, Iceland, Ireland, Italy, Luxembourg, the Netherlands, Norway, Poland, Portugal,
theSlovakRepublic, Slovenia, Spain, Sweden, Switzerland, Turkey and the UnitedKingdom.
There is a break in series between the data points of the OECD-Europe aggregate for 2010 and 2011.
2013 data are provisional estimates based on the 1st semester or 9 months.
Figure 20. Participation in e-commerce by individuals and enterprises, 2007-08 and 2012-13
All indicators are computed on the basis of countries with available data for the specic year or the subpopulation
considered. To increase thecoverage, in some cases, data for contiguous years or for similar age (individuals) and
size (enterprises) brackets were also used.

MEASURING THE DIGITAL ECONOMY: A NEW PERSPECTIVE © OECD 2014 47
1. THE DIGITAL ECONOMY TODAY 1. THE DIGITAL ECONOMY TODAY
References
References
Bakshi, H., A.Bravo-Biosca and J. Mateos-Garcia (2014a), Inside the datavores: estimating the effect of data and online
analytics on rm performance, NESTA, March.
Bakshi, H., J. Mateos-Garcia and A. Whitby (2014b), Model workers: How leading companies are recruiting and managing
their data talent, NESTA, July.
DeCarlo, M. (2011), “Gartner: SSDs will reach mainstream prices in 2012”, TechSpot, 11 May, www.techspot.com/
news/43752-gartner-ssds-will-reach-mainstream-prices-in-2012.html.
European Commission (2013), “Digital Agenda Scoreboard 2013”, Commission Staff Working Document, SWD(2013)217
nal, Brussels.
Eurostat (2013), ESSnet on Linking of Microdata to Analyse ICT Impact, Final Report, Eurostat, Luxembourg,
www.cros-portal.eu/content/nal-reporting-esslait-project.
Federal Trade Commission (2014), Consumer Sentinel Network Databook for January-December 2013, Washington, DC,
www.ftc.gov/reports/consumer-sentinel-network-data-book-january-december-2013.
Information and Communications Technology Council (ICTC) (2012), Employment, Investment, and Revenue in the
Canadian App Economy, Ottawa, Ontario, www.cdmn.ca/research/information-and-communications-technology-
council-ictc-report-employment-investment-and-revenue-in-the-canadian-app-economy.
Internet Crime Complaint Center (IC3) (2013), 2013 Internet Crime Report, Federal Bureau of Investigation, Washington,
DC, www.ic3.gov/media/annualreport/2013_IC3Report.pdf.
JST-NSF (2014), Big Data and Disaster Management, JST/NSF Joint Workshop, March, grait-dm.gatech.edu/wp-content/
uploads/2014/03/BigDataAndDisaster-v34.pdf.
Lehr, W. (2012), “Measuring the Internet: The Data Challenge”, OECD Digital Economy Papers, No. 194, OECD Publishing.
Doi: http://dx.doi.org/10.1787/5k9bhk5fzvzx-en.
Mandel, M. (2012), Where the Jobs Are: The App Economy, TechNet, February, www.technet.org/wp-content/
uploads/2012/02/TechNet-App-Economy-Jobs-Study.pdf.
OECD (2015), Data-driven innovation for growth and well-being, OECD Publishing, forthcoming.
OECD (2014a), “The OECD Model Survey on ICT Access and Usage by Households and Individuals”, Working Party
on Measurement and Analysis of the Digital Economy, DSTI/ICCP/IIS(2013)1/FINAL, OECD, Paris.
OECD (2014b), “The OECD Model Survey on ICT Usage by Businesses”, Working Party on Measurement and Analysis
of the Digital Economy, DSTI/ICCP/IIS(2013)2/FINAL, OECD, Paris.
OECD (2013a), “Building Blocks for Smart Networks”, OECD Digital Economy Papers, No. 215, OECD Publishing.
Doi: http://dx.doi.org/10.1787/5k4dkhvnzv35-en.
OECD (2013b), OECD Science, Technology and Industry Scoreboard 2013: Innovation for Growth, OECD Publishing.
Doi: http://dx.doi.org/10.1787/sti_scoreboard-2013-en.
OECD (2012), OECD Internet Economy Outlook 2012, OECD Publishing. Doi: http://dx.doi.org/10.1787/9789264086463-en.
OECD (2011), OECD Guide to Measuring the Information Society 2011, OECD Publishing. Doi: http://dx.doi.
org/10.1787/9789264113541-en.

MEASURING THE DIGITAL ECONOMY: A NEW PERSPECTIVE © OECD 2014 49
Chapter 2
INVESTING IN SMART INFRASTRUCTURE
2.1 • Broadband penetration ............................................................................................................50
2.2 • Mobile data communication ............................................................................................... 52
2.3 • The growth of the Internet....................................................................................................54
2.4 • Toward higher speed ...................................................................................................................56
2.5 • Prices for connectivity...............................................................................................................58
2.6 • ICT devices and applications .............................................................................................. 60
2.7 • E-commerce across borders .................................................................................................62
2.8 • Security ................................................................................................................................................... 64
2.9 • Perceiving security and privacy threats ....................................................................66
2.10 • Improving the evidence base for online security and privacy .............68

MEASURING THE DIGITAL ECONOMY: A NEW PERSPECTIVE © OECD 201450
2. INVESTING IN SMART INFRASTRUCTURE 2. INVESTING IN SMART INFRASTRUCTURE
Key ndings
Broadband communication networks and the services
provided over them support existing economic and
social activities and hold potential for tremendous
innovation.
Broadband diffusion remains uneven across OECD
economies but continues to increase everywhere.
Progress has been particularly swift in mobile (terres-
trial wireless) broadband. Since the end of 2009 the
rate of mobile wireless broadband penetration has
more than doubled for the OECD area, reaching 72% in
December 2013.
Penetration rates reached over 100% in Australia,
Denmark, Finland, Japan, Korea and Sweden and
theUnitedStates. Australia edged into the second place
after a 13% surge in smartphone subscriptions in the
rst half of 2013. Mobile wireless broadband penetration
stood at 32% or less in Hungary, Mexico and Turkey, but
progress to date and the universal diffusion of standard
mobile subscriptions indicate strong potential for
catch-up by lagging economies.
Fixed (wired) broadband subscriptions in the OECD
area reached 339million as of December 2013, giving
an average penetration rate of 27%, up from 23% at
theend of 2009.
Take-up for xed broadband has increased at a slower
pace than for mobile, and in some countries this latter
has been substituting xed broadband rather than
complementing it. The general trend, however, indicates
signicant improvement in available technologies.
Deploying bre closer to the home has been an
on-going process in all OECD countries for many
years. More recently, network operators have started
to evaluate whether to bring bre directly to a premise
or to a nearby point and use existing or upgraded
DSL and cable infrastructure. The majority of xed
wired broadband connections are currently provided
over DSL (51%) and cable modem (31%) technologies.
InDecember 2013, the share of direct bre connections
in the OECD area was 17%, up from 11% in December
2009.
Two-digit growth in bre over the December 2012-13
period was sustained by increases in large OECD
economies with low penetration levels, such as France
(73%), Spain (84%), Turkey (85%) and theUnitedKingdom
(116%). Japan and Korea remain the OECD leaders,
with bre making up 70% and 65% of xed broadband
connections.
DID YOU KNOW?
In December 2013, almost 3 out of 4 OECD
inhabitants had a mobile wireless broadband
subscription.
Denitions
Broadband penetration indicators comprise the number
of subscriptions to xed wired and mobile wireless
broadband services, divided by the number of residents
in each country.
Fixed (wired) broadband includes DSL, cable, bre to the
home (FTTH) and other xed wired technologies.
Mobile wireless broadband includes satellite, terrestrial
xed wireless and terrestrial mobile wireless (standard
mobile and dedicated data).
All components include only connections with
advertised data speeds of 256kbit/s or more.
A standard mobile subscription is counted as an active
broadband subscription only when it allows for full
access to the Internet via HTTP (subscriptions that only
offer walled gardens or email access are not counted)
and when content or services were accessed using the
Internet Protocol (IP) during the previous three months.
All active mobile subscriptions are counted. Hence,
penetration rates can be over 100%. For xed subscrip-
tions saturation is reached at much lower rates, as
these typically consist of one per household.
Measurability
Fixed (wired) and mobile wireless broadband subscrip-
tions for OECD countries are collected according to
agreed denitions and are highly comparable.
Data for wireless broadband subscriptions improved
greatly in recent years, especially with regard to meas-
urement of standard mobile and dedicated mobile data
subscriptions.
In the case of standard mobile subscriptions, these
need to be active during the last three months before
the date of measurement, which can pose difculties.
Data respecting these standards are now available for
most OECD countries.
2.1 Broadband penetration
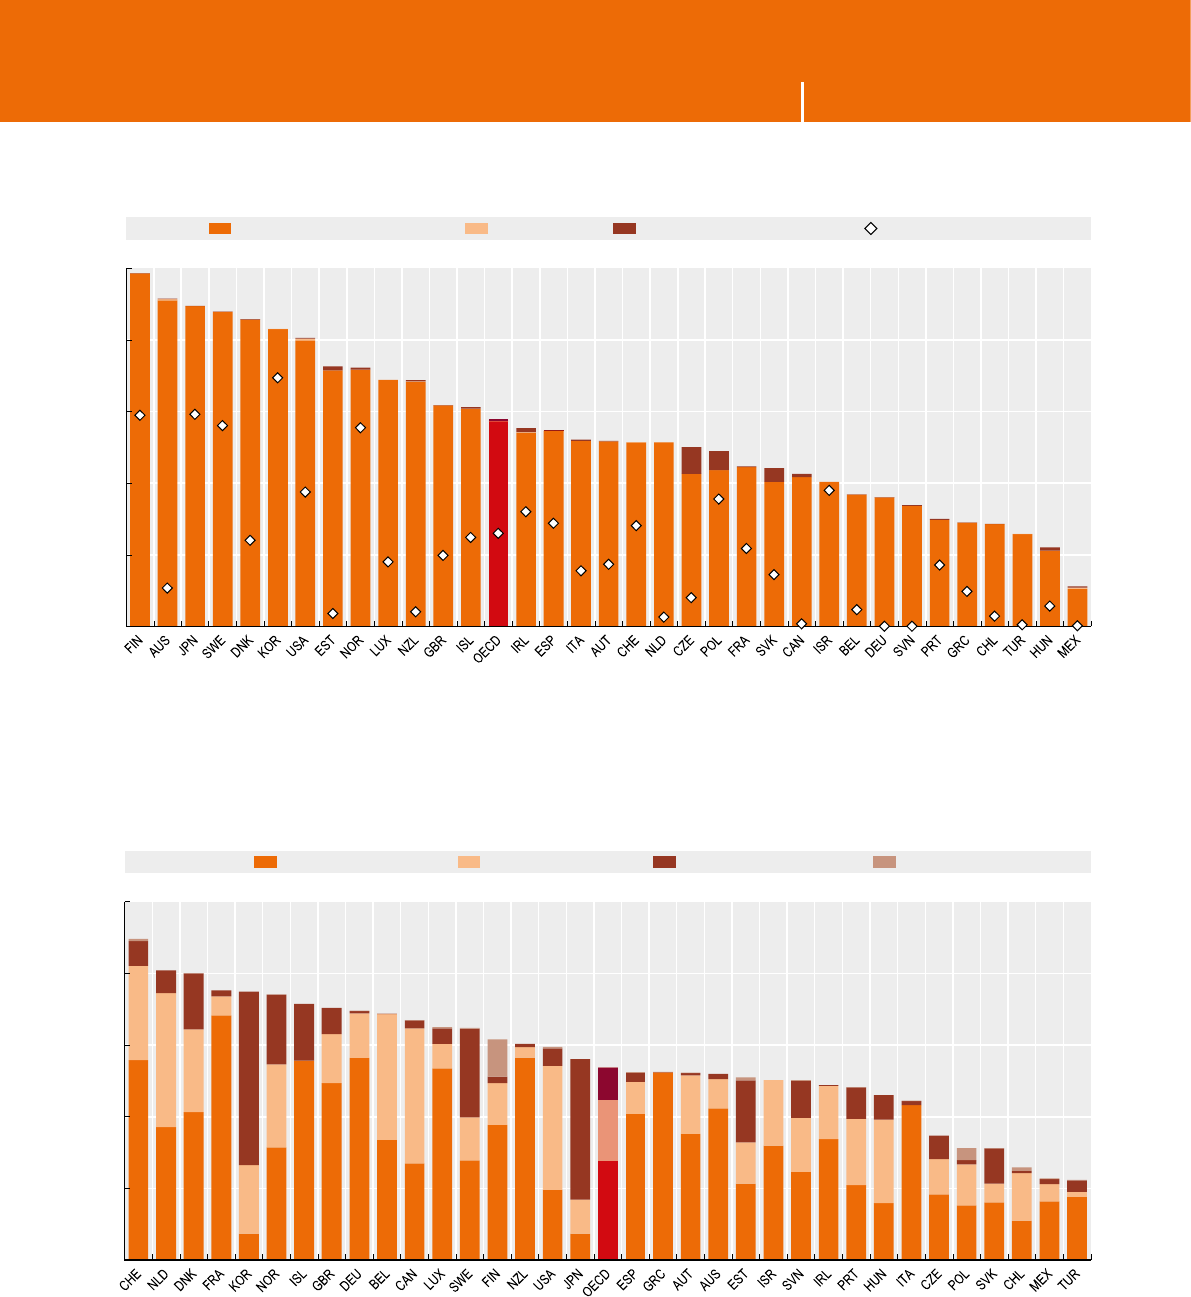
MEASURING THE DIGITAL ECONOMY: A NEW PERSPECTIVE © OECD 2014 51
2. INVESTING IN SMART INFRASTRUCTURE 2. INVESTING IN SMART INFRASTRUCTURE
Source: OECD, Broadband Portal, www.oecd.org/sti/broadband/oecdbroadbandportal.htm, July 2014.
1 2 http://dx.doi.org/10.1787/888933147973
Mobile wireless broadband penetration, by technology, December 2009 and 2013
Subscriptions per 100 inhabitants
0
25
50
75
100
125
Subscriptions per 100 inhabitants
Terrestrial mobile wireless Satellite Terrestrial fixed wireless All technologies, 2009
0
10
20
30
40
50
Subscriptions per 100 inhabitants
DSL Cable Fibre/LAN Other
Source: OECD, Broadband Portal, www.oecd.org/sti/broadband/oecdbroadbandportal.htm, July 2014.
1 2 http://dx.doi.org/10.1787/888933147981
Fixed (wired) broadband penetration by technology, December 2013
Subscriptions per 100 inhabitants
2.1 Broadband penetration

MEASURING THE DIGITAL ECONOMY: A NEW PERSPECTIVE © OECD 201452
2. INVESTING IN SMART INFRASTRUCTURE 2. INVESTING IN SMART INFRASTRUCTURE
Key ndings
The popularity of smartphones has stimulated greater
use of mobile Internet. The average subscription rate of
mobile Internet access in OECD countries rose to 72.4
per 100 inhabitants in December 2013, up from just
32.4 in December 2009.
Mobile broadband subscriptions represent 73%
(910million) of all broadband access paths in the OECD.
Broadband mobile penetration was highest in Australia,
Finland and Japan and lowest in Hungary, Mexico and
Turkey.
In calculating the number of mobile connections it is
important to factor in users that have more than one
subscription. Some people use multiple SIM cards
to take advantage of different tariffs or for different
uses, for example, a mobile handset with a separate
dedicated mobile data connection, such as a mobile
broadband dongle, data card or data-only SIM.
While a large majority of mobile broadband subscrip-
tions in the OECD include a voice connection, an
increasing number are now dedicated data connections
with subscribers using a mobile device primarily to
access the Internet (although telephony is still possible
via a VoIP application). In December 2013, about
128million mobile subscriptions were dedicated data,
almost double that of December 2009.
SIM cards for machine-to-machine (M2M) usage
account for a growing segment of mobile data
subscriptions. These are dedicated exclusively to
communication between equipment at a distance and
are not intended for interpersonal communications.
Some of the functionality of M2M communications is
built into navigation services for automobiles, access
to the Internet and emergency communications,
among others. These devices connect millions of
sensors and actuators, providing ever-greater amounts
of “big data” to facilitate the monitoring of machines,
environments and people’s health.
Some telecommunication operators now have specic
offers for M2M data services, which are used for e-book
readers, vehicles and smart meters. OECD countries
are examining or have started to liberalise access
to SIM cards for M2M applications independent of
mobile operators. This allows users to switch mobile
operators or use multiple networks at the same time.
The Netherlands is the rst country to change
regulation in this area. In 2012, there were 35.8 million
M2M SIM cards in the 18 OECD countries for which data
are available. Sweden is an outlier for M2M penetration
with 511 M2M SIM cards per 1000 inhabitants. Finland,
Denmark, Italy and France follow with over 100 M2M
SIM cards per 1000 inhabitants.
DID YOU KNOW?
In 2012, there were more than 35 million SIMcards
for machine-to-machine communication in
the18OECD countries for which data are available.
Denitions
Mobile broadband connections are used together with
a voice connection (standard subscriptions) or are
dedicated to mobile broadband services exclusively
(dedicated subscriptions).
Subscriptions to dedicated data services over a mobile
network are purchased separately from voice services,
either as a stand-alone service (modem/dongle) or as an
add-on data package to voice services, which requires
an additional subscription. All dedicated mobile data
subscriptions with recurring subscription fees are
included as “active data subscriptions”, regardless of
actual use. Prepaid mobile broadband plans require
active use if there is no monthly subscription.
A segment of M2M communication relies on mobile
wireless networks and, as with mobile telephony,
isbased on the use of SIM cards for authentication and
telephone numbers for connectivity. SIM card numbers
and telephone numbers are obtained from regulators
who, as of recently, require that mobile operators use
different telephone number ranges for M2M.
Measurability
International comparability of mobile communications
statistics is limited by the fact that not all countries are
able to comply with the same denitions. For example,
the number of standard mobile subscriptions should
include only subscriptions in use over the previous
three months; however, not all countries are able to
provide this information.
In addition, coverage of dedicated data mobile statistics
tends to vary across countries, which may contribute to
explaining the very high penetration rates found in some
of them. A few countries do not report separate statistics
for standard and dedicated mobile subscriptions.
Finally, there is not yet an ofcial methodology to dene
the limits of M2M SIM cards. National telecom regulators
in some OECD countries have begun to release M2M SIM
cards gures along with mobile and wireless broadband
subscriptions. However, M2M use may still be mixed
in with other subscriptions. Therefore, the indicators
presented here are still at an initial stage.
2.2 Mobile data communication
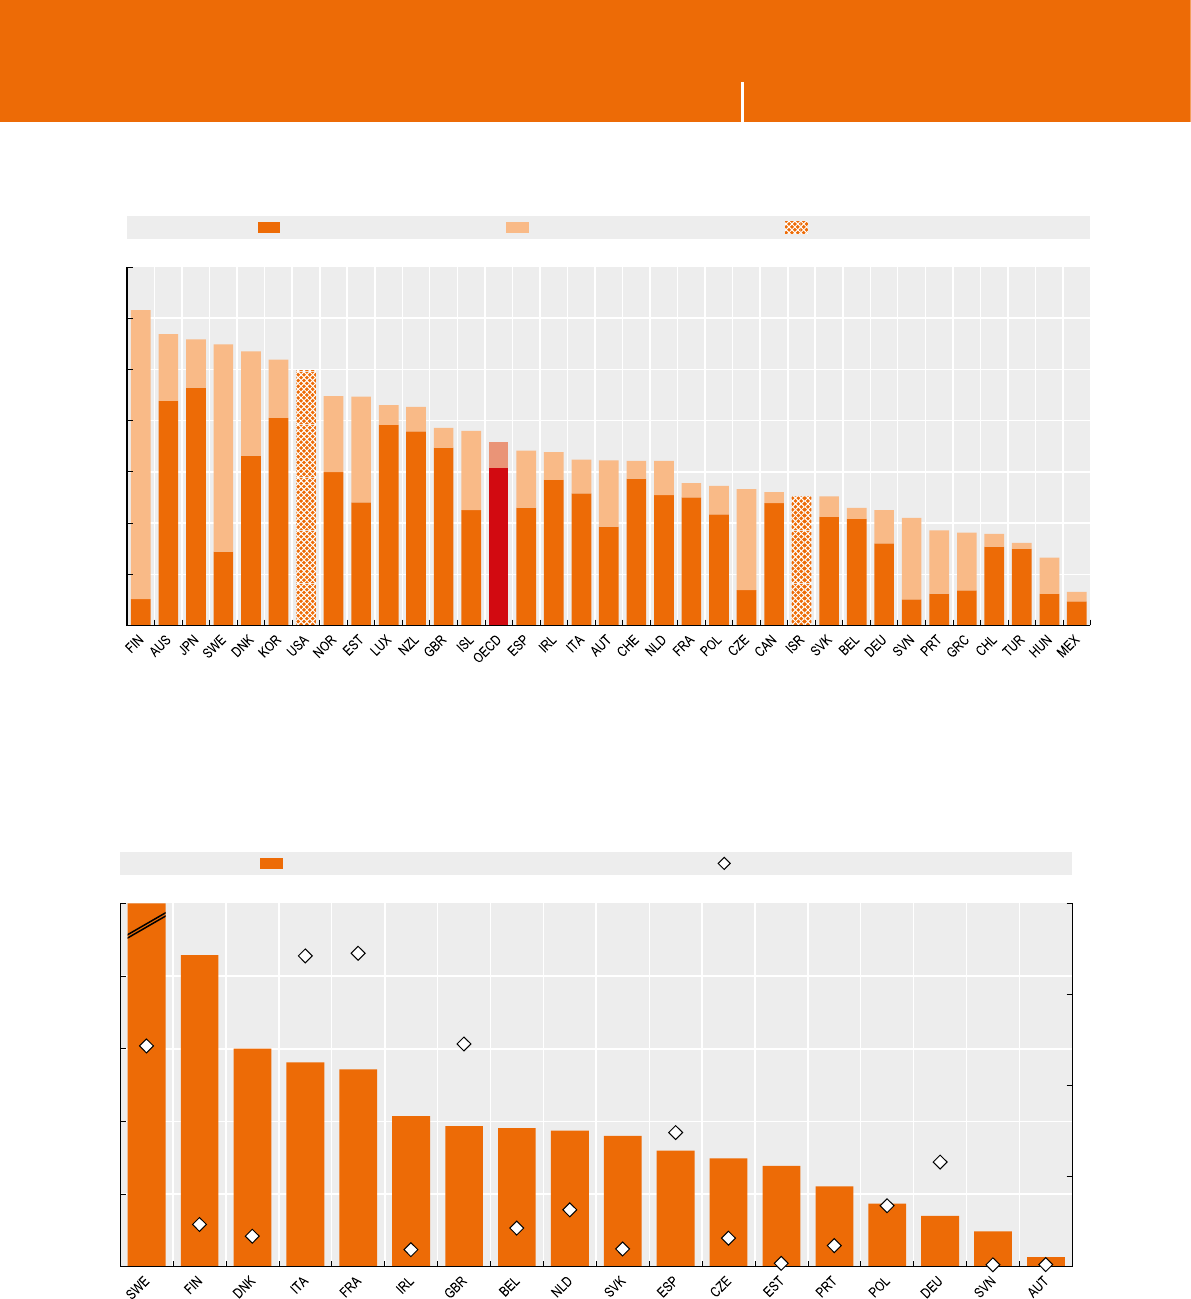
MEASURING THE DIGITAL ECONOMY: A NEW PERSPECTIVE © OECD 2014 53
2. INVESTING IN SMART INFRASTRUCTURE 2. INVESTING IN SMART INFRASTRUCTURE
Note: The gure refers to the sum of standard and dedicated data mobile subscriptions.
Source: OECD, Broadband Portal, www.oecd.org/sti/broadband/oecdbroadbandportal.htm, July 2014.
1 2 http://dx.doi.org/10.1787/888933147993
Mobile data subscriptions, by type, December 2013
0
20
40
60
80
100
120
140
Per 100 inhabitants
Standard mobile Dedicated mobile data Breakdown not available
0
2
4
6
8
0
40
80
120
160
200
Millions
‰511
M2M cards, per thousand inhabitants (left-hand scale) M2M cards, millions (right-hand scale)
Source: OECD computations based on data from communications regulatory bodies and ministries, May 2014. See chapter notes.
1 2 http://dx.doi.org/10.1787/888933148000
The penetration of M2M SIM cards, 2012
2.2 Mobile data communication

MEASURING THE DIGITAL ECONOMY: A NEW PERSPECTIVE © OECD 201454
2. INVESTING IN SMART INFRASTRUCTURE 2. INVESTING IN SMART INFRASTRUCTURE
Key ndings
In May 2014, registered domains reached 241 million,
up from 233 million in mid-2012. This increase
represented a marked slowdown in comparison with
earlier years, reecting possible saturation of the
domain name market. About 150 million domains are
registered under generic top-level domains (gTLD)
(i.e. “com”, “org”, “net”, etc.), with .com (commercial)
accounting for three-quarters of registrations.
Therecent availability of new addresses (e.g. “.hotel”)
might provide new impetus to gTLD registration. Regis-
trations under OECD-related country code top-level
domains (ccTLDs) stood at almost 65 million at the end
of the rst quarter of 2014.
Statistics on domain name registration offer a partial
but valuable perspective on the development of the
World Wide Web. These indicators can inform discus-
sions in areas such as domain name pricing policies,
and help to ensure transparency in registration
management for service providers, business users and
consumers.
Cross-country differences are wide and reect diversity
in the presence of websites combined with country
specicities in terms of ease and cost of registration
and maintenance. Denmark, the Netherlands and
Switzerland have 200 or more ccTLDs registered per
1 000 inhabitants, while other OECD countries have
50 per 1 000 users or less. This latter group includes
countries where use of ccTLDs is historically lower,
for example, Korea, where users rely on second-level
domains, and the United States, where some gTLDs
are “domestic” (e.g.: .gov for government, or .edu for
educational institutions) and gTLDs have consistently
been used more widely than the .us domain. For other
countries in this range, such as Mexico and Turkey,
therate generally reects lower Internet penetration.
The number of Internet hosts has historically provided
a complementary perspective on the size of the Internet
and its growth. However, this indicator is gradually
losing ground, as the one-to-one relationship between
a host and an IP address is blurred, not least due to the
depletion of IPv4 addresses. As of January 2014, hosts
worldwide reached 1.01 billion, up 6% annually from
888 million in 2012, but representing a slowdown from
10% in the previous biennium and a 26% compound
annual growth rate from 2000 to 2010.
The number of routed autonomous systems (AS) that a
country has may be a proxy for the amount of compe-
tition in a market. It indicates the ease with which
acompany may take control over routing its trafc and
exchange with other networks. Most countries saw an
increase in the number of AS per capita between 2010
and 2012.
DID YOU KNOW?
There were about 241 million registered domains
inthe world in mid-2014.
On average, there was one geographical top-level
domain (ccTLD) per tenOECDInternet users.
Denitions
The Domain Name System (DNS) translates user-friendly
host names (e.g. www.oecd.org) into IP addresses.
Thehierarchical syntax of a domain name is supported
by the “dot” in the name and is read by the DNS server
from right to left (.org is the top level domain and .oecd
is the sub-domain of this TLD.) Generic top level domains
(gTLDs) include “.com” or “.org”, country code-top level
domains (ccTLDs) consist of two-letter codes generally
reserved for a country or a dependent territory (e.g. “.au”
for Australia). Registry operators, known as Network
Information Centres (NICs), distribute two-letter codes.
An Internet host is a machine or application connected to
the Internet and uniquely identied with an IP address.
An autonomous system (AS) can be dened by the
aggregate of IP blocks for which the network is respon-
sible. Such networks are termed autonomous because
they can determine the routing of their trafc indepen-
dently from any other network. Every AS is assigned
aunique number (ASN) by a regional Internet registry
(RIR).
Measurability
The measure of domain names works by asking the
network a question such as “where is OECD.org located?”
The DNS answers using resolvers that query the data
stored in a hierarchical and widely distributed sets of
machines known as DNS servers that are essential for
the smooth functioning of the Internet. The number
of Internet hosts is measured by the Internet Systems
Consortium (ISC) survey, which queries the domain
system for the name assigned to every possible IP address.
Hosts used to proxy for IP addresses; the one-to-one
relationship between a host and an IP address is now
being blurred by the use of Network address translation
(NAT), which allows many computers to share a single
IP address, to mitigate the depletion of IP(v4) addresses.
Autonomous systems vary signicantly and differ
considerably in size. The majority of measurement
forms available calculate the extent of the Internet the
network can reach directly. Another approach examines
the number of IP addresses behind an AS. These data
only show information from routing tables, not on
number of customers, revenues or geographic size.
2.3 The growth of the Internet
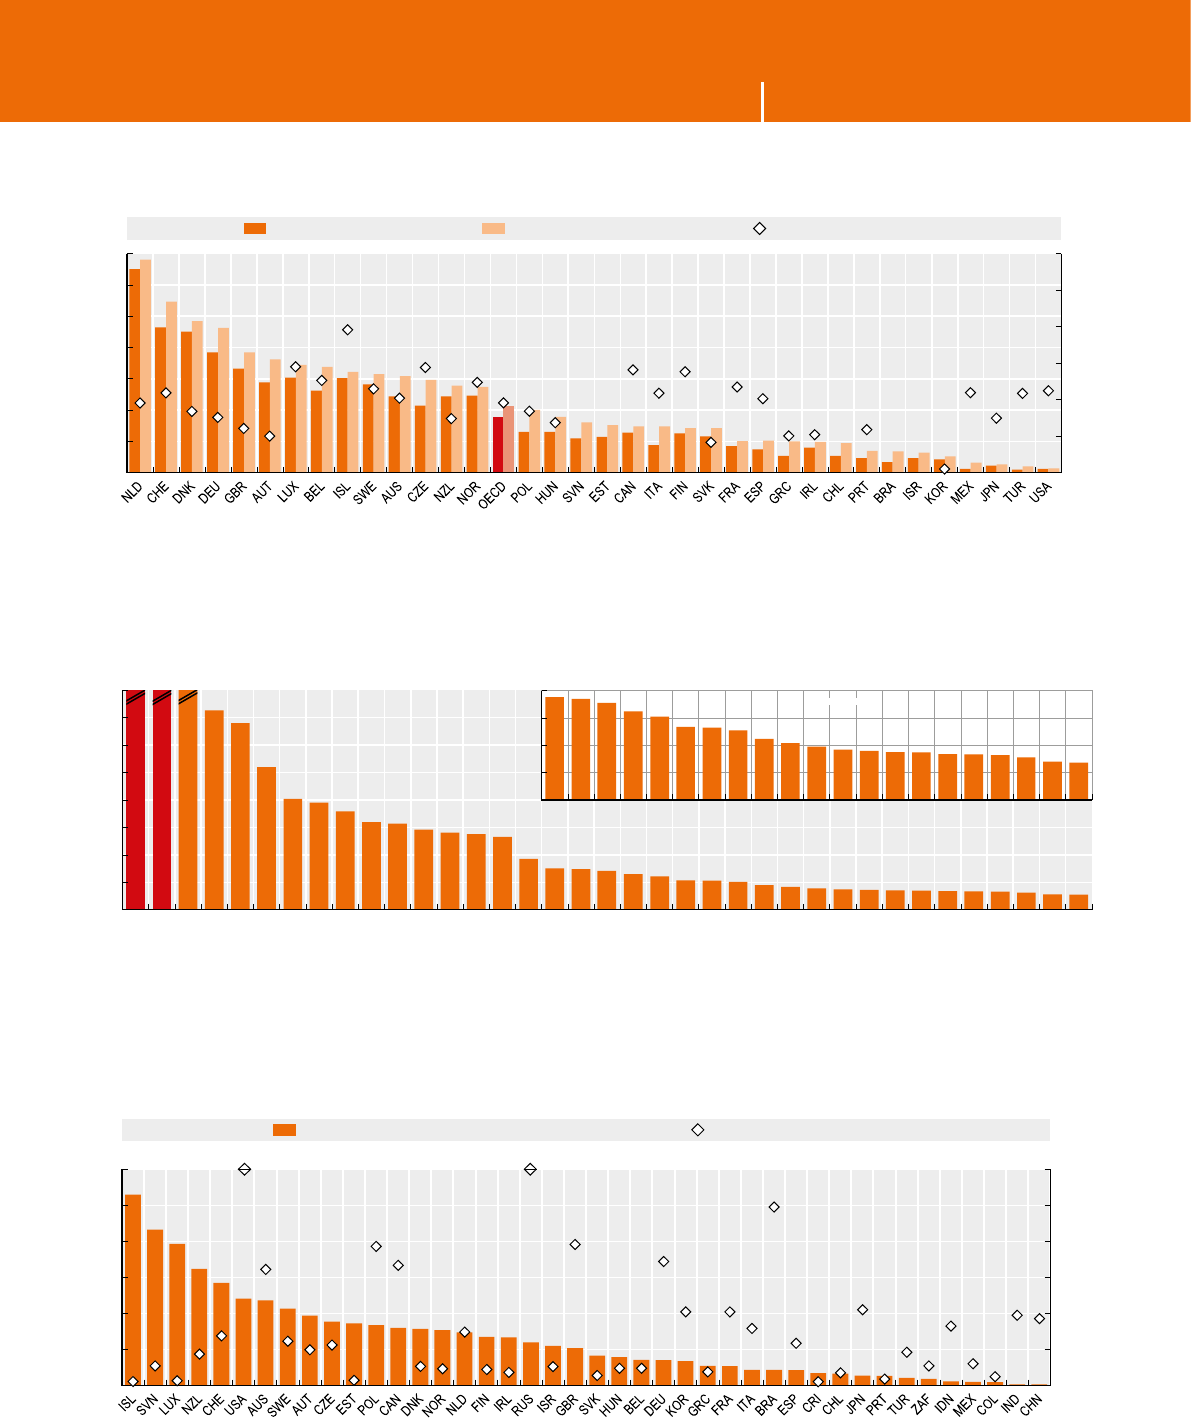
MEASURING THE DIGITAL ECONOMY: A NEW PERSPECTIVE © OECD 2014 55
2. INVESTING IN SMART INFRASTRUCTURE 2. INVESTING IN SMART INFRASTRUCTURE
Source: OECD computations based on countries’ Network Information Centres (NICs) and KISA, May 2014. See chapter notes.
1 2 http://dx.doi.org/10.1787/888933148012
Country code top-level domain registration (ccTLD) density 2014 Q1 and growth (2013 Q1-2014 Q1)
Per thousand inhabitants and Internet users, annual growth rate (right-hand scale)
-4
0
4
8
12
16
20
0
50
100
150
200
250
300
350
% ‰ ccTLD/inhabitants ccTLD/Internet users ccTLD growth (right-hand scale)
Note: US-related domains include .us, .edu, .mil and .gov.
Source: Internet Systems Consortium (ISC), ftp.isc.org/www/survey/reports/current/bynum.txt, June 2014.
1 2 http://dx.doi.org/10.1787/888933148021
Hosts by type of domain, January 2014
0
5
10
15
20
25
30
35
40
Millions
384 159 74
.net
.com
.jp
.br
.de
.it
.cn
US related
.mx
.au
.fr
.ru
.nl
.ar
.pl
.ca
.uk
.in
.tr
.tw
.se
.be
.ch
.co
.fi
.es
.pt
.th
.at
.cz
.za
.gr
.no
.hu
.nz
.ro
.dk
0
2
4
6
8
.uk
.in
.tr
.tw
.se
.be
.ch
.co
.fi
.es
.pt
.th
.at
.cz
.za
.gr
.no
.hu
.nz
.ro
.dk
Magnified
Source: OECD computations based on Potaroo, April 2014.
1 2 http://dx.doi.org/10.1787/888933148033
Routed autonomous systems, 2013
0
500
1 000
1 500
2 000
2 500
3 000
0
30
60
90
120
150
180
Number of ASPer million inhabitants
AS, per million inhabitants (left-hand scale) Total AS number (right-hand scale)
22 690 5 115
2.3 The growth of the Internet

MEASURING THE DIGITAL ECONOMY: A NEW PERSPECTIVE © OECD 201456
2. INVESTING IN SMART INFRASTRUCTURE 2. INVESTING IN SMART INFRASTRUCTURE
Key ndings
Adequate network access speed is essential to fully
exploit existing services over the Internet and to foster
the diffusion of new ones.
In December 2013, xed (wired) broadband subscrip-
tions rates in the OECD area reached 27%, up from 23%
at the end of 2009. In the Denmark, the Netherlands
and Switzerland, subscription rates are 40% or above,
but remain below 20% in six other OECD countries.
Distribution of xed broadband subscriptions across
speed tiers varies signicantly across countries, due to
a variety of factors (e.g. level of competition, population
density in the market addressed, availability of
back-haul, type of technology most widespread, etc.).
In December 2013, Korea was the OECD country with
the highest share of xed broadband subscribers with
a download speed above 10 Mbit/s (71%), followed by
Japan (47%), the Netherlands (45%) and Switzerland
(42%). The share of subscribers with a download speed
below 4 Mbit/s was largest in Chile (74%) followed by
Mexico (65%) and Turkey (56%).
Users in Korea and Japan are recorded as having the
highest speed levels, as a result of extensive deployment
of bre to the home. Countries with competing DSL
and cable television networks also perform well with
cable networks overcoming some distance barriers,
particularly in places with lower population densities.
It is notable that the countries with the three lowest
penetration rates also offer the lowest actual speeds.
Differences in speed levels are important for customers.
For example, high-speed broadband subscribers (above
10Mbit/s) can download a high-quality movie (1.5GB)
in less than 22minutes, while the same process takes
at least 52 minutes for low-speed subscribers (below
4Mbit/s).
In most OECD economies, mobile connectivity
is undergoing major advancements through the
deployment of Long Term Evolution (LTE) networks.
Mobile broadband providers are advertising download
speeds at levels increasingly closer to those of some
xed broadband offers. The two networks are comple-
mentary as wireless networks are effective only to the
extent that trafc can be quickly ofoaded to xed
networks (a consequence of spectrum limitations).
DID YOU KNOW?
In 2013, the share of xed high-speed broadband
subscribers (above 10 Mbit/s) ranged between over
70% and less than 2% across OECD countries.
Denitions
Fixed (wired) broadband penetration is computed as the
number of subscriptions to xed (wired) broadband
services, divided by the number of residents in each
country.
Fixed (wired) broadband includes DSL, cable, bre to
the home (FTTH) and other xed wired technologies.
All components include only connections with adver-
tised data speeds of 256kbit/s or more.
Measurability
Measurement of broadband performance is affected
by the potential gap between advertised and “actual”
speeds delivered to consumers. Several tools are avail-
able to measure actual download and upload speeds,
together with other quality-of-service parameters.
Among the major providers of broadband speed data,
M-Lab and Ookla compile results from Internet access
speed tests conducted by users. The willingness to
perform the test, the overall broadband adoption rate,
the extent to which ISPs promote the tool and the
languages spoken, are all factors that may affect the
number of tests and the comparability of the results
among countries.
By way of contrast, Akamai runs tests on the speed at
which content is delivered to users through its server
network located around the world.
Despite signicant differences in methodologies, the
results from Akamai, M-Lab and Ookla are strongly
correlated, except in the case of Japan, where Akamai
reports lower broadband speed. It can also be observed
that Ookla delivers systematically higher download
speed measurement than the other two tools.
The breakdown of xed broadband penetration by
speed tiers presented here is based on Akamai.
2.4 Toward higher speed
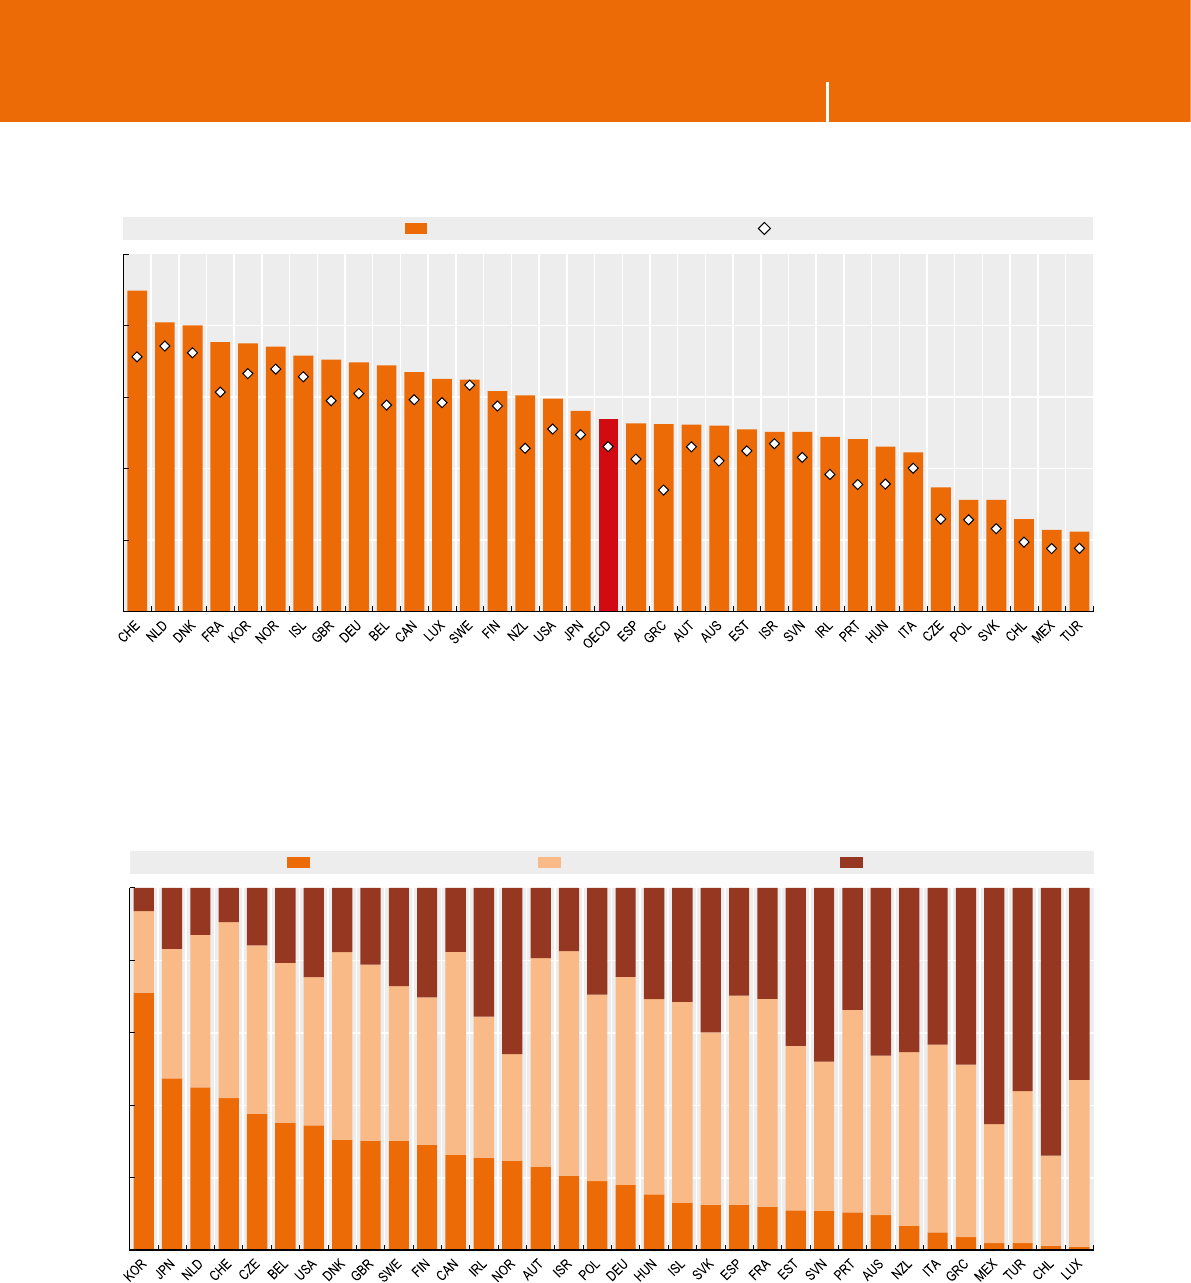
MEASURING THE DIGITAL ECONOMY: A NEW PERSPECTIVE © OECD 2014 57
2. INVESTING IN SMART INFRASTRUCTURE 2. INVESTING IN SMART INFRASTRUCTURE
Source: OECD, Broadband Portal, www.oecd.org/sti/broadband/oecdbroadbandportal.htm, July 2014.
1 2 http://dx.doi.org/10.1787/888933148044
Fixed (wired) broadband penetration rates, December 2009 and 2013
As a percentage of subscriptions
0
10
20
30
40
50
%2013 2009
0
20
40
60
80
100
%> 10 mbps > 4 mbps / < 10 mbps < 4 mbps
Source: OECD computations based on Akamai, July 2014. See chapter notes.
1 2 http://dx.doi.org/10.1787/888933148053
Fixed (wired) broadband penetration rates by speed tiers, December 2013
As a percentage of subscriptions
2.4 Toward higher speed

MEASURING THE DIGITAL ECONOMY: A NEW PERSPECTIVE © OECD 201458
2. INVESTING IN SMART INFRASTRUCTURE 2. INVESTING IN SMART INFRASTRUCTURE
Key ndings
Prices for connectivity provide useful insights into
competition and efciency levels in communication
markets. Benchmarking these prices allows stake-
holders, including telecommunication operators, policy
makers and consumers, to evaluate progress towards
their objectives.
The OECD uses a set of telecommunication prices based
on a basket approach. It selects the least costly options
among surveyed offers, thereby providing a tool to
compare prices available to consumers and businesses
with a range of differed usage patterns.
Assessment of any market requires consideration
of prices from a range of baskets, including for users
that have widely varying requirements and signicant
differences in their ability to pay. Here, one basket is
shown by way of example, but a full range is available
in theOECD Communications Outlook 2013.
In 2014, a xed-line broadband subscription basket
with 33GB usage and at least 15Mbit/s download speed
costs from USD 58 to less than USD 17 per month,
expressed in purchasing power parity (PPP).
Country performance for any single basket can vary
widely, hence the need to examine a range of baskets. In
this case, the average price for the same basket across
the OECD decreased from USD38.1 to USD34.5 PPP in
the 18 months from September 2012 (with the largest
decreases observed in Iceland, Mexico and Turkey).
Broadband mobile services are rapidly gaining a larger
share of the wireless and overall market for commu-
nication services. Nonetheless, wireless and xed
services are viewed as being complimentary, even
though they may be substitutable for some services
such as telephony.
Operators in all countries offer voice and data packages
that include a specied volume of trafc or unlimited
offers, with mobile data trafc nearly always more
costly than xed-line services. This is one reason why
smartphone users predominantly access data services
when connected to Wi-Fi in locations such as ofces
and at home.
One of several mobile baskets tracked by the OECD
includes 100 calls, 140 SMS and 500 MB of data.
In February 2014, this basket was priced between
USD 19 and USD 36 PPP a month in half of OECD
countries. Monthly subscription prices were lowest in
the United Kingdom (USD10.4 PPP), Estonia (11.9) and
Austria (13.6) and highest in Japan (77.0), Chile (58.6)
and Hungary(54.5).
DID YOU KNOW?
Depending on the country of residence, smartphone
users in the OECD can pay up to seven times more
for a comparable basket of mobile services.
Denitions
Broadband services are frequently sold as mixed
bundles including Internet access, telephony and (for
xed networks) television. As broadband bundles are
sometimes sold at a lower price than stand-alone
services, connectivity prices are not always directly
comparable among offers and across countries.
The OECD methodology for measuring prices of
communication services is based on “baskets” of xed
broadband and mobile communication services,
collected from several operators with the largest
market shares in each country. USD PPP is used to
facilitate international comparisons, with data also
being available in USD using exchange rates.
The OECD has developed a new set of baskets for
broadband services, both for xed broadband (adopted
in 2009) and wireless broadband (2012).
Measurability
To collect broadband price data, 1 950 stand-alone xed
broadband offers from 102 operators and 1 300 mobile
voice plus data offers from 74 operators in the 34 OECD
countries were surveyed for the OECD/Teligen baskets.
Where stand-alone broadband was not available from
a given operator, the least expensive bundled package
was selected and included in the comparison.
For xed broadband, a set of three operators per country
was chosen (with an average of 19 offers per operator).
These included the incumbent telecommunications
operator, the largest cable provider (if cable exists) and
one alternative provider, if available, over DSL, cable
orbre.
The surveyed offers had to be advertised clearly on the
operator’s website. In the case of DSL, cable and bre
offers, these were recorded but not used in calculations
when speeds were below 256 Kbit/s. The considered
offers were for month-to-month service and had to be
available in the country’s largest city or in the largest
regional city for rms with only regional coverage.
Mobile baskets were based on consumer proles and
offers available from the largest operators in each
country.
2.5 Prices for connectivity
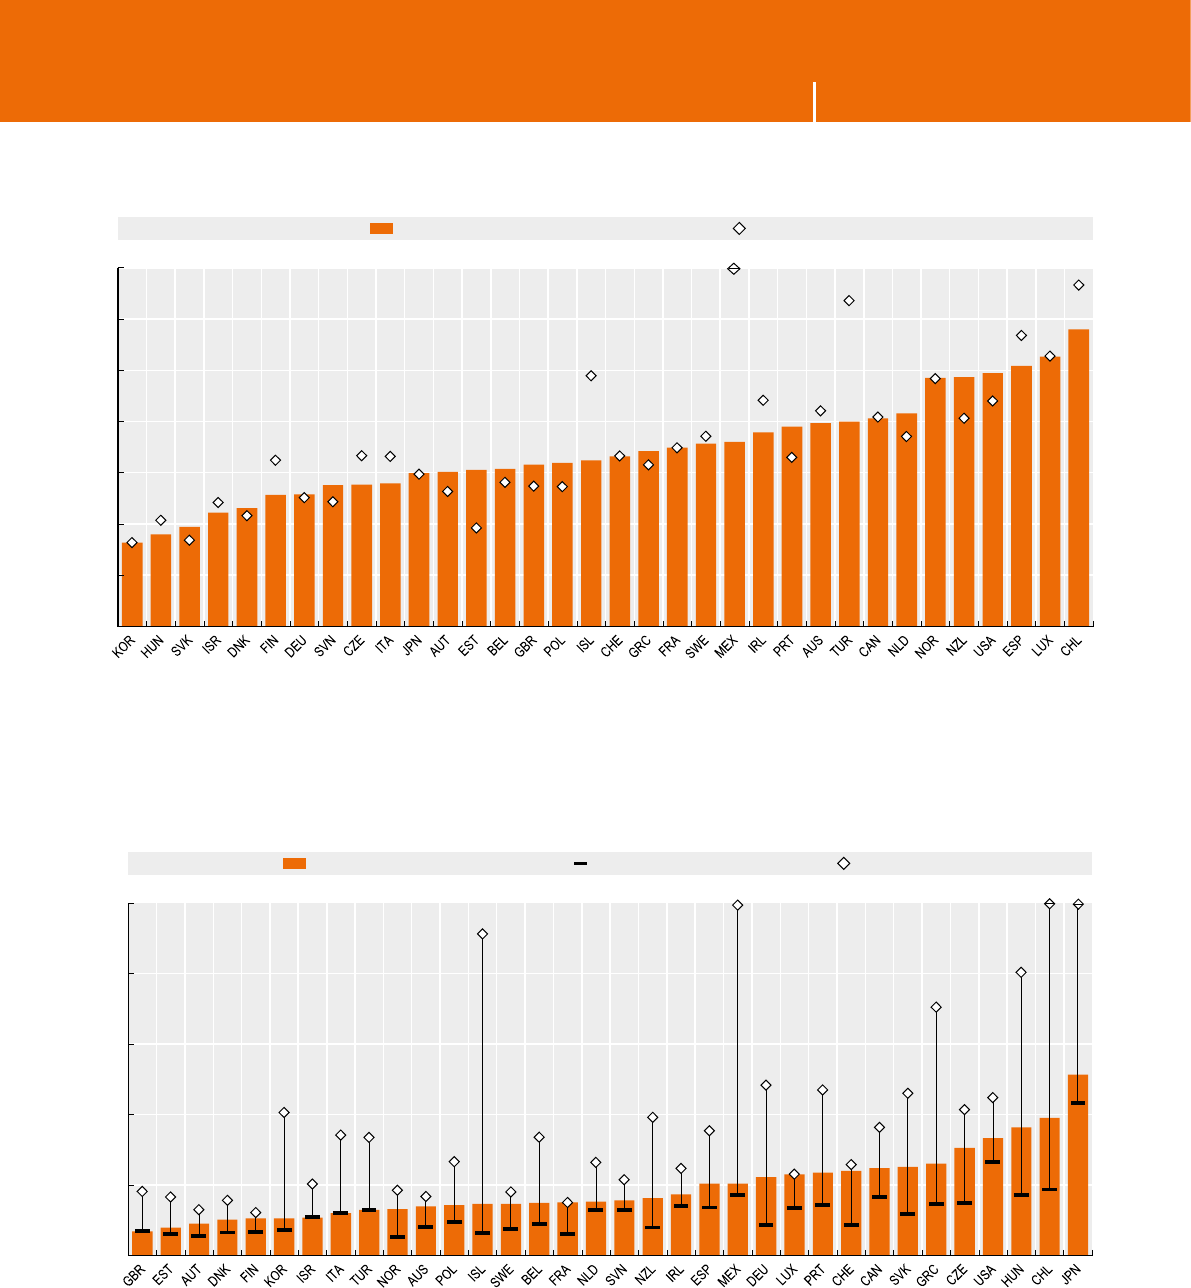
MEASURING THE DIGITAL ECONOMY: A NEW PERSPECTIVE © OECD 2014 59
2. INVESTING IN SMART INFRASTRUCTURE 2. INVESTING IN SMART INFRASTRUCTURE
Source: OECD and Teligen, April 2014. See chapter notes.
1 2 http://dx.doi.org/10.1787/888933148062
Prices of xed broadband basket, 33 GB, 15 Mbit/s and above, September 2012 and March 2014
USD PPP per month
0
10
20
30
40
50
60
70
USD PPP
March 2014 September 2012
132
0
30
60
90
120
150
USD PPP
100 calls /500MB 30 calls/100MB 900 calls/2GB
171 222
Source: OECD and Teligen, April 2014. See chapter notes.
1 2 http://dx.doi.org/10.1787/888933148078
Prices of mobile voice calls plus data trafc reference baskets, February 2014
USD PPP per month
2.5 Prices for connectivity

MEASURING THE DIGITAL ECONOMY: A NEW PERSPECTIVE © OECD 201460
2. INVESTING IN SMART INFRASTRUCTURE 2. INVESTING IN SMART INFRASTRUCTURE
Key ndings
Most ICT devices today are Wi-Fi enabled, allowing
users to connect to the Internet anywhere and anytime.
More than 60% of Internet users in the OECD area
employ a laptop computer and almost as many use
a desktop. Meanwhile, 37% of users now connect to
the Internet via smartphones and 13% via tablets.
Insome OECD countries, well above 10% of users report
connecting through other devices as well, such as game
consoles or TVs.
Overall, the number of devices per user is associated
with rates of Internet usage and other factors, including
per capita income and age. These factors affect, in
particular, the diffusion of tablets and smartphones,
which show the highest variability across countries
and, together, inuence to a large extent their position
with respect to the average number of devices per user.
The diffusion of smartphones and tablets is accom-
panied by the multiplication of dedicated software
applications, otherwise known as “apps”.
Apps extend the rich communication potential of the
Internet beyond the traditional desktop computer
and enable users to benet from a myriad of services,
including many related to mobility, such as location-
based services and a growing array of sensors available
with handheld devices. They also represent an
increasingly important channel for governments and
companies to deliver content, information and services
to users.
The average smartphone user in the OECD has
on average 28 applications installed, but uses only
about 11. In general, the number of apps installed is
closely correlated with the number of apps in use.
Familiarity is an important factor in explaining
sophistication of usage. Other things being equal,
in countries where the diffusion of smartphones is
comparatively high, a higher share of individuals are
likely to install and use a broader array of applications.
There are exceptions, however. On average, users in
Japan are among those with the highest number of
apps installed (37), but also among those with lowest
number of apps in use (less than 8).
DID YOU KNOW?
The average user in Korea connects to the Internet
using 2.5 different devices, against 1.2 in Hungary.
The average OECD smartphone user has about
28apps available, but uses only 11.
Denitions
The average number of devices used is an approximation
based on the sum of the items surveyed in ICT usage
surveys.
Apps are computer software (applications) meant
to execute specic tasks, as opposed to the system
software. Here, they are considered with respect to
mobile devices only. Statistics on apps are based
on a survey commissioned by Google to specialised
enterprises in different countries. The reference period
for the number of apps in use was the previous 30 days.
Measurability
The design and breadth of surveys on ICT usage by
individuals is quite diverse across countries (see 3.1).
Data on the variety of devices in use, in particular,
ought to be considered as indicative only.
Devices are surveyed in different ways and are
sometimes bundled together (e.g. laptops combined
with personal computers). As such it is not possible to
achieve fully comparable indicators. In particular, the
average number of devices per user might be underesti-
mated for Canada and Japan, due to the lack of specic
gures for tablets and laptops, respectively.
Apps-related information from the Google multi-
country survey can be considered sufciently reliable,
but is based on relatively small country-level samples
(about 1000 individuals) limiting its use. A specic
module on apps has been included in the 2014 revision
of the OECD Model Survey on ICT Access and Usage
by Households and Individuals. In the future it will be
possible to collect data for applications on mobile phones
with ofcial statistics, using much larger samples and
capturing a richer set of policy relevant metrics. These
include the diffusion of specic types of apps (e.g. health
or education related) or aspects related to security,
distinguished by different groups of individuals.
2.6 ICT devices and applications
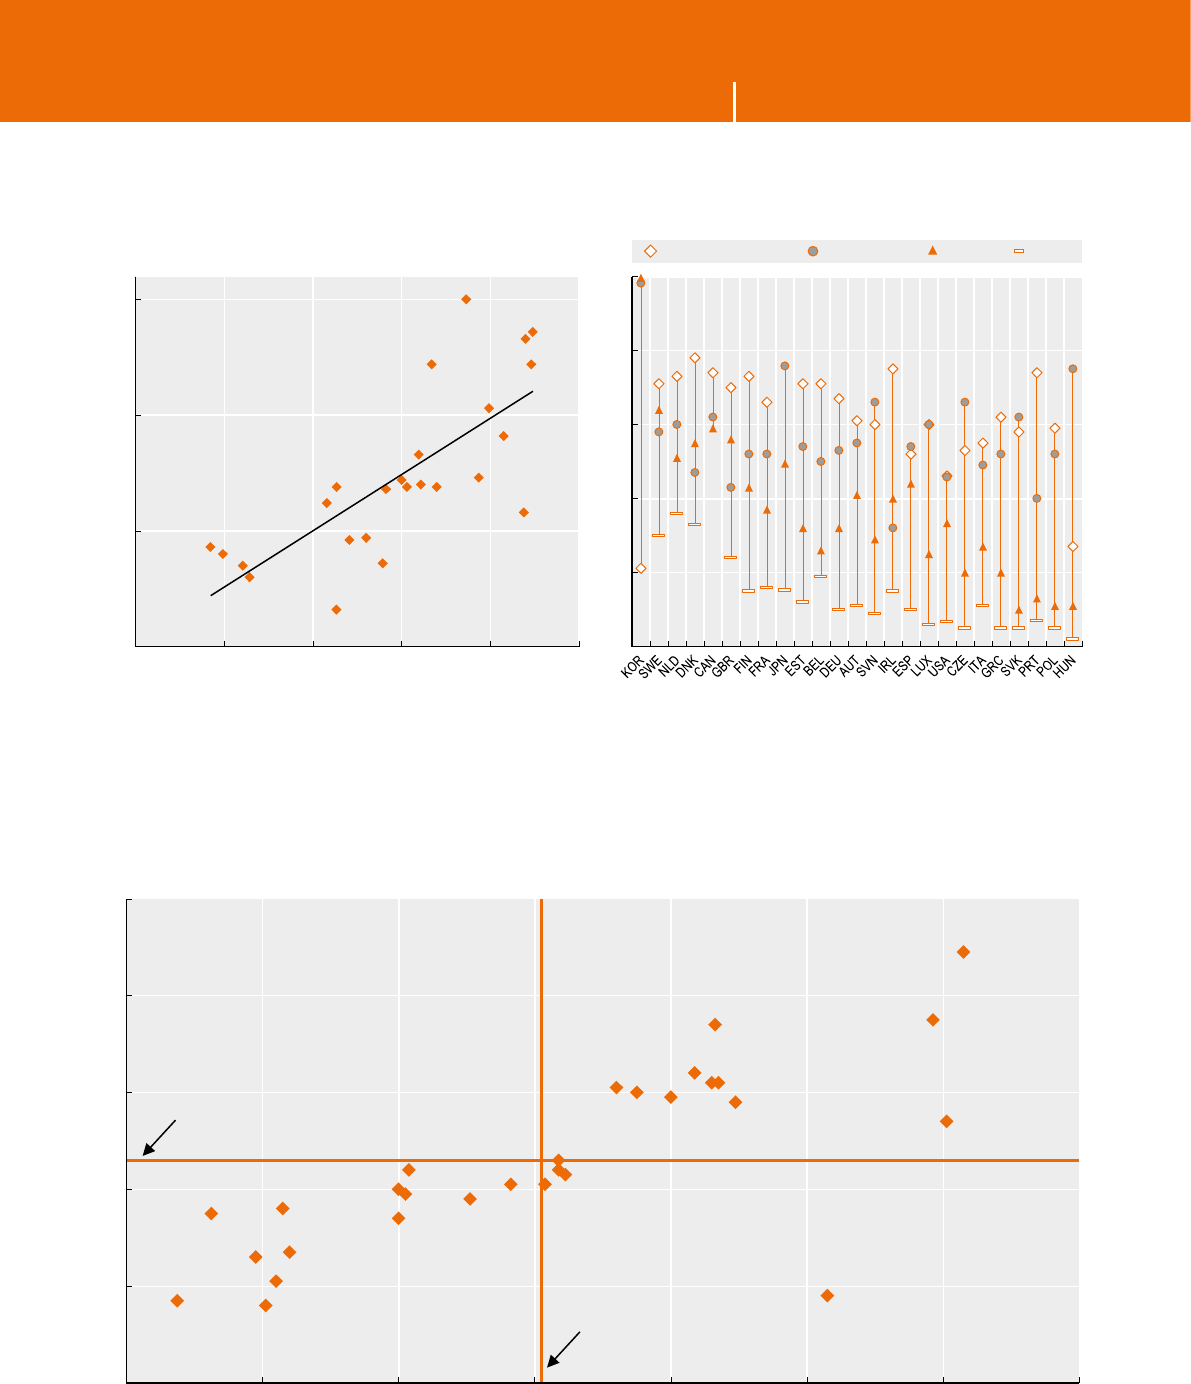
MEASURING THE DIGITAL ECONOMY: A NEW PERSPECTIVE © OECD 2014 61
2. INVESTING IN SMART INFRASTRUCTURE 2. INVESTING IN SMART INFRASTRUCTURE
Source: OECD, ICT Database, May 2014; European Commission (2013), Cyber security, Special Eurobarometer, No. 404, Brussels and national sources.
See chapter notes.
1 2 http://dx.doi.org/10.1787/888933148083
Devices used to access the Internet, 2013
Variety of devices per user linked to the percentage of Internet users (left-hand panel)
and Users by device as a percentage of Internet users (right-hand panel)
0
20
40
60
80
100
%Laptop computer/Netbook Desktop computer Smartphone Tablet
R² = 0.55
1
1.5
2
2.5
50 60 70 80 90 100
Internet users (%)
Devices per user
KOR
SWE
NLD
DNKCAN
GBR
FIN
FRA
JPN
EST BEL
DEU
AUT
SVN
ESP LUX
USA
CZE
ITA GRC SVK
PRT
POL
HUN
IRL
Source: Google, Our Mobile Planet, Smartphone research 2013, think.withgoogle.com/mobileplanet/en/downloads. See chapter notes.
1 2 http://dx.doi.org/10.1787/888933148094
6
8
10
12
14
16
16 20 24 28 32 36 40 44
Apps in use
Apps available
Average number of apps available
Average number of apps in use
CHE
KOR
SWE
JPN
AUS
NOR
DNK
USA
FRA
ISR
IRL
CAN
GBR
AUT
DEU
NLD
NZL
BEL
CZE
PRT
ITA
SVK
HUN
MEX
ESP
FIN
GRC
TUR
POL
Smartphone apps availability and usage, 2013
Average number per user
2.6 ICT devices and applications

MEASURING THE DIGITAL ECONOMY: A NEW PERSPECTIVE © OECD 201462
2. INVESTING IN SMART INFRASTRUCTURE 2. INVESTING IN SMART INFRASTRUCTURE
2.7 E-commerce across borders
Key ndings
The Internet opens up new opportunities on global
markets for consumers and businesses. IT infrastruc-
ture, regulatory framework and economic integration
of countries are among key factors that impact
cross-border e-commerce uptake by individuals and
enterprises.
Despite recent initiatives both at the national and
international level to foster cross-border online trans-
actions, e-commerce activities mostly remain within
national borders. In 2012, in a majority of countries
for which data are available, the percentage of enter-
prises that engaged in electronic sales (e-sales) in their
own country was much higher than those who carried
out cross-border e-sales. Exceptions were Ireland and
Luxembourg, where multinational enterprises (MNEs)
play a larger role.
In Finland and Norway, the share of enterprises that
conducted cross-border online sales within the EU was
less than 30%, as opposed to Austria and Italy, where
this share was 62% and 56% respectively.
In general, European countries prefer EU partners both
for online sales and purchases, while consumers in
Canada mostly order from the United States as regards
cross-border online purchases. In 2013, 26% of individ-
uals who ordered goods or services over the Internet
in the EU28 chose sellers located in other EU countries,
against 14% from those located in the rest of the world.
In Canada, 63% of e-consumers reported ordering from
sellers in the United States.
Most OECD countries are placing greater emphasis
today on policies and programmes that promote market
transparency and provide information and guidance to
empower citizens by strengthening their ability and
condence to buy goods and services across borders,
in particular online.
In 2012, at the EU level, consumer trust in purchasing
goods or services via the Internet from retailers located
in another EU country was highest in Iceland, Ireland
and Luxembourg, and lowest in Germany.
Language appears to be one of the enabling factors
related to consumer trust. Available data from the EU28
show that trust in cross-border online purchases in
non-English speaking European countries increases
with willingness to place orders in another EU language.
DID YOU KNOW?
In 2013, 63% of e-consumers in Canada ordered
goods or services from theUnitedStates,
and 26% of e-consumers in the EU28 ordered
products from other EU countries.
Denitions
An e-commerce transaction is the sale or purchase of
goods or services, conducted over computer networks
by methods specically designed for the purpose of
receiving or placing of orders (OECD Guide to Measuring
the Information Society 2011). For individuals, whether
sellers or purchasers, such transactions typically occur
over the Internet. For enterprises, e-commerce sales
gures presented here include all transactions carried
out over webpages, extranet or Electronic Data Inter-
change (EDI) systems.
MNEs are treated as national sellers once their website
declares them to be registered as a company with
an address in the surveyed country. National sellers
include the trade business or sales ofces established
in the country by foreign owners.
Partner countries refer to the EU members for
countries in the European Statistical System and to
theUnitedStates for Canada.
Shares of Internet users who trust in EU cross-border
sellers and of those who are willing to use another EU
language for purchases over the Internet are computed as
a percentage of those who expressed an opinion about
the statements (agree or disagree).
Measurability
Flash Eurobarometers are thematic public opinion
surveys conducted at the request of the European
Commission to obtain relatively rapid results by
focusing on a specic target group. The survey on
consumer attitudes towards cross-border trade and
consumer protection was carried out in the 28 EU
countries, Iceland and Norway in September 2012
across a sample of 25 543 individuals aged 15 years
and more. Different social and demographic groups
were interviewed via telephone in their mother tongue
on behalf of the European Commission Directorate-
General for Health and Consumers (DG SANCO).
As is the case for all public opinion surveys, interpreta-
tion of the results is subject to caution. As the samples
used are relatively small, marginal differences observed
across countries might be the result of sampling
errors and not necessarily represent differences in the
underlying population.
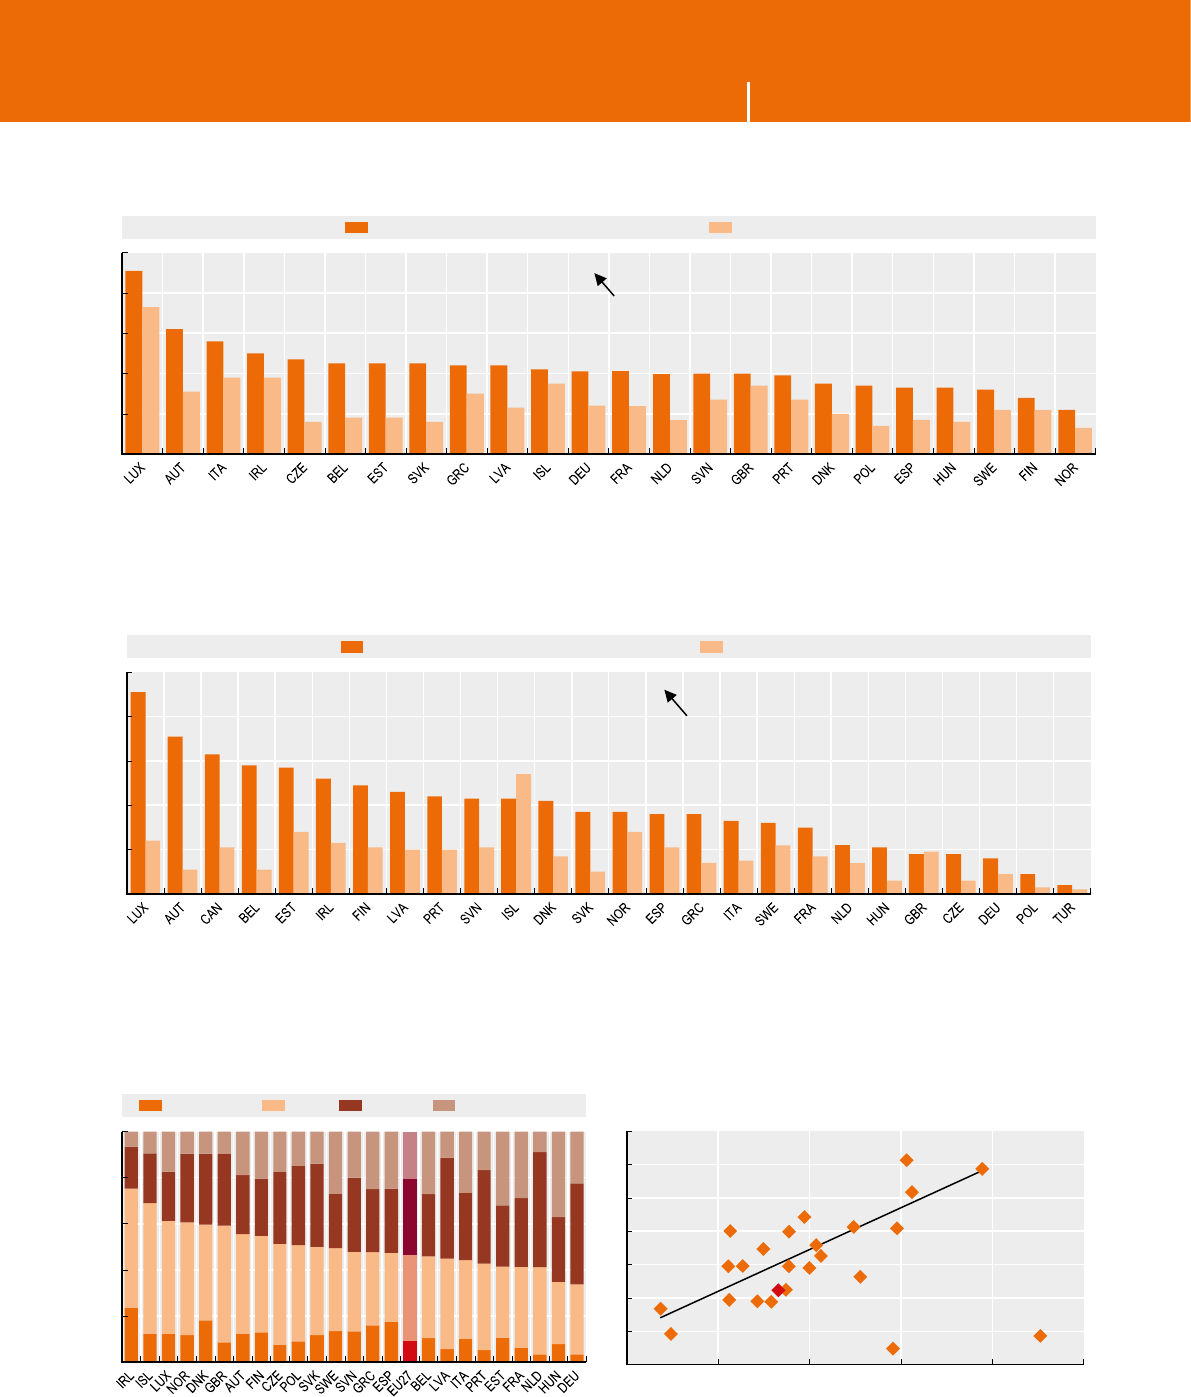
MEASURING THE DIGITAL ECONOMY: A NEW PERSPECTIVE © OECD 2014 63
2. INVESTING IN SMART INFRASTRUCTURE 2. INVESTING IN SMART INFRASTRUCTURE
2.7 E-commerce across borders
Source: OECD based on Eurostat, Information Society Statistics, June 2014. See chapter notes.
1 2 http://dx.doi.org/10.1787/888933148101
Cross-border e-commerce sales by enterprises, 2012
As a percentage of all enterprises having undertaken sales via e-commerce
80 95 97 30 99 92 94 92 97 96 86 89 99 97 94 99 96 97 98 98 97 95 92 90
0
20
40
60
80
100
%To other EU countries To the rest of the world
Percentage of enterprises having undertaken e-sales in their own country
Source: OECD based on Eurostat, Information Society Statistics and national sources, June 2014. See chapter notes.
1 2 http://dx.doi.org/10.1787/888933148115
Cross-border online purchases by individuals, 2013
As a percentage of individuals who ordered goods or services over the Internet in the last 12 months
33 57 82 80 83 79 82 81 78 85 65 83 87 83 81 72 79 93 88 95 92 93 90 94 98 96
0
20
40
60
80
100
%From partner countries From the rest of the world
Percentage of individuals who ordered online from national sellers
Source: OECD based on European Commission (2012), Consumer attitudes towards cross-border trade and consumer protection, Flash Eurobarometer,
No.358, Brussels.
1 2 http://dx.doi.org/10.1787/888933148121
Consumer trust in cross-border online purchases, 2012
“I feel condent purchasing goods or services via the Internet from retailers/providers in another EU country” (left-hand panel)
linked to the willingness to use another EU language for purchases over the Internet (right-hand panel)
20
30
40
50
60
70
80
90
30 40 50 60 70 80
Internet users who feel confident about the EU cross-border sellers (%)
Internet users who are willing to use another EU language (%)
0
20
40
60
80
100
%Strongly agree Agree Disagree Strongly disagree
R² = 0.64
(Excl. GBR and IRL)
AUT
BEL
CZE
DEU
DNK
EST
GRC
ESP
EU27
FIN
FRA
HUN
ISL
ITA
LUX
LVA
NLD
NOR
POL
PRT
SWE
SVN
SVK
GBR IRL

MEASURING THE DIGITAL ECONOMY: A NEW PERSPECTIVE © OECD 201464
2. INVESTING IN SMART INFRASTRUCTURE 2. INVESTING IN SMART INFRASTRUCTURE
2.8 Security
Key ndings
The digitisation of information and network connec-
tivity create new challenges for the protection of
sensitive data and network communications.
Most businesses adopt security measures to protect
their digitised information and networks. The extent
to which they undertake these measures depends on
their awareness and capabilities and the digital security
risks they face. This in turn relates to factors such as
their size and the industry in which they operate.
In 2010, the most widespread security measures adopted
by enterprises included offsite backup of archives and
strong-password authentication. A minority of rms
adopted intrusion detection systems (IDS) and authen-
tication and identication tools such as hardware
tokens and biometric methods. Offsite backup was used
by 75% or more of enterprises in Denmark and Norway,
against less than 20% in Hungary, the SlovakRepublic
and Turkey. In 2012, this rate was also low in Korea,
possibly due to the substitution of ofine with online
backup over the cloud. The use of strong passwords is
still the easiest way to protect access to information,
in particular for SMEs, and in 2010 was used by most
rms, especially in Ireland, Italy and Spain where the
business sector is dominated by small enterprises.
Major security issues include denial-of-service (DoS)
and distributed denial-of-service (DDoS) attacks, the
latter employing several machines. Such attacks often
target access to the networks of individual organisa-
tions (e.g. banks) and can result in partial or complete
disruption of Internet access in whole areas when a
major service provider is affected. Taking into account
the number of active hosts, data on (D)DoS attacks
provide an indication of threat levels and show that
certain areas are particularly attractive to this type of
security threat.
In general, large enterprises are more prone to DoS
attacks. Differences across economies are signicant,
but are difcult to explain. The share of enterprises
suffering from DoS attacks in 2010-12 was 1% or below
in Hungary, Japan and New Zealand, but above 10% in
the Slovak Republic.
At the global level and in absolute terms, China,
theRussian Federation and the United States lead both
in terms of DDos attacks originating from or targeting
each geographical area. These two measures are highly
correlated, suggesting to some extent the local nature
of many attacks. Exceptions include Chinese Taipei,
the Netherlands, Panama and Romania, which are at
the origin of many more attacks than they receive,
while the opposite is the case in Canada, Estonia, Italy,
Norway, Poland, Spain and Sweden.
DID YOU KNOW?
In 2010-12, between 2% and 6% of businesses in
most economies experienced an IT securityproblem
resulting in denial-of-service. Large rms are
targeted proportionally more frequently than SMEs.
Denitions
Security methods considered here include two informa-
tion protection systems: offsite data backup and the use
of digital intrusion detection systems (devices or software
applications monitoring for malicious activities or
policy violations). Three identication and authentica-
tion tools are also considered: strong passwords (where
the concept of strength encompasses length, the use
of different types of characters and limited duration),
hardware tokens (including smartcards) and biometric
methods. Tools within each group are not mutually
exclusive (i.e. are not additive) and the two groups
are complementary. The information is collected by
national surveys on ICT usage in businesses.
Denial-of-service (DoS) attacks aim to make machines
or network resources unavailable by interrupting or
suspending the services of a host connected to the
Internet (websites, Internet services or whole network).
Attacks can take several forms; a distributed denial-of-
service (DDoS) attack occurs when the bandwidth or
the computing resources of the targeted systems is
ooded using multiple machines, which are often
controlled remotely by the attacker by means of
malware. The indicator on businesses experiencing
DoS problems highlights the diffusion of attacks on
enterprises by employment size and is based on user
survey information drawn from ofcial statistics.
Theindicators on numbers of DDoS attacks by origin
and target geographical area are based on monitoring
of websites undertaken by a not-for-prot organisation,
Shadowserver (shadowserver.org).
Measurability
Data availability and comparability on security topics
still pose challenges. Security tools and issues evolve
rapidly, and the latest collection of data by Eurostat
dates from 2010. Information on incidence of security
issues also requires the validation of methodologies
used to gather data from the Internet, and should be
complemented by an appreciation of the gravity of
security incidents.
The OECD is working with National Computer Security
Incident Response Teams to develop a common set of
metrics on incidents (see 2.10), and proposed a dedicated
module on security and privacy in its 2014 revision of
the OECD Model Survey on ICT Usage by Businesses.
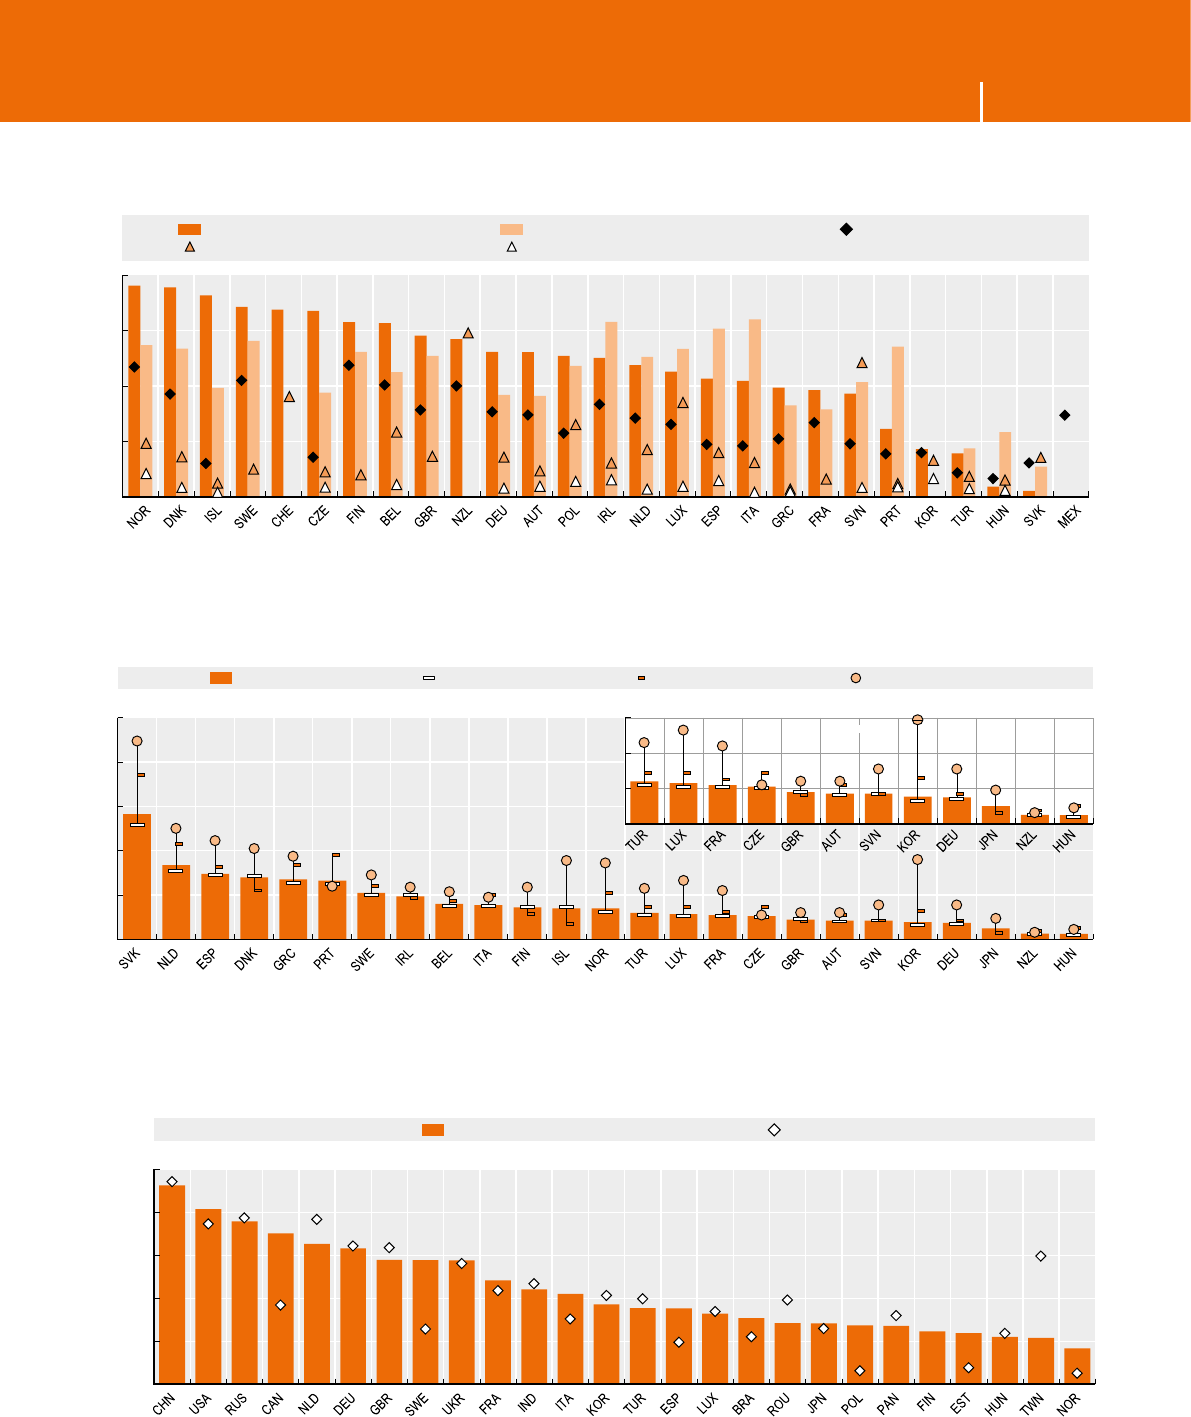
MEASURING THE DIGITAL ECONOMY: A NEW PERSPECTIVE © OECD 2014 65
2. INVESTING IN SMART INFRASTRUCTURE 2. INVESTING IN SMART INFRASTRUCTURE
2.8 Security
Source: OECD, ICT Database and Eurostat, Information Society Statistics, June 2014. See chapter notes.
1 2 http://dx.doi.org/10.1787/888933148133
Use of security methods for authentication/identication and the protection of data by enterprises, 2010
As a percentage of all enterprises
0
20
40
60
80
%
Offsite data backup Strong password authentication Intrusion detection systems
Identification/authentication via hardware tokens Indentification/authentication via biometric methods
Source: OECD, ICT Database and Eurostat, Information Society Statistics, June 2014. See chapter notes.
1 2 http://dx.doi.org/10.1787/888933148142
Businesses having encountered IT security problems, attacks resulting in denial-of-service, by size, 2010
As a percentage of all businesses in each employment size class
0
4
8
12
16
20
%
All enterprises 10-49 50-249 250+
0
2
4
67.1
Magnified
Source: Shadowserver, www.shadowserver.org/wiki/pmwiki.php/Stats/GeoLocations, May 2014.
1 2 http://dx.doi.org/10.1787/888933148153
Distributed denial-of-service attacks originating from or targeting each geographical area, April 2014
Numbers based on the location of command and control points, logarithmic scale
100
1000
10000
100000
1000000
10000000
DDoS attacks
Target Origin

MEASURING THE DIGITAL ECONOMY: A NEW PERSPECTIVE © OECD 201466
2. INVESTING IN SMART INFRASTRUCTURE 2. INVESTING IN SMART INFRASTRUCTURE
2.9 Perceiving security and privacy threats
Key ndings
Security and privacy are among the most challenging
issues facing online services and the development
of e-commerce. Both concern consumer trust that
personal information will not be viewed, stored or
manipulated during transit and storage by third parties
without their consent or for fraudulent purposes.
Trust is a central factor in all economic transactions,
both ofine or online. However, the importance of trust
increases with online shopping, as this is more prone to
uncertainty and risk than traditional shopping.
In 2009, security was cited as the main reason for not
buying online for over one-third of Internet users in
the European Union who had not made any purchases
online. Privacy concerns accounted for a slightly smaller
share (about 30%). The strong variation in perceptions
of security and privacy risks across countries with
comparable degrees of law enforcement and technolog-
ical know-how suggests that cultural attitudes towards
online transactions play a signicant role.
Online security and privacy concerns show a positive
relationship in most countries. In 2009, security
concerns among Internet users not buying online
were the highest in France, the Slovak Republic and
Switzerland and the weakest in the Czech Republic,
Ireland and Poland. Privacy concerns were the highest
in Switzerland, followed by the Slovak Republic and
Finland, and the weakest in Australia, Canada and
theCzechRepublic.
Traditionally, security issues in e-commerce have been
considered in relation to the abilities of e-merchants
to protect their online transaction systems. However,
e-consumers are becoming increasingly aware that
security depends crucially on their behaviour.
In recent years, Internet users have changed their
behaviour in a number of ways because of security
concerns. They are now less likely to give personal
information on websites or in response to open emails
from people they know. However, in 2013 only about
one-third of Internet users in the European Union
had ever changed the security settings of their
browsers, ranging from above 50% in Austria to 15%
intheCzechRepublic.
DID YOU KNOW?
In 2013, only about one-third of Internet users
intheEuropeanUnion had ever changed
thesecurity settings of their browsers.
Denitions
Security concerns for regarding online payments include
misgivings about giving credit card details over the
Internet and related anxiety about nancial loss.
Privacy concerns refer to reluctance to provide personal
details over the Internet, including names and
addresses, but also private photos or private nancial
information.
Modifying the security settings of Internet browsers refers
to any action to improve browser settings to ensure
higher protection against viruses and other attacks
or attempts at intrusion (normally accessible under
“Tools”, “Internet options” in the web browser menu).
Measurability
Information on perceived security and privacy is
collected through the e-commerce module of the
ICT usage surveys in households and by individuals.
Information on whether Internet users have ever
changed their browser’s security setting is collected
through a module on e-skills.
Both the European and OECD model surveys on ICT
usage ask direct questions about security and privacy,
including on the use of protection from IT threats, the
frequency of security updates and security incidents.
The 2014 revision of the OECD Model Survey on ICT
Access and Usage by Households and Individuals
includes a specic module on security and privacy,
based on policy-relevant indications from the OECD
Working Party on Security and Privacy in the Digital
Economy.
It is a matter of debate among statisticians whether
respondents are able to answer technical questions
about IT security. To minimise this problem, coverage
of the OECD security module is limited to home use,
as this is the ICT environment about which users are
more likely to have information, as opposed to ICT use
at work or school.
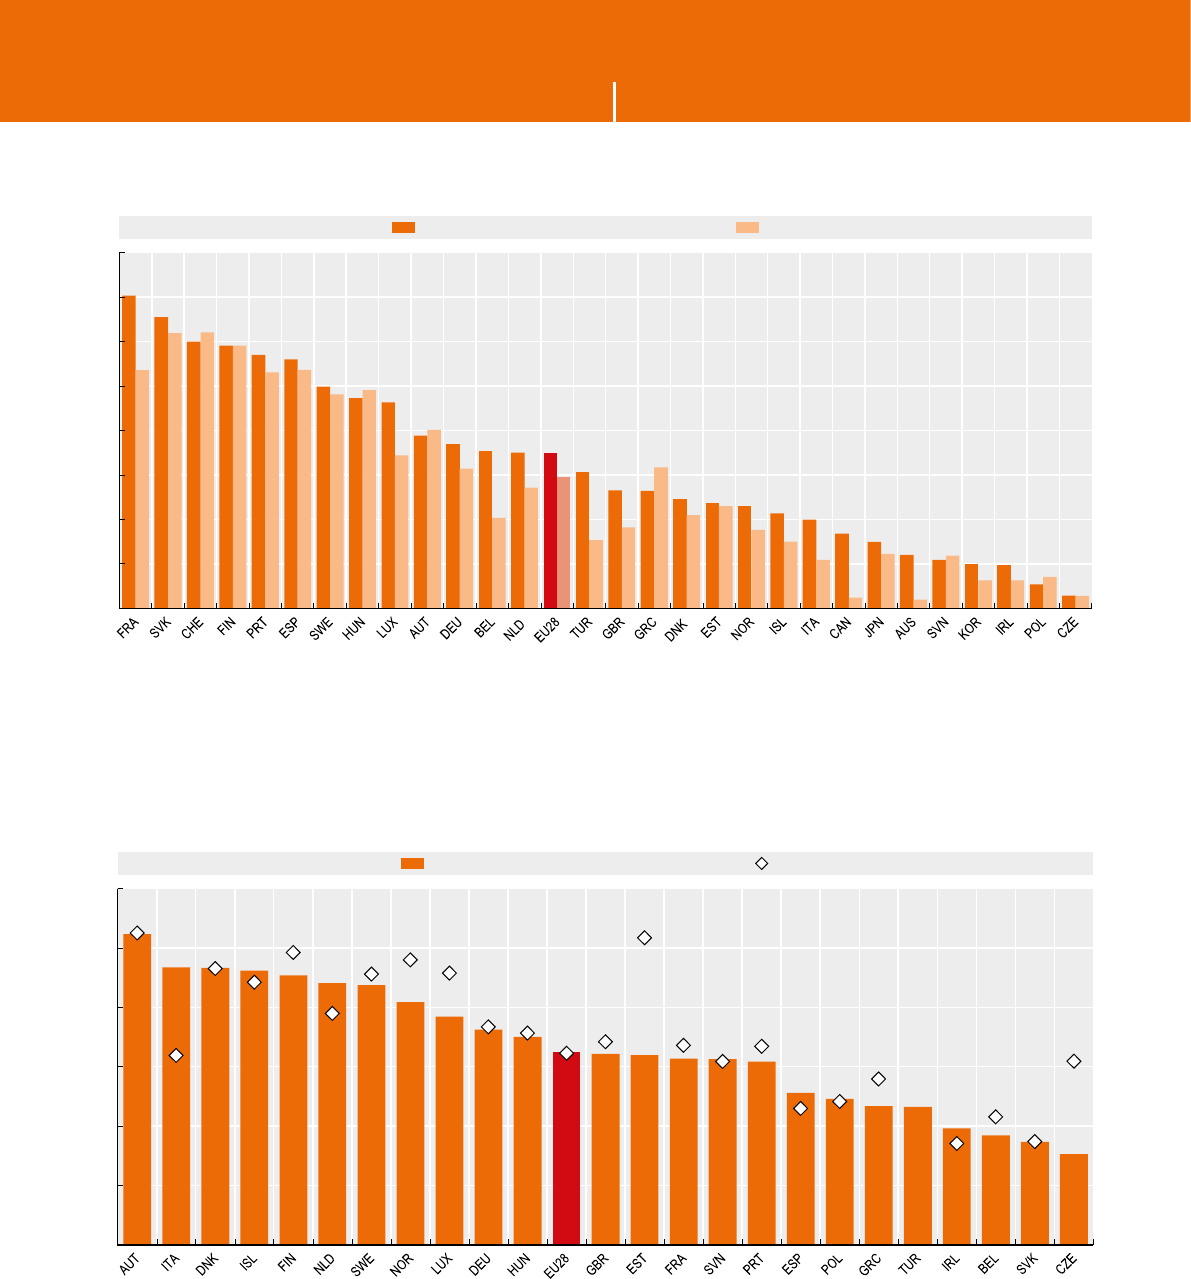
MEASURING THE DIGITAL ECONOMY: A NEW PERSPECTIVE © OECD 2014 67
2. INVESTING IN SMART INFRASTRUCTURE 2. INVESTING IN SMART INFRASTRUCTURE
2.9 Perceiving security and privacy threats
Source: OECD computations based on Eurostat, Information Society Statistics and national sources, May 2014. See chapter notes.
1 2 http://dx.doi.org/10.1787/888933148160
Main reasons for not buying online because of privacy and security concerns, 2009 or more recent year available
Percentage of Internet users who did not make online purchases
0
10
20
30
40
50
60
70
80
%Security Privacy
0
10
20
30
40
50
60
%2013 2011
Source: OECD computations based on Eurostat, Information Society Statistics, May 2014.
1 2 http://dx.doi.org/10.1787/888933148178
Acknowledging the issue of Internet security: users changing browser security settings, 2011 and 2013
As a percentage of Internet users

MEASURING THE DIGITAL ECONOMY: A NEW PERSPECTIVE © OECD 201468
2. GAP PAGE 2. GAP PAGE
2.10 Improving the evidence base for online security and privacy
Why do we need indicators?
The protection of security and privacy online has become a key policy issue as individuals, businesses and govern-
ments shift large parts of their daily activities to the Internet. Malware are reported to be spreading at high rates,
increasing the risks of compromising information infrastructures (van Eeten et al., 2010). Advances in trans-border
ows of personal data, as well as big data storage and analytics, amplify the risk of misuse of personal data and
challenge the application of privacy protection regulation (OECD, 2011).
These issues have reached a tipping point where policy makers can no longer neglect their implications on
innovation, economic growth and prosperity. A recent OECD work on the economics of personal data, for example,
highlights the value of personal data and its contribution to innovation as a “New Source of Growth” in sectors as
diverse as healthcare, nance, energy and marketing. Likewise, the OECD report National Cybersecurity Strategies
reveals that OECD governments now recognise that the Internet has evolved from a useful platform for e-commerce
and e-government to an essential infrastructure for the functioning of society, making online security a “national
security” concern (OECD, 2012).
These evolving challenges and opportunities call for improvement in the evidence base for security and privacy
policies, for at least three reasons – rst, to assess whether policy interventions on online privacy and security are
warranted, second, to design more effective measures for online security and privacy and, nally, to better assess
the benets and costs of online security and privacy policies currently in place.
What are the challenges?
Statistical information on online security and privacy are typically drawn from three major sources: user surveys,
activity reports and the Internet.
Surveys among individuals and business have a number of major advantages. These include comparable data
based on international standards that can be associated to characteristics of respondents, the possibility to collect
subjective information and the exibility to adjust to new policy needs. They also have several drawbacks when
it comes to the measurement of online security and privacy. Respondents may not answer the surveys correctly,
either because they do not have the necessary information or knowledge to understand or to answer the questions
correctly (e.g. about security threats), or because they do not wish to answer questions on sensitive matters
(e.g.illegal downloading).
Activity reports are intended to give stakeholders information about an organisation’s routine work, for example,
rms’ nancial statements and reports by privacy enforcement authorities. One of the biggest advantages of
activity reports as a source of data is their periodic release, which allows the building of time series from the
reported data. However, international differences in reporting requirements and changes in national reporting
rules may make the collected information non-comparable across countries and over time.
The Internet is itself a rich source of data. When it comes to measuring Internet-related activities, Internet trafc
can provide big data sets for analysis. The main strength of Internet-based data is that it is automatically generated
and can be collected and distributed in real-time via the Internet. For example, data collected on malware, whether
through antivirus or rewall solutions, can be transmitted directly to providers of these tools, thus circumventing
sensitivity and information issues raised by household and business surveys. The most severe drawback of
Internet-based data, however, is statistical: it is very hard to dene an Internet sample and to generalise the
results from particular users, service providers or websites to the whole Internet population. Therefore, Internet-
based data should be linked to more traditional sources, such as surveys and reports. However, this data linking
is not without problems. In order to protect the privacy of users, Internet identiers (e.g. IP addresses) are usually
anonymised or aggregated, making the link to individual or rm-level data unfeasible.
Besides the issues specic to each data source, there is a more fundamental challenge to the measurement of
security and privacy, whether online or ofine. Because of the illegal nature of privacy and security violations,
not all incidents are identied or reported. Only incidents that have been identied as such can be measured, and
such incidents represent an unknown share of the total number of incidents. This has some serious implications
concerning how to interpret numbers of privacy and security incidents. For example, a decrease in the number of
reported malware infections may reect an actual decrease in malware or a reduced ability to detect it.
MEASURING THE DIGITAL ECONOMY: A NEW PERSPECTIVE © OECD 2014 69
2. GAP PAGE 2. GAP PAGE
2.10 Improving the evidence base for online security and privacy
Options for international action
A number of internationally coordinated actions have been undertaken or are currently ongoing to improve
the measurement of online security and privacy. The OECD Working Party on Security and Privacy in the Digital
Economy issued a series of suggestions for improving ICT use surveys for policy makers in the areas of cybersecu-
rity and privacy, notably the economics of personal data and security, prevention measures and incident response.
These recommendations were implemented in the 2014 revision of the OECD Model Surveys on ICT usage by
households/individuals and by businesses.
The OECD is also undertaking a project to improve the use of data generated by Computer Security Incidents
Response Teams with national responsibilities (“national CSIRTs”), as a source of internationally comparable
statistics. Many national CSIRTs already produce and report statistics based on data about their activities and the
incidents they handle. However, these statistics are often difcult to compare for reasons including differences in
CSIRT constituencies, lack of common reporting rules and divergent taxonomies of key aspects of CSIRT operations,
such as the notion of “incident”. These current statistics are thus not ideal to inform policy-making decisions.
The following gure shows this point by comparing the number of alerts/warnings and vulnerability reports issued
by ve national CSIRTs in 2010-13. In general, these CSIRTs use a different basis for publishing alerts/warnings and
vulnerability reports. For example, some CSIRTs separate publications of alerts/warning from that of vulnerabilities
while others bring them together. In addition, some provide a single publication for multiple vulnerabilities while
others do the opposite. This explains why cross-country differences in the number of alerts/warnings and vulner-
ability reports are not correlated to the size of the country, either in terms of population or number of Internet users.
Source: OECD computations based on CSIRTs reports, July 2014.
1 2 http://dx.doi.org/10.1787/888933148183
Number of alerts/warnings and vulnerability reports issued by ve national CSIRTs, 2010-13
0
200
400
600
800
CERT-FR (France) JPCERT/CC (Japan) Bund-CERT (Germany) US-CERT (United States) CNCERT/CC (China)
2010 2011 2012 2013
Number of alerts/warnings and vulnerability reports
0
40
80
120
160
Bund-CERT (Germany) US-CERT (United States) CNCERT/CC (China)
Magnified
The OECD is engaging with CSIRTs from member countries as well as non-members to improve this situation.
Theoverall objective of the work is to develop guidance for CSIRTs to produce and report internationally comparable
statistics. This guidance would provide statistical denitions for a set of indicators (e.g. budget, personnel, skills
and co-operation, along with specic kinds of incidents) that national CSIRTs could report on a voluntary basis,
in addition to suggestions for CSIRTs to better leverage existing data, such as from third-party institutions, for
statistical purposes.
References
OECD (2012), “Cybersecurity Policy Making at a Turning Point: Analysing a New Generation of National Cybersecurity Strategies for the Internet
Economy”, OECD Digital Economy Papers, No. 211, OECD Publishing. Doi: http://dx.doi.org/10.1787/5k8zq92vdgtl-en.
OECD (2011), “The Evolving Privacy Landscape: 30 Years After the OECD Privacy Guidelines”, OECD Digital Economy Papers, No. 176, OECD Publishing.
Doi: http://dx.doi.org/10.1787/5kgf09z90c31-en.
Van Eeten, M., J.M. Bauer, H. Asghari and S. Tabatabaie (2010), “The role of Internet service providers in botnet mitigation: An empirical analysis based
on spam data”, OECD Science, Technology and Industry Working Papers, No. 2010/5, OECD Publishing. Doi: http://dx.doi.org/10.1787/5km4k7m9n3vj-en.

MEASURING THE DIGITAL ECONOMY: A NEW PERSPECTIVE © OECD 201470
2. INVESTING IN SMART INFRASTRUCTURE 2. INVESTING IN SMART INFRASTRUCTURE
Notes
Notes
2.2 Mobile data communication
The penetration of M2M SIM cards, 2012
Data originate from the following national sources: Austria (RTR), Belgium (BIPT), Czech Republic (CTU), Denmark
(ERST), Estonia (MKM), Finland (FICORA), France (ARCEP), Germany (Bundesnetzagentur), Ireland (Ofcom), Italy
(AGCOM), the Netherlands (ACM), Poland (Ministry of Administration and Digitization), Portugal (ANACOM),
theSlovakRepublic (Ministry of Transport, Construction and Regional Development), Slovenia (AKOS), Spain (CMT),
Sweden (PTS) and the UnitedKingdom (Ofcom).
For France, Ireland and Portugal, data refer to 2013.
2.3 The growth of the Internet
Country code top-level domain registration (ccTLD) density 2014 Q1 and growth (2013 Q1-2014 Q1)
For Brazil, Chile, Estonia and Slovenia, data refer to end-May 2014.
2.4 Toward higher speed
Fixed (wired) broadband penetration rates by speed tiers, December 2013
This gure is based on OECD subscription data (December 2013) merged with Akamai’s actual speed data
(1st quarter, 2014).
2.5 Prices for connectivity
Prices of xed broadband basket, 33 GB, 15 Mbit/s and above, September 2012 and March 2014
The OECD basket of xed broadband services includes total charges for a subscription with a minimum speed of
15 Mbit/s and 33 GB for 60 hours of usage per month. USD purchasing power parities (PPP) are used to facilitate
international comparisons.
Prices of mobile voice calls plus data trafc reference baskets, February 2014
Price benchmarking results for mobile broadband services presented here cover services provided over a handset
or smartphone.
The 30 calls/100 MB, 100 calls/500 MB and 900 calls/2 GB OECD baskets of mobile telephone charges include xed
and usage charges for respectively 30, 100 and 900 voice calls, and a volume of 100 MB, 500 MB and 2 GB of data
trafc per month. These baskets portray approximately small, average and large users of voice and mobile data.
USD purchasing power parities (PPP) are used to facilitate international comparisons. Additional information on
the computation methodology can be found in the OECD Communications Outlook 2013.
Mobile tariff plans in some OECD countries (e.g. Japan) may focus on a different balance of usage between data and
voice (e.g. larger volume of data and fewer minutes of calls), and mobile users may benet from an extra monthly
subsidy for a handset purchase provided by the operator. These points should be taken into consideration when
interpreting indicators of mobile prices.
Israel
“The statistical data for Israel are supplied by and under the responsibility of the relevant Israeli authorities
or third party. The use of such data by the OECD is without prejudice to the status of the Golan Heights, East
Jerusalem and Israeli settlements in the West Bank under the terms of international law.

MEASURING THE DIGITAL ECONOMY: A NEW PERSPECTIVE © OECD 2014 71
2. INVESTING IN SMART INFRASTRUCTURE 2. INVESTING IN SMART INFRASTRUCTURE
Notes
2.6 ICT devices and applications
Devices used to access the Internet, 2013
For Canada, data refer to 2012. Devices per user data originate from the Internet Use Survey 2012 as published in
The Daily on 28 October 2013 and relate to the percentage of households with Internet access by Internet access
device. Data include laptops only instead of laptop computers/netbooks, and all wireless handheld devices instead
of smartphones only. Data on tablets are not available.
For countries in the European Statistical System, data originate from the Special Eurobarometer No. 404 on cyber
security.
For Japan, devices per user data are based on the Internet Usage Trend Survey 2012 and relate to individuals aged
6 or more. Data refer to PC use at home instead of desktop computers. Data on laptop computers/netbooks are not
available.
For Korea, data originate from the Survey on the Internet Usage 2012. Devices per user data relate to the percentage
of households with Internet access by Internet access device. The smartphone category includes all mobile phones.
Data on tablets are not available.
For theUnitedStates, data originate from the US Bureau of the Census, relate to individuals aged 15 and more, and
refer to 2011. The category laptop computers/netbooks includes laptops only. The category Smartphones includes
all cellular phones and tablets includes e-books.
Devices per user data are computed using an additional “Other” category, which typically includes game consoles
and televisions with Internet access.
Smartphone apps availability and usage, 2013
For the number of apps installed, data refer to the question: “And of the apps you currently have installed on your
smartphone, how many have you used actively in the last 30 days? Please type in a number. If you don’t know the
exact number please provide your best estimate.”
For the number of apps actively used, data refer to the question: “And of the apps you currently have installed on
your smartphone, how many have you purchased for a certain amount in an app distribution platform such as
Apple App Store and Google Play? Please type in a number. If you don’t know the exact number please provide
your best estimate.”
The average excludes zero values.
2.7 E-commerce across borders
Cross-border e-commerce sales by enterprises, 2012
For Germany, data refer to 2010.
Cross-border online purchases by individuals, 2013
Partner countries refer to other EU countries for those in the European Statistical System and to theUnitedStates
for Canada.
For Canada, data refer to 2012.
2.8 Security
Use of security methods for authentication/identication and the protection of data by enterprises, 2010
For Korea, data refer to 2012.
For Mexico, data refer to 2008.
Businesses having encountered IT security problems, attacks resulting in denial-of-service, by size, 2010
For Japan, data refer to 2011.
For New Zealand, data refer to 2012.

MEASURING THE DIGITAL ECONOMY: A NEW PERSPECTIVE © OECD 201472
2. INVESTING IN SMART INFRASTRUCTURE 2. INVESTING IN SMART INFRASTRUCTURE
Notes
2.9 Perceiving security and privacy threats
Main reasons for not buying online because of privacy and security concerns, 2009 or more recent year available
For Australia, data originate from the Multipurpose Household Survey as published in the Household Use of
Information Technology 2012-13 and refer to 2012/2013 (scal year ending in June 2013) instead of 2013. “Payment
security concern” relates to “concerned about providing personal details online”.
For Canada, data originate from the Internet Use Survey 2012.
For Japan, data originate from the Internet Usage Trend Survey 2011. “Security concern” relates to “concerned
about security when giving out credit card information” and “Privacy concern” relates to “protection of personal
information”. Data cover Internet users aged 15 and more, instead of 16-74 year-olds.
For Korea, data originate from the Survey on the Internet Usage 2009 and relate to “Privacy concern” and “Security
concern” as reasons for not using Internet shopping.
For Switzerland, data originate from the Omnibus TIC 2010 survey.

MEASURING THE DIGITAL ECONOMY: A NEW PERSPECTIVE © OECD 2014 73
2. INVESTING IN SMART INFRASTRUCTURE 2. INVESTING IN SMART INFRASTRUCTURE
References
References
Cisco (2014), Cisco Visual Networking Index: Global Mobile Data Trafc Forecast Update, 2013–2018, Cisco White Paper,
CISCO, San Jose, CA, www.cisco.com/c/en/us/solutions/collateral/service-provider/visual-networking-index-vni/
white_paper_c11-520862.pdf.
European Commission (2013a), Consumer Conditions Scoreboard – Consumers at home in the single market, 9th edition,
Brussels.
European Commission (2013b), Cyber Security, Special Eurobarometer, No. 404, Brussels.
OECD (2014a), “The OECD Model Survey on ICT Access and Usage by Households and Individuals”, Working Party
on Measurement and Analysis of the Digital Economy, DSTI/ICCP/IIS(2013)1/FINAL, OECD, Paris.
OECD (2014b), “The OECD Model Survey on ICT Usage by Businesses”, Working Party on Measurement and Analysis
of the Digital Economy, DSTI/ICCP/IIS(2013)2/FINAL, OECD, Paris.
OECD (2013), OECD Communications Outlook 2013, OECD Publishing. Doi: http://dx.doi.org/10.1787/comms_outlook-
2013-en.
OECD (2012), “Cybersecurity Policy Making at a Turning Point: Analysing a New Generation of National Cybersecurity
Strategies for the Internet Economy”, OECD Digital Economy Papers, No. 211, OECD Publishing. Doi: http://dx.doi.
org/10.1787/5k8zq92vdgtl-en.
OECD (2011a), OECD Guide to Measuring the Information Society 2011, OECD Publishing. Doi: http://dx.doi.
org/10.1787/9789264113541-en.
OECD (2011b), “The Evolving Privacy Landscape: 30 Years After the OECD Privacy Guidelines”, OECD Digital Economy
Papers, No. 176, OECD Publishing. Doi: http://dx.doi.org/10.1787/5kgf09z90c31-en.
OECD (2010), Consumer Policy Toolkit, OECD Publishing. Doi: http://dx.doi.org/10.1787/9789264079663-en.
Van Eeten, M., J.M. Bauer, H. Asghari and S. Tabatabaie (2010), “The role of Internet service providers in botnet
mitigation: An empirical analysis based on spam data”, OECD Science, Technology and Industry Working Papers,
No.2010/5, OECD Publishing. Doi: http://dx.doi.org/10.1787/5km4k7m9n3vj-en.

MEASURING THE DIGITAL ECONOMY: A NEW PERSPECTIVE © OECD 2014 75
3.1 • Internet users .................................................................................................................................... 76
3.2 • Online activities ..............................................................................................................................78
3.3 • User sophistication ......................................................................................................................80
3.4 • Digital natives ...................................................................................................................................82
3.5 • Children online ................................................................................................................................84
3.6 • ICTs in education ...........................................................................................................................86
3.7 • ICT skills in the workplace .................................................................................................... 88
3.8 • E-consumers .......................................................................................................................................90
3.9 • Content without borders.........................................................................................................92
3.10 • E-government use .........................................................................................................................94
3.11 • ICT and health ..................................................................................................................................96
Chapter 3
EMPOWERING SOCIETY

MEASURING THE DIGITAL ECONOMY: A NEW PERSPECTIVE © OECD 201476
3. EMPOWERING SOCIETY 3. EMPOWERING SOCIETY
Key ndings
Internet usage varies widely across OECD countries and
among social groups. In 2013, 90% and more of the adult
population were accessing the Internet in Luxembourg,
the Netherlands, the Nordic countries and Switzerland,
but less than 60% in Greece, Italy, Mexico and Turkey.
Usage rates across the OECD reached almost 80% in
2013, an 18-percentage point increase on 2006. Many
lagging countries caught up thanks to recent advances
in mobile broadband availability and uptake.
Developments in mobile technology have also enabled
people to conduct daily personal computing and
communications activities “on the go”. As a result,
society is increasingly made up of “nomadic” computer
and Internet users: in 2013, more than 40% of adults
used a mobile or smartphone to connect to the Internet
in the OECD.
For most people, the Internet is now part of everyday
life. On average, over three quarters of users connect
to the Internet on a daily basis. In Iceland and Italy the
share of daily users is very similar to that of total users;
in Chile, Japan and Mexico, however, many users do not
access the Internet daily.
Differences in Internet uptake are linked primarily to
age and educational factors, often intertwined with
income levels. In most countries, uptake by young
people is nearly universal, but there are wide differ-
ences for older generations (notably seniors). More
than 75% of 55-74 year-olds in Denmark, Iceland,
Luxembourg, the Netherlands and Sweden reported
using the Internet in 2013 against less than 10% in
Mexico and Turkey.
Education appears to be a much more relevant factor
for older people than for younger people. Usage rates
for 55-74 year-olds with tertiary education are generally
in line with those of the overall population, and in
leading countries approach that of 16-24 year-olds.
Older people, in particular those with a lower education,
are thus a potential focus of strategies to foster digital
inclusion. In 2013, the differential between the Internet
usage rates of 55-74 year-olds with high and low
educational attainment was particularly signicant in
Hungary, Poland and Spain.
DID YOU KNOW?
On average, almost 80% of adults
and 95% of 16-24 year-olds in the OECD use
the Internet, most of them on a daily basis.
Denitions
Users include individuals who accessed the Internet
within the last three months prior to surveying.
Different recall periods have been used for some
countries (see chapter notes). Daily users consist of
individuals accessing the Internet approximately every
day on a typical week (i.e. excluding holidays, etc.).
Figures on individuals using the Internet via mobile or
smartphones also include Wi-Fi networks for countries
in the European Statistical System; for other countries
see chapter notes.
The education gap corresponds to the percentage
difference between the shares of Internet users with
tertiary education (ISCED level 5 or 6) and those with
at most lower secondary education (ISCED levels
0, 1 and2). The focus is on 55 to 74 year-olds.
Measurability
Not all OECD countries survey ICT usage by households
and individuals. Data availability for specic indicators
also varies. Surveys in Australia, Canada, Chile, Israel
and New Zealand are undertaken on a multi-year
or occasional basis, but take place annually in other
countries. Even among European countries, where
indicators are fully harmonised, data collection
practices differ; for example, ICT usage is not always
monitored by means of a dedicated survey. In Austria,
Belgium, Czech Republic, Estonia and Ireland, data are
collected through the Labour Force Survey, while in Italy
and the United Kingdom data are gathered through
ageneral survey on living conditions.
Other potential sources of difference include the
compulsory or voluntary nature of responses and
recall periods (in the European Union the survey is
compulsory in only eight countries). Breakdown of
indicators by age or educational attainment groups
may also raise issues concerning the robustness of
information, especially for smaller countries, owing to
sample size and surveydesign.
3.1 Internet users
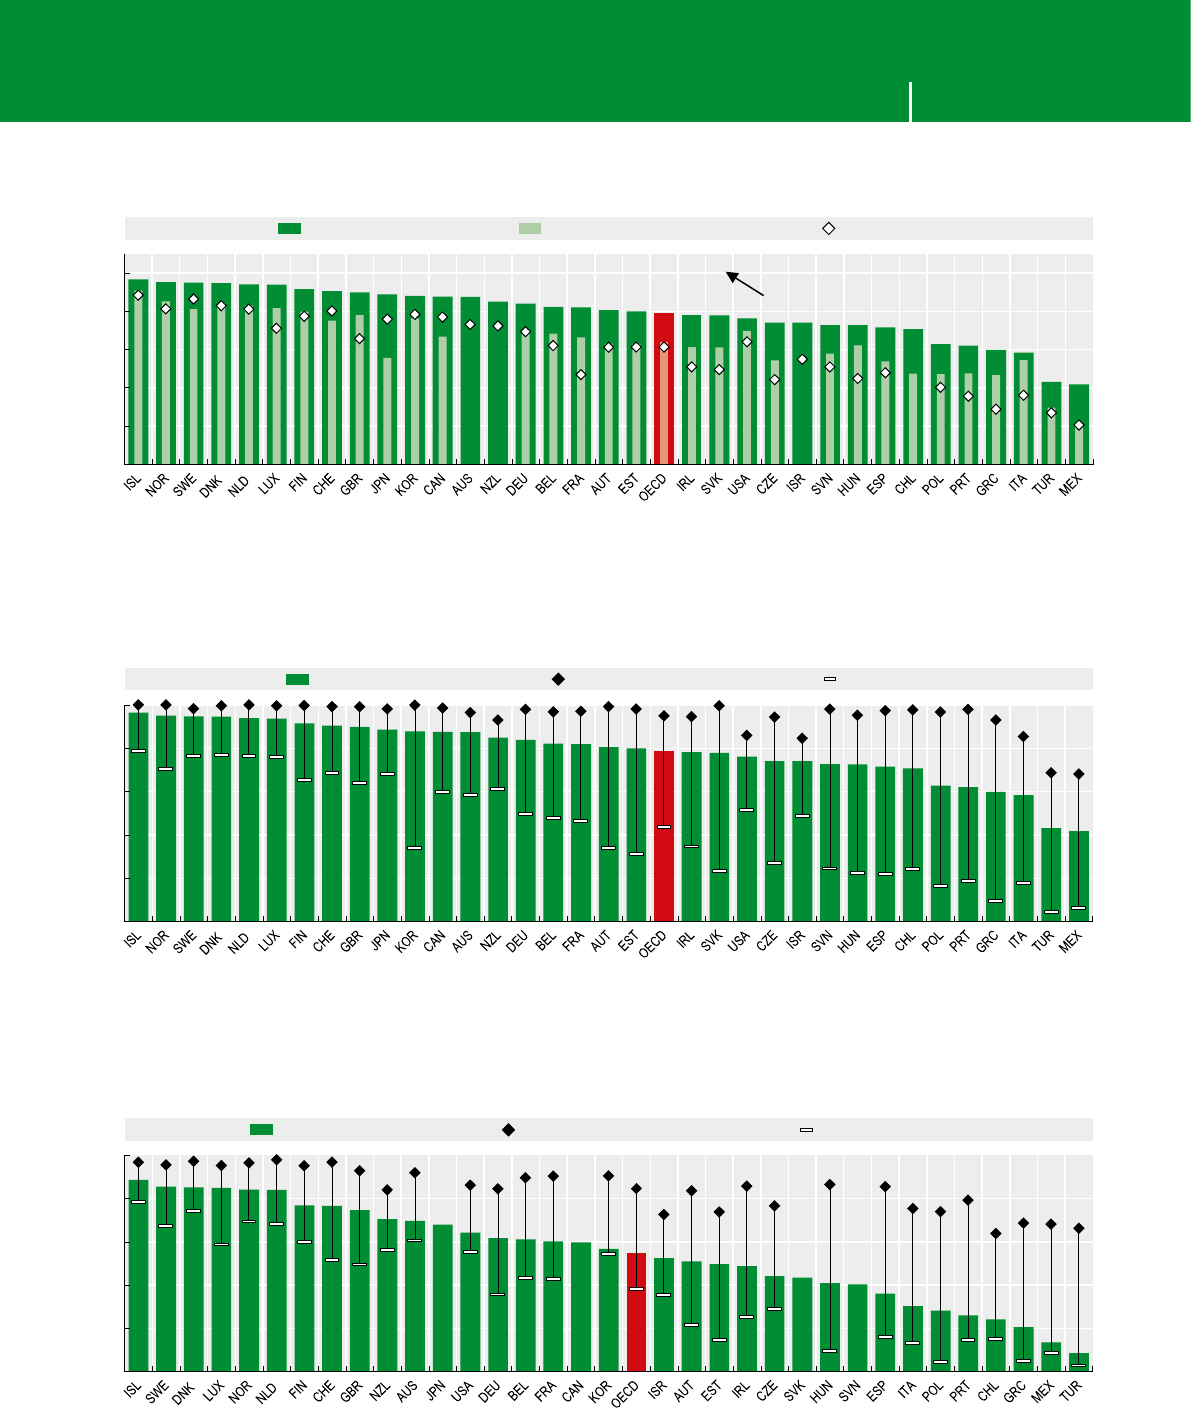
MEASURING THE DIGITAL ECONOMY: A NEW PERSPECTIVE © OECD 2014 77
3. EMPOWERING SOCIETY 3. EMPOWERING SOCIETY
Source: OECD, ICT Database; Eurostat, Information Society Statistics and national sources, May 2014. See chapter notes.
1 2 http://dx.doi.org/10.1787/888933148196
Total, daily and mobile Internet users, 2006 and 2013
As a percentage of 16-74 year-olds
46 65 65 57 57 55 52 36 58 83 49 48 35 37 42 45 26 41 41 33 22 31 23 45 21 16 21 15 18
0
20
40
60
80
100
%Total users Of which daily users Total users, 2006
Percentage of Internet users via mobile or smartphones
Source: OECD, ICT Database; Eurostat, Information Society Statistics and national sources, May 2014. See chapter notes.
1 2 http://dx.doi.org/10.1787/888933148208
Internet users by age, 16-24 and 65-74 year-olds, 2013
As a percentage of population in each age group
0
20
40
60
80
100
%Total users 16-24 year-olds 65-74 year-olds
Source: OECD, ICT Database; Eurostat, Information Society Statistics and national sources, May 2014. See chapter notes.
1 2 http://dx.doi.org/10.1787/888933148219
Internet users among 55-74 year-olds by educational attainment level, 2013
As a percentage of 55-74 year-olds in each educational attainment group
0
20
40
60
80
100
%55-74 year-olds High educational attainment Low educational attainment
3.1 Internet users

MEASURING THE DIGITAL ECONOMY: A NEW PERSPECTIVE © OECD 201478
3. EMPOWERING SOCIETY 3. EMPOWERING SOCIETY
3.2 Online activities
Key ndings
Internet usage to perform specic activities varies
widely both according to the type of activity and
across countries, as a result of institutional, cultural
or economic factors. Comparing diffusion of different
online activities among individuals can help to shed
light on factors that encourage and discourage their
diffusion.
Over 2012-13, on average almost 90% of Internet users
reported sending emails, about 80% reported using the
Internet to obtain information on goods and products,
and 70% reported reading online news. The share of
Internet users ordering products online was 57% while
only 22% sold products over the Internet.
Activities such as sending emails, searching product
information or social networking show little variation
across all countries. However, the shares of Internet
users performing activities usually associated with
a higher level of education, with cultural elements
or more sophisticated service infrastructures, tend
to present higher inter-country variability. This is the
case, for example, for the majority of indicators related
to e-government, e-commerce and online banking.
In 2013, the use of online banking varied signicantly
from over 90% in Estonia, Finland and Norway to less
than 20% in Chile and Greece. Overall income and
wealth levels contribute to these differences, but are
not the sole factors. For example, in Estonia the share
of individuals who carried out online banking activities
was rather high compared to the relatively low per
capita income.
Income-related differentials within countries were
also uneven, the highest gap in 2013 being observed
in Spain. The gap between the highest and the lowest
quartiles was also high for Belgium and Luxembourg,
but much lower in countries with comparable online
banking rates, such as Austria or France.
Country uptake patterns for sophisticated activities
tend to be similar. For example, online banking is
positively correlated with the use of e-government
services (also requiring trust, familiarity and infra-
structural development), software downloading and,
toa lesser extent, e-purchases, audio-video streaming
and online gaming. Hence, other elements are likely
to come into play, including familiarity with online
services, trust and skills, together with country-specic
elements not considered here (see Measurability).
DID YOU KNOW?
Over 2012-13, on average, 60% of OECD Internet
users participated in social networks, while less
than 30% sent lled forms to public administrations
and only 20% sold products online.
Denitions
Diffusion indicators by activity are computed as the
simple average (i.e. not weighted by population)
of country percentage shares, as well as extreme
(minimum and maximum) and quartile values of each
distribution. This approach shows the variability in
uptake of each activity among Internet users across
countries, with the lines between the 1st and the 3rd
quartile including the central 50% of country values for
each indicator.
In the case of online banking, the poorest and richest
25%of households are compared.
Measurability
Collection of data on ICT usage by individuals is uneven
across OECD countries, due to differences in the
frequency and nature of surveys (see 3.1).
Collection of data varies as well over time, as surveys
commonly shift their focus on a regular basis to ensure
that the response burden remains acceptable.
Data might also reect a variety of country-specic
elements, including the diffusion and ease of use of
alternative channels to perform certain activities (e.g.
local terminals of government ofces or ATMs in the
case of banking services, as in Portugal and Turkey),
aswell as institutional aspects. For example, in Korea
the amount of money individuals are allowed to
transfer via the Internet is subject to limitations on
grounds of security.
Finally, indicators are not always fully harmonised
across countries.
The OECD is actively engaged in work to facilitate
the collection of comparable information in this eld
through its Model Survey on ICT Access and Usage
by Households and Individuals, and by encouraging
the co-ordinated collection of statistics on usage, in
particular, on emerging topics. It is also currently
exploring alternative ways to collect information,
including the use of Internet-based statistics (see 3.9).
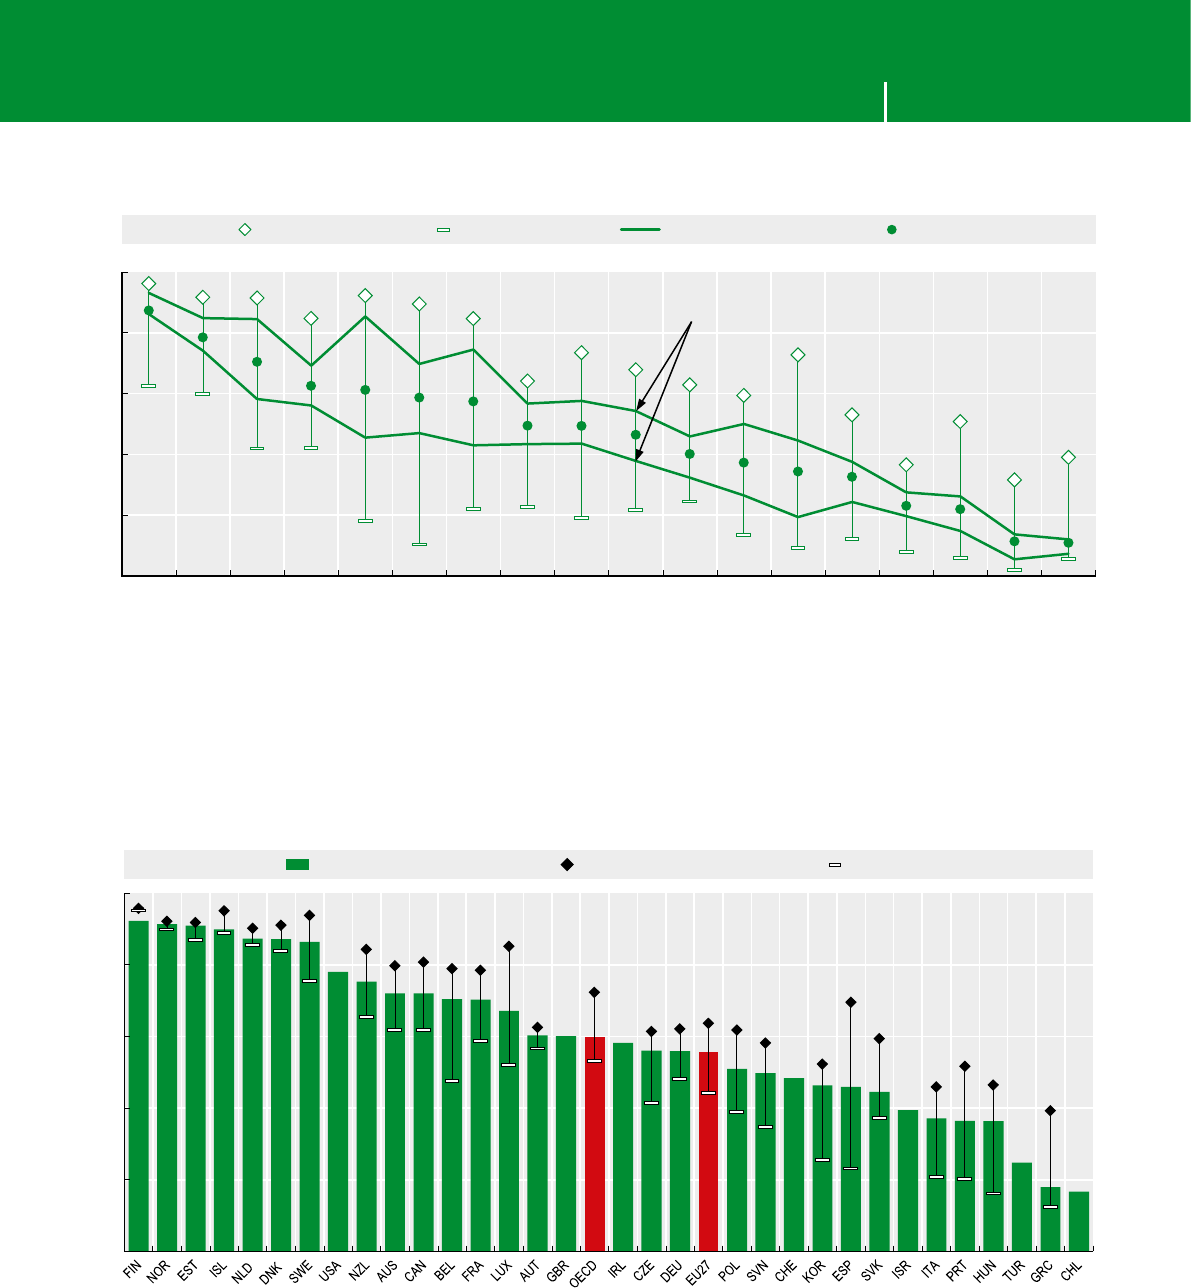
MEASURING THE DIGITAL ECONOMY: A NEW PERSPECTIVE © OECD 2014 79
3. EMPOWERING SOCIETY 3. EMPOWERING SOCIETY
Source: OECD, ICT Database; Eurostat, Information Society Statistics and national sources, July 2014. See chapter notes.
1 2 http://dx.doi.org/10.1787/888933148228
The diffusion of selected online activities among Internet users, 2012-13
Percentage of Internet users performing each activity
NLD DEU NOR
KOR
FIN DNK
DEU
FIN
LUX
NOR
ISL ISL
ISL
SWE
CAN
NLD
DNK
KOR
TUR TUR
IRL JPN
GRC
CHL
TUR IRL POL JPN FIN
TUR CZE CZE CZE GRC GRC IRL
0
20
40
60
80
100
%
The values for half of the countries are between the two lines
Highest Lowest 1st and 3rd quartiles Average
E-mail
Product information
News reading
Social networking
E-banking
E-gov. (any interaction)
Online purchases
Gaming/audio-video
Travel/accomodation
Web radio/TV
Telephone
E-gov. (download)
E-gov. (upload)
Software download
Job search
Online sales
Medical appointment
Content creation
0
20
40
60
80
100
%All individuals Highest quartile Lowest quartile
Source: OECD, ICT Database; Eurostat, Information Society Statistics and national sources, May 2014. See chapter notes.
1 2 http://dx.doi.org/10.1787/888933148231
The diffusion of Internet banking, 2013
Percentage of Internet users by income quartile of the household
3.2 Online activities

MEASURING THE DIGITAL ECONOMY: A NEW PERSPECTIVE © OECD 201480
3. EMPOWERING SOCIETY 3. EMPOWERING SOCIETY
Key ndings
The breadth of activities performed by each Internet
user can be analysed to develop an indicator of user
sophistication.
The average number of activities performed by users,
for all available countries combined, shows that in
2013 Internet users performed on average 6.3 out of the
12activities selected, up from 5.4 in 2009 (i.e. from 45%
to 51.6% of the listed activities), mirroring a growing
maturity of usage.
By country, the averages range from 7.5 to 8 activities
per user in the Nordic countries and the Netherlands, to
about 5 activities or less in Greece, Italy, Korea, Poland
and Turkey. The growth rates between 2009 and 2013
ranged from 6.2% in Spain to 22.9% in Iceland.
The breadth of activities performed by country is,
on average, closely related to differences in the level
of Internet uptake. This suggests that “experience
matters”, as countries leading in uptake also have a
proportionally larger share of individuals using the
Internet over a longer period of time.
Regardless of the reason, this pattern demonstrates
that countries with low levels of uptake benet less
from the Internet than the rate of usage implies, as
their users on average are performing fewer activities
(i.e. are less “sophisticated” users).
Not controlling for other factors, the education gap is
among the most important explanatory factors of the
breadth of activities performed on the Internet. While
users with tertiary education perform on average
7.3 different activities, those with at most lower
secondary education perform only 4.6.
This is not surprising, as some of the activities in the
list are either more complex or otherwise indirectly
connected to education (e.g. through age or income).
Differences by level of education are particularly
high for Belgium, Hungary, Ireland, Korea and Turkey.
Furthermore, users with low levels of education in
countries experiencing a wide education gap perform
fewer activities than senior users (dened as individuals
between 55 and 74 years old).
DID YOU KNOW?
The breadth of activities performed online isrelated
to rates of Internet usage and education levels.
Educated users in Italy are engaged
in less sophisticated online activities than average
users inNorthern Europe.
Denitions
The average number of online activities per user is based
on information on the share of users for each activity.
The following 12 activities were considered: using
e-mail, telephoning or video calling over the Internet,
participating in social networks, nding information
about goods or services, reading online news, online
banking, using services related to travel and accom-
modation, interacting online with public authorities,
selling goods or services, buying physical goods, buying
digital content and buying services.
These indicators are derived from individual micro-data
made available by Eurostat for countries in the European
Statistical System (ESS). For Korea, a special tabulation
has been produced by the Korean Internet and Security
Agency (KISA).
To portray the (gross) relation with Internet uptake,
the number of activities per user by country is plotted
jointly with the shares of Internet users, showing for
convenience a simple (non-linear) regression line and
the corresponding variance explained. The average
number of activities has also been computed for indi-
viduals with tertiary and low or no formal education,
and for the subpopulation of individuals aged 55 and
above.
Measurability
Collection of information on ICT usage by individuals
is uneven across OECD countries, due to differences
in frequency and the nature of surveys (see 3.1).
Inparticular, data on the type of activities performed
– potentially wide and increasing – are often restricted
to basic information. For this reason, the comparison is
limited to countries participating in the ESS (OECD EU
member countries, Iceland, Norway and Turkey). Data
for Korea are also presented, although activities do not
fully correspond to those listed for the ESS countries,
resulting in a possible underestimation of the number
of activities performed.
3.3 User sophistication
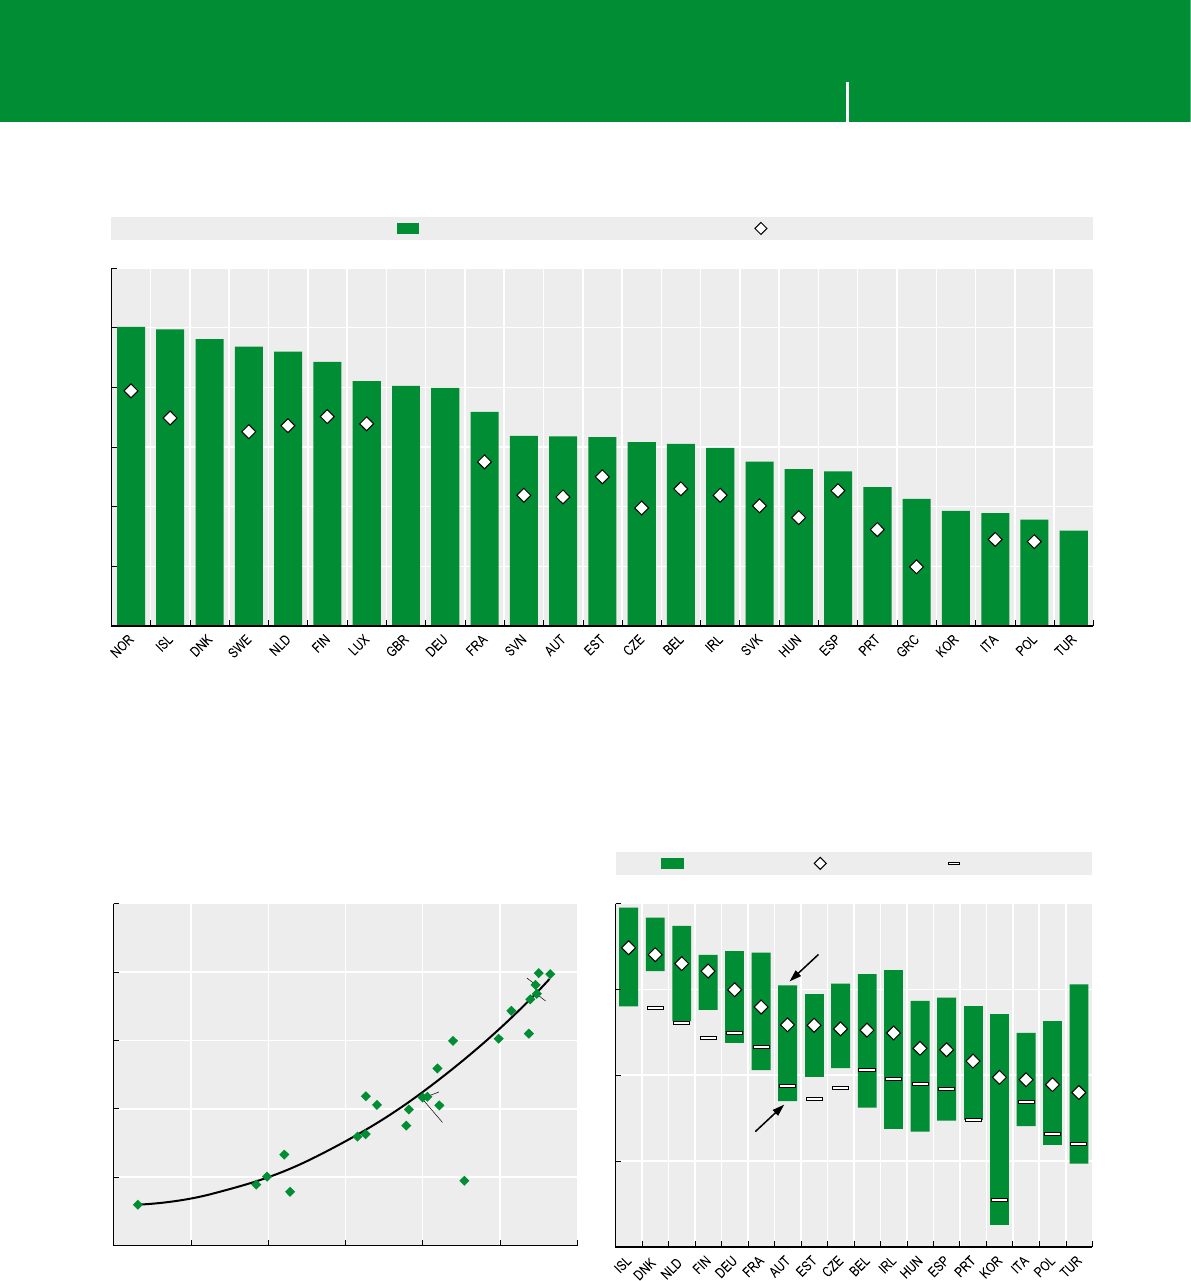
MEASURING THE DIGITAL ECONOMY: A NEW PERSPECTIVE © OECD 2014 81
3. EMPOWERING SOCIETY 3. EMPOWERING SOCIETY
Source: OECD computations based on Eurostat, Information Society Statistics and ad-hoc data tabulation by KISA, May 2014. See chapter notes.
1 2 http://dx.doi.org/10.1787/888933148245
The variety of activities performed online by Internet users, 2009 and 2013
Average number of activities per user
3
4
5
6
7
8
9
Number of activities
2013 2009
1
3
5
7
9
Education gap All individuals 55-74 year-olds
Tertiary graduates
Individuals with low or
no formal education
Number of activities
R² = 0.94
(Excl. KOR)
4
5
6
7
8
9
40 50 60 70 80 90 100
Internet uptake (%)
Number of activities
CZE
DEU
DNK
EST
GRC ESP
FIN
FRA
HUN
ISL
ITA KOR
LUX
SWE
NLD
NOR
POL
PRT
SVN
SVK
GBR
TUR
IRL BEL
AUT
Source: OECD computations based on Eurostat, Information Society Statistics and ad-hoc data tabulation by KISA, May 2014. See chapter notes.
1 2 http://dx.doi.org/10.1787/888933148252
Factors inuencing the variety of activities per user: Internet uptake, education and age, 2013
Number of activities linked to the percentage of users (left-hand panel) and by education level and age (right-hand panel)
3.3 User sophistication

MEASURING THE DIGITAL ECONOMY: A NEW PERSPECTIVE © OECD 201482
3. EMPOWERING SOCIETY 3. EMPOWERING SOCIETY
Key ndings
The Internet permeates every aspect of the economy
and society, and is also becoming an essential element
of children’s lives.
According to the results of the 2012 OECD Programme
for International Student Assessment (PISA), 90% of
students in the OECD rst access the Internet before
the age of 13. On average, for countries where data are
available, less than 0.5% of 15 year-olds reported never
having accessed the Internet.
Age of rst access to the Internet varies largely across
countries. More than one third of students started
using the Internet aged 6 or younger in Denmark and
the Netherlands. About 80% of students accessed
the Internet before age 10 in the Nordic countries,
the Netherlands and Estonia, as opposed to 30% in
Greece and the Slovak Republic.
Early use of the Internet appears to be correlated with
time spent online by 15 year-olds, across countries.
InAustralia, Denmark and Sweden, the average student
spends about 4 hours on the Internet on a typical
weekday, whereas students in Korea spend less than
1.5 hours. Students use the Internet mostly outside
of school. Time spent online at school is slightly more
than half an hour per day in the OECD, with little
variation among countries.
While access to information via the Internet may
bring considerable benets for children’s education,
it also exposes them to online risks such as access
to inappropriate content, harmful interactions with
other children or adults, and exposure to aggressive
marketing practices. Children online may also put at
risk the computers they use and inadvertently dissemi-
nate their own personal data.
Parental control software is the most common tech-
nological solution for enhancing child safety online.
There are notable differences across countries in terms
of individual use of such tools. In 2010, the share of
individuals using parental control or web-ltering
software varied from 22.5% in Slovenia to 2% in
the Slovak Republic. Recent data from Japan show
an increase in usage from about 20% in 2010 to 26%
in2012.
Protection of children online is an important public
policy concern in many countries. The 2012 OECD
Recommendation of the Council on the Protection of Children
Online offers guidelines for all stakeholders (businesses,
civil society and the online technical community)
involved in making the Internet a safer environment
for children.
DID YOU KNOW?
On average, 15-year-olds in the OECD spend about
3hours a day on the Internet on a typical weekday.
Denitions
Students assessed by PISA are between the ages of
15years 3 months and 16 years 2 months. They must
be enrolled in school and have completed at least
6 years of formal schooling, regardless of the type of
institution, the programme followed, or whether the
education is full-time or part-time.
The average number of hours spent online is computed
by taking the midpoint of each category available
in the questionnaire, except for the rst category
(no time), which is recoded as zero minutes, and the
last category (more than six hours per day), which is
recoded as sixhours.
All PISA shares are reported as a percentage of
respondents.
A parental control or a web ltering software is designed
to control the content viewed and restrict the material
delivered over the Internet. Parents may use this
software to limit the sites that children may view on
computers at home.
Measurability
PISA 2012 assessed the skills of 15 year-olds in
65 economies. Around 510 000 students between
theages of 15 years 3 months and 16 years 2 months
participated, representing 28 million 15 year-olds globally.
The ICT familiarity questionnaire is an optional
module and consists of questions on the availability
of ICTs at home and school, the frequency of use of
different devices and technologies, and student’s
attitudes towards computers. In 2012, 43 out of 65
economies participating in PISA ran this specic
module on an overall student population of 310 000.
Despite the valuable information gained as a result of
implementation, the ICT questionnaire is not admin-
istered in several countries, including Canada, France,
the United Kingdom and the United States, due to
the high costs generated by the inclusion of these
additional questions in the survey.
The information on use of parental control and web-
ltering software for all countries, excluding Japan,
originates from the special module on Internet security
of the 2010 Community Survey on ICT Usage in
Households and by Individuals. This type of data has
not been collected subsequently.
3.4 Digital natives
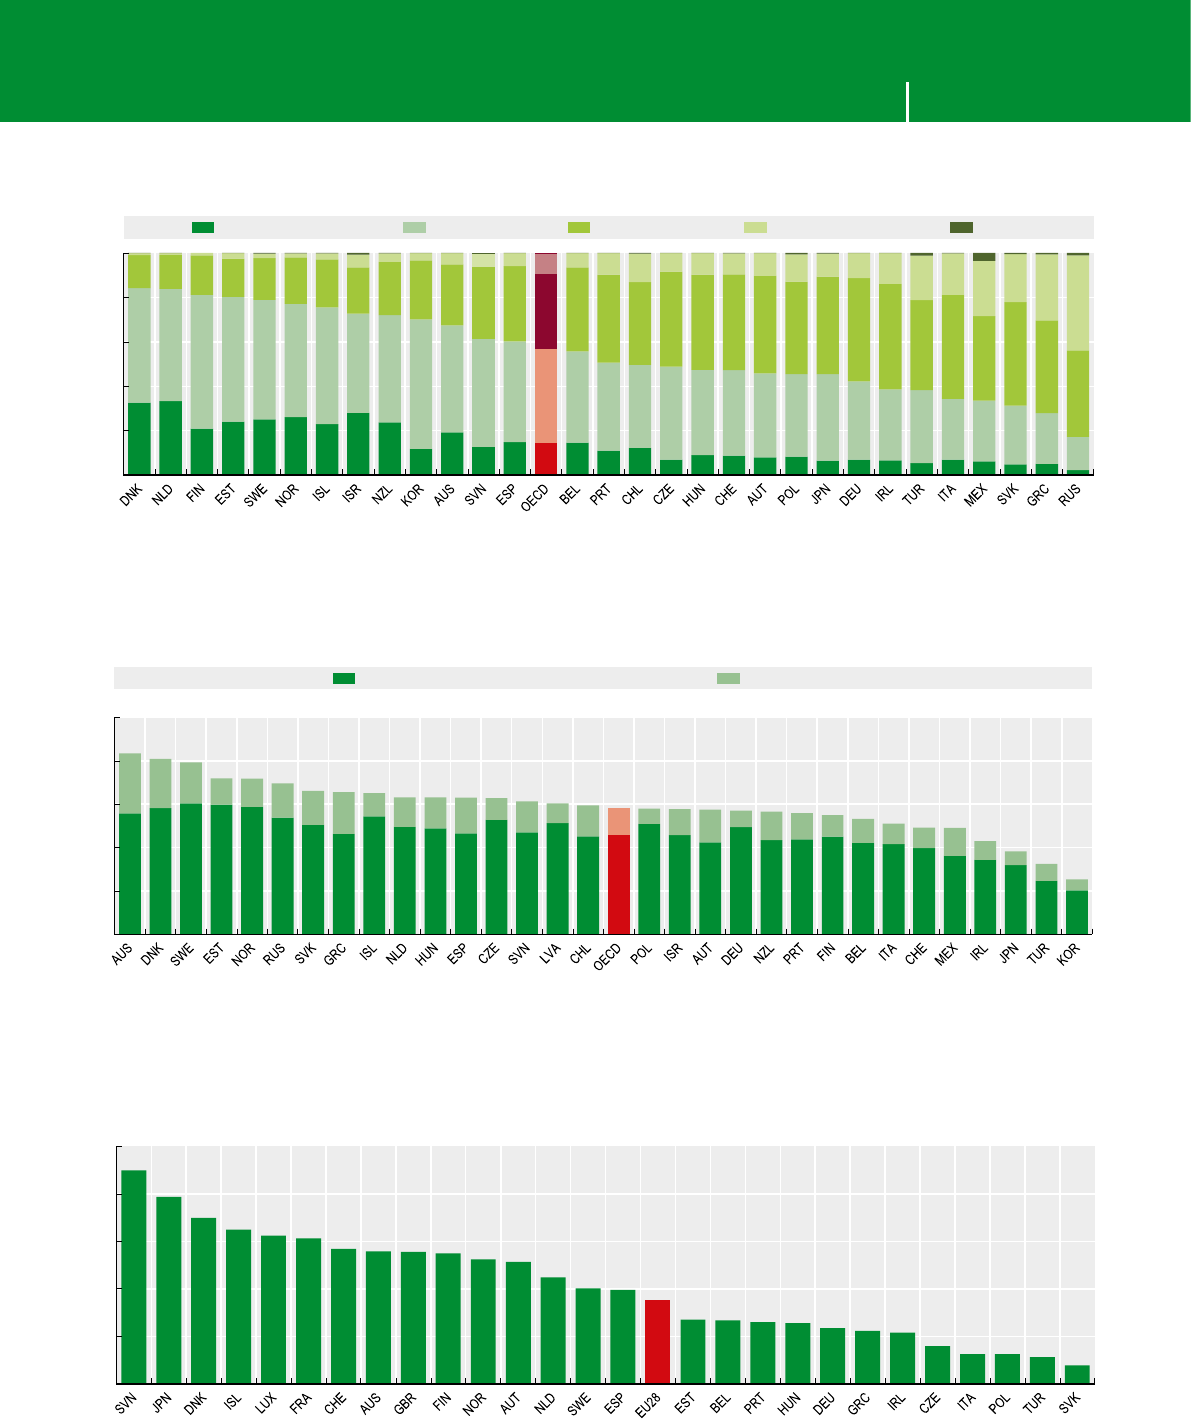
MEASURING THE DIGITAL ECONOMY: A NEW PERSPECTIVE © OECD 2014 83
3. EMPOWERING SOCIETY 3. EMPOWERING SOCIETY
Source: OECD, PISA 2012 Database, May 2014.
1 2 http://dx.doi.org/10.1787/888933148262
Age of rst access to the Internet, 2012
As a percentage of all students
0
20
40
60
80
100
%6 years old or younger 7-9 years old 10-12 years old 13 years old or older Never
Source: OECD, PISA 2012 Database, May 2014.
1 2 http://dx.doi.org/10.1787/888933148275
Internet use of 15 year-old students at school and outside school, 2012
Average number of hours spent on the Internet during a typical weekday
0
1
2
3
4
5
Hours
Internet use outside school Internet use at school
Source: OECD, ICT Database and Eurostat, Information Society Statistics, May 2014.
1 2 http://dx.doi.org/10.1787/888933148282
Individuals using a parental control or web-ltering software, 2010
As a percentage of all individuals having used the Internet in the last 12 months
0
5
10
15
20
25
%
3.4 Digital natives

MEASURING THE DIGITAL ECONOMY: A NEW PERSPECTIVE © OECD 201484
3. GAP PAGE 3. GAP PAGE
3.5 Children online
Why do we need indicators?
In 2012, about 55% of 15 year-olds in the OECD reported having accessed the Internet for the rst time before
the age of 10, and spending on average 3 hours per day online (see 3.4). The Internet is becoming an essential
component of children’s lives, but carries a spectrum of risks to which children are more vulnerable than adults.
Addressing risks faced by children online is becoming a policy priority for an increasing number of governments.
However, a number of measurement gaps need to be lled to improve comparable assessments across countries of
the contexts in which children make use of different ICT tools, and the broader impacts of their activities online.
Indicators of children’s online activity can be derived from ofcial statistics, if the age range in the population
scope of the ICT usage surveys permits, as in the case for Japan and Korea. Alternatively, countries may choose
to add a specic module (e.g. Poland) to the main ICT survey or run separate surveys (e.g. Australia, Brazil, Egypt,
theUnitedKingdom) to collect additional information on usage patterns and issues related to child protection
online.
The lack of harmonisation in the coverage, concepts and denitions used in different ICT surveys often hinders
sound international assessments (see 3.1) and does not allow information on children online to be fully captured
in an internationally comparable fashion. For example, age coverage in surveys varies considerably with some
countries assessing from age 5 upwards as in the Ofcom surveys on Children’s Media Literacy (United Kingdom) or
in the specic module of the 2013 survey on ICT usage by households in Poland. Some others (e.g. ICT Kids Online
survey, Brazil) cover children from age 9 upwards. A broader age range in the population scope, such as found in
Korea, would permit better understanding of the determinants of online activities and the role played by early
childhood institutions in framing the use of different online technologies.
Data needs remain important in the eld of child protection online, especially with regard to children’s exposure
to online incidents, their behaviour while facing different risks, and the roles played by parents, teachers and
different IT protection tools in terms of risk prevention. Finally, too little is known about how children reap the
benets of online activity and the impacts of this activity on school performance, personal development, and
health and well-being in the short and long term.
What are the challenges?
There are a number of challenges to better assessment of children’s online activities and protection, the most
signicant of which relates to the administrative burden on national statistical ofces. Some countries introduce
specic questions on children’s ICT use into ICT usage surveys, thereby obtaining valuable information, however
many others are discouraged by the high costs involved.
In parallel, more targeted surveys allow a deeper investigation of the opportunities and risks associated with
Internet use by children. However, the collection of such data often remains ad-hoc and does not allow for timely
international comparisons in a context characterised by rapid change.
In the case of household surveys, it should be noted that questions related to children online are sometimes
addressed both to parents and children with responses not necessarily being identical. Therefore, the identica-
tion of the respondent has an impact on the reliability of the information collected.
Finally, as in the case of all subjective assessments, robust data collection – on awareness and knowledge of online
threats, concerns and attitudes towards online risks, preventive measures and the perception of harm – remains
difcult from both an national and international perspective.
Options for international action
An attempt in 2010 by the EU Kids Online research network to collect internationally comparable data on children’s
online activity surveyed 1 000 individuals aged between 9-16 years old across 25 countries (Livingstone et al., 2011).
The results showed that the percentage of children who reported experiencing one or more risks online increased
with daily use of Internet.
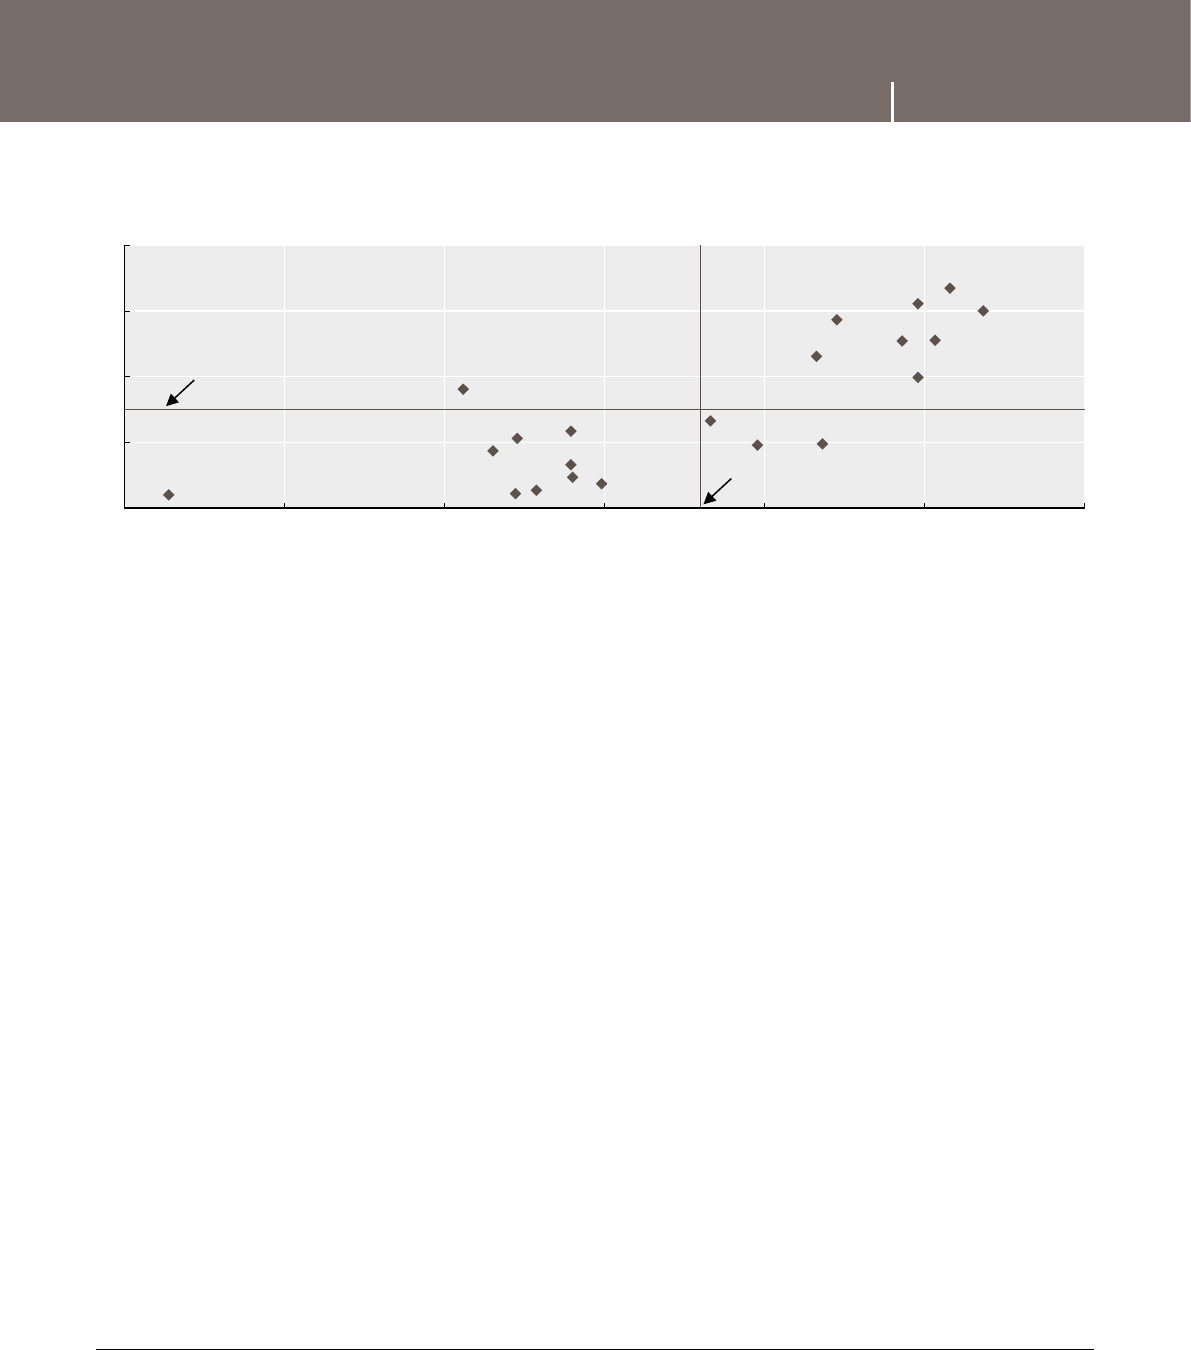
MEASURING THE DIGITAL ECONOMY: A NEW PERSPECTIVE © OECD 2014 85
3. GAP PAGE 3. GAP PAGE
3.5 Children online
Despite the relatively small size of the sample, the EU Kids Online survey sheds light on children’s online experi-
ences from Internet use (length, devices, location), their online activities (opportunities, skills, risky practices),
therisks encountered online and the experienced outcomes (whether harmful or not, how children cope).
ITU (2010) provides a statistical framework for the measurement of child online protection within the Global Cyber-
security Agenda framework with the specic aim of establishing measures suitable for international comparisons.
The report also recommends a list of main indicators related to measuring child online protection along with their
denitions and suggestions for data collection.
The 2014 revision of the OECD Model Survey on ICT Access and Usage by Households and Individuals also contains
a specic module on children online. It aims to better identify and assess different incidents faced by children
online such as cyber bullying, child solicitation, grooming or exposure to a medium that might foster harmful
behaviour on the part of children.
Protection of children online remains today an important public policy concern in many countries. The 2012 OECD
Recommendation of the Council on the Protection of Children Online offers guidelines for all stakeholders (businesses,
civil society and the online technical community) involved in making the Internet a safer environment for children.
In particular, it underlines the need for governments to share information about national policy approaches to
protect children online and develop the empirical foundations for quantitative and qualitative international
comparative policy analysis. The Internet Literacy Assessment indicator for Students (ILAS) developed by Japan is
an insightful example of follow-up to the Recommendation. The results of the project were presented at the OECD
Working Party on Information Security and Privacy in 2013 and illustrate specic policy issues, including the role
played by parents and the negative impact of excessive restriction on the use of the Internet.
References
ITU (2010), Child Online Protection: Statistical Framework and Indicators, Geneva, ITU.
Livingstone, S., L. Haddon, A. Görzig, and K. Ólafsson (2011), Risks and Safety on the Internet: The Perspective of European Children. Full Findings and Policy
Implications from the EU Kids Online Survey of 9-16 Year-olds and Their Parents in 25 Countries, EU Kids Online Deliverable D4, EU Kids Online Network,
London, eprints.lse.ac.uk/33731.
OECD (2012), Recommendation of the Council on the Protection of Children Online, acts.oecd.org/Instruments/ShowInstrumentView.aspx?InstrumentID=272.
Internet use and online risk experience of 9-16 year-olds, 2010
Percentage of children who use the Internet daily linked to those who experienced one or more online risk factors
Source: Livingstone et al. (2011).
1 2 http://dx.doi.org/10.1787/888933148299
SWE
EST
DNK
NOR
NLD
FIN
CZE
POL
SVN
GBR
BEL
ITA
ESP
FRA
HUN
GRC
DEU
PRT
IRL
AUT
TUR
30
40
50
60
70
30 40 50 60 70 80 90
Children who use the Internet daily (%)
Children who experienced one or more online risk factors (%)
Average share of chilren who use the Internet daily
Average share of chilren who experienced
one or more online risk factors

MEASURING THE DIGITAL ECONOMY: A NEW PERSPECTIVE © OECD 201486
3. EMPOWERING SOCIETY 3. EMPOWERING SOCIETY
Key ndings
Students are at the forefront of ICT uptake across all
OECD countries. Differences in the use of ICTs persist,
however, even among young people; and schools play a
crucial role in reducing this digital gap.
The results of the 2012 OECD Programme for International
Student Assessment (PISA) show that about 70% of
students in the OECD use the Internet at school. This
share ranges from 97% in Denmark to about 40% in
Turkey. More than 40% of 15-year-olds in Korea reported
that Internet access was available at school, but that
they did not use it. About 30% of students in Japan and
Mexico stated that Internet access was unavailable in
school compared with an OECD average of 10%.
ICTs are used at school for various purposes such as
communication, playing games, homework assign-
ments, searching for information, and practising and
drilling, including for foreign language learning or
mathematics. According to the 2012 PISA results, there
are signicant differences across countries in terms of
activities carried out on computers at school. In Norway,
about 70% of 15-year-olds reported using a computer
for practising and drilling, a percentage that dropped
to 27% in Ireland and less than 10% in Korea and Japan.
In some countries such as Israel, Italy, Mexico and
Turkey, the use of computers at school for practising
and drilling appears to be rather diffused compared
to the relatively low level of Internet connection avail-
ability at school. This variation across countries is
related to differences in the education systems, policy
priorities and school policies in terms of student access
to and use of ICTs.
Regarding frequency of use, in most countries the
majority of students use computers for practising and
drilling only once or twice a month. The percentage of
students using computers for this purpose on a daily
basis remains low, standing at 12% in Denmark, 10% in
Norway and around 2% in Finland and Germany.
Over the last few years, ICTs have contributed increas-
ingly to a wider array of learning opportunities and
education programmes through the development of
online courses, in particular, the massive open online
courses (MOOCs).
In 2013, 7.8% of Internet users in the EU followed an
online course against 4.7% in 2007. This increase was
generalised across countries, and shares more than
doubled in some of them. On average, for the 30 OECD
countries for which data are available, 9.4% of Internet
users followed an online course in 2013. This percentage
varied from 40% in Korea and 33% in Canada, to less than
4% in Austria, the Czech Republic, Japan and Poland.
DID YOU KNOW?
More than 70% of 15-year-olds across the OECD
use the Internet at school.
Denitions
Students assessed by PISA are between the ages of
15years 3 months and 16 years 2 months. They must
be enrolled in school and have completed at least
6 years of formal schooling, regardless of the type of
institution, the programme followed, or whether the
education is full-time or part-time.
All PISA shares are reported as a percentage of
respondents.
The Internet is considered as available even if student
access is limited to certain times or to certain activities.
An online course reects learning courses distant from
the location of education and training organisations
or employer where courses can be attended in person
(often, but not necessarily done at home). Interac-
tion with teachers, trainers and/or learning material
is effected via the Internet. Often, individuals use
e-learning software programmes. Data also include indi-
viduals who take acourse only partially delivered online.
Measurability
PISA 2012 assessed the skills of 15 year-olds in
65 economies. Around 510 000 students between the
ages of 15 years 3 months and 16 years 2 months partic-
ipated, representing 28 million 15 year-olds globally.
The ICT familiarity questionnaire is an optional module
administered to an overall student population of
310000across 43 countries and economies. It provides
information on the availability of ICTs at home and
school, the frequency of use of different devices
and technologies, and student’s attitudes towards
computers.
There is still an important lack of internationally
comparable data over time in terms of ICT uptake, use
and impact, especially at the higher education level and
in vocational education. For example, as regards online
courses, more detailed cross-country information on
the type of courses offered, attendance frequency and
participants’ characteristics would allow for a better
understanding of ICT use in education today.
The OECD’s Innovation Strategy for Education and
Training is leading to a measurement agenda in line
with the increasingly important role played by ICTs for
education as enablers of pedagogical innovation.
3.6 ICTs in education
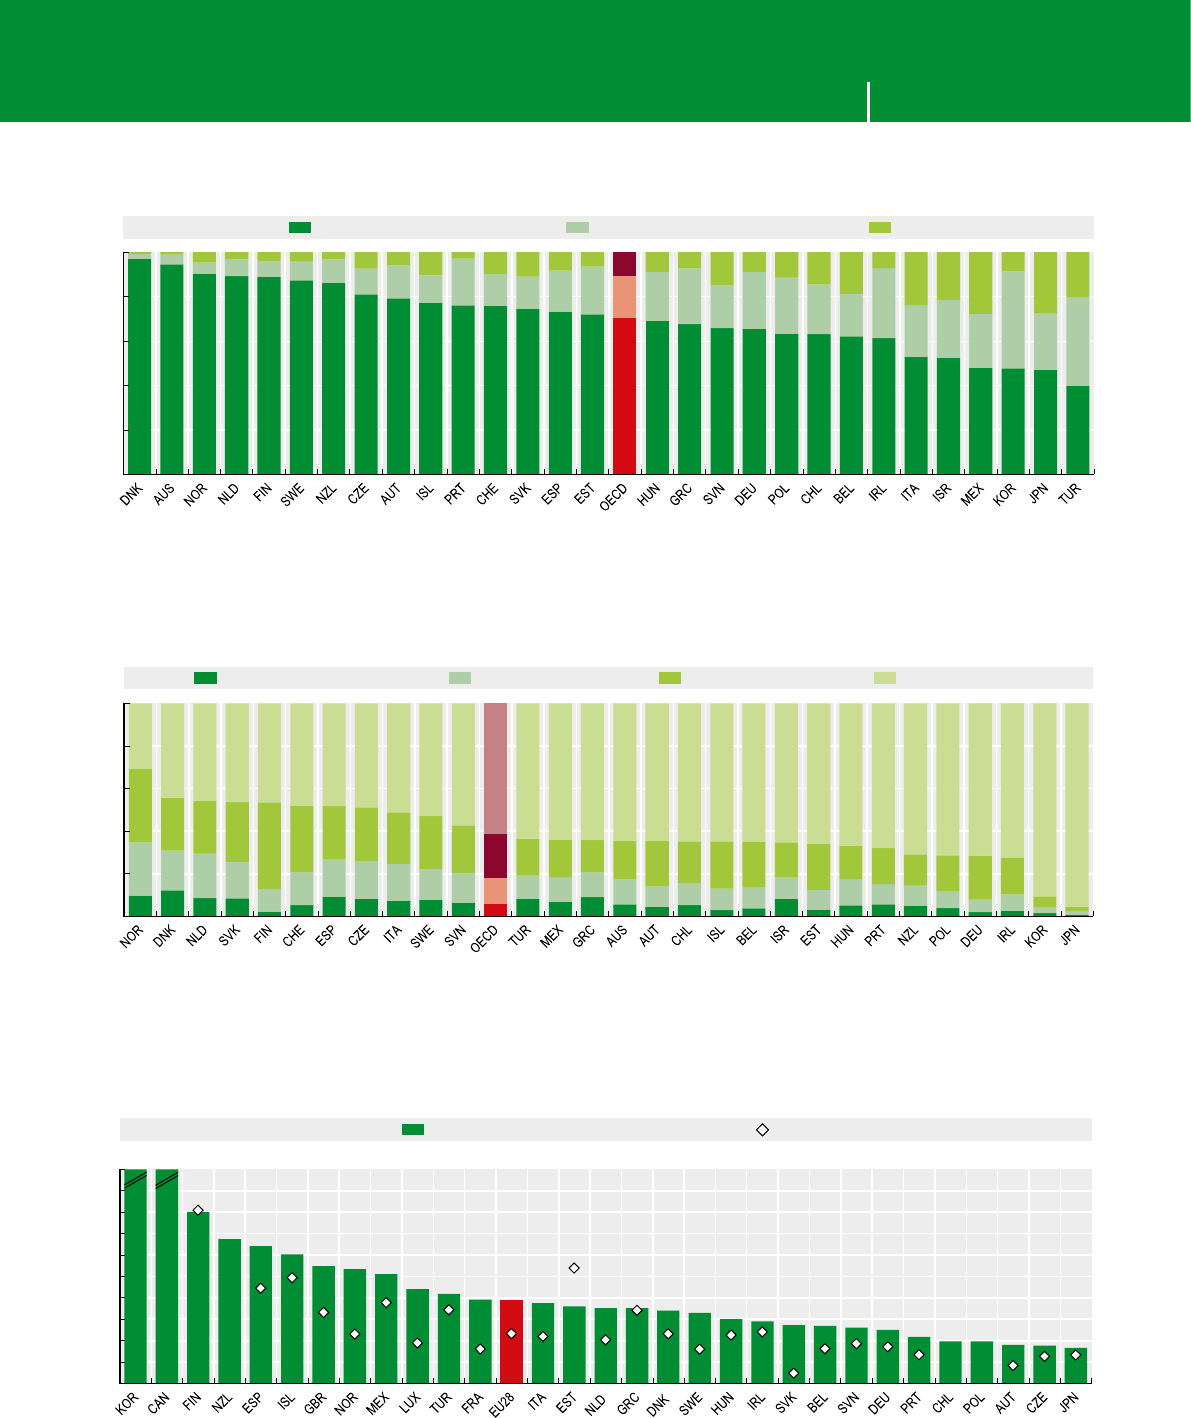
MEASURING THE DIGITAL ECONOMY: A NEW PERSPECTIVE © OECD 2014 87
3. EMPOWERING SOCIETY 3. EMPOWERING SOCIETY
Source: OECD, PISA 2012 Database, May 2014.
1 2 http://dx.doi.org/10.1787/888933148307
Internet connection availability at school, 2012
Percentage breakdown of all students
0
20
40
60
80
100
%Yes, and I use it Yes, but I don’t use it No
Source: OECD, PISA 2012 Database, May 2014.
1 2 http://dx.doi.org/10.1787/888933148314
Computer use at school for practising and drilling, such as for foreign language learning or mathematics, 2012
Percentage breakdown of all students
0
20
40
60
80
100
%Every day or almost every day Once or twice a week Once or twice a month Never or hardly ever
Source: OECD, ICT Database and Eurostat, Information Society Statistics, May 2014. See chapter notes.
1 2 http://dx.doi.org/10.1787/888933148328
Individuals who attended an online course, 2007 and 2013
As a percentage of individuals who used the Internet in the last three months
0
2
4
6
8
10
12
14
16
18
20
%
2013 2007
33
40 (2012)
38 (2007)
3.6 ICTs in education

MEASURING THE DIGITAL ECONOMY: A NEW PERSPECTIVE © OECD 201488
3. EMPOWERING SOCIETY 3. EMPOWERING SOCIETY
Key ndings
Intensication of ICT use in the home and the workplace
has strongly affected the set of skills needed to partici-
pate fully in and benet from connected societies and
increasingly knowledge-based economies.
The results from the rst OECD Programme for the
International Assessment of Adult Competencies
(PIAAC) show important differences across countries
in terms of computer use at work. In 2012, about 80%
of individuals at work reported having experience with
a computer in the Nordic countries, as opposed to
about 50% in Italy and 45% in the Russian Federation.
However, a signicant majority of individuals in all
countries reported their computer use in the workplace
as being straightforward or moderate. The share of
individuals experiencing complex computer use varied
between 8% of all individuals at work in Denmark and
3% in the Russian Federation.
In 2012, on average, 54% of workers reported using word
processors, while 46% used spreadsheets and about 10%
carried out programming tasks. Despite the relatively
generalised use of word processors and spreadsheets
across countries, the share of individuals with program-
ming skills remains low varying between 17% in Korea
and 6% in Italy.
While such cross-country variation in the type of ICT
skills used at work may reect differences in the labour
market structure, it also provides an indication of the
skill base and its characteristics. For instance, workers
in countries that report relatively high ICT skills use at
work, such as the Netherlands and Norway, also cite
higher condence in their computer skills should they
change jobs.
Job mobility is an important driver of knowledge
transfer and spillovers, which in turn foster innovation
and growth in the digital economy. However, in 2013
only 39% of individuals in the EU labour force judged
their computer skills to be sufcient to look for a job
or change job within a year. Among the European
countries, this percentage varied between 60% in the
Netherlands and 25% in Greece. In all countries, indi-
viduals with a higher level of formal education report
higher condence in their computer skills, as compared
to those with no or low formal education. The gap
between these two groups exceeds 60 percentage
points in Poland and Turkey.
Education and labour policies play a crucial role in the
acquisition of ICT skills, their use at work and also their
obsolescence if they remain unused. Governments need
to craft policies that sustain a skilled labour force, are
able to meet current labour market needs and easily
adapt to changing skills demands over time.
DID YOU KNOW?
In 2013, more than 60% of the EU labour force
reported their computer skills as being insufcient
to apply for a new job.
Denitions
Straightforward computer use includes basic routines
such as data entry or sending and receiving e-mails.
Moderate computer use refers to word-processing, use
of spreadsheets or database management. Complex
computer use encompasses developing software
or modifying computer games, programming using
languages like Java, SQL, PHP or Perl, or maintaining
acomputer network.
All PIAAC shares are reported as a percentage of
respondents.
Potential job change does not necessarily mean a change
of employer and can concern change of functions within
the same organisation. This variable provides general
information on perceived skills sufciency or gaps in
relation to labour market requirements. Thedata refer
to skills sufcient for performing a job that requires
computer or Internet skills or professional ICT skills for
individuals employed in ICT occupations.
Measurability
PIAAC surveyed around 166 000 adults aged 16-65 in
24 countries and sub-national regions. These included
22OECDcountries (Australia, Austria, Belgium(Flanders),
Canada, the Czech Republic, Denmark, Estonia,
Finland, France, Germany, Ireland, Italy, Japan, Korea,
the Netherlands, Norway, Poland, the Slovak Republic,
Spain, Sweden, the United Kingdom (England and
Northern Ireland), and the United States; and two
partner countries (Cyprus and the Russian Federation).
PIAAC provides information on how skills are used at
home, in the workplace and in the community; how
these skills are developed, maintained and lost over
a lifetime; and how they are linked to labour market
participation, income, health, and social and political
engagement. With this information, the Survey of Adult
Skills helps policy makers to: (i) examine the impact
of reading, numeracy and problem-solving skills on
a range of economic and social outcomes; (ii) assess
the performance of education and training systems,
workplace practices and social policies in developing
the skills required by the labour market and by society
in general; and (iii) identify policy levers to reduce
deciencies in key competencies.
3.7 ICT skills in the workplace
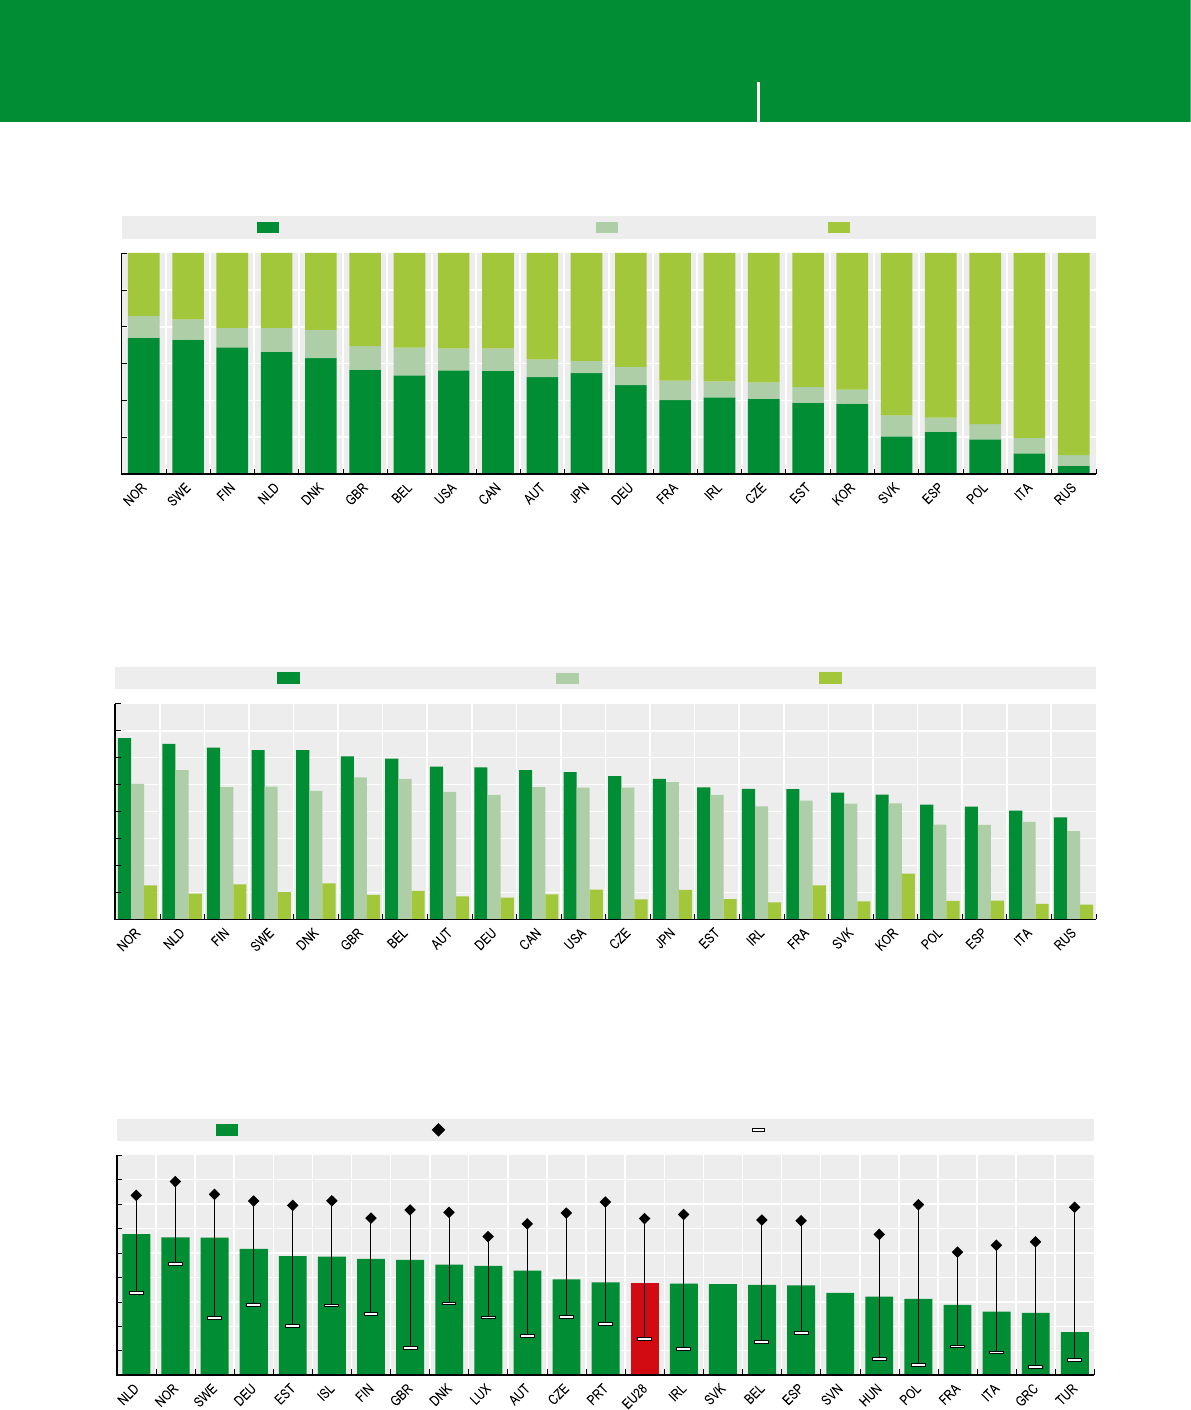
MEASURING THE DIGITAL ECONOMY: A NEW PERSPECTIVE © OECD 2014 89
3. EMPOWERING SOCIETY 3. EMPOWERING SOCIETY
Source: OECD, PIAAC Database, May 2014. See chapter notes.
1 2 http://dx.doi.org/10.1787/888933148332
Computer use at work, 2012
Percentage shares of all workers
40
50
60
70
80
90
100
%Straightforward and moderate use Complex use No computer use
Source: OECD, PIAAC Database, May 2014. See chapter notes.
1 2 http://dx.doi.org/10.1787/888933148347
ICT skills use at work, 2012
Percentage shares of all workers
0
10
20
30
40
50
60
70
80
%Word processors Spreadsheets Programming
Source: OECD computations based on Eurostat, Information Society Statistics, May 2014.
1 2 http://dx.doi.org/10.1787/888933148354
Individuals who judge their computer skills to be sufcient if they were to apply for a new job within a year, 2013
As a percentage of all individuals
0
10
20
30
40
50
60
70
80
90
%All Individuals Individuals with high formal education Individuals with no or low formal education
3.7 ICT skills in the workplace

MEASURING THE DIGITAL ECONOMY: A NEW PERSPECTIVE © OECD 201490
3. EMPOWERING SOCIETY 3. EMPOWERING SOCIETY
Key ndings
E-commerce can substantially widen choices and
convenience for consumers.
On average, 47% of individuals in OECD countries now
buy products online, up from 30% in 2007. This trend is
bound to continue in the coming years and has already
disrupted traditional distribution channels for some
categories of products.
The rapid diffusion of smart mobile devices has
resulted in a growing number of individuals who make
purchases on the go. The share of mobile purchases
varies widely across countries as well as across different
product categories, with age, education, income and
experience all playing a role in determining the uptake
of e-commerce by individuals.
In Denmark and the United Kingdom, more than 75%
of adults purchase online. This percentage is between
10% and 20% in Chile, Italy and Turkey and below
5% in Mexico.
When considering the population of Internet users
these shares increase and differences between leading
and lagging countries are overall narrower. About 80%
or more of Internet users in Denmark, Germany and the
United Kingdom make purchases online, against less
than 30% in Chile, Estonia or Turkey and below 10% in
Mexico. In addition, it is possible to discern a substan-
tial increase in the diffusion of online purchases with
respect to 2007 in most countries, particularly in
Belgium, Israel, New Zealand, the Slovak Republic and
Switzerland.
The inuence of income on e-commerce uptake is
reected in the high shares observed for 25-44 year-olds
and in the comparatively high diffusion among 65-74
year-old users in many countries (in particular, Chile,
the United Kingdom and the United States), when
compared to the age gap observed for Internet usage
(see 3.1).
The most common items purchased online are travel
and holiday services (about half of online shoppers on
average), tickets for events, digital products and books.
However, other categories are growing such as food and
grocery products.
The diffusion of different categories of products via
online purchase might depend on income as well as
other factors, including consumer habits and supply-
side elements, such as the availability of e-commerce
channels by local providers and their associated pricing
decisions.
DID YOU KNOW?
About half of individuals in OECD countries
purchase goods and services online, and
almost 20% in Denmark, Korea, Sweden and
theUnitedKingdom use a mobile device to do so.
Denitions
Online purchases are a component of electronic
commerce (e-commerce).
This includes transactions of goods and services
“conducted over computer networks by methods specif-
ically designed for the purpose of receiving or placing
orders” (OECD Guide to Measuring the Information Society
2011). For individuals, whether sellers or purchasers,
such transactions typically occur over the Internet.
Online purchases are measured with respect to a
12-month recall period, taking into consideration that
this is not always a high-frequency activity.
The main indicator of Internet purchases (including
with handheld devices) is computed with reference to
the total adult population (16-74 year-olds with a few
exceptions as detailed in the chapter notes).
Measurability
The collection of information on ICT usage by indi-
viduals is uneven across OECD countries, due to
differences in the frequency and nature of surveys
(see3.1).
For online purchases, issues of comparability might be
linked to several factors. These include differences in age
limits (for Japan and the United States, data refer to all
individuals aged 6 and over instead of 16-74 year-olds,
and this might reduce overall rates); in reference periods
(for Israel, the period is 3 months instead of 12, while
no recall period is specied for the United States and
Chile); in the denition itself (for New Zealand only
e-purchases accompanied by an online payment are
considered); and in survey methodology (techniques,
time of year, etc.).
Finally, differences in the typology of items considered
in the surveys run by the OECD countries partici-
pating in the European Statistical System, and by other
member countries, limit the comparability of types of
products purchased online.
3.8 E-consumers
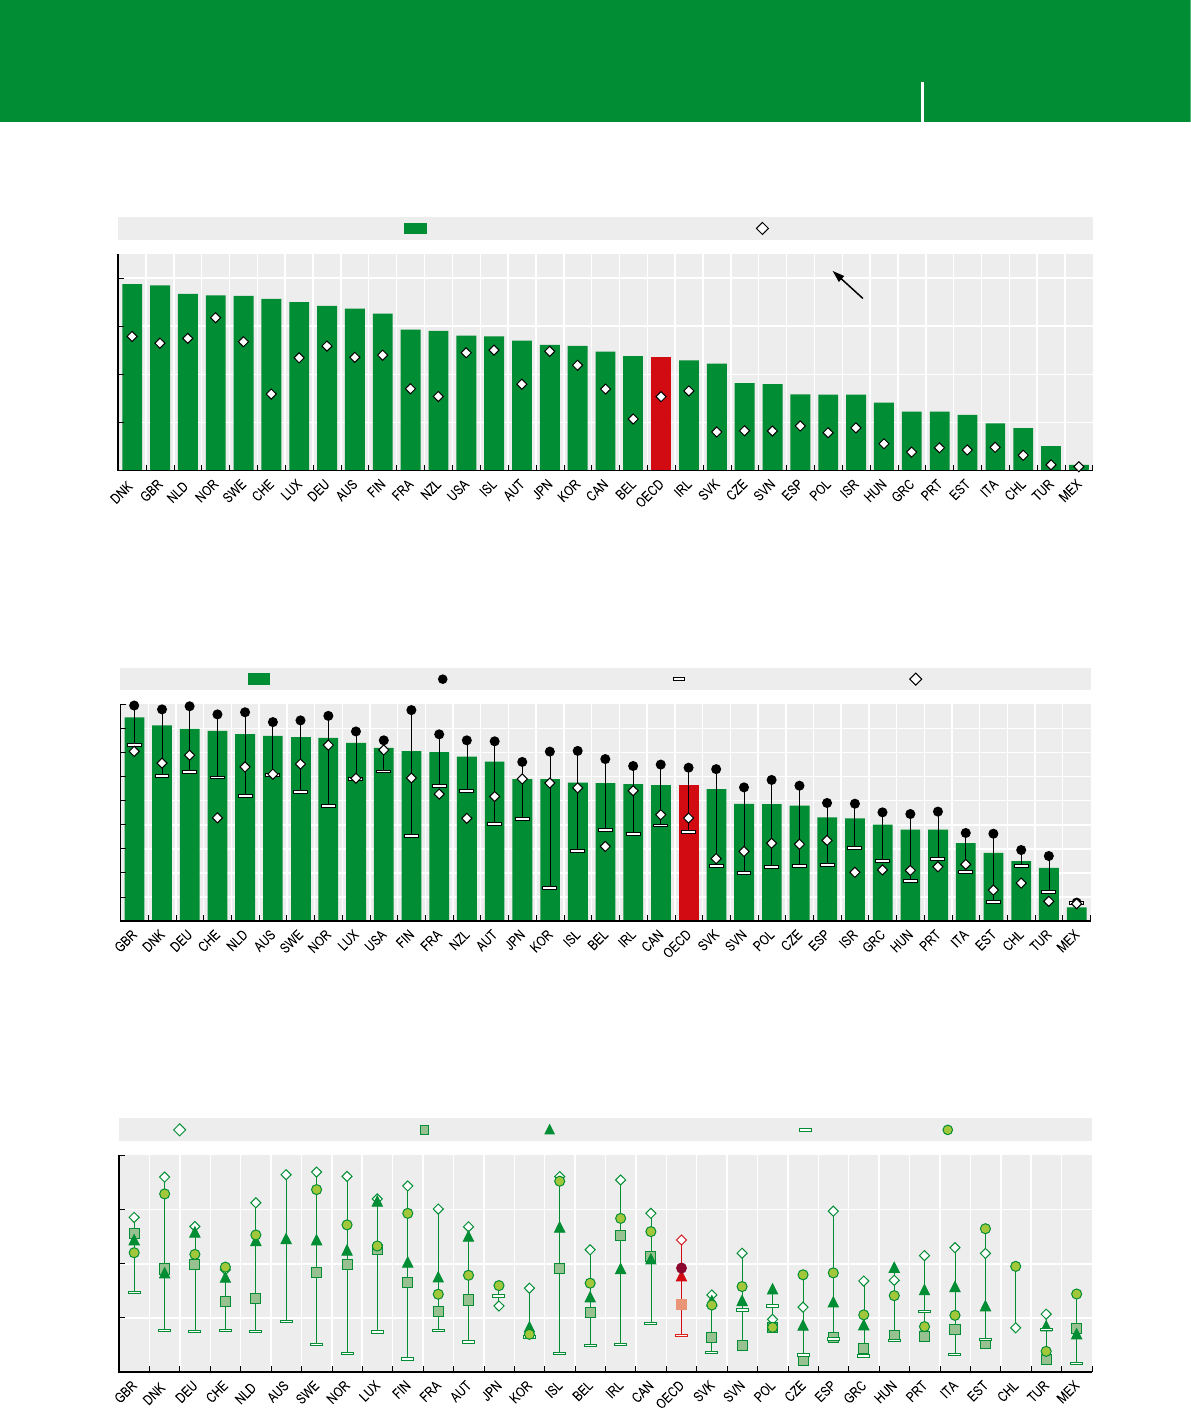
MEASURING THE DIGITAL ECONOMY: A NEW PERSPECTIVE © OECD 2014 91
3. EMPOWERING SOCIETY 3. EMPOWERING SOCIETY
Source: OECD, ICT Database; Eurostat, Information Society Statistics and national sources, May 2014. See chapter notes.
1 2 http://dx.doi.org/10.1787/888933148361
Diffusion of online purchases, including via handheld devices, 2007 and 2013
Individuals having ordered goods or services online as a percentage of all individuals
18 19 15 18 11 7 5 6 6 6 19 5 7 12 2 1 3 7 3 3 1 1 4
0
20
40
60
80
%
2013 2007
Percentage of individuals having ordered via
a handheld device (2012)
Source: OECD, ICT Database; Eurostat, Information Society Statistics and national sources, May 2014. See chapter notes.
1 2 http://dx.doi.org/10.1787/888933148373
Individuals who purchased online in the last 12 months, by age class, 2013
As a percentage of Internet users
0
10
20
30
40
50
60
70
80
90
%All 25-44 year-olds 65-74 year-olds 2007
Source: OECD, ICT Database; Eurostat, Information Society Statistics and national sources, May 2014. See chapter notes.
1 2 http://dx.doi.org/10.1787/888933148386
Online purchasers by selected types of products, 2013
As a percentage of Internet users having purchased online
0
20
40
60
80
%Travel and holiday accommodation Films/music Books/magazines/e-learning material Food/groceries Tickets for events
3.8 E-consumers

MEASURING THE DIGITAL ECONOMY: A NEW PERSPECTIVE © OECD 201492
3. EMPOWERING SOCIETY 3. EMPOWERING SOCIETY
Key ndings
The borderless nature of the Internet combined with
recent technological developments have led to the
emergence of multi-language international platforms,
whose success is rooted in the similarity of needs,
interests and behaviours of individuals across countries.
These platforms encompass online search, social
networking, information sources and entertainment,
and often build on user-created content.
Wikipedia – currently the 6th or 7th most-visited
website globally and the most-visited not-for-prot site –
exemplies the way in which the Internet can favour the
diffusion of information and culture across countries
and languages, based on the contributions of users.
Across the OECD, each Internet user visits on average
more than nine Wikipedia pages (articles) per month,
with about 1.6 monthly contributions (edits) per
thousand Internet users. Page-views per Internet user
vary from 14 or above in Estonia, Finland and Iceland, to
6 or less in Japan and Korea (depending on the existence
of alternate sources of a similar nature), and in Chile,
Mexico, Slovak Republic and Turkey.
In most countries about 10% to 12% of visits to Wikipedia
point to a different language than that currently spoken
in the country, highlighting the cross-border and cross-
language nature of websites such as Wikipedia. Rates are
much higher where local languages have few speakers or
multiple languages coexist, and are very low for English-
speaking countries. In addition, automated translation
tools favour the re-production of information in less
diffused languages, contributing to their survival.
The number of YouTube views reveals that, for most of
OECD and partner countries, content uploaded domes-
tically accounts for less than half of total views. Views
of domestic content are more common in large, non-
English speaking countries such as Brazil, Japan and
Turkey, than in smaller countries, as well as those where
most people speak English.
The most-visited websites across all OECD countries are
the same: Google, Facebook and YouTube, with Yahoo!
at some distance. These companies have developed an
entire ecosystem starting from their initial business of
offering a compass (and a map) to surf the Web, keeping
in touch with friends or accessing self-created audio and
video contents.
The development of ecosystems with an increasing
number of available services creates numerous
advantages for users. The high level of concentration
on these digital markets, however, also raises issues of
competition, privacy and security, as well as the risk of
limitations in content offers.
DID YOU KNOW?
People have very similar online interests. Google,
Facebook, YouTube are the top 3 visited sites inOECD.
Wikipedia ranks 6th or 7th in most countries.
Denitions
The indicators proposed here follow the established
practice in website-related statistics. The diffusion of
websites among the public is assessed in terms of the
number of unique visitors. This means that visits from
the same IP address (machine or router) are counted
only once. Websites are usually automatically grouped
under the rst-level entry (e.g. oecd.org). A further
manual aggregation is performed for websites with
multiple top-level domains (such as .com and .fr).
The number of page views looks at how much content
has been viewed, irrespective of the number of people
viewing the material. The number of edits refers to the
modications to existing pages (articles) done by users,
regardless of their breadth. For the case of Wikipedia,
these data are netted for visits and edits by bots
(machines), and have been normalised on the number
of Internet users and on resident population.
Data on YouTube views refer to content les. The indicator
targets the incidence of local content – proxied by
domestic uploads – in each country’s total views.
Measurability
Statistics presented on this page are drawn from
selected Internet services. They are based on a full
count directly provided by the owner for Wikipedia
(stats.wikimedia.org/) and YouTube (courtesy of Google
Inc.), while the ranking of websites can only be assessed
based on specialised providers’ partial counts, which
differ from one another and often offer a point-in-time
only estimate.
Information on individual websites is not always freely
accessible. Furthermore, it is sometimes hard to disen-
tangle the action of bots accessing websites from that
of humans.
Finally, web-visit statistics offer a limited view on what
users do: numbers often distort the real quantity they
aim at portraying, let aside the quality. Indeed, visitors
might visit a website because they are led there by a
search engine or by direct solicitations, raising the
count of visits without any underlying real activity.
Eurostat and the OECD are currently working to develop
methodologies and algorithms to derive new reliable
indicators directly from the Internet and other digital
footprints (e.g. GPS).
3.9 Content without borders
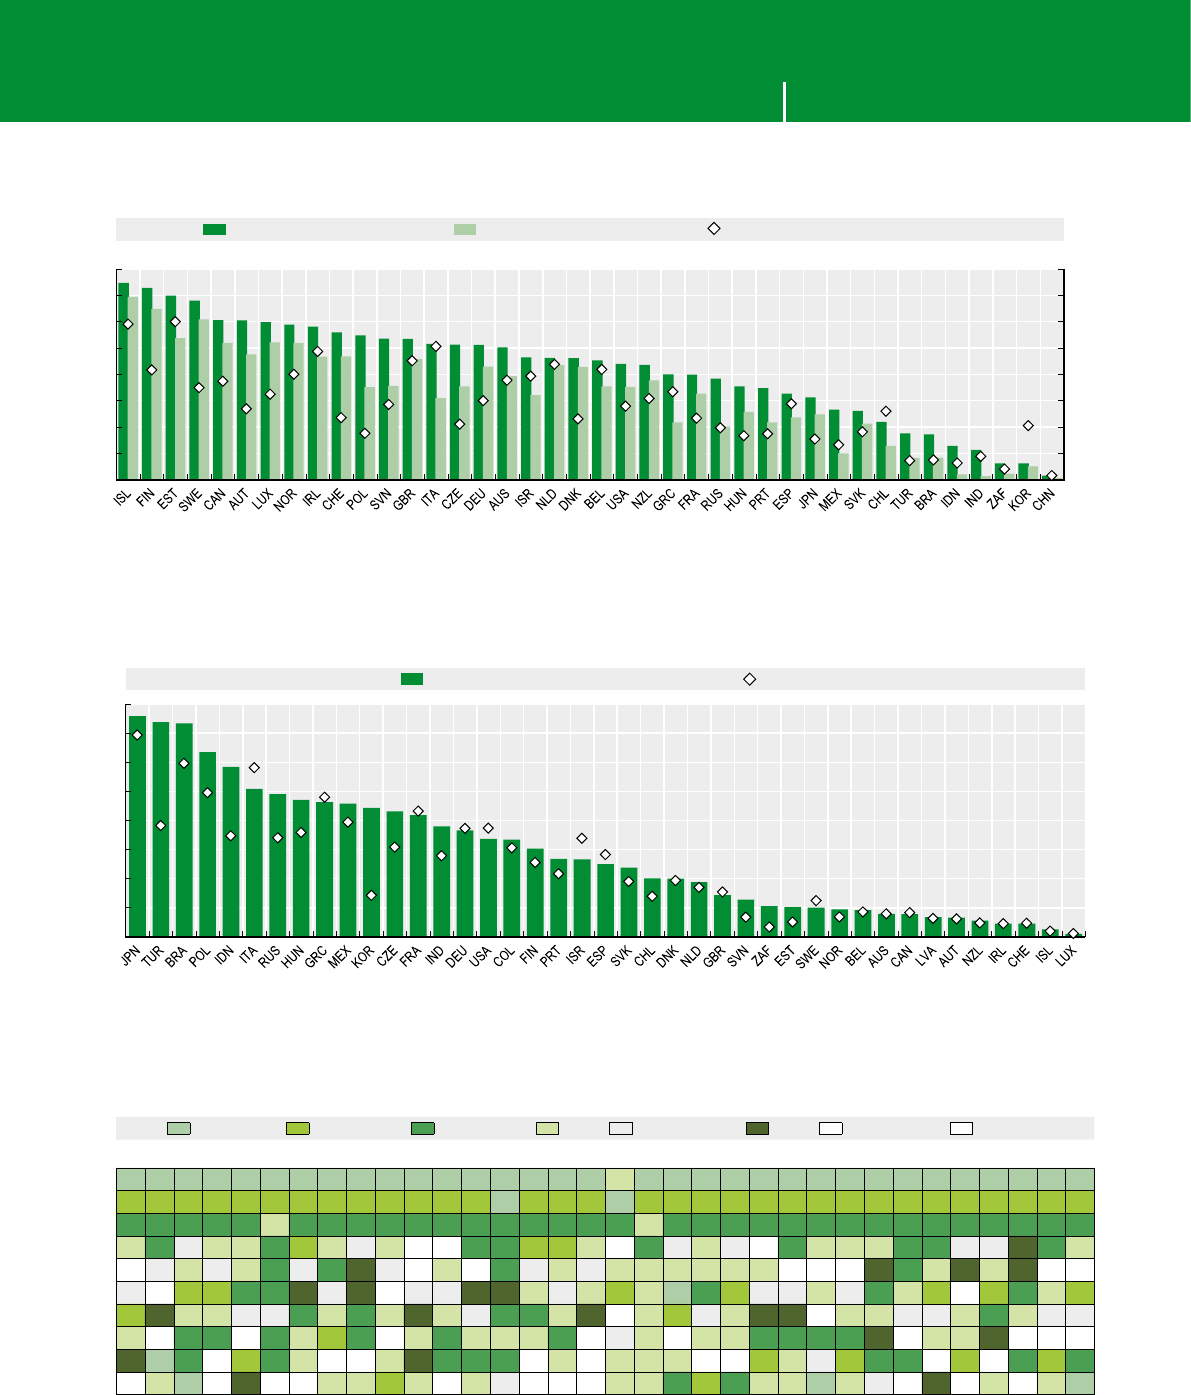
MEASURING THE DIGITAL ECONOMY: A NEW PERSPECTIVE © OECD 2014 93
3. EMPOWERING SOCIETY 3. EMPOWERING SOCIETY
Source: OECD computations based on Wikimedia, May 2014.
1 2 http://dx.doi.org/10.1787/888933148392
Wikipedia monthly page views and edits, 2014 Q1
Per Internet user, per inhabitant
0.0
0.5
1.0
1.5
2.0
2.5
3.0
3.5
4.0
0
2
4
6
8
10
12
14
16
Edits
Page views
Page views per Internet user Page views per inhabitant Edits per thousand Internet users (right-hand scale)
Source: OECD computations based on an ad-hoc data tabulation by Google, June 2014.
1 2 http://dx.doi.org/10.1787/888933148402
YouTube views of contents uploaded domestically, 2010-11 and 2013
As a percentage of views in each country
0
10
20
30
40
50
60
70
80
%2013 2010-11
Source: OECD based on Alexa, www.alexa.com, visited on 20 April 2014.
1 2 http://dx.doi.org/10.1787/888933148891
Top 10 websites by type of service, April 2014
Ranked number of unique visitors
3.9 Content without borders
SE Search engine SN Social network MC Media-Content PT Portal Ref. Ref.-Encyclopedia Ns News e$ eComm/banking Blog Blogging
Rank
1 SE SE SE SE SE SE SE SE SE SE SE SE SE SN SE SE SE PT SE SE SE SE SE SE SE SE SE SE SE SE SE SE SE SE
2 SN SN SN SN SN SN SN SN SN SN SN SN SN SE SN SN SN SE SN SN SN SN SN SN SN SN SN SN SN SN SN SN SN SN
3 MC MC MC MC MC PT MC MC MC MC MC MC MC MC MC MC MC MC PT MC MC MC MC MC MC MC MC MC MC MC MC MC MC MC
4 PT MC Ref. PT PT MC SN PT Ref. PT e$ e$ MC MC SN SN PT e$ MC Ref. PT Ref. e$ MC PT PT PT MC MC Ref. Ref. Ns MC PT
5e$ Ref. PT Ref. PT MC Ref. MC Ns Ref. e$ PT e$ MC Ref. PT Ref. PT PT PT PT PT PT e$ e$ e$ Ns MC PT Ns PT Ns e$ e$
6 Ref. e$ SN SN MC MC Ns Ref. Ns e$ Ref. Ref. Ns Ns PT Ref. PT SN PT SE MC SN Ref. Ref. PT Ref. MC PT SN e$ SN MC PT SN
7 SN Ns PT PT Ref. Ref. MC PT MC PT Ns PT Ref. MC MC PT Ns e$ PT SN Ref. PT Ns Ns Blog PT PT Ref. Ref. PT MC PT Ref. Ref.
8 PT e$ MC MC Blog MC PT SN MC e$ PT MC PT PT PT MC e$ Ref. PT e$ PT PT MC MC MC MC Ns e$ PT PT Ns e$ e$ e$
9Ns SE MC e$ SN MC PT e$ e$ PT Ns MC MC MC e$ PT Blog PT PT PT e$ e$ SN PT Ref. SN MC MC Blog SN e$ MC SN MC
10 e$ PT SE e$ Ns e$ e$ PT PT SN PT Blog PT Ref. e$ e$ e$ PT PT MC SN MC PT PT SE PT Ref. e$ Ns e$ PT Blog PT SE
AUS
AUT
BEL
CAN
CHL
CZE
DNK
EST
FIN
FRA
DEU
GRC
HUN
ISL
IRL
ISR
ITA
JPN
KOR
LUX
MEX
NLD
NZL
NOR
POL
PRT
SVK
SVN
ESP
SWE
CHE
TUR
GBR
USA

MEASURING THE DIGITAL ECONOMY: A NEW PERSPECTIVE © OECD 201494
3. EMPOWERING SOCIETY 3. EMPOWERING SOCIETY
3.10 E-government use
Key ndings
ICTs can play a considerable role in simplifying inter-
actions with public authorities, while simultaneously
saving taxpayer resources, thanks to the digitisation
and automation of many processes. For both individuals
and businesses, online interactions can include simple
document browsing, downloading of forms, and the
completion of administrative procedures.
The overall share of individuals using the Internet
to perform administrative procedures has increased
in recent years, but remains widely dispersed across
countries – from 70% in Iceland to less than 10% in Chile,
the Czech Republic and Turkey. This might reect
issues of data comparability, as well as differences in
Internet usage rates (see 3.1) and the propensity of
users to start performing administrative procedures
online. TheNordic countries, Korea and theNetherlands
rank high on both dimensions, while countries such as
Germany and the United Kingdom, despite relatively
high Internet usage rates, are characterised by a
relatively low propensity to use online government
services.
Explanations for these differences range from existing
infrastructure and supply of e-services by the public
authorities, to structural issues linked to institutional,
cultural or economic factors. The perception and utility
of services provided by public authority websites and
their coherence with individual user needs, which are
inuenced by age and life cycle factors, are also key
elements. Ease of access and use of a website appear to
be strategic factors to foster usage and user satisfaction.
Online interactions between businesses and public
authorities are more developed than for individuals,
because Internet usage is generalised and enterprises
are required to undertake more frequent administra-
tive procedures, and also because the use of online tools
in some cases is imposed by law. In 2012, more than
95% of businesses in Ireland interacted online with
public authorities against 58% in Italy. This share has
increased by almost 20 percentage points since 2010
in the CzechRepublic and Italy, and by more than 10
percentage points in Ireland, NewZealand and Norway.
In general, differences between countries are less
pronounced when simpler interactions are considered
(e.g. obtaining information or downloading forms),
and are performed on average by 83% of enterprises.
This suggests that service availability might be a key
obstacle to more complex interactions in some lagging
countries.
DID YOU KNOW?
E-government services are used on average
by35%of individuals, and by more than
80% of businesses in OECD countries.
Denitions
Indicators presented here portray the diffusion of selected
types of online interaction with public authorities among
Internet users and businesses.
Interactions range from the simple collection of
information from browsing government websites to
interactive procedures where completed forms are
sent via the Internet, excluding any interaction via
e-mail (for businesses) or manually typed e-mail (for
individuals). For businesses, simple interactions include
here obtaining information and downloading forms;
theindicator shows the highest value on the basis of
data availability.
Problems encountered in using government websites are
shown for countries in the European Statistical System
and include technical issues, lack of clear and updated
information, lack of (off and onsite) support and other
unspecied problems. The variable reporting the share
of users encountering at least one problem refers to
the list above. This is matched with the share of users
satised with respect to the information obtained.
Public authorities refer to both public services and admin-
istration activities, for example, tax, customs, business
registration, social security, public health, environment
or municipal administrations. These authorities can be
at local, regional or national level.
Measurability
The collection of information on e-government service
usage by individuals and businesses is uneven across
OECD countries, due to differences in the frequency
and nature of surveys (see 3.1). The Governmental and
Public Authorities delineation varies across countries,
as does the variety and sophistication of services
delivered to citizens and businesses.
The OECD is actively engaged in the collection of
comparable and more detailed information in this
eld, by means of its Model Surveys on ICT usage
by households/individuals and by businesses. Other
complementary ways to collect information are
also being explored, including the ongoing Digital
Government Performance Survey carried out by
the OECD Directorate for Public Governance and
Territorial Development, including by means of infor-
mation on public administration web-portals.
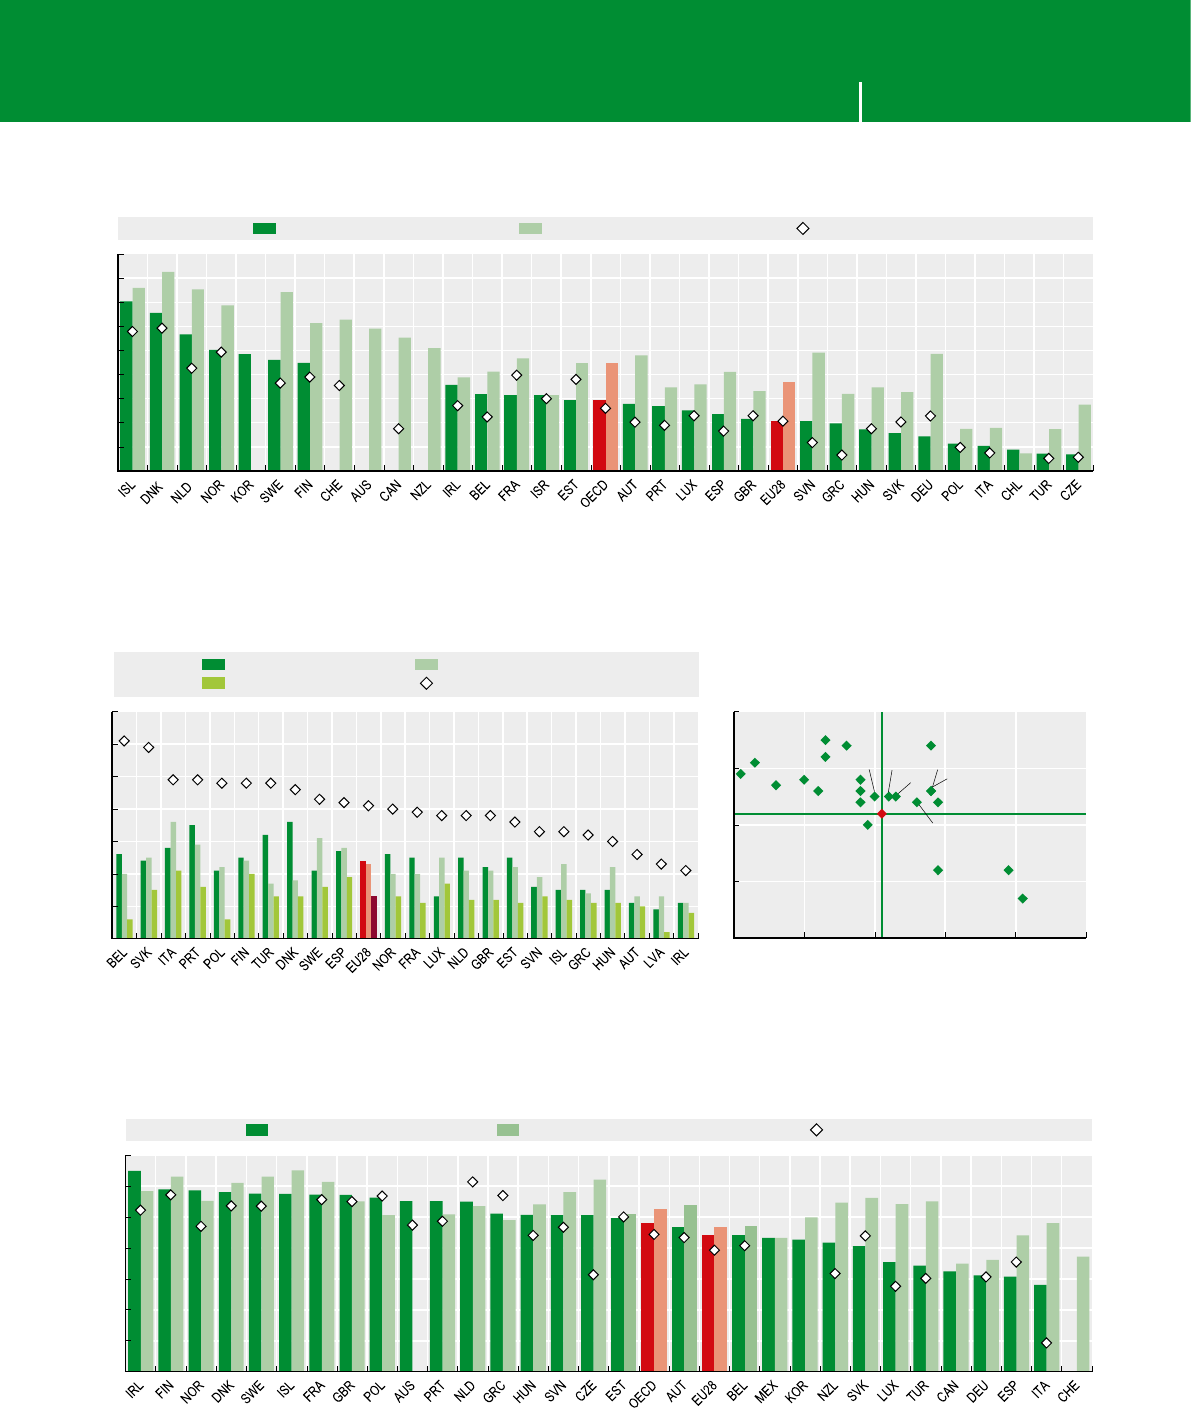
MEASURING THE DIGITAL ECONOMY: A NEW PERSPECTIVE © OECD 2014 95
3. EMPOWERING SOCIETY 3. EMPOWERING SOCIETY
3.10 E-government use
Source: OECD, ICT Database and Eurostat, Information Society Statistics, May 2014. See chapter notes.
1 2 http://dx.doi.org/10.1787/888933148419
Individuals using e-government services, 2010 and 2013
Percentage of individuals obtaining information and sending completed forms on government websites in the last 12 months
0
10
20
30
40
50
60
70
80
90
%Sending filled forms Getting information Sending filled forms, 2010
Source: OECD based on Eurostat, Information Society Statistics, May 2014. See chapter notes.
1 2 http://dx.doi.org/10.1787/888933148425
Problems in using e-government services (left-hand panel) and satisfaction (right-hand panel), 2013
Percentage of individuals having used e-government services in the last 12 months
0
10
20
30
40
50
60
70
%
Website technical failure Unclear or outdated information
Lack of support At least one problem
60
70
80
90
100
20 30 40 50 60 70
Had at least one problem in usage (%)
Mainly satisfied (%)
BEL
SVK
ITA
PRT
POL
FIN
TUR
DNK
SWE
ESP
EU28
NOR
FRA
LUX
NLD
GBR
EST
SVN
ISL
GRC
HUN
AUT
LVA
IRL
Source: OECD, ICT Database; Eurostat, Information Society Statistics and national sources, May 2014. See chapter notes.
1 2 http://dx.doi.org/10.1787/888933148431
Businesses using e-government services, 2010 and 2012
Percentage of enterprises with ten or more persons employed
30
40
50
60
70
80
90
100
%Sending filled forms Obtaining information/forms Sending filled forms, 2010
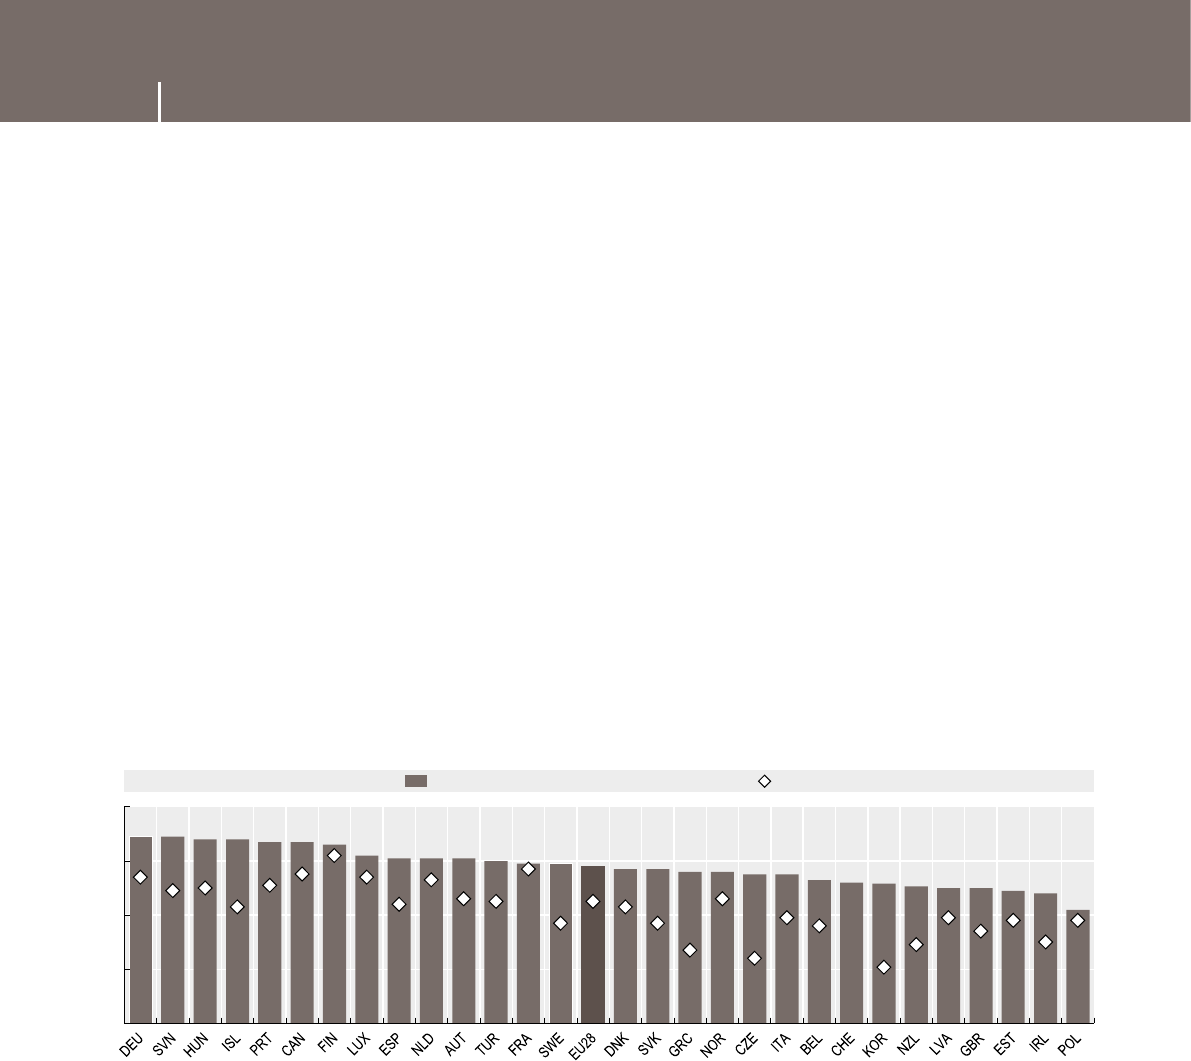
MEASURING THE DIGITAL ECONOMY: A NEW PERSPECTIVE © OECD 201496
3. GAP PAGE 3. GAP PAGE
3.11 ICT and health
Source: OECD, ICT Database and Eurostat, Information Society Statistics. See chapter notes.
1 2 http://dx.doi.org/10.1787/888933148446
Individuals who searched for health-related information online, 2008 and 2013
As a percentage of individuals who used the Internet in the last three months
0
20
40
60
80
%2013 2008
Why do we need indicators?
Governments today have recognised the large-scale changes that are made possible by health ICTs and in response
they are developing approaches to leverage these technologies to pursue a range of health system reforms, such as
primary care renewal and results-based nancing. While the potential gains from greater use of these technolo-
gies have been apparent for years, most countries are still facing major implementation and adoption challenges.
This highlights the large gap between what is possible and where we are now, with little known about how to fully
leverage ICTs to improve the health and wellness of the population. Data on successful adoption and use across
countries is therefore an essential learning tool for policy development in this area.
What are the challenges?
Many countries are looking to learn from others’ successes and failures to inform their own policy development.
This requires a shared understanding of ICT denitions in health systems as well as common approaches to
measuring adoption and impact that take into account inter-country difference in their pace of ICT deployment.
Over the past decade, there has been a rising interest across countries to monitor ICT adoption in health systems
which led to a proliferation of surveys of varying quality and utility. These surveys were sometimes conducted
by ofcial government statistical agencies, and more often by academic entities and private-sector collection
agencies funded by government health departments (OECD, 2010). Most surveys were run as standalone surveys,
on an ad-hoc basis and with a main focused on the ICT adoption in the primary care sector.
National statistical ofces typically limit the collection of data on the use of ICTs for health purposes to their
surveys of ICT use by households and individuals. The available data show an upward trend in individuals’ health-
related ICT use in almost all countries over the recent period.
While the collection of such data is rather straightforward, current surveys remain limited in terms of the types
of health-related online activities undertaken by individuals and on the wider adoption and use of ICTs by health
systems. The OECD has undertaken two initiatives to address this limitation.
The OECD Model Survey on ICT Access and Usage by Households and Individuals has been revised in 2014 and
now contains specic questions on various health-related activities carried out online (e.g. participating in social
networks on health and wellness, asking medical advice, buying medicine etc.) including via apps.
Additionally, in 2008, the OECD launched a multi-stakeholder initiative to develop a robust measurement framework
and comparable cross-national measures on ICT adoption and use in health systems. Three critical conclusions
emerged from this work. First, one of the key challenges in achieving comparable international measures is the
need to accommodate countries that are at different levels of ICT diffusion and progress towards achieving their
broader e-health goals. In particular, advanced countries are unlikely to devote substantial resources to collecting
data on the availability of ICTs if their policy needs are focused on effective use for better health outcomes.
Organising measures along a continuum, starting from ICT availability, moving next towards effective use,

MEASURING THE DIGITAL ECONOMY: A NEW PERSPECTIVE © OECD 2014 97
3. GAP PAGE 3. GAP PAGE
3.11 ICT and health
and ending with measuring outcomes and impact on population health allows all countries to participate in
thebenchmarking process (Adler-Milstein et al., 2013; Ronchi et al., 2013).
Second, OECD experience with measurement of ICT usage indicates that model surveys that comprise separate,
self-contained modules are more exible and adaptable to rapidly changing technological and policy environ-
ments. The use of core modules (as an add-on to existing national surveys or as a standalone survey) allows
measurement on an internationally comparable basis. Additional modules and new measures can be added to
respond to evolving or country-specic policy needs in this area.
Third, a key challenge to a model survey is to ensure that the terminology has comparable meaning across different
countries, and that when individual countries make changes, they are done in ways that preserve this compara-
bility. To this end, the OECD focused on developing indicators using a functionality-based approach (i.e. on core
types of clinical and other activities that are supported by electronic systems).
Options for international action
The effort of developing a framework for comparable cross-national measures was accomplished in 2014 with the
publication of the OECD Guide to Measuring ICTs in the Health Sector (OECD, 2014) which has two primary components.
The rst is a model survey in which each module shows sample questions with an accompanying glossary containing
explanations of key terms. The second component is a methodological guide to aid implementation and promote
validity and comparability of resulting benchmark measures. The initial set of benchmark measures included in the
Guide is at present focused on four areas related to current policy demand across countries:
• Provider-centric electronic records systems: These systems are used by healthcare professionals to store and
manage patient health information and data, and include functionalities that support the care delivery process.
Examples include electronic medical records, EHRs and electronic patient records.
• Patient-centric electronic records systems: These systems are used mostly by patients and their families
toaccess and manage their health information and organise their healthcare. Examples include personal health
records, patient portals and other patient-centric electronic records.
• Health information exchange: This area entails the process of electronically transferring (or aggregating and
enabling access to) patient health information and data across provider organisations. Examples include
thee-transfer of patient data between ambulatory care providers or the transmission of prescriptions from
theprovider to a pharmacy.
• Telehealth: This programme encompasses the broad set of technologies that support care between patients
and providers, or among providers, who are not co-located. Examples include video-mediated consultations
between physicians and patients, remote home monitoring of patients and teleradiology.
Ten pilot countries (Brazil, Canada, Finland, Germany, Israel, Korea, the Netherlands, Switzerland, theUnitedKingdom
and the United States) are currently testing the OECD Guide to Measuring ICTs in the Health Sector and broad
implementation is expected in the near future.
In parallel, the inclusion of detailed questions on individuals’ use of ICTs for health purposes in the main ICT
usage surveys would shed more light on usage patterns by age, gender or educational attainment. The information
collected through ofcial sources can be augmented with the broader use of Internet-based statistics however, the
collection and use of such data require the development of international statistical standards, close co-operation
between different actors (businesses, Internet intermediaries and national statistical ofces), and a regulatory
framework to preserve user security and privacy.
References
Adler-Milstein, G.R., E. Ronchi, G.R. Cohen, L.P. Winn and A.K. Jha (2013) “Benchmarking health IT among OECD countries: better data for better
policy”. J Am Med Inform Assoc, Vol. 21, No. 1, pp. 111-116.
Buntin, M.B., M.F. Burke, M.C. Hoaglin and D. Blumental (2011), “The benets of health information technology: a review of the recent literature
shows predominantly positive results”, Health Affairs, Vol. 30, No. 3, pp. 464-471.
OECD (2014), OECD Guide to Measuring ICTs in the Health Sector, OECD Publishing, forthcoming.
OECD (2013), ICTs and the Health Sector: Towards Smarter Health and Wellness Models, OECD Publishing. Doi: http://dx.doi.org/10.1787/9789264202863-en.
OECD (2010), Improving Health Sector Efciency: The Role of Information and Communication Technologies, OECD Health Policy Studies, OECD Publishing.
Doi: http://dx.doi.org/10.1787/9789264084612-en.
Ronchi, E., J. Adler-Milstein, G.R. Cohen, L.P. Winn and A.K. Jha (2013), “Better Measurements for Realizing the Full Potential of Health Information
Technologies”, in B. Bilbao-Osorio, S. Dutta and B. Lanvin (eds.), The Global Information Technology Report 2013: Growth and Jobs in a Hyperconnected
World, World Economic Forum, Geneva.

MEASURING THE DIGITAL ECONOMY: A NEW PERSPECTIVE © OECD 201498
3. EMPOWERING SOCIETY 3. EMPOWERING SOCIETY
Notes
Notes
3.1 Internet users
General notes:
Unless otherwise stated, a recall period of three months is used for Internet users. For Australia, Canada, Chile,
Japan, Korea, Mexico and New Zealand, the recall period is 12 months. For Switzerland, the recall period is six
months. For the United States, no time period is specied.
For Australia, data refer to 2012/13 (scal year ending in June 2013) instead of 2013, and 2006/07 (scal year ending
in June 2007) instead of 2007.
Additional notes:
Total, daily and mobile Internet users, 2006 and 2013
Notes for data on all users:
For Canada, data refer to 2007 and 2012.
For Chile, Japan and New Zealand, data refer to 2012.
For Israel, data refer to individuals aged 20 or more instead of 16-74 year-olds.
For the United States, data originating from the Census Bureau refer to 2012 and to individuals aged 18 and above.
For Turkey, data refer to 2007 instead of 2006.
Notes for data on all daily users:
“Daily users” relates to Internet users accessing the Internet “at least once a day” for Canada and Japan, and
“every day or almost every day” for Chile, Korea, Mexico and Switzerland. For the United States, data relate to
thepercentage of individuals answering “yes” to the question “Did you use the Internet yesterday?”
For Canada, data originate from the Internet Use Survey and refer to individuals aged 16 and above.
For Japan, data are OECD estimates based on data from the Communication Usage Trend Survey.
Cyprus
The following note is included at the request of Turkey:
“The information in this document with reference to ‘Cyprus’ relates to the southern part of the Island. There
is no single authority representing both Turkish and Greek Cypriot people on the Island. Turkey recognizes
the TurkishRepublic of Northern Cyprus (TRNC). Untila lasting and equitable solution is found within the
context of theUnitedNations, Turkey shall preserve its position concerning the‘Cyprus issue’.”
The following note is included at the request of all the European Union Member States of the OECD and the
EuropeanUnion:
“The Republic of Cyprus is recognized by all members of the United Nations with the exception of Turkey.
The information in this document relates to the area under the effective control of the Government of the
RepublicofCyprus.”
Israel
“The statistical data for Israel are supplied by and under the responsibility of the relevant Israeli authorities
or third party. The use of such data by the OECD is without prejudice to the status of the Golan Heights, East
Jerusalem and Israeli settlements in the West Bank under the terms of international law.

MEASURING THE DIGITAL ECONOMY: A NEW PERSPECTIVE © OECD 2014 99
3. EMPOWERING SOCIETY 3. EMPOWERING SOCIETY
Notes
For the United States, data originate from the PEW Internet Project.
Notes for data on mobile users:
Unless otherwise stated, mobile Internet users relate to individuals who used a mobile phone (or a smartphone)
to access the Internet away from home or away from work.
For Canada, data originate from the Internet Use Survey and relate to the percentage of individuals aged 16 or
more using Internet with a wireless handheld device.
For Korea, data originate from the Survey on the Internet Usage and refer to individuals aged 3 and above. Mobile
Internet users relate to individuals who have used a mobile phone, smartphone, handheld device or tablet to access
the Internet away from home via a wireless broadband connection. The recall period is the last three months.
For New Zealand and Switzerland, the term “mobile Internet users” relates to individuals who have used a mobile
phone, smartphone, handheld device or a tablet to access the Internet away from home via a wireless broadband
connection. The recall period is the last three months for Switzerland and the last 12 months for New Zealand.
Internet users by age, 16-24 and 65-74 year-olds, 2013
For Australia, data refer to individuals aged 65 and above instead of 65-74 year-olds.
For Canada, Chile, Japan, New Zealand and the United States, data refer to 2012.
For Switzerland, data refer to individuals aged 20-29 instead of 16-24 year-olds, and to individuals aged 70 years
old and more instead of 65-74 year-olds.
For Israel, data refer to individuals aged 20 and above instead of 16-74 year-olds, and to individuals aged 20-24
instead of 16-24 year-olds.
For the United States, data originate from the Census Bureau, include all individuals aged 15 and more. Thecategory
“16-24 year-olds” refers to individuals aged 18-34 and the category “65-74 year-olds” refers to individuals aged 65
and above.
Internet users among 55-74 year-olds by educational attainment level, 2013
For Australia, data refer to individuals aged 65 and above instead of 65-74 year-olds.
For Canada and Chile, data refer to individuals aged 65-74, and for Japan, to individuals aged 60-69.
For Chile, Japan and New Zealand, data refer to 2012.
For Israel and the United States, data refer to 2011.
For Australia, Israel, Korea and New Zealand, low levels of educational attainment include the middle level of
educational attainment.
The breakdown by level of education is not available for Canada and Japan, and corresponds to the OECD estimate
for the United States.
3.2 Online activities
General notes:
Unless otherwise stated, a recall period of three months is used for Internet users. For Australia, Canada, Chile,
Japan, Korea, Mexico and New Zealand, the recall period is 12 months. For Switzerland, the recall period is six
months. For the United States, no time period is specied.
Additional notes:
The diffusion of selected online activities among Internet users, 2012-13
For countries in the European Statistical System, data refer to 2012 for gaming, movies, audio, web-based radio/
television, medical appointments online and content creation. For online purchases and e-government categories,
the recall period is 12 months instead of three months and data relate to individuals who used the Internet in
thelast 12 months instead of three months.
For Australia, Canada, Chile, Japan and New Zealand, data refer to 2012.
For Australia, Chile and New Zealand, values for “Any interaction with public authorities” might be slightly
underestimated, as data relate to “obtaining information from public authorities”.

MEASURING THE DIGITAL ECONOMY: A NEW PERSPECTIVE © OECD 2014100
3. EMPOWERING SOCIETY 3. EMPOWERING SOCIETY
Notes
For Japan, data refer to individuals aged 15-69. Data for the e-purchase category correspond to a recall period of
12 months. Social networking includes constructing/updating websites and blogs, viewing/posting to forums and
chat sites, and using video posting/sharing sites.
The diffusion of Internet banking, 2013
For Australia, Internet banking relates to “paying bills or banking online”. Data for highest and lowest quartiles are
OECD estimates based on original quintile data.
For Canada, data refer to 2012 and relate to Internet users aged 16 and over conducting electronic banking activities
(paying bills, viewing statements, transferring funds between accounts).
For Chile, data refer to 2009.
For Israel, data refer to all individuals aged 20 and over (instead of 16-74 year-olds) using the Internet for paying bills.
For Korea, households in the lowest quartile have an income of less than 2 million wons and those in the highest
quartile have an income of more than 4 million wons.
For New Zealand, data refer to 2012.
For Switzerland, data refer to 2010.
For the United States, data originate from the Federal Reserve Board (2013).
Quartiles data are not available for Chile, Ireland, Israel, Switzerland, Turkey, the United Kingdom and
theUnitedStates.
3.3 User sophistication
General notes:
Data refer to the following activities: using e-mail, telephoning or video calling over the Internet, participating in
social networks, nding information about goods or services, reading online news, online banking, using services
related to travel and accommodation, interacting online with public authorities, selling goods or services, buying
physical goods, buying digital content and buying services.
For Korea, data originate from special tabulations by KISA and refer to 2012. Due to lack of full correspondence
with the list of activities provided in the Community Survey on ICT Usage in Households and by Individuals
(Eurostat), the number of activities performed might be underestimated.
3.6 ICTs in education
Individuals who attended an online course, 2007 and 2013
For Canada, Chile, Japan and Korea, data refer to 2012.
For Canada, data refer to formal education, training or school work.
For Japan, data relate to individuals aged 15-69 (instead of 16-74 year-olds) who used the Internet in the last 12 months.
For New Zealand, data refer to 2006.
For Poland, data refer to 2008 and 2011.
3.7 ICT skills in the workplace
Computer use at work, 2012 and;
ICT skills use at work, 2012
GBR data point relates to England only.
3.8 E-consumers
General notes:
For Australia, data refer to 2012/2013 (scal year ending in June 2013) instead of 2013. For 2007, data refer to
2006/2007 (scal year ending in June 2007), and to individuals aged 15 and over instead of 16-74 year-olds.

MEASURING THE DIGITAL ECONOMY: A NEW PERSPECTIVE © OECD 2014 101
3. EMPOWERING SOCIETY 3. EMPOWERING SOCIETY
Notes
For Canada, data refer to 2012 and relate to individuals who ordered goods or services over the Internet from any
location (for personal or household use).
For Chile, data refer to 2009 and 2012.
For Japan, data refer to 2012 and to individuals aged 15-69 instead of 16-74 year-olds.
Diffusion of online purchases, including via handheld devices, 2007 and 2013
For Israel, data refer to all individuals aged 20 and over who used the Internet for purchasing all types of goods or
services.
For Korea, the gure shows OECD estimates based on the Survey on the Internet Usage 2012. Data refer to the
population aged 12 or more. In 2013, the share of individuals buying via handheld devices reached 35.5%.
For New Zealand, data refer to 2006 and 2012 and relate to individuals who made a purchase through the Internet
for personal use, which required an online payment.
For Switzerland, data refer to 2005 instead of 2007.
For the United States, data originate from May 2011 and September 2007 PEW Internet Surveys and cover individuals
aged 18 or more.
Individuals who purchased online in the last 12 months, by age class, 2013
For Chile, in 2009, no time period is specied (instead of last 12 months).
For Israel, data relate to online purchases in the last three months and refer to 2006 instead of 2007; data cover all
individuals aged 20 and over instead of 16-74 year-olds.
For Japan, data refer to individuals aged 20-39 instead of 25-44 year-olds, and 60-69 instead of 65-74 year-olds.
For New Zealand, data refer to 2006 instead of 2007 and relate to e-purchases for personal use only requiring an
online payment.
For Switzerland, data relate to online purchases in the last six months and to 2005 instead of 2007.
For the United States, data originate from May 2011 and August 2006 PEW Internet Surveys and refer to Internet
users aged 18 and over who “ever purchased a product online”. The category “16-24 year-olds” refers to individuals
aged 18-24 only.
Online purchasers by selected types of products, 2013
For Australia, Chile, Japan, Korea and Mexico, data are not available for some of the selected types of products.
For Australia, data refer to the following categories: Food, groceries or alcohol; CDs, music, DVDs, videos, books or
magazines; travel, accommodation, memberships and tickets of any kind.
For Canada, data relate to the following categories: Ordering food or beverages (e.g. specialty foods or wine, pizza
delivery); ordering music (e.g. CDs, MP3) or videos or DVDs, tickets for entertainment events (e.g. concerts, movies,
sports), books/magazines/newspapers and making travel arrangements (e.g. hotel reservations, travel tickets,
rental cars). Data for the category “Books/magazines/newspapers/e-learning material” do not explicitly include
e-learning material.
For Japan, Internet users buying online include individuals conducting nancial transactions online.
For Switzerland, data refer to 2010.
3.10 E-government use
Individuals using e-government services, 2010 and 2013
Unless otherwise stated, “sending lled forms” relates to “sending lled forms to public authorities or public
services over the Internet for private purposes in the last 12 months” for countries in the European Statistical
System, and to “completing/lodging lled in forms from government organisations’ websites in the last 12 months”
for other countries.
For Australia, data refer to 2012/2013 (scal year ending in June 2013) instead of 2013, and to individuals aged 15
and over instead of 16-74 year-olds.

MEASURING THE DIGITAL ECONOMY: A NEW PERSPECTIVE © OECD 2014102
3. EMPOWERING SOCIETY 3. EMPOWERING SOCIETY
Notes
For Canada, data refer to 2012 for obtaining information, and to 2009 for sending lled forms. Obtaining information
relates to visits or interactions with Canadian municipal, provincial or federal government websites.
For Chile, Japan, Korea and New Zealand, data refer to 2012.
For Israel, data refer to 2009, and to all individuals aged 20 and over (instead of 16-74) who used the Internet for
obtaining services online from government ofces, including downloading or completing ofcial forms.
For New Zealand, data refer to individuals who have accessed a New Zealand local or central government website
in the last 12 months to download or complete a form.
For Switzerland, data refer to 2010.
Problems in using e-government services (left-hand panel) and satisfaction (right-hand panel), 2013
“At least one problem” category includes website technical failure, unclear or outdated information, lack of support
(online or ofine), and other problems (unspecied).
Businesses using e-government services, 2010 and 2012
Unless otherwise stated, sector coverage consists of all activities in manufacturing and non-nancial market
services. Only enterprises with ten or more persons employed are considered.
For Australia, Korea, Mexico and New Zealand, data for sending lled forms refer to the proportion of businesses
interacting online with government organisations to complete/submit forms electronically (excluding any
interaction via e-mails).
For Canada, Korea, Mexico, New Zealand and Switzerland, data for obtaining information/forms refer to the
proportion of businesses interacting online with government organisations for obtaining information/downloading
forms (excluding any interaction via e-mails).
For Australia, data refer to the scal year ending 30 June 2012 (2011/12) instead of 2012, and the scal year ending
30 June 2010 (2009/10) instead of 2010. The total includes Agriculture, forestry and shing.
For Canada, data for returning completed forms refer to enterprises that completed or submitted taxation forms
online.
For Mexico, data refer to 2008 and to businesses with 20 or more persons employed.
For Switzerland, data refer to 2011 and to businesses with ve or more persons employed.
3.11 ICT and health
Individuals who searched for health-related information online, 2008 and 2013
For Canada and New Zealand, data refer to individuals who used the Internet in the last 12 months with a recall
period of 12 months instead of three months.
For Canada, data refer to 2007 and 2012 and to all individuals aged 16 and over instead of 16-74 year-olds in 2007.
For Korea, data in 2013 refer to a recall period of 12 months instead of three months.
For New Zealand, data refer to 2006 and 2012.
For Switzerland, data refer to 2010.

MEASURING THE DIGITAL ECONOMY: A NEW PERSPECTIVE © OECD 2014 103
3. EMPOWERING SOCIETY 3. EMPOWERING SOCIETY
References
References
Adler-Milstein, G.R., E. Ronchi, G.R. Cohen, L.P. Winn and A.K. Jha (2013) “Benchmarking health IT among OECD
countries: better data for better policy”. J Am Med Inform Assoc, Vol. 21, No. 1, pp. 111-116.
Buntin, M.B., M.F. Burke, M.C. Hoaglin and D. Blumental (2011), “The benets of health information technology:
areview of the recent literature shows predominantly positive results”, Health Affairs, Vol. 30, No. 3, pp. 464-471.
Federal Reserve Board (2013), Consumers and Mobile Financial Services 2013, Washington, DC.
ITU (2010), Child Online Protection: Statistical Framework and Indicators, Geneva, ITU.
Livingstone, S., L. Haddon, A. Görzig, and K. Ólafsson (2011), Risks and Safety on the Internet: The Perspective of
European Children. Full Findings and Policy Implications from the EU Kids Online Survey of 9-16 Year-olds and Their Parents
in 25Countries, EU Kids Online Deliverable D4, EU Kids Online Network, London, eprints.lse.ac.uk/33731.
OECD (2014a), OECD Guide to Measuring ICTs in the Health Sector, OECD Publishing, forthcoming.
OECD (2014b), PISA 2012 Results: What Students Know and Can Do (Volume I, Revised edition, February 2014): Student
Performance in Mathematics, Reading and Science, PISA, OECD Publishing. Doi: http://dx.doi.org/10.1787/9789264208780-en.
OECD (2014c), “The OECD Model Survey on ICT Access and Usage by Households and Individuals”, Working Party
on Measurement and Analysis of the Digital Economy, DSTI/ICCP/IIS(2013)1/FINAL, OECD, Paris.
OECD (2014d), “The OECD Model Survey on ICT Usage by Businesses”, Working Party on Measurement and Analysis
of the Digital Economy, DSTI/ICCP/IIS(2013)2/FINAL, OECD, Paris.
OECD (2013a), ICTs and the Health Sector: Towards Smarter Health and Wellness Models, OECD Publishing. Doi: http://
dx.doi.org/10.1787/9789264202863-en.
OECD (2013b), OECD Skills Outlook 2013: First Results from the Survey of Adult Skills, OECD Publishing. Doi: http://
dx.doi.org/10.1787/9789264204256-en.
OECD (2012), Recommendation of the Council on the Protection of Children Online, acts.oecd.org/Instruments/
ShowInstrumentView.aspx?InstrumentID=272.
OECD (2011a), OECD Guide to Measuring the Information Society 2011, OECD Publishing. Doi: http://dx.doi.
org/10.1787/9789264113541-en.
OECD (2011b), “The Protection of Children Online: Risks Faced by Children Online and Policies to Protect Them”,
OECD Digital Economy Papers, No. 179, OECD Publishing. Doi: http://dx.doi.org/10.1787/5kgcjf71pl28-en.
OECD (2010), Improving Health Sector Efciency: The Role of Information and Communication Technologies, OECD Health
Policy Studies, OECD Publishing. Doi: http://dx.doi.org/10.1787/9789264084612-en.
Ronchi, E., J. Adler-Milstein, G.R. Cohen, L.P. Winn and A.K. Jha (2013), “Better Measurements for Realizing theFull
Potential of Health Information Technologies”, in Bilbao-Osorio B., S. Dutta and B. Lanvin (eds.), The Global Information
Technology Report 2013: Growth and Jobs in a Hyperconnected World, World Economic Forum, Geneva.

MEASURING THE DIGITAL ECONOMY: A NEW PERSPECTIVE © OECD 2014 105
Chapter 4
UNLEASHING INNOVATION
4.1 • ICT and R&D ...................................................................................................................................106
4.2 • Innovation in ICT industries ............................................................................................108
4.3 • E-business .........................................................................................................................................110
4.4 • Unleashing the potential of micro-data ................................................................112
4.5 • ICT patents ....................................................................................................................................... 114
4.6 • ICT designs .......................................................................................................................................116
4.7 • ICT trademarks ............................................................................................................................118
4.8 • Knowledge diffusion ................................................................................................................120

MEASURING THE DIGITAL ECONOMY: A NEW PERSPECTIVE © OECD 2014106
4. UNLEASHING INNOVATION 4. UNLEASHING INNOVATION
Key ndings
ICT technologies are key enablers of innovation
throughout all sectors of the economy. In most OECD
countries, information industries account for the
largest share of the business expenditure on R&D
(BERD), amounting to about 20-25% of total BERD and
0.2-0.3% of GDP in most countries.
In Finland, Israel, Japan, Korea and the United States,
the sector accounts for 30% to over 50% of BERD, and
ICT BERD alone represents between about 0.8% to more
than 1.5% of GDP, reecting both the high research
intensity of these economies and of the sector itself.
In general, ICT R&D expenditures tend to be concen-
trated in manufacturing, even when ICT goods are
produced offshore. Telecommunication services account
for a lower share in ICT R&D in most countries except
Portugal, while IT services have gained ground in
Denmark and Ireland. R&D expenditure on publishing
and audio-visual activities (which includes some
software development) is also substantial in Ireland.
BERD intensity (business R&D/value added) in ICT
manufacturing for many OECD countries ranges from
20% to about 35%, with a tendency to grow. In 2011, this
share reached an exceptionally high gure in Finland
as Nokia’s value added fell abruptly.
The lower-than-average values in countries such
as Italy and Spain reect a specialisation in low
R&D intensity segments, and in others such as
the Czech Republic, Estonia or Hungary reect their
nature as production centres at the lower end of
thevalue chain.
BERD intensity in information and communication
services is also growing in many countries, but
generally ranges from 2-3% to 5-6% of value added.
In2011, this share was above 6% in Denmark, followed
by the United States and Portugal, as opposed to
Hungary, Italy and Switzerland which ranked below 2%.
The level of BERD intensity in information and
communication services, much lower than in ICT
manufacturing, is partly linked to the weight of
network infrastructure on value added in telecommu-
nication services, and to the well-known difculties in
unbundling the R&D component from the activity of
software development in IT services.
ICT BERD intensity is generally correlated with the
relative share of ICT-related patents (see 4.5).
DID YOU KNOW?
In the OECD area, information industries account
for about 25% of total business expenditure
on research and development.
Denitions
Business enterprise expenditure on R&D (BERD) includes all
expenditures performed by enterprises, irrespective of
the sources of funding. They are generally classied by
the main economic activity of the enterprise in terms
of turnover.
The OECD in 2007 dened the information economy
sector (see the OECD Guide to Measuring the Information
Society 2011) as the aggregate combining ICT and
digital media and content industries. Here these are
all referred as information industries. This aggregate
includes ISIC Rev.4 Division 26 (Manufacture of
computer, electronic and optical products) and
Section J (Information and communication services),
consisting of Divisions 58-60 (Publishing and broad-
casting industries), 61 (Telecommunications) and 62-63
(Computer programming and information services).
ICT trade and repair activities (in Groups 465 and 951)
are also included, but are not considered here due to
issues of data availability.
BERD intensity gures are reported in terms of percentage
points of value added for total economy (i.e. GDP) and
for the corresponding industries.
Measurability
There is considerable diversity in the methods countries
use to report R&D by economic activity. These include
reporting on the basis of the enterprise’s main activity,
the product for which R&D is intended or a mixture
of both. The ongoing revision of the Frascati Manual
(OECD,2002) attempts to promote greater uniformity of
R&D data reporting, although information and commu-
nication services pose particular issues. In addition,
statistics on BERD by industry are not always available
at the required level of detail due to issues related to
condentiality and robustness of estimates.
The coding of enterprises by industry is another source
of concern, due to changes in the main sector of activity
of large R&D performers (e.g. when physical production
is outsourced), and to the lack of attribution for R&D
performed by specialised subsidiaries (i.e. rms whose
main activity is to provide R&D services for others),
which might lead to an unknown underestimation of
industry-level intensities. Finally, intensity indicators
suffer from variability of economic indicators (particu-
larly value added) through the business cycle.
4.1 ICT and R&D
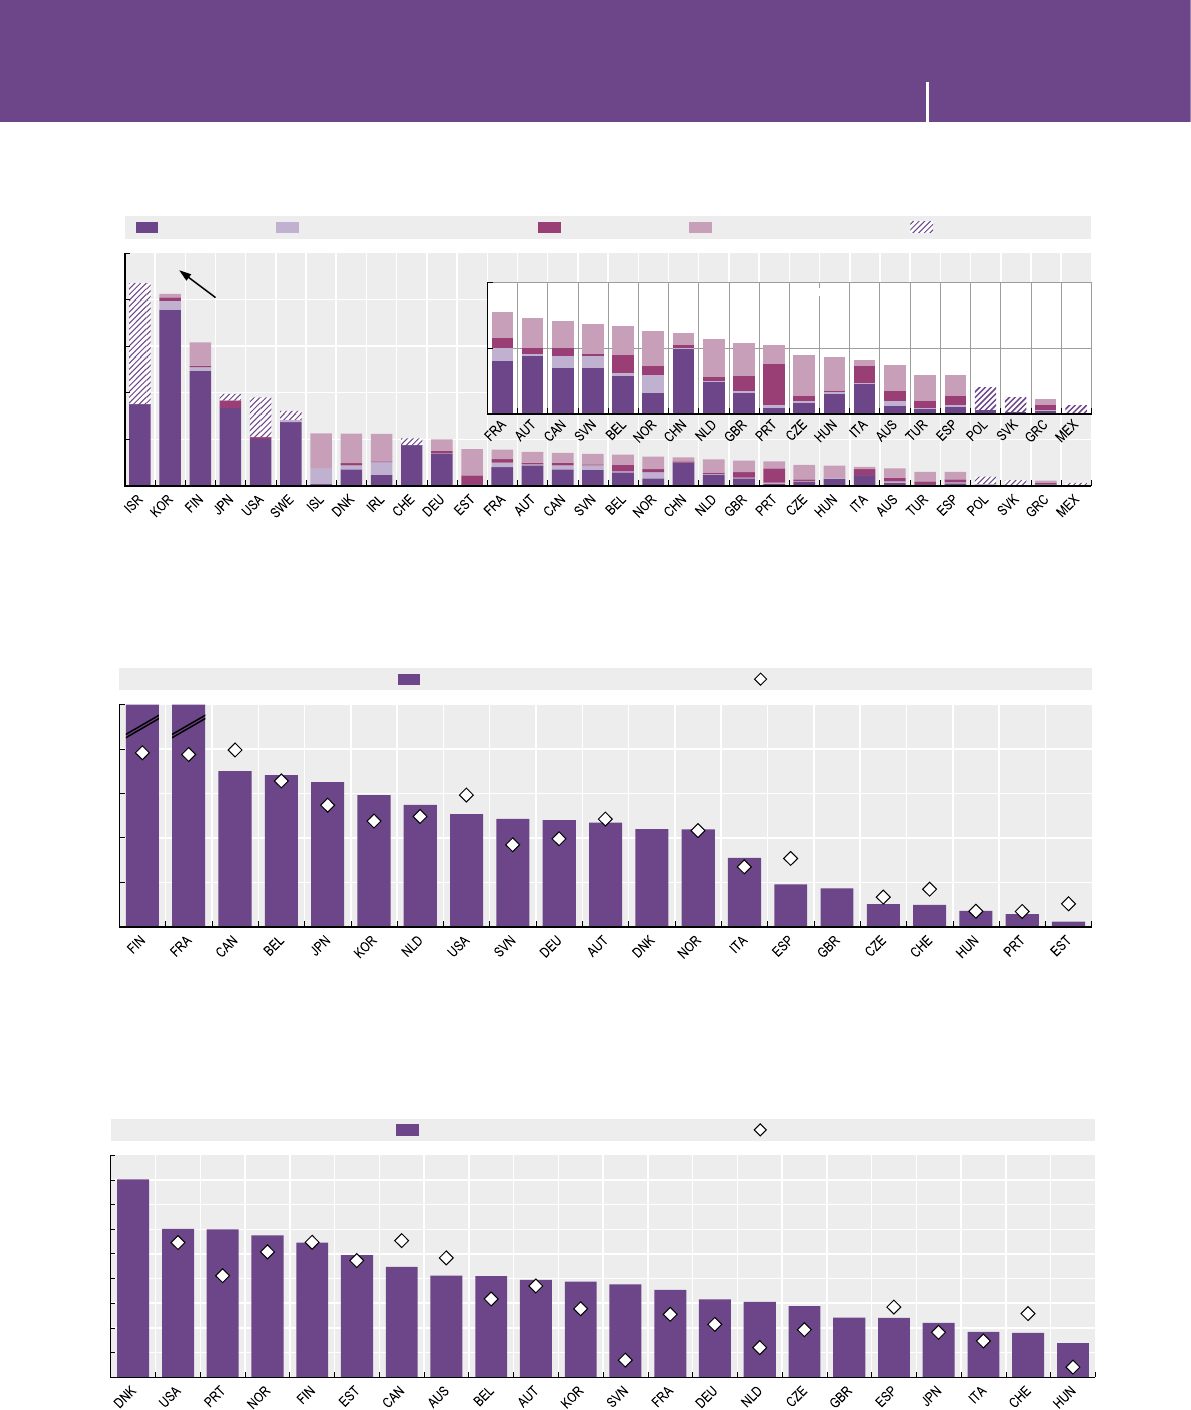
MEASURING THE DIGITAL ECONOMY: A NEW PERSPECTIVE © OECD 2014 107
4. UNLEASHING INNOVATION 4. UNLEASHING INNOVATION
Source: OECD, ANBERD and RDS Databases, www.oecd.org/sti/anberd, www.oecd.org/sti/rds, April 2014. See chapter notes.
1 2 http://dx.doi.org/10.1787/888933148452
Business R&D performed by information industries, 2011 or more recent year available
As a percentage of GDP and of total business expenditure on R&D
0
0.4
0.8
1.2
1.6
2.0
%
BERD performed by information industries
as a percentage of total BERD
49 53 51 30 40 28 32 23 39 19 20 25 22 15 31 14 18 29 20 20 19 29 18 20 24 12 28 17 23 14 19 14
ICT manufacturing Publishing, audiovisual and broadcasting Telecommunications IT and other information services ICT services not allocated
0
0.2
0.4 Magnified
Source: OECD computations based on OECD, ANBERD Database, www.oecd.org/sti/anberd; OECD, STAN, ISIC Rev.4 Database,
www.oecd.org/sti/stan and national sources, July 2014. See chapter notes.
1 2 http://dx.doi.org/10.1787/888933148465
Business R&D intensity in ICT manufacturing industries, 2007 and 2011
R&D expenditure as a percentage of value added
0
10
20
30
40
50
%116 62
2011 2007
Source: OECD computations based on OECD, ANBERD Database, www.oecd.org/sti/anberd; OECD, STAN, ISIC Rev.4 Database,
www.oecd.org/sti/stan and national sources, July 2014. See chapter notes.
1 2 http://dx.doi.org/10.1787/888933148472
Business R&D intensity in information and communication service industries, 2007 and 2011
R&D expenditure as a percentage of value added
0
1
2
3
4
5
6
7
8
9
%2011 2007
4.1 ICT and R&D

MEASURING THE DIGITAL ECONOMY: A NEW PERSPECTIVE © OECD 2014108
4. UNLEASHING INNOVATION 4. UNLEASHING INNOVATION
Key ndings
Innovation is acknowledged as an important source of
competitiveness for businesses. It can do so in many
ways: by reducing production costs, by enhancing
existing products and leading to the creation of new
ones, or by presenting and selling products more
effectively.
Most OECD countries collect information, through
innovation surveys, on the innovativeness of sectors by
type of enterprises, on the different types of innovation
and on various aspects of the development of an
innovation, such as the objectives, the sources of infor-
mation, the public funding, the innovation expendi-
tures etc.
According to the 2010 Community Innovation Survey
(CIS) results, the share of innovative enterprises in ICT
industries is by far higher than for other industries in
both ICT manufacturing and IT services, with differ-
ences of about 20percentage points on average.
In addition, rms these sectors have a greater likelihood
of combining different modes of innovation (product
and/or process with organisational and/or marketing
innovations).
With a few exceptions, country rankings are
comparable in terms of innovation activity by ICT
manufacturing and IT services rms. Austria, Belgium,
Germany, Iceland, Luxembourg and Portugal lead in
ICT innovating rms for both manufacturing and
IT services. In Denmark, France and Sweden, about
80% ICT manufacturing enterprises are innovators,
while ICT innovators in the Netherlands are mostly
found in IT services.
While not all of the above countries are among
innovation leaders in the broader array of manufac-
turing and innovation core service activities, patterns
of ICT innovation activity are often similar to those of
ICTspecialisation.
A large proportion of innovative enterprises are also
engaged in in-house R&D activities. In the ICT sector
industries, across all countries for which data are
available except the SlovakRepublic, these shares are
far higher than prevailing levels in manufacturing and
services.
This is particularly evident for innovative enterprises
in ICT manufacturing in Denmark, Latvia, Portugal and
Spain. IT service activities are relatively R&D intensive
with respect to innovation core service activities,
especially in Belgium, Germany, Latvia and Portugal.
DID YOU KNOW?
About 70% of rms in ICT industries introduce
innovations, against an average of 50% in
thebusiness enterprise sector.
Denitions
TheOslo Manual (OECD/Eurostat, 2005) denes innovation
as “the implementation of a new or signicantly
improved product (good or service) or process, a new
marketing method, or a new organisational method
in business practices, workplace organisation or
external relations”. An innovative rm is one that has
implemented an innovation during the period under
review. For product and process innovation, rms with
ongoing/abandoned innovation activities are also
included. Innovation activities are “all scientic, tech-
nological, organisational, nancial and commercial
steps” aimed at the implementation of innovations.
Some innovation activities are themselves innovative.
Innovation activities also include R&D that is not directly
related to the development of specic innovations.
Information technology (IT) services include Publishing,
Computer programming and consultancy, and Infor-
mation service activities under ISICRev.4 Divisions58,
62 and63.
Innovation core service activities include ISIC Rev.4
DivisionsG46, H, J58, J61, J62, J63, K and M71.
Measurability
The most recent wave of CIS surveys (2010) offers
comparable information on 22 OECD countries and
Latvia. Data refer to the population of rms in manu-
facturing and selected business services.
Not all OECD countries survey non-R&D innovation
activities and, despite ongoing harmonisation based
on the Oslo Manual, national innovation surveys still
present signicant differences in methodology and
design. In particular, some collect information on
innovation as part of business R&D surveys.
Depending on survey features and cultural aspects,
innovation variables are not uniformly interpreted by
respondents, especially for those requiring a subjective
assessment. Oslo-based surveys follow a subject-based
approach (i.e.the unit of analysis is the rm, not the
innovation), and therefore request information about
the use of a particular knowledge sourcing strategy
across one or more innovations. Innovations can also
be mainly developed outside and implemented by the
innovating rm.
4.2 Innovation in ICT industries
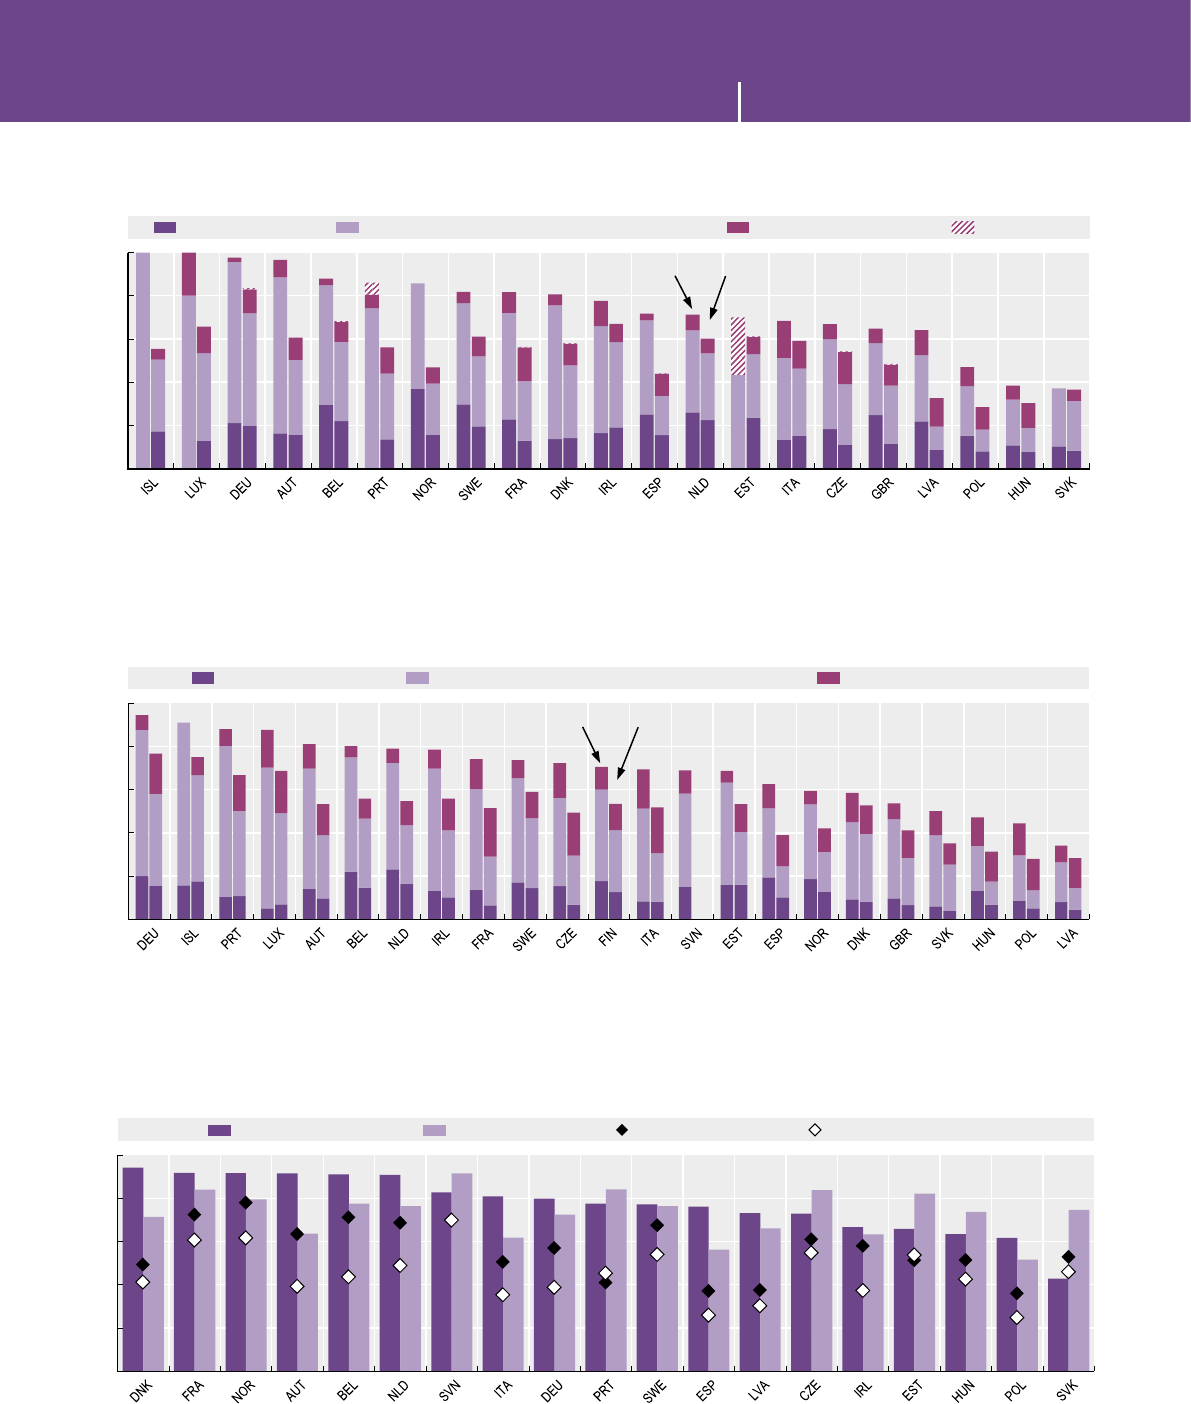
MEASURING THE DIGITAL ECONOMY: A NEW PERSPECTIVE © OECD 2014 109
4. UNLEASHING INNOVATION 4. UNLEASHING INNOVATION
Source: OECD computations based on Eurostat, Community Innovation Survey (2010), June 2014.
1 2 http://dx.doi.org/10.1787/888933148482
Innovative enterprises in ICT manufacturing and total manufacturing, by type of innovation, 2010
As a percentage of enterprises with ten or more persons employed
0
20
40
60
80
100
%Product or process only Product or process and marketing or organisational innovation Marketing or organisational only Not specified
ICT manufacturing Total manufacturing
Source: OECD computations based on Eurostat, Community Innovation Survey (2010), June 2014. See chapter notes.
1 2 http://dx.doi.org/10.1787/888933148493
Innovative enterprises in IT services and innovation core service activities, by type of innovation, 2010
As a percentage of enterprises with ten or more persons employed
0
20
40
60
80
100
%Product or process only Product or process and marketing or organisational innovation Marketing or organisational only
IT services Innovation core service activities
Source: OECD computations based on Eurostat, Community Innovation Survey (2010), June 2014.
1 2 http://dx.doi.org/10.1787/888933148502
Engagement in in-house R&D activities in ICT industries, total manufacturing and innovation core services, 2010
As a percentage of enterprises in each industry
0
20
40
60
80
100
%ICT manufacturing IT services Total manufacturing Innovation core service activities
4.2 Innovation in ICT industries

MEASURING THE DIGITAL ECONOMY: A NEW PERSPECTIVE © OECD 2014110
4. UNLEASHING INNOVATION 4. UNLEASHING INNOVATION
4.3 E-business
Key ndings
Examination of the comparative diffusion of ICT tech-
nologies in businesses can help to explain uptake
patterns and show how technologies are incorporated
into company production processes.
Almost no business today is run without the help of
ICTs. In 2013, 94% of enterprises had a broadband
connection and more than 75% had a website but only
around 20% conducted e-commerce sales (see 5.6).
The use of more sophisticated ICT technologies was
also less frequent. These include ICT applications used
to manage information ows, where implementation
requires changes in business organisation, and Radio
Frequency Identication (RFID), where uptake is limited
to certain types of businesses.
The speed of adoption depends in some cases on prior
uptake. It took 15 to 20 years for slightly more than
three quarters of enterprises to develop a website,
but only a few years for around 30% of businesses to
become active on social networks.
Inter-country variations are large even for nearly
universal phenomena, such as broadband. Almost
100%of large enterprises have a broadband connection
in all countries. However, there is still considerable
variation in uptake among small enterprises across
countries. In 2013, broadband uptake by small rms was
almost universal in Canada, Denmark, Finland, France,
Iceland, Korea and Switzerland, but below 80% in Greece
and Poland. A sharp rise in uptake (especially among
smaller businesses) was recorded in recent years across
most countries, in particular, in Austria, Denmark, Italy,
Poland, the SlovakRepublic and Slovenia.
Much larger cross-country differences subsist in
adoption and dynamics over time for indicators related
to e-commerce (see 5.6) and to the management of
information ows within companies.
The role of e-business processes in handling internal
information ows can be seen in the diffusion of
enterprise resource planning (ERP) software applica-
tions. In 2013, on average, such technologies were used
to share information by more than 28% of enterprises,
against less than 22% in 2010. ERP software was used
in about 74% of larger (and more complex) enterprises,
but by less than 23% of small rms, for which it is only
recently becoming more affordable.
Adoption rates across countries range between 92%
and 51% for larger enterprises and between 41% and
7% for smaller ones, with Belgium, Finland, Greece,
Sweden and Switzerland leading, and Estonia, Hungary,
Iceland and the UnitedKingdom lagging for enterprises
of all sizes.
DID YOU KNOW?
In 2013, almost all enterprises had a broadband
connection, while slightly less than 30% managed
information ows using ERP software.
Denitions
Data on the diffusion of ICT tools and activities across
countries are computed as the simple average of country
percentage shares (i.e. not weighted by population)
and provide extreme (minimum and maximum) and
quartile values of each distribution. This approach
shows the variability in uptake by enterprises across
countries. The lines between the 1st and 3rd quartile
include the central 50% of country values (i.e. variability
for the 17 OECD countries nearer to the average, when
all are represented).
Broadband includes both xed and mobile connections
with an advertised download rate of at least 256 Mbps.
Supply chain management refers to the use of automated
data exchange (ADE) applications.
Enterprise resource planning (ERP) systems are software-
based tools that can integrate the management of
internal and external information ows, from material
and human resources to nance, accounting and
relations with customers. Here, only sharing of infor-
mation within the rm is considered.
Measurability
Not all OECD countries undertake specic surveys on
ICT usage by businesses. Aside from differences in
the survey vehicle, most of the indicators portrayed
correspond to generic denitions, which can only
proxy ICT tools functionalities and potential uses.
For example, a website may be a static and seldom
updated webpage or a live tool including a shopping
cart and other services (e.g. for order tracking).
For broadband, not all countries reported information
for 2013. In the case of Japan, data do not include leased
lines, used by about 10% of enterprises, and are limited
to larger businesses only (see chapter notes).
Various software tools with different functionalities
fall under the ERP heading but these are not always
reported accurately. Such interpretation differences
cause comparability issues (e.g. the United Kingdom
ranks last in ERP adoption, but high in supply chain
management software). This causes some compara-
bility issues. The sophistication of ERP systems and
their degree of implementation may lead to substantial
changes in the picture of usage.
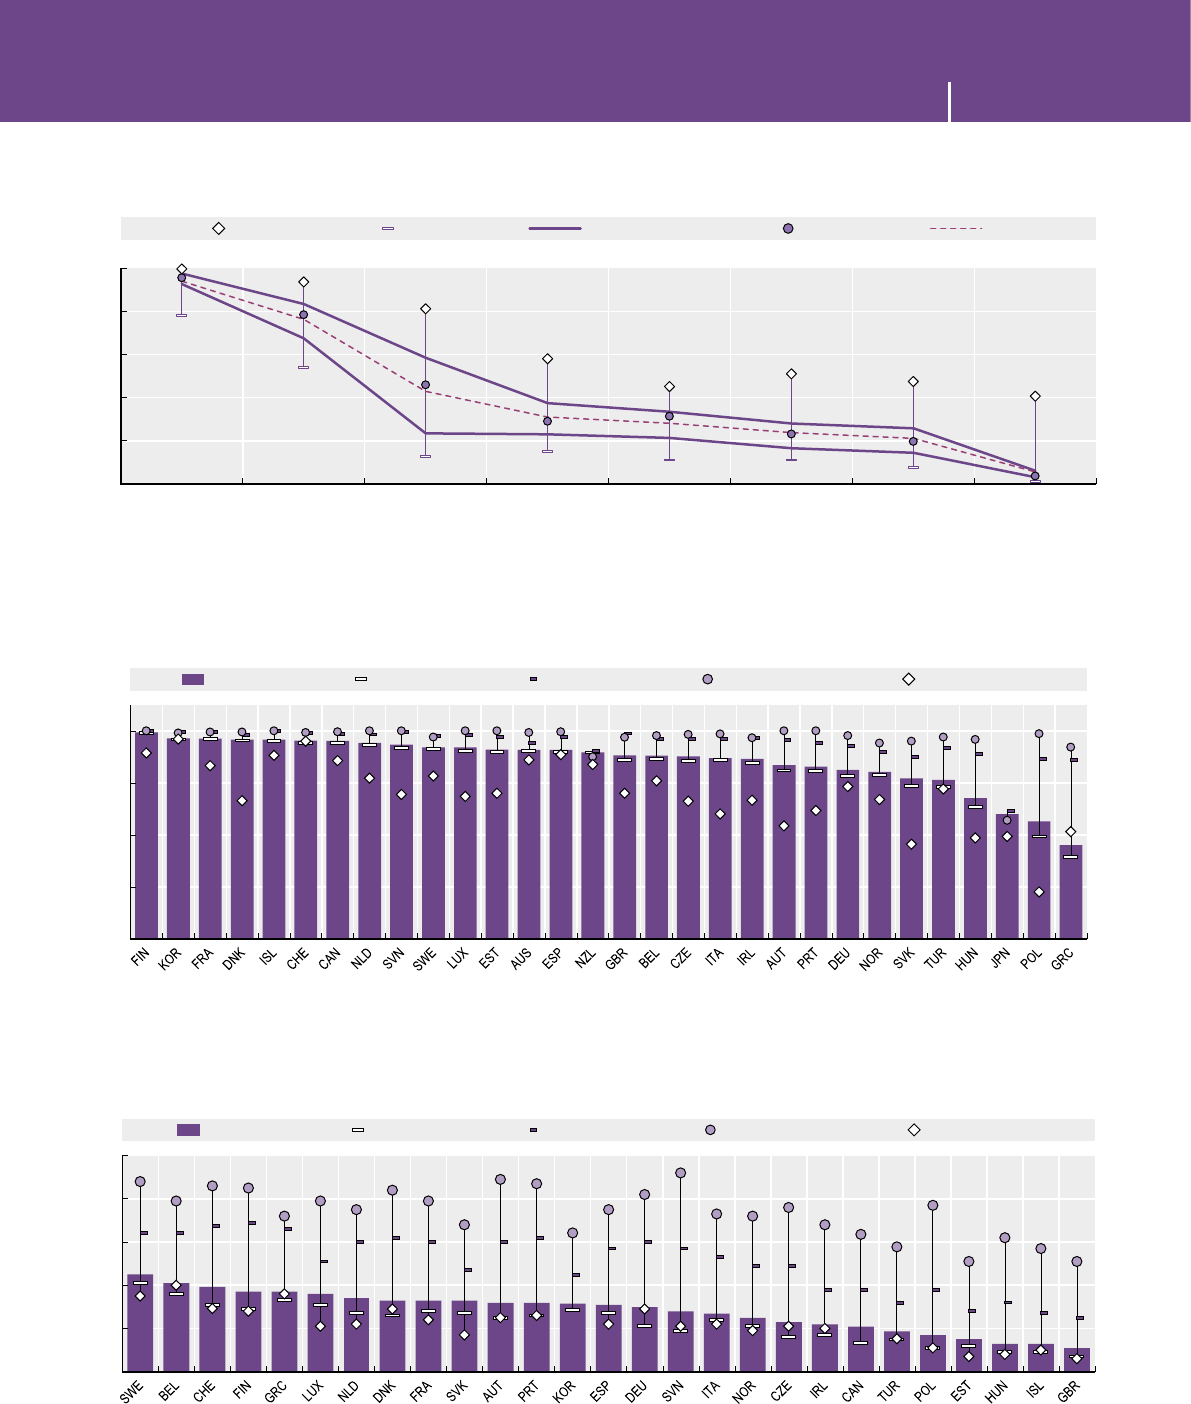
MEASURING THE DIGITAL ECONOMY: A NEW PERSPECTIVE © OECD 2014 111
4. UNLEASHING INNOVATION 4. UNLEASHING INNOVATION
Source: OECD, ICT Database; Eurostat, Information Society Statistics and national sources, July 2014. See chapter notes.
1 2 http://dx.doi.org/10.1787/888933148510
The diffusion of selected ICT tools and activities in enterprises, 2013
Percentage of enterprises with ten or more persons employed
FIN FIN
NZL
ISL
SWE PRT NZL
KOR
GRC
TUR
TUR CZE GBR HUN ITA GBR
0
20
40
60
80
100
%
Broadband Website E-purchases Social network ERP Supply chain management
(ADE)
E-sales RFID
Highest Lowest 1st and 3rd quartiles Median Average
Source: OECD, ICT Database; Eurostat, Information Society Statistics and national sources, July 2014. See chapter notes.
1 2 http://dx.doi.org/10.1787/888933148520
Broadband connectivity, by size, 2010 and 2013
Percentage of enterprises in each employment size class
60
70
80
90
100
%
All enterprises 10-49 50-249 250+ All enterprises, 2010
Source: OECD, ICT Database; Eurostat, Information Society Statistics and national sources, July 2014. See chapter notes.
1 2 http://dx.doi.org/10.1787/888933148530
Use of enterprise resource planning software, by size, 2010 and 2013
Percentage of enterprises in each employment size class
0
20
40
60
80
100
%All enterprises 10-49 50-249 250+ All enterprises, 2010
4.3 E-business

4. UNLEASHING INNOVATION 4. UNLEASHING INNOVATION
MEASURING THE DIGITAL ECONOMY: A NEW PERSPECTIVE © OECD 2014112
4. GAP PAGE 4. GAP PAGE
4.4 Unleashing the potential of micro-data
Why do we need indicators?
Detailed enterprise information is essential to ascertain the reasons behind rms’ success in the knowledge
economy and, ultimately, to tailor more appropriate policies to foster this progress. Ideally, data collection should
embrace the structural and economic features of enterprises, as well as their underlying intangible endowments
(e.g.ICT skills) and behavioural patterns, especially with respect to innovation as enabled by ICT adoption.
Unlike sectoral or macro statistics, micro-data (e.g.rm-level data), permit to account for the rich dynamics of
production and innovation activities, where rms with different levels of productivity compete through different
market strategies.
Micro-data are also better suited to economic analysis, as rm output (e.g.productivity) can be directly related to
inputs (e.g.R&D). This permits the factors behind the better performance of some rms to be identied, as these
are typically averaged out in the aggregation of data across rms.
One shortcoming of micro-data is that they do not account for the potential impacts of rm behaviour on other
rms. For example, an increase in the market share of one rm may occur at the expense of another. For these
effects to be captured it is essential that micro-data be related in a statistically and economically signicant way
to sectoral and macro data, a process of aggregation sometimes referred to as meso data.
What are the challenges?
National Statistical Ofces (NSOs) are by far the largest holder of micro-level information on enterprises and
households/individuals. But although the starting point of statistical production by NSOs is always micro-level
information, the main objective remains aggregated indicators. In addition, statistical surveys are designed to
produce robust estimates on a given domain, not to be reused in combination with other surveys. In some cases,
a negative coordination policy is undertaken, excluding rms covered by other surveys from the sample, so as to
reduce the burden on respondents. In practice, joint sampling tends to be considerably smaller, skewed towards
larger rms, and with time series available for only a few enterprises. Finally, until recently micro-data were
usually kept dormant and even now are seldom made accessible to third parties, including other NSOs.
Things are changing fast, however. Analysts increasingly demand access to this valuable asset, and NSOs
themselves are actively working to add value to their statistical production by rethinking collection practices,
producing new (multi-dimensional and distribution-related) indicators and directly undertaking micro-based
social and economicanalysis.
For instance, in Australia and New Zealand business surveys encompass questions on innovation and ICT use.
Italy implemented this practice for its 2011 enterprise census, and some countries use sampling strategies to
increase longitudinal and joint coverage – for example, the Canadian Centre for Data Development and Economic
Research (CDER). Furthermore, the future Euro Groups Register (EGR), which will include structural information on
all relevant multinationals operating in Europe, is predicted to become the coordination framework for all European
statistical authorities and will represent an important step towards sharing information at a multi-country level.
Additional challenges are mainly legal. Laws restrict access to micro-data from NSOs in all countries to protect
condentiality and secrecy. As a consequence, ofcial micro-data from different countries cannot be pooled
and, as country specic analyses generally use different models and methodologies, the results are not typically
comparable across countries.
Options for international action
In recent years, several important international projects based on micro-data have examined the same aspects from
different perspectives. The OECD rm-level project on the analysis of productivity and growth was launched as early as
2001/2, with ten participating countries (Bartelsman, Scarpetta and Schivardi, 2005). Eight countries contributed to
a rst round of OECD work with micro-data on ICT and economic growth, including a cross-country comparison of
Japan, theUnitedStates and Denmark (OECD, 2004). More recent activity on micro-data analysis includes theOECD
projects on Innovation, based on innovation survey data in 20 countries (OECD, 2009); Human Capital, based on labour
force survey data (Liu, 2011), and ICT-Enabled Innovation, which links ICT and innovation surveys (Spiezia, 2011).
Micro-data-based work by Eurostat includes the Feasibility study on linking data from different sources (Eurostat, 2008),
the projects ESSLimit on Linking Microdata on ICT Usage, which links ICT, innovation and business surveys from
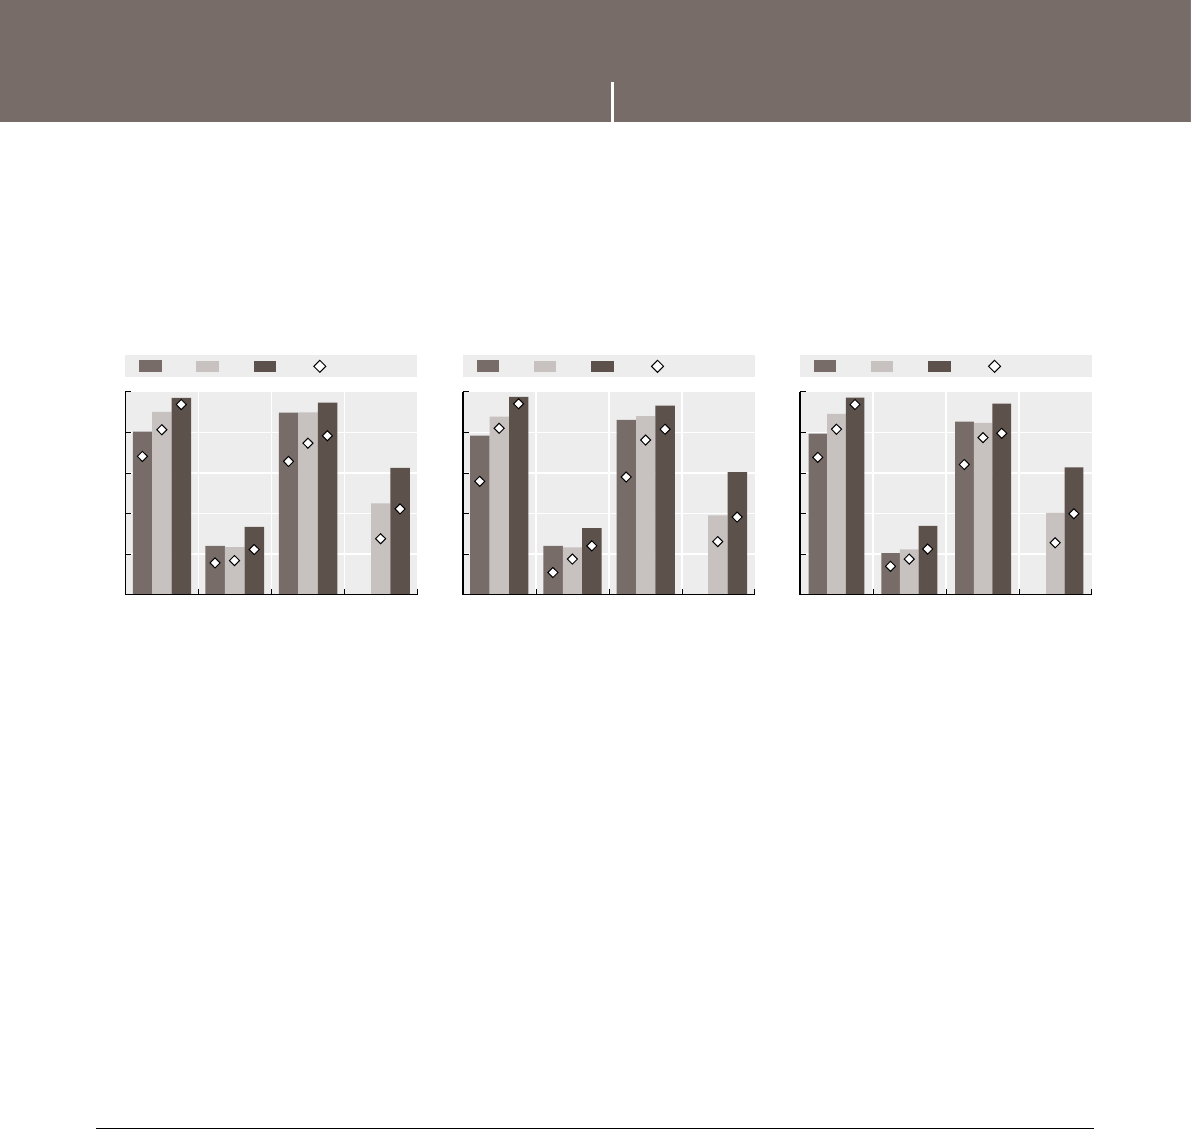
MEASURING THE DIGITAL ECONOMY: A NEW PERSPECTIVE © OECD 2014 113
4. UNLEASHING INNOVATION 4. UNLEASHING INNOVATION 4. GAP PAGE 4. GAP PAGE
Source: OECD based on the EU ESSLait project Micro Moments Database, June 2014. See chapter notes.
1 2 http://dx.doi.org/10.1787/888933148548
ICT uptake among innovators and non-innovators in 13 European countries, 2004, 2008 and 2010
Percentage shares of adopters of the selected technologies in the two groups, all countries averages
%
Product innovators
2004 2008 2010 Non-innovators
0
20
40
60
80
100
Broadband E-sales Website ERP
%
Process innovators
2004 2008 2010 Non-innovators
0
20
40
60
80
100
Broadband E-sales Website ERP
%
Organisational innovators
2004 2008 2010 Non-innovators
0
20
40
60
80
100
Broadband E-sales Website ERP
4.4 Unleashing the potential of micro-data
15European countries (Eurostat, 2012), and the ESSLait on Linking of Microdata to Analyse ICT Impact (Eurostat, 2013),
which also covers other variables such as exports and ICT skills, and offers a wealth of information on ICT usage
linked to other behavioural and performance variables as shows the following gure.
The OECD has pioneered a distributed approach to empirical analysis, which draws on condential micro-
data. TheOrganisation provides a common framework (experts meet and identify common research and policy
questions, the indicators and the econometric modelling are agreed upon and software routines are developed
in-house) and researchers with access to their own country’s micro-data compile results, which are then compared
and analysed by the OECD or lead countries. The latest and ongoing OECD initiative is the DYNEMP project, an
analysis of the contribution of rms (young/old, small/large) to net job creation across 18 countries (Criscuolo etal.,
2014). As a follow up to the DYNEMP project, the MULTIPROD project will look at productivity dispersion (labour
and possibly multifactor productivity) in different countries with a view to shedding light on differences across
countries beyond averages. This analysis will highlight the dynamics of rms in the information industries relative
to enterprises in the rest of the economy.
The OECD has also developed a Micro-data lab, which compiles and links large-scale administrative and commercial
datasets at the micro level. The source datasets are not condential, as in the case of micro-data from statistical
ofces, but in some cases data providers are private companies and licensing agreements are needed. The exploi-
tation of large datasets, for example, on patents, trademarks, design rights, scientic publications and company
information, enables analyses of emerging technologies, including ICTs, and their links to rms’ performance.
References
Bartelsman, E.J., S.Scarpetta and F.Schivardi (2005), “Comparative analysis of rm demographics and survival: Evidence from micro-level sources
in OECD countries”, Industrial and Corporate Change, Vol. 14, No. 3, pp. 365-391.
Criscuolo, C., P.N. Gal and C. Menon (2014), “The Dynamics of Employment Growth: New Evidence from 18 Countries”, OECD Science, Technology and
Industry Policy Papers, No. 14, OECD Publishing. Doi: http://dx.doi.org/10.1787/5jz417hj6hg6-en.
Eurostat (2013), ESSnet on Linking of Microdata to Analyse ICT Impact, Final Report, Eurostat, Luxembourg, www.cros-portal.eu/content/nal-reporting-
esslait-project.
Eurostat (2012), ESSnet on Linking of Microdata on ICT Usage, Final Report, Eurostat, Luxembourg, www.cros-portal.eu/content/nal-report-ict-impact-
esslimit-project.
Eurostat (2008), Information Society: ICT Impact Assessment by Linking Data from Different Source, Final Report, Eurostat, Brussels, epp.eurostat.ec.europa.
eu/portal/page/portal/information_society/documents/Tab/ICT_IMPACTS_FINAL_REPORT_V2.pdf.
Liu, G. (2011), “Measuring the Stock of Human Capital for Comparative Analysis: An Application of the Lifetime Income Approach to Selected
Countries”, OECD Statistics Working Papers, No. 2011/06, OECD Publishing. Doi: http://dx.doi.org/10.1787/5kg3h0jnn9r5-en.
OECD (2009), Innovation in Firms: A Microeconomic Perspective, OECD Publishing. Doi: http://dx.doi.org/10.1787/9789264056213-en.
OECD (2004), The Economic Impact of ICT: Measurement, Evidence and Implications, OECD Publishing. Doi: http://dx.doi.org/10.1787/9789264026780-en.
Spiezia, V. (2011), “Are ICT users more innovative? An analysis of ICT-enabled innovation in OECD rms”, OECD Journal: Economic Studies, Vol.2011/1,
OECD Publishing. Doi: http://dx.doi.org/10.1787/eco_studies-2011-5kg2d2hkn6vg.

MEASURING THE DIGITAL ECONOMY: A NEW PERSPECTIVE © OECD 2014114
4. UNLEASHING INNOVATION 4. UNLEASHING INNOVATION
Key ndings
While R&D provides a measure of innovation input,
patent indicators reect inventive output.
Patents can be observed by technology (classes),
irrespective of the industry to which applicants belong.
Patents also allow for analysis of the interaction of
different technologies (see 4.8).
In 2009-11, patents in ICT technologies accounted for
more than 38% of total patents led under the Patent
Cooperation Treaty (PCT), about the same share as
in 1999-2001. In absolute terms, ICT-related patents
almost doubled in number, reaching approximately
200 000 in 2011. At the OECD level, the share of ICT-
related patents in 2009-11 represented about 36%
of the total (adecrease of 3.5 percentage points with
respect to 1999-2001), while in BRIICS this share more
than doubled to almost 55%, largely as a result of the
increasing share of China.
Computer, telecommunications and other ICT-related
patents account for almost all applications, and
have broadly similar weights. Telecommunication
services, however, are comparatively more important
in economies featuring relatively higher shares of ICT-
related patents.
Overall, the distribution of patents led under the PCT
has evolved signicantly since the beginning of the last
decade. The United States continues to account for the
largest number of patents, but its share has fallen from
about 45% to just above 25%.
A similar pattern can be observed for most other
countries, counterbalanced by the rising shares of
Japan, Korea and especially China, which now ranks
third at the global level, with a share of 13%. Thepatterns
observed are the result of changes not only in trends in
overall inventions, but also in the propensity to apply
for PCT patents.
The positioning of countries in ICT-related patents
nevertheless looks substantially different when
indicators capturing the economic and technological
value of patented inventions are employed. This can
be seen, for instance, with respect to patent radical-
ness indicators, which aim to capture the extent to
which patented inventions differ from innovations and
knowledge (i.e. the ‘prior art’) on which they rely.
In general terms, the share of radical inventions in
ICT-related technologies is higher than for the average
patent in most countries. Leading economies in this
respect are Israel, India, Korea and the United States,
where the indicator of radicalness is more than 20%
higher than that for lagging economies.
DID YOU KNOW?
ICT-related patents represent more than 38% of total
applications led under the Patent CooperationTreaty.
The United States accounts for the most
applications, but China’s share is growing rapidly
and the country now ranks 3rd at the global level.
Denitions
Patent documents contain a wealth of information
related to ownership, inventors, references to prior
art and technology elds to which inventions belong,
as detailed in the International Patent Classication (IPC).
An invention may be accorded one or several IPC codes
during the patent examination process. Here, ICT-
related technologies are identied based on a compre-
hensive allocation of 4-digit IPC codes developed by
the OECD, which relies on a content examination of
IPC classes and subclasses, as well as keyword-based
searches performed on the full text of the patent.
Assessment of patent radicalness is based on citations:
a patent that cites more prior patents in classes other
than those it belongs to is considered to be more radical
(Shane, 2001). Such relatively higher dissimilarity is
deemed to indicate that the patent builds upon technol-
ogies different from those to which it is applied. Patent
radicalness is thus measured as the time invariant count
of the number of 4-digit IPC technology classes of prior
patents cited by the given patent, but in which the patent
itself is not classied. This number is then normalised by
the total number of IPC classes cited, so that it ranges
from 0 to 1 (Squicciarini et al., 2013).
Measurability
Applicants can use different channels to obtain legal
protection for inventions. Typically, such channels are
local. While applications to national patent ofces are
thus usually characterised by home biases, data from
different ofces cannot be combined in a straight-
forward manner due to risks of double counting. PCT
applications offer worldwide protection, but are not
immune from (hardly measurable) biases.
The duration of the patenting process (patent appli-
cations are published at the earliest 18 months after
having been led) renders patent statistics unavoidably
retrospective with respect to the dynamics of inventions.
To address these issues and simultaneously distil more
valuable inventions, the OECD has developed compu-
tational algorithms that allow for the production of
statistics for triadic patents (i.e. patents led in all the
three major [EU, Japan and US] patent ofces), and for
early estimates of patent applications.
4.5 ICT patents
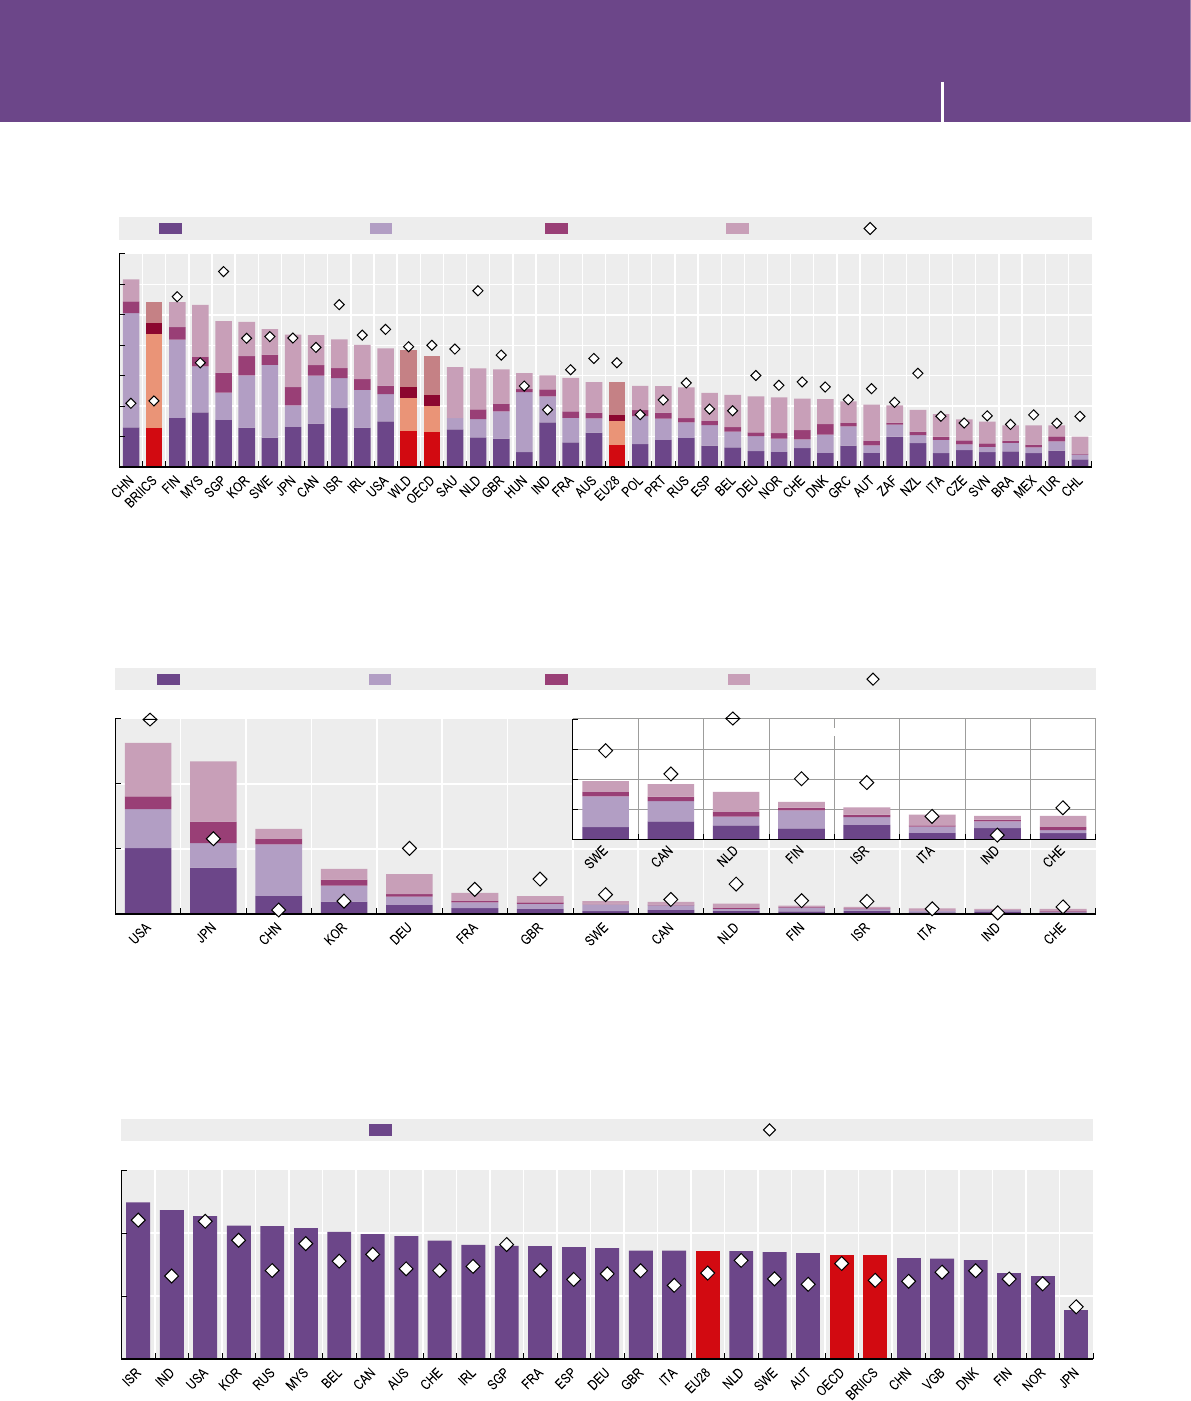
MEASURING THE DIGITAL ECONOMY: A NEW PERSPECTIVE © OECD 2014 115
4. UNLEASHING INNOVATION 4. UNLEASHING INNOVATION
Source: OECD, Patent Database, April 2014. See chapter notes.
1 2 http://dx.doi.org/10.1787/888933148550
Specialisation in ICT-related patents, 1999-2001 and 2009-11
ICT-related patents as a percentage of total PCT patent applications, by country
0
10
20
30
40
50
60
70
%Computer, office machinery Telecommunications Consumer electronics Other ICT ICT-related patents, 1999-2001
Source: OECD, Patent Database, April 2014. See chapter notes.
1 2 http://dx.doi.org/10.1787/888933148567
Top 15 applicants’ share in ICT-related patent applications, 1999-2001 and 2009-11
Percentage of total PCT patent applications in ICT-related technologies
0
10
20
30
%
Computer, office machinery Telecommunications Consumer electronics Other ICT ICT-related patents, 1999-2001
45
0
1
2
3
4Magnified
5
Source: OECD, Patent Database, April 2014. See chapter notes.
1 2 http://dx.doi.org/10.1787/888933148572
Radicalness of ICT-related patents, 2010-12
Average radicalness index based on PCT patent applications
0.3
0.4
0.5
0.6
Index
ICT-related patents All patents
4.5 ICT patents

MEASURING THE DIGITAL ECONOMY: A NEW PERSPECTIVE © OECD 2014116
4. UNLEASHING INNOVATION 4. UNLEASHING INNOVATION
Key ndings
The design of a product is the result of a creative process
aimed at shaping one or more of its visual features to
make its appearance appealing to consumers.
Administrative data related to registered designs
provide information on how creativity moulds the
“look and feel” of products; on the importance rms
and customers attribute to their aesthetic features; on
product differentiation and customisation and, more
generally, on the role of design in shaping competi-
tion in the marketplace. The complexity of a product
and the range of aesthetic features that may make it
attractive to consumers can be better understood by
looking at the number of distinct designs contained in
design applications. On average, there are 3.5 designs
per application overall and about 3 per application for
ICT and audio-visual-related products.
ICT and audio-visual items are among the most repre-
sented product categories of European Registered
Community Designs (RCD), following furnishing and
clothing. In 2010-13, they accounted for 8.5% of total
RCD, 1 percentage point more than in 2005-08.
Across all economies, about 60% of registered ICT and
audio-visual-related designs refer to data-processing
and recording equipment, followed by communication
and audio-visual devices.
The United States and Korea are the most active
economies in ICT and audio-visual-related RCD (both
gaining shares with respect to 2005-08), followed by
Germany and Japan (both losing shares) with the
other large European economies tailing behind. China
doubled its share but remains a minor player with
regard to designs registered in Europe.
The United States scores high in data-processing
equipment and Korea in communication equipment,
while France and Japan lead in the design of audio-
visual devices.
Design related to ICT and audio-visual products
represents almost 60% of Korean total RCD (down by
some percentage points from 2005-08). Other economies
specialising in this eld are Canada, Chinese Taipei,
Japan and theUnitedStates.
Revealed comparative advantage (RCA) indicators
highlight the relative specialisation of economies in
different elds. The 2010-13 RCA values in ICT and audio-
visual related design show an overall rebalancing across
economies. Among the leaders, only Canada and the
United States show an improvement in their RCA in ICT,
while Finland, Japan and Korea register a decline. In the
case of Korea, this decline mirrors a rise in shares and
reects the strong expansion of design in other areas.
DID YOU KNOW?
ICT and audio-visual-related designs represented
about 8.5% of total Registered Community Designs
in 2010-13 (up from 7.5% in 2005-08),
with Korea and theUnitedStates accounting
for more than one third of the total.
Denitions
Registered Community Designs (RCD) protect the
ornamental or aesthetic aspects of an article or its parts
against copying or the independent development of
similar designs. RCDs are valid in the European Union
as a whole, have an initial life of ve years from ling,
and can be renewed for up to a maximum of 25 years.
Only products or parts thereof can be legally protected,
not functionalities or services. A single application can
include several designs (e.g. for similar products or
different parts of the same product).
Industrial designs follow the Locarno Classication
(established in 1968). Its 9th edition, which entered into
force in 2009, contains 32 classes and 219 subclasses of
goods. The classication is administrative in character
and does not bind contracting economies with respect
to the nature and protection afforded by the design.
Theowner of an RCD can act against infringement and
request EU customs authorities to retain suspected
counterfeit goods while under their control.
Measurability
Registered design data are used here as a proxy for the
creativity that economies seek to protect on the European
market. Such data are publicly available and provide a
homogenous set of information related to ownership
and the specic goods concerned, among others.
Design data suffer from some drawbacks, including
selectivity and truncation. Indeed, not all designs
are registered (designers and owners may decide
not to seek intellectual property protection), nor
can be registered (e.g. if they are exclusively dictated
by technical functions). Furthermore, industrial
designs cannot be registered everywhere in the world.
TheUnitedStates is a notable exception, as industrial
design is protected through the concurrent use of
design patents, copyrights and trademarks. Finally, no
information about the value of the asset is available in
administrative data.
Truncation mainly arises because of delays in making
administrative data public and, in the case of RCD,
because applicants have the right to keep the design
condential for up to 30 months from ling.
4.6 ICT designs
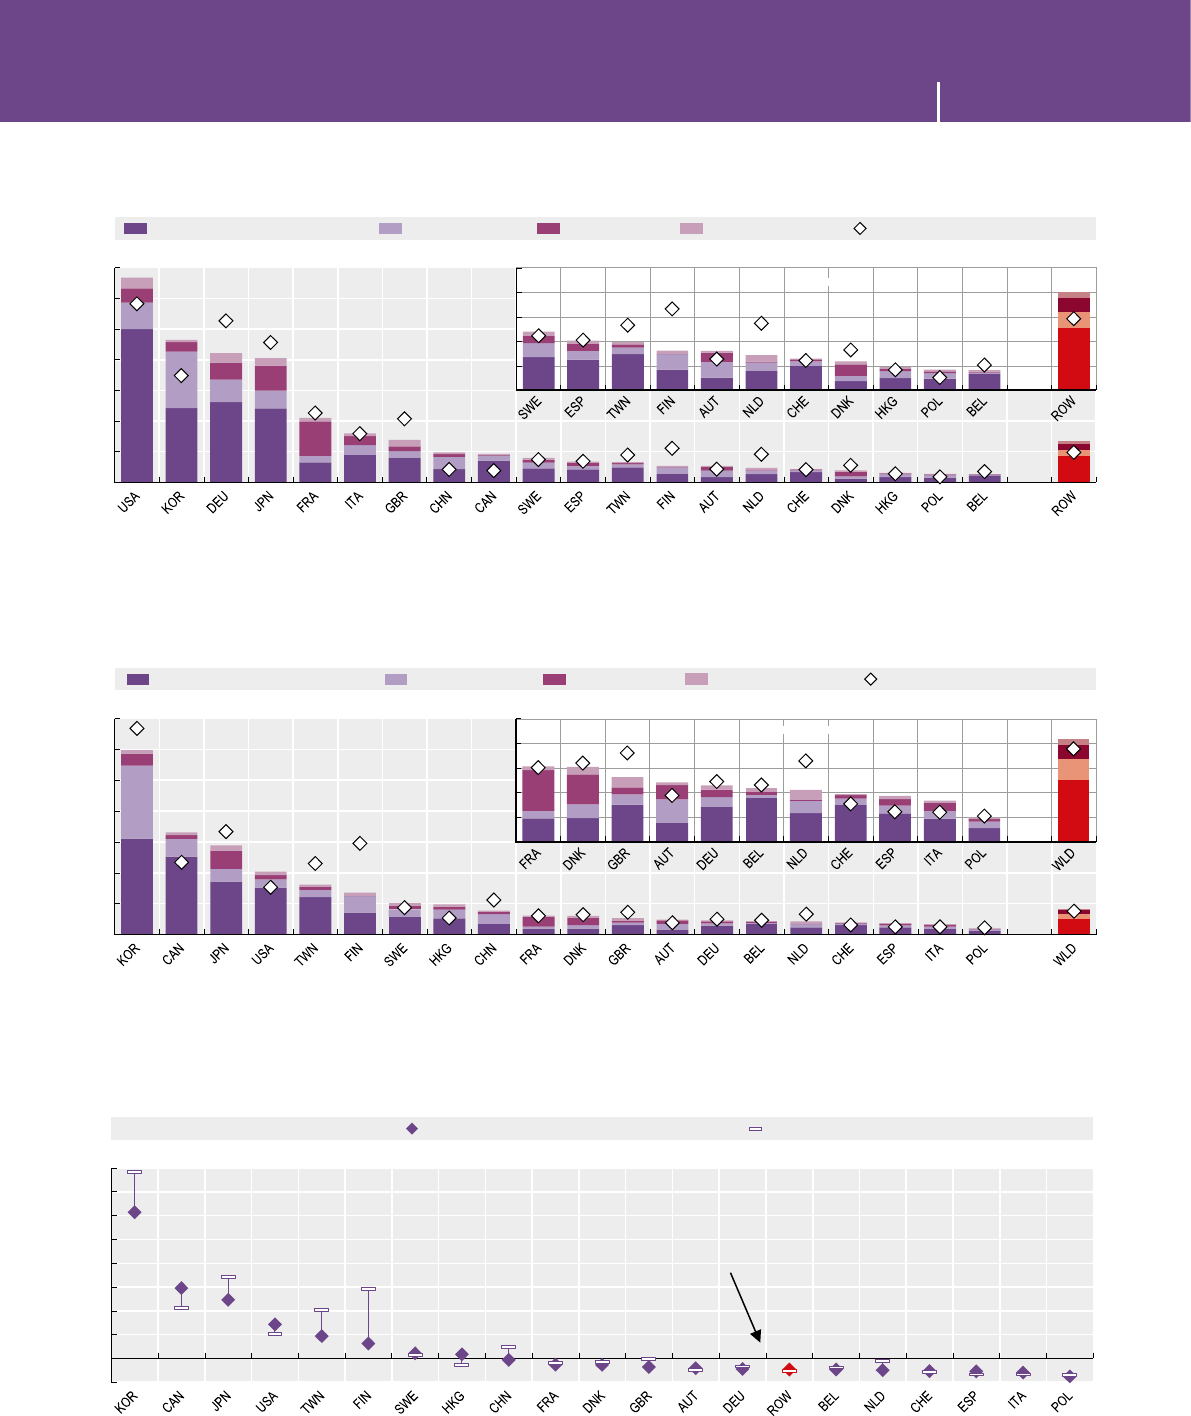
MEASURING THE DIGITAL ECONOMY: A NEW PERSPECTIVE © OECD 2014 117
4. UNLEASHING INNOVATION 4. UNLEASHING INNOVATION
Source: OECD calculations based on OHIM, Registered Community Design Database, RCD Download, April 2014. See chapter notes.
1 2 http://dx.doi.org/10.1787/888933148580
Top 20 applicants’ share in ICT and audio-visual-related designs, 2005-08 and 2010-13
Percentage of total ICT and audio-visual-related Registered Community Designs
0
3
6
9
12
15
18
21
Data processing and recording equipment Communication devices Audio-visual devices Other ICT and audio-visual ICT and audio-visual designs, 2005-2008
%
0
1
2
3
4
5Magnified
Source: OECD calculations based on OHIM, Registered Community Design Database, RCD Download, April 2014. See chapter notes.
1 2 http://dx.doi.org/10.1787/888933148592
Specialisation in ICT and audio-visual-related designs, top 20 applicants, 2005-08 and 2010-13
ICT and audio-visual-related designs as a percentage of applicants’ total Registered Community Designs
0
10
20
30
40
50
60
70
%
Data processing and recording equipment Communication devices Audio-visual devices Other ICT and audio-visual ICT and audio-visual designs, 2005-08
0
2
4
6
8
10 Magnified
Source: OECD calculations based on OHIM, Registered Community Design Database, RCD Download, April 2014. See chapter notes.
1 2 http://dx.doi.org/10.1787/888933148606
Revealed comparative advantage in ICT and audio-visual-related designs, top 20 applicants, 2005-08 and 2010-13
Index based on Registered Community Designs
0
1
2
3
4
5
6
7
8
9
Index
2010-13 2005-08
World average=1
4.6 ICT designs

MEASURING THE DIGITAL ECONOMY: A NEW PERSPECTIVE © OECD 2014118
4. UNLEASHING INNOVATION 4. UNLEASHING INNOVATION
Key ndings
Branding activities of ICT-related products, as measured
by trademark registrations, are high and growing.
In 2010-13 they reached about one third of total
trademark lings at the European Ofce for Harmoni-
sation in the Internal Market (OHIM), and one fth at
theUnitedStates Patent and Trademark Ofce (USPTO).
The distribution of trademarks offers a distinctive
perspective on the competitive position of economies
concerning ICT products. Indeed, national trademark
shares do not align with R&D, patents or export shares.
The local nature of trademarks, which need to be
registered in each market where companies operate or
sell, also leads to a very strong home bias.
The United States appears to be the largest overall
player, accounting for almost 80% of total ICT-related
applications at the USPTO and more than 12% at OHIM.
ICT-related trademarks on the European market are
conversely led by applicants in Germany, followed by
theUnitedStates, theUnitedKingdom, Spain, France
and Italy. The share of Italy and Spain in ICT branding
activity at OHIM is notably higher than their relative
importance in ICT industries (although their trademark
presence on the US market is limited), while the
opposite is the case for Japan and Korea.
With respect to the 2005-08 period, a number
of large trademark players, including Japan and
the United States but excepting Germany and Spain,
lost shares in EU branding to the benet of China, Korea
and smaller EU economies.
The share of ICT-related trademarks as a proportion
of total trademark registrations grew in nearly all
economies. Korea is by far the most specialised
economy; almost 60% of its total OHIM trademark
registrations were ICT related in 2010-13, up from 40%
in 2005-08. The composition of Korea’s ICT trademarks
is also more oriented towards goods than services,
reecting the economy’s specialisation in ICT manufac-
turing. The same holds true for China, Chinese Taipei
and Japan. Other key actors such as Germany, Italy and
the United States have fallen behind, demonstrating the
strong propensity of companies in these economies to
seek brand protection across all sectors, not only in ICTs.
An examination of economies’ revealed comparative
advantage (RCA) in ICT trademarks, measured as the
share of their ICT lings over the share of their total
lings at OHIM and USPTO, allows a better appreciation
of these recent changes. While Korea, Luxembourg and
Spain show a high and growing RCA for both ofces,
the RCA in ICT at OHIM remains at around the world
average for France, Germany and the United States, and
lower than the average for Italy.
DID YOU KNOW?
In 2010-13, ICT-related products accounted
for 23%of total trademarks registered in Europe
and the United States together.
Denitions
A trademark is a sign (e.g. text or graphic) used to distin-
guish the goods or services of one enterprise from those
of other enterprises.
Statistics on trademark registrations provide a measure
of the relevance of branding in given product areas,
conditional on the need to protect these brands against
counterfeiting.
Trademark registrations typically remain in effect for
10 years and are renewable.
The four-year registration ows considered here are
taken from OHIM and USPTO, the two ofces repre-
senting some of the world’s largest markets.
Trademark registrations are classied on the basis of
the Nice Agreement Concerning the International Clas-
sication of Goods and Services for the Purposes of the
Registration of Marks of 1957. Overall, 45 product classes
exist, 34 of which are related to goods and 11 to services.
Here, ICT-related trademarks have been identied as
trademarks belonging to classes 9, 28, 35, 38, 41 and/or
42 of the Nice Classication and containing ICT-related
keywords in the description of products.
Measurability
Trademark registrations depend on the need to
promote company value and gain legal protection
against imitation.
Fees vary substantially across economies and are not
always proportional to the number of designated classes
(e.g. OHIM allows up to three classes for the same initial
fee). This may affect overall statistics and the observed
proportions of goods and services trademarked.
The lack of classes explicitly denoting ICT goods and
services requires the performance of text-based counting,
which can be imprecise and limits the opportunity to
uncover possible synergies with other product areas.
Finally, national (or EU)-only coverage may be fraught
with possible home biases in registrations. OHIM and
USPTO are therefore considered separately to avoid
double counting. However, this leaves unaddressed
protection on other markets.
4.7 ICT trademarks
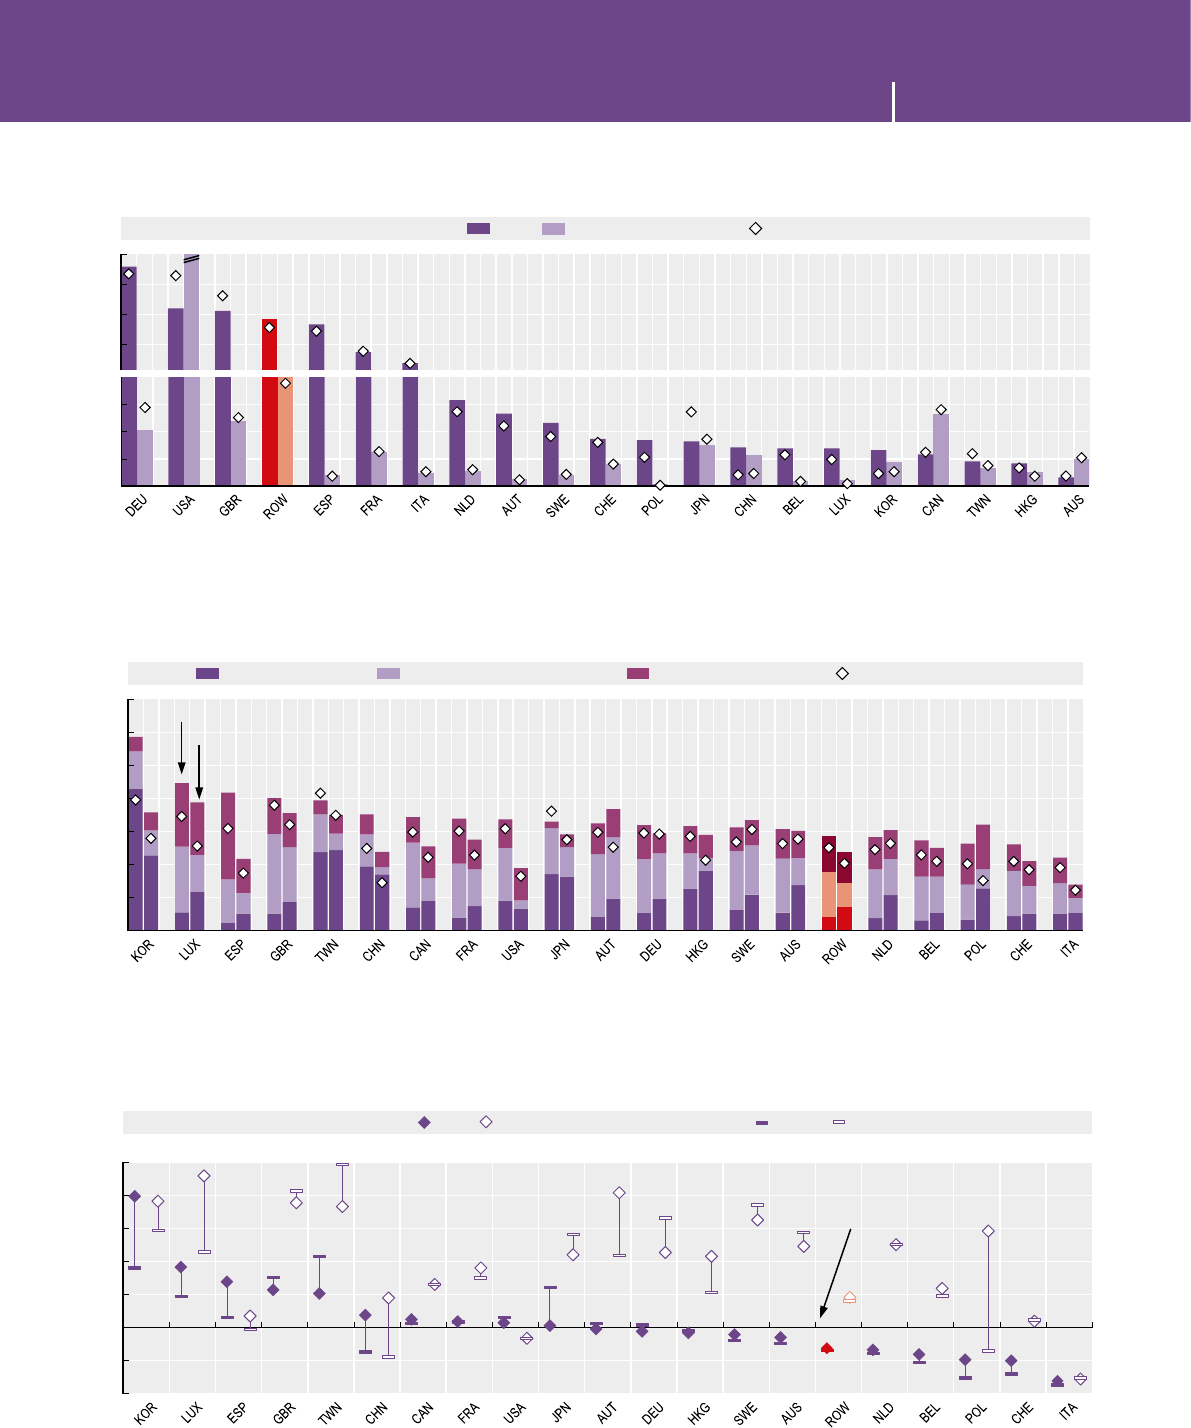
MEASURING THE DIGITAL ECONOMY: A NEW PERSPECTIVE © OECD 2014 119
4. UNLEASHING INNOVATION 4. UNLEASHING INNOVATION
Source: OECD calculations based on US Patent and Trademark Ofce and OHIM Community Trademark Database, April 2014.
1 2 http://dx.doi.org/10.1787/888933148613
ICT-related trademarks, top 20 applicants, 2005-08 and 2010-13
As a percentage of total ICT-related trademark applications at OHIM and USPTO
4
8
12
16
20
%2010-13 2005-08
78.4 (2010-13)
78.7 (2005-08)
OHIM USPTO
0
1
2
3
Source: OECD calculations based on US Patent and Trademark Ofce and OHIM Community Trademark Database, April 2014.
1 2 http://dx.doi.org/10.1787/888933148628
Specialisation in ICT-related trademarks, top 20 applicants, 2005-08 and 2010-13
ICT-related trademarks as a percentage of applicants’ total trademark registrations at OHIM and USPTO
0
10
20
30
40
50
60
70
%Goods, 2010-13 Goods and services, 2010-13 Services, 2010-13 Goods and services, 2005-08
USPTO
OHIM
Source: OECD calculations based on US Patent and Trademark Ofce and OHIM Community Trademark Database, April 2014.
1 2 http://dx.doi.org/10.1787/888933148639
Revealed comparative advantage in ICT trademarks, top 20 applicants, 2005-08 and 2010-13
Index based on registrations at OHIM and USPTO
0.6
0.8
1.0
1.2
1.4
1.6
1.8
2.0
Index
OHIM OHIM
World average=1
2010-13 2005-08USPTO USPTO
4.7 ICT trademarks

MEASURING THE DIGITAL ECONOMY: A NEW PERSPECTIVE © OECD 2014120
4. UNLEASHING INNOVATION 4. UNLEASHING INNOVATION
4.8 Knowledge diffusion
Key ndings
ICTs are a key enabling factor in knowledge creation
and diffusion. ICT-related innovations are adopted by
rms in all sectors of the economy and are diffused to
other science and technology elds.
The ICT sector itself is prone to innovation (see 4.2),
and enterprises in ICT industries are keen to engage in
innovative activity in collaboration with other organisa-
tions. According to the results of the 2010 Community
Innovation Survey (CIS), more than of half of the
innovative rms in ICT manufacturing collaborated
in innovation with other organisations, as compared
to34% for manufacturing rms overall.
This difference is smaller for rms in the service sectors.
In countries where data are available, on average 39%
of innovative rms in the information and communi-
cation service industries engaged in collaboration in
2010, against 31% in all innovation core service rms
that innovate.
Cooperation in innovation among innovators located in
different countries provides a measure of international
ows in knowledge. In 2009-11, with the exception
of digital communication, the share of international
co-inventions was lower in IT technology elds than in
other technologies.
International co-inventions generally account for
around 6% in computer technologies and telecom-
munications, 5% in semiconductors and about 4% in
audio-visual technologies.
An examination of technological elds attributed to
patents applications led under the Patent Co-operation
Treaty (PCT) can function as a proxy for knowledge
ows between ICTs and other technological areas.
In 2009-11, about a quarter of ICT-related patents also
belonged to one or more other technological elds.
Patents in medical, biotechnology or pharmaceutical
technology elds added up to about 14% of this group,
while transport, logistics and machine tools amounted
to 8%.
Many patents cover technological elds contiguous to
ICTs, such as electrical machinery (14%) or audio-visual
technologies (5%). Numerous examples include patents
in technologies likely to be applied in the ICT eld, such
as basic chemistry or nano-technologies.
Often ICT-related inventions in this group lie at the
crossroads between several other technological elds
and their potential applications also bridge different
industrial domains.
DID YOU KNOW?
In 2010, on average, about 54% of innovative rms
in ICT manufacturing engaged in collaboration
with other organisations, against 34% in
themanufacturing sector overall.
Denitions
Collaboration involves “active participation in joint
innovation projects with other organisations”, but
excludes pure contracting out of innovation-related
work. It can involve the joint implementation of
innovations with customers and suppliers, as well
as partnerships with other rms or organisations.
Innovation core service activities include ISIC Rev.4
Divisions G46, H, J58, J61, J62, J63, K and M71.
International co-inventions feature at least one foreign
co-inventor in patents invented domestically.
Technology elds are dened according to the classication
proposed by Schmoch (2008) and rely on the Interna-
tional Patent Classication (IPC) codes contained in the
patent document. An invention may be accorded one or
several IPC codes during the patent examination process.
ICT-related patents cover the following technology
elds, based on selected IPC codes of the 8th edition
of the IPC: Telecommunications, Consumer electronics,
Computers, ofce machinery and Other ICT. Combinations
between ICTs and other technologies in patent applications
are computed on the basis of ICT-patents with at least
one additional IPC class in other technology elds.
Measurability
Applicants can use different channels to obtain legal
protection for inventions. Typically, such channels are
local. While applications to national patent ofces are
thus usually characterised by home biases, data from
different ofces cannot be combined in a straightfor-
ward manner due to risks of double counting. PCT data
reduce this risk as the protection for patent applica-
tions has a worldwide coverage.
In the case of emerging technologies, specic appli-
cations might not yet be incorporated into the IPC,
rendering their identication difcult. ICT-related
technologies are identied here on the basis of a
comprehensive allocation of 4-digit IPC codes developed
by the OECD, which relies on a content examination of
IPC classes and subclasses, as well as keyword-based
searches performed on the full text of the patent. Such
a method might exclude, or include, patents that are,
or are not, relevant for a specic domain, but provides
a relatively good picture of the innovative activity in
different technology elds.
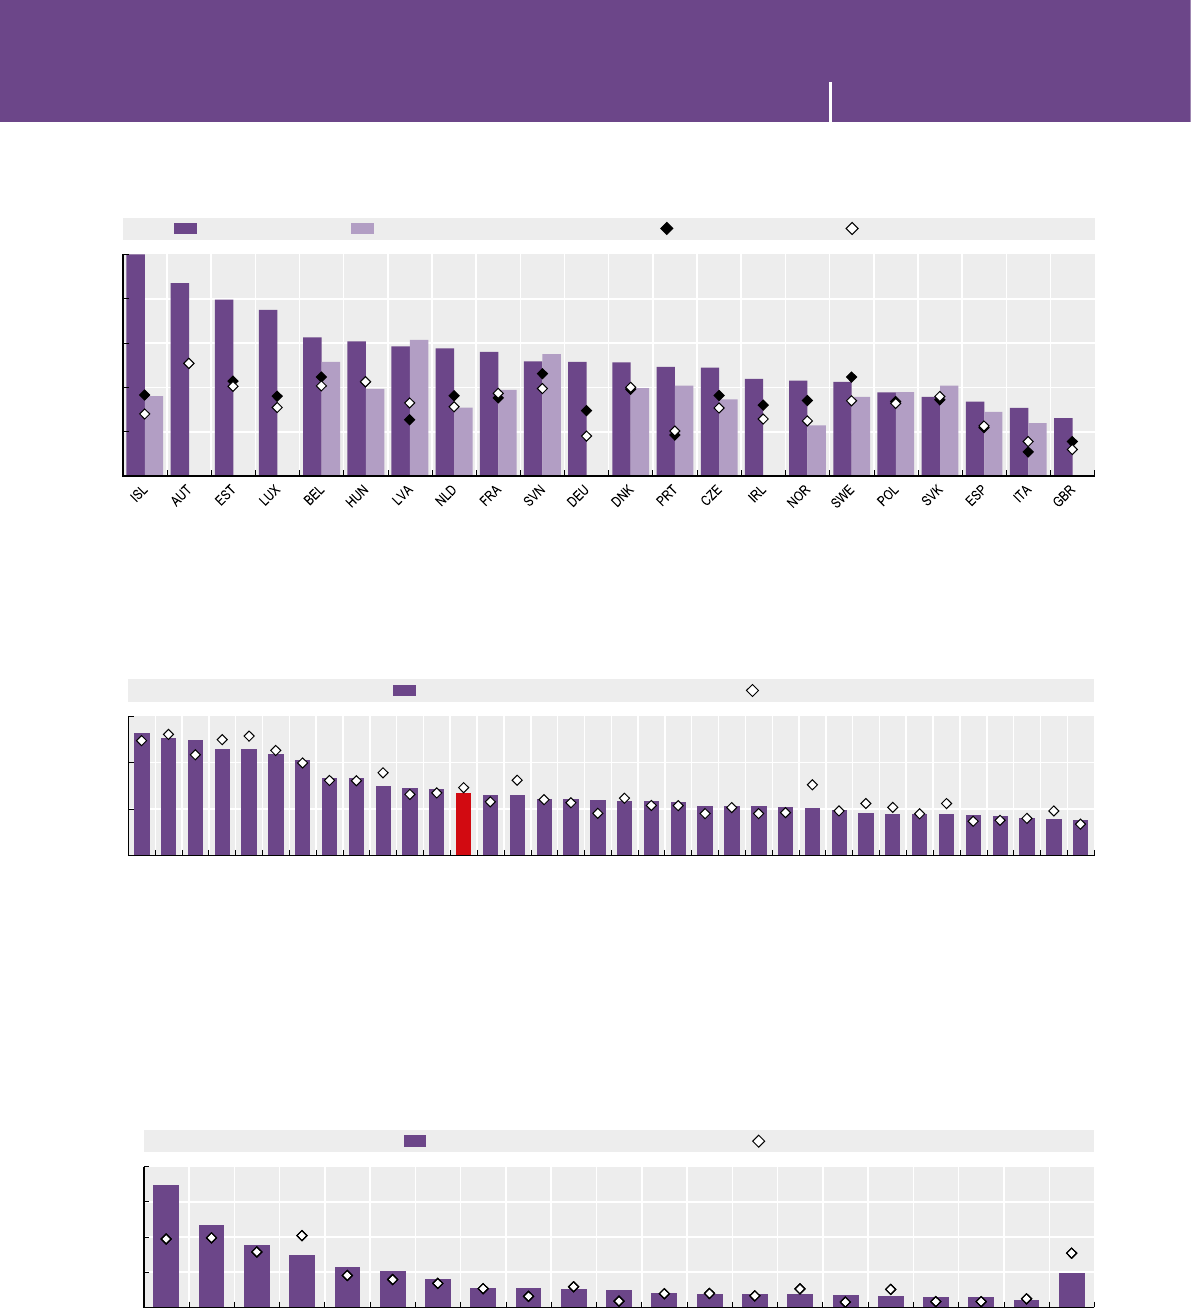
MEASURING THE DIGITAL ECONOMY: A NEW PERSPECTIVE © OECD 2014 121
4. UNLEASHING INNOVATION 4. UNLEASHING INNOVATION
4.8 Knowledge diffusion
Source: OECD computations based on Eurostat, Community Innovation Survey (2010), June 2014.
1 2 http://dx.doi.org/10.1787/888933148648
Firms engaging in collaboration on innovation, by sector, 2010
As a percentage of product and/or process innovative rms
0
20
40
60
80
100
%ICT manufacturing Information and communication services Total manufacturing Innovation core service activities
Source: OECD, Patent Database, June 2013. See chapter notes.
1 2 http://dx.doi.org/10.1787/888933148653
International co-inventions by technology elds, 1999-2001 and 2009-11
As a percentage of PCT patent applications
0
5
10
15
%2009-11 1999-2001
Polymers
Organic chemistry
Food chemistry
Pharmaceuticals
Basic chemistry
Biotechnology
Bio materials
Chemical engineering
Digital communication
Materials, metallurgy
Micro- and nano-technology
Textile and paper machines
All technologies
Computer technology
Surface and coating
Measurement
Environmental technology
Civil engineering
Medical technology
Telecommunications
Other special machines
Basic communication
IT methods
Handling and logistics
Engines, pumps, turbines
Semiconductors
Control
Thermal devices
Electrical machinery
Machine tools
Optics
Other consumer goods
Mechanical elements
Audio-visual technology
Transport
Furniture, games
Source: OECD, Patent Database, April 2014. See chapter notes.
1 2 http://dx.doi.org/10.1787/888933148668
Top 20 combinations between ICTs and other technologies in patent applications, 1999-2001 and 2009-11
As a percentage of all ICT-related patent applications also belonging to other technology elds
0
4
8
12
16
%2009-11 1999-2001
Electrical machinery
Optics
Medical technology
Biotechnology
Audio-visual technology
Transport
Surface and coating
Handling and logistics
Civil engineering
Chemical engineering
Basic chemistry
Machine tools
Control
Other special machines
Furniture, games
Polymers
Other consumer goods
Materials, metallurgy
Micro- and nano-technology
Pharmaceuticals
All other technologies

MEASURING THE DIGITAL ECONOMY: A NEW PERSPECTIVE © OECD 2014122
4. UNLEASHING INNOVATION 4. UNLEASHING INNOVATION
Notes
Notes
4.1 ICT and R&D
Business R&D performed by information industries, 2011 or more recent year available
The category “ICT services not allocated” refers to industries within ISIC Rev.4 Divisions 58-63 that cannot be
separated.
For Australia and the United States, GDP is computed according to the SNA 2008.
For Canada, the Czech Republic, Estonia, Finland, Germany, Hungary, Poland, the Slovak Republic, Slovenia,
Switzerland and Turkey, data refer to 2012.
For China, data refer to 2009.
Business R&D intensity in ICT manufacturing industries, 2007 and 2011
For Canada and Japan, data refer to 2007 and 2009.
For Finland and the Netherlands, data refer to 2008 and 2011.
For the Czech Republic, data refer to 2007 and 2012.
For Portugal, the United Kingdom and the United States, data refer to 2007 and 2010.
For Switzerland, data refer to 2008 and 2012.
Business R&D intensity in information and communication service industries, 2007 and 2011
For Australia, Portugal, the United Kingdom and the United States, data refer to 2007 and 2010.
For Canada, data refer to 2007 and 2009.
For Finland and the Netherlands, data refer to 2008 and 2011.
For Switzerland, data refer to 2008 and 2012, and include ICT services only.
4.2 Innovation in ICT industries
Innovative enterprises in IT services and innovation core service activities, by type of innovation, 2010
For Slovenia, IT services include ISIC Rev.4 Section J (Information and communication services), consisting of ISIC
Rev.4 Divisions 58 to 63.
Israel
“The statistical data for Israel are supplied by and under the responsibility of the relevant Israeli authorities
or third party. The use of such data by the OECD is without prejudice to the status of the Golan Heights, East
Jerusalem and Israeli settlements in the West Bank under the terms of international law.
“It should be noted that statistical data on Israeli patents and trademarks are supplied by the patent and
trademark ofces of the relevant countries.”

MEASURING THE DIGITAL ECONOMY: A NEW PERSPECTIVE © OECD 2014 123
4. UNLEASHING INNOVATION 4. UNLEASHING INNOVATION
Notes
4.3 E-business
The diffusion of selected ICT tools and activities in enterprises, 2013
For countries in the European Statistical System, e-commerce variables (online purchases and online sales) refer
to 2012.
Supply chain management refers to the use of automated data exchange (ADE) applications, and data refer to 2012.
Data for Radio Frequency Identication (RFID) refer to 2011.
For Australia, e-purchases data refer to 2011.
Broadband connectivity, by size, 2010 and 2013
For Australia and New Zealand, data refer to the scal year ending 30 June 2012 instead of 2012. For Australia, the
total includes Agriculture, forestry and shing.
For Canada, data refer to 2007 instead of 2010; medium-sized enterprises have 50 to 299 employees and large
enterprises have 300 or more employees.
For Japan and Korea, data refer to 2012.
For Japan, data refer to businesses with 100 or more persons employed instead of 10 or more; medium-sized
enterprises have 100-299 persons employed and large enterprises have 300 or more persons employed.
For Switzerland, data refer to 2008 and 2011.
Use of enterprise resource planning software, by size, 2010 and 2013
Unless otherwise stated, sector coverage consists of all activities in manufacturing and non-nancial market
services. Only enterprises with ten or more persons employed are considered. Size classes are dened as: small
(from 10 to 49 persons employed), medium (50 to 249) and large (250 and above).
For Canada, medium-sized enterprises have 50 to 299 employees. Large enterprises have 300 or more employees.
For Switzerland, data refer to 2011.
4.4 Unleashing the potential of micro-data
ICT uptake among innovators and non-innovators in 13 European countries, 2004, 2008 and 2010
The gures show simple averages for all reporting countries across reference years in which the Community
Innovation Survey (CIS) and the Community Survey on ICT Usage in Enterprises were performed.
Data refer to Austria, Denmark, Finland, France, Ireland, Italy, Luxembourg, the Netherlands, Norway, Poland,
Slovenia, Sweden and the United Kingdom.
Cell values for each variable are reweighted to represent the business structure by employment size in each country.
Data for ERP in 2010 are limited to Finland, France and Luxembourg.
4.5 ICT patents
Specialisation in ICT-related patents, 1999-2001 and 2009-11
Patent counts are based on the priority date, the inventor’s residence and fractional counts. Only economies that
applied for more than 250 patents in 2009-11 are included.
Top 15 applicants’ share in ICT-related patent applications, 1999-01 and 2009-11
Patent counts are based on the priority date, the inventor’s residence and fractional counts. Only economies that
applied for more than 1 000 patents in 2009-11 are included.
Radicalness of ICT-related patents, 2010-12
The radicalness index refers to the number of IPC classes in which patents cited by a given patent are classied,
but in which the patent itself is not classied (Shane, 2001), normalised by the total number of IPC classes listed
in the backward citations.
Data relate to patent applications led under the PCT, by ling date and the applicant’s residence.
Only economies with more than 250 ICT-related patents in 2010-12 are included.

MEASURING THE DIGITAL ECONOMY: A NEW PERSPECTIVE © OECD 2014124
4. UNLEASHING INNOVATION 4. UNLEASHING INNOVATION
Notes
4.6 ICT designs
General notes:
Figures are calculated using fractional counts of the Locarno classes mentioned in the design registration.
Data processing and recording equipment correspond to the Locarno subclasses 14-01, 14-02 and 14-04;
communication devices correspond to subclass 14-03; audio-visual devices correspond to class 16. Total ICT and
audio-visual designs correspond to designs in classes 14, 16 and 18.
Additional notes:
Revealed comparative advantage in ICT and audio-visual-related designs, top 20 applicants, 2005-08 and 2010-13
The revealed design advantage index is dened as the share of an economy’s designs in a particular eld relative
to the share of total designs in that economy. The index is equal to zero when the economy has no design in a
given eld; is equal to 1 when the economy’s share in the eld equals its share in all elds (no specialisation); and
above 1 when a positive specialisation is observed.
4.8 Knowledge diffusion
International co-inventions by technology elds, 1999-2001 and 2009-11
Patent counts are based on the priority date and fractional counts by technology elds.
Top 20 combinations between ICTs and other technologies in patent applications, 1999-2001 and 2009-11
Patent counts are based on the priority date. ICT-related patents are dened using a selection of International
Patent Classication (IPC) classes. Additional IPC codes listed in ICT-related patent documents have been classied
according to the IPC-Technology Concordance proposed by Schmoch (2008), revised in January 2013, available at
www.wipo.int/ipstats/en/statistics/technology_concordance.html.

MEASURING THE DIGITAL ECONOMY: A NEW PERSPECTIVE © OECD 2014 125
4. UNLEASHING INNOVATION 4. UNLEASHING INNOVATION
References
References
Bartelsman, E.J., S. Scarpetta and F. Schivardi (2005), “Comparative analysis of rm demographics and survival:
Evidence from micro-level sources in OECD countries”, Industrial and Corporate Change, Vol. 14, No. 3, pp. 365-391.
Criscuolo, C., P.N. Gal and C. Menon (2014), “The Dynamics of Employment Growth: New Evidence from
18 Countries”, OECD Science, Technology and Industry Policy Papers, No. 14, OECD Publishing. Doi: http://dx.doi.
org/10.1787/5jz417hj6hg6-en.
Eurostat (2013), ESSnet on Linking of Microdata to Analyse ICT Impact, Final Report, Eurostat, Luxembourg, www.cros-
portal.eu/content/nal-reporting-esslait-project.
Eurostat (2012), ESSnet on Linking of Microdata on ICT Usage, Final Report, Eurostat, Luxembourg, www.cros-portal.eu/
content/nal-report-ict-impact-esslimit-project.
Eurostat (2008), Information Society: ICT Impact Assessment by Linking Data from Different Source, Final Report, Eurostat,
Brussels, epp.eurostat.ec.europa.eu/portal/page/portal/information_society/documents/Tab/ICT_IMPACTS_FINAL_
REPORT_V2.pdf.
Graham, S.J.H., G. Hancock, A.C. Marco, A.F. Myers (2013), “The USPTO Trademark Case Files Dataset: Descriptions,
Lessons, and Insights”, Journal of Economics & Management Strategy, Vol. 22, No. 4, pp. 669-705.
Liu, G. (2011), “Measuring the Stock of Human Capital for Comparative Analysis: An Application of the Lifetime
Income Approach to Selected Countries”, OECD Statistics Working Papers, No. 2011/06, OECD Publishing. Doi: http://
dx.doi.org/10.1787/5kg3h0jnn9r5-en.
OECD/Eurostat (2005), Oslo Manual: Guidelines for Collecting and Interpreting Innovation Data, 3rd edition, OECD
Publishing and Statistical Ofce of the European Communities, Luxembourg, www.oecd.org/sti/oslomanual. Doi:
http://dx.doi.org/10.1787/9789264013100-en.
OECD (2013), OECD Science, Technology and Industry Scoreboard 2013: Innovation for Growth, OECD Publishing. Doi:
http://dx.doi.org/10.1787/sti_scoreboard-2013-en.
OECD (2011), OECD Guide to Measuring the Information Society 2011, OECD Publishing. Doi: http://dx.doi.
org/10.1787/9789264113541-en.
OECD (2010), Measuring Innovation: A New Perspective, OECD Publishing. Doi: http://dx.doi.org/10.1787/9789264059474-en.
OECD (2009), Innovation in Firms: A Microeconomic Perspective, OECD Publishing. Doi: http://dx.doi.
org/10.1787/9789264056213-en.
OECD (2004), The Economic Impact of ICT: Measurement, Evidence and Implications, OECD Publishing. Doi: http://dx.doi.
org/10.1787/9789264026780-en.
OECD (2002), Frascati Manual 2002. The Measurement of Scientic and Technological Activities. Proposed Standard Practice for
Surveys on Research and Experimental Development, 6th edition, OECD Publishing, www.oecd.org/sti/frascatimanual.
Doi: http://dx.doi.org/10.1787/9789264199040-en.
Shane, S. (2001), “Technological opportunities and new rm creation”, Management Science, Vol. 47, No. 2, pp. 205-220.
Schmoch, U. (2008), “Concept of a Technology Classication for Country Comparisons, Final Report to the World
Intellectual Property Organisation (WIPO)”, revised in January 2013, www.wipo.int/export/sites/www/ipstats/en/
statistics/patents/pdf/wipo_ipc_technology.pdf.
Spiezia, V. (2011), “Are ICT users more innovative? An analysis of ICT-enabled innovation in OECD rms”, OECD Journal:
Economic Studies, Vol. 2011/1, OECD Publishing. Doi: http://dx.doi.org/10.1787/eco_studies-2011-5kg2d2hkn6vg.
Squicciarini, M., H. Dernis and C. Criscuolo (2013), “Measuring Patent Quality: Indicators of Technological and
Economic Value”, OECD Science, Technology and Industry Working Papers, No. 2013/03, OECD Publishing. Doi: http://
dx.doi.org/10.1787/5k4522wkw1r8-en.

MEASURING THE DIGITAL ECONOMY: A NEW PERSPECTIVE © OECD 2014 127
Chapter 5
DELIVERING GROWTH AND JOBS
5.1 • ICT investment .............................................................................................................................128
5.2 • ICT business dynamics .........................................................................................................130
5.3 • ICT value added ...........................................................................................................................132
5.4 • Labour productivity in information industries ...............................................134
5.5 • Measuring quality in communication services...............................................136
5.6 • E-commerce .....................................................................................................................................138
5.7 • Human capital in ICT .............................................................................................................140
5.8 • ICT jobs and jobs in the ICT sector ............................................................................ 142
5.9 • Trade competitiveness and GVCs ................................................................................144

MEASURING THE DIGITAL ECONOMY: A NEW PERSPECTIVE © OECD 2014128
5. DELIVERING GROWTH AND JOBS 5. DELIVERING GROWTH AND JOBS
5.1 ICT investment
Key ndings
Investment in ICT goods and services is an important
driver of growth. However, in 2012 ICT investment as a
share of GDP and gross xed capital formation (GFCF)
was signicantly lower than the peak reached in 2000 in
nearly all OECD countries for which data are available.
Data for 26 OECD countries show that ICT investment
dropped from 3.2% to 2.3% of GDP, and from 13.8% to
12.1% of total investment between 2000 and 2012.
The pro-cyclical nature of investment reinforced the fall
in spending on IT and communication equipment, which
was also partly driven by relative falls in unit prices
compared to other forms of investment. At the same
time, investment in software as a share of GDP remained
stable or grew and, on average, increased its weight to
57% of total ICT investment, from less than 40% in 2000.
Depending on specialisation, position in the business
cycle and structural features of the economy, national
ICT investment gures vary from 3% of GDP and above
in Austria, Denmark, Japan, New Zealand, Sweden,
Switzerland and the United States to less than 1.5%
in Greece, Ireland, Luxembourg, Mexico and the Slovak
Republic. Signicant falls in shares occurred in Sweden,
as well as in Australia, Canada, the Czech Republic,
Korea, Luxembourg, and the Slovak Republic, largely
driven by falls in the equipment component.
The generalised fall in ICT investment does not
correspond to a similar decrease in the contribution of
the ICT sector to economic growth, employment and
exports (see 5.3 for value added, 5.8 for employment
and 5.9 for international trade), reecting at least in part
increasing embodiment of ICT intermediates in non-ICT
goods and services. In assessing the relevance of ICT
investment in the economy, it should also be considered
that a growing share of ICT expenditure by businesses
might be non-capitalised. In this respect, detailed infor-
mation available for the United States reveals that about
one third of total business expenditure in ICTs is non-
capitalised and that the ICT sector itself is responsible
for about 40% of capitalised expenditure. The overall
decline in the share of ICT over total investment is
partly due to price declines, which affected in particular
the equipment component. Adjusting ICT investment
by means of appropriate deators reveals the relative
contribution of ICT investment to GDP growth.
In the last decade, ICT investment has contributed
between 0.6 and 0.2 percentage points to GDP annual
growth. The contribution of ICT investment to growth
was higher than that of non-ICT investment in 9 out of
the 20 countries considered, particularly in Japan and
Switzerland. The contribution of non-ICT investment
has been relatively higher in Australia, Canada, Ireland,
Korea, Portugal and Spain.
DID YOU KNOW?
ICT investment represents on average 12%
of total investment, but its contribution to GDP
growth during the 2000-12 period was comparable
to that of non-ICT investment.
Denitions
The denition of GFCF used here follows the 1993
System of National Accounts (SNA). ICT investment
has three components: information technology equipment
(computers and related hardware), communications
equipment and software. Software includes acquisition
of pre-packaged software, customised software and
software developed in-house.
ICT investment is shown below as a share of Gross
Domestic Product and as a proportion of Gross Fixed
Capital Formation. GFCF reects investment gross of
depreciation and includes expenditures – on buildings,
machinery, equipment and intellectual property
products – that satisfy the criteria set out in the SNA,
namely that the acquired assets can be used repeatedly
in production for more than one year. The contribution
of ICT investment to GDP growth looks at the contribution
made by the stock of capital and reects the contribu-
tion of ICT capital services, as opposed to the contri-
bution from non-ICT capital services, labour and multi-
factor productivity, by means of harmonised deators.
Measurability
As ICT products, in particular software, are often
included as intermediates to non-ICT capital goods,
estimates of investment in ICT may understate the
underlying importance of ICTs to overall investment.
Some care is needed in particular when comparing
investment in software across countries and years, as
levels may be affected by the degree to which software
is bundled with other products, including other ICT
equipment, and so, are not recorded as software
investment. Timeliness and the level of detail with
which information on ICT investment, and indeed all
ICT expenditures, is made available across countries,
also remain uneven.
At present, only a few countries, including
the United States,
collect data on total ICT expendi-
ture by industry. But work is ongoing to improve this
situation. A similar effort is planned in countries
participating in the European Statistical System, where
results are pending, and the OECD is promoting the
inclusion of a specic module on ICT expenditure via
its 2014 revision of the Model Survey on ICT Usage by
Businesses.
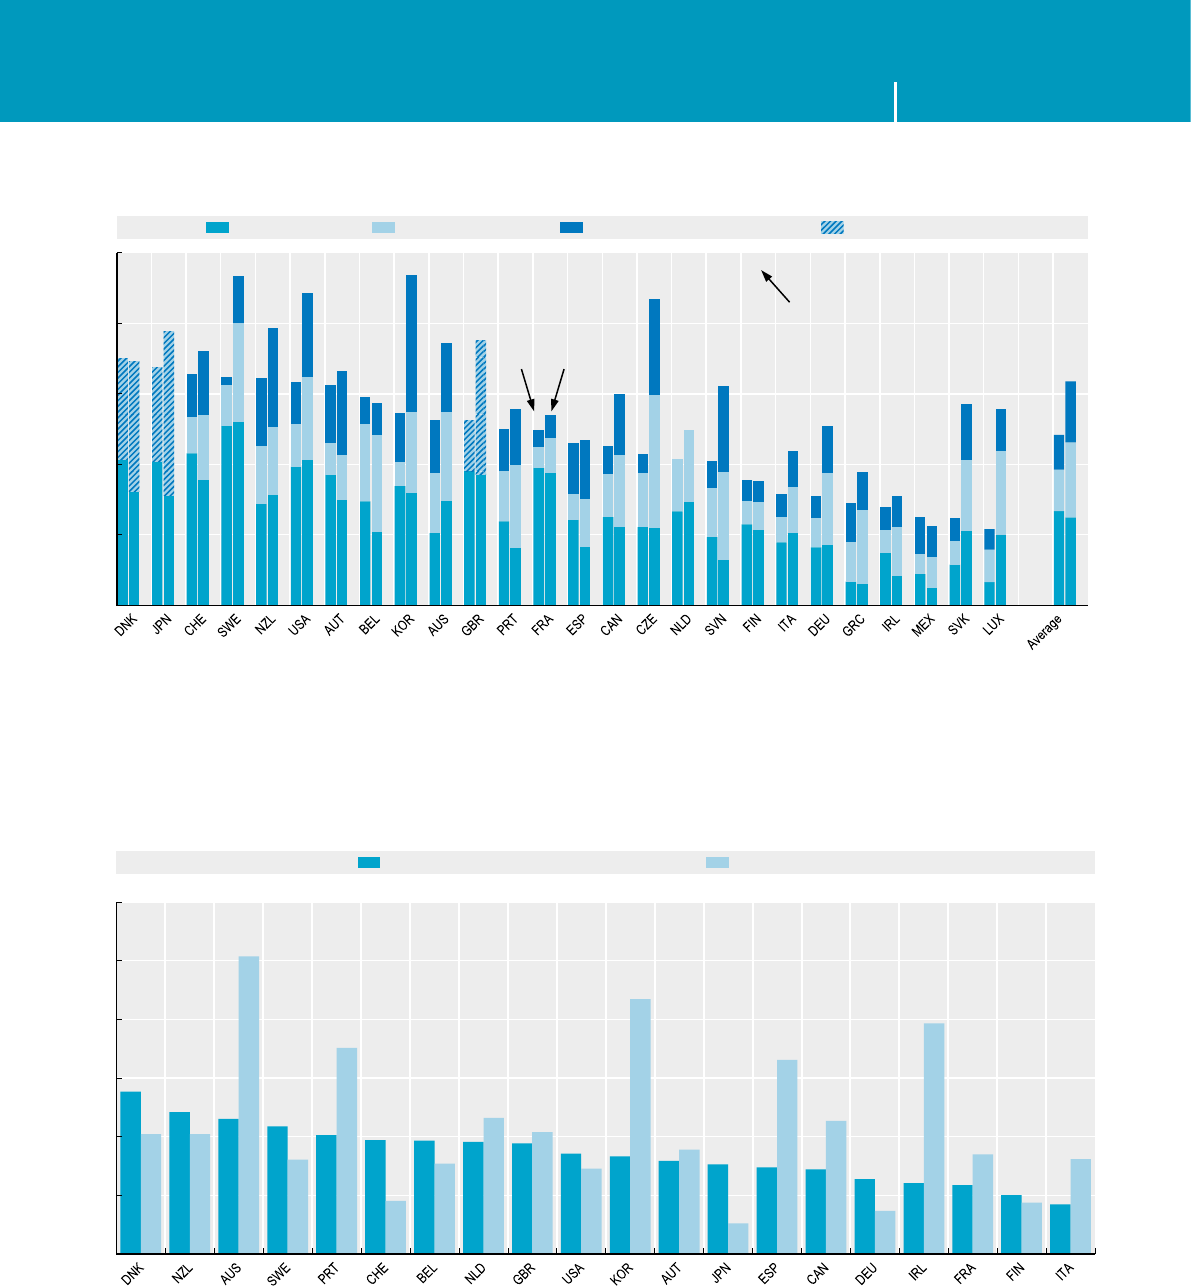
MEASURING THE DIGITAL ECONOMY: A NEW PERSPECTIVE © OECD 2014 129
5. DELIVERING GROWTH AND JOBS 5. DELIVERING GROWTH AND JOBS
Source: OECD, Annual National Accounts (SNA) Database; Eurostat, National Accounts Statistics and national sources, June 2014. See chapter notes.
1 2 http://dx.doi.org/10.1787/888933148671
ICT investment by asset, 2000 and 2012
As a percentage of GDP and Gross Fixed Capital Formation
19 16 16 17 17 17 15 14 10 9 18 14 13 12 9 9 12 12 9 9 9 10 13 6 6 6 12
0
1
2
3
4
5
%Software IT equipment Communication equipment Breakdown not available
2012 2000
ICT investment as a percentage of GFCF (2012)
0
0.2
0.4
0.6
0.8
1
1.2
ICT investment Non-ICT investment
Percentage points
Source: OECD, Productivity Database, July 2014. See chapter notes.
1 2 http://dx.doi.org/10.1787/888933148682
Contribution of ICT and non-ICT investments to GDP growth, 2000-12
In percentage points, on yearly basis
5.1 ICT investment

MEASURING THE DIGITAL ECONOMY: A NEW PERSPECTIVE © OECD 2014130
5. DELIVERING GROWTH AND JOBS 5. DELIVERING GROWTH AND JOBS
5.2 ICT business dynamics
Key ndings
Entrepreneurship and entrepreneurial dynamics are at
the heart of employment and productivity. The birth
of new rms and the death of non-viable ones are
essential to an economy’s experimentation with new
technologies and business models.
Between 2009 and 2012, net business population
growth in the ICT sector was about 4.5% on average
as compared to 1% in the business economy overall.
Typically, the ICT sector is also characterised by higher
rates of survival among start-ups after ve years.
The rate of net business population growth varies widely
across countries depending both on the economic cycle
and structural factors. Over the recent period, business
population in the ICT sector grew at an average annual
rate of about 8% or more in Latvia, Poland, the Slovak
Republic and Turkey, while Austria, the Czech Republic,
Italy and Portugal were characterised by slightly
negative growth rates of their ICT business population.
In almost all countries, the ICT sector outperformed the
rest of the economy in terms of net business population
growth. In Estonia, Hungary, Ireland, Spain and the
United Kingdom, the ICT sector was the exception to
the negative trend in net business population growth
observed in the business economy overall.
The dynamism of ICT businesses can also be observed
through gures on medium and high-growth enter-
prises (MHGEs). Based on their employment perfor-
mance, in 2012, MHGE represented on average about
21% of all active enterprises with ten or more employees
in ICT manufacturing, against 10% in the manufac-
turing sector overall. This share was 17% in information
and communication services against about 10% in total
business sector services.
The gures vary considerably across countries for the
ICT manufacturing sector, where MHGE shares ranged
from 30% and above in Finland and Germany to less
than 10% in Belgium, Latvia and Luxembourg. Cross-
country differences were less pronounced for informa-
tion and communication services.
For both aggregates, the share of MHGEs among
ICT rms was higher than the average in nearly all
countries.
In 2012, across all European countries, the employment
share of MHGEs in the ICT sector was 7.3% against 4.8%
in the business economy overall. MHGEs are usually
larger than average enterprises, but this difference is
smaller in ICT industries.
DID YOU KNOW?
Over the recent period, net business population
growth in the ICT sector amounted to 4.5%
on average and involved relatively high shares
of medium and high-growth rms both
in manufacturing and services.
Denitions
Net business population growth reects the change
in the population of active enterprises (in terms of
employment and/or turnover) between the beginning
and the end of the period.
ICT industries cover ISIC Rev. 4 Groups C261 to C264 and
C268 for ICT manufacturing and Groups G465 (Trade),
J582 (Software publishing), J61 (Telecommunications),
J62 and J631 (IT services) and S951 (Repairs) for ICT
services.
Business economy gures include all sectors except
agriculture, public services and activities of holding
companies.
Medium and high-growth enterprises (MHGE), here
measured by employment, are enterprises with an
average annual growth in employees greater than 10%
a year, over a three-year period, and with ten or more
employees at the beginning of the observation period.
Due to data availability, MHGE numbers are expressed
as a percentage of the population of enterprises in the
previous year. ICT manufacturing gures refer to the
ISIC Rev.4 Division C26.
Measurability
The concepts underlying indicators of business
demography (i.e. denitions of active enterprises,
births, deaths, etc.) follow the guidelines agreed in
the Eurostat-OECD Manual on Business Demography
Statistics (2008). These require that only real events be
considered. For instance, when two enterprises merge
into a new entity, two exits and one entry would be
recorded in administrative registers, while in statis-
tical business registers no demographic event should
be recorded except a variation in the stock of active
enterprises. In practice, distinguishing real from purely
administrative events is a hard task. Indeed, more
dynamic enterprises in particular can undergo mergers,
acquisitions, demergers and so on, and are thus more
prone to errors and the inclusion of some “administra-
tive noise”. In addition, the implementation of recent
guidelines on business demography requires time and
a robust statistical infrastructure. In recent years, the
quality of demographic indicators has been substan-
tially enhanced and their diffusion broadened.
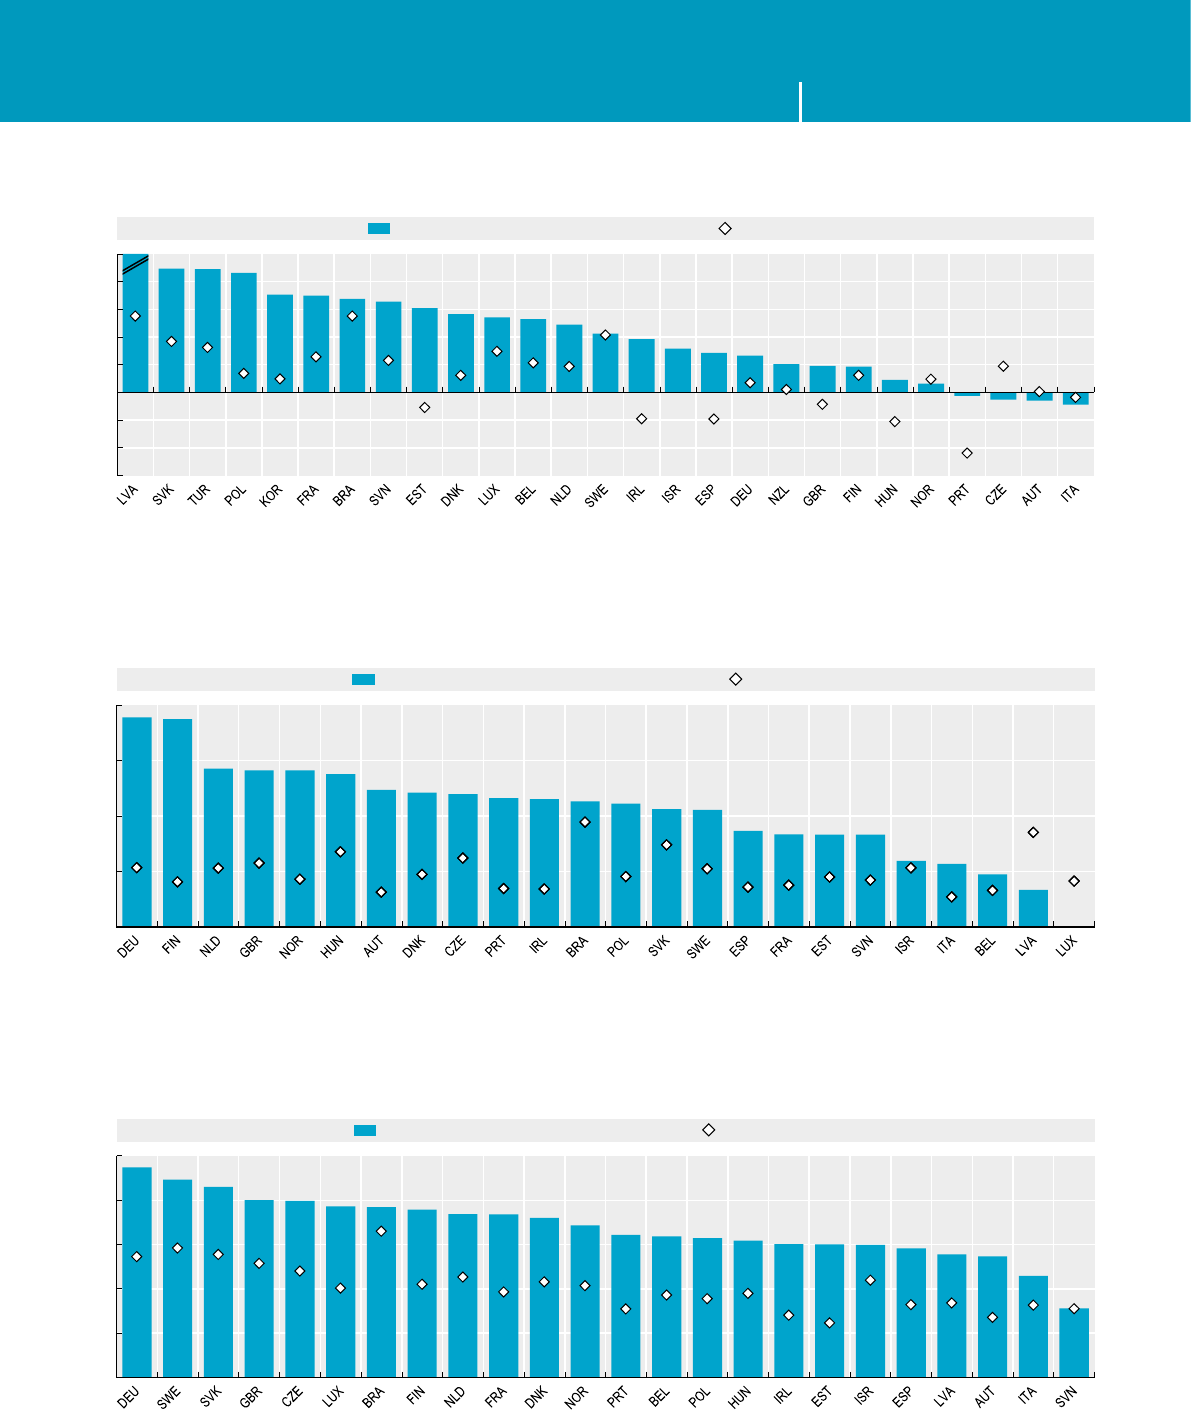
MEASURING THE DIGITAL ECONOMY: A NEW PERSPECTIVE © OECD 2014 131
5. DELIVERING GROWTH AND JOBS 5. DELIVERING GROWTH AND JOBS
5.2 ICT business dynamics
Source: OECD computations based on OECD, Structural and Demographic Business Statistics and Eurostat, Business Demography Statistics,
August 2014. See chapter notes.
1 2 http://dx.doi.org/10.1787/888933148696
Net business population growth between 2009 and 2012
Average annual growth rate
-6
-4
-2
0
2
4
6
8
10
%ICT sector Business economy
16
Source: OECD computations based on OECD, Structural and Demographic Business Statistics Database and Eurostat, Business Demography
Statistics, August 2014. See chapter notes.
1 2 http://dx.doi.org/10.1787/888933148706
Medium and high-growth enterprises in ICT and total manufacturing, measured by employment growth, 2012
As a percentage of active rms with ten or more employees in the previous year
0
10
20
30
40
%ICT manufacturing Total manufacturing
Source: OECD computations based on OECD, Structural and Demographic Business Statistics Database and Eurostat, Business Demography
Statistics, August 2014. See chapter notes.
1 2 http://dx.doi.org/10.1787/888933148717
Medium and high-growth enterprises in ICT and business sector services, measured by employment, 2012
As a percentage of active rms with ten or more employees in the previous year
0
5
10
15
20
25
%ICT services Business sector services

MEASURING THE DIGITAL ECONOMY: A NEW PERSPECTIVE © OECD 2014132
5. DELIVERING GROWTH AND JOBS 5. DELIVERING GROWTH AND JOBS
5.3 ICT value added
Key ndings
Demand for information and communication products
has increased continuously since 2000. In most OECD
economies, however, the share in values added of infor-
mation industries remained the same or diminished.
On average, it decreased slightly, to little less than
6%of GDP.
This overall trend hides important changes in the
composition of the aggregate, as well as some country-
specic patterns.
Computer and electronics manufacturing and, to a
lesser extent, telecommunication services saw their
weight in total value added diminish as production
shifted to other, mostly non-OECD, economies, and
unit prices fell as a result of productivity growth and
increased competition.
On average, the share of ICT manufacturing activities
dropped from 1.5% to 1.1% of total value added. This
share grew only in Switzerland and in a few countries
in Eastern Europe, which beneted from offshoring,
and fell steeply in Finland and Ireland.
The share of telecommunication services also
decreased from 2% to 1.7% on average with respect
to 2000, and even further with regard to the 2003-04
peak, as a result of a steep fall in prices.
Meanwhile, the share of publishing and media activities
in total value added remained the same at 1.2-1.3%,
while the share of IT services rose in all reporting
economies, from 1.3% to 1.9% on average, largely
offsetting losses in the other ICT sectors.
In the Czech Republic, Estonia, Hungary, Ireland,
the Slovak Republic and Slovenia, the share of IT
services in total value added increased by about
1percentage point or more. Even in larger economies
such as Germany, Japan, Spain, the United Kingdom
and theUnitedStates the share of IT services rose by
about 0.5percentage points.
Despite the increasing importance of IT services,
country differences in the overall weight of the infor-
mation economy sector remain mainly driven by the
relative importance of ICT manufacturing industries
and, to a lesser extent, publishing, audio-visual and
broadcasting activities.
DID YOU KNOW?
Information industries account for about
6% of total industry GDP in the OECD.
Denitions
Value added consists of the value of production net of
the costs of intermediate inputs. In practice, it includes
both gross prots and wages, and at an aggregate level
is equivalent to GDP.
The OECD in 2007 dened the information economy
sector (see the OECD Guide to Measuring the Informa-
tion Society 2011) as the aggregate combining ICT and
digital media and content industries in the current
version of the International Standard Industry
Classication (ISIC Rev.4). Here these are all referred
as information industries.
This aggregate includes ISIC Rev.4 Division 26 (Manufac-
ture of computer, electronic and optical products) and
Section J (Information and communication services),
consisting of Divisions 58-60 (Publishing and broad-
casting industries), 61 (Telecommunications) and 62-63
(Computer programming and information services).
ICT trade and repair activities (in Groups 465 and 951)
are also included, but are not considered here due to
issues of data availability.
Measurability
The current breakdown of Section J (Divisions 58-63)
provides a better appraisal of key ICT activities with
respect to the previous ISIC (Rev.3) classication, thanks
to the newly created Division 61 devoted to telecommu-
nications.
However, it is not always possible to isolate ICT activities
or obtain a comprehensive overview, as data are usually
made available only at the Division level (2 digits).
In particular, software publishing (Group 582) is
included under Division 58 on publishing (although
part of IT services), while news agencies and other
information services activities (Group 639) are found
under Division 63 on IT services, although they belong
to media and content industries.
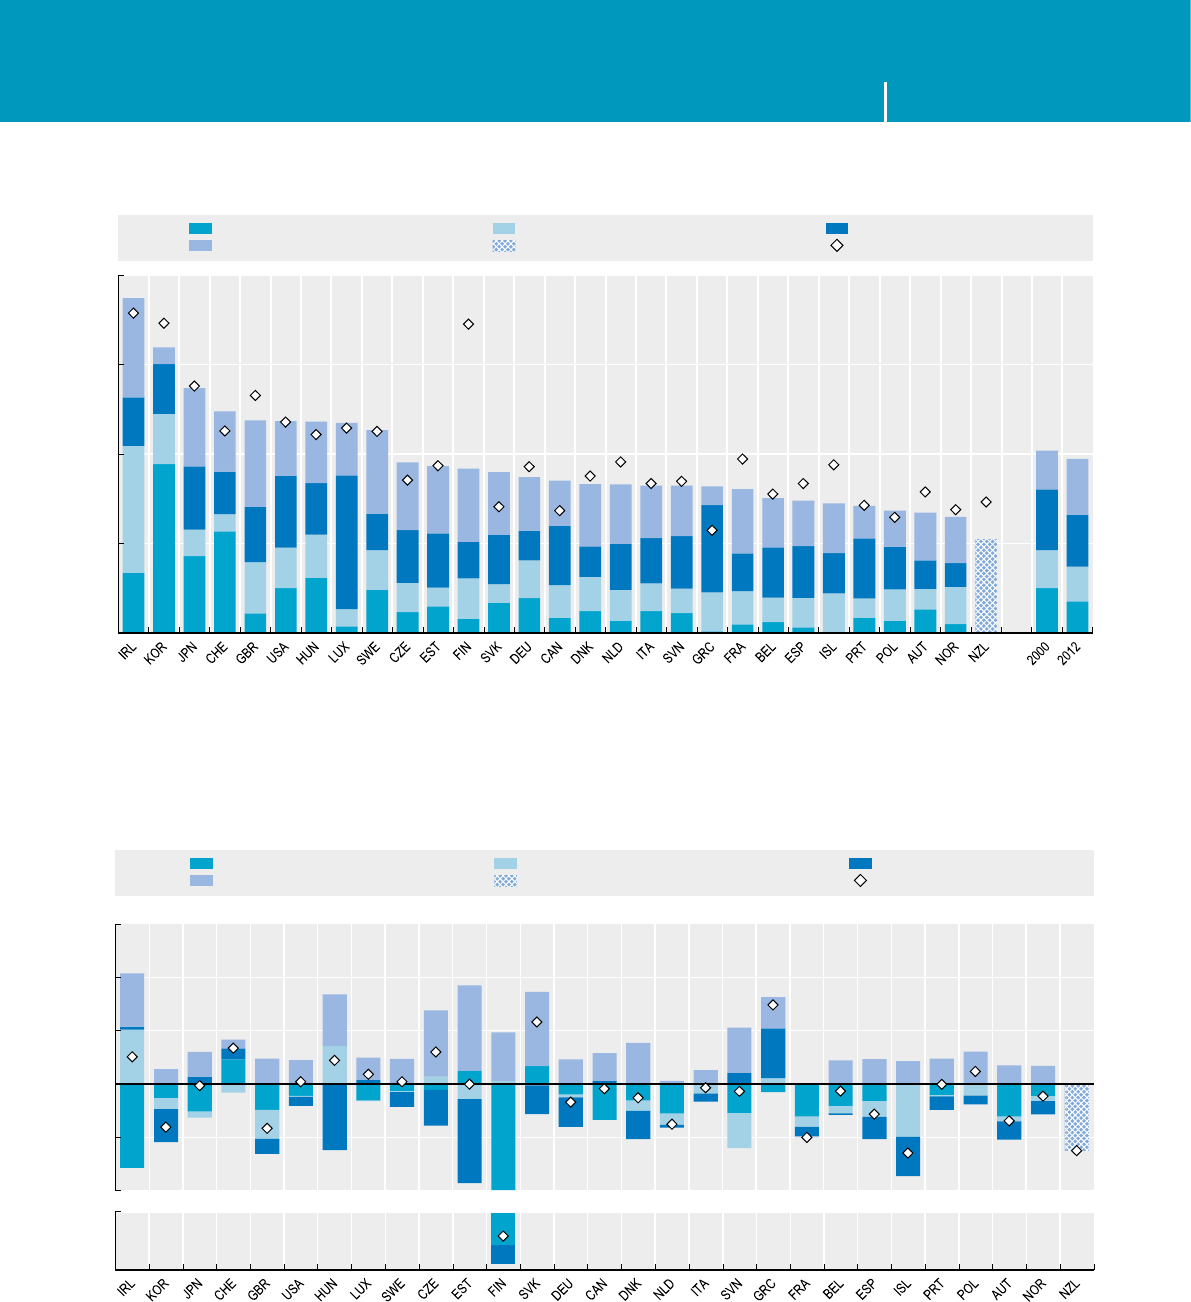
MEASURING THE DIGITAL ECONOMY: A NEW PERSPECTIVE © OECD 2014 133
5. DELIVERING GROWTH AND JOBS 5. DELIVERING GROWTH AND JOBS
Source: OECD, STAN Database, ISIC Rev.4, www.oecd.org/sti/stan; Eurostat, National Accounts Statistics and national sources, June 2014.
See chapter notes.
1 2 http://dx.doi.org/10.1787/888933148726
Value added of information industries, 2000 and 2012
As a percentage of total value added at basic prices
0
3
6
9
12
%
Computer, electronic and optical products Publishing, audio-visual and broadcasting activities Telecommunications
IT and other information services Breakdown not available Information industries, 2000
Average
-2
-1
0
1
2
3
Percentage points
Computer, electronic and optical products Publishing, audio-visual and broadcasting activities Telecommunications
IT and other information services Breakdown not available Total
-6
-4
Source: OECD, STAN Database, ISIC Rev.4, www.oecd.org/sti/stan; Eurostat, National Accounts Statistics and national sources, June 2014.
See chapter notes.
1 2 http://dx.doi.org/10.1787/888933148738
Change in the share of information industries in total value added between 2000 and 2012
Total and industry contributions
5.3 ICT value added

MEASURING THE DIGITAL ECONOMY: A NEW PERSPECTIVE © OECD 2014134
5. DELIVERING GROWTH AND JOBS 5. DELIVERING GROWTH AND JOBS
5.4 Labour productivity in information industries
Key ndings
Information industries are characterised by higher
than average levels of labour productivity across all
OECD economies, reecting their relative intensity in
xed and knowledge-based capital.
On average, labour productivity measured on persons
employed stands at more than three times that of the
whole economy in Telecommunication services, is 50%
higher for Publishing and audio-visual services (which
include packaged software), and around 15% and 25%
higher than average for Computer manufacturing and
IT services, respectively.
Ratios of the information industries to total economy
levels and underlying gures for individual activities
are very diverse across countries. Aggregate ratios
range between 1.9 to 2.7 in the UnitedStates, Ireland,
Canada, Portugal and Greece, reecting the strength
of these industries in the three rst countries and
therelative weakness of the rest of the economy in the
latter ones (see 5.1 and 5.8). In Denmark, Finland and
Norway, productivity level of the information industries
are just above the national average.
Variability is higher between industries than across
countries.
For ICT manufacturing, productivity levels are between
1.5 and 2.1 times the average in Austria, Portugal,
Sweden, the United Kingdom and the United States.
Values are below the total economy average in a number
of countries, including Finland (where the huge drop in
value added due to the Nokia crisis was not matched
by a similar fall in employment), France, Luxembourg,
Norway and some offshoring destinations, such as
theCzechRepublic, Hungary and Poland.
In almost all countries, labour productivity is very high
in telecommunication services (up to six times average
levels) while productivity levels in IT services are
between 1 and 1.6 times the average. In Publishing and
media industries, relative levels of productivity present
a greater variability.
Part of the strategic importance of information industries
lies in the substantial contribution they provide to the
aggregate dynamics of labour productivity, resulting
from both within-industry dynamics and compositional
effects (i.e. shifts in employment shares), although this
is not uniform across countries and industries.
Over the period 2001-11, the contribution of informa-
tion industries to total economy labour productivity
growth ranged from 10% to 40%, and from about 0.1 to
more than 1 percentage point on a yearly basis, rising
to 0.5 percentage points or more in Estonia, Sweden,
the SlovakRepublic and the UnitedStates.
DID YOU KNOW?
On average, in the OECD the level of labour
productivity in the information sectors is about
60% higher than that of the total economy.
Denitions
Labour productivity is dened as the amount of output
produced by a unit of labour input. Typically, value
added is used as the measure for output (an alterna-
tive measure being turnover), while the input consists
of the total amount of hours worked. Due to data avail-
ability, here the number of persons employed (national
accounts estimate) is used instead. Industry values are
computed relative to the whole economy (i.e. to GDP per
person employed in each country), netting the indicator
for differences in productivity levels across countries.
The OECD dened the information economy sector
(here referred as information industries) in 2007 (see the
OECD Guide to Measuring the Information Society 2011)
as combining ICT with media and content industries,
as specied in the current version of the International
Standard Industry Classication (ISIC Rev.4). This
aggregate includes ISIC Division 26 (Manufacture of
computer, electronic and optical products) and SectionJ
(Information and communication services), consisting of
Divisions 58-60 (Publishing and broadcasting industries),
61 (Telecommunications) and 62-63 (Computer program-
ming and information services). ICT trade and repair
activities (in Groups 465 and 951) are also included, but
are not considered here due to issues of data availability.
Measurability
The measurement of labour productivity using persons
employed instead of hours worked does not take into
account differences in average working hours across
sectors within each economy. Additionally, data do not
refer to a homogeneous period across all economies, as
in some countries the availability of detailed industry-
level information is lagging behind by two or more
years. Yearly estimates are affected by the business
cycle, as is the case for Finland.
Finally, the use of hedonic deators to take into
account the quality of ICT products has a high impact
on value added in volume terms, which is reected in
the contribution of the sector to productivity growth.
Such treatment is not homogeneous across countries
and, more importantly, quality adjustment is applied to
ICT manufacturing only, while similar quality changes
are now happening in services, notably with respect to
broadband. To address this issue, the OECD is currently
working to develop guidelines on quality adjustment
criteria for telecommunication services.
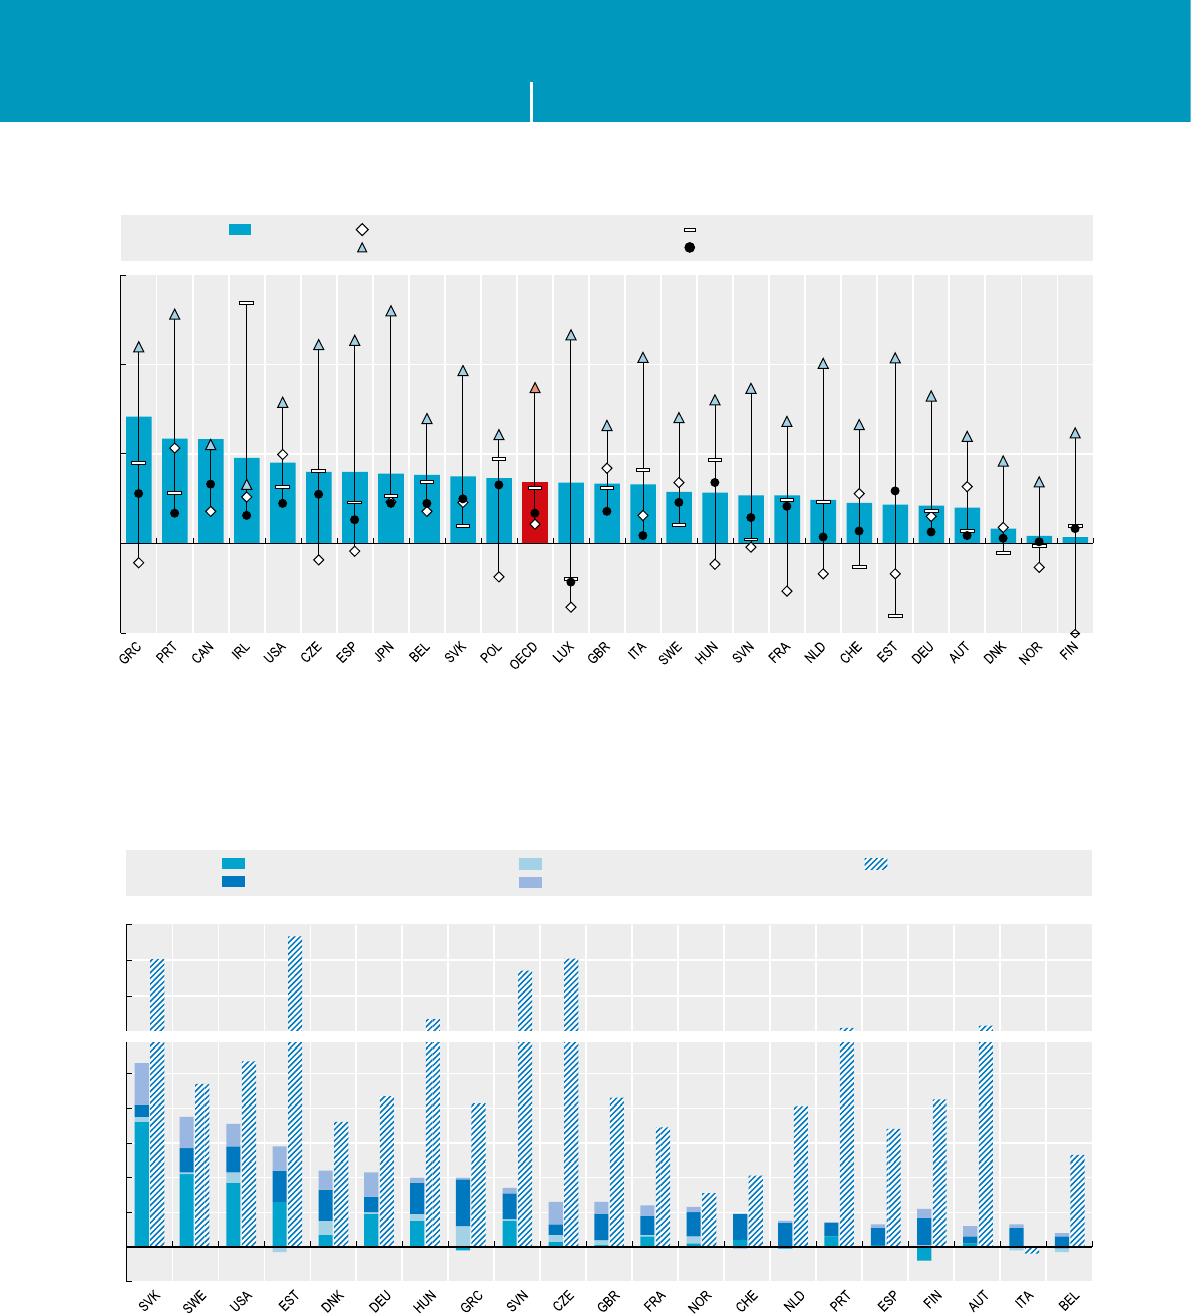
MEASURING THE DIGITAL ECONOMY: A NEW PERSPECTIVE © OECD 2014 135
5. DELIVERING GROWTH AND JOBS 5. DELIVERING GROWTH AND JOBS
5.4 Labour productivity in information industries
Source: OECD, STAN Database, ISIC Rev.4, www.oecd.org/sti/stan and Eurostat, National Accounts Statistics, May 2014. See chapter notes.
1 2 http://dx.doi.org/10.1787/888933148744
Apparent labour productivity in information industries, relative levels, 2012
By industry ratios to productivity in total economy (Total economy level = 1), logarithmic scale
Total Computer, electronic and optical products Publishing, audio-visual and broadcasting activities
Telecommunications IT and other information services
0.5
1
2
4
8
0.4
-0.2
0.0
0.2
0.4
0.6
0.8
1.0
1.2
2.0
2.8
3.6
Percentage points
Computer, electronic and optical products Publishing, audio-visual and broadcasting activities
Telecommunications IT and other information services
Other sectors
Source: OECD, STAN Database, ISIC Rev.4, www.oecd.org/sti/stan and Eurostat, National Accounts Statistics, May 2014. See chapter notes.
1 2 http://dx.doi.org/10.1787/888933148755
Contribution of information industries and of other sectors to labour productivity growth, 2001-11
Yearly rates
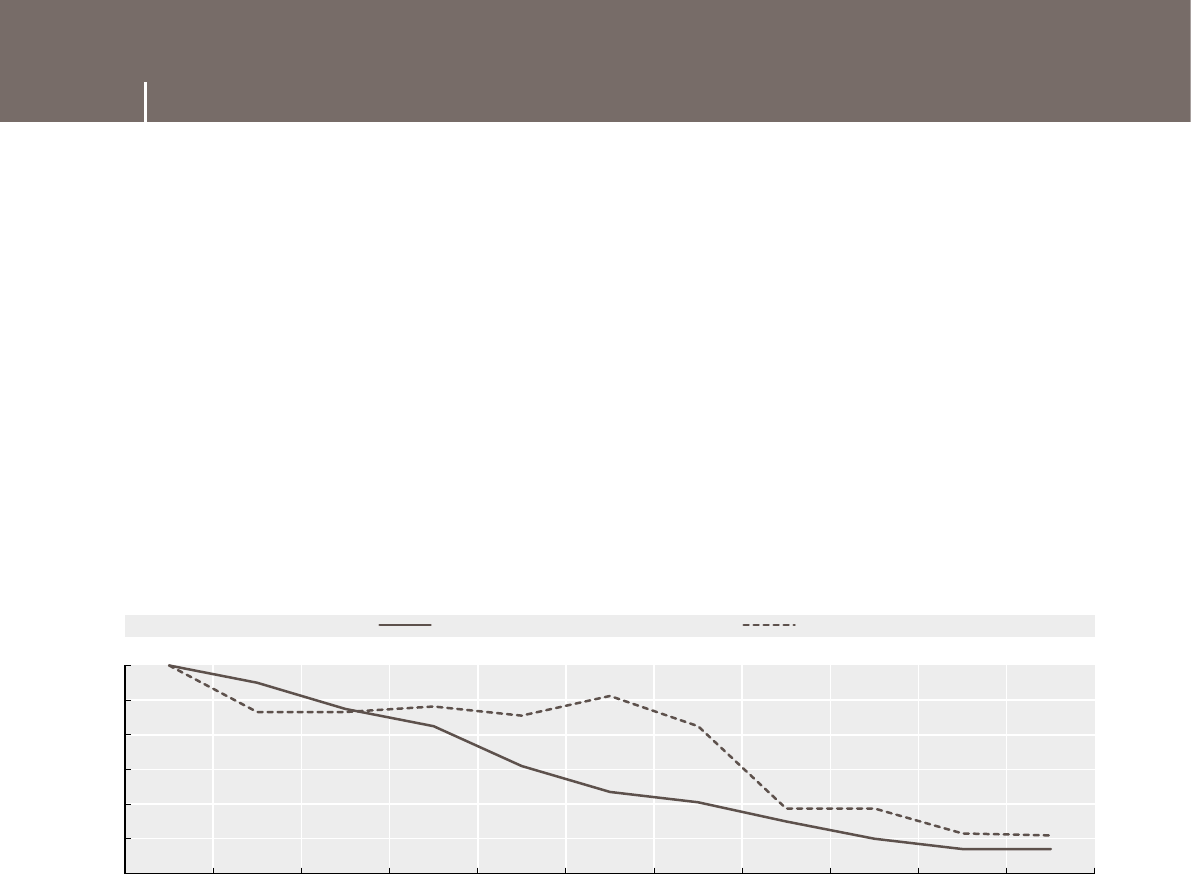
MEASURING THE DIGITAL ECONOMY: A NEW PERSPECTIVE © OECD 2014136
5. GAP PAGE 5. GAP PAGE
5.5 Measuring quality in communication services
Producer price indices for computer and software in the United States, 2003-13
Source: OECD based on BLS Producer Price Index Industry Database, July 2014.
1 2 http://dx.doi.org/10.1787/888933148766
2003 2004 2005 2006 2007 2008 2009 2010 2011 2012 2013
88
90
92
94
96
98
100
Index 2003 = 100
Computer Software
Why do we need indicators?
In the digital economy, measuring the quality of communication services is essential for several reasons. First,
observed price differences for communication services among operators and across countries may reect either
differences in the quality of the services provided or imperfect competition in upstream and downstream markets.
These two factors have opposite policy implications: while service quality is a key ingredient for competition, non-
competitive prices call for appropriate policy measures.
Second, measuring real growth in communication services requires an appropriate price deator to separate
increases in prices due to quality improvements from actual ination. For example, many consumers are buying
more communication services with a constant level of communication expenditures due to the “better quality” of
these services (e.g.higher speed, broader geographic coverage, new features, etc.).
Finally, the contribution of communication investments to value added growth depends on the extent to which new
equipment deliver better services (i.e.are more productive). In the past, poor measurement of technical progress
embodied in newly installed capital goods led to underestimation of the contribution of hardware and software to
growth, thus contributing to the so-called Solow paradox. As an example, the gure below shows the dramatic decline
in producer prices for computers and software in theUnitedStates once quality improvements are controlled for.
While the issue of quality is not specic to communication services, its measurement is particularly important
due to the rapid rate of technological progress in the sector, and because bundles of different communication
services render price comparison among offers difcult.
What are the challenges?
There are two main approaches to the measurement of quality in communication services: basket benchmarking
and hedonic models.
The rst approach is the one currently used by the OECD and most regulators of communication services.
Theunderlying rationale is to group offers of communication services in clusters of similar consumption patterns,
which in turn are compared across countries. The OECD has developed price-benchmarking baskets, in use since
the 1990s, through a consensus-based and harmonised methodology for price comparison among all member
countries. The basket methodologies were updated in 2009 (OECD, 2010) and a wireless broadband basket was
developed in 2012 (OECD, 2012). Some improvements and updates were introduced for xed broadband services by
the OECD Broadband Metrics Workshops in 2011 and 2012.
In recent times, increasing availability of bundles of communication services has made the basket benchmarking
approach more challenging. For example, nearly half of all households in the European Union purchase commu-
nications services as part of a bundle (46%). In particular, Internet access purchased through a bundled offer
represents 64% of all Internet connections in theEU (European Commission, 2014). This is why some communi-
cation regulators, such as OFCOM in theUnitedKingdom, have developed baskets that benchmark a bundle of
services against other countries.

MEASURING THE DIGITAL ECONOMY: A NEW PERSPECTIVE © OECD 2014 137
5. GAP PAGE 5. GAP PAGE
5.5 Measuring quality in communication services
Communication bundles are typically sold with a signicant price discount over stand-alone prices. Indeed, these
discounts are crucial in comparing price levels in the market, but their inclusion in the established OECD price-
benchmarking baskets on a permanent basis is challenging, given that communication bundles can vary greatly
across the OECD area.
One possible approach to evaluating the inuence of bundled prices is to calculate the discount of the bundle
over the purchase of stand-alone services (e.g.voice, television and broadband in the case of a triple-play bundle).
However, such an approach would face serious limitations, the most important being that all the stand-alone
services are not necessarily available from all operators.
Options for international action
The OECD is looking at the feasibility of hedonic models as a complementary approach to measuring quality in
communication services across countries. Hedonic models can be described as a tool designed to isolate and
measure the inuence on price of economically meaningful product characteristics. For instance, the price of
a bundle of communication services can be modelled as a function of the prices of the different characteristics
of the services included in that bundle. As the prices of these characteristics (e.g.speed, geographic coverage,
contract length, etc.) are not observable, a hedonic model permits users to estimate them. These implicit prices
provide values for the quality adjustments when product characteristics change over time.
Hedonic models require a large sample of service plans, including detailed information about their quality
characteristics, in order to properly assess cross-country differences in prices. The hedonic approach is therefore
very data intensive.
A further issue relates to the method for measuring cross-country differences in communication prices. One
common method at the national level is the dummy variable approach. Dummy coefcients may be interpreted as
the price differential among countries after controlling for all quality features. This estimation, however, relies on
hypotheses that are highly problematic for international comparisons.
The rst hypothesis is that all relevant characteristics of the bundle are included in the model. If some relevant
characteristics are omitted, these would be captured by the country dummy (e.g.one country may turn out to
have higher prices because its bundle provides for valuable characteristics that are not included in the regression).
Thesecond hypothesis is that the implicit price for each characteristic of the communication services is the same
in all countries. In fact, consumer preferences and production costs may differ across countries, causing variance
in the prices of such characteristics as well. For instance, consumers in some countries may value broadband
speed more than in others. In addition, the deployment costs of broadband infrastructures may not be the same
in countries with a large territory as in small countries.
For the above reasons, other hedonic methods may be more suitable, as discussed in the OECD Handbook for Hedonic
Indexes and Quality Adjustments in Price Indexes (Triplett, 2006). These methods include the characteristics price index
method, the imputation method and the hedonic quality adjustment method. In practice, statistical agencies that have
implemented hedonic indexes have mostly used the latter, partly because of the necessity for producing a timely index.
The OECD is currently reviewing existing practices in member countries (e.g.Statistics Canada, ANACOM in Portugal,
the FCC and BLS in the United States) with the aim of developing those most suited to international comparison.
References
ANACOM (2013), Characterization of consumption and access of packaged services for electronic communications, ANACOM, Lisbon, www.anacom.pt/
streaming/Estudo_ANACOM_consumo_pacotesCE.pdf?contentId=1173917&eld=ATTACHED_FILE, accessed July 2014.
Bureau of Labor Statistics (2014), “Producer prices”, BLS Handbook of Methods, Bureau of Labor Statistics, Washington, DC. www.bls.gov/opub/hom/
pdf/homch14.pdf.
European Commission, (2014), E-Communications and Telecom Single Market Household Survey, Special Eurobarometer, No. 414, Brussels.
OECD (2014), “Connected Televisions: Convergence and Emerging Business Models”, OECD Digital Economy Papers, No. 231, OECD Publishing.
Doi:http://dx.doi.org/10.1787/5jzb36wjqkvg-en.
OECD (2012), “Methodology for Constructing Wireless Broadband Price Baskets”, OECD Digital Economy Papers, No. 205, OECD Publishing.
Doi:http://dx.doi.org/10.1787/5k92wd5kw0nw-en.
OECD (2010), “Revision of the methodology for constructing telecommunication price baskets”, DSTI/ICCP(2009)14/FINAL, OECD, Paris. www.oecd.
org/sti/broadband/48242089.pdf.
Triplett, J. (2006), Handbook on Hedonic Indexes and Quality Adjustments in Price Indexes: Special Application to Information Technology Products, OECD
Publishing. Doi: http://dx.doi.org/10.1787/9789264028159-en.

MEASURING THE DIGITAL ECONOMY: A NEW PERSPECTIVE © OECD 2014138
5. DELIVERING GROWTH AND JOBS 5. DELIVERING GROWTH AND JOBS
5.6 E-commerce
Key ndings
Electronic business (e-business) can help drive growth
by enlarging the market reach of enterprises and
helping them to save on costs.
Businesses increasingly operate online. In 2013, on
average more than three out of four businesses in
the 30 reporting countries had a website, including
homepages hosted by a third party, up from about
70%in2009.
The share of enterprises with a web presence ranges
from over 90% in Denmark, Finland and Switzerland,
to about 60% in Greece, Hungary, Korea and Portugal.
Progress since 2009 was particularly strong in Ireland
and New Zealand, as well as in France, Hungary,
Portugal and Spain among lagging countries.
In all countries except Hungary, Korea, theSlovakRepublic
and Turkey, 90% or more of larger enterprises have a
website, while web presence in SMEs ranges between
90% and above in Denmark, Finland and Switzerland,
and less than 60% in Hungary, Greece, Korea, Portugal
andTurkey.
In most cases, a web presence is still used as a window
to provide information on the enterprise. Indeed, gures
on participation in e-commerce are much lower,
particularly for web sales, which in the EU28 represent
less than 30% of the total turnover from e-commerce in
2012, the bulk of value being generated by transactions
between businesses (B2B) over EDI applications.
On average in 2012, 21% of rms in reporting OECD
countries with at least 10 persons employed received
electronic orders, 4 percentage points more than
in2009. Differences among countries are considerable.
InNewZealand the share is above 45%, while in Greece,
Italy, Mexico, Poland and Turkey it is about 10% or less.
These gures closely mimic shares of smaller rms,
which dominate in numbers. For enterprises with 250
or more persons employed the average value is 40% and
the share is above 30% even in some lagging countries.
The overall economic relevance of e-business trans-
actions, measured by the share of e-commerce sales
in turnover, stands at about 16% of total turnover on
average in reporting countries. Up to about 90% of
thevalue of e-commerce (based on proxy information)
comes from B2B transactions.
Results are dominated by the economic weight of large
enterprises, for which e-commerce sales represent,
onaverage, about 20% of turnover against 7% for small
rms. This also renders differences among countries
less sizeable than for the propensity to engage in
e-commerce.
DID YOU KNOW?
Over 2012-13, more than 75% of enterprises
inthe OECD had a web presence and around
20%conducted e-sales.
Denitions
An e-commerce transaction is the sale or purchase of
goods or services, conducted over computer networks
by methods specically designed for the purpose of
receiving or placing of orders (OECD Guide to Measuring
the Information Society 2011). The goods or services
are ordered by those methods, but the payment and
the ultimate delivery of the goods or services do not
have to be conducted online. Transactions can occur
between enterprises, households, individuals, govern-
ments and other organisations. In this respect, they
are classied as business-to-business (B2B), business-to-
consumer(B2C), business-to-government(B2G) and, more
recently, consumer-to-consumer(C2C).
For enterprises, e-commerce sales gures presented here
include all transactions carried out over webpages,
extranet or Electronic Data Interchange (EDI) systems
and exclude orders by telephone calls, fax or manually
typed e-mails.
Size classes are dened as small (from 10 to 49 persons
employed), medium (50 to 249) and large (250 and more).
Measurability
Measurement of e-commerce presents many methodo-
logical challenges that can affect the comparability of
estimates, such as the adoption of different practices
for data collection and estimations, and the treatment
of outliers and e-commerce by multinationals, or for the
imputation of values from ranges recorded in surveys.
Other issues include differences in sectoral coverage of
surveys, and a lack of measures concerning the actors
involved (B2B, B2C, etc.).
For this last aspect, Korea provides direct estimates,
while theUnitedStates Census Bureau uses transactions
originating from the retail sector as a proxy for B2C.
For European countries the best available proxy consists
of EDI (B2B and B2G) vs. web sales (B2C, etc.). Conver-
gence of technologies brings additional challenges for
the treatment (and surveying) of emerging transac-
tions, notably over mobile phones, via SMS or using
devices that enable near eld communication.
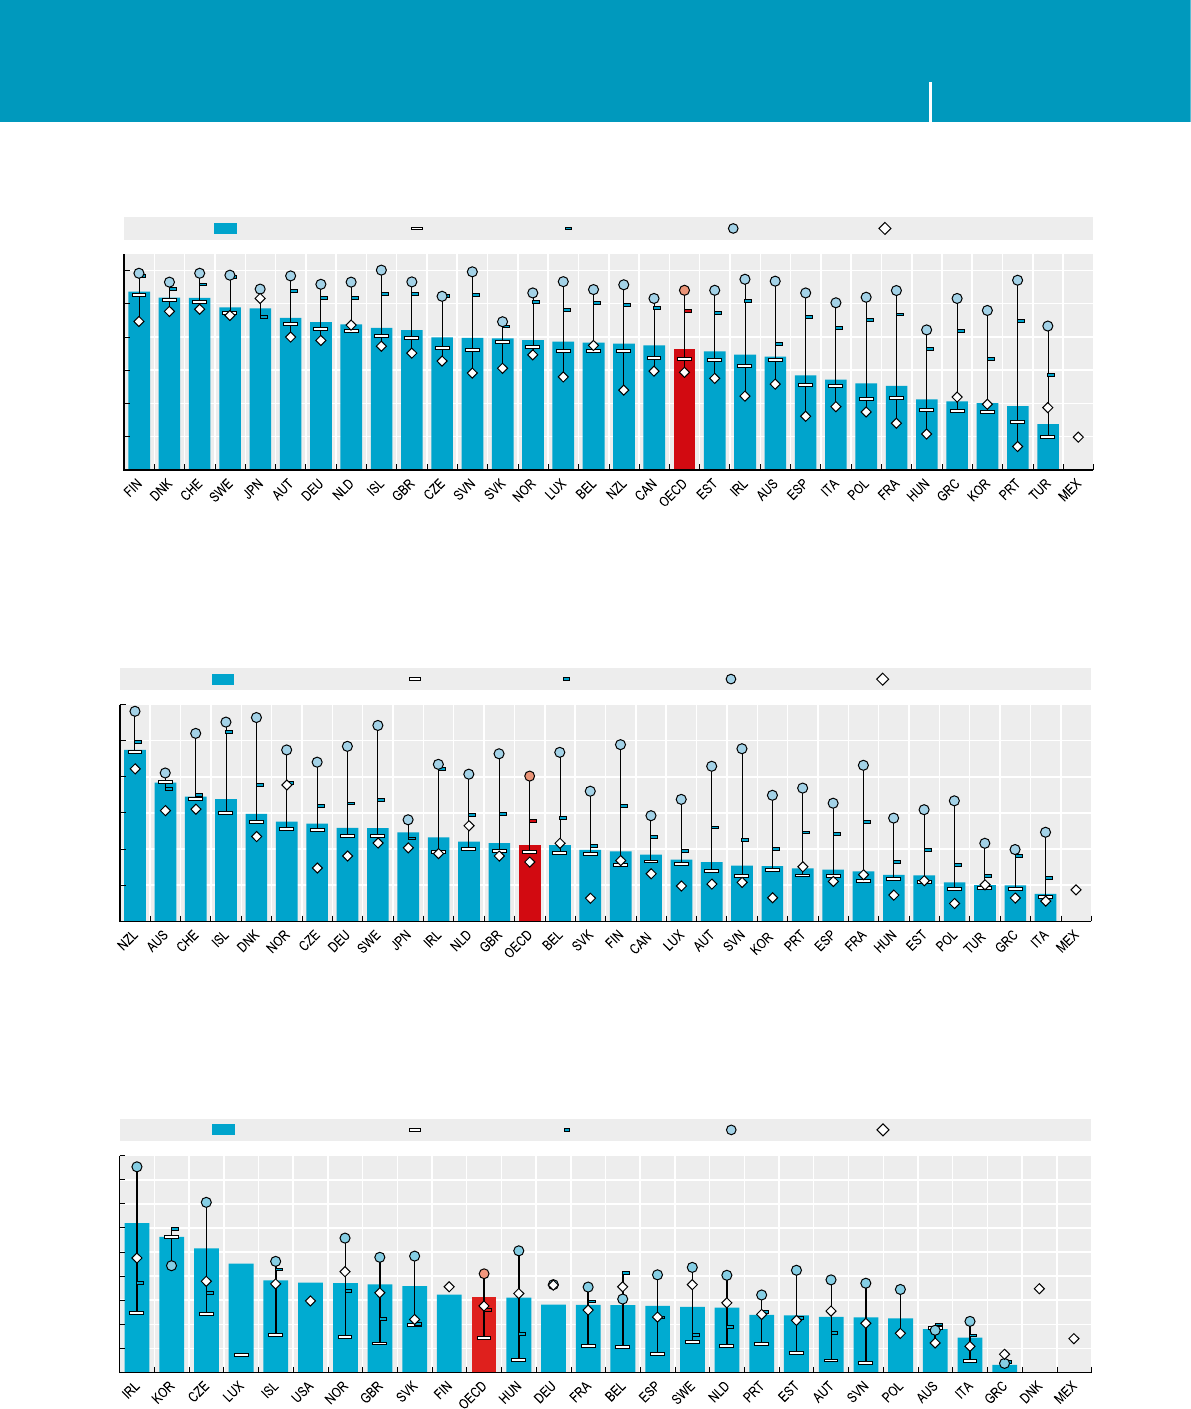
MEASURING THE DIGITAL ECONOMY: A NEW PERSPECTIVE © OECD 2014 139
5. DELIVERING GROWTH AND JOBS 5. DELIVERING GROWTH AND JOBS
Source: OECD, ICT Database; Eurostat, Information Society Statistics and national sources, July 2014. See chapter notes.
1 2 http://dx.doi.org/10.1787/888933148775
Enterprises with website or home page, by size, 2009 and 2013
As a percentage of enterprises in each employment size class
40
50
60
70
80
90
100
%
All enterprises 10-49 50-249 250+ All enterprises, 2009
Source: OECD, ICT Database; Eurostat, Information Society Statistics and national sources, July 2014. See chapter notes.
1 2 http://dx.doi.org/10.1787/888933148789
Enterprises engaged in sales via e-commerce by employment size, 2008 and 2012
As a percentage of enterprises in each employment size class
0
10
20
30
40
50
60
%All enterprises 10-49 50-249 250+ All enterprises, 2008
Source: OECD, ICT Database; Eurostat, Information Society Statistics and national sources, July 2014. See chapter notes.
1 2 http://dx.doi.org/10.1787/888933148799
Turnover from e-commerce, by size, 2008 and 2012
As a percentage of turnover in each employment size class
0
5
10
15
20
25
30
35
40
45
%All enterprises 10-49 50-249 250+ All enterprises, 2008
5.6 E-commerce

MEASURING THE DIGITAL ECONOMY: A NEW PERSPECTIVE © OECD 2014140
5. DELIVERING GROWTH AND JOBS 5. DELIVERING GROWTH AND JOBS
5.7 Human capital in ICT
Key ndings
In today’s information-driven economy, human
resources have become a key asset for economic
growth and worker employability. Specialised skills in
ICT, inparticular, are key knowledge assets required to
sustain innovation and productivity growth.
In 2012, the share of computer science tertiary graduates
in all graduates in the OECD was just above 3%, down
by almost 2 percentage points from 2005. The country
with the highest share of computer science graduates
was New Zealand (6%), although it also experienced
adeclining share.
Attracting women to tertiary-level courses in computer
science remains a challenge in many countries.
On average, women represent only around 20% of
graduates in this eld. Some countries such as Ireland
and South Africa have a better gender balance with
over 40% of women, while Indonesia is the only country
where women accounted for the majority of computer
science graduates in 2012.
Over the period 2005-12, the largest declines in the
number of computer science graduates, relative to
the population of 20-34 year-olds, were observed in
Australia, Belgium, Canada, Ireland, Norway, Mexico,
Switzerland and the United Kingdom. Countries that
experienced the most important increase in the share
of computer science graduates relative to those in
the20-34 age cohorts were the CzechRepublic, Slovenia
and Turkey.
Innovation depends crucially on the availability of
research personnel and skilled employees. In the
OECD area, on average 30% of researchers in the
business enterprise sector are employed in information
industries. This share rises above 50% in Finland, Israel
and Korea, which also account for the largest shares of
R&D performed by information industries (see 4.1).
Reecting industrial specialisation, in these three
countries and in Japan ICT manufacturing industries
alone employ between around 20% and 40% of total
business sector researchers, while in Estonia, Iceland,
Ireland, Israel, Poland and Turkey, information and
communication service activities employ over 30% of
total researchers in the business sector.
DID YOU KNOW?
Only 3% of OECD tertiary graduates attained
a degree in computer science in 2012.
However, information and communication
industries employ on average over 30%ofbusiness
sector researchers.
Denitions
Tertiary graduates in computer science have attained
a degree in the eld of Computing (48) based on
the International Standard Classication of Educa-
tion (ISCED-97), levels 5A and 5B. Tertiary type-A
programmes are theory-based programmes, while
type-B programmes are more vocational.
Researchers in information industries are dened as
professionals engaged in the conception and creation
of new knowledge, products, processes, methods and
systems working in the ICT industries (except trade and
repair) and media and content industries. Researchers
are measured in full-time equivalents (FTE), a more
accurate measure of the volume of human resources
devoted to research in a country than headcounts
orjobs.
This aggregate includes ISIC Rev.4 Division 26
(Manufacture of computer, electronic and optical
products) and Section J (Information and commu-
nication). This section includes the production and
distribution of information and cultural products, and
the provision of the means to transmit or distribute
these products, as well as data or communications,
information technology activities, and the processing
of data and other information service activities.
Measurability
Tertiary graduates in the eld of Computing may
underestimate the actual number of ICT graduates in
countries where equivalent ICT degrees are granted
by other faculties (e.g. engineering). The Career of
Doctorate Holders (CDH) data collection provides
complementary and useful data on doctorate holders
employed as ICT professionals (ISCO-08, Sub-major
Group 25) by eld of doctoral degree. The latest data
available are for 2009, but a new data collection is
scheduled for the end of 2014. For the rst time the
new data will include numbers of employed doctorate
holders by industry.
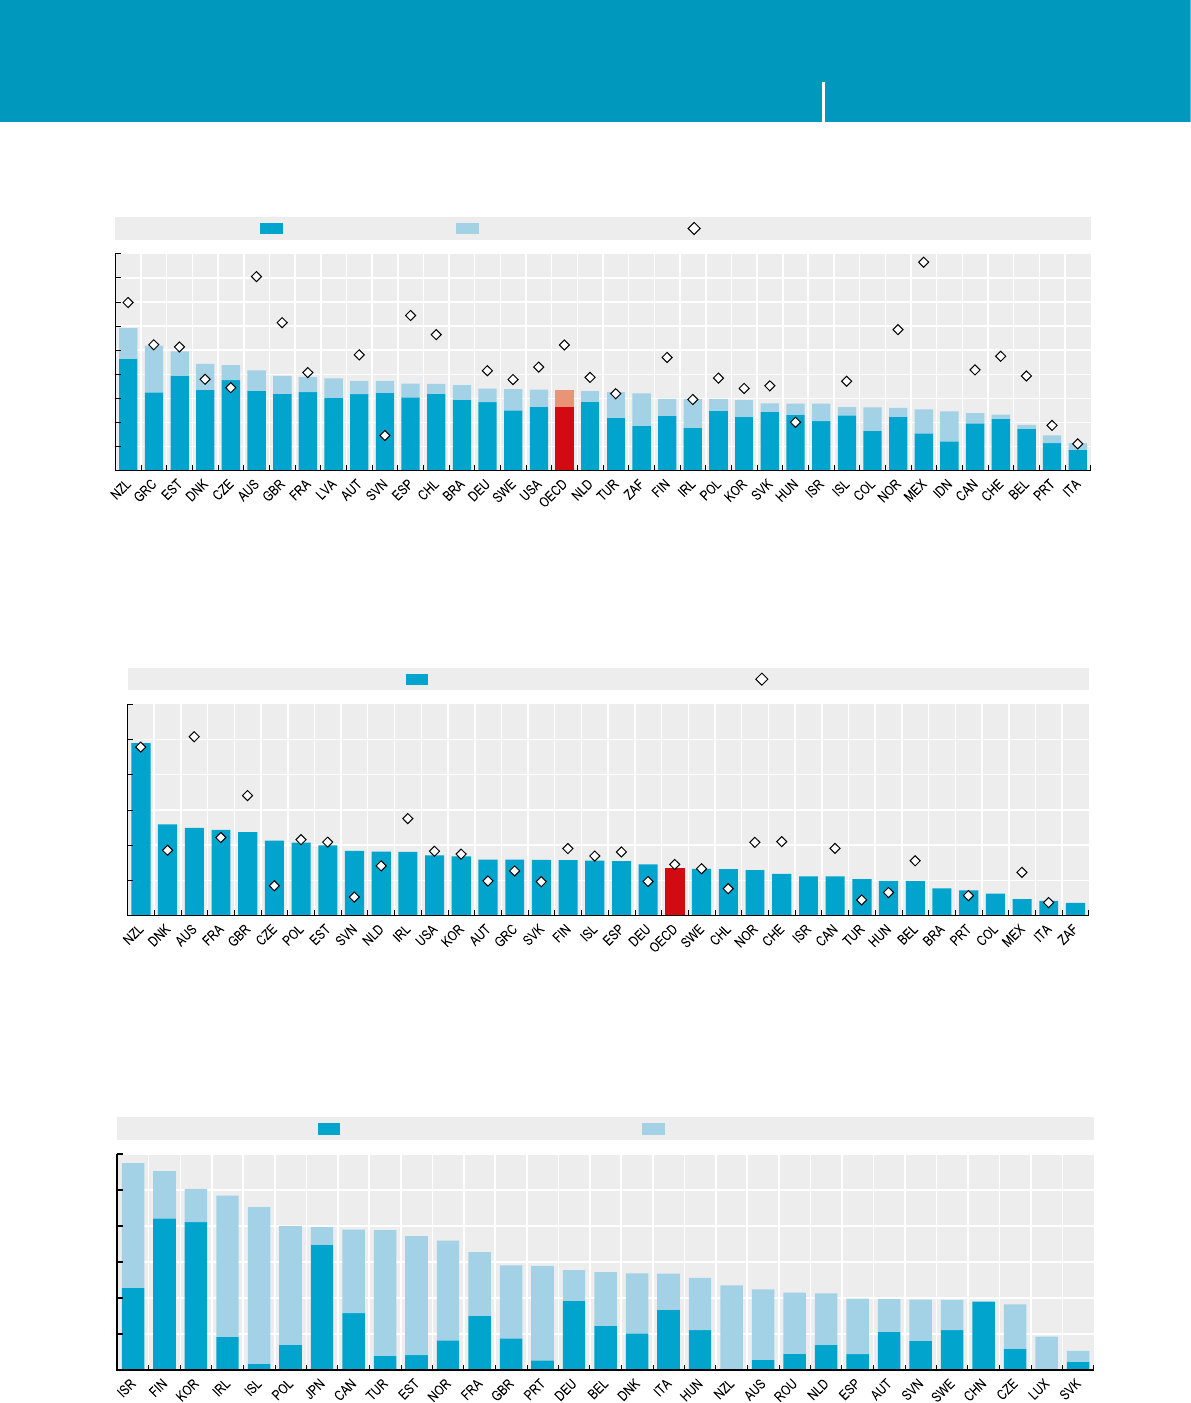
MEASURING THE DIGITAL ECONOMY: A NEW PERSPECTIVE © OECD 2014 141
5. DELIVERING GROWTH AND JOBS 5. DELIVERING GROWTH AND JOBS
Source: OECD, Education Database, www.oecd.org/education/database.htm, September 2014 and OECD (2014), Education at a Glance 2014:
OECDIndicators, OECD Publishing. See chapter notes.
1 2 http://dx.doi.org/10.1787/888933148808
Tertiary graduates in computer science, by gender, 2005 and 2012
As a percentage of all tertiary graduates
0
1
2
3
4
5
6
7
8
9
%Men Women Tertiary graduates in computer science, 2005
Source: OECD, Education Database, www.oecd.org/education/database.htm, September 2014. See chapter notes.
1 2 http://dx.doi.org/10.1787/888933148815
Supply of tertiary graduates in computer science, 2005 and 2012
Tertiary graduates in computer science as a percentage of all 20-34 year-olds
0
0.1
0.2
0.3
0.4
0.5
0.6
%2012 2005
Source: OECD, RDS Database, www.oecd.org/sti/rds, June 2014. See chapter notes.
1 2 http://dx.doi.org/10.1787/888933148829
Researchers in information industries, 2011
As percentage of researchers in the business sector
0
10
20
30
40
50
60
%ICT manufacturing Information and communication services
5.7 Human capital in ICT

MEASURING THE DIGITAL ECONOMY: A NEW PERSPECTIVE © OECD 2014142
5. DELIVERING GROWTH AND JOBS 5. DELIVERING GROWTH AND JOBS
5.8 ICT jobs and jobs in the ICT sector
Key ndings
Statistics on ICT-related occupations and on employ-
ment in information industries offer complementary
perspectives on the importance of ICT in OECD
countries.
In OECD countries, on average, ICT-related occupations
accounted for about 3.5% of total employment in 2013.
This gure ranged from about 6% in Finland to just
above 1% in Turkey. The breakdown of employment by
occupational groups shows that most of ICT-related
workers are employed in high-skill occupations and
that by country variations are mainly due to the
different weight of professionals and engineers in the
workforce.
In 2012, about 40% of ICT-related jobs were in the ICT
sector. This gure rises to 45% accounting for the infor-
mation industries aggregate.
On average, employment in information industries
accounted for 3.6% of total employment in OECD
countries in 2012, slightly less than in 2000.
By country shares (and trends) in employment are
similar to those reported for value added (see 5.3)
although in general much lower, given the compar-
atively high level of labour productivity in these
industries (see 5.4). The share was above 5% in Finland,
Ireland and Switzerland and below 2% in Australia,
Greece and Portugal.
In nearly all countries, IT and other information
services have become the largest information industry
in employment terms.
Cross-country differences in ICT employment still
reect the relative importance of ICT manufacturing
activities, although the employment share of these
activities has declined due to productivity gains and
offshoring.
Since 2000, the employment shares of ICT manufac-
turing, publishing activities and telecommunication
services have fallen nearly everywhere, while the share
of IT and other information services has increased in
all countries except Australia.
Overall, the employment share of information
industries decreased between 2000 and 2012 in a
majority of countries; with the most important decline
being observed in the United States followed by Sweden.
DID YOU KNOW?
In OECD countries, ICT-related occupations accounted
for about 3.5% of total employment in 2013.
Over 50% were employed in non-ICT industries.
Denitions
ICT-related occupations, originally dened as ICT special-
ists, consist of (individuals employed in) “tasks related
to developing, maintaining or operating ICT systems,
and where ICTs are the main part of their job” (see
OECD, 2004). This denition has been revisited in light
of the latest edition of the International Standard
Classication of Occupations (ISCO-08) and includes
Minor Groups 133 (ICT service managers), 215
(Electrotechnology engineers) and 742 (Electronics and
telecommunications installers and repairers), as well
as Sub-major Groups 25 (Information and communica-
tions technologies professionals) and 35 (Information
and communications technicians).
The OECD in 2007 dened the information economy
sector (see the OECD Guide to Measuring the Information
Society 2011) as the aggregate combining ICT and digital
media and content industries in the current version
of the International Standard Industry Classication
(ISIC Rev.4). Here these are all referred as information
industries. This aggregate includes ISIC Rev.4 Division
26 (Manufacture of computer, electronic and optical
products) and Section J (Information and communica-
tion services), consisting of Divisions 58-60 (Publishing
and broadcasting industries), 61 (Telecommunications)
and 62-63 (Computer programming and information
services). ICT trade and repair activities (in Groups 465
and 951) are also included but are not considered here
due to issues of data availability.
Measurability
Employment by occupation data are usually collected
in the labour force surveys. Data for theUnitedStates
are based on the Current Population Survey.
National classications of occupations are not easily
comparable across countries and are not always
consistent with ISCO. The latest revision (ISCO-08)
allows for a better description of ICT occupations.
However, the lack of a direct correspondence with
several occupational categories in the previous edition
(ISCO-88) has resulted in a break in time series that
theOECD is currently addressing.
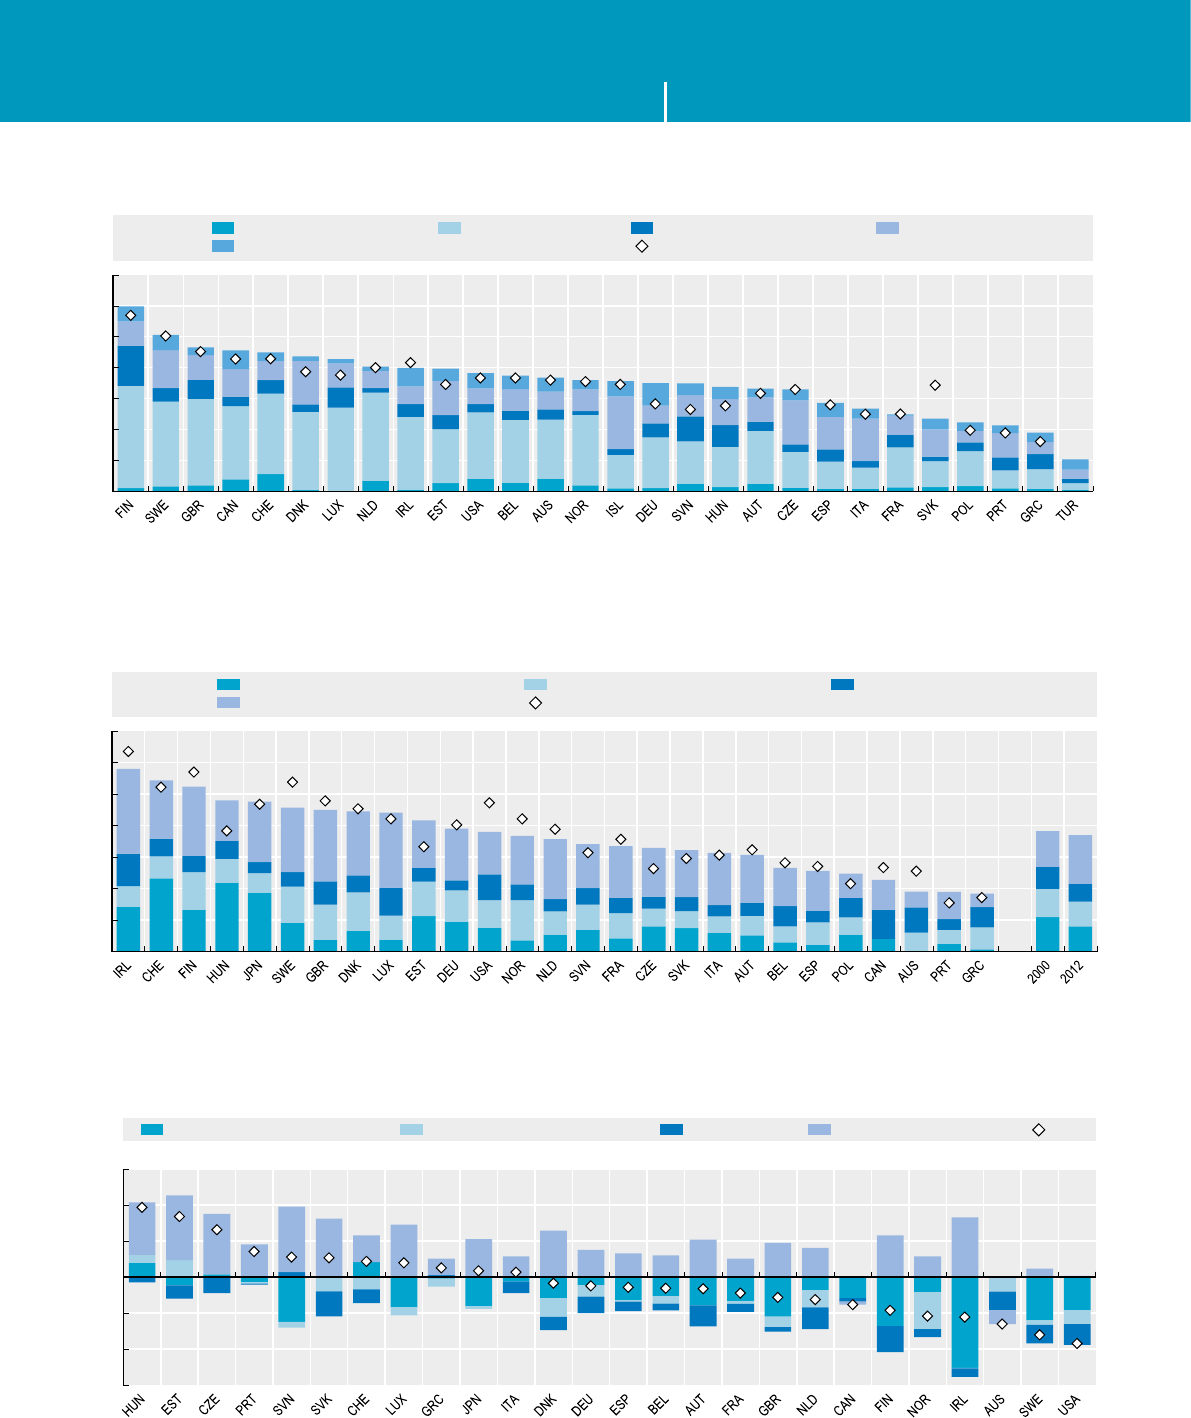
MEASURING THE DIGITAL ECONOMY: A NEW PERSPECTIVE © OECD 2014 143
5. DELIVERING GROWTH AND JOBS 5. DELIVERING GROWTH AND JOBS
Source: OECD computations based on Australian, Canadian and European labour force surveys and United States Current Population Survey, May
2014. See chapter notes.
1 2 http://dx.doi.org/10.1787/888933148839
Employment in ICT-related occupations, 2011 and 2013
As a percentage of total employment
0
1
2
3
4
5
6
7
%
ICT service managers ICT professionals Electrotechnology engineers ICT technicians
Electronics and telecom installers and repairers ICT occupations, 2011
Source: OECD, STAN Database, ISIC Rev.4, www.oecd.org/sti/stan and Eurostat, National Accounts Statistics, May 2014. See chapter notes.
1 2 http://dx.doi.org/10.1787/888933148841
Employment in information industries, 2000 and 2012
As a percentage of total employment
0
1
2
3
4
5
6
7
%
Computer, electronic and optical products Publishing, audio-visual and broadcasting Telecommunications
IT and other information services Information industries, 2000
Average
Source: OECD, STAN Database, ISIC Rev.4, www.oecd.org/sti/stan and Eurostat, National Accounts Statistics, May 2014. See chapter notes.
1 2 http://dx.doi.org/10.1787/888933148857
Change in employment shares of information industries between 2000 and 2012
Total and industry contributions
-1.5
-1.0
-0.5
0
0.5
1.0
1.5
Percentage points
Computer, electronic and optical products Publishing, audio-visual and broadcasting Telecommunications IT and other information services Total
5.8 ICT jobs and jobs in the ICT sector

MEASURING THE DIGITAL ECONOMY: A NEW PERSPECTIVE © OECD 2014144
5. DELIVERING GROWTH AND JOBS 5. DELIVERING GROWTH AND JOBS
5.9 Trade competitiveness and GVCs
Key ndings
Between 2000 and 2012 world exports of manufactured
ICT goods grew by 65% to more than USD 1.5trillion.
However, their share in total world exports of goods
decreased by about 5 percentage points, partly due to
widespread falls in unit prices. This reects a major
shift in world trade and consumption patterns, with
demand for communication equipment and consumer
electronics growing much faster than that for computers
and peripherals.
Production and exports of ICT goods are increasingly
concentrated in a few economies. Owing in part to the
offshoring of production, the shares of Japan and the
United States in world exports of ICT goods halved from
2000 to 2012, while China’s grew from 4.4% to over 30%,
with a tenfold increase in USD terms. Korea and Mexico
were the only OECD economies of the top ten exporters
to maintain their share of the world market for ICT
goods, where Mexico beneted from the relocation of
international (not only the United States) activities
linked to NAFTA.
An alternative perspective, albeit only up to 2009, is
obtained by comparing such “gross export” shares with
corresponding shares of exports in value added terms.
China and Mexico’s shares of value added embodied in
the global nal demand of ICT products are much lower
than their shares of gross exports, reecting the high
import content of their ICT exports. Germany, Japan
and the United States instead have higher shares in
global nal demand, as providers of intermediate goods
and services to economies producing nal ICT goods.
International trade in ICT services grew much faster
than that of ICT goods, increasing ve-fold in current
USD terms to USD 400billion between 2000 and 2013.
In particular, the share of Computer and informa-
tion services doubled from 3% to 6% of world exports
of services, while that of communication services
increased marginally to 2.4%. For the OECD, the
combined share of Computer and information and
Communication services rose from 5.3% to 8.9% of total
service exports.
As with trade in ICT goods, a few economies account
for a signicant share in global exports of ICT services,
with some major shifts in recent years. India is now the
leading exporter of ICT services, having started from a
very modest level, followed by Ireland, which benets
from the presence of transnational corporations. China
is also becoming a major exporter along with Germany,
the United Kingdom and the United States. Together,
these countries account for more than 60% of total
exports of ICT services. The top exporters of commu-
nication services include the UnitedStates, the largest
European economies and the Netherlands.
DID YOU KNOW?
The share of China in world exports of ICT products
is more than double that of theUnitedStates.
However, both economies hold a similar position
in ICT global value chains, measured in value
added terms.
Denitions
ICT goods exports data are based on international trade
statistics, which typically report gross ows. To improve
comparability, data have been adjusted to remove
China’s re-imports of ICT goods via HongKong, China.
These are also recorded as re-exports by Hong Kong,
China. Adjustments were not made for other countries
due to a lack of exhaustive data. Exports of ICT services
are computed from balance of payments statistics.
Domestic value added embodied in foreign nal demand
(or “exports of value added”) are derived from the
OECD-WTO, Trade in Value Added (TiVA) Database in
which inter-country and inter-industry ows of inter-
mediate goods and services are presented. The database
captures the industry value added in foreign demand
coming from both exports of domestically produced
nal goods and services and, indirectly, via exports of
intermediates present in goods and services produced
by other countries for their nal consumption or export
to third countries and beyond. Industries upstream in
avalue chain may be connected to nal demand in other
countries, even where no direct trade relationship exists.
The indicator can thus reveal the full impact of nal
demand in foreign markets on domestic production.
Measurability
There are many asymmetries in trade statistics:
reported exports may not match corresponding imports
reported by partners. Besides valuation differences, a
principle reason for such asymmetries is re-exports
present in reported exports, notably for economies
acting as regional trade hubs, such as Hong-Kong China
or the Netherlands. A key requirement when building
an Inter-Country Input-Output (ICIO) system, such as
that underlying the OECD-WTO, TiVA Database, is that
gross trade ows are adjusted so that they balance
across countries. Consequently the gross ows used
to compare with value added ows may not match the
gross ows reported by countries.
Service exports are also affected by measurement
issues. In particular, efforts are being undertaken by
UNCTAD, jointly with the OECD, to identify the role
of ICT-enabled (and related) services within the large
aggregate of Other Business services. ICTs are also likely
to be a major component of Royalties and fees.
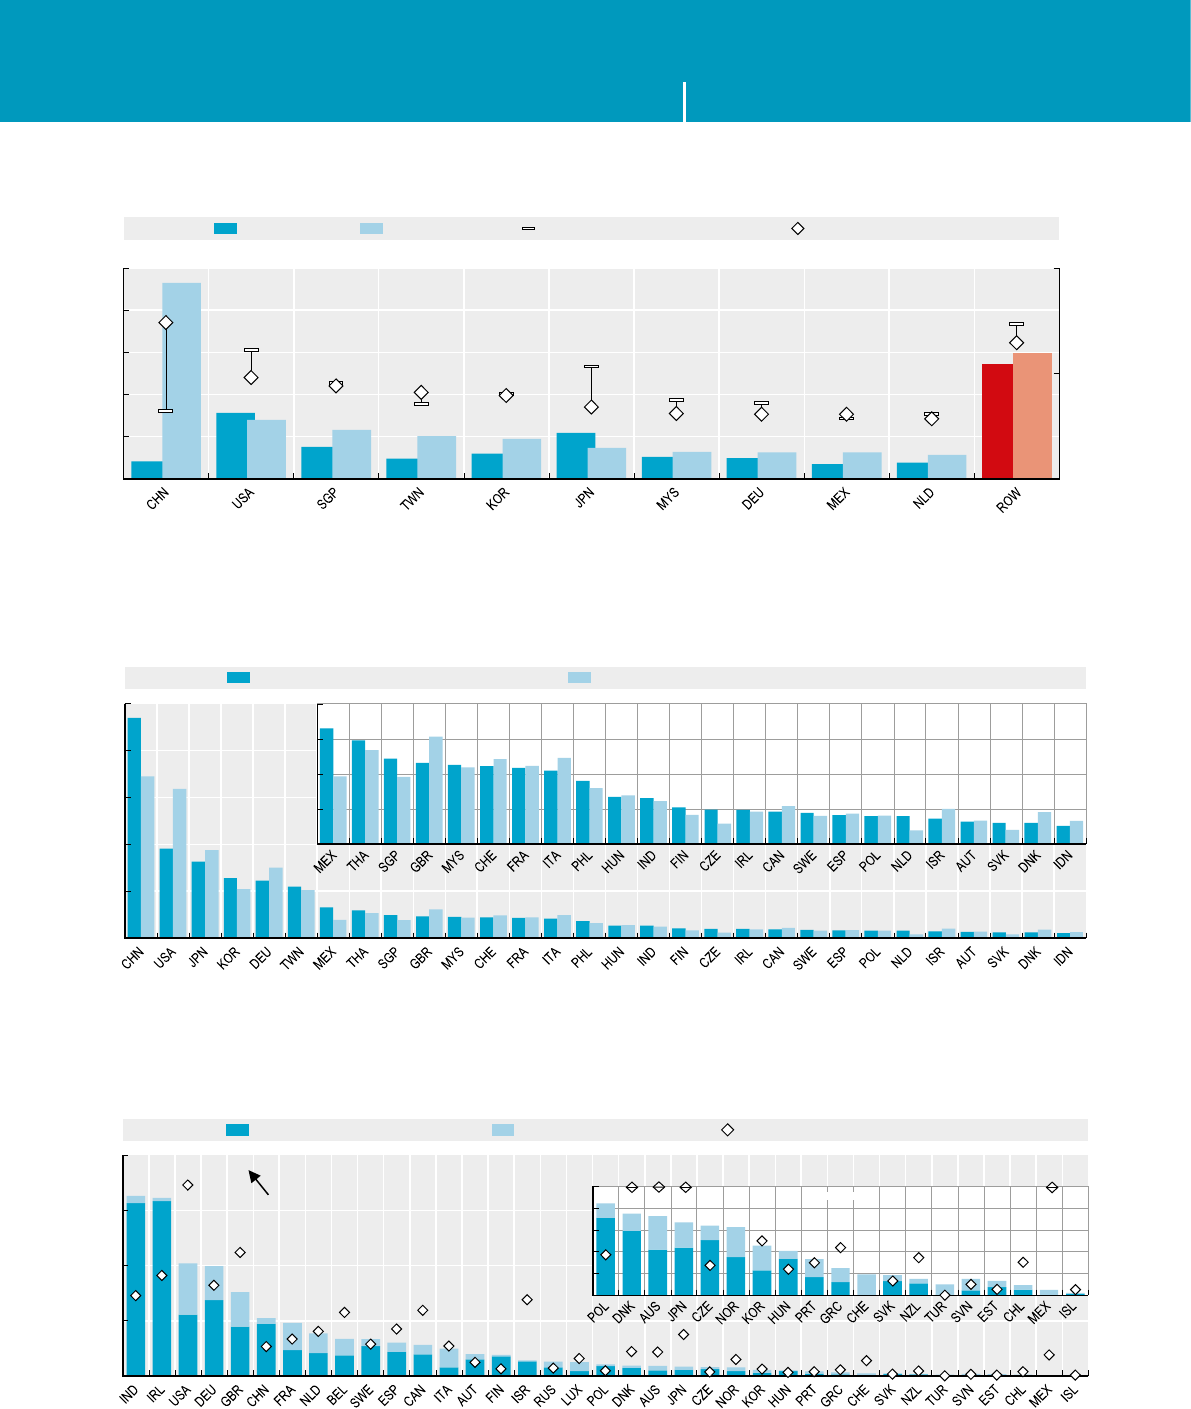
MEASURING THE DIGITAL ECONOMY: A NEW PERSPECTIVE © OECD 2014 145
5. DELIVERING GROWTH AND JOBS 5. DELIVERING GROWTH AND JOBS
Source: OECD, STAN Bilateral Trade Database by Industry and End-use category (BTDIxE), http://oe.cd/btd, May 2014. See chapter notes.
1 2 http://dx.doi.org/10.1787/888933148862
Global trade in ICT goods and top ten exporters, 2000 and 2012
Billions of USD and percentage shares (right-hand and logarithmic scale)
1
10
100
0
100
200
300
400
500
%USD billions
2000 2012 2000 share (right-hand scale) 2012 share (right-hand scale)
Source: OECD, Inter-Country Input-Output (ICIO) Database, May 2014.
1 2 http://dx.doi.org/10.1787/888933148876
Gross exports of ICT products and ICT domestic value added embodied in foreign nal demand, 2009
Percentage shares on world total
0
5
10
15
20
25
%Gross exports of ICT goods and services Domestic value added in foreign final demand of ICT goods and services
0
1
2
3
4Magnified
Source: OECD based on UNCTAD, UNCTADstat, July 2014. See chapter notes.
1 2 http://dx.doi.org/10.1787/888933148882
OECD and major exporters of ICT services, 2000 and 2013
Percentage shares of total world exports and in absolute values
53 53 33 32 25 17 16 13 11 11 10 9 8 6 6 5 4 4 3 3 3 3 3 3 2 2 1 1 1 1 0.4 1 1 0.4 0.1
0
4
8
12
16
%
Value in USD billions, 2013
Computer and information Communication Percentage of world ICT service exports, 2000
0
0.2
0.4
0.6
0.8
1.0 Magnified
3
222
5.9 Trade competitiveness and GVCs

MEASURING THE DIGITAL ECONOMY: A NEW PERSPECTIVE © OECD 2014146
5. DELIVERING GROWTH AND JOBS 5. DELIVERING GROWTH AND JOBS
Notes
Notes
5.1 ICT investment
ICT investment by asset, 2000 and 2012
For Denmark, Japan and the United Kingdom, investment in communications equipment is included under IT
equipment.
For Denmark, data refer to 2009. Software investment represented 2.36% of GDP in 2012, but data on IT and
communications equipment are not yet available for 2009 onwards due to ongoing changes in SNA.
For Germany, Greece, Korea, New Zealand, Portugal, Sweden, Switzerland and the United Kingdom, data refer to 2011.
For Mexico, data refer to 2003 instead of 2000.
For the Netherlands, data on investment in communication equipment are not available.
For the Slovak Republic, data refer to 2004 instead of 2000.
Contribution of ICT and non-ICT investments to GDP growth, 2000-12
For Denmark, Korea, Netherlands, New Zealand, Portugal, Sweden, Switzerland and the United Kingdom, data
refer to 2000-11.
5.2 ICT business dynamics
Net business population growth in ICT industries and the business economy, 2009-11
For Brazil, data include only employer enterprises and refer to 2010-11. The ICT sector includes ICT manufacturing
and Information and communication services (ISIC Rev.4 Divisions C26 and J58 to 63).
For Estonia and Finland, data refer to 2008-11.
For Ireland and the Netherlands, data refer to 2008-10.
For Israel, data include only employer enterprises and refer to 2011-12. Business economy aggregate is not available.
The ICT sector includes ICT manufacturing and Information and communication services (ISIC Rev.4 Divisions C26
and J58 to 63).
For Korea, data include only employer enterprises and refer to 2011-12. The ICT sector includes Information and
communication services (ISIC Rev.4 Divisions J58 to 63) only. Business economy refers to service activities in ISIC
Rev.4 Divisions 45 to 82 only.
For New Zealand, data include only employer enterprises and refer to 2010-12. The ICT sector includes ICT
manufacturing and Information and communication services (ISIC Rev.4 Divisions C26 and J58 to J63), with
the exception of Electronic components and boards (C261), Magnetic and optical media (C268), and of Satellite
telecommunications (J613).
For Turkey, data refer to 2009-11.
Medium and high-growth enterprises in ICT and total manufacturing, measured by employment growth, 2012
For Ireland, data refer to 2011 for medium and high-growth enterprises and to 2010 for the total number of active rms.
Medium and high-growth enterprises in ICT and business sector services, measured by employment, 2012
For Brazil, Estonia and Israel, data refer to the aggregate of Information and communication services (ISIC Rev.4
Divisions J58 to 63) instead of ICT services.
For Estonia, business sector services aggregate does not include Accommodation.
Israel
“The statistical data for Israel are supplied by and under the responsibility of the relevant Israeli authorities
or third party. The use of such data by the OECD is without prejudice to the status of the Golan Heights, East
Jerusalem and Israeli settlements in the West Bank under the terms of international law.

MEASURING THE DIGITAL ECONOMY: A NEW PERSPECTIVE © OECD 2014 147
5. DELIVERING GROWTH AND JOBS 5. DELIVERING GROWTH AND JOBS
Notes
For Ireland, data refer to 2011 for medium and high-growth enterprises and to 2010 for the total number of
active rms. Information and communication services do not include Repair of computers and communication
equipment (ISIC Rev.4 Division S951).
5.3 ICT value added
General notes:
For Canada, data refer to 2009.
For Germany, Greece, Iceland, Korea, Luxembourg, Mexico, New Zealand, Poland, Portugal, Sweden, the United Kingdom
and the United States, data refer to 2011.
For Japan, data refer to 2008.
For New Zealand, data refer to the scal years 1999/2000 and 2010/11 ending on 31 March, instead of 2000 and
2012. Data refer to information and communication services only. Therefore, the average gures do not include
New Zealand.
For Switzerland, data refer to 2010.
5.4 Labour productivity in information industries
General note:
For Switzerland, data refer to 2010.
Additional notes:
Apparent labour productivity in information industries, relative levels, 2012
For Canada, data refer to 2009.
For Japan, data refer to 2008.
For Germany, Greece, Luxembourg, Poland, Portugal, Sweden, the United Kingdom and the United States, data refer
to 2011.
5.6 E-commerce
General notes:
Unless otherwise stated, sector coverage consists of all activities in manufacturing and non-nancial market
services. Only enterprises with ten or more persons employed are considered. Size classes are dened as: small
(from 10 to 49 persons employed), medium (50 to 249), large (250 and more).
For Canada, medium-sized enterprises have 50-299 employees. Large enterprises have 300 or more employees.
For Japan, data refer to businesses with 100 or more employees. Medium-sized enterprises have 100-299 employees.
Large enterprises have 300 or more employees.
For Mexico, data refer to businesses with 20 or more persons employed.
For Australia, data for the scal years 2009/10 and 2011/12 include agriculture, forestry and shing activities.
Additional notes:
Enterprises with website or home page, by size, 2009 and 2013
For Australia, data refer to the scal years 2008/09 and 2011/12, ending on 30 June, instead of 2009 and 2013.
For Canada, data refer to 2007 instead of 2009.
For Japan and Korea, data refer to 2012.
For Mexico, data refer to 2008.
For New Zealand, data refer to the scal years 2007/08 and 2011/12, ending on 31 March, instead of 2009 and 2013.
For Switzerland, data refer to 2011.
Enterprises engaged in sales via e-commerce, by size, 2008 and 2012
For Australia, data refer to any transaction where the commitment to purchase was made via the Internet, including
via email, for the scal years 2007/08 and 2011/12, ending on 30 June, instead of 2008 and 2012.
For Canada, data refer to 2007 and 2013. In 2013, data refer to sales online over the Internet.
For New Zealand, data refer to orders received via the Internet for the scal years 2007/08 and 2011/12, ending on
31 March, instead of 2008 and 2012.

MEASURING THE DIGITAL ECONOMY: A NEW PERSPECTIVE © OECD 2014148
5. DELIVERING GROWTH AND JOBS 5. DELIVERING GROWTH AND JOBS
Notes
For Switzerland, data refer to 2011. In 2008, data refer to businesses with ve or more persons employed.
Turnover from e-commerce, by size, 2008 and 2012
For Australia, data refer to the scal years 2009/10 and 2011/12, ending on 30 June, instead of 2008 and 2012.
For Belgium, data refer to 2011 instead of 2012.
For Denmark and Mexico, data refer to 2008.
For Denmark, Finland, Mexico and the United States, data are not available by rm size.
For Greece, data refer to 2010 instead of 2008.
For Luxembourg, data refer to 2011 for the total and to 2012 for the size class 10-49.
5.7 Human capital in ICT
Tertiary graduates in computer science, by gender, 2005 and 2012 and;
Supply of tertiary graduates in computer science, 2005 and 2012
For Australia, data refer to 2011 and data on ISCED 5B is not available.
For France, data refer to 2011.
For Israel, data on ISCED 5B is not available.
For Japan, data are not available at such detailed level.
For Luxembourg, data are not available.
Researchers in information industries, 2011
For Luxembourg, data on ICT manufacturing researchers are condential.
For New Zealand, data refer only to researchers in Computer programming.
5.8 ICT jobs and jobs in the ICT sector
Employment in ICT-related occupations, 2011 and 2013
For Canada, data refer to 2012.
Employment in information industries, 2000 and 2012 and;
Change in employment shares of information industries between 2000 and 2012
For Australia, data refer to 2009.
For Canada, Germany, Greece, Luxembourg, Poland, Portugal, Sweden, Switzerland and the United States, data
refer to 2011.
For Japan, data refer to 2008.
For Poland, data refer to 2004 instead of 2000.
For Spain, data refer to 2010.
5.9 Trade competitiveness and GVCs
Global trade in ICT goods and top ten exporters, 2000 and 2012
China and world data are computed net of China’s re-imports and Hong Kong, China re-exports. Gross of these
components, world exports of ICT products totalled USD 986 billion in 2000 and USD 1 830 billion in 2012, while
China’s exports totalled USD 44 billion in 2000 and USD 554 billion in 2012, with no substantial change in its
shares. Netting for the ows of goods mediated by Hong Kong, China and for Chinese re-imports removes two key
intertwined elements of distortion in ICT trade statistics. Indeed, re-exports account for 99% of Hong Kong, China
exports of ICT goods, while China makes extensive use of East Asian logistics hubs (including Hong Kong, China)
for internal trade. Estimates do not consider similar ows for all other countries owing to a lack of exhaustive data.
OECD and major exporters of ICT services, 2000 and 2013
For Denmark, data refer to 2004 instead of 2000.
For Iceland and Israel, data refer to 2012.
For Luxembourg, data refer to 2002 instead of 2000.
For Mexico and Switzerland, exports of computer and information services are not included.

MEASURING THE DIGITAL ECONOMY: A NEW PERSPECTIVE © OECD 2014 149
5. DELIVERING GROWTH AND JOBS 5. DELIVERING GROWTH AND JOBS
References
References
ANACOM (2013), Characterization of consumption and access of packaged services for electronic communications, ANACOM,
Lisbon, www.anacom.pt/streaming/Estudo_ANACOM_consumo_pacotesCE.pdf?contentId=1173917&eld=ATTACHED_
FILE, accessed July 2014.
Bureau of Labor Statistics (2014), “Producer prices”, BLS Handbook of Methods, Bureau of Labor Statistics, Washington,
DC. www.bls.gov/opub/hom/pdf/homch14.pdf.
European Commission (2014), E-Communications and Telecom Single Market Household Survey, Special Eurobarometer,
No. 414, Brussels.
OECD/Eurostat (2008), Eurostat-OECD Manual on Business Demography Statistics, OECD Publishing. Doi: http://dx.doi.
org/10.1787/9789264041882-en.
OECD (2014a), “Connected Televisions: Convergence and Emerging Business Models”, OECD Digital Economy
Papers, No. 231, OECD Publishing. Doi: http://dx.doi.org/10.1787/5jzb36wjqkvg-en.
OECD (2014b), Education at a Glance 2014: OECD Indicators, OECD Publishing. Doi: http://dx.doi.org/10.1787/eag-2014-en.
OECD (2014c), “The OECD Model Survey on ICT Usage by Businesses”, Working Party on Measurement and Analysis
of the Digital Economy, DSTI/ICCP/IIS(2013)2/FINAL, OECD, Paris.
OECD (2012), “Methodology for Constructing Wireless Broadband Price Baskets”, OECD Digital Economy Papers,
No.205, OECD Publishing. Doi: http://dx.doi.org/10.1787/5k92wd5kw0nw-en.
OECD (2011), OECD Guide to Measuring the Information Society 2011, OECD Publishing. Doi: http://dx.doi.
org/10.1787/9789264113541-en.
OECD (2010), “Revision of the methodology for constructing telecommunication price baskets”, Committee on
theDigital Economy Policy, DSTI/ICCP(2009)14/FINAL, OECD, Paris. www.oecd.org/sti/broadband/48242089.pdf.
OECD (2004), “ICT Skills and Employment”, in OECD, Information Technology Outlook 2004, OECD Publishing. Doi:
http://dx.doi.org/10.1787/it_outlook-2004-en.
Triplett, J. (2006), Handbook on Hedonic Indexes and Quality Adjustments in Price Indexes: Special Application to Information
Technology Products, OECD Publishing. Doi: http://dx.doi.org/10.1787/9789264028159-en.

DATA SOURCES DATA SOURCES
MEASURING THE DIGITAL ECONOMY: A NEW PERSPECTIVE © OECD 2014 151
Data sources
ABI research, www.abiresearch.com.
Akamai, www.akamai.com/stateoftheinternet/soti-visualizations.html#stoi-graph.
Alexa, www.alexa.com/topsites/countries.
Australian Bureau of Statistics, Labour Force Survey, www.abs.gov.au/AUSSTATS/abs@.nsf/
ViewContent?readform&view=ProductsbyTopic&Action=Expand&Num=5.9.12.
Bureau of Labor Statistics, Producer Price Index Industry Database, www.bls.gov/ppi.
Bureau of Labor Statistics, United States Current Population Survey (CPS), www.bls.gov/cps.
EU ESSLAIT, Micro Moments Database, www.cros-portal.eu/content/esslait.
Eurostat, Community Innovation Survey (CIS) Database, epp.eurostat.ec.europa.eu/portal/page/
portal/science_technology_innovation/data/database.
Eurostat, European Union Labour Force Survey, epp.eurostat.ec.europa.eu/portal/page/portal/
labour_market/introduction.
Eurostat, Information Society Statistics, epp.eurostat.ec.europa.eu/portal/page/portal/
information_society/introduction.
Eurostat, National Accounts Statistics, epp.eurostat.ec.europa.eu/portal/page/portal/national_
accounts/introduction.
Eurostat, Structural Business Statistics, epp.eurostat.ec.europa.eu/portal/page/portal/
european_business/introduction.
Google, Our Mobile Planet, Smartphone research 2013, think.withgoogle.com/mobileplanet/
en/downloads.
Internet Systems Consortium (ISC), ftp.isc.org/www/survey/reports/current/bynum.txt.
NHGRI, Genome Sequencing Program (GSP), www.genome.gov/sequencingcosts.
OECD, ANBERD Database, www.oecd.org/sti/anberd.
OECD, Annual National Accounts (SNA) Database, www.oecd.org/std/ana.
OECD, Broadband Portal, www.oecd.org/sti/ict/broadband.
OECD, Education Database, www.oecd.org/education/database.htm.
OECD, ICT Database.
OECD, Inter-Country Input-Output Database, www.oecd.org/sti/inputoutput.
OECD, Patent Database, www.oecd.org/sti/ipr-statistics.
OECD, Productivity Database, www.oecd.org/std/productivity-stats.
OECD, Programme for International Student Assessment (PISA) 2012 Database, pisa2012.
acer.edu.au.
OECD, Research and Development Statistics (RDS) Database, www.oecd.org/sti/rds.
OECD, STAN Bilateral Trade Database by Industry and End Use (BTDIxE), http://oe.cd/btd.
OECD, Structural and Demographic Business Statistics (SDBS) Database, www.oecd.org/std/
business-stats/structuralanddemographicbusinessstatisticssdbsoecd.htm.
OECD, Structural Analysis (STAN), ISIC Rev.4 Database, www.oecd.org/sti/stan.

DATA SOURCES
MEASURING THE DIGITAL ECONOMY: A NEW PERSPECTIVE © OECD 2014152
OECD, Survey of Adult Skills Database, Programme for the International Assessment of
Adult Competencies (PIAAC), www.oecd.org/site/piaac.
OECD-WTO, Trade in Value Added (TiVA) Database, www.oecd.org/trade/valueadded.
OHIM, Community Trademark Database, CTM Download.
OHIM, Registered Community Design Database, RCD Download.
PricewaterhouseCoopers (PCW), MoneyTreeTM report, www.pwcmoneytree.com.
Potaroo.net, Automated Systems Number Analysis Reports, bgp.potaroo.net/index-as.html.
Royal Pingdom blog, royal.pingdom.com/tag/blog.
ScienceDirect repository, www.sciencedirect.com.
Shadowserver, Geo Locations Statistics, www.shadowserver.org/wiki/pmwiki.php/Stats/
GeoLocations.
Statistics Canada, Labour Force Survey, www23.statcan.gc.ca/imdb/p2SV.pl?Function=getSurvey
&SDDS=3701.
Teligen, a division of Strategy Analytics Ltd, www.strategyanalytics.com.
United Nations Conference on Trade and Development (UNCTAD), UNCTADstat Database,
unctadstat.unctad.org.
United States Patent and Trademark Ofce Bulk Downloads: Trademark Application Text
hosted by Reed Technology Information Services.
Wikimedia Foundation Statistics, stats.wikimedia.org.
WIPO, Patentscope Database, patentscope.wipo.int.

LIST OF FIGURES
MEASURING THE DIGITAL ECONOMY: A NEW PERSPECTIVE © OECD 2014 153
Chapter 1 THE DIGITAL ECONOMY TODAY
Figure 1. Internet usage trends in the OECD and differences by country
(top panel) and by age groups (bottom panel), 2005-13............................................. 27
Figure 2. Trends in broadband speed across the OECD, Q4 2009-13 ...................................... 28
Figure 3. Wikipedia monthly page views on mobile platforms,
by language, 2010-13 ................................................................................................................................... 29
Figure 4. The progress of smartphones, 2010-13 ..................................................................................... 31
Figure 5. Average data storage cost for consumers, 1998-2012 .................................................. 33
Figure 6. Data mining-related scientific articles, 1995-2014 ......................................................... 33
Figure 7. R&D intensity and contribution to total BERD by industry
in the OECD, 2011 ........................................................................................................................................... 34
Figure 8. Methods to stimulate creativity across 22 European countries
in information industries vs. other sectors, 2010 ........................................................... 35
Figure 9. ICT uptake among process and organisational innovators
and non-innovators in 13 European countries, 2004, 2008 and 2010 ........... 35
Figure 10. Patents on M2M, data analytics and 3D printing technologies,
2004-14 ..................................................................................................................................................................... 36
Figure 11. Cost of genome sequencing, 2001-14 .......................................................................................... 36
Figure 12. The relative size of information industries in the OECD,
2000 and 2012..................................................................................................................................................... 37
Figure 13. Apparent labour productivity levels, information industries vs.
total economy, 2012 ..................................................................................................................................... 38
Figure 14. OECD shares in global exports of ICT goods and in underlying
value added, 2000 and 2009 .................................................................................................................. 38
Figure 15. Performance trends of top 250 ICT firms, 2000-13 ......................................................... 39
Figure 16. Venture capital investment in the United States,
by industry, 1995-2012 ............................................................................................................................... 40
Figure 17. The dynamics of ICT sector employment in the OECD, 1995-2012 ................ 41
Figure 18. The dynamics of ICT-related occupations in OECD countries, 2003-13 ...... 41
Figure 19. Computer use at work in OECD countries,
by level of sophistication, 2012 ......................................................................................................... 42
Figure 20. Participation in e-commerce by individuals and enterprises,
2007-08 and 2012-13 .................................................................................................................................... 43
Chapter 2 INVESTING IN SMART INFRASTRUCTURE
2.1 Broadband penetration
Mobile wireless broadband penetration, by technology, December 2009 and 2013 ..... 51
Fixed (wired) broadband penetration by technology, December 2013................................... 51
2.2 Mobile data communication
Mobile data subscriptions, by type, December 2013 ............................................................................... 53
The penetration of M2M SIM cards, 2012 .......................................................................................................... 53
2.3 The growth of the Internet
Country code top-level domain registration (ccTLD) density 2014 Q1
and growth (2013 Q1-2014 Q1) ..................................................................................................................................... 55
Hosts by type of domain, January 2014 ............................................................................................................... 55
Routed autonomous systems, 2013 ........................................................................................................................ 55
2.4 Toward higher speed
Fixed (wired) broadband penetration rates, December 2009 and 2013 ................................. 57
Fixed (wired) broadband penetration rates by speed tiers, December 2013 .................... 57
List of Figures

LIST OF FIGURES LIST OF FIGURES
MEASURING THE DIGITAL ECONOMY: A NEW PERSPECTIVE © OECD 2014154
2.5 Prices for connectivity
Prices of fixed broadband basket, 33 GB, 15 Mbit/s and above,
September 2012 and March 2014 ............................................................................................................................... 59
Prices of mobile voice calls plus data traffic reference baskets, February 2014........... 59
2.6 ICT devices and applications
Devices used to access the Internet, 2013 ........................................................................................................ 61
Smartphone apps availability and usage, 2013 ........................................................................................... 61
2.7 E-commerce across borders
Cross-border e-commerce sales by enterprises, 2012 ........................................................................... 63
Cross-border online purchases by individuals, 2013 .............................................................................. 63
Consumer trust in cross-border online purchases, 2012.................................................................... 63
2.8 Security
Use of security methods for authentication/identification
and the protection of data by enterprises, 2010 ......................................................................................... 65
Businesses having encountered IT security problems, attacks resulting
in denial-of-service, by size, 2010 ............................................................................................................................. 65
Distributed denial-of-service attacks originating from or targeting each
geographical area, April 2014 ........................................................................................................................................ 65
2.9 Perceiving security and privacy threats
Main reasons for not buying online because of privacy and security concerns,
2009 or more recent year available .......................................................................................................................... 67
Acknowledging the issue of Internet security: users changing browser
security settings, 2011 and 2013 ................................................................................................................................ 67
2.10 Improving the evidence base for online security and privacy
Number of alerts/warnings and vulnerability reports issued
by five national CSIRTs, 2010-13 ................................................................................................................................ 69
Chapter 3 EMPOWERING SOCIETY
3.1 Internet users
Total, daily and mobile Internet users, 2006 and 2013 ......................................................................... 77
Internet users by age, 16-24 and 65-74 year-olds, 2013 ........................................................................ 77
Internet users among 55-74 year-olds by educational attainment level, 2013 ............. 77
3.2 Online activities
The diffusion of selected online activities among Internet users, 2012-13 ..................... 79
The diffusion of Internet banking, 2013 ............................................................................................................. 79
3.3 User sophistication
The variety of activities performed online by Internet users, 2009 and 2013 ................ 81
Factors influencing the variety of activities per user: Internet uptake,
education and age, 2013 ..................................................................................................................................................... 81
3.4 Digital natives
Age of first access to the Internet, 2012.............................................................................................................. 83
Internet use of 15 year-old students at school and outside school, 2012 .......................... 83
Individuals using a parental control or web-filtering software, 2010 .................................... 83
3.5 Children online
Internet use and online risk experience of 9-16 year-olds, 2010 ................................................ 85
3.6 ICTs in education
Internet connection availability at school, 2012 ......................................................................................... 87
Computer use at school for practising and drilling, such as for foreign
language learning or mathematics, 2012 .......................................................................................................... 87
Individuals who attended an online course, 2007 and 2013 ........................................................... 87
3.7 ICT skills in the workplace
Computer use at work, 2012 .......................................................................................................................................... 89
ICT skills use at work, 2012 ............................................................................................................................................. 89

LIST OF FIGURES
MEASURING THE DIGITAL ECONOMY: A NEW PERSPECTIVE © OECD 2014 155
Individuals who judge their computer skills to be sufficient if they were
to apply for a new job within a year, 2013 ........................................................................................................ 89
3.8 E-consumers
Diffusion of online purchases, including via handheld devices, 2007 and 2013 ......... 91
Individuals who purchased online in the last 12 months, by age class, 2013 ............... 91
Online purchasers by selected types of products, 2013 ....................................................................... 91
3.9 Content without borders
Wikipedia monthly page views and edits, 2014 Q1 ................................................................................. 93
YouTube views of contents uploaded domestically, 2010-11 and 2013 ................................ 93
Top 10 websites by type of service, April 2014 .............................................................................................. 93
3.10 E-government use
Individuals using e-government services, 2010 and 2013 ................................................................. 95
Problems in using e-government services (left-hand panel) and satisfaction
(right-hand panel), 2013 ..................................................................................................................................................... 95
Businesses using e-government services, 2010 and 2012.................................................................. 95
3.11 ICT and health
Individuals who searched for health-related information online, 2008 and 2013 ...... 96
Chapter 4 UNLEASHING INNOVATION
4.1 ICT and R&D
Business R&D performed by information industries, 2011 or more
recent year available.............................................................................................................................................................. 107
Business R&D intensity in ICT manufacturing industries, 2007 and 2011 ........................ 107
Business R&D intensity in information and communication service industries,
2007 and 2011 ............................................................................................................................................................................... 107
4.2 Innovation in ICT industries
Innovative enterprises in ICT manufacturing and total manufacturing,
by type of innovation, 2010 ............................................................................................................................................. 109
Innovative enterprises in IT services and innovation core service activities,
by type of innovation, 2010 ............................................................................................................................................. 109
Engagement in in-house R&D activities in ICT industries, total manufacturing
and innovation core services, 2010 ......................................................................................................................... 109
4.3 E-business
The diffusion of selected ICT tools and activities in enterprises, 2013 ................................ 111
Broadband connectivity, by size, 2010 and 2013 ......................................................................................... 111
Use of enterprise resource planning software, by size, 2010 and 2013 ................................. 111
4.4 Unleashing the potential of micro-data
ICT uptake among innovators and non-innovators in 13 European countries,
2004, 2008 and 2010 ................................................................................................................................................................ 113
4.5 ICT patents
Specialisation in ICT-related patents, 1999-2001 and 2009-11 ...................................................... 115
Top 15 applicants’ share in ICT-related patent applications,
1999-2001 and 2009-11 ........................................................................................................................................................ 115
Radicalness of ICT-related patents, 2010-12 ................................................................................................... 115
4.6 ICT designs
Top 20 applicants’ share in ICT and audio-visual-related designs,
2005-08 and 2010-13 .............................................................................................................................................................. 117
Specialisation in ICT and audio-visual-related designs, top 20 applicants,
2005-08 and 2010-13 .............................................................................................................................................................. 117
Revealed comparative advantage in ICT and audio-visual-related designs,
top 20 applicants, 2005-08 and 2010-13 .............................................................................................................. 117
4.7 ICT trademarks
ICT-related trademarks, top 20 applicants, 2005-08 and 2010-13 .............................................. 119
Specialisation in ICT-related trademarks, top 20 applicants, 2005-08 and 2010-13 ..... 119

LIST OF FIGURES LIST OF FIGURES
MEASURING THE DIGITAL ECONOMY: A NEW PERSPECTIVE © OECD 2014156
Revealed comparative advantage in ICT trademarks, top 20 applicants,
2005-08 and 2010-13 .............................................................................................................................................................. 119
4.8 Knowledge diffusion
Firms engaging in collaboration on innovation, by sector, 2010 ................................................. 121
International co-inventions by technology fields, 1999-2001 and 2009-11 ....................... 121
Top 20 combinations between ICTs and other technologies in patent
applications, 1999-2001 and 2009-11 ..................................................................................................................... 121
Chapter 5 DELIVERING GROWTH AND JOBS
5.1 ICT investment
ICT investment by asset, 2000 and 2012 ............................................................................................................. 129
Contribution of ICT and non-ICT investments to GDP growth, 2000-12 ............................. 129
5.2 ICT business dynamics
Net business population growth between 2009 and 2012 ................................................................. 131
Medium and high-growth enterprises in ICT and total manufacturing,
measured by employment growth, 2012 ............................................................................................................ 131
Medium and high-growth enterprises in ICT and business sector services,
measured by employment, 2012 ................................................................................................................................ 131
5.3 ICT value added
Value added of information industries, 2000 and 2012 ....................................................................... 133
Change in the share of information industries in total value added
between 2000 and 2012 ....................................................................................................................................................... 133
5.4 Labour productivity in information industries
Apparent labour productivity in information industries, relative levels, 2012 ............. 135
Contribution of information industries and of other sectors to labour
productivity growth, 2001-11......................................................................................................................................... 135
5.5 Measuring quality in communication services
Producer price indices for computer and software in the United States, 2003-13 ........ 136
5.6 E-commerce
Enterprises with website or home page, by size, 2009 and 2013 ................................................. 139
Enterprises engaged in sales via e-commerce by employment size,
2008 and 2012 ............................................................................................................................................................................... 139
Turnover from e-commerce, by size, 2008 and 2012 ............................................................................... 139
5.7 Human capital in ICT
Tertiary graduates in computer science, by gender, 2005 and 2012 ........................................ 141
Supply of tertiary graduates in computer science, 2005 and 2012 ........................................... 141
Researchers in information industries, 2011 ................................................................................................. 141
5.8 ICT jobs and jobs in the ICT sector
Employment in ICT-related occupations, 2011 and 2013 ................................................................... 143
Employment in information industries, 2000 and 2012 ...................................................................... 143
Change in employment shares of information industries
between 2000 and 2012 ....................................................................................................................................................... 143
5.9 Trade competitiveness and GVCs
Global trade in ICT goods and top ten exporters, 2000 and 2012 ............................................... 145
Gross exports of ICT products and ICT domestic value added embodied
in foreign final demand, 2009 ....................................................................................................................................... 145
OECD and major exporters of ICT services, 2000 and 2013.............................................................. 145
ORGANISATION FOR ECONOMIC CO-OPERATION
AND DEVELOPMENT
The OECD is a unique forum where governments work together to address the economic, social and
environmental challenges of globalisation. The OECD is also at the forefront of efforts to understand and
to help governments respond to new developments and concerns, such as corporate governance, the
information economy and the challenges of an ageing population. The Organisation provides a setting
where governments can compare policy experiences, seek answers to common problems, identify good
practice and work to co-ordinate domestic and international policies.
The OECD member countries are: Australia, Austria, Belgium, Canada, Chile, the Czech Republic,
Denmark, Estonia, Finland, France, Germany, Greece, Hungary, Iceland, Ireland, Israel, Italy, Japan, Korea,
Luxembourg, Mexico, the Netherlands, New Zealand, Norway, Poland, Portugal, the Slovak Republic, Slovenia,
Spain, Sweden, Switzerland, Turkey, the United Kingdom and the United States. The European Union takes
part in the work of the OECD.
OECD Publishing disseminates widely the results of the Organisation’s statistics gathering and
research on economic, social and environmental issues, as well as the conventions, guidelines and
standards agreed by its members.
OECD PUBLISHING, 2, rue André-Pascal, 75775 PARIS CEDEX 16
(93 2014 02 1 P) ISBN 978-92-64-1130-8 – 2014

Consult this publication on line at http://dx.doi.org/10.1787/9789264221796-en.
This work is published on the OECD iLibrary, which gathers all OECD books, periodicals and statistical databases.
Visit www.oecd-ilibrary.org for more information.
Measuring the Digital Economy
A NEW PERSPECTIVE
The growing role of the digital economy in daily life has heightened demand for new data and measurement
tools. Internationally comparable and timely statistics combined with robust cross-country analyses are crucial
to strengthen the evidence base for digital economy policy making, particularly in a context of rapid change.
Measuring the Digital Economy: A New Perspective presents indicators traditionally used to monitor the
information society and complements them with experimental indicators that provide insight into areas of
policy interest. The key objectives of this publication are to highlight measurement gaps and propose actions
to advance the measurement agenda.
Contents
• A measurement agenda for the digital economy
• The digital economy today
• Investing in smart infrastructure
• Empowering society
• Unleashing creativity and innovation
• Delivering growth and jobs
For more information about the OECD’s work on measurement and analysis of the digital economy,
see www.oecd.org/sti/measuring-the-digital-economy.htm.
Measuring the Digital Economy A NEW PERSPECTIVE
Measuring the
Digital Economy
A NEW PERSPECTIVE
ISBN 978-92-64-21130-8
93 2014 02 1 P 9HSTCQE*cbbdai+
932014021Cov.indd 1 29-Sep-2014 11:28:11 AM
