Cloud Control Administrator's Guide OEM 01 PDF 132 Admin
User Manual:
Open the PDF directly: View PDF ![]() .
.
Page Count: 1232 [warning: Documents this large are best viewed by clicking the View PDF Link!]
- Contents
- Preface
- Part I Monitoring and Managing Targets
- 1 Enterprise Monitoring
- 1.1 Monitoring Overview
- 1.2 Comprehensive Out-of-Box Monitoring
- 1.3 Monitoring: Basics
- 1.3.1 Metric Thresholds: Determining When a Monitored Condition is an Issue
- 1.3.2 Metric Baselines: Determining Valid Metric Thresholds
- 1.3.3 Advanced Threshold Management
- 1.3.4 Events: Defining What Conditions are of Interest
- 1.3.5 Corrective Actions: Resolving Issues Automatically
- 1.3.6 Metric Extensions: Customizing Monitoring
- 1.3.7 Blackouts and Notification Blackouts
- 1.4 Monitoring: Advanced Setup
- 1.5 Notifications
- 1.6 Managing Events, Incidents, and Problems
- 1.7 Accessing Monitoring Information
- 2 Using Incident Management
- 2.1 Management Concepts
- 2.2 Setting Up Your Incident Management Environment
- 2.3 Working with Incidents
- 2.3.1 Finding What Needs to be Worked On
- 2.3.2 Searching for Incidents
- 2.3.3 Setting Up Custom Views
- 2.3.4 Sharing/Unsharing Custom Views
- 2.3.5 Responding and Working on a Simple Incident
- 2.3.6 Responding to and Managing Multiple Incidents, Events and Problems in Bulk
- 2.3.7 Searching My Oracle Support Knowledge
- 2.3.8 Submitting an Open Service Request (Problems-only)
- 2.3.9 Suppressing Incidents and Problems
- 2.3.10 Managing Workload Distribution of Incidents
- 2.3.11 Reviewing Events on a Periodic Basis
- 2.4 Advanced Topics
- 2.4.1 Automatic Diagnostic Repository (ADR): Incident Flood Control
- 2.4.2 Defining Custom Incident Statuses
- 2.4.3 Clearing Stateless Alerts for Metric Alert Event Types
- 2.4.4 Automatically Clearing "Manually Clearable" Events
- 2.4.5 User-reported Events
- 2.4.6 Additional Rule Applications
- 2.4.6.1 Setting Up a Rule to Send Different Notifications for Different Severity States of an Event
- 2.4.6.2 Creating a Rule to Notify Different Administrators Based on the Event Type
- 2.4.6.3 Creating a Rule to Create a Ticket for Incidents
- 2.4.6.4 Creating a Rule to Send SNMP Traps to Third Party Systems
- 2.4.7 Exporting and Importing Incident Rules
- 2.4.8 Creating Corrective Actions for Events
- 2.4.9 Compressing Multiple Events into a Single Incident
- 2.4.10 Event Prioritization
- 2.4.11 Root Cause Analysis (RCA) and Target Down Events
- 2.4.11.1 How RCA Works
- 2.4.11.2 Leveraging RCA Results in Incident Rule Sets
- 2.4.11.3 Leveraging RCA Results in Incident Manager
- 2.4.11.4 Leveraging RCA Results in the System Dashboard
- 2.4.11.5 Creating a Rule to Update Incident Priority for Non-symptom Events
- 2.4.11.6 Creating Incidents On Non-symptom Events
- 2.4.11.7 Introducing a Time Delay
- 2.5 Moving from Enterprise Manager 10/11g to 12c and Greater
- 2.6 Monitoring: Common Tasks
- 3 Using Notifications
- 3.1 Setting Up Notifications
- 3.2 Extending Notification Beyond Email
- 3.3 Sending Notifications Using OS Commands and Scripts
- 3.4 Sending Notifications Using PL/SQL Procedures
- 3.5 Sending SNMP Traps to Third Party Systems
- 3.6 Management Information Base (MIB)
- 3.7 Passing Corrective Action Status Change Information
- 3.8 Passing Job Execution Status Information
- 3.9 Passing User-Defined Target Properties to Notification Methods
- 3.10 Notification Reference
- 3.10.1 EMOMS Properties
- 3.10.2 Passing Event, Incident, Problem Information to an OS Command or Script
- 3.10.2.1 Environment Variables Common to Event, Incident and Problem
- 3.10.2.2 Event Notification-Specific Environment Variables
- 3.10.2.3 Environment Variables Specific to Event Types
- 3.10.2.4 Environment Variables Specific to Incident Notifications
- 3.10.2.5 Environment Variables Specific to Problem Notifications
- 3.10.2.6 Environment Variables Common to Incident and Problem Notifications
- 3.10.3 Passing Information to a PL/SQL Procedure
- 3.10.4 Troubleshooting Notifications
- 3.11 System Broadcasts
- 4 Using Blackouts and Notification Blackouts
- 5 Managing Groups
- 5.1 Introduction to Groups
- 5.2 Managing Groups
- 5.2.1 Creating and Editing Groups
- 5.2.2 Creating Dynamic Groups
- 5.2.3 Adding Members to Privilege Propagating Groups
- 5.2.4 Converting Conventional Groups to Privilege Propagating Groups
- 5.2.5 Viewing and Managing Groups
- 5.2.6 Overview of Group Charts
- 5.2.7 Overview of Group Members
- 5.2.8 Viewing Group Status History
- 5.2.9 About the System Dashboard
- 5.3 Using Out-of-Box Reports
- 6 Using Administration Groups
- 6.1 What is an Administration Group?
- 6.2 Planning an Administrative Group
- 6.3 Implementing Administration Groups and Template Collections
- 6.3.1 Creating the Administration Group Hierarchy
- 6.3.2 Accessing the Administration Group Home Page
- 6.3.3 Defining the Hierarchy
- 6.3.4 Defining Template Collections
- 6.3.5 Associating Template Collections with Administration Groups
- 6.3.5.1 Associating a Template Collection with an Administration Group
- 6.3.5.2 Searching for Administration Groups
- 6.3.5.3 Setting the Global Synchronization Schedule
- 6.3.5.4 When Template Collection Synchronization Occurs
- 6.3.5.5 Viewing Synchronization Status
- 6.3.5.6 Group Member Type and Synchronization
- 6.3.5.7 System Targets and Administration Groups
- 6.3.5.8 Disassociating a Template Collection from a Group
- 6.3.5.9 Viewing Aggregate (Group Management) Settings
- 6.3.5.10 Viewing the Administration Group Homepage
- 6.3.5.11 Identifying Targets Not Part of Any Administration Group
- 6.4 Changing the Administration Group Hierarchy
- 7 Using Monitoring Templates
- 7.1 About Monitoring Templates
- 7.2 Definition of a Monitoring Template
- 7.3 Default Templates (Auto Apply Templates)
- 7.4 Viewing a List of Monitoring Templates
- 7.5 Creating a Monitoring Template
- 7.6 Editing a Monitoring Template
- 7.7 Applying Monitoring Templates to Targets
- 7.8 Comparing Monitoring Templates with Targets
- 7.9 Comparing Metric Settings Using Information Publisher
- 7.10 Exporting and Importing Monitoring Templates
- 7.11 Upgrading Enterprise Manager: Comparing Monitoring Templates
- 7.12 Changing the Monitoring Template Apply History Retention Period
- 8 Using Metric Extensions
- 8.1 What are Metric Extensions?
- 8.2 Metric Extension Lifecycle
- 8.3 Working with Metric Extensions
- 8.3.1 Administrator Privilege Requirements
- 8.3.2 Granting Create Metric Extension Privilege
- 8.3.3 Managing Administrator Privileges
- 8.3.4 Managing Administrator Access to Metric Extensions
- 8.3.5 Creating a New Metric Extension
- 8.3.6 Creating a New Metric Extension (Create Like)
- 8.3.7 Editing a Metric Extension
- 8.3.8 Creating the Next Version of an Existing Metric Extension
- 8.3.9 Importing a Metric Extension
- 8.3.10 Exporting a Metric Extension
- 8.3.11 Deleting a Metric Extension
- 8.3.12 Deploying Metric Extensions to a Group of Targets
- 8.3.13 Creating an Incident Rule to Send Email from Metric Extensions
- 8.3.14 Updating Older Versions of Metric Extensions Already Deployed to a Group of Targets
- 8.3.15 Creating Repository-side Metric Extensions
- 8.4 Adapters
- 8.5 Converting User-defined Metrics to Metric Extensions
- 8.6 Metric Extension Command Line Verbs
- 9 Advanced Threshold Management
- 10 Utilizing the Job System and Corrective Actions
- 10.1 Job System Purpose and Overview
- 10.2 Preliminary Considerations
- 10.3 Creating Jobs
- 10.4 Viewing and Analyzing Job Status
- 10.5 Generating Job Event Criteria
- 10.6 Creating Event Rules For Job Status Change
- 10.7 Using Diagnostic Tools
- 10.8 Creating Corrective Actions
- 10.8.1 Providing Credentials
- 10.8.2 Creating Corrective Actions for Metrics
- 10.8.3 Creating a Library Corrective Action
- 10.8.4 Specifying Access to Corrective Actions
- 10.8.5 Setting Up Notifications for Corrective Actions
- 10.8.6 Providing Agent-side Response Actions
- 10.8.7 Viewing the Details of a Corrective Action Execution
- 11 Monitoring Access Points Configured for a Target
- 11.1 Introduction to Monitoring Access Points
- 11.2 Viewing a List of Access Points Configured for a Target
- 11.3 Deleting Access Points Configured for a Target
- 11.4 Viewing the Capability Metric Map for a Target
- 11.5 Viewing the Best Access Point Implementers (and their History) for Various Operations Supported for a Target
- 11.6 Modifying or Reconfiguring the Monitoring Properties of the Access Points Configured for a Target
- 11.7 EM CLI Verbs for Managing the Access Points Configured for a Target
- 12 Always-On Monitoring
- 12.1 Prerequisites
- 12.2 Best Practices
- 12.3 Installing Always-On Monitoring
- 12.4 Configuring Always-On Monitoring
- 12.4.1 Saving the Em Key
- 12.4.2 Using the Always-On Monitoring Configuration Assistant (EMSCA)
- 12.4.3 Removing the Em Key
- 12.4.4 Configuring Email Servers in Enterprise Manager
- 12.4.5 Configuring Downtime Contacts in Enterprise Manager
- 12.4.6 Synchronizing Always-On Monitoring with Enterprise Manager for the First Time
- 12.4.7 Configuring Enterprise Manager to Work with Always-On Monitoring
- 12.4.8 Enabling Notifications
- 12.4.9 Verifying the Always-On Monitoring Upload URL on Enterprise Manager
- 12.5 Controlling the Service
- 12.6 Updating Always-On Monitoring
- 12.7 Data Maintenance
- 12.8 Controlling Always-On Monitoring Configuration Settings
- 12.9 Getting Performance Information
- 12.10 Modifiable Always-On Monitoring Properties
- 12.11 Creating an SSO Wallet and JKS for CA Certificates
- 12.12 Diagnosing Problems
- 12.13 High Availability and Disaster Recovery
- 12.14 Uninstalling Always-On Monitoring
- 12.15 Configuring the Always-On Monitoring Application for Secure Communication Using the TLSv1.2 Protocol
- 1 Enterprise Monitoring
- Part II Discovery
- 13 Discovering and Adding Host and Non-Host Targets
- 14 Discovering and Adding Database Targets
- 14.1 Enabling Autodiscovery of Database Targets
- 14.2 Discovering and Adding Container Database and Pluggable Database Targets
- 14.3 Discovering and Adding Cluster Database Targets
- 14.4 Discovering and Adding Single Instance Database Targets
- 14.5 Discovering and Adding Cluster Targets
- 14.6 Discovering and Adding Single Instance High Availability Service Targets
- 14.7 Discovering and Adding Cluster Automatic Storage Management Targets
- 14.8 Configuring a Target Database for Secure Monitoring
- 14.9 Adding Connection Manager Targets By Using the Declarative Process
- 15 Discovering and Adding Middleware Targets
- 16 Discovering, Promoting, and Adding System Infrastructure Targets
- 16.1 Discovering and Promoting Oracle MiniCluster
- 16.8 Configuring Snmp traps for Supercluster and Minicluster monitored hosts
- 16.2 About Discovering, Promoting, and Adding System Infrastructure Targets
- 16.3 Discovering and Promoting Operating Systems
- 16.4 Discovering and Promoting Oracle Solaris Zones
- 16.5 Discovering and Promoting Oracle VM Server for SPARC
- 16.6 Discovering and Promoting Servers
- 16.7 Discovering and Promoting Oracle SuperCluster
- 16.9 Discovering and Promoting PDUs
- 16.10 Discovering and Promoting Oracle ZFS Storage
- 16.11 Discovering Fabrics
- 16.12 Related Resources for Discovering and Promoting System Infrastructure Targets
- Part III Hybrid Cloud Management
- 17 Enabling Hybrid Cloud Management
- 17.1 What is Oracle Hybrid Cloud?
- 17.2 Setting Up Hybrid Cloud Management in Three Steps
- 17.3 Hybrid Cloud Management Prerequisites and Basic Setup
- 17.4 Advanced Topics
- 17.4.1 Discovering and Monitoring Oracle Cloud Targets
- 17.4.2 Patching Cloud-based Agents and Gateways
- 17.4.3 Configuring an External Proxy to Enable Gateways to Communicate with the Oracle Cloud
- 17.4.4 Performing Additional Hybrid Cloud Management Tasks
- 17.4.5 Troubleshooting Cloud-based Management Agents
- 17.4.6 Frequently Asked Questions About Hybrid Cloud Management
- 17.4.6.1 Can I deploy more than one Agent on the same Oracle Cloud virtual host?
- 17.4.6.2 Can I deinstall or deconfigure a Gateway without deinstalling an associated Cloud-based Agent?
- 17.4.6.3 How do I relocate the Gateway to another host without deinstalling anything else?
- 17.4.6.4 How can I redistribute my connections once I have added the Gateways? Does it need reconfiguration?
- 17.4.6.5 After an Oracle PaaS instance is decommissioned, what happens to the Cloud-based Agent and the related targets?
- 17.4.6.6 If I change my SSH keys on Oracle Cloud, what should I do in Enterprise Manager?
- 17.4.6.7 What are the guidelines for sizing the number of Gateways? What is the indication that my gateway Agent is overloaded?
- 17.4.6.8 Once the first Gateway is up after being patched, will it monitor the Cloud-based Agents?
- 17.4.6.9 What are the user restrictions on Cloud-based Agents and the targets on Oracle Cloud?
- 17.4.6.10 On what operating system can I deploy a Cloud-based Agent and a Gateway?
- 17.5 List of Unsupported Features
- 18 Deploying JVMD for Hybrid Cloud
- 18.1 Overview of Deploying JVMD for Hybrid Cloud
- 18.2 Prerequisites for Deploying JVMD Agents on Oracle Cloud Virtual Hosts
- 18.3 Deploying JVMD Agents on Oracle Cloud Virtual Hosts
- 18.4 Changing the Default JVMD End Point for Hybrid Cloud Gateway Agents
- 18.5 After Deploying JVMD Agents on Oracle Cloud Virtual Hosts
- 17 Enabling Hybrid Cloud Management
- Part IV Administering Cloud Control
- 19 Maintaining Enterprise Manager
- 20 Maintaining and Troubleshooting the Management Repository
- 20.1 Management Repository Deployment Guidelines
- 20.2 Management Repository Data Retention Policies
- 20.2.1 Management Repository Default Aggregation and Purging Policies
- 20.2.2 Management Repository Default Aggregation and Purging Policies for Other Management Data
- 20.2.3 Modifying the Default Aggregation and Purging Policies
- 20.2.4 How to Modify the Retention Period of Job History
- 20.2.5 DBMS_SCHEDULER Troubleshooting
- 20.3 Dropping and Recreating the Management Repository
- 20.4 Troubleshooting Management Repository Creation Errors
- 20.5 Cross Platform Enterprise Manager Repository Migration
- 21 Updating Cloud Control
- 22 Configuring a Software Library
- 22.1 Overview of Software Library
- 22.2 Users, Roles, and Privileges
- 22.3 What's New in Software Library
- 22.4 Performing Software Library Tasks Using EM CLI Verbs or in Graphical Mode
- 22.5 Software Library Storage
- 22.6 Prerequisites for Configuring Software Library
- 22.7 Configuring Software Library Storage Location
- 22.8 Configuring Software Library on a Multi-OMS System
- 22.9 Software Library Cache Nodes
- 22.10 Software Library File Transfers
- 22.11 Using Software Library Entities
- 22.12 Tasks Performed Using the Software Library Home Page
- 22.12.1 Organizing Entities
- 22.12.2 Creating Entities
- 22.12.3 Customizing Entities
- 22.12.4 Managing Entities
- 22.12.4.1 Accessing Software Library Home Page
- 22.12.4.2 Accessing Software Library Administration Page
- 22.12.4.3 Granting or Revoking Privileges
- 22.12.4.4 Moving Entities
- 22.12.4.5 Changing Entity Maturity
- 22.12.4.6 Adding Notes to Entities
- 22.12.4.7 Adding Attachments to Entities
- 22.12.4.8 Viewing, Editing, and Deleting Entities
- 22.12.4.9 Purging Deleted Entities
- 22.12.4.10 Searching Entities
- 22.12.4.11 Exporting Entities
- 22.12.4.12 Importing Entities
- 22.12.5 Staging Entities
- 22.13 Maintaining Software Library
- 22.13.1 Periodic Maintenance Tasks
- 22.13.2 Re-Importing Oracle Owned Entity Files
- 22.13.3 Removing (and Migrating) Software Library Storage Location
- 22.13.4 Removing a Referenced Storage Location
- 22.13.5 Deactivating and Activating a Storage Location
- 22.13.6 Scheduling Purge Job
- 22.13.7 Backing Up Software Library
- 23 Managing Plug-Ins
- 23.1 Getting Started
- 23.2 Introduction to Plug-ins
- 23.3 Workflow of Plug-In Deployment
- 23.4 Introduction to Plug-In Manager
- 23.5 Knowing Your Plug-Ins
- 23.6 Downloading, Deploying, and Upgrading Plug-Ins
- 23.7 Undeploying Plug-Ins
- 23.8 Advanced Operations with Plug-Ins
- 23.9 Troubleshooting
- 24 Patching Oracle Management Service and the Repository
- 24.1 OMSPatcher Automation
- 24.2 Required OMSPatcher Parameters
- 24.3 Prerequisites for Running OMSPatcher
- 24.4 Using OMSPatcher
- 24.5 OMSPatcher Command Syntax
- 24.6 Troubleshooting
- 24.6.1 OMSPatcher Troubleshooting Architecture
- 24.6.2 OMSPatcher Log Management Architecture
- 24.6.3 Logs for Oracle Support
- 24.6.4 OMSPatcher: Cases Analysis, Error Codes, and Remedies/Suggestions
- 24.6.5 OMSPatcher: External Utilities Error Codes
- 24.6.6 Special Error Cases for OMSPatcher OMS Automation
- 24.6.7 Multi-OMS Execution for UNIX based Systems
- 24.7 Features in OMSPatcher
- 25 Patching Oracle Management Agents
- 25.1 Overview
- 25.2 Automated Management Agent Patching Using Patch Plans (Recommended)
- 25.3 Manual Management Agent Patching
- 26 Personalizing Cloud Control
- 27 Administering Enterprise Manager Using EMCTL Commands
- 27.1 Executing EMCTL Commands
- 27.2 Guidelines for Starting Multiple Enterprise Manager Components on a Single Host
- 27.3 Starting and Stopping Oracle Enterprise Manager 13c Cloud Control
- 27.4 Services That Are Started with Oracle Management Service Startup
- 27.5 Starting and Stopping the Oracle Management Service and Management Agent on Windows
- 27.6 Reevaluating Metric Collections Using EMCTL Commands
- 27.7 Specifying New Target Monitoring Credentials in Enterprise Manager
- 27.8 EMCTL Commands for OMS
- 27.9 EMCTL Commands for Management Agent
- 27.10 EMCTL Security Commands
- 27.11 EMCTL HAConfig Commands
- 27.12 EMCTL Resync Commands
- 27.13 EMCTL Connector Command
- 27.14 EMCTL Patch Repository Commands
- 27.15 EMCTL Commands for Windows NT
- 27.16 EMCTL Partool Commands
- 27.17 EMCTL Plug-in Commands
- 27.18 EMCTL Command to Sync with OPSS Policy Store
- 27.19 Troubleshooting Oracle Management Service Startup Errors
- 27.20 Troubleshooting Management Agent Startup Errors
- 27.21 Using emctl.log File to Troubleshoot
- 28 Locating and Configuring Enterprise Manager Log Files
- 28.1 Managing Log Files
- 28.2 Managing Saved Searches
- 28.3 Locating Management Agent Log and Trace Files
- 28.4 Locating and Configuring Oracle Management Service Log and Trace Files
- 28.4.1 About the Oracle Management Service Log and Trace Files
- 28.4.2 Locating Oracle Management Service Log and Trace Files
- 28.4.3 Controlling the Size and Number of Oracle Management Service Log and Trace Files
- 28.4.4 Controlling the Contents of the Oracle Management Service Trace File
- 28.4.5 Controlling the Oracle WebLogic Server and Oracle HTTP Server Log Files
- 28.5 Monitoring Log Files
- 28.6 Configuring Log Archive Locations
- 29 Configuring and Using Services
- 29.1 Introduction to Services
- 29.2 Creating a Service
- 29.3 Monitoring a Service
- 29.4 Configuring a Service
- 29.4.1 Availability Definition (Generic and Aggregate Service)
- 29.4.2 Root Cause Analysis Configuration
- 29.4.3 System Association
- 29.4.4 Monitoring Settings
- 29.4.5 Service Tests and Beacons
- 29.4.5.1 Defining Additional Service Tests
- 29.4.5.2 Deploying and Using Beacons
- 29.4.5.3 Configuring the Beacons
- 29.4.5.4 Creating an ATS Service Test Using OATS Load Script
- 29.4.5.4.1 Creating a Self Contained Zip File
- 29.4.5.4.2 Creating an ATS Service Test
- 29.4.5.4.3 Troubleshooting ATS Service Test Playback Issues
- 29.4.5.4.4 Using Databanking and Parameterization
- 29.4.5.4.5 Parameterizing URLs
- 29.4.5.4.6 Success or Failure Validation
- 29.4.5.4.7 Using Beacon Override
- 29.4.5.4.8 Updating the Databank File
- 29.4.5.4.9 Using SLM Header for RUEI Integration
- 29.4.6 Performance Metrics
- 29.4.7 Usage Metrics
- 29.5 Using the Transaction Recorder
- 29.6 Setting Up and Using Service Level Agreements
- 29.7 Using the Services Dashboard
- 29.8 Using the Test Repository
- 29.9 Configuring Service Levels
- 29.10 Configuring a Service Using the Command Line Interface
- 29.11 Troubleshooting Service Tests
- 30 Introducing Enterprise Manager Support for SNMP
- Part V Systems Infrastructure
- 31 Working with Systems Infrastructure Targets
- 32 Managing Networks
- 33 Managing Storage
- 33.1 Get Started with Managing Storage
- 33.2 Location of Storage Information in the User Interface
- 33.3 Actions for Storage Management
- 33.4 About Storage Appliance Dashboard
- 33.5 About Photorealistic Image
- 33.6 About Summary
- 33.7 About Projects
- 33.8 About Charts
- 33.9 About Host Storage Information
- 33.10 About Storage Configuration Topology
- 33.11 About Storage Metrics
- 33.12 About Storage Cluster Membership
- 33.13 About Storage Resource Deletion
- 33.14 Using Oracle ZFS Storage Appliance in Engineered Systems
- 33.15 Related Resources for Storage
- 34 Monitoring Servers
- 34.1 Get Started With Server Management
- 34.2 Location of Server Information in the UI
- 34.3 Actions for Server Management
- 34.4 About the Hardware Dashboard
- 34.5 Viewing the Hardware Dashboard
- 34.6 About Server Metrics
- 34.7 Viewing Server Metrics
- 34.8 About the Photorealistic Image of the Hardware
- 34.9 Viewing the Photorealistic Image of the Hardware
- 34.10 About the Logical View
- 34.10.1 About CPU Information
- 34.10.2 About Memory Information
- 34.10.3 About Power Information
- 34.10.4 About Fan Information
- 34.10.5 About Storage Information
- 34.10.6 About Disk Controller Information
- 34.10.7 About Disk Expander Information
- 34.10.8 About Network Ports Information
- 34.10.9 About PCI Devices Information
- 34.10.10 About PDOMs Information
- 34.10.11 About DCUs Information
- 34.11 Viewing the Logical View
- 34.12 About Energy Consumption
- 34.13 Viewing the Energy Consumption
- 34.14 About Network Connectivity
- 34.15 Viewing the Network Connectivity
- 34.16 About the Service Processor Configuration
- 34.17 Viewing the Service Processor Configuration
- 34.18 Managing Metrics and Incident Notifications
- 34.19 Administering Servers
- 34.20 Related Resources for Server Management
- 35 Managing the PDU
- 35.1 Getting Started with PDU Management
- 35.2 Location of PDU Information in the User Interface
- 35.3 Actions for PDU
- 35.4 PDU Version Identification
- 35.5 Viewing the PDU Information
- 35.6 Changing PDU Monitoring Credentials
- 35.7 PDU Test Connection and Metric Collection Error Troubleshooting
- 35.8 PDU Error States
- 35.9 PDU Alerts and Configuration
- 35.10 Related Resources for PDU Management
- 36 Managing the Rack
- 37 Managing Oracle MiniCluster
- 38 Managing Oracle SuperCluster
- 39 Monitoring Oracle Operating Systems
- 39.1 Get Started with Monitoring Oracle Operating Systems
- 39.2 Location of Oracle Operating System Information in the UI
- 39.3 Features of Operating Systems
- 39.4 About the Dashboard for all Hosts
- 39.5 How to Get Information About a Specific Host
- 39.6 About the Host Menu
- 39.7 About Open Incidents
- 39.8 Overview of Performance and Resource Metrics
- 39.9 About Host Memory
- 39.10 Viewing Host Storage
- 39.11 Viewing Network Connectivity
- 39.12 About Boot Environments
- 39.13 Viewing Running Host Processes
- 39.14 Viewing Managed Host Services
- 39.15 Working with Host Metrics
- 39.16 Managing Metrics and Incident Notifications for Hosts
- 39.17 About Host Compliance
- 39.18 Related Resources for Operating Systems
- 40 Monitoring Oracle Solaris Zones
- 40.1 Get Started with Monitoring Oracle Solaris Zones
- 40.2 Location of Oracle Solaris Zone Information in the UI
- 40.3 Actions for Zones
- 40.4 Target Navigation for Zones
- 40.5 How to Get Information About a Zone
- 40.6 Working with Zone Platform Metrics
- 40.7 Working with Zone-Specific Metrics
- 40.8 Viewing All Metrics
- 40.9 Working with Incidents for Zones
- 40.10 Managing Metrics and Incident Notifications for Zones
- 40.10.1 Viewing Zone Metric Collection Errors
- 40.10.2 Editing Metric and Collection Settings for Zones
- 40.10.3 Editing a Zone's Monitoring Configuration
- 40.10.4 Suspending Monitoring Notifications for Zones
- 40.10.5 Suspending Zone Monitoring for Maintenance
- 40.10.6 Ending a Monitoring Brownout or Blackout for Zones
- 40.11 Administering Zones
- 40.12 Additional Resources for Oracle Solaris Zones
- 41 Monitoring Oracle VM Server for SPARC
- 41.1 Getting Started With Oracle VM Server for SPARC Virtualization
- 41.2 Location of Oracle VM Server for SPARC Information in the UI
- 41.3 Actions for Oracle VM Server for SPARC
- 41.4 Target Navigation for Oracle VM Server for SPARC
- 41.5 Supported Versions
- 41.6 Viewing all Oracle VM Server for SPARC Virtualization Platforms
- 41.7 About Virtualization Platform Information
- 41.7.1 Viewing the Virtualization Platform Basic Information
- 41.7.2 About the Virtualization Platform's Guest Summary
- 41.7.3 Viewing the Virtualization Platform Guest Summary
- 41.7.4 About the Virtualization Platform's Services
- 41.7.5 Viewing the Virtualization Platform Services
- 41.7.6 About the Virtualization Platform's vCPU and Core Allocation
- 41.7.7 Viewing the Virtualization Platform vCPU and Core Allocation
- 41.7.8 About Virtualization Platform Metrics
- 41.7.9 Viewing Platform Metrics
- 41.8 Zones within a Logical Domain
- 41.9 About Logical Domain Information
- 41.10 Managing Metrics and Incident Notifications
- 41.11 Administering Oracle VM Server for SPARC
- 41.12 Related Resources for Oracle VM Server for SPARC
- 42 Provisioning Zones with Oracle Database on Database Domains
- Part VI Generating Reports
- 43 Using Information Publisher
- 44 Creating Usage Tracking Reports
- 44.1 Usage Tracking Reports
- 44.2 Collecting Data for Database Usage Tracking
- 44.3 Generating Database Usage Tracking Report
- 44.4 Database Usage Tracking Summary Report
- 44.5 Generating the Fusion Middleware Usage Tracking Summary Report
- 44.6 Host Usage Tracking Reports
- Part VII Accessing Enterprise Manager via Mobile Devices
- 45 Remote Access To Enterprise Manager
- 45.1 Reviewing System Requirements
- 45.2 Performing Initial Setup
- 45.3 Connecting the First Time
- 45.4 Encountering the Login Screen
- 45.5 Managing Settings
- 45.6 Using Cloud Control Mobile in Incident Manager
- 45.7 Working in Cloud Control Mobile
- 45.8 Learning Tips and Tricks
- 45.9 Connecting to Enterprise Manager Desktop Version
- 45 Remote Access To Enterprise Manager
- Part VIII Appendixes
- A Interpreting Variables of the Enterprise Manager MIB
- A.1 oraEMNGEvent
- A.1.1 oraEMNGEventIndex
- A.1.2 oraEMNGEventNotifType
- A.1.3 oraEMNGEventMessage
- A.1.4 oraEMNGEventMessageURL
- A.1.5 oraEMNGEventSeverity
- A.1.6 oraEMNGEventSeverityCode
- A.1.7 oraEMNGEventRepeatCount
- A.1.8 oraEMNGEventActionMsg
- A.1.9 oraEMNGEventOccurrenceTime
- A.1.10 oraEMNGEventReportedTime
- A.1.11 oraEMNGEventCategories
- A.1.12 oraEMNGEventCategoryCodes
- A.1.13 oraEMNGEventType
- A.1.14 oraEMNGEventName
- A.1.15 oraEMNGAssocIncidentId
- A.1.16 oraEMNGAssocIncidentOwner
- A.1.17 oraEMNGAssocIncidentAcked
- A.1.18 oraEMNGAssocIncidentStatus
- A.1.19 oraEMNGAssocIncidentPriority
- A.1.20 oraEMNGAssocIncidentEscLevel
- A.1.21 oraEMNGEventTargetName
- A.1.22 oraEMNGEventTargetNameURL
- A.1.23 oraEMNGEventTargetType
- A.1.24 oraEMNGEventHostName
- A.1.25 oraEMNGEventTargetOwner
- A.1.26 oraEMNGEventTgtLifeCycleStatus
- A.1.27 oraEMNGEventTargetVersion
- A.1.28 oraEMNGEventUserDefinedTgtProp
- A.1.29 oraEMNGEventSourceObjName
- A.1.30 oraEMNGEventSourceObjNameURL
- A.1.31 oraEMNGEventSourceObjType
- A.1.32 oraEMNGEventSourceObjSubType
- A.1.33 oraEMNGEventSourceObjOwner
- A.1.34 oraEMNGEventCAJobName
- A.1.35 oraEMNGEventCAJobStatus
- A.1.36 oraEMNGEventCAJobOwner
- A.1.37 oraEMNGEventCAJobStepOutput
- A.1.38 oraEMNGEventCAJobType
- A.1.39 oraEMNGEventRuleSetName
- A.1.40 oraEMNGEventRuleName
- A.1.41 oraEMNGEventRuleOwner
- A.1.42 oraEMNGEventSequenceId
- A.1.43 oraEMNGEventRCADetails
- A.1.44 oraEMNGEventContextAttrs
- A.1.45 oraEMNGEventUserComments
- A.1.46 oraEMNGEventUpdates
- A.1.47 oraEMNGEventTotalOccurrenceCount
- A.1.48 oraEMNGEventCurrOccurrenceCount
- A.1.49 oraEMNGEventCurrFirstOccurDate
- A.1.50 oraEMNGEventCurrLastOccurDate
- A.1.51 oraEMNGRCAStatus
- A.1.52 oraEMNGEventReportedState
- A.1.53 oraEMNGEventTypeAttr(1-71)
- A.2 oraEM4AlertTable
- A.2.1 oraEM4AlertTargetName
- A.2.2 oraEM4AlertTargetType
- A.2.3 oraEM4AlertHostName
- A.2.4 oraEM4AlertMetricName
- A.2.5 oraEM4AlertKeyName
- A.2.6 oraEM4AlertKeyValue
- A.2.7 oraEM4AlertTimeStamp
- A.2.8 oraEM4AlertSeverity
- A.2.9 oraEM4AlertMessage
- A.2.10 oraEM4AlertRuleName
- A.2.11 oraEM4AlertRuleOwner
- A.2.12 oraEM4AlertMetricValue
- A.2.13 oraEM4AlertContext
- A.2.14 oraEM4AlertCycleGuid
- A.2.15 oraEM4AlertRepeatCount
- A.2.16 oraEM4AlertUDTargetProperties
- A.2.17 oraEM4AlertAck
- A.2.18 oraEM4AlertAckBy
- A.2.19 oraEM4AlertNotifType
- A.2.20 oraEM4AlertViolationGuid
- A.3 oraEM4JobAlertTable
- A.3.1 oraEM4JobAlertJobName
- A.3.2 oraEM4JobAlertJobOwner
- A.3.3 oraEM4JobAlertJobType
- A.3.4 oraEM4JobAlertJobStatus
- A.3.5 oraEM4JobAlertTargets
- A.3.6 oraEM4JobAlertTimeStamp
- A.3.7 oraEM4JobAlertRuleName
- A.3.8 oraEM4JobAlertRuleOwner
- A.3.9 oraEM4JobAlertMetricName
- A.3.10 oraEM4JobAlertMetricValue
- A.3.11 oraEM4JobAlertContext
- A.3.12 oraEM4JobAlertKeyName
- A.3.13 oraEM4JobAlertKeyValue
- A.3.14 oraEM4JobAlertSeverity
- A.3.15 oraEM4JobAlertJobId
- A.3.16 oraEM4JobAlertJobExecId
- A.1 oraEMNGEvent
- B Enterprise Manager MIB Definition
- C SNMP Trap Mappings
- D Overview of Target Availability States
- E Timeout Values for Enterprise Manager Components
- Index

Oracle® Enterprise Manager
Cloud Control Administrator's Guide
13c Release 2
E74458-08
October 2017
Oracle Enterprise Manager Cloud Control Administrator's Guide, 13c Release 2
E74458-08
Copyright © 2016, 2017, Oracle and/or its affiliates. All rights reserved.
This software and related documentation are provided under a license agreement containing restrictions on
use and disclosure and are protected by intellectual property laws. Except as expressly permitted in your
license agreement or allowed by law, you may not use, copy, reproduce, translate, broadcast, modify,
license, transmit, distribute, exhibit, perform, publish, or display any part, in any form, or by any means.
Reverse engineering, disassembly, or decompilation of this software, unless required by law for
interoperability, is prohibited.
The information contained herein is subject to change without notice and is not warranted to be error-free. If
you find any errors, please report them to us in writing.
If this is software or related documentation that is delivered to the U.S. Government or anyone licensing it on
behalf of the U.S. Government, then the following notice is applicable:
U.S. GOVERNMENT END USERS: Oracle programs, including any operating system, integrated software,
any programs installed on the hardware, and/or documentation, delivered to U.S. Government end users are
"commercial computer software" pursuant to the applicable Federal Acquisition Regulation and agency-
specific supplemental regulations. As such, use, duplication, disclosure, modification, and adaptation of the
programs, including any operating system, integrated software, any programs installed on the hardware,
and/or documentation, shall be subject to license terms and license restrictions applicable to the programs.
No other rights are granted to the U.S. Government.
This software or hardware is developed for general use in a variety of information management applications.
It is not developed or intended for use in any inherently dangerous applications, including applications that
may create a risk of personal injury. If you use this software or hardware in dangerous applications, then you
shall be responsible to take all appropriate fail-safe, backup, redundancy, and other measures to ensure its
safe use. Oracle Corporation and its affiliates disclaim any liability for any damages caused by use of this
software or hardware in dangerous applications.
Oracle and Java are registered trademarks of Oracle and/or its affiliates. Other names may be trademarks of
their respective owners.
Intel and Intel Xeon are trademarks or registered trademarks of Intel Corporation. All SPARC trademarks are
used under license and are trademarks or registered trademarks of SPARC International, Inc. AMD, Opteron,
the AMD logo, and the AMD Opteron logo are trademarks or registered trademarks of Advanced Micro
Devices. UNIX is a registered trademark of The Open Group.
This software or hardware and documentation may provide access to or information about content, products,
and services from third parties. Oracle Corporation and its affiliates are not responsible for and expressly
disclaim all warranties of any kind with respect to third-party content, products, and services unless otherwise
set forth in an applicable agreement between you and Oracle. Oracle Corporation and its affiliates will not be
responsible for any loss, costs, or damages incurred due to your access to or use of third-party content,
products, or services, except as set forth in an applicable agreement between you and Oracle.

Contents
Preface
Audience xli
Documentation Accessibility xli
Related Documents xli
Conventions xli
Part I Monitoring and Managing Targets
1 Enterprise Monitoring
1.1 Monitoring Overview 1-1
1.2 Comprehensive Out-of-Box Monitoring 1-1
1.3 Monitoring: Basics 1-2
1.3.1 Metric Thresholds: Determining When a Monitored Condition is an Issue
1-3
1.3.2 Metric Baselines: Determining Valid Metric Thresholds 1-3
1.3.3 Advanced Threshold Management 1-4
1.3.4 Events: Defining What Conditions are of Interest 1-5
1.3.5 Corrective Actions: Resolving Issues Automatically 1-5
1.3.6 Metric Extensions: Customizing Monitoring 1-5
1.3.7 Blackouts and Notification Blackouts 1-6
1.4 Monitoring: Advanced Setup 1-7
1.4.1 Monitoring Templates 1-7
1.4.2 Administration Groups and Template Collections 1-7
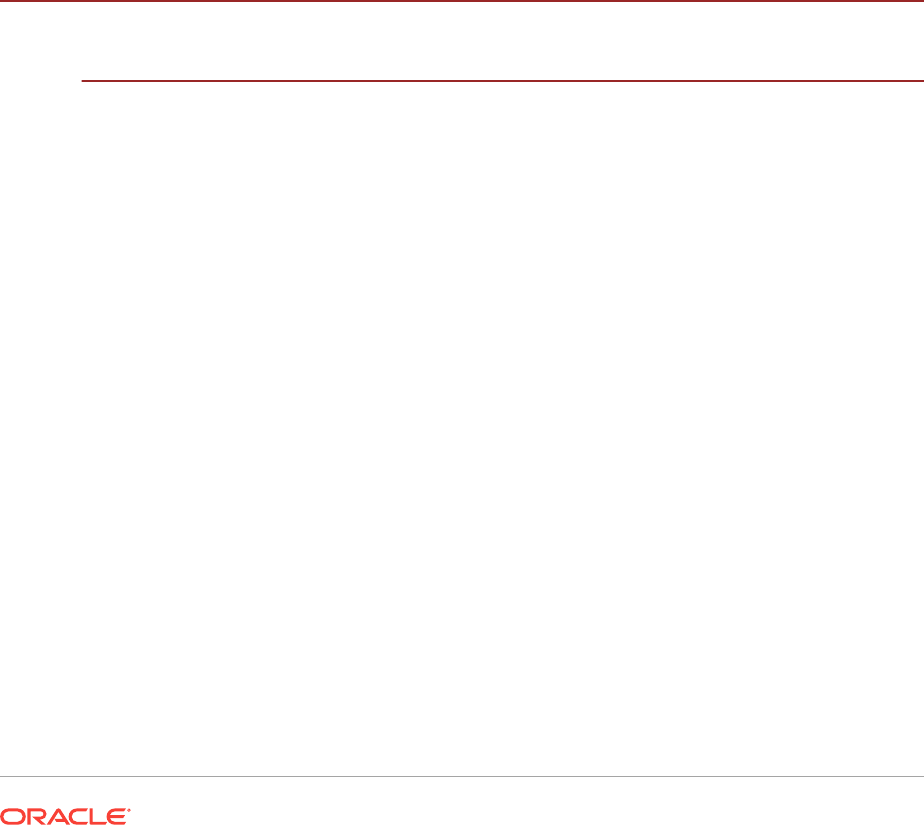
1.4.3 Customizing Alert Messages 1-8
1.5 Notifications 1-10
1.5.1 Customizing Notifications 1-11
1.6 Managing Events, Incidents, and Problems 1-11
1.6.1 Incident Manager 1-12
1.6.2 Incident Rules and Rule Sets 1-13
1.6.3 Connectors 1-14
iii

1.7 Accessing Monitoring Information 1-15
2 Using Incident Management
2.1 Management Concepts 2-2
2.1.1 Event Management 2-2
2.1.2 Incident Management 2-5
2.1.2.1 Working with Incidents 2-6
2.1.2.2 Incident Composed of a Single Event 2-9
2.1.2.3 Incident Composed of Multiple Events 2-10
2.1.2.4 How are Incidents Created? 2-11
2.1.3 Problem Management 2-11
2.1.4 Rule Sets 2-12
2.1.4.1 Out-of-Box Rule Sets 2-13
2.1.4.2 Rule Set Types 2-14
2.1.4.3 Rules 2-15
2.1.5 Incident Manager 2-19
2.1.5.1 Views 2-20
2.1.6 Summing Up 2-20
2.2 Setting Up Your Incident Management Environment 2-22
2.2.1 Setting Up Your Monitoring Infrastructure 2-22
2.2.1.1 Rule Set Development 2-23
2.2.2 Setting Up Administrators and Privileges 2-26
2.2.3 Monitoring Privileges 2-29
2.2.4 Setting Up Rule Sets 2-32
2.2.4.1 Creating a Rule Set 2-32
2.2.4.2 Creating a Rule to Create an Incident 2-33
2.2.4.3 Creating a Rule to Manage Escalation of Incidents 2-34
2.2.4.4 Creating a Rule to Escalate a Problem 2-35
2.2.4.5 Testing Rule Sets 2-36
2.2.4.6 Subscribing to Receive Email from a Rule 2-38
2.2.4.7 Receiving Email for Private Rules 2-39
2.3 Working with Incidents 2-40
2.3.1 Finding What Needs to be Worked On 2-41
2.3.2 Searching for Incidents 2-42
2.3.3 Setting Up Custom Views 2-43
2.3.3.1 Incident Dashboard 2-44
2.3.4 Sharing/Unsharing Custom Views 2-46
2.3.5 Responding and Working on a Simple Incident 2-47
2.3.6 Responding to and Managing Multiple Incidents, Events and Problems
in Bulk 2-48
2.3.7 Searching My Oracle Support Knowledge 2-50
iv

2.3.8 Submitting an Open Service Request (Problems-only) 2-50
2.3.9 Suppressing Incidents and Problems 2-51
2.3.10 Managing Workload Distribution of Incidents 2-51
2.3.11 Reviewing Events on a Periodic Basis 2-52
2.3.11.1 Creating an Incident Manually 2-52
2.4 Advanced Topics 2-53
2.4.1 Automatic Diagnostic Repository (ADR): Incident Flood Control 2-53
2.4.1.1 Working with ADR Diagnostic Incidents Using Incident Manager 2-53
2.4.1.2 Incident Flood Control 2-53
2.4.2 Defining Custom Incident Statuses 2-55
2.4.2.1 Creating a New Resolution State 2-55
2.4.2.2 Modifying an Existing Resolution State 2-56
2.4.3 Clearing Stateless Alerts for Metric Alert Event Types 2-56
2.4.4 Automatically Clearing "Manually Clearable" Events 2-58
2.4.5 User-reported Events 2-58
2.4.5.1 Format 2-59
2.4.5.2 Options 2-59
2.4.5.3 Examples 2-60
2.4.6 Additional Rule Applications 2-61
2.4.6.1 Setting Up a Rule to Send Different Notifications for Different
Severity States of an Event 2-61
2.4.6.2 Creating a Rule to Notify Different Administrators Based on the
Event Type 2-62
2.4.6.3 Creating a Rule to Create a Ticket for Incidents 2-63
2.4.6.4 Creating a Rule to Send SNMP Traps to Third Party Systems 2-64
2.4.7 Exporting and Importing Incident Rules 2-65
2.4.7.1 Exporting Rule Sets using the Enterprise Manager Console 2-65
2.4.7.2 Importing Rule Sets using the Enterprise Manager Console 2-66
2.4.7.3 Importing Rule Sets Using EM CLI 2-66
2.4.7.4 Exporting Rule Sets Using EM CLI 2-67
2.4.8 Creating Corrective Actions for Events 2-67
2.4.9 Compressing Multiple Events into a Single Incident 2-70
2.4.10 Event Prioritization 2-81
2.4.11 Root Cause Analysis (RCA) and Target Down Events 2-82
2.4.11.1 How RCA Works 2-82
2.4.11.2 Leveraging RCA Results in Incident Rule Sets 2-84
2.4.11.3 Leveraging RCA Results in Incident Manager 2-85
2.4.11.4 Leveraging RCA Results in the System Dashboard 2-86
2.4.11.5 Creating a Rule to Update Incident Priority for Non-symptom
Events 2-86
2.4.11.6 Creating Incidents On Non-symptom Events 2-87
2.4.11.7 Introducing a Time Delay 2-90
v

2.5 Moving from Enterprise Manager 10/11g to 12c and Greater 2-90
2.6 Monitoring: Common Tasks 2-91
2.6.1 Setting Up an Email Gateway 2-91
2.6.2 Sending Email for Metric Alerts 2-93
2.6.3 Sending SNMP Traps for Metric Alerts 2-96
2.6.4 Sending Events to an Event Connector 2-98
2.6.5 Sending Email to Different Email Addresses for Different Periods of the
Day 2-101
3 Using Notifications
3.1 Setting Up Notifications 3-2
3.1.1 Setting Up a Mail Server for Notifications 3-2
3.1.2 Setting Up Email for Yourself 3-4
3.1.2.1 Defining Email Addresses 3-4
3.1.2.2 Setting Up a Notification Schedule 3-5
3.1.2.3 Subscribe to Receive Email for Incident Rules 3-6
3.1.3 Setting Up Email for Other Administrators 3-8
3.1.4 Email Customization 3-9
3.1.4.1 Email Customization Reference 3-9
3.1.5 Setting Up Repeat Notifications 3-12
3.2 Extending Notification Beyond Email 3-13
3.3 Sending Notifications Using OS Commands and Scripts 3-13
3.3.1 Script Examples 3-16
3.3.2 Migrating pre-12c OS Command Scripts 3-18
3.3.2.1 Migrating Metric Alert Event Types 3-19
3.3.2.2 Migrating Target Availability Event Types 3-20
3.3.2.3 Migrating Job Status Change Event Types 3-20
3.3.2.4 Migrating Corrective Action-Related OS Scripts 3-21
3.3.2.5 Notification Type Mapping 3-22
3.4 Sending Notifications Using PL/SQL Procedures 3-22
3.4.1 Defining a PL/SQL-based Notification Method 3-22
3.4.2 Migrating Pre-12c PL/SQL Advanced Notification Methods 3-30
3.4.2.1 Mapping for MGMT_NOTIFY_SEVERITY 3-30
3.4.2.2 Mapping for MGMT_NOTIFY_JOB 3-34
3.4.2.3 Mapping for MGMT_NOTIFY_CORRECTIVE_ACTION 3-35
3.5 Sending SNMP Traps to Third Party Systems 3-36
3.5.1 SNMP Version 1 Versus SNMP Version 3 3-37
3.5.2 Working with SNMP V3 Trap Notification Methods 3-37
3.5.2.1 Configuring the OMS to Send SNMP Trap Notifications 3-37
3.5.2.2 Creating/Editing an SNMP V3 Trap Notification Method 3-38
3.5.2.3 Editing a User Security Model Entry 3-39
vi

3.5.2.4 Viewing Available SNMP V3 Trap Notification Methods 3-41
3.5.2.5 Deleting an SNMP V3 Trap Notification Method 3-41
3.5.3 Creating an SNMP V1 Trap 3-41
3.5.4 SNMP Traps: Moving from Previous Enterprise Manager Releases to
12c and Greater 3-44
3.6 Management Information Base (MIB) 3-45
3.6.1 About MIBs 3-45
3.6.2 MIB Definition 3-45
3.6.3 Reading the MIB Variable Descriptions 3-46
3.6.3.1 Variable Name 3-46
3.7 Passing Corrective Action Status Change Information 3-47
3.7.1 Passing Corrective Action Execution Status to an OS Command or
Script 3-47
3.7.2 Passing Corrective Action Execution Status to a PLSQL Procedure 3-48
3.8 Passing Job Execution Status Information 3-49
3.8.1 Passing Job Execution Status to a PL/SQL Procedure 3-49
3.8.2 Passing Job Execution Status to an OS Command or Script 3-52
3.9 Passing User-Defined Target Properties to Notification Methods 3-52
3.10 Notification Reference 3-53
3.10.1 EMOMS Properties 3-53
3.10.2 Passing Event, Incident, Problem Information to an OS Command or
Script 3-57
3.10.2.1 Environment Variables Common to Event, Incident and Problem 3-57
3.10.2.2 Event Notification-Specific Environment Variables 3-59
3.10.2.3 Environment Variables Specific to Event Types 3-61
3.10.2.4 Environment Variables Specific to Incident Notifications 3-63
3.10.2.5 Environment Variables Specific to Problem Notifications 3-65
3.10.2.6 Environment Variables Common to Incident and Problem
Notifications 3-65
3.10.3 Passing Information to a PL/SQL Procedure 3-67
3.10.3.1 Notification Payload Elements Specific to Event Types 3-75
3.10.4 Troubleshooting Notifications 3-79
3.10.4.1 General Setup 3-79
3.10.4.2 Notification System Errors 3-79
3.10.4.3 Notification System Trace Messages 3-79
3.10.4.4 Email Errors 3-81
3.10.4.5 OS Command Errors 3-81
3.10.4.6 SNMP Trap Errors 3-82
3.10.4.7 PL/SQL Errors 3-82
3.11 System Broadcasts 3-83
vii

4 Using Blackouts and Notification Blackouts
4.1 Blackouts and Notification Blackouts 4-1
4.1.1 About Blackouts 4-1
4.1.2 About Notification Blackouts 4-2
4.2 Working with Blackouts/Notification Blackouts 4-3
4.2.1 Creating Blackouts/Notification Blackouts 4-3
4.2.2 Editing Blackouts/Notification Blackouts 4-4
4.2.3 Viewing Blackouts/Notification Blackouts 4-4
4.2.4 Purging Blackouts/Notification Blackouts That Have Ended 4-4
4.3 Controlling Blackouts Using the Command Line Utility 4-5
4.4 About Blackouts Best Effort 4-7
4.4.1 When to Use Blackout Best Effort 4-7
5 Managing Groups
5.1 Introduction to Groups 5-1
5.1.1 Overview of Groups 5-1
5.1.2 Overview of Privilege Propagating Groups 5-2
5.1.3 Overview of Dynamic Groups 5-3
5.1.4 Overview of Administration Groups 5-4
5.1.5 Choosing Which Type of Group To Use 5-4
5.2 Managing Groups 5-5
5.2.1 Creating and Editing Groups 5-5
5.2.2 Creating Dynamic Groups 5-6
5.2.3 Adding Members to Privilege Propagating Groups 5-8
5.2.4 Converting Conventional Groups to Privilege Propagating Groups 5-8
5.2.5 Viewing and Managing Groups 5-9
5.2.6 Overview of Group Charts 5-10
5.2.7 Overview of Group Members 5-11
5.2.8 Viewing Group Status History 5-11
5.2.9 About the System Dashboard 5-11
5.3 Using Out-of-Box Reports 5-13
6 Using Administration Groups
6.1 What is an Administration Group? 6-1
6.1.1 Developing an Administration Group 6-3
6.2 Planning an Administrative Group 6-3
6.3 Implementing Administration Groups and Template Collections 6-10
6.3.1 Creating the Administration Group Hierarchy 6-11
6.3.2 Accessing the Administration Group Home Page 6-12
viii

6.3.3 Defining the Hierarchy 6-12
6.3.4 Defining Template Collections 6-17
6.3.4.1 Required Privileges 6-18
6.3.4.2 Corrective Action Credentials 6-19
6.3.5 Associating Template Collections with Administration Groups 6-20
6.3.5.1 Associating a Template Collection with an Administration Group 6-20
6.3.5.2 Searching for Administration Groups 6-21
6.3.5.3 Setting the Global Synchronization Schedule 6-23
6.3.5.4 When Template Collection Synchronization Occurs 6-24
6.3.5.5 Viewing Synchronization Status 6-25
6.3.5.6 Group Member Type and Synchronization 6-25
6.3.5.7 System Targets and Administration Groups 6-26
6.3.5.8 Disassociating a Template Collection from a Group 6-26
6.3.5.9 Viewing Aggregate (Group Management) Settings 6-26
6.3.5.10 Viewing the Administration Group Homepage 6-27
6.3.5.11 Identifying Targets Not Part of Any Administration Group 6-27
6.4 Changing the Administration Group Hierarchy 6-28
6.4.1 Adding a New Hierarchy Level 6-29
6.4.2 Removing a Hierarchy Level 6-29
6.4.3 Merging Administration Groups 6-29
6.4.4 Removing Administration Groups 6-33
7 Using Monitoring Templates
7.1 About Monitoring Templates 7-1
7.2 Definition of a Monitoring Template 7-2
7.3 Default Templates (Auto Apply Templates) 7-2
7.4 Viewing a List of Monitoring Templates 7-2
7.5 Creating a Monitoring Template 7-3
7.6 Editing a Monitoring Template 7-4
7.7 Applying Monitoring Templates to Targets 7-5
7.7.1 Applying a Monitoring Template 7-5
7.7.2 Monitoring Template Application Options 7-5
7.7.2.1 Apply Options 7-6
7.7.2.2 Metrics with Key Value Settings 7-6
7.8 Comparing Monitoring Templates with Targets 7-8
7.8.1 When is a metric between a template and a target considered
"different"? 7-8
7.9 Comparing Metric Settings Using Information Publisher 7-9
7.10 Exporting and Importing Monitoring Templates 7-10
7.11 Upgrading Enterprise Manager: Comparing Monitoring Templates 7-11
ix

7.12 Changing the Monitoring Template Apply History Retention Period 7-11
8 Using Metric Extensions
8.1 What are Metric Extensions? 8-1
8.2 Metric Extension Lifecycle 8-3
8.3 Working with Metric Extensions 8-5
8.3.1 Administrator Privilege Requirements 8-5
8.3.2 Granting Create Metric Extension Privilege 8-6
8.3.3 Managing Administrator Privileges 8-6
8.3.4 Managing Administrator Access to Metric Extensions 8-7
8.3.4.1 Granting Full/Edit Privileges on a Metric Extension 8-7
8.3.4.2 Revoking Access Privileges on a Metric Extension 8-7
8.3.4.3 Transferring Metric Extension Ownership 8-8
8.3.5 Creating a New Metric Extension 8-8
8.3.6 Creating a New Metric Extension (Create Like) 8-13
8.3.7 Editing a Metric Extension 8-14
8.3.8 Creating the Next Version of an Existing Metric Extension 8-14
8.3.9 Importing a Metric Extension 8-15
8.3.10 Exporting a Metric Extension 8-15
8.3.11 Deleting a Metric Extension 8-16
8.3.12 Deploying Metric Extensions to a Group of Targets 8-16
8.3.13 Creating an Incident Rule to Send Email from Metric Extensions 8-17
8.3.14 Updating Older Versions of Metric Extensions Already Deployed to a
Group of Targets 8-17
8.3.15 Creating Repository-side Metric Extensions 8-17
8.4 Adapters 8-21
8.4.1 OS Command Adapter - Single Column 8-22
8.4.2 OS Command Adapter- Multiple Values 8-24
8.4.3 OS Command Adapter - Multiple Columns 8-25
8.4.4 SQL Adapter 8-26
8.4.5 SNMP (Simple Network Management Protocol) Adapter 8-28
8.4.6 JMX Adapter 8-28
8.5 Converting User-defined Metrics to Metric Extensions 8-29
8.5.1 Overview 8-29
8.5.2 Commands 8-30
8.6 Metric Extension Command Line Verbs 8-34
9 Advanced Threshold Management
9.1 Accessing the Advanced Threshold Management Page 9-1
9.2 Adaptive Thresholds 9-1
x

9.2.1 Registering Adaptive Threshold Metrics 9-2
9.2.2 Configuring Adaptive Thresholds 9-6
9.2.3 Determining whether Adaptive Thresholds are Correct 9-7
9.2.4 Testing Adaptive Metric Thresholds 9-9
9.2.5 Deregistering Adaptive Threshold Metrics 9-10
9.2.6 Setting Adaptive Thresholds using Monitoring Templates 9-10
9.3 Time-based Static Thresholds 9-11
9.3.1 Registering Time-based Static Thresholds 9-11
9.3.2 Deregistering Time-based Static Thresholds 9-13
9.4 Determining What is a Valid Metric Threshold 9-14
10
Utilizing the Job System and Corrective Actions
10.1 Job System Purpose and Overview 10-1
10.1.1 Changing Job Activity Summary Table Views 10-2
10.1.2 Job Searches 10-3
10.1.2.1 Saving Job Searches 10-3
10.1.2.2 Editing Saved Job Searches 10-3
10.1.2.3 Importing/Exporting Saved Job Searches 10-4
10.1.3 What Are Job Executions and Job Runs? 10-4
10.1.3.1 Job Executions 10-4
10.1.3.2 Job Runs 10-4
10.1.4 Operations on Job Executions and Job Runs 10-4
10.2 Preliminary Considerations 10-5
10.2.1 Administrator Roles 10-5
10.2.2 Creating Scripts 10-6
10.2.3 Sharing Job Responsibilities 10-6
10.2.4 Submitting Jobs for Groups 10-6
10.3 Creating Jobs 10-7
10.3.1 Selecting a Job Type 10-7
10.3.2 Creating an OS Command Job 10-7
10.3.2.1 Specifying a Single Operation 10-13
10.3.2.2 Specifying a Script 10-13
10.3.2.3 Access Level Rules 10-15
10.3.3 Creating a SQL Script Job 10-15
10.3.3.1 Specifying Targets 10-15
10.3.3.2 Specifying Options for the Parameters Page 10-16
10.3.3.3 Specifying Host and Database Credentials 10-16
10.3.3.4 Returning Error Codes from SQL Script Jobs 10-17
10.3.4 Creating a Multi-task Job 10-18
10.3.4.1 Job Capabilities 10-18
xi

10.3.4.2 Specifying Targets for a Multi-task Job 10-18
10.3.4.3 Adding Tasks to the Job 10-19
10.4 Viewing and Analyzing Job Status 10-19
10.5 Generating Job Event Criteria 10-21
10.5.1 Enabling Events For Job Status, Status Severity, and Targetless Jobs 10-22
10.5.2 Adding Targets To Generate Events For Job Status 10-23
10.6 Creating Event Rules For Job Status Change 10-23
10.6.1 Creating Job Status Change Event Rules For Jobs 10-23
10.6.2 Creating Job Status Change Event Rules For Targets 10-27
10.7 Using Diagnostic Tools 10-31
10.7.1 Enabling Job Logging 10-31
10.7.2 Viewing Job Logging 10-31
10.7.3 Debugging a Failed Job 10-32
10.7.4 Checking for Incidents Related to a Failed Job 10-32
10.7.5 Packaging an Incident Generated by a Job Step 10-33
10.7.6 Viewing Remote Log Files 10-34
10.7.7 Diagnosing Problems with Cloud Control Management Tools 10-34
10.7.7.1 Health Overview 10-34
10.7.7.2 Repository Home Page 10-36
10.7.7.3 Management Services and Repository: All Metrics 10-36
10.7.7.4 OMS and Repository: Diagnostic Metrics 10-37
10.7.7.5 OMS and Repository: Charts 10-37
10.7.7.6 Management Servers and Job Activity Details Pages 10-37
10.7.7.7 Job System Reports 10-38
10.8 Creating Corrective Actions 10-38
10.8.1 Providing Credentials 10-39
10.8.2 Creating Corrective Actions for Metrics 10-39
10.8.3 Creating a Library Corrective Action 10-41
10.8.4 Specifying Access to Corrective Actions 10-41
10.8.4.1 Defining or Modifying Access 10-41
10.8.4.2 Access Level Rules 10-42
10.8.5 Setting Up Notifications for Corrective Actions 10-42
10.8.6 Providing Agent-side Response Actions 10-43
10.8.6.1 Specifying Commands and Scripts 10-44
10.8.6.2 Using Target Properties in Commands 10-44
10.8.6.3 Using Advanced Capabilities 10-45
10.8.7 Viewing the Details of a Corrective Action Execution 10-45
xii

11
Monitoring Access Points Configured for a Target
11.1 Introduction to Monitoring Access Points 11-1
11.2 Viewing a List of Access Points Configured for a Target 11-3
11.3 Deleting Access Points Configured for a Target 11-3
11.4 Viewing the Capability Metric Map for a Target 11-3
11.5 Viewing the Best Access Point Implementers (and their History) for Various
Operations Supported for a Target 11-5
11.6 Modifying or Reconfiguring the Monitoring Properties of the Access Points
Configured for a Target 11-5
11.7 EM CLI Verbs for Managing the Access Points Configured for a Target 11-6
12
Always-On Monitoring
12.1 Prerequisites 12-1
12.1.1 Installing the Always-On Monitoring Repository Database 12-2
12.1.1.1 Database Sizing 12-2
12.1.1.2 Database Character Set Definition 12-5
12.1.2 Creating the Always-On Monitoring Repository User 12-6
12.1.2.1 Granting Required Privileges to the Always-On Monitoring
Schema Owner 12-6
12.2 Best Practices 12-7
12.3 Installing Always-On Monitoring 12-7
12.3.1 Installing Always-On Monitoring from an Enterprise Manager Software
Distribution 12-8
12.3.2 Installing Always-On Monitoring from Self-Update 12-8
12.3.3 Installing Multiple Always-On Monitoring Instances 12-12
12.4 Configuring Always-On Monitoring 12-12
12.4.1 Saving the Em Key 12-12
12.4.2 Using the Always-On Monitoring Configuration Assistant (EMSCA) 12-13
12.4.3 Removing the Em Key 12-17
12.4.4 Configuring Email Servers in Enterprise Manager 12-17
12.4.5 Configuring Downtime Contacts in Enterprise Manager 12-17
12.4.6 Synchronizing Always-On Monitoring with Enterprise Manager for the
First Time 12-20
12.4.7 Configuring Enterprise Manager to Work with Always-On Monitoring 12-21
12.4.8 Enabling Notifications 12-21
12.4.9 Verifying the Always-On Monitoring Upload URL on Enterprise
Manager 12-22
12.5 Controlling the Service 12-23
12.5.1 Always-On Monitoring Commands 12-24
12.6 Updating Always-On Monitoring 12-26
12.7 Data Maintenance 12-27
xiii
12.8 Controlling Always-On Monitoring Configuration Settings 12-27
12.9 Getting Performance Information 12-28
12.10 Modifiable Always-On Monitoring Properties 12-28
12.11 Creating an SSO Wallet and JKS for CA Certificates 12-30
12.12 Diagnosing Problems 12-30
12.13 High Availability and Disaster Recovery 12-31
12.13.1 Running Multiple Always-On Monitoring Instances 12-31
12.13.1.1 Shared Configuration Storage for the Multiple Instances 12-32
12.13.1.2 Notification Queues for Tracking Incoming Alerts 12-32
12.13.1.3 Task Scheduler System 12-33
12.13.1.4 Configuring an SLB 12-33
12.13.2 Always-On Monitoring Disaster Recovery 12-33
12.13.3 Setting Up Multiple Always-On Monitoring Instances 12-34
12.14 Uninstalling Always-On Monitoring 12-35
12.15 Configuring the Always-On Monitoring Application for Secure
Communication Using the TLSv1.2 Protocol 12-36
Part II Discovery
13
Discovering and Adding Host and Non-Host Targets
13.1 Overview of Discovering and Adding Targets 13-1
13.1.1 Understanding Discovery Terminology 13-1
13.1.1.1 What are Targets and Managed Targets? 13-1
13.1.1.2 What is Discovery? 13-2
13.1.1.3 What is Promotion? 13-2
13.1.2 Options for Discovering Targets 13-3
13.1.3 Discovery and Monitoring in Enterprise Manager Lifecycle 13-4
13.1.4 Discovery and Monitoring Process 13-5
13.2 Discovering and Adding Host Targets 13-7
13.2.1 Configuring Autodiscovery of Host Targets 13-7
13.2.1.1 Prerequisites for Autodiscovering Host Targets 13-7
13.2.1.2 Setting Up Autodiscovery of Host Targets 13-8
13.2.2 Adding Host Targets Using the Manual Guided Discovery Process 13-11
13.3 Discovering and Adding Non-Host Targets 13-11
13.3.1 Configuring Autodiscovery of Non-Host Targets 13-12
13.3.2 Adding Non-Host Targets Using the Guided Discovery Process 13-14
13.3.3 Adding Non-Host Targets By Using the Declarative Process 13-15
13.4 Discovering and Promoting Oracle Homes 13-16
13.5 Retrieving Deleted Targets 13-20
13.5.1 Retrieving Deleted Target Types 13-20
xiv

13.5.2 Retrieving Deleted Host and Corresponding Management Agent
Targets 13-21
14
Discovering and Adding Database Targets
14.1 Enabling Autodiscovery of Database Targets 14-1
14.2 Discovering and Adding Container Database and Pluggable Database
Targets 14-2
14.2.1 Discovering CDB and PDB Targets Using Autodiscovery 14-2
14.2.2 Adding CDB and PDB Targets Using the Guided Discovery Process 14-5
14.2.3 Adding CDB and PDB Targets By Using the Declarative Process 14-8
14.3 Discovering and Adding Cluster Database Targets 14-9
14.3.1 Discovering Cluster Database Targets Using Autodiscovery 14-10
14.3.2 Adding Cluster Database Targets Using the Guided Discovery Process
14-11
14.3.3 Adding Cluster Database Targets By Using the Declarative Process 14-14
14.4 Discovering and Adding Single Instance Database Targets 14-16
14.4.1 Discovering Single Instance Database Targets Using Autodiscovery 14-16
14.4.2 Adding Single Instance Database Targets Using Guided Discovery
Process 14-19
14.4.3 Adding Single Instance Database Targets By Using the Declarative
Process 14-22
14.5 Discovering and Adding Cluster Targets 14-23
14.5.1 Discovering Cluster Targets Using Autodiscovery 14-24
14.5.2 Adding Cluster Targets Using the Guided Discovery Process 14-26
14.5.3 Adding Cluster Targets By Using the Declarative Process 14-28
14.6 Discovering and Adding Single Instance High Availability Service Targets 14-29
14.6.1 Discovering Single Instance High Availability Service Targets Using
Autodiscovery 14-29
14.6.2 Adding Single Instance High Availability Service Targets Using the
Guided Discovery Process 14-31
14.6.3 Adding Single Instance High Availability Service Targets By Using the
Declarative Process 14-32
14.7 Discovering and Adding Cluster Automatic Storage Management Targets 14-33
14.7.1 Discovering Cluster ASM Targets Using Autodiscovery 14-34
14.7.2 Adding Cluster ASM Targets Using the Guided Discovery Process 14-35
14.7.3 Adding Cluster ASM Targets By Using the Declarative Process 14-38
14.8 Configuring a Target Database for Secure Monitoring 14-38
14.8.1 About Secure Monitoring of Databases 14-39
14.8.2 Configuring a Target Database for Secure Monitoring 14-39
14.9 Adding Connection Manager Targets By Using the Declarative Process 14-40
xv

15
Discovering and Adding Middleware Targets
15.1 Discovering and Adding WebLogic Domains 15-1
15.1.1 Discovering WebLogic Domains Using Autodiscovery 15-1
15.1.2 Adding WebLogic Domains Using the Guided Discovery Process 15-5
15.1.3 Adding Multiple WebLogic Domains Using EM CLI 15-11
15.2 Discovering New or Modified Domain Members 15-11
15.2.1 Enabling Automatic Discovery of New Domain Members 15-11
15.2.2 Manually Checking for New or Modified Domain Members 15-12
15.3 Adding Standalone Oracle HTTP Servers 15-13
15.3.1 Meeting the Prerequisites 15-13
15.3.2 Adding Standalone Oracle HTTP Servers Using the Guided Discovery
Process 15-14
15.4 Adding Exalytics Targets 15-15
15.4.1 Meeting the Prerequisites 15-16
15.4.2 Adding Exalytics System Targets Using the Guided Discovery Process 15-16
15.5 Removing Middleware Targets 15-18
16
Discovering, Promoting, and Adding System Infrastructure Targets
16.1 Discovering and Promoting Oracle MiniCluster 16-1
16.1.1 Prerequisites 16-1
16.1.2 Credentials Required for Oracle MiniCluster Discovery 16-1
16.1.3 Oracle MiniCluster Discovery 16-2
16.8 Configuring Snmp traps for Supercluster and Minicluster monitored hosts 16-4
16.2 About Discovering, Promoting, and Adding System Infrastructure Targets 16-5
16.3 Discovering and Promoting Operating Systems 16-6
16.4 Discovering and Promoting Oracle Solaris Zones 16-6
16.5 Discovering and Promoting Oracle VM Server for SPARC 16-7
16.6 Discovering and Promoting Servers 16-8
16.6.1 Discover an ILOM Server Using the User Interface 16-9
16.6.2 Discover an ILOM Server Using the Command Line Interface 16-10
16.6.3 Change the Display Name of a Discovered ILOM Server 16-12
16.7 Discovering and Promoting Oracle SuperCluster 16-12
16.7.1 Prerequisites 16-12
16.7.2 Obtain the Discovery Precheck Script 16-12
16.7.3 Run the Discovery Precheck Script 16-13
16.7.4 Credentials Required for Oracle SuperCluster Discovery 16-13
16.7.5 Manual Prerequisite Verification 16-14
16.7.6 Oracle SuperCluster Discovery 16-14
16.9 Discovering and Promoting PDUs 16-18
16.9.1 Verify PDU v1 NMS Table and Trap Hosts Setup Table 16-18
xvi

16.9.2 Verify PDU v2 NMS Table, SNMPv3 Access Table, and Trap Hosts
Setup Table 16-19
16.9.3 PDU Discovery in the Enterprise Manager 16-19
16.9.4 Discovering a PDU Using Command Line Interface 16-21
16.10 Discovering and Promoting Oracle ZFS Storage 16-22
16.10.1 Discovering an Oracle ZFS Storage Appliance using AKCLI 16-24
16.10.1.1 Target Members of an Oracle ZFS Storage Appliance 16-24
16.10.1.2 Target Members of an Oracle ZFS Storage Appliance Cluster 16-25
16.10.2 Discovering an Oracle ZFS Storage Appliance using WebSvc 16-25
16.11 Discovering Fabrics 16-26
16.11.1 Discover an InfiniBand Network Switch 16-26
16.11.2 Discover an Ethernet Network Switch 16-29
16.11.3 Use the Command Line To Discover a Switch 16-32
16.12 Related Resources for Discovering and Promoting System Infrastructure
Targets 16-33
Part III Hybrid Cloud Management
17
Enabling Hybrid Cloud Management
17.1 What is Oracle Hybrid Cloud? 17-1
17.2 Setting Up Hybrid Cloud Management in Three Steps 17-3
17.3 Hybrid Cloud Management Prerequisites and Basic Setup 17-4
17.3.1 Prerequisites for Configuring a Management Agent as a Gateway 17-5
17.3.2 Configuring a Management Agent as a Gateway 17-6
17.3.3 Prerequisites for Installing Agents on Oracle Cloud VMs 17-9
17.3.4 Installing an Agent on an Oracle Cloud VM 17-10
17.3.4.1 Installing an Agent on an Oracle Cloud VM Using EM CLI 17-10
17.3.4.2 Installing an Agent on an Oracle Cloud VM Using the Add Host
Targets Wizard 17-12
17.4 Advanced Topics 17-15
17.4.1 Discovering and Monitoring Oracle Cloud Targets 17-15
17.4.2 Patching Cloud-based Agents and Gateways 17-16
17.4.3 Configuring an External Proxy to Enable Gateways to Communicate
with the Oracle Cloud 17-17
17.4.4 Performing Additional Hybrid Cloud Management Tasks 17-17
17.4.4.1 Configuring Cloud-based Agents for High Availability 17-18
17.4.4.2 Disabling Gateways 17-19
17.4.4.3 Disassociating Gateways from a Cloud-based Agent 17-20
17.4.4.4 Decommissioning Cloud-based Agents 17-21
17.4.5 Troubleshooting Cloud-based Management Agents 17-21
17.4.6 Frequently Asked Questions About Hybrid Cloud Management 17-23
xvii

17.4.6.1 Can I deploy more than one Agent on the same Oracle Cloud
virtual host? 17-23
17.4.6.2 Can I deinstall or deconfigure a Gateway without deinstalling an
associated Cloud-based Agent? 17-24
17.4.6.3 How do I relocate the Gateway to another host without
deinstalling anything else? 17-24
17.4.6.4 How can I redistribute my connections once I have added the
Gateways? Does it need reconfiguration? 17-25
17.4.6.5 After an Oracle PaaS instance is decommissioned, what
happens to the Cloud-based Agent and the related targets? 17-25
17.4.6.6 If I change my SSH keys on Oracle Cloud, what should I do in
Enterprise Manager? 17-25
17.4.6.7 What are the guidelines for sizing the number of Gateways?
What is the indication that my gateway Agent is overloaded? 17-26
17.4.6.8 Once the first Gateway is up after being patched, will it monitor
the Cloud-based Agents? 17-26
17.4.6.9 What are the user restrictions on Cloud-based Agents and the
targets on Oracle Cloud? 17-26
17.4.6.10 On what operating system can I deploy a Cloud-based Agent
and a Gateway? 17-26
17.5 List of Unsupported Features 17-27
18
Deploying JVMD for Hybrid Cloud
18.1 Overview of Deploying JVMD for Hybrid Cloud 18-1
18.2 Prerequisites for Deploying JVMD Agents on Oracle Cloud Virtual Hosts 18-1
18.3 Deploying JVMD Agents on Oracle Cloud Virtual Hosts 18-2
18.4 Changing the Default JVMD End Point for Hybrid Cloud Gateway Agents 18-3
18.5 After Deploying JVMD Agents on Oracle Cloud Virtual Hosts 18-3
Part IV Administering Cloud Control
19
Maintaining Enterprise Manager
19.1 Overview: Managing the Manager 19-1
19.2 Health Overview 19-2
19.2.1 Viewing Enterprise Manager Topology and Charts 19-2
19.2.2 Determining Enterprise Manager Page Performance 19-3
19.3 Repository 19-9
19.3.1 Repository Tab 19-9
19.3.2 Metrics Tab 19-14
19.3.3 Schema Tab 19-17
19.4 Controlling and Configuring Management Agents 19-17
xviii

19.4.1 Manage Cloud Control Agents Page 19-17
19.4.2 Agent Home Page 19-18
19.4.3 Controlling a Single Agent 19-19
19.4.4 Configuring Single Management Agents 19-19
19.4.5 Controlling Multiple Management Agents 19-20
19.4.6 Configuring Multiple Agents 19-21
19.4.7 Upgrading Multiple Management Agents 19-22
19.5 Management Servers 19-22
20
Maintaining and Troubleshooting the Management Repository
20.1 Management Repository Deployment Guidelines 20-1
20.2 Management Repository Data Retention Policies 20-2
20.2.1 Management Repository Default Aggregation and Purging Policies 20-2
20.2.2 Management Repository Default Aggregation and Purging Policies for
Other Management Data 20-5
20.2.3 Modifying the Default Aggregation and Purging Policies 20-5
20.2.4 How to Modify the Retention Period of Job History 20-6
20.2.5 DBMS_SCHEDULER Troubleshooting 20-7
20.3 Dropping and Recreating the Management Repository 20-9
20.3.1 Dropping the Management Repository 20-9
20.3.2 Recreating the Management Repository 20-10
20.3.2.1 Using a Connect Descriptor to Identify the Management
Repository Database 20-11
20.4 Troubleshooting Management Repository Creation Errors 20-12
20.4.1 Package Body Does Not Exist Error While Creating the Management
Repository 20-12
20.4.2 Server Connection Hung Error While Creating the Management
Repository 20-12
20.4.3 General Troubleshooting Techniques for Creating the Management
Repository 20-12
20.5 Cross Platform Enterprise Manager Repository Migration 20-14
20.5.1 Common Prerequisites 20-14
20.5.2 Methodologies 20-15
20.5.2.1 Using Cross Platform Transportable Database 20-15
20.5.2.2 Migration Using Physical Standby 20-19
20.5.3 Post Migration Verification 20-21
21
Updating Cloud Control
21.1 Using Self Update 21-1
21.1.1 What Can Be Updated? 21-1
21.2 Setting Up Self Update 21-2
xix

21.2.1 Setting Up Enterprise Manager Self Update Mode 21-2
21.2.2 Assigning Self Update Privileges to Users 21-3
21.2.3 Setting Up the Software Library 21-3
21.2.4 Setting My Oracle Support Preferred Credentials 21-3
21.2.5 Registering the Proxy Details for My Oracle Support 21-3
21.2.6 Setting Up the EM CLI Utility (Optional) 21-5
21.3 Applying an Update 21-5
21.3.1 Applying an Update in Online Mode 21-5
21.3.2 Applying an Update in Offline Mode 21-6
21.4 Accessing Informational Updates 21-7
21.5 Acquiring or Updating Management Agent Software 21-8
22
Configuring a Software Library
22.1 Overview of Software Library 22-1
22.2 Users, Roles, and Privileges 22-3
22.3 What's New in Software Library 22-5
22.4 Performing Software Library Tasks Using EM CLI Verbs or in Graphical
Mode 22-5
22.5 Software Library Storage 22-8
22.5.1 Upload File Locations 22-9
22.5.2 Referenced File Location 22-11
22.5.3 Cache Nodes 22-12
22.6 Prerequisites for Configuring Software Library 22-12
22.7 Configuring Software Library Storage Location 22-12
22.7.1 Configuring an OMS Shared File system Location 22-13
22.7.2 Configuring an OMS Agent File system Location 22-14
22.7.3 Configuring a Referenced File Location 22-16
22.8 Configuring Software Library on a Multi-OMS System 22-18
22.9 Software Library Cache Nodes 22-18
22.9.1 Configuring the Cache Nodes 22-19
22.9.1.1 Adding Cache Nodes 22-19
22.9.1.2 Editing the Cache Nodes 22-20
22.9.1.3 Deleting the Cache Nodes 22-21
22.9.1.4 Activating or Deactivating the Cache Nodes 22-21
22.9.1.5 Clearing the Cache Nodes 22-21
22.9.1.6 Synchronizing the Cache Nodes 22-21
22.9.2 Exporting and Importing Files for Cache Nodes 22-22
22.9.2.1 Export 22-22
22.9.2.2 Import 22-22
22.10 Software Library File Transfers 22-22
22.11 Using Software Library Entities 22-23
xx

22.12 Tasks Performed Using the Software Library Home Page 22-24
22.12.1 Organizing Entities 22-24
22.12.2 Creating Entities 22-25
22.12.2.1 Creating Generic Components 22-25
22.12.2.2 Creating Directives 22-27
22.12.3 Customizing Entities 22-30
22.12.4 Managing Entities 22-30
22.12.4.1 Accessing Software Library Home Page 22-31
22.12.4.2 Accessing Software Library Administration Page 22-31
22.12.4.3 Granting or Revoking Privileges 22-31
22.12.4.4 Moving Entities 22-32
22.12.4.5 Changing Entity Maturity 22-32
22.12.4.6 Adding Notes to Entities 22-32
22.12.4.7 Adding Attachments to Entities 22-33
22.12.4.8 Viewing, Editing, and Deleting Entities 22-33
22.12.4.9 Purging Deleted Entities 22-34
22.12.4.10 Searching Entities 22-34
22.12.4.11 Exporting Entities 22-36
22.12.4.12 Importing Entities 22-37
22.12.5 Staging Entities 22-37
22.13 Maintaining Software Library 22-39
22.13.1 Periodic Maintenance Tasks 22-39
22.13.2 Re-Importing Oracle Owned Entity Files 22-40
22.13.3 Removing (and Migrating) Software Library Storage Location 22-40
22.13.4 Removing a Referenced Storage Location 22-42
22.13.5 Deactivating and Activating a Storage Location 22-43
22.13.6 Scheduling Purge Job 22-43
22.13.7 Backing Up Software Library 22-44
23
Managing Plug-Ins
23.1 Getting Started 23-1
23.2 Introduction to Plug-ins 23-2
23.2.1 Enterprise Manager Extensibility Paradigm 23-2
23.2.2 Plug-Ins 23-3
23.2.3 Plug-Ins Deployed by Default 23-3
23.2.4 Plug-In Releases 23-4
23.2.5 Obsolete and Deprecated Plug-ins 23-4
23.2.6 Roles Required to Manage Plug-Ins 23-4
23.3 Workflow of Plug-In Deployment 23-4
23.4 Introduction to Plug-In Manager 23-9
xxi

23.4.1 Accessing Plug-In Manager 23-9
23.4.2 Performing Operations Using Plug-In Manager 23-9
23.5 Knowing Your Plug-Ins 23-10
23.5.1 Customizing Your View 23-10
23.5.1.1 Customizing Displayed Plug-Ins 23-10
23.5.1.2 Customizing Displayed Columns 23-11
23.5.2 Checking the Availability of Plug-Ins 23-11
23.5.3 Viewing Information about Plug-Ins 23-12
23.5.3.1 Differentiating Plug-In Releases from Enterprise Manager
Platform Releases 23-12
23.5.3.2 Identifying Plug-In ID 23-13
23.5.3.3 Viewing Targets and Operating Systems Certified for Deployed
Plug-Ins 23-13
23.5.3.4 Viewing Plug-In Dependencies 23-14
23.5.3.5 Verifying Deployed Plug-Ins 23-14
23.6 Downloading, Deploying, and Upgrading Plug-Ins 23-15
23.6.1 Downloading Plug-Ins 23-15
23.6.1.1 Downloading Plug-Ins in Online Mode 23-16
23.6.1.2 Downloading Plug-Ins in Offline Mode 23-16
23.6.1.3 Importing Catalog Archives 23-17
23.6.1.4 Importing Plug-In Archives 23-17
23.6.2 Deploying Plug-Ins to Oracle Management Service (Reduce OMS
Restart time and Downtime) 23-19
23.6.2.1 Tracking the Deployment Status of Plug-Ins on Oracle
Management Service 23-21
23.6.3 Upgrading Plug-Ins Deployed to Oracle Management Service 23-22
23.6.4 Deploying Plug-Ins on Oracle Management Agent 23-22
23.6.4.1 Tracking the Deployment Status of Plug-Ins on Oracle
Management Agent 23-23
23.6.5 Upgrading Plug-Ins Deployed to Oracle Management Agent 23-23
23.7 Undeploying Plug-Ins 23-23
23.7.1 Undeploying Plug-Ins from Oracle Management Service 23-24
23.7.2 Undeploying Plug-Ins from Oracle Management Agent 23-24
23.8 Advanced Operations with Plug-Ins 23-25
23.8.1 Re-deploying Plug-Ins on Oracle Management Agent 23-26
23.8.2 Deploying Plug-In Patches While Deploying or Upgrading
Management Agent (Create Custom Plug-In Update) 23-26
23.8.2.1 Creating Custom Plug-In Update Using EMCLI 23-27
23.8.2.2 Creating Custom Plug-In Update Using EDK 23-29
23.9 Troubleshooting 23-29
23.9.1 Understanding Plug-In Homes 23-30
23.9.2 Troubleshooting OMS Plug-In Deployment and Upgrade Issues 23-31
23.9.2.1 Troubleshooting OMS Plug-In Deployment Issues 23-31
xxii

23.9.2.2 Rollback and Resume OMS Plug-In Upgrade 23-32
23.9.3 Troubleshooting Management Agent Plug-In Deployment, Upgrade,
and Blocked Issues 23-32
23.9.3.1 Troubleshooting Management Agent Plug-In Deployment Issues 23-32
23.9.3.2 Troubleshooting Management Agent Plug-In Upgrade Issues 23-32
23.9.3.3 Resolving a Plug-in Mismatch on a Management Agent 23-33
23.9.3.4 Running a Plug-in Mismatch Job to Resolve All Plug-in
Mismatches 23-33
24
Patching Oracle Management Service and the Repository
24.1 OMSPatcher Automation 24-1
24.1.1 Supported OMS Configurations and OMSPatcher Patchability 24-1
24.1.2 NextGen OUI Inventory Configurations 24-3
24.1.3 Supported Patch Format 24-3
24.1.4 Supported Patching Methodologies 24-4
24.2 Required OMSPatcher Parameters 24-4
24.2.1 Creating a Property File 24-4
24.3 Prerequisites for Running OMSPatcher 24-6
24.4 Using OMSPatcher 24-9
24.4.1 My Oracle Support: Searching for Patches 24-11
24.4.2 Running omspatcher apply 24-11
24.4.3 Running omspatcher rollback 24-12
24.4.4 Running omspatcher lspatches 24-12
24.4.5 Running omspatcher version 24-13
24.4.6 Patching a Standby OMS System 24-13
24.5 OMSPatcher Command Syntax 24-14
24.5.1 Apply 24-15
24.5.2 Rollback 24-17
24.5.3 lspatches 24-19
24.5.4 version 24-20
24.5.5 checkApplicable 24-20
24.5.6 saveConfigurationSnapshot 24-21
24.6 Troubleshooting 24-22
24.6.1 OMSPatcher Troubleshooting Architecture 24-23
24.6.2 OMSPatcher Log Management Architecture 24-23
24.6.3 Logs for Oracle Support 24-26
24.6.4 OMSPatcher: Cases Analysis, Error Codes, and Remedies/
Suggestions 24-26
24.6.5 OMSPatcher: External Utilities Error Codes 24-28
24.6.6 Special Error Cases for OMSPatcher OMS Automation 24-28
24.6.7 Multi-OMS Execution for UNIX based Systems 24-31
xxiii

24.7 Features in OMSPatcher 24-34
24.7.1 Resume capability in Single-OMS Configuration 24-35
24.7.2 Resume Capability in Multi-OMS Configuration 24-38
25
Patching Oracle Management Agents
25.1 Overview 25-1
25.2 Automated Management Agent Patching Using Patch Plans
(Recommended) 25-1
25.2.1 Advantages of Automated Management Agent Patching 25-2
25.2.2 Accessing the Patches and Updates Page 25-2
25.2.3 Viewing Patch Recommendations 25-3
25.2.4 Searching for Patches 25-3
25.2.4.1 Searching for Patches On My Oracle Support 25-4
25.2.4.2 Searching for Patches in Software Library 25-4
25.2.5 Applying Management Agent Patches 25-5
25.2.6 Verifying the Applied Management Agent Patches 25-10
25.2.7 Management Agent Patching Errors 25-10
25.2.7.1 Oracle Home Credentials Are Not Set 25-10
25.2.7.2 Management Agent Target Is Down 25-11
25.2.7.3 Patch Conflicts Are Detected 25-11
25.2.7.4 User Is Not a Super User 25-12
25.2.7.5 Patch Is Not Staged or Found 25-13
25.3 Manual Management Agent Patching 25-13
26
Personalizing Cloud Control
26.1 Personalizing a Cloud Control Page 26-1
26.2 Customizing a Region 26-2
26.3 Setting Your Homepage 26-3
26.4 Setting Pop-Up Message Preferences 26-4
27
Administering Enterprise Manager Using EMCTL Commands
27.1 Executing EMCTL Commands 27-2
27.2 Guidelines for Starting Multiple Enterprise Manager Components on a Single
Host 27-2
27.3 Starting and Stopping Oracle Enterprise Manager 13c Cloud Control 27-2
27.3.1 Starting Cloud Control and All Its Components 27-3
27.3.2 Stopping Cloud Control and All Its Components 27-3
27.4 Services That Are Started with Oracle Management Service Startup 27-4
xxiv

27.5 Starting and Stopping the Oracle Management Service and Management
Agent on Windows 27-5
27.6 Reevaluating Metric Collections Using EMCTL Commands 27-5
27.7 Specifying New Target Monitoring Credentials in Enterprise Manager 27-7
27.8 EMCTL Commands for OMS 27-8
27.9 EMCTL Commands for Management Agent 27-13
27.10 EMCTL Security Commands 27-18
27.10.1 EMCTL Secure Commands 27-18
27.10.2 Security diagnostic commands 27-21
27.10.3 EMCTL EM Key Commands 27-22
27.10.4 Configuring Authentication 27-23
27.10.4.1 Configuring OSSO Authentication 27-24
27.10.4.2 Configuring OAM Authentication 27-25
27.10.4.3 Configuring LDAP (OID and AD) Authentication 27-25
27.10.4.4 Configuring Repository Authentication (Default Authentication) 27-25
27.11 EMCTL HAConfig Commands 27-26
27.12 EMCTL Resync Commands 27-27
27.13 EMCTL Connector Command 27-28
27.14 EMCTL Patch Repository Commands 27-28
27.15 EMCTL Commands for Windows NT 27-29
27.16 EMCTL Partool Commands 27-29
27.17 EMCTL Plug-in Commands 27-30
27.18 EMCTL Command to Sync with OPSS Policy Store 27-31
27.19 Troubleshooting Oracle Management Service Startup Errors 27-31
27.20 Troubleshooting Management Agent Startup Errors 27-32
27.20.1 Management Agent starts up but is not ready 27-32
27.20.2 Management Agent fails to start due to time zone mismatch between
agent and OMS 27-32
27.20.3 Management Agent fails to start due to possible port conflict 27-33
27.20.4 Management Agent fails to start due to failure of securing or
unsecuring 27-33
27.21 Using emctl.log File to Troubleshoot 27-33
28
Locating and Configuring Enterprise Manager Log Files
28.1 Managing Log Files 28-1
28.1.1 Viewing Log Files and Their Messages 28-3
28.1.1.1 Restricting Access to the View Log Messages Menu Item and
Functionality 28-4
28.1.1.2 Registering Additional Log Files 28-5
28.1.2 Searching Log Files 28-6
28.1.2.1 Searching Log Files: Basic Searches 28-6
xxv

28.1.2.2 Searching Log Files: Advanced Searches 28-7
28.1.3 Downloading Log Files 28-8
28.2 Managing Saved Searches 28-9
28.2.1 Saving Searches 28-10
28.2.2 Retrieving Saved Searches 28-10
28.2.3 Managing Saved Searches 28-10
28.3 Locating Management Agent Log and Trace Files 28-11
28.3.1 About the Management Agent Log and Trace Files 28-11
28.3.1.1 Structure of Agent Log Files 28-12
28.3.2 Locating the Management Agent Log and Trace Files 28-12
28.3.3 Setting Oracle Management Agent Log Levels 28-13
28.3.3.1 Modifying the Default Logging Level 28-14
28.3.3.2 Setting gcagent.log 28-14
28.3.3.3 Setting gcagent_error.log 28-15
28.3.3.4 Setting the Log Level for Individual Classes and Packages 28-15
28.3.3.5 Setting gcagent_mdu.log 28-15
28.3.3.6 Setting the TRACE Level 28-17
28.4 Locating and Configuring Oracle Management Service Log and Trace Files 28-17
28.4.1 About the Oracle Management Service Log and Trace Files 28-18
28.4.2 Locating Oracle Management Service Log and Trace Files 28-18
28.4.3 Controlling the Size and Number of Oracle Management Service Log
and Trace Files 28-19
28.4.4 Controlling the Contents of the Oracle Management Service Trace File 28-20
28.4.5 Controlling the Oracle WebLogic Server and Oracle HTTP Server Log
Files 28-21
28.5 Monitoring Log Files 28-23
28.5.1 About Log Viewer 28-23
28.5.2 Overview of WebLogic Server and Application Deployment Log File
Monitoring 28-24
28.5.3 Enabling Log File Monitoring 28-25
28.5.4 Configuring Log File Monitoring 28-26
28.5.5 Viewing Alerts from Log File Monitoring 28-28
28.6 Configuring Log Archive Locations 28-28
29
Configuring and Using Services
29.1 Introduction to Services 29-1
29.1.1 Defining Services in Enterprise Manager 29-1
29.2 Creating a Service 29-2
29.2.1 Creating a Generic Service - Test Based 29-3
29.2.2 Creating a Generic Service - System Based 29-4
29.2.3 Creating an Aggregate Service 29-4
xxvi

29.3 Monitoring a Service 29-5
29.3.1 Viewing the Generic / Aggregate Service Home Page 29-5
29.3.2 Viewing the Performance / Incidents Page 29-6
29.3.3 Viewing the SLA Dashboard 29-6
29.3.4 Viewing the Test Summary 29-6
29.3.5 Viewing the Service Topology 29-7
29.3.6 Sub Services 29-7
29.4 Configuring a Service 29-7
29.4.1 Availability Definition (Generic and Aggregate Service) 29-8
29.4.2 Root Cause Analysis Configuration 29-9
29.4.2.1 Getting the Most From Root Cause Analysis 29-10
29.4.3 System Association 29-10
29.4.4 Monitoring Settings 29-11
29.4.5 Service Tests and Beacons 29-12
29.4.5.1 Defining Additional Service Tests 29-12
29.4.5.2 Deploying and Using Beacons 29-13
29.4.5.3 Configuring the Beacons 29-15
29.4.5.4 Creating an ATS Service Test Using OATS Load Script 29-16
29.4.6 Performance Metrics 29-22
29.4.6.1 Rule Based Target List 29-24
29.4.6.2 Static Based Target List 29-25
29.4.7 Usage Metrics 29-25
29.5 Using the Transaction Recorder 29-26
29.6 Setting Up and Using Service Level Agreements 29-26
29.6.1 Actionable Item Rules for SLAs 29-29
29.6.2 Creating a Service Level Objective 29-29
29.6.3 Lifecycle of an SLA 29-30
29.6.4 Viewing the Status of SLAs for a Service 29-31
29.6.5 Defining Custom SLA Business Calendars 29-32
29.7 Using the Services Dashboard 29-33
29.7.1 Viewing the All Dashboards Page 29-33
29.7.2 Viewing the Dashboard Details Page 29-33
29.7.3 Customizing and Personalizing the Dashboard 29-34
29.7.4 Viewing the Dashboard Service Details Page 29-35
29.8 Using the Test Repository 29-36
29.8.1 Viewing the Test Repository 29-36
29.8.2 Editing an ATS Script 29-37
29.9 Configuring Service Levels 29-37
29.9.1 Defining Service Level Rules 29-38
29.9.2 Viewing Service Level Details 29-39
29.10 Configuring a Service Using the Command Line Interface 29-39
xxvii

29.11 Troubleshooting Service Tests 29-43
29.11.1 Verifying and Troubleshooting Forms Transactions 29-43
29.11.1.1 Troubleshooting Forms Transaction Playback 29-43
29.11.1.2 Troubleshooting Forms Transaction Recording 29-45
29.11.2 Verifying and Troubleshooting Web Transactions 29-45
30
Introducing Enterprise Manager Support for SNMP
30.1 Benefits of SNMP Support 30-1
30.2 About the SNMP Management Station 30-2
30.3 How Enterprise Manager Supports SNMP 30-2
30.4 Sending SNMP Trap Notifications 30-4
30.4.1 About the Management Information Base (MIB) 30-5
30.5 Monitoring External Devices Using SNMP 30-5
30.5.1 About SNMP Receivelets 30-6
30.5.2 About SNMP Fetchlets 30-6
30.6 About Metric Extensions 30-6
Part V Systems Infrastructure
31
Working with Systems Infrastructure Targets
31.1 Overview of Enterprise Manager Systems Infrastructure 31-1
31.1.1 About Monitoring for the Systems Infrastructure Targets 31-2
31.1.2 About Dynamic Views for the Systems Infrastructure Targets 31-3
31.2 Overview of the Systems Infrastructure User Interface 31-3
31.2.1 About the Target Home Page 31-3
31.2.2 About the Virtualization Home Page 31-5
31.2.3 About the Oracle Engineered Systems Home Page 31-5
31.3 Creating Roles for Systems Infrastructure Administration 31-5
31.4 Related Resources for Systems Infrastructure Targets 31-6
32
Managing Networks
32.1 Get Started with Managing Networks 32-1
32.2 Location of Network Information in the User Interface 32-2
32.3 Actions for Network Management 32-2
32.4 View Topology 32-3
32.5 Fabric 32-5
32.5.1 About Fabrics 32-5
32.5.2 View Information About Fabrics 32-6
xxviii

32.5.3 About Fabric Information 32-8
32.5.4 About Performance of Fabrics 32-9
32.5.5 Delete a Fabric 32-10
32.6 Datalinks 32-10
32.6.1 About Datalinks 32-10
32.6.2 View Information About Datalinks 32-10
32.7 Networks 32-11
32.7.1 About Networks 32-11
32.7.2 View Information About Networks 32-12
32.7.3 Delete Networks 32-13
32.7.4 View Network Details of a Host Target 32-13
32.8 Related Resources for Network Management 32-13
33
Managing Storage
33.1 Get Started with Managing Storage 33-1
33.2 Location of Storage Information in the User Interface 33-2
33.3 Actions for Storage Management 33-2
33.4 About Storage Appliance Dashboard 33-2
33.4.1 Viewing the Storage Appliance Dashboard 33-3
33.4.2 Viewing Storage Appliance Cluster Dashboard 33-4
33.5 About Photorealistic Image 33-4
33.5.1 Viewing the Photorealistic Image 33-5
33.6 About Summary 33-5
33.6.1 Viewing the Summary 33-7
33.7 About Projects 33-7
33.7.1 Viewing the Projects 33-8
33.8 About Charts 33-9
33.8.1 Viewing Resources Chart 33-9
33.8.2 Viewing Devices Chart 33-10
33.8.3 Viewing SAN Usage Chart 33-11
33.8.4 Viewing NAS Usage Chart 33-11
33.8.5 Viewing ZFS Storage Pools Chart 33-12
33.9 About Host Storage Information 33-13
33.9.1 Disks of a Host 33-14
33.9.1.1 Viewing Disks of a Host 33-14
33.9.2 Filesystems of a Host 33-15
33.9.2.1 Viewing Filesystems of a Host 33-15
33.9.3 SAN Configuration of a Host 33-16
33.9.3.1 Viewing SAN Configuration of a Host 33-16
33.9.4 Linux Volume Groups of a Host 33-16
xxix

33.9.4.1 Viewing Linux Volume Groups of a Host 33-17
33.9.5 ZFS Storage Pools of a Host 33-17
33.9.5.1 Viewing ZFS Storage Pools of a Host 33-18
33.10 About Storage Configuration Topology 33-18
33.10.1 Viewing Storage Configuration Topology 33-18
33.11 About Storage Metrics 33-19
33.11.1 Viewing Storage Performance Metrics 33-19
33.11.2 Viewing Storage Configuration Metrics 33-20
33.11.3 Changing Metric Collection 33-20
33.12 About Storage Cluster Membership 33-21
33.12.1 Viewing Storage Cluster Membership 33-21
33.13 About Storage Resource Deletion 33-22
33.13.1 Removing a Storage Resource 33-22
33.13.2 Removing an Oracle ZFS Storage Appliance Cluster 33-23
33.14 Using Oracle ZFS Storage Appliance in Engineered Systems 33-23
33.15 Related Resources for Storage 33-24
34
Monitoring Servers
34.1 Get Started With Server Management 34-1
34.2 Location of Server Information in the UI 34-1
34.3 Actions for Server Management 34-2
34.4 About the Hardware Dashboard 34-2
34.4.1 About Basic Hardware Information 34-2
34.4.2 About Open Incidents 34-2
34.4.3 About Fan and Temperature Information 34-3
34.4.4 About Power Usage 34-3
34.4.5 About Core Information 34-3
34.4.6 About the Last Configuration Change and Incident 34-3
34.5 Viewing the Hardware Dashboard 34-3
34.6 About Server Metrics 34-4
34.7 Viewing Server Metrics 34-4
34.8 About the Photorealistic Image of the Hardware 34-4
34.9 Viewing the Photorealistic Image of the Hardware 34-4
34.10 About the Logical View 34-5
34.10.1 About CPU Information 34-5
34.10.2 About Memory Information 34-5
34.10.3 About Power Information 34-5
34.10.4 About Fan Information 34-6
34.10.5 About Storage Information 34-6
34.10.6 About Disk Controller Information 34-6
xxx

34.10.7 About Disk Expander Information 34-6
34.10.8 About Network Ports Information 34-6
34.10.9 About PCI Devices Information 34-7
34.10.10 About PDOMs Information 34-7
34.10.11 About DCUs Information 34-7
34.11 Viewing the Logical View 34-7
34.12 About Energy Consumption 34-7
34.13 Viewing the Energy Consumption 34-8
34.14 About Network Connectivity 34-8
34.14.1 About Network Interfaces 34-8
34.14.2 About Network Data Links 34-8
34.14.3 About Network Ports 34-8
34.15 Viewing the Network Connectivity 34-8
34.16 About the Service Processor Configuration 34-9
34.16.1 About Firmware Information 34-9
34.16.2 About the Host Policy Configuration 34-9
34.16.3 About the Power On Self Test Configuration 34-9
34.16.4 About the SP Alert Configuration 34-9
34.16.5 About the DNS & NTP Information 34-9
34.17 Viewing the Service Processor Configuration 34-9
34.18 Managing Metrics and Incident Notifications 34-10
34.18.1 Viewing Metric Collection Errors 34-10
34.18.2 Editing Metric and Collection Settings 34-10
34.18.3 Editing a Monitoring Configuration 34-10
34.18.4 Suspending Monitoring Notifications 34-11
34.18.5 Suspending Monitoring for Maintenance 34-11
34.18.6 Ending a Monitoring Brownout or Blackout 34-11
34.19 Administering Servers 34-12
34.19.1 Viewing Compliance 34-12
34.19.2 Identifying Changes in a Server Configuration 34-12
34.19.3 Editing Server Administrator Access 34-12
34.19.4 Adding a Server to a Group 34-13
34.19.5 Editing Server Properties 34-13
34.20 Related Resources for Server Management 34-13
35
Managing the PDU
35.1 Getting Started with PDU Management 35-1
35.2 Location of PDU Information in the User Interface 35-1
35.3 Actions for PDU 35-2
35.4 PDU Version Identification 35-2
xxxi

35.5 Viewing the PDU Information 35-4
35.5.1 Physical View of the PDU 35-4
35.5.2 PDU Load View 35-5
35.6 Changing PDU Monitoring Credentials 35-5
35.6.1 Change the HTTP Credentials 35-5
35.6.2 Changing the SNMP Credentials 35-7
35.7 PDU Test Connection and Metric Collection Error Troubleshooting 35-8
35.7.1 Test Connection Error Identification 35-8
35.7.2 Metric Collection Error Identification 35-9
35.7.3 Metric Recollection 35-9
35.8 PDU Error States 35-11
35.9 PDU Alerts and Configuration 35-17
35.9.1 Configuring Alerts in a PDU 35-17
35.9.2 Configuring Alerts in Enterprise Manager 35-18
35.9.3 Viewing Alert Incidents 35-19
35.9.4 SNMP Traps Forwarding 35-19
35.10 Related Resources for PDU Management 35-20
36
Managing the Rack
36.1 Getting Started with Rack Management 36-1
36.2 Location of Rack Information in the User Interface 36-1
36.3 Actions for Rack 36-2
36.4 Target Navigation for Rack Management 36-2
36.5 Creating a Rack 36-3
36.5.1 Creating a Rack Using Command Line Interface 36-4
36.5.1.1 Properties of Rack 36-5
36.6 Viewing the Rack Information 36-7
36.6.1 Physical View of the Rack 36-7
36.6.2 Firmware View 36-9
36.6.3 Load View 36-9
36.6.4 Temperature View 36-9
36.7 Placing Targets in the Rack 36-9
36.7.1 Place a Target in the Rack 36-9
36.7.2 Edit Target Placement in the Rack 36-10
36.7.3 Remove a Target from the Rack 36-10
36.7.4 Delete a Rack 36-10
36.8 Related Resources for Rack Management 36-11
xxxii

37
Managing Oracle MiniCluster
37.1 Getting Started with Oracle MiniCluster 37-1
37.2 Actions for Oracle MiniCluster 37-1
37.3 Target Navigation for Oracle MiniCluster 37-1
37.4 Viewing the Oracle MiniCluster System 37-2
37.4.1 Physical View of Oracle MiniCluster 37-3
37.4.2 Storage View of Oracle MiniCluster 37-4
37.4.3 Virtualization Management on the Oracle MiniCluster System 37-5
37.5 Related Resources for Oracle MiniCluster 37-5
38
Managing Oracle SuperCluster
38.1 Getting Started with Oracle SuperCluster 38-1
38.2 Actions for Oracle SuperCluster 38-1
38.3 Target Navigation for Oracle SuperCluster 38-1
38.4 Viewing the Oracle SuperCluster System 38-2
38.4.1 Physical View of Oracle SuperCluster 38-3
38.4.2 Virtualization Management on the Oracle SuperCluster System 38-4
38.5 Task Title 38-5
38.6 Related Resources for Oracle SuperCluster 38-5
39
Monitoring Oracle Operating Systems
39.1 Get Started with Monitoring Oracle Operating Systems 39-1
39.2 Location of Oracle Operating System Information in the UI 39-2
39.3 Features of Operating Systems 39-3
39.4 About the Dashboard for all Hosts 39-3
39.4.1 Viewing the Dashboard of all Hosts 39-3
39.5 How to Get Information About a Specific Host 39-4
39.5.1 Viewing the Host Target Home Page 39-4
39.5.2 About Dashlets for Hosts 39-4
39.5.3 About Tabs for Hosts 39-5
39.6 About the Host Menu 39-5
39.6.1 Viewing the Host Monitoring Menu 39-6
39.7 About Open Incidents 39-6
39.7.1 Viewing Open Incidents 39-6
39.7.2 Identifying Changes in an OS Configuration 39-7
39.8 Overview of Performance and Resource Metrics 39-7
39.8.1 About CPU Utilization 39-8
39.8.2 Viewing CPU Metrics 39-8
39.8.3 About CPU Threads Utilization 39-8
xxxiii

39.8.4 About Processor Group Utilization for Oracle Solaris 11 39-8
39.9 About Host Memory 39-9
39.9.1 Viewing Host Memory Utilization 39-9
39.9.2 Viewing Memory and Swap File Details 39-10
39.9.3 Viewing Memory Details for a Host 39-10
39.10 Viewing Host Storage 39-10
39.11 Viewing Network Connectivity 39-10
39.12 About Boot Environments 39-11
39.12.1 Viewing Oracle Solaris Boot Environments 39-11
39.13 Viewing Running Host Processes 39-11
39.14 Viewing Managed Host Services 39-12
39.15 Working with Host Metrics 39-12
39.15.1 Viewing CPU, Memory, and Disk Details for a Host 39-12
39.15.2 Viewing a Host's Program Resource Utilization 39-12
39.15.3 Viewing All Metrics 39-13
39.16 Managing Metrics and Incident Notifications for Hosts 39-13
39.16.1 Viewing Host Metric Collection Error 39-13
39.16.2 Editing Metric and Collection Settings for Hosts 39-13
39.17 About Host Compliance 39-14
39.17.1 Viewing Compliance Frameworks 39-14
39.17.2 Viewing Compliance Standards 39-14
39.17.3 Viewing Target Compliance 39-15
39.18 Related Resources for Operating Systems 39-15
40
Monitoring Oracle Solaris Zones
40.1 Get Started with Monitoring Oracle Solaris Zones 40-1
40.2 Location of Oracle Solaris Zone Information in the UI 40-2
40.3 Actions for Zones 40-3
40.4 Target Navigation for Zones 40-3
40.5 How to Get Information About a Zone 40-4
40.6 Working with Zone Platform Metrics 40-5
40.6.1 Viewing Zone Platform Metrics 40-6
40.7 Working with Zone-Specific Metrics 40-7
40.7.1 Viewing a Summary of Zone Metrics 40-7
40.7.2 Viewing Zone CPU and Memory Metrics 40-8
40.8 Viewing All Metrics 40-8
40.9 Working with Incidents for Zones 40-8
40.9.1 About Incidents for Zones 40-8
40.9.2 Viewing Open Incidents for Zones 40-9
40.10 Managing Metrics and Incident Notifications for Zones 40-10
xxxiv

40.10.1 Viewing Zone Metric Collection Errors 40-10
40.10.2 Editing Metric and Collection Settings for Zones 40-10
40.10.3 Editing a Zone's Monitoring Configuration 40-11
40.10.4 Suspending Monitoring Notifications for Zones 40-11
40.10.5 Suspending Zone Monitoring for Maintenance 40-11
40.10.6 Ending a Monitoring Brownout or Blackout for Zones 40-12
40.11 Administering Zones 40-12
40.11.1 Viewing Zone Compliance 40-12
40.11.2 Identifying Changes in a Zone Configuration 40-12
40.11.3 Editing Zone Administrator Access 40-13
40.11.4 Adding a Zone to a Group 40-13
40.11.5 Editing Zone Properties 40-13
40.12 Additional Resources for Oracle Solaris Zones 40-13
41
Monitoring Oracle VM Server for SPARC
41.1 Getting Started With Oracle VM Server for SPARC Virtualization 41-1
41.1.1 Terminology 41-1
41.1.2 Logical Domains 41-1
41.2 Location of Oracle VM Server for SPARC Information in the UI 41-2
41.3 Actions for Oracle VM Server for SPARC 41-2
41.4 Target Navigation for Oracle VM Server for SPARC 41-3
41.5 Supported Versions 41-4
41.6 Viewing all Oracle VM Server for SPARC Virtualization Platforms 41-4
41.7 About Virtualization Platform Information 41-5
41.7.1 Viewing the Virtualization Platform Basic Information 41-6
41.7.2 About the Virtualization Platform's Guest Summary 41-6
41.7.3 Viewing the Virtualization Platform Guest Summary 41-7
41.7.4 About the Virtualization Platform's Services 41-7
41.7.5 Viewing the Virtualization Platform Services 41-7
41.7.6 About the Virtualization Platform's vCPU and Core Allocation 41-8
41.7.7 Viewing the Virtualization Platform vCPU and Core Allocation 41-8
41.7.8 About Virtualization Platform Metrics 41-8
41.7.9 Viewing Platform Metrics 41-8
41.8 Zones within a Logical Domain 41-8
41.8.1 Viewing Zones in a Logical Domain 41-9
41.9 About Logical Domain Information 41-9
41.9.1 Viewing the Logical Domain's Basic Information 41-9
41.9.2 About the Virtual Server Summary Information 41-9
41.9.3 Viewing the Virtual Server Summary Information 41-10
41.9.4 About the Virtual Server Power and CPU Usage Charts 41-10
xxxv

41.9.5 Viewing the Virtual Server Power and CPU Usage Charts 41-10
41.10 Managing Metrics and Incident Notifications 41-10
41.10.1 Viewing Metric Collection Errors 41-11
41.10.2 Editing Metric and Collection Settings 41-11
41.10.3 Editing a Monitoring Configuration 41-11
41.10.4 Suspending Monitoring Notifications 41-12
41.10.5 Suspending Monitoring for Maintenance 41-12
41.10.6 Ending a Monitoring Brownout or Blackout 41-12
41.11 Administering Oracle VM Server for SPARC 41-13
41.11.1 Viewing Compliance 41-13
41.11.2 Identifying Changes in a Virtual Server Configuration 41-13
41.11.3 Editing Virtual Server Administrator Access 41-14
41.11.4 Adding a Virtual Server to a Group 41-14
41.11.5 Editing Virtual Server Properties 41-14
41.12 Related Resources for Oracle VM Server for SPARC 41-14
42
Provisioning Zones with Oracle Database on Database Domains
42.1 Prerequisites 42-1
42.2 Create a DB Zones Cluster 42-2
42.3 Scale Up Cluster 42-13
42.4 Scale Down Cluster 42-23
42.5 Delete Cluster 42-27
Part VI Generating Reports
43
Using Information Publisher
43.1 About Information Publisher 43-1
43.2 Out-of-Box Report Definitions 43-2
43.3 Custom Reports 43-2
43.3.1 Creating Custom Reports 43-2
43.3.2 Report Parameters 43-3
43.3.3 Report Elements 43-3
43.4 Scheduling Reports 43-3
43.4.1 Flexible Schedules 43-4
43.4.2 Storing and Purging Report Copies 43-4
43.4.3 E-mailing Reports 43-4
43.5 Sharing Reports 43-4
xxxvi

44
Creating Usage Tracking Reports
44.1 Usage Tracking Reports 44-1
44.2 Collecting Data for Database Usage Tracking 44-2
44.2.1 Setting Database Usage Tracking Credentials 44-2
44.2.2 Enabling/Disabling the Metric Collection using Monitoring Templates 44-3
44.2.3 Enabling/Disabling the Metric Collection using the Command Line
Interface 44-14
44.2.3.1 Setting up EM CLI login 44-15
44.2.3.2 Enabling/disabling the metric collection 44-15
44.2.3.3 Using EM CLI to list all the database targets 44-17
44.2.3.4 Using SQL to verify collection status 44-17
44.2.4 Creating a Database Usage Tracking Report 44-18
44.3 Generating Database Usage Tracking Report 44-20
44.3.1 Configuring Business Intelligence Publisher (BI Publisher) 44-20
44.3.2 Running Usage Tracking Reports: 44-27
44.4 Database Usage Tracking Summary Report 44-30
44.5 Generating the Fusion Middleware Usage Tracking Summary Report 44-36
44.6 Host Usage Tracking Reports 44-40
44.6.1 Generating the Host Usage Tracking Summary Report 44-41
44.6.2 Generating the Host Usage Tracking Details Report 44-43
Part VII Accessing Enterprise Manager via Mobile Devices
45
Remote Access To Enterprise Manager
45.1 Reviewing System Requirements 45-1
45.2 Performing Initial Setup 45-1
45.3 Connecting the First Time 45-2
45.4 Encountering the Login Screen 45-2
45.5 Managing Settings 45-3
45.6 Using Cloud Control Mobile in Incident Manager 45-4
45.7 Working in Cloud Control Mobile 45-6
45.7.1 Viewing Incidents and Problems 45-7
45.7.2 Changing Views 45-8
45.7.3 Performing Actions 45-8
45.8 Learning Tips and Tricks 45-9
45.9 Connecting to Enterprise Manager Desktop Version 45-10
xxxvii

Part VIII Appendixes
A Interpreting Variables of the Enterprise Manager MIB
A.1 oraEMNGEvent A-1
A.1.1 oraEMNGEventIndex A-3
A.1.2 oraEMNGEventNotifType A-4
A.1.3 oraEMNGEventMessage A-4
A.1.4 oraEMNGEventMessageURL A-5
A.1.5 oraEMNGEventSeverity A-5
A.1.6 oraEMNGEventSeverityCode A-5
A.1.7 oraEMNGEventRepeatCount A-6
A.1.8 oraEMNGEventActionMsg A-6
A.1.9 oraEMNGEventOccurrenceTime A-6
A.1.10 oraEMNGEventReportedTime A-7
A.1.11 oraEMNGEventCategories A-7
A.1.12 oraEMNGEventCategoryCodes A-7
A.1.13 oraEMNGEventType A-8
A.1.14 oraEMNGEventName A-8
A.1.15 oraEMNGAssocIncidentId A-9
A.1.16 oraEMNGAssocIncidentOwner A-9
A.1.17 oraEMNGAssocIncidentAcked A-9
A.1.18 oraEMNGAssocIncidentStatus A-10
A.1.19 oraEMNGAssocIncidentPriority A-10
A.1.20 oraEMNGAssocIncidentEscLevel A-10
A.1.21 oraEMNGEventTargetName A-11
A.1.22 oraEMNGEventTargetNameURL A-11
A.1.23 oraEMNGEventTargetType A-12
A.1.24 oraEMNGEventHostName A-12
A.1.25 oraEMNGEventTargetOwner A-12
A.1.26 oraEMNGEventTgtLifeCycleStatus A-13
A.1.27 oraEMNGEventTargetVersion A-13
A.1.28 oraEMNGEventUserDefinedTgtProp A-13
A.1.29 oraEMNGEventSourceObjName A-14
A.1.30 oraEMNGEventSourceObjNameURL A-14
A.1.31 oraEMNGEventSourceObjType A-14
A.1.32 oraEMNGEventSourceObjSubType A-15
A.1.33 oraEMNGEventSourceObjOwner A-15
A.1.34 oraEMNGEventCAJobName A-15
A.1.35 oraEMNGEventCAJobStatus A-16
A.1.36 oraEMNGEventCAJobOwner A-16
xxxviii

A.1.37 oraEMNGEventCAJobStepOutput A-16
A.1.38 oraEMNGEventCAJobType A-17
A.1.39 oraEMNGEventRuleSetName A-17
A.1.40 oraEMNGEventRuleName A-17
A.1.41 oraEMNGEventRuleOwner A-18
A.1.42 oraEMNGEventSequenceId A-18
A.1.43 oraEMNGEventRCADetails A-18
A.1.44 oraEMNGEventContextAttrs A-19
A.1.45 oraEMNGEventUserComments A-19
A.1.46 oraEMNGEventUpdates A-19
A.1.47 oraEMNGEventTotalOccurrenceCount A-20
A.1.48 oraEMNGEventCurrOccurrenceCount A-20
A.1.49 oraEMNGEventCurrFirstOccurDate A-21
A.1.50 oraEMNGEventCurrLastOccurDate A-21
A.1.51 oraEMNGRCAStatus A-21
A.1.52 oraEMNGEventReportedState A-22
A.1.53 oraEMNGEventTypeAttr(1-71) A-22
A.2 oraEM4AlertTable A-27
A.2.1 oraEM4AlertTargetName A-27
A.2.2 oraEM4AlertTargetType A-28
A.2.3 oraEM4AlertHostName A-28
A.2.4 oraEM4AlertMetricName A-29
A.2.5 oraEM4AlertKeyName A-29
A.2.6 oraEM4AlertKeyValue A-30
A.2.7 oraEM4AlertTimeStamp A-30
A.2.8 oraEM4AlertSeverity A-31
A.2.9 oraEM4AlertMessage A-31
A.2.10 oraEM4AlertRuleName A-32
A.2.11 oraEM4AlertRuleOwner A-32
A.2.12 oraEM4AlertMetricValue A-33
A.2.13 oraEM4AlertContext A-33
A.2.14 oraEM4AlertCycleGuid A-33
A.2.15 oraEM4AlertRepeatCount A-34
A.2.16 oraEM4AlertUDTargetProperties A-34
A.2.17 oraEM4AlertAck A-35
A.2.18 oraEM4AlertAckBy A-35
A.2.19 oraEM4AlertNotifType A-36
A.2.20 oraEM4AlertViolationGuid A-36
A.3 oraEM4JobAlertTable A-37
A.3.1 oraEM4JobAlertJobName A-38
A.3.2 oraEM4JobAlertJobOwner A-38
xxxix

A.3.3 oraEM4JobAlertJobType A-38
A.3.4 oraEM4JobAlertJobStatus A-39
A.3.5 oraEM4JobAlertTargets A-39
A.3.6 oraEM4JobAlertTimeStamp A-40
A.3.7 oraEM4JobAlertRuleName A-40
A.3.8 oraEM4JobAlertRuleOwner A-41
A.3.9 oraEM4JobAlertMetricName A-41
A.3.10 oraEM4JobAlertMetricValue A-42
A.3.11 oraEM4JobAlertContext A-42
A.3.12 oraEM4JobAlertKeyName A-43
A.3.13 oraEM4JobAlertKeyValue A-43
A.3.14 oraEM4JobAlertSeverity A-44
A.3.15 oraEM4JobAlertJobId A-44
A.3.16 oraEM4JobAlertJobExecId A-45
B Enterprise Manager MIB Definition
B.1 MIB Definition B-1
C SNMP Trap Mappings
C.1 Pre-12c Enterprise Manager Metric Alerts C-1
C.2 Pre-12C Target Availability Alerts C-2
C.3 Pre-12C Corrective Action Results for Metric Alerts C-3
C.4 Corrective Action Results for Target Availability C-4
C.5 Job Status Change C-5
D Overview of Target Availability States
D.1 Target Availability State Changes D-1
D.2 Target Status Change Updates D-3
E Timeout Values for Enterprise Manager Components
Index
xl

Preface
This guide describes how to use Oracle Enterprise Manager Cloud Control 12c core
functionality.
The preface covers the following:
•Audience
•Documentation Accessibility
•Related Documents
•Conventions
Audience
This document is intended for Enterprise Manager administrators and developers who
want to manage their Enterprise Manager infrastructure.
Documentation Accessibility
For information about Oracle's commitment to accessibility, visit the Oracle
Accessibility Program website at
http://www.oracle.com/pls/topic/lookup?
ctx=acc&id=docacc
.
Access to Oracle Support
Oracle customers that have purchased support have access to electronic support
through My Oracle Support. For information, visit
http://www.oracle.com/pls/topic/
lookup?ctx=acc&id=info
or visit
http://www.oracle.com/pls/topic/lookup?ctx=acc&id=trs
if you are hearing impaired.
Related Documents
For the latest releases of these and other Oracle documentation, check the Oracle
Technology Network at:
http://docs.oracle.com/en/enterprise-manager/
Conventions
The following text conventions are used in this document:
xli

Convention Meaning
boldface Boldface type indicates graphical user interface elements associated
with an action, or terms defined in text or the glossary.
italic Italic type indicates book titles, emphasis, or placeholder variables for
which you supply particular values.
monospace
Monospace type indicates commands within a paragraph, URLs, code
in examples, text that appears on the screen, or text that you enter.
Preface
xlii

Part I
Monitoring and Managing Targets
This section contains the following chapters:
•Enterprise Monitoring
•Discovering and Adding Host and Non-Host Targets
•Using Incident Management
•Using Notifications
•Using Blackouts and Notification Blackouts
•Managing Groups
•Using Administration Groups
•Using Monitoring Templates
•Using Metric Extensions
•Advanced Threshold Management
•Utilizing the Job System and Corrective Actions
•Monitoring Access Points Configured for a Target
•Always-On Monitoring

1
Enterprise Monitoring
This chapter covers the following topics:
•Monitoring Overview
•Monitoring: Basics
•Monitoring: Advanced Setup
•Notifications
•Managing Events, Incidents, and Problems
•Accessing Monitoring Information
1.1 Monitoring Overview
Enterprise Manager Cloud Control monitoring functionality permits unattended
monitoring of your IT environment. Enterprise Manager comes with a comprehensive
set of performance and health metrics that allows monitoring of key components in
your environment, such as applications, application servers, databases, as well as the
back-end components on which they rely (such as hosts, operating systems, storage).
The Management Agent on each monitored host monitors the status, health, and
performance of all managed components (targets) on that host. If a target goes down,
or if a performance metric crosses a warning or critical threshold, an event is triggered
and sent to Enterprise Manager. Administrators or any interested party can be notified
of the triggered event through the Enterprise Manager notification system.
Adding targets to monitor is simple. Enterprise Manager provides you with the option
of either adding targets manually or automatically discovering all targets on a host.
Enterprise Manager can also automatically and intelligently apply monitoring settings
for newly added targets. For more information, see Administration Groups and
Template Collections). While Enterprise Manager provides a comprehensive set of
metrics used for monitoring, you can also use metric extensions (see Metric
Extensions: Customizing Monitoring) to monitor conditions that are specific to your
environment. As your data center grows, it will become more challenging to manage
individual targets separately, thus you can use Enterprise Manager's group
management functionality to organize large sets of targets into groups, allowing you to
monitor and manage many targets as one.
1.2 Comprehensive Out-of-Box Monitoring
Monitoring begins as soon as you install Enterprise Manager Cloud Control 12c.
Enterprise Manager's Management Agents automatically start monitoring their host's
systems (including hardware and software configuration data on these hosts) as soon
as they are deployed and started. Enterprise Manager provides auto-discovery scripts
that enable these Agents to automatically discover all Oracle components and start
monitoring them using a comprehensive set of metrics at Oracle-recommended
thresholds.
1-1

This monitoring functionality includes other components of the Oracle ecosystem such
as NetApp Filer, BIG-IP load balancers, Checkpoint Firewall, and IBM WebSphere.
Metrics from all monitored components are stored and aggregated in the Management
Repository, providing administrators with a rich source of diagnostic information and
trend analysis data. When critical alerts are detected, notifications are sent to
administrators for rapid resolution.
Out-of-box, Enterprise Manager monitoring functionality provides:
•In-depth monitoring with Oracle-recommended metrics and thresholds.
•Monitoring of all components of your IT infrastructure (Oracle and non-Oracle) as
well as the applications and services that are running on them.
•Access to real-time performance charts.
•Collection, storage, and aggregation of metric data in the Management Repository.
This allows you to perform strategic tasks such as trend analysis and reporting.
•E-mail and pager notifications for detected critical events.
Enterprise Manager can monitor a wide variety of components (such as databases,
hosts, and routers) within your IT infrastructure.
Some examples of monitored metrics are:
•Archive Area Used (Database)
•Component Memory Usage (Application Server)
•Segments Approaching Maximum Extents Count (Database)
•Network Interface Total I/O Rate (Host)
Monitoring Without Management Agents
When it is not practical to have a Management Agent present to monitor specific
components of your IT infrastructure, as might be the case with an IP traffic controller
or remote Web application, Enterprise Manager provides Extended Network and
Critical URL Monitoring functionality. This feature allows the Beacon functionality of
the Agent to monitor remote network devices and URLs for availability and
responsiveness without requiring an Agent to be physically present on that device.
You simply select a specific Beacon, and add key network components and URLs to
the Network and URL Watch Lists. Enterprise Manager monitoring concepts and the
underlying subsystems that support this functionality are discussed in the following
sections.
1.3 Monitoring: Basics
Enterprise Manager Cloud Control 13c comes with a comprehensive set of predefined
performance and health metrics that enables automated monitoring of key
components in your environment, such as applications, application servers,
databases, as well as the back-end components on which they rely, such as hosts,
operating systems, storage. While Enterprise Manager can monitor for many types of
conditions (events), the most common use of its monitoring capability centers around
the basics of monitoring for violation of acceptable performance boundaries defined by
metric values. The following sections discuss the basic concepts and Enterprise
Manger functionality that supports monitoring of targets.
Chapter 1
Monitoring: Basics
1-2

1.3.1 Metric Thresholds: Determining When a Monitored Condition is
an Issue
Some metrics have associated predefined limiting parameters called thresholds that
cause metric alerts (specific type of event) to be triggered when collected metric
values exceed these limits. Enterprise Manager allows you to set metric threshold
values for two levels of alert severity:
•Warning - Attention is required in a particular area, but the area is still functional.
•Critical - Immediate action is required in a particular area. The area is either not
functional or indicative of imminent problems.
Hence, thresholds are boundary values against which monitored metric values are
compared. For example, for each disk device associated with the Disk Utilization (%)
metric, you might define a warning threshold at 80% disk space used and critical
threshold at 95%.
Note:
Not all metrics need a threshold: If the values do not make sense, or are not
needed in a particular environment, they can be removed or simply not set.
While the out-of-box predefined metric threshold values will work for most monitoring
conditions, your environment may require that you customize threshold values to more
accurately reflect the operational norms of your environment. Setting accurate
threshold values, however, may be more challenging for certain categories of metrics
such as performance metrics.
For example, what are appropriate warning and critical thresholds for the Response
Time Per Transaction database metric? For such metrics, it might make more sense to
be alerted when the monitored values for the performance metric deviates from normal
behavior. Enterprise Manager provides features to enable you to capture normal
performance behavior for a target and determine thresholds that are deviations from
that performance norm.
Note:
Enterprise Manager administrators must be granted Manage Target Metrics or
greater privilege on a target in order to perform any metric threshold changes.
1.3.2 Metric Baselines: Determining Valid Metric Thresholds
Determining what metric threshold values accurately reflect the performance
monitoring needs of your environment is not trivial. Rather than relying on trial and
error to determine the correct values, Enterprise Manager provides metric baselines.
Metric baselines are well-defined time intervals (baseline periods) over which
Enterprise Manager has captured system performance metrics, creating statistical
characterizations of system performance over specific time periods. This historical
Chapter 1
Monitoring: Basics
1-3

data greatly simplifies the task of determining valid metric threshold values by
providing normalized views of system performance. Baseline normalized views of
metric behavior help administrators explain and understand event occurrences.
The underlying assumption of metric baselines is that systems with relatively stable
performance should exhibit similar metric observations (values) over times of
comparable workload. Two types of baseline periods are supported:
•Moving Window Baseline Periods: Moving window baseline periods are defined
as some number of days prior to the current date (Example: Last 7 days). This
allows comparison of current metric values with recently observed history. Moving
window baselines are useful for operational systems with predictable workload
cycles (Example: OLTP days and batch nights).
•Static Baseline Periods: Static baselines are periods of time you define that are
of particular interest to you (Example: End of the fiscal year). These baselines can
be used to characterize workload periods for comparison against future
occurrences of that workload (Example: Compare the end of the fiscal year from
one calendar year to the next).
1.3.3 Advanced Threshold Management
While metric baselines are generally useful for determining valid target alert
thresholds, these thresholds are static and are not able to account for expected
performance variation. There are monitoring situations in which different work loads for
a target occur at regular (expected) intervals. Here, a static alert threshold would prove
to be inaccurate. For example, the alert thresholds for a database performing Online
Transaction Process (OLTP) during the day and batch processing at night would be
different. Similarly, database workloads can change based purely on different time
periods, such as weekday versus weekend. Thus, fixed static values for thresholds
might result in false alert reporting, and with excessive alerting could generate
excessive overhead with regard to performance management. For this OLTP example,
using static baselines to determine accurate alert thresholds fails to account for
expected cyclic variations in performance, adversely affecting problem detection.
Static baselines introduce the following configuration issues:
•Baselines configured for Batch performance may fail to detect OLTP performance
degradation.
•Baselines configured for OLTP performance may generate excessive alerts during
Batch cycles
Beginning with Enterprise Manager Release 12.1.0.4, Advanced Threshold
Management can be used to compute thresholds using baselines that are either
adaptive (self-adjusting) or time-based (user-defined).
•Adaptive Thresholds: Allows Enterprise Manager to statistically compute threshold
that are adaptive in nature. Adaptive thresholds apply to all targets (both Agent
and repository monitored).
•Time-based Thresholds: Allows you to define a specific threshold values to be
used at different times to account for changing workloads over time.
A convenient UI allows you to create time-based and adaptive thresholds. From a
target home page (a host, for example), navigate to the Metric Collection and Settings
page. Click Advanced Threshold Management in the Related Links region.
Only numeric and View Collect metrics can be registered as adaptive thresholds. In
addition, only the following types of metrics are permitted:
Chapter 1
Monitoring: Basics
1-4

•Load
•Load Type
•Utilization and Response
1.3.4 Events: Defining What Conditions are of Interest
When a metric threshold value is reached, a metric alert is raised. A metric alert is a
type of event. An event is a significant occurrence that indicates a potential problem;
for example, either a warning or critical threshold for a monitored metric has been
crossed. Other examples of events include: database instance is down, a configuration
file has been changed, job executions ended in failure, or a host exceeded a specified
percentage CPU utilization. Two of the most important event types used in enterprise
monitoring are:
•Metric Alert
•Target Availability
For more information on events and available event types for which you can monitor,
see Using Incident Management .
1.3.5 Corrective Actions: Resolving Issues Automatically
Corrective actions allow you to specify automated responses to metric alerts, saving
administrator time and ensuring issues are dealt with before they noticeably impact
users. For example, if Enterprise Manager detects that a component, such as the
SQL*Net listener is down, a corrective action can be specified to automatically start it
back up. A corrective action is, therefore, any task you specify that will be executed
when a metric triggers a warning or critical alert severity. In addition to performing a
corrective task, a corrective action can be used to gather more diagnostic information,
if needed. By default, the corrective action runs on the target on which the event has
been raised.
A corrective action can also consist of multiple tasks, with each task running on a
different target. Administrators can also receive notifications for the success or failure
of corrective actions. A corrective action can also consist of multiple tasks, with each
task running on a different target.
Corrective actions for a target can be defined by all Enterprise Manager administrators
who have been granted Manage Target Metrics or greater privilege on the target. For
any metric, you can define different corrective actions when the metric triggers at
warning severity or at critical severity.
Corrective actions must run using the credentials of a specific Enterprise Manager
administrator. For this reason, whenever a corrective action is created or modified, the
credentials that the modified action will run with must be specified. You specify these
credentials when you associate the corrective action with elements such as incident or
event rules.
1.3.6 Metric Extensions: Customizing Monitoring
Metric Extensions let you extend Enterprise Manager's monitoring capabilities to cover
conditions specific to your IT environment, thus providing you with a complete and
comprehensive view of your monitored environment.
Chapter 1
Monitoring: Basics
1-5

Metric extensions allow you to define new metrics on any target type that utilize the
same full set of data collection mechanisms used by Oracle provided metrics. For
example, some target types you can create metrics on are:
•Hosts
•Databases
•IBM Websphere
•Oracle Exadata Databases and Storage Servers
•Oracle Business Intelligence Components
Once these new metrics are defined, they are used like any other Enterprise Manager
metric. For more information about metric extensions, see Using Metric Extensions .
User-Defined Metrics (Pre-12c)
If you upgraded your Enterprise Manager 12c site from an older version of Enterprise
Manager, then all user-defined metrics defined in the older version will also be
migrated to Enterprise Manager 12c. These user-defined metrics will continue to work,
however they will no longer be supported a future release. If you have existing user-
defined metrics, it is recommended that you migrate them to metric extensions as
soon as possible to prevent potential monitoring disruptions in your managed
environment. For information about the migration process, see Converting User-
defined Metrics to Metric Extensions in Using Metric Extensions
1.3.7 Blackouts and Notification Blackouts
Blackouts allow you to support planned outage periods to perform scheduled or
emergency maintenance. When a target is put under blackout, monitoring is
suspended, thus preventing unnecessary alerts from being sent when you bring down
a target for scheduled maintenance operations such as database backup or hardware
upgrade. Blackout periods are automatically excluded when calculating a target's
overall availability.
A blackout period can be defined for individual targets, a group of targets or for all
targets on a host. The blackout can be scheduled to run immediately or in the future,
and to run indefinitely or stop after a specific duration. Blackouts can be created on an
as-needed basis, or scheduled to run at regular intervals. If, during the maintenance
period, you discover that you need more (or less) time to complete maintenance tasks,
you can easily extend (or stop) the blackout that is currently in effect. Blackout
functionality is available from both the Enterprise Manager console as well as via the
Enterprise Manager command-line interface (EM CLI). EM CLI is often useful for
administrators who would like to incorporate the blacking out of a target within their
maintenance scripts. When a blackout ends, the Management Agent automatically re-
evaluates all metrics for the target to provide current status of the target post-blackout.
If an administrator inadvertently performs scheduled maintenance on a target without
first putting the target under blackout, these periods would be reflected as target
downtime instead of planned blackout periods. This has an adverse impact on the
target's availability records. In such cases, Enterprise Manager allows Super
Administrators to go back and define the blackout period that should have happened
at that time. The ability to create these retroactive blackouts provides Super
Administrators with the flexibility to define a more accurate picture of target availability.
Notification Blackouts
Chapter 1
Monitoring: Basics
1-6

Beginning with Enterprise Manager 13c, you can stop notifications only. These are
called Notification Blackouts and are intended solely for suppressing event
notifications on targets. Because the Agent continues to monitor the target during the
Notification Blackout duration, the OMS will continue to show the actual target status
along with an indication that the target is currently under Notification Blackout.
1.4 Monitoring: Advanced Setup
Enterprise Manager greatly simplifies managing your monitored environment and also
allows you to customize and extend Enterprise Manager monitoring capabilities.
However, the primary advantage Enterprise Manager monitoring provides is the ability
to monitor and manage large-scale, heterogeneous environments. Whether you are
monitoring an environment with 10 targets or 10,000 targets, the following Enterprise
Manager advanced features allow you to implement and maintain your monitored
environment with the equal levels of convenience and simplicity.
1.4.1 Monitoring Templates
Monitoring Templates simplify the task of standardizing monitoring settings across
your enterprise by allowing you to specify your standards for monitoring in a template
once and apply them to monitored targets across your organization. This makes it
easy for you to apply specific monitoring settings to specific classes of targets
throughout your enterprise. For example, you can define one monitoring template for
test databases and another monitoring template for production databases.
A monitoring template defines all Enterprise Manager parameters you would normally
set to monitor a target, such as:
•Target type to which the template applies.
•Metrics (including user-defined metrics), thresholds, metric collection schedules,
and corrective actions.
When a change is made to a template, you can reapply the template across affected
targets in order to propagate the new changes. The apply operation can be automated
using Administration Groups and Template Collections. For any target, you can
preserve custom monitoring settings by specifying metric settings that can never be
overwritten by a template.
Enterprise Manager comes with an array of Oracle-certified templates that provide
recommended metric settings for various Oracle target types.
For more information about monitoring templates, see Using Monitoring Templates .
1.4.2 Administration Groups and Template Collections
Monitored environments are rarely static—new targets are constantly being added
from across your ecosystem. Enterprise Manager allows you to maintain control of this
dynamic environment through administration groups. Administration groups automate
the process of setting up targets for management in Enterprise Manager by
automatically applying management settings such as monitoring settings or
compliance standards. Typically, these settings are manually applied to individual
targets, or perhaps semi-automatically using monitoring templates (see Monitoring
Templates) or custom scripts. Administration groups combine the convenience of
applying monitoring settings using monitoring templates with the power of automation.
Chapter 1
Monitoring: Advanced Setup
1-7

Template collections contain the monitoring settings and other management settings
that are meant to be applied to targets as they join the administration group.
Monitoring settings for targets are defined in monitoring templates. Monitoring
templates are defined on a per target type basis, so you will need to create monitoring
templates for each of the different target types in your administration group. You will
most likely create multiple monitoring templates to define the appropriate monitoring
settings for an administration group.
Every target added to Enterprise Manager possesses innate attributes called target
properties. Enterprise Manager uses these target properties to add targets to the
correct administration group. Administration group membership is based on target
properties as membership criteria so target membership is dynamic. Once added to
the administration group, Enterprise Manager automatically applies the requisite
monitoring settings using monitoring templates that are part of the associated template
collection .
Administration groups use the following target properties to define membership
criteria:
•Contact
•Cost Center
•Customer Support Identifier
•Department
•Lifecycle Status
•Line of Business
•Location
•Target Version
•Target Type
1.4.3 Customizing Alert Messages
Whenever a metric threshold is reached, an alert is raised along with a metric-specific
message. These messages are written to address generic metric alert conditions.
Beginning with Enterprise Manager Release 12.1.0.4, you can customize these
messages to suit the specific requirements of your monitored environment.
Customizing an alert message allows you to tailor the message to suit your monitoring
needs. You can tailor the message to include their operational context specific to your
environment such as IT error codes used in your data center, or add additional
information collected by Enterprise Manager such as:
•Metric name for which the alert has been triggered
•Severity level of the alert or violation
•Threshold value for which warning or critical violation has been triggered
•Number of Occurrences after which alert has been triggered
Alert message customization allows for more efficient alert management by increasing
message usability.
To customize a metric alert message:
1. Navigate to a target homepage.
Chapter 1
Monitoring: Advanced Setup
1-8
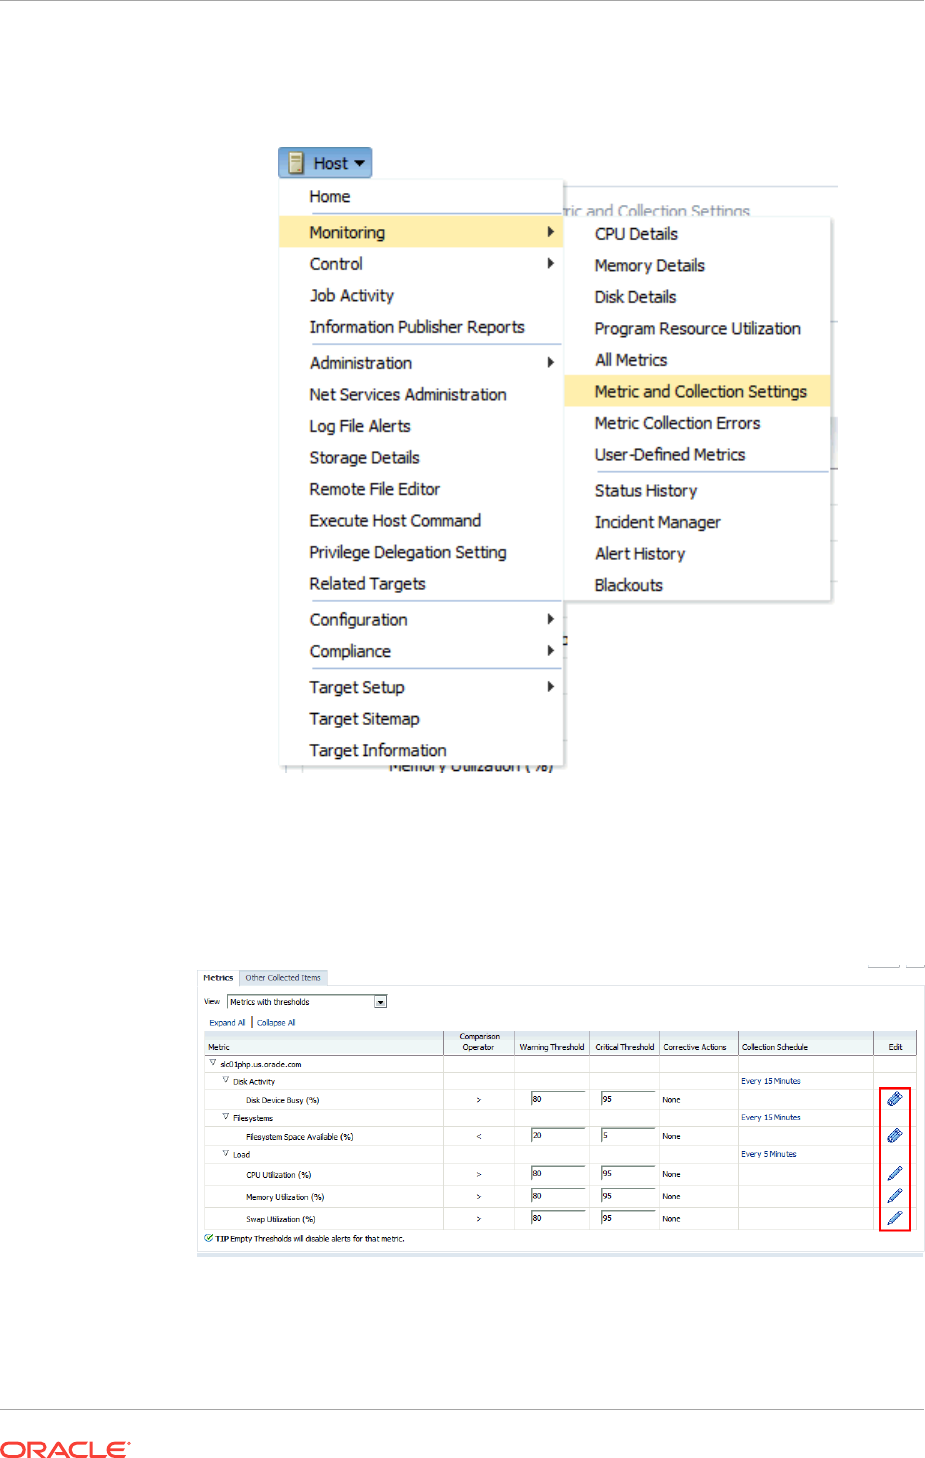
2. From the target menu (host target type is shows in the graphic), select Monitoring
and then Metric and Collection Settings.
The Metric and Collection Settings page displays.
3. In the metric table, find the specific metric whose message you want to change
and click the edit icon (pencil).
The Edit Advanced Settings page displays.
4. In the Monitored Objects region, click Edit Alert Message.
Chapter 1
Monitoring: Advanced Setup
1-9
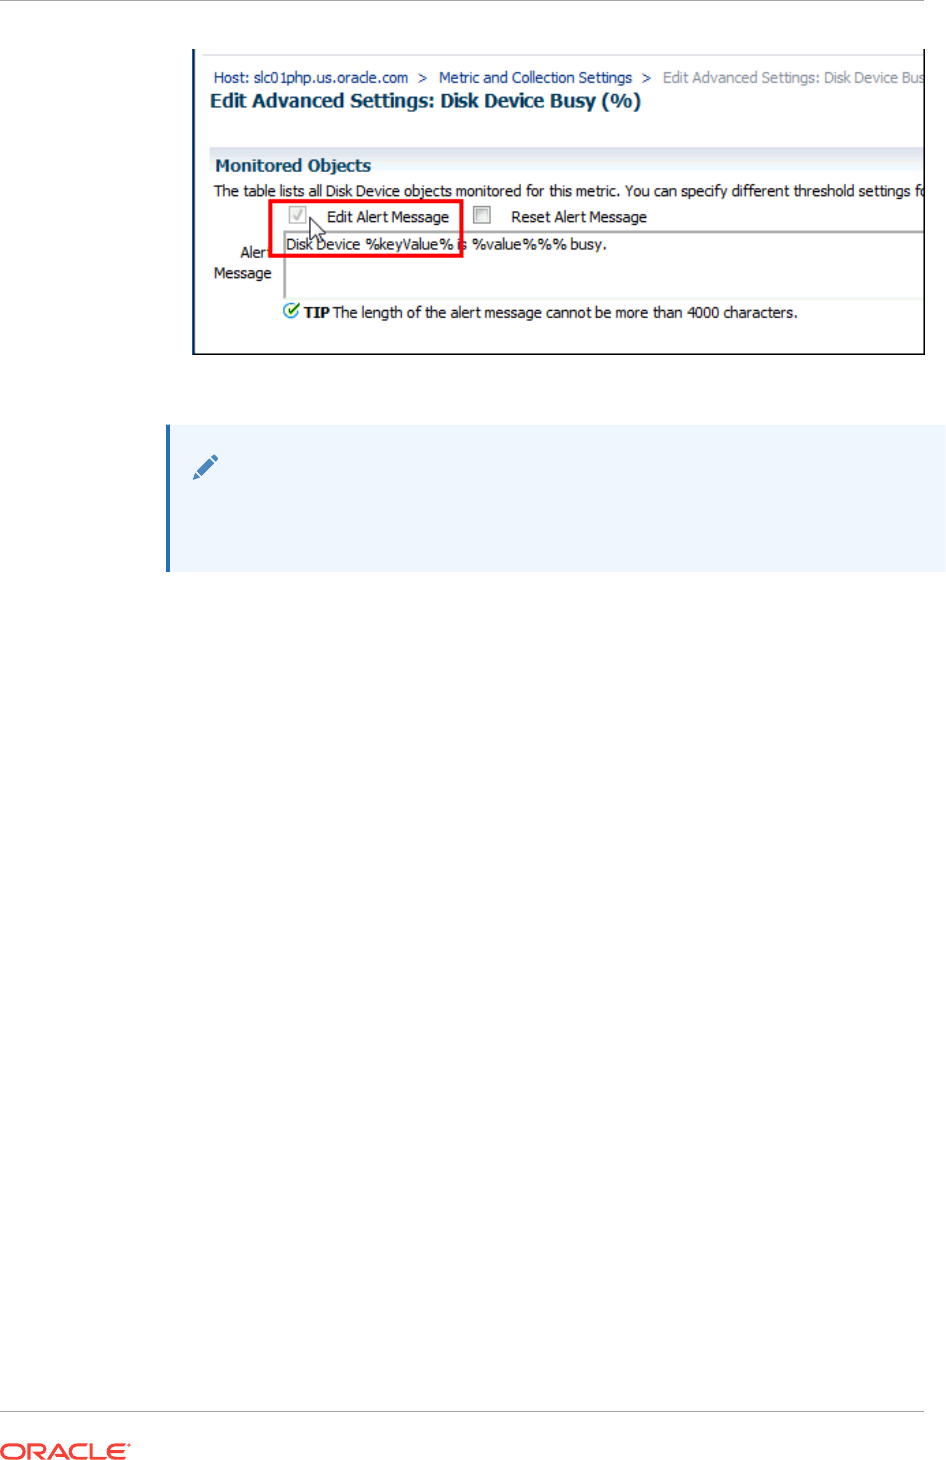
5. Modify the alert message as appropriate.
Note:
To change your revised message back to the original Oracle-defined message
at any time, click Reset Alert Message.
6. Click Continue to return to the Metric and Collection Settings page.
7. To modify additional metric alert messages, repeat steps three through six.
8. Once you are finished, click OK to save all changes to the Enterprise Manager
Repository. Enterprise Manager will display a message indicating the updates
have succeeded.
9. Click OK to dismiss the message and return to the target homepage.
1.5 Notifications
For a typical monitoring scenario, when a target becomes unavailable or if thresholds
for performance are crossed, events are raised and notifications are sent to the
appropriate administrators. Enterprise Manager supports notifications via email, pager,
SNMP traps, or by running custom scripts and allows administrators to control these
notification mechanisms through:
•Notification Methods
•Rules and Rule Sets
•Notification Blackouts
Notification Methods
A notification method represents a specific way to send notifications. Besides e-mail,
there are three types of notification methods: OS Command, PL/SQL, SNMP Traps.
When configuring a notification method, you need to specify the particulars associated
with a specific notification mechanism such as which SMTP gateway(s) to use for e-
mail or which custom OS script to run. Super Administrators perform a one-time setup
of the various types of notification methods available for use.
Rules
Chapter 1
Notifications
1-10

A rule instructs Enterprise Manager to take specific action when events or incidents
(entity containing one important event or related events) occur, such as notifying an
administrator or opening a helpdesk ticket (see Managing Events, Incidents, and
Problems). For example, you can define a rule that specifies e-mail should be sent to
you when CPU Utilization on any host target is at critical severity, or another rule that
notifies an administrator's supervisor if an incident is not acknowledged within 24
hours.
Notification Blackouts
Notification Blackouts allow you to stop notifications while at the same time allowing
the Agents to continue monitoring your targets. This allows Enterprise Manager to
more accurately collect target availability information. For more information, see
"Blackouts and Notification Blackouts."
1.5.1 Customizing Notifications
Notifications that are sent to Administrators can be customized based on message
type and on-call schedule. Message customization is useful for administrators who rely
on both e-mail and paging systems as a means for receiving notifications. The
message formats for these systems typically vary—messages sent to e-mail can be
lengthy and can contain URLs, and messages sent to a pager are brief and limited to a
finite number of characters. To support these types of mechanisms, Enterprise
Manager allows administrators to associate a long or short message format with each
e-mail address. E-mail addresses that are used to send regular e-mails can be
associated with the long format; pages can be associated with the short format. The
long format contains full details about the event/incident; the short format contains the
most critical pieces of information.
Notifications can also be customized based on an administrator's on-call schedule. An
administrator who is on-call might want to be contacted by both his pager and work
email address during business hours and only by his pager address during off hours.
Enterprise Manager offers a flexible notification schedule to support the wide variety of
on-call schedules. Using this schedule, an administrator defines his on-call schedule
by specifying the email addresses by which they should be contacted when they are
on-call. For periods where they are not on-call, or do not wish to receive notifications
for incidents, they simply leave that part of the schedule blank. All alerts that are sent
to an administrator automatically adhere to his specified schedule.
1.6 Managing Events, Incidents, and Problems
Enterprise Manager's monitoring functionality is built upon the precept of monitoring by
exception. This means it monitors and raises events when exception conditions exist
in your IT environment and allowing administrators to address them in a timely
manner. As discussed earlier, the two most commonly used event types to monitor for
are metric alert and target availability. Although these are the most common event
types for which Enterprise Manager monitors, there are many others. Available event
types include:
•Target Availability
•Metric Alert
•Metric Evaluation Errors
•Job Status Changes
Chapter 1
Managing Events, Incidents, and Problems
1-11

•Compliance Standard Rule Violations
•Compliance Standard Score Violations
•High Availability
•Service Level Agreement Alerts
•User-reported
•JVM Diagnostics Threshold Violation
By definition, an incident is a unit containing a single, or closely correlated set of
events that identify an issue that needs administrator attention within your managed
environment. So an incident might be as simple as a single event indicating available
space in a tablespace has fallen below a specified limit, or more complex such as an
incident consisting of multiple events relating to potential performance issue when a
server is running out of resources. Such an incident would contain events relating to
the usage of CPU, I/O , and memory resources. Managing by incident gives you the
ability to address issues that may consist of any number of causal factors. For an in-
depth discussion on incidents and events, see Using Incident Management .
Although incidents can correspond to a single events, incidents more commonly
correspond to groups of related events. A large number of discrete events can quickly
become unmanageable, but handled as an assemblage of related events, incidents
allow you to manage large numbers of event occurrences more effectively.
Once an incident is created, Enterprise Manager makes available a rich set of incident
management workflow features that let you to manage and track the incident through
its complete lifecycle. Incident management features include:
•Assign incident ownership.
•Track the incident resolution status.
•Set incident priority.
•Set incident escalation level.
•Ability to provide a manual summary.
•Ability to add user comments.
•Ability to suppress/unsuppress
•Ability to manually clear the incident.
•Ability to create a ticket manually.
Problems pertain to the diagnostic incidents and problems stored in Automatic
Diagnostic Repository (ADR), which are automatically raised by Oracle software when
it encounters critical errors in the software. When problems are raised for Oracle
software, Oracle has determined that the recommended recourse is to open a Service
Request (SR), send support the diagnostic logs, and eventually provide a solution from
Oracle. A problem represents the underlying root cause of a set of incidents.
Enterprise Manager provides features to track and manage the lifecycle of a problem.
1.6.1 Incident Manager
Enterprise Manager Cloud Control simplifies managing incidents through an intuitive
UI called Incident Manager. Incident Manager provides and easy-to-use interface that
allows you to search, view, manage, and resolve incidents and problems impacting
Chapter 1
Managing Events, Incidents, and Problems
1-12
your environment. To access Incident Manager, from the Enterprise menu, select
Monitoring, and then Incident Manager.
Figure 1-1 Incident Manager
From the Incident Manager UI, you can:
•Filter incidents, problems, and events by using custom views
topicid:emadm_cs_gs_filter
•Respond and work on an incident topicid:incmgr_work_incident
•Manage incident lifecycle including assigning, acknowledging, tracking its status,
prioritization, and escalation
•Access (in context) My Oracle Support knowledge base articles and other Oracle
documentation to help resolve the incident.
•Access direct in-context diagnostic/action links to relevant Enterprise Manager
functionality allowing you to quickly diagnose or resolve the incident.
1.6.2 Incident Rules and Rule Sets
An incident rule specifies criteria and actions that determine when a notification should
be sent and how it should be sent whenever an event or incident is raised. The criteria
defined within a rule can apply to attributes such as the target type, events and
severity states (clear, warning or critical) and the notification method that should be
used when an incident is raised that matches the rule criteria. Rule actions can be
conditional in nature. For example, a rule action can be defined to page a user when
an incident severity is critical or just send e-mail if it is warning.
A rule set is a collection of rules that apply to a common set of targets such as hosts,
databases, groups, jobs, metric extensions, or self updates and take appropriate
actions to automate the business processes underlying incident. Incident rule sets can
be made public for sharing across administrators. For example, administrators can
subscribe to the same rule set if they are interested in receiving notifications for the
same criteria defined in the rule. Alternatively, an Enterprise Manager Super
Chapter 1
Managing Events, Incidents, and Problems
1-13

Administrator can assign incident rule sets to other administrators so that they receive
notifications for incidents as defined in the rule.
In addition to being used by the notification system (see Rules in Notifications ), rule
sets can also instruct Enterprise Manager to perform other actions, such as creating
incidents, updating incidents, or call into a trouble ticketing system as discussed in
Connectors.
1.6.3 Connectors
An Oracle Management Connector integrates third-party management systems with
Enterprise Manager. There are two types of connectors: Event connectors and
helpdesk connectors.
Using the event connector, you can configure Enterprise Manager to share events with
non-Oracle management systems. The connector monitors all events sent from Oracle
Enterprise Manager and automatically updates alert information in the third-party
management system. Event connectors support the following functions:
•Sharing of event information from Oracle Enterprise Manager to the third-party
management system.
•Customization of event to alert mappings between Oracle Enterprise Manager and
the third-party management system.
•Synchronization of event changes in Oracle Enterprise Manager with the alerts in
the third-party management system.
Using the helpdesk connector, you can configure Enterprise Manager to create,
update, or close a ticket for any event created in Enterprise Manager. The ticket
generated by the connector contains the relevant information about the Enterprise
Manager incident, including a link to the Enterprise Manager console to enable
helpdesk analysts leverage Enterprise Manager's diagnostic and resolution features to
resolve the incident. In Enterprise Manger, the ticket ID, ticket status, and link to the
third-party ticketing system is the shown in the context of the incident. This provides
Enterprise Manager administrators with ticket status information and an easy way to
quickly access the ticket.
Available connectors include:
•BMC Remedy Service Desk Connector
•HP Service Manager Connector
•CA Service Desk Connector
•HP Operations Manager Connector
•Microsoft Systems Center Operations Manager Connector
•IBM Tivoli Enterprise Console Connector
•IBM Tivoli Netcool/OMNIbus Connector
For more information about Oracle-built connectors, see the Enterprise Manager Plug-
ins Exchange.
http://www.oracle.com/goto/emextensibility
Chapter 1
Managing Events, Incidents, and Problems
1-14
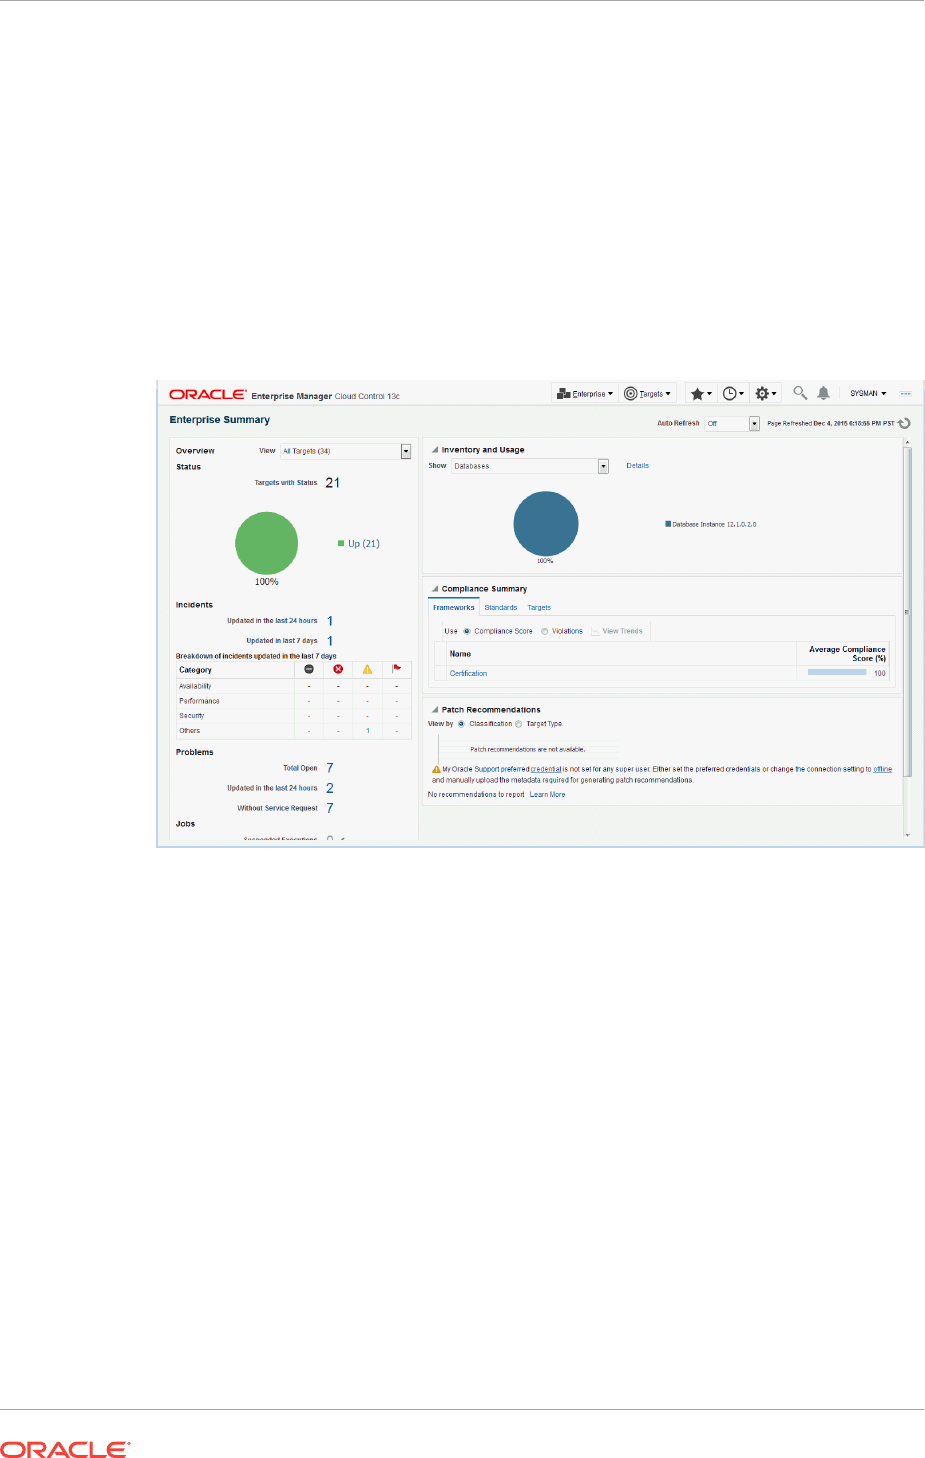
1.7 Accessing Monitoring Information
Enterprise Manager provides multiple ways to access monitoring information. The
primary focal point for incident management is the Incident Manager console, however
Enterprise Manager also provides other ways to access monitoring information. The
following figures show the various locations within Enterprise Manager that display
target monitoring information. The following figure shows the Enterprise Manager
Overview page that conveniently displays target status rollup and rollup of incidents.
Figure 1-2 Enterprise Manager Console
The next figure shows the Incident Manager home page which displays incidents for a
system or target.
Chapter 1
Accessing Monitoring Information
1-15
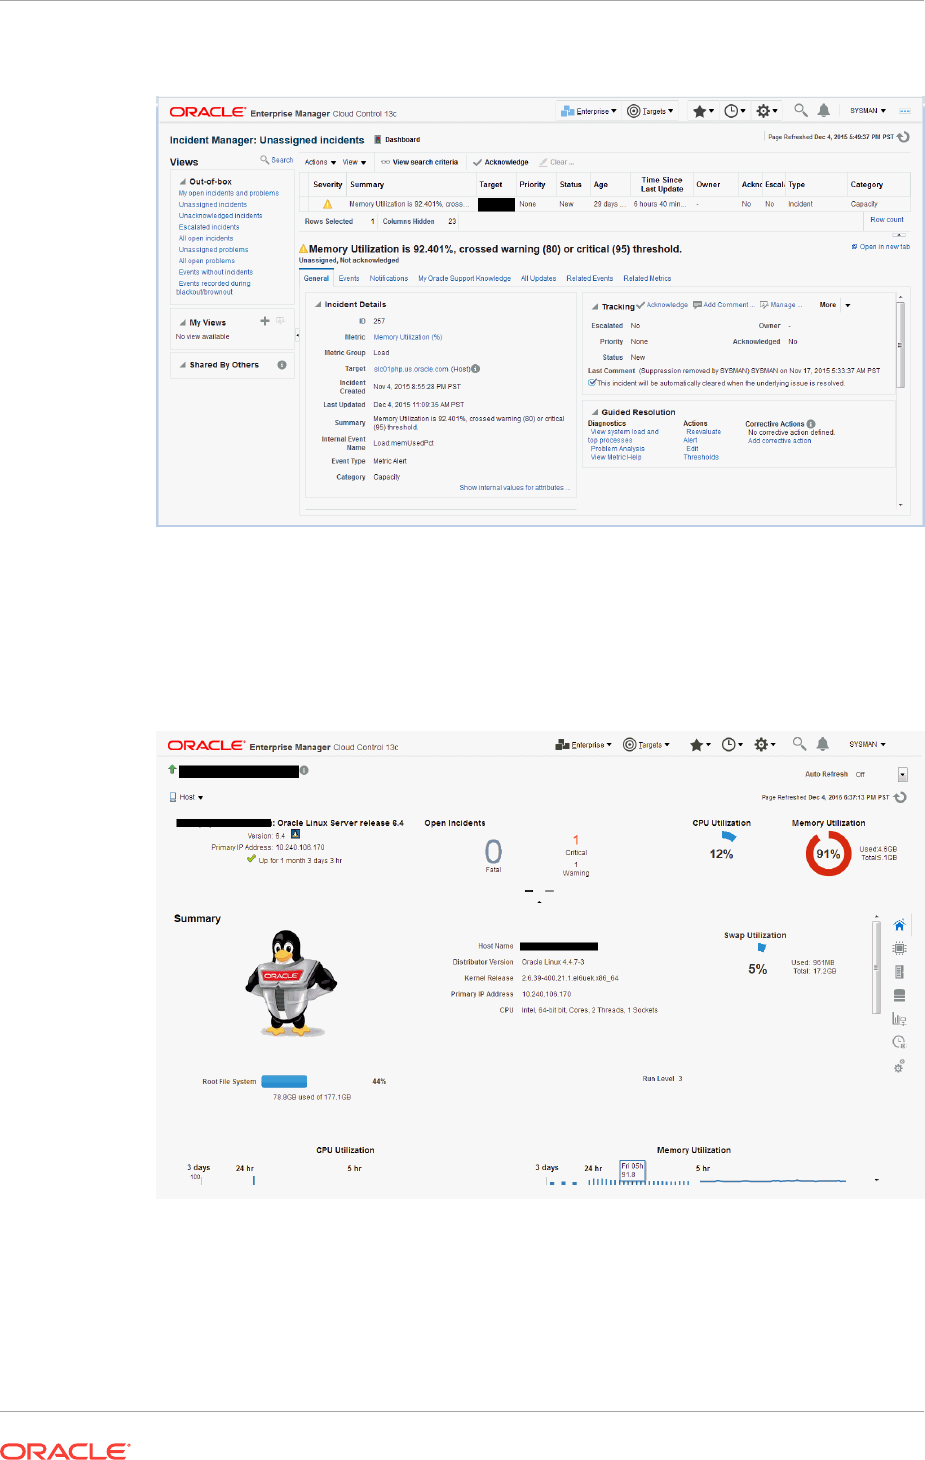
Figure 1-3 Incident Manager (in context of a system or target)
Monitoring information is also displayed on target home pages. In the following figure,
you can see target status as well as a rollup of incidents.
Figure 1-4 Target Home Pages
Chapter 1
Accessing Monitoring Information
1-16

2
Using Incident Management
Incident management allows you to monitor and resolve service disruptions quickly
and efficiently by allowing you to focus on what is important from a broader
management perspective (incidents) rather than isolated, discrete events that may
point to the same underlying issue.
In this chapter: You will learn:
Management Concepts Fundamental approaches to managing your
monitored environment.
•Event Management
•Incident Management
•Problem Management
Setting Up Your Incident Management
Environment
How to set up and configure key Enterprise
Manager components used for incident
management.
•Setting Up Your Monitoring Infrastructure
•Setting Up Notifications
•Setting Up Administrators and Privileges
Working with Incidents How to use incident management to track and
resolve IT operation issues.
•Finding What Needs to be Worked On
•Searching for Incidents
•Setting Up Custom Views
•Responding and Working on a Simple
Incident
•Responding to and Managing Multiple
Incidents, Events and Problems in Bulk
•Searching My Oracle Support Knowledge
•Submitting an Open Service Request
(Problems-only)
•Suppressing Incidents and Problems
•Managing Workload Distribution of
Incidents
•Reviewing Events on a Periodic Basis
Common Tasks Step-by-step examples illustrating how to
perform common incident management tasks..
•Sending Email for Metric Alerts
•Sending SNMP Traps for Metric Alerts
•Sending Events to an Event Connector
•Sending Email to Different Email
Addresses for Different Periods of the Day
2-1

In this chapter: You will learn:
Advanced Topics How to perform specialized incident
management operations.
•Defining Custom Incident Statuses
•Clearing Stateless Alerts for Metric Alert
Event Types
•User-reported Events
•Additional Rule Applications
•Event Prioritization
•Root Cause Analysis (RCA) and Target
Down Events
Moving from Enterprise Manager 10/11g to
12c and Greater
Migrating notification rules to incident rules.
2.1 Management Concepts
Enterprise Manager exposes three levels of management granularity that, when
combined, provide complete monitoring/management coverage of your environment.
These management levels are:
•Event Management
•Incident Management
•Problem Management
•Rule Sets
•Incident Manager
2.1.1 Event Management
Intuitively, you monitor for specific events in your monitored environment. An event is a
significant occurrence on a managed target that typically indicates something has
occurred outside normal operating conditions--they provide a uniform way to indicate
that something of interest has occurred in an environment managed by Enterprise
Manager. Examples of events are:
•Metric Alerts
•Compliance Violations
•Job Events
•Availability Alerts
Existing Enterprise Manager customers may be familiar with metric alerts and metric
collection errors. For Enterprise Manager 12c, metric alerts are a type of event, one of
many different event types. The notion of an event unifies the different exception
conditions that are detected by Enterprise Manager, such as monitoring issues or
compliance issues, into a common concept. It is backed by a consistent and uniform
set of event management capabilities that can indicate something of interest has
occurred in a datacenter managed by Enterprise Manager.
All events have the following attributes:
Chapter 2
Management Concepts
2-2

Table 2-1 Event Attributes
Attribute Description
Type Type of event that is being reported. All events of a specific type
share the same set of attributes that describe the exact nature of
the problem. For example, Metric Alert, Compliance Standard
Score Violation, or Job Status Change.
Severity Event severity. For example, Fatal, Warning, or Critical.
Internal Name An internal name that describes the nature of the event and can
be used to search for events. For example, you can search for
all tablespacePctUsed events.
Entity on which the event is
raised.
An event can be raised on a target, a non-target source object
(such as a job) or be related to a target and a non-target source
object. Note: This attribute is important when determining what
privileges are required to manage the event.
Message Informational text associated with the event.
Reported Date Time the event was reported.
Category Functional or operational classification for an event.
Available Categories:
•Availability
•Business
•Capacity
•Configuration
•Diagnostics
•Error
•Fault
•Jobs
•Load
•Performance
•Security
Causal Analysis Update Used for Root Cause Analysis of target down events.
Possible Values: Root Cause or Symptom
Event Types
The type of an event defines the structure and payload of an event and provides the
details of the condition it is describing. For example, a metric alert raised by threshold
violation has a specific payload whereas a job state change has a different structure.
As shown in the following table, the range of events types greatly expands Enterprise
Manager's monitoring flexibility.
Event Type Description
Target Availability The Target Availability Event represents a
target's availability status (Example: Up,
Down, Agent Unreachable, or Blackout).
Chapter 2
Management Concepts
2-3

Event Type Description
Metric Alert A metric alert event is generated when an
alert occurs for a metric on a specific target
(Example: CPU utilization for a host target)
or metric on a target and object combination
Example: Space usage on a specific
tablespace of a database target.
Metric Evaluation Error A metric evaluation error is generated when
the collection for a specific metric group fails
for a target.
Job Status Change All changes to the status of an Enterprise
Manager job are treated as events, and
these events are made available via the Job
Status Change event class.
Note: A prerequisite to creating Incident
Rules, is to enable the relevant job status
and add required targets to job event
generation criteria. To change this criteria,
from the Setup menu, select Incidents, and
then Job Events.
Compliance Standard Rule Violation Events are generated for compliance
standard rule violations. Each event
corresponds to a violation of a compliance
rule on a specific target.
Compliance Standard Score Violation Events are generated for compliance
standard score violations. An event is
generated when the compliance score for a
compliance standard on a specific target falls
below predefined thresholds.
High Availability High Availability events are generated for
database availability operations (shutdown
and startup), database backups and Data
Guard operations (switchover, failover, and
other state changes).
Service Level Agreement Alert These events are generated when a service
level or service level objective is violated for
a service. occurs for a Service Level
Agreement or a Service Level Objective.
User-reported These events are created by end-users.
Application Performance Management KPI Alert An Application Performance Management
(APM) Key Performance Indicator (KPI) alert
event is generated when a KPI violation alert
occurs for a metric on an APM managed
entity associated with a Business Application
target.
JVM Diagnostics Threshold Violation A JVMD Diagnostics event is raised when a
JVMD metric exceeds its threshold value on
a Java Virtual Machine target.
Event Severity
The severity of an event indicates the criticality of a specific issue. The following table
shows the various event severity levels along with the associated icon.
Chapter 2
Management Concepts
2-4
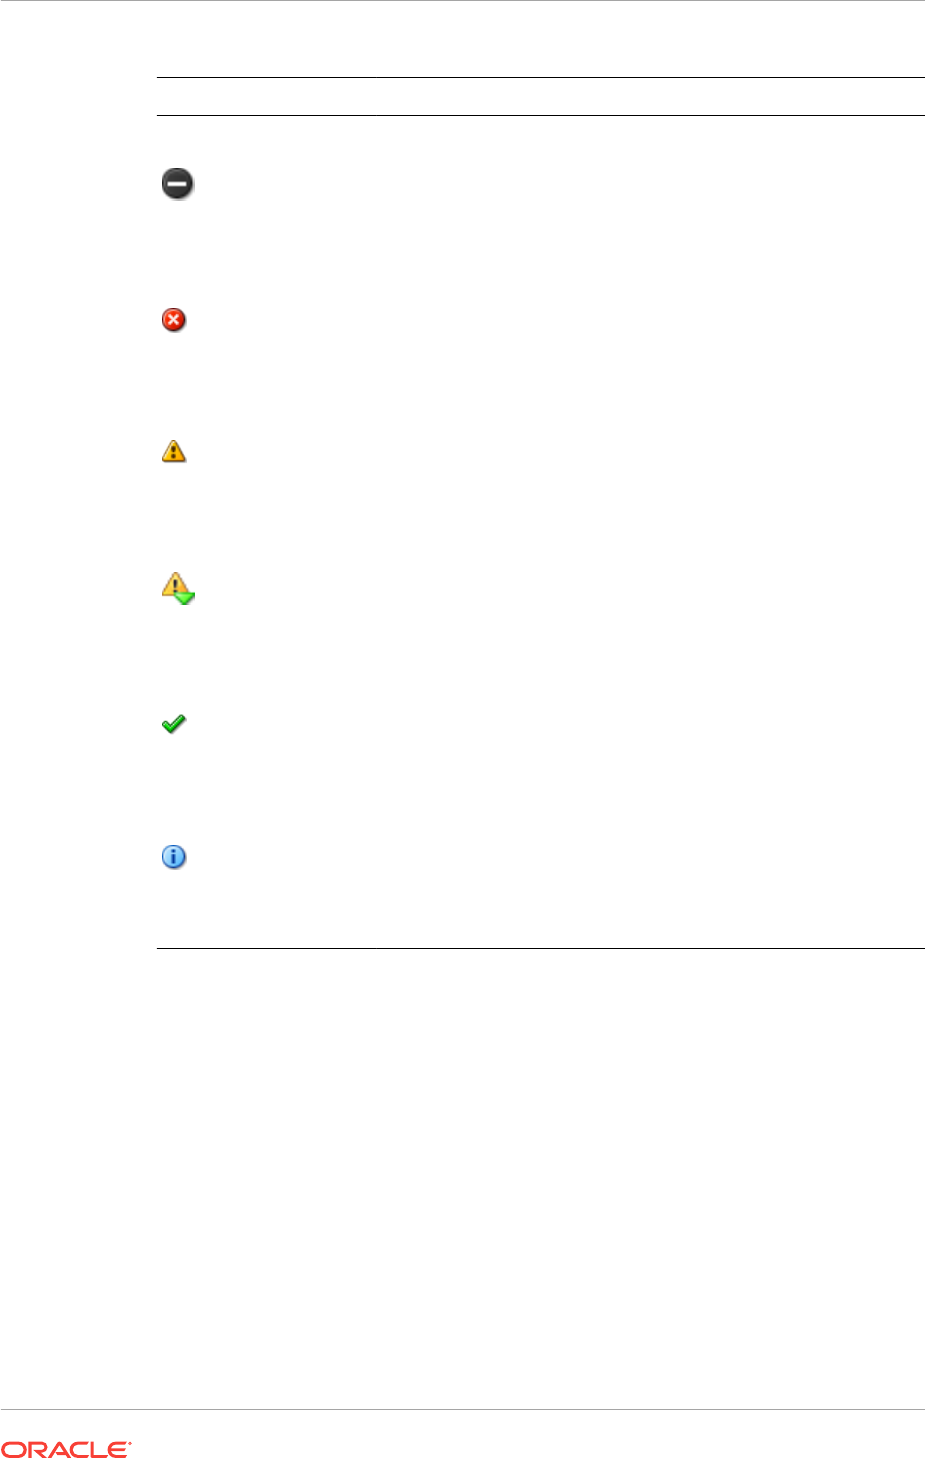
Icon Severity Description
Fatal Corresponding service is no longer available. For example, a
monitored target is down (target down event). A Fatal severity is
the highest level severity and only applies to the Target Availability
event type.
Critical Immediate action is required in a particular area. The area is either
not functional or indicative of imminent problems.
Warning Attention is required in a particular area, but the area is still
functional.
Advisory While the particular area does not require immediate attention,
caution is recommended regarding the area's current state. This
severity can be used, for example, to report Oracle best practice
violations.
Clear Conditions that raised the event have been resolved.
Informational A specific condition has just occurred but does not require any
remedial action.
Events with an informational severity:
•do not appear in the incident management UI.
•cannot create incidents.
•are not stored within Enterprise Manager.
2.1.2 Incident Management
You monitor and manage your Enterprise Manager environment via incidents and not
discrete events (even though an incident can conceivably consist of a single event). Of
all events raised within your managed environment, there is likely only a subset that
you need to act on because they impact your business applications (such as a target
down event). However, managing by incident also allows you to address more
complex situations where the subset of events you are interested in are related and
may indicate a higher level issue needs to be addressed as a single issue and not as
individual events: A cluster of events by themselves may indicate a minor
administrative issue, but when viewed together may signify a larger problem that can
potentially consist of events from multiple domains/layers of your monitored
infrastructure.
For example, you are monitoring a host. If you want to monitor 'load' being placed on
one or more hosts you might be interested in events such as CPU utilization, memory
Chapter 2
Management Concepts
2-5

utilization, and swap utilization exceeding acceptable metric thresholds. Individually,
these events may or may not indicate an issue with the host, but together, these
events form an incident indicating extreme load is being placed on a monitored host.
Incidents represent the larger service disruptions that may impact your business
instead of discrete events. Managing by incidents, therefore, allows you to monitor for
complex operational issues that may affect multiple domains that may impact your
business. These incidents typically need to be tracked, assigned to appropriate
personnel, and resolved as quickly as possible. You can effectively implement a
centralized monitoring that consolidates monitoring information and more effectively
allocate resource across your ecosystem to resolve or prevent issues from occurring.
The end result is better implementation of your business processes that in turn lead to
better performance of your IT resources.
While events indicate issues requiring attention in your managed environment, it is
more efficient to work on a collective subset of related events as a single unit of work--
you can work on different events representing the same issue or you can work on one
incident containing multiple space-related events. For example, you have multiple
space events from various targets that indicate you are running low on space. Instead
of managing numerous discrete events, you can more efficiently manage a smaller set
of incidents.
An incident is a significant event or set of related significant events that need to be
managed because it can potentially impact your business applications. These
incidents typically need to be tracked, assigned to appropriate personnel, and resolved
as quickly as possible. You perform these incident management operations through
Incident Manager, an intuitive UI within Enterprise Manager.
Incident Manger provides you with a central location from which to view, manage,
diagnose and resolve incidents as well as identify, resolve and eliminate the root
cause of disruptions. See Incident Manager for more information about this UI.
2.1.2.1 Working with Incidents
When an incident is created, Enterprise Manager makes available a rich set of incident
management workflow features that let you to manage and track the incident through
its complete lifecycle.
•Assign incident ownership.
•Track the incident resolution status.
•Set incident priority.
•Set incident escalation level.
•Ability to provide a manual summary.
•Ability to add user comments.
•Ability to suppress/unsuppress
•Ability to manually clear the incident.
•Ability to create a ticket manually.
All incident management/tracking operations are carried out from Incident Manager.
Creation of incidents for events, assignment of incidents to administrators, setting
priority, sending notifications and other actions can be automated using (incident)
rules.
Chapter 2
Management Concepts
2-6

Incident Status
The lifecycle of an incident within an organization is typically determined by two pieces
of information: The current resolution state of the incident (Incident Status) and how
important it is to resolve the incident relative to other incidents (Priority). As key
incident attributes, the following options are available:
•New
•Work in Progress
•Closed
•Resolved
You can define additional statuses if the default options are not adequate. In addition,
you can change labels using the Enterprise Manager Command Line Interface (EM
CLI). See Advanced Topics for more information.
Priority
By changing the priority, you can escalate the incident and perform operations such as
assigning it to a specific IT operator or notifying upper-management. The following
priority options are available:
•None
•Low
•Medium
•High
•Very High
•Urgent
Priority is often based on simple business rules determined by the business impact
and the urgency of resolution.
Incident Attributes
Every incident possesses attributes that provide information as identification, status for
tracking, and ownership. The following table lists available incident attributes.
Incident Attribute Definition
Escalated An escalation level signifying a escalation to raise the level of
attention on the incident from your organization's IT or
management hierarchy.
Available escalation levels:
•None (Not escalated)
•Level 1 through Level 5
Chapter 2
Management Concepts
2-7

Incident Attribute Definition
Category Operational or organizational classification for an incident.
Incidents (and events) can have multiple categories.
Categories for all events within an incident are aggregated.
Available Categories:
•Availability
•Business
•Capacity
•Configuration
•Diagnostics
•Error
•Fault
•Jobs
•Load
•Performance
•Security
Summary An intuitive message indicating what the incident is about. By
default, the incident summary is pulled from the message of the
last event of the incident, however, this message can be
changed to a fixed summary by any administrator working on the
incident.
Incident Created Date and time the incident was created.
Last Updated Date and time the incident was last updated or when the incident
was closed.
Severity Severity is based on the worst severity of the events in the
incident. For example, Fatal, Warning, or Critical.
Source Source entities of the incident.
Priority Priority Values
•None (Default)
•Low
•Medium
•High
•Very High
•Urgent
Chapter 2
Management Concepts
2-8

Incident Attribute Definition
Status Incident Status.
•New (Default)
•Work in Progress
•Closed (Terminal state when the incident is closed. See
below for more information.)
•Resolved
You can define additional statuses if the default options are not
adequate. In addition, you can change labels using the
Enterprise Manager Command Line Interface (EM CLI).
Closed Status: Enterprise Manager automatically sets the status
to closed when an incident severity is cleared--administrators do
not manually select the Closed status. The incident severity is
set to Clear when all of the events contained within the incident
have been cleared. Typically the Agent sets the Clear severity,
as would be the case when a metric alert value falls below a
severity threshold. If an event or incident supports manual
clearing, then the Clear option will be shown in the Incident
Manager UI. Once an incident has been cleared by an
administrator or by Enterprise Manager, only then will Enterprise
Manager set the status to Closed.If you do not see the option to
clear the incident in the UI, this means Enterprise Manager will
automatically set the status to Clear if it detects the monitored
condition no longer holds true. For example, you want to indicate
that an incident has been fixed. You can set the status to
Resolved and Enterprise Manager will set the status to Closed
when it clears the severity.
Comment Annotations added by an administrator to communicate analysis
information or actions taken to resolve the incident.
Owner Administrator/user currently working on the incident.
Acknowledged Indicates that a user has accepted ownership of an incident or
problem. Available options: Yes or No.
When an incident is acknowledged, it will be implicitly assigned
to the user who acknowledged it. When a user assigns an
incident to himself, it is considered 'acknowledged'. Once
acknowledged, an incident cannot be unacknowledged, but can
be assigned to another user. Acknowledging an incident stops
any repeat notifications for that incident.
Causal Analysis Update Used for Root Cause Analysis of target down incidents.
Possible Values: Root Cause or Symptom
2.1.2.2 Incident Composed of a Single Event
The simplest incident is composed of a single event. In the following example, you are
concerned whenever any production target is down. You can create an incident for the
target down event which is raised by Enterprise Manager if it detects the monitored
target is down. Once the incident is created, you will have all incident management
functionality required to track and manage its resolution.
Chapter 2
Management Concepts
2-9
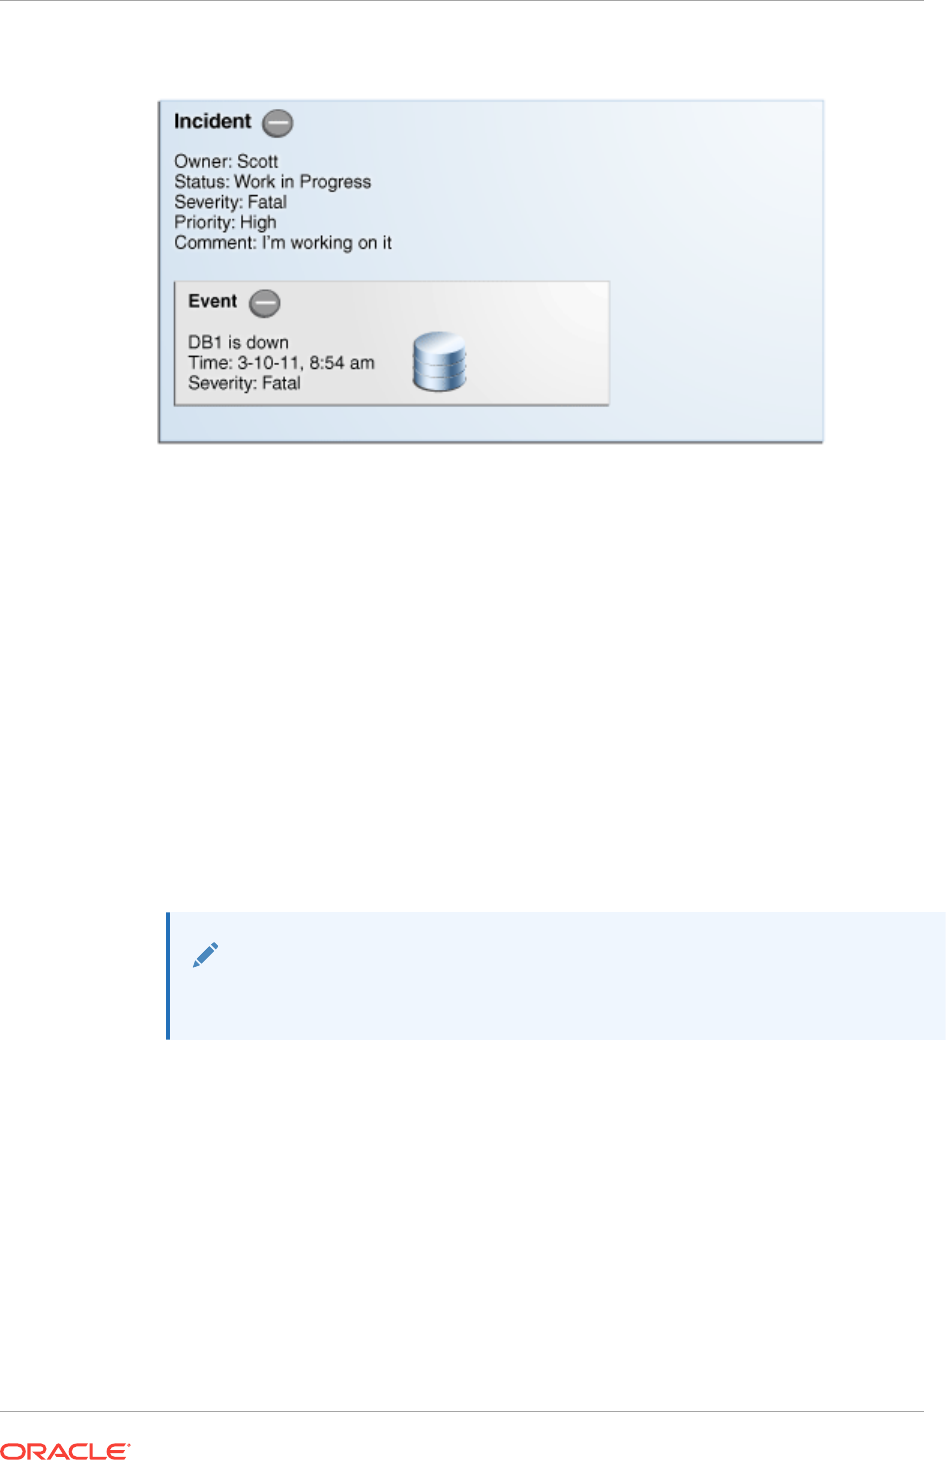
Figure 2-1 Incident with a Single Event
The figure shows how both the incident and event attributes are used to help you
manage the incident. From the figure, we see that the database DB1 has gone down
and an event of Fatal severity has been raised. When the event is newly generated,
there is no ownership or status. An incident is opened that can be updated manually or
by automated rules to set owners, status, as well as other attributes. In the example,
the owner/administrator Scott is currently working to resolve the issue.
The incident severity is currently Fatal as the incident inherits the worst severity of all
the events within incident. In this case there is only one event associated with the
incident so the severity is Fatal.
2.1.2.3 Incident Composed of Multiple Events
Situations of interest may involve more than a single event. It is an incident's ability to
contain multiple events that allows you to monitor and manage complex and more
meaningful issues.
Note:
Multi-event incidents are not automatically generated.
For example, if a monitored system is running out of space, separate multiple events
such as tablespace full and filesystem full may be raised. Both, however, are related to
running out of space. Another machine resource monitoring example might be the
simultaneous raising of CPU utilization, memory utilization, and swap utilization
events. See "Creating an Incident Manually" for more information. Together, these
events form an incident indicating extreme load is being placed on a monitored host.
The following figure illustrates this example.
Chapter 2
Management Concepts
2-10
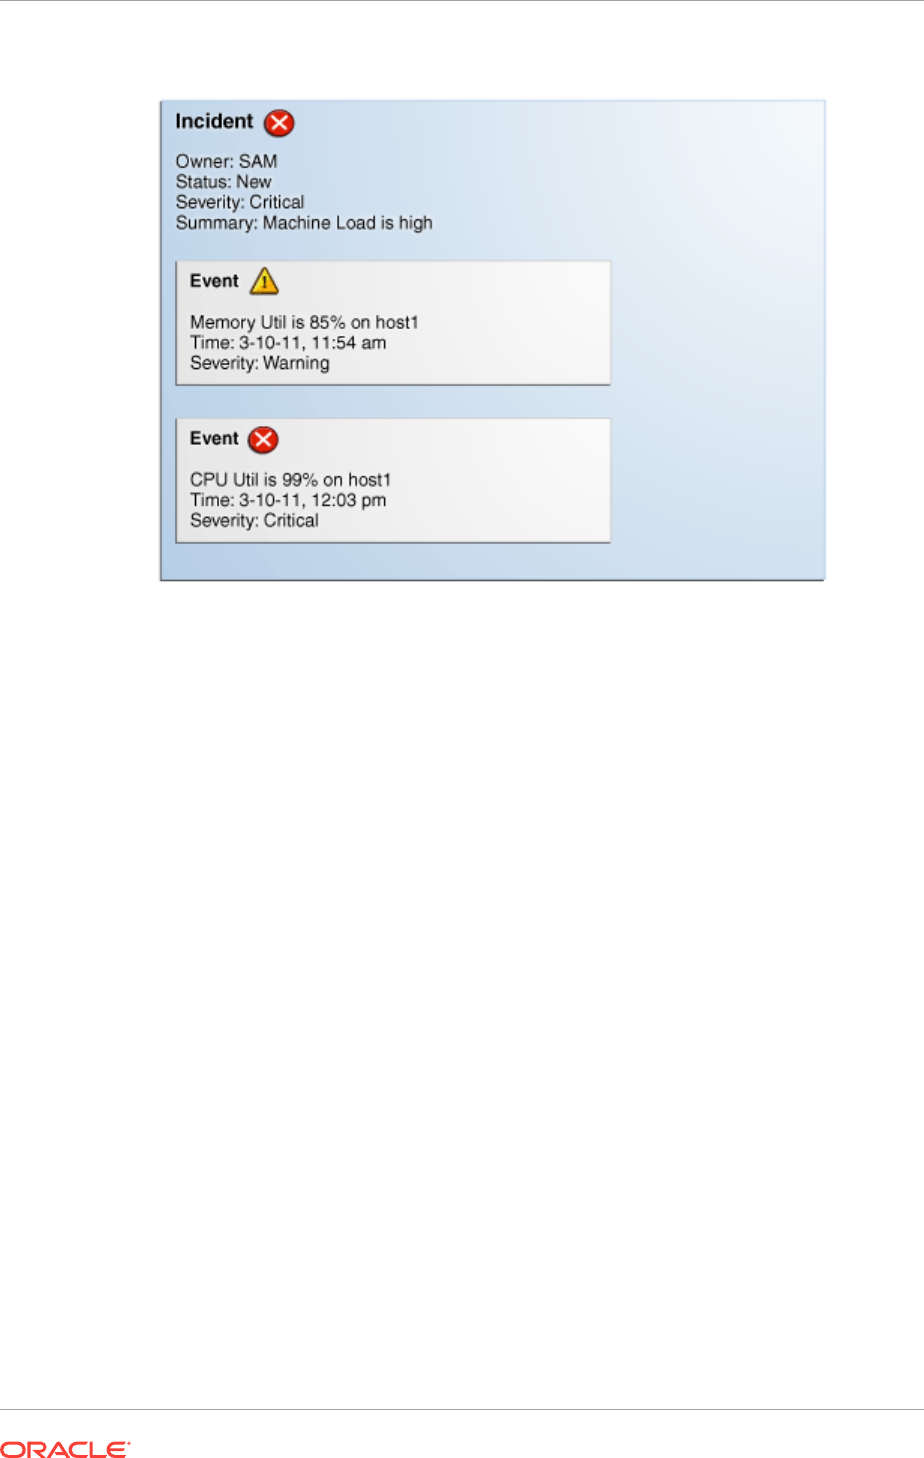
Figure 2-2 Incident with Multiple Events
Incidents inherit the worst severity of all the events within incident. The incident
summary indicates why this incident should be of interest, in this case, "Machine Load
is high". This message is an intuitive indicator for all administrators looking at this
incident. By default, the incident summary is pulled from the message of the last event
of the incident, however, this message can be changed by any administrator working
on the incident.
Because administrators are interested in overall machine load, administrator Sam has
manually created an incident for these two metric events because they are related—
together these events represent a host overload situation. An administrator needs to
take action because memory is filling up and consumed CPU resource is too high. In
its current state, this condition will impact any applications running on the host.
2.1.2.4 How are Incidents Created?
Incidents are most commonly created automatically through rules and rule sets (user-
defined instructions that tell Incident Manager how to handle specific events when they
occur). As shown in the preceding examples, incidents can also be created manually.
Once an incident is raised, its severity is inherited from the worst severity of all events
within the incident. The latest event Message, by default, becomes the Incident
Summary. Beginning with Enterprise Manager 13c, you can also define customized
messages for grouped incidents. Incidents can also be created manually. See
"Creating an Incident Manually" for more information.
2.1.3 Problem Management
Problem management involves the functionality that helps track the underlying root
causes of incidents. Once the immediate service disruptions represented by incidents
are resolved, you can then progress to understanding and resolving the underlying
root cause of the issue.
Chapter 2
Management Concepts
2-11

For Enterprise Manager 12c, problems focus on the diagnostic incidents and problem
diagnostic incidents/problems stored in Advanced Diagnostic Repository (ADR), which
are automatically raised by Oracle software when it encounters critical errors in the
software. A problem, therefore, represents the root cause of all the Oracle software
incidents. For these diagnostic incidents, in order to address root cause, a problem is
created that represents the root cause of these diagnostic incidents. A problem is
identified by a problem key which uniquely identifies the particular error in software.
Each occurrence of this error results in a diagnostic incident which is then associated
with the problem object.
When a problem is raised for Oracle software, Oracle has determined that the
recommended recourse is to open a service request (SR), send support the diagnostic
logs, and eventually provide a solution from Oracle. As an incident, Enterprise
Manager makes available all tracking, diagnostic, and reporting functions for problem
management. Whenever you view all open incidents and problems, whether you are
using Incident Manager, or in context of a target/group home page, you can easily
determine what issues are actually affecting your monitored target.
To manage problems, you can use Support Workbench to package the diagnostic
details gathered in ADR and open SR. Users should then manage the problems in
Incident Manager. Access to Support Workbench functionality is available through
Incident Manager (Guided Resolution area) in context of the problem.
2.1.4 Rule Sets
Incident rules and rule sets automate actions related to events, incidents and
problems. They can automate the creation of incidents based on important events,
perform notification actions such as sending email or opening helpdesk tickets, or
perform operations to manage the incident workflow lifecycle such as changing
incident ownership, priority, or escalation level.
With previous versions of Enterprise Manager, you used notification rules to choose
the individual targets and conditions for which you want to perform actions or receive
notifications (send email, page, open a helpdesk ticket) from Enterprise Manager. For
Enterprise Manager 13c, the concept and function of notification rules has been
replaced with incident rules and rule sets.
•Rules: A rule instructs Enterprise Manager to take specific actions when incidents,
events, or problems occur, such as performing notifications. Beyond notifications,
rules can also instruct Enterprise Manager to perform specific actions, such as
creating incidents, updating incidents and problems. The actions can also be
conditional in nature. For example, a rule action can be defined to page a user
when an incident severity is critical or just send email if it is warning.
•Rule Set: An incident rule set is a collection of rules that apply to a common set of
objects such as targets (hosts, databases, groups), jobs, metric extensions, or self
updates and take appropriate actions to automate the business processes
underlying event, incident and problem management.
Operationally, individual rules within a rule set are executed in a specified order as are
the rule sets themselves. Rule sets are executed in a specified order. By default, the
execution order for both rules and rule sets is the order in which they are created, but
they can be reordered from the Incident Rules UI.
The following figure shows typical rule set structure and how the individual rules are
applied to a heterogeneous group of targets.
Chapter 2
Management Concepts
2-12
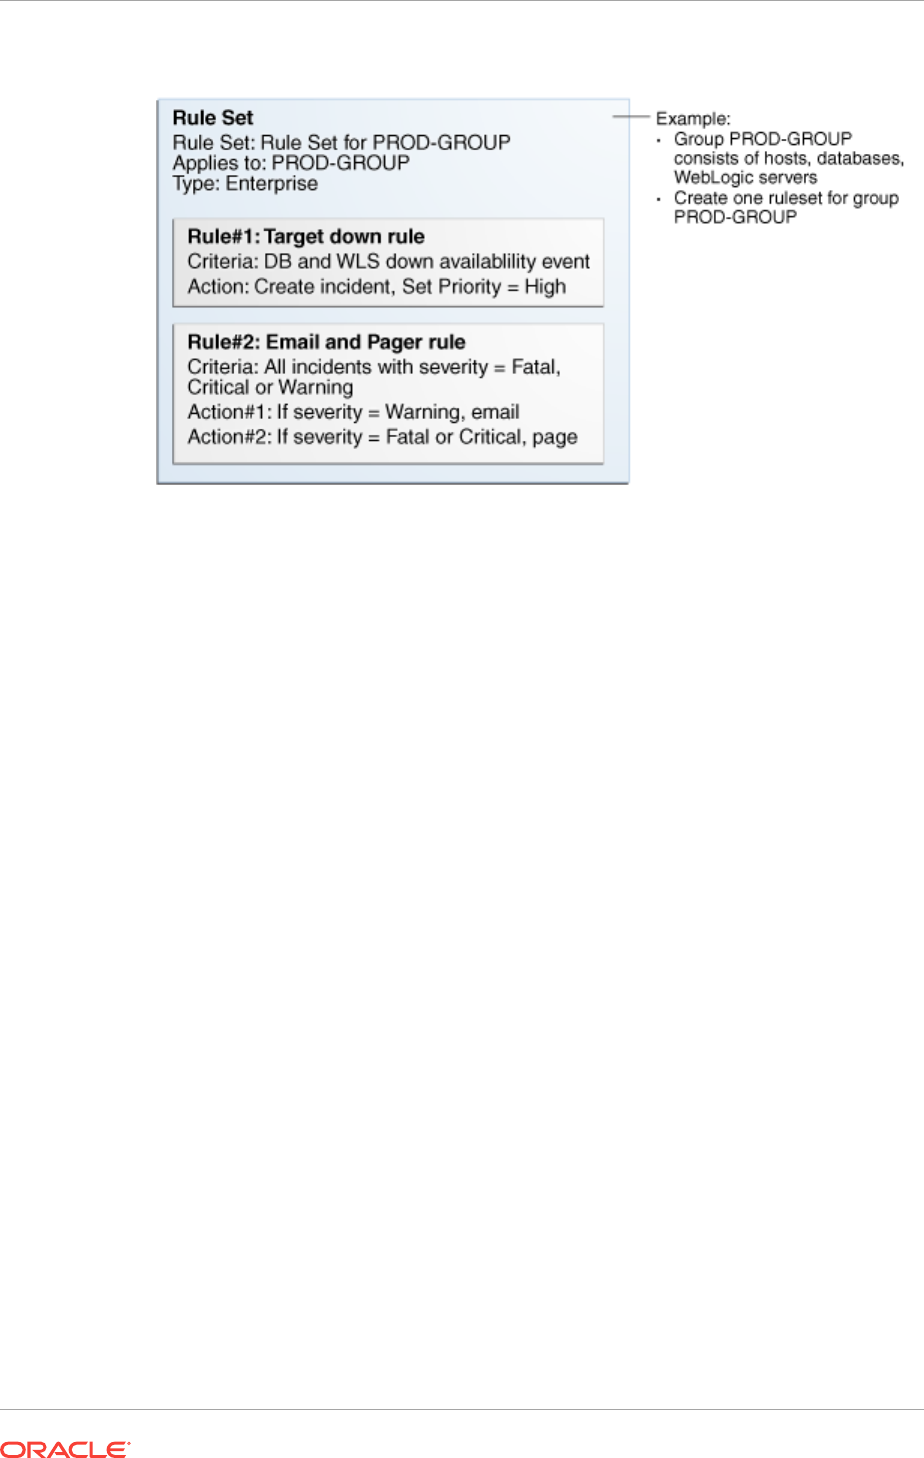
Figure 2-3 Rule Set Application
The graphic illustrates a situation where all rules pertaining to a group of targets can
be put into a single rule set (this is also a best practice). In the above example, a
group named PROD-GROUP consists of hosts, databases, and WebLogic servers
exists as part of a company's managed environment. A single rule set is created to
manage the group.
In addition to the actual rules contained within a rule set, a rule set possesses the
following attributes:
•Name: A descriptive name for the rule set.
•Description: Brief description stating the purpose of the rule set.
•Applies To: Object to which all rules in the rule set apply: Valid rule set objects
are targets, jobs, metric extensions, and self update.
•Owner: The Enterprise Manager user who created the rule set. Rule set owners
have the ability to update or delete the rule set and the rules in the rule set.
•Enabled: Whether or not the rule set is actively being applied.
•Type: Enterprise or Private. See "Rule Set Types"
2.1.4.1 Out-of-Box Rule Sets
Enterprise Manager provides out-of-box rule sets for incident creation and event
clearing based on typical scenarios. Out-of-box rule sets cannot be edited or deleted,
however, they can be disabled. As a best practice, you should create your own copies
of out-of-box rule sets and then subscribe to the rule set copies rather than subscribing
directly to the out-of-box rule sets. Effectively, you are making a copy of the rule set
and changing the target criteria to fit your enterprise needs by selecting an appropriate
group of targets (preferably an administration group).
Please note that out-of-box rule set definitions and actions they perform can be
changed by Oracle at any time and will be applied during patching or software
upgrade.
Chapter 2
Management Concepts
2-13

Regular Enterprise Manager administrators are allowed to perform the following
operations on rule sets:
•Subscribe
•Subscribe for email notifications
•Unsubscribe
•Unsubscribe from email notifications
•Enable
•Disable
Note:
Even though administrators can subscribe to a rule set, they will only receive
notification from the targets for which they have at least the View Target
privilege.
Enterprise Manager Super Administrators have the added ability to reorder the rule
sets.
Enterprise rule sets are evaluated sequentially and may go through multiple passes as
needed. When there is a change to the entity being processed - such as an incident
being created for an event or an incident priority changing due to a rule - we rerun
through all the rules from the beginning again until there are no matches. Any rule that
is matched in a prior pass will not match again (to prevent infinite loops).
For example, when a new event, incident, or problem arises, the first rule set in the list
is checked to see if any of its member rules apply and appropriate actions specified in
those rules are taken. The second rule is then checked to see if its rules apply and so
on. Private rule sets are only evaluated once all enterprise rule set evaluations are
complete and in no particular order.
Note:
Use caution when reordering rule sets as their order defines the event,
incident, and problem handling workflow. Reordering rule sets without fully
understanding the impact on your system can result in unintended actions
being taken on incoming events, incidents, and problems.
2.1.4.2 Rule Set Types
There are two types of Rule Sets:
•Enterprise: Used to implement all operational practices within your IT
organization. All supported actions are available for this type of rule set. However,
because this type of rule set can perform all actions, there are restrictions as to
who can create an enterprise rule set.
In order to create or edit an enterprise rule set, an administrator must have been
granted the Create Enterprise Rule Set privilege on the Enterprise Rule Set
Chapter 2
Management Concepts
2-14

resource. However, if the rule set owner loses the Create Enterprise Rule Set
system privilege at some future time, he can still edit or delete the rule set. Super
Administrators can edit or delete any rule set. If the originator of the rule set wants
other administrators to edit the rule set, he will need to share access in order to
work collaboratively by adding co-authors. Enterprise rule sets are visible to all
administrators.
•Private: Used when an administrator wants to be notified about something he is
monitoring but not as a standard business practice. The only action a private rule
set can perform is to send email to the rule set owner. Any administrator can
create a private rule set regardless of whether they have been granted the Create
Enterprise Rule Set resource privilege. Oracle recommends that private rule sets
be used only in rare or exceptional situations.
When a rule set performs actions, the privileges of the rule set creator are used. For
example, a rule set owner/creator must have at least View Target privilege in order to
receive notifications and at least Manage Target Events privilege in order to update
the incident. The exception is when a rule set sends a notification. In this case, the
privileges of the user it is sent to is used.
2.1.4.3 Rules
Rules are instructions within a rule set that automate actions on incoming events or
incidents or problems. Because rules operate on incoming incidents/events/problems,
if you create a new rule, it will not act retroactively on incidents/events/problems that
have already occurred.
Every rule is composed of two parts:
•Criteria: The events/incidents/problems on which the rule applies.
•Action(s): The ordered set of one or more operations on the specified events,
incidents, or problems. Each action can be executed based on additional
conditions.
The following table shows how rule criteria and actions determine rule application. In
this rule operation example there are three rules which take actions on selected events
and incidents. Within a rule set, rules are executed in a specified order. The rule
execution order can be changed at any time. By default, rules are executed in the
order they are created.
Table 2-2 Rule Operation
Rule
Name
Execution
Order
Criteria Condition Actions
Rule 1 First CPU Util(%), Tablespace
Used(%) metric alert
events of warning or
critical severity
_ Create incident.
Rule 2 Second Incidents of warning or
critical severity
If severity = critical
If severity =warning
Notify by page
Notify by email
Rule 3 Third Incidents are
unacknowledged for more
than six hours
_ Set escalation level to 1
Chapter 2
Management Concepts
2-15

In the rule operation example, Rule 1 applies to two metric alert events: CPU
Utilization and Tablespace Used. Whenever these events reach either Warning or
Critical severity threshold levels, an incident is created.
When the incident severity level (the incident severity is inherited from the worst event
severity) reaches Warning, Rule 2 is applied according to its first condition and
Enterprise Manager sends an email to the administrator. If the incident severity level
reaches Critical, Rule 2's second condition is applied and Enterprise Manager sends a
page to the administrator.
If the incident remains open for more than six hours, Rule 3 applies and the incident
escalation level is increased from None to Level 1. At this point, Enterprise Manager
runs through all the rule sets and their rules from the beginning again.
2.1.4.3.1 Rule Application
Each rule within a rule set applies to an event, incident OR problem. For each of
these, you can choose rule application criteria such as:
•Apply the rule to incoming events or updated events only
•Apply the rule to critical events only.
Rules are applied to events, incidents, and problems according to criteria selected at
the time of rule creation (or update). The following situations illustrate the methodology
used to apply rules.
•If one of the rules creates a new incident in response to an incoming event,
Enterprise Manager finishes matching the event to any further rules/rule sets.
Once completed, Enterprise Manager then matches the newly created incident to
all the rule sets from the beginning to see if any incident-specific rules match.
•If an incoming event is already associated with an incident (for example, a
Warning event creates an incident and then a Critical event is generated for the
same issue), Enterprise Manager applies all the matching rules to the event and
then matches all rules to the incident.
•If, while applying a rule to an incident, changes are made to the incident (change
priority. for example), Enterprise Manager stops rule application at that point and
then re-applies the rules to the incident from the beginning. The conditional action
that updated the incident will not be matched again in the same rule application
cycle.
2.1.4.3.2 Rule Criteria
The following tables list selectable criteria for each type.
Table 2-3 Rule Criteria: Events
Criteria Description
Type Rule applies to a specific event type.
Severity Rule applies to a specific event severity.
Category Rule applies to a specific event category.
Target type Rule applies to a specific target type.
Chapter 2
Management Concepts
2-16

Table 2-3 (Cont.) Rule Criteria: Events
Criteria Description
Target Lifecycle Status Rule applies to a specific lifecycle status for a target. Lifecycle
status is a target property that specifies a target's operational
status.
Associated with incident Typically, events are associated with incidents through rules.
Specify Yes or No.
Event name Rule applies to events with a specific name. The specified name
can either be an exact match or a pattern match.
Causal analysis update Upon completion of Root Cause Analysis (RCA) event, the rule
applies to the event that is marked either as root cause or
symptom. Alternatively, the rule can act on an RCA event when
it is no longer a symptom.
Associated incident
acknowledged
Rule applies to an event that is associated with a specific
incident when that incident is acknowledged by an administrator.
Specify Yes or No.
Total occurrence count For duplicated events, the rule is applies when the total number
of event occurrences reaches a specified number.
Comment added Rule applies to events where an administrator adds a comment.
For incidents, a rule can apply to all new and/or updated incidents, or newly created
incidents that match specific criteria shown in the following table.
Table 2-4 Rule Criteria: Incidents
Criteria Description
Rules that created the
incident
Rule applies to incidents raised by a specific rule.
Category Rule applies to a specific incident category.
Target Type Rule applies to a specific target type.
Target Lifecycle Status Rule applies to a specific lifecycle status for a target. Lifecycle
status is a target property that specifies a target's operational
status.
Severity Rule applies to a specific incident severity.
Acknowledged Rule applies if the incident has been acknowledged by an
administrator. Specify Yes or No.
Owner Rule applies for a specified incident owner.
Priority Rule applies when incident priority matches a selected priority.
Status Rule applies when the incident status matches a selected
incident status.
Escalation Level Rule applies when the incident escalation level matches the
selected level. Available escalation levels: None, Level 1, Level
2, Level 3, Level 4, Level 5
Associated with Ticket Rule applies when the incident is associated with a helpdesk
ticket. Specify Yes or No.
Associated with Service
Request
Rule applies when the incident is associated with a service
request. Specify Yes or No.
Chapter 2
Management Concepts
2-17

Table 2-4 (Cont.) Rule Criteria: Incidents
Criteria Description
Diagnostic Incident Rule applies when the incident is a diagnostic incident. Specify
Yes or No.
Unassigned Rule applies if the newly raised incident does not have an owner.
Comment Added Rule applies if an administrator adds a comment to the incident.
For problems, a rule can apply to all new and/or updated problems, or newly created
problems that match specific criteria shown in the following table.
Table 2-5 Rule Criteria: Problems
Criteria Description
Problem key Each problem has a problem key, which is a text string that
describes the problem. It includes an error code (such as ORA
600) and in some cases, one or more error parameters.
Rule can apply to a specific problem key or a key matching a
specific pattern (using a wildcard character).
Category Rule applies to a specific problem category.
Target Type Rule applies to a specific target type.
Target Lifecycle Status Rule applies to a specific lifecycle status for a target. Lifecycle
status is a target property that specifies a target's operational
status.
Acknowledged Rule applies when the problem is acknowledged.
Owner Rule applies for a specified problem owner.
Priority Rule applies when problem priority matches a selected priority.
Status Rule applies when the problems matches a specific status.
Escalation Level Rule applies when the problem escalation level matches the
selected level. Available escalation levels: None, Level 1, Level
2, Level 3, Level 4, Level 5
Incident Count Rule applies when the number of incidents related to the
problem reaches the specified count limit. The problem owner
and the Operations manager are notified via email.
Associated with Service
Request
Rule applies if the incoming problem is has an associated
Service Request. Specify Yes or No.
Associated with Bug Rule applies if the incoming problem is has an associated bug.
Specify Yes or No.
Unassigned Rule applies if the newly raised incident does not have an owner.
Comment Added Rule applies if an administrator adds a comment to the problem.
2.1.4.3.3 Rule Actions
For each rule, Enterprise Manager allows you to define specific actions.
Some examples of the types of actions that a rule set can perform are:
•Create an incident based on an event.
Chapter 2
Management Concepts
2-18

•Perform notification actions such as sending an email or generating a helpdesk
ticket.
•Perform actions to manage incident workflow notification via email/PL/SQL
methods/ SNMP traps. For example, if a target down event occurs, create an
incident and email administrator Joe about the incident. If the incident is still open
after two days, set the escalation level to one and email Joe's manager.
The following table summarizes available actions for each rule application.
Table 2-6 Available Rule Actions
Action Event Incident Problem
Email Yes Yes Yes
Page Yes Yes Yes
Advanced Notifications
Send SNMP Trap Yes No No
Run OS Command Yes Yes Yes
Run PL/SQL Procedure Yes Yes Yes
Create an Incident Yes No No
Set Workflow Attributes Yes
Note: Within an event
rule, the workflow
attributes of the
associated incident can
also be updated.
Yes Yes
Create a Helpdesk Ticket Yes
Note: Action performed
indirectly by first
creating an incident and
then creating a ticket for
the incident.
Yes No
Note:
you can test rule actions against targets without actually performing the
actions using Enterprise Manager's event rule simulation feature. For more
information, see "Testing Rule Sets".
2.1.5 Incident Manager
Incident Manager provides, in one location, the ability to search, view, manage, and
resolve incidents and problems impacting your environment. Use Incident Manager to
perform the following tasks:
•Filter incidents, problems, and events by using custom views
•Search for specific incidents by properties such as target name, summary, status,
or target lifecycle status
•Respond and work on an incident
Chapter 2
Management Concepts
2-19

•Manage incident lifecycle including assigning, acknowledging, tracking its status,
prioritization, and escalation
•Access (in context) My Oracle Support knowledge base articles and other Oracle
documentation to help resolve the incident.
•Access direct in-context diagnostic/action links to relevant Enterprise Manager
functionality allowing you to quickly diagnose or resolve the incident.
For example, you have an open incident. You can use Incident Manager to track its
ownership, its resolution status, set the priority and, if necessary, add annotations to
the incident to share information with others when working in a collaborative
environment. In addition, you have direct access to pertinent information from MOS
and links to other areas of Enterprise Manager that will help you resolve issues
quickly. By drilling down on an open incident, you can access this information and
modify it accordingly.
Displaying Target Information in the Context of an Incident
You can directly view information about a target for which an incident or event has
been raised. The type of information shown varies depending on the target type.
To display in-context target information:
1. From the Enterprise menu, select Monitoring and then Incident Manager.
2. From the Incident Manager UI, choose an incident. Information pertaining to the
incident displays.
3. From the Incident Details area of the General tab, click on the information icon "i"
next to the target. Target information as it pertains to the incident displays.
Being able to display target information in this way provides you with more operational
context about the targets on which the events and incidents are raised. This in turn
helps you manage the lifecycle of the incident more efficiently.
Cloud Control Mobile
Also available is the mobile application Cloud Control Mobile, which lets you manage
incidents and problems on the go using any iDevice to remotely connect to Enterprise
Manager.
For more information about this mobile application, see Remote Access To Enterprise
Manager
2.1.5.1 Views
Views let you work efficiently with incidents by allowing you to categorize and focus on
only those incidents of interest. A view is a set of search criteria for filtering incidents
and problems in the system. Incident Manager provides a set of predefined standard
views that cover the most common event, incident, and problem search scenarios. In
addition, Incident Manager also allows you to create your own custom views. Custom
views can be shared with other users. For instructions on creating custom views, see
"Setting Up Custom Views". For instructions on sharing a custom view, see "Sharing/
Unsharing Custom Views".
2.1.6 Summing Up
•Event: A significant occurrence of interest on a target that has been detected by
Enterprise Manager.
Chapter 2
Management Concepts
2-20

Goal: Ensure that your environment is monitored.
•Incident: A set of significant events or combination of related events that pertain
to the same issue.
Goal: Ensure that service disruptions are either avoided or resolved quickly.
•Problems: The underlying root cause of incidents. Currently, this represents
critical errors in Oracle software that represents the underlying root cause of
diagnostic incidents.
Goal: Ensure underlying root causes of issues are resolved to avoid future
occurrence of issues.
Events, incidents, and problems work in concert to allow you to manage your complete
IT ecosystem both effectively and efficiently. The following illustration summarizes how
they work within your managed environment.
Figure 2-4 Event/Incident/Problem Flow
Chapter 2
Management Concepts
2-21

The following sections delve into events, incidents, and problems in more detail.
2.2 Setting Up Your Incident Management Environment
Before you can monitor and manage your environment using incidents, you must
ensure that your monitoring environment is properly configured. Proper configuration
consists of the following:
•Setting Up Your Monitoring Infrastructure
•Setting Up Administrators and Privileges
•Monitoring Privileges
•Setting Up Rule Sets
2.2.1 Setting Up Your Monitoring Infrastructure
The first step in setting up your monitoring infrastructure is to determine which
conditions need to be monitored and hence are the source of events. To prevent an
inordinate number of extraneous events from being generated, thus reducing system
and administrator overhead, you need to determine what is of interest to you and
enable monitoring based on your requirements. You can leverage Enterprise Manager
features such as Administrations Groups to automatically apply management settings
such as monitoring settings or compliance standards when new targets are added to
your monitored environment. This greatly simplifies the task of ensuring that events
are raised only for those conditions in which you are interested. For more information,
see Using Administration Groups .
Example: You want to ensure that the database containing your human resource
information is available round the clock. One condition you are monitoring for is
whether that database target is up or down. If it goes down, you want the appropriate
person to be notified and have them resolve the problem as quickly as possible. Other
conditions that you may want to monitor include performance threshold violations, any
changes in application configuration files, or job failures. Working with events, you are
monitoring and managing individual targets and issues directly related to those targets.
For example, you monitor for individual database availability, individual host threshold
violations such as CPU and I/O load, or perhaps the performance of a Web service.
In general, if you are primarily interested in availability and some key performance
related metrics, you should use default monitoring templates and other template
features to ensure the only those specific metrics are collected and events are raised
only for those metrics.
Job Events: The status of a job can change throughout its lifecycle - from the time it is
submitted to the time it has executed. For each of these job statuses, events can be
raised to notify administrators of the status of the job.
As a general rule, events should be generated only for job status values that require
administration attention. These job status values include Action Required and Problem
status values such as Failed or Stopped. However, in order to avoid overloading the
system with unnecessary events, job events are not enabled for any target by default.
Hence, if you would like to generate events for jobs, you must:
1. Set the appropriate job status. You can use the default settings or modify them as
required.
Chapter 2
Setting Up Your Incident Management Environment
2-22

2. Specify the set of targets for which you would like job-related events to be
generated.
You can perform these operations from the Job Event Generation Criteria page.
From the Setup menu, choose Incidents and then Job Events.
2.2.1.1 Rule Set Development
Before creating incident rules/rule sets, the first step is to strategically determine when
incidents should be created based on the business requirements of your organization.
Important questions to consider are:
1. What events should create incidents? Which service disruptions need to be
tracked and resolved by IT administrators?
2. Which administrators should be notified for incoming events or incidents?
3. Are any of the events or incidents being forwarded to external systems (such as a
helpdesk ticketing system)?
Example 2-1 Example Rule Set
•Rule Set applies to target: Group Target G
•Rules in the Rule Set:
1. Rule(s) to create incidents for specified events
2. Rule(s) that send notifications on incidents
3. Rule(s) that escalate incidents based on some condition. For example, the
length of time an incident is open.
Example 2-2 Example Rule Set in Greater Detail
•Rule Set for Production Group G
–Target: Production Group G
–Rule 1: Create an incident for all target down events.
–Rule 2: Create an incident for specific database, host, and WebLogic Server
metric alert event of critical or warning severity.
–Rule 3: Create an incident for any problem job events.
–Rule 4: For all critical incidents, sent a page. For all warning incidents, send
email.
–Rule 5: If a Fatal incident is open for more than 12 hours, set the escalation
level to 1 and email a manager.
Once the exact business requirements are understood, you translate those into
enterprise rule sets. Adhering to the following guidelines will result in efficient use of
system resource as well as operational efficiency.
•For rule sets that operate on targets (for example, hosts and databases), use
groups to consolidate targets into a smaller number of monitoring entities for the
rule set. Groups should be composed of targets that have similar monitoring
requirements including incident management and response.
•All the rules that apply to the same groups of targets should be consolidated into
one rule set. You can create multiple rules that apply to the targets in the rule set.
You can create rules for events specific to an event class, rules that apply to
Chapter 2
Setting Up Your Incident Management Environment
2-23

events of a specific event class and target type, or rules that apply to incidents on
these targets.
•Leverage the execution order of rules within the rule set. Rule sets and rules within
a rule set are executed in sequential order. Therefore, ensure that rules and rule
sets are sequenced with that in mind.
When creating a new rule, you are given a choice as to what object the rule will apply
— events, incidents or problems. Use the following rule usage guidelines to help guide
your selection.
Table 2-7 Rule Usage Guidelines
Rule Usage Application
Rules on Event To create incidents for the events managed in Enterprise
Manager.
To send notifications on events.
To create tickets for incidents managed by helpdesk analysts,
you want to create an incident for an event, then create a ticket
for the incident.
Send events to third-party management systems.
Rules on Incidents Automate management of incident workflow operations (assign
owner, set priority, escalation levels..) and send notifications
Create tickets based on incident conditions. For example, create
a ticket if the incident is escalated to level 2.
Rules on Problems Automate management of problem workflow operations (assign
owner, set priority, escalation levels..) and send notifications
Rule Set Example
The following example illustrates many of the implementation guidelines just
discussed. All targets have been consolidated into a single group, all rules that apply
to group members are part of the same rule set, and the execution order of the rules
has been set. In this example, the rule set applies to a group (Production Group G)
that consists of the following targets:
•DB1 (database)
•Host1 (host)
•WLS1 (WebLogic Server)
All rules in the rule set perform three types of actions: incident creation, notification,
and escalation.
In a more detailed view of the rule set, we can see how the guidelines have been
followed.
In this detailed view, there are five rules that apply to all group members. The
execution sequence of the rules (rule 1 - rule 5) has been leveraged to correspond to
the three types of rule actions in the rule set: Rules 1-3
•Rules 1-3: Incident Creation
•Rule 4: Notification
•Rule 5: Escalation
Chapter 2
Setting Up Your Incident Management Environment
2-24

By synchronizing rule execution order with the progression of rule action categories,
execution efficiency is achieved. As shown in this example, by using conditional
actions that take different actions for the same set of events based on severity, it is
easier to change the event selection criteria in the future without having to change
multiple rules. Note: This assumes that the action requirements for all incidents (from
rules 1 - 3) are the same.
The following table illustrates explicit rule set operation for this example. All targets are
within Production Group G.
Table 2-8 Example Rule Set for Production Group G
Rule
Name
Execution
Order
Criteria Triggering
Condition
Actions
Rule 1 First DB1 goes down .
Host1 goes down.
WLS1 goes down.
N/A Create incident.
Rule 2 Second DB1
Tablespace Full (%)
Note: The warning and
critical thresholds are
defined in Metric and
Policy settings, not from
the rules UI.
Host1
CPU Utilization (%)
WLS1
Heap Usage (%)
If severity=Warning
If severity=Critical
Create incident.
Rule 3 Third Event generated for
problem job status
changes for DB1, Host1,
and WLS1.
N/A Create incident.
Rule 4 Fourth All incidents for
Production Group G
Severity=Warning
Severity=Critical
Send email
Send page
Rule 5 Fifth Incident remains open for
more than 12 days.
Status=Fatal Increase escalation
level to 1.
2.2.1.1.1 Before Using Rules
Before you use rules, ensure the following prerequisites have been set up:
•User's Enterprise Manager account has notification preferences (email and
schedule). This is required not just for the administrator who is creating/editing a
rule, but also for any user who is being notified as a result of the rule action.
•If you decide to use connectors, tickets, or advanced notifications, you need to
configure them before using them in the actions page.
•Ensure that the SMTP gateway has been properly configured to send email
notifications.
Chapter 2
Setting Up Your Incident Management Environment
2-25

•User's Enterprise Manager account has been granted the appropriate privileges to
manage incidents from his managed system.
2.2.1.1.2 Setting Up Notifications
After determining which events should be raised for your monitoring environment, you
need to establish a comprehensive notification infrastructure for your enterprise by
configuring Enterprise Manager to send out email and or pages, setting up email
addresses for administrators and tagging them as email/paging. In addition, depending
on the needs of your organization, notification setup may involve configuring advanced
notification methods such as OS scripts, PL/SQL procedures, or SNMP traps. For
detailed information and setup instructions for Enterprise Manager notifications, see
Using Notifications .
2.2.2 Setting Up Administrators and Privileges
This step involves defining the appropriate administrators (which includes assigning
the proper privileges for security) and then setting up notification assignments based
on their defined roles and domain ownership within your organization.
To perform user account administration, click Setup on the Enterprise Manager home
page, select Security, then select Administrators to access the Administrators page.
There are two types of administrators typically involved in incident management.
•Business Rules Architect/Analyst: Administrator who has a deep understanding of
how the business works and translates this knowledge to operational rules. Once
these rules have been deployed, the business architect uses their knowledge of
the dynamic organization to keep these rules up-to-date.
In order to create or edit an enterprise rule set, the business architect/analyst must
have been granted the Create Enterprise Rule Set privilege on the Enterprise Rule
Set resource. The architect/analyst can share ownership of the rule sets with other
administrators who may or may not have the Create Enterprise Rule Set privilege
but are responsible for managing a specific rule set.
•IT Operator/Manager: The IT manager is responsible for day-to-day management
of incident assignment. The IT operator is assigned the incidents and is
responsible for their resolution.
Privileges Required for Enterprise Rule Sets
Chapter 2
Setting Up Your Incident Management Environment
2-26
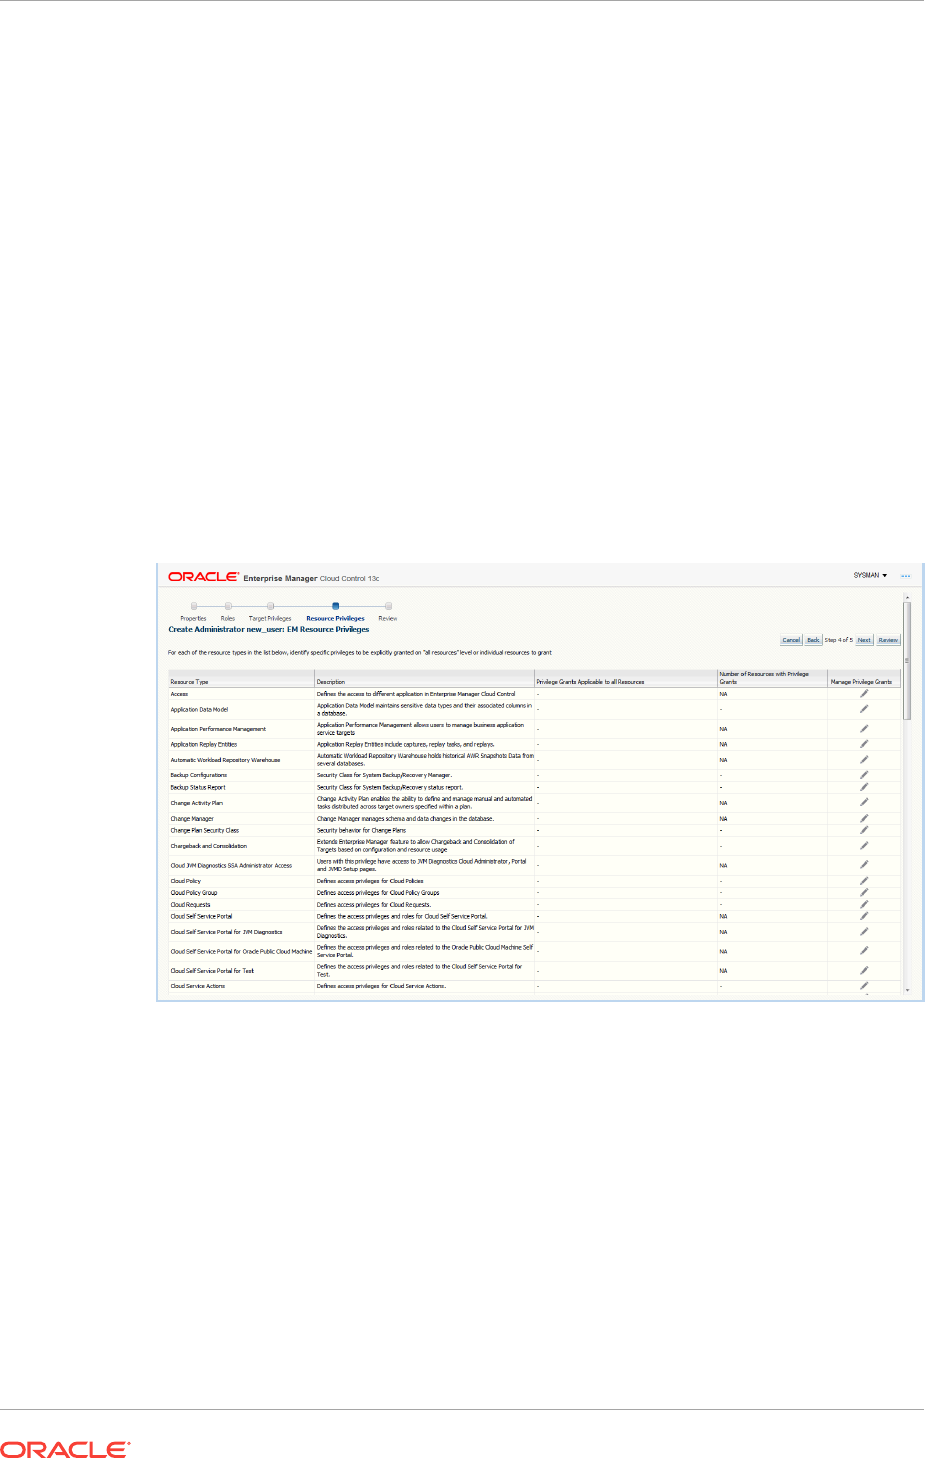
As the owner of the rule set, an administrator can perform the following:
•Update or delete the rule set, and add, modify, or delete the rules in the rule set.
•Assign co-authors of the rule set. Co-authors can edit the rule set the same as the
author. However, they cannot delete rule sets nor can they add additional co-
authors.
•When a rule action is to update an event, incident, or problem (for example,
change priority or clear an event), the action succeeds only if the owner has the
privilege to take that action on the respective event, incident, or problem.
•Additionally, user must be granted privilege to create an enterprise rule set.
If an incident or problem rule has an update action (for example, change priority), it will
take the action only if the owner of the respective rule set has manage privilege on the
matching incident or problem.
To grant privileges, from the Setup menu on the Enterprise Manager home page,
select Security, then select Administrators to access the Administrators page. Select
an administrator from the list, then click Edit to access the Administrator properties
wizard as shown in the following graphic.
Granting User Privileges for Events, Incidents and Problems
In order to work with incidents, all relevant Enterprise Manager administrator accounts
must be granted the appropriate privileges to manage incidents. Privileges for events,
incidents, and problems are determined according to the following rules:
•Privileges on events are calculated based on the privilege on the underlying
source objects. For example, the user will have VIEW privilege on an event if he
can view the target for the event.
•Privileges on an incident are calculated based on the privileges on the events in
the incident.
•Similarly, problem privileges are calculated based on privileges on underlying
incidents.
Chapter 2
Setting Up Your Incident Management Environment
2-27

Users are granted privileges for events, incidents, and problems in the following
situations.
For events, two privileges are defined in the system:
•The View Event privilege allows you to view an event and add comments to the
event.
•The Manage Event privilege allows you to take update actions on an event such
as closing an event, creating an incident for an event, and creating a ticket for an
event. You can also associate an event with an incident.
Note:
Incident privilege is inherited from the underlying events.
If an event is raised on a target alone (the majority of event types are raised on targets
such as metric alerts, availability events or service level agreement), you will need the
following privileges:
•View on target to view the event.
•Manage Target Events to manage the event.
Note: This is a sub-privilege of Operator.
If an event is raised on both a target and a job, you will need the following privileges:
•View on target and View on the job to view the event.
•View on target and Full on the job to manage the event.
If the event is raised on a job alone, you will need the following privileges:
•View on the job to view the event.
•Full on the job to manage the event.
If an event is raised on a metric extension, you will need View privilege on the metric
extension to view the event. Because events raised on metric extensions are
informational (and do not appear in Incident Manager) event management privileges
do not apply in this situation.
If an event is raised on a Self-update, only system privilege is required. Self-update
events are strictly informational.
For incidents, two privileges are defined in the system:
•The View Incident privilege allows you to view an incident, and add comments to
the incident.
•The Manage Incident privilege allows you to take update actions on an incident.
The update actions supported for an incident includes incident assignment and
prioritization, resolution management, manually closing events, and creating
tickets for incidents.
If an incident consists of a single event, you can view the incident if you can view the
event and manage the incident if you can manage the event.
Chapter 2
Setting Up Your Incident Management Environment
2-28

If an incident consists of more than one event, you can view the incident if you can
view at least one event and manage incident if you can manage at least one of the
events.
For problems, two privileges are defined:
•The View Problem privilege allows you to view a problem and add comments to
the problem.
•The Manage Problem privilege allows you to take update actions on the problem.
The update actions supported for a problem include problem assignment and
prioritization, resolution management, and manually closing the problem.
In Enterprise Manager 12c, problems are always related to a single target. So the
View Problem privilege, if an administrator has View privilege on the target, and the
Manage Problem privilege, if an administrator has manage_target_events privilege on
the target, implicitly grants management privileges on the associated event. This, in
turn, grants management privileges on the incident within the problem.
2.2.3 Monitoring Privileges
The monitoring functions that an administrator can perform within the Enterprise
Manager environment depend on privileges that have been granted to that user. To
maintain the integrity and security of a monitored infrastructure, only the required
privileges for a specific role should be granted. The following guidelines can be used
to grant proper privilege levels based on user roles.
Administrators who set up monitoring
Create a role with privileges and grant it to administrators:
•Recommend using individual user accounts instead of shared account
•If using super administrator, do not use sysman
•If privilege is based on targets, create privilege-propagating group containing the
targets (or use administration group if it meets requirements) and grant privilege
on the group to the role
Administrators who respond to events / incidents
•Create a role and grant it to administrators
•Create privilege-propagating group (or use administration group if it meets
requirements) containing relevant targets and grant appropriate privilege on the
group to the role
Example: You create the role DB_Admins and grant Manage Target Events on a the
privilege-propagating group named DB-group containing relevant databases. You then
grant role DB_Admins to the DBAs.
Monitoring Actions and Required Privileges
Enterprise Manager supports fine-grained privileges to enable more granular control
over actions performed in Enterprise Manager.
The table below shows a (non-exhaustive) list of various job responsibilities and the
corresponding privilege in Enterprise Manager required to support these
The following tables summarize the privilege levels required to perform specific
monitoring responsibilities.
Chapter 2
Setting Up Your Incident Management Environment
2-29

Table 2-9 Monitoring Operations and Required Privileges
Monitoring Operation Required Privilege(s)
Monitoring Setup _
Configure SMTP gateway (email) Super Administrator
Create Advanced Notification Methods (e.g. SNMP traps) Super Administrator
Configure event or ticketing connector Super Administrator
Creating Roles Super Administrator
Create Administration Group Hierarchy Full Any Target
Create Privilege Propagating
Group
Edit Administration Group Hierarchy Full Any Target
Create Privilege Propagating
Group (if adding new target
property values as group criteria
within a level of the administration
group hierarchy)
Delete Administration Group Hierarchy Full Any Target
View entire Administration Group hierarchy in Group
Administration pages
View Any Target
Note: Administrators who have
privileges to only a subset of the
groups can view these groups in
the Groups list page accessible via
Targets-->Groups
Use Monitoring Templates No privileges required to create
new monitoring templates.
However if the monitoring template
contains a corrective action, then
Create on Job System privilege is
required
View on specific monitoring
template to use the template
created by another user (e.g. to
add the monitoring template to a
Template Collection
Use Template Collections Create Template Collection (to
create new Template
Collections)View Template
Collection on specific Template
Collection to view/associate the
Template Collection created by
another userView Any Template
Collection to view/associate any
Template CollectionFull Template
Collection on specific Template
Collection to edit/delete the
Template Collection created by
another user
Chapter 2
Setting Up Your Incident Management Environment
2-30

Table 2-9 (Cont.) Monitoring Operations and Required Privileges
Monitoring Operation Required Privilege(s)
Associate a Template Collection with an Administration
Group
Manage Template Collection
Operations on the group (this
includes Manage Target
Compliance and Manage Target
Metrics privileges)
View Template Collection on the
Template Collection
Operations on the Administration Group _
Manage privileges on the group (for example, grant to
other users)
Group Administration on the group
Add a target to an Administration Group by setting its
target properties
Configure Target (on the target to
be added to the Administration
Group)
Perform a manual sync of the group with the associated
Template Collection
Manage Template Collection
Operations on the group
Operations on the members of the Administration
Group
_
Delete the target from Enterprise Manager Full on the target (Full also
contains the privileges enumerated
below
Set blackout for planned downtime
Change monitoring settings
Change monitoring configuration
Manage events and incidents on the target
View target, receive notifications for events or incidents
Operator on the target also
contains the following privileges:
•Blackout Target on the target
•Manage Target Metrics on the
target
•Configure Target on the target
•Manage Target Events on the
target
•View on the target
Create Incident Rule Sets Create Enterprise Rule Set
Manage Target Events on target if
rule is creating incidents for the
target
Granting privileges on administration group to roles No extra privilege required if
creator of the administration group
Set a target's property values Configure Target
Edit Monitoring Template that is part of Template
Collection
Full on the Monitoring Template
Manage Target Metrics on
administration group
Change monitoring settings on specific target Manage Target Metrics
Receive email for events, incidents View on Target and/or
View on source object (for
example, view on job for job
events)
Create incident for event Manage Target Events
Chapter 2
Setting Up Your Incident Management Environment
2-31
Table 2-9 (Cont.) Monitoring Operations and Required Privileges
Monitoring Operation Required Privilege(s)
Incident management actions (for example, acknowledge,
assign incident, prioritize, set escalation level)
Manage Target Events
Note:
SYSMAN is a system account intended for Enterprise Manager infrastructure
installation and maintenance. It should never be used for administrator access
to Enterprise Manager as a Super Administrator.
2.2.4 Setting Up Rule Sets
Rule sets automate actions in response to incoming events, incidents and problems or
updates to them. This section covers the most common tasks and examples.
•Creating a Rule Set
•Creating a Rule to Create an Incident
•Creating a Rule to Manage Escalation of Incidents
•Creating a Rule to Escalate a Problem
•Testing Rule Sets
•Subscribing to Receive Email from a Rule
•Receiving Email for Private Rules
2.2.4.1 Creating a Rule Set
In general, to create a rule set, perform the following steps:
1. From the Setup menu, select Incidents then select Incident Rules.
2. On the Incident Rules - All Enterprise Rules page, edit the existing rule set or
create a new rule set. For new rule sets, you will need to first select the targets to
which the rules apply. Rules are created in the context of a rule set.
Note:
In the case where there is no existing rule set, create a rule set by clicking
Create Rule Set... You then create the rule as part of creating the rule set.
Narrowing Rule Set Scope Based on Target Lifecycle Status
When creating a new rule set, you can choose to have the rule set apply to a
narrower set of targets based on the target's Lifecycle Status value. For example,
you can create one rule set that only applies only to targets that have a Lifecycle
Chapter 2
Setting Up Your Incident Management Environment
2-32
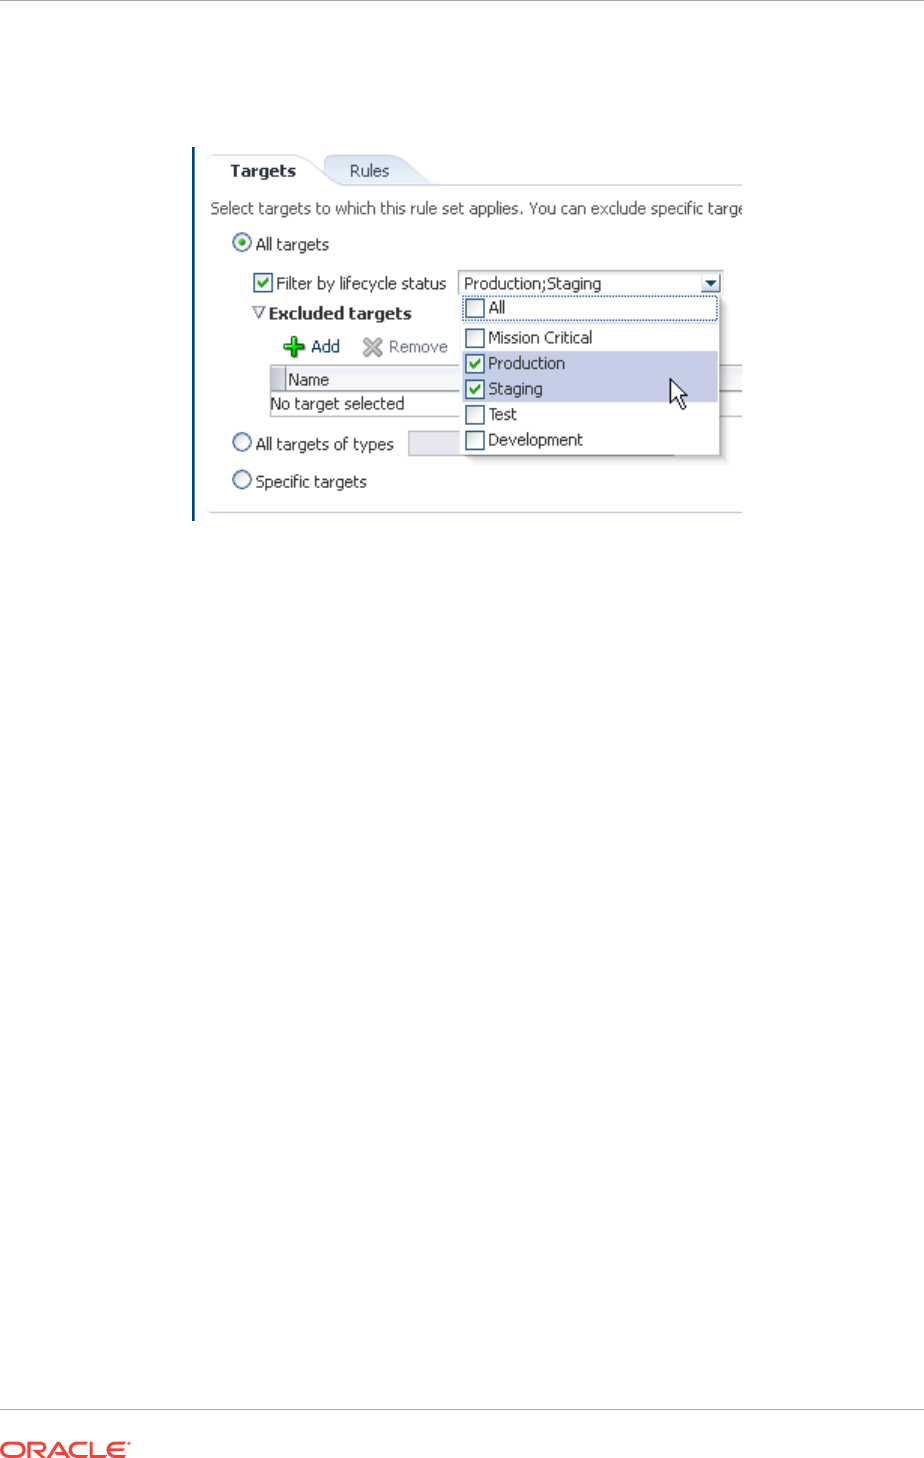
Status of Staging and Production. As shown in the following graphic, you
determine rule set scope by setting the Lifecycle Status filter.
Using this filter allows you to create rules for targets based on their Lifecycle
Status without having to first create a group containing only such targets.
3. In the Rules tab of the Edit Rule Set page, click Create... and select the type of
rule to create (Event, Incident, Problem) on the Select Type of Rule to Create pop-
up dialog. Click Continue.
4. In the Create New Rule wizard, provide the required information.
5. Once you have finished defining the rule, click Continue to add the rule to the rule
set. Click Save to save the changes made to the rule set.
2.2.4.2 Creating a Rule to Create an Incident
To create a rule that creates an incident, perform the following steps:
1. From the Setup menu, select Incidents, then select Incident Rules.
2. Determine whether there is an existing rule set that contains a rule that manages
the event. In the Incident Rules page, use the Search option to find the rule/rule
set name, description, target name, or target type for the target and the associated
rule set. You can search by target name or the group target name to which this
target belongs to locate the rule sets that manage the targets.
Note: In the case where there is no existing rule set, create a rule set by clicking
Create Rule Set... You then create the rule as part of creating the rule set.
3. Select the rule set that will contain the new rule. Click Edit... In the Rules tab of
the Edit Rule Set page,
a. Click Create ...
b. Select "Incoming events and updates to events"
c. Click Continue.
Provide the rule details using the Create New Rule wizard.
Chapter 2
Setting Up Your Incident Management Environment
2-33

a. Select the Event Type the rule will apply to, for example, Metric Alert. (Metric
Alert is available for rule sets of the type Targets.) Note: Only one event type
can be selected in a single rule and, once selected, it cannot be changed
when editing a rule.
You can then specify metric alerts by selecting Specific Metrics. The table for
selecting metric alerts displays. Click the +Add button to launch the metric
selector. On the Select Specific Metric Alert page, select the target type, for
example, Database Instance. A list of relevant metrics display. Select the ones
in which you are interested. Click OK.
You also have the option to select the severity and corrective action status.
b. Once you have provided the initial information, click Next. Click +Add to add
the actions to occur when the event is triggered. One of the actions is to
Create Incident.
As part of creating an incident, you can assign the incident to a particular user,
set the priority, and create a ticket. Once you have added all the conditional
actions, click Continue.
c. After you have provided all the information on the Add Actions page, click
Next to specify the name and description for the rule. Once on the Review
page, verify that all the information is correct. Click Back to make corrections;
click Continue to return to the Edit (Create) Rule Set page.
d. Click Save to ensure that the changes to the rule set and rules are saved to
the database.
4. Test the rule by generating a metric alert event on the metrics chosen in the
previous steps.
2.2.4.3 Creating a Rule to Manage Escalation of Incidents
To create a rule to manage incident escalation, perform the following steps:
1. From the Setup menu, select Incidents, then select Incident Rules.
2. Determine whether there is an existing rule set that contains a rule that manages
the incident. You can add it to any of your existing rule sets on incidents.
Note: In the case where there is no existing rule set, create a rule set by clicking
Create Rule Set... You then create the rule as part of creating the rule set.
3. Select the rule set that will contain the new rule. Click Edit... in the Rules tab of the
Edit Rule Set page, and then:
a. Click Create ...
b. Select "Newly created incidents or updates to incidents"
c. Click Continue.
4. For demonstration purposes, the escalation is in regards to a production database.
As per the organization's policy, the DBA manager is notified for escalation level 1
incidents where a fatal incident is open for 48 hours. Similarly, the DBA director is
paged if the incident has been escalated to level 2, the severity is fatal and it has
been open for 72 hours. If the fatal incident is still open after 96 hours, then it is
escalated to level 3 and the operations VP is notified.
Provide the rule details using the Create New Rule wizard.
Chapter 2
Setting Up Your Incident Management Environment
2-34

a. To set up the rule to apply to all newly created incidents or when the incident
is updated with fatal severity, select the Specific Incidents option and add the
condition Severity is Fatal .
b. In the Conditions for Actions region located on the Add Actions page, select
Only execute the actions if specified conditions match.
Select Incident has been open for some time and is in a particular state
(select time and optional expressions).
Select the time to be 48 hours and Status is not resolved or closed.
c. In the Notification region, type the name of the administrator to be notified by
email or page. Click Continue to save the current set of conditions and
actions.
d. Repeat steps b and c to page the DBA director (Time in this state is 72 hours,
Status is Not Resolved or Closed). If open for more than 96 hours, set
escalation level to 3, page Operations VP.
e. After reviewing added actions sets, click Next. Click Next to go to the
Summary screen. Review the summary information and click Continue to
save the rule.
5. Review the sequence of existing enterprise rules and position the newly created
rule in the sequence.
In Edit Rule Set page, click on the desired rule from the Rules table and select
Reorder Rules from the Actions menu to reorder rules within the rule set, then
click Save to save the rule sequence changes.
Example Scenario
To facilitate the incident escalation process, the administration manager creates a rule
to escalate unresolved incidents based on their age:
•To level 1 if the incident is open for 30 minutes
•To level 2 if the incident is open for 1 hour
•To level 3 if the incident is open for 90 minutes
As per the organization's policy, the DBA manager is notified for escalation level 1.
Similarly, the DBA director and operations VP are paged for incidents escalated to
levels "2" and "3" respectively.
Accordingly, the administration manager inputs the above logic and the respective
Enterprise Manager administrator IDs in a separate rule to achieve the above
notification requirement. Enterprise Manager administrator IDs represents the
respective users with required target privileges and notification preferences (that is,
email addresses and schedule).
2.2.4.4 Creating a Rule to Escalate a Problem
In an organization, whenever an unresolved problem has more than 20 occurrences of
associated incidents, the problem should be auto-assigned to the appropriate
administrator based on target type of the target on which the problem has been raised.
Accordingly, a problem rule is created to observe the count of incidents attached to the
problem and notify the appropriate administrator handling that specific target type.
The problem owner and the Operations manager are notified by email.
Chapter 2
Setting Up Your Incident Management Environment
2-35

To create a rule to escalate a problem, perform the following steps:
1. Navigate to the Incident Rules page.
From the Setup menu, select Incidents, then select Incident Rules.
2. On the Incident Rules - All Enterprise Rules page, either create a new rule set
(click Create Rule Set...) or edit an existing rule set (highlight the rule set and click
Edit...). Rules are created in the context of a rule set.
Note: In the case where there is no existing rule set, create a rule set by clicking
Create Rule Set... You then create the rule as part of creating the rule set.
3. In the Rules section of the Edit Rule Set page, select Create...
4. From the Select Type of Rule to Create dialog, select Newly created problems
or updates to problems and click Continue.
5. On the Create New Rule page, select Specific problems and add the following
criteria:
The Attribute Name is Incident Count, the Operator is Greater than or equals
and the Values is 20.
Click Next.
6. In the Conditions for Actions region on the Add Actions page select Always
execute the action. As the actions to take when the rule matches the condition:
•In the Notifications region, send email to the owner of the problem and to the
Operations Manager.
•In the Update Problem region, enter the email address of the appropriate
administrator in the Assign to field.
Click Continue.
7. Review the rules summary. Make corrections as needed. Click Continue to return
to Edit Rule Set page and then click Save to save the rule set.
2.2.4.5 Testing Rule Sets
When developing a rule set, it can be difficult to develop rule criteria to match all
possible event conditions. Previously, the only way to test rules was to trigger an event
within your monitored environment and seeing which rules match the event and what
actions the rules perform. Beginning with Enterprise Manager Release 12.1.0.4, you
can simulate existing events, thus allowing you to test rule actions during the rule set
development phase and not waiting for specific event conditions to occur. The rule
simulation feature lets you see how the rules will perform given a specific event. You
immediately see which rules match for a given event and then see what actions are
taken.
Note:
The simulate rule feature can only be used with event rules. Incident rules
cannot be tested with this feature.
To simulate rules:
Chapter 2
Setting Up Your Incident Management Environment
2-36

This procedure assumes you have already created rule sets. See "Creating a Rule
Set" for instructions on creating a rule set. Ensure that the rule type is Incoming events
and updates to events.
1. From the Setup menu, select Incidents, and then Incident Rules. The Incident
Rules - All Enterprise Rules page displays.
2. Click Simulate Rules. The Simulate Rules dialog displays.
3. Enter the requisite search parameters to find matching events and click Search.
4. Select an event from the list of results.
5. Click Start Simulation. The event will be passed through the rules as if the event
had newly occurred. Rules will be simulated based on the current notification
configuration (such as email address, schedule for the assigned administrator, or
repeat notification setting).
Changing the Target Name: Under certain circumstances, an event matching
rule criteria may occur on a target that is not a rule target. For testing purposes,
you are only interested in the event. To use the alternate target for the simulation,
click Alter Target Name and Start Simulation.
Results are displayed.
Chapter 2
Setting Up Your Incident Management Environment
2-37
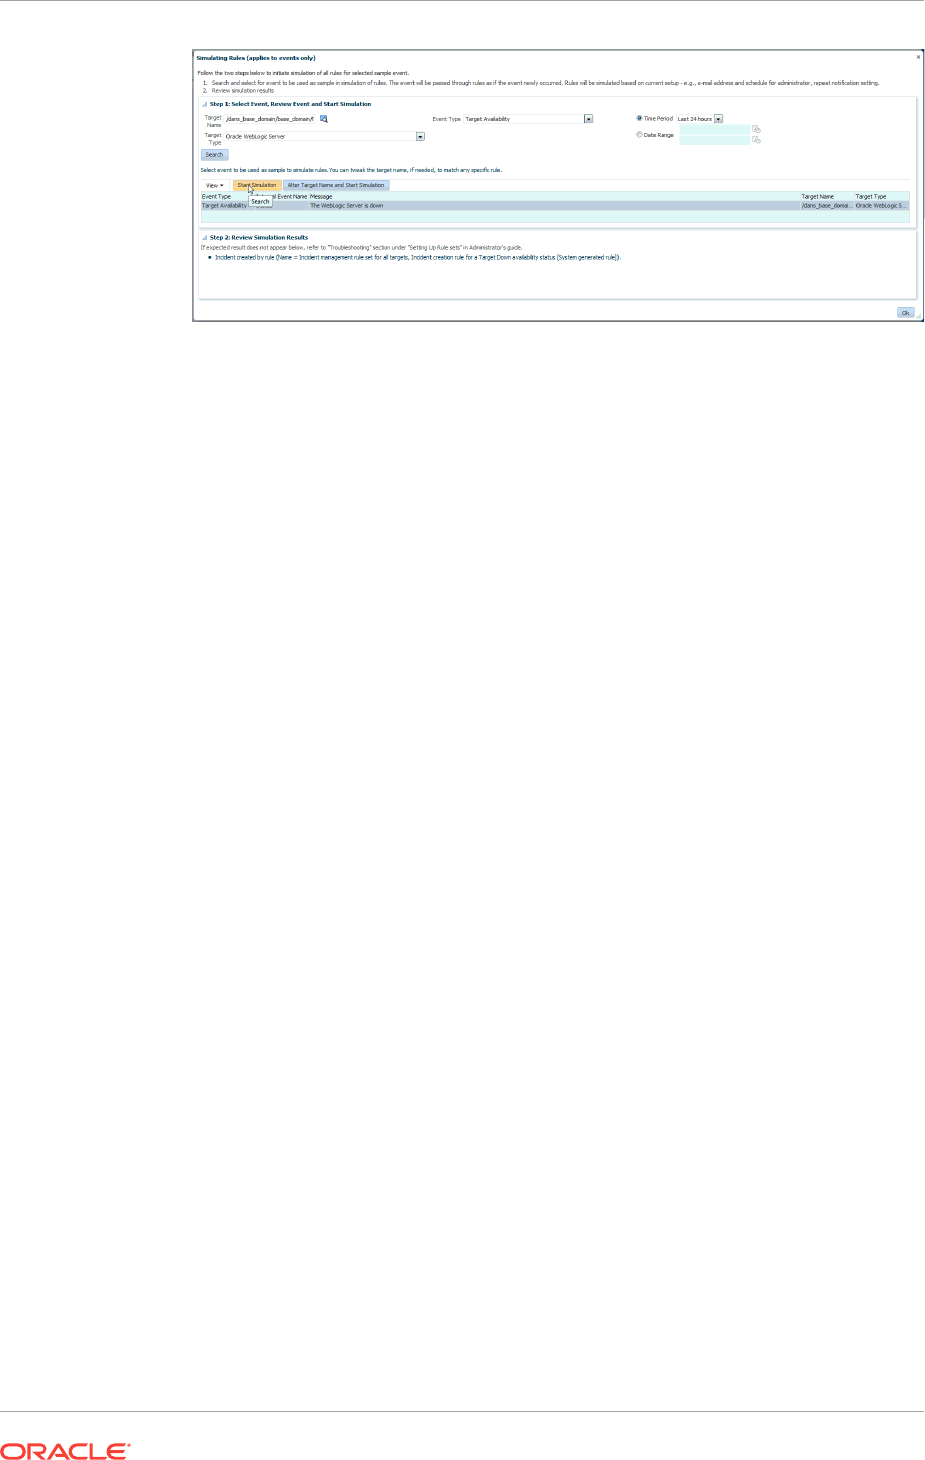
Testing Event Rules on a Production Target: Although you can generate an
event on a test target, you may want to check the actions on a production target
for final verification. You can safely test event rules on production targets without
performing rule actions (sending email, SNMP traps, opening trouble tickets). To
test your event rule on a production target, change the Target Name to a
production target. When you run the simulation, you will see a list of actions to be
performed by Enterprise Manager. None of these actions, however, will actually be
performed on the production target.
6. If the rule actions are not what you intended, edit the rules and repeat the rule
simulation process until the rules perform the desired actions. The following
guidelines can help ensure predictable/expected rule simulation results.
If you do not see a rule action for email:
•Make sure there is a rule that includes that event and has an action to send
email.
•If the specified email recipient is an Enterprise Manager administrator, make
sure that administrator has an email address and notification schedule set up.
•Make sure the email recipient has at least View privileges on the target of the
event.
•Check the SMTP gateway setup and make sure that the administrator has
performed a Test Email.
If you do not see other rule actions such as creating an incident or opening a
ticket:
•Make sure there is a rule that includes the event and corresponding action
(create incident, for example).
•Make sure the target is included in the rule set.
•Make sure the rule set owner has at least Manage Events target privilege on
the target of the event.
•For notifications such as Open Ticket, Send SNMP trap, or Call Event
Connector, make sure these are specified as actions in the event rule.
2.2.4.6 Subscribing to Receive Email from a Rule
A DBA is aware that incidents owned by him will be escalated when not resolved in 48
hours. The DBA wants to be notified when the rule escalates the Incident. The DBA
Chapter 2
Setting Up Your Incident Management Environment
2-38

can subscribe to the Rule, which escalates the Incident and will be notified whenever
the rule escalates the Incident.
Before you set up a notification subscription, ensure there exists a rule that escalates
High Priority Incidents for databases that have not been resolved in 48 hours
Perform the following steps:
1. From the Setup menu, select Incidents, and then select Incident Rules.
2. On the Incident Rules - All Enterprise Rules page, click on the rule set containing
incident escalation rule in question and click Edit... Rules are created in the
context of a rule set.
Note: In the case where there is no existing rule set, create a rule set by clicking
Create Rule Set... You then create the rule as part of creating the rule set.
3. In the Rules section of the Edit Rule Set page, highlight the escalation rule and
click Edit....
4. Navigate to the Add Actions page.
5. Select the action that escalates the incident and click Edit...
6. In the Notifications section, add the DBA to the email cc list.
7. Click Continue and then navigate back to the Edit Rule Set page and click Save.
As a result of the edit to the enterprise rule, when an incident stays unresolved for 48
hours, the rule marks it to escalation level 1. An email is sent out to the DBA notifying
him about the escalation of the incident.
Alternate Rule Set Subscription Method: From the Incident Rules - All Enterprise
Rules page, select the rule in incident rules table. From the Actions menu, select
email and then Subscribe me (or Subscribe administrator....).
2.2.4.7 Receiving Email for Private Rules
A DBA has setup a backup job on the database that he is administering. As part of the
job, the DBA has subscribed to email notification for "completed" job status. Before
you create the rule, ensure that the DBA has the requisite privileges to create jobs.
See Utilizing the Job System and Corrective Actions for job privilege requirements.
Perform the following steps:
1. Navigate to the Rules page.
From the Setup menu, select Incidents, then select Incident Rules.
2. On the Incident Rules - All Enterprise Rules page, either edit an existing rule set
(highlight the rule set and click Edit...) or create a new rule set.
Note: The rule set must be defined as a Private rule set.
3. In the Rules tab of the Edit Rule Set page, select Create... and select Incoming
events and updates to events. Click Continue.
4. On the Select Events page, select Job Status Change as the Event Type. Select
the job in which you are interested either by selecting a specific job or selecting a
job by providing a pattern, for example, Backup Management.
Add additional criteria by adding an attribute: Target Type as Database Instance.
Chapter 2
Setting Up Your Incident Management Environment
2-39

5. Add conditional actions: Event matches the following criteria (Severity is
Informational) and email Me for notifications.
6. Review the rules summary. Make corrections as needed. Click Save.
7. Create a database backup job and subscribe for email notification when the job
completes.
When the job completes, Enterprise Manager publishes the informational event for
"Job Complete" state of the job. The newly created rule is considered 'matching'
against the incoming job events and email will be sent to the DBA.
The DBA receives the email and clicks the link to access the details section in
Enterprise Manager console for the event.
2.3 Working with Incidents
Data centers follow operational practices that enable them to manage events and
incidents by business priority and in a collaborative manner. Enterprise Manager
provides the following features to enable this management and automation:
•Send notifications to the appropriate administrators.
•Create incidents and rules.
•Assigning initial ownership of an incident and perhaps transferring ownership
based on shift assignments or expertise.
•Tracking its resolution status.
•Assigning priorities based on the component affected and nature of the incident.
•Escalating incidents.
•Accessing My Oracle Support knowledge articles.
•Opening Oracle Service Requests to request assistance with issues with Oracle
software (Problems).
You can update resolution information for an incident by performing the following:
1. In the All Open Incidents view, select the incident.
2. In the resulting Details page, click the General tab, then click Manage. The
Manage dialog displays.
You can then adjust the priority, escalate the incident, and assign it to a specific IT
operator.
Working with incidents involves the following stages:
1. Finding What Needs to be Worked On
2. Searching for Incidents
3. Setting Up Custom Views
4. Responding and Working on a Simple Incident
5. Responding to and Managing Multiple Incidents, Events and Problems in Bulk
6. Managing Workload Distribution of Incidents
7. Creating an Incident Manually
Chapter 2
Working with Incidents
2-40

2.3.1 Finding What Needs to be Worked On
Enterprise Manager provides multiple access points that allow you to find out what
needs to be worked on. The primary focal point for incident management is the
Incident Manager console, however Enterprise Manager also provides other methods
of notification. The most common way to be notified that you have an issue that needs
to be addressed is by email. However, incident information can also be found in the
following areas:
Custom Views (See "Setting Up Custom Views")
Group or System Homepages (See Managing Groups)
Target Homepages
Incident Manager (in context of a system or target)
Chapter 2
Working with Incidents
2-41
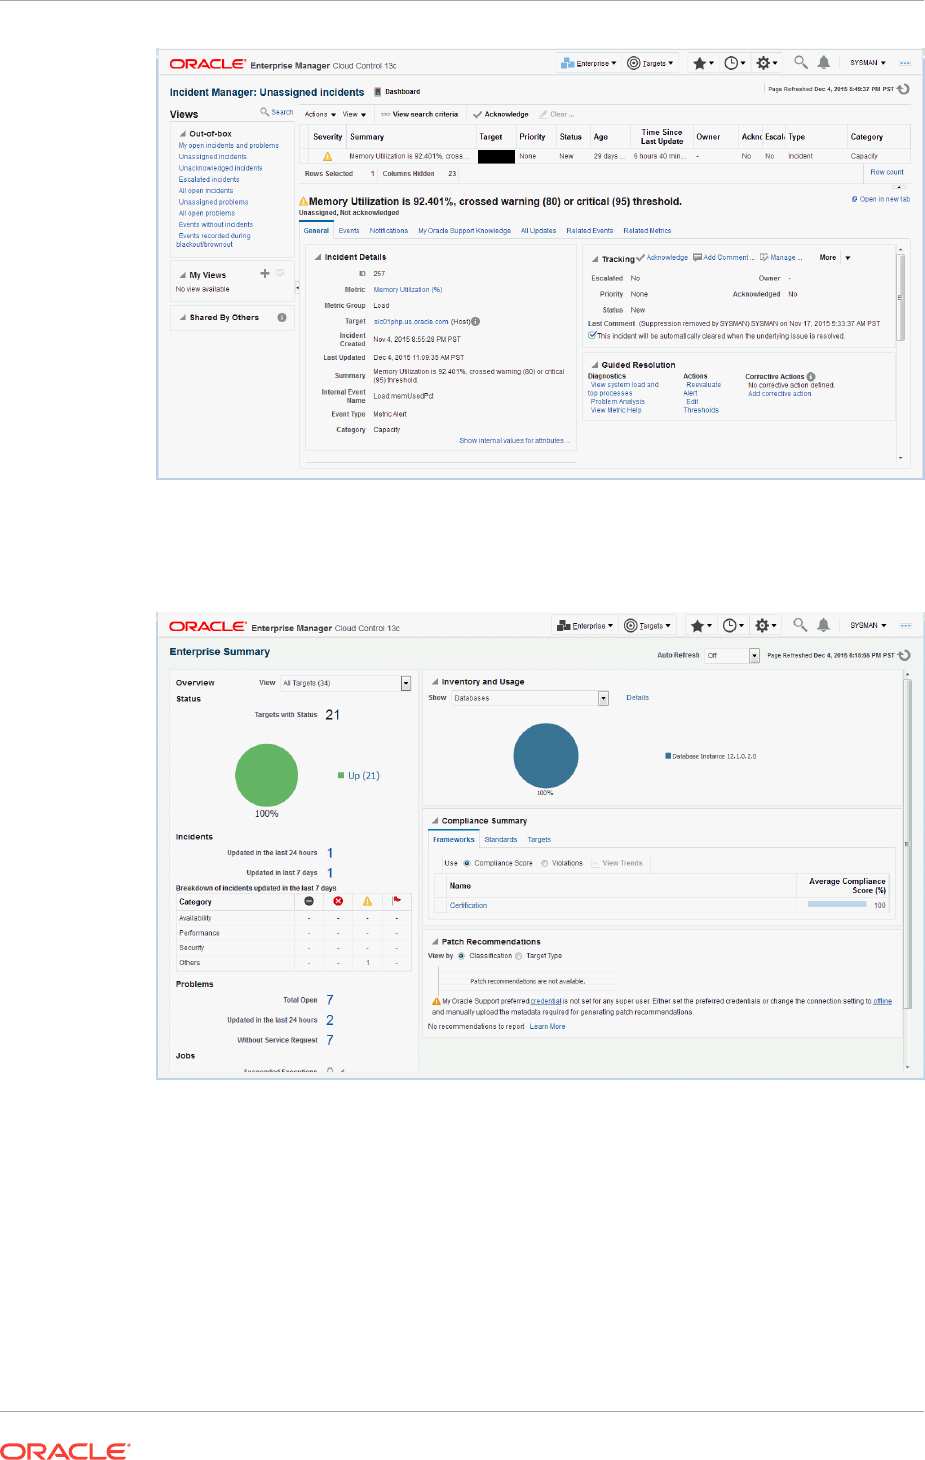
Enterprise Manager Console
2.3.2 Searching for Incidents
You can search for incidents based on a variety of incident attributes such as the time
incidents were last updated, target name, target type, or incident status.
1. Navigate to the Incident Manager page.
From the Enterprise menu on the Enterprise Manager home page, select
Monitoring, then select Incident Manager.
2. In the Views region located on the left, click Search.
Chapter 2
Working with Incidents
2-42

a. In the Search region, search for Incidents using the Type list and select
Incidents.
b. In the Criteria region, choose all the criteria that are appropriate. To add fields
to the criteria, click Add Fields... and select the appropriate fields.
c. After you have provided the appropriate criteria, click Get Results.
Validate that the list of incidents match what you are looking for. If not, change
the search criteria as needed.
d. To view all the columns associated with this table, in the View menu, select
Columns, then select Show All.
Searching for Incidents by Target Lifecycle Status
In addition to searching for incidents using high-level incident attributes, you can also
perform more granular searches based on individual target lifecycle status. Briefly,
lifecycle status is a target property that specifies a target's operational status. Status
options for which you can search are:
•All
•Mission Critical
•Production
•Staging
•Test
•Development
For more discussion on lifecycle status, see Event Prioritization.
To search for incidents by target lifecycle status:
1. Navigate to the Incident Manager page.
From the Enterprise menu on the Enterprise Manager home page, select
Monitoring, then select Incident Manager.
2. In the Views region located on the left, click Search.
3. In the Search region, click Add Fields. A pop-up menu appears showing the
available lifecycle statuses.
4. Choose on one or more of the lifecycle status options.
5. Enter any additional search criteria.
6. Click Get Results.
2.3.3 Setting Up Custom Views
Incident Manager also allows you to define custom views to help you gain quick
access to the incidents and problems on which you need to focus. For example, you
may define a view to display all critical database incidents that you own. By specifying
and saving view preferences to display only those incident attributes that you are
interested in Enterprise Manager will show only the list of matching incidents.
You can then search the incidents for only the ones with specific attributes, such as
priority 1. The view allows easy access to pertinent incidents for daily triage.
Accordingly, you can save the search criteria as a filter named "All priority 1 incidents
for my targets". The view becomes available in the UI for immediate use and will be
Chapter 2
Working with Incidents
2-43

available anytime you log in to access the specific incidents. The last view you used
will be the default view used on your next login.
Perform the following steps:
1. Navigate to the Incident Manager page.
From the Enterprise menu on the Enterprise Manager home page, select
Monitoring, then select Incident Manager.
2. In the MyViews region located on the left, click the create "+" icon.
a. In the Search region, search for Incidents using the Type list and select
Incidents.
b. In the Criteria region, choose all the criteria that are appropriate. To add fields
to the criteria, click Add Fields... and select the appropriate fields.
c. After you have provided the appropriate criteria, click Get Results.
Validate that the list of incidents match what you are looking for. If not, change
the search criteria as needed.
d. To view all the columns associated with this table, in the View menu, select
Columns, then select Show All.
To select a subset of columns to display and also the order in which to display
them, from the View menu, select Columns, then Manage Columns. A dialog
displays showing a list of columns available to be added in the table.
e. Click the Create View... button.
f. Enter the view name. If you want other administrators to use this view, check
the Share option.
g. Click OK to save the view.
Note:
From the View creation dialog, you can also mark the view as shared. See
Sharing/Unsharing Custom Views for more information.
2.3.3.1 Incident Dashboard
An incident dashboard allows you to track and monitor the state of different aspects of
incident management, such as getting a sense of how the incidents are distributed.
Specifically, the incident dashboard presents another way of looking at a scoped set of
incidents using custom views (one dashboard per view). In addition to providing an
intuitive way to interpret incidents and incident distribution patterns, the dashboard
provides you with quick and easy access to incident lifecycle actions such as
acknowledging, assigning, and adding comments.
An incident dashboard is shown in the following figure.
Chapter 2
Working with Incidents
2-44
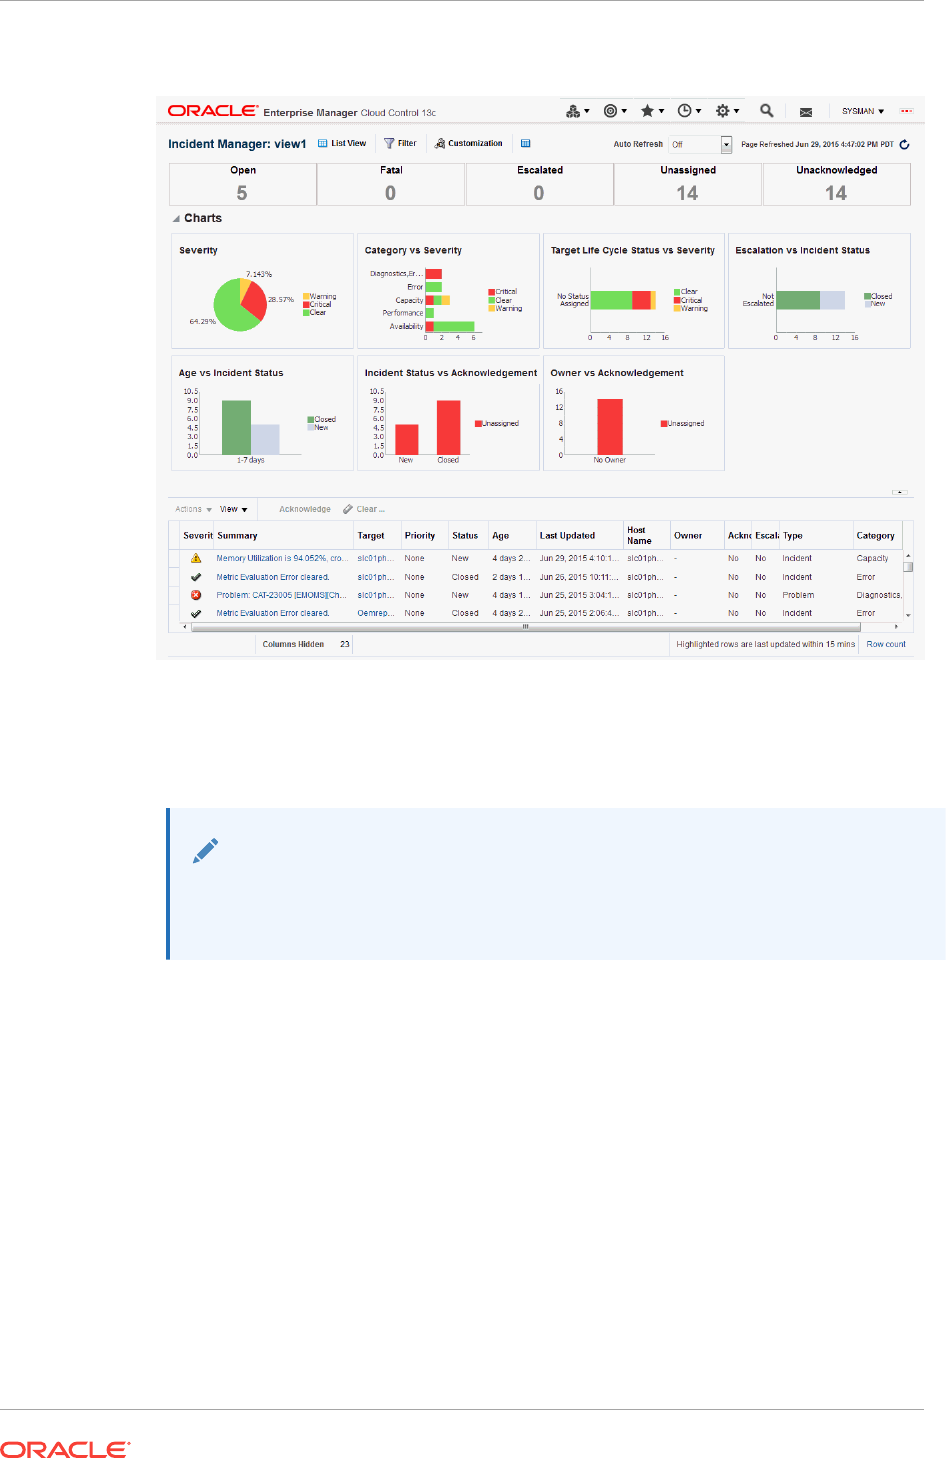
Figure 2-5 Incident Dashboard
Incident Dashboard Areas
The content of the incident dashboard is divided into three sections:
Note:
By default, data is automatically refreshed every 30 seconds. You can
increase or decrease the refresh interval as required.
•Summary area displays the number of:
–Open incidents including those created in the last hour.
–Fatal incidents including those created or updated to Fatal in the last hour.
–Escalated incidents including those escalated in the last hour.
–Unassigned incidents.
–Unacknowledged incidents.
Incident dashboard elements that are highlighted in red require immediate
attention. Clicking on the summary numbers allows you to view only incidents
pertaining to that incident area. Data displayed in the charts and incident list are
modified accordingly.
•Charts provide you with an easy-to-understand look at the current incident
distribution and management status for each incident. You can click on slices of
Chapter 2
Working with Incidents
2-45

the charts to filter the data displayed in the incident dashboard only to those
incidents.
•Incident List that shows the open incidents listed in reverse chronological order
by last updated time stamp. From this list, you can perform requisite incident
lifecycle actions such as escalating, prioritizing, acknowledging, assigning owners,
adding comments to incident.
Creating an Incident Dashboard
To create an incident dashboard for all open incidents, navigate to Incident Manager
and click the Dashboard button located at the upper-left side of the page above the
incident table.
While an open incident dashboard can be useful, a more typical scenario involves
creating a custom view so that the incident dashboard only displays data for incidents
that are of interest to you. See "Setting Up Custom Views" for information on creating
a custom view. To view an incident dashboard for a specific view, select the desired
view from the My Views list in the Incident Manager UI and then click Dashboard.
Customizing the Incident Dashboard
If the default dashboard does not meet your requirements, you can modify the
dashboard in a variety of ways, such as removing an out-of-box chart, adding one of
the predefined charts, or altering an existing chart, such as changing the dimensions
of the chart or changing from a pie chart to a bar chart, for example.
Click Customization located above the Summary section in order to customize the
Incident Dashboard. Once changes are made, click Save to save changes.
Note:
Only the view owner and Super Administrators can create or edit view
customizations. Without view ownership, users can only change the chart
auto-refresh frequency and chart type. These changes, however, are not
permanent.
2.3.4 Sharing/Unsharing Custom Views
When you create your own views, they are private (only you can see them). Beginning
with Enterprise Manager Release 12.1.0.4, you can share your private views with
other administrators. When you share a view, all Enterprise Manager users will be able
to use the view.
As mentioned previously, you are given the opportunity to share a view during the view
creation process. If you have already created custom views, you can share them at
any time.
1. Navigate to Incident Manager.
From the Enterprise menu on the Enterprise Manager home page, select
Monitoring, then select Incident Manager.
2. From the My Views region, click the Manage icon.
Chapter 2
Working with Incidents
2-46
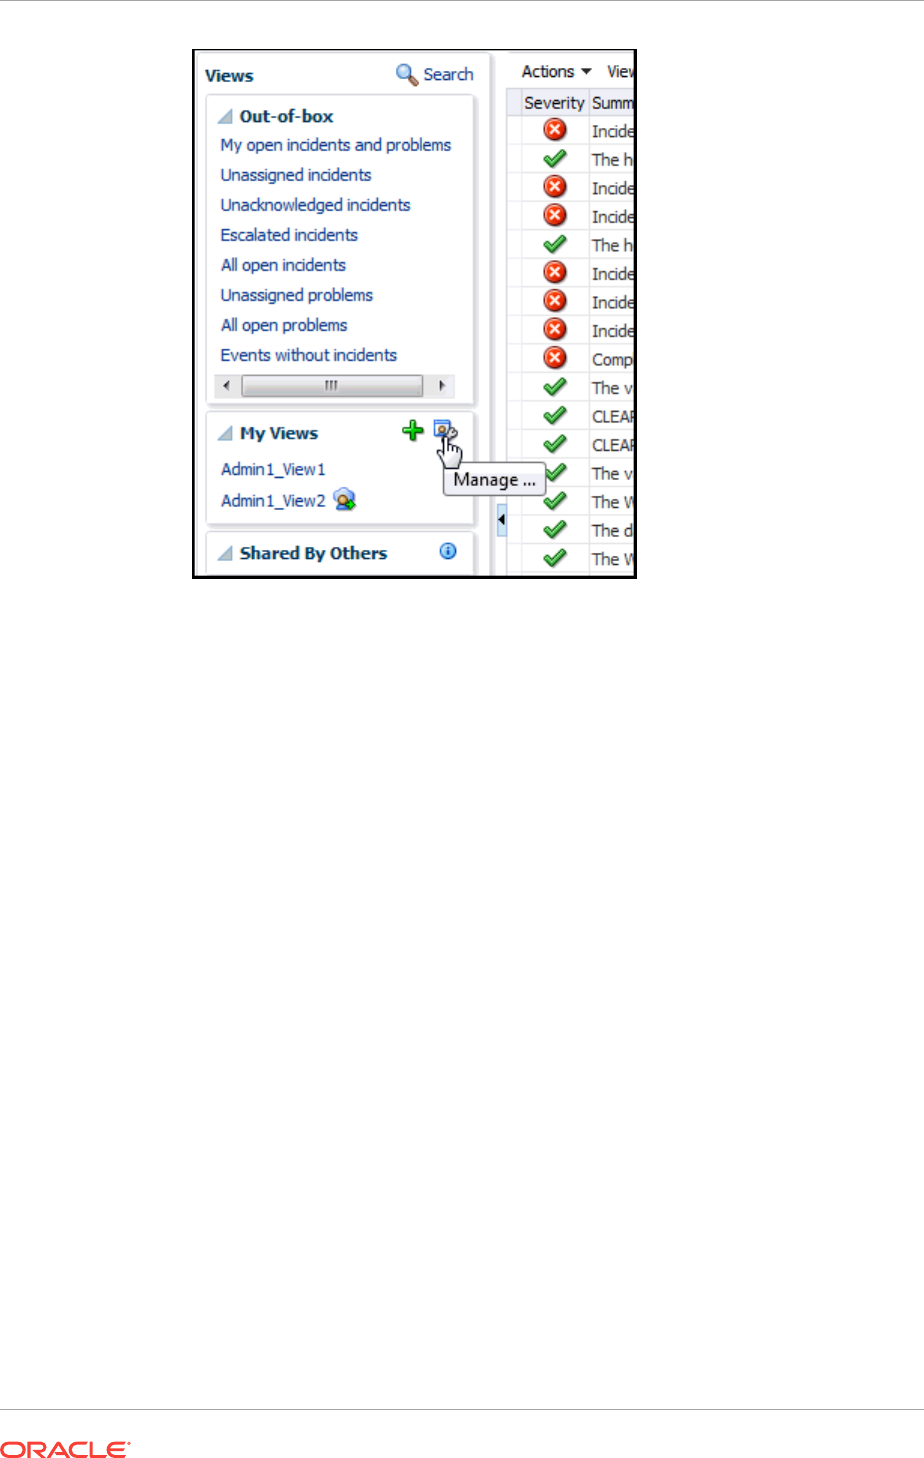
3. From the Manage Custom Views dialog, choose a custom view.
4. Click Share (or Unshare if the view is already shared and you want to unshare it.)
5. Click Yes to confirm the share/unshare operation.
2.3.5 Responding and Working on a Simple Incident
The following steps take you through one possible incident management scenario.
1. Navigate to Incident Manager.
From the Enterprise menu on the Enterprise Manager home page, select
Monitoring, then select Incident Manager.
2. Use a view to filter the list of incidents. For example, you should use My Open
Incidents and Problems view to see incidents and problems assigned to you.
You can then sort the list by priority.
3. To work on an incident, select the incident. In the General tab, click Acknowledge
to indicate that you are working on this incident, and to stop receiving repeat
notifications for the incident.
In addition to the acknowledging the incident, you can perform other incident
management operations such as:
•Adding a comment.
•Managing the incident. See Responding to and Managing Multiple Incidents,
Events and Problems in Bulk for more information on incident management
options.
•Editing the summary.
•Manually creating a ticket.
•Suppressing/unsuppressing the incident.
Chapter 2
Working with Incidents
2-47

•Clearing the incident.
Be aware that as you are working on an individual incident, new incidents might be
coming in. Update the list of incidents by clicking the Refresh icon.
4. If the solution for the incident is unknown, use one or all of the following methods
made available in the Incident page:
•Use the Guided Resolution region and access any recommendations,
diagnostic and resolution links available.
•Check My Oracle Support Knowledge base for known solutions for the
incident.
•Study related incidents available through the Related Events and Incidents
tab.
5. Once the solution is known and can be resolved right away, resolve the incident by
using tools provided by the system, if possible.
6. In most cases, once the underlying cause has been fixed, the incident is cleared in
the next evaluation cycle. However, in cases like log-based incidents, clear the
incident.
Alternatively, you can work with incidents for a specific target from that target's home
page. From the target menu, select Monitoring and then select Incident Manager to
access incidents for that target (or group).
2.3.6 Responding to and Managing Multiple Incidents, Events and
Problems in Bulk
There may be situations where you want to respond to multiple incidents in the same
way. For example, you find that a cluster of incidents that are assigned to you are due
to insufficient tablespace issues on several production databases. Your manager
suggests that these tablespaces be transferred to a storage system being procured by
another administrator. In this situation, you want to set all of the tablespace incidents
to a customized resolution state "Waiting for Hardware." You also want to assign the
incidents to the other administrator and add a comment to explain the scenario. In this
situation, you want to update all of these incidents in bulk rather than individually.
To respond to incidents in bulk:
1. Navigate to Incident Manager.
From the Enterprise menu on the Enterprise Manager home page, select
Monitoring, then select Incident Manager.
2. Use a view to filter the list of incidents to the subset of incidents you want to work
on. For example, you can use My Open Incidents and Problems view to see
incidents and problems assigned to you. You can then sort the list by priority.
3. Select the incidents to which you want to respond. You can select multiple
incidents by holding down the Control key and selecting individual incidents or you
can hold down the Shift key and select the first and last incidents to select a
contiguous block of incidents.
4. From the Action menu, choose the desired response action.
•Acknowledge: Indicate that you have viewed the incidents. This option also
stops any repeat notifications sent out for the incidents. This sets the
Acknowledged flag to Yes and also makes you the owner of the incident
Chapter 2
Working with Incidents
2-48

•Manage: Allows you to perform a multi-action response to the incidents.
–Acknowledge: If an incident is acknowledged, it will be implicitly assigned
to the user who acknowledged it. When a user assigns an incident to
himself, it is considered acknowledged. Once acknowledged, an incident
cannot be unacknowledged. Acknowledgement also stops any repeat
notifications for that incident
–Assign to: Assign the incident(s) to the administrator who will take
ownership of the incident.
–Prioritization: The priority level of an incident can be set by selecting one
of the out-of-the-box priority values: None, Urgent, Very High, High,
Medium, Low
–Incident Status: The resolution state for the incident can be set by
selecting either Work in Progress or Resolved or to any custom status
defined.
–Escalation Level: Administrators can update incidents to set an escalation
level: Level 1 through 5, in addition to the default value of None. An
escalated issue can be de-escalated by setting the escalation to None.
The appropriate Escalation Level depends on the IT procedures you have
in place.
–Comment: You can enter comments such as those you want to pass to
the owner of the incident.
•Suppress: Suppressing an incident stops corresponding notifications, and
removes it from out-of-the-box views and default totals (such as those
presented in the summary region). Suppression is typically performed when
you want to defer action on the incident until a future time and in the meantime
want to visually hide them from appearing in the console. Administrators can
see suppressed incidents by explicitly searching for them such as performing
a search on incidents where the search criteria includes the Suppressed
search field
Incidents can be suppressed until any of the following conditions are met:
–Until the suppression is manually removed
–Until specified date in the future
–Until the severity state changes (incidents only)
–Until it is closed
•Clear: Administrators can clear incidents or problems manually. For incidents,
this applies only to incidents containing incidents that can be manually
cleared.
•Add Comment: Users can add comments on incidents and events.
Comments may be used for sharing information with other users or to provide
tracking information on any actions being taken. Comments can be added
even on closed issues.
Note:
The single action Acknowledge and Clear buttons are enabled for open
incidents and can be used for multiple incident selection.
Chapter 2
Working with Incidents
2-49

If any of the above actions applies only to a subset of selected incidents (for
example, if an administrator tries to acknowledge multiple incidents, of which some
are already acknowledged), the action will be performed only where applicable.
The administrator will be informed of the success or failure of the action. When an
administrator selects any of these actions, a corresponding annotation is added to
the incident for future reference.
5. Click OK. Enterprise Manager displays a process summary and confirmation
dialogs.
6. Continue working with the incidents as required.
2.3.7 Searching My Oracle Support Knowledge
To access My Oracle Support Knowledge base entries from within Incident Manager,
perform the following steps:
1. Navigate to Incident Manager.
From the Enterprise menu on the Enterprise Manager home page, select
Monitoring, then select Incident Manager.
2. Select one of the standard views. Choose the appropriate incident or problem in
the View table.
3. In the resulting details region, click My Oracle Support Knowledge.
If your My Oracle Support (MOS) login credentials have been saved as MOS
Preferred Credentials, you do not need to log in manually. If not, you will need to
sign in to My Oracle Support. To save your MOS login information as Preferred
Credentials.
Setting MOS Preferred Credentials: From the Setup menu, select Security and
then Preferred Credentials. From the My Oracle Support Preferred Credentials
region, click Set MOS Credentials.
4. On the My Oracle Support page, click the Knowledge tab to browse the
knowledge base.
From this page, in addition to accessing formal Oracle documentation, you can
also change the search string in to look for additional knowledge base entries.
2.3.8 Submitting an Open Service Request (Problems-only)
There are times when you may need assistance from Oracle Support to resolve a
problem. This procedure is not relevant for incidents or events.
To submit a service request (SR), perform the following steps:
1. Navigate to Incident Manager.
From the Enterprise menu on the Enterprise Manager home page, select
Monitoring, then select Incident Manager.
2. Use one of the views to find the problem or search for it or use one of your custom
views. Select the appropriate problem from table.
3. Click on the Support Workbench: Package Diagnostic link.
4. Complete the workflow for opening an SR. Upon completing the workflow, a draft
SR will have been created.
Chapter 2
Working with Incidents
2-50

5. Sign in to My Oracle Support if you are not already signed in.
6. On the My Oracle Support page, click the Service Requests tab.
7. Click Create SR button.
2.3.9 Suppressing Incidents and Problems
There are times when it is convenient to hide an incident or problem from the list in the
All Open Incidents page or the All Open Problems page. For example, you need to
defer work on the incident until a future date (for example, until maintenance window).
In order to avoid having it appear in the UI, you want to temporarily hide or suppress
the incident until a future date. In order to find a suppressed incident, you must
explicitly search for the incident using either the Show all or the Only show suppressed
search option. In order to unhide a suppressed incident or problem, it must be
manually unsuppressed.
To suppress an incident or problem:
1. Navigate to Incident Manager.
From the Enterprise menu on the Enterprise Manager home page, select
Monitoring, then select Incident Manager.
2. Select either the All Open Incidents view or the All Open Problems view.
Choose the appropriate incident or problem. Click the General tab.
3. In the resulting details region, click More, then select Suppress.
4. On the resulting Suppress pop-up, choose the appropriate suppression type.
Add a comment if desired.
5. Click OK.
To unsuppress an incident or problem:
1. Navigate to Incident Manager.
From the Enterprise menu on the Enterprise Manager home page, select
Monitoring, then select Incident Manager.
2. Click Search.
3. From the Suppressed menu, select Only show suppressed.
4. Click Get Results.
The suppressed incidents are displayed. Choose the appropriate incident or
problem.
5. Click the General tab.
6. In the resulting details region, click More, and then select Unsuppress.
2.3.10 Managing Workload Distribution of Incidents
Incident Manager enables you to manage incidents and problems to be addressed by
your team.
Perform the following tasks:
1. Navigate to Incident Manager.
Chapter 2
Working with Incidents
2-51

From the Enterprise menu on the Enterprise Manager home page, select
Monitoring, then select Incident Manager.
2. Use the standard or custom views to identify the incidents for which your team is
responsible. You may want to focus on unassigned and unacknowledged incidents
and problems.
3. Review the list of incidents. This includes: determining person assigned to the
incident, checking its status, progress made, and actions taken by the incident
owner.
4. Add comments, change priority, reassign the incident as needed by clicking on the
Manage button in the Incident Details region.
Example Scenario
The DBA manager uses Incident Manager to view all the incidents owned by his team.
He ensures all of them are correctly assigned; if not, he reassigns and prioritizes them
appropriately. He monitors the escalated events for their status and progress, adds
comments as needed for the owner of the incident. In the console, he can view how
long each of the incidents has been open. He also reviews the list of unassigned
incidents and assigns them appropriately.
2.3.11 Reviewing Events on a Periodic Basis
Oracle recommends managing via incidents in order to focus on important events or
groups of related events. Due to the variety and sheer number of events that can be
generated, it is possible that not all important events will be covered by incidents. To
help you find these important yet untreated events, Enterprise Manager provides the
Events without incidents standard view.
Perform the following steps:
1. From the Enterprise menu, select Monitoring, then select Incident Manager.
2. In the Views region, click Events without incidents.
3. Select the desired event in the table. The event details display.
4. In the details area, choose More and then either Create Incident or Add Event to
Incident.
Example Scenario
During the initial phase of Enterprise Manager uptake, every day the DBA manager
reviews the events for the databases his team is responsible for and filters them to
view only the ones which are not tracked by ticket or incident. He browses such events
to ensure that none of them requires incidents to track the issue. If he feels that one
such event requires an incident to track the issue, he creates an incident directly for
this event.
2.3.11.1 Creating an Incident Manually
If an event of interest occurs that is not covered by any rule and you want to convert
that event to an incident, perform the following:
1. Using an available view, find the event of interest.
2. Select the event in the table.
3. From the More... drop-down menu, choose Create Incident...
Chapter 2
Working with Incidents
2-52

4. Enter the incident details and click OK.
5. Should you decide to work on the incident, set yourself as owner of the incident
and update status to Work in Progress.
Example Scenario
As per the operations policy, the DBA manager has setup rules to create incidents for
all critical issues for his databases. The remainder of the issues are triaged at the
event level by one of the DBAs.
One of the DBA receives email for an "SQL Response" event (not associated with an
incident) on the production database. He accesses the details of the event by clicking
on the link in the email. He reviews the details of the event. This is an issue that needs
to be tracked and resolved, so he opens an incident to track the resolution of the
issue. He marks the status of the incident as "Work in progress".
2.4 Advanced Topics
The following sections discuss incident/event management features relating advanced
applications or operational areas.
2.4.1 Automatic Diagnostic Repository (ADR): Incident Flood Control
ADR is a file-based repository that stores database diagnostic data such as traces,
dumps, the alert log, and health monitor reports. ADR's unified directory structure and
a unified set of tools enable customers and Oracle Support to correlate and analyze
diagnostic data across multiple instances and Oracle products.
Like Enterprise Manager, ADR creates and tracks incidents and problems to allow you
to resolve issues.
•A problem is a critical error in the database. Critical errors manifest as internal
errors, such as ORA-00600, or other severe errors, such as ORA-07445
(operating system exception) or ORA-04031 (out of memory in the shared pool).
•An incident is a single occurrence of a problem. When a problem (critical error)
occurs multiple times, an incident is created for each occurrence. Incidents are
timestamped and tracked in ADR. When an incident occurs, ADR sends a
diagnostic incident alert to Enterprise Manager.
2.4.1.1 Working with ADR Diagnostic Incidents Using Incident Manager
Each diagnostic incident recorded in the ADR is also recorded as an incident in
Enterprise Manager, thus providing you with a unified view of ADR/Enterprise
Manager incidents and problems from within Incident Manager. For the ADR
diagnostic incidents, you can access Enterprise Manager Support Workbench to take
further action, such as packaging a problem or raising a service request with Oracle
Support.
2.4.1.2 Incident Flood Control
Prior to Enterprise Manager Release 12.1.0.4, there was no limit to the number of
diagnostic incidents recorded for a single problem in Incident Manager. It is
conceivable that a problem could generate dozens or perhaps hundreds of incidents in
a short period of time. While incidents generated during the early stages of a problem
Chapter 2
Advanced Topics
2-53

may be useful, after a certain point the excess diagnostic data would provide little
value and possibly slow down your efforts to diagnose and resolve the problem.
Because diagnostic problems typically tend to be long-lived, a significant number of
incidents could be generated over time. Also, depending on the size of your monitored
environment, the diagnostic data may consume considerable system resources.
For these reasons, the Enterprise Manager applies flood control limits on the number
of diagnostic incidents that can be raised for a given problem in Incident Manager.
Flood-controlled incidents provide a way of informing you that a critical error is
ongoing, without overloading the system with diagnostic data.
Beginning with Enterprise Manager Release 12.1.0.4, two limits are placed on the
number of diagnostic incidents that can be raised for a given problem in Incident
Manager. A problem is identified by a unique problem signature called a problem key
and is associated with a single target.
Enterprise Manager Limits on Diagnostic Incidents
Enterprise Manager enforces two limits for diagnostic incidents:
•For any given hour, Enterprise Manager only records up to five (default value)
diagnostic incidents for a given target and problem key combination.
•On any given day, Enterprise Manager only records up to 25 (default value)
diagnostic incidents for a given problem key and target combination.
When either of these limits is reached, any diagnostic incidents for the same target/
problem key combination will not be recorded until the corresponding hour or day is
over. Diagnostic incident recording will commence once a new hour or day begins.
Note:
Hour and day calculations are based on UTC (or GMT).
These diagnostic incident limits only apply to Incident Manager and not to the
underlying ADR. All incidents continue to be recorded in the ADR repository. Using
Enterprise Manager Support Workbench, users can view all the incidents for a given
problem at any time and take appropriate actions.
Enterprise Manager diagnostic incident limits are configurable. As mentioned earlier,
the defaults for these two limits are set to 5 incidents per hour and 25 incidents per
day. These defaults should not be changed unless there is a clear business reason to
track all diagnostic incidents.
Changing Enterprise Manager Diagnostic Incident Limits
To update the diagnostic limits, execute the following SQL against the Enterprise
Manager repository as the SYSMAN user using the appropriate limit values as shown
in the following example.
The PL/SQL shown in the following example prints out the current limits.
Chapter 2
Advanced Topics
2-54

Note:
The Enterprise Manager incident limits are in addition to any diagnostic
incident limits imposed by underlying applications such as Oracle database,
Middleware and Fusion Applications. These limits are specific to each
application. See the respective application documentation for more
information.
Example 2-3 SQL Used to Change Diagnostic Incident Limits
exec EM_EVENT_UTIL.SET_ADR_INC_LIMITS(5,25);
Example 2-4 SQL Used to Print Out Current Diagnostic Incident Limits
DECLARE
l_adr_hour_limit NUMBER;
l_adr_day_limit NUMBER;
BEGIN
em_event_util. GET_ADR_INC_LIMITS
(p_hourly_limit => l_adr_hour_limit,
p_daily_limit => l_adr_day_limit);
dbms_output.put_line(l_adr_hour_limit || '-' || l_adr_day_limit);
END;
2.4.2 Defining Custom Incident Statuses
As discussed in "Working with Incidents", one of the primary incident workflow
attributes is status. For most conditions, these predefined status attributes will suffice.
However, the uniqueness of your monitoring and management environment may
require an incident workflow requiring specialized incident states. To address this
need, you can define custom states using the create_resolution_state EM CLI verb.
2.4.2.1 Creating a New Resolution State
emcli create_resolution_state
-label="Label for display"
-position="Display position"
[-applies_to="INC|PBLM"]
This verb creates a new resolution state for describing the state of incidents or
problems.
Note:
This command can only be executed by Enterprise Manager Super
Administrators.
The new state is always added between the New and Closed states. You must specify
the exact position of this state in the overall list of states by using the
-position
option.
The position can be between 2 and 98.
Chapter 2
Advanced Topics
2-55

By default, the new state is applicable to both incidents and problems. The
-applies_to
option can be used to indicate that the state is applicable only to incidents or
problems.
A success message is reported if the command is successful. An error message is
reported if the change fails.
Examples
The following example adds a resolution state that applies to both incidents and
problems at position 25.
emcli create_resolution_state -label="Waiting for Ticket" -position=25
The following example adds a resolution state that applies to problems only at position
35.
emcli create_resolution_state -label="Waiting for SR" -position=35 -
applies_to=PBLM
2.4.2.2 Modifying an Existing Resolution State
You can chance the both the display label and the position of an existing state by
using the modify_resolution_state verb.
emcli modify_resolution_state
-label="old label of the state to be changed"
-new_label="New label for display"
-position="New display position"
[-applies_to=BOTH]
This verb modifies an existing resolution state that describes the state of incidents or
problems. As with the create_resolution_state verb, this command can only be
executed by Super Administrators.
You can optionally indicate that the state should apply to both incidents and problems
using the
-applies_to
option.
Examples
The following example updates the resolution state with old label "Waiting for TT" with
a new label "Waiting for Ticket" and if necessary, changes the position to 25.
emcli modify_resolution_state -label="Waiting for TT" -new_label="Waiting for
Ticket" -position=25
The following example updates the resolution state with the old label "SR Waiting" with
a new label "Waiting for SR" and if necessary, changes the position to 35. It also
makes the state applicable to incidents and problems.
emcli modify_resolution_state -label="SR Waiting" -new_label="Waiting for SR" -
position=35 -applies_to=BOTH
2.4.3 Clearing Stateless Alerts for Metric Alert Event Types
For metric alert event types, an event (metric alert) is raised based on the metric
threshold values. These metric alert events are called stateful alerts. For those metric
alert events that are not tied to the state of a monitored system (for example, snapshot
too old, or resumable session suspended ), these alerts are called stateless alerts.
Chapter 2
Advanced Topics
2-56

Because stateless alerts are not cleared automatically, they need to be cleared
manually. You can perform a bulk purge of stateless alerts using the
clear_stateless_alerts EM CLI verb.
Note:
For large numbers of incidents, you can manually clear incidents in bulk. See
"Responding to and Managing Multiple Incidents, Events and Problems in
Bulk".
clear_stateless_alerts clears the stateless alerts associated with the specified target.
The clearing must be manually performed as the Management Agent does not
automatically clear stateless alerts. To find the metric internal name associated with a
stateless alert, use the EM CLI get_metrics_for_stateless_alerts verb.
Format
emcli clear_stateless_alerts -older_than=number_in_days -target_type=target_type -
target_name=target_name [-include_members][-
metric_internal_name=target_type_metric:metric_name:metric_column] [-
unacknowledged_only][-ignore_notifications] [-preview][ ] indicates that the
parameter is optional
Options
•older_than
Specify the age of the alert in days. (Specify 0 for currently open stateless alerts.)
•target_type
Internal target type identifier, such as host, oracle_database, and emrep.
•target_name
Name of the target.
•include_members
Applicable for composite targets to examine alerts belonging to members as well.
•metric_internal_name
Metric to be cleaned up. Use the get_metrics_for_stateless_alerts verb to see a
complete list of supported metrics for a given target type.
•unacknowledged_only
Only clear alerts if they are not acknowledged.
•ignore_notifications
Use this option if you do not want to send notifications for the cleared alerts. This
may reduce the notification sub-system load.
•ignore_notifications
Use this option if you do not want to send notifications for the cleared alerts. This
may reduce the notification sub-system load.
•preview
Chapter 2
Advanced Topics
2-57

Shows the number of alerts to be cleared on the target(s).
Example
The following example clears alerts generated from the database alert log over a week
old. In this example, no notifications are sent when the alerts are cleared.
emcli clear_stateless_alerts -older_than=7 -target_type=oracle_database -tar
get_name=database -metric_internal_name=oracle_database:alertLog:genericErrStack -
ignore_notifications
2.4.4 Automatically Clearing "Manually Clearable" Events
There are those events that clear automatically, such as CPU Utilization and those
events that must be manually cleared, either through the Incident Manager UI or
automatically via rule (such as Job Failure, or Log Metric events). Auto-clear events,
as the term implies, are cleared automatically by Enterprise Manager once the
underlying issue is resolved. In the case of CPU Utilization, the event CPU Utilization
clears automatically once the percent utilization falls below the warning threshold.
However, for those events that must be cleared manually, a user must intervene and
clear the event using Incident Manager either by selecting the incident/event and
clicking Clear, or creating an event rule to do the job (recommended method).
As mentioned previously, an event rule automates the clearing of manually clearable
events. Enterprise Manager provides a limited number of out-of-box rules that
automatically clear manually clearable events, such as job failures or ADP events that
remain open for seven days. However, to more accurately meet the needs of your
monitoring environment, Oracle recommends creating your own event rules to
automatically clear those manually clearable events that are most prevalent in your
environment.
During the rule creation process, you can specify that an event be automatically
cleared by selecting the Clear Event option while you are adding conditional actions.
Getting Notified when the Event Clears
The event clearing action is an asynchronous operation, which means that when the
rule action (clear) is initiated, the manually clearable event will be enqueued for
clearing, but not actually cleared. Hence, an email notification sent upon rule execution
will indicate that the event has not been cleared. Asynchronous clearing is by design
as it reduces overall rule engine processing load and processing time. Subscribing to
this event clearing rule with the intent to be notified when the event clears will be of
little value. If you want to be notified when the event clears, you must create a new
event rule and explicitly specify a Clear severity. In doing so, you will be notified once
the event is actually cleared.
2.4.5 User-reported Events
Users may create (publish) events manually using the EM CLI verb publsh_event. A
User-reported event is published as an event of the "User-reported event" class. Only
users with Manage Target privilege can publish these events for a target. An error
message is reported if the publish fails.
After an event is published with a severity other than CLEAR (see below), end-users
with appropriate privileges can manually clear the event from the UI, or they can
publish a new event using a severity level of CLEAR and the same details to report
clearing of the underlying situation.
Chapter 2
Advanced Topics
2-58

2.4.5.1 Format
emcli publish_event
-target_name="Target name"
-target_type="Target type internal name"
-message="Message for the event"
-severity="Severity level"
-name="event name"
[-key="sub component name"
-context="name1=value1;name2=value2;.."
-separator=context="alt. pair separator"
-subseparator=context="alt. name-value separator"]
[ ] indicates that the parameter is optional
2.4.5.2 Options
•target_name
Target name.
•target_type
Target type name.
•message
Message to associate for the event. The message cannot exceed 4000
characters.
•severity
Numeric severity level to associate for the event. The supported values for severity
level are as follows:
"CLEAR"
"MINOR_WARNING"
"WARNING"
"CRITICAL"
"FATAL"
•name
Name of the event to publish. The event name cannot exceed 128 characters.
This is indicative of the nature of the event. Examples include "Disk Used
Percentage," "Process Down," "Number of Queues," and so on. The name must
be repeated and identical when reporting different severities for the same
sequence of events. This should not have any identifying information about a
specific event; for example, "Process xyz is down." To identify any specific
components within a target that the event is about, see the key option below.
•key
Name of the sub-component within a target this event is related to. Examples
include a disk name on a host, name of a tablespace, and so forth. The key cannot
exceed 256 characters.
•context
Chapter 2
Advanced Topics
2-59

Additional context that can be published for a given event. This is a series of
strings of format name:value separated by a semi-colon. For example, it might be
useful to report the percentage size of a disk when reporting space issues on the
disk. You can override the default separator ":" by using the sub-separator option,
and the pair separator ";" by using the separator option.
The context names cannot exceed 256 characters, and the values cannot exceed
4000 characters.
•separator
Set to override the default ";" separator. You typically use this option when the
name or the value contains ";". Using "=" is not supported for this option.
•subseparator
Set to override the default ":" separator between the name-value pairs. You
typically use this option when the name or value contains ":". Using "=" is not
supported for this option.
2.4.5.3 Examples
Example 1
The following example publishes a warning event for "my acme target" indicating that a
HDD restore failed, and the failure related to a component called the "Finance DB
machine" on this target.
emcli publish_event -target_name="my acme target" -target_type="oracle_acme"
-name="HDD restore failed" -key="Finance DB machine" -message="HDD restoration
failed due to corrupt disk" -severity=WARNING
Example 2
The following example publishes a minor warning event for "my acme target" indicating
that a HDD restore failed, and the failure related to a component called the "Finance
DB machine" on this target. It specifies additional context indicating the related disk
size and name using the default separators. Note the escaping of the \ in the disk
name using an additional "\".
emcli publish_event -target_name="my acme target" -target_type="oracle_acme"
-name="HDD restore failed" -key="Finance DB machine" -message="HDD restoration
failed due to corrupt disk" -severity=MINOR_WARNING -context="disk size":800GB
\;"disk name":\\uddo0111245
Example 3
The following example publishes a critical event for "my acme target" indicating that a
HDD restore failed, and the failure related to a component called the "Finance DB
machine" on this target. It specifies additional context indicating the related disk size
and name. It uses alternate separators, because the name of the disk includes the ":"
default separator.
emcli publish_event -target_name="my acme target" -target_type="oracle_acme"
-name="HDD restore failed" -key="Finance DB machine" -message="HDD restoration
failed due to corrupt disk" -severity=CRITICAL -context="disk size"^800GB\;"disk
name"^\\sdd1245:2 -subseparator=context=^
Chapter 2
Advanced Topics
2-60

2.4.6 Additional Rule Applications
Rules can be set up to perform more complicated tasks beyond straightforward
notifications. The following tasks illustrate additional rule capabilities.
•Setting Up a Rule to Send Different Notifications for Different Severity States of an
Event
•Creating a Rule to Notify Different Administrators Based on the Event Type
•Creating a Rule to Create a Ticket for Incidents
•Creating a Rule to Send SNMP Traps to Third Party Systems
2.4.6.1 Setting Up a Rule to Send Different Notifications for Different Severity
States of an Event
Before you perform this task, ensure the DBA has set appropriate thresholds for the
metric so that a critical metric alert is generated as expected.
Consider the following example:
The Administration Manager sets up a rule to page the specific DBA when a critical
metric alert event occurs for a database in a production database group and to email
the DBA when a warning metric alert event occurs for the same targets. This task
occurs when a new group of databases is deployed and DBAs request to create
appropriate rules to manage such databases.
Perform the following tasks to set appropriate thresholds:
1. From the Setup menu, select Incidents, then select Incident Rules.
2. On the Incident Rules - All Enterprise Rules page, highlight a rule set and click
Edit.... (Rules are created in the context of a rule set. If there is no existing rule set
to manage the newly added target, create a rule set.)
3. In the Edit Rule Set page, locate the Rules section. Click Create...
4. From the Select Type of Rule to Create dialog, choose Incoming events and
updates to events. Click Continue.
5. Provide the rule details as follows:
a. For Type, select Metric Alerts as the Type.
b. In the criteria section, select Severity. From the drop-down list, check and
Critical and Warning as the selected values. Click Next.
c. On the Add Actions page, click +Add.
In the Create Incident section, check the Create Incident option. Click
Continue. The Add Action page displays with the new rule. Click Next.
d. Specify a name for the rule and a description. Click Next.
e. On the Review page, ensure your settings are correct and click Continue. A
message appears informing you that the rule has been successfully created.
Click OK to dismiss the message.
Next, you need to create a rule to perform the notification actions.
6. From the Rules section on the Edit Rules page, click Create.
Chapter 2
Advanced Topics
2-61

7. Select Newly created incidents or updates to incidents as the rule type and
click Continue.
8. Check Specific Incidents.
9. Check Severity and from the drop-down option selector, check Critical and
Warning. Click Next.
10. On the Add Actions page, click Add. The Conditional Actions page displays.
11. In the Conditions for actions section, choose Only execute the actions if
specified conditions match.
12. From the Incident matches the following criteria list, choose Severity and then
Critical from the drop-down option selector.
13. In the Notifications section, enter the DBA in the Page field. Click Continue. The
Add Actions page displays.
14. Click Add to create a new action for the Warning severity.
15. In the Conditions for actions section, choose Only execute the actions if
specified conditions match.
16. From the Incident matches the following criteria list, choose Severity and then
Warning from the drop-down option selector.
17. In the Notifications section, enter the DBA in the Email to field. Click Continue.
The Add Actions page displays with the two conditional actions. Click Next.
18. Specify a rule name and description. Click Next.
19. On the Review page, ensure your rules have been defined correctly and click
Continue. The Edit Rule Set page displays.
20. Click Save to save your newly defined rules.
2.4.6.2 Creating a Rule to Notify Different Administrators Based on the Event
Type
As per operations policy for production databases, the incidents that relate to
application issues should go to the application DBAs and the incidents that relate to
system parameters should go to the system DBAs. Accordingly, the respective
incidents will be assigned to the appropriate DBAs and they should be notified by way
of email.
Before you set up rules, ensure the following prerequisites are met:
•DBA has setup appropriate thresholds for the metric so that critical metric alert is
generated as expected.
•Rule has been setup to create incident for all such events.
•Respective notification setup is complete, for example, global SMTP gateway,
email address, and schedule for individual DBAs.
Perform the following steps:
1. Navigate to the Incident Rules page.
From the Setup menu, select Incidents, then select Incident Rules.
2. Search the list of enterprise rules matching the events from the production
database.
Chapter 2
Advanced Topics
2-62

3. On the Incident Rules - All Enterprise Rules page, highlight a rule set and click
Edit....
Rules are created in the context of a rule set. If there is no existing rule set, create
a rule set.
4. From the Edit Rule Set page (Rules tab), select the rule which creates the
incidents for the metric alert events for the database. Click Edit
5. From the Select Events page, click Next.
6. From the Add Actions page, click +Add. The Add Conditional Actions page
displays.
7. In the Notifications area, enter the email address of the DBA you want to be
notified for this specific event type and click Continue to add the action. Enterprise
Manager returns you to the Add Actions page. Click Next.
8. On the Specify Name and Description page, enter an intuitive rule name and a
brief description.
9. Click Next.
10. On the Review page, review the Applies to, Actions and General information for
correctness .
11. Click Continue to create the rule.
12. Create/Edit additional rules to handle alternate additional administrator
notifications according to event type.
13. Review the rules summary and make corrections as needed. Click Save to save
your rule set changes.
2.4.6.3 Creating a Rule to Create a Ticket for Incidents
If your IT process requires a helpdesk ticket be created to resolve incidents, then you
can use the helpdesk connector to associate the incident with a helpdesk ticket and
have Enterprise Manager automatically open a ticket when the incident is created.
Communication between Incident Manager and your helpdesk system is bidirectional,
thus allowing you to check the changing status of the ticket from within Incident
Manager. Enterprise Manager also allows you to link out to a Web-based third-part
console directly from the ticket so that you can launch the console in context directly
from the ticket.
For example, according to the operations policy of an organization, all critical incidents
from a production database should be tracked by way of Remedy tickets. A rule is set
up to create a Remedy ticket when a critical incident occurs for the database. When
such an incident occurs, the ticket is generated by the rule, the incident is associated
with the ticket, and the operation is logged for future reference to the updates of the
incident. While viewing the details of the incident, the DBA can view the ticket ID and,
using the attached URL link, access the Remedy to get the details about the ticket.
Before you perform this task, ensure the following prerequisites are met:
•Monitoring support has been set up.
•Remedy ticketing connector has been configured.
Perform the following steps:
1. From the Setup menu, select Incidents, then select Incident Rules.
Chapter 2
Advanced Topics
2-63

2. On the Incident Rules - All Enterprise Rules page, select the appropriate rule set
and click Edit.... (Rules are created in the context of a rule set. If there is no
applicable rule set , create a new rule set.)
3. Select the appropriate rule that covers the incident conditions for which tickets
should be generated and click Edit...
4. Click Next to proceed to the Add Actions page.
5. Click +Add to access the Add Conditional Actions page.
a. Specify that a ticket should be generated for incidents covered by the rule.
b. Specify the ticket template to be used.
6. Click Continue to return to the Add actions page.
7. On the Add Actions page, click Next.
8. On the Review page, click Continue.
9. On the Specify Name and Description page, click Next.
10. On the Review page, click Continue. A message displays indicating that the rule
has been successfully modified. Click OK to close the message.
11. Repeat steps 3 through 10 until all appropriate rules have been edited.
12. Click Save to save your changes to the rule set.
2.4.6.4 Creating a Rule to Send SNMP Traps to Third Party Systems
As mentioned in Using Notifications , Enterprise Manager supports integration with
third-party management tools through the SNMP. Sending SNMP traps to third party
systems is a two-step process:
Step 1: Create an advanced notification method based on an SNMP trap.
Step 2: Create an incident rule that invokes the SNMP trap notification method.
The following procedure assumes you have already created the SNMP trap notification
method. For instruction on creating a notification method based on an SNMP trap, see
"Sending SNMP Traps to Third Party Systems".
1. From the Setup menu, select Incidents, then select Incident Rules.
2. On the Incident Rules - All Enterprise Rules page, click Create Rule Set...
3. Enter the rule set Name, a brief Description, and select the type of source object
the rule Applies to (Targets).
4. Click on the Rules tab and then click Create...
5. On the Select Type of Rule to Create dialog, select Incoming events and
updates to events and then click Continue.
6. On the Create New Rule : Select Events page, specify the criteria for the events
for which you want to send SNMP traps and then click Next.
Chapter 2
Advanced Topics
2-64

Note:
You must create one rule per event type. For example, if you want to send
SNMP traps for Target Availability events and Metric Alert events, you must
specify two rules.
7. On the Create New Rule : Add Actions page, click Add. The Add Conditional
Actions page displays.
8. In the Notifications section, under Advanced Notifications, select an existing
SNMP trap notification method.
For information on creating SNMP trap notification methods, see "Sending SNMP
Traps to Third Party Systems".
9. Click Continue to return to the Create New Rule : Add Actions page.
10. Click Next to go to the Create New Rule : Specify Name and Description page.
11. Specify a rule name and a concise description and then click Next.
12. Review the rule definition and then click Continue add the rule to the rule set. A
message displays indicating the rule has been added to the rule set but has not
yet been saved. Click OK to close the message.
13. Click Save to save the rule set. A confirmation is displayed. Click OK to close the
message.
2.4.7 Exporting and Importing Incident Rules
You invest a great deal of time and effort carefully designing and testing the incident
rule sets that automate Enterprise Manager incident management practices within
your organization. Typically, the design and test phase of rule set creation is carried
out in a separate Enterprise Manager test environment. Incident Manager's rule set
import/export functionality simplifies moving rule sets from your development
environment to your production environment.
In addition to moving rule sets from a test environment to a production environment,
the import/export functionality also allows you to back up incident rule sets so they can
be safely archived in case of disaster. More importantly, the import/export functionality
makes it easy to standardize incident management automation processes across your
Enterprise Manager environments.
2.4.7.1 Exporting Rule Sets using the Enterprise Manager Console
To export an incident rule set:
1. From the Setup menu, select Incidents then select Incident Rules.
2. On the Incident Rules - All Enterprise Rules page, select the desired rule set you
wish to export.
Note:
You cannot export Oracle-supplied out-of-box rule sets.
Chapter 2
Advanced Topics
2-65

3. Click Export. Your browser's file dialog appears prompting you to save or open
the file. Save the file to your local disk. By default the file name will be the name of
your rule set with a.xml extension.
Note:
You should not edit the generated rule set XML files.
2.4.7.2 Importing Rule Sets using the Enterprise Manager Console
In order to import an incident rule set, administrators must have the Create Enterprise
Rule Set privilege.
When an incident rule set is first imported, it will be disabled by default. You will need
to edit the imported rule set in order to specify environment-specific parameters such
as target names for specific target selection or user names for email notification. You
will then need to enable the rule set.
To import an incident rule set:
1. From the Setup menu, select Incidents then select Incident Rules.
2. Click Import. The Import Rule Set dialog displays.
3. From the Import Rule Set dialog, click Choose File. The File Upload dialog
displays.
4. Select the incident rule set XML file and click Open.
5. Click OK.
If there is a naming conflict for the name, you will be asked to select one of the
following:
•Override rule set with same name
•Create rule set with different name
2.4.7.3 Importing Rule Sets Using EM CLI
Using EM CLI, you can write scripts to import/export large numbers of rule sets. The
Create Enterprise Rule Set privilege is required in order to run the import operation
from the command line or script.
You can import a rule set from list of enterprise rule set(s) except for predefined (out-
of-box) rule sets supplied by Oracle.
emcli import_incident_rule_set
-import_file=<XML file name along with the file path for the exported rule set
earlier>
[-alt_rule_set_name=<rule set name>]
Options
•import_file=<XML file name along with the file path for the exported rule set
earlier>
•alt_rule_set_name=<rule set name>
Chapter 2
Advanced Topics
2-66

Optionally, you can specify the name of an enterprise rule set to use in case rule
set already exists.
Example
emcli import_incident_rule_set -import_file="/tmp/TEST_RULESET.xml" -
alt_rule_set_name=COPY_OF_TEST_RULESET
This command imports the rule set and names it as 'COPY_OF_TEST_RULESET'
from rule set XML specified 'TEST_RULESET.xml'
2.4.7.4 Exporting Rule Sets Using EM CLI
You can export a rule set from list of enterprise rule set(s) except for predefined (out-
of-box) rule sets supplied by Oracle. Any user can run the export operation. No special
privileges are required.
emcli export_incident_rule_set
-rule_set_name=<rule set name>
[-rule_set_owner=<ruleset owner>]
-export_file=<XML file name along with the file path for the exported rule set>
Options
•rule_set_name=<rule set name>
Name of an enterprise rule set.
•rule_set_owner=<ruleset owner>
Optionally, you can specify the owner of the rule set.
•export_file=<XML file name along with the file path for the exported rule set>
If the filename is specified as directory, it will create a file with rule set name in that
directory.
Examples:
emcli export_incident_rule_set -rule_set_name=TEST_RULESET -rule_set_owner=sysman
-export_file="/tmp/"
This command exports the ruleset named 'TEST_RULESET' from rule set(s) and
saves at '/tmp/TEST_RULESET.xml'
2.4.8 Creating Corrective Actions for Events
Prior to Enterprise Manager release 13.1, corrective actions could only be associated
with metric alerts. Enterprise Manager release 13.1 now allows script-based corrective
actions to fire on an event by associating them with event rules. This greatly increases
the number of situations where corrective actions can be used, such as compliance
standard violations, metric errors, or target availability. By associating corrective
actions with event rules, you can have the corrective action performed automatically.
You can also initiate the corrective action manually through the event details Guided
Resolutions area of Incident Manager. For a detailed discussion about corrective
actions, see "Creating Corrective Actions.".
Corrective Actions in Event Rules
Chapter 2
Advanced Topics
2-67

When you create an event rule to be triggered when a matching event occurs, you can
select an appropriate predefined corrective action from the Corrective Actions Library.
The corrective actions available for selection will depend on the event type and target
type selected for the rule.
When an event rule set is exported or imported, the associated corrective actions will
be exported/imported as well. For more information about importing/exporting event
rules, see "Exporting and Importing Incident Rules."
Create the Corrective Action
In order to associate a corrective action with an event rule, you must first add it to the
Corrective Action Library. After a corrective action is in the library, you can reuse the
corrective action definition whenever you define a corrective action for an event rule.
1. From the Enterprise menu, select Monitoring, and then Corrective Actions. The
Corrective Action Library page appears.
2. Select a job type from the Create Library Corrective Action drop-down. For
events, you must create an OS Command job type so that a script can be
executed. Select OS Command, specify a name and then click Go. The Create
OS Command Corrective Action page displays.
Specify a corrective action Name and a brief Description or event type.
3. From the Target Type drop-down menu, choose a target type. Click on the
Parameters tab.
4. From the Command Type drop-down menu, choose Script.
5. Enter the OS script text.
All target and event Properties that can be used in the script are listed in the table
to the right.
Tip: When accessing an Event Details page from Incident Manager, you can click
Show Internal Values for Attributes to display the internal name and values for
the event attributes. You can use this to determine what information you can
access when writing the script for the corrective action. Just copy and paste the
information from the dialog into a text editor and refer to this list of attributes when
creating your script
Note:
If you are using an event context parameter, it must be prefixed with EVTCTX.
6. Specify an interpreter. For example,
%perlbin%/perl
7. Once you have finished, click Save to Library. The Corrective Actions Library
page displays and your corrective action appears in the library list.
At this point, the corrective action will be in draft status. At this stage, you can test
and revise the corrective action. However, only you, as owner, can test the CA by
running the CA manually from Incident Manager.
To test the corrective action, you must trigger an event that matches the event rule
with the associated corrective action to see if the actions are what you expect.
Once you are satisfied and are ready for other administrators to use the corrective
action, proceed to the next step.
Chapter 2
Advanced Topics
2-68

Note: The Access tab on the "Create 'OS Command' Corrective Action" page
displays administrators and roles that have access to this corrective action. You
can change access to this corrective action from this tab, if required.
8. Navigate to the Corrective Actions Library page and select the Corrective Action
and then click Publish. A confirmation message displays. Click Yes to confirm
publication.
9. Set the Preferred Credentials. From the Setup menu, select Security and then
Preferred Credentials. The Preferred Credentials page displays. Note that the
preferred credential of the rule set owner will be used by the corrective action
linked to the rule.
Note:
The corrective action will use these credentials to access the system and carry
out the actions (in this case, running the script). For example, set credential for
host if your corrective action is going to perform corrective actions on a
specific host.
10. If not already set, select the Target Type to be accessed by the corrective action
and click Manage Preferred Credentials. You need to define the Default
Preferred Credentials for the specific target type that the CA is going to perform
the actions on. The target type's Preferred Credentials page displays. On the My
preferences tab, navigate to the Default Preferred Credentials region and select
the applicable credential. Click Set.
Note:
Preferred credentials must be set or the corrective action will fail.
Associate the Corrective Action with an Event Rule
Once you have created the corrective action to be associated with an event, you are
now ready to create an event rule that uses the corrective action. You can only
associate one corrective action per conditional action of the rule.
1. From the Setup menu, select Incidents and then Incident Rules. The Incident
Rules - All Enterprise Rules page displays.
2. Click Create Incident Rule Set. The Create Rule Set page displays.
3. Enter a rule set Name and Description.
4. Select the appropriate Targets.
5. Scroll down to the Rules section and click Create... The Select Type of Rule dialog
displays. Choose Incoming events and updates to events and click Continue.
The Create Rule Set wizard appears.
6. From the Type drop-down menu, select the event Type. By default, Metric Alert is
selected. Choose one of the event types, Compliance Standard Rule Violation, for
example. Expand the Advanced Selection Options and set any event
parameters to which the event rule should apply.
7. Click Next to proceed to the Add Actions page.
Chapter 2
Advanced Topics
2-69

8. On the Add Actions page, click Add. The Add Conditional Actions page displays.
9. Scroll down to the Submit Corrective Action section and click Select Corrective
Action. The corrective action selection dialog displays.
10. Choose the corrective action to be attached and click OK.
Note:
You are not prompted for credentials because the rules are run in the
background and the rule set owner's preferred credentials are used to execute
the corrective action.
11. Click Continue. You are returned to the main Add Actions page. Continue to add
more actions, if necessary.
12. Complete the rule set definition and ensure that it appears in the list of incident
rule sets on the Incident Rules - All Enterprise Rules page.
You will need to recreate the particular rule violation in order to test the CA.
Running the Corrective Action Manually
If you are aware that there exists a corrective action in the Corrective Action Library
that can resolve the current event, you can run the corrective action manually from the
library. In the Guided Resolution section of an Event Details page, the Corrective
Actions area displays the Submit from Library link.
Click Submit from Library to display the Corrective Action Library dialog. This dialog
lists ONLY those corrective actions that apply to the current event conditions. Select a
corrective action from the list. The credential settings are displayed. By default, the
preferred credentials are shown. You have the option of using alternate credentials.
Once set, click Submit. The Corrective action <CA name> submitted successfully
dialog displays. Click the link Click here to view the execution details."to go to the
job execution page. Here, you can view the job status and output.
2.4.9 Compressing Multiple Events into a Single Incident
An incident is created for an event when there is a corresponding incident rule defined.
In this situation, multiple events will generate multiple incidents. However, if the events
relate to the same issue, instead of generating multiple incidents, it is better from a
manageability standpoint to just generate a single incident. This is especially true if
these related events are to be managed by the same administrator.
Beginning with Enterprise Manager 13c, Intelligent Incident Compression allows
multiple events to be automatically grouped into a single incident. Some situations
where it is beneficial to deal with multiple events as a single incident are:
•You want automatic consolidation of all Tablespace Used (%) alerts across all
tablespaces for a specific database into a single incident.
•You want automatic consolidation of all Metric Collection Errors for a target into a
single incident.
•You want automatic consolidation of all SOA composite Target Down events within
a WebLogic Domain into a single incident.
Chapter 2
Advanced Topics
2-70
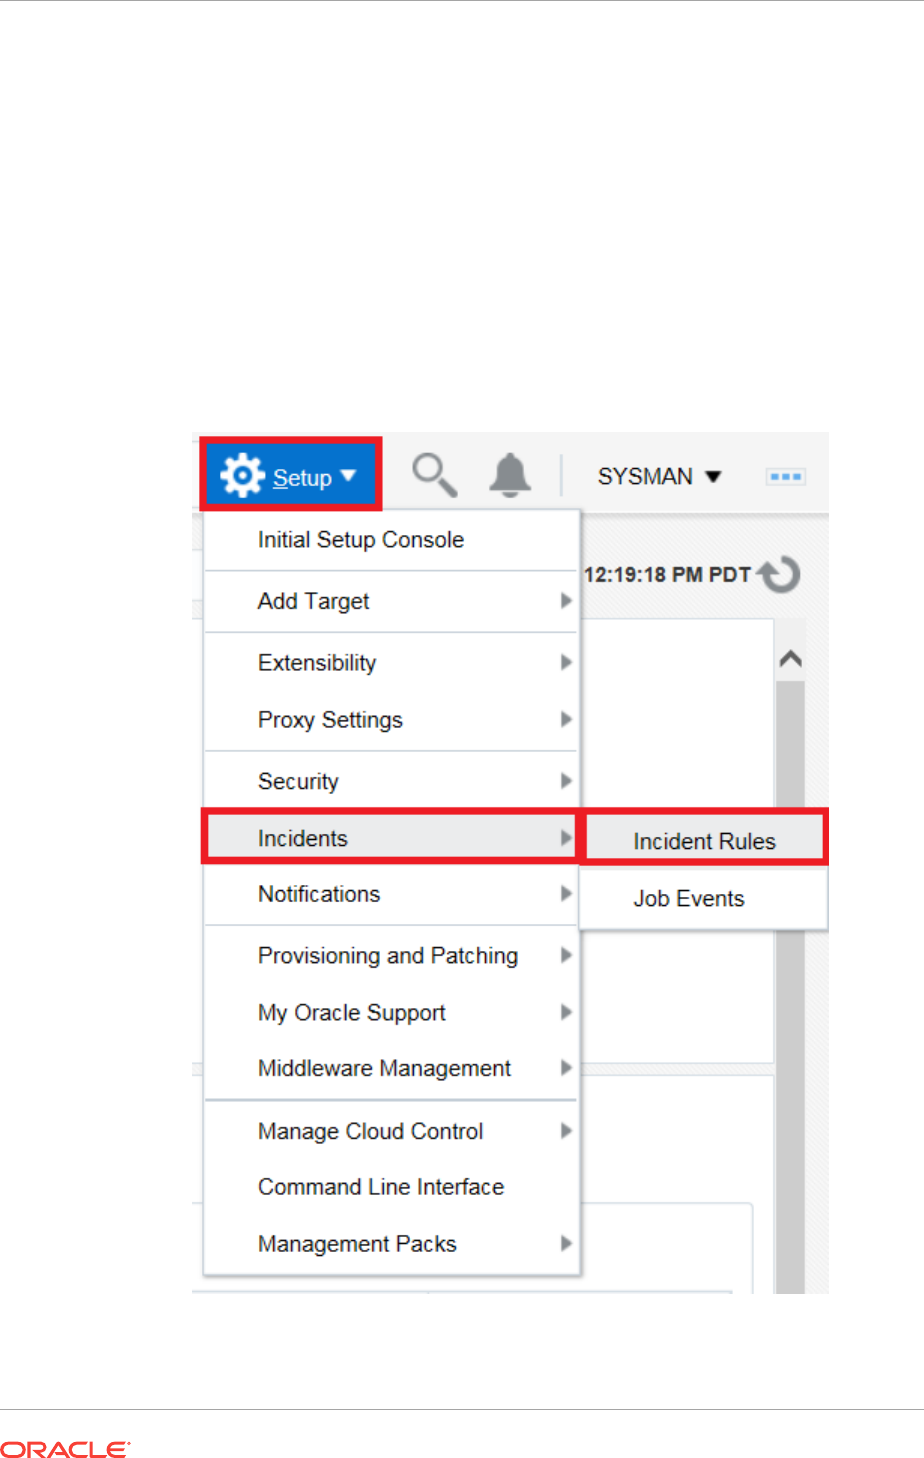
For convenience, Enterprise Manager provides out-of-box rules that automatically
compress related events into single incidents. These rules address some of the most
common conditions where event grouping could be helpful.
•Target down for RAC database instances.
•Metric collection errors for a target.
•Configuration standard violations for a rule on a target.
Creating an Incident Compression Rule Set
The following example shows you how to create an incident rule set that generates a
single incident (compressed), and notifies an administrator of via email that a
compressed incident has been generated.
1. Click Setup > Incidents > Incident Rules.
2. Click Create Rule Set.
Chapter 2
Advanced Topics
2-71

3. Enter the name of the Rule Set and select the target the rule applies to. In this
example, a Database Instance target is selected.
4. Scroll down to the Rules section and click Create.
5. In the Select Type of Rule to Create popup window, leave the default (Incoming
events and updates to events) selected and click Continue.
Chapter 2
Advanced Topics
2-72
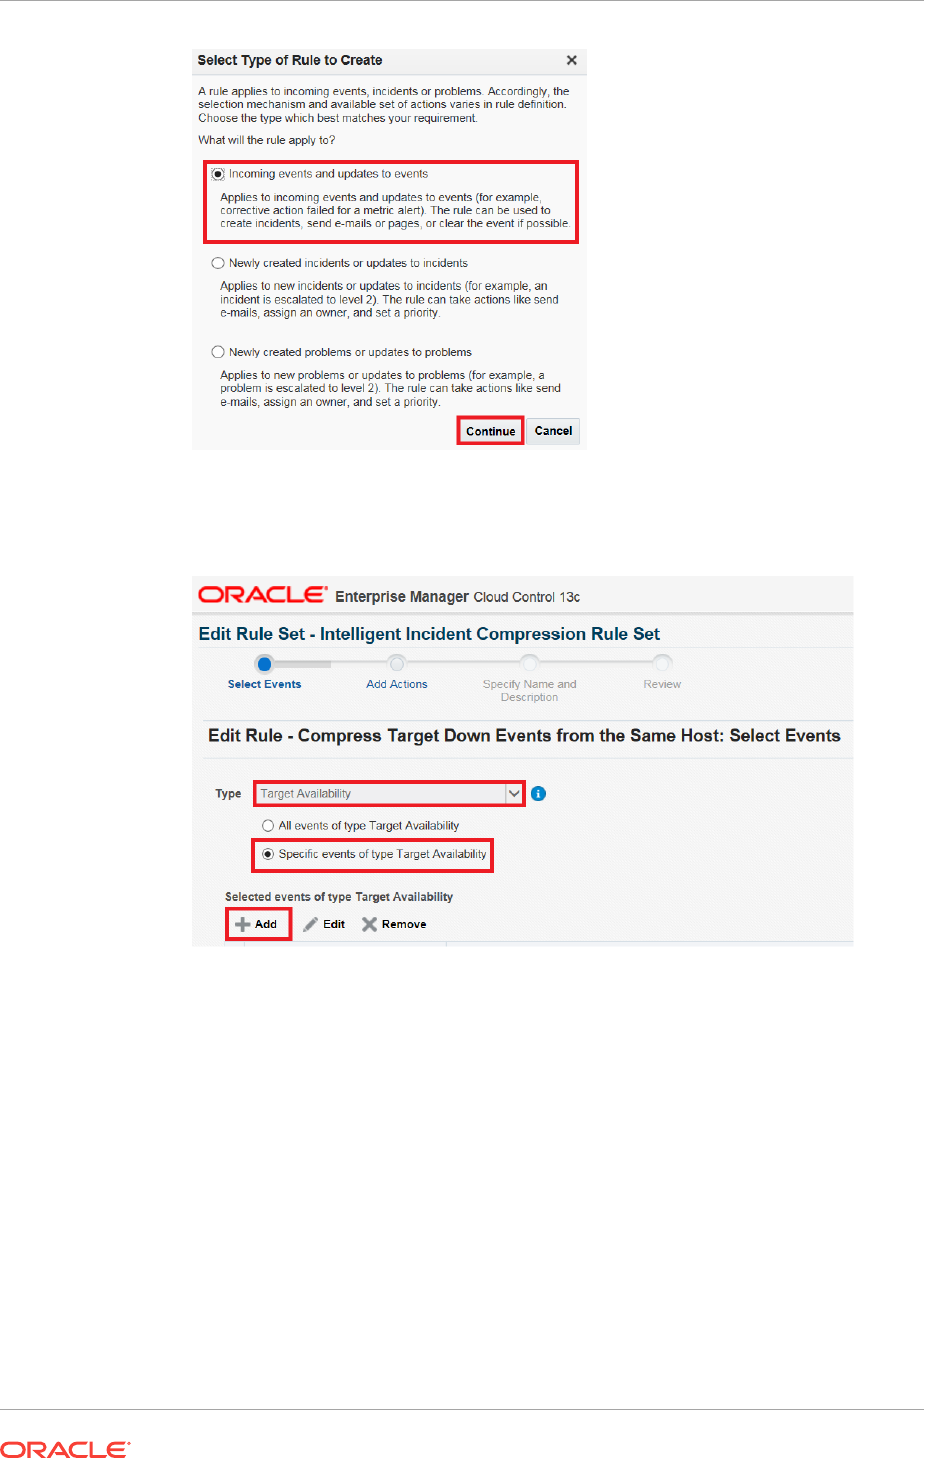
6. Select Target Availability from the Type drop down menu and select Specific
events of type Target Availability. Click Add.
7. Check the “Down” checkbox and click OK.
Chapter 2
Advanced Topics
2-73
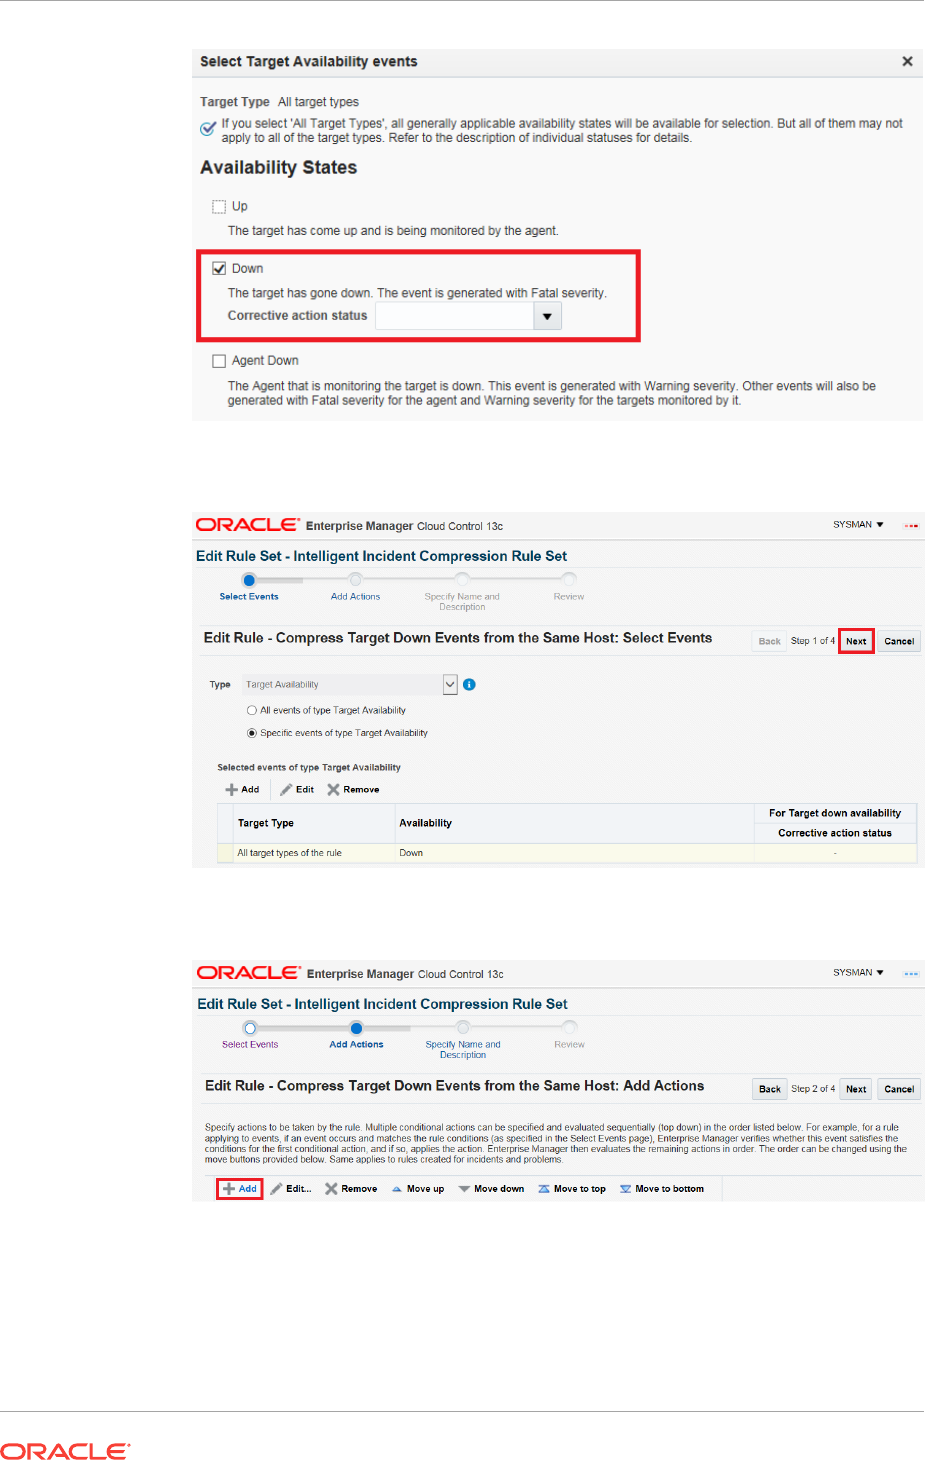
8. Click Next.
9. Click Add to add Conditional Actions.
10. Select the conditions for compressing the events and click Continue. In this
example we are compressing events from targets on the same host.
Chapter 2
Advanced Topics
2-74
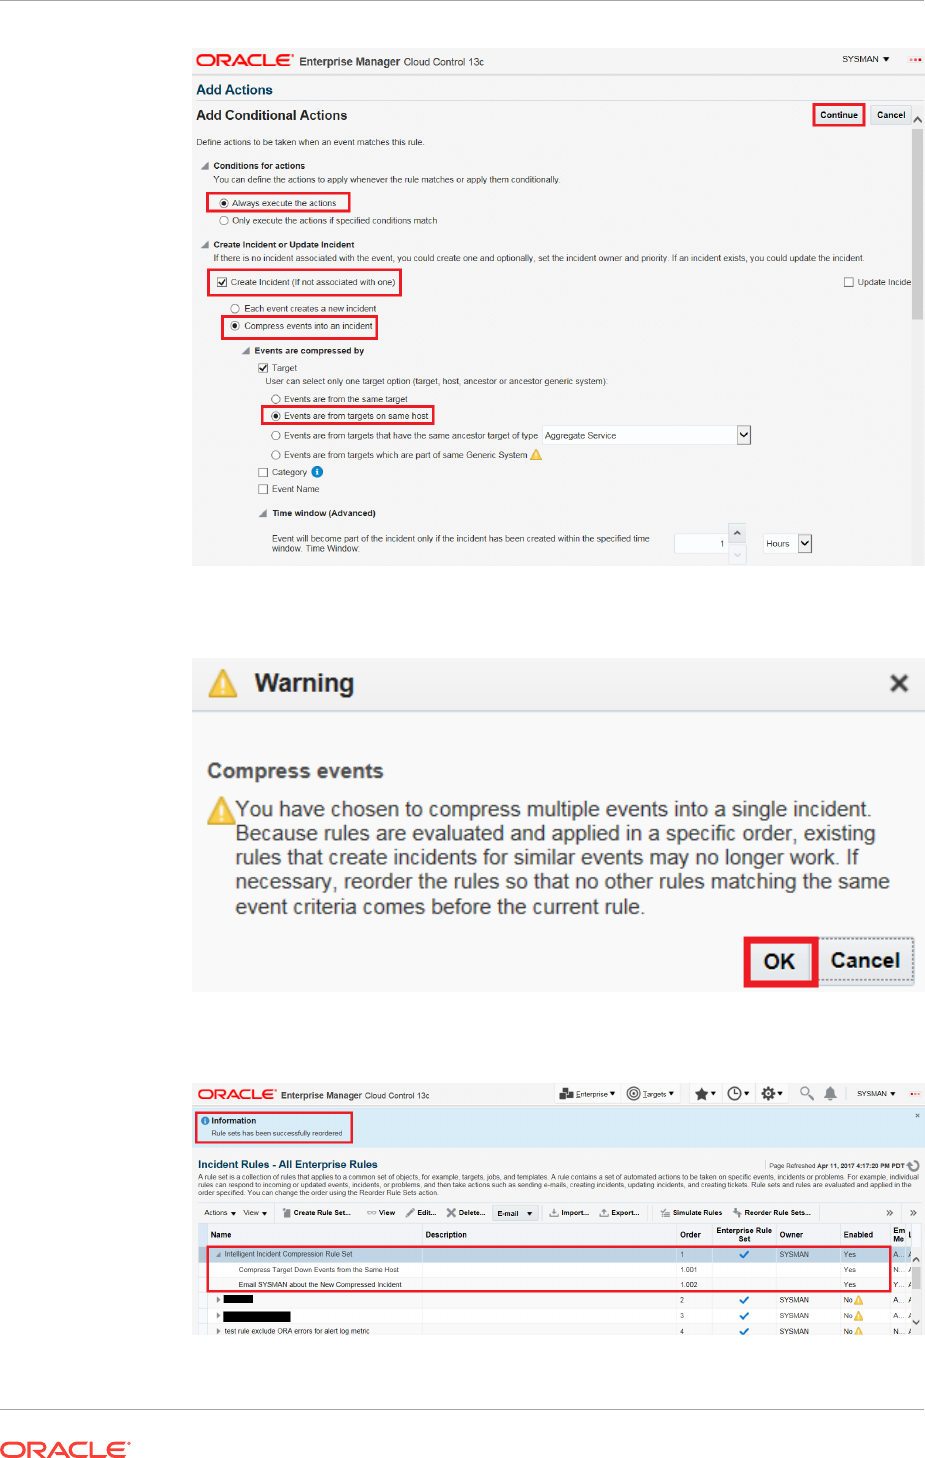
11. Click OK in the popup window.
12. Click Next.
Chapter 2
Advanced Topics
2-75
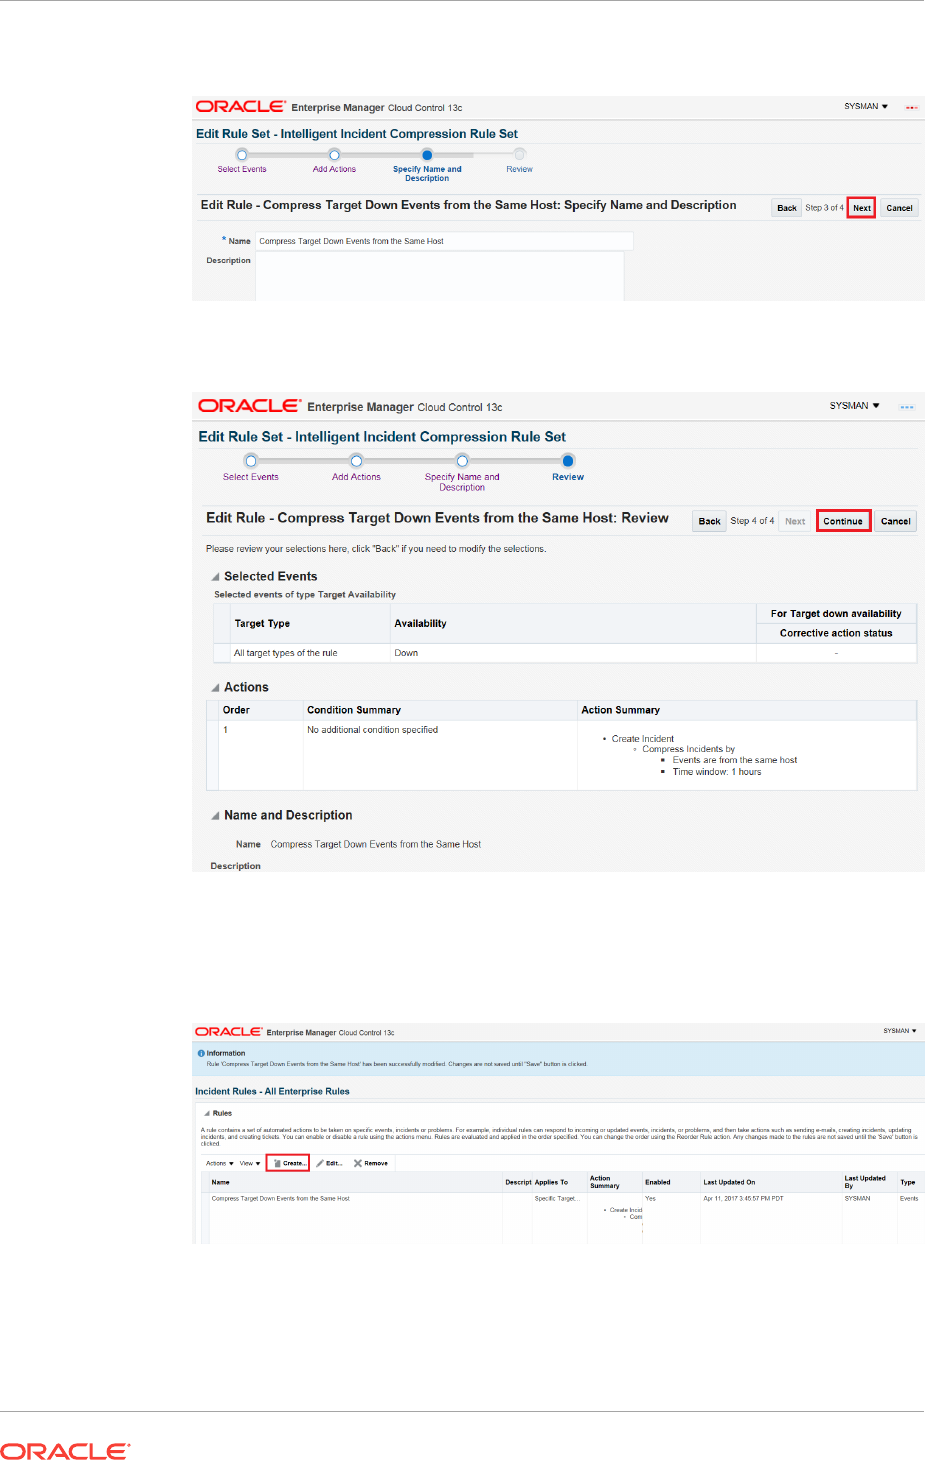
13. Provide a name for the rule and click Next.
14. Click Continue to add the rule.
Next, you will create a new rule to notify an administrator for the compressed
incident.
15. Click Create to create a new rule to configure email notification.
16. Select Newly created incidents or updates to incidents and click Continue.
Chapter 2
Advanced Topics
2-76
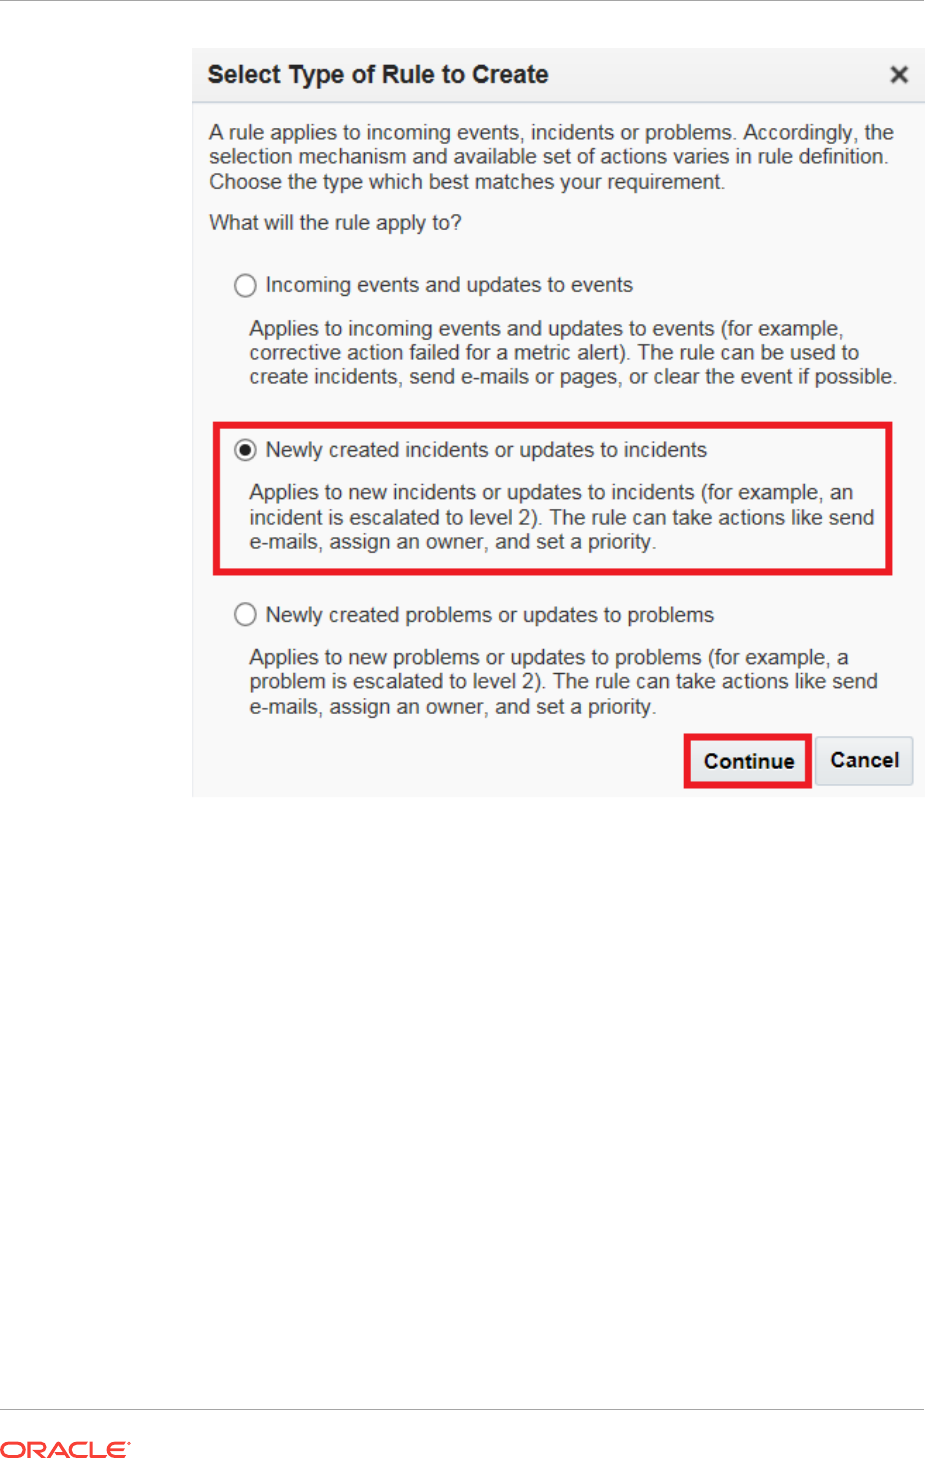
17. Select Specific incidents.
a. Select the checkbox for Rules that created the incidents and select the rule
that you just created.
b. Select the checkbox for Status and select New.
c. Click Next.
Chapter 2
Advanced Topics
2-77
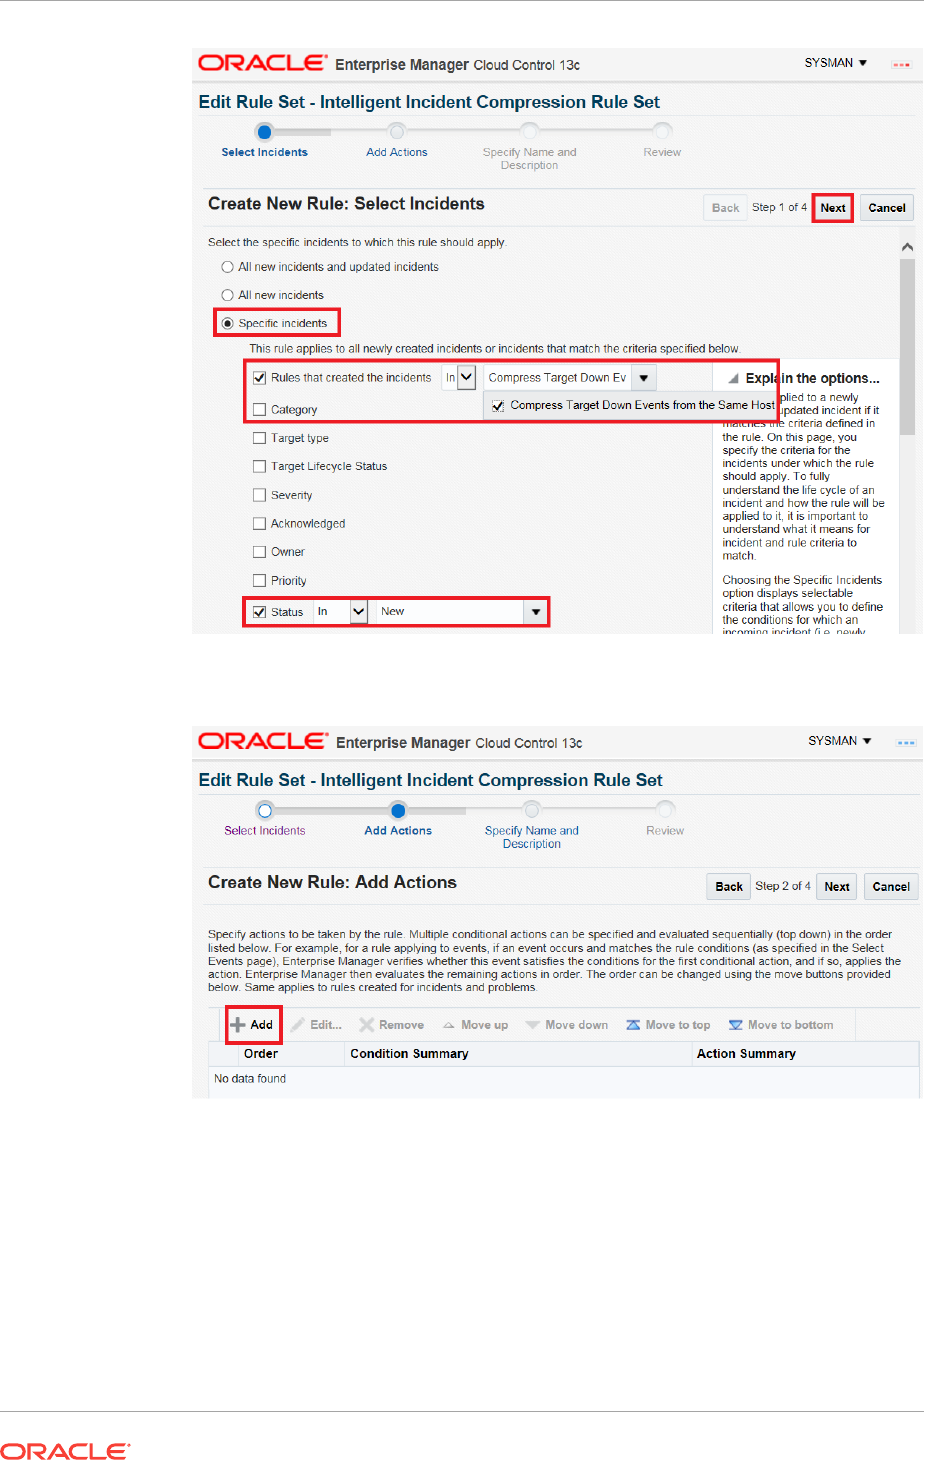
18. Click Add to add a Conditional Action.
19. Populate Conditional Actions as shown in the screen shot below. Change the
notified user according to your requirement.
Chapter 2
Advanced Topics
2-78
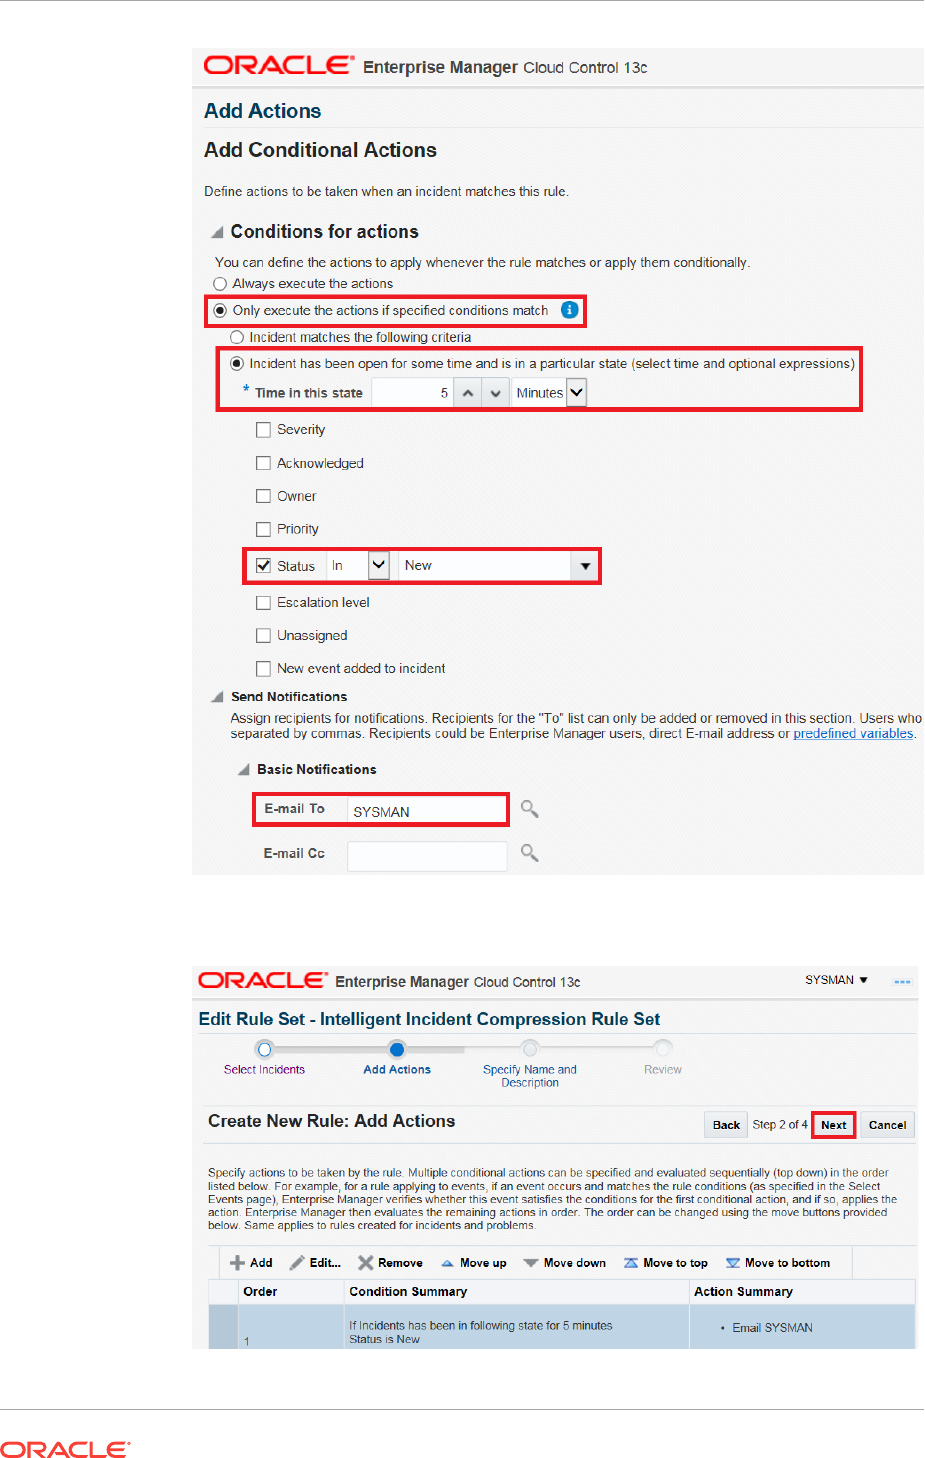
20. Click Next.
Chapter 2
Advanced Topics
2-79
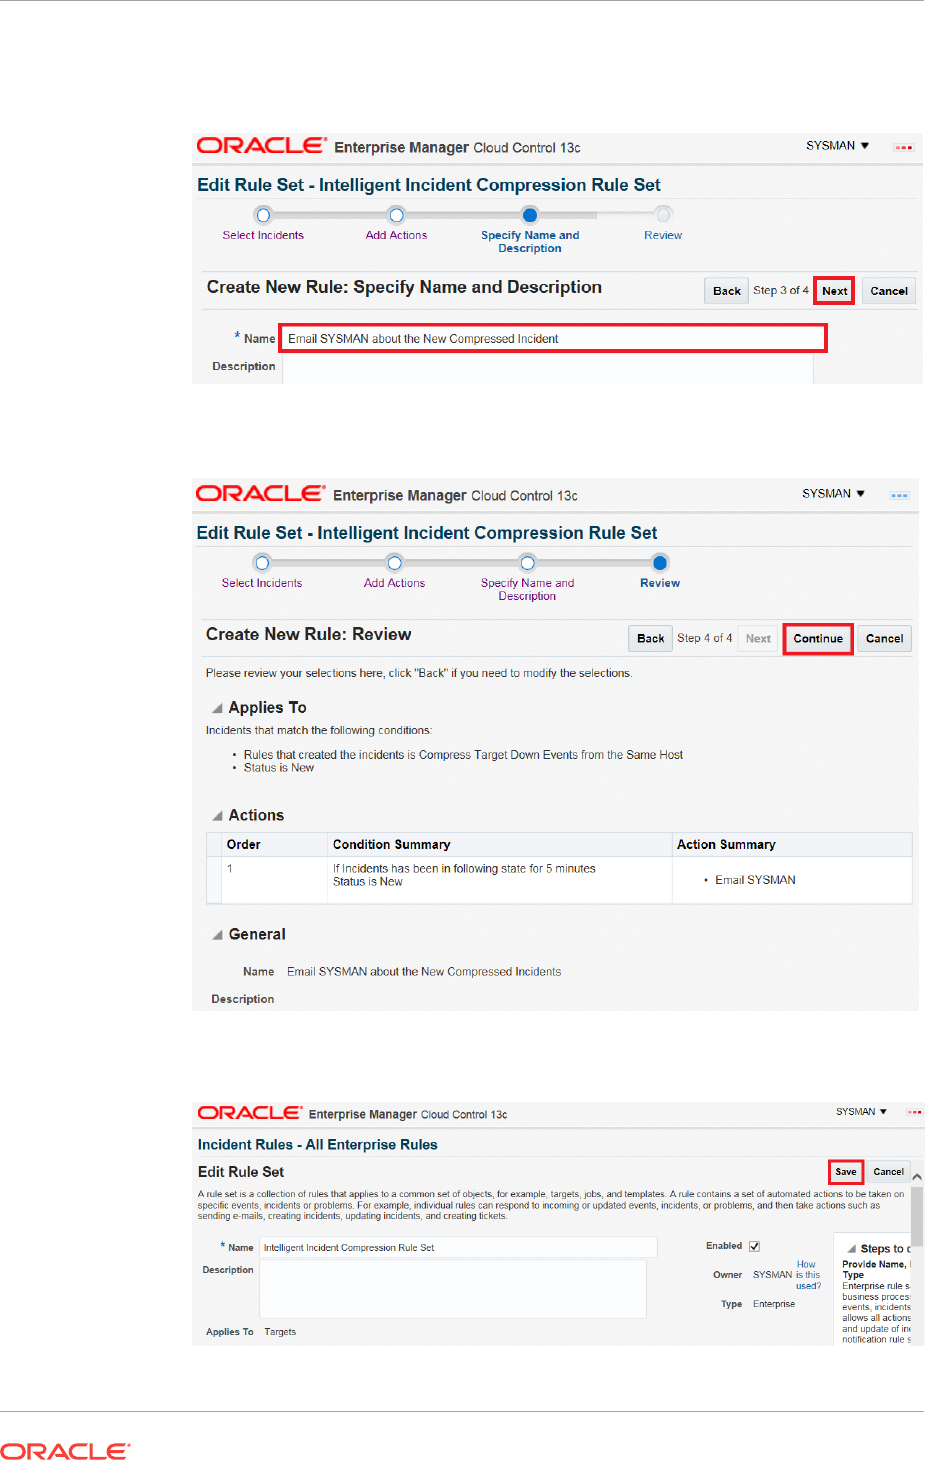
21. Enter a name for the rule and click Next.
22. Click Continue.
23. Click Save to save the rule set.
Chapter 2
Advanced Topics
2-80
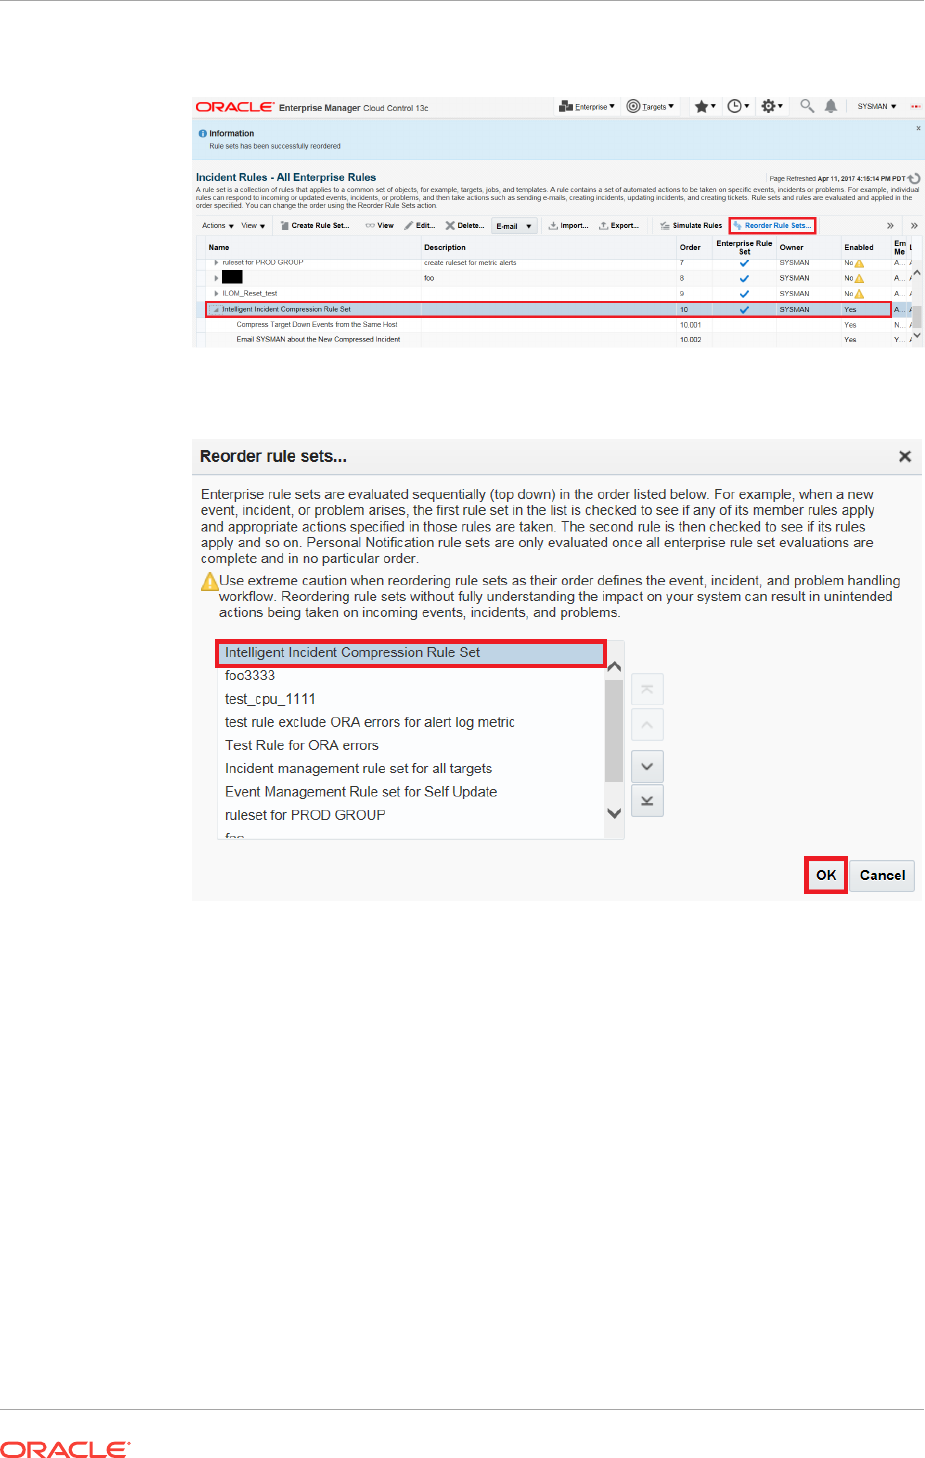
24. Highlight the rule set and click Reorder Rule Sets.
25. Move the rule set to the top and click OK.
Once the new rule set is moved to the top of the list, it will be evaluated first by the
rules engine.
2.4.10 Event Prioritization
When working in a large enterprise, it is conceivable that when systems are under
heavy load, a large number of incidents and events may be generated. All of these
need to be processed in a timely and efficient manner in accordance with your
business priorities. An effective prioritization scheme is needed to determine which
events/incidents should be resolved first.
In order to determine which event/incidents are high priority, Enterprise Manager uses
a prioritization protocol based on two incident/event attributes: Lifecycle Status of the
target and the Incident/Event Type. Lifecycle Status is a target property that specifies
a target's operational status. You can set/view a target's Lifecycle Status from the UI
(from a target's Target Setup menu, select Properties). You can set target Lifecycle
Chapter 2
Advanced Topics
2-81

Status properties across multiple targets simultaneously by using the Enterprise
Manager Command Line Interface (EM CLI) set_target_property_value verb.
A target's Lifecycle Status is set when it is added to Enterprise Manager for
monitoring. At that time, you determine where in the prioritization hierarchy that target
belongs—the highest level being "mission critical" and the lowest being "development."
Target Lifecycle Status
•Mission Critical (highest priority)
•Production
•Stage
•Test
•Development (lowest priority)
Incident/Event Type
•Availability events (highest priority)
•Non-informational events.
•Informational events
2.4.11 Root Cause Analysis (RCA) and Target Down Events
Root Cause Analysis (RCA) tries to identify the root causes of issues that cause
operational events. Beginning with Enterprise Manager Could Control 12.1.0.3,
Incident Manager automatically performs RCA over target down events, thus actively
identifying whether the target down event is the cause or symptom of other target
down events.The term target down event specifically pertains to Target Availability
events that are raised when the targets are detected to be down.
2.4.11.1 How RCA Works
RCA is an ongoing process that identifies whether a target down event is root cause or
symptom. It uses the Causal Analysis Update attribute of the event to store the results
of its analysis, i.e. identifying whether or not the target down event is root cause or
symptom. Whenever a new target availability event comes in, RCA is automatically
performed on the incoming event and existing target down events that are related to it.
Based on the analysis, it updates the Causal Analysis Update attribute value if the
incoming event is a target down event. It also updates the Causal Analysis Update
attribute for the related target down events if there is a change.
Two types of target relationships are used for identifying the related targets:
dependency and containment.
When one target depends on another target for its availability, dependency
relationship exists between them. For example, J2EE application target depends on
the WebLogic Server target over which it is deployed.
The causal analysis update attribute is used only for target down events (such as a
Target Availability event for target down) and can have be assigned any one of the
following values by the RCA process:
•Symptom -- The target down event has been caused by another target down
event.
Chapter 2
Advanced Topics
2-82

•Cause - The target down event has caused another target down event and it is not
the symptom of any other target down event.
•Root Cause - The target down event has caused another target down event and it
is not the symptom of any other target down event.
•N/A - Root cause analysis is not applicable to this event. Root cause analysis
applies to target down events only.
•Not a cause and not a symptom - The target down event is not a root cause and
not a symptom of other target down events. This is shown in Incident Manager as
a dash (-).
The following rules describe the RCA process:
•Rule 1: Down event on a non-container target (a target that does not have
members) is marked as the cause if a dependent target is down and it is not
symptom of other target down events.
Examples:
–You have J2EE applications deployed on a standalone WebLogic Server. If
both J2EE application and WebLogic Server targets are down, the WebLogic
Server down event is the cause for the J2EE applications deployed on it.
–You have a J2EE application deployed on couple of WebLogic Servers, which
are part of a WebLogic Cluster. If one WebLogic Server is down along with its
J2EE application, then the WebLogic Server down event is the cause of the
J2EE application target down. This assumes the WebLogic Cluster is not
down.
•Rule 2: Down event on a non-container target (a target that does not have
members) is marked as a symptom if a target it depends on is down or if the target
containing it is down.
Examples:
–You have a J2EE application deployed on a standalone WebLogic Server. If
both J2EE application and WebLogic Server targets are down, J2EE
application down event is the symptom of WebLogic Server being down.
–You have a couple of WebLogic Servers which are part of a WebLogic Cluster.
Each WebLogic Server has a J2EE application deployed on it. If the WebLogic
Cluster is down, this means both WebLogic Servers are down. Consequently,
the J2EE applications that are deployed on these servers are also down. The
WebLogic Server down events would be marked as the causes of the
WebLogic Cluster being down. See Rule 3 for details.
–You have a couple of RAC database instance targets that are part of a cluster
database target. If the cluster database is down, then all RAC instances are
also down. The RAC instance down events would be marked as the causes of
cluster database being down. See Rule 3 for details..
•Rule 3: Down event on a container target is marked as symptom down if all
member targets are down and any target containing it is not down.
Examples:
–You have a couple of WebLogic Servers, which are part of a standalone
WebLogic Cluster. A WebLogic Cluster down event would be marked as
symptom, if both the WebLogic Servers are down.
Chapter 2
Advanced Topics
2-83

–You have a couple of RAC database instance targets that are part of a cluster
database target. The cluster database target down event would be marked as
a symptom, if both database instances are down.
•Rule 4: Down event on a container target is marked as symptom if the target
containing it is down.
Example:
You have a couple of WebLogic Clusters that are part of a WebLogic Domain
target. If the WebLogic domain is down, this means the WebLogic Clusters are
also down. The WebLogic Cluster target down events would be the cause of
WebLogic Domain being down. The WebLogic Domain down event would be
marked as symptom.
2.4.11.2 Leveraging RCA Results in Incident Rule Sets
As described above, RCA is an ongoing process which results in marking target down
events as cause, symptom or neither as new target down events come in and are
processed. So a target down event may be marked as a cause or symptom as it
comes in or after some time when RCA has analyzed additional event information.
Most datacenters automatically create incidents for target down events since these are
important events that need to be resolved right away. This is recommended best
practice and also implemented by the out-of-the-box rule sets. However, in terms of
notifying response teams or creating trouble tickets, it is not desirable to do so for
symptom incidents. Some datacenters may also choose to not create incidents for
symptom events.
So the RCA results can be leveraged to do the following:
1. Notify or create tickets only for non-symptom events:
This can be achieved in 2 ways:
•Create two separate event rules , one event rule to create incidents for all
relevant events, but take no further action (no notification or ticket creation)
and another one to create incidents for non-symptom events only and also
send notifications and create tickets. See "Creating Incidents On Non-
symptom Events" for instructions.
•Create an event rule that creates incidents for all target down events. Create
another rule to update the incident priority, send notifications and create
tickets only for incidents stemming from non-symptom events. Once the
incident priority is set to say "Urgent", customer can also create additional
incident rules to take additional actions on the Urgent priority incidents. See
"Creating a Rule to Update Incident Priority for Non-symptom Events".
2. Only create incidents after a suitable wait for events that are not initially marked as
neither a cause nor a symptom:
As mentioned previously, RCA is an iterative process whereby incoming target
down events are continually being evaluated, resulting in updates to causal
analysis state of existing events. Over a period of time (minutes), a target down
event that was initially marked as a root cause may or may not remain a root
cause depending on other incoming target down events. The original target down
event may later be classified as a symptom.
To avoid prematurely creating an incident and opening a ticket for an event which
may later turn out to be a symptom event, you can set up your rules as follows:
Chapter 2
Advanced Topics
2-84
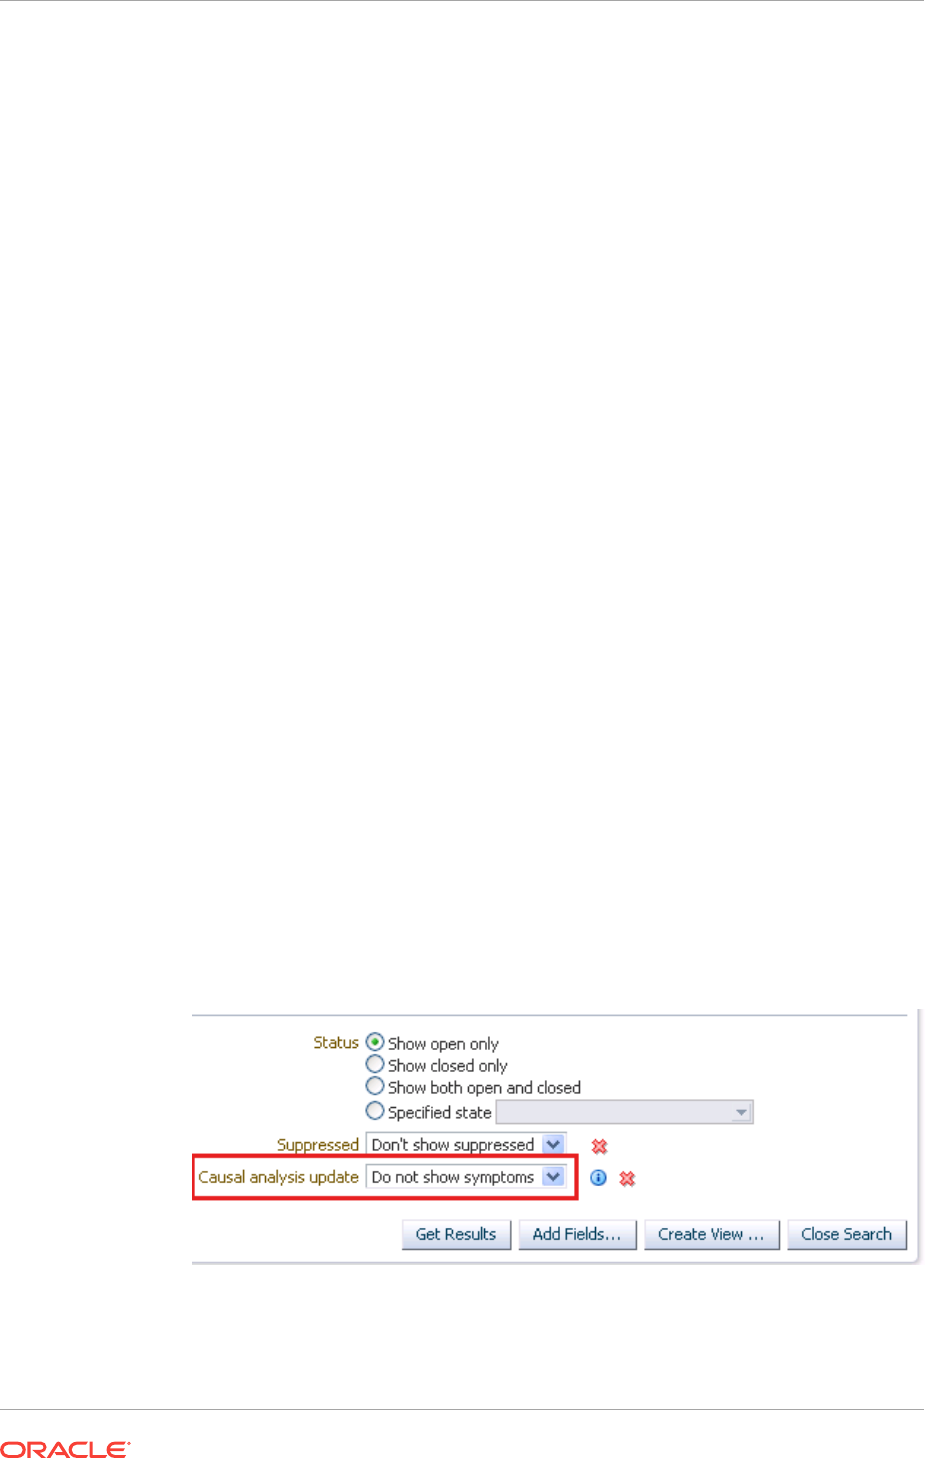
•In addition to the rules already defined in the previous step, create an
additional event rule to act upon RCA updates to events and when the RCA
update indicates that the event is marked as a symptom, lower the priority of
the incident to "Low". This will also send an update to the ticket automatically.
This is recommended. See "Introducing a Time Delay" for instructions.
OR
•To allow time for target down events to be reported, analyzed, and then acted
upon (such as creating an incident or updating an incident), you can add a
delay in the rule actions. This is useful when customer have some tolerance to
take action after some minimum delay (typically 5 minutes).
3. Only create incidents for non-symptom events.
Some datacenters may choose not to create any incidents for symptom events.
This can be achieved by changing the rules to only create incidents for events
marked as cause or neither a cause nor symptom. See "Creating Incidents On
Non-symptom Events" for instructions.
Please note that, even in this approach, it is possible that an event that was
originally marked as cause or neither a cause nor symptom, may be marked as a
symptom when more information is received. Customers can use an approach
similar to that of the second option in step 2 to build some delay in creating the
incidents. Even with this, it is still feasible but a bit unlikely, that newer information
shows up after the pre-set delay and ends up marking the event as symptom. So it
is recommended to use the approach of setting incident priority and using that as a
way to manage workflow.
2.4.11.3 Leveraging RCA Results in Incident Manager
You can use the RCA results to focus on the non-symptom incidents in Incident
Manager. This involves using the Causal Analysis Update incident attribute when
creating custom views.
1. From the Enterprise menu, select Monitoring, and then Incidents. The Indicent
Manager page displays.
2. From the Views region, click Create. The Search page displays.
3. Click Add Fields... and then choose Causal analysis update. The Causal
analysis update displays as additional search criteria.
4. Choose 'Do Not Show Symptoms' from the list of available criteria. This will
automatically exclude incidents that have been marked as 'symptom'. Incidents
that are not marked as symptom or root cause will be included as long as it
matches any other criteria you may have specified.
Chapter 2
Advanced Topics
2-85

5. Click Create View, enter a View Name when prompted, and then click OK.
Showing RCA Results in an Incident Detail
An incident that is a root cause or symptom will be identified prominently as part of the
details of the incident in Incident Manager. In addition, in case the incident is a
symptom, a Causes section will be added to identify the root cause(s) of the incident.
In case the incident has, in turn, caused other target down incidents, an Impacted
Targets section will also be added to show the targets that have been affected, that is.
other targets that are down as a result of the original target down.
2.4.11.4 Leveraging RCA Results in the System Dashboard
In the System Dashboard, you can use the RCA results to exclude symptom incidents
from the Incidents table so administrators can focus their attention on incidents that
are root cause or have not been caused by other target down events.
To exclude Symptom Incidents:
1. In the System Dashboard, click on the View option that is accessible from the
upper left hand corner of the Incidents and Problems table.
2. Choose the option to 'Exclude symptoms'. Alternatively, you can also choose the
option 'Cause only' show only shows target down incidents that have been
identified as cause of other target down incidents. Regardless of the option
chosen, incidents that have not been marked as symptom or root cause will
continue to be displayed.
2.4.11.5 Creating a Rule to Update Incident Priority for Non-symptom Events
1. Create an event rule to select only non-symptom events.
Chapter 2
Advanced Topics
2-86
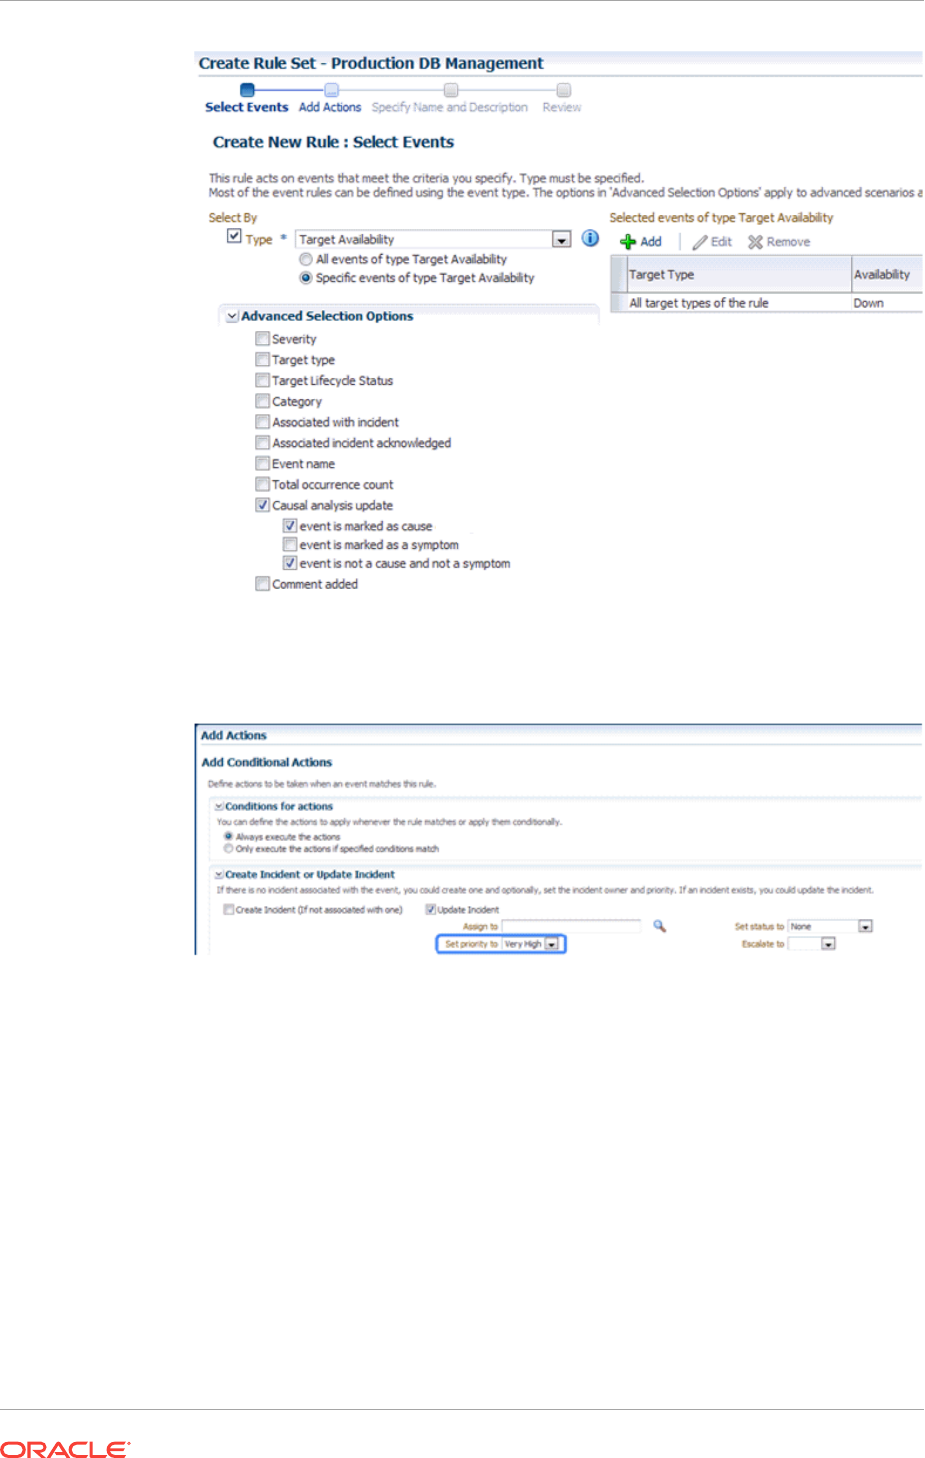
2. When adding an action, select the priority to be set for incidents associated with
the non-symptom events selected above.
2.4.11.6 Creating Incidents On Non-symptom Events
You can leverage Incident Manager's Root Cause Analysis (RCA) capability by
creating rule sets that generate incidents for non-symptom, target down events. For
monitoring situations where a high number of symptom target down events are
generated, but only a few non-symptom target down events, you can create/modify a
rule set that generates incidents and send notifications only for non-symptom events.
To create a rule set that generates incidents for this monitoring condition, you need to
create two event rules (one for each of the RCA filters):
•Event Rule 1: Generate incidents for all relevant events, but take no further
action (no notification or ticket creation). The event is marked as a cause.
•Event Rule 2: Generate incidents for non-symptom events only and also send
notifications and create tickets. The event is not a cause and not a symptom.
Chapter 2
Advanced Topics
2-87
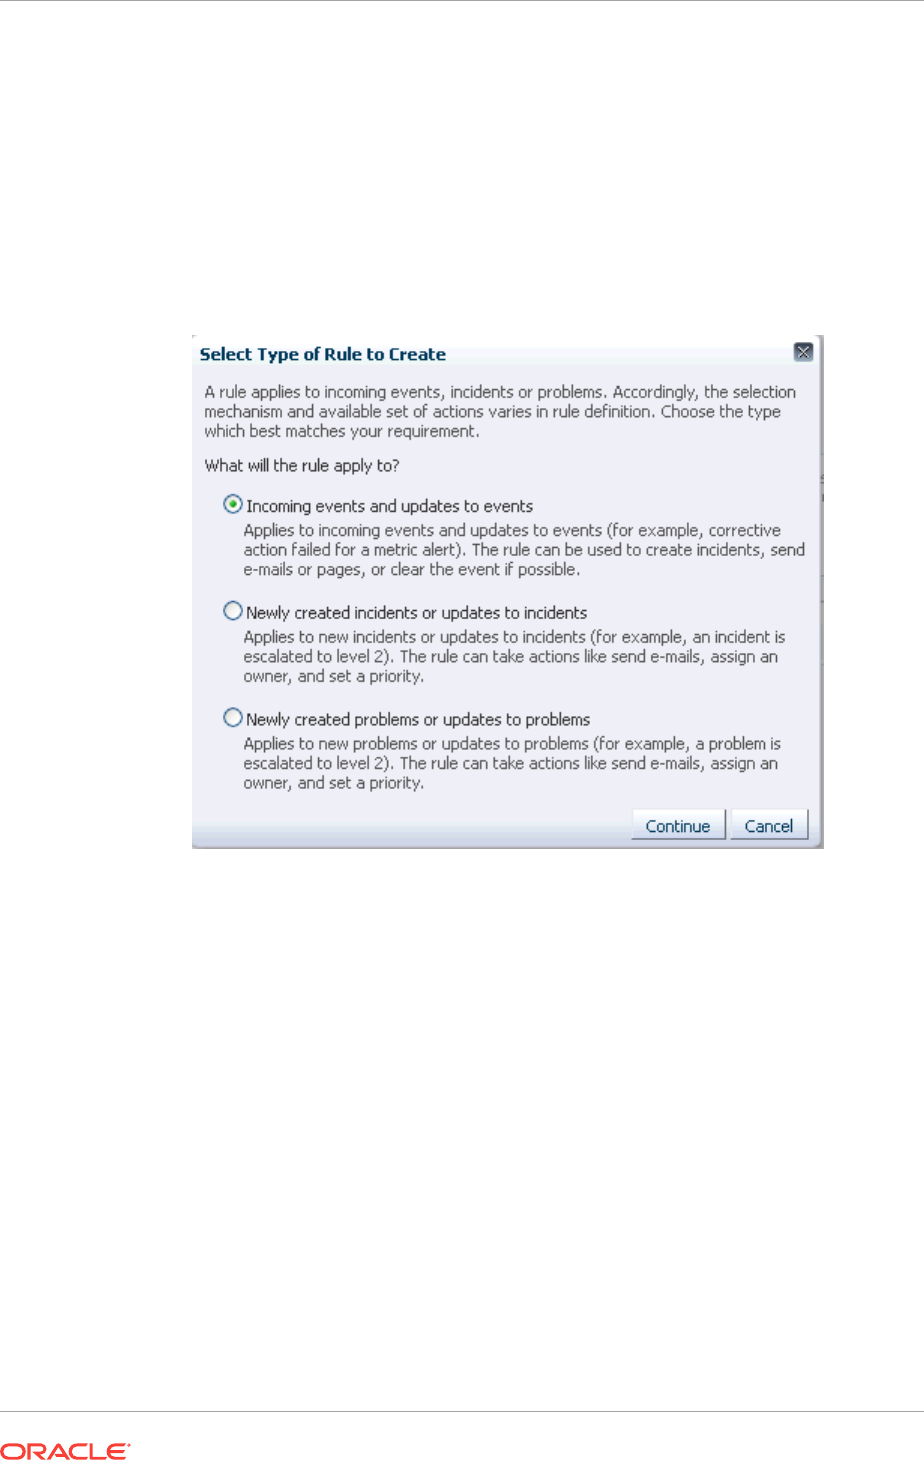
To create the event rules to handle non-symptom target down events, navigate to the
Incident Rules - All Enterprise Rules page (Setup—>Incidents—>Incident Rules).
From here, you can create a new rule set (click Create Rule Set…) or edit an existing
rule set (click Edit…).
To create a rule that generates incidents for all relevant events:
1. From the Rules region of the Create Rule Set/Edit Rule Set page, click Create ...
The Select Type of Rule to Create dialog appears.
2. Select Incoming events and updates to events.
3. Click Continue. The Create New Rule: Select Events dialog displays. Select
Target Availability.
Chapter 2
Advanced Topics
2-88
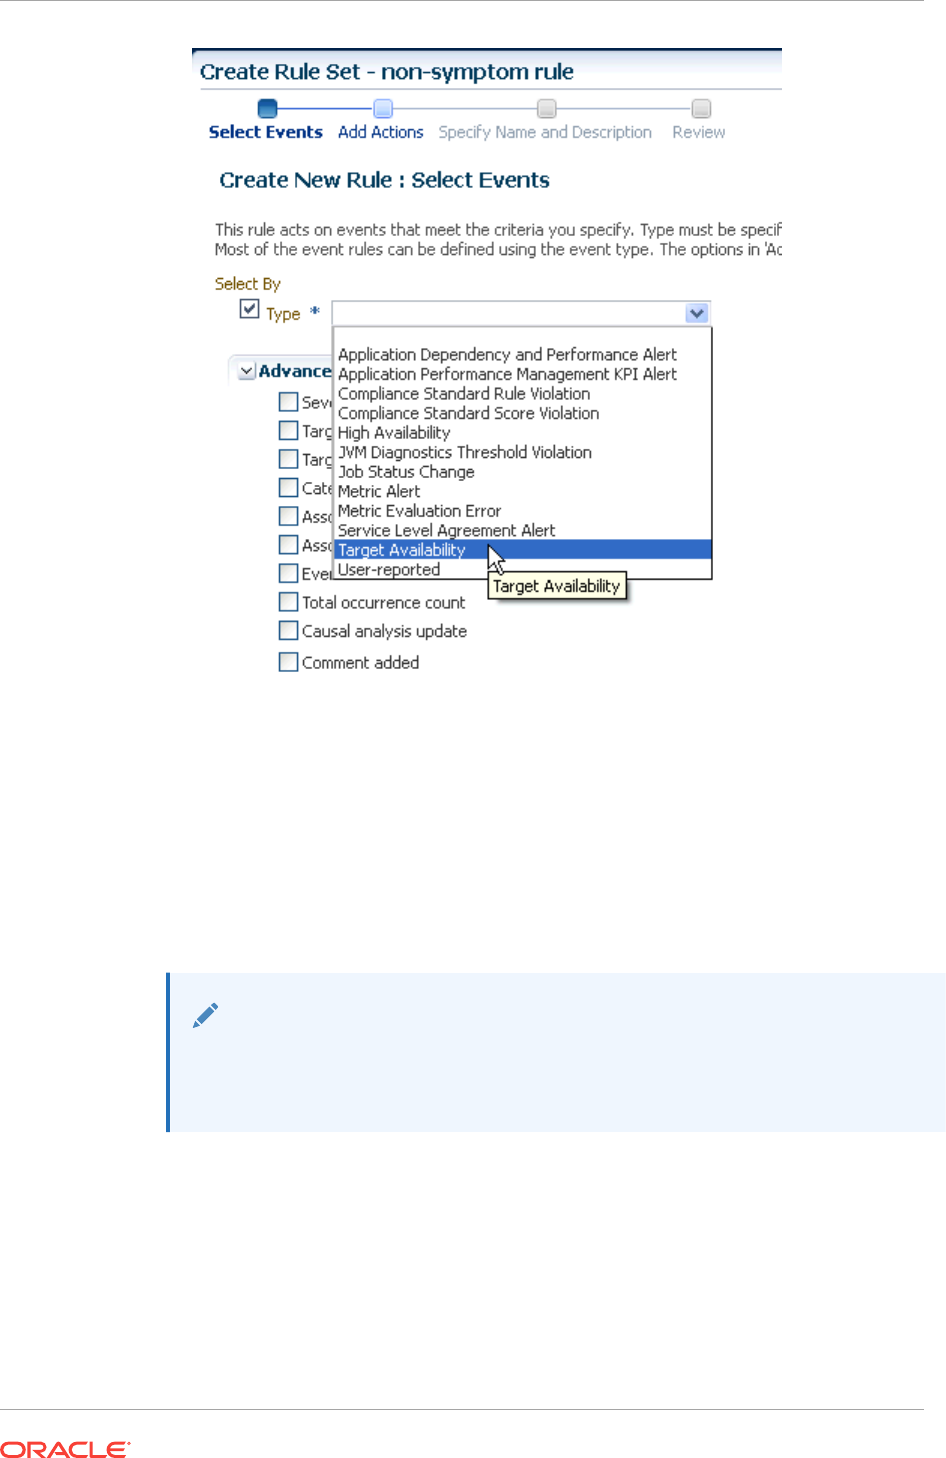
4. In the Advanced Selection Options region, choose Causal analysis update.
Three causal event options display:
•Event is marked as cause: A target down is considered a cause if other targets
depending on it are down.
•Event is marked as a symptom: A target down is considered a symptom if a
target it depends on is also down.
•Event is not a cause and not a symptom: A target down is neither a cause or
symptom.
Note:
Note: By selecting an option, you filter out extraneous target down events and
focus on those target availability events that pertain to targets with
interdependencies.
5. Select event is marked as a cause and click Next.
6. On the Create New Rule : Add Actions page, click Add. The Add Conditional
Actions page displays.
7. In the Create Incident or Update Incident region, choose Create Incident (if not
associated with one) and click Continue.
8. Complete the remaining Create Rule Set wizard pages to return to the Create Rule
Set/Edit Rule Set page.
Chapter 2
Advanced Topics
2-89

Next, you need to create a rule that generates incidents for non-symptom events
only and also send notifications.
9. Repeat steps 1-4.
10. Select event is not a cause and not a symptom and click Next.
11. On the Create New Rule: Add Actions page, click Add. The Add Conditional
Actions page displays.
12. In the Create Incident or Update Incident region, choose Create Incident (if not
associated with one).
13. In the Send Notifications region, complete the requisite notification details and
click Continue. The Edit Rule Set page displays with the newly defined action
listed in the table.
14. Complete the remaining Create Rule Set wizard pages to return to the Create Rule
Set/Edit Rule Set page. At this point, the two RCA event rules will have been
added to the rule set.
15. Click Save to save the changes to the rule set.
2.4.11.7 Introducing a Time Delay
As mentioned previously, Incident Manager RCA is an iterative process whereby
incoming target down events are continually being evaluated, resulting in updates to
causal analysis states. Over a period of time (minutes), a root cause may or may not
remain a root cause depending on incoming target down events. The original target
down event may later be classified as a symptom. To allow time for target down
events to be reported, analyzed, and then acted upon (such as creating an incident),
you can define an event evaluation time delay when creating a rule set.
In the previous example, where incidents are created for non-symptom events, without
a time delay in the rule, there could potentially be an incident created for a non-
symptom event that eventually becomes a symptom.
To add a time delay to the rule:
1. From the Create Rule Set wizard Add Actions page, click Add or Edit (modify an
existing rule). The Add Conditional Actions page displays.
2. In the Conditions for Actions region, choose Only execute the actions if
specified conditions match. A list of conditions displays.
3. Choose Event has been open for specified duration.
4. Specify the desired time delay.
5. Click Continue and complete the remaining steps in the wizard.
2.5 Moving from Enterprise Manager 10/11g to 12c and
Greater
Beginning with Enterprise Manager 12c, incident management functionality leverages
your existing pre-12c monitoring setup out-of-box. Migration is seamless and
transparent. For example, if your Enterprise Manager 10/11g monitoring system sends
you emails based on specific monitoring conditions, you will continue to receive those
Chapter 2
Moving from Enterprise Manager 10/11g to 12c and Greater
2-90

emails without interruption. To take advantage of 12c features, however, you may
need to perform additional migration tasks.
Note:
Alerts that were generated pre-12c will still be available. For example, critical
metric alerts will be available as critical incidents.
Rules
When you migrate to Enterprise Manger 12c, all of your existing notification rules are
automatically converted to rules. Technically, they are converted to event rules first
with incidents automatically being created for each event rule.
In general, event rules allow you to define which events should become incidents.
However, they also allow you to take advantage of the Enterprise Manager's increased
monitoring flexibility.
For more information on rule migration, see the following documents:
•Appendix A, " Overview of Notification in Enterprise Manager Cloud Control"
section "Migrating Notification Rules to Rule Sets" in the Enterprise Manager
Cloud Control Upgrade Guide.
•Chapter 29 "Updating Rules" in the Enterprise Manager Cloud Control Upgrade
Guide.
Privilege Requirements
The Create Enterprise Rule Set resource privilege is now required in order to edit/
create enterprise rule sets and rules contained within. The exception to this is migrated
notification rules. When pre-12c notification rules are migrated to event rules, the
original notification rule owners will still be able to edit their own rules without having
been granted the Create Enterprise Rule Set resource privilege. However, they must
be granted the Create Enterprise Rule Set resource privilege if they wish to create new
rules. Enterprise Manager Super Administrators, by default, can edit and create rule
sets.
2.6 Monitoring: Common Tasks
The following sections provide "how-to" examples illustrating common tasks for
incident/monitoring setup and usage.
•"Setting Up an Email Gateway"
•"Sending Email for Metric Alerts"
•"Sending SNMP Traps for Metric Alerts"
•"Sending Events to an Event Connector"
•"Sending Email to Different Email Addresses for Different Periods of the Day"
2.6.1 Setting Up an Email Gateway
Task
Chapter 2
Monitoring: Common Tasks
2-91

In order for Enterprise Manager to send email notifications to administrators, it must
access an available email gateway within your organization. The instructions below
step you through the process of configuring Enterprise Manager to use a designated
email gateway.
User Roles
•Enterprise Manager Administrator
Prerequisites
•User must have Super Administrator privileges.
For more information, see "Setting Up a Mail Server for Notifications".
How to do it:
1. From the Setup menu, select Notifications, then select Notification Methods.
The Notification Methods page displays.
2. Enter the requisite parameters. The following examples illustrate valid parameter
values.
•Outgoing Mail (SMTP) Server - smtp01.example.com:587,
smtp02.example.com
•User Name - myadmin
•Password - ******
•Confirm Password - ******
•Identify Sender As - Enterprise Manager
•Sender's Email Address - mgmt_rep@example.com
•Use Secure Connection - No: Email is not encrypted. SSL: Email is
encrypted using the Secure Sockets Layer protocol. TLS, if available: Email is
encrypted using the Transport Layer Security protocol if the mail server
supports TLS. If the server does not support TLS, the email is automatically
sent as plain text.
3. Ensure Enterprise Manager can connect to the specified email gateway. Click
Test Mail Servers. Enterprise Manager displays a success/failure message. Click
OK to return to the Notification Methods page.
4. Once Enterprise Manager verifies that it can successfully connect to your email
gateway, click Apply.
What you have accomplished:
At this point, you have configured Enterprise Manager to use your corporate email
gateway. Enterprise Manager can now notify registered users while monitoring
conditions within your managed environment.
What next?
"Defining Email Addresses"
"Setting Up a Notification Schedule"
"Setting Up Email for Yourself"
"Setting Up Email for Other Administrators"
Chapter 2
Monitoring: Common Tasks
2-92

2.6.2 Sending Email for Metric Alerts
Task
Configure Enterprise Manager to send email to administrators when a metric alert
threshold is reached. In this example, you want to send an email notification when a
metric alert is raised when CPU Utilization reaches Critical severity.
User Roles
•IT Operator/Manager
•Enterprise Manager Administrator
Prerequisites
•Set up an Email Gateway that allows Enterprise Manager to send email to
administrators.
For more information, see "Setting Up a Mail Server for Notifications".
•Metric thresholds have been set for CPU Utilization.
•User's Enterprise Manager account has been granted the appropriate privileges to
manage incidents from his managed system.
For information, see "Setting Up Administrators and Privileges".
•User's Enterprise Manager account has notification preferences (email and
schedule). This is required not just for the administrator who is creating/editing a
rule, but also for any user who is being notified as a result of the rule action.
For more information, see "Setting Up a Notification Schedule".
How to do it:
1. From the Setup menu, select Incidents, then select Incident Rules.
2. Click Create Rule Set.
3. Enter a name and description for the rule set.
4. In the Targets tab, select All targets that the rule set owner can view.
Chapter 2
Monitoring: Common Tasks
2-93
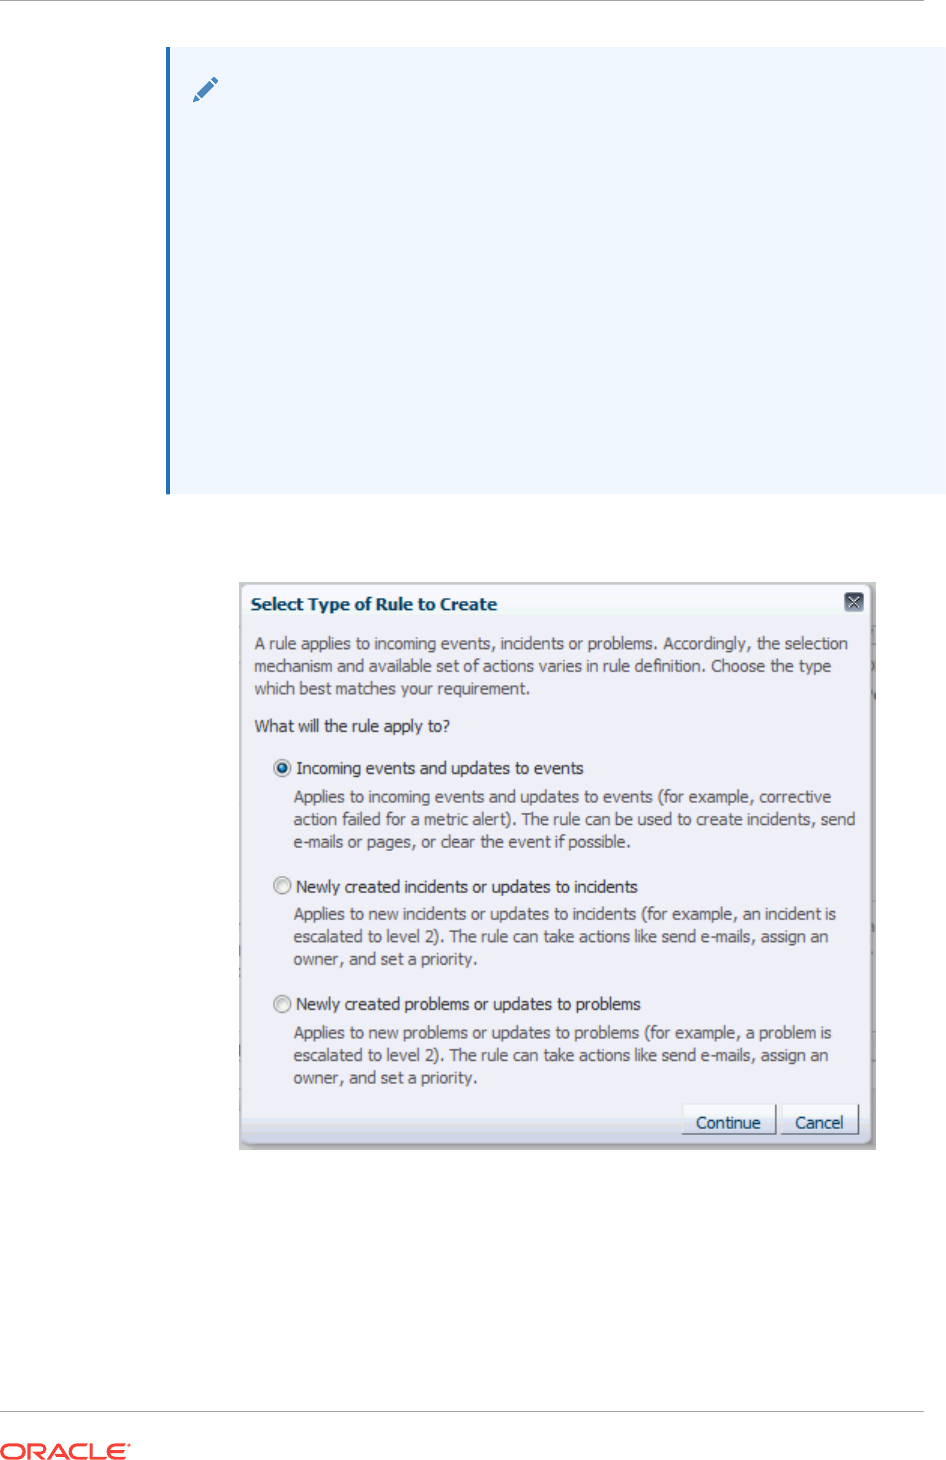
Note:
Having the rule set apply to specific targets/group.
Although we have chosen to have the rule set apply to all targets in this
example, alternatively, you can have a rule set apply only to specific targets or
groups.
To do this:
a. From the Targets tab, select Specific targets.
b. From the Add drop-down menu, choose Groups or Targets
c. Click Add. The Target selector dialog displays.
d. Either search for a target/group name or select one from the table.
e. Click Select once you have chosen the targets/groups of interest. The
dialog closes and the targets appear in the Specific Targets list.
5. In the Rules tab, click Create. The Select Type of Rule to Create dialog appears.
6. Select Incoming events and updates to events, and click Continue.
7. On the Select Events page, set the criteria for events based on which the rule
should act. In this case, choose Metric Alert from the drop down list.
Click Next.
8. Select the Specific events of type Metric Alert option. A metric selection area
displays.
Chapter 2
Monitoring: Common Tasks
2-94
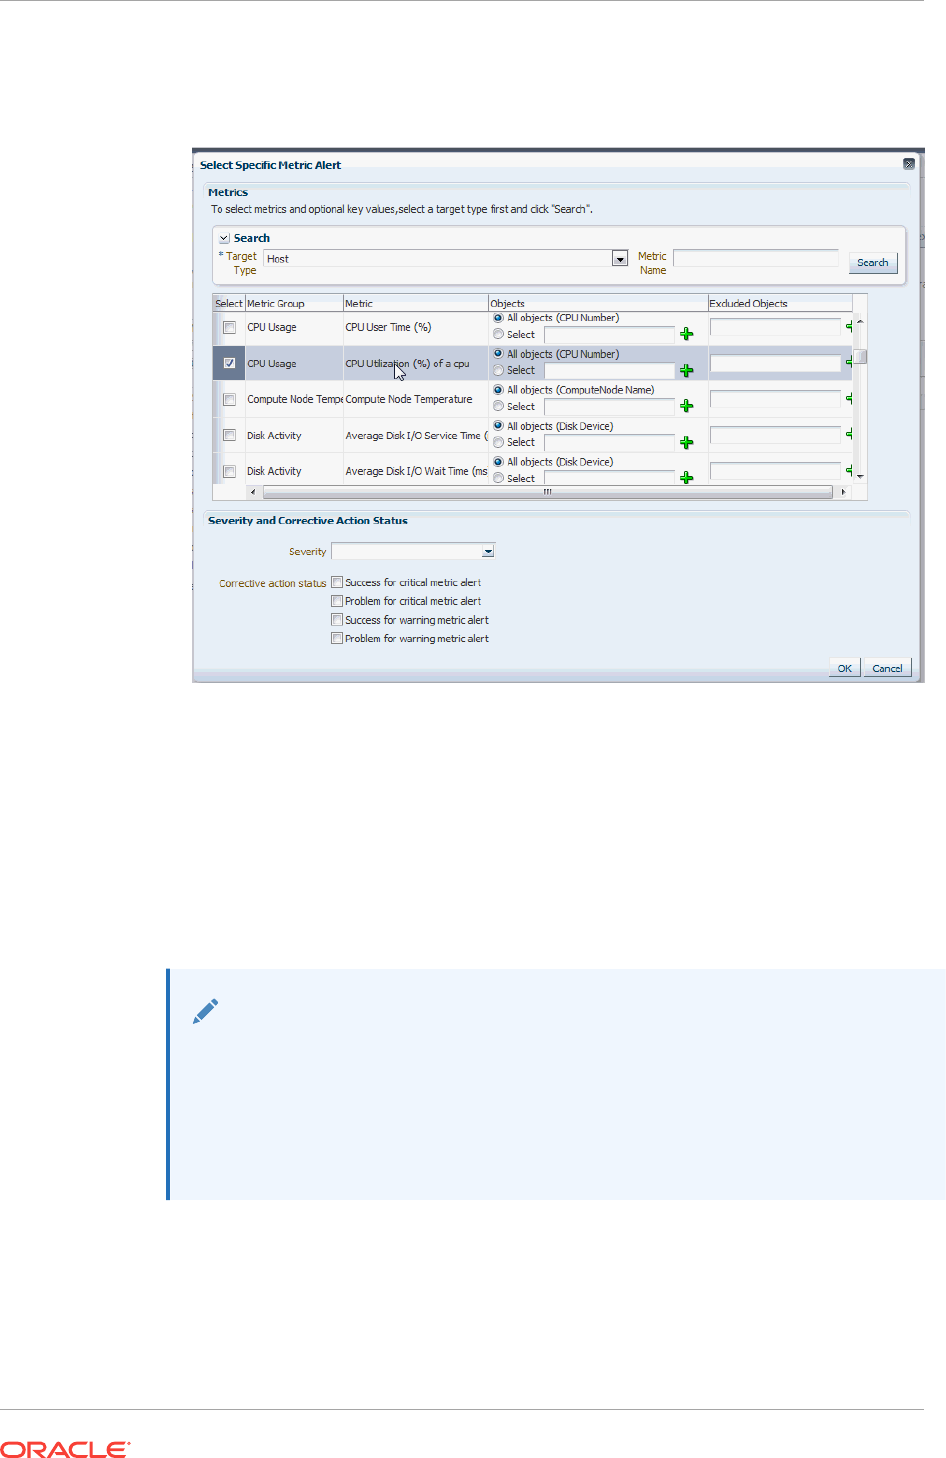
In this example, we only want to send notifications for CPU % Utilization greater
reaches the defined Critical threshold.
9. Choose Severity Critical from the drop down menu.
Click OK.
10. Click Next.
11. On the Add Actions page, click Add and add actions to be taken by the rule. In the
Notifications section, enter the email addresses where the notifications must be
send. Click Next.
Multiple conditional actions can be specified and evaluated sequentially (top down)
in the order you add them.
Note:
Sending email notifications to mailing list.
In addition to specifying email addresses, you may also specify defined
Enterprise Manager administrators. Mailing distribution lists can also be
specified to notify entire categories of users. Using mailing lists allows you to
change who gets notified without having to update individual rule sets.
12. On the Specify Name and Description page, enter a name and description for the
rule. Click Next.
13. On the review page, review the details, and click Continue.
14. On the Create Rule Set page, click Save.
What you have accomplished:
Chapter 2
Monitoring: Common Tasks
2-95
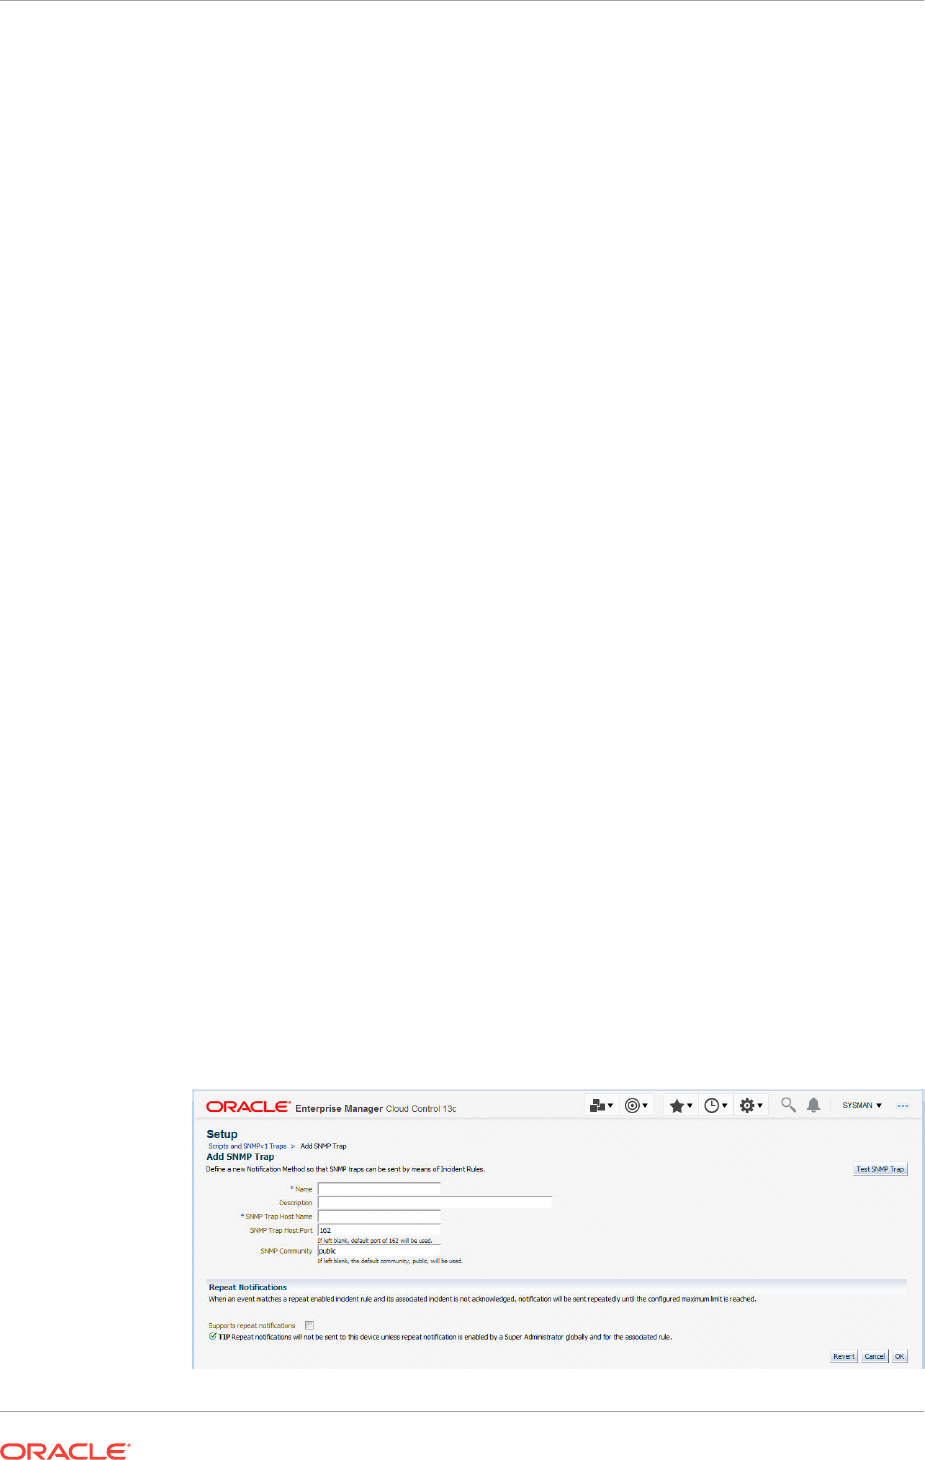
At this point, you have created a new rule set that will send an administrator email a
notification whenever the CPU Utilization reaches the Critical metric threshold. To
subscribe to this rule set, see " Subscribing to Receive Email from a Rule " for further
instructions.
What's Next?
•How Do I Set Up Email Notifications for Other Administrators
•Add/Update/Delete Email Addresses and Define a Notification Schedule
•"Responding and Working on a Simple Incident"
2.6.3 Sending SNMP Traps for Metric Alerts
Task
You want to configure Enterprise Manager to send event information (for example, a
metric alert) via SNMP trap to an HP Openview console. This is done in two phases
1. Create a notification method to send the SNMP Trap
2. Create an incident rule to send an SNMP trap when a metric alert is raised.
User Roles
•Enterprise Manager Administrator
Prerequisites
•User must have Super Administrator privileges.
For more information, see "Setting Up a Mail Server for Notifications".
How to do it:
Create a notification method based on an SNMP Trap.
1. From the Setup menu, select Notifications, then select Notification Methods.
The Notification Methods page displays.
2. From the Add drop-down menu, choose SNMP Trap and then click Go. The Add
SNMP Trap page displays.
You must provide the name of the host (machine) on which the SNMP master
agent is running and other details as shown in the following graphic.
The following examples illustrate valid parameter values.
Chapter 2
Monitoring: Common Tasks
2-96
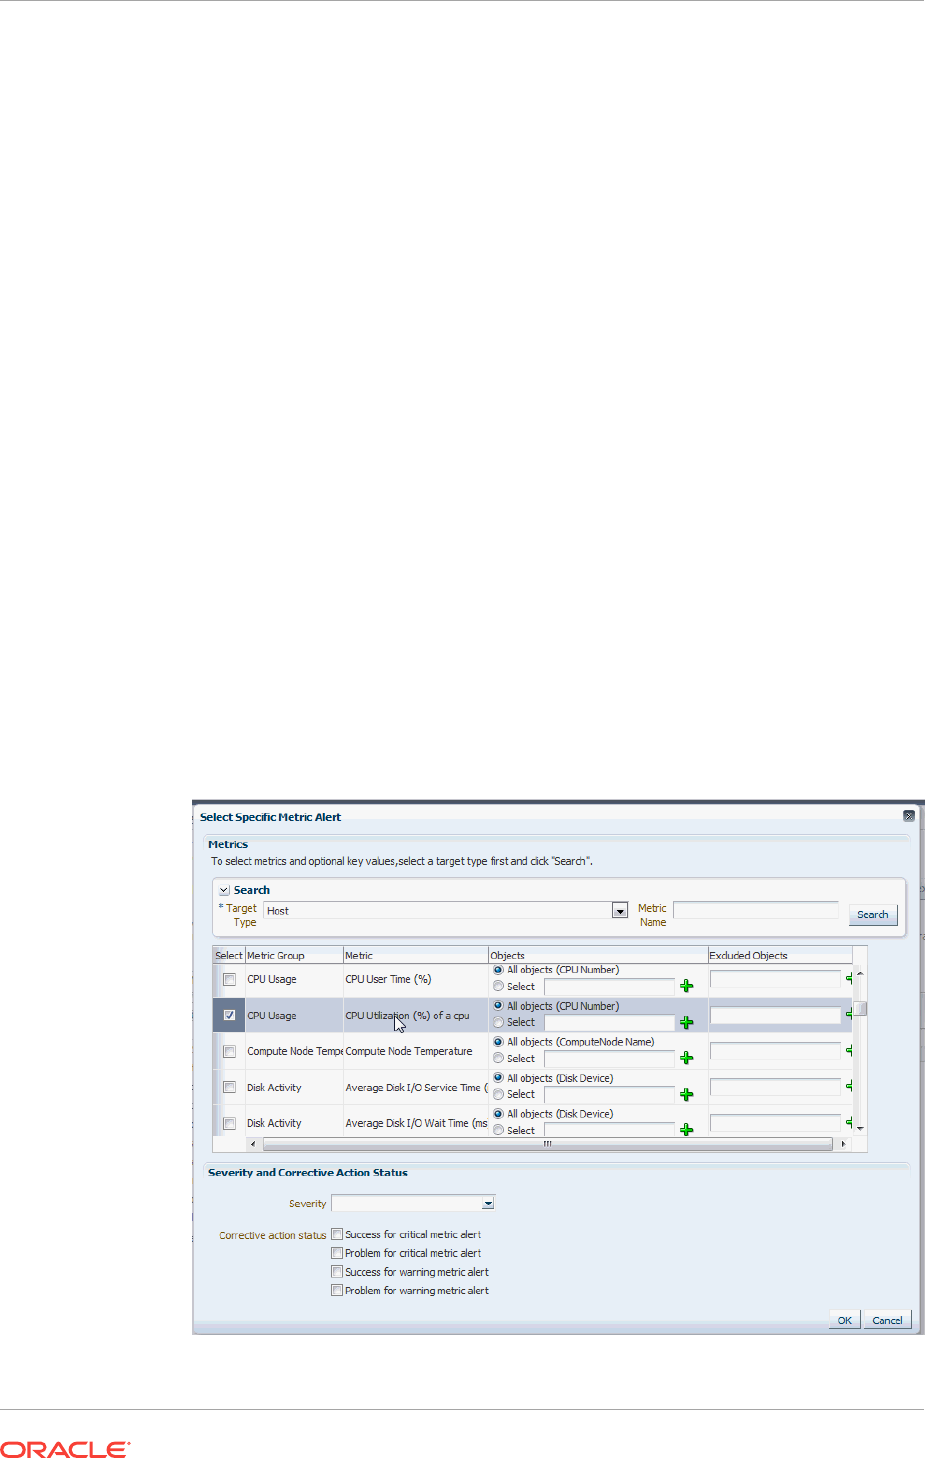
3. Click Test SNMP Trap to validate the SNMP trap settings. Enterprise Manager
displays a success/failure message. Click OK to return to the Add SNMP Trap
page.
4. Click OK to return to the Notification Methods page.
5. Click OK to add the new SNMP Trap-based notification method.
Create an incident rule to send an SNMP trap when a metric alert is raised.
1. From the Setup menu, select Incidents, then select Incident Rules.
The Incident Rules - All Enterprise Rules page displays.
2. On the Incident Rules - All Enterprise Rules page, click Create Rule Set... The
Create Rule Set page displays.
3. Enter the rule set Name, a brief Description, and select the type of source object
the rule Applies to (Targets).
4. Click on the Rules tab and then click Create...
5. On the Select Type of Rule to Create dialog, select Incoming events and
updates to events and then click Continue.
6. On the Select Events page, set the criteria for events based on which the rule
should act. In this case, choose Metric Alert from the drop down list.
Click Next.
7. Select the Specific events of type Metric Alert option. A metric selection area
displays:
In this example, we only want to send notifications for CPU % Utilization greater
reaches the defined Critical threshold.
8. Choose Severity Critical from the drop down menu.
Chapter 2
Monitoring: Common Tasks
2-97

Click OK.
9. Click Next.
10. On the Create New Rule : Add Actions page, click Add. The Add Conditional
Actions page displays.
11. In the Notifications section, under Advanced Notifications, select an existing
SNMP trap notification method.
For information on creating SNMP trap notification methods, see "Sending SNMP
Traps to Third Party Systems".
12. Click Continue to return to the Create New Rule : Add Actions page.
13. Click Next to go to the Create New Rule : Specify Name and Description page.
14. Specify a rule name and a concise description and then click Next.
15. Review the rule definition and then click Continue add the rule to the rule set. A
message displays indicating the rule has been added to the rule set but has not
yet been saved. Click OK to close the message.
16. Click Save to save the rule set. A confirmation is displayed. Click OK to close the
message.
What you have accomplished:
At this point, you have created an incident rule set that instructs Enterprise Manager to
send an SNMP trap to a third-party system whenever a metric alert is raised (%CPU
Utilization).
What's next?
•" Subscribing to Receive Email from a Rule "
•"Searching for Incidents"
2.6.4 Sending Events to an Event Connector
Task
You want to send event information from Enterprise Manager to IBM Tivoli Netcool/
OMNIbus using a connector. To do so, you must create an incident rule that invokes
the IBM Tivoli Netcool/OMNIbus Connector connector.
User Roles
•System Administrator
•IT Operator
Prerequisites
•User must have the Create Enterprise Rule Set resource privilege and at least
View privileges on the targets where events are to be forward to Netcool/
OMNIbus.
For more information, see "Setting Up a Mail Server for Notifications".
•The IBM Tivoli Netcool/OMNIbus connector must be installed and configured.
For more information, see the Oracle® Enterprise Manager IBM Tivoli Netcool/
OMNIbus Connector Installation and Configuration Guide.
Chapter 2
Monitoring: Common Tasks
2-98
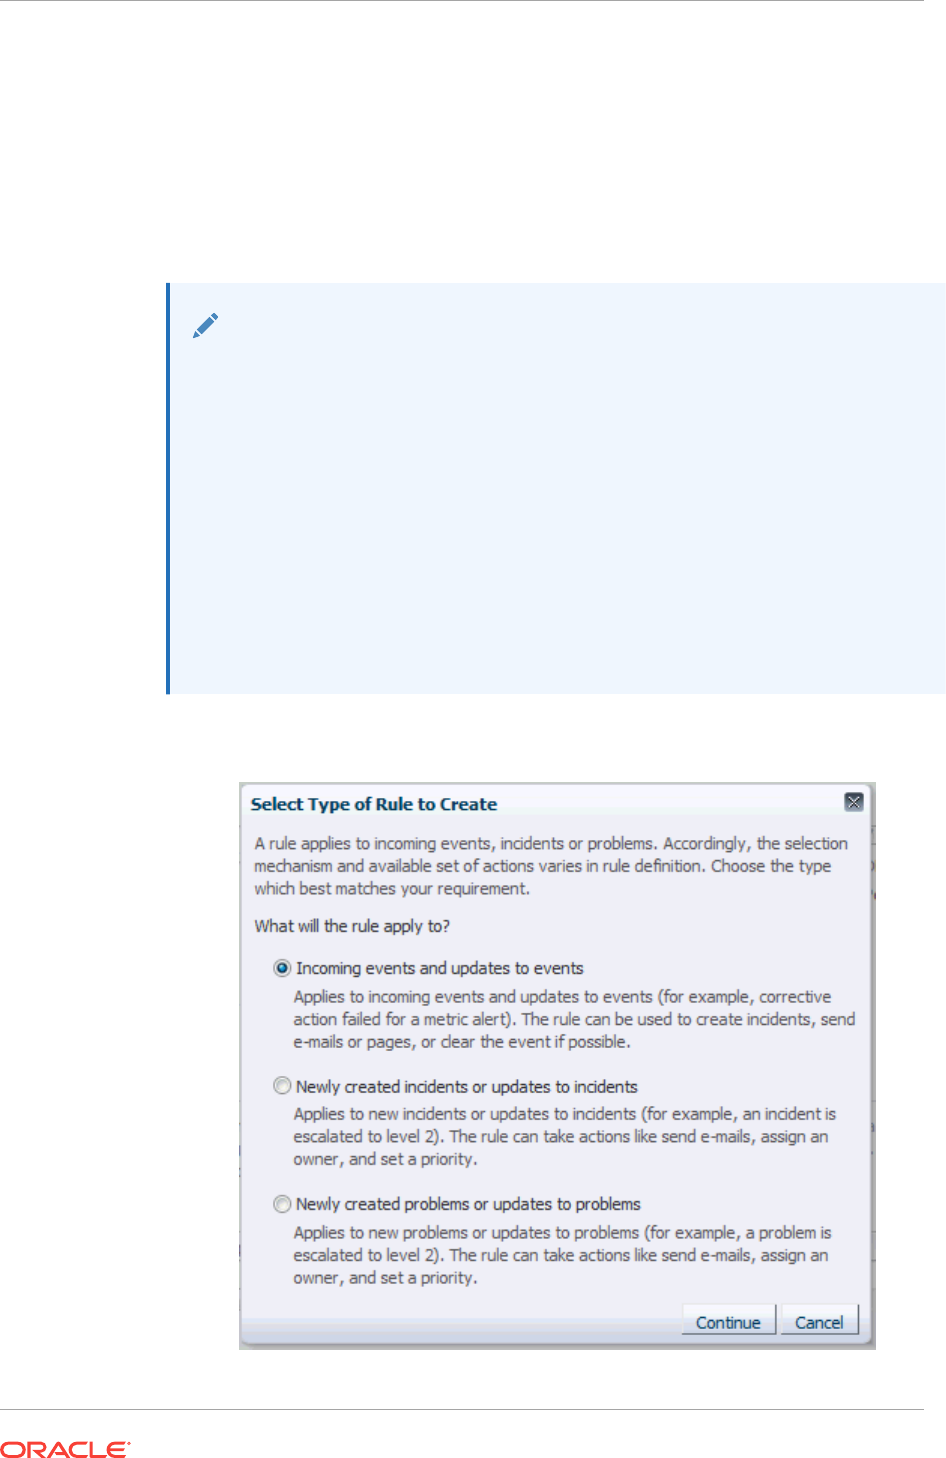
How to do it:
1. From the Setup menu, select Incidents, then select Incident Rules.
The Incident Rules - All Enterprise Rules page displays.
2. Click Create Rule Set.
3. Enter a name and description for the rule set.
4. In the Targets tab, select All targets that the rule set owner can view.
Note:
Although we have chosen to have the rule set apply to all targets in this
example, you can alternatively have a rule set apply only to specific targets or
groups.
To do this:
a. From the Targets tab, select Specific targets.
b. From the Add drop-down menu, choose Groups or Targets
c. Click Add. The Target selector dialog displays.
d. Either search for a target/group name or select one from the table.
e. Click Select once you have chosen the targets/groups of interest. The
dialog closes and the targets appear in the Specific Targets list.
5. In the Rules tab, click Create. The Select Type of Rule to Create dialog appears.
Chapter 2
Monitoring: Common Tasks
2-99
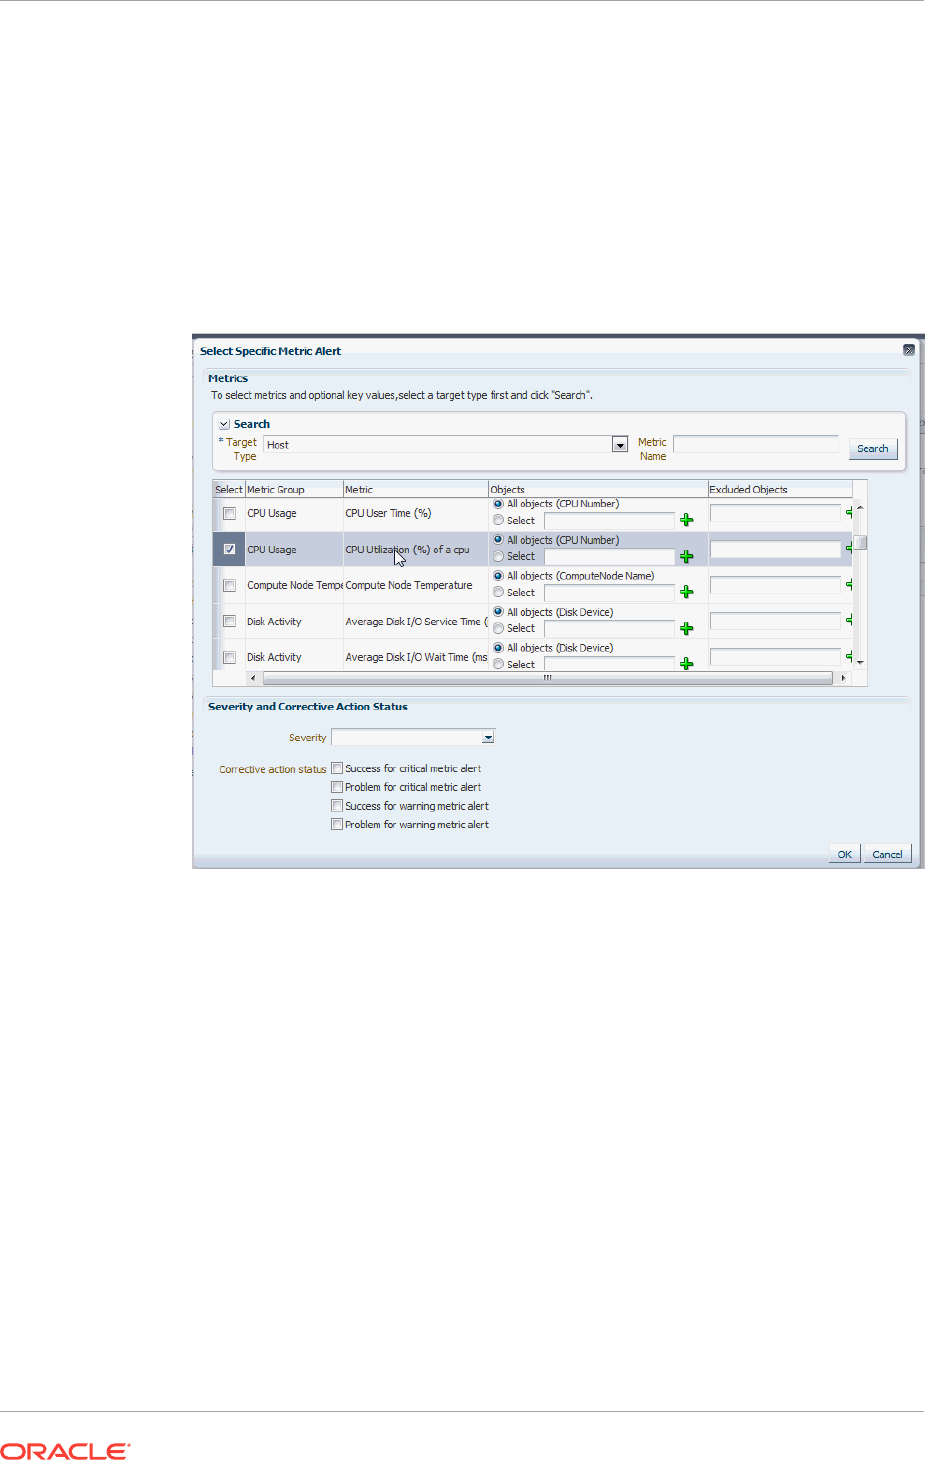
6. Select Incoming events and updates to events, and click Continue.
7. On the Select Events page, set the criteria for events based on which the rule
should act. In this case, choose Metric Alert from the drop down list.
Click Next.
8. Select the Specific events of type Metric Alert option. A metric selection area
displays:
In this example, we only want to send notifications for CPU % Utilization greater
reaches the defined Critical threshold.
9. Choose Severity Critical from the drop down menu.
Click OK.
10. Click Next. The Add Actions page displays.
11. Click Add. The Add Conditional Actions page displays.
12. Select one or more connector instances listed in the Forward to Event Connectors
section and, click > button to add the connector to the Selected Connectors list
and then click Continue.The Add Actions page appears again and lists the new
action.
13. Click Next. The Specify Name and Description page displays.
14. Enter a name and description for the rule, then click Next. The Review page
displays.
15. Click Continue if everything appears correct.
An information pop-up appears that states, "Rule has been successfully added to
the current rule set. Newly added rules are not saved until the Save button is
clicked."
You can click Back and make corrections to the rule if necessary.
Chapter 2
Monitoring: Common Tasks
2-100

What you have accomplished:
At this point, you have created a rule that invokes the IBM Tivoli Netcool/OMNIbus
Connector connector when a metric alert is raised.
What's next?
" Subscribing to Receive Email from a Rule "
2.6.5 Sending Email to Different Email Addresses for Different Periods
of the Day
Task
Your worldwide IT department operates 24/7. Support responsibility rotates to different
data centers across the globe depending on the time of day. When Enterprise
Manager sends an email notification, you want it sent to the administrator currently on
duty (normal work day), which in this situation changes depending on the time of day.
There are four adminstrators to handle Enterprise Manager notification:
•ADMIN_ASIA
•ADMIN_EU
•ADMIN_UK
•ADMIN_US
You want the notifications to be sent to specific administrators during their normal work
hours.
User Roles
•System Administrator
•IT Operator
Prerequisites
•Email addresses have been defined for all administrators you want to send email
nofifications.
For more information, see "Defining Email Addresses".
•You must have Super Administrator privileges.
•All administrators who are to receive email notifications have been defined.
How to do it:
1. From the Setup menu, select Notifications, then select My Notification
Schedule.
The Notification Schedule page displays.
2. Specify the administrator who's notification schedule you wish to edit and click
Change. The selected administrator's notification schedule displays. You can click
the search icon (magnifying glass) for a list of available administrators.
3. Click Edit Schedule Definition. The Edit Schedule Definition: Time Period page
displays. The Edit Existing Schedule option is chosen by default. If necessary,
modify the rotation schedule.
Chapter 2
Monitoring: Common Tasks
2-101

4. Click Continue. The Edit Schedule Definition: Email Addresses page displays.
5. Follow the instructions on the Edit Schedule Definition: Email Addresses page to
adjust the administrator's notification schedule as required.
6. Click Finish once the notification schedule changes for the selected administrator
are have been made. You are returned to the Notification Schedule page.
7. Repeat this process (steps two through six) for each administrator until all four
administrators' notification schedules are in sync with their normal workdays.
What you have accomplished:
You have created a notification schedule where administrators in different time zones
across the globe are only sent alert notifications during their assigned work hours.
What's next?
" Subscribing to Receive Email from a Rule "
Chapter 2
Monitoring: Common Tasks
2-102

3
Using Notifications
The notification system allows you to notify Enterprise Manager administrators when
specific incidents, events, or problems arise.
Note:
This chapter assumes that you are familiar with incident management. For
information about monitoring and managing your IT infrastructure via incident
management, see Using Incident Management .
As an integral part of the management framework, notifications can also perform
actions such as executing operating system commands (including scripts) and PL/SQL
procedures when specific incidents, events, or problems occur. This capability allows
you to automate IT practices. For example, if an incident (such as monitoring of the
operational (up/down) status of a database) arises, you may want the notification
system to automatically open an in-house trouble-ticket using an OS script so that the
appropriate IT staff can respond in a timely manner.
By using Simple Network Management Protocol (SNMP) traps, the Enterprise
Manager notification system also allows you to send traps to SNMP-enabled third-
party applications such as HP OpenView for events published in Enterprise Manager.
Some administrators may want to send third-party applications a notification when a
certain metric has exceeded a threshold.
This chapter covers the following:
•Setting Up Notifications
•Extending Notification Beyond Email
•Sending Notifications Using OS Commands and Scripts
•Sending Notifications Using PL/SQL Procedures
•Sending SNMP Traps to Third Party Systems
•Management Information Base (MIB)
•Passing Corrective Action Status Change Information
•Passing Job Execution Status Information
•Passing User-Defined Target Properties to Notification Methods
•Troubleshooting Notifications
•EMOMS Properties
•Passing Event, Incident, Problem Information to an OS Command or Script
•Passing Information to a PL/SQL Procedure
3-1

3.1 Setting Up Notifications
All Enterprise Manager administrators can set up email notifications for themselves.
Super Administrators also have the ability to set up notifications for other Enterprise
Manager administrators.
3.1.1 Setting Up a Mail Server for Notifications
Before Enterprise Manager can send email notifications, you must first specify the
Outgoing Mail (SMTP) servers to be used by the notification system. Once set, you
can then define email notifications for yourself or, if you have Super Administrator
privileges, you can also define notifications for other Enterprise Manager
administrators.
You specify the Outgoing Mail (SMTP) server on the Notification Methods page. To
display the Notification Methods page, from the Setup menu, select Notifications,
then select Mail Servers.
Note:
You must have Super Administrator privileges in order to configure the
Enterprise Manager notifications system. This includes:
•Setting up the SMTP server
•Defining notification methods
•Customizing notification email formats
Specify one or more outgoing mail server names, the mail server authentication
credentials (User Name, Password, and Confirm Password), if required, the name you
want to appear as the sender of the notification messages, and the email address you
want to use to send your email notifications. This address, called the Sender's Mail
Address, must be a valid address on each mail server that you specify. A message will
be sent to this email address if any problem is encountered during the sending of an
email notification. Example 3-1 shows sample notification method entries.
Note:
The email address you specify on this page is not the email address to which
the notification is sent. You will have to specify the email address (where
notifications will be sent) from the Password and Email page. From the Setup
menu, choose MyPreferences and then Enterprise Manager Password &
Email.
As standard practice, each user should have their own email address.
After configuring the email server, click Test Mail Servers to verify your email setup.
You should verify that an email message was received by the email account specified
in the Sender's Email Address field.
Chapter 3
Setting Up Notifications
3-2
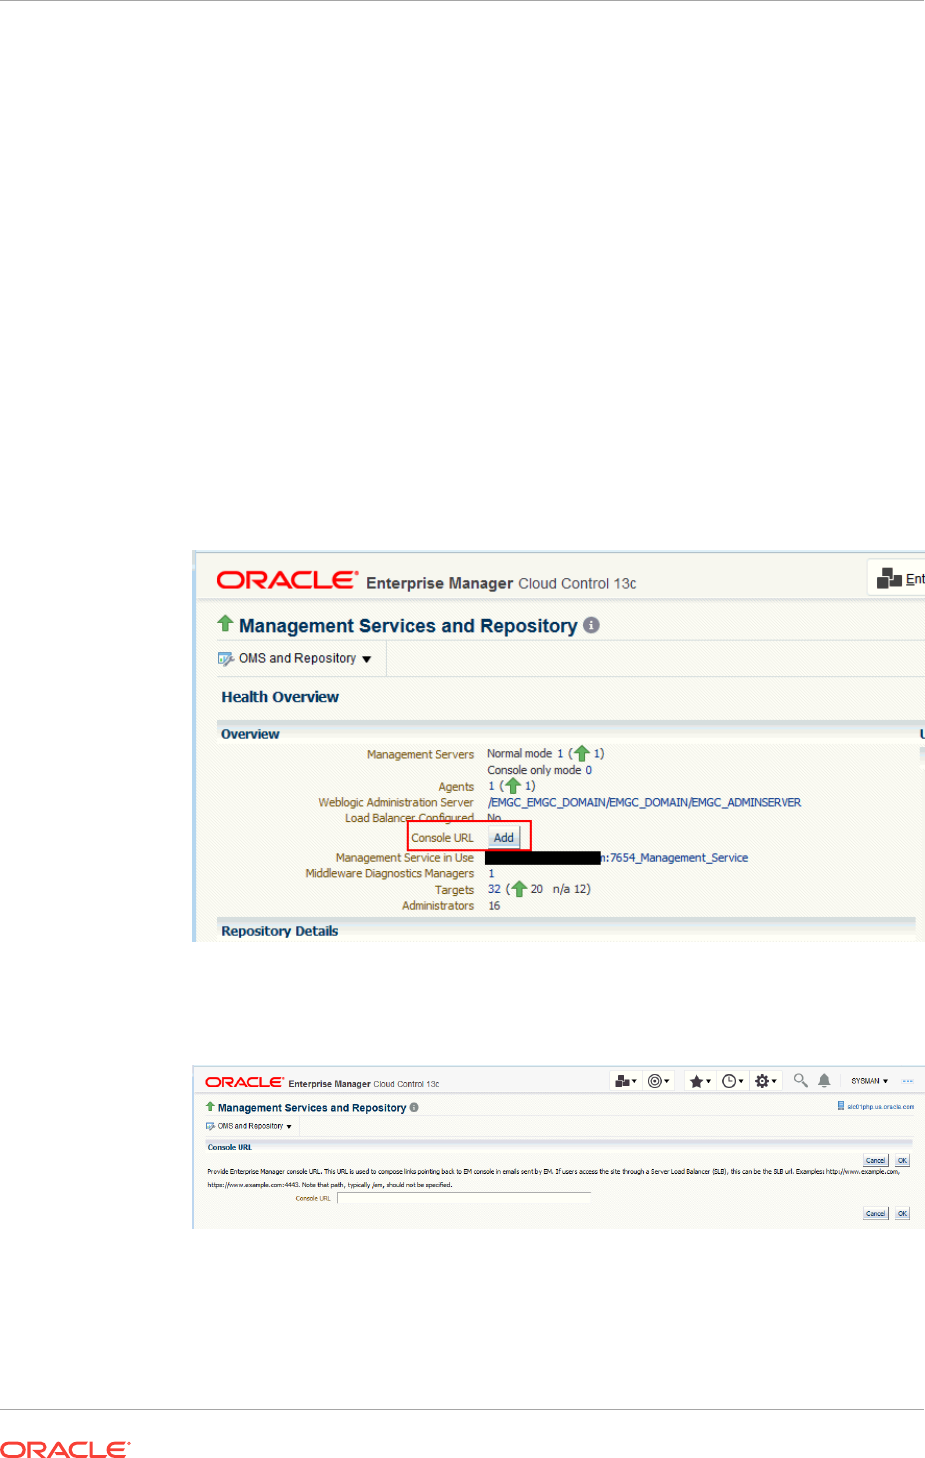
Defining multiple mail servers will improve the reliability of email notification delivery.
Email notifications will be delivered if at least one email server is up. The notification
load is balanced across multiple email servers by the OMS, which switches through
them (servers are allocated according to availability) after 20 emails have been sent.
Switching is controlled by the oracle.sysman.core.notification.emails_per_connection
emoms property.
Setting the Cloud Control Console URL when Using an SLB
If you have a multi-OMS environment with a Server Load Balancer (SLB) configured
for the OMS instances, you should update the console URL to ensure that any emails
from Enterprise Manager direct you to the Enterprise Manager console through the
SLB URL and not the specific OMS URL from which the email may have originated.
To change the console URL:
1. From the Setup menu, select Manage Cloud Control, and then Health
Overview. The Management Services and Repository page displays.
2. On the Management Services and Repository page, in the Overview section, click
Add/Edit against the Console URL label.
The Console URL page displays.
3. Modify the Console URL to the SLB URL.
Examples:
http://www.example.com
https://www.example.com:4443.
Chapter 3
Setting Up Notifications
3-3

Note that path, typically /em, should not be specified.
4. Click OK.
Example 3-1 Mail Server Settings
•Outgoing Mail (SMTP) Server - smtp01.example.com:587, smtp02.example.com
•User Name - myadmin
•Password - ******
•Confirm Password - ******
•Identify Sender As - Enterprise Manager
•Sender's Email Address - mgmt_rep@example.com
•Use Secure Connection - No: Email is not encrypted. SSL: Email is encrypted
using the Secure Sockets Layer protocol. TLS, if available: Email is encrypted
using the Transport Layer Security protocol if the mail server supports TLS. If the
server does not support TLS, the email is automatically sent as plain text.
3.1.2 Setting Up Email for Yourself
If you want to receive notifications by email, you will need to specify your email
address(s) in the Password & Email page (from the Setup menu, select
MyPreferences, then select Enterprise Manager Password & Email). In addition to
defining notification email addresses, you associate the notification message format
(long, short, pager) to be used for your email address.
Setting up email involves three steps:
Step 1: Define an email addresses.
Step 2: Set up a Notification Schedule.
Step 3: Subscribe to incident rules in order to receive emails.
3.1.2.1 Defining Email Addresses
An email address can have up to 128 characters. There is no upper limit with the
number of email addresses.
To add an email address:
1. From username drop-down menu, select Enterprise Manager Password &
Email.
2. Click Add Another Row to create a new email entry field in the Email Addresses
table.
3. Specify the email associated with your Enterprise Manager account. All email
notifications you receive from Enterprise Manager will be sent to the email
addresses you specify.
For example,
user1@myco.com
Select the Email Type (message format) for your email address. Email (Long)
sends a HTML formatted email that contains detailed information. Example 3-2
shows a typical notification that uses the long format.
Chapter 3
Setting Up Notifications
3-4

Email (Short) and Pager(Short) (Example 3-3) send a concise, text email that is
limited to a configurable number of characters, thereby allowing the email be
received as an SMS message or page. The content of the message can be sent
entirely in the subject, entirely in the body or split across the subject and body.
For example, in the last case, the subject could contain the severity type (for
example, Critical) and the target name. The body could contain the time the
severity occurred and the severity message. Since the message length is limited,
some of this information may be truncated. If truncation has occurred there will be
an ellipsis end of the message. Pager(Short) addresses are used for supporting
the paging feature in incident rules. Note that the incident rules allow the rule
author to designate some users to receive a page for critical issues.
4. Click Apply to save your email address.
Example 3-2 Long Email Notification for Metric Alerts
Target type=Host Target name=machine6140830.example.com Message=Filesystem / has
54.39% available space, fallen below warning (60) or critical (30) threshold.
Severity=Warning Event reported time=Apr 28, 2011 2:33:55 PM PDT Event Type=Metric
Alert Event name=Filesystems:Filesystem Space Available (%) Metric
Group=FilesystemsMetric=Filesystem Space Available (%)Metric value=54.39Key Value=/
Key Column 1=Mount PointRule Name=NotifRuleSet1,Event rule1 Rule Owner=SYSMAN
Example 3-3 Short Email Notification for Alerts
Subject is :
EM:Unreachable Start:myhost
Body is :
Nov 16, 2006 2:02:19 PM EST:Agent is Unreachable (REASON = Connection refused)
but the host is UP
More about Email(Short) and Pager(Short) Formats
Enterprise Manager does not directly support message services such as paging or
SMS, but instead relies on external gateways to, for example, perform the conversion
from email to page. Beginning with Enterprise Manager 12c, the notification system
allows you to tag email addresses explicitly as 'page' or 'email'. Explicit system
differentiation between these two notification methods allows you to take advantage of
the multiple action capability of incident rules. For example, the email versus page
distinction is required in order to send you an email if an event severity is 'warning' or
page you if the severity is 'critical'. To support this capability, a Pager format has been
made available that sends an abbreviated version of the short format email.
Note:
To receive a Page, an administrator should be added to the Page Notification
option in the Incident Rule.
3.1.2.2 Setting Up a Notification Schedule
Once you have defined your email notification addresses, you will need to define a
notification schedule. For example, if your email addresses are user1@myco.com,
user2@myco.com, user3@myco.com, you can choose to use one or more of these
email addresses for each time period in your notification schedule. Only email
Chapter 3
Setting Up Notifications
3-5

addresses that have been specified with your user preferences (Enterprise Manager
Password and Email page) can be used in the notification schedule.
Note:
When you enter email addresses for the first time, a 24x7 weekly notification
schedule is set automatically. You can then review and modify the schedule to
suit your monitoring needs.
A notification schedule is a repeating schedule used to specify your on-call schedule—
the days and time periods and email addresses that should be used by Enterprise
Manager to send notifications to you. Each administrator has exactly one notification
schedule. When a notification needs to be sent to an administrator, Enterprise
Manager consults that administrator's notification schedule to determine the email
address to be used. Depending on whether you are Super Administrator or a regular
Enterprise Manager administrator, the process of defining a notification schedule
differs slightly.
If you are a regular Enterprise Manager administrator and are defining your own
notification schedule:
1. From Setup menu, select Notifications, then select My Notification Schedule.
2. Follow the directions on the Notification Schedule page to specify when you want
to receive emails.
3.1.2.3 Subscribe to Receive Email for Incident Rules
An incident rule is a user-defined rule that specifies the criteria by which notifications
should be sent for specific events that make up the incident. An incident rule set, as
the name implies, consists of one or more rules associated with the same incident.
When creating an incident rule, you specify criteria such as the targets you are
interested in, the types of events to which you want the rule to apply. Specifically, for a
given rule, you can specify the criteria you are interested in and the notification
methods (such as email) that should be used for sending these notifications. For
example, you can set up a rule that when any database goes down or any database
backup job fails, email should be sent and the "log trouble ticket" notification method
should be called. Or you can define another rule such that when the CPU or Memory
Utilization of any host reach critical severities, SNMP traps should be sent to another
management console. Notification flexibility is further enhanced by the fact that with a
single rule, you can perform multiple actions based on specific conditions. Example:
When monitoring a condition such as machine memory utilization, for an incident
severity of 'warning' (memory utilization at 80%), send the administrator an email, if the
severity is 'critical' (memory utilization at 99%), page the administrator immediately.
You can subscribe to a rule you have already created.
1. From the Setup menu, select Incidents, then select Incident Rules.
2. On the Incident Rules - All Enterprise Rules page, click on the rule set containing
incident escalation rule in question and click Edit... Rules are created in the
context of a rule set.
Chapter 3
Setting Up Notifications
3-6

Note: In the case where there is no existing rule set, create a rule set by clicking
Create Rule Set... You then create the rule as part of creating the rule set.
3. In the Rules section of the Edit Rule Set page, highlight the escalation rule and
click Edit....
4. Navigate to the Add Actions page.
5. Select the action that escalates the incident and click Edit...
6. In the Notifications section, add the DBA to the Email cc list.
7. Click Continue and then navigate back to the Edit Rule Set page and click Save.
Out-of-Box Incident Rules
Enterprise Manager comes with two incident rule sets that cover the most common
monitoring conditions, they are:
•Incident Management Ruleset for All Targets
•Event Management Ruleset for Self Update
If the conditions defined in the out-of-box incident rules meet your requirements, you
can simply subscribe to receive email notifications for the conditions defined in the rule
using the subscribe procedure shown in the previous section.
The out-of-box incident rule set for all targets does not generate emails for warning
alerts by default.
Creating Your Own Incident Rules
You can define your own custom rules. The following procedure documents the
process of incident rule creation for non-Super Administrators.
To create your own incident rule:
1. From the Setup menu, select Incidents, then select Incident Rules.
The Incident Rules page displays. From this page you can create a new rule set,
to which you can add new rules. Alternatively, if you have the requisite
permissions, you can add new rules to existing
2. Click Create Rule Set...
The create rule set page displays.
3. Specify the Name, Description, and the Targets to which the rules set should
apply.
4. Click the Rules tab, then click Create.
5. Choose the incoming incident, event or problem to which you want the rule to
apply. See "Setting Up Rule Sets" for more information.
6. Click Continue.
Enterprise Manager displays the Create Incident Rule pages. Enter the requisite
information on each page to create your incident rule.
7. Follow the wizard instructions to create your rule.
Once you have completed defining your rule, the wizard returns you to the create
rule set page.
8. Click Save to save the incident rule set.
Chapter 3
Setting Up Notifications
3-7

3.1.3 Setting Up Email for Other Administrators
If you have Super Administrator privileges, you can set up email notifications for other
Enterprise Manager administrators. To set up email notifications for other Enterprise
Manager administrators, you need to:
Step 1: Ensure Each Administrator Account has an Associated Email Address
Each administrator to which you want to send email notifications must have a valid
email address.
1. From the Setup menu, select Security and then Administrators.
2. For each administrator, define an email address. This sets up a 24x7 notification
schedule for this user that uses all the email addresses specified. By default, this
adds the Email ID with type set to Email Long. It is not possible to specify the
Email Type option here.
Enterprise Manager also allows you to specify an administrator address when editing
an administrator's notification schedule.
Step 2: Define Administrators' Notification Schedules
Once you have defined email notification addresses for each administrator, you will
need to define their respective notification schedules. Although a default 24x7
notification schedule is created when you specify an email address for the first time,
you should review and edit the notification schedule as needed.
1. From the Setup menu, select Notifications, then select Notification Schedule.
From the vertical navigation bar, click Schedules (under Notification). The
Notification Schedule page appears.
2. Specify the administrator who's notification schedule you wish to edit and click
Change.
3. Click Edit Schedule Definition. The Edit Schedule Definition: Time Period page
appears. If necessary, modify the rotation schedule.
4. Click Continue. The Edit Schedule Definition: Email Addresses page appears.
5. Follow the directions on the Edit Schedule Definition: Email Addresses page to
modify the notification schedule.
6. Click Finish when you are done.
7. Repeat steps three through seven for each administrator.
Step 3: Assign Incident Rules to Administrators
With the notification schedules set, you now need to assign the appropriate incident
rules for each designated administrator.
1. From the Setup menu, select Incidents, then select Incident Rules.
2. Select the desired Ruleset and click Edit.
3. Click on the Rules tab, select the desired rule and click Edit.
4. Click Add Actions, select desire action and click Edit.
5. Enter the Administrator name on either Email To or Email Cc field in the Basic
Notification region.
Chapter 3
Setting Up Notifications
3-8

6. Click Continue, click Next, click Next, click Continue, and finally click Save.
3.1.4 Email Customization
Enterprise Manager allows Super Administrators to customize global email
notifications for the following types: All events, incidents, problems, and specific event
types installed. You can alter the default behavior for all events by customizing Default
Event Email Template. In addition, you can further customize the behavior for a
specific event type by customizing the template for the event type. For instance, you
can customize the Metric Alert Events template for the metric alert event type. Using
predefined building blocks (called attributes and labels) contained within a simple
script, Super Administrators can customize alert emails by selecting from a wide
variety of information content.
To customize an email:
1. From the Setup menu, select Notifications, then select Customize Email
Formats.
2. Choose the Type and Format.
3. Click Customize. The Customize Email Template page displays.
From the Customize Email Template page, you can modify the content of the email
template Enterprise Manager uses to generate email notifications. Extensive
information on script formatting, syntax, and options is available from the Edit Email
Template page via imbedded assistance and online help.
3.1.4.1 Email Customization Reference
The following reference summarizes the semantics and component syntax of the
pseudo-language used to define emails. The pseudo-language provides you with a
simple, yet flexible way to customize email notifications. The following is a summary of
pseudo-language conventions/limitations:
•You can add comments (or any free-form text) using separate lines beginning with
"--" or at end of lines.
•You can use attributes.
•You can use IF & ELSE & ENDIF control structures. You can also use multiple
conditions using "AND" or "OR". Nested IF statements are not supported.
•You can insert spaces for formatting purposes. Spaces at the beginning of a line
will be ignored in the actual email. To insert spaces at the beginning of a line, use
the [SP] attribute.
•Use "/" to escape and "[" or "]" if you want to add attribute names, operators, or IF
clauses to the actual email.
•HTML is not supported.
Reserved Words and Operators
The following table lists all reserved words and operators used when modifying email
scripts.
Chapter 3
Setting Up Notifications
3-9

Table 3-1 Reserved Words and Operators
Reserved Word/Operator Description
IF, ELSIF, ENDIF, ELSE Used in IF-ELSE constructs.
AND, OR Boolean operators – used in IF-ELSE constructs only.
NULL To check NULL value for attributes - used in IF-ELSE constructs
only.
| Pipe operator – used to show the first non-NULL value in a list of
attributes.
For example:
METRIC_NAME|SEVERITY
EQ, NEQ Equal and Not-Equal operators – applicable to NULL, STRING
and NUMERIC values.
/ Escape character – used to escape reserved words and
operators. Escape characters signify that what follows the
escape character takes an alternative interpretation.
[ , ] Delimiters used to demarcate attribute names and IF clauses.
Syntax Elements
Literal Text
You can specify any text as part of the email content. The text will be displayed in the
email and will not be translated if the Oracle Management Services (OMS) language
setting is changed. For example, ‘my Oracle Home' appears as ‘my Oracle Home' in
the generated email.
Predefined Attributes
Predefined attributes/labels will be substituted with actual values in a specific context.
To specify a predefined attribute/label, use the following syntax:
[PREDEFINED_ATTR]
Attribute names can be in either UPPER or LOWER case. The parsing process is
case-insensitive.
A pair of square brackets is used to distinguish predefined attributes from literal text.
For example, for a job email notification, the actual job name will be substituted for
[EXECUTION_STATUS]
. For a metric alert notification, the actual metric column name will
be substituted for
[METIRC_COLUMN]
.
You can use the escape character “/" to specify words and not have them interpreted
as predefined labels/attributes. For example, "
/[NEW/]
" will not be considered as the
predefined attribute
[NEW]
when parsed.
Operators
EQ, NEQ
– for text and numeric values
NULL
- for text and numeric values
GT, LT, GE, LE
– for numeric values
Control Structures
Chapter 3
Setting Up Notifications
3-10

The following table lists acceptable script control structures.
Table 3-2 Control Structures
Control Structure Description
Pipe "|" Two or more attributes can be separated by ‘|' character. For
example,
[METRIC_NAME|SEVERITY]
In this example, only the applicable attribute within the current
alert context will be used (replaced by the actual value) in the
email. If more than one attribute is applicable, only the left-most
attribute is used.
IF Allows you to make a block of text conditional. Only one level of
IF and ELSIF is supported. Nested IF constructs are not
supported.
All attributes can be used in IF or ELSIF evaluation using
EQ/NEQ operators on NULL values. Other operators are allowed
for “SEVERITY" and “REPEAT_COUNT" only.
Inside the IF block, the values need to be contained within
quotation marks “ ". Enterprise Manager will extract the attribute
name and its value based on the position of “EQ" and other key
words such as “and", “or". For example,
[IF REPEAT_COUNT EQ “1" AND SEVERITY EQ “CRITICAL" THEN]
The statement above will be true when the attributes of the alert
match the following condition:
•Attribute Name: REPEAT_COUNT
•Attribute Value: 1
•Attribute Name: SEVERITY
•Attribute Value: CRITICAL
Example IF Block:
[IF EXECUTION_STATUS NEQ NULL]
[JOB_NAME_LABEL]=[EXECUTION_STATUS]
[JOB_OWNER_LABEL]=[JOB_OWNER]
[ENDIF]
[IF SEVERITY_CODE EQ CRITICAL ]
[MTRIC_NAME_LABEL]=[METRIC_GROUP]
[METRIC_VALUE_LABEL]=[METRIC_VALUE]
[TARGET_NAME_LABEL]=[TARGET_NAME]
[KEY_VALUES]
[ENDIF]
Example IF and ELSEIF Block:
[IF SEVERITY_CODE EQ CRITICAL]
statement1[ELSIF SEVERITY_CODE EQ WARNING]
statement2[ELSIF SEVERITY_CODE EQ CLEAR]
statement3[ELSE] statement4[ENDIF]
Comments
You can add comments to your script by prefacing a single line of text with two
hyphens "--". For example,
Chapter 3
Setting Up Notifications
3-11

-- Code added on 8/3/2009 [IF REPEAT_COUNT NEQ NULL] . . .
Comments may also be placed at the end of a line of text.
[IF SEVERITY_SHORT EQ W] -- for Warning alert
HTML Tags in Customization Content
Use of HTML tags is not supported.
When Enterprise Manager parses the email script, it will convert the “<" and “>"
characters of HTML tags into encoded format (< and >). This ensures that the
HTML tag is not treated as HTML by the destination system.
Examples
Email customization template scripts support three main operators.
•Comparison operators: EQ/NEQ/GT/LT/GE/LELogic operators: AND/ORPipeline
operator: |
3.1.5 Setting Up Repeat Notifications
Repeat notifications allow administrators to be notified repeatedly until an incident is
either acknowledged or the number of Maximum Repeat Notifications has been
reached. Enterprise Manager supports repeat notification for all notification methods
(email, OS command, PL/SQL procedure, and SNMP trap).
Configuring Repeat Notifications Globally
To enable repeat notifications for a notification method (globally), select the Send
Repeat Notifications option on the Notification Methods page . In addition to setting
the maximum number of repeat notifications, you can also set the time interval at
which the notifications are sent.
Note:
For Oracle database versions 10 and higher, it is recommend that no
modification be made to aq_tm_processes init.ora parameter. If, however, this
parameter must be modified, its value should be at least one for repeat
notification functionality. If the Enterprise Manager Repository database
version is 9.2, the aq_tm_processes init.ora parameter must be set to at least
one to enable repeat notification functionality.
Configuring Repeat Notifications Via Incident Rules
Setting repeat notifications globally at the notification method level may not provide
sufficient flexibility. For example, you may want to have different repeat notification
settings based on event type. Enterprise Manager accomplishes this by allowing you
to set repeat notifications for individual incident rule sets or individual rules within a
rule set. Repeat notifications set at the rule level take precedence over those defined
at the notification method level.
Chapter 3
Setting Up Notifications
3-12

Note:
Repeat notifications will only be sent if the Send Repeat Notifications option
is enabled in the Notification Methods page.
Non-Email Repeat Notifications
For non-email repeat notifications (PL/SQL, OS command, and SNMP trap notification
methods), you must enable each method to support repeat notifications. You can
select Supports Repeat Notifications option when adding a new notification method
or by editing an existing method.
3.2 Extending Notification Beyond Email
Notification Methods are the mechanisms by which notifications are sent. Enterprise
Manager Super Administrators can set up email notifications by configuring the 'email'
notification method. Most likely this would already have been set up as part of the
Oracle Management Service installation.
Enterprise Manager Super Administrators can also define other custom notification
methods. For example, event notifications may need to be forwarded to a 3rd party
trouble-ticketing system. Assuming APIs to the third-party trouble-ticketing system are
available, a custom notification method can be created to call a custom OS script that
has the appropriate APIs. The custom notification method can be named in a user-
friendly fashion, for example, "Log trouble ticket". Once the custom method is defined,
whenever an administrator needs to send alerts to the trouble-ticketing system, he
simply needs to invoke the now globally available notification method called "Log
trouble ticket".
Custom notification methods can be defined based on any custom OS script, any
custom PL/SQL procedure, or by sending SNMP traps. A fourth type of notification
method (Java Callback) exists to support Oracle internal functionality and cannot be
created or edited by Enterprise Manager administrators.
Only Super Administrators can define OS Command, PL/SQL, and SNMP Trap
notification methods. However, any Enterprise Manager administrator can add these
notification methods (once defined by the Super Administrator) as actions to their
incident rules.
Through the Notification Methods page, you can:
•Set up the outgoing mail servers if you plan to send email notifications through
incident rules
•Create other custom notification methods using OS and PL/SQL scripts and
SNMP traps.
•Set global repeat notifications.
3.3 Sending Notifications Using OS Commands and Scripts
Notification system can invoke a custom script when an incident rule matches the OS
Command advanced notification action. A custom script receives notifications for
matching events, incidents and problem through environment variables.
Chapter 3
Extending Notification Beyond Email
3-13

The length of any environment variable's value is limited to 512 characters by default.
Configure emoms property named
oracle.sysman.core.notification.oscmd.max_env_var_length for changing the default
limit.
Note:
Notification methods based on OS commands must be configured by an
administrator with Super Administrator privileges.
Note:
Running an OS command such as "sudo" for receiving notifications will fail
because the command does not have read permission of the OMS account.
The OMS account must have read permission over the OS command in order
to send notifications.
To overcome the permissions problem, embed the command in a wrapper
script that is readable by the OMS administrator account. Once the command
is contained within the wrapper script, you then specify this script in place of
the OS command.
Registering a Custom Script
In order to use a custom script, you must first register the script with the notification
system. This is performed in four steps:
1. Define your OS command or script.
2. Deploy the script on each Management Service host.
3. Register your OS Command or Script as a new Notification Method.
4. Assign the notification method to an incident rule.
Example 3-4 Changing the oracle.sysman.core.notification.os_cmd_timeout
emoms Property
emctl set property -name oracle.sysman.core.notification.os_cmd_timeout value 30
Example 3-5 OS Command Notification Method
Name Trouble Ticketing
Description Notification method to log trouble ticket for a severity occurrence
OS Command /private/mozart/bin/logTicket.sh
Step 1: Define your OS command or script.
You can specify an OS command or script that will be called by the notification system
when an incident rule matches the OS Command advanced notification action. You
can use incident, event, or problem context information, corrective action execution
status and job execution status within the body of the script. Passing this contextual
information to OS commands/scripts allows you to customize automated responses
Chapter 3
Sending Notifications Using OS Commands and Scripts
3-14

specific event conditions. For example, if an OS script opens a trouble ticket for an in-
house support trouble ticket system, you will want to pass severity levels (critical,
warning, and so on) to the script to open a trouble ticket with the appropriate details
and escalate the problem. For more information on passing specific types of
information to OS Command or Scripts, see:
•"Passing Event, Incident, Problem Information to an OS Command or Script"
•" Passing Corrective Action Execution Status to an OS Command or Script"
•" Passing Job Execution Status to an OS Command or Script"
Step 2: Deploy the script on each Management Service host.
You must deploy the OS Command or Script on each Management Service host
machine that connects to the Management Repository. The OS Command is run as
the user who started the Management Service. The OS Command or Script should be
deployed on the same location on each Management Service host machine.
Note:
Both scripts and OS Commands should be specified using absolute paths. For
example, /u1/bin/logSeverity.sh.
The command is run by the user who started the Management Service. If an error is
encountered during the running of the OS Command, the Notification System can be
instructed to retry the sending of the notification to the OS Command by returning an
exit code of 100. The procedure is initially retried after one minute, then two minutes,
then three minutes, eventually progressing to 30 minutes. From here, the procedure is
retried every 30 minutes until the notification is a 24 hours old. The notification will be
then be purged.
Example 3-4 shows the parameter in emoms.properties that controls how long the OS
Command can execute without being killed by the Management Service. This prevents
OS Commands from running for an inordinate length of time and blocks the delivery of
other notifications. By default the command is allowed to run for 30 seconds before it
is killed. The oracle.sysman.core.notification.os_cmd_timeout emoms property can be
configured to change the default timeout value.
Step 3: Register your OS Command or Script as a new Notification Method.
Add this OS command as a notification method that can be called in incident rules.
Log in as a Super Administrator. From the Setup menu, select Notifications, then
select Notification Methods. From this page, you can define a new notification based
on the 'OS Command' type. See "Sending Notifications Using OS Commands and
Scripts".
The following information is required for each OS command notification method:
•Name
•Description
Both Name and Description should be clear and intuitive so that the function of the
method is clear to other administrators.
•OS Command
Chapter 3
Sending Notifications Using OS Commands and Scripts
3-15

You must enter the full path of the OS command or script in the OS command field (for
example,
/u1/bin/myscript.sh
). For environments with multiple Management Services,
the path must be exactly the same on each machine that has a Management Service.
Command line parameters can be included after the full path (for example, /u1/bin/
myscript.sh arg1 arg2).
Example 3-5 shows information required for the notification method.
Note:
There can be more than one OS Command configured per system.
Step 4: Assign the notification method to an incident rule.
You can edit an existing rule (or create a new instance rule), then go to the Methods
page. From the Setup menu, choose Incidents and then Incident Rules. The
Incident Rules page provides access to all available rule sets.
For detailed reference information on passing event, incident, and problem information
to an OS Command or script, see "Passing Event, Incident, Problem Information to an
OS Command or Script".
3.3.1 Script Examples
The sample OS script shown in Example 3-6 appends environment variable entries to
a log file. In this example, the script logs a severity occurrence to a file server. If the
file server is unreachable then an exit code of 100 is returned to force the Oracle
Management Service Notification System to retry the notification
Example 3-6 Sample OS Command Script
#!/bin/ksh
LOG_FILE=/net/myhost/logs/event.log
if test -f $LOG_FILE
then
echo $TARGET_NAME $MESSAGE $EVENT_REPORTED_TIME >> $LOG_FILE
else
exit 100
fi
Example 3-7 shows an OS script that logs alert information for both incidents and
events to the file 'oscmdNotify.log'. The file is saved to the /net/myhost/logs directory.
Example 3-7 Alert Logging Scripts
#!/bin/sh#
LOG_FILE=/net/myhost/logs/oscmdNotify.log
echo '-------------' >> $LOG_FILE
echo 'issue_type=' $ISSUE_TYPE >> $LOG_FILE
echo 'notif_type=' $NOTIF_TYPE >> $LOG_FILE
echo 'message=' $MESSAGE >> $LOG_FILE
echo 'message_url' = $MESSAGE_URL >>$LOG_FILE
echo 'severity=' $SEVERITY >> $LOG_FILE
Chapter 3
Sending Notifications Using OS Commands and Scripts
3-16

echo 'severity_code' = $SEVERITY_CODE >>$LOG_FILE
echo 'ruleset_name=' $RULESET_NAME >> $LOG_FILE
echo 'rule_name=' $RULE_NAME >> $LOG_FILE
echo 'rule_owner=' $RULE_OWNER >> $LOG_FILE
echo 'repeat_count=' $REPEAT_COUNT >> $LOG_FILE
echo 'categories_count' = $CATEGORIES_COUNT >>$LOG_FILE
echo 'category_1' = $CATEGORY_1 >>$LOG_FILE
echo 'category_2' = $CATEGORY_2 >>$LOG_FILE
echo 'category_code_1' = $CATEGORY_CODE_1 >>$LOG_FILE
echo 'category_code_2' = $CATEGORY_CODE_2 >>$LOG_FILE
echo 'category_codes_count' = $CATEGORY_CODES_COUNT >>$LOG_FILE
# event
if [ $ISSUE_TYPE -eq 1 ]
then
echo 'host_name=' $HOST_NAME >> $LOG_FILE
echo 'event_type=' $EVENT_TYPE >> $LOG_FILE
echo 'event_name=' $EVENT_NAME >> $LOG_FILE
echo 'event_occurrence_time=' $EVENT_OCCURRENCE_TIME >> $LOG_FILE
echo 'event_reported_time=' $EVENT_REPORTED_TIME >> $LOG_FILE
echo 'sequence_id=' $SEQUENCE_ID >> $LOG_FILE
echo 'event_type_attrs=' $EVENT_TYPE_ATTRS >> $LOG_FILE
echo 'source_obj_name=' $SOURCE_OBJ_NAME >> $LOG_FILE
echo 'source_obj_type=' $SOURCE_OBJ_TYPE >> $LOG_FILE
echo 'source_obj_owner=' $SOURCE_OBJ_OWNER >> $LOG_FILE
echo 'target_name' = $TARGET_NAME >>$LOG_FILE
echo 'target_url' = $TARGET_URL >>$LOG_FILE
echo 'target_owner=' $TARGET_OWNER >> $LOG_FILE
echo 'target_type=' $TARGET_TYPE >> $LOG_FILE
echo 'target_version=' $TARGET_VERSION >> $LOG_FILE
echo 'lifecycle_status=' $TARGET_LIFECYCLE_STATUS >> $LOG_FILE
echo 'assoc_incident_escalation_level' = $ASSOC_INCIDENT_ESCALATION_LEVEL
>>$LOG_FILE
echo 'assoc_incident_id' = $ASSOC_INCIDENT_ID >>$LOG_FILE
echo 'assoc_incident_owner' = $ASSOC_INCIDENT_OWNER >>$LOG_FILE
echo 'assoc_incident_acknowledged_by_owner'
= $ASSOC_INCIDENT_ACKNOWLEDGED_BY_OWNER >>$LOG_FILE
echo 'assoc_incident_acknowledged_details' = $ASSOC_INCIDENT_ACKNOWLEDGED_DETAILS
>>$LOG_FILE
echo 'assoc_incident_priority' = $ASSOC_INCIDENT_PRIORITY >>$LOG_FILE
echo 'assoc_incident_status' = $ASSOC_INCIDENT_STATUS >>$LOG_FILE
echo 'ca_job_status' = $CA_JOB_STATUS >>$LOG_FILE
echo 'event_context_attrs' = $EVENT_CONTEXT_ATTRS >>$LOG_FILE
echo 'last_updated_time' = $LAST_UPDATED_TIME >>$LOG_FILE
echo 'sequence_id' = $SEQUENCE_ID >>$LOG_FILE
echo 'test_date_attr_noref' = $TEST_DATE_ATTR_NOREF >>$LOG_FILE
echo 'test_raw_attr_noref' = $TEST_RAW_ATTR_NOREF >>$LOG_FILE
echo 'test_str_attr1' = $TEST_STR_ATTR1 >>$LOG_FILE
echo 'test_str_attr2' = $TEST_STR_ATTR2 >>$LOG_FILE
echo 'test_str_attr3' = $TEST_STR_ATTR3 >>$LOG_FILE
echo 'test_str_attr4' = $TEST_STR_ATTR4 >>$LOG_FILE
echo 'test_str_attr5' = $TEST_STR_ATTR5 >>$LOG_FILE
echo 'test_str_attr_ref' = $TEST_STR_ATTR_REF >>$LOG_FILE
echo 'total_occurrence_count' = $TOTAL_OCCURRENCE_COUNT >>$LOG_FILE
fi
# incident
if [ $ISSUE_TYPE -eq 2 ]
then
echo 'action_msg=' $ACTION_MSG >> $LOG_FILE
echo 'incident_id=' $INCIDENT_ID >> $LOG_FILE
Chapter 3
Sending Notifications Using OS Commands and Scripts
3-17

echo 'incident_creation_time=' $INCIDENT_CREATION_TIME >> $LOG_FILE
echo 'incident_owner=' $INCIDENT_OWNER >> $LOG_FILE
echo 'incident_acknowledged_by_owner' = $INCIDENT_ACKNOWLEDGED_BY_OWNER >>$LOG_FILE
echo 'incident_status' = $INCIDENT_STATUS >>$LOG_FILE
echo 'last_modified_by=' $LAST_MODIFIED_BY >> $LOG_FILE
echo 'last_updated_time=' $LAST_UPDATED_TIME >> $LOG_FILE
echo 'assoc_event_count=' $ASSOC_EVENT_COUNT >> $LOG_FILE
echo 'adr_incident_id=' $ADR_INCIDENT_ID >> $LOG_FILE
echo 'occurrence_count=' $OCCURRENCE_COUNT >> $LOG_FILE
echo 'escalated=' $ESCALATED >> $LOG_FILE
echo 'escalated_level=' $ESCALATED_LEVEL >> $LOG_FILE
echo 'priority=' $PRIORITY >> $LOG_FILE
echo 'priority_code' = $PRIORITY_CODE >>$LOG_FILE
echo 'ticket_id=' $TICKET_ID >> $LOG_FILE
echo 'ticket_status=' $TICKET_STATUS >> $LOG_FILE
echo 'ticket_url=' $TICKET_ID_URL >> $LOG_FILE
echo 'total_duplicate_count=' $TOTAL_DUPLICATE_COUNT >> $LOG_FILE
echo 'source_count=' $EVENT_SOURCE_COUNT >> $LOG_FILE
echo 'event_source_1_host_name' = $EVENT_SOURCE_1_HOST_NAME >>$LOG_FILE
echo 'event_source_1_target_guid' = $EVENT_SOURCE_1_TARGET_GUID >>$LOG_FILE
echo 'event_source_1_target_name' = $EVENT_SOURCE_1_TARGET_NAME >>$LOG_FILE
echo 'event_source_1_target_owner' = $EVENT_SOURCE_1_TARGET_OWNER >>$LOG_FILE
echo 'event_source_1_target_type' = $EVENT_SOURCE_1_TARGET_TYPE >>$LOG_FILE
echo 'event_source_1_target_url' = $EVENT_SOURCE_1_TARGET_URL >>$LOG_FILE
echo 'event_source_1_target_lifecycle_status'
= $EVENT_SOURCE_1_TARGET_LIFECYCLE_STATUS >>$LOG_FILE
echo 'event_source_1_target_version' = $EVENT_SOURCE_1_TARGET_VERSION >>$LOG_FILE
fi
exit 0
Example 3-8 shows a script that sends an alert to an HP OpenView console from
Enterprise Manager Cloud Control. When a metric alert is triggered, the Enterprise
Manager Cloud Control displays the alert. The HP OpenView script is then called,
invoking opcmsg and forwarding the information to the HP OpenView management
server.
Example 3-8 HP OpenView Script
/opt/OV/bin/OpC/opcmsg severity="$SEVERITY" app=OEM msg_grp=Oracle
msg_text="$MESSAGE" object="$TARGET_NAME"
3.3.2 Migrating pre-12c OS Command Scripts
This section describes how to map pre-12c OS Command notification shell
environment variables to 13c OS Command shell environment variables.
Note:
Pre-12c notification rules only map to event level rules. Mapping to incident
level rules is not permitted.
Chapter 3
Sending Notifications Using OS Commands and Scripts
3-18

Note:
Policy Violations are no longer supported beginning with the Enterprise
Manager 12c release.
3.3.2.1 Migrating Metric Alert Event Types
Following table is the mapping for the OS Command shell environment variables when
the event_type is metric_alert.
Table 3-3 Pre-12c/13c metric_alert Environment Variable Mapping
Pre-12c Environment
Variable
Corresponding 13c Environment Variables
ACKNOWLEDGED ASSOC_INCIDENT_ACKNOWLEDGED_BY_OWNER
ACKNOWLEDGED_BY ASSOC_INCIDENT_OWNER
CYCLE_GUID CYCLE_GUID
HOST HOST_NAME
KEY_VALUE Note: See detail description below.
KEY_VALUE_NAME Note: See detail description below
MESSAGE MESSAGE
METRIC METRIC_COLUMN
NOTIF_TYPE NOTIF_TYPE; use the map in section 2.3.5
REPEAT_COUNT REPEAT_COUNT
RULE_NAME RULESET_NAME
RULE_OWNER RULE_OWNER
SEVERITY SEVERITY
TARGET_NAME TARGET_NAME
TARGET_TYPE TARGET_TYPE
TIMESTAMP EVENT_REPORTED_TIME
METRIC_VALUE VALUE
VIOLATION_CONTEXT EVENT_CONTEXT_ATTRS
VIOLATION_GUID SEVERITY_GUID
POLICY_RULE No mapping, Obsolete as of Enterprise Manager 12c release.
To obtain KEY_VALUE_NAME and KEY_VALUE, perform the following steps.
•If $NUM_KEYS variable is null, then $KEY_VALUE_NAME and $KEY_VALUE are
null.
•If $NUM_KEYS equals 1
KEY_VALUE_NAME=$KEY_COLUMN_1
KEY_COLUMN_1_VALUE
•If $NUM_KEYS is greater than 1
Chapter 3
Sending Notifications Using OS Commands and Scripts
3-19

KEY_VALUE_NAME="$KEY_COLUMN_1;$KEY_COLUMN_2;..;KEY_COLUMN_
x"
KEY_VALUE="$KEY_COLUMN_1_VALUE;$KEY_COLUMN_2_VALUE;..;KEY_C
OLUMN_x_VALUE "
Where x is the value of $NUM_KEYS and ";" is the separator.
3.3.2.2 Migrating Target Availability Event Types
Following table is the mapping for the OS Command shell environment variables when
the event_type is 'target_availability'.
Table 3-4 pre-12c/12c target_availability Environment Variable Mappings
Pre-12c Environment
Variable
Corresponding 13c Environment Variables
TARGET_NAME TARGET_NAME
TARGET_TYPE TARGET_TYPE
METRIC Status
CYCLE_GUID CYCLE_GUID
VIOLATION_CONTEXT EVENT_CONTEXT_ATTRS
SEVERITY TARGET_STATUS
HOST HOST_NAME
MESSAGE MESSAGE
NOTIF_TYPE NOTIF_TYPE; use the map in section 2.3.5
TIMESTAMP EVENT_REPORTED_TIME
RULE_NAME RULESET_NAME
RULE_OWNER RULE_OWNER
REPEAT_COUNT REPEAT_COUNT
KEY_VALUE ""
KEY_VALUE_NAME ""
3.3.2.3 Migrating Job Status Change Event Types
Following table is the mapping for the OS Command shell environment variables when
the event_type is 'job_status_change'.
Table 3-5 pre-12c/13c job_status_change Environment Variable Mappings
Pre-12c Environment
Variable
Corresponding 13c Environment Variables
JOB_NAME SOURCE_OBJ_NAME
JOB_OWNER SOURCE_OBJ_OWNER
JOB_TYPE SOURCE_OBJ_SUB_TYPE
JOB_STATUS EXECUTION_STATUS
NUM_TARGETS 1 if $ TARGET_NAME is not null, 0 otherwise
Chapter 3
Sending Notifications Using OS Commands and Scripts
3-20

Table 3-5 (Cont.) pre-12c/13c job_status_change Environment Variable
Mappings
Pre-12c Environment
Variable
Corresponding 13c Environment Variables
TARGET_NAME1 TARGET_NAME
TARGET_TYPE1 TARGET_TYPE
TIMESTAMP EVENT_REPORTED_TIME
RULE_NAME RULESET_NAME
RULE_OWNER RULE_OWNER
3.3.2.4 Migrating Corrective Action-Related OS Scripts
Refer to section "Migrating Metric Alert Event Types" for mapping the following
environment variables while receiving notifications for corrective actions.
KEY_VALUE
KEY_VALUE_NAME
METRIC
METRIC_VALUE
RULE_NAME
RULE_OWNER
SEVERITY
TIMESTAMP
VIOLATION_CONTEXT
Use the map below for mapping other environment variables.
Table 3-6 pre-12c/13c Corrective Action Environment Variable Mappings
Pre-12c Environment
Variable
Corresponding 13c Environment Variables
NUM_TARGETS 1
TARGET_NAME1 TARGET_NAME
TARGET_TYPE1 TARGET_TYPE
JOB_NAME CA_JOB_NAME
JOB_OWNER CA_JOB_OWNER
JOB_STATUS CA_JOB_STATUS
JOB_TYPE CA_JOB_TYPE
Chapter 3
Sending Notifications Using OS Commands and Scripts
3-21

3.3.2.5 Notification Type Mapping
Table 3-7 pre-12c/13c notif_type Mappings
notif_type (13c) notif_type (Pre-12c)
NOTIF_NORMAL 1
NOTIF_REPEAT 4
NOTIF_DURATION 9
NOTIF_RETRY 2
3.4 Sending Notifications Using PL/SQL Procedures
A user-defined PL/SQL procedure can receive notifications for matching events,
incidents and problems.
Note:
When upgrading from pre-12c to 13c versions of Enterprise Manager, existing
pre-12c PL/SQL advanced notification methods will continue to work without
modification. You should, however, update the procedures to use new
signatures.
New PL/SQL advanced notification methods created with Enterprise Manager
13c must use the new signatures documented in the following sections.
Complete the following four steps to define a notification method based on a PL/SQL
procedure.
3.4.1 Defining a PL/SQL-based Notification Method
Creating a PL/SQL-based notification method consists of four steps:
1. Define the PL/SQL procedure.
2. Create the PL/SQL procedure on the Management Repository.
3. Register your PL/SQL procedure as a new notification method.
4. Assign the notification method to an incident rule.
Example 3-9 PL/SQL Procedure Required Information
Name Open trouble ticket
Description Notification method to open a trouble ticket in the event
PLSQL Procedure ticket_sys.ticket_ops.open_ticket
Example 3-10 PL/SQL Script
-- Assume log_table is created by following DDL
-- CREATE TABLE log_table (message VARCHAR2(4000)) ;
-- Define PL/SQL notification method for Events
Chapter 3
Sending Notifications Using PL/SQL Procedures
3-22

CREATE OR REPLACE PROCEDURE log_table_notif_proc(s IN GC$NOTIF_EVENT_MSG)
IS
l_categories gc$category_string_array;
l_category_codes gc$category_string_array;
l_attrs gc$notif_event_attr_array;
l_ca_obj gc$notif_corrective_action_job;
BEGIN
INSERT INTO log_table VALUES ('notification_type: ' ||
s.msg_info.notification_type);
INSERT INTO log_table VALUES ('repeat_count: ' || s.msg_info.repeat_count);
INSERT INTO log_table VALUES ('ruleset_name: ' || s.msg_info.ruleset_name);
INSERT INTO log_table VALUES ('rule_name: ' || s.msg_info.rule_name);
INSERT INTO log_table VALUES ('rule_owner: ' || s.msg_info.rule_owner);
INSERT INTO log_table VALUES ('message: ' || s.msg_info.message);
INSERT INTO log_table VALUES ('message_url: ' || s.msg_info.message_url);
INSERT INTO log_table VALUES ('event_instance_guid: ' ||
s.event_payload.event_instance_guid);
INSERT INTO log_table VALUES ('event_type: ' || s.event_payload.event_type);
INSERT INTO log_table VALUES ('event_name: ' || s.event_payload.event_name);
INSERT INTO log_table VALUES ('event_msg: ' || s.event_payload.event_msg);
INSERT INTO log_table VALUES ('source_obj_type: ' ||
s.event_payload.source.source_type);
INSERT INTO log_table VALUES ('source_obj_name: ' ||
s.event_payload.source.source_name);
INSERT INTO log_table VALUES ('source_obj_url: ' ||
s.event_payload.source.source_url);
INSERT INTO log_table VALUES ('target_name: ' ||
s.event_payload.target.target_name);
INSERT INTO log_table VALUES ('target_url: ' || s.event_payload.target.target_url);
INSERT INTO log_table VALUES ('severity: ' || s.event_payload.severity); INSERT
INTO log_table VALUES ('severity_code: ' || s.event_payload.severity_code);
INSERT INTO log_table VALUES ('event_reported_date: ' ||
to_char(s.event_payload.reported_date, 'D MON DD HH24:MI:SS'));
l_categories := s.event_payload.categories;
IF l_categories IS NOT NULL
THEN
FOR c IN 1..l_categories.COUNT
LOOP
INSERT INTO log_table VALUES ('category ' || c || ' - ' || l_categories(c));
END LOOP;
END IF;
l_category_codes := s.event_payload.category_codes;
IF l_categories IS NOT NULL
THEN
FOR c IN 1..l_category_codes.COUNT
LOOP
INSERT INTO log_table VALUES ('category_code ' || c || ' - ' ||
l_category_codes(c));
END LOOP;
END IF;
l_attrs := s.event_payload.event_attrs;
IF l_attrs IS NOT NULL
THEN
FOR c IN 1..l_attrs.COUNT
LOOP
INSERT INTO log_table VALUES ('EV.ATTR name=' || l_attrs(c).name || '
value=' || l_attrs(c).value || ' nls_value=' || l_attrs(c).nls_value); END LOOP;
END IF;
Chapter 3
Sending Notifications Using PL/SQL Procedures
3-23

COMMIT ;
END ;
/
Example 3-11 PL/SQL Script to Log Events to a Table
CREATE TABLE event_log (
notification_type VARCHAR2(32),
repeat_count NUMBER,
ruleset_name VARCHAR2(256),
rule_owner VARCHAR2(256),
rule_name VARCHAR2(256),
message VARCHAR2(4000),
message_url VARCHAR2(4000),
event_instance_guid RAW(16),
event_type VARCHAR2(20),
event_name VARCHAR2(512),
event_msg VARCHAR2(4000),
categories VARCHAR2(4000),
source_obj_type VARCHAR2(120),
source_obj_name VARCHAR2(256),
source_obj_url VARCHAR2(4000),
severity VARCHAR2(128),
severity_code VARCHAR2(32),
target_name VARCHAR2(256),
target_type VARCHAR2(128),
target_url VARCHAR2(4000),
host_name VARCHAR2(256),
timezone VARCHAR2(64),
occured DATE,
ca_guid RAW(16),
ca_name VARCHAR2(128),
ca_owner VARCHAR2(256),
ca_type VARCHAR2(256),
ca_status VARCHAR2(64),
ca_status_code NUMBER,
ca_job_step_output VARCHAR2(4000),
ca_execution_guid RAW(16),
ca_stage_change_guid RAW(16)
)
;
CREATE OR REPLACE PROCEDURE log_event(s IN GC$NOTIF_EVENT_MSG)
IS
l_categories gc$category_string_array;
l_ca_obj gc$notif_corrective_action_job;
l_categories_new VARCHAR2(1000);
BEGIN
-- save event categories
l_categories := s.event_payload.categories;
IF l_categories IS NOT NULL
THEN
FOR c IN 1..l_categories.COUNT
LOOP
l_categories_new := (l_categories_new|| c || ' - ' || l_categories(c)||',');
END LOOP;
END IF;
-- save event message
IF s.msg_info.notification_type = 'NOTIF_CA' AND
Chapter 3
Sending Notifications Using PL/SQL Procedures
3-24

s.event_payload.corrective_action IS NOT NULL
THEN
l_ca_obj := s.event_payload.corrective_action;
INSERT INTO event_log (notification_type, repeat_count, ruleset_name,
rule_name, rule_owner, message, message_url, event_instance_guid, event_type,
event_name, event_msg, categories, source_obj_type, source_obj_name, source_obj_url,
severity, severity_code, target_name, target_type, target_url, host_name, timezone,
occured, ca_guid, ca_name, ca_owner, ca_type, ca_status, ca_status_code,
ca_job_step_output, ca_execution_guid, ca_stage_change_guid)
VALUES (s.msg_info.notification_type, s.msg_info.repeat_count,
s.msg_info.ruleset_name, s.msg_info.rule_name,s.msg_info.rule_owner,
s.msg_info.message, s.msg_info.message_url, s.event_payload.event_instance_guid,
s.event_payload.event_type, s.event_payload.event_name, s.event_payload.event_msg,
l_categories_new, s.event_payload.source.source_type,
s.event_payload.source.source_name, s.event_payload.source.source_url,
s.event_payload.severity, s.event_payload.severity_code,
s.event_payload.target.target_name, s.event_payload.target.target_type,
s.event_payload.target.target_url, s.event_payload.target.host_name,
s.event_payload.target.target_timezone, s.event_payload.occurrence_date,
l_ca_obj.JOB_GUID, l_ca_obj.JOB_NAME, l_ca_obj.JOB_OWNER, l_ca_obj.JOB_TYPE,
l_ca_obj.JOB_STATUS, l_ca_obj.JOB_STATUS_CODE, l_ca_obj.JOB_STEP_OUTPUT,
l_ca_obj.JOB_EXECUTION_GUID, l_ca_obj.JOB_STATE_CHANGE_GUID); ELSE
INSERT INTO event_log (notification_type, repeat_count, ruleset_name,
rule_name, rule_owner, message, message_url, event_instance_guid, event_type,
event_name, event_msg, categories, source_obj_type, source_obj_name, source_obj_url,
severity, severity_code, target_name, target_type, target_url, host_name, timezone,
occured, ca_guid, ca_name, ca_owner, ca_type, ca_status, ca_status_code,
ca_job_step_output, ca_execution_guid, ca_stage_change_guid)
VALUES (s.msg_info.notification_type, s.msg_info.repeat_count,
s.msg_info.ruleset_name, s.msg_info.rule_name, s.msg_info.rule_owner,
s.msg_info.message, s.msg_info.message_url, s.event_payload.event_instance_guid,
s.event_payload.event_type, s.event_payload.event_name, s.event_payload.event_msg,
l_categories_new, s.event_payload.source.source_type,
s.event_payload.source.source_name, s.event_payload.source.source_url,
s.event_payload.severity, s.event_payload.severity_code,
s.event_payload.target.target_name, s.event_payload.target.target_type,
s.event_payload.target.target_url, s.event_payload.target.host_name,
s.event_payload.target.target_timezone, s.event_payload.occurrence_date,
null,null,null,null,null,null,null,null,null);
END IF;
COMMIT;
END log_event;
/
Example 3-12 PL/SQL Script to Log Incidents to a Table
CREATE TABLE incident_log (
notification_type VARCHAR2(32),
repeat_count NUMBER,
ruleset_name VARCHAR2(256),
rule_owner VARCHAR2(256),
rule_name VARCHAR2(256),
message VARCHAR2(4000),
message_url VARCHAR2(4000),
incident_id VARCHAR2(128),
ticket_url VARCHAR2(4000),
assoc_event_cnt NUMBER,
severity VARCHAR2(128),
severity_code VARCHAR2(32),
priority VARCHAR2(128),
priority_code VARCHAR2(32),
Chapter 3
Sending Notifications Using PL/SQL Procedures
3-25

status VARCHAR2(32),
categories VARCHAR2(1000),
target_name VARCHAR2(256),
target_type VARCHAR2(128),
host_name VARCHAR2(256),
timezone VARCHAR2(64),
occured DATE
)
;
CREATE OR REPLACE PROCEDURE log_incident(s IN GC$NOTIF_INCIDENT_MSG)
IS
l_src_info_array GC$NOTIF_SOURCE_INFO_ARRAY;
l_src_info GC$NOTIF_SOURCE_INFO;
l_categories gc$category_string_array;
l_target_obj GC$NOTIF_TARGET;
l_target_name VARCHAR2(256);
l_target_type VARCHAR2(256);
l_target_timezone VARCHAR2(256);
l_hostname VARCHAR2(256);
l_categories_new VARCHAR2(1000);
BEGIN
-- Save Incident categories
IF l_categories IS NOT NULL
THEN
FOR c IN 1..l_categories.COUNT
LOOP
l_categories_new := (l_categories_new|| c || ' - ' || l_categories(c)||',');
END LOOP;
END IF;
-- GET target info
l_src_info_array := s.incident_payload.incident_attrs.source_info_arr;
IF l_src_info_array IS NOT NULL
THEN
FOR I IN 1..l_src_info_array.COUNT
LOOP
IF l_src_info_array(I).TARGET IS NOT NULL
THEN
l_target_name := l_src_info_array(I).TARGET.TARGET_NAME;
l_target_type := l_src_info_array(I).TARGET.TARGET_TYPE;
l_target_timezone := l_src_info_array(I).TARGET.TARGET_TIMEZONE;
l_hostname := l_src_info_array(I).TARGET.HOST_NAME;
END IF;
END LOOP;
END IF;
-- save Incident notification message INSERT INTO
incident_log(notification_type, repeat_count, ruleset_name, rule_owner, rule_name,
message, message_url, incident_id, ticket_url, assoc_event_cnt, severity,
severity_code, priority, priority_code, status, categories, target_name,
target_type, host_name, timezone, occured)
VALUES (s.msg_info.notification_type, s.msg_info.repeat_count,
s.msg_info.ruleset_name, s.msg_info.rule_owner, s.msg_info.rule_name,
s.msg_info.message, s.msg_info.message_url, s.incident_payload.incident_attrs.id,
s.incident_payload.ticket_url, s.incident_payload.assoc_event_count,
s.incident_payload.incident_attrs.severity,
s.incident_payload.incident_attrs.severity_code,
s.incident_payload.incident_attrs.priority,
s.incident_payload.incident_attrs.priority_code,
s.incident_payload.incident_attrs.STATUS, l_categories_new, l_target_name,
l_target_type, l_hostname,l_target_timezone,
Chapter 3
Sending Notifications Using PL/SQL Procedures
3-26

s.incident_payload.incident_attrs.creation_date);
COMMIT;
END log_incident;
/
Example 3-13 PL/SQL Script to Log Problems to a Table
CREATE TABLE problem_log (
notification_type VARCHAR2(32),
repeat_count NUMBER,
ruleset_name VARCHAR2(256),
rule_owner VARCHAR2(256),
rule_name VARCHAR2(256),
message VARCHAR2(4000),
message_url VARCHAR2(4000),
problem_key VARCHAR2(850),
assoc_incident_cnt NUMBER,
problem_id NUMBER,
owner VARCHAR2(256),
severity VARCHAR2(128),
severity_code VARCHAR2(32),
priority VARCHAR2(128),
priority_code VARCHAR2(32),
status VARCHAR2(32),
categories VARCHAR2(1000),
target_name VARCHAR2(256),
target_type VARCHAR2(128),
host_name VARCHAR2(256), timezone VARCHAR2(64),
occured DATE
)
;
CREATE OR REPLACE PROCEDURE log_problem(s IN GC$NOTIF_PROBLEM_MSG)
IS
l_src_info_array GC$NOTIF_SOURCE_INFO_ARRAY;
l_src_info GC$NOTIF_SOURCE_INFO;
l_categories gc$category_string_array;
l_target_obj GC$NOTIF_TARGET;
l_target_name VARCHAR2(256);
l_target_type VARCHAR2(256);
l_target_timezone VARCHAR2(256);
l_hostname VARCHAR2(256);
l_categories_new VARCHAR2(1000);
BEGIN
-- Save Problem categories
l_categories := s.problem_payload.problem_attrs.categories;
IF l_categories IS NOT NULL
THEN
FOR c IN 1..l_categories.COUNT
LOOP
l_categories_new := (l_categories_new|| c || ' - ' || l_categories(c)||',');
END LOOP;
END IF;
-- GET target info
l_src_info_array := s.problem_payload.problem_attrs.source_info_arr;
IF l_src_info_array IS NOT NULL
THEN
FOR I IN 1..l_src_info_array.COUNT
LOOP
IF l_src_info_array(I).TARGET IS NOT NULL
Chapter 3
Sending Notifications Using PL/SQL Procedures
3-27

THEN
l_target_name := l_src_info_array(I).TARGET.TARGET_NAME;
l_target_type := l_src_info_array(I).TARGET.TARGET_TYPE;
l_target_timezone := l_src_info_array(I).TARGET.TARGET_TIMEZONE;
l_hostname := l_src_info_array(I).TARGET.HOST_NAME;
END IF;
END LOOP;
END IF;
-- save Problem notification message
INSERT INTO problem_log(notification_type, repeat_count, ruleset_name,
rule_owner, rule_name, message, message_url, problem_key, assoc_incident_cnt,
problem_id, owner, severity, severity_code, priority, priority_code, status,
categories, target_name, target_type, host_name, timezone, occured)
VALUES (s.msg_info.notification_type, s.msg_info.repeat_count,
s.msg_info.ruleset_name, s.msg_info.rule_owner, s.msg_info.rule_name,
s.msg_info.message, s.msg_info.message_url,
s.problem_payload.problem_key, s.problem_payload.ASSOC_INCIDENT_COUNT,
s.problem_payload.problem_attrs.id,
s.problem_payload.problem_attrs.owner,
s.problem_payload.problem_attrs.severity,
s.problem_payload.problem_attrs.severity_code,
s.problem_payload.problem_attrs.PRIORITY,
s.problem_payload.problem_attrs.PRIORITY_CODE,
s.problem_payload.problem_attrs.status, l_categories_new, l_target_name,
l_target_type, l_hostname,l_target_timezone,
s.problem_payload.problem_attrs.CREATION_DATE);
COMMIT;
END log_problem;
/
Step 1: Define the PL/SQL Procedure
The procedure must have one of the following signatures depending on the type of
notification that will be received.
For Events:
PROCEDURE event_proc(event_msg IN gc$notif_event_msg)
For Incidents:
PROCEDURE incident_proc(incident_msg IN gc$notif_incident_msg)
For Problems:
PROCEDURE problem_proc(problem_msg IN gc$notif_problem_msg)
Note:
The notification method based on a PL/SQL procedure must be configured by
an administrator with Super Administrator privileges before a user can select it
while creating/editing a incident rule.
For more information on passing specific types of information to scripts or PL/SQL
procedures, see the following sections:
"Passing Information to a PL/SQL Procedure"
Chapter 3
Sending Notifications Using PL/SQL Procedures
3-28

"Passing Corrective Action Status Change Information"
" Passing Job Execution Status Information"
Step 2: Create the PL/SQL procedure on the Management Repository.
Create the PL/SQL procedure on the repository database using one of the following
procedure specifications:
PROCEDURE event_proc(event_msg IN gc$notif_event_msg)
PROCEDURE incident_proc(incident_msg IN gc$notif_incident_msg)
PROCEDURE problem_proc(problem_msg IN gc$notif_problem_msg)
The PL/SQL procedure must be created on the repository database using the
database account of the repository owner (such as SYSMAN)
If an error is encountered during the running of the procedure, the Notification System
can be instructed to retry the sending of the notification to the procedure by raising a
user-defined exception that uses the error code -20000. The procedure initially retried
after one minute, then two minutes, then three minutes and so on, until the notification
is a day old, at which point it will be purged.
Step 3: Register your PL/SQL procedure as a new notification method.
Log in as a Super Administrator. From the Setup menu, choose Notifications and
then Notification Methods to access the Notification Methods page. From this page,
you can define a new notification based on 'PL/SQL Procedure'. See Sending
Notifications Using PL/SQL Procedures.
Make sure to use a fully qualified name that includes the schema owner, package
name and procedure name. The procedure will be executed by the repository owner
and so the repository owner must have execute permission on the procedure.
Create a notification method based on your PL/SQL procedure. The following
information is required when defining the method:
•Name
•Description
•PL/SQL Procedure
You must enter a fully qualified procedure name (for example,
OWNER.PKGNAME.PROCNAME) and ensure that the owner of the Management
Repository has execute privilege on the procedure.
An example of the required information is shown in Example 3-9.
Figure 3-1 illustrates how to add a PL/SQL-based notification method from the
Enterprise Manager UI.
Chapter 3
Sending Notifications Using PL/SQL Procedures
3-29
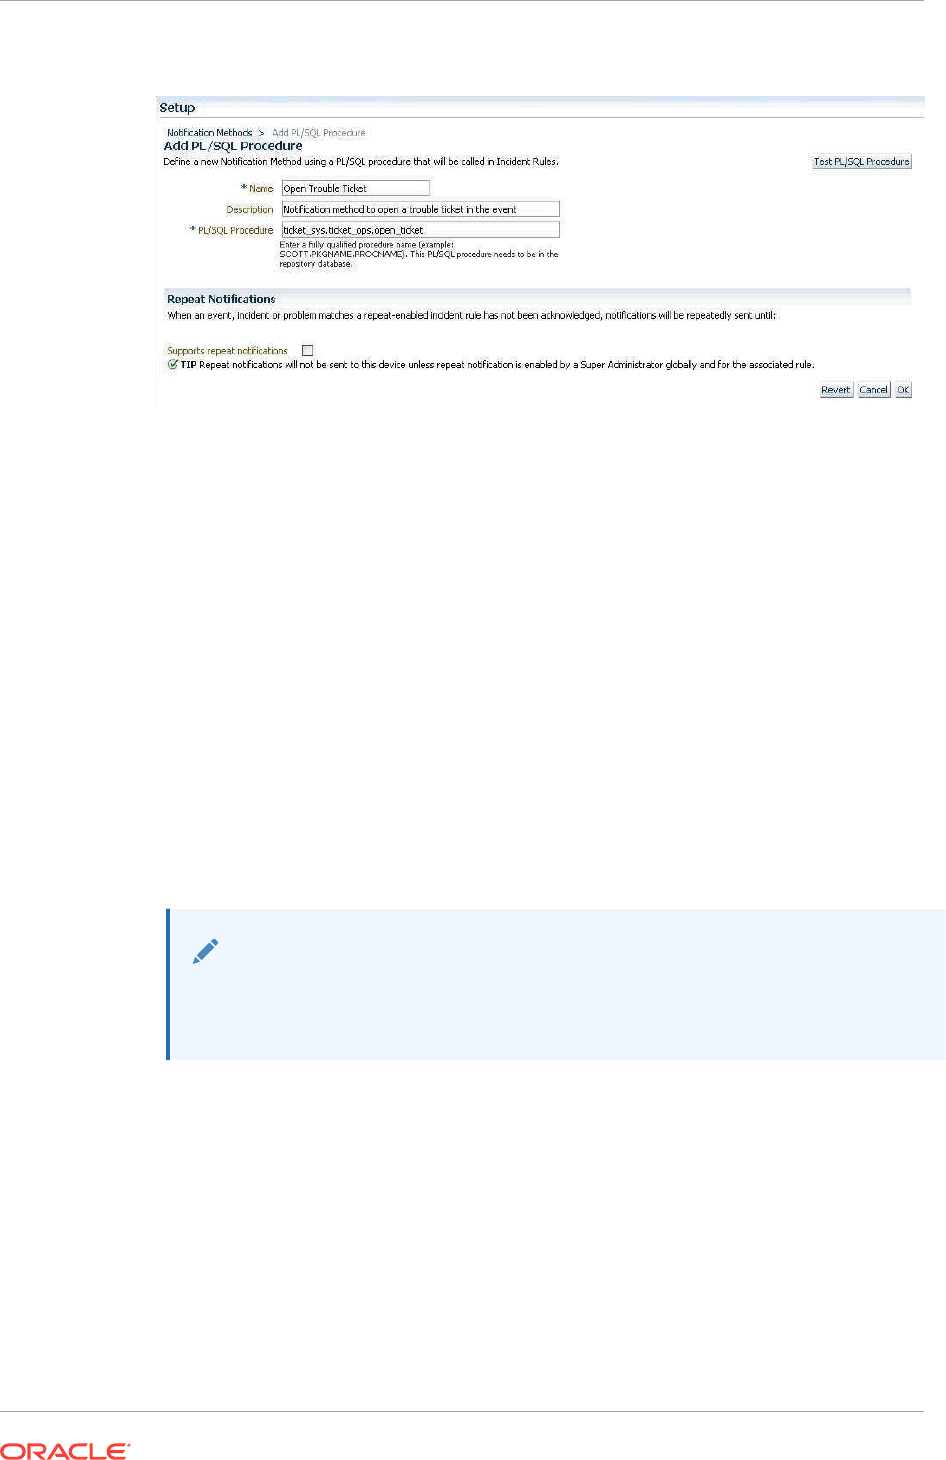
Figure 3-1 Adding a PL/SQL Procedure
Step 4: Assign the notification method to an incident rule.
You can edit an existing rule (or create a new incident rule). From the Setup menu,
select Incidents and then select Incident Rules. The Incident Rules page displays.
From here, you can add an action to a rule specifying the new PL/SQL procedure
found under Advanced Notification Method.
There can be more than one PL/SQL-based method configured for your Enterprise
Manager environment.
See "Passing Information to a PL/SQL Procedure" for more information about how
incident, event, and problem information is passed to the PLSQL procedure.
3.4.2 Migrating Pre-12c PL/SQL Advanced Notification Methods
Pre-12c notifications map to event notifications in Enterprise Manager 12c. The event
types metric_alert, target_availability and job_status_alert correspond to the pre-12c
notification functionality.
Note:
Policy Violations are no longer available beginning with Enterprise Manager
12c.
This section describes the mapping between Enterprise Manager 13c PL/SQL
notification payload to the pre-12c PL/SQL notification payload. You can use this
information for updating the existing pre-12c PL/SQL user callback procedures to use
the 13c PL/SQL notification payload.Please note that Policy Violations are no longer
supported in the 13c release.
3.4.2.1 Mapping for MGMT_NOTIFY_SEVERITY
When event type is metric_alert
Use the following map when gc$notif_event_payload .event_type='metric_alert'.
Chapter 3
Sending Notifications Using PL/SQL Procedures
3-30

Table 3-8 Metric Alert Mapping
MGMT_NOTIFY_SEVERITY 13c Notification Payload
TARGET_NAME gc$notif_target.target_name
TARGET_TYPE gc$notif_target.target_type
TIMEZONE gc$notif_target.target_timezone
HOST_NAME gc$notif_target.host_name
MERTIC_NAME gc$notif_event_attr.value where its name=' metric_group'
in gc$notif_event_attr_array.
METRIC_DESCRIPTION gc$notif_event_attr.value where its name='
metric_description' in gc$notif_event_attr_array.
METRIC_COLUMN gc$notif_event_attr.value where its name='
metric_column' in gc$notif_event_attr_array.
METRIC_VALUE gc$notif_event_attr.value where its name=' value' in
gc$notif_event_attr_array.
KEY_VALUE It is applied for multiple keys based metric when value of
gc$notif_event_attr.name='num_keys' is not null and is
greater than 0 in gc$notif_event_attr_array.
See detail descriptions below.
KEY_VALUE_NAME It is applied for multiple keys based metric when value of
gc$notif_event_attr.name='num_keys' is not null and is
greater than 0 in gc$notif_event_attr_array.
See detail descriptions below.
KEY_VALUE_GUID gc$notif_event_attr.value where its name='key_ value' in
gc$notif_event_attr_array.
CTXT_LIST gc$notif_event_context_array
COLLECTION_TIMESTAMP gc$notif_event_payload. reported_date
SEVERITY_CODE Derive from gc$notif_event_payload.severity_code, see
Table 3-9.
MESSAGE gc$notif_msg_info.message
SEVERITY_GUID gc$notif_event_attr.value where its name='
severity_guid' in gc$notif_event_attr_array.
METRIC_GUID gc$notif_event_attr.value where its name=' metric_guid'
in gc$notif_event_attr_array.
TARGET_GUID gc$notif_target.target_guid
RULE_OWNER gc$notif_msg_info.rule_owner
RULE_NAME gc$notif_msg_info.ruleset_name
The following example illustrates how to obtain similar pre-12c KEY_VALUE and
KEY_VALUE_NAME from an Enterprise Manager 13c notification payload.
Example 3-14 Extracting KEY_VALUE and KEY_VALUE_NAME
-- Get the pre-12c KEY_VALUE and KEY_VALUE_NAME from an Enterprise Manager 13c
-- notification payload
-- parameters
-- IN Parameters:
-- event_msg : The event notification payload
-- OUT Parameters
Chapter 3
Sending Notifications Using PL/SQL Procedures
3-31

-- key_value_name_out : the KEY_VALUE_NAME backward compitable to pre-12c
-- notification payload
-- key_value_out : the KEY_VALUE backward compitable to pre-12c
-- notification payload
--
CREATE OR REPLACE PROCEDURE get_pre_12c_key_value(
event_msg IN GC$NOTIF_EVENT_MSG,
key_value_name_out OUT VARCHAR2,
key_value_out OUT VARCHAR2)
IS
l_key_columns MGMT_SHORT_STRING_ARRAY := MGMT_SHORT_STRING_ARRAY();
l_key_column_values MGMT_MEDIUM_STRING_ARRAY := MGMT_MEDIUM_STRING_ARRAY();
l_key_value VARCHAR2(1790) := NULL;
l_num_keys NUMBER := 0;
l_attrs gc$notif_event_attr_array;
l_key_value_name VARCHAR2(512);
BEGIN
l_attrs := event_msg.event_payload.event_attrs;
key_value_name_out := NULL;
key_value_out := NULL;
IF l_attrs IS NOT NULL AND
l_attrs.COUNT > 0
THEN
l_key_columns.extend(7);
l_key_column_values.extend(7);
FOR c IN 1..l_attrs.COUNT
LOOP
CASE l_attrs(c).name
WHEN 'num_keys' THEN
BEGIN
l_num_keys := to_number(l_attrs(c).value);
EXCEPTION
WHEN OTHERS THEN
-- should never happen, but guard against it l_num_keys := 0;
END;
WHEN 'key_value' THEN
l_key_value := substr(l_attrs(c).nls_value,1,1290);
WHEN 'key_column_1' THEN
l_key_columns(1) := substr(l_attrs(c).nls_value,1,64);
WHEN 'key_column_2' THEN
l_key_columns(2) := substr(l_attrs(c).nls_value,1,64);
WHEN 'key_column_3' THEN
l_key_columns(3) := substr(l_attrs(c).nls_value,1,64);
WHEN 'key_column_4' THEN
l_key_columns(4) := substr(l_attrs(c).nls_value,1,64);
WHEN 'key_column_5' THEN
l_key_columns(5) := substr(l_attrs(c).nls_value,1,64);
WHEN 'key_column_6' THEN
l_key_columns(6) := substr(l_attrs(c).nls_value,1,64);
WHEN 'key_column_7' THEN
l_key_columns(7) := substr(l_attrs(c).nls_value,1,64);
WHEN 'key_column_1_value' THEN
l_key_column_values(1) := substr(l_attrs(c).nls_value,1,256);
WHEN 'key_column_2_value' THEN
l_key_column_values(2) := substr(l_attrs(c).nls_value,1,256);
WHEN 'key_column_3_value' THEN
l_key_column_values(3) := substr(l_attrs(c).nls_value,1,256);
WHEN 'key_column_4_value' THEN
l_key_column_values(4) := substr(l_attrs(c).nls_value,1,256);
Chapter 3
Sending Notifications Using PL/SQL Procedures
3-32

WHEN 'key_column_5_value' THEN
l_key_column_values(5) := substr(l_attrs(c).nls_value,1,256);
WHEN 'key_column_6_value' THEN
l_key_column_values(6) := substr(l_attrs(c).nls_value,1,256);
WHEN 'key_column_7_value' THEN
l_key_column_values(7) := substr(l_attrs(c).nls_value,1,256);
ELSE
NULL;
END CASE;
END LOOP;
-- get key_value and key_value_name when l_num_keys > 0
IF l_num_keys > 0
THEN
-- get key value name
IF l_key_columns IS NULL OR l_key_columns.COUNT = 0
THEN
key_value_name_out := NULL;
ELSE
l_key_value_name := NULL;
FOR i in l_key_columns.FIRST..l_num_keys
LOOP
IF i > 1
THEN
l_key_value_name := l_key_value_name || ';';
END IF;
l_key_value_name := l_key_value_name || l_key_columns(i);
END LOOP;
key_value_name_out := l_key_value_name;
END IF;
-- get key_value
IF l_num_keys = 1
THEN
key_value_out := l_key_value;
ELSE
l_key_value := NULL;
IF l_key_column_values IS NULL OR l_key_column_values.COUNT = 0
THEN
key_value_out := NULL;
ELSE
FOR i in l_key_column_values.FIRST..l_num_keys
LOOP
IF i > 1
THEN
l_key_value := l_key_value || ';';
END IF;
l_key_value := l_key_value || l_key_column_values(i);
END LOOP;
-- max length for key value in pre-12c = 1290
key_value_out := substr(l_key_value,1,1290);
END IF;
END IF;
END IF; -- l_num_keys > 0
END IF; -- l_attrs IS NOT NULL
END get_pre_12c_key_value;
/
When the event type is metric_alert:
Chapter 3
Sending Notifications Using PL/SQL Procedures
3-33

Use the following severity code mapping from 13c to pre-12c when the event type is
metric_alert.
Table 3-9 Severity Code Mapping
13c Severity Code Pre-12c Severity Code
GC_EVENT_RECEIVER.FATAL 32 MGMT_GLOBAL.G_SEVERITY_CRITICAL 25
GC_EVENT_RECEIVER.CRITICAL 16 MGMT_GLOBAL.G_SEVERITY_CRITICAL 25
GC_EVENT_RECEIVER.WARNING 8 MGMT_GLOBAL.G_SEVERITY_WARNING 20
GC_EVENT_RECEIVER.CLEAR 0 MGMT_GLOBAL.G_SEVERITY_CLEAR 15
When event type is target_availability:
Use the following map when gc$notif_event_payload .event_type='target_availability'.
Table 3-10 Target Availability Mapping
MGMT_NOTIFY_SEVERITY 13c Notification Payload
TARGET_NAME gc$notif_target.target_name
TARGET_TYPE gc$notif_target.target_type
TIMEZONE gc$notif_target.target_timezone
HOST_NAME gc$notif_target.host_name
MERTIC_NAME Use fixed value "Response".
METRIC_DESCRIPTION NULL
METRIC_COLUMN Use fixed value "Status".
METRIC_VALUE gc$notif_event_attr.value where its
name='target_status' in gc$notif_event_attr_array.
KEY_VALUE NULL
KEY_VALUE_NAME NULL
KEY_VALUE_GUID NULL
CTXT_LIST gc$notif_event_context_array
COLLECTION_TIMESTAMP gc$notif_event_payload. reported_date
SEVERITY_CODE gc$notif_event_attr.value where its name='
avail_severity' in gc$notif_event_attr_array.
MESSAGE gc$notif_msg_info.message
SEVERITY_GUID gc$notif_event_attr.value where its name='
severity_guid' in gc$notif_event_attr_array.
METRIC_GUID gc$notif_event_attr.value where its name='
metric_guid_id' in gc$notif_event_attr_array.
TARGET_GUID gc$notif_target.target_guid
RULE_OWNER gc$notif_msg_info.rule_owner
RULE_NAME gc$notif_msg_info.ruleset_name
3.4.2.2 Mapping for MGMT_NOTIFY_JOB
Use the following map when gc$notif_event_payload .event_type=job_status_change'.
Chapter 3
Sending Notifications Using PL/SQL Procedures
3-34

Table 3-11 Job Status Change Mapping
MGMT_NOTIFY_JOB 13c Notification Payload
JOB_NAME gc$notif_source.source_name
JOB_OWNER gc$notif_source.source_owner
JOB_TYPE gc$notif_source.source_sub_type
JOB_STATUS gc$notif_event_attr.value where its name='
execution_status_code' in
gc$notif_event_attr_array.
STATE_CHANGE_GUID gc$notif_event_attr.value where its name='
state_change_guid' in gc$notif_event_attr_array.
JOB_GUID gc$notif_source.source_guid
EXECUTION_ID gc$notif_event_attr.value where its name='
execution_id' in gc$notif_event_attr_array.
TARGETS gc$notif_target.target_name,
gc$notif_target.target_type
RULE_OWNER gc$notif_msg_info.rule_owner
RULE_NAME gc$notif_msg_info.ruleset_name
OCCURRED_DATE gc$notif_event_payload. reported_date
3.4.2.3 Mapping for MGMT_NOTIFY_CORRECTIVE_ACTION
Note that corrective action related payload is populated when
gc$notif_msg_info.notification_type is set to NOTIF_CA.
For mapping the following attributes, use the mapping information provided for
MGMT_NOTIFY_SEVERITY object Table 3-8
MERTIC_NAME
METRIC_COLUMN
METRIC_VALUE
KEY_VALUE
KEY_VALUE_NAME
KEY_VALUE_GUID
CTXT_LIST
RULE_OWNER
RULE_NAME
OCCURRED_DATE
For mapping the job related attributes in MGMT_NOTIFY_CORRECTIVE_ACTION
object, use the following map.
Chapter 3
Sending Notifications Using PL/SQL Procedures
3-35

Table 3-12 Corrective Action Mapping
MGMT_NOTIFY_CORRECTIVE_ACTION 13c Notification Payload
JOB_NAME gc$ notif_corrective_action_job.job_name
JOB_OWNER gc$ notif_corrective_action_job.job_owner
JOB_TYPE gc$ notif_corrective_action_job.job_type
JOB_STATUS gc$ notif_corrective_action_job.status_code
STATE_CHANGE_GUID gc$ notif_corrective_action_job.
job_state_change_guid
JOB_GUID gc$ notif_corrective_action_job. job _guid
EXECUTION_ID gc$ notif_corrective_action_job.
job_execution_guid
OCCURRED_DATE gc$ notif_corrective_action_job.occurred_date
TARGETS There can be at most one target. Use the values
from gc$notif_target.target_name,
gc$notif_target.target_type for the associated
target.
3.5 Sending SNMP Traps to Third Party Systems
Enterprise Manager supports integration with third-party management tools through
the Simple Network Management Protocol (SNMP). For example, you can use SNMP
to notify a third-party application that a selected metric has exceeded its threshold.
Note:
In order for a third-party system to interpret traps sent by the OMS, the
omstrap.v1 file must first be loaded into the third-party SNMP console. For
more information about this file and its location, see "MIB Definition".
The Enterprise Manager 13c version of the MIB file incorporates the 10g and
11g MIB content, thus ensuring backward compatibility with earlier Enterprise
Manager releases.
Enterprise Manager supports both SNMP Version 1 and Version 3 traps. The traps are
described by the MIB definition shown in Enterprise Manager MIB Definition. See
"Management Information Base (MIB)" for an explanation of how the MIB works. If you
are using Enterprise Manager 13c, see Interpreting Variables of the Enterprise
Manager MIB and Enterprise Manager MIB Definition. If you are upgrading from a
pre-12c version of Enterprise Manager, see SNMP Trap Mappings for specific version
mappings.
For Enterprise Manager 13c, SNMP traps are delivered for event notifications only.
SNMP trap notifications are not supported for incidents or problems.
Chapter 3
Sending SNMP Traps to Third Party Systems
3-36

Note:
Notification methods based on SNMP traps must be configured by an
administrator with Super Administrator privileges before any user can then
choose to select one or more of these SNMP trap methods while creating/
editing a incident rule.
3.5.1 SNMP Version 1 Versus SNMP Version 3
SNMP Version 3 shares the same basic architecture of Version 1, but adds numerous
enhancements to SNMP administration and security. The primary enhancement
relevant to Enterprise Manager involves additional security levels that provide both
authentication and privacy as well as authorization and access control.
User-based Security Model (USM)
USM defines the security-related procedures followed by an SNMP engine when
processing SNMP messages. Enterprise Manager SNMP V3 support takes advantage
of this added SNMP message-level security enhancement to provide a secure
messaging environment.
USM protects against two primary security threats:
•Modification of information: The modification threat is the danger that some
unauthorized entity may alter in-transit SNMP messages generated on behalf of
an authorized principal in such a way as to effect unauthorized management
operations, including falsifying the value of an object.
•Masquerade: The masquerade threat is the danger that management operations
not authorized for some user may be attempted by assuming the identity of
another user that has the appropriate authorizations.
For both SNMP versions, the basic methodology for setting up Enterprise Manager
advanced notifications using SNMP traps remains the same:
1. Define the notification method based on an SNMP trap.
2. Assign the notification method to an incident rule.
3.5.2 Working with SNMP V3 Trap Notification Methods
The procedure for defining an SNMP V3 trap notification method differs slightly from
that of V1. Beginning with Enterprise Manager Release 12.1.0.4, a separate interface
consolidates key information and configuration functionality pertaining to SNMP V3
trap notification methods. The SNMP V3 Trap interface helps guide you through the
process of creating SNMP notification methods, enabling the OMS to send SNMP
traps, and defining user security settings for SNMP trap notifications.
3.5.2.1 Configuring the OMS to Send SNMP Trap Notifications
Before creating an SNMP Trap notification method, you must enable at least one OMS
is your environment to handle SNMP Trap notifications. For SNMP V3, the OMS
serves as an SNMP Agent which sends traps to the SNMP Manager that is monitoring
all SNMP Agents deployed in the network.
Chapter 3
Sending SNMP Traps to Third Party Systems
3-37
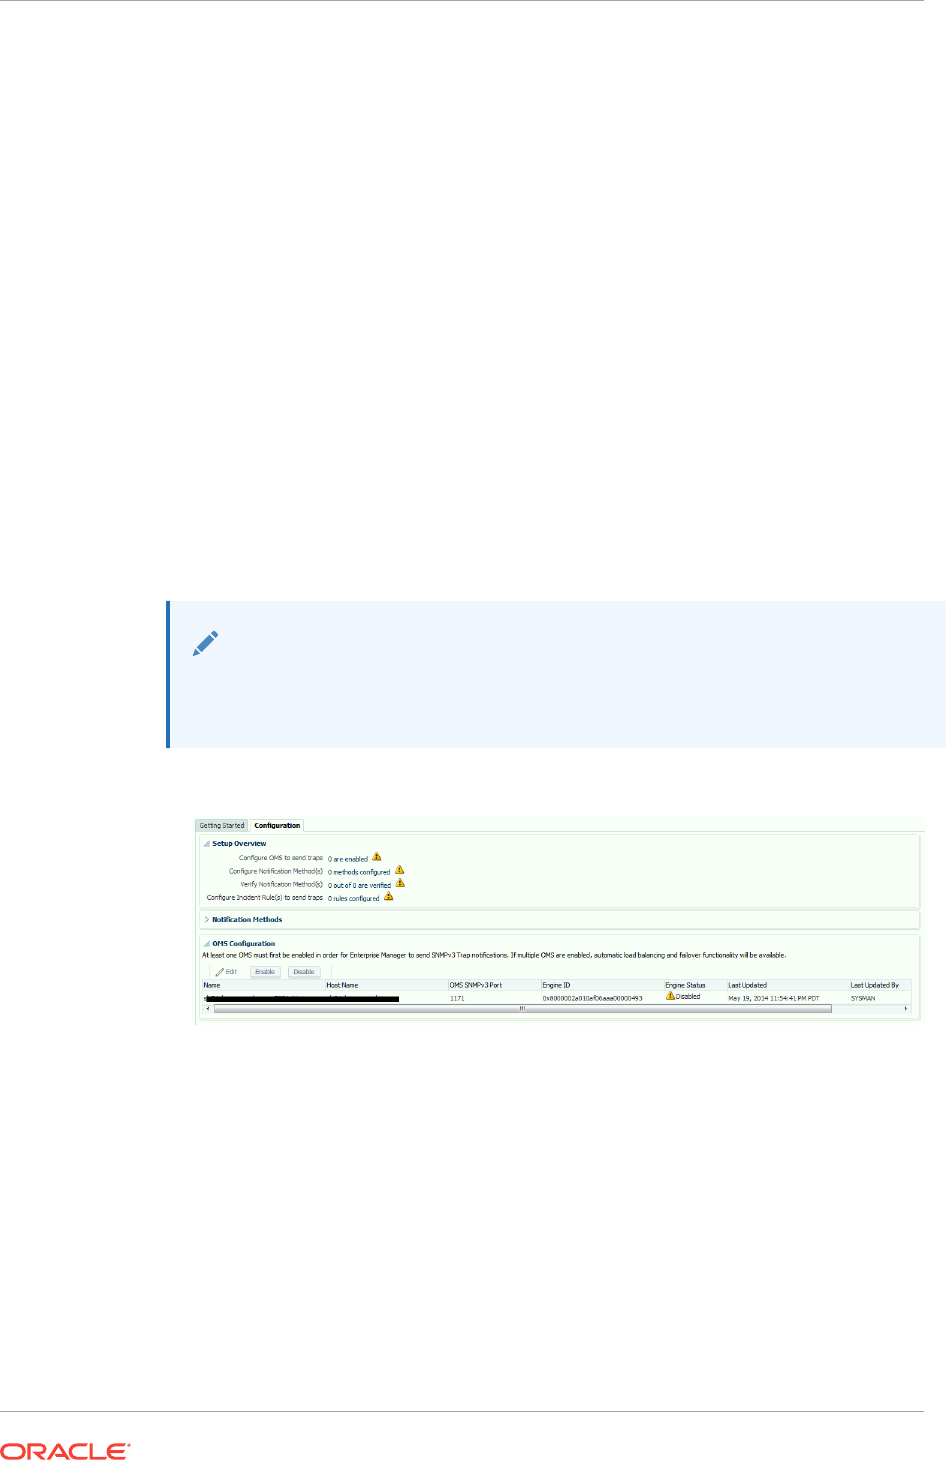
1. From the Setup menu, select Notifications and then SNMP V3 Traps. The
Getting Started page displays. This page documents the high-level workflow for
configuring Enterprise Manager to send traps to third-party SNMP Managers.
2. Click the Configuration tab. The Configuration page displays.
3. In the OMS Configuration region, select the OMS you wish to enable.
4. Check the following for each OMS and make changes, if necessary:
•OMS requires a port for SNMPv3 traps. Check if the default port can be used
by OMS.
•OMS requires a unique Engine ID for sending traps. By default, it is being
generated from the host name and port.
5. Click Enable.
3.5.2.2 Creating/Editing an SNMP V3 Trap Notification Method
Once an OMS has been enabled to send SNMP traps notifications, the next step is to
create a notification method than can be used by an incident rule.
1. From the Setup menu, select Notifications and then SNMP V3 Traps. The
Getting Started page displays.
Note:
If want to edit an existing Notification Method, select the desired method from
the Notification Methods region and click Edit.
2. Click the Configuration tab. The Configuration page displays.
3. From the Notification Methods region, click Create. The SNMPv3 Traps: Create
Notification Method page displays.
4. Enter the requisite Notification Method definition parameters. Note: You can
enable Repeat Notifications at this point.
5. If you choose to create a new User Security Model entry, from the User Security
Model region, ensure the Create New option is chosen.
a. Specify a Username that uniquely identifies the credential. SNMP V3 allows
multiple usernames to be set in an SNMP Agent as well as SNMP Manager
applications.
b. Select a Security Level from the drop-down menu. Available parameters
become available depending on the security level. There are three levels from
which to choose:
Chapter 3
Sending SNMP Traps to Third Party Systems
3-38

AuthPriv (Authentication + Privacy:) The sender's identity must be confirmed
by the receiver (authentication). SNMP V3 messages are encrypted by the
sender and must be decrypted by the receiver (privacy).
AuthNoPriv (Authentication only): The receiver must authenticate the
sender's identity before accepting the message.
NoAuthNoPriv (no security): Neither sender identity confirmation nor
message encryption is used.
c. For AuthPriv and AuthNoPriv security levels, choose a the desired
Authentication Protocol. Two authentication protocols are available:
Secure Hash Algorithm (SHA)
Message Digest algorithm (MD5)
The authentication protocols are used to build the message digest when the
message is authenticated.
Privacy Protocol (used for the AuthPriv security level) is used to encrypt/
decrypt messages. USM uses the Data Encryption Standard (DES). The
Privacy Password is used in conjunction with the Privacy Protocol. the
privacy password on both the SNMP Agent and SNMP Manager must match
in order for encryption/decryption to succeed.
If you have already have predefined User Security Model entries, choose the Use
Existing option and select one of the USM entries from the drop-down menu.
USM entries are listed by username.
Note:
Ensure that the USM credentials are identical in OMS and the external trap
receiver. If they do not match, Enterprise Manager will still send the SNMP
trap, but the trap will not be received. If the USM credentials are invalid,
Enterprise Manager will still send the SNMP trap, however, the trap will not be
received as the incorrect credentials will result in an authentication error at the
SNMP receiver. This type of authentication error will not be apparent from the
Enterprise Manager console.
6. Once you have entered the requisite Notification Method and USM parameters,
click Save. The newly created notification method appears in the Notification
Method region of the Configuration page.
Note:
Once you have defined the SNMP V3 Trap notification method, you must add
it to a rule. See "Creating a Rule to Send SNMP Traps to Third Party Systems"
for instructions.
3.5.2.3 Editing a User Security Model Entry
You can add USM entries at any time.
1. From the Setup menu, select Notifications, and then SNMP V3 Traps.
Chapter 3
Sending SNMP Traps to Third Party Systems
3-39
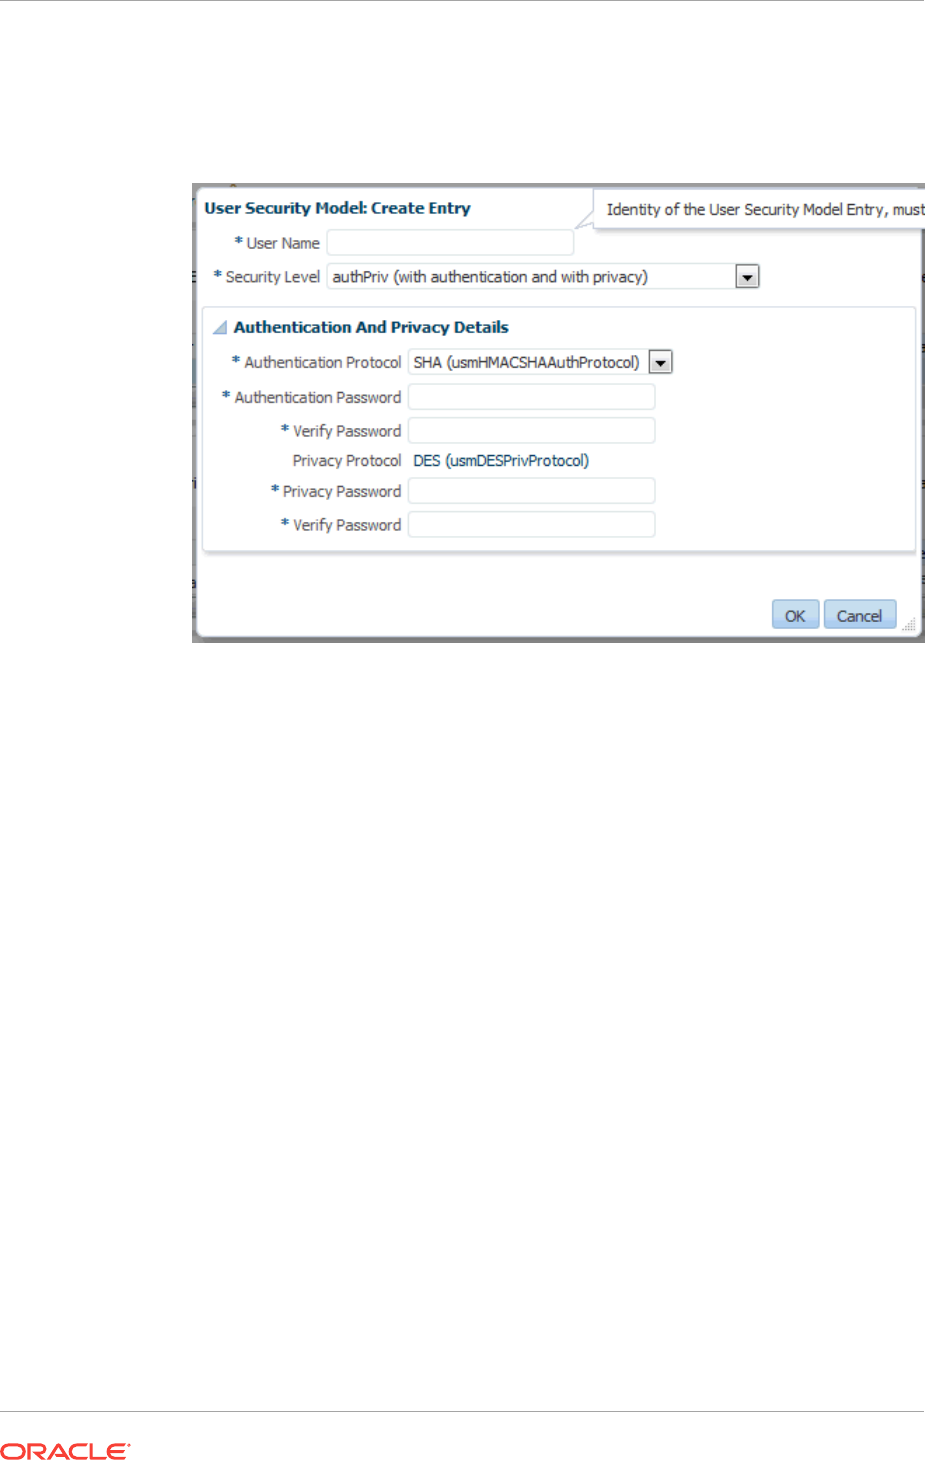
2. Click on the Configurations tab.
3. From the User Security Model Entries region, click Create. The User Security
Model Entries dialog displays.
4. Specify a Username that uniquely identifies the credential. SNMP V3 allows
multiple usernames to be set in an SNMP Agent as well as SNMP Manager
applications.
5. Select a Security Level from the drop-down menu. Available parameters become
available depending on the security level. There are three levels from which to
choose:
AuthPriv (Authentication + Privacy:) The sender's identity must be confirmed by
the receiver (authentication). SNMP V3 messages are encrypted by the sender
and must be decrypted by the receiver (privacy).
AuthNoPriv (Authentication only): The receiver must authenticate the sender's
identity before accepting the message.
NoAuthNoPriv (no security): Neither sender identity confirmation nor message
encryption is used.
6. For AuthPriv and AuthNoPriv security levels, choose a the desired Authentication
Protocol. Two authentication protocols are available:
Secure Hash Algorithm (SHA)
Message Digest algorithm (MD5)
The authentication protocols are used to build the message digest when the
message is authenticated.
Privacy Protocol (used for the AuthPriv security level) is used to encrypt/decrypt
messages. USM uses the Data Encryption Standard (DES). The Privacy
Password is used in conjunction with the Privacy Protocol. the privacy password
on both the SNMP Agent and SNMP Manager must match in order for encryption/
decryption to succeed.
Chapter 3
Sending SNMP Traps to Third Party Systems
3-40

7. Click OK.
The new USM username will appear in the User Security Model Entries table.
When creating new SNMP V3 Trap notification methods, the USM username will
appear as a selectable option from the Existing Entries drop-down menu.
After editing the USM, you should verify the change via the notification methods
that use it.
3.5.2.4 Viewing Available SNMP V3 Trap Notification Methods
To view available SNMP V3 Trap notification methods:
1. From the Setup menu, select Notifications, and then SNMP V3 Traps.
2. Click on the Configurations tab.
3. The Notification Methods region displays existing SNMP V3 Trap notification
methods.
3.5.2.5 Deleting an SNMP V3 Trap Notification Method
To delete available SNMP V3 Trap notification methods:
1. From the Setup menu, select Notifications, and then SNMP V3 Traps.
2. Click on the Configurations tab.
3. From the Notification Methods region, select an existing SNMP V3 Trap
notification method.
4. Click Delete.
3.5.3 Creating an SNMP V1 Trap
Step 1: Define a new notification method based on an SNMP trap.
Log in to Enterprise Manager as a Super Administrator. From the Setup menu, select
Notifications and then select Scripts and SNMPv1 Traps.
You must provide the name of the host (machine) on which the SNMP master agent is
running and other details as shown in the following example. As shown in, the SNMP
host will receive your SNMP traps.
Figure 3-2 SNMP Trap Required Information
Chapter 3
Sending SNMP Traps to Third Party Systems
3-41

Note:
A Test SNMP Trap button exists for you to test your setup.
Metric severity information will be passed as a series of variables in the SNMP trap.
Step 2: Assign the notification method to a rule.
You can edit an existing rule (or create a new incident rule), then add an action to the
rule that subscribes to the advanced notification method. For instructions on setting up
incident rules using SNMP traps, see "Creating a Rule to Send SNMP Traps to Third
Party Systems".
Example SNMP Trap Implementation
In this scenario, you want to identify the unique issues from the SNMP traps that are
sent. Keep in mind that all events that are related to the same issue are part of the
same event sequence. Each event sequence has a unique identification number.
An event sequence is a sequence of related events that represent the life of a specific
issue from the time it is detected and an event is raised to the time it is fixed and a
corresponding clear event is generated. For example, a warning metric alert event is
raised when the CPU utilization of a host crosses 80%. This starts the event sequence
representing the issue CPU Utilization of the host is beyond normal level. Another
critical event is raised for the same issue when the CPU utilization goes above 90%
and the event is added to the same event sequence. After a period of time, the CPU
utilization returns to a normal level and a clear event is raised. At this point, the issue
is resolved and the event sequence is closed.
The SNMP trap sent for this scenario is shown in Example 3-15. Each piece of
information is sent as a variable embedded in the SNMP Trap.
This following example illustrates how OIDs are used during the lifecycle of an event.
Here, for one event (while the event is open), the event sequence OID remains the
same even though the event severity changes.
The OID for the event sequence is:
1.3.6.1.4.1.111.15.3.1.1.42.1: C77AE9E578F00773E040F00A6D242F90
The OID for the event severity code is:
1.3.6.1.4.1.111.15.3.1.1.6.1: CRITICAL
When the event clears, these OIDs show the same event sequence with a different
severity code:
The OID for the event sequence is:
1.3.6.1.4.1.111.15.3.1.1.42.1: C77AE9E578F00773E040F00A6D242F90
The OID for the event severity code is:
1.3.6.1.4.1.111.15.3.1.1.6.1: CLEAR
The length of the SNMP OID value is limited to 2560 bytes by default. Configure the
emoms property oracle.sysman.core.notification.snmp.max_oid_length to change the
default limit.
Chapter 3
Sending SNMP Traps to Third Party Systems
3-42

Example 3-15 SNMP Trap
**************V1 TRAP***[1]*****************
Community : public
Enterprise :1.3.6.1.4.1.111.15.2
Generic :6
Specific :3
TimeStamp :67809
Agent adress :10.240.36.109
1.3.6.1.4.1.111.15.3.1.1.2.1: NOTIF_NORMAL
1.3.6.1.4.1.111.15.3.1.1.3.1: CPU Utilization is 92.658%, crossed warning (80) or
critical (90) threshold.
1.3.6.1.4.1.111.15.3.1.1.4.1: https://sampleserver.oracle.com:5416/em/redirect?
pageType=sdk-core-event-console-detailEvent&issueID=C77AE9E578F00773E040F00A6D242F90
1.3.6.1.4.1.111.15.3.1.1.5.1: Critical
1.3.6.1.4.1.111.15.3.1.1.6.1: CRITICAL
1.3.6.1.4.1.111.15.3.1.1.7.1: 0
1.3.6.1.4.1.111.15.3.1.1.8.1:
1.3.6.1.4.1.111.15.3.1.1.9.1:
1.3.6.1.4.1.111.15.3.1.1.10.1: Aug 17, 2012 3:26:36 PM PDT
1.3.6.1.4.1.111.15.3.1.1.11.1: Capacity
1.3.6.1.4.1.111.15.3.1.1.12.1: Capacity
1.3.6.1.4.1.111.15.3.1.1.13.1: Metric Alert
1.3.6.1.4.1.111.15.3.1.1.14.1: Load:cpuUtil
1.3.6.1.4.1.111.15.3.1.1.15.1: 281
1.3.6.1.4.1.111.15.3.1.1.16.1:
1.3.6.1.4.1.111.15.3.1.1.17.1: No
1.3.6.1.4.1.111.15.3.1.1.18.1: New
1.3.6.1.4.1.111.15.3.1.1.19.1: None
1.3.6.1.4.1.111.15.3.1.1.20.1: 0
1.3.6.1.4.1.111.15.3.1.1.21.1: sampleserver.oracle.com
1.3.6.1.4.1.111.15.3.1.1.22.1: https://sampleserver.oracle.com:5416/em/redirect?
pageType=TARGET_HOMEPAGE&targetName=sampleserver.oracle.com&targetType=host
1.3.6.1.4.1.111.15.3.1.1.23.1: Host
1.3.6.1.4.1.111.15.3.1.1.24.1: sampleserver.oracle.com
1.3.6.1.4.1.111.15.3.1.1.25.1: SYSMAN
1.3.6.1.4.1.111.15.3.1.1.26.1:
1.3.6.1.4.1.111.15.3.1.1.27.1: 5.8.0.0.0
1.3.6.1.4.1.111.15.3.1.1.28.1: Operating System=Linux, Platform=x86_64,
1.3.6.1.4.1.111.15.3.1.1.29.1:
1.3.6.1.4.1.111.15.3.1.1.30.1:
1.3.6.1.4.1.111.15.3.1.1.31.1:
1.3.6.1.4.1.111.15.3.1.1.32.1:
1.3.6.1.4.1.111.15.3.1.1.33.1:
1.3.6.1.4.1.111.15.3.1.1.34.1:
1.3.6.1.4.1.111.15.3.1.1.35.1:
1.3.6.1.4.1.111.15.3.1.1.36.1:
1.3.6.1.4.1.111.15.3.1.1.37.1:
1.3.6.1.4.1.111.15.3.1.1.38.1:
1.3.6.1.4.1.111.15.3.1.1.39.1: SnmpNotifRuleset
1.3.6.1.4.1.111.15.3.1.1.40.1: SnmpNotifRuleset,SnmpNotifEvent
1.3.6.1.4.1.111.15.3.1.1.41.1: SYSMAN
1.3.6.1.4.1.111.15.3.1.1.42.1: C77AE9E578F00773E040F00A6D242F90
1.3.6.1.4.1.111.15.3.1.1.43.1:
1.3.6.1.4.1.111.15.3.1.1.44.1:
1.3.6.1.4.1.111.15.3.1.1.45.1:
1.3.6.1.4.1.111.15.3.1.1.46.1: CPU Utilization is 92.658%, crossed warning (80) or
critical (90) threshold., Incident created by rule (Name = Incident management
Ruleset for all targets, Incident creation Rule for metric alerts.; Owner =
<SYSTEM>).
1.3.6.1.4.1.111.15.3.1.1.61.1: Metric GUID=0C71A1AFAC2D7199013837DA35522C08
Chapter 3
Sending SNMP Traps to Third Party Systems
3-43

1.3.6.1.4.1.111.15.3.1.1.62.1: Severity GUID=C77AE9E578EC0773E040F00A6D242F90
1.3.6.1.4.1.111.15.3.1.1.63.1: Cycle GUID=C77AE9E578EC0773E040F00A6D242F90
1.3.6.1.4.1.111.15.3.1.1.64.1: Collection Name=LoadLinux
1.3.6.1.4.1.111.15.3.1.1.65.1: Metric Group=Load
1.3.6.1.4.1.111.15.3.1.1.66.1: Metric=CPU Utilization (%)
1.3.6.1.4.1.111.15.3.1.1.67.1: Metric Description=
1.3.6.1.4.1.111.15.3.1.1.68.1: Metric value=92.658
1.3.6.1.4.1.111.15.3.1.1.69.1: Key Value=
1.3.6.1.4.1.111.15.3.1.1.70.1:
1.3.6.1.4.1.111.15.3.1.1.71.1:
1.3.6.1.4.1.111.15.3.1.1.72.1:
1.3.6.1.4.1.111.15.3.1.1.73.1:
1.3.6.1.4.1.111.15.3.1.1.74.1:
1.3.6.1.4.1.111.15.3.1.1.75.1:
1.3.6.1.4.1.111.15.3.1.1.76.1:
1.3.6.1.4.1.111.15.3.1.1.77.1:
1.3.6.1.4.1.111.15.3.1.1.78.1:
1.3.6.1.4.1.111.15.3.1.1.79.1:
1.3.6.1.4.1.111.15.3.1.1.80.1:
1.3.6.1.4.1.111.15.3.1.1.81.1:
1.3.6.1.4.1.111.15.3.1.1.82.1:
1.3.6.1.4.1.111.15.3.1.1.83.1:
1.3.6.1.4.1.111.15.3.1.1.84.1: Number of keys=0
1.3.6.1.4.1.111.15.3.1.1.85.1:
**************END V1 TRAP******************
3.5.4 SNMP Traps: Moving from Previous Enterprise Manager
Releases to 12c and Greater
Note:
When you upgrade from a pre-Enterprise Manager 12c release to 12c and
greater, SNMP advanced notification methods defined using previous versions
of Enterprise Manager (pre-12c) will continue to function without modification.
For Enterprise Manager 11g and earlier, there were two types of SNMP traps:
•Alerts
•Job Status
Beginning with Enterprise Manager 12c there is now a single, comprehensive SNMP
trap type that covers all available event types such as metric alerts, target availability,
compliance standard violations, or job status changes. For more information about
pre-12c to 12c SNMP trap mappings, see SNMP Trap Mappings . Traps will conform
to the older Enterprise Manager MIB definition. Hence, pre-Enterprise Manager 12c
traps will continue to be sent. See SNMP Trap Mappings for more information.
Also, for Enterprise Manager 12c, size of SNMP trap has increased in order to
accommodate all event types and provide more comprehensive information. By
default, the maximum SNMP packet size is 5120 bytes. If the third party system has a
limit in the size of SNMP trap it can receive, you can change the default size of SNMP
trap that Enterprise Manager sends. To change the default packet size, set this
emoms
oracle.sysman.core.notification.snmp_packet_length
parameter, and then
bounce the OMS.
Chapter 3
Sending SNMP Traps to Third Party Systems
3-44

Note:
When limiting the SNMP trap packet size, Oracle recommends not setting the
oracle.sysman.core.notification.snmp_packet_length parameter any lower
than 3072 bytes (3K).
The Enterprise Manager 12c MIB includes all pre-Enterprise Manager 12c MIB
definitions. Hence, if you have an Enterprise Manager 12c MIB in your third party
system, you can receive SNMP traps from both pre-Enterprise Manager 12c as well as
Enterprise Manager 12c sites. For detailed information on version mapping, see
SNMP Trap Mappings .
3.6 Management Information Base (MIB)
Enterprise Manager Cloud Control can send SNMP Traps to third-party, SNMP-
enabled applications. Details of the trap contents can be obtained from the
management information base (MIB) variables. The following sections discuss
Enterprise Manager MIB variables in detail.
3.6.1 About MIBs
A MIB is a text file, written in ASN.1 notation, which describes the variables containing
the information that SNMP can access. The variables described in a MIB, which are
also called MIB objects, are the items that can be monitored using SNMP. There is
one MIB for each element being monitored. Each monolithic or subagent consults its
respective MIB in order to learn the variables it can retrieve and their characteristics.
The encapsulation of this information in the MIB is what enables master agents to
register new subagents dynamically — everything the master agent needs to know
about the subagent is contained in its MIB. The management framework and
management applications also consult these MIBs for the same purpose. MIBs can be
either standard (also called public) or proprietary (also called private or vendor).
The actual values of the variables are not part of the MIB, but are retrieved through a
platform-dependent process called "instrumentation". The concept of the MIB is very
important because all SNMP communications refer to one or more MIB objects. What
is transmitted to the framework is, essentially, MIB variables and their current values.
3.6.2 MIB Definition
You can find the SNMP MIB file at the following location:
OMS_HOME/network/doc/omstrap.v1
Note:
The omstrap.v1 file is compatible with both SNMP V1 and SNMP V3.
The file omstrap.v1 is the OMS MIB.
Chapter 3
Management Information Base (MIB)
3-45

For more information, see Interpreting Variables of the Enterprise Manager MIB.
A hardcopy version of omstrap.v1 can be found in Enterprise Manager MIB Definition.
The length of the SNMP OID value is limited to 2560 bytes by default. Configure
emoms property oracle.sysman.core.notification.snmp.max_oid_length to change the
default limit.
For Enterprise Manager 12c, SNMP traps are delivered for event notifications only.
SNMP trap notifications are not supported for incidents or problems.
Note:
SNMP advanced notification methods defined using previous versions of
Enterprise Manager (pre-12c) will continue to function without modification.
Traps will conform to the older Enterprise Manager MIB definition.
3.6.3 Reading the MIB Variable Descriptions
This section covers the format used to describe MIB variables. Note that the STATUS
element of SNMP MIB definition, Version 1, is not included in these MIB variable
descriptions. Since Oracle has implemented all MIB variables as CURRENT, this
value does not vary.
3.6.3.1 Variable Name
Syntax
Maps to the SYNTAX element of SNMP MIB definition, Version 1.
Max-Access
Maps to the MAX-ACCESS element of SNMP MIB definition, Version 1.
Status
Maps to the STATUS element of SNMP MIB definition, Version 1.
Explanation
Describes the function, use and precise derivation of the variable. (For example, a
variable might be derived from a particular configuration file parameter or
performance table field.) When appropriate, incorporates the DESCRIPTION part of
the MIB definition, Version 1.
Typical Range
Describes the typical, rather than theoretical, range of the variable. For example,
while integer values for many MIB variables can theoretically range up to
4294967295, a typical range in an actual installation will vary to a lesser extent. On
the other hand, some variable values for a large database can actually exceed this
"theoretical" limit (a "wraparound"). Specifying that a variable value typically ranges
from 0 to 1,000 or 1,000 to 3 billion will help the third-party developer to develop the
most useful graphical display for the variable.
Chapter 3
Management Information Base (MIB)
3-46

Significance
Describes the significance of the variable when monitoring a typical installation.
Alternative ratings are Very Important, Important, Less Important, or Not Normally
Used. Clearly, the DBA will want to monitor some variables more closely than others.
However, which variables fall into this category can vary from installation to
installation, depending on the application, the size of the database, and on the DBA's
objectives. Nevertheless, assessing a variable's significance relative to the other
variables in the MIB can help third-party developers focus their efforts on those
variables of most interest to the most DBAs.
Related Variables
Lists other variables in this MIB, or other MIBs implemented by Oracle, that relate in
some way to this variable. For example, the value of this variable might derive from
that of another MIB variable. Or perhaps the value of this variable varies inversely to
that of another variable. Knowing this information, third-party developers can develop
useful graphic displays of related MIB variables.
Suggested Presentation
Suggests how this variable can be presented most usefully to the DBA using the
management application: as a simple value, as a gauge, or as an alarm, for example.
3.7 Passing Corrective Action Status Change Information
Passing corrective action status change attributes (such as new status, job name, job
type, or rule owner) to PL/SQL procedures or OS commands/scripts allows you to
customize automated responses to status changes. For example, you many want to
call an OS script to open a trouble ticket for an in-house support trouble ticket system
if a critical corrective action fails to run. In this case, you will want to pass status (for
example, Problems or Aborted) to the script to open a trouble ticket and escalate the
problem.
3.7.1 Passing Corrective Action Execution Status to an OS Command
or Script
The notification system passes information to an OS script or executable via system
environment variables. Conventions used to access environmental variables vary
depending on the operating system:
•UNIX: $ENV_VARIABLE
•MS Windows: %ENV_VARIABLE%
The notification system sets the following environment variables before calling the
script. The notification system will set the environment variable $NOTIF_TYPE =
NOTIF_CA for Corrective Action Execution. The script can then use any or all of these
variables within the logic of the script.
Following table lists the environment variables for corrective action, they are populated
when a corrective action is completed for an event.
Table 3-13 Corrective Action Environment Variables
Environment Variable Description
CA_JOB_STATUS Corrective action job execution status.
Chapter 3
Passing Corrective Action Status Change Information
3-47

Table 3-13 (Cont.) Corrective Action Environment Variables
Environment Variable Description
CA_JOB_NAME Name of the corrective action.
CA_JOB_OWNER Owner of corrective action.
CA_JOB_STEP_OUTPUT The value will be the text output from the corrective action
execution.
CA_JOB_TYPE Corrective action job type
3.7.2 Passing Corrective Action Execution Status to a PLSQL
Procedure
The notification system passes corrective action status change information to PL/SQL
procedure -
PROCEDURE p(event_msg IN gc$notif_event_msg)
. The instance
gc$notif_corrective_action_job object is defined in event_msg.event_payload.
corrective_action if event_msg. msg_info. notification_type is equal to
GC$NOTIFICATIONNOTIF_CA. When a corrective action executes, the notification
system calls the PL/SQL procedure associated with the incident rule and passes the
populated object to the procedure. The procedure is then able to access the fields of
the object that has been passed to it. See Table 3-44 for details.
The following status codes are possible values for the job_status field of the
MGMT_NOTIFY_CORRECTIVE_ACTION object.
Table 3-14 Corrective Action Status Codes
Name Datatype Value
SCHEDULED_STATUS NUMBER(2) 1
EXECUTING_STATUS NUMBER(2) 2
ABORTED_STATUS NUMBER(2) 3
FAILED_STATUS NUMBER(2) 4
COMPLETED_STATUS NUMBER(2) 5
SUSPENDED_STATUS NUMBER(2) 6
AGENTDOWN_STATUS NUMBER(2) 7
STOPPED_STATUS NUMBER(2) 8
SUSPENDED_LOCK_STATUS NUMBER(2) 9
SUSPENDED_EVENT_STATUS NUMBER(2) 10
SUSPENDED_BLACKOUT_STATUS NUMBER(2) 11
STOP_PENDING_STATUS NUMBER(2) 12
SUSPEND_PENDING_STATUS NUMBER(2) 13
INACTIVE_STATUS NUMBER(2) 14
QUEUED_STATUS NUMBER(2) 15
FAILED_RETRIED_STATUS NUMBER(2) 16
WAITING_STATUS NUMBER(2) 17
Chapter 3
Passing Corrective Action Status Change Information
3-48

Table 3-14 (Cont.) Corrective Action Status Codes
Name Datatype Value
SKIPPED_STATUS NUMBER(2) 18
REASSIGNED_STATUS NUMBER(2) 20
3.8 Passing Job Execution Status Information
Passing job status change attributes (such as new status, job name, job type, or rule
owner) to PL/SQL procedures or OS commands/scripts allows you to customize
automated responses to status changes. For example, you many want to call an OS
script to open a trouble ticket for an in-house support trouble ticket system if a critical
job fails to run. In this case you will want to pass status (for example, Problems or
Aborted) to the script to open a trouble ticket and escalate the problem. The job
execution status information is one of event type - job_status_change event, and its
content is in OS command and PL/SQL payload as described in Sending Notifications
Using OS Commands and Scripts and Sending Notifications Using PL/SQL
Procedures.
3.8.1 Passing Job Execution Status to a PL/SQL Procedure
The notification system passes job status change information to a PL/SQL procedure
via the event_msg.event_payload object where event_type is equal to
job_status_change. An instance of this object is created for every status change.
When a job changes status, the notification system calls the PL/SQL
p(event_msg IN
gc$notif_event_msg)
procedure associated with the incident rule and passes the
populated object to the procedure. The procedure is then able to access the fields of
the event_msg.event_payload object that has been passed to it.
Table 3-15 lists all corrective action status change attributes that can be passed:
Table 3-15 Job Status Attributes
Attribute Datatype Additional Information
event_msg.event_paylo
ad.source.source_name
VARCHAR2(128) The job name.
event_msg.event_paylo
ad.source.source_owner
VARCHAR2(256) The owner of the job.
event_msg.event_paylo
ad.source.source_sub_t
ype
VARCHAR2(32) The type of the job.
event_msg.event_paylo
ad. event_attrs(i).value
where
event_attrs(i).name='
execution_status'
NUMBER The new status of the job.
Chapter 3
Passing Job Execution Status Information
3-49

Table 3-15 (Cont.) Job Status Attributes
Attribute Datatype Additional Information
event_msg.event_paylo
ad. event_attrs(i).value
where
event_attrs(i).name='sta
te_change_guid'
RAW(16) The GUID of the state change record.
event_msg.event_paylo
ad.source.source_guid
RAW(16) The unique id of the job.
event_msg
target.event_payload.
event_attrs(i).value
where
event_attrs(i).name='
execution_id'
RAW(16) The unique id of the execution.
event_msg.event_paylo
ad.target
gc$notif_target Target Information object..
event_msg.msg_info.rul
e_owner
VARCHAR2(64) The name of the notification rule that cause
the notification to be sent.
event_msg.msg_info.rul
e_name
VARCHAR2(132) The owner of the notification rule that cause
the notification to be sent.
event_msg.event_paylo
ad. reported_date
DATE The time and date when the status change
happened.
When a job status change occurs for the job, the notification system creates an
instance of the event_msg.event_payload. event_attrs(i).value where
event_attrs(i).name=' execution_status' object and populates it with values from the
status change. The following status codes have been defined as constants in the
MGMT_JOBS package and can be used to determine the type of status in the
job_status field of the event_msg.event_payload. event_attrs(i).value where
event_attrs(i).name=' execution_status' object.
Table 3-16 Job Status Codes
Name Datatype Value
SCHEDULED_STATUS NUMBER(2) 1
EXECUTING_STATUS NUMBER(2) 2
ABORTED_STATUS NUMBER(2) 3
FAILED_STATUS NUMBER(2) 4
COMPLETED_STATUS NUMBER(2) 5
SUSPENDED_STATUS NUMBER(2) 6
AGENTDOWN_STATUS NUMBER(2) 7
STOPPED_STATUS NUMBER(2) 8
SUSPENDED_LOCK_STATUS NUMBER(2) 9
SUSPENDED_EVENT_STATUS NUMBER(2) 10
SUSPENDED_BLACKOUT_STATUS NUMBER(2) 11
STOP_PENDING_STATUS NUMBER(2) 12
Chapter 3
Passing Job Execution Status Information
3-50

Table 3-16 (Cont.) Job Status Codes
Name Datatype Value
SUSPEND_PENDING_STATUS NUMBER(2) 13
INACTIVE_STATUS NUMBER(2) 14
QUEUED_STATUS NUMBER(2) 15
FAILED_RETRIED_STATUS NUMBER(2) 16
WAITING_STATUS NUMBER(2) 17
SKIPPED_STATUS NUMBER(2) 18
REASSIGNED_STATUS NUMBER(2) 20
Example 3-16 PL/SQL Procedure Using a Status Code (Job)
CREATE TABLE job_log (jobid RAW(16), status_code NUMBER(2), occured DATE);
CREATE OR REPLACE PROCEDURE LOG_JOB_STATUS_CHANGE(event_msg IN GC$NOTIF_EVENT_MSG)
IS
l_attrs gc$notif_event_attr_array;
exec_status_code NUMBER(2) := NULL;
occured_date DATE := NULL;
job_guid RAW(16) := NULL;
BEGIN
IF event_msg.event_payload.event_type = 'job_status_change'
THEN
l_attrs := event_msg.event_payload.event_attrs;
IF l_attrs IS NOT NULL
THEN
FOR i IN 1..l_attrs.COUNT
LOOP
IF l_attrs(i).name = 'exec_status_code'
THEN
exec_status_code := TO_NUMBER(l_attrs(i).value);
END IF;
END LOOP;
END IF;
occured_date := event_msg.event_payload.reported_date;
job_guid := event_msg.event_payload.source.source_guid;
-- Log all jobs' status
BEGIN
INSERT INTO job_log (jobid, status_code, occured)
VALUES (job_guid, exec_status_code, occured_date);
EXCEPTION
WHEN OTHERS
THEN
-- If there are any problems then get the notification retried
RAISE_APPLICATION_ERROR(-20000, 'Please retry');
END;
COMMIT;
ELSE
null; -- it is not a job_status_change event, ignore
END IF;
END LOG_JOB_STATUS_CHANGE;
/
Chapter 3
Passing Job Execution Status Information
3-51

3.8.2 Passing Job Execution Status to an OS Command or Script
The notification system passes job execution status information to an OS script or
executable via system environment variables. Conventions used to access
environmental variables vary depending on the operating system:
•UNIX: $ENV_VARIABLE
•MS Windows: %ENV_VARIABLE%
The notification system sets the following environment variables before calling the
script. The script can then use any or all of these variables within the logic of the script.
Table 3-17 Environment Variables
Environment Variable Description
SOURCE_OBJ_NAME The name of the job.
SOURCE_OBJ_OWNE The owner of the job.
SOURCE_OBJ_SUB_TYP
E
The type of job.
EXEC_STATUS_CODE The job status.
EVENT_REPORTED_TIM
E
Time when the severity occurred.
TARGET_NAME The name of the target.
TARGET_TYPE The type of the target.
RULE_NAME Name of the notification rule that resulted in the severity.
RULE_OWNER Name of the Enterprise Manager administrator who owns the
notification rule.
3.9 Passing User-Defined Target Properties to Notification
Methods
Enterprise Manager allows you to define target properties (accessed from the target
home page) that can be used to store environmental or usage context information
specific to that target. Target property values are passed to custom notification
methods where they can be processed using conditional logic or simply passed as
additional alert information to third-party devices, such as ticketing systems. By
default, Enterprise Manager passes all defined target properties to notification
methods.
Note:
Target properties are not passed to notification methods when short email
format is used.
Chapter 3
Passing User-Defined Target Properties to Notification Methods
3-52

Figure 3-3 Host Target Properties
3.10 Notification Reference
This section contains the following reference material:
•EMOMS Properties
•Passing Event, Incident, Problem Information to an OS Command or Script
•Passing Information to a PL/SQL Procedure
•
•Troubleshooting Notifications
3.10.1 EMOMS Properties
EMOMS properties can be used for controlling the size and format of the short email.
The following table lists emoms properties for Notification System.
Table 3-18 emoms Properties for Notifications
Property Name Default
Value
Description
oracle.sysman.core.notification.email
s_per_minute
250 Email delivery limits per minute. The
Notification system uses this value to throttle
number of Email delivery per minutes.
Customer should set the value lower if doesn't
want to over flow the Email server, or set the
value higher if the Email server can handle
high volume of Emails.
oracle.sysman.core.notification.cmds
_per_minute
100 OS Command delivery limits per minute. The
Notification system uses this value to throttle
number of OS Command delivery per minutes.
Chapter 3
Notification Reference
3-53

Table 3-18 (Cont.) emoms Properties for Notifications
Property Name Default
Value
Description
oracle.sysman.core.notification.os_c
md_timeout
30 OS Command delivery timeout in seconds.
This value indicates how long to allow OS
process to execute the OS Command delivery.
Set this value higher if the OS command script
requires longer time to complete execution.
oracle.sysman.core.notification.plsql
_per_minute
250 PL/SQL delivery limits per minute. The
Notification system uses this value to throttle
number of PL/SQL delivery per minutes.
em.notification.java_per_minute 500 JAVA delivery limits per minute. The
Notification system uses this value to throttle
number of Java delivery per minutes.
em.notification.ticket_per_minute 250 Ticket delivery limits per minute. The
Notification system uses this value to throttle
number of Ticket delivery per minutes.
oracle.sysman.core.notification.traps
_per_minute
250 SNMP delivery limits per minute. The
Notification system uses this value to control
the number of SNMP trap per minutes.
oracle.sysman.core.notification.local
e.plsql
OMS
Locale
This property specifies the Locale delivered by
advanced PL/SQL notification. The customer
can define this property to overwrite the
default Locale where the OMS is installed.
Valid Locales:
•en (English)
•de (German)
•es (Spanish)
•fr (French)
•it (Italian)
•ja (Japanese)
•ko (Korean)
•pt_br (Portuguese, Brazilian)
•zh_cn (Chinese, simplified)
•zh_tw (Chinese, traditional)
oracle.sysman.core.notification.local
e.email
OMS
Locale
This property specifies the Locale delivered by
Email. Customer can define this property to
overwrite the default Locale where the OMS is
installed.
Valid Locales:
•en (English)
•de (German)
•es (Spanish)
•fr (French)
•it (Italian)
•ja (Japanese)
•ko (Korean)
•pt_br (Portuguese, Brazilian)
•zh_cn (Chinese, simplified)
•zh_tw (Chinese, traditional)
Chapter 3
Notification Reference
3-54

Table 3-18 (Cont.) emoms Properties for Notifications
Property Name Default
Value
Description
oracle.sysman.core.notification.local
e.oscmd
OMS
Locale
This property specifies the Locale delivered by
OS Command. Customer can define this
property to overwrite the default Locale where
the OMS is installed.
Valid Locales:
•en (English)
•de (German)
•es (Spanish)
•fr (French)
•it (Italian)
•ja (Japanese)
•ko (Korean)
•pt_br (Portuguese, Brazilian)
•zh_cn (Chinese, simplified)
•zh_tw (Chinese, traditional)
oracle.sysman.core.notification.local
e.snmp
OMS
Locale
This property specifies the Locale delivered by
SNMP trap. Customer can define this property
to overwrite the default Locale where the OMS
is installed.
Valid Locales:
•en (English)
•de (German)
•es (Spanish)
•fr (French)
•it (Italian)
•ja (Japanese)
•ko (Korean)
•pt_br (Portuguese, Brazilian)
•zh_cn (Chinese, simplified)
•zh_tw (Chinese, traditional)
oracle.sysman.core.notification.oscm
d.max_env_var_length
512 The maximum length of OS Common
environment variable value.
oracle.sysman.core.notification.snmp
.max_oid_length
2560 The maximum length of SNMP OID value.
oracle.sysman.core.notification.min_
delivery_threads
6 The minimum number of active threads in the
thread pool initially and number of active
threads are running when system is in low
activities. Setting the value higher will use
more system resources, but will deliver more
notifications.
oracle.sysman.core.notification.max_
delivery_threads
24 The maximum number of active threads in the
thread pool when the system is in the high
activities. This value should greater than
em.notification.min_delivery_threads. Setting
the value higher will use more system
resources and deliver more notifications.
Chapter 3
Notification Reference
3-55

Table 3-18 (Cont.) emoms Properties for Notifications
Property Name Default
Value
Description
oracle.sysman.core.notification.short
_format_length
>=1
(155)
The size limit of the total number of characters
in short email format. The customer should
modify this property value to fit their email or
pager limit content size. The email subject is
restricted to a maximum of 80 characters for
short email format notifications.
oracle.sysman.core.notification.snmp
_packet_length
<=1
(5120)
The maximum size of SNMP Protocol Data
unit.
oracle.sysman.core.notification.email
_content_transfer_encoding
8-bit, 7-
bit(QP),
7-
bit(BAS
E64) (8-
bit)
The character set that can encode the Email.
Oracle supports three character sets : 8-bit, 7-
bit(QP), and7-bit(BASE64).
oracle.sysman.core.notification.email
s_per_connection
>=1
(20)
The maximum number of emails delivered to
same email gateway before switching to the
next available email gateway (assumes
customers have configured multiple email
gateways). This property is used for email
gateway load balance.
oracle.sysman.core.notification.short
_format
both,
subject,
body
(both)
Use short format on both subject and body,
subject only, or body only..
oracle.sysman.core.notification.send
_prior_status_after_agent_unreacha
ble_clears
True By default , a notification is sent indicating a
target's status whenever the monitoring Agent
comes out of unreachable status, even if the
target's status has not changed. Use this
emoms property to enable (True)/disable
(False) the duplicate target status notification.
To disable duplicate target status notifications,
set this property to False:
1. emctl set property
oracle.sysman.core.notification.send_prior
_status_after_agent_unreachable_clears -
value false
2. Restart the OMS.
To enable duplicate target status notifications,
set the property to True.
1. emctl set property
oracle.sysman.core.notification.send_prior
_status_after_agent_unreachable_clears -
value true
2. Restart the OMS.
You must establish the maximum size your device can support and whether the
message is sent in subject, body or both.
Chapter 3
Notification Reference
3-56

You can modify the emoms properties by using the Enterprise Manager command line
control
emctl
get/set/delete/list
property command.
Note:
The following commands require an OMS restart in order for the changes to
take place.
Get Property Command
emctl get [-sysman_pwd "sysman password"]-name
oracle.sysman.core.notification.short_format_length
Set Property Command
emctl set property -name oracle.sysman.core.notification.short_format_length -value
155
Emoms Properties Entries for a Short Email Format
emctl set property -name oracle.sysman.core.notification.short_format_length -value
155
emctl set property -name oracle.sysman.core.notification.short_format -value both
3.10.2 Passing Event, Incident, Problem Information to an OS
Command or Script
The notification system passes information to an OS script or executable using system
environment variables.
Conventions used to access environmental variables vary depending on the operating
system:
•UNIX: $ENV_VARIABLE
•Windows:%ENV_VARIABLE%
The notification system sets the following environment variables before calling the
script. The script can then use any or all of these variables within the logic of the script.
3.10.2.1 Environment Variables Common to Event, Incident and Problem
Table 3-19 Generic Environment Variables
Environment Variable Description
NOTIF_TYPE Type of notification and possible values
NOTIF_NORMAL,
NOTIF_RETRY,
NOTIF_DURATION,
NOTIF_REPEAT,
NOTIF_CA,
NOTIF_RCA
Chapter 3
Notification Reference
3-57

Table 3-19 (Cont.) Generic Environment Variables
Environment Variable Description
REPEAT_COUNT How many times the notification has been sent out
before this notification.
RULESET_NAME The name of the ruleset that triggered this notification.
RULE_NAME The name of the rule that triggered this notification.
RULE_OWNER The owner of the ruleset that triggered this notification.
MESSAGE The message of the event, incident, or problem.
MESSAGE_URL EM console URL for this message.
Table 3-20 Category-Related Environment Variables
Environment Variable Description
CATEGORIES_COUNT Number of categories in this notification. This value is equal to1 if
one category is associated with event, incident or problem. It is
equal to 0 if no category associated with event, incident or
problem.
CATEGORY_CODES_CO
UNT
Number of category codes in this notification.
CATEGORY_n Category is translated based on locale defined in OMS server.
Valid values for the suffix "_n" are between
1.. $CATEGORIES_COUNT
CATEGORY_CODE_n Codes for the categories. Valid values for the suffix "_n" are
between 1..$CATEGORY_CODES_COUNT
Table 3-21 lists the common environment variables for User Defined Target
Properties. They will be populated under the following cases: (a) When an event has a
related target, (b) When an incident or a problem have single event source and have a
related target.
Table 3-21 User-Defined Target Property Environment Variables
Environment Variable Description
ORCL_GTP_COMMENT Comment
ORCL_GTP_CONTACT Contact
ORCL_GTP_COST_CENT
ER
Cost Center
ORCL_GTP_DEPARTME
NT
Department
ORCL_GTP_DEPLOYME
NT_TYPE
Deployment type
ORCL_GTP_LINE_OF_BU
S
Line of Business
ORCL_GTP_LOCATION Location
Chapter 3
Notification Reference
3-58

3.10.2.2 Event Notification-Specific Environment Variables
Table 3-22 Event Notification-Specific Environment Variables
Environment Variable Description
EVENT_NAME Event Name.
EVENT_REPORTED_TIM
E
Event reported date.
EVENT_SOURCE_COUN
T
Number of Sources associated with this event.
EVENT_TYPE Event type.
EVENT_OCCURRENCE_
TIME
Event occurrence time.
EVENT_TYPE_ATTRS The list of event type specific attributes.
EVENT_CONTEXT_ATTR
S
Event context data.
LAST_UPDATED_TIME Last updated time
SEQUENCE_ID The unique event sequence identifier. An event sequence may
consist of one or more events. All events in this sequence have
the same event sequence ID.
SEVERITY Severity of event, it is translated.
SEVERITY_CODE Code for event severity. Possible values are the following.
FATAL, CRITICAL, WARNING, MINOR_WARNING,
INFORMATIONAL, and CLEAR
ACTION_MSG Message describing the action to take for resolving the event.
TOTAL_OCCURRENCE_
COUNT
Total number of duplicate occurrences
RCA_DETAILS If RCA is associated with this events.
CURRENT_OCCURRENC
E_COUNT
Total number of occurrences of the event in the current collection
period. This attribute only applies to de-duplicated events.
CURRENT_FIRST_OCCU
R_DATE
Time stamp when the event first occurred in the current collection
period. This attribute only applies to de-duplicated events.
CURRENT_LAST_OCCU
R_DATE_DESC
Time stamp when the e vent last occurred in the current collection
period. This attribute only applies to de-duplicated events.
Table 3-23 lists the environment variables for the incident associated with an event.
They are populated when the event is associated with an incident.
Table 3-23 Associated Incident Environment Variables
Environment Variable Description
ASSOC_INCIDENT_ACKN
OWLEDGED_BY_OWNER
Set to yes, if associated incident was acknowledged by owner
ASSOC_INCIDENT_ACKN
OWLEDGED_DETAILS
The details of associated incident acknowledgement. For
example:No - if not acknowledged Yes By userName - if
acknowledged
Chapter 3
Notification Reference
3-59

Table 3-23 (Cont.) Associated Incident Environment Variables
Environment Variable Description
ASSOC_INCIDENT_STAT
US
Associated Incident Status
ASSOC_INCIDENT_ID Associated Incident ID
ASSOC_INCIDENT_PRIO
RITY
Associated Incident priority. Supported value are Urgent, Very
High, High, Medium,Low, None.
ASSOC_INCIDENT_OWN
ER
Associated Incident Owner if it is existed.
ASSOC_INCIDENT_ESCA
LATION_LEVEL
Escalation level of the associated incident has a value between 0
to 5.
Table 3-24 lists the common environment variables related to the Source Object. They
are populated when $SOURCE_OBJ_TYPE is not TARGET.
Table 3-24 Source Object-Related Environment Variables
Environment Variable Description
SOURCE_OBJ_TYPE Type of the Source object. For example, JOB, TEMPLATE.
SOURCE_OBJ_NAME Source Object Name.
SOURCE_OBJ_NAME_U
RL
Source's event console URL.
SOURCE_OBJ_SUB_TYP
E
Sub-type of the Source object. For example, it provides the
underlying job type for job status change events.
SOURCE_OBJ_OWNER Owner of the Source object.
Table 3-25 lists the common environment variables for the target, associated with the
given issue. They are populated when the issue is related to a target.
Table 3-25 Target-Related Environment Variables
Environment Variable Description
TARGET_NAME Name of Target
TARGET_TYPE Type of Target
TARGET_OWNER Owner of Target
HOST_NAME The name of the host on which the target is deployed upon.
TARGET_URL Target's Enterprise Manager Console URL.
TARGET_LIFECYCLE_ST
ATUS
Life Cycle Status of the target.
Possible values: Production, Mission Critical, Stage, Test, and
Development.
It is null if not defined.
TARGET_VERSION Target Version of the target
Chapter 3
Notification Reference
3-60

3.10.2.3 Environment Variables Specific to Event Types
Events are classified into multiple types. For example, the mertc_alert event type is
used for modeling metric alerts. You can use SQL queries to list the event types in
your deployment as well as their event-specific payload. The following SQL example
can be used to list all internal event type names that are registered in Enterprise
Manager.
Select event_class as event_type, upper(name) as env_var_name
from em_event_class_attrs
where notif_order != 0
and event_class is not null
union
select event_class as event_type, upper(name) || '_NLS' as env_var_name
from em_event_class_attrs
where notif_order != 0
and event_class is not null
and is_translated = 1
order by event_type, env_var_name;
The environment variable payload specific to each event type can be accessed via the
OS scripts. The following tables list notification attributes for the most critical event
types.
Table 3-26 Environment Variables Specific to Metric Alert Event Type
Environment Variable Description
COLL_NAME The name of the collection collecting the metric.
COLL_NAME_NLS The translated name of the collection collecting the metric
KEY_COLUMN_X Internal name of Key Column X where X is a number between 1
and 7.
KEY_COLUMN_X_NLS Translated name of Key Column X where X is a number between
1 and 7.
KEY_COLUMN_X_VALUE Value of Key Column X where X is a number between 1 and 7.
KEY_VALUE Monitored object for the metric corresponding to the Metric Alert
event.
METRIC_COLUMN The name of the metric column
METRIC_COLUMN_NLS The translated name of the metric column.
METRIC_DESCRIPTION Brief description of the metric.
METRIC_DESCRIPTION_
NLS
Translated brief description of the metric.
METRIC_GROUP The name of the metric.
METRIC_GROUP_NLS The translated name of the metric
NUM_KEYS The number of key metric columns in the metric.
SEVERITY_GUID The GUID of the severity record associated with this metric alert.
CYCLE_GUID A unique identifier for a metric alert cycle, which starts from the
time the metric alert is initially generated until the time it is clear.
VALUE Value of the metric when the event triggered.
Chapter 3
Notification Reference
3-61

Table 3-27 Environment variables specific to Target Availability Event Type
Environment Variable Description
AVAIL_SEVERITY The transition severity that resulted in the status of the target to
change to the current availability status.
Possible Values for AVAIL_SEVERITY
•15 (Target Up)
•25 (Target Down)
•115 (Agent Unreachable, Cleared)
•125 (Agent Unreachable)
•215 (Blackout Ended)
•225 (Blackout Started)
•315 (Collection Error Cleared)
•325 (Collection Error)
•425 (No Beacons Available)
•515 (Status Unknown)
AVAIL_SUB_STATE The substatus of a target for the current status.
CYCLE_GUID A unique identifier for a metric alert cycle, which starts from the
time the metric alert is initially generated until the time it is clear.
METRIC_GUID Metric GUID of response metric.
SEVERITY_GUID The GUID of the severity record associated with this availability
status.
TARGET_STATUS The current availability status of the target.
TARGET_STATUS_NLS The translated current availability status of the target.
Table 3-28 Environment variables specific to Job Status Change event type
Environment Variable Description
EXECUTION_ID Unique ID of the job execution..
EXECUTION_LOG The job output of the last step executed.
EXECUTION_STATUS The internal status of the job execution.
EXECUTION_STATUS_N
LS
The translated status of the job execution.
EXEC_STATUS_CODE Execution status code of job execution. For possible values, see
Table 3-16.
STATE_CHANGE_GUID Unique ID of last status change
You can use SQL queries to list the deployed event types in your deployment and the
payload specific to each one of them. The following SQL can be used to list all internal
event type names which are registered in the Enterprise Manager.
select class_name as event_type_name from em_event_class;
Following SQL lists environment variables specific to metric_alert event type.
select env_var_name
from
( Select event_class as event_type, upper(name) as env_var_name
from em_event_class_attrs
Chapter 3
Notification Reference
3-62

where notif_order != 0
and event_class is not null
union
select event_class as event_type, upper(name) || '_NLS' as env_var_name
from em_event_class_attrs
where notif_order != 0
and event_class is not null
and is_translated = 1)
where event_type = 'metric_alert';
You can also obtain the description of notification attributes specific to an event type
directly from the Enterprise Manager console:
1. From the Setup menu, select Notifications, then select Customize Email
Formats.
2. Select the event type.
3. Click Customize.
4. Click Show Predefined Attributes.
Environment variables, ending with the suffix _NLS, provide the translated value for
given attribute. For example, METRIC_COLUMN_NLS environment variable will
provide the translated value for the metric column attribute. Translated values will be in
the locale of the OMS.
3.10.2.4 Environment Variables Specific to Incident Notifications
Table 3-29 Incident-Specific Environment Variables
Environment Variable Description
SEVERITY Incident Severity, it is translated. Possible Values: Fatal, Critical,
Warning, Informational, Clear
SEVERITY_CODE Code for Severity.
Possible values are the
FATAL, CRITICAL, WARNING, MINOR_WARNING,
INFORMATIONAL, and CLEAR
INCIDENT_REPORTED_T
IME
Incident reported time
INCIDENT_ACKNOWLED
GED_BY_OWNER
Set yes, if incident is acknowledged by owner.
INCIDENT_ID Incident ID
INCIDENT_OWNER Incident Owner
ASSOC_EVENT_COUNT The number events associated with this incident.
INCIDENT_STATUS Incident status. There are two internal fixed resolution status.
NEW
CLOSED
Users can define additional statuses.
ESCALATED Is Incident escalated
ESCALATED_LEVEL The escalated level of incident.
PRIORITY Incident priority. It is the translated priority name. Possible Values:
Urgent, Very High, High, Medium, Low, None
Chapter 3
Notification Reference
3-63

Table 3-29 (Cont.) Incident-Specific Environment Variables
Environment Variable Description
PRIOTITY_CODE Incident priority code
It is the internal value defined in EM.
PRIORITY_URGENT
PRIORITY_VERY_HIGH
PRIORITY_HIGH
PRIORITY_MEDIUM
PRIORITY_LOW
PRIORITY_NONE
TICKET_STATUS Status of external ticket, if it exists.
TICKET_ID ID of external ticket, if it exists.
LAST_UPDATED_TIME Incident last update time.
ADR_INCIDENT_ID Automatic Diagnostic Reposito ry (ADR) Incident ID: A unique
numeric identifier for the ADR Incident. An ADR I ncident is an
occurrence of a Problem.
ADR_IMPACT Impact of the Automatic Diagnostic Repository (ADR) Incident.
ADR_ECID Execution Context ID (ECID) associated with the associated
Automatic Diagnostic Repository (ADR) incident. An ECID i s a
globally unique identifier used to tag and track a single call
through the Oracle software stack. It is used to correlate problems
that could occur across multiple tiers of the stack.
ASSOC_PROBLEM_KEY Problem key associated with the Automatic Diagnostic Repository
(ADR) incident. Problems are critical error s in an Oracle product.
The Problem key is a text string that describes the prob lem. It
includes an error code and in some cases, other error-specific
values.
Table 3-30 lists the associated problem's environment variables, when the incident is
associated with a problem.
Table 3-30 Associated Problem Environment Variables for Incidents
Environment Variable Description
ASSOC_PROBLEM_ACK
NOWLEDGED_BY_OWNE
R
Set to yes, if this problem was acknowledged by owner
ASSOC_PROBLEM_STAT
US
Associated Problem Status
ASSOC_PROBLEM_ID Associated Problem ID
ASSOC_PROBLEM_PRIO
RITY
Associated Problem priority
ASSOC_PROBLEM_OWN
ER
Associated Problem Owner if it is existed.
ASSOC_PROBLEM_ESC
ALATION_LEVEL
Escalation level of the associated Problem has a value between 0
to 5.
Chapter 3
Notification Reference
3-64

3.10.2.5 Environment Variables Specific to Problem Notifications
Table 3-31 Problem-Specific Environment Variables
Environment Variable Description
SEVERITY Problem Severity, it is translated.
SEVERITY_CODE Code for Severity.
Possible values are :
FATAL, CRITICAL, WARNING, MINOR_WARNING,
INFORMATIONAL, and CLEAR
PROBLEM_REPORTED_
TIME
Problem reported time.
PROBLEM_ACKNOWLED
GED_BY_OWNER
Set yes, if problem is acknowledged by owner.
PROBLEM_ID Problem ID
PROBLEM_KEY Problem Key
PROBLEM_OWNER Problem Owner
ASSOC_INCIDENT_COU
NT
The number incident associated with this problem..
PROBLEM_STATUS Incident status. They are
STATUS_NEW
STATUS_CLOSED
Any other user defined status.
ESCALATED Is Incident escalated. Yes if it is escalated, otherwise No.
ESCALATED_LEVEL The escalated level of incident.
PRIORITY Incident priority. It is the translated priority name..
PRIOTITY_CODE Incident priority code
It is the internal value defined in Enterprise Manager.
PRIORITY_URGENT
PRIORITY_VERY_HIGH
PRIORITY_HIGH
PRIORITY_MEDIUM
PRIORITY_LOW
PRIORITY_NONE
LAST_UPDATED_TIME Last updated time
SR_ID Oracle Service Request Id, if it exists.
BUG_ID Oracle Bug ID, if an associated bug exists.
3.10.2.6 Environment Variables Common to Incident and Problem Notifications
An incident or problem may be associated with multiple event sources. An event
source can be a Target, a Source Object, or both.
Chapter 3
Notification Reference
3-65

3.10.2.6.1 Environment Variables Related to Event Sources
The number of event sources is set by the EVENT_SOURCE_COUNT environment
variable. Using the EVENT_SOURCE_COUNT information, a script can be written to
loop through the relevant environment variables to fetch the information about multiple
event sources. Environment variables for all event sources are prefixed with
EVENT_SOURCE_. Environment variables for source objects are suffixed with
SOURCE_<attribute_name> . For example, EVENT_SOURCE_1_SOURCE_TYPE
provides the source object type of first event source. Environment variables for a
target are suffixed with TARGET_<attribute_name>. For example,
EVENT_SOURCE_1_TARGET_NAME provides the target name of first event source.
The following table lists the environment variables for source object of x-th Event
Source.
Table 3-32 Source Object of the x-th Event Source
Environment Variable Description
EVENT_SOURCE_x_SOU
RCE_GUID
Source Object GUID.
EVENT_SOURCE_x_SOU
RCE_TYPE
Source Object Type
EVENT_SOURCE_x_SOU
RCE_NAME
Source Object Name.
EVENT_SOURCE_x_SOU
RCE_OWNER
Source Object Owner.
EVENT_SOURCE_x_SOU
RCE_SUB_TYPE
Source Object Sub-Type.
EVENT_SOURCE_x_SOU
RCE_URL
Source Object URL to EM console.
Table 3-33 lists the environment variables for a target of xth Event Source.
Table 3-33 Target of x-th Event Source
Environment Variable Description
EVENT_SOURCE_x_TAR
GET_GUID
Target GUID
EVENT_SOURCE_x_TAR
GET_NAME
Target name
EVENT_SOURCE_x_TAR
GET_OWNER
Target Owner
EVENT_SOURCE_x_TAR
GET_VERSION
Target version
EVENT_SOURCE_x_TAR
GET_LIFE_CYCLE_STAT
US
Target life cycle status
EVENT_SOURCE_x_TAR
GET_TYPE
Target Type
Chapter 3
Notification Reference
3-66

Table 3-33 (Cont.) Target of x-th Event Source
Environment Variable Description
EVENT_SOURCE_x_HOS
T_NAME
Target Host Name
EVENT_SOURCE_x_TAR
GET_URL
Target URL to EM Console.
3.10.3 Passing Information to a PL/SQL Procedure
Passing event, incident, and problem information (payload) to PL/SQL procedures
allows you to customize automated responses to these conditions. All three types of
notification payloads have a common element:
gc$notif_msg_info
. It provides generic
information that applies to all types of notifications. In addition, each of the three
payloads have one specific element that provides the payload specific to the given
issue type.
gc$notif_event_msg (payload for event notifications)
gc$notif_event_msg contains two objects - event payload object and message
information object.
Table 3-34 Event Notification Payload
Attribute Datatype Additional Information
EVENT_PAYLOAD gc$notif_event_paylo
ad
Event notification payload. See
gc$notif_event_payload type definition for
detail.
MSG_INFO gc$notif_msg_info Notification message. See gc$notif_msg_info
definition for detail.
gc$notif_incident_msg (payload for incident notifications)
gc$notif_incident_msg type contains two objects - incident payload and message
information. This object represents the delivery payload for Incident notification
message, contains all data associated with Incident notification, and can be accessed
by user's custom PL/SQL procedures.
Table 3-35 Incident Notification Payload
Attribute Datatype Additional Information
INCIDENT_PAYLOAD gc$notif_incident_pay
load
Incident notification payload. See
gc$notif_incident_payload type definition for
detail.
MSG_INFO gc$notif_msg_info Envelope level notification information. See
gc$notif_msg_info type definition for detail.
gc$notif_problem_msg (payload for problem notifications)
Chapter 3
Notification Reference
3-67

This object represents the delivery payload for Problem notification message, contains
all data associated with problem notification, and can be accessed by a user's custom
PL/SQL procedures.
Table 3-36 Problem Notification Payload
Attribute Datatype Additional Information
PROBLEM_PAYLOAD gc$notif_problem_pa
yload
Problem notification payload. See
gc$notif_problem_payload type definition for
detail.
MSG_INFO gc$notif_msg_info Notification message. See gc$notif_msg_info
type definition for detail.
gc$notif_msg_info (common for event/incident/problem payloads)
This object contains the generic notification information including notification_type, rule
set and rule name, etc. for Event, Incident or Problem delivery payload.
Table 3-37 Event, Incident, Problem Common Payload
Attribute Datatype Description
NOTIFICATION_TYPE VARCHAR2(32) Type of notification, can be one of the
following values.
GC$NOTIFICATION.NOTIF_NORMAL
GC$NOTIFICATION.NOTIF_RETRY
GC$NOTIFICATION.NOTIF_REPEAT
GC$NOTIFICATION.NOTIF_DURATION
GC$NOTIFICATION.NOTIF_CA
GC$NOTIFICATION.NOTIF_RCA
REPEAT_COUNT NUMBER Repeat notification count
RULESET_NAME VARCHAR2(256) Name of the rule set that triggered the
notification
RULE_NAME VARCHAR2(256) Name of the rule that triggered the
notification
RULE_OWNER VARCAH2(256) EM User who owns the rule set
MESSAGE VARCHAR2(4000) Message about event/incident/problem.
MESSAGE_URL VARCHAR2(4000) Link to the Enterprise Manager console
page that provides the details of the event/
incident/problem.
gc$notif_event_payload (payload specific to event notifications)
This object represents the payload specific to event notifications.
Table 3-38 Common Payloads for Events, Incidents, and Problems
Attribute Datatype Additional Information
EVENT_INSTANCE_G
UID
RAW(16) Event instance global unique identifier.
Chapter 3
Notification Reference
3-68

Table 3-38 (Cont.) Common Payloads for Events, Incidents, and Problems
Attribute Datatype Additional Information
EVENT_SEQUENCE_G
UID
RAW(16) Event sequence global unique identifier.
TARGET gc$notif_target Related Target Information object. See
gc$notif_target type definition for detail.
SOURCE gc$notif_source Related Source Information object, that is not
a target. See gc$notif_source type definition
for detail.
EVENT_ATTRS gc$notif_event_attr_a
rray
The list of event specified attributes. See
gc$notif_event_attr type definition for detail.
CORRECTIVE_ACTION gc$notif_corrective_a
ction_job
Corrective action information, optionally
populated when corrective action job
execution has completed.
EVENT_TYPE VARCHAR2(20) Event type - example: Metric Alert.
EVENT_NAME VARCHAR2(512) Event name.
EVENT_MSG VARCHAR2(4000) Event message.
REPORTED_DATE DATE Event reported date.
OCCURRENCE_DATE DATE Event occurrence date.
SEVERITY VARCHAR2(128) Event Severity. It is the translated severity
name.
SEVERITY_CODE VARCHAR2(32) Event Severity code. It is the internal severity
name used in Enterprise Manager.
ASSOC_INCIDENT gc$notif_issue_summ
ary
Summary of associated incident. It is
populated if the event is associated with an
incident. See gc$notif_issue_summary type
definition for detail
ACTION_MSG VARCHAR2(4000) Message describing the action to take for
resolving the event.
RCA_DETAIL VARCHAR2(4000) Root cause analysis detail. The size of RCA
details output is limited to 4000 characters
long.
EVENT_CONTEXT_DA
TA
gc$notif_event_conte
xt_array
Event context data. See
gc$notif_event_context type definition for
detail.
CATEGORIES gc$category_string_a
rray
List of categories that the event belongs to.
Category is translated based on locale
defined in OMS server. Notification system
sends up to 10 categories.
CATEGORY_CODES gc$category_string_a
rray
Codes for the categories. The size of array is
up to 10.
gc$notif_incident_payload (payload specific to incident notifications)
Contains the incident specific attributes, associated problem and ticket information.
Chapter 3
Notification Reference
3-69

Table 3-39 Incident Notification Payloads
Attribute Datatype Additional Information
INCIDENT_ATTRS gc$notif_issue_attrs Incident specific attributes. See
gc$notif_issue_attrs type definition for detail.
ASSOC_EVENT_COUN
T
NUMBER The total number of events associated with
this incident.
TICKET_STATUS VARCHAR2(64) The status of external Ticket, if it exists.
TICKET_ID VARCHAR2(128) The ID of external Ticket, if it exists.
TICKET_URL VARCHAR2(4000) The URL for external Ticket, if it exists.
ASSOC_PROBLEM gc$notif_issue_summ
ary
Summary of the problem, if it has an
associated problem. See
gc$notif_issue_summary type definition for
detail.
gc$notif_problem_payload (payload specific to problems)
Contains problem specific attributes, key, Service Request(SR) and Bug information.
Table 3-40 Problem Payload
Attribute Datatype Additional Information
PROBLEM_ATTRS gc$notif_issue_attrs Problem specific attributes. See
gc$notif_issue_attrs type definition for detail.
PROBLEM_KEY VARCHAR2(850) Problem key if it is generated.
ASSOC_INCIDENT_CO
UNT
NUMBER Number of incidents associated with this
problem.
SR_ID VARCHAR2(64) Oracle Service Request Id, if it exists.
SR_URL VARCHAR2(4000) URL for Oracle Service Request, if it exists.
BUG_ID VARCHAR2(64) Oracle Bug ID, if an associated bug exists.
gc$notif_issue_attrs (payload common to incidents and problems)
Provides common details for incident and problem. It contains details such as id,
severity, priority, status, categories, acknowledged by owner, and source information
with which it is associated.
Table 3-41 Payload Common to Incidents and Problems
Attribute Datatype Additional Information
ID NUMBER(16) ID of the incident or problem.
SEVERITY VARCHAR2(128) Issue Severity. It is the translated.
Chapter 3
Notification Reference
3-70

Table 3-41 (Cont.) Payload Common to Incidents and Problems
Attribute Datatype Additional Information
SEVERITY_CODE VARCHAR2(32) Issue Severity Code.The possible values are
defined in descending order of severity:
GC$EVENT.FATAL
GC$EVENT.CRITICAL
GC$EVENT.WARNING
GC$EVENT.MINOR_WARNING
GC$EVENT.INFORMATIONAL
GC$EVENT.CLEAR
PRIORITY VARCHAR2(128) Issue Priority. It is the translated priority
name.
PRIORITY_CODE VARCHAR2(32) Issue Priority. It is the internal value defined
in EM. The possible values are defined in
descending order of priority:
GC$EVENT.PRIORITY_URGENT
GC$EVENT.PRIORITY_VERY_HIGH
GC$EVENT.PRIORITY_HIGH
GC$EVENT.PRIORITY_MEDIUM
GC$EVENT.PRIORITY_LOW
GC$EVENT.PRIORITY_NONE
STATUS VARCHAR2(32) Status of Issue. The possible values are
GC$EVENT.STATUS_NEW
GC$EVENT.STATUS_CLOSED
Any other user defined status.
ESCALATION_LEVEL NUMBER(1) Escalation level of the issue, has a value
between 0 to 5.
OWNER VARCHAR(256) Issue Owner. Set to NULL if no owner exists.
ACKNOWLEDGED_BY
_OWNER
NUMBER(1) Set to 1, if this issue was acknowledged by
owner.
CREATION_DATE DATE Issue creation date.
CLOSED_DATE DATE Issue closed date, null if not closed.
CATEGORIES gc$category_string_a
rray
List of categories that the event belongs to.
Category is translated based on locale
defined in OMS server. Notification system
sends up to 10 categories.
CATEGORY_CODES gc$category_string_a
rray
Codes for the categories. Notification system
sends up to 10 category codes.
SOURCE_INFO_ARR gc$notif_source_info_
array
Array of source information associated with
this issue. See $gcnotif_source_info type
definition for detail.
LAST_MODIFIED_BY VARCHAR2(256) Last modified by user.
LAST_UPDATED_DAT
E
DATE Last updated date.
gc$notif_issue_summary (common to incident and problem payloads)
Chapter 3
Notification Reference
3-71

Represents the associated incident summary in the event payload, or associated
problem summary in the incident payload, respectively.
Table 3-42 Payload
Attribute Datatype Additional Information
ID NUMBER Issue Id, either Incident Id or Problem Id.
SEVERITY VARCHAR(128) The severity level of an issue. It is translated
severity name.
SEVERITY_CODE VARCHAR2(32) Issue Severity Code, has one of the following
values.
GC$EVENT.FATAL
GC$EVENT.CRITICAL
GC$EVENT.WARNING
GC$EVENT.MINOR_WARNING
GC$EVENT.INFORMATIONAL
GC$EVENT.CLEAR
PRIORITY VARCHAR2(128) Current priority. It is the translated priority
name.
PRIORITY_CODE VARCHAR2(32) Issue priority code, has one of the following
values. GC$EVENT.PRIORITY_URGENT
GC$EVENT.PRIORITY_VERY_HIGH
GC$EVENT.PRIORITY_HIGH
GC$EVENT.PRIORITY_MEDIUM
GC$EVENT.PRIORITY_LOW
GC$EVENT.PRIORITY_NONE
STATUS VARCHAR2(64) Status of issue. The possible values are
GC$EVENT.STATUS_NEW
GC$EVENT.STATUS_CLOSED
GC$EVENT.WIP (work in progress)
GC$EVENT.RESOLVED
any other user defined status
ESCALATION_LEVEL VARCHAR2(2) Issue escalation level range from 0 to 5,
default 0.
OWNER VARCHAR2(256) Issue Owner. Set to NULL if no owner exists.
ACKNOWLEDGED_BY
_OWNER
NUMBER(1) Set to 1, if this issue was acknowledged by
owner.
gc$category_string_array
gc$category_string_array is an array of string containing the categories which event,
incident or problem is associated with. The notification system delivers up to 10
categories.
gc$notif_event_context_array
gc$notif_event_context_array provides information about the additional diagnostic
data that was captured at event detection time. Note that notification system delivers
up to 200 elements from the captured event context. Each element of this array is of
the type gc$notif_event_context.
Chapter 3
Notification Reference
3-72

gc$notif_event_context: This object represents the detail of event context data which
is additional contextual information captured by the source system at the time of event
generation that may have diagnostic value. The context for an event should consist of
a set of keys and values along with data type (Number or String only).
Table 3-43 Event Context Type
Attribute Datatype Additional Information
NAME VARCHAR2(256) The event context name.
TYPE NUMBER(1) The data type of the value, which is stored
(0) - for numeric data
(1) - for string data.
VALUE NUMBER The numerical value.
STRING_VALUE VARCHAR2(4000) The string value.
gc$notif_corrective_action_job
Provides information about the execution of a corrective action job. Note that the
corrective actions are supported for metric alert and target availability events only.
Table 3-44 Corrective Action Job-Specific Attributes
Attribute Datatype Additional Information
JOB_GUID RAW(16) Corrective action job global unique identifier.
JOB_NAME VARCHAR2(128) The value will be the name of the corrective
action. It applies to Metric Alert and Target
Availability Events.
JOB_OWNER VARCHAR2(256) Corrective action job owner.
JOB_TYPE VARCHAR2(256) Corrective action job type.
JOB_STATUS VARCHAR2(64) Corrective action job execution status.
JOB_STATUS_CODE NUMBER Corrective action job execution status code. It
is the internal value defined in Enterprise
Manager. For more information on status
codes, see Table 3-14.
JOB_STEP_OUTPUT VARCHAR2(4000) The value will be the text output from the
corrective action execution. This will be
truncated to last 4000 characters.
JOB_EXECUTION_GUI
D
RAW(16) Corrective action job execution global unique
identifier.
JOB_STATE_CHANGE
_GUID
RAW(16) Corrective action job change global unique
identifier.
OCCURRED_DATE DATE Corrective action job occurred date.
gc$notif_source_info_array
Provides access to the multiple sources to which an incident or a problem could be
related. NOTE: The notification system delivers up to 200 sources associated with an
incident or a problem.
CREATE OR REPLACE TYPE gc$notif_source_info_array AS VARRAY(200) OF
gc$notif_source_info;
Chapter 3
Notification Reference
3-73

gc$notif_source_info
Notification source information which is used for referencing source information
containing either target or source, or both.
Table 3-45 Source Information Type
Attribute Datatype Additional Information
TARGET gc$notif_target It is populated when the event is related to a
target. See gc$notif_target type definition for
detail.
SOURCE gc$notif_source It is populated when the event is related to a
(non-target) source. See gc$notif_source
type definition for detail.
gc$notif_source
Used for referencing source objects other than a job target.
Table 3-46 Payload
Attribute Datatype Additional Information
SOURCE_GUID RAW(16) Source's global unique identifier.
SOURCE_TYPE VARCHAR2(120) Type of the Source object, e.g., TARGET,
JOB, TEMPLATE, etc.
SOURCE_NAME VARCHAR2(256) Source Object Name.
SOURCE_OWNER VARCHAR2(256) Owner of the Source object.
SOURCE_SUB_TYPE VARCHAR2(256) Sub-type of the Source object, for example,
within the TARGET these would be the target
types like Host, Database etc.
SOURCE_URL VARCHAR2(4000) Source's event console URL.
gc$notif_target
Target information object is used for providing target information.
Table 3-47 Target Information
Attribute Datatype Additional Information
TARGET_GUID RAW(16) Target's global unique identifier.
TARGET_NAME VARCHAR2(256) Name of target.
TARGET_OWNER VARCHAR2(256) Owner of target.
TARGET_LIFECYCLE_
STATUS
VARCHAR2(1024) Life Cycle Status of the target.
TARGET_VERSION VARCHAR2(64) Target Version of the target.
TARGET_TYPE VARCHAR2(128) Type of a target.
TARGET_TIMEZONE VARCHAR2(64) Target's regional time zone.
HOST_NAME VARCHAR2(256) The name of the host on which the target is
deployed upon.
Chapter 3
Notification Reference
3-74

Table 3-47 (Cont.) Target Information
Attribute Datatype Additional Information
TARGET_URL VARCHAR2(4000) Target's EM Console URL.
UDTP_ARRAY gc$notif_udtp_array The list of user defined target properties. It is
populated for events that are associated with
a target. It is populated for incidents and
problems, when they are associated with a
single source (gc$notif_source_info).
gc$notif_udtp_array
Array of gc$notif_udtp type with a maximum size of 20.
CREATE OR REPLACE TYPE gc$notif_udtp_array AS VARRAY(20) OF gc$notif_udtp
;
gc$notif_udtp
Used for referencing User-defined target properties. UDTP should consist of a set of
property key names and property values.
Table 3-48 Payload
Attribute Datatype Additional Information
NAME VARCHAR2(64), The name of property.
VALUE VARCHAR2(1024) Property value.
LABEL VARCHAR(256) Property label.
NLS_ID VARCHAR(64) Property nls id
3.10.3.1 Notification Payload Elements Specific to Event Types
gc$notif_event_attr_array
Array of gc$notif_event_attr is used for referencing event-specific attributes. The array
has a maximum size of 25. Each element of the array is of type gc$notif_event_attr
(used for referencing event type-specific attributes).
Table 3-49 Event Attribute Type
Attribute Datatype Additional Information
NAME VARCHAR2(64) The internal name of event type specific
attribute.
VALUE VARCHAR2(4000) value.
NLS_VALUE VARCHAR2(4000) Translated value for the attribute.
You can use SQL queries to list the deployed event types in your deployment and the
payload specific to each. The following SQL can be used to list all internal event type
names which are registered in the Enterprise Manager.
Select event_class as event_type, upper(name) as env_var_name
from em_event_class_attrs
Chapter 3
Notification Reference
3-75

where notif_order != 0
and event_class is not null
order by event_type, env_var_name;
You should convert the attribute name to upper case before using the name for
comparison.
There is an attribute variable payload specific to each event type that can be accessed
from a gc$notif_event_attr_array database type. The following tables list notification
attributes for the most critical event types. You should convert the attribute name to
uppercase before using the name for comparison.
Table 3-50 Environment variables specific to Metric Alert Event Type
Environment Variable Description
COLL_NAME The name of the collection collecting the metric.
KEY_COLUMN_X Internal name of Key Column X where X is a number between 1
and 7.
KEY_COLUMN_X_VALUE Value of Key Column X where X is a number between 1 and 7.
KEY_VALUE Monitored object for the metric corresponding to the Metric Alert
event.
METRIC_COLUMN The name of the metric column
METRIC_DESCRIPTION Brief description of the metric.
METRIC_GROUP The name of the metric.
NUM_KEYS The number of key metric columns in the metric.
SEVERITY_GUID The GUID of the severity record associated with this metric alert.
VALUE Value of the metric when the event triggered.
Table 3-51 Environment variables specific to Target Availability Event Type
Environment Variable Description
AVAIL_SEVERITY The transition severity (0-6) that resulted in the status of the target
to change to the current availability status.
Possible Values for AVAIL_SEVERITY
•0 (Target Down)
•1 (Target Up)
•2 (Target Status Error)
•3 (Agent Down)
•4 (Target Unreachable)
•5 (Target Blackout)
•6 (Target Status Unknown)
AVAIL_SUB_STATE The substatus of a target for the current status.
CYCLE_GUID A unique identifier for a metric alert cycle, which starts from the
time the metric alert is initially generated until the time it is clear.
METRIC_GUID Metric GUID of response metric.
SEVERITY_GUID The GUID of the severity record associated with this availability
status.
TARGET_STATUS The current availability status of the target.
Chapter 3
Notification Reference
3-76

Table 3-52 Environment variables specific to Job Status Change event type
Environment Variable Description
EXECUTION_ID Unique ID of the job execution..
EXECUTION_LOG The job output of the last step executed.
EXECUTION_STATUS The internal status of the job execution.
EXEC_STATUS_CODE Execution status code of job execution. For possible values, see
Table 3-16.
STATE_CHANGE_GUID Unique ID of last status change
Example 3-17 PL/SQL Script: Event Type Payload Elements
-- log_table table is created by following DDL to demostrate how to access
-- event notification payload GC$NOTIF_EVENT_MSG.
CREATE TABLE log_table (message VARCHAR2(4000)) ;
-- Define PL/SQL notification method for Events
CREATE OR REPLACE PROCEDURE log_table_notif_proc(s IN GC$NOTIF_EVENT_MSG)
IS
l_categories gc$category_string_array;
l_category_codes gc$category_string_array;
l_attrs gc$notif_event_attr_array;
l_ca_obj gc$notif_corrective_action_job;
BEGIN
INSERT INTO log_table VALUES ('notification_type: ' ||
s.msg_info.notification_type);
INSERT INTO log_table VALUES ('repeat_count: ' || s.msg_info.repeat_count);
INSERT INTO log_table VALUES ('ruleset_name: ' || s.msg_info.ruleset_name);
INSERT INTO log_table VALUES ('rule_name: ' || s.msg_info.rule_name);
INSERT INTO log_table VALUES ('rule_owner: ' || s.msg_info.rule_owner);
INSERT INTO log_table VALUES ('message: ' || s.msg_info.message);
INSERT INTO log_table VALUES ('message_url: ' || s.msg_info.message_url);
INSERT INTO log_table VALUES ('event_instance_guid: ' ||
s.event_payload.event_instance_guid);
INSERT INTO log_table VALUES ('event_type: ' || s.event_payload.event_type);
INSERT INTO log_table VALUES ('event_name: ' || s.event_payload.event_name);
INSERT INTO log_table VALUES ('event_msg: ' || s.event_payload.event_msg);
INSERT INTO log_table VALUES ('source_obj_type: ' ||
s.event_payload.source.source_type);
INSERT INTO log_table VALUES ('source_obj_name: ' ||
s.event_payload.source.source_name);
INSERT INTO log_table VALUES ('source_obj_url: ' ||
s.event_payload.source.source_url);
INSERT INTO log_table VALUES ('target_name: ' ||
s.event_payload.target.target_name);
INSERT INTO log_table VALUES ('target_url: ' || s.event_payload.target.target_url);
INSERT INTO log_table VALUES ('severity: ' || s.event_payload.severity);
INSERT INTO log_table VALUES ('severity_code: ' || s.event_payload.severity_code);
INSERT INTO log_table VALUES ('event_reported_date: ' ||
to_char(s.event_payload.reported_date, 'D MON DD HH24:MI:SS'));
IF s.event_payload.target.TARGET_LIFECYCLE_STATUS IS NOT NULL
THEN
INSERT INTO log_table VALUES ('target lifecycle_status: ' ||
s.event_payload.target.TARGET_LIFECYCLE_STATUS);
END IF;
Chapter 3
Notification Reference
3-77

-- Following block illustrates the list of category codes to which the event
-- belongs.
l_category_codes := s.event_payload.category_codes;
IF l_categories IS NOT NULL
THEN
FOR c IN 1..l_category_codes.COUNT
LOOP
INSERT INTO log_table VALUES ('category_code ' || c || ' - ' ||
l_category_codes(c));
END LOOP;
END IF;
--
-- Each event type has a specific set of attributes modeled. Examples of
-- event types include metric_alert, target_availability, job_status_change.
-- Following block illustrates how to access the attributes for job_status change
-- event type
--
IF s.event_payload.event_type = 'job_staus_chage'
THEN
l_attrs := s.event_payload.event_attrs;
IF l_attrs IS NOT NULL
THEN
FOR c IN 1..l_attrs.COUNT
LOOP
INSERT INTO log_table VALUES ('EV.ATTR name=' || l_attrs(c).name || '
value=' || l_attrs(c).value || ' nls_value=' || l_attrs(c).nls_value);
END LOOP;
END IF;
END IF;
-- Following block illustrates how to access corrective action job's attributes
IF s.msg_info.notification_type = GC$NOTIFICATION.NOTIF_CA AND
s.event_payload.corrective_action IS NOT NULL
THEN
l_ca_obj := s.event_payload.corrective_action;
INSERT INTO log_table VALUES ('CA JOB_GUID: ' || l_ca_obj.JOB_GUID);
INSERT INTO log_table VALUES ('CA JOB_NAME: ' || l_ca_obj.JOB_NAME);
INSERT INTO log_table VALUES ('CA JOB_OWNER: ' || l_ca_obj.JOB_OWNER);
INSERT INTO log_table VALUES ('CA JOB_TYPE: ' || l_ca_obj.JOB_TYPE);
INSERT INTO log_table VALUES ('CA JOB_STATUS: ' || l_ca_obj.JOB_STATUS);
INSERT INTO log_table VALUES ('CA JOB_STATUS_CODE: ' ||
l_ca_obj.JOB_STATUS_CODE);
INSERT INTO log_table VALUES ('CA JOB_STEP_OUTPUT: ' ||
l_ca_obj.JOB_STEP_OUTPUT);
INSERT INTO log_table VALUES ('CA JOB_EXECUTION_GUID: ' ||
l_ca_obj.JOB_EXECUTION_GUID);
INSERT INTO log_table VALUES ('CA JOB_STATE_CHANGE_GUID: ' ||
l_ca_obj.JOB_STATE_CHANGE_GUID);
INSERT INTO log_table VALUES ('CA OCCURRED_DATE: ' || l_ca_obj.OCCURRED_DATE);
END IF;
COMMIT ;
END ;
/
Chapter 3
Notification Reference
3-78

3.10.4 Troubleshooting Notifications
To function properly, the notification system relies on various components of
Enterprise Manager and your IT infrastructure. For this reason, there can be many
causes of notification failure. The following guidelines and suggestions can help you
isolate potential problems with the notification system.
3.10.4.1 General Setup
The first step in diagnosing notification issues is to ensure that you have properly
configured and defined your notification environment.
OS Command, PL/SQL and SNMP Trap Notifications
Make sure all OS Command, PLSQL and SNMP Trap Notification Methods are valid
by clicking the Test button. This will send a test notification and show any problems
the OMS has in contacting the method. Make sure that your method was called, for
example, if the OS Command notification is supposed to write information to a log file,
check that it has written information to its log file.
Email Notifications
•Make sure an email gateway is set up under the Notification Methods page of
Setup. The Sender's email address should be valid. Clicking the Test button will
send an email to the Sender's email address. Make sure this email is received.
Note that the Test button ignores any Notification Schedule.
•Make sure an email address is set up. Clicking the Test button will send an email
to specified address and you should make sure this email is received. Note that
the Test button ignores any Notification Schedule.
•Make sure an email schedule is defined. No emails will be sent unless a
Notification Schedule has been defined.
•Make sure a incident rule is defined that matches the states you are interested and
make sure email and notification methods are assigned to the rule.
3.10.4.2 Notification System Errors
For any alerts involving problems with notifications, check the following for notification
errors.
•Any serious errors in the Notification System are logged as system errors in the
MGMT_SYSTEM_ERROR_LOG table. From the Setup menu, select
Management Services and Repository to view these errors.
•Check for any delivery errors. You can view them from Incident Manager. From
the Enterprise menu, select Monitoring, then select Incident Manager. The
details will give the reason why the notification was not delivered.
3.10.4.3 Notification System Trace Messages
The Notification System can produce trace messages in sysman/log/emoms.trc file.
Tracing is configured by setting the log4j.category.oracle.sysman.em.notification
property flag using the
emctl set property
command. You can set the trace level to
INFO, WARN, DEBUG. For example,
Chapter 3
Notification Reference
3-79

emctl set property -name log4j.category.oracle.sysman.em.notification -value
DEBUG -module logging
Note: The system will prompt you for the SYSMAN password.
Trace messages contain the string "em.notification". If you are working in a UNIX
environment, you can search for messages in the emoms.trc and emoms_pbs.trc files
using the
grep
command. For example,
grep em.notification emoms.trc emoms_pbs.trc
What to look for in the trace file.
The following entries in the emoms.trc file are relevant to notifications.
Normal Startup Messages
When the OMS starts, you should see these types of messages.
2011-08-17 13:50:29,458 [EventInitializer] INFO em.notification init.167 - Short
format maximum length is 155
2011-08-17 13:50:29,460 [EventInitializer] INFO em.notification init.185 - Short
format is set to both subject and body
2011-08-17 13:50:29,460 [EventInitializer] INFO em.notification init.194 - Content-
Transfer-Encoding is 8-bit
2011-08-17 13:50:29,460 [EventInitializer] DEBUG em.notification
registerAdminMsgCallBack.272 - Registering notification system message call back
2011-08-17 13:50:29,461 [EventInitializer] DEBUG em.notification
registerAdminMsgCallBack.276 - Notification system message callback is registered
successfully
2011-08-17 13:50:29,713 [EventInitializer] DEBUG em.notification
upgradeEmailTemplates.2629 - Enter upgradeEmailTemplates
2011-08-17 13:50:29,735 [EventInitializer] INFO em.notification
upgradeEmailTemplates.2687 - Email template upgrade is not required since no
customized templates exist.
2011-08-17 13:49:28,739 [EventCoordinator] INFO events.EventCoordinator logp.251 -
Creating event worker thread pool: min = 4 max = 15
2011-08-17 13:49:28,791 [[STANDBY] ExecuteThread: '2' for queue:
'weblogic.kernel.Default (self-tuning)'] INFO emdrep.pingHBRecorder
initReversePingThreadPool.937 - Creating thread pool for reverse ping : min = 10 max
= 50
2011-08-17 13:49:28,797 [[STANDBY] ExecuteThread: '2' for queue:
'weblogic.kernel.Default (self-tuning)'] DEBUG emdrep.HostPingCoordinator logp.251 -
Creating thread pool of worker thread for host ping: min = 1 max = 10
2011-08-17 13:49:28,799 [[STANDBY] ExecuteThread: '2' for queue:
'weblogic.kernel.Default (self-tuning)'] DEBUG emdrep.HostPingCoordinator logp.251 -
Creating thread pool for output of worker's output for host ping: min = 2 max = 20
2011-08-17 13:49:30,327 [ConnectorCoordinator] INFO connector.ConnectorPoolManager
logp.251 - Creating Event thread pool: min = 3 max = 10
2011-08-17 13:51:48,152 [NotificationMgrThread] INFO notification.pbs logp.251 -
Creating thread pool: min = 6 max = 24
2011-08-17 13:51:48,152 [NotificationMgrThread] INFO em.rca logp.251 - Creating RCA
thread pool: min = 3 max = 20
Notification Delivery Messages
2006-11-08 03:18:45,387 [NotificationMgrThread] INFO em.notification run.682 -
Notification ready on EMAIL1
2006-11-08 03:18:46,006 [DeliveryThread-EMAIL1] INFO em.notification run.114 -
Deliver to SYSMAN/admin@myco.com
Chapter 3
Notification Reference
3-80

2006-11-08 03:18:47,006 [DeliveryThread-EMAIL1] INFO em.notification run.227 -
Notification handled for SYSMAN/admin@myco.com
Notification System Error Messages
2011-08-17 14:02:23,905 [NotificationMgrThread] DEBUG notification.pbs logp.251 -
Notification ready on EMAIL1
2011-08-17 14:02:23,911 [NotificationMgrThread] DEBUG notification.pbs logp.251 -
Notification ready on PLSQL4
2011-08-17 14:02:23,915 [NotificationMgrThread] DEBUG notification.pbs logp.251 -
Notification ready on OSCMD14
2011-08-17 14:02:19,057 [DeliveryThread-EMAIL1] INFO notification.pbs logp.251 -
Deliver to To: my.admin@myco.com; issue type: 1; notification type: 1
2011-08-17 14:02:19,120 [DeliveryThread-OSCMD14] INFO notification.pbs logp.251 -
Deliver to SYSMAN, OSCMD, 8; issue type: 1; notification type: 1
2011-08-17 14:02:19,346 [DeliveryThread-PLSQL4] INFO notification.pbs logp.251 -
Deliver to SYSMAN, LOG_JOB_STATUS_CHANGE, 9; issue type: 1; notification type: 1
2011-08-17 14:02:19,977 [DeliveryThread-PLSQL4] DEBUG notification.pbs logp.251 -
Notification handled for SYSMAN, LOG_JOB_STATUS_CHANGE, 9
2011-08-17 14:02:20,464 [DeliveryThread-EMAIL1] DEBUG notification.pbs logp.251 -
Notification handled for To: my.admin@myco.com
2011-08-17 14:02:20,921 [DeliveryThread-OSCMD14] DEBUG notification.pbs logp.251 -
Notification handled for SYSMAN, OSCMD, 8
3.10.4.4 Email Errors
The SMTP gateway is not set up correctly:
Failed to send email to my.admin@myco.com: For email notifications to be sent, your
Super Administrator must configure an Outgoing Mail (SMTP) Server within Enterprise
Manager. (SYSMAN, myrule)
Invalid host name:
Failed to connect to gateway: badhost.oracle.com: Sending failed;
nested exception is:
javax.mail.MessagingException: Unknown SMTP host: badhost.example.com;
Invalid email address:
Failed to connect to gateway: rgmemeasmtp.mycorp.com: Sending failed;
nested exception is:
javax.mail.MessagingException: 550 5.7.1 <smpemailtest_ie@example.com>... Access
denied
Always use the Test button to make sure the email gateway configuration is valid.
Check that an email is received at the sender's email address
3.10.4.5 OS Command Errors
When attempting to execute an OS command or script, the following errors may occur.
Use the Test button to make sure OS Command configuration is valid. If there are any
errors, they will appear in the console.
Invalid path or no read permissions on file:
Could not find /bin/myscript (machineb10.oracle.com_Management_Service) (SYSMAN,
myrule )
Chapter 3
Notification Reference
3-81

No execute permission on executable:
Error calling /bin/myscript: java.io.IOException: /bin/myscript: cannot execute
(machineb10.oracle.com_Management_Service) (SYSMAN, myrule )
Timeout because OS Command ran too long:
Timeout occurred running /bin/myscript (machineb10.oracle.com_Management_Service)
(SYSMAN, myrule )
Any errors such as out of memory or too many processes running on OMS machine
will be logged as appropriate.
Always use the Test button to make sure OS Command configuration is valid.
3.10.4.6 SNMP Trap Errors
Use the Test button to make sure SNMP Trap configuration is valid.
The OMS will not report an error if the SNMP trap cannot reach the third party SNMP
console as this is sent via UDP. If the SNMP trap encounters problems when trying to
reach the third party SNMP console, possible SNMP trap problems include: invalid
host name, port, community for a machine running an SNMP Console or a network
issue such as a firewall problem.
Other possible SNMP trap problems include: invalid host name, port, or community for
a machine running an SNMP Console.
3.10.4.7 PL/SQL Errors
When attempting to execute an PL/SQL procedure, the following errors may occur.
Use the Test button to make sure the procedure is valid. If there are any errors, they
will appear in the console.
Procedure name is invalid or is not fully qualified. Example: SCOTT.PKG.PROC
Error calling PL/SQL procedure plsql_proc: ORA-06576: not a valid function or
procedure name (SYSMAN, myrule)
Procedure is not the correct signature. Example:
PROCEDURE event_proc(s IN
GC$NOTIF_EVENT_MSG)
Error calling PL/SQL procedure plsql_proc: ORA-06553: PLS-306: wrong number or types
of arguments in call to 'PLSQL_PROC' (SYSMAN, myrule)
Procedure has bug and is raising an exception.
Error calling PL/SQL procedure plsql_proc: ORA-06531: Reference to uninitialized
collection (SYSMAN, myrule)
Care should be taken to avoid leaking cursors in your PL/SQL. Any exception due to
this condition will result in delivery failure with the message being displayed in the
Details section of the alert in the Cloud Control console.
Always use the Test button to make sure the PL/SQL configuration is valid.
Chapter 3
Notification Reference
3-82
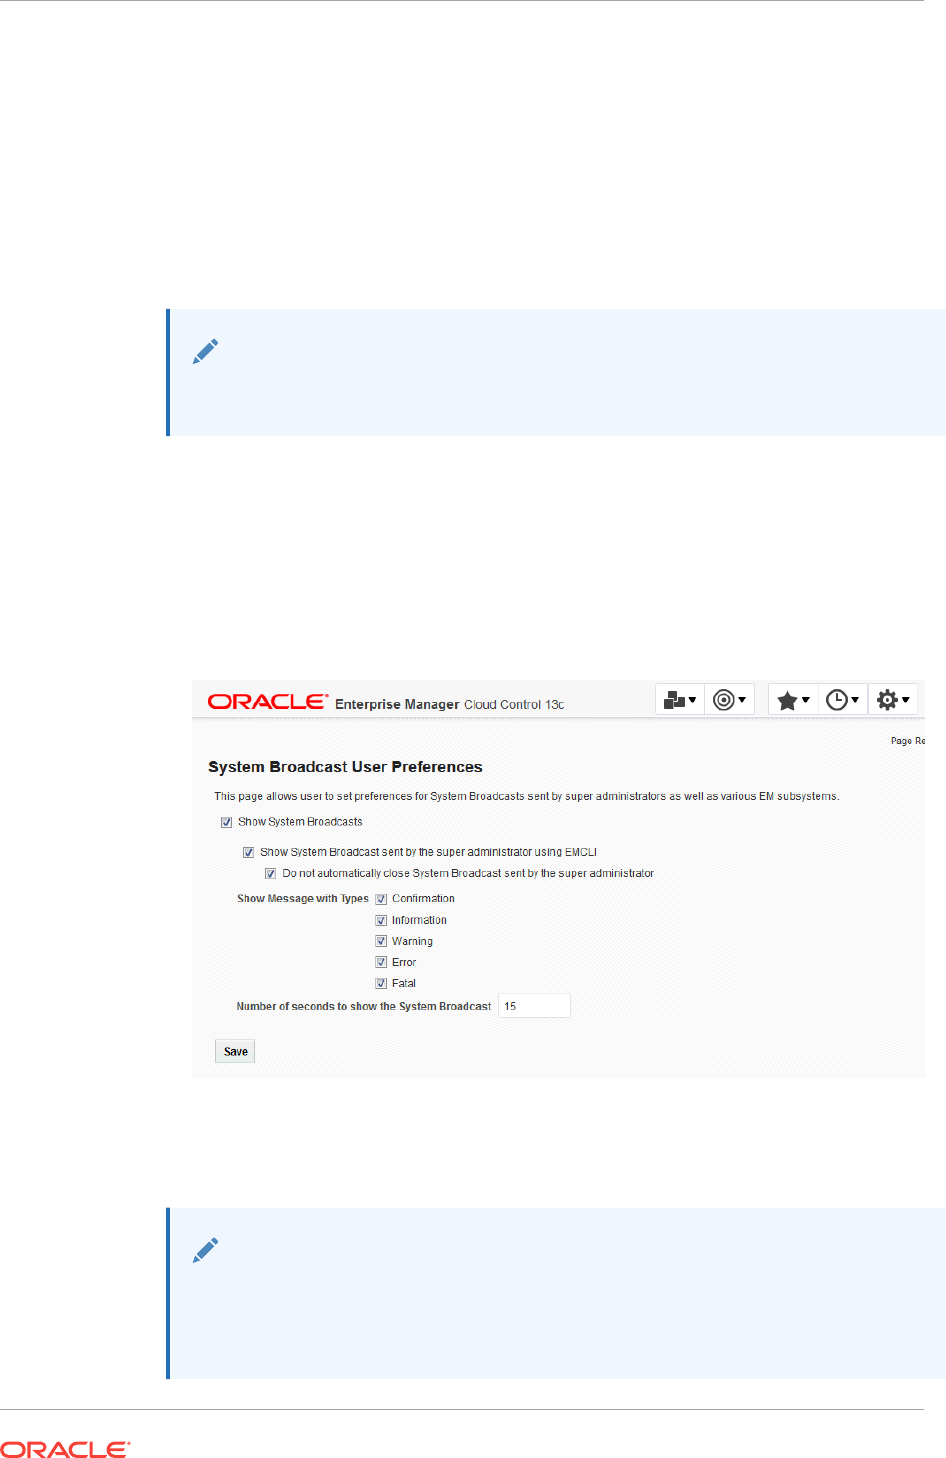
3.11 System Broadcasts
Enterprise Manager allows you to broadcast important instantly viewable system
messages to Enterprise Manager consoles throughout your managed environment.
These messages can be directed to specific users or all Enterprise Manager users.
This feature can be useful when notifying users that Enterprise Manager is about to go
down, when some part of your managed infrastructure has been updated, or when
there is a system emergency.
Note:
Only Super Administrators can send system broadcasts.
Setting System Broadcast Preferences
Before you can send a system broadcast, you must first set your broadcast
preferences.
1. Log in to Enterprise Manager as a Super Administrator.
2. From the <USERNAME> menu, select Preference and then System Broadcast.
The System Broadcast User Preferences UI displays.
3. Check the desired broadcast message preferences then click Save.
Whenever you send a system broadcast message, these are the preferences that
will be used.
Note:
The Number of seconds to show the System Broadcast setting will only work
when the Do not automatically close System Broadcast sent by the super
administrator option is disabled.
Chapter 3
System Broadcasts
3-83

Creating a System Broadcast
Once your preferences are set, you use the EM CLI verb send_system_broadcast to
send a system broadcast message.
emcli send_system_broadcast
-toOption="ALL|SPECIFIC"
[-to="comma separated user names"]
[-messageType="INFO|CONF|WARN|ERROR|FATAL" (default is INFO)]
-message="message details"
Options
•toOption
Enter the value ALL to send the broadcast message to all users logged into the
Enterprise Manager Console. Or enter SPECIFIC to send System Broadcast to
users specified by -to.
•to
Comma-separated list of users who are to receive the broadcast message. This
option can only be used if the -toOption is set to SPECIFIC.
•messageType
Type of System Broadcast, it can be one of following types
–INFO (Information)
–CONF (Confirmation)
–WARN (Warning)
–ERROR
–FATAL
•message
Message to be sent in the System Broadcast. The message has a maximum of
200 characters.
Example:
In this example, you want to broadcast an informational message indicating that you
will be bringing down Enterprise Manager within an hour in order to perform an
emergency patching operation.
emcli send_system_broadcast -messageType="INFO" -toOption="ALL" -message="Enterprise
Manager will be taken down in an hour for an emergency patch"
Chapter 3
System Broadcasts
3-84

4
Using Blackouts and Notification Blackouts
This chapter covers the following topics:
•Blackouts and Notification Blackouts
•Working with Blackouts/Notification Blackouts
•Controlling Blackouts Using the Command Line Utility
•About Blackouts Best Effort
4.1 Blackouts and Notification Blackouts
Blackouts and Notification Blackouts (notification blackouts) help you maintain
monitoring accuracy during target maintenance windows by providing you with the
ability to suspend various Enterprise Manager monitoring functions for the duration of
the maintenance period. For example, when bringing down targets for upgrade or
patching, you may not want that downtime included as part of the collected metric data
or have it affect a Service Level Agreement (SLA).
Blackout/Notification Blackout functionality is available from both the Enterprise
Manager console as well as via the Enterprise Manager command-line interface
(EMCLI).
4.1.1 About Blackouts
Blackouts allow you to suspend monitoring on one or more targets in order to perform
maintenance operations. Blackouts, also known as patching blackouts, ensure that the
target is not changed during the period of the blackout so that a maintenance
operation on the actual target will not be affected. During this period, the Agent does
not perform metric data collection on the target and no notifications will be raised for
the target. Blackouts will allow Enterprise Manager jobs to run on the target during the
blackout period by default. Optionally, job runs can be prevented during the blackout
period.
A blackout can be defined for individual target(s), a group of multiple targets that
reside on different hosts, or for all targets on a host. The blackout can be scheduled to
run immediately or in the future, or stop after a specific duration. Blackouts can be
created on an as-needed basis, or scheduled to run at regular intervals. If, during the
maintenance period, the administrator discovers that he needs more (or less) time to
complete his maintenance tasks, he can easily extend (or stop) the blackout that is
currently in effect. Blackout functionality is available from both the Enterprise Manager
console as well as via the Enterprise Manager command-line interface (EMCLI).
EMCLI is often useful for administrators who would like to incorporate the blacking out
of a target within their maintenance scripts.
Why use blackouts?
Blackouts allow you to collect accurate monitoring data. For example, you can stop
data collections during periods where a managed target is undergoing routine
4-1

maintenance, such as a database backup or hardware upgrade. If you continue
monitoring during these periods, the collected data will show trends and other
monitoring information that are not the result of normal day-to-day operations. To get a
more accurate, long-term picture of a target's performance, you can use blackouts to
exclude these special-case situations from data analysis.
Blackout Access
Enterprise Manager administrators that have at least Blackout Target privileges on all
Selected Targets in a blackout will be able to create, edit, stop, or delete the blackout.
In case an administrator has at least Blackout Target privileges on all Selected Targets
(targets directly added to the blackout), but does not have Blackout Target privileges
on some or all of the Dependent Targets, then that administrator will be able to edit,
stop, or delete the blackout. For more information on Blackout access, see "About
Blackouts Best Effort".
4.1.2 About Notification Blackouts
Notification Blackouts are solely for suppressing the notifications on targets during the
Notification Blackout duration. The Agent continues to monitor the target under
Notification Blackout and the OMS will show the actual target status along with an
indication that the target is currently under Notification Blackout. Events will be
generated as usual during a Notification Blackout. Only the event notifications are
suppressed.
The period of time under which the target is in Notification Blackout is not used to
calculate the target's Service Level Agreement (SLA).
To place a target under Notification Blackout, you need to have at least Blackout
Target privilege on the target.
There are two types of Notification Blackouts:
•Maintenance Notification Blackout: The target is under a planned maintenance
and administrators do not want to receive any notifications during this period.
Since the target is brought down deliberately for maintenance purposes, the
Notification Blackout duration should not be considered while calculating the
availability percentage and SLA. In this scenario, an administrator should create a
maintenance Notification Blackout.
•Notification-only Notification Blackout: The target is experiencing an
unexpected down time such as a server crash. While the administrator is fixing the
server, they do not want to receive alerts as they are already aware of the issue
and are currently working to resolve it. However, the availability percentage
computation should consider the actual target status of the Notification Blackout
duration and the SLA should be computed accordingly. In this scenario, the
administrator should create a Notification-only Notification Blackout.
By default, when a Notification Blackout is created, it is a maintenance Notification
Blackout (the Under Maintenance option will be selected by default and the
administrator will need to select the Non-maintenance option in order to create a
regular Notification-only Notification Blackout.
A Notification Blackout can be defined for individual target(s), a group of multiple
targets that reside on different hosts, or for all targets on a host. The Notification
Blackout can be scheduled to run immediately or in the future, or stop after a specific
duration. Notification Blackouts can be created on an as-needed basis, or scheduled
Chapter 4
Blackouts and Notification Blackouts
4-2

to run at regular intervals. If, during the maintenance period, the administrator
discovers that he needs more (or less) time to complete his maintenance tasks, he can
easily extend (or stop) the Notification Blackout that is currently in effect. Notification
Blackout functionality is available from both the Enterprise Manager console as well as
via the Enterprise Manager command-line interface (EMCLI). EMCLI is often useful for
administrators who would like to incorporate the blacking out of a target within their
maintenance scripts.
Notification Blackout Access
Enterprise Manager administrators that have at least Blackout Target privileges on all
Selected Targets in a Notification Blackout will be able to create, edit, stop, or delete
the Notification Blackout.
In case an administrator has at least Blackout Target privileges on all Selected Targets
(targets directly added to the Notification Blackout), but does not have Blackout Target
privileges on some or all of the Dependent Targets, then that administrator will be able
to edit, stop, or delete the Notification Blackout.
4.2 Working with Blackouts/Notification Blackouts
Blackouts allow you to collect accurate monitoring data. For example, you can stop
data collections during periods where a managed target is undergoing routine
maintenance, such as a database backup or hardware upgrade. If you continue
monitoring during these periods, the collected data will show trends and other
monitoring information that are not the result of normal day-to-day operations. To get a
more accurate, long-term picture of a target's performance, you can use blackouts to
exclude these special-case situations from data analysis.
4.2.1 Creating Blackouts/Notification Blackouts
Blackouts/Notification Blackouts allow you to suspend monitoring on one or more
managed targets.
To create a Blackout/Notification Blackout:
1. From the Enterprise menu, select Monitoring and then Blackouts and
Notification Blackouts.
2. From the table, click Create. Blackout and Notification Blackout selection dialog
displays.
3. Choose either Blackout or Notification Blackout and click Create. The Create
Blackout/Notification Blackout page displays.
When creating a Notification Blackout, you will also be able to specify the type of
Notification Blackout via the Maintenance Window options.
•Under maintenance. Target downtime is excluded from Availability(%)
calculations.
•Non-maintenance. Any target downtime will impact Availability(%) calculations.
4. Enter the requisite parameters for the new blackout/Notification Blackout and then
click Submit.
Chapter 4
Working with Blackouts/Notification Blackouts
4-3

4.2.2 Editing Blackouts/Notification Blackouts
Blackouts allow you to suspend monitoring on one or more managed targets.
To edit a Blackout:
1. From the Enterprise menu, select Monitoring and then Blackouts and
Notification Blackouts.
2. If necessary, use the Search and display options to show the blackouts you want
to change in the blackouts table.
3. Select the desired Blackout/Notification Blackout. Details are displayed. click Edit.
The Edit Blackout/Notification Blackout page displays.
4. Make the desired changes and click Submit.
Note: Enterprise Manager also allows you to edit blackouts after they have already
started.
4.2.3 Viewing Blackouts/Notification Blackouts
To view information and current status of a blackout:
1. From the Enterprise menu, select Monitoring and then Blackouts and
Notification Blackouts.
2. If necessary, you can use the Search and display options to show the blackouts
you want to view in the blackouts table.
3. Select the desired Blackout/Notification Blackout. Details are displayed.
Viewing Blackouts from Target Home Pages
For most target types, you can view a Blackout/Notification Blackout information from
the target home page for any target currently under Blackout/Notification Blackout. The
Blackout/Notification Blackout Summary region provides pertinent Blackout/Notification
Blackout status information for that target.
Viewing Blackout/Notification Blackouts from Groups and Systems Target
Administration Pages
For Groups and Systems, you can view Blackout/Notification Blackout information
about the number of active/scheduled Blackouts/Notification Blackouts on a group/
system and its member targets.
4.2.4 Purging Blackouts/Notification Blackouts That Have Ended
When managing a large number of targets, the number of completed Blackouts/
Notification Blackouts, or those Blackouts/Notification Blackouts that have been ended
by an administrator can become quite large. Removing these ended Blackouts/
Notification Blackouts facilitates better search and display for current Blackouts/
Notification Blackouts.
To purge ended Blackouts/Notification Blackouts from Enterprise Manager:
1. From the Enterprise menu, select Monitoring and then Blackouts and
Brownouts.
Chapter 4
Working with Blackouts/Notification Blackouts
4-4

2. Use the search criteria to filter for the desired targets.
3. From the Show drop-down menu, select History.
4. In the table, select the ended Blackouts/Notification Blackouts you want to remove
and click Delete. The Delete Blackout/Brownout confirmation page appears.
5. Click Delete to complete the purge process.
4.3 Controlling Blackouts Using the Command Line Utility
You can control blackouts from the Oracle Enterprise Manager 13c Cloud Control
Console or from the Enterprise Manager command line utility (
emctl
). However, if you
are controlling target blackouts from the command line, you should not attempt to
control the same blackouts from the Cloud Control console. Similarly, if you are
controlling target blackouts from the Cloud Control console, do not attempt to control
those blackouts from the command line.
From the command line, you can perform the following blackout functions:
•Starting Immediate Blackouts
•Stopping Immediate Blackouts
•Checking the Status of Immediate Blackouts
Note:
When you start a blackout from the command line, any Enterprise Manager
jobs scheduled to run against the blacked out targets will still run. If you use
the Cloud Control Console to control blackouts, you can optionally prevent
jobs from running against blacked out targets.
To use the Enterprise Manager command-line utility to control blackouts:
1. Change directory to the
AGENT_HOME/bin
directory (UNIX) or the
AGENT_INSTANCE_HOME
\bin
directory (Windows).
2. Enter the appropriate command as described in Table 4-1.
Note:
When you start a blackout, you must identify the target or targets affected by
the blackout. To obtain the correct target name and target type for a target,
see Administering Enterprise Manager Using EMCTL Commands.
Chapter 4
Controlling Blackouts Using the Command Line Utility
4-5

Table 4-1 Summary of Blackout Commands
Blackout Action Command
Set an immediate blackout
on a particular target or list
of targets
emctl start blackout <Blackoutname>
[<Target_name>[:<Target_Type>]].... [-d <Duration>]
Be sure to use a unique name for the blackout so you can refer
to it later when you want to stop or check the status of the
blackout.
The
-d
option is used to specify the duration of the blackout.
Duration is specified in
[days] hh:mm where:
•days indicates number of days, which is optional
•hh indicates number of hours
•mm indicates number of minutes
If you do not specify a target or list of targets, Enterprise
Manager will blackout the local host target. All monitored targets
on the host are not blacked out unless a list is specified or you
use the
-nodelevel
argument.
If two targets of different target types share the same name, you
must identify the target with its target type.
Stop an immediate blackout
emctl stop blackout <Blackoutname>
Set an immediate blackout
for all targets on a host
emctl start blackout <Blackoutname> [-nodeLevel] [-d
<Duration>]
The
-nodeLevel
option is used to specify a blackout for all the
targets on the host; in other words, all the targets that the
Management Agent is monitoring, including the Management
Agent host itself. The
-nodeLevel
option must follow the
blackout name. If you specify any targets after the
-nodeLevel
option, the list is ignored.
Check the status of a
blackout
emctl status blackout
[<Target_name>[:<Target_Type>]]....
Use the following examples to learn more about controlling blackouts from the
Enterprise Manager command line:
•To start a blackout called "bk1" for databases "db1" and "db2," and for Oracle
Listener "ldb2," enter the following command:
$PROMPT> emctl start blackout bk1 db1 db2 ldb2:oracle_listener -d 5 02:30
The blackout starts immediately and will last for 5 days 2 hours and 30 minutes.
•To check the status of all the blackouts on a managed host:
$PROMPT> emctl status blackout
•To stop blackout "bk2" immediately:
$PROMPT> emctl stop blackout bk2
•To start an immediate blackout called "bk3" for all targets on the host:
$PROMPT> emctl start blackout bk3 -nodeLevel
•To start an immediate blackout called "bk3" for database "db1" for 30 minutes:
$PROMPT> emctl start blackout bk3 db1 -d 30
•To start an immediate blackout called "bk3" for database "db2" for five hours:
Chapter 4
Controlling Blackouts Using the Command Line Utility
4-6

$PROMPT> emctl start blackout bk db2 -d 5:00
4.4 About Blackouts Best Effort
The Blackouts Best Effort feature allows you to create blackouts on aggregate targets,
such as groups or systems, for which you do not have Blackout Target (or Higher)
privileges on all members of the aggregate target.
Here, an Enterprise Manager administrator has Blackout Target privilege on an
aggregate target but do not have OPERATOR privilege on its member/associated
targets. You should ideally create a Full Blackout on this aggregate target. When
defining the blackout, you are allowed to select any member target, even those
member targets for which you have no Blackout Target privileges.
When the blackout actually starts, Enterprise Manager checks privileges on each
member target and only blackout those on which you have Blackout Target( or Higher)
privileges. This automated privilege check and target blackout selection is Enterprise
Manager's "best effort" at blacking out the aggregate target.
4.4.1 When to Use Blackout Best Effort
The Blackout Best Effort functionality is targeted towards the creation of blackouts on
targets of any aggregate type, such as Group, Hosts, Application Servers, Web
Applications, Redundancy Groups, or Systems.
All targets the blackout creator has Blackout Target (or higher) privilege on will be
displayed in the first step of Create/Edit Blackout Wizard. Once the blackout creator
selects an aggregate type of target to be included in the Blackout Definition, this
Blackout is "Full Blackout" by default.
The creator has the option of choosing the Blackout to run on “All Current" or
“Selected" Targets, by selecting the appropriate values from the List box. Only when
the "Full Blackout" option is chosen, will Blackout Best Effort affect targets for which
the creator does not have Blackout Target (or higher) privileges.
Example Use Case
Consider 3 targets T1,T2 and T3 (all databases). A Group G1 contains all these 3
targets.
User U1 has OPERATOR privilege on T1,T2 and G1. User U1 has VIEW privilege on
T3.
User U1 creates a scheduled full blackout on target G1. Scheduled implies that the
blackout will start at a later point in time.
At the time of blackout creation, the tip text Needs Blackout Target privilege, see Tip
below the table would be shown beside target T3.
When this blackout starts, if by that time User U1 has been granted OPERATOR
privileges on target T3, then target T3 would also be under blackout. Otherwise only
targets T1, T2 and G1 will be under blackout.
Chapter 4
About Blackouts Best Effort
4-7

5
Managing Groups
This chapter introduces the concept of group management and contains the following
sections:
•Introduction to Groups
•Managing Groups
•Using Out-of-Box Reports
5.1 Introduction to Groups
Groups are an efficient way to logically organize, manage, and monitor the targets in
your global environments. Each group has its own group home page. The group home
page shows the most important information for the group and enables you to drill down
for more information. The home page shows the overall status of the group and other
information such as current availability, incidents, and patch recommendations for
members of the group.
Group Management Tasks
You can use Enterprise Manager to perform the following group management
functions:
•Edit the configuration of a selected group, remove groups, and, in the case of an
Administration Group, associate or disassociate a Template Collection.
•View the status and health of the group from the System Dashboard
•Drill down from a specific group to collectively monitor and manage its member
targets.
•View a roll-up of member statuses and open incidents for members of the group.
•Apply blackouts to all targets in a group.
•Run jobs against a group
•Run a report
•Apply monitoring templates
•Associate compliance standards
In addition to creating groups, you can also create specific types of groups, such as
redundancy groups, privilege propagating groups, and dynamic groups. The following
sections explain the different types of groups.
5.1.1 Overview of Groups
Groups enable you to collectively monitor and administer many targets as a single
logical unit. For example, you can define a group to contain all the databases serving
an enterprise application, and define another group to contain all the hosts in a host
farm. You can then use these groups to perform administrative operations. To create a
5-1

group, you can manually select and add the members of the group. If you add an
aggregate target, such as a Cluster Database, all of its member targets are
automatically added to the group.
A group can include targets of the same type, such as all your production databases,
or it could include all the targets on a host which would be comprised of different target
types. You can nest static groups inside each other. In the target selector when you
are selecting group members, choose Group as the target type, or choose a parent
group as part of the process of creating a group.
If a system target is added to a group, it automatically pulls in its member targets. This
could be the case of a regular group where a system such as WebLogic Server is
added and also pulls in its members, or in a dynamic group where you specify a
Target type to be an Oracle WebLogic Server and it also pulls in members of the
WebLogic Server even though it does not match the dynamic group criteria. In this
scenario, the group operations (for example, runnning jobs, blackouts, and so on)
apply to all members of the group.
Note:
Because the Enterprise Manager Repository is a member of the OMS and the
Enterprise Manager Repository is a RAC database, the ASMs and listeners
are added as group members as well.
You can also check the member relationships of any target by navigating to
the target home page. From the <target> menu, select Members—>Topology
—>View: System Members
After you configure a group, you can perform various administrative operations, such
as:
•View a summary status of the targets within the group.
•View a roll-up of member statuses and open incidents for members of the group.
•View a summary of critical patch advisories.
•View configuration changes during the past 7 days.
•Create jobs and view the status of job executions.
•Create blackouts and view the status of current blackouts.
5.1.2 Overview of Privilege Propagating Groups
Privilege propagating groups enable administrators to propagate privileges to
members of a group. You can grant a privilege on a group once to an administrator or
a role and have that same privilege automatically propagate to any new member of the
group. For example, granting operator privilege on a privilege propagating group to an
Administrator grants him the operator privilege on its member targets and also to any
members that will be added in the future. Privilege propagating groups can contain
individual targets or other privilege propagating groups. Any aggregate that you add to
a privilege propagating group must also be privilege propagating as well. For example,
any group that you add to a privilege propagating group must also be privilege
propagating.
Chapter 5
Introduction to Groups
5-2

Privileges on the group can be granted to an Enterprise Manager administrator or a
role. Use a role if the privileges you want to grant are to be granted to a group of
Enterprise Manager administrators.
For example, suppose you create a privilege propagating group and grant a privilege
to a role which is then granted to administrators. If new targets are later added to the
privilege propagating group, then the administrators receive the privileges on the
target automatically. Additionally, when a new administrator is hired, you only need to
grant the role to the administrator for the administrator to receive all the privileges on
the targets automatically.
5.1.3 Overview of Dynamic Groups
The membership management for groups is typically manual or static in nature.
Manually managing memberships works well for small deployments but not
necessarily in large, dynamic environments where new targets come into the system
frequently. Groups whose members are added frequently would be easier to maintain
if they were to be defined by membership criteria instead of adding targets directly into
the group. When the membership criteria is defined once, Enterprise Manager will
automatically add targets.
A dynamic group is a group whose membership is determined by membership criteria.
The owner of a dynamic group specifies the membership criteria during dynamic group
creation (or modification) and membership in the group is determined solely by the
criteria specified. Membership in a dynamic group cannot be modified directly because
targets cannot be directly added to a dynamic group. Enterprise Manager
automatically adds targets that match membership criteria when a dynamic group is
created. It also updates group membership as new targets are added or target
properties are changed and the target matches the group's membership criteria.
It is important to note that static groups can contain dynamic groups as members but
not the other way around. You cannot include a static group as a member of a
dynamic group.
Use the Define Membership Criteria function of Dynamic Groups to define the criteria
for group membership. Once you have defined criteria, the targets selected by the
criteria will be displayed in a read-only table in the Members region of the Groups
page. Since dynamic groups are defined by criteria, you can intentionally or
unintentionally define criteria that could result in very large groups.
The following requirements apply to dynamic groups:
•Dynamic groups cannot contain static groups, other dynamic groups, or
administration groups.
•Administration groups cannot contain dynamic groups, however, a static group can
contain dynamic groups as a member.
•OR-based criteria is not supported. All criteria selected on the criteria page are
AND-based.
•Supported properties are limited to global properties plus other attributes
specifically supported for administration groups such as Version, Platform, Target
Name and Type, and so on. Specifically user-defined properties and other
instance properties, plus config data elements are not supported as criteria.
•The View Any Target and Add Any Target privileges are required to create a
dynamic group.
Chapter 5
Introduction to Groups
5-3

•The Full Any Target, Add Any Target, and Create Privilege Propagating Group
privileges are required to create a privilege-propagating dynamic group.
5.1.4 Overview of Administration Groups
Administration Groups greatly simplify the process of setting up targets for
management in Enterprise Manager by automating the application of management
settings such as monitoring settings or compliance standards. Typically, these settings
are manually applied to individual target, or perhaps semi-automatically using custom
scripts. However, by defining Administration Groups, Enterprise Manager uses specific
target properties to direct the target to the appropriate Administration Group and then
automatically apply the requisite monitoring and management settings. This level of
automation simplifies the target setup process and also enables a datacenter to easily
scale as new targets are added to Enterprise Manager for management.
Administration groups are a special type of group used to fully automate application of
monitoring and other management settings upon joining the group. When a target is
added to the group, Enterprise Manager applies these settings using a Template
Collection consisting of Monitoring Templates, compliance standards, and cloud
policies. This completely eliminates the need for administrator intervention.
To watch Part 1 of a video about using administrative groups and template collections,
click here.
To watch Part 2 of the video about using administrative groups and template
collections, click here.
5.1.5 Choosing Which Type of Group To Use
There are two major types of groups you can choose to manage targets: Static
Groups/ Dynamic groups, which can be one or more groups that you define, and
Administration Groups for automating monitoring setup using templates.
You should carefully consider the purpose of your group and the function it serves
before determining which type of group to use.
The following table diagrams when you should use Administration Groups or Dynamic
Groups.
Table 5-1 When To Use Administration Groups vs. Dynamic Groups
Type of Group Main Purpose Membership Based
on Criteria
Additional
Membership
Requirements
Privilege
Propagating
Administration Group Auto-apply monitoring
templates
Yes, based on target
properties
Target can belong to
at most one
administration group
Yes (always)
Dynamic Group Perform any group
operation.
Yes, based on target
properties
Target can belong to
one or more groups
User-specified
option
The main purpose of an Administration Group is to automate the application of
management settings, such as monitoring settings or compliance standards. When a
target is added to the group, Enterprise Manager automatically applies these settings
using templates to eliminate the need for administrator action.
Chapter 5
Introduction to Groups
5-4

Dynamic groups, on the other hand, can be used to manage many targets as a single
unit where you can define the group membership by defining the properties that
constitute the group. For example, you could use dynamic groups to manage
privileges or groups that you create containing the targets that are managed for
different support teams.
5.2 Managing Groups
By combining targets in a group, Enterprise Manager provides management features
that enable you to efficiently manage these targets as one group. Using the Group
functionality, you can:
•View a summary status of the targets within the group.
•Monitor incidents for the group collectively, rather than individually.
•Monitor the overall performance of the group.
•Perform administrative tasks, such as scheduling jobs for the entire group, or
blacking out the group for maintenance periods.
You can also customize the console to provide direct access to group management
pages.
When you choose Groups from the Targets menu in the Enterprise Manager, the
Groups page appears. You can view the currently available groups and perform the
following tasks:
•View a list of all the defined groups.
•Search for existing groups and save search criteria for future searches.
•View a member status summary and rollup of incidents for members in a group.
•Create Groups, Dynamic Groups or the Administration Group hierarchy, edit the
configuration of a selected group, remove groups, and, in the case of an
Administration Group, associate or disassociate a Template Collection.
•Add groups or privilege propagating groups, remove groups, and change the
configuration of currently defined groups.
•Drill down from a specific group to collectively monitor and manage its member
targets.
•Customize the homepage of a specific group
Redundancy systems and special high availability groups are not accessed from this
Groups page. You can access them from the All Targets page or you can access
Redundancy Systems and other systems from the Systems page.
5.2.1 Creating and Editing Groups
Enterprise Manager Groups enable administrators to logically organize distributed
targets for efficient and effective management and monitoring.
To create a group, follow these steps:
1. From the Enterprise Manager Console, choose Targets then choose Groups.
Alternately, you can choose Add Target from the Setup menu and choose the
menu option to add the specific type of group.
Chapter 5
Managing Groups
5-5

2. Click Create and choose the type of group you want to create. The Enterprise
Manager Console displays a set of Create Group pages that function similarly to a
wizard.
3. On the General tab of the Create Group page, enter the Name of the Group you
want to create. If you want to make this a privilege propagating group, then enable
the Privilege Propagation option by clicking Enabled. If you enable Privilege
Propagation for the group, the target privileges granted on the group to an
administrator or a role are propagated to the member targets. As with regular
groups with privilege propagation, the Create Privilege Propagating Group
privilege is required for creation of privilege propagating dynamic groups. In
addition, the Full any Target privilege is required to enable privilege propagation
because only targets on which the owner has Full Target privileges can be
members, and any target can potentially match the criteria and a system wide Full
privilege is required. To create a regular dynamic group, the View any Target
system wide privilege is required as the group owner must be able to view any
target that can potentially match the membership criteria.
4. Configure each page, then click OK. You should configure all the pages before
clicking OK. For more information about these steps, see the online help.
After you create the group, you always have immediate access to it from the Groups
page.
You can edit a group to change the targets that comprise the group, or change the
metrics that you want to use to summarize a given target type. To edit a group, follow
these steps:
1. From the Enterprise Manager Console, choose Targets then choose Groups.
2. Click the group Name for the group you want to edit.
3. Click Edit from the top of the groups table.
4. Change the configuration for a page or pages, then click OK.
5.2.2 Creating Dynamic Groups
The owner of a dynamic group specifies the membership criteria during dynamic group
creation (or modification) and membership in the group is determined solely by the
criteria specified. Membership in a dynamic group cannot be modified directly.
Enterprise Manager automatically adds targets that match membership criteria when a
dynamic group is created. It also updates group membership as new targets are
added or target properties are changed and the targets match the group's membership
criteria.
To create a dynamic group, follow these steps:
1. From the Groups page, click Create and then select Dynamic Group from the
drop-down list. Alternately, you can choose Add Target from the Setup menu and
then select Group.
2. On the General tab of the Create Dynamic Group page, enter the Name of the
Dynamic Group you want to create. If you want to make this a privilege
propagating dynamic group, then enable the Privilege Propagation option by
clicking Enabled. If you enable Privilege Propagation for the group, the target
privileges granted on the group to an administrator or a role are propagated to the
member targets. As with regular groups with privilege propagation, the Create
Privilege Propagating Group privilege is required for creation of privilege
Chapter 5
Managing Groups
5-6

propagating dynamic groups. In addition, the Full any Target privilege is required
to enable privilege propagation because only targets on which the owner has Full
Target privileges can be members, and any target can potentially match the
criteria and a system wide Full privilege is required. To create a regular dynamic
group, the View any Target system wide privilege is required as the group owner
must be able to view any target that can potentially match the membership criteria.
The privilege propagating group feature contains two privileges:
•Create Privilege Propagating Group
This privileged activity allows the administrators to create the privilege
propagating groups. Administrators with this privilege can create propagating
groups and delegate the group administration activity to other users.
•Group Administration
Grant this privilege to an administrator or role that enables him to become
group administrator for the group. This means he can perform operations on
the group, share privileges on the group with other administrators, etc.
The Group Administration Privilege is available for both Privilege Propagating
Groups and conventional groups. If you are granted this privilege, you can
grant full privilege access to the group to other Enterprise Manager users
without having to be the SuperAdministrator to grant the privilege.
3. In the Define Membership Criteria section, define the criteria for the dynamic group
membership by clicking Define Membership Criteria.
The Define Membership Criteria page appears where you can Add or Remove
properties of targets to be included in the group. Group members must match one
value in each of the populated target properties. Use the Member Preview section
to review a list of targets that match the criteria. Click OK to return to the General
page.
At least one of the criteria on the Define Membership Criteria page must be
specified. You cannot create a Dynamic group without at least one of the target
types, on hosts or target properties specified. Use the following criteria for dynamic
groups:
•Target type(s)
•Department
•On Host
•Target Version
•Lifecycle Status
•Operating System
•Line of Business
•Platform
•Location
•CSI
•Cost Center
•Contact
•Comment
Chapter 5
Managing Groups
5-7

You can add or remove properties using the Add or Remove Target Properties
button on the Define Membership Criteria page.
4. Enter the Time Zone. The time zone you select is used for scheduling operations
such as jobs and blackouts on this group. The groups statistics charts will also use
this time zone.
5. Click the Charts tab. Specify the charts that will be shown in the Dynamic Group
Charts page. By default, the commonly used charts for the target types contained
in the Dynamic Group are added.
6. Click the Columns tab to add columns and abbreviations that will be seen in the
Members page and also in the Dashboard.
7. Click the Dashboard tab to specify the parameters for the System Dashboard.
The System Dashboard displays the current status and incidents and compliance
violations associated with the members of the Dynamic Group in graphical format.
8. Click the Access tab. Use the Access page to administer access privileges for the
group. On the Access page you can grant target access to Enterprise Manager
roles and grant target access to Enterprise Manager administrators.
9. Click OK to create the Dynamic Group.
5.2.3 Adding Members to Privilege Propagating Groups
The target privileges granted on a propagating group are propagated to member
targets. The administrator grants target objects scoped to another administrator, and
the grantee maintains the same privileges on member targets. The propagating groups
maintain the following features:
•The administrator with a Create Privilege Propagating Group privilege will be able
to create a propagating group
•To add a target as a member of a propagating group, the administrator must have
Full target privileges on the target
You can add any non-aggregate target as the member of a privilege propagating
group. For aggregate targets in Cloud Control version 12c, cluster and RAC databases
and other propagating groups can be added as members. Cloud Control version 12c
supports more aggregate target types, such as redundancy systems, systems and
services.
If you are not the group creator, you must have at least the Full target privilege on the
group to add a target to the group.
5.2.4 Converting Conventional Groups to Privilege Propagating
Groups
In Enterprise Manager release 12c you can convert conventional groups to privilege
propagating groups (and vice-versa) through the use of the specified EM CLI verb.
Two new parameters have been added in the modify_group EM CLI verb:
•privilege_propagation
This parameter is used to modify the privilege propagation behavior of the group.
The possible value of this parameter is either true or false.
•drop_existing_grants
Chapter 5
Managing Groups
5-8

This parameter indicates whether existing privilege grants on that group are to be
revoked at the time of converting a group from privilege propagation to normal (or
vice versa). The possible values of this parameter are yes or no. The default value
of this parameter is yes.
These same enhancements have been implemented on the following EM CLI verbs:
modify_system, modify_redundancy_group, and modify_aggregrate_service.
The EM CLI verb is listed below:
emcli modify_group
-name="name"
[-type=<group>]
[-add_targets="name1:type1;name2:type2;..."]...
[-delete_targets="name1:type1;name2:type2;..."]...
[-privilege_propagation = true/false]
[-drop_existing_grants = Yes/No]
For more information about this verb and other EM CLI verbs, see the EM CLI
Reference Manual.
5.2.5 Viewing and Managing Groups
Enterprise Manager enables you to quickly view key information about members of a
group, eliminating the need to navigate to individual member targets to check on
availability and performance. You can view the entire group on a single screen and
drill down to obtain further details. The Group Home page provides the following
sections:
•A General section that displays the general information about the group, such as
the Owner, Group Type, and whether the group is privilege propagating. You can
drill down to the Edit Group page to enable or disable privilege propagating by
clicking on the Privilege Propagating field.
•A Status section that shows how many member targets are in Up, Down, and
Unknown states. For nested groups, this segment shows how many targets are in
up, down, and unknown states across all its sub-groups. The status roll up count is
based on the unique member targets across all sub-groups. Consequently, even if
a target appears more than once in sub-groups, it is counted only once in status
roll ups.
•An Overview of Incidents and Problems section that displays the summary of
incidents on members of the group that have been updated in the recent period of
time. It also shows a count of open problems as well as problems updated in
recent period of time.
The rolled up information is shown for all the member targets regardless of their
status. The status roll up count is based on the unique member targets across all
sub-groups. Consequently, even if a target appears more than once in sub-groups,
its alerts are counted only once in alert roll ups.
Click the number in the Problems column to go to the Incident Manager page to
search, view, and manage exceptions and issues in your environment. By using
Incident Manager, you can track outstanding incidents and problems.
•A Compliance Summary section that shows the compliance of members of the
group against the compliance standards defined for the group. This section also
Chapter 5
Managing Groups
5-9

shows a rollup of violations by severity (critical, warning, minor warning) as well as
the average compliance score(%).
•A Job Activity section that displays a summary of jobs for the targets in the group
whose start date is within the last 7 days. You can click Show to see the latest run
or all runs. Click View to select and reorder the columns that appear in the table or
to adjust scrolling and expanding the table.
•A Blackouts section that displays information about current or pending blackouts.
You can also create a blackout from this section.
•A Patch Recommendations section that displays the Oracle patch
recommendations that are applicable to your enterprise. You can view patch
recommendations by classification or target type.
You can navigate to My Oracle Support to view all recommendations by clicking
the All Recommendations link.
•An Inventory and Usage section where you can view inventory summaries for
deployments such as hosts, database installations, and fusion middleware
installations on an enterprise basis or for specific targets. You can also view
inventory summary information in the context of different dimensions. From here
you can click See Details to display the Inventory and Usage page.
•A Configuration Changes section that displays the number of configuration
changes to the group in the previous 7 days. You can click the number to display a
page that displays detailed information about the changes. Enterprise Manager
automatically collects configuration information for group targets and changes to
configurations are recorded and may be viewed from that page.
Viewing a Group
To view a group, follow these steps:
1. From the Enterprise Manager Console, choose Targets then choose Groups. A
summary table lists all defined groups.
2. Click the desired group to go to the Home page of that group.
You can use View By filters (located in the upper right corner of the home page) to
change the view of the homepage to members of targets of a specific type. When you
do this, the Group homepage refreshes to only show information for targets of that
type. Additional regions of interest might display. For example, DBAs might switch to
the Database filter to view information specifically on Database targets in the group.
You can also personalize the home page by clicking the Actions icon in the upper right
corner of each region on the home page to move that region up or down on the page.
You can also expand or contract a region by clicking the arrow icon in the upper left
corner of each region.
You can also navigate to other management operations on the group using the Group
menu. For example, you can view all the members in a group by choosing Member
from the Group menu. Likewise you can view the Membership History of the group
by choosing Membership History from the Group menu.
5.2.6 Overview of Group Charts
Group Charts enable you to monitor the collective performance of a group. Out-of-box
performance charts are provided based on the type of members in the group. For
example, when databases are part of the group, a Wait Time (%) chart is provided that
Chapter 5
Managing Groups
5-10

shows the top databases with the highest wait time percentage values. You can view
this performance information over the last 24 hours, last 7 days, or last 31 days. You
can also add your own custom charts to the page.
5.2.7 Overview of Group Members
Enterprise Manager allows you to summarize information about the member targets in
a group. It provides information on their current availability status, roll-up of open
incidents and compliance violations, and key performance metrics based on the type
of targets in the group.
You can visually assess availability and relative performance across all member
targets. You can rank members by a certain criterion (for example, database targets in
order of decreasing wait time percentage). You can display default key performance
metrics based on the targets you select, but you can customize these to include
additional metrics that are important for managing your group.
You can view the members of a group by choosing Members from the Group menu.
Enterprise Manager displays the Members page where you can view the table of
members filtered by All Members, Direct Members, or Indirect Members. Direct
members are targets directly added to the group. Indirect members are targets that are
members of a direct member target, and are automatically included into the group
because their parent target was added to the group. The page provides the option to
Export or Edit the group.
You can also access information about membership history by choosing Membership
History from the Group menu. The Membership History page displays changes in the
group membership over time.
5.2.8 Viewing Group Status History
You can view Status History for a group to see the historical availability of a member
during a specified time period or view the current status of all group members. You
can access the Status History page by choosing Monitoring from the Group menu
and then selecting Status History.
Bar graphs provide a historical presentation of the availability of group members
during a time period you select from the View Data drop-down list. The color-coded
graphs can show statuses of Up, Down, Under Blackout, Agent Down, Metric
Collection Error, and Status Pending. You can select time periods of 24 hours, 7 days,
or 31 days.
To view the current status of a member, you can click a Status icon on the View Group
Status History page to go to the Availability page, which shows the member's current
and past availability status within the last 24 hours, 7 days, or 31 days. Click a
member Name to go to the member's Home page. You can use this page as a starting
point when evaluating the performance of the selected member.
5.2.9 About the System Dashboard
The System Dashboard enables you to proactively monitor the status, incidents and
compliance violations in the group as they occur. The color-coded interface is
designed to highlight problem areas — targets that are down are highlighted in red,
metrics in critical severity are shown as red dots, metrics in warning severity are
Chapter 5
Managing Groups
5-11

shown as yellow dots, and metrics operating within normal boundary conditions are
shown as green dots.
Using these colors, you can easily determine the problem areas for any target and drill
down for details as needed. An incident table is also included to provide a summary for
all open incidents in the group. The incidents in the table are presented in reverse
chronological order to show the most recent incidents first, but you can also click any
column in the table to change the sort order. The colors in top bar of the Member
Targets table change based on the incident's critical level. The priority progresses from
warning to critical to fatal. If the group has at least one fatal incident (irrespective of
critical or warning incidents), the top bar becomes dark red. If the group has at least
one critical incident (irrespective of warning incidents), the top bar becomes faint red. If
the group has only warning incidents, the top bar turns yellow. If the group has no
incidents, the top bar remains colorless.
The Dashboard auto-refreshes based on the Refresh Frequency you set on the
Customize Dashboard page.
The Dashboard allows you to drill down for more detailed information. You can click
the following items in the Dashboard for more information:
•A target name to access the target home page
•A group or system name to access the System Dashboard
•Status icon corresponding to specific metric columns to access the metric detail
page
•Status icon for a metric with key values to access the metric page with a list of all
key values
•Dashboard header to access the group home page
•Incidents and Problems table to view summary information about all incidents or
specific categories of incidents.
Click Customize to access the Customize Dashboard page. This page allows you to
change the refresh frequency and display options for the Member Targets table at the
top of the dashboard. You can either show all individual targets or show by target type.
There is also the option to expand or contract the Incidents and Problems table at the
bottom. To change the columns shown in the Member Targets table, go to the
Columns tab of the Edit Group page which you can access by choosing Target Setup
from the Group menu.
In the Group by Target Type mode, the Dashboard displays information of the targets
based on the specific target types present in the group or system. The statuses and
incidents displayed are rolled up for the targets in that specific target type.
If you minimize the dashboard window, pertinent alert information associated with the
group or system is still displayed in the Microsoft Windows toolbar.
You can use Information Publisher reports to make the System Dashboard available to
non-Enterprise Manager users. First, create a report and include the System
Monitoring Dashboard reporting element. In the report definition, choose the option,
Allow viewing without logging in to Enterprise Manager. Once this is done, you can
view it from the Enterprise Manager Information Publisher Reports website.
Chapter 5
Managing Groups
5-12

5.3 Using Out-of-Box Reports
Enterprise Manager provides several out-of-box reports for groups as part of the
reporting framework, called Information Publisher. These reports display important
administrative information, such as hardware and operating system summaries across
all hosts within a group, and monitoring information, such as outstanding alerts and
incidents for a group.
You can access these reports from the Information Publisher Reports menu item on
the Groups menu.
See Also:
Using Information Publisher
Chapter 5
Using Out-of-Box Reports
5-13

6
Using Administration Groups
Administration groups greatly simplify the process of setting up targets for
management in Enterprise Manager by automating the application of management
settings such as monitoring settings or compliance standards. Typically, these settings
are manually applied to individual target, or perhaps semi-automatically using custom
scripts. However, by defining administration groups, Enterprise Manager uses specific
target properties to direct the target to the appropriate administration group and then
automatically apply the requisite monitoring and management settings. Any change to
the monitoring setting will be automatically applied to the appropriate targets in the
administration group. This level of automation simplifies the target setup process and
also enables a datacenter to easily scale as new targets are added to Enterprise
Manager for management.
This chapter covers the following topics:
•What is an Administration Group?
•Planning an Administrative Group
•Implementing Administration Groups and Template Collections
•Removing Administration Groups
Note:
For a video tutorials on using administration groups and template collections,
see:
Use Administration Groups and Template Collections - Part 1
https://apex.oracle.com/pls/apex/f?
p=44785:24:6424795248965:::24:P24_CONTENT_ID%2CP24_PREV_PAGE:5732%2C24
Use Administration Groups and Template Collections - Part 2
https://apex.oracle.com/pls/apex/f?
p=44785:24:15101831740469:::24:P24_CONTENT_ID%2CP24_PREV_PAGE:5733%2C24
6.1 What is an Administration Group?
Administration groups are a special type of group used to fully automate application of
monitoring and other management settings targets upon joining the group. When a
target is added to the group, Enterprise Manager applies these settings using a
template collection consisting of monitoring templates, compliance standards, and
cloud policies. This completely eliminates the need for administrator intervention. The
following illustration demonstrates the typical administration group workflow:
6-1
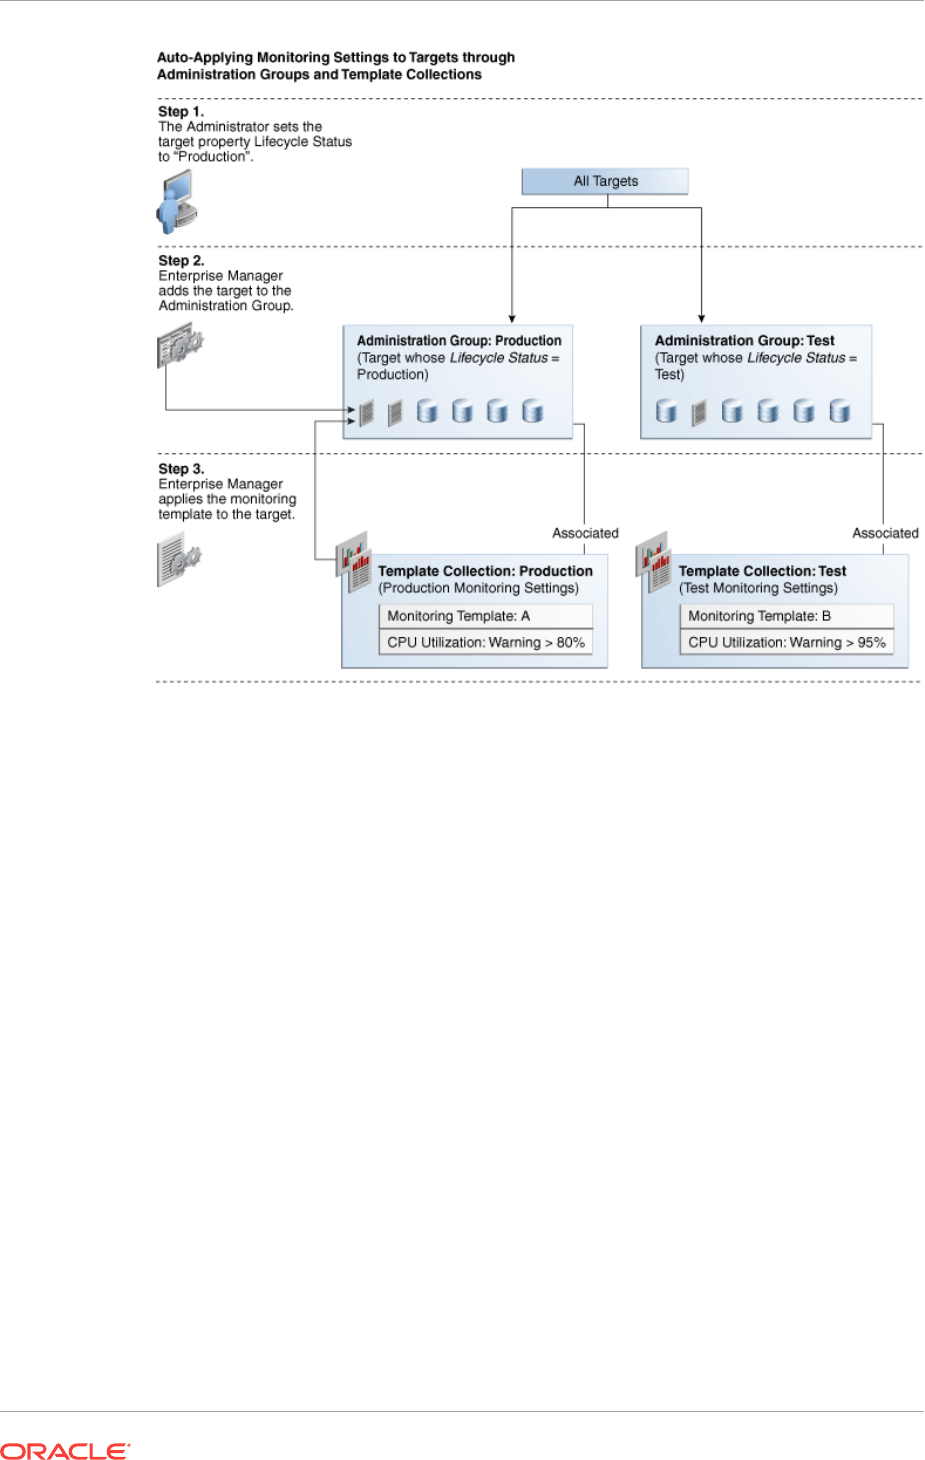
The first step involves setting a target's Lifecycle Status property when a target is first
added to Enterprise Manager for monitoring. At that time, you determine where in the
prioritization hierarchy that target belongs; the highest level being "mission critical" and
the lowest being "development."Target Lifecycle Status prioritization consists of the
following levels:
•Mission Critical (highest priority)
•Production
•Stage
•Test
•Development (lowest priority)
As shown in step two of the illustration, once Lifecycle Status is set, Enterprise Manger
uses it to determine which administration group the target belongs.
In order to prevent different monitoring settings to be applied to the same target,
administration groups were designed to be mutually exclusive with other administration
groups in terms of group membership. Administration groups can also be used for
hierarchically classifying targets in an organization, meaning a target can belong to at
most one administration group. This also means you can only have one administration
group hierarchy in your Enterprise Manager deployment.
For example, in the previous illustration, you have an administration group hierarchy
consisting of two subgroups: Production targets and Test targets, with each subgroup
having its own template collections. In this example, the Production group inherits
Chapter 6
What is an Administration Group?
6-2

monitoring settings from monitoring template A while targets in the Test subgroup
inherit monitoring settings from monitoring template B.
6.1.1 Developing an Administration Group
In order to create an administration group, you must have both Full Any Target and
Create Privilege Propagating Group target privileges.
Developing an administration group is performed in two phases:
•Planning
–Plan your administration group hierarchy by creating a group hierarchy in a
way reflects how you monitor your targets.
–Plan the management settings associated with the administration groups in
the hierarchy.
*Management settings: Monitoring settings, Compliance standard settings,
Cloud policy settings
*For Monitoring settings, you can have additional metric settings or
override metric settings lower in your hierarchy
*For Compliance standards or Cloud policies, additional rules/policies lower
in the hierarchy are additive
•Implementation
–Enter the group hierarchy definition and management settings in Enterprise
Manager.
*Create the administration group hierarchy.
*Create the monitoring templates, compliance standards, cloud policies
and add these to template collections.
*Associate template collections with administration groups.
*Add targets to the administration group by assigning the appropriate
values to the target properties such that Enterprise Manager automatically
adds them to the appropriate administration group.
6.2 Planning an Administrative Group
As with any management decision, the key to effective implementation is planning and
preparation. The same holds true for administration groups.
Step 1: Plan Your Group Hierarchy
You can only have one administration group hierarchy in your Enterprise Manager
deployment, thus ensuring that administration group member targets can only directly
belong to one administration group. This prevents monitoring conflicts from occurring
as a result of having a target join multiple administration groups with different
associated monitoring settings.
To define the hierarchy, you want to think about the highest (root) level as consisting
of all targets that have been added to Enterprise Manager. Next, think about how you
want to divide your targets along the lines of how they are monitored, where targets
that are monitored in one way are in one group, and targets that are monitored in
another way are part of another group. For example, Production targets might be
Chapter 6
Planning an Administrative Group
6-3
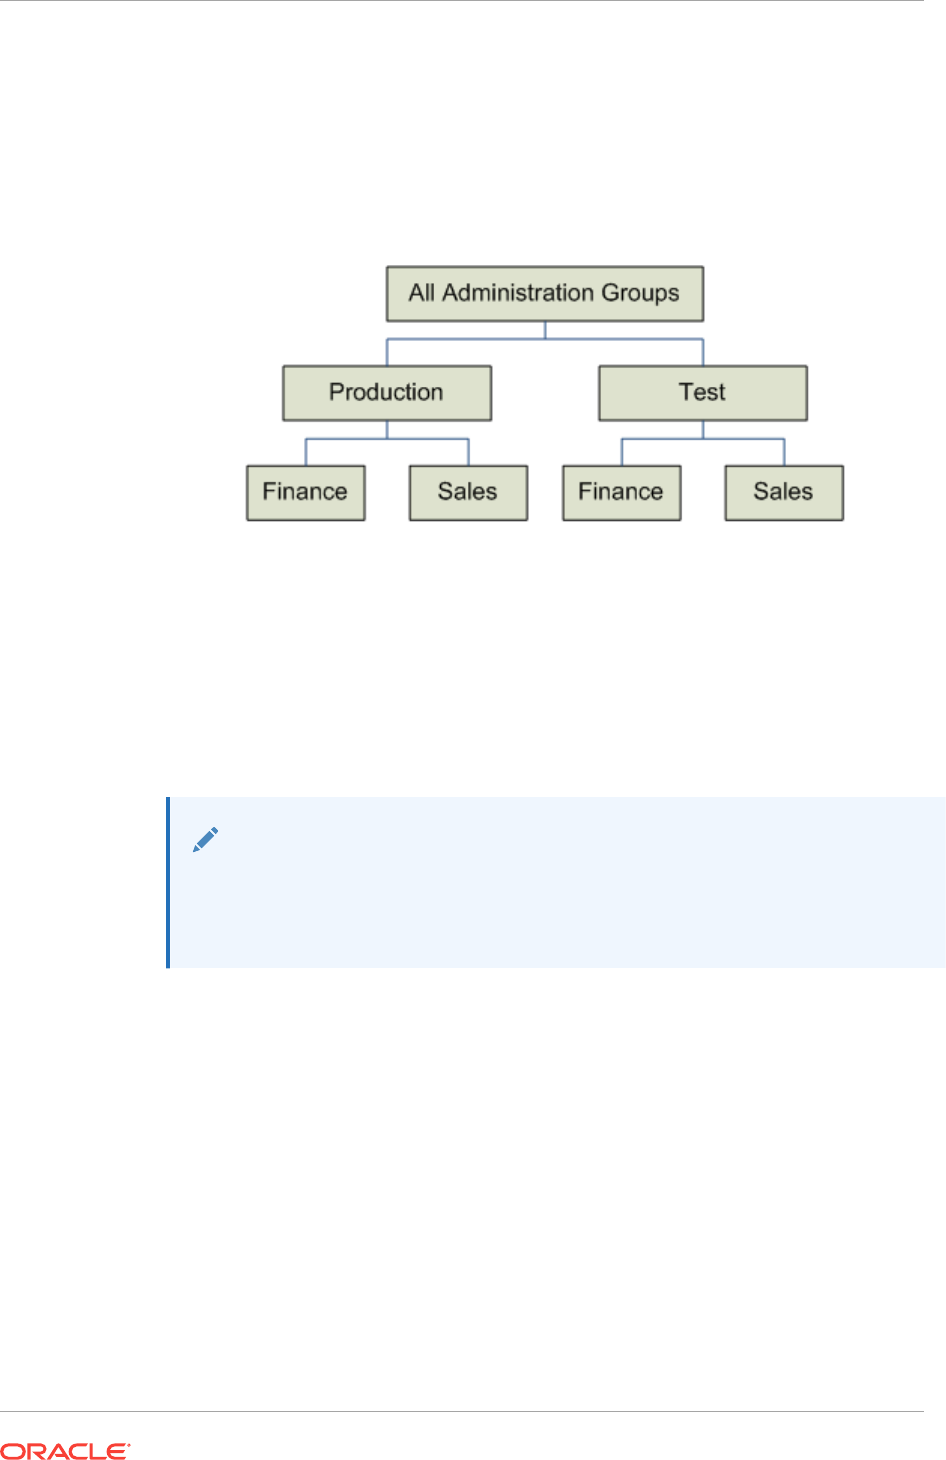
monitored one way and Test targets might be monitored in another way. You can
further divide individual groups if there are further differences in monitoring. For
example, your Production targets might be further divided based on the line of
business they support because they might have additional metrics that need to be
monitored for that line of business. Eventually, you will end up with a hierarchy of
groups under a root node.
The attributes used to define each level of grouping and thus the administration group
membership criteria are based on global target properties as well as user-defined
target properties. These target properties are attributes of every target and specify
operational information within the organization. For example, location, line of business
to which it belongs, and lifecycle status. The global target properties that can be used
in the definition of administration groups are:
•Lifecycle Status
Note:
Lifecycle Status target property is of particular importance because it denotes
a target's operational status. Lifecycle Status can be any of the following:
Mission Critical, Production, Staging, Test, or Development.
•Location
•Line of Business
•Department
•Cost Center
•Contact
•Platform
•Operating System
•Target Version
•Customer Support Identifier
•Target Type (Allowed but not a global target property.)
Chapter 6
Planning an Administrative Group
6-4

You can create custom user-defined target properties using the EM CLI verbs
add_target_property and set_target_property_value. See the Oracle Enterprise
Manager Command Line Interface Guide for more information.
You cannot manually add targets to an administration group. Instead, you set the
target properties of the target (prospective group member) to match the membership
criteria defined for the administration group. Once the target properties are set,
Enterprise Manager automatically adds the target to the appropriate administration
group.
Target Properties Master List
To be used with administration group (and dynamic groups), target properties must be
specified in a uniformly consistent way by all users in your managed environment. In
addition, you may want to limit the list of target property values that can be defined for
a given target property value. To accomplish this, Enterprise Manager lets you define
a target properties master list. When a master list is defined for a specific target type, a
drop-down menu containing the predefined property values appears in place of a text
entry field on a target's target properties page. You use the following EM CLI verbs to
manage the master properties list:
•use_master_list: Enable or disable a master list used for a specified target a
property.
•add_to_property_master_list: Add target property values to the master list for a
specified property.
•delete_from_property_master_list: Delete values from the master list for
specified property.
•list_property_values: List the values for a property's master list
•list_targets_having_property_value: Lists all targets with the specified property
value for this specified property name.
•rename_targets_property_value: Changes the value of a property for all targets.
For more information about the master list verbs, see the Oracle Enterprise Manager
Command Line Interface Guide. Note: You must have Super Administrator privileges
in order to define/maintain the target properties master list.
Enterprise Manager Administrators and Target Properties
When creating an Enterprise Manager administrator, you can associate properties
such as Contact, Location, and Description. However, there are additional resource
allocation properties that can be associated with their profile. These properties are:
•Department
•Cost Center
•Line of Business
It is important to note that these properties are persistent--when associated with an
administrator, the properties (which mirror, in part, the target properties listed above)
are automatically passed to any targets that are discovered or created by the
administrator.
Example
In the following administration group hierarchy, two administration groups are created
under the node Root Administration Group, Production and Test, because monitoring
settings for production targets will differ from the monitoring settings for test targets.
Chapter 6
Planning an Administrative Group
6-5
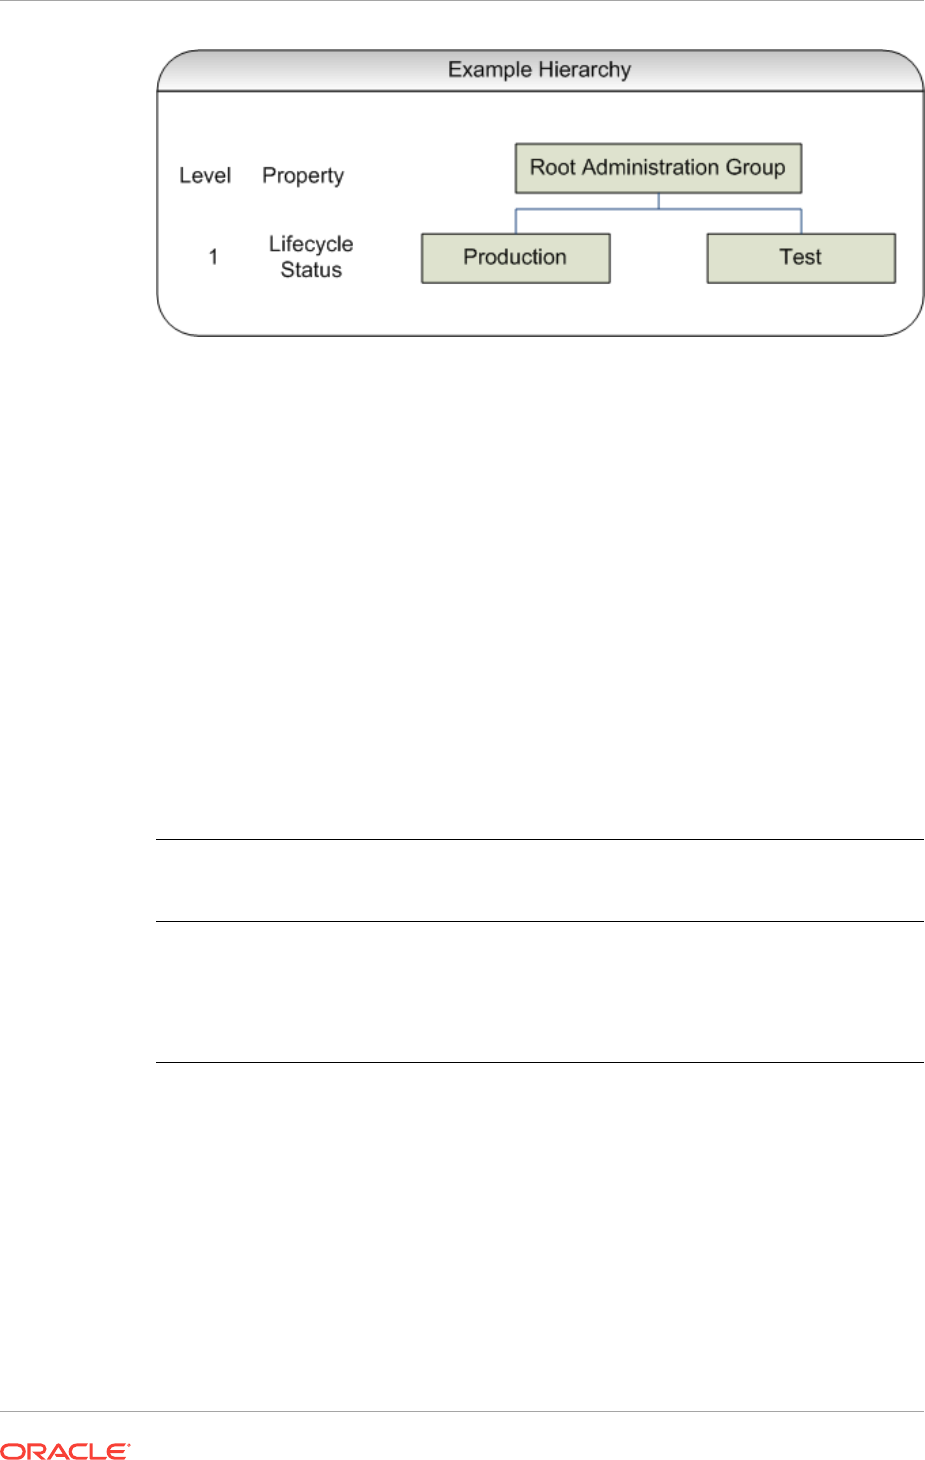
In this example, the group membership criteria are based on the Lifecycle Status
target property. Targets whose Lifecycle Status is 'Production' join the Production
group and targets whose Lifecycle Status is 'Test' join the Test group. For this reason,
Lifecycle Status is the target property that determines the first level in the
administration group hierarchy. The values of Lifecycle Status property determine the
membership criteria of the administration groups in the first level: Production group
has membership criteria of "Lifecycle Status = Production" and Test group has
membership criteria of "Lifecycle Status = Test' membership criteria.
Additional levels in the administration group hierarchy can be added based on other
target properties. Typically, additional levels are added if there are additional
monitoring (or management) settings that need to be applied and these could be
different for different subsets of targets in the administration group. For example, in the
Production group, there could be additional monitoring settings for targets in Finance
line of business that are different from targets in Sales line of business. In this case, an
additional level based on Line of Business target property level would be added.
The end result of this hierarchy planning exercise is summarized in the following table.
Root Level (First Row) Level 1 target property
(second row)
Lifecycle Status
Level 2 target property
(third row)
Line of Business
Root Administration Group Production or Mission Critical Finance
_ _ Sales
_ Staging or Test or
Development
Finance
_ _ Sales
Each cell of the table represents a group. The values in each cell represent the values
of the target property that define membership criteria for the group.
It is possible to have the group membership criteria be based on more than one target
property value. In that case, any target whose target property matches any of the
values will be added to the group. For example, in the case of the Production group, if
the Lifecycle Status of a target is either Production or Mission Critical, then it will be
added to the Production group.
It is also important to remember that group membership criteria is cumulative. For
example, for the Finance group under Production or Mission Critical group, a target
must have its Lifecycle Status set to Production or Mission Critical AND its Line of
Business set to Finance before it can join the group. If the target has its Lifecycle
Chapter 6
Planning an Administrative Group
6-6
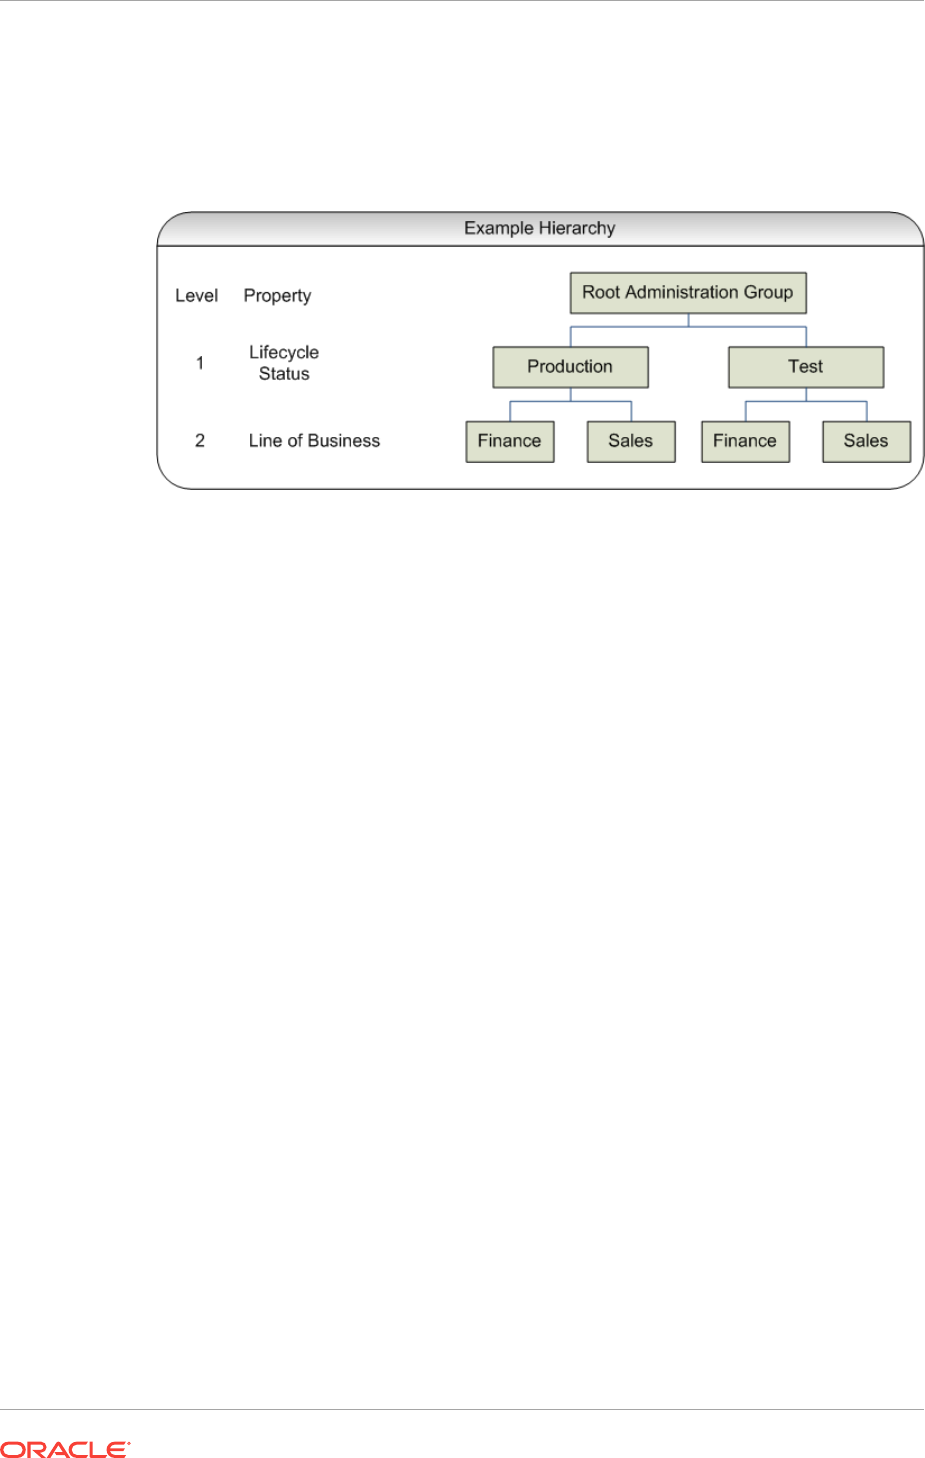
Status set to Production but does not have its Line of Business set to Finance or
Sales, then it does not join any administration group.
For this planning example, the resulting administration group hierarchy would appear
as shown in the following graphic.
It is important to note that a target can become part of hierarchy if and only if its
property values match criteria at both the levels. A target possessing matching values
for lifecycle status cannot become member of the administration group at the first
level. Also, all targets in the administration group hierarchy will belong to the lowest
level groups.
Step 2: Assign Target Properties
After establishing the desired administration group hierarchy, you must make sure
properties are set correctly for each target to ensure they join the correct
administration group. Using target properties, Enterprise Manager automatically places
targets into the appropriate administration group without user intervention. For targets
that have already been added to Enterprise Manager, you can also set the target
properties via the console or using the EM CLI verb set_target_property_value, See
the Oracle Enterprise Manager Command Line Interface Guide for more information.
Note that when running set_target_property_value, any prior values of the target
property are overwritten. If you set target properties before hierarchy creation, it will
join the group after it is created. The targets whose properties are set using EM CLI
will automatically join their appropriate administration groups. Target properties can,
however, be set after the administration group hierarchy is created.
For small numbers of targets, you can change target properties directly from the
Enterprise Manager console.
1. From an Enterprise Manager target's option menu, select Target Setup, then
select Properties.
Chapter 6
Planning an Administrative Group
6-7
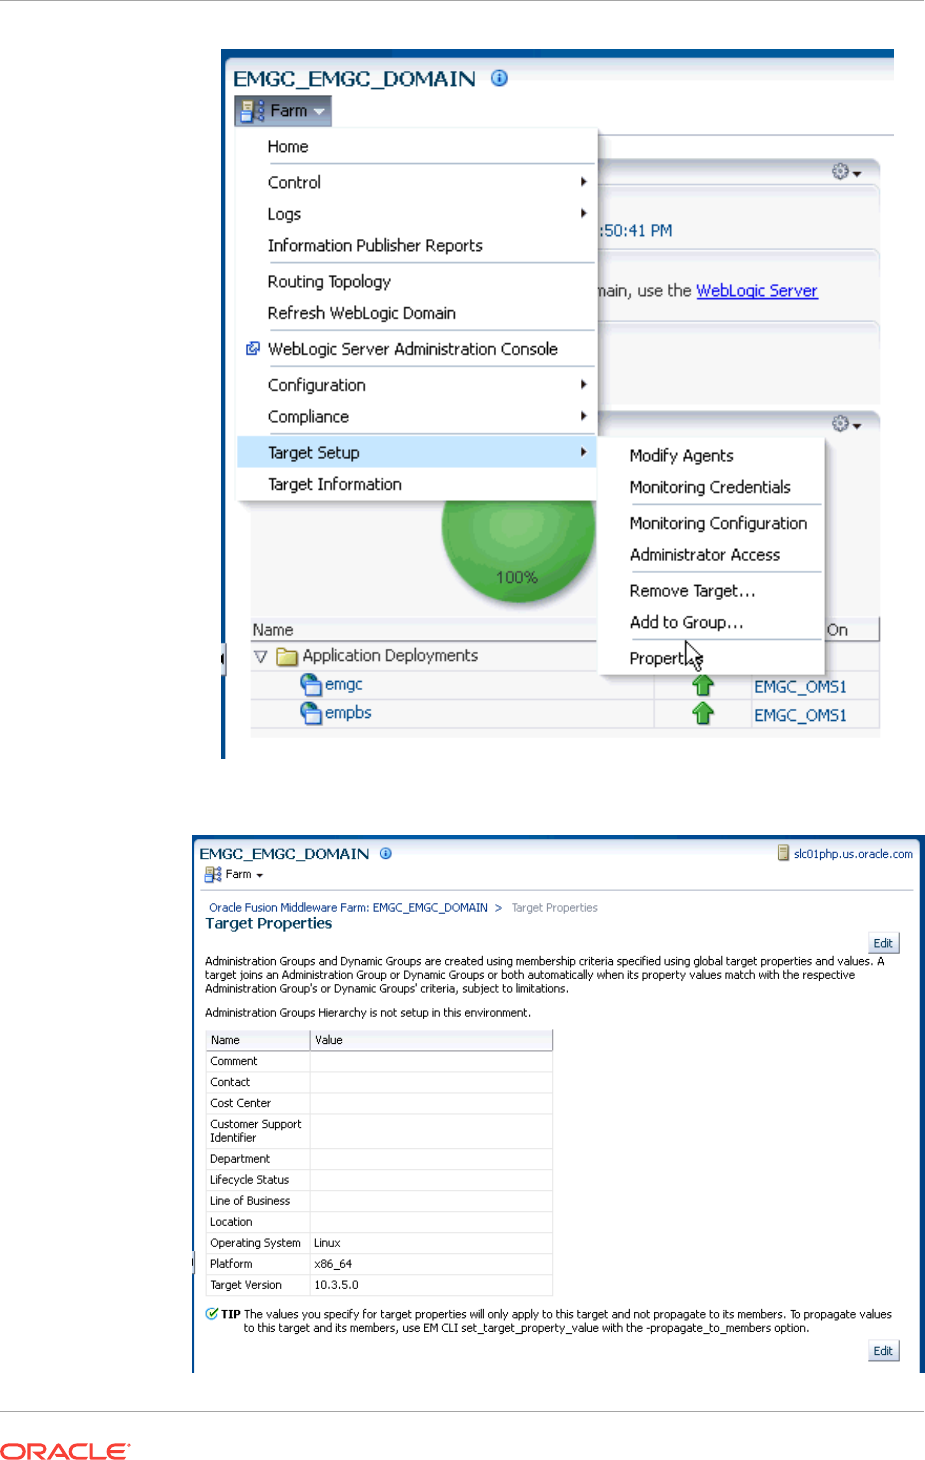
2. On the Target Properties page, click Edit to change the property values.
Chapter 6
Planning an Administrative Group
6-8

To help you specify the appropriate target property values used as administration
group criteria, pay attention to the instructional verbiage at the top of the page.
3. Once you have set the target properties, click OK.
For large numbers of targets, it is best to use the Enterprise Manager Command Line
Interface (EM CLI)
set_target_property_value
verb to perform a mass update. For
more information about this EM CLI verb, see the Enterprise Manager Command Line
Interface guide.
Administration groups are privilege-propagating: Any privilege that you grant on the
administration group to a user (or role) automatically applies to all members of the
administration group. For example, if you grant Operator privilege on the Production
administration group to a user or role, then the user or role automatically has Operator
privileges on all targets in the administration group. Because administration groups are
always privilege propagating, any aggregate target that is added to an administration
group must also be privilege propagating.
Note:
An aggregate target is a target containing other member targets. For example,
a Cluster Database (RAC) is an aggregate target has RAC instances.
A good example of aggregate target is the Privilege Propagating Group. See
"Managing Groups" for more information.
At any time, you can use the All Targets page to view properties across all targets. To
view target properties:
1. From the Targets menu, select All Targets to display the All Targets page.
2. From the View menu, select Columns, then select Show All.
3. Alternatively, if you are interested in specific target properties, choose Columns
and then select Show More Columns.
Step 3: Prepare for Creating Template Collections
Template collections contain the monitoring settings and other management settings
that are meant to be applied to targets as they join the administration group.
Monitoring settings for targets are defined in monitoring templates. Monitoring
templates are defined on a per target type basis, so you will need to create monitoring
templates for each of the different target types in your administration group. You will
most likely create multiple monitoring templates to define the appropriate monitoring
settings for an administration group. For example, you might create a database
Monitoring template containing the metric settings for your production databases and a
separate monitoring template containing the settings for your non-production
databases. Other management settings that can be added to a template collection
include Compliance Standards and Cloud Policies. Ensure all of these entities that you
want to add to your template collection are correctly defined in Enterprise Manager
before adding them to template collections.
If you have an administration group hierarchy defined with more than two levels, such
as the hierarchy shown in the following figure, it is important to understand how
management settings are applied to the targets in the administration group.
Chapter 6
Planning an Administrative Group
6-9
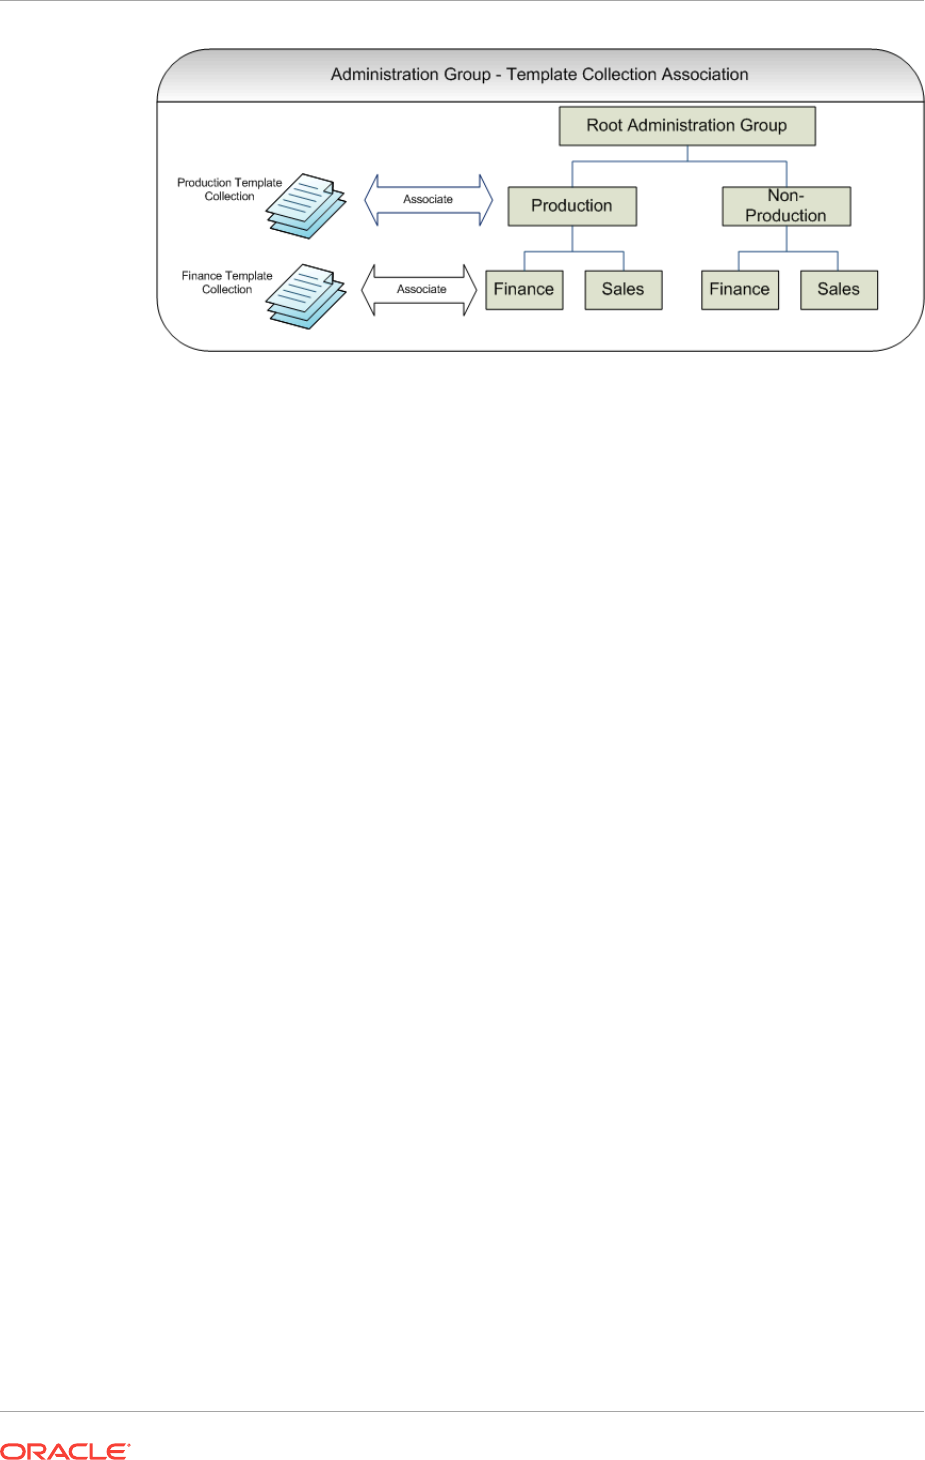
Each group in the administration group hierarchy can be associated with a template
collection (containing monitoring templates, compliance standards, and cloud policies).
If you associate a template collection containing monitoring settings with the
Production group, then the monitoring settings will apply to the Finance and Sales
subgroup under Production. If the Finance group under Production has additional
monitoring settings, then you can create a monitoring template with only those
additional monitoring settings. (Later, this monitoring template should be added to
another template collection and associated with the Finance group). The monitoring
settings from the Finance Template Collection will be logically combined with the
monitoring settings from the Production Template Collection. In case there are
duplicate metric settings in both template collections, then the metric settings from the
Finance Template Collection takes precedence and will be applied to the targets in the
Finance group. This precedence rule only applies to the case of metric settings. In the
case of compliance standard rules and cloud policies, even if there are duplicate
compliance standard rules and cloud policies in both template collections, they will be
all applied to the targets in the Finance group.
Once you have completed all the planning and preparation steps, you are ready to
begin creating an administration group.
6.3 Implementing Administration Groups and Template
Collections
With the preparatory work complete, you are ready to begin the four step process of
creating an administration group hierarchy and template collections. The
administration group user interface is organized to guide you through the creation
process, with each tab containing the requisite operations to perform each step.
This process involves:
1. Creating the administration group hierarchy.
2. Create monitoring templates.
3. Creating template collections.
4. Associating template collections to administration group.
5. Synchronizing the targets with the selected items.
Chapter 6
Implementing Administration Groups and Template Collections
6-10
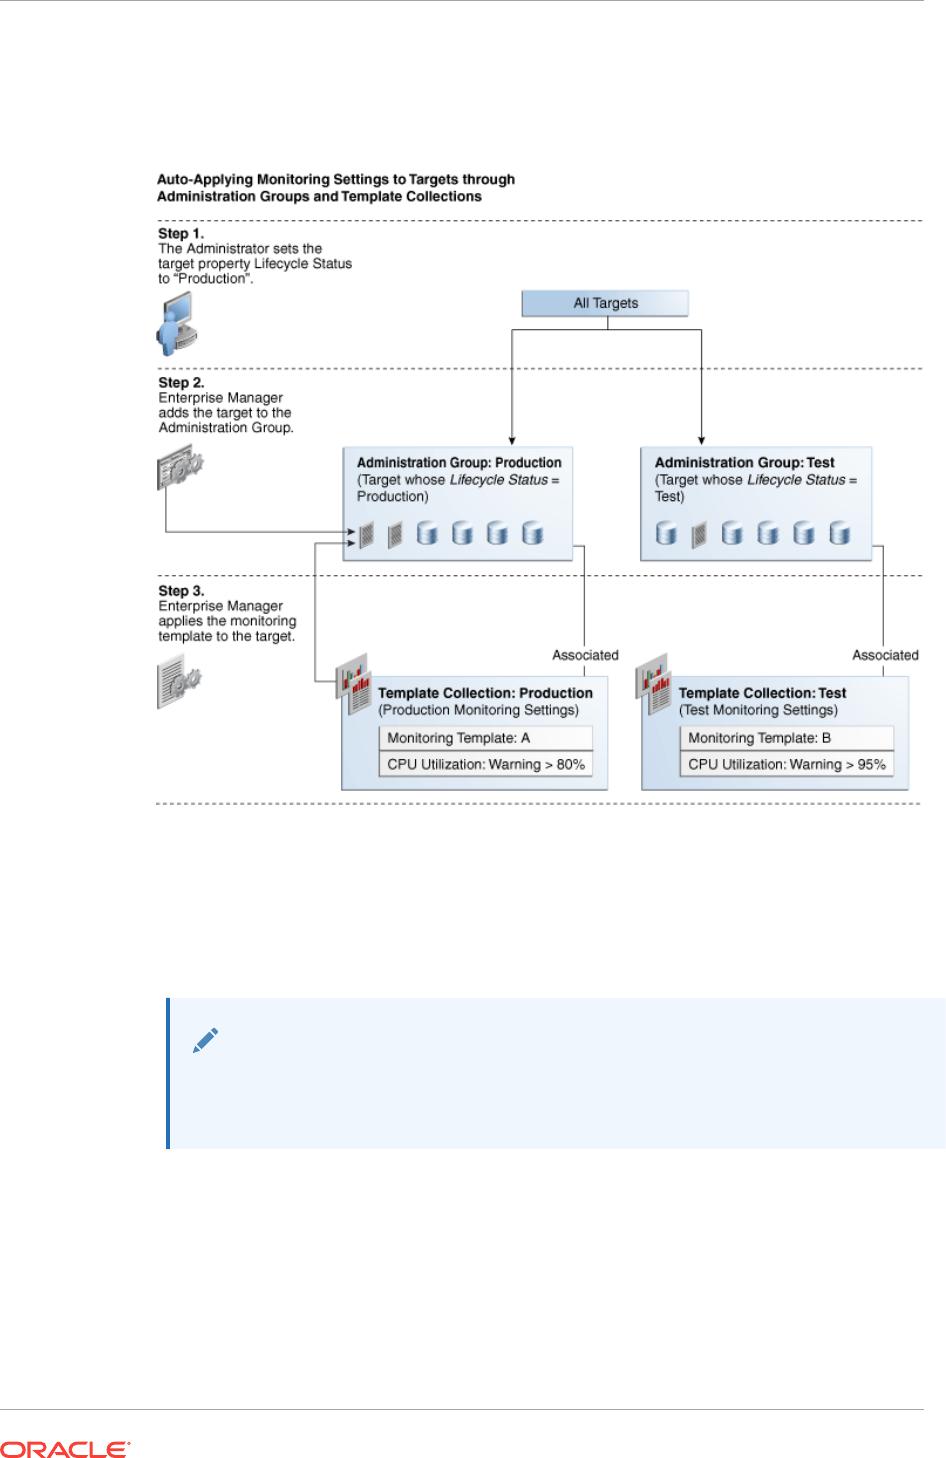
The following graphic shows a completed administration group hierarchy with
associated template collections. It illustrates how Enterprise Manager uses this to
automate the application of target monitoring settings.
6.3.1 Creating the Administration Group Hierarchy
The following four primary tasks summarize the administration group creation process.
These tasks are conveniently arranged in sequence via tabbed pages.
Note:
In order to create the administration group hierarchy, you must have both Full
Any Target and Create Privilege Propagating Group target privileges.
Task 1: Access the Administration Group and Template Collections page.
Task 2: Define the hierarchy.
From the Hierarchy tab, you define the administration group hierarchy that matches
the way you manage your targets. See Defining the Hierarchy.
Task 3: Define the Template Collections.
Chapter 6
Implementing Administration Groups and Template Collections
6-11
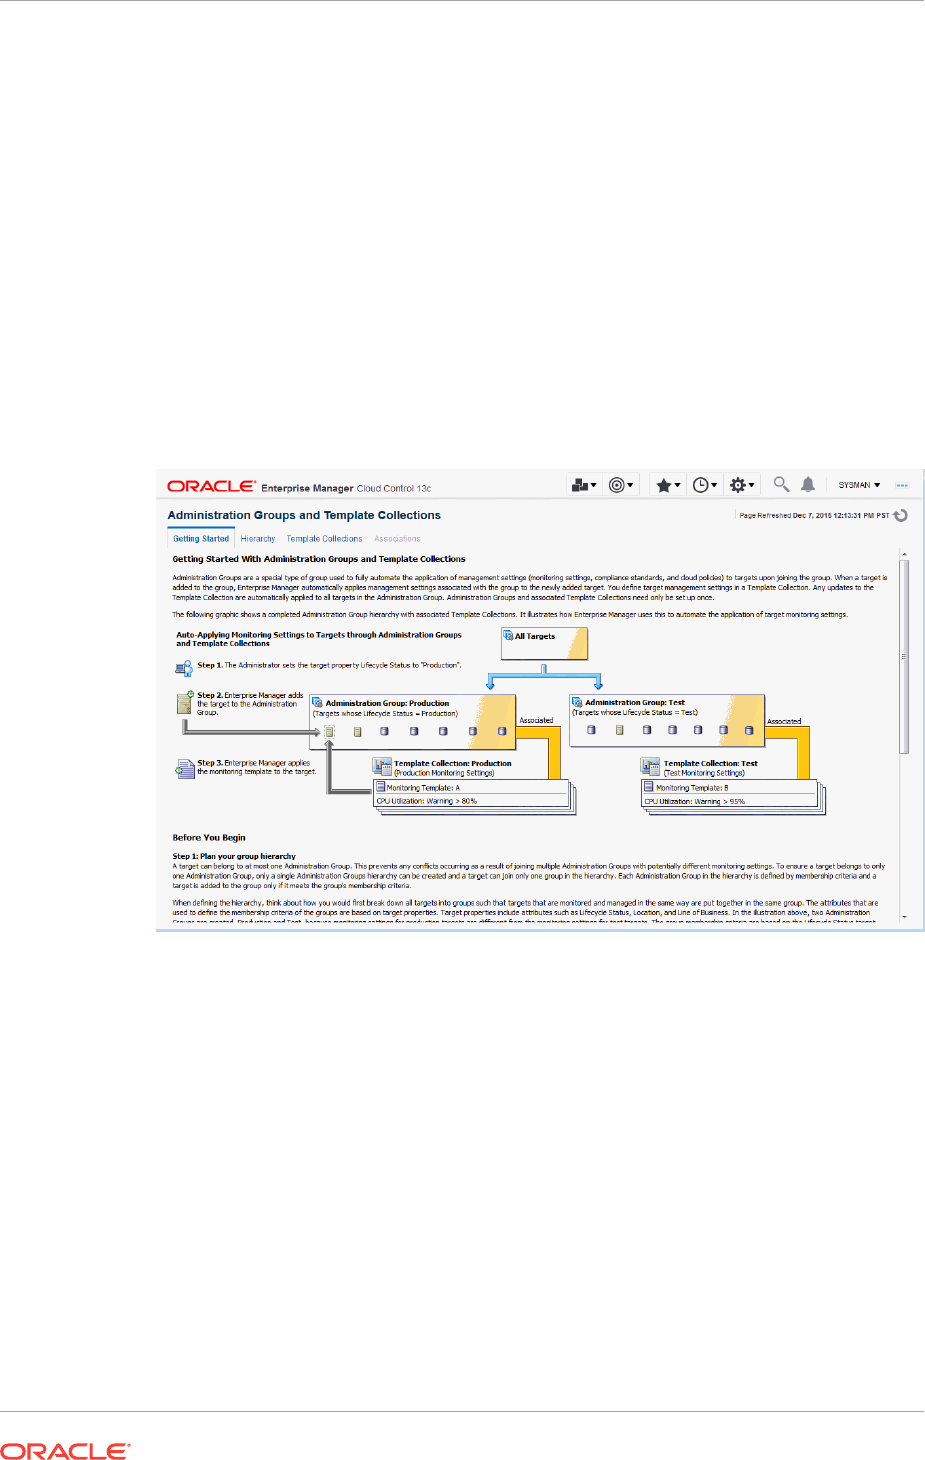
From the Template Collections tab, you define the monitoring and management
settings you want applied to targets. See Defining Template Collections.
Task 4: Associate the Template Collections with the Administration Group.
From the Associations tab, you tie the monitoring and management settings to the
appropriate administration group. See Associating Template Collections with
Administration Groups.
6.3.2 Accessing the Administration Group Home Page
All administration group operations are performed from the Administration Groups
home page.
From the Setup menu, select Add Target and then select Administration Groups.
The Administration Groups home page displays.
Read the relevant information on the Getting Started page. The information contained
in this page summarizes the steps outlined in this chapter. For your convenience, links
are provided that take you to appropriate administration group functions, as well as the
Enterprise Manager All Targets page where you can view target properties.
6.3.3 Defining the Hierarchy
On this page you define the administration group hierarchy that reflects the
organizational hierarchy you planned earlier and which target properties are
associated with a particular hierarchy level.
On the left side of the page are two tables: Hierarchy Levels and Hierarchy Nodes.
Chapter 6
Implementing Administration Groups and Template Collections
6-12
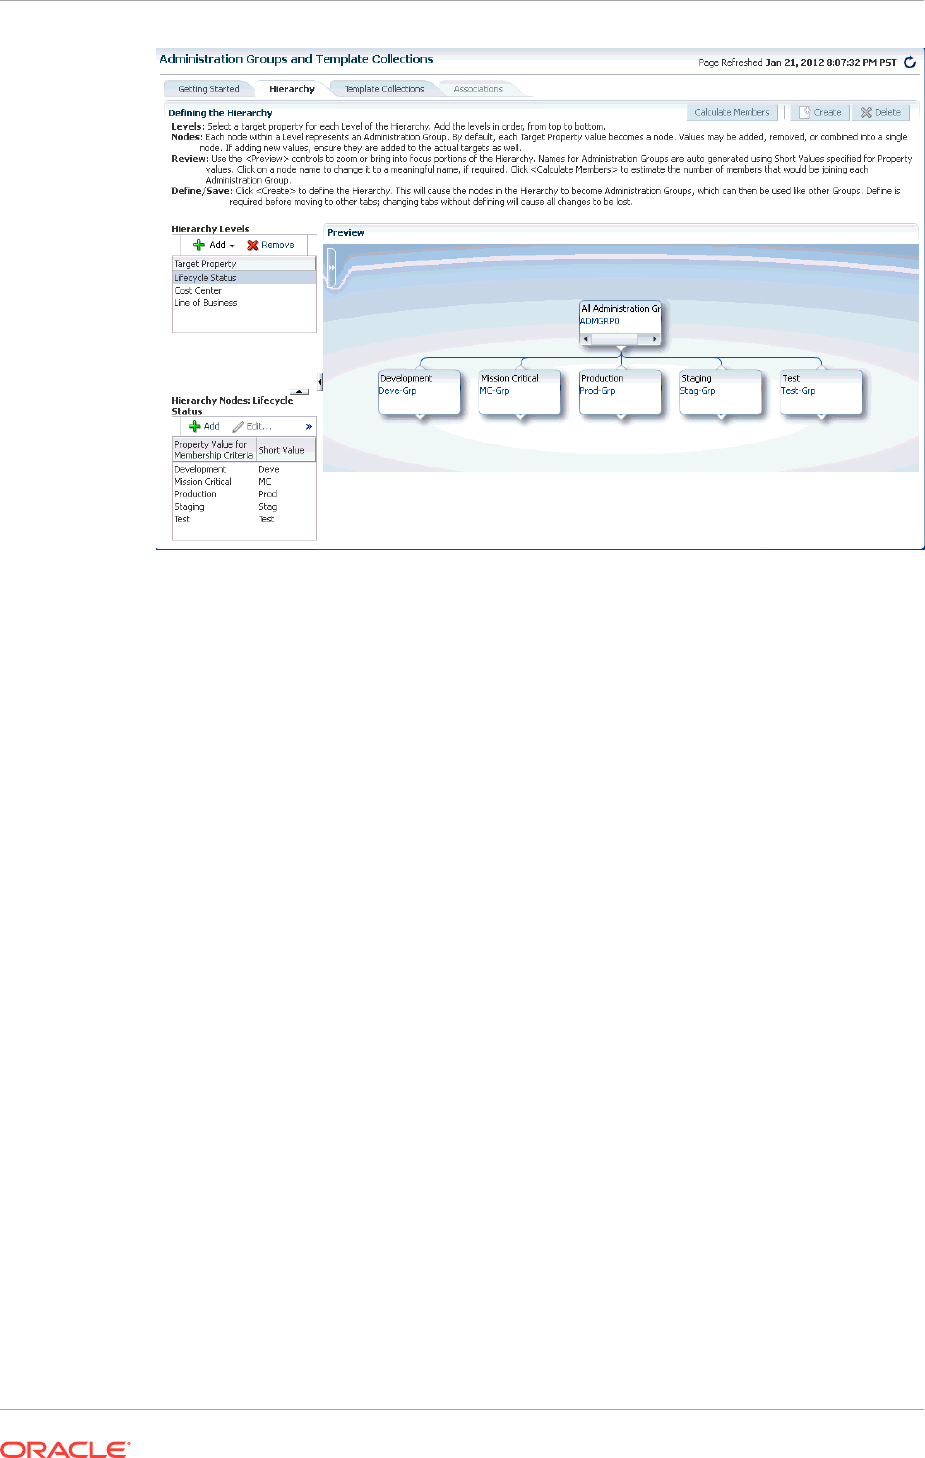
The Hierarchy Levels table allows you to add the target properties that define
administration group hierarchy. The Hierarchy Nodes table allows you to define the
values associated with the target properties in the Hierarchy Levels table. When you
select a target property, the related property values are made available in the
Hierarchy Nodes table, where you can add/remove/merge/split the values. In the
Hierarchy Nodes table, each row corresponds to a single administration group. The
Short Value column displays abbreviated value names that are used to auto-generate
group names.
The Hierarchy Levels table allows you to add the target properties that define each
level in the administration group hierarchy. The Hierarchy Nodes table allows you to
define the values associated with the target properties in the Hierarchy Levels table.
Each row in the Hierarchy Nodes table will correspond to a node or group in the
administration group hierarchy for that level. When you select a target property in the
Hierarchy Levels table, the related property values are made available in the
Hierarchy Nodes table, where you can add/remove/merge/split the values. Merge two
or more values if either value should be used as membership criteria for the
corresponding administration group. The Short Value column displays abbreviated
value names that are used to auto-generate group names.
Adding a Hierarchy Level
1. On the Administration Group page, click the Hierarchy tab.
2. From the Hierarchy Levels table, click Add and choose one of the available
target properties. You should add one property/level at a time instead of all
properties at once.
3. With the target property selected in the Hierarchy Levels table, review the list of
values shown in the Hierarchy Nodes table. The values of the target property in
the Hierarchy Nodes table.
Enterprise Manager finds all existing values of the target property across all
targets and displays them in the Hierarchy Nodes table. For some target
Chapter 6
Implementing Administration Groups and Template Collections
6-13

properties, such as Lifecycle Status, predefined property values already exist and
are automatically displayed in the Hierarchy Nodes table. You can select and
remove target property values that will not be used as membership criteria in any
administration group. However, property values that are not yet available but will
be used as administration group membership criteria, will need to be added.
The next step shows you how to add property values.
4. From the Hierarchy Nodes table, click Add. The associated property value add
dialog containing existing values from various targets displays. Add the requisite
value(s). Multiple values can be specified using a comma separated list. For
example, to add multiple locations such as San Francisco and Zurich, add the
Location target property to the Hierarchy Level table. Select Location and then
click Add in the Hierarchy Nodes table. The Values for Hierarchy Nodes dialog
displays. Enter "San Francisco,Zurich" as shown in the following graphic.
Extending Administration Group Hierarchy Maximum Limits
There is a default maximum for the number of values that can be supported for a
target property as administration group criteria. If you see a warning message
indicating that you have reached this maximum value, you can extend it using the
OMS property admin_groups_width_limit. Specify the maximum number of values
that should be supported for a target property. For example, to support up to 30
values for a target property that will be used in administration group criteria, set
the admin_groups_width_limit as follows (using the OMS
emctl
utility):
emctl set property -name admin_groups_width_limit -value 30 -module emoms
You can also add up to four levels after the root node of an administration group
hierarchy. If there is a need to add additional level, you will first need to change
the OMS admin_groups_height_limit property to the maximum height limit. For
example, if you want to create to administration group hierarchy consisting of five
levels after the root node, set the admin_groups_height_limit property as follows
(using the OMS emctl utility):
emctl set property -name admin_groups_height_limit -value 5 -module emoms
This is a global property and only needs to be set once using the emctl utility of
any OMS. This is also a dynamic property and does not require a stop/restart of
the OMS in order to take effect.
Click OK. The two locations "San Francisco" and "Zurich" appear as nodes in the
Preview pane as shown in the following graphic.
Chapter 6
Implementing Administration Groups and Template Collections
6-14
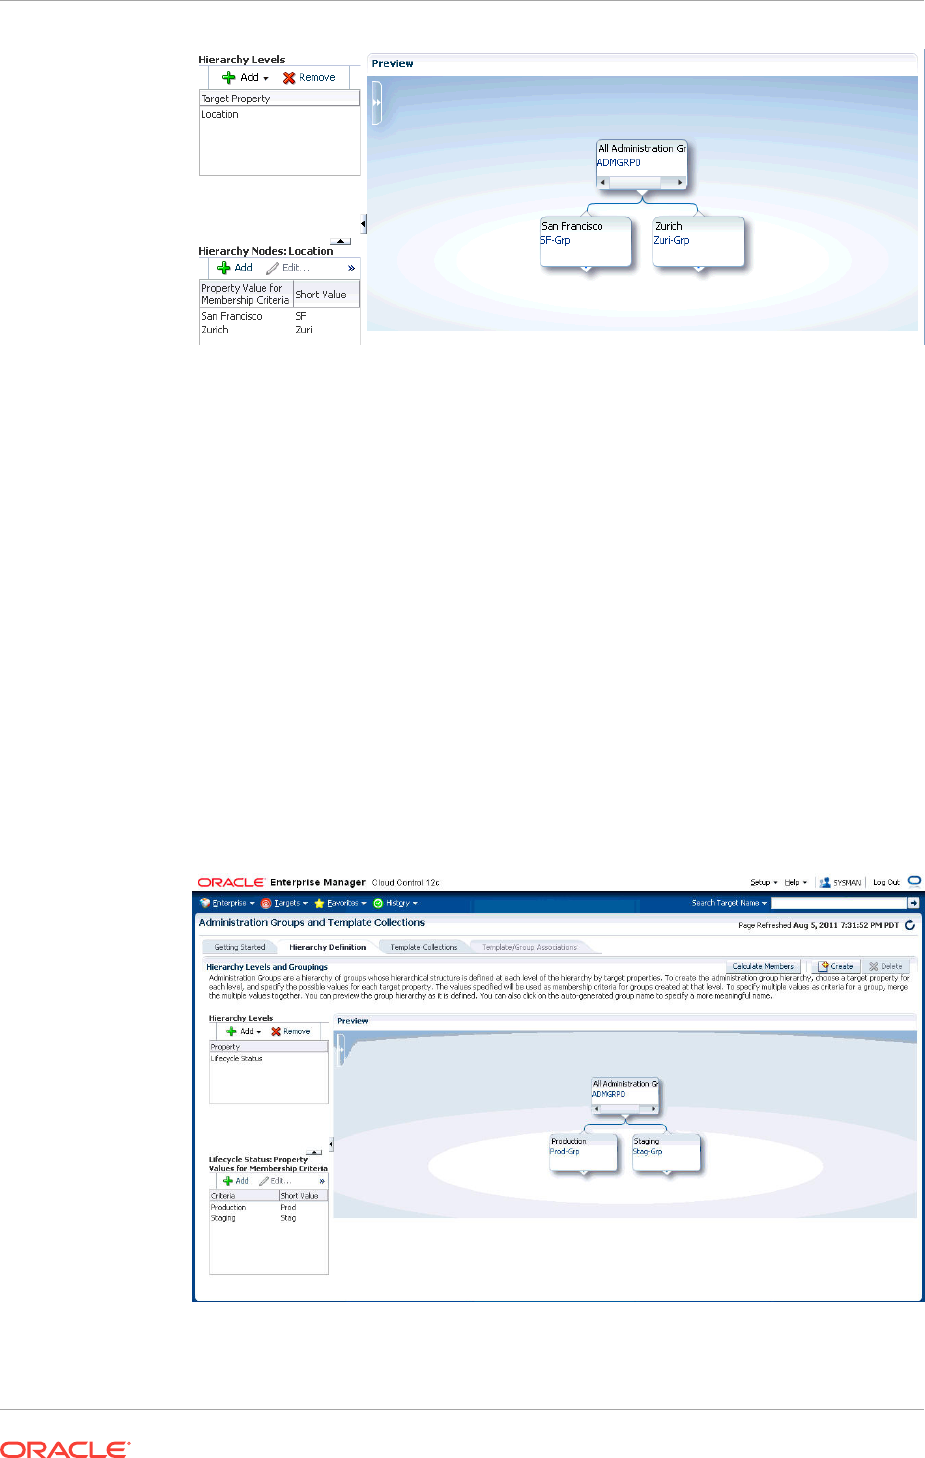
Under certain circumstances, it may be useful to treat multiple property values as
one: Targets may have different target property values, but should belong to the
same administration group because they have same monitoring profile/settings.
For example, if a combination of values is needed, such as Production or Mission
Critical for the Lifecycle Status property, they need to be merged (combined into a
single node).
To merge property values:
a. Select a target property from the list of chosen properties in the Hierarchy
Levels table. The associated property values are displayed.
b. Select two or more property values by holding down the Shift key and clicking
on the desired values.
c. Click Merge.
5. Continue adding hierarchy levels until the group hierarchy is complete. The
Preview pane dynamically displays any changes you make to your administration
group hierarchy.
6. Set the time zone for the group.
Chapter 6
Implementing Administration Groups and Template Collections
6-15
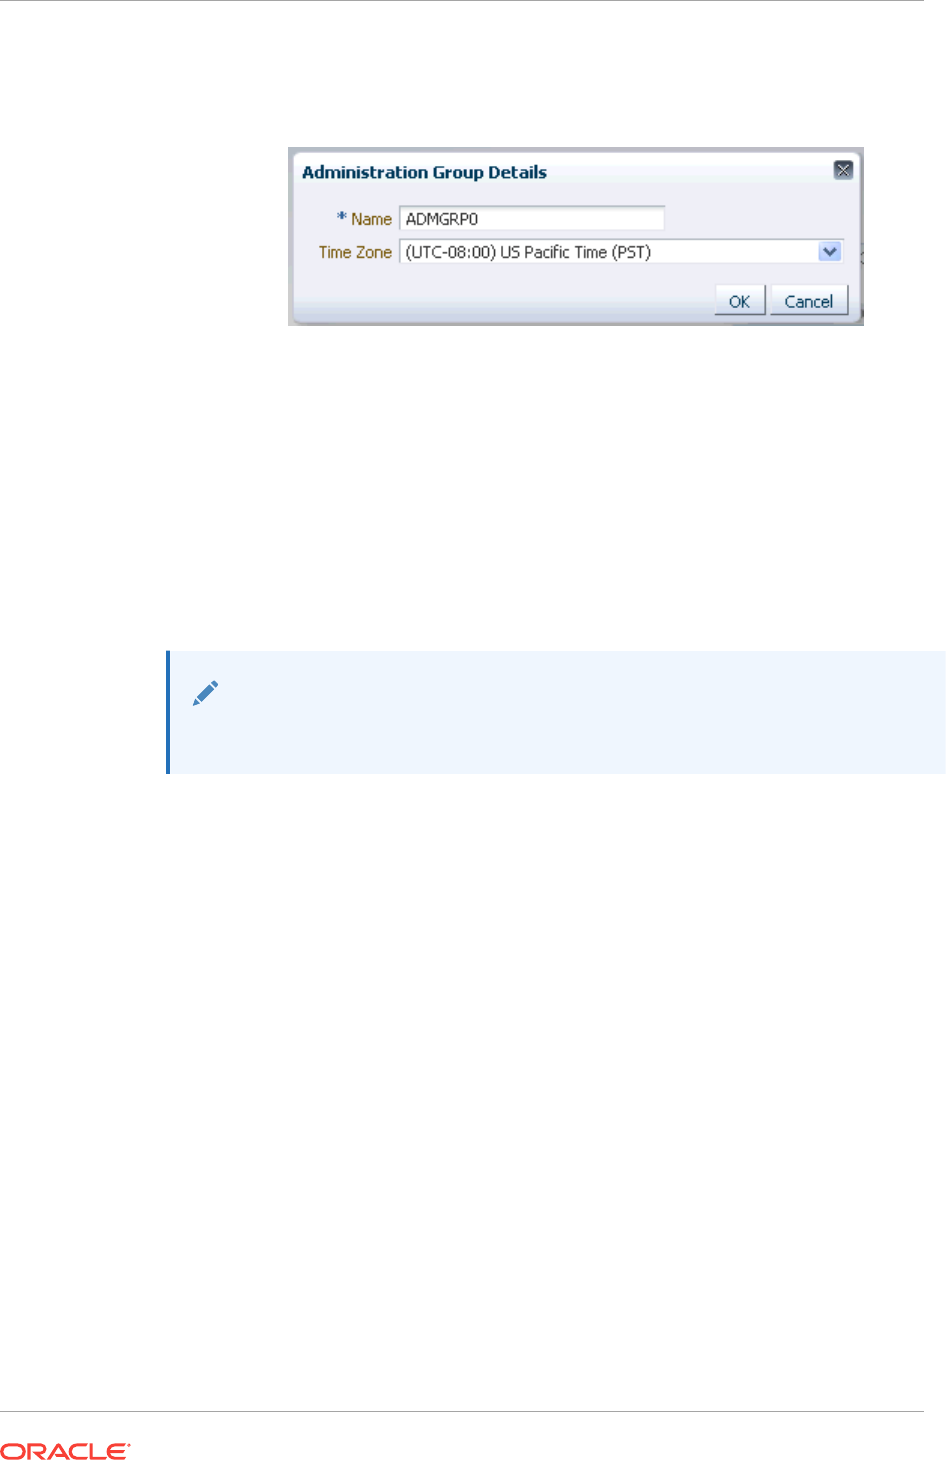
a. Click on the group name. The Administration Group Details dialog displays
allowing you to select the appropriate time zone.
The administration group time zone is used for displaying group charts and
also for scheduling operations on the group. Because this is also the default
time zone for all subgroups that may be created under this group, you should
specify the time zone at the highest level group in the administration group
hierarchy before the subgroups are created. Note that the parent group time
zone will be used when creating any child subgroups, but user can always
select a child subgroup and change its time zone.
The auto-generated name can also be changed.
7. Click Create to define the hierarchy.
Note:
Review and define the complete hierarchy before clicking Create.
Even after your administration group hierarchy has been created, you can always
make future updates if organizational needs change. For example, adding/
removing group membership criteria property values, which equates to creating/
deleting additional administration groups for a given level. Using the previous
example, if in addition to San Francisco and Zurich you add more locations, say
New York and Bangalore, you can click Add in the Hierarchy Node table to add
additional locations, as shown in the following graphic. For more information about
changing the administration group hierarchy, see "Changing the Administration
Group Hierarchy".
Chapter 6
Implementing Administration Groups and Template Collections
6-16
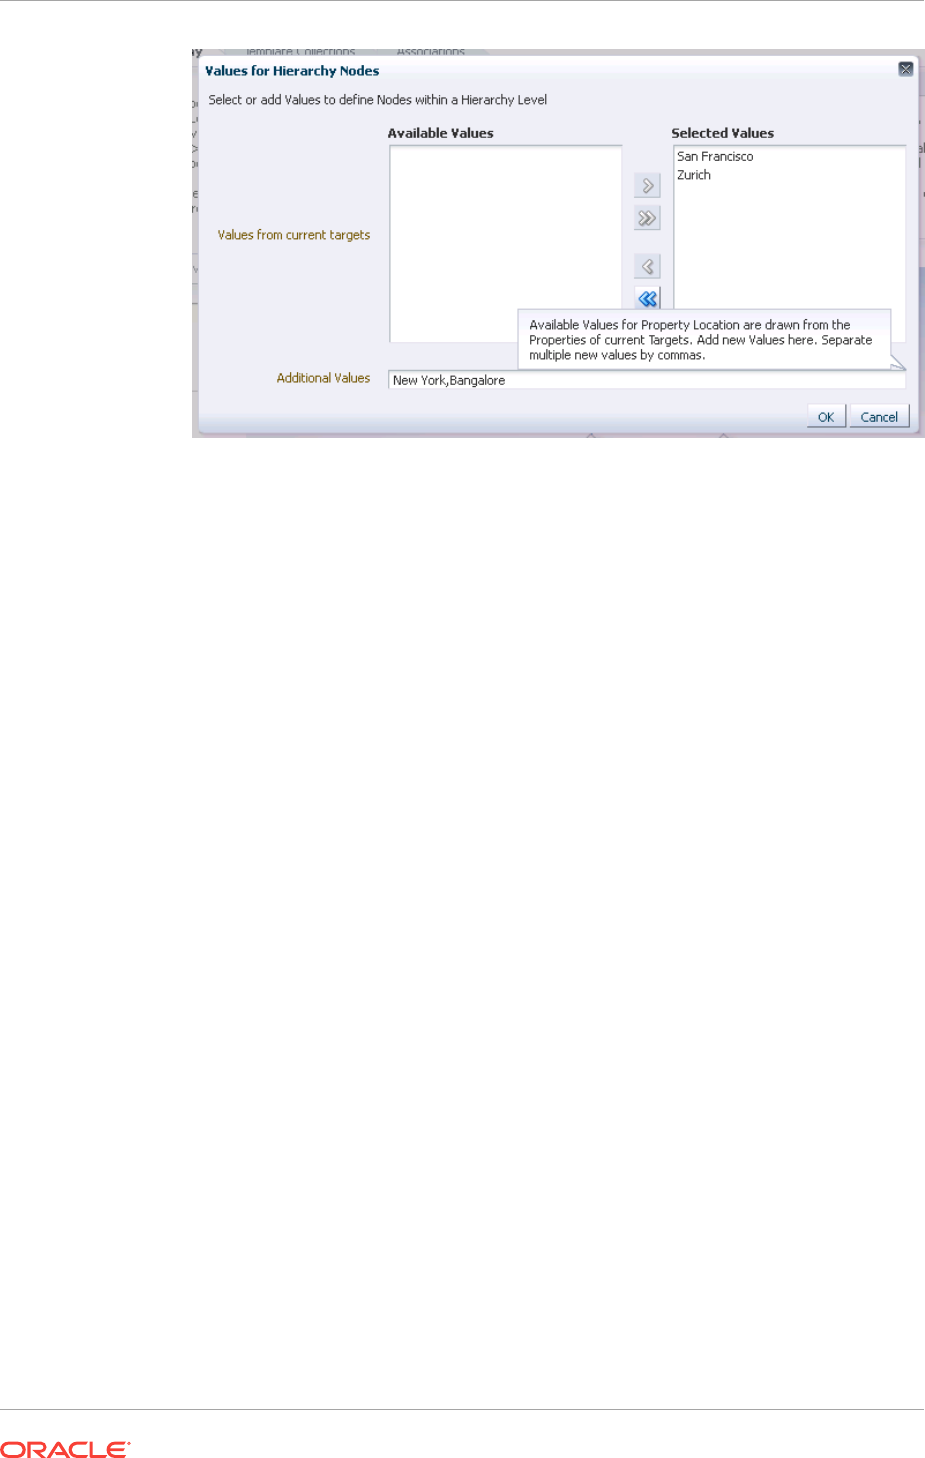
Click Update to save your changes.
6.3.4 Defining Template Collections
A template collection is an assemblage of monitoring/management settings to be
applied to targets in the administration group. Multiple monitoring templates can be
added to a template collection that in turn is associated with an administration group.
However, you can only have one monitoring template of a particular target type in the
template collection. The monitoring template should contain the complete set of metric
settings for the target in the administration group. You should create one monitoring
template for each type of target in the administration group. For example, you can
have a template collection containing a template for database and a template for
listener, but you cannot have a template collection containing two templates for
databases. When members targets are added to an administration group, the template
monitoring and management settings are automatically applied. A template will
completely replace all metric settings in the target. This means applying the template
copies over metric settings (thresholds, corrective actions, collection schedule) to the
target, removes the thresholds of the metrics that are present in the target, but not
included in the template. Removing of thresholds disables alert functionality for these
metrics. Metric data will continue to be collected.
Template collections may consist of three types of monitoring/management setting
categories:
•Monitoring Templates (monitoring settings)
•Compliance Standards (compliance policy rules)
•Cloud Policies (cloud policies such as determining when to start virtual machines
or scale out clusters).
When creating a template collection, you can use the default monitoring templates,
compliance standards, or cloud templates supplied with Enterprise Manager or you
can create your own. For more information, see Using Monitoring Templates .
To create a template collection:
1. Click the Template Collections tab. The Template Collection page displays.
Chapter 6
Implementing Administration Groups and Template Collections
6-17
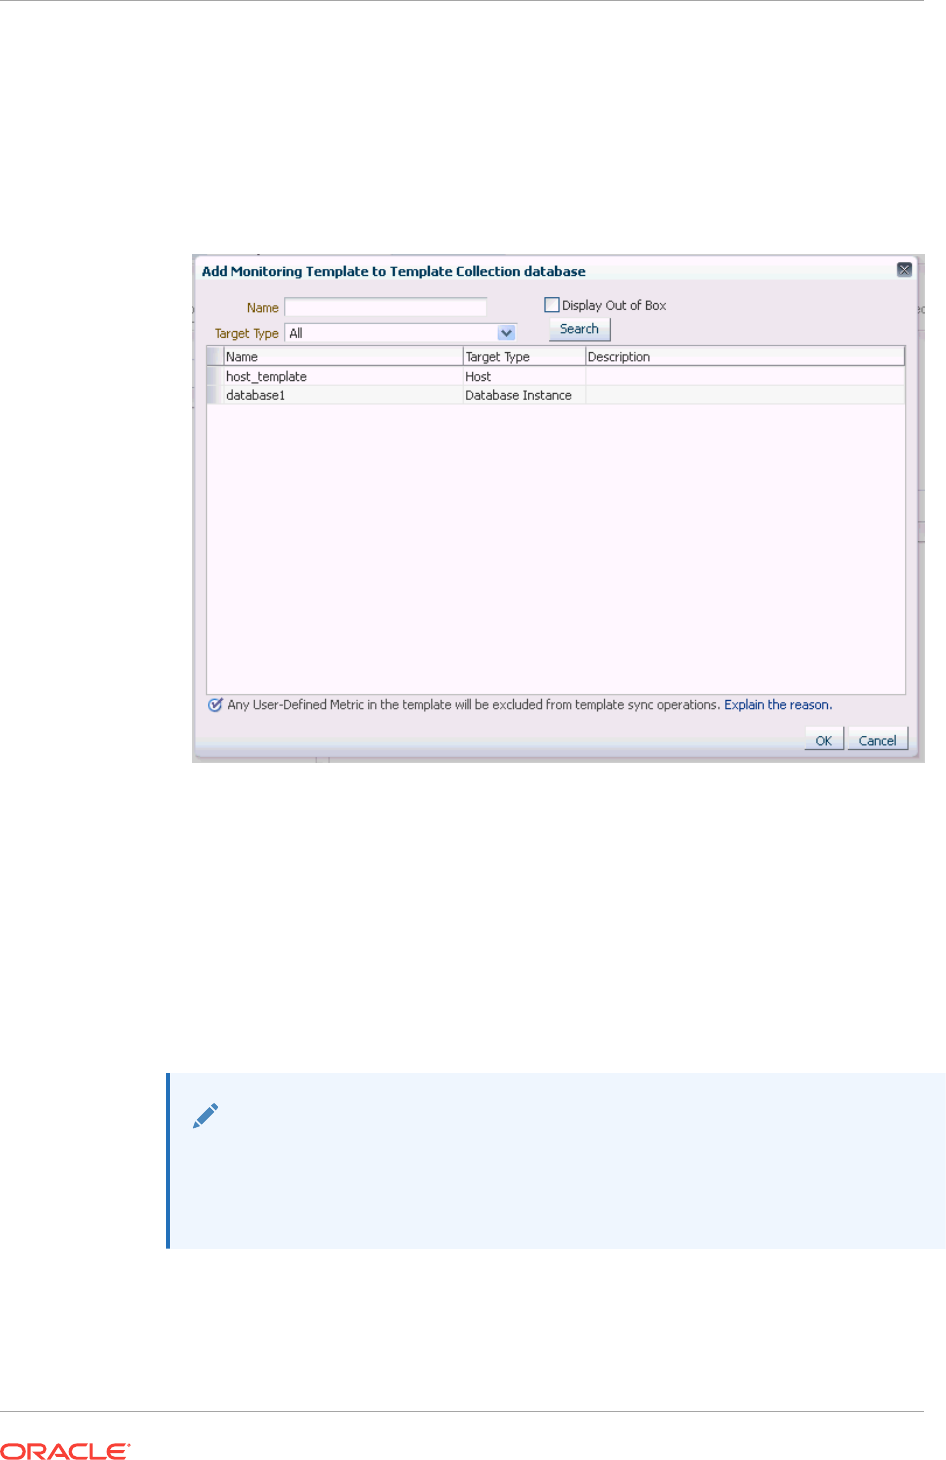
2. Click Create.
3. In the Name field, specify the template collection name.
4. Click the template collection member type you want to add (Monitoring Template,
Compliance Standard, Cloud Polices). The requisite definition page appears.
5. Click Add. A list of available template entities appears.
6. Select the desired template entities you want added to the template collection.
7. Click OK.
8. Continue adding template entities (Monitoring Template, Compliance Standard,
Cloud Policies) as required.
9. Click Save. The newly defined collection appears in the Template Collections
Library.
10. To create another template collection, click Create and create and repeat steps
two through eight. Repeat this process until you have created all required template
collections.
Note:
When editing existing template collections, you can back out of any changes
made during the editing session by clicking Cancel. This restores the template
collection to its state when it was last saved.
6.3.4.1 Required Privileges
To create a template collection, you must have the Create Template Collection
resource privilege. To include a monitoring template into a template collection, you
Chapter 6
Implementing Administration Groups and Template Collections
6-18

need at least View privilege on the specific monitoring template or View Any
Monitoring Template privilege, which allows you to view any monitoring template and
add it to the template collection. The following table summarizes privilege
requirements for all Enterprise Manager operations related to template collection
creation.
Enterprise Manager Operation Minimum Privilege Requirement
Create administration group hierarchy. Full Any Target
Create Privilege Propagating Group
Create monitoring templates. Create Monitoring Template
Create template collection. Create template collection (resource
privilege).
VIEW on the monitoring template to be
added to the template collection
or
View any monitoring template
(resource privilege).
Create compliance standards. Create Compliance Entity
No privileges are required to view
compliance standards.
Create cloud policies. Create Any Policy
View Cloud Policy
Associate template collection with administration
group.
VIEW on the specific template
collection.
Manage Target Metrics on the group.
Perform on-demand synchronization. OPERATOR on the group or Manage
Target Metrics.
Define global synchronization schedule. Enterprise Manager Super
Administrator privileges.
Set the value of target properties for a target (allows
the target to "join" an administration group).
Configure Target on the specific target
Delete an administration group hierarchy. Full Any Target
6.3.4.2 Corrective Action Credentials
A corrective action is an automated task that is executed in response to a metric alert.
When a corrective action is part of a monitoring template/template collection, the
credentials required to execute the corrective action will vary depending on how the
template is applied.
The two situations below illustrate the different credential requirements.
•The corrective action is part of a monitoring template that is manually applied to a
target.
When the corrective action runs, it can use one of the following:
–The preferred credentials of the user who is applying the template
or
–The user-specified named credentials.
The user selects the desired credential option during the template apply operation.
Chapter 6
Implementing Administration Groups and Template Collections
6-19
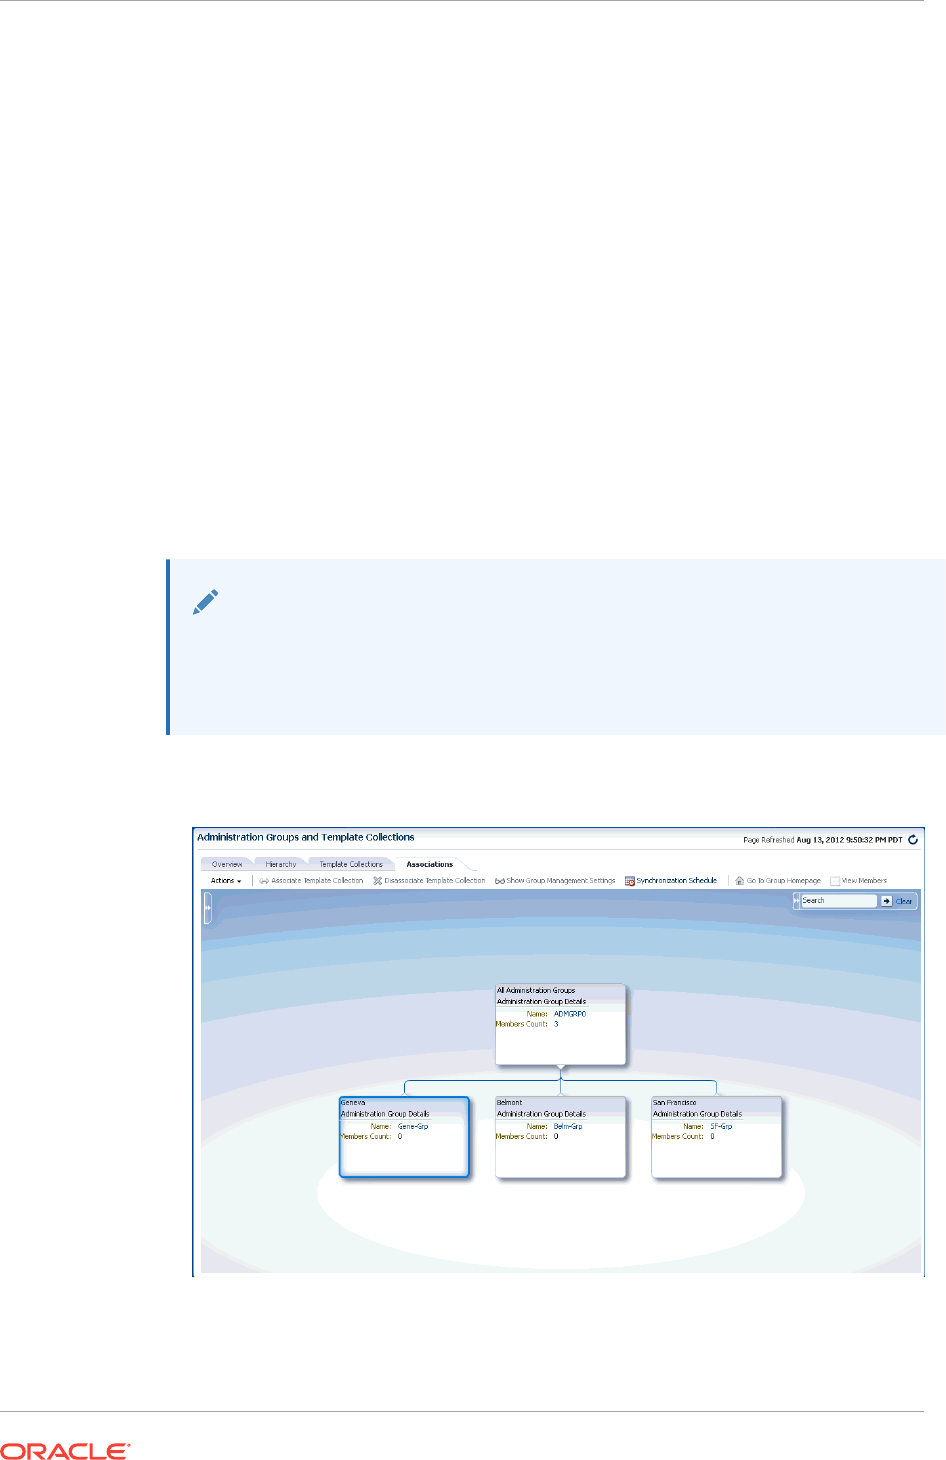
•The corrective action is part of a monitoring template within a template collection
that is associated with an administration group.
When the corrective action runs, the preferred credentials of the user who is
associating the template collection with the administration group is used.
6.3.5 Associating Template Collections with Administration Groups
Once you have defined one or more template collections, you need to associate them
to administration groups in the hierarchy. You can associate a template collection with
one or more administration groups. As a rule, you should associate the template
collection with the applicable administration group residing at the highest level in the
hierarchy as the template collection will also be applied to targets joining any
subgroup.
The Associations page displays the current administration group hierarchy diagram.
Each administration group in the hierarchy can only be associated with one template
collection.
6.3.5.1 Associating a Template Collection with an Administration Group
Note:
For users that do not have View privilege on all administration groups, you can
also perform the association/disassociation operation from the Groups page
(from the Targets menu, select Groups).
1. Click the Associations tab. The Associations page displays.
2. Select the desired administration group in the hierarchy.
3. Click Associate Template Collection. The Choose a Template Collection
dialog displays.
Chapter 6
Implementing Administration Groups and Template Collections
6-20
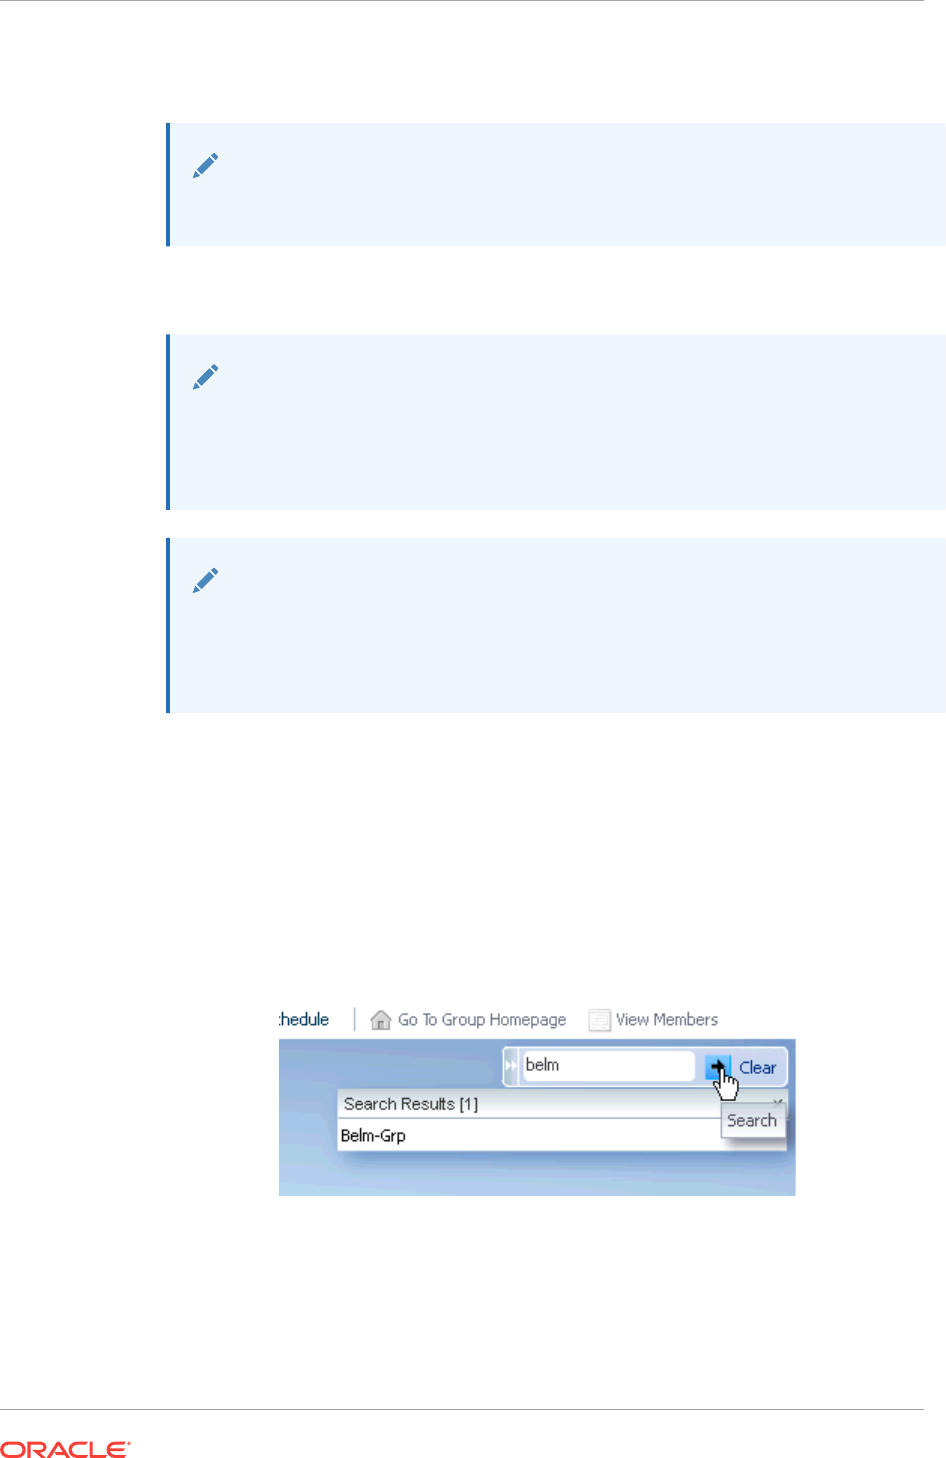
4. Choose the desired template collection and click Select. The list of targets
affected by this operation is displayed. Confirm or discard the operation.
Note:
All sub-nodes in the hierarchy will inherit the selected template collection.
5. Repeat steps 1-3 until template collections have been associated with the desired
groups.
Note:
The target privileges of the administrator who performs the association will be
used when Enterprise Manager applies the template to the group. The
administrator needs at least Manage Target Metrics privileges on the group.
Note:
Settings from monitoring templates applied at lower levels in the hierarchy
override settings inherited from higher levels. This does not apply to
compliance standards or cloud policies.
6.3.5.2 Searching for Administration Groups
While the administration group UI is easy to navigate, there may be cases where the
administration group hierarchy is inordinately large, thus making it difficult to find
individual groups. At the upper right corner of the Associations page is a search
function that greatly simplifies finding groups in a large hierarchy.
Figure 6-1 Administration Group Search Dialog
To search for a specific administration group:
1. If not already displayed, expand the Search interface.
Chapter 6
Implementing Administration Groups and Template Collections
6-21
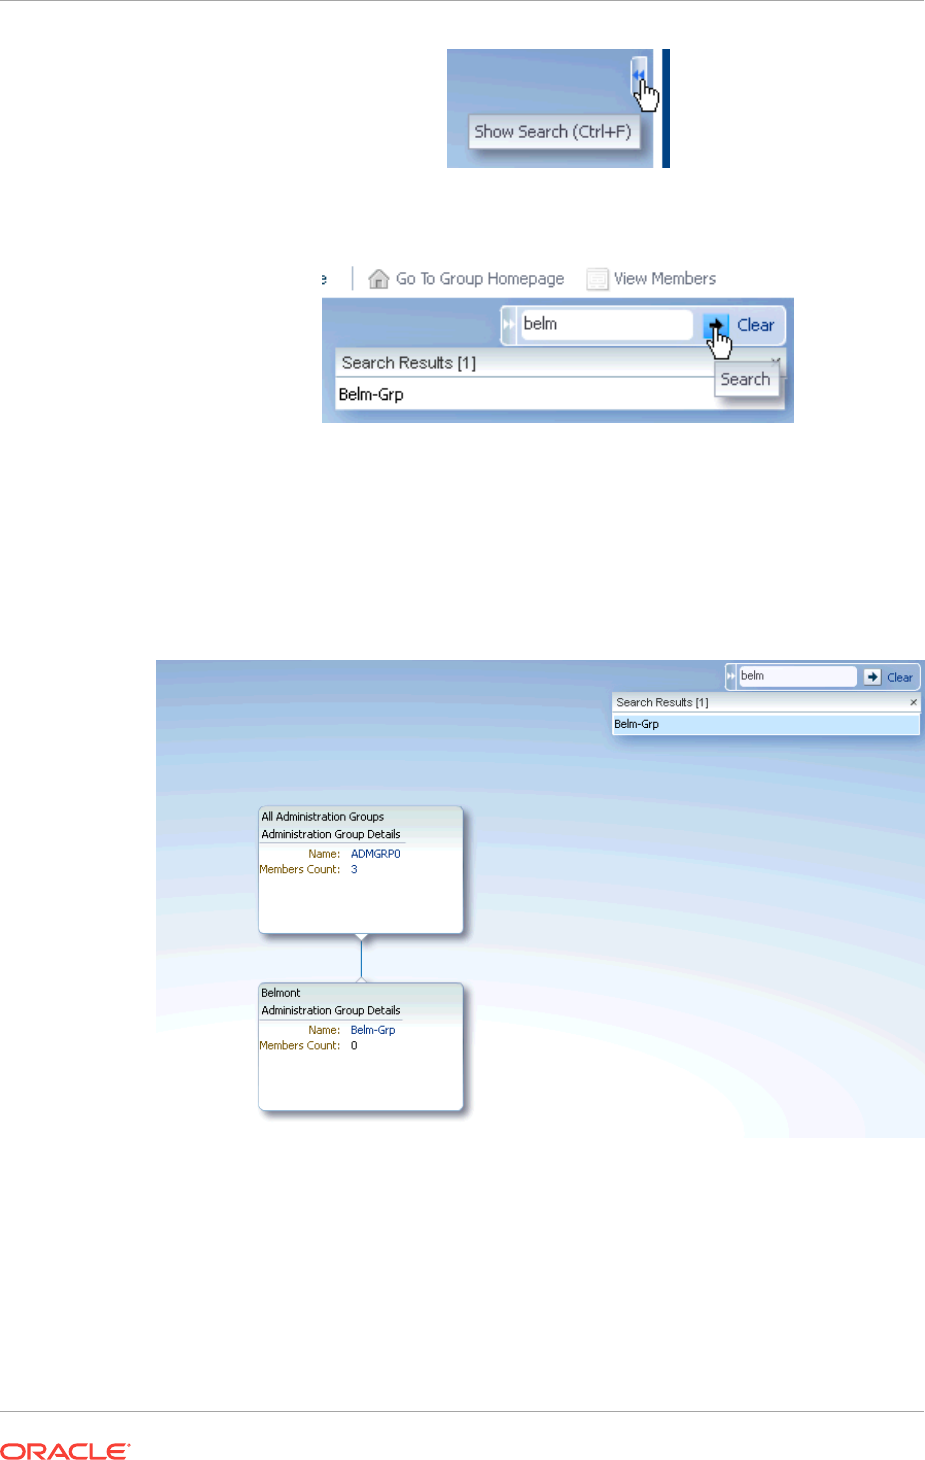
2. Enter either a full or partial group name and click Search.
As shown in the graphic, the search results display a list of administration groups that
match the search criteria. You can then choose an administration group from the list
by double-clicking on the entry. The administration group hierarchy will then display a
vertical slice (subset) of the administration group hierarchy from the root node to the
group you selected.
Figure 6-2 Administration Group Search: Graphical Display
To restore the full administration group hierarchy, click Clear.
Group Names and Searches
In order to perform effective searches for specific administration groups, it is helpful to
know how Enterprise Manager constructs an administration group name: Enterprise
Manger uses the administration group criteria to generate names. For example, you
have an administration group with the following criteria:
Chapter 6
Implementing Administration Groups and Template Collections
6-22

•Lifecycle Status: Development or Mission Critical
•Department: DEV
•Line of Business: Finance or HR
•Location: Bangalore
Enterprise Manager assembles a group name based on truncated abbreviations. In
this example, the generated administration group name is DC-DEV-FH-Bang-Grp
As you are building the hierarchy, you can change the abbreviation associated with
each value (this is the Short Value column next to the property value in the Hierarchy
Nodes table. Hence, you can specify a short value and Enterprise Manager will use
that value when constructing new names for any subgroups created.
During the design phase of an administration group, you have the option of specifying
a custom name. However, if there is large number of groups, it is easier to allow
Enterprise Manager to generate unique names.
6.3.5.3 Setting the Global Synchronization Schedule
In order to apply the template collection/administration group association, you must set
up a global synchronization schedule. This schedule is used to perform
synchronization operations, such as applying templates to targets in administration
groups. If no synchronization schedule is set up, when a target joins an administration
group, Enterprise Manager will auto-apply the associated template. However, if there
are changes to the template later on, then Enterprise Manager will only apply these
based on synchronization schedule, otherwise these operations are pending.When
there are any pending synchronization operations, they will be scheduled on the next
available date based on the synchronization schedule.
Note:
You must set the synchronization schedule as there is no default setting. You
can specify a non-peak time such as weekends.
To set up the synchronization schedule:
1. Click Synchronization Schedule. The Synchronization Schedule dialog displays.
Chapter 6
Implementing Administration Groups and Template Collections
6-23
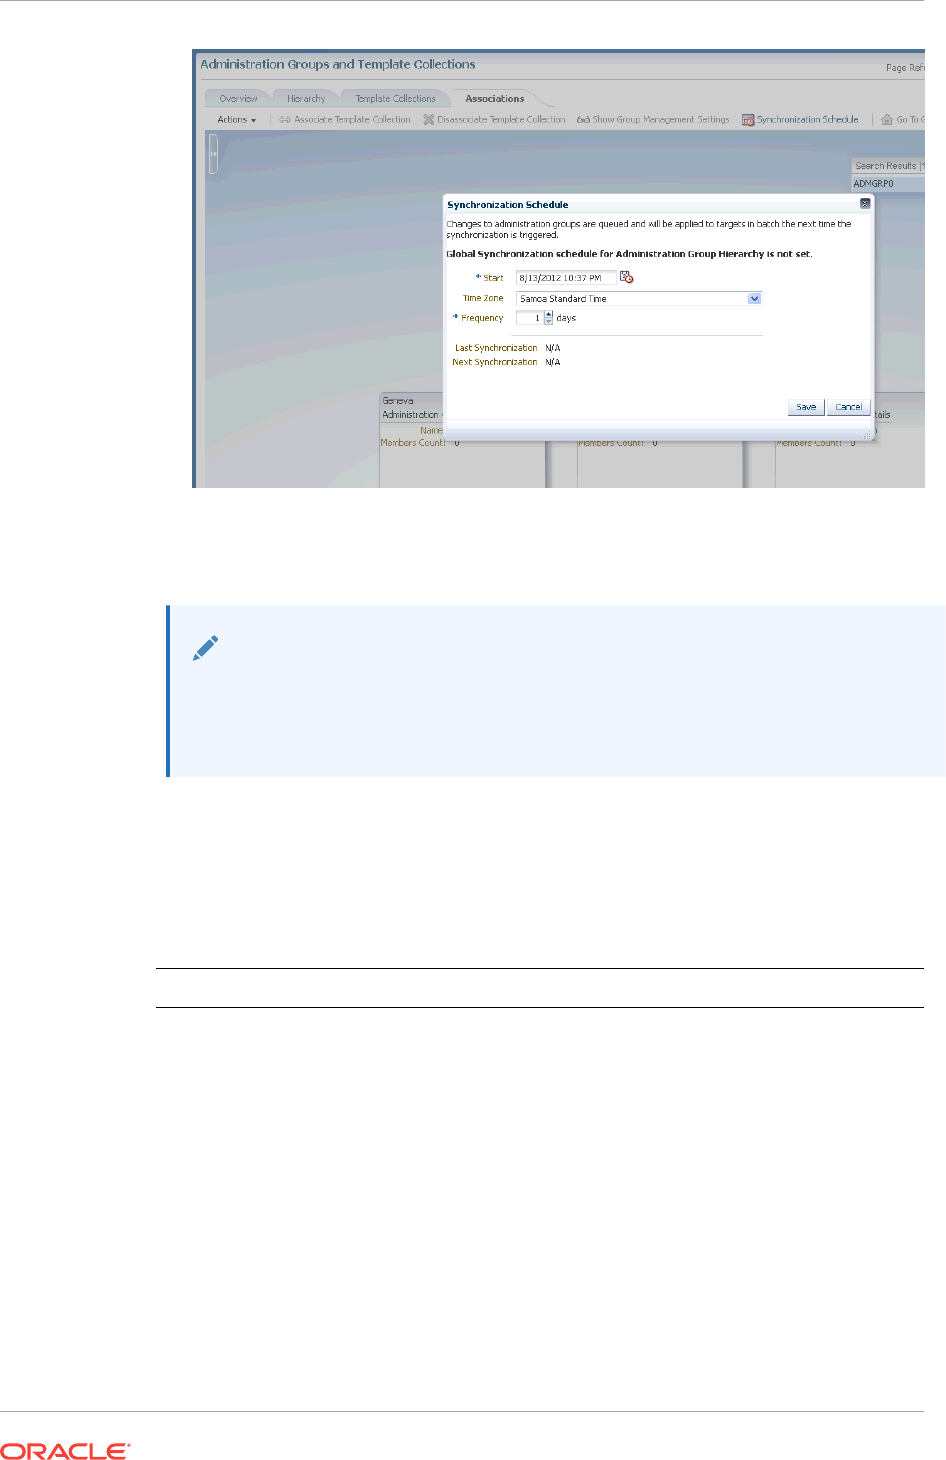
2. Click Edit and then choose a date and time you want any pending sync operations
(For example, template apply operations) to occur. By default, the current date and
time is shown.
Note:
You can specify a start date for synchronization operations and interval in
days. Whenever there are any pending sync operations, then they will be
scheduled on the next available date based on this schedule.
3. Click Save.
6.3.5.4 When Template Collection Synchronization Occurs
The following table summarizes when Template Collection Synchronization operations
(such as apply operations) occur on targets in administration groups.
Action When Synchronization Occurs
Target is added to an administration group (by
setting its target properties)
Immediate upon joining the administration
group.
Template collection is associated with the
administration group.
Targets in an administration group will be
synchronized based on next scheduled date in
global Synchronization Schedule.
Changes are made to any of the templates in
the template collection.
Targets in an administration group will be
synchronized based on the next scheduled
date in global Synchronization Schedule.
Target is removed from an administration
group (by changing its target properties).
No change in target's monitoring settings.
Compliance Standards and Cloud Policies will
be disassociated with the target.
Immediate synchronization operation occurs.
Chapter 6
Implementing Administration Groups and Template Collections
6-24

Action When Synchronization Occurs
Template collection is disassociated with
administration group.
No change in target's monitoring settings for
all the targets in the administration
group.Compliance Standards and Cloud
Policies will be disassociated with the target.
Targets under the administration group will be
synchronized based on next schedule date in
Global Synchronization Schedule.
User performs an on-demand synchronization
by clicking on the Start Synchronization
button in the Synchronization Status region
in the administration group's homepage.
Immediate synchronization operation occurs.
6.3.5.5 Viewing Synchronization Status
You can check the current synchronization status for a specific administration group
directly from the group's homepage.
1. Select an administration group in the hierarchy.
2. Click Goto Group Homepage.
3. From the Synchronization Status region, you can view the status of the
monitoring template, compliance standard, and/or cloud policies synchronization
(In Sync, Pending, or Failed).
You can initiate an immediate synchronization by clicking Start Synchronization.
6.3.5.6 Group Member Type and Synchronization
There are two types of administration group member targets: Direct and Indirect
•Direct Members: Group members whose target properties match the
administration group criteria. Monitoring settings, compliance standards, cloud
policies from the associated template collection are applied to direct members.
•Indirect Members: Indirect members are targets whose target properties DO NOT
match administration group criteria. However, they have been added to the
administration group because their parent target are direct members of the
administration group. These targets are categorized as aggregate targets because
they have other member targets. When such targets are added to a group
(administration group or other types of groups), all members of the aggregate
target are also added to the group. An example of an aggregate target is Oracle
WebLogic Server. If that is added to a group, then all Application Deployment
targets on it are also pulled into the group. Indirect group members will NOT be
part of any template apply/sync operations.
Only direct members are represented in the targets count in the Synchronization
Status region.
1. From the hierarchy diagram, click on a group name to access the group's home
page. You can also access this information from All Targets groups page.
2. From the Group menu, select Members. The Members page displays.
Chapter 6
Implementing Administration Groups and Template Collections
6-25

6.3.5.7 System Targets and Administration Groups
If a system target gets added to an administration group because it matches group
criteria, then the system target and its constituent members are also added. However,
for template apply purposes, it will only operate on the direct members that also match
the administration group criteria. Template apply operations will not occur on member
targets whose target properties do not match administration group criteria. All other
group operations, such as jobs and blackouts, will apply on all members, both direct
and indirect.
6.3.5.8 Disassociating a Template Collection from a Group
To disassociate a template collection from an administration group.
1. From the Setup menu, select Add Target and then Administration Groups. The
Administration Group home page displays.
2. Click on the Associations tab to view the administration group hierarchy diagram.
3. From the hierarchy diagram, select the administration group with the template
collection you wish to remove. If necessary, use the Search option to locate the
administration group.
4. Click Disassociate Template Collection. The number of targets affected by this
operation is displayed. Click Continue or Cancel.
The template collection is immediately removed. See "When Template Collection
Synchronization Occurs" in Defining the Hierarchy for more information.
6.3.5.9 Viewing Aggregate (Group Management) Settings
For any administration group, you can easily view what template collection
components (monitoring templates, compliance standards, and/or cloud policies) are
associated with individual group members.
Note:
For monitoring templates, the settings for a target could be a union of two or
more monitoring templates from different template collections.
1. From the Setup menu, select Add Target and then Administration Groups. The
Administration Group home page displays.
2. Click on the Associations tab to view the administration group hierarchy diagram.
3. From the hierarchy diagram, select the desired administration group.
4. Click Show Group Management Settings.
The Administration Group Details page displays.
This page displays all aggregate settings for monitoring templates, compliance
standards and cloud policies that will be applied to members of the selected
administration group (listed by target type). The page also displays the
synchronization status of group members.
Chapter 6
Implementing Administration Groups and Template Collections
6-26
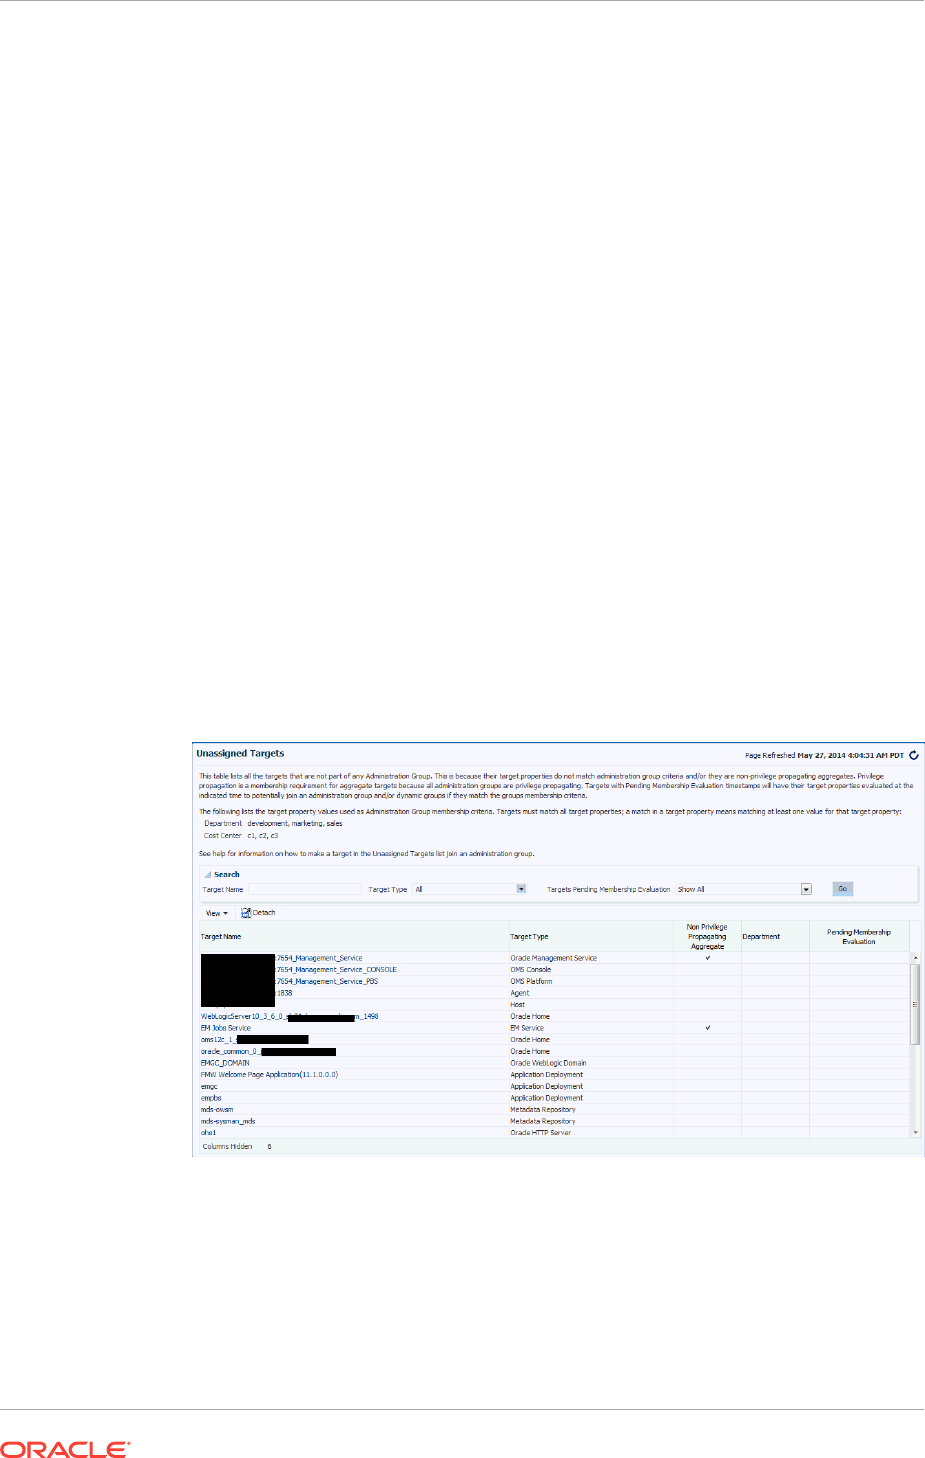
To can change the display to show a different branch of the administration group
hierarchy, click Select Branch at the upper-right area of the page. This function
lets you display hierarchy branches by choosing different target property values
6.3.5.10 Viewing the Administration Group Homepage
Like regular groups, each administration group has an associated group homepage
providing a comprehensive overview of group member status and/or activity such as
synchronization status, details of the Associated Template Collection for the group
selected in hierarchy viewer, job activity, or critical patch advisories. To view
administration group home pages:
1. From the hierarchy diagram, select an administration group.
2. Click Goto Group Homepage. The homepage for that particular administration
group displays.
Alternatively, from the Enterprise Manger Targets menu, choose Groups. From the
table, you can expand the group hierarchy.
6.3.5.11 Identifying Targets Not Part of Any Administration Group
From the Associations page, you can determine which targets do not belong to any
administration group by generating an Unassigned Targets Report.
1. From the Actions menu, select Unassigned Targets Report. The report lists all
the targets that are not part of any administration group. The values for the target
properties defining the administration groups hierarchy are shown.
2. From the View menu, choose the customization options to display only the desired
information.
Chapter 6
Implementing Administration Groups and Template Collections
6-27
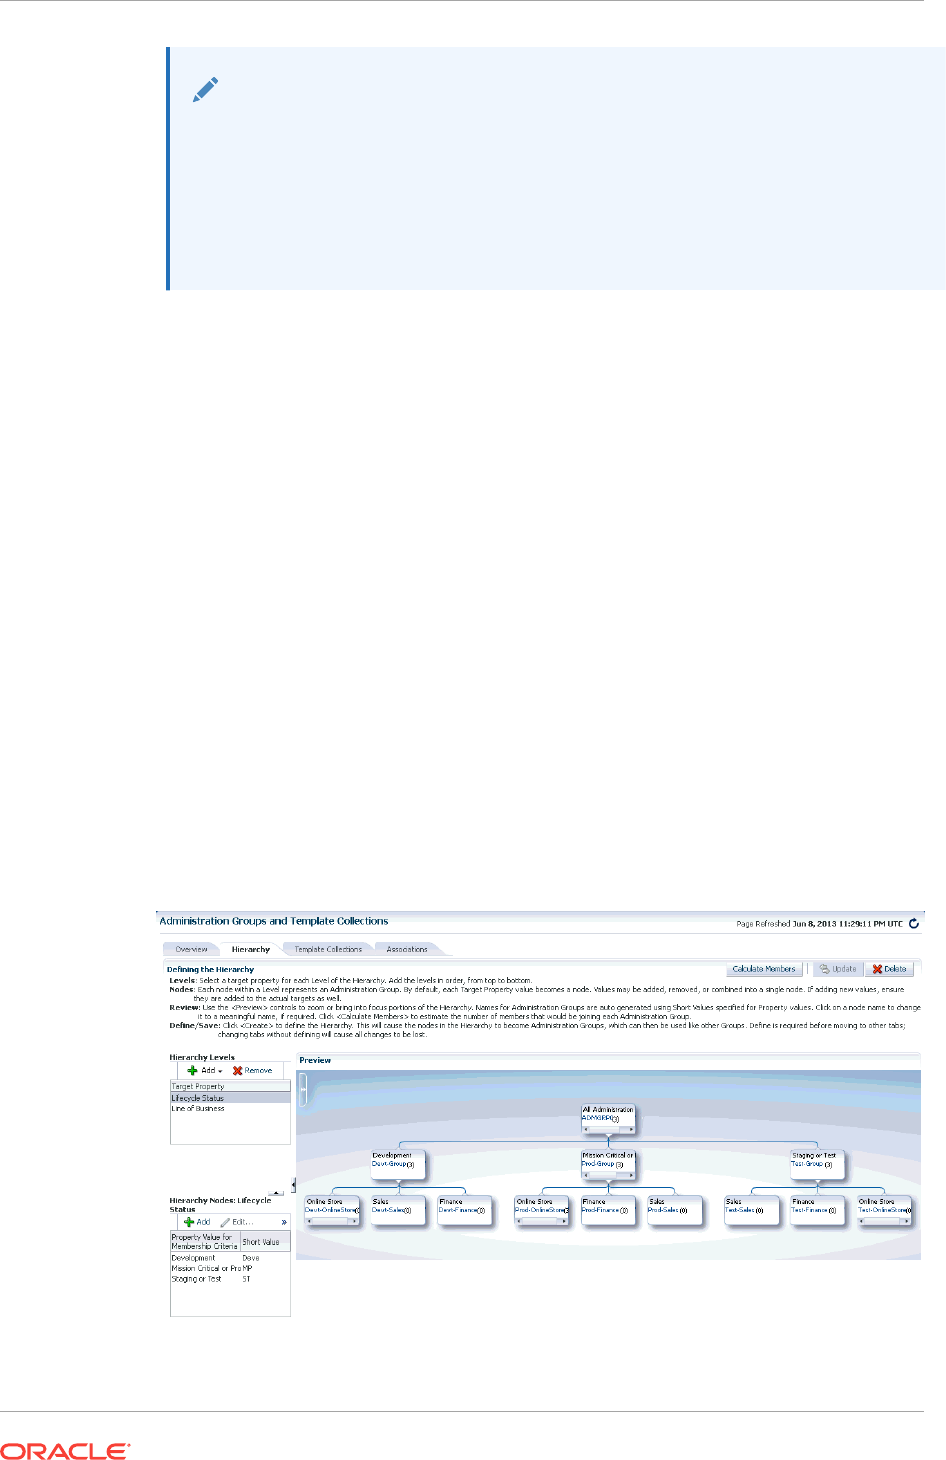
Note:
The Non-Privilege Propagating Aggregate column indicates whether a
target is a non-privilege propagating aggregate. This type of target cannot be
added to an administration group, which are by design privilege propagating.
For this reason, any aggregate target added to administration group must also
be privilege propagating. To make an aggregate target privilege propagating,
use the EM CLI verb modify_system with -privilege_propagation=true option.
On this page, you can review the list to see if there any targets that need to be
added to the administration group. Click on the target names shown in this page to
access the target's Edit Target Properties page where you can change the target
property values. After making the requisite changes and clicking OK, you are
returned to the Unassigned Targets page.
For information on changing target properties, see "Planning an Administrative
Group".
3. Click your browser back button to return to the Administration Groups and
Template Collections homepage.
6.4 Changing the Administration Group Hierarchy
Organizations are rarely static--new lines of business may be added or perhaps
groups are reorganized due to organizational expansion. To accommodate these
changes, you may need to make changes to the existing administration group
hierarchy.
Beginning with Enterprise Manager 12c Release 12.1.0.3, you can change the
administration group hierarchy without having to rebuild the entire hierarchy. You can
easily perform administration group alterations such as adding more groups to each
hierarchy level, merging two or more groups, or adding/deleting entire hierarchy levels.
All of these operations can be performed from the Hierarchy page.
Chapter 6
Changing the Administration Group Hierarchy
6-28

Note:
After making any change to the administration group hierarchy, click Update
to save your changes.
6.4.1 Adding a New Hierarchy Level
Adding a new hierarchy level equates to adding a new target property to the
administration group criteria. For this reason, you must set the value of this target
property for all your targets in order for them to continue to be part of the
administration group hierarchy. Any new target property added/hierarchy level added
will always be added as the bottom-most level of the hierarchy. You cannot insert a
new level between levels.
To insert a hierarchy level, you must remove a hierarchy level, then add the levels you
want. Think carefully before removing a hierarchy level as removing a level will result
in the deletion of groups corresponding to that hierarchy level.
See "Adding a Hierarchy Level" in Defining the Hierarchy for step-by-step instructions
on adding a new level.
6.4.2 Removing a Hierarchy Level
Removing a hierarchy level equates to deleting a target property, which in turn causes
groups at that level to be deleted. For this reason, think carefully about the groups that
will be removed when you remove the hierarchy level, especially if those groups are
used in other functional areas of Enterprise Manager.
To remove a hierarchy level:
1. On the Administration Group page, click the Hierarchy tab.
2. From the Hierarchy Levels table, select a hierarchy level and click Remove
3. Click Update to save your changes.
If any of those groups have an associated template collection, then the monitoring
settings of the subgroups of the deleted group will be impacted since the subgroups
obtained monitoring settings from the associated template collection. You may need to
review the remaining template collections and re-associate the template collection with
the appropriate administration group.
6.4.3 Merging Administration Groups
If you want to merge two or more administration groups, you merge their
corresponding target property criteria in the administration group hierarchy definition.
The group merge operation consists of retaining one of the groups to be merged and
then moving over the targets from the other groups into the group that is retained.
Once the targets have been moved, the other groups will be deleted.
You choose which group is retained by choosing its corresponding target property
value. The group(s) containing the selected target property value as part of its criteria
is retained. If the retained target property criteria corresponds to multiple groups, i.e.
group containing subgroups, the movement of targets will actually occur at the lowest
Chapter 6
Changing the Administration Group Hierarchy
6-29
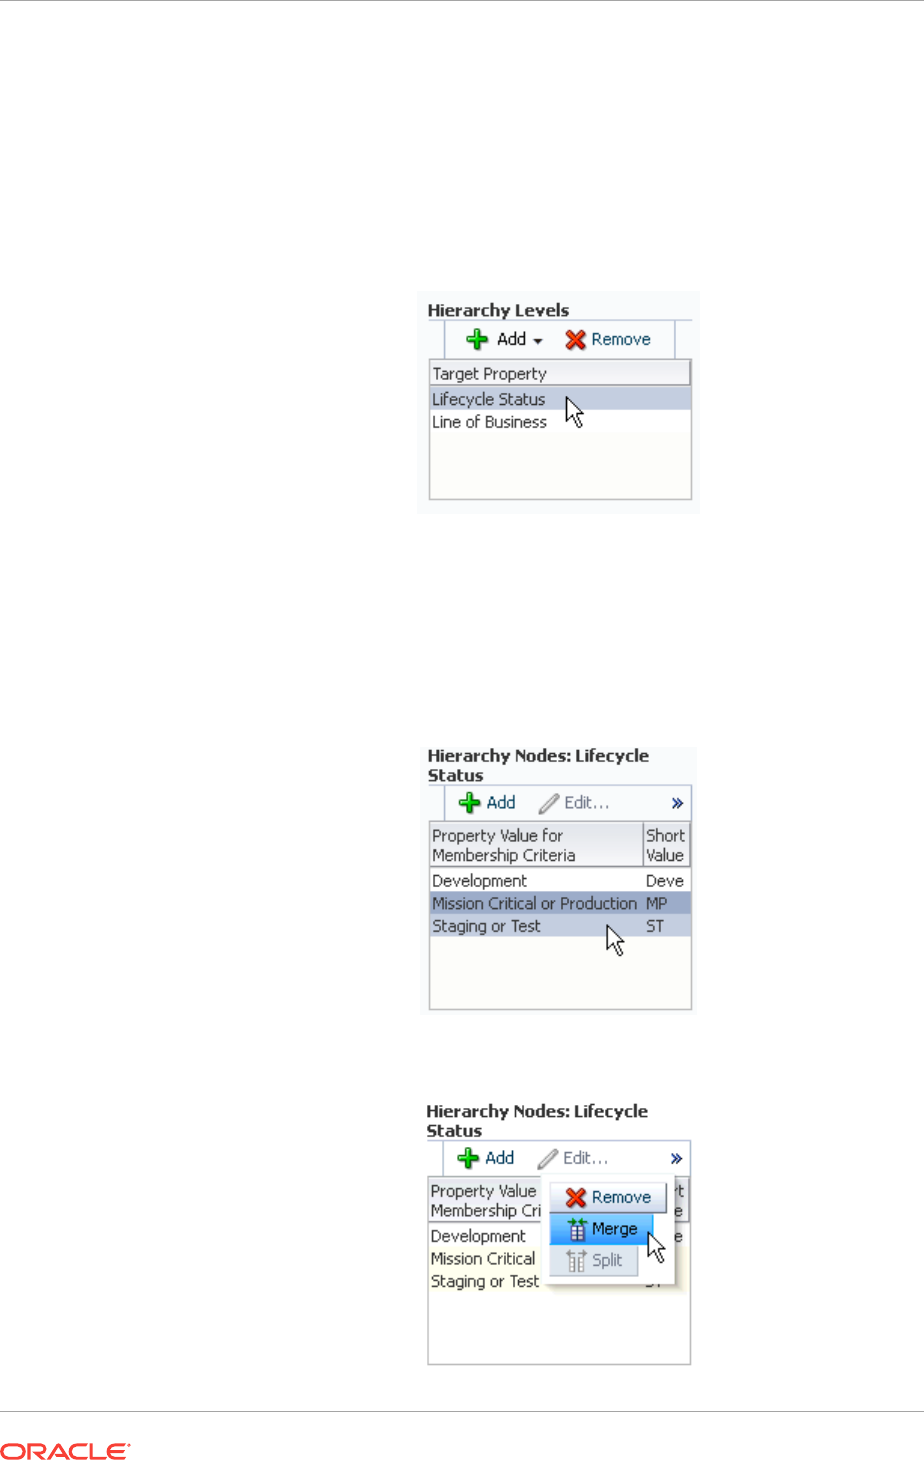
level administration groups since the targets only reside in the lowest level
administration groups. The upper-level administration groups' criteria will be updated
to include the criteria of the other groups that have been merged into it.
To merge groups:
1. Select a target property from the list of chosen properties in the Hierarchy Levels
table. You choose the target property corresponding to the groups you want to
merge.
For example, let us assume you want to merge <Devt-Group> with <Test or Stage
Group>. In the hierarchy, this corresponds to target property Lifecycle Status. The
associated property values are displayed.
2. Select two or more property values corresponding to the groups you would like to
merge by holding down the Shift or CTRL key and clicking on the desired values.
3. Click Merge.
Chapter 6
Changing the Administration Group Hierarchy
6-30
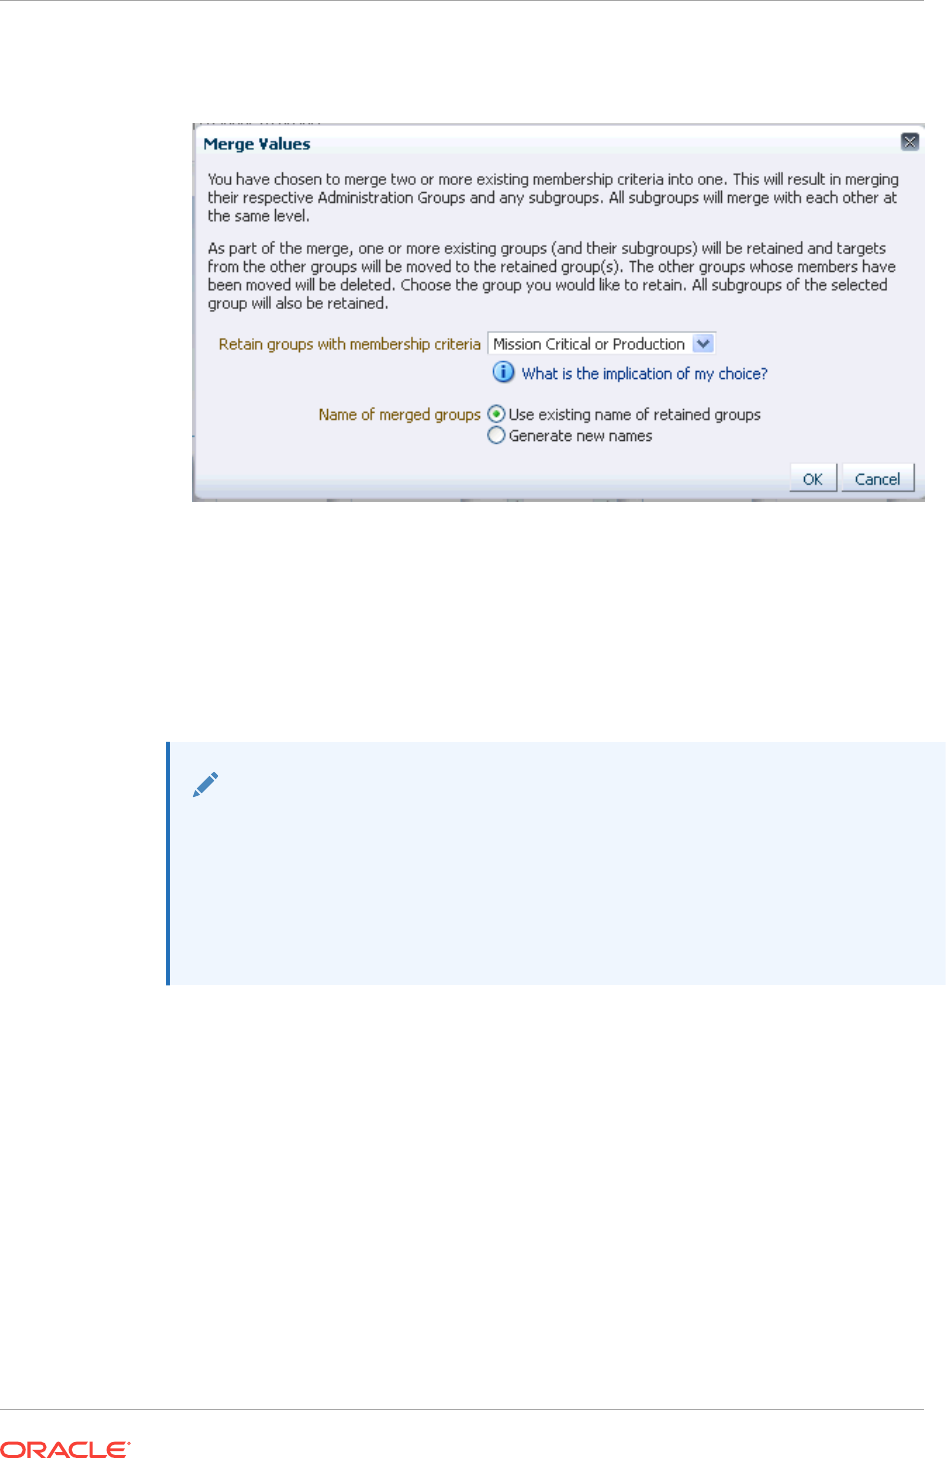
The Merge Values dialog displays.
Again, by merging membership criteria (target properties), you are merging
administration groups and their respective subgroups. You choose the
administration group to be retained. The other groups will be merged into that
group.
4. Choose the group you wish to retain and specify whether you want to use the
existing name of the retained group or specify a new name.
Note:
When deciding which group to retain, consider choosing the group that is used
in most group operations such as incident rule sets, system dashboard, or
roles. These groups will be retained and the members of the other merged
groups will join the retained groups. After the merge, group operations on the
retained groups will also now apply to the members from the other merged
groups. Doing so minimizes the impact of the merge.
5. Click OK to merge the groups.
6. Click Update to save the new hierarchy.
Example
Your administration group consists of the following:
Hierarchy Levels
•Lifecycle Status
•Line of Business
Hierarchy Nodes
•Lifecycle Status
–Development
Chapter 6
Changing the Administration Group Hierarchy
6-31
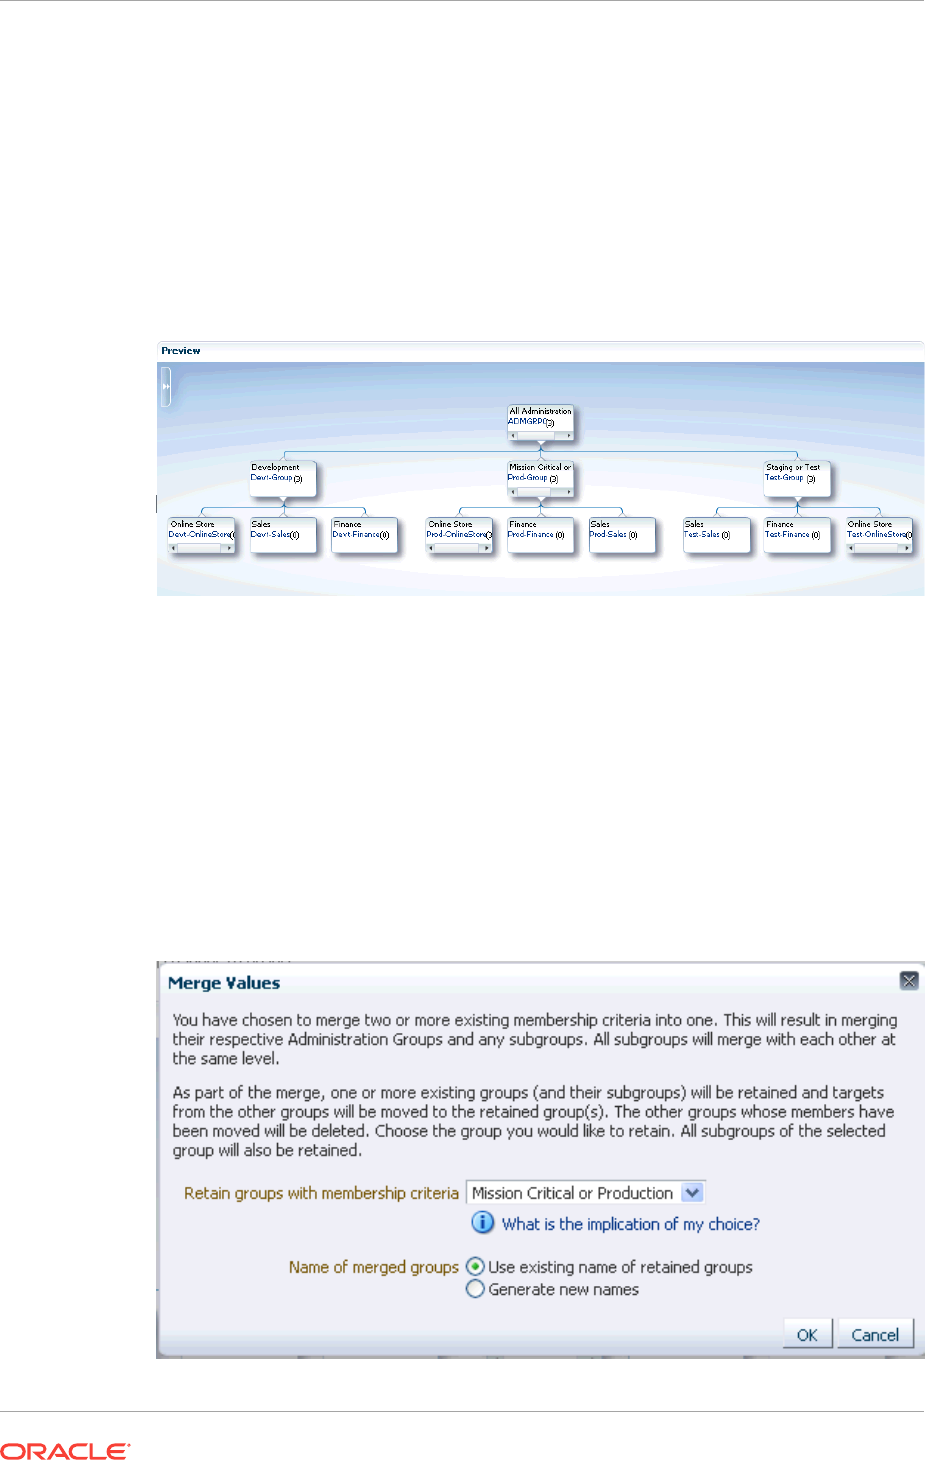
–Mission Critical or Production
–Staging or Test
•Line of Business
–Online Store
–Sales
–Finance
The following graphic shows the administration group hierarchy.
You decide that you want to merge the Mission Critical or Production group with the
Staging or Test group because they have the same monitoring settings.
Choose Lifecycle Status from the Hierarchy Levels table.
From the Hierarchy Nodes table, choose both Mission Critical or Production and
Staging or Test.
Select Merge from the Hierarchy Nodes menu.
The Merge Values dialog displays. In this case, you want to keep original name
(Mission Critical or Production) of the retained group.
Chapter 6
Changing the Administration Group Hierarchy
6-32
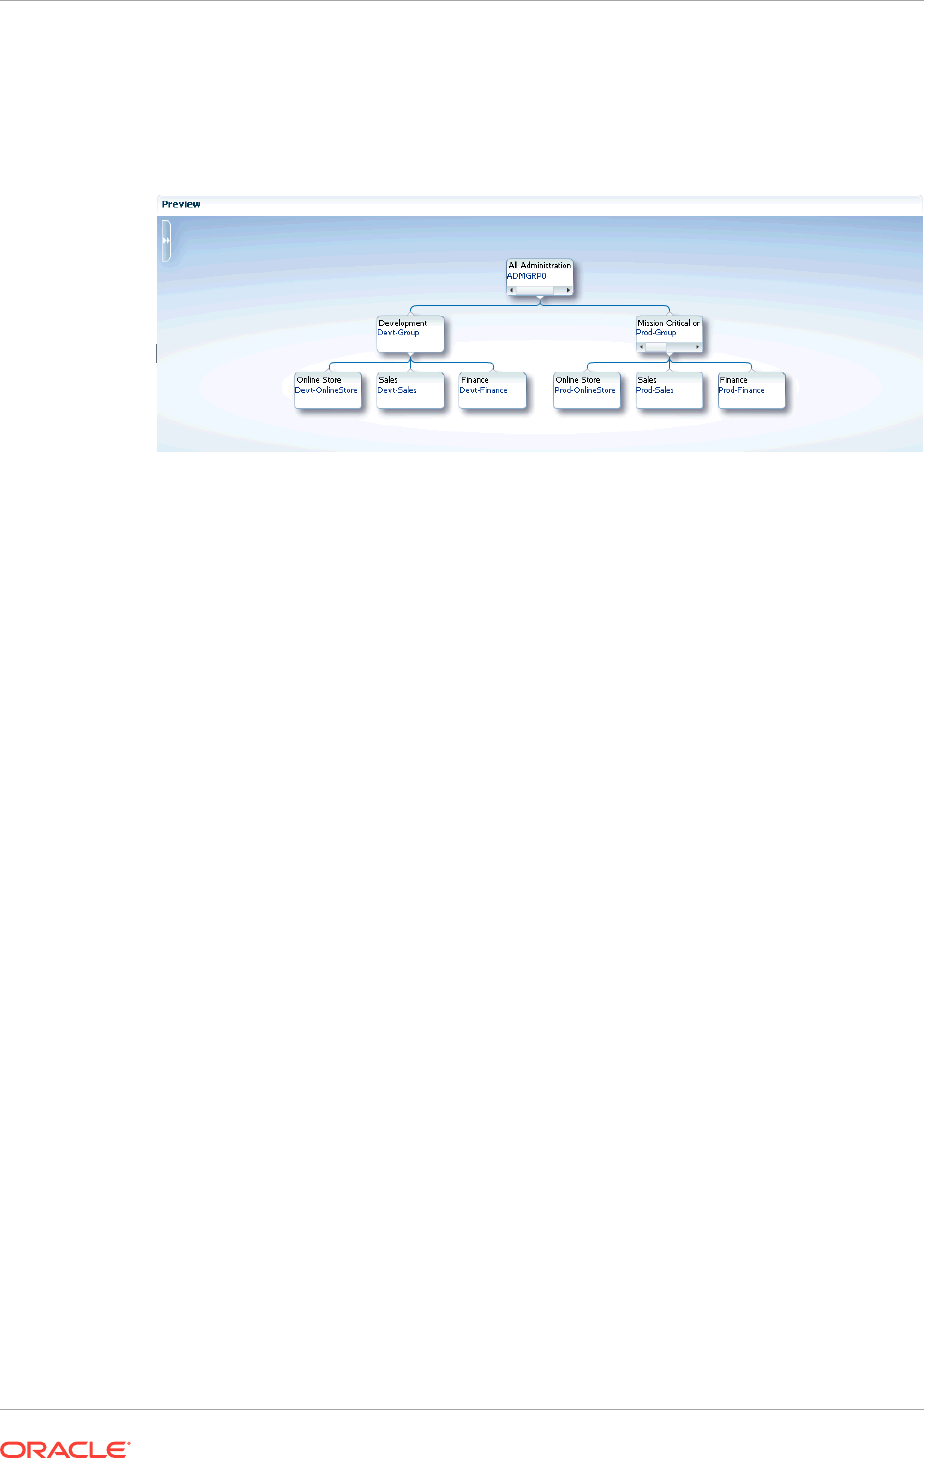
After clicking OK to complete the merge, the resulting administration group hierarchy
is displayed. All targets from Test-Sales group moved to the Prod-Sales group. The
Test-Sales group was deleted. All targets from the Test-Finance group moved to the
Prod-Finance group. The Test-Finance group got deleted.
Click Update to save the changes.
6.4.4 Removing Administration Groups
You can completely remove an administration group hierarchy or just individual
administration groups from the hierarchy. Deleting an administration group will not
delete targets or template collections, but it will remove associations. Any stored
membership criteria is removed. When you delete an administration group, any stored
membership criteria is removed.
To remove the entire administration group hierarchy:
1. From the Setup menu, select Add Target, then select Administration Groups.
2. Click on the Hierarchy tab.
3. Click Delete.
To remove individual administration groups from the hierarchy:
1. From the Setup menu, choose Add Target, then select Administration Groups.
2. Click on the Hierarchy tab.
3. From the Hierarchy Levels table, choose the target property that corresponds to
the hierarchy level containing the administration group to be removed.
4. From the Hierarchy Nodes table, select the administration group (Property Value
for Membership Criteria) to be removed.
5. Choose Remove from the drop-down menu.
6. Click Update.
Chapter 6
Changing the Administration Group Hierarchy
6-33

7
Using Monitoring Templates
Monitoring templates simplify the task of setting up monitoring for large numbers of
targets by allowing you to specify the monitoring and Metric and Collection Settings
once and applying them to many groups of targets as often as needed.
This chapter covers the following topics:
•About Monitoring Templates
•Definition of a Monitoring Template
•Default Templates (Auto Apply Templates)
•Viewing a List of Monitoring Templates
•Creating a Monitoring Template
•Editing a Monitoring Template
•Applying Monitoring Templates to Targets
•Comparing Monitoring Templates with Targets
•Comparing Metric Settings Using Information Publisher
7.1 About Monitoring Templates
Monitoring templates let you standardize monitoring settings across your enterprise by
allowing you to specify the monitoring settings once and apply them to your monitored
targets. You can save, edit, and apply these templates across one or more targets or
groups. A monitoring template is specified for a particular target type and can only be
applied to targets of the same type. For example, you can define one monitoring
template for test databases and another monitoring template for production databases.
A monitoring template defines all Enterprise Manager parameters you would normally
set to monitor a target, such as:
•Target type to which the template applies.
•Metrics (including metric extensions), thresholds, metric collection schedules, and
corrective actions.
Once a monitoring template is defined, it can be applied to your targets. This can be
done either manually through the Enterprise Manager console, via the command line
interface (EM CLI), or automatically using template collections. See "Defining
Template Collections" for more information. For any target, you can preserve custom
monitoring settings by specifying metric settings that can never be overwritten by a
template.
Oracle-Certified Templates
In addition to templates that you create, there are also Oracle-certified templates.
These templates contain a specific set of metrics for a specific purpose. The purpose
of the template is indicated in the description associated with the template.
7-1

Example: The template called Oracle Certified - Enable AQ Metrics for SI Database
contains metrics related to Advanced Queueing for single instance databases. You
can use this Oracle-certified template if you want to use the AQ metrics. Or you can
copy the metric settings into your own template.
7.2 Definition of a Monitoring Template
A monitoring template defines all Enterprise Manager parameters you would normally
set to monitor a target. A template specifies:
•Name: A unique identifier for the template. The template name must be globally
unique across all templates defined within Enterprise Manager.
•Description: Optional text describing the purpose of the template.
•Target Type: Target type to which the template applies.
•Owner: Enterprise Manager administrator who created the template.
•Metrics: Metrics for the target type. A monitoring template allows you to specify a
subset of all metrics for a target type. With these metrics, you can specify
thresholds, collection schedules and corrective actions.
•Other Collected Items: Additional collected information (non-metric) about your
environment.
7.3 Default Templates (Auto Apply Templates)
Under certain circumstances, Oracle's out-of-box monitoring settings may not be
appropriate for targets in your monitored environment. Incompatible Metric and
Collection Settings for specific target types can result in unwanted/unintended alert
notifications. Enterprise Manager allows you to set default monitoring templates that
are automatically applied to newly added targets, thus allowing you to apply monitoring
settings that are appropriate for your monitored environment.
Note:
Super Administrator privileges are required to define default monitoring
templates.
7.4 Viewing a List of Monitoring Templates
To view a list of all Monitoring Templates, from the Enterprise menu, select
Monitoring and then Monitoring Templates.
The Monitoring Templates page displays all the out-of-box templates and the
templates for which you have has at least VIEW privilege on. Enterprise Manager
Super Administrators can view all templates.
Chapter 7
Definition of a Monitoring Template
7-2
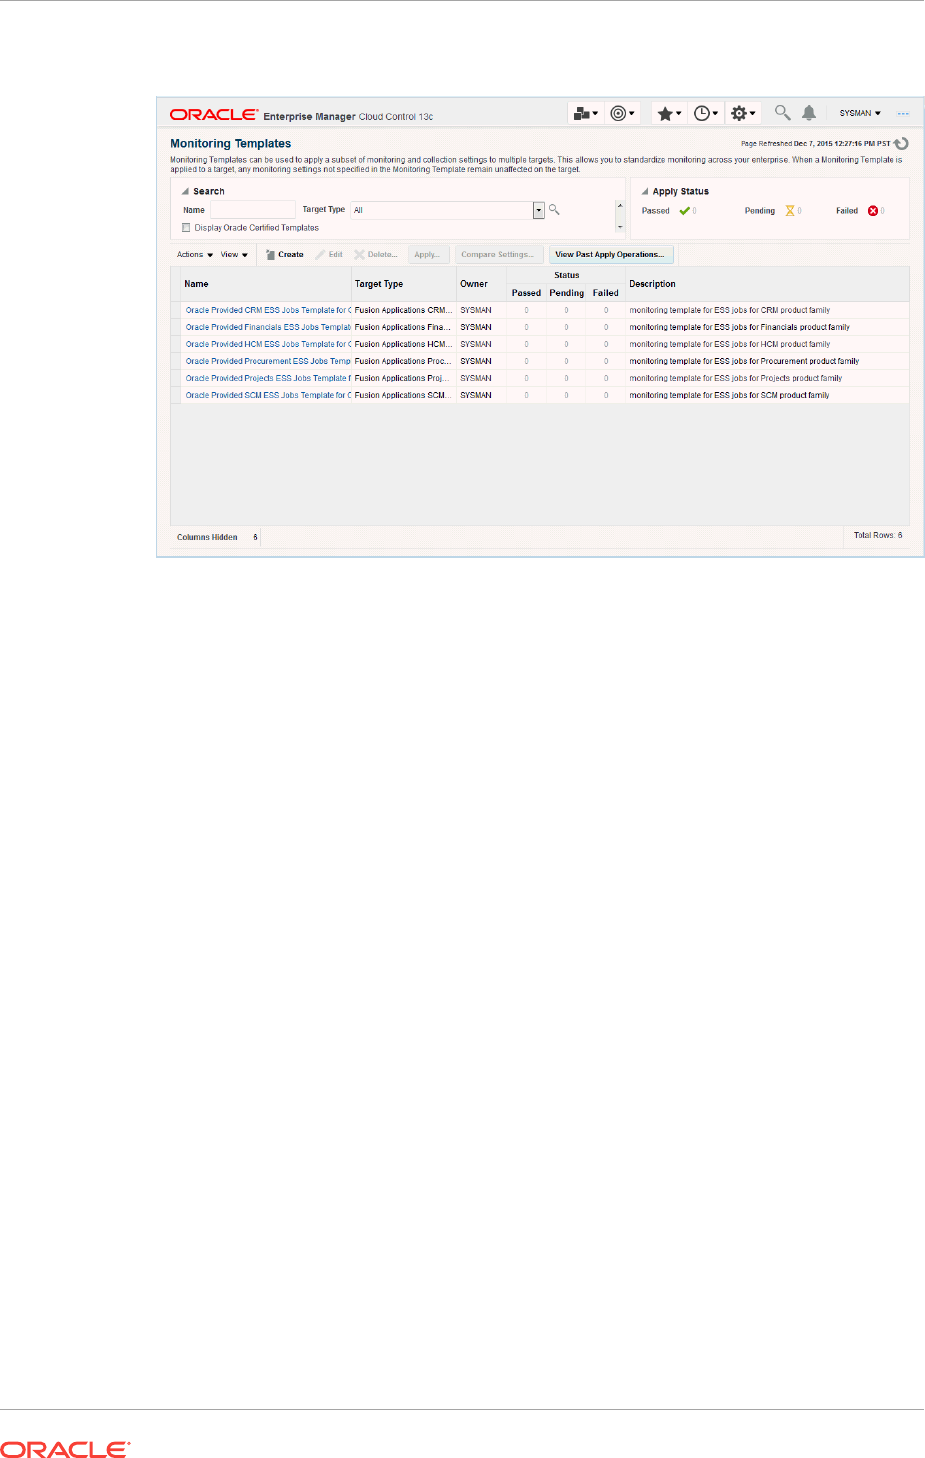
Figure 7-1 Monitoring Templates
You can begin the monitoring template creation process from this page.
7.5 Creating a Monitoring Template
Monitoring templates allow you to define and save monitoring settings for specific
target types. As such, specific Enterprise Manager privileges are required in order to
create monitoring templates.
There are two resource privileges that can be granted to a user/role that allows you to
create and/or view monitoring templates:
•Create Monitoring Template
This privilege allows you to create a monitoring template.
•View Any Monitoring Template
This privilege allows you to view any monitoring template.
These privileges can be granted from the Resource Privilege page of an Enterprise
Manager user, or when creating a role.
Monitoring templates adhere to a typical access model: You can grant either FULL or
VIEW access on a template to other users or roles. VIEW access allows you to see
and use the monitoring template. FULL access allows you to see, use, edit and delete
a monitoring template. The template owner can change access to a template.
By default, Enterprise Manager Super Administrators have FULL access on all
monitoring templates.
Monitoring template allow you to define and save monitoring settings for specific target
types. To define a new template:
1. From the Enterprise menu, select Monitoring and then Monitoring Templates.
Chapter 7
Creating a Monitoring Template
7-3
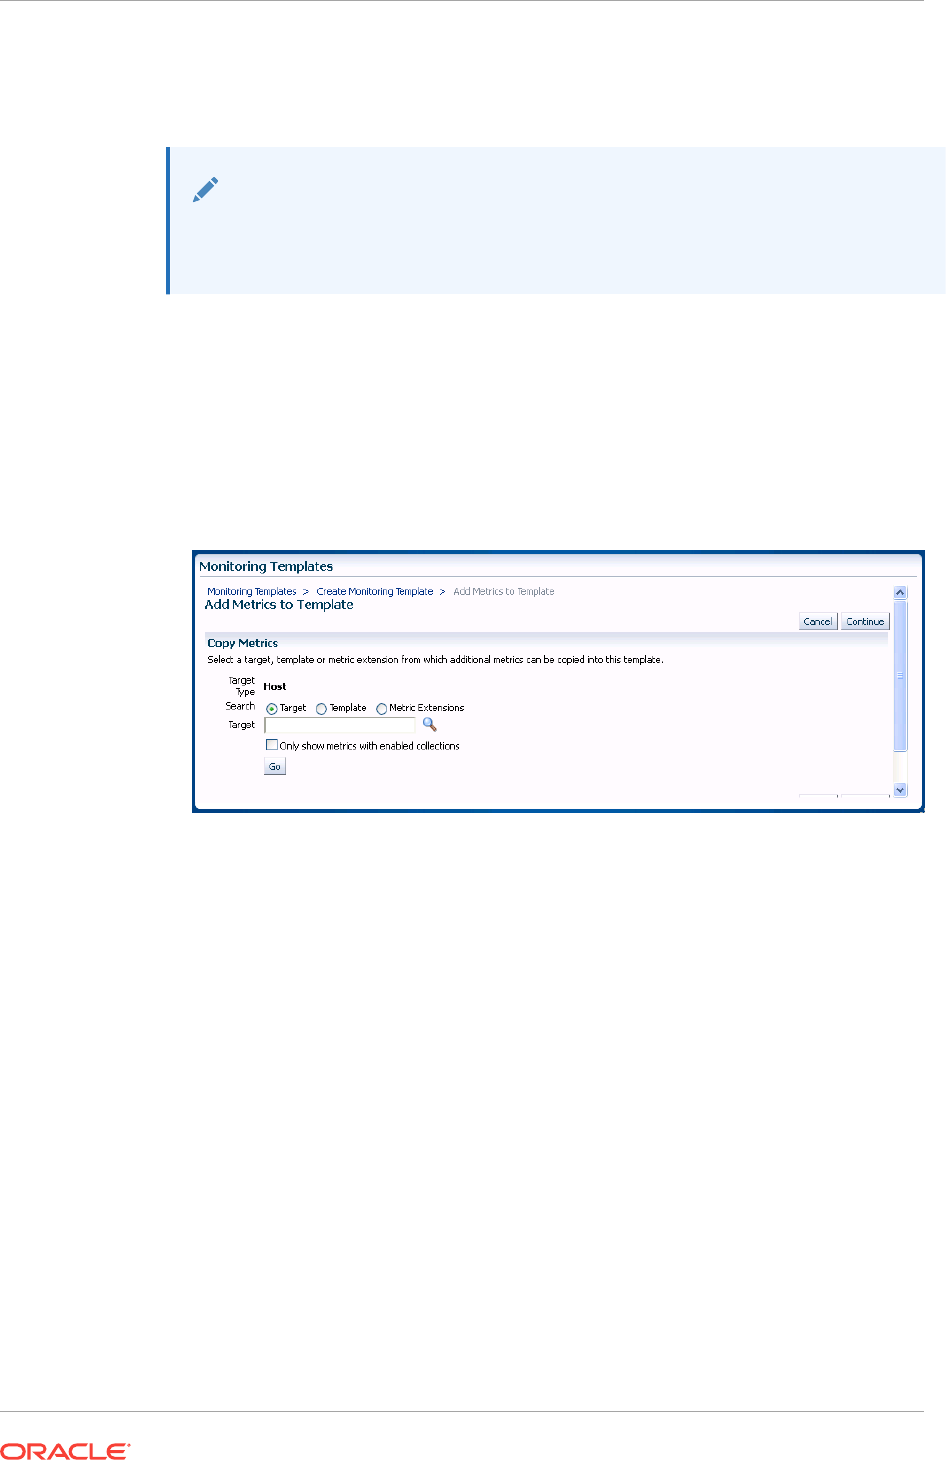
2. Click Create. Enterprise Manager gives you the option of selecting either a
specific target or a target type. Template monitoring settings are populated
according to the selected target or target type. Click Continue.
Note:
If the selected target type is either Web Application or Service, you will only be
able to select those targets for which you have Operator privilege.
3. Enter requisite template information on the General, Metric Thresholds, and Other
Collected Items tabs.
On the Metric Thresholds tab, you can delete or add monitoring template metrics.
To delete existing metrics, select one or more metrics and click Remove Metrics
from Template.
To add metrics, click Add Metrics to Template. The Add Metrics to Template
page displays as shown in the following graphic.
On this page, you can select a source from which you can copy metrics to the
template. Sources include specific targets, other monitoring templates, or metric
extensions. When adding metric to a template from another template, if the metric
has adaptive settings, then the adaptive settings will not be copied: Only the metric
will be copied along with existing thresholds.
Note: You must define the metric extension thresholds in order to add it to a
monitoring template.
Click Continue once your have finished modifying the template metrics.
4. Once you have finished entering requisite information, click OK.
7.6 Editing a Monitoring Template
The Monitoring Templates page lists all viewable templates. To edit a template, you
must have FULL access privileges.
To edit a Monitoring Template:
1. From the Enterprise menu, select Monitoring, and then Monitoring Templates.
2. Choose the desired template from the table.
Chapter 7
Editing a Monitoring Template
7-4

3. Click Edit.
4. Once you have finished making changes, click OK.
Sharing Access with Other Users
By default, template owners (creators) have FULL access privileges on the template
and Enterprise Manager Super Administrators have FULL access privileges on all
templates. Only the template owner can change access to the template. You, as
owner, can grant VIEW (view the template) or FULL (edit or delete the template) on
the template to a user or role.
7.7 Applying Monitoring Templates to Targets
As mentioned earlier, a monitoring template can be applied to one or more targets of
the same target type, or to composite targets such as groups. For composite targets,
the template is applied to all member targets that are of the appropriate type. If you
applied the template manually or via EM CLI, once a template is applied, future
changes made to the template will not be automatically propagated to the targets: You
must reapply the template to all affected targets
Administration Groups and Template Collections: Applying Monitoring
Templates Automatically
Monitoring templates can be automatically applied whenever a new targets are added
to your Enterprise Manager environment. Automation is carried out through
Administration Groups and Template Collections Administration Groups are a special
type of group used to automate application of monitoring settings to targets upon
joining the group. When a target is added to the administration group Enterprise
Manager applies monitoring settings from the associated template collection consisting
of monitoring templates, compliance standards, and cloud policies. If changes are later
made to the monitoring template, Enterprise Manager automatically applies the
changes to the relevant targets based on the synchronization schedule. For more
information, see "Using Administration Groups ".
7.7.1 Applying a Monitoring Template
To apply a template, you must have at least Manage Target Metrics target privileges
on the destination target(s).
1. From the Enterprise menu, select Monitoring and then Monitoring Templates.
2. Select the desired template from the table.
3. Click Apply.
4. Select the desired apply options and the target(s) to which you want the templates
applied. See Monitoring Template Application Options for additional information.
5. Click OK.
7.7.2 Monitoring Template Application Options
You can choose aggregate targets such groups, systems or clusters as destination
targets. The templates will apply to the appropriate members of the group/system/
cluster as they currently exist. If new members are later added to the group, you will
need to re-apply the template to those new members. Template application is
performed in the background as asynchronous jobs, so after the apply operation is
Chapter 7
Applying Monitoring Templates to Targets
7-5

performed, you can click on the link under the Pending Apply Operations column in the
main templates table to see any apply operations that still are pending.
When applying a Monitoring Template, metric settings such as thresholds, comparison
operators, and corrective actions are copied to the destination target. In addition,
metric collection schedules including collection frequency and upload interval are also
copied to the target. You determine how Enterprise Manager applies the metric
settings from the template to the target by choosing an apply option.
7.7.2.1 Apply Options
Template apply options control how template metric and policy settings are applied to
a target. Two template apply options are available:
•Template will completely replace all metric settings in the target: When the
template is applied, all metrics and policies defined in the template will be applied
to the target. Pre-existing target monitoring settings not defined in the template will
be disabled: Metric thresholds will be set to NULL or blank. Policies will be
disabled. This effectively eliminates alerts from these metrics and policies by
clearing current severities and violations.
•Template will only override metrics that are common to both template and
target: When the template is applied, only metrics and policies common to both
the template and target are updated. Existing target metric and policies that do not
exist in the template will remain unaffected. When this option is selected,
additional template apply options are made available for metrics with key value
settings.
7.7.2.2 Metrics with Key Value Settings
A metric with key value settings is one that can monitor multiple objects at different
thresholds. For example, the Filesystem Space Available(%) metric can monitor
different mount points using different warning and critical thresholds for each mount
point.
When the template contains a metric that has key value settings, you can choose one
of three options when applying this template to a target. As an example, consider the
case where the template has the following metric:
Filesystem Space Available(%)
Mount Point Operator Warning Threshold Critical Threshold
/ ≤ 40 20
/private ≤ 30 20
/private2 ≤ 20 20
/u1 ≤ 30 20
All Others ≤ 25 15
And a host target has the same metric at different settings:
Mount Point Operator Warning Threshold Critical Threshold
/ ≤ 30 10
/private ≤ 25 15
Chapter 7
Applying Monitoring Templates to Targets
7-6

Mount Point Operator Warning Threshold Critical Threshold
/private2 ≤ 20 20
All Others ≤ 25 15
These are the results for each option:
1) All key value settings in the template will be applied to the target, any
additional key values settings on the target will not be removed
When the template is applied to the target using this copy option, all the template
settings for the mount points, /, /private, and /U1 will be applied. Existing target
settings for mount points not covered by the template remain unaffected. Thus, the
resulting settings on the target for this metric will be:
Mount Point Operator Warning Threshold Critical Threshold
/ ≤ 40 20
/private ≤ 30 20
/u1 ≤ 30 20
2) All key value settings in the template will be applied to target, any additional
key value settings on the target will be removed.
When the template is applied to the target using this copy option, all template settings
will be applied to the target. Any object-specific threshold settings that exist only on the
target will be removed, any object-specific thresholds that are only in the template will
be added to the target. Thus, the final settings on the target will be:
Mount Point Operator Warning Threshold Critical Threshold
/ ≤ 40 20
/private ≤ 30 20
/u1 ≤ 30 20
All Others ≤ 25 15
3) Only settings for key values common to both template and target will be
applied to the target
When the template is applied to the target using this copy option, only the settings for
the common mount points, / and /private will be applied. Thus, the resulting settings on
the target for this metric will be:
Mount Point Operator Warning Threshold Critical Threshold
/ ≤ 40 20
/private ≤ 30 20
/private2 ≤ 20 20
All Others ≤ 25 15
Chapter 7
Applying Monitoring Templates to Targets
7-7

7.8 Comparing Monitoring Templates with Targets
The intended effect of applying Monitoring Templates to destination targets is not
always clear. Deciding how and when to apply a template is simplified by using the
Compare Monitoring Template feature of Enterprise Manager. This allows you to see
at a glance how metric and collection settings defined in the template differ from those
defined on the destination target. You can easily determine whether your targets are
still compliant with the monitoring settings you have applied in the past. This template
comparison capability is especially useful when used with aggregate targets such as
groups and systems. For example, you can quickly compare the metric and collection
settings of group members with those of a template, and then apply the template as
appropriate.
Performing a Monitoring Template-Target comparison:
1. From the Enterprise menu, select Monitoring and then Monitoring Templates.
2. Choose the desired template from the table.
3. Click Compare Settings. The Compare Monitoring Template page displays.
4. Click Add to add one or more destination targets. The Search and Select dialog
displays.
5. Select a one or more destination targets and then click Select. The selected
targets are added to the list of destination targets.
6. Select the newly added destination targets and then click Continue. A
confirmation message displays indicating the Compare Template Settings job was
successfully submitted.
7. Click OK to view the job results. Note: Depending on the complexity of the job run,
it may take time for the job to complete.
7.8.1 When is a metric between a template and a target considered
"different"?
The metric is said to be different when any or all the following conditions are true
(provided the target does not have "Template Override" set for that metric):
•The Warning Threshold settings are different
•The Critical Threshold settings are different.
•The Collection Schedules are different.
•The Upload Intervals are different.
•The number of occurrences (for which the metric has to remain at a value above
the threshold before an alert is raised) are different.)
•For user-defined metrics, in addition to the above, the OS Command/SQL
statement used to evaluate the user-defined metric is different. Note that this
applies only if the user-defined metric name and the return type are the same.
•The metric extension marked for delete will be shown as "different" on the
destination target and the template only if:
–A metric extension with the same name exists on both the destination target
and template.
Chapter 7
Comparing Monitoring Templates with Targets
7-8

–The return type (String, Numeric) of the metric extension is the same on both
the destination target and template.
–The metric type is the same on both the destination target and the template.
7.9 Comparing Metric Settings Using Information Publisher
In addition to viewing metric differences between Monitoring Templates and
destination targets using the Compare Monitoring Template user-interface, you can
also use Information Publisher to generate reports containing the target-template
differences. Using Information Publisher's reporting capabilities gives you more
flexibility for displaying and distributing metric comparison data. For more information,
see "Using Information Publisher ".
Create a Report Definition
1. From the Enterprise menu, select Reports and then Information Publisher
Reports.
2. Click Create. The Create Report Definition user interface is displayed.
3. On the General page, specify the report name, how targets should be included,
target privileges, report time period, and display options.
4. On the Elements page, click Add to access the Add Element page.
5. Select the Monitoring Template Comparison element and click Continue to return
to the Element page.
6. Once you have added the report element, click the Set Parameter icon to specify
requisite operational parameters. On this page, you specify a report header, select
a monitoring template, destination targets, and template application settings for
multiple threshold metrics. Click Continue to return to the Elements page.
7. Click Layout to specify how information should be arranged in the report.
8. Click Preview to validate that you are satisfied with the data and presentation of
the report.
9. On the Schedule page, define when reports should be generated, and whether
copies should be saved and/or sent via e-mail, and how stored copies should be
purged.
10. On the Access page, click Add to specify which Enterprise Manager
administrators and/or roles will be permitted to view this generated report.
Additionally, if you have GRANT_ANY_REPORT_VIEWER system privilege, you
can make this report definition accessible to non-credential users via the
Enterprise Manager Reports Website
11. Click OK when you are finished.
12. Validate the report definition. If the parameters provided conflict, validation errors
or warnings will appear and let you know what needs attention.
13. Once the report definition has been saved successfully, it appears in the Report
Definition list under the Category and Subcategory you specified on the General
page.
Viewing the Report
1. Find the template comparison report definition in the Report Definition list. You can
use the Search function to find or filter the list of report definitions.
Chapter 7
Comparing Metric Settings Using Information Publisher
7-9

2. Click on the report definition title. If the report has a specified target, the report will
be generated immediately. If the report does not have a specified target, you will
be prompted to select a target.
Scheduling Reports for Automatic Generation
1. Create or edit a report definition.
2. On the Schedule page, choose the Schedule Report option.
3. Specify a schedule type. The schedule parameters on this page change according
to the selected schedule type.
When reports are scheduled for automatic generation, you have the option of saving
copies to the Management Repository and/or sending an e-mail version of the report
to designated recipients.
If a report has been scheduled to save copies, a copy of the report is saved each time
a scheduled report completes. When a user views a report with saved copies by
clicking on the report title, the most recently saved copy of the report is rendered. To
see the complete list of saved copies click on the Saved Copies link at the top of the
report. Enterprise Manager administrators can generate a copy of the report on-
demand by clicking on the Refresh icon on the report.
7.10 Exporting and Importing Monitoring Templates
For portability, monitoring templates can be exported to an XML file and then imported
into another Enterprise Manager installation as an active template.
Note:
You can export templates from Enterprise Manager 10g release 2 or higher
and import them into Enterprise Manager 13c.
Exporting a Monitoring Template
To export a template to an XML file:
1. From the Enterprise menu, select Monitoring and then Monitoring Templates.
2. Select the desired monitoring template from the table.
3. Click Export.
Note: If you are running an Enterprise Manager 11g or earlier release, use the EM
CLI export_template verb to perform the export operation. Note that if the
monitoring template contains policy rules from earlier Enterprise Manager releases
(pre-12c) , these will not be imported into Enterprise Manager 12c as policy rules
no longer exist in this release.
Importing a Monitoring Template
To import a template from an XML file:
1. From the Enterprise menu, select Monitoring and then Monitoring Templates.
2. Click Import. The Import Template page displays.
3. Specify the monitoring template XML file you want to import.
Chapter 7
Exporting and Importing Monitoring Templates
7-10

4. Click Import.
7.11 Upgrading Enterprise Manager: Comparing Monitoring
Templates
When upgrading from one Enterprise Manager release to the next, you will accumulate
monitoring templates that have been created for different releases. Beginning with
Enterprise Manager release 12.1.0.4, you can generate a post-upgrade Monitoring
Template Difference Report that allows you to view what templates had been created
for various Enterprise Manager releases. To generate the Monitoring Template
Difference Report, from the Setup menu, select Manage Cloud Control, and then
Post Upgrade Tasks.
7.12 Changing the Monitoring Template Apply History
Retention Period
You can view monitoring template apply history using the predefined report in
Information Publisher. From the Enterprise menu, select Reports and then
Information Publisher. On the Information Publisher page, you can enter "template"
in the Title text entry field and click Go. The predefined report Monitoring Template
Apply History (last 7 days) appears in the report list.
By default, Enterprise Manager retains the monitoring template apply history for a
period of 180 days. If required, you can change the retention period to a value suitable
for your monitoring needs. Although the retention period cannot be indefinite, it can be
set to an extremely long period of time. Enterprise Manager provides the following
PL/SQL API to change the retention period.
mgmt_template_ui.modify_purge_policy(p_retention_days=><num_days>)
This procedure takes a NUMBER as input (num_days).
Chapter 7
Upgrading Enterprise Manager: Comparing Monitoring Templates
7-11

8
Using Metric Extensions
Metric extensions provide you with the ability to extend Oracle's monitoring capabilities
to monitor conditions specific to your IT environment. This provides you with a
comprehensive view of your environment. Furthermore, metric extensions allow you to
simplify your IT organization's operational processes by leveraging Enterprise
Manager as the single central monitoring tool for your entire datacenter instead of
relying on other monitoring tools to provide this supplementary monitoring.
This chapter covers the following:
•What are Metric Extensions?
•Metric Extension Lifecycle
•Working with Metric Extensions
•Adapters
•Converting User-defined Metrics to Metric Extensions
•Metric Extension Command Line Verbs
Note:
For video tutorials on using metric extensions, see:
Metric Extensions Part 1: Create Metric Extensions
https://apex.oracle.com/pls/apex/f?
p=44785:24:115515960475402:::24:P24_CONTENT_ID%2CP24_PREV_PAGE:5741%2C24
Metric Extensions Part 2: Deploy Metric Extensions
https://apex.oracle.com/pls/apex/f?
p=44785:24:15296555051584:::24:P24_CONTENT_ID%2CP24_PREV_PAGE:5742%2C24
8.1 What are Metric Extensions?
Metric extensions allow you to create metrics on any target type. Unlike user-defined
metrics (used to extend monitoring in previous Enterprise Manager releases), metric
extensions allow you to create full-fledged metrics for a multitude of target types, such
as:
•Hosts
•Databases
•Fusion Applications
•IBM Websphere
•Oracle Exadata databases and storage servers
8-1
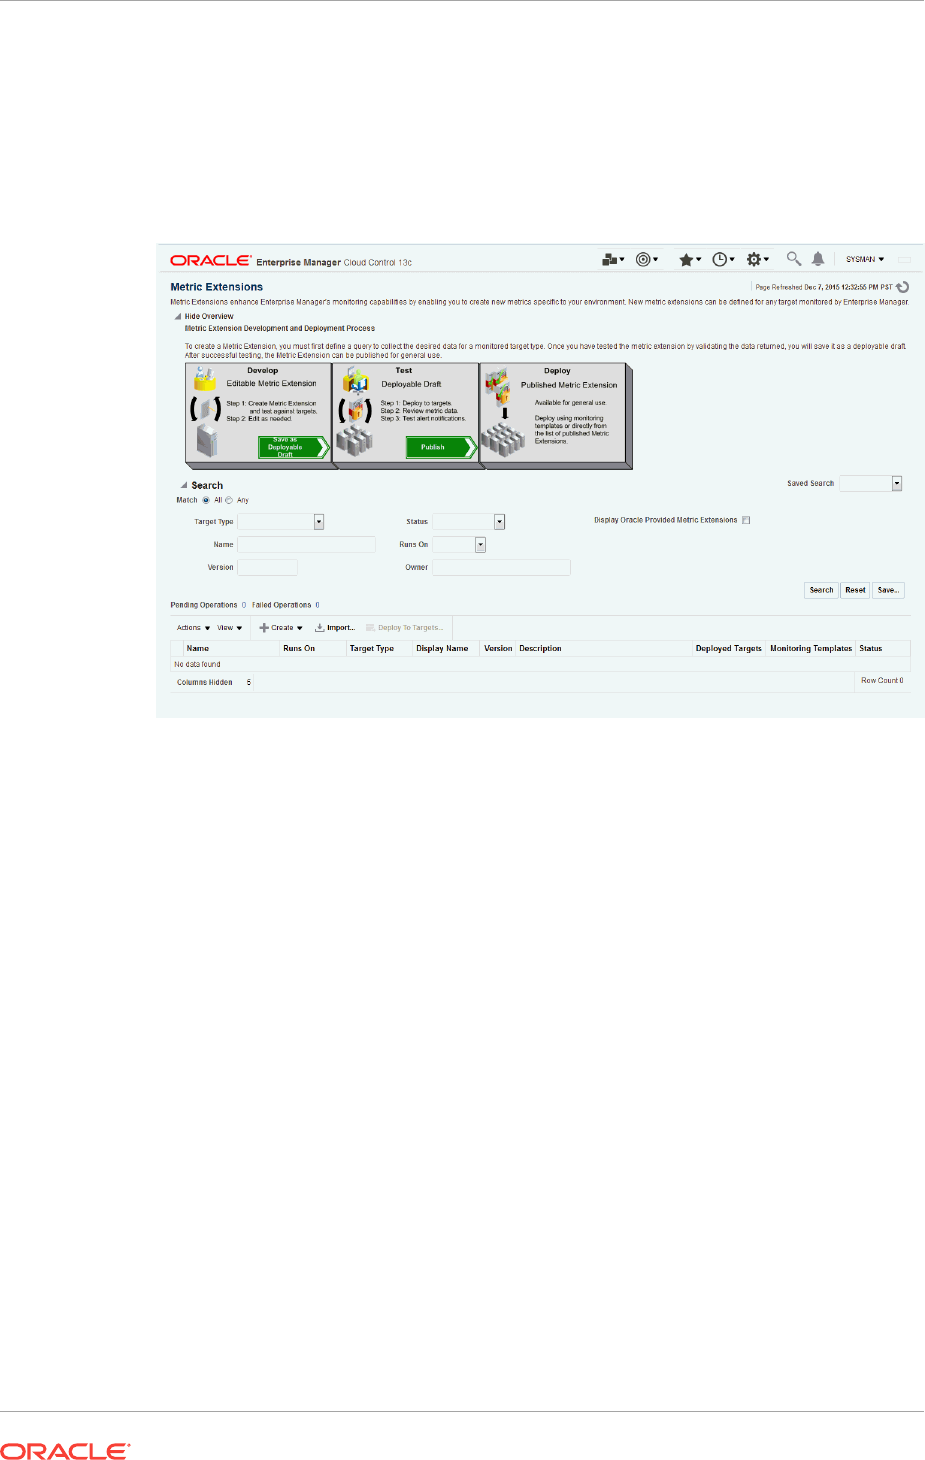
•Siebel components
•Oracle Business Intelligence components
You manage metric extensions from the Metric Extensions page. This page lists all
metric extensions in addition to allowing you to create, edit, import/export, and deploy
metric extensions.
The cornerstone of the metric extension is the Oracle Integration Adapter. Adapters
provide a means to gather data about targets using specific protocols. Adapter
availability depends on the target type your metric extension monitors.
How Do Metric Extensions Differ from User-defined Metrics?
In previous releases of Enterprise Manager, user-defined metrics were used to extend
monitoring capability in a limited fashion: user-defined metrics could be used to collect
point values through execution of OS scripts and a somewhat more complex set of
values (one per object) through SQL. Unlike metric extensions, user-defined metrics
have several limitations:
•Limited Integration: If the OS or SQL user-defined metric executed custom
scripts, or required atonal dependent files, the user needed to manually transfer
these files to the target's file system.
•Limited Application of Query Protocols: OS user-defined metrics cannot model
child objects of servers by returning multiple rows from a metric (this capability
only exists for SQL user-defined metrics).
•Limited Data Collection: Full-fledged Enterprise Manager metrics can collect
multiple pieces of data with a single query and reflect the associated data in alert
context. However, in the case of user-defined metrics, multiple pieces of data must
be collected by creating multiple user-defined metrics. Because the data is being
collected separately, it is not possible to refer to the associated data when alerts
are generated.
Chapter 8
What are Metric Extensions?
8-2

•Limited Query Protocols: User-defined metrics can only use the "OS" and "SQL"
protocols, unlike metric extensions which can use additional protocols such as
SNMP and JMX.
•Limited Target Application: User-defined metrics only allow OS user-defined
metrics against host targets and SQL user-defined metrics against database
targets. No other target types are permitted. If, for example, you want to deploy a
user-defined metric against WebLogic instances in your environment, you will not
be able to do so since it is neither a host or database target type.
Most importantly, the primary difference between metric extensions and user-defined
metrics is that, unlike user-defined metrics, metric extensions are full-fledged metrics
similar to Enterprise Manager out-of-box metrics. They are handled and exposed in all
Enterprise Manager monitoring features as any Enterprise Manager-provided metric
and will automatically apply to any new features introduced.
8.2 Metric Extension Lifecycle
Developing a metric extension involves the same three phases you would expect from
any programmatic customization:
•Developing Your Metric Extension
•Testing Your Metric Extension
•Deploying and Publishing Your Metric Extension
Developing Your Metric Extension
The first step is to define your monitoring requirements. This includes deciding the
target type, what data needs to be collected, what mechanism (adapter) can be used
to collect that data, and if elevated credentials are required. After making these
decisions, you are ready to begin developing your metric extension. Enterprise
Manager provides an intuitive user interface to guide you through the creation process.
Chapter 8
Metric Extension Lifecycle
8-3

The metric extension wizard allows you to develop and refine your metric extension in
a completely editable format. And more importantly, allows you to interactively test
your metric extension against selected targets without having first to deploy the
extension to a dedicated test environment. The Test page allows you to run real-time
metric evaluations to ensure there are no syntactical errors in your script or metric
extension definition.
When you have completed working on your metric extension, you can click Finish to
exit the wizard. The newly created metric extension appears in the Metric Extension
Library where it can be accessed for further editing or saved as a deployable draft that
can be tested against multiple targets.
Note:
You can edit a metric extension only if its status is editable. Once it is saved
as a deployable draft, you must create a new version to implement further
edits.
Testing Your Metric Extension
Once your metric extension returns the expected data during real-time target testing,
you are ready to test its robustness and actual behavior in Enterprise Manager by
deploying it against targets and start collecting data. At this point, the metric extension
is still private (only the developer can deploy to targets), but is identical to Oracle out-
of-box metrics behavior wise. This step involves selecting your editable metric
extension in the library and generating a deployable draft.
You can now deploy the metric extension to actual targets by going through the
“Deploy To Targets…" action. After target deployment, you can review the metric data
returned and test alert notifications. As mentioned previously, you will not be able to
Chapter 8
Metric Extension Lifecycle
8-4

edit the metric extension once a deployable draft is created: You must create a new
version of the metric extension.
Deploying Your Metric Extension
After rigorous testing through multiple metric extension versions and target
deployments, your metric extension is ready for deployment to your production
environment. Until this point, your metric extension is only viewable by you, the metric
extension creator. To make it accessible to all Enterprise Manager administrators, it
must be published. From the Actions menu, select Publish Metric Extension.
Now that your metric extension has been made public, your metric extension can be
deployed to intended production targets. If you are monitoring a small number of
targets, you can select the Deploy To Targets menu option and add targets one at a
time. For large numbers of targets, you deploy metric extensions to targets using
monitoring templates. An extension is added to a monitoring template in the same way
a full-fledged metric is added. The monitoring template is then deployed to the targets.
Note:
You cannot add metric extensions to monitoring templates before publishing
the extension. If you attempt to do so, the monitoring template page will warn
you about it, and will not proceed until you remove the metric extension.
Updating Metric Extensions
Beginning with Enterprise Manager Release 12.1.0.4, metric extensions can be
updated using the Enterprise Manager Self-update feature. See Updating Cloud
Control for more information.
8.3 Working with Metric Extensions
Most all metric extension operations can be carried out from the Metric Extension
home page. If you need to perform operations on published extensions outside of the
UI, Enterprise Manger also provides EM CLI verbs to handle such operations as
importing/exporting metric extensions to archive files and migrating legacy user-
defined metrics to metric extensions. This section covers metric extension operations
carried out from the UI.
8.3.1 Administrator Privilege Requirements
In order to create, edit, view, deploy or undeploy metric extensions, you must have the
requisite administrator privileges. Enterprise Manager administrators must have the
following privileges:
•Create Metric Extension: System level access that:
Lets administrators view and deploy metric extensions
Allows administrators to edit and delete extensions.
•Edit Metric Extension: Lets users with "Create Metric Extension" privilege edit
and create next versions of a particular metric extensions. The metric extension
Chapter 8
Working with Metric Extensions
8-5

creator has this privilege by default. This privilege must be granted on a per-metric
extension basis.
•Full Metric Extension: Allows users with 'Create Metric Extension' privilege to
edit and create new versions of a particular metric extension.
•Manage Metrics: Lets users deploy and un-deploy extensions on targets
Note: The Manage Metrics privilege must be granted on a per-target basis.
8.3.2 Granting Create Metric Extension Privilege
To grant create metric extension privileges to another administrator:
1. From the Setup menu, select Security, then select Administrators.
2. Choose the Administrator you would like to grant the privilege to.
3. Click Edit.
4. Go to the Resource Privileges tab, and click Manage Privilege Grants for the
Metric Extension resource type.
5. Under Resource Type Privileges, click the Create Metric Extension check box.
6. Click Continue, review changes, and click Finish in the Review tab.
8.3.3 Managing Administrator Privileges
Before an Enterprise Manager administrator can edit or delete a metric extension
created by another administrator, that administrator must have been granted requisite
access privileges. Edit privilege allows editing and creating next versions of the
extension. Full privilege allows the above operations and deletion of the extension.
To grant edit/full access to an existing metric extension to another administrator:
1. From the Setup menu, select Security, then select Administrators.
2. Choose the Administrator you would like to grant access to.
3. Click Edit.
4. Go to Resource Privileges and click Manage Privilege Grants (pencil icon) for the
Metric Extensions resource type.
5. Under Resource Privileges, you can search for and add existing metric
extensions. Add the metric extensions you would like to grant privileges to. This
allows the user to edit and create next versions of the metric extension.
On this page, you can also grant an administrator the Create Metric Extension
privilege, which will allow them to manage metric extension access. See
"Managing Administrator Access to Metric Extensions" for more information.
6. If you would additionally like to allow delete operations, then click the pencil icon in
the Manage Resource Privilege Grants column, and select Full Metric
Extension privilege in the page that shows up.
7. Click Continue, review changes, and click Finish in the review tab.
Chapter 8
Working with Metric Extensions
8-6

8.3.4 Managing Administrator Access to Metric Extensions
Administrators commonly share the responsibility of monitoring and managing targets
within the IT environment. Consequently, creating and maintaining metric extensions
becomes a collaborative effort involving multiple administrators. Metric extension
owners can control access directly from the metric extension UI.
8.3.4.1 Granting Full/Edit Privileges on a Metric Extension
As metric extension owner or Super Administrator, perform the following actions to
assign full/edit privileges on a metric extension to another administrator:
1. From the Enterprise menu, select Monitoring, then select Metric Extensions.
2. Choose a metric extension requiring update.
3. From the Actions menu, select Manage Access.
4. Click Add. The administrator selection dialog box appears. You can filter the list by
administrator, role, or both.
5. Choose one or more administrators/roles from the list.
6. Click Select. The chosen administrators/roles appear in the access list.
In the Privilege column, Edit is set by default. Choose Full from the drop-down
menu to assign Full privileges on the metric extension.
Edit Privilege: Allows an administrator to make changes to the metric extension
but not delete it.
Full Privilege: Allows an administrator to edit and also delete the metric extension.
The privilege granted to a user or role applies to all versions of the metric
extension.
7. Click OK.
8.3.4.2 Revoking Access Privileges on a Metric Extension
As metric extension owner or Super Administrator, perform the following actions to
revoke metric extension privileges assigned to another administrator:
1. From the Enterprise menu, select Monitoring, then select Metric Extensions.
2. Choose a metric extension requiring update.
3. From the Actions menu, select Manage Access.
4. Choose one or more administrators/roles from the list.
5. Click Remove. The chosen administrators/roles is deleted from the access list.
6. Click OK.
Enterprise Manager allows metric extension ownership to be transferred from the
current owner of the metric extension to another administrator as long as that
administrator has been granted the Create Metric Extension privilege.
Chapter 8
Working with Metric Extensions
8-7

Note:
The Enterprise Manager Super Administrator has full managerial access to all
metric extensions (view, edit, and ownership transfer).
As mentioned above, manage access is only enabled for the owner of the extension or
an Enterprise Manager Super User. Once the ownership is transferred, the previous
owner does not have any management privileges on the metric extension unless
explicitly granted before ownership transfer. The Change Owner option is only
available to users and not roles.
Manage access allows the metric extension owner or Super Administrator to grant
other Enterprise Manager users or roles the ability to edit, modify, or delete metric
extensions.
8.3.4.3 Transferring Metric Extension Ownership
Enterprise Manager allows metric extension ownership to be transferred from the
current owner of the metric extension to another administrator as long as that
administrator has been granted the Create Metric Extension privilege.
Note:
The Enterprise Manager Super Administrator has full managerial access to all
metric extensions (view, edit, and ownership transfer).
As mentioned above, manage access is only enabled for the owner of the extension or
an Enterprise Manager Super User. Once the ownership is transferred, the previous
owner does not have any management privileges on the metric extension unless
explicitly granted before ownership transfer. The Change Owner option is only
available to users and not roles.
Manage access allows the metric extension owner or Super Administrator to grant
other Enterprise Manager users or roles the ability to edit, modify, or delete metric
extensions.
8.3.5 Creating a New Metric Extension
To create a new metric extension:
1. From the Enterprise menu, select Monitoring, then select Metric Extensions.
2. From the Create menu, select Metric Extension. Enterprise Manager will
determine whether you have the Create Extension privilege and guide you through
the creation process.
3. Decide on a metric extension name. Be aware that the name (and Display Name)
must be unique across a target type.
4. Enter the general parameters.
Chapter 8
Working with Metric Extensions
8-8

The selected Adapter type defines the properties you must specify in the next step
of the metric extension wizard. The following adapter types are available:
•OS Command Adapter - Single Column
Executes the specified OS command and returns the command output as a
single value. The metric result is a 1 row, 1 column table.
•OS Command Adapter- Multiple Values
Executes the specified OS command and returns each command output line
as a separate value. The metric result is a multi-row, 1 column table.
•OS Command Adapter - Multiple Columns
Executes the specified OS command and parses each command output line
(delimited by a user-specified string) into multiple values. The metric result is a
mult-row, multi-column table.
•SQL Adapter
Executes custom SQL queries or function calls against single instance
databases and instances on Real Application Clusters (RAC).
•SNMP (Simple Network Management Protocol) Adapter
Allow Enterprise Manager Management Agents to query SNMP agents for
Management Information Base (MIB) variable information to be used as metric
data.
•JMX (Java Management Extensions) Adapter
Retrieves JMX attributes from JMX-enabled servers and returns these
attributes as a metric table.
Refer to the Adapters section for specific information on the selected adapter
needed in the Adapter page (step 2) of the wizard.
Note:
Be aware that if you change the metric extension Adapter, all your previous
adapter properties (in Step 2) will be cleared.
Collection Schedule
You defined the frequency with which metric data is collected and how it is used
(Alerting Only or Alerting and Historical Trending) by specifying collection schedule
properties.
Depending on the target type selected, an Advanced option region may appear.
This region may (depending on the selected target type) contain one or two
options that determine whether metric data continues to be collected under certain
target availability/alert conditions. The options are:
•Option 1: Continue metric data collection even if the target is down. This
option is visible for all target types except for Host target types as it is not
possible to collect metric data when the host is down.
•Option 2: Continue metric data collection when an alert severity is raised for a
specific target metric. This metric is defined in such a way (AltSkipCondition
element is defined on this metric) that when a severity is generated on this
Chapter 8
Working with Metric Extensions
8-9

metric, the metric collections for other target metrics are stopped. The
explanatory text above the checkbox for this option varies depending on the
selected target type.
The Management Agent has logic to skip evaluation of metrics for targets that
are known to be down to reduce generation of metric errors due to connection
failures. If the AltSkipCondition element is defined for that target metric, other
metrics are skipped whenever there is an error in evaluating the Response
metric or there is a non-clear severity on the Response:Status metric. There
are two situations where a metric collection will be skipped or not happen:
–When a target is down (option 1). This is same as the Severity on
Response/Status metric.
–When a target is UP, but there is a severity on any other metric. Such
conditions are called Alt Skip (Alternate Skip) conditions.
Option 2 is only visible if an AltSkipCondition defined for one of the target's
metrics. For example, this option will not be visible if the selected target type is
Oracle Weblogic Domain, but will be visible if the selected target type is
Database Instance.
The following graphic shows the Advanced collection schedule options.
5. From the Columns page, add metric columns defining the data returned from the
adapter. Note that the column order should match the order with which the adapter
returns the data.
•Column Type
A column is either a Key column, or Data column. A Key column uniquely
identifies a row in the table. For example, employee ID is a unique identifier of
a table of employees. A Data column is any non-unique data in a row. For
example, the first and last names of an employee. You can also create rate
and delta metric columns based on an existing data column. See Rate and
Delta Metric Columns below.
•Value Type
A value type is Number or String. This determines the alert comparison
operators that are available, and how Enterprise Manager renders collection
data for this metric column.
•Alert Thresholds
The Comparison Operation, Warning, and Critical fields define an alert
threshold.
Chapter 8
Working with Metric Extensions
8-10

•Alert Thresholds By Key
The Comparison Operation, Warning Thresholds By Key, and Critical
Thresholds By Key fields allow you to specify distinct alert thresholds for
different rows in a table. This option becomes available if there are any Key
columns defined. For example, if your metric is monitoring CPU Usage, you
can specify a different alert threshold for each distinct CPU. The syntax is to
specify the key column values in a comma separated list, the "=" symbol,
followed by the alert threshold. Multiple thresholds for different rows can be
separated by the semi-colon symbol ";". For example, if the key columns of the
CPU Usage metric are cpu_id and core_id, and you want to add a warning
threshold of 50% for procecessor1, core1, and a threshold of 60% for
processor2, core2, you would specify:
procecessor1,core1=50;processor2,core2=60
•Manually Clearable Alert
Note:
You must expand the Advanced region in order to view the Manually Clearable
Alert option.
If this option is set to true, then the alert will not automatically clear when the
alert threshold is no longer satisfied. For example, if your metric is counting
the number of errors in the system log files, and you set an alert threshold of
50, if an alert is raised once the threshold is met, the alert will not
automatically clear once the error count falls back below 50. The alert will
need to be manually cleared in the Alerts UI in the target home page or
Incident Manager.
•Number of Occurrences Before Alert
The number of consecutive metric collections where the alert threshold is met,
before an alert is raised.
•Alert Message / Clear Message
The message that is sent when the alert is raised / cleared. Variables that are
available for use are: %columnName%, %keyValue%, %value%,
%warning_threshold%, %critical_threshold%
You can also retrieve the value of another column by surrounding the desired
column name with "%". For example, if you are creating an alert for the
cpu_usage column, you can get the value of the core_temperature column by
using %core_temperature%. Note that the same alert / clear message is used
for warning or critical alerts.
Chapter 8
Working with Metric Extensions
8-11
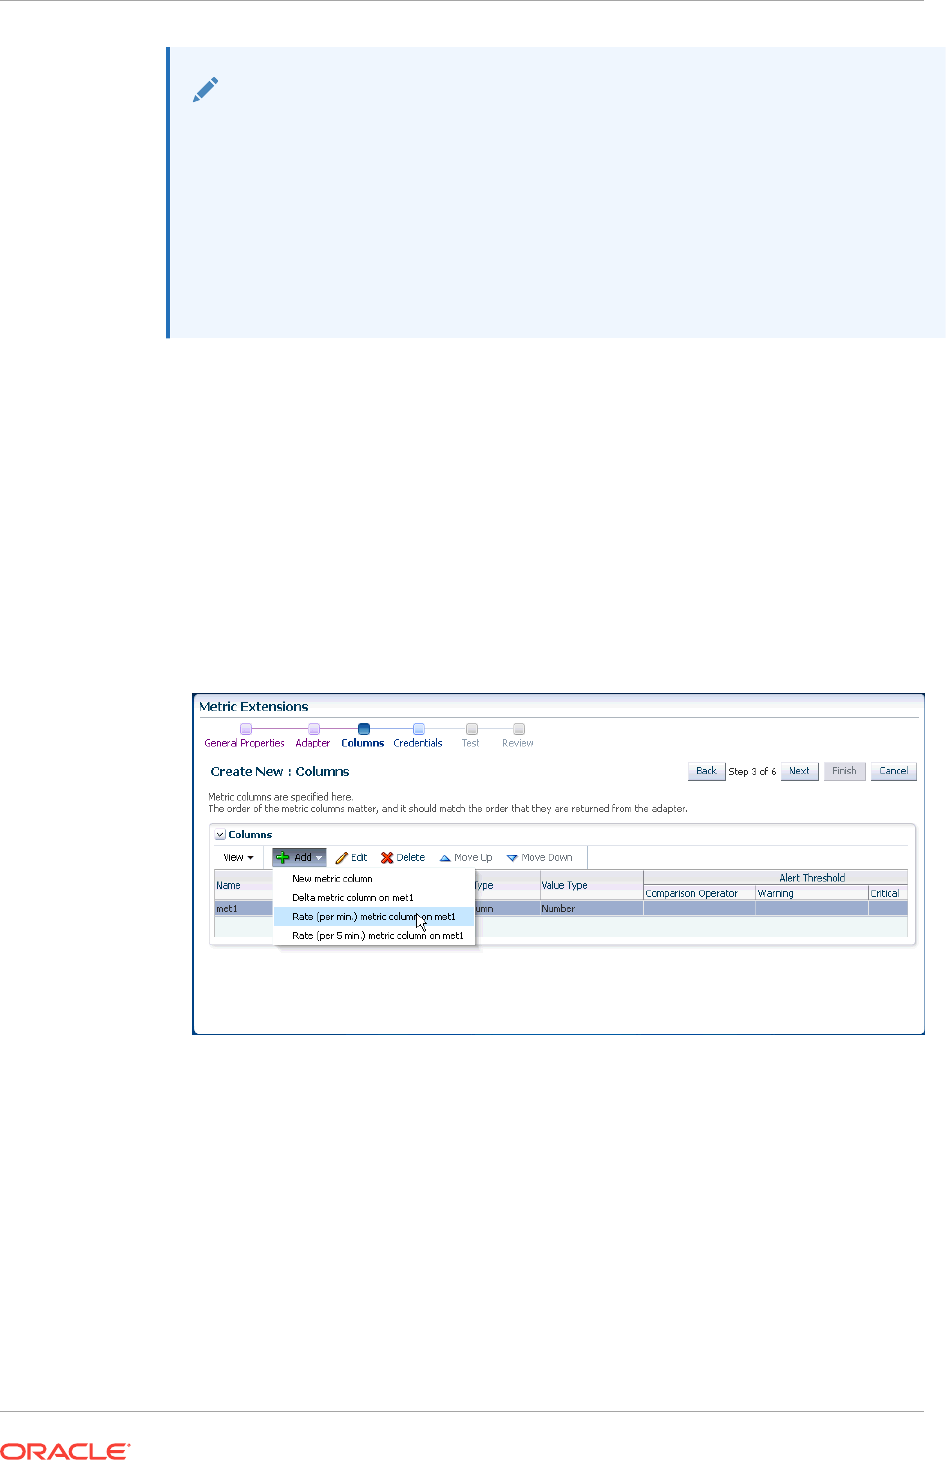
Note:
Think carefully and make sure all Key columns are added, because you
cannot create additional Key columns in newer versions of the metric
extension. Once you click Save As Deployable Draft, the Key columns are
final (edits to column display name, alert thresholds are still allowed). You can
still add new Data columns in newer versions. Also be aware that some
properties of existing Data columns cannot be changed later, including
Column Type, Value Type, Comparison Operator (you can add a new
operator, but not change an existing operator), and Manually Clearable Alert.
•Metric Category
The metric category this column belongs to.
Rate and Delta Metric Columns
You can create additional metric columns based on an existing data column that
measures the rate at which data changes or the difference in value (delta) since
the last metric collection. The rate/delta metric definition will be allowed when a
metric's collection frequency is periodic. For example, collected every 10 minutes.
Converseley, a metric that is computed every Monday and Tuesday only cannot
have a rate/delta metric as data sampling is too infrequent.
After at least one data column has been created, three additional options appear
in the Add menu as shown in the following graphic.
•Add Delta metric columns based on another metric column
Example: You want to know the difference in the table space used since the
last collection.
Delta Calculation:
current metric value - previous metric value
•Add Rate Per Minute metric column based on another metric column
Example: You want to know the average table space usage per minute based
on the table space column metric which is collected every 1 hr.
Rate Per Minute Calculation:
Chapter 8
Working with Metric Extensions
8-12

(current metric value - previous metric value)/ collection schedule
where the collection schedule is in minutes.
•Add Rate Per Five Minutes metric column based on another metric column
Example: You want to know the average table space usage every five minutes
based on the table space column which is collected say every 1 hour]
Rate Per Five Minute Calculation:
[(current metric value - previous metric value)/ collection schedule ] * 5
where the collection schedule is in minutes.
To create a rate/delta metric column, click on an existing data column in the table
and then select one of the rate/delta column options from the Add menu.
6. From the Credentials page, you can override the default monitoring credentials by
using custom monitoring credential sets. By default, the metric extension wizard
chooses the existing credentials used by Oracle out-of-box metrics for the
particular target type. For example, metric extensions will use the dbsnmp user for
database targets. You have the option to override the default credentials, by
creating a custom monitoring credential set through the "emcli
create_credential_set" command. Refer to the Enterprise Manager Command Line
Interface Guide for additional details. Some adapters may use additional
credentials, refer to the Adapters section for specific information.
7. From the Test page, add available test targets.
8. Click Run Test to validate the metric extension. The extension is deployed to the
test targets specified by the user and a real-time collection is executed.
Afterwards, the metric extension is automatically undeployed. The results and any
errors are added to the Test Results region.
9. Repeat the edit /test cycle until the metric extension returns data as expected.
10. Click Finish.
8.3.6 Creating a New Metric Extension (Create Like)
To create a new metric extension based on an existing metric extension:
1. From the Enterprise menu, select Monitoring, then select Metric Extensions.
2. From the Metric Extensions page, determine which extensions are accessible.
The page displays the list of metric extensions along with target type, owner,
production version and deployment information.
3. Select an existing metric extension.
4. From the Actions menu, select Create Like. Enterprise Manager will determine
whether you have the Create Extension privilege and guide you through the
creation process.
5. Make desired modifications.
6. From the Test page, add available test targets.
7. Click Run Test to validate the metric extension. The extension is deployed to the
test targets specified by the user and a real-time collection is executed.
Afterwards, the metric extension is automatically undeployed. The results and any
errors are added to the Test Results region.
Chapter 8
Working with Metric Extensions
8-13

8. Repeat the edit /test cycle until the metric extension returns data as expected.
9. Click Finish.
8.3.7 Editing a Metric Extension
Before editing an existing metric extension, you must have Edit privileges on the
extension you are editing or be the extension creator. Note: Once a metric extension is
saved as a deployable draft, it cannot be edited, you can only create a new version.
To edit an existing metric extension:
1. From the Enterprise menu, select Monitoring, then select Metric Extensions.
2. From the Metric Extensions page, determine which extensions are accessible.
The page displays the list of metric extensions along with target type, owner,
production version and deployment information.
3. Select the metric extension to be edited.
4. From the Actions menu, select Edit.
5. Update the metric extension as needed.
6. From the Test page, add available test targets.
7. Click Run Test to validate the metric extension. The extension is deployed to the
test targets specified by the user and a real-time collection is executed.
Afterwards, the metric extension is automatically undeployed. The results and any
errors are added to the Test Results region.
8. Repeat the edit /test cycle until the metric extension returns data as expected.
9. Click Finish.
8.3.8 Creating the Next Version of an Existing Metric Extension
Before creating the next version of an existing metric extension, you must have Edit
privileges on the extension you are versioning or be the extension creator.
To create next version of an existing metric extension:
1. From the Enterprise menu, select Monitoring, then select Metric Extensions.
2. From the Metric Extensions page, determine which extensions are accessible. The
page displays the list of metric extensions along with target type, owner,
production version and deployment information.
3. Select the metric extension to be versioned.
4. From the Actions menu, select Create Next Version.
5. Update the metric extension as needed. The target type, and extension name
cannot be edited, but all other general properties can be modified. There are also
restrictions on metric columns modifications. See Note in Creating a New Metric
Extension section for more details.
6. From the Test page, add available test targets.
7. Click Run Test to validate the metric extension. The extension is deployed to the
test targets specified by the user and a real-time collection is executed.
Afterwards, the metric extension is automatically undeployed. The results and any
errors are added to the Test Results region.
Chapter 8
Working with Metric Extensions
8-14

8. Repeat the edit /test cycle until the metric extension returns data as expected.
9. Click Finish.
8.3.9 Importing a Metric Extension
Metric extensions can be converted to portable, self-contained packages that allow
you to move the metric extension to other Enterprise Manager installations, or for
storage/backup. These packages are called Metric Extension Archives (MEA) files.
MEA files are zip files containing all components that make up the metric extension:
metric metadata, collections, and associated scripts/jar files. Each MEA file can
contain only one metric extension. To add the metric extension back to your Enterprise
Manager installation, you must import the metric extension from the MEA.
To import a metric extension from an MEA file:
1. From the Enterprise menu, select Monitoring, then select Metric Extensions.
2. Click Import.
3. Browse to file location, and select the MEA file. Enterprise Manager checks if the
target type and metric extension name combination is already used in the system.
If not, the system will create a new metric extension. If the extension name is
already in use, the system will attempt to create a new version of the existing
extension using the MEA contents. This will require the MEA to contain a superset
of all the existing metric extension's metric columns. You also have the option to
rename the metric extension.
4. Clicking on OK creates the new metric extension or the new version of an existing
metric extension.
5. From the Actions menu, select Edit to verify the entries.
6. From the Test page, add available test targets.
7. Click Run Test to validate the metric extension. The extension is deployed to the
test targets specified by the user and a real-time collection is executed.
Afterwards, the metric extension is automatically undeployed. The results and any
errors are added to the Test Results region.
8. Repeat the edit /test cycle until the metric extension returns data as expected.
9. Click Finish.
8.3.10 Exporting a Metric Extension
Existing metric extensions can be package as self-contained zip files (exported) for
portability and/or backup and storage.
To export an existing metric extension:
1. From the Enterprise menu, select Monitoring, then select Metric Extensions.
2. From the Metric Extensions page, determine which extensions are accessible.
The page displays the list of metric extensions along with target type, owner,
production version and deployment information.
3. Select the metric extension to be exported.
4. From the Actions menu, select Export. Enterprise Manager prompts you to enter
the name and location of the MEA file that is to be created.
Chapter 8
Working with Metric Extensions
8-15

5. Enter the name and location of the package. Enterprise Manager displays the
confirmation page after the export is complete.
Note: You can only export Production, Deployable Draft and Published metric
extension versions.
6. Confirm the export file is downloaded.
8.3.11 Deleting a Metric Extension
Initiating the deletion of a metric extension is simple. However, the actual deletion
triggers a cascade of activity by Enterprise Manager to completely purge the metric
extension from the system. This includes closing open metric alerts, and purging
collected metric data (if the latest metric extension version is deleted).
Before a metric extension version can be deleted, it must be undeployed from all
targets, and removed from all monitoring templates (including templates in pending
apply status).
To delete a metric extension:
1. From the Enterprise menu, select Monitoring, then select Metric Extensions.
2. From the Metric Extensions page, determine which extensions are accessible.
The page displays the list of metric extensions along with target type, owner,
production version and deployment information.
3. Select the metric extension that is to be deleted.
4. From the Actions menu, select Delete. Enterprise Manager prompts you to
confirm the deletion.
5. Confirm the deletion.
8.3.12 Deploying Metric Extensions to a Group of Targets
A metric extension must be deployed to a target in order for it to begin collecting data.
To deploy a metric extension to one or more targets:
1. From the Enterprise menu, select Monitoring, then select Metric Extensions.
2. From the Metric Extensions page, determine which extensions are accessible.
The page displays the list of metric extensions along with target type, owner,
production version and deployment information.
3. Select the metric extension that is to be deployed.
4. From the Actions menu, select Manage Target Deployments. The Manage
Target Deployments page appears showing you on which target(s) the selected
metric extension is already deployed.
5. Return to the Metric Extensions page.
6. Select the metric extension.
7. From the Actions menu, select Deploy to Targets. Enterprise Manager
determines whether you have "Manage Target Metrics" privilege, and only those
targets where you do show up in the target selector.
Chapter 8
Working with Metric Extensions
8-16

8. Add the targets where the metric extension is to be deployed and click Submit.
Enterprise Manager submits a job deploying the metric extension to each of the
targets. A single job is submitted per deployment request.
9. You are automatically redirected to the Pending Operations page, which shows a
list of currently scheduled, executing, or failed metric extension deploy operations.
Once the deploy operation completes, the entry is removed from the pending
operations table.
8.3.13 Creating an Incident Rule to Send Email from Metric Extensions
One of the most common tasks administrators want Enterprise Manager to perform is
to send an email notification when a metric alert condition occurs. Specifically,
Enterprise Manager monitors for alert conditions defined as incidents. For a given
incident you create an incident rule set to tell Enterprise Manager what actions to take
when an incident occurs. In this case, when an incident consisting of an alert condition
defined by a metric extension occurs, you need to create an incident rule to send email
to administrators. For instructions on sending email for metric alerts, see "Sending
Email for Metric Alerts".
For information incident management see Using Incident Management .
8.3.14 Updating Older Versions of Metric Extensions Already
Deployed to a Group of Targets
When a newer metric extension version is published, you may want to update any
older deployed instances of the metric extension.
To update old versions of the metric extension already deployed to targets:
1. From the Enterprise menu, select Monitoring, then select Metric Extensions.
2. From the Metric Extensions page, determine which extensions are accessible.
The page displays the list of metric extensions along with target type, owner,
production version and deployment information.
3. Select the metric extension to be upgraded.
4. From the Actions menu, select Manage Target Deployments. The Manage
Target Deployments page appears showing a list of targets where the metric
extension is already deployed.
5. Select the list of targets where the extension is to be upgraded and click Upgrade.
Enterprise Manager submits a job for the deployment of the newest Published
metric extension to the selected targets. A single job is submitted per deployment
request.
6. You are automatically redirected to the Pending Operations page, which shows a
list of currently scheduled, executing, or failed metric extension deploy operations.
Once the deploy operation completes, the entry is removed from the pending
operations table.
8.3.15 Creating Repository-side Metric Extensions
Beginning with Enterprise Manager Release 12.1.0.4, you can create repository-side
metric extensions. This type of metric extension allows you to use SQL scripts to
extract information directly from the Enterprise Manager repository and raise alerts for
Chapter 8
Working with Metric Extensions
8-17
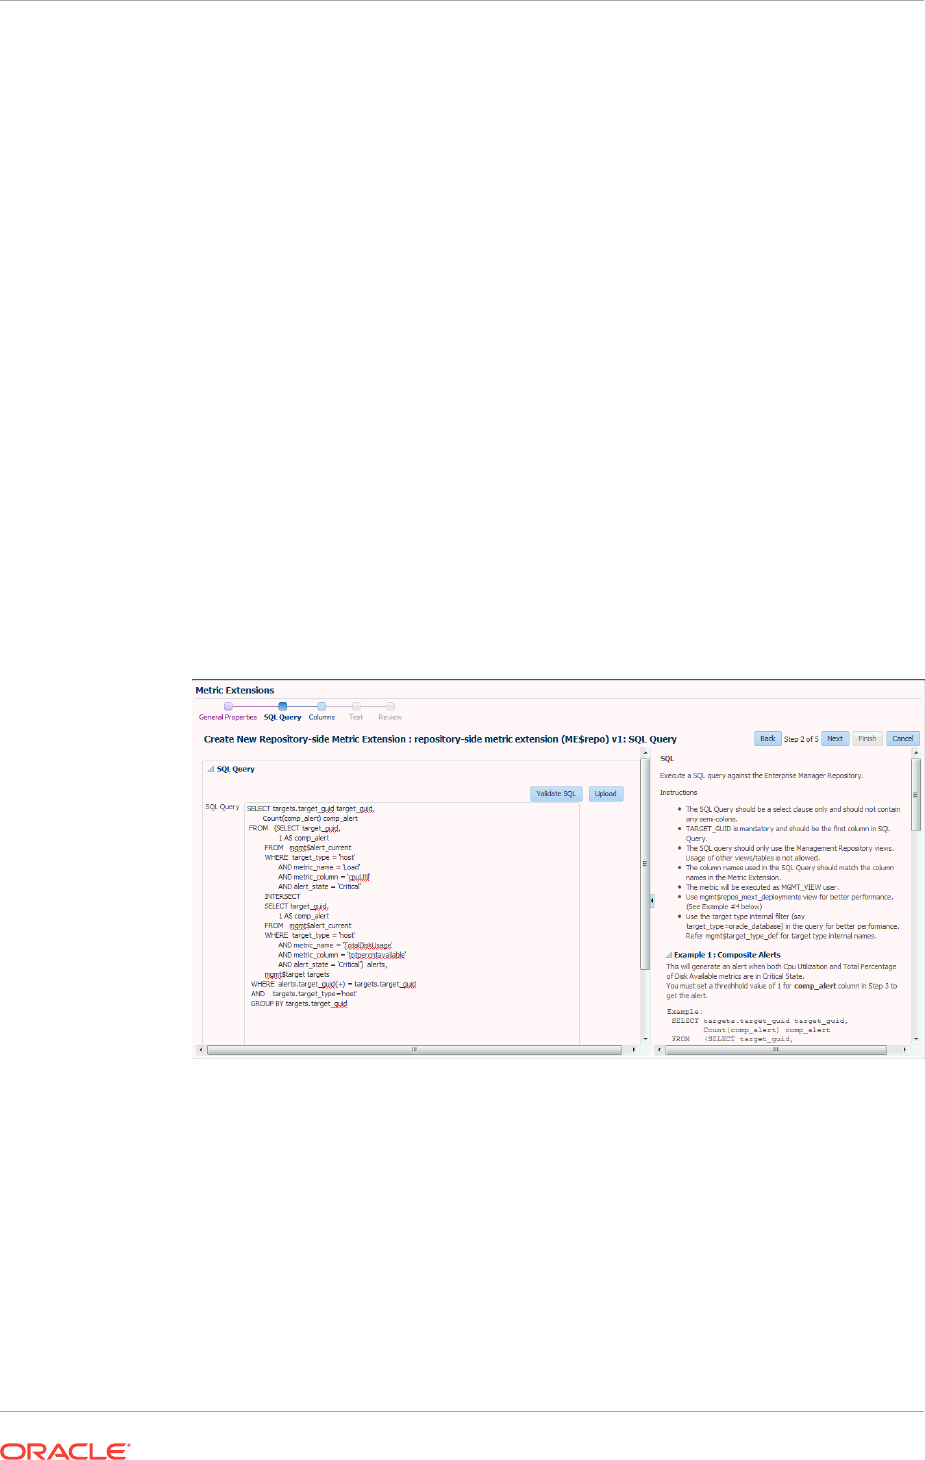
the target against which the repository-side extension is run. For example, you can
use repository-side metric extensions to raise an alert if the total number of alerts for a
host target is greater than 5. Or perhaps, raise an alert if the CPU utilization on that
host is greater than 95% AND the number of process running on that host is greater
than 500. Repository-side metrics allows you to monitor your Enterprise Manager
infrastructure with greater flexibility.
To create a repository-side metric:
1. From the Enterprise menu, select Monitoring, then select Metric Extensions.
2. From the Create menu, select Repository-side Metric Extension. Enterprise
Manager will determine whether you have the Create Extension privilege and
guide you through the creation process.
3. Decide on a target type and metric extension name. Be aware that the name (and
Display Name) must be unique across a target type.
4. Enter the general parameters.
Collection Schedule
You defined the frequency with which metric data is collected and how it is used
(Alerting Only or Alerting and Historical Trending) by specifying collection schedule
properties.
5. Create the SQL query to be run against the Enterprise Manager Repository.
Explicit instructions for developing the query as well as examples are provide on
the SQL Query page.
Click Validate SQL to test the query.
If you already have a SQL script, you can click Upload to load the SQL from an
external file.
6. From the Columns page, you can view/edit columns returned by the SQL query.
You may edit the columns, however, you cannot add or delete columns from this
page.
•Column Type
A column is either a Key column, or Data column. A Key column uniquely
identifies a row in the table. For example, employee ID is a unique identifier of
Chapter 8
Working with Metric Extensions
8-18

a table of employees. A Data column is any non-unique data in a row. For
example, the first and last names of an employee. You can also create rate
and delta metric columns based on an existing data column. See Rate and
Delta Metric Columns below.
•Value Type
A value type is Number or String. This determines the alert comparison
operators that are available, and how Enterprise Manager renders collection
data for this metric column.
•Alert Thresholds
The Comparison Operation, Warning, and Critical fields define an alert
threshold.
•Alert Thresholds By Key
The Comparison Operation, Warning Thresholds By Key, and Critical
Thresholds By Key fields allow you to specify distinct alert thresholds for
different rows in a table. This option becomes available if there are any Key
columns defined. For example, if your metric is monitoring CPU Usage, you
can specify a different alert threshold for each distinct CPU. The syntax is to
specify the key column values in a comma separated list, the "=" symbol,
followed by the alert threshold. Multiple thresholds for different rows can be
separated by the semi-colon symbol ";". For example, if the key columns of the
CPU Usage metric are cpu_id and core_id, and you want to add a warning
threshold of 50% for procecessor1, core1, and a threshold of 60% for
processor2, core2, you would specify:
procecessor1,core1=50;processor2,core2=60
•Manually Clearable Alert
Note:
You must expand the Advanced region in order to view the Manually Clearable
Alert option.
If this option is set to true, then the alert will not automatically clear when the
alert threshold is no longer satisfied. For example, if your metric is counting
the number of errors in the system log files, and you set an alert threshold of
50, if an alert is raised once the threshold is met, the alert will not
automatically clear once the error count falls back below 50. The alert will
need to be manually cleared in the Alerts UI in the target home page or
Incident Manager.
•Number of Occurrences Before Alert
The number of consecutive metric collections where the alert threshold is met,
before an alert is raised.
•Alert Message / Clear Message
The message that is sent when the alert is raised / cleared. Variables that are
available for use are: %columnName%, %keyValue%, %value%,
%warning_threshold%, %critical_threshold%
You can also retrieve the value of another column by surrounding the desired
column name with "%". For example, if you are creating an alert for the
Chapter 8
Working with Metric Extensions
8-19

cpu_usage column, you can get the value of the core_temperature column by
using %core_temperature%. Note that the same alert / clear message is used
for warning or critical alerts.
Note:
Think carefully and make sure all Key columns are added, because you
cannot create additional Key columns in newer versions of the metric
extension. Once you click Save As Deployable Draft, the Key columns are
final (edits to column display name, alert thresholds are still allowed). You can
still add new Data columns in newer versions. Also be aware that some
properties of existing Data columns cannot be changed later, including
Column Type, Value Type, Comparison Operator (you can add a new
operator, but not change an existing operator), and Manually Clearable Alert.
•Metric Category
The metric category this column belongs to.
•Add Delta metric columns based on another metric column
Example: You want to know the difference in the table space used since the
last collection.
Delta Calculation:
current metric value - previous metric value
•Add Rate Per Minute metric column based on another metric column
Example: You want to know the average table space usage per minute based
on the table space column metric which is collected every 1 hr.
Rate Per Minute Calculation:
(current metric value - previous metric value)/ collection schedule
where the collection schedule is in minutes.
•Add Rate Per Five Minutes metric column based on another metric column
Example: You want to know the average table space usage every five minutes
based on the table space column which is collected say every 1 hour]
Rate Per Five Minute Calculation:
[(current metric value - previous metric value)/ collection schedule ] * 5
where the collection schedule is in minutes.
To create a rate/delta metric column, click on an existing data column in the table
and then select one of the rate/delta column options from the Add menu.
7. From the Test page, add available test targets.
8. Click Run Test to validate the metric extension. The extension is deployed to the
test targets specified by the user and a real-time collection is executed.
Afterwards, the metric extension is automatically undeployed. The results and any
errors are added to the Test Results region.
9. Repeat the edit /test cycle until the metric extension returns data as expected.
10. Click Finish.
Chapter 8
Working with Metric Extensions
8-20
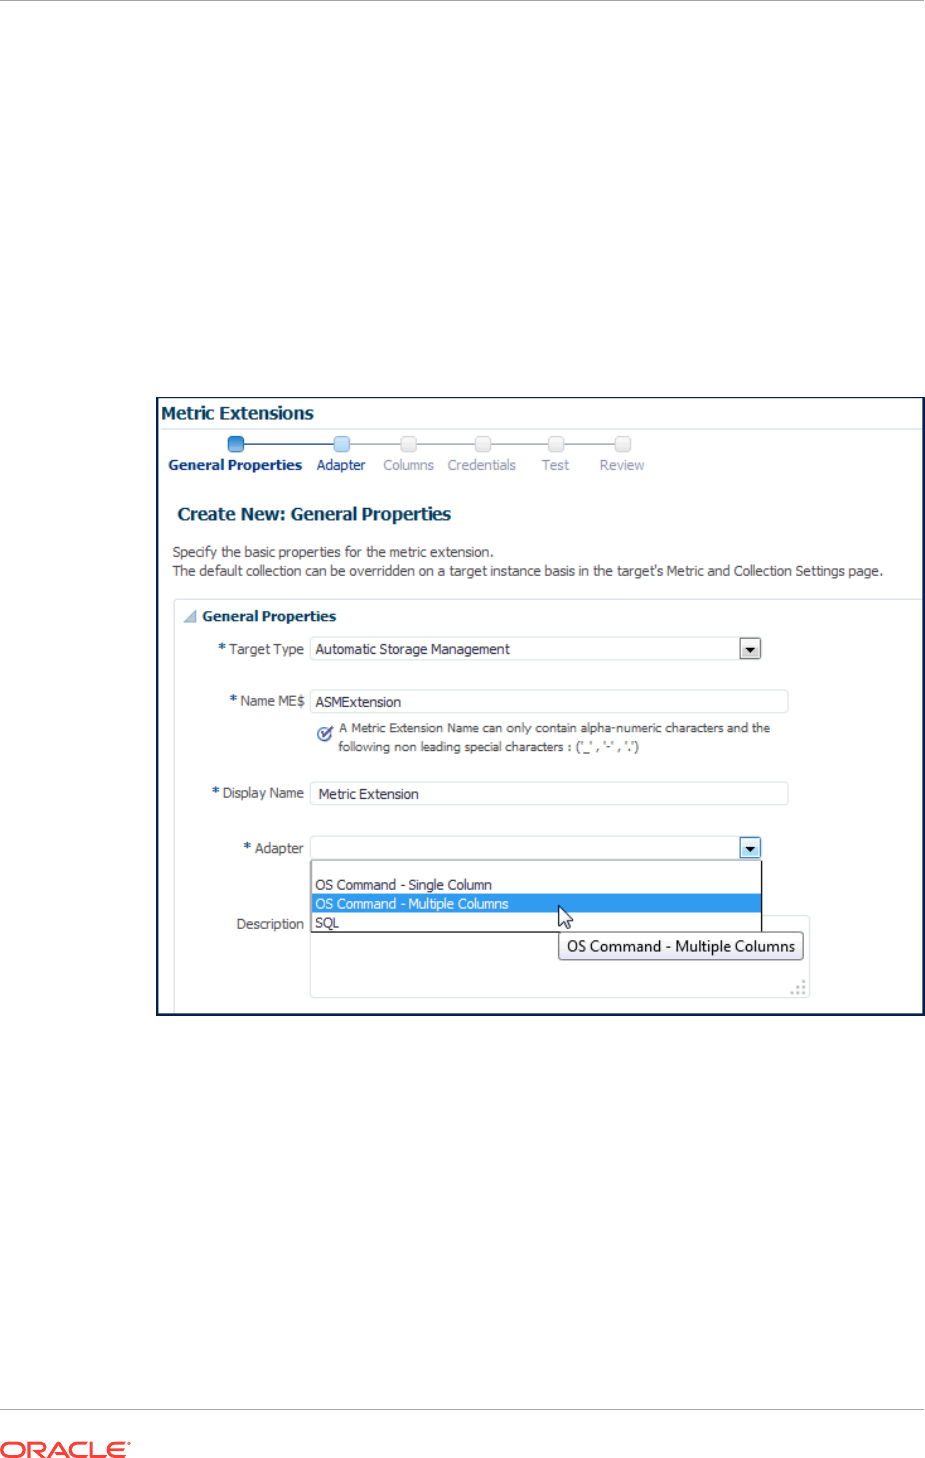
8.4 Adapters
Oracle Integration Adapters provide comprehensive, easy-to-use monitoring
connectivity with a variety of target types. The adapter enables communication with an
enterprise application and translates the application data to standards-compliant XML
and back.
The metric extension target type determines which adapters are made available from
the UI. For example, when creating a metric extension for an Automatic Storage
Management target type, only three adapters (OS Command-Single Column, OS
Command-Multiple Columns, and SQL) are available from the UI.
A target type's out-of-box metric definition defines the adapters for which it has native
support, and only those adapters will be shown in the UI. No other adapters are
supported for that target type.
A complete list of all adapters is shown below.
•OS Command Adapter - Single Column
•OS Command Adapter- Multiple Values
•OS Command Adapter - Multiple Columns
•SQL Adapter
•SNMP (Simple Network Management Protocol) Adapter
Chapter 8
Adapters
8-21

•JMX Adapter
8.4.1 OS Command Adapter - Single Column
Executes the specified OS command and returns the command output as a single
value. The metric result is a 1 row, 1 column table.
Basic Properties
The complete command line will be constructed as: Command + Script + Arguments.
•Command - The command to execute. For example,
%perlBin%/perl
. The
complete command line will be constructed as: Command + Script + Arguments.
•Script - A script to pass to the command. For example,
%scriptsDir%/myscript.pl
.
You can upload custom files to the agent, which will be accessible under the
%scriptsDir%
directory.
•Arguments - Additional arguments to be appended to the Command.
Advance Properties
•Input Properties - Additional properties can be passed to the command through
its standard input stream. This is usually used for secure content, such as
username or passwords, that you don't want to be visible to other users. For
example, you can add the following Input Property:
Name=targetName
,
Value=%NAME%
which the command can read through it's standard input stream as
"STDINtargetName=<target name>".
•Environment Variables - Additional properties can be accessible to the command
from environment variables. For example, you can add Environment Variable:
Name=targetType
,
Value="%TYPE%"
, and the command can access the target type
from environment variable "ENVtargetType".
Credentials
•Host Credentials - The credential used to launch the OS Command.
•Input Credentials - Additional credentials passed to the OS Command's standard
input stream.
Example 1
Read the contents of a log file, and dump out all lines containing references to the
target.
•Approach 1 - Use the grep command, and specify the target name using %NAME
% parameter.
Command = /bin/grep %NAME% mytrace.log
•Approach 2 - Run a perl script
Command = %perlBin%/perl
Script = %scriptsDir%/filterLog.pl
Input Properties:
targetName = %NAME%
targetType = %TYPE%
Chapter 8
Adapters
8-22

filterLog.pl:
require "emd_common.pl";
my %stdinVars = get_stdinvars();
my $targetName = $stdinVars{"targetName"};
my $targetType = $stdinVars{"targetType"};
open (MYTRACE, mytrace.log);
foreach $line (<MYTRACE >)
{
# Do line-by-line processing
}
close (MYTRACE);
Example 2
Connect to a database instance from a PERL script and query the HR.JOBS sample
schema table.
•Approach 1 - Pass credentials from target type properties into using Input
Properties:
Command = %perlBin%/perl
Script = %scriptsDir%/connectDB.pl
Input Properties:
EM_DB_USERNAME = %Username%
EM_DB_PASSWORD = %Password%
EM_DB_MACHINE = %MachineName%
EM_DB_PORT = %Port%
EM_DB_SID = %SID%
connectDB.pl
use DBI;
require "emd_common.pl";
my %stdinVars = get_stdinvars();
my $dbUsername = $stdinVars{"EM_DB_USERNAME"};
my $dbPassword = $stdinVars{"EM_DB_PASSWORD"};
my $dbMachine = $stdinVars{"EM_DB_MACHINE"};
my $dbPort = $stdinVars{"EM_DB_PORT"};
my $dbSID = $stdinVars{"EM_DB_SID"};
my $dbAddress = "(DESCRIPTION=(ADDRESS=(PROTOCOL=TCP)(HOST=$dbMachine)
(Port=$dbPort))(CONNECT_DATA=(SID=$dbSID)))";
# Establish Target DB Connection
my $db = DBI->connect('dbi:Oracle:', "$dbUsername@".$dbAddress, "$dbPassword",
{PrintError => 0, RaiseError => 0, AutoCommit => 0})
or die (filterOraError("em_error=Could not connect
to $dbUsername/$dbAddress: $DBI::errstr\n", $DBI::err));
my $query = "SELECT JOB_TITLE, MIN_SALARY FROM HR.JOBS";
my $st = $db->prepare($query);
$st->execute();
Chapter 8
Adapters
8-23

while ( my ($job_title, $min_sal) = $st->fetchrow_array() )
{
print "$job_title|$min_sal\n";
}
$db->disconnect
or warn "disconnect $DBI::errstr\n";
exit 0;
•Approach 2 - Pass monitoring credential set using Input Credentials
Command = %perlBin%/perl
Script = %scriptsDir%/connectDB.pl
Input Credentials:
dbCreds = MyCustomDBCreds
connectDB.pl
use DBI;
require "emd_common.pl";
my %stdinVars = get_stdinvars();
my $credType = getCredType("dbCred", \%stdinVars);
my %credProps = getCredProps("dbCreds", \%stdinVars);
my $dbUsername = $credProps{"DBUserName"};
my $dbPassword = $credProps{"DBPassword"};
Example 3
Overriding default monitoring credentials by creating and using a custom monitoring
credential set for host target.
Creating host credentials for the host target type:
> emcli create_credential_set -set_name=myCustomCreds -target_type=host -
auth_target_type=host -supported_cred_types=HostCreds -monitoring -description='My
Custom Credentials'
When you go to the Credentials page of the Metric Extension wizard, and choose to
"Specify Credential Set" for Host Credentials, you will see "My Custom Credentials"
show up as an option in the drop down list.
Note that this step only creates the Monitoring Credential Set for the host target type,
and you need to set the credentials on each target you plan on deploying this metric
extension to. You can set credentials from Enterprise Manager by going to Setup, then
Security, then Monitoring Credentials. Alternatively, this can be done from the
command line.
> emcli set_monitoring_credential -target_name=target1 -target_type=host -
set_name=myCustomCreds -cred_type=HostCreds -auth_target_type=host -
attributes='HostUserName:myusername;HostPassword:mypassword'
8.4.2 OS Command Adapter- Multiple Values
Executes the specified OS command and returns each command output line as a
separate value. The metric result is a multi-row, 1 column table.
Chapter 8
Adapters
8-24

For example, if the command output is:
em_result=out_x
em_result=out_y
then three columns are populated with values 1,2,3 respectively.
Basic Properties
•Command - The command to execute. For example, %perlBin%/perl.
•Script - A script to pass to the command. For example,
%scriptsDir%/myscript.pl
.
You can upload custom files to the agent, which will be accessible under the
%scriptsDir%
directory.
•Arguments - Additional arguments to be appended to the Command.
•Starts With - The starting string of metric result lines.
Example: If the command output is:
em_result=4354
update
test
setting Starts With = em_result specifies that only lines starting with em_result will
be parsed.
Advanced Properties
•Input Properties - Additional properties to be passed to the command through its
standard input stream. For example, you can add Input Property:
Name=targetName, Value=%NAME%, which the command can read through its
standard input stream as "STDINtargetName=<target name>". See usage
examples in OS Command Adapter - Single Columns.
•Environment Variables - Additional properties can be accessible to the command
from environment variables. For example, you can add Environment Variable:
Name=targetType, Value="%TYPE%", and the command can access the target
type from environment variable "ENVtargetType". See usage examples in OS
Command Adapter - Single Columns.
Credentials
•Host Credentials - The credential used to launch the OS Command. See usage
examples in OS Command Adapter - Single Columns.
•Input Credentials - Additional credentials passed to the OS Command's standard
input stream. See usage examples in OS Command Adapter - Single Columns.
8.4.3 OS Command Adapter - Multiple Columns
Executes the specified OS command and parses each command output line (delimited
by a user-specified string) into multiple values. The metric result is a mult-row, multi-
column table.
Example: If the command output is
em_result=1|2|3
em_result=4|5|6
and the Delimiter is set as "|", then there are two rows of three columns each:
Chapter 8
Adapters
8-25

Basic Properties
The complete command line will be constructed as: Command + Script + Arguments
•Command - The command to execute. For example, %perlBin%/perl.
•Script - A script to pass to the command. For example, %scriptsDir%/myscript.pl.
You can upload custom files to the agent, which will be accessible under the
%scriptsDir% directory.
•Arguments - Additional arguments.
•Delimiter - The string used to delimit the command output.
•Starts With - The starting string of metric result lines.
Example: If the command output is
em_result=4354 out_x out_y
setting Starts With = em_result specifies that only lines starting with em_result will
be parsed.
•Input Properties - Additional properties can be passed to the command through
its standard input stream. For example, you can add Input Property:
Name=targetName, Value=%NAME%, which the command can read through it's
standard input stream as STDINtargetName=<target name>. To specify multiple
Input Properties, enter each property on its own line.
•Environment Variables - Additional properties can be accessible to the command
from environment variables. For example, you can add Environment Variable:
Name=targetType, Value="%TYPE%, and the command can access the target
type from environment variable "ENVtargetType".
Advanced Properties
•Input Properties - Additional properties can be passed to the command through
its standard input stream. For example, you can add Input Property:
Name=targetName, Value=%NAME%, which the command can read through its
standard input stream as STDINtargetName=<target name>. See usage examples
in OS Command Adapter - Single Columns.
•Environment Variables - Additional properties can be accessible to the command
from environment variables. For example, you can add Environment Variable:
Name=targetType, Value="%TYPE%, and the command can access the target
type from environment variable "ENVtargetType". See usage examples in OS
Command Adapter - Single Columns.
Credentials
•Host Credentials - The credential used to launch the OS Command. See usage
examples in OS Command Adapter - Single Columns
•Input Credentials - Additional credentials passed to the OS Command's standard
input stream. See usage examples in OS Command Adapter - Single Columns.
8.4.4 SQL Adapter
Executes custom SQL queries or function calls supported against single instance
databases and instances on Real Application Clusters (RAC).
Properties
Chapter 8
Adapters
8-26

•SQL Query - The SQL query to execute. Normal SQL statements should not be
semi-colon terminated. For example, SQL Query = "select a.ename, (select
count(*) from emp p where p.mgr=a.empno) directs from emp a". PL/SQL
statements are also supported, and if used, the "Out Parameter Position" and "Out
Parameter Type" properties should be populated.
•SQL Query File - A SQL query file. Note that only one of "SQL Query" or "SQL
Query File" should be used. For example, %scriptsDir%/myquery.sql. You can
upload custom files to the agent, which will be accessible under the %scriptsDir%
directory.
•Transpose Result - Transpose the SQL query result.
•Bind Variables - Declare bind variables used in normal SQL statements here. For
example, if the SQL Query = "select a.ename from emp a where a.mgr = :1", then
you can declare the bind variable as Name=1, Value=Bob.
•Out Parameter Position - The bind variable used for PL/SQL output. Only
integers can be specified.
Example: If the SQL Query is
DECLARE l_output1 NUMBER; l_output2 NUMBER;
BEGIN ..... OPEN :1 FOR SELECT l_output1, l_output2
FROM dual; END;
you can set Out Parameter Position = 1, and Out Parameter Type =
SQL_CURSOR
•Out Parameter Type - The SQL type of the PL/SQL output parameter. See
comment for Out Parameter Position
Credentials
•Database Credentials - The credential used to connect to the database.
Example
Overriding default monitoring credentials by creating and using a custom monitoring
credential set for database target.
Creating host credentials for the database target type:
> emcli create_credential_set -set_name=myCustomDBCreds -target_type=oracle_database
-auth_target_type=oracle_database -supported_cred_types=DBCreds -monitoring -
description='My Custom DB Credentials'
When you go to the Credentials page of the Metric Extension wizard, and choose to
"Specify Credential Set" for Database Credentials, you will see "My Custom DB
Credentials" show up as an option in the drop down list.
Note that this step only creates the Monitoring Credential Set for the host target type,
and you need to set the credentials on each target you plan on deploying this metric
extension to. You can set credentials from Enterprise Manager by going to Setup,
then selecting Security, then selecting Monitoring Credentials. Alternatively, this can
be performed using the Enterprise Manager Command Line Interface.
> emcli set_monitoring_credential -target_name=db1 -target_type=oracle_database -
set_name=myCustomDBCreds -cred_type=DBCreds -auth_target_type=oracle_database -
attributes='DBUserName:myusername;DBPassword:mypassword'
Chapter 8
Adapters
8-27

8.4.5 SNMP (Simple Network Management Protocol) Adapter
Allow Enterprise Manager Management Agents to query SNMP agents for
Management Information Base (MIB) variable information to be used as metric data.
Basic Properties
•Object Identifiers (OIDs): Object Identifiers uniquely identify managed objects in
a MIB hierarchy. One or more OIDs can be specified. The SNMP adapter will
collect data for the specified OIDs. For example, 1.3.6.1.4.1.111.4.1.7.1.1
Advanced Properties
•Delimiter - The delimiter value used when specifying multiple OID values for an
OID's attribute. The default value is space or \n or \t
•Tabular Data - Indicates whether the expected result for a metric will have
multiple rows or not. Possible values are TRUE or FALSE. The default value is
FALSE
•Contains V2 Types - Indicates whether any of the OIDs specified is of SNMPV2
data type. Possible values are TRUE or FALSE. The default value is FALSE. For
example, if an OID value specified is of counter64 type, then this attribute will be
set to TRUE.
8.4.6 JMX Adapter
Retrieves JMX attributes from JMX-enabled servers and returns these attributes as a
metric table.
Properties
•Metric -- The MBean ObjectName or ObjectName pattern whose attributes are to
be queried. Since this is specified as metric metadata, it needs to be instance-
agnostic. Instance-specific key properties (such as servername) on the MBean
ObjectName may need to be replaced with wildcards.
•ColumnOrder -- A semi-colon separated list of JMX attributes in the order they
need to be presented in the metric.
Advanced Properties
•IdentityCol -- The MBean key property that needs to be surfaced as a column
when it is not available as a JMX attribute. For example:
com.myCompany:Name=myName,Dept=deptName, prop1=prop1Val, prop2=prop2Val
In this example, setting identityCol as Name;Dept will result in two additional key
columns representing Name and Dept besides the columns representing the JMX
attributes specified in the columnOrder property.
•AutoRowPrefix -- Prefix used for an automatically generated row. Rows are
automatically generated in situations where the MBean ObjectName pattern
specified in metric property matches multiple MBeans and none of the JMX
attributes specified in the columnOrder are unique for each. The autoRowId value
specified here will be used as a prefix for the additional key column created. For
example, if the metric is defined as:
com.myCompany:Type=CustomerOrder,* columnOrder
Chapter 8
Adapters
8-28

is
CustomerName;OrderNumber;DateShipped
and assuming CustomerName;OrderNumber;Amount may not be unique if an
order is shipped in two parts, setting autoRowId as "ShipItem-" will populate an
additional key column for the metric for each row with ShipItem-0, ShipItem-1,
ShipItem-2...ShipItem-n.
•Metric Service -- True/False. Indicate whether MetricService is enabled on a
target Weblogic domain. This property would be false (unchecked) in most cases
for Metric Extensions except when metrics that are exposed via the Oracle DMS
MBean needs to be collected. If MetricService is set to true, then the basic
property metric becomes the MetricService table name and the basic property
columnOrder becomes a semicolon-separated list of column names in the
MetricService table.
Note:
Refer to the Monitoring Using Web Services and JMX chapter in the for an in-
depth example of creating a JMX-based Metric Extension.
8.5 Converting User-defined Metrics to Metric Extensions
For targets monitored by Enterprise Manager 12c or greater Agents, both older user-
defined metrics and metric extensions will be supported. After release 12c, only metric
extensions will be supported. If you have existing user-defined metrics, it is
recommended that you migrate them to metric extensions as soon as possible to
prevent potential monitoring disruptions in your managed environment.
Migration of user-defined metric definitions to metric extensions is not automatic and
must be initiated by an administrator. The migration process involves migrating user-
defined metric metadata to metric extension metadata.
Note:
Migration of collected user-defined metric historic data is not supported.
After the user-defined metric is migrated to the metric extension and the metric
extension has been deployed successfully on the target, the user-defined metric
should be either disabled or deleted. Disabling the collection of the user-defined metric
will retain the metadata definition of the user-defined metric) but will clear all the open
alerts, remove the metric errors and prevent further collections of the user-defined
metric. Deleting the user-defined metric will delete the metadata, historic data, clear
open alerts and remove metric errors.
8.5.1 Overview
The User Defined Metric (UDM) to Metric Extension (ME) migration replaces an
existing UDM with a new or existing ME. The idea behind the migration process is to
Chapter 8
Converting User-defined Metrics to Metric Extensions
8-29

consolidate UDMs with the same definition that have been created on different targets
into a single ME. In addition, MEs support multiple metric columns, allowing the user to
combine multiple related UDMs into a single ME.
This migration process is comprised of the following steps:
1. Identify the UDMs that need to be migrated.
2. Use the provided EM CLI commands to create or select a compatible metric
extension.
3. Test and publish the metric extension.
4. Deploy the metric extension to all targets and templates where the original UDMs
are located. Also update the existing notification rules to refer to the ME.
5. Delete the original UDMs. Note that the historical data and alerts from the old
UDM is still accessible from the UI, but the new ME will not inherit them.
Note that the credentials being used by the UDM are NOT migrated to the newly
created ME. The user interface allows a user to specify the credential set required by
the metric extension. If the ME does not use the default monitoring credentials, the
user will need to create a new credential set to accommodate the necessary
credentials through the relevant EM CLI commands. This set will then be available in
the credentials page of the metric extension wizard.
The migration process is categorized by migration sessions. Each session is
responsible for migrating one or more UDMs. The process of migrating an individual
session is referred to as a task. Therefore, a session is comprised of one or more
tasks. In general terms, the migration involves creating a session and providing the
necessary input to complete each tasks within that session. The status of the session
and tasks is viewable throughout the workflow.
8.5.2 Commands
A number of EM CLI commands are responsible for completing the various steps of
this process. For a more detailed explanation of the command definition, please use
the 'EM CLI help <command>' option.
•list_unconverted_udms - Lists the UDMs that have yet to be migrated and not in
a session
•create_udmmig_session - Creates a session to migrate one or more UDMs
•udmmig_summary - Lists the migration sessions in progress
•udmmig_session_details - Provides the details of a specific session
•udmmig_submit_metricpics - Provides a mapping between the UDM and the
ME in order to create a new ME or use an existing one
•udmmig_retry_deploys - Deploys the ME to the targets where the UDM is
present. Note that the ME has to be in a deployable draft or published state for this
command to succeed
•udmmig_request_udmdelete - Deletes the UDM and completing the migration
process
Usage Examples
The following exercise outlines a simple use case to showcase the migration
Chapter 8
Converting User-defined Metrics to Metric Extensions
8-30

Consider a system with one host (host1) that has one host UDM (hostudm1) on it. The
goal is to create a new ME (me1) that represents the UDM. The sequence of
commands would be as follows
$ emcli list_unconverted_udms
-------------+----------------------+-----------+--------------------
Type | Name | Metric | UDM
-------------+----------------------+-----------+--------------------
host | host1 |UDM | hostudm1
The command indicates that there is only one UDM that has not been migrated or in
the process of migration at this stage. Now proceed with the creation of a session.
$ emcli create_udmmig_session -name=migration1 -desc="Convert UDMs for host target" -
udm_choice=hostudm1 -target=host:host1
Migration session created - session id is 1
The command creates a migration session with name migration1 and the description
"convert UDMs for host target". The udm_choice flag indicates the UDM chosen and
the target flag describes the target type and the target on which the UDM resides.
Migration sessions are identified by session IDs. The current session has an ID of 1.
$ emcli udmmig_summary
------+--------------+------------------+------+------+--------+------+--------
ID | Name | Description |#Tgts |Todo |#Tmpls |Todo |IncRules
------+--------------+------------------+------+------+--------+------+--------
1 |migration1 |Convert UDMS | | 1/1 | 0 | -/0 | -/0
------+--------------+------------------+------+------+--------+------+--------
The command summarizes all the migrations sessions currently in progress. The
name and description fields identify the session. The remaining columns outline the
number of targets, templates and incident rules that contain references to the UDM
that is being converted to a metric extension. The 'Todo' columns indicate the number
of targets, templates and incident rules whose references to the UDM are yet to be
updated. Since a migration session can be completed over a protracted period of time,
the command provides an overview of the portion of the session that was been
completed.
$ emcli list_unconverted_udms
There are no unconverted udms
Since the UDM is part of a migration session, it no longer shows up in the list of
unconverted UDMs.
$ emcli udmmig_session_details -session_id=1
Name: migration1
Desc: Convert UDMs for host target
Created: <date> <time>
UDM Pick: [hostudm1]
UDMs being converted:
----------+----------+---------+------+------------+---------+---------+-----
Type |Name |UDM |#MC |Metric |Column |DepS |DelS
----------+----------+---------+------+------------+---------+---------+-----
host |host1 |hostudm1 | 0 | | |WAIT |WAIT
----------+----------+---------+------+------------+---------+---------+-----
Chapter 8
Converting User-defined Metrics to Metric Extensions
8-31

The command provides the status of a single migration session. It lists the name of the
UDM and the target type and name of the target on which the UDM resides. In
addition, it also outlines the metric extensions currently in the EM instance that match
the UDM. The user can elect to use one of the existing choices or create an entirely
new metric extension.
The system attempts to find compatible metric extensions by matching the properties
of the UDM. For example, in the case of a host UDM, the system tries to find a metric
extension that has the same command, script and argument fields. In the case of a
database UDM, the system attempts to match the SQL query.
Finally, the DepS column indicates whether the metric extension that was matched to
the UDM has been deployed to the target on which the UDM is defined. The DelS
column tells the user whether the UDM has been deleted after the metric extension
has been deployed. As the user proceeds with the migration, the above table is
updated from left to right. When the delete status column is set to complete, the
migration session has ended.
$ emcli udmmig_submit_metricpicks -session_id=1 -input_file=metric_picks:filename
Successfully submitted metric picks for migration session
The command instructs the Enterprise Manager instance to use an existing metric
extension or create a new one to replace the UDM. The various options are presented
through a file, which is filename in the above command. The contents of the file are
shown below
"host,host1,hostudm1,N,ME$me1,Usage"
Each line in the file represents a mapping from n UDM to an ME. The line provides the
target type, the name of the target, the name of the UDM, a flag to indicate whether
the metric extension is new (N) or existing (E), the name of the metric extension (note
that ME$ must be prefixed) and the column name.
The types of UDMs supported are:
•Host (host)
•Database (oracle_database)
•RAC (rac_database)
A user can only specify the names of the data columns via the collection item portion
of the file. A metric extension created through migration will always have two columns
to represent the structure of the UDM. The first column is an index column for single
column UDMs while the second column uses the column name mentioned in the file.
In the case of two column UDMs, the first column of the ME is termed as the 'KEY'
column and the collection name is used for the second column.
At this stage, the metric extension has been created and is visible in the metric
extensions library.
$ emcli udmmig_session_details -session_id=1
Name: migration1
Desc: Convert UDMs for host target
Created: <date> <time>
UDM Pick: [hostudm1]
Udms being converted:
----------+--------+---------+------+----------+------------+---------+-----
Type |Name |UDM |#MC |Metric |Column |DepS |DelS
Chapter 8
Converting User-defined Metrics to Metric Extensions
8-32

----------+--------+---------+------+----------+------------+---------+-----
host |host1 |hostudm1 | 1 | ME$me1 | Usage |WAIT |WAIT
----------+--------+---------+------+----------+------------+---------+-----
#MC : There are 1 matches for udms in this session.
Use emcli udmmig_list_matches to list available matches
The session details command indicates that there is one matching metric extension for
this UDM (the value of the MC column is 1) and that metric extension is named as
ME$me1. At this stage, we are ready to test the metric extension through the library
page. Once the testing is complete and the user is satisfied with the metric extension
that has been created, it is ready to be deployed. In order to deploy, the metric
extension has to be minimally saved as a deployable draft.
$ emcli udmmig_retry_deploys -session_id=1 -input_file=metric_tasks:filename2
Metric Deployments successfully submitted
Note that the system will trigger a job to automatically deploy the metric extension to
all targets where the UDM was present once the metric extension is published. If the
user is interested in manually controlling the operation, the above command will
perform the necessary steps. The command is similar to the submit_metricpicks option
in that a file with the UDM to target mapping is provided. It is referred to by filename2
above. The contents of the file are as follows
"host,host1,hostudm1"
Each line in the file is a mapping from the UDM to the targets type and target on which
it resides. Once the command is executed, jobs to deploy the metric extensions to
various targets have been launched and can be tracked through the user interface.
$ emcli udmmig_request_udmdelete -session_id=1 -input_file=metric_tasks:demo_tasks
Udm deletes successfully submitted
The final command deletes the UDMs that were migrated to metric extensions. Note
that this command might partially finish based on how many of the deployments were
completed when the command was run.
$ emcli udmmig_session_details -session_id=1
Name: migration1
Desc: Convert UDMs for host target
Created: <date > <time>
Completed: <date > <time>
UDM Pick: [hostudm1]
Udms being converted:
--------+----------+---------+------+------------+------------+---------+-----
Type |Name |UDM |#MC |Metric |Column |DepS |DelS
--------+----------+---------+------+------ ----+------------+---------+-----
host |host1 |hostudm1 | 1 | ME$me1 | Usage |COMP |COMP
--------+----------+---------+------+------------+------------+---------+-----
#MC : There are 1 matches for udms in this session.
Use emcli udmmig_list_matches to list available matches
The session details command shows that the migration process is indeed complete.
Chapter 8
Converting User-defined Metrics to Metric Extensions
8-33

8.6 Metric Extension Command Line Verbs
Metric extensions can be manipulated outside the UI via the Enterprise Manager
Command Line Interface (EM CLI). Two categories of verbs are available:
•Metric Extension Verbs
–export_metric_extension: Export a metric extension to an archive file
–get_unused_metric_extensions: Get a list of unused metric extensions.
–import_metric_extension: Import a metric extension archive file.
–publish_metric_extension: Publish a metric extension for use by all
administrators.
–save_metric_extension_draft: Save a deployable draft of a metric extension.
•User-defined Metric Migration Verbs
–abort_udmmig_session: Abort (partially) user-defined metric migration
session.
–analyze_unconverted_udms: Analyze the unconverted user-defined metrics.
–create_udmmig_session: Create a user-defined metric migration session.
–list_unconverted_udms: List the user-defined metrics that are not yet in a
migration session.
–udmmig_list_matches: List the matching metrics per user-defined metric in a
specific user-defined metric migration session.
–udmmig_request_udmdelete: Request deletion of user-defined metrics from
targets.
–udmmig_retry_deploys: Retry deployment of metric extensions to targets.
–udmmig_session_details: Retrieve the details of a specific user-defined metric
migration session.
–udmmig_submit_metricpicks: Select the metrics to replace user-defined
metrics in a session.
–udmmig_summary: Summarize the status of all user-defined metric migration
sessions.
–udmmig_update_incrules: Update user-defined metric incident rules to include
replacement metric references.
Metric Extension Verbs
emcli export_metric_extension
-file_name=<name of the metric extension archive>
-target_type=<target type of the metric extension>
-name=<name of the metric extension
-version=<version of the metric extension>
Description:
Export a metric extension archive file.
Options:
-file_name=<file name>
The name of the metric extension archive file to export into.
Chapter 8
Metric Extension Command Line Verbs
8-34

-target_type=<target type>
Target type of the metric extension.
-name=<name>
Name of the metric extension.
-version=<version>
Version of the metric extension to be exported.
emcli get_unused_metric_extensions
Description:
Get a list of metric extensions that are deployed to agents but not attached to
any targets.
emcli import_metric_extension
-file_name=<name of the metric extension archive>
-rename_as=<name of the metric extension to import as>
Description:
Import a metric extension archive file.
Options:
-file_name=<file name>
The name of the metric extension archive file to be imported.
-rename_as=<metric extension name>
Import the metric extension using the specified name, replacing the name given
in the archive.
emcli publish_metric_extension
-target_type=<target type of the metric extension>
-name=<name of the metric extension
-version=<version of the metric extension>
Description:
Publish a metric extension for use by all administrators.
The metric extension must currently be a deployable draft.
Options:
-target_type=<target type>
Target type of the metric extension.
-name=<name>
Name of the metric extension.
-version=<version>
Version of the metric extension to be published.
emcli save_metric_extension_draft
-target_type=<target type of the metric extension>
-name=<name of the metric extension
-version=<version of the metric extension>
Description:
Save a deployable draft of a metric extension. The metric
extension must currently be in editable state. Once saved as
draft, the metric extension will no longer be editable.
Options:
-target_type=<target type>
Target type of the metric extension.
Chapter 8
Metric Extension Command Line Verbs
8-35

-name=<name>
Name of the metric extension.
-version=<version>
Version of the metric extension to be saved to draft.
User-Defined Metric Verbs
emcli abort_udmmig_session
-session_id=<sessionId>
[-input_file=specific_tasks:<complete path to file>]
Description:
Abort the migration of user-defined metrics to MEs in a session
Options:
-session_id=<id of the session>
Specify the id that was returned at time of session created,
or from the output of udmmig_summary
[-input_file=specific_tasks:<complete file path>]
This optional parameter points at a file name that contains a
target, user-defined metric,
one per line in the following format:
<targetType>,<targetName>,<collection name>
Use targetType=Template to indicate a template
Use * for collection name to abort all user-defined metrics for a target
emcli analyze_unconverted_udms [-session_id=<sessionId>]
Description:
Analyze user-defined metrics and list unique user-defined metrics, any possible
matches, and
templates that can apply these matching metric extensions
Options:
-session_id=<id of a session to be reanalyzed>
Not specifying a session id causes the creation of a analysis
session that contains all unconverted user-defined metrics. You can specify
this session id in future invocations to get fresh analysis.
emcli create_udmmig_session
-name=<name of the session>
-desc=<description of the session>
[-udm_choice=<specific udm to convert>]*
{-target=<type:name of the target to migrate> }*
| {-input_file=targetList:<complete path to file>}; {-template=<name of
the template to update> }*
| {-input_file=templateList:<complete path to file>}
[-allUdms]
Description:
Creates a session to migrate user-defined metrics to metric extensions for
targets.
Options:
-name=<session name>
The name of the migration session to be created.
-desc=<session session description>
A description of the migration session to be created.
-udm_choice=<udm name>
Chapter 8
Metric Extension Command Line Verbs
8-36

If the session should migrate specific user-defined metrics, specify them
Otherwise, all user-defined metrics will be migrated
-target=<type:name of target to migrate>
The type:name of the target to be updated.
Multiple values may be specified.
-input_file=targetList:<complete file path>
This takes a file name that contains a list of targets,
one per line in the following format:
<targetType>:<targetName>
-template=<name of template to migrate>
The name of the template to update.Multiple values may be specified
-input_file=templateList:<complete file path>
This takes a file name that contains a list of templates,
one name per line
-allUdms
This forces the session to contain all user-defined metrics from targets and
templates (default behavior just picks those not in a session)
emcli list_unconverted_udms [-templates_only]
Description:
Get the list of all user-defined metrics that are not yet in a migration session
Options:
-templates_only
Only lists unconverted user-defined metrics in templates.
emcli udmmig_list_matches
-session_id=<sessionId>
Description:
Lists the matching metrics per user-defined metric in a migration session
Options:
-session_id=<id of the session>
Specify the id that was returned at time of session created,
or from the output of udmmig_summary
emcli udmmig_request_udmdelete
-session_id=<sessionId>
-input_file=metric_tasks:<complete path to file>
Description:
Delete the user-defined metrics that have been replaced by Metric Extenions
Options:
-session_id=<id of the session>
Specify the id that was returned at time of session created,
or from the output of udmmig_summary
-input_file=metric_tasks:<complete file path>
This takes a file name that contains a target, user-defined metric,
one per line in the following format:
<targetType>,<targetName>,<collection name>
emcli udmmig_retry_deploys
-session_id=<sessionId>
-input_file=metric_tasks:<complete path to file>
Description:
Chapter 8
Metric Extension Command Line Verbs
8-37

Retry the deployment of metric extensions to a target
Options:
-session_id=<id of the session>
Specify the id that was returned at time of session created,
or from the output of udmmig_summary
-input_file=metric_tasks:<complete file path>
This takes a file name that contains a target, user-defined metric,
one per line in the following format:
<targetType>,<targetName>,<collection name>
emcli udmmig_submit_metricpicks
-session_id=<sessionId>
-input_file=metric_picks:<complete path to file>
Description:
Supply the metric picks to use to replace user-defined metrics per target in a
session
Options:
-session_id=<id of the session>
Specify the id that was returned at time of session created,
or from the output of udmmig_summary
-input_file=metric_picks:<complete file path>
This takes a file name that contains a target, user-defined metric, metric
pick,
one per line in the following format:
<targetType>,<targetName>,<collection name>,[N/E],<metric>,<column>
using N if a new metric should be created or E if an existing
metric is referenced.
emcli udmmig_summary
[-showAll]
Description:
Gets the summary details of all migration sessions in progress
Options:
-showAll
This prints out all sessions including those that are complete.
By default, only in-progress sessions are listed.
emcli udmmig_update_incrules
-session_id=<sessionId>
-input_file=udm_inc_rules:<complete path to file>
Description:
Update Incident Rules that reference user-defined metrics with a reference to
replacing metric extension.
Options:
-session_id=<id of the session>
Specify the id that was returned at time of session created,
or from the output of udmmig_summary
-input_file=udm_inc_rules:<complete file path>
This takes a file name that contains rule, user-defined metric, metric,
one per line in the following format:
<ruleset id>,<rule id>,<udm name>,<metric name>
Chapter 8
Metric Extension Command Line Verbs
8-38

9
Advanced Threshold Management
There are monitoring situations in which different workloads for a target occur at
regular (expected) intervals. Under these conditions, a static alert threshold would
prove to be inaccurate. For example, the accurate alert thresholds for a database
performing Online Transaction Process (OLTP) during the day and batch processing
at night would be different. Similarly, database workloads can change based purely on
different time periods, such as weekday versus weekend. In both these situations,
fixed, static values for thresholds might result in false alert reporting.
Advanced Thresholds allow you to define and manage alert thresholds that are either
adaptive (self-adjusting) or time-based (static).
•Adaptive Thresholds are thresholds based on statistical calculations from the
target's observed behavior (metrics).
•Time-based Thresholds are user-defined threshold values to be used at different
times of the day/week to account for changing target workloads.
This chapter covers the following topics:
•Accessing the Advanced Threshold Management Page
•Adaptive Thresholds
•Time-based Static Thresholds
•Determining What is a Valid Metric Threshold
9.1 Accessing the Advanced Threshold Management Page
You manage advanced thresholds from the Enterprise Manager console. The
Advanced Threshold Management page allows you to create time-based static
thresholds and adaptive thresholds. To access this page:
1. From a target home page (host, for example), navigate to the Metric Collection
and Settings page.
2. From the Related Links region, click Advanced Threshold Management.
The Advanced Threshold Management page displays.
9.2 Adaptive Thresholds
Adaptive thresholds are statistically computed thresholds that adapt to target workload
conditions. Adaptive thresholds apply to all targets (both Agent and repository-
monitored).
Important Concepts
Creating an adaptive threshold is based on the following key concepts:
•Baseline periods
9-1

For the purpose of performance evaluation, a baseline period is a period of time
used to characterize the typical behavior of the system. You compare system
behavior over the baseline period to that observed at some other time.
There are two types of baseline periods:
•Moving window baseline periods: Moving window baselines are defined as
some number of days prior to the current date. This "window" of days forms a
rolling interval that moves with the current time. The number of days that can be
used to define moving window baseline in Enterprise Manager are:
–7 days
–14 days
–21 days
–30 days
Example: Suppose you have specified trailing 7 days as a time period while
creating moving window baseline. In this situation, the most recent 7-day
period becomes the baseline period for all metric observations and
comparisons today. Tomorrow, this reference period drops the oldest day and
picks up today.
Moving window baselines allow you to compare current metric values with
recently observed history, thus allowing the baseline to incorporate changes to
the system over time. Moving window baselines are suitable for systems with
predictable workload cycles.
Note:
Enterprise Manager computes moving window statistics every day rather than
sampling.
9.2.1 Registering Adaptive Threshold Metrics
Adaptive threshold metrics are not immediately available by default; they must be
defined and added to the system (registered) in order for them to become available for
use by Enterprise Manager. Not all metrics can have adaptive thresholds: Adaptive
Threshold metrics must fall into one of the following categories:
•Load
•LoadType
•Utilization
•Response
You can register adaptive threshold metrics from the Advanced Threshold
Management page.
1. From a target menu (Host is used in this example), select Monitoring and then
Metric and Collection Settings.
2. In the Related Links area, click Advanced Threshold Management.The
Advanced Threshold Management page displays.
Chapter 9
Adaptive Thresholds
9-2
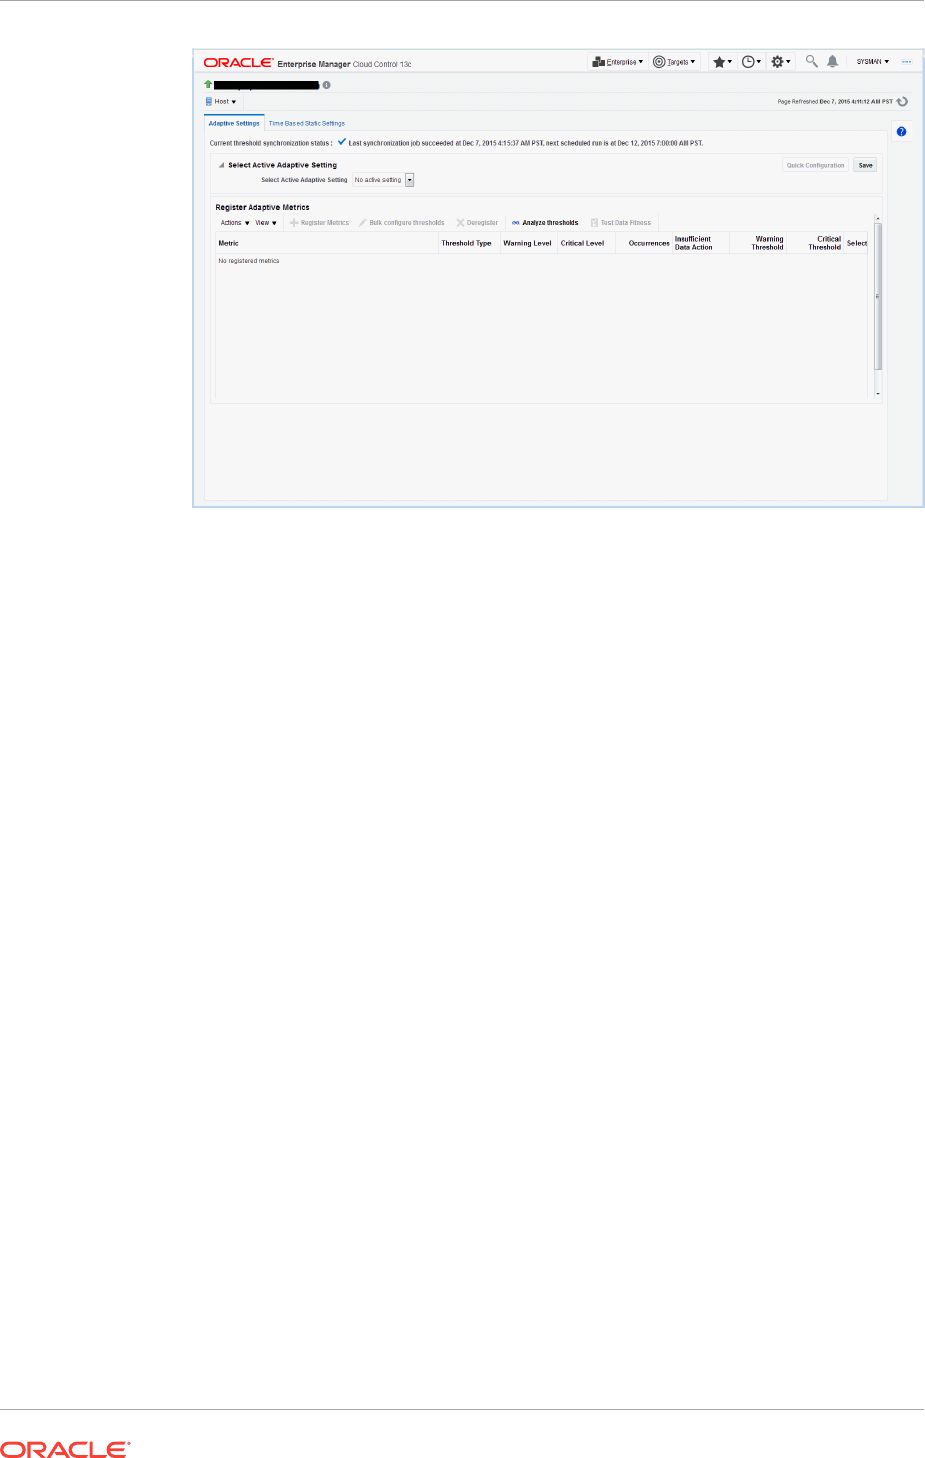
3. From the Select Active Adaptive Setting menu, select Moving Window,
additional controls are displayed allowing you to define the moving window's
Threshold Change Frequency and the Accumulated Trailing Data that will be used
to compute the adaptive thresholds.
•Threshold Change Frequency (The target timezone is used.)
–None: One set of thresholds will be calculated using past data. This set of
thresholds will be valid for the entire week.
None should be used when there is no usage pattern between daytime
versus nighttime or within hours of a day.
–By Day and Night: Two sets of thresholds (day and night) will be
calculated using past data. Day thresholds will be calculated using
previous day's daytime data, Night thresholds will be calculated using
previous day's nighttime data. Thresholds will be changed every day and
night.
By Day and Night should be used when there are distinct performance
and usage variations between day hours and night hours.
–By Weekdays and Weekend: Two sets of thresholds (weekdays and
weekend) will be calculated using past data. Weekdays thresholds will be
calculated using the previous weekdays data. Weekend thresholds will be
calculated using the previous weekend data. Thresholds will be changed
at start of the weekdays and start of the weekend.
–By Day and Night, over Weekdays and Weekend: Four sets of
thresholds will be calculated using past data. Weekdays Day thresholds
will be calculated using the previous weekday's daytime data, Weekdays
Night thresholds will be calculated using the previous weekday's nighttime
data. Weekends Day thresholds will be calculated using previous
weekend's daytime data, Weekends Night thresholds will be calculated
using previous weekend's nighttime data. Thresholds will be changed
each day and night.
Weekday day hours (7a.m. to 7p.m)
Weekend day hours (7am to 7pm)
Chapter 9
Adaptive Thresholds
9-3

Weekday night hours (7pm to 7am)
Weekend night hours (7pm to 7am)
–By Day of Week: Seven sets of thresholds will be calculated, one for each
day of the week. Thresholds will be calculated using the previous week's
same-day data. Thresholds will be changed every day.
By Day of Week should be used when there is significant daily variation in
usage for each day of week.
–By Day and Night, per Day of Week: Fourteen sets of thresholds will be
calculated, one for each day of the week and one for each night of the
week. Day thresholds will be calculated using previous weeks same-day
daytime data, Night thresholds will be calculated using the previous
week's same-day nighttime data. Thresholds will be changed every day
and night each day of the week.
•Accumulated Trailing Data
Total time period for which metric data will be collected. Options are 7, 14, 21,
and 28 days. In general, you should select the larger value as the additional
data helps in computing more accurate thresholds.
4. Click Save and accept the confirmation. The Register Metrics button becomes
active in the Register Adaptive Metrics region. Click Register Metrics. The Metric
Selector dialog displays.
Chapter 9
Adaptive Thresholds
9-4
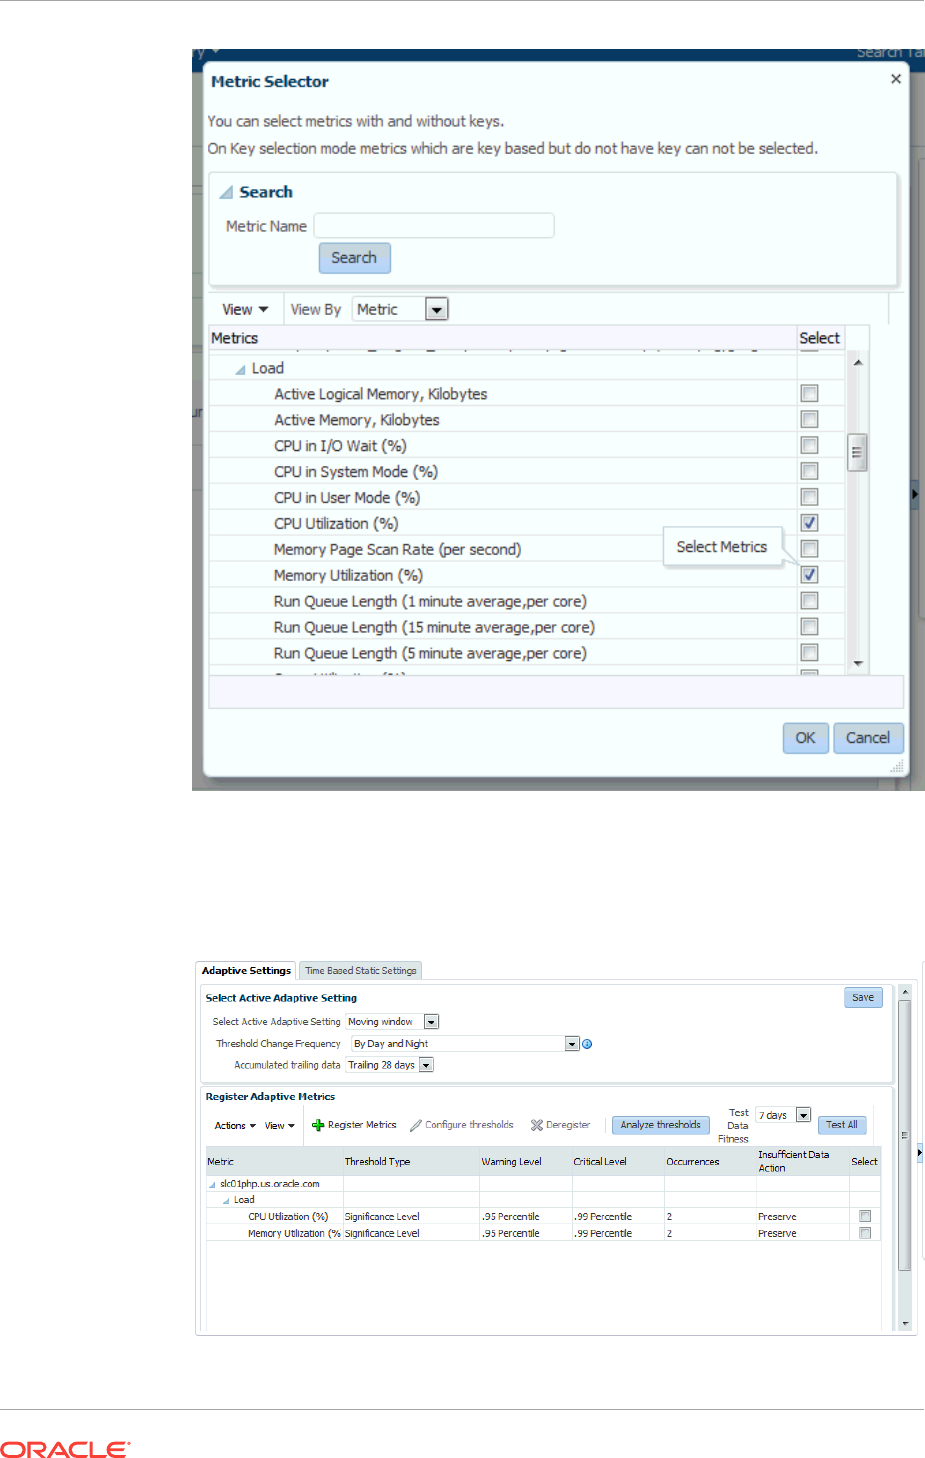
5. Select the desired metric(s) and then click OK. A confirmation dialog displays
stating that the selected metric(s) will be added to this target's Adaptive Setting.
Click Yes to confirm the action. The selected metrics appear in the Register
Adaptive Metrics region.
Chapter 9
Adaptive Thresholds
9-5
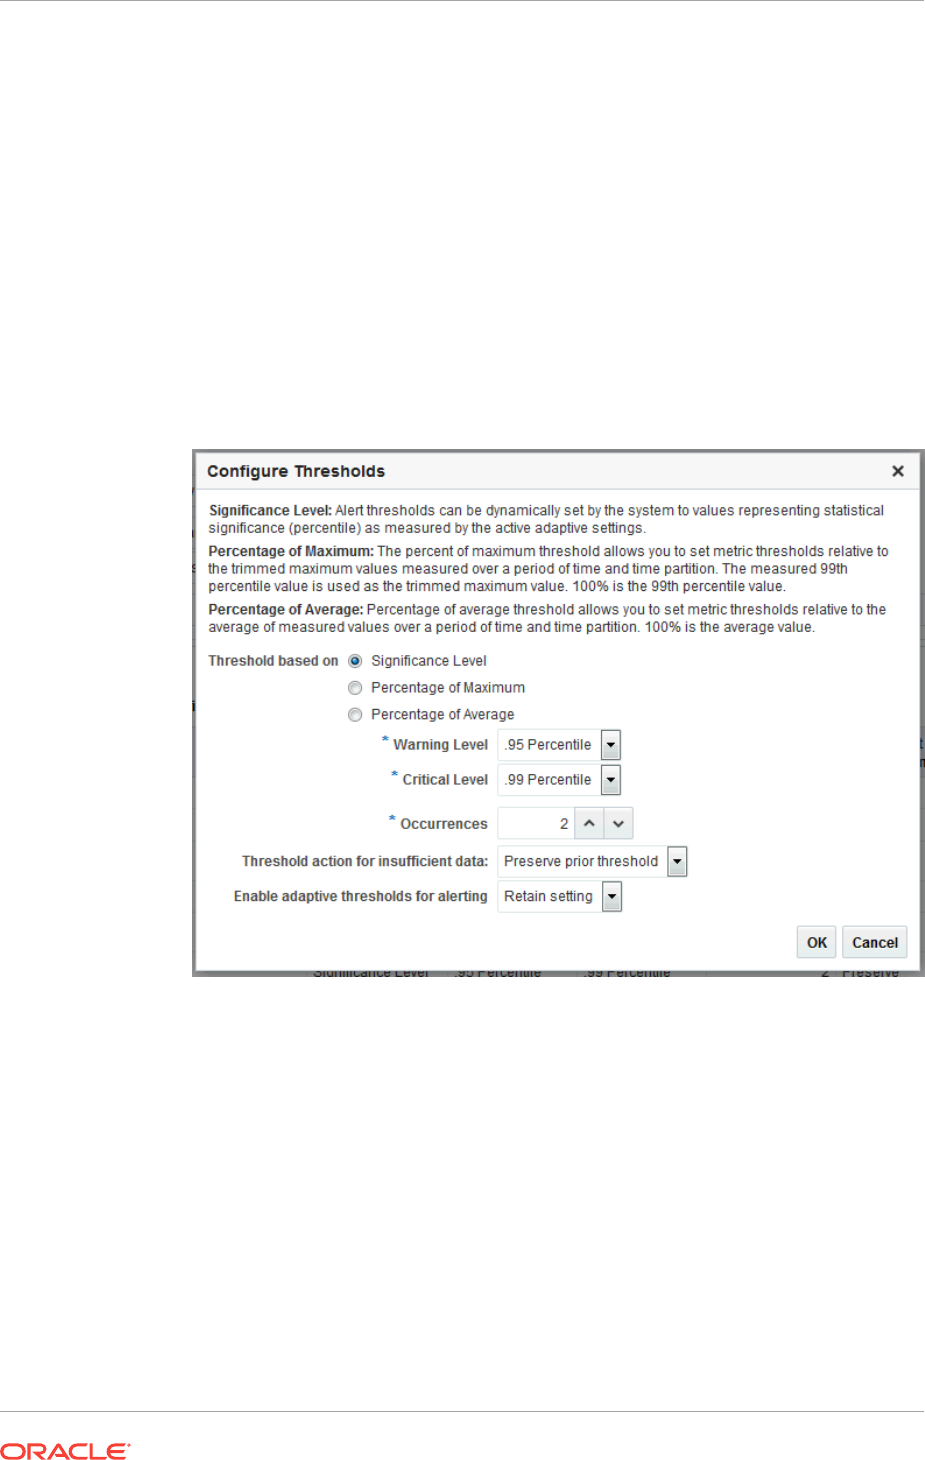
6. Once registered as adaptive metrics, you can then select individual metrics to
configure thresholds. When metrics are first registered, by default, Enterprise
Manager enables Significance Level and sets the warning and critical thresholds
at 95 and 99 percentile respectively.
9.2.2 Configuring Adaptive Thresholds
Once you have registered the adaptive metrics, you now have the option of configuring
the thresholds if the predefined thresholds do not meet your monitoring requirements.
To configure adaptive thresholds:
1. From the Register Adaptive Metrics region, select the metric(s) you wish to
configure and click Bulk Configure Thresholds. The Configure Thresholds dialog
displays.
2. Choose whether you want your threshold to be based on:
Significance Level: Thresholds based on significance level use statistical
relevance to determine which current values are statistical outliers. The primary
reason to use Significance Level for alerting is that you are trying to detect
statistical outliers in metric values as opposed to simply setting a threshold value.
Hence, thresholds are percentile based. For example, if the significance level is
set to .95 for a warning threshold, the metric threshold is set where 5% of the
collected metric values fall outside this value and any current values that exceed
this value trigger an alert. A higher significance level of .98 or .99 will cause fewer
alerts to be triggered.
Percentage of Maximum: These types of thresholds compute the threshold
values based on specified percentages of the maximum observed over the period
of time you selected. Percentage-of-maximum-based alerts are generated if the
current value is at or above the percentage of maximum you specify. For example,
if a maximum value of 1000 is encountered during a time group, and if 105 is
Chapter 9
Adaptive Thresholds
9-6
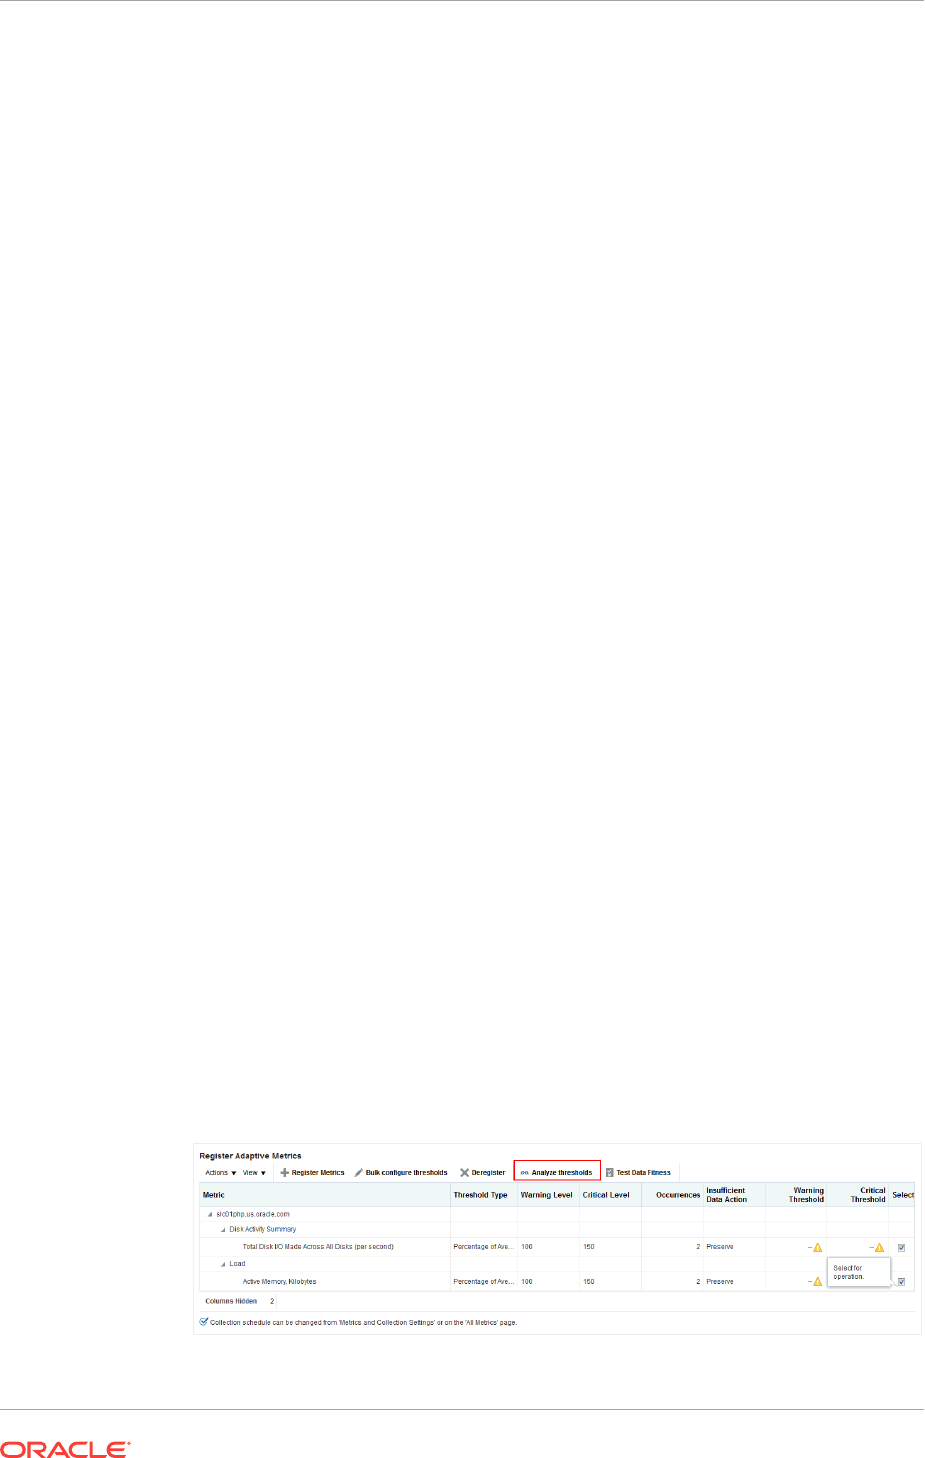
specified as the Warning level, then values above 1050 (105% of 1000 = 1050)
will raise an alert.
Percentage of Average. Based on the time grouping and bucketing, the threshold
average is computed allowing you to set metric thresholds relative to the average
of measured values over a period of time and time partition. 100% is the average
value.
For all types of alerts you can set the Occurrences parameter, which is the
number of times the metric crosses a threshold value before an alert is generated.
Clear Threshold: Thresholds for the selected metrics will be cleared. No Alert will
be generated. Use this option when you do not want any thresholds set for the
metrics but you do not want to remove historical data. Important: Deregistering
metrics will remove the historical data.
Depending on the option selected, the Warning, Critical, and Occurrence setting
options will change.
You can set the deviation over the computed average value.
The Threshold action for insufficient data menu allows you set the appropriate
action for Enterprise Manager to take if there is not enough data to calculate a
valid metric threshold. There are two actions available: Preserve the prior
threshold and Suppress Alerts.
Maximum Allowed Threshold allows you to set a threshold limit that, if crossed,
will raise a critical alert. A warning alert will automatically be raised at 25% less the
maximum value.
3. Click OK to set the changes.
9.2.3 Determining whether Adaptive Thresholds are Correct
Even though Enterprise Manager will use the adaptive threshold settings to determine
an accurate target workload-metric threshold match, it is still be necessary to match
the metric sampling schedule with the actual target workload. For example, your
moving window baseline period (see Moving Window Baseline Periods ) should match
the target workloads. In some situations, you may not know the actual target
workloads, in which case setting adaptive thresholds may be problematic.
To help you determine the validity of your adaptive thresholds, Enterprise Manager
allows you to analyze threshold using various adaptive settings to determine whether
the settings are correct.
To analyze existing adaptive thresholds:
1. From the Register Adaptive Metrics region, click Analyze Thresholds.
Chapter 9
Adaptive Thresholds
9-7
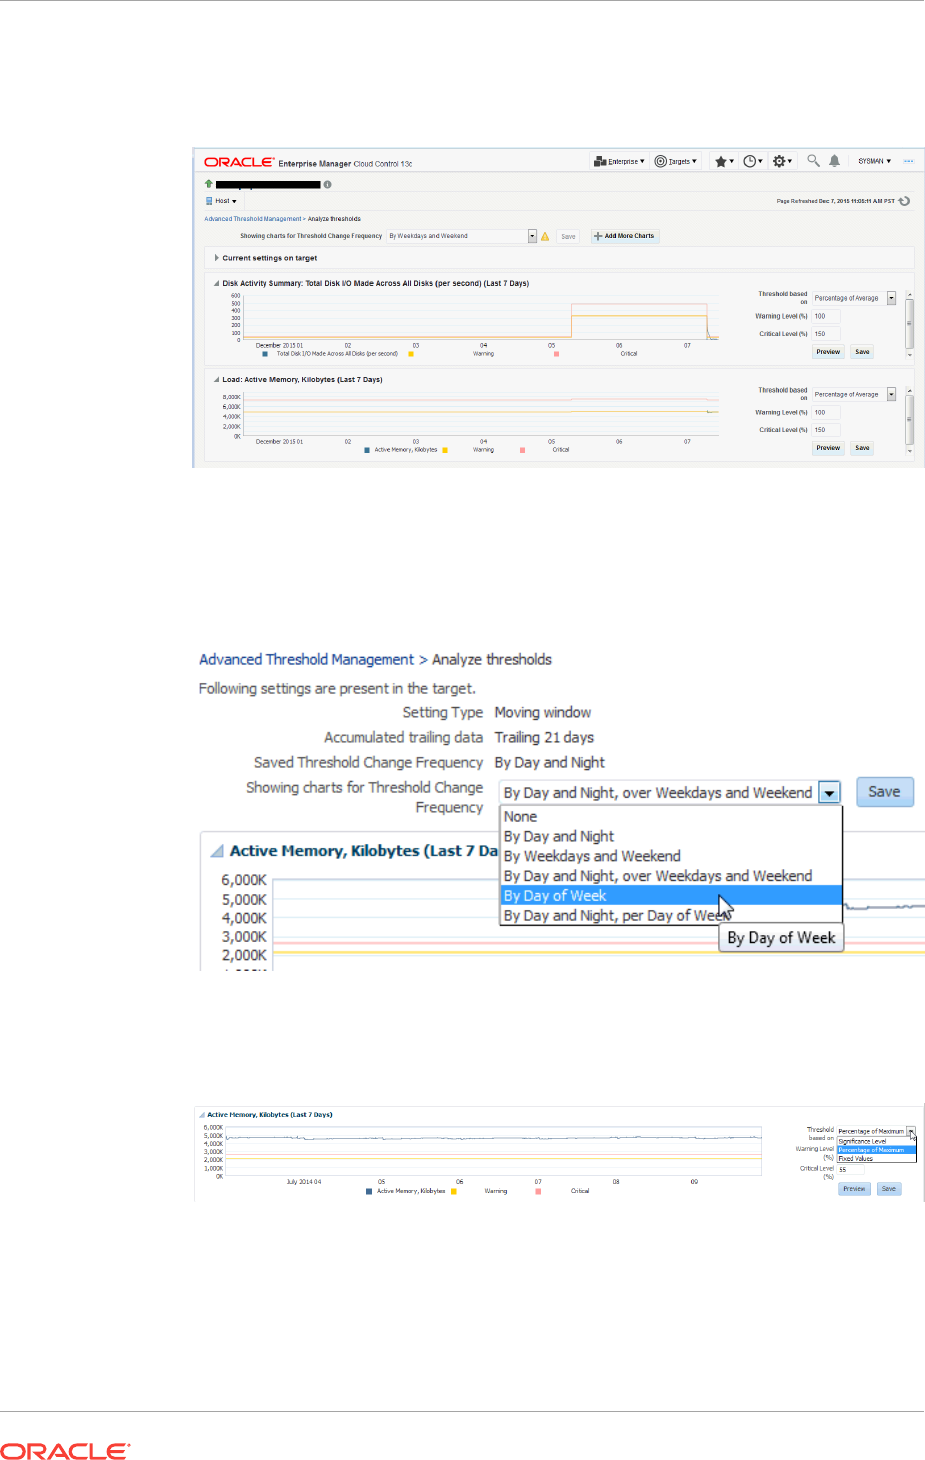
The Analyze Threshold page displays containing historical metric data charts (one
for each metric).
2. Modify the adaptive threshold parameters to closely match metric threshold
settings with the target workload. You can experiment with the following adaptive
metric parameters:
Threshold Change Frequency
Threshold Based On
Metric Warning and Critical Thresholds
Chapter 9
Adaptive Thresholds
9-8
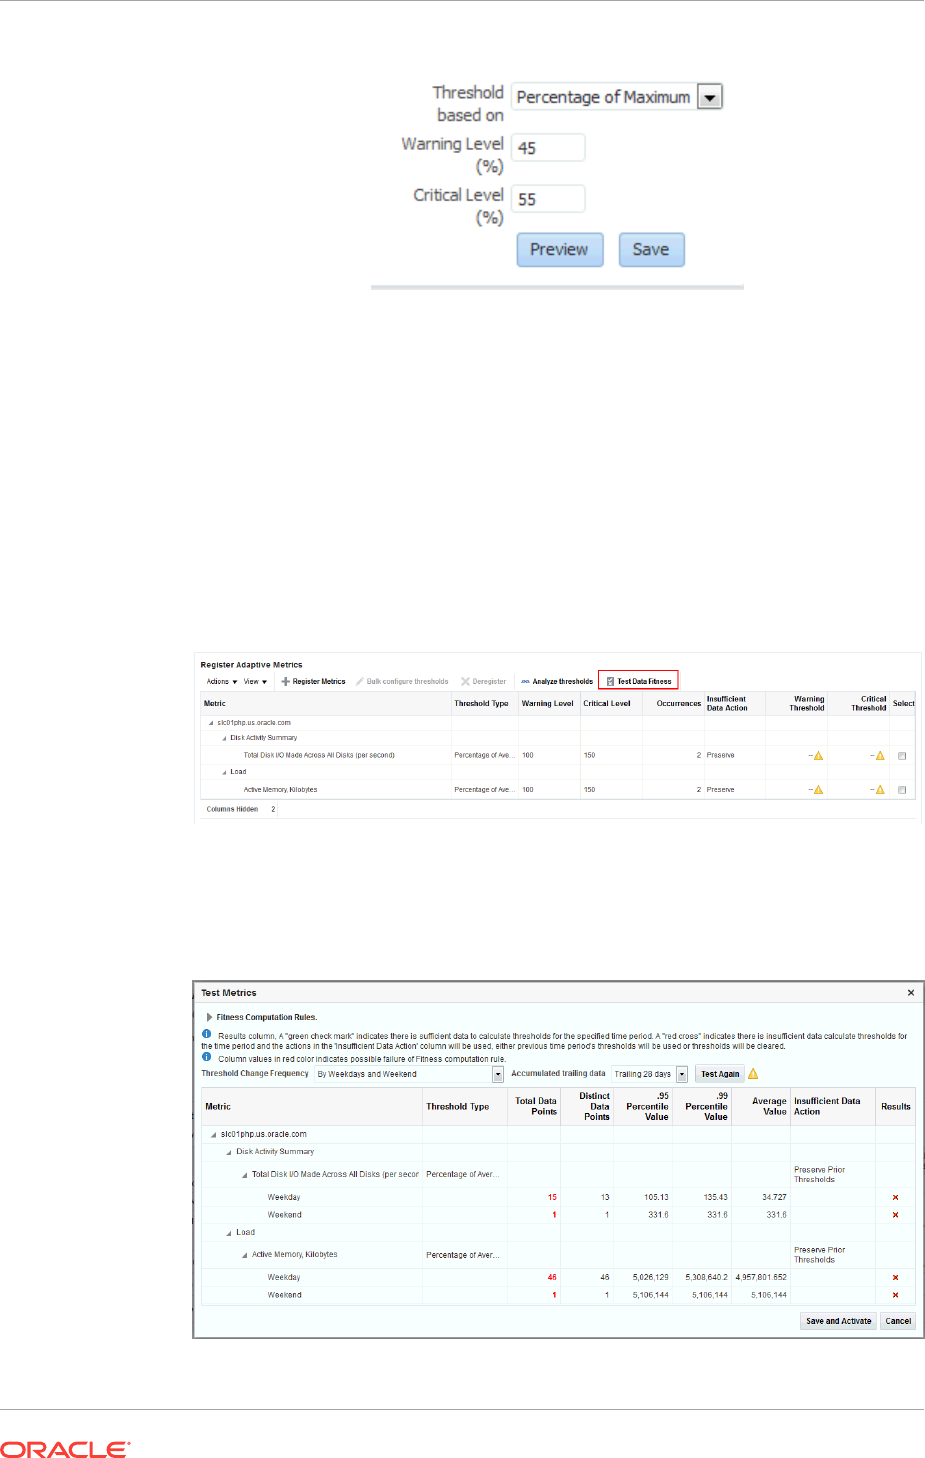
3. Once you are satisfied with the modifications for the Threshold Change Frequency
or any of the individual metrics, click Save to set the new parameters.
9.2.4 Testing Adaptive Metric Thresholds
Because adaptive metric thresholds utilize statistical sampling of data over time, the
accuracy of the thresholds will rely on the quantity and quality of the data collected.
Hence, a sufficient amount of metric data needs to have been collected in order for the
thresholds to be valid. To verify whether enough data has been collected for metrics
registered with adaptive thresholds, use the Test Data Fitness function.
1. From the Registered Adaptive Metrics region, click Test Data Fitness.
Enterprise Manager evaluates the adaptive threshold metrics and then displays
the results in the Test Metrics window.
Chapter 9
Adaptive Thresholds
9-9

If there is sufficient data collected to compute the adaptive threshold, a green
check appears in the results column. A red 'x' appears in the results column if
there is insufficient data collected. To resolve this situation, you can use a longer
accumulating trailing data window. Additionally, you can have metric data collected
more frequently.
2. Click Save and Activate once you are finished viewing the results.
9.2.5 Deregistering Adaptive Threshold Metrics
If you no longer want specific metrics to be adaptive, you can deregister them at any
time. To deregister an adaptive threshold metric:
1. From the Register Adaptive Metrics regions, select the metric(s) you wish to
deregister.
2. Click Deregister. A confirmation displays asking if you want the metric removed
from the target's adaptive setting.
3. Click Yes.
9.2.6 Setting Adaptive Thresholds using Monitoring Templates
You can use monitoring templates to apply adaptive thresholds broadly across targets
within your environment. For example, using a monitoring template, you can apply
adaptive threshold setting for the CPU Utilization metric for all Host targets.
To apply adaptive thresholds using monitoring templates:
1. Create a template out of a target that already has adaptive threshold settings
enabled.
From the Enterprise menu, select Monitoring and then Monitoring
Templates.The Monitoring Templates page displays.
2. Click Create. The Create Monitoring Template: Copy Monitoring Settings
page displays.
3. Choose a target on which adaptive thresholds have already been set and click
Continue.
4. Enter a template Name and a brief Description. Click OK.
Once the monitoring template has been created, you can view or edit the template as
you would any other template. To modify, add, or delete adaptive metrics in the
template:
1. From the Enterprise menu, select Monitoring and then Monitoring
Templates.The Monitoring Templates page displays.
2. On the Monitoring Templates page, select the monitoring template from the list.
3. From the Actions menu, select Edit Advanced Monitoring Settings. The Edit
Advanced Monitoring Settings page displays with the Adaptive Settings tab
selected.
4. Modify the adaptive metrics as required.
Chapter 9
Adaptive Thresholds
9-10
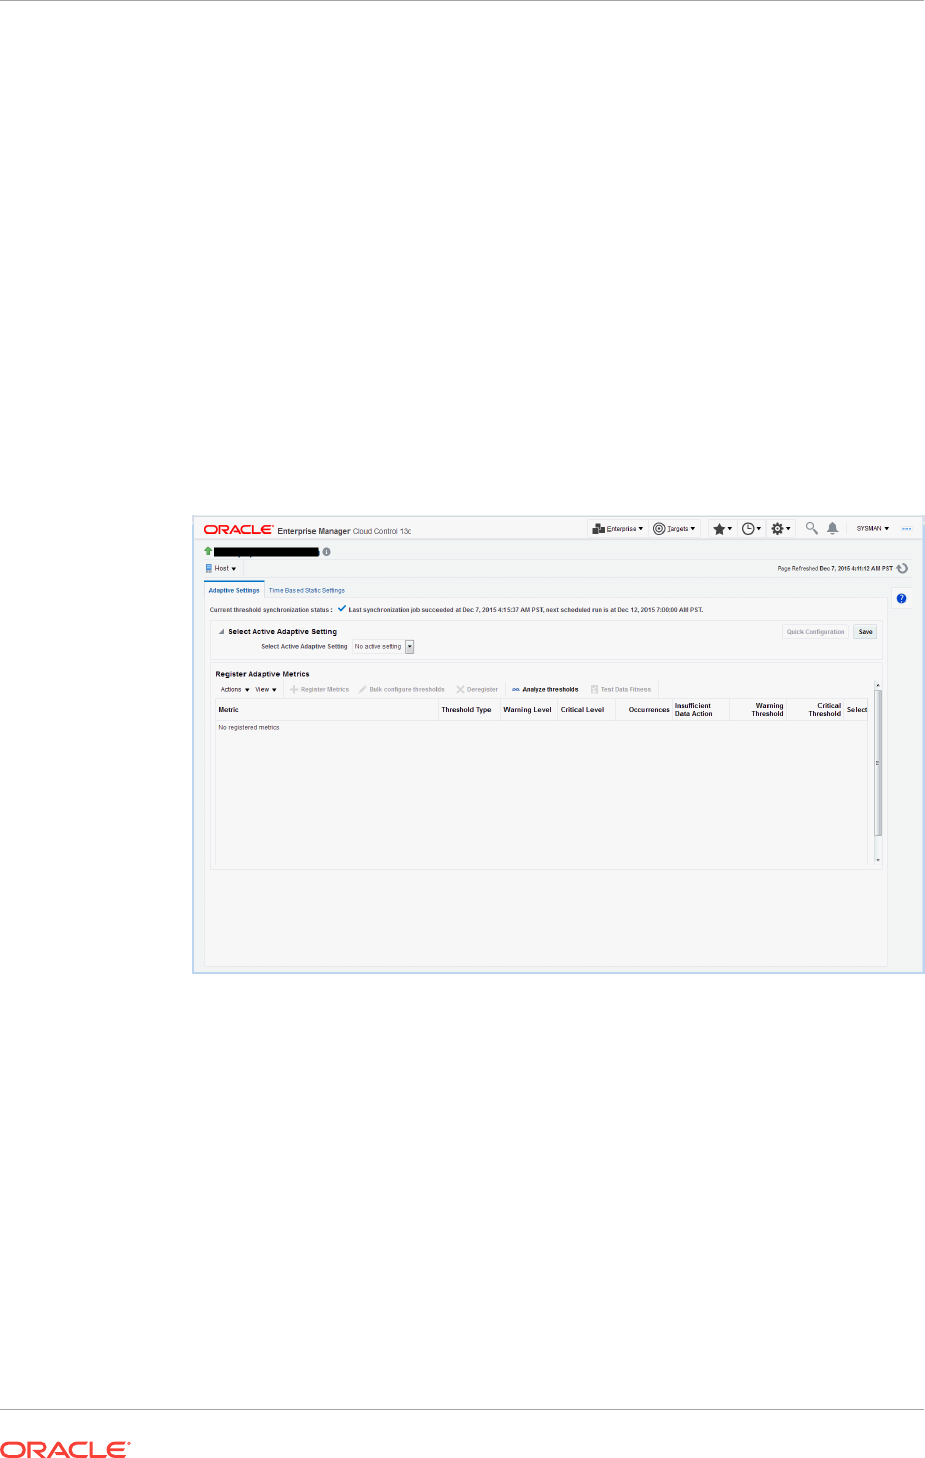
9.3 Time-based Static Thresholds
Time-based static thresholds allow you to define specific threshold values to be used
at different times to account for changing workloads over time. Using time-based static
thresholds can be used whenever the workload schedule for a specific target is well
known or if you know what thresholds you want to specify.
9.3.1 Registering Time-based Static Thresholds
To register metrics with time-based static thresholds:
1. From the target menu (Host is used in this example), select Monitoring and then
Metric and Collection Settings.
2. In the Related Links area, click Advanced Threshold Management.The
Advanced Threshold Management page displays.
3. Click on the Time Based Static Settings tab.
4. Select the Threshold Change Frequency.
5. Click Register Metrics.
Chapter 9
Time-based Static Thresholds
9-11
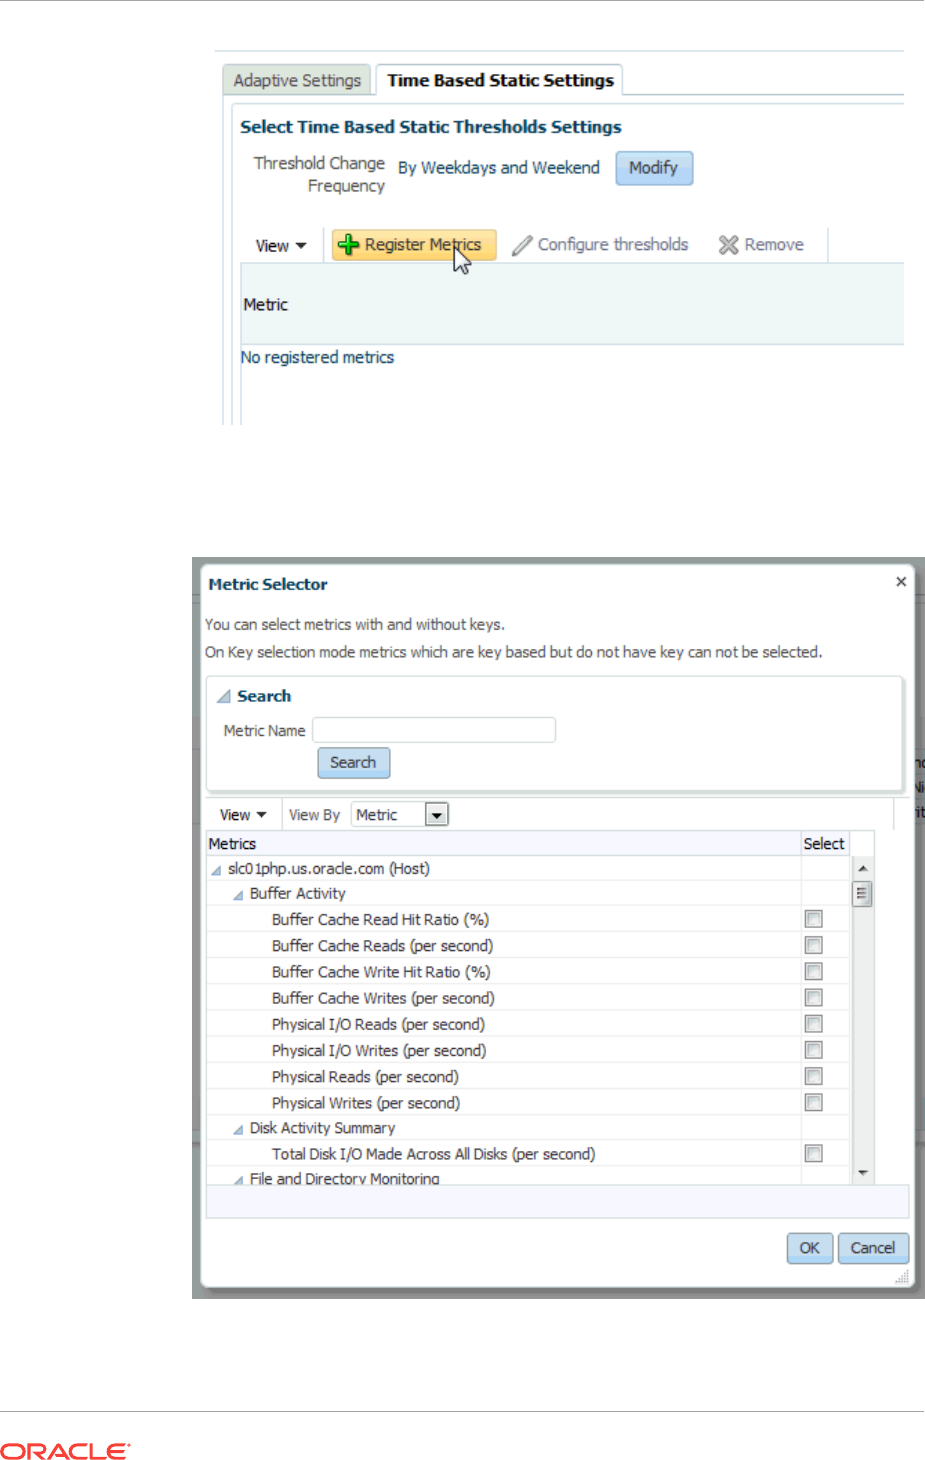
The Metric Selector dialog displays.
6. Select the desired metric(s) and click OK.
The selected metrics appear in the Registered Metrics table.
Chapter 9
Time-based Static Thresholds
9-12

7. Enter the desired metric thresholds and click Save once you are done.
If you want to set the thresholds for multiple metrics simultaneously, check the
Select box for the metrics you want to update and click Bulk Configure
Thresholds. The Configure Thresholds dialog displays.
Enter the revised Warning and Critical threshold values and click OK. A
confirmation dialog displays stating that existing metric threshold values will be
overwritten. Click Yes.
8. Optionally, you can change the Threshold Change Frequency. To do so, from the
Time Based Static Thresholds Settings page, click Modify. The Modify Threshold
Change Frequency dialog displays allowing you to select a new change frequency.
Select a new frequency and click OK.
A confirmation dialog displays stating that changing Threshold Change Frequency
will affect all the registered metrics and whether you want to continue. Click Yes to
proceed.
9. Click Save to ensure all changes have been saved to the Enterprise Manager
repository.
9.3.2 Deregistering Time-based Static Thresholds
If you no longer require time-based static threshold metrics, you can deregister them
from the target.
To deregister time-based static metric thresholds:
1. From the Time Based Static Thresholds tab, select the metric(s) you want to
deregister.
Chapter 9
Time-based Static Thresholds
9-13

2. Click Remove. The metric entry is removed from list of
3. Click Save to save the changes to the Enterprise Manager repository.
9.4 Determining What is a Valid Metric Threshold
As previously discussed, static thresholds do not account for expected performance
variation due to increased/decreased workloads encountered by the target, such as
the workload encountered by a warehouse database target against which OLTP
transactions are performed. Workloads can also change based on different time
periods, such as weekday versus weekend, or day versus night. These types of
workload variations present conditions where fixed static metric threshold values may
cause monitoring issues, such as the generation of false and/or excessive metric
alerts. Ultimately, your monitoring needs dictate how to best go about obtaining
accurate metric thresholds.
Chapter 9
Determining What is a Valid Metric Threshold
9-14

10
Utilizing the Job System and Corrective
Actions
The Enterprise Manager Cloud Control Job System can automate routine
administrative tasks and synchronize components in your environment so you can
manage them more efficiently.
This chapter facilitates your usage of the Job System by presenting instructional
information in the following sections:
•Job System Purpose and Overview
•Preliminary Considerations
•Creating Jobs
•Viewing and Analyzing Job Status
•Generating Job Event Criteria
•Creating Event Rules For Job Status Change
•Using Diagnostic Tools
•Creating Corrective Actions
10.1 Job System Purpose and Overview
The Enterprise Manager Job System serves these purposes:
•Automates many administrative tasks; for example: backup, cloning, and patching
•Enables you to create your own jobs using your own custom OS and SQL scripts
•Enables you to create your own multi-task jobs comprised of multiple tasks
•Centralizes environment job scheduling into one robust tool
A job is a unit of work that you define to automate commonly-run tasks. Scheduling
flexibility is one of the advantages of jobs. You can schedule a job to start immediately
or start at a later date and time. You can also run the job once or at a specific interval,
such as three times every month.
The Job Activity page is the hub of the Job System. From this page, you can:
•Search for existing job runs and job executions filtered by name, owner, status,
scheduled start, job type, target type, and target name
•Create a job
•View or edit the job definition
•Create like, copy to library, suspend, resume, stop, and delete a job
•View results, edit, create like, suspend, resume, retry, stop, and delete a job run or
execution
10-1
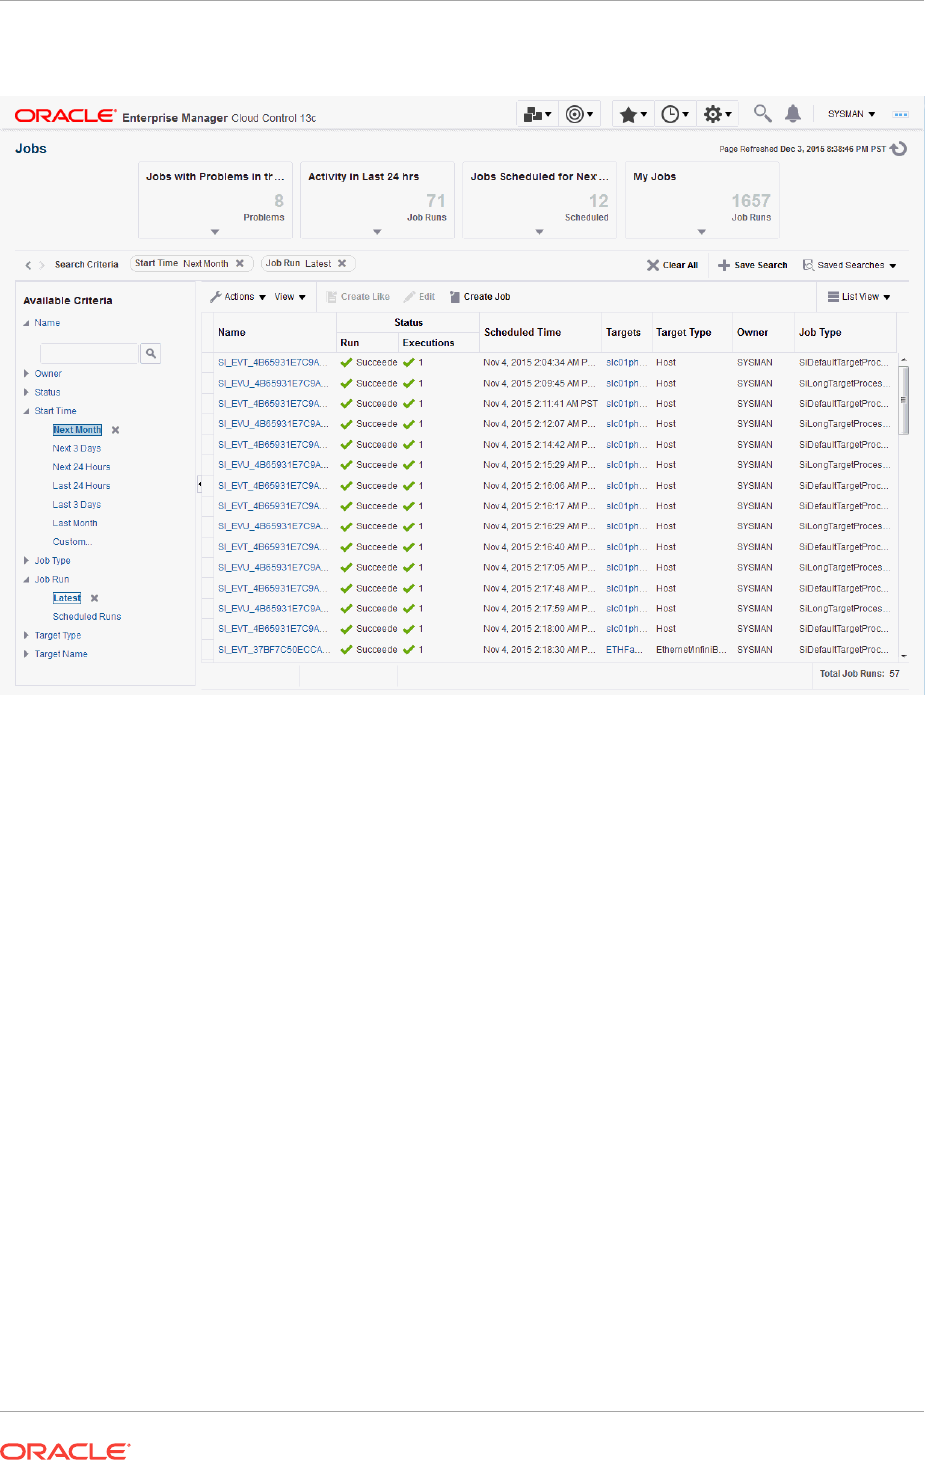
Figure 10-1 Job Activity Page
Besides accessing the Job Activity page from the Enterprise menu, you can also
access this page from any target-specific menu for all target types by selecting Job
Activity from the target type's menu. When you access this page from these alternate
locations, rather than showing the entire list of jobs, the Job Activity page shows a
subset of the jobs associated with the particular target.
10.1.1 Changing Job Activity Summary Table Views
In addition to listing job executions in a conventional tabular format, Enterprise
Manager also allows you to display the job executions using in using alternate views
that can make job execution data more meaningful. For example, seeing which jobs
are using the most resource or are taking the longest to run.
There are three job activity display options:
•List: Conventional tabular display of job information.
•Summary: Displays a graphical rollup of job runs based on selected attributes of
attributes. Clicking on any cell in the rollup view further refines the search and
takes you to the tabular view where you can analyze job runs in more granular
detail.
Chapter 10
Job System Purpose and Overview
10-2

10.1.2 Job Searches
For convenience, you can define job searches that allow you to view/access specific
jobs that are of frequent interest. By default, there are predefined job searches at the
top of the Job Activity page.
•Jobs with problems in the Last 24 Hours
•Job Run activity in the last 24 hours
•Jobs scheduled to run in the next 24 hours
•Jobs belonging to the currently logged in user
10.1.2.1 Saving Job Searches
Saving commonly used job searches allows you to view pertinent job information
quickly.
To create a saved search:
1. From the Available Criteria region, choose the requisite parameters for your
search. The results display immediately in the Job Activity table.
2. Click the Save Search button. The Create Saved Search dialog displays.
3. Enter a name for your search.
4. Choose how you want your saved search displayed:
Show this search when I come to this page (available from the Saved Searches
drop-down list)
OR
Show on top of the page (available as one of the summary boxes at the top of the
page)
5. Click OK to save your search.
6. Click Run to run your search and view the results.
10.1.2.2 Editing Saved Job Searches
To edit a saved job search:
1. From the Saved Searches menu, select Manage Saved Searches. The Manage
Saved Searches dialog displays.
2. Click the Edit icon (pencil). The Edit Saved Search dialog displays. Note: In
addition to editing search criteria, you can set whether you wan the job to be a
Default (Choosing Default runs the search whenever you access the Job Activity
page. ) or want the job to appear at the top of the Job Activity page.
3. Click OK to save your Job search changes.
4. Click Done to close the Manage Saved Searches dialog.
Chapter 10
Job System Purpose and Overview
10-3

10.1.2.3 Importing/Exporting Saved Job Searches
By default, you can only see searches that you have created. To use searches other
administrators have created, you can import them. Conversely, you can make job
searches you have created available to other administrators by exporting your
searches. Once the job searches are accessible to you, they will appear in your list of
saved searches.
10.1.3 What Are Job Executions and Job Runs?
The following sections explain the characteristics of each of these.
10.1.3.1 Job Executions
Job executions are usually associated with one target, such as a patch job on a
particular database. These are called single-target jobs because each execution has
only one target. However, job executions are not always a one-to-one mapping to a
target. Some executions have multiple targets, such as comparing hosts. These jobs
are called single-execution jobs, since there is only one execution for all the targets.
When a job is run against multiple targets, it runs in one or many executions
depending on whether it is a single-execution or single-target job. A few jobs have no
target. These jobs are called targetless jobs and run in one execution.
When you submit a job to many targets, it would be tedious to examine the status of
each execution of the job against each target. For example, suppose you run a backup
job against several databases. A typical question would be: Were all the backup jobs
successful, and if not, which jobs failed? If this backup job runs every week, you would
want to know which backups were successful and those that failed each week.
10.1.3.2 Job Runs
With the Job System, you can easily get these answers by viewing the job run. A job
run is the summary of all job executions of a job that ran on a particular scheduled
date. For example, if you have a job scheduled for March 5th, you will have a March 5
job run. The job table that shows the job run provides a roll-up of the status of the
executions, such as Succeeded, Failed, or Error.
10.1.4 Operations on Job Executions and Job Runs
Besides supporting the standard job operations of create, edit, create like, and delete,
the Job System enables you to:
•Suspend jobs —
You can suspend individual executions or entire jobs. For example, you may need
to suspend a job if a needed resource was unavailable, or the job needs to be
postponed.
If a job is scheduled to repeat but is suspended past the scheduled repeat time, or
a maximum of one day, the execution of this job would be marked "Skipped." A job
is also skipped when the scheduled time plus the grace period has passed.
•Resume jobs —
Chapter 10
Job System Purpose and Overview
10-4

After you suspend a job, any scheduled executions do not occur until you decide
to resume the job.
•Retry all failed executions in a job run —
When analyzing individual executions or entire jobs, it is useful to retry a failed
execution after you determine the cause of the problem. This alleviates the need
to create a new job for that failed execution. When you use the Retry operation in
the Job System, Enterprise Manager provides links from the failed execution to the
retried execution and vice versa, should it become useful to retroactively examine
the causes of the failed executions. Only the most recent retry is shown in the Job
Run page.
With regard to job runs, the Job System enables you to:
•Delete old job runs
•Stop job runs
•Retry all failed executions in a job run. Successful executions are never retried.
See Also:
For more information on job executions and runs, refer to Enterprise Manager
Cloud Control online help.
10.2 Preliminary Considerations
Before proceeding to the procedural information presented in Creating Jobs, it is
suggested that you read the topics presented in the sections below:
•Administrator Roles
•Creating Scripts
•Sharing Job Responsibilities
•Submitting Jobs for Groups
10.2.1 Administrator Roles
Enterprise Manager provides the following administrator types:
•Administrator — Most jobs and other activities should be initiated using this
"normal" user type
•Super Administrator — There may be limited use cases for a super administrator
to run jobs, create blackouts, or own targets.
•Repository owner (SYSMAN) — The special repository owner user SYSMAN
should almost never own or do any of the tasks listed for the other two types
above. This user should only be reserved for top-level actions, such as setting up
the site and so forth.
Chapter 10
Preliminary Considerations
10-5

10.2.2 Creating Scripts
Besides predefined job tasks, you can define your own job tasks by writing code to be
included in OS and SQL scripts. The advantages of using these scripts include:
•When defining these jobs, you can use target properties.
•When defining these jobs, you can use the job library, which enables you to share
the job and make updates as issues arise. However, you need to resubmit
modified library jobs for them to take effect.
•You can submit the jobs against multiple targets.
•You can submit the jobs against a group. The job automatically keeps up with
changes to group membership.
•For host command jobs, you can submit to a cluster.
10.2.3 Sharing Job Responsibilities
To allow you to share job responsibilities, the Job System provides job privileges.
These job privileges allow you to share the job with other administrators. Using
privileges, you can:
•Grant access to the administrators who need to see the results of the job.
•Grant Full access to the administrators who may need to edit the job definition or
control the job execution (suspend, resume, stop).
You can grant these privileges on an as-needed basis.
10.2.4 Submitting Jobs for Groups
Rather than listing a large number of targets individually, you can use a group as the
target of a job. All member targets in the group that match the selected target type of
the job are selected as actual targets of the job when it runs. If the membership of the
group changes, the actual target list of the job changes with it. If the job repeats, each
iteration (or "run") of the job executes on the matching targets in the group at the time
of the run.
Overriding the Target Type Selection
To override the target type selection for a group, set
targetType=<override_target_type> in the input file for the create_job verb. For
example, the default target type for OSCommand jobs is "host". To submit a job
against a group of databases, specify:
target_list=my_db_group:composite
targetType=oracle_database
Note that any targets in the group that do not match the target type selected are
ignored.
Chapter 10
Preliminary Considerations
10-6

See Also:
Managing Groups
10.3 Creating Jobs
Your first task in creating a job from the Job Activity page is to choose a job type,
which the next section, Selecting a Job Type, explains. The most typical job types are
OS command jobs, script jobs, and multi-task jobs, which are explained in these
subsequent sections:
•Creating an OS Command Job
•Creating a SQL Script Job
•Creating a Multi-task Job
10.3.1 Selecting a Job Type
Using the Job System, you can create a job by clicking Create Job in the Job Activity
page and selecting the job type from the Select Job Type dialog. You can find a
specifc job type by either searching for the name of a job type or by specifying a target
type.
The most commonly used types are as follows:
•OS Command — Runs an operating system command or script.
•SQL Script — Runs a user-defined SQL or PL/SQL script.
•Multi-Task — Use to specify primary characteristics for multi-task jobs or
corrective actions. Multi-task jobs enable you to create composite jobs by defining
tasks, with each task functioning as an independent job. You edit and define tasks
similarly to a regular job.
10.3.2 Creating an OS Command Job
Use this type of job to run an operating system command or script. Tasks and their
dependent steps for creating an OS command are discussed below.
Task 1: Initiate Job Creation
1. From the Enterprise menu, select Job, then Activity.
2. Click Create Job. The Select Job Type dialog displays.
3. Choose the OS Command job type and click Select.
Task 2: Specify General Job Information
Perform these steps on the General property page:
1. Provide a required Name for the job, then select a Target Type from the drop-
down.
Chapter 10
Creating Jobs
10-7

After you have selected a target of a particular type for the job, only targets of that
same type can be added to the job. If you change target types, the targets you
have populated in the Targets table disappear, as well as parameters and
credentials for the job.
If you specify a composite as the target for this job, the job executes only against
targets in the composite that are of the selected target type. For example, if you
specify a target type of host and a group as the target, the job only executes
against the hosts in the group, even if there are other non-host targets in the
group. You can also include clusters in the target list if they are of the same base
target type. For example, a host cluster would be selected if the target type is
"host" and a RAC database would be selected if the target type is database.
2. Click Add, then select one or more targets from the Search and Select: Targets
pop-up window. The targets now appear in the Targets table.
3. Click the Parameters property page link.
Task 3: Specify Parameters
Perform these steps on the Parameters property page:
1. Select either Single Operation or Script from the Command Type drop-down.
The command or script you specify executes against each target specified in the
target list for the job. The Management Agent executes it for each of these targets.
Depending on your objectives, you can choose one of the following options:
•Single Operation to run a specific command
•Script to run an OS script and optionally provide an interpreter, which
processes the script; for example, %perlbin%/perl or /bin/sh .
Sometimes, a single command line is insufficient to specify the commands to run,
and you may not want to install and update a script on all hosts. In this case, you
can use the Script option to specify the script text as part of the job.
2. Based on your objectives, follow the instructions in Specifying a Single Operation
or Specifying a Script.
3. Click the Credentials property page link.
Note:
The OS Command relies on the target host's shell to execute the command/
interpreter specified. On *nix systems, it is /bin/sh -c and on Windows
systems, it is cmd /c. The command line specified is interpreted by the
corresponding shell.
Task 4: Specify Credentials - (optional)
You do not need to provide input on this page if you want to use the system default of
using preferred credentials.
On the Credentials property page, you can specify the credentials that you want the
Oracle Management Service to use when it runs the OS Command job against target
hosts. The job can use either the job submitter's preferred host-based credentials for
Chapter 10
Creating Jobs
10-8

the selected targets, or you can specify other credentials to override the preferred
credentials.
You do not need to provide input on this page if you have already set preferred
credentials.
Tip:
preferred credentials are useful when a job is submitted on multiple targets
and each target needs to use different credentials for authentication.
•To use preferred credentials:
1. Select the Preferred Credential radio button, which is the default selection.
If the target for the OS Command job is a host or host group, the preferred
host credentials are used. You specify these for the host target on the
Preferred Credentials page, and they are different from the host credentials for
the host on which the database resides.
2. Select either Normal Host Credentials or Privileged Host Credentials from
the Host Credentials drop-down.
You specify these separately on the Preferred Credentials page, which you
can access by selecting Security from the Setup menu, then Preferred
Credentials. The Preferred Credentials page appears, where you can click
the Manage Preferred Credentials button to set credentials.
•To use named credentials:
1. Select the Named Credential radio button to override database or host
preferred credentials.
The drop-down list is a pre-populated credential set with values saved with
names. These are not linked to targets, and you can use them to provide
credential and authentication information to tasks.
•To use other credentials:
1. Select the New Credential radio button to override previously defined
preferred credentials.
Note that override credentials apply to all targets. This applies even for named
credentials.
2. Optionally select Sudo or PowerBroker as the run privilege.
Sudo enables you to authorize certain users (or groups of users) to run some
(or all) commands as root while logging all commands and arguments.
PowerBroker provides access control, manageability, and auditing of all types
of privileged accounts.
If you provide Sudo or PowerBroker details, they must be applicable to all
targets. It is assumed that Sudo or PowerBroker settings are already applied
on all the hosts on which this job is to run.
See your Super Administrator about setting up these features if they are not
currently enabled.
Chapter 10
Creating Jobs
10-9

Tip:
For information on using Sudo or PowerBroker, refer to the product guides on
their respective product documentation pages.
Task 5: Schedule the Job - (optional)
You do not need to provide input on this page if you want to proceed with the system
default of running the job immediately after you submit it.
1. Select the type of schedule:
•One Time (Immediately)
If you do not set a schedule before submitting a job, Enterprise Manager
executes the job immediately with an indefinite grace period. You may want to
run the job immediately, but specify a definite grace period in case the job is
unable to start for various reasons, such as a blackout, for instance.
A grace period is a period of time that defines the maximum permissible delay
when attempting to start a scheduled job. The job system sets the job status to
Skipped, if it cannot start the execution between the scheduled time and the
time equal to the scheduled time plus the grace period, or within the grace
period from the scheduled time.
•One Time (Later)
–Setting up a custom schedule:
You can set up a custom schedule to execute the job at a designated time
in the future. When you set the Time Zone for your schedule, the job runs
simultaneously on all targets when this time zone reaches the start time
you specify. If you select each target's time zone, the job runs at the
scheduled time using the time zone of the managed targets. The time
zone you select is used consistently when displaying date and time
information about the job, such as on the Job Activity page, Job Run page,
and Job Execution page.
For example, if you have targets in the Western United States (US Pacific
Time) and Eastern United States (US Eastern Time), and you specify a
schedule where Time Zone = US Pacific Time and Start Time = 5:00 p.m.,
the job runs simultaneously at 5:00 p.m. against the targets in the Western
United States and at 8:00 p.m. against the targets in the Eastern United
States. If you specify 5:00 p.m. in the Agent time zone, the executions do
not run concurrently. The EST target would run 3 hours earlier.
–Specifying the Grace Period:
The grace period controls the latest start time for the job in case the job is
delayed. A job might not start for many reasons, but the most common
reasons are that the Agent was down or there was a blackout. By default,
jobs are scheduled with indefinite grace periods.
A job can start any time before the grace period expires. For example, a
job scheduled for 1 p.m. with a grace period of 1 hour can start any time
before 2 p.m., but if it has not started by 2 p.m., it is designated as
skipped.
•Repeating
Chapter 10
Creating Jobs
10-10

–Defining the repeat interval:
Specify the Frequency Type (time unit) and Repeat Every (repeat interval)
parameters to define your job's repeat interval.
The Repeat Until options are as follows:
–Indefinite: The job will run at the defined repeat interval until it is manually
unscheduled.
–Specified Date: The job will run at the defined repeat interval until the
Specified Date is reached.
2. Click the Access property page link.
Task 6: Specify Who Can Access the Job - (optional)
You do not need to provide input on this page if you want to proceed with the system
default of not sharing the job. The table shows the access that administrators and
roles have to the job. Only the job owner (or Super Administrator) can make changes
on the Job Access page.
1. Change access levels for administrators and roles, or remove administrators and
roles. Your ability to make changes depends on your function.
If you are a job owner, you can:
•Change the access of an administrator or role by choosing the Full or View
access privilege in the Access Level column in the table.
•Remove all access to the job for an administrator or role by clicking the icon in
the Remove column for the administrator or role. All administrators with Super
Administrator privileges have the View access privilege to a job. If you choose
to provide access privileges to a role, you can only provide the View access
privilege to the role, not the Full access privilege. For private roles, it is
possible to grant Full access privileges.
If you are a Super Administrator, you can:
•Grant View access to other Enterprise Manager administrators or roles.
•Revoke all administrator access privileges.
Note:
Neither the owner nor a super user can revoke View access from a super
user. All super users have View access.
For more information on access levels, see Access Level Rules.
2. Click Add to add administrators and roles. The Create Job Add Administrators and
Roles page appears.
a. Specify a Name and Type in the Search section and click Go. If you just click
Go without specifying a Name or Type, all administrators and roles in the
Management Repository appear in the table.
The value you specify in the Name field is not case-sensitive. You can specify
either * or % as a wildcard character at any location in a string (the wildcard
character is implicitly added to the end of any string). For example, if you
Chapter 10
Creating Jobs
10-11

specify %na in the Name field, names such as ANA, ANA2, and CHRISTINA
may be returned as search results in the Results section.
b. Select one or more administrators or roles in the Results section, then click
Select to grant them access to the job. Enterprise Manager returns to the
Create Job Access page or the Edit Job Access page, where you can modify
the access of administrators and roles.
3. Define a notification rule.
You can use the Notification system (rule creation) to easily associate specific jobs
with a notification rule. The Cloud Control Notification system enables you to
define a notification rule that sends e-mail to the job owner when a job enters one
of these chosen states:
•Scheduled
•Running
•Suspended
•Succeeded
•Problems
•Action Required
Note:
Before you can specify notifications, you need to set up your email account
and notification preferences. See Using Notifications for this information.
Task 7: Conclude Job Creation
At this point, you can either submit the job for execution or save it to the job library.
•Submitting the job —
Click Submit to send the active job to the job system for execution, and then view
the job's execution status on the main Job Activity page. If you are creating a
library job, Submit saves the job to the library and returns you to the main Job
Library page where you can edit or create other library jobs.
If you submit a job that has problems, such as missing parameters or credentials,
an error appears and you will need to correct these issues before submitting an
active job. For library jobs, incomplete specifications are allowed, so no error
occurs.
Note:
If you click Submit without changing the access, only Super Administrators can
view your job.
•Saving the job to the library —
Click Save to Library to the job to the Job Library as a repository for frequently
used jobs. Other administrators can then share and reuse your library job if you
Chapter 10
Creating Jobs
10-12

provide them with access privileges. Analogous to active jobs, you can grant View
or Full access to specific administrators. Additionally, you can use the job library to
store:
–Basic definitions of jobs, then add targets and other custom settings before
submitting the job.
–Jobs for your own reuse or to share with others. You can share jobs using
views or giving Full access to the jobs.
–Critical jobs for resubmitting later, or revised versions of these jobs as issues
arise.
10.3.2.1 Specifying a Single Operation
Note:
The following information applies to step Creating an OS Command Job in
Creating an OS Command Job .
Enter the full command in the Command field. For example:
/bin/df -k /private
Note the following points about specifying a single operation:
•You can use shell commands as part of your command. The default shell for the
platform is used, which is /bin/sh for Linux and cmd/c for Windows.
ls -la /tmp > /tmp/foobar.out
•If you need to execute two consecutive shell commands, you must invoke the shell
in the Command field and the commands themselves in the OS Script field. You
would specify this as follows in the Command field:
sleep 3; ls
•The job status depends on the exit code returned by the command. If the
command execution returns 0, the job returns a status of Succeeded. If it returns
any other value, it returns a job status of Failed.
10.3.2.2 Specifying a Script
Note:
The following information applies to step Creating an OS Command Job in
Specifying a Script .
The value you specify in the OS Script field is used as stdin for the command
interpreter, which defaults to /bin/sh on Linux and cmd/c on Windows. You can
override this with another interpreter; for example: %perlbin%/perl. The shell scripts
size is limited to 2 GB.
Chapter 10
Creating Jobs
10-13

To control the maximum output size, set the mgmt_job_output_size_limit parameter in
MGMT_PARAMETERS to the required limit. Values less than 10 KB and greater than
2 GB are ignored. The default output size is 10 MB.
The job status depends on the exit code returned by the last command in the script. If
the last command execution returns 0, the job returns a status of Succeeded. If it
returns any other value, it returns a job status of Failed. You should implement proper
exception handling in the script and return non-zero exit codes when appropriate. This
will avoid situations in which the script failed, but the job reports the status as
Succeeded.
You can run a script in several ways:
•OS Scripts — Specify the path name to the script in the OS Script field. For
example:
OS Script field: /path/to/mycommand Interpreter field:
•List of OS Commands — You do not need to enter anything in the Interpreter
field for the following example of standard shell commands for Linux or Unix
systems. The OS's default shell of /bin/sh or cmd/c will be used.
/usr/local/bin/myProg arg1 arg2
mkdir /home/$USER/mydir
cp /dir/to/cp/from/file.txt /home/$USER/mydir
/usr/local/bin/myProg2 /home/$USER/mydir/file.txt
When submitting shell-based jobs, be aware of the syntax you use and the targets
you choose. This script does not succeed on NT hosts, for example.
•Scripts Requiring an Interpreter — Although the OS shell is invoked by default,
you can bypass the shell by specifying an alternate interpreter. For example, you
can run a Perl script by specifying the Perl script in the OS Script field and the
location of the Perl executable in the Interpreter field:
OS Script field: <Enter-Perl-script-commands-here> Interpreter field: %perlbin%/
perl
The following example shows how to run a list of commands that rely on a certain
shell syntax:
setenv VAR1 value1
setenv VAR2 value2
/user/local/bin/myProg $VAR1 $VAR2
You would need to specify csh as the interpreter. Depending on your system
configuration, you may need to specify the following string in the Interpreter field:
/bin/csh
You have the option of running a script for a list of Windows shell commands, as
shown in the following example. The default shell of cmd/c is used for Windows
systems.
C:\programs\MyApp arg1 arg2
md C:\MyDir
copy C:\dir1x\copy\from\file.txt \home\$USER\mydir
Chapter 10
Creating Jobs
10-14

10.3.2.3 Access Level Rules
Note:
The following rules apply to Task 6, "Specify Who Can Access the Job -
(optional)".
•Super Administrators always have View access on any job.
•The Enterprise Manager administrator who owns the job can make any access
changes to the job, except revoking View from Super Administrators.
•Super Administrators with a View or Full access level on a job can grant View (but
not Full) to any new user. Super Administrators can also revoke Full and View
from normal users, and Full from Super Administrators.
•Normal Enterprise Manager administrators with Full access levels cannot make
any access changes on the job.
•If the job owner performs a Create Like operation on a job, all access privileges for
the new job are identical to the original job. If the job owner grants other
administrators View or Full job access to other administrators, and any of these
administrators perform a Create Like operation on the job, ALL administrators will,
by default, have View access on the newly created job.
10.3.3 Creating a SQL Script Job
The basic process for creating a SQL script job is the same as described in Creating
an OS Command Job. The following sections provide supplemental information
specific to script jobs:
•Specifying Targets
•Specifying Options for the Parameters Page
•Specifying Host and Database Credentials
•Returning Error Codes from SQL Script Jobs
10.3.3.1 Specifying Targets
You can run a SQL Script job against database and cluster database target types. You
select the targets to run the job against by doing the following:
1. Click Add in the Targets section.
2. Select the database target(s) from the pop-up.
Your selection(s) now appears in the Target table.
Chapter 10
Creating Jobs
10-15

Note:
For a cluster host or RAC database, a job runs only once for the target,
regardless of the number of database instances. Consequently, a job cannot
run on all nodes of a RAC cluster.
10.3.3.2 Specifying Options for the Parameters Page
In a SQL Script job, you can specify any of the following in the SQL Script field of the
Parameters property page:
•Any directives supported by SQL*Plus
•Contents of the SQL script itself
•Fully-qualified SQL script file; for example:
@/private/oracle/scripts/myscript.sql
Make sure that the script file is installed in the appropriate location on all targets.
•PL/SQL script using syntax supported by SQL*Plus; for example, one of the
following:
EXEC plsql_block;
or
DECLARE
local_date DATE;
BEGIN
SELECT SYSDATE INTO local_date FROM dual;
END;
/
You can use target properties in the SQL Script field, a list of which appears in the
Target Properties table. Target properties are case-sensitive. You can enter
optional parameters to SQL*Plus in the Parameters field.
10.3.3.3 Specifying Host and Database Credentials
In the Credentials property page, you specify the host credentials and database
credentials. The Management Agent uses the host credentials to launch the SQL*Plus
executable, and uses database credentials to connect to the target database and run
the SQL script. The job can use either the preferred credentials for hosts and
databases, or you can specify other credentials that override the preferred credentials.
•Use Preferred Credentials —
Select this choice if you want to use the preferred credentials for the targets for
your SQL Script job. The credentials used for both host and database are those
you specify in the drop-down. If you choose Normal Database Credentials, your
normal database preferred credentials are used. If you choose SYSDBA Database
Credentials, the SYSDBA preferred credentials are used. For both cases, the host
credentials associated with the database target are used. Each time the job
executes, it picks up the current values of your preferred credentials.
Chapter 10
Creating Jobs
10-16

•Named Credentials —
Select this choice if you want to override the preferred credentials for all targets,
then enter the named credentials you want the job to use on all targets.
Many IT organizations require that passwords be changed on regular intervals.
You can change the password of any preferred credentials using this option. Jobs
and corrective actions that use preferred credentials automatically pick up these
new changes, because during execution, Enterprise Manager uses the current
value of the credentials (both user name and password). Named credentials are
also centrally managed. A change to a named credential is propagated to all jobs
or corrective actions that use it.
For corrective actions, if you specify preferred credentials, Enterprise Manager
uses the preferred credentials of the last Enterprise Manager user who edited the
corrective action. For this reason, if a user attempts to edit the corrective action
that a first user initially specified, Enterprise Manager requires this second user to
specify the credentials to be used for that corrective action.
10.3.3.4 Returning Error Codes from SQL Script Jobs
The SQL Script job internally uses SQL*Plus to run a user's SQL or PL/SQL script. If
SQL*Plus returns 0, the job returns a status of Succeeded. If it returns any other value,
it returns a job status of Failed. By default, if a SQL script runs and encounters an
error, it may still result in a job status of Succeeded, because SQL*Plus still returned a
value of 0. To make such jobs return a Failed status, you can use SQL*Plus EXIT to
return a non-zero value.
The following examples show how you can return values from your PL/SQL or SQL
scripts. These, in turn, will be used as the return value of SQL*Plus, thereby providing
a way to return the appropriate job status (Succeeded or Failed). Refer to the
SQL*Plus User's Guide and Reference for more information about returning EXIT
codes.
Example 1
WHENEVER SQLERROR EXIT SQL.SQLCODE
select column_does_not_exist from dual;
Example 2
-- SQL*Plus will NOT return an error for the next SELECT statement
SELECT COLUMN_DOES_NOT_EXIST FROM DUAL;
WHENEVER SQLERROR EXIT SQL.SQLCODE;
BEGIN
-- SQL*Plus will return an error at this point
SELECT COLUMN_DOES_NOT_EXIST FROM DUAL;
END;
/
WHENEVER SQLERROR CONTINUE;
Example 3
variable exit_code number;
BEGIN
DECLARE
local_empno number(5);
BEGIN
Chapter 10
Creating Jobs
10-17

-- do some work which will raise exception: no_data_found
SELECT 123 INTO local_empno FROM sys.dual WHERE 1=2;
EXCEPTION
WHEN no_data_found THEN
:exit_code := 10;
WHEN others THEN
:exit_code := 2;
END;
END;
/
exit :exit_code;
10.3.4 Creating a Multi-task Job
The basic process for creating a multi-task job is the same as described in Creating an
OS Command Job. The following sections provide supplemental information specific to
multi-task jobs:
•Job Capabilities
•Specifying Targets for a Multi-task Job
•Adding Tasks to the Job
10.3.4.1 Job Capabilities
Multi-task jobs enable you to create complex jobs consisting of one or more distinct
tasks. Because multi-task jobs can run against targets of the same or different type,
they can perform ad hoc operations on one or more targets of the same or different
type.
The Job System's multi-task functionality makes it easy to create extremely complex
operations. You can create multi-task jobs in which all tasks run on a single target.
You can also create a multi-task job consisting of several tasks, each of which has a
different job type, and with each task operating on separate (and different) target
types. For example:
•Task 1 (OS Command job type) performs an operation on Host 1.
•If Task 1 is successful, run Task2 (SQL Script job type) against Database 1 and
Database 2.
10.3.4.2 Specifying Targets for a Multi-task Job
You can run a multi-task job against any targets for which jobs are defined that can be
used as tasks. Not all job types can be used as tasks.
The Target drop-down in the General page enables you to choose between running
the job against the same targets for all tasks, or different targets for different tasks.
Because each task of a multi-task job can be considered a complete job, when
choosing the Same targets for all tasks option, you add all targets against which the
job is to run from the General page. If you choose the Different targets for different
tasks option, you specify the targets (and required credentials) the tasks will run
against as you define each task.
After making your choice from the Target drop-down, you then select the targets to run
the job against by clicking Add in the Targets section.
Chapter 10
Creating Jobs
10-18

10.3.4.3 Adding Tasks to the Job
You can use the Tasks page to:
•Add, delete, or edit tasks of various job types
•Set task condition and dependency logic
•Add task error handling
You must define at least two tasks in order to set Condition and Depends On options.
Task conditions define states in which the task will be executed. Condition options
include:
•Always — Task is executed each time the job is run.
•On Success — Task execution Depends On the successful execution of another
task.
•On Failure — Task execution Depends On the execution failure of another task.
The Error Handler Task is often a "clean-up" step that can undo the partial state of the
job. The Error Handler Task executes if any task of the multi-task job has an error.
Errors are a more severe form of failure, usually meaning that the job system could not
run the task. Failures normally indicate that the task ran, but failed. The Error Handler
Task does not affect the job execution status. Use the Select Task Type page to
specify the job type of the task to be used for error handling.
10.4 Viewing and Analyzing Job Status
Viewing the Aggregate Status of All Jobs
After you submit jobs, the status of all job executions across all targets is automatically
rolled up and available for review on the Enterprise Summary page. Figure 10-2 shows
the Jobs section at the bottom of the Enterprise Summary page.
Chapter 10
Viewing and Analyzing Job Status
10-19
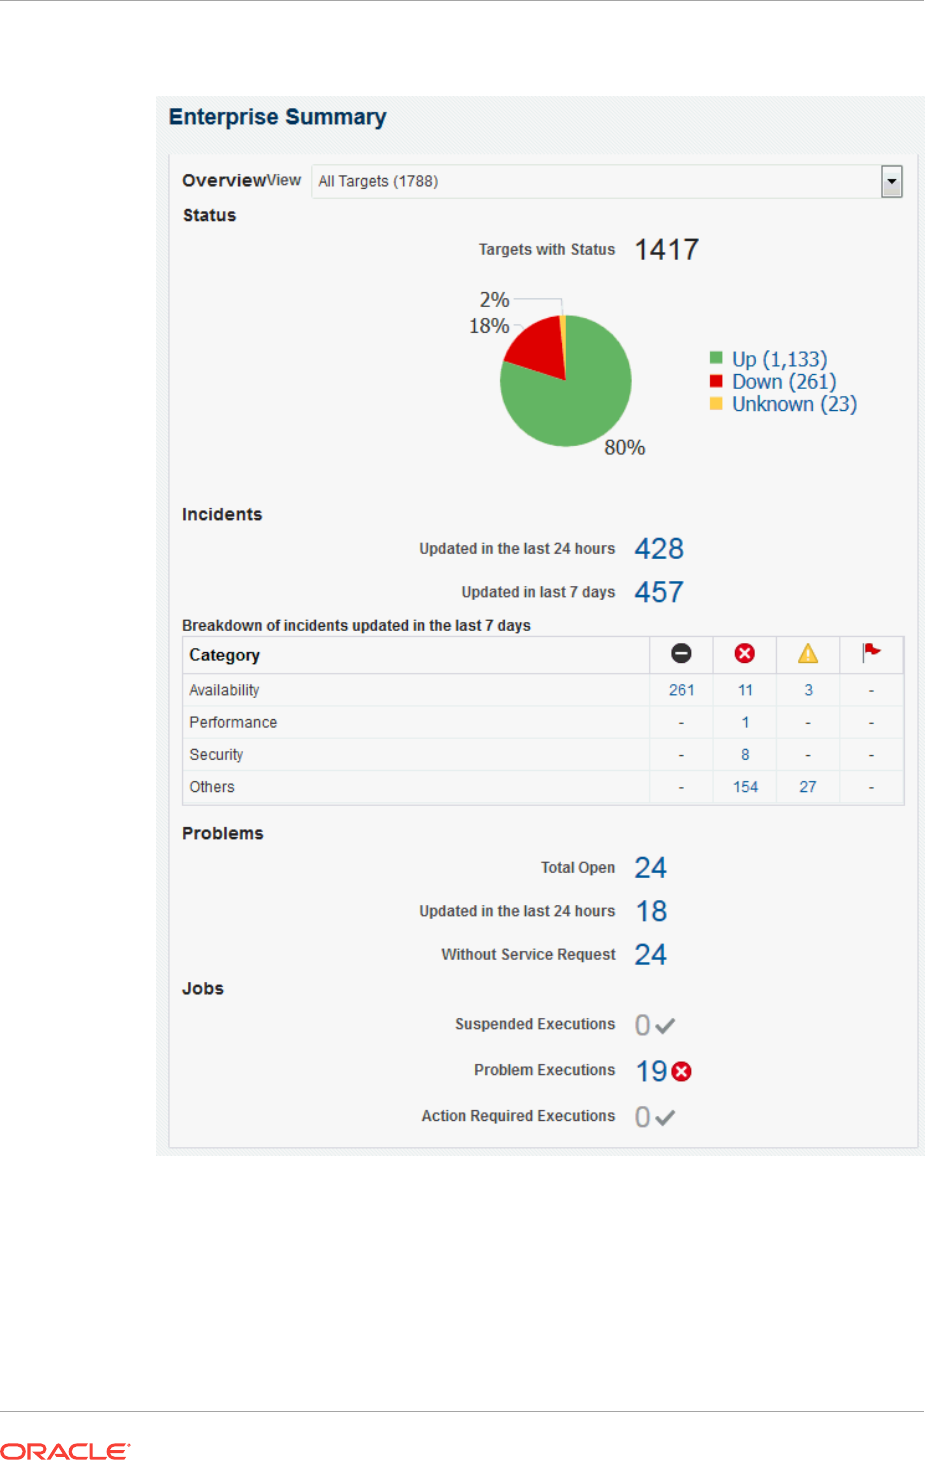
Figure 10-2 Summary of Target Jobs on the Enterprise Summary Page
This information is particularly important when you are examining jobs that execute
against hundreds or thousands of systems. You can determine the job executions that
have failed. By clicking the number associated with a particular execution, you can drill
down to study the details of the failed jobs.
Viewing the General Status of a Particular Job
Chapter 10
Viewing and Analyzing Job Status
10-20

To find out general status information for a particular job or jobs you have submitted,
search for them in the Job Activity page, shown in Figure 10-1.
Viewing the Status of Job Executions
You can view detailed information about a single execution or multiple executions. A
single execution can have a single step or multiple steps.
To view the status of executions:
1. From the Job Activity page, click the Name link for the job of interest. The Job
Execution page displays.
2. In addition to displaying the job execution summary, you can drill down on specific
tasks for further information.
Switching to Enhanced View
Beginning with Cloud Control version 12.1.0.4, you can optionally invoke a view of job
runs that combines the views of several drill-downs on one page. To enable the
enhanced view, execute the following command:
emctl set property -name oracle.sysman.core.jobs.ui.useAdfExecutionUi -value true
To revert to the standard view, execute the following command:
emctl set property -name oracle.sysman.core.jobs.ui.useAdfExecutionUi -value false
Note:
These commands do not require you to restart the OMS.
Viewing the Enhanced Status of a Job Run with a Single Execution
A single execution can have a single step or multiple steps. To view the status of a
single execution:
Viewing the Enhanced Status of a Job Run with Multiple Executions
To view the status of multiple executions:
1. From the Job Activity page, click the Name link or Status link for a job containing
multiple executions.
The Job Execution page appears.
2. Click on an execution of interest in the left table.
The details for the particular execution appears on the right side of the page.
10.5 Generating Job Event Criteria
The job system publishes status change events when a job changes its execution
status, and these events have different severities based on the execution status.
Use the Job Event Generation Criteria page to set up targets for job event
notifications. This page enables you to decide about the jobs or targets or statuses for
which you want to raise events or notifications. This ensures that users raise only
Chapter 10
Generating Job Event Criteria
10-21
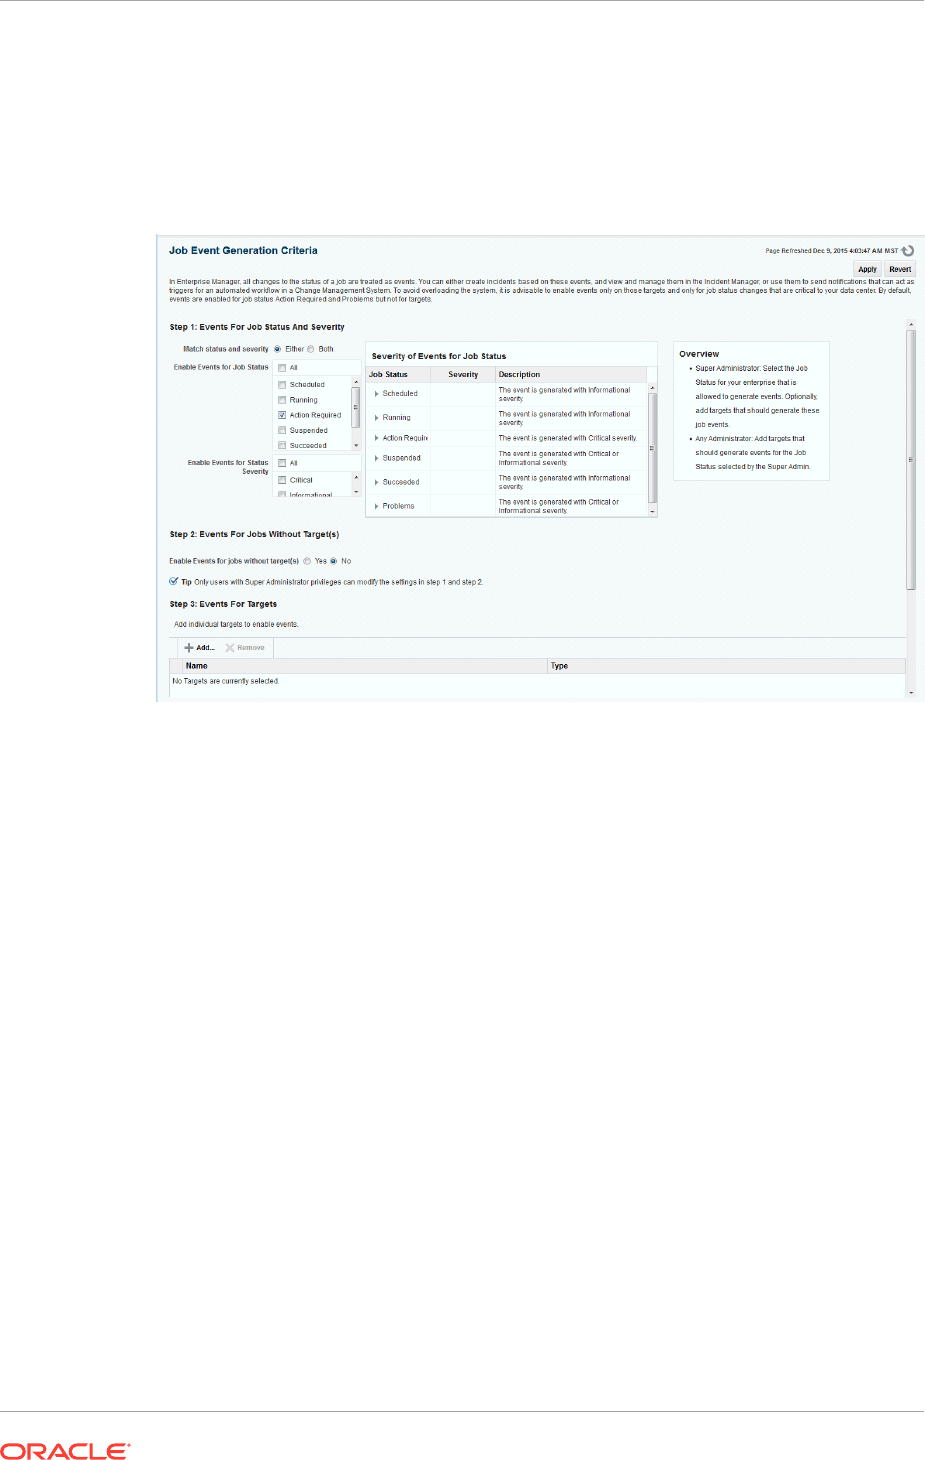
useful events. Any settings you make on this page do not change the job behavior
whatsoever. You can set up notifications on job events through incident rule sets.
To access this page, from the Setup menu, select Incidents, then Job Events.
Figure 10-3 Job Event Generation Criteria Page
10.5.1 Enabling Events For Job Status, Status Severity, and
Targetless Jobs
To enable events for job status and targetless jobs, do the following:
1. Ensure that you have Super Administrator privileges to select the job status for
which you want to generate events.
2. Ensure that you are an administrator with View Target privileges to add targets for
which you want to generate events for the job status set by the Super
Administrator.
3. Log into Cloud Control as a Super Administrator.
4. From the Setup menu, select Incidents and then select Job Events. The Job
Event Generation Criteria Page is displayed.
5. In the Job Event Generation Criteria page, do the following:
a. In the "Enable Events for Job Status"region, select the statuses for which you
want to publish events.
b. In the "Enable Events for Status Severity" region, select whether you want to
enable events for a critical status, informational status, for both.
c. In the "Enable Events for Jobs Without Target(s)" section, select Yes if you
want to create events for jobs that are not associated with any target.
Chapter 10
Generating Job Event Criteria
10-22

d. In the "Events for Targets" section, click Add to add targets for which you want
the job events to be enabled.
6. Click Apply.
10.5.2 Adding Targets To Generate Events For Job Status
After a Super Administrator selects events for which job status will be published,
administrators can add targets to generate events. To add targets to generate events
for job status, do the following:
1. Ensure that you are an administrator with View Target privileges to add targets for
which you want to generate events for the job status set by a Super Administrator.
2. Log into Cloud Control as an administrator.
3. From the Setup menu, select Incidents and then select Job Events. The Job
Event Generation Criteria Page is displayed.
4. In the Job Event Generation Criteria page, do the following:
a. In the Events For Job Status And Targetless Jobs section, you can view the
status for which events can be published. You can also see if events have
been enabled for targetless job filters.
b. In the Events For Targets section, click Add to add targets for which you want
the job events to be enabled. You can also remove targets for which you do
not want the job events to be enabled by clicking Remove.
Note:
Your selected settings in the Events for Targets section are global. Adding or
removing targets for events also affect other Enterprise Manager users.
5. Click Apply.
10.6 Creating Event Rules For Job Status Change
Enterprise Manager enables you to create and apply rules to events, incidents, and
problems. A rule is applied when a newly created or updated event, incident, or
problem matches the conditions defined in the rule. The following sections explain how
to create event rules for job status change events:
•Creating Job Status Change Event Rules For Jobs
•Creating Job Status Change Event Rules For Targets
10.6.1 Creating Job Status Change Event Rules For Jobs
To create job status change event rules for jobs, do the following:
1. Ensure that the relevant job status is enabled and required targets have been
added to job event generation criteria.
2. Ensure that you have administrator privileges to create event rules for job status
change events.
Chapter 10
Creating Event Rules For Job Status Change
10-23

3. Log into Cloud Control as an administrator.
4. From the Setup menu, select Incidents and then Incident Rules. The Incident
Rules Page appears.
5. In the Incident Rules page, click Create Rule Set to create rule sets for incidents.
6. Specify the Name, Description, and select Enabled to enable the rule set. Select
Type as Enterprise if you want to set the rule for all Enterprise Manager users or
Private if you want to set the rule for a specific user only. Select Applies to Job.
In the Job tab, click Add to add jobs for which you want to create event rules.
7. In the Add Jobs dialog box, if you select the job By Pattern, provide Job name
like and select the Job Type. Specify Job owner like. For the Specific jobs
choice, select the job. Click OK.
8. In the Rules tab, click Create.
In the Select Type of Rule to Create dialog box that appears, you can select from
the following choices according to the rule set you want to create:
•Incoming events and updates to events to receive notification or create
incidents for job rules. If you are operating on events (for example, if you want
to create incidents for incoming events, such as job failed, or notify someone),
choose this option.
•Newly created incidents or updates to incidents receive notifications or
create rules for incidents even though the events for which incidents are
generated do not have associated rules. If you are operating on incidents
already created or newly created (for example, you want to direct all incidents
related to a group, say foo, to a particular user or escalate all incidents open
for more than 3 days), choose this option.
•Newly created problems or updates to problems to receive notifications or
create rules for problems even though the incidents for which problems are
generated do not have associated rules. This option does not apply for jobs.
Chapter 10
Creating Event Rules For Job Status Change
10-24
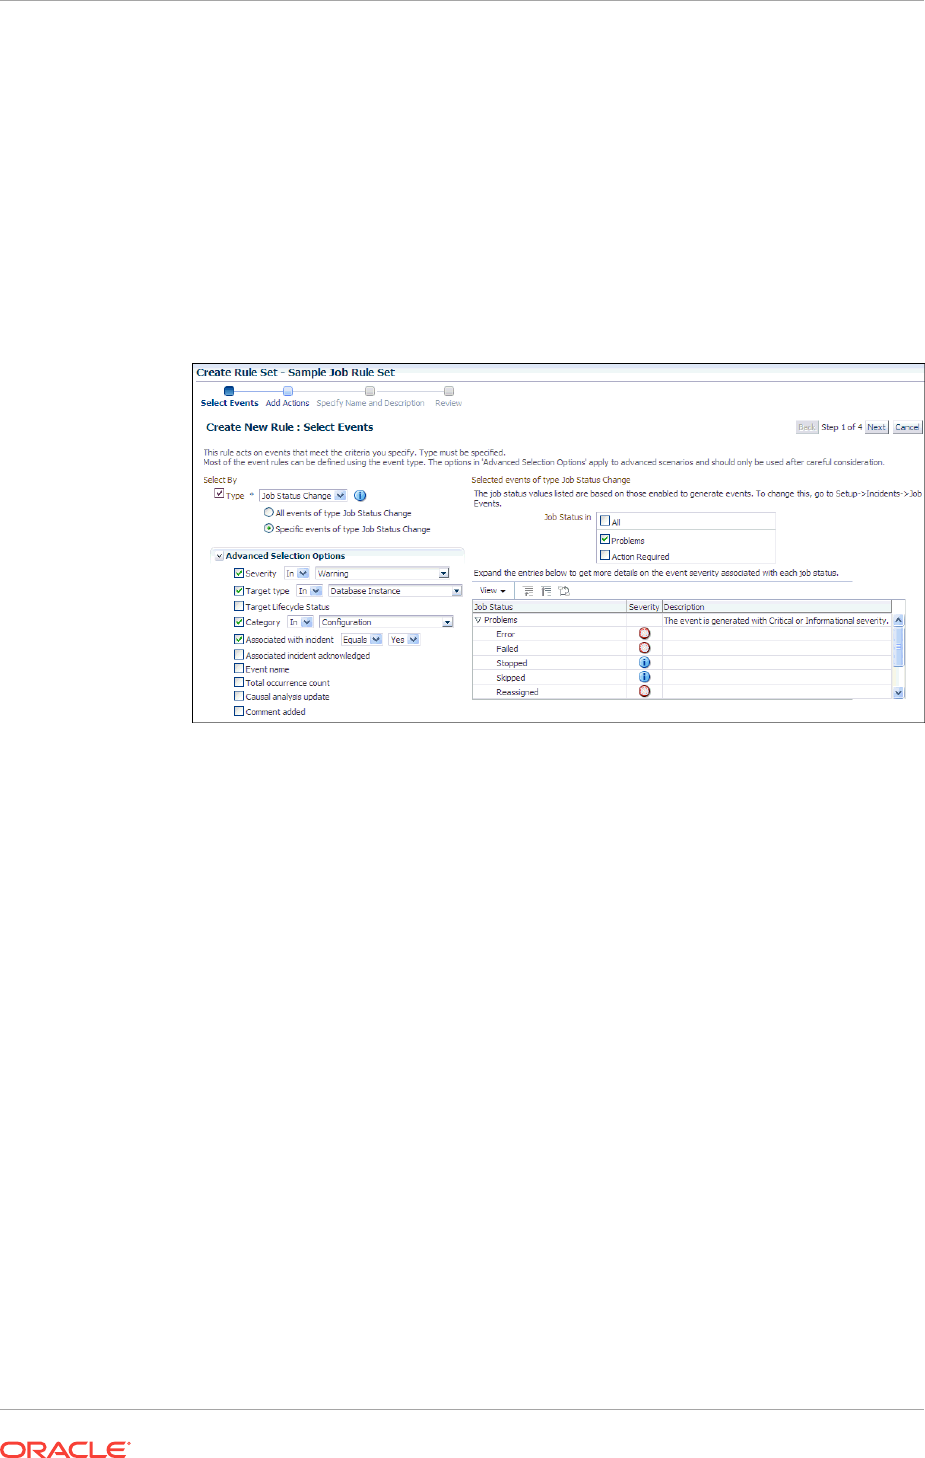
9. Select Incoming events and updates to events, and in the Create New Rule:
Select Events page, do the following:
a. Select By Type to Job Status Change. Select All events of type Job
Status Change if you want to take an action for all job state change events for
the selected jobs. Select Specific events of type Job Status Change if you
only want to act on specific job states. If you have selected Specific events of
type Job Status Change, select Job Status for events for which you want to
create the rule.
b. Set the other criteria for which you want to set the rule as displayed in the
graphic below.
10. Select Newly created incidents or updates to incidents if you want to create
rules for an incident, though the event associated with the incident does not have
notification rules. In the Create New Rule: Select Incidents page, select any of the
following:
•All new incidents and updated incidents to apply the rule to all new and
updated incidents
•All new incidents to apply the rule to all new incidents
•Specific incidents and then select the criteria for the incidents
Chapter 10
Creating Event Rules For Job Status Change
10-25
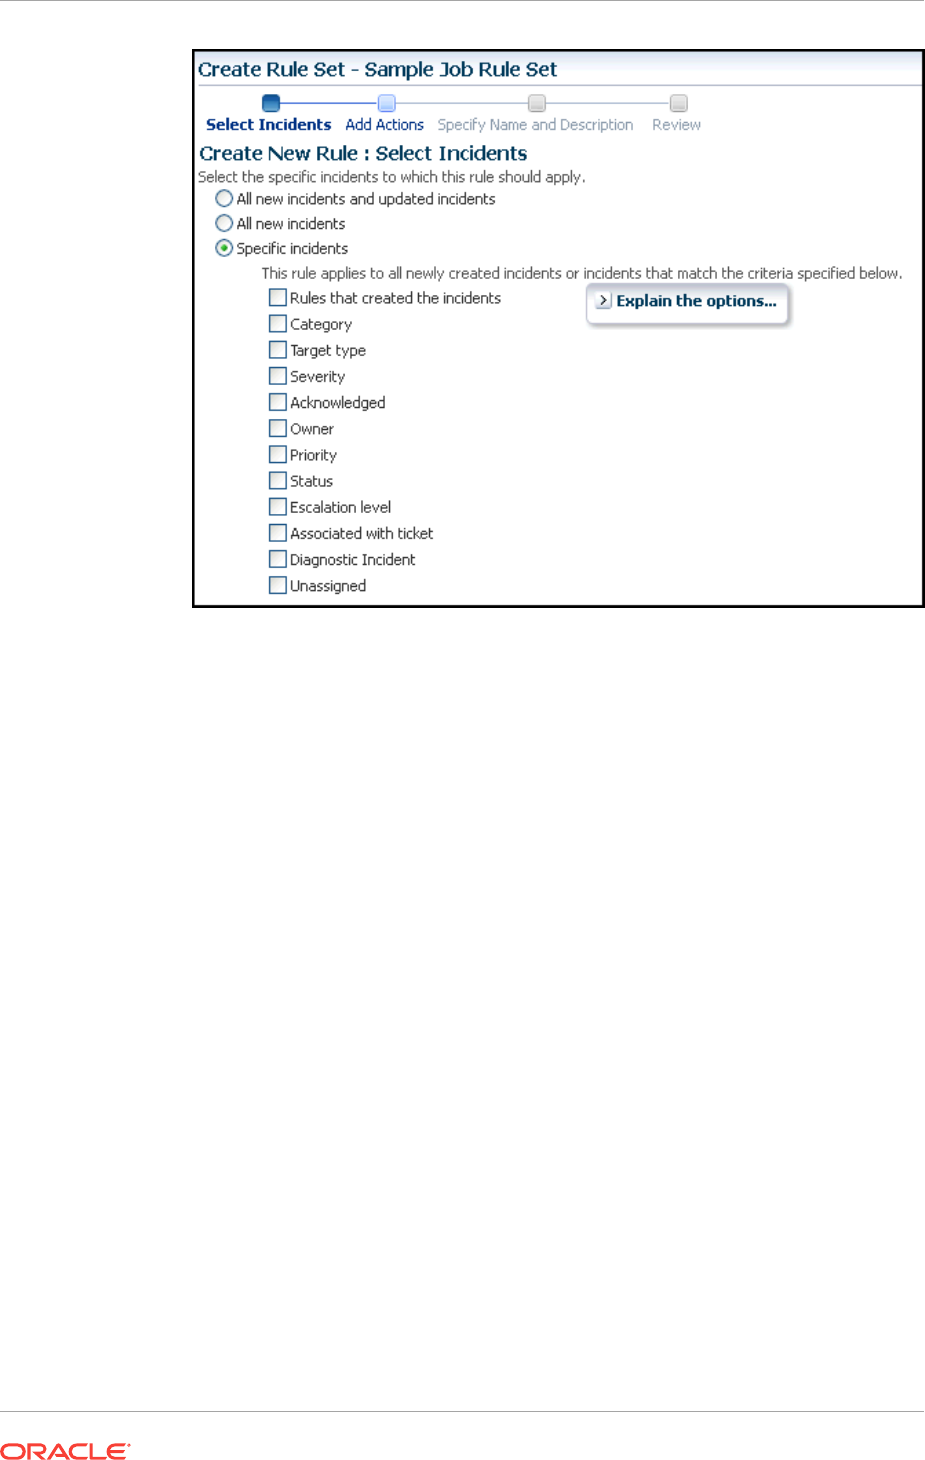
11. In the Create New Rule: Add Actions page, click Add to add actions to the rule.
12. In the Add Conditional Actions page, specify actions to be performed when the
event matches the rule.
In the Conditions for actions section, select:
•Always execute the actions to execute actions regardless of event.
•Only execute the actions if specified conditions match to execute actions
to match specific criteria.
When adding actions to events, specify the following:
•Select Create Incident to create an incident for the event to manage and track
its resolution.
•In the Notifications section, specify recipients for notifications in the E-mail To,
E-mail Cc, and Page fields who will receive e-mail when the event for which a
condition is set occurs. If Advanced and Repeat Notifications options have
been set, specify them.
•In the Clear events section, select Clear permanently if you want to clear an
event after the issue that generated the event is resolved.
•If you have configured event connections, in the Forward to Event Connectors
section, you can send the events to third-party event management systems.
When adding actions to incidents, specify the following:
•In the Notifications section, specify recipients for notifications in the E-mail To,
E-mail Cc, and Page fields who will receive e-mail when the event for which a
condition is set occurs. If Advanced and Repeat Notifications options have
been set, specify them.
Chapter 10
Creating Event Rules For Job Status Change
10-26
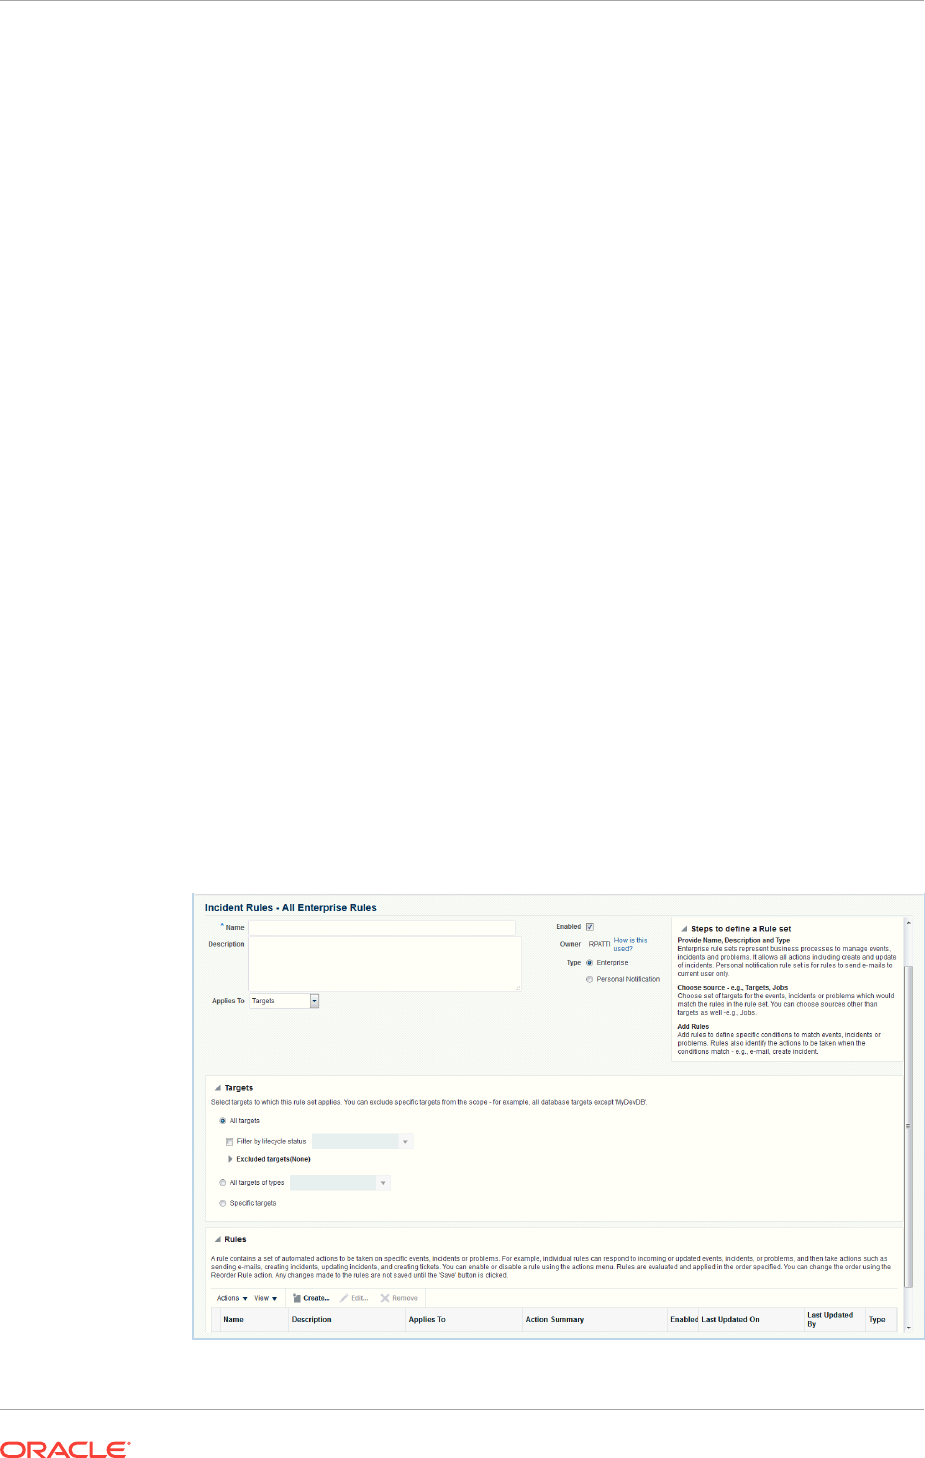
•In the Update Incident section, specify the details to triage incidents when they
occur. Specify Assign to, Set priority to, Set status to, and Escalate to
details.
•In the Create Ticket section, if a ticket device has been configured, specify
details to create the ticket.
Click Continue.
13. In the Specify Name and Description page, specify a Name and Description for
the event rule. Click Next.
14. In the Review page, verify the details you have selected for the event rule and
click Continue to add this rule in the rule set.
15. On the Create Rule Set page, click Save to save the rule set.
10.6.2 Creating Job Status Change Event Rules For Targets
To create job status change event rules for targets, do the following:
1. Ensure that the relevant job status is enabled and required targets have been
added to job event generation criteria.
2. Ensure that you have administrator privileges to create event rules for job status
change events.
3. Log into Cloud Control as an administrator.
4. From the Setup menu, select Incidents, then Incident Rules. The Incident Rules
Page is displayed.
5. In the Incident Rules page, click Create Rule Set to create rule sets for incidents.
6. Specify the Name, Description, and select Enabled to enable the rule set. Select
Type as Enterprise if you want to set the rule for all Enterprise Manager users, or
Private if you want to set the rule for a only specific user. Select Applies to
Targets.
Chapter 10
Creating Event Rules For Job Status Change
10-27

In the Targets tab, select one of the following:
•All targets to apply to all targets. In the Excluded Targets section, click Add to
search and select the target that you want to exclude from the rule set. Click
Select.
•All targets of types to select the types of targets to which you want to apply
the rule set.
•Specific targets to individually specify the targets. Select to Add Groups or
Targets to add groups or targets and click Add to search and select the
targets to which you want to apply the rule set. Click Select. In the Excluded
Targets section, click Add to search and select the target that you want to
exclude from the rule set. Click Select.
7. In the Rules area, click Create.
8. In the Select Type of Rule to Create dialog box, select from the following choices
according to the rule set you want to create:
•Incoming events and updates to events to receive notifications or create
incidents for job rules. If you are operating on events (for example, if you want
to create incidents for incoming events, such as job failed, or notify someone),
choose this option.
•Newly created incidents or updates to incidents receive notifications or
create rules for incidents even though the events for which incidents are
generated do not have associated rules. If you are operating on incidents
already created or newly created (for example, you want to direct all incidents
related to a group, say foo, to a particular user or escalate all incidents open
for more than 3 days), choose this option.
•Newly created problems or updates to problems to receive notifications or
create rules for problems even though the incidents for which problems are
generated do not have associated rules. This option does not apply for jobs.
9. Select Incoming events and updates to events, and in the Create New Rule:
Select Events page, do the following:
•Select By Type to Job Status Change. Select All events of type Job
Status Change if you want to take an action for all job state change events for
the selected jobs. Select Specific events of type Job Status Change if you
only want to act on specific job states. If you have selected Specific events of
type Job Status Change, select Job Status for events for which you want to
create the rule.
Chapter 10
Creating Event Rules For Job Status Change
10-28
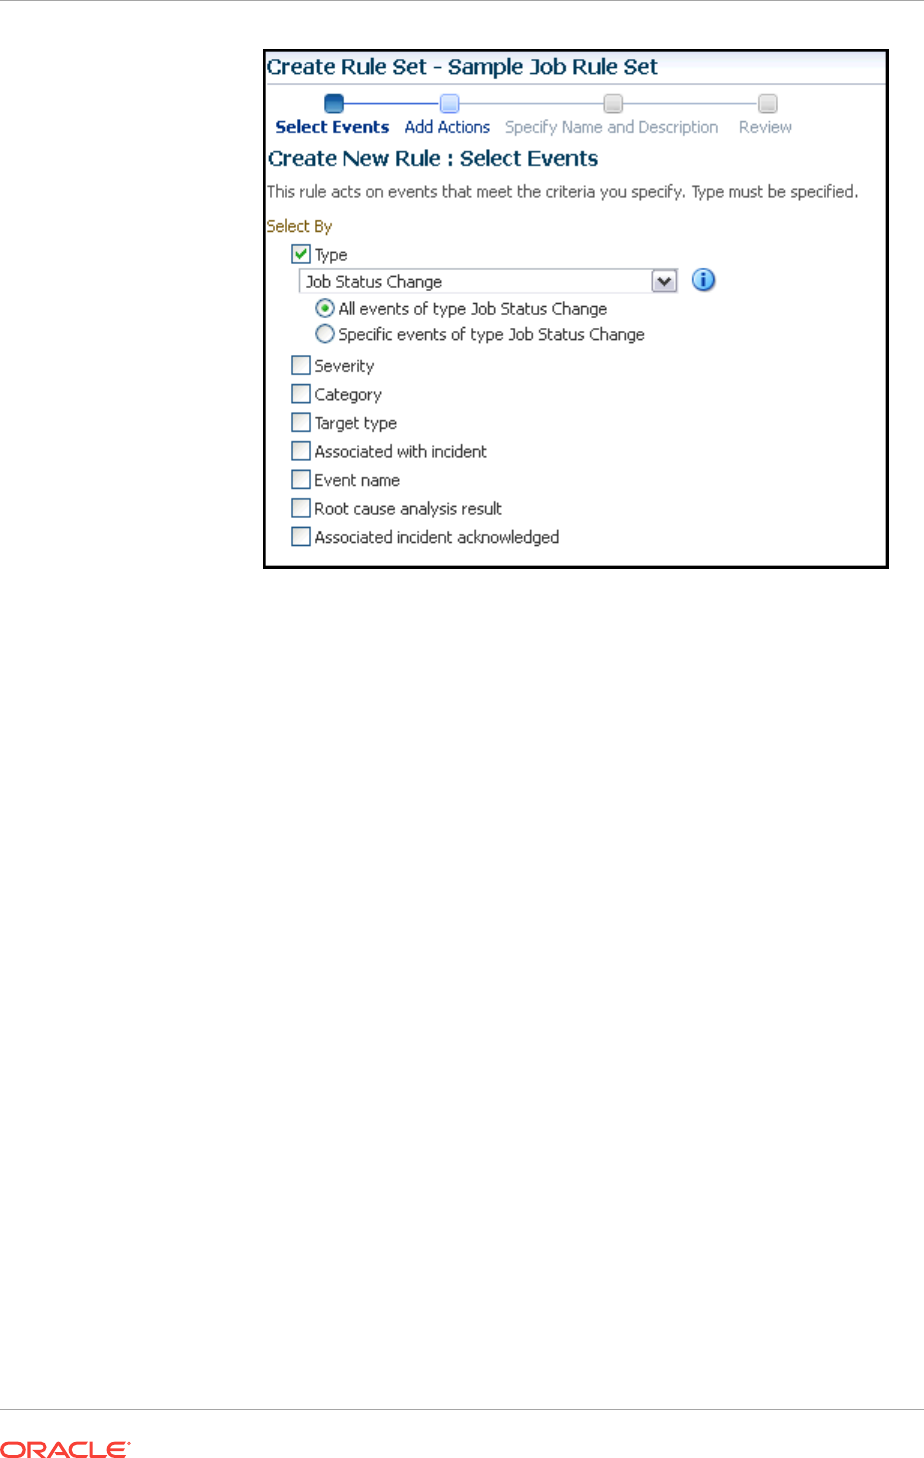
•Set the other criteria for which you want to set the rule as displayed in the
above graphic.
10. Select Newly created incidents or updates to incidents if you want to create
rules for an incident, though the event associated with the incident does not have
notification rules. In the Create New Rule: Select Incidents page, select any of the
following:
•All new incidents and updated incidents to apply the rule to all new and
updated incidents.
•All new incidents to apply the rule to all new incidents.
•Specific incidents and then select the criteria for the incidents.
Chapter 10
Creating Event Rules For Job Status Change
10-29
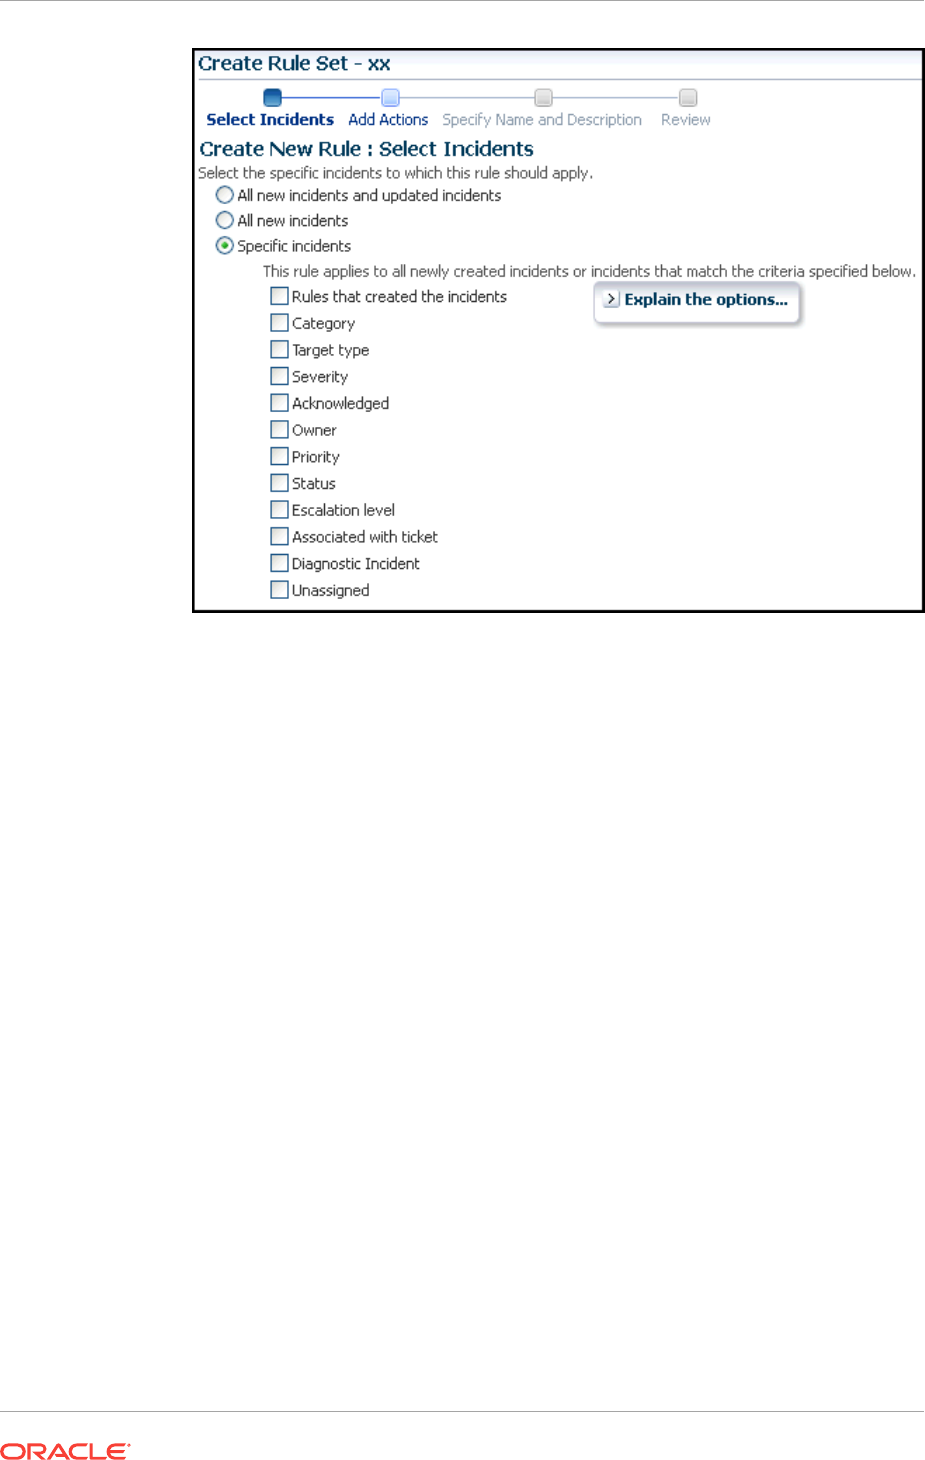
11. In the Create New Rule: Add Actions page, click Add to add actions to the rule.
12. In the Add Conditional Actions page, specify actions to be performed when the
event matches the rule.
In the Conditions for actions section, select:
•Always execute the actions to execute actions regardless of event.
•Only execute the actions if specified conditions match to execute actions
to match specific criteria.
When adding actions to events, specify the following:
•Select Create Incident to create an incident for the event to manage and track
its resolution.
•In the Notifications section, specify recipients for notifications in the E-mail To,
E-mail Cc, and Page fields who will receive e-mail when the event for which a
condition is set occurs. If Advanced and Repeat Notifications options have
been set, specify them.
•In the Clear events section, select Clear permanently if you want to clear an
event after the issue that generated the event is resolved.
•If you have configured event connections, in the Forward to Event Connectors
section, you can send the events to third-party event management systems.
When adding actions to incidents, specify the following:
•In the Notifications section, specify recipients for notifications in the E-mail To,
E-mail Cc, and Page fields who will receive e-mail when the event for which a
condition is set occurs. If Advanced and Repeat Notifications options have
been set, specify them.
Chapter 10
Creating Event Rules For Job Status Change
10-30

•In the Update Incident section, specify the details to triage incidents when they
occur. Specify Assign to, Set priority to, Set status to, and Escalate to
details.
•In the Create Ticket section, if a ticket device has been configured, specify the
details to create the ticket.
Click Continue.
13. In the Specify Name and Description page, specify a Name and Description for
the event rule. Click Next.
14. In the Review page, verify the details you have selected for the event rule and
click Continue to add this rule in the rule set.
15. On the Create Rule Set page, click Save to save the rule set.
10.7 Using Diagnostic Tools
The following sections provided procedures for these diagnostic topics:
•Enabling Job Logging
•Viewing Job Logging
•Debugging a Failed Job
•Checking for Incidents Related to a Failed Job
•Packaging an Incident Generated by a Job Step
•Viewing Remote Log Files
•Diagnosing Problems with Cloud Control Management Tools
10.7.1 Enabling Job Logging
You can enable and disable object logging for diagnostic purposes.
To enable job logging for a scheduled job:
1. From the Enterprise menu of the Cloud Control console, select Job, then Activity.
2. In the Top Activity table, click the Name link for the job you want to log.
3. In the Execution page that appears, click Debug from the Actions menu.
A confirmation message appears that states "Successfully enabled logging at
DEBUG level."
10.7.2 Viewing Job Logging
If there is user-visible logging for a particular job, you can view the job execution log by
doing the following:
1. In the Top Activity page, click the Name link of the job for which you want to view
the log. The Job Execution page displays.
2. The job output log is displayed
You can also access job logging from the Execution page by clicking the link that
appears in the Status column of the Job Run page, then clicking Log Report on the
Execution page as shown below.
Chapter 10
Using Diagnostic Tools
10-31

To view the log for a job step, do the following:
1. In the Top Activity page, click the link of the job for which you want to view the log.
2. In the Job Run table, click the link that appears in the Status column for the step
you want to examine.
The Output Log appears for the step.
10.7.3 Debugging a Failed Job
If an execution fails and you had not previously set debug as the logging level, you can
choose to set the debug level when you retry the execution. For new job executions,
you can set logging at the debug level in advance by clicking the Debug button. The
Object Logging field indicates whether logging is enabled at the debug level.
Perform the following procedure if you encounter a job that fails.
1. View the job steps that failed.
2. Check the output for the failed step(s). Aggregated job output is displayed for all
steps, and also for specific steps.
3. If the output does not contain the reason for the failure, view the logging output.
You may also want to check for any incidents that have occurred while the job was
running.
4. Determine the cause of the failure and fix the problem.
5. Enable debug mode, then resubmit the job.
Note that the checkbox for Debug mode only appears on the confirmation page if
the earlier execution was not in Debug mode. If the earlier execution was already
in Debug mode, the retried execution is automatically in Debug mode.
10.7.4 Checking for Incidents Related to a Failed Job
It is possible for a job to fail because of an internal code error, a severe scaling issue,
or other Enterprise Manager issue for which you may be able to investigate an incident
or event trail. For example, if the OMS bounced because all Job Workers were stuck,
this would cause many jobs to fail. If the loader were failing, that could also cause
some jobs to fail.
1. Check for incidents or alerts in the time-frame of the job.
•To check for incidents, select Summary from the Enterprise menu of the
Cloud Control console, then view the Incidents section of the Enterprise
Summary page.
For more detailed information, select Monitoring from the Enterprise menu,
then select Support Workbench.
•To check for alerts,
2. Submit a service request with the related incident(s) or event data.
All step output, error output, logging, remote log files, and incident dump files for a
given job are captured for an incident.
•To submit a service request, select My Oracle Support from the Enterprise
menu of the console, then select Service Requests.
Chapter 10
Using Diagnostic Tools
10-32

•To create a technical SR, click Create SR on the Service Requests Home
page. To create a contact us SR, click Create "Contact Us" SR at the top of
the Contact Us Service Requests region, or click Contact Us at the top of any
My Oracle Support page. If you are creating a technical service request,
depending on the Support IDs registered in your profile, you can create
hardware or software SRs, or both.
The Create Service Request wizard guides you through the process of
specifying product information and attaching configuration information to the
SR when it is filed with Oracle Support. To ensure that Oracle Support has the
most accurate target information, select the Configuration tab in the What is
the Problem? section of Step 1: Problem, then select a target.
3. Apply a patch that support provides.
•Select Provisioning and Patching from the Enterprise menu of the console,
then select Patches & Updates.
•Provide login credentials, then click Go.
•Access the online help for assistance with this page.
4. Try to submit the job again after applying the patch.
To package an incident or manually trigger an incident:
1. Access Support Workbench.
2. Gather all job-related dumps and log files, as well as other data from the same
time, and package it for Support.
3. Review the incident-related data in Support Workbench, searching for relevant
errors.
4. If you determine the root cause without support intervention, fix the job and
resubmit it.
10.7.5 Packaging an Incident Generated by a Job Step
Incidents (and the problems that contain them) are not packaged by default. You will
need to package the problems of interest or concern in Support Workbench. You can
choose whether to package all problems or only a portion thereof.
Note:
If a job with remote log files is involved in an incident, the remote files are
automatically included in the incident as part of packaging. For more
information on remote log files, see Viewing Remote Log Files.
To package an incident generated by a job step:
1. On the Log Report page, click the Incident ID link.
2. Click the Problem Key link on the Support Workbench Incident Details page.
3. In the Support Workbench Problem Details page, either click the Package the
Problem link or the Quick Package button as shown below, then follow the
instructions in the Quick Packaging wizard and online help.
Chapter 10
Using Diagnostic Tools
10-33

10.7.6 Viewing Remote Log Files
Some jobs or Provisioning Adviser Framework (PAF) procedures run external
commands, such as DBCA or the installer. These commands generate their own log
files local to the system and Oracle home where they ran.
To view remote log files:
1. In the Top Activity page, click the link of the job for which you want to view the log.
2. In the Job Run table, click Log Report.
3. In the Log Report page, click the Remote Log Files link.
4. Specify host credentials, then click OK.
The Remote File Viewer appears and displays the file contents.
10.7.7 Diagnosing Problems with Cloud Control Management Tools
The Cloud Control management portion of the console provides several tools that can
assist you in assessing the current state of the job system and determining a proper
course of action for optimum performance. All of these tools are accessible from the
Setup menu of the Cloud Control console.
The following sections provide information on each of the available tools.
10.7.7.1 Health Overview
1. From the Setup menu of the Cloud Control console, select Manage Cloud
Control.
2. Select the Health Overview sub-menu.
The Job System Status region of the Health Overview page displays the following
information:
•Step Scheduler Status
The job step scheduler processes the job steps that are ready to run. If the status
indicates that job step scheduler is running in warning or error mode, the job
system is not functioning normally. In this case, the job system may run in fail-over
mode, where the job dispatcher process may also run the task performed by the
job step scheduler periodically. However, the job system may be running below its
potential capacity, so resolving this situation would be beneficial.
Several possible messages can appear:
–DBMS_SCHEDULER job for step-scheduler not found
This message is very rare and usually indicates a potentially serious issue.
The job was likely removed inadvertently or due to some special processing
(patch installation, for example, that requires recycling all
DBMS_SCHEDULER jobs). No automatic resolution is possible here, and this
would need to be addressed on a case by case basis.
–Failure in checking status
Chapter 10
Using Diagnostic Tools
10-34

This is a rare occurrence. The error message is usually shown. The error may
disappear on its own as this error indicates that the status could not be
calculated.
–DBMS_SCHEDULER is disabled
All of the DBMS_SCHEDULER jobs are disabled in the environment. This
should not occur unless a type of installation is in progress. Resolve this by
starting DBMS_SCHEDULER processes.
–All job queue processes are in use
The DBMS_SCHEDULER processes have been expended. Increase the
parameter job_queue_processes in the repository RDBMS.
–All slave processes are in use
The cause is similar to the above case. In this situation, you need to increase
MAX_JOB_SLAVE_PROCESSES of the DBMS_SCHEDULER.
–All sessions are in use
No RDBMS sessions were available for the DBMS_SCHEDULER. Increase
the PROCESSES for the RDBMS.
–Reason for delay could not be established
This usually appears because none of the above criteria were met, and is the
most common warning. The dispatcher may just be overloaded because there
is more work than available workers. Check the backlog in this case. The
situation should resolve automatically, but if it persists, the number of workers
available for the job system may be insufficient for the load the site
experiences.
•Job Backlog
The job backlog indicates the number of job steps that have passed their
scheduled time but have not executed yet. If this number is high and has not
decreased for a long period, the job system is not functioning normally. This
situation usually arises if job engine resources are unable to meet the inflow of
jobs from system or user activity.
A high backlog can also happen because of the abnormal processing of specific
jobs because they are stuck for extended periods. For more information on stuck
job worker threads, do the following:
1. From the OMS and Repository menu of the Health Overview page, select
Monitoring, then Diagnostic Metrics.
If the jobs system has a backlog for long periods of time, or if you would like to
process the backlog faster, set the following parameters with the emctl set
property command. These settings assume that sufficient database resources are
available to support more load. These parameters are likely to be needed in a
Large configuration with 2 OMS nodes.
Table 10-1 Large Job System Backlog Settings
Parameter Value
oracle.sysman.core.jobs.shortPoolSize 50
oracle.sysman.core.jobs.longPoolSize 24
oracle.sysman.core.jobs.longSystemPoolSize 20
Chapter 10
Using Diagnostic Tools
10-35

Table 10-1 (Cont.) Large Job System Backlog Settings
Parameter Value
oracle.sysman.core.jobs.systemPoolSize 50
oracle.sysman.core.conn.maxConnForJobWorkers 144
This setting may
require an increase
of the processes
setting in the
database of 144 *
number of OMS
servers.
10.7.7.2 Repository Home Page
1. From the Setup menu of the Cloud Control console, select Manage Cloud
Control.
2. Select the Repository sub-menu.
The Repository Scheduler Jobs Status table in the Management Services and
Repository page displays the job system purge status and next run schedule.
10.7.7.3 Management Services and Repository: All Metrics
There are two navigation paths for accessing the All Metrics page:
•From the Setup menu
•From the Targets menu
Setup Menu Navigation
1. From the Setup menu of the Cloud Control console, select Manage Cloud
Control.
2. Select the Health Overview sub-menu.
3. From the Management Services and Repository page that appears, select
Monitoring from the OMS and Repository menu, then select All Metrics.
4. Scroll down to DBMS Job Status in the left pane, then select a metric.
5. Scroll down further and expand Repository Job Scheduler Performance.
Definitions for the available metrics are as follows:
•Average number of steps marked as ready by the scheduler — Average
number of steps processed by the job step scheduler to mark the steps
"ready" for execution. This number usually depends on the job system load
over a time period.
•Estimated time for clearing current Job steps backlog (Mins) — Estimated
time to clear the backlog assuming the current inflow rate of the job system.
•Job step backlog — Number of job steps that have passed their scheduled
time but have not executed yet. If this number is high and has not decreased
for a long period, the job system is not functioning normally. This situation
usually arises if job engine resources are unable to meet the inflow of jobs
from system or user activity.
Chapter 10
Using Diagnostic Tools
10-36

•Latency in marking steps as ready by the scheduler — The job step
scheduler moves scheduled steps to ready queue. This metric indicates the
average latency in marking the steps to ready queue. High latency means
abnormal functioning of the job step scheduler process.
•Overall job steps per second — Average number of steps the job system
executes per second.
•Scheduler cycles — Frequency of dbms scheduler process. Executes a
minimum of 5 cycles per min, and may increase depending on the job system
load. A low number usually indicates a problem in the job step scheduler
process.
6. Scroll down further and expand the Usage Summary entries for Jobs, then select
the metric for which you are interested.
Target Menu Navigation
1. From the Targets menu of the Cloud Control console, select All Targets.
2. In the left pane of the All Targets page, scroll down and expand Internal, then
select OMS and Repository.
3. Click on the OMS and Repository table entry in the page that follows.
4. From the OMS and Repository menu in the Health Overview page that appears,
select Monitoring, then All Metrics.
10.7.7.4 OMS and Repository: Diagnostic Metrics
1. From the Setup menu of the Cloud Control console, select Manage Cloud
Control.
2. Select the Health Overview sub-menu.
3. From the Management Services and Repository page that appears, select
Monitoring from the OMS and Repository menu, then select Diagnostic Metrics.
pbs_* metrics are relevant for diagnosing issues in the job system. This information is
useful if you are searching for more information on stuck job system threads, or job
threads usage statistics to determine outliers preventing other jobs from running.
10.7.7.5 OMS and Repository: Charts
1. From the Setup menu of the Cloud Control console, select Manage Cloud
Control.
2. Select the Health Overview sub-menu.
3. From the Management Services and Repository page that appears, select
Monitoring from the OMS and Repository menu, then select Charts.
Assuming that the job had steps, this page shows historical charts for the overall
upload backlog, job step backlog, and overall job steps per second.
10.7.7.6 Management Servers and Job Activity Details Pages
1. From the Targets menu of the Cloud Control console, select All Targets.
2. On the left pane under Groups, Systems, and Services, click Management
Servers.
Chapter 10
Using Diagnostic Tools
10-37

3. Click Management Servers in the Target Name table.
The Job System region displays a snapshot of job system status and details of
processed executions. The Recent Job Executions Summary table displays the
total user job executions that are expected to run within a specific time period, the
completed count, running count, and the count of executions that are neither
completed nor running. This helps you to determine if various user jobs are
running as expected in the system.
4. Click the More Details link below the summary table.
5. Select the desired time frame in the drop-down for when executions are expected
to start.
Jobs and their status, if any, appear in the table.
6. Select the Job Dispatchers tab.
If more than one management server is configured, the page displays the job
dispatcher and thread pool utilization information for each management servers.
•Dispatcher Utilization (%) — Measures how frequently the job dispatcher
picks up the job steps. High utilization indicates a heavy job system load.
•Throughput (steps dispatched/min) — Indicates the average number of
steps other than internal steps processed by dispatcher every minute.
•Thread Pool Utilization — Displays the total number of threads configured for
each pool, the average steps selected by the thread pool per minute, and the
average number of available threads.
10.7.7.7 Job System Reports
The job system provides both a diagnostic report and usage report.
Diagnostic Report
1. From the Setup Enterprise of the Cloud Control console, select Reports.
2. Select the Information Publisher Reports sub-menu.
3. Search for job in the Title field, then click Go.
4. Click the Job System Diagnostic Report link in the table.
This report provides an overview of the job system's health and displays diagnostic
information about executing jobs or jobs that are possibly delayed beyond their
scheduled time. This information is usually relevant for an Oracle Support engineer
diagnosing problems in the job system.
Usage Report
Follow the steps above to access this report, except click the Job Usage Report link
in step 4.
This report provides an overview of the job system usage information over the past 7
days.
10.8 Creating Corrective Actions
Corrective actions enable you to specify automated responses to metric alerts and
events. Corrective actions ensure that routine responses to metric alerts are
Chapter 10
Creating Corrective Actions
10-38

automatically executed, thereby saving you time and ensuring problems are dealt with
before they noticeably impact end users.
Corrective actions share many features in common with the Job System. By default, a
corrective action runs on the target on which the metric alert is triggered. Alternatively,
you can specify a corrective action to contain multiple tasks, with each task running on
a different target. You can also receive notifications for the success or failure of
corrective actions.
You define corrective actions for individual metrics for monitored targets. The following
sections provide instructions on setting up corrective actions and viewing the details of
a corrective action execution:
•Providing Credentials5
•Creating Corrective Actions for Metrics
•Creating a Library Corrective Action
•Specifying Access to Corrective Actions
•Setting Up Notifications for Corrective Actions
•Providing Agent-side Response Actions
•Viewing the Details of a Corrective Action Execution
10.8.1 Providing Credentials
Since corrective actions are associated with a target's metric thresholds, you can
define corrective actions if you have been granted OPERATOR or greater privilege on
the target. You can define separate corrective actions for both Warning and Critical
thresholds. Corrective actions must run using the credentials of a specific user. For
this reason, whenever a corrective action is created or modified, you must specify the
credentials that the modified action runs with.
If the corrective actions are part of a monitoring template/template collection that is
automatically applied to an administration group, the preferred credentials of the user
who associated the template with the administration group will be used for the
corrective action.
10.8.2 Creating Corrective Actions for Metrics
For any target, the Metric and Collection Settings page shows whether corrective
actions have been set for various metrics. For each metric, the Corrective Actions
column shows whether Critical and/or Warning severities of corrective actions have
been set.
1. From any target's home page menu, select Monitoring, then Metric and
Collection Settings. The Metric and Collection Settings page appears.
Tip:
For instance, on the home page for a host named dadvmn0630.myco.com,
you would select the Host menu, then Monitoring, then Metric and Collection
Settings.
Chapter 10
Creating Corrective Actions
10-39

2. Click the pencil icon for a specific metric to access the Edit Advanced Settings
page for the metric.
3. In the Corrective Actions section, click Add for the metric severity (Warning and/or
Critical) for which you want to associate a corrective action.
4. Select the task type on the Add Corrective Actions page, then click Continue.
•If you want to use a corrective action from the library, select From Library as
the task type. Using a library corrective action copies the description,
parameters, and credentials from the library corrective action. You must still
define a name for the new corrective action. You can provide corrective action
parameters if necessary.
•If you want to create a corrective action to store in the library, see Creating a
Library Corrective Action.
•If you want to provide an Agent-side response action, select Agent Response
Action as the task type. See Providing Agent-side Response Actions for more
information.
5. On the Corrective Action page, provide input for General, Parameters, and
Credentials as you would similarly do when creating a job.
6. Click Continue to save the corrective action and return to the Edit Advanced
Settings page, where your corrective action now appears.
7. Optional: To prevent multiple instances of a corrective action from operating
simultaneously, enable the Allow only one corrective action for this metric to
run at any given time checkbox.
This option specifies that both Critical and Warning corrective actions will not run if
a severity is reported to the Oracle Management Services when an execution of
either corrective action is currently running. This can occur if a corrective action
runs longer than the collection interval of the metric it corrects; the value of the
metric may be oscillating back and forth across one of the thresholds (leading to
multiple executions of the same corrective action), or may be rising or falling
quickly past both thresholds (in which case an execution of the Warning corrective
action may overlap an execution of the Critical corrective action).
If you do not select this option, multiple corrective action executions are launched
under the aforementioned circumstances. It is the administrator's responsibility to
ensure that the simultaneous corrective action executions do not conflict.
8. Click Continue when you have finished adding corrective actions to return to the
Metric and Collection Settings page.
The page shows the corrective action value you have provided for the metric in the
Corrective Actions column. Possible values are:
•None — No corrective actions have been set for this metric.
•Warning — A corrective action has been set for Warning, but not Critical,
alerts for this metric.
•Critical — A corrective action has been set for Critical, but not Warning, alerts
for this metric.
•Warning and Critical — Corrective actions have been set for both Warning
and Critical alerts for this metric. If an Agent-side response action is
associated with the metric, the value is also Warning and Critical, since Agent-
side response actions are always triggered on either Critical or Warning alert
severities.
Chapter 10
Creating Corrective Actions
10-40

9. Continue the process from step 2 forward, then click OK on the Metric and
Collection Settings page to save your corrective actions and return to the target
page you started from in step 1.
10.8.3 Creating a Library Corrective Action
For corrective actions that you use repeatedly, you can define a library corrective
action. After a corrective action is in the library, you can reuse the corrective action
definition whenever you define a corrective action for a target metric or policy rule.
1. From the Enterprise menu, select Monitoring, then Corrective Actions. The
Corrective Action Library page appears.
2. Select a job type from the Create Library Corrective Action drop-down, then
click Go.
3. Define the corrective action as you would for creating a job in Creating a Library
Corrective Action for General, Parameters, and Credentials. For Access, go to the
following optional step.
4. Optional: Select Access to define or modify the access you want other users to
have for this corrective action.
For more information, see Specifying Access to Corrective Actions.
5. Click Save to Library when you have finished. The Corrective Action Library page
reappears, and your corrective action appears in the list.
You can now create another corrective action based on this one (Create Like
button), edit, or delete this corrective action.
You can access this library entry whenever you define a corrective action for a metric
severity by selecting From Library as the task type in the Add Corrective Actions page.
See step Creating Corrective Actions for Events in Creating Corrective Actions for
Metrics, for more information.
10.8.4 Specifying Access to Corrective Actions
As mentioned in the procedure above, you can determine the access to corrective
actions by other users. You do not need to provide input for this page if you do not
want to share the corrective action.
10.8.4.1 Defining or Modifying Access
The table on the Access page shows the access that administrators and roles have to
the corrective action. Only the corrective action owner (or Super Administrator) can
make changes on this page.
As the corrective action owner, you can do the following:
•Add other administrators and roles to the table by clicking Add, then selecting the
appropriate type in the subsequent page that appears.
•Change the access of an administrator or role by choosing the Full or View
access right in the Access Level column in the table.
•Remove all access to the corrective action for an administrator or role by clicking
the icon in the Remove columns for this administrator or role. All administrators
Chapter 10
Creating Corrective Actions
10-41

with Super Administrator privileges have the View access right to a corrective
action.
If you choose to provide access rights to a role, you can only provide the View access
right to the role, not the Full access right.
If you are a Super Administrator, you can:
•Grant View access to other Enterprise Manager administrators or roles.
•Revoke all administrator access privileges.
Note:
If a new user is being created, the user should have the CREATE_JOB
privilege to create corrective actions.
10.8.4.2 Access Level Rules
Access level rules are as follows:
•Super Administrators always have View access for any corrective action.
•The Enterprise Manager administrator who owns the corrective action can make
any access changes to the corrective action (except revoking View from Super
Administrators).
•Super Administrators with a View or Full access level for a corrective action can
grant View (but not Full) access to any new user. Super Administrators can also
revoke Full and View access from normal users, and Full access from Super
Administrators.
•Normal Enterprise Manager administrators with Full access levels cannot make
any access changes on the corrective action.
•If the corrective action owner performs a Create Like operation on a corrective
action, all access privileges for the new corrective action become identical to the
original corrective action. If the corrective action owner grants other administrators
View or Full access to other administrators, and any of these administrators
perform a Create Like operation on this corrective action, all administrators will, by
default, have View access on the newly created corrective action.
10.8.5 Setting Up Notifications for Corrective Actions
Corrective actions are associated with metrics whose alerts trigger them. Any
Enterprise Manager administrator with View or higher privileges on a target can
receive notifications following the success or failure of a corrective action.
A single incident rule can contain any combination of alert and corrective action states.
All metrics and targets selected by the incident rule are notified for the same alert and
corrective action states. Therefore, if you want to be notified of corrective action
success or failure for one metric, but only on failure for another, you need to use two
incident rules. An incident rule can include corrective action states for metrics with
which no corrective actions have been associated. In this case, no notifications are
sent.
Chapter 10
Creating Corrective Actions
10-42

Note:
Notifications cannot be sent for Agent-side response actions, regardless of the
state of any incident rules applied to the target.
To create incident rules for notifications:
1. From the Setup menu, select Incidents, then Incident Rules.
2. Click Create Rule Set. The Create Rule Set wizard appears.
3. Provide the requisite information at the top of the Create Rule Set page, then
select one of the target choices in the Targets sub-tab, supplying additional
information as needed for the "All targets of types" and "Specific targets" choices.
4. Select the Rules sub-tab, then click Create.
5. In the pop-up that appears, select the default Incoming events and update to
events choice, the click Continue.
6. On the Select Events page, enable the Type checkbox, then select Metric Alert.
7. Click the Specific events of type Metric alert radio button, then click Add in the
table that appears.
8. In the pop-up that appears, select the Target Type, filter and select the metric,
select a severity, then enable the desired corrective action status. Click OK.
9. From the Add Actions page, click Add.
10. Specify recipients in the Basic Notifications section of the Add Conditional Actions
page.
11. Proceed through the final two pages of the wizard, then click Continue. Your new
rule appears in the Create Rule Set page.
12. Click Save to save this rule.
After you have created one or more rule sets, you need to set up notification methods
as follows:
1. From the Setup menu, select Notifications, then Notification Methods.
2. From the Notification Methods page, select Help, then Enterprise Manager Help
for assistance on providing input for this page.
10.8.6 Providing Agent-side Response Actions
Agent-side response actions perform simple commands in response to an alert. When
the metric triggers a warning or critical alert, the Management Agent automatically
runs the specified command or script without requiring coordination with the Oracle
Management Service (OMS). The Agent runs this command or script as the OS user
who owns the Agent executable. Specific target properties can be used in the Agent
response action script.
Chapter 10
Creating Corrective Actions
10-43

Note:
Use the Agent-side Response Action page to specify a single command-line
action to be executed when a Warning or Critical severity is reached for a
metric. For tasks that require alert context, contain more complex logic, or
require that notifications be sent on success or failure, corrective actions
should be used instead of an Agent-side response action.
To access this page, follow steps 1 through 4 in Creating Corrective Actions for
Metrics.
10.8.6.1 Specifying Commands and Scripts
You can specify a single command or execute a script. You cannot specify special
shell command characters (such as > and <) as part of the response action command.
If you must include these types of special characters in your response action
commands, you should use them in a script, then specify the script as the response
action command.
If using a script, make sure the script is installed on the host machine that has the
Agent. If using shell scripts, make sure the shell is specified either in the Response
Action command line:
Script/Command: /bin/csh myScript
... or within the body of the script itself:
Script/Command: myScript
... where myScript contains the following:
!#/bin/csh<
<rest of script>
10.8.6.2 Using Target Properties in Commands
You can use target properties in a command. Click Show Available Target
Properties to display target properties you can use in the Script/Command field. The
list of available target properties changes according to the type of target the response
action is to run against.
Use Target Properties as command-line arguments to the script or command, then
have the script reference these command-line arguments. For example, to use the
%OracleHome% and %SID% target properties, your command might appear as
follows:
/bin/csh MyScript %OracleHome% %SID%
.... and your script, MyScript, can reference these properties as command-line
arguments. For example:
IF $1 = 'u1/bin/OracleHome' THEN...
Target properties are case-sensitive. For example, if you want to access the
Management Agent's Perl interpreter, you can specify %perlBin%/perl
<my_perl_script> in the Script/Command field.
Chapter 10
Creating Corrective Actions
10-44

10.8.6.3 Using Advanced Capabilities
You can get other target properties from the target's XML file in the OracleHome/
sysman/admin/metadata directory, where OracleHome is the Oracle home of the
Management Agent that is monitoring the target. In the XML file, look for the
PROP_LIST attribute of the DynamicProperties element to get a list of properties that
are not listed in the targets.xml entry for the target.
The following example is an excerpt from the hosts.xml file:
<InstanceProperties>
<DynamicProperties NAME="Config" FORMAT="ROW"
PROP_LIST="OS;Version;OS_patchlevel;Platform;Boottime;IP_address">
<ExecutionDescriptor>
<GetTable NAME="_OSConfig"/>
<GetView NAME="Config" FROM_TABLE="_OSConfig">
<ComputeColumn NAME="osName" EXPR="Linux" IS_VALUE="TRUE"/>
<Column NAME="osVersion"/>
<Column NAME="osPatchLevel"/>
<Column NAME="Platform"/>
<Column NAME="Boottime"/>
<Column NAME="IPAddress"/>
</GetView>
</ExecutionDescriptor>
</DynamicProperties>
<InstanceProperty NAME="Username" OPTIONAL="TRUE" CREDENTIAL="TRUE">
<ValidIf>
<CategoryProp NAME="OS" CHOICES="Linux"/>
</ValidIf>
<Display>
<Label NLSID="host_username_iprop">Username</Label>
</Display>
</InstanceProperty>
<InstanceProperty NAME="Password" OPTIONAL="TRUE" CREDENTIAL="TRUE">
<ValidIf>
<CategoryProp NAME="OS" CHOICES="Linux"/>
</ValidIf>
<Display>
<Label NLSID="host_password_iprop">Password</Label>
</Display>
</InstanceProperty>
</InstanceProperties>
10.8.7 Viewing the Details of a Corrective Action Execution
There are two methods of displaying the outcome of a corrective action execution.
•Incident Manager method
1. From the Enterprise Manager Cloud Control console Enterprise menu, select
Monitoring, then Incident Manager.
2. Click the Search icon, select Events from the Type drop-down, then click Get
Results.
3. Double-click the message of interest in the search results table.
The Corrective Action History table now appears at the bottom of the page.
Chapter 10
Creating Corrective Actions
10-45
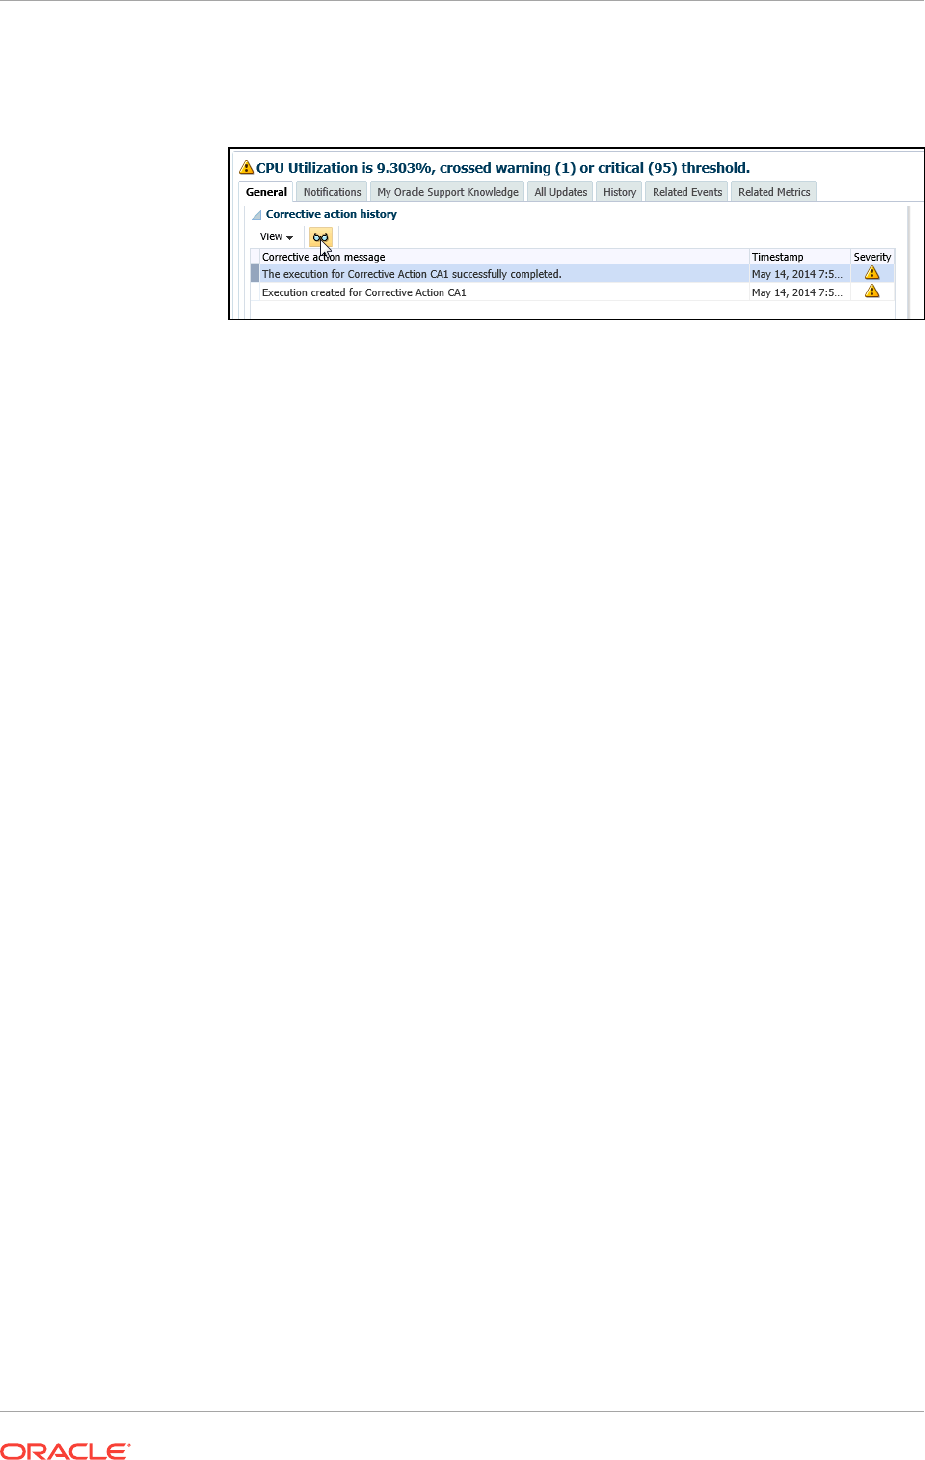
4. Select the desired message in the history table, then click the glasses icon as
shown below.
The Corrective Action Execution page now appears, which displays the output
of the corrective action, status, start time, end time, and so forth.
•All Metrics method
1. From the target's home page, select Monitoring, then All Metrics.
2. From the tree panel on the left, click the desired metric name.
A row for the metric alert now appears in the Metric Alert History table.
3. Click the glasses icon in the Details column as shown below.
The Incident Manager Event Details page now appears.
4. In the Corrective Action History table at the bottom of the page, select the
message in the history table, then click the glasses icon.
The Corrective Action Execution page now appears, which displays the output
of the corrective action, status, start time, end time, and so forth.
Chapter 10
Creating Corrective Actions
10-46

11
Monitoring Access Points Configured for a
Target
Access points are channels of communication using which a software or a hardware
deployment can be monitored in Enterprise Manager Cloud Control. They are upload
points through which data is collected and uploaded to Oracle Management Service
(OMS). While most targets have a single access point, some targets have multiple
access points.
This chapter introduces you to the concept of access points, and describes how you
can monitor the access points that are configured for a multi-access point target (for
example, System Infrastructure Server, System Infrastructure Cisco Switch, and so
on). In particular, this chapter covers the following:
•Introduction to Monitoring Access Points
•Viewing a List of Access Points Configured for a Target
•Deleting Access Points Configured for a Target
•Viewing the Capability Metric Map for a Target
•Viewing the Best Access Point Implementers (and their History) for Various
Operations Supported for a Target
•Modifying or Reconfiguring the Monitoring Properties of the Access Points
Configured for a Target
•Modifying or Reconfiguring the Monitoring Properties of the Access Points
Configured for a Target
•EM CLI Verbs for Managing the Access Points Configured for a Target
11.1 Introduction to Monitoring Access Points
Access points are channels of communication using which a software or a hardware
deployment can be monitored in Enterprise Manager Cloud Control. They are upload
points through which metric data is collected and uploaded to Oracle Management
Service.
Typically, to discover a software deployment and monitor it as a target in Enterprise
Manager Cloud Control, you must first install an Oracle Management Agent
(Management Agent) on the host where the software is deployed. In this case, the
Management Agent collects data about the software deployment and acts as the only
channel of communication with the software deployment on that host.
However, for some targets (for example, System Infrastructure Server, System
Infrastructure Cisco Switch, System Infrastructure Oracle InfiniBand Switch, and
System Infrastructure Rack, and so on) you can have multiple access points to collect
metric data about the target. The access points can be a chip that is integrated with
the hardware, a plug-in that is deployed onto the hardware, and so on.
11-1
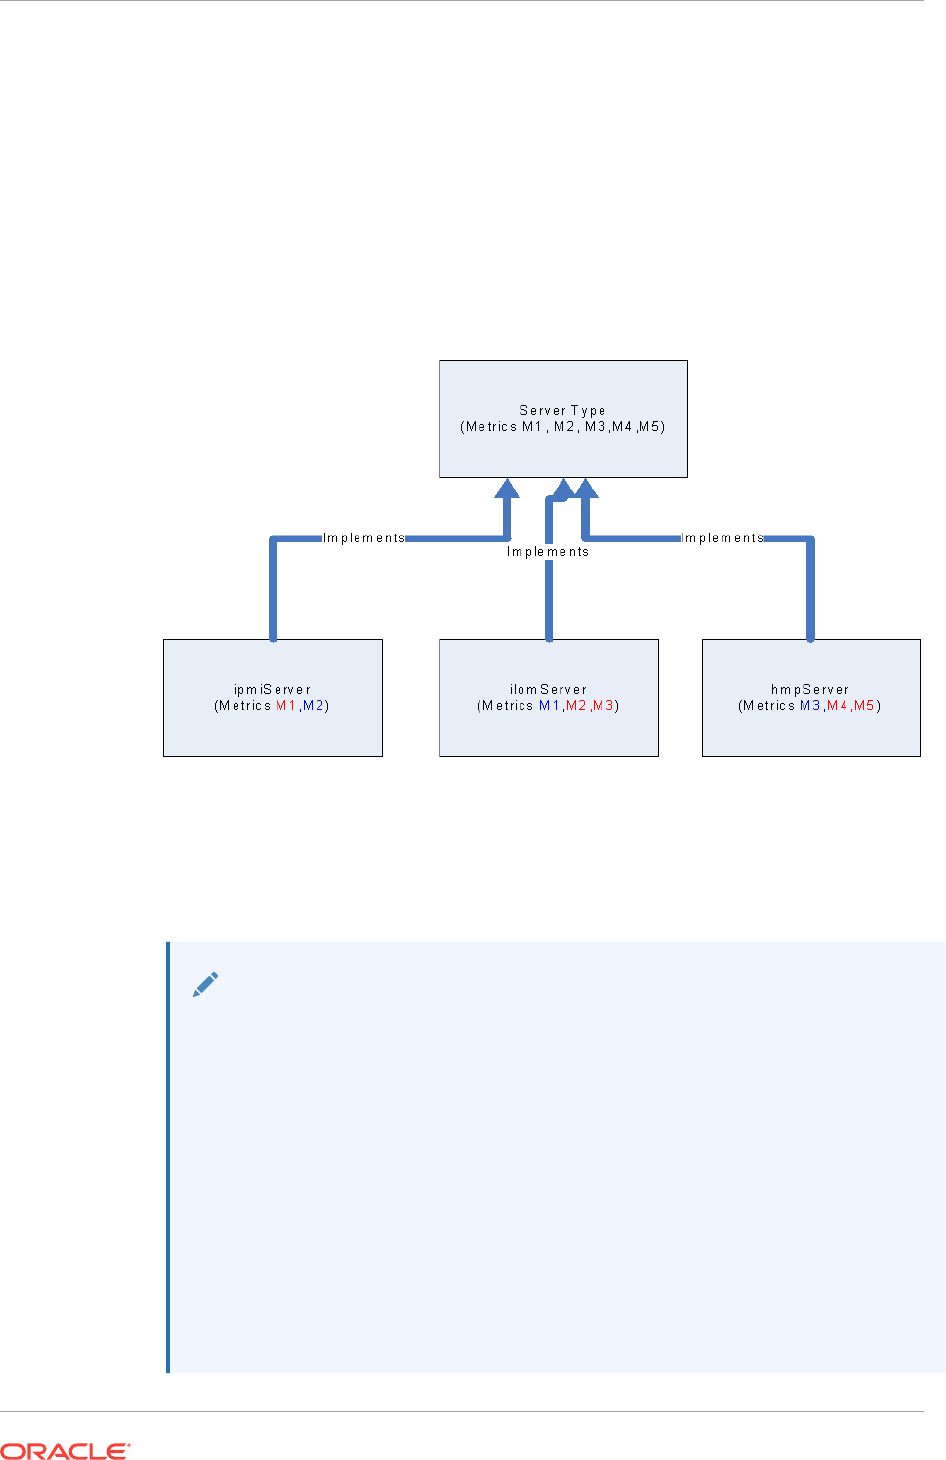
Different access point types are used to distinguish between the different management
interfaces that are used to interact with a given target type, and each access point type
typically has its own separate implementation of metrics and actions for the target.
In Figure 11-1, you can see how each of the access points implement a subset of the
metrics for a given multi-access point target. The access points with metric names in
red indicate that they are the best implementers of those metrics. The access points
with metric names in blue indicate that they are the second best implementers of those
metrics.
Figure 11-1 Implementation of Access Points
Enterprise Manager Cloud Control enables you to view a list of such access points that
are configured for a multi-access point target. In addition, you can view the historical
status of access points, the capability maps of access points, and the best
implementers for collecting certain types of metric data.
Note:
When a multi-access point target is blacked out, either explicitly or when a
group containing such targets is blacked out, the multi-access point target and
its access points are blacked out and they go into the Blackout status in the
Enterprise Manager Cloud Control Console.
On the other hand, if a multi-access point target is not blacked out but all its
access points are blacked out by virtue of full host blackouts on all the
Management Agents that are monitoring the access points, then the multi-
access point target goes into the Pending status because none of the access
points are available to collect metric data for that target. This is particularly in
the case of multi-access point targets that have only one access point. If only
one access point is blacked out and all other access points are still available,
then the multi-access point target continues to appear as up and running
because it has other available access points that can collect metric data.
Chapter 11
Introduction to Monitoring Access Points
11-2

11.2 Viewing a List of Access Points Configured for a Target
Enterprise Manager Cloud Control enables you to view a list of access points that are
configured for a multi-access point target. Access points are channels of
communication using which a software or a hardware deployment can be monitored in
Enterprise Manager Cloud Control. They are upload points through which data is
collected and uploaded to Oracle Management Service.
To view a list of access points configured for a multi-access point target, follow these
steps:
1. From the Targets menu, select All Targets.
2. On the All Targets page, select a multi-access point target (for example, System
Infrastructure Server, System Infrastructure Switch, and so on.)
3. On the Home page, from the target-specific menu, select Monitoring, then select
Access Points - Overview.
4. On the Access Points - Overview page, you can view a list of access points
configured for the selected multi-access point target.
11.3 Deleting Access Points Configured for a Target
Enterprise Manager Cloud Control enables you to delete the access points that are not
required for monitoring. Access points are channels of communication using which a
software or a hardware deployment can be monitored in Enterprise Manager Cloud
Control. They are upload points through which data is collected and uploaded to
Oracle Management Service.
To delete the access points configured for a multi-access point target, follow these
steps:
1. From the Targets menu, select All Targets.
2. On the All Targets page, select a multi-access point target (for example, System
Infrastructure Server, System Infrastructure Switch, and so on.)
3. On the Home page, from the target-specific menu, select Monitoring, then select
Access Points - Overview.
WARNING:
Removing the last access point will remove the multi-access point target from
Enterprise Manager Cloud Control.
4. On the Access Points - Overview page, select the access point you want to delete,
and click Remove.
11.4 Viewing the Capability Metric Map for a Target
Enterprise Manager Cloud Control enables you to view the capability map of the
access points that are configured for a multi-access point target. Access points are
channels of communication using which a software or a hardware deployment can be
Chapter 11
Viewing a List of Access Points Configured for a Target
11-3

monitored in Enterprise Manager Cloud Control. They are upload points through which
data is collected and uploaded to Oracle Management Service.
An access point can have the capability to either collect metric data or take action
against the target. Enterprise Manager Cloud Control provides a tabulated view of the
capabilities of the access points. You can view this capability map and determine what
each access point is efficient at.
To view the capability metric map for a multi-access point target, follow these steps:
1. From the Targets menu, select All Targets.
2. On the All Targets page, select a multi-access point target (for example, System
Infrastructure Server, System Infrastructure Switch, and so on.)
3. On the Home page, from the target-specific menu, select Monitoring, then select
Access Points - Current Capability Map.
4. On the Access Points - Current Capability Map page, view a list of access points
and their capabilities. See Table 11-1.
You can also identify which access point is the best implementer for collecting the
required metric data by selecting Show only best implementers.
If you want to filter the table based on the capability type and the capability name,
use the Capability Type and Capability Name drop-down lists, and click Search.
Table 11-1 describes the columns in the Current Capability Map table.
Table 11-1 Description of the Columns in the Capability Map Table
Column Name Description
Access Point Name of the access point configured for the multi-access
point target.
Priority Measure of the capability of the access point to collect metric
data. The access point with the highest priority is the first one
to collect and upload metric data. If and when this access
point becomes unavailable, the access point with the next
highest priority takes over and collects the metric data.
Capability Type Whether the access point is capable of collecting metric data
or taking action against the target. The possible values are
Action and Collection.
Capability Name Name of the metric collection capability or the action
capability that the access point has.
Is Current Best
Implementer
Whether or not the access point is currently the best
implementer. The possible values are Yes or No.
An access point can have the capability to either collect
metric data or take action against the target, and sometimes,
two or more access points can have overlapping set of
capabilities. Access points are termed best implementers
when they are best suited for a certain metric or action.
Status Stratus of the access point and whether the collection
capability is enabled or disabled for that access point.
Chapter 11
Viewing the Capability Metric Map for a Target
11-4

11.5 Viewing the Best Access Point Implementers (and their
History) for Various Operations Supported for a Target
Enterprise Manager Cloud Control not only provides a tabulated view of the
capabilities of the access points but also highlights the ones that are considered best
implementers or best suited for a certain metric or action.
Access points are channels of communication using which a software or a hardware
deployment can be monitored in Enterprise Manager Cloud Control. They are upload
points through which data is collected and uploaded to Oracle Management Service.
An access point can have the capability to either collect metric data or take action
against the target, and sometimes, two or more access points can have overlapping
set of capabilities. Access points are termed best implementers when they are best
suited for a certain metric or action.
The best implementer is determined when an event that changes the capability map
for the target occurs. Events that affect the capability map for the target include agent
going down, access points being down or broken, capability metric for an access point
reporting a different priority, and capability metric reporting a new or removed
capabilities. Thus, when an access point defined as the best implementer is
unavailable to collect the metric, Enterprise Manager Cloud Control automatically
switches over the next best implementer to collect the same metric data.
To view the best access point implementers for a multi-access point target, follow
these steps:
1. From the Targets menu, select All Targets.
2. On the All Targets page, select a multi-access point target (for example, System
Infrastructure Server, System Infrastructure Switch, and so on.)
3. On the Home page, from the target-specific menu, select Monitoring, then select
Access Points - Current Capability Map.
4. On the Access Points - Current Capability Map page, view a list of access points
and their capabilities. Select Show Only the Best Implementers. To further filter
the list and view the history of the best implementers, select the start date and end
date, and click Search.
11.6 Modifying or Reconfiguring the Monitoring Properties of
the Access Points Configured for a Target
Enterprise Manager Cloud Control enables you to view a list of access points that are
configured for a multi-access point target. Access points are channels of
communication using which a software or a hardware deployment can be monitored in
Enterprise Manager Cloud Control. They are upload points through which data is
collected and uploaded to Oracle Management Service.
While discovering a multi-access point target, the access points configured for that
target are automatically added to Enterprise Manager Cloud Control for monitoring.
These access points are added with default monitoring configuration properties.
However, after they are added to Enterprise Manager Cloud Control, you can choose
to modify or reconfigure their monitoring properties if you want.
Chapter 11
Viewing the Best Access Point Implementers (and their History) for Various Operations Supported for a Target
11-5

To modify or reconfigure the monitoring properties of the access points configured for
a multi-access point target, follow these steps:
1. From the Targets menu, select All Targets.
2. On the All Targets page, select a multi-access point target (for example, System
Infrastructure Server, System Infrastructure Switch, and so on.)
3. On the Home page, do one of the following:
•From the target-specific menu, select Monitoring, then select Access Points
- Overview. On the Access Points - Overview page, select the access point
whose monitoring properties you want to change, and click Configure.
•From the target-specific menu, select Target Setup, then Monitoring
Configuration.
4. On the Monitoring Configuration page, in the Access Point drop-down list, ensure
that the correct access point is selected. If not, select the correct access point.
5. In the Monitoring Properties section, edit the properties, and click Save.
11.7 EM CLI Verbs for Managing the Access Points
Configured for a Target
Table 11-2 lists the EM CLI verbs for managing the access points configured for a
target. For more information about these verbs, see the Oracle Enterprise Manager
Cloud Control Command Line Interface Guide.
Table 11-2 EM CLI Verbs for Managing the Access Points Configured for a
Target
EM CLI Verb Description
add_target
Adds a multi-access point target to the Enterprise Manager
system.
modify_target
Modifies a multi-access point target that is already existing in the
Enterprise Manager system.
delete_target
Deletes a multi-access point target.
get_accesspoints
Lists the access points configured for a target.
get_best_implementer
Lists the best access point implementers for various operations
supported for a multi-access point target.
set credentials
Modifies or reconfigures the monitoring properties of the access
points configured for a multi-access point target.
Chapter 11
EM CLI Verbs for Managing the Access Points Configured for a Target
11-6

12
Always-On Monitoring
The Enterprise Manager Always-On Monitoring application provides the ability to
monitor critical target status and metric alerts when the Oracle Management Service is
unavailable. The service continuously monitors critical targets through the Enterprise
Manager Agent and can be easily configured to send email notifications for these
events to administrators.
Always-On Monitoring can be configured to send notifications at any time, but is
particularly useful when experiencing downtime of your central Enterprise Manager
site for maintenance operations such as upgrade and patching.
The Always-On Monitoring is synchronized with Enterprise Manager to reuse the
configuration of monitored targets as well as requisite notification data such as
notification contacts and email gateway configuration. Once properly configured and
synchronized, the service will receive alerts from Enterprise Manager Agents and send
email notifications to the appropriate administrators.
This chapter covers the following topics:
•Prerequisites
•Best Practices
•Installing Always-On Monitoring
•Configuring Always-On Monitoring
•Controlling the Service
•Updating Always-On Monitoring
•Data Maintenance
•Controlling Always-On Monitoring Configuration Settings
•Getting Performance Information
•Modifiable Always-On Monitoring Properties
•Creating an SSO Wallet and JKS for CA Certificates
•Diagnosing Problems
•High Availability and Disaster Recovery
•Uninstalling Always-On Monitoring
12.1 Prerequisites
Before installing Always-On Monitoring, ensure that the following prerequisite tasks
have been performed:
Environment Setup
•Install or identify an Oracle Database instance to hold the Always-On Monitoring
repository.
12-1

•Enterprise Manager must be upgraded to 13.2. In addition, the Management Agent
should also be upgraded to 13.2.
•If you do not have database administrator access, you need to ask the DB
administrator to add you to the Always-On Monitoring repository. You can use the
script found in Granting Required Privileges to the Always-On Monitoring Schema
Owner.
Save the EM key to the Enterprise Manager repository. See Saving the Em Key
for more information.
Java Requirements
•JDK7 must be installed in the environment where the user will run Always-On
Monitoring (including emsca). The JAVA_HOME environment variable must point
to the JDK7 location.
System Resource Requirements
•The number of open file descriptors used by Always-On Monitoring is
http.queueSize + http.maxThreads. Always-On Monitoring also uses the database
connection pool. The number of open database connections ranges between the
number of active threads up to a maximum of 100 connections.
•Maximum memory requirement is estimated at 10 Megabytes per thread. Memory
demand peaks when Always-On Monitoring is first started because the Agents
must communicate the complete status of all their monitored targets.
12.1.1 Installing the Always-On Monitoring Repository Database
You must install and configure an Oracle database instance to house the Always-On
Monitoring repository. Because you must create the schema for the repository
separately, it is critical to have an idea of the space that needs to be allocated to the
schema, and how the space is broken down.
Because the purpose of Always-On Monitoring is to continuously monitor and send
notifications when Enterprise Manager is down, the Always-On Monitoring Repository
database should be installed as a separate instance of Oracle with the Always-On
Monitoring Schema on another machine so that Always-On Monitoring continues to
run when the Enterprise Manager Repository is either being upgraded or unexpectedly
goes down.
Like the Enterprise Manager Repository, the Always-On Monitoring Repository needs
to be installed on an Oracle database. The database version supported depends on
the Always-On Monitoring version as shown in the following table:
Always-On Monitoring Version Oracle Database Version
All Versions Oracle Database 12.1.0.2.0 with Bundle Patch
10
Always-On Monitoring 13.2.0.1.0 and Greater Oracle Database 12.2.0.1.0
12.1.1.1 Database Sizing
The factors to consider when sizing and configuring the database are as follows:
Chapter 12
Prerequisites
12-2

•Undo Tablespace: The Undo tablespace is utilized when running the SYNC
processes, especially during the initial SYNC when potentially larger numbers of
rows are pulled from the Enterprise Manager instance to Always-On Monitoring.
•Temp Tablespace: The SYNC process will also utilize TEMP tablespace,
especially when indexes are created or sorting occurs during the data movement
process.
•Always-On Monitoring Tablespace: Table data and indexes specific to Always-
On Monitoring are stored in this tablespace.
•Redo Logs: Redo logs should be large enough to minimize the number of
checkpoints that occur during times when the SYNC is occurring. It is
recommended to configure 3 x 1 GB REDO log files.
•Special Oracle Parameter Settings: For Always-On Monitoring, it is desirable to
maintain the parameters used in the Enterprise Manager repository, especially if
the Always-On Monitoring schema is to be populated in the Enterprise Manager
repository database. To ensure correctness of the Enterprise Manager parameter
settings that are passed in as part of the Always-On Monitoring install, you can run
the SYNC and other Always-On Monitoring functions that are part of the emsctl
verbs. This is important to consider when configuring a separate database
instance. As is the case with the Enterprise Manager Repository, the following
parameter should be set for the Always-On Monitoring Repository to avoid
unforeseen optimizer issues:
ALTER SYSTEM SET OPTIMIZER_ADAPTIVE_FEATURES=FALSE SCOPE=BOTH SID='*';
The following table represents an example of the sizing of the above components
for an Always-On Monitoring schema that is being used for a large enterprise
database. Note that these figures represent the sizes of the tablespaces after the
initial full SYNC between Always-On Monitoring and Enterprise Manager. Also
note that the Redo Log files are not included in these calculations:
Table 12-1 Always-On Monitoring Repository Tablespace Sizing
Tablespace Name Used Space
(MB)
Free Space
(MB)
Total
Allocation
(MB)
Percentage
Free (%)
TEMP 0 30,720 30,720 100%
EMS_TABLESPAC
E
6,430 44,797 51,200 87%
SYSAUX 1,385 85 1,470 6%
SYSTEM 896 4 900 0%
UNDOTBS1 84 30,636 30,720 100%
USERS 1 4 5 30%
Totals 8.769 106,246 115,015 92%
For this particular configuration, the absolute minimum for disk space required was 9
GB based on the used Tablespace. To ensure room for growth with this schema, it is
recommended to plan on allocating at least 120 GB of space for the Always-On
Monitoring database if creating a new Oracle instance. The TEMP and UNDO
tablespaces are configured to handle initial and subsequent SYNC operations
ensuring there is no issue with TEMP or REDO saturation. In addition, the Always-On
Chapter 12
Prerequisites
12-3

Monitoring tablespace is sized to ensure no interruption due to saturation of the
tablespace.
In order to accurately size the Always-On Monitoring tablespace for current usage and
future growth, it is important to understand the following:
•What data from what tables is being transferred from the Enterprise Manager
Repository to the Always-On Monitoring Schema.
•Knowing the number of rows transferred for each table, what is the approximate
number of Bytes per Row for the tables and indexes?
The following table shows a subset of the tables and indexes in the Always-On
Monitoring schema, highlighting the number of rows, total space consumption, and the
number of bytes per row:
Table 12-2 Always-On Monitoring Table and Index Space Allocation
Owner Segment Name Segme
nt Type
Partition Name Size
(MB)
Number of
Rows
Always-On
Monitoring
MGMT_TARGET_PROPERTIES TABLE Non-Partitioned 1,472 15,408,952
Always-On
Monitoring
MGMT_TARGET_PROPERTIES_IDX_02 INDEX Non-Partitioned 1,152 15,215,316
Always-On
Monitoring
MGMT_TARGET_PROPERTIES_PK INDEX Non-Partitioned 856 15,462,104
Always-On
Monitoring
MGMT_TARGET_PROPERTIES_IDX_01 INDEX Non-Partitioned 584 14,871,521
Always-On
Monitoring
EM_MANAGEABLE_ENTITIES TABLE Non-Partitioned 496 1,177,065
Always-On
Monitoring
MGMT_TARGET_PROPERTIES_IDX_03 INDEX Non-Partitioned 472 16,105,162
Always-On
Monitoring
EM_MANAGEABLE_ENTITIES_UK1 INDEX Non-Partitioned 136 1,201,617
Always-On
Monitoring
EM_MANAGEABLE_ENTITIES_UK2 INDEX Non-Partitioned 120 1,133,804
Always-On
Monitoring
EM_MANAGEABLE_ENTITIES_IDX01 INDEX Non-Partitioned 112 1,184,414
Always-On
Monitoring
EM_MANAGEABLE_ENTITIES_IDX07 INDEX Non-Partitioned 112 1,166,536
Always-On
Monitoring
EM_MANAGEABLE_ENTITIES_IDX03 INDEX Non-Partitioned 96 1,182,817
Always-On
Monitoring
EM_MANAGEABLE_ENTITIES_IDX04 INDEX Non-Partitioned 80 1,218,977
Always-On
Monitoring
EM_MANAGEABLE_ENTITIES_IDX05 INDEX Non-Partitioned 72 1,104,428
Always-On
Monitoring
EM_MANAGEABLE_ENTITIES_IDX06 INDEX Non-Partitioned 59 673,838
Always-On
Monitoring
EM_MANAGEABLE_ENTITIES_IDX08 INDEX Non-Partitioned 44 1,215,411
Always-On
Monitoring
EM_MANAGEABLE_ENTITIES_PK INDEX Non-Partitioned 41 1,172,101
Chapter 12
Prerequisites
12-4

Table 12-2 (Cont.) Always-On Monitoring Table and Index Space Allocation
Owner Segment Name Segme
nt Type
Partition Name Size
(MB)
Number of
Rows
Always-On
Monitoring
EM_MANAGEABLE_ENTITIES_IDX09 INDEX Non-Partitioned 40 1,192,236
Always-On
Monitoring
EM_MANAGEABLE_ENTITIES_IDX02 INDEX Non-Partitioned 37 1,178,410
Always-On
Monitoring
EM_VIOLATIONS TABLE Non-Partitioned 28 112,106
Always-On
Monitoring
EM_METRIC_COLUMN_VER_PK INDEX Non-Partitioned 17 611,561
12.1.1.2 Database Character Set Definition
To ensure that the data being transferred from the Enterprise Manager Repository to
the Always-On Monitoring Repository is stored and represented properly when the
Always-On Monitoring Repository is on a separate instance from Enterprise Manager,
it is important to ensure that the character set matches between the two databases/
instances. For Enterprise Manager, the NLS_CHARACTERSET is defined as
AL32UTF8..
If using Oracle Installer to manually set up the database instance that Always-On
Monitoring uses, the instance will default to WE8MSWIN1252. Ensure at this point that
the option AL32UTF8 is selected from the drop down box so that the correct character
set is installed from the start..
To determine the character set on the Enterprise Manager Repository, run the
following query:
SELECT * from nls_database_parameters where parameter='NLS_CHARACTERSET';
Run this query as well on the Always-On Monitoring Repository to ensure the
character sets match. If the Always-On Monitoring Repository character set is
different, the following is recommended to change the character set on the Always-On
Monitoring Repository to match that of the Enterprise Manager Repository.
--Shutdown and start the database in a restricted mode.
SHUTDOWN IMMEDIATE;
STARTUP RESTRICT;
--Set JOB_QUEUE_PROCESSES and AQ_TM_PROCESSES to its default value i.e.0
ALTER SYSTEM SET JOB_QUEUE_PROCESSES = 0;
ALTER SYSTEM SET AQ_TM_PROCESSES=0;
-- Set the required character set.
ALTER DATABASE CHARACTER SET AL32UTF8;
-- if the above fails:
ALTER DATABASE CHARACTER SET INTERNAL_USE AL32UTF8;
--Shutdown and restart the database in normal mode.
SHUTDOWN IMMEDIATE;
STARTUP;
/
Chapter 12
Prerequisites
12-5

12.1.2 Creating the Always-On Monitoring Repository User
The Always-On Monitoring user should be created by a database administrator with
SYSDBA privileges. If you are running emsca as a user with SYSDBA privileges, you
can skip this section as the emsca configuration assistant will automatically create the
user for you.
Note:
The Always-On Monitoring Repository should not be housed within the
Enterprise Manager Repository database. Housing the Always-On Monitoring
Repository in a separate database allows Always-On Monitoring to function
even if the Enterprise Manager Repository goes down.
Connect to the database to be used as the Always-On Monitoring Repository, create
the Always-On Monitoring user and then grant it the required privileges.
Note:
The Always-On Monitoring user should be created by a database
administrator with SYSDBA privileges. Alternatively, you can supply SYSDBA
credentials when running the emsca configuration utility. emsca will then
create the Always-On Monitoring repository user automatically.
If you have SYSDBA access, you can skip this step since it will be done automatically
by the emsca configuration assistant. See Using the Always-On Monitoring
Configuration Assistant (EMSCA) for more information.
12.1.2.1 Granting Required Privileges to the Always-On Monitoring Schema
Owner
To ensure proper functionality of Always-On Monitoring, the Always-On Monitoring
schema owner needs to have the correct privileges. The following sample script details
all grants required for the Always-On Monitoring Schema:
create user ems identified by ems;
grant CREATE SESSION,
ALTER SESSION,
CREATE DATABASE LINK,
CREATE MATERIALIZED VIEW,
CREATE PROCEDURE,
CREATE PUBLIC SYNONYM,
CREATE ROLE,
CREATE SEQUENCE,
CREATE SYNONYM,
CREATE TABLE,
CREATE TRIGGER,
CREATE TYPE,
CREATE VIEW,
UNLIMITED TABLESPACE,
SELECT ANY DICTIONARY to ems;
Chapter 12
Prerequisites
12-6

grant EXECUTE ON SYS.DBMS_CRYPTO to ems;
grant EXECUTE ON SYS.DBMS_AQADM to ems;
grant EXECUTE ON SYS.DBMS_AQ to ems;
grant EXECUTE ON SYS.DBMS_AQIN to ems;
grant EXECUTE on SYS.DBMS_LOCK to ems;
grant EXECUTE ON SYS.DBMS_SCHEDULER to ems;
grant create job to ems;
Under certain circumstances you may need to grant privileges directly to an Always-
On Monitoring user. However, directly granting privileges to any user may violate
security policy and compliance rules. In this situation, you can can assign most of the
privileges to a role and then assign that role to the user.
For multitenant environments, when creating a user in a multitenant container
database (CDB) and not in one of its constituent pluggable databases (PDB), then the
user has to be prefixed by "C##".
12.2 Best Practices
Oracle recommends keeping an Always-On Monitoring instance running at all times
regardless of whether Enterprise Manager is up or down. By telling the Always-On
Monitoring to turn off notifications, you can have it run in the background while
Enterprise Manager is up. During Enterprise Manager downtime, whether planned or
unplanned, you can issue an emsctl command to tell Always-On Monitoring to restart
notifications. The primary advantage to having Always-On Monitoring running at all
times is that it will stay up to date with any changes made to your Enterprise Manager
installation. Always-On Monitoring keeps itself in sync with Enterprise Manager by
periodically running a synchronization job. This job runs every 24 hours by default,
however the job execution time can be changed to meet the needs of your monitored
environment.
You may also run Always-On Monitoring only when needed instead of having it run
constantly in the background. However, doing so will require Always-On Monitoring to
synchronize with the Enterprise Manager OMS. Depending on the size of your
Enterprise Manager deployment, synchronization may take 10-15 minutes in order to
obtain current information on all Enterprise Manager targets and metrics.
Note:
Always-On Monitoring and Enterprise Manager must be in SYNC before
Enterprise Manager goes down.
12.3 Installing Always-On Monitoring
Always-On Monitoring is a self-contained application that is supplied with the
Enterprise Manager software distribution and is also available via the Self-Update
function in Enterprise Manager. It is recommended to go to Self Update to download
the latest Always-On Monitoring release.
Steps to install Always-On Monitoring:
1. Uninstall any previous installations of Always-On Monitoring. For more information,
see Uninstalling Always-On Monitoring.
Chapter 12
Best Practices
12-7
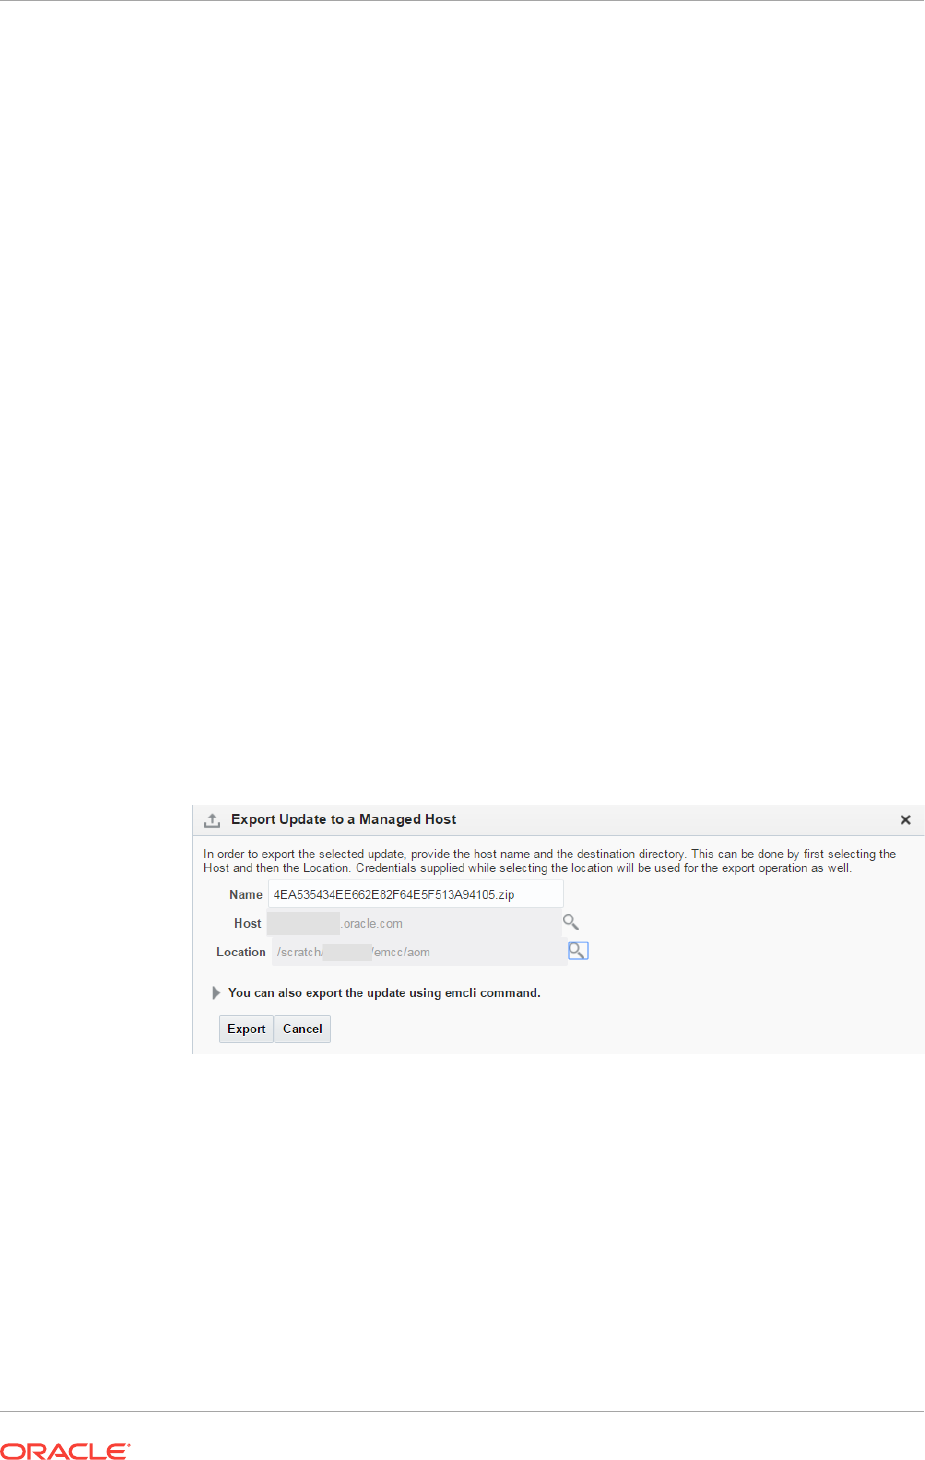
2. Download the latest Always-On Monitoring release from Self-Update.
3. Copy the downloaded ZIP file to the Always-On Monitoring host and unzip the
contents to the location where Always-On Monitoring is to be installed.
12.3.1 Installing Always-On Monitoring from an Enterprise Manager
Software Distribution
The Always-On Monitoring installation zip file is shipped with Enterprise Manager.
From the sysman/ems directory, find the Always-On Monitoring installation zip file (e.g.
ems_13.2.0.1.0.zip). Unzip the file to the location where you want to install Always-On
Monitoring.
12.3.2 Installing Always-On Monitoring from Self-Update
From the Self-Update home page, click on the Check Updates link. The number of
available updates for Always-On Monitoring type should increase by one, unless there
is no new available update. Proceed to the Always-On Monitoring entity type page in
Self-Update. To download the entity from ARU, click on Actions → Download
Once the entity has been downloaded, you are ready to begin.
1. To export to your workstation, select the entity and click on Actions → Export to
→ Your Workstation. The Self-Update file (in zip format) automatically downloads
to your workstation. After unzipping this file, go to the archives subdirectory and
copy ems_13.2.0.1.0.zip to the AOM host. Unzip ems_13.2.0.1.0.zip and continue
the steps outlined in the product documentation. See Configuring Always-On
Monitoring.
2. To export to a managed host, select Actions → Export to → Managed Host.
The Export Update to a Managed Host dialog displays.
3. Enter the name of the export file name or accept the default name.
4. Click the search icon for the Host field. The Search and Select Hosts dialog
displays.
Chapter 12
Installing Always-On Monitoring
12-8
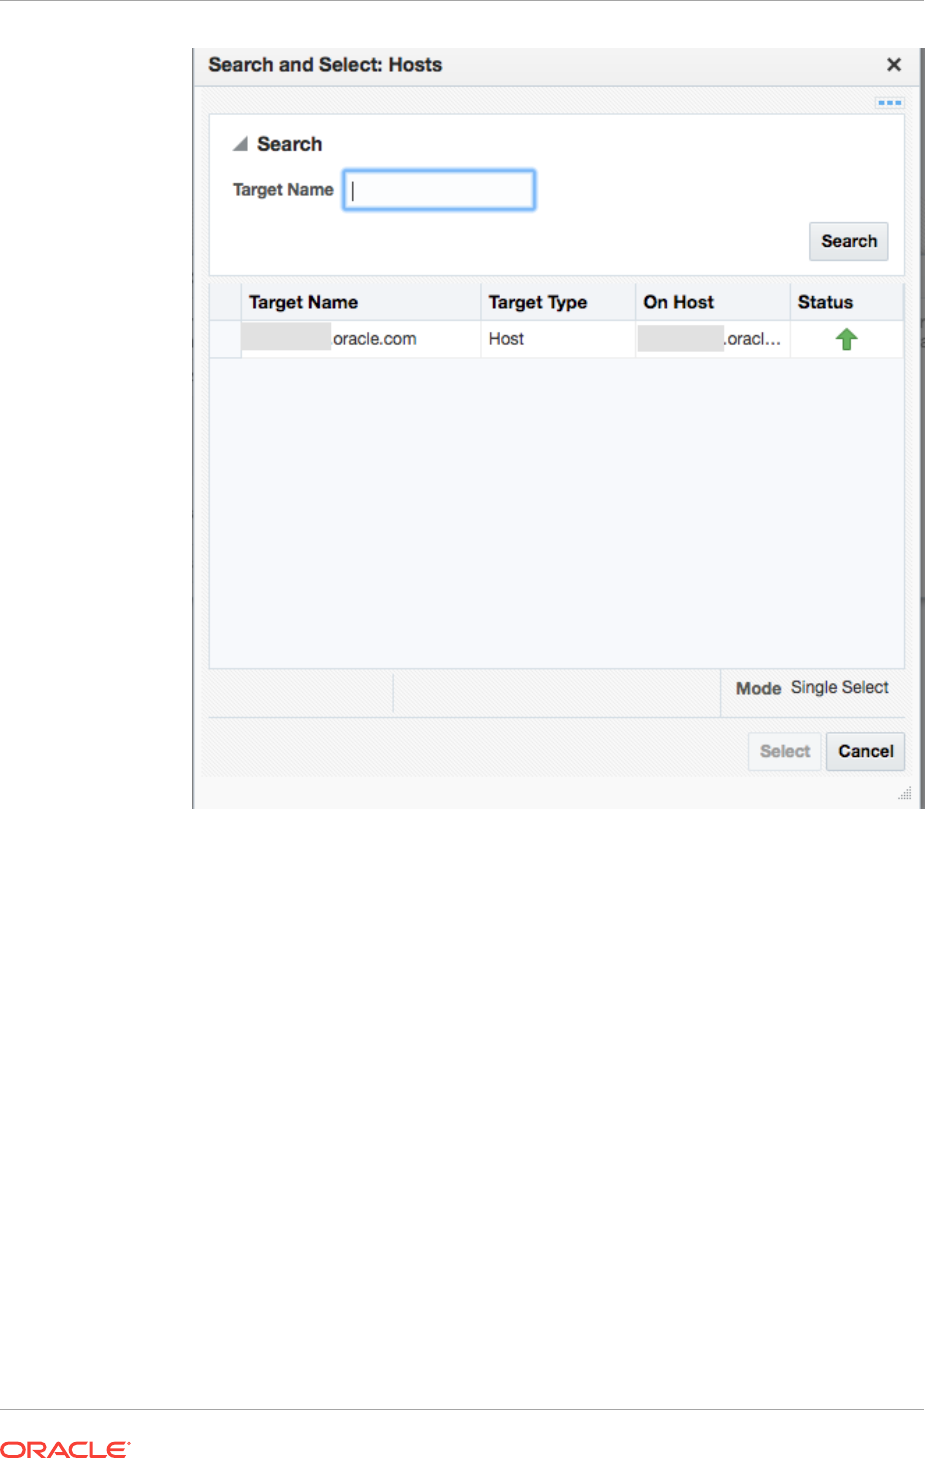
5. Select a host and click Select. You might need to enter a search string to narrow
the results.
6. Click the search icon for the Location field. The Remote File Browser dialog
displays.
Chapter 12
Installing Always-On Monitoring
12-9
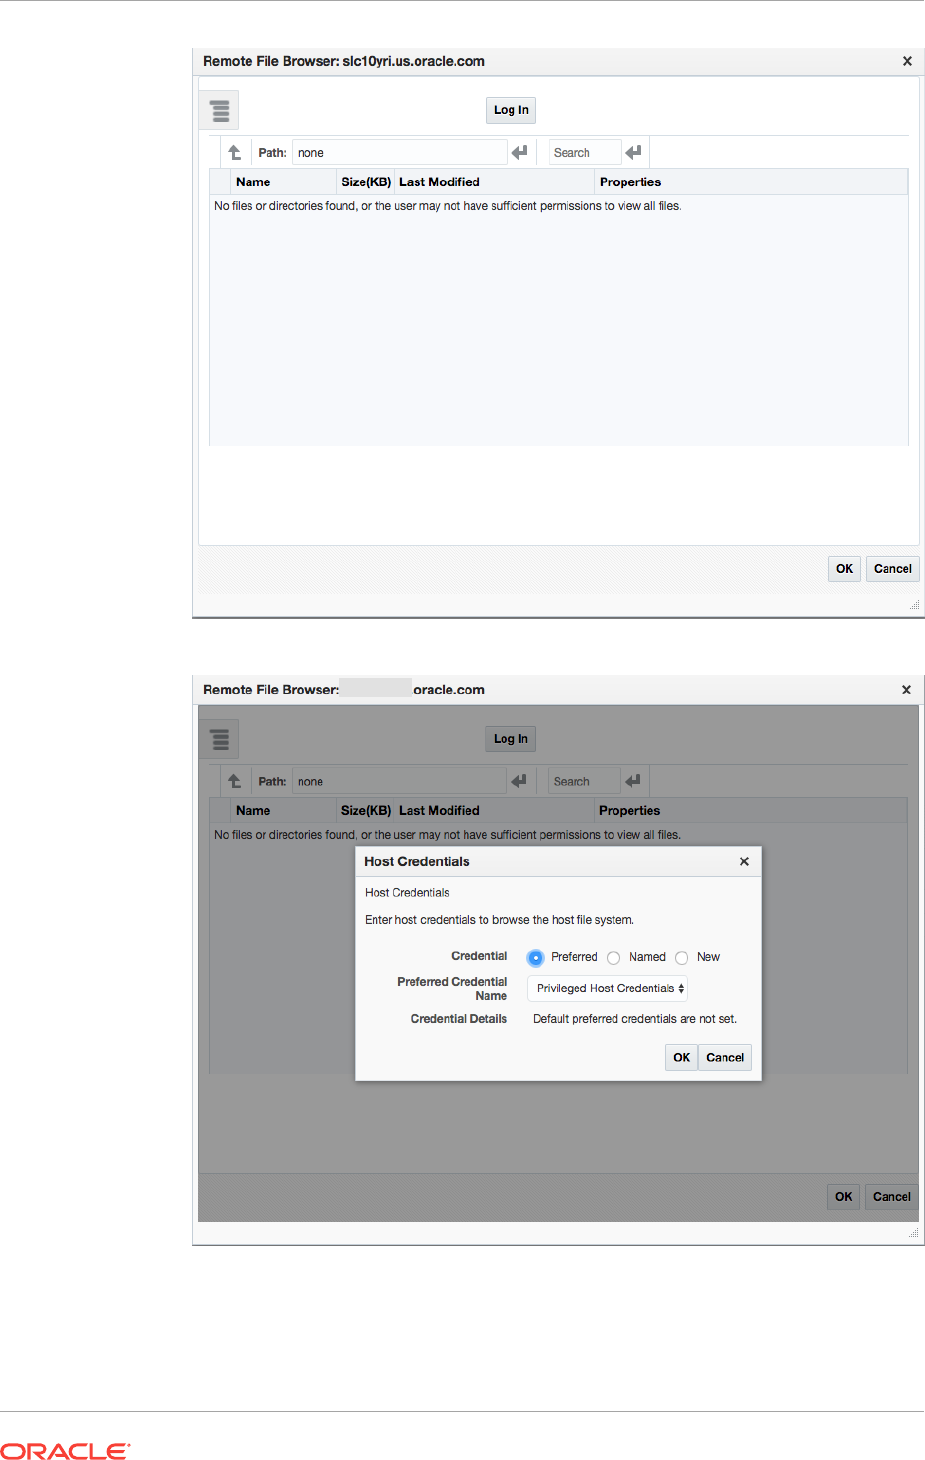
7. Click Log In. The Host Credentials dialog displays.
8. Select existing Preferred or Named credentials or enter a New set of named
credentials and click OK.
9. Select the path where you want to place the export file and click OK.
Chapter 12
Installing Always-On Monitoring
12-10
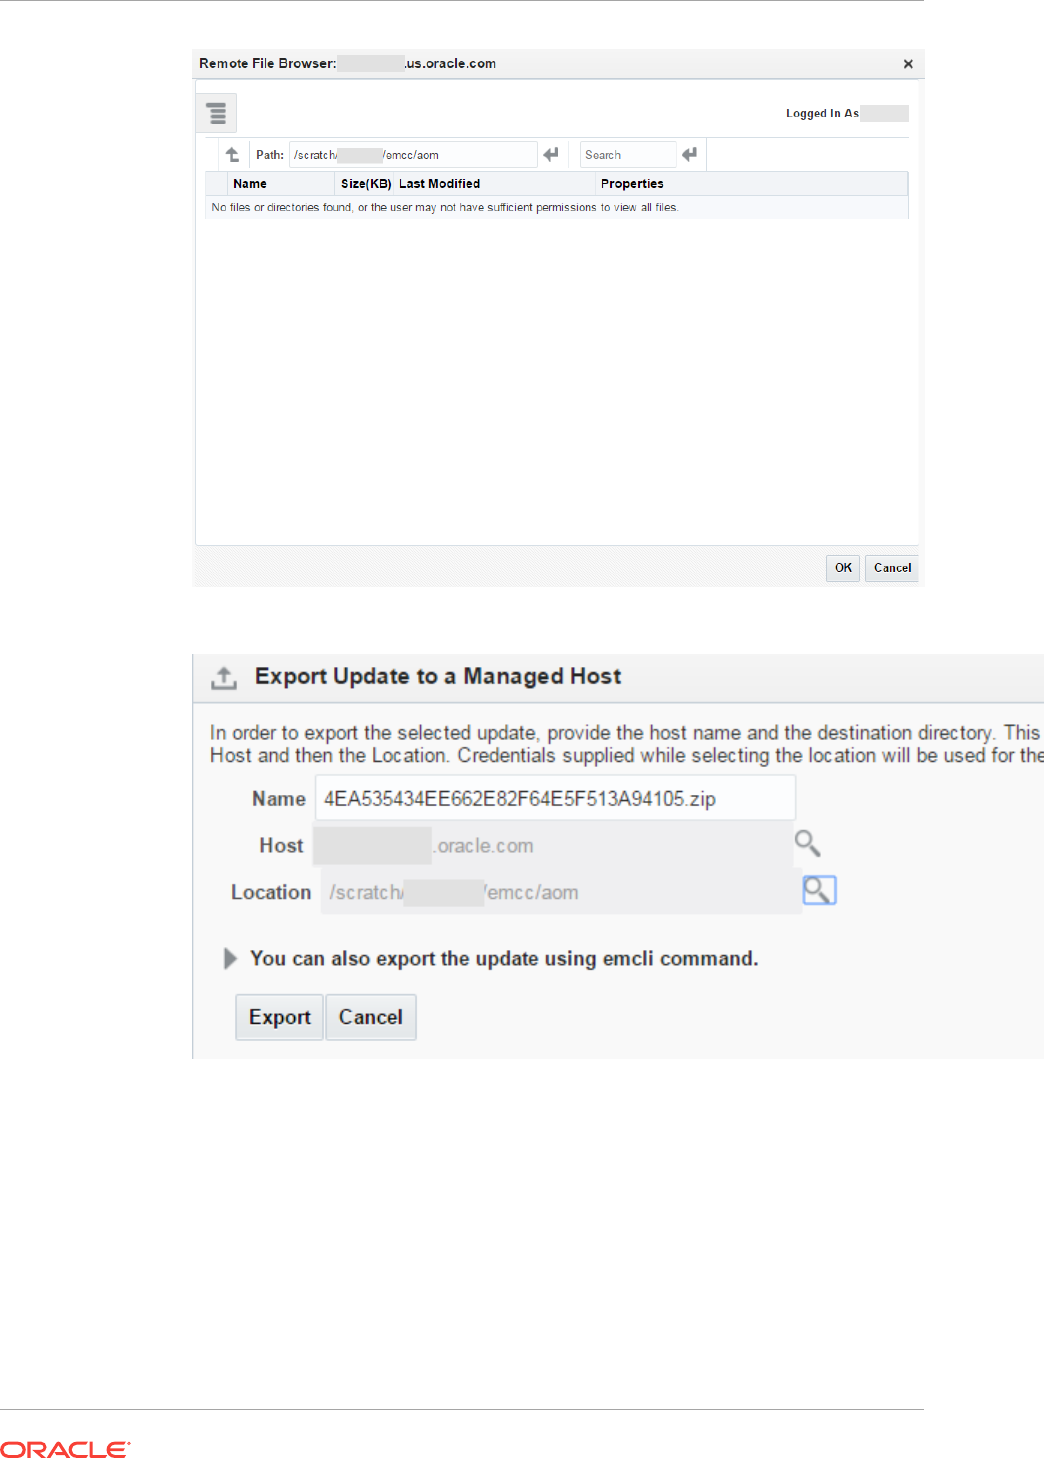
The Export Update to a Managed Host pop-up window will be displayed with
the selections listed.
10. Click Export. A confirmation window will appear confirming the update has been
exported successfully to this host.
Chapter 12
Installing Always-On Monitoring
12-11
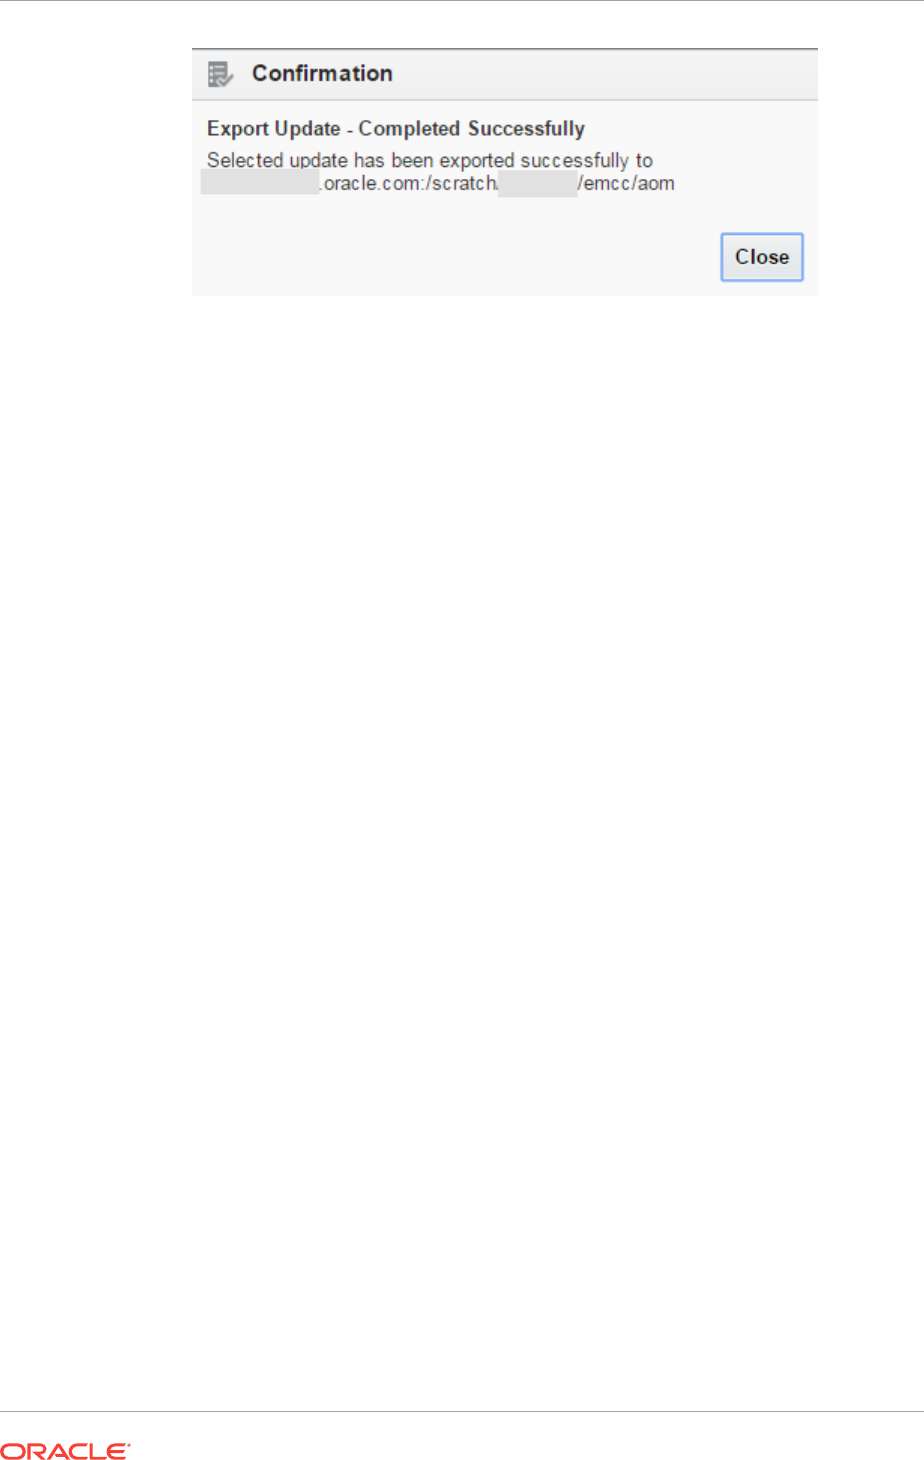
11. Log on to the host and unzip the exported zip file (which will have the default file
name or designated file name from above). After unzipping this file, go to the
archives subdirectory and copy ems_13.2.0.1.0.zip to the AOM host.
12. Unzip ems_13.2.0.1.0.zip and continue the steps outlined in the product
documentation. See Configuring Always-On Monitoring.
12.3.3 Installing Multiple Always-On Monitoring Instances
You can set up multiple Always-On Monitoring (AOM) instances to ensure Always-On
Monitoring is available in the event of outages. See Setting Up Multiple Always-On
Monitoring Instances for more information.
12.4 Configuring Always-On Monitoring
Once Always-On Monitoring has been installed, the Always-On Monitoring
configuration assistant script can be used to configure the service to communicate with
the Enterprise Manager repository.
Always-On Monitoring configuration involves the following steps:
1. Saving the Em Key
2. Using the Always-On Monitoring Configuration Assistant (EMSCA)
3. Removing the Em Key
4. Configuring Email Servers in Enterprise Manager
5. Configuring Downtime Contacts in Enterprise Manager
6. Synchronizing Always-On Monitoring with Enterprise Manager for the First Time
7. Configuring Enterprise Manager to Work with Always-On Monitoring
8. Enabling Notifications
9. Verifying the Always-On Monitoring Upload URL on Enterprise Manager
12.4.1 Saving the Em Key
Always-On Monitoring requires the Em key in order to be able to synchronize with the
Enterprise Manager repository and reuse the SMTP (email) gateway configuration
information from Enterprise Manager.
Chapter 12
Configuring Always-On Monitoring
12-12

Note:
The Em key needs to be copied to the Enterprise Manager repository
BEFORE configuring Always-On Monitoring. Not doing so will result in errors
when running emsca.
Once Always-On Monitoring configuration is complete (emsca has successfully run
through completion), immediately remove the Em key from the Enterprise Manager
repository. Note: Always-On Monitoring does not have to be restarted. To store the
key in the repository, run the following emctl commands from the
$MW_HOME/bin
directory, where $MW_HOME is the Enterprise Manager Middleware Home directory.
% emctl config emkey -copy_to_repos
Once Always-On Monitoring configuration is complete, execute the following command
to remove the key.
% emctl config emkey -remove_from_repos
12.4.2 Using the Always-On Monitoring Configuration Assistant
(EMSCA)
The Always-On Monitoring configuration assistant, emsca, is a script located under the
Always-On Monitoring installation scripts directory. Running emsca requires the bash
shell to be installed.
If you have database administrator credentials, you can pass them to the emsca script
and it will create the Always-On Monitoring user for you.
If you do not have database administrator credentials, you need to:
1. Ask the database administrator to run the script. See Creating the Always-On
Monitoring Repository User.
2. Run
emsca -createEmsDbUser=false
The following example usage scenarios assume Always-On Monitoring is installed in a
location referred to using the environment variable AOM_HOME. Run the
configuration assistant located in $AOM_HOME/scripts. The EMSCA may be invoked
with no parameters and will prompt for the necessary information. Once the
configuration has completed, record the Always-On Monitoring Upload URL as it will
be used later to configure Enterprise Manager.
Example EMSCA Installation Scenarios
The user installing Always-On Monitoring has SYSDBA credentials.
Copyright (c) 1996, 2016 Oracle Corporation. All rights reserved.
---------------------------------------------------------------
Always-On Monitoring Repository Connection String : slc03qon.us.oracle.com:
25059:s307480
Always-On Monitoring Repository Username [ems] :
Always-On Monitoring Repository Password [ems] :
User "ems" cannot be found in the database.
In order to create this user, SYSDBA credentials are required. If you do not want to
Chapter 12
Configuring Always-On Monitoring
12-13

continue, answer "n" to the question below.
Create the Always-On Monitoring Repository user [y] :
Always-On Monitoring Repository SYSDBA Username : sys
Always-On Monitoring Repository SYSDBA Password :
Enterprise Manager Repository Connection String : slc03qon.us.oracle.com:
25059:s307480
Enterprise Manager Repository Username : sysman
Enterprise Manager Repository Password :
Creating Always-On Monitoring repository user ems
Agent Registration Password :
Keystore for host slc03qon.us.oracle.com created successfully.
Connecting to Always-On Monitoring Repository.
Creating Always-On Monitoring Repository schema
Creating repository storage for Targets data.
Creating repository storage for Alerts and Availability data.
Creating repository storage for Notification Metadata data.
Creating repository storage for Target Metric Metadata data.
Registering Always-On Monitoring instance
Always-On Monitoring Upload URL: https://slc03qon:8081/upload
The user installing Always-On Monitoring does not have SYSDBA credentials.
Example 1: SYSDBA creates an Always-On Monitoring user and grants user privileges
shown in the following example.
aomuser is the name of the Always-On Monitoring user in the database.
SYSDBA privileges are required to run the following script
create user aomuser identified by <password>;
grant CREATE JOB,
CREATE SESSION,
ALTER SESSION,
CREATE DATABASE LINK,
CREATE MATERIALIZED VIEW,
CREATE PROCEDURE,
CREATE PUBLIC SYNONYM,
CREATE ROLE,
CREATE SEQUENCE,
CREATE SYNONYM,
CREATE TABLE,
CREATE TRIGGER,
CREATE TYPE,
CREATE VIEW,
UNLIMITED TABLESPACE,
SELECT ANY DICTIONARY to aomuser;
grant EXECUTE ON SYS.DBMS_CRYPTO to aomuser;
grant EXECUTE ON SYS.DBMS_AQADM to aomuser;
grant EXECUTE ON SYS.DBMS_AQ to aomuser;
grant EXECUTE ON SYS.DBMS_AQIN to aomuser;
grant EXECUTE ON SYS.DBMS_SCHEDULER to aomuser;
grant EXECUTE ON SYS.DBMS_LOCK to aomuser;
Example 2: The Always-On Monitoring user invokes the EMSCA script..
Oracle Enterprise Manager Cloud Control 13c Release 2
Copyright (c) 1996, 2016 Oracle Corporation. All rights reserved.
---------------------------------------------------------------
Chapter 12
Configuring Always-On Monitoring
12-14

Always-On Monitoring Repository Connection String : slc03qon.us.oracle.com:
25059:s307480
Always-On Monitoring Repository Username [ems] : aomuser
Always-On Monitoring Repository Password [ems] :
Always-On Monitoring Repository user "aomuser" has already been created
Enterprise Manager Repository Connection String : slc03qon.us.oracle.com:
25059:s307480
Enterprise Manager Repository Username : sysman
Enterprise Manager Repository Password :
Agent Registration Password :
Keystore for host slc03qon.us.oracle.com created successfully.
Connecting to Always-On Monitoring Repository.
Creating Always-On Monitoring Repository schema
Creating repository storage for Targets data.
Creating repository storage for Alerts and Availability data.
Creating repository storage for Notification Metadata data.
Creating repository storage for Target Metric Metadata data.
Registering Always-On Monitoring instance
Always-On Monitoring Upload URL: https://slc03qon:8081/upload
SYSDBA creates a role and assigns it to Always-On Monitoring user then emsca
is executed.
Some sites prefer to create a role and assign that role to the Always-On Monitoring
user. In this situation, you must run the scripts shown in the following examples.
Example 1: SYSDBA creates a role and then assigns it to the Always-On Monitoring
user.
create user <aom_user> identified by <aom_password>;
create role ems_role;
grant CREATE SESSION,
ALTER SESSION,
CREATE DATABASE LINK,
CREATE MATERIALIZED VIEW,
CREATE PROCEDURE,
CREATE PUBLIC SYNONYM,
CREATE ROLE,
CREATE SEQUENCE,
CREATE SYNONYM,
CREATE TABLE,
CREATE TRIGGER,
CREATE TYPE,
CREATE VIEW,
SELECT ANY DICTIONARY to ems_role;
grant ems_role to <aom_user>;
Example 2: SYSDBA grants the following privileges directly to the Always-On
Monitoring user.
grant CREATE JOB,
UNLIMITED TABLESPACE to <aom_user>;
grant EXECUTE ON SYS.DBMS_CRYPTO to <aom_user>;
grant EXECUTE ON SYS.DBMS_AQADM to <aom_user>;
grant EXECUTE ON SYS.DBMS_AQ to <aom_user>;
grant EXECUTE ON SYS.DBMS_AQIN to <aom_user>;
Chapter 12
Configuring Always-On Monitoring
12-15

grant EXECUTE ON SYS.DBMS_SCHEDULER to <aom_user>;
grant EXECUTE ON SYS.DBMS_LOCK to <aom_user>;
Example 3: The Always-On Monitoring user invokes the emsca script.
Oracle Enterprise Manager Cloud Control 13c Release 2
Copyright (c) 1996, 2016 Oracle Corporation. All rights reserved.
---------------------------------------------------------------
Always-On Monitoring Repository Connection String : slc03qon.us.oracle.com:
25059:s307480
Always-On Monitoring Repository Username [ems] :
Always-On Monitoring Repository Password [ems] :
Always-On Monitoring Repository user "ems" has already been created
Enterprise Manager Repository Connection String : slc03qon.us.oracle.com:
25059:s307480
Enterprise Manager Repository Username : sysman
Enterprise Manager Repository Password :
Agent Registration Password :
Keystore for host slc03qon.us.oracle.com created successfully.
Connecting to Always-On Monitoring Repository.
Creating Always-On Monitoring Repository schema
Creating repository storage for Targets data.
Creating repository storage for Alerts and Availability data.
Creating repository storage for Notification Metadata data.
Creating repository storage for Target Metric Metadata data.
Registering Always-On Monitoring instance
Always-On Monitoring Upload URL: https://slc03qon:8081/upload
Running EMSCA with a Response File
You can also use the -responseFile option to provide the parameters to the script
using a response input file. For example
$ emsca -responseFile=<response_filename>
Where response_filename is the response file containing the following script
parameters:
emsRepConnectString=localhost:1521:xe
emsRepUsername=ems
emsRepPassword=ems
emRepConnectString=mymachine.mycompany.com:15044:semgc3
emRepUsername=sysman
emRepPassword=sysman
#
emsPort=8081
http.protocol=http
#
The following table lists available EMSCA parameters.
Table 12-3 EMSCA Parameters
EMSCA Prompt Description
Always-On Monitoring
Repository Connection
String
The connect string used to locate the Always-On Monitoring
repository. This may be any valid service descriptor or may be a
host:port:sid
.
Chapter 12
Configuring Always-On Monitoring
12-16

Table 12-3 (Cont.) EMSCA Parameters
EMSCA Prompt Description
Always-On Monitoring
Repository Username
The username associated with the Always-On Monitoring
repository. See Creating the Always-On Monitoring Repository
Userfor more details.
Always-On Monitoring
Repository Password
The password associated with the Always-On Monitoring
repository user. See Creating the Always-On Monitoring
Repository User for more details.
Enterprise Manager
Repository Connection
String
The connect string used to locate the Enterprise Manager
repository. This may be any valid service descriptor or may be a
host:port:sid.
Enterprise Manager
Repository Username
The username of the Enterprise Manager SYSMAN user.
Enterprise Manager
Repository Password
The password of the Enterprise Manager SYSMAN user.
12.4.3 Removing the Em Key
% emctl config emkey -remove_from_repos
Always-On Monitoring does not have to be restarted.
12.4.4 Configuring Email Servers in Enterprise Manager
When Always-On Monitoring sends email notifications, it does so using email server
configurations that it obtains from Enterprise Manager during the synchronization step.
For Always-On Monitoring to function properly, email servers must be configured in
Enterprise Manager before performing an Always-On Monitoring synchronization. See
for more information.
If changes to the email server configurations are made in Enterprise Manager, Always-
On Monitoring must be synchronized again to retrieve the updated email server
configuration. SeeUpdating Always-On Monitoring “Running an Incremental
Synchronization Manually” for additional details.
12.4.5 Configuring Downtime Contacts in Enterprise Manager
Once Always-On Monitoring is synchronized with Enterprise Manager, the monitoring
service can send email notifications to the appropriate administrators when the OMS is
down via configured downtime contacts. Prior to running Always-On Monitoring for the
first time, downtime contacts should be configured in Enterprise Manager. The
downtime contacts that Always-On Monitoring sends notification to may be any one of
the following forms.
•Global downtime contact
•Per-target downtime contact based on target property
•Per-target downtime contact based on event rules
If email addresses are specified for both Global and Per-target forms, then all email
addresses will be used.
Chapter 12
Configuring Always-On Monitoring
12-17
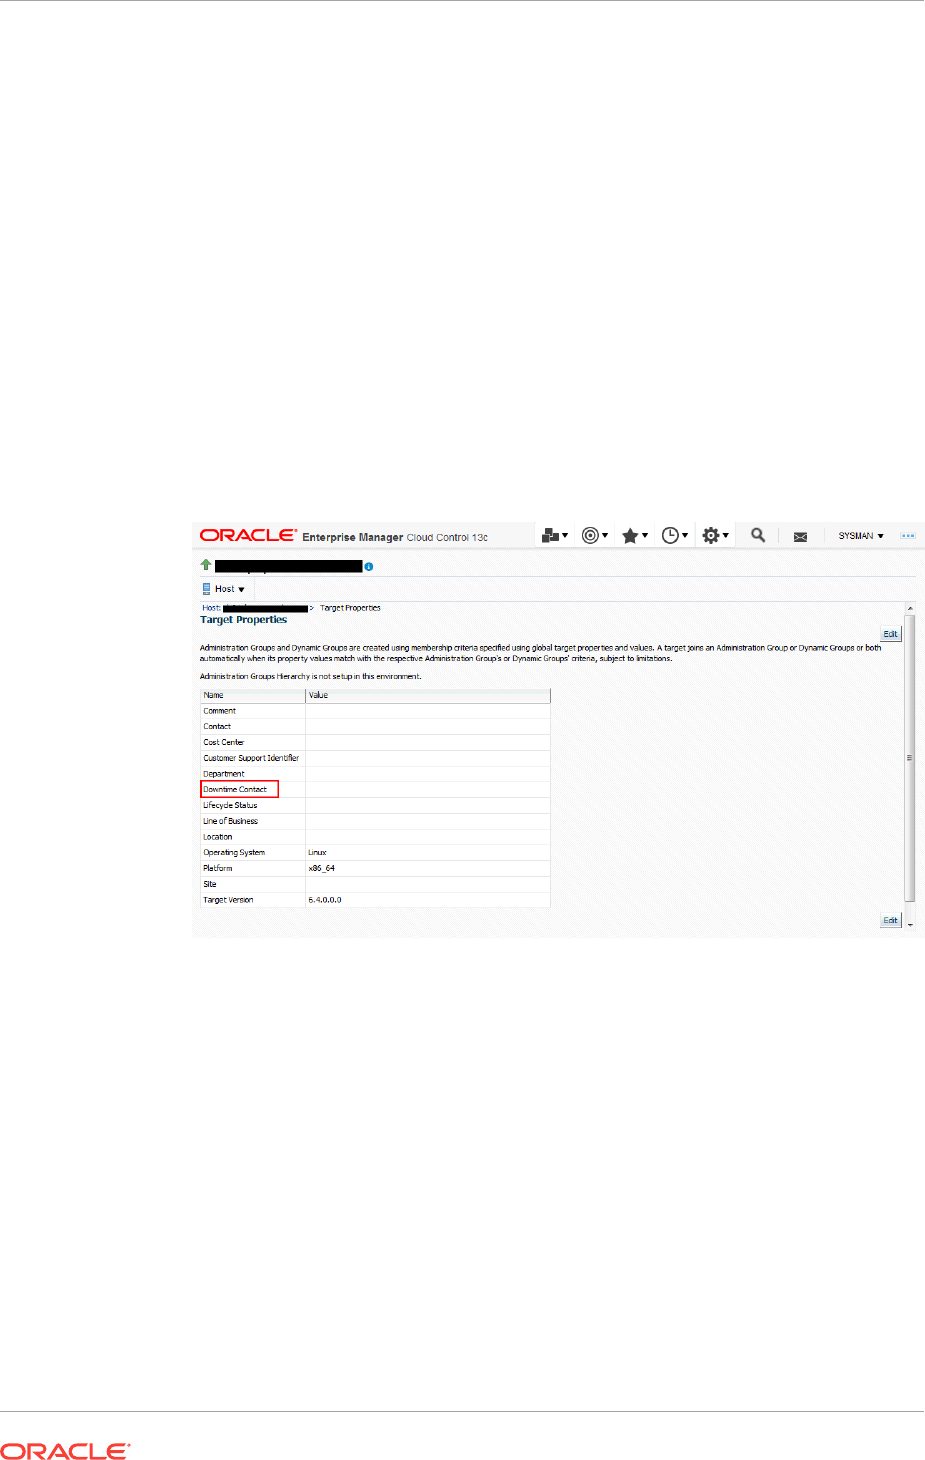
Global Downtime Contact
The global downtime contact is a single property set on the Enterprise Manager site.
Once set, all target status events and metric alerts across all targets will be sent to the
recipients specified in the global downtime contact property.
% emcli set_oms_property -
property_name='oracle.sysman.core.events.ems.downtimeContact'
-property_value='<email addresses>'
Per-Target Downtime Contact from Target Property
The email addresses for these downtime contacts should be specified in the Downtime
Contact target property for each target. There are three ways to specify the Downtime
Contact target property:
•For each target, navigate to the Target Properties page, which can be accessed
from the target's homepage. From the target menu on the target homepage, select
Target Setup and then Properties. The Target Properties page displays.
Click on Edit and specify the email address in the Downtime Contact target
property. You can specify multiple email addresses by separating them with
commas.
•Use the EM CLI set_target_property_value verb.
emcli set_target_property_value -
property_records="target_name:target_type:property_name:property_value"
Example:
%./emcli set_target_property_value -property_records="myhost:host:Downtime
Contact:John.Doe@mycompany.com"
For more information about the set_target_property_value verb, see the Oracle
Enterprise Manager Command Line Interface Guide.
•By leveraging the email recipients in the target down event rules in Enterprise
Manager Cloud Control. See the following section for more details.
Chapter 12
Configuring Always-On Monitoring
12-18

Per-Target Downtime Contact from Event Rules
Always-On Monitoring may also send email notifications to different users for each
target. These contacts are generated in Enterprise Manager based on the event rules
for that target. Therefore, as event rules are changed in Enterprise Manager, the
contacts must be re-generated and an incremental synchronization performed
By leveraging the event rule setup, the downtime contact will be generated based on
the email recipient for the event rule for a Target Availability event type where Down
status has been selected.
Note:
Although downtime contacts are generating using only Target Availability
event rules, Always-On Monitoring will send notifications for both target
availability and metric threshold alerts.
You can review and update the recipients of your target availability (status down)
event rules. Doing so allows you to generate a list of downtime contacts using EM CLI
or by submitting the downtime contact generation job.
Generating Downtime Contact using EM CLI
From the EM CLI, use the generate_downtime_contact command to produce
downtime contacts for a specific target. The command simulates ALL Target
Availability rules that would affect that particular target and generates a list of email
addresses that includes the output from all rules. The optional -set parameter will
cause the contact to be saved so that Always-On Monitoring synchronization can
retrieve it later.
% emcli generate_downtime_contact -target_name=<name> -target_type=<type> -set
Generating Downtime Contact Enterprise Manager Job
% emcli create_job -input_file=property_file:<job_prop_file> -
name="GenerateDowntimeContacts"
Where the job_prop_file refers to a properties file with the following content:
# job type
type=CoreSetDowntimeContacts
# description
description=You job description
# target names, the list of target names
variable.target_names=host1,database2
# target types, the list of target types corresponding to the target list above
variable.target_types=host,oracle_database
# set on all targets, true to update contacts, false to print output but not save
variable.set_all_targets=true
# frequency to run job, refer to Enterprise Manager documentation for options
schedule.frequency=IMMEDIATE
Chapter 12
Configuring Always-On Monitoring
12-19

Note:
The process of generating the downtime contacts thru either the EM CLI or the
downtime contact generation job, does not immediately make the contacts
available to the monitoring service. A separate Always-On Monitoring
synchronization must be done each time these contacts are updated. This is
done using the emsctl sync command.
Types of Alerts Received by Downtime Contacts
Once configured, Always-On Monitoring will send email notifications for:
•All target status alerts and metric alerts (critical, warning, and clear).
•Metric collection errors (both critical and clear).
Target status alerts for aggregate targets, such as groups and clusters, whose status
is based on the status of its component members is not supported. Instead, alerts will
be sent for the individual members of these aggregate targets..
Note:
Currently, email notification is the only type of notification supported.
The recipients of the email should be email addresses. The recipients are specified
using the global property downtimeContact or the per-target Downtime Contact. If both
are specified, emails will be sent to all recipients specified.
If the global property downtimeContact is specified, all alerts on all targets will be sent
to the recipients specified in the global property downtimeContact. If the per-target
property Downtime Contact is specified, all target status and metric alerts for that
target will be sent to the recipients specified in that property.
12.4.6 Synchronizing Always-On Monitoring with Enterprise Manager
for the First Time
Before starting Always-On Monitoring for the first time, you must synchronize Always-
On Monitoring with Enterprise Manager. Synchronization copies notification
configuration and downtime contacts from Enterprise Manager targets, thus allowing
Always-On Monitoring to monitor alerts and send email notifications.
To perform Always-On Monitoring-Enterprise Manager synchronization:
% $AOM_HOME/scripts/emsctl sync
Oracle Enterprise Manager Cloud Control 13c Release 2
Copyright (c) 1996, 2016 Oracle Corporation. All rights reserved.
------------------------------------------------------------------
Connecting to Always-On Monitoring repository.
Starting synchronization with Enterprise Manager.
Synchronizing with Enterprise Manager repository: sysman@myserver.myco.com:
35074:semgc4
Chapter 12
Configuring Always-On Monitoring
12-20

Synchronizing Targets data.
Synchronizing Alerts and Availability data.
Synchronizing Notification Metadata data.
Synchronizing Target Metric Metadata data.
Synchronization complete at : Thu Oct 22 06:50:56 PDT 2016
Note:
Synchronization should be run again whenever there are changes made to
Enterprise Manager. For example, after adding new hosts or targets, changing
the email server, or changing the downtime contacts, an incremental
synchronization is required in order for Always-On Monitoring to pick up the
latest configurations.. See "Running an Incremental Synchronization Manually"
for additional details.
12.4.7 Configuring Enterprise Manager to Work with Always-On
Monitoring
The final step in the configuration of Always-On Monitoring is to update Enterprise
Manager to include the upload URL for the service. The upload URL is displayed by
Always-On Monitoring Configuration Assistant upon successful completion of the
configuration of the service. Always-On Monitoring configuration properties file also
includes the protocol and port configured for the service so that the upload URL will be
of the form:
https://yourhostname:8081/upload
Once configured, the URL will be sent to all Agents (version 13.1 and greater), both
existing Agents and any Agents deployed in future. Hence, configuration only needs to
be done once. Agents less than 13.1 will not receive the Always-On Monitoring upload
URL.
HTTPS is the default protocol for Always-On Monitoring and the default port is 8081.
Please refer to the emsca or Always-On Monitoring configuration file for the configured
values.You can find the configuration file at the following location:
$EMS_HOME/conf/emsConfig.properties
To configure Enterprise Manager with Always-On Monitoring upload location, the
following command should be executed from Enterprise Manager.
% emctl set property -name "oracle.sysman.core.events.ems.emsURL" -value "https://
yourhostname:8081/upload" -sysman_pwd sysman
12.4.8 Enabling Notifications
Always-On Monitoring initial configuration has notifications disabled—the service will
not send emails as new alerts are received. You must first enable Always-On
Monitoring to send email notifications.The Always-On Monitoring notification enable/
disable setting is persistent across starts/stops of Always-On Monitoring. The
enable_notification command will automatically perform an incremental sync.
% $AOM_HOME/scripts/emsctl enable_notification
Oracle Enterprise Manager Cloud Control 13c Release 2
Chapter 12
Configuring Always-On Monitoring
12-21

Copyright (c) 1996, 2016 Oracle Corporation. All rights reserved.
------------------------------------------------------------------
Notifications have been enabled. There are downtime contacts configured.
Connecting to Always-On Monitoring repository.
Starting synchronization with Enterprise Manager.
Synchronizing with Enterprise Manager repository: sysman@myserver.myco.com:
35074:semgc4
Synchronizing Targets data.
Synchronizing Alerts and Availability data.
Synchronizing Notification Metadata data.
Synchronizing Target Metric Metadata data.
Synchronization complete at : Thu Oct 22 07:01:20 PDT 2016
If you do not want to perform a SYNC then add the -nosync option.
$AOM_HOME/scripts/emsctl enable_notification -nosync
Oracle Enterprise Manager Cloud Control 13c Release 2
Copyright (c) 1996, 2016 Oracle Corporation. All rights reserved.
------------------------------------------------------------------
Notifications have been enabled. There are downtime contacts configured.
To disable notifications but leave Always-On Monitoring running use the
disable_notification command:
% $AOM_HOME/scripts/emsctl disable_notification
Oracle Enterprise Manager Cloud Control 13c Release 2
Copyright (c) 1996, 2016 Oracle Corporation. All rights reserved.
---------------------------------------------------------------
Notifications have been disabled.
12.4.9 Verifying the Always-On Monitoring Upload URL on Enterprise
Manager
You can determine the upload URL by issuing the following command:
%emsctl status
Example:
$ ./emsctl status
Oracle Enterprise Manager Cloud Control 13c Release 2
Copyright (c) 1996, 2016 Oracle Corporation. All rights reserved.
------------------------------------------------------------------
Always-On Monitoring Version : 13.2.0.0.0
Always-On Monitoring Home : /mycomputer/ems
Started At : December 4, 2016 8:07:12 AM PST
Last Repository Sync : December 4, 2016 8:06:10 AM PST
Upload URL : https://myserver:8081/upload
Always-On Monitoring Process ID : 28171
Always-On Monitoring Repository : myserver.myco.com:15044:sarview
Enterprise Manager Repository : myserver.myco.com:15044:sarview
Notifications Enabled : false
Total Downtime Contacts Configured : 1
You can verify the setting in the OMS by using the
emctl get property
command.
You can verify the setting on a particular Agent by looking at $AGENT_HOME/
sysman/config/emd.properties and searching for EMS_URL.
Chapter 12
Configuring Always-On Monitoring
12-22

12.5 Controlling the Service
Starting Always-On Monitoring:
% $AOM_HOME/scripts/emsctl start
Oracle Enterprise Manager Cloud Control 13c Release 2
Copyright (c) 1996, 2016 Oracle Corporation. All rights reserved.
------------------------------------------------------------------
Pinging Always-On Monitoring...
Always-On Monitoring is not running.
Starting Always-On Monitoring.
Waiting for process to start
Retrying...
Notifications Enabled : true
Total Downtime Contacts Configured : 1
Always-On Monitoring is up.
Getting Status & Logs
Use the
emsctl
status
command to ascertain the operational status of Always-On
Monitoring.
Example:
% $AOM_HOME/scripts/emsctl status
Oracle Enterprise Manager Cloud Control 13c Release 2
Copyright (c) 1996, 2016 Oracle Corporation. All rights reserved.
------------------------------------------------------------------
Always-On Monitoring Version : 13.2.0.0.0
Always-On Monitoring Home : /homedirectory/ems
Started At : October 22, 2016 6:53:30 AM PDT
Last Repository Sync : October 22, 2016 6:50:51 AM PDT
Upload URL : https://myserver:8081/upload
Always-On Monitoring Process ID : 563
Always-On Monitoring Repository : myserver.myco.com:35074:semgc4
Enterprise Manager Repository : sysman
Notifications Enabled : false
Always-On Monitoring is up.
Pinging Always-On Monitoring
In addition to running the emsctl status command, you can also issue the ping
command if you just want to see that Always-On Monitoring service is up without
listing all the operational details.
Example:
$AOM_HOME/scripts/emsctl ping
Oracle Enterprise Manager Cloud Control 13c Release 2
Copyright (c) 1996, 2016 Oracle Corporation. All rights reserved.
------------------------------------------------------------------
Always-On Monitoring is running
Log Files
Chapter 12
Controlling the Service
12-23
Log files record Always-On Monitoring events that occur during operation and are
generated as follows:
•emsca logs: emsca.err (only errors), emsca.log.0 (rotating log file that contains all
output including errors).
•ems logs: ems.err (only errors), ems.log.0 (rotating log file that contains all output
including errors).
These files are located in the
$AOM_HOME/logs
directory.
Log levels determine the type and operational severity of information recorded in the
log files. Levels can be set to any one of the following:
•INFO: Always-On Monitoring operational events such and login, logout, or any
other events tied to Always-On Monitoring lifecycle.
•DEBUG: Information considered useful when tracing the flow of Always-On
Monitoring events to isolate specific problems.
•WARN (default setting): Unexpected operational Always-On Monitoring events.
These are Always-On Monitoring events that should be tracked, but may not
require immediate administrator intervention.
•ERROR: Always-On Monitoring operational malfunction.
To change the log level, add the
logLevel=... property to $AOM_HOME/conf/
emsConfig.properties
. Note that this applies only to the current Always-On Monitoring
instance.
Note:
You must bounce Always-On Monitoring in order for the log level changes to
take affect.
Stopping the Service
Use the
emsctl stop
command to stop Always-On Monitoring.
$AOM_HOME/scripts/emsctl stop
Oracle Enterprise Manager Cloud Control 13c Release 2
Copyright (c) 1996, 2016 Oracle Corporation. All rights reserved.
------------------------------------------------------------------
Shutting down Always-On Monitoring.
Always-On Monitoring is stopped.
12.5.1 Always-On Monitoring Commands
The following EMSCTL commands are used to control Always-On Monitoring.
Command What it does
emsctl start Starts Always-On Monitoring.
emsctl stop Shuts down Always-On Monitoring.
Chapter 12
Controlling the Service
12-24

Command What it does
emsctl enable_notification -nosync (optional) Allow Always-On Monitoring to send email
notifications. By default, an incremental SYNC
is performed when enabling email
notifications. To prevent synchronization with
the Enterprise Manager repository, specify the
-nosync option.
emsctl disable_notification Prevent Always-On Monitoring from sending
email notifications.
emsctl list_agents Lists the URLs of Agents and a count of
Agents that have communicated with the
Always-On Monitoring Service in the past
hour.
emsctl ping Ping the Always-On Monitoring service to
determine whether it is up or down.
emsctl sync Synchronize Always-On Monitoring target and
notification data with the Enterprise Manager
repository.
emsctl secure [-wallet=<absolute path to the
wallet location>] | [-reg_pwd=<Agent
registration password>] [-host=<Fully qualified
Always-On Monitoring hostname>] [-
cert_validity=<validity period in days - defaults
to 10 years] [-key_strength=<certificate key
strength - defaults to 1024] [sign_alg=<md5|
sha1|sha256|sha384|sha512 - defaults to
sha512>
Generates a wallet file for Always-On
Monitoring service to run on a secured port.
emsctl status Display information related to Always-On
Monitoring operational status.
emsctl getstats Display the current Always-On Monitoring
performance statistics
emsctl list_properties Display Always-On Monitoring configuration
properties.
emsctl set_property -name=<property name> -
value=<property value>
Set Always-On Monitoring configuration
properties. For a complete list of configuration
properties, see Modifiable Always-On
Monitoring Properties
emsctl unset_property -name=<property
name>
Unset an existing Always-On Monitoring
configuration property. For a complete list of
configuration properties, see Modifiable
Always-On Monitoring Properties.
emsctl update_task -task_name=<SYNC|
PURGE> -run_interval=<time in minutes
between task executions>
Update the intervals for performing Always-On
Monitoring tasks such as SYNC or PURGE.
emsctl set_em_repos_conn -username=<em
username> -password=<em password> -
connect_string=<em connect descriptor>
Update the username, password and connect
string used to connect to Enterprise Manager
repository database.
emsctl set_ems_repos_conn -
username=<ems username> -password=<ems
password> -connect_string=<ems connect
descriptor>
Update username, password and connect
string used to connect to the Always-On
Monitoring repository database.
Chapter 12
Controlling the Service
12-25

12.6 Updating Always-On Monitoring
In order to carry out the notification function of Enterprise Manager, Always-On
Monitoring requires target monitoring and administrator notification configuration data
to be synchronized with the Enterprise Manager repository. Full synchronization is
performed when you install Always-On Monitoring and run the following command:
$AOM_HOME/scripts/emsctl sync
Incremental synchronization must be performed thereafter in order to keep Always-On
Monitoring monitoring/notification configuration current.
The following changes to Enterprise Manager will require an incremental Always-On
Monitoring synchronization:
•New hosts (Agents) added
•New targets added
•Changes to downtime contacts
•Changes to administrator email addresses
•Changes to email server configuration
Always-On Monitoring stays in SYNC with Enterprise Manager automatically via an
incremental synchronization job that runs every 24 hours. You can change the
synchronization interval using the emsctl update_task command.
$AOM_HOME/emsctl update_task -task_name=<SYNC|PURGE> -run_interval=<time in minutes
between task executions>
Incremental synchronization can be run manually via the emsctl sync command.
Running an Incremental Synchronization Manually
You can, at any time, perform an incremental Always-On Monitoring synchronization
by running the sync command.
% $AOM_HOME/scripts/emsctl sync
When performing a manual incremental synchronization, you do not need to shut
down Always-On Monitoring: You can run the SYNC command regardless of whether
Always-On Monitoring is up or down.
Note:
An incremental synchronization is automatically performed whenever you run
the enable_notification command. You can bypass the synchronization by
specifying the -nosync option.
Chapter 12
Updating Always-On Monitoring
12-26

12.7 Data Maintenance
The Always-On Monitoring repository contains historical availability and metric
violations data. This data is maintained for 6 months (default interval). Data older than
6 months is deleted (purged) from the repository.
Data maintenance is controlled by following settings:
•Purge Interval—Determines how often the data is purged from Always-On
Monitoring repository.
•Purge Duration—Determines how much data is kept during the purge process.
You can change the purge interval via the update_task command:
$AOM_HOME/scripts/emsctl update_task -task_name=PURGE -run_interval=<the number of
minutes between purge runs>
You can change the purge duration via the set_property command:
$AOM_HOME/scripts/emsctl set_property -name=purge.Duration -value=<the number of
minutes of data to keep>
12.8 Controlling Always-On Monitoring Configuration
Settings
Always-On Monitoring configuration settings define how your Always-On Monitoring
deployment operates within your environment.
Properties that are specific to a particular instance of Always-On Monitoring can be
found at the following location:
$AOM_HOME/conf/emsConfig.properties
Properties are added/updated in the
emsConfig.properties
file using a text editor.
Always-On Monitoring must be restarted in order for the changes to take effect. Global
properties that are shared by all Always-On Monitoring instances are stored in the
Always-On Monitoring repository and are manipulated using the
emsctl
commands
described below.
The following commands are used to view and set the global configuration properties:
To list all properties and their values:
$AOM_HOME/scripts/emsctl list_properties
To set a property value:
$AOM_HOME/scripts/emsctl set_property -name=<propertyname> -value=<propertyvalue>
To remove a property value:
$AOM_HOME/scripts/emsctl unset_property -name=<propertyname>
Chapter 12
Data Maintenance
12-27

12.9 Getting Performance Information
You can see how well your Always-On Monitoring installation is operating by viewing
Always-On Monitoring performance information such as load and throughput. Use the
getstats command to display Always-On Monitoring performance statistics:
$AOM_HOME/scripts/emsctl getstats
12.10 Modifiable Always-On Monitoring Properties
Always-On Monitoring allows you to change various properties that define how your
Always-On Monitoring deployment operates. The following table lists the global
properties that are available. These properties can be set as global properties or
locally in the
emsConfig.properties
file..
Table 12-4 Always-On Monitoring Global Properties
Property Name Description Default
Value
Range of Values
connPool.initialSize The initial number of Always-
On Monitoring repository
connections to be created in
the repository connection
pool.
1 1-connPool.maxSize
connPool.maxSize The maximum number of
Always-On Monitoring
repository connections to be
created in the repository
connection pool.
100 connPool.minSize – 500
connPool.minSize The minimum number of
Always-On Monitoring
repository connections to be
kept in the repository
connection pool after growth.
10 connPool.initialSize –
connPool.maxSize
failover.heartbeatInterval The interval in seconds
between heartbeats sent
from the running Always-On
Monitoring to other Always-
On Monitoring instances.
60 30 – 3600
http.idleTimeout Time in milliseconds before
idle web server connections
in the Always-On Monitoring
are released and terminated.
60000 10000 – 120000
http.maxThreads The maximum number of
Always-On Monitoring web
server threads to be created
in the web server connection
pool. This value is of
particular interest on large
sites with 10000 hosts or
more.
50 http.minThreads – 100
Chapter 12
Getting Performance Information
12-28

Table 12-4 (Cont.) Always-On Monitoring Global Properties
Property Name Description Default
Value
Range of Values
http.minThreads The minimum number of
Always-On Monitoring web
server threads to be created
in the web server connection
pool.
10 1 – http.maxThreads
nls.useSystemLocale Reserved for future use. false
notif.enabled If email notifications are
enabled or not; typically sent
using
emsctl
enable_notification
true true/false
notif.senderAddress Override sender email
address for emails sent from
Always-On Monitoring.
Otherwise the address is the
same as the Enterprise
Manager email address.
null
notif.senderName Override sender email
username for e-mails sent
from Always-On Monitoring.
Otherwise name is the same
as the Enterprise Manager
email name.
null
purge.Duration Amount of data (in minutes)
kept in all historical Always-
On Monitoring tables.
259200 10080 – 0 (infinite)
sync.allowIncrSync Reserved for future use. false true/false
tasks.poolSize Number of threads to use in
the background task
execution pool.
20 1-50
tasks.purgeRunInterval Interval in minutes between
instances of the data purge
task.
10080 3600 – 10080
tasks.syncRunInterval Interval in minutes between
instances of the incremental
sync task.
1440 60 - 3600
The following table lists the Always-On Monitoring local properties that can only be
defined locally in the
emsConfig.properties
file.
Table 12-5 Always-On Monitoring Local Properties
Property Name Description Default Value Range of Values
logLevel The level of log
messages to include
in the Always-On
Monitoring logs
INFO DEBUG, INFO,
WARN, ERROR
Chapter 12
Modifiable Always-On Monitoring Properties
12-29

Table 12-5 (Cont.) Always-On Monitoring Local Properties
Property Name Description Default Value Range of Values
emsPort The port number to
use when listening for
requests from the
agent.
8081 1024-65535
oracle.sysman.core.no
tification.smtp.retry_en
abled
Property that
determines whether
failed email
notifications should be
retried.
false true/false
oracle.sysman.core.no
tification.max_email_d
elivery_time
Property in seconds
that determines how
long failed email
notifications should be
retried.
600 seconds 60-86400
12.11 Creating an SSO Wallet and JKS for CA Certificates
You can create a single sign-on (SSO) wallet and Java Keystore (JKS) for certificates
issued by an external Certificate Authority for use with your Always-On Monitoring
environment. To do so, perform the following:
1. Copy the EM key from the Enterprise Manager repository by running:
emctl config emkey -copy_to_repos
2. Generate the certificate and the wallet for the host by running:
$AOM_HOME/bin/emsctl secure
If a certificate is issued by a third-party Certificate Authority, then you need to store the
certificate in the wallet. Once the wallet has the certificate, you must run the following:
emsctl secure -wallet=<absolute location of the wallet file>
12.12 Diagnosing Problems
Though robust and easy to install and configure, you may encounter problems while
using Always-On Monitoring. In general, Always-On Monitoring problems can be
classified into three types:
•Problems starting Always-On Monitoring
•Problems with Always-On Monitoring-Enterprise Manager repository SYNC.
•Not receiving email
By performing diagnostic tasks listed below, you can resolve a majority of issues that
may occur when using Always-On Monitoring.
1. Check the log files in the $AOM_HOME/log sub-directory
2. Verify that the URL is set in Enterprise Manager by running the following
emctl get property -name "oracle.sysman.core.events.ems.emsURL" -sysman_pwd
<sysman-password>
Chapter 12
Creating an SSO Wallet and JKS for CA Certificates
12-30

3. Verify that the URL is set on the Management Agent by checking
the $AGENT_HOME/sysman/config/emd.properties file and searching for
EMS_URL
4. Verify that Always-On Monitoring is running and notifications are enabled by
running emsctl status or emsctl ping
5. Verify that downtime contacts have been specified in Enterprise Manager and
Always-On Monitoring by running emsctl status.
6. Check the version of the Agent by running the following command:
emctl status agent
The minimum Agent version must be 13.2 if Always-On Monitoring and OMS are
NOT colocated and 13.1 if they are colocated. The emctl command can be run
form the following directory:
$AGENT_HOME/agent_inst/bin
12.13 High Availability and Disaster Recovery
The purpose of Always-On Monitoring is to make sure your Enterprise Manager
environment continues to be monitored while Enterprise Manager OMS is down.
However, to protect against a single point of failure within the Always-On Monitoring
environment itself, the Always-On Monitoring service can be made highly available by
adhering to the Enterprise Manager Maximum Availability Architecture (MAA)
guidelines. By setting up Always-On Monitoring as a highly available service, you can
ensure that targets will continue to be monitored in the event of catastrophic system
failure.
12.13.1 Running Multiple Always-On Monitoring Instances
Always-On Monitoring provides you with the ability to continue alert monitoring while
Enterprise Manager is down. By itself, Always-On Monitoring can be made highly
available by implementing multiple instances for load sharing/high availability. It is also
important to note that the Always-On Monitoring repository should be configured as a
cluster database since you need to implement basic High Availability (HA) for this
component as well.
Adding multiple Always-On Monitoring instances provides the following HA
advantages:
•Shares the work of receiving and recording alerts from agents. If an instance goes
down for some reason, a server load balancer (SLB) can redirect those requests
to surviving instances
•Shares the work of sending of notifications. For ordering reasons, all notifications
for a target are directed to one Always-On Monitoring instance. If that Always-On
Monitoring instance goes down, the responsibility for its "queues" are transferred
to another instance.
Once you have configured an Always-On Monitoring instance, you can add another
instance by running the following emsca command:
emsca add_ems
The following diagram shows a typical Always-On Monitoring HA deployment.
Chapter 12
High Availability and Disaster Recovery
12-31
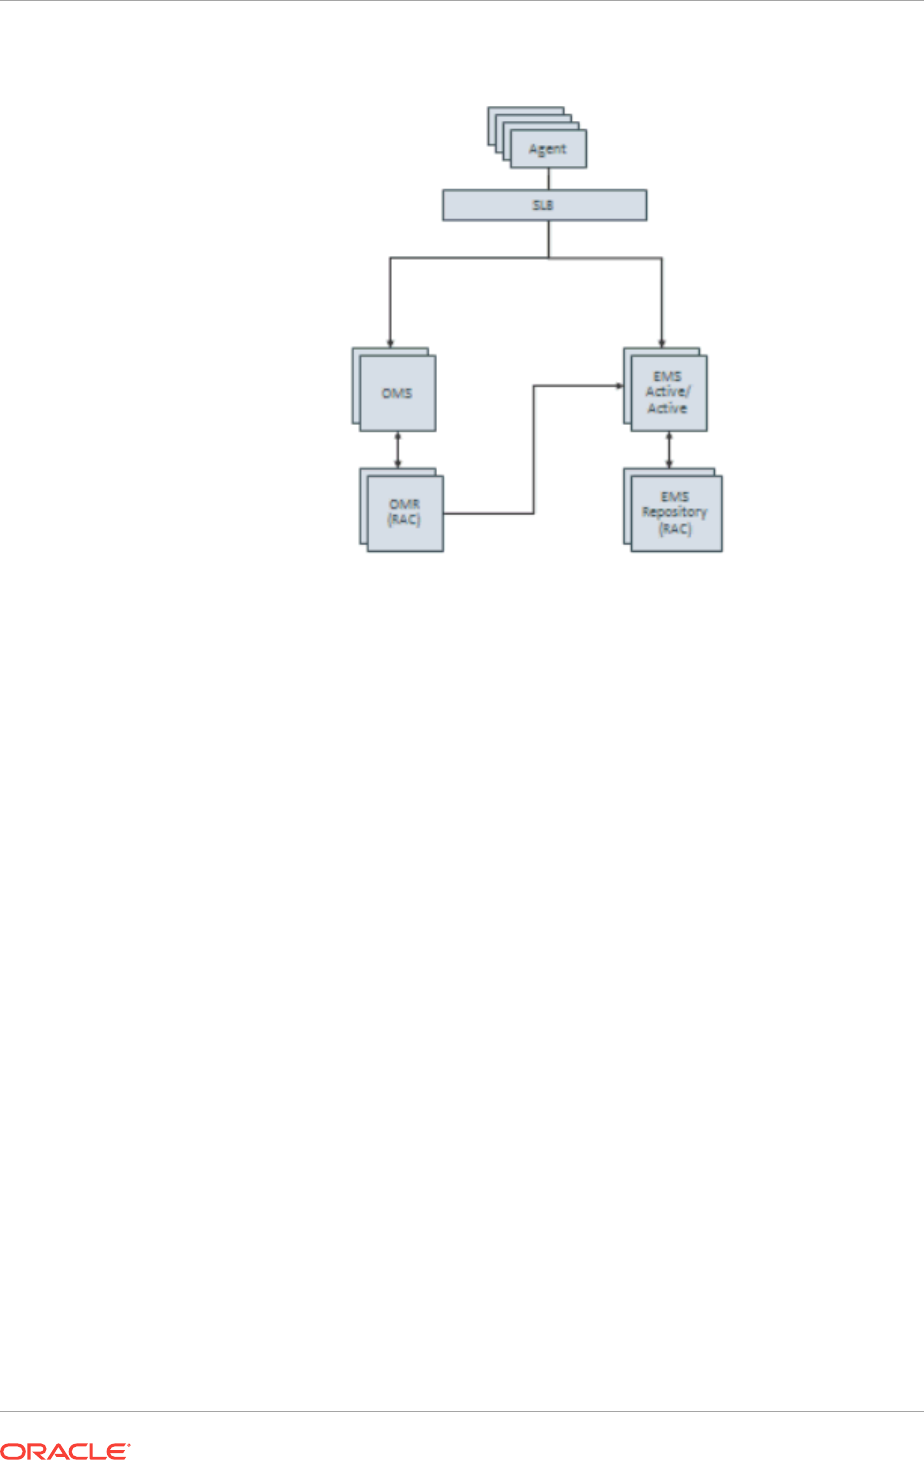
Figure 12-1 Always-On Monitoring HA Deployment
12.13.1.1 Shared Configuration Storage for the Multiple Instances
Instead of maintaining Always-On Monitoring configuration in the file system on each
node, all instances can share a common configuration. This allows a single
configuration at one location to be modified and read from all the instances.
You use the following EMSCTL commands to modify properties:
•
emsctl set_property
•
emsctl unset_property
To obtain a list of current property values:
•
emsctl list_properties
When a property is modified on one instance, all other Always-On Monitoring
instances receive a JMS AQ message that tells them to refresh the value from the
repository.
12.13.1.2 Notification Queues for Tracking Incoming Alerts
Each Always-On Monitoring instance that receives an alert stores the alert and records
an entry in one of 16 event notification queues. Ownership of these notifications
queues is distributed among the running Always-On Monitoring instances.
A failover system notices when Always-On Monitoring instances are not up (and
heartbeating) and switches ownership away from the instance that is down to other
Always-On Monitoring instances that are up. The failover system then sends a JMS
AQ message notifying all up instances of the change.
Chapter 12
High Availability and Disaster Recovery
12-32

12.13.1.3 Task Scheduler System
A Task scheduler system remembers shared responsibilities among the Always-On
Monitoring instances and is responsible for reminding the instances to do the work on
a schedule. The task request is sent to an Always-On Monitoring instance that is
known to be up. This reduces the possibility of multiple instances trying to do the same
work and running into conflicts.
12.13.1.4 Configuring an SLB
When multiple Always-On Monitoring instances are present, we expect that traffic to
these instances is directed through a SLB.
When HA is added to an Always-On Monitoring instance that was configured as a
single instance, you need to repopulate the Always-On Monitoring instance's
certificates with fresh copies that have the SLB host name in them. For Always-On
Monitoring released with Enterprise Manager 13.2, you generate a certificate for the
SLB and store that in a wallet by running the emsctl secure command.
1. Run
emsctl secure
2. Restart the Always-On Monitoring instance.
3. Repeat for all Always-On Monitoring instances already configured.
4. Make sure to run emctl set property for the emsUrl property to use the newly
configured Always-On Monitoring upload URL set up on the SLB. For example:
./
emctl set property -name "oracle.sysman.core.events.ems.emsURL" -value
"https://<slb hostname>:<slb aom port>8081/upload"
The URL displayed from emsca and/or emsctl status is the local URL for that Always-
On Monitoring instance. In an HA configuration, this local URL is NOT used as the
Always-On Monitoring URL, but is used to set up the Always-On Monitoring pool in the
SLB. The host and port for each Always-On Monitoring instance is used in the pool
with the /upload PUT URL as the target for that pool.
When configuring the SLB, the monitoring URL is the /upload GET URL. This URL
returns the string "Always On Monitoring is active."
Note:
Always-on monitoring is supported on F5 from version 11.4.x onwards.
12.13.2 Always-On Monitoring Disaster Recovery
Disaster Recovery (DR) allows Always-On Monitoring functionality to transition to a
different location in the case of a site-wide failure.
There are existing procedures that allow an Enterprise Manager site to have a standby
created for DR reasons. These procedures involve having the primary repository
database's contents mirrored at the standby site using DataGuard, and the ability to
link to the file system contents from the secondary site.
Chapter 12
High Availability and Disaster Recovery
12-33
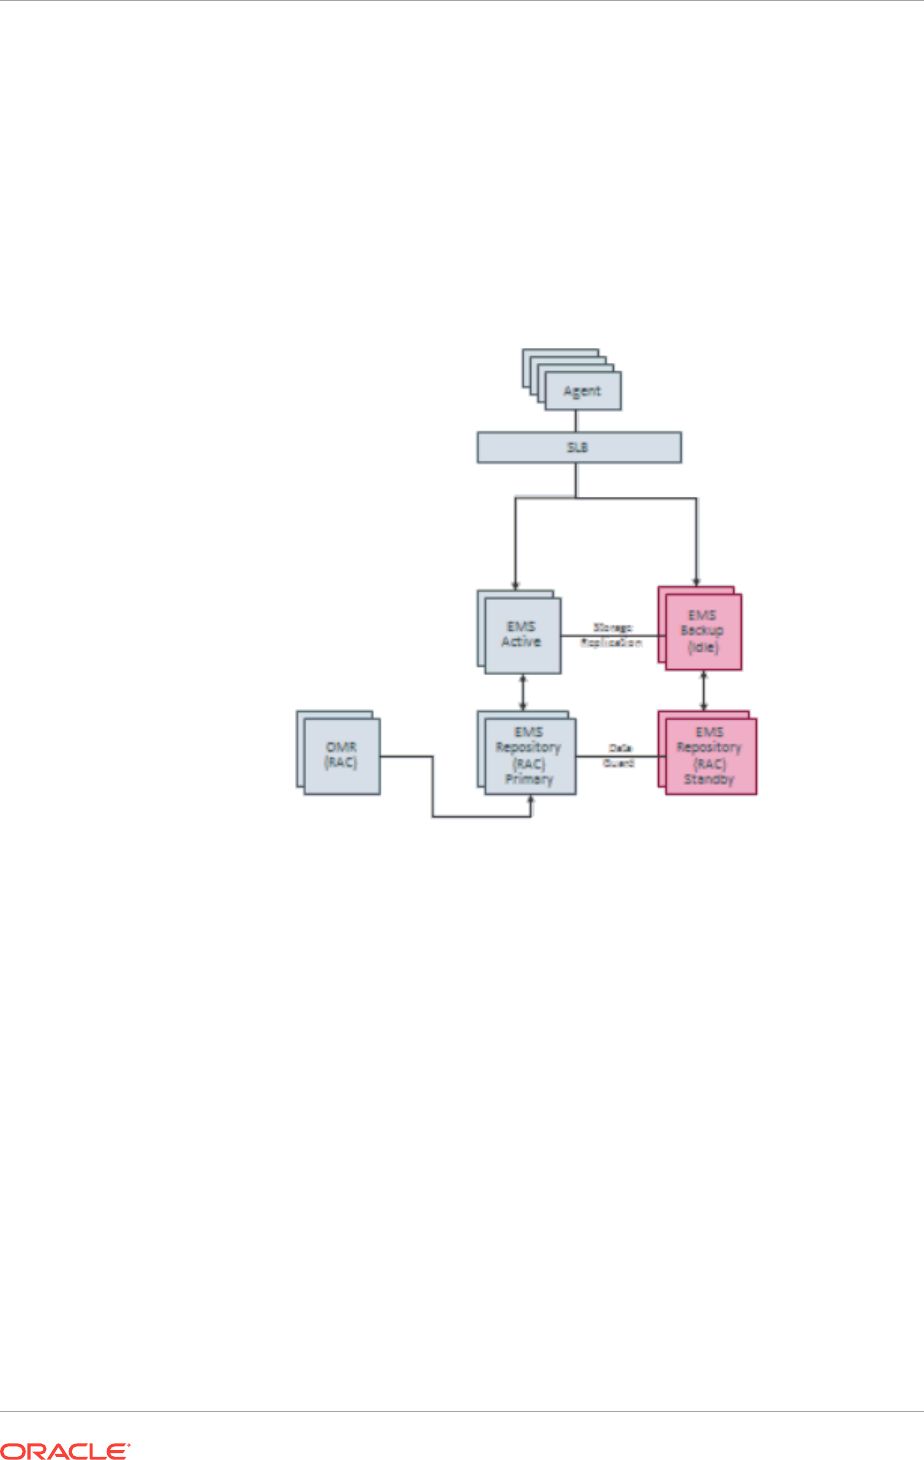
A very similar implementation can be used for Always-On Monitoring instances as
well. An Always-On Monitoring DR setup is active-passive: If the primary site goes
down, the virtual IP fails over to the standby node and, once the standby Always-On
Monitoring instance is brought up, it runs exactly as it did on the primary node
(because of the file system sharing and the virtual IP). In summary, the Always-On
Monitoring repository needs to be available at the standby site, and the Always-On
Monitoring instances' file systems need to be replicated. The following diagram shows
the typical DR deployment for Always-On Monitoring.
Figure 12-2 Always-On Monitoring Disaster Recovery Deployment
12.13.3 Setting Up Multiple Always-On Monitoring Instances
You can set up multiple Always-On Monitoring (AOM) instances to ensure Always-On
Monitoring is available in the event of outages. IMPORTANT: Only Always-On
Monitoring release 13.2 and beyond support multiple instance deployment. Also, only
Management Agents release 13.2 and greater support this feature.
1. Uninstall any 13.1 Always-On Monitoring instances, if any.
Except for the last running AOM instance (in this example, there are three AOM
instances AOM1, AOM2 and AOM3) you must perform the following for AOM1 and
AOM2):
•Shut down the instances (AOM1 and AOM2) by running
$AOM_HOME/scripts/
emsctl stop
•Remove all the files and sub-directories under $AOM_HOME
And on the last AOM instance (AOM3):
•Shut down the instance (AOM3) by running
$AOM_HOME/scripts/emsctl stop
Chapter 12
High Availability and Disaster Recovery
12-34

•Uninstall AOM by running
$AOM_HOME/scripts/emsca uninstall
•Remove all files and sub-directories under $AOM_HOME
•To remove any trace of the previous AOM installation, you can drop the AOM
repository user in the repository by executing drop user ems cascade.
2. Download the latest Always-On Monitoring release from Self-Update. Copy the
ems_13.2.x.x.x.zip file to a location where you want AOM to be installed and unzip
the file.
unzip ems_13.2.0.0.0.zip
Note:
For AOM 13.2 to run, both the Management Agent and Enterprise Manager
installation MUST BE upgraded to 13.2 as well.
3. Install AOM.
For setting up the very first AOM instance, the user must run
$AOM_HOME/scripts/
emsca
For installing subsequent AOM instances the user must run
$AOM_HOME/scripts/
emsca add_ems
4. Finally, you must run the following steps on all instances before starting AOM.
•To generate the certificate and the wallet for the SLB host, run
$AOM_HOME/
scripts/emsctl secure
•Configure the downtime contacts. For more information, see Configuring
Downtime Contacts in Enterprise Manager.
•To sync the AOM repository schema with the Enterprise Manager repository
schema, execute
$AOM_HOME/scripts/emsctl sync
•Set the upload URL, by running
emctl config emkey -copy_to_repos
on the
Enterprise Manager host.
•Start the AOM instances by running,
$AOM_HOME/scripts/emsctl start
12.14 Uninstalling Always-On Monitoring
If the purpose of uninstalling Always-On Monitoring is to upgrade to a new release,
you should back up the following files.
•AOM_HOME/conf/emsConfig.properties
•Custom certificates (if any) located at $AOM_HOME/conf (cwallet.sso,
cwallet.sso.lck, ewallet.p12, and ewallet.p12.lck)
Use emsca to uninstall Always-On Monitoring as shown in the following example:
$ ./emsca uninstall
Oracle Enterprise Manager Cloud Control 13c Release 2
Copyright (c) 1996, 2017 Oracle Corporation. All rights reserved.
---------------------------------------------------------------
Loading configuration from: /homedirectory/ems/conf/emsConfig.properties
Connecting to Always-On Monitoring repository.
Chapter 12
Uninstalling Always-On Monitoring
12-35

Execute the following:
emctl delete property -name "oracle.sysman.core.events.ems.emsURL" -sysman_pwd
<pwd> to unset the value of the property.
Uninstall completed.
Remove all files and sub-directories under $AOM_HOME.
To remove any trace of the previous AOM installation, you can drop the AOM
repository user in the repository by running the following command:
drop user ems cascade
12.15 Configuring the Always-On Monitoring Application for
Secure Communication Using the TLSv1.2 Protocol
Transport Layer Security (TLS) is a cryptographic protocol used to increase security
over computer networks by providing communication privacy and data integrity
between applications. In the case of Always-On Monitoring (AOM), these secure
communication channels are between the following components:
•The AOM application and the AOM repository
•The AOM application and the Enterprise Manager repository
The following instructions cover how to enable TLSv1.2 communication for Always-On
Monitoring.
Storing CA Certificates
The server CA certificates of the Always-On Monitoring repository and Enterprise
Manager repository can be stored either in an external Trust Store or in the Oracle
Management Service’s JDK Trust Store
(JAVA_HOME/jre/lib/security/cacerts
).
Storing the Certificates in an External Trust Store
If you choose to store the certificates in an external Trust Store, then you need to set
the following environment variables:
•AOM_DB_WALLET_LOC - Absolute path to the external Trust Store. For
example:
/home/aom/externalTrustSTore.jks
•AOM_DB_WALLET_TYPE - The type of Trust Store being used. JKS. PKCS12
(For Enterprise Manager 13.2, the SSO Trust Store is not supported)
•AOM_DB_WALLET_PASSWORD - The Trust Store password (For JKS and
PKCS12)
Chapter 12
Configuring the Always-On Monitoring Application for Secure Communication Using the TLSv1.2 Protocol
12-36

Note:
In CSH, to set the environment variable, use the setenv command. For
example, to set the AOM_DB_WALLET_LOC environment variable, run the
following:
% setenv AOM_DB_WALLET_LOC /home/aom/externalTrustStore.jks
To set the same environment variable in a Bash environment, run the
following:
% export AOM_DB_WALLET_LOC=/home/aom/externalTrustStore.jks
Storing the Certificates in the Oracle Management Service’s JDK Trust Store
If you choose to store the certificates in the Oracle Management Service’s JDK Trust
Store, then you can use the emsca or emsctl scripts without additional configuration.
Guidelines for Configuring Always-On Monitoring to use TLSv1.2
•During initial Always-On Monitoring setup with emsca, when prompted for the DB
connection string, you must specify the connection string using the long form that
has the protocol type (TCPS) being used and not the short form as shown in the
following examples.
Long Form
(DESCRIPTION=(ADDRESS=(PROTOCOL=tcps)(HOST=my.us.oracle.com) (PORT=15045))
(CONNECT_DATA =(SID=dbview))
Short Form (will not work with TCPS):
my.us.oracle.com:15044:dbview
•If Always-On Monitoring was initially configured to use the TCP protocol as part of
emsca configuration, and at a later point you want to switch over to TCPS, you can
re-configure Always-On Monitoring by performing the following steps:
1. Change the Always-On Monitoring database connection string in the
emsConfig.properties file (
AOM_HOME/conf/emsConfig.properties
).
2. Change Enterprise Manager Repository connection string in Always-On
Monitoring database which is stored in table -
EMS_SYNC_CONNECT_PROPS.connect_string.
3. Ensure that either the JDK wallet (under
JAVA_HOME/jre/lib/security/cacerts
)
or the external Trust Store has the root CA certificates for both the Always-On
Monitoring and Enterprise Manager repositories.
•If Always-On Monitoring was initially configured to use the TCPS protocol as part
of emsca configuration, and at a later point you want to switch over to TCP, you
can re-configure Always-On Monitoring by performing the following steps:
1. In the
AOM_HOME/conf/emsConfig.properties
file, replace the correct AOM
databse connection string with the property emsRepConnectString. If TCP
protocol is used to connect to the database, you can use either short or long
form for the connection string. If TCPS is used, you must provide the database
connection string in the long form as discussed previously.
Chapter 12
Configuring the Always-On Monitoring Application for Secure Communication Using the TLSv1.2 Protocol
12-37

2. To change the Enterprise Manager connection string, you must update the
EMS_SYNC_CONNECT_PROPS.connect_string
field in the Always-On Monitoring
database.
Chapter 12
Configuring the Always-On Monitoring Application for Secure Communication Using the TLSv1.2 Protocol
12-38


13
Discovering and Adding Host and Non-
Host Targets
Enterprise Manager Cloud Control (Cloud Control) enables you to discover, promote,
add, and then monitor software deployments across your network, using a single GUI-
rich console. This chapter introduces you to the concepts of discovery and promotion,
and describes how you can perform these tasks using Cloud Control.
In particular, this chapter covers the following:
•Overview of Discovering and Adding Targets
•Discovering and Adding Host Targets
•Discovering and Adding Non-Host Targets
•Discovering and Promoting Oracle Homes
•Retrieving Deleted Targets
13.1 Overview of Discovering and Adding Targets
This section introduces you to basic concepts of discovery, promotion, and monitoring.
It familiarizes you with the different methods of discovering and monitoring targets
using Enterprise Manager Cloud Control. In particular, this section covers the
following:
•Understanding Discovery Terminology
•Options for Discovering Targets
•Discovery and Monitoring in Enterprise Manager Lifecycle
•Discovery and Monitoring Process
13.1.1 Understanding Discovery Terminology
This section describes the following:
•What are Targets and Managed Targets?
•What is Discovery?
•What is Promotion?
13.1.1.1 What are Targets and Managed Targets?
Targets are entities such as host machines, databases, Fusion Middleware
components, server targets (hardware), that can be managed and monitored in Cloud
Control.
Managed targets are entities that are actively being monitored and managed by Cloud
Control.
13-1
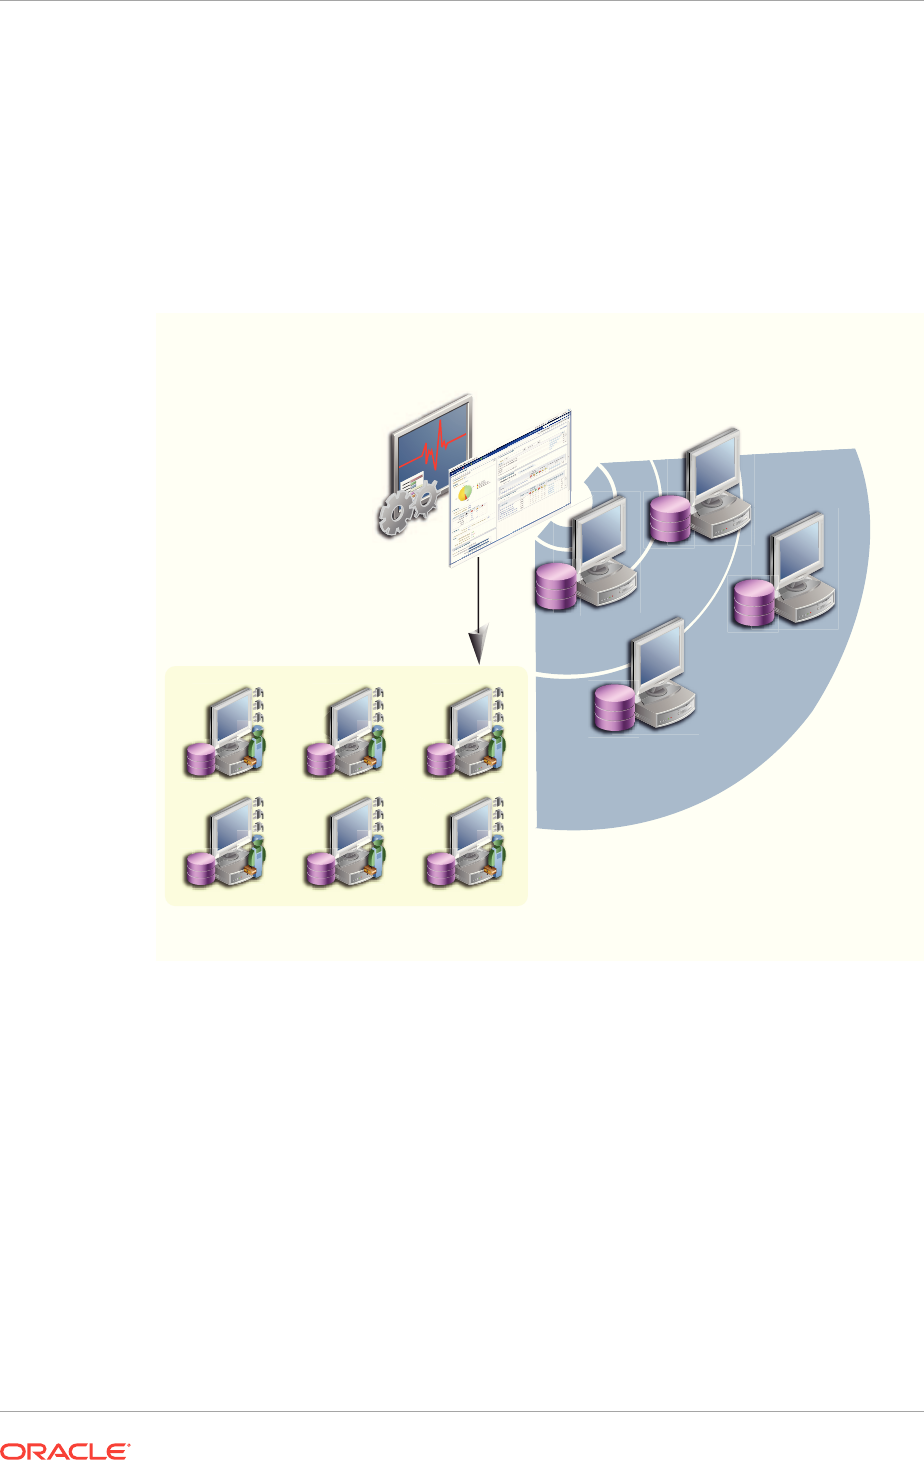
13.1.1.2 What is Discovery?
Discovery refers to the process of identifying unmanaged hosts and targets in your
environment. You can discover hosts and targets automatically or manually.
Figure 13-1 illustrates the discovery process.
Figure 13-1 Discovery
OMS
OMS
Console
Detecting New
Hosts in the
Network
Monitored Hosts with Management Agents
Installed
13.1.1.3 What is Promotion?
Promotion refers to the process of converting unmanaged hosts and targets, which
have been discovered in your network, to managed hosts and targets in Cloud Control
so that they can be monitored and managed efficiently. While conversion of
unmanaged hosts to managed hosts involves deployment of a Management Agent on
those hosts, conversion of unmanaged targets running on those hosts to managed
targets involves only adding the targets as manageable entities in Cloud Control
without deploying any additional component on the hosts.
Figure 13-2 illustrates the promotion process.
Chapter 13
Overview of Discovering and Adding Targets
13-2
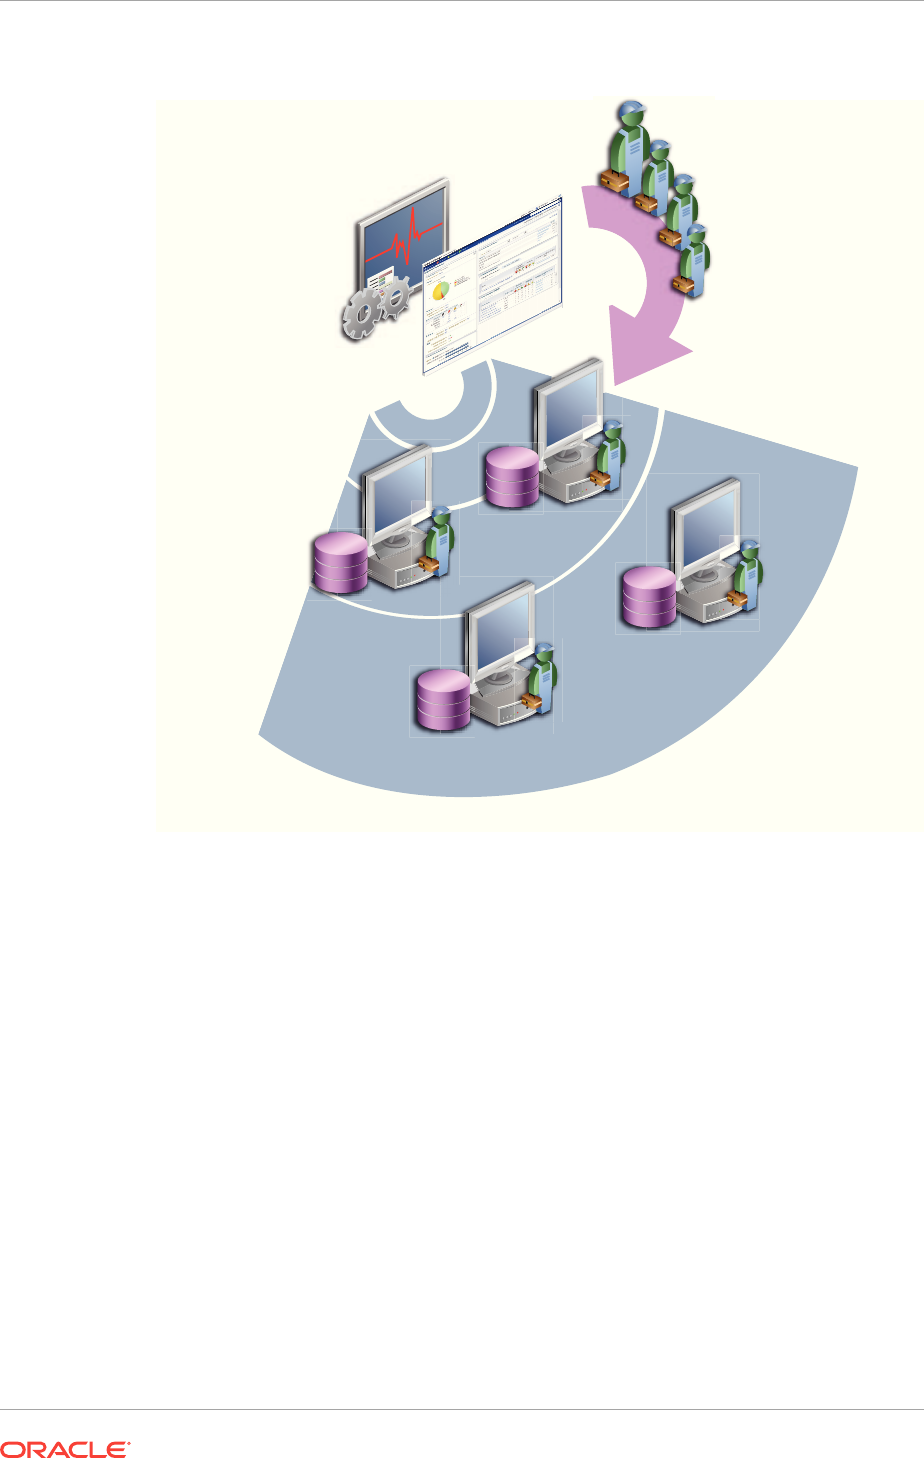
Figure 13-2 Promotion
Install
Management
Agents
OMS
OMS
Console
13.1.2 Options for Discovering Targets
You can discover targets using either of the following methods:
Autodiscovery Process
For discovery of a host, the autodiscovery process enables a Management Agent
running on the host to run an Enterprise Manager job that scans for unmanaged hosts.
You then convert these unmanaged hosts to managed hosts by deploying
Management Agents on these hosts. Next, you search for targets such as databases
or other deployed components or applications on these managed hosts, and finally
you promote these targets to managed status.
For discovery of targets, the autodiscovery process enables you to search for targets
on the host and then add these targets using Enterprise Manager.
The benefit of using this process is that as new components are added to your
infrastructure, they can be found and brought under management on a regularly-
scheduled basis.
Chapter 13
Overview of Discovering and Adding Targets
13-3
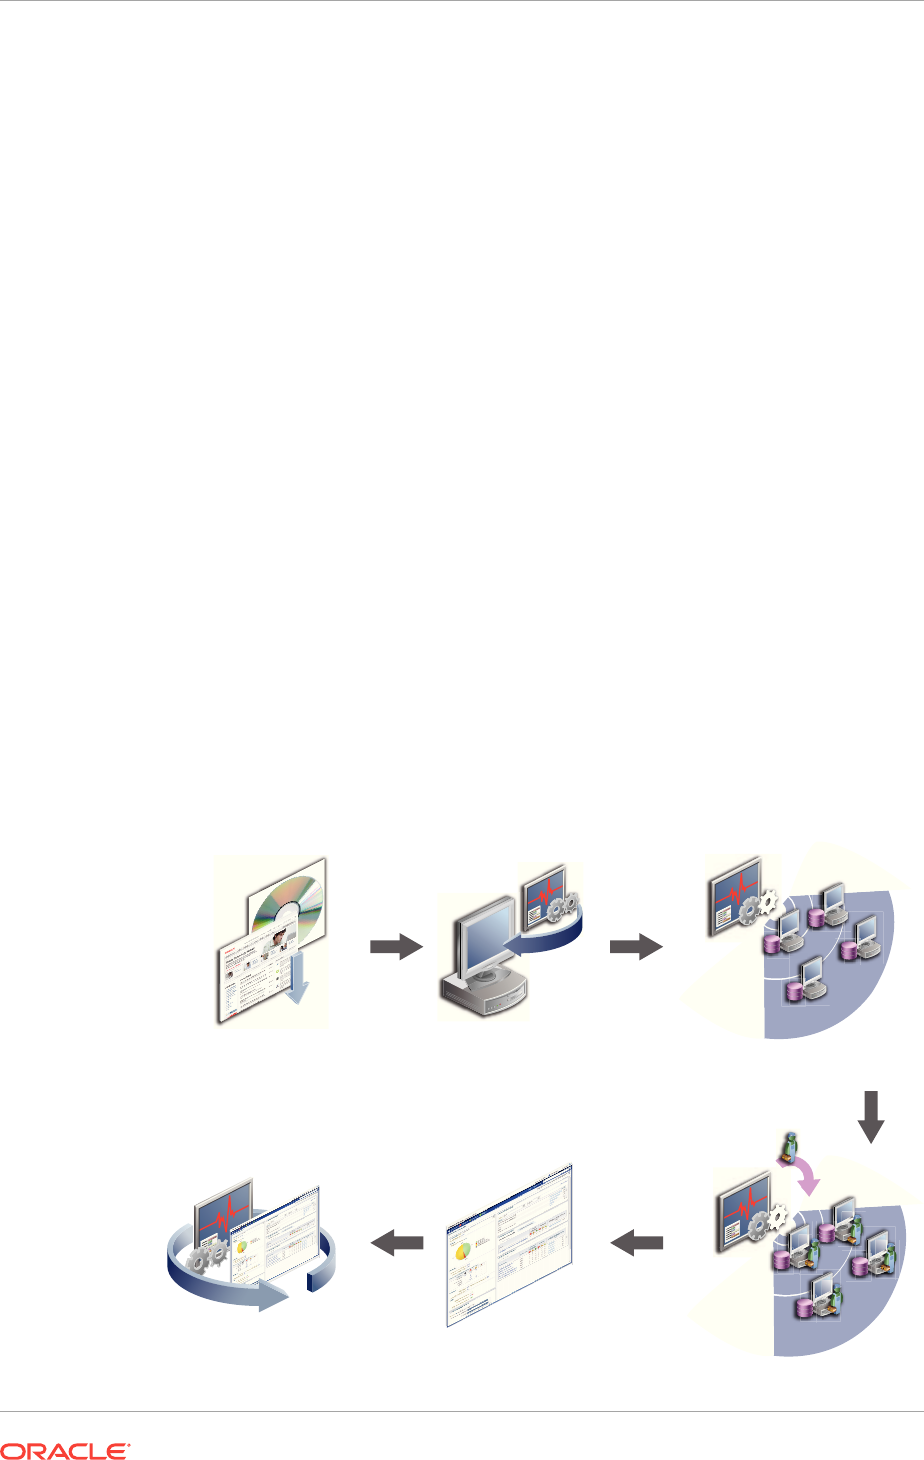
Guided Discovery Process
The guided discovery process enables you to explicitly add a target to bring under
management. The discovery wizard guides you through the process and most of the
specifications required are filled by default.
The benefits of using this process are as follows:
•You can find targets with less effort.
•You can find a new database that has been added recently even if autodiscovery
has not been run.
•You can find a non-promoted database that already exists in autodiscovery
results, but has a change in details. For example, the port.
•You eliminate unnecessary consumption of resources on the Management Agent
when discovery is not needed.
Declarative Process
Declaring target monitoring properties enables you to manually specify all the details
required to discover the database target, such as the host name and location, target
name and location, and other specific information. This process is generally used
when the autodiscovery process and guided discovery process fails to discover the
target that you want to add.
13.1.3 Discovery and Monitoring in Enterprise Manager Lifecycle
Figure 13-3 illustrates the lifecycle process of discovering and monitoring targets in
Cloud Control.
Figure 13-3 Discovery and Monitoring in Enterprise Manager Lifecycle
OTN/DVD
Discover New
Hosts/Targets
PromoteMonitor
Install Enterprise
Manager 12c
Maintain EM
Download Enterprise
Manager 12c
OMS
EM
Console
EM
Console
Chapter 13
Overview of Discovering and Adding Targets
13-4

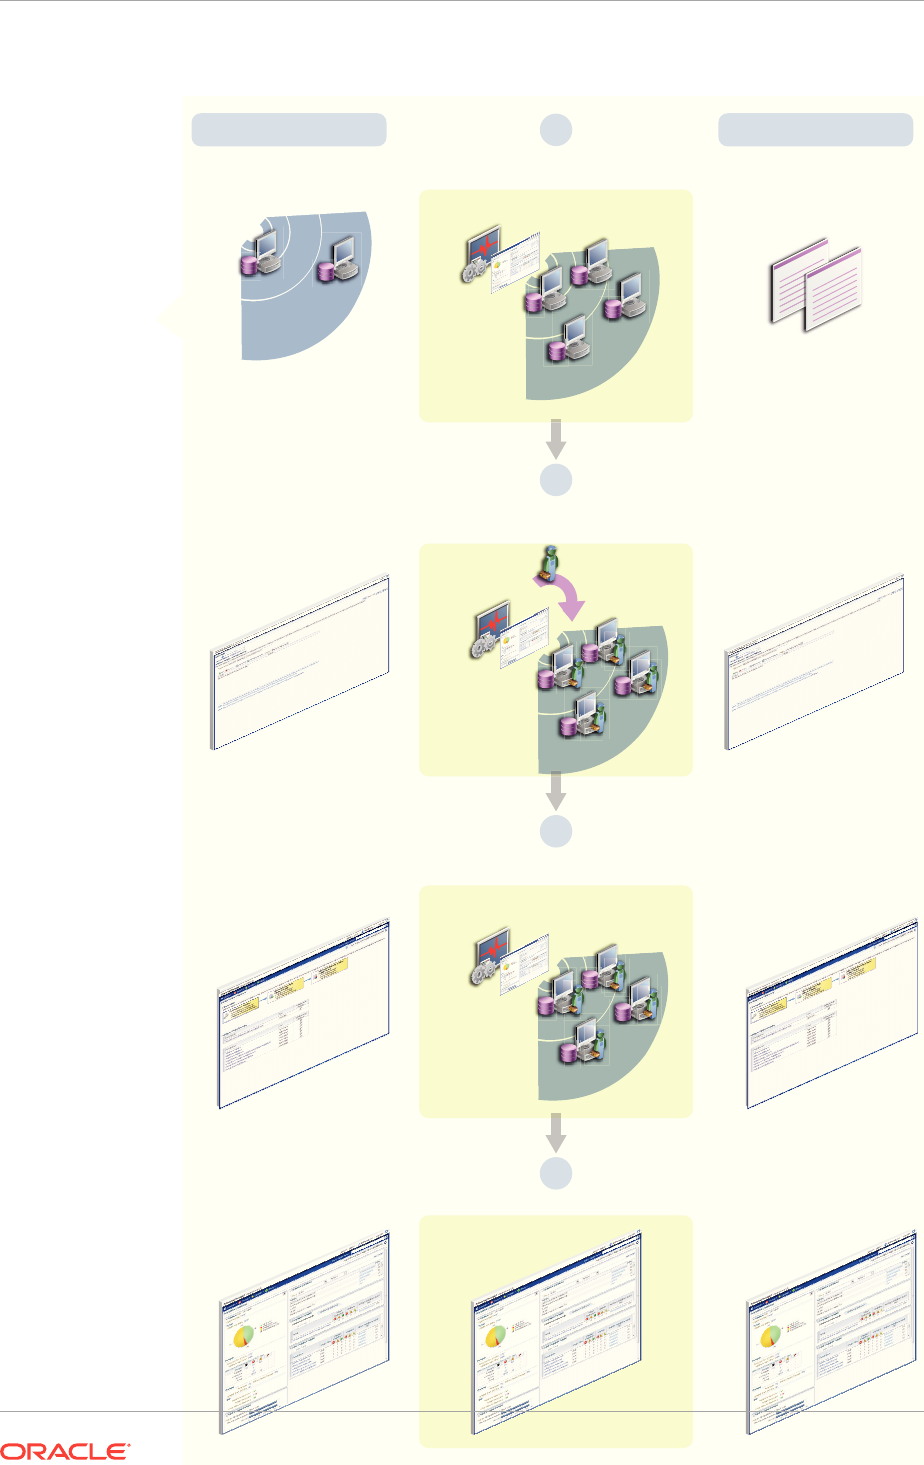
Figure 13-4 Discovery and Monitoring Process
Manual ProcessAutomatic Process
Discover Targets on
Managed Hosts
OMS
OMS
Console
Install Management Agent on
Unmanaged Hosts
IInstall using Add Host Wizard
Target or by Silent Method
Discover Targets using All Discovery
Modules in Auto Discovery Table
Discover Targets using Configure
Auto Discovery
Install using Add Host
Wizard Target
Discover New Hosts
Discover new hosts by
using IP scan
OMS
OMS Console
2
1
LIST
LIST
Discover new hosts by getting
a list from your Administrator
OMS
OMS
CONSOLE
3
Monitor TargetsMonitor Targets Monitor Targets
4
EM ConsoleEM Console EM Console
Chapter 13
Overview of Discovering and Adding Targets
13-6

13.2 Discovering and Adding Host Targets
This section covers the following:
•Configuring Autodiscovery of Host Targets
•Adding Host Targets Using the Manual Guided Discovery Process
13.2.1 Configuring Autodiscovery of Host Targets
This section covers the following:
•Prerequisites for Autodiscovering Host Targets
•Setting Up Autodiscovery of Host Targets
13.2.1.1 Prerequisites for Autodiscovering Host Targets
Before you discover host targets using the autodiscovery process, meet these
prerequisites:
•IP Scan is done by one or more installed Cloud Control Management Agents. The
IP Scan can currently be executed only by Cloud Control Management Agents
installed and running on the following platforms:
–Linux 32 bits and 64 bits
–Solaris 11 cluster (SPARC or x86-64) (Cloud Control Release 12.1.0.2 or
higher.)
•Ensure that the user performing the Agent installation is part of the ASMDBA
group.
•To run automatic host discovery (Nmap binary) on a Management Agent installed
on a Solaris system, follow these steps:
1. Install Cloud Control 3.4.3 or higher on the Solaris system.
2. Stop the Management Agent from the running.
3. Execute the following commands on the terminal session which you will use to
start the Management Agent:
bash-2.03$ LD_LIBRARY_PATH=<directory path of Cloud ControlCloud Control
libraries>:$LD_LIBRARY_PATH
bash-2.03$ export LD_LIBRARY_PATH
Note:
These steps ensure that Nmap refers to the Cloud Control libraries while the
Management Agent is running.
4. Start the Management Agent using the terminal session used for the previous
step.
Chapter 13
Discovering and Adding Host Targets
13-7

Note:
Add
LD_LIBRARY_PATH
to your start up scripts so that this setting is retained after
you reboot your system.
•To discover hosts from a Management Agent running on the following systems,
follow the prerequisites stated in Table 13-1.
Table 13-1 Prerequisites for discovering hosts
System Prerequisites
Solaris 11 cluster (SPARC
or x86-64)
Create a static IPv4 address on interface
net0
:
ipadm create-addr -T static -a local=X.X.X.X/YY
net0/ZZ
Here,
X.X.X.X
is a static IPv4 address,
YY
is the sub network
mask, and
ZZ
is the specific identity for the
net0
interface.
The created static address will subsequently be identified by
net0/ZZ
.
For example:
ipadm create-addr -T static -a
local=10.134.108.101/24 net0/hh
SUSE Linux for System
z™ 1. Run the
QETH_OPTIONS='fake_ll=1'
option by adding it
to the configuration file for the NIC present in the
/etc/
sysconfig/hardware directory.
The name of the configuration file changes according to
the NIC used. Contact your system administration for the
name of the configuration file that your system uses.
2. Restart your system for the changes to take effect.
RedHat Linux for System z 1. Run the
OPTIONS='fake_ll=1'
option by adding it to the
configuration file for the NIC present in the
/etc/
sysconfig/network-scripts
directory.
The name of the configuration file changes according to
the NIC used. Contact your system administration for the
name of the configuration file that your system uses.
2. Verify that the alias in the
/etc/modprobe.conf
file
includes the following command:
alias eth0 geth
3. Restart the system for the changes to take effect.
13.2.1.2 Setting Up Autodiscovery of Host Targets
To discover and configure hosts using IP scan, follow these steps:
Chapter 13
Discovering and Adding Host Targets
13-8
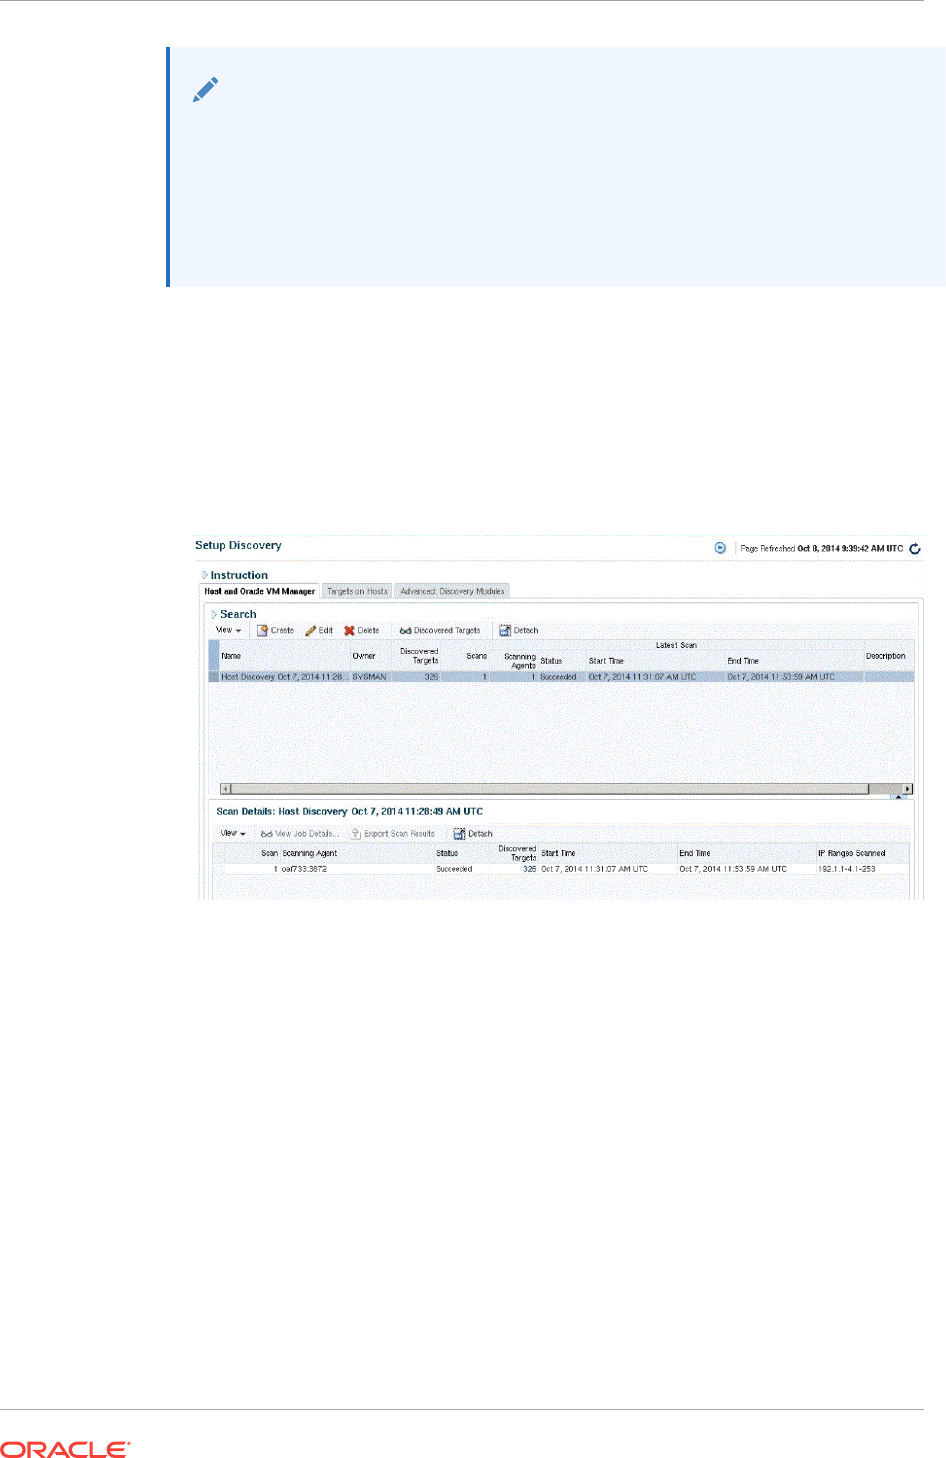
Note:
If automatic host discovery is not available for your platform, deploy the
Management Agent manually. To deploy the Management Agent, refer to
following URL:
http://docs.oracle.com/cd/E24628_01/install.121/e24089/
install_agent_usng_rsp.htm
1. From the Setup menu, select Add Target, then select Configure Auto
Discovery.
2. On the Setup Discovery page, in the Host and Oracle VM Manager tab, click
Create. You will now create the discover job. By default, the Name field will be
populated with a title including that date and time the job was created. Note that
you can edit the discovery jobs and schedule discovery to run immediately or later.
3. On the Network Scan Discovery: Create page, click Add. You will now select the
Management Agent that will perform the network scan. You can select the
Management Agent that is installed by default on the Oracle Management Service
host, or can select another Agent if desired.
Chapter 13
Discovering and Adding Host Targets
13-9
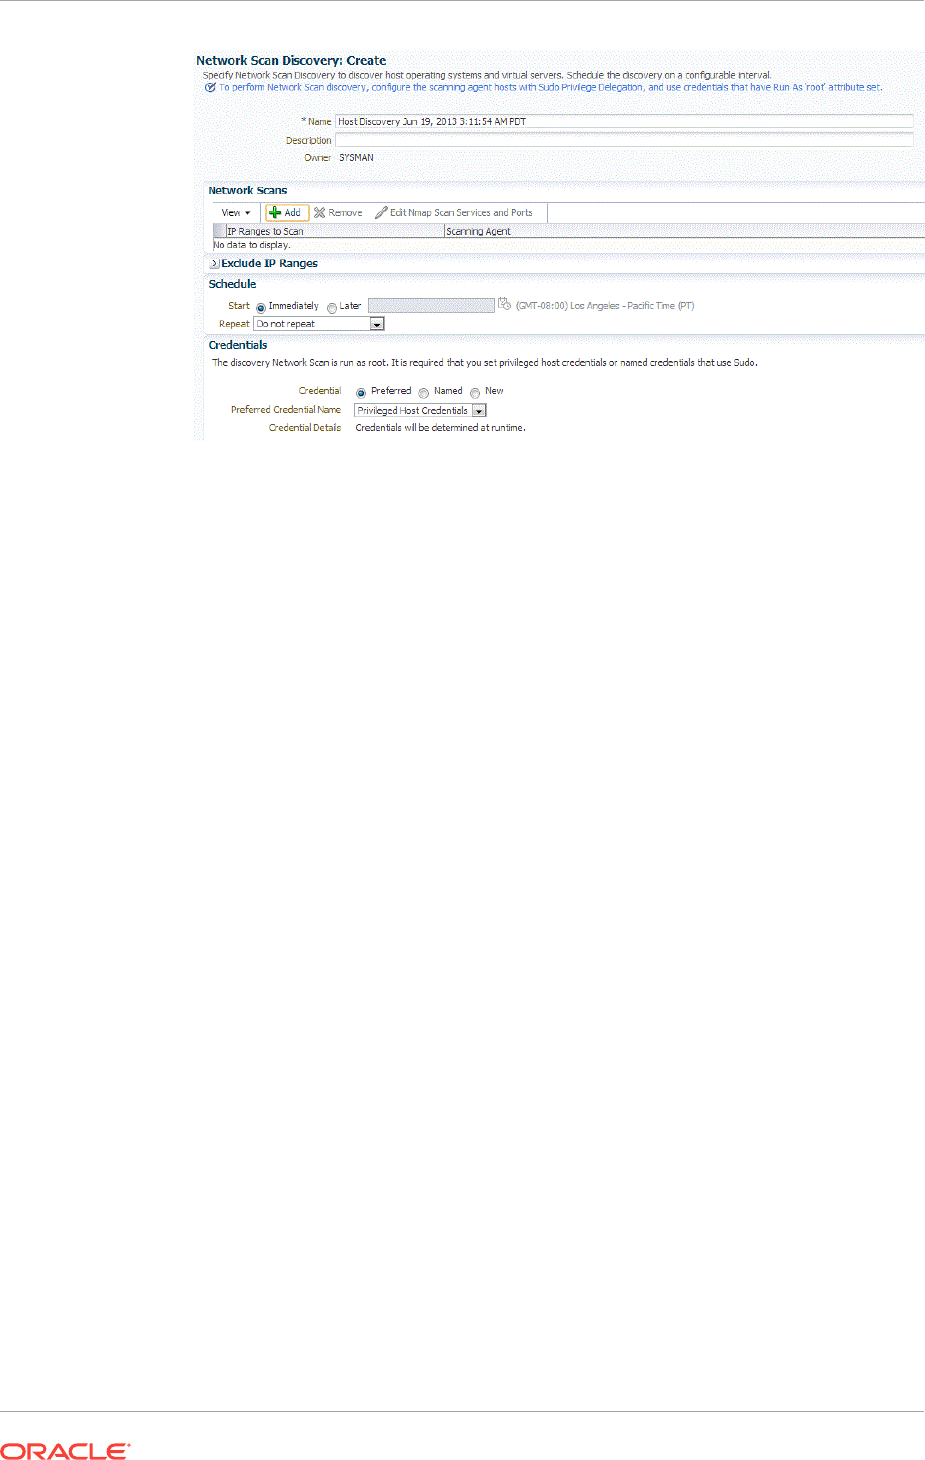
Note that because the entire network will be scanned, the Privilege Delegation
must be set on the Management Agent host that will perform the scan. Since the
Network Scan is run as root, use Host Credentials with Run as root or SSH Key
Credentials.
4. Select the agent in the IP Ranges for scan table, and enter the IP ranges to scan.
You can specify any or even all of the following:
•One or more absolute hostnames, each separated by a space; for example:
host1.example.com host3.example.com
•One or more IP addresses, each separated by a space
•A range of addresses; for example:
10.0.0-255.1-250
. Note that IP addresses
and IP ranges must be separated by a comma; for example:
10.0.0-255.1-250
•Classless Inter-Domain Routing (CIDR) notations; for example:
128.16.10.0/24
Separate each value with a space; for example:
host1.example.com 192.168.0.1 128.16.10.0/24 10.0.0-255.1-250,254
5. A default list of ports to scan within the IP ranges you specified is listed in the
Configure Ports table. These are default ports typically used by the listed Oracle
components.
To modify the port values for a component, select the component in the table and
change the values accordingly. Up to 10 ports and/or port ranges can be specified.
6. If you want to add more component ports to the list, click Add. Enter the name of
the service to include, and specify the port(s) or port range to scan.
7. Specify the following:
•The schedule at which the discovery job will run. Note that you can start the
job immediately.
•The credentials set on the Management Agent that will perform the scan.
As noted, the Privilege Delegation must be set on the Management Agent host
that will perform the scan. The named credential that will be used must be
configured to run as root.
Chapter 13
Discovering and Adding Host Targets
13-10
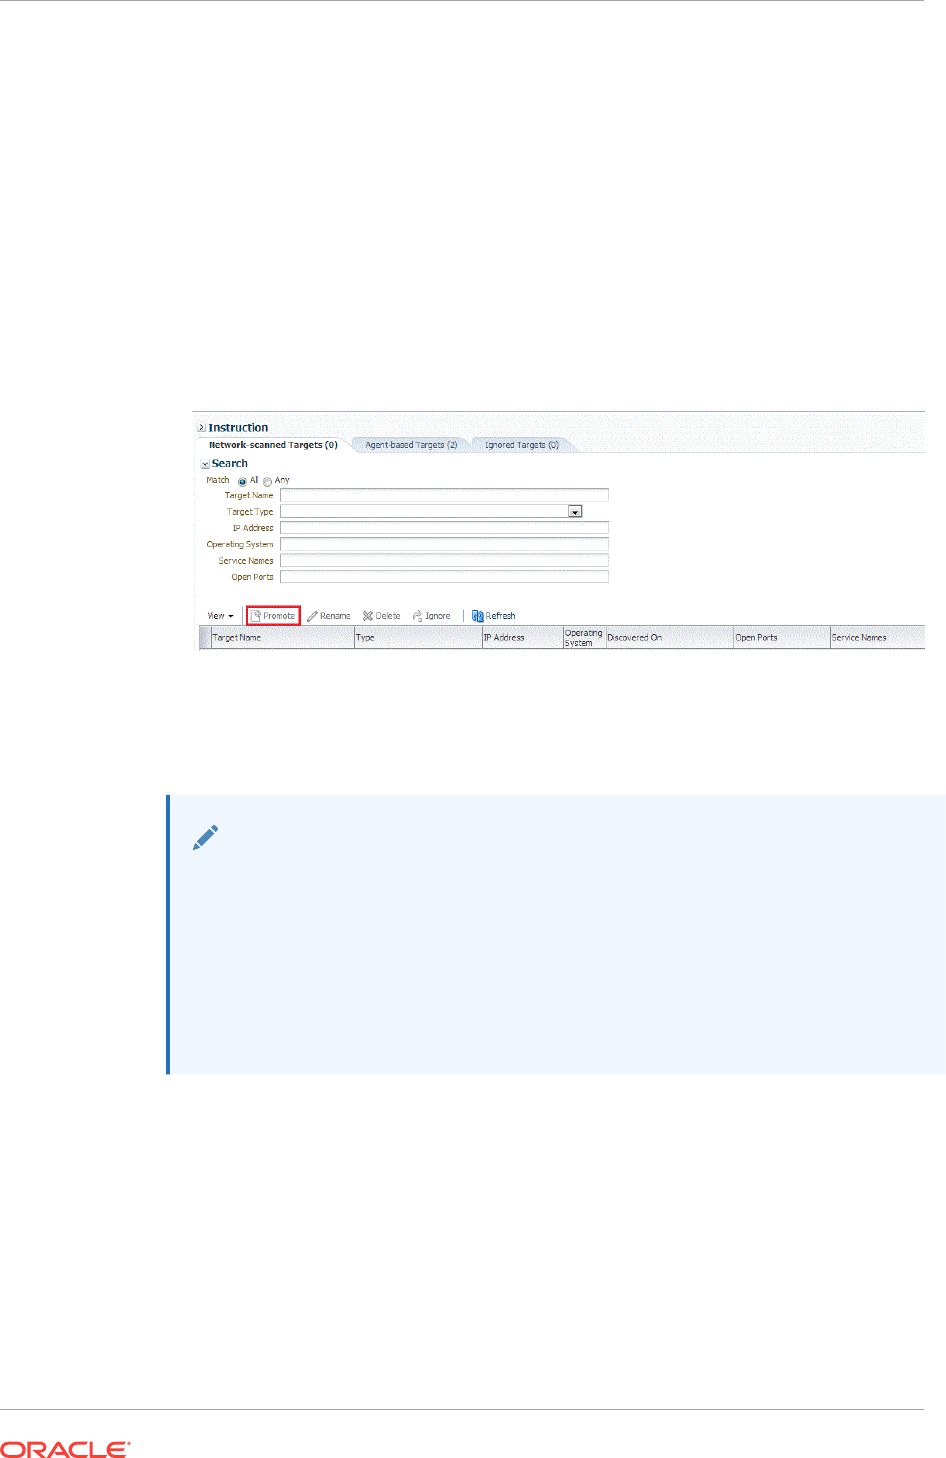
Click Save and Submit Scan.
8. To check for discovered targets from the Setup menu, select Add Target, then
select Auto Discovery Results.
9. On the Auto Discovery Results page, select the Network-scanned Targets tab.
All discovered hosts are listed, with the open ports and identifiable service names
shown. Based on your understanding of the Oracle components deployed on your
network, you should be able to determine the types of potential targets that have
been discovered.
10. Select a host from the table, then click Promote to promote the host to managed
target status. The Add Host Targets wizard opens. You will use this wizard to
install a Management Agent on the host.
Installing a Management Agent on an unmanaged host promotes the unmanaged
host to managed target status, thereby converting the host to a managed host.
Note:
To convert unmanaged hosts to managed hosts manually, you should
manually install a Management Agent on each host. You can install a
Management Agent in graphical or in silent mode.
For instructions to install in graphical mode, see Oracle Enterprise Manager
Cloud Control Basic Installation Guide. For instructions to install in silent
mode, see Enterprise Manager Cloud Control Advanced Installation and
Configuration Guide.
13.2.2 Adding Host Targets Using the Manual Guided Discovery
Process
To add host targets manually, refer to the instructions outlined in the Oracle Enterprise
Manager Cloud Control Basic Installation Guide.
13.3 Discovering and Adding Non-Host Targets
This section covers the following:
Chapter 13
Discovering and Adding Non-Host Targets
13-11
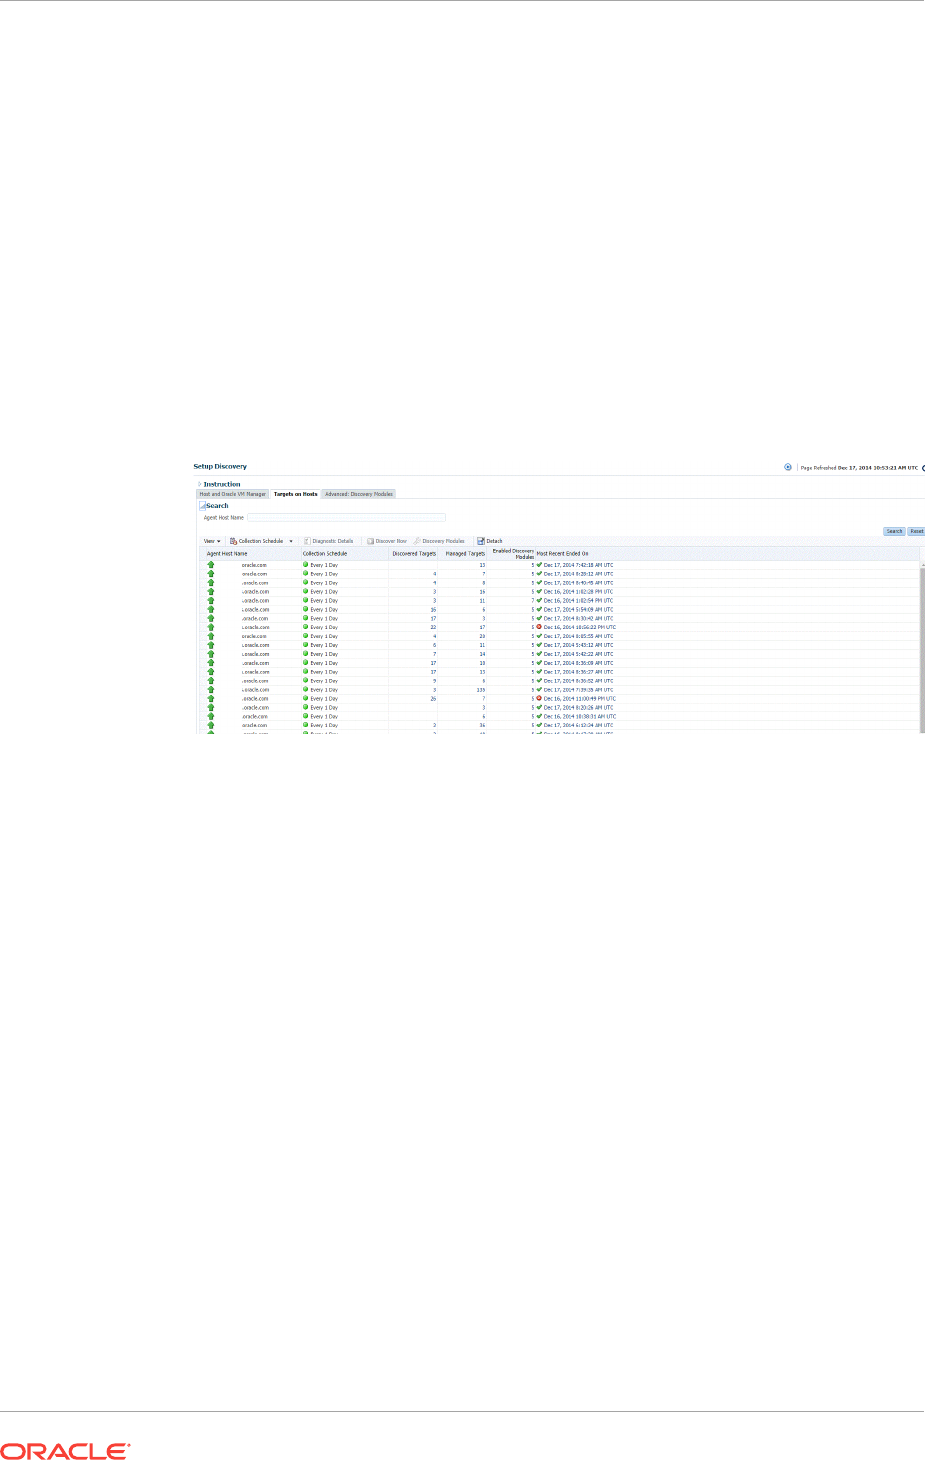
•Configuring Autodiscovery of Non-Host Targets
•Adding Non-Host Targets Using the Guided Discovery Process
•Adding Non-Host Targets By Using the Declarative Process
13.3.1 Configuring Autodiscovery of Non-Host Targets
To discover targets on managed hosts, follow these steps:
1. From the Setup menu, select Add Target, and then select Configure Auto
Discovery.
2. On the Setup Discovery page, in the Targets on Hosts tab, expand Search, then
enter the hostname for the host you want to check for targets in the Agent Host
Name field. The host must have a Management Agent installed on it.
3. On the Target Discovery (Agent-based) page, expand Search, then enter the
hostname for the host you want to check for targets in the Agent Host Name field.
The host must have a Management Agent installed on it.
4. To search for a specific Management Agent, click Search. The table lists all the
Management Agents and filters the list based on what you search for.
5. Select the host in the table and click Discovery Modules.
6. On the Discovery Modules page, select the target types that you want to discover
on the host. Note that you must supply search parameters for some target types.
To specify a parameter, select the target type in the Discovery Module column and
click Edit Parameters.
•Oracle Cluster and High Availability Service: No parameters required.
•Oracle Database, Listener and Automatic Storage Management: Specify the
path to the Clusterware Home.
•Oracle Home Discovery: No parameters required.
•Oracle Secure Backup Domain: No parameters required.
•Oracle Fusion Middleware: Specify * (the "star" character) to search all
Middleware Homes, or specify the path to one or more Middleware Homes on
the host, each separated by a comma.
Chapter 13
Discovering and Adding Non-Host Targets
13-12
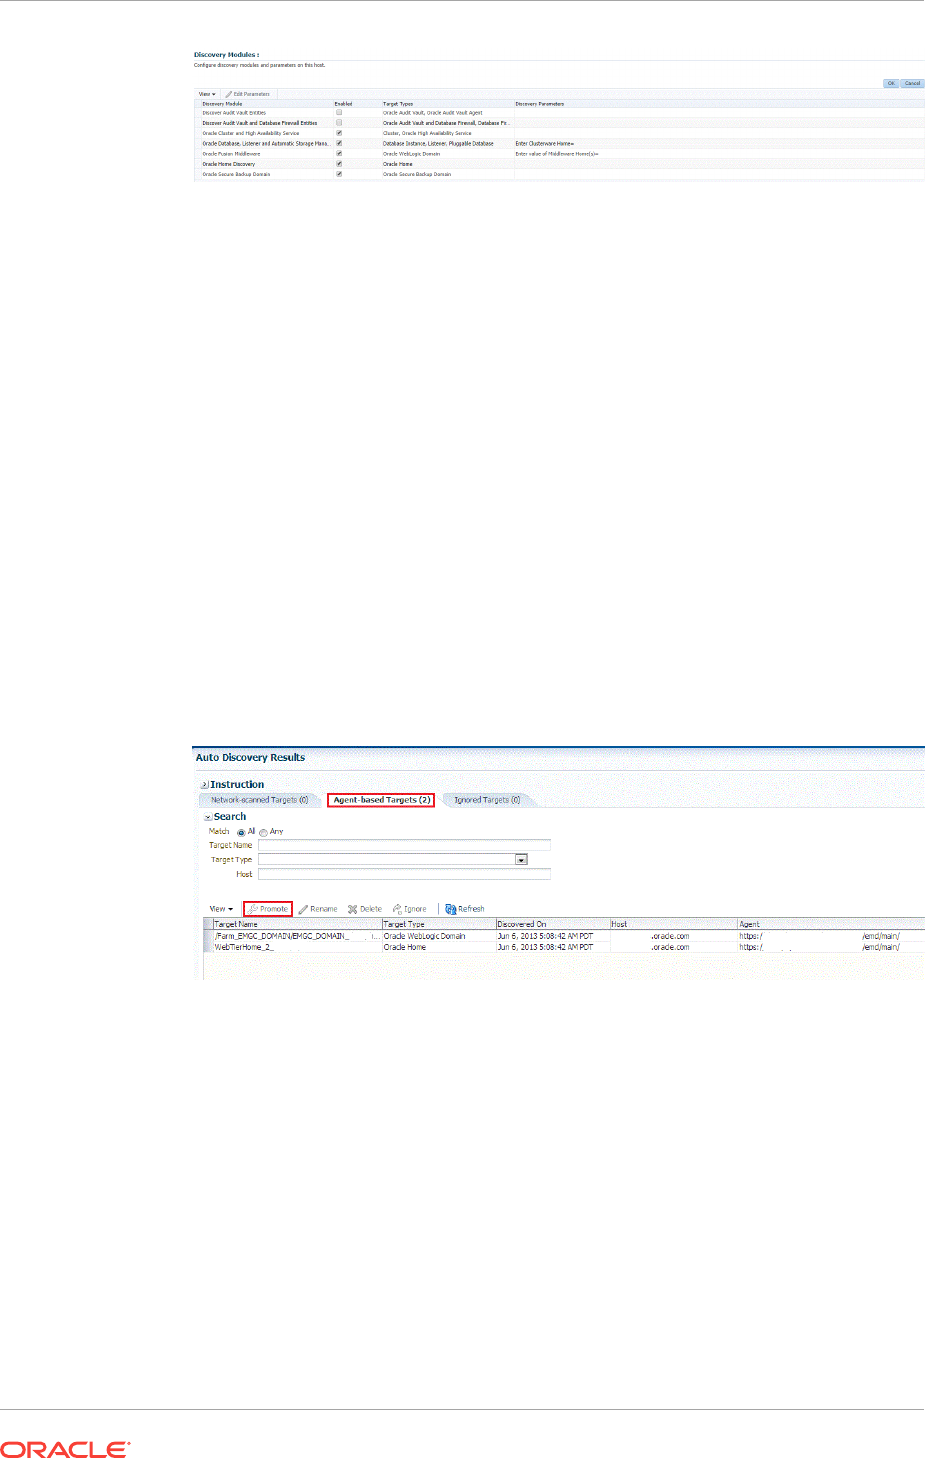
Click OK when finished. Target discovery has been configured on this host.
7. On the Setup Discovery page, in the Targets on Host tab, select the hosts you
want to set the schedule at which discovery will be run. Click Collection
Schedule, and then select For all hosts, or For selected hosts. In the Collection
Schedule dialog box, enable or disable collection for the hosts that you have
selected. If you have enabled collection, then select the frequency of collection.
This schedule will be applied to all selected hosts. By default the discovery will run
every 24 hours. Click OK.
8. Repeat these steps for each additional host on which you want to configure
discovery.
9. Click Discover Now to discover targets immediately. The discovery will also run at
the scheduled interval.
10. To check for discovered targets from the Setup menu, select Add Target, then
select Auto Discovery Results.
11. Select a target to promote, then click Promote. A wizard specific to the target type
you are promoting opens. Supply the required values.
12. Click the Agent-based Targets tab.You can choose one or several targets to
promote.
13. Note that you can optionally click Ignore for a discovered target. Ignoring a target
puts it into a list of targets that you do not want to manage.
Ignored targets will be displayed in the Ignored Targets tab, and will remain in
Cloud Control as un-managed targets until you decide to either promote or remove
them. If you delete a target, it would be rediscovered the next time discovery runs.
14. Check the target type home page to verify that the target is promoted as an Cloud
Control target. Once a target is successfully promoted, the Management Agent
installed on the target host will begin collecting metric data on the target.
Chapter 13
Discovering and Adding Non-Host Targets
13-13

Note:
•When you promote a discovered target to managed status, the plug-in
required for the target is automatically deployed to the Management
Agent, which monitors the host where the target has been discovered. For
the plug-in to be deployed, the Management Agent must be secure.
Therefore, before promoting the discovered targets to managed status,
ensure that the Management Agent is secure. You can always unsecure it
after the discovered target is promoted to managed status, that is, after
the required plug-in is deployed.
To verify the secure status of a Management Agent, and to secure it if
required, use any one of the following methods:
–From the Setup menu, select Manage Cloud Control, and then click
Agents. Click the required Management Agent. Verify whether the
Management Agent is secure. If it is not secure, from the Agent
menu, click Secure to secure it.
–Run the following command to verify if the Management Agent is
secure:
<EMSTATE>/bin/emctl status agent
If the Management Agent is secure, the Management Agent URL
displayed in the output of the previous command is an HTTPS URL.
However, if the Management Agent URL displayed is an HTTP URL,
secure the Management Agent by running the following command:
<EMSTATE>/bin/emctl secure agent
•Cloud Control supports simultaneous promotion of multiple targets only for
some target types. Additionally, multiple selection of database targets has
been disabled to avoid a user selecting RAC databases across clusters.
This is similar to the user-guided discovery feature where a user cannot
discover targets across a cluster in the same session.
13.3.2 Adding Non-Host Targets Using the Guided Discovery Process
To add non-host targets using the guided process, follow these steps:
Note:
When you add a target using the guided process, some scripts and automated
processes are run that are particular for the target type that you select. You
may have to input credentials in order to run the guided process.
1. From the Setup menu, select Add Target, then select Add Targets Manually.
Cloud Control displays the Add Targets Manually page.
2. On the Add Targets Manually page, select Add Using Guided Process.
Chapter 13
Discovering and Adding Non-Host Targets
13-14

3. In the Add Using Guided Process dialog box, select the target type such as
Exalogic Elastic Cloud, Oracle Cluster and High Availability Service, System
Infrastructure server ILOM, or Oracle WebLogic Domain. Click Add...
4. After you select the target type, a wizard specific to the target type guides you
through the process of manually adding the target.
Upon confirmation, the target becomes a managed target in Cloud Control. Cloud
Control simply accepts the information, performs validation of the supplied data
where possible and starts monitoring the target.
Note:
When you manually add a non-host target to Cloud Control, the plug-in
required for the target is automatically deployed to the Management Agent,
which monitors the host where the non-host target exists. For the plug-in to be
deployed, the Management Agent must be secure. Therefore, before manually
adding a non-host target to Cloud Control, ensure that the Management Agent
is secure. You can always unsecure it after the target is added to Cloud
Control, that is, after the required plug-in is deployed.
To verify the secure status of a Management Agent, and to secure it if
required, use any one of the following methods:
•From the Setup menu, select Manage Cloud Control and then, click
Agents. Click the required Management Agent. Verify whether the
Management Agent is secure. If it is not secure, from the Agent menu,
click Secure to secure it.
•Run the following command to verify if the Management Agent is secure:
<EMSTATE>/bin/emctl status agent
If the Management Agent is secure, the Management Agent URL
displayed in the output of the previous command is an HTTPS URL.
However, if the Management Agent URL displayed is an HTTP URL,
secure the Management Agent by running the following command:
<EMSTATE>/bin/emctl secure agent
13.3.3 Adding Non-Host Targets By Using the Declarative Process
To add a target on a managed host by specifying the target monitoring properties,
follow these steps:
1. From the Setup menu, select Add Target, then select Add Targets Manually.
Cloud Control displays the Add Targets Manually page.
2. On the Add Targets Manually page, select Add Target Declaratively.
3. In the Add Target Declaratively dialog box, choose one of the target types to add
from the Target Types list, such as ADF Business Components for Java,
Cluster Database, or Oracle HTTP Server.
4. Specify the Management Agent that will be used to monitor the target, or click on
the Search icon to search for and select the Management Agent. Click Add...
Chapter 13
Discovering and Adding Non-Host Targets
13-15

5. After you select the target type, a wizard specific to the target type guides you
through the process of manually adding the target.
Upon confirmation, the target becomes a managed target in Cloud Control. Cloud
Control simply accepts the information, performs validation of the supplied data
where possible and starts monitoring the target.
Note:
When you manually add a non-host target to Cloud Control, the plug-in
required for the target is automatically deployed to the Management Agent,
which monitors the host where the non-host target exists. For the plug-in to be
deployed, the Management Agent must be secure. Therefore, before manually
adding a non-host target to Cloud Control, ensure that the Management Agent
is secure. You can always unsecure it after the target is added to Cloud
Control, that is, after the required plug-in is deployed.
To verify the secure status of a Management Agent, and to secure it if
required, use any one of the following methods:
•From the Setup menu, select Manage Cloud Control, and then, click
Agents. Click the required Management Agent. Verify whether the
Management Agent is secure. If it is not secure, from the Agent menu,
click Secure to secure it.
•Run the following command to verify if the Management Agent is secure:
<EMSTATE>/bin/emctl status agent
If the Management Agent is secure, the Management Agent URL
displayed in the output of the previous command is an HTTPS URL.
However, if the Management Agent URL displayed is an HTTP URL,
secure the Management Agent by running the following command:
<EMSTATE>/bin/emctl secure agent
13.4 Discovering and Promoting Oracle Homes
When you deploy an Oracle software component outside of the deployment
procedures provided by Enterprise Manager, the Oracle home is not automatically
discovered and promoted as targets. You will have to manually discover and promote
the Oracle home target.
To discover and promote an Oracle home target, follow these steps:
1. From the Enterprise menu, select Job, and then select Activity.
Chapter 13
Discovering and Promoting Oracle Homes
13-16
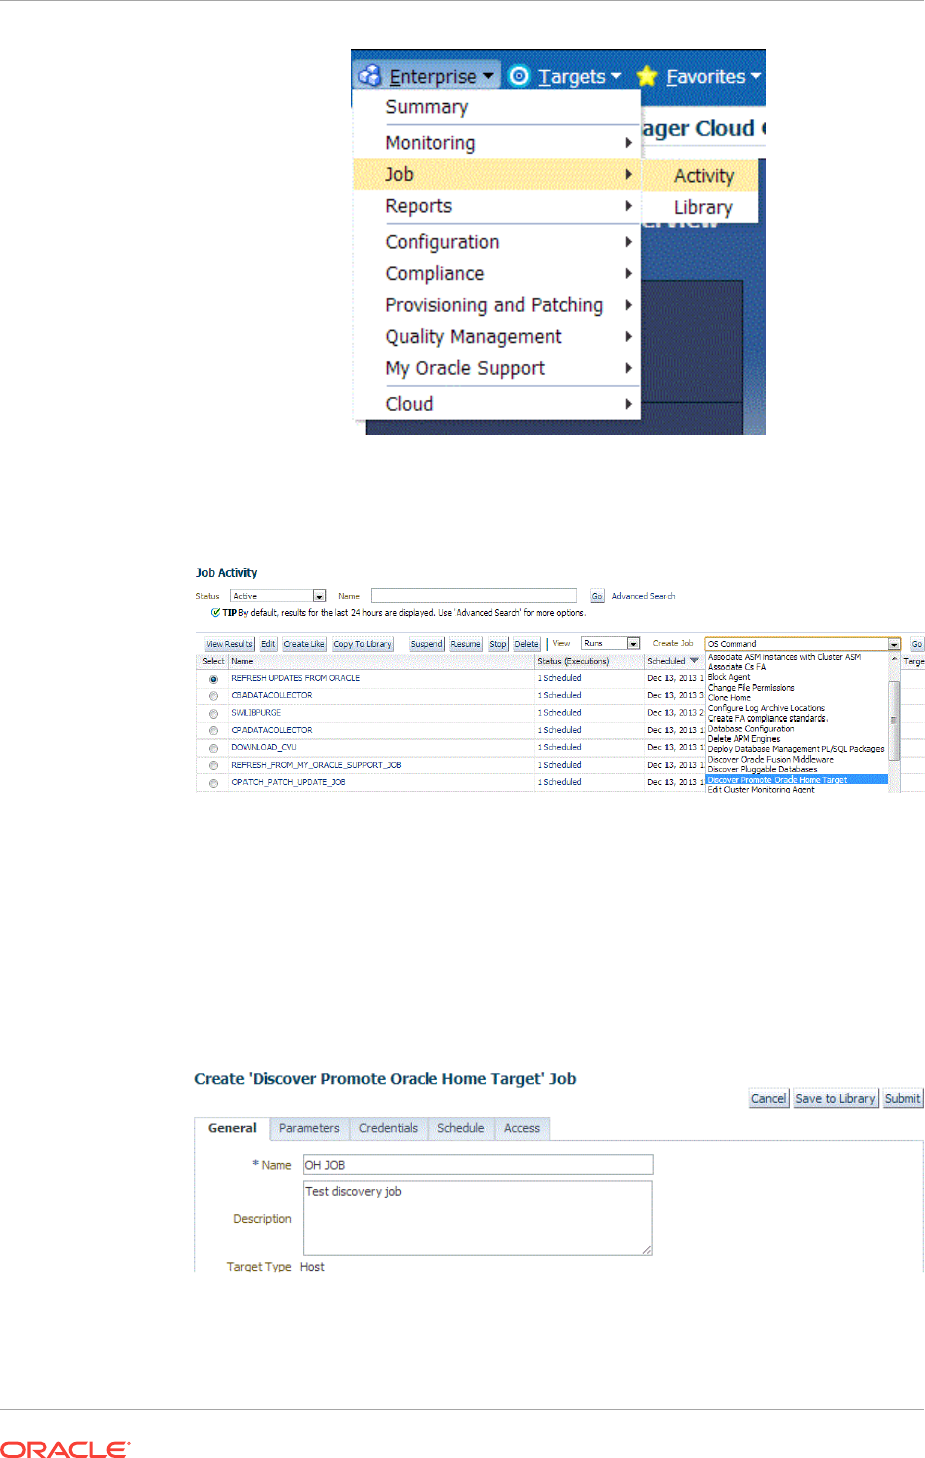
2. On the Job Activity page, from the drop-down list in the table, select Discover
Promote Oracle Home Target.
Click Go.
3. On the 'Create Discover Promote Oracle Home Target' Job page, in the General
tab, specify the name of the discovery.
For example:
OHDiscovery
You can optionally add a description for the discovery.
Click Add.
Chapter 13
Discovering and Promoting Oracle Homes
13-17
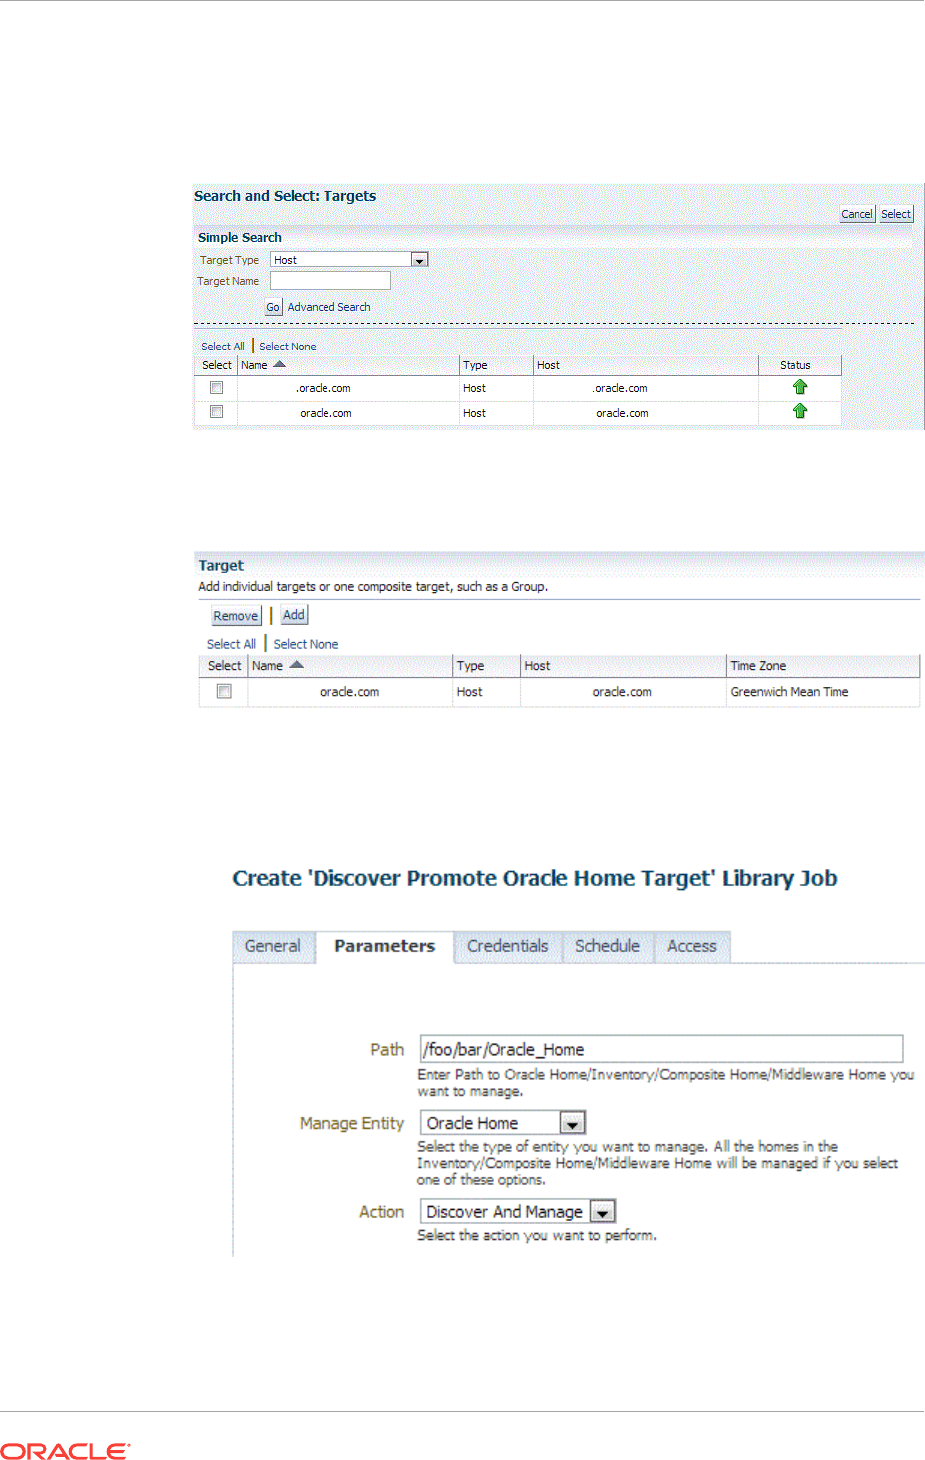
4. In the Search and Select: Target dialog box, select Target Type as Host, and then
select all the host targets listed by clicking Select All.
Click Select.
5. On the'Create Discover Promote Oracle Home Target' Job page, the host targets
that you selected are displayed in the table.
6. Select the Parameters tab, and then do one of the following:
•To discover a single Oracle Home, specify the path to the home, and then
select Oracle Home as the manage entity.
•To discover all Homes in an inventory, specify the path to the inventory, and
then select Inventory as the manage entity.
Chapter 13
Discovering and Promoting Oracle Homes
13-18
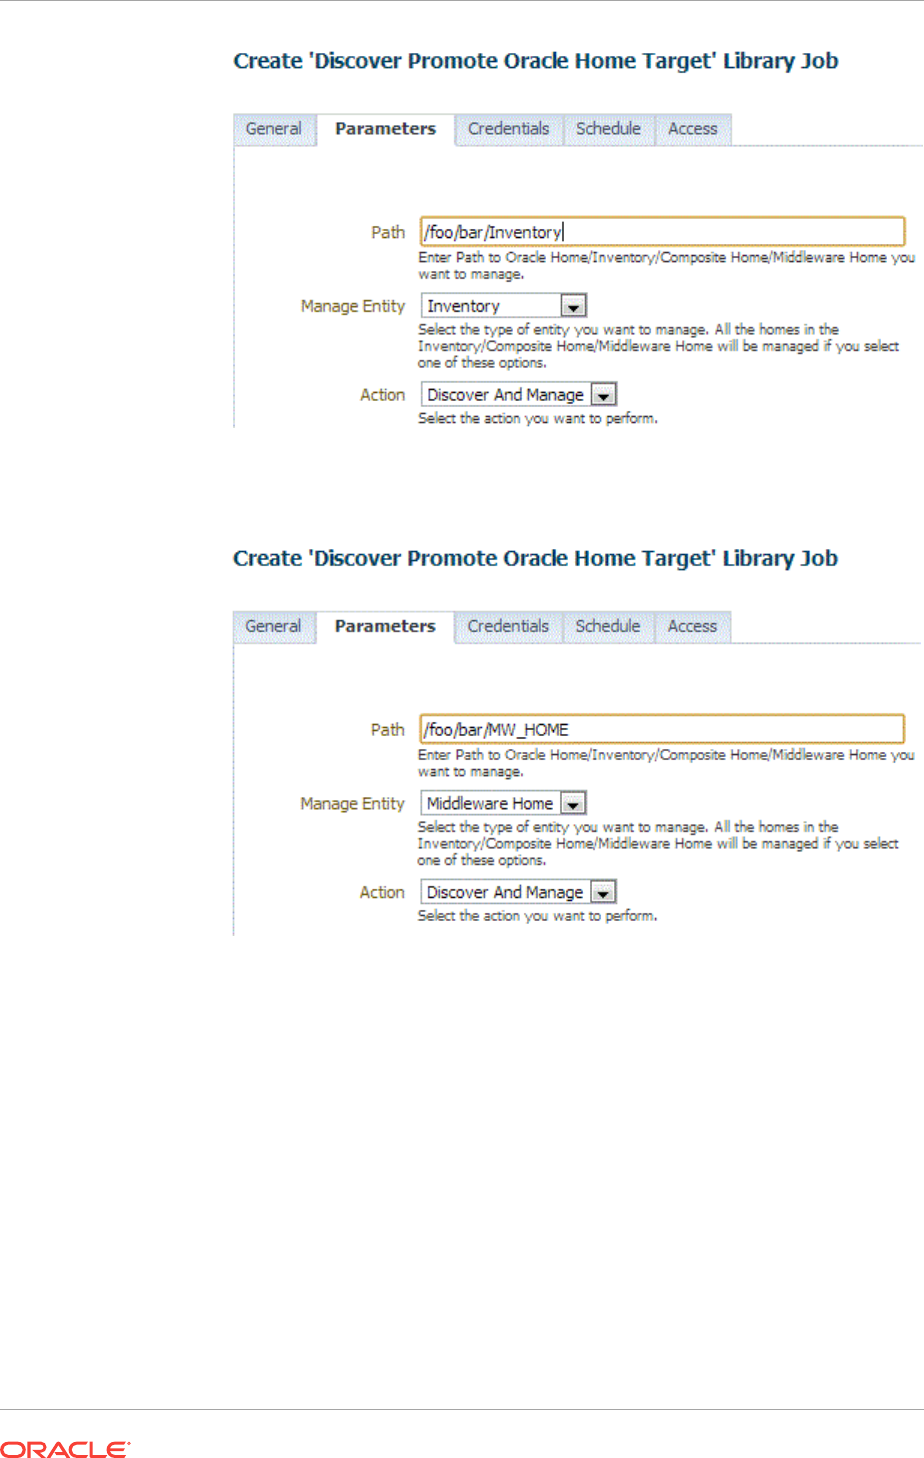
•To discover all Homes in a Middleware Home, specify the path to the
Middleware Home and select Middleware Home as the manage entity.
7. To save the job for later, click Save to Library. To submit it, click Submit. When
the discovery is successful, a confirmation is displayed on the Job Activity page.
Chapter 13
Discovering and Promoting Oracle Homes
13-19

Note:
If you submit the discovery job without specifying a path, a discovery of the
whole host will be performed. In order for a Home to be discoverable by the
Management Agent, it needs to be registered in an inventory that the
Management Agent recognizes. The default inventory is the central inventory,
which in Unix systems is found in
/etc/oraInst.loc.
Any Home registered here
will automatically be discovered.
If there are other inventories in the host, they need to be added to the
inventory list of the Management Agent. A line must be added to
$EMSTATE/
sysman/config/OUIinventories.add.
If the inventory is not found here, the Management Agent will not know of its
existence, and hence any Home registered there will not be discovered.
13.5 Retrieving Deleted Targets
This sections covers the following:
•Retrieving Deleted Target Types
•Retrieving Deleted Host and Corresponding Management Agent Targets
13.5.1 Retrieving Deleted Target Types
If you have deleted one or more targets (such as a database target or a weblogic
domain, or any other target), you can retrieve them and add them back to the
Enterprise Manager Cloud Control Console. If autodiscovery is configured on the host
where the targets were present, the targets are automatically discovered during the
next scheduled autodiscovery operation. Once they are autodiscovered, you can
promote them and add them to the console. If autodiscovery is not configured on the
host where the targets were present, you have to discover the targets using one of the
following methods:
•By enabling autodiscovery as described in Configuring Autodiscovery of Non-Host
Targets to automatically discover and promote the targets in the next scheduled
autodiscovery operation.
•By using the guided discovery process as described in Adding Non-Host Targets
Using the Guided Discovery Process to manually discover and add the discovered
targets to the console.
•By specifying the target monitoring properties for each target as described in
Adding Non-Host Targets By Using the Declarative Process to manually discover
and add the discovered targets to the console.
•By using the following EM CLI verb:
$ emcli add_target
-name="name"
-type="type"
-host="hostname"
[-properties="pname1:pval1;pname2:pval2;..."]
[-separator=properties="sep_string"]
[-subseparator=properties="subsep_string"]
Chapter 13
Retrieving Deleted Targets
13-20

[-credentials="userpropname:username;pwdpropname:password;..."]
[-input_file="parameter_tag:file_path"]
[-display_name="display_name"]
[-groups="groupname1:grouptype1;groupname2:grouptype2;..."]
[-timezone_region="gmt_offset"]
[-monitor_mode="monitor_mode"]
[-instances="rac_database_instance_target_name1:target_type1;..."]
[-force]
[-timeout="time_in_seconds"]
[ ] indicates that the parameter is optional
For more information, access the following URL:
http://docs.oracle.com/cd/E24628_01/em.121/e17786/cli_verb_ref.htm#CACHFHCA
13.5.2 Retrieving Deleted Host and Corresponding Management
Agent Targets
If you have deleted a host target and the corresponding Management Agent target,
you can retrieve both of them. To do so, follow these steps:
Discover and add the host and the Management Agent by running the following
command from the agent instance home of the corresponding host:
$ emctl config agent addInternalTargets
Once the host and the Management Agent are discovered and added to the console,
add each target on that host as targets to be monitored in the console, by running the
following EM CLI verb:
$ emcli add_target
-name="name"
-type="type"
-host="hostname"
[-properties="pname1:pval1;pname2:pval2;..."]
[-separator=properties="sep_string"]
[-subseparator=properties="subsep_string"]
[-credentials="userpropname:username;pwdpropname:password;..."]
[-input_file="parameter_tag:file_path"]
[-display_name="display_name"]
[-groups="groupname1:grouptype1;groupname2:grouptype2;..."]
[-timezone_region="gmt_offset"]
[-monitor_mode="monitor_mode"]
[-instances="rac_database_instance_target_name1:target_type1;..."]
[-force]
[-timeout="time_in_seconds"]
[ ] indicates that the parameter is optional
For more information, access the following URL:
http://docs.oracle.com/cd/E24628_01/em.121/e17786/cli_verb_ref.htm#CACHFHCA
Chapter 13
Retrieving Deleted Targets
13-21
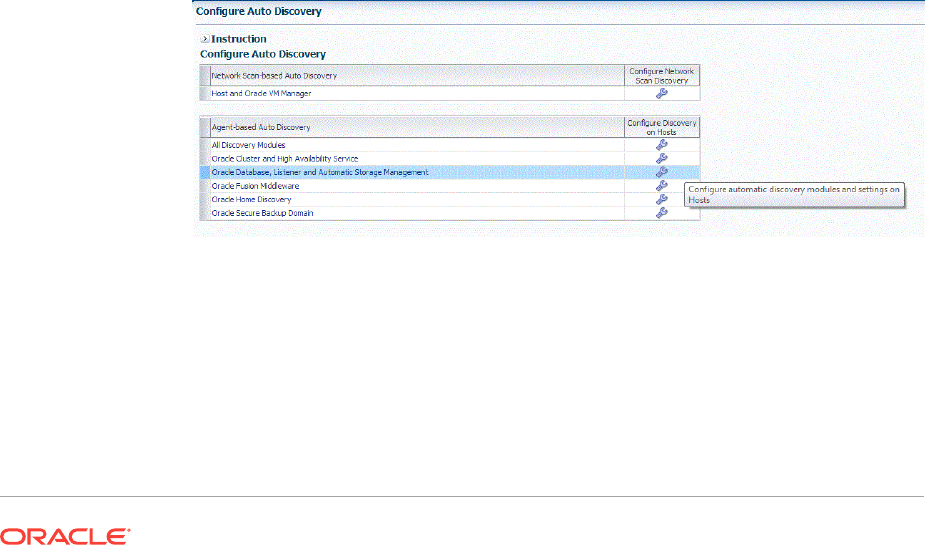
14
Discovering and Adding Database Targets
This chapter describes how you can discover and add database targets to be
managed by Enterprise Manager Cloud Control. In particular, this chapters covers the
following:
•Enabling Autodiscovery of Database Targets
•Discovering and Adding Container Database and Pluggable Database Targets
•Discovering and Adding Cluster Database Targets
•Discovering and Adding Single Instance Database Targets
•Discovering and Adding Cluster Targets
•Discovering and Adding Single Instance High Availability Service Targets
•Discovering and Adding Cluster Automatic Storage Management Targets
•Configuring a Target Database for Secure Monitoring
14.1 Enabling Autodiscovery of Database Targets
Autodiscovery of database targets is enabled by default. If autodiscovery has been
disabled, you can enable it, by following these steps:
1. From the Setup menu, select Add Target, then select Configure Auto
Discovery.
2. On the Configure Auto Discovery page, in the Agent-based Auto Discovery table,
select Oracle Database, Listener, and Automatic Storage Management.
3. On the Configure Target Discovery page, click Add Host.
14-1
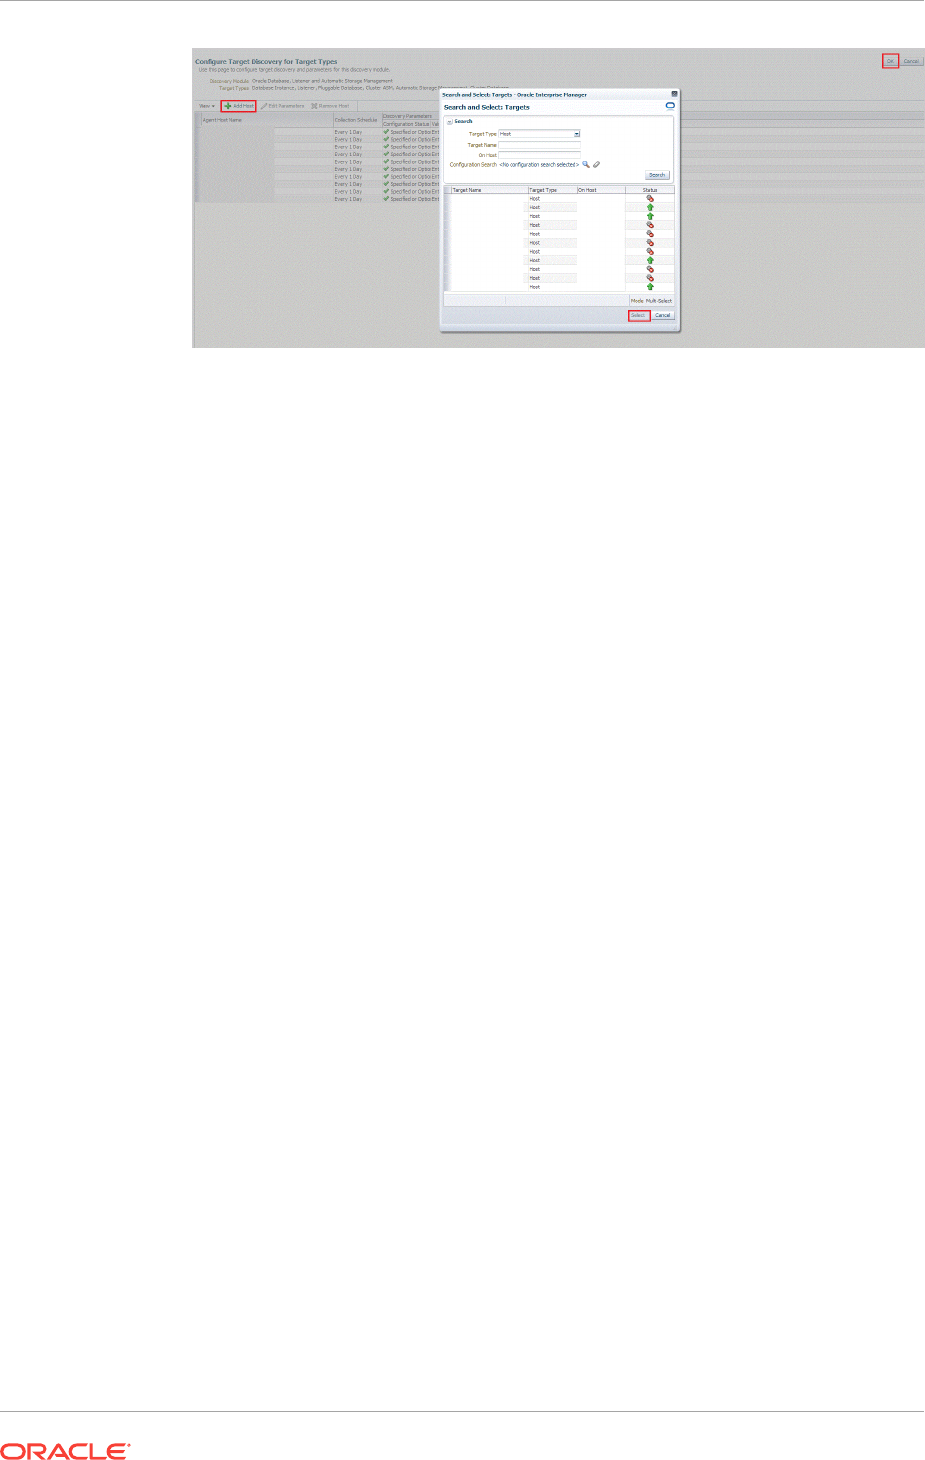
4. From the Search and Select Targets dialog box, select a target that you want to be
configured, and click Select.
5. You can click Edit Parameters to edit the parameters of the target.
Click OK.
14.2 Discovering and Adding Container Database and
Pluggable Database Targets
This section describes the different methods in which you can discover, promote, and
add container database (CDB) and pluggable database (PDB) targets in Cloud
Control. In particular, this section covers the following:
•Discovering CDB and PDB Targets Using Autodiscovery
•Adding CDB and PDB Targets Using the Guided Discovery Process
•Adding CDB and PDB Targets By Using the Declarative Process
14.2.1 Discovering CDB and PDB Targets Using Autodiscovery
Autodiscovery of databases is enabled by default. If autodiscovery has been disabled,
follow the steps described in Enabling Autodiscovery of Database Targets.
Chapter 14
Discovering and Adding Container Database and Pluggable Database Targets
14-2

Note:
A database system is automatically created on discovery of an Oracle
Database. The system is built on the new target and association model that
can be used to monitor the database's storage, connectivity, and high
availability. This also enables you to monitor and manage applications that are
dependent on the database. Database System topology can be used to view
relationship between various entities within the database system as well as
external dependencies.
A database system contains a primary database and related targets such as
Listener and Automatic Storage Management. It also includes standby
databases and their related targets if the database is in a Data Guard
configuration. However, you cannot create database systems for standby
databases.
To promote a CDB target and its associated PDB targets using automatic discovery,
follow these steps:
Note:
By default, promoting a CDB target also promotes all its associated discovered
PDB targets. Also, by default, Enterprise Manager runs a background job
(every 24 hours) to automatically discover and promote newly created PDB
targets present on managed hosts. Hence, to discover and promote PDB
targets, you only need to discover and promote the associated CDB target, as
described in this section.
1. From the Setup menu, select Add Target, then select Auto discovery Results.
Click Agent-based Targets.
2. Search for and select the Database Instance target that you want to promote, then
click Promote.
Note:
You can also discover Application Root PDBs. However, they are not explicitly
shown as Application Root Pluggable Database, but just as Pluggable
Database.
Chapter 14
Discovering and Adding Container Database and Pluggable Database Targets
14-3
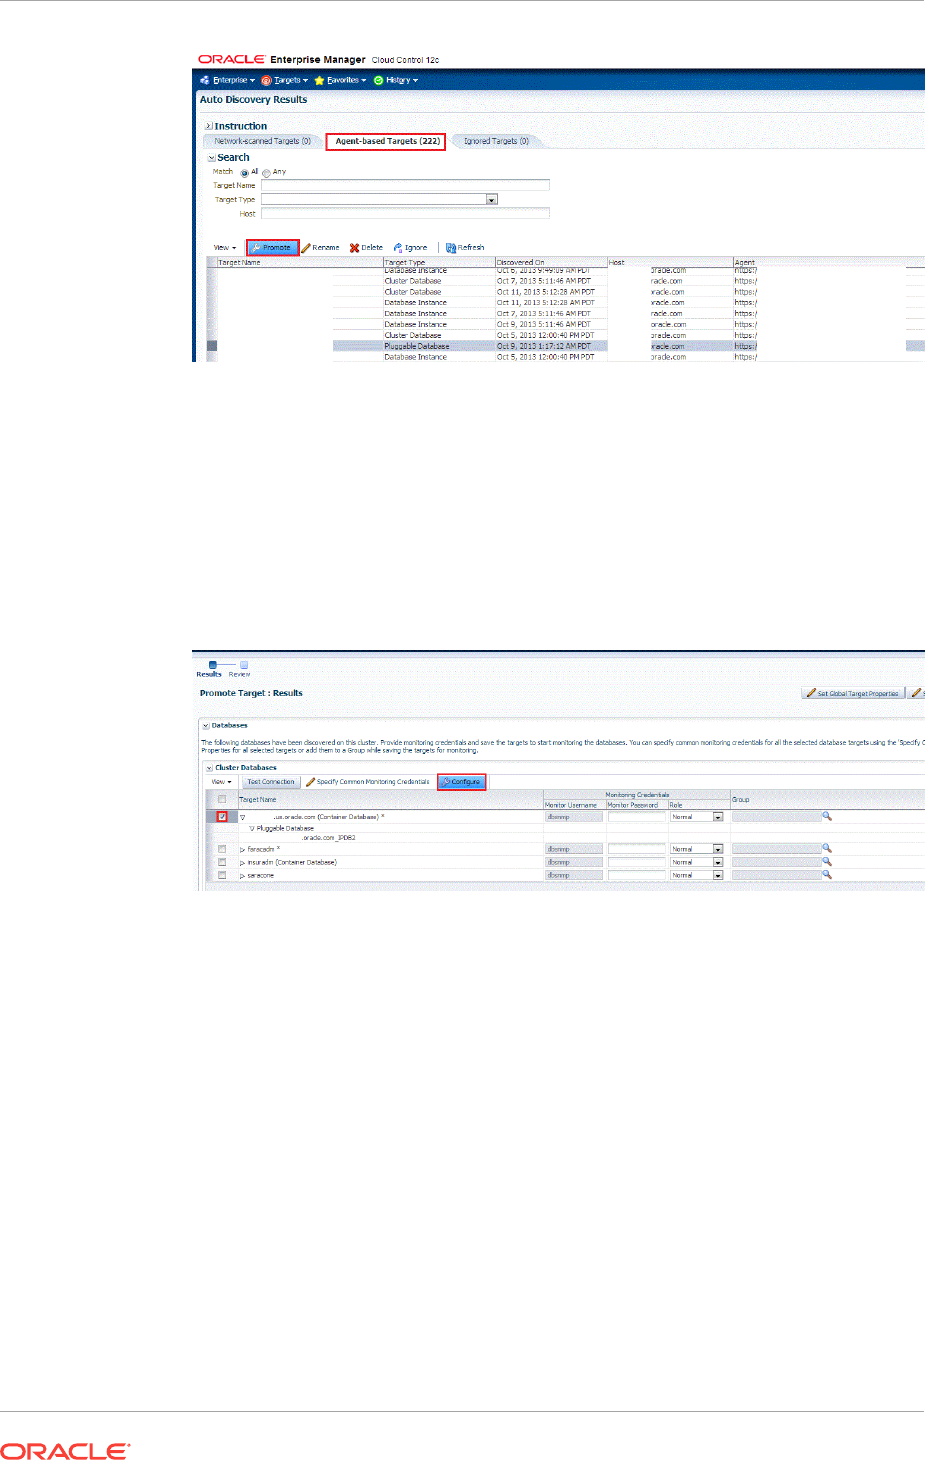
3. On the Promote Target: Results page, under the Databases section, select the
CDB target.
By default, selecting a CDB target for promotion also selects all its associated and
discovered PDB (and Application Root PDB) targets for promotion. If you want to
add or remove a target from the ones selected for promotion, select the CDB
target, then click Configure.
Select the Pluggable Databases tab, then click Add or Remove. Click Save.
Chapter 14
Discovering and Adding Container Database and Pluggable Database Targets
14-4
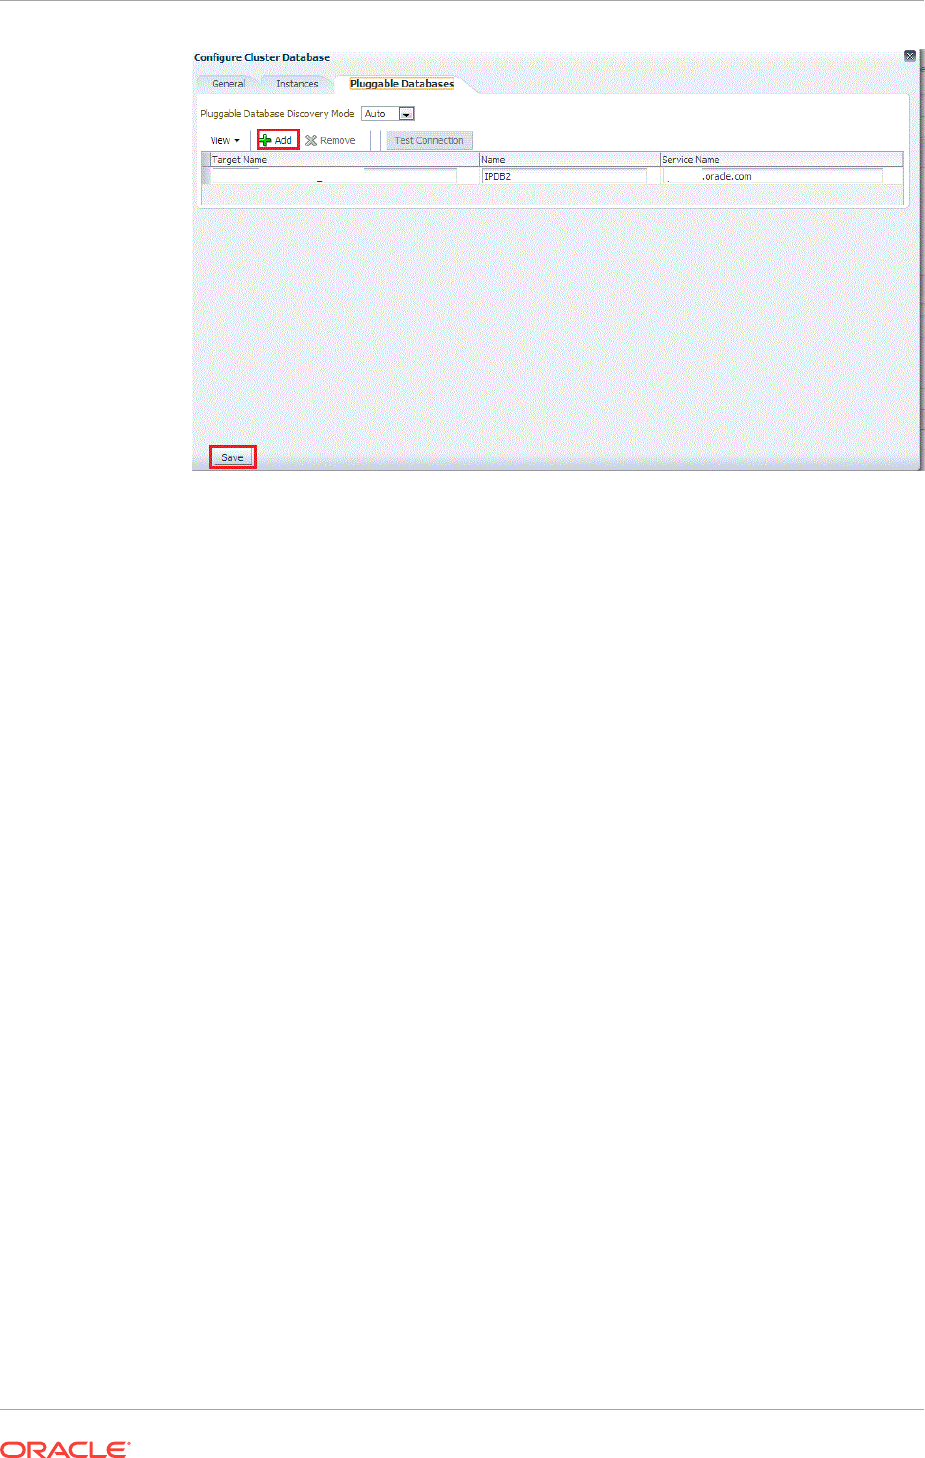
Enterprise Manager runs a background job (every 24 hours) to automatically
discover and promote newly created PDB targets present on managed hosts. If
you do not want Enterprise Manager to automatically promote the PDB targets
associated with a particular CDB target, and instead want to promote them
manually, select the CDB target on the Promote Target: Results page, then click
Configure. Select the Pluggable Databases tab, then select Manual for
Pluggable Database Discovery Mode. Click Save.
4. Specify the monitoring credentials for the selected CDB target, that is, the user
name, password, and role. Also, if you want the selected target to be added to a
group, specify a value for Group.
If you specify Normal for Role, then the user name must be
dbsnmp;
you cannot
provide a different user name. However, if you specify SYSDBA for Role, then you
can provide any SYSDBA user. Only SYSDBA users and the
dbsnmp
user have the
privileges required for target monitoring.
5. Click Test Connection to test the connection made to the CDB target using the
specified monitoring credentials.
6. To specify global target properties for all the targets you have selected on the
Promote Target: Results page, click Set Global Target Properties, specify the
required properties, then click OK.
To specify a common group for all the targets you have selected on the Promote
Target: Results page, click Specify Group for Targets, select a group, then click
Select.
7. Click Next.
8. Review the displayed information, then click Submit.
14.2.2 Adding CDB and PDB Targets Using the Guided Discovery
Process
To add a CDB target and its associated PDB (and Application Root PDB) targets using
a guided discovery process, follow these steps:
Chapter 14
Discovering and Adding Container Database and Pluggable Database Targets
14-5
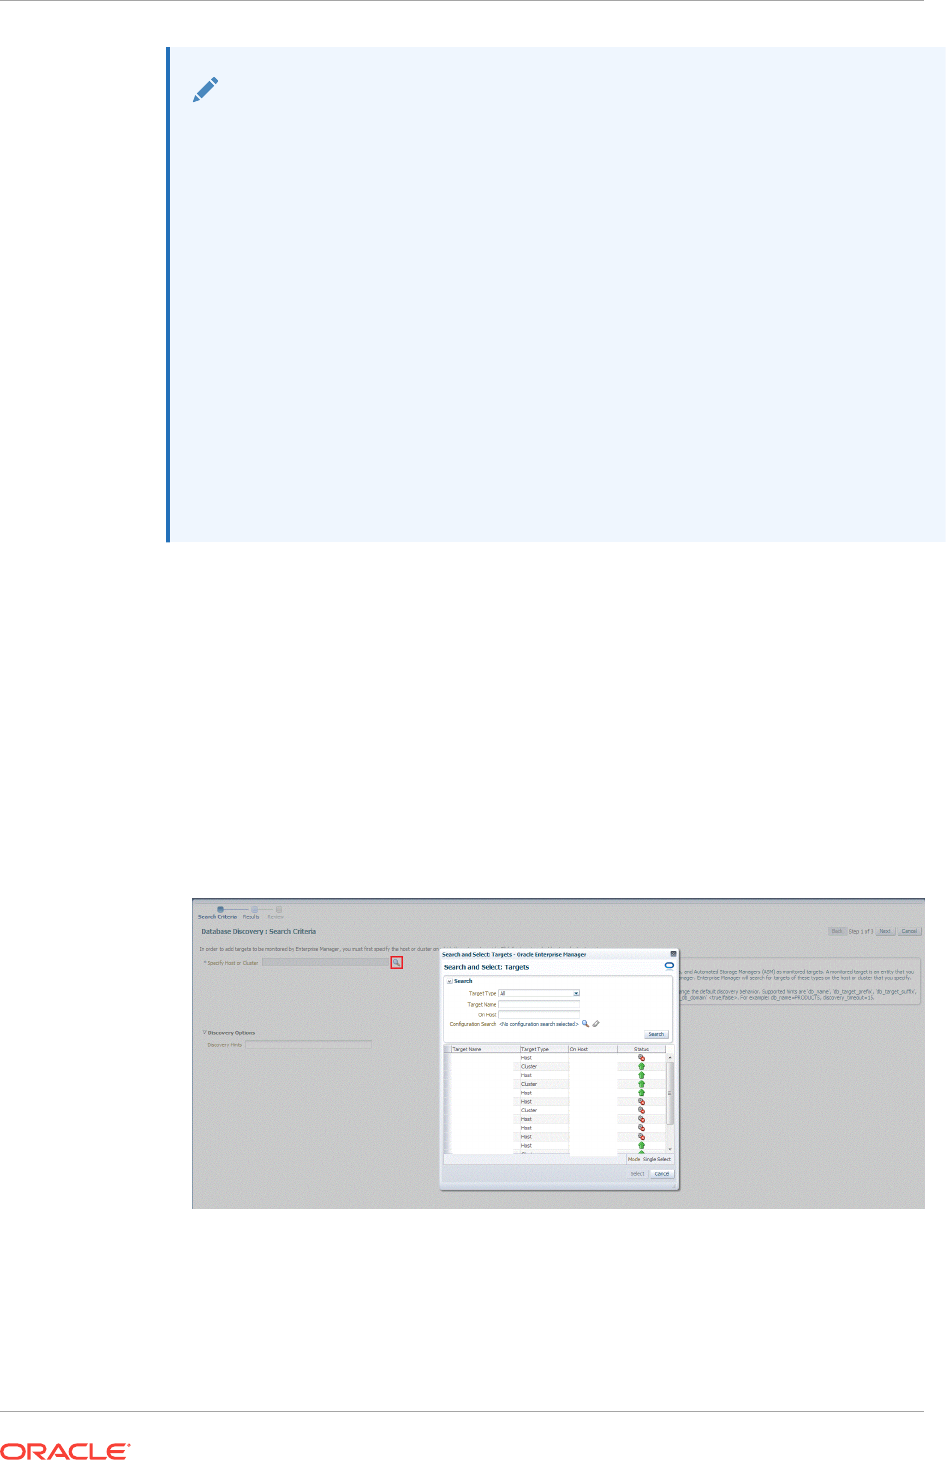
Note:
•You can also add Application Root PDBs. However, they are not explicitly
shown as Application Root Pluggable Database, but just as Pluggable
Database.
•A database system is automatically created on discovery of an Oracle
Database. The system is built on the new target and association model
that can be used to monitor the database's storage, connectivity, and high
availability. This also enables you to monitor and manage applications that
are dependent on the database. Database System topology can be used
to view relationship between various entities within the database system
as well as external dependencies.
A database system contains a primary database and related targets such
as Listener and Automatic Storage Management. It also includes standby
databases and their related targets if the database is in a Data Guard
configuration. However, you cannot create database systems for standby
databases.
1. From the Setup menu, select Add Target, then select Add Targets Manually.
2. On the Add Targets Manually page, select Add Using Guided Process.
3. In the Add Using Guided Process dialog box, select Oracle Database, Listener,
and Automatic Storage Management. Click Add...
4. Select Add Targets Using Guided Process (Also Adds Related Targets). For
Target Types, select Oracle Database, Listener, and Automatic Storage
Management. Click Add Using Guided Process.
5. On the Database Discovery: Search Criteria page, for Specify Host or Cluster,
specify the CDB host.
If the host you select is a member of a cluster, then use this page to also indicate
whether the PDB targets should be searched only on the selected host or on all
hosts within the cluster.
Chapter 14
Discovering and Adding Container Database and Pluggable Database Targets
14-6
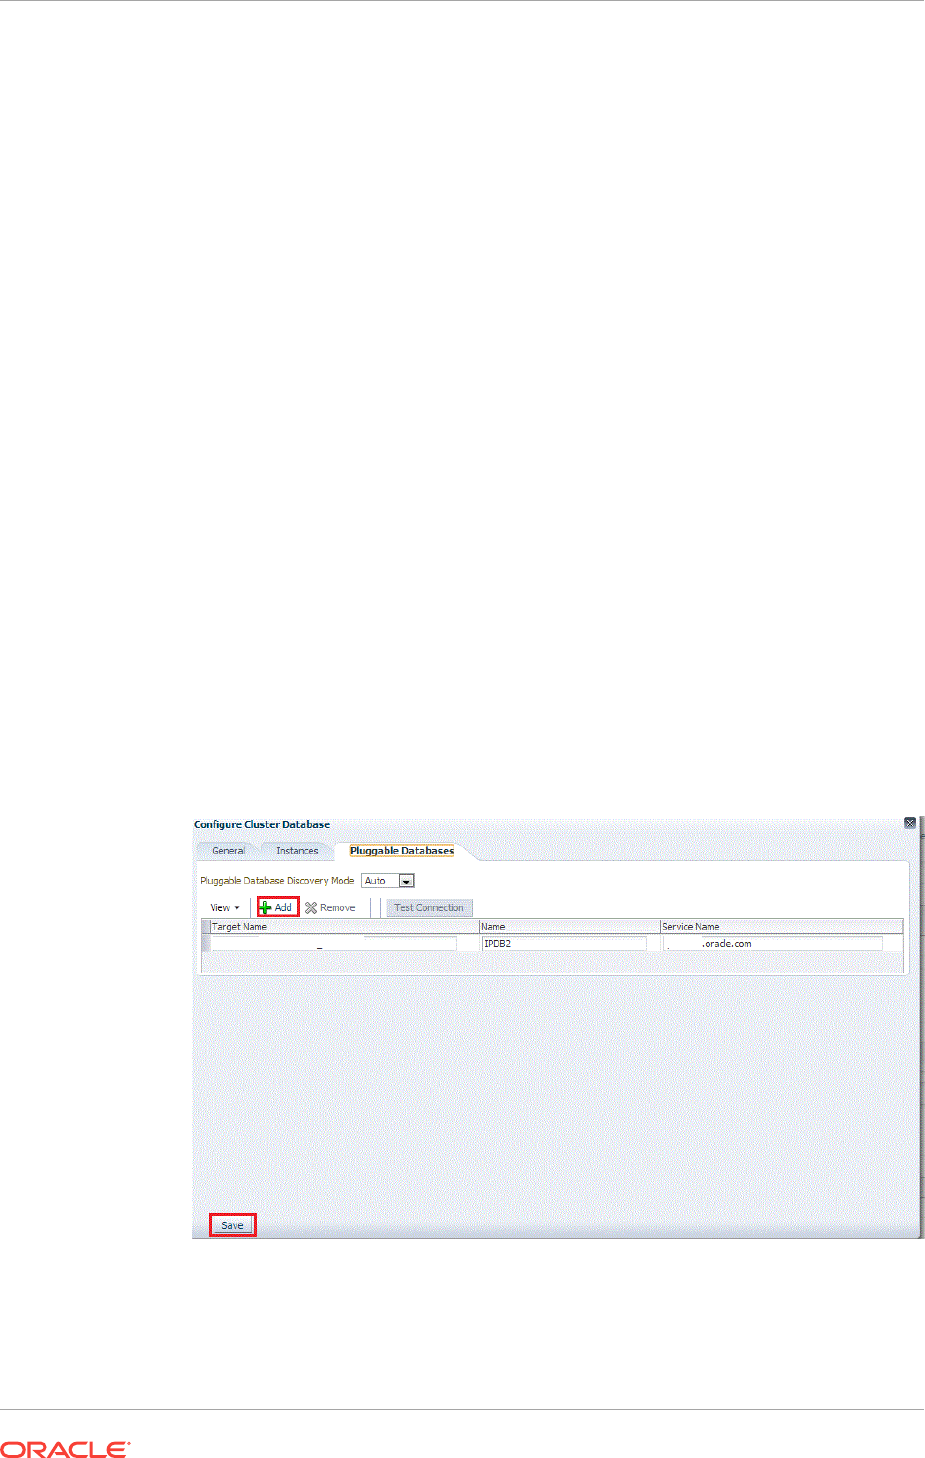
After you click the search icon, a Select Targets dialog box appears. Specify the
target name or select a target from the target table. You can filter the search to
search for all down targets or up targets, by clicking the filter arrows in the Status
column.
You can also configure your search by clicking the Configuration Search icon.
After you select the CDB, click Select.
You get an option to choose if you want to search for pluggable database targets
only on the current host that you selected, or on all the hosts in the cluster that the
host target is a member of.
This option enables you to save time, if you want to search for PDB targets only on
the current host selected.
The Discovery Options section enables you to specify discovery hints. You can
specify additional discovery options to change the default discovery behavior.
Supported hints are
db_name, db_target_prefix, db_target_suffix,
discovery_timeout <in seconds per host>
, and
no_db_domain.
For example,
db_name=PRODUCTS, discovery timeout=15.
6. Click Next.
7. On the Database Discovery: Results page, under the Databases section, select
the CDB target.
By default, selecting a CDB target for promotion also selects all its associated and
discovered PDB (and Application Root PDB) targets for promotion. If you want to
add or remove a PDB target from the ones selected for promotion, select the CDB
target, then click Configure. Select the Pluggable Databases tab, then click Add
or Remove. Click Save.
Enterprise Manager runs a background job (every 24 hours) to automatically
discover and promote newly created PDB targets present on managed hosts. If
you do not want Enterprise Manager to automatically promote the PDB targets
Chapter 14
Discovering and Adding Container Database and Pluggable Database Targets
14-7

associated with a particular CDB target, and instead want to promote them
manually, select the CDB target on the Promote Target: Results page, then click
Configure. Select the Pluggable Databases tab, then select Manual for
Pluggable Database Discovery Mode. Click Save.
8. Specify the monitoring credentials for the selected CDB target, that is, the user
name, password, and role. Also, if you want the selected target to be added to a
group, specify a value for Group.
If you specify Normal for Role, then the user name must be
dbsnmp;
you cannot
provide a different user name. However, if you specify SYSDBA for Role, then you
can provide any SYSDBA user. Only SYSDBA users and the
dbsnmp
user have the
privileges required for target monitoring.
9. Click Test Connection to test the connection made to the CDB target using the
specified monitoring credentials.
10. To specify global target properties for all the targets you have selected on the
Promote Target: Results page, click Set Global Target Properties, specify the
required properties, then click OK.
To specify a common group for all the targets you have selected on the Promote
Target: Results page, click Specify Group for Targets, select a group, then click
Select.
If you have selected multiple databases and you want to set the same monitoring
properties for all of them, select Specify Common Monitoring Credentials. Enter
the monitoring credentials, monitoring password, and role. Click Apply.
11. Click Next.
12. Review the displayed information, then click Submit.
14.2.3 Adding CDB and PDB Targets By Using the Declarative
Process
To add a CDB target and its associated PDB (and Application Root) targets by
specifying target monitoring properties, follow these steps:
Note:
A database system is automatically created on discovery of an Oracle
Database. The system is built on the new target and association model that
can be used to monitor the database's storage, connectivity, and high
availability. This also enables you to monitor and manage applications that are
dependent on the database. Database System topology can be used to view
relationship between various entities within the database system as well as
external dependencies.
A database system contains a primary database and related targets such as
Listener and Automatic Storage Management. It also includes standby
databases and their related targets if the database is in a Data Guard
configuration. However, you cannot create database systems for standby
databases.
Chapter 14
Discovering and Adding Container Database and Pluggable Database Targets
14-8
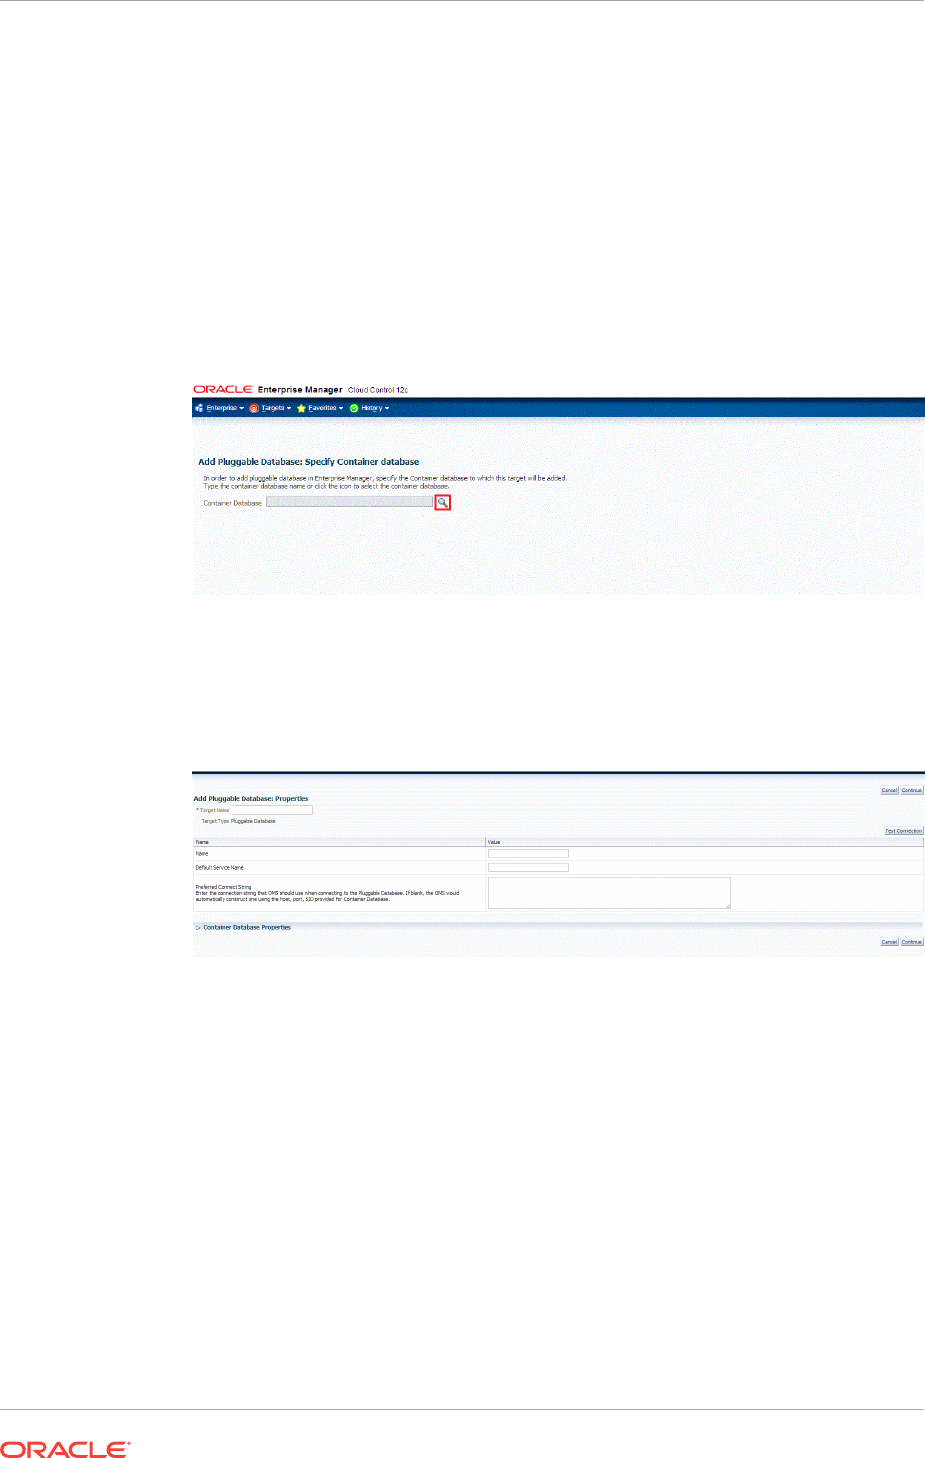
1. From the Setup menu, select Add Target, then select Add Targets Manually.
2. On the Add Targets Manually page, select Add Target Declaratively.
3. In the Add Target Declaratively dialog box, select Pluggable Database, and click
Add...
For Monitoring Agent, specify the Management Agent present on the CDB host.
Click Add Manually.
4. On the Add Pluggable Database: Specify Container Database page, specify the
CDB or click the search icon to select the CDB to which the target will be added.
Click Continue.
5. On the Add Pluggable Database: Properties page, specify a unique name for the
target, the name, the default service name, and the preferred string connection.
Expand the Container Database section to verify the properties of the CDB.
Click Test Connection to test the connection made to the CDB target using the
specified monitoring credentials.
Click Continue.
6. Specify the required information on each page and then click Next, until you reach
the Review page.
7. Review the displayed information, and then click Submit.
14.3 Discovering and Adding Cluster Database Targets
This section describes the different methods in which you can discover and add cluster
database targets. In particular, this section cover the following:
Chapter 14
Discovering and Adding Cluster Database Targets
14-9
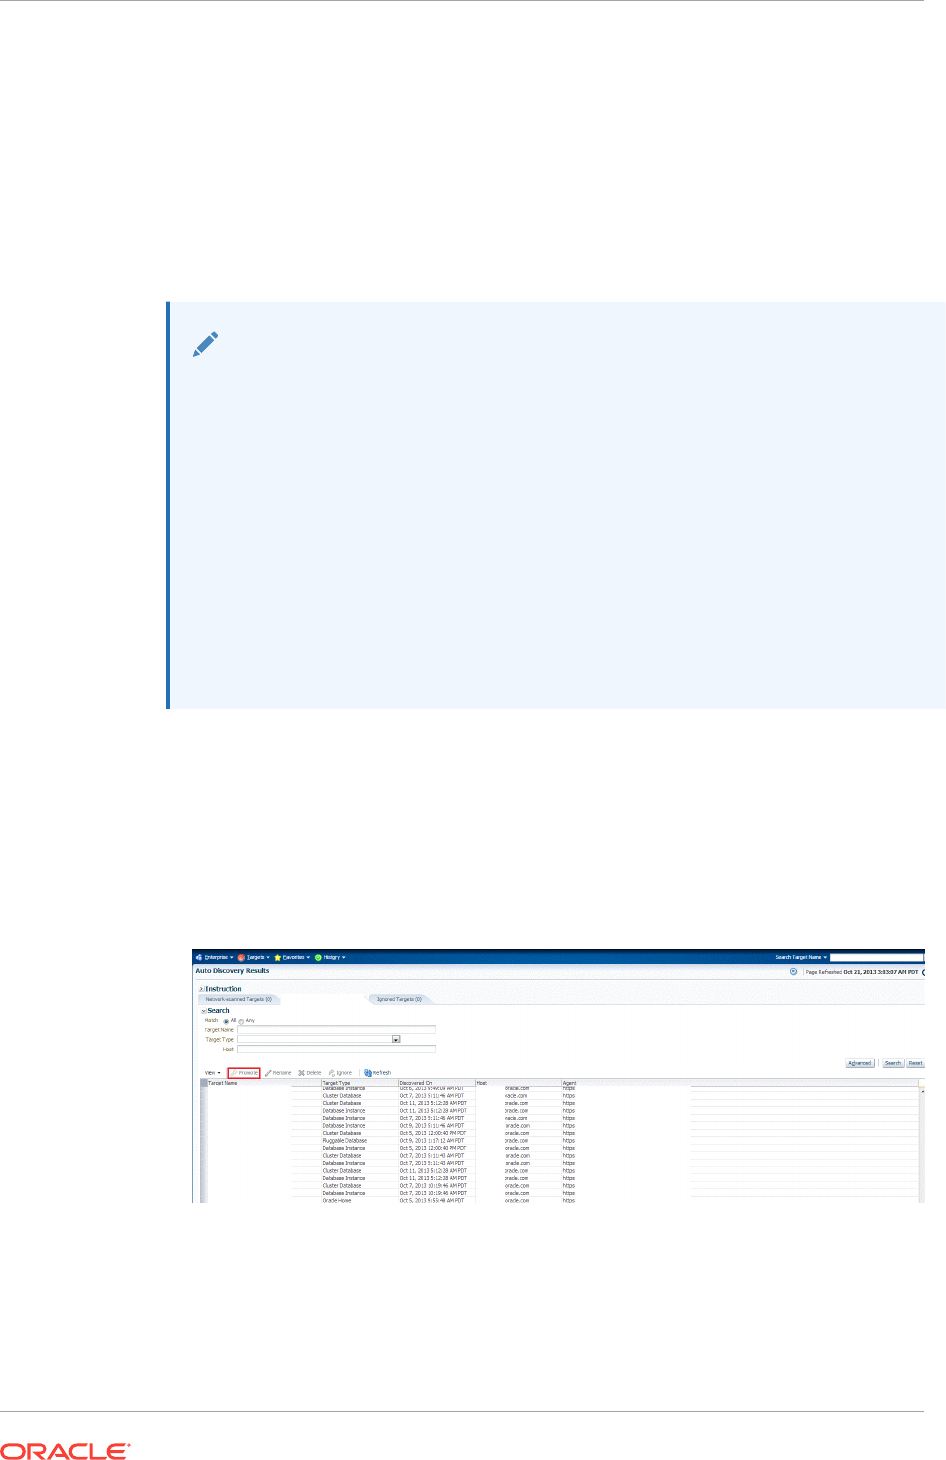
•Discovering Cluster Database Targets Using Autodiscovery
•Adding Cluster Database Targets Using the Guided Discovery Process
•Adding Cluster Database Targets By Using the Declarative Process
14.3.1 Discovering Cluster Database Targets Using Autodiscovery
Autodiscovery of databases is enabled by default. If autodiscovery has been disabled,
follow the steps described in Enabling Autodiscovery of Database Targets.
Note:
A database system is automatically created on discovery of an Oracle
Database. The system is built on the new target and association model that
can be used to monitor the database's storage, connectivity, and high
availability. This also enables you to monitor and manage applications that are
dependent on the database. Database System topology can be used to view
relationship between various entities within the database system as well as
external dependencies.
A database system contains a primary database and related targets such as
Listener and Automatic Storage Management. It also includes standby
databases and their related targets if the database is in a Data Guard
configuration. However, you cannot create database systems for standby
databases.
To promote cluster database targets using autodiscovery, follow these steps:
1. From the Setup menu, select Add Target, and then select Auto Discovery
Results.
From the results table, from the Agent-based targets tab, select the discovered
cluster database target that you want to add for monitoring, and click Promote.
2. The Promote Targets:Result page displays the databases discovered on the
cluster. Select the database
On the Promote Target: Results page, under the Databases section, in the Cluster
Databases section, select the cluster database target that you want to promote.
Chapter 14
Discovering and Adding Cluster Database Targets
14-10
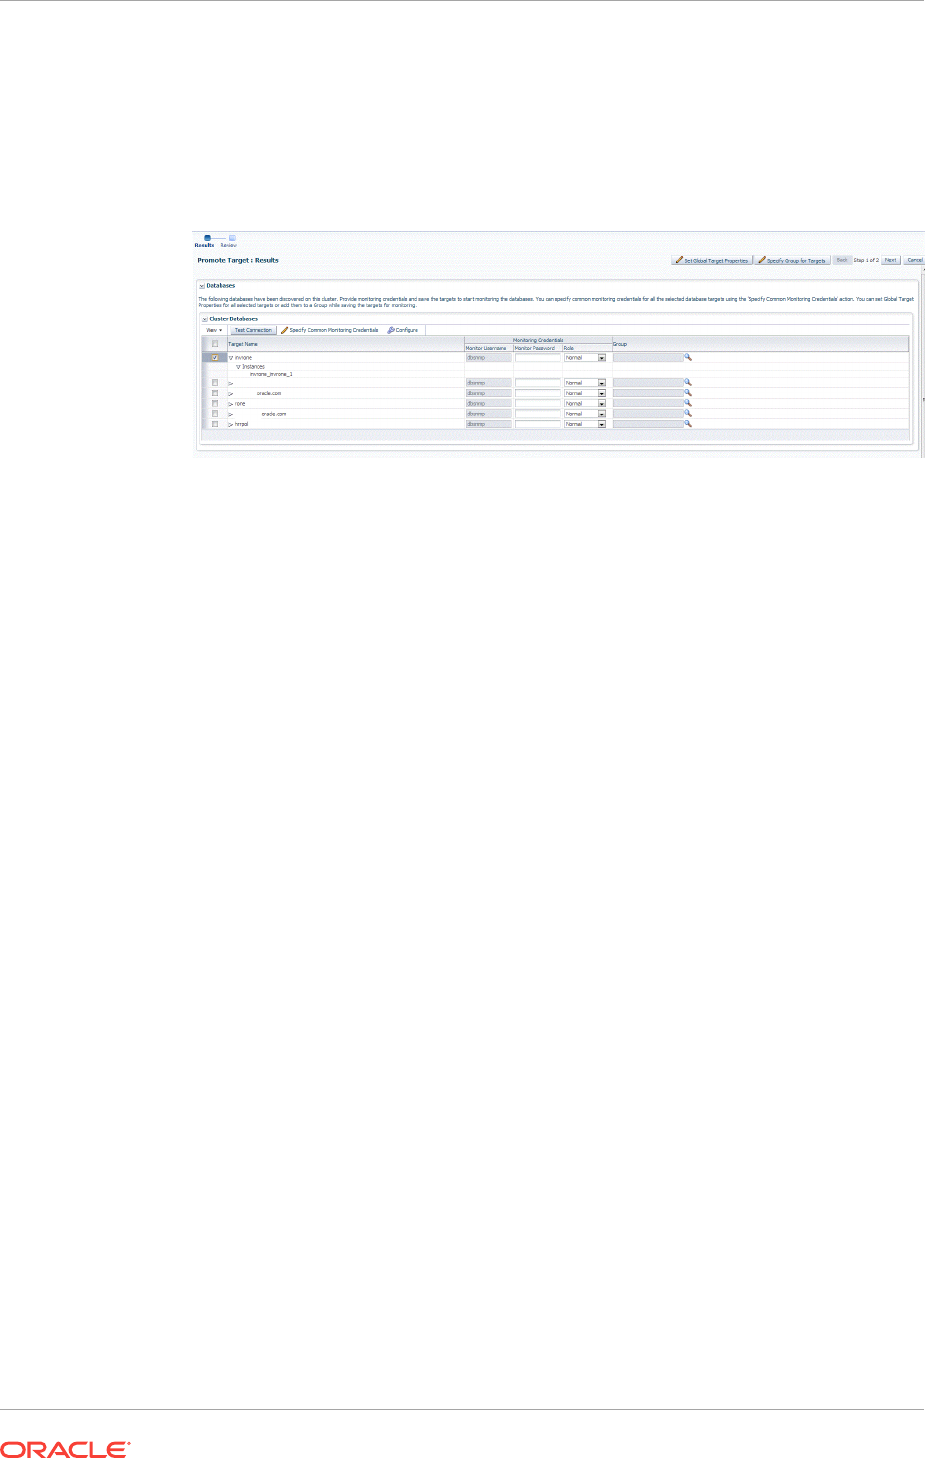
By default, selecting the cluster database target for promotion also selects all its
associated discovered database instance targets for promotion. If you want to add
or remove a database instance target from the ones selected for promotion, select
the cluster database target, then click Configure. Select the Instances tab, then
click Add or Remove. Click Save.
3. In the Cluster Databases section, specify the monitoring credentials for the
selected cluster database target, that is, the Monitor user name, Monitor
password, and role. Also, if you want the selected target to be added to a group,
specify a value for Group.
If you specify Normal for Role, then the user name must be
dbsnmp;
you cannot
provide a different user name. However, if you specify SYSDBA for Role, then you
can provide any SYSDBA user. Only SYSDBA users and the
dbsnmp
user have the
privileges required for target monitoring.
4. Click Test Connection to test the connection made to the cluster database target
using the specified monitoring credentials.
5. To specify global target properties for all the targets you have selected on the
Promote Target: Results page, click Set Global Target Properties, specify the
required properties, then click OK.
To specify a common group for all the targets you have selected on the Promote
Target: Results page, click Specify Group for Targets, select a group, then click
Select.
6. If you have selected multiple databases and you want to set the same monitoring
properties for all of them, select Specify Common Monitoring Credentials. Enter
the monitoring credentials, monitoring password, and role. Click Apply.
7. Click Next.
8. Review the displayed information, then click Submit.
14.3.2 Adding Cluster Database Targets Using the Guided Discovery
Process
To add cluster database targets using the guided process, follow these steps:
Chapter 14
Discovering and Adding Cluster Database Targets
14-11
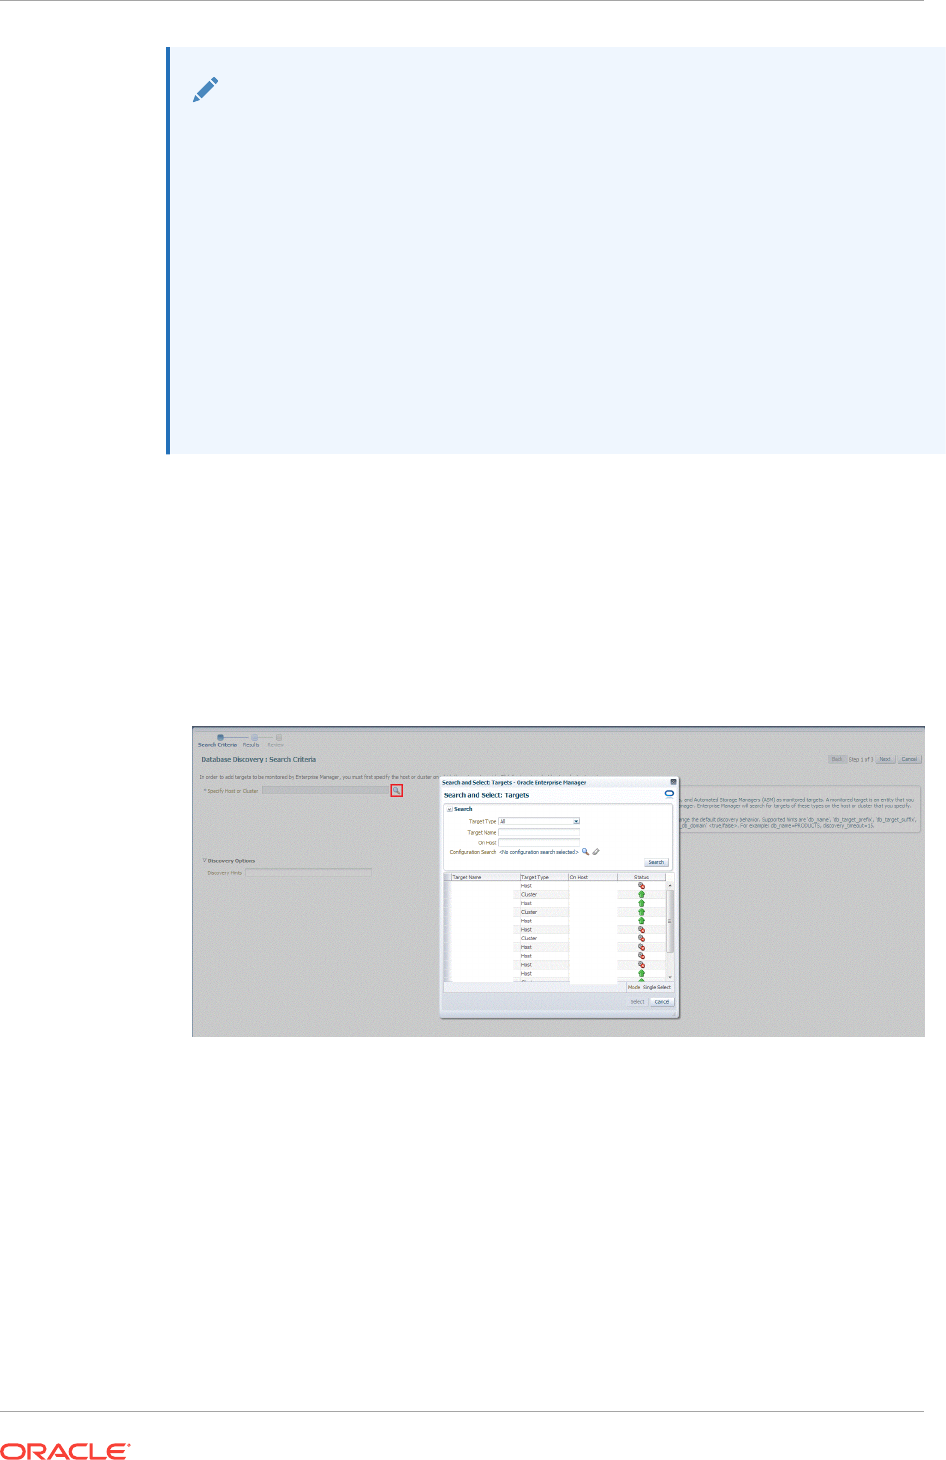
Note:
A database system is automatically created on discovery of an Oracle
Database. The system is built on the new target and association model that
can be used to monitor the database's storage, connectivity, and high
availability. This also enables you to monitor and manage applications that are
dependent on the database. Database System topology can be used to view
relationship between various entities within the database system as well as
external dependencies.
A database system contains a primary database and related targets such as
Listener and Automatic Storage Management. It also includes standby
databases and their related targets if the database is in a Data Guard
configuration. However, you cannot create database systems for standby
databases.
1. From the Setup menu, select Add Target, then select Add Targets Manually.
2. On the Add Targets Manually page, select Add Using Guided Process.
3. In the Add Using Guided Process dialog box, select Oracle Database, Listener,
and Automatic Storage Management. Click Add...
4. On the Database Discovery: Search Criteria page, specify the cluster database
host, or click on the Specify Host or Cluster search icon to select the cluster.
If the host you select is a member of a cluster, then use this page to also indicate
whether the database targets should be searched only on the selected host or on
all hosts within the cluster.
After you click the search icon, a Select Targets dialog box appears.Specify the
target name or select a target from the target table. You can filter the search to
search for all down targets or up targets, by clicking the filter arrows in the Status
column.
You can also configure your search by clicking the Configuration Search icon.
After you select the host target, click Select.
Chapter 14
Discovering and Adding Cluster Database Targets
14-12
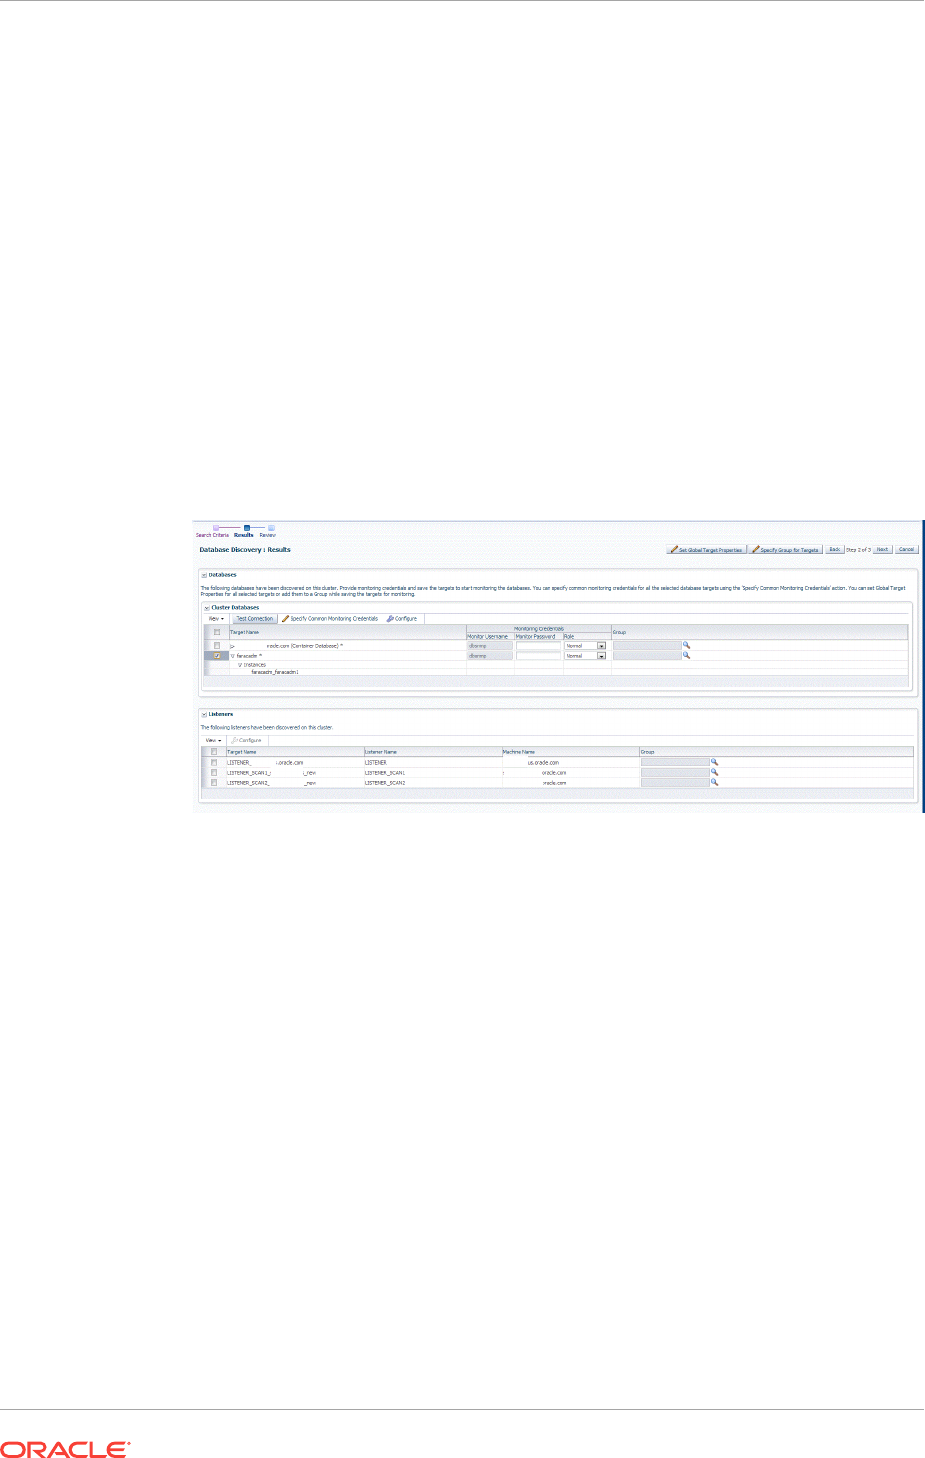
You get an option to choose if you want to search for cluster database targets only
on the current host that you selected, or on all the hosts in the cluster that the host
target is a member of.
This option enables you to save time, if you want to search for cluster database
targets only on the current host selected.
The Discovery Options section enables you to specify discovery hints. You can
specify additional discovery options to change the default discovery behavior.
Supported hints are
db_name, db_target_prefix, db_target_suffix,
discovery_timeout <in seconds per host>
, and
no_db_domain.
For example,
db_name=PRODUCTS, discovery timeout=15.
Click Next.
5. On the Database Discovery: Results page, under the Databases section, in the
Cluster Databases section, select the cluster database target that you want to add.
By default, selecting a cluster database target for promotion also selects all its
associated discovered database instance targets for promotion. If you want to add
or remove a database instance target from the ones selected for promotion, select
the cluster database target, then click Configure. Select the Instances tab, then
click Add or Remove. Click Save.
Chapter 14
Discovering and Adding Cluster Database Targets
14-13

6. Specify the monitoring credentials for the selected cluster database target, that is,
the user name, password, and role. Also, if you want the selected target to be
added to a group, specify a value for Group.
If you specify Normal for Role, then the user name must be
dbsnmp;
you cannot
provide a different user name. However, if you specify SYSDBA for Role, then you
can provide any SYSDBA user. Only SYSDBA users and the
dbsnmp
user have the
privileges required for target monitoring.
7. Click Test Connection to test the connection made to the cluster database target
using the specified monitoring credentials.
8. To specify global target properties for all the targets you have selected on the
Promote Target: Results page, click Set Global Target Properties, specify the
required properties, then click OK.
To specify a common group for all the targets you have selected on the Promote
Target: Results page, click Specify Group for Targets, select a group, then click
Select.
If you have selected multiple databases and you want to set the same monitoring
properties for all of them, select Specify Common Monitoring Credentials. Enter
the monitoring credentials, monitoring password, and role. Click Apply.
9. Click Next.
10. Review the displayed information, then click Submit.
14.3.3 Adding Cluster Database Targets By Using the Declarative
Process
To add a cluster database target declaratively by specifying target monitoring
properties, follow these steps:
Chapter 14
Discovering and Adding Cluster Database Targets
14-14
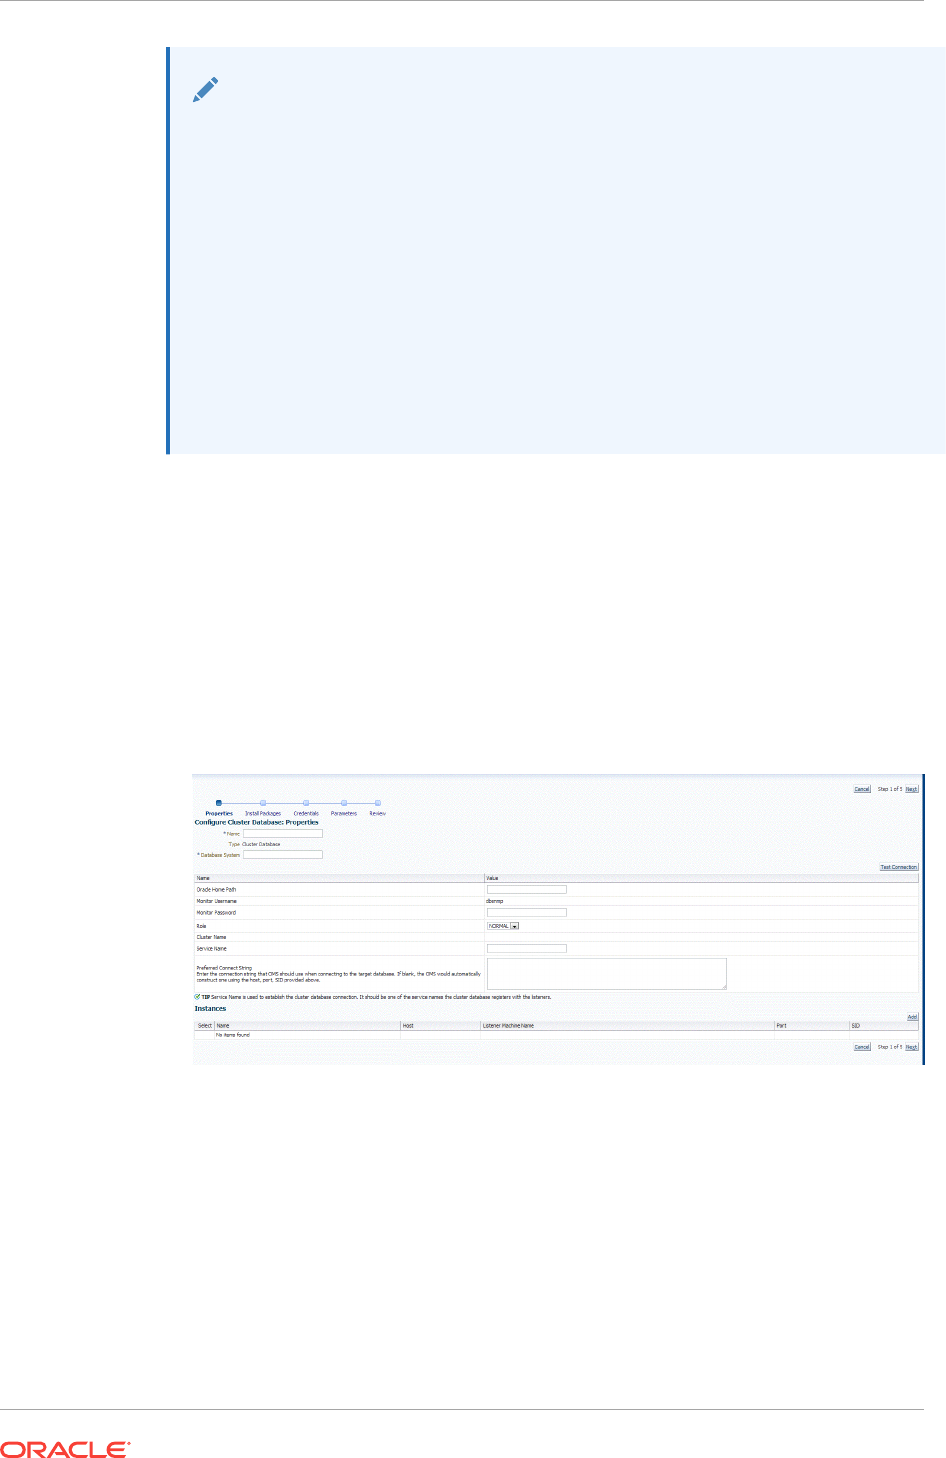
Note:
A database system is automatically created on discovery of an Oracle
Database. The system is built on the new target and association model that
can be used to monitor the database's storage, connectivity, and high
availability. This also enables you to monitor and manage applications that are
dependent on the database. Database System topology can be used to view
relationship between various entities within the database system as well as
external dependencies.
A database system contains a primary database and related targets such as
Listener and Automatic Storage Management. It also includes standby
databases and their related targets if the database is in a Data Guard
configuration. However, you cannot create database systems for standby
databases.
1. From the Setup menu, select Add Target, then select Add Targets Manually.
2. On the Add Targets Manually page, select Add Target Declaratively.
3. In the Add Target Declaratively dialog box, select Cluster Database, and click
Add...
4. On the Configure Cluster Database: Properties, specify a name and a database
system name for the cluster database target. Next, specify all the properties of the
target, that is, Oracle Home path, monitoring username and password, role,
Listener machine name, port, database SID, and preferred connect string.
Click Next.
5. Specify all the details required on the Install Packages, Credentials, and
Parameters pages. Click Next after each page until you reach the Review page.
6. Review the displayed information, then click Submit.
Chapter 14
Discovering and Adding Cluster Database Targets
14-15

14.4 Discovering and Adding Single Instance Database
Targets
This section describes the different methods in which you can discover and add single
instance database targets. In particular, this section covers the following:
•Discovering Single Instance Database Targets Using Autodiscovery
•Adding Single Instance Database Targets Using Guided Discovery Process
•Adding Single Instance Database Targets By Using the Declarative Process
14.4.1 Discovering Single Instance Database Targets Using
Autodiscovery
Autodiscovery of databases is enabled by default. If autodiscovery has been disabled,
follow the steps described in Enabling Autodiscovery of Database Targets.
Note:
A database system is automatically created on discovery of an Oracle
Database. The system is built on the new target and association model that
can be used to monitor the database's storage, connectivity, and high
availability. This also enables you to monitor and manage applications that are
dependent on the database. Database System topology can be used to view
relationship between various entities within the database system as well as
external dependencies.
A database system contains a primary database and related targets such as
Listener and Automatic Storage Management. It also includes standby
databases and their related targets if the database is in a Data Guard
configuration. However, you cannot create database systems for standby
databases.
To promote single instance database targets, follow these steps:
1. From the Setup menu, select Add Target, and then select Auto Discovery
Results.
From the results table, from the Agent-based targets tab, select the discovered
database instance target that you want to add for monitoring, and click Promote.
Chapter 14
Discovering and Adding Single Instance Database Targets
14-16
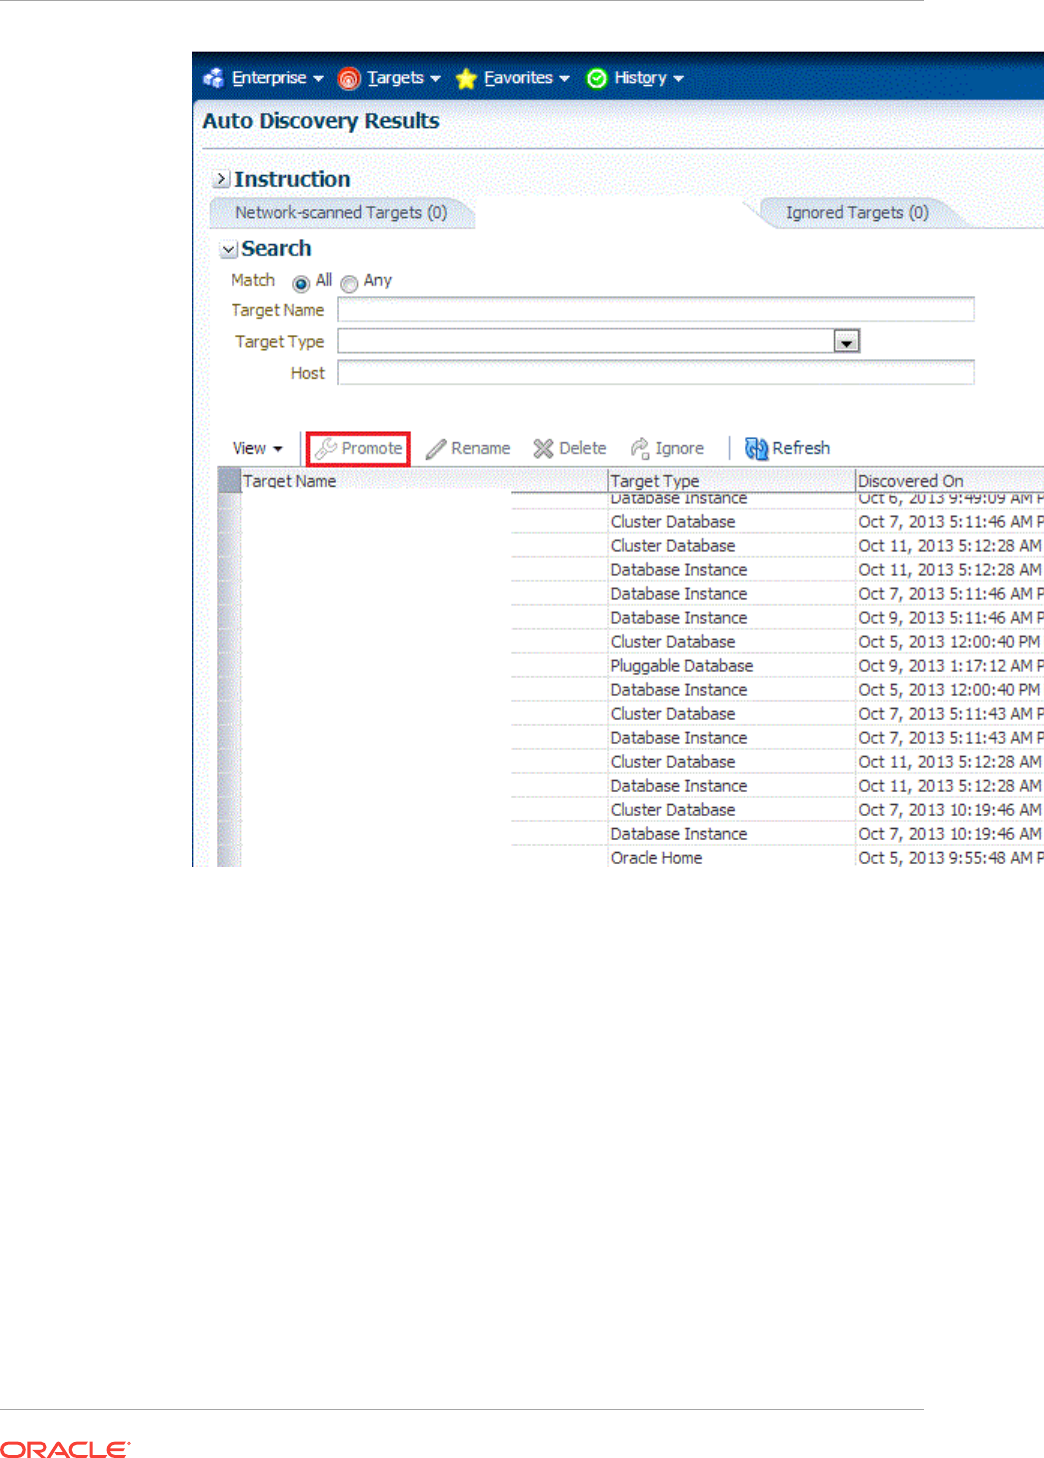
2. The Promote Targets:Result page displays the databases Select the database
instance.
On the Promote Target: Results page, under the Databases section, in the Single
Instance Databases section, select the database instance target that you want to
promote.
Chapter 14
Discovering and Adding Single Instance Database Targets
14-17
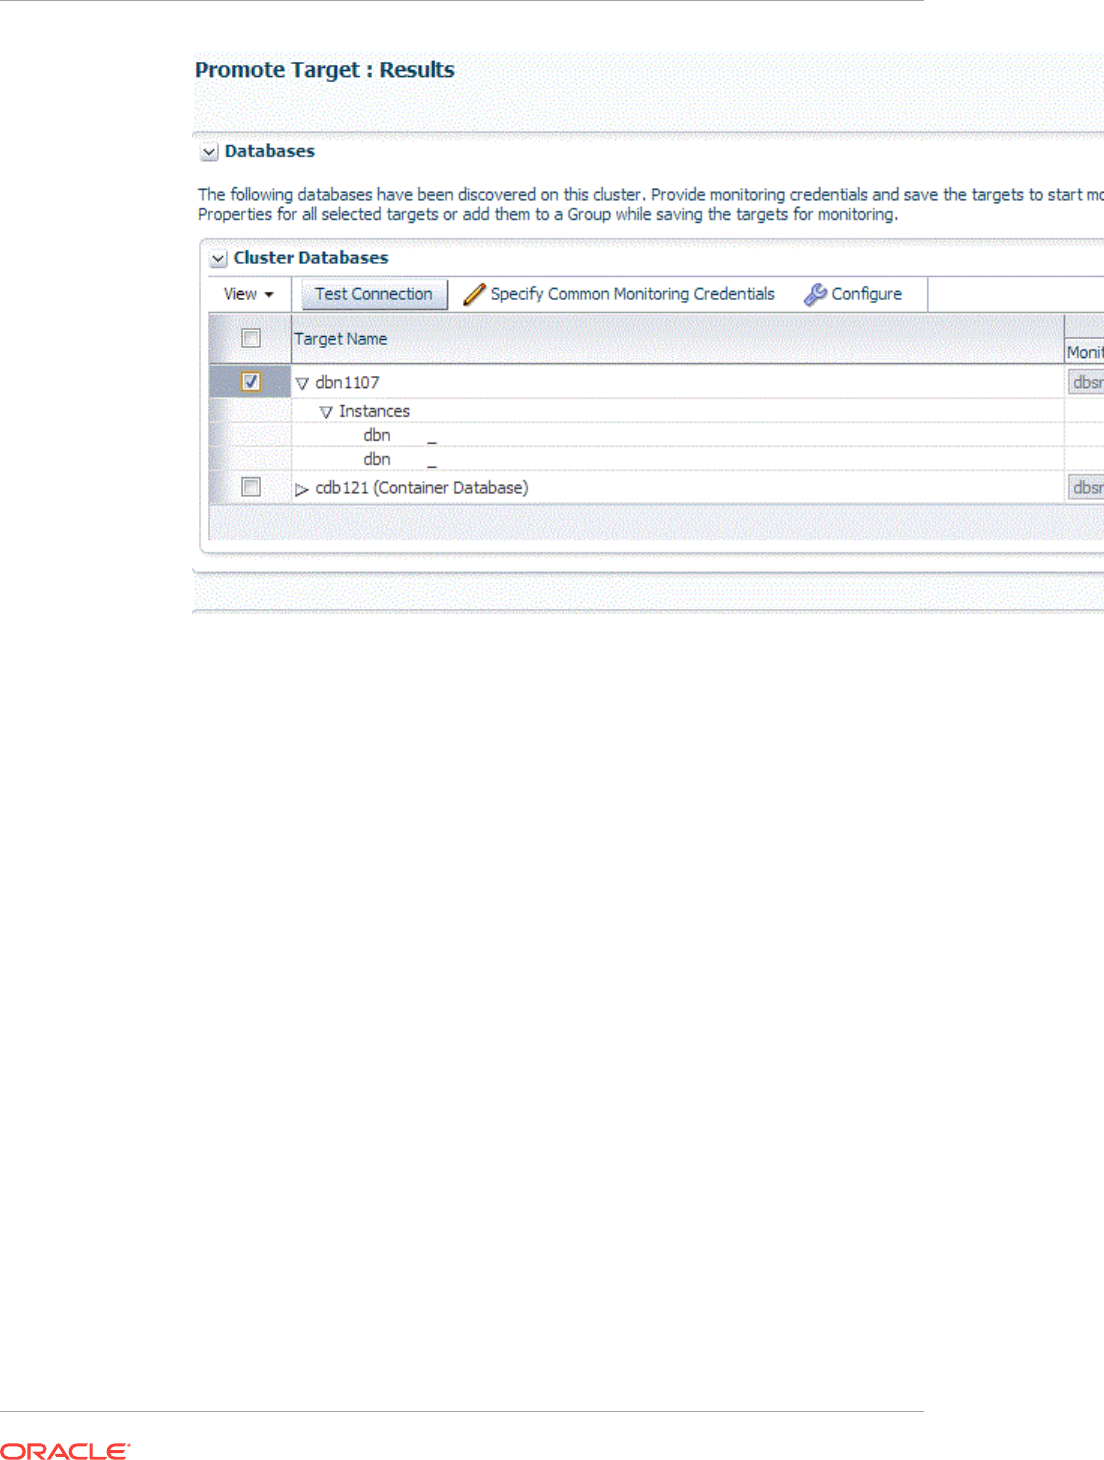
3. Specify the monitoring credentials for the selected database instance target, that
is, the Monitor user name, Monitor password, and role. Also, if you want the
selected target to be added to a group, specify a value for Group.
If you specify Normal for Role, then the user name must be
dbsnmp;
you cannot
provide a different user name. However, if you specify SYSDBA for Role, then you
can provide any SYSDBA user. Only SYSDBA users and the
dbsnmp
user have the
privileges required for target monitoring.
4. Click Test Connection to test the connection made to the database instance
target using the specified monitoring credentials.
5. To specify global target properties for all the targets you have selected on the
Promote Target: Results page, click Set Global Target Properties, specify the
required properties, then click OK.
To specify a common group for all the targets you have selected on the Promote
Target: Results page, click Specify Group for Targets, select a group, then click
Select.
6. If you have selected multiple databases and you want to set the same monitoring
properties for all of them, select Specify Common Monitoring Credentials. Enter
the monitoring credentials, monitoring password, and role. Click Apply.
7. Click Next.
8. Review the displayed information, then click Submit.
Chapter 14
Discovering and Adding Single Instance Database Targets
14-18

14.4.2 Adding Single Instance Database Targets Using Guided
Discovery Process
To add single instance database targets, follow these steps:
Note:
A database system is automatically created on discovery of an Oracle
Database. The system is built on the new target and association model that
can be used to monitor the database's storage, connectivity, and high
availability. This also enables you to monitor and manage applications that are
dependent on the database. Database System topology can be used to view
relationship between various entities within the database system as well as
external dependencies.
A database system contains a primary database and related targets such as
Listener and Automatic Storage Management. It also includes standby
databases and their related targets if the database is in a Data Guard
configuration. However, you cannot create database systems for standby
databases.
1. From the Setup menu, select Add Target, then select Add Targets Manually.
2. On the Add Targets Manually page, select Add Using Guided Process.
3. In the Add Using Guided Process dialog box, select Oracle Database, Listener,
and Automatic Storage Management. Click Add...
4. On the Database Discovery: Search Criteria page, specify the database instance
host, or click on the Specify Host or Cluster search icon to select the host.
Chapter 14
Discovering and Adding Single Instance Database Targets
14-19
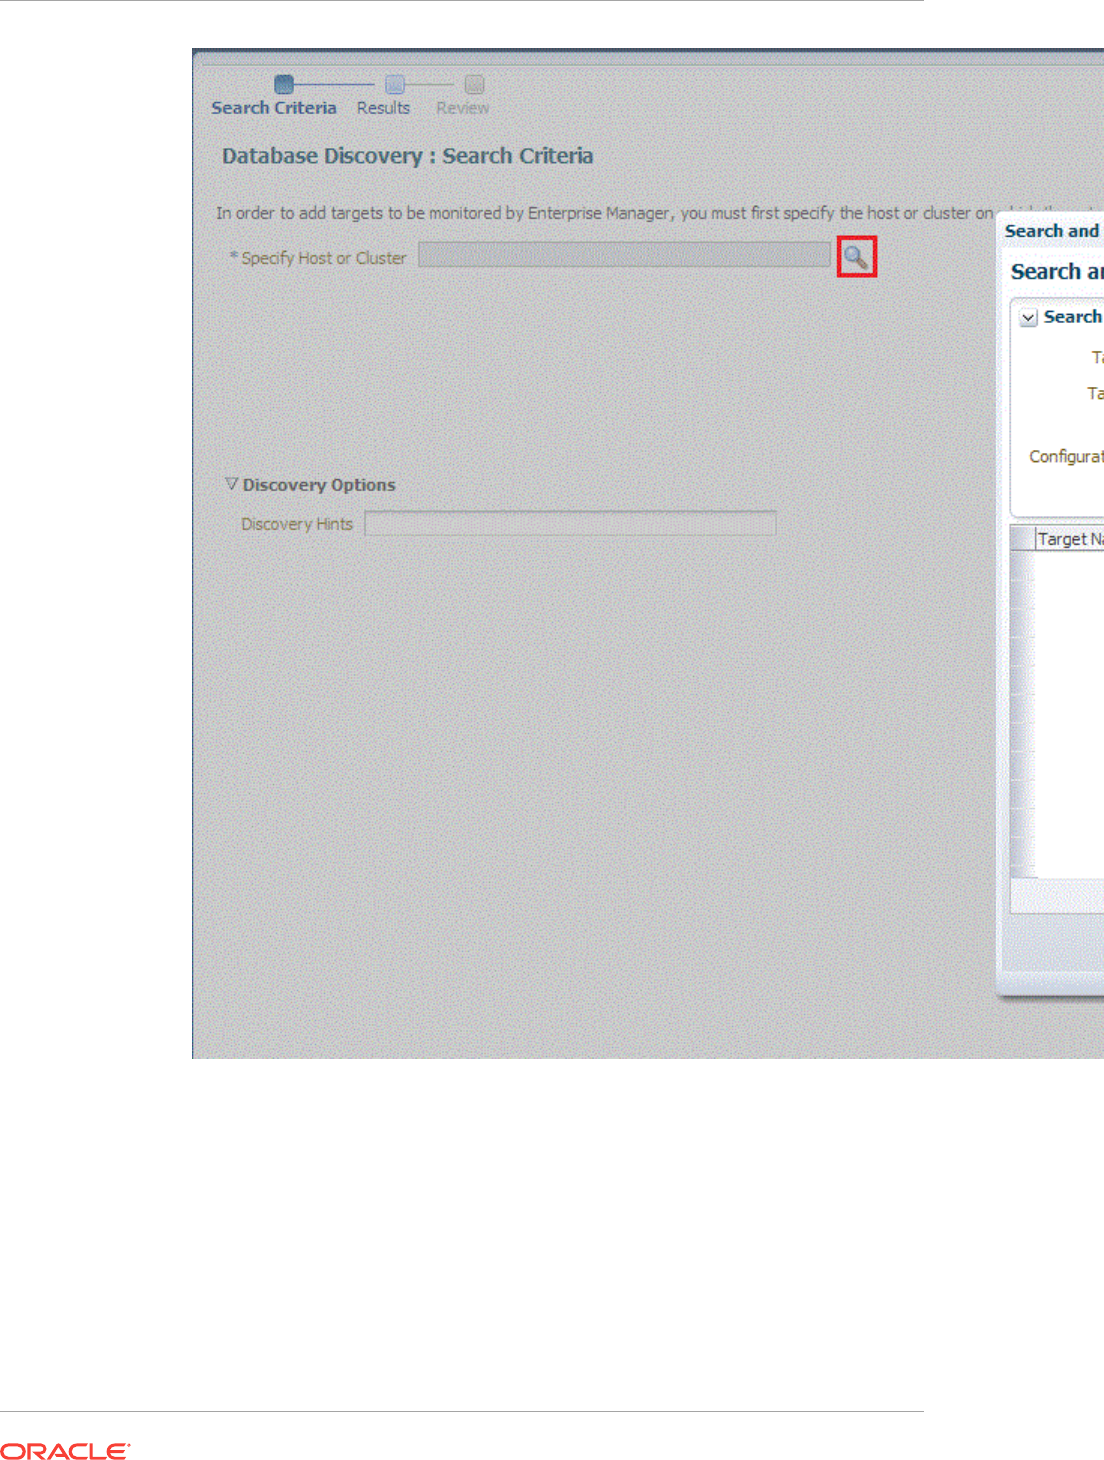
If the host you select is a member of a cluster, then use this page to also indicate
whether the databases should be searched only on the selected host or on all
hosts within the cluster.
After you click the search icon, a Select Targets dialog box appears.Specify the
target name or select a target from the target table. You can filter the search to
search for all down targets or up targets, by clicking the filter arrows in the Status
column.
You can also configure your search by clicking the Configuration Search icon.
After you select the host, click Select.
Chapter 14
Discovering and Adding Single Instance Database Targets
14-20
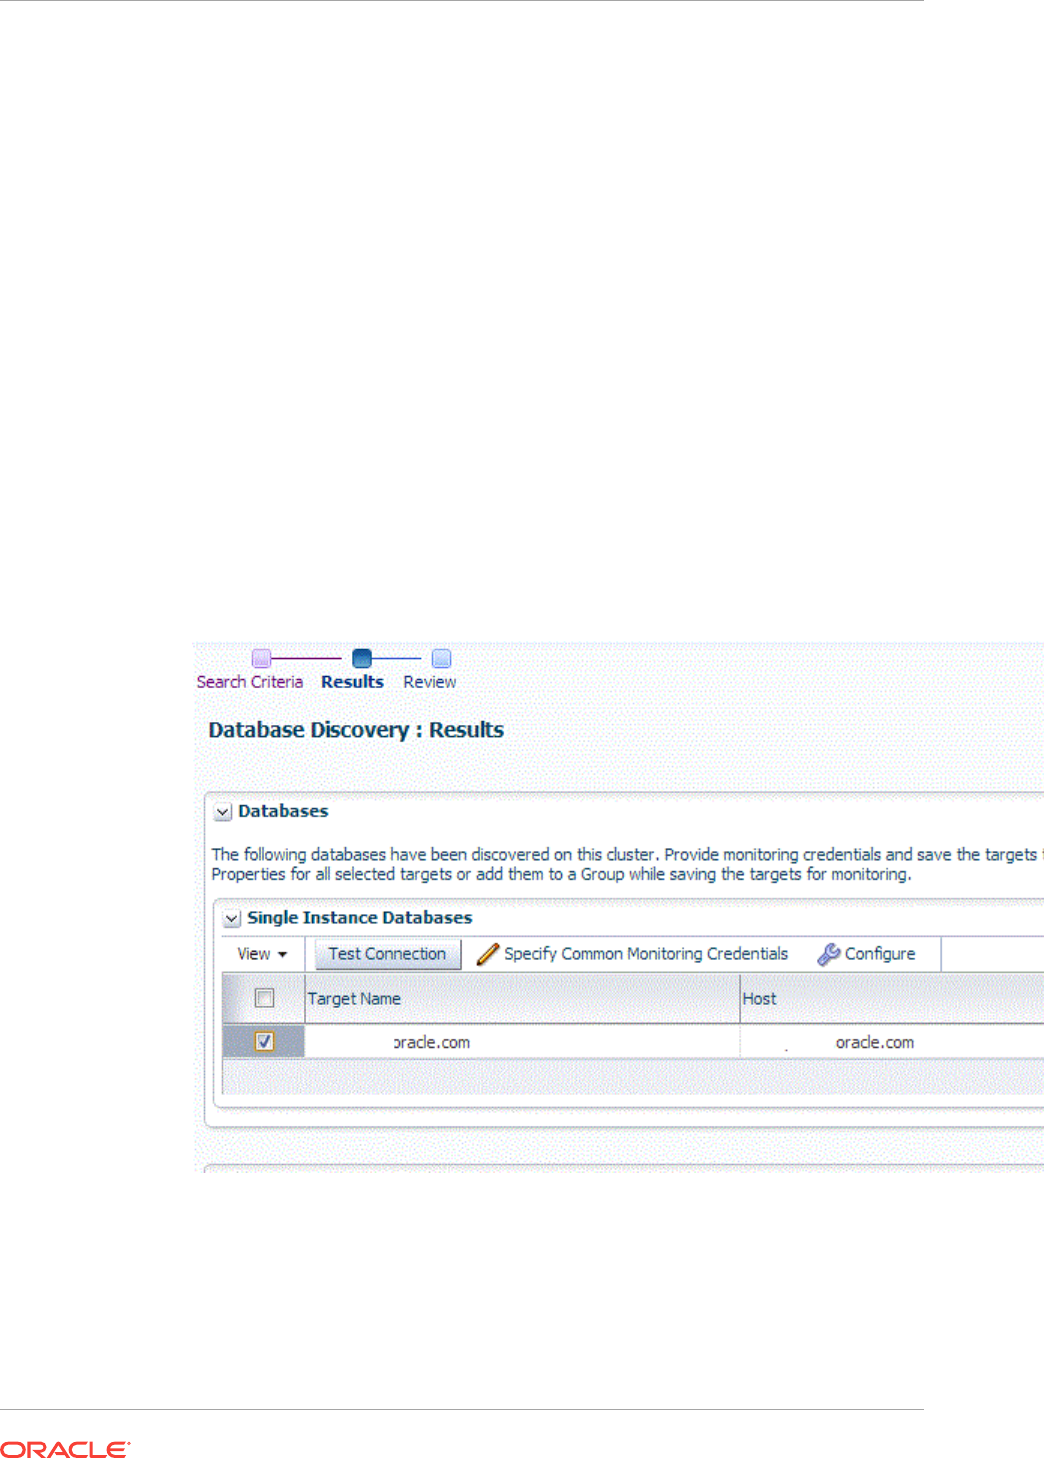
You get an option to choose if you want to search for database targets only on the
current host that you selected, or on all the hosts in the cluster that the host target
is a member of.
This option enables you to save time, if you want to search for database targets
only on the current host selected.
The Discovery Options section enables you to specify discovery hints. You can
specify additional discovery options to change the default discovery behavior.
Supported hints are
db_name, db_target_prefix, db_target_suffix,
discovery_timeout <in seconds per host>
, and
no_db_domain.
For example,
db_name=PRODUCTS, discovery timeout=15.
Click Next to proceed with the discovery process.
Click Next.
5. The Database Discovery:Result page displays the databases discovered on the
cluster. Select the database
On the Database Discovery: Results page, under the Databases section, in the
Single Instance Databases section, select the database instance target that you
want to promote.
6. Specify the monitoring credentials for the selected database instance target, that
is, the Monitor user name, Monitor password, and role. Also, if you want the
selected target to be added to a group, specify a value for Group.
If you specify Normal for Role, then the user name must be
dbsnmp;
you cannot
provide a different user name. However, if you specify SYSDBA for Role, then you
Chapter 14
Discovering and Adding Single Instance Database Targets
14-21

can provide any SYSDBA user. Only SYSDBA users and the
dbsnmp
user have the
privileges required for target monitoring.
7. Click Test Connection to test the connection made to the database instance
target using the specified monitoring credentials.
8. To specify global target properties for all the targets you have selected on the
Promote Target: Results page, click Set Global Target Properties, specify the
required properties, then click OK.
To specify a common group for all the targets you have selected on the Promote
Target: Results page, click Specify Group for Targets, select a group, then click
Select.
9. If you have selected multiple databases and you want to set the same monitoring
properties for all of them, select Specify Common Monitoring Credentials. Enter
the monitoring credentials, monitoring password, and role. Click Apply.
10. Click Next.
11. Review the displayed information, then click Submit.
14.4.3 Adding Single Instance Database Targets By Using the
Declarative Process
To add a single instance database target declaratively by specifying target monitoring
properties, follow these steps:
Note:
A database system is automatically created on discovery of an Oracle
Database. The system is built on the new target and association model that
can be used to monitor the database's storage, connectivity, and high
availability. This also enables you to monitor and manage applications that are
dependent on the database. Database System topology can be used to view
relationship between various entities within the database system as well as
external dependencies.
A database system contains a primary database and related targets such as
Listener and Automatic Storage Management. It also includes standby
databases and their related targets if the database is in a Data Guard
configuration. However, you cannot create database systems for standby
databases.
1. From the Setup menu, select Add Target, then select Add Targets Manually.
2. On the Add Targets Manually page, select Add Target Declaratively.
3. In the Add Target Declaratively dialog box, select Database Instance.
4. In the Monitoring Agent field, select the Management Agent monitoring the
database.
5. Click Add...
6. On the Configure Database Instance: Properties, specify a name and a database
system name for the database instance target. Next, specify all the properties of
Chapter 14
Discovering and Adding Single Instance Database Targets
14-22
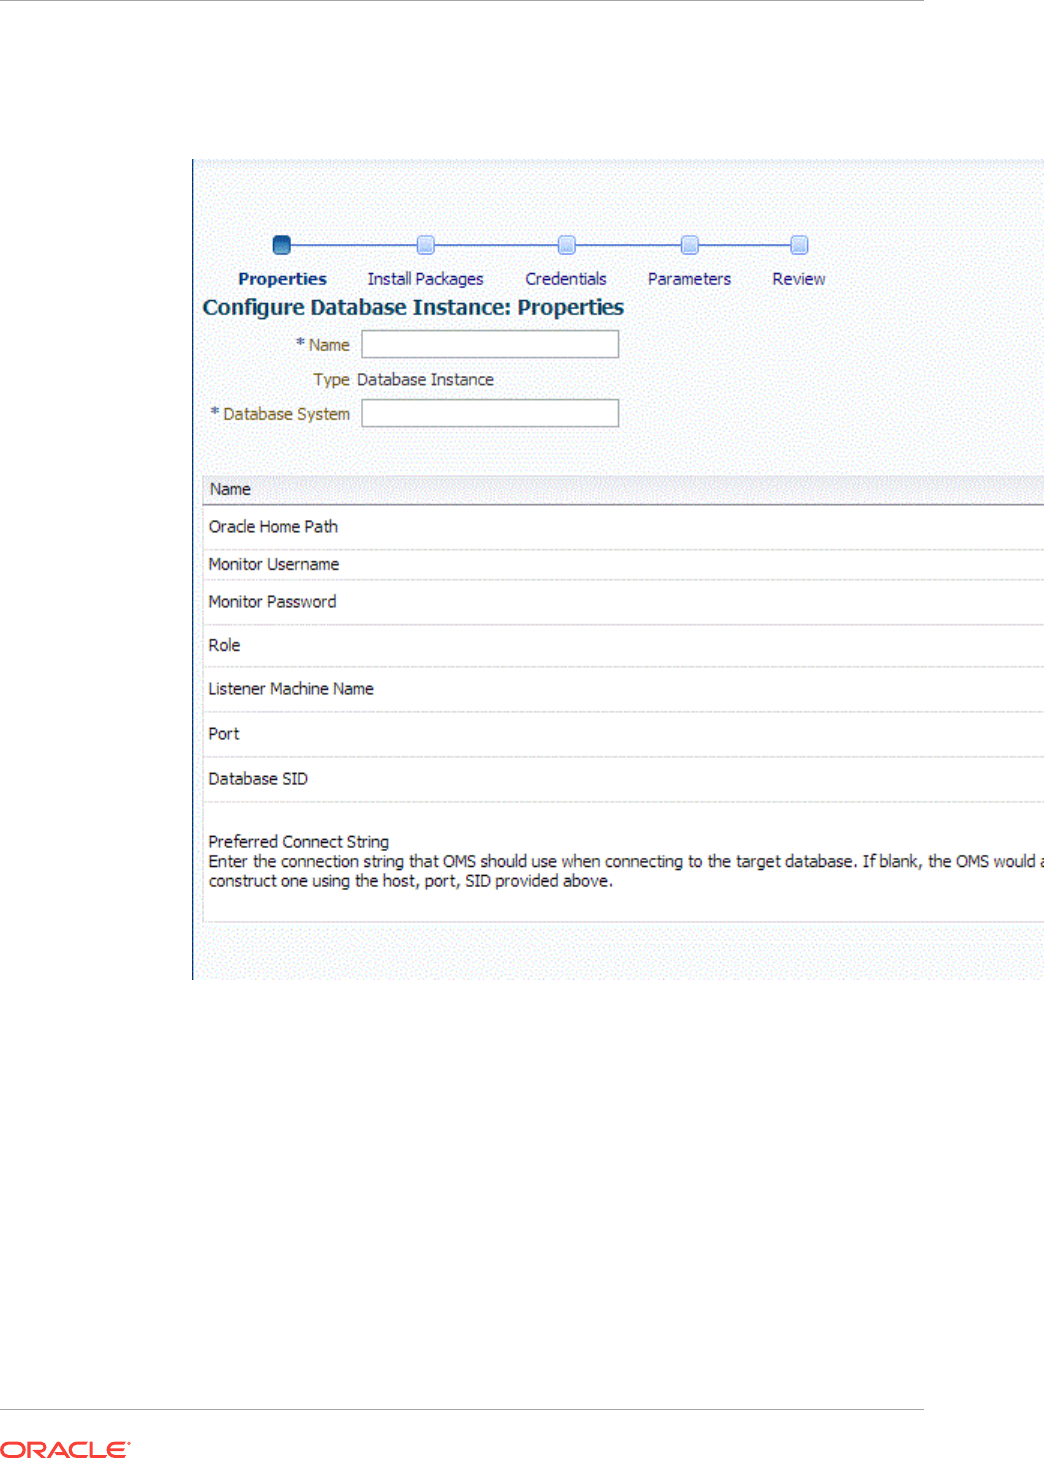
the target, that is, Oracle Home path, monitoring username and password, role,
Listener machine name, port, database SID, and preferred connect string.
Click Next.
7. Specify all the details required on the Install Packages, Credentials, and
Parameters pages. Click Next after each page until you reach the Review page.
8. Review the displayed information, then click Submit.
14.5 Discovering and Adding Cluster Targets
This section describes the different methods in which you can discover and add cluster
targets. In particular, this section covers the following:
•Discovering Cluster Targets Using Autodiscovery
Chapter 14
Discovering and Adding Cluster Targets
14-23

•Adding Cluster Targets Using the Guided Discovery Process
•Adding Cluster Targets By Using the Declarative Process
14.5.1 Discovering Cluster Targets Using Autodiscovery
Autodiscovery of databases is enabled by default. If autodiscovery has been disabled,
follow the steps described in Enabling Autodiscovery of Database Targets.
Note:
A database system is automatically created on discovery of an Oracle
Database. The system is built on the new target and association model that
can be used to monitor the database's storage, connectivity, and high
availability. This also enables you to monitor and manage applications that are
dependent on the database. Database System topology can be used to view
relationship between various entities within the database system as well as
external dependencies.
A database system contains a primary database and related targets such as
Listener and Automatic Storage Management. It also includes standby
databases and their related targets if the database is in a Data Guard
configuration. However, you cannot create database systems for standby
databases.
To promote cluster targets, follow these steps:
1. From the Setup menu, select Add Target, and then select Auto Discovery
Results.
From the results table, from the Agent-based targets tab, select the discovered
cluster target that you want to add for monitoring, and click Promote.
Chapter 14
Discovering and Adding Cluster Targets
14-24
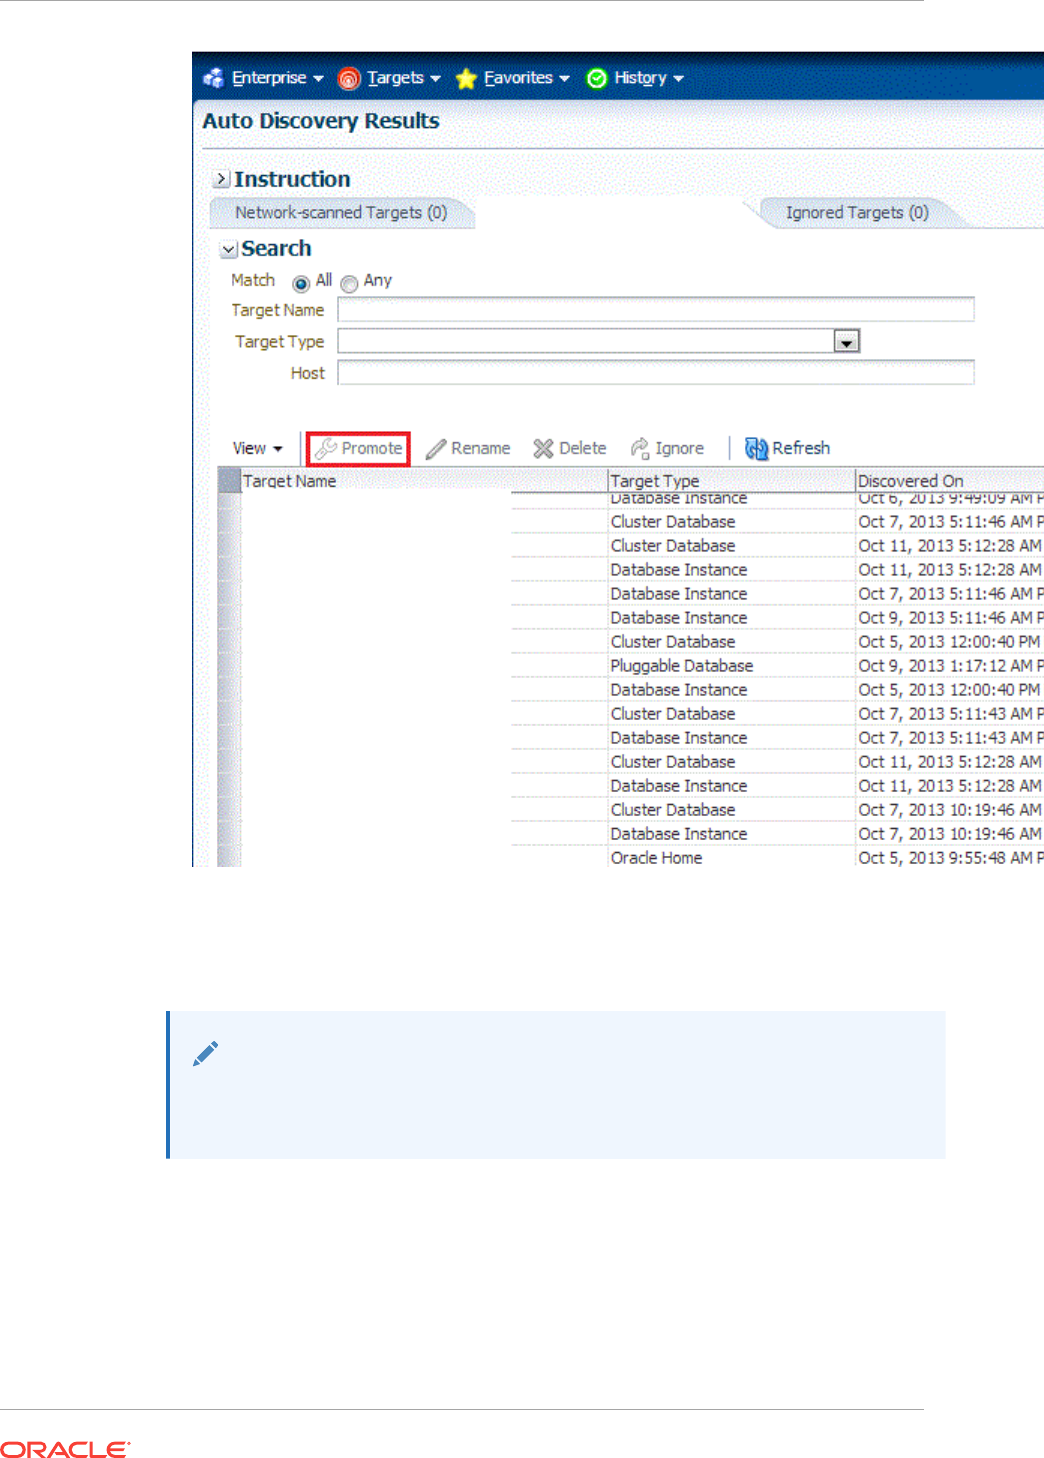
2. The Promote Targets:Result page displays the hosts discovered on the cluster.
Select the host that you want to promote.
Note:
A host can belong to only one cluster. If a particular host is not displayed, it
can mean that the host belongs to another cluster.
On the Promote Target: Results page, in the Clusters section, select the cluster
target that you want to promote.
By default, selecting the cluster target for promotion also selects all its associated
discovered hosts for promotion. If you want to add or remove a host from the ones
selected for promotion, select the cluster database target, then click Configure.
Select the Hosts tab, then click Add or Remove. Click Save.
Chapter 14
Discovering and Adding Cluster Targets
14-25

3. In the Clusters section, specify the monitoring credentials for the selected cluster
target, that is, the Monitor user name, Monitor password, and role. Also, if you
want the selected target to be added to a group, specify a value for Group.
If you specify Normal for Role, then the user name must be
dbsnmp;
you cannot
provide a different user name. However, if you specify SYSDBA for Role, then you
can provide any SYSDBA user. Only SYSDBA users and the
dbsnmp
user have the
privileges required for target monitoring.
4. Click Test Connection to test the connection made to the cluster target using the
specified monitoring credentials.
5. To specify global target properties for all the targets you have selected on the
Promote Target: Results page, click Set Global Target Properties, specify the
required properties, then click OK.
To specify a common group for all the targets you have selected on the Promote
Target: Results page, click Specify Group for Targets, select a group, then click
Select.
6. If you have selected multiple databases and you want to set the same monitoring
properties for all of them, select Specify Common Monitoring Credentials. Enter
the monitoring credentials, monitoring password, and role. Click Apply.
7. Click Next.
8. Review the displayed information, then click Submit.
14.5.2 Adding Cluster Targets Using the Guided Discovery Process
To add cluster targets using the guided process, follow these steps:
Note:
A database system is automatically created on discovery of an Oracle
Database. The system is built on the new target and association model that
can be used to monitor the database's storage, connectivity, and high
availability. This also enables you to monitor and manage applications that are
dependent on the database. Database System topology can be used to view
relationship between various entities within the database system as well as
external dependencies.
A database system contains a primary database and related targets such as
Listener and Automatic Storage Management. It also includes standby
databases and their related targets if the database is in a Data Guard
configuration. However, you cannot create database systems for standby
databases.
1. From the Setup menu, select Add Target, then select Add Targets Manually.
2. On the Add Targets Manually page, select Add Using Guided Process.
3. In the Add Using Guided Process dialog box, select Oracle Database, Listener,
and Automatic Storage Management. Click Add...
4. On the Cluster Discovery: Specify Host page, specify the cluster host, or click on
the Specify Host or Cluster search icon to select the cluster.
Chapter 14
Discovering and Adding Cluster Targets
14-26
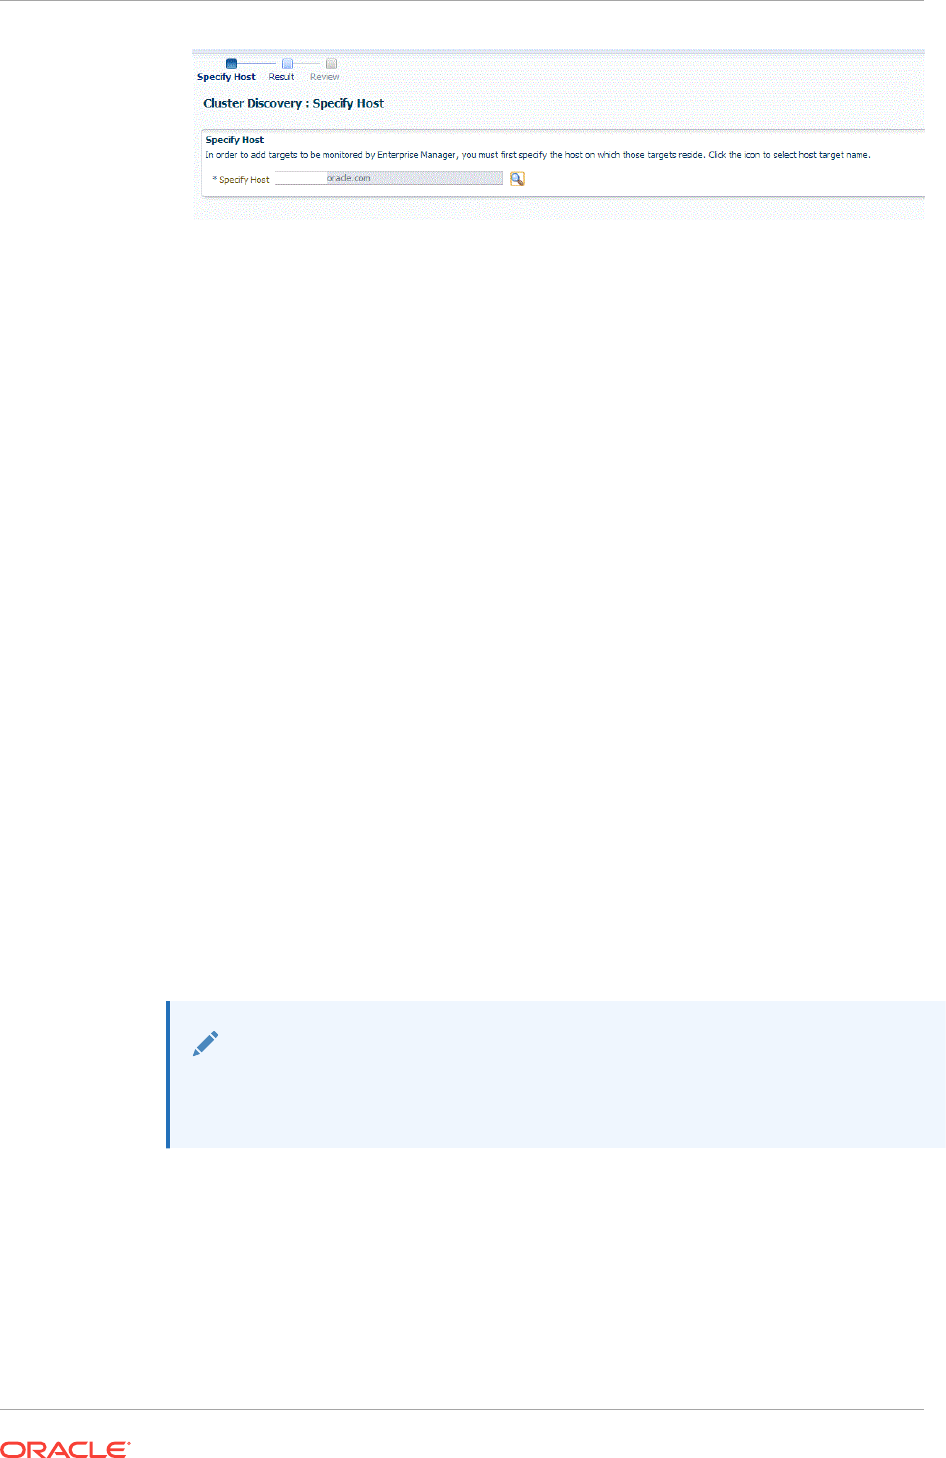
If the host you select is a member of a cluster, then use this page to also indicate
whether the clusters should be searched only on the selected host or on all hosts
within the cluster.
After you click the search icon, a Select Targets dialog box appears.Specify the
target name or select a target from the target table. You can filter the search to
search for all down targets or up targets, by clicking the filter arrows in the Status
column.
You can also configure your search by clicking the Configuration Search icon.
After you select the CDB, click Select.
You get an option to choose if you want to search for cluster targets only on the
current host that you selected, or on all the hosts in the cluster that the host target
is a member of.
This option enables you to save time, if you want to search for cluster targets only
on the current host selected.
The Discovery Options section enables you to specify discovery hints. You can
specify additional discovery options to change the default discovery behavior.
Supported hints are
db_name, db_target_prefix, db_target_suffix,
discovery_timeout <in seconds per host>
, and
no_db_domain.
For example,
db_name=PRODUCTS, discovery timeout=15.
Click Next to proceed with the discovery process.
Click Next.
5. The Cluster Discovery:Result page displays the hosts discovered on the cluster.
Select the host that you want to add.
Note:
A host can belong to only one cluster. If a particular host is not displayed, it
can mean that the host belongs to another cluster.
On the Cluster Discovery: Result page, in the Clusters Target Properties section,
verify the properties of the cluster.
Chapter 14
Discovering and Adding Cluster Targets
14-27
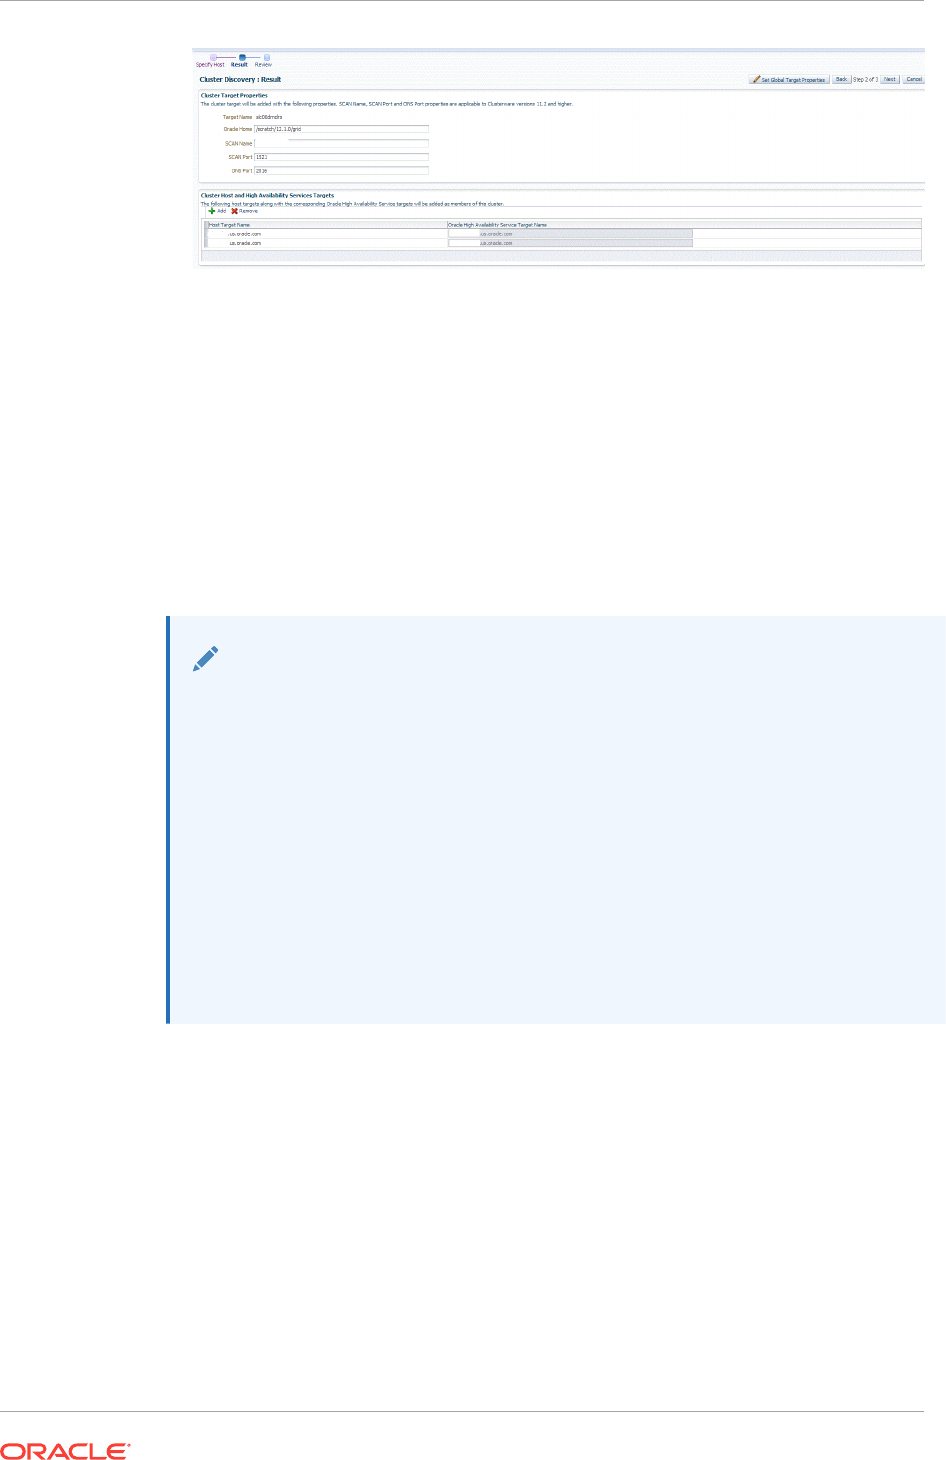
If you want to add or remove a host, select a host from the Cluster Host and High
Availability Service Targets section. Click Add or Remove.
6. Click Next.
7. Review the displayed information, then click Submit.
14.5.3 Adding Cluster Targets By Using the Declarative Process
To add a cluster target declaratively by specifying target monitoring properties, follow
these steps:
Note:
A database system is automatically created on discovery of an Oracle
Database. The system is built on the new target and association model that
can be used to monitor the database's storage, connectivity, and high
availability. This also enables you to monitor and manage applications that are
dependent on the database. Database System topology can be used to view
relationship between various entities within the database system as well as
external dependencies.
A database system contains a primary database and related targets such as
Listener and Automatic Storage Management. It also includes standby
databases and their related targets if the database is in a Data Guard
configuration. However, you cannot create database systems for standby
databases.
1. From the Setup menu, select Add Target, then select Add Targets Manually.
2. On the Add Targets Manually page, select Add Target Declaratively.
3. In the Add Target Declaratively dialog box, select Cluster.
4. In the Monitoring Agent field, select the Management Agent monitoring the
database.
5. Click Add...
6. On the Cluster Discovery:Result page, specify the target name, Oracle Home,
SCAN name, SCAN port, and ONS port.
Chapter 14
Discovering and Adding Cluster Targets
14-28
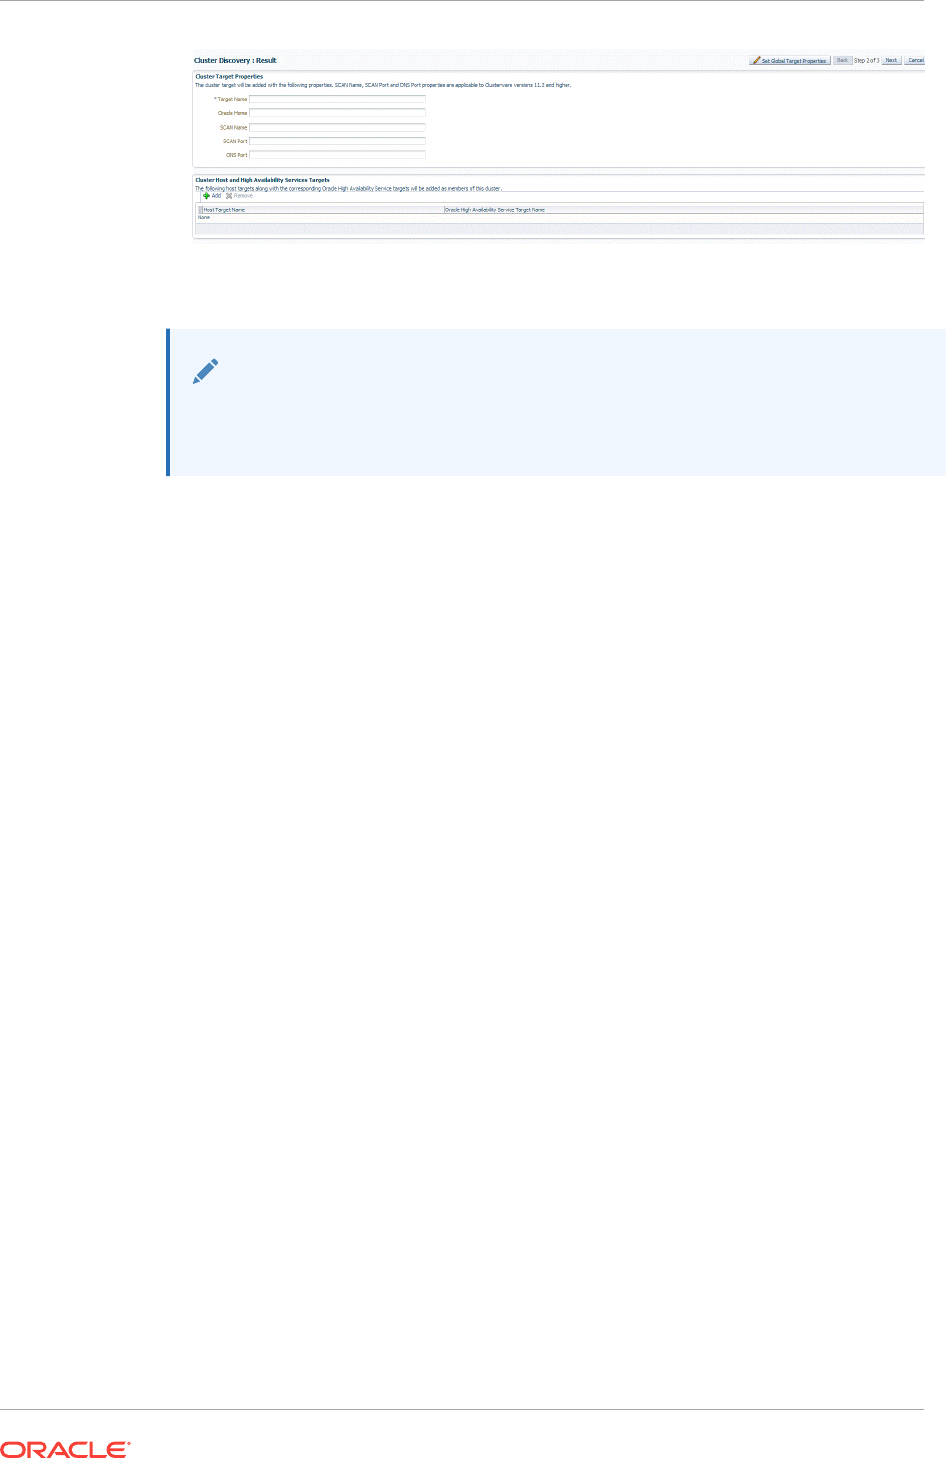
Note:
The SCAN name, SCAN port, and ONS port properties are applicable only for
Clusterware versions 11.2 and higher.
7. You can add more hosts and high availability service targets to the cluster. If a
particular host is not displayed when you click Add, it is possible that the host
already belongs to another cluster.
To specify global target properties for all the targets you have selected on the
Promote Target: Results page, click Set Global Target Properties, specify the
required properties, then click OK.
Click Next.
8. Review the displayed information, then click Submit.
14.6 Discovering and Adding Single Instance High
Availability Service Targets
This section describes the different methods in which you can discover and add single
instance high availability service targets. In particular, this section covers the following:
•Discovering Single Instance High Availability Service Targets Using Autodiscovery
•Adding Single Instance High Availability Service Targets Using the Guided
Discovery Process
•Adding Single Instance High Availability Service Targets By Using the Declarative
Process
14.6.1 Discovering Single Instance High Availability Service Targets
Using Autodiscovery
Autodiscovery of databases is enabled by default. If autodiscovery has been disabled,
follow the steps described in Enabling Autodiscovery of Database Targets.
Chapter 14
Discovering and Adding Single Instance High Availability Service Targets
14-29
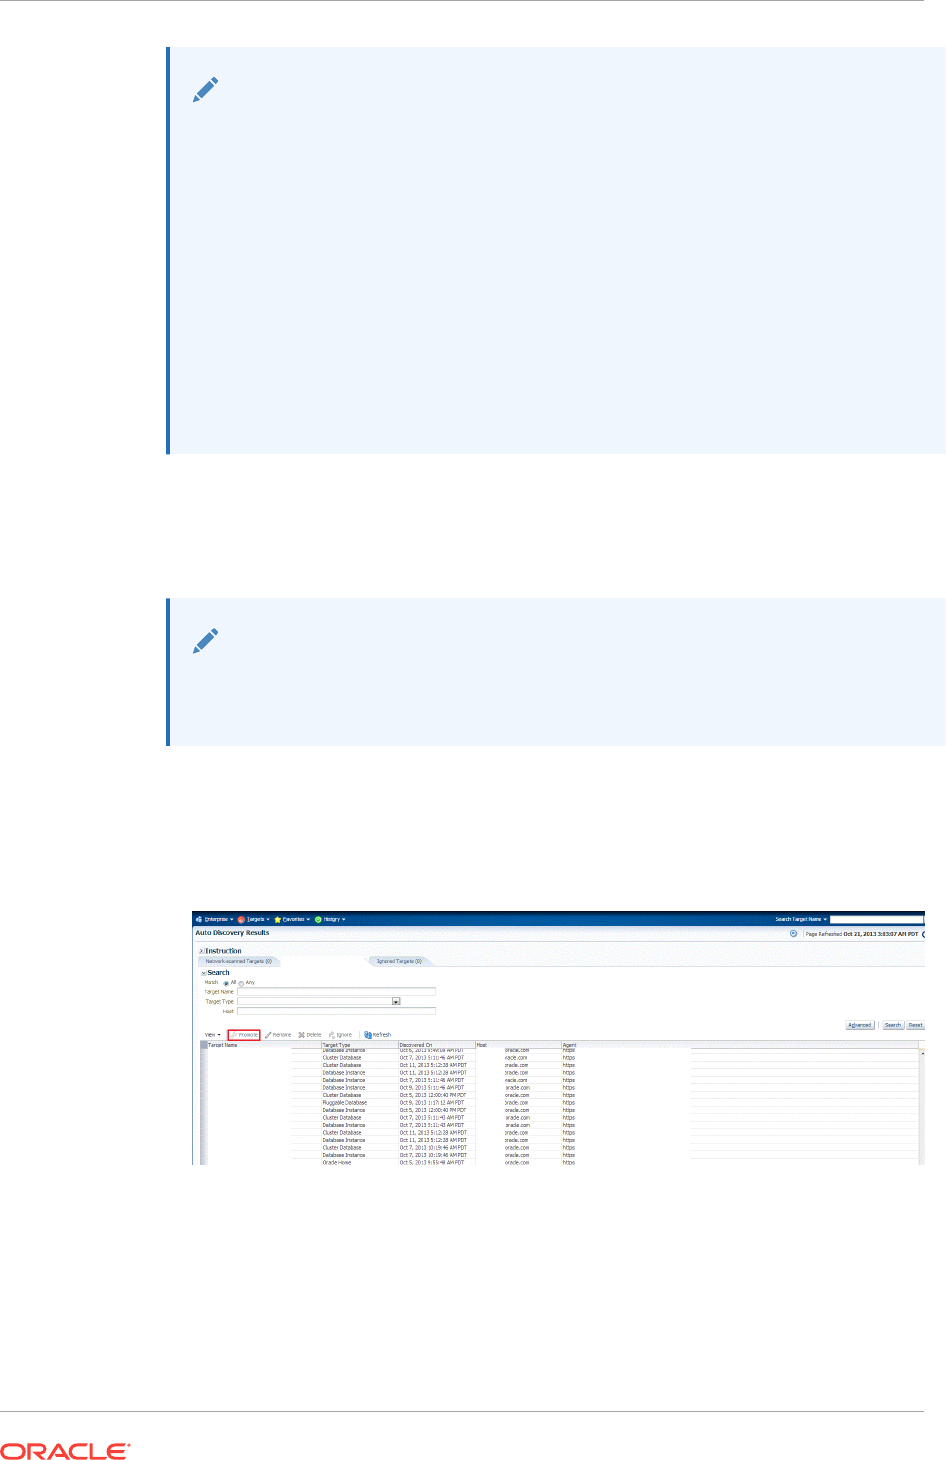
Note:
A database system is automatically created on discovery of an Oracle
Database. The system is built on the new target and association model that
can be used to monitor the database's storage, connectivity, and high
availability. This also enables you to monitor and manage applications that are
dependent on the database. Database System topology can be used to view
relationship between various entities within the database system as well as
external dependencies.
A database system contains a primary database and related targets such as
Listener and Automatic Storage Management. It also includes standby
databases and their related targets if the database is in a Data Guard
configuration. However, you cannot create database systems for standby
databases.
To promote single instance high availability targets, follow these steps:
1. From the Setup menu, select Add Target, and then select Auto Discovery
Results.
Note:
If you do not see any results, then autodiscovery of targets has been disabled.
To enable autodiscovery refer to Enabling Autodiscovery of Database Targets.
From the results table, from the Agent-based targets tab, select the discovered
High Availability instance target that you want to add for monitoring, and click
Promote.
2. The Promote Targets:Result page displays the High Availability instances
discovered. Select the database
On the Promote Target: Results page, under the High Availability Services section,
select the SIHA target that you want to promote.
Chapter 14
Discovering and Adding Single Instance High Availability Service Targets
14-30

3. Specify the monitoring credentials for the selected SIHA target, that is, the Monitor
user name, Monitor password, and role. Also, if you want the selected target to be
added to a group, specify a value for Group.
If you specify Normal for Role, then the user name must be
dbsnmp;
you cannot
provide a different user name. However, if you specify SYSDBA for Role, then you
can provide any SYSDBA user. Only SYSDBA users and the
dbsnmp
user have the
privileges required for target monitoring.
4. Click Test Connection to test the connection made to the SIHA target using the
specified monitoring credentials.
5. To specify global target properties for all the targets you have selected on the
Promote Target: Results page, click Set Global Target Properties, specify the
required properties, then click OK.
To specify a common group for all the targets you have selected on the Promote
Target: Results page, click Specify Group for Targets, select a group, then click
Select.
6. If you have selected multiple databases and you want to set the same monitoring
properties for all of them, select Specify Common Monitoring Credentials. Enter
the monitoring credentials, monitoring password, and role. Click Apply.
7. Click Next.
8. Review the displayed information, then click Submit.
14.6.2 Adding Single Instance High Availability Service Targets Using
the Guided Discovery Process
To add single instance high availability service targets using the guided process, follow
these steps:
Note:
A database system is automatically created on discovery of an Oracle
Database. The system is built on the new target and association model that
can be used to monitor the database's storage, connectivity, and high
availability. This also enables you to monitor and manage applications that are
dependent on the database. Database System topology can be used to view
relationship between various entities within the database system as well as
external dependencies.
A database system contains a primary database and related targets such as
Listener and Automatic Storage Management. It also includes standby
databases and their related targets if the database is in a Data Guard
configuration. However, you cannot create database systems for standby
databases.
1. From the Setup menu, select Add Target, then select Add Targets Manually.
2. On the Add Targets Manually page, select Add Using Guided Process.
3. In the Add Using Guided Process dialog box, select Oracle Database, Listener,
and Automatic Storage Management. Click Add...
Chapter 14
Discovering and Adding Single Instance High Availability Service Targets
14-31

4. On the Cluster Discovery: Specify Host page, specify the single instance high
availability service host, or click on the Specify Host or Cluster search icon to
select the cluster.
Click Next.
5. The Cluster Discovery:Result page displays the high availability service instances
discovered.
On the Cluster Discovery: Result page, under the High Availability Services
section, select the high availability service instance target that you want to
promote.
6. Click Next.
7. Review the displayed information, then click Submit.
14.6.3 Adding Single Instance High Availability Service Targets By
Using the Declarative Process
To add a single instance High Availability Service target declaratively by specifying
target monitoring properties, follow these steps:
Chapter 14
Discovering and Adding Single Instance High Availability Service Targets
14-32
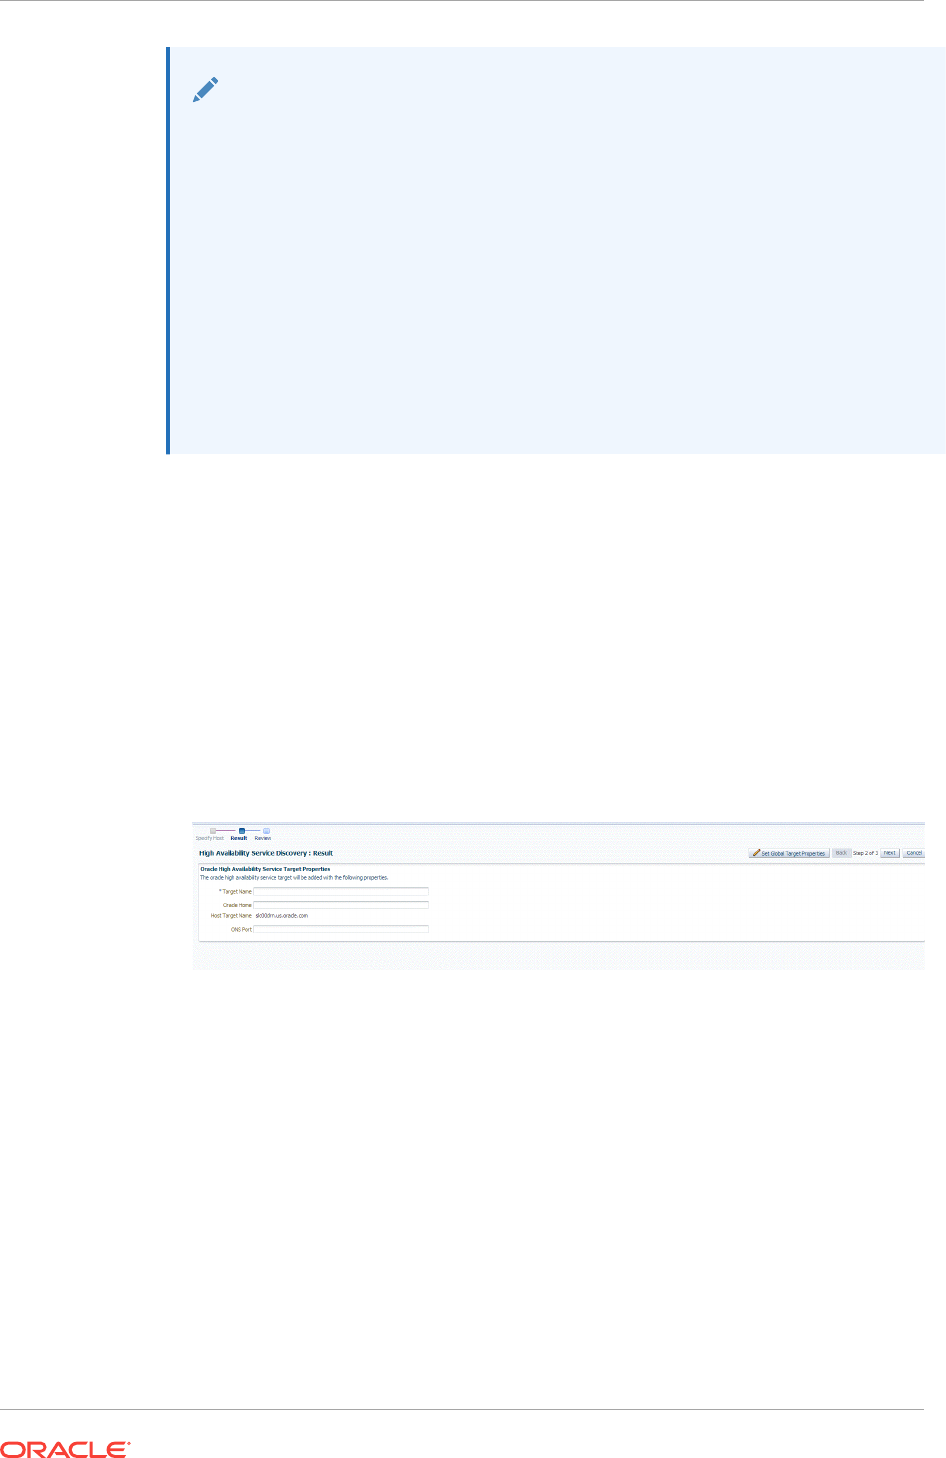
Note:
A database system is automatically created on discovery of an Oracle
Database. The system is built on the new target and association model that
can be used to monitor the database's storage, connectivity, and high
availability. This also enables you to monitor and manage applications that are
dependent on the database. Database System topology can be used to view
relationship between various entities within the database system as well as
external dependencies.
A database system contains a primary database and related targets such as
Listener and Automatic Storage Management. It also includes standby
databases and their related targets if the database is in a Data Guard
configuration. However, you cannot create database systems for standby
databases.
1. From the Setup menu, select Add Target, then select Add Targets Manually.
2. On the Add Targets Manually page, select Add Target Declaratively.
3. In the Add Target Declaratively dialog box, select Oracle High Availability
Service.
4. In the Monitoring Agent field, select the Management Agent monitoring the
database.
5. Click Add...
6. On the High Availability Service: Result page, specify a name for the target, the
Oracle home, and the ONS port.
To specify global target properties for all the targets you have selected on the
Promote Target: Results page, click Set Global Target Properties, specify the
required properties, then click OK.
Click Next.
7. Review the displayed information, and then click Submit.
14.7 Discovering and Adding Cluster Automatic Storage
Management Targets
This section describes the different methods in which you can discover and add ASM
cluster targets. In particular, this section covers the following:
Chapter 14
Discovering and Adding Cluster Automatic Storage Management Targets
14-33

•Discovering Cluster ASM Targets Using Autodiscovery
•Adding Cluster ASM Targets Using the Guided Discovery Process
•Adding Cluster ASM Targets By Using the Declarative Process
14.7.1 Discovering Cluster ASM Targets Using Autodiscovery
Autodiscovery of databases is enabled by default. If autodiscovery has been disabled,
follow the steps described in Enabling Autodiscovery of Database Targets.
Note:
A database system is automatically created on discovery of an Oracle
Database. The system is built on the new target and association model that
can be used to monitor the database's storage, connectivity, and high
availability. This also enables you to monitor and manage applications that are
dependent on the database. Database System topology can be used to view
relationship between various entities within the database system as well as
external dependencies.
A database system contains a primary database and related targets such as
Listener and Automatic Storage Management. It also includes standby
databases and their related targets if the database is in a Data Guard
configuration. However, you cannot create database systems for standby
databases.
To promote Cluster Automatic Storage Management targets using autodiscovery,
follow these steps:
1. From the Setup menu, select Add Target, and then select Auto Discovery
Results.
Note:
If you do not see any results, then autodiscovery of targets has been disabled.
To enable autodiscovery refer to Enabling Autodiscovery of Database Targets.
From the results table, from the Agent-based targets tab, select the discovered
cluster ASM target that you want to add for monitoring, and click Promote.
Chapter 14
Discovering and Adding Cluster Automatic Storage Management Targets
14-34
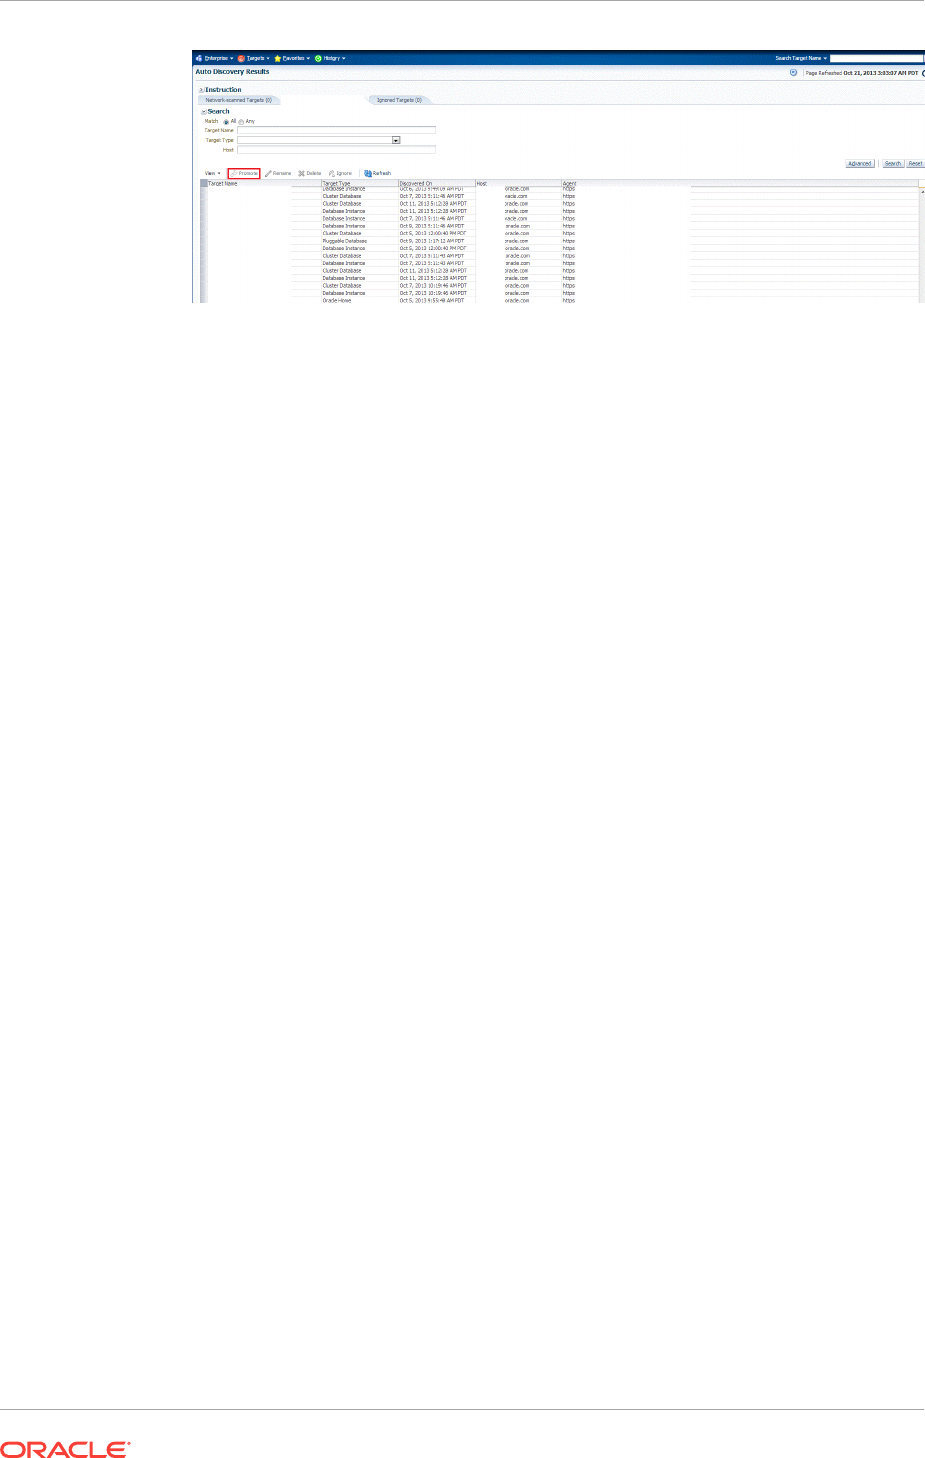
2. The Promote Targets:Result page displays the targets discovered on the cluster
ASM.
On the Promote Target: Results page, in the Cluster ASM section, select the
target that you want to promote.
By default, selecting the cluster ASM target for promotion also selects all its
associated discovered targets for promotion. If you want to add or remove a target
from the ones selected for promotion, select the cluster ASM target, then click
Configure. Select the Instances tab, then click Add or Remove. Click Save.
3. In the cluster ASM section, specify the monitoring credentials for the selected
cluster ASM target, that is, the Monitor user name, Monitor password, and role.
Also, if you want the selected target to be added to a group, specify a value for
Group.
If you specify Normal for Role, then the user name must be
dbsnmp;
you cannot
provide a different user name. However, if you specify SYSDBA for Role, then you
can provide any SYSDBA user. Only SYSDBA users and the
dbsnmp
user have the
privileges required for target monitoring.
4. Click Test Connection to test the connection made to the cluster ASM target
using the specified monitoring credentials.
5. To specify global target properties for all the targets you have selected on the
Promote Target: Results page, click Set Global Target Properties, specify the
required properties, then click OK.
To specify a common group for all the targets you have selected on the Promote
Target: Results page, click Specify Group for Targets, select a group, then click
Select.
6. If you have selected multiple targets and you want to set the same monitoring
properties for all of them, select Specify Common Monitoring Credentials. Enter
the monitoring credentials, monitoring password, and role. Click Apply.
7. Click Next.
8. Review the displayed information, then click Submit.
14.7.2 Adding Cluster ASM Targets Using the Guided Discovery
Process
To add cluster ASM targets using the guided process, follow these steps:
Chapter 14
Discovering and Adding Cluster Automatic Storage Management Targets
14-35

Note:
A database system is automatically created on discovery of an Oracle
Database. The system is built on the new target and association model that
can be used to monitor the database's storage, connectivity, and high
availability. This also enables you to monitor and manage applications that are
dependent on the database. Database System topology can be used to view
relationship between various entities within the database system as well as
external dependencies.
A database system contains a primary database and related targets such as
Listener and Automatic Storage Management. It also includes standby
databases and their related targets if the database is in a Data Guard
configuration. However, you cannot create database systems for standby
databases.
1. From the Setup menu, select Add Target, then select Add Targets Manually.
2. On the Add Targets Manually page, select Add Using Guided Process.
3. In the Add Using Guided Process dialog box, select Oracle Database, Listener,
and Automatic Storage Management. Click Add...
4. On the Database Discovery: Search Criteria page, specify the cluster ASM host, or
click on the Specify Host or Cluster search icon to select the cluster.
If the host you select is a member of a cluster, then use this page to also indicate
whether the Automated Storage Managers should be searched only on the
selected host or on all hosts within the cluster.
After you click the search icon, a Select Targets dialog box appears. Specify the
target name or select a target from the target table. You can filter the search to
search for all down targets or up targets, by clicking the filter arrows in the Status
column.
You can also configure your search by clicking the Configuration Search icon.
After you select the CDB, click Select.
Chapter 14
Discovering and Adding Cluster Automatic Storage Management Targets
14-36

You get an option to choose if you want to search for ASM targets only on the
current host that you selected, or on all the hosts in the cluster that the host target
is a member of.
This option enables you to save time, if you want to search for ASM targets only
on the current host selected.
The Discovery Options section enables you to specify discovery hints. You can
specify additional discovery options to change the default discovery behavior.
Supported hints are
db_name, db_target_prefix, db_target_suffix,
discovery_timeout <in seconds per host>
, and
no_db_domain.
For example,
db_name=PRODUCTS, discovery timeout=15.
Click Next to proceed with the discovery process.
Click Next.
5. The Database Discovery:Result page displays the targets discovered on the
cluster ASM target.
On the Database Discovery: Results page, in the Cluster ASM section, select the
target that you want to promote.
By default, selecting the cluster ASM target for promotion also selects all its
associated discovered targets for promotion. If you want to add or remove a target
from the ones selected for promotion, select the cluster ASM target, then click
Configure. Select the Instances tab, then click Add or Remove. Click Save.
6. In the cluster ASM section, specify the monitoring credentials for the selected
cluster ASM target, that is, the Monitor user name, Monitor password, and role.
Also, if you want the selected target to be added to a group, specify a value for
Group.
If you specify Normal for Role, then the user name must be
dbsnmp;
you cannot
provide a different user name. However, if you specify SYSDBA for Role, then you
can provide any SYSDBA user. Only SYSDBA users and the
dbsnmp
user have the
privileges required for target monitoring.
7. Click Test Connection to test the connection made to the cluster ASM target
using the specified monitoring credentials.
8. To specify global target properties for all the targets you have selected on the
Promote Target: Results page, click Set Global Target Properties, specify the
required properties, then click OK.
To specify a common group for all the targets you have selected on the Promote
Target: Results page, click Specify Group for Targets, select a group, then click
Select.
9. If you have selected multiple targets and you want to set the same monitoring
properties for all of them, select Specify Common Monitoring Credentials. Enter
the monitoring credentials, monitoring password, and role. Click Apply.
10. Click Next.
11. Review the displayed information, then click Submit.
Chapter 14
Discovering and Adding Cluster Automatic Storage Management Targets
14-37

14.7.3 Adding Cluster ASM Targets By Using the Declarative Process
To add a cluster ASM target declaratively by specifying target monitoring properties,
follow these steps:
Note:
A database system is automatically created on discovery of an Oracle
Database. The system is built on the new target and association model that
can be used to monitor the database's storage, connectivity, and high
availability. This also enables you to monitor and manage applications that are
dependent on the database. Database System topology can be used to view
relationship between various entities within the database system as well as
external dependencies.
A database system contains a primary database and related targets such as
Listener and Automatic Storage Management. It also includes standby
databases and their related targets if the database is in a Data Guard
configuration. However, you cannot create database systems for standby
databases.
1. From the Setup menu, select Add Target, then select Add Targets Manually.
2. On the Add Targets Manually page, select Add Target Declaratively.
3. In the Add Target Declaratively dialog box, select Cluster ASM.
4. In the Monitoring Agent field, select the Management Agent monitoring the
database.
5. Click Add...
6. On the Configure Cluster ASM: Properties page, specify a name for the Cluster
ASM, the Oracle home path, username and password, role, cluster name, and
service name.
Note:
The Service Name is used to establish the cluster ASM connection. It should
be one of the service names the cluster ASM registers with the listeners.
7. You can add instances, ASM IO server instances, and ASM proxy instances by
clicking Add in the respective sections.
Click Test Connection to test the connection made to the cluster ASM target
using the specified monitoring credentials.
OK.
14.8 Configuring a Target Database for Secure Monitoring
This section covers the following:
Chapter 14
Configuring a Target Database for Secure Monitoring
14-38

•About Secure Monitoring of Databases
•Configuring a Target Database for Secure Monitoring
14.8.1 About Secure Monitoring of Databases
The Oracle Database uses various encryption algorithms to secure the information
moving across the network between the Oracle Database Server and a client. The
Enterprise Manager agent communicates with the Database target over a TCP
protocol to get real-time monitoring data. The Oracle Management Server (OMS) also
communicates with the Database target in clear text over the network to manage the
target. As TCP transfers data in clear text format over the network, anyone can access
and modify the data. To secure the data exchanges between the OMS and managed
target, Enterprise Manager can use the TCPS protocol to encrypt and protect the data.
The Secure Monitoring feature in Enterprise Manager allows you to monitor Oracle
Database targets on secure channels using a TCP/IP with SSL (Secure Socket Layer)
protocol. You can also discover and monitor the Listener processes running on TCPS
ports using the Enterprise Manager console.
You can choose from the following options available for target monitoring:
•Target Monitoring over TCP
In this case, Enterprise Manager connects to the target database for target
monitoring using the TCP protocol. The data communication between the target
database and the Enterprise Manager OMS happens in clear text form over the
network.
•Target Monitoring over TCPS with Server Authentication using Trusted Certificate
Enterprise Manager connects to the target database TCP over a secure socket
layer (SSL) for target monitoring. In this case, the client authenticates the
database server using a trusted certificate of the server. The data communicates
over the network between Enterprise Manager and the target database in
encrypted form.
•Target Monitoring over TCPS with Server Authentication using Kerberos
Enterprise Manager connects to the target database TCP over a secure socket
layer (SSL) for target monitoring. In this case, the client authenticates the
database server using the Kerberos authentication protocol. The data
communicates over the network between Enterprise Manager and the target
database in encrypted form.
You can enable secure monitoring while discovering the target database, or you can
change the secure monitoring settings for a target database on the Monitoring
Configuration page.
14.8.2 Configuring a Target Database for Secure Monitoring
You can enable secure monitoring either while discovering a target database, or by
changing the secure monitoring settings for a selected target database after discovery.
Follow these steps to change the settings of a discovered database target:
1. From the Enterprise Manager page, choose Databases from the Targets menu.
Enterprise Manager displays the Databases page.
2. Choose the database for which you want to configure monitoring.
Chapter 14
Configuring a Target Database for Secure Monitoring
14-39

The Database Home page for that database appears.
3. From the Oracle Database menu, select Monitoring Configuration from the
Target Setup menu.
Enterprise Manager displays the Configure Database Instance: Properties page.
4. On the Configure Database Instance: Properties page, scroll down to the
Connection Protocol field and select from one of the following drop-down menu
choices:
•TCP -- Enterprise Manager connects to the target database for target
monitoring using the TCP protocol. The data communication between the
target database and the Enterprise Manager OMS happens in clear text form
over the network.
•TCPS -- Enterprise Manager connects to the target database TCP over a
secure socket layer (SSL) for target monitoring. In this case, the client
authenticates the database server using a trusted certificate of the server. The
data communicates over the network between Enterprise Manager and the
target database in encrypted form.
•TCPS with Server Authentication using Kerberos -- Enterprise Manager
connects to the target database TCP over a secure socket layer (SSL) for
target monitoring. In this case, the client authenticates the database server
using the Kerberos authentication protocol. The data communicates over the
network between Enterprise Manager and the target database in encrypted
form.
5. Optionally you can test the connection by clicking Test Connection to determine
whether the change in Connection Protocol has impacted the connection to the
database.
6. Click Next to move to the Configure Database Instance: Review Page.
7. Click Submit to apply your changes.
The database target now connects using the protocol you selected.
14.9 Adding Connection Manager Targets By Using the
Declarative Process
To add a Connection Manager target declaratively by specifying target monitoring
properties, follow these steps:
1. From the Setup menu, select Add Target, then select Add Targets Manually.
2. On the Add Targets Manually page, select Add Target Declaratively.
3. In the Add Target Declaratively dialog box, enter the host and select Connection
Manager as the target type.
4. Click Add.
5. On the Add: Connection Manager page, specify a name and the credentials.
6. Specify all the properties of the target, that is, Connection Manager Name,
Connection Protocol, Machine Name, Oracle Home, Port Number, and
cman.ora Directory.
7. Click OK.
Chapter 14
Adding Connection Manager Targets By Using the Declarative Process
14-40

8. Review the displayed information, and then click Submit.
Chapter 14
Adding Connection Manager Targets By Using the Declarative Process
14-41

15
Discovering and Adding Middleware
Targets
This chapter describes how you can discover and add fusion middleware targets to be
managed by Enterprise Manager Cloud Control. In particular, this chapter covers the
following:
•Discovering and Adding WebLogic Domains
•Discovering New or Modified Domain Members
•Adding Standalone Oracle HTTP Servers
•Adding Exalytics Targets
•Removing Middleware Targets
15.1 Discovering and Adding WebLogic Domains
This section describes the different methods in which you can discover, promote, and
add WebLogic domain targets in Cloud Control. In particular, this section covers the
following:
•Discovering WebLogic Domains Using Autodiscovery
•Adding WebLogic Domains Using the Guided Discovery Process
•Adding Multiple WebLogic Domains Using EM CLI
15.1.1 Discovering WebLogic Domains Using Autodiscovery
To discover and promote WebLogic domains, follow these steps:
1. From the Setup menu, select Add Target, then select Configure Auto
Discovery.
2. On the Configure Auto Discovery page, select the Oracle Fusion Middleware link
in the table to configure auto discovery for Oracle Fusion Middleware or click the
icon in the Configure Host Discovery column to configure that Oracle Fusion
Middleware row.
3. Set the schedule at which the discovery job will be run, in days. This schedule will
be applied to all selected hosts. By default the job will run every 24 hours.
4. Click Add Host. Select the host machines you want to include in the discovery.
5. Select a host in the table, and then click Edit Parameters to specify the
Middleware Homes to search for targets. The Middleware Home is the top-level
directory for all Oracle Fusion Middleware products, created when Oracle
WebLogic Domain is installed.
Enter * to search all Middleware Homes, or specify the path to one or more
Middleware Homes on the host, each separated by a comma.
15-1

6. Click the OK button located at the right of the screen. At this point, automatic
discovery has been enabled, and the discovery job will run at the scheduled
frequency.
7. From the Setup menu, select Add Target, then select Auto Discovery Results.
8. Click the Targets on Hosts tab to view the discovered Oracle Fusion Middleware
targets.
9. Select a target, then click Promote.
If multiple targets of various types are listed, you can expand Search, then select
the Target Type you are looking for (such as Oracle WebLogic Domain). Click
Search to display the selected discovered target types.
10. Supply or accept values for the following parameters:
•Administration Server Host
Enter the host name on which the Administration Server is installed and
running for the Oracle WebLogic Domain that you want to promote to a
managed target, for example:
myhost06.example.com
•Port
Enter the WebLogic Administration Server port. The default is 7001.
If the WebLogic Administration Server is secured using the Secure Sockets
Layer (SSL) protocol, specify the location of the trusted keystore file. The
keystore is a protected database that holds keys and certificates for an
enterprise. See Advanced Parameters.
You can access My Oracle Support at the following URL:
http://support.oracle.com/CSP/ui/flash.html
•Enter the WebLogic Administration Server user name and password.
If you want to discover the target only for monitoring purposes, then it is
sufficient to provide a user name that has a monitoring role. If you want to
monitor the target and also perform start/stop operations, then ensure that you
provide a user name that has either an operator role or an administrator role.
Note: There is the potential of account locking issues if you enter the default
WebLogic user name, and the account password is changed without updating
the Enterprise Manager monitoring credentials for the Domain and Farm.
•Unique Domain Identifier.
Specify a Unique Domain Identifier. This value is used as a prefix to ensure
domain names are unique in environments with the same domain name. By
default, Enterprise Manager will pre-pend the name with "Farm", followed by a
two-digit number, such as "Farm01".
•Agent
Host name for a Management Agent that will be used to discover the Fusion
Middleware targets.
If a Management Agent exists on the WebLogic Administration Server host,
the host name for this Management Agent will be supplied by default.
However, you can specify any Management Agent on any host that is
managed by Cloud Control to perform the discovery.
Chapter 15
Discovering and Adding WebLogic Domains
15-2

Note: To access all supported features, Oracle recommends that you have a
Management Agent local to each managed server in the domain and to use
that Management Agent to monitor the WebLogic Domains on that local host
machine. Though remote Management Agents can manage WebLogic
Domain targets, the local Management Agent is recommended.
Some features that are not supported when there is no local Management
Agent:
–To patch a WebLogic Domain, you need a local Management Agent on
each WebLogic Server machine.
–If you want to use Oracle Support Workbench for a WebLogic Domain
target, then the target requires a local Management Agent.
–Cloning requires a local Management Agent at the source administration
server machine and a local Management Agent at all destination
machines.
Advanced Parameters
If the target domain is secured, expand the Advanced node to specify the protocol
to use in the Protocol field. The default value is t3.
For additional details on discovering a domain secured using the Secure Sockets
Layer (SSL) protocol, see section "C" in My Oracle Support Note 1093655.1. You
can access My Oracle Support at the following URL:
https://support.oracle.com/CSP/ui/flash.html
•JMX Protocol
Used to make a JMX connections to the Administration Server. For Secure
domain JMX protocol - use t3s. If WebLogic domain is using a demo
certificate, this certificate is automatically updated to monitoring and discovery
agent. If a custom certificate is used, refer to Monitoring WebLogic Domains
for information on how to import a certificate.
•Discover Down Servers
Use this check box to discover servers that are down. While adding Oracle
Fusion Middleware WebLogic Domain targets to Cloud Control, you can now
choose whether to add WebLogic Domain targets that are discovered in a
down state. This gives you more control in determining what to automatically
add to Cloud Control for centralized management and monitoring.
To monitor down servers, their Listener Address must be set. Otherwise, these
servers will have'temp-host' as host value and the local agent cannot be
determined for monitoring. Therefore, the servers will always be shown as
down.
When servers come up, this WebLogic domain needs to be refreshed for
populating the correct host name and monitoring.
•JMX Service URL
Optionally supply the Java Management Extensions (JMX) Service URL that
will be used to establish a JMX connection to the WebLogic Administration
Server. For example:
service:jmx:t3://server.example.com:5555/jndi/
WebLogic.management.mbeanservers.domainruntime
Chapter 15
Discovering and Adding WebLogic Domains
15-3

If you do not specify this URL, Enterprise Manager will provide the Service
URL based on the host port and protocol. If this is specified, the Administration
server host and port information still must be provided in the input parameters.
•Discover Application Versions
By default, each version of a deployed Java EE application will be discovered
as a target. Therefore, with every new version, a new target will be discovered.
Deselect this check box if you want only the active version of the application to
be discovered.
•Enable Automatic Refresh
This option refreshes the WebLogic domain every 24 hours.
•Use Host Name in Service URL
You can use host name in service URL instead of JMX. It is recommended to
use this option if you are using a private network and there are many hosts
using the same IP address.
•Create Incident for Discovery Failure
This option creates an OMS incident if discovery fails. You can view the
incident from the Support workbench page.
•External Parameters
Optionally enter any system properties to be used by the Java process to
connect to the WebLogic Administration Server in the Parameters field.
Supply space-separated name/value pairs. Preface each parameter with
-D
.
For example:
-Dparam1=xxx -Dparam2=yyy
-
Dparam3=zzz
•Discovery Debug File Name
If problems occur while adding Middleware-related targets or refreshing
domain membership, you can enable additional debugging information to
quickly diagnose and resolve the issue. This file will be created in the
discovery Agent's log directory.
11. Click Continue. Enterprise Manager will discover all Fusion Middleware targets
within the domain.
12. Click Close in the Finding Targets dialog to automatically assign Management
Agents to the discovered targets.
The Assign Agents page lists each Fusion Middleware target discovered and the
Management Agent assigned to each. Agents are automatically assigned as
follows:
•If a local Management Agent is installed on the discovered target host, that
Agent will be assigned.
•If a local Management Agent cannot be found on the host, the Agent specified
in the Targets page will be assigned.
Note that you can also manually assign Management Agents to specific targets, if
desired.
13. As a rare case, if you want to disable one or more target types for discovery, scroll
down to the Disable Target Types section under Advanced, and move the target
type from the Available Target Types list to the Selected Target Types list.
Chapter 15
Discovering and Adding WebLogic Domains
15-4

Click Refresh Targets to view the refreshed Targets and Agents Assignments
table.
Note:
•If you disable a target type, it will remain disabled for future refresh
operations.
•Child target types are disabled if you disable a parent target type.
14. Click Add Targets to assign Management Agents as listed in the Assign Agents
page.
The Saving Target to Agent processing window appears, indicating how many
total targets have been added and successfully saved. It will also indicate the
number of targets that were unsuccessfully added.
15. Click Close in the processing window when finished. The Results page displays
the targets and Agent assignments.
16. Click OK when finished. There may be a delay before these targets are visible and
monitored. All the agents used for monitoring the targets must be up.
Note:
After you discover a middleware target for the first time, it is recommended
that you learn the best practices for monitoring and managing the discovered
target. To navigate to the Target Management Best Practices page, from the
target home page, select the WebLogic Domain menu, and then select
Target Management Best Practices. The page lists the best practices items
for a Fusion Middleware Domain.
15.1.2 Adding WebLogic Domains Using the Guided Discovery
Process
Oracle WebLogic Domains and their respective components can be discovered using
Cloud Control. A wizard guides you through the guided discovery process.
For any Java EE application deployed on any number of servers, only one Domain
Application target will be discovered.
Note:
To discover a WebLogic Domain, the Administration Server must be up
because the Management Agent must make a JMX connection to it. If the
Administration Server is down, discovery cannot occur.
Thereafter, to monitor the WebLogic Domain, the Administration Server need
not be up.
Chapter 15
Discovering and Adding WebLogic Domains
15-5
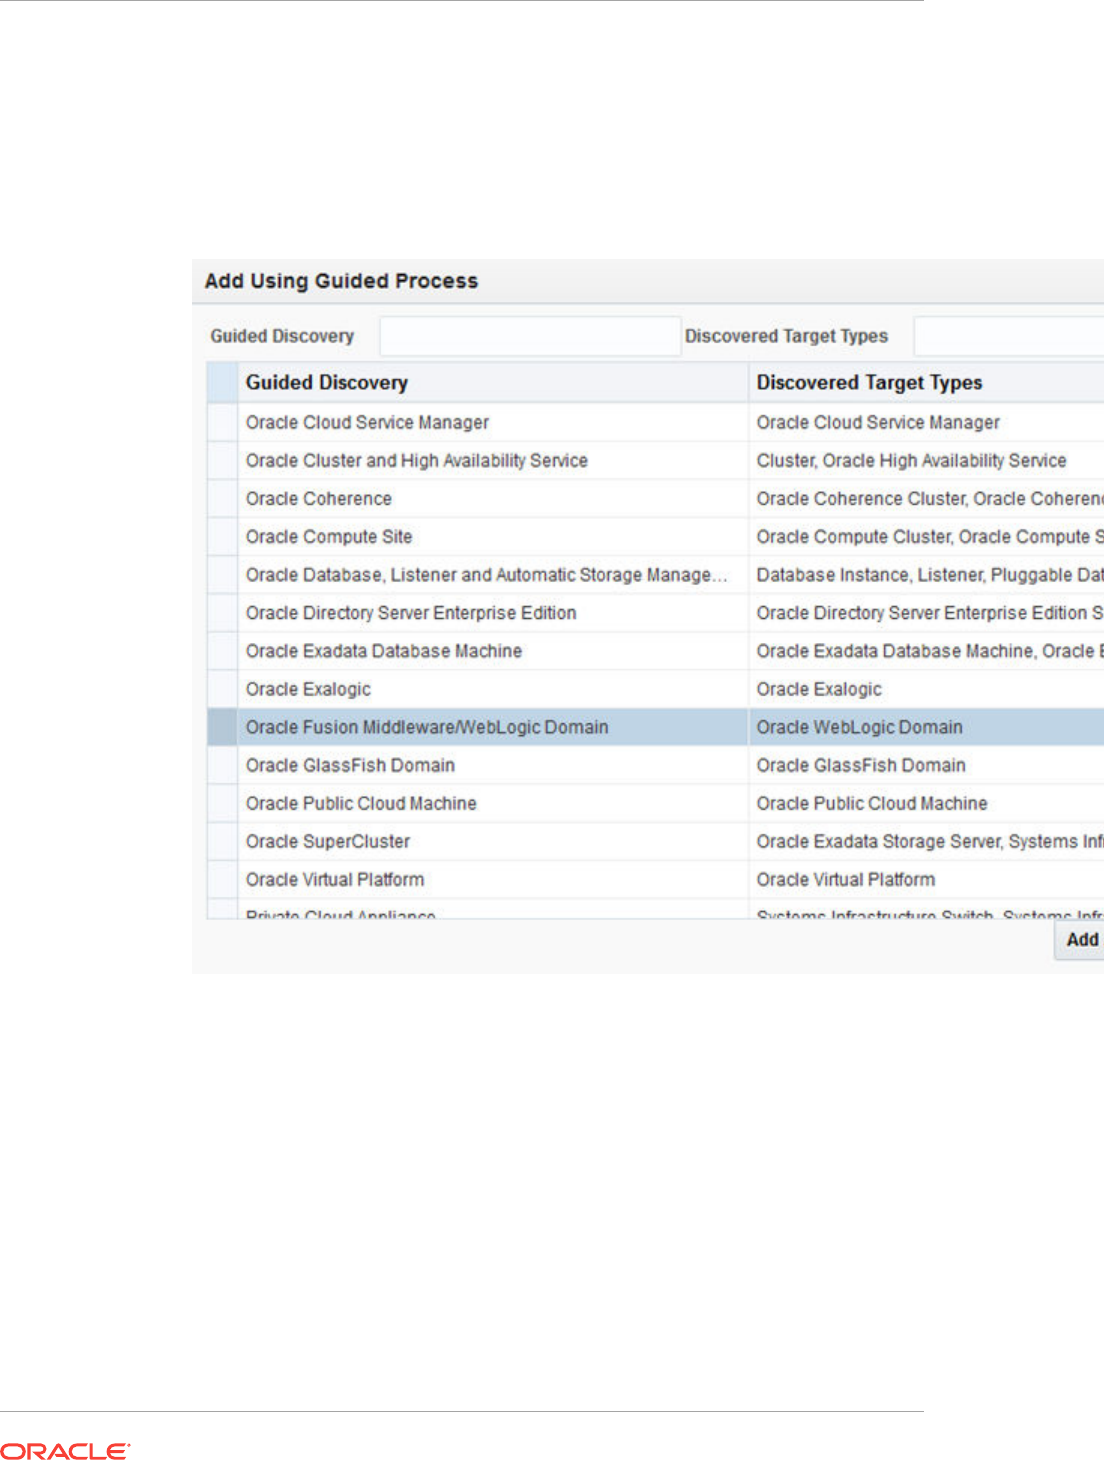
To add a WebLogic domain using the guided process, follow these steps:
1. From the Setup menu, select Add Target, then select Add Targets Manually.
2. Select the Add Using Guided Process option.
3. In the Add Using Guided Process dialog box, select Oracle Fusion Middleware/
WebLogic Domain from the Guided Discovery column.
4. Click Add...
5. Supply or accept values for the following parameters:
Chapter 15
Discovering and Adding WebLogic Domains
15-6
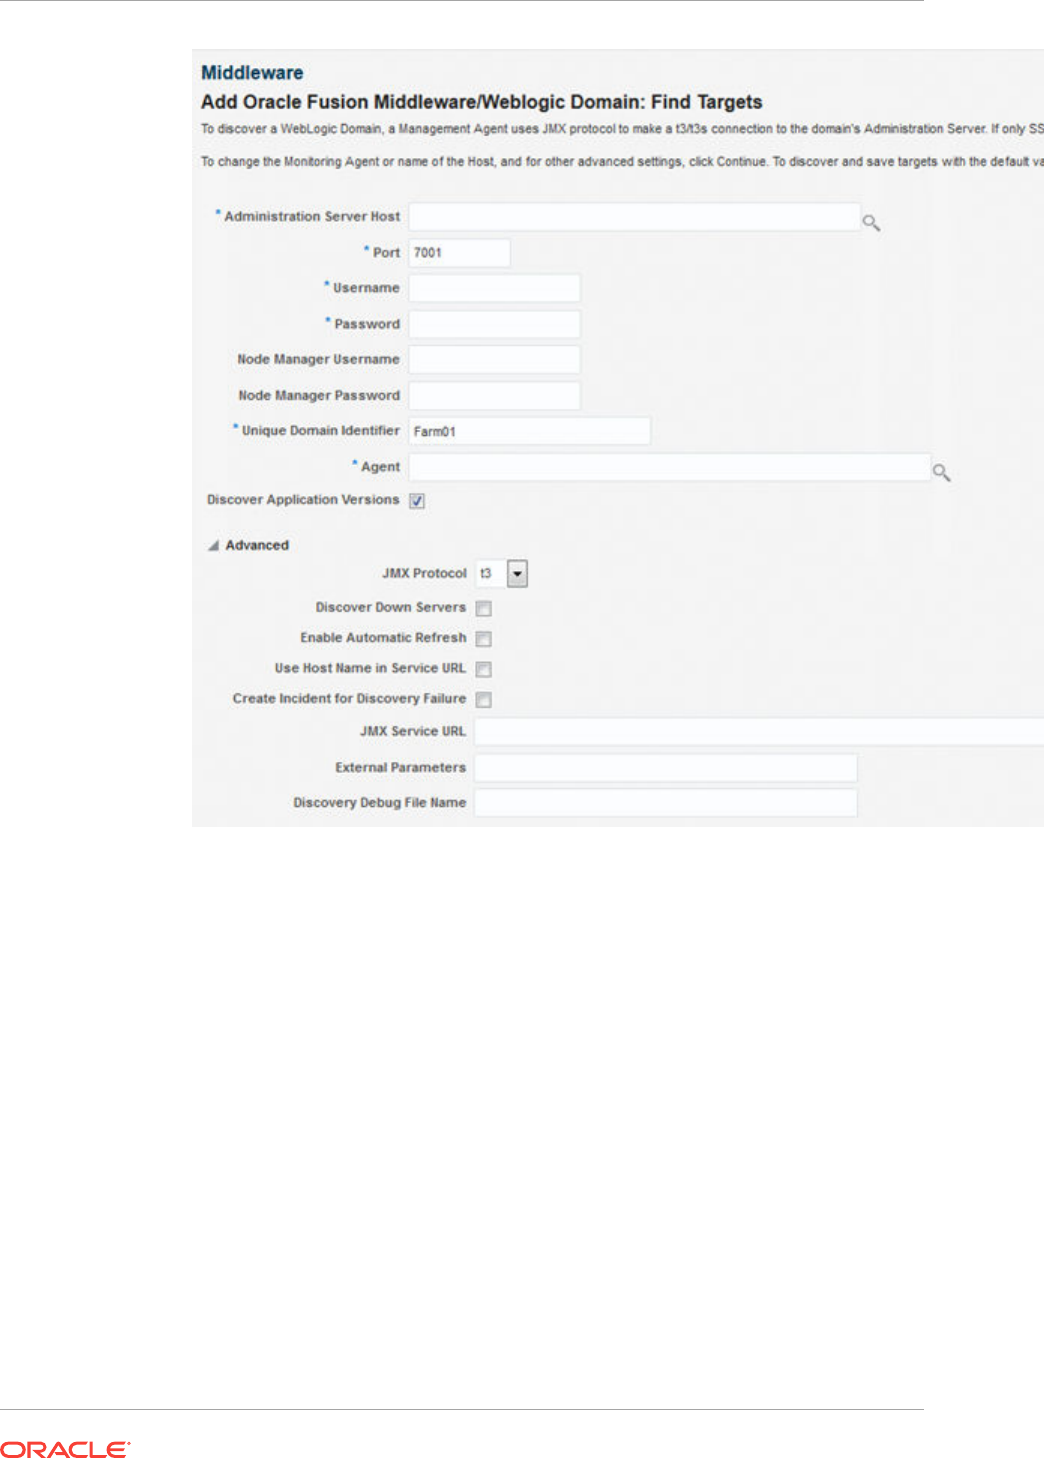
•Administration Server Host
Enter the host name on which the Administration Server is installed and
running for the Oracle WebLogic Domain that you want to promote to a
managed target, for example: myhost06.example.com
•Port
Enter the WebLogic Administration Server port. The default value is 7001.
If the WebLogic Administration Server is secured using the Secure Sockets
Layer (SSL) protocol, specify the location of the trusted keystore file. The
keystore is a protected database that holds keys and certificates for an
enterprise. See Advanced Parameters.
You can access My Oracle Support at the following URL:
https://support.oracle.com/CSP/ui/flash.html
•WebLogic Administration Server user name and password
If you want to discover the target only for monitoring purposes, then it is
sufficient to provide a user name that has a monitoring role. If you want to
Chapter 15
Discovering and Adding WebLogic Domains
15-7

monitor the target and also perform start/stop operations, then ensure that you
provide a user name that has either an operator role or an administrator role.
•Node Manager user name and password
•Unique Domain Identifier.
Specify a Unique Domain Identifier. This value is used as a prefix to ensure
domain names are unique in environments with the same domain name. By
default, Enterprise Manager will pre-pend the name with "Farm", followed by a
two-digit number, such as, "Farm01".
•Agent
The host name for a Management Agent that will be used to discover the
Fusion Middleware targets.If a Management Agent exists on the WebLogic
Administration Server host, the host name for this Management Agent will be
supplied by default. However, you can specify any Management Agent on any
host that is managed by Cloud Control to perform the discovery.
Note: To access all supported features, Oracle recommends that you have a
Management Agent local to each managed server in the domain and to use
that Management Agent to monitor the WebLogic Domains on that local host
machine. Though remote Management Agents can manage WebLogic
Domain targets, the local Management Agent is recommended.
Some features that are not supported when there is no local Management
Agent:
–To patch a WebLogic Domain, you need a local Management Agent on
each WebLogic Domain machine.
–If you want to use Oracle Support Workbench for a WebLogic Domain
target, then the target requires a local Management Agent.
–Cloning requires a local Management Agent at the source administration
server machine and a local Management Agent at all destination
machines.
Advanced Parameters
If the target domain is secured, expand the Advanced node to specify the protocol
to use in the Protocol field. The default value is t3.
You can access My Oracle Support at the following URL:
https://support.oracle.com/CSP/ui/flash.html
•JMX Protocol
Used to make a JMX connections to the Administration Server. For Secure
domain JMX protocol - use t3s. If WebLogic domain is using a demo
certificate, this certificate is automatically updated to monitoring and discovery
Agent.
•Discover Down Servers
Use this check box to discover servers that are down. While adding Oracle
Fusion Middleware WebLogic Domain targets to Cloud Control, you can now
choose whether to add WebLogic Domain targets that are discovered in a
down state. This gives you more control in determining what to automatically
add to Cloud Control for centralized management and monitoring.
Chapter 15
Discovering and Adding WebLogic Domains
15-8

To monitor down servers, their Listener Address must be set. Otherwise, these
servers will have'temp-host' as host value and the local agent cannot be
determined for monitoring. Therefore, the servers will always be shown as
down.
When servers come up, this WebLogic domain needs to be refreshed for
populating the correct host name and monitoring.
•Discover Application Versions
By default, each version of a deployed Java EE application will be discovered
as a target. Therefore, with every new version, a new target will be discovered.
Deselect this check box if you want only the active version of the application to
be discovered.
•JMX Service URL
Optionally supply the Java Management Extensions (JMX) Service URL that
will be used to establish a JMX connection to the WebLogic Administration
Server. For example:
service:jmx:t3://server.example.com:5555/jndi/
WebLogic.management.mbeanservers.domainruntime
If you do not supply a value, Enterprise Manager will provide the Service URL
based on the host port and protocol. If this is specified, the Administration
server host and port information still must be provided in the input parameters.
•Discover Application Versions
By default, each version of a deployed Java EE application will be discovered
as a target. Therefore, with every new version, a new target will be discovered.
Deselect this check box if you want only the active version of the application to
be discovered.
•Enable Automatic Refresh
This option refreshes the WebLogic domain every 24 hours.
•Use Host Name in Service URL
You can use host name in service URL instead of JMX. It is recommended to
use this option if you are using a private network and there are many hosts
using the same IP address.
•Create Incident for Discovery Failure
This option creates an OMS incident if discovery fails. You can view the
incident from the Support workbench page.
•External Parameters
Optionally enter any system properties to be used by the Java process to
connect to the WebLogic Administration Server in the Parameters field.
Supply space-separated name/value pairs. Preface each parameter with
-D
.
For example:
-Dparam1=xxx -Dparam2=yyy
-
Dparam3=zzz
•Discovery Debug File Name
If problems occur while adding Middleware-related targets or refreshing
domain membership, you can enable additional debugging information to
quickly diagnose and resolve the issue.
Chapter 15
Discovering and Adding WebLogic Domains
15-9

6. Click Continue. Enterprise Manager will discover all Fusion Middleware targets
within the domain.
7. Click Close in the Finding Targets dialog to automatically assign Management
Agents to the discovered targets.
The Assign Agents page lists each Fusion Middleware target discovered and the
Management Agent assigned to each. Agents are automatically assigned as
follows:
•If a local Management Agent is installed on the discovered target host, that
Agent will be assigned.
•If a local Management Agent cannot be found on the host, the Agent specified
in the Targets page will be assigned.
Note that you can also manually assign Management Agents to specific targets, if
desired.
8. As a rare case, if you want to disable one or more target types for discovery, scroll
down to the Disable Target Types section under Advanced, and move the target
type from the Available Target Types list to the Selected Target Types list.
Click Refresh Targets to view the refreshed Targets and Agents Assignments
table.
Note:
•If you disable a target type, it will remain disabled for future refresh
operations.
•Child target types are disabled if you disable a parent target type.
9. Click Add Targets to assign Management Agents as listed in the Assign Agents
page.
The Saving Target to Agent processing window appears, indicating how many
total targets have been added and successfully saved. It will also indicate the
number of targets that were unsuccessfully added.
10. Click Close in the processing window when finished. The Results page displays
the targets and Agent assignments.
11. Click OK when finished. There may be a delay before these targets are visible and
monitored. All the agents used for monitoring the targets must be up.
Note:
After you discover a middleware target for the first time, it is recommended
that you learn the best practices for monitoring and managing the discovered
target. To navigate to the Target Management Best Practices page, from the
target home page, select the WebLogic Domain menu, and then select
Target Management Best Practices. The page lists the best practices items
for a Fusion Middleware Domain.
Chapter 15
Discovering and Adding WebLogic Domains
15-10

15.1.3 Adding Multiple WebLogic Domains Using EM CLI
If you have multiple WebLogic domains that you want to manage through Cloud
Control, you can use the Enterprise Manager Command Line Interface (EM CLI)
discover_wls verb to discover them all at once, rather than discovering them one at a
time using the discovery wizards.
The discover_wls verb can be used to discover the supported WebLogic domain
versions. The verb reads a file named domain_discovery_file that contains the
information required to discover each domain.
Note:
To know the supported WebLogic domain versions:
1. Log into https://support.oracle.com/.
2. On the My Oracle Support home page, select Certifications tab.
3. On the Certifications page, enter the product name as Enterprise
Manager Base Platform - OMS in the Product field and select the
relevant release number from the Release list.
4. Click Search.
5. In the Certification Results section, expand the Application Servers
menu to view the supported versions.
See the Enterprise Manager Command Line Interface book for instructions on using
the discover_wls verb.
15.2 Discovering New or Modified Domain Members
In the typical enterprise, Oracle WebLogic domains do not remain static. Instead,
membership in the domain changes regularly: New Java EE applications are
deployed, WebLogic Domain instances are created or removed, clusters are added,
and so on.
By default, Cloud Control is not automatically aware of changes made to Oracle
WebLogic domains that have been configured as managed targets. However, the
application does provide the ability to discover and uptake new or modified domain
members.
This section covers the following:
•Enabling Automatic Discovery of New Domain Members
•Manually Checking for New or Modified Domain Members
15.2.1 Enabling Automatic Discovery of New Domain Members
You can enable a pre-defined Cloud Control job named "WebLogic Domain Refresh"
to automatically discover new domain members and add them as managed targets.
Chapter 15
Discovering New or Modified Domain Members
15-11

Note:
Whenever you perform the Refresh operation, the Administration Server must
be up and the Discovery Agent must be able to connect to it using JMX.
1. From the Targets menu, select Middleware.
2. Click on the WebLogic Domain you want to enable the job for in the Middleware
home page.
3. In the General region of the page, click the timestamp link next to the WebLogic
Domain Refreshed property. The Refresh WebLogic Domain dialog opens.
4. Check the Enable Automatic Refresh box in the Refresh WebLogic Domain
dialog, then click OK.
Once enabled, the job will check for new domain members once every 24 hours by
default. To change the job settings, including the frequency at which it is run:
1. Click the Jobs tab.
2. Click the job title in the Job Activity page.
3. Click Edit.
15.2.2 Manually Checking for New or Modified Domain Members
You can use Cloud Control to check a domain for new or modified members on a
periodic basis.
1. From the Targets menu, select Middleware.
2. Click the WebLogic Domain you want to (enable the job for in the Middleware
home page) refresh.
3. From either the Farm or WebLogic Domain menu, select Refresh WebLogic
Domain. The Refresh WebLogic Domain dialog opens.
4. Click Add/Update Targets. The Management Agent refreshes by connecting to
the Administration Server. The Administration Server must be up for the refresh to
occur. Click Close on the Confirmation page. Cloud Control will search the domain
for new and modified targets.
When any entity in a domain is removed from a WebLogic domain such as
WebLogic j2eeaserver, j2eeapp, and the like, they are still displayed in Enterprise
Manager. Click Remove Targets if you do not need the historical data of these
targets. The obsolete targets which can be removed from the domain are then
displayed.
5. Discovery Debug File Name option
If problems occur while adding Middleware-related targets or refreshing domain
membership, you can enable additional debugging information to quickly diagnose
and resolve the issue. This file will be created in the discovery Agent's log
directory.
6. The Assign Agents page displays the Fusion Middleware targets discovered and
the Management Agent assigned to each. Click Add Targets to assign
Management Agents as listed in the Assign Agents page.
Chapter 15
Discovering New or Modified Domain Members
15-12

Agents are automatically assigned as follows:
•If a local Agent can be found on the target host, that Agent will be assigned.
•If a local Agent cannot be found on the host, the Agent specified in the Targets
page will be assigned.
Note that you can also manually assign Agents to specific targets, if desired.
This page also provides the option of Selective Discovery. Using this option, you
can disable the discovery of only new target types.
You can also modify the Domain Global Properties, for example, Contact, Cost
Center, Lifecycle Status, and so on).
7. The Saving Targets to Agent processing window appears, indicating how many
total targets have been added and successfully saved. It will also indicate the
number of targets that were unsuccessfully added.
8. Click Close in the processing window when finished. The Results page displays
the following options: Show Targets Details and Show WebLogic Domain Global
Properties. The Show Targets Details page shows the targets and Agent
assignments.
Note: If there were targets that were removed, you can go back to the Refresh
WebLogic Domain page and click Remove Targets to remove the targets and any
historical information in the Management Repository. See Removing Middleware
Targets.
9. Click OK when finished. There may be a delay before these targets are visible and
monitored. All the agents used for monitoring the targets must be up.
To do this, on the WebLogic domain homepage, from the WebLogic domain menu,
select Target setup, and then click Monitoring credentials.
15.3 Adding Standalone Oracle HTTP Servers
To add standalone Oracle HTTP Servers, follow these steps:
•Meeting the Prerequisites
•Adding Standalone Oracle HTTP Servers Using the Guided Discovery Process
Note:
To view a visual demonstration on how to discover and manage standalone
Oracle HTTP Servers, access the following URL and click Begin Video. The
discovery described in this visual demonstration is based Enterprise Manager
Cloud Control 12c Release 2 (12.1.0.3) and the Oracle Fusion Middleware
Plug-in 12.1.0.5.
http://apex.oracle.com/pls/apex/f?
p=44785:24:0::::P24_CONTENT_ID,P24_PREV_PAGE:8529,1
15.3.1 Meeting the Prerequisites
Before you discover a standalone Oracle HTTP server, meet the following:
Chapter 15
Adding Standalone Oracle HTTP Servers
15-13

•Ensure that an Oracle Management Agent (Management Agent) is installed on the
host where the standalone Oracle HTTP Server is running. For instructions to
install a Management Agent, see the Oracle Enterprise Manager Cloud Control
Basic Installation Guide available in the Enterprise Manager documentation library.
•Ensure that the standalone Oracle HTTP Server you are about to discover is of
one of the following releases: 12.2.1.x, 12.1.3.x, 12.1.2.x, 11.1.1.9.x, 11.1.1.7.x,
11.1.1.6.x, 11.1.1.5.x, 11.1.1.4.x, 11.1.1.3.x, 11.1.1.2.x, 11.1.1.1.x, 10.1.2.x.
15.3.2 Adding Standalone Oracle HTTP Servers Using the Guided
Discovery Process
To add a standalone Oracle HTTP server, follow these steps:
Note:
You can add only standalone Oracle HTTP Servers using this method. To add
a managed Oracle HTTP Server, use the Add Oracle Fusion Middleware/
Weblogic Domain wizard.
1. From the Setup menu, select Add Target, then select Add Targets Manually.
2. On the Add Targets Manually page, select Add Using Guided Process.
3. From the Target Types list, select Standalone Oracle HTTP Server.
4. Click Add Using Guided Process.
5. On the Add Standalone Oracle HTTP Server page, provide the following details,
and click Add Target.
Element Description
Oracle HTTP Server Host Click the search icon to search and select the host where the
standalone Oracle HTTP Server is running. In the Search and
Select: Targets dialog, search the host, select it, and click
Select.
For example,
example.com
Agent URL URL of the Management Agent that is installed on the host
where the standalone Oracle HTTP Server is running.
Appears automatically by default when you select the
standalone Oracle HTTP Server host.
For example,
https://example.com:1838/emd/main/
Oracle HTTP Server Port Specify the Oracle HTTP Server port. The Oracle HTTP
Server port is not validated. You need to specify the correct
values.
Chapter 15
Adding Standalone Oracle HTTP Servers
15-14

Element Description
Target Name Specify the name with which you want to add and monitor the
standalone Oracle HTTP Server target in Enterprise Manager
Cloud Control.
For example,
Standalone_OHS1
Once the standalone Oracle HTTP Server is discovered and
added to Enterprise Manager Cloud Control, from the Targets
menu, select All Targets. On the All Targets page, in the
Search Target Name field, enter the target name with which
you discovered and added the standalone Oracle HTTP
Server target, and press Enter. Enterprise Manager Cloud
Control displays the Home page of the standalone Oracle
HTTP Server, with the target name you specified while
discovering and adding it.
Oracle Home Click the search icon to log in to the standalone Oracle HTTP
Server host, and select the Oracle home where the
standalone Oracle HTTP Server is running.
For example, /u01/software/oracle/Standalone_OHS1
Configuration Path Click the search icon to log in to the standalone Oracle HTTP
Server host, and select the
httpd.conf
file. The value for this
field must ideally be the absolute directory path to the
httpd.conf
file.
For example,
/u01/software/oracle/Standalone_OHS1/
Oracle_WT1/instances/instance1/config/OHS/ohs1/
httpd.conf
Version Select the version of the target. If you selected a 11.x target,
you need to specify the OHS Process Owner Credentials, or
select from a list of available OHS Process Owner/ SSH Key
Credentials.. If you selected a 12c target, you need to specify
the Node Manager credentials.
OHS Process Owner
Credentials
(This field is only for discovering standalone Oracle HTTP
Server 11.x targets)
Provide the OHS Process Owner Credentials. These
credentials are optional and are required for collecting metrics
for the target. These credentials are stored as monitoring
credentials for the target and can be updated from the
monitoring credentials page.
To use SSH Key Credentials, create the SSH Host
Credentials by accessing the Security tab, selecting
Credentials, and then navigating to the Named Credentials
page.
Node Manager User
Name
(This field is only for discovering standalone Oracle HTTP
Server 12c target)
Specify the Node Manager user name.
Node Manager Password (This field is only for discovering standalone Oracle HTTP
Server 12c target)
Specify the Node Manager password.
15.4 Adding Exalytics Targets
In order to manage and monitor Oracle Fusion Middleware components running on
Exalytics, such as WebLogic domain, Oracle BI Foundation 11g, and Oracle TimesTen
Chapter 15
Adding Exalytics Targets
15-15

(in-memory database), Cloud Control must first discover the Exalytics machine
containing these components.
An Exalytics system consists of one or more Exalytics machines. The machine(s) can
be physical, virtualized, or a mix of both.
Once discovered, the Exalytics machine and the components within it can be
promoted to "managed target" status, enabling Cloud Control to collect the data
needed to monitor the target.
Related targets running on the Exalytics machine such as OBIEE, Times Ten and
WebLogic, need to be discovered following the respective flows for those components.
If the Exalytics target has been discovered, the related targets will be associated with
the Exalytics target when they are discovered. Else, the association will happen when
the Exalytics target is discovered.
To add an Exalytics target, follow these steps:
•Meeting the Prerequisites
•Adding Exalytics System Targets Using the Guided Discovery Process
15.4.1 Meeting the Prerequisites
Before adding an Exalytics machine target, you must meet the following prerequisites:
•A Management Agent for discovering targets must be deployed onto the physical
Exalytics machine (host).
For discovering a virtual machine, make sure that at least one of the virtual
Exalytics has a Management Agent running on it. The Management Agent should
be on one of the VM Guest part of the virtual Exalytics Machine deployment.
However, all virtual machines that contain components that need to be monitored
require a Management Agent to be deployed on.
•To identify the Exalytics machine, ensure that you have the context info file which
contains the Exalytics machine ID.
•To discover and monitor ILOM for a virtual Exalytics machine, you must install
IMPITOOL on the VM guest. To install IMPITOOL, follow these steps:
1. Download the latest Hardware Management Pack compatible with the
operating system on your VM guest. Instructions for downloading the
Hardware Management Pack are available here:
http://www.oracle.com/
technetwork/server-storage/servermgmt/downloads/index.html
2. Extract the IMPITOOL package from the downloaded zip file and install it on
the operating system on the VM guest.
15.4.2 Adding Exalytics System Targets Using the Guided Discovery
Process
To add Exalytics system target in an Exalytics system, follow these steps:
1. From the Setup menu, select Add Target, and then select Add Targets
Manually.
2. On the Add Targets Manually page, select Add Using Guided Process (Also
Adds Related Targets).
Chapter 15
Adding Exalytics Targets
15-16
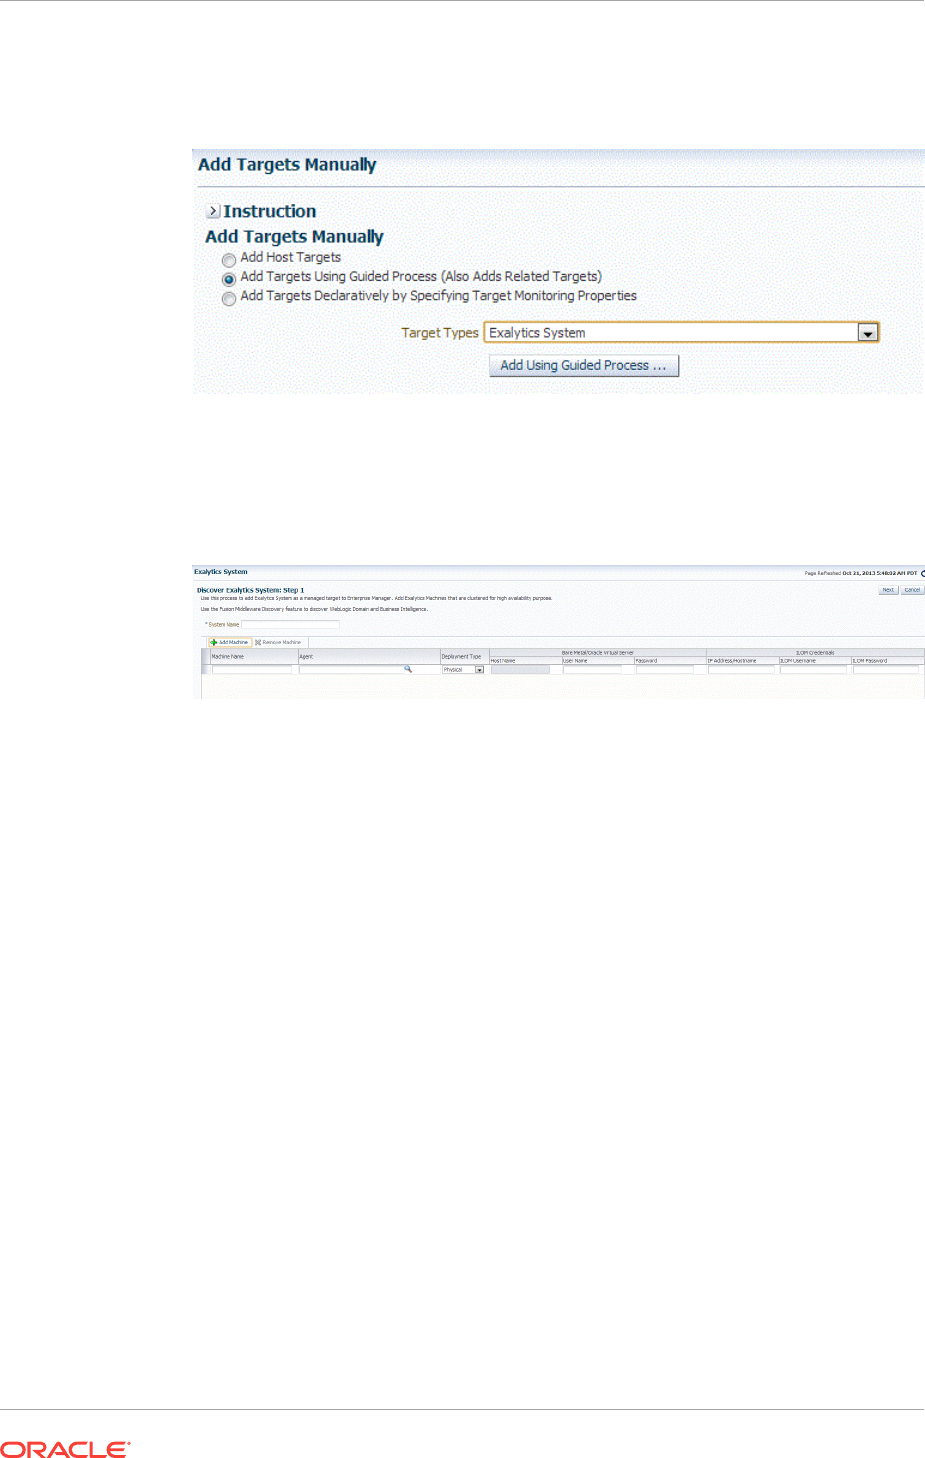
3. From the Target Types drop-down list, select Exalytics System, and then click
Add Using Guided Process...
4. On the Discover Exalytics System page, provide a name for the Exalytics System,
and then click Add Machine.
5. Provide the following details:
•Machine Name
Provide a unique for the Oracle Exalytics machine target.
•Agent
Specify or select the Management Agent to use for the Oracle Exalytics
Machine discovery process.
•Deployment Type
Select Physical or Virtual depending on if you want to discover a physical
target or a virtual target.
•Host Name (only for Virtual target)
Enter the host name or IP Address where Oracle Virtual Server is running
•User Name and Password
For a physical Exalytics machine, provide credentials of the root user which
has privileges to run the imageinfo command.
For a virtual Exalytics machine, provide credentials to log in to Oracle Virtual
Server (OVS). You should have privileges to run the imageinfo command.
•ILOM Credentials
Specify the ILOM IP address or hostname, ILOM username, and ILOM
password of the root user.
Chapter 15
Adding Exalytics Targets
15-17

Note:
The ILOM Credentials are optional. If you do not add the ILOM Credentials,
the ILOM target will not be discovered.
You can add the ILOM target later by using the Refresh Exalytics System
option.
Click Next.
6. A confirmation box appears. Click OK.
Note:
Click Add Targets to save the targets as a Manageable Entity.
15.5 Removing Middleware Targets
Removing Middleware targets from the Management Repository:
•Identifies targets that are deleted from the WebLogic Domain, for example,
WebLogic Servers, Clusters, Applications (both generic and custom), and any
other System Components.
•Shows the list of targets which might have been deleted from the product, but
Enterprise Manager cannot determine if they were deleted or not. For these
targets, decide whether these targets should be deleted and mark them as such.
•Shows duplicate targets. For example, if for the same application deployment
there is a custom and a generic target, the will shows the generic target which can
be deleted.
•Shows the older versioned application deployments which can be deleted if a
newer version of the same application is present.
•Lists all the down servers. You can decide to either blackout or delete these
servers.
Chapter 15
Removing Middleware Targets
15-18

16
Discovering, Promoting, and Adding
System Infrastructure Targets
This chapter describes how you can use Cloud Control to discover, promote, and add
system infrastructure targets. This chapter covers the following:
•Discovering and Promoting Oracle MiniCluster
•About Discovering, Promoting, and Adding System Infrastructure Targets
•Discovering and Promoting Operating Systems
•Discovering and Promoting Oracle Solaris Zones
•Discovering and Promoting Oracle VM Server for SPARC
•Discovering and Promoting Servers
•Discovering and Promoting Oracle SuperCluster
•Configuring Snmp traps for Supercluster and Minicluster monitored hosts
•Discovering and Promoting PDUs
•Discovering and Promoting Oracle ZFS Storage
•Discovering Fabrics
•Related Resources for Discovering and Promoting System Infrastructure Targets
16.1 Discovering and Promoting Oracle MiniCluster
Before you begin the discovery process, there are several checks you should perform
to ensure a smooth discovery.
16.1.1 Prerequisites
Enterprise Manager Agents have to be installed on Oracle Solaris global zones of both
MiniCluster compute nodes. You can install EM Agents into Oracle Solaris Global and
Non-Global Zones using Add Host Targets wizard.
16.1.2 Credentials Required for Oracle MiniCluster Discovery
The following are the credentials required for the discovery of Oracle MiniCluster.
Target Type Credentials Description
Systems Infrastructure Server ILOM Monitoring Credentials,
SNMP Credentials
Required to monitor
MiniCluster compute nodes
through their ILOMs
16-1

16.1.3 Oracle MiniCluster Discovery
To discover the Oracle MiniCluster system, perform the following steps:
Prerequisites
It is required to use Enterprise Manager Agents on both MiniCluster compute node
Oracle Solaris global zones. Deploy the Enterprise Manager Agents to the Oracle
Solaris global zones of the MiniCluster compute nodes prior to starting the Oracle
MiniCluster discovery process.
Note:
To enable monitoring of Oracle VM for SPARC the non-privileged user used to
install and run the Enterprise Manager agent must be granted
the solaris.ldoms.read and solaris.ldoms.ldmpower authorizations
and be assigned the LDoms Power Mgmt Observability rights profile.
For example:
/usr/sbin/usermod -A
solaris.ldoms.read,solaris.ldoms.ldmpower oracle
/usr/sbin/usermod -P 'LDoms Power Mgmt Observability'
oracle
1. Log in to Enterprise Manager.
2. Under Setup, click Add Target, then click Add Targets Manually.
3. In the Overview section, click Add using Guided Process.
4. In the Add Using Guided Process screen, scroll down to Oracle MiniCluster and
click Add. The Oracle MiniCluster Discovery wizard opens.
5. The Introduction wizard guides you through the steps required to discover Oracle
MiniCluster in Oracle Enterprise Manager. Click Next to continue with the
discovery process.
Note:
The guided discovery process assumes that Oracle Enterprise Manager
Agents are already deployed to Oracle Solaris Global zones of the MiniCluster
Compute Nodes. The Enterprise Manager agent must be deployed in order to
discover MiniCluster system, monitor disk shelves and a virtualization stack on
compute nodes.
If you want to monitor database instances running on a DB domain, you must
install the Enterprise Manager Agents on all the Zones where the databases
are installed.
6. In the Discovery Input screen provide the Agent EMD URL. Click the search icon
and select an agent.
Chapter 16
Discovering and Promoting Oracle MiniCluster
16-2

Click Next to proceed to the next step. The Oracle MiniCluster discovery process
is started. When the discovery is completed, a confirmation window displays the
number of targets discovered. Click Close to close the window.
7. The Discovery Prerequisites screen opens. It displays basic information of the
discovery. It also displays any warnings and errors found during the discovery
process. Click Next to continue.
8. The Discovered Targets screen lists all the targets discovered in the Oracle
MiniCluster system. All targets are selected by default. The Managed column
indicates if the targets have already been discovered and managed by Enterprise
Manager. Deselect the targets that you do not want to be discovered and
monitored.
a. Select monitoring and backup agents for MiniCluster compute node ILOMs.
b. Provide ILOM Monitoring Credentials for the ILOMs of the MiniCluster system
compute nodes.
c. Select monitoring and backup agents for MiniCluster disk shelves.
Click Next to proceed to the Review screen.
Note:
Before you are taken to the Review screen, a validation is executed to find out
if the correct agent for Disk Shelf Monitoring was selected. This agent has to
be deployed to the host which Disk Shelf is directly connected using Serial
Attached SCSI. If you selected an agent on another host where Disk Shelf is
not directly connected, you will get a warning. You have to select the correct
agent first otherwise you cannot proceed in MiniCluster discovery. After the
Disk Shelf agent selection validation, another validation is executed. This
validation checks if you correctly configured Solaris host so you can see
hardware related incidents in Enterprise Manager. You can see result of this
validation on the Review screen. If the Solaris Host is not configured properly
to deliver incidents, you won't see FMA alerts with Disk Shelf failures as
incidents in Enterprise Manager. This configuration is not mandatory to finish
MiniCluster discovery but highly recommended. For information on how to
configure incidents for Solaris Host, see Configuring Snmp traps for
Supercluster and Minicluster monitored hosts.
9. In the System Review screen, review the system information.
a. Click Test Connection to check whether the specified credentials are correct
for all selected targets.
b. Click Promote Targets to create and manage targets. This may take few
minutes to complete. You are informed about any errors that occur during the
process. In case there is at least one error, no targets are created. Fix all
errors and rerun the discovery. Once the process completes without any
errors, the targets are managed and you can view the Oracle MiniCluster
system with all its targets.
Chapter 16
Discovering and Promoting Oracle MiniCluster
16-3

16.8 Configuring Snmp traps for Supercluster and
Minicluster monitored hosts
After the EM agents are deployed to the engineered system, it is recommended to
configure the hosts to send the snmp traps to the agents. Perform the following steps
to configure the snmp:
1. Find the EM agent numeric IP address and port number.
Login to the host where the EM agent is deployed. From the agent directory
<AGENT_HOME>/bin
run the following command to obtain the port number of the
agent:
$ emctl status agent | grep 'Agent URL'
Agent URL: https://hostname.domain:3863/emd/main/
The port number can be seen after the fully qualified domain name of the agent, it
is 3863 in the example above.
To get the numeric IP address, use ping or
nslookup
command.
2. Configure the snmpd.
Add the
trap2sink
entry information into the
snmpd.conf
configuration file.
The configuration file
snmpd.conf
is in different location for Solaris 10 and Solaris
11.
For Solaris 11 the location is
vi /etc/net-snmp/snmp/snmpd.conf
For Solaris 10 the location is
vi /etc/snmp/snmpd.conf
Add the following line:
trap2sink <numericip> public <transport>
where,
•The <transport> is the port number obtained in step (1). It is the port number
of the EM agent.
•The <numericip> is the IP address of the EM agent host, obtained in step (1).
For example
trap2sink 10.133.249.68 public 3863
3. Restart the SNMP services.
For Solaris11:
svcadm restart net-snmp
svcadm restart snmp-notify
For Solaris10:
svcadm restart sma
Chapter 16
Configuring Snmp traps for Supercluster and Minicluster monitored hosts
16-4
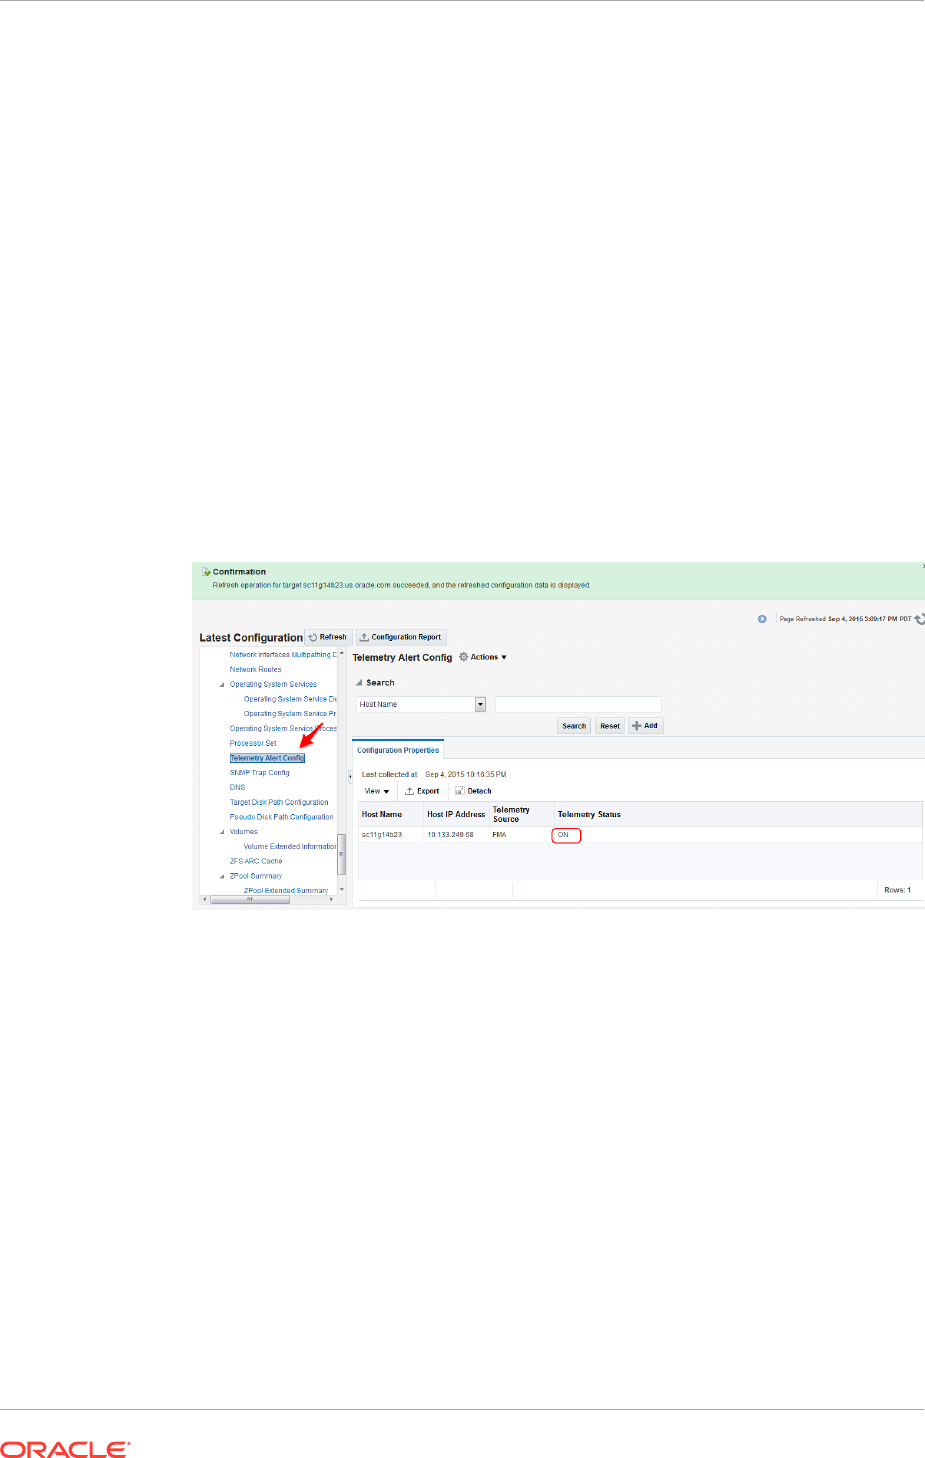
If the SNMP service was not enabled before, ensure that the services are enabled.
For Solaris11:
svcadm enable net-snmp
svcadm enable snmp-notify
For Solaris10:
svcadm enable sma
4. Optionally, verify the snmpd configuration by making sure the status for Telemetry
Status is ON in the host target, in the Telemetry Alert Config metric.
After the configuration of the snmp through steps (1) – (3), navigate to Host home
page and perform the following steps:
a. Select Host and click Configuration.
b. Click Last collected.
c. Select Telemetry Alert Config metric.
d. Click Refresh, wait for few minutes until the metrics get refreshed.
If the Telemetry Status is ON in Telemetry Alert Config metric, it indicates the the
configuration of FMA SNMP traps is done correctly.
16.2 About Discovering, Promoting, and Adding System
Infrastructure Targets
Cloud Control enables you to monitor a variety of system infrastructure targets,
including Oracle VM Server for SPARC, Oracle Solaris Zones, Oracle SuperClusters,
servers, operating systems, storage, networks, racks, and power distribution units
(PDUs). The steps to add System Infrastructure targets is the same for most targets.
However, a few targets do require special procedures.
When fully managed, systems infrastructure targets provides monitoring and an
enterprise-wide view of the bottom half of the stack, including Oracle Solaris and Linux
operating systems, virtualized operating systems (zones) and virtual machines (logical
Chapter 16
About Discovering, Promoting, and Adding System Infrastructure Targets
16-5
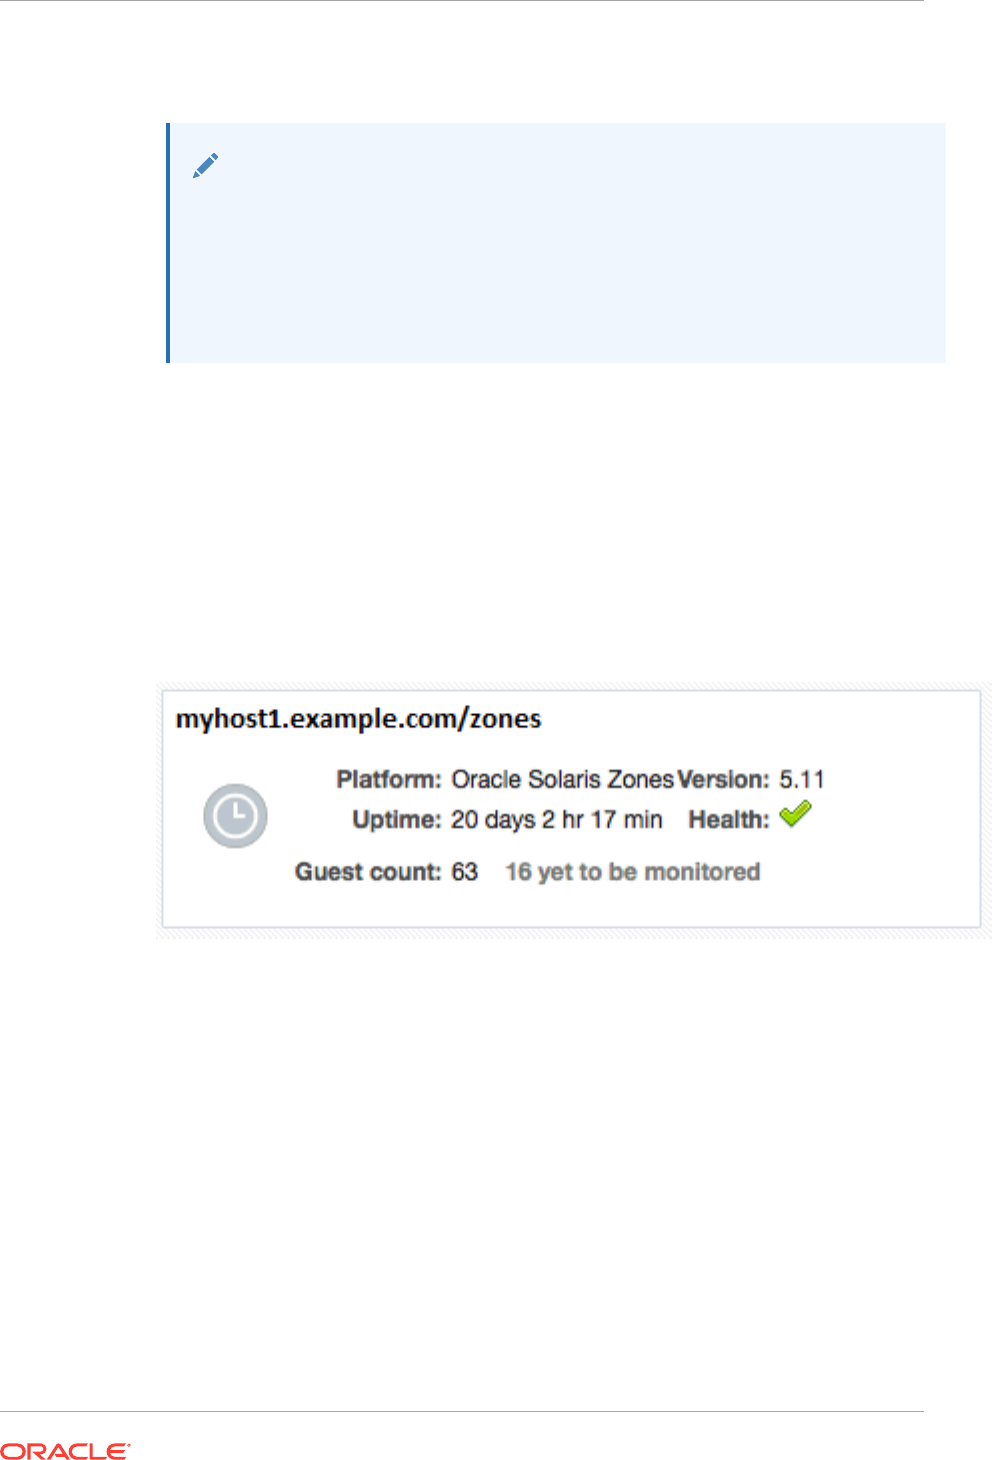
domains), power distribution units (PDUs), servers, storage appliances, storage for a
host, and network resources.
Note:
To monitor ILOM servers or virtualization targets, deploy the EM Agent with
sudo
privileges or manually install and run the
root.sh
script.
Monitoring requires that the
root.sh
script is executed and installs the nmr
binary. When you deploy an EM Agent with
sudo
privileges, the
root.sh
script
is executed.
How long it takes to begin monitoring all discovered targets varies, depending on your
environment, configuration, and the number of guests. For virtualization targets, the
Summary dashlet on the Virtualization Platform includes the total number of guests
being monitored. When guests are discovered and configured on the platform, but not
yet monitored, an icon appears in the dashlet along with the number of guests that are
pending monitoring. For example, in Figure 16-1 there are 63 guests configured on the
host and 16 of those guests are not yet being monitored. The icon will not appear in
the dashlet when all guests are monitored.
Figure 16-1 Summary Dashlet Showing the Number of Guests to be Monitored
16.3 Discovering and Promoting Operating Systems
Oracle Solaris and Linux operating systems are discovered and promoted as part of
the host discovery and promotion process. See Discovering and Adding Host and
Non-Host Targets for more about discovery, promotion, and the steps to discover and
promote a host target.
16.4 Discovering and Promoting Oracle Solaris Zones
Discovering and promoting Oracle Solaris Zones relies on the host discovery. When a
host on a global zone is promoted, it triggers the discovery and monitoring of the
zones.
Chapter 16
Discovering and Promoting Operating Systems
16-6

Note:
To take advantage of all supported Oracle Solaris Zone monitoring, the Oracle
Solaris release on the global zone must be Oracle Solaris 10 Update 11 or
later.
To discover and monitor zone targets, deploy the EM Agent with
sudo
privileges or manually install and run the
root.sh
script.
When a host is in a zone, you should discover the global zone before you add the
virtual server targets. If you see a message stating that there is not a virtual platform
associated with this virtual server, discover and add the virtual server's global zone as
a managed target.
Oracle Solaris Zones are displayed with the following target display names:
•Virtualization Platform: <Oracle Solaris Global Zone OS Host Name> (Solaris
Zones Virtual Platform)
•Virtual Server: <Oracle Solaris Zone Name>
You can change the display name of a discovered Oracle Solaris Zone using the CLI.
For example, to change a Virtualization Platform display name:
emcli modify_target -name="Virtual Platform Target Name" -
type="oracle_si_virtual_platform_map" -display_name="New Display Name"
To change a Virtual Server display name:
emcli modify_target -name="Virtual Server Target Name" -
type="oracle_si_virtual_server_map" -display_name="New Display Name"
See Discovering and Adding Host and Non-Host Targets for more about discovery,
promotion, and the steps to add a host.
16.5 Discovering and Promoting Oracle VM Server for
SPARC
Discovering and promoting Oracle VM Server for SPARC relies on the host discovery.
When a host on a control domain is promoted, it triggers the discovery and monitoring
of the other domains.
Note:
To discover and monitor targets, deploy the EM Agent with
sudo
privileges or
manually install and run the
root.sh
script.
When an agent is deployed to a control domain or logical domain OS, related targets
including the ILOM server, virtual platform, and virtual server are automatically
promoted.
Chapter 16
Discovering and Promoting Oracle VM Server for SPARC
16-7

When a host is in a logical domain, you should discover the control domain before you
add the virtual server targets. If you see a message stating that there is not a virtual
platform associated with this virtual server, discover and add the virtual server's
primary domain as a managed target.
An Oracle VM Server for SPARC must meet the following prerequisites to be
discovered and added:
•The Oracle Solaris release on the control domain must be Oracle Solaris 11.1 or
later.
•The Oracle VM Server for SPARC software must be version 3.1 or later.
•The non-privileged user used to install and run the Enterprise Manager agent must
be granted the
solaris.ldoms.read
and
solaris.ldoms.ldmpower
authorizations and
be assigned the LDoms Power Mgmt Observability rights profile. For example:
/usr/sbin/usermod -A solaris.ldoms.read,solaris.ldoms.ldmpower oracle
/usr/sbin/usermod -P 'LDoms Power Mgmt Observability' oracle
If other software is consuming a lot of resources on the system or control domain, it
might take longer to discover and monitor the target.
Oracle VM Server for SPARC are displayed with the following target display names:
•Virtualization Platform: <Control Domain OS Host Name> (OVM SPARC Virtual
Platform)
•Virtual Server: <Domain Name>
You can change the display name of a discovered Oracle VM Server for SPARC using
the CLI. For example, to change a Virtualization Platform display name:
emcli modify_target -name="Virtual Platform Target Name" -
type="oracle_si_virtual_platform_map" -display_name="New Display Name"
To change a Virtual Server display name:
emcli modify_target -name="Virtual Server Target Name" -
type="oracle_si_virtual_server_map" -display_name="New Display Name"
See Discovering and Adding Host and Non-Host Targets for more about discovery,
promotion, and the steps to promote a host.
16.6 Discovering and Promoting Servers
Discovering and adding servers can be performed separately or as part of the host
discovery. When a host is promoted, it triggers the discovery and auto promotion of
the server supporting the host. See Discovering and Adding Host and Non-Host
Targets for more about discovery, promotion, and the steps to promote a host.
To discover and promote an ILOM server, see the following:
•Discover an ILOM Server Using the User Interface
•Discover an ILOM Server Using the Command Line Interface
To change the display name after you have discovered an ILOM server, see Change
the Display Name of a Discovered ILOM Server.
Chapter 16
Discovering and Promoting Servers
16-8

Note:
To auto-promote targets, deploy the EM Agent with
sudo
privileges or manually
install and run the
root.sh
script.
A Systems Infrastructure Server is displayed with the ILOM server name if the
ILOM is discovered before the host, and if the HMP package is installed on the
host. Otherwise, the Systems Infrastructure Server is displayed with the name
"<host name>/server".
For some servers, a minimum firmware version is recommended to improve
performance.
Note:
For SPARC M6-32 servers, system firmware 9.4.2.E or higher is
recommended.
16.6.1 Discover an ILOM Server Using the User Interface
To discover an ILOM server, perform the following steps:
1. From the Setup menu, select Add Target.
2. Click Add Targets Manually.
3. Click Add Using Guided Process listed under Add Non-Host Targets Using
Guided Process.
The Add Using Guided Process window is displayed with the list of Guided
Discovery and Discovered Target Types.
4. Select Systems Infrastructure Server ILOM from the list in the Add Using
Guided Process window and click Add.
5. For Target, enter the following details:
a. Target Name: Enter the name of the ILOM server.
b. Server ILOM DNS Name or IP Address: Enter the Server DNS Name or IP
Address.
6. For Monitoring Agents, enter the following details:
a. Enter the Monitoring Agent EMD URL.
b. (Optional): Enter the Backup Agent EMD URL.
7. For Monitoring Credentials, enter the following SSH monitoring credentials:
a. Select the Credential type as ILOM SSH Credentials.
b. Enter the root user name in the Username field.
c. Enter the root password in the Password and Confirm Password fields.
8. For SNMP v1 and v2 configurations, enter the following credential parameters:
Chapter 16
Discovering and Promoting Servers
16-9

a. Select the Credential type as SNMP V1/V2 Credentials.
b. Enter your community string in the Community String and Confirm Community
String fields.
9. For SNMP v3 configurations, enter the following parameters:
a. User name
b. User password
c. Confirm user password
d. Authorization protocol, either MD5 or SHA
e. Privacy password
f. Confirm privacy password
10. Click Add.
A confirmation window appears when the target is successfully added.
Note:
The user needs at least to provide a SNMP V1/V2 community string even if he
wants to explicitly disable the SNMP configuration to occur on the ILOM
server.
For disabling the SNMP Monitoring Configuration, type true in the Skip SNMP
Subscription field.
16.6.2 Discover an ILOM Server Using the Command Line Interface
You can discover a server using the
emcli
command line tool. You must configure the
command line interface before you can issue commands. For more information, click
the Setup menu, then click Command Line Interface. Follow the Download and
Deploy instructions.
To discover a server using the
emcli
, perform the following steps:
1. Open your command line on the host where OMS is running.
2. Login to emcli using command
emcli login –username=
<Your user name>.
3. Type the password when prompted.
4. Execute command
emcli sync
.
5. Discover a new server using the
emcli add_target
command and define the
following options:
•
-name=
Name of the server to be displayed within Enterprise Manager
•
-type=
oracle_si_server_map
•
-host=
Host name from which you discover the server target for monitoring
•
-access point name=
Access point name to be displayed within EM
•
-access_point_type=
oracle_si_server_ilom
Chapter 16
Discovering and Promoting Servers
16-10

•
-properties=
key:ILOM IP address that will be used in discovery. For example,
-properties='dispatch.url=ilom-ssh://<ILOM_IP_ADDRESS>'.
•
-subseparator=
properties with sub separator string, For example, you can use
=
as a separator between key value pairs. Alternatively, you can use the
-
separator
option when there are multiple properties (key value pairs) that need
to be separate.
•
-monitoring_cred=
The credentials of the server ILOM to be discovered
Example 16-1 SNMP Credential-based Configuration
The user will have to provide "snmpv1v2_v3" monitoring credentials, specifying the
SNMPV1Creds and the desired SNMP Community string as shown in the example
below:
emcli add_target -name=<target name> -type=oracle_si_server_map -host=<EM Agent> -
access_point_name=<ILOM Access Point Name> -access_point_type=oracle_si_server_ilom -
subseparator=properties== -properties=dispatch.url=ilom-ssh://<ILOM server host
name> '-
monitoring_cred=ilom_creds_set;oracle_si_server_ilom;ilom_creds;username:<ILOM user
name>;password:<ILOM user password>' '-
monitoring_cred=snmp_v1v2_v3;oracle_si_server_ilom;SNMPV1Creds;COMMUNITY:<SNMP
Community string>'
Example 16-2 Legacy Community String Property-based Configuration
Despite the fact that this not encouraged, it is still possible to perform the ILOM
discovery using a SNMP community string as a property as in the example below:
emcli add_target -name=<target name> -type=oracle_si_server_map -host=<EM Agent> -
access_point_name=<ILOM server Access Point name> -
access_point_type=oracle_si_server_ilom -subseparator=properties== '-
properties=SNMPCommunity=<SNMP Community String>;dispatch.url=ilom-ssh://<ILOM
Server host name>' '-
monitoring_cred=ilom_creds_set;oracle_si_server_ilom;ilom_creds;username:<ILOM user
name>;password:<ILOM User password>'
Example 16-3 Discovery without SNMP subscription
As with the UI discovery flow, the user can disable the automatic SNMP rules
configuration on the ILOM server by setting the "SkipSnmpSubscription" property to
"true" as shown below:
emcli add_target -name=<target name> -type=oracle_si_server_map -host=<EM Agent> -
access_point_name=<ILOM server Access Point name> -
access_point_type=oracle_si_server_ilom -subseparator=properties== '-
properties=SkipSnmpSubscription=true;dispatch.url=ilom-ssh://<ILOM Server host
name>' '-
monitoring_cred=ilom_creds_set;oracle_si_server_ilom;ilom_creds;username:<ILOM user
name>;password:<ILOM User password>'
Example 16-4 SNMP V3 Monitoring configuration
The user needs to provide the "snmp_v1v2_v3" monitoring credentials configuration to
perform SNMP V3 subscription on the ILOM server. The following parameters will be
configured:
•authUser
•authPwd
•authProtocol, either MD5or SHA
Chapter 16
Discovering and Promoting Servers
16-11

•privPwd, which is optional
emcli add_target -name=<target name> -type=oracle_si_server_map -host=<EM Agent> -
access_point_name=<ILOM server Access Point name> -
access_point_type=oracle_si_server_ilom -subseparator=properties== -
properties=dispatch.url=ilom-ssh://<ILOM Server host name> '-
monitoring_cred=ilom_creds_set;oracle_si_server_ilom;ilom_creds;username:<ILOM User
name>;password:<ILOM User password>' '-
monitoring_cred=snmp_v1v2_v3;oracle_si_server_ilom;SNMPV3Creds;authUser:<SNMP
Authorization User>;authPwd:<SNMP Authorization User
password>;authProtocol:MD5;privPwd:<SNMP privacy password>
16.6.3 Change the Display Name of a Discovered ILOM Server
You can change the display name of a discovered server using the CLI by running the
emcli command to modify the target name. For example:
emcli modify_target -name="Server Target Name" -type="oracle_si_server_map" -
display_name="New Display Name"
16.7 Discovering and Promoting Oracle SuperCluster
Before you begin the discovery process, there are several checks you should perform
to ensure a smooth discovery.
16.7.1 Prerequisites
A discovery precheck script is available to automatically verify many of the common
problem areas prior to discovery.
Some of Oracle SuperCluster discoveries on Oracle Enterprise Manager 13c may run
into issues due to configuration mismatches in the software setup. The discovery pre-
check script helps you resolve most common configuration problems. Run the script
before the Oracle SuperCluster discovery and examine the output before proceeding
with the discovery in Oracle Enterprise Manager.
For the best possible discovery result, run the script and resolve all issues even
though some of them might be ignored to successfully finish the process.
The script is part of Enterprise Manager Agent bundle.
16.7.2 Obtain the Discovery Precheck Script
You can obtain the script in one of the following ways:
1. Access the script as part of Systems Infrastructure plug-in 13.2.2.0.0 after the
plug-in is deployed to the agent:
<agent installation directory>/plugins/
oracle.sysman.si.discovery.plugin_13.2.2.0.0/discover/sscDiscoveryPreCheck.pl
2. Check My Oracle Support for the latest version of the prerequisites script. If you
run the script downloaded from My Oracle Support, make sure you run it on a
compute node (CDOM) where the Enterprise Manager Agent bundle is deployed.
Chapter 16
Discovering and Promoting Oracle SuperCluster
16-12

16.7.3 Run the Discovery Precheck Script
Type the following commands to run the script:
•
$ cd <agent installation directory>/plugins/
oracle.sysman.si.discovery.plugin_13.2.2.0.0/discover
•
$ perl ./sscDiscoveryPrecheck.pl
Type the following command to check the help for optional parameters:
•$ perl ./sscDiscoveryPrecheck.pl --help
As the script runs, you are prompted for various inputs. The script executes all the
built-in checks and displays important messages on standard output. Detailed
information is stored in a log file and can be used to debug execution errors.
The discovery pre-check script performs the following checks:
•Execution environment and network
•Network configuration (IP, host name validity, ping)
•Hardware monitoring credentials (optional)
•Detailed hardware or software checks (may require credentials)
•Correct ILOM versions of the monitored targetsExadata Cell management and cell
server version and status
•PDU firmware version, Trap and NMS table availability
•IPMI tool version
16.7.4 Credentials Required for Oracle SuperCluster Discovery
The following are the credentials required for the discovery of Oracle SuperCluster.
Table 16-1 Credentials for SSC Discovery
Target Type Credentials
Systems Infrastructure
Server
ILOM Monitoring Credentials, SNMP Credentials
Systems Infrastructure
InfiniBand Switch
ILOM Monitoring Credentials, SNMP Credentials
Systems Infrastructure
CISCO Switch
Cisco Switch IOS Credentials, SNMP Credentials
Systems Infrastructure ZFS
Storage Appliance
Controller
ZFS SA Storage Controller SSH Credentials
Systems Infrastructure PDU HTTP Monitoring Credentials, SNMP Credentials
Oracle Exadata Storage
Server
Exadata Privileged Credentials, SNMP Community String.
Allows SNMP subscription and can be used once only. Use
other lower privileged credentials for monitoring.
Host Agent Host User Credentials. This credential is required to setup
passwordless access to the storage cell.
Chapter 16
Discovering and Promoting Oracle SuperCluster
16-13
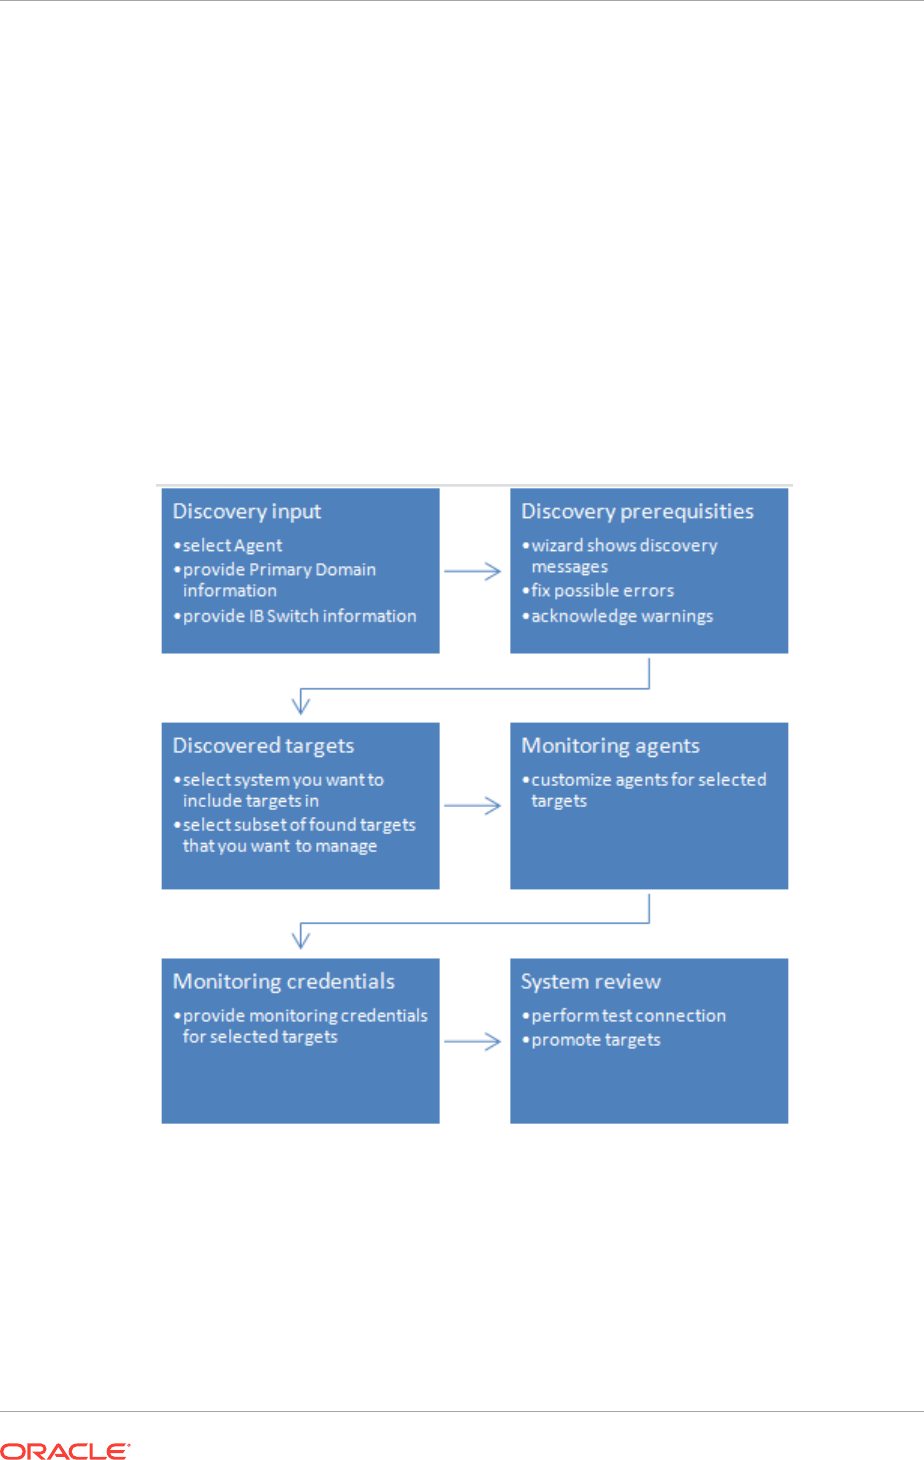
16.7.5 Manual Prerequisite Verification
Ensure that the host names of compute nodes and Exadata cells in each individual
Oracle SuperCluster system have a unique prefix.
16.7.6 Oracle SuperCluster Discovery
It is recommended to use multiple Enterprise Manager Agents to manage targets.
Deploy the agents prior to the Oracle Supercluster discovery process. The Enterprise
Manager Agent has to be deployed to each of the virtualization platforms that is
planned to be managed.
Figure 16-2 is a pictorial representation of Oracle SuperCluster discovery workflow.
Figure 16-2 Oracle SuperCluster Discovery Workflow
To discover the Oracle SuperCluster system, perform the following steps:
1. Log in to Enterprise Manager.
2. Under Setup, click Add Target, then click Add Targets Manually.
3. In the Overview section, click Add Targets using Guided Process.
4. In the Add Using Guided Process screen, scroll down to Oracle SuperCluster and
click Add. The Oracle SuperCluster Discovery wizard opens.
Chapter 16
Discovering and Promoting Oracle SuperCluster
16-14

5. The Introduction wizard guides you through the steps required to discover Oracle
SuperCluster in Oracle Enterprise Manager. Click Next to continue with the
discovery process.
Note:
The guided discovery process assumes that Oracle Enterprise Manager
Agents are already deployed to Compute Nodes. The Enterprise Manager
agent must be deployed in order to monitor a virtualization stack on compute
nodes.
Note:
If you want to monitor database instances running on a DB domain, you must
install the Enterprise Manager Agents on all the Zones and Guest LDOMs
where the databases are installed.
6. In the Discovery Input screen, enter the required information.
a. In the Agent EMD URL field, click the search icon and select an agent.
Note:
The agent must be on the same network where one of the Oracle
SuperCluster InfiniBand switches is located.
b. In the Primary Domain Host name field, specify the host name of the primary
domain that was used for OneCommand execution during setup of the Oracle
SuperCluster system.
Note:
The domain is used to discover system targets. This is a one-time operation.
Discovery requires privileged user (root) credentials to discover details of the
system and presence of catalog.xml or databasemachine.xml file in
OneCommand directory located in /opt/oracle.SupportTools/onecommand. It is
suggested to verify that configuration files mentioned above are up-to-date.
c. In the Credential field, select New to create credentials.
•Click Named if you already have existing credentials.
d. In the User Name field, enter the name of the user with root privileges.
e. In the Password field, enter the password of the compute node.
f. Click Save As to save the credentials for later use.
g. In the InfiniBand Switch Host name field, enter the DNS name or IP address of
the InfiniBand switch.
Chapter 16
Discovering and Promoting Oracle SuperCluster
16-15

h. In the Credential field, select New to create credentials.
•Click Named if you already have existing credentials.
i. In the Username field, enter the user name to connect to the InfiniBand switch
ILOM.
j. In the Password field, enter the password for the InfiniBand switch ILOM.
k. In the Run Privilege field, select None.
•Click Save As to save the credentials for later use.
l. (Optional) Click Test Connection to test your connection.
7. Click Next to proceed to the next step. The Oracle SuperCluster discovery
process is started. When the discovery is completed, a confirmation window
displays the number of targets discovered. Click Close to close the window.
8. The Discovery Prerequisites screen opens. It displays basic information of the
discovery. It also displays any warnings and errors found during the discovery
process. Click Next to continue.
Note:
If you receive errors, you must fix the errors before you can proceed to the
next step. To continue with warnings, read the warnings carefully and then
acknowledge them.
9. The Discovered Targets screen lists all the targets discovered in the Oracle
SuperCluster system. All targets are selected by default. The Managed column
indicates if the targets have already been discovered and managed by Enterprise
Manager. Deselect the targets that you do not want to have discovered and
monitored.
To associate discovered targets to an existing SuperCluster system target, user
can provide name or use the target selector to pick an existing system. If newly
discovered hardware belongs to a rack that is already member of the system, then
the racks will be updated.
10. Click Next to proceed.
11. The Monitoring Agents screen allows you to assign monitoring and backup
agents to targets selected in the previous step. The discovery wizard assigns
available agents automatically to achieve best possible performance and reliability.
For targets that are not already managed by Enterprise Manager you can
manually select other agents than the default ones if necessary. You can assign
the same primary or backup monitoring agent to all targets in a group of targets
(like Compute nodes, etc.) using buttons next to first drop down selection with
agents in every target group. You can reset automatically assigned agents using
Reset button at the upper top corner of the page. Click Next when finished with
the agent selection.
Chapter 16
Discovering and Promoting Oracle SuperCluster
16-16

Note:
The agent must be on the same network and be able to reach the target.
Selected agents for a target should be on different compute nodes to prevent
failure in case one compute node goes down.
12. The Monitoring Credentials screen lists the credentials that are used to monitor the
targets. Click Edit to change or provide monitoring credentials for targets that do
not have the information. Click Next.
Note:
Use the root username and password to discover an InfiniBand network
switch.
Note:
For the Monitoring Agent Hosts section, enter the user name and password of
the user under which the EM agent is running on a given host.
Note:
Select the Use for all option to use the same credentials for all targets of the
same target type.
Note:
Before you are taken to the Review Screen, a validation is executed to find out
if the Solaris host was correctly configured so you can see hardware related
incidents in Enterprise Manager. You can see result of this validation on the
Review screen. If the Solaris Hosts was not configured properly to deliver
incidents, you won't see FMA alerts generated on in Solaris OS with disk,
memory and other hardware failures as incidents in Enterprise Manager. This
configuration is not mandatory to finish SuperCluster discovery but highly
recommended. To see how to configure incidents for Solaris Host, see
"Enabling Incidents on Solaris Host".
13. In the System Review screen, review the system information. Click Test
Connection to check whether the specified credentials are correct for all selected
targets.
14. Click Promote Targets to create and manage targets. This may take few minutes
to complete. You are informed about any errors that occur during the process. In
case there is at least one error, no targets are created. Fix all errors and rerun the
Chapter 16
Discovering and Promoting Oracle SuperCluster
16-17

discovery. Once the process completes without any errors, the targets are
managed and you can view the Oracle SuperCluster system with all its targets.
Note:
In the Oracle SuperCluster discovery wizard, if any hardware target is not
discovered, you can return to any screen, correct the input data or deselect
the problematic hardware, and then rerun the discovery. You can rerun the
discovery later and discover any missing targets of the system.
At this point, the Oracle SuperCluster is discovered and monitored by
Enterprise Manager. If you want to discover and monitor the database cluster
running on the system, you need to proceed with Oracle Exadata Database
Machine discovery.
16.9 Discovering and Promoting PDUs
Before you run the PDU discovery, verify that the NMS table and Trap Hosts Setup
table of the PDU have an empty row for monitoring agent and an empty slot for backup
agent, if you plan to use backup monitoring agent.
16.9.1 Verify PDU v1 NMS Table and Trap Hosts Setup Table
To verify and modify the NMS table and Trap Hosts setup table on a PDU v1 (see,
PDU Version Identification), perform the following steps in the PDU user interface:
1. Open the PDU Management Interface in the web browser.
2. In the PDU User Interface, click Net Configuration.
3. Login with your user name and password.
4. Locate the NMS table and make sure there are enough empty slots for IP
addresses of EM agents that will monitor the PDU.
•Empty slot contains 0.0.0.0 value in the IP address field and empty string in
the Community string field.
5. Enter 0.0.0.0 value in the IP address field and empty Community string field if
there are not enough empty slots.
6. Click Submit.
7. Locate the Trap Hosts Setup table on the same page and make sure there are
enough empty slots for IP addresses of EM agents that will monitor the PDU.
•Empty slot contains 0.0.0.0 value in the IP address field and empty string in
the Community string field.
8. Enter 0.0.0.0 value in the IP address field and empty Community string field if
there are not enough empty slots.
9. Click Submit.
10. Logout from the PDU interface.
Chapter 16
Discovering and Promoting PDUs
16-18

16.9.2 Verify PDU v2 NMS Table, SNMPv3 Access Table, and Trap
Hosts Setup Table
To verify and modify the NMS table and Trap Hosts setup table use SNMPv1
credentials. If you’re using SNMPv3 credentials, use the SNMPv3 Access Table and
Trap Hosts Setup table on a PDU v2. Perform the following steps in the PDU user
interface:
1. Open the PDU Management Interface in the web browser.
2. In the PDU User Interface, click Net Configuration.
3. Login with your user name and password.
4. Click SNMP Access tab.
5. Make sure there are enough empty slots in NMS (SNMP v1/v2) table for IP
addresses of EM agents that will monitor the PDU.
•Empty slot is a slot where the Enable check box is deselected.
6. Deselect the Enable check boxes if there are not enough empty slots.
7. Click Submit.
8. Make sure there is an empty slot in SNMP v3 table for user that will be used to
monitor PDU.
•Empty slot is a slot where the Enable check box is deselected.
9. Deselect the Enable check boxes if there are not enough empty slots.
10. Click Submit.
11. Click SNMP Traps tab.
12. Make sure there are enough empty slots in Trap Remote Host Setup table for IP
addresses of EM agents that will monitor the PDU.
•Empty slot is a slot where the Enable check box is deselected.
13. Deselect Enable check boxes if there are not enough empty slots.
14. Click Submit.
15. Logout from the PDU interface.
16.9.3 PDU Discovery in the Enterprise Manager
To discover the PDU, perform the following steps:
1. Log in to Enterprise Manager.
2. Under Setup, click Add Target, then click Add Targets Manually.
3. In the Overview section, click Add Targets using Guided Process.
4. In the Add Using Guided Process screen, scroll down to Systems Infrastructure
PDU, then click Add.
5. In the Systems Infrastructure PDU Discovery screen, enter the required
information.
a. In the Target Name field, enter a name for the target.
Chapter 16
Discovering and Promoting PDUs
16-19

b. In the PDU DNS Name or IP Address field, enter the IP address or DNS name
of the PDU.
c. In the Monitoring Agent EMD URL field, click the search icon and select a
monitoring agent. The agent must be able to communicate with the PDU over
the network. (Optional) You can select backup monitoring agent for the PDU.
In the Backup Agent EMD URL field, click the search icon and select a
monitoring agent.
Note:
Backup agent is used to monitor a target and collect its metrics when the
primary agent is not reachable or is in maintenance state.
d. Enter credentials for the PDU Management Interface in the HTTP Monitoring
Credentials section.
•In the Credential Type field, choose SNMPv1 or SNMPv3 Creds .
Note:
Currently PDU monitoring supports SNMPv1 credentials only for SNMPv3 only
no privacy and authentication options. Privacy password is not supported.
Please do not enter a privacy password..
•Enter the SNMP Community String or SNMPv3 user and authentication
password and method to be used to communicate with the PDU using
SNMP protocol.
The agent IP address and community string is automatically added to the
NMS table and the Trap Hosts Setup table for SNMPv1 or user is added
to SNMPv3 Access table of the PDU when the PDU is discovered.
e. (Optional) The Properties section is populated by default. Enter the SNMP
Port and Timeout value if you want to change the port and timeout setting.
f. (Optional) If you discover PDU v2 you can specify in properties section in
property SNMP MIB version whether PDU should be monitored using original
or enhanced SNMP MIB variant. Please enter word “Original”, “Enhanced” or
leave property empty.
If you select enhanced or original MIB here, this MIB version will be enforced
and configured in PDU web management interface.
If you leave property empty, no MIB version will be enforced in PDU and
Enterprise Manager will select appropriate monitoring method automatically.
Enhanced MIB has advantage over the Original one that Enterprise Manager
monitors PDU completely using SNMP which performance is higher than when
PDU is monitored using SNMP only partially.
Be careful when selecting Enhanced MIB. Some obsolete PDU monitoring
tools which depends on Original MIB may loose connection to PDU.
6. It is highly recommended to test all entered values and PDU reachability and
configuration correctness using the Test Connection button in the right corner of
Chapter 16
Discovering and Promoting PDUs
16-20

the screen. Once the test connection is successfully completed, you can continue
to add the target.
7. Click Add in the top right corner of the screen. Once the job is successfully run,
the PDU is discovered and the Add Targets Manually screen is displayed. It might
take a few minutes for the data to load before you open the PDU target landing
page to view.
16.9.4 Discovering a PDU Using Command Line Interface
You can discover a power distribution unit using the emcli command line tool.
To discover PDU using the emcli, perform the following steps:
1. Open the command line on the host where OMS is running.
2. Login to emcli using command emcli login –username=<Your user name>.
3. Type the password when prompted.
4. Execute command emcli sync.
5. Discover a new PDU using the following command if you want to use SNMPv1
credentials:
emcli add_target \
-name='Name of your PDU' \
-type=oracle_si_pdu \
-host=’Host on which the deployed agent is used to monitor the PDU’ \
-subseparator=properties='=' \
-separator=properties=';' \
-properties='dispatch.url=http://PDU IP or DNS name' \
-monitoring_cred='http;oracle_si_pdu;http;username:PDU admin user
username;password:PDU admin user password' \
-monitoring_cred='snmp_v1v2_v3;oracle_si_pdu;SNMPV1Creds;COMMUNITY:SNMP
community string'
6. Discover a new PDU using the following command if you want to use SNMPv3
credentials:
emcli add_target \
-name='Name of your PDU' \
-type=oracle_si_pdu \
-host='Host on which the deployed agent is used to monitor the PDU' \
-subseparator=properties='=' \
-separator=properties=';' \
-properties='dispatch.url=http://PDU IP or DNS name' \
-monitoring_cred='http;oracle_si_pdu;http;username:PDU admin user
username;password:PDU admin user password' \
-monitoring_cred='snmp_v1v2_v3;oracle_si_pdu;SNMPV3Creds;authUser:SNMPv3 user
name;authProtocol:SHA;authPwd:SNMPv3 user password'
Chapter 16
Discovering and Promoting PDUs
16-21

Set the following in the emcli add_target command:
•Replace Name of your PDU with the name of your PDU.
•To host, set the Monitoring Agent EMD URL without port, that is, the host name of
host where agent is deployed, the agent must be able to communicate with the
PDU over the network.
•Replace PDU IP or DNS name with the IP address or DNS name of the PDU.
•Replace PDU admin user username with the user name of the admin user that can
manage the PDU using the PDU Web Management Interface.
•Replace PDU admin user password with the password of the admin user that can
manage the PDU using the PDU Web Management Interface.
•If you’re using SNMPv1, replace SNMP community string with the SNMP
Community String to be used to communicate with the PDU using SNMP protocol.
•In you’re using SNMPv3, replace SNMPv3 user name and SNMPv3 user
password with the user name and password of user which will be used to
communicate with the PDU using SNMPv3 protocol. (Optional) You can replace
SHA authentication protocol with MD5.
The following is a sample command to create a generic PDU:
emcli add_target \
-name=pdu.example.com \
-type=oracle_si_pdu \
-host=host.example.com \
-subseparator=properties='=' \
-separator=properties=';' \
-properties='dispatch.url=http://pdu.example.com'\
-monitoring_cred='http;oracle_si_pdu;http;username:admin;password:password123' \
-monitoring_cred='snmp_v1v2_v3;oracle_si_pdu;SNMPV1Creds;COMMUNITY:public'
16.10 Discovering and Promoting Oracle ZFS Storage
This section describes the manual storage discovery procedure for the Oracle ZFS
Storage Appliance target and Oracle ZFS Storage Appliance Cluster.
The ZFS Storage Server target is a multi access point (MAP) target that supports two
access points, AKCLI and REST/WebSvc access points. The discovery user interface
supports only the AKCLI access point. However, you can add the REST/WebSvc
access point through EMCLI.When the REST/WebSvc access point is added, it can
implement most of the metrics except the metrics that are not supported through
AKCLI. Both the REST/WebSvc and AKCLI access points are available, but only the
metrics from the REST/WebSvc access point are uploaded. The following command
can be used to add the REST/WebSvc access point:
Chapter 16
Discovering and Promoting Oracle ZFS Storage
16-22
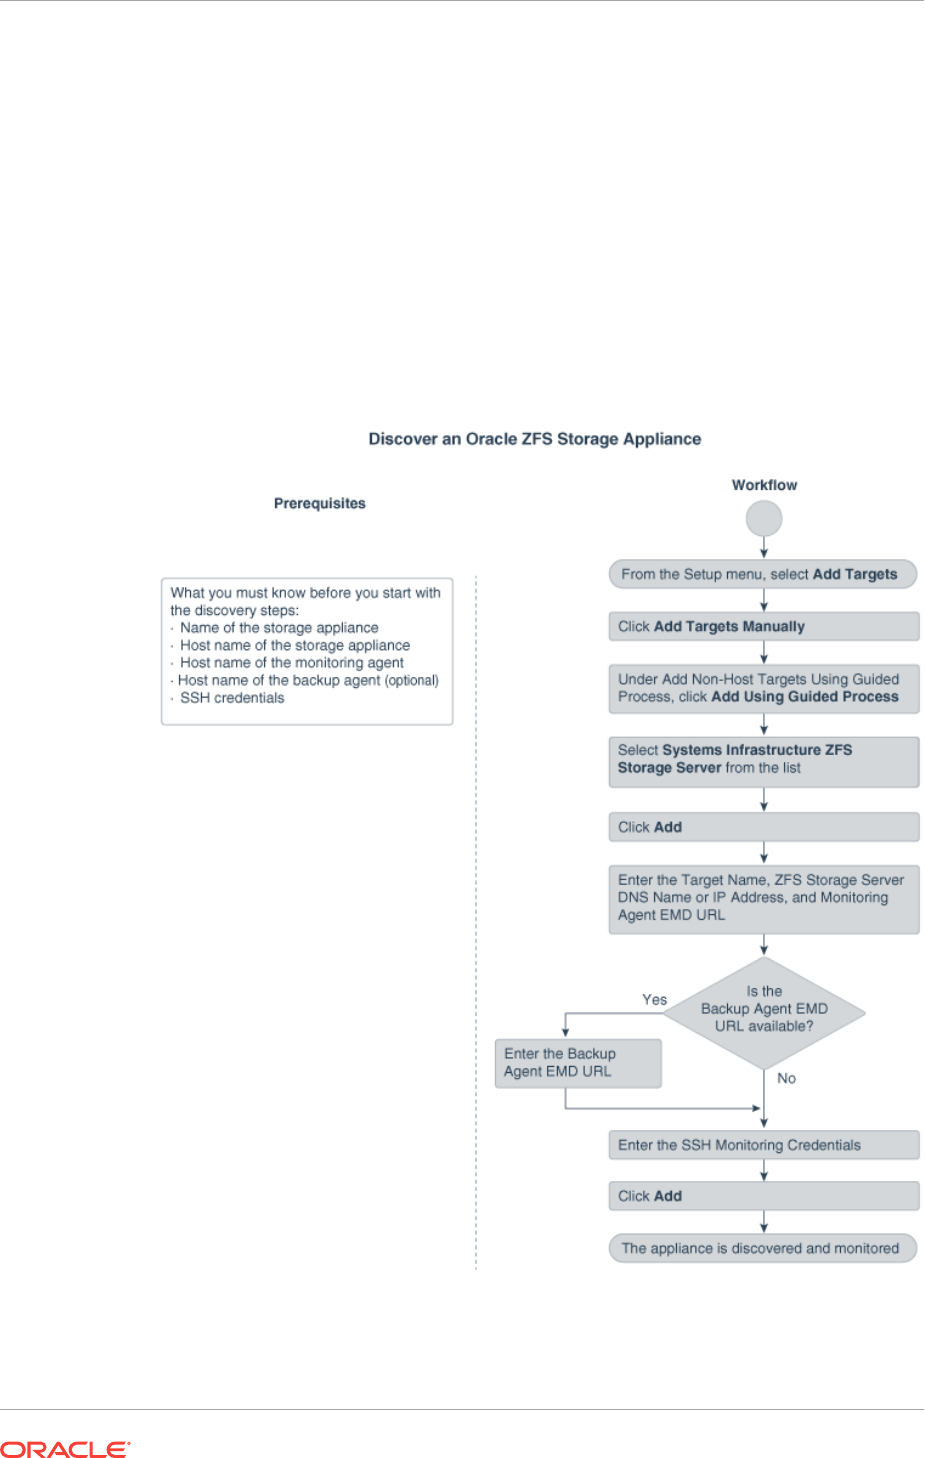
emcli add_target -name=<name> -type=oracle_si_zfssa_storage_server -host=<emagent
name>
-access_point_name=<any name> -
access_point_type='oracle_si_zfssa_storage_server_websvc'
-properties='dispatch.url=https://<applianceURL>:215/api/' -
subseparator=properties='='
-
monitoring_cred='ZfssaHttpCredentialSet;oracle_si_zfssa_storage_server_websvc;AliasCr
edential;Alias:root;Password:<password>'
The below flowchart is a visual for the procedure to discover an Oracle ZFS Storage
Appliance.
Figure 16-3 Discovering an Oracle ZFS Storage Appliance
Chapter 16
Discovering and Promoting Oracle ZFS Storage
16-23

16.10.1 Discovering an Oracle ZFS Storage Appliance using AKCLI
To discover an Oracle ZFS Storage Appliance using AKCLI, perform the following
steps:
1. From the Setup menu, select Add Target.
2. Click Add Targets Manually.
3. Click Add Using Guided Process listed under Add Non-Host Targets Using
Guided Process.
The Add Using Guided Process window is displayed with the list of Guided
Discovery and Discovered Target Types.
4. Select Systems Infrastructure ZFS Storage Server from the list in the Add Using
Guided Process window.
5. Click Add.
6. Select SSH Credentials option.
7. Click Discover ZFS Target.
8. For Target, enter the following details:
a. Enter the Target Name.
b. Enter the ZFS Storage Server DNS Name or IP Address.
9. For Monitoring Agents, enter the following details:
a. Enter the Monitoring Agent EMD URL.
b. (Optional): Enter the Backup Agent EMD URL.
10. For Monitoring Credentials, enter the following details:
a. Select the Credential type as SSH Credentials.
b. Enter the User name and Password in the respective fields.
c. Retype the password in the Confirm Password field.
d. (Optional): You can enter the Role Name, Role Password and retype the
password in the Confirm Role Password field.
11. Click Add.
16.10.1.1 Target Members of an Oracle ZFS Storage Appliance
The following target members are automatically promoted when you add an Oracle
Systems Infrastructure ZFS Storage Server target through the discovery wizard:
•ZFS Storage Server
Target Type: Oracle ZFS Storage Server
•Diskshelf
Target Type: ZFS Diskshelf Storage
Chapter 16
Discovering and Promoting Oracle ZFS Storage
16-24

16.10.1.2 Target Members of an Oracle ZFS Storage Appliance Cluster
When you add two ZFS Storage Appliance nodes, which are setup as cluster nodes,
then the ZFS Storage Appliance Cluster is auto-discovered.
The following targets are added when two ZFS Storage Servers have cluster
configuration setup:
•ZFS Storage Server
Target Type: Oracle ZFS Storage Server
•Diskshelf
Target Type: ZFS Diskshelf Storage
•ZFS Storage Appliance Cluster
Target Type: Oracle ZFS Storage Server Cluster
16.10.2 Discovering an Oracle ZFS Storage Appliance using WebSvc
To discover an Oracle ZFS Storage Appliance using WebSvc, perform the following
steps:
1. From the Setup menu, select Add Target.
2. Click Add Targets Manually.
3. Click Add Using Guided Process listed under Add Non-Host Targets Using
Guided Process.
The Add Using Guided Process window is displayed with the list of Guided
Discovery and Discovered Target Types.
4. Select Systems Infrastructure ZFS Storage Server from the list in the Add Using
Guided Process window.
5. Click Add.
6. Select HTTP Credentials option.
7. Click Discover ZFS Target.
8. For Target, enter the following details:
a. Enter the Target Name.
b. Enter the ZFS Storage Server DNS Name or IP Address.
9. For Monitoring Agents, enter the following details:
a. Enter the Monitoring Agent EMD URL.
b. (Optional): Enter the Backup Agent EMD URL.
10. For Monitoring Credentials, enter the following details:
a. Enter the Alias and Password in the respective fields.
b. Retype the password in the Confirm Password field.
11. Click Add.
Chapter 16
Discovering and Promoting Oracle ZFS Storage
16-25

16.11 Discovering Fabrics
Enterprise Manager discovers and manages Ethernet fabrics and InfiniBand fabrics. A
network switch contributes its ports, datalinks, and networks to a fabric.
•Discover an InfiniBand Network Switch
•Discover an Ethernet Network Switch
•Use the Command Line To Discover a Switch
After discovery, you can manage the components of these fabrics and view their
attributes and metrics, according to the procedures in Managing Networks .
16.11.1 Discover an InfiniBand Network Switch
1. In the Setup menu, select Add Target.
2. Click Add Targets Manually.
3. In the Add Non-Host Target Using Guided Process section, click Add Using
Guided Process.
4. Scroll to Systems Infrastructure Oracle InfiniBand Switch and then click the
Add... button.
Chapter 16
Discovering Fabrics
16-26
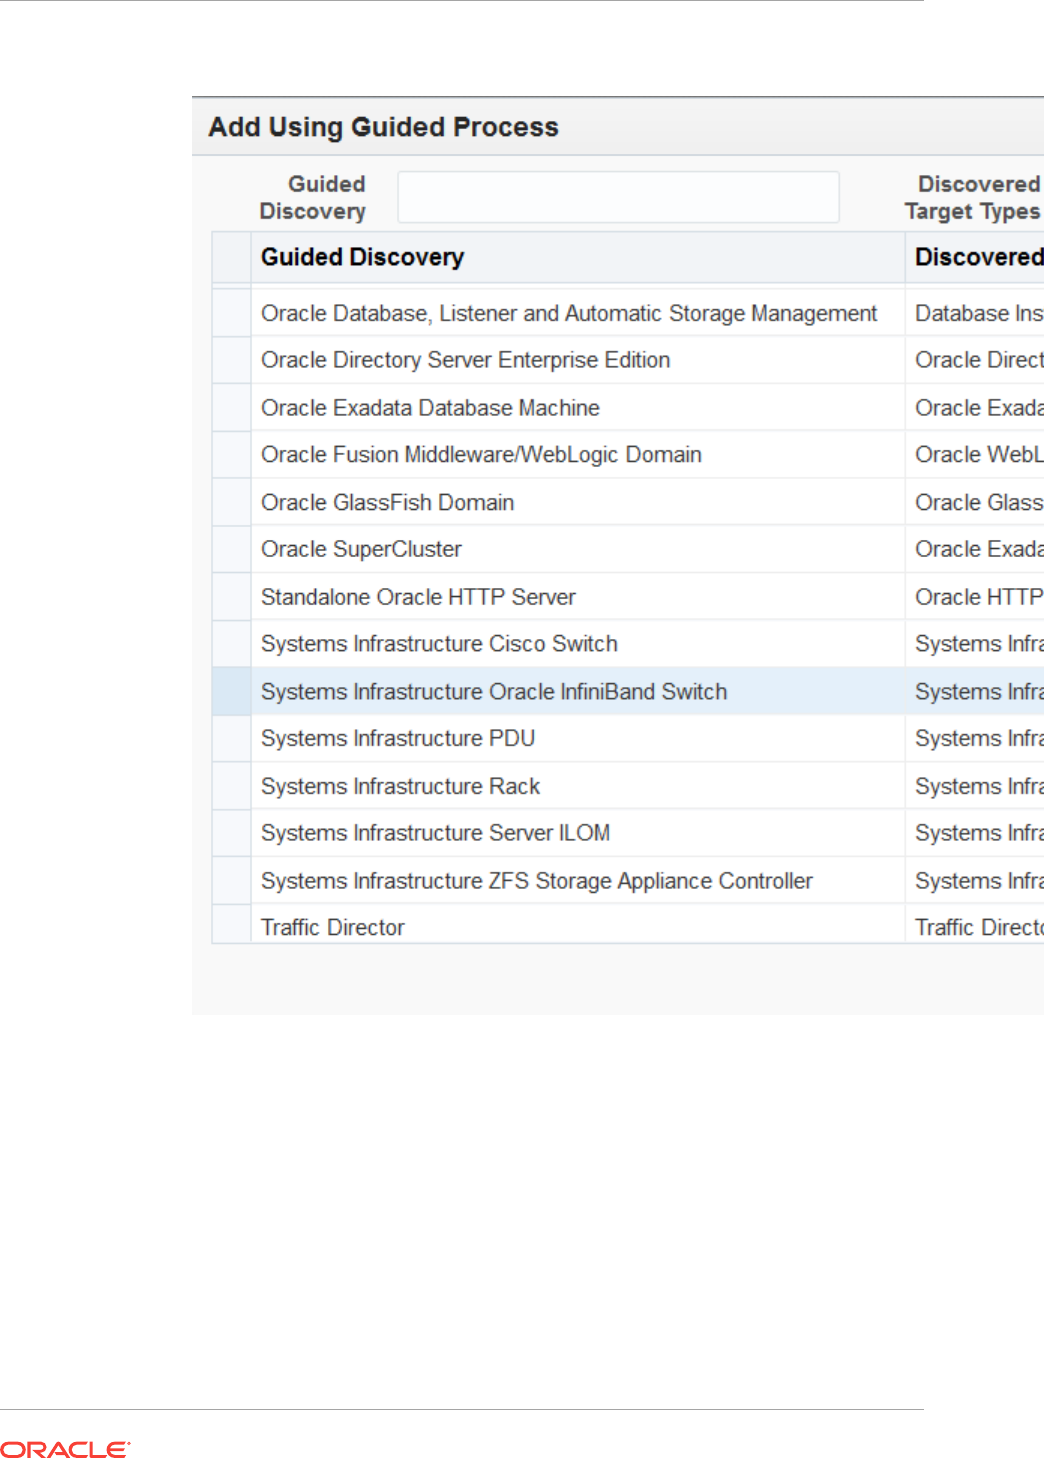
Figure 16-4 InfiniBand Switch Target Type
5. In the Target section, enter a name for the new target and its DNS name or IP
address.
Chapter 16
Discovering Fabrics
16-27
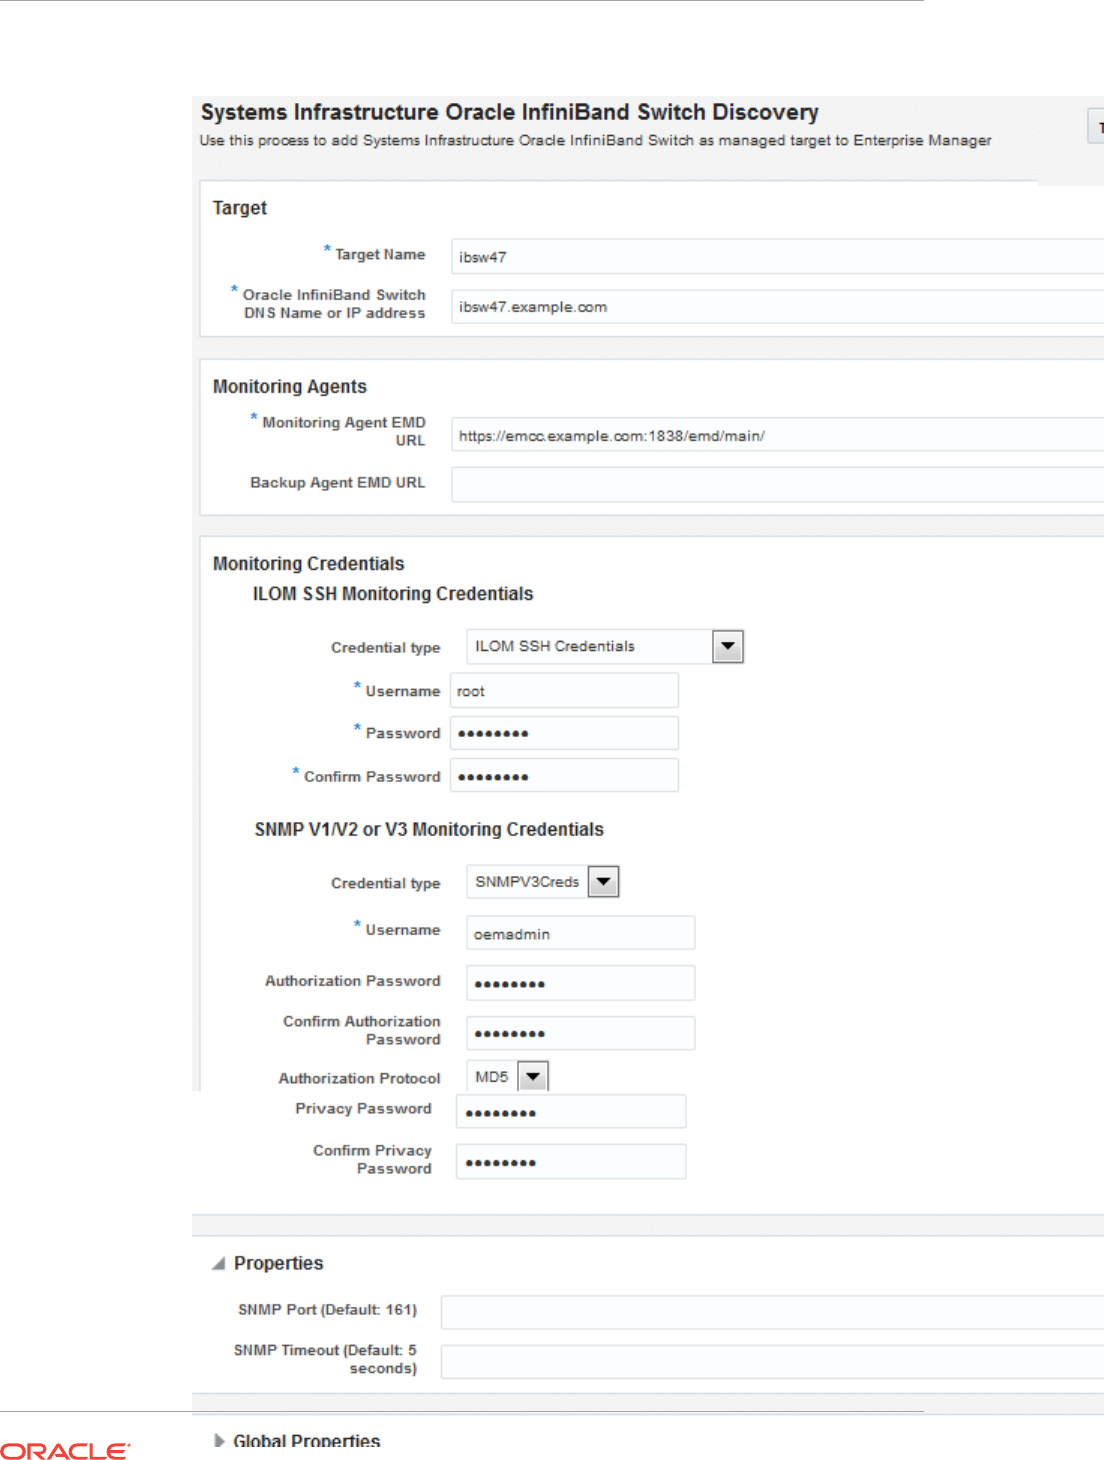
Figure 16-5 Discovery Specifications for InfiniBand Switches
Chapter 16
Discovering Fabrics
16-28

6. In the Monitoring Agents section, enter the URL of the monitoring system and the
URL of a backup system.
7. In the ILOM SSH Monitoring Credentials section, select the type of credentials and
enter the username and the password. The credentials enable Enterprise Manager
to monitor the switch's service processor.
Note:
Use the
root
username and password to discover an InfiniBand network
switch.
8. In the SNMP Monitoring Credentials section, specify the SNMP version number
that Enterprise Manager uses to monitor the hardware components. Version 2c is
the default version and requires only a community string. Version 3 requires a
username, a password of exactly eight characters, and the encryption type.
Version 1 is supported but not recommended, as described in About Performance
of Fabrics.
9. In the Properties section, you can accept the default port number and timeout
interval or change them.
10. In the Global Properties section, you can specify site-specific values, such as the
Oracle Customer Support Identifier (CSI).
11. Click Add, located at the top of the window.
16.11.2 Discover an Ethernet Network Switch
1. In the Setup menu, select Add Target.
2. Click Add Targets Manually.
3. In the Add Non-Host Target Using Guided Process section, click Add Using
Guided Process.
4. Scroll to Systems Infrastructure Cisco Switch or Systems Infrastructure
Juniper Switch and then click the Add... button.
Chapter 16
Discovering Fabrics
16-29

Figure 16-6 Juniper Ethernet Switch Target Type
5. In the Target section, enter a name for the new target and provide its DNS name
or IP address.
Chapter 16
Discovering Fabrics
16-30
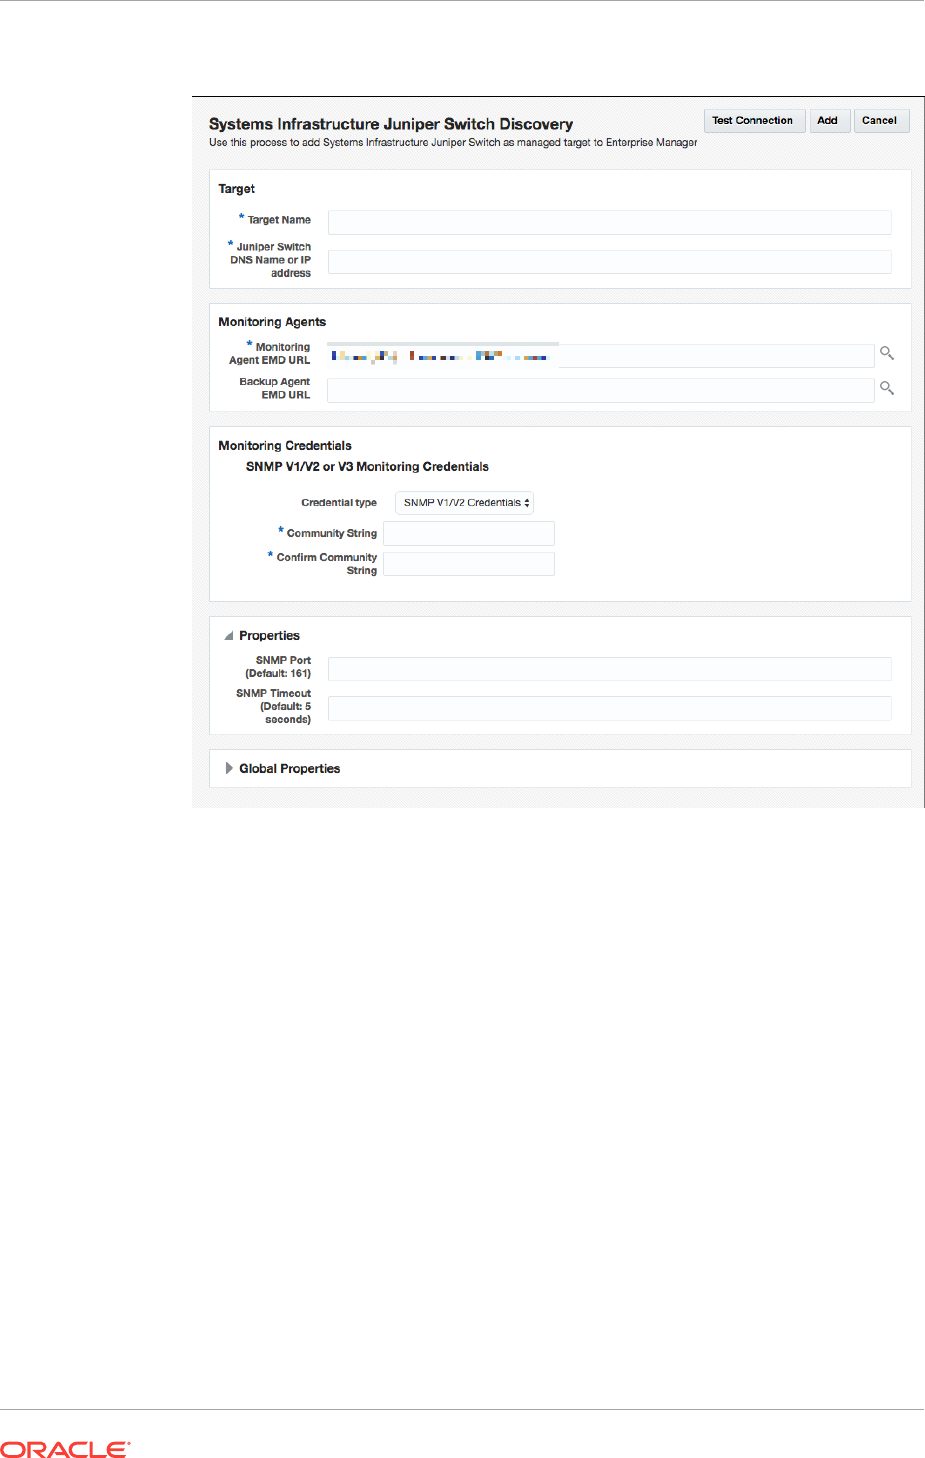
Figure 16-7 Discovery Specifications for Juniper Ethernet Switches
6. In the Monitoring Agents section, enter the URL of the monitoring system and the
URL of a backup system.
7. In the Cisco Switch IOS Monitoring Credential section, specify the type of
credentials and enter the username and password. Also, enter the Cisco EXEC
password. The credentials enable Enterprise Manager to monitor the switch's
service processor.
8. In the SNMP Monitoring Credential section, specify the SNMP version number that
Enterprise Manager uses to monitor the hardware components. Version 3 requires
a username, a password of exactly eight characters, and the encryption type.
Version 1 is supported but not recommended, as described in About Performance
of Fabrics.
9. In the Properties section, you can change the default configuration details such as
port number and timeout interval.
10. In the Global Properties section, you can specify site-specific values, such as the
Oracle Customer Support Identifier (CSI).
11. Click Add, located at the top of the window.
Chapter 16
Discovering Fabrics
16-31

Example 16-5 Example. Command to Discover a Juniper Ethernet Switch Using
SNMP Version 3
The following command discovers and manages a Juniper Ethernet switch named
MY_SWITCH and sets the SNMP version to Version 3.
emcli add_target -name=MY_SWITCH -type=oracle_si_netswitch -host=AGENT_HOST -
access_point_name=MY_SWITCH -access_point_type=oracle_si_switch_juniper_junos -
properties='dispatch.url=snmp://MY_SWITCH_IP_ADDR' -subseparator=properties='=' -
monitoring_cred='snmp_v1v2_v3;oracle_si_switch_cisco_ios;SNMPV3Creds;authUser:PRINCIP
AL;authPwd:AUTHCRED;authProtocol:MD5;privPwd:PRIV_CREDS'
16.11.3 Use the Command Line To Discover a Switch
These examples use the Command Line Interface to discover and manage a network
switch. You must configure the command line interface before you can issue
commands. For more information, click the Setup menu, then click Command Line
Interface. Follow the Download and Deploy instructions.
Example 16-6 Command to Discover an InfiniBand Switch Using SNMP Version
3
The following command discovers and manages an InfiniBand switch named
MY_SWITCH
and sets the SNMP version to Version 3.
emcli add_target -name=MY_SWITCH -type=oracle_si_netswitch -host=AGENT_HOST -
access_point_name=MY_SWITCH -access_point_type=oracle_si_switch_oracle_ib -
properties='dispatch.url=ilom-ssh://MY_SWITCH_IP_ADDR' -subseparator=properties='=' -
monitoring_cred='ilom_creds_set;oracle_si_switch_oracle_ib;ilom_creds;username:PRIV_U
SER;password:PASSWORD' -
monitoring_cred='snmp_v1v2_v3;oracle_si_switch_oracle_ib;SNMPV3Creds;authUser:PRINCIP
AL;authPwd:AUTHCRED;authProtocol:MD5;privPwd:PRIV_CREDS'
Example 16-7 Command to Discover a Cisco Ethernet Switch Using SNMP
Version 3
The following command discovers and manages a Cisco Ethernet switch named
MY_SWITCH
and sets the SNMP version to Version 3.
emcli add_target -name=MY_SWITCH -type=oracle_si_netswitch -host=AGENT_HOST -
access_point_name=MY_SWITCH -access_point_type=oracle_si_switch_cisco_ios -
properties='dispatch.url=ios-ssh://MY_SWITCH_IP_ADDR' -subseparator=properties='=' -
monitoring_cred='cisco_creds_set;oracle_si_switch_cisco_ios;cisco_creds;username:PRIV
_USER;userpass:USER_PASSWORD;privpass:PRIV_PASSWORD' -
monitoring_cred='snmp_v1v2_v3;oracle_si_switch_cisco_ios;SNMPV3Creds;authUser:PRINCIP
AL;authPwd:AUTHCRED;authProtocol:MD5;privPwd:PRIV_CREDS'
Example 16-8 Command to Discover an InfiniBand Switch Using SNMP Version
1
The following command discovers and manages an InfiniBand switch named
MY_SWITCH
, sets the SNMP version to Version 1, and changes the time interval for the
SNMP property.
emcli add_target -name=MY_SWITCH -type=oracle_si_netswitch -host=AGENT_HOST -
access_point_name=MY_SWITCH -access_point_type=oracle_si_switch_oracle_ib -
properties='dispatch.url=ilom-ssh://MY_SWITCH_IP_ADDR;SNMPTimeout=180' -
subseparator=properties='='-
monitoring_cred='ilom_creds_set;oracle_si_switch_oracle_ib;ilom_creds;username:PRIV_U
SER;password:PASSWORD' -
Chapter 16
Discovering Fabrics
16-32

monitoring_cred='snmp_v1v2_v3;oracle_si_switch_oracle_ib;SNMPV1Creds;COMMUNITY:<COMMU
NITY>'
16.12 Related Resources for Discovering and Promoting
System Infrastructure Targets
See the following for more information:
•Discovering and Adding Host and Non-Host Targets
•Working with Systems Infrastructure Targets
•Managing Storage
•Managing Networks
Chapter 16
Related Resources for Discovering and Promoting System Infrastructure Targets
16-33


17
Enabling Hybrid Cloud Management
With Oracle Hybrid Cloud, you can use the Enterprise Manager Cloud Control console
to administer both your on-premises and Oracle Cloud deployments. Oracle Hybrid
Cloud lets on-premises Enterprise Manager administrators monitor and manage cloud
services using the same Oracle Enterprise Manager tools they use to monitor,
provision, and maintain Oracle Databases, Engineered Systems, Oracle Applications,
Oracle Middleware, and a variety of third-party systems.
This chapter consists of the following sections:
•What is Oracle Hybrid Cloud?
•Setting Up Hybrid Cloud Management in Three Steps
•Hybrid Cloud Management Prerequisites and Basic Setup
–Prerequisites for Configuring a Management Agent as a Gateway
–Configuring a Management Agent as a Gateway
–Prerequisites for Installing Agents on Oracle Cloud VMs
–Installing an Agent on an Oracle Cloud VM
•Troubleshooting Cloud-based Management Agents
•Frequently Asked Questions About Hybrid Cloud Management
•List of Unsupported Features
17.1 What is Oracle Hybrid Cloud?
Your IT infrastructure may consist of a mix of on-premises and cloud-based targets.
For example, you may have instances of Oracle Database Cloud Services and Java
Cloud Services to manage along with various on-premises software. No matter where
your IT assets reside, Enterprise Manager allows you to manage this Hybrid Cloud
environment through a single pane of glass.
Configuring Enterprise Manager to manage a Hybrid Cloud environment involves
deploying Management Agents throughout your Hybrid Cloud environment to allow
your cloud services to communicate with Enterprise Manager. By deploying Agents on
the Oracle Public Cloud virtual hosts running your Oracle Cloud services, you are able
to manage these services just as you would any other monitored target from the
Enterprise Manager Cloud Control console.
You can monitor four service types with Oracle Hybrid Cloud:
•Database Cloud
•Java Cloud
•Compute Cloud
•Cloud Machine
17-1

Communication between your cloud services and the OMS is secure from external
interference. As shown in the following graphic, the on-premises OMS communicates
via HTTPS, SQL*Net and JMX over SSH (if VPN is not available) with Agents installed
on the VMs running your cloud services.
How do I set up Oracle Hybrid Cloud Monitoring?
Setting up your Oracle Hybrid Cloud environment is straightforward. The following
table provides a quick how-to reference.
Step What you need to do:
1. Make sure the on-premises host running an
Agent can communicate with the Oracle Cloud
VMs.
This step is IMPORTANT! All subsequent
setup tasks will fail without an open
communication channel between the on-
premises Agent and the Oracle Cloud.
Ensure there is network connectivity between
the OMS and Oracle Cloud. SSH must work
between the host that the Gateway is installed
on and VMs in the Oracle Cloud.
For more information about Oracle Hybrid
Cloud prerequisites, see Hybrid Cloud
Management Prerequisites and Basic Setup,
Prerequisites for Configuring a Management
Agent as a Gatewayand Prerequisites for
Installing Agents on Oracle Cloud VMs.
Make sure you have supported cloud services
to monitor. Oracle Hybrid Cloud supports the
following services:
•Oracle Database Cloud Services
See Creating a Service Instance (Oracle
Database Cloud-Database as a Service
Quick Start.
•Oracle Java Cloud Services
See Getting Started with Oracle Java
Cloud Service.
•Oracle Compute Cloud Services
See Creating an Oracle Linux Instance
Using the Oracle Compute Cloud Service
Web Console.
2. Configure an Enterprise Manager Agent as
a Gateway.
See Configuring a Management Agent as a
Gateway
Important: Ensure environment requirements
have been met before deploying a
Management Agent as a Gateway. For more
information, see Prerequisites for Configuring
a Management Agent as a Gateway
Chapter 17
What is Oracle Hybrid Cloud?
17-2

Step What you need to do:
3. (Optional) Set up an external proxy. Configure an external proxy between the
Oracle Cloud and the Gateway to enhance
security. See Configuring an External Proxy to
Enable Gateways to Communicate with the
Oracle Cloud.
4. Deploy Agents to the VMs running your
Oracle Cloud services.
See Installing an Agent on an Oracle Cloud
VM.
Important: Ensure resource and network
requirements have been met before installing
the Agent. For more information, see
Prerequisites for Installing Agents on Oracle
Cloud VMs.
17.2 Setting Up Hybrid Cloud Management in Three Steps
Now that you understand the Hybrid Cloud management setup flow shown in What is
Oracle Hybrid Cloud?, you now know that setting up Hybrid Cloud management is
fairly straightforward. Setting up your on-premises Enterprise Manager system to
manage and monitor an Oracle Cloud can be done in as little as three steps:
Step 1 Make sure an on-premises Agent can communicate with the Oracle Cloud
via SSH.
From the on-premises side: Make sure that an on-premises host running an Agent
(12c version 12.1.0.5 or 13c) can connect via SSH with the Oracle Cloud VM you want
to monitor.
From the Oracle Cloud side:
•Make sure the default port is set to 1748, or that one port in the range 1830 to
1848 is free on the Oracle Cloud VM.
•Make sure the user installing the Enterprise Manager Agent on the Oracle Cloud
VM has SUDO privileges in order to run the root.sh script.
Step 2: Configure an on-premises Agent to serve as a Gateway.
Use the EM CLI
register_hybridgateway_agent
verb to designate an Agent as a
Gateway.
emcli register_hybridgateway_agent -hybridgateway_agent_list=“<On-premises target
name for the Agent chosen in Step 1>”
-named_credential="named_credential"
-named_credential_owner="named_credential_owner"
-cloud_hostname="cloud_hostname"
Step 3: Deploy Agents on Oracle Cloud VMs to communicate with the on-
premises Gateway.
Before starting the Agent deployment process, make sure you have the following
information:
•IP Address of the Oracle Cloud VM.
•SSH public keys mapped as Enterprise Manager Named Credentials.
Chapter 17
Setting Up Hybrid Cloud Management in Three Steps
17-3

You can create a Named Credential either through the Enterprise Manager
console (Setup –> Security –> Named Credentials) or by using the EM CLI
create_named_credential
verb.
•Details about the Gateway you configured in Step 2.
You can deploy the Agent to the Cloud VM using Agent Push functionality from the
Enterprise Manager console, or by using the EM CLI
submit_add_host
verb shown
below:
emcli submit_add_host
-host_names=<IP addresses of Oracle Cloud VM>
-installation_base_directory=<Path for installing the Agent on the Oracle Cloud
VM>
-credential_name=<Enterprise Manager Credential for the SSH Key>
-configure_hybrid_cloud_agent -hybrid_could_gateway_agent=<Target Name of the
Gateway Agent>
-hybrid_cloud_gateway_proxy_port=<Port on the Gateway host used for outbound SSH
communication>
17.3 Hybrid Cloud Management Prerequisites and Basic
Setup
Setting up Hybrid Cloud management consists of the following steps:
1. Ensure that your on-premises OMS is version 13c, and that at least one 13c
Management Agent exists in your on-premises environment.
If your on-premises OMS is an earlier version, ensure that you upgrade the OMS
to version 13c. For information on how to do so, see the Oracle Enterprise
Manager Cloud Control Upgrade Guide.
To ensure that at least one 13c Management Agent exists in your on-premises
environment, either deploy a new 13c Management Agent, or upgrade an existing
Management Agent of an earlier version to version 13c.
For information on how to deploy a new 13c Management Agent, see Oracle
Enterprise Manager Cloud Control Basic Installation Guide. For information on
how to upgrade an existing Management Agent of an earlier version to version
13c, see the Oracle Enterprise Manager Cloud Control Upgrade Guide.
Note:
Oracle strongly recommends that you first upgrade the earlier version of the
Management Agent to 13c and then configure that Agent to serve as a
Gateway. This way, your entire stack will be at 13c. However, if you do not
want to upgrade the earlier version, you can continue to use it and configure it
to act as a Gateway. However, only the earlier version 12c Release 5
(12.1.0.5) is supported in this case. All pre-12.1.0.5 Agents must be upgraded
to either 12c Release 5 (12.1.0.5) or 13c.
2. Configure one or more 13c Management Agents within your on-premises
environment to serve as a Gateway. A Gateway provides an SSH-based
communication channel between the Oracle Cloud virtual hosts and the on-
premises OMS. For more information on configuring an external proxy to enable
Chapter 17
Hybrid Cloud Management Prerequisites and Basic Setup
17-4

Hybrid Cloud Gateways, see Configuring an External Proxy to Enable Hybrid
Cloud Gateway Agents to Communicate with Oracle Cloud
To ensure high availability, Oracle recommends that you configure multiple 13c
Management Agents to act as Gateways.
3. Ensure that the on-premises OMS can communicate with the Oracle Cloud targets
via the Gateway.
If the Gateway is unable to communicate with the Oracle Cloud targets directly,
configure an external proxy for the communication. For information on how to do
so, see Configuring an External Proxy to Enable Gateways to Communicate with
the Oracle Cloud.
To communicate with Oracle Cloud targets, the on-premises OMS uses the My
Oracle Support (MOS) proxy by default. You can also configure an Agent Proxy
instead of the default proxy. Ensure that the proxy configured in your enterprise
supports SSH tunneling, or configure a new MOS proxy that supports SSH
tunneling.
4. Deploy Management Agents to the Oracle Cloud virtual hosts using the Add Host
Targets Wizard or EM CLI. and configure them in Hybrid mode. Management
Agents configured in Hybrid mode enable Enterprise Manager to manage the
Oracle Cloud targets. As part of the Hybrid Cloud Agent deployment process, you
will associate each with the Gateway that it will use to communicate with the on-
premises OMS.
17.3.1 Prerequisites for Configuring a Management Agent as a
Gateway
Before configuring a Management Agent to act as a Gateway, ensure the following
prerequisites are met:
•Ensure there is network connectivity between the OMS and Oracle Cloud. SSH
must work between the host that the Gateway is installed on and VMs in the
Oracle Cloud.
•Ensure that the CPU, RAM, and hard disk space requirements are met.
The CPU, RAM, and hard disk space requirements for a Hybrid Cloud Gateway
are described in Oracle Enterprise Manager Cloud Control Basic Installation
Guide.
Note that the hardware requirements for the Hybrid Cloud Gateway and regular
Management Agents are the same.
•(Recommendation) You should install a new Agent on a dedicated host to serve
as the Hybrid Cloud Gateway. This ensures high Gateway performance.
Note:
Oracle recommends that you do not designate the central Agent as a Hybrid
Cloud Gateway. In an enterprise with a large number of targets, the
designated central Agent may compete with the OMS for resources.
Chapter 17
Hybrid Cloud Management Prerequisites and Basic Setup
17-5

In general, any prerequisites required for deploying Management Agents also apply to
Gateways. For more information, see Oracle Enterprise Manager Cloud Control Basic
Installation Guide.
17.3.2 Configuring a Management Agent as a Gateway
To configure an existing 13c Management Agent as a Gateway, follow these three
steps:
Note:
You can use an existing Management Agent of an earlier version and
configure that to act as a Gateway. However, Oracle strongly recommends
that you first upgrade that Management Agent of the earlier version to 13c and
then configure that to act as a Gateway. This way, your entire stack will be at
13c.
1. As SYSMAN user, log in to EM CLI. You can log in from the default EM CLI
installation that is available in the OMS home, or from the EM CLI installation that
is set up on any other host.
$<emcli_install_location>/bin/emcli login -username=sysman
EM CLI is set up by default on the on-premises OMS host (the EM CLI install
location is the OMS home). Hence, if you choose to run EM CLI from the on-
premises OMS host, no additional steps are required. This is the recommended
option.
For example, if you are logging in from the EM CLI installation that is available in
the OMS home, then run the following command:
/em13c/oraclehome/bin/emcli login -username=sysman
If you choose to run EM CLI from a custom location on a host that is not running
the on-premises OMS, you must first set up EM CLI on the required host..
2. Designate the selected Management Agent to act as a Hybrid Cloud Gateway. To
do so, run the
register_hybridgateway_agent
EM CLI verb from the OMS home or
from any other host where EM CLI is set up. The verb can be executed from a
command line or from a script.
The verb takes a list of Management Agents and marks each Agent as a
hybridgateway.
Command Line Mode
$<emcli_install_location>/bin/emcli register_hybridgateway_agent -
hybridgateway_agent_list="<list_of_hybrid_cloud_gateway_agents>"
[-named_credential="named_credential"]
[-named_credential_owner="named_credential_owner"]
[-cloud_hostname="cloud_hostname"]
[-ignore_central_agent_check]
[-ignore_network_check]
[-ssh_port="ssh_port"]
[-timeout="timeout"]
Script/Interactive Mode
Chapter 17
Hybrid Cloud Management Prerequisites and Basic Setup
17-6

$<emcli_install_location>/bin/emcli
register_hybridgateway_agent(hybridgateway_agent_list="<list_of_hybrid_cloud_gate
way_agents>"
[,named_credential="named_credential"]
[,named_credential_owner="named_credential_owner"]
[,cloud_hostname="cloud_hostname"]
[,ignore_central_agent_check=True/False]
[,ignore_network_check=True/False]
[,ssh_port="ssh_port"]
[,timeout="timeout"]
)
For more information about the
register_hybridgateway_agent
verb, see the
Enterprise Manager Command Line Interface Guide.
Options:
•hybridgateway_agent_list
List of Management Agents that need to be registered as Gateways. You can
specify more than one Management Agent (host name and port combination).
Ensure that you specify the fully qualified name for the Management Agents,
and separate the Management Agent names using a space.
Multiple Gateways are only needed for failover and load balancing and are not
mandatory. Multiple Gateways can be added at initial Hybrid Cloud setup or
can be added at a later point in time. See Configuring Cloud-based Agents for
High Availabilityfor more information.
•named_credential
Named credential used to make SSH connection to the cloud host. This is
used for the network check.
*Optional only if '-ignore_network_check' is present..
•named_credential_owner
Owner of named credential.
*Optional only if '-ignore_network_check' is present.
•cloud_hostname
Cloud hostname where you want to install hybrid agent.
*Optional only if '-ignore_network_check' is present.
•ignore_central_agent_check
Flag used to skip the central Agent check for the specified list of Agents. We
recommend not registering the Agent on the OMS host as a Gateway.
However, you can use this flag to ignore that check.
•ignore_network_check
Flag used to skip the network check for the specified list of Agents. Use this
flag only if you are sure that the network connection works from Gateway to
the cloud host.
•ssh_port
Specifies the SSH port used to check network. 22 is used as the default.
•timeout
Chapter 17
Hybrid Cloud Management Prerequisites and Basic Setup
17-7

Specifies the amount of time (in seconds) the network check process will wait
for a connection. 5 seconds is the default.
Example 1: Basic Command Usage
Standard Mode
emcli register_hybridgateway_agent -hybridgateway_agent_list="agent1:port
agent2:port..."
-named_credential="named_credential"
-named_credential_owner="named_credential_owner"
-cloud_hostname="cloud_hostname"
Interactive or Script Mode
register_hybridgateway_agent(hybridgateway_agent_list="agent1:port
agent2:port...",
named_credential="named_credential",
named_credential_owner="named_credential_owner",
cloud_hostname="cloud_hostname" )
Example 2: If the '-ignore_network_check' flag is present, the parameters '-
named_credential', '-named_credential_owner' and '-cloud_hostname' are
not required.
Standard Mode
emcli register_hybridgateway_agent -hybridgateway_agent_list="agent1:port
agent2:port..." -ignore_network_check -ignore_central_agent_check
Interactive or Script Mode
register_hybridgateway_agent(hybridgateway_agent_list="agent1:port
agent2:port...",
ignore_network_check=True,
ignore_central_agent_check=True
)
Example 3: . If the '-ignore_central_agent_check' flag is present, but the '-
ignore_network_check' flag is missing, the parameters '-named_credential',
'-named_credential_owner' and '-cloud_hostname' are required.
Standard Mode
emcli register_hybridgateway_agent -hybridgateway_agent_list="agent1:port
agent2:port..." -named_credential="named_credential" -
named_credential_owner="named_credential_owner" -cloud_hostname="cloud_hostname"
-ignore_central_agent_check
Interactive or Script Mode
register_hybridgateway_agent(hybridgateway_agent_list="agent1:port
agent2:port...",
named_credential="named_credential",
named_credential_owner="named_credential_owner",
cloud_hostname="cloud_hostname",
ignore_central_agent_check=True
)
3. Verify that the Management Agent has been configured as a Gateway. You can do
this only while installing an Agent on an Oracle Cloud VM as described in Installing
an Agent on an Oracle Cloud VM Using the Add Host Targets Wizard.
Chapter 17
Hybrid Cloud Management Prerequisites and Basic Setup
17-8

17.3.3 Prerequisites for Installing Agents on Oracle Cloud VMs
Before deploying Agents on your Oracle Cloud VMs, ensure that the following
prerequisites have been met:
•Ensure that the CPU, RAM, and hard disk space requirements are met.
The CPU, RAM, and hard disk space requirements for a Hybrid Cloud Agent are
described in Oracle Enterprise Manager Cloud Control Basic Installation Guide.
•Ensure that you configure at least one Management Agent to act as a Gateway. A
Gateway provides a communication channel between the Oracle Cloud VMs and
the on-premises OMS.
For information on how to configure a version 13c Management Agent to act as a
Gateway, see Configuring a Management Agent as a Gateway.
•Ensure that port 22 is open on the destination Oracle Cloud virtual host (the virtual
host on which you want to install an Agent), and the SSH daemon process must
be running on it. To verify whether the SSH Daemon process is running on the
destination virtual host, run the following command from the virtual host:
ps –ef | grep sshd
Note:
If the SSH daemon is configured and running other than on the default port 22,
then make sure the SSH port number is updated in the
$MW_HOME/oui/prov/
resources/Paths.properties
file. For example, if the SSH daemon is running
on port 23, then update the parameter
SSH_PORT
in the Paths.properties file and
proceed with deployment.
•Ensure that port 1748, or at least one port in the range 1830 - 1848 is free on
every destination Oracle Cloud virtual host.
By default, Cloud Control uses port 1748 as the Gateway Proxy port. If port 1748
is not free, the application uses a free port in the range 1830 - 1848.
•Ensure that the user installing the Agent on the Cloud VM er has the root
privileges to run the
root.sh
script. If the user installing this Agent does not have
the root privileges, ensure that you run the
root.sh
script manually on all the
destination virtual hosts, after the deployment operation. Make sure to have a write
permission on the directory.
•Meet the prerequisites required for deploying on-premises Management Agents,
as described in Oracle Enterprise Manager Cloud Control Basic Installation Guide.
•Ensure that the Cloud-based Agent is deployed only on an Oracle Linux x86-64
operating system. It is supported only on Oracle Linux x86-64 operating system.
•To install an Agent on a Cloud-based virtual host, it is recommended to install it on
the local file system of the virtual host. Optionally, you can create a mount using
an external storage device and install the Agent on it. Otherwise, you will lose all
the data that is stored in the boot volume every time you stop, start, or restart the
virtual host.
•Ensure that you do not modify the domain name in the Virtual Machine (VM)
network or host configuration settings. The Agent must be used only for Oracle
Chapter 17
Hybrid Cloud Management Prerequisites and Basic Setup
17-9

Public Cloud-hosted VMs, so if you change the VM domain name to reflect a non-
Oracle Public Cloud-hosted VM, then the Agent deployment will fail.
To verify this, log in to the VM and run the
hostname -d
command, and ensure that
the output contains
oracle.com,
oraclecloud.com,
or
oraclecloud.internal.
If you
see any other domain name, remove it from the list.
Also run the following commands, and ensure that the output contains either
oracle.com
or
oraclecloud.internal.
If you see any other domain name, remove it
from the list.
cat /etc/sysconfig/network
cat /etc/resolv.conf
cat /etc/hosts
17.3.4 Installing an Agent on an Oracle Cloud VM
This section covers the following methods to install an Agent on an Oracle Cloud VM:
•Installing an Agent on an Oracle Cloud VM Using EM CLI
•Installing an Agent on an Oracle Cloud VM Using the Add Host Targets Wizard
Note:
Since an Agent connects to the on-premises OMS through an SSH bridge,
manual deployment such as Silent Agent Installation is not supported for
Cloud-based Agents. You can only deploy Agents using the Add Host Targets
Wizard, or EM CLI.
You can deploy a Cloud-based Agent only on an Oracle Linux x86-64
operating system. An Agent configured as a Gateway is supported on all
operating systems.
17.3.4.1 Installing an Agent on an Oracle Cloud VM Using EM CLI
Follow these steps to install a Cloud-based Agent using EM CLI:
1. Log in to EM CLI from the
/bin
directory present within the EM CLI install location:
$<emcli_install_location>/bin/emcli login -username=<user_name>
Once you run this command, EM CLI will prompt you for a password. Enter the
password for the user name you specified.
EM CLI is set up by default on the on-premises OMS host (the EM CLI install
location is the OMS home). Hence, if you choose to run EM CLI from the on-
premises OMS host, no additional steps are required. This is the recommended
option.
If you choose to run EM CLI from a custom location on a host that is not running
the on-premises OMS, you must first set up EM CLI on the required host. For
information on how to do so, see Oracle Enterprise Manager Command Line
Interface Guide.
Chapter 17
Hybrid Cloud Management Prerequisites and Basic Setup
17-10

2. Run the
list_add_host_platforms
verb to obtain a list of the platforms for which the
Hybrid Cloud Agent software is available in Self Update:
$<emcli_install_location>/bin/emcli list_add_host_platforms
[-all]
[-noheader]
[-script | -format]
Note that the parameters mentioned in
[ ]
are optional.
For example,
$<emcli_install_location>/bin/emcli list_add_host_platforms -all
If the Management Agent software for a particular platform is not available,
download and apply it using Self Update. For information on how to download and
apply the Management Agent software for a platform, see Enterprise Manager
Cloud Control Basic Installation Guide.
To view more information on the syntax and the usage of the
list_add_host_platforms
verb, run the following command:
$<emcli_install_location>/bin/emcli help list_add_host_platforms
3. If you want to deploy Agents on the selected Oracle Public Cloud virtual hosts in a
rolling manner, such that the deployment proceeds continuously from one
deployment phase to another, ignoring the failed hosts in each deployment phase,
specify the following in the
$OMS_HOME/sysman/prov/agentpush/agentpush.properties
file:
oracle.sysman.prov.agentpush.continueIgnoringFailedHost=true
4. Run the
submit_add_host
verb, specifying the
-configure_hybrid_cloud_agent, -
hybrid_cloud_gateway_agent,
and
-hybrid_cloud_gateway_proxy_port
options to
submit the Add Host session and install the Cloud-based Agents:
$<emcli_install_location>/bin/emcli submit_add_host
-host_names=<list_of_hosts>
-platform=<platform_ID>
-installation_base_directory=<install_directory_of_agent>
-credential_name=<named_credential_for_agent_install>
-configure_hybrid_cloud_agent
-
hybrid_cloud_gateway_agent=<hybrid_cloud_gateway_agent_name>
[-
hybrid_cloud_gateway_proxy_port=<hybrid_cloud_gateway_proxy_port>]
[-credential_owner=<named_credential_owner>]
[-instance_directory=<agent_instance_directory>]
[-port=<agent_port>]
[-session_name=<add_host_session_name>]
[-deployment_type=<type_of_agent_deployment>]
[-privilege_delegation_setting=<privilege_delegation>]
[-additional_parameters=<additional_params_for_install>]
[-source_agent=<source_agent_for_cloned_agent_install>]
[-master_agent=<master_agent_for_shared_agent_install>]
[-properties_file=<properties_file_having_inputs>]
[-preinstallation_script=<pre_install_script>]
[-preinstallation_script_on_oms]
[-preinstallation_script_run_as_root]
[-postinstallation_script=<post_install_script>]
[-postinstallation_script_on_oms]
[-postinstallation_script_run_as_root]
[-wait_for_completion]
Note that the parameters mentioned in
[ ]
are optional.
Chapter 17
Hybrid Cloud Management Prerequisites and Basic Setup
17-11

For example,
$<emcli_install_location>/bin/emcli submit_add_host -
host_names=opc1.example.com -platform=226 -installation_base_directory=/opt/
agent -credential_name=oracle -configure_hybrid_cloud_agent -
hybrid_cloud_gateway_agent=abc.example.com -
hybrid_cloud_gateway_proxy_port=1748
This example installs an Agent on the Oracle Public Cloud virtual host
opc1.example.com
having the platform ID
226,
in the directory
/opt/agent,
using the
named credential
oracle.
The deployed Agent will use
abc.example.com
as the
Gateway, and use port
1748
to communicate with the Gateway Proxy.
To view more information on the syntax and the usage of the
submit_add_host
verb,
run the following command:
$<emcli_install_location>/bin/emcli help submit_add_host
Note:
Can I deploy more than one Agent on the same Oracle Cloud virtual host?
17.3.4.2 Installing an Agent on an Oracle Cloud VM Using the Add Host
Targets Wizard
Follow these steps to install an Agent on an Oracle Cloud VM using the Add Host
Targets Wizard:
1. In Cloud Control, from the Setup menu, select Add Target, then click Add
Targets Manually. On the Add Targets Manually page, select Add Host Targets,
then click Add Host.
2. On the Host and Platform page, do the following:
a. Accept the default name assigned for this session or enter a unique name of
your choice. The custom name you enter can be any intuitive name, and need
not necessarily be in the same format as the default name. For example,
add_host_hybrid_cloud_operation_1
b. Click Add to enter the fully qualified host name (preferred) or IP address and
select the platform of the Oracle Cloud virtual host on which you want to install
the Agent. The IP address for the virtual host running each of your Oracle
Cloud services would have been provided to you by Oracle.
Note:
•Cloud-based Agent deployment is supported for the Linux x86-64 platform
only.
•You must enter only one IP address per row. Entering multiple addresses
separated by a comma is not supported.
Alternatively, you can click Load from File to add the IP addresses that are
stored in a file.
Chapter 17
Hybrid Cloud Management Prerequisites and Basic Setup
17-12

Specify the platform as Linux x86-64 for all the virtual hosts. To do so, you can
specify the platform as Linux x86-64 for the first virtual host, then from the
Platform list, you can select Same for All Hosts.
c. Click Next.
3. On the Installation Details page, do the following:
a. In the Deployment Type section, select Fresh Agent Install.
b. From the table, select the first row that indicates the virtual hosts grouped by
their common platform name.
c. In the Installation Details section, provide the installation details common to
the virtual hosts selected in Step 3 (b). For Installation Base Directory, enter
the absolute path to the base directory on the Oracle Cloud virtual host where
you want the software binaries, security files, and inventory files of the Hybrid
Cloud Agent to be copied.
For example,
/u01/app/Oracle/
.
If the path you enter does not exist, the application creates a directory at the
specified path, and copies the Agent software binaries, security files, and
inventory files there.
d. For Instance Directory, accept the default instance directory location or enter
the absolute path to a directory of your choice where all Agent-related
configuration files can be stored.
For example,
/u01/app/Oracle/agent_inst
.
If you are entering a custom location, then ensure that the directory has write
permissions. Oracle recommends that you maintain the instance directory
inside the installation base directory.
If the path you enter does not exist, the application creates a directory at the
specified path, and stores all the Agent-related configuration files there.
e. For Named Credential, select the named credential that you want to use to
set up SSH connectivity between the on-premises OMS and the destination
Oracle Cloud virtual hosts, and to install a Agent on each of the Oracle Cloud
virtual hosts. Beginning with Enterprise Manager 13c Release 2, you can
create SSH key named credentials directly from the wizard so there's no need
to pre-create the credentials.
Ensure that you only specify a named credential that uses SSH public key
authentication. Password based authentication is not supported. Also, note
that deploying Cloud-based Agents using a locked user account (by switching
to the locked user account using a privilege delegation provider) is not
supported.
For information on how to create a named credential that uses SSH public key
authentication, see Prerequisites for Installing Agents on Oracle Cloud VMs.
f. For Privileged Delegation Setting, use the default value. Privilege delegation
providers and locked accounts are not supported for Agent deployment.
If the Agent install user has root privileges, then
root.sh
is run automatically
on the destination virtual hosts post deployment. Else, you must manually run
root.sh
on every destination virtual host post deployment.
g. For Port, accept the default port (3872) that is assigned for the Agent to
communicate, or enter a port of your choice.
Chapter 17
Hybrid Cloud Management Prerequisites and Basic Setup
17-13

The custom port you enter must not be busy. If you are not sure, you can
leave this field blank. Cloud Control automatically assigns the first available
free port within the range of 1830 - 1849.
h. If you want to run certain scripts before or after deploying the Agents, in the
Optional Details section, enter the absolute path to the locations where the
scripts that you want to run are available. Note that only shell scripts are
supported, and only one pre-installation or one post-installation script can be
specified.
If you want to run the script as root, then select Run as Root. If the script is on
the host where the on-premises OMS is running and is not on the virtual host
where you want to install the Agent, then select Script on OMS. In this case,
the script will be copied from the on-premises OMS host to the destination
virtual hosts, and then run on the destination virtual hosts.
i. If you want to specify certain additional parameters for the deployment, in the
Optional Details section, for Additional Parameters, enter a white space-
separated list of the additional parameters.
For example, provide the following path:
INVENTORY_LOCATION=/u01/app/oracle/oraInventory
However, note that this parameter is supported only on UNIX platforms, and
not on Microsoft Windows platforms.
j. Select Configure Hybrid Cloud Agent to specify the details for the Gateway
that the Cloud-based Agent must communicate with.
For Hybrid Cloud Gateway, specify the Management Agent within your
enterprise that you want to use as a Gateway for the Cloud-based Agent to
communicate with. Click the magnifying glass icon, and select a Hybrid Cloud
Gateway from the displayed list (only those Gateways that are up and running
are displayed).
Note that for this field, you can only select a Management Agent that has
already been designated as a Gateway. For information on how to designate a
particular Management Agent as a Gateway, see Configuring a Management
Agent as a Gateway.
For Hybrid Cloud Gateway Proxy Port, specify the port for communication
between the Cloud-based Agent and the Gateway Proxy. If you do not specify
a value, port 1748 is used, and if port 1748 is not free, then a free port
between 1830 and 1848 is used.
k. Click Next.
4. On the Review page, review the details you have provided for the installation and
if you are satisfied with the details, then click Deploy Agent to install the Agent.
If you want to modify the details, then click Back repeatedly to reach the page
where you want to make the changes.
When you click Deploy Agent and submit the deployment session, you are
automatically taken to the Agent Deployment Details page that enables you to
monitor the progress of the deployment session. To understand the tasks you can
perform on this page, click Help.
5. To verify that the Agent was deployed on Oracle Cloud, from the Setup menu,
select Manage Cloud Control, then select Agents. Search for, then click the
Chapter 17
Hybrid Cloud Management Prerequisites and Basic Setup
17-14

name of the Cloud-based Agent to access its home page. Beside the Agent target
name, Running in Oracle Cloud, and a cloud icon must be displayed.
Note:
The following features are not supported, or are partially supported for Cloud-
based Agents:
•Buddy Agent
•Management Agent to Management Agent communication
•Distributed Software Library
•Target Relocation
•Support for third party Management Agent certificates
•Support Workbench
Note:
Can I deploy more than one Agent on the same Oracle Cloud virtual host?
17.4 Advanced Topics
Topics
•Discovering and Monitoring Oracle Cloud Targets
•Patching Cloud-based Agents and Gateways
•Configuring an External Proxy to Enable Gateways to Communicate with the
Oracle Cloud
•Performing Additional Hybrid Cloud Management Tasks
•Troubleshooting Cloud-based Management Agents
•Frequently Asked Questions About Hybrid Cloud Management
17.4.1 Discovering and Monitoring Oracle Cloud Targets
Once the Hybrid Cloud is deployed in the on-premises environment and the Agent is
deployed in the Oracle Cloud environment, the Oracle Cloud virtual hosts become
manageable targets in Enterprise Manager Cloud Control. To discover and monitor the
targets running on these manageable virtual hosts, you should follow the instructions
outlined in Oracle Enterprise Manager Cloud Control Administrator's Guide. The
procedure to discover and promote the targets running on an Oracle Cloud virtual host
is the same as the procedure to discover and promote targets running on any normal
host in the on-premises environment.
However, for discovering Fusion Middleware domains running on Oracle Cloud virtual
hosts, such as WebLogic JCS domains, you should use the public IP address and port
Chapter 17
Advanced Topics
17-15

9001 (representing the custom t3 channel that is configured by default on these Admin
Servers).
To find out more about cloning in Hybrid Cloud, see the chapter on cloning solutions in
the Enterprise Manager Lifecycle Management Administrator’s Guide.
17.4.2 Patching Cloud-based Agents and Gateways
You can patch Agents installed on Oracle Cloud VMs and Gateways using patch
plans. Patch plans are consolidated plans that include one or more patches to be
rolled out as a group. The patching procedure remains the same for normal
Management Agents, Agents installed on Oracle Cloud VMs, and Gateways.
Caution:
The database instance created on Oracle Cloud before the first week of June
2015 is typically based on the database patchset update released in January
2015 (Jan DB PSU). If you want to patch such a database instance with the
database patchset update released in April 2015 (Apr DB PSU), then as a
prerequisite, before you apply the patchset update, create the following file
and add the absolute path to the directory where the Cloud-based Agent is
available.
/var/opt/oracle/patch/files_to_save.ora
If you do not follow the aforementioned instruction, you will notice that the
Cloud-based Agent in /u01/app/oracle is automatically moved to /u01/
app.ORG/oracle as part of the database patching process. You will then have
to manually copy the directory back to its original location. To circumvent this
issue and avoid any manual effort from your end, Oracle recommends that you
follow the aforementioned instruction to create a file as described and add the
Cloud-based Agent location to it.
To patch Agents on the Oracle Cloud virtual hosts, follow these steps:
1. If the patch you are applying accesses the
sbin
directory of the agent home, then
first follow the instructions outlined in the ReadMe file of the patch.
2. For scalability and performance, use Gold Image based patching to patch Hybrid
Agents. For more information on upgrading agents using Gold Image, see the
Oracle Enterprise Manager Cloud Control Upgrade Guide.
3. Patch the Agents by following the instructions outlined in Oracle Enterprise
Manager Cloud Control Lifecycle Management Guide. The patching procedure
remains the same for normal Management Agents and Hybrid Cloud Agents.
To patch Agents configured as Gateways, follow the instructions outlined in Oracle
Enterprise Manager Cloud Control Lifecycle Management Guide.
Chapter 17
Advanced Topics
17-16

Note:
Once the first Gateway is up after being patched, will it monitor the Cloud-
based Agents?
17.4.3 Configuring an External Proxy to Enable Gateways to
Communicate with the Oracle Cloud
For security, you can optionally configure external proxies between the Cloud-based
Agents and the Gateway. However, only proxies that support tunneling (for example,
SOCK4, SOCK5, HTTP) are supported.
To configure an external proxy between a Cloud-based Agent and a Gateway, follow
these steps:
1. Set up a proxy server. HTTP, SOCKS4, and SOCKS5 proxy servers are
supported. Ensure that the proxy server supports tunneling.
2. From the Setup menu, select Manage Cloud Control, then select Agents.
3. Search for and click the name of the Gateway for which you want to configure an
external proxy. You should select an Agent from the list for which the 'register'
command has been executed.
4. From the Agent menu, select Properties.
5. From the Show menu, select Basic Properties. For externalProxyPort, specify
the communication port that must be used to connect to Oracle Cloud.
Click Apply.
6. From the Show menu, select Advanced Properties. Expand the Runtime
Settings section. For externalProxyHost, specify the host name of the proxy. For
externalProxyType, select whether the proxy uses HTTP, SOCKS4, or SOCKS5
for communication.
If the proxy server that you set up requires user name and password
authentication, specify values for externalProxyUsername and
externalProxyPassword.
7. Click Apply.
8. Verify the external proxy without authentication. To do so, run the following
command:
ssh -l <user> -i <path_to_private_key> -o "ProxyCommand /usr/bin/nc -X connect
-x <proxy host>:<proxy port> %h %p" <opc_host> "<test command>"
17.4.4 Performing Additional Hybrid Cloud Management Tasks
This section describes the additional Hybrid Cloud Management tasks that you can
perform. It consists of the following:
•Configuring Cloud-based Agents for High Availability
•Disabling Gateways
•Disassociating Gateways from a Cloud-based Agent
Chapter 17
Advanced Topics
17-17

•Decommissioning Cloud-based Agents
17.4.4.1 Configuring Cloud-based Agents for High Availability
When you deploy an Agent on an Oracle Cloud VM, you associate it with a single
Gateway by default. Throughout the lifecycle of the Cloud-based Agent, the Agent is
dependent on the Gateway to forward the collected monitoring data to the on-premises
Cloud Control OMS. Hence, if the Gateway is down or is not reachable, the Cloud-
basedAgent monitoring data will not reach the on-premises OMS. Thus, Oracle
recommends that you enable every Cloud-based Agent to use multiple Gateways to
decrease the probability of a loss in monitoring data.
While deploying an Agent to the Oracle Cloud, the first Gateway that you select is
designated as the primary Hybrid Cloud Gateway. If you enable the deployed Agent to
use additional Gateways, then the additional Gateways are designated as secondary
Hybrid Cloud Gateways. This way, if the primary Hybrid Cloud Gateway for a Cloud-
based Agent is down or is unreachable, then one of the secondary Hybrid Cloud
Gateways takes over. If the secondary Hybrid Cloud Gateway that took over also goes
down or becomes unreachable at some point of time, then the next available
secondary Hybrid Cloud Gateway takes over.
Figure 17-1 depicts the communication from the Hybrid Cloud Agents to the on-
premises OMS through multiple Hybrid Cloud Gateways.
Figure 17-1 Communication from the Hybrid Cloud Agents to the On-Premise
OMS Using Multiple Hybrid Cloud Gateways for High Availability
To configure a Cloud-based Agent for high availability, you must associate one or
more secondary Hybrid Cloud Gateways with the Cloud-based Agents. To do so,
follow these steps:
1. Log in to EM CLI from the
/bin
directory present within the EM CLI install location:
$<emcli_install_location>/bin/emcli login -username=<user_name>
Once you run this command, EM CLI will prompt you for a password. Enter the
password for the user name you specified.
Chapter 17
Advanced Topics
17-18
EM CLI is set up by default on the on-premises OMS host (the EM CLI install
location is the OMS home). Hence, if you choose to run EM CLI from the on-
premises OMS host, no additional steps are required. This is the recommended
option.
If you choose to run EM CLI from a custom location on a host that is not running
the on-premises OMS, you must first set up EM CLI on the required host. For
information on how to do so, see Oracle Enterprise Manager Command Line
Interface Guide.
2. Associate secondary Hybrid Cloud Gateway(s) with a Hybrid Cloud Agent.
$<emcli_install_location>/bin/emcli add_hybridgateway_for_hybrid_agent
-hybrid_agent_name="<hybrid_cloud_agent>:<port>" -
hybridgateway_agent_list="<secondary1_hybrid_cloud_gateway_agent>:<port>
<secondary2_hybrid_cloud_gateway_agent>:<port>
<secondaryN_hybrid_cloud_gateway_agent>:<port>"
For example,
emcli add_hybridgateway_for_hybrid_agent -
hybrid_agent_name="abc.example.com:1831" —
hybridgateway_agent_list="secondary1.example.com:1831 secondary2.example.com:
1831"
Note:
In the
—hybridgateway_agent_list
, you can specify more than one Gateway.
Ensure that you specify the fully qualified name for each Gateway, and
separate the Gateway names using a space.
Note:
Once the first Gateway is up after being patched, will it monitor the Cloud-
based Agents?
How can I redistribute my connections once I have added the Gateways?
Does it need reconfiguration?
17.4.4.2 Disabling Gateways
To disable the gateway functionality of a Gateway, that is, to ensure that a Gateway
functions like a regular Management Agent again and does not forward
communication from the Cloud-based Agents to the on-premises OMS, follow these
steps:
1. Log in to EM CLI from the
/bin
directory present within the EM CLI install location:
$<emcli_install_location>/bin/emcli login -username=<user_name>
Once you run this command, EM CLI will prompt you for a password. Enter the
password for the user name you specified.
EM CLI is set up by default on the on-premises OMS host (the EM CLI install
location is the OMS home). Hence, if you choose to run EM CLI from the on-
Chapter 17
Advanced Topics
17-19

premises OMS host, no additional steps are required. This is the recommended
option.
If you choose to run EM CLI from a custom location on a host that is not running
the on-premises OMS, you must first set up EM CLI on the required host. For
information on how to do so, see Oracle Enterprise Manager Command Line
Interface Guide.
2. Disable the Gateway functionality of a set of Gateways.
$<emcli_install_location>/bin/emcli deregister_hybridgateway_agent -
hybridgateway_agent_list="<hybrid_cloud_gateway_agent1>:<port>
<hybrid_cloud_gateway_agent2>:<port> <hybrid_cloud_gateway_agentN>:<port>"
For example,
emcli deregister_hybridgateway_agent -
hybridgateway_agent_list="abc.example.com:3873 def.example.com:3873"
Note that for
-hybridgateway_agent_list,
you can specify more than one Hybrid
Cloud Gateway. Ensure that you specify the fully qualified name for each
Gateway, and separate the Gateway names using a space.
17.4.4.3 Disassociating Gateways from a Cloud-based Agent
To disassociate Gateways from a Cloud-based Agent, such that the specified Agent
does not communicate with the Gateway and the on-premises OMS anymore, follow
these steps:
1. Log in to EM CLI from the
/bin
directory present within the EM CLI install location:
$<emcli_install_location>/bin/emcli login -username=<user_name>
Once you run this command, EM CLI will prompt you for a password. Enter the
password for the user name you specified.
EM CLI is set up by default on the on-premises OMS host (the EM CLI install
location is the OMS home). Hence, if you choose to run EM CLI from the on-
premises OMS host, no additional steps are required. This is the recommended
option.
If you choose to run EM CLI from a custom location on a host that is not running
the on-premises OMS, you must first set up EM CLI on the required host. For
information on how to do so, see Oracle Enterprise Manager Command Line
Interface Guide.
2. Disassociate Gateways from a Cloud-based Agent.
$<emcli_install_location>/bin/emcli delete_hybridgateway_for_hybrid_agent
-hybrid_agent_name="<hybrid_cloud_agent>:<port>" -
hybridgateway_agent_list="<hybrid_cloud_gateway1_agent_to_disassociate>:<port>
<hybrid_cloud_gateway2_agent_to_disassociate>:<port>
<hybrid_cloud_gatewayN_agent_to_disassociate>:<port>"
For example,
emcli delete_hybridgateway_for_hybrid_agent -
hybrid_agent_name="abc.example.com:1831" -
hybridgateway_agent_list="gateway1.example.com:1831 gateway2.example.com:1831"
Chapter 17
Advanced Topics
17-20

Note:
Can I deinstall or deconfigure a Gateway without deinstalling an associated
Cloud-based Agent?
17.4.4.4 Decommissioning Cloud-based Agents
To decommission an Agent installed on an Oracle Cloud VM, follow these steps:
1. Stop the Agent running on the Oracle Cloud VM.
2. On the Agent Home page of the Agent, from the Agent menu, select Target
Setup, then select Agent Decommission.
Note:
Can I deinstall or deconfigure a Gateway without deinstalling an associated
Cloud-based Agent?
17.4.5 Troubleshooting Cloud-based Management Agents
This section provides tips to issues that you might encounter when installing or
working with Management Agents installed on Oracle VMs.
Table 17-1describes the error messages that you might encounter, along with its
causes and suggestions.
Table 17-1 Troubleshooting Cloud-based Management Agents
Warnings/Error Messages Cause or Possible Causes Solution
The host names specified
include IP addresses or
short names. It is advised
to provide Fully Qualified
Host Names, such as
foo.mydomain.com, that are
persistent over the life of
the targets. It is
recommended for ease of
maintenance and overall
security. However, you can
choose to ignore this
warning and proceed by
clicking Next.
IP address is used in place of fully
qualified name.
Click Continue all hosts.
Chapter 17
Advanced Topics
17-21

Table 17-1 (Cont.) Troubleshooting Cloud-based Management Agents
Warnings/Error Messages Cause or Possible Causes Solution
The requiretty flag is set
in the sudoers file on the
remote host, and as a result
the user will not be able to
run sudo over ssh.
Agent push failure. Either set the
oracle.sysman.prov.agentpush.enab
lePty
property to
true
in the
/
scratch/aime/mw_41005/oms/sysman/
prov/agentpush/
agentpush.properties
file, which is
present on the OMS host, or disable
the
requiretty
flag in the sudoers file.
You can also ignore this warning and
continue in which case the root.sh, any
preinstallation or postinstallation scripts
specified with run as root enabled will
not be run and you have to run them
manually after installation.
The other option is click Continue all
hosts.
Execution of command/
scratch/passagt6/
ADATMP_2015-04-06_04-10-01-
AM/prereq_stage/core/
12.1.0.4.0/oui/bin/
runInstaller -prereqchecker
-silent -ignoreSysPrereqs -
waitForCompletion -
prereqlogloc /scratch/
passagt6/
ADATMP_2015-04-06_04-10-01-
AM/prereqlogs -entryPoint
oracle.sysman.top.agent_Comp
lete
PREREQ_CONFIG_LOCATION=/
scratch/passagt6/
ADATMP_2015-04-06_04-10-01-
AM/prereq_stage/core/
12.1.0.4.0/prereqs -J-
DFORWARDER_PROXY_PORT=-1 -J-
DAGENT_PORT=-1 -J-
DALLOW_IPADDRESS=true -J-
DAGENT_BASE_DIR=/scratch/
passagt6 -J-
DSTAGE_LOCATION=/scratch/
passagt6/
ADATMP_2015-04-06_04-10-01-
AM/prereq_stage on host
129.152.134.156 Failed.
Agent push failure. 1. Check the .bashrc or.cshrc file in
the installation user home
directory.
2. Comment on the following two
lines
•export TMP=$TMPDIR
•export TEMP=$TMPDIR
OR
Provide Read/Write/Execute
permission to the temd directory.
Chapter 17
Advanced Topics
17-22

Table 17-1 (Cont.) Troubleshooting Cloud-based Management Agents
Warnings/Error Messages Cause or Possible Causes Solution
Execution of
command /u01/app/oracle/
agent/
ADATMP_2016-04-25_05-56-23-
AM/agentDeploy.sh
AGENT_BASE_DIR=/u01/app/
oracle/agent -softwareOnly
AGENT_MODE=PAAS on host
129.191.1.207 Failed
Agent push failure. Include
ignorePrereqs
to additional
parameters during the agent
deployment.
When VM is created on OPC
and user is deploying agent
to OPC VM. See this error -
Port not free [ see this
error for range of ports
which are actually free ].
Agent push failure. Check security rules. Enable compute
instance security rule to accept
connections on the desired port.
Check port connectivity using nc utility
to confirm if host:port is accessible
from the OMS host.
17.4.6 Frequently Asked Questions About Hybrid Cloud Management
This section provides answers to the following frequently asked questions about
Hybrid Cloud Management.
•Can I deploy more than one Agent on the same Oracle Cloud virtual host?
•Can I deinstall or deconfigure a Gateway without deinstalling an associated Cloud-
based Agent?
•How do I relocate the Gateway to another host without deinstalling anything else?
•How can I redistribute my connections once I have added the Gateways? Does it
need reconfiguration?
•After an Oracle PaaS instance is decommissioned, what happens to the Cloud-
based Agent and the related targets?
•If I change my SSH keys on Oracle Cloud, what should I do in Enterprise
Manager?
•What are the guidelines for sizing the number of Gateways? What is the indication
that my gateway Agent is overloaded?
•Once the first Gateway is up after being patched, will it monitor the Cloud-based
Agents?
•What are the user restrictions on Cloud-based Agents and the targets on Oracle
Cloud?
•On what operating system can I deploy a Cloud-based Agent and a Gateway?
17.4.6.1 Can I deploy more than one Agent on the same Oracle Cloud virtual
host?
Yes, you can. However, make sure you first decommission the Cloud-based Agent
that is already present on the Oracle Cloud virtual host, and then deploy another one.
Chapter 17
Advanced Topics
17-23

To decommission the Agent that is already present on the Oracle Cloud virtual host,
follow these steps:
1. On the Agent Home page of the Hybrid Cloud Agent, from the Agent menu, select
Target Setup, then select Agent Decommission.
2. Deploy a new Agent as described in Installing an Agent on an Oracle Cloud VM.
17.4.6.2 Can I deinstall or deconfigure a Gateway without deinstalling an
associated Cloud-based Agent?
No, you can't. You must first decommission the Agent that is present on the Oracle
Cloud virtual host. When you decommission the Agent, the Gateway with which it is
associated is automatically removed.
If you have a single Gateway, and if you want to deinstall it, then follow these steps:
1. Stop the Agent running on the Oracle Cloud VM.
2. On the Agent Home page of this Cloud-based Agent, from the Agent menu, select
Target Setup, then select Agent Decommission.
If you have multiple Gateways, and if you want to deinstall the primary Hybrid Cloud
Gateway, then follow these steps:
1. Shut down the primary Hybrid Cloud Gateway. This will automatically redirect the
communication from the Cloud-based Agent to the secondary Hybrid Cloud
Gateway.
2. Deinstall the primary Hybrid Cloud Gateway.
Note:
No need to decommission the Agent that is associated with the primary Hybrid
Cloud Gateway. You only have to shut down the primary Hybrid Cloud
Gateway as described in Step (1).
After Step (2), the secondary Hybrid Cloud Gateway will act as the primary
Hybrid Cloud Gateway.
When you bring back the Hybrid Cloud Gateway that you deinstalled in Step
(2), it will come back only as a secondary Hybrid Cloud Gateway.
Note:
How do I relocate the Gateway to another host without deinstalling anything
else?
17.4.6.3 How do I relocate the Gateway to another host without deinstalling
anything else?
You can't relocate the Gateway from one host to another host because the relocate
logic is only for targets monitored by the Gateway and not for the Gateway.
Chapter 17
Advanced Topics
17-24

17.4.6.4 How can I redistribute my connections once I have added the
Gateways? Does it need reconfiguration?
Yes, you can redistribute the connections once you have added additional Gateways.
However, there is no automated way to do this. You must manually redistribute the
connections.
For example, if you have one Gateway and multiple Cloud-based Agents associated
with it, and if you now deploy another Gateway, then you can redistribute the
connections between the two gateways.
To do so, follow these steps:
1. Remove the primary Gateway from serving the Cloud-based Agent. To do so, run
the following command. This command causes the OMS to switch the primary
gateway to the secondary gateway.
emcli delete_hybridgateway_for_hybrid_agent -
hybrid_agent_name="<hybrid_agent_name>:<port>" -
hybridgateway_agent_list="<primary_gateway_agent>:<port>"
2. Add back the old primary gateway to the Cloud-based Agent. To do so, run the
following command. This command restores the old primary gateway as a
secondary gateway to the Cloud-based Agent.
emcli add_hybridgateway_for_hybrid_agent -
hybrid_agent_name="<hybrid_agent_name>:<port>" -
hybridgateway_agent_list="<old_primary_gateway_agent>:<port>"
17.4.6.5 After an Oracle PaaS instance is decommissioned, what happens to
the Cloud-based Agent and the related targets?
After an Oracle PaaS instance is decommissioned from Oracle Cloud, the associated
Agent will be in a unreachable state. To clean up the Agent from the Enterprise
Manager Cloud Control Console, follow these steps:
1. In the Enterprise Manager Cloud Control Console, from the Setup menu, select
Manage Cloud Control, then select Agents.
2. Click the name of the Cloud-based Agent you want to clean up from the console.
3. On the Agent Home page, from the Agent menu, select Target Setup, then click
Agent Decommission.
4. Select the targets you want to remove, and click Submit.
17.4.6.6 If I change my SSH keys on Oracle Cloud, what should I do in
Enterprise Manager?
Update the monitoring credentials with the new SSH keys so that all Cloud-based
Agents can automatically honor them for new deployments. Once the new keys are
saved, the SSH tunnelling uses the new keys to communicate with the Cloud-based
Agents.
To update the monitoring credentials, follow these steps:
Chapter 17
Advanced Topics
17-25

1. In the Enterprise Manager Cloud Control Console, from the Setup menu, select
Security, then select Monitoring Credentials.
2. On the Monitoring Credentials page, in the table click Hybrid Cloud Connection.
3. On the Hybrid Cloud Connection Monitoring Credentials page, select the target
name where you want to update the new SSH keys, and click Set Credentials.
4. In the Enter monitoring credentials dialog, enter the new SSH private key and the
SSH public key, and click Save.
17.4.6.7 What are the guidelines for sizing the number of Gateways? What is
the indication that my gateway Agent is overloaded?
Currently, there are no statistics available. You can continue to use utilities such as
EM Diag Kit to assess the load on the Hybrid Cloud Gateway.
17.4.6.8 Once the first Gateway is up after being patched, will it monitor the
Cloud-based Agents?
No. The only time there is a switch of a primary Gateway is when the primary Gateway
goes down.
To list the Gateways for a given Cloud-based Agent, run the following query:
SELECT emd_url FROM MGMT_TARGETS
WHERE target_name LIKE '%PAAS_AGENT_NAME%' AND
target_type='oracle_hybridcloud_connection'
17.4.6.9 What are the user restrictions on Cloud-based Agents and the targets
on Oracle Cloud?
No restrictions as such for users. The Cloud-based Agent install user can be different
from the Oracle Cloud target install user, but both users must belong to the same
primary operating system group. Otherwise, the discovery might fail.
For example, the Cloud-based Agent install user can be
opc,
and the Oracle Cloud
target install user can be
oracle.
However, both these users must belong to the
oinstall
operating system group.
In addition, the user must have sudo access. Otherwise, the root.sh script will have to
be run as a manual step during agent deployment.
17.4.6.10 On what operating system can I deploy a Cloud-based Agent and a
Gateway?
You can deploy a Gateway on any operating system, but you must deploy a Cloud-
based Agent only on an Oracle Linux x86-64 operating system.
Chapter 17
Advanced Topics
17-26

17.5 List of Unsupported Features
Table 17-2 lists the features that Hybrid Cloud Management does not currently
support.
Table 17-2 Features Not Supported by Hybrid Cloud Management
Targets Features Not Supported
Database Automatic Workload Repository Warehouse
Collection from Oracle Cloud databases.
SQL Performance Analyzer
•Remote trials to Database Cloud Service instances.
•Copy of workload artifacts (capture files/STS) to Oracle Cloud
using deployment procedures. Workaround is to manually copy.
•Active Data Guard support for Database Cloud Service instances
(needs a database link).
Database Replay
Disabled for database PaaS targets.
Reorganized Objects
Reorganized objects.
Change Management
Data Synchronization.
Database Cloning
Data Guard
Management of standby databases on Oracle Cloud.
Oracle Exadata Cloud •Oracle Exadata hardware and hypervisor monitoring,
configuration settings.
•Patching and upgrade.
•Backup and restore.
•Provisioning database services in Oracle Cloud.
Enterprise Manager •Agent:
- Manual deployment.
- Buddy Agents.
Sudo and Run As Different User
•Target Relocation.
•Software Library on Oracle Cloud.
•Third-party certificates.
•Support workbench of Oracle Cloud targets.
Chapter 17
List of Unsupported Features
17-27

18
Deploying JVMD for Hybrid Cloud
This chapter describes how to deploy Java Virtual Machine Diagnostics (JVMD)
Agents in a Hybrid Cloud setup. It consists of the following sections:
•Overview of Deploying JVMD for Hybrid Cloud
•Prerequisites for Deploying JVMD Agents on Oracle Cloud Virtual Hosts
•Deploying JVMD Agents on Oracle Cloud Virtual Hosts
•Changing the Default JVMD End Point for Hybrid Cloud Gateway Agents
•After Deploying JVMD Agents on Oracle Cloud Virtual Hosts
18.1 Overview of Deploying JVMD for Hybrid Cloud
Enterprise Manager Cloud Control offers Hybrid Cloud Management that enables you
to monitor certain Oracle Cloud targets using an on-premise Enterprise Manager
Cloud Control instance. Leveraging this feature, Enterprise Manager Cloud Control
enables you to deploy JVMD Agents on your Oracle Cloud virtual hosts, which can
report to a JVMD Engine deployed on-premise. Thus, you can monitor your Oracle
Cloud JVM targets and diagnose performance problems in Java applications that are
deployed in Oracle Cloud, using an on-premise Cloud Control instance.
For more information on the Hybrid Cloud feature, see Enabling Hybrid Cloud
Management .
The deployed JVMD Agent (on the Oracle Cloud virtual host) uses the Hybrid Cloud
Gateway Proxy and a Hybrid Cloud Gateway Agent to communicate with the on-
premise JVMD Engine. The Hybrid Cloud Gateway Proxy forwards communication
from the JVMD Agent to the on-premise Hybrid Cloud Gateway Agent, which in turn
forwards the message to the JVMD Engine and from the JVMD Engine back to the
JVMD Agent. Reverse communication follows the same flow, that is, the Hybrid Cloud
Gateway Agent forwards communication from the JVMD Engine to the Hybrid Cloud
Gateway Proxy, which in turn forwards the message to the JVMD Agent.
Note that except cross-tier functions, all JVMD features are supported for a Hybrid
Cloud setup.
18.2 Prerequisites for Deploying JVMD Agents on Oracle
Cloud Virtual Hosts
Before deploying JVMD Agents on Oracle Cloud virtual hosts, ensure that you meet
the following prerequisites:
•Deploy a Hybrid Cloud Agent on the Oracle Cloud virtual host on which you want
to deploy a JVMD Agent.
For information on how to deploy a Hybrid Cloud Agent on an Oracle Cloud target,
see Enabling Hybrid Cloud Management .
18-1

•Meet the prerequisites for deploying an on-premise JVMD Agent. These
prerequisites are described in Oracle Enterprise Manager Cloud Control Basic
Installation Guide.
18.3 Deploying JVMD Agents on Oracle Cloud Virtual Hosts
To deploy JVMD Agents on Oracle Cloud virtual hosts, follow these steps:
1. From the Setup menu, select Middleware Management, then select Application
Performance Management.
2. On the Application Performance Management page, under the Application
Performance Management Agents section, click Manage Diagnostics Agents.
3. For Operation, ensure that Deploy is selected.
If you select Expand All from the View menu, you can view the target name,
target type, target host, target status, platform, and so on of all the discovered
WebLogic Administration Servers and Managed Servers (part of all discovered
WebLogic domains).
Select the WebLogic Managed Servers on which you want to deploy JVMD
Agents. Click Next.
4. On the Target Credentials page, for each WebLogic domain, specify a value for
Oracle WebLogic Administration Server Host Credentials and Oracle
WebLogic Domain Credentials, then click Apply.
Click Next.
5. To deploy JVMD Agents on Oracle Cloud virtual hosts, select Configure Hybrid
Mode, and specify the Hybrid Cloud Gateway Proxy host and port that you want to
use. When you select Configure Hybrid Mode, the value for Available JVMD
Engine is automatically set to Other, as the JVMD Agent connects to the Hybrid
Cloud Gateway Proxy, which in turn connects to the JVMD Engine (via the Hybrid
Cloud Gateway Agent).topicid:jvmd_adp_overview_paas_agent
By default, all JVMD Agents deployed on Oracle Cloud virtual hosts will effectively
report to the JVMD Engine marked as the default end point.
To view the default JVMD end point for all the Hybrid Cloud Gateway Agents
deployed in your enterprise, on the Application Performance Management page,
select JVM Diagnostics Engines, then click Configure. Select the Hybrid
Gateways Configuration tab. The default JVMD end point is displayed. For
information on how to change the default JVMD end point for the Hybrid Cloud
Gateway Agents deployed in your enterprise, see Changing the Default JVMD End
Point for Hybrid Cloud Gateway Agents.
Click Next.
6. On the Review page, review all the information, then click Deploy.
Once the JVMD Agent deployment is successful, you can verify the deployment by
navigating to the Application Performance Management page, and viewing the
Application Performance Management Agents section.
Chapter 18
Deploying JVMD Agents on Oracle Cloud Virtual Hosts
18-2

18.4 Changing the Default JVMD End Point for Hybrid Cloud
Gateway Agents
The deployed Hybrid Cloud JVMD Agents use the Hybrid Cloud Gateway Agents to
communicate with an on-premise JVMD Engine. The JVMD Engine that is deployed by
default with the 13c OMS is marked as the default end point for all the Hybrid Cloud
Gateway Agents deployed in your enterprise. This means that, effectively, all the
deployed Hybrid Cloud JVMD Agents will report to the JVMD Engine that is marked as
the default end point. To change the default end point to a different JVMD Engine, or
to a load balancer that is configured in your enterprise, follow these steps:
1. From the Setup menu, select Middleware Management, then select Application
Performance Management.
2. Select JVM Diagnostics Engines, then click Configure.
3. Select the Hybrid Gateways Configuration tab. Click the edit icon displayed
against JVMD default end point URL.
4. If you want to set the default end point to a load balancer that is configured in your
environment, select Load Balancer URL, then specify the required value. If you
want to set the default end point to a different JVMD Engine (that is, different from
the default end point), select JVMD Engine, then select the required JVMD
Engine from the drop down list.
Note:
Typically, all the Hybrid Cloud Gateway Agents deployed in your enterprise
are configured for JVMD and are marked with the default JVMD end point. In
case a particular Hybrid Cloud Gateway Agent is not marked with the default
JVMD end point, select it from the list displayed in the Hybrid Gateways
section, then click Update.
18.5 After Deploying JVMD Agents on Oracle Cloud Virtual
Hosts
After deploying JVMD Agents to your Oracle Cloud virtual hosts, verify the deployment
as described in Oracle Enterprise Manager Cloud Control Basic Installation Guide.
Chapter 18
Changing the Default JVMD End Point for Hybrid Cloud Gateway Agents
18-3

Part IV
Administering Cloud Control
This section contains the following chapters:
•Maintaining Enterprise Manager
•Maintaining and Troubleshooting the Management Repository
•Updating Cloud Control
•Configuring a Software Library
•Managing Plug-Ins
•Patching Oracle Management Service and the Repository
•Patching Oracle Management Agents
•Personalizing Cloud Control
•Administering Enterprise Manager Using EMCTL Commands
•Locating and Configuring Enterprise Manager Log Files
•Configuring and Using Services
•Introducing Enterprise Manager Support for SNMP

19
Maintaining Enterprise Manager
Enterprise Manager provides extensive monitoring and management capabilities for
various Oracle and non-Oracle products. Used to manage your heterogeneous IT
infrastructure, Enterprise Manager plays an integral role in monitoring and maintaining
the health of your IT resources. It is therefore essential to ensure Enterprise Manager
itself is operating at peak efficiency.
To help you maintain your Enterprise Manager installation, a variety of enhanced self-
monitoring and diagnostic functionality is available from the Enterprise Manager
console. These functions are designed to help you understand and monitor various
components of Enterprise Manger, monitor/measure the quality of services Enterprise
Manager provides, diagnose failures quickly, and manage Agents more easily.
This chapter covers the following topics:
•Overview: Managing the Manager
•Health Overview
•Repository
•Controlling and Configuring Management Agents
•Management Servers
19.1 Overview: Managing the Manager
Although Enterprise Manager functions as a single entity to manage your IT
infrastructure, in reality it is composed of multiple components working in concert to
provide a complete management framework from a functional standpoint. All major
components of Enterprise Manager have been grouped into a single system. A special
set of services has been created (based on the system) to model Enterprise Manager
functions.
Management Features
•Topology view that allows you to see all major components of Enterprise Manager
and their current status.
•Dashboard displaying the overall health of Enterprise Manager.
•Full control of the Agent directly from the Enterprise Manager console. Functions
include:
–View/edit Agent configuration properties.
–View Agent(s) configuration history and compare the results against other
Agents.
–Perform Agent control operations (start/stop/secure).
–Upgrade Management Agents
19-1

19.2 Health Overview
The Health Overview provides a comprehensive overview of OMS and Repository
operation and performance, and therefore allows you to view the overall health of your
Enteprise Manager environment.
Accessing the Health Overview
From the Setup menu, select Manage Cloud Control and then Health Overview.
All major areas of Enterprise Manager are represented.
•Overview: Provides key information for active Management Services such as the
Management Agents, the WebLogic Administration Server, total number of
monitored targets, number of administrators, and server load balancer (SLB)
upload and console URLs, provided SLB is configured. If configured, the SLB
upload and console URLs are also displayed.
•Repository Details: Provides physical information about the Management
Repository and the host on which the database is located. You can drill down into
the database home page for more information and carry out administrative
operations.
•Job System Status: Displays key operational parameters of the Enterprise
Manager Job service. For detailed information, you can click on the status icon to
drill down into the Enterprise Manager Job Service home page.
•Console Activity: Displays the overall load on the Enterprise Manager console
through the average number of requests per minute and the average time required
to process those requests.
•Alerts: Provides details on the metric errors recorded and when an alert was
triggered. In-context links to Incident Manager are also provided.
•Performance Charts: Upload Backlog and Upload Rate, Backoff Requests,
Notification backlog. You can drill down into any chart to view detailed metric
information.
From this page, you can carry out all monitoring and management operations using
the OMS and Repository menu.
Note:
The Diagnostic Metrics page is intended for use by Oracle Support when
diagnosing issues with the OMS. The page can be accessed by selecting
Monitoring and then Diagnostic Metrics from the OMS and Repository
menu.
19.2.1 Viewing Enterprise Manager Topology and Charts
The Enterprise Manager Topology page provides a graphical representation of the
Enterprise Manager infrastructure components and their association. Each node in the
hierarchy displays key information about the member type, the host on which it
Chapter 19
Health Overview
19-2

resides, and the number of incidents, if any. The incident icons on each of the nodes
expand to display a global view of current status for each node in the hierarchy.
Note:
In order for the Enterprise Manager repository database to appear in the
Topology page, you must first manually discover the database. Manual
discovery is also required in order to have the database's metric data
(Database Time (centiseconds per second)) displayed in the charts.
Accessing the Enterprise Manager Topology
1. From the Setup menu, select Manage Cloud Control and then Health Overview.
2. Click on the OMS and Repository menu to display available operations that can
be performed from this page.
3. Select Members and then Topology.
Enterprise Manager Charts
The Enterprise Manager Charts page displays eight charts representing key areas that
together indicate the overall health of Enterprise Manager. These are Overall Files
Pending Load -Agent, Job Step Backlog, Job Step Throughput (per second), Request
Processing Time (ms), Database Time (centiseconds per second), CPU Utilization
(%), Pages Paged-in (per second), Pages Paged-out (per second). Data can be
viewed for the Last 24 hours, last 7 days or last 31 days.
Accessing the Enterprise Manager Charts
1. From the Setup menu, select Manage Cloud Control and then Health Overview.
2. Click on the OMS and Repository menu to display available operations that can
be performed from this page.
3. Select Monitoring and then Charts.
19.2.2 Determining Enterprise Manager Page Performance
Page Performance Monitoring and diagnosis feature provides you with the ability to
identify and diagnose performance issues with Enterprise Manager pages without
having to contact Oracle support.
Chapter 19
Health Overview
19-3
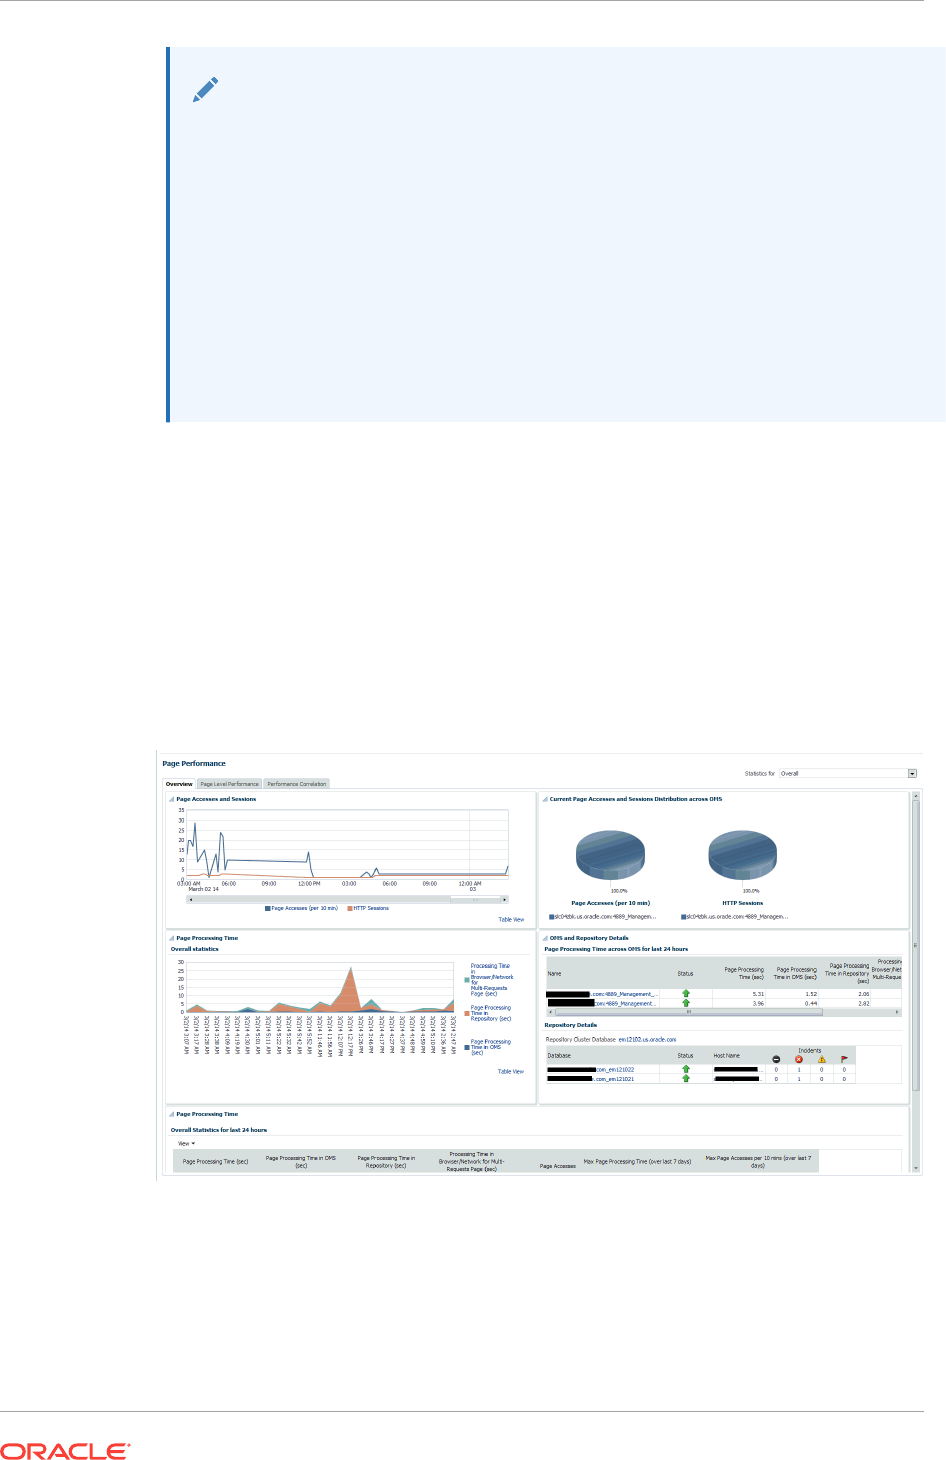
Note:
The Enterprise Manager page performance tracing feature requires Agent
version 12.1.0.4 or later.
The charts and tables in this page will display data only if the Agent that is
monitoring Management Services and Repository target is version 12.1.0.4 or
later. If you have upgraded Enterprise Manager 12.1.0.4, you should also
upgrade the Agents on Management Service (OMS) machines to 12.1.0.4 in
order to access the latest monitoring capabilities for the Management Services
and Repository, as well as related targets.
See the Oracle® Enterprise Manager Cloud Control Upgrade Guide for more
information on upgrading Agents.
To access Page Performance Monitoring and Diagnosis functionality:
1. From the Setup menu, select Manage Cloud Control, and then Health Overview
or Repository.
2. From the OMS and Repository menu, select Monitoring and then Page
Performance. The Page Performance page displays.
Overview
The overview tab provides details of the overall page performance in Enterprise
Manager.
The charts display the Page Accesses and Sessions, Current Page Accesses and
Sessions Distribution across OMSs and the Overall Statistics of page performance in
the last 24 hours. There are details of the page performance in each of the OMSs as
well as the details of the available repositories.
Chapter 19
Health Overview
19-4
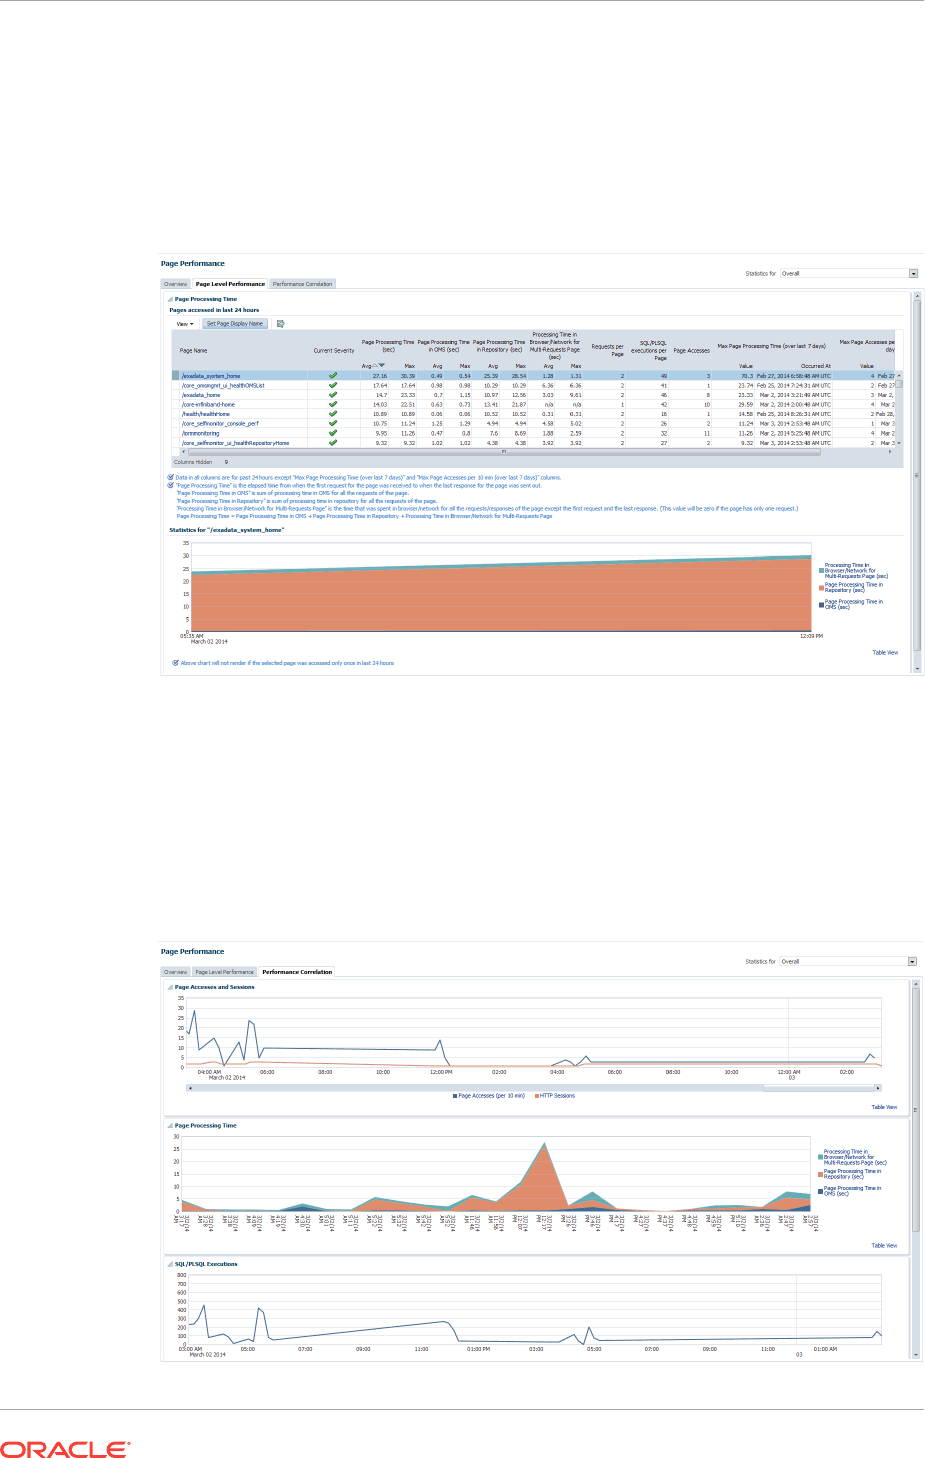
The Overall Statistics table provides the breakdown of times spent in the Repository,
the OMS and network and the number of page accesses, the maximum time taken by
page in the last 24 hours.
Page Level Performance
The page level performance tab shows the list of pages accessed in the last 24 hours.
The page also displays the breakdown of time spent in the Repository and the OMS
and network in a line graph format for each page.
Performance Correlation
The performance correlation tab displays graphs for page performance that allow you
to correlate performance trends.
Chapter 19
Health Overview
19-5
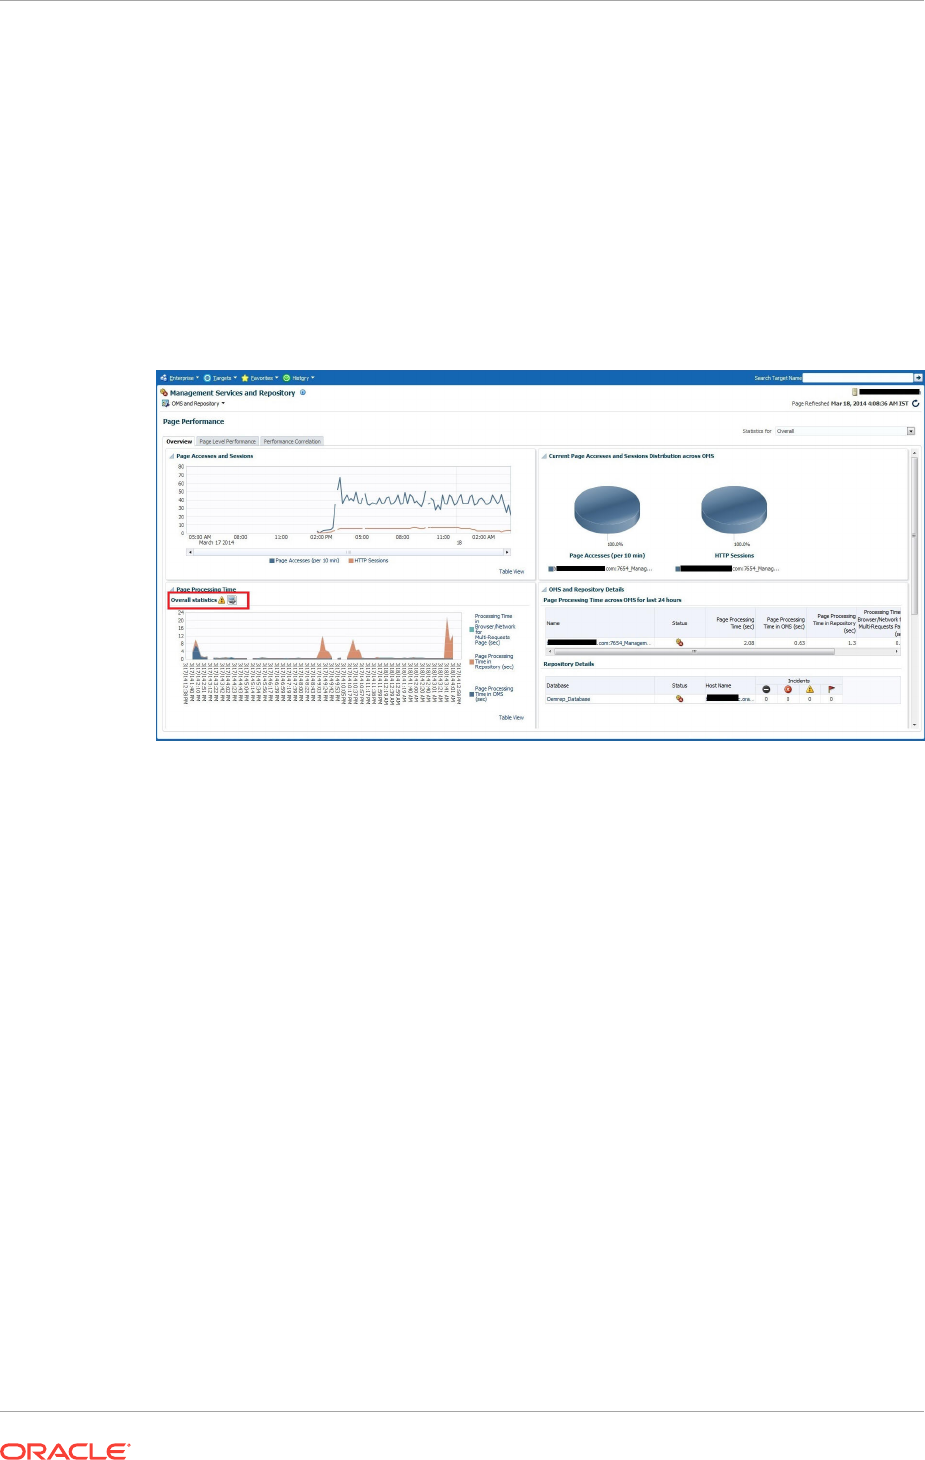
This tab provides details of page accesses and sessions, page processing time, SQL/
PLSQL executions, and average active sessions.
Symptom Diagnosis
Symptom diagnosis can be performed for both overall page processing time and
individual page times. Symptom diagnosis is triggered when the set metric thresholds
for overall page processing time are exceeded. Diagnosis is accessed by means of an
icon in the Overview tab in the Overall Statistics section when the overall page
performance threshold is exceeded, as shown in the following graphic.
Figure 19-1 Symptom Diagnosis Icon
For individual pages, the symptom diagnosis icon is displayed in the table in the
Current Severity column if the page performance metric threshold is exceeded.
When the icon is displayed in the Overall Statistics section, it indicates that the overall
performance of the Enterprise Manager pages has exceeded the threshold in the last
10 minutes. Clicking on the icon, you are taken to another tab where the details of the
diagnosis are presented. The diagnosis indicates the root cause for the overall page
performance exceeding the metric threshold, the findings that were deduced on
diagnosis and the checks that were performed to analyze the overall page
performance issue.
The checks are performed at the database level, middle-tier level and the browser/
network level to isolate which part of the system might be the cause of the issue. Each
check is analyzed and the checks that are identified as the top causes are reported as
findings. The topmost finding is then reported as the root cause for the performance
issue.
Target Availability Symptom Diagnosis:
Symptom diagnosis can be performed on the availability of the Agent as well. The icon
is displayed in the Agent List and Agent Home pages in the event that the Agent target
is unreachable or in pending status.
Chapter 19
Health Overview
19-6
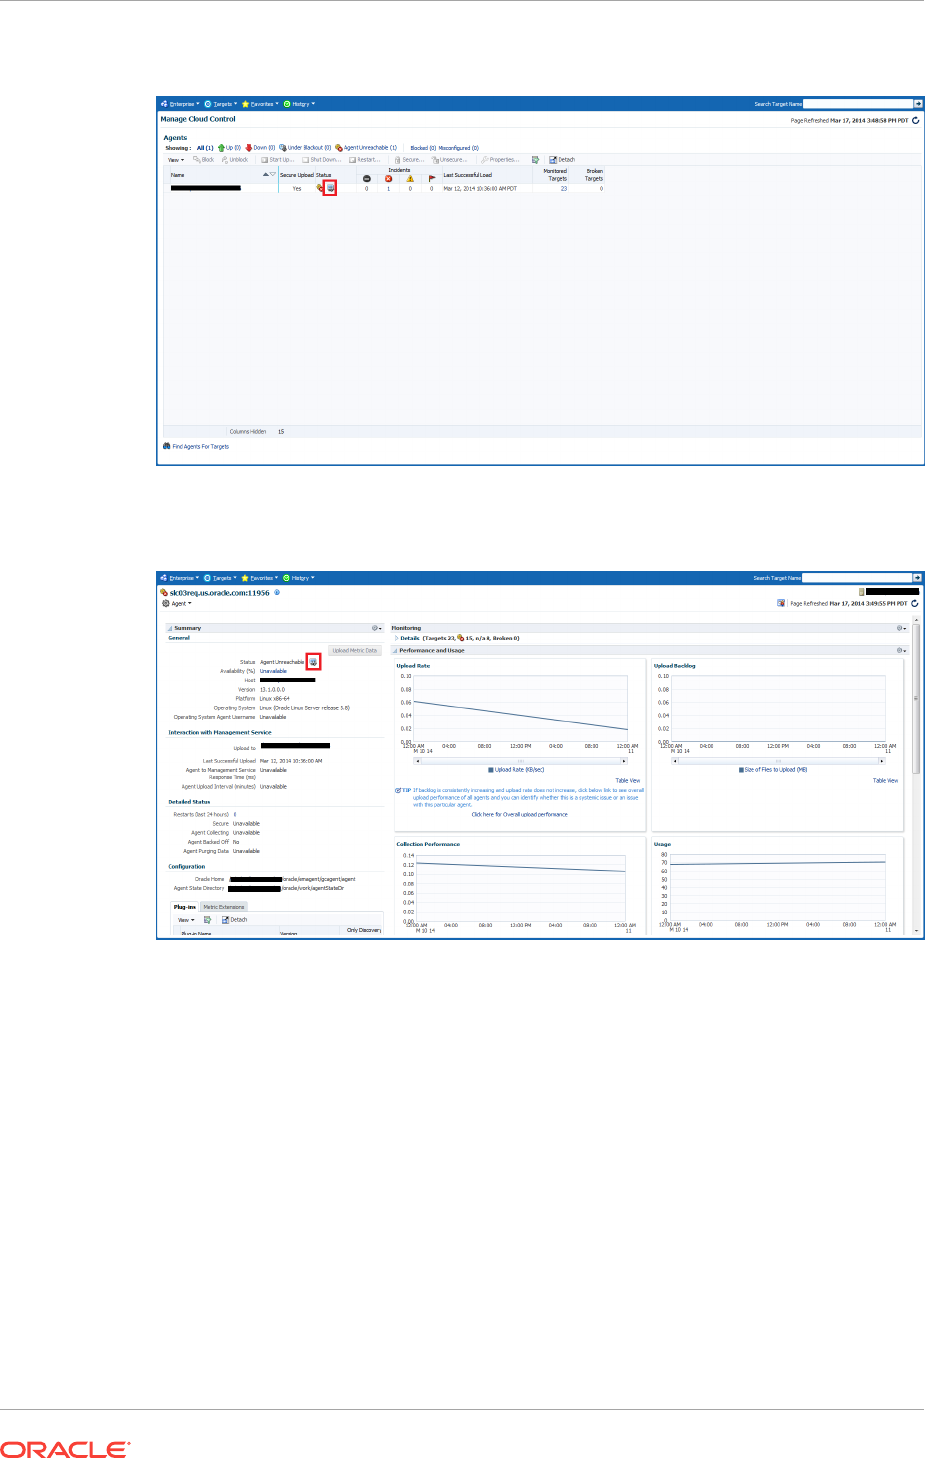
Figure 19-2 Agent List Page
Figure 19-3 Agent Home Page
On clicking the icon, the user is navigated to another tab where the details of the
diagnosis are presented. The diagnosis indicates the root cause for the Agent's
unreachable/pending state, the findings that were deduced from the diagnosis and the
checks that were performed to analyze the Agent availability issue.
The checks performed to diagnose the issue consist of the following:
•if the communication between the Management Service and the Agent is
successful
•if the Agent has communicated with the Management Service
•if reasons can be deduced from the Repository
•if further reasons can be deduced by performing checks from the Agent side
(whether communication between the OMS and the Agent exists).
Chapter 19
Health Overview
19-7
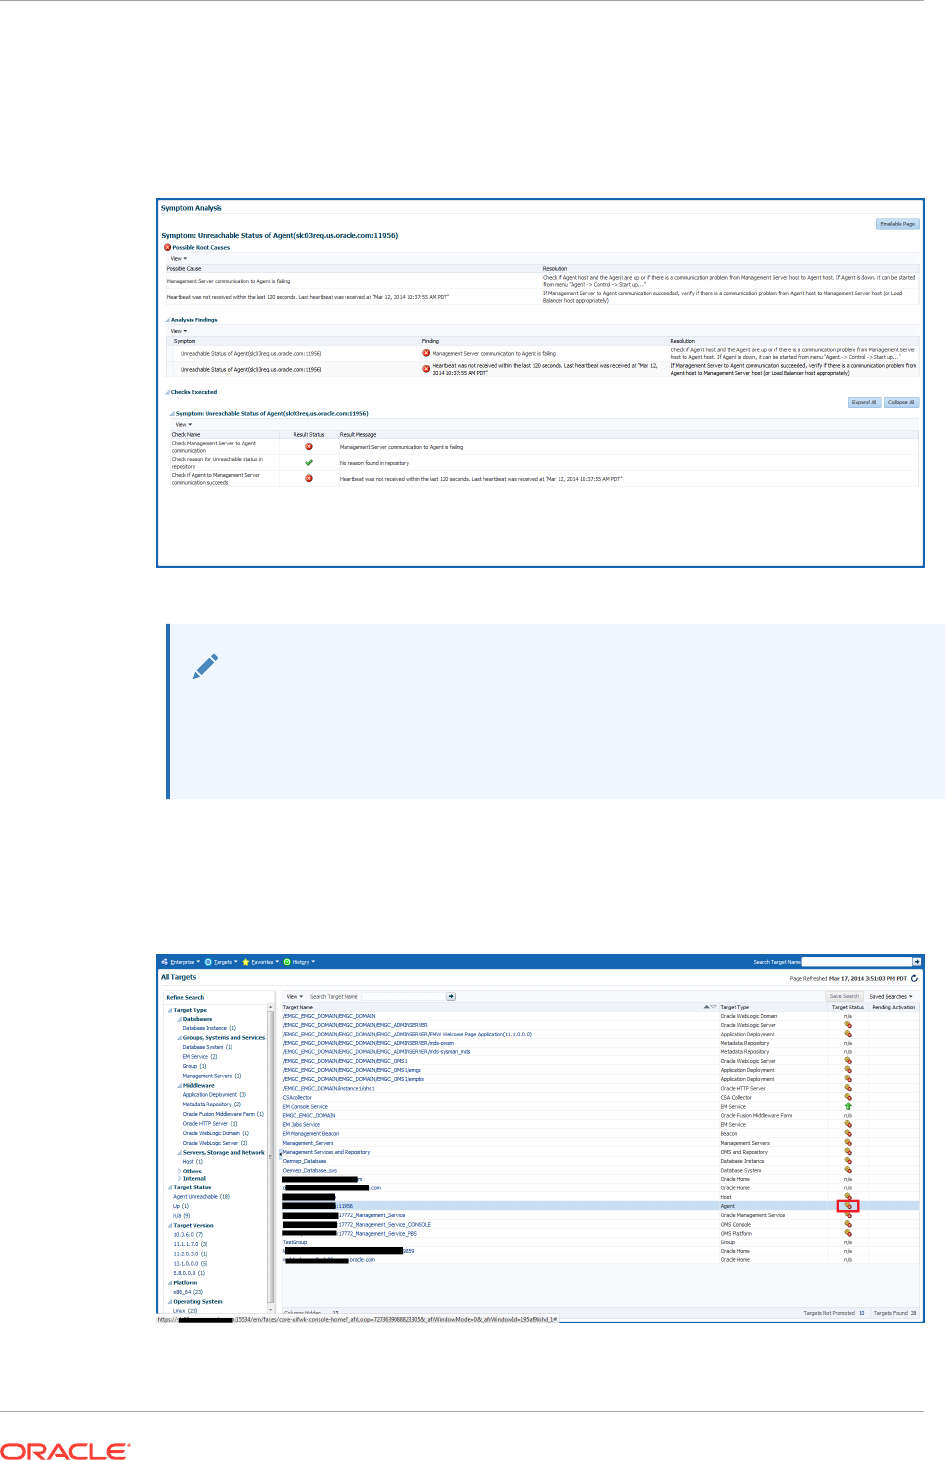
Each check is analyzed and the checks that are identified as the top causes are
reported as findings. The topmost finding is then reported as the root cause for the
performance issue.
Figure 19-4 Agent Symptom Diagnosis
Note:
If communication between the OMS and Agent cannot be established, then
the diagnosis will report findings based on the data available in Management
Repository, which may not be the real cause for the issue.
The symptom diagnosis feature is also available in the All Targets page for targets in
unreachable or pending status by clicking on the status icon.
Figure 19-5 All Targets Page
Chapter 19
Health Overview
19-8
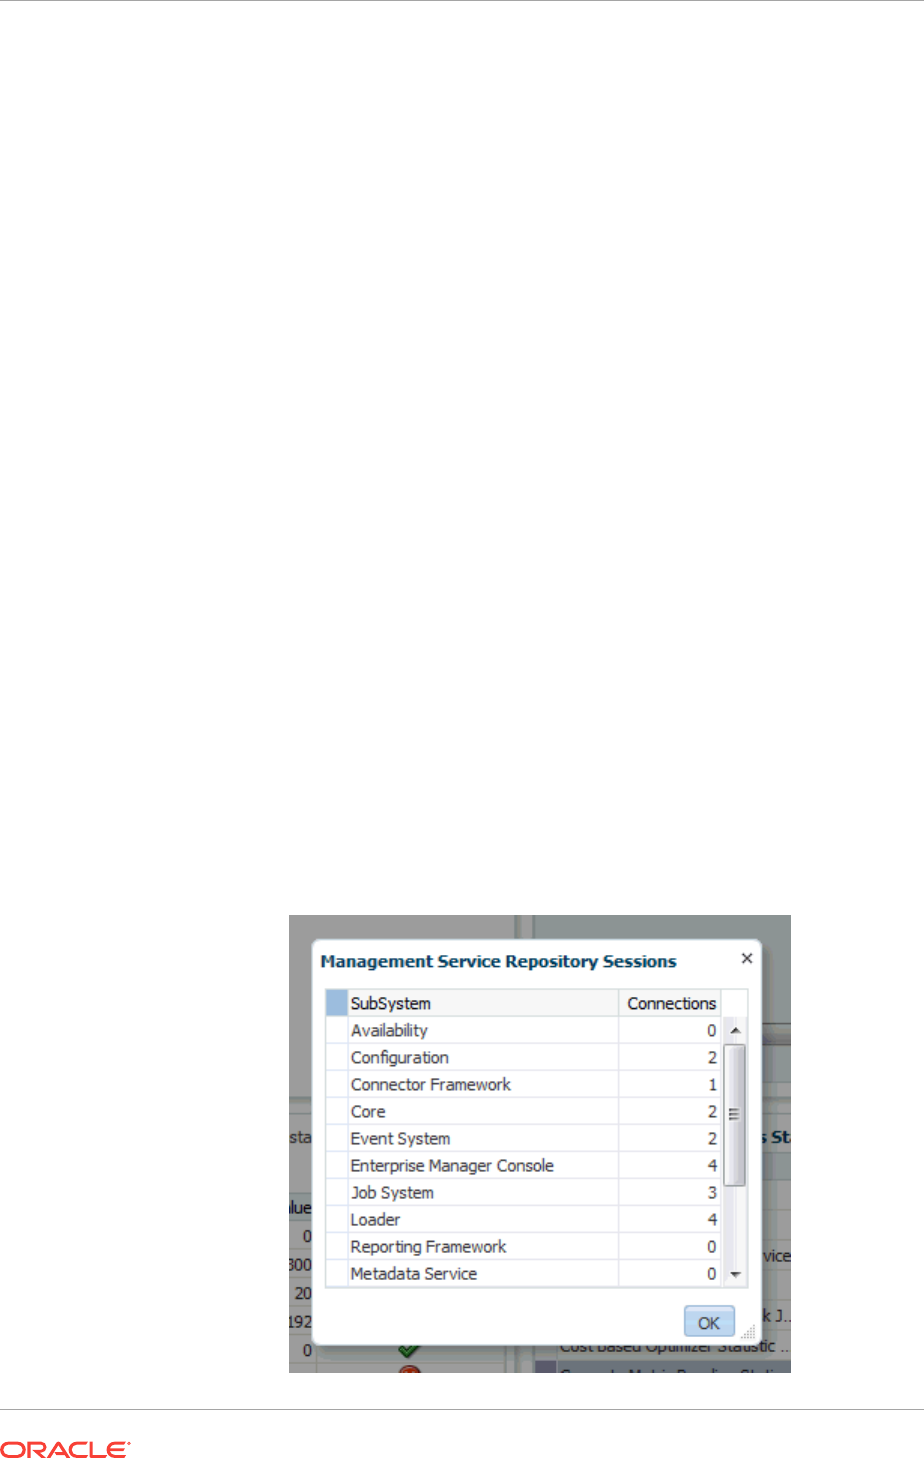
19.3 Repository
The Repository page provides you with an overview of the status and performance of
the Repository DBMS Jobs that handle part of Enterprise Manager's maintenance and
monitoring functionality. These DBMS jobs run within the Management Repository and
require no user input. Charts showing the key Repository Details and Backlog in
Repository Collection are provided The Scheduler Status region provides the status of
the scheduler and the number of Job Queue Processes.
Accessing Repository Information
From the Setup menu, select Manage Cloud Control and then Repository.
Three tabs are displayed providing a comprehensive view of repository attributes,
performance, as well as access to requisite operational parameters.
•Repository Tab
•Metrics Tab
•Schema Tab
19.3.1 Repository Tab
As shown in #unique_600/unique_600_Connect_42_CHDCIFFF, the Repository tab
provides a comprehensive snapshot of repository-specific monitoring.
Repository Details
The Repository Details region provides high-level database information for the
Enterprise Manager repository. From this region, you can click on the number
Management Service Repository Sessions details to view the exact number of
repository connections per individual Enterprise Manager subcomponent such as the
event system, console, job system, or connector framework.
Figure 19-6 Repository Sessions Per Subcomponent
Chapter 19
Repository
19-9
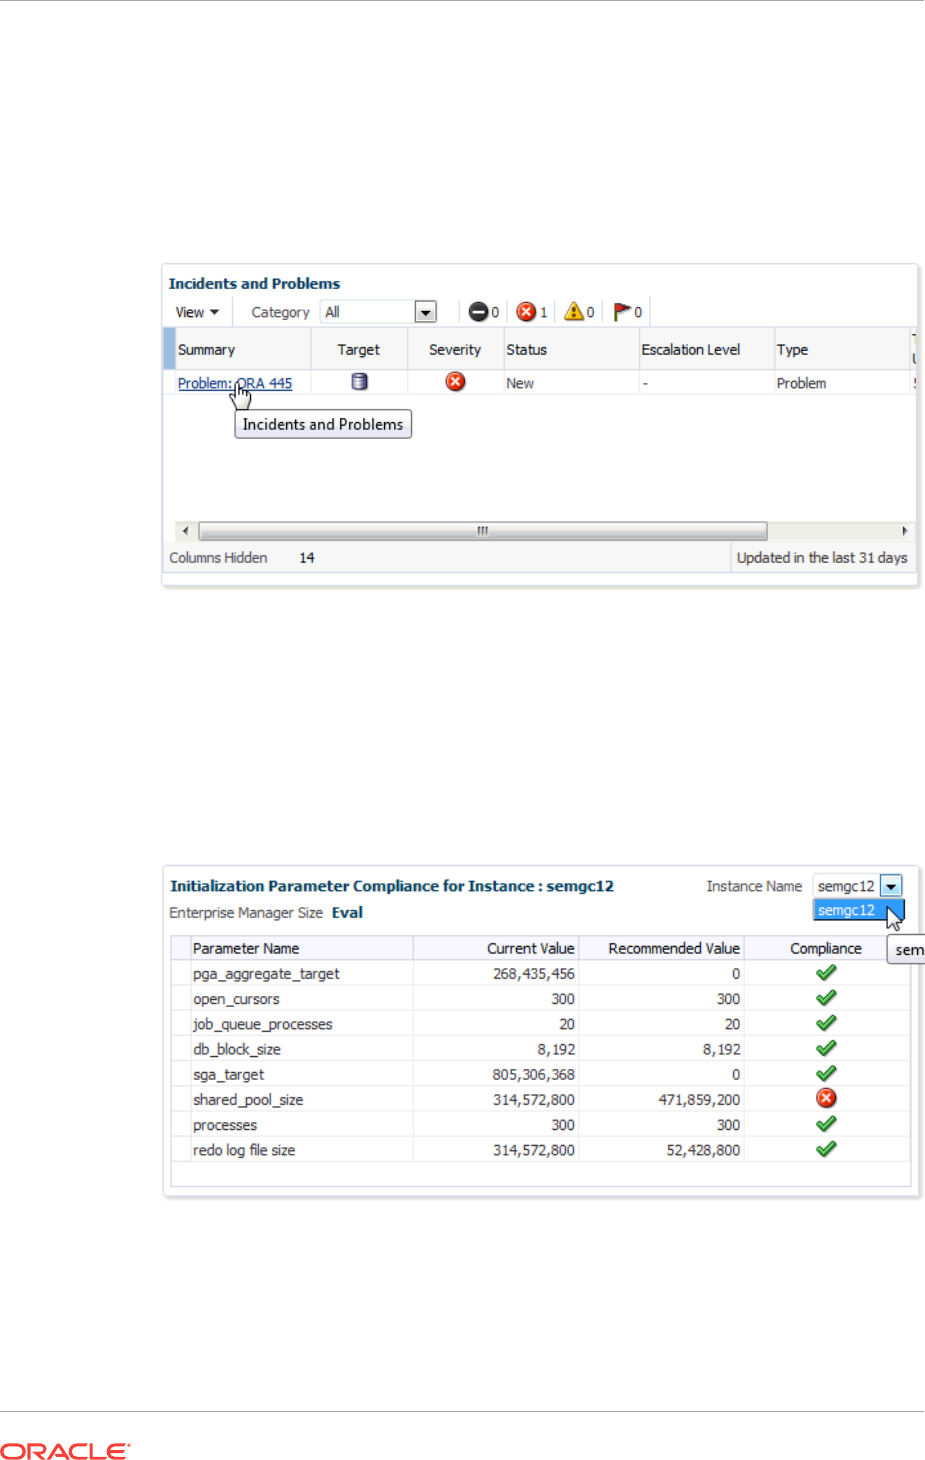
Incidents and Problems
The Incidents and Problems region displays all incidents an problems associated with
the repository database. For more detailed incident or problem information, you can
click on the Summary link to access the issue in Incident Manager.
Figure 19-7 Accessing Incident/Problem Information
Initialization Parameter Compliance for Instance
This region displays the currents initialization parameter settings, recommended
standards, and whether the current parameter values comply with those standard
values.
Figure 19-8 Initialization Parameter Compliance
If you are running the repository in a RAC environment, this region also lets you select
individual database instances in order to view initialization parameter compliance for
that specific instance.
Repository Scheduler Job Status
Chapter 19
Repository
19-10
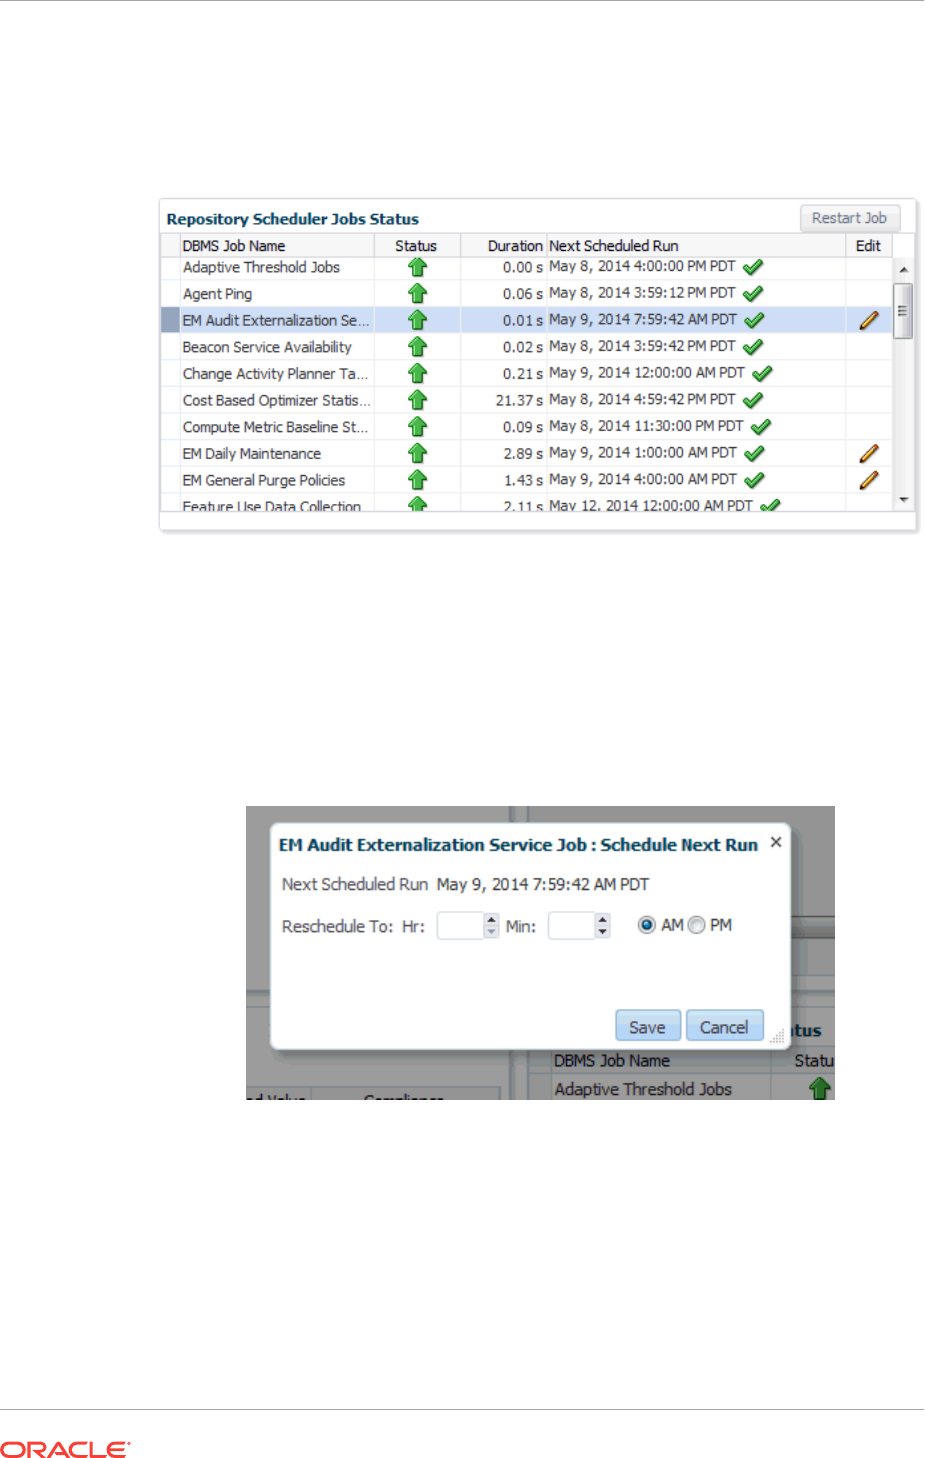
The Repository Scheduler Jobs Status region provides details of the DBMS Jobs
regarding their status, duration, and the next scheduled run time.
Figure 19-9 Repository Scheduler Job Status Region
If the Status of a job is down, you can run the job again by clicking Restart Job.
For high-cost jobs requiring greater resources that, when run, can reduce repository
performance, an edit icon (pencil) appears in the Edit column. Clicking on the icon
displays a dialog allowing you to reschedule the next run time.
Figure 19-10 Job Reschedule Dialog
Repository Collection Performance
The Repository Collection Performance region provides information on the
performance of repository collections. They are collected by background DBMS jobs in
the repository database called collection workers.
Chapter 19
Repository
19-11
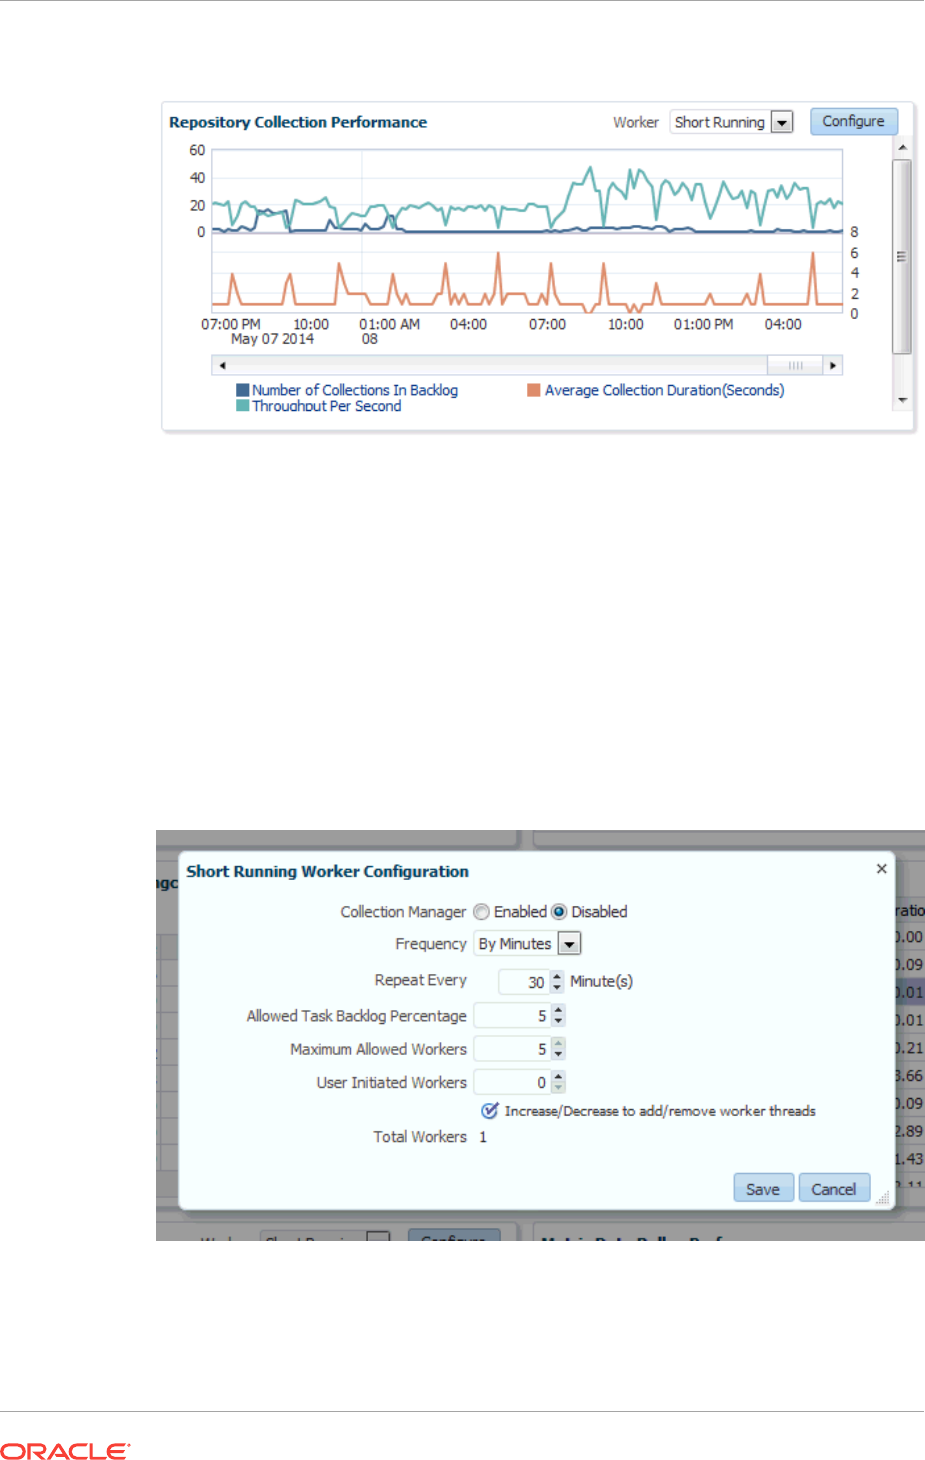
Figure 19-11 Repository Collection Performance Region
Repository metrics are sub-divided into long and short running metrics. These are
called task classes (short task class and long task class). Some collection workers
process the short task class and some process long task class. Repository collection
performance metrics measure the performance data for repository metric collections
for each task class. This metric is a repository metric and hence collected by the
collection workers.
You can select between Short Running and Long Running collection workers. When
viewing Short Running workers, you can click Configure to change short worker
settings.
Figure 19-12 Short Worker Configuration Dialog
Clicking Save submits a job to change the worker configuration. For this reason, the
change will not be instantaneous and may require a minute or so in order to take
effect.
Chapter 19
Repository
19-12

Clicking on an item in the legend allows you to drill down into Problem Analysis, Metric
Details, or the Target Home.
Figure 19-13 Collection Performance Information
Metric Data Rollup Performance
This region displays the rollup performance by graphically displaying the quantity of
data being rolled up (Number of Records Rolled Up) and speed (Throughput per
Minute) over time.
Figure 19-14 Metric Data Rollup Performance Region
The graphs for Number of Records Rolled Up and Throughput per Minute may
increase over time as more targets are added, but on a daily basis should remain
about the fairly level. Large spikes could indicate that agents are not communicating
properly to the OMS
Clicking Configure allows you to change the number of rollup worker threads that will
be started.
Chapter 19
Repository
19-13

19.3.2 Metrics Tab
The Metrics tab provides a graphical rollup of key repository performance
measurements. Information includes:
•Top 25 Metric Data Loading Target Types In Last 30 Days
•Top 10 Data Loading Metrics In Last 30 Days
•Metric Alerts Per Day In Last 30 Days
•Top 10 Metric Collection Errors By Target Type In Last 30 Days
Figure 19-15 Metrics Tab
The graphs allow you to drill down to access information in greater detail.
Top 25 Metric Data Loading Target Types In Last 30 Days
Chapter 19
Repository
19-14
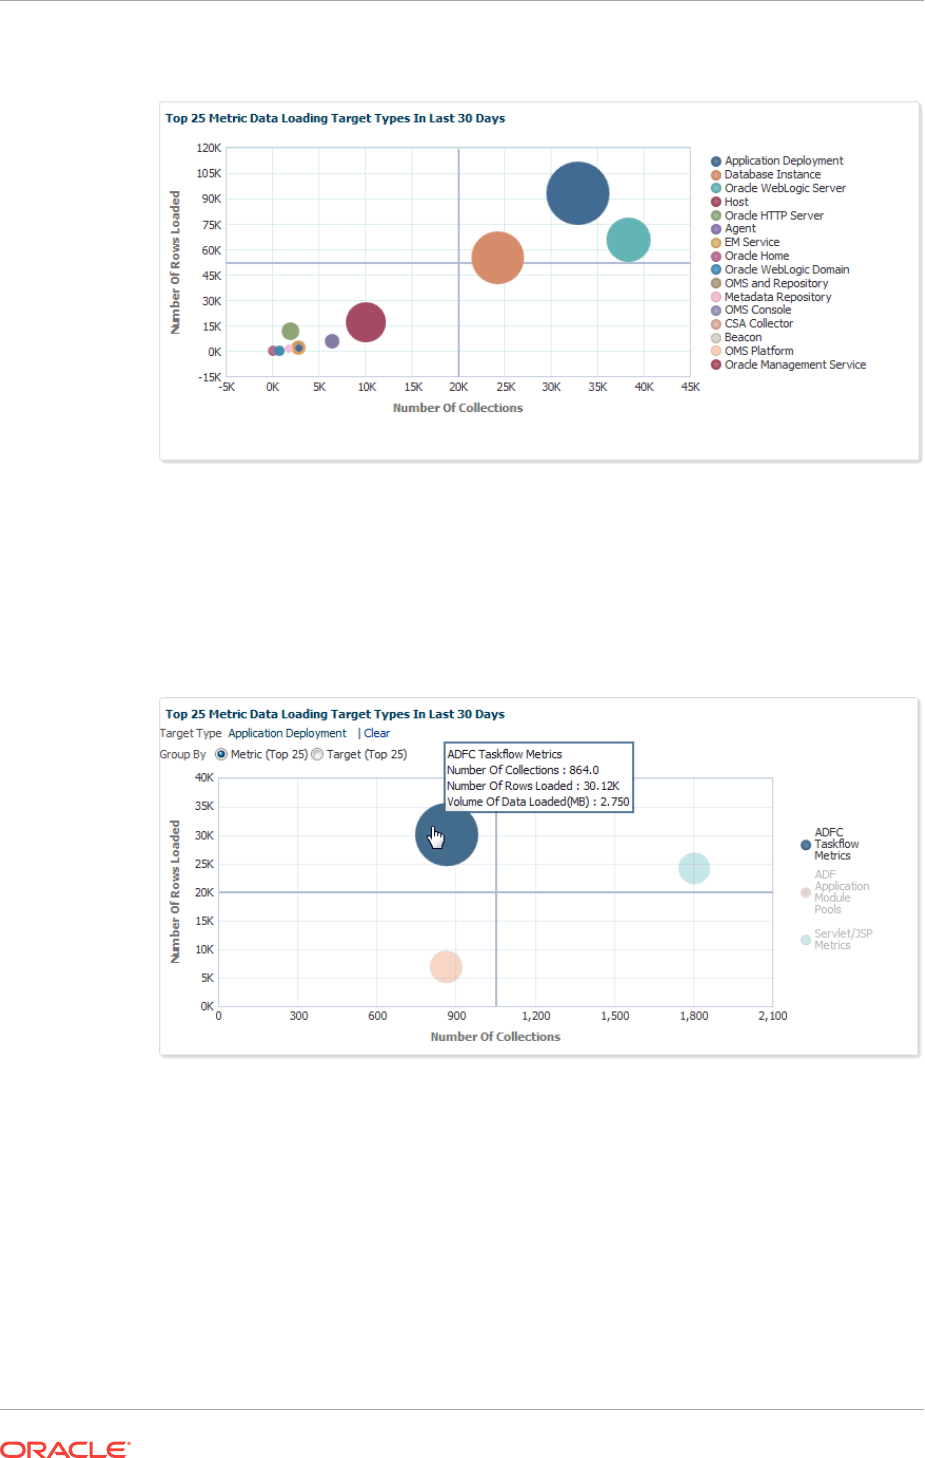
Figure 19-16 Top 25 Metric Data Loading Target Types In Last 30 Days
If you wish to view only metrics for a specific target type, click on a specific metric
target type area within the graph. A new graph displays showing only metrics for that
specific target type. You have the option grouping the results by metric or target.
Figure 19-17 Top 25 Metric Data Loading for a Single Target Type
Click Clear to return to the original graph containing all target types.
Top 10 Data Loading Metrics In Last 30 Days
Chapter 19
Repository
19-15
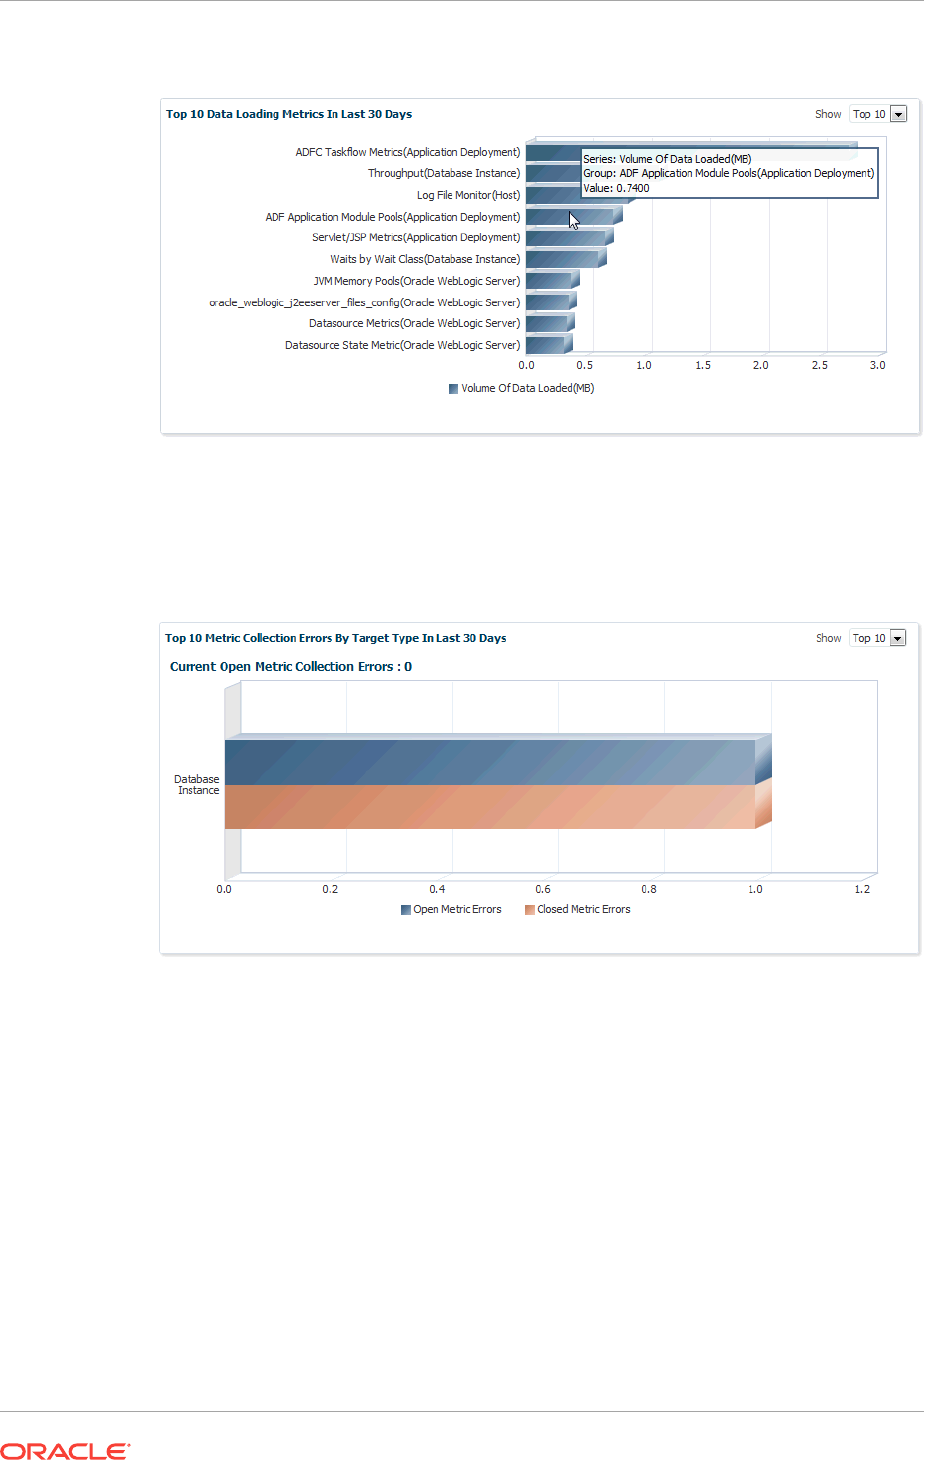
Figure 19-18 Metric Data Load Volume
Top 10 Metric Collection Errors By Target Type In Last 30 Days
Figure 19-19 Open Metric Collection Errors
Metric Alerts Per Day In Last 30 Days
The Metric Alerts Per Day In Last 30 Days graphically displays the number of open,
closed, and backlogged metric alerts over time. If you wish to focus on a narrower time
span, click Zoom.
Chapter 19
Repository
19-16
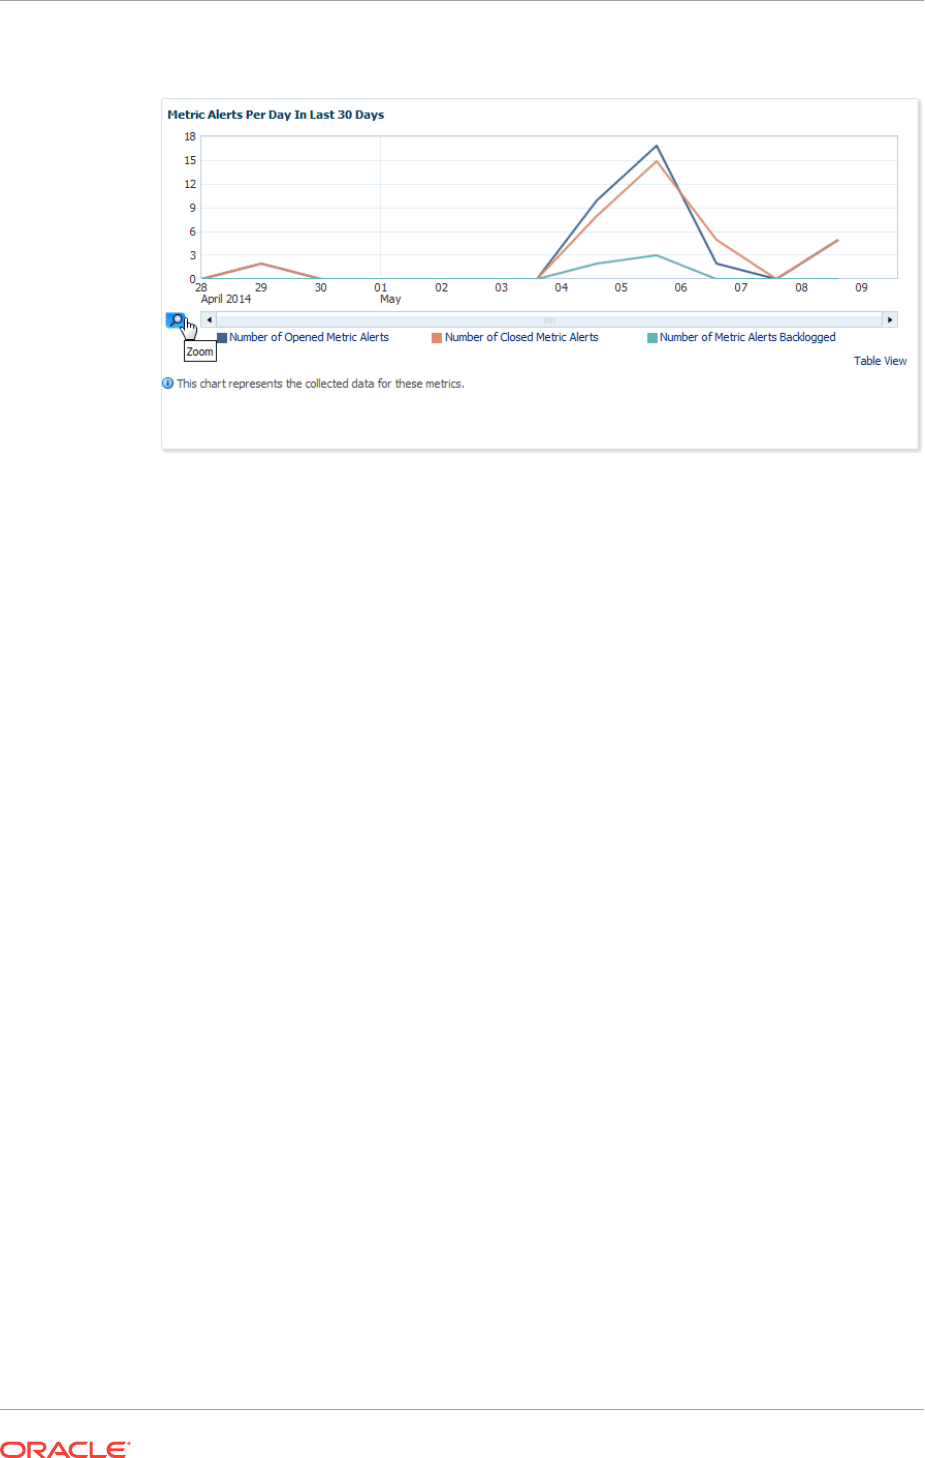
Figure 19-20 Metric Alerts Per Day
19.3.3 Schema Tab
The Schema tab provides physical attribute and performance data pertaining to the
repository database schema. Information includes:
•Tablespace Growth Rate
You can select the specific tablespace: MGMT_TABLESPACE,
MGMT_ECM_DEPOT_TS, or MGMT_AD4J_TS. Top 20 Large Tables/Indexes are
also displayed.
•Top 20 Tables with Unused Space in Repository
•Purge Policies
•Partition Retention
19.4 Controlling and Configuring Management Agents
Beginning with Enterprise Manager Cloud Control 12c, controlling Management
Agents can be performed directly from the Enterprise Manager console. This provides
a central point where all Management Agents within your monitored environment can
be compared, configured and controlled.
19.4.1 Manage Cloud Control Agents Page
The Agents page lists all Management Agents within your monitored environment.
This page also includes misconfigured, blocked and both upgradable and non-
upgradable Agents.
Accessing the Agent Page
From the Setup menu, select Manage Cloud Control and then Agents.
Misconfigured and Blocked Agents
Chapter 19
Controlling and Configuring Management Agents
19-17

A misconfigured Agent is an Agent that is not able to perform a heartbeat or upload
data to the Oracle Management Service (OMS) due to invalid configuration or invalid
data. Agent misconfiguration alerts are triggered by the following metrics:
•Consecutive metadata upload failure count
•Consecutive ping failure count
•Consecutive severity upload failure count
•OMS Agent time skew
If the Agent heartbeat or upload requests are failing consistently, and the problem
cannot be resolved in a timely manner, you can manually block the Agent to prevent
excessive load on the OMS. When you block an Agent, the OMS rejects all heartbeat
or upload requests from the blocked Agent. However, even though blocked Agents
continue to collect monitoring data, it will not be able to upload any alerts or metric
data to the OMS. Once the Agent configuration problem is resolved, you must
manually unblock the Agent to resume normal operation.
Note:
Before unblocking the Agent, ensure that all issues related to Agent
misconfiguration have been resolved.
From this page, you can also initiate the Agent upgrade process. For more information
about upgrading Agents see "Upgrading Multiple Management Agents".
19.4.2 Agent Home Page
The Agent home page provides details for a single Agent. This page also lets you drill
down for more detailed information. You can access an Agent home page by clicking
on a specific Agent from in the Agent list page or by selecting it from the All Targets
page.
•The Summary region provides primary details of the Agent such as its status and
availability. The Interaction with Management Service region provides details on
the communication between the OMS and the Agent and metric extensions and
management plug-ins deployed in the Agent.
•The Status region provides further details on the Agent status such as the number
of restarts, the action that the Agent is performing currently.
•The Performance, Usage and Resource Consumption charts provide further
details on the Agent in graphical format.
•The Incidents region lists the incidents recorded for the Agent.
•The Monitoring region provides details on the targets that are being monitored by
the Agent. You can filter targets in this region by All, Broken, and Not Uploading.
Separate tabs within the Monitoring section display Metric Issues and Top
Collections.
Chapter 19
Controlling and Configuring Management Agents
19-18
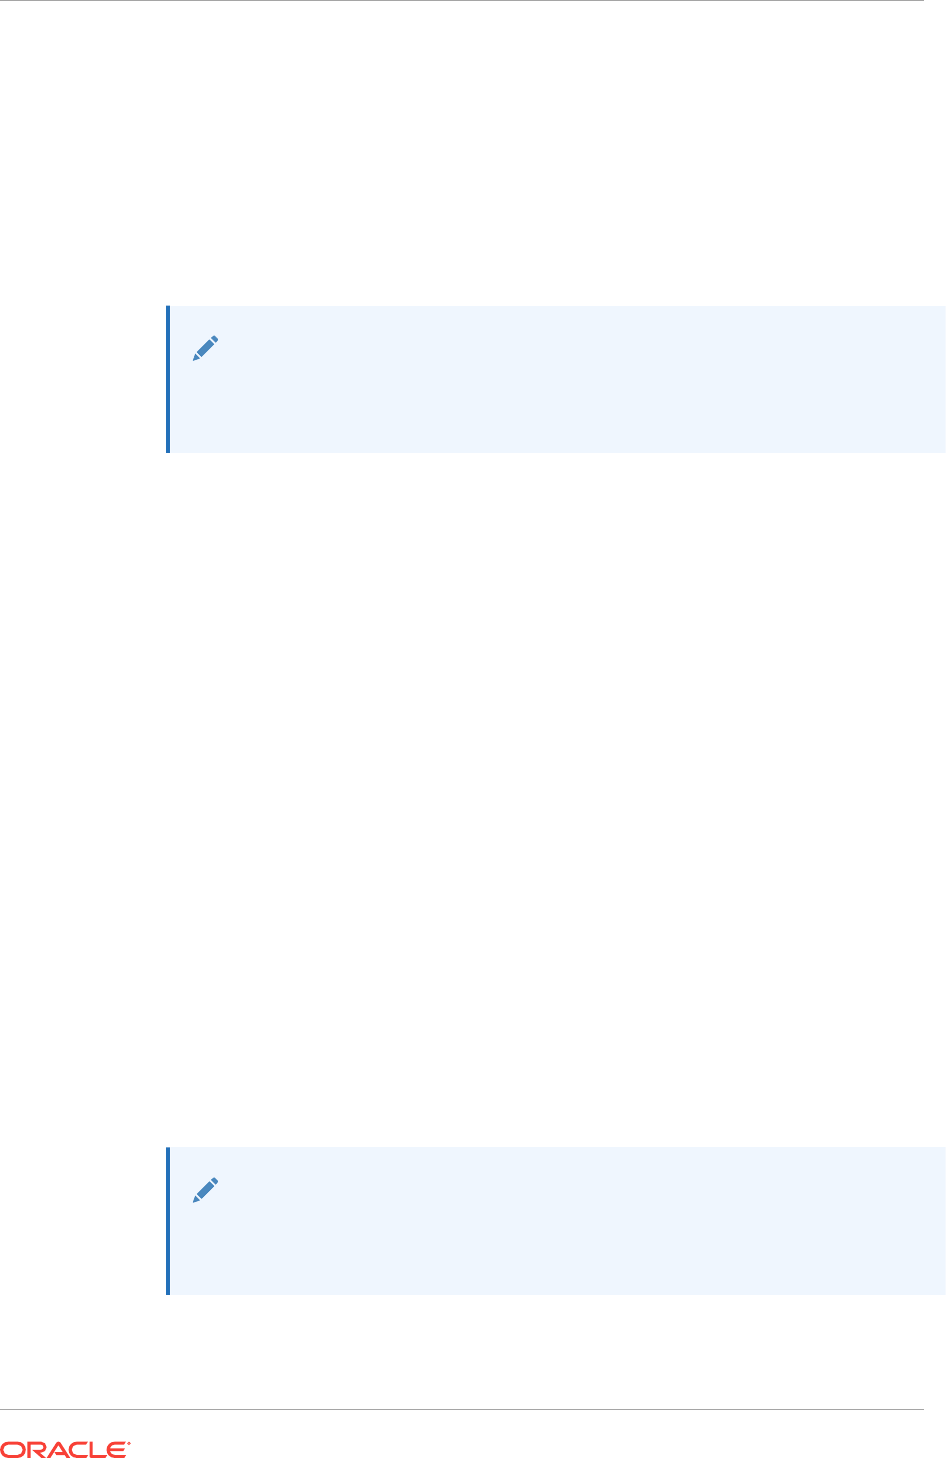
19.4.3 Controlling a Single Agent
Control operations for a single Agent can be performed on the Agent home page for
that Agent.
1. Navigate to the desired Agent home page.
2. From the Agent drop-down menu, choose Control and then one of the control
operations (Start Up/Shut Down, or Restart)
Note:
You must have at least operator privileges in order to perform Agent control
operations.
Upon choosing any of the above control menu options, a pop-up dialog requesting the
credentials of the user displays. These operations require the credentials of the OS
user who owns the Agent, or credentials of a user who has SUDO or PowerBroker
privilege of the Agent owner. At this point, you can either choose from a previously
stored username/password, preferred or named credential. You also have the option
of choosing a new set of credentials which could also be saved as the preferred
credential or as a named credential for future use.
Once you are authenticated, the chosen control operation begins and continues even
if the pop-up dialog is closed. Any message of failure/success of the task is displayed
in the pop-up dialog.
When choosing the Secure/Resecure/Unsecure options, you must provide the
requisite Registration Password.
Agent Control When Using a Server Load Balancer
When choosing the Agent Secure/Resecure options in a multi-OMS environment with
a server load balancer (SLB), the Agent will be secured/resecured against the SLB
automatically without administrator intervention.
19.4.4 Configuring Single Management Agents
Configuration operations for a single Agent can be performed from the Agent home
page. To access the Agent properties page:
1. Navigate to the desired Agent home page.
2. From the Agent drop-down menu, select Properties.
Note:
You must have at least Configure privileges in order to perform Agent
configuration operations.
Chapter 19
Controlling and Configuring Management Agents
19-19

Figure 19-21 Agent Properties Page
The properties on this page can be filtered to show All Properties, Basic Properties,
or Advanced Properties. The Basic Properties are a simple name, value
combination of a property and its value. Advanced Properties are also a combination
of name and value but can also be grouped into categories. You must have at least
configure privileges in order to modify the existing properties and set custom
properties.
19.4.5 Controlling Multiple Management Agents
In order to perform control operations on multiple Management Agents, Enterprise
Manager makes use of the Job system to automate repetitive tasks. Therefore, you
must have Job privileges for controlling multiple Management Agents through a single
action. To access
1. From the Setup menu, select Manage Cloud Control and then Agents. The
Agent page displays.
2. Select multiple Management Agents from the list.
3. Click one of the control operation buttons (Start Up/Shut Down/Restart/Secure/
Resecure/Unsecure).
When you click on any of the control operations, you are taken to the Job creation
wizard where you schedule a new job to perform the action on the selected Agents.
In the Jobs page, you can view the chosen Management Agents in Target section in
the General tab. You can add more Management Agents by clicking the Add button.
You then provide the parameters for the operation in the Parameters tab, if needed.
The credentials must be specified in the Credentials tab where you can either choose
from a previously stored username/password, preferred, or named credential. You
also have the option of choosing a new set of credentials which could also be saved
as the preferred credential or as a named credential for future use.You are given the
option to start the job immediately or schedule the job for a later time. At this point, you
can also create a repeating job by specifying the job start time, the frequency, and the
end time.
The Access tab displays the Administrator details and the access levels they have to
the job. You can then add a new administrator or modify the access level to View or
Full, if you have the requisite privileges.
Chapter 19
Controlling and Configuring Management Agents
19-20
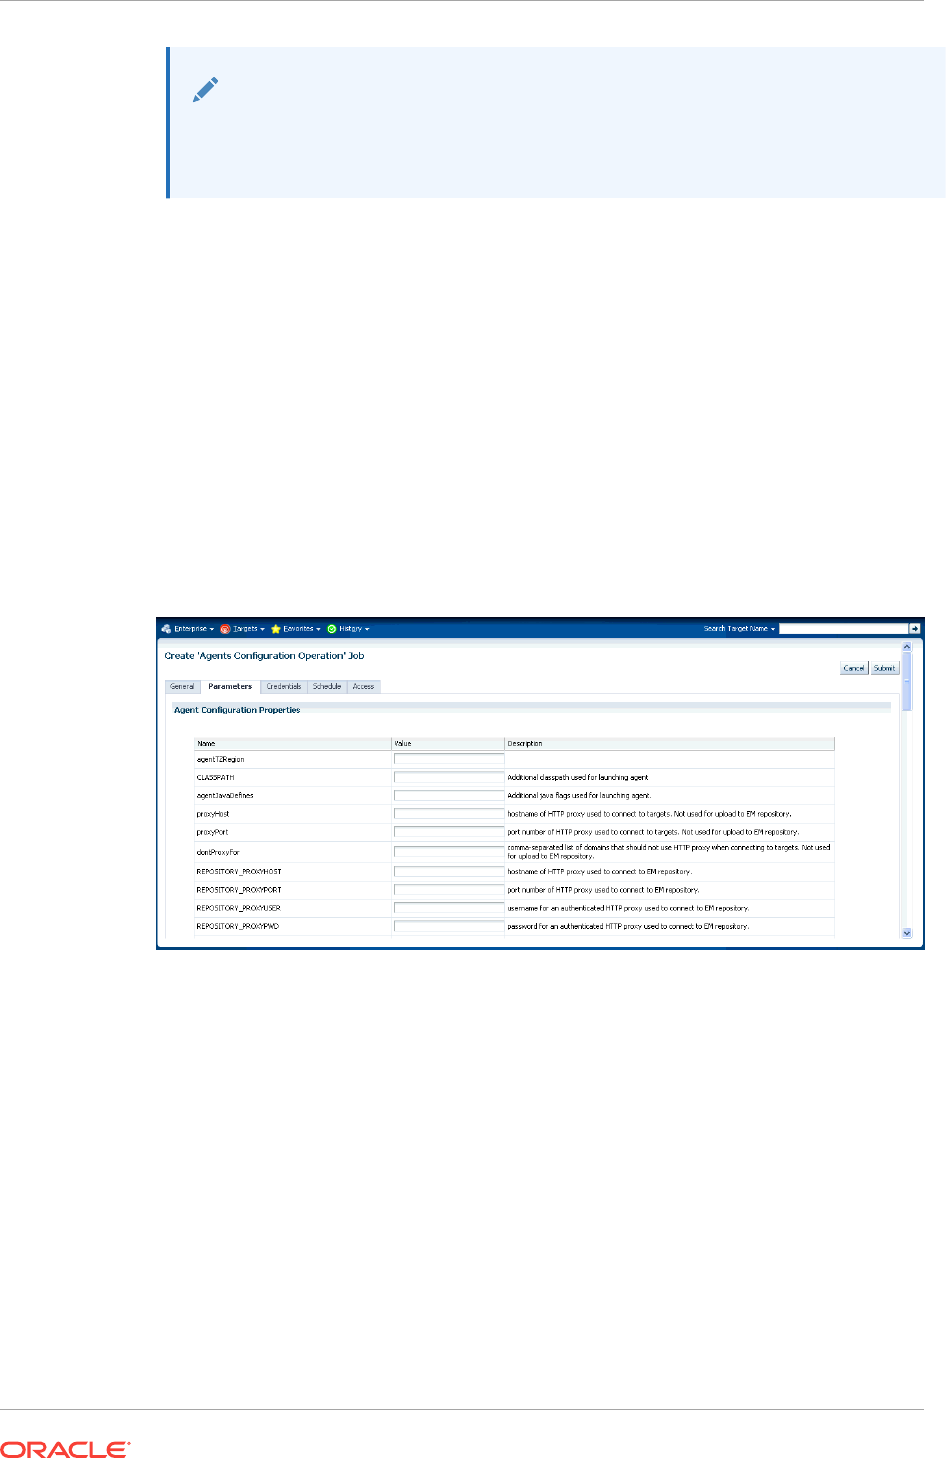
Note:
Administrators with insufficient privileges can also schedule jobs for these
control operations, but in this situation, the jobs will not complete successfully.
19.4.6 Configuring Multiple Agents
As with multi-Agent control operations, you can also perform Agent configuration on
multiple Agents in the same way. This greatly simplifies standardizing Agent
configurations across your enterprise. To access Agent properties:
1. From the Setup menu, select Manage Cloud Control and then Agents. The Agent
page displays.
2. Select multiple Management Agents from the list.
3. Click Properties. As with any multi-Agent operation, configuration is implemented
using the Job system.
Figure 19-22 Agent Properties Page
In the Jobs page, you can view the chosen Management Agents in the Target section
of the General tab. You can add more Management Agents by clicking the Add button
if necessary. In the Parameters tab, you provide the modified value for a particular set
of properties that you want to change. You can also set a custom property for the
chosen agents. No credentials are required for modifying Agent properties.
The Access tab displays the administrator details and the access levels they have to
the job. You can then add a new administrator or modify the access level to View or
Full if you have the requisite privileges.
Chapter 19
Controlling and Configuring Management Agents
19-21
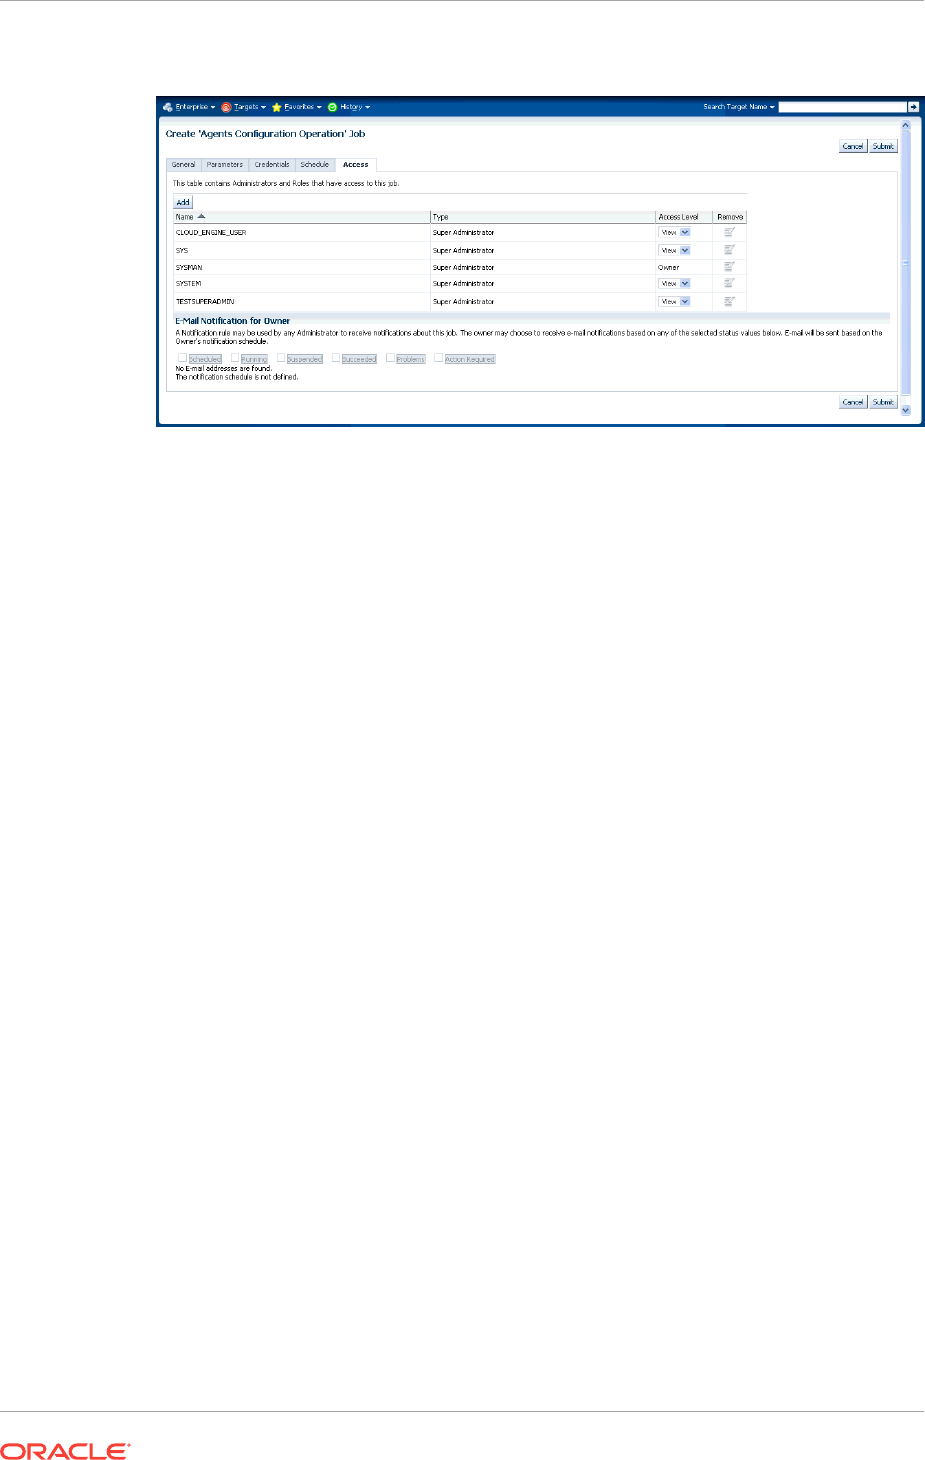
Figure 19-23 Multi-Agent Configuration: Job Access
19.4.7 Upgrading Multiple Management Agents
When you upgrade to the current Enterprise Manager Cloud Control 12c release, you
upgrade your Oracle Management Services (OMS) to the current release, but not your
target Oracle Management Agents (Management Agents). To mass-upgrade your
Management Agents, access the Upgrade Agents page. To access this page:
1. From the Setup menu, select Manage Cloud Control, then select Agents.
2. Click Upgradable, then select the Management Agents you want to upgrade.
3. Click Upgrade.
Alternatively, to access the Upgrade Agents page, from the Setup menu, select
Manage Cloud Control, then select Upgrade Agent. For more information on
upgrading Management Agents, refer Upgrading Oracle Management Agents.
19.5 Management Servers
A Management Server is a composite target consisting of multiple Enterprise Manager
Management Services.
The Management Servers page displays the list of Management Services, their status,
incidents, the loader throughput, CPU usage, and the JVM memory usage metrics. In
addition, the Management Services displayed can be filtered by Normal Mode,
Console Only, PBS only and Standby Management Services.
Accessing the Management Servers Page
From the Setup menu, select Manage Cloud Control and then Management
Services.
This page consists of the following sections:
•Summary: Displays the high-level information about WebLogic administration
server and Load balancer.
•Job System: Displays information about the status of jobs over past time periods
(such as the last 30 minutes, 1 hour, or 2 hours).
Chapter 19
Management Servers
19-22

•Servers: Displays information about individual Management Services of the
Management Server.
•Loader: Displays information that provides insight into the Loader subsystem
performance as a whole.
There are primarily 3 graphs as follows.
–Throughtput (Rows processed per second): Indicates the rate (rows processed
per second) at which the Loader is processing files.
–Files Processed vs Backoff: Indicates the number of files processed versus
backed off (rejected) by the Loader. Note: You should contact Oracle Support
if consistent backoffs are being generated.
–% Utilized Capacity: Sows the current Loader CPU utilization. If the Loader
consistently runs at more than 85% capacity, contact Oracle Support to
confirm whether your system capacity needs to be increased.
To view detailed IP reports of Loader statistics, click the Loader Statistics link
located below the graphs.
•Incidents: This displays the incidents and problems that have occurred against
individual targets hosting Management Services.
Chapter 19
Management Servers
19-23

20
Maintaining and Troubleshooting the
Management Repository
This section describes maintenance and troubleshooting techniques for maintaining a
well-performing Management Repository.
Specifically, this chapter contains the following sections:
•Management Repository Deployment Guidelines
•Management Repository Data Retention Policies
•Dropping and Recreating the Management Repository
•Troubleshooting Management Repository Creation Errors
•Cross Platform Enterprise Manager Repository Migration
20.1 Management Repository Deployment Guidelines
To be sure that your management data is secure, reliable, and always available,
consider the following settings and configuration guidelines when you are deploying
the Management Repository:
•Install a RAID-capable Logical Volume Manager (LVM) or hardware RAID on the
system where the Management Repository resides. At a minimum the operating
system must support disk mirroring and stripping. Configure all the Management
Repository data files with some redundant configuration.
•Use Real Application Clusters to provide the highest levels of availability for the
Management Repository.
•If you use Enterprise Manager to alert administrators of errors or availability issues
in a production environment, be sure that the Cloud Control components are
configured with the same level of availability. At a minimum, consider using Oracle
Data Guard to mirror the Management Repository database. Configure Data
Guard for zero data loss. Choose between Maximum Availability or Maximum
Protection based on your environment and needs.
See Also:
Oracle Database High Availability Architecture and Best Practices
Oracle Data Guard Concepts and Administration
•Oracle strongly recommends that archive logging be turned on and that a
comprehensive backup strategy be in place prior to an Enterprise Manager
implementation going live in a production environment. The backup strategy
should include archive backups and both incremental and full backups as required.
20-1

See Also:
Oracle Enterprise Manager Cloud Control Installation and Basic Configuration
for information about the database initialization parameters required for the
Management Repository
•Oracle recommends that you not use SQL Plan Management (SQL plan baselines
and capture) with the Enterprise Manager Cloud Control repository. If you do need
to use it for a specific problem, shut it off immediately after using. Issues with the
Enterprise Manager Cloud Control repository may occur when using SQL Plan
Management, such as very poor SQL performance using unverified plans, and
deadlocks between SQL Plan Management capture and the Enterprise Manager
security VPD.
•After enabling auditing for the repository database and for audit entries related to
ORA- errors, error messages should be ignored if they are not reported in the
Enterprise Manager application logs; for example, emoms.trc, the
MGMT_SYSTEM_ERROR_LOG table, or in the alert.log of the repository
database. In these cases the errors are harmless.
•To see a list of the regular maintenance activities that need to be performed for the
repository, see the Sizing Your Enterprise Manager Deployment in the Oracle®
Enterprise Manager Cloud Control Advanced Installation and Configuration Guide.
•To monitor the repository database activities using the Enterprise Manager user
interface, see Maintaining Enterprise Manager .
20.2 Management Repository Data Retention Policies
When the various components of Enterprise Manager are configured and running
efficiently, the Oracle Management Service gathers large amounts of raw data from
the Management Agents running on your managed hosts and loads that data into the
Management Repository. This data is the raw information that is later aggregated,
organized, and presented to you in the Cloud Control console.
After the Oracle Management Service loads information into the Management
Repository, Enterprise Manager aggregates and purges the data over time.
The following sections describe:
•The default aggregation and purging policies used to maintain data in the
Management Repository.
•How you can modify the length of time the data is retained before it is aggregated
and then purged from the Management Repository.
20.2.1 Management Repository Default Aggregation and Purging
Policies
Enterprise Manager aggregates collected metric data by hour and by day to enhance
query performance and help minimize the size of the Management Repository. Before
the data is aggregated, each data point is stored in a raw metric data table. Once a
day, the previous day's raw metric data is rolled up, or aggregated, into a one-hour
Chapter 20
Management Repository Data Retention Policies
20-2

and a one-day table. These hourly and daily records will have hourly and daily metric
data averages, minimums, maximums and standard deviations respectively.
After Enterprise Manager aggregates the data, the data is then considered eligible for
purging. A certain period of time must pass for data to actually be purged. This period
of time is called the retention time.
The raw data, with the highest insert volume, has the shortest default retention time,
which is set to 7 days. As a result, 7 days after it is aggregated into a one-hour record,
a raw data point is eligible for purging.
Note:
This data retention policy varies for JVMD and ADP data.
Hourly aggregate metric data records are purged after 31 days. The highest level of
aggregation, one day, is kept for 12 months (roughly 365 days).
The default data retention policies are summarized in Table 20-1.
Table 20-1 Default Repository Purging Policies
Aggregate Level Retention Time
Raw metric data 7 days
Hourly aggregated metric data 31 days
Daily aggregated metric data 24 months
If you have configured and enabled Application Performance Management, Enterprise
Manager also gathers, saves, aggregates, and purges response time data. The
response time data is purged using policies similar to those used for metric data. The
Application Performance Management purging policies are shown in Table 20-2.
Table 20-2 Default Repository Purging Policies for Application Performance
Management Data
Aggregate Level Retention Time
Raw response time data 24 hours
One-hour aggregated
response time data
7 days
One-hour distribution
response time data
24 hours
One-day aggregated
response time data
31 days
One-day distribution
aggregated response time
data
31 days
If you do not want to keep severity data for the default period (6 months), and want to
reduce the retention period for the EVENTS purge policy, you can use the following
command:
Chapter 20
Management Repository Data Retention Policies
20-3

em_purge.modify_purge_policy_group('EVENTS',NULL,*l_new_purge_hours*);
This command will modify only the purge policy group which will affect all the purge
policies associated with that group. Note that if a purge policy is associated with a
purge group, the retention period is taken as the retention period of the group. When
the retention of a purge policy (associated with a purge policy group) is changed, then
the retention is determined from the purge policy and not from the purge policy group.
To modify an individual purge policy use the following command:
em_purge.modify_purge_policy(
p_policy_name IN VARCHAR2,
p_retention_hours IN NUMBER
)
You can modify the purge policy and also the partition retention values by choosing
Manage Cloud Control from the Setup menu, then selecting Repository. From that
page, choose the Schema tab and then make any necessary changes in the Purge
Policies section (click Modify) or Partition Retention section.
Events data is partitioned and maintains six months of historical data by default. You
can change the default retention period using the procedure described above. The
severity data is tied to the events data purge policy and will be adjusted accordingly.
The fixed set of tables affected by this data purge are listed below:
EM_EVENT_SEQUENCES
EM_EVENT_RAW
EM_EVENT_MSGS
EM_EVENT_CONTEXT
EM_EVENT_ANNOTATIONS
EM_EVENTS_INCIDENT
EM_ISSUES_INTERNAL
EM_ISSUES_MSG
EM_ISSUES_ANNOTATIONS
EM_INCIDENT_ISSUE
EM_PROBLEM_ISSUE
EM_INCIDENTS_PROBLEM
The following list is a dynamic set of tables that store data for different event types
supported by Enterprise Manager. This list can vary over time as new event types or
unsupported event types are added or removed:
EM_EV_CS_RULE_VIOLATION
EM_EV_CS_SCORE
EM_EV_JOB_STATUS_CHANGE
EM_EV_METRIC_ALERT
EM_EV_METRIC_ERROR
EM_EV_MEXT_UPDATE
EM_EV_MNTR_DISRUPTION
EM_EV_SELFUPDATE
EM_EV_SLA_ALERT
EM_EV_TARGET_AVAILABILITY
EM_EV_USER_REPORTED
EM_EV_ADP_ALERT
EM_EV_APM_KPI_ALERT
EM_EV_JVMDIAG_ALERT
EM_EV_HA_EVENT
Chapter 20
Management Repository Data Retention Policies
20-4

20.2.2 Management Repository Default Aggregation and Purging
Policies for Other Management Data
Besides the metric data and Application Performance Monitoring data, other types of
Enterprise Manager data accumulates over time in the Management Repository.
For example, the last availability record for a target will also remain in the
Management Repository indefinitely, so the last known state of a target is preserved.
20.2.3 Modifying the Default Aggregation and Purging Policies
The Enterprise Manager default aggregation and purging policies were designed to
provide the most available data for analysis while still providing the best performance
and least disk-space requirements for the Management Repository. As a result, you
should not modify these policies to improve performance or increase your available
disk space.
However, if you plan to extract or review the raw or aggregated data using data
analysis tools other than Enterprise Manager, you may want to increase the amount of
raw or aggregated data available in the Management Repository. You can accomplish
this by increasing the retention times for the raw or aggregated data.
A PL/SQL API has been provided to modify the default retention time for the core
metric data tables in the Enterprise Manager repository. Table 20-3 shows the default
number of partitions retained for each of the three tables and the size of the partitions
for each table. The API will allow you to change the number of partitions retained only.
Table 20-3 Core EM Metric Data Tables and Default Data Retention in the
Management Repository
Table Name Partitions Retained Partition Size
EM_METRIC _VALUES 7 DAY
EM_METRIC_VALUES_HOURLY 32 DAY
EM_METRIC_VALUES_DAILY 24 MONTH
To modify the retention period for any of the above tables, execute the following
command:
SQL> execute gc_interval_partition_mgr.set_retention('SYSMAN', <table name>,
<number of partitions to retain>);
Replace the <table name> by name of table as listed above. The API will allow you to
change the number of partitions retained only.
For example, to modify the default retention time for the table EM_METRIC_VALUES
from 7 partitions to 14 partitions, follow these steps:
1. Use SQL*Plus to connect to the repository database as the SYSMAN user.
2. Check the current value of the retention periods:
SQL> select table_name, partitions_retained
from em_int_partitioned_tables
where table_name in
Chapter 20
Management Repository Data Retention Policies
20-5

('EM_METRIC_VALUES','EM_METRIC_VALUES_HOURLY','EM_METRIC_VALUES_DAILY');
TABLE_NAME PARTITIONS_RETAINED
------------------------- -------------------
EM_METRIC_VALUES 7
EM_METRIC_VALUES_HOURLY 32
EM_METRIC_VALUES_DAILY 24
3. To modify the default retention time for the table EM_METRIC_VALUES from 7
partitions to 14, execute the following command:
SQL> execute gc_interval_partition_mgr.set_retention('SYSMAN',
'EM_METRIC_VALUES', 14);
4. Verify that the retention period has been modified:
SQL> select table_name, partitions_retained
from em_int_partitioned_tables
where table_name in
('EM_METRIC_VALUES','EM_METRIC_VALUES_HOURLY','EM_METRIC_VALUES_DAILY');
TABLE_NAME PARTITIONS_RETAINED
------------------------- -------------------
EM_METRIC_VALUES 14
EM_METRIC_VALUES_HOURLY 32
EM_METRIC_VALUES_DAILY 24
20.2.4 How to Modify the Retention Period of Job History
Enterprise Manager Cloud Control has a default purge policy which removes all
finished job details which are older than 30 days. This section provides details for
modifying this default purge policy.
The actual purging of completed job history is implemented via a
DBMS_SCHEDULER job that runs once a day in the repository database. When the
job runs, it looks for finished jobs that are 'n' number of days older than the current
time (value of sysdate in the repository database) and deletes these jobs. The value of
'n' is, by default, set to 30 days.
The default purge policy cannot be modified via the Enterprise Manager console, but it
can be changed using SQL*Plus.
To modify this purge policy, follow these steps:
1. Log in to the repository database as the SYSMAN user, via SQL*Plus.
2. Check the current values for the purge policies using the following command:
SQL> select * from mgmt_job_purge_policies;
POLICY_NAME TIME_FRAME
-------------------------------- ----------
SYSPURGE_POLICY 30
REFRESHFROMMETALINKPURGEPOLICY 7
FIXINVENTORYPURGEPOLICY 7
OPATCHPATCHUPDATE_PAPURGEPOLICY 7
The purge policy responsible for the job deletion is called SYSPURGE_POLICY.
As seen above, the default value is set to 30 days.
3. To change the time period, you must drop and recreate the policy with a different
time frame:
Chapter 20
Management Repository Data Retention Policies
20-6

SQL> execute MGMT_JOBS.drop_purge_policy('SYSPURGE_POLICY');
PL/SQL procedure successfully completed.
SQL> execute MGMT_JOBS.register_purge_policy('SYSPURGE_POLICY', 60, null);
PL/SQL procedure successfully completed.
SQL> COMMIT;
Commit complete.
SQL> select * from mgmt_job_purge_policies;
POLICY_NAME TIME_FRAME
-------------------------------- ----------
SYSPURGE_POLICY 60
....
The above commands increase the retention period to 60 days. The time frame can
also be reduced below 30 days, depending on the requirement.
You can check when the purge job will be executed next. The actual time that the
purge runs is set to 5 AM repository time and can be verified using these steps:
1. Login to the Repository database using the SYSMAN account.
2. Execute the following command:
SQL> select job_name,
to_char(last_start_date, 'DD-MON-YY HH24:MI:SS') last_run,
to_char(next_run_date, 'DD-MON-YY HH24:MI:SS') next_run
from all_scheduler_jobs
where job_name ='EM_JOB_PURGE_POLICIES';
JOB_NAME LAST_RUN NEXT_RUN
--------------------- ------------------ ------------------
EM_JOB_PURGE_POLICIES 07-SEP-11 05:00:00
The schedule can also be verified from the Enterprise Manager console by
following these steps:
a. From the Setup menu, select Management Service, then select Repository.
b. Click the Repository Operations tab.
c. Find the Next Scheduled Run and Last Scheduled Run information for Job
Purge in the list.
Please note that the time of the next scheduled execution of the Job Purge does
not represent the cutoff time for the retention period; the cutoff time is determined
by the purge policy at the time the Job Purge runs.
20.2.5 DBMS_SCHEDULER Troubleshooting
Enterprise Manager uses the database scheduler (dbms_scheduler) to run various
processes in the repository. When the dbms_scheduler is stopped or has insufficient
resources to operate, the Enterprise Manager processes do not run or are delayed.
The following is a list of common causes that may prohibit the dbms_scheduler from
running normally.
Job Queue Processes
Chapter 20
Management Repository Data Retention Policies
20-7

The dbms_scheduler uses a separate job-queue process for each job it runs. The
maximum number of these processes is controlled by the database parameter,
job_queue_processes. If all processes are in use, no new jobs will be started.
The following query returns the number of currently running jobs.
SQL> SELECT count(*)
FROM dba_scheduler_running_jobs;
If the count is close to the setting of job_queue_processes, it could mean that
Enterprise Manager dbms_scheduler jobs cannot be started (on time). Determine if
any of the running dbms_scheduler jobs are stuck and consider increasing the setting
for job_queue_processes.
Job Slave Processes
The dbms_scheduler also depends on the setting of the dbms_scheduler property
MAX_JOB_SLAVE_PROCESSES. If the number of running dbms_scheduler jobs
exceeds this setting, no new jobs will be started. This attribute can be checked using
this query.
SQL> SELECT value
FROM dba_scheduler_global_attribute
WHERE attribute_name='MAX_JOB_SLAVE_PROCESSES';
If the count equals the number of running dbms_scheduler jobs, then determine if any
of the running dbms_scheduler jobs are stuck and consult the dbms_scheduler
documentation about how to adjust this attribute.
DBMS_SCHEDULER Program Disabled
The dbms_scheduler has an attribute that can be set to disable this feature in the
database. When set, the Enterprise Manager dbms_scheduler jobs will not run. To
check if this attribute has been set (inadvertently), run this query.
SQL> SELECT *
FROM dba_scheduler_global_attribute
WHERE attribute_name = 'SCHEDULER_DISABLED';
When a row is returned, the dbms_scheduler is disabled. Execute
dbms_scheduler.set_scheduler_attribute('SCHEDULER_DISABLED', 'FALSE');
Consult the dbms_scheduler documentation about how to remove this attribute.
Too Many Database Sessions
Each dbms_scheduler job requires two database sessions. When no more sessions
are available, Enterprise Manager dbms_scheduler jobs will not run. The following two
queries give the maximum number of allowed sessions and the current number of
active sessions:
SQL> SELECT value
FROM v$parameter
WHERE name='sessions';
SQL> SELECT count(*)FROM v$session;
When the current number of sessions approaches the maximum, then you should
determine if any of the sessions are stuck and consult the Oracle Database
documentation about how to increase the maximum number of sessions.
Chapter 20
Management Repository Data Retention Policies
20-8

Also the high water mark of the number of sessions may indicate that this issue has
played a role in the past:
SQL> select *
from v$resource_limit
where resource_name = 'sessions' ;
If the MAX_UTILIZATION column indicates a value that is close the maximum number
of sessions, it could explain why some of the Enterprise Manager dbms_scheduler
jobs may not have run (on time) in the past.
Insufficient Memory
The database may not be able to spawn a new job queue process when there is
insufficient memory available. The following message in the database alert file, Unable
to spawn jobq slave processes, in combination with, (free memory = 0.00M), would be
indicative of this problem. Please consult the Oracle Database documentation about
how to diagnose this memory problem further.
20.3 Dropping and Recreating the Management Repository
This section provides information about dropping the Management Repository from
your existing database and recreating the Management Repository after you install
Enterprise Manager.
It should be noted here that there is no recovery from the drop command so this action
is only appropriate if you are decommissioning an Enterprise Manager site.
20.3.1 Dropping the Management Repository
To recreate the Management Repository, you first remove the Enterprise Manager
schema from your Management Repository database. You accomplish this task using
the
-action drop
argument to the
RepManager
script, which is described in the following
procedure.
To remove the Management Repository from your database:
1. Locate the
RepManager
script in the following directory of the Middleware Home
where you have installed and deployed the Management Service:
ORACLE_HOME/sysman/admin/emdrep/bin
Note:
Do not use the database version of the Repmanager script. It does not delete
all components which will result in a failed re-installation.
Also, RepManager is the only way to drop the repository, so you should be
sure not to delete the OMS Home until the drop has successfully completed.
2. At the command prompt, enter the following command:
$PROMPT> RepManager repository_host repository_port repository_SID
-sys_password password_for_sys_account -action drop
In this syntax example:
Chapter 20
Dropping and Recreating the Management Repository
20-9
•
repository_host
is the machine name where the Management Repository
database is located
•
repository_port
is the Management Repository database listener port
address, usually 1521
•
repository_SID
is the Management Repository database system identifier
•
password_for_sys_account
is the password of the SYS user for the database.
For example,
change_on_install
•
-action drop
indicates that you want to drop the Management Repository,
MDS, OPSS, APM, and Schemas. If you use drop, the command drops only
the Management Repository.
Note:
The drop command will remove the BI schema (SYSMAN_BIPLATFORM) if it
exists.
Alternatively, you can use a connect descriptor to identify the database on the
RepManager command line. The connect descriptor identifies the host, port, and name
of the database using a standard Oracle database syntax.
For example, you can use the connect descriptor as follows to create the Management
Repository:
$PROMPT> ./RepManager -connect "(DESCRIPTION=(ADDRESS=(PROTOCOL=TCP)
(HOST=host1)(PORT=1521)) (CONNECT_DATA=(SERVICE_NAME=servicename)))"
-sys_password efkl34lmn -action drop
See Also:
"Establishing a Connection and Testing the Network" in the Oracle Enterprise
Manager Licensing Information for more information about connecting to a
database using connect descriptors.
20.3.2 Recreating the Management Repository
The preferred method for creating the Management Repository is to create the
Management Repository during the Enterprise Manager installation procedure, which
is performed using Oracle Universal Installer.
See Also:
Oracle Enterprise Manager Cloud Control Installation and Basic Configuration
for information about installing Enterprise Manager.
In the event a repository is dropped, you cannot create the repository alone using the
"RepManager create" command. The command will not create all the required users in
Chapter 20
Dropping and Recreating the Management Repository
20-10

the repository database. To create the repository you must completely reinstall Cloud
Control.
If you are following recommended best practices by regularly backing up the
repository, then you can use a backup of the repository as long as any one of the
following is true:
•The primary OMS home is intact
•There is an export/config of the primary OMS
•There is a file system back up of the primary OMS
20.3.2.1 Using a Connect Descriptor to Identify the Management Repository
Database
You can use a connect descriptor to identify the database on the
RepManager
command
line. The connect descriptor identifies the host, port, and name of the database using a
standard Oracle database syntax.
For example, you can use the connect descriptor as follows to create the Management
Repository:
$PROMPT> ./RepManager -connect "(DESCRIPTION=(ADDRESS=(PROTOCOL=TCP)
(HOST=host1)(PORT=1521)) (CONNECT_DATA=(SERVICE_NAME=servicename)))"
-sys_password efkl34lmn -action create
See Also:
"Establishing a Connection and Testing the Network" in the Oracle Enterprise
Manager Licensing Information for more information about connecting to a
database using a connect descriptor
The ability to use a connect string allows you to provide an address list as part of the
connection string. The following example shows how you can provide an address list
consisting of two listeners as part of the
RepManager
command line. If a listener on one
host becomes unavailable, the second listener can still accept incoming requests:
$PROMPT> ./RepManager -connect "(DESCRIPTION=
(ADDRESS_LIST=
(ADDRESS=(PROTOCOL=TCP)(HOST=host1)(PORT=1521)
(ADDRESS=(PROTOCOL=TCP)(HOST=host2)(PORT=1521)
(CONNECT_DATA=(SERVICE_NAME=servicename)))"
-sys_password efkl34lmn -action create
See Also:
Oracle Database High Availability Architecture and Best Practices
Oracle Enterprise Manager Cloud Control Installation and Basic Configuration
Chapter 20
Dropping and Recreating the Management Repository
20-11

20.4 Troubleshooting Management Repository Creation
Errors
Oracle Universal Installer creates the Management Repository using a configuration
step at the end of the installation process. If the repository configuration tool fails, note
the exact error messages displayed in the configuration tools window, wait until the
other configuration tools have finished, exit from Universal Installer, and then use the
following sections to troubleshoot the problem.
20.4.1 Package Body Does Not Exist Error While Creating the
Management Repository
If the creation of your Management Repository is interrupted, you may receive the
following error when you attempt to create or drop the Management Repository at a
later time:
SQL> ERROR:
ORA-00604: error occurred at recursive SQL level 1
ORA-04068: existing state of packages has been discarded
ORA-04067: not executed, package body "SYSMAN.MGMT_USER" does not exist
ORA-06508: PL/SQL: could not find program unit being called
ORA-06512: at "SYSMAN.SETEMUSERCONTEXT", line 5
ORA-06512: at "SYSMAN.CLEAR_EMCONTEXT_ON_LOGOFF", line 4
ORA-06512: at line 4
To fix this problem, see "General Troubleshooting Techniques for Creating the
Management Repository".
20.4.2 Server Connection Hung Error While Creating the Management
Repository
If you receive an error such as the following when you try to connect to the
Management Repository database, you are likely using an unsupported version of the
Oracle Database:
Server Connection Hung
To remedy the problem, upgrade your database to the supported version as described
in Oracle Enterprise Manager Cloud Control Installation and Basic Configuration.
20.4.3 General Troubleshooting Techniques for Creating the
Management Repository
If you encounter an error while creating the Management Repository, drop the
repository by running the
-drop
argument to the
RepManager
script.
Chapter 20
Troubleshooting Management Repository Creation Errors
20-12

See Also:
Dropping the Management Repository
If the
RepManager
script drops the repository successfully, try creating the Management
Repository again.
If the
RepManager -action drop/drop
fails for any reason, perform the following steps:
1. Apply the Bundle Patch to the 12c OMS home. Note that this step is only
applicable to 12.1.0.1 OMS. Refer to My Oracle Support Note 1393173.1:
Enterprise Manager Cloud Control Installation Instructions for Bundle Patch 1 and
12.1.0.2 Plug-ins for instructions.
2. Stop the OMS and verify that all the WLS / OMS processes have been stopped in
the OMS home:
cd <ORACLE_HOME>/bin
emctl stop oms -all
Note:
You should use the -all option so that the Admin Server is stopped as well
Verify that there are no WLS / OMS processes still running:
$ ps -ef | grep EMGC
$ ps -ef | grep java
3. Drop the repository objects using the "Repmanager drop" command:
cd <ORACLE_HOME>/sysman/admin/emdrep/bin
RepManager <database hostname> <database listener port> <database sid> -action
drop -dbUser sys -dbPassword <sys user password> -dbRole sysdba -mwHome
<Middleware Home> -mwOraHome <Middleware Home> -oracleHome <OMS Home>
For example:
RepManager repomachine.domain 1521 orcl -action drop -dbUser sys -dbPassword
oracle123 -dbRole sysdba -mwHome /home/oracle/Middleware
-mwOraHome /home/oracle/Middleware -oracleHome /home/oracle/Middleware/oms
4. Log in to the Repository Database as sys or any DBA user and verify that all the
repository objects have been dropped:
SQL> select username,account_status from dba_users where username in ('SYSMAN',
'SYSMAN_MDS','MGMT_VIEW','SYSMAN_BIPLATFORM','SYSMAN_APM','BIP','SYSMAN_OPSS','SY
SMAN_RO') ;
SQL> select owner,synonym_name from dba_synonyms where table_owner in ('SYSMAN',
'SYSMAN_MDS','MGMT_VIEW','SYSMAN_BIPLATFORM','SYSMAN_APM','BIP','SYSMAN_OPSS','SY
SMAN_RO') ;
SQL> select tablespace_name from dba_tablespaces where tablespace_name like 'MGMT
%';
SQL> select comp_name from SCHEMA_VERSION_REGISTRY;
Chapter 20
Troubleshooting Management Repository Creation Errors
20-13

None of the above queries should return any rows. If any of the above queries
return any rows, then raise an SR with Oracle Support.
Note:
The above solution is applicable if the OMS is in working condition. If the OMS
home is not available or not intact, raise an SR with Oracle Support.
20.5 Cross Platform Enterprise Manager Repository
Migration
There are user requirements for migrating an Enterprise Manager repository across
servers - same and cross platforms.
The Enterprise Manager repository migration process is not exactly the same as
database migration. In the case of Enterprise Manager Repository migration you must
take care of Enterprise Manager specific data, options, and pre-requisites for the
repository move. You should make sure data integrity is maintained from both the
Enterprise Manager and Oracle database perspective.
This raises the need for defining the process that can be followed by end users for
successful and reliable migration of repository in minimum time and with maximum
efficiency.
The overall strategy for migration depends on:
•The source and target database version
•The amount of data/size of repository
•Actual data to migrate [selective/full migration]
If the source and target is not on release 12c then export/import is the only way to get
the data migrated cross platform.
More details on cross platform transportable tablespace, data pump, and export/import
options can be found at the Oracle Technology Network (OTN) or in the Oracle
Database Administrator's Guide.
20.5.1 Common Prerequisites
The following lists the common prerequisites for a repository migration:
•Source and target database must use the same character set and should be at
same version.
•The source and target database platform must be at the same endian format.
•The target database should meet all the pre-requisites for the Enterprise Manager
Repository software requirements mentioned in the Oracle Enterprise Manager
Installation Guide.
•If the source and target database are on release 10gR2 and higher rdbms
versions, and provided they are meeting other prerequisites, cross platform
Chapter 20
Cross Platform Enterprise Manager Repository Migration
20-14

transportable database migration can be used for cross platform repository
migration.
•You cannot transport a tablespace to a target database in which a tablespace with
the same name already exists. However, you can rename either the tablespace to
be transported or the destination tablespace before the transport operation.
•To plug a transportable tablespace set into an Oracle Database on a different
platform, both databases must have compatibility set to at least Release 10.0.
•Most of the platforms (but not all) are supported for cross-platform tablespace
transport. You can query the V$TRANSPORTABLE_PLATFORM view to see the
platforms that are supported, and to determine their platform IDs and their endian
format (byte ordering).
•Source and Destination host should have Enterprise Manager Management Agent
running and configured to the instance which is to be migrated.
•If the target database has an Enterprise Manager repository installed, it should be
first dropped using RepManager before target database related steps are carried
out.
20.5.2 Methodologies
The following sections discuss two methodologies for a repository migration:
•Using Cross Platform Transportable Database
•Migration Using Physical Standby
20.5.2.1 Using Cross Platform Transportable Database
Oracle's transportable database feature allows users to quickly move a user
tablespace across Oracle databases. It is the most efficient way to move bulk data
between databases. With the cross platform transportable database, you can transport
tablespaces across platforms.
Cross platform transportable database allows a database to be migrated from one
platform to another (use with Data Pump or Import/Export). The following set of steps
for migration using Transportable Database can be used for migrations between
same-endian platforms:
1. Verify whether migration is possible on the destination platform from
v$db_transportable_platform.
SQL> select platform_name from v$db_transportable_platform;
You may see a list of platforms similar to the list below:
Microsoft Windows IA (32-bit)
Linux IA (32-bit)
HP Tru64 UNIX
Linux IA (64-bit)
HP Open VMS
Microsoft Windows IA (64-bit)
Linux x86 64-bit
Microsoft Windows x86 64-bit
Solaris Operating System (x86)
HP IA Open VMS
Solaris Operating System (x86-64)
Chapter 20
Cross Platform Enterprise Manager Repository Migration
20-15

2. Verify that the external tables and files exist in the database.
SQL> set serveroutput on
SQL> declare x boolean;
2 begin x := dbms_tdb.check_external;
3 end;
4 /
The following output results:
The following external tables exist in the database:
SH.SALES_TRANSACTIONS_EXT
The following directories exist in the database:
SYS.SUBDIR, SYS.SS_OE_XMLDIR, SYS.MEDIA_DIR, SYS.LOG_FILE_DIR,
SYS.DATA_FILE_DIR, SYS.XMLDIR, SYS.DATA_PUMP_DIR, SYS.ORACLE_OCM_CONFIG_DIR
The following BFILEs exist in the database:
PM.PRINT_MEDIA
Enter the following command:
SQL> select directory_path from dba_directories;
The following output results:
DIRECTORY_PATH
--------------------------------------------------------------------------------
/home/oracle/app/oracle/product/11.2.0/dbhome_1/demo/schema/order_entry//2002/Sep
/home/oracle/app/oracle/product/11.2.0/dbhome_1/demo/schema/order_entry/
/home/oracle/app/oracle/product/11.2.0/dbhome_1/demo/schema/log/
/home/oracle/app/oracle/product/11.2.0/dbhome_1/demo/schema/sales_history/
/ade/b/1191423112/oracle/rdbms/xml
/home/oracle/app/oracle/product/11.2.0/dbhome_1/demo/schema/product_media/
/home/oracle/app/oracle/admin/orcl/dpdump/
/home/oracle/app/oracle/product/11.2.0/dbhome_1/ccr/state
8 rows selected.
Enter the following command:
SQL> select directory_path||'/'||location External_file_path from
dba_directories a, dba_external_locations b where
a.directory_name=b.directory_name;
The following output results:
EXTERNAL_FILE_PATH
----------------------------------------------------------------------------
/home/oracle/app/oracle/product/11.2.0/dbhome_1/demo/schema/sales_history//
sale1v3.dat
Enter the following command:
SQL> @tgt_get_bfile_dirs.sql
The following output results:
The following directories contain external files for BFILE columns
Copy the files within these directories to the same path on the target system
/home/oracle/app/oracle/product/11.2.0/dbhome_1/demo/schema/product_media/
There are 1 directories, 4 total BFILEs
SQL> @tgt_get_bfiles.sql
Chapter 20
Cross Platform Enterprise Manager Repository Migration
20-16

External files for BFILE column AD_GRAPHIC in table PM.PRINT_MEDIA
/home/oracle/app/oracle/product/11.2.0/dbhome_1/demo/schema/product_media//
monitor.jpg
/home/oracle/app/oracle/product/11.2.0/dbhome_1/demo/schema/product_media//
mousepad.jpg
/home/oracle/app/oracle/product/11.2.0/dbhome_1/demo/schema/product_media//
keyboard.jpg
/home/oracle/app/oracle/product/11.2.0/dbhome_1/demo/schema/product_media//
modem.jpg
3. Stop the OMS.
emctl stop oms -all
Enter the following SQL commands:
SQL> shutdown immediate
Database closed.
Database dismounted.
ORACLE instance shut down.
SQL> startup mount;
ORACLE instance started.
Total System Global Area 1473089536 bytes
Fixed Size 1336596 bytes
Variable Size 1124076268 bytes
Database Buffers 335544320 bytes
Redo Buffers 12132352 bytes
Database mounted.
4. Open the database in read-only mode.
SQL> alter database open read only;
Enter the following SQL commands:
SQL> set serveroutput on
SQL> declare
2 retcode boolean;
3 begin
4 retcode := dbms_tdb.check_db('Linux IA (64-bit)',dbms_tdb.skip_none);
5 end;
6 /
SQL> declare
2 retcode boolean;
3 begin
4 retcode := dbms_tdb.check_db('Linux x86 64-bit',dbms_tdb.skip_none);
5 end;
6 /
PL/SQL procedure successfully completed.
5. Generate the RMAN conversion script.
[oracle]$ ./rman
Recovery Manager: Release 11.2.0.1.0 - Production on Fri dd-mm-yy 12:10:29 2012
Copyright (c) 1982, 2009, Oracle and/or its affiliates. All rights reserved.
RMAN> connect target /
connected to target database: ORCL (DBID=1308105793)
RMAN> convert database on target platform
2> convert script '/tmp/convert_mydb.rman'
Chapter 20
Cross Platform Enterprise Manager Repository Migration
20-17

3> transport script '/tmp/transport_mydb.sql'
4> new database 'mydb'
5> format '/tmp/mydb%U'
6> db_file_name_convert '/home/oracle/app/oracle/oradata/mydb/','/tmp';
Starting conversion at source at dd-mm-yy
using target database control file instead of recovery catalog
allocated channel: ORA_DISK_1
channel ORA_DISK_1: SID=135 device type=DISK
External table SH.SALES_TRANSACTIONS_EXT found in the database
Directory SYS.SUBDIR found in the database
Directory SYS.SS_OE_XMLDIR found in the database
Directory SYS.MEDIA_DIR found in the database
Directory SYS.LOG_FILE_DIR found in the database
Directory SYS.DATA_FILE_DIR found in the database
Directory SYS.XMLDIR found in the database
Directory SYS.DATA_PUMP_DIR found in the database
Directory SYS.ORACLE_OCM_CONFIG_DIR found in the database
BFILE PM.PRINT_MEDIA found in the database
User SYS with SYSDBA and SYSOPER privilege found in password file
channel ORA_DISK_1: starting to check datafiles
input datafile file number=00001 name=/home/oracle/app/oracle/oradata/orcl/
system01.dbf
channel ORA_DISK_1: datafile checking complete, elapsed time: 00:00:00
channel ORA_DISK_1: starting to check datafiles
input datafile file number=00002 name=/home/oracle/app/oracle/oradata/orcl/
sysaux01.dbf
channel ORA_DISK_1: datafile checking complete, elapsed time: 00:00:00
channel ORA_DISK_1: starting to check datafiles
input datafile file number=00007 name=/home/oracle/app/oracle/oradata/orcl/
mgmt.dbf
channel ORA_DISK_1: datafile checking complete, elapsed time: 00:00:00
channel ORA_DISK_1: starting to check datafiles
input datafile file number=00003 name=/home/oracle/app/oracle/oradata/orcl/
undotbs01.dbf
channel ORA_DISK_1: datafile checking complete, elapsed time: 00:00:00
channel ORA_DISK_1: starting to check datafiles
input datafile file number=00008 name=/home/oracle/app/oracle/oradata/orcl/
mgmt_ad4j.dbf
channel ORA_DISK_1: datafile checking complete, elapsed time: 00:00:00
channel ORA_DISK_1: starting to check datafiles
input datafile file number=00005 name=/home/oracle/app/oracle/oradata/orcl/
example01.dbf
channel ORA_DISK_1: datafile checking complete, elapsed time: 00:00:00
channel ORA_DISK_1: starting to check datafiles
input datafile file number=00006 name=/home/oracle/app/oracle/oradata/orcl/
mgmt_depot.dbf
channel ORA_DISK_1: datafile checking complete, elapsed time: 00:00:00
channel ORA_DISK_1: starting to check datafiles
input datafile file number=00004 name=/home/oracle/app/oracle/oradata/orcl/
users01.dbf
channel ORA_DISK_1: datafile checking complete, elapsed time: 00:00:00
Edit init.ora file /tmp/init_mydb00nbs6dl_1_0.ora. This PFILE will be used to
create the database on the target platform
Run RMAN script /tmp/convert_mydb.rman on target platform to convert datafiles
Run SQL script /tmp/transport_mydb.sql on the target platform to create database
To recompile all PL/SQL modules, run utlirp.sql and utlrp.sql on the target
Chapter 20
Cross Platform Enterprise Manager Repository Migration
20-18

platform
To change the internal database identifier, use DBNEWID Utility
Finished conversion at source at dd-mm-yy
6. Copy all the required files to a temporary location and mount on the target
machine.
convert_mydb.rman
init_mydb.ora
transport_mydb.sql (and other data files listed in rman script
[convert_mydb.rman] and redolog files)
7. Execute the scripts generated in Step 5 on the target machine.
The RMAN script contains convert datafile commands. The SQL script contains
control file creation, invalidating objects, and recompiling objects. On the target
machine, execute the following:
RMAN> connect target /
RMAN> @/home/oracle/migrate/convert_mydb.rman
8. Ensure the database is up and running and the database is registered with the
listener.
RMAN> STARTUP NOMOUNT PFILE = '/home/oracle/migrate/
init_mydb00nbs6dl_1_0.ora'; database is already started
9. Start the OMS to ensure the admin server is up.
[oracle]$ ./emctl status oms
[oracle]$ ./emctl start oms
10. Stop the OMS.
[oracle]$ ./emctl stop oms
11. Update repository database connection details.
[oracle]$ ./emctl config oms -store_repos_details -repos_conndesc
"(DESCRIPTION=(ADDRESS_LIST=(ADDRESS=(PROTOCOL=TCP)
(HOST=evildead.idc.oracle.com)(PORT=1521)))(CONNECT_DATA=(SID=mydb)))" -
repos_user SYSMAN -repos_pwd Oracle123
If there are multiple Oracle Management Services in this environment, run this
store_repos_details command on all of them.
12. Restart the OMS.
[oracle]$ ./emctl start oms
[oracle]$ ./emctl status oms
Oracle Enterprise Manager Cloud Control 12c Release 12.1.0.4.0
Copyright (c) 1996, 2013 Oracle Corporation. All rights reserved.
WebTier is Up
Oracle Management Server is Up
13. Relocate Management Services and the Repository target.
20.5.2.2 Migration Using Physical Standby
The following steps describe the process you can use to migrate a repository using
Physical Standby. This method can be used when the source and target platforms are
Chapter 20
Cross Platform Enterprise Manager Repository Migration
20-19

supported. See My Oracle Support Note:413484.1 for details of which platform
combinations are supported.
1. Install the database ORACLE_HOME on the target machine. The binaries should
be the same version as the source.
If the target machine is Windows, install and configure CYGWIN on the Windows
box for Management Agent deployment.
2. Deploy the Management Agent to the target server.
3. Create a Physical Standby as described in the Data Guard documentation.
4. Configure the Data Guard broker as described in the Data Guard Broker
documentation.
5. Shutdown the OMS.
emctl stop oms -all
6. Check the OMS connect descriptor.
./emctl config oms -list_repos_details
7. Switchover the database using dgmgrl.
Use the following commands:
DGMGRL> switchover to target_db
verify
show configuration
show database target_db
show database source_db
8. Start the OMS admin server.
emctl start oms -admin_only
9. Update connect descriptor to point to the Standby Database.
eemctl config oms -store_repos_details -repos_conndesc "(DESC= )" -repos_user
sysman
[oracle]$ ./emctl config oms -store_repos_details -repos_conndesc
"(DESCRIPTION=(ADDRESS=(PROTOCOL=TCP)(HOST=sample2.us.company.com)(PORT=1521))
(CONNECT_DATA=(SERVER=DEDICATED)(SERVICE_NAME=test_win)))" -repos_user sysman
Oracle Enterprise Manager Cloud Control 12c Release 12.1.0.4.0
Copyright (c) 1996, 2013 Oracle Corporation. All rights reserved.
Enter Repository User's Password :
Successfully updated datasources and stored repository details in Credential
Store.
If there are multiple Oracle Management Services in this environment, run this
store_repos_details command on all of them.
10. Stop all the Oracle Management Services.
emctl stop oms -all
11. Start the OMS.
emctl start oms
12. Relocate Oracle Management Services and the Repository.
emctl config emrep -conn_desc
Chapter 20
Cross Platform Enterprise Manager Repository Migration
20-20

[oracle]$ ./emctl config emrep -conn_desc "(DESCRIPTION=(ADDRESS=(PROTOCOL=TCP)
(HOST=sample2.us.company)(PORT=1521))(CONNECT_DATA=(SERVER=DEDICATED)
(SERVICE_NAME=test_win)))"
Oracle Enterprise Manager Cloud Control 12c Release 12.1.0.4.0
Copyright (c) 1996, 2013 Oracle Corporation. All rights reserved.
Please enter repository password:
Enter password :
Login successful
Moved all targets from sample.us.company.com:3872 to sample2.us.company.com:3872
Command completed successfully!
Enter password :
Login successful
Moved all targets from sample.us.company.com:3872 to sample2.us.company.com:3872
Command completed successfully!
13. Create a backup of the OMS (on the OMS where the Admin server is running).
$ <ORACLE_HOME>/bin/emctl exportconfig oms [-sysman_pwd <sysman password>]
Specify the directory in which to store backup file
[-dir <backup dir>]
Specify the following parameter if the OMS was installed using a virtual hostname
(using ORACLE_HOSTNAME=<virtual_hostname>)
[-keep_host]
20.5.3 Post Migration Verification
These verification steps should be carried out post migration to ensure that the
migration was completely successful:
•Verify any discrepancy in objects by comparing source and target databases
through Enterprise Manager.
•Verify the migrated database through Enterprise Manager to determine whether
the database is running without any issues.
•Verify the repository operations, dbms jobs and whether any management system
errors are reported.
•Verify that all Enterprise Manager functionalities are working correctly after the
migration.
•Make sure Management Services and the Repository target is properly relocated
by verifying it through Enterprise Manager.
Chapter 20
Cross Platform Enterprise Manager Repository Migration
20-21

21
Updating Cloud Control
The Self Update feature allows you to expand Enterprise Manager's capabilities by
updating Enterprise Manager components whenever new or updated features become
available. Updated plug-ins are made available via the Enterprise Manager Store, an
external site that is periodically checked by Enterprise Manager Cloud Control to
obtain information about updates ready for download.
This chapter contains the following sections:
•Using Self Update
•Setting Up Self Update
•Applying an Update
•Accessing Informational Updates
•Acquiring or Updating Management Agent Software
21.1 Using Self Update
The Self Update feature is accessed via the Self Update home page, a common
dashboard used to obtain information about new updates and a common workflow to
review, download and apply the updates. The Self Update console frees you from
having to monitor multiple channels to get informed about new updates that are
available from Oracle. The Self Update console automatically informs you whenever
new updates are made available by Oracle. Only those updates that are applicable to
your site are shown, eliminating the need to wade through unrelated updates.
21.1.1 What Can Be Updated?
Specific updates authored by Oracle that are usually bundled with specific Cloud
Control releases can be updated via Self Update. Some examples are Oracle
authored Management Plug-ins or Deployment Procedures. In general, Oracle-
supplied entities are read-only. You can create a copy and customize the copy as per
your needs but you cannot modify the original Oracle-supplied entity.
These entities can also be published on Oracle Web sites such as Oracle Technology
Network (OTN) and My Oracle Support (MOS). You can download and import the
entity archive into their Cloud Control deployment using specific import features
provided by the updatable entity.
Entity Types That Can Be Updated
Examples of updatable entity types are:
•Management Agents
•Management Plug-ins
•Management Connectors
•Database Profiles and Gold Images
21-1

•Application Server Profiles and Gold Images
•Provisioning Bundles
•Enterprise Manager Deployment Prerequisite Checks
•Compliance Content
•Diagnostic Checks
21.2 Setting Up Self Update
Before you can use the Self Update feature, you must satisfy these prerequisites:
•My Oracle Support credentials have been set up using the SYSMAN user. This is
required to enable entities to be downloaded from the My Oracle Support site.
•The Software Library (also known as the local store) has been configured.
Updates are downloaded to this local store before being deployed into Cloud
Control.
Review the following sections for instructions on setting up Self Update:
•Setting Up Enterprise Manager Self Update Mode
•Assigning Self Update Privileges to Users
•Setting Up the Software Library
•Setting My Oracle Support Preferred Credentials
•Registering the Proxy Details for My Oracle Support
•Setting Up the EM CLI Utility (Optional)
21.2.1 Setting Up Enterprise Manager Self Update Mode
In order to set up or modify the Enterprise Manager Self Update feature, you must
have Enterprise Manager Super Administrator privileges.
1. Log in to Enterprise Manager as an administrator with Super Administrator
privileges.
2. From the Setup menu, select Extensibility, then select Self Update. The Self
Update console appears with the default setup displayed.
3. From the General status area, click the Connection Mode status to set either
offline or online mode. Enterprise Manager takes you to the Patching Setup page
to specify online and offline settings.
Note:
When Cloud Control runs in Online mode, it does not upload any data to MOS.
It only uses MOS to download the latest updates.
4. Once the desired connection mode has been selected, return to the Self Update
console.
From here you can select entity types and schedule updates from the Enterprise
Manager Update Store.
Chapter 21
Setting Up Self Update
21-2

21.2.2 Assigning Self Update Privileges to Users
Enterprise Manager administrators must have the requisite privileges to use the Self
Update feature. The Enterprise Manager Super Administrator must assign the
following Self Update roles/privileges to these administrators:
•View any Enterprise Manager Update–User can view the Self Update console and
can monitor the status of download and apply jobs.
•Self Update Administrator–User can schedule download and apply jobs. User can
also suppress/unsuppress updates. This privilege implicitly contains the View any
Enterprise Manager Update privilege.
•EM_INFRASTRUCTURE_ADMIN–User can perform all self update operations.
This role implicitly contains the Self Update Administrator privilege.
By default, the Super Administrator will be granted EM_INFRASTRUCTURE_ADMIN
privilege.
To assign Self Update privileges to regular Enterprise Manager administrators:
1. From the Setup menu, select Security, then select Administrators.
2. Select an administrator and click Edit.
3. From the Roles page, assign the appropriate Self Update roles.
21.2.3 Setting Up the Software Library
The Software Library is a repository that stores software entities such as software
patches, virtual appliance images, reference gold images, application software, and
their associated directive scripts. In addition to storing them, it also enables you to
maintain versions, maturity levels, and states of these software entities. In the context
of applying updates, it is the "local store" that entities are downloaded to before
deployment.
If the Software Library is not already set up in your environment, see Chapter 8,
"Configuring Software Library," for instructions on the various ways you can configure
the Software Library.
21.2.4 Setting My Oracle Support Preferred Credentials
To set the preferred credentials that must be used by the OMS to connect to My
Oracle Support (MOS), follow these steps:
1. From the Setup menu, select My Oracle Support, then select Set Credentials.
2. Specify the user name and the password.
3. Click Apply.
21.2.5 Registering the Proxy Details for My Oracle Support
Cloud Control uses the Internet connectivity you have on the OMS host to connect to
My Oracle Support. However, if you have a proxy server set up in your environment,
then you must register the proxy details. You can register the proxy details for My
Oracle Support using the My Oracle Support Proxy Settings page.
Chapter 21
Setting Up Self Update
21-3

Note:
Beginning with Enterprise Manager Cloud Control 12c Release 3 (12.1.0.3),
My Oracle Support accesses support.oracle.com directly. This means that you
must provide network access to this URL, or grant proxy access to it from any
client that will access My Oracle Support.
To register the proxy details for My Oracle Support (MOS), follow these steps:
1. From the Setup menu, select Proxy Settings, then select My Oracle Support.
2. If you want the OMS to connect to MOS directly, without using a proxy server,
follow these steps:
a. Select No Proxy.
b. Click Test to test if the OMS can connect to MOS directly.
c. If the connection is successful, click Apply to save the proxy settings to the
repository.
3. If you want the OMS to connect to MOS using a proxy server, follow these steps:
a. Select Manual proxy configuration.
b. Specify the proxy server host name for HTTPS and an appropriate port value
for Port.
c. If the specified proxy server has been configured using a security realm, login
credentials, or both, select Password/Advanced Setup, then provide values
for Realm, User Name, and Password.
d. Click Test to test if the OMS can connect to MOS using the specified proxy
server.
e. If the connection is successful, click Apply to save the proxy settings to the
repository.
Note:
•If you are using a proxy server in your setup, ensure that it allows
connectivity to aru-akam.oracle.com, ccr.oracle.com, login.oracle.com,
support.oracle.com, and updates.oracle.com.
NTLM (NT LAN Manager) based Microsoft proxy servers are not
supported. If you are using an NTLM based Microsoft proxy server, to
enable access to the above sites, add the above URLs to the
Unauthenticated Sites Properties of the proxy server.
•The MOS proxy server details specified on the MOS Proxy Settings page
apply to all OMSes in a multi-OMS environment.
Chapter 21
Setting Up Self Update
21-4

21.2.6 Setting Up the EM CLI Utility (Optional)
If you plan to apply software updates in offline mode, you will need to use the
Enterprise Manager Command Line Utility, or EM CLI, to import entity archives for
deployment to Enterprise Manager.
EM CLI is set up on OMS out-of-box. If you need to set up EM CLI on another
machine managed by Enterprise Manager, a page is provided in the Cloud Control
console with instructions on setting up EM CLI. Access the page by appending
/
console/emcli/download
to the URL used to access the Cloud Control console:
https://emcc_host:emcc_port/em
For example:
https://emcc_host:emcc_port/em/console/emcli/download
21.3 Applying an Update
The process for applying updates is essentially as follows:
•Check for the latest updates available from Oracle.
•Download the updates you want to apply to the Software Library.
•Apply the update.
Review the following sections to learn how to apply an update:
•Applying an Update in Online Mode
•Applying an Update in Offline Mode
21.3.1 Applying an Update in Online Mode
Updates must be downloaded to the Software Library (the local store) before they can
be applied. You can review the latest available updates from the Self Update console.
Note that Enterprise Manager must have access to the Enterprise Manager Store via
the Internet to download available updates. If this access is not possible, you can
download entities in offline mode. See Applying an Update in Offline Mode for details.
1. From the Setup menu, select Extensibility, then select Self Update.
2. Click Check Updates to submit a job to check for new updates from Oracle. Click
OK to close the confirmation message.
3. When the job completes, select the desired entity type, then select Open from the
Actions menu. The entity type page appears.
4. Select an update from the list of available updates.
5. Click Download. The Schedule Download dialog appears.
6. Select when to download the update. Note that multiple downloads can be
scheduled simultaneously.
The following options are available:
•Immediately
Chapter 21
Applying an Update
21-5

•Later (specified time)
•Whether or not to send a notification when the download is complete
7. Click Select. An Enterprise Manager job is created to download the update to the
Software Library.
Enterprise Manager starts downloading the archive from the Oracle Enterprise
Manager store. Wait for the download to complete. (When in offline mode the
system starts reading from the specified location.)
When the download is complete, Enterprise Manager displays the Confirmation
page.
Note:
The page is not refreshed automatically. Click the refresh icon to view the
updated download status.
8. Once an entity has been downloaded to the Software Library, it is ready to be
applied to your installation. Select an update from the list whose status is
Downloaded, then click Apply.
Note that the application process varies according to the entity type:
•For connectors, diagnostic checks, and compliance content, clicking Apply will
install the update to Enterprise Manager. No further action is required.
•For plug-ins, you will be redirected to the plug-in deployment page.
•For provisioning bundles, you will need to exit the Enterprise Manager
console, run Opatch and other commands via a terminal, and then restart the
OMS.
21.3.2 Applying an Update in Offline Mode
Under certain circumstances, such as in high security environments, an active Internet
connection between Enterprise Manager and the Enterprise Manager Update Store
may not be available. In such situations, the Self Update feature can be used in offline
mode.
The update process still requires that a computer exist at your site that has Internet
access, as a connection to the Enterprise Manager Update Store is still required to
obtain the updates. Update files from this computer can then be transferred to a
computer behind your firewall.
The generic offline mode update procedure is as follows:
1. Ensure that Cloud Control is set to offline mode. From the Setup menu, select
Provisioning and Patching, then select Offline Patching.
2. Change the setting for Connection to Offline.
3. Click Check Updates on the Self Update home page. A message is displayed that
contains the URL to be accessed to download a catalog of all updates.
4. From an Internet-enabled computer, download the catalog file using the
aforementioned URL.
Chapter 21
Applying an Update
21-6
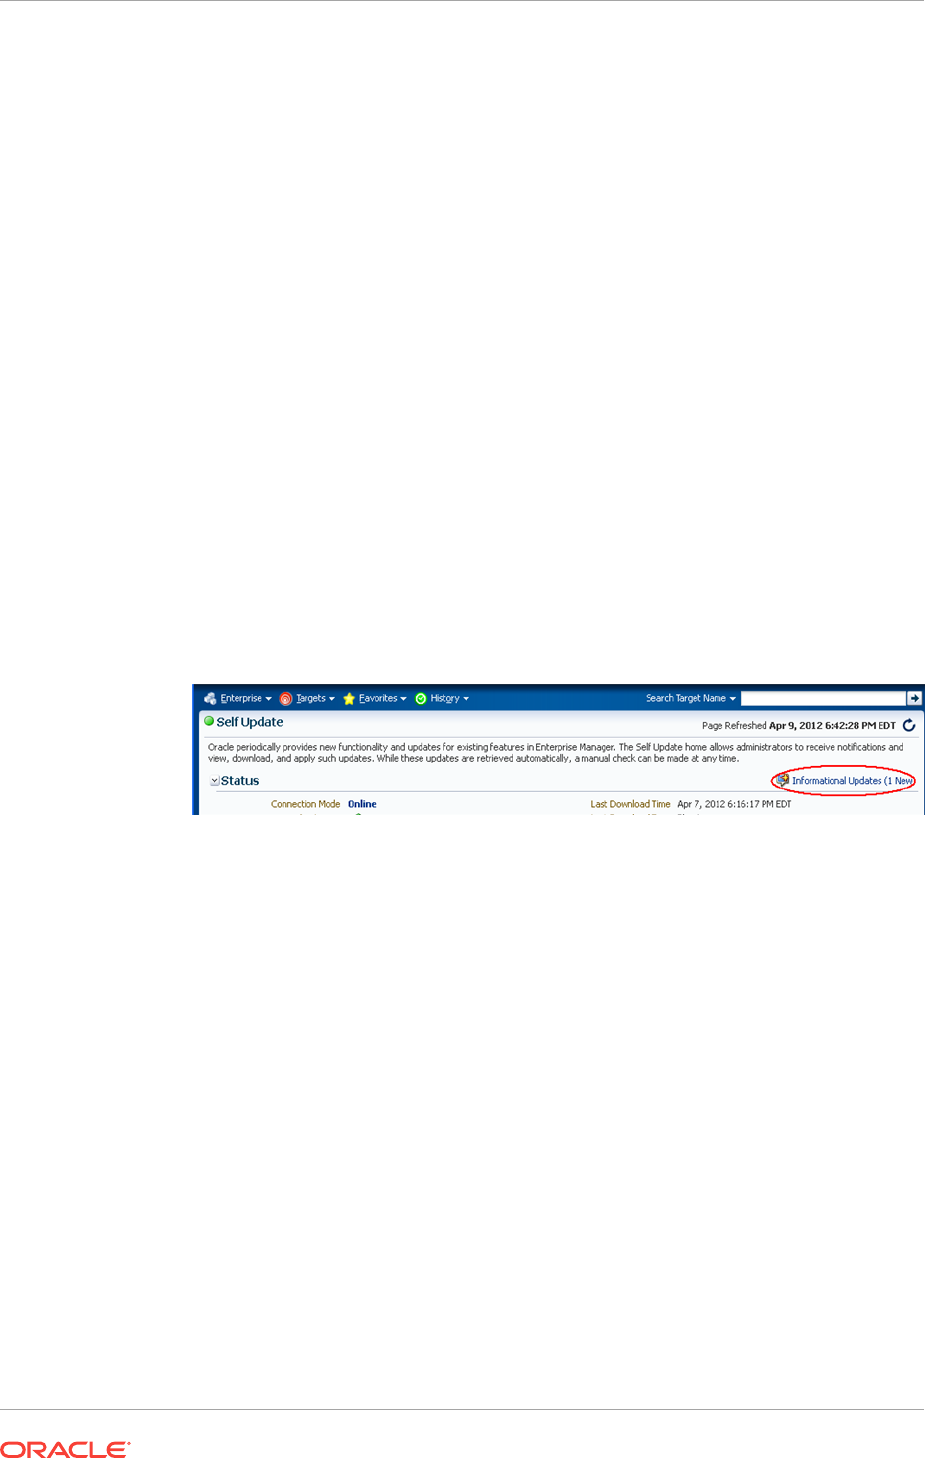
5. Copy the downloaded file to the Oracle Management Service host or the
Management Agent host you will deploy the update to.
6. Run the
emcli import_update_catalog
command to import the file into the Oracle
Management Service instance or the Management Agent you want to update.
7. Review the update from Self Update Home and click Download in the Actions
menu. A message displays with a URL and instructions.
8. Click Apply in the Actions menu to apply the update.
21.4 Accessing Informational Updates
The Self Update feature also serves as a news feed, providing new product
announcements, news stories, industry updates, and any number of other items of
interest to the Oracle community. These informational updates occur on an ad hoc
basis and typically include useful links where you can obtain additional information and
download items.
1. From the Setup menu, select Extensibility, then select Self Update.
2. On the Self Update page, click the Informational Updates link at the top-right
corner, as shown in Figure 21-1. The link includes the number of new updates. A
number appears only if there are new (unread) updates.
Figure 21-1 Informational Updates Link on the Self Update Home Page
The Informational Updates dialog opens.
3. Select an update notification in the table and click Details.
A popup appears describing the new product and listing applicable links.
Figure 21-2 shows the informational update announcing availability of Enterprise
Manager Cloud Control Mobile, a new iPhone app that enables you to connect to
Enterprise Manager remotely. Notice in this case that the announcement includes
a link to iTunes where you can go to download the app.
Chapter 21
Accessing Informational Updates
21-7
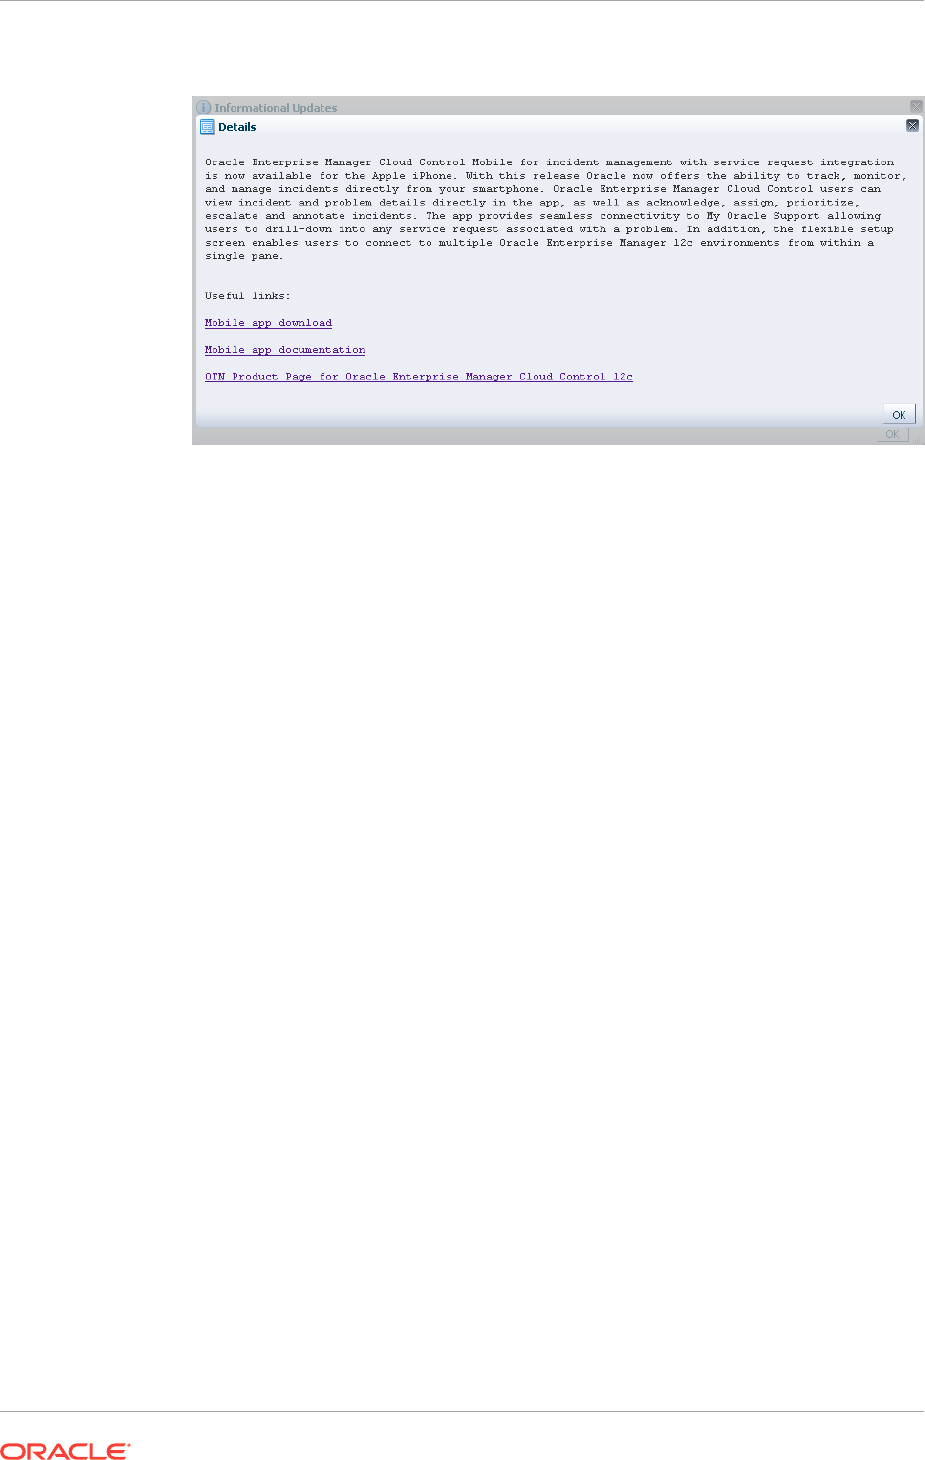
Figure 21-2 Informational Update for Mobile App
4. Click OK to close the details display and return to the table of announcements.
By default, the table displays only unread announcements. You can choose to
display all or only read announcements. You can also toggle selected items
between read and unread states. Note that if you mark an item as read, you are
doing so for all users. A warning to this effect appears.
21.5 Acquiring or Updating Management Agent Software
Management Agent software for the various platforms (operating systems) supported
by Enterprise Manager Cloud Control can be downloaded to the Software Library
using the Self Update console. Once a Management Agent is persisted to the
Software Library, it can be installed on host machines that you want to bring under
Cloud Control management using the Add Host Targets wizard.
For instructions on obtaining Management Agent software in both online and offline
modes, see the section "Meeting Management Agent Software Prerequisites" in the
Oracle Enterprise Manager Cloud Control Basic Installation Guide.
Chapter 21
Acquiring or Updating Management Agent Software
21-8

22
Configuring a Software Library
This chapter describes how you can configure a new Software Library using Cloud
Control console, the various users and the privileges required to access the Software
Library, and finally how to maintain an existing Software Library in the Enterprise
Manager Cloud Control environment.
Note:
Oracle strongly recommends that you select the Configure Oracle Software
Library option and configure it at the time of installation so that the installer
can automatically configure it for you, thus saving your time and effort. For
more information on this, see Oracle Enterprise Manager Cloud Control Basic
Installation Guide.
However, if you have not already configured the Software Library, you can do
so from the Enterprise Manager Cloud Control Console as described in this
chapter.
In particular, this chapter covers the following:
•Overview of Software Library
•Users, Roles, and Privileges
•What's New in Software Library
•Performing Software Library Tasks Using EM CLI Verbs or in Graphical Mode
•Software Library Storage
•Prerequisites for Configuring Software Library
•Configuring Software Library Storage Location
•Configuring Software Library on a Multi-OMS System
•Software Library Cache Nodes
•Software Library File Transfers
•Using Software Library Entities
•Tasks Performed Using the Software Library Home Page
•Maintaining Software Library
22.1 Overview of Software Library
Oracle Software Library (Software Library) is one of the core features offered by
Enterprise Manager Cloud Control. Technically, it is a repository that stores software
entities such as software patches, virtual appliance images, reference gold images,
application software, and their associated directive scripts. In addition to storing them,
22-1
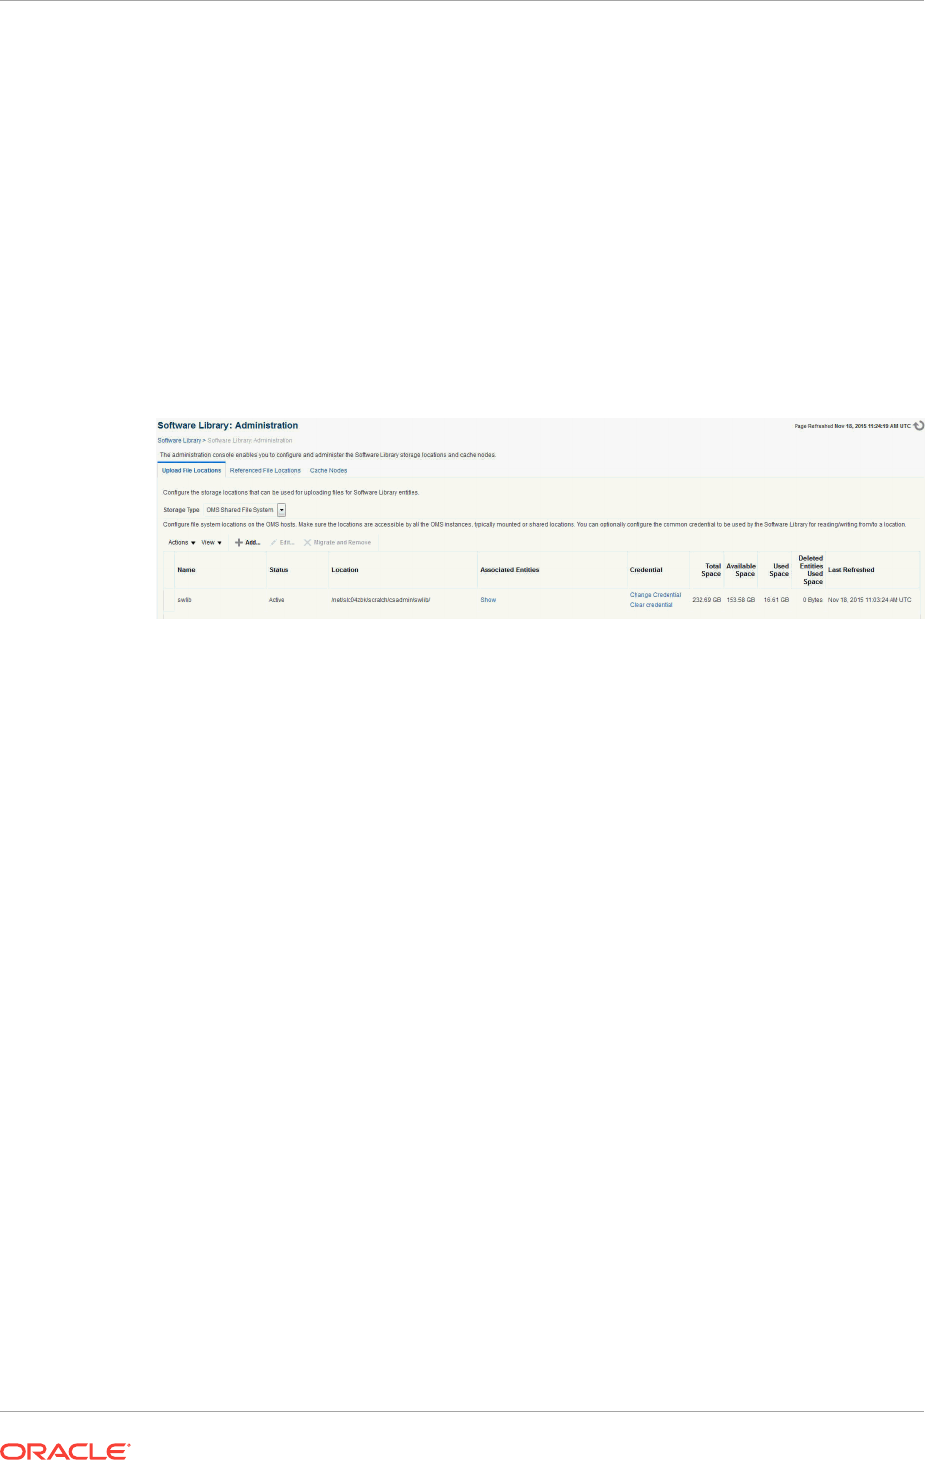
it also enables you to maintain versions, maturity levels, and states of these software
entities.
To access the Software Library console page, from the Enterprise menu, select
Provisioning and Patching, then click Software Library. On the Software Library
home page, as shown in Figure 22-1, there are two types of folders: Oracle-owned
folders (marked by a lock symbol) and User-owned folders.
Oracle-owned folders and their contents (including other subfolders and entities)
offered with the product by default, and appear on the Software Library home page
after Software Library is configured. User-owned folders are logical top level folders
that the user creates to organize the entities that he/she intends to create.
Figure 22-1 Software Library Console
The Software Library Page facilitates storage of Enterprise Manager entities. For
example,
•Self Update entities like plug-ins, connectors, DB workload, and so on.
•Provisioning and Patching entities like gold images, application archives, Perl/shell
scripts, and so on.
Advantages:
•Software Library supports patching and provisioning in Online mode and Offline
mode. For example, if database patches cannot be downloaded directly from My
Oracle Support, you can download them separately, and stage them from
Software Library for offline deployment.
•Starting with Enterprise Manager Cloud Control 12c, Referenced File Locations
are supported, which means that the Software Library allows you to leverage your
organizations existing IT infrastructure (like file servers, web servers, or storage
systems) to stage the files to host targets as part of a provisioning or patching
activity.
•Software Library allows you to organize the entities, which basically refer to the
software binaries or directive scripts in your enterprise, into logical folders for
efficient management.
From the Software Library Console page, you can perform the following tasks:
•Configure Software Library Storage, see Configuring Software Library Storage
Location for more information.
•Create Software Library Entities. For example, Creating a Generic Component,
Creating Directives, and so on.
Chapter 22
Overview of Software Library
22-2

•Manage Software Library Entities. For example, Viewing Entities, Editing Entities,
Deleting Entities, Searching Entities, and so on.
22.2 Users, Roles, and Privileges
By default, all the Software Library folders and entities that are offered with the product
are viewable by all the Enterprise Manager users. Fine grained privileges provide a
way to control user access to the different entities in the Software Library.
Administrators by default do not have any Software Library privileges, it is for the
Super Administrator to grant access, privileges to an Administrator.
Note:
To run any procedure on a Windows host which involves executing some
Software Library entities (for example, directive scripts), you (the Windows
user) must be granted the following privileges:
•Act as part of the operating system
•Adjust memory quotas for a process
•Logon as batch job
•Replace a process level token
If not, the execution of the directive steps in the procedure may fail.
Software Library user roles can be broadly classified as:
•Designers are administrators who perform design time tasks such as setting up
Software library, migrating entities, granting privileges to the Operators, deleting
entities, and so on. They can perform both design time activities and run-time
activities that the Operator can perform. Designers in Enterprise Manager Cloud
Control can be granted Super Administrator role or the
EM_PROVISIONING_DESIGNER
role which allows him to create and maintain any Software Library entity.
•Operators are administrators who can perform run-time activities like deleting
entities, changing the maturity status, and so on. Operators are typically granted
roles like
EM_PROVISIONING_OPERATOR
or
EM_PATCH_OPERATOR
and so on.
Any Enterprise Manager user requires, at the very least, a view privilege on an entity
for the entity to be visible on the Software Library Home page. Users will not be able to
see this entity until the Super Administrator or the owner of the entity grants them at
least a view privileges on the entity.
Note:
All the folders and entities that are offered along with the product also known
as the Oracle-owned entities, by default are viewable by all the Enterprise
Manager users.
Chapter 22
Users, Roles, and Privileges
22-3

Administrator by default do not have any Software Library privileges, it is for the Super
Administrator, to grant access, privileges to an Administrator. Table 22-1 describes all
the available Software Library privileges that can be granted to a user or role.
Users and roles can be granted privileges on specific entities by the owner of the entity
or the Super Administrator. For more details, see Oracle Enterprise Manager
Administrator's Guide for Software and Server Provisioning and Patching.
Table 22-1 Software Library Privileges for Administrators
Resource Type Description
View any Template Entity Ability to view any Template Entity
Export Any Software Library Entity Ability to export any Software entity
Edit any Software Library Entity Ability to edit any Software Library entity
Manage Any Software Library Entity Ability to create, view, edit, and delete any Software
Library entity
Import Any Software Library Entity Ability to import any Software Library entity
Create Any Software Library Entity Ability to create any Software Library entity
View Any Software Library Entity Ability to view any Software Library entity
View Any Assembly Entity Ability to view any Assembly entity
Grant Any Entity Privilege Ability to grant view, edit, and delete privileges on any
Software Library entity.This privilege is required if the
user granting the privilege on any entity is not a Super
Administrator or owner of the entity.
Table 22-2 describes all the primary users of Software Library, and their associated
privileges:
Table 22-2 Roles and Privileges
Role Software Library Privileges
Super Administrator All Software Library Privileges
EM_PROVISIONING_DESIGNER
(Designer)
Create Any Software Library Entity
EM_PROVISIONING_OPERATOR
(Operator)
View Any Software Library Entity
EM_PATCH_OPERATOR
Create Any Software Library Entity
View Any Software Library Entity
EM_USER
(Administrator) Access Enterprise Manager
Super Administrators have complete privileges on all the entities present in Software
Library, and can exercise access control on the entities by granting one or more
privileges, and later revoking the previously granted privilege to another user or role.
Designers by default are given create privileges, which allow them to create entities
and manage them.
Operators by default are given view privileges, which allow them to view all the entities
in Enterprise Manager Cloud Control.
Chapter 22
Users, Roles, and Privileges
22-4

Any Enterprise Manager user requires, at the very least, a view privilege on an entity
for the entity to be visible on the Software Library console. The Super Administrator
can choose to grant additional privileges described in Table 22-1 to the user or role.
Users will not be able to see this entity till the Super Administrator grants them at least
a view privilege on the entity.
22.3 What's New in Software Library
For Enterprise Manager 13c Software Library enhancements, refer to the Oracle
Enterprise Manager Concepts Guide.
22.4 Performing Software Library Tasks Using EM CLI
Verbs or in Graphical Mode
Starting with Oracle Enterprise Manager Cloud Control 12c Release 2 (12.1.0.2),
command line utility has been introduced for Software Library users in Oracle
Enterprise Manager Cloud Control that enables you to perform some of the console-
based Software Library operations using the text-based consoles.
The following table describes both approaches to perform some of the Software
Library tasks:
•Enterprise Manager Command Line Interface (EM CLI)
•Enterprise Manager Graphical User Interface (EM GUI)
Note:
For more information about the syntax and usage of the EM CLI verbs
described in Table 22-3
,
along with workflow examples, refer to the Oracle
Enterprise Manager Lifecycle Management Administrator’s Guide.
Table 22-3 Software Library EMCLI Verbs
Description Approach A: Using EM CLI
Verb
Approach B: Using Enterprise
Manager Cloud Control Console
Adding a Software
Library storage
location
add_swlib_storage_location
Configuring an OMS Shared File
system Location
Configuring an OMS Agent File
system Location
Configuring a Referenced File
Location
Creating a Software
Library entity
create_swlib_entity
Creating Generic Components
Creating Directives
Creating a Software
Library folder
create_swlib_folder
Organizing Entities
Listing the Software
Library entities
list_swlib_entities
Accessing Software Library Home
Page
Searching Entities
Chapter 22
What's New in Software Library
22-5

Table 22-3 (Cont.) Software Library EMCLI Verbs
Description Approach A: Using EM CLI
Verb
Approach B: Using Enterprise
Manager Cloud Control Console
Listing Software
Library entity types
list_swlib_entity_types
NA
Listing Software
Library entity
subtypes
list_swlib_entity_subtypes
NA
Listing Software
Library folders
list_swlib_folders
NA
Listing Software
Library storage
locations
list_swlib_storage_locations
Accessing Software Library
Administration Page
Referring files from
a Software Library
entity
refer_swlib_entity_files
Creating Entities
Viewing, Editing, and Deleting
Entities
Re-Importing
Software Library
metadata
reimport_swlib_metadata
Re-Importing Oracle Owned Entity
Files
Removing a
Software Library
storage location
remove_swlib_storage_location
Removing (and Migrating) Software
Library Storage Location
Modifying a
Software Library
entity
update_swlib_entity
Viewing, Editing, and Deleting
Entities
Uploading files to a
Software Library
entity
upload_swlib_entity_files
Creating Entities
Viewing, Editing, and Deleting
Entities
Modifying a
Software Library
OMS Agent storage
location to change
the associated OMS
Host and the
credential for
accessing the
location.
switch_swlib_oms_agent_storag
e
NA
Verifying the files
uploaded to
software library, and
reporting the
missing files in the
storage locations.
This action is
typically initiated
when some
provisioning/
patching/deployment
activity fails due to
missing file in the
associated storage
location.
verify_swlib
NA
Chapter 22
Performing Software Library Tasks Using EM CLI Verbs or in Graphical Mode
22-6

Table 22-3 (Cont.) Software Library EMCLI Verbs
Description Approach A: Using EM CLI
Verb
Approach B: Using Enterprise
Manager Cloud Control Console
Staging one or more
files associated with
an entity revision
available in the
Software Library to a
file system location
on a host target.
stage_swlib_entity_files
Staging Entities
Staging one or more
files associated with
an entity revision in
the Software Library
to the local file
system of a host not
monitored by an EM
Agent.
stage_swlib_entity_files_loca
l
Staging Entities
Creating an entity of
the
Directive
type
in the Software
Library. On
successful creation,
the entity revision
appears in the
specified folder on
the Software Library
Home page.
create_swlib_directive_entity
Creating Directives
Modifying an entity
of the
Directive
type in the Software
Library. A new
revision of the entity
is created by default.
Changing only the
description or
attribute values do
not create a new
revision, and such
changes are visible
across all existing
revisions of the
entity
update_swlib_directive_entity
Viewing, Editing, and Deleting
Entities
Listing all the details
of an entity revision.
get_swlib_entity_details
Viewing, Editing, and Deleting
Entities
Exporting files of
Software Library
entities to be
imported on a cache
node as cached
files.
export_swlib_cache_files
Exporting and Importing Files for
Cache Nodes
Chapter 22
Performing Software Library Tasks Using EM CLI Verbs or in Graphical Mode
22-7

Table 22-3 (Cont.) Software Library EMCLI Verbs
Description Approach A: Using EM CLI
Verb
Approach B: Using Enterprise
Manager Cloud Control Console
Importing Software
Library entity files
from a compressed
file to a cache node.
import_swlib_cache_files
Exporting and Importing Files for
Cache Nodes
Invoking
resynchronize for
one or all cache
nodes.
resync_swlib_cache
Synchronizing the Cache Nodes
22.5 Software Library Storage
The Software Library Administration console allows you to configure and administer
Software Library. To start using the Software Library, you must add at least one
upload file storage location (OMS Shared File System, or OMS Agent File System) on
the host where the OMS is running. A storage location in Software Library represents
a repository of files that are either uploaded to Software Library or referenced by it.
Note:
If you choose to newly configure an OMS Shared Storage Location, then
ensure that the file system path that you specify for the location is either a
shared path or a mounted path. By doing so, the newly configured location
can be made accessible in a multiple OMS environment in the future. If the
new location is being added in a multiple OMS environment, then the file
system path should be accessible from all the OMS hosts.
However, if you have configured the OMS Shared Storage Location on a local
file system, then perform the steps listed in the Configuring Software Library
Storage Location to migrate this location to another OMS Shared Storage
Location that has a shared or mounted path.
To access the administration console, log in to Enterprise Manager Cloud Control with
Administration access, and follow these steps:
In Cloud Control, from Setup menu, select Provisioning and Patching, and then click
Software Library.
OR
In Cloud Control, from the Enterprise menu, select Provisioning and Patching and
then, click Software Library. On the Software Library home page, from Actions
menu, select Administration.
Chapter 22
Software Library Storage
22-8
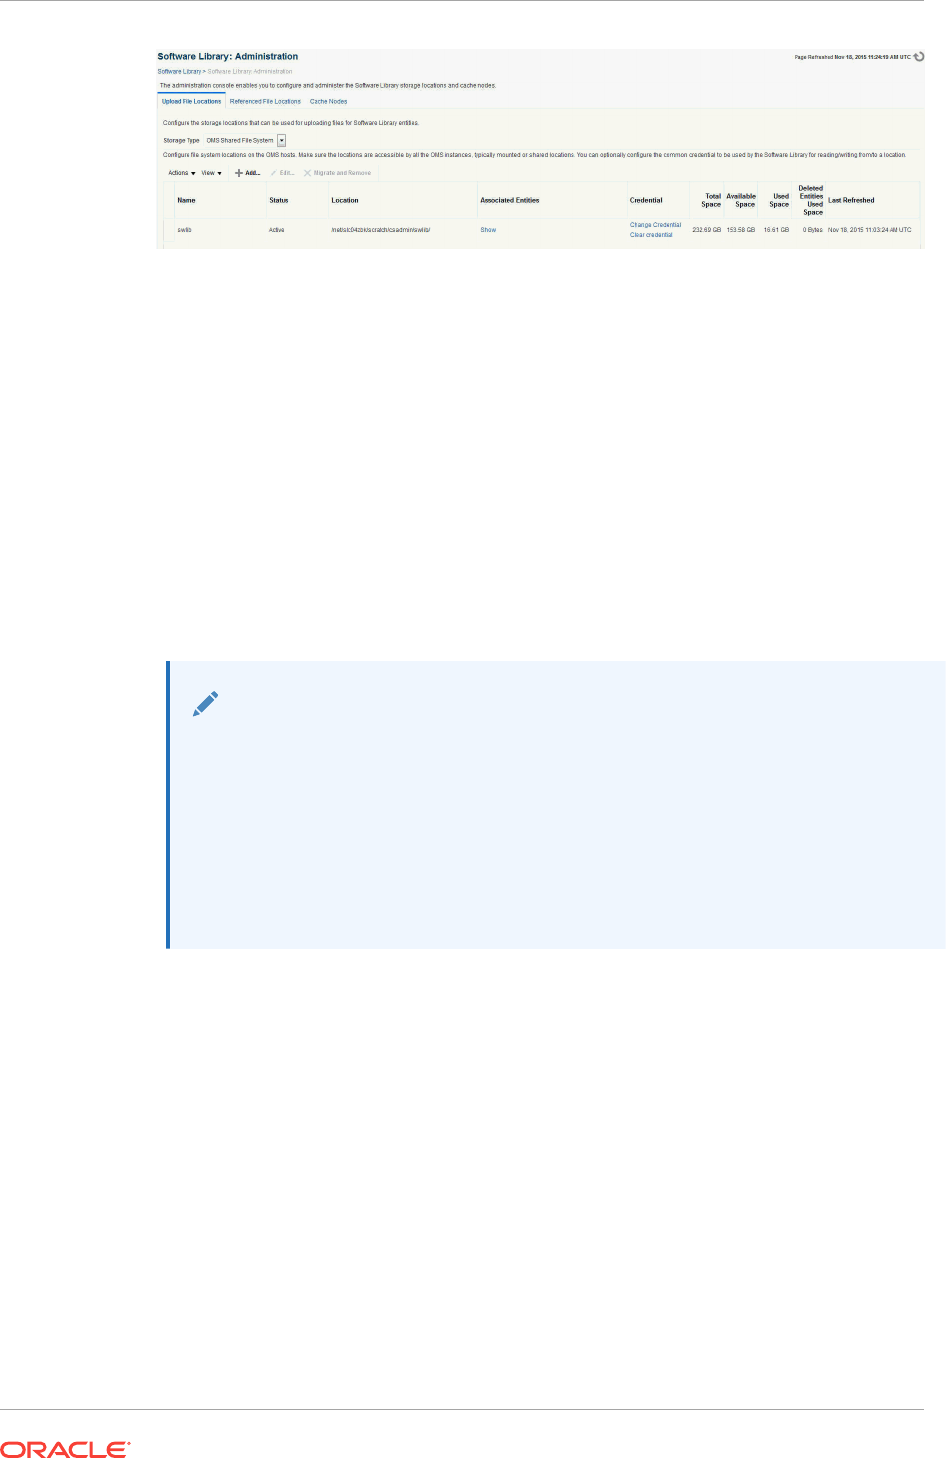
The Software Library Administration Page is a GUI based screen that enables you to
create one or more storage locations to store or refer to files that are associated with
an entity. To view the entities present in the storage location, click show on the
Administration page. You can create a storage location on the OMS or the agent
running on the same host as the OMS. With Enterprise Manager 12c, a new feature
called Referenced File Location has been introduced, wherein Software Library
entities can refer to files that are stored on another host. These locations are however
read-only for Software Library, and will not be used for uploading files.
The space requirements for configuring Software Library depends on the amount of
space required for storing the software binaries, and its associated scripts.
Understandably, this space requirement increases over a period of time as you create
more entities. Depending on the features or software required for provisioning and
patching, you must decide and configure the Software Library storage space.
Note:
For production environments, Oracle recommends allocating a minimum
100GB of storage for your software library. Also, ensure that this storage can
easily be extended in future, if it starts running out of space.
Once the storage location starts running out of space, it is important to
deactivate the configured storage location so that no new uploads can happen
to this location. For more information about removing a storage location, see
Maintaining Software Library
The following types of storage locations are available:
•Upload File Locations
•Referenced File Location
•Cache Nodes
22.5.1 Upload File Locations
Upload File Locations are locations configured for storing files uploaded by Software
Library as part of creating or updating an entity.
For Software Library to become usable, at least one upload file location must be
configured. On adding the first upload file location, a job is submitted to import the
Software Library metadata from the Oracle home of each of the installed Enterprise
Chapter 22
Software Library Storage
22-9

Manager plug-in. Ensure that you wait for this job to complete successfully, before
performing other patching or provisioning operations.
Note:
To physically delete a file system configured as an Upload storage location
with Software Library, you must ensure that you first configure an alternate
storage location where you can migrate the existing contents (entities). If you
fail to perform this migration, then the entities dependent on the files from this
location will be rendered unusable. For more information about deleting a
storage location, and migrating the contents, see Removing (and Migrating)
Software Library Storage Location.
Prerequisites
As a prerequisite, before using Upload File Locations as storage option, you must set
credentials for using an OMS Shared File System or OMS Agent File System:
•For multiple OMS environment, all the OMS hosts must have a preferred normal
host credential set.
When OMS instances are added, it is necessary to ensure that the configured
locations are accessible from the designated host where the new OMS will be
provisioned. For an OMS that will be provisioned using the Add Management
Service functionality, the shared location configured as upload location should be
mounted on the designated host, and verified manually.
•For OMS Agent File System location configuration, a credential (preferred or
named) has to be specified.
Upload File Locations support two storage options as follows:
OMS Shared File System (Recommended Storage Option)
An OMS Shared File System location is required to be shared (or mounted) across all
the Oracle Management Server (OMS) hosts. This option is ideal for UNIX systems.
Note:
Oracle recommends using OMS Shared File System option for storing files
uploaded to Software Library. However, if you are not able to set up a shared
file system because of some constraints, then you may use the OMS Agent
File System. For more information, see "Upload File Locations."
For single OMS environments, you can configure the Software Library either on the
host where the OMS is running, or in a shared location. However, in future, if you plan
to expand the single OMS setup to a multiple OMS setup, then local file system path is
not recommended.
Chapter 22
Software Library Storage
22-10

Note:
For a multi-OMS scenario, you must set up clustered file system using NFS, or
ACFS, or DBFS. On Windows, for sharing, the OCFS2 cluster file system is
recommended.
If you are implementing multiple management servers for high availability you should
also make the Software Library file system highly available. Besides accessibility and
availability, it is important to ensure that there is enough space (more than 100 GB for
production deployment of Enterprise Manager) available for the storage of software
binaries, and associated scripts for the entities that you want to create and store.
OMS Agent File System
An OMS Agent File System location should be accessible to the agent running on the
host machine where the OMS is deployed. To use OMS Agent File system storage
option, ensure that you have a preferred, or a named credential for the OMS host.
Click Change Credential to change the associated credential to be used to access
this location.
Note:
If you can not set up an OMS Shared File System for storage because of
some constraints, then you may use the OMS Agent File System.
22.5.2 Referenced File Location
Referenced File Locations are locations that allow you to leverage the organization's
existing IT infrastructure (like file servers, web servers, or storage systems) for
sourcing software binaries and scripts. Such locations allow entities to refer to files
without having to upload them explicitly to a Software Library storage.
Referenced File Locations support three storage options:
•HTTP: An HTTP storage location represents a base URL which acts as the source
of files that can be referenced.
For example, the base URL
http://my.files.com/scripts
could be configured as
an HTTP location for sourcing files such as
http://my.files.com/scripts/perl/
installMyDB.pl
or
http://my.files.com/scripts/linux/stopMyDB.sh.
•NFS: An NFS storage location represents an exported file system directory on a
server. The server need not be an Enterprise Manager host target.
For example, the directory
/exported/scripts
is exported on server
my.file.server
could be configured as an NFS location for sourcing files such as
/exported/
scripts/generic/installMyDB.pl
or
/exported/scripts/linux/stopMyDB.sh
once
mounted on a target host file system.
•Agent: An Agent storage location is similar to the OMS Agent File System option,
but can be any host monitored by an Enterprise Manager Agent. The Agent can be
configured to serve the files located on that host.
Chapter 22
Software Library Storage
22-11

For example, the directory
/u01/binaries
on the Enterprise Manager Host
my.em.file.server
could be configured as an Agent location for sourcing files such
as
/u01/binaries/rpms/myCustomDB.rpm
or
/u01/binaries/templates/
myTemplate.tar.gz
.
These locations require a named credential to be associated which will be used to
access the files from the base location on the host through the Enterprise Manager
Agent.
Note:
To use entities referring files of a location, you must have view privilege on the
credentials associated with the locations.
22.5.3 Cache Nodes
Cache Nodes is a feature in Enterprise Manager that enhances the file transfer
experience to distant servers and data centers by reducing the load on the OMS.
Cache nodes work on a set of predefined targets that function as one unit called the
Group, and each cache node is an intermediate storage location on a host that serves
a particular group of targets that it is associated with. For more information about
Cache Nodes, see Configuring the Cache Nodes
22.6 Prerequisites for Configuring Software Library
To administer the different storage types, and to configure software library, keep the
following points in mind:
•Depending on the features or software required for provisioning and patching, you
must decide and configure the Software Library storage space. The storage needs
change based on the usage pattern.
•Each OMS host must have a preferred normal host credential set before
configuring the location. For OMS Agent File System location configuration, a
credential (preferred or named) has to be specified.
•You (the user configuring the Software Library) must have view privilege on all the
OMS, and the agent targets running on the host machine. As per the accessibility
verification, you must be able to view, and edit these newly configured locations.
•To add an OMS Agent storage location, ensure that you have view privileges on
the target OMS host, and the agents running on that target host.
22.7 Configuring Software Library Storage Location
System Administrators are responsible for configuring a storage location. Only after
the storage location is configured, you can start uploading the entity files.
Chapter 22
Prerequisites for Configuring Software Library
22-12

Note:
Deployment procedures and area-specific jobs in your on-prem Cloud setup
may in turn use entities like Components and Directives from the Software
Library for managing Oracle Public Cloud (OPC) targets. For your procedure
to successfully manage the OPC targets, Software Library must be configured
to use an OMS Shared File system storage for the uploaded files. If these
Components and Directives use OMS Agent File system storage, the
procedure will fail when attempting to transfer the files to the OPC targets.
You can configure the Software Library in one of the following locations:
•Configuring an OMS Shared File system Location
•Configuring an OMS Agent File system Location
•Configuring a Referenced File Location
Note:
Starting with Oracle Enterprise Manager Cloud Control 12c Release 2
(12.1.0.2), in addition to using the GUI as described in this section, you can
alternatively use the command line interface tool to Configure the Software
Library. To do so, refer to Oracle Enterprise Manager Lifecycle Management
Administrator's Guide.
22.7.1 Configuring an OMS Shared File system Location
To configure an OMS Shared File System storage location that can be used for
uploading Software Library entity files, perform the following steps:
1. From the Setup menu, select Provisioning and Patching, then select Software
Library.
2. On the Software Library: Administration page, select OMS Shared File system.
3. To add a new OMS Shared File System, click +Add.
4. In the Add OMS Shared File System location dialog box, provide a unique name,
host name, and location on the OMS host, where you want to set up the upload
location.
Chapter 22
Configuring Software Library Storage Location
22-13

Providing Credentials is optional. If you provide, then it will be used for transferring
files.
Ensure that the configured storage location is a shared location that is accessible
by all the OMS instances. For a Multi OMS setup, set the Normal Preferred
Credentials for all the OMS(s).
When you configure an upload location for the first time, a metadata registration
job is submitted which imports all the metadata information of all the installed plug-
ins from the Oracle home of the OMS.
To track the progress of the job, click Show Detailed Results. Typically, the name
of the job starts with
SWLIBREGISTERMETADATA
_*.
If the Import job fails, see Maintaining Software Library for information on Re-
importing metadata for Oracle-owned files.
5. Click OK to create a new entry for the storage location in the table, with details like
Name, Location, Host, Status, and Host Credentials.
In addition to this, you can click Associated Entities to view or search the entities
present in the selected upload location.
22.7.2 Configuring an OMS Agent File system Location
Note:
The OMS Agent File system must be set up only when the recommended
storage option, which is the OMS Shared File System cannot be set up
because of some constraints. For more information, see Upload File
Locations.
To configure an OMS Agent location, perform the following steps:
Chapter 22
Configuring Software Library Storage Location
22-14
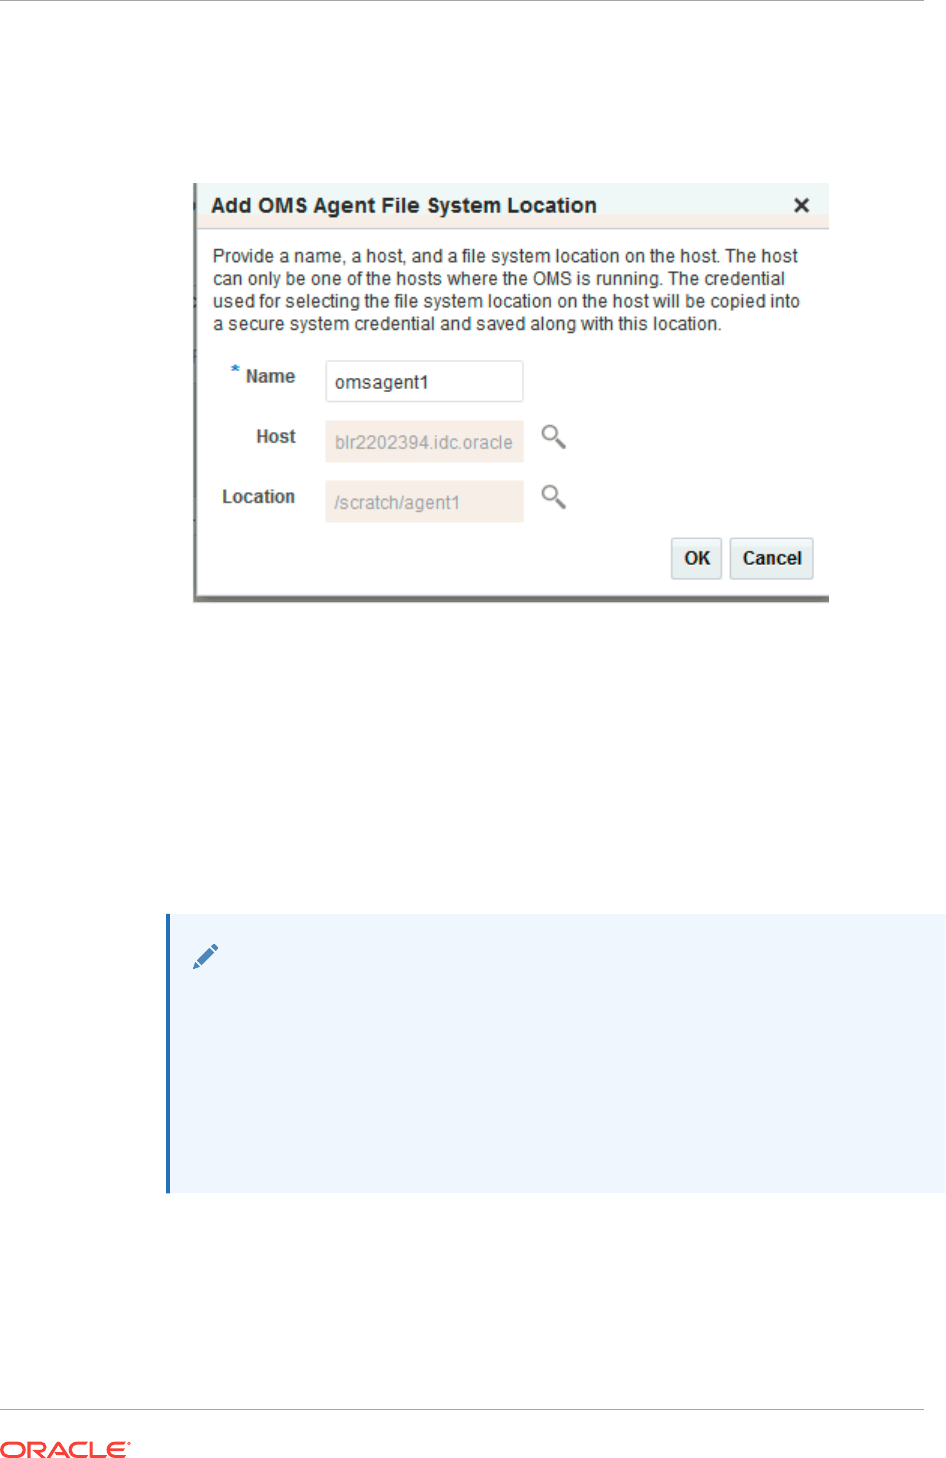
1. From the Setup menu, select Provisioning and Patching, then select Software
Library.
2. On the Software Library: Administration page, select OMS Agent File system.
3. Click +Add, in the Add OMS Agent File System Location dialog box, enter the
following details:
a. In the Name field, enter a unique name for the storage.
b. In the Host field, click the magnifier icon. From the Search and Select: Hosts
dialog box, select a host where the OMS is running, and click Select.
For example,
xyz.acme.com
c. In the Location field, click the magnifier icon. In the Remote File Browser
dialog box, click Login As to log in to the host machine with either Preferred,
Named or New credentials.
Note:
For a user to access and leverage an OMS Agent File system upload location
successfully, the owner of the Named Credential (basically, the credential
used to connect to the host machine), must grant a View Privilege on the
credential chosen to all the Administrators (or users) accessing this OMS
Agent File system location.
For more information about granting privileges on a Named Credential, refer to
Oracle Enterprise Manager Lifecycle Management Administrator's Guide.
Navigate to the location on the host where you want to create the Agent File
System, and click OK.
The selected credential is saved along with the host and selected file system
path. The saved credential is used to upload files and stage the uploaded files
to a host target as part of some provisioning or patching activity.
Chapter 22
Configuring Software Library Storage Location
22-15

Note: The credential is copied into a system owned credential with a
generated name that starts with SWLIB. This will appear as the original
credential name during Edit Credential flow.
4. Click OK to create a new entry for the storage location in the table, with details like
Name, Location, Host, Status, and Host Credentials.
In addition to this, you can click Associated Entities to view or search the entities
present in the selected upload location.
These newly configured OMS Agent locations are now available for storing entity files.
22.7.3 Configuring a Referenced File Location
To configure storage location that can be used for referring to files from the Software
Library entities, perform the following steps:
1. From the Setup menu, select Provisioning and Patching, then select Software
Library.
2. On the Software Library: Administration page, click Referenced File Locations
tab.
3. To add an HTTP location that can be accessed through a HTTP URL, select HTTP
from the Storage Type list and click +Add.
In the Add HTTP Location dialog box, enter a unique name and a HTTP location
for the storage that you want to reference, and click OK.
A new entry for the storage location is created, with details like Name, Location,
and Status.
4. To add an NFS shared location, select NFS from the Storage Type list and click
+Add.
In the Add NFS Location dialog box, do the following:
Chapter 22
Configuring Software Library Storage Location
22-16
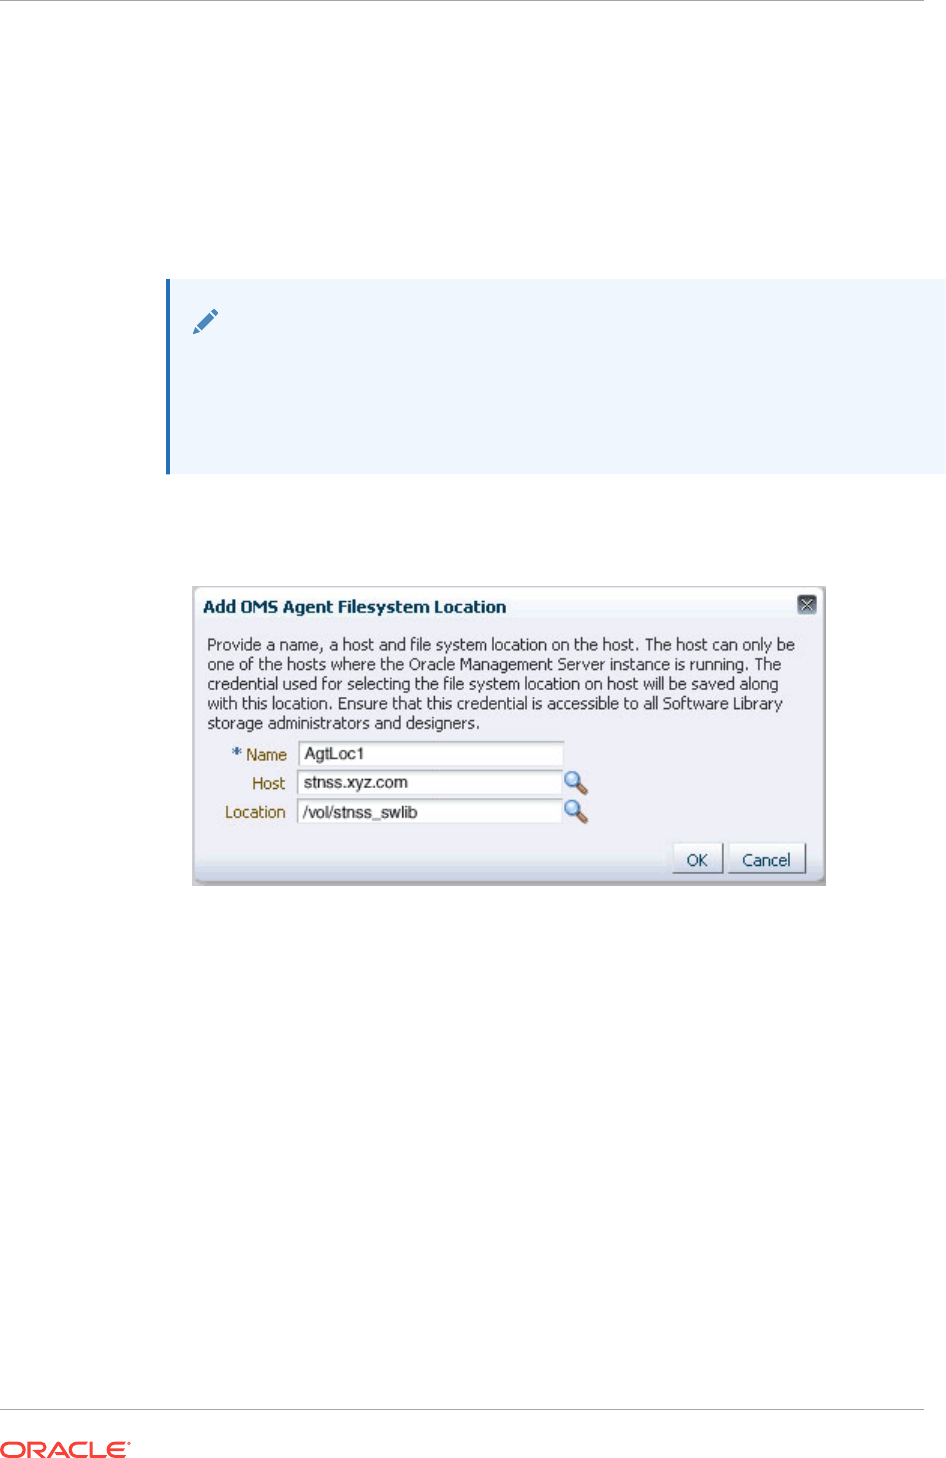
a. Enter a unique name in the Name field for the storage.
b. In NFS server field, provide a fully qualified domain name or the IP address of
the hosted machine that has NFS services running on them.
c. In the Location field, provide the shared location or directory path on the NFS
server to define a storage location, then click OK.
A new entry for the storage location is created in the table, with details like Name,
Location, and Status.
Note:
While creating a procedure, if you have a component step or a directive step
that refers to an NFS file location, then you must ensure that you set the
preferred privileged credentials for the target host before the procedure is
submitted for execution.
5. To add an Agent location that has read-only privileges set on it, select Agent from
the Storage Type list and click +Add.
In the Add Agent Location dialog box, enter the following details:
a. In the Name field, enter a unique name for the storage.
b. In the Host field, click the magnifier icon to select a target from the list
available.
For example,
xyz.company.com
c. In the Location field, click Login As to select the credentials and browse the
previously selected host.
The credential selected, either Preferred, Named or New, is saved along with
the host and selected file system path. The saved credential is used for
staging the files to a host target as part of some provisioning or patching
activity.
Note: The administrator configuring the Software Library must grant view
privilege (at least) on the credential chosen to all designers uploading or
staging the files to or from this location.
Chapter 22
Configuring Software Library Storage Location
22-17

Note: When you create a new entity, these newly configured Referenced File
Locations are available as storage options.
22.8 Configuring Software Library on a Multi-OMS System
Oracle recommends that you configure each OMS Shared Storage Location to use a
shared or mounted file system path. Doing this will ensure that this newly configured
location remains accessible from any OMS host as and when they are added. All
upload and stage requests for the files will happen through the Management Agent
monitoring the OMS host.
Note:
Starting with Enterprise Manager 12c, use the EM CLI utility to migrate files
across upload locations of different storage types. To migrate files from an
OMS Shared storage location to an OMS Agent storage location, use the EM
CLI verb
remove_swlib_storage_location
. The same verb supports the reverse
action as well. Alternatively, you can also use the Cloud Control UI. For
information about how to use the Cloud Control to migrate files across storage
locations, see Removing (and Migrating) Software Library Storage Location.
If however, you have configured the OMS Shared storage location to use a local file
system path, then you must migrate it to another OMS Shared Storage Location that
uses a shared or mounted path. To do so, follow these steps:
1. In Cloud Control, from Setup menu, select Provisioning and Patching, then
select Software Library.
2. On the Software Library Administration page, add a new OMS Shared storage
location by specifying a name (for example: NewShared), and a shared file system
path.
3. On successful completion, select the location you want to migrate, (For example:
OldNonShared), and click Migrate and Remove.
4. In the popup dialog box, select the new OMS Shared File System as the storage
plugin type, and the new OMS shared storage location (NewShared) as the
destination to migrate the files.
5. Click Remove to submit a job, which on successful completion deletes the storage
location entry from the table.
22.9 Software Library Cache Nodes
The Oracle Enterprise Manger Cloud Control 13c R1 introduces support for
configuring one or more cache nodes in close proximity to a group of targets. Once
configured, the Software Library File Transfer job ensures that entity files are picked
from the appropriate cache node, caching the entity files as needed, thereby reducing
the time taken for transferring files to targets distant from the Oracle Management
Service.
Chapter 22
Configuring Software Library on a Multi-OMS System
22-18

22.9.1 Configuring the Cache Nodes
Cache Nodes is a feature in Enterprise Manager that enhances the file transfer
experience to distant servers and data centers by reducing the load on the OMS.
Cache nodes work on a set of predefined targets that function as one unit called the
Group, and each cache node is an intermediate storage location on a host that serves
a particular group of targets that it is associated with.
Typically, creating a group with targets that belong to the same geographical location
is beneficial. Proximity of these targets ensures efficient file transfers. Having a cache
node is also hugely beneficial to reduce the load on the OMS. For example, patching
100 targets at the same time is a huge load on the OMS, as the OMS will have to
orchestrate file transfers with each of the 100 targets individually. However, you can
counter this by using cache nodes in a way that the OMS just needs to transfer the
files to the cache node once, and the cache node in turn processes the file transfer to
the individual targets in the group that it is serving. Note that a given group of targets
can be linked to more than one cache node. This approach is employed to ensure that
the load is equally balanced across the nodes, which in turn helps in maximizing the
performance of the individual cache node of the associated group.
In particular, this section covers the following:
•Adding Cache Nodes
•Editing the Cache Nodes
•Deleting the Cache Nodes
•Activating or Deactivating the Cache Nodes
•Clearing the Cache Nodes
•Synchronizing the Cache Nodes
22.9.1.1 Adding Cache Nodes
Note:
The credential is copied into a system owned credential with a generated
name that starts with SWLIB. This will appear as the original credential name
during the Edit Credential flow.
Before your begin adding cache nodes, you must ensure that you have created a
group of targets to associate with the relevant cache nodes. For information on
creating groups, see Groups page.
To add cache nodes, follow these steps:
1. In Cloud Control, from the setup menu select Provisioning and Patching, then
click Software Library.
2. On the Software Library Administration page, select Cache Nodes.
3. On the Cache Node tab, click Add.
Chapter 22
Software Library Cache Nodes
22-19

4. In the Add Cache Node dialog box, enter the following details:
a. Enter a display name for the cache node. For example: Austin Nodes.
b. Add a short description for the cache node for your reference. For example,
these are the targets on different hosts restricted to Austin, U.S.A.
c. Provide the host target machine that will be used as the cache node. For
example, slc01.example.com
d. Provide a location on the host to store the files that are transferred from the
OMS. Note that the directory must already exist and must be empty. For
example,
/usr/cachenodes
e. Search and select the group to be associated with the cache node. For
example, Austin Group.
f. Quota by default is 10 GB, you can change this value and customize it to your
requirement.
5. Click OK to create a cache node that serves the targets added to the group
specified.
A summary of the available disk space, the file transfer history, and the information
about the cache node is displayed once the node is successfully created.
Once the cache node is successfully created, you can click show to view all the
entities associated with the targets in the group. Additionally, you can view the
group details by clicking the group name.
22.9.1.2 Editing the Cache Nodes
To edit cache nodes, follow these steps:
Chapter 22
Software Library Cache Nodes
22-20

1. In Cloud Control, from the setup menu select Provisioning and Patching, then
click Software Library.
2. On the Software Library Administration page, select Cache Nodes.
3. On the Cache Node tab select the cache node that you want to update, and click
Edit. This is particularly useful when you want to change the group associated
with the cache or update the quota details.
4. Click OK to reflect the changes.
22.9.1.3 Deleting the Cache Nodes
To remove a cache, follow these steps:
1. In Cloud Control, from the setup menu select Provisioning and Patching, then
click Software Library.
2. On the Software Library Administration page, select Cache Nodes.
3. On the Cache Node tab select one or more cache nodes, and click Delete.
22.9.1.4 Activating or Deactivating the Cache Nodes
If you want to temporarily suspend the functioning of a particular cache node, click
Deactivate. Typically, when the quota is full or when you have to carry out some
maintenance tasks on the cache nodes, this option becomes useful.
To deactivate a cache node, follow these steps:
1. In Cloud Control, from the setup menu select Provisioning and Patching, then
click Software Library.
2. On the Software Library Administration page, select Cache Nodes.
3. On the Cache Node tab select a cache node, and click Deactivate.
22.9.1.5 Clearing the Cache Nodes
If you want to remove all the files associated with a cache node in order to free up the
quota, click Clear.
To clear a cache node, follow these steps:
1. In Cloud Control, from the setup menu select Provisioning and Patching, then
click Software Library.
2. On the Software Library Administration page, select Cache Nodes.
3. On the Cache Node tab select a cache node, and click Clear.
22.9.1.6 Synchronizing the Cache Nodes
To identify and clean up the inconsistencies within the cache node, follow these steps:
1. In Cloud Control, from the setup menu select Provisioning and Patching, then
click Software Library.
2. On the Software Library Administration page, select Cache Nodes.
3. On the Cache Node tab select a cache node, and click Resynchronize.
Chapter 22
Software Library Cache Nodes
22-21

22.9.2 Exporting and Importing Files for Cache Nodes
EM CLI verbs are available for exporting Software Library entities' files into
compressed files. These compressed files can be transported to a cache node host
and imported into the cache node. If Software Library entities are staged to one or
more targets in the group served by the cache node, then the files will be served
directly from the cache node in place of the OMS.
22.9.2.1 Export
Create a file with one Software Library entity internal ID per line. The internal ID of
entities can be revealed by emcli verb
list_swlib_entities
. The
file /u01/urnfe
in the
following example is such a file. Files of entities represented by lines in this file will be
exported as
/u01/exportcache/cachefiles.zip
on host
syq.acme.com,
using credential
named
creds1
owned by the EM user
ADMIN1.
e
mcli export_swlib_cache_files -dest_dir_path=/u01/exportcache -
zip_file_name=cachefiles.zip -dest_host_name=syq.acme.com -
urn_file_entry_file="/u01/urnfe" -dest_host_tmp_dir=/tmp -credential_name=creds1 -
credential_owner=ADMIN1
Once the file cachefiles.zip has been exported, it can be taken to the intended
destination cache node, such as
skx.af.acme.com
.
22.9.2.2 Import
The zip file can now be imported into the cache node using the following emcli verb:
emcli import_swlib_cache_files -src_dir_path=/u01/cachefiles -
zip_file_name=cachefiles.zip -cache_node_name=afcachenode -src_host_tmp_dir=/tmp -
src_host_name=skx.af.acme.com
The credential associated with the cache node will be used for performing the import.
For more details, see Oracle Enterprise Manager command line interface guide.
22.10 Software Library File Transfers
The Software Library File Transfer jobs submitted as part of different provisioning/
patching procedure/job runs can be searched and viewed from the File Transfer
Activity page.
File Transfer Activity Page
The File Transfer Activity page enables you to track file transfers related to Software
Library.
To access this page, log in to Enterprise Manager Cloud Control and from the
Enterprise menu, select Provisioning and Patching, then click Software Library. On
the Software Library home page, from the Actions menu, select File Transfer
Activity.
The table on this page shows all file transfer activities that have been performed
recently. The Job Name column displays the job for which the file transfer activity was
performed, and the Procedure Run Name column displays the Deployment
Chapter 22
Software Library File Transfers
22-22
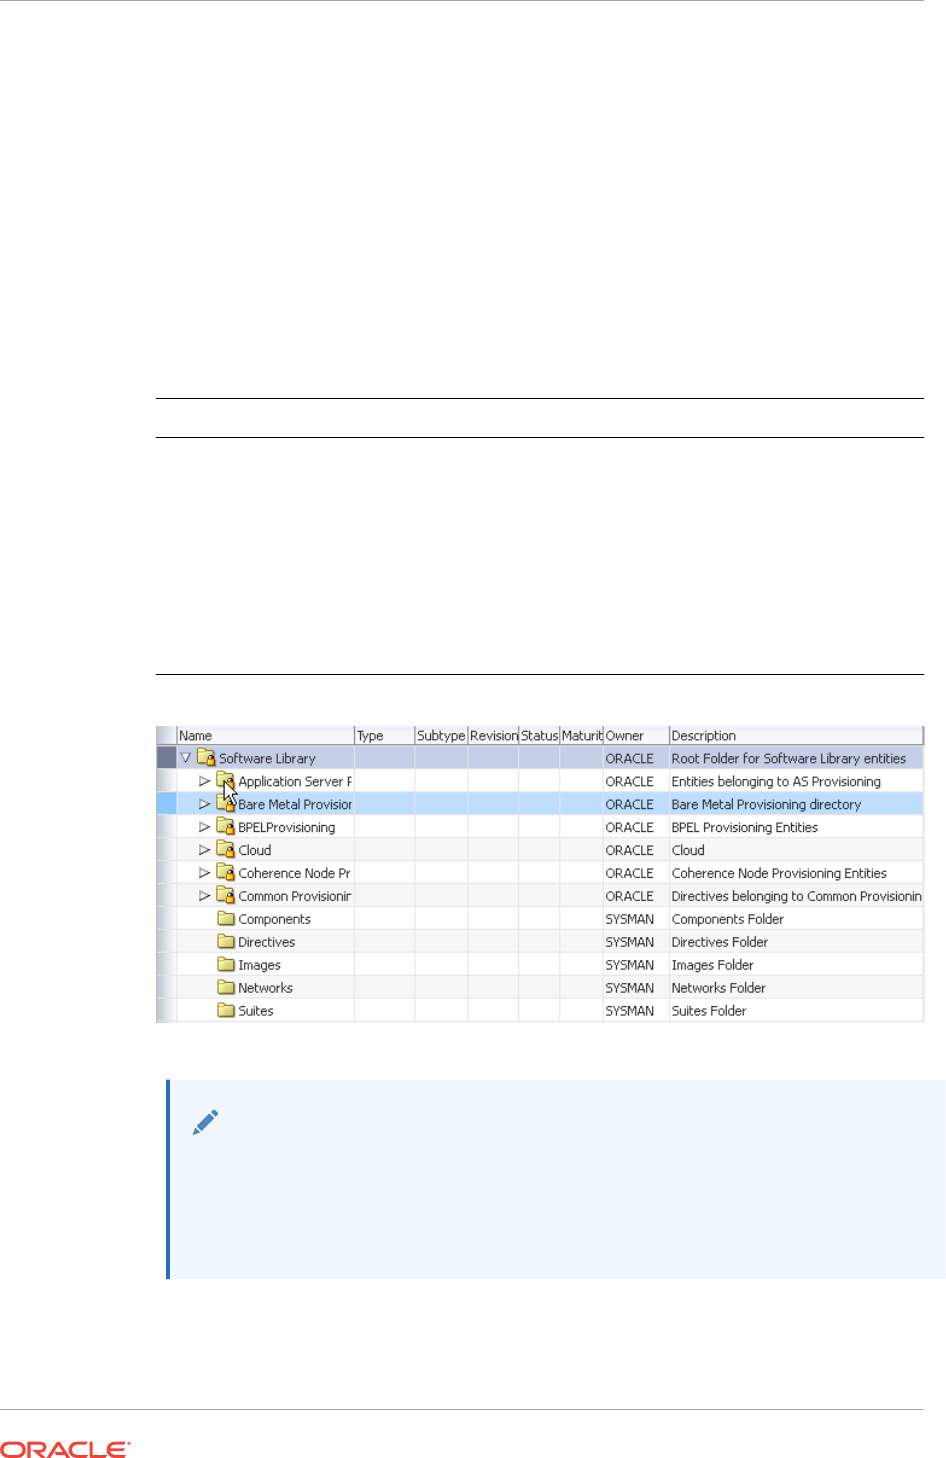
Procedure run name if it is run within a Deployment Procedure. Both these columns
together can be used to identify the file transfer activity.
22.11 Using Software Library Entities
To access the Software Library Home Page, in Cloud Control, from the Enterprise
menu, select Provisioning and Patching and then, click Software Library. Software
Library is a repository that stores certified software binaries such as software patches,
virtual appliance images, reference gold images, application software and their
associated directive scripts, generally referred to as Entities. Accesses and privileges
on these entities are decided by the Super Administrators or the owner of the entity.
Entities can broadly be classified as:
Types Description
Oracle-owned Entities These entities are available by default on the Software Library Home
page, once the Software Library is configured. In the following
graphic, all the entities that are owned by Oracle, qualify as Oracle-
owned entities, and all the folders that appear with a lock icon against
them are Oracle-owned folders like Application Server Provisioning,
Bare Metal Provisioning, Cloud, and so on.
Custom Entities These entities are created by the Software Library users. For
example, in the following graphic you can see a custom folder called
My Entities, and entities called os2 and os1 created by the owner of
the entity. These entities are called User-owned entities.
Note:
All Oracle-owned folders (and entities) are available on the Software Library
Home page by default. The Oracle-owned folders have a read-only privilege,
so you cannot select these folders to create an entity. You must create a
custom folder to place your entities in them.
A number of lifecycle management tasks such as patching and provisioning
deployment procedures make use of the entities available in Software Library to
accomplish the desired goal. Here is a pictorial representation of how a Provisioning
Chapter 22
Using Software Library Entities
22-23

Deployment Procedure and a Patching Deployment Procedure makes use of the
entities available in the Software Library:
Figure 22-2 Using Software Library Entities for Provisioning and Patching
Tasks
22.12 Tasks Performed Using the Software Library Home
Page
From the Software Library Home page, you can do the following:
•Organizing Entities
•Creating Entities
•Customizing Entities
•Managing Entities
•Staging Entities
22.12.1 Organizing Entities
Only designers who have the privilege to create any Software Library entity, can
create folders.
Note:
Starting with Oracle Enterprise Manager Cloud Control 12c Release 2
(12.1.0.2), in addition to using the GUI as described in this section, you can
alternatively use the command line interface tool to Create Folders. To do so,
refer to Oracle Enterprise Manager Lifecycle Management Administrator's
Guide.
Chapter 22
Tasks Performed Using the Software Library Home Page
22-24

To create a custom folder, perform the following steps:
1. From the Enterprise menu, select Provisioning and Patching, then select
Software Library.
2. On the Software Library Home page, from Actions menu, click Create Folder to
create a custom folder of your own.
The custom folder can contain User-owned folders, entities, and customized
entities created by using the Create Like option.
3. In the Create Folder dialog box, enter a unique name for the folder. Also, select
the parent folder in which you want to create this new custom folder and click
Save.
For example, if the root folder is
Software Library
and you created a custom folder
in it called
Cloud12gTest
, then the Parent Folder field is populated as follows:
/
Software Library/Cloud12gTest.
Note: Only the owner of the folder or the Super Administrator has the privilege to
delete the folder, nobody else can.
22.12.2 Creating Entities
From the Software Library Home page, you can create the following entities:
•Creating Generic Components
•Creating Directives
Note:
Starting with Oracle Enterprise Manager Cloud Control 12c Release 2
(12.1.0.2), in addition to using the GUI as described in this section, you can
alternatively use the command line interface tool to Create Entities. To do so,
refer to Oracle Enterprise Manager Lifecycle Management Administrator's
Guide.
22.12.2.1 Creating Generic Components
To create a generic component from the Software Library Home page, perform the
following steps:
1. From the Enterprise menu, select Provisioning and Patching, then select
Software Library.
2. On the Software Library Home page, select a custom folder that is not owned by
Oracle.
Note: You cannot create a generic component in an Oracle Owned Folder. To
create a custom folder, see Organizing Entities.
3. From the Actions menu, select Create Entity and click Component. Alternately,
right click the custom folder, and from the menu, select Create Entity and click
Component.
4. From the Create Entity: Component dialog box, select Generic Component and
click Continue.
Chapter 22
Tasks Performed Using the Software Library Home Page
22-25

Enterprise Manager Cloud Control displays the Create Generic Component:
Describe page.
5. On the Describe page, enter the Name, Description, and Other Attributes that
describe the entity.
Note: The component name must be unique to the parent folder that it resides in.
Sometime even when you enter a unique name, it may report a conflict, this is
because there could be an entity with the same name in the folder that is not
visible to you, as you do not have view privilege on it.
Click +Add to attach files that describe the entity better such as readme, collateral,
licensing, and so on. Ensure that the file size is less than 2 MB.
In the Notes field, include information related to the entity like changes being
made to the entity or modification history that you want to track.
6. On the Configure page, you can customize the generic component that you are
creating by adding some new properties or updating the existing properties of the
component.
Note: Select Shared Type to reuse the component property. Shared Type can be
stored as a template, which can be used for creating different and more
complicated top level types.
To add a new property, do the following, and click Next:
a. Select Top Level Type or Shared Type, and click Add.
b. Enter a unique name for the property. Depending on the property type
selected, enter an initial or default value for the property.
c. To add a constraint, specify the Minimum or Maximum value for the selected
property type, and click Add Constraint.
The Configured Constraints table lists all the constraints added. To remove a
particular constraint from the property, select the property and click Remove.
7. On the Select Files page, you can select one or more files to be associated with
the entity. Select one of the following options:
•Upload Files: If you want to upload some entity files from the local file system
or the agent machine to the selected destination location.
To select the destination location, in the Specify Destination section, in the
Upload Location field, click the magnifier icon to select one of the following
options:
–OMS Shared File System
–OMS Agent File System
The corresponding Storage Type and Location Path of the selected location is
populated.
Note:
To upload the files, the status of the storage location to which the files are to
be uploaded should be Active.
If you select OMS Agent File system location, then ensure that you have the
necessary privileges to access the location
Chapter 22
Tasks Performed Using the Software Library Home Page
22-26

In the Specify Source section, enter the location from where the files are being
sourced, these locations can either be local file system or a remote file system
monitored by the Management Agent. Select one of the following options for
File Source:,:
–If you select Local Machine, and click Add, the Add File dialog box
appears. Click Browse to select the entity file from the source location,
and give a unique name, and click OK.
You can upload the files to any of the configured storage locations
available in OMS Shared File system location or OMS Agent File system
location
–If you select Agent Machine, select the name of the host machine from
where you want to pick up the entity files. Click +Add and log in to the
host machine with the desired credentials. For more information about the
different credential types and their setup, see the Oracle Enterprise
Manager Lifecycle Management Guide.
Once you log in to the host machine, browse to the location where the files
to be uploaded are present. You can upload the files to any of the
configured storage locations available in OMS Shared File system location
or OMS Agent File system location.
•Refer Files: If you select the Refer Files option, you only need to enter the
source location details, since you are not technically uploading anything to the
Software Library. In the Specify Source section, select from HTTP, NFS, or
Agent Storage types, and click OK. The corresponding Storage Type and
Location Path of the selected location is populated.
Click +Add to reference the entity present at the selected Referenced File
Location. In the Add Referenced File dialog box, enter a relative path to the file
under Base Location. Click Stage As to organize the file in a temporary stage
location with a unique name.
For details about each of these storage options, see Configuring a Referenced
File Location
8. On the Set Directives page, click Choose Directives to associate a component
with one or more directives. Click Next.
9. On the Review page, review all the details, and click Finish to create the
component and upload it on the Software Library.
22.12.2.2 Creating Directives
Directives are entities in the Software Library that represent a set of instructions to be
performed. These are constructs used to associate scripts with software components
and images. These scripts contain directions on how to interpret and process the
contents of a particular component or an image.
To create a directive from a Software Library Home page, perform the following steps:
1. From the Enterprise menu, select Provisioning and Patching, then select
Software Library.
2. On the Software Library Home page, select a custom folder that is not owned by
Oracle.
Note: You cannot create a generic component in an Oracle Owned Folder. To
create a custom folder, see Organizing Entities.
Chapter 22
Tasks Performed Using the Software Library Home Page
22-27

3. From Actions menu, select Create Entity and click Directive. Enterprise
Manager Cloud Control displays the Create Entity: Directives wizard.
4. On the Describe page, enter the Name, Description, and Other Attributes that
describe the entity.
Note: The component name must be unique to the parent folder that it resides in.
In case you enter a unique name and it reports a conflict, it may be due to an
entity with the same name in the folder that is not visible to you, as you do not
have view privilege on it.
Click +Add to attach files that describe the entity better such as readme, collateral,
licensing, and so on. Ensure that the file size is less than 2 MB.
In the Notes field, include information related to the entity like changes being
made to the entity or modification history that you want to track.
5. On the Configure page, specify the command line arguments that must be passed
to the directive to configure it. This command provides the parameters required to
execute the directive.
To add the command line arguments or parameters, click Add.
In the Add Command Line Arguments dialog box, enter the values in the following
fields:
•Argument Prefix, is a switch or a constant command line argument.
The Argument Prefix eliminates the error-prone task of manually specifying the
order of the parameter executions in a given directive. This is specially useful
when a directive is made of multiple parameters.
Oracle recommends that you create command line arguments using an
Argument Prefix.
•Property Name, is the name of the property, that must be a string value.
•Argument Suffix, is the text that must follow the command line property.
Though the suffix is rarely used, it determines how the parameters must be
executed, based on the suffix value.
For example, if the command line argument you want to pass is as follows:
./test.sh -user={username}
Then,
Argument Prefix is:
–user
Property Name is:
username
All the parameters added appear in the order of addition against the Command
Line field.
To change the order of the parameter or edit any property of an existing
parameter, click Edit.
To remove any of the parameters, click Remove.
In the Configuration Properties section, select either Bash or Perl as defined in
the script.
Select Run Privileged to run the script with
root
privileges.
6. On the Select Files page, you can select one or more files to be associated with
the entity. Select one of the following options:
Chapter 22
Tasks Performed Using the Software Library Home Page
22-28

•Upload Files: If you want to upload some entity files from the local file system
or the agent machine to the selected destination location.
To select the destination location, in the Specify Destination section, in the
Upload Location field, click the magnifier icon to select one of the following
options:
–OMS Shared File System
–OMS Agent File System
The corresponding Storage Type and Location Path of the selected location is
populated.
Note:
To upload the files, the status of the storage location to which the files are to
be uploaded should be Active.
If you select OMS Agent File system location, then ensure that you have the
necessary privileges to access the location.
In the Specify Source section, enter the location from where the files are being
sourced, these locations can either be local file system or a remote file system
monitored by the Management Agent. Select one of the following options for
File Source:
–If you select Local Machine, and click Add, the Add File dialog box
appears. Click Browse to select the entity file from the source location,
and give a unique name, and click OK.
You can upload the files to any of the configured storage locations
available in OMS Shared File system location or OMS Agent File system
location
–If you select Agent Machine, select the name of the host machine from
where you want to pick up the entity files. Click +Add and log in to the
host machine with the desired credentials. For more information about the
different credential types and their setup, see the Oracle Enterprise
Manager Lifecycle Management Guide.
Once you log into the host machine, browse to the location where the files
to be uploaded are present. You can upload the files to any of the
configured storage locations available in OMS Shared File system location
or OMS Agent File system location.
•Refer Files: If you select the Refer Files option, you only need to enter the
source location details, since you are not technically uploading anything to the
Software Library. In the Specify Source section, select from HTTP, NFS, or
Agent Storage types, and click OK. The corresponding Storage Type and
Location Path of the selected location is populated.
Click +Add to reference the entity present at the selected Referenced File
Location. In the Add Referenced File dialog box, enter a relative path to the file
under Base Location. Click Stage As to organize the file in a temporary stage
location with a unique name.
Chapter 22
Tasks Performed Using the Software Library Home Page
22-29

For details about each of these storage options, see Configuring a Referenced
File Location
7. On the Review page, review all the details, and click Finish to create the
component and upload it on the Software Library.
22.12.3 Customizing Entities
You cannot edit an entity present in an Oracle owned folder. However, to edit an
Oracle-owned entity, you can make a copy of the entity and store it in a custom folder.
Since you now have full access on the entity, you can customize the entity based on
your requirement and may even choose to grant other users access to this entity.
To create a custom entity from an Oracle owned entity, perform the following steps:
1. From the Enterprise menu, select Provisioning and Patching, then select
Software Library.
2. On the Software Library Home page, select an entity or alternately, search and
select an entity.
For more information about searching for an entity, see Searching Entities.
3. From Actions menu, select Create Like.
4. On the Create Like: <Entity Name> dialog box, enter a name that is unique to the
parent folder and a description for the entity.
By default, the root directory Software Library is preselected in the Parent Folder
field.
To change the parent folder and organize the entities, click Change Parent
Folder. and select the desired folder.
5. Click OK to apply the changes.
The new entity appears in the Entities table, under the selected parent folder.
You as the owner have all the privileges on the entity, and can update the
properties as per your requirement.
To update the properties of the entity, see Viewing, Editing, and Deleting Entities.
For more information on Oracle Owned Entities and User Owned Entities, see Using
Software Library Entities.
22.12.4 Managing Entities
From the Software Library Home page, you can perform the following maintenance
tasks on the existing entities:
•Accessing Software Library Home Page
•Accessing Software Library Administration Page
•Granting or Revoking Privileges
•Moving Entities
•Changing Entity Maturity
•Adding Notes to Entities
•Adding Attachments to Entities
Chapter 22
Tasks Performed Using the Software Library Home Page
22-30

•Viewing, Editing, and Deleting Entities
•Searching Entities
•Exporting Entities
•Importing Entities
Note:
Starting with Oracle Enterprise Manager Cloud Control 12c Release 2
(12.1.0.2), you can either use the GUI or use the command line interface tool
to perform all the tasks listed in Table 22-3.
22.12.4.1 Accessing Software Library Home Page
To access the Software Library Home page, from the Enterprise menu, select
Provisioning and Patching, then select Software Library.
22.12.4.2 Accessing Software Library Administration Page
To access the Software Library Administration page, from the Setup menu, select
Provisioning and Patching, then select Software Library.
22.12.4.3 Granting or Revoking Privileges
An Enterprise Manager user requires, at the very least, a view privilege on an entity for
the entity to be visible on the Software Library Home. The owner or super
administrator can choose to grant additional privileges like edit (Update notion) or
manage (or full) or at a later point of time, revoke the previously granted privilege.
To grant or revoke privileges, perform the following steps:
1. From the Enterprise menu, select Provisioning and Patching, then select
Software Library.
2. To grant or revoke fine-grained privileges to the other users on any entity that you
own, select the custom entity and from Actions menu, click Grant/Revoke
Privileges.
3. On Grant/Revoke Privileges on: <entity_name> window, you can either grant or
revoke Software Library privileges depending on the users roles and
responsibilities in the organization.
Granting Privileges: To grant one or more new privileges, click +Add and search
for the users. You can grant them one of the following privileges on the entity you
own:
•View Software Library Entity: This is normally an operator privilege where
the user can only view the entity on the Software Library Home. The user
cannot edit or manage the entity. All the Oracle owned entities can be viewed
by all Enterprise Manager users.
•Edit Software Library Entity: This is a designer privilege where a user has
Create, Update, and Edit privileges on the entity.
Chapter 22
Tasks Performed Using the Software Library Home Page
22-31

•Manage Software Library Entity: This is a super-administrator privilege
where the user has complete access on the entity. With this privilege, you can
grant or revoke accesses on this entity to other users, or delete the entity.
Revoking Privileges: To revoke previously granted privileges, select the user and
click Remove.
4. Click Update to apply the selected grants on the entity.
22.12.4.4 Moving Entities
To move all the revisions of an entity from one folder to another, do the following:
1. From the Enterprise menu, select Provisioning and Patching, then select
Software Library.
2. On the Software Library Home page, select an entity or alternately, search and
select an entity.
For more information about searching for an entity, see Searching Entities.
3. From the Actions menu, click Move Entity and accept the confirmation.
4. From the Move Entity dialog box, select the destination folder for the entities and
click Set New Parent Folder.
Note: Ensure that the source and the destination folders are not owned by Oracle,
as you cannot move or edit them.
22.12.4.5 Changing Entity Maturity
When an entity is created from the Enterprise Manager Home, it is present in an
Untested state. It is the responsibility of a designer to test the entity, and change the
maturity level based on the test result.
To manage the lifecycle and indicate the quality (maturity level) of an entity, perform
the following steps:
1. From the Enterprise menu, select Provisioning and Patching, then select
Software Library.
2. On the Software Library Home page, select an entity or alternately, search and
select an entity.
For more information about searching for an entity, see Searching Entities.
3. From the Actions menu, click Change Maturity to change the maturity value an
entity after testing.
For example, an Oracle Database Clone component would be tested by selecting it in
a deployment procedure interview flow that provisions a database. Once the entity is
tested, the designer can change the maturity of the entity to either Beta or Production
based on test results. Only when the entity is marked with Production level, the
Operator can use it.
22.12.4.6 Adding Notes to Entities
To log information about the changes or updates made to an existing entity, perform
the following steps:
Chapter 22
Tasks Performed Using the Software Library Home Page
22-32

1. From the Enterprise menu, select Provisioning and Patching, then select
Software Library.
2. On the Software Library Home page, select an entity or alternately, search and
select an entity.
For more information about searching for an entity, see Searching Entities.
3. From Actions menu, click Notes to include any important information related to
the entity. You can also add notes while editing an entity.
The most recent note appears on top of the table, and the older notes appear
below.
4. After updating the details, click Finish to submit the changes, and return to the
Software Library Home page.
22.12.4.7 Adding Attachments to Entities
To add or upload files that are typically documents (like README, installation,
configuration) related to the software the entity represents, perform the following steps:
1. From the Enterprise menu, select Provisioning and Patching, then select
Software Library.
2. On the Software Library Home page, select an entity or alternately, search and
select an entity.
For more information about searching for an entity, see Searching Entities.
3. From Actions menu, click Attachments to include one or more files related to the
entity. These files contain some important information about the entity. You can
also attach files while editing an entity.
For example, you can attach a readme file to a patch or a component, attach a test
script to a directive and so on. However, you must ensure that the file size of each
attachment is not more than 2 MB.
4. Click Finish to submit the changes, and return to the Software Library Home
page.
22.12.4.8 Viewing, Editing, and Deleting Entities
To view, edit, or delete the details of an entity, perform the following steps:
1. From the Enterprise menu, select Provisioning and Patching, then select
Software Library.
2. On the Software Library Home page, select an entity or alternately, search and
select an entity.
For more information about searching for an entity, see Searching Entities.
3. To manage an existing entity, select the entity and perform any of the following
functions:
•View: Click View icon on the table to view the details of an entity. You cannot
update the properties of the entity from here.
•Edit: Click Edit icon on the table or right-click the entity and select Edit from
the context menu to update the properties of an entity.
Chapter 22
Tasks Performed Using the Software Library Home Page
22-33
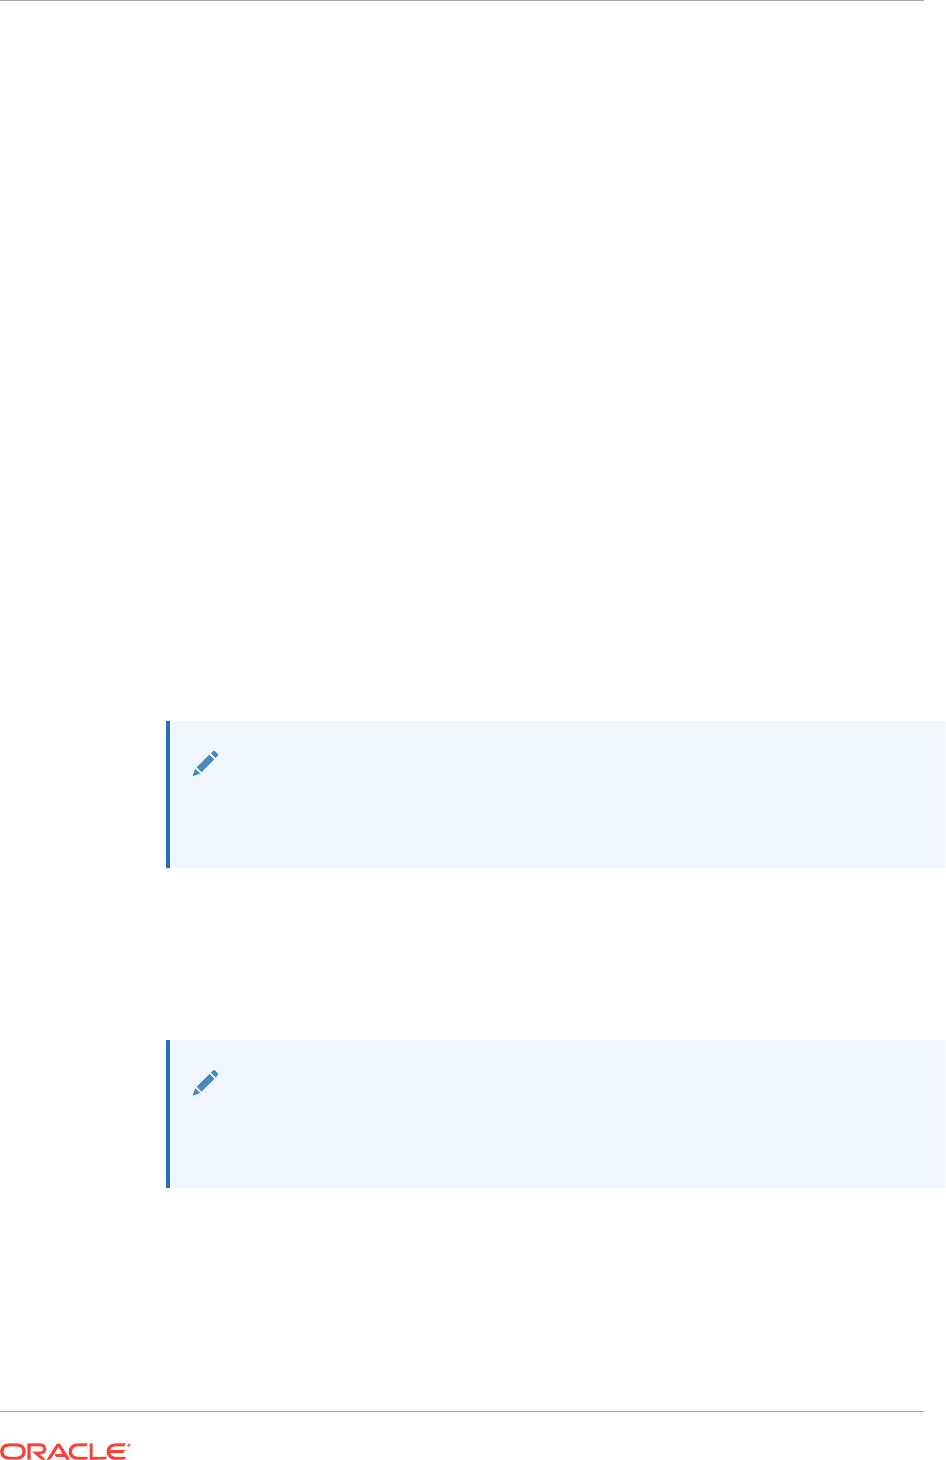
If you are satisfied with the details, click Save and Upload to make the
changes available on the Software Library Home page.
•Delete: Click Delete icon to remove the entity from the Software Library Home
page.
Note: By deleting an entity, the entity is no longer available for selection,
viewing, or editing, and will not be displayed on the Software Library Home
page. However, the entity continues to exist in the repository and the
associated files, if uploaded, continue to exist in the respective disk storage.
To delete the entity completely from the repository and the associated files
from the file system, you must purge the deleted entities from the
administration page. The purge job not only deletes the files associated with
the deleted entity, but removes the deleted entities itself from the repository
tables.
For more information about how to purge the deleted entities from the storage
location, see Purging Deleted Entities.
22.12.4.9 Purging Deleted Entities
To purge the deleted entities from all the configured Agent Storage locations, you can
run a purge job. To do so, follow these steps:
1. In Cloud Control, from the Enterprise menu, select Provisioning and Patching,
then select Software Library.
2. On the Software Library home page, from Actions menu, select Deleted Entities.
A list of entities that are deleted from Software Library are displayed.
Note:
The Space Used attribute is displayed only for the deleted entities that had
uploaded files to Software Library.
3. On the Deleted Entities page, click Purge to permanently remove these entities
from Oracle Management Repository, and the associated files from upload storage
locations.
4. A Confirmation Message dialog box is displayed. Click Job Details to view the
status of the purge job submitted.
Note:
A periodic job named
SWLIBPURGE
runs daily to purge the deleted entities from
the Software Library.
22.12.4.10 Searching Entities
This section contains the following topics:
•Performing Basic and Advanced Searches
•Saving Searches
Chapter 22
Tasks Performed Using the Software Library Home Page
22-34

•Retrieving Saved Searches
•Managing Saved Searches
22.12.4.10.1 Performing Basic and Advanced Searches
To perform a basic or an advanced search for an entity, follow these steps:
1. From the Enterprise menu, select Provisioning and Patching, then select
Software Library.
2. To search for an entity, perform one of the following operations:
a. Find: On the Software Library Home page, you can search for an entity by its
Name, Description, or Type. Select the search category, enter the desired
value and then click the arrow icon.
On clicking the arrow icon, the result page displays a number of matching
results, and allows you to toggle between the result rows by clicking the up
and down arrows.
b. Search: To perform a detailed search for an entity, click Search. The search
option, by default, allows you to search by Type, Name, Description,
Revision, Maturity, Status, and File Name to retrieve a more granular search
result.
Note: If you choose entities that have associated subtypes (like Components),
then the page is refreshed with Subtype as an additional search category.
Specify appropriate values in All or Any of the search fields, and click Search.
To add more search parameters, in the Advanced Search section, click Add
Fields menu and, select the desired search fields. The selected fields appear
in the Advanced Search section as new search parameters. This new search
feature enables you to refine your search, and drill down to the most accurate
and desired search result.
To revert to the simple search view, click Close Search.
22.12.4.10.2 Saving Searches
Optionally, search criteria on the Advanced Search screen of the console, can be
saved. Saved searches can be retrieved and executed again. They can also be edited
and deleted.
1. Search for entities.
2. Click Save Search.
3. Enter the preferred name for the search in the text box, and click Ok.
22.12.4.10.3 Retrieving Saved Searches
To retrieve saved searches, follow these steps:
1. Search for entities.
2. Click Saved Searches, and select the preferred saved search from the list.
Alternatively, you can also select the preferred saved search from the Favorites
menu. To do so, from the Favorites menu, select Saved Software Library
Searches, and select the preferred saved search.
Chapter 22
Tasks Performed Using the Software Library Home Page
22-35

22.12.4.10.4 Managing Saved Searches
Using the Manage Saved Searches option, you can edit the name of the saved
search, or delete the saved search. To do so, follow these steps:
•To manage saved searches, you can perform one of the following steps:
–From the Favorites menu, select Manage Favorites.
–Click Saved Searches, and select Manage Saved Searches.
•To edit the name of the saved search, select the preferred saved search, and in
the Name text field, enter the new name. Click Ok to save changes.
•To delete or remove a saved search, select the preferred saved search, and click
Remove Selected. Click Ok to save changes.
22.12.4.11 Exporting Entities
To export selected entities, perform the following steps:
1. From the Enterprise menu, select Provisioning and Patching, then select
Software Library.
2. On the Software Library Home page, from the Actions menu, click Export to
export entities present in the Software Library as a Provisioning Archive (PAR) file.
The PAR file can be used for recreating the entities on an Enterprise Manager with
a different repository.
3. On the Export Software Library Entities page, do the following:
•Click +Add to search and select an entity.
•In Directory Location, enter a directory location accessible to OMS for storing
the generated PAR files.
•In PAR File, enter the name of the PAR file with a
.par
extension generated
during export.
•To encrypt and securely store all the secret property values of the PAR file
being exported, enter a value in the Oracle Wallet Password field.
Note: Specify the same password for importing this PAR file. For more
information on importing, see Importing Entities.
•Select Exclude Associated Files, to exclude the files, binaries, or scripts
associated with an entity, from being exported.
For example, let us consider that you have a separate test and production
environment and want to import only the entities that have been tested and
certified in the test environment into production. The entities exported from the test
system are made available as a Provisioning Archive (PAR) file. You can now
choose to import this PAR file into the production system (which is identical to the
test system) and use the tested entities.
4. Click Submit to submit an export job. Once the job runs successfully, the selected
entities from the Software Library are exported as a PAR file.
Chapter 22
Tasks Performed Using the Software Library Home Page
22-36

Note:
•Provisioning Archive Files that were exported from any Enterprise
Manager version prior to 12c can not be imported into Enterprise Manager
12c.
•Enterprise Manager does not support exporting Oracle-owned entities.
22.12.4.12 Importing Entities
To import PAR (Provisioning Archive) files into the Software Library or deploy them to
an OMS, perform the following steps:
1. From the Enterprise menu, select Provisioning and Patching, then select
Software Library.
2. On the Software Library Home page, from Actions menu, click Import to import
the PAR files.
3. On the Import Software Library Entities page, specify the PAR File to be imported.
To import the PAR file successfully, in the Password field, enter the same
password that was set on the PAR file to secure the secret property values during
export.
For example, let us consider that you have a separate test and production
environment and want to import only the entities that have been tested and
certified in the test environment into production. The entities exported from the test
system are made available as a Provisioning Archive (PAR) file. You can now
choose to import this PAR file into the production system (which is identical to the
test system) and use the tested entities.
4. If a revision of the entity being imported already exists in Software Library, then
you can overwrite the existing entity with a newer revision during import by
selecting Force New Revision.
Note: If a revision of the entity being imported already exists in the repository, and
you do not select the Force New Revision option, then import process fails.
5. Click Submit to submit an import job. On successful completion of the job, the
PAR files are imported into the Software Library.
Note:
Provisioning Archive Files that were exported from any Enterprise Manager
version prior to 12c can not be imported into Enterprise Manager 12c.
22.12.5 Staging Entities
For transferring files associated with multiple entities to multiple target hosts, follow the
steps outlined in this section.
Prerequisites
Chapter 22
Tasks Performed Using the Software Library Home Page
22-37

Ensure that you meet the following prerequisites before staging the files:
1. Only hosts that are monitored by the Enterprise Manager can be specified as the
destination for staging the files associated with an entity.
2. For each entity, only files that have been successfully uploaded to the entity
(hence, in Ready status) can be selected for staging.
Note:
To verify if the entity has any files in the Ready state, follow these steps:
a. Select the entity, and click View.
b. On the View Entity page, select Select Files tab, to verify the files
associated with the entity.
c. Unless there is at least one file with a Ready status, you cannot proceed
with the staging process.
3. Only users with View Job Privileges can perform staging.
4. Only entities for which the user has at least view privileges can be selected for
staging.
5. The location should be writeable using the credential given for the target host.
6. If the source files to be staged are on NFS, then the credentials used for browsing
the destination target should have
root
permissions to be able to mount the NFS
location.
Staging Procedure
Log in to Enterprise Manager Cloud Control and perform the following steps:
1. From the Enterprise menu, select Provisioning and Patching, then select
Software Library.
2. From the Actions menu, select Stage Entities.
3. On the Stage Entities page, expand the Entities section (if not already expanded).
4. Click +Add to search and select the entities. Only those entities which are not
already added and those that have at least one file in the READY status can be
added.
5. All the files in the READY status are selected for staging by default. To change the
selection, expand the row of the added entity in the table and check/uncheck the
Select column.
6. You can optionally select the Overwrite files on the staging location to overwrite an
existing version of the same file. If not, ignore this option and proceed.
7. In the Staging Destination section, click +Add to add the stage destination details.
8. Click +Add to select the target hosts for staging.
9. Specify the Stage Location in the text box applicable for the host targets selected.
10. Choose the credentials that should be used for staging. If more than one host
target is selected, then the stage location should be writeable using the selected
credential on each host.
Chapter 22
Tasks Performed Using the Software Library Home Page
22-38

11. Click OK to update the selected hosts in the staging destination table.
12. Click Submit.
13. To verify the status of the submitted job, click the Job Details link that leads to the
File Transfer Activity page displaying the file transfer details. Alternately, from the
Enterprise menu, select Job, then click Activity and search for the job.
22.13 Maintaining Software Library
To maintain the health and proper functionality of the Software Library, the
administrator who configured the Software Library, or the Designer who has
administration access on it must perform the tasks listed here.
This section includes:
•Periodic Maintenance Tasks
•Re-Importing Oracle Owned Entity Files
•Removing (and Migrating) Software Library Storage Location
•Removing a Referenced Storage Location
•Deactivating and Activating a Storage Location
•Scheduling Purge Job
•Backing Up Software Library
22.13.1 Periodic Maintenance Tasks
Periodically, the Administrator must perform the following tasks for proper functioning
of the Software Library:
•Refresh the Software Library regularly to compute the available space, free space,
and the space used by deleted entities. To do so, on the Administration page, in
the upload file locations tab, select the storage location. From the Actions menu,
select Refresh. On successful refresh, a confirmation is displayed. Alternately,
you can search for the periodic refresh job
SWLIBREFRESHLOCSTATS
, and edit the
schedule and other attributes to suit your requirements. By default, this job is
scheduled to run every 6 hours.
•Purge deleted entities to conserve disk space. To do so, see Scheduling Purge
Job. Alternatively, you can search for the periodic purge job
SWLIBPURGE
, and edit
the schedule and attributes to suit your requirements. By default, this job is
scheduled to run every 24 hours.
•Check accessibility of the configured Software Library locations. To do so, on the
Administration page, in the upload file locations tab, select the storage location.
From the Actions menu, select Check Accessibility.
Chapter 22
Maintaining Software Library
22-39

22.13.2 Re-Importing Oracle Owned Entity Files
Note:
Re-importing metadata applies only to the Oracle owned files, which means all
the entity files offered with the Enterprise Manager product by default. The
metadata of User owned entity files cannot be recovered through the Re-
import functionality.
Re-Importing the metadata of Oracle owned entity files is not a periodic activity. Re-
import helps to recover the metadata files in one of the following situations:
•If you delete the file system location where the metadata was imported. For
example,
/scratch/swlib1/
•If the import job submitted while creating the first upload location fails.
To re-import the metadata of Oracle owned files, do the following:
1. In Cloud Control, from Setup menu, select Provisioning and Patching, and then
click Software Library.
2. On the Software Library Administration page, in the Upload File Location tab, from
Actions menu, select Re-Import Metadata option to submit a job that re-initiates
the re-import process.
22.13.3 Removing (and Migrating) Software Library Storage Location
Software Library Storage Administrators have the required privileges to delete a
storage location. If a storage location is not in use, then you can remove it instantly.
However, if it is in use, then you must migrate the contents to another location so that
the entities using these files continue to remain usable.
Before removing a storage location that is currently in use, you are prompted for an
alternate location for the files. After you select an alternate location, a migration job is
submitted, and the location is marked as Migrating. After successful migration of the
entity files to the new location, the location configuration is deleted. In case of any
errors during migration, the location is marked as Inactive. Once the errors are fixed,
and the storage administrator ascertains that the location is good to use, the location is
marked as Active.
Note:
To remove a location from OMS Agent File System or Referenced Agent File
System storage, you must have a view privilege on the credentials for the
location being removed, and the alternate location where the files are
migrated.
To delete a configured storage location, perform the following steps:
Chapter 22
Maintaining Software Library
22-40
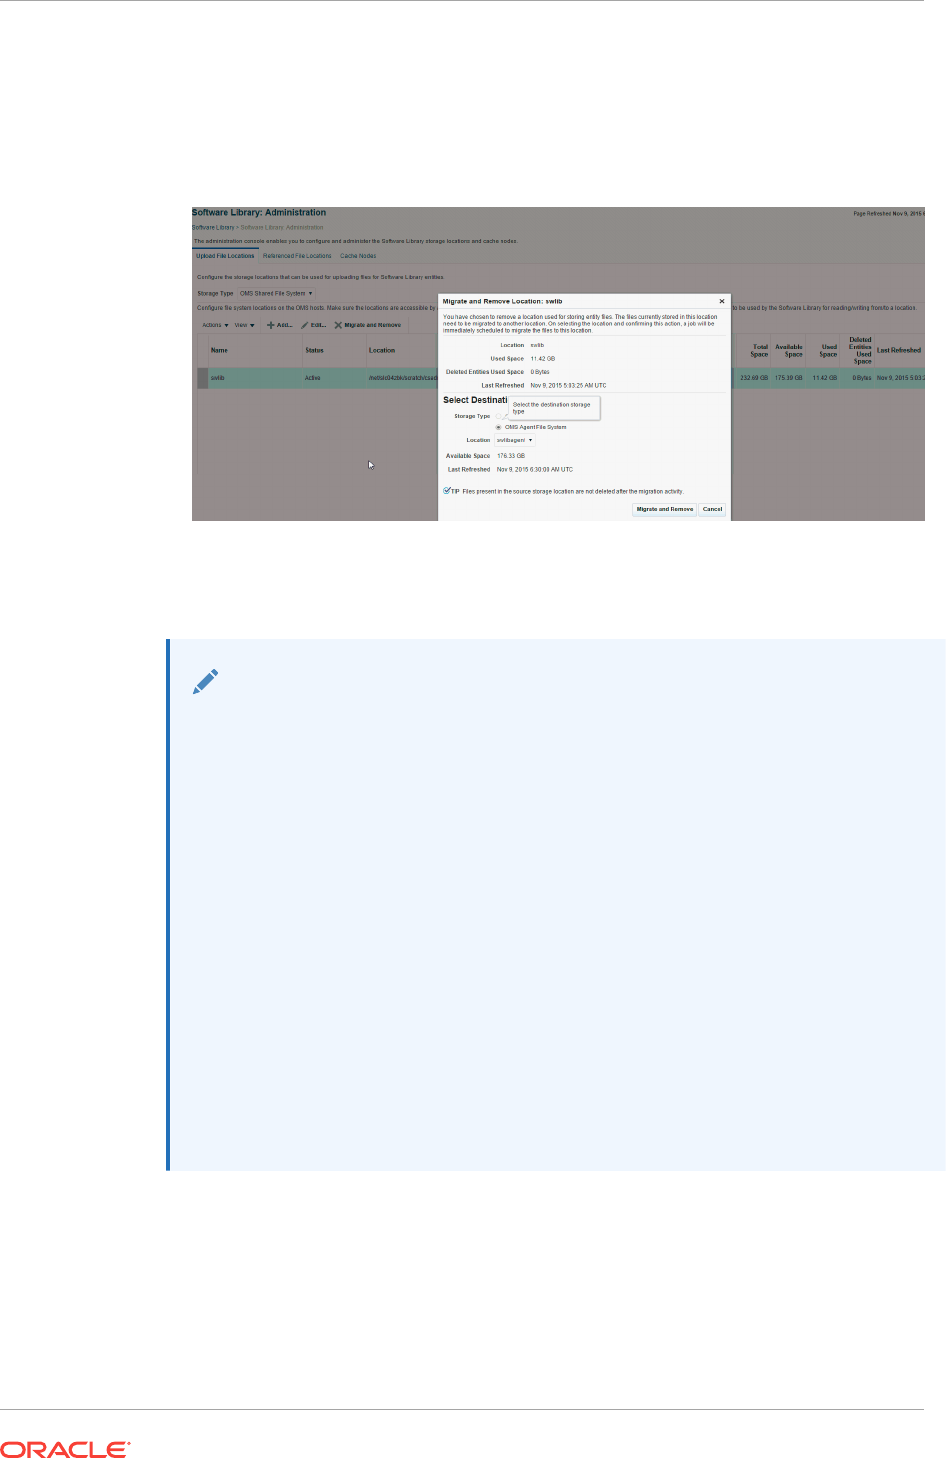
1. In Cloud Control, from Setup menu, select Provisioning and Patching, then
select Software Library.
2. On the Software Library Administration page, select the storage location, and click
Migrate and Remove.
3. On the Migrate and Remove Locations dialog box, select either OMS Shared File
System or OMS Agent File System. A list of available active storage locations
are displayed, select one and click Migrate and Remove.
Note:
At least one upload location (either OMS Shared File System or OMS Agent
File System) should be present. The last active upload location cannot be
removed. Use ei using the steps listed inther Cloud Control or EMCLI to
migrate an upload location to another upload location of either upload storage
types (either OMS Shared File System or OMS Agent File System). For
example, you can migrate an OMS Shared File System storage location to an
OMS Agent File System storage location. Even the reverse operation is
supported. However, note that this type of migration, across storage types, is
supported specifically for upload storage types, and is not applicable for the
reference storage types.
For a storage location, if there are no active upload locations (OMS Shared
File System or OMS Agent File System), then the Migrate and Remove
button will not be enabled for that location
To migrate the files from one upload location to another, you can also use the
EM CLI verb
emcli remove_swlib_storage_location.
For more information
about this command, see Performing Software Library Tasks Using EM CLI
Verbs or in Graphical Mode.
4. In the confirmation dialog box, click Migrate and Remove to submit a job, which
on successful completion deletes the storage entry from the table.
Chapter 22
Maintaining Software Library
22-41
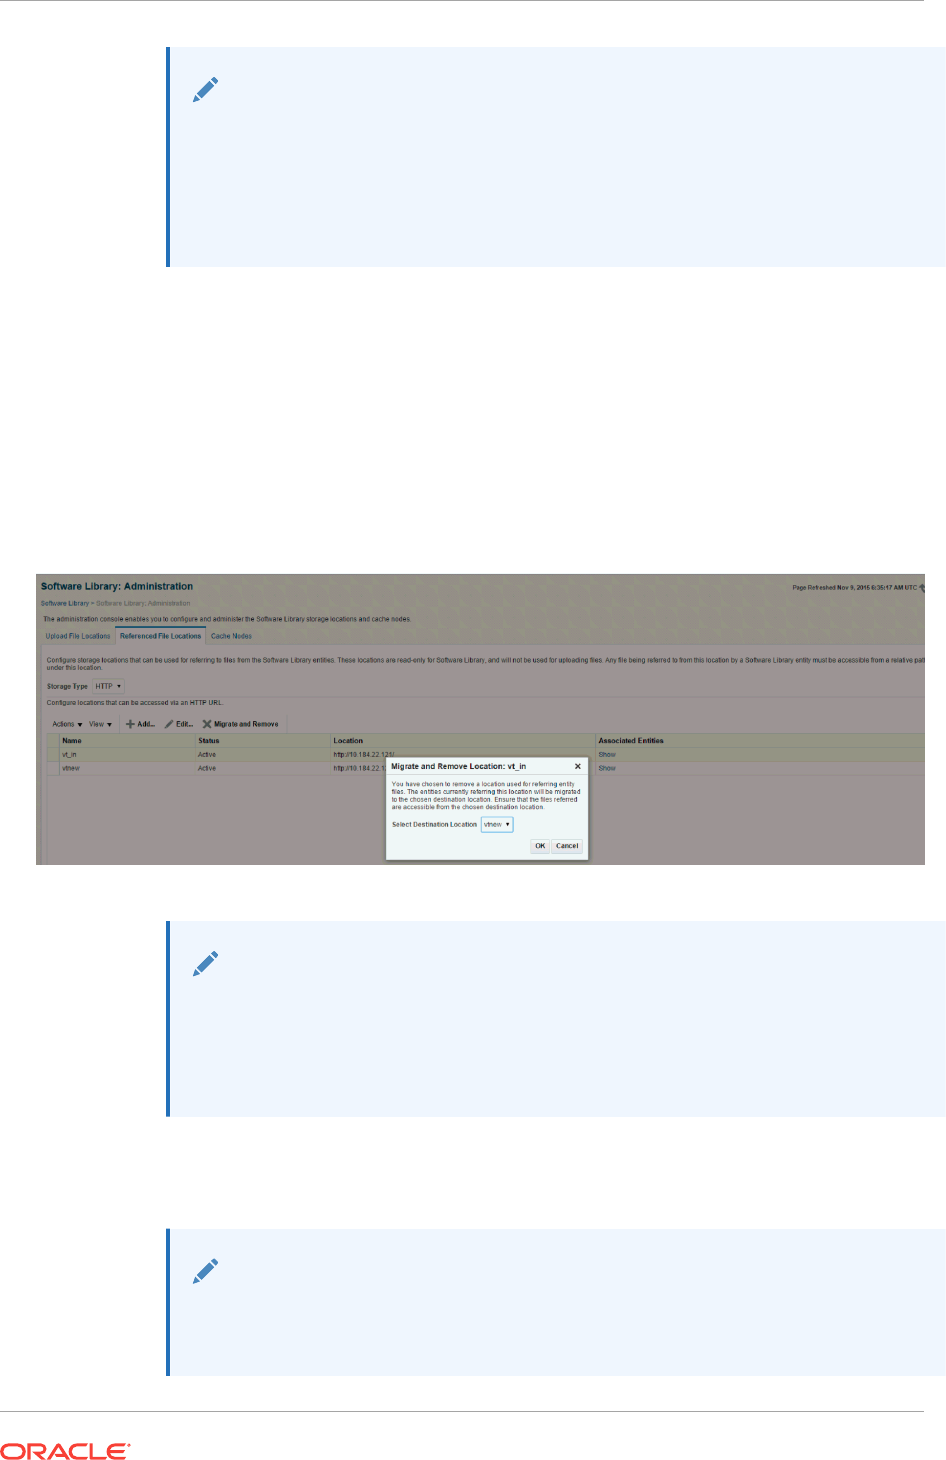
Note:
When one storage location is migrated to another location, for example,
from
/vol/swlib1
to
/vol/swlib2
, the file system contents of the source
location (
/vol/swlib1
) are not deleted during the migration. However, going
forward, the source location and the files are never referenced by Software
Library.
22.13.4 Removing a Referenced Storage Location
To remove a configured reference storage location (HTTP/ NFS/ External Agent
Location), perform the following steps:
1. In Cloud Control, from Setup menu, select Provisioning and Patching, then
select Software Library.
2. On the Software Library Administration page, select the storage location, and click
Migrate and Remove.
Note:
If a location is not in use, then select the storage location and click OK to
remove the location. However, if some entities are using a storage location,
then you must migrate the files to another location before deleting the existing
location.
3. To migrate the files to another location from the Migrate and Remove Locations
dialog box, select a destination location from the list of active storage locations,
then click OK.
Note:
If there are no active locations of the same storage type available for
migration, then the Migrate and Remove button is disabled for the location.
Chapter 22
Maintaining Software Library
22-42
22.13.5 Deactivating and Activating a Storage Location
An upload or reference storage location can be deactivated. Once deactivated, the
status of the storage location becomes Inactive and no further uploads will be allowed
to the upload storage location. A storage location in an inactive state can be activated
to be put back in use.
To deactivate a storage location, follow these steps:
1. In Cloud Control, from Setup menu, select Provisioning and Patching, then
select Software Library.
2. On the Software Library Administration page, select the storage location that is in
an Active state, then from the Actions menu select Deactivate. A confirmation
dialog is displayed.
3. Upon confirmation, the storage location is deactivated, and state changes to
Inactive.
To activate a storage location, follow these steps:
1. In Cloud Control, from Setup menu, select Provisioning and Patching, then
select Software Library.
2. On the Software Library Administration page, select the storage location that is in
an inactive state, then from the Actions menu select Activate. A confirmation
dialog is displayed.
3. Upon confirmation, the storage location is activated, and state changes to Active.
22.13.6 Scheduling Purge Job
Starting with Enterprise Manager 12c the purge job can be scheduled. To do so follow
these steps:
1. In Cloud Control, from Setup menu, select Provisioning and Patching, then
select Software Library.
2. On the Software Library Administration page, select the storage location, and from
the Actions menu select Purge. The following dialog box appears where you can
schedule the purge job:
3. Enter all the details and click OK to submit the job, on successful completion of the
job all the deleted entities are removed from the storage location.
Chapter 22
Maintaining Software Library
22-43

However, you can also perform this operation in the following method:
1. In Cloud Control, from Setup menu, select Provisioning and Patching, then
select Software Library.
2. On the Software Library Administration page, from the Actions menu, select
Deleted Entities. The list of deleted entities with type, subtype, owner, and size is
displayed.
3. Click Purge to submit the job, on successful completion of the job all the deleted
entities are removed from the storage location.
22.13.7 Backing Up Software Library
For information about backing up your Software Library, see the chapter on "Backing
Up and Recovering Enterprise Manager" in the Enterprise Manager Advanced
Installation and Configuration Guide.
Chapter 22
Maintaining Software Library
22-44
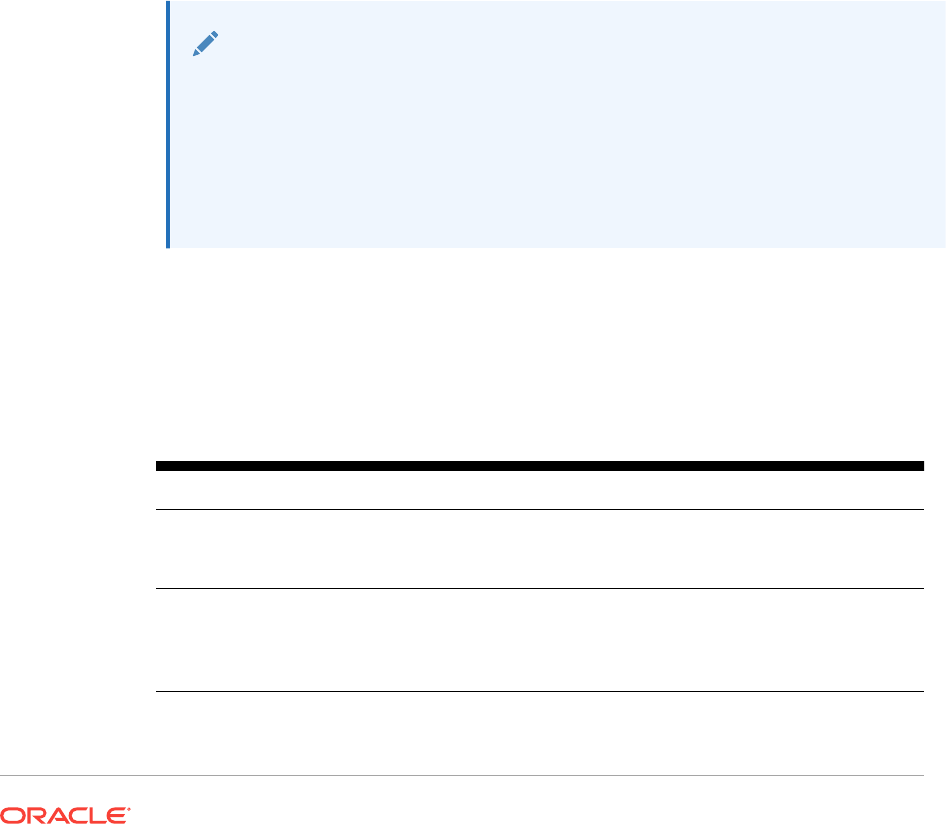
23
Managing Plug-Ins
This chapter provides an overview of Plug-In Manager, and describes how you can
use it to view, deploy, administer, and undeploy plug-ins.
In particular, this chapter covers the following:
•Introduction to Plug-ins
•Workflow of Plug-In Deployment
•Introduction to Plug-In Manager
•Knowing Your Plug-Ins
•Downloading, Deploying, and Upgrading Plug-Ins
•Undeploying Plug-Ins
•Advanced Operations with Plug-Ins
•Troubleshooting
Note:
Starting with 13c Release 1 some plug-ins are obsoleted while some are
deprecated. Obsoleted plug-ins will not be supported on Enterprise Manager
(EM) Cloud Control completely, whereas deprecated plug-ins will not be
supported from the future releases. When upgrading EM to 13c Release 1 the
obsoleted plug-ins need to be undeployed from EM before proceeding to
upgrade. For details, see Obsolete and Deprecated Plug-ins.
23.1 Getting Started
Table 23-1 provides a quick view of the sections within this chapter that might be of
interest to you.
Table 23-1 Getting Started
User Sections of Interest
Beginner •Introduction to Plug-ins
•Workflow of Plug-In Deployment
•Introduction to Plug-In Manager
Basic •Workflow of Plug-In Deployment
•Customizing Your View
•Checking the Availability of Plug-Ins
•Viewing Information about Plug-Ins
23-1

Table 23-1 (Cont.) Getting Started
User Sections of Interest
Intermediate •Customizing Your View
•Checking the Availability of Plug-Ins
•Viewing Information about Plug-Ins
•Downloading Plug-Ins
•Deploying Plug-Ins to Oracle Management Service (Reduce
OMS Restart time and Downtime)
•Upgrading Plug-Ins Deployed to Oracle Management
Service
•Deploying Plug-Ins on Oracle Management Agent
•Upgrading Plug-Ins Deployed to Oracle Management Agent
•Undeploying Plug-Ins from Oracle Management Service
•Undeploying Plug-Ins from Oracle Management Agent
•Troubleshooting
Advanced •Re-deploying Plug-Ins on Oracle Management Agent
•Deploying Plug-In Patches While Deploying or Upgrading
Management Agent (Create Custom Plug-In Update)
•Troubleshooting
23.2 Introduction to Plug-ins
This section covers the following:
•Enterprise Manager Extensibility Paradigm
•Plug-Ins
•Plug-Ins Deployed by Default
•Plug-In Releases
•Roles Required to Manage Plug-Ins
23.2.1 Enterprise Manager Extensibility Paradigm
Enterprise Manager is system management software that delivers centralized
monitoring, administration, and life cycle management functionality for the complete IT
infrastructure, including systems running Oracle and non-Oracle technologies.
Enterprise Manager has grown in size and magnitude over the years to offer a
spectrum of powerful IT management and monitoring solutions. This growth has lead
to changes in managing support for new features, enhancements, and bug fixes.
Considering these developments, Oracle has carefully redesigned the architecture of
Enterprise Manager in such a way that the framework or the core base on which the
product runs is clearly separated from the layer that offers IT solutions by means of
features. This new architecture implemented in Enterprise Manager 12c and future
releases enables Oracle to provide a much stronger framework with capabilities to
extend itself seamlessly from time to time for supporting new features and
enhancements.
You no longer have to wait for the next release of Enterprise Manager to access the
latest monitoring features for released products. The pluggable framework in
Chapter 23
Introduction to Plug-ins
23-2

Enterprise Manager 12c and future releases allows target support to be included soon
after new versions of targets ship. You can install a new Enterprise Manager system or
upgrade an existing one, as soon as the Enterprise Manager release is made available
by Oracle.
Based on the new design, the Enterprise Manager 12c and future releases
architecture constitutes the following logical parts:
•EM Platform: Consists of a set of closely integrated UI and backend services that
most monitoring and management functionality in Enterprise Manager depends
on. Examples of platform subsystems include the Enterprise Manager target and
metric model, the job, event, and provisioning framework. The platform also
includes Oracle Management Agent (Management Agent) as well as the core
background services such as the data loader, job dispatcher, and notification
manager. The platform is delivered as part of an Enterprise Manager release, and
can only be upgraded by upgrading to a new version of Enterprise Manager.
•EM Plug-ins: Modules that can be plugged to an existing Enterprise Manager
Platform to provide target management or other vertical functionality in Enterprise
Manager. Plug-ins offer special solutions or new features, for example,
connectivity to My Oracle Support, and extend monitoring and management
capability to Enterprise Manager, which enable you to monitor a particular target
on a host. Plug-ins work in conjunction with OMS and Management Agent to offer
monitoring services, and therefore they are deployed to the OMS as well as the
Management Agent.
The plug-in releases happen more often than Enterprise Manager Core Platform
releases. The plug-ins enable Enterprise Manager 12c and future releases to be
updated with new features and management support for the latest Oracle product
releases, without having to wait for the next platform release to provide such
functionality.
23.2.2 Plug-Ins
Plug-ins are modules that can be plugged into an existing Enterprise Manager Cloud
Control deployment to extend target management or other vertical functionality in
Enterprise Manager.
At a high level, plug-ins contain archives for monitoring and discovering OMS
instances and Management Agents. The archives contain Java and SQL codes, and
metadata.
23.2.3 Plug-Ins Deployed by Default
As a part of Enterprise Manager Cloud Control installation, a set of basic plug-ins is
deployed by default. You can deploy other plug-ins to extend the basic functionality of
Enterprise Manager Cloud Control.
The plug-ins that are deployed by default, or are shipped out of box are as follows.
•Oracle Database: oracle.sysman.db
•Oracle Fusion Middleware: oracle.sysman.emas
•Oracle Systems Infrastructure: oracle.sysman.si
•Oracle Exadata: oracle.sysman.xa
•Oracle Cloud Framework: oracle.sysman.cfw
Chapter 23
Introduction to Plug-ins
23-3

23.2.4 Plug-In Releases
Plug-in releases happen more often than Enterprise Manager Core platform releases.
This new pluggable framework enables Enterprise Manager Cloud Control to be
updated with management support for the latest Oracle product releases, without
having to wait for the next platform release to provide such functionality.
For example, when a new version of Oracle Database is released, you can simply
download and deploy the latest Oracle Database plug-in, which will include
management support for the latest Oracle Database release. You can also work with
plug-ins in Offline Mode.
23.2.5 Obsolete and Deprecated Plug-ins
Obsolete plug-ins are plug-ins that are not supported for the 13c Release 1 and future
releases of Enterprise Manager. These plug-ins must be undeployed from the
Management Agents and Oracle Management Services before upgrading to
Enterprise Manager 13c Release 1 or higher.
Deprecated plug-ins are plug-ins for which support will not be available in the future
releases of Enterprise Manager. Oracle recommends you limit your deployment of the
deprecated plug-ins.
To undeploy obsolete and deprecated plug-ins from Enterprise Manager, first
undeploy the plug-ins from the Management Agent (see Undeploying Plug-Ins from
Oracle Management Agent), and then from the OMS (see Undeploying Plug-Ins from
Oracle Management Service).
It is recommended that you remove the plug-in binaries of the undeployed plug-ins
from Self Update.
23.2.6 Roles Required to Manage Plug-Ins
You need one or more of the following out-of-the-box roles to download, manage, and
deploy plug-ins:
•EM_PLUGIN_OMS_ADMIN: Enables you to manage the lifecycle of plug-ins on
Management Server instances.
•EM_PLUGIN_AGENT_ADMIN: Enables you to manage the lifecycle of plug-ins on
Management Agents.
•EM_PLUGIN_USER: Enables you to view the plug-in lifecycle console.
23.3 Workflow of Plug-In Deployment
Figure 23-1 illustrates the workflow of plug-in deployment—how you typically set up
the Enterprise Manager infrastructure, deploy plug-ins to OMS, and discovery and
monitor targets using the deployed plug-ins.
Chapter 23
Workflow of Plug-In Deployment
23-4
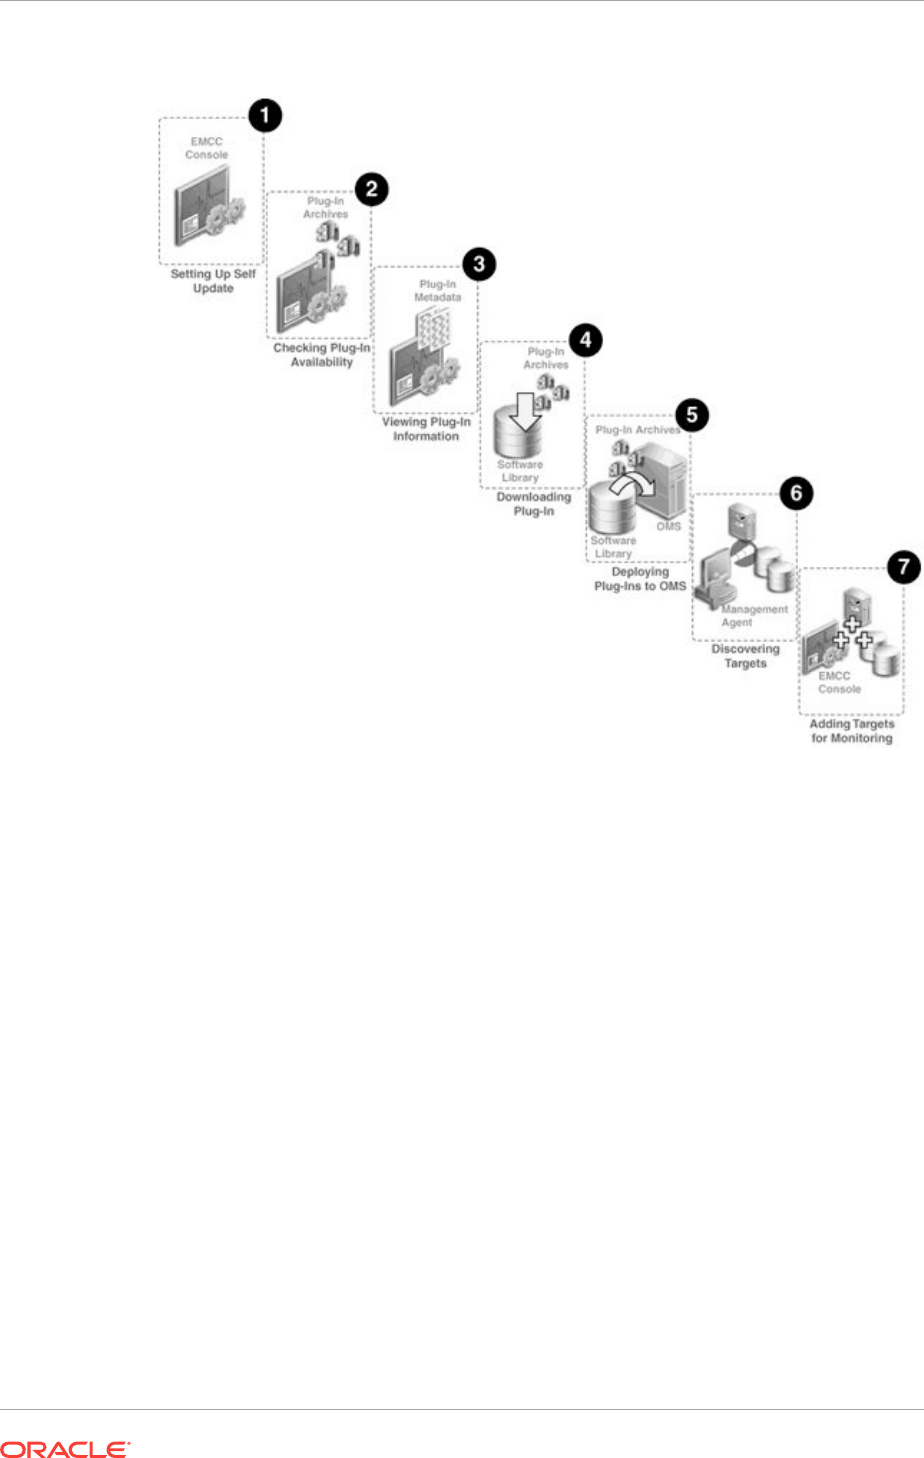
Figure 23-1 Plug-In Deployment Workflow
Step 1: Setting up Self-Update Console
Self Update console is a common dashboard used for reviewing, downloading, and
applying new updates available for Enterprise Manager. The console frees you from
having to monitor multiple channels to get informed about new updates that are
available from Oracle. The updates automatically downloaded by Self Update include
plug-ins. For checking the availability of plug-ins and downloading them to Enterprise
Manager, you must set up the Self Update Console. Set up the Self Update Console
as described in Oracle Enterprise Manager Cloud Control Administrator's Guide.
Step 2: Checking Plug-In Availability
Checking the plug-in availability essentially refers to the act of verifying whether the
plug-ins are available on My Oracle Support for download and deployment in
Enterprise Manager. This is a prerequisite before downloading plug-ins. To check
plug-in availability, follow the steps outlined in Checking the Availability of Plug-Ins.
Step 3: Viewing Plug-In Information
Viewing plug-in information refers to the act of viewing basic information related to a
particular plug-in, such as the plug-in ID, the plug-in release number, and other basic
information. You must view plug-in information to understand what targets and
operating systems are certified for plug-ins. You can also check whether or not a
particular plug-in has already been deployed. To view plug-in information, follow the
steps outlined in Viewing Information about Plug-Ins.
Chapter 23
Workflow of Plug-In Deployment
23-5
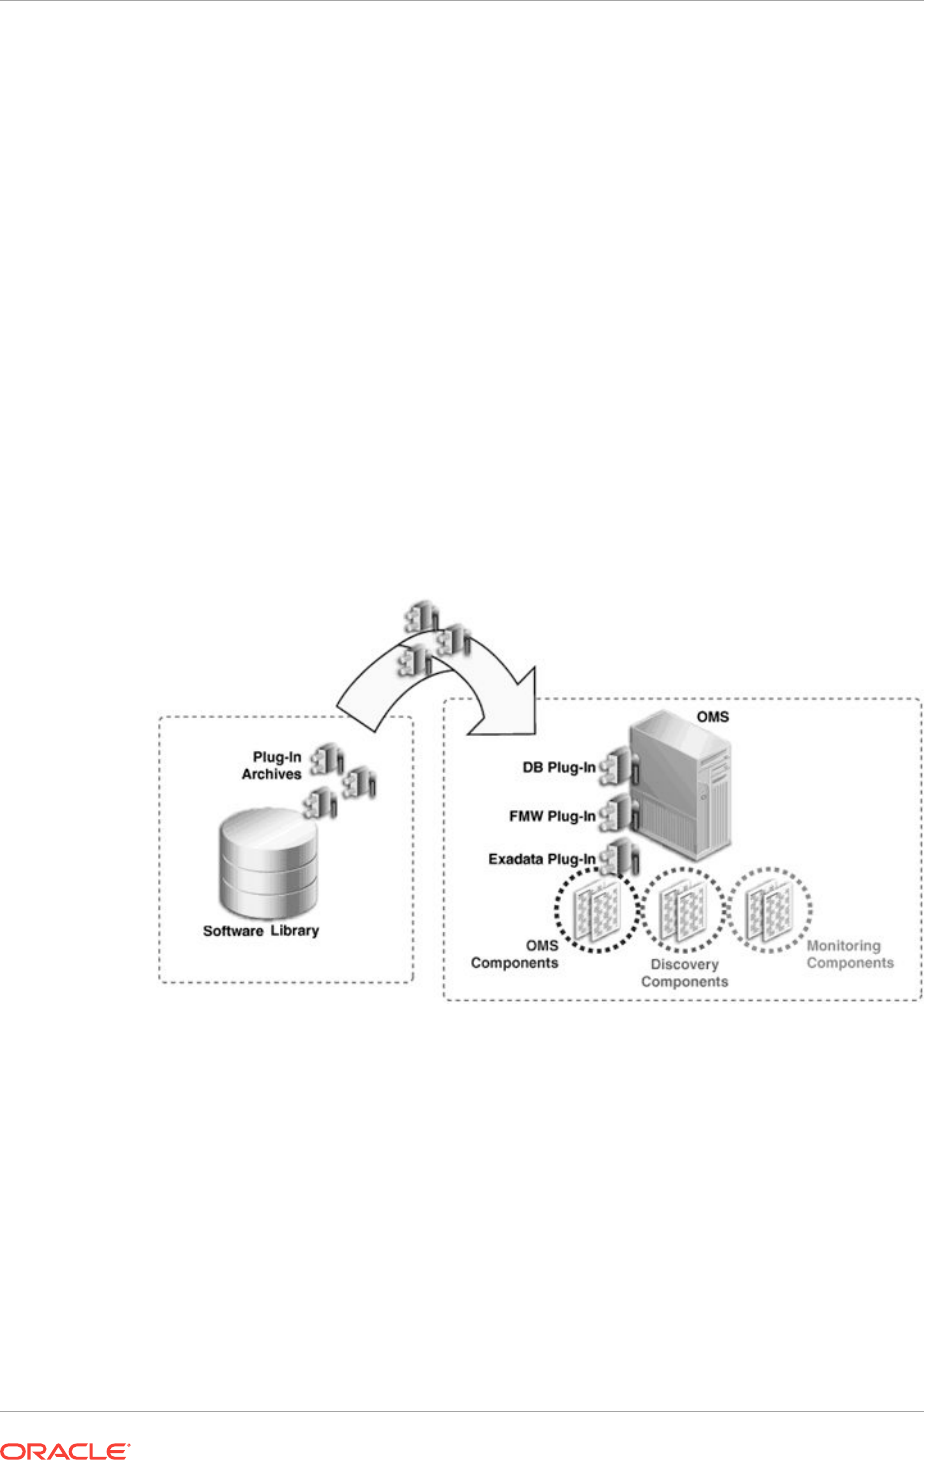
Step 4: Downloading Plug-Ins
Downloading plug-ins is the act of downloading plug-in archives or components, and
its metadata, from My Oracle Support to Oracle Software Library (Software Library), so
that they can be deployed suitably for discovering and monitoring certain targets. If
you find that a particular target is not being monitored by plug-ins, you must download
the required plug-ins. You can download both in online mode and offline mode. To
download plug-ins, follow the steps outlined in Downloading Plug-Ins.
Step 5: Deploying Plug-Ins to OMS
Deploying plug-ins to OMS is the next natural course of action once a plug-in is
downloaded from My Oracle Support. This is to ensure the OMS capabilities are
extended to either manage a new target or to add a new vertical capability. The
installation and configuration of plug-ins on the OMS is essentially referred to as
Deployment. Some plug-ins, when deployed, require the OMS to be re-started.
Figure 23-2 illustrates how plug-ins are deployed to the OMS.
Figure 23-2 Deploying Plug-Ins to OMS
When the plug-in archives are deployed from the Software Library to the OMS, the
OMS receives three different components for each plug-in, namely the OMS plug-in
components, the discovery plug-in components, and the monitoring plug-in
components.
Discovery plug-in components are those components that help in the discovery of
unmanaged targets. Monitoring plug-in components are those components that help in
the adding of discovered targets to Enterprise Manager Cloud Control Console for
monitoring purposes.
To deploy plug-ins on OMS, follow the steps outlined in Deploying Plug-Ins to Oracle
Management Service (Reduce OMS Restart time and Downtime).
Step 6: Discovering Targets
Chapter 23
Workflow of Plug-In Deployment
23-6

Discovering targets refers to the process of identifying unmanaged hosts and targets
in your environment. During discovery of targets, the discovery components of plug-ins
are deployed to the Management Agent home. Note that this enables Enterprise
Manager Cloud Control to only identify a new target in your environment; it however
does not monitor the target.
After converting unmanaged hosts to managed hosts in Enterprise Manager Cloud
Control, you must configure automatic discovery of targets on those hosts so that the
unmanaged targets running on those hosts can be identified.
For instructions to configure automatic discovery of targets on managed hosts, refer to
the Discovering and Monitoring Targets section in the Oracle Enterprise Manager
Cloud Control Administrator's Guide, using the following URL:
http://docs.oracle.com/cd/E24628_01/doc.121/e24473/discovery.htm#CBAGJFHC
Note:
When you configure automatic discovery of targets on managed hosts,
discovery plug-in components are copied to Management Agent.
Once you have configured automatic discovery of targets on managed hosts, you must
regularly check for discovered targets so that they can be promoted and monitored in
Enterprise Manager Cloud Control.
For instructions to check for and promote discovered targets to managed status, refer
to the Discovering and Monitoring Targets section in the Oracle Enterprise Manager
Cloud Control Administrator's Guide, using the following URL:
http://docs.oracle.com/cd/E24628_01/doc.121/e24473/discovery.htm#CBAFHEHC
Note:
The plug-in for a specific target type is automatically deployed to the
Management Agent that will monitor targets of that type. For example, if you
discover a database target, the discovery plug-in component of the database
plug-in is automatically deployed to the Management Agent installed on the
database host.
However, this is true only for initial deployment. All subsequent updates to the
Management Agent plug-in must be explicitly deployed. For example, if you
want to deploy a new version of the database plug-in on the Management
Agent, you must initiate the deployment using the instructions outlined in
Oracle Enterprise Manager Cloud Control Basic Installation Guide.
Similarly, any patches to be applied on the Management Agent (framework or
plug-in) must be explicitly applied using the instructions outlined in Oracle
Enterprise Manager Cloud Control Administrator's Guide.
Figure 23-3 illustrates how the discovery plug-in components are deployed to the
Management Agent while discovering new targets.
Chapter 23
Workflow of Plug-In Deployment
23-7
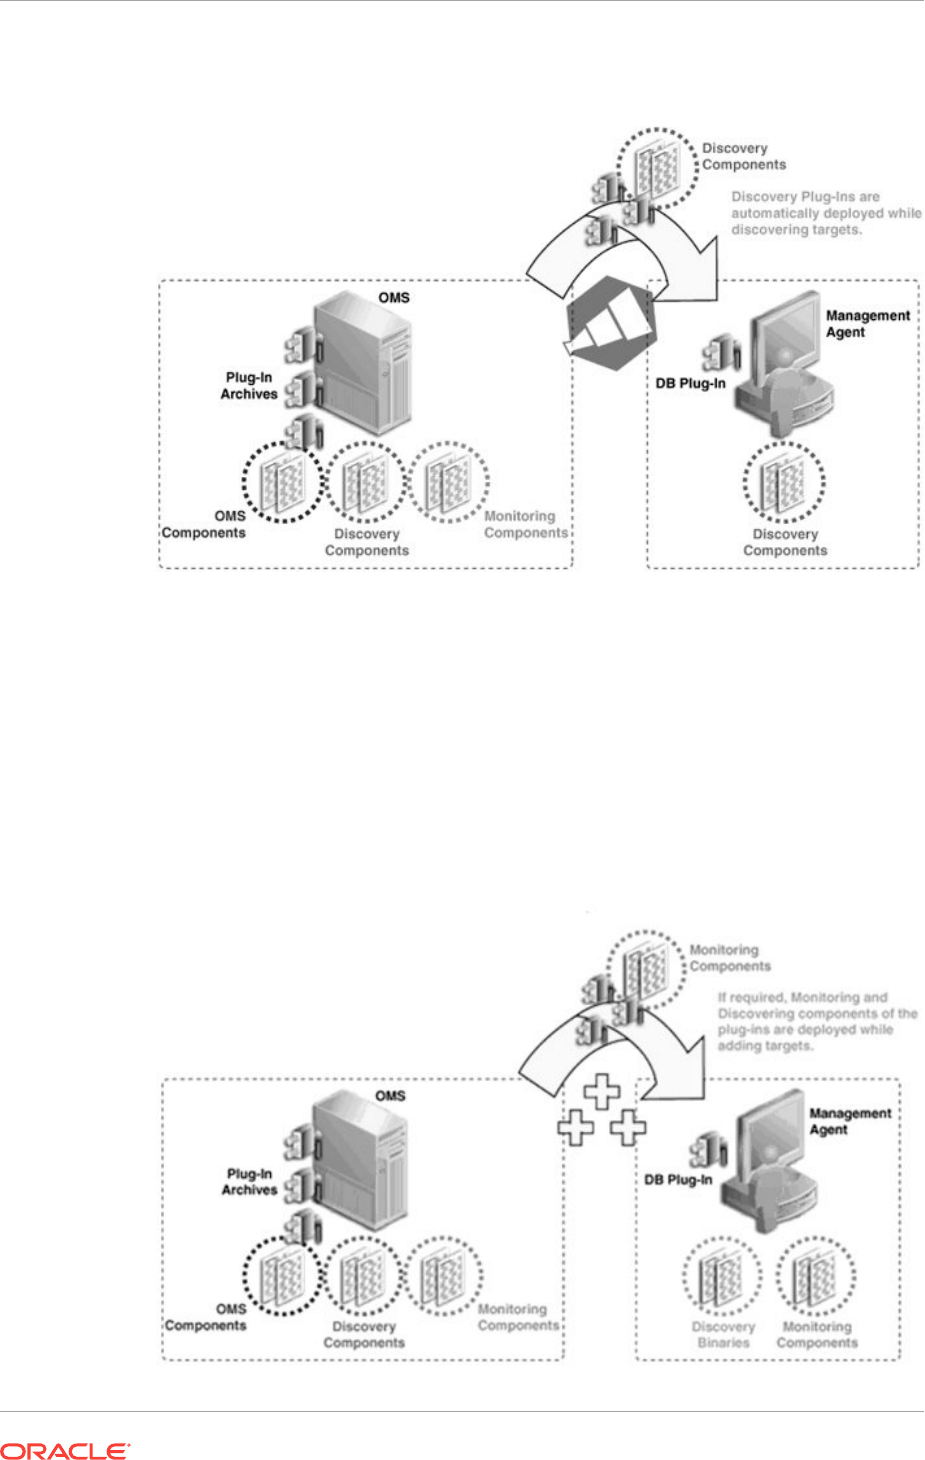
Figure 23-3 Discovering Targets
Step 7: Adding Targets for Monitoring
Once the targets are discovered, they are added to the infrastructure, so that they can
be monitored in Enterprise Manager Cloud Control. While adding targets, the
monitoring components of plug-ins are deployed to the Management Agent home.
Figure 23-4 illustrates how the monitoring plug-in components are deployed to the
Management Agent while adding targets.
Figure 23-4 Adding Targets
Chapter 23
Workflow of Plug-In Deployment
23-8
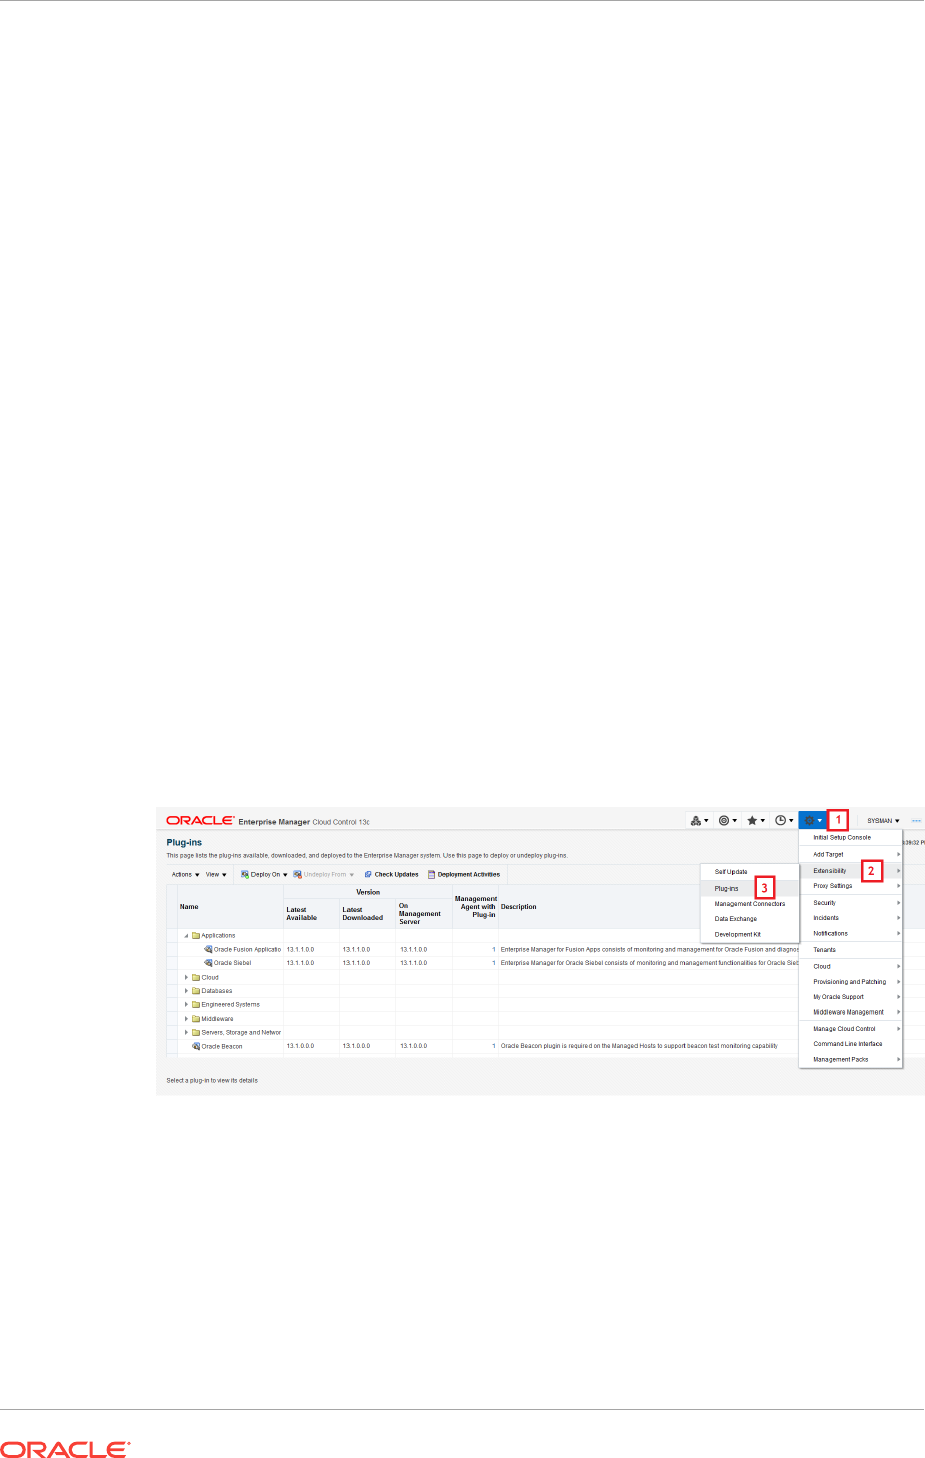
23.4 Introduction to Plug-In Manager
Plug-In Manager is a feature of Enterprise Manager Cloud Control, that serves as a
single window solution for performing all plug-in deployment-related activities, through
GUI as well as CLI. Using Plug-In Manager, you can:
•View plug-ins available for download; plug-ins that have been downloaded; and
plug-ins that have been deployed to Cloud Control.
•View certification and critical information about plug-ins such as the name of the
plug-in, the vendor who supplied it, the plug-in ID and version, and a short
description.
•Deploy plug-ins on OMS.
•Deploy and re-deploy plug-in on Management Agent.
•Create custom plug-in update.
•Undeploy plug-ins from OMS and Management Agent.
•View the status of a plug-in deployment operations.
23.4.1 Accessing Plug-In Manager
To access the Plug-In Manager console, from the Setup menu, select Extensibility,
and then select Plug-ins.
Figure 23-5 illustrates how you can access Plug-in Manager.
Figure 23-5 Navigating to Plug-In Manager
23.4.2 Performing Operations Using Plug-In Manager
Using Plug-in Manager, you can deploy, upgrade, redeploy, and undeploy plug-ins.
Figure 23-6 shows the operations you can perform using the Plug-In Manager.
Chapter 23
Introduction to Plug-In Manager
23-9
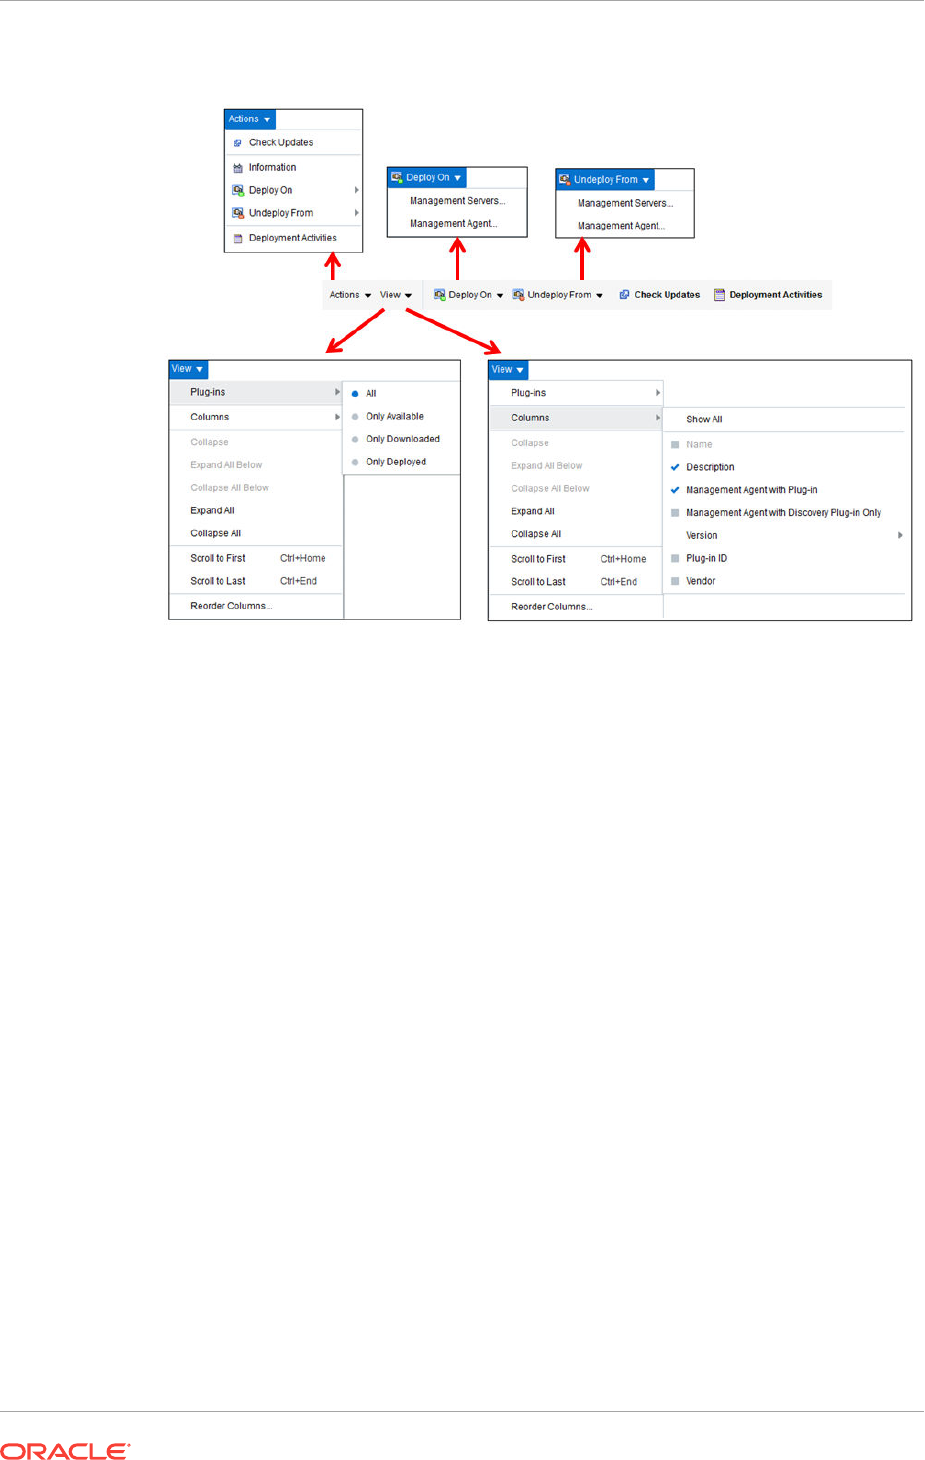
Figure 23-6 Plug-In Manager Operations
23.5 Knowing Your Plug-Ins
This section explains the following:
•Customizing Your View
•Checking the Availability of Plug-Ins
•Viewing Information about Plug-Ins
23.5.1 Customizing Your View
This section tells you how to customize your view, and organize the plug-ins and
columns displayed.
23.5.1.1 Customizing Displayed Plug-Ins
Over a period of time, as you download and deploy plug-ins, the number of plug-ins on
your list increases. You can sort these plug-ins to view only the ones you require, for
example, only the plug-ins available, or only the plug-ins deployed.
In order to customize your view, follow these steps.
1. From the View menu, select Plug-Ins.
2. From the Plug-Ins menu, select one of the following filters.
•All, using this filter, you can view all plug-ins, including available, downloaded,
and deployed plug-ins.
Chapter 23
Knowing Your Plug-Ins
23-10

•Only Available, using this filter, you can view the plug-ins that are available
for download.
•Only Downloaded, using this filter, you can view the plug-ins that are
downloaded.
•Only Deployed, using this filter, you can view the plug-ins that are deployed.
23.5.1.2 Customizing Displayed Columns
By default, only a few columns of information are displayed. Optionally, you can either
enable other columns of your interest, or disable ones that are already displayed.
In order to customize the displayed columns, follow these steps.
1. From the View menu, select Columns.
2. From the Columns menu, select one of the following filters for columns.
•Show All, using this filter, you can view all columns.
•Vendor, using this filter, you can view information about the vendor.
•Plug-In Id, using this filter, you can view the plug-in id.
•Version, this filter has three options you can choose from. They are as
follows.
–Latest Available, using this filter, you can view the newest plug-ins that
are available.
–Latest Downloaded, using this filter, you can view the plug-ins that have
been downloaded recently.
–On Management Server, using this filter, you can view the plug-ins that
are deployed to the OMS.
•Management Agent with Discovery Plug-Ins Only, this filter displays the
Management Agent which has only Discovery Plug-Ins deployed.
•Management Agent with Plug-In, this filter displays the Management Agent
which has any plug-in deployed on it.
•Description, this filter displays the description of the plug-ins.
23.5.2 Checking the Availability of Plug-Ins
To check the availability of plug-ins, follow these steps:
1. Set up the Self Update Console as described in Oracle Enterprise Manager Cloud
Control Administrator's Guide.
2. From the Setup menu, select Extensibility, then select Plug-ins.
3. On the Plug-ins page, in the Latest Available column of the table, check whether
the plug-ins are available.
To refresh the list of available plug-ins, click Check Updates. Note that clicking
Check Updates will take you to the Self Update page.
Chapter 23
Knowing Your Plug-Ins
23-11
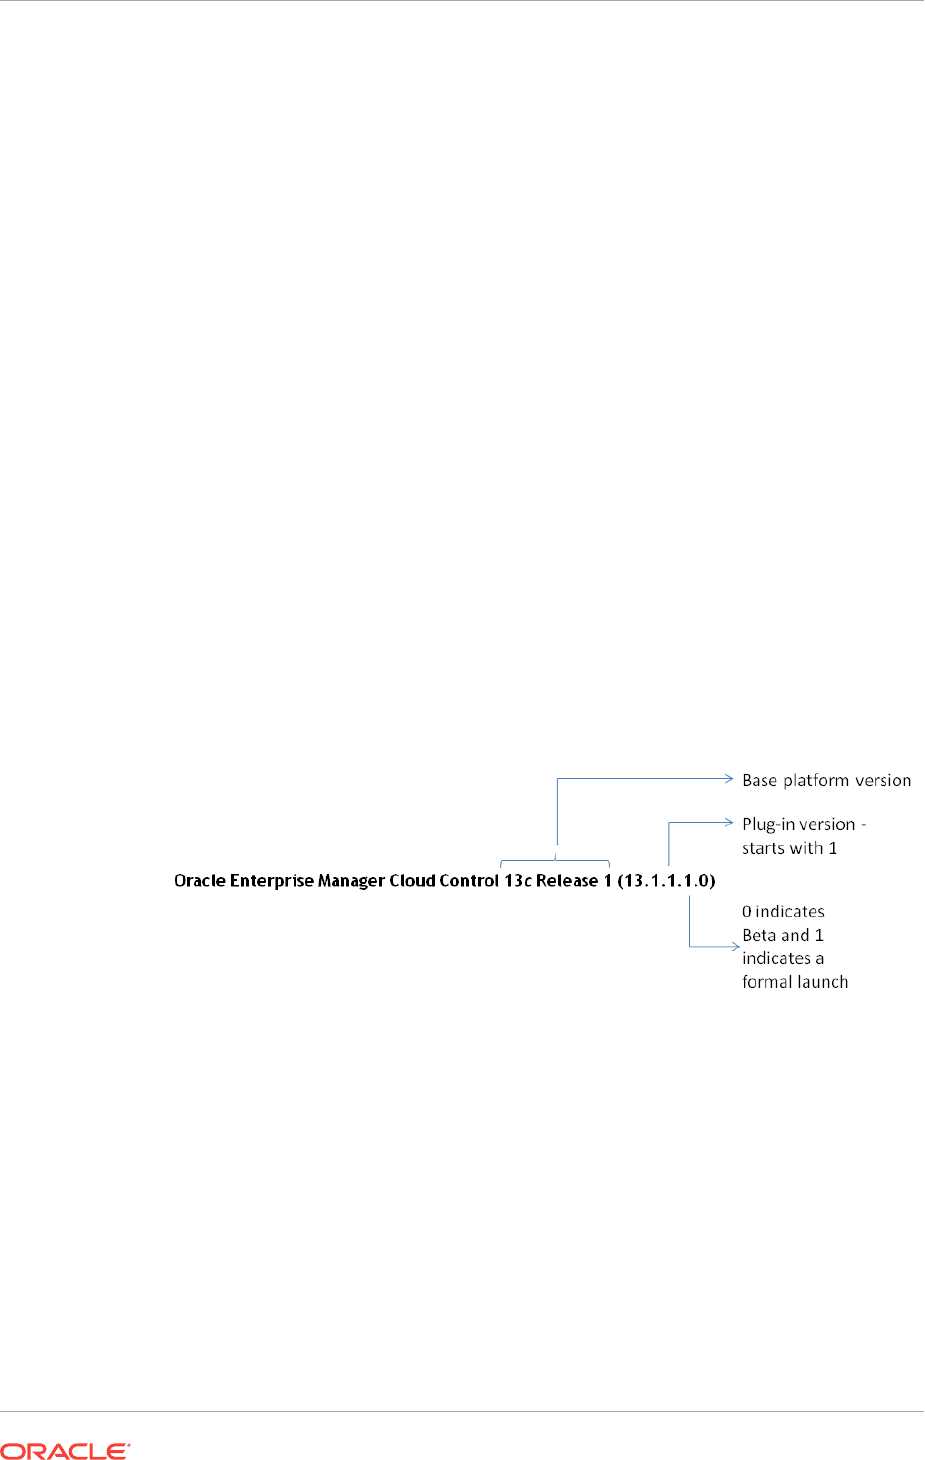
23.5.3 Viewing Information about Plug-Ins
This section gives you more information on plug-ins, and functions related to plug-ins.
This section covers the following sections:
•Differentiating Plug-In Releases from Enterprise Manager Platform Releases
•Identifying Plug-In ID
•Viewing Targets and Operating Systems Certified for Deployed Plug-Ins
•Viewing Plug-In Dependencies
•Verifying Deployed Plug-Ins
23.5.3.1 Differentiating Plug-In Releases from Enterprise Manager Platform
Releases
Plug-ins have independent release cycles and release numbers, which may or may
not be tied to Enterprise Manager Cloud Control product releases and release
numbers.
Plug-in releases typically happen more often than Enterprise Manager platform
releases.
Figure 23-7 describes how plug-in releases are numbered.
Figure 23-7 Plug-In Release Number Format
Figure 23-8 describes how Enterprise Manager platform releases are numbered.
Chapter 23
Knowing Your Plug-Ins
23-12
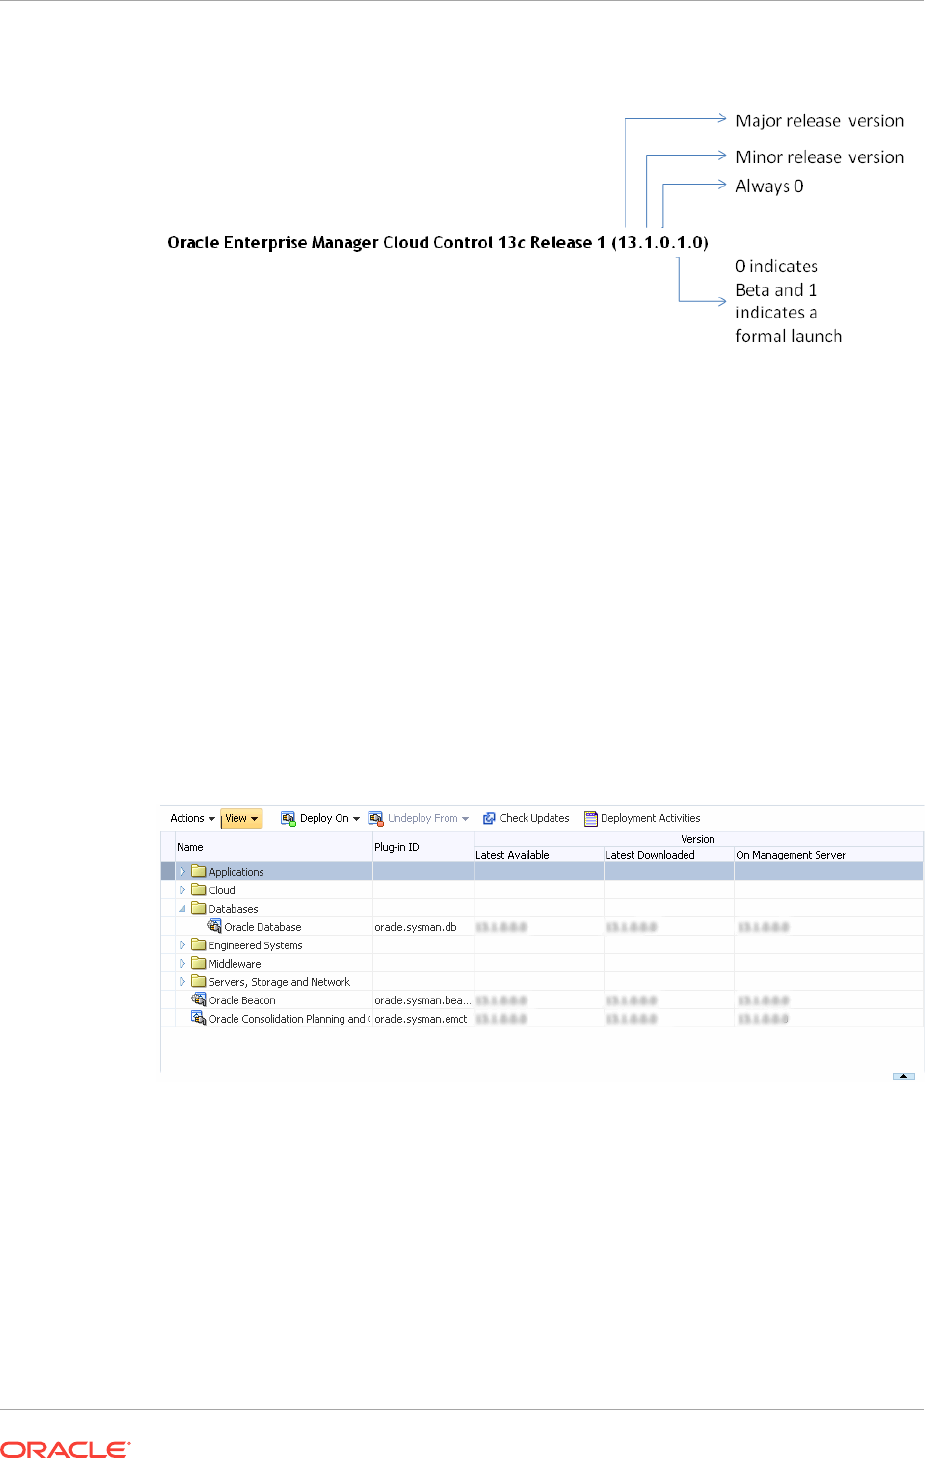
Figure 23-8 Enterprise Manager Core Platform Release Number Format
23.5.3.2 Identifying Plug-In ID
To identify the ID of a plug-in, follow these steps:
1. From the Setup menu, select Extensibility, then select Plug-ins.
2. On the Plug-ins page, in the Plug-in ID column of the table, note the plug-in ID of
the plug-in of your interest.
If you do not see this column, from the View menu, select Columns, then select
Plug-in ID.
Figure 23-9 illustrates how you can identify the plug-in ID of the Oracle Database plug-
in.
Figure 23-9 Identifying Plug-In ID
23.5.3.3 Viewing Targets and Operating Systems Certified for Deployed Plug-
Ins
To view a list of targets and operating systems certified for a deployed plug-in, follow
these steps:
1. From the Setup menu, select Extensibility, then select Plug-ins.
2. On the Plug-ins page, select the plug-in of your interest, and from the Actions
menu, select Information.
Chapter 23
Knowing Your Plug-Ins
23-13

3. On the Plug-in Information page, in the General tab, review the information
provided in the Certified Targets and Certified Operating Systems tables.
23.5.3.4 Viewing Plug-In Dependencies
To view the dependencies of the preferred plug-in, follow these steps:
1. From the Setup menu, select Extensibility, then select Plug-ins.
2. On the Plug-ins page, select the plug-in of your interest, and from the Actions
menu, select Information.
3. On the Plug-in Information page, in the Dependencies tab, review the information
provided in the tables.
23.5.3.5 Verifying Deployed Plug-Ins
To view and administer the deployed plug-ins, from the Setup menu, select
Extensibility, then select Plug-ins. Enterprise Manager Cloud Control displays the
Plug-ins page, which is essentially the Plug-In Manager console.
To identify the OMS instances on which the plug-in of your interest is deployed, follow
these steps using Enterprise Manager Cloud Control Console:
1. From the Setup menu, select Extensibility, then select Plug-ins.
2. On the Plug-ins page, select the plug-in of your interest, and from the Actions
menu, select Information.
3. On the Plug-in Information page, in the Management Servers tab, review the
Oracle Management Services on which the plug-in is deployed.
To identify the Management Agents on which the plug-in of your interest is deployed,
follow these steps using Enterprise Manager Cloud Control Console:
1. From the Setup menu, select Extensibility, then select Plug-ins.
2. On the Plug-ins page, select the plug-in of your interest, and from the Actions
menu, select Information.
3. On the Plug-in Information page, in the Management Agent tab, review the
Management Agents on which the plug-in is deployed.
Example 23-1 Sample List of Plug-Ins Deployed on OMS
example.com:7654_Management_Service
Plug-in Name Plug-in ID Version (Revision)
Oracle Database oracle.sysman.db 12.1.0.4.0
Oracle Fusion Middleware oracle.sysman.emas 12.1.0.4.0
Oracle MOS (My Oracle
Support)
oracle.sysman.mos 12.1.0.5.0
Oracle Exadata oracle.sysman.xa 12.1.0.4.0
Example 23-2 Sample List of Plug-ins Deployed on Management Agent
emcli list_plugins_on_agent -agent_names=agent1.example.com:3872
Lists plug-ins on the agent agent1.example.com
Chapter 23
Knowing Your Plug-Ins
23-14

emcli list_plugins_on_agent -agent_names=agent1.example.com:3872,agent2.example.com:
3872 -include_discovery
Lists plug-ins on both the agents provided along with their discovery components
emcli list_plugins_on_agent -agent_names='agent*,st*93'
Lists plug-ins on all agents with name matching one of the regular expressions
agent* or st*93
emcli list_plugins_on_agent -all
Lists plug-ins on all the management agents.
To identify the Plug-ins deployed on OMS, on EM CLI, log in to EMCLI, and enter the
following command. The command displays a list of all the plug-ins deployed on the
OMS.
$emcli login
-username=<EM Console Username>
[-password=<EM Console Password>]
[-force]
$emcli list_plugins_on_server
To identify and view all the Plug-ins deployed on Management Agent, on EM CLI,
enter the following command:
$emcli list_plugins_on_agent
[agent_names="agent1,agent2,agent3..."
[-all] [-include_discovery]
23.6 Downloading, Deploying, and Upgrading Plug-Ins
This section explains the following:
•Downloading Plug-Ins
•Deploying Plug-Ins to Oracle Management Service (Reduce OMS Restart time
and Downtime)
•Upgrading Plug-Ins Deployed to Oracle Management Service
•Deploying Plug-Ins on Oracle Management Agent
•Upgrading Plug-Ins Deployed to Oracle Management Agent
23.6.1 Downloading Plug-Ins
You can download the plug-ins in online or offline mode. Online refers to an
environment where you have Internet connectivity to the Enterprise Manager Store.
Offline refers to an environment where you do not have Internet connectivity. This
section contains the following sections:
•Downloading Plug-Ins in Online Mode
•Downloading Plug-Ins in Offline Mode
•Importing Catalog Archives
Chapter 23
Downloading, Deploying, and Upgrading Plug-Ins
23-15

•Importing Plug-In Archives
23.6.1.1 Downloading Plug-Ins in Online Mode
To download the plug-ins in online mode, follow these steps:
1. From the Setup menu, select Extensibility, then select Self Update.
2. On the Self Update page, in the table, click on Plug-in.
3. On the Plug-in Updates page, select the plug-in available for download, and click
Download.
Multiple selection of plug-ins is not supported.
4. In the Schedule Download dialog, select an appropriate option to schedule the
download. You can also select Immediately which schedules the job for immediate
action. Select Notify Once downloaded if you want to be informed once the
download is complete.
5. Click Select.
Enterprise Manager Cloud Control submits a job to download the selected plug-in
from the Enterprise Manager Store to the Software Library.
A confirmation dialog appears to confirm that the job has been submitted
successfully. In this confirmation dialog, you can click Job Details to track the
status of the job.
23.6.1.2 Downloading Plug-Ins in Offline Mode
To download the plug-ins in offline mode, follow these steps:
1. Set Enterprise Manager Cloud Control to Offline Mode. To do so, follow these
steps.
a. From the Setup menu, select Provisioning and Patching, then select Offline
Patching.
b. In the Online and Offline Settings tab, select Offline.
2. From the Setup menu, select Extensibility, then select Self Update.
3. On the Self Update page, click Check for Updates.
A message appears with the following URL to an Oracle site from where the
updates catalog file can be downloaded.
https://updates.oracle.com/Orion/Download/download_patch/
p9348486_112000_Generic.zip
4. From an Internet-enabled computer, download the catalog file using the
aforementioned URL.
5. Copy the downloaded catalog file to the OMS host or the Management Agent host
where you plan to deploy the plug-ins.
6. Import the catalog file to Enterprise Manager. For instructions, refer to Importing
Catalog Archives.
7. On the Self Update page, in the table, click Plug-in.
8. On the Plug-in Updates page, select the imported update that is available for
download. Click Download.
Chapter 23
Downloading, Deploying, and Upgrading Plug-Ins
23-16

A message appears with a URL to an Oracle site from where the update can be
downloaded.
9. From a computer that is connected to the internet, download the update using the
aforementioned URL.
10. Copy the downloaded file to the OMS host or the Management Agent host where
you plan to deploy the plug-ins.
11. Import the downloaded plug-in archive to Enterprise Manager. For instructions,
refer to Importing Plug-In Archives.
23.6.1.3 Importing Catalog Archives
To import a catalog archive, follow these steps:
1. Download the catalog archive as described in Downloading Plug-Ins in Offline
Mode.
2. Execute the following
emcli
command to import the downloaded catalog archive.
Example 23-3 Sample for Importing Catalog Archive
$emcli import_update_catalog
-file="/u01/common/p9984818_121000_Generic.zip"
-omslocal
Imports the master catalog file p9984818_121000_Generic.zip. The file must exist on
the OMS host. In a multiple OMS setup, the request can be processed by any OMS, so
the file should be accessible from the OMS processing the request. This means that
the file must be kept on a shared location that is accessible from all the OMS
instances.
$emcli import_update_catalog
-file="/u01/common/p9984818_121000_Generic.zip"
-host="host1.example.com"
-credential_set_name="HostCredsNormal"
Imports the master catalog file p9984818_121000_Generic.zip that is present on the
host host1.example.com. The host must be a managed host target in Enterprise
Manager, and the Management Agent on this host must be up and running. The preferred
unprivileged credentials for host host1.example.com are used to retrieve the remote
file.
$emcli import_update_catalog
-file="file"
-omslocal
emcli import_update_catalog
-file="file"
-host="hostname"
[-credential_set_name="setname"] | -credential_name="name" -
credential_owner="owner"
23.6.1.4 Importing Plug-In Archives
Import plug-in archives to Oracle Software Library in the following cases:
Chapter 23
Downloading, Deploying, and Upgrading Plug-Ins
23-17

•When you want to deploy any non-Oracle plug-ins, that is, plug-ins that have been
created by a company other than Oracle, and are not available for download on
the Self Update console.
•When you want to import other types of entity archives when Self Update is used
in offline mode.
To import a plug-in archive, follow these steps:
1. Download the external archive as described in the previous section.
2. Set up the Enterprise Manager Command Line (EM CLI) utility. To do so, from the
Setup menu, click Command Line Interface. Follow the instructions outlined on
the Enterprise Manager Command Line Interface Download page.
3. Import the external archive in one of the following ways, depending on where
EMCLI is installed.
•If Enterprise Manager server is on the system on which you downloaded the
plug-in archive (
*.opar
file), run the following command:
$emcli import_update
-file="<path to *.opar file>"
-omslocal
The
-omslocal
flag indicates that the plug-in archive path mentioned in the
-
file
option is directly accessible to the EM server.
•If Enterprise Manager server is on a different system than the plug-in archive,
run the following command:
$emcli import_update
-file="<path to *.opar file you created>"
-host="host1.example.com"
-credential_name="host1_creds"
-credential_owner="admin1"
The command syntax is as follows:
-file
: The absolute path to the *.opar file on the system where you created
the archive.
-host
: The target name for a host target where the file is available.
-credential_name
: The name of the credentials on the remote system you are
connecting to.
-credential_owner
: The owner of the credentials on the host system you are
connecting to.
Chapter 23
Downloading, Deploying, and Upgrading Plug-Ins
23-18

Note:
As an alternative to the previous step, you can also run the following
command:
$emcli import_update
-file="<path to *.opar file you created>"
-host="hostname"
-credential_set_name="setname"
-credential_set_name
: The set name of the preferred credential stored in the
Management Repository for the host target. It can be one of the following:
•
HostCredsNormal
: The default unprivileged credential set.
•
HostCredsPriv
: The privileged credential set.
23.6.2 Deploying Plug-Ins to Oracle Management Service (Reduce
OMS Restart time and Downtime)
You can deploy multiple plug-ins to an OMS instance in graphical interface or
command line interface.
Note:
•Plug-ins must be deployed on the OMS prior to being deployed on
Management Agents.
•In a multi OMS environment, Plug-in Manager automates plug-in
deployment on all the management servers.
•A plug-in upgrade failure could put the Management Repository in an
inconsistent state. Oracle recommends that your repository database
should be running in archive log mode, and that your backup policies are
in place.
•The deployment time varies from one plug-in to another, depending on the
volume of data populated in the Management Repository. A page is
displayed that allows you to monitor the deployment status, as described
in Tracking the Deployment Status of Plug-Ins on Oracle Management
Service.
•The deployment of some plug-ins requires the OMS to be stopped, and
then restarted. This process occurs automatically as part of the plug-in
deployment process.
•While deploying plug-ins to the OMS, OMS plug-in components, discovery
plug-in components, and monitoring plug-in components are deployed to
the OMS.
To deploy plug-ins to the OMS in graphical mode, follow these steps:
1. From the Setup menu, select Extensibility, then select Plug-ins.
Chapter 23
Downloading, Deploying, and Upgrading Plug-Ins
23-19

2. On the Plug-ins page, select the plug-in you want to deploy.
Note:
Alternately, you can move to the next step and select the plug-ins after the
next step.
3. From the Deploy On menu, select Management Servers.
4. In the Deploy Plug-ins on Management Servers: Plug-ins page, verify that the
plug-in details on the lower portion of the screen are correct. Additionally, you can
add more plug-ins by clicking Add.
5. Select the Use Last Successful Prerequisite check box to skip the prerequisite
checks.
The check box is enabled only if the plug-in had successfully cleared the
prerequisites checks within the last 24 hours and was not deployed.
6. Click Next.
7. In the Deploy Plug-ins on Management Servers: Prerequisite Checks page, wait
for the prerequisite checks to complete (if not cleared already) and click Next.
8. In the Deploy Plug-ins on Management Servers: Repository page, specify the
Management Repository SYS credentials. Click Named option to select the saved
credentials or click New option to enter new credentials.
The newly entered credentials will be automatically saved for future deployments,
after the deployment is successful.
9. Click Next.
10. The Deploy Plug-ins on Management Servers: Review page displays the OMSs
and the statuses of the OMSs where the plug-ins will be deployed, and the plug-
ins. Verify that all the details are correct and click Deploy.
To deploy plug-ins to the OMS in silent mode, follow these steps:
1. Log in to
EMCLI
as follows:
$ORACLE_HOME/bin/emcli login -username=sysman
2. Run the following command if the emcli client is an old version, and does not have
all required verbs:
$ORACLE_HOME/bin/emcli sync
3. To deploy the plug-ins on the OMS, run the following command:
$emcli deploy_plugin_on_server
-plugin="plug-in_id[:version]
[-sys_password=sys_password]
[-prereq_check]
"
Chapter 23
Downloading, Deploying, and Upgrading Plug-Ins
23-20

Note:
For information on plug-in id, refer to Identifying Plug-In ID.
For example,
$emcli deploy_plugin_on_server -plugin="oracle.sysman.db:
12.1.0.2.0;oracle.sysman.emas:12.1.0.2.0"
Note:
The procedure for plug-in deployment remains the same even in a multi-OMS
environment. Enterprise Manager automatically detects whether it is a single-
OMS or a multi-OMS environment and in case of a multi-OMS environment,
Enterprise Manager automatically deploys the selected plug-in on all OMS
instances.
If the plug-in deployment fails on a primary OMS, where the Administration
Server is running, then you must first address the issue, and then resume the
deployment or restore the system from backup. If however, the plug-in
deployment fails on a non-primary OMS, identify the cause for the failure. If
there is a fix or a workaround, fix the problem, and perform the same steps
again. The system automatically detects which OMS instances do not have
the plug-ins deployed, and deploys them on those servers.
If the problem persists, contact Oracle Support.
23.6.2.1 Tracking the Deployment Status of Plug-Ins on Oracle Management
Service
This section describes the procedure of monitoring the deployment status of plug-ins
that do not require down time as well as those that do require down time.
To monitor the status of deployment and undeployment operations of plug-ins that
require down time, execute the following command:
emctl status oms -details
To monitor the status of deployment and undeployment operations for plug-ins that do
not require down time, follow these steps:
1. From the Setup menu, select Extensibility, then select Plug-ins.
2. On the Plug-ins page, do one of the following:
•From the Actions menu, select Deployment Activities.
•Select a plug-in, and click the Recent Deployment Activities tab at the
bottom of the page. Alternatively, you can also run the following command
using EMCLI.
$emcli get_plugin_deployment_status -plugin_id=<plugin_id>
Chapter 23
Downloading, Deploying, and Upgrading Plug-Ins
23-21

23.6.3 Upgrading Plug-Ins Deployed to Oracle Management Service
You can upgrade across plug-in versions, that is, from one plug-in version to another
higher plug-in version or a revision of another higher plug-in version. For example,
from Oracle Database plug-in version 12.1.0.1.0 to version 12.1.0.2.0, or from Oracle
Database plug-in version 12.1.0.1.0 to version 12.1.0.2.0 [u120427].
To upgrade across plug-in versions deployed to the OMS, follow these steps:
1. Check for the latest available versions and revisions in the Enterprise Manager
Store as described in Checking the Availability of Plug-Ins.
2. Download them as described in Downloading Plug-Ins.
3. Deploy them to the OMS as described in Deploying Plug-Ins to Oracle
Management Service (Reduce OMS Restart time and Downtime).
23.6.4 Deploying Plug-Ins on Oracle Management Agent
While installing a Management Agent using the Add Host Targets Wizard, all the core
discovery plug-ins available on the OMS are automatically deployed to the
Management Agent.
For information about discovery plug-ins, refer to Viewing Information about Plug-Ins.
If you want to deploy any additional plug-ins after installing the Management Agent,
then follow these steps:
1. Set up the Self Update console.
2. Check whether the plug-ins are available on Enterprise Manager store. For
instructions refer to Checking the Availability of Plug-Ins.
3. Download the available plug-ins. For instructions, refer to Downloading Plug-Ins.
4. Deploy the downloaded plug-ins to the Management Agent.
a. From the Setup menu, select Extensibility, then select Plug-ins.
b. On the Plug-ins page, select the plug-in you want to deploy.
c. From the Deploy On menu, select Management Agent.
d. Follow the steps mentioned in the Deploy Plug-ins on Management Agent
dialogue box.
e. Click Deploy.
To deploy plug-ins in EM CLI, use the following command:
$emcli deploy_plugin_on_agent
-agent_names="agent1[;agent2...]"
-plugin="plug-in_id[:version"]
[-discovery_only]
To deploy the latest revision of the plug-in, run the command above with an additional
argument:
allow_revision_update.
Chapter 23
Downloading, Deploying, and Upgrading Plug-Ins
23-22

23.6.4.1 Tracking the Deployment Status of Plug-Ins on Oracle Management
Agent
To track the deployment status of plug-ins on Management Agent, refer to Tracking
the Deployment Status of Plug-Ins on Oracle Management Service.
23.6.5 Upgrading Plug-Ins Deployed to Oracle Management Agent
You can upgrade across plug-in versions, that is, from one plug-in version to another,
higher plug-in version or a revision of another, higher plug-in version. For example,
from Oracle Database plug-in version 12.1.0.1.0 to version 12.1.0.2.0, or from Oracle
Database plug-in version 12.1.0.1.0 to version 12.1.0.2.0 [u120427].
Note:
You will upgrade the plug-in versions and revisions only on Management
Agents that are already installed in your environment.
When a plug-in is deployed explicitly or a target is promoted on new
Management Agents, then the latest plug-in version and revision automatically
gets included from the OMS.
To upgrade across plug-in versions deployed to the Management Agent, follow these
steps:
1. Check for the latest available versions and revisions in the Enterprise Manager
Store as described in Checking the Availability of Plug-Ins.
2. Download them as described in Downloading Plug-Ins.
3. From the Setup menu, select Extensibility, then select Plug-ins.
4. On the Plug-ins page, select the plug-in you want to upgrade.
5. From the Deploy On menu, select Management Agent.
6. In the Deploy Plug-in on Management Agent dialog, select the version or revision
of the plug-in you want to upgrade to., and click Continue.
7. Select the preferred Management Agent to upgrade the plug-in on, and click
Continue. Then click Next. And then click Deploy.
8. On the Confirmation dialog, click Close.
23.7 Undeploying Plug-Ins
This section explains the following:
•Undeploying Plug-Ins from Oracle Management Service
•Undeploying Plug-Ins from Oracle Management Agent
Chapter 23
Undeploying Plug-Ins
23-23

23.7.1 Undeploying Plug-Ins from Oracle Management Service
To undeploy plug-ins from the OMS, follow the steps:
1. First, undeploy all plug-ins from all Management Agents. To do so, follow the steps
mentioned in Undeploying Plug-Ins from Oracle Management Agent.
2. From the Setup menu, select Extensibility, then select Plug-ins.
3. On the Plug-ins page, select the plug-in you want to undeploy, and from the
Actions menu, select Undeploy From, then select Management Servers.
4. In the Undeploy Plug-in From Management Server dialog, enter the Management
Repository SYS password, and click Continue. Then click Undeploy.
5. On the Confirmation dialog, click Close.
To monitor the undeployment operation, click Show Status.
To undeploy a plug-in in EM CLI, use the following command:
$emcli undeploy_plugin_from_server
-plugin="plug-inId"
[-sys_password="sys_password"]
Note:
When a metadata plug-in is undeployed/redeployed, it is recomended that you
run the following command. The command should be run in each OMS
environment instance.
$
emcli metric_control -command=flush_metadata_cache
If you want to undeploy only the plug-ins from the OMS, and not the entire
Enterprise Manager system, then use the Plug-ins page within the Enterprise
Manager Cloud Control Console. Do NOT use runInstaller to undeploy only
the plug-ins.
23.7.2 Undeploying Plug-Ins from Oracle Management Agent
To undeploy plug-ins from the Management Agent, follow the steps below:
Chapter 23
Undeploying Plug-Ins
23-24

Note:
•These steps are applicable for obsolete and deprecated plug-ins as well.
•Undeploying a plug-in from Management Agent removes all the targets
that were monitored by the plug-in.
•Undeployment of a plug-in from the Management Agent restarts the
Management Agent. The Management Agent does not monitor any target
during downtime.
1. From the Setup menu, select Extensibility, then select Plug-ins.
2. On the Plug-ins page, select the plug-in you want to undeploy, and from the
Actions menu, select Undeploy From, then select Management Agent.
3. In the Undeploy Plug-in From Management Agent dialog, click Add and add the
Management Agents from which you want to undeploy the plug-in. Click
Continue. Then click Undeploy.
4. On the Confirmation dialog, click Close.
To monitor the undeployment operation, click Show Status.
Note:
Undeploying a plug-in from Management Agent removes all the targets that
were monitored by the plug-in.
Undeployment of a plug-in from the Management Agent restarts the
Management Agent. The Management Agent does not monitor any target
during downtime.
To undeploy a plug-in using EM CLI, use the following command:
$emcli undeploy_plugin_from_agent
-plugin="pluginId"
{-agent_names="agent1[;agent2...]" | -all_discovery_only_agents}
To undeploy all versions of
oracle.sysman.db2
plug-ins from all Management Agents
where only Discovery Plug-ins are deployed, use the following command:
$
emcli undeploy_plugin_from_agent -plugin=oracle.sysman.db2 -
all_discovery_only_agents
23.8 Advanced Operations with Plug-Ins
This section explains the following:
•Re-deploying Plug-Ins on Oracle Management Agent
Chapter 23
Advanced Operations with Plug-Ins
23-25

•Deploying Plug-In Patches While Deploying or Upgrading Management Agent
(Create Custom Plug-In Update)
23.8.1 Re-deploying Plug-Ins on Oracle Management Agent
Using re-deploy option, you can re-deploy plug-ins on Oracle Management Agent. The
re-deploy plug-in option reconfigures the same plug-in on the Management Agent, and
does not change the configuration details.
$emcli redeploy_plugin_on_agent
{-agent_names="agent1[;agent2...]" | -group_name="group1"}
-plugin="plug-in_id:version"
[-redeploy_noprompt]
Note:
While using this option, note that the existing plug-in home will be overwritten,
and all applied patches will be lost.
The re-deploy wizard displays the following warning message:
Re-deployment of a plug-in overwrites the existing OracleHome of a plug-in
and you will lose any patch(es) that has been applied on plug-in OracleHome.
However, if you have enabled
-redeploy_nopromt
option, then the warning
message will not be displayed.
To continue, click Yes.
The redeploy command cannot be used on multiple Management Agents without
having Custom Plug-in Update for a plug-in.
Note:
After a metadata plug-in is redeployed, it is recomended that you run the
following command.
$emcli metric_control -command=flush_metadata_cache
The command should be run on all OMS instances.
23.8.2 Deploying Plug-In Patches While Deploying or Upgrading
Management Agent (Create Custom Plug-In Update)
When a new plug-in is released, it can be downloaded using Self-update. If there are
defects with the Management Agent plug-ins, Oracle then releases O-patch style
patches. While plug-ins get deployed automatically during target discovery on
Chapter 23
Advanced Operations with Plug-Ins
23-26

Management Agents, patches for the plug-ins have to be applied on each plug-in
manually.
Custom plug-in update is the user copy of the plug-in, along with patches applied to it.
Using the Create Custom Plug-In Update command allows you to create a custom
copy of plug-in along with the patches applied in self update. Once the patches are
applied, you can create a custom plug-in update of the plug-ins on that Management
Agent. The custom plug-in update then becomes a gold image for that plug-in with all
the patches applied on that Oracle Home, along with the base plug-in binaries.
After the Custom Plug-in Update is created, any plug-in deployment operation for the
plug-in on any Management Agent, using either UI or EMCLI, the new custom copy
will be deployed instead of the Oracle supplied version. In this way you don't have to
reapply the plug-in patches manually on each plugin home of agent. This custom plug-
in image is also used by Agent deployment to upgrade activity so that the plug-ins
getting deployed on these agents are with the patch included.
There are two methods of creating Custom Plug-in Update. The following sections
describe the two methods.
•Creating Custom Plug-In Update Using EMCLI(recommended)
•Creating Custom Plug-In Update Using EDK
23.8.2.1 Creating Custom Plug-In Update Using EMCLI
To create a custom plug-in update, follow these steps:
1. Select a test Management Agent which is up and running on which the preferred
plug-in is already deployed. Apply any patches that you want to apply on this plug-
in.
2. Perform the required testing.
3. Create a custom plug-in update using the following command:
$emcli create_custom_plugin_update
-agent_name="agent_name"
-plugin_id="plugin_id"
Chapter 23
Advanced Operations with Plug-Ins
23-27

Note:
To overwrite and update your current custom plug-in update that is stored in a
repository, use the
overwrite
option.
$emcli create_custom_plugin_update
-agent_name="agent_name"
-plugin_id="plugin_id"
[-overwrite]
This command creates and imports a custom plug-in update from an existing
Management Agent where the selected plug-in is deployed. The custom plug-
in update will be used for all subsequent plug-in deployments on any
Management Agent, in place of Oracle supplied versions.
Custom plug-in update is created as per plug-in type. If a custom plug-in
update is created, and after three days, a patch is applied, in order to include
the patch, the custom plug-in update will have to be created again.
To view a list of all Custom Plug-in Updates created, run the following command.
$emcli list_custom_plugin_updates
To view a a list of patches included in a particular Custom Plug-in Update, run the
following command.
$emcli list_patches_in_custom_plugin_update -plugin=<plugin_id>:<version> [-
discovery]
On the Plug-in Manager console, when you select a plug-in, if a Custom Plug-in
Update exists, an icon is displayed beside the version identifier, indicating that that
particular plug-in version is customized in the environment, with a list of patches.
Figure 23-10 displays the Custom Plug-in Update icon. Once the custom plug-in
update exists, it will be used by the Management Agent for deployment and upgrade
automatically.
Figure 23-10 Custom Plug-in Update Icon
When you click the Custom Plug-in Update icon, the page that displays the information
on Custom Plug-in Update is displayed. Figure 23-11 displays the Custom Plug-in
Update information page.
Chapter 23
Advanced Operations with Plug-Ins
23-28
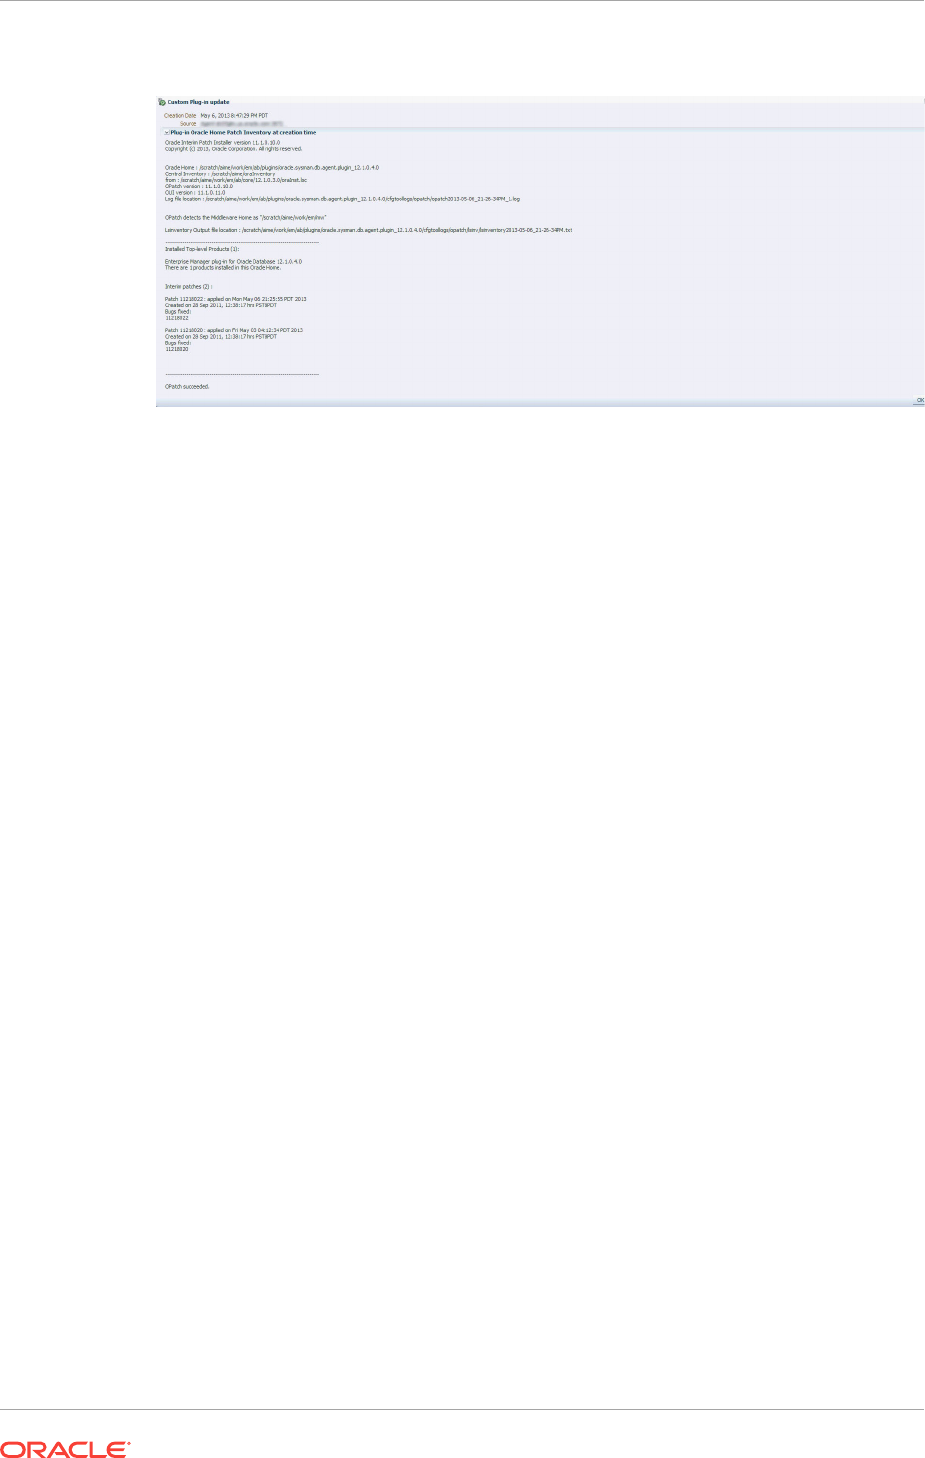
Figure 23-11 Custom Plug-in Update Information Page
23.8.2.2 Creating Custom Plug-In Update Using EDK
To create custom plug-in update using EDK, follow these steps.
1. Download EDK, using the UI or EMCLI, on the Management Agent Host.
To download EDK using UI, from the Setup menu, select Extensibility, and then
select Development Kit.
To download EDK using EMCLI, run the following command.
$emcli get_ext_dev_kit
2. Run the following command.
$empdk create_custom_plugin_update -out_dir <output dir>
-agent_state_dir <agent_state_dir>
-agent_oracle_home <agent_oracle_home>
-plug_id <plugin_id>
For help with empdk commands, run the following command.
$/empdk -help
The plug-in update is saved to on a local directory as a .zip file. The .zip file has to be
copied to an OMS instance. Once the .zip file is created, from the OMS Home, run the
following command to import the custom plug-in update.
$emcli import_plugin_update -archive=<archive path>
On the Plug-in Manager console, when you select a plug-in, if a Custom Plug-in
Update exists, an icon is displayed beside the version identifier, indicating that
particular plug-in version is customized in the environment, with a list of patches.
23.9 Troubleshooting
This section contains information on troubleshooting plug-in related issues. The
following sections are covered in this section:
•Understanding Plug-In Homes
Chapter 23
Troubleshooting
23-29
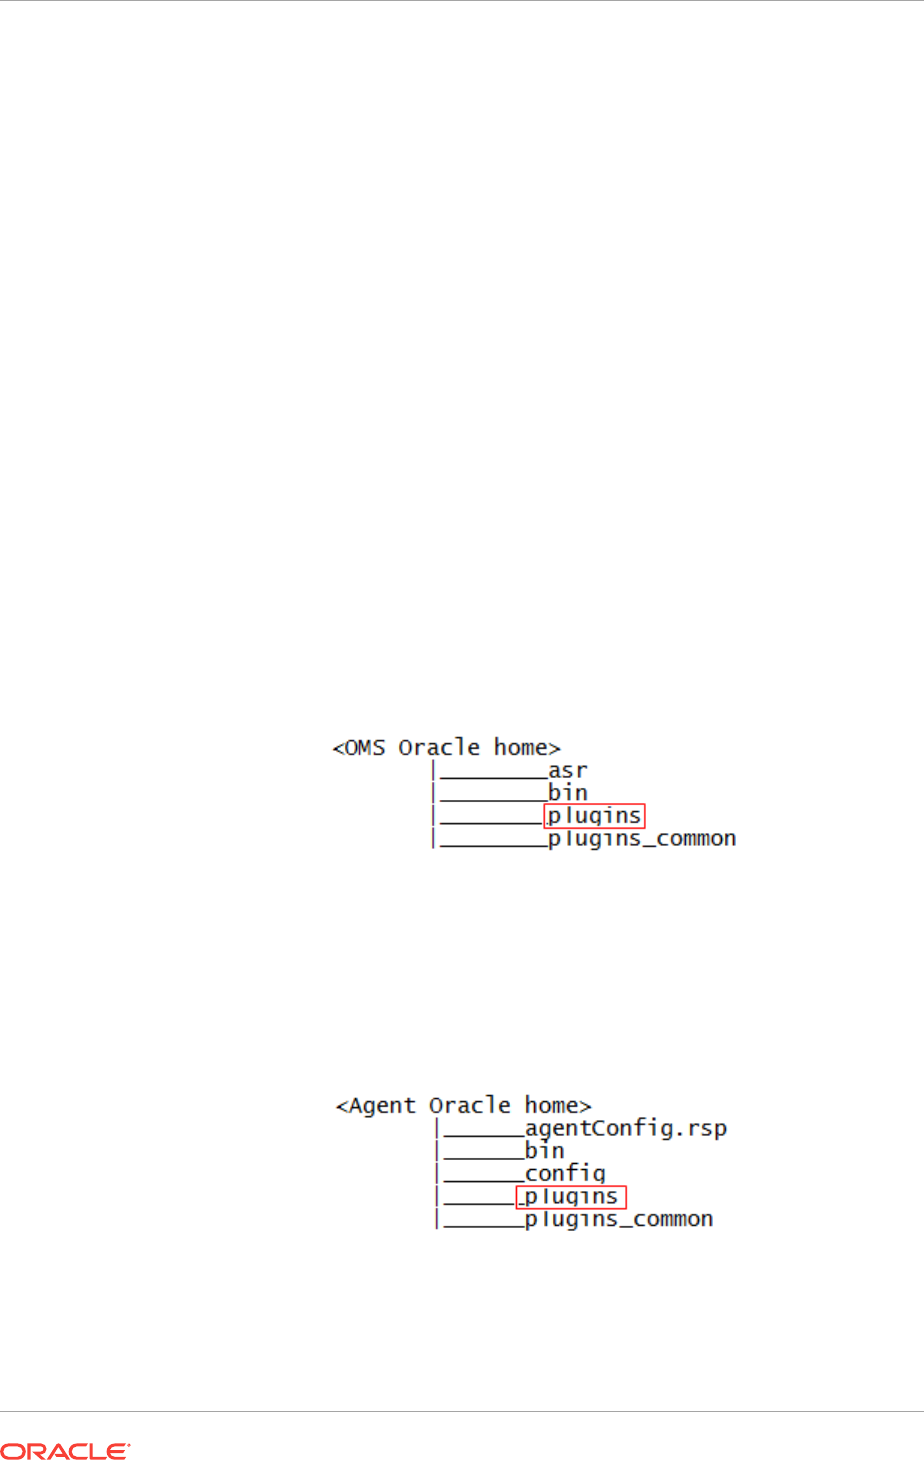
•Troubleshooting OMS Plug-In Deployment and Upgrade Issues
–Troubleshooting OMS Plug-In Deployment Issues
–Rollback and Resume OMS Plug-In Upgrade
•Troubleshooting Management Agent Plug-In Deployment, Upgrade, and Blocked
Issues
–Troubleshooting Management Agent Plug-In Deployment Issues
–Troubleshooting Management Agent Plug-In Upgrade Issues
–Resolving a Plug-in Mismatch on a Management Agent
–Running a Plug-in Mismatch Job to Resolve All Plug-in Mismatches
23.9.1 Understanding Plug-In Homes
Plug-in homes are essentially directories under Oracle homes that are dedicated for
plug-ins. The plug-in home for plug-ins deployed to the OMS is different from the plug-
in home for plug-ins deployed to the Management Agent. Since plug-in homes are
registered in the
oraInventory
, they should not be manually deleted or manipulated.
Figure 23-12 shows the plug-in home directory for plug-ins deployed to Enterprise
Manager Cloud Control 13c Release 1 (for OMS).
Figure 23-12 Plug-In Home for Enterprise Manager Cloud Control 13c Release
1 (for OMS)
Figure 23-13 indicates the plug-in home directory for plug-ins deployed to
Management Agents of 13c Release 1.
Figure 23-13 Plug-In Home for Oracle Management Agents 13c Release 1
Chapter 23
Troubleshooting
23-30

23.9.2 Troubleshooting OMS Plug-In Deployment and Upgrade Issues
If the deployment of a new plug-in fails, the system automatically recovers. When the
automatic recovery is complete, all OMS instances are started. If the upgrade of an
existing plug-in fails, manual system recovery is required.
This section provides troubleshooting tips related to the following topics:
•Troubleshooting OMS Plug-In Deployment Issues
•Rollback and Resume OMS Plug-In Upgrade
23.9.2.1 Troubleshooting OMS Plug-In Deployment Issues
If plug-in deployment to the OMS fails, first check the details of the deployment, using
the following commands.
•If the OMS is down, use the following command.
$emctl status oms -details
•If the OMS is running, use the following command.
$emcli get_plugin_deployment_status
Note:
When the status of the OMS is displayed, review the log files that are
displayed in the output.
It is recommended that you take a backup of the Repository in case of a failure
in the Recovery.
Review the
pluginca
log file available in the following location. Use them to debug the
issue, and if you raise a service request to Oracle Support, then make sure you
append these to the service request.
$<OMS_HOME>/cfgtoollogs/pluginca/*
Note:
When you install an additional OMS by cloning an existing, running OMS
instance, the plug-in deployed to the source OMS are automatically carried
over to the cloned OMS as well. Therefore, you do not have to redeploy the
plug-ins on the cloned OMS.
In case of multi OMS environment, the
OMS_HOME
in the log file path indicates
the root folder of the OMS where the failure occurs.
For information about installing an additional OMS, refer to the Oracle
Enterprise Manager Cloud Control Basic Installation Guide.
Chapter 23
Troubleshooting
23-31

23.9.2.2 Rollback and Resume OMS Plug-In Upgrade
If plug-in upgrade fails, then do one of the following:
•Raise a Service Request to find out if there is a possibility of recovering from the
current Management Repository.
•Rollback to the latest backup of the Management Repository.
•If you have not taken a backup of the Management Repository, diagnose and
resolve the issue that is causing the plug-in upgrade to fail.
Then, run the following command to resume the plug-in upgrade:
$<OMS_HOME>/bin/emctl resume_plugin_upgrade
This command automatically detects and resumes the last failed upgrade session.
Once the plug-in upgrade succeeds, the OMS restarts automatically. The same
deployment ID is updated with the current status of the operation. In case of a
multi-OMS environment, the plug-in upgrade happens on the first OMS, and then
on all other additional OMS instances.
•If flashback is enabled, the section number will be printed.
23.9.3 Troubleshooting Management Agent Plug-In Deployment,
Upgrade, and Blocked Issues
This section provides troubleshooting tips related to the following topics:
•Troubleshooting Management Agent Plug-In Deployment Issues
•Troubleshooting Management Agent Plug-In Upgrade Issues
•Resolving a Plug-in Mismatch on a Management Agent
•Running a Plug-in Mismatch Job to Resolve All Plug-in Mismatches
23.9.3.1 Troubleshooting Management Agent Plug-In Deployment Issues
If plug-in deployment to the Management Agent fails, then review the log file available
in the following locations.
agent_inst/sysman/log/*
agent_inst/sysman/registry.xml
agent_inst/install/logs/*
23.9.3.2 Troubleshooting Management Agent Plug-In Upgrade Issues
If plug-in upgrade fails, then review the log file available in the following locations.
•To review the log files using the UI, follow these steps.
1. From the Setup menu, select Extensibility, and then select Plug-ins.
2. Select the preferred plug-in, and review the information displayed in the
Recent Deployment Activities tab.
Chapter 23
Troubleshooting
23-32

3. Click the link in the Action column for the preferred Management Agent. From
the Deployment Steps tab, select the job name. Selecting the job name
opens the job details wizard.
•The detailed logs for Management Agent upgrade and deployment are available at
the following location.
agent_inst/install/logs/agentplugindeploy_N.log
In the aforementioned location, N refers to the internal ID. Check the latest log files
in the location.
•While filing an SR, upload the following log files.
agent_inst/install/logs/*
agent_inst/sysman/log/*
agent_inst/sysman/registry.xml
23.9.3.3 Resolving a Plug-in Mismatch on a Management Agent
When there is a plug-in version mismatch on the Management Agent and OMS, and in
this situation the Management Agent is restarted (bounced), the Management Agent is
moved to the “Blocked" state.
If a Management Agent is in the Blocked state due to a plug-in mismatch, follow the
steps below to resolve the mismatch error:
1. From the Setup menu, select Manage Cloud Control and then click Agents.
2. In the Status column look for the Management Agents which are in the Blocked
state.
3. Click on the Management Agent name link to open the agent home page.
4. In the Summary pane look for the Status row and click the Resolve Mismatches
icon next to “Blocked."
5. In the Plug-in Mismatch page review all the plug-in mismatches discovered on the
agent and click Resolve Mismatches.
6. Click OK in the Confirmation pop-up window.
A confirmation message with the status is displayed.
23.9.3.4 Running a Plug-in Mismatch Job to Resolve All Plug-in Mismatches
When there is a plug-in version mismatch on the Management Agent and OMS, and in
this situation the Management Agent is restarted (bounced), the Management Agent is
moved to the “Blocked" state.
Follow the steps below to run a job to find any plug-in mismatches in Management
Agents and to resolve the issue/s if there are any mismatches:
1. From the Enterprise menu, select Job, and then click Activity.
2. Click Create Job.
3. Select Plug-in Mismatch Check from the Job Type column and click Select.
4. Enter a name for the job in the Name field.
5. From the Target section click Add.
Chapter 23
Troubleshooting
23-33

6. Select the Management Agents on which you want to run the job and click Select.
7. Click Parameters tab.
8. From the Fix Mismatch drop-down list select True.
Note:
When the Fix Mismatch field is set to True, the job may shut down the
selected Management Agents if the plug-in mismatch is found. Exercise
caution when setting this option.
9. Click Submit to run the job.
10. After the job has completed click on the job name link to open the Job page.
The Output Log provides the details of the job run and the action taken to resolve
the plug-in mismatches (if any).
Chapter 23
Troubleshooting
23-34

24
Patching Oracle Management Service and
the Repository
Note:
The patching methodology discussed in this chapter can only be used with
Enterprise Manager Cloud Control Release 13.2.0.0.0 and later.
OMSPatcher automates the patching process by generating custom patching
instructions based your particular environment and then automatically applies the
patch.
This chapter covers the following topics:
•OMSPatcher Automation
•Required OMSPatcher Parameters
•Prerequisites for Running OMSPatcher
•Using OMSPatcher
•OMSPatcher Command Syntax
•Troubleshooting
•Features in OMSPatcher
24.1 OMSPatcher Automation
With OMSPatcher, you can automatically patch a typical OMS configuration (core,
plug-in homes) with minimal intervention.
OMSPatcher performs many of the pre-patch checks such as:
•Configuration-based prerequisite checks
•Patch-based binary prerequisite checks
OMSPatcher performs end-to-end configuration patching. Configuration patching is the
process of patching a target based on its configuration. By incorporating the
configuration information into the patch process, OMSPatcher is able to simplify
patching tasks by automating most of the steps.
24.1.1 Supported OMS Configurations and OMSPatcher Patchability
•Single OMS – OMS application that runs from a single OMS instance of the
system. OMSPatcher performs patching and deployment operations
•Multiple OMS – OMS applications that run on two or more machines. The OMSs
are connected by the Oracle WebLogic domain and separate managed servers.
24-1
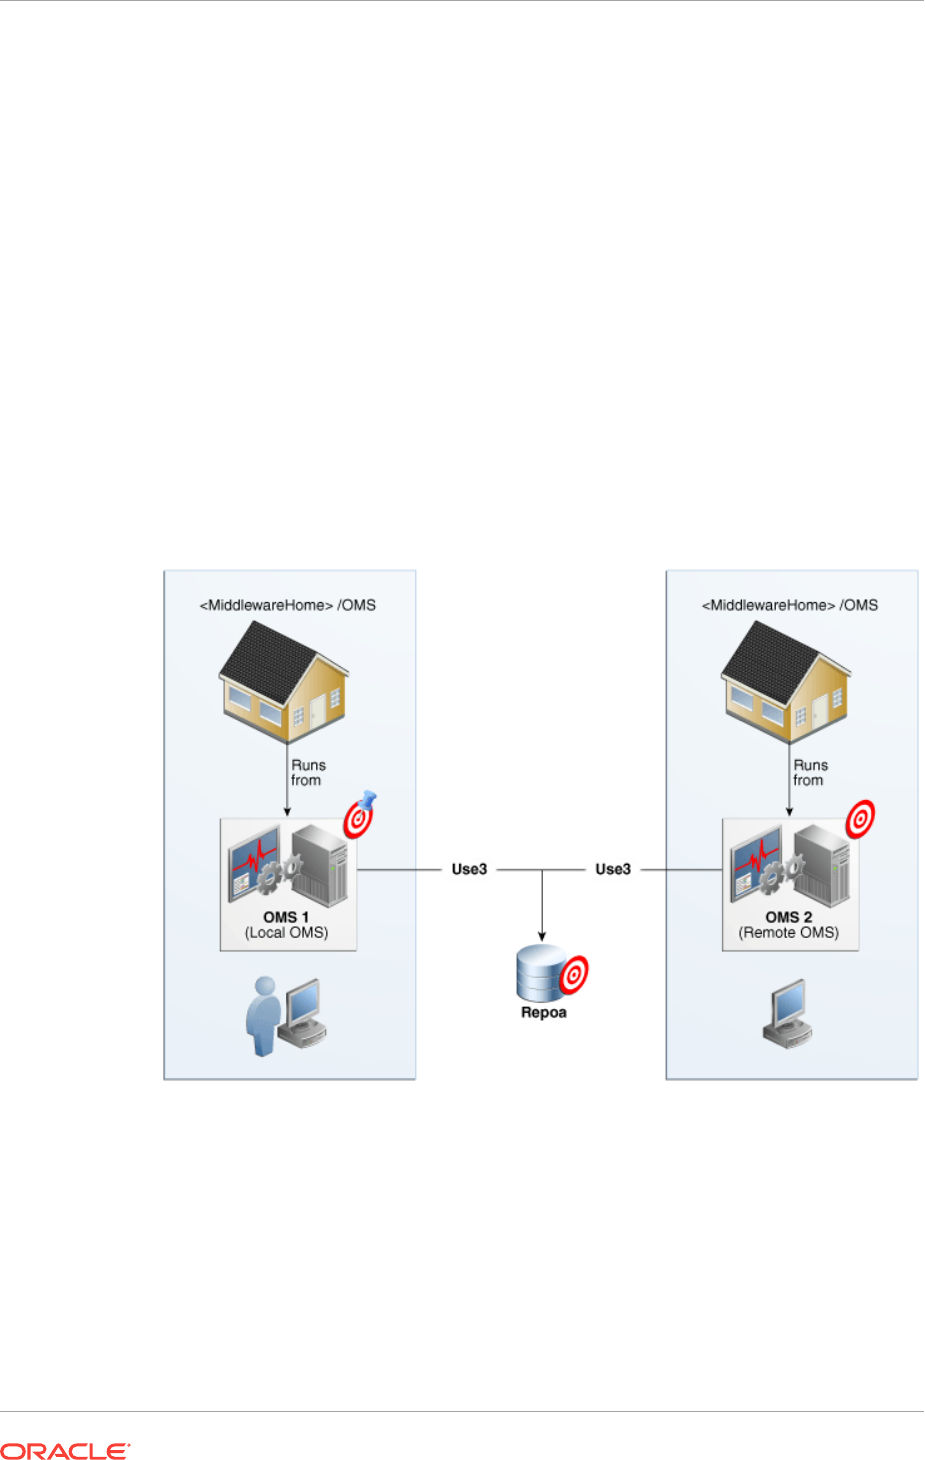
There is a one-to-one mapping between the managed servers and the separate
OMS bits residing on a single machine. OMSPatcher provides auto-generated
bash scripts (one per OMS instance) for UNIX based systems. For Windows, it
only provides context-sensitive steps (text and HTML). For both cases,
administrator needs to follow the steps given by OMSPatcher.
•Single Instance Database or Real Application Cluster - shared or Real Application
Cluster (RAC)
Example: Multi-OMS System
The following figure illustrates a multi-OMS deployment. The following terms are used:
•Administrator: Person installing patches to the OMS core and plug-in homes.
•Local OMS: OMS instance on which the administrator runs OMSPatcher.
•Remote OMS: OMS instances on other machines (within the same OMS domain
as the local OMS) where the administrator has not started any patching
operations.
Figure 24-1 Simple Multi-OMS System
For a single OMS system (primary), OMSPatcher will execute the patching steps. For
a multi-OMS UNIX system, OMSPatcher generates bash scripts for execution, one per
OMS instance; follow the instructions given by OMSPatcher to find those scripts. For
Windows multi-OMS systems, OMSPatcher will generate customized patching
instructions/commands for the environment in text and HTML formats; administrators
must execute these instructions to patch the various Oracle Management Services.
Chapter 24
OMSPatcher Automation
24-2

24.1.2 NextGen OUI Inventory Configurations
Apart from the target or instance-based configuration, OMSPatcher utilizes installation
configuration relationships established in the NextGen OUI inventory as core and plug-
in feature-sets. A typical OMS 13c home is organized as follows:
<Middleware Home>
|_____<CORE_BITS>
|_____<PLUGINS_DIRECTORY>
|_____oracle.sysman.db.oms.plugin_13.2.1.0.0
|_____oracle.sysman.emas.oms.plugin_13.2.1.0.0
|_____oracle.sysman.mos.oms.plugin_13.2.1.0.0
.
.
.
24.1.3 Supported Patch Format
Beginning with Enterprise Manager Release 12.1.0.3, Enterprise Manager patches
have been converted to a System patch format in order to support patch automation.
What is a System Patch?
A System patch contains several sub-patches whose locations are determined by a file
called bundle.xml in the top level directory of the patch. The sub-patches are intended
for different sub-systems of a system that correspond with the OMS core and plug-in
home organization.
A typical System patch format is organized as follows:
<System patch location - directory>
|_____ Readme.txt (or) Readme.html
bundle.xml
automation
|_____ apply_automation.xml
|_____rollback_automation.xml
Sub-patch1
|_____ etc
|_____config
|_____ inventory.xml
|_____ actions.xml
|_____ artifact_apply.xml
|_____ artifact_rollback.xml
|_____ files/Subpatch1 'payload'
Sub-patch2
|_____ etc
|_____config
|_____ inventory.xml
|_____ actions.xml
|_____ artifact_apply.xml
|_____ artifact_rollback.xml
|_____ files/Subpatch1 'payload'
For Enterprise Manager release 12.1.0.2 or below, OMSPatcher (earlier known as
opatchauto) is not supported for the released one-off patches. For these older
releases, you must use OPatch and follow the patch README instructions.
Chapter 24
OMSPatcher Automation
24-3

24.1.4 Supported Patching Methodologies
OMSPatcher supports rolling mode only for System patches without any automation
(binary-only patching through OMSPatcher). For all other artifacts (MRS, SQL),
OMSPatcher only supports complete system downtime patching operations.
Refer to the patch README for the explicit information on supported patching
methodologies.
24.2 Required OMSPatcher Parameters
OMSPatcher for the Enterprise Manager OMS will prompt for the following input
parameters when performing patching operations. These parameters were determined
at the time of Enterprise Manager installation.
•Oracle WebLogic Admin Sever URL & port number
•Oracle WebLogic Administration Server username
•Oracle WebLogic Administration Server password
Because OMSPatcher requires this input for each patching operation, OMSPatcher
provides the ability to encrypt the username and password via WebLogic encryption
APIs and pass this information using a property file when running OMSPatcher apply
and rollback operations. The next section discusses how to create a property file.
24.2.1 Creating a Property File
The automated patching functionality achieved using OMSPatcher expects WebLogic
Administration Server URL and credentials as an input for patching and configuration
detection operations. Primarily, the WebLogic Administration server is the host that
manages the Managed Server where the OMS instance is deployed. If you do not
want to set the credentials every time you are prompted while patching the OMS, you
can update the property file. OMSPatcher allows you to repeatedly provide the inputs
using property file option.
Note:
Property file for a Primary OMS and Standby OMS are different, as they are in
different domains.
To create an OMSPatcher property file:
1. Run the following script to create the WebLogic encrypted configuration and key
files.
On UNIX:
$ OMSPatcher/wlskeys/createkeys.sh -oh <full path of platform home> -location
<location to put the encrypted files>
On Windows:
Chapter 24
Required OMSPatcher Parameters
24-4
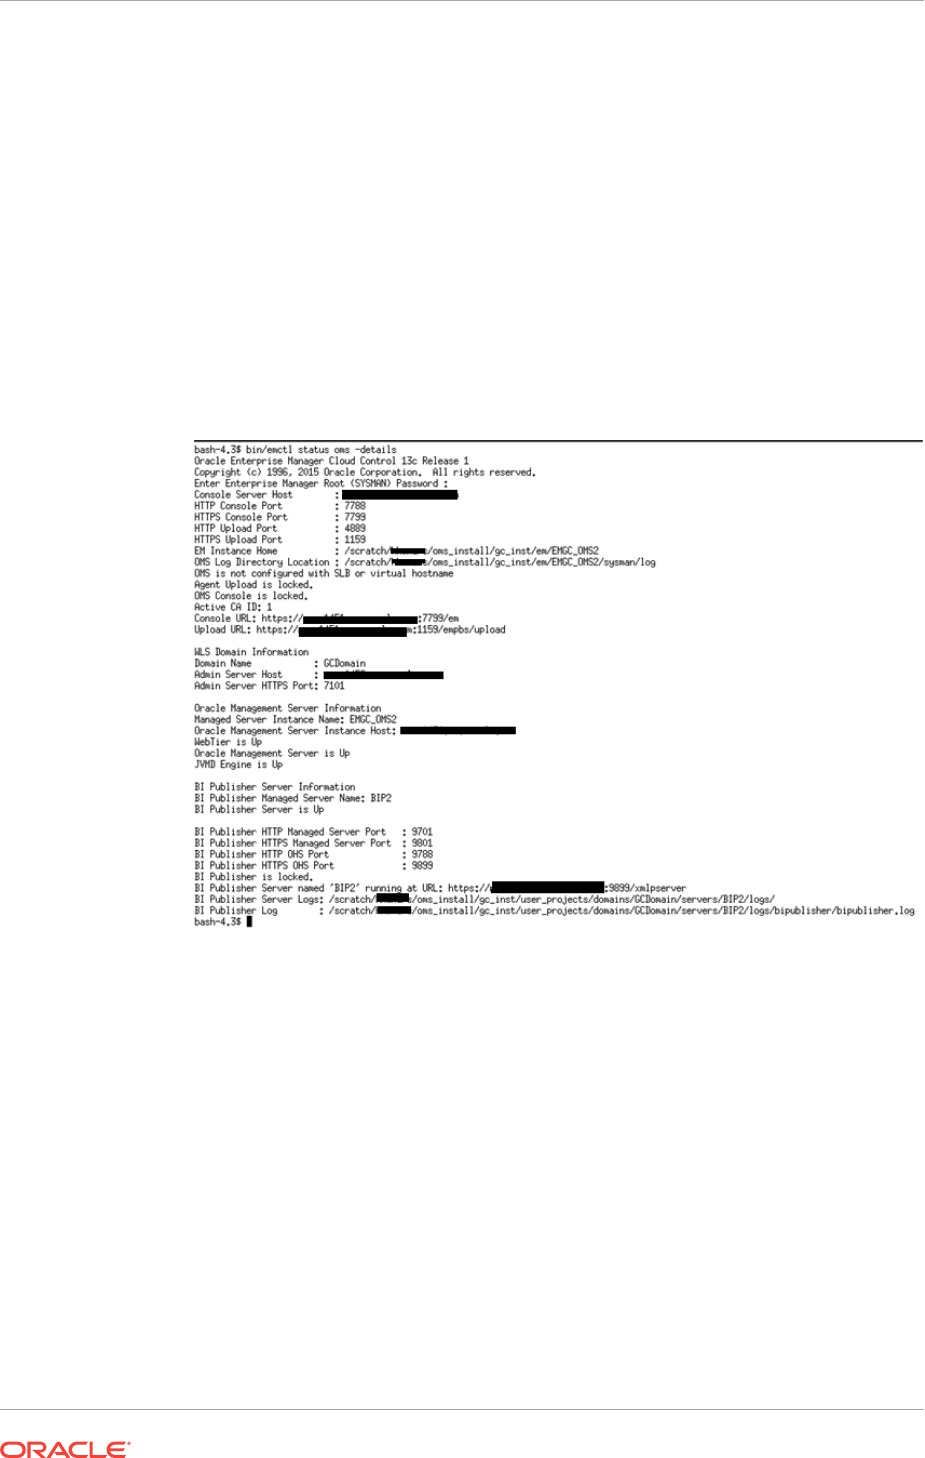
$ OMSPatcher\wlskeys\createkeys.cmd -oh <full path of platform home> -location
<location to put the encrypted files>
When prompted, enter the credentials of the Oracle WebLogic Administration
Server that manages the Managed Server on which OMS instance is deployed.
Two files are generated with the file names:
config
and
key
.
2. Create the property file with the following entries:
AdminServerURL=t3s://<host address from where admin server is running>:<port of
the admin server>
AdminConfigFile=<'config' file location>
AdminKeyFile=<'key' file location>
The values for host address and port of admin server can be located by running
the following 'emctl command' on an Oracle Home.
Following is the example of how a property file (constructed by the above
mentioned guidelines) should appear:
AdminServerURL=t3s://my_admin_server.oracle.com:7101
AdminConfigFile=/scratch/patch/oms_install_dir/middleware/oms/config/config
AdminKeyFile=/scratch/patch/oms_install_dir/middleware/oms/config/key
Chapter 24
Required OMSPatcher Parameters
24-5

Note:
To retrieve the WebLogic Administration Server URL details, run the following
commands on the OMS home that you are patching:
On Unix:
$ORACLE_HOME/bin/emctl status oms -details
On Windows:
%ORACLE_HOME%\bin\emctl.bat status oms -details
The command output contains the WebLogic Administration Server details.
Here is an example on how to construct the URL with these output details.
Example:
WLS Domain Information
Domain Name : GCDomain
Admin Server Host : my_wls.oracle.com
Admin Server HTTPS Port: 7103
To construct the Administrator Server URL, use the following syntax:
t3s://<admin server host>:<port>
In this example, the URL translates as follows:
t3s://my_wls.oracle.com:7103
24.3 Prerequisites for Running OMSPatcher
Before running an OMSPatcher patching session, you must ensure the following
configuration and inventory-based prerequisites are satisfied: Configuration-based
conditions that have to be honored for OMS automation is given below.
•The Enterprise Manager Software library must be configured.
•The Oracle WebLogic Administration Server that controls the OMS instance
(currently to be patched) through a managed server must be up and running.
•Ensure that the Oracle Database, which houses the OMS Management
Repository, and its listener are up and running.
•Ensure that you have the latest version of the OMSPatcher in the OMS platform
home of each host.
If you do not have the latest OMSPatcher version, follow the instructions outlined
in the My Oracle Support note 2135028.1 available at:
https://support.oracle.com/epmos/faces/DocumentDisplay?
_afrLoop=529643231574036&id=2135028.1&_adf.ctrl-state=c5dyo92tl_489#REF
•Check your patch README to determine whether there are any specific
prerequisites to be executed based on patch and patching methodologies.
Checking System Prerequisites
Chapter 24
Prerequisites for Running OMSPatcher
24-6

Note:
To run omspatcher commands, ensure that 'ORACLE_HOME/OMSPatcher is
included in the PATH environment variable.
To make sure all prerequisite checks pass and no errors occur during the OMSPatcher
patching session, Oracle recommends running the following commands on each OMS
instance (in your OMS system).
omspatcher apply <PATCH_LOC> -analyze
Must be run from the System patch location (for apply operations)
Note:
OMS systems need not be shut down when running
apply -analyze
.
Note:
Check the Patch README and the instructions given for chosen patching
methodologies.
OR
omspatcher rollback -analyze -id <comma (,) separated list of sub-patches to be
rolled back for System patch>
Note:
In order to roll back all sub-patches together, all sub-patches should be from
same system patch.
Chapter 24
Prerequisites for Running OMSPatcher
24-7
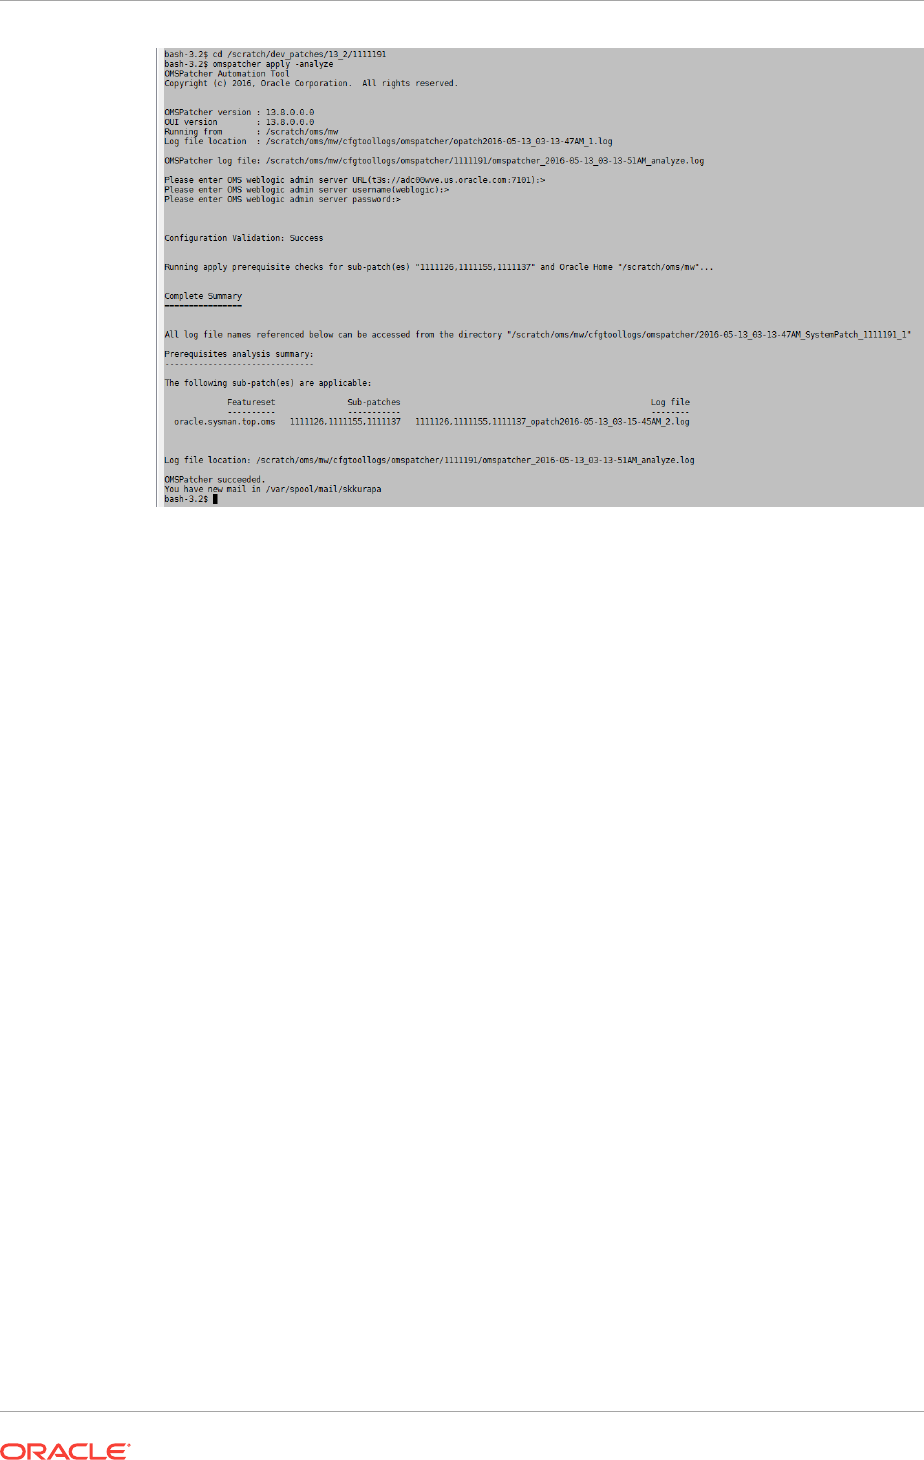
Example 24-1 OMSPatcher rollback -analyze output
-------------------------------
omspatcher rollback -id 1111137 -analyze
OMSPatcher Automation Tool
Copyright (c) 2015, Oracle Corporation. All rights reserved.
OMSPatcher version : 13.8.0.0.0
OUI version : 13.8.0.0.0
Running from : /scratch/mw
Log file location : /scratch/mw/cfgtoollogs/omspatcher/1111137_Nov_11_2015_22_54_57/
rollback2015-11-11_22-54-57PM_1.log
OMSPatcher log file: /scratch/mw/cfgtoollogs/omspatcher/SystemPatch/
omspatcher_2015-11-11_22-55-02PM_analyze.log
Please enter OMS weblogic admin server URL(t3s://myserver.myco.com:7101):>
Please enter OMS weblogic admin server username(weblogic):>
Please enter OMS weblogic admin server password:>
Sub-patch(es) " 1111137 " are part of the OMS System patch.
Oracle Home: /scratch/mw, Sub-patch(es): [1111137, 1111126]
Do you want to rollback sub-patch(es) "1111137" only? [y|n]
y
User Responded with: Y
Configuration Validation: Success
Running rollback prerequisite checks for patch(es) "1111137" and Oracle Home "/
scratch/mw"...
Sub-patch(es) "1111137" are successfully analyzed for Oracle Home "/scratch/mw"
Complete Summary
================
Chapter 24
Prerequisites for Running OMSPatcher
24-8

All log file names referenced below can be accessed from the directory "/scratch/mw/
cfgtoollogs/omspatcher/2015-11-11_22-54-57PM_SystemPatch_1111192_1"
Prerequisites analysis summary:
-------------------------------
The following sub-patch(es) are rollbackable:
Featureset Sub-patches Log file
---------- ----------- --------
oracle.sysman.top.oms 1111137
1111137_RollbackPrereq2015-11-11_22-55-25PM_2.log
Log file location: /scratch/mw/cfgtoollogs/omspatcher/SystemPatch/
omspatcher_2015-11-11_22-55-02PM_analyze.log
OMSPatcher succeeded.
bash-3.2$
Note:
Once the analysis finishes, you can refer to the OMSPatcher log to see what
steps would be executed by OMSPatcher in non -analyze mode. The log file
contains references to the HTML and text output file HTML containing detailed
steps.
24.4 Using OMSPatcher
OMSPatcher must be run from the platform home of the OMS being patched. To run
OMSPatcher commands from any directory include <ORACLE_HOME__PATH>/
OMSPatcher in the PATH environment variable. The ORACLE_HOME environment
variable must be set as the platform home or provided using the omspatcher "–oh"
option. For example:
omspatcher apply <patch>
Minimum Required OMSPatcher Version: 13.8.0.0.0
Ensuring You Have the Latest Version of OMSPatcher
OMSPatcher is the patching utility that executes end to end patching procedure for
OMS Patches. Ensure that the latest version of OMSPatcher is available on all
instances of OMS platform homes.
To check the version of OMSPatcher residing on the system, run the following
command:
omspatcher version
To get the latest OMSPatcher version, follow the instructions outlined in the My Oracle
Support note 2135028.1 available at:
https://support.oracle.com/epmos/faces/DocumentDisplay?
_afrLoop=277259559046496&id=2135028.1&_afrWindowMode=0&_adf.ctrl-
state=4eefxg576_200
Ensuring You Have the Latest Version of OPatch
Chapter 24
Using OMSPatcher
24-9

OMSPatcher uses the OPatch utility to apply the patch. For this reason, you must
ensure that you have the latest version of OPatch on all instance of OMS platform
homes. To check the version of OPatch residing on the system, run the following
command. Ensure to execute the command after including ORACLE_HOME/OPatch in
the PATH environment variable.
opatch version
To download the latest version of OPatch, follow the instructions outlined in the My
Oracle Support note 224346.1 available at the following location:
https://support.oracle.com/CSP/main/article?cmd=show&type=NOT&id=224346.1
Minimum Required OPatch Version: 13.8.0.0.0
Patching Quickstart
Using OMSPatcher typically involves the following phases:
1. Determining Whether Your System Meets OMSPatcher System Requirements
Run
omspatcher apply -analyze
The
apply -analyze
command simulates an OMSPatcher apply session by running all
prerequisite checks, when possible, without making changes to the system (either bits
or configurations). This command does not apply the patch.
See "Prerequisites for Running OMSPatcher" for additional information.
2. Determining What System Patches Currently Exist on Your System
Run
omspatcher lspatches
See "lspatches" for more information.
3. Obtaining Patches from My Oracle Support (MOS)
OMSPatcher requires that the required platform or plug-in System patches be
obtained from My Oracle Support and downloaded to the OMS instance on which
OMSPatcher is to be run.
See " My Oracle Support: Searching for Patches" for more information.
4. Applying a Patch
Run
omspatcher apply <patch>
The apply command applies all patches within a specified System patch to the
platform home from which
omspatcher
command is run.
See "Running
omspatcher apply
" for more information.
5. Deinstalling Individual Sub-patches of a System Patch
Run
omspatcher rollback -id <list of comma separated sub-patches of System patch>
Note:
For a complete list of sub-patches of the System patch, refer to the patch
README.
Chapter 24
Using OMSPatcher
24-10

If, after applying the patch, the system is not stable, the most likely cause is the patch
itself. Contact Oracle Support. They will recommend that you remove the patch using
the
omspatcher rollback
command.
See "Running
omspatcher rollback
" for more information.
24.4.1 My Oracle Support: Searching for Patches
The first step in the patching process is to determine what patches you need from My
Oracle Support (MOS). MOS is the single source of truth for patching. You can access
MOS at the following location:
https://support.oracle.com
Once you have logged in, you have access to interactive support tools and information
that simplify searching for and obtaining the requisite patches for your Oracle
environment. .
My Oracle Support contains many features and capabilities that are grouped under
tabs across the top of the application. Of primary interest is the Patches and Updates
tab. From this tab you can search for the patches based on the OMS patch area (core,
plug-in, or combination).
24.4.2 Running
omspatcher apply
Once you have downloaded the patch, see the patch README for explicit patch
details and instructions on applying the patch. You can find the README at the
following location
<System patch location>/README.txt (or) README.html
As you step through the patching operations in the README, running
omspatcher
apply
(depending on the configuration that is patched, primary or standby) will
generate a custom, environment-specific version of the README for patching
operations for the primary site multi-OMS or standby site OMS systems. For a primary
site single OMS system, running
omspatcher apply
will perform patching and
deployment operations.
On your local OMS instance, run the following command from the top level System
patch directory:
omspatcher apply <patch>
Note:
Unlike
omspatcher analyze
, you should not run
omspatcher apply
on every OMS
instance. OMSPatcher will either execute all patching and deployment
operations, or will generate environment-specific steps that include complete
configuration aspects of the System.
For a multi-OMS UNIX system, OMSPatcher generates bash scripts for execution, one
per OMS instance; follow the instructions given by OMSpatcher to find those scripts.
For Windows multi-OMS systems, OMSpatcher will generate customized patching
Chapter 24
Using OMSPatcher
24-11

instructions/commands for the environment in text and HTML formats; administrators
must execute these instructions to patch the various OMSs.
24.4.3 Running
omspatcher rollback
See the patch README for explicit patch details and instructions on deinstalling the
patch. You can find the README at the following location
<System patch location>/README.txt (or) README.html
As you step through the patch deinstallation operations in the README, running
omspatcher rollback
(depending on the configuration that is patched, primary or
standby) will generate a custom, environment-specific version of the README for
patching operations for the primary site multi-OMS or standby site OMS systems. For
a primary site single OMS system, running
omspatcher rollback
will perform the
deinstallation operations.
On your local OMS instance, run the following command from the top level System
patch directory:
omspatcher rollback -id <list of comma separated sub-patches of System patch
Note:
•Unlike
omspatcher analyze
, you should not execute the omspatcher
rollback command on every OMS instance. OMSPatcher will either
execute all patching and deployment operations, or will generate
environment-specific steps that include complete configuration aspects of
the System.
•The list of sub-patches within the System patch can be retrieved from
patch README.
The list of sub-patches listed in System patch README may differ from
the patches that are actually installed. During System patch installation,
some sub-patches may be skipped (not installed).
For a multi-OMS UNIX system, OMSPatcher generates bash scripts for execution, one
per OMS instance; follow the instructions given by omspatcher to find those scripts.
For Windows multi-OMS systems, OMSPatcher will generate customized patching
instructions/commands for the environment in text and HTML formats; administrators
must execute these instructions to patch the various OMSs.
24.4.4 Running
omspatcher lspatches
After the patch is applied or rolled back, you can run the
omspatcher lspatches
command to generate a comprehensive Component type - patches map of the OMS
homes and installed patches.
Chapter 24
Using OMSPatcher
24-12
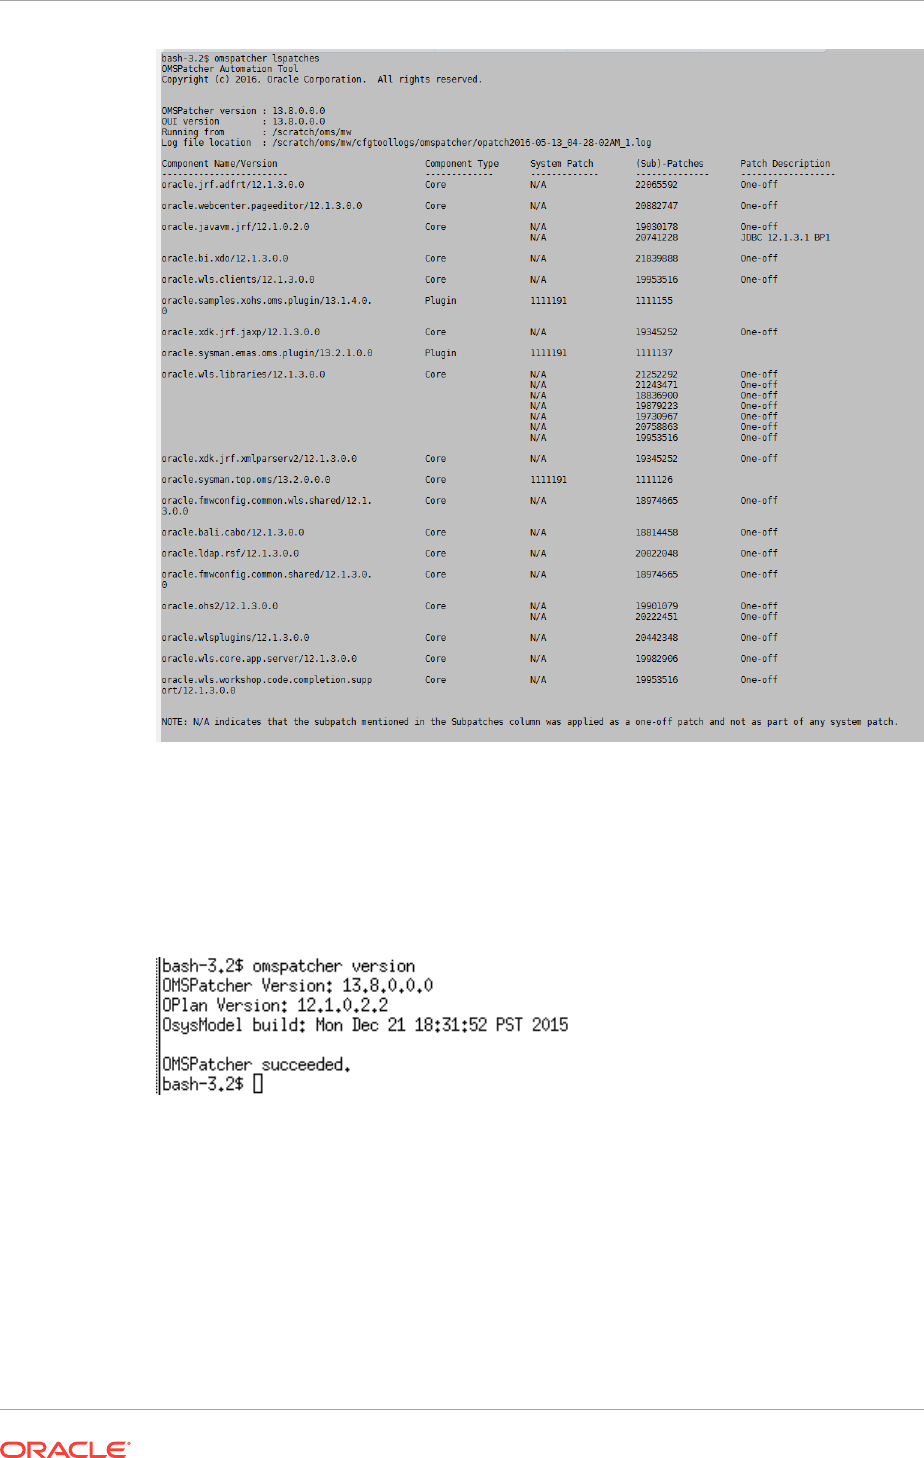
24.4.5 Running
omspatcher version
To determine the version numbers of the various OMSPatcher utilities (OPlan,
OsysModel) that reside on your system, you can run
omspatcher version
.
24.4.6 Patching a Standby OMS System
If you have configured a standby OMS for High Availability, refer to the chapter on
"Enterprise Manager Disaster Recovery" and the appendix on Standby OMSs Using
Standby WebLogic Domain" both of which can be found in the Oracle Enterprise
Manager Advanced Installation and Configuration Guide.
Chapter 24
Using OMSPatcher
24-13

24.5 OMSPatcher Command Syntax
This section provides a comprehensive listing and description of all OMSPatcher
commands used to patch an OMS.
Note:
OMSPatcher commands must be run from the OMS Middleware home.
OMSPatcher Commands
The OMSPatcher commands are run from the OMS Middleware home out of the
OMSPatcher directory. The Middleware home must be set as $ORACLE_HOME. In
the following generic example, an OMSPatcher command is run from a Middleware
home.
omspatcher apply <PATH_TO_PATCH_DIRECTORY>
where <PATH_TO_PATCH_DIRECTORY> is the full path to the System patch top
level directory.
You can view online help for any command (except version) by specifying the -help
option.
OMSPatcher Automation Tool
Copyright (c) 2016, Oracle Corporation. All rights reserved.
Usage: omspatcher [ -help ] [ -analyze ] [ command ]
command := apply
rollback
checkApplicable
lspatches
version
saveConfigurationSnapshot
<global_arguments> := -help Displays the help message for the command.
-analyze Print the actions, steps to be performed without
any execution.
example:
'omspatcher -help'
'omspatcher apply -help'
'omspatcher rollback -help'
'omspatcher checkApplicable -help'
'omspatcher lspatches -help'
'omspatcher saveConfigurationSnapshot -help'
OMSPatcher succeeded.
omspatcher
consists of six primary commands.
•apply
Chapter 24
OMSPatcher Command Syntax
24-14

•rollback
•checkapplicable
•saveConfigurationSnapshot
•lspatches
•version
24.5.1 Apply
Apply a System patch to OMS instance homes. You must specify the patch location or
the current directory will be used as the patch location.
Note:
OMSPatcher must be run from the platform home. ORACLE_HOME
environment variable must be set as the platform home or provided using the
–oh option.
You must run the Apply command directly from the System patch location.
When running
omspatcher apply
, you will be prompted the following:
•WebLogic Admin Server URL of the primary OMS (or standby OMS)
•Username and Password
Silent interaction is supported by using the silent and property_file options.The
standby option should be used if a stand by OMS system is patched. OMSPatcher can
pass 'x=y' properties through the command line. See Table 24-2.
Syntax
omspatcher apply <System patch location>
[-custCertPath <Path to customer optional certificate>]
[-jre <Path to JRE>] [-nonrolling]
[-invPtrLoc <Path to oraInst.loc>]
[-property_file <Path to property file>]
[-analyze] [-silent] [-oh <Platform home path>]
[-standby]
Parameters
<System patch location>
Path to the location of the patch. If the patch location is not specified, then the current
directory is taken as the patch location. The patch can only be a System patch.
Apply Command Options
Chapter 24
OMSPatcher Command Syntax
24-15

Table 24-1 Apply
Option Description
jre This option tells OMSPatcher to use JRE (java) from the
specified location instead of the default location under Oracle
Home.
invPtrLoc Used to locate the oraInst.loc file. Needed when the installation
used the -invPtrLoc flag. This should be the path to the
oraInst.loc file.
property_file The user-defined property file for OMSPatcher to use. The path
to the property file should be absolute.
The keys for 'omspatcher' are:
'AdminConfigFile' - Encrypted file for Admin Server user of OMS
instance domain.
'AdminKeyFile' - Encrypted file for Admin Server password of
OMS instance domain.
'AdminServerURL' - Admin Server URL of OMS instance
domain.
(Example: t3s://<host address>:<port number>)
The Key, value pair is of the format 'x=y' where 'x' is omspatcher
understood key and each pair is separated by new line in the
property file. This option is typically used for silent operations.
This option is very useful for silent mode of 'omspatcher'
invocation. In order to create encrypted files for WebLogic admin
server username & password. Please use
$ORACLE_HOME/OMSPatcher/wlskeys/createkeys.sh
(.cmd for
windows) to get the files and load it through a custom file by
'property_file' option.
NOTE: For Windows, please make sure that directories and files
in the path are separated by "\\" in the property file.
analyze Just prints out the actions without any configuration/binary
change through
omspatcher
.
silent This suppresses any user-interaction.
oh The location of EM platform home. This overrides the
ORACLE_HOME environment variable.
custCertPath This option tells OMSPatcher to use the certificate from the
specified location.
nonrolling Apply and deploy the patch in non-rolling fashion, provided it is
supported by the patch.
standby This option should be used for standby OMS patching
operations.
Apply Command Properties
Chapter 24
OMSPatcher Command Syntax
24-16

Table 24-2 Apply Properties
Option Description
OMSPatcher.OMS_DISABLE_HOST_CHECK=true Used to disable host verification
check for WebLogic admin server.
Please set this property to true if your
OMS configuration is based on virtual
host.
OMSPatcher.OMS_USER=<installed OMS user> Use this property if OMSPatcher is
not able to get the installed OMS
administrator name by itself. This
switch is applicable only for Windows.
OMSPatcher.OMS_SCRIPTS_DIR=<existing
directory>
This switch is applicable only for
UNIX systems. By providing an
existing directory, the bash scripts
produced by OMSPatcher for multi-
OMS are copied to a newly created
time stamped sub-directory under the
directory specified by the
administrator. This would help OMS
administrator to execute the scripts
from pre-determined shared location,
if any, rather than manual scripts
copied to each OMS box.
24.5.2 Rollback
Roll back sub-patches of a System patch from OMS instance home. Administrator
specifies the sub-patch IDs of the System patch. You can obtain the sub-patch IDs by
running the
omspatcher lspatches
command. See "Running
omspatcher lspatches
".
Important: OMSPatcher must be run from the Middleware home. ORACLE_HOME
environment variable must be set as platform home or provided via the
–oh
option.
When running
omspatcher rollback
, you will be prompted the following:
•WebLogic Admin Server URL of the primary OMS (or standby OMS)
•Username and Password
Silent interaction is supported by using the silent and property_file options.The
standby option should be used if a stand by OMS system is patched. OMSPatcher can
pass 'x=y' properties through the command line. See Table 24-2.
Syntax
omspatcher rollback -id <sub patches ID of System patch>
[-custCertPath <Path to customer optional
certificate>]
[-idFile <file contains list of sub-patch IDs of
System patch>]
[-invPtrLoc <Path to oraInst.loc>
[-jre <LOC>] [-silent] [-nonrolling]
[-property_file <path to property file>]
[-analyze] [-oh <Platform home path>]
[-standby]
Chapter 24
OMSPatcher Command Syntax
24-17

Parameters
Sub patch IDs for the System patch to be rolled back. If you want to rollback a whole
System patch, the ids of all sub-patches of that System patch must be specified.
Rollback Options
Table 24-3 Rollback
Option Description
id Use
omspatcher lspatches
option to display all patch ids for
both core home and plug in homes with relation to the System
patch bundles. The patch ids can be only from one bundle in a
session. The list is separated by commas.
idFile File that contains the list of sub-patch IDs of a System patch.
invPtrLoc Used to locate the oraInst.loc file. Needed when the installation
used the invPtrLoc flag. This should be the path to the
oraInst.loc file.
jre This option tells omspatcher to use JRE (java) from the specified
location instead of the default location under Oracle Home.
silent This option suppresses any user-interaction.
nonrolling Roll back and deploy the patch in non-rolling fashion, provided it
is supported by the patch.
property_file The administrator defined property file for omspatcher to use.
The path to the property file should be absolute.
The keys for 'omspatcher' are:
'AdminConfigFile' - Encrypted file for Admin Server user of OMS
instance domain.
'AdminKeyFile' - Encrypted file for Admin Server password of
OMS instance domain.
'AdminServerURL' - Admin Server URL of OMS instance
domain.
(Example: t3s://<host address>:<port number>)
The key value pair is of the format 'x=y' where 'x' is omspatcher
understood key and each pair is separated by new line in the
property file. This option is typically used for silent operations.
This option is very useful for silent mode of 'omspatcher'
invocation. In order to create encrypted files for WebLogic admin
server username & password, Please use $ORACLE_HOME/
OMSPatcher/wlskeys/createkeys.sh (command for
windows) to get the files and load it through a custom file by
‘property_file' option.
NOTE: For Windows, ensure that directories and files in the path
are separated by "\\" in the property file.
analyze Displays out the actions without any configuration/binary change
through 'omspatcher'.
custCertPath This option tells OMSPatcher to use the certificate from the
specified location.
oh The location of EM platform home. This overrides the
ORACLE_HOME environment variable.
standby This option should be used for standby OMS patching
operations.
Chapter 24
OMSPatcher Command Syntax
24-18

Rollback Command Properties
Table 24-4 Rollback Properties
Option Description
OMSPatcher.OMS_DISABLE_HOST_CHECK=true Used to disable host verification
check for WebLogic admin server.
Please set this property to true if your
OMS configuration is based on virtual
host.
OMSPatcher.OMS_USER=<installed OMS user> Use this property if OMSPatcher is
not able to get the installed OMS
administrator name by itself. This
switch is applicable only for Windows.
OMSPatcher.OMS_SCRIPTS_DIR=<existing
directory>
This switch is applicable only for
UNIX systems. By providing an
existing directory, the bash scripts
produced by OMSPatcher for multi-
OMS are copied to a newly created
and time stamped sub-directory under
the directory specified by the
administrator. This would help OMS
administrator to execute the scripts
from pre-determined shared location,
if any, rather than a manual script
used to copy to each OMS box.
24.5.3 lspatches
Displays the list of patches applied to the OMS home. It will show the component
Name/Version, Component Type, System patch, Sub-patch and patch description
where patch has been applied. Please note that OMSPatcher will be used to apply
only system patches. However the OMS can have one-off patches which would have
already been applied at the time of the Enterprise Manager installation. OMSPatcher
provides information about whether the patch is a system patch or one-off patch and, if
it is the system patch, then it will also show all other patches that are part of that
system patch.
Syntax
omspatcher lspatches [ -invPtrLoc <Path to oraInst.loc> ]
[-jre <LOC> ]
[-oh]
Options
Table 24-5 lspatches
Option Description
jre This
jre
option instructs OMSPatcher to use the JRE (java) from the
specified location instead of the default location under Oracle Home.
Chapter 24
OMSPatcher Command Syntax
24-19

Table 24-5 (Cont.) lspatches
Option Description
invPtrLoc The
invPtrLoc
option is used to locate the Central Inventory Pointer
File (
oraInst.loc.
Input for this option is the path to the
oraInst.loc
file.
oh The location of Middleware home. This overrides the ORACLE_HOME
environment variable.
24.5.4 version
The
version
command shows the current version number of the OPatch utility,
dependent OPlan version, and the osysmodel version.
Important: OMSPatcher must be run from the Middleware home.
Syntax
omspatcher version [-invPtrLoc <Path to oraInst.loc>]
[-jre <LOC>]
[-oh <ORACLE_HOME>]
[-help] [-h]
Options
The following table describes the options available for the
version
command.
Table 24-6
version
Command Options
Option Description
-invPtrLoc The
invPtrLoc
option is used to locate the Central Inventory Pointer
File (
oraInst.loc).
Input for this option is the path to the
oraInst.loc
file.
-jre This
jre
option instructs OMSPatcher to use the JRE (java) from the
specified location instead of the default location under Oracle Home.
-oh The
oh
option specifies the Oracle Home to work on. This takes
precedence over the environment variable ORACLE_HOME.
24.5.5 checkApplicable
The
checkApplicable
command performs prerequisite binary checks on the OMS
platform home and plug-in homes to determine the applicability of a System patch
and/or the whether sub-patches of the System patch can be rolled back.
Syntax
omspatcher checkApplicable
[-id <singleton or System Patch ID to be
rolled back>]
[-custCertPath <Path to customer optional
certificate>]
[-invPtrLoc <Path to oraInst.loc>]
Chapter 24
OMSPatcher Command Syntax
24-20

[-jre <LOC>]
[-ph <System patch that is to be installed>]
[-silent]
Options
The following table describes the options available for the
checkApplicable
command.
Table 24-7
checkApplicable
Command Options
Option Description
id This option can be used to specify the sub-patch IDs that are to be
rolled back from the OMS platform home or plug in homes.
invPtrLoc Used to locate the oraInst.loc file. Needed when the installation
used the -invPtrLoc flag. This should be the path to the
oraInst.loc file.
jre This option tells OMSPatcher to use JRE (java) from the specified
location instead of the default location under Oracle Home.
ph This option can be used to specify the path to the patch location. The
input must be a System patch location.
silent This suppresses any user-interaction.
custCertPath This option tells OMSPatcher to use the certificate from the specified
location.
24.5.6 saveConfigurationSnapshot
The
saveConfigurationSnapshot
command generates configuration a snapshot for the
primary OMS (along with OMS repository) and saves it to an XML file that can be read
by OMSPatcher.
If file is not specified, it will be saved to a default file (configData.xml) at the following
location
ORACLE_HOME/cfgtoollogs/opatch/sysconfig/configData.xml
When running the
saveConfigurationSnapshot
command, you will be prompted for the
following:
•WebLogic Admin Server URL of the primary OMS
•Username and password
You can run the command in silent mode (suppress user interaction) via the silent and
property_file options.
This command must be run from an OMS instance belonging to the primary OMS
system. If the OMS configuration is running on a virtual host, you must set the
OMSPatcher.OMS_DISABLE_HOST_CHECK=true
option from the command line.
Syntax
omspatcher saveConfigurationSnapshot
[-configFile <File to save configuration snapshot> ]
[-oh <ORACLE_HOME> ]
[-invPtrLoc <Path to oraInst.loc> ]
[-jre <LOC> ]
[-silent ]
Chapter 24
OMSPatcher Command Syntax
24-21

[-property_file <path to file> ]
Options
The following table describes the options available for the
version
command.
Table 24-8
saveConfigurationSnapshot
Command Options
Option Description
configFile Enables OPatch to write the configuration for the specified product to an
XML file. The XML file can only be recognized by Oracle System Model
APIs and accessed through via the Enterprise Manager SDK.
oh Specifies the Oracle home to be worked on. The Oracle Home specified
takes precedence over the environment variable ORACLE_HOME.
invPtrLoc Used to locate the oraInst.loc file. Needed when the installation used the
-invPtrLoc flag. This should be the path to the oraInst.loc file.
jre Instructs OMSPatcher to use JRE (java) from the specified location
instead of the default location under Oracle Home.
silent Suppresses any user-interaction.
property_file The user-defined property file for OMSPatcher to use. The path to the
property file must be absolute.
The keys for 'OMSPatcher' are:
•AdminConfigFile - Encrypted file for Admin Server user of the GC
Domain.
•AdminServerURL' - Admin Server URL of GC Domain (Example:
t3s://<host address>:<port number>)
•AdminKeyFile - Encrypted file for Admin Server password of the GC
Domain.
The Key, value pair is of the format 'x=y' where 'x' is an OMSPatcher
understood key and each pair is separated by newline in the property
file.
The
property_file
option is typically used when running OMSPatcher
in silent mode operation (suppress user interaction)
In order to create encrypted files for a WebLogic Admin Server
username & password, run the following script:
$MW_HOME/OMSPatcher/wlskeys/createKeys.sh
(createKeys.cmd for Windows) to obtain the files and load them through
a custom file using the property_file option.
NOTE: For Windows, maker sure that directories, files in the path are
separated by "\\" in the property file.
24.6 Troubleshooting
This chapter describes common OMSPatcher problems that may occur during
patching operations or the analyze phase.
This chapter covers the following:
•OMSPatcher Troubleshooting Architecture
•OMSPatcher Log Management Architecture
•Logs for Oracle Support
Chapter 24
Troubleshooting
24-22

•OMSPatcher: Cases Analysis, Error Codes, and Remedies/Suggestions
•OMSPatcher: External Utilities Error Codes
•Special Error Cases for OMSPatcher OMS Automation
24.6.1 OMSPatcher Troubleshooting Architecture
In order for OMSPatcher to fully automate the patching process, it accesses various
tools/utilities to carry out different patching tasks in their respective phases. The
primary tools/utilities outside of OMSPatcher are:
•
emctl stop oms
- Life cycle
•
emctl start oms
- Life cycle
•
emctl applypatch
,
emctl rollbackpatch
– Apply, rollback SQL changes in the OMS
repository SYSMAN schema respectively
•
emctl register
,
emctl deregister
– Register, de-register metadata services with
the right XMLs for MRS artifacts as per patch metadata instructions respectively
These tools/utilities are accessed during the patching process. Note that failure during
invocation of these utilities can also happen and the errors & remedies for those
commands are not handled in this document. They need to be followed up with Oracle
Support for details. However, OMSPatcher will trap errors from these commands
output, push it to appropriate logs and announce it to the administrator and finally to
support.
Apart from the above external tools/utilities, OMSPatcher uses the following internal
utilities to do binary patching operations. They have separated log files generated by
OMSPatcher. The internal utilities are patch binary prerequisite checks and patch
binary apply, rollback operations.
24.6.2 OMSPatcher Log Management Architecture
This section refers to the information through logs published by OMSPatcher as part of
its patching operations. This knowledge is needed for the administrator to obtain the
appropriate logs from right area to troubleshoot and inform Oracle Support for further
analysis. The following annotated example shows OMSPatcher apply output that
displays the various log files that are created when running OMSPatcher.
Sample OMSPatcher apply Output
$ OMSPatcher/omspatcher apply /scratch/dev_patches/13_2/1111191
OMSPatcher Automation Tool
Copyright (c) 2016, Oracle Corporation. All rights reserved.
OMSPatcher version : 13.8.0.0.0
OUI version : 13.8.0.0.0
Running from : /scratch/oms/mw
Log file location : /scratch/oms/mw/cfgtoollogs/omspatcher/
opatch2016-05-30_03-21-43AM_1.log
OMSPatcher log file: /scratch/oms/mw/cfgtoollogs/omspatcher/1111191/
omspatcher_2016-05-30_03-21-48AM_deploy.log
Please enter OMS weblogic admin server URL(t3s://adc00wve.us.oracle.com:7101):>
Please enter OMS weblogic admin server username(weblogic):>
Chapter 24
Troubleshooting
24-23

Please enter OMS weblogic admin server password:>
Configuration Validation: Success
Running apply prerequisite checks for sub-patch(es) "1111126,1111155,1111137" and
Oracle Home "/scratch/oms/mw"...
To continue, OMSPatcher will do the following:
[Patch and deploy artifacts] : Apply sub-patch(es) [ 1111126 1111137 1111155 ]
Register MRS artifact "eventsaux";
Register MRS artifact "VCPUUtilization";
Register MRS artifact "mpcui"
Do you want to proceed? [y|n]
y
User Responded with: Y
Applying sub-patch(es) "1111126,1111137,1111155"
Please monitor log file: /scratch/oms/mw/cfgtoollogs/opatch/
opatch2016-05-30_03-23-31AM_3.log
Registering service "eventsaux" with register file "/scratch/oms/mw/sysman/metadata/
events/auxiliary/metric_alert_aux.xml"...
Please monitor log file: /scratch/oms/mw/cfgtoollogs/omspatcher/
2016-05-30_03-21-43AM_SystemPatch_1111191_1/
emctl_register_eventsaux_2016-05-30_03-24-20AM.log
Registering service "VCPUUtilization" with register file "/scratch/oms/mw/plugins/
metadata/vcpu/vcpu-exalogic-registration.xml"...
Please monitor log file: /scratch/oms/mw/cfgtoollogs/omspatcher/
2016-05-30_03-21-43AM_SystemPatch_1111191_1/
emctl_register_VCPUUtilization_2016-05-30_03-24-28AM.log
Registering service "mpcui" with register file "/scratch/oms/mw/plugins/
test_mpcui_1.xml"...
Please monitor log file: /scratch/oms/mw/cfgtoollogs/omspatcher/
2016-05-30_03-21-43AM_SystemPatch_1111191_1/
emctl_register_mpcui_2016-05-30_03-24-34AM.log
Registering service "mpcui" with register file "/scratch/oms/mw/plugins/
test_mpcui_2.xml"...
Please monitor log file: /scratch/oms/mw/cfgtoollogs/omspatcher/
2016-05-30_03-21-43AM_SystemPatch_1111191_1/
emctl_register_mpcui_2016-05-30_03-24-40AM.log
Complete Summary
================
All log file names referenced below can be accessed from the directory "/
scratch/oms/mw/cfgtoollogs/omspatcher/2016-05-30_03-21-43AM_SystemPatch_1111191_1"
Chapter 24
Troubleshooting
24-24

Patching summary:
-----------------
Binaries of the following sub-patch(es) have been applied successfully:
Featureset Sub-
patches Log file
----------
----------- --------
oracle.sysman.top.oms_13.2.0.0.0 1111126,1111137,1111155
1111126,1111137,1111155_opatch2016-05-30_03-23-31AM_3.log
Deployment summary:
-------------------
The following artifact(s) have been successfully deployed:
Artifacts Log file
--------- --------
MRS-eventsaux emctl_register_eventsaux_2016-05-30_03-24-20AM.log
MRS-VCPUUtilization emctl_register_VCPUUtilization_2016-05-30_03-24-28AM.log
MRS-mpcui emctl_register_mpcui_2016-05-30_03-24-34AM.log
MRS-mpcui emctl_register_mpcui_2016-05-30_03-24-40AM.log
Log file location: /scratch/oms/mw/cfgtoollogs/omspatcher/1111191/
omspatcher_2016-05-30_03-21-48AM_deploy.log
OMSPatcher succeeded.
bash-3.2$
Log output to a consolidated directory
As shown in the example above, there is a reference to pushing all logs to a
consolidated log directory. The following line in the trace example shows this
consolidation log directory.
...
All log file names referenced below can be accessed from the directory "/
scratch/oms/mw/cfgtoollogs/omspatcher/2016-05-30_03-21-43AM_SystemPatch_1111191_1"
...
This consolidated log directory contains the following files (here with reference to the
example for rollback).
$ ls -l /scratch/oms/mw/cfgtoollogs/omspatcher/
2016-05-30_03-21-43AM_SystemPatch_1111191_1
-rw-r--r-- 1 skkurapa g900 39975 May 30 03:24
1111126,1111137,1111155_opatch2016-05-30_03-23-31AM_3.log
-rw-r--r-- 1 skkurapa g900 13219 May 30 03:24
1111126,1111155,1111137_opatch2016-05-30_03-22-01AM_2.log
-rw-r--r-- 1 skkurapa g900 120 May 30 03:22
AdminServerStatusPrerequisites_2016-05-30_03-22-01AM.log
-rw-r--r-- 1 skkurapa g900 66 May 30 03:22
RepositoryStatusPrerequisites_2016-05-30_03-22-01AM.log
-rw-r--r-- 1 skkurapa g900 71 May 30 03:22
Swlib_Prerequisite_2016-05-30_03-22-01AM.log
-rw-r--r-- 1 skkurapa g900 456 May 30 03:24
Chapter 24
Troubleshooting
24-25

emctl_register_VCPUUtilization_2016-05-30_03-24-28AM.log
-rw-r--r-- 1 skkurapa g900 451 May 30 03:24
emctl_register_eventsaux_2016-05-30_03-24-20AM.log
-rw-r--r-- 1 skkurapa g900 418 May 30 03:24
emctl_register_mpcui_2016-05-30_03-24-34AM.log
-rw-r--r-- 1 skkurapa g900 418 May 30 03:24
emctl_register_mpcui_2016-05-30_03-24-40AM.log
-rw-r--r-- 1 skkurapa g900 12574 May 30 03:24 opatch2016-05-30_03-21-43AM_1.log
-rw-r--r-- 1 skkurapa g900 3938 May 30 03:24 temp_apply_automation.xml
-rw-r--r-- 1 skkurapa g900 3149 May 30 03:24 temp_rollback_automation.xml
All individual log files of all invocation commands are finally copied to a consolidated
place as highlighted above. Each command naming convention is self-explanatory and
it indicates the actual operations being performed in automation. The omspatcher log
file will refer the individual log files so that administrator can easily connect to
individual files to refer to any failure.
24.6.3 Logs for Oracle Support
If the administrator wants to contact Oracle Support, the administrator must provide
the following references to Support.
•Administrator interface trace(s).
•Consolidated log directory as zip
•OPatch log file
•OMSPatcher log file
•Output of
omspatcher lspatches
command on all OMS instance homes.
24.6.4 OMSPatcher: Cases Analysis, Error Codes, and Remedies/
Suggestions
Refer to the following table for common OMSPatcher error codes.
Table 24-9 OMSPatcher Error Codes
Error Code Description Remedy/Suggestion
231 Wrong Oracle WebLogic
Administration Server URL and/or
invalid credentials
Correct the interview inputs and run
OMSPatcher again.
234 Malformed Oracle WebLogic
Administration Server URL
If the Oracle WebLogic
Administration Server URL is
already defaulted (value given),
type <enter>. If it is not given,
construct the Oracle WebLogic
Administration Server URL as t3s://
<WebLogic Administration Server
host address>:<WebLogic
Administration Server port> .of the
domain that controls the managed
server on which the OMS is
deployed.
Chapter 24
Troubleshooting
24-26

Table 24-9 (Cont.) OMSPatcher Error Codes
Error Code Description Remedy/Suggestion
235 Unable to connect to OMS
repository
Check the OMS repository
connectivity for SYSMAN
administrator and run OMSPatcher
again.
236 OUI central inventory read issue Check if the OUI inventory is locked
by some other processes. Check if
OUI inventory is readable.
238 Patch binary prerequisite checks
failure
Check OMSPatcher, OPatch, patch
binary prerequisite log files for
more details on the errors. If not
resolved, contact Oracle Support.
240 - 251 Binary updates (or) deployment
failure
•This is a case for single OMS
system. Patching steps are
decided by OMSPatcher but it
failed to execute steps.
OMSPatcher will print the
failed executed step and the
remaining steps to be
executed for completion of
patching operations.
Administrator needs to contact
Oracle support with logs,
resolve why it failed and then
must execute manually the
failed step and steps referred
by OMSPatcher (in
OMSPatcher log file) to
complete operations.
•In case of multi OMS (or) stand
by OMS patching operations,
failure of individual commands
that got executed through text/
html output must be brought to
support notice for further
diagnosis. After the failure
condition is resolved,
administrator needs to execute
the failed steps and further
steps mentioned in HTML (or)
text output to complete the
patching operations.
233 Software library not configured
OMS repository connectivity not
achieved. (post successful check of
the same during credential inputs
Oracle WebLogic Administration
Server not reachable (post
successful check of the same
during credential inputs)
Check the OMSPatcher log file for
the failure.
Chapter 24
Troubleshooting
24-27

24.6.5 OMSPatcher: External Utilities Error Codes
The following table lists exit codes for external utilities that OMSPatcher uses for life
cycle and deployment. If the deployment (or) life cycle fails through OMSPatcher, the
administrator can search individual log files for the error messages shown in the Error
Message/Recommendation column.
Table 24-10 OMSPatcher External Utilities Error Codes
Exit Code Error Message / Recommendation
34 Displays the usage of the command.
35 Unable to read password! Exiting...
36 Unable to get a connection to the repository! Exiting...
37 The Plug-in is not deployed on this Management Server. The plug-in has
to be deployed first to register metadata for that plug-in.
38 Input file does not exist
39 This operation is not supported by service.
40 Metadata operation is skipped.
41 Error occurred during Metadata registration.
42 Error occurred during Metadata de-registration.
24.6.6 Special Error Cases for OMSPatcher OMS Automation
This section provides issue resolution information for special cases when using
OMSPatcher. This information will allow the administrator to handle these issues
easily with less need for support team intervention.
Windows patching failure due to lock of files by Oracle WebLogic Administration
Server
In Windows operating systems, it has been noticed that some of the Enterprise
Manager related files (used for patching) are locked by running of Oracle WebLogic
Administration Server. As OMSPatcher required Oracle WebLogic Administration
Server to be RUNNING for the configuration detection, we need to perform the
following steps to make sure that this conflict with respect to environment and patching
is removed.
1. Go to ORACLE_HOME
2. Run OMSPatcher in non-analyze mode. For further instructions, refer to the patch
README and Administrator guide.
Once the OMSPatcher is run in non-analyze mode, it will check if active files are
locked by Oracle WebLogic administration server and will provide a prompt as
shown below (in silent mode it will be auto-yes):
Running prerequisite checks to verify if any files or services are locked by
admin server process...
Please monitor OPatch log file: c:\MW_130518\oms\cfgtoollogs\opatch\1111112_Jun_
26_2014_08_16_19\ApplyPrereq2014-06-26_08-16-57AM_8.log
The details are:
Chapter 24
Troubleshooting
24-28

Following files are active :
c:\MW_130518\oms\sysman\jlib\emCoreConsole.jar
Due to active files to be patched, OMSPatcher will stop all OMS processes so tha
t lock on active files may be released...
Do you want to proceed? [y|n]
y
User Responded with: Y
OMSPatcher has stopped all OMS processes successfully.
If there is a failure while stopping OMS processes, OMSPatcher will accordingly
error out. Refer to the OMSPatcher log file for details.
3. OMSPatcher will stop the stack and then ask for a confirmation from the
administrator on whether to proceed with prerequisite checks of patch binaries (in
silent mode it will be auto-yes):
OMSPatcher has stopped all OMS processes successfully. Please make sure the
above listed active files are unlocked by all windows processes.
Do you want to proceed? [y|n] y
User Responded with: Y
Note:
Administrators are requested to use some open source utilities like process
explorer and search for file strings given as output in (2) to check if any files
are still active. If so, kill the process tree of those files so that OPatch will run
the checks, patch, and deploy the automation elements.
4. OMSPatcher will not attempt to re-start the stack. The administrator must restart
the stack as needed.
A complete sample trace of this case is shown below:
C:\MW_130518\oms\OPatch_June26>omspatcher apply ..\patches\cmdRcu\1111112
OMSPatcher Automation Tool
Copyright (c) 2016, Oracle Corporation. All rights reserved.
OMSPatcher version : 13.8.0.0.0
OUI version : 13.8.0.0.0
Running from : c:\MW_130518\oms
Log file location:
c:\MW_130518\oms\cfgtoollogs\omspatcher\omspatcher2014-06-26_08-16-19AM_1.log
omspatcher log file: c:\MW_130518\oms\cfgtoollogs\omspatcher
\1111112\opatch_oms_2014-06-26_08-16-23AM_deploy.log
Please enter the WebLogic Admin Server URL for primary OMS:> t3s://example.o
racle.com:7101
Please enter the WebLogic Admin Server username for primary OMS:> weblogic
Please enter the WebLogic Admin Server password for primary OMS:>
Configuration Validation: Success
Chapter 24
Troubleshooting
24-29

Running prerequisite checks to verify if any files or services are locked by
admin server process...
Please monitor OPatch log file: c:\MW_130518\oms\cfgtoollogs\omspatcher
\1111112_Jun_26_2014_08_16_19\ApplyPrereq2014-06-26_08-16-57AM_8.log
The details are:
Following files are active:
c:\MW_130518\oms\sysman\jlib\emCoreConsole.jar
Due to active files to be patched, omspatcher will stop all OMS processes so
that lock on active files may be released...
Do you want to proceed? [y|n]
y
User Responded with: Y
omspatcher has stopped all OMS processes successfully.
omspatcher has stopped all OMS processes successfully. Please make sure the
above listed active files are unlocked by all windows processes.
Do you want to proceed? [y|n]
y
User Responded with: Y
Running apply prerequisite checks for patch(es) "1111112" and Oracle Home "c:\MW
_130518\oms"...
Please monitor omspatcher log file: c:\MW_130518\oms\cfgtoollogs\omspatcher
\1111112_Jun_26_2014_09_01_33\ApplyPrereq2014-06-26_09-03-41AM_10.log
Patches "1111112" are successfully analyzed for Oracle Home "c:\MW_130518\oms"
To continue, OMSPatcher will do the following:
[Patch and deploy patch(es) binaries] : Apply patch(es) [ 1111112 ] to Oracle
Home "c:\MW_130518\oms";
Apply RCU artifact with patch "c:\MW_130518\oms\.omspatcher_storage
\1111112_Feb_21_2014_06_30_38\original_patch"
Do you want to proceed? [y|n]
y
User Responded with: Y
Applying patch "1111112" to Oracle Home "c:\MW_130518\oms"...
Please monitor OMSPatcher log file: c:\MW_130518\oms\cfgtoollogs\omspatcher
\1111112_Jun_26_2014_09_01_33\apply2014-06-26_09-04-17AM_12.log
Updating repository with RCU reference file "c:\MW_130518\oms\.omspatcher_storage
\1111112_Feb_21_2014_06_30_38\original_patch"
Copying all logs to: c:\MW_130518\oms\cfgtoollogs\omspatcher
\2014-06-26_09-01-32AM_SystemPatch_1111112_1
Patching summary:
Following patch(es) are successfully applied (Oracle home:patch list):
c:\MW_130518\oms:1111112
Log file location: c:\MW_130518\oms\cfgtoollogs\omspatcher
\1111112\omspatcher_oms_2013-06-26_09-01-36AM_deploy.log
OMSPatcher succeeded.
Chapter 24
Troubleshooting
24-30

24.6.7 Multi-OMS Execution for UNIX based Systems
This section deals with possible issues you may encounter when running bash scripts
generated by OMSPatcher in multi-OMS (UNIX-based systems) environment. The
following OMSPatcher-generated output illustrates various script-based issues.
Example 24-2 OMSPatcher Output: Multi-OMS, UNIX-based Environment
omspatcher apply /net/slc09jcy/scratch/patch_2nd_nov/em13_1/bundle_patches/1111191
OMSPatcher Automation Tool
Copyright (c) 2016, Oracle Corporation. All rights reserved.
OMSPatcher version : 13.8.0.0.0
OUI version : 13.8.0.0.0
Running from : /scratch/hkumars/oms_install/mw
Log file location : /scratch/hkumars/oms_install/mw/cfgtoollogs/omspatcher/
opatch2015-11-11_23-27-35PM_1.log
OMSPatcher log file: /scratch/hkumars/oms_install/mw/cfgtoollogs/omspatcher/1111191/
omspatcher_2015-11-11_23-27-46PM_deploy.log
Please enter OMS weblogic admin server URL(t3s://rwsv1452.myco.com:7101):>
Please enter OMS weblogic admin server username():> weblogic
Please enter OMS weblogic admin server password:>
WARNING: Could not apply the patch "1111155" because the
"oracle.samples.xohs.oms.plugin with version 13.1.4.0.0" core component of the OMS
or the plug-in for which the patch is intended is either not deployed or deployed
with another version in your Enterprise Manager system.
Configuration Validation: Success
WARNING:You have a multi-OMS setup. The patch application is not complete until the
following steps are executed successfully.
Please perform the following steps to complete patching operations.
-------------------------------------------------------------------
1. Please copy the script "/scratch/hkumars/oms_install/
mw/.omspatcher_storage/oms_session/scripts_2015-11-11_23-28-33/
run_script#1_on_host_rwsv1452_us_oracle_com_as_user_hkumars.sh" to
"rwsv1452.myco.com" and execute the script on host "rwsv1452.myco.com".
2. Please execute the script "/scratch/hkumars/oms_install/
mw/.omspatcher_storage/oms_session/scripts_2015-11-11_23-28-33/
run_script#2_on_host_rwsv1451_us_oracle_com_as_user_hkumars.sh" on local host.
Complete Summary
================
All log file names referenced below can be accessed from the directory "/scratch/
hkumars/oms_install/mw/cfgtoollogs/omspatcher/
2015-11-11_23-27-35PM_SystemPatch_1111191_1"
Patching summary:
-----------------
Chapter 24
Troubleshooting
24-31

The following sub-patches are incompatible with components installed in the OMS
system:
1111155
--------------------------------------------------------------------------------
The following warnings have occurred during OPatch execution:
1) Could not apply the patch "1111155" because the "oracle.samples.xohs.oms.plugin
with version 13.1.4.0.0" core component of the OMS or the plug-in for which the
patch is intended is either not deployed or deployed with another version in your
Enterprise Manager system.
2) You have a multi-OMS setup. The patch application is not complete until the
following steps are executed successfully.
--------------------------------------------------------------------------------
OMSPatcher Session completed with warnings.
Log file location: /scratch/hkumars/oms_install/mw/cfgtoollogs/omspatcher/1111191/
omspatcher_2015-11-11_23-27-46PM_deploy.log
OMSPatcher completed with warnings.
Chapter 24
Troubleshooting
24-32

Note:
WARNING: You have a multi-OMS setup. The patch application is not
complete until the following steps are executed successfully
This message means that patching and deployment are not complete until the
administrator performs the bash script execution instructions generated by
OMSPatcher.
The administrator needs to provide the credential while running the
OMSPatcher generated bash script on secondary OMS.
Example:
/net/slc00skv/scratch/hkumars/work/omshome1967/.omspatcher_storage/
oms_session/scripts_2015-11-19_06-40-51/
run_script#1_on_host_slc09pjb_us_oracle_com_as_user_hkumars.sh
Verifying embedded script host-address "slc09pjb.myco.com" against the
network interface for a match...
Trying for a match with: fe80:0:0:0:221:f6ff:fe6f:
9ac1%2(fe80:0:0:0:221:f6ff:fe6f:9ac1%2)
Trying for a match with: slc09pjb.myco.com(10.248.10.100)
Script-host address matched with host network interface.
Creating session file /scratch/hkumars/work/omshome1967/.omspatcher_storage/
oms_session/oms_session_2015-11-18_22-40-19PM...
Copying your script to OMSPatcher defined path /scratch/hkumars/work/
omshome1967/.omspatcher_storage/oms_session/scripts_2015-11-19_06-40-51/
run_script#1_on_host_slc09pjb_us_oracle_com_as_user_hkumars.sh...
The System Patch directory already exists in the machine (this could mean
that System Patch is already downloaded). Do you want to overwrite it (y|
n)?
n
User provided n for patch transfer. Ignoring patch transfer...
The Patch backup location /scratch/hkumars/work/
omshome1967/.omspatcher_storage/1111126_Sep_7_2015_02_06_54/original_patch
does not exists in the machine (this could mean that the patch automation
data are not present on this host and which is mandatory to rollback this
patch later from this host). You need to provide host credential to copy it.
Executing command: mkdir -p /scratch/hkumars/work/
omshome1967/.omspatcher_storage/1111126_Sep_7_2015_02_06_54;scp -r
slc00skv.myco.com:/scratch/hkumars/work/omshome1967/.omspatcher_storage/
1111126_Sep_7_2015_02_06_54/original_patch /scratch/hkumars/work/
omshome1967/.omspatcher_storage/1111126_Sep_7_2015_02_06_54
hkumars@slc00skv.myco.com's password:
Here, the administrator has to provide the user credential to copy the
automation data on the secondary OMS which will be used while rolling back
the patches.
Troubleshooting Bash Script Execution
The following section covers the most common issues you may encounter while
executing OMSPatcher-generated bash scripts in multi-OMS (UNIX-based)
environments.
No Windows Support
Chapter 24
Troubleshooting
24-33

Microsoft Windows does not support bash script execution. So, this optimization (steps
reduction) is not applicable for Windows OMS PS2 environments. The older context
sensitive individual steps output through OMSPatcher remains in Windows.
Bash script program availability
The scripts assume that bash is located at
/bin/bash
. However, if this is not true, make
sure the first line of the scripts are updated with the output of
whereis bash
.
In-between command failure in bash script
If there is a failure in between execution of commands in the bash script, the script
stops running. The OMS administrator must triage the failure and comment out
(inserting a hash "#" character at the beginning of a line) the already executed portions
of the script and restart the bash script execution. Make sure you do not to comment
out prompts and prompt-related code in the script.
Complete execution needed for all bash scripts
ALL bash script steps must be executed. No script and no step within any script can
be omitted, even in the event of failures. Patching is correct and complete if and only if
all steps of all bash scripts are executed correctly as per the order specification.
Patch location (if mounted)
The patch location input may exist on a mounted location. The bash scripts try to
perform a secure copy (SCP) from the local OMS (where the OMSPatcher Perl script
was invoked). The SCP attempt could fail if the location is mounted. The bash script
will ignore the SCP failure.
OMS repository SYSMAN password and prompts
If the script has automation steps to be executed, it will prompt for sysman password,
pay attention to it and provide the requested information.
The bash script prompt will appear as follows:
Please provide credential for OMS repository SYSMAN user:
User Credentials to copy automation metadata files to remote node
While running scripts for remote nodes, user will be prompted to entire user
credentials to copy automation metadata files from primary node to this node, please
pay attention to this and provide the requested information.
The bash script prompt will appear as:
hkumars@slc00skv.us.oracle.com's password:
Patch Transfer/Download
The script will provide an option to download patch from local OMS to remote nodes
(for the scripts that involve remote nodes). If the patch is on shared location (or)
already downloaded to a specified location mentioned by the script, a user can choose
to input n when prompted, and ignore this transfer.
24.7 Features in OMSPatcher
OMSPatcher supports resume upon failure capability for both single-OMS and multi-
OMS configurations.
Chapter 24
Features in OMSPatcher
24-34

This section covers the following topics:
•Resume capability in Single-OMS Configuration
•Resume Capability in Multi-OMS Configuration
24.7.1 Resume capability in Single-OMS Configuration
On a single OMS System, OMSPatcher executes end-to-end automation of patching
steps. once a failure has occurred, OMSPatcher can generate a bash script containing
list of all incomplete (or) failed steps. The OMS administrator must refer to the master
log file created by OMSPatcher to ascertain and resolve the root cause of the failure,
and then run the bash script given by OMSPatcher. The bash script runs the steps
from the point of failure.
Example
1. OMSPatcher, while applying an auto system patch. fails due to file permission
issue.
Example:
omspatcher apply /scratch/patch_2nd_nov/em13_1/bundle_patches/1111191
OMSPatcher Automation Tool
Copyright (c) 2016, Oracle Corporation. All rights reserved.
OMSPatcher version : 13.8.0.0.0
OUI version : 13.8.0.0.0
Running from : /scratch/kamlesku/mw
Log file location : /scratch/kamlesku/mw/cfgtoollogs/omspatcher/
opatch2015-12-01_01-06-42AM_1.log
OMSPatcher log file: /scratch/kamlesku/mw/cfgtoollogs/omspatcher/1111191/
omspatcher_2015-12-01_01-06-50AM_deploy.log
Please enter OMS weblogic admin server URL(t3s://slc09jcy.us.oracle.com:7101):>
Please enter OMS weblogic admin server username(weblogic):>
Please enter OMS weblogic admin server password:>
WARNING: Could not apply the patch "1111155" because the
"oracle.samples.xohs.oms.plugin with
version 13.1.4.0.0" core component of the OMS or the plug-in for which the
patch is intended
is either not deployed or deployed with another version in your Enterprise
Manager system.
Configuration Validation: Success
Running apply prerequisite checks for sub-patch(es) "1111126 1111137" and
Oracle Home "/scratch/kamlesku/mw"...
Sub-patch(es) "1111126 1111137" are successfully analyzed for Oracle Home "/
scratch/kamlesku/mw"
To continue, OMSPatcher will do the following:
[Patch and deploy artifacts] : Apply sub-patch(es) [ 1111126 ]
Apply sub-patch(es)
[ 1111137 ]
Register MRS artifact "eventsaux";
Register MRS artifact "VCPUUtilization"
Do you want to proceed? [y|n]
y
User Responded with: Y
Applying sub-patch "1111126 "
Applying sub-patch "1111137 "
OMSPatcher failed to apply following patch(es) "1111137" to core/plugin Oracle
Chapter 24
Features in OMSPatcher
24-35

home(s).
Complete Summary
================
All log file names referenced below can be accessed from the directory
"/scratch/kamlesku/mw/cfgtoollogs/omspatcher/
2015-12-01_01-06-42AM_SystemPatch_1111191_1"
Patching summary:
-----------------
Binaries of the following sub-patch(es) have been applied successfully:
Featureset Sub-
patches Log file
----------
----------- --------
oracle.sysman.top.oms_13.1.0.0.0 1111126
1111126_opatch2015-12-01_01-07-32AM_3.log
Binaries of the following sub-patch(es) failed to get applied:
Featureset Sub-
patches Log file
----------
----------- --------
oracle.sysman.emas.oms.plugin_13.1.1.0.0 1111137
1111137_opatch2015-12-01_01-08-06AM_4.log
The following sub-patches are incompatible with components installed in the OMS
system:
1111155
OMSPatcher failed to execute some of the patching steps. Please check the
Patching summary,individual logs and
try to resolve the issue. Once the issue is resolved,Please execute below script
to complete patching session:
"/scratch/kamlesku/mw/.omspatcher_storage/oms_session/
scripts_2015-12-01_01-06-42AM/run_script_singleoms_resume.sh"
---------------------------------------------------------------------------------
---------------
OMSPatcher wont allow any other patching operations unless the script is
executed successfully
---------------------------------------------------------------------------------
---------------
[ Error during Patch and deploy artifacts Phase]. Detail: OMSPatcher failed to
apply
some of the patches to the OMS instance home(s).
OMSPatcher failed: OMSPatcher failed to execute some of the OMS operations.
Please refer log file(s) for details.
--------------------------------------------------------------------------------
The following warnings have occurred during OPatch execution:
1) Could not apply the patch "1111155" because the
"oracle.samples.xohs.oms.plugin with
version 13.1.4.0.0" core component of the OMS or the plug-in for which the
patch is intended
is either not deployed or deployed with another version in your Enterprise
Manager system.
--------------------------------------------------------------------------------
Log file location: /scratch/kamlesku/mw/cfgtoollogs/omspatcher/1111191/
omspatcher_2015-12-01_01-06-50AM_deploy.log
Recommended actions: Please refer log file(s) for more details on the errors.
Please contact Oracle Support.
Chapter 24
Features in OMSPatcher
24-36

2. OMS Administrator cannot start a new patching session when there are remnants
of an incomplete patching session. OMSPatcher clearly errors out with the detailed
information regarding the failure and what action need to be taken to fix this issue.
Example:
omspatcher apply /scratch/patch_2nd_nov/em13_1/bundle_patches/1111191
OMSPatcher Automation Tool
Copyright (c) 2016, Oracle Corporation. All rights reserved.
OMSPatcher version : 13.8.0.0.0
OUI version : 13.8.0.0.0
Running from : /scratch/kamlesku/mw
Log file location : /scratch/mw/cfgtoollogs/omspatcher/
opatch2015-12-01_01-15-09AM_1.log
OMSPatcher failed:
OMSPatcher finds that previous patching session is not yet completed. Please
refer log file
"/scratch/mw/cfgtoollogs/omspatcher/1111191/
omspatcher_2015-12-01_01-06-50AM_deploy.log"
for the previous session and execute the script
"/scratch/mw/.omspatcher_storage/oms_session/scripts_2015-12-01_01-06-42AM/
run_script_singleoms_resume.sh"
to complete the previous session. OMSPatcher can proceed to execute new
operations only if previous session is completed successfully.
Log file location: /scratch/mw/cfgtoollogs/omspatcher/
opatch2015-12-01_01-15-09AM_1.log
OMSPatcher failed with error code 73
3. Now OMS Administrator can run the single-OMS Resume script to finish the failed
patching session.
Example:
/scratch/mw/.omspatcher_storage/oms_session/scripts_2015-12-01_01-06-42AM/
run_script_singleoms_resume.sh
Verifying embedded script host-address "myserver.myco.com" against the network
interface for a match...
Trying for a match with:
fe80:0:0:0:221:f6ff:feb6:424%2(fe80:0:0:0:221:f6ff:feb6:424%2)
Trying for a match with: myserver.myco.com(10.252.41.52)
Script-host address matched with host network interface.
Please provide credential for OMS repository SYSMAN user:
Command to execute (Step 1): echo /scratch/patch_2nd_nov/em13_1/bundle_patches/
1111191/1111137 >> /scratch/mw/.phBaseFile2015-12-01_01-06-42AM.txt
Command to execute (Step 1): /scratch/mw/OPatch/opatch napply -phBaseFile /
scratch/mw/.phBaseFile2015-12-01_01-06-42AM.txt -invPtrLoc /scratch/mw/
oraInst.loc -oh /scratch/mw -silent
Command to execute (Step 1): rm /scratch/mw/.phBaseFile2015-12-01_01-06-42AM.txt
Command to execute (Step 1): mkdir -p /scratch/mw/.omspatcher_storage/
1111137_Aug_31_2015_01_01_58; cp -Rf /scratch/mw/.patch_storage/
1111137_Aug_31_2015_01_01_58/original_patch /scratch/mw/.omspatcher_storage/
1111137_Aug_31_2015_01_01_58
Oracle Interim Patch Installer version 13.8.0.0.0
Copyright (c) 2016, Oracle Corporation. All rights reserved.
Oracle Home : /scratch/kamlesku/mw
Central Inventory : /scratch/kamlesku/oraInventory
from : /scratch/kamlesku/mw/oraInst.loc
OPatch version : 13.8.0.0.0
Chapter 24
Features in OMSPatcher
24-37

OUI version : 13.8.0.0.0
Log file location : /scratch/mw/cfgtoollogs/opatch/
opatch2015-12-01_01-16-33AM_1.log
OPatch detects the Middleware Home as "/scratch/mw"
Verifying environment and performing prerequisite checks...
OPatch continues with these patches: 1111137
Do you want to proceed? [y|n]
y
Y (auto-answered by -silent)
User Responded with: Y
All checks passed.
Backing up files...
Applying interim patch '1111137' to OH '/scratch/mw'
Patching component oracle.sysman.emas.oms.plugin, 13.1.1.0.0...
Patch 1111137 successfully applied.
Log file location: /scratch/mw/cfgtoollogs/opatch/
opatch2015-12-01_01-16-33AM_1.log
OPatch succeeded.
Command to execute (Step 2): /scratch/mw/bin/emctl register oms metadata -
service eventsaux -file /scratch/mw/sysman/metadata/events/auxiliary/
metric_alert_aux.xml -core -sysman_pwd %EM_REPOS_PASSWORD%
Oracle Enterprise Manager Cloud Control 13c Release 1
Copyright (c) 1996, 2015 Oracle Corporation. All rights reserved.
Metadata registration successful
Command to execute (Step 3): /scratch/mw/bin/emctl register oms metadata -
service VCPUUtilization -file /scratch/mw/plugins/
oracle.sysman.emas.oms.plugin_13.1.1.0.0/metadata/vcpu/vcpu-exalogic-
registration.xml -pluginId oracle.sysman.emas -sysman_pwd %EM_REPOS_PASSWORD%
Oracle Enterprise Manager Cloud Control 13c Release 1
Copyright (c) 1996, 2015 Oracle Corporation. All rights reserved.
Metadata registration successful
Command to execute (Step 4): /scratch/mw/OMSPatcher/omspatcher commit -id
1111126 -oh /scratch/mw -invPtrLoc /scratch/mw/oraInst.loc
OMSPatcher Automation Tool
Copyright (c) 2016, Oracle Corporation. All rights reserved.
OMSPatcher version : 13.8.0.0.0
OUI version : 13.8.0.0.0
Running from : /scratch/kamlesku/mw
Log file location : /scratch/mw/cfgtoollogs/omspatcher/
opatch2015-12-01_01-17-14AM_1.log
OMSPatcher will now mark the patch "1111126,1111137" as auto-executed.
Log file location: /scratch/mw/cfgtoollogs/omspatcher/
opatch2015-12-01_01-17-14AM_1.log
OMSPatcher succeeded.
24.7.2 Resume Capability in Multi-OMS Configuration
OMSPatcher prompts for the SYSMAN password at the start of the script.
OMSPatcher cannot execute patching steps on a multi-OMS configuration; it
generates a bash script containing the entire patching steps specific to each host for
all the nodes. The name of the script contains the hostname and username. The OMS
Chapter 24
Features in OMSPatcher
24-38

administrator can run a specific script for each host on all nodes to complete patching
session.
1. OMSPatcher apply executes successfully as it generates only patching
instructions without executing bash scripts.
Example:
omspatcher apply /scratch/opatchdev/targetPatchingImplRegistration/1111118
OMSPatcher Automation Tool
Copyright (c) 2016, Oracle Corporation. All rights reserved.
OMSPatcher version : 13.8.0.0.0
OUI version : 13.8.0.0.0
Running from : /scratch/aime1/work/midnew9693/oms
Log file location : /scratch/aime1/work/midnew9693/oms/cfgtoollogs/opatch/
opatch2014-05-05_22-43-08PM_1.log
OMSPatcher log file: /scratch/aime1/work/midnew9693/oms/cfgtoollogs/omspatcher/
1111118/opatch_oms_2014-05-05_22-43-14PM_deploy.log
Please enter OMS weblogic admin server URL(t3s://linux01amd.myco.com:7101):>
Please enter OMS weblogic admin server username:> weblogic
Please enter OMS weblogic admin server password:>
Configuration Validation: Success
WARNING: OMSPatcher cannot run patching steps in multi-OMS environment.
Please perform the following steps to complete patching operations.
-------------------------------------------------------------------
1. Please copy the script "/scratch/aime1/work/midnew9693/
oms/.omspatcher_storage/oms_session/scripts_2014-05-05_22-43-51/
run_script#1_on_host_linux07jdx_us_oracle_com_as_user_aime1.sh" to
"linux07jdx.myco.com" and execute the script.
2. Please execute the script "/scratch/aime1/work/midnew9693/
oms/.omspatcher_storage/oms_session/scripts_2014-05-05_22-43-51/
run_script#2_on_host_linux01amd_us_oracle_com_as_user_aime1.sh" on local host.
--------------------------------------------------------------------------------
The following warnings have occurred during OMSPatcher execution:
1) OMSPatcher cannot run patching steps in multi-OMS environment.
--------------------------------------------------------------------------------
OMSPatcher Session completed with warnings.
Log file location: /scratch/aime1/work/midnew9693/oms/cfgtoollogs/omspatcher/
1111118/opatch_oms_2014-05-05_22-43-14PM_deploy.log
OMSPatcher completed with warnings.
Run the bash script corresponding to the local host (primary host on a Multi-OMS
configuration). Script execution has failed because of issue in connecting to
database repository because of incorrect sysman password.
Example:
$ /scratch/aime1/work/midnew9693/oms/.omspatcher _storage/oms_session/
scripts_2014-05-05_22-43-51/
run_script#2_on_host_linux01amd_us_oracle_com_as_user_aime1.sh
Chapter 24
Features in OMSPatcher
24-39

Creating master log file /scratch/aime1/work/midnew9693/oms/.omspathcer_storage/
oms_session/oms_session_log_2014-05-05_22-43-08PM...
Creating session file /scratch/aime1/work/midnew9693/oms/.omspatcher_storage/
oms_session/oms_session_2014-05-05_22-43-08PM...
Please provide credential for OMS repository SYSMAN user:
Command to execute (Step 2): /scratch/aime1/work/midnew9693/oms/OMSPatcher/
omspatcher checkApplicable -ph /scratch/opatchdev/targetPatchingImplRegistration/
1111118 -oh /scratch/aime1/work/midnew9693/oms -invPtrLoc /scratch/aime1/work/
midnew9693/oms/oraInst.loc
OMSPatcher Automation Tool
Copyright (c) 2016, Oracle Corporation. All rights reserved.
OMSPatcher version : 13.8.0.0.0
OUI version : 13.8.0.0.0
Running from : /scratch/aime1/work/midnew9693/oms
Log file location : /scratch/aime1/work/midnew9693/oms/cfgtoollogs/opatch/
opatch2014-05-05_22-45-52PM_1.log
OMSPatcher log file: /scratch/aime1/work/midnew9693/oms/cfgtoollogs/omspatcher/
1111118/opatch_oms_2014-05-05_22-45-53PM_analyze.log
Running apply prerequisite checks for sub-patch(es) "1111118" and Oracle Home "/
scratch/aime1/work/midnew9693/oms"...
Please monitor OPatch log file: /scratch/aime1/work/midnew9693/oms/cfgtoollogs/
opatch/1111118_May_05_2014_22_45_52/ApplyPrereq2014-05-05_22-45-57PM_2.log
Sub-patch(es) "1111118" are successfully analyzed for Oracle Home "/scratch/
aime1/work/midnew9693/oms"
Complete Summary
================
All log file names referenced below can be accessed from the directory "/scratch/
aime1/work/midnew9693/oms/cfgtoollogs/opatch/
2014-05-05_22-45-52PM_SystemPatch_1111118_1"
Prerequisites analysis summary:
-------------------------------
The following sub-patch(es) are applicable:
Oracle Home Name Sub-patches Log file
---------------- ----------- --------
oms12c1 1111118 1111118_ApplyPrereq2014-05-05_22-45-57PM_2.log
Log file location: /scratch/aime1/work/midnew9693/oms/cfgtoollogs/omspatcher/
1111118/opatch_oms_2014-05-05_22-45-53PM_analyze.log
OMSPatcher succeeded.
Command to execute (Step 4): echo /scratch/opatchdev/
targetPatchingImplRegistration/1111118/1111118 >> /scratch/aime1/work/midnew9693/
oms/.phBaseFile2014-05-05_22-43-08PM.txt
Command to execute (Step 4): /scratch/aime1/work/midnew9693/oms/OPatch/opatch
napply -phBaseFile /scratch/aime1/work/midnew9693/
oms/.phBaseFile2014-05-05_22-43-08PM.txt -invPtrLoc /scratch/aime1/work/
midnew9693/oms/oraInst.loc -oh /scratch/aime1/work/midnew9693/oms -silent
Command to execute (Step 4): rm /scratch/aime1/work/midnew9693/
oms/.phBaseFile2014-05-05_22-43-08PM.txt
Oracle Interim Patch Installer version 13.6.0.0.0
Copyright (c) 2016, Oracle Corporation. All rights reserved.
Chapter 24
Features in OMSPatcher
24-40

Oracle Home : /scratch/aime1/work/midnew9693/oms
Central Inventory : /ade/aime1_opatchauto_fix_lat/oracle/work/DB112/oraInventory
from : /scratch/aime1/work/midnew9693/oms/oraInst.loc
OPatch version : 13.8.0.0.0
OUI version : 13.8.0.0.0
Log file location : /scratch/aime1/work/midnew9693/oms/cfgtoollogs/opatch/
opatch2014-05-05_22-46-00PM_1.log
OPatch detects the Middleware Home as "/scratch/aime1/work/midnew9693"
Verifying environment and performing prerequisite checks...
OPatch continues with these patches: 1111118
Do you want to proceed? [y|n]
Y (auto-answered by -silent)
User Responded with: Y
All checks passed.
Backing up files...
Applying interim patch '1111118' to OH '/scratch/aime1/work/midnew9693/oms'
Patching component oracle.sysman.oms.core, 13.1.0.0.0...
Verifying the update...
Patch 1111118 successfully applied.
Log file location: /scratch/aime1/work/midnew9693/oms/cfgtoollogs/opatch/
opatch2014-05-05_22-46-00PM_1.log
OPatch succeeded.
Command to execute (Step 6): /scratch/aime1/work/midnew9693/oms/bin/emctl
register oms metadata -service TargetPatchingImplRegistration -debug -file /
scratch/aime1/work/midnew9693/oms/sysman/metadata/targetpatchingregister/
RegisterAgentTarget.xml -core -sysman_pwd %EM_REPOS_PASSWORD%
Oracle Enterprise Manager Cloud Control 12c Release 4
Copyright (c) 1996, 2016 Oracle Corporation. All rights reserved.
Starting output for debug mode.
Debug logs will be written to /scratch/aime1/work/insthome9693/em/EMGC_OMS1/
sysman/log/emctl.log
EM-04036: Unable to get a connection to the repository! Exiting...
The command failed with error code 36
Script execution has failed. Please refer to log file: /scratch/aime1/work/
midnew9693/oms/.omspatcher_storage/oms_session/
oms_session_log_2014-05-05_22-43-08PM for more details
Please fix the failures and re-run the same script to complete the patching
session.
OMS Administrator can re-run the script by fixing the issue (provide correct
sysman password to connect to database repository). Script resumes execution
from the failure point and executes successfully.
Example:
$ /scratch/aime1/work/midnew9693/oms/.omspatcher _storage/oms_session/
scripts_2014-05-05_22-43-51/
run_script#2_on_host_linux01amd_us_oracle_com_as_user_aime1.sh
Please provide credential for OMS repository SYSMAN user:
Command to execute (Step 2): /scratch/aime1/work/midnew9693/oms/OMSPatcher/
Chapter 24
Features in OMSPatcher
24-41

omspatcher checkApplicable -ph /scratch/opatchdev/targetPatchingImplRegistration/
1111118 -oh /scratch/aime1/work/midnew9693/oms -invPtrLoc /scratch/aime1/work/
midnew9693/oms/oraInst.loc
SKIP command for step 2...
Command to execute (Step 4): echo /scratch/opatchdev/
targetPatchingImplRegistration/1111118/1111118 >> /scratch/aime1/work/midnew9693/
oms/.phBaseFile2014-05-05_22-43-08PM.txt
Command to execute (Step 4): /scratch/aime1/work/midnew9693/oms/OPatch/opatch
napply -phBaseFile /scratch/aime1/work/midnew9693/
oms/.phBaseFile2014-05-05_22-43-08PM.txt -invPtrLoc /scratch/aime1/work/
midnew9693/oms/oraInst.loc -oh /scratch/aime1/work/midnew9693/oms -silent
Command to execute (Step 4): rm /scratch/aime1/work/midnew9693/
oms/.phBaseFile2014-05-05_22-43-08PM.txt
SKIP command for step 4...
Command to execute (Step 6): /scratch/aime1/work/midnew9693/oms/bin/emctl
register oms metadata -service TargetPatchingImplRegistration -debug -file /
scratch/aime1/work/midnew9693/oms/sysman/metadata/targetpatchingregister/
RegisterAgentTarget.xml -core -sysman_pwd %EM_REPOS_PASSWORD%
Oracle Enterprise Manager Cloud Control 12c Release 4
Copyright (c) 1996, 2014 Oracle Corporation. All rights reserved.
Starting output for debug mode.
Debug logs will be written to /scratch/aime1/work/insthome9693/em/EMGC_OMS1/
sysman/log/emctl.log
Metadata registration successful
Command to execute (Step 7): /scratch/aime1/work/midnew9693/oms/OMSPatcher/
omspatcher commit -id 1111118 -oh /scratch/aime1/work/midnew9693/oms -invPtrLoc /
scratch/aime1/work/midnew9693/oms/oraInst.loc
OMSPatcher Automation Tool
Copyright (c) 2016, Oracle Corporation. All rights reserved.
OMSPatcher version : 13.8.0.0.0
OUI version : 13.8.0.0.0
Running from : /scratch/aime1/work/midnew9693/oms
Log file location : /scratch/aime1/work/midnew9693/oms/cfgtoollogs/opatch/
opatch2014-05-05_22-49-34PM_1.log
OMSPatcher will now mark the patch "1111118" as auto-executed.
Log file location: /scratch/aime1/work/midnew9693/oms/cfgtoollogs/opatch/
opatch2014-05-05_22-49-34PM_1.log
OMSPatcher succeeded.
All operations for this script are appended to log file: /scratch/aime1/work/
midnew9693/oms/.omspatcher_storage/oms_session/
oms_session_log_2014-05-05_22-43-08PM
Chapter 24
Features in OMSPatcher
24-42

25
Patching Oracle Management Agents
This chapter describes how to patch Oracle Management Agents (Management
Agents) in Enterprise Manager Cloud Control (Cloud Control).
This chapter consists of the following sections:
•Overview
•Automated Management Agent Patching Using Patch Plans (Recommended)
•Manual Management Agent Patching
25.1 Overview
Management Agent patches are released to fix one or more errors related to
Management Agent targets. You can patch Management Agents that are deployed on
OMS hosts, as well as remote hosts. In Cloud Control, separate Management Agent
patches exist for core components of Management Agents and Management Agent
plug-ins.
You can apply Management Agent patches using the automated approach (that is,
using patch plans) or the manual approach. Oracle recommends using the automated
approach to carry out your patching operations. This approach not only saves time and
effort while mass-deploying patches, but also reduces human intervention, thereby
minimizing the errors involved while patching. For more information about this
approach, see Automated Management Agent Patching Using Patch Plans
(Recommended).
If you are unable to patch your Management Agent targets using patch plans, you can
use the manual patching approach. However, this approach is not recommended. For
more information about this approach, see Manual Management Agent Patching.
25.2 Automated Management Agent Patching Using Patch
Plans (Recommended)
Automated patching is a quick, easy, and reliable patching mechanism that is
facilitated using patch plans in Cloud Control. Patch plans can be created, accessed,
and deployed using the Cloud Control console, or EM CLI. For large scale
deployments, you can use EM CLI to create, access, and deploy patch plans. This
section only describes how to patch your Management Agent targets using the Cloud
Control console. For information about patching targets using EM CLI, see Oracle
Enterprise Manager Lifecycle Management Administrator's Guide.
Automated patching can be performed while Cloud Control is running in the Online
mode, as well as the Offline mode. When Cloud Control is running in the Online mode,
you can connect to My Oracle Support to download the patches that you want to
apply. However, if Cloud Control is running in the Offline mode, you must ensure that
the patches that you want to apply are already available in Oracle Software Library
(Software Library).
25-1

This section consists of the following:
•Advantages of Automated Management Agent Patching
•Accessing the Patches and Updates Page
•Viewing Patch Recommendations
•Searching for Patches
•Applying Management Agent Patches
•Verifying the Applied Management Agent Patches
•Management Agent Patching Errors
25.2.1 Advantages of Automated Management Agent Patching
The advantages of patching your Management Agent targets using the automated
approach (as compared to the manual approach) are:
•Patching operations are more organized, done through a single window, and are
always initiated only from the OMS.
•This approach allows you to schedule periodic patching jobs that connect to My
Oracle Support, check for the latest patches, and automatically download them.
This saves the effort involved in searching for the latest patches and patch sets,
and downloading them whenever they are available.
•Multiple patches and multiple sets of homogeneous targets can be added to a
single patch plan. For example, both core and plug-in component Management
Agent patches can be patched by adding them to the same patch plan.
25.2.2 Accessing the Patches and Updates Page
To access the Patches and Updates page in Cloud Control, from the Enterprise
menu, select Provisioning and Patching, then select Patches & Updates.
Figure 25-1 displays the Patches and Updates page.
Chapter 25
Automated Management Agent Patching Using Patch Plans (Recommended)
25-2
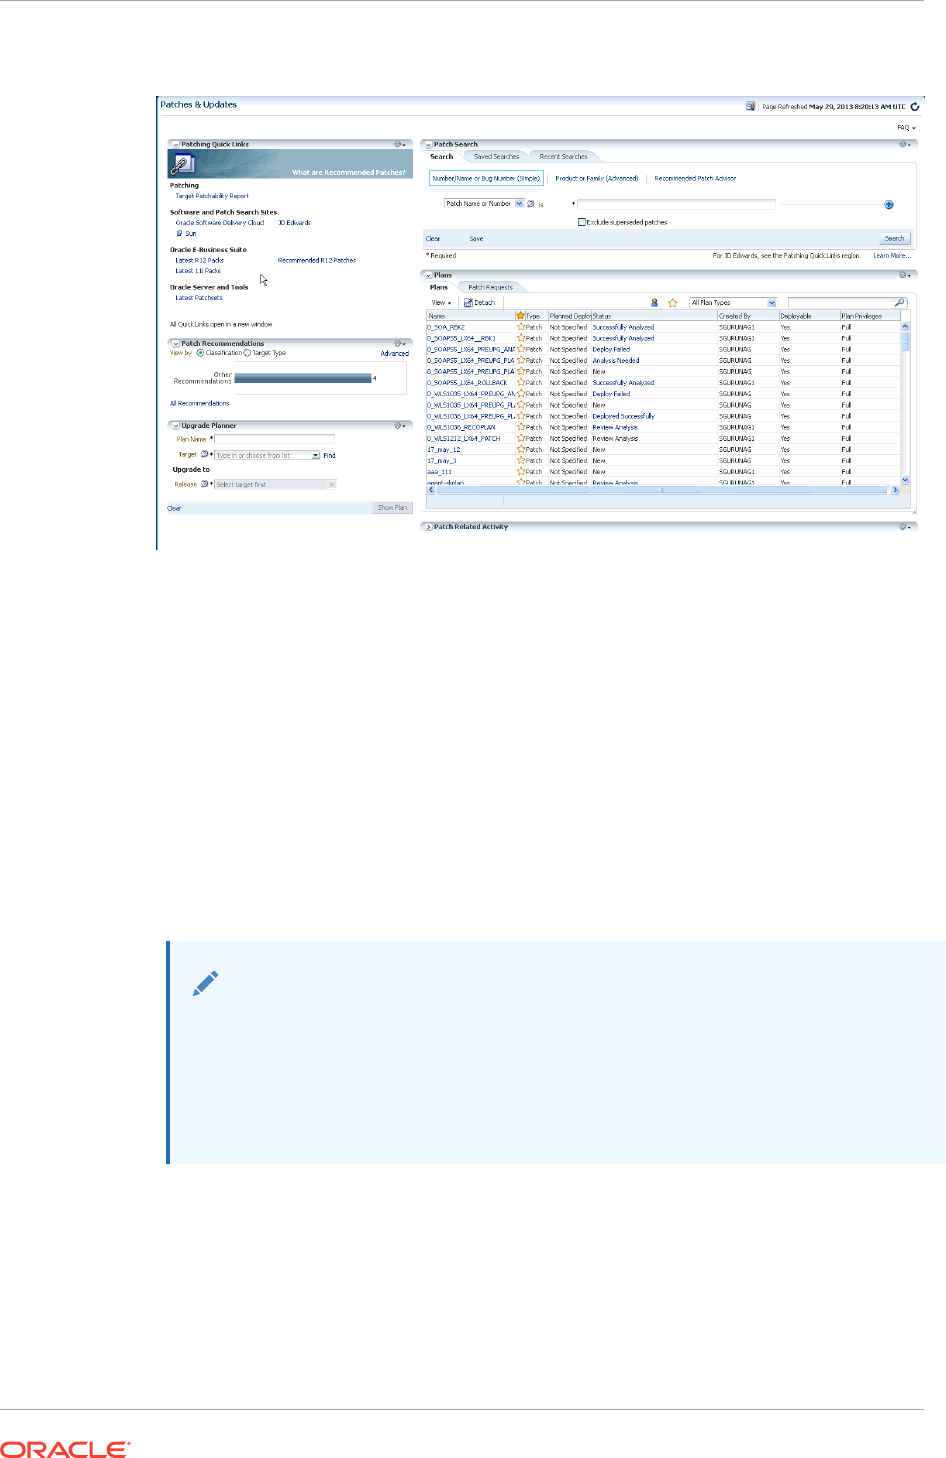
Figure 25-1 Patches and Updates Page
25.2.3 Viewing Patch Recommendations
Patch recommendations are proactive notifications of potential system problems and
recommendations that help you improve system performance and avert outages.
Patch recommendations minimize the effort required to search for the critical patches
that must be applied on your targets.
The Patch Recommendations section is available on the Patches and Updates page.
The patches in this section are classified as security patches, and other recommended
patches.
For more information about patch recommendations, see Oracle Enterprise Manager
Lifecycle Management Administrator's Guide.
Note:
•Patch recommendations are available only if Oracle Configuration
Manager Release 10.3.2 or higher is deployed in your enterprise.
•Patch recommendations are not available for custom plug-ins. They
available only for the default plug-ins that are released with Cloud Control.
25.2.4 Searching for Patches
This section consists of the following:
•Searching for Patches On My Oracle Support
•Searching for Patches in Software Library
Chapter 25
Automated Management Agent Patching Using Patch Plans (Recommended)
25-3

25.2.4.1 Searching for Patches On My Oracle Support
If you already know about the existence of a patch from external sources such as
blogs, Oracle technology forums, or from colleagues, then use the search functionality
to search for those patches. The search functionality enables you to perform more
flexible and advanced searches, and offers capabilities such as saving a search that is
used routinely, and searching based on existing saved searches. All of this enables
you to perform searches quickly and efficiently.
To search for a patch on My Oracle Support, follow these steps:
1. From the Enterprise menu, select Provisioning and Patching, then select
Patches & Updates.
2. To perform a simple search, in the Patch Search region, select Number/Name or
Bug Number (Simple), then specify the patch name, patch number, or the bug
number. Click Search.
To perform an advanced search, select Product or Family (Advanced), then
specify the product, release, and any other criteria you wish to use for the patch
search.
Alternatively, you can use the Saved tab to search for previously saved searches.
You can also use the Recent tab to access any recently performed searches.
Once the patch search is complete, the results appear in the Patch Search
Results page. On this page, you can select a patch and download it either to the
local host or to Software Library.
25.2.4.2 Searching for Patches in Software Library
By default, when you search for a patch on the Patches & Updates page, Cloud
Control connects to My Oracle Support using the Internet connectivity available on that
host, and searches for the requested patch on My Oracle Support. This is because the
search functionality is set to perform in online mode by default.
However, if your host does not have Internet connectivity, then you must switch over to
offline mode so that the search can be performed in Software Library.
To switch over to offline mode, follow these steps:
1. From the Setup menu, select Provisioning and Patching, then select Offline
Patching.
2. For Connection, select Offline.
Chapter 25
Automated Management Agent Patching Using Patch Plans (Recommended)
25-4

Note:
In offline mode, you cannot:
•Search and download patches from My Oracle Support
•Resolve patch conflicts with merge patches
•View the Related Activity region
•Access Quicklinks
•View or create upgrade plans
To search for a patch in Software Library, follow these steps:
1. From the Enterprise menu, select Provisioning and Patching, then select
Patches & Updates.
2. To perform a simple search, in the Software Library Patch Search region, select
Number/Name or Bug Number (Simple), then specify the patch name, patch
number, or the bug number. Click Search.
To perform an advanced search, select Product or Family (Advanced), then
specify the product, release, and any other criteria you wish to use for the patch
search.
Alternatively, you can use the Saved tab to search for previously saved searches.
You can also use the Recent tab to access any recently performed searches.
Once the patch search is complete, the results appear in the Patch Search
Results page.
25.2.5 Applying Management Agent Patches
To apply Management Agent patches using patch plans, follow these steps:
Note:
•Using patch plans, you can apply patches on the core components of
Management Agents, as well as on Management Agent plug-ins. The
patching process that must be used for both actions is the same, and is
described in this section.
•For a large scale deployments, you can use EM CLI. For information
about patching using EM CLI, see Oracle Enterprise Manager Lifecycle
Management Administrator's Guide.
1. In Cloud Control, from the Enterprise menu, select Provisioning and Patching,
then select Patches and Updates.
2. On the Patches and Updates page, select the Management Agent patches that
you want to apply from the Patch Recommendations section, or the Patch Search
section.
Chapter 25
Automated Management Agent Patching Using Patch Plans (Recommended)
25-5
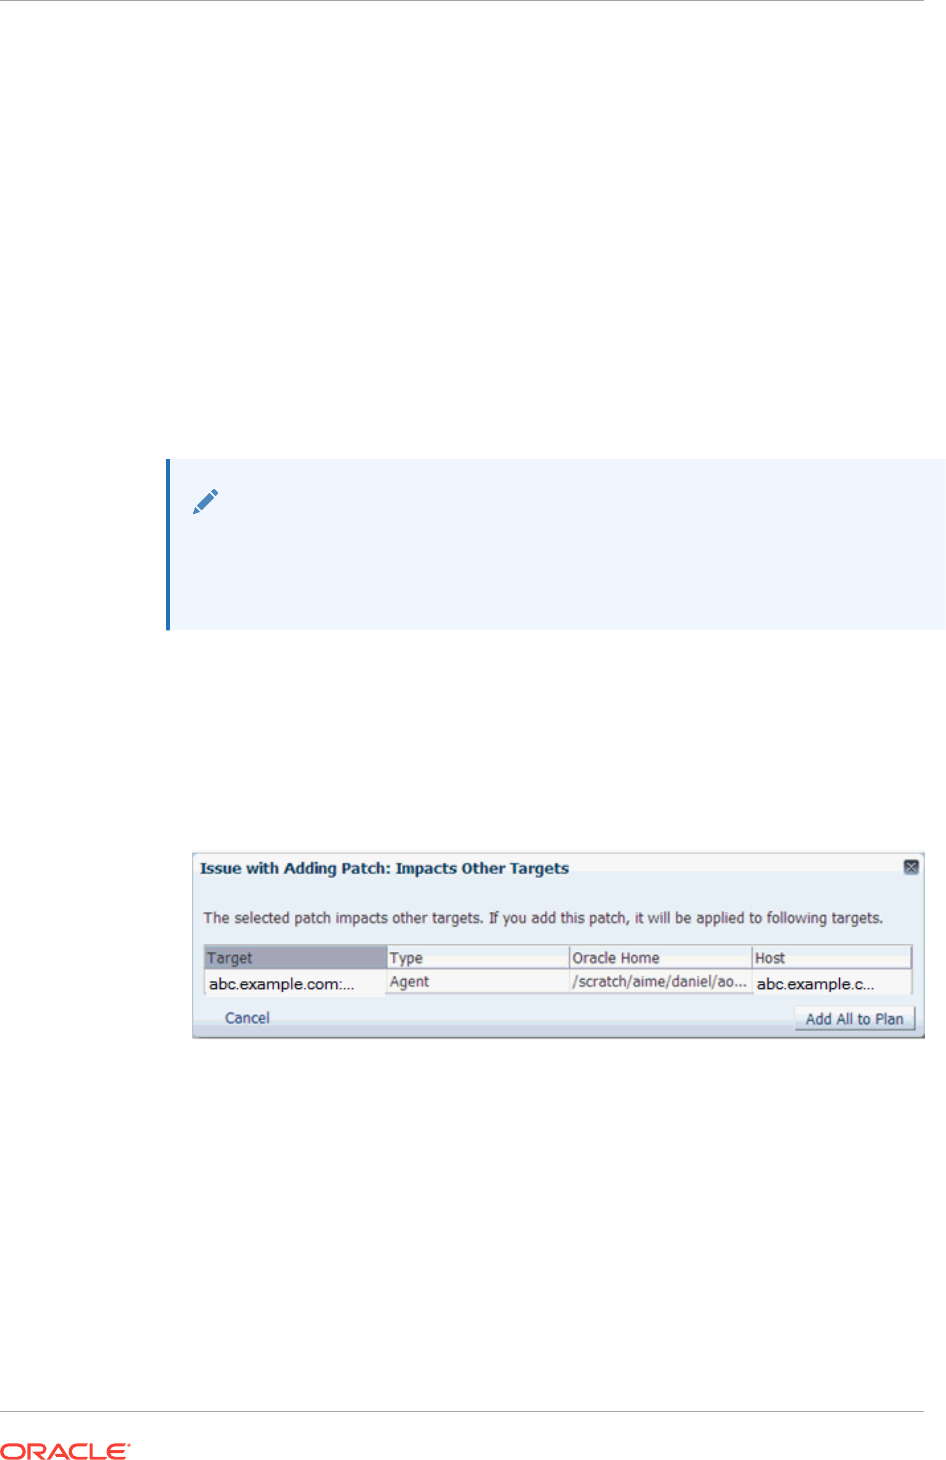
For more information on the Patch Recommendation section, see Viewing Patch
Recommendations. For more information on how to search for patches, see
Searching for Patches.
3. From the context menu that appears, select one of the following options:
•Add to New: Select this option if you want to create a new patch plan that has
the selected patch.
Specify a plan name, the targets that you want to patch, then click Create
Plan.
The patch and the associated targets are added to the patch plan.
•Add to Existing Plan: Select this option if you want to add the selected patch
to an existing patch plan.
Select the existing patch plan that you want to add the required patch to,
specify the patch targets, then click Add Patch to Plan.
Note:
Ensure that the patches you select have the same platform as the targets that
you want to patch. For example, Linux x86 patches can be applied only on
Linux x86 targets. Any mismatch will result in a patching error.
4. If the selected patches are applied on homogeneous targets, then the patch plan
is created successfully with a link to view the patch plan. Click the link to view the
patch plan details.
If any of the Management Agent targets added to the patch plan are shared
agents or cluster Management Agents, then you may see a warning message
mentioning that there are issues with adding the patch to the patch plan.
As a solution to this problem, click Add All To Plan to add all the affected targets
to the patch plan.
However, if the platform of the selected patch does not match the platform of the
selected target, you may see one of the following errors or warnings:
•A null platform error occurs when the selected target appears with a null
platform. The patch plan validation fails as platform of the patch and the
platform of the target do not match. This may occur when a target is down. In
this case, the patch plan is not created until the error is fixed.
•A platform mismatch warning appears when the platform of the patch and the
platform of a target do not match. This target is ignored, and the patch plan is
Chapter 25
Automated Management Agent Patching Using Patch Plans (Recommended)
25-6

created without this target. The other homogeneous targets are added to the
plan.
Note:
Oracle recommends that you fix the warnings before proceeding, as they may
result in an error during patch plan validation. However, if you want to proceed
regardless, you can select Ignore Warnings and Add.
5. Navigate to the Patches & Updates page. In the Plans region, click the name of
the patch plan that you want to view.
The Create Plan wizard is displayed.
6. On the Plan Information page, do the following:
a. In the Overview section, validate the patch plan name. You can choose to edit
it if you want.
b. (Optional) Enter a short description for the patch plan.
c. (Optional) In the Allow Access For section, click Add to grant patch plan
access permissions to administrators or roles for the current patch plan.
In the Add Privileges to Administrators window, select an administrator or a
role, the access permission that you want to grant, then click Add Privilege.
d. Click Next.
7. On the Patches page, review the patches added to the patch plan.
To add new patches to the patch plan or add additional targets to a patch that has
already been added to the patch plan, click Add Patch. In the Edit Search dialog
box, enter the patch number, then click Search. Select the required patch, then
click Add to This Plan. Select the targets that you want to add to the patch, then
click Add to This Plan.
Click Next.
8. On the Deployment Options page, do the following:
a. In the Where to Stage section, select one of the following options:
Yes, if you want the wizard to stage the patches from Software Library to a
temporary location accessible to the target host, before the patch is applied on
the target. By default, the wizard stages the patches to a default location on
the target host, but if you want to change the location, you can enter a location
where the patch can be staged.
No, if you have already manually staged the patches to a temporary location
accessible to the target host. This can even be a shared, NFS-mounted
location. In this case, ensure that you download the patch you want to apply,
navigate to the location (parent directory) where you want to stage the patch,
create a subdirectory with the same name as the patch ZIP file, then extract
the contents of the patch ZIP file in this subdirectory. In the Where to Stage
section, enter the absolute path to the parent directory where you have
manually staged the patches.
For example, if you downloaded patch
699099.zip,
and the stage location,
which is the parent directory, is
/u01/app/oracle/em/stagepatch,
then in this
Chapter 25
Automated Management Agent Patching Using Patch Plans (Recommended)
25-7
parent directory, create a subdirectory titled
699099
and extract the contents of
the zip file. Enter
/u01/app/oracle/em/stagepatch
as the stage path.
b. In the Credential Information section, provide the required credentials for
patching. You can choose to use preferred credentials, or override the
preferred credentials with different credentials.
In Enterprise Manager Cloud Control 12c Release 4 (12.1.0.4), normal Oracle
home credentials are not required for patching secure Management Agent
targets. If the patches that you want to apply on the Management Agent
targets require root user access to perform certain tasks, then you must
provide the privileged Oracle home credentials for the Management Agent
targets.
If the Management Agent targets that you want to patch are not secure, then
you must set the preferred Management Agent host credentials for all the
Management Agent targets that you want to patch. To set the preferred host
credentials for Management Agent targets, from the Setup menu, select
Security, then select Preferred Credentials. Select the Agent target type,
then click Manage Preferred Credentials. Set the preferred host credentials
for the required Management Agent targets.
For more information about setting preferred credentials, see Oracle
Enterprise Manager Lifecycle Management Administrator's Guide.
Note:
The named credentials of type SSH Key Credentials cannot be set as the
normal host preferred credentials or the privileged host preferred credentials
for Oracle home targets.
Click Validate Credentials to verify the accuracy of the provided credentials.
c. In the Notification section, specify whether or not you want to enable email
notifications when the patch plan is scheduled, starts, requires action, is
suspended, succeeds, and fails.
To enable email notifications, select Receive notification emails when the
patching process, then select the required options. If a warning message,
mentioning that the sender or the receiver email address is not set up, is
displayed, perform the action mentioned in the warning.
d. In the Rollback section, select Rollback patches in the plan to roll back the
patches listed in the plan, rather than deploy them.
e. In the OPatch Upgrade section, select OPatch Upgrade to upgrade the
OPatch component before the patching operation begins.
For the OPatch component to be upgraded, ensure that it is downloaded and
unzipped to the same location where the patches that you want to apply are
staged.
f. In the Conflict Check section, specify whether you want to enable or disable
ARU Conflict Check, a check that uses Oracle Automated Release Updates
(ARU) to search for patch conflicts within the patch plan during the analysis
stage. Also, specify the action that the patching procedure must take when a
patch conflict is encountered during deployment.
Chapter 25
Automated Management Agent Patching Using Patch Plans (Recommended)
25-8

For Conflicts, select Stop at Conflicts if you want the patching procedure to
stop the deployment of the plan when a conflict is encountered, select Force
Apply if you want the patching procedure to roll back the conflicting patches
and apply the incoming patches when a conflict is encountered, or select Skip
conflicts if you want the patching procedure to apply only the non-conflicting
patches, and skip the application of the conflicting patches, when a conflict is
encountered.
g. Click Next.
9. On the Validation page, click Analyze to validate the patch before deploying it. A
validation job is submitted, which checks for patch conflicts, checks for the latest
OPatch version, checks if the version and platform of the targets and the patch are
the same, and so on. To track the progress of the validation job, click Show
Detailed Results.
Alternatively, you can navigate directly to the Review and Deploy page to deploy
the Management Agent patches without analyzing the plan. If you do so, a deploy
job is submitted which analyzes the plan, and deploys it on successful analysis.
Note:
If any problems are encountered during the analysis phase, then the split plan
feature is enabled, in which the patch plan is split into two patch plans, one
having the targets for which the analysis failed, and another having the targets
for which the analysis was successful. The patch plan having the targets for
which the analysis was successful is available for deployment, while the other
patch plan must be reanalyzed and deployed separately.
Figure 25-5 illustrates the split plan feature.
Upon validation, if there are conflicts between two patches, then it is
recommended that you request for replacement patches. In this case, click
Request Replacement Patches. If there is a merge patch already available for
the conflicting patches, you can choose to directly replace the conflicting patches
with the merge patch. To do this, click Replace Conflicting Patches.
For information about the errors that may occur during the validation phase, see
Management Agent Patching Errors.
Click Next.
10. On the Review & Deploy page, review the details that you have provided for the
patch plan, then click Deploy.
Once you click Deploy, a Deploy Confirmation dialog box appears, which enables
you to schedule the Deploy operation. Select Deploy. If you want to begin the
Deploy operation immediately, select Immediately. If you want to schedule the
Deploy operation such that it begins at a later time, select Later, then specify the
time. Click Submit.
After scheduling a deploy operation, the Deploy button on the Review and Deploy
page is renamed to Reschedule. If you want to reschedule the Prepare or Deploy
operation, click Reschedule, specify the time, then click Submit. If you want to
discard the schedule and bring the patch plan back to its last valid state, click Stop
Schedule. Note that the deploy operation schedule is discarded if you edit a patch
Chapter 25
Automated Management Agent Patching Using Patch Plans (Recommended)
25-9

plan deployment option or a patch target. In this case, you must validate the patch
plan again.
A deploy job is submitted. To track the progress of the job, click Show Detailed
Results.
25.2.6 Verifying the Applied Management Agent Patches
To verify the applied Management Agent patches, perform the following steps:
1. In Cloud Control, from the Targets menu, select All Targets.
2. On the All Targets page, for the Search Target Name field, enter the name of the
Management Agent target that you just patched, then click the search icon. Click
the name of the required target.
3. On the Management Agent target home page, under the Summary section and the
Configuration sub-section, click Oracle Home and Patch Details to view all the
jobs that have run on the Oracle home target of the Management Agent.
4. Under the Patch Advisories section, select the Patches Applied tab to verify all
the patches that have been applied successfully on the Management Agent target.
25.2.7 Management Agent Patching Errors
The following are some of the errors that you may encounter while patching
Management Agent targets:
•Oracle Home Credentials Are Not Set
•Management Agent Target Is Down
•Patch Conflicts Are Detected
•User Is Not a Super User
•Patch Is Not Staged or Found
25.2.7.1 Oracle Home Credentials Are Not Set
Error Description
This error occurs when the preferred Management Agent host credentials (for patching
Management Agents that are not secure), or the privileged Oracle home credentials
(for patches that require root user access) are not set.
Workaround
If the Management Agent targets that you want to patch are not secure, set the
preferred Management Agent host credentials for all these targets. To set the
preferred host credentials for a Management Agent target, from the Setup menu,
select Security, then select Preferred Credentials. Select the Agent target type, then
click Manage Preferred Credentials. Set the preferred host credentials for the
Management Agent target. Analyze and deploy the patch plan.
If the patches that you want to apply (on the Management Agent targets) require root
user access, set the privileged Oracle home credentials for the Management Agent
targets. Analyze and deploy the patch plan.
Chapter 25
Automated Management Agent Patching Using Patch Plans (Recommended)
25-10
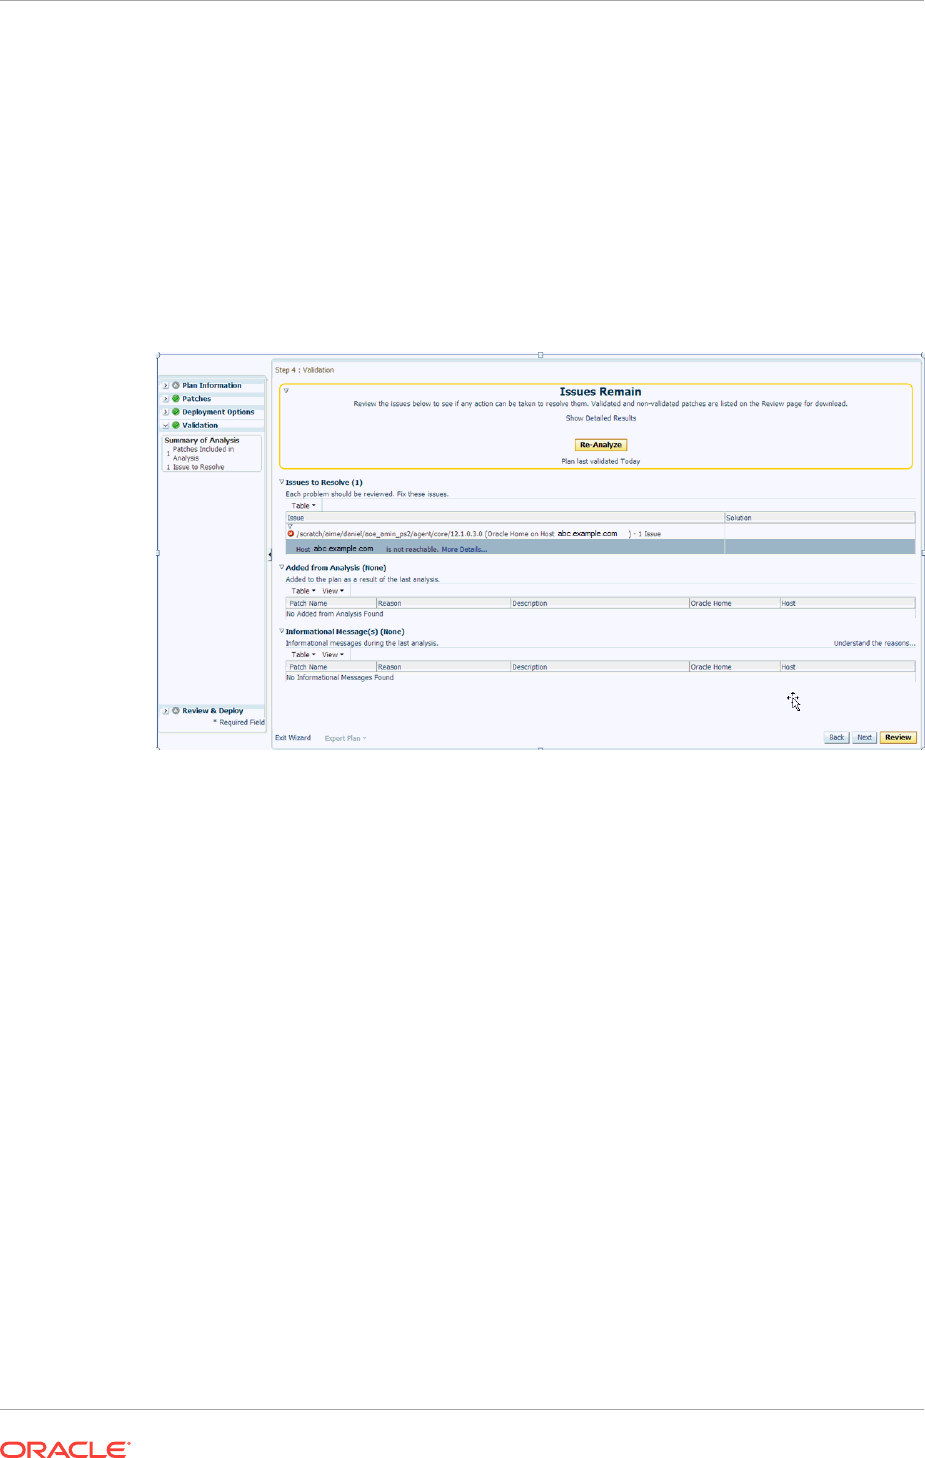
25.2.7.2 Management Agent Target Is Down
Error Description
This error occurs when the Management Agent target added for patching is not up and
running.
Figure 25-2 displays an example of this error.
Figure 25-2 Patching Error: Management Agent Target Is Down
Workaround
Start the Management Agent target, then analyze and deploy the patch plan.
25.2.7.3 Patch Conflicts Are Detected
Error Description
This error occurs when there is a conflict between two added patches.
Figure 25-3 displays an example of this error.
Chapter 25
Automated Management Agent Patching Using Patch Plans (Recommended)
25-11
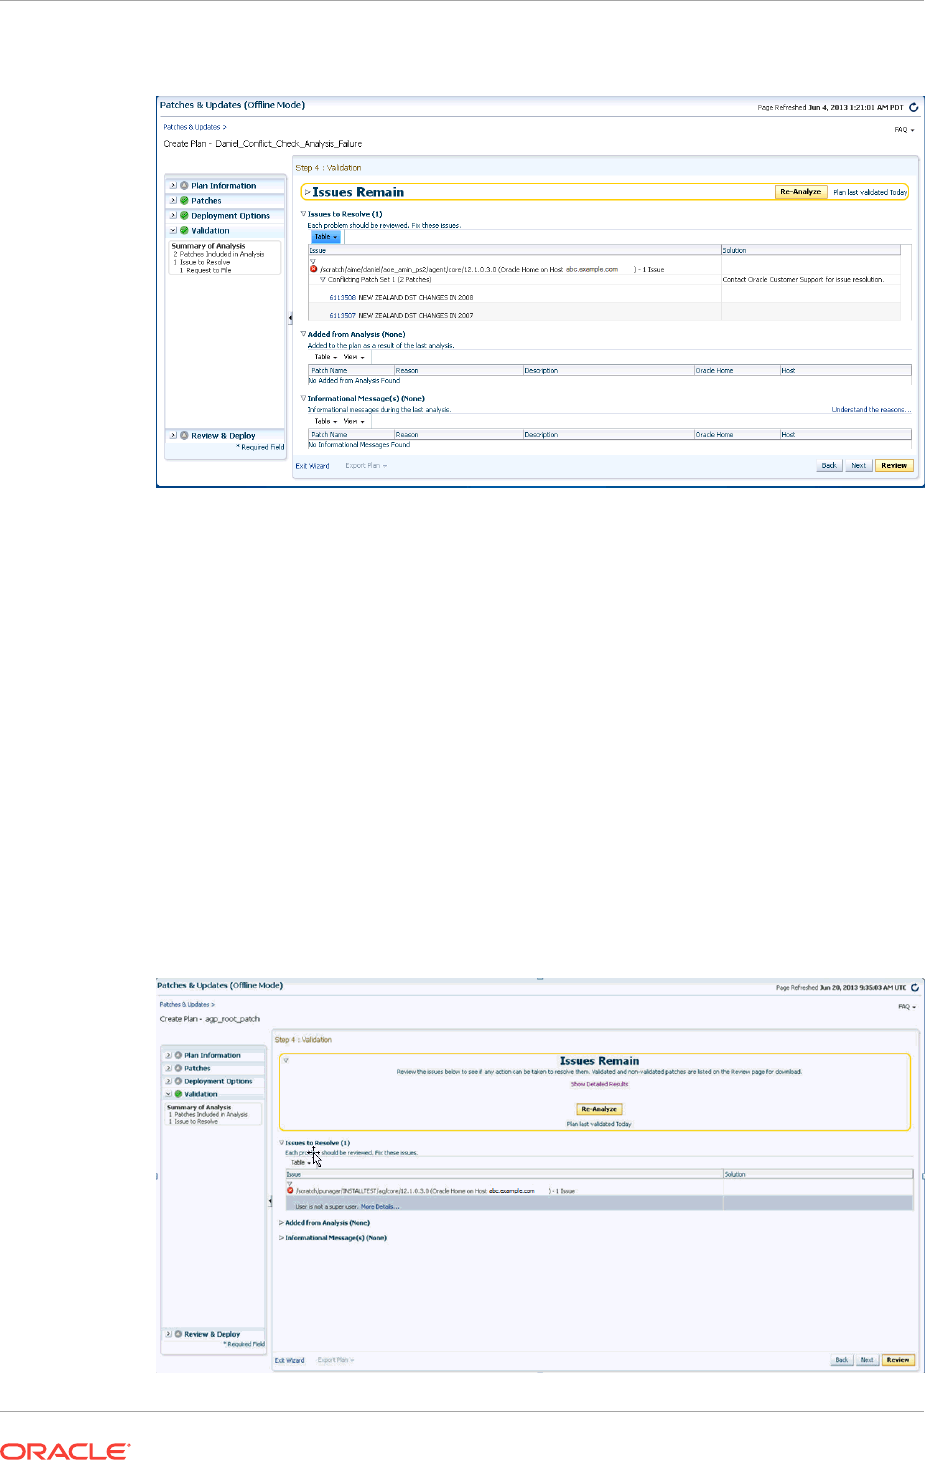
Figure 25-3 Patching Error: Patch Conflicts
Workaround
Do one of the following:
•Contact Support to obtain a merged patch.
•Choose the advanced OPatch options to force apply the patch. However, choosing
this option and applying the patch will result in the loss of earlier patch changes.
25.2.7.4 User Is Not a Super User
Error Description
This error occurs when the user that runs the patch plan does not have root access.
Figure 25-4 displays an example of this error.
Figure 25-4 Patching Error: User Is Not a Super User
Chapter 25
Automated Management Agent Patching Using Patch Plans (Recommended)
25-12
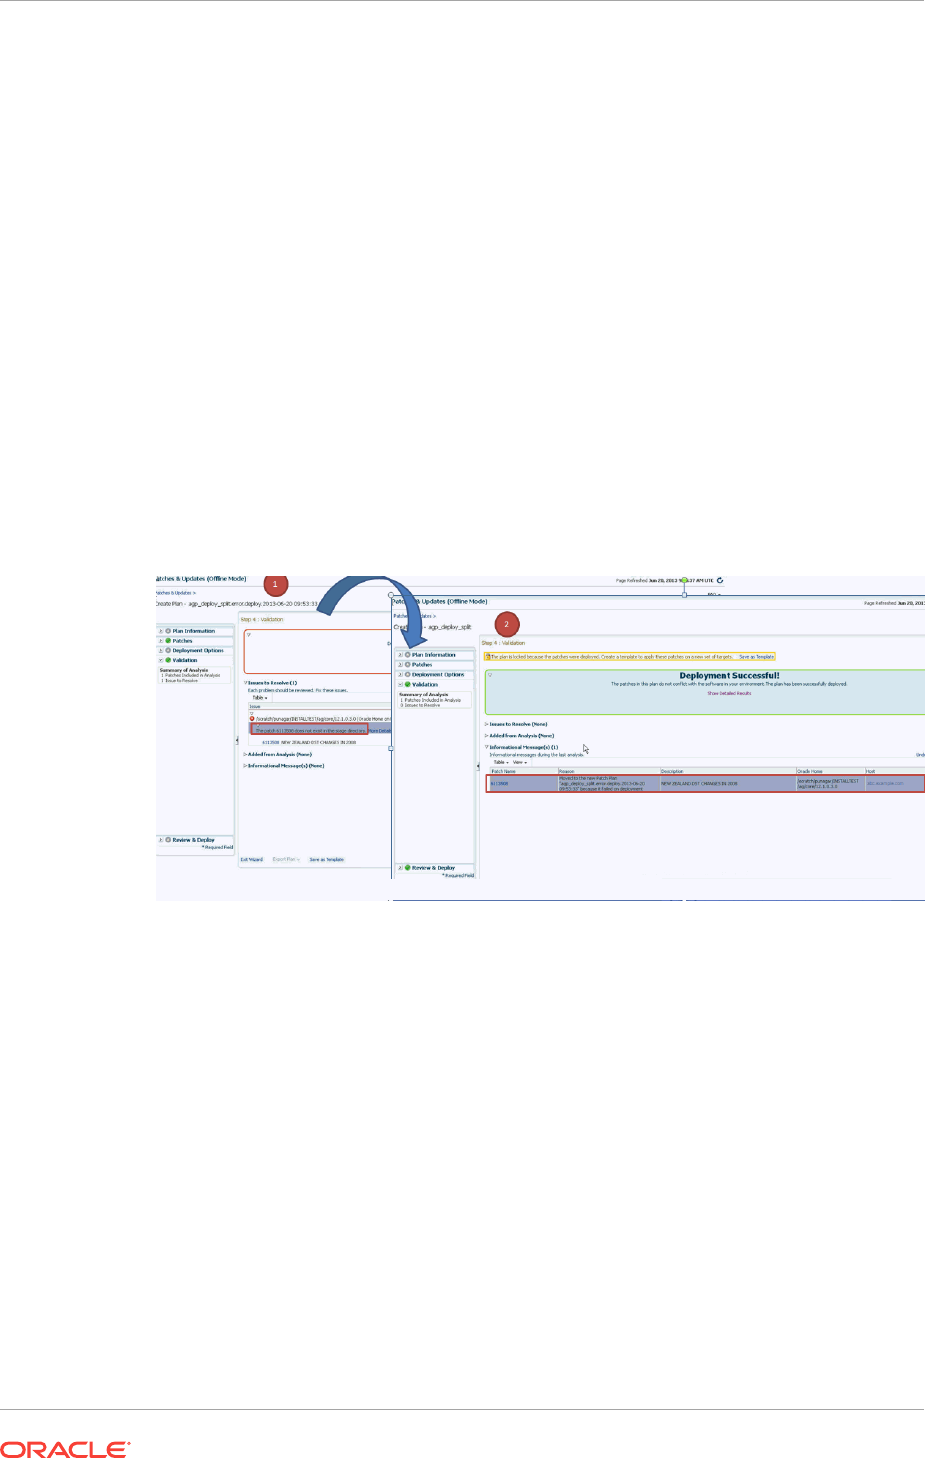
Workaround
Follow these steps:
1. Create a new credential that has root access.
2. Ensure that privilege delegation settings have been configured on the target
Management Agent host. For more information about privilege delegation, see
Oracle Enterprise Manager Lifecycle Management Administrator's Guide.
3. Analyze and deploy the patch plan.
25.2.7.5 Patch Is Not Staged or Found
Error Description
This error occurs when the patch is not present in the stage location.
Figure 25-5 displays an example of this error. This figure also illustrates the split plan
feature.
Figure 25-5 Patching Error: Patch Is Not Staged or Found
Workaround
Ensure that the patch is available in the stage location. Analyze and deploy the patch
plan.
25.3 Manual Management Agent Patching
Manual patching is a patching mechanism that requires you to follow step-by-step
instructions to patch a Management Agent manually. This mechanism of patching
requires you to ensure certain prerequisites, manually validate the patch for
applicability and conflicts, and can be used to patch only a single Management Agent
at a time.
Chapter 25
Manual Management Agent Patching
25-13

Note:
Oracle recommends that you use the automated patching mechanism as it not
only saves time and effort in mass-deploying patches, but also reduces human
intervention, thereby minimizing the errors involved during the patching
process.
To patch a Management Agent target manually, perform the following steps:
1. Log into My Oracle Support (
https://support.oracle.com
).
Note:
Ensure that you check the Patch Recommendation section to view the patches
that are recommended for your environment.
2. On the My Oracle Support home page, click Patches and Updates.
3. Enter the required patch number in the Patch Search section, then click Search.
4. Select the patch, and from the context menu that appears, select Download.
5. Extract the patch zip file and follow the instructions available in
Readme.html
or
Readme.txt
to install the patch.
Note:
In Cloud Control, separate Management Agent patches exist for core
components of Management Agents and Management Agent plug-ins. Ensure
that you navigate to the correct directory location under
<installation_base_directory>
while manually patching a Management Agent
core component or a Management Agent plug-in. For example, to patch a
Management Agent core component manually, you must navigate to
<installation_base_directory>/core/,
and to patch a Management Agent
plug-in, you must navigate to
<installation_base_directory>/plugins
. The
following is the structure of the Management Agent installation base directory:
<installation_base_directory>
|_____core
|_____12.1.0.4.0
|_____plugins
|_____plugins.txt
|_____plugins.txt.status
|_____agent_inst
|_____sbin
|_____agentimage.properties
Chapter 25
Manual Management Agent Patching
25-14

26
Personalizing Cloud Control
You can personalize the page layout and data displayed in certain Cloud Control
pages, including target home pages such as the Oracle WebLogic Server target home
page. The changes you make are persisted for the currently logged in user, enabling
you to create customized consoles for monitoring various target types.
Personalization support provided in the current release allows you to:
•Customize the layout of regions on a page
•Add a region to, or remove a region, from a page
•Specify what data should be displayed within each region
•Set your own homepage
Note that not all pages in Cloud Control can be personalized. The page edit mode will
only be enabled for those pages or page regions that can be modified.
This chapter contains the following sections:
•Personalizing a Cloud Control Page
•Customizing a Region
•Setting Your Homepage
•Setting Pop-Up Message Preferences
26.1 Personalizing a Cloud Control Page
Pages in Cloud Control are laid out in a columnar format. Each column contains one or
more regions, each of which contains data rendered as a bar chart, graph or other
visual component.
You can modify the layout of columns within a page, as well as select the regions to
display within each column, enabling you to personalize how the data on a page is
arranged and displayed.
To personalize a page:
1. Navigate to the page you want to personalize.
2. Do one of the following:
•Select Personalize Page from the menu item that displays the username of
the currently logged-in user, just to the left of the Log Out menu item. In
Figure 26-1, the menu item displays the SYSMAN user name.
26-1
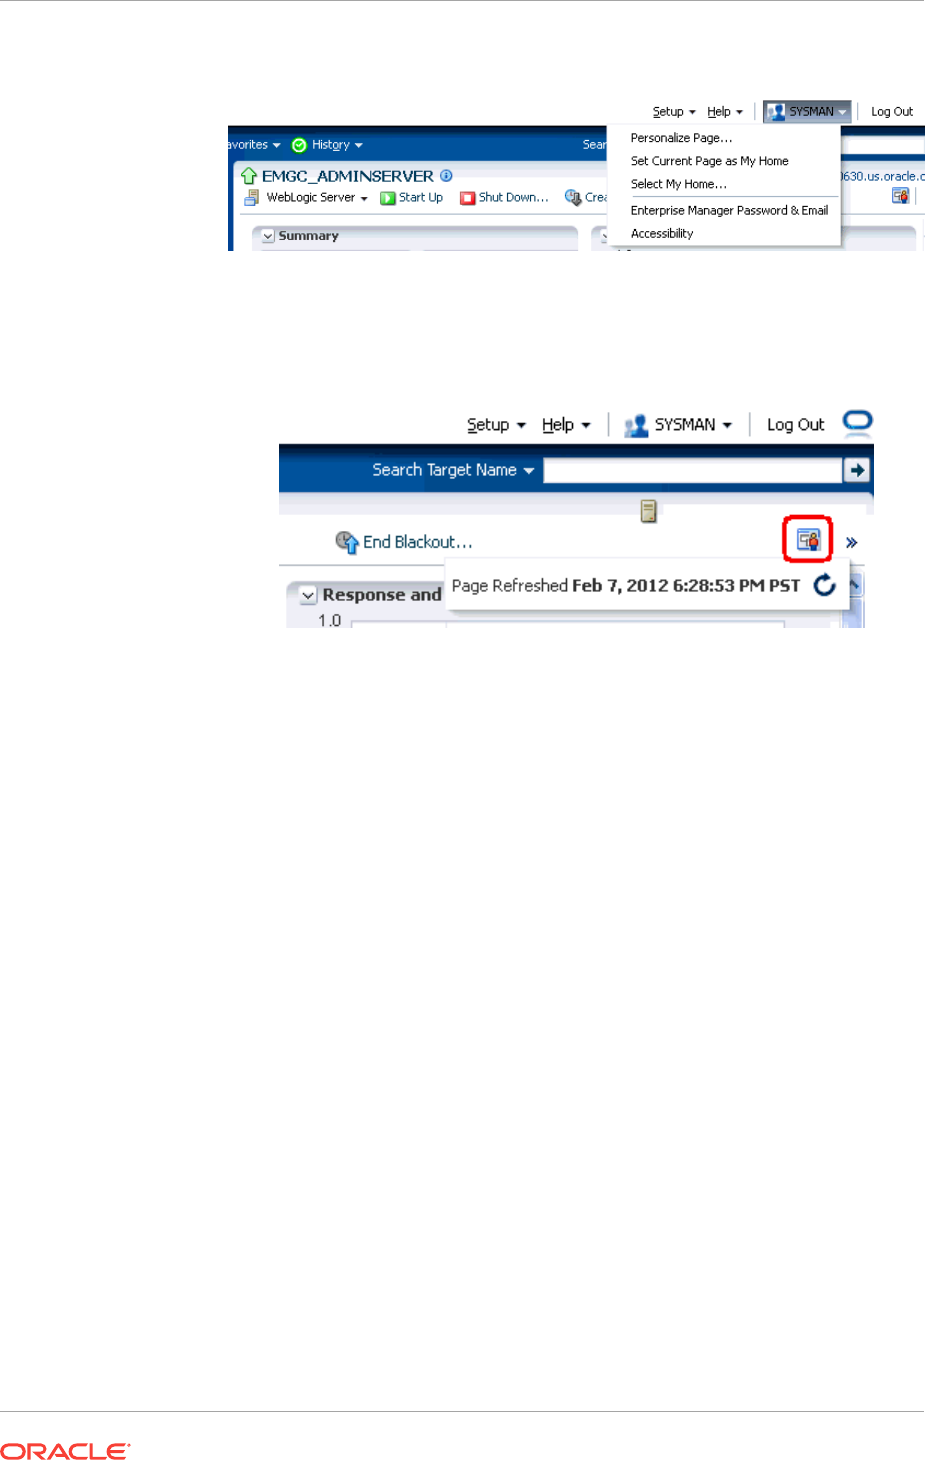
Figure 26-1 Personalize Page Menu
•Or, click the “Personalize Page" icon on the right-hand side of the page,
shown just above the “Page Refreshed" time stamp, as shown in Figure 26-2.
Figure 26-2 Personalize Page Icon
Note that the menu item or icon will only be enabled if the page you are currently
on can be personalized.
3. You are now in page edit mode. Click the Change Layout button. A graphical
menu of column layout options opens.
4. Select the column layout you want to use.
5. Next, add a region to each column. Click the Add Content button for a specific
column. The Resource Catalog, which contains available components used to
display data, opens.
6. Select a region, then click Add to add it to the column. Note that you can “stack"
regions on top of one another.
7. Once a region has been added to a column, you can:
•Customize the region. See Customizing a Region for details.
•Click the View Actions menu in the upper right corner of the region to move
the region up or down within the column.
•Drag the region from one column to another.
8. Click Close to save your changes.
26.2 Customizing a Region
A region contains business data rendered as a bar chart, graph or other visual
component. You can select the component to display within a specific region.
To customize a region within a page column:
1. Navigate to the page containing the region you want to customize and enable the
page editing mode as described in Personalizing a Cloud Control Page.
Chapter 26
Customizing a Region
26-2
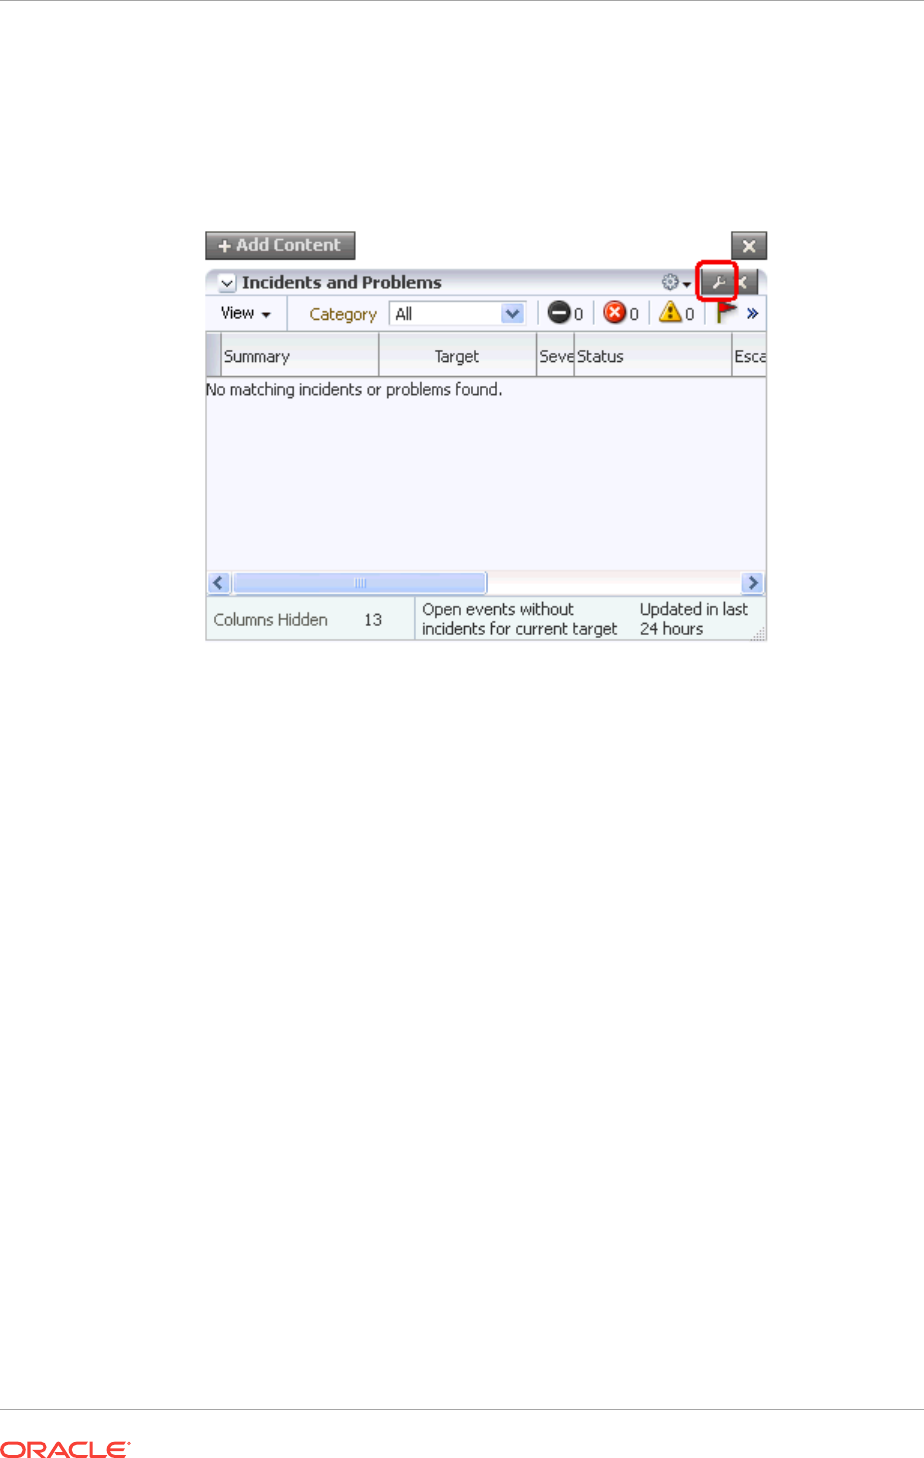
2. Click the “ratchet" icon next to the “X" icon within a region, as shown in
Figure 26-3. Note that the icon will only be enabled if the region can be
customized.
Figure 26-3 Customize Region Icon
For most resources, you will specify the target host from which to collect data.
Other configurable parameters and customization options vary between regions.
When you click the icon, a dialog opens to enable you to specify parameters, such
as target type, target name and metric name.
3. If at a later time you want to remove the region from the page, click the “X" icon in
the region.
4. Click Close to save your changes.
26.3 Setting Your Homepage
Cloud Control allows you to choose the page that will serve as your homepage - the
first page you see after logging in to Cloud Control. You can either:
•Choose your own page, such as a target homepage that you view frequently or
have customized to suit your specific needs
•Select from a pre-designed homepage templates created for specific types of
Cloud Control users
Choosing Your Own Homepage
1. Navigate to the page you want to set as your homepage.
2. Select Set Current Page As My Home from the menu item that displays the
username of the currently logged-in user, just to the left of the Log Out menu item,
as shown in Figure 26-1.
Chapter 26
Setting Your Homepage
26-3

Selecting a Pre-Designed Homepage
1. Select Select My Home from the menu item that displays the username of the
currently logged-in user, just to the left of the Log Out menu item, as shown in
Figure 26-1.
2. Click the Preview button to preview a page design template you are interested in.
3. Click the Select As My Home button to select a template as your homepage.
Once you have selected a page, you can customize it to suit your needs.
De-selecting Your Homepage
Your homepage is saved as a “favorite" page. To de-select your current homepage:
1. From the Favorites menu, select Manage Favorites.
2. Select your homepage from the list, then click the Remove Selected button.
3. Click OK when finished.
26.4 Setting Pop-Up Message Preferences
The Pop-Up Message Preferences page allows you to select the messages from
different sub-components, that you would like to display in real-time to the user on any
page in the Enterprise Manager Cloud Console.
Notification messages like target status change, and command-line broadcast
messages from the Super Administrators can be displayed by making appropriate
setting changes to this page. By default, the pop-up messages are set to show status.
If you choose to retain the show status for these pop-up messages, you can set the
following preferences:
•Show target status change messages: This option displays a message every
time there is a change in the target status. For example, if your target goes down
or comes up, you will see a notification on the page. By default, the messages
lasts for 15 seconds. If you deselect this option, the messages will not be
displayed on the target page.
•Show messages sent by super administrator using EMCLI messages: This
option enables you to see all the messages sent by the super administrator. By
default, the messages appear on all the screens in the Enterprise Manager Cloud
Control Console. If you deselect this option, the messages will not be displayed on
the screens.
For example, if you run the following command, a pop-up with the custom
message appears on every screen of the Enterprise Manager Cloud Control
Console.
emcli send_popup_message -messageType="INFO" -toOption="ALL" -message="EM will
be taken down in an hour for an emergency patch"
The messages are usually transient and last for a stipulated amount of time on a
particular page. However, for command line messages, there is an added flexibility
in terms of allowing the message to stay on the page until the user chooses to
close it.
Chapter 26
Setting Pop-Up Message Preferences
26-4

The following types of messages are supported from this page: Confirmation,
information, warning, error, and fatal. By default, the length that a message is
displayed for is set to 15 seconds. You can change this value, if required.
Chapter 26
Setting Pop-Up Message Preferences
26-5

27
Administering Enterprise Manager Using
EMCTL Commands
Enterprise Manager Control (EMCTL) is a command line utility installed with EM to
administer or control the core components of Enterprise Manager Cloud Control,
particularly Oracle Management Service (OMS) and Oracle Management Agent
(Management Agent). The utility is available by default with every Enterprise Manager
installation.
This chapter explains the following:
•Executing EMCTL Commands
•Guidelines for Starting Multiple Enterprise Manager Components on a Single Host
•Starting and Stopping Oracle Enterprise Manager 13c Cloud Control
•Services That Are Started with Oracle Management Service Startup
•Starting and Stopping the Oracle Management Service and Management Agent on
Windows
•Reevaluating Metric Collections Using EMCTL Commands
•Specifying New Target Monitoring Credentials in Enterprise Manager
•EMCTL Commands:
–EMCTL Commands for OMS
–EMCTL Commands for Management Agent
–EMCTL Security Commands
–EMCTL HAConfig Commands
–EMCTL Resync Commands
–EMCTL Connector Command
–EMCTL Patch Repository Commands
–EMCTL Commands for Windows NT
–EMCTL Partool Commands
–EMCTL Plug-in Commands
–EMCTL Command to Sync with OPSS Policy Store
•Troubleshooting:
–Troubleshooting Oracle Management Service Startup Errors
–Troubleshooting Management Agent Startup Errors
–Using emctl.log File to Troubleshoot
27-1

27.1 Executing EMCTL Commands
In UNIX systems, to run EMCTL commands for Oracle Management Service (OMS),
navigate to the
<OMS_HOME>/bin
directory and run the desired command. To run EMCTL
commands for Management Agent, navigate to the
<AGENT_HOME>/bin
directory and run
the desired command.
Similarly, for Windows systems, to run EMCTL commands for OMS, navigate to the
<OMS_HOME>\bin
directory and to
<AGENT_HOME>\bin
directory for Management Agent
commands.
27.2 Guidelines for Starting Multiple Enterprise Manager
Components on a Single Host
Oracle Enterprise Manager components are used to manage a variety of Oracle
software products. In most cases, in a production environment, you will want to
distribute your database and WebLogic Server instances among multiple hosts to
improve performance and availability of your software resources. However, in cases
where you must install multiple WebLogic Servers or databases on the same host,
consider the following guidelines.
When you start Fusion Middleware Control, the Management Agent, or Database
Control, Enterprise Manager immediately begins gathering important monitoring data
about the host and its managed targets. Keep this in mind when you develop a
process for starting the components on the host.
Specifically, consider staggering the startup process so that each Enterprise Manager
process has a chance to start before the next process begins its startup procedure.
Using a staggered startup procedure ensures that the processes are not in contention
for resources during the CPU-intensive startup phase for each component. However,
in the case of a system restart,
/etc/init.d/gcstartup
script which is registered during
the EM deployment ensures that the OMS and the Management Agent are started
automatically in a staggered manner.
27.3 Starting and Stopping Oracle Enterprise Manager 13c
Cloud Control
The following sections describe how to stop and start all the Cloud Control
components that are installed by the Oracle Enterprise Manager 13c Cloud Control
Console installation procedure.
You can use these procedure to start all the framework components after a system
reboot or to shutdown all the components before bringing the system down for system
maintenance.
The following procedures are covered under this section:
•Starting Cloud Control and All Its Components
•Stopping Cloud Control and All Its Components
Chapter 27
Executing EMCTL Commands
27-2

27.3.1 Starting Cloud Control and All Its Components
The following procedure summarizes the steps required to start all the components of
the Cloud Control. For example, use this procedure if you have restarted the host
computer and all the components of the Cloud Control have been installed on that
host.
To start all the Cloud Control components on a host, use the following procedure:
1. If your Oracle Management Repository resides on the host, change directory to
the Oracle Home for the database where you installed the Management
Repository and start the database and the Net Listener for the database:
a. Set the ORACLE_HOME environment variable to the Management Repository
database home directory.
b. Set the ORACLE_SID environment variable to the Management Repository
database SID (default is asdb).
c. Start the Net Listener:
$PROMPT> $ORACLE_HOME/bin/lsnrctl start
d. Start the Management Repository database instance:
ORACLE_HOME/bin/sqlplus /nolog
SQL> connect SYS as SYSDBA
SQL> startup
SQL> quit
2. Start the Oracle Management Service:
$PROMPT> OMS_HOME/bin/emctl start oms
3. Change directory to the home directory for the Oracle Management Agent and
start the Management Agent:
$PROMPT> AGENT_HOME/bin/emctl start agent
Note:
Be sure to run the
emctl start agent
command in the Oracle Management
Agent home directory and not in the Management Service home directory.
27.3.2 Stopping Cloud Control and All Its Components
The following procedure summarizes the steps required to stop all the components of
the Cloud Control. For example, use this procedure if you have installed all the
components of the Cloud Control on the same host you want to shut down or restart
the host computer.
To stop all the Cloud Control components on a host, use the following procedure:
1. Stop the Oracle Management Service:
$PROMPT> $ORACLE_HOME/bin/emctl stop oms -all
Chapter 27
Starting and Stopping Oracle Enterprise Manager 13c Cloud Control
27-3

2. Change directory to the home directory for the Oracle Management Agent and
stop the Management Agent:
$PROMPT> AGENT_HOME/bin/emctl stop agent
Note:
Be sure to run the
emctl stop agent
command in the Oracle Management
Agent home directory and not in the Oracle Management Service home
directory.
3. If your Oracle Management Repository resides on the same host, follow these
steps:
a. Set the ORACLE_HOME environment variable to the Management Repository
database home directory.
b. Set the ORACLE_SID environment variable to the Management Repository
database SID (default is asdb).
c. Stop the database instance:
$PROMPT> ORACLE_HOME/bin/sqlplus /nolog
SQL> connect SYS as SYSDBA
SQL> shutdown
SQL> quit
d. Stop the Net Listener:
$PROMPT> $ORACLE_HOME/bin/lsnrctl stop
27.4 Services That Are Started with Oracle Management
Service Startup
When you start the Management Service, the following services are started:
1. OPMN process. This is the watchdog for the Apache process. The OPMN process
starts the Apache process if it crashes.
2. Apache processes to start the HTTP server.
3. Node Manager Java process. This is the watchdog for the Managed Server and
Admin Server processes. It restarts the Managed Server and Admin Server
processes if they crash.
4. Admin Server Java process (if the command to start OMS is executed on the first
OMS machine). This is the WebLogic Server instance that maintains configuration
data for configured Enterprise Manager domain.
5. Managed Server Java process. This is the Managed WebLogic Server on which
Enterprise Manager application is deployed.
6. (On Windows only) Node Manager service process. This is the Windows service
for starting and stopping the Node Manager (equivalent to the Node Manager
process on Linux).
7. (On Windows only) OMS service process. This is the Windows service for starting
and stopping the OMS.
Chapter 27
Services That Are Started with Oracle Management Service Startup
27-4

8. BI Publisher Server Java process, if it has been configured on the system. This is
the Managed WebLogic Server on which the Oracle BI Publisher application is
deployed.
27.5 Starting and Stopping the Oracle Management Service
and Management Agent on Windows
When you install the Oracle Management Service (OMS) or the Management Agent
on a Windows system, the installation procedure creates new services in the Services
control panel.
The procedure for accessing the Services control panel varies, depending upon the
version of Microsoft Windows you are using. For example, on Windows 2000, locate
the Services control panel by selecting Settings, then Administrative Tools from the
Start menu.
Note:
The
emctl
utility is available in the
bin
subdirectory of the Oracle home where
you have installed the OMS or Management Agent; however, Oracle
recommends that you use the Services control panel to start and stop OMS or
Management Agent on Windows systems.
Table 27-1 describes the Windows service that you use to control the OMS and
Management Agent.
Table 27-1 Service Installed and Configured When Installing the OMS and
Management Agent on Windows
Component Service Name Format Description
Oracle Management
Server
OracleManagementServer_EMGC_OMS1
_1
Use this service to start and stop
all components that were installed
and configured as part of the
Management Service J2EE
application.
Oracle Management
Agent
Oracle<agent_home>Agent
For example:
OracleOraHome1Agent
Use this service to start and stop
the Management Agent.
27.6 Reevaluating Metric Collections Using EMCTL
Commands
Use the following command to perform an immediate reevaluation of a metric
collection:
emctl control agent runCollection <targetName>:<targetType> <colletionItemName>
Chapter 27
Starting and Stopping the Oracle Management Service and Management Agent on Windows
27-5

where
<collectionItemName>
is the name of the Collection Item that collects the metric.
Related metrics are typically collected together; collectively a set of metrics collected
together is called a Metric Collection. Each Metric Collection has its own name. If you
want to reevaluate a metric, you first need to determine the name of the Metric
Collection to which it belongs, then the CollectionItem for that Metric Collection.
When you run the command above to reevaluate the metric, all other metrics that are
part of the same Metric Collection and Collection Item will also be reevaluated.
Perform the following steps to determine the Metric Collection name and Collection
Item name for a metric:
1. Go to
$INSTALL_BASE/ngagent/plugins
directory, where $INSTALL_BASE is the root
of the installation. The Oracle Home of the Management Agent exists in this
directory.
2. Locate the XML file for the target type. For example, if you are interested in the
host metric 'Filesystem Space Available(%)' metric, look for the host.xml file.
3. In the xml file, look for the metric in which you are interested. The metric that you
are familiar with is actually the display name of the metric. The metric name would
be preceded by a tag that started with:
<Label NLSID=
For example, in the host.xml file, the metric 'Filesystem Space Available(%)" would
have an entry that looks like this:
<Label NLSID="host_filesys_pctAvailable">Filesystem Space Available (%) </Label>
4. Once you have located the metric in the xml file, you will notice that its entry is part
of a bigger entry that starts with:
<Metric NAME=
Take note of the value defined for "Metric NAME". This is the Metric Collection
name. For example, for the 'Filesystem Space Available(%)' metric, the entry
would look like this:
<Metric NAME="Filesystems"
So for the 'Filesystem Space Available(%)' metric, the Metric Collection name is
'Filesystems'.
5. The Collection Item name for this Metric Collection needs to be determined next.
Go to the
$INSTALL_BASE/plugins/<plugin id
directory, where $INSTALL_BASE is
the Oracle Home of the Management Agent.
6. In this directory, look for the collection file for the target type. In our example, this
would be host.xml.
7. In cases where a Metric Collection is collected by itself, there would be a single
Collection Item of the same name in the collection file. To determine if this is the
case for your Metric Collection, look for an entry in the collection file that starts
with:
<CollectionItem NAME=
where the value assigned to the CollectionItem NAME matches the Metric NAME
in step (4).
For the 'Filesystem Space Available(%)' metric, the entry in the collection file
would look like:
Chapter 27
Reevaluating Metric Collections Using EMCTL Commands
27-6

<CollectionItem NAME = "Filesystems"
8. If you find such an entry, then the value assigned to "CollectionItem NAME" is the
collection item name that you can use in the emctl command.
9. Otherwise, this means the Metric Collection is collected with other Metric
Collections under a single Collection Item. To find the Collection Item for your
Metric Collection, first search for your Metric Collection. It should be preceded by
the tag:
<MetricColl NAME=
Once you have located it, look in the file above it for:
<CollectionItem NAME=
The value associated with the CollectionItem NAME is the name of the collection
item that you should use in the emctl command.
For example if the you want to reevaluate the host metric "Open Ports", using the
previous steps, you would do the following:
a. Go to the
$INSTALL_BASE/plugins/<plugin id
directory where $INSTALL_BASE
is the Oracle Home of the Management Agent. Look for the host.xml file and in
that file locate:
<Metric NAME="openPorts"
.
b. Then go to the
$INSTALL_BASE/ngagent/plugins/default_collection
directory.
Look for the host.xml file and in that file look for
<CollectionItem
NAME="openPorts"
.
Failing this, look for
<MetricColl NAME="openPorts"
.
c. Look above this entry in the file to find the
<CollectionItem NAME=
string and
find
<CollectionItem NAME="oracle_security"
.
The CollectionItem NAME oracle_security is what you would use in the emctl
command to reevaluate the Open Ports metric.
27.7 Specifying New Target Monitoring Credentials in
Enterprise Manager
To monitor the performance of your database targets, Enterprise Manager connects to
your database using a database user name and password. This user name and
password combination is referred to as the database monitoring credentials.
Note:
The instructions in this section are specific to the monitoring credentials for a
database target, but you can use this procedure for any other target type that
requires monitoring credentials. For example, you can use this procedure to
specify new monitoring credentials for your Oracle Management Service and
Management Repository.
When you first add an Oracle9i Database target, or when it is added for you during the
installation of the Management Agent, Enterprise Manager uses the DBSNMP
database user account and the default password for the DBSNMP account as the
monitoring credentials.
Chapter 27
Specifying New Target Monitoring Credentials in Enterprise Manager
27-7

When you install Oracle Database 11g, you specify the DBSNMP monitoring password
during the database installation procedure.
As a result, if the password for the DBSNMP database user account is changed, you
must modify the properties of the database target so that Enterprise Manager can
continue to connect to the database and gather configuration and performance data.
Similarly, immediately after you add a new Oracle Database 11g target to the Cloud
Control, you may need to configure the target so it recognizes the DBSNMP password
that you defined during the database installation. Otherwise, the Database Home page
may display no monitoring data and the status of the database may indicate that there
is a metric collection error.
Note:
You can modify the Enterprise Manager monitoring credentials by using the
Oracle Enterprise Manager 12c Cloud Control Console.
27.8 EMCTL Commands for OMS
Table 27-2 lists the EMCTL commands for OMS.
Table 27-2 EMCTL Commands for OMS
EMCTL Command Description
emctl getversion oms
Shows the version of the OMS instance.
emctl start oms
Starts the Fusion Middleware components required to run the
OMS application and the JVMD engine.
Specifically, this command starts HTTP Server, the Node
Manager, OPMN process, and the managed server on which the
Management Service is deployed. In addition, if this command is
run on the host that has the Administration Server, then the
Administration Server is also started. Similarly, if this command
is run on a host that has Oracle BI Publisher configured, then
Oracle BI Publisher is also started.
Note: Only the Oracle software owner can start or stop the
OMS.
emctl start oms -
admin_only
Starts only the Administration Server of the domain.
emctl start oms -
bip_only
Starts only the BI Publisher server.
emctl stop oms
Stops the OMS managed server, JVMD engine, and HTTP
server but leaves Node Manager and Administration Server
running.
Note: The
emctl stop oms
command does not stop Fusion
Middleware.
emctl stop oms -all
Stops all Enterprise Manager processes including Administration
Server, OMS, HTTP Server, Node Manager, Management
Server, JVMD engine, and Oracle BI Publisher (if it is configured
on the host).
Chapter 27
EMCTL Commands for OMS
27-8

Table 27-2 (Cont.) EMCTL Commands for OMS
EMCTL Command Description
emctl stop oms -all -
force
and
emctl stop oms -force
Stops the OMS.
The parameter
-force
can be used with both
emctl stop oms -
all
and
emctl stop oms
commands. The
-force
option
forcefully stops the relevant processes. Using this parameter is
not recommended.
emctl stop oms -bip_only
[-force]
Stops only the BI Publisher server.
The parameter
-force
forcefully stops the process instead of a
graceful shutdown. Using this parameter is not recommended.
emctl status oms
Lists the statuses of the OMS, JVMD engine, and the BI
Publisher server.
emctl status oms -
bip_only
Lists the status of only the BI Publisher server.
emctl status oms -
details [-sysman_pwd
<pwd>]
Lists the OMS details such as:
•HTTP and HTTPS upload and console ports of the OMS
and the respective URLs
•Instance home location
•OMS log directory
•Software Load Balancer configuration details
•Administration server machine and port
•Oracle BI Publisher details
•JVMD engine
The
-sysman_pwd
parameter indicates the Enterprise Manager
SYSMAN password. If it is not provided on the command line,
you will be prompted for it.
emctl set property
Sets the values of the OMS configuration properties.
By default, the command
emctl set property
will set the
property value for all the OMSs. To set the property value for a
specific OMS, specify an extra option
-oms_name
, which should
be in the format
hostname.myco.com:
17707_Management_Service
. To set the property value for the
current OMS, specify
-oms_name = "local_oms
.". To set the
property for a remote OMS, specify
-oms_name=<name of remote
OMS>.
Note: From Enterprise Manager 12.1.0.2.0 onwards, you can
also view and edit OMS properties from the Cloud Control
console as follows:
1. From the Setup menu, select Manage Cloud Control, then
select Management Services.
2. On the Management Services page, click Configuration
Properties.
3. On the Configuration Properties page, you can view and edit
OMS properties.
Note: You will need OMS Configuration Property resource
privilege to navigate to this page.
emctl get property
Displays the values of OMS configuration properties.
Chapter 27
EMCTL Commands for OMS
27-9

Table 27-2 (Cont.) EMCTL Commands for OMS
EMCTL Command Description
emctl get property -name
<property name> [-
oms_name <OMS name>] [-
sysman_pwd "sysman
password"]
Displays the value of the specified property.
-name
indicates the name of the property and
-oms_name
indicates the name of the OMS for which the property value is to
be derived. If
-oms_name
is not mentioned, the property value for
all the OMSs are displayed.
emctl set property -name
<property name> -value
<property value> [-
oms_name <OMS name>] [-
module <emoms|logging>]
[-sysman_pwd "sysman
password"]
Sets the value of the specified property.
The parameters are explained below:
•
-name:
Indicates the name of the property.
•
-oms_name:
Indicates the OMS for which the property value
has to be set. In case this option is not specified, the
property value is set at a global level or for the current OMS.
•
-module_name:
Indicates the module for the property.
Specify either
logging
or
emoms
. Logging properties are
used to configure Log4j whereas emoms properties are
used to configure the OMS.
emctl set property -file
<absolute path of the
file containing
properties> [-oms_name
<OMS name>] [-module
<emoms|logging>] [-
sysman_pwd "sysman
password"]
Sets the values of the properties in the specified file.
The parameters are explained below:
•
-file_name:
Indicates the absolute path of the .properties
file containing the properties and the values. This file should
contain only those properties whose values need to be set.
•
-oms_name:
Indicates the OMS for which the property values
has to be set. In case this option is not specified, the
property values are set at a global level or for the current
OMS.
•
-module_name:
Indicates the module for the property.
Specify either
logging
or
emoms
. Logging properties are
used to configure Log4j whereas emoms properties are
used to configure the OMS.
emctl delete property -
name <property name> [-
oms_name <OMS name>] [-
module <emoms|logging>]
[-sysman_pwd "sysman
password"]
Deletes the configured value of the specified property and sets it
to the default value.
-name
indicates the name of the property and
-oms_name
indicates the name of the OMS for which the property value is to
be deleted. If
-oms_name
is not mentioned, the property value is
deleted at the global level or for the current OMS.
emctl list properties
Displays the properties of all OMSs.
Use
-out_file
parameter to get a list of all the properties for all
OMSs. This command enables easy comparison of configuration
across two OMSs.
emctl list properties [-
oms_name <OMS name>] [-
module <emoms|logging>]
[-out_file <output file
name>] [-sysman_pwd
"sysman password"]
Displays the values of all the customer visible OMS properties.
The parameters are explained below:
•
-oms_name:
Indicates the OMS for which the property values
are to be displayed. In case this option is not specified, the
property values for all the OMSs are displayed.
•
-module_name:
Indicates the module of the properties. This
option can be used as a filter to display module-specific
properties. Logging properties are used to configure Log4j
whereas emoms properties are used to configure the OMS.
•-out_file: Indicates the absolute path of the output file. This
is an optional parameter to save the output in a file.
Chapter 27
EMCTL Commands for OMS
27-10

Table 27-2 (Cont.) EMCTL Commands for OMS
EMCTL Command Description
emctl config oms -
list_repos_details
Displays the OMS repository details.
emctl config oms -
store_repos_details [-
repos_host <host> -
repos_port <port> -
repos_sid <sid> | -
repos_conndesc <connect
descriptor> ] -
repos_user <username> [-
repos_pwd <pwd>]
Configures the OMS to use the specified database as the
Management Repository.
All the additional parameters mentioned in the command need to
be specified.
emctl config oms -
change_repos_pwd [-
old_pwd <old_pwd>] [-
new_pwd <new_pwd>] [-
use_sys_pwd [-sys_pwd
<sys_pwd>]]
Changes the password of root user (SYSMAN) in the repository
database and in the OMS.
To change the Enterprise Manager root user (SYSMAN)
password:
1. Stop all the OMSs using
emctl stop oms
command.
2. Run
emctl config oms -change_repos_pwd
on one of the
OMSs.
3. Restart all the OMSs using the
emctl stop oms -all
and
emctl start oms
commands.
emctl config oms -
change_view_user_pwd [-
sysman_pwd <sysman_pwd>]
[-user_pwd <user_pwd>]
[-auto_generate]
Configures the password used by OMS for MGMT_VIEW user
that is used for report generation.
To change the Enterprise Manager MGMT_VIEW user
password:
1. Stop all the OMSs using
emctl stop oms
command.
2. Run
emctl config oms -change_view_user_pwd
on one of
the OMSs.
3. Restart all the OMSs using the
emctl stop oms -all
and
emctl start oms
commands.
emctl secure oms
Sets up the SSL configuration for OMS.
emctl genreport oms -
file_name <file_name> [-
dest_dir <dest_dir>]
Generates and saves the emcli tracing performance report.
-file_name
indicates the name of the input file containing the
trace data and
-dest_dir
indicates the name of the output
directory where the performance report is saved.
emctl
gen_ui_trace_report oms
[-start_time <start_time
in hh:mm:ss format>] [-
duration <duration in
hh:mm format>] [-
user_name <username>] [-
out_file <out_file>] [-
sysman_pwd <sysman_pwd>]
Generates the performance report for user interface (UI) access.
The parameters are explained below:
•
-user_name:
Indicates the user name for which the UI
access performance report has to be generated. The default
is for all users.
•
-start_time:
Indicates the start time in hh:mm:ss format
from when the report has to be generated.
•
-duration:
Indicates the duration in hh:mm format for
which report has to be generated. The default is 01:00. The
maximum duration is limited to 24:00.
•
-out_file:
Indicates the name of the output report file.
Chapter 27
EMCTL Commands for OMS
27-11

Table 27-2 (Cont.) EMCTL Commands for OMS
EMCTL Command Description
emctl config oms -
set_startup_mode
[pbs_only | console_only
| normal]
Configures the startup mode of the OMS. This command cannot
be executed on the primary OMS.
The three startup modes are as below:
•
pbs_only:
If the startup mode is configured to
pbs_only,
then the command
emctl start oms
starts only the PBS
application.
•
console_only:
If the startup mode is configured to
console_only,
then the command
emctl start oms
starts
only the console application.
•
normal:
If the startup mode is configured to
normal,
then
the command
emctl start oms
starts both the PBS
application and the console application.
emctl config oms -
get_startup_mode
Displays the OMS startup mode of the current OMS.
emctl config oms sso -
host ssoHost -port
ssoPort -sid ssoSid -
pass ssoPassword -das
dasURL -u user
Configures Enterprise Manager (EM) to use Oracle SSO
(OSSO) for authentication. To run this command you should
have registered the EM site with the OSSO server, as you will
need the generated registration file as an input for this
command.
emctl config oms -
update_ds_pwd -ds_name
<datasource_name> [-
ds_pwd <datasource_pwd>]
Updates a new password for the specified datasource.
In the command,
-ds_name
indicates the name of the
datasource, and
-ds_pwd
indicates the new password of the
datasource.
emctl config oms -
store_embipws_creds [-
admin_pwd
<weblogic_pwd>] [-
embipws_user
<new_embipws_username>]
[-embipws_pwd
<new_embipws_pwd>]
Changes the password, and optionally the user name used by
the Enterprise Manager to access the installed BI Publisher Web
Server.
The
emctl
verb does not change the credentials of the user in
the back end. Use the corresponding application or console to
configure the back end credentials to match the credentials used
in this
emctl
verb.
This command is operational only if the BI Publisher is installed.
It is not necessary for you to restart any OMS (i.e.
EMGC_OMS####, BIP####) for this command.
emctl config oms -
bip_shared_storage -
config_volume <vol1> -
cluster_volume <vol2> [-
admin_pwd <adminpwd>] [-
sysman_pwd <sysmanpwd>]
Sets the shared storage for BI Publisher, in preparation of
adding an OMS (which will also contain a scaled-out BI
Publisher). Adding an OMS automatically adds a BI Publisher
server that functions in a High Availability environment.
Therefore, the BI Publisher will support both redundancy and
scalability.
This command is used to set up or move a shared storage
location in preparation of running the BI Publisher in a High
Availability (HA) environment.
The parameter
-config_volume
specifies the BI Publisher
repository and configuration files. The existing volume is copied
to the volume specified in this parameter.
The parameter
-cluster_volume
specifies the storage required
for the BI Publisher scheduler to operate in a HA environment.
This command is normally run only once on the system that
contains the primary OMS and the primary BI Publisher.
Chapter 27
EMCTL Commands for OMS
27-12

Table 27-2 (Cont.) EMCTL Commands for OMS
EMCTL Command Description
emctl extended oms
<verb> [verb_args] [-
help]
Executes the
<verb>
registered with the EMCTL extended
framework.
The
verb_args
parameter specifies the verb-specific arguments.
The
-help
parameter provides the verb specific help. For a list of
extended verbs, run
emctl extended oms.
emctl register oms
metadata -service
<Metadata Service Id> (-
file <Metadata Instance
file> | -file_list <File
containing list of files
to register>) (-core | -
pluginId <Plugin Id>) [-
sysman_pwd <sysman
password>]
Registers the metadata.
The
-file_list
parameter provides the path to the file
containing a list of the file paths (one on each line). These file
paths are relative to OMS Oracle home or Plug-in Oracle home
depending on whether the
-core
parameter is passed or the
-
pluginId
parameter is passed.
emctl register oms
metadata -service
targetType -file <XML
filename> [-core | -
pluginId <Plugin Id>] [-
sysman_pwd "sysman
password"]
and
emctl
register oms metadata -
service storeTargetType
-file <XML filename> [-
core | -pluginId <Plugin
Id>] [-sysman_pwd
"sysman password"]
Registers a target type when these two commands are
executed, one after the other.
The parameter
-file <XML filename>
specifies the target
type .
xml
file name with the absolute path or the relative path.
emctl deregister oms
metadata -service
<Metadata Service Id> (-
file <Metadata Instance
file> && (-old_file
<File containing
previous metadata
instances> | -
no_old_file <in case
there are no previous
metadata instances>)) |
-file_list <File
containing list of ';'
separeated new and old
files to deregister>) (-
core | -pluginId <Plugin
Id>) [-sysman_pwd
<sysman password>]
Erases the metadata.
The
-file_list
option provides the path to the file containing
the list of file paths (one on each line). These file paths are
relative to OMS Oracle home or Plug-in Oracle home depending
on whether the
-core
parameter is passed or the
-pluginId
parameter is passed.
27.9 EMCTL Commands for Management Agent
Table 27-3 lists the EMCTL commands for Management Agents.
Chapter 27
EMCTL Commands for Management Agent
27-13

Table 27-3 EMCTL Commands for Management Agent
EMCTL Command Description
emctl start agent
Starts the Management Agent.
On IBM AIX environment with a large memory configuration
where the Management Agent is monitoring a large number of
targets, the Agent may not start. To prevent this issue, prior to
starting the Management Agent, add the following parameters to
the common environment file:
LDR_CNTRL="MAXDATA=0x80000000"@NOKRTL
AIXTHREAD_SCOPE=S
The
LDR_CNTRL
variable sets the data segment size and disables
loading of run time libraries in kernel space. The
AIXTHREAD_SCOPE
parameter changes AIX Threadscope context
from the default Processwide 'P' to Systemwide 'S'. This causes
less mutex contention.
emctl stop agent
Stops the Management Agent.
emctl status agent
Lists the status of Management Agent.
If the Management Agent is running, this command displays
status information about the Management Agent, including the
Agent Home, the process ID, and the time and date of the last
successful upload to the Management Repository ().
Note: On a Windows system change the directory to the
AGENT_INSTANCE_HOME
directory before executing the command.
emctl status agent -
secure
Lists the secure status of the Mangement Agent and the secure
mode port on which the Management Agent is running. It also
lists the OMS security status and the port.
emctl status agent
scheduler
Lists all the running, ready, and scheduled collection threads.
emctl status agent jobs
Lists the status of the jobs that are running at present on the
Management Agent.
emctl status agent
target <target
name>,<target
type>,<metric>
Lists the detailed status of the specified targets such as target
name, target type, and so on. You can also provide a particular
metric name in the
emctl status agent
command to get the
status of a particular metric of a target.
emctl status agent
mcache <target
name>,<target
type>,<metric>
Lists the names of the metrics whose values are present in the
metric cache.
emctl upload
Uploads the
.xml
files that are pending to the OMS under the
upload directory.
emctl upload (agent)
Use this command to force an immediate upload of the current
management data from the managed host to the Management
Service. Use this command instead of waiting until the next
scheduled upload of the data.
Chapter 27
EMCTL Commands for Management Agent
27-14

Table 27-3 (Cont.) EMCTL Commands for Management Agent
EMCTL Command Description
emctl reload (agent)
This command can be used to apply the changes after you have
manually modified the
emd.properties
file. For example, to
change the upload interval, emd.properties can be modified, and
emctl reload
can then be run.
Note: Oracle does not support manual editing of the
targets.xml
files unless the procedure is explicitly documented
or you are instructed to do so by Oracle Support.
emctl reload agent
dynamicproperties
[<Target_name>:<Target_T
ype>]...
Recomputes the dynamic properties of a target and displays
them.
emctl pingOMS [agent]
Pings the OMS to check if the Management Agent is able to
connect to the OMS. Management Agent will wait for the reverse
ping from the OMS so that Management Agent can confirm that
the
pingOMS
is successful.
emctl config agent getTZ
Configures the current time zone as set in the environment.
emctl config agent
getSupportedTZ
Displays the supported time zone based on the setting in the
environment.
emctl config console
<fileloc> [<EM loc>]
Configures the console based on the configuration entries
mentioned in the file
<fileloc>.
The
<EM loc>
parameter is optional and can be used to operate
on a different Oracle home.
emctl config agent
listtargets [<EM loc>]
Lists all the target names and types monitored by the
Management Agent, that are present in
targets.xml
file.
The
<EM loc>
parameter is optional and can be used to operate
on a different Oracle home.
emctl control agent
runCollection
<target_name>:<target_ty
pe> <metric_name>
Allows you to manually run the collections for a particular metric
of a target.
For example,
emctl control agent runCollection
myOracleHomeTargetName:oracle_home oracle_home_config.
emctl control agent
runCollection
<targetName>:<targetType
> <colletionItemName>
Performs an immediate reevaluation of a metric collection
Executing this command causes the reevaluated value of the
metric to be uploaded into the Management Repository, and
possibly trigger alerts if the metric crosses its threshold.
To identify the metric name and the collection item name
associated with the metric, see Reevaluating Metric Collections
Using EMCTL Commands.
Chapter 27
EMCTL Commands for Management Agent
27-15

Table 27-3 (Cont.) EMCTL Commands for Management Agent
EMCTL Command Description
emctl resetTZ agent
Resets the time zone of the Management Agent. To change the
current time zone to a different time zone, stop the Management
Agent and then run this command. You can then start the
Management Agent.
Important:
Before you change the Management Agent time zone, first check
to see if there are any blackouts that are currently running or
scheduled to run on any targets managed by that Management
Agent. Refer to Viewing Blackouts/Notification Blackouts to know
how to check for blackouts.
If any blackouts exist, then from the Cloud Control Console, stop
all the scheduled and all the currently running blackouts on all
targets monitored by that Management Agent. You can then
change the Management Agent's time zone and later create new
blackouts on the targets as needed.
emctl getversion agent
Prints the version of the Management Agent.
emctl dumpstate agent
<component> . . .
Generates the dumps for the Management Agent. This
command allows you to analyze the memory/CPU issues of the
Management Agent.
emctl gensudoprops
Generates the sudo properties of the Management Agent.
emctl clearsudoprops
Clears the sudo properties.
emctl clearstate
Clears the state directory contents. The files that are located in
the
$ORACLE_HOME/sysman/emd/state
will be deleted if this
command is run. The state files are the files which are waiting for
the Management Agent to convert them into corresponding
.xml
files.
emctl getemhome
Prints the Management Agent home directory.
emctl start blackout
<Blackoutname> [-
nodeLevel]
[<Target_name>[:<Target_
Type>]].... [-d
<Duration>]
Starts blackout on a target.
If the parameter
<Target_name:Target_type>
is not entered,
then the local node target is taken as the default.If
-nodeLevel
parameter is specified after
<Blackoutname>
,the blackout will be
applied to all targets and any target list that follows will be
ignored.The
<Duration>
should be specified in [days] hh:mm
format.
emctl stop blackout
<Blackoutname>
Stops the blackout that was started on a particular target. Only
those blackouts that are started by the emctl tool can be stopped
using emctl. This command cannot stop the blackouts that are
started using the console or em cli utility.
emctl status blackout
[<Target_name>[:<Target_
Type>]]....
Provides the status of the target blackout. The status includes
the type of blackout and whether it is a one-time action, or
repeating, or a scheduled blackout. This command also specifies
whether the blackout has started or stopped.
Chapter 27
EMCTL Commands for Management Agent
27-16

Table 27-3 (Cont.) EMCTL Commands for Management Agent
EMCTL Command Description
emctl secure agent
[registration password]
-emdWalletSrcUrl <url> -
protocol <ssl|tls>
Secures the Management Agent with an OMS. The registration
password is essential, as you will be prompted for it if you do not
provide it along with the command.
The
-emdWalletSrcUrl
parameter indicates the URL of the OMS
with which the agent has to be secured.
The
-protocol
parameter indicates the protocol to be used to
secure the Management Agent. The allowed values are
ssl
and
tls.
emctl unsecure agent
Un-secures the Management Agent. This command changes the
Management Agent's port to a HTTP port. After executing this
command the Management Agent will be able to upload to the
OMS on HTTP by connecting to OMS's HTTP upload port
instead of the HTTPS upload port.
emctl verifykey
Verifies the communication between the OMS and Management
Agent by sending
pingOMS
.
emctl deploy agent [-s
<install-password>] [-o
<omshostname:consoleSrvP
ort>] [-S] <deploy-dir>
<deploy-hostname>:<port>
<source-hostname>
Creates and deploys only the Management Agent.
The parameters are explained below:
•
[-s <password>]:
Indicates the install password for
securing the Management Agent.
•
[-S ]:
Indicates that the password will be provided in
STDIN.
•
[-o <omshostname:consoleSrvPort>]:
Indicates the OMS
host name and the console servlet port. Choose the un-
secured port.
•
<deploy-dir>:
Indicates the directory to create the shared
(state-only) installation port.
•
<deploy-hostname:port>:
Indicates the host name and the
port of the shared (state-only) installation. Choose an
unused port.
•
<source-hostname>:
Indicates the host name of the source
install. Typically, it is the machine where the EM is installed.
The host name is searched for and replaced in the
targets.xml
file with the host name provided in the
argument
<deploy-hostname:port>.
•
<sid>:
Indicates the instance of the remote database. It is
only specified when deploying the
dbconsole.
emctl setproperty agent
Configures the specified property name and value in the
Management Agent configuration file. The flag,
allow_new
is an
optional flag that inserts a new property in the Management
Agent configuration file, if it does not exist.
emctl getproperty agent
Gets the specified properties or a category of properties from the
Management Agent configuration files. Currently, this command
does not support spaces in the name. The flag,
-name
provides a
list of property names separated by spaces.
emctl clear_property
agent
Clears the value of the specified property in the Management
Agent configuration file.
emctl status agent
verify
Verifies that the Management Agent is live.
Chapter 27
EMCTL Commands for Management Agent
27-17

27.10 EMCTL Security Commands
This section explains the EMCTL security commands.
The topics covered in this section are:
•EMCTL Secure Commands
•Security diagnostic commands
•EMCTL EM Key Commands
•Configuring Authentication
27.10.1 EMCTL Secure Commands
Table 27-6 lists the general EMCTL security commands.
Table 27-4 EMCTL Secure Commands
EMCTL Command Description
emctl secure console [-
sysman_pwd <pwd>] (-
wallet <wallet_loc>| -
self_signed) [-
key_strength <strength>]
[-cert_validity
<validity>]
Sets up the SSL configuration for the HTTPS console port of the
OMS.
emctl secure lock [-
sysman_pwd <pwd>] [-
console] [-upload]
Locks the OMS upload and console, thereby avoiding HTTP
access to the OMS.
The
-console
and
-upload
parameters are optional.
The
-console
parameter locks and prevents HTTP access to the
EM console, in which case, the EM console can be accessed
only over HTTPS.
The
-upload
parameter prevents the Management Agents from
uploading data to the OMS over HTTP, due to which the
Management Agents can connect to the OMS only over HTTPS.
emctl secure unlock [-
sysman_pwd <pwd>] [-
console] [-upload]
Unlocks the OMS upload and console thereby allowing HTTP
access to the OMS.
The
-console
and
-upload
parameters are optional.
The
-console
parameter unlocks the console for access over
HTTP as well.
The
-upload
parameter unlocks the upload activity thereby
allowing the Management Agents to upload data to the OMS
over HTTP as well.
Chapter 27
EMCTL Security Commands
27-18

Table 27-4 (Cont.) EMCTL Secure Commands
EMCTL Command Description
emctl secure createca [-
sysman_pwd <pwd>] [-
root_country
<root_country>] [-
root_state <root_state>]
[-root_org <root_org>]
[-root_unit <root_unit>]
[-key_strength
<strength>] [-
cert_validity
<validity>]
Creates a new Certificate Authority (CA) which is used to issue
certificates during subsequent securing of OMS and
Management Agents.
emctl secure setpwd
[sysman password] [new
registration password]
Adds a new Management Agent registration password.
emctl secure sync
Verifies if the Management Repository is up.
emctl secure
create_admin_creds_walle
t [-admin_pwd <pwd>] [-
nodemgr_pwd <pwd>]
Re-creates the Administrator Credentials wallet.
Chapter 27
EMCTL Security Commands
27-19

Table 27-4 (Cont.) EMCTL Secure Commands
EMCTL Command Description
emctl secure oms [-
sysman_pwd <sysman
password>] [-reg_pwd
<registration password>]
[-host <hostname>] [-
ms_hostname <Managed
Server hostname>]
[slb_port <SLB HTTPS
upload port>] [-
slb_console_port <SLB
HTTPS console port>] [-
no_slb] [-secure_port
<OHS HTTPS upload Port>]
[-upload_http_port <OHS
HTTP upload port>] [-
reset] [-console] [-
force_newca] [-
lock_upload] [-
lock_console] [-
unlock_upload] [-
unlock_console] [-wallet
<wallet_loc> -
trust_certs_loc
<certs_loc>] [-
key_strength <strength>]
[-sign_alg <md5|sha1|
sha256|sha384|sha512>]
[-cert_validity
<validity>] [-protocol
<protocol>] [-root_dc
<root_dc>] [-
root_country
<root_country>] [-
root_email <root_email>]
[-root_state
<root_state>] [-root_loc
<root_loc>] [-root_org
<root_org>] [-root_unit
<root_unit>]
The
emctl secure oms
command generates a root key within
the Management Repository, modifies the WebTier to enable an
HTTPS channel between the OMS and Management Agents,
and enables the OMS to accept requests from the Management
Agents using the Enterprise Manager Framework Security.
emctl secure wls [-
sysman_pwd <sysman
password>] (-jks_loc
<loc> -jks_pvtkey_alias
<alias> | -wallet <loc>
| -use_demo_cert)
The
emctl secure wls
command secures the WebLogic Server.
The parameter descriptions for the above commands are explained below.
•
-host:
Indicates the Software Load Balancer (SLB) or virtual host name.
•
-ms_hostname:
Indicates the actual host name of the machine where the OMS is
running.
•
-slb_port:
Indicates the HTTPS port configured on SLB for uploads.
Chapter 27
EMCTL Security Commands
27-20

•
-slb_console_port:
Indicates the HTTPS port configured on SLB for console
access.
•
-no_slb:
Removes the SLB configuration.
•
-secure_port :
Specifies the HTTPS upload port change on WebTier.
•
-upload_http_port:
Specifies the HTTP upload port change on WebTier.
•
-reset:
Creates new CA.
•
-force_newca:
Forces OMS to secure with the new CA, even when there are
Management Agents secured with the older CA.
•
-console:
Creates a certificate for console HTTPS port as well.
•
-lock_upload:
Locks upload.
•
-lock_console:
Locks console.
•
-unlock_upload:
Unlocks upload.
•
-unlock_console:
Unlocks console.
•
-wallet:
Indicates the directory where the external wallet is located.
•
-trust_certs_loc:
Indicates the file containing all the trusted certificates.
•
-key_strength:
512|1024|2048
•
-sign_alg:
Signature Algorithm; md5|sha1|sha256|sha384|sha512.
•
-cert_validity:
Indicates the number of days the certificate should be valid. The
minimum value is 1 and the maximum value is 3650.
•
-protocol:
Indicates the SSL protocol to be used on WebTier. The valid values for
<protocol>
are the allowed values for Apache's SSL protocol directive.
•
-jks_loc:
Indicates the location of JKS containing the custom certificate for
administrator and managed servers.
•
-jks_pvtkey_alias:
Indicates the JKS private key alias.
•
-jks_pwd:
Indicates the JKS key store password.
•
-jks_pvtkey_pwd:
Indicates the JKS private key password.
•
-wallet:
Indicates the location of the wallet containing the custom certificate for
administrator and managed servers.
•
-use_demo_cert:
Configures the demonstration certificate for administrator and
managed servers.
27.10.2 Security diagnostic commands
Table 27-5 lists the EMCTL security diagnostic commands.
Chapter 27
EMCTL Security Commands
27-21

Table 27-5 EMCTL Security Diagnostic Commands
EMCTL Command Description
emctl secdiag openurl -
url <url> [-trust_store
<location of jks or
base64 file>] [-
ssl_protocol <protocol>]
[-cipher <low|medium|
high|
some_ciphersuite_name>]
[-proxy_host <host> -
proxy_port <port>] [-
proxy_realm <realm>] [-
proxy_user <user> -
proxy_pwd <pwd>]
Diagnoses the connectivity issues to the specified URL.
The parameter descriptions are as follows:
•
-url:
Indicates the URL to be tested.
•
-trust_store:
Indicates the location of the trust store. It
can be a
jks
or
base64
file. If it is not specified, the
connection will be blindly trusted.
•
-ssl protocol:
Indicates the protocol to be used to make
the connection.
•
-cipher:
Indicates the cipher suites to be used. You can
specify low, medium, high or a cipher suite name.
•
-proxy_host:
Indicates the host name of the proxy server.
•
-proxy_port:
Indicates the proxy server's port number.
•
-proxy_realm:
Indicates the proxy server's realm.
•
-proxy_user:
Indicates the proxy user ID.
•
-proxy_password:
Indicates the proxy user password.
emctl secdiag
dumpcertsinrepos -
repos_conndesc <connect
desriptor> [-repos_pwd
<pwd>]
Displays the trust certificates stored in the specified repository.
emctl secdiag
dumpcertsinfile -file
<location of
jks/sso/p12/base64 file>
Displays the trust certificates present in the specified key store,
or wallet, or base64 file.
27.10.3 EMCTL EM Key Commands
Table 27-6 lists the EMCTL EM Key commands.
Table 27-6 EMCTL EM Key Commands
EMCTL Command Description
emctl status emkey [-
sysman_pwd <pwd>]
Displays the health or status of the
emkey
.
emctl config emkey -
copy_to_credstore [-
sysman_pwd <pwd>]
Copies the
emkey
from the Management Repository to the
Credential Store.
emctl config emkey -
remove_from_repos [-
sysman_pwd <pwd>]
Removes the
emkey
from the Management Repository.
Chapter 27
EMCTL Security Commands
27-22

Table 27-6 (Cont.) EMCTL EM Key Commands
EMCTL Command Description
emctl config emkey -
copy_to_file_from_credst
ore -admin_host <host> -
admin_port <port> -
admin_user <username> [-
admin_pwd <pwd>] [-
repos_pwd <pwd>] -
emkey_file <emkey file>
Copies the
emkey
from the Credential Store to the specified file.
emctl config emkey -
copy_to_file_from_repos
(-repos_host <host> -
repos_port <port> -
repos_sid <sid> | -
repos_conndesc <conn
desc>) -repos_user
<username> [-repos_pwd
<pwd>] [-admin_pwd
<pwd>] -emkey_file
<emkey file>
Copies the
emkey
from the Management Repository to the
specified file.
emctl config emkey -
copy_to_credstore_from_f
ile -admin_host <host> -
admin_port <port> -
admin_user <username> [-
admin_pwd <pwd>] [-
repos_pwd <pwd>] -
emkey_file <emkey file>
Copies the
emkey
from the specified file to the credential store.
emctl config emkey -
copy_to_repos_from_file
(-repos_host <host> -
repos_port <port> -
repos_sid <sid> | -
repos_conndesc <conn
desc>) -repos_user
<username> [-repos_pwd
<pwd>] [-admin_pwd
<pwd>] -emkey_file
<emkey file>
Copies the
emkey
from the specified file to the Management
Repository.
27.10.4 Configuring Authentication
This section explains the EMCTL commands for configuring authentications.
The commands covered in this section are:
•Configuring OSSO Authentication
•Configuring OAM Authentication
•Configuring LDAP (OID and AD) Authentication
•Configuring Repository Authentication (Default Authentication)
Chapter 27
EMCTL Security Commands
27-23

The parameter descriptions for all these commands are as below:
•
-enable_auto_provisioning:
Enables automatic-provisioning in EM, wherein
external LDAP users need not be provisioned manually in EM.
•
-auto_provisioning_minimum_role <min_role>:
Automatically provisions only those
external users in EM who have the
min_role
granted to them in LDAP.
•
-minimum_privilege <min_priv>:
Prevents access to EM to users who do not have
the
min_priv
granted to them.
•
-use_ssl:
Indicates the SSL to connect to the LDAP server.
•
-cert_file <cert>:
Indicates the LDAP server certificate to establish trust while
connecting to LDAP server over SSL. Specify this option if the LDAP server has
the certificate signed by a non-popular (or non-trusted) certificate authority.
Note:
This parameter accepts only a single certificate. Importing certificate chains is
not supported. Import the certificate using
keytool
utility before running this
command.
•
-trust_cacerts:
Establishes trust to the LDAP server's certificate while connecting
to the LDAP server. This parameter is typically used if the certificate is signed by a
well known certificate authority.
•
-keystore_pwd <passwd>:
Indicates the password for the default
DemoTrust.jks
keystore
(if the default password has changed), or any custom
keystore
to which
the LDAP server's certificate will be imported as a part of validation.
•
-use_anonymous_bind:
Uses anonymous bind to connect to LDAP server.
27.10.4.1 Configuring OSSO Authentication
EMCTL OSSO authentication command configures the Enterprise Manager to use the
Oracle Application Server Single Sign-On to register any single sign-on user as an
Enterprise Manager administrator. The EMCTL command to configure OSSO
authentication is:
emctl config auth sso -ossoconf <conf file loc> -dasurl <DAS URL> [-unsecure] [-
sysman_pwd <pwd>] [-domain <domain>] -ldap_host <ldap host> -ldap_port <ldap port>
-ldap_principal <ldap principal> [-ldap_credential <ldap credential>] -
user_base_dn <user base DN> -group_base_dn <group base DN> [-logout_url <sso
logout url>] [-enable_auto_provisioning] [-auto_provisioning_minimum_role
<min_role>] [-minimum_privilege <min_priv>] [-use_ssl] [-cert_file <cert>] [-
trust_cacerts] [-use_anonymous_bind] [-keystore_pwd <passwd>]
For example,
emctl config auth sso -ossoconf $T_WORK/osso.conf -dasurl "http://
xxx.oracle.com:11" -sysman_pwd sysman -ldap_host xxx.oracle.com -ldap_port 111 -
ldap_principal cn=orcladmin -ldap_credential ackdele1 -user_base_dn
"cn=Users,dc=us,dc=oracle,dc=com" -group_base_dn
"cn=Groups,dc=us,dc=oracle,dc=com" -logout_url "http://xxx.oracle.com:11/pls/
orasso/orasso.wwsso_app_admin.ls_logout?p_done_url=https//xyy.oracle.com:216/em.
Chapter 27
EMCTL Security Commands
27-24

27.10.4.2 Configuring OAM Authentication
Oracle Access Manager authentication is the Oracle Fusion Middleware single sign-on
solution. This authentication scheme is used for data centers that have standardized
on Oracle Access Manager as the central tool for authentication across all enterprise
applications. The EMCTL command to configure OAM authentication is:
emctl config auth oam [-sysman_pwd <pwd>] -oid_host <host> -oid_port <port> -
oid_principal <principal> [-oid_credential <credential>] [-use_anonymous_bind] -
user_base_dn <dn> -group_base_dn <dn> -oam_host <host< -oam_port <port> [-
logout_url <url>] [-is_oam10g] [-user_dn <dn>] [-group_dn <dn>] [-
enable_auto_provisioning] [-auto_provisioning_minimum_role <min_role>] [-
minimum_privilege <min_priv>] [-use_ssl] [-cert_file <cert>] [-trust_cacerts] [-
keystore_pwd <passwd>]
For example,
emctl config auth oam -oid_host "xxx.oracle.com" -oid_port "111" -
oid_principal "cn=orcladmin" -user_base_dn "cn=users,dc=us,dc=oracle,dc=com" -
group_base_dn "cn=groups,dc=us,dc=oracle,dc=com" -oam_host "xxx.oracle.com" -
oam_port "555" -oid_credential "eldleco1" -sysman_pwd "sysman" -logout_url http://
xxx.oracle.com:23716/oam/server/logout?end_url=https://yyy.oracle.com:5416/em -
enable_auto_provisioning -auto_provisioning_minimum_role “EM_DBA".
27.10.4.3 Configuring LDAP (OID and AD) Authentication
The EMCTL command for configuring OID authentication is as below. For AD, replace
the command syntax
emctl config auth oid
below with
emctl config auth ad.
All other
parameters remain the same.
OID authentication command configures the Oracle Internet Directory as the identity
store for all the applications to authenticate it's users against the OID.
Similarly, AD authentication command configures the Microsoft Active Directory as the
identity store for all the applications to authenticate it's users against the AD.
emctl config auth oid -ldap_host <ldap host> -ldap_port <ldap port> -
ldap_principal <ldap principal> [-ldap_credential <ldap credential>] [-sysman_pwd
<pwd>] -user_base_dn <user base DN> -group_base_dn <group base DN> [-user_dn <dn>]
[-group_dn <dn>] [-enable_auto_provisioning] [-auto_provisioning_minimum_role
<min_role>] [-minimum_privilege <min_priv>] [-use_ssl] [-cert_file <cert>] [-
trust_cacerts] [-use_anonymous_bind] [-keystore_pwd <passwd>]
For example,
emctl config auth oid -ldap_host "xxx.oracle.com" -ldap_port "111" -
ldap_principal "cn=orcladmin" -user_base_dn "cn=users,dc=us,dc=oracle,dc=com" -
group_base_dn "cn=groups,dc=us,dc=oracle,dc=com" -ldap_credential "elecmee1" -
sysman_pwd "sysman" –use_ssl –cert_file “/scratch/oidcert.txt".
27.10.4.4 Configuring Repository Authentication (Default Authentication)
The repository authentication command validates the user credentials against the
Management Repository for authentication. The EMCTL command to configure the
repository authentication is:
emctl config auth repos [-sysman_pwd <pwd>]
Chapter 27
EMCTL Security Commands
27-25

27.11 EMCTL HAConfig Commands
Table 27-7 lists the EMCTL HA configuration commands.
Table 27-7 EMCTL HA Configuration Commands
EMCTL Commands Description
emctl exportconfig oms
[-sysman_pwd <sysman
password>]
Exports a snapshot of the OMS configuration to the specified
directory. It is recommended to save the configuration details in
a secure location and to save it every time there is a change in
the configuration. These details will be required during a system
recovery.
The parameter descriptions are as below:
•
-oms_only
: Specifies the OMS-only backup on
Administration server host.
•
-keep_host
: Specifies that the host name will also be a part
of the backup if no SLB is defined. Use this option only if
recovery will be done on a machine that responds to this
host name.
emctl importconfig oms -
file <backup file> [-
no_resecure] [-
sysman_pwd <sysman
password>] [-reg_pwd
<registration password>]
Imports the OMS configuration from the specified backup file.
This command is used during a system recovery. The parameter
descriptions are as below:
•
-file <backup file>
: Indicates the backup file to import
from.
•
-no_resecure
: Specifies that the system will not re-secure
OMS after the import is complete. The default is to re-
secure the OMS after the import is complete.
emctl config emrep [-
sysman_pwd <sysman
password>]
Configures the OMS and repository target. This command is
used to change the monitoring Agent for the target and/or the
connection string used to monitor this target. The parameter
descriptions are as below:
•
-agent <new agent>
: Specifies a new destination agent for
the
emrep
target
•
-conn_desc [<jdbc connect descriptor>]
: Updates
Connect Descriptor with the specified value. If the value is
not specified, it is taken from the stored value in
emoms.properties
.
•
-ignore_timeskew:
Ignores time skew on Agents.
Chapter 27
EMCTL HAConfig Commands
27-26

Table 27-7 (Cont.) EMCTL HA Configuration Commands
EMCTL Commands Description
emctl config repos [-
sysman_pwd <sysman
password>]
Configures the repository database target. This command is
used to change the monitoring Agent for the target and/or the
monitoring properties (host name, Oracle Home and connection
string used to monitor this target). The parameter descriptions
are as below:
•
-agent <new agent>:
Specifies a new destination agent for
the repository target.
•
-host <new host>]:
Specifies a new host name for the
repository target.
•
-oh <new oracle home>:
Specifies a new Oracle home for
the repository target.
•
-conn_desc [<jdbc connect descriptor>]:
Updates
Connect Descriptor with the specified value. If the value is
not specified, it is taken from the stored value in
emoms.properties
.
•
-ignore_timeskew:
Ignores time skew on Agents.
emctl enroll oms [-
as_host <host>]
-as_port
<port> - as_pws <admin
password> -nm_pwd
<nodemanager password>
Enrolls the OMS on to the specified Administration Server host.
This command is used in the process of recovering an OMS in a
multi-OMS environment. The parameter descriptions are as
below:
•
-as_port <port>:
Specifies the Administration Server
secure port.
•
-as_pwd <admin password>
: Specifies the Administration
Server password.
•
-nm_pwd <nodemanager password>:
Specifies the node
manager password.
27.12 EMCTL Resync Commands
Table 27-8 lists the EMCTL resync commands.
Table 27-8 EMCTL Resync Commands
EMCTL Commands Description
emctl resync repos (-
full|-agentlist "agent
names") [-name "resync
name"] [-sysman_pwd
"sysman password"]
Submits a repository re-synchronization operation. When the
–
full
option is specified, all agents are instructed to upload the
latest state to the repository.
The
-agent
parameter indicates the list of agents to re-
synchronize with.
Note: To use this command shut down the OMSes first and then
submit the
resync repos
command. You can then start the
OMSes to start the resync jobs.
emctl abortresync repos
(-full|-agentlist "agent
names") -name "resync
name" [-sysman_pwd
"sysman password"]
Aborts the currently running repository re-synchronization
operation. The
–full
option stops the complete repository re-
synchronization, and the
–agentlist
option stops the re-
synchronization of the list of agents.
Chapter 27
EMCTL Resync Commands
27-27

Table 27-8 (Cont.) EMCTL Resync Commands
EMCTL Commands Description
emctl statusresync repos
-name "resync name"
Lists the status of the given repository re-synchronization
operation.
27.13 EMCTL Connector Command
The EMCTL command to add and register a custom template on Enterprise Manager
is:
emctl register_template connector [-t <template.xml>] [-repos_pwd <repos
password>] [-cname <connectorName>] [-iname <internalName>] [-tname
<templateName>] [-ttype <templateType>] [-d <description>]
The parameter descriptions are as below:
•
-t:
Indicates the full path of the template.
•
-repos_pwd:
Indicates the Enterprise Manager root (SYSMAN) password.
•
-cname:
Indicates the connector name.
•
-iname:
Indicates the internal name of the template.
•
-tname:
Indicates the displayed template name.
•
-ttype:
Indicates the template type. The different template types are:
–
<templateType> 1
: inbound transformation
–
<templateType> 2:
outbound transformation
–
<templateType> 3:
xml based outbound transformation
•
-d:
Indicates the description.
27.14 EMCTL Patch Repository Commands
Table 27-9 lists the EMCTL patch repository commands.
Table 27-9 EMCTL Patch Repository Commands
EMCTL Commands Description
emctl applypatch repos
[-patchHome <patch home
directory> -pluginHome
<plugin home directory>]
Loads the
.sql
files in the patch to the repository. This
command has to be run from the patch directory and the path to
the location where the patch is unzipped has to be specified.
emctl rollbackpatch
repos [-patchHome <patch
home directory> -
pluginHome <plugin home
directory>]
Recalls the
.sql
files from the repository to the patch directory
location that is specified.
Chapter 27
EMCTL Connector Command
27-28

27.15 EMCTL Commands for Windows NT
The
emctl create service
command creates a service for the OMS on Windows. Use
this command to manage the Windows service for the OMS on a failover host in a
Cold Failover Cluster setup. This command is applicable only on Windows NT. The
syntax of the command is:
emctl create service [-oms_svc_name <oms_service_name> -user <username>] [-passwd
<password>]
The parameter descriptions are as below:
•
-oms_svc_name <servicename>:
Indicates the name of the OMS service to be
created. If a name is not specified, the system uses the service names in the EM
properties file.
•
-user <username>:
Indicates the OS user name to register the service with. If the
user name is not specified, the system registers it as LocalSystem.
•
-passwd <password>:
OS password for the OS user specified.
The
emctl delete service
command deletes the service for the OMS on Windows.
This command is applicable only on Windows NT. The command syntax is as below,
where,
-oms_svc_name <servicename>
indicates the name of OMS service to be deleted.
emctl delete service [-oms_svc_name <oms_service_name>]
27.16 EMCTL Partool Commands
The
emctl partool
utility helps you:
•Export deployment procedures, and its associated components and directives as
par
files
•Import
par
files to the same instance or any other instance of Cloud Control
The different flavors of the
emctl partool
command are listed below:
•
emctl partool <deploy|view> -parFile <file> -force(optional)
•
emctl partool <deploy|view> -parFile <file> -force(optional) -ssPasswd
<password>
•
emctl partool <deploy|view> -parDir <dir> -force(optional)
•
emctl partool export -guid <procedure guid> -file <file> -displayName <name> -
description <desc> -metadataOnly(optional)
•
emctl partool check
•
emctl partool help
Table 27-10 lists the EMCTL partool command options.
Table 27-10 EMCTL Partool Command Options
EMCTL Command Option Description
<deploy|view|export>
Deploys, displays, or exports the
par
files.
Chapter 27
EMCTL Commands for Windows NT
27-29

Table 27-10 (Cont.) EMCTL Partool Command Options
EMCTL Command Option Description
repPasswd <repPasswd>
Indicates the repository password.
force
Forces the
swlib
entities to be created or uploaded again. If they
are already present, it creates a new revision.
check
Checks if the software library is configured.
f
ile <file>
Indicates the
par
file.
verbose
Indicates the
verbose
mode.
help
Displays the help message.
displayName
<displayName>
Indicates the
par
file name.
parDir <dir>
Indicates the directory where the
par
files are located.
metadataOnly
Filters for metadata-only exports.
guid <guid>
Indicates the procedure
guid
to export. To export multiple
procedures provide the
guids
separated by comma (,).
parFile <file>
Indicates the path of the
par
file.
description
<description>
Indicates the
par
file description.
ssPasswd
<secretStorePassword>
This parameter is optional. This parameter creates an Oracle
Wallet with the specified password to store the value of the
secret property in the exported software library entity. The user
must use the same password while importing the
par
file in to a
new repository.
Note:
For more information on
emctl partool
command see the topic Using emctl
partool Utility in the Oracle Enterprise Manager Lifecycle Management
Administrator's Guide.
27.17 EMCTL Plug-in Commands
The EMCTL plug-in command is used to resume a previous plug-in upgrade session
that had failed. If the previous failure had occurred in a schema manager session, then
the execution will be resumed from failed PL/SQL block. The command syntax is:
emctl resume_plugin_upgrade
Note:
To know the status of the plug-in deployments run the command
emctl status
oms -details [-sysman_pwd <pwd>].
Chapter 27
EMCTL Plug-in Commands
27-30

27.18 EMCTL Command to Sync with OPSS Policy Store
The EMCTL command to sync roles and users between the EM repository and the
OPSS policy store is:
emctl sync_opss_policy_store [-force]
Note:
If
-force
parameter is specified, it removes the OPSS application roles and
role memberships that are not present in the EM.
27.19 Troubleshooting Oracle Management Service Startup
Errors
Following are the log files you can check if the Oracle Management Service (OMS)
fails to start:
Oracle Management Service Fails to Start
Check the logs located as indicated in Table 27-11. The INSTANCE_HOME
mentioned in the table is the OMS instance home and n is the index of the OMS
server.
Table 27-11 OMS Log Files Location
OMS Log File Log File Location
EMCTL log file $INSTANCE_HOME/sysman/log/emctl.log file
Managed Server log files $INSTANCE_HOME/user_projects/domains/<DOMAIN_NAME>/
servers/EMGC_OMS<n>/logs/EMGC_OMS<n>.log
$INSTANCE_HOME/user_projects/domains/<DOMAIN_NAME>/
servers/EMGC_OMS<n>/logs/EMGC_OMS<n>.out
OMS log files $INSTANCE_HOME/sysman/log/emoms_pbs.log
$INSTANCE_HOME/sysman/log/emoms_pbs.trc
$INSTANCE_HOME/sysman/log/emoms.trc
$INSTANCE_HOME/sysman/log/emoms.log
Node Manager log files $INSTANCE_HOME/NodeManager/emnodemanager/
nodemanager.log
WebTier Service Fails to Start
Check logs under
<WebTier Instance Home>/diagnostics
folder in case WebTier start
fails.
Chapter 27
EMCTL Command to Sync with OPSS Policy Store
27-31

27.20 Troubleshooting Management Agent Startup Errors
If the agent fails to start, see the
emctl.log
and
emagent.nohup
log files for details. The
log files are saved in the
$AGENT_INSTANCE_HOME/sysman/logs
directory. Following are
common issues and troubleshooting suggestions:
•Management Agent starts up but is not ready
•Management Agent fails to start due to time zone mismatch between agent and
OMS
•Management Agent fails to start due to possible port conflict
•Management Agent fails to start due to failure of securing or unsecuring
27.20.1 Management Agent starts up but is not ready
The Management Agent goes through the following process when it starts up:
1. Starting up (the Management Agent has just received the request to start up and is
going to start the initialization sequence)
2. Initializing (the Management Agent is iterating over each of its components and is
initializing them)
3. Ready (All components have been initialized and the Management Agent is ready
to accept requests)
The command to start the Management Agent (
emctl start agent
) has a default
timeout of 120 seconds. At the end of that timeout, it will return control to the caller and
will indicate what the last state of the Management Agent was when it returns control.
Depending on the number of targets being monitored by the Management Agent, step
2 listed above could take a long time and it is possible that when the command exits,
the state of the agent is "Initializing" and the command reports that the "agent is
running but is not ready".
You can increase the timeout by setting an environment variable
"EMAGENT_TIME_FOR_START_STOP". The value should indicate the number of
seconds to wait before returning control to the caller.
27.20.2 Management Agent fails to start due to time zone mismatch
between agent and OMS
The Management Agent uses the time zone set in emd.properties file. During the
install process of the Management Agent, the agent and the host target are registered
with the OMS along with the time zone. If the Management Agent's time zone is
modified at any point after the installation, the OMS will signal the Management Agent
to shut down as soon as it detects this mismatch.
To reset the Management Agent's time zone, run the following command:
emctl resetTZ agent
For more information about setting the time zone for the agent, see the description of
the
emctl resetTZ agent
command in the Table 27-3.
Chapter 27
Troubleshooting Management Agent Startup Errors
27-32

27.20.3 Management Agent fails to start due to possible port conflict
If the Management Agent cannot start and EMCTL reports that there is a possible port
conflict, check the Management Agent's port (based on emd.properties:EMD_URL)
and see if there is another application, such as another agent, running on the machine
that is already bound to the port.
To resolve this issue, stop the application currently bound to the Management Agent's
port.
27.20.4 Management Agent fails to start due to failure of securing or
unsecuring
Securing or unsecuring of the Management Agent can fail if the password to secure
the agent against the OMS is incorrect or if the OMS is locked or down. You can find
the reason for the failure in the
<agent state directory>/sysman/log/secure.log
file.
27.21 Using emctl.log File to Troubleshoot
The
emctl.log
file is a file that captures the results of all EMCTL commands you run.
For Management Agent, the log file resides in the
$AGENT_INSTANCE_HOME/sysman/log
directory of the Management Agent, and for OMS, the log file resides in
the
$OMS_INSTANCE_HOME/em/EMGC_OMS<n>/sysman/log/
directory. The file is updated every
time you run an EMCTL command. If your EMCTL command fails for some reason,
access this log file to diagnose the issue.
For example, run the following command from the Oracle home directory of the
Management Agent to check its status:
For Unix:
<agent_instance_home>/bin/emctl status agent
For Windows:
<agent_instance_home>\bin\emctl status agent
After running the command, navigate to the log directory to view the following
information in the
emctl.log
file:
1114306 :: Wed Jun 10 02:29:36 2011::AgentLifeCycle.pm: Processing status agent
1114306 :: Wed Jun 10 02:29:36 2011::AgentStatus.pm:Processing status agent
1114306 :: Wed Jun 10 02:29:37 2011::AgentStatus.pm:emdctl status returned 3
Here, the first column, that is, 1114306, is the PID that was used to check the status.
The second column shows the date and time when the command was run. The third
column mentions the Perl script that was run for the command. The last column
describes the result of the command, where it shows the progress made by the
command and the exit code returned for the command. In this case, the exit code is 3,
which means that the Management Agent is up and running.
Similarly, for the OMS, you can run the following command from the Oracle home
directory of the Management Service to check its status:
For Unix:
Chapter 27
Using emctl.log File to Troubleshoot
27-33

<OMS_HOME>/bin/emctl status oms
For Windows:
<OMS_HOME>\bin\emctl status oms
Example 27-1 Sample Log Content for OMS
2013-06-23 22:50:25,686 [main] INFO wls.OMSController main.219 - Executing emctl
command : status
2013-06-23 22:50:26,281 [main] INFO commands.BaseCommand printMessage.404 -
statusOMS finished with result: 0
2013-06-23 22:50:35,885 [main] INFO wls.OMSController main.219 - Executing emctl
command : status
2013-06-23 22:50:36,464 [main] INFO commands.BaseCommand printMessage.404 -
statusOMS finished with result: 0
In another example, run the following command from the Oracle home directory of the
Management Agent to upload data:
For Unix:
<Agent_Instance_Home>/bin/emctl upload agent
For Windows:
<Agent_Instance_Home>\bin\emctl upload agent
After running the command, navigate to the log directory to view the following
information in the
emctl.log
file:
1286220 :: Tue Jun 9 07:13:09 2011::AgentStatus.pm:Processing upload
1286220 :: Tue Jun 9 07:13:10 2011::AgentStatus.pm:emdctl status agent returned 3
1286220 :: Tue Jun 9 07:13:41 2011::AgentStatus.pm: emdctl upload returned with
exit code 6
Here, the entries are similar to the entries in the first example, but the exit code
returned is 6, which means the upload operation is failing for some reason.
The exit codes returned depend on the emctl command executed. In general, exit
code of zero means success and any exit code other than zero means failure. For
details about the cause of failure, view the error message.
Chapter 27
Using emctl.log File to Troubleshoot
27-34

28
Locating and Configuring Enterprise
Manager Log Files
When you install the Oracle Management Agent (Management Agent) or the Oracle
Management Service (OMS), Enterprise Manager automatically configures the system
to save certain informational, warning, and error information to a set of log files.
Log files can help you troubleshoot potential problems with an Enterprise Manager
installation. They provide detailed information about the actions performed by
Enterprise Manager and whether or not any warnings or errors occurred.
This chapter not only helps you locate and review the contents of Enterprise Manager
log files, but also includes instructions for configuring the log files to provide more
detailed information to help in troubleshooting or to provide less detailed information to
save disk space.
This chapter contains the following sections:
•Managing Log Files
•Managing Saved Searches
•Locating Management Agent Log and Trace Files
•Locating and Configuring Oracle Management Service Log and Trace Files
•Monitoring Log Files
•Configuring Log Archive Locations
28.1 Managing Log Files
Many Enterprise Manager components generate log files containing messages that
record errors, notifications, warnings, and traces.
Table 28-1 describes the columns in the Log Message table. For any given
component, the optional column may not be populated in the message.
Table 28-1 Message Columns
Column Name Description
Time The date and time when the message was generated. This reflects
the local time zone.
Message Type The type of message. Possible values are: Incident Error Warning,
Notification, and Trace. In addition, the value Unknown may be used
when the type is not known.
28-1

Table 28-1 (Cont.) Message Columns
Column Name Description
Message ID The ID that uniquely identifies the message within the component.
The ID consists of a prefix that represents the component, followed
by a dash, then a 5-digit number. For example:
OHS-51009
Message The text of the error message.
Target (Expanded) Expanded target name.
Target Target name
Target Type Target type
Execution Context The Execution Context ID (ECID), which is a global unique identifier
of the execution of a particular request in which the originating
component participates. You can use the ECID to correlate error
messages from different components.
The Relationship ID, which distinguishes the work done in one thread
on one process, from work done by any other threads on this and
other processes, on behalf of the same request.
Component The component that originated the message.
Module The identifier of the module that originated the message.
Incident ID The identifier of the incident to which this message corresponds.
Instance The name of the Oracle instance to which the component that
originated the message belongs.
Message Group The name of the group to which this message belongs.
Message Level The message level, represented by an integer value that qualifies the
message type. Possible values are from 1 (highest severity) through
32 (lowest severity).
Hosting Client The identifier for the client or security group to which this message
relates.
Organization The organization ID for the originating component. The ID is
oracle
for all Oracle components.
Host The name of the host where the message originated.
Host IP Address The network address of the host where the message originated.
User The name of the user whose execution context generated the
message.
Process ID The ID for the process or execution unit that generated the message.
Thread ID The ID of the thread that generated the message.
Upstream Component The component that the originating component is working with on the
client (upstream) side.
Downstream
Component
The component that the originating component is working with on the
server (downstream) side.
Detail Location A URL linking to additional information regarding the message.
Supplemental Detail Supplemental information about the event, including more detailed
information than the message text.
Chapter 28
Managing Log Files
28-2

Table 28-1 (Cont.) Message Columns
Column Name Description
Archive Values are Yes or No. If the checkbox is checked, the message is
collected from the archive location. Otherwise, the message is
collected from the live system.
Target Log Files Link to the log files page for this target.
Log File Log file that this message contains.
Using Log Viewer, you can do the following:
•Viewing Log Files and Their Messages
•Searching Log Files
•Downloading Log Files
28.1.1 Viewing Log Files and Their Messages
You can use Enterprise Manager Cloud Control to view messages across log files.
In particular, when you navigate in the context of a farm or domain, then the logs that
you can view and search are filtered to just those associated with that farm or domain.
When you navigate to Logs by way of the Enterprise menu, you can pick and choose
exactly what targets you want to view and search logs against. You could also, for
example pick multiple WebLogic Server targets that span across domains/farm.
For example, to view the log files and their messages:
1. From the Enterprise menu, select Monitoring, select Logs, then select the target
from the popup target selector.
or
The Logs menu is available at the individual target label and at the parent target
level. For example, for WebLogic server and for other j2ee components, the logs
menu can be accessed by choosing Logs from the Targets menu. The same is
applicable for parent targets like domain and farm targets.
2. In the context of a farm or domain, expand Selected Targets and in the row for a
particular component or application, click the Target Log Files icon.
When you are in the context of the Enterprise menu, add targets to the Target
table and click the Target Log Files icon.
The Log Files page is displayed. On this page, you can see a list of log files
related to the target.
3. Select a file and click View Log File.
The View Log File page is displayed. On this page, you can view the list of
messages and download the log file from this page.
4. To view the details of a message, select the message.
By default, the messages are sorted by time, in ascending order. You can sort the
messages by the any of the columns, such as Message Type, by clicking the
column name. The Message Type is sorted by importance from highest to lowest
and uses the order of Incident Error, Error, Warning, Notification, and then Trace.
Chapter 28
Managing Log Files
28-3

5. When you are in context of one domain or one farm and looking at logs, the
related messages are confined to that one domain or one farm. For example, to
view messages that are related by time or ECID, click View Related Messages
and select by Time or by ECID (Execution Context ID).
The Related Messages page is displayed.
When trying to view log messages, you may see the following error:
Logging Configuration is missing or invalid for the targets (). Also, make sure that
these targets are up and EM User has the CONFIGURE_TARGET privilege on the
corresponding domains.
To ascertain which method to use to fix the problem, choose one of these three
alternatives:
•The domain's Administration Server is down. To resolve the problem, start the
Administration Server and try viewing log messages again.
•The Managed Server for which you are trying to view log messages is down. To
resolve the problem, start the Managed Server and try viewing log messages
again.
•The Enterprise Manager Cloud Control administrator who is trying to access log
messages does not have the necessary target privileges to do so. In order to view
log messages, the administrator must have been granted the target privilege
“Configure target" for the corresponding WebLogic Domain target. Talk to your
Oracle Enterprise Manager site administrator or super administrator regarding
whether or not you have this privilege.
28.1.1.1 Restricting Access to the View Log Messages Menu Item and
Functionality
You can restrict which administrators in Oracle Enterprise Manager Cloud Control
have access to the View Log Messages menu item and its corresponding functionality.
You can grant a target privilege labeled “Ability to view Fusion Middleware Logs" to
administrators and/or roles. This target privilege is applicable to all Oracle Fusion
Applications related and Oracle Fusion Middleware related target types. This target
privilege is automatically included as part of the following other target privileges:
Operator Fusion Middleware, Operator, and Full. Consequently, you can grant an
administrator one of the following privileges in order for him/her to be able to view log
messages for Oracle Fusion Applications related and Oracle Fusion Middleware
related log files:
•Ability to view Fusion Middleware Logs target privilege
•Operator Fusion Middleware target privilege
•Operator target privilege
•Full target privilege
To grant the ability to an administrator to view the Fusion Middleware Logs target
privilege, follow these steps:
1. Log in to the Oracle Enterprise Manager 12c Cloud Control console as a super
administrator.
2. From the Setup menu, choose Security, then Administrators.
3. Select the appropriate administrator and click Edit.
Chapter 28
Managing Log Files
28-4

4. Click Next twice to arrive on the Target Privileges page of the wizard.
5. Scroll down the page and click Add in the Target Privileges section of the page.
6. From the Search and Add: Targets popup dialog, select the appropriate targets
for which the administrator should have access to view logs. Click Select.
7. From the Target Privileges section of the Target Privileges page of the wizard,
select the targets to which you want to grant the “Ability to view Fusion Middleware
Logs" target privilege and select Grant to Selected. Notice that the default target
privilege automatically given for this target is View.
8. Select the Ability to view Fusion Middleware Logs target privilege and click
Continue. Notice that the “Ability to view Fusion Middleware Logs" target privilege
is also included as part of other target privileges (for example, Operator target
privilege). So, depending on the responsibilities of the administrator, you may want
to grant the Operator target privilege to the administrator.
9. Notice on the Target Privileges page of the wizard the appearance of the new
privilege. Click Review and then Finish to conclude the operation.
28.1.1.2 Registering Additional Log Files
You may find that you want to add custom log files for WebLogic Server such that
those log files and messages appear in the Enterprise Manager Log Viewer. While
Enterprise Manager does not support adding custom log files via the Log Viewer user
interface, there is a way to do it outside of Enterprise Manager.
Normally the ODL LogQueryMBean automatically discovers the Weblogic server logs
and any ODL log file defined in the logging.xml file associated with the Weblogic
server. However, you can register additional log files with the ODL LogQueryMBean,
so that these files can be viewed and/or downloaded from the Enterprise Manager Log
Viewer.
When registering a new log file there are two options you can use:
•You can register a log file with an associated LogReader that can be used to parse
the contents of the file. In this case the contents of the file can be viewed and
searched from the main Log Messages page.
•You can register the path to the log file, but do not provide a LogReader to parse
the contents of the file. In this case the contents of the file cannot be viewed and
searched from the main Log Messages page, but you can view the raw contents of
the file or download its contents from the Target Log Files page.
To register one or more additional log files you can create a file under directory:
DOMAIN_HOME/config/fmwconfig/servers/SERVER_NAME/diagnostics-registration
The file must have a .xml suffix and it should have contents similar to the following:
<?xml version='1.0' encoding='UTF-8'?>
<logs xmlns='http://www.oracle.com/iAS/EMComponent/ojdl'>
<log path="/home/oracle/mylogs/my-odl-diagnostic.log">
<logreader class="oracle.core.ojdl.reader.ODLLogReaderFactory">
</logreader>
</log>
</logs>
Chapter 28
Managing Log Files
28-5

In this case the file is an ODL file and it is being registered with a LogReader. In
addition to the ODL LogReader, there are a few existing log readers that can be used
to read other formats.
You can also register a log without a log reader as seen here:
<?xml version='1.0' encoding='UTF-8'?>
<logs xmlns='http://www.oracle.com/iAS/EMComponent/ojdl'>
<log path="/home/oracle/mylogs/my-other-diagnostic.log"/>
</logs>
You may use variables or a wildcard in the log path. The wildcard is denoted by "%*
%", while a variable has the form of "%NAME%". Multiple occurrences of the same
variable in the path must have the exact same value. If a variable appears only once, it
will behave like a wildcard.
All log files registered in this way are associated with the server target in Enterprise
Manager.
28.1.2 Searching Log Files
You can search for diagnostic messages using the Log Messages page. By default,
this page shows a summary of the logged issues for the last 10 minutes.
You can modify the search criteria to identify messages of relevance. You can view
the search results in different modes, allowing ease of navigation through large
amounts of data.
The following sections describe how to search log files:
•Searching Log Files: Basic Searches
•Searching Log Files: Advanced Searches
28.1.2.1 Searching Log Files: Basic Searches
You can search for all of the messages for all of the entities in a domain, an Oracle
WebLogic Server, a component, or an application.
For example, to search for messages for a domain:
1. From the Enterprise menu, select Monitoring, select Logs, then select the target
from the popup target selector.
or
From the Targets menu, select Middleware, click a farm. From the Farm menu,
select Logs, then select View Log Messages.
The Log Messages page displays a Search section and a table that shows a
summary of the messages for the last hour.
2. In the Search Mode secstion, you can choose to search for only Live Logs, only
Archive Logs, or Both.
3. In the Date Range section, you can select either:
•Most Recent: If you select this option, select a time, such as 3 hours. The
default is 10 minutes.
Chapter 28
Managing Log Files
28-6

•Time Interval: If you select this option, select the calendar icon for Start Date.
Select a date and time. Then, select the calendar icon for End Date. Select a
date and time.
4. In the Message Types section, select one or more of the message types.
5. You can specify more search criteria, for example, by providing text in the
Message text field, so you can search on explicit words or patterns across log
files.You can specify more search criteria, as described in Searching Log Files:
Advanced Searches.
6. Click Search.
7. To help identify messages of relevance, in the table, for Show, select one of the
following modes:
•Messages - You can select an operator, such as contains and then enter a
value to be matched.
To see the details of a particular message, click the message. The details are
displayed below the table of messages.
To view related messages, select a message, then click View Related
Messages and select by Time or by ECID (Execution Context ID).
•Application ID - Groups messages related to a particular application.
•ECID + Relationship ID - Groups messages by Execution Context (ECID) and
Relationship ID (RID) which enables you to use log file entries to correlate
messages from one application or across application server components. By
searching related messages using the message correlation information, you
can examine multiple messages and identify the component that first
generated the problem.
•Host - Groups messages associated with a particular host.
•Host IP Address - Groups messages associated with a particular host IP
address.
•Incident ID
•Message Type - Groups messages for each target based on the message
type. It displays the total number of messages available for each message
type, for example, ERROR, INCIDENT ERROR, WARNING, NOTIFICATION,
TRACE, and UNKNOWN for every target.
•Message ID - Groups messages based on the combination of Message ID,
Message Type, Target, Message Level, Component, Module, and
Organization.
•Module - Groups the classes / modules that originated the message.
•Target
•Thread ID - Groups messages by Thread ID
•User - Groups all messages for a particular user. For example, all the
messages for user Jones will be listed before the messages for user Smith.
28.1.2.2 Searching Log Files: Advanced Searches
You can refine your search criteria using the following controls in the Log Messages
page:
Chapter 28
Managing Log Files
28-7

•Message: You can select an operator, such as contains and then enter a value to
be matched.
•Add Fields: Click this to specify additional criteria, such as Host, which lets you
narrow the search to particular hosts. Then click Add.
For each field you add, select an operator, such as contains and then enter a
value to be matched.
•Selected Targets: Expand this to see the targets that are participating in the
search. To add targets, click Add and provide information in the dialog box. To
remove targets, select the target and click Remove.
•Search Archived Logs: Enable this check box to access the log viewer. These
are the archive log file locations for multiple targets you configured on the
Configure Archive Locations page.
Note:
The Search Archived Logs check box is not applicable to standalone Oracle
HTTP Servers.
28.1.3 Downloading Log Files
You can download the log messages to a file. You can download either the matching
messages from a search or the messages in a particular log file.
To download the matching messages from a search to a file:
1. From the Enterprise menu, select Monitoring, then select Logs.
or
From the Targets menu, select Middleware, then select a domain. From the
Farm menu, select Logs, then select View Log Messages.
The Log Messages page is displayed.
2. Search for particular types of messages as described in Searching Log Files:
Basic Searches.
3. Select a file type by clicking Export Messages to File and select one of the
following:
•As Oracle Diagnostic Log Text (.txt)
•As Oracle Diagnostic Log XML (.xml)
•As Comma-Separated List (.csv)
An Opening dialog box is displayed.
4. Select either Open With or Save to Disk. Click OK.
To export specific types of messages or messages with a particular Message ID to a
file:
1. From the Enterprise menu, select Monitoring, then select Logs.
or
Chapter 28
Managing Log Files
28-8

From the Targets menu, select Middleware, then select a domain. From the
Farm menu, select Logs, then select View Log Messages.
The Log Messages page is displayed.
2. Search for particular types of messages as described in Searching Log Files:
Basic Searches.
3. For Show, select Group by Message Type or Group by Message ID.
4. To download the messages into a file, if you selected Group by Message Type,
select the link in one of the columns that lists the number of messages, such as
the Errors column. If you selected Group by Message ID, select one of the links in
the Occurrences column.
The Messages by Message Type page or Message by Message ID is displayed.
5. Select a file type by clicking the arrow near Export Messages to File.
You can select one of the following:
•As Oracle Diagnostic Log Text (.txt)
•As Oracle Diagnostic Log XML (.xml)
•As Comma-Separated List (.csv)
An Opening dialog box is displayed.
6. Select either Open With or Save to Disk. Click OK.
To download the log files for a specific component:
1. From the Enterprise menu, select Monitoring, then select Logs.
or
From the Targets menu, select Middleware, click a domain. From the Farm
menu, select Logs, then select View Log Messages.
The Log Messages page is displayed.
2. Expand the Selected Targets section because it is hidden by default. Click Target
Log Files.
The Log Files page is displayed.
Select one of the possibly many Target Log Files icons. Select the icon that is
associated with the target type log files you want to view.
3. Select a log file and click Download.
4. An Opening dialog box is displayed.
5. Select either Open With or Save to Disk. Click OK.
28.2 Managing Saved Searches
The following sections provide information on creating, retrieving, and managing saved
searches:
•Saving Searches
•Retrieving Saved Searches
•Managing Saved Searches
Chapter 28
Managing Saved Searches
28-9

28.2.1 Saving Searches
Saved searches save administrators time by not having to redefine the same search
again in the future. Saved searches help you in diagnosing problems faster because
you are only a few clicks away from accessing a saved search as opposed to
redefining the search again and again.
Note: Saved searches are per administrator. Therefore when the administrator logs
out of the console, the search is stored and is available the next time the administrator
logs in. In other words, saved searches that one administrator defines are not
accessible by another administrator.
Once you have specified search criteria as described in Searching Log Files, you save
it by clicking Save Search located at the top-right of the page. The name of the search
is automatically created by concatenating fields used in the search, for example, Log
Messages - Saved Search: "error", Last 1 hours, Incident Error,Error,Unknown.
Note: You can change the default name using the Manage Saved Search popup. This
allows you to accept the default name and change it later.
28.2.2 Retrieving Saved Searches
To retrieve a saved search. follow these steps:
1. From the Enterprise menu, select Monitoring, select Logs., then select the
target from the popup target selector.
or
From the Targets menu, select Middleware, click a farm. From the Farm menu,
select Logs, then select View Log Messages.
or
Access the saved search from the Favorites menu.
The Log Messages page appears.
2. On the Logs page, click Saved Searches located at the top-right of the page.
3. Choose a search.
The search results populate the Search region.
28.2.3 Managing Saved Searches
To manage a saved search, follow these steps:
1. From the Enterprise menu, select Monitoring, select Logs, then select the target
from the popup target selector.
or
From the Targets menu, select Middleware, click a farm. From the Farm menu,
select Logs, then select View Log Messages. You can manage the saved
searches pertaining to the target context only.
or
Chapter 28
Managing Saved Searches
28-10

Access the saved search from the Favorites menu and select Manage Favorites.
You can manage all the log-saved searches which you have created irrespective
of the context. You can see all the saved searches.
The Log Messages page appears.
2. On the Logs page, click Saved Searches located at the top-right of the page.
3. On the list, click Manage Saved Searches.
The Manage Favorites pop-up appears. You can:
•Change the name of the search.
When you select a row from the table, the name of search appears in the
Name field at the bottom of the screen. You can edit the name of the search
and click OK or you can click Cancel.
Note: When you click OK, you will only be changing the name of the search,
not the saved search criteria. Once the search criteria is changed, the Save
Searches button is enabled.
•Edit the search criteria.
Click the link of the saved search. The Log Viewer screen appears in the
context of the saved search. Make the changes and click Save.
•Delete a search
Choose a search and click Remove Selected.
28.3 Locating Management Agent Log and Trace Files
The following sections provide information on the log and trace files for the Oracle
Management Agent:
•About the Management Agent Log and Trace Files
•Locating the Management Agent Log and Trace Files
28.3.1 About the Management Agent Log and Trace Files
Oracle Management Agent log and trace files store important information that support
personnel can later use to troubleshoot problems. The agent main log is located
in
$EMSTATE/sysman/log
. The log is segmented by default to 11 segments, 5MB each.
The segments are named gcagent.log and gcagent.log.# where # is a number in the
range of 1-10. These settings are controlled by properties in emd.properties as
explained in the following sections. The latest segment is always gcagent.log and the
oldest is the gcagent.log.X where X is the highest number.
The Management Agent uses the following log files:
•Oracle Management Agent metadata log file (
gcagent.log
)
This log file contains trace, debug, information, error, or warning messages from
the agent.
•Oracle Management Agent fetchlet trace file (
gcagent_sdk.trc
)
This log file contains logging information about fetchlets and receivelets.
•Oracle Management Agent errors log file (
gcagent_errors.log
)
Chapter 28
Locating Management Agent Log and Trace Files
28-11

This error log file contains information about errors. The errors in this file are
duplicate of the errors in
gcagent.log
.
•Oracle Management Agent metadata log file (
gcagent_mdu.log
)
This log tracks the metadata updates to the agent.
•Enterprise Manager Control log file (
emctl.log
)
The information is saved to
emctl.log
file, when you run the Enterprise Manager
Control commands. For more information about
emctl.log
file, see chapter Starting
and Stopping Enterprise Manager Components.
Note:
All the agent logs mentioned above (existing in $EMSTATE/sysman/log) are
transient. Agent logs are segmented and have a limited overall size and hence
need not be deleted or managed.
28.3.1.1 Structure of Agent Log Files
The log contain individual log messages with the following format:
YYYY-MM-DD HH:MM:SS,### [<tid>:<thread code or code:name>] <level> -<the message>
Where:
•YYYY-MM-DD HH:MM:SS,### is a timestamp (in 24 hours format and ### is the
fraction in msec).
•<tid> is the thread id (as a decimal number)
•<thread name or code> is the thread full name or an abbreviated hexadecimal
code (see the following example).
•<level> is the logging level that can be one of (in ascending order of importance):
DEBUG, INFO, WARN, ERROR, FATAL.
•<the message> is the free text message that is being logged. The message can
contain new lines and spawn multiple lines.
For example:
2011-06-07 15:00:00,016 [1:3305B9:main] DEBUG - ADR_BASE='/ade/example_user/oracle/
example/agentStateDir'
2011-06-07 15:00:01,883 [1:3305B9] INFO - Agent is starting up
28.3.2 Locating the Management Agent Log and Trace Files
The log and trace files for the Management Agent are written in the agent runtime
directory. You can find the runtime directory by using this command:
$ emctl getemhome
The log and trace files will be located at
<EMHOME>/sysman/log
.
Chapter 28
Locating Management Agent Log and Trace Files
28-12

28.3.3 Setting Oracle Management Agent Log Levels
Every log message is logged using a specific log level. The log levels are ordered in
priority order: DEBUG, INFO, WARN, ERROR, and FATAL. The log setting
determines the minimum level that will be included in the log. For example, if the log
level is set to INFO (the default), only log messages of level INFO and above (INFO,
WARN, ERROR and FATAL) are going to be included in the log.
The logging configuration syntax uses the concept of handlers (appendares in log4j
terms) and loggers. A handler defines a single output file and how the file is to be
managed (maximum file size, number of segments, and so on). Note that there is a
default logging prefix oracle.sysman that is used for all handlers that does not specify
any logging prefix. The logging properties uses the
Logger.
prefix for agent (log4j)
logging configuration and
ODLLogger.
prefix for the ODL (which is based on
java.util.logger.*) logging configuration. Beside the prefix, both systems share the
same syntax. The configuration full syntax (without a Logger or ODLLogger prefix) is
the following:
Table 28-2
Property
Name
Description Mandator
y
Default Value
directory=<di
rectory>
Defines the logging system (log4j or ODL)
logging directory. Specifing a directoryfor
one system does not affect the other
system (setting
Logger.
directory will only
affect the
Logger.
configuration but not
ODLLogger.
)
No $EMSTATE/sysman/log
<handler>.file
name=<filena
me>
The filename to use for the handler. If the
filename is relative it will be relative to the
logging directory (see direrctory property
above). An absolute file name will be used
as is.
Yes
<handler>.lev
el=<level>
The default logging level for the handler.
Possbile levels are:
DEBUG, INFO, WARN, ERROR, FATAL
Yes
<handler>.tot
alSize=<size
>
The total size in MB for all the handler file
segments.
No No limit
<handler>.se
gment.count
=<count>
The number of segments to use for the
handler.
No 1
<handler>.lo
gger=<logger
names>
A comma delimited list of logger names
that will use this handler.
No When not specified, the
default logger is used.
level.<logger
name>=<lev
el>
Set a specific logging level to the logger
and all its descendants. Possbile levels
are:
DEBUG, INFO, WARN, ERROR, FATAL
No
Chapter 28
Locating Management Agent Log and Trace Files
28-13

Table 28-2 (Cont.)
Property
Name
Description Mandator
y
Default Value
additivity.<lo
gger
name>=<true
or false>
If set to false, only handlers that are
configured for the specific logger name
will be used. Otherwise, handlers that are
configured for the logger parent name will
also be used.
No true
An example of the syntax is as follows:
# logging properties
Logger.log.filename=gcagent.log
Logger.log.level=INFO
Logger.log.totalSize=100
Logger.log.segment.count=20
ODLLogger.wsm.level=ERROR
ODLLogger.wsm.totalSize=5
ODLLogger.wsm.segment.count=5
ODLLogger.wsm.filename=gcagent_wsm.log
The above log configuration sets up a handler (log) that creates a gcagent.log file (in
the default logging directory) with a default logging level of INFO, total size of 100MB,
uses up to 20 segments, and is configured to be used by the default logger
(oracle.sysman).
28.3.3.1 Modifying the Default Logging Level
To enable DEBUG level logging for the Management Agent, set the log handler level
to DEBUG (see below). And then reload the agent.
Logger.log.level=DEBUG
Alternatively, use emctl setproperty agent command as follows:
$ emctl setproperty agent -name "Logger.log.level" -value DEBUG
or
$ emctl setproperty agent -name "Logger.log.level" -value "DEBUG"
28.3.3.2 Setting gcagent.log
The gcagent.log is the agent main log that contain log entries from all the agent core
code. The following is gcagent.log configuration:
Logger.log.filename=gcagent.log
Logger.log.level=DEBUG
Logger.log.totalSize=100
Logger.log.segment.count=20
Chapter 28
Locating Management Agent Log and Trace Files
28-14

28.3.3.3 Setting gcagent_error.log
The gcagent_errors.log is a subset of the gcagent.log and contains log messages of
ERROR and FATAL levels. The logging configuration for gcagent_errors.log is
specified in
emd.properties
. Following are the settings for gcagent_errors.log:
Logger.err.filename=gcagent_errors.log
Logger.err.level=ERROR
Logger.err.totalSize=100
Logger.err.segment.count=5
28.3.3.4 Setting the Log Level for Individual Classes and Packages
The logging level for individual class and/or packages can also be set. The following
are examples that are currently configured by default:
# Set the class loaders to level INFO
Logger.level.oracle.sysman.gcagent.metadata.impl.ChainedClassLoader=INFO
Logger.level.oracle.sysman.gcagent.metadata.impl.ReverseDelegationClassLoader=INFO
Logger.level.oracle.sysman.gcagent.metadata.impl.PluginLibraryClassLoader=INFO
Logger.level.oracle.sysman.gcagent.metadata.impl.PluginClassLoader=INFO
The above configuration changed the default level of logging for the four classes to be
INFO. When the default level of logging is INFO it does not make any difference but if
the default log level is set to DEBUG (when debugging the code) it will prevent those
four classes from logging at DEBUG level (as they are normally too verbose).
The reverse is also true, for example if the following configuration is added (not set by
default):
Logger.level.oracle.sysman.gcagent.metadata.impl.collection=DEBUG
It will cause all classes in the oracle.sysman.gcagent.metadata.impl.collection
package to log at DEBUG level even if the default log level is INFO.
28.3.3.5 Setting gcagent_mdu.log
A set of entries are created in the gcagent_mdu.log file for each client command that
modifies target instances, target instance collections, or blackouts. Entries are as
follows:
2011-08-18 22:56:40,467 [HTTP Listener-34 - /emd/main/ (DispatchRequests)] - SAVE
TARGET(S)
<Target IDENTIFIER="TARGET_GUID=6A3A159D0BB320C50B7926E0671A1A98" STATUS="MONITORED"
TIMEZONE_REGION="" ON_HOST="" DISPLAY_NAME="EM Management Beacon" NAME="EM
Management Beacon" TYPE="oracle_beacon"/>
<Target IDENTIFIER="TARGET_GUID=51F9BBC6F5B833058F4278B51E496000" STATUS="MONITORED"
TIMEZONE_REGION="" ON_HOST="" DISPLAY_NAME="mytestBeacon" NAME="mytestBeacon"
TYPE="oracle_beacon"><Property VALUE="***" NAME="proxyHost"/><Property VALUE="***"
NAME="proxyPort"/><Property VALUE="***" NAME="dontProxyFor"/></Target>
<Target IDENTIFIER="TARGET_GUID=7C4336B536C9F241DBCAC4D1D082AD22" STATUS="MONITORED"
TIMEZONE_REGION="" ON_HOST="" DISPLAY_NAME="CSAcollector" NAME="CSAcollector"
TYPE="oracle_csa_collector"><Property VALUE="***" NAME="recvFileDir"/></Target>
<Target IDENTIFIER="TARGET_GUID=207B57A3FE300C86F81FE7D409F5DD1C" STATUS="MONITORED"
TIMEZONE_REGION="" ON_HOST="" DISPLAY_NAME="Oemrep_Database" NAME="Oemrep_Database"
TYPE="oracle_database"><Property VALUE="***" NAME="MachineName"/><Property
VALUE="***" NAME="Port"/><Property VALUE="***" NAME="SID"/><Property VALUE="***"
NAME="OracleHome"/><Property ENCRYPTED="FALSE" VALUE="***" NAME="UserName"/
Chapter 28
Locating Management Agent Log and Trace Files
28-15

><Property ENCRYPTED="FALSE" VALUE="***" NAME="Role"/><Property ENCRYPTED="FALSE"
VALUE="***" NAME="password"/></Target>
<Target IDENTIFIER="TARGET_GUID=0C48C5AE0FAFB42ED91F897FF398FC84" STATUS="MONITORED"
TIMEZONE_REGION="" ON_HOST="" DISPLAY_NAME="Management Services and Repository"
NAME="Management Services and Repository" TYPE="oracle_emrep"><Property VALUE="***"
NAME="ConnectDescriptor"/><Property ENCRYPTED="FALSE" VALUE="***" NAME="UserName"/
><Property ENCRYPTED="FALSE" VALUE="***" NAME="password"/><AssocTargetInstance
ASSOC_TARGET_TYPE="oracle_oms" ASSOC_TARGET_NAME="linuxserver07.myco.com:
41034_Management_Service" ASSOCIATION_NAME="app_composite_contains"/
><AssocTargetInstance ASSOC_TARGET_TYPE="oracle_oms"
ASSOC_TARGET_NAME="linuxserver07.myco.com:41034_Management_Service"
ASSOCIATION_NAME="internal_contains"/><CompositeMembership><Member ASSOCIATION=""
NAME="linuxserver07.myco.com:41034_Management_Service_CONSOLE"
TYPE="oracle_oms_console"/><Member ASSOCIATION="" NAME="linuxserver07.myco.com:
41034_Management_Service_PBS" TYPE="oracle_oms_pbs"/><Member ASSOCIATION=""
NAME="linuxserver07.myco.com:41034_Management_Service" TYPE="oracle_oms"/></
CompositeMembership></Target>
<Target IDENTIFIER="TARGET_GUID=DF64B4A7C0F2EEBA7894EA3AD4CAF61E" STATUS="MONITORED"
TIMEZONE_REGION="" ON_HOST="" DISPLAY_NAME="linuxserver07.myco.com:
41034_Management_Service" NAME="linuxserver07.myco.com:41034_Management_Service"
TYPE="oracle_oms"><Property VALUE="***" NAME="InstanceHome"/><Property VALUE="***"
NAME="OracleHome"/><AssocTargetInstance ASSOC_TARGET_TYPE="oracle_oms_console"
ASSOC_TARGET_NAME="linuxserver07.myco.com:41034_Management_Service_CONSOLE"
ASSOCIATION_NAME="app_composite_contains"/><AssocTargetInstance
ASSOC_TARGET_TYPE="oracle_oms_pbs" ASSOC_TARGET_NAME="linuxserver07.myco.com:
41034_Management_Service_PBS" ASSOCIATION_NAME="app_composite_contains"/
><AssocTargetInstance ASSOC_TARGET_TYPE="oracle_oms_console"
ASSOC_TARGET_NAME="linuxserver07.myco.com:41034_Management_Service_CONSOLE"
ASSOCIATION_NAME="internal_contains"/><AssocTargetInstance
ASSOC_TARGET_TYPE="oracle_oms_pbs" ASSOC_TARGET_NAME="linuxserver07.myco.com:
41034_Management_Service_PBS" ASSOCIATION_NAME="internal_contains"/
><CompositeMembership><MemberOf ASSOCIATION="" NAME="Management Services and
Repository" TYPE="oracle_emrep"/><Member ASSOCIATION="" NAME="linuxserver07.myco.com:
41034_Management_Service_CONSOLE" TYPE="oracle_oms_console"/><Member ASSOCIATION=""
NAME="linuxserver07.myco.com:41034_Management_Service_PBS" TYPE="oracle_oms_pbs"/></
CompositeMembership></Target>
<Target IDENTIFIER="TARGET_GUID=4D290260F13596502EFD8F3E22752404" STATUS="MONITORED"
TIMEZONE_REGION="" ON_HOST="" DISPLAY_NAME="linuxserver07.myco.com:
41034_Management_Service_CONSOLE" NAME="linuxserver07.myco.com:
41034_Management_Service_CONSOLE" TYPE="oracle_oms_console"><Property VALUE="***"
NAME="InstanceHome"/><Property VALUE="***" NAME="OracleHome"/
><CompositeMembership><MemberOf ASSOCIATION="" NAME="Management Services and
Repository" TYPE="oracle_emrep"/><MemberOf ASSOCIATION=""
NAME="linuxserver07.myco.com:41034_Management_Service" TYPE="oracle_oms"/></
CompositeMembership></Target>
<Target IDENTIFIER="TARGET_GUID=D0A23AE06A9E678221B075A216364541" STATUS="MONITORED"
TIMEZONE_REGION="" ON_HOST="" DISPLAY_NAME="linuxserver07.myco.com:
41034_Management_Service_PBS" NAME="linuxserver07.myco.com:
41034_Management_Service_PBS" TYPE="oracle_oms_pbs"><Property VALUE="***"
NAME="InstanceHome"/><Property VALUE="***" NAME="OracleHome"/
><CompositeMembership><MemberOf ASSOCIATION="" NAME="Management Services and
Repository" TYPE="oracle_emrep"/><MemberOf ASSOCIATION=""
NAME="linuxserver07.myco.com:41034_Management_Service" TYPE="oracle_oms"/></
CompositeMembership></Target>
2011-08-18 22:57:10,084 [HTTP Listener-34 - /emd/main/ (DispatchRequests)] - SUCCESS
2011-08-18 22:57:10,084 [HTTP Listener-34 - /emd/main/ (DispatchRequests)] - SUCCESS
2011-08-18 22:57:10,084 [HTTP Listener-34 - /emd/main/ (DispatchRequests)] - SUCCESS
2011-08-18 22:57:10,084 [HTTP Listener-34 - /emd/main/ (DispatchRequests)] - SUCCESS
2011-08-18 22:57:10,084 [HTTP Listener-34 - /emd/main/ (DispatchRequests)] - SUCCESS
2011-08-18 22:57:10,084 [HTTP Listener-34 - /emd/main/ (DispatchRequests)] - SUCCESS
Chapter 28
Locating Management Agent Log and Trace Files
28-16
2011-08-18 22:57:10,084 [HTTP Listener-34 - /emd/main/ (DispatchRequests)] - SUCCESS
2011-08-18 22:57:10,084 [HTTP Listener-34 - /emd/main/ (DispatchRequests)] - SUCCESS
For the batch of saved targets in the above example, the original request came in at
22:56:40 and the list of targets saved are found in the line(s) following the SAVE
TARGET(S) message. In this case, there were 8 targets. The result of saving the
targets is available in the next 8 lines (for the same thread) and in this case all were
saved successfully by 22:57:10.
The pattern is the same for saved collection items (or collections) and blackouts.
The logging configuration for the gcagent_mdu log is specified in
emd.properties
but
you must not modify this log. For example, these entries are logged at INFO level,
which means that if you decided to save space and change this to WARN only by
editing the mdu log entries in the
emd.properties
file, you will have effectively disabled
this log.
Following are the settings for gcagent_mdu log:
Logger.mdu.filename=gcagent_mdu.log
Logger.mdu.level=INFO
Logger.mdu.totalSize=100
Logger.mdu.segment.count=5
Logger.mdu.logger=Mdu
Note:
Change the filename and logger settings only if asked by Support.
28.3.3.6 Setting the TRACE Level
The following
_enableTrace
property when set to "true" will enable the TRACE logging
level that shows as DEBUG messages.
Logger._enableTrace=true
The default log level for the agent log must be set to DEBUG for the tracing level to
work.
28.4 Locating and Configuring Oracle Management Service
Log and Trace Files
The following sections describe how to locate and configure the OMS log files:
•About the Oracle Management Service Log and Trace Files
•Locating Oracle Management Service Log and Trace Files
•Controlling the Size and Number of Oracle Management Service Log and Trace
Files
•Controlling the Contents of the Oracle Management Service Trace File
•Controlling the Oracle WebLogic Server and Oracle HTTP Server Log Files
Chapter 28
Locating and Configuring Oracle Management Service Log and Trace Files
28-17

28.4.1 About the Oracle Management Service Log and Trace Files
OMS log and trace files store important information that Oracle Support can later use
to troubleshoot problems. OMS uses the following six types of log files:
•log file (
emoms.log
)
The Management Service saves information to the log file when it performs an
action (such a starting or stopping) or when it generates an error. This is a log file
for console application.
•Oracle Management Service trace file (
emoms.trc
)
OMS trace file provides an advanced method of troubleshooting that can provide
support personnel with even more information about what actions the OMS was
performing when a particular problem occurred. This is a trace file for Console
application.
•Oracle Management Service log file (
emoms_pbs.log
)
The Management Service saves information to this log file for background
modules such as the loader, job system, event system, notification system, and so
on. This file contains messages logged at ERROR or WARN levels.
•Oracle Management Service trace file (
emoms_pbs.trc
)
This trace file provides additional logging for the background modules such as the
loader, job system, event system, notification system, and so on when DEBUG or
INFO level logging is enabled for these modules. This file can provide Support
personnel with even more information about actions these modules were
performing when a particular problem occurred.
•Enterprise Manager Control log file (
emctl.log
)
The information is saved to
emctl.log
file, when you run the Enterprise Manager
Control commands. For more information about emctl.log file, see chapter Starting
and Stopping Enterprise Manager Components.
•Enterprise Manager Control message file
(emctl.msg)
This file is created by the HealthMonitor thread of the OMS when it restarts the
OMS because of a critical error. This file is used for troubleshooting the OMS
restart problem. It provides information such as the exact time when the OMS is
restarted and which module has caused the crash.
28.4.2 Locating Oracle Management Service Log and Trace Files
The OMS Instance Base directory is
gc_inst
in the Oracle Middleware Home
(middleware home). This directory stores all log and trace files related to OMS 12c.
You can choose to change this, if you want, in the installer.
For example, if the Middleware home is
/u01/app/Oracle/Middleware/
, then the
instance base location is
/u01/app/Oracle/gc_inst
. You can choose to change this, if
you want, in the installer. However, you can change it for only advanced installation
and not for simple installation.
Chapter 28
Locating and Configuring Oracle Management Service Log and Trace Files
28-18

28.4.3 Controlling the Size and Number of Oracle Management
Service Log and Trace Files
OMS log and trace files increases in size over time as information is written to the files.
However, the files are designed to reach a maximum size. When the files reach the
predefined maximum size, the OMS renames (or rolls) the logging information to a
new file name and starts a new log or trace file. This process keeps the log and trace
files from growing too large.
As a result, you will often see multiple log and trace files in the OMS log directory. The
following example shows one archived log file and the current log file in the
/u01/app/
Oracle/gc_inst/em/EMGC_OMS1/sysman/log/
directory:
emoms.log
emoms.log.1
To control the maximum size of the OMS log and OMS trace files, as well as the
number of rollover files, run the following command, and specify details as described
in Controlling the Size and Number of Oracle Management Service Log and Trace
Files:
emctl set property -name <property> -value <property value> -module logging
The above command will set the property for all OMSes. If you want to set it for a
single OMS, then specify an extra option
-oms_name
as follows:
emctl set property -name <name> -value <value> -module logging -oms_name
example.myco.com:portnumber_Management_Service
To set it for the current OMS, use the property -oms_name local_oms. To set it for any
other OMS, you can provide the name of that OMS. The OMS name has to be similar
to
example.myco.com:portnumber_Management_Service
.
Note:
In Oracle Enterprise Manager Cloud Control 12c, you do not have to restart
OMS for the changes to take effect.
Note:
In Oracle Enterprise Manager Cloud Control 12c,
emctl set property
by
default sets the logging properties for all the OMS. To set the property for only
one OMS, use the
-oms_name
option.
Chapter 28
Locating and Configuring Oracle Management Service Log and Trace Files
28-19

Table 28-3 Oracle Management Service Log File Properties in the
emomslogging.properties File
Property Purpose Example
log4j.appender.emlogAppende
r. MaxFileSize
When OMS log file reaches
this size, then OMS copies the
logging data to a new rollover
file and creates a new
emoms.log
log file. The size of
the log is specified in units of
bytes. This property is also
applicable for emoms_pbs.log.
log4j.appender.emlogAppende
r. MaxFileSize=20000000
log4j.appender.emlogAppende
r. MaxBackupIndex
This optional property
indicates how many times
OMS will rollover the log file to
a new file name before
deleting logging data. This
property is also applicable for
emoms_pbs.log.
Note: Because the log file
does not contain as much data
as the trace file, it is usually
not necessary to create more
than one rollover file.
log4j.appender.emlogAppende
r. MaxBackupIndex=1
log4j.appender.emtrcAppende
r. MaxFileSize
When the OMS trace file
reaches this size, then OMS
copies the logging data to a
new rollover file and creates a
new
emoms.trc
log file. This
property is also applicable for
emoms_pbs.trc.
log4j.appender.emtrcAppende
r. MaxFileSize=5000000
log4j.appender.emtrcAppende
r. MaxBackupIndex
This property indicates how
many times the OMS will
rollover the trace file to a new
file name before deleting
tracing data. This property is
also applicable for
emoms_pbs.trc.
log4j.appender.emtrcAppende
r. MaxBackupIndex=10
28.4.4 Controlling the Contents of the Oracle Management Service
Trace File
By default, the OMS will save all critical and warning messages to the
emoms.trc
file.
However, you can adjust the amount of logging information that the OMS generates.
To change the amount of logging information generated by the OMS, run the following
command:
emctl set property -name "log4j.rootCategory" -value "<LEVEL>, emlogAppender,
emtrcAppender" -module logging
The above command will change the log level for all OMS, unless
-oms_name option
is
specified.
Chapter 28
Locating and Configuring Oracle Management Service Log and Trace Files
28-20

Note:
If you change the
root
logging level for the
emoms.trc
file, then a lot of
messages are written to the trace file filling up the space quickly, and
potentially slowing down the system. Run the following command to enable
debug selectively for specific modules that need to be assessed:
emctl set property -name <logging module> -value DEBUG -module logging
Where,
<logging module>
represents the logging module from a specific
subsystem.
For example,
oracle.sysman.emdrep.dbjava.loader.
The logging level can be changed for specific modules by running the
following command:
emctl set property -name "<CATEGORY>" -value "<LEVEL>" -module logging
where LEVEL can be DEBUG, INFO, WARN, or ERROR, and CATEGORY is
specific to the module for which level has to be changed. To change the
logging module, contact Oracle Support.
Note:
The location of emoms.trc, emoms.log, emoms_pbs.trc, and emoms_pbs.log
files can be changed to a different location from the default location. However,
it is not advisable to do so.
28.4.5 Controlling the Oracle WebLogic Server and Oracle HTTP
Server Log Files
Oracle Management Service is a Java EE application deployed on an Oracle
WebLogic Server. Different components of the Oracle WebLogic Server generate their
own log files. These files contain important information that can be used later by
support personnel to troubleshoot problems.
Table 28-4 lists the location of the log files for some components.
Table 28-4 Component Log File Location
Component Location
Oracle HTTP
Server (OHS)
<EM_INSTANCE_BASE>/<webtier_instance_name>/diagnostics/
logs/OHS/<ohs_name>
For example,
/u01/app/Oracle/gc_inst/WebTierIH1/diagnostics/logs/OHS/ohs1
Chapter 28
Locating and Configuring Oracle Management Service Log and Trace Files
28-21

Table 28-4 (Cont.) Component Log File Location
Component Location
OPMN
<EM_INSTANCE_BASE>/<webtier_instance_name>/diagnostics/logs/
OPMN/<opmn_name>
For example,
/u01/app/Oracle/gc_inst/WebTierIH1/diagnostics/logs/OPMN/opmn
Oracle WebLogic The log data from WebLogic will be at:
<EM_INSTANCE_BASE>/user_projects/domains/<domain_name>/servers/
<SERVER_NAME>/logs/<SERVER_NAME>.log
This log can be restricted, rotated by size, time, and other conditions from
the WebLogic Console. The default settings are:
•In production mode, they are rotated at a default of 5MB.
•The log level is WARNING.
•The number files are restricted to 10.
For example,
/u01/app/Oracle/gc_inst/user_projects/domains/GCDomain/servers/
EMGC_OMS1/logs/EMGC_OMS1.log
The messages written to sysout and syserr will be available in the .out
files. They cannot be rotated by size or time. They are rotated only when
the server starts. They are located at:
<EM_INSTANCE_BASE>/user_projects/domains/<domain_name>/servers/
<SERVER_NAME>/logs/<SERVER_NAME>.out
For example,
/u01/app/Oracle/gc_inst/user_projects/domains/GCDomain/servers/
EMGC_OMS1/logs/EMGC_OMS1.ou
t
The node manager logs are at
<INST_HOME>/NodeManager/emnodemanager
and the admin server logs are at
<INST_HOME>/user_projects/domains/
GCDomain/servers/EMGC_ADMINSERVER/logs
.
By default, the Enterprise Manager Cloud Control configures Oracle HTTP Server logs
to roll over periodically to a new file, so that each file does not grow too large in size.
You must also ensure that you delete the old rollover files periodically to free up the
disk space. You can use an operating system scheduler, like cron on UNIX, to
periodically delete the rollover files.
Chapter 28
Locating and Configuring Oracle Management Service Log and Trace Files
28-22

Note:
Following are log files that you will need to maintain and manually purge:
•
<gc_inst>/user_projects/domains/<domain_name>/servers/EMGC_ADMINSERVER/
logs/<domain_name>.log*
•All files under
<gc_inst>/user_projects/domains/<domain_name>/servers/
ohs1/logs
. For example:
em_upload_http_access_log.*
access_log.*
em_upload_https_access_log.*
ohs1-*.log
console~OHS~1.log*
mod_wl_ohs.log*
For instructions on controlling the size and rotation of these log files, refer to chapter
"Managing Log Files and Diagnostic Data" in Oracle Fusion Middleware
Administrator's Guide.
For information about configuring Enterprise Manager to view Fusion Applications
PL/SQL and C diagnostic log files, see chapter "Managing Oracle Fusion Applications
Log Files and Diagnostic Tests" in the Oracle Fusion Applications Administrator's
Guide.
28.5 Monitoring Log Files
You can use Log File Monitoring to monitor WebLogic Server and Application
Deployment log files for specific patterns. You can set up Cloud Control to receive
alert notifications in the context of targets when patterns are found. This allows you to
be more proactive and learn of problems as an administrator before end users
discover them.
Use the following topics to learn how to set up and use Log File Monitoring:
•topicid:log_cs_log_file_monitor_overviewAbout Log Viewer
•Overview of WebLogic Server and Application Deployment Log File Monitoring
•Enabling Log File Monitoring
•Configuring Log File Monitoring
•Viewing Alerts from Log File Monitoring
28.5.1 About Log Viewer
Log Viewer enables administrators to view, search, and download middleware-related
log files regardless of where the files reside on disk. Complex search criteria can be
specified and saved for future reference in order to help administrators quickly
diagnose performance problems across multiple middleware components spanning
multiple Fusion Middleware Farms and WebLogic Domains.
Chapter 28
Monitoring Log Files
28-23

Note:
If you want to use all features of the log viewer in Cloud Control, and the target
domain for which you want to view log messages is SSL-enabled with a
custom certificate, then log viewer features will not function properly. For most
features of log viewer, the OMS makes a JMX connection to the Admin Server
of that domain. The only log viewer feature that does not have the OMS make
a direct JMX connection to the Admin Server is the feature used for archived
log files. Instead, the agent is used for viewing archived log files.
For log viewer features to fully function in this environment, you must apply
additional configuration changes.You must take the rootca of the custom
certificate from the Admin Server target for the domain against which you want
to view log messages and import it into the trust store of the OMS.
When accessing Log Viewer, default search criteria is specified for the selected target
type. The administrator can then refine the search criteria based on diagnostic
requirements for the particular Fusion Middleware Farm. By using the Add Fields
button, you can refine the search criteria to include:
•Selecting one or more member targets of the Fusion Middleware Farm
•Specifying the date range
•Selecting the message types
•Specifying the messages to be searched
•Specifying the ECIDs to be searched
•Specifying the application name
•Specifying the user name
Once the search criteria has been defined, the administrator clicks on the search
button.
The administrator modifies the search as needed and clicks the Save Search button
on the Log Viewer.
The search criteria specified, including the targets against which the search was
performed, is then saved to the Management Repository for the currently logged in
administrator.
You can click on the Saved Searches button to retrieve and apply a previously stored
Search Criteria.
You can click on the Manage Saved Searches and bring up a pop-up to edit or delete
the previously Saved Search Criteria.
28.5.2 Overview of WebLogic Server and Application Deployment Log
File Monitoring
You can use Log File Monitoring to monitor WebLogic Server and Application
Deployment log files for specific patterns and thereby reduce troubleshooting time.
You can set up Cloud Control to receive alert notifications in context of targets when
patterns are found.
Chapter 28
Monitoring Log Files
28-24

The Log File Monitoring metric, Log File Pattern Matched Line Count for WebLogic
Server and Application Deployment target types allows you to monitor one or more log
files for the occurrence of one or more search patterns. In addition, you can specify a
pattern to be ignored for the log file. Periodic scanning, which occurs by default every
60 minutes, is performed against any new content added since the last scan. Lines
matching the ignore pattern are ignored first, then lines matching specified match
patterns result in one record being uploaded to the repository for each pattern. You
can set a threshold against the number of lines matching the given pattern. File
rotation will be handled within the given file.
You can also use the monitoring templates functionality, which allows an administrator
to configure a metric once in a template and then apply the template to several
WebLogic Server or Application Deployment targets at once, rather than having to
configure each WebLogic Server log file monitoring metric individually.
If you are currently using log file monitoring via the Host target type, you should
configure log file monitoring via the Fusion Middleware related target type instead so
you can see alerts in context of a Fusion Middleware target.
Prerequisites to Use Log File Monitoring
Log File Monitoring requires a local Management Agent monitoring target. In other
words, the host on which the log files you want to monitor reside must have a
Management Agent installed and running. The operating system user who installed the
Management Agent must have read access to the directories where the monitored log
files reside. Log file monitoring is disabled by default. You must enable it in order to
use this feature.
28.5.3 Enabling Log File Monitoring
Log File Monitoring is disabled by default. To enable Log File Monitoring, follow these
steps:
1. From the target menu, select Monitoring.
2. Choose Metric and Collection Settings.
3. On the Metric and Collection Settings page, in the Metrics tab, from the View
drop-down menu, select All metrics.
4. Search for Log File Monitoring. Against the Log File Monitoring row, click the
Disabled link.
5. On the Edit Collection Settings: Log File Monitoring page, in the Collection
Schedule section, click Enable. The default collection schedule is set for every 60
minutes.
6. Click Continue.
The Metric and Collection Settings page appears. At this point, Enterprise
Manager Cloud Control enables Log File Monitoring but does not save the
changes to the Management Repository.
7. On the Metric and Collection Settings page, click OK.
Enterprise Manager Cloud Control saves your changes to the Management
Repository.
Chapter 28
Monitoring Log Files
28-25

28.5.4 Configuring Log File Monitoring
To configure Log File Monitoring, follow these steps:
1. From the target menu, choose Monitoring.
2. From the Monitoring menu, select Metric and Collection Settings.
3. On the Metric and Collection Settings page, in the Metrics tab, from the View
drop-down menu, select All metrics.
4. Search for Log File Monitoring.
5. Under the Log File Monitoring row, in the Log File Pattern Matched Line Count
row, click the Edit icon on the right.
6. On the Edit Advanced Settings:Log File Pattern Matched Line Count page, in the
Monitored Objects section, click Add to add new objects to specify settings for the
log files to be monitored.
The table in the Monitored Objects section lists all log file names, match patterns,
and ignore patterns set for this metric. You can specify different threshold settings
for each of the columns. The Reorder button specifies which log file to scan first.
You can use a combination of wildcards and regular expressions to set your
search criteria.
7. In the Log File Name column, enter the log file name pattern you want to search
for.
You can use a combination of wildcards and regular expressions. However, when
you use wildcards in the Log File Name column, make sure you use them only for
identifying the log file names and not for identifying the location path of the log
directory where the log files reside.
For example,
•If you provide
/u01/domains/EMGC_DOMAIN/servers/EMGC_OMS1/logs/%.log,
then
all files that have the .log extension in the log directory are selected.
•If you provide
/u01/domains/EMGC_DOMAIN/servers/EMGC_OMS1/logs/%diagnostics
%,
then all files that have diagnostics in their file names in the log directory are
selected.
•If you provide
/u01/domains/%_DOMAIN%/servers/EMGC_OMS1/logs/%diagnostics%,
then it will be treated as an invalid pattern. Do not use wildcards to identify the
log directory path.
8. In the Match Pattern column, enter the match pattern that should be considered in
the log file. You can use a combination of wildcards and regular expressions. Case
is ignored.
For example:
•Set the match pattern as
FATAL.
This pattern will be true for any lines
containing fatal.
•Set the match pattern as
%fatal%critical%.
This pattern will be true for any
lines containing fatal and critical.
9. In the Ignore Pattern column, enter the pattern that should be ignored in the log
file. By default, % appears in the column; you should remove the default value if
Chapter 28
Monitoring Log Files
28-26

nothing should be ignored. You can use a combination of wildcards and regular
expressions. Case is ignored.
•Set the match pattern as
BEA-0023
and the ignore pattern as
warning.
This
pattern searches for BEA-0023 but ignores it if the same line contains warning.
•Set the match pattern as
ADFC-1023%FAILED%.
This pattern searches for
ADFC-1023 only if it is followed by FAILED anywhere in the same line.
•Set the match pattern as
BEA-%
and the ignore pattern as
BEA-1005.
This
pattern searches for all patterns starting with BEA- but ignores BEA-1005.
10. In the Warning Threshold and Critical Threshold columns, set the threshold
values to a number such that if the pattern occurs in the log file the specified
number of times within the collection schedule, then an alert will be triggered. If the
number of occurrences is specified in the advanced settings, then this factors into
when alert is raised.
For example, if you set the critical threshold to 1 (if pattern found more than 1 time
in log file, it is critical alert) and the number of occurrences to 2, then a critical alert
is raised only when the pattern is found more than once in the log file within 2
consecutive collections.
Including the Log File Pattern Matched Line Count Metric As Part of a Monitoring
Template
Once log file monitoring is enabled and configured, you can include the ‘Log File
Pattern Matched Line Count' metric as part of a Monitoring Template. Log file locations
must be the same across targets to which the template is applied. You can apply the
template to multiple WebLogic servers or Application Deployment targets at once
rather than setting monitoring settings individually on a per-target basis.
If after configuring the Log File Monitoring metric the log file contains the specified
patterns but the alerts are not generated in the OMS, you should do the following:
•Check whether the log file name contains a perl pattern.
•Check whether the ignore pattern contains an asterisk (*). Providing an asterisk in
the ignore pattern field will also ignore all the lines which include the matched
patterns.
Configuration Issues
If an error message displays indicating that logging configuration is missing or invalid
for certain targets, you can try the following options.
First, the WebLogic Domain that you are accessing may not be Oracle JRF (Java
Required Files) enabled. Oracle JRF consists of components not included in the
Oracle WebLogic Server installation and that provide common functionality for Oracle
business applications and application frameworks. To view log messages, the target
must be Oracle JRF enabled. To check to see if your WebLogic Domain, for example,
is Oracle JRF enabled, perform the following steps:
1. From the WebLogic Domain menu, select Target Setup submenu and then
Monitoring Configuration.
2. On the Monitoring Configuration page for the domain, look for the property labeled
“Can Apply JRF". The value for this property could be true or false. If the value is
false, then the domain is not Oracle JRF enabled.
If the value of the “Can Apply JRF" property is true for the domain, this does not
necessarily mean that all managed servers within the domain are Oracle JRF enabled.
Chapter 28
Monitoring Log Files
28-27

If you are unable to access log messages in the context of a specific managed server,
then navigate to the relevant managed server's Monitoring Configuration page. From
the Monitoring Configuration page, look for the property “Is JRF Enabled". The value
for this property could be true or false. If the value is false, then the managed server is
not Oracle JRF enabled.
Second, the Enterprise Manager Cloud Control administrator who is trying to access
log messages does not have the necessary target privileges to do so. In order to view
log messages, the administrator must have been granted the target privilege “Ability to
view Fusion Middleware Logs" for the corresponding target. Talk to your Oracle
Enterprise Manager's site administrator or super administrator regarding whether you
have this privilege or not. Refer to later questions in this document for additional
details on this target privilege and granting the privilege to administrators.
28.5.5 Viewing Alerts from Log File Monitoring
Alerts generated from the Log File Pattern Matched Line Count metric appear on the
home page of the target or the Alert History page.
Triggered alerts must be manually cleared.
28.6 Configuring Log Archive Locations
You can configure the host, its credentials, and archive location information for a
WebLogic domain and for all targets under the domain. You can either configure
everything collectively under the target at the same time, or you can configure the
targets individually.
To configure all of the targets at the same time, follow these steps:
1. From the WebLogic domain home page, select Logs from the WebLogic Domain
menu, then select Configure Archive Locations.
The Configure Archive Locations page appears.
2. Select the WebLogic domain in the table, then click Assign Host Credentials.
An Assign Host Credentials pop-up appears.
3. Provide the requisite information and make sure that the Apply Above Host
Credentials to Child Targets check box is enabled, then click OK.
The host name you selected now appears in the Host column of the Configure
Archive Locations page, and the column also displays this host for all of the child
targets.
4. Click Assign Archive Location.
A Remote File Browser pop-up appears.
5. Double-click a directory name to enter in the host name field, then repeat this
process for each sub-directory that you want to in the field. Click OK when you
have finished.
The directory location you selected now appears in the Archive Location column of
the Configure Archive Locations page, and the column also displays this location
for all of the child targets.
To configure the targets separately, follow the procedure above, except select a
particular target rather than the WebLogic domain.
Chapter 28
Configuring Log Archive Locations
28-28

29
Configuring and Using Services
This chapter provides an overview of services and describes the procedures to
configure and monitor services with Enterprise Manager. It contains the following
sections:
•Introduction to Services
•Creating a Service
•Monitoring a Service
•Configuring a Service
•Using the Transaction Recorder
•Setting Up and Using Service Level Agreements
•Using the Services Dashboard
•Using the Test Repository
•Configuring Service Levels
•Configuring a Service Using the Command Line Interface
•Troubleshooting Service Tests
29.1 Introduction to Services
The critical and complex nature of today's business applications has made it very
important for IT organizations to monitor and manage application service levels at high
standards of availability. Problems faced in an enterprise include service failures and
performance degradation. Since these services form an important type of business
delivery, monitoring these services and quickly correcting problems before they can
impact business operations is crucial in any enterprise.
Enterprise Manager provides a comprehensive monitoring solution that helps you to
effectively manage services from the overview level to the individual component level.
When a service fails or performs poorly, Enterprise Manager provides diagnostics
tools that help to resolve problems quickly and efficiently, significantly reducing
administrative costs spent on problem identification and resolution. Finally, customized
reports offer a valuable mechanism to analyze the behavior of the applications over
time.Enterprise Manager monitors not only individual components in the IT
infrastructure, but also the applications hosted by those components, allowing you to
model and monitor business functions using a top-down approach, or from an end-
user perspective. If modeled correctly, services can provide an accurate measure of
the availability, performance, and usage of the function or application they are
modeling.
29.1.1 Defining Services in Enterprise Manager
A service is defined as an entity that provides a useful function to its users. Some
examples of services include CRM applications, online banking, and e-mail services.
29-1

Some simpler forms of services are business functions that are supported by protocols
such as DNS, LDAP, POP, FTP or SMTP.
Enterprise Manager allows you to define one or more services that represent the
business functions or applications that run in your enterprise. You can define these
services by creating one or more tests that simulate common end-user functionality.
You can also define services based on system targets, or on both system and service
tests.
You can create service tests to proactively monitor your services. Using these tests,
you can measure the performance and availability of critical business functions,
receive notifications when there is a problem, identify common issues, and diagnose
causes of failures.
You can define different types of service models based on your requirement. Some of
the types of service models that you can create are:
•Generic Service: A Generic Service is the simple service model you can create in
Enterprise Manager. You can define one or more service models by associating
service tests and/or associating relevant system targets that represent a critical
business function.
•Aggregate Service: A number of services can be combined together to form an
Aggregate Service. Within the context of an Aggregate Service, the individual
services are referred to as sub-services. An Aggregate Service can also be used
as a sub-service to create other Aggregate Services.
An aggregate service must contain at least one of the following: member service,
system, or test. The metrics can be promoted from a member service, or a system,
or a test.
You can define other service models based on your requirement.
29.2 Creating a Service
Before you create a service, you must be familiar with the concepts of service
management. You must also perform the following tasks:
•Identify the locations where the Management Agents must be available to monitor
the services using the appropriate service tests and protocols. For example, if your
service includes HTTP based service tests or IMAP based service tests, ensure
that the location of the Management Agent within your network architecture allows
these tests. You must ensure that the Management Agents are installed at
appropriate locations according to the network security (firewalls) and network
routing guidelines.
Note that the beacon targets must already be created on the Management Agents
before creating the service.
•Discover all the components for your service so that they can be listed as
Enterprise Manager targets.
•Define systems on which the service is based.
You can create:
•Generic Service - Test Based: You can create a service that is based on a type of
service test such as ATS, CalDAV, DNS, FTP, and so on.
Chapter 29
Creating a Service
29-2
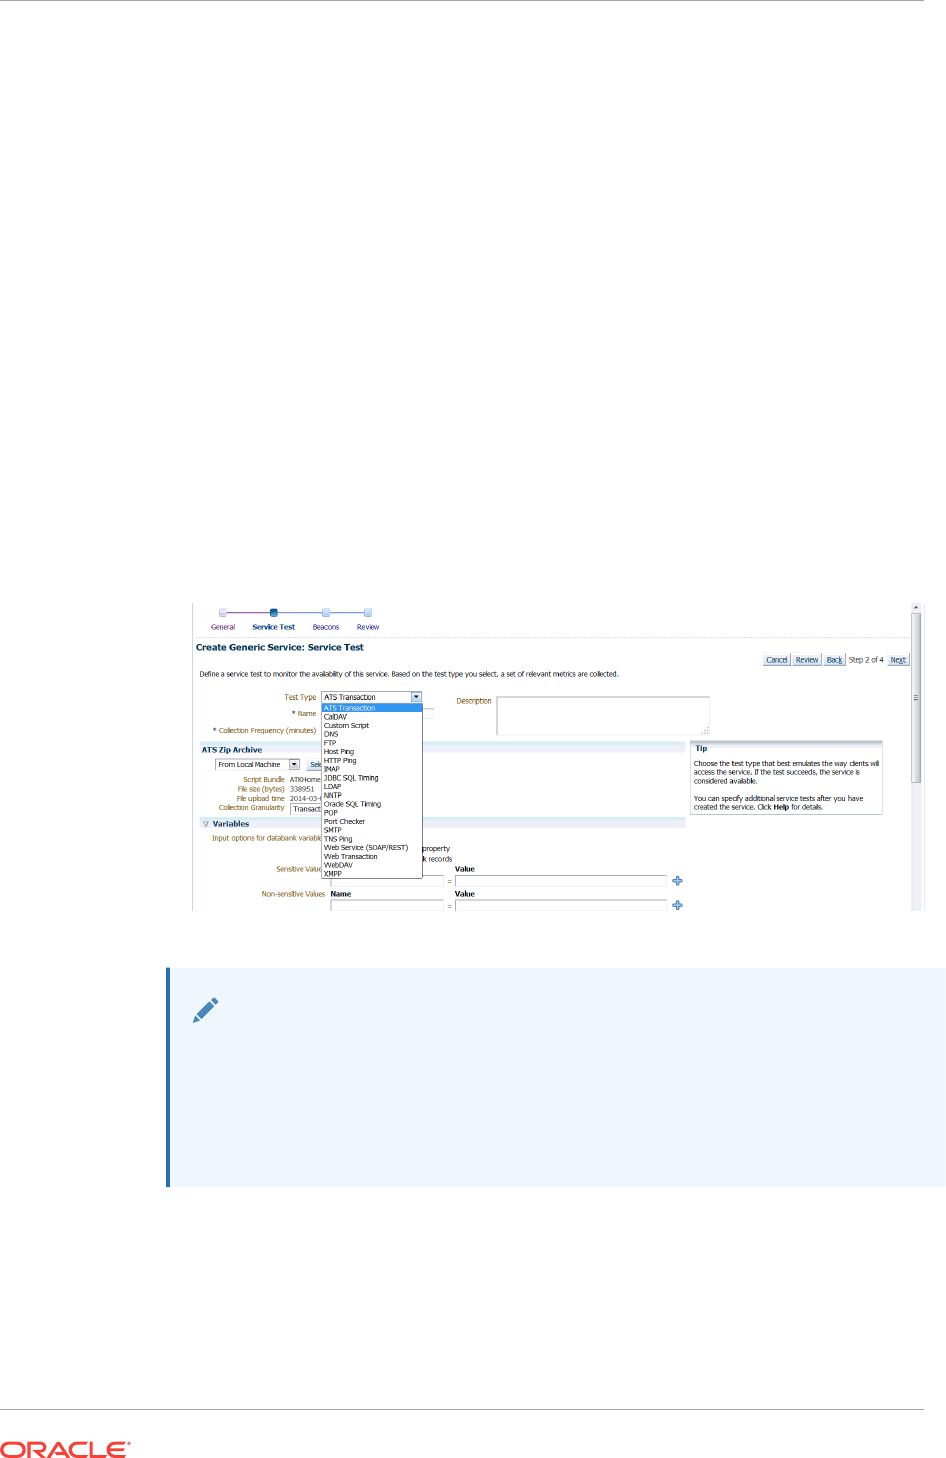
•Generic Service - System Based: You can create a service that is based on a
system or one or more system components.
•Aggregate Service: An aggregate service consists of one or more sub services
which can either test based or system based generic services.
29.2.1 Creating a Generic Service - Test Based
To create a test based generic service, follow these steps:
1. From the Targets menu, select Services. The Services main page is displayed.
2. From the Create menu, select Generic Service - Test Based. The Create
Generic Service: General page appears.
3. Enter a name for the service and select a time zone in which the service has to be
monitored. The availability of the service and the SLA computation is based on the
time zone you select here. Click Next.
4. The Create Generic Service: Service Test page appears. Select a test from the
Test Type drop down list.
Figure 29-1 Create Generic Service: Service Test Page
Note:
If you select ATS Transaction test type, then in the ATS Zip Archive section
you can import the files either from your local machine or from test repository.
However, to use the latter, ensure that you have uploaded the test script to the
test repository. For information on how to use the Test Repository, see Using
the Test Repository.
5. Depending on the test type you selected, enter the other parameters on this page
and click Next. The Create Generic Service: Beacons page appears.
6. Click Add to add one or more beacons for monitoring the service. It is
recommended that you use beacons that are strategically located in your key user
communities in order for them to pro-actively test the availability of the service
from those locations. If no beacons exist, you must create a new beacon. See
Deploying and Using Beacons for details.
Chapter 29
Creating a Service
29-3

Note:
•Only a single beacon should be added from a Management Agent to
monitor service tests. Adding multiple beacons from the same
Management Agent to a service test is not recommended.
Beacons are targets that are used to monitor service tests, primarily to
measure performance of the service or business function from a different
geographic location. Thus, adding multiple beacons from the same
Management Agent does not add any value.
•Beacons marked as key beacons will be used to determine the availability
of the service. The service is available if one or more service tests can be
successfully executed from at least one key beacon.
•It is recommended that you create the beacons before you create the
service.
7. Click Next. The Create Generic Service: Review page appears. Review the
information entered so far and click Finish to create the service. The newly created
service appears on the main Services page.
29.2.2 Creating a Generic Service - System Based
To create a system based generic service, follow these steps:
1. From the Targets menu, select Services. The Services main page is displayed.
2. From the Create menu, select Generic Service - System Based. The Create
Generic Service: General page appears.
3. Enter a name for the service and select a time zone for the service. Click Next.
The Create Generic Service: System page appears. Select a system on which the
service is to be based. A system refers to the infrastructure used to host the
service. A system can consist of components such as hosts, databases, and other
targets.
4. Click Next. The Create Generic Service: Review page appears. Review the
information entered so far and click Submit to create the service. The newly
created service appears on the main Services page.
29.2.3 Creating an Aggregate Service
Aggregate services consist of one or more services, called sub services or member
services. A subservice is any service created in Enterprise Manager Cloud Control.
The availability, performance, and usage for the aggregate service depend on the
availability, performance, and usage for the individual sub services comprising the
service. When creating an aggregate service, at the very least, either a system or one
or more sub services must be associated. You can include both sub services and a
system if required.
To create an aggregate service, follow these steps:
1. From the Targets menu, select Services. The Services main page is displayed.
Chapter 29
Creating a Service
29-4

2. From the Create menu, select Aggregate Service. The Create Aggregate
Service: General page appears.
3. Enter a name for the aggregate service and select a time zone in which the
service is to be monitored. The monitored data will be displayed in the selected
time zone. Click Next.
4. The Create Aggregate Service: Services page appears. Click Add and select one
or more member services (sub services) that are to be part of the aggregate
service. You can add one or more test based, system based generic services, and
one or more aggregate services. Click Next.
5. The Create Aggregate Service: System page appears. Select a system target on
which the service is to be based. Associating a system with a service is not
mandatory but is recommended. Features like Root Cause Analysis depend on
key system components being correctly defined.
After you have created an aggregate service, you can add or remove its constituent
sub services, modify the availability definition and add or delete performance or usage
metrics.
WARNING:
If you delete or remove a subservice from an aggregate service, the aggregate
service performance, usage, and business metrics may be affected if they are
based on a deleted subservice's metrics.
29.3 Monitoring a Service
After a service has been defined, you can monitor the status of the service, view the
availability history, performance, enabled SLAs, topology, and so on. This section
describes the following:
•Generic / Aggregate Service Home Page
•Performance Incidents Page
•SLA Dashboard
•Test Summary
•Topology
29.3.1 Viewing the Generic / Aggregate Service Home Page
To view the overview of the performance, availability, and usage of your service, click
on a selected service in the main service pages. The Home page of the selected
service appears. It contains the following regions:
•General: In this region, you can view the current status of the service and the
availability (%) over the last 24 hours. You can also view whether the availability is
based on the service test, or the system. In the case of aggregate services,
availability can also be based on the sub services. The Availability History chart
shows the period of time for which the service was available, when it was down, in
a blackout status, and so on.
Chapter 29
Monitoring a Service
29-5

•Component Availability: This region shows the availability of the service tests or
system components on which the service is based. Select the Show Only Key
Tests check box to view only the key components or tests.
29.3.2 Viewing the Performance / Incidents Page
On this page, you can view charts for the performance and usage metrics defined for
the service and drill down to view additional metric details.
Performance metrics to help you identify how well the service test is performing for
each of the remote beacons. In general, the local beacon should have a very efficient
and consistent response time because it is local to the Web application host. Remote
beacons provide data to reflect the response time experienced by your application end
users.
Usage metrics are used to measure the user demand or workload for the service.
Usage metrics are collected based on the usage of the underlying system components
on which the service is hosted. You can monitor the usage of a specific component or
statistically calculate the average, minimum and maximum value from a set of
components.
In the Incidents and Problems region, you can view any incidents or problems
associated with the service.
29.3.3 Viewing the SLA Dashboard
This page displays the list of enabled SLAs for this service. For each SLA, you can
see the following:
•The current status of the SLA and its SLOs along with the service level value for
the current SLA period.
•The History column shows the SLA status for the last seven days.
•The Violations column shows the actual, remaining, and total allowable SLA
violation times for that SLO.
29.3.4 Viewing the Test Summary
The Test Reporting Dashboard shows the list of all the enabled tests for that particular
service. Apart from the execution history of the tests over the last 24 hours, the most
failed step of the test information is also displayed, both at the beacon level and at the
test (aggregate) level.
The trend of the total time taken by the transaction is also displayed over the last 24
hours. Also, the breakdown of the step metrics are displayed for a particular
transaction execution.
Use this page to see an overview of all the tests, by performance and issues, and to
drill down to individual executions per beacon and drill down to transaction results with
an execution.
How to Use This Page
By default, on arriving at this page, all the enabled tests are shown at the overall level.
The most failed step information is displayed which shows the most failing step of the
test across all executing beacons.
Chapter 29
Monitoring a Service
29-6

On expanding any test node in the tree-table, the beacon level execution summary is
displayed showing the test execution history (last 24 hours) along with the information
of the most failed step.
On clicking on the test node in the tree table, the transaction diagnostics region shows
up in the lower part of page. If the parent node, that is the test (overall) node, is
selected, then the diagnostics regions in the lower part show the aggregated data
across all successfully executing beacons.
The left part of this region shows the transaction total time trend (last 24 hours) and
has a time selector slider. The intention of this slider is to select the transaction/
transaction period to see the step diagnostics region which occupies the right part of
the lower region.
29.3.5 Viewing the Service Topology
The topology viewer provides a graphical representation of the components of your
service. The topology viewer shows all dependent components and sub services,
represented as icons, as well as the relationships between them, represented as links.
For system components, only key components are displayed.
You can do the following:
•View the relationship between the service and its dependencies, including other
services, and system key components. All determinants for your service's
availability are displayed in the Enterprise Manager Cloud Control Topology
Viewer.
•View the causes of service failure, as identified by Root Cause Analysis. Potential
root causes and down targets are highlighted. Select highlighted links between
components to view details on the cause of service failure. For more information,
see About Root Cause Analysis. If you have installed and configured the SMARTS
Network Adapter, the topology page shows the status of the network for your failed
service as well. For more information on Network Manager Adapter plug-ins, refer
to About the SMARTS Network Adapter.
For more details on the topology viewer, refer to the Enterprise Manager Online Help.
29.3.6 Sub Services
Aggregate services consist of one or more services, called sub services or member
services. A subservice is any generic test based on system based service The
availability, performance, and usage for the aggregate service depend on the
availability, performance, and usage for the individual sub services comprising the
service.
This page lists all the sub services that are part of the aggregate service. For each sub
service, the status of the service, key components, incidents, and so on are displayed.
29.4 Configuring a Service
After you have created a service, you can define the service availability, associate a
system with the service, define performance and usage metrics, and so on. This
section describes the following:
•Availability Definition
Chapter 29
Configuring a Service
29-7

•Root Cause Analysis Configuration
•System Association
•Service Tests and Beacons
•Test Summary
•Monitoring Settings for Tests
•Usage Metrics
•Performance Metrics
•Edit Service Level Rule
29.4.1 Availability Definition (Generic and Aggregate Service)
The availability of a service indicates whether the service is available to the users at
any given point in time. The rules for what constitutes availability may differ from one
application to another. For example, for a Customer Relationship Management (CRM)
application, availability may mean that a user can successfully log onto the application
and access a sales report. For an e-mail application, it may be mean that the user can
access the application, send and receive e-mails.
Click on the service for which you want to define the availability and navigate to the
Service Home page. From the Generic Service menu, select Administration, then
select Availability. The availability of a service can be based on:
•Service Tests: Choose this option if the availability of your service is determined
by the availability of a critical functionality to your end users. Examples of critical
functions include accessing e-mail, generating a sales report, performing online
banking transactions, and so on. While defining a service test, choose the protocol
that most closely matches the critical functionality of your business process, and
beacon locations that match the locations of your user communities.
You can define one or more service tests using standard protocols and designate
one or more service tests as Key Tests. These key tests can be executed by one
or more Key Beacons in different user communities. You can also indicate
whether the service test is a key test by enabling the Key Service Test checkbox.
Only key service tests are used to compute the availability of the service. You can
then select the beacons that will be used to execute the key tests and determine
the availability of the service. Depending on the definition, a service is considered
available if all key service tests are successful or at least one key service test is
successful. See Deploying and Using Beacons for details on beacons and how to
create them.
You can specify whether the service should be available when:
–All key service tests are successful (Default). This option is recommended.
–At least one key service test is successful
Note:
A service test is considered available if it can be executed by at least one key
beacon. If there are no key beacons, the service test will have an unknown
status.
Chapter 29
Configuring a Service
29-8

•System: The availability of a service can alternatively be based on the underlying
system that hosts the service or selected components of the system. If availability
is based on selected system components, you must select the components that
are critical to running your service and designate one or more components as Key
Components, which are used to determine the availability of the service. The
service is considered available as long as at least one or all key components are
up and running, depending on your availability definition.
You can specify whether the service should be available when:
–All key components are up (Default)
–At least one key component is up
You can also mark one or more components as key system components that will
be used to compute the availability of the service. Key system components are
used to determine the possible root cause of a service failure. For more
information, refer to "Root Cause Analysis Configuration".
•Sub Service: For an aggregate service, availability can also be based on the
availability of the sub services. You can specify if availability should be determined
based on the availability of all sub services or a single sub service.
29.4.2 Root Cause Analysis Configuration
You can use Root Cause Analysis (RCA) to filter a set of events to determine the
cause of a higher level system, service, or application problem. RCA can help you to
eliminate apparent performance problems that may otherwise appear to be root
causes but which are only side effects or symptoms of the actual root cause of the
problem, allowing you to quickly identify problem areas. You can view the RCA results
on the Home page or Topology page of any service that is currently down. The
Topology page gives you a graphical representation of the service, along with the
system and component dependencies. Targets that have caused the service failure
are highlighted in the Topology page.
Before running RCA, you can choose to:
•Configure the tool to run automatically whenever a service fails.
•Disable RCA by changing the default Analysis Mode to Manual.
•Define component tests for the service and thresholds for individual tests.
To configure Root Cause Analysis, follow these steps:
1. From the Service Home page, click Monitoring Configuration.
2. From the Monitoring Configuration page, click Root Cause Analysis
Configuration.
3. If the current mode is set to Automatic, click Set Mode Manual to disable RCA. If
you choose to perform the analysis manually, you can perform the analysis from
the Service home page at anytime by choosing Perform Analysis if the service is
down. If the current mode is set for Manual, click Set Mode Automatic to enable
RCA when the state of the service and its components change
4. Click the link in the Component Tests column of the table for the key component
you want to manage. You can then manage the key components for the service on
the Component Tests page by adding, removing, or editing component tests.
When a service is down, you can drill down to the key components to verify the
Chapter 29
Configuring a Service
29-9

underlying issue. Refer to the Enterprise Manager Online Help for details on
defining component tests.
Note:
When you disable RCA and set it back to automatic mode, RCA does not
store the previous history results for you, thus providing no history for later
reference.
29.4.2.1 Getting the Most From Root Cause Analysis
Root Cause Analysis (RCA) can provide you with great value by filtering through large
amounts of data related to your services and identifying the most significant events
that have occurred that are affecting your service's availability. If you are constructing
your own services to manage in Enterprise Manager it is important that the services
are defined with some thought and planning in order to get the most out of RCA.
The first item to consider in getting the most from RCA is the set of dependencies that
your service has on other services or system components. Be sure to identify all of the
system components that your service utilizes in order to accomplish its task. If you
omit a key component and the service fails, RCA will not be able to identify that
component as a possible cause. Conversely, if you include components in the service
definition that the service does not actually depend on, RCA may erroneously identify
the component as a cause of service failures.
When building service dependencies, keep in mind that you can take advantage of the
aggregate service concept that is supported by Enterprise Manager. This allows you to
break your service into smaller sub-services, each with its own set of dependencies.
RCA considers the status of a sub-service (a service that you depend on) as well the
system components or service on which the sub-service depends.
The second item to consider in getting the most from RCA is the use of component
tests. As you define the system components that your service depends on, consider
that there may be aspects of these components that may result in your service failure
without the component itself failing. Component tests allow RCA to test the status not
only of the target itself but also the status of its key aspects.
The RCA system allows you to create component tests based on any metric that is
available for the key component. Remember, this includes any user-defined metrics
that you have created for the component, allowing you great flexibility in how RCA
tests the aspects of that component should your service fail. RCA can be configured to
run in two modes. It can run automatically based on the failure of a service or can be
configured to run manually. You can decide the mode based on the Expected Service
Level Agreement % of the service being monitored. If the Expected Service Level
Agreement % is high, you must select the automatic mode to ensure that that possible
errors and the root cause of the failure is easily detected.
29.4.3 System Association
A system is the set of infrastructure components (hosts, databases, application
servers, etc.) that work together to host your applications. For example, an e-mail
application can be hosted by a database, listener, application server, and the hosts on
which these components reside.
Chapter 29
Configuring a Service
29-10

After you create a service, you can specify the associations between the components
in the system to logically represent the connections or interactions between them. For
example, you can define an association between the database and the listener to
indicate the relationship between them. These associations are displayed in the
topology viewer for the system. Some data centers have systems dedicated to one
application or service. Alternatively, others have systems that host multiple services.
You can associate single or multiple services to a System, based on how the data
center is set up.
Use this page to select the Enterprise Manager system that will be used to host this
service. You can do the following:
•Add or select a system
•Change or remove a selected system
After you have selected the system, mark one or more system components as key
components that are critical for running the service. These key components are used
to determine service availability or identify causes of service failure.
29.4.4 Monitoring Settings
For each service, you can define the frequency (which determines how often the
service will be triggered against your application) and the performance thresholds.
When a service exceeds its performance thresholds, an alert is generated.
To define metrics and thresholds, from the Generic Service menu, select
Administration, then select Monitoring Settings for Tests. The Metric and Policy
Settings page is displayed. Click the Monitoring Settings link. The Monitoring
Settings - Thresholds page appears.
•View By Metric, Beacon - In this view, you can click Add Beacon Overrides to
override the default threshold values for one or more beacons. In this case, the
default thresholds will only be used for beacons without any overrides. Any new
beacons added to the service will use the default thresholds. Click Add Metric to
add one or more metrics.
•View By Beacon, Metric - In this view, you can click on the Default icon to toggle
between Edit and View modes for a specific metric. In the Edit mode, you can
modify the parameters of the metric. You can also modify the parameters of the
metric for a specific beacon. In the View mode, the default parameters of the
metric will be used.
Apart from these procedures, you can also define metrics at the step, and step
group level for Web transactions. You can choose either of the following views:
–View By Step, Metric, Beacon: In this view, you can click Add Beacon
Overrides to override the default threshold values for one or more beacons. In
this case, the default thresholds will only be used for beacons without any
overrides. Any new beacons added to the Web transaction will use the default
thresholds. Click Add Metric to define thresholds for one or more metrics.
Incidents are generated only if the value of the Data Granularity property is set
to 'Transaction' for the service tests. For more information on the Web
transaction properties, refer to the Create / Edit Service Test - Web
Transaction help page in the Enterprise Manager Online Help.
–View By Step, Beacon, Metric: In this view, you can click on the Default icon
to toggle between Edit and View modes for a specific metric. In the Edit mode,
you can modify the parameters of the metric for a specific beacon. In the View
Chapter 29
Configuring a Service
29-11

mode, the default parameters of the metric will be used. Incidents are
generated only if the value of the Data Granularity property is set to ' Step'.
To define the default collection frequency and collection properties, click the
Collection Settings tab on the Monitoring Settings page. You can do the following:
•Specify the default collection frequency for all the beacons. To override the
collection frequency for a specific beacon, click Add Beacon Overrides.
•Specify the collection properties and their corresponding values for one or more
beacons.
Refer to the Enterprise Manager Online Help for more details on the defining the
collection intervals and performance thresholds.
29.4.5 Service Tests and Beacons
You can add additional service tests and specify one or more beacons that will
execute these service tests. To add a service test or modify an existing service test,
click the Service Test and Beacons link in the Monitoring Configuration page. The
Service Tests and Beacons page appears. You can select a test type from the drop
down list and create a service test.
29.4.5.1 Defining Additional Service Tests
You can create different types of service tests based on the protocol and the location
of the beacons. From the Service Tests and Beacons page, you can do the following:
•Add one or more service tests for your service. Select the Test Type and click
Add. Some of the test types that can be defined are ATS, FTP, Web Transaction,
DNS, SOAP and others.
•After you have created the service test, you must enable it. If your service test is
not enabled, it will not be executed by any of the beacons. You can define one or
more service tests as key tests. These key tests are used to monitor the
availability and performance of your service. Only service tests that are enabled
can be designated as key tests. To set up a service test as a key test, click the
Availability Definition link at the bottom of the page.
•Create, add, or remove a beacon. When you identify the beacon locations, select
locations on your internal network or on the Internet that are important to your e-
business. These are typical locations where your end users are located. For
example, if your business is hosted in Canada and you have customers in the
United States, use a beacon installed on a host computer in the United States to
measure the availability and performance of your applications.
•After you have created the service test, you can verify it by clicking Verify Service
Test. The Status icon indicates the status of the service test i.e. whether it can be
successfully executed by the key beacons. If there are no key beacons defined for
the service, the status will be unknown even if there are other beacons executing
the service test. Click Status to go to the Status History page.
Chapter 29
Configuring a Service
29-12

Note:
–While defining a SOAP (Simple Object Access Protocol) service test, if the
WSDL URL to be accessed is outside the company's intranet, proxy
settings need to be added to the
$OMS_HOME/sysman/config/
emoms.properties
file.
For example, to set up
www-myproxy.myco.com
as proxy, specify the values
as follows:
proxyHost=www-myproxy.myco.com
proxyPort=80
dontProxyFor=myco.com,mycorp.com
The
proxyUser
,
proxyPwd
,
proxyRealm
,and
proxyPropsEncrypted
properties are
used to configure an authenticated proxy. After you have modified the
proxy settings, you must restart all the OMSes for the changes to be
effective.
–The Forms Transaction test type has been deprecated in Enterprise
Manager 12c. Forms transactions created in earlier releases can still be
used but you cannot create new Forms Transaction test types. You must
create a Generic Service target and create an ATS Transaction using
OATS EBS/Forms Load test scripts. This ATS test type is used to monitor
Oracle Forms applications.
–The Web Transaction test type is in maintenance mode only. To monitor
Web applications, we recommend that you create an ATS load script and
use the ATS Transaction test type to monitor Web applications. See
Creating an ATS Service Test Using OATS Load Script for details.
The creation of different types of service tests is covered in detail in the Enterprise
Manager Online Help. In this chapter, we have covered the creation of the ATS
test type as an example.
29.4.5.2 Deploying and Using Beacons
A beacon is a target that allows the Management Agent to remotely monitor services.
A beacon can monitor one or more services at any point in time.
Note:
Before you create a beacon, you must ensure that the Oracle Beacon 12.1.0.2
or higher plug-in has been deployed.
To create a beacon to run one or more service tests, follow these steps:
1. From the Targets menu, select Services to view the Services page.
2. From the Services Features menu, select Beacons and then click Create.
The Create Beacon page appears.
Chapter 29
Configuring a Service
29-13

3. Enter the following details:
•Name: Name of the beacon being created.
•Agent: Select the Management Agent on which the beacon will be running.
•Proxy Information: If the beacon is accessing the service through a firewall,
you must specify the proxy server settings as follows:
–Proxy Host and Port: The name of the proxy server host and through
which the beacon communicates.
–Proxy Authentication Realm: The authentication realm (used for Basic and
Digest authentication schemes) that is used to verify the credentials on the
proxy server.
–Proxy Authentication Username: The (fully qualified) username to be used
for proxy server authentication.
–Proxy Authentication Password: The accompanying password to be used
for proxy server authentication.
•Enable Message ID Request Header: Select the checkbox to include an
additional header in HTTP requests issued when Web Transactions and HTTP
Ping service tests are executed. This allows Real User Experience Insight
(RUEI) monitoring of Web Transactions and HTTP Ping tests.
•Web Transaction: For Windows agents, specify the account credentials to be
used when launching a browser to playback a Web transaction.
•Selenium Transaction: For Selenium test type, specify the following:
–Count of Selenium Test Results to Retain: Specify the number of
Selenium test records that are to be retained. This value is set to 3 by
default but can be changed.
–Vnc Pool for Selenium Test: Specify the VNC session range to be used to
execute Selenium tests. The number of VNC sessions depends on the
number of parallel tests that are executed by this beacon.
Note:
This field must be configured if multiple Selenium tests are to be executed
simultaneously.
–Alias for localhost: Enter the alias for the localhost (the first value as
specified in the
/etc/hosts
file). For example, if the entry in the
/etc/hosts
file is
127.0.0.0=localhost.localdomain,localhost,localhost1
, then enter
localhost.localdomain
here.
4. Click Create to create the beacon and return to the Beacon Home page. You can
now use the beacon to monitor service tests.
5. From the Generic Service menu, select Administration, then select Service
Tests and Beacons. You will see a list of service tests that have been enabled
along with a list of beacons.
6. Select the service test to be monitored, then from the Beacons table, select the
beacon that you have created. Indicate if it is a key beacon.
7. Click Verify Service Test to execute the service test by the selected beacon.
Chapter 29
Configuring a Service
29-14

29.4.5.3 Configuring the Beacons
This section lists additional beacon related configuration tasks.
•Configuring SSL Certificates for the Beacon: When a beacon is used to
monitor a URL over Secure Sockets Layer (SSL) HTTPS URL, the beacon must
be configured to recognize the Certificate Authority that has been used by the
Website where that URL resides.
To use the SSL option with the Port Checker test, you may need to add additional
certificates to the Management Agent's monitoring wallet. To add an additional
certificate, follow these steps:
1. Obtain the certificate, which is in
Base64encoded X.509 (.CER)
format, in the
b64SiteCertificate.txt
file. (The file name may be different in your
configuration.) An example of the contents of the file is given below:
------BEGIN CERTIFICATE--------------
MIIDBzCCAnCgAw...
...... base 64 certificate content .....
------END CERTIFICATE-----------------
This file is stored in the Home directory of the Management Agent as
<AGENT_BASE>/agent_inst/sysman/config/b64InternetCertificate.txt
file.
2. Create the
b64InternetCertificate.txt
file in the agent core and instance
directory if it does not exist.
<AGENT_BASE>/agent_inst/sysman/config/b64InternetCertificate.txt
<AGENT_BASE>/core/12.1.0.2.0/sysman/config/b64InternetCertificate.txt
3. Append the
Base64encoded X.509
certificate to the end of both
b64InternetCertificate.txt
files. Include both the
BEGIN
and
END CERTIFICATE
lines.
4. Restart the Management Agent.
•Configuring Dedicated Beacons: Beacon functionality on an agent requires the
the use of an internal Java VM. The use of a Java VM can increase the virtual
memory size of the agent by several hundred megabytes. Because of memory
constraints, it is preferable to create beacons only on agents that run on dedicated
hosts. If you are running large numbers of tests (e.g., several hundred per minute)
on a given beacon, you may also wish to install that beacon's agent on a
dedicated host. To take full advantage of dedicated hardware, edit the
agent's
$ORACLE_HOME/sysman/config/emd.properties
file. as follows:
applicationmetadataquota: the disk quota in bytes for each application area
–Set the property,
ThreadPoolModel=LARGE
. This allows the agent to
simultaneously run many threads.
–Set the property,
useAllCPUs=TRUE
. This allows the agent to run on multiple
CPUs simultaneously.
–The
applicationMetadataQuota_BEACON
property determines the total size that
can be used to store ATS zip files. If you are using a ATS zip file or need to
configure a large number of small ATS zip files on the beacon, you must
specify a higher value for the
applicationMetadataQuota_BEACON
property.
–@ This property determines the total size that the beacon can consume to
store
Chapter 29
Configuring a Service
29-15

@ ATS zip files. If the user intends to use large ATS zip files or wishes to
@ configure large number of small ATS zip files on a beacon then this
property
@ should be appropriately increased.
–Append
-Xms512m -Xmx1024m
to the
agentJavaDefines
property. This increases
the Java VM heap size to 1024 MB.
•Configuring a Web Proxy for a Beacon: Depending on your network
configuration, the beacon may need to be configured to use a Web proxy. To
configure the Web proxy for a beacon, search for the beacon in the All Targets
page. Select the beacon you wish to configure and click Configure. Enter the
properties for the Web proxy. For example, to set up
www-proxy.example.com
as the
beacon's Web proxy, specify the values as the following:
Proxy Host: www-proxy.example.com
Proxy Port: 80
Don't use Proxy for: .example.com,.example1.com
Note:
You cannot play Siebel service tests and Web Transaction (Browser) service
tests on the same machine.
29.4.5.4 Creating an ATS Service Test Using OATS Load Script
You can use the Oracle Application Test Suite (OATS) to define an Openscript
Transaction Service Test. This test is used to enable beacon application transaction
monitoring using Openscript load testing scripts. Openscript is a component of OATS
and provides advanced capabilities to record and play back various types of Web
transactions, such as web/HTTP, Oracle EBS/Forms, Oracle Fusion/ADF, Siebel,
Adobe Flex, and so on.
By using ATS load scripts, you can:
•Reuse ATS testing scripts for production application transaction monitoring as part
of application lifecycle management.
•Expand the beacon capabilities by:
–Supporting complex application flows with mixed application types and
protocols such as HTTP and Oracle Forms application in one flow.
–Supporting protocol based Siebel application monitoring.
–Providing Databank support.
–Incorporating enhanced scripting and debugging features from Openscript.
–Adding the latest script modules and features without updating Enterprise
Manager.
Creating an ATS service test involves the following:
•Visit http://www.oracle.com/technetwork/oem/app-test/index-084446.html to
download Openscript.
•Launch the installer and follow the steps to install Openscript.
Chapter 29
Configuring a Service
29-16

•Record a new ATS transaction script by following these steps:
–Launch Openscript and from the File menu, select New.
–Select the type of script to be created and click Next. Some of the script types
you can create are Adobe Flex, Oracle Fusion / ADF, Siebel, Database, Java
Code Script, Web/HTTP and so on.
–Select the location where the script is to be stored, enter a script name, and
click Finish.
–From the View menu, select Openscript Preferences to set the recording
preferences.
–Select Record Category and then select HTTP Preferences. Change the
Record Mode from Web to HTTP. This ensures that scripts are played back
correctly.
–Select Record from the Script menu. The browser automatically opens when
you start recording.
–Load the web page where you want to start recording into the browser.
Navigate the web site to record page objects, actions, and navigations. When
you have finished navigating pages, close the browser and click Stop.
–Select Playback from the Script menu to verify that the script has been
properly recorded. Watch the application flow being played back in the play
pane. Make sure the message log pane does not have any errors or failures.
Save the script.
•After the script has been recorded, from the File menu, select Export Script.
–Specify the location in which the script is to be saved. You can save the script
in a repository or workspace.
–Enter a name for the script and click Finish. A script bundle (.zip) is created.
Make sure that the script bundle is self contained. See Creating a Self
Contained Zip File.
Note:
If the script file is very large, uncheck the Recorded Data option.
•Log into Enterprise Manager, upload the script bundle, and create an ATS service
test. See Creating an ATS Service Test for details.
For more details on OATS, please refer to Oracle® Functional Testing OpenScript
User's Guide.
29.4.5.4.1 Creating a Self Contained Zip File
You must ensure that the zip file is self contained and contains the following:
•<txn name>.jwg: The archive file that contains the compiled script executable to
be run by Execution Engine.
•script.java: The actual script Java source file.
•<script name>-descriptor.xml – Describes the step hierarchy
•script.xml: Describes the variables in the databank.
Chapter 29
Configuring a Service
29-17

•modules.properties: Describes which internal modules are required for the
engine.
•Assets.xml: Describes the dependent resources used by the root scripts including
databank files, sub scripts, object libraries, and so on.
•Databank Files: The databank files used by the script while substituting different
variable values.
•Object Libraries: The libraries that contain user-defined object identification rules
and names. This is only applicable for functional testing scripts
•Dependent Scripts: A script can call out to other script.
29.4.5.4.2 Creating an ATS Service Test
To create an ATS service test, follow these steps:
Note:
To use the command line utility (EM CLI) to create and customize an ATS Test
instance using the service test available in the repository, see Oracle
Enterprise Manager Lifecycle Management Administrator's Guide.
1. From the Targets menu, select Services, then from the Create menu, select
Generic Service - Test Based.
2. Enter a name for the service and select a time zone.
3. Click Next. In the Create Generic Service: Availability page, select Service Test.
4. In the Create Generic Service: Service Test, select the Test Type as ATS
Transaction.
5. Enter a name, description, and collection frequency for the service test.
6. In the ATS Zip Archive region, you can specify the location from which the ATS zip
archive is to be imported. It can be imported from:
•From Local Machine: Click Browse to select the zip file to be uploaded from
your local machine.
•From Test Repository: Select a zip file that is present in the test repository and
click Continue. See Using the Test Repository for details.
Click Continue. Based on the zip file uploaded, the ATS ZIP Archive section and
Variables section are populated.
7. You will return to the ATS Service Test page where you can specify the following:
•Usage Options: You can configure the script variable values by selecting the
required usage option. You can either use the values recorded during the
transaction or use the databank. A databank is an external CSV file that ATS
scripts can refer to supply different input values over multiple iterations of the
same script. For example, a login script can use a databank file, named
login_credential.csv
, to supply different login credentials during iteration.
You can select:
Chapter 29
Configuring a Service
29-18

–Use Recorded Values: While playing back the transaction, the beacon
uses the recorded values in the script.
–Use Values From EM Test Property: You can specify values in the
databank columns. These values are used by the beacon while playing
back the script. This is useful if the same value is to be used for each
variable. If variables defined as test properties, the value can be easily
modified without having to modify script bundle or databank files.
–Loop Through All Databank Records: While playing back the
transaction, the beacon will go through each row in the script. For
example, the first iteration will use the first rows of all the databanks. The
second iteration will use the second rows of data and so on.
•Encryption Password: If you have configured ATS Openscript to encrypt
script data (using the Openscript View File > Openscript Preferences >
Generic > Encryption) option, when you create the scripts, you need to enter
the same encryption password as specified in the ATS openscript, so that
beacon can play back the script properly.
•Default Playback Options: The default playback options the beacon uses to
play back the ATS Script.
•Additional Playback Options: If additional playback options have to be
specified, you can specify them here.
29.4.5.4.3 Troubleshooting ATS Service Test Playback Issues
If the space quota for the beacon has been exhausted, the beacon cannot playback
the recorded values in the ATS script and you may see the following error:
Beacon synchronization did not transfer the needed files to the agent. Please
check the agent log. File at: <directory>
To address this issue, the applicationMetadataQuota agent property must be set to a
higher value in the emd.properties file. The default value is 500 MB but if there are
several large files to be uploaded, this must be increased. After the property value has
bee changed, you must restart the Management Agent.
Notes:
•The ATS files are present in the
/EMSTATE/sysman/ApplicationState/beacon
directory.
•File names have following naming convention
<Txn guid>_<beacon guid>.zip
.
•ATS related logs
(gcagent.log
,
gcagent_error.log
,
emagent.nohup
) are available in
the
EMSTATE/sysman/log
folder
29.4.5.4.4 Using Databanking and Parameterization
You can parameterize recorded script inputs to perform data driven testing. Examples
of inputs that can be parameterized include user name, password on the login page,
data entered in the search field, recorded navigations or user actions, and so on.
You can use databanks as the data source for parameterizing script inputs. Databanks
are one or more external comma-separated value (CSV) or text (TXT) files that
provide inputs to script parameters. Multiple Databank files can be attached to a single
script and users can specify how OpenScript assigns data during script playback.
Chapter 29
Configuring a Service
29-19

You can select data input values from an
external
.
csv
file and substitute the variable
values with the values from the Databank. The field names are on the first line of the
file separated by commas (no spaces). The field data is on subsequent lines
separated by commas (different line for each record, no spaces around commas). An
example is shown below:
FirstName,LastName,Mail,Phone
John,Smith,JohnS@company.com,x993
Mary,Ellen,MaryE@company.com,x742
To use the databank records, follow these steps:
1. Open or create a script project.
2. Configure the Databank to use with a script in the Assets Script Properties.
3. Select the script node where you want to use the Databank record.
4. Select the Script menu and then select Other from the Add sub menu.
5. Expand the General node and select Get Next Databank Record. Click OK.
6. Select Databank avitek alias to specify the Databank file from which the records
are to be retrieved.
7. Click OK. A GetNextDatabankRecord: databank alias node will be added to the
script. In the Java Code view, the
getDatabank("databank
alias").getNextDataBankRecord()
method will be added to the script code as
follows:
getDatabank("avitek").getNextDatabankRecord();
After you have configured the databank for use with a script, you can map the
databank files to specific script parameters. To map databank fields to script
parameters, follow these steps:
1. Expand the [4] Oracle WebLogic Server - Medical Record Sample Application
script tree node.
2. Right-click the usernameInput parameter and select Substitute Variable. The
Substitute Variable window opens with the databank field names listed.
3. Select the Username field and click Finish. The parameter value changes to a
databank variable in double braces
{{db.avitek.Username,fred#@golf.com}}
4. Right-click the passwordInput parameter and select Substitute Variable. The
Substitute Variable window opens with the databank field names listed.
5. Select the Password field and click Finish. The parameter value changes to a
databank variable in double braces
{{db.avitek.Password,weblogic}}
6. Save the script.
For more details on setting up the Databank, see the Oracle® Functional Testing
OpenScript User's Guide.
Adding a Beacon Specific Databank File
You can use the
upload_ats_test_databank_file
emcli command to add a beacon
specific databank file. The format of this command is given below:
emcli upload_ats_test_databank_file -name=<service_name> -type=<service_type> -
testname=<test_name> -testtype=<test_type> -databankAlias=<databank alias> -
input_file=databank:<input_file> -beaconName=<beacon_name>
Chapter 29
Configuring a Service
29-20

29.4.5.4.5 Parameterizing URLs
You can create variables to use for URLs in a script. If you need to change the base
URL of a script, parametrizing the URLs provides a quick way to re-baseline a script to
use a new URL.
To parameterize URLs, follow these steps:
1. After you have recorded your script, from the Tools menu, select Parameterize
URLs.
2. Select the URL to parameterize and enter a variable name to use for the URL.
Click Next.
3. Select or unselect the checkbox to specify the instances of the URL that are to be
changed. Click Finish.
4. In the Java Code view, the getVariables().set("variable name", "value",scope);
method will be added to the script code in the initialize() section as follows:
getVariables().set("myServerVar", "http://myServer.com",
Variables.Scope.GLOBAL);
5. Repeat these steps to parameterize other URLs in the script.
29.4.5.4.6 Success or Failure Validation
You can perform text matching from TreeView and CodeView. For example, if you
enter a string "hello" in a Google search window, the text matching is as follows:
web.document("/web:window[@index='0' or @title='Google']/
web:document[@index='0']").assertText("MatchText", "hello", Source.DisplayContent,
TextPresence.PassIfPresent, MatchOption.Exact);
Source - enum - (Html,Display Content)
Html - Raw Html including Tags
Display Content - Html without tags
MatchOption - Not Case Sensitive
•Exact - sensitive: Matches any part of source string. For example, if the text
entered is abcdef, if you enter abc, the string will match.
•ExactEntireString: Matches the exact source string.
•RegEx - Not Case Sensitive: Matches source string and sub-string. For example,
if the text entered is abcdef, you can enter a.*d.
•RegExEntireString: Matches the entire source string only. For example, if the text
entered is abcdef, you can enter a.*f.
•Wildcard - wildcard pattern: Matches source string and substring. For example,
if the text entered is abcdefghijklm, you can enter a?c*f.
•WildcardEntireString: Matches the entire source string. For example, if the text
entered is abcdefghijklm, you can enter a*m.
Chapter 29
Configuring a Service
29-21

29.4.5.4.7 Using Beacon Override
You can use the beacon override feature to specify different variable values for a test
running on a different beacon. To do so, follow these steps:
1. Databank a script.
2. Select Use EM Test Property option.
3. Define beacon by specifying the sensitive and non-sensitive values as follows:
Databank_Alias>."<COLUMN_NAME>"="VALUE",<Databank_Alias>."<COLUMN_NAME>"="VALUE",.
..
For example:
FusionCredentials."host"="fs-aufsn4x0cxf",FusionCredentials."hostlogin"="login-
aufsn4x0cxf",FusionCredentials."username"="faadmin",FusionCredentials."password"="
fusionfa1"
29.4.5.4.8 Updating the Databank File
To update the ATS test script, follow these steps:
1. From the Generic Service menu, select Administration, then select Service
Tests and Beacons.
2. From the Service Tests table, select ATS Transaction test type, and click Edit.
3. In the ATS Zip Archive region, click Download. Select the location where it is to
be downloaded and click OK.
4. Edit the
.csv
file using a spreadsheet editor and save the changes.
5. Log into Enterprise Manager and navigate to the ATS Transaction Test page.
6. In the ATS Zip Archive region, click Upload to upload the updated file.
29.4.5.4.9 Using SLM Header for RUEI Integration
If the ATS service test data is to be monitored by RUEI, you must specify the
x-oracle-
slm-message-id
request header in the Additional Playback Options field. The format
is in the form:
name1:value1;name2:value2;name3:value3
.
For example,
x-oracle-slm-message-id: bcn=<beacon_name>;
svc=<service_name>;test=<test_name>;step={{@getTopLevelStepName())}}
29.4.6 Performance Metrics
Performance metrics are used to measure the performance of the service. If a service
test has been defined for this service, then the response time measurements as a
result of executing that service test can be used as a basis for the service's
performance metrics. Alternatively, performance metrics from the underlying system
components can also be used to determine the performance of the service.
Performance metrics to help you identify how well the service test is performing for
each of the remote beacons. In general, the local beacon should have a very efficient
and consistent response time because it is local to the Web application host. Remote
Chapter 29
Configuring a Service
29-22

beacons provide data to reflect the response time experienced by your application end
users.
You can do the following:
•Add a performance metric for a service test. After selecting a metric, you can
choose to:
–Use the metric values from one beacon. Choose this option if you want the
performance of the service to be based on the performance of one specific
location.
–Aggregate the metric across multiple beacons. Choose this option if you want
to consider the performance from different locations. If you choose this option,
you need to select the appropriate aggregation function:
Table 29-1 Beacon Aggregation Functions
Function Description
Maximum The maximum value of the metric from data collected across all
beacons will be used. Use this function if you want to measure the
worst performance across all beacons.
Minimum The minimum value of the metric from data collected across all
beacons will be used. Use this function if you want to measure the best
performance across all beacons.
Average The average value of the metric will be used. Use this function if you
want to measure the 'average performance' across all beacons.
Sum The sum of the metric values will be calculated. Use this function if you
want to measure the sum of all response times across each beacon.
Note:
If you are configuring a Web transaction, you can specify the Source which
can be transaction, step group or step. Based on this selection, the metric you
add will be applicable at the transaction, step group, or step level.
•Add a performance metric for the underlying system components on which the
service is hosted. After selecting a metric for a target, you can choose to:
–Use the metric from a specific component. Choose this option if you want the
performance of the service to be based on the performance of one specific
system component. If you select this option, you can choose the Rule Based
Target List.
–Aggregate the metric across multiple components. Choose this option if you
want to consider the performance from multiple components. If you choose
this option, you need to select the appropriate aggregation function.
Table 29-2 System Aggregation Functions
Function Description
Maximum The maximum value of the metric across all components will be used as
the value of this performance metric for the service.
Chapter 29
Configuring a Service
29-23

Table 29-2 (Cont.) System Aggregation Functions
Function Description
Minimum The minimum value of the metric across all components will be used as
the value of this performance metric for the service.
Average The average value of the metric across all components will be used.
Sum The sum of values of metrics across all components will be calculated.
Note:
When a system is deleted, performance metrics associated with the system
will not be collected.
•Edit a performance metric that has been defined. For service test-based
performance metrics, you can modify the beacon function that should be used to
calculate the metric values. For system-based performance metrics, you can
modify the target type, metric, and whether the aggregation function should be
used. You can also modify the Critical and Warning thresholds for the metric.
•Delete a performance metric that has been defined.
Note:
If you are defining performance metrics for an aggregate service, you can:
•Add performance metrics from a single sub service.
•Specify statistical aggregations of more than one metric.
After selecting the metrics, you can set the thresholds to be used to trigger
incidents, or remove metrics that are no longer required.
29.4.6.1 Rule Based Target List
The Rule Based Target List is applicable for system based performance metrics and
direct members of system. You can define a rule that matches a system component
you have selected. System components that match the user-provided rule will
participate in the metric evaluation process. Later if any system component is added
that matches this rule, this component will also participate in the metric evaluation
process. If any system component that matches the rule is removed, that component
will not participate in the metric evaluation process. The rule you define can be based
on:
•All (All system components)
•Contains (Any system component that contains given criteria'
•Starts With (Any system component that starts with given criteria)
•Ends With (Any system component that ends with given criteria)
•Equals (Any system component that matches with given criteria)
Chapter 29
Configuring a Service
29-24

29.4.6.2 Static Based Target List
In this case, the dependent targets that are selected will participate in the metric
evaluation and the targets that are not selected will not be included.
29.4.7 Usage Metrics
Usage metrics are used to measure the user demand for the service. Usage metrics
are collected based on the usage of the underlying system components on which the
service is hosted. You can monitor the usage of a specific component or statistically
calculate the average, minimum and maximum value from a set of components. For
example, if you are defining an email service, which depends on an IMAP server, then
you can use the 'Total Client Connections' metric of the IMAP server to represent
usage of this email service. You can define usage metrics only for services that are
associated with a system. You can do the following:
•Add a usage metric. After selecting a metric for a target, you can choose to:
–Use the metric from a specific component. Use this option if you want to
monitor the usage of a specific component.
–Aggregate the metric across multiple components. Use this option if you want
to statistically calculate the usage across multiple components. If you choose
this option, you need select the appropriate aggregation function.
Table 29-3 Aggregation Functions - Usage Metrics
Function Description
Maximum The maximum value of the metric across all components will be used
as the value of this usage metric for the service.
Minimum The minimum value of the metric across all components will be used
as the value of this usage metric for the service.
Average The average value of the metric across all components will be used.
Sum The sum of the values of metrics across all components will be
calculated.
•Edit a usage metric that has been defined.
•Delete a usage metric that has been defined.
Note that only metrics from system targets can be added as usage metrics. Metrics
from tests are not indicative of usage, and therefore cannot be added as usage
metrics.
Chapter 29
Configuring a Service
29-25

Note:
If you are defining usage metrics for an aggregate service, you can
•Add usage metric from a single sub service.
•Specify statistical aggregations of more than one metric.
After selecting the usage metrics, you can set the threshold to be used to
trigger incidents or remove metrics that are no longer required.
Rule Based Target List
The Rule Based Target List is applicable for system based performance metrics and
direct members of system. You can define a rule that matches a system component
you have selected. This enables you to promote performance metrics for evaluation.
System components that match the user-provided rule will participate in the metric
evaluation process. Later if any system component is added that matches this rule,
this component will also participate in the metric evaluation process. If any system
component that matches the rule is removed, that component will not participate in the
metric evaluation process. The rule you define can be based on:
•All (All system components)
•Contains (Any system component that contains given criteria'
•Starts With (Any system component that starts with given criteria)
•Ends With (Any system component that ends with given criteria)
•Equals (Any system component that matches with given criteria)
29.5 Using the Transaction Recorder
You can record a transaction using an intuitive playback recorder that automatically
records a series of user actions and navigation paths. You can play back transactions
interactively, know whether it is internal or external to the data center, and understand
the in-depth break-out of response times across all tiers of the Web application for
quick diagnosis.
You must install the transaction recorder in your computer to record transactions. The
transaction recorder is also used for playing back and tracing transactions. The
transaction recorder is downloaded from the Enterprise Manager Cloud Control server
the first time any of these actions is performed. The transaction recorder requires
some Microsoft libraries to be installed in your computer. If these libraries are not
present during installation, they are automatically downloaded and installed from the
Microsoft site. Make sure that your computer has access to the Internet to download
these files. After the installation has been completed, you may need to restart your
computer to make the changes effective.
29.6 Setting Up and Using Service Level Agreements
A service level agreement (SLA) is a contract between a service provider and a
customer on the expected quality of service for a specified business period. An SLA
consists of one or more service level objectives (SLOs) for different business
Chapter 29
Using the Transaction Recorder
29-26
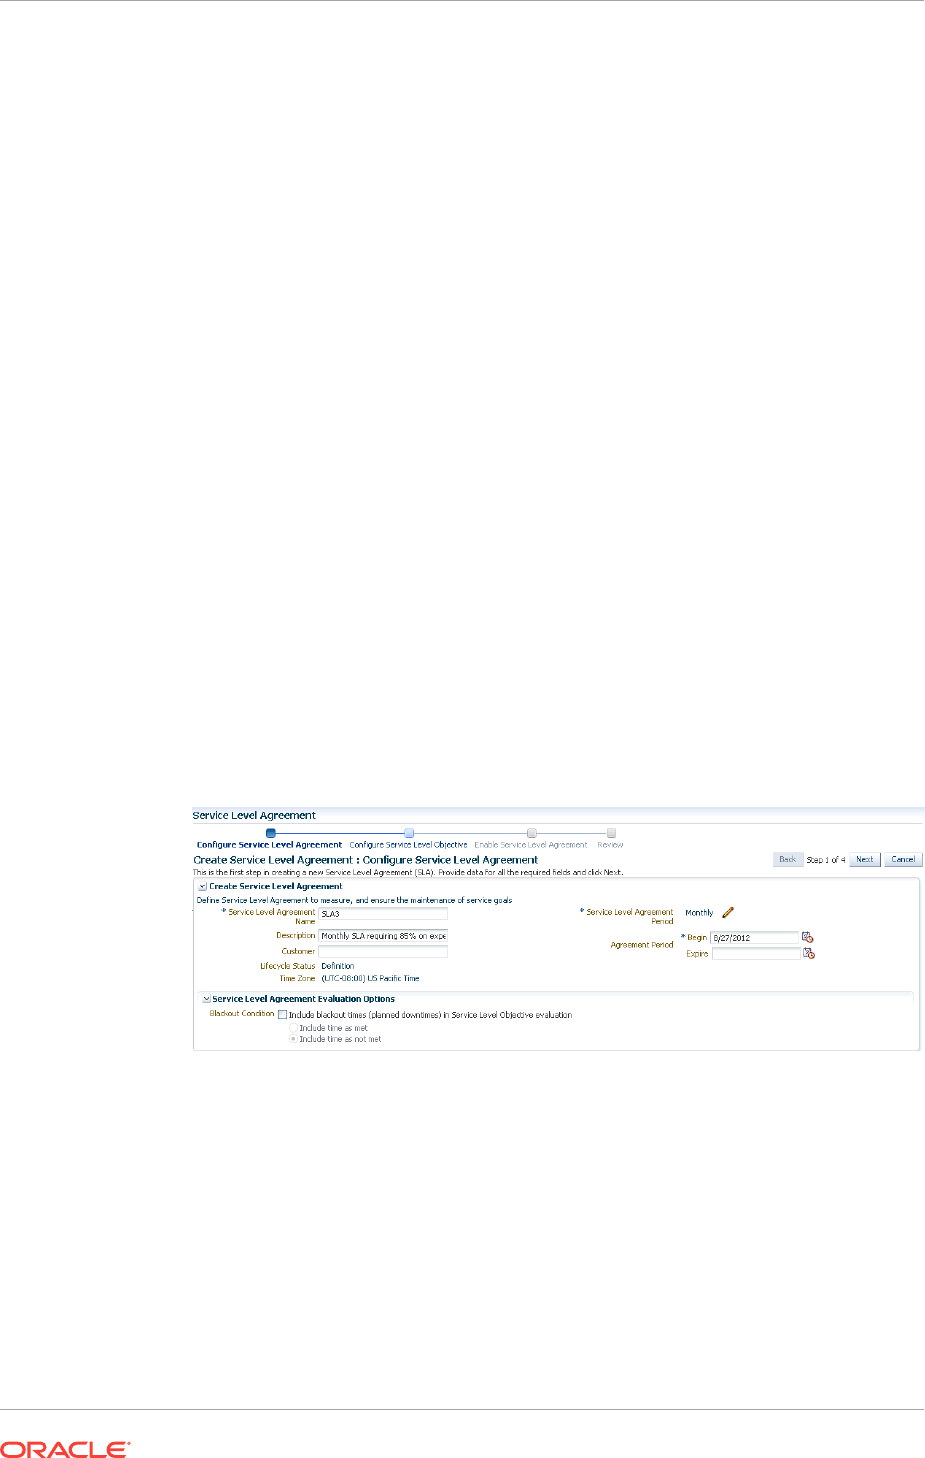
calendars and different service periods for which define the service levels to be
provided. Whether an SLA is satisfied or not is based on the evaluation of the
underlying SLOs. Service level indicators (SLIs) allow SLOs to be quantified and
measured. An SLO can have one or more SLIs.
SLOs define the service level objectives to be provided. An SLO is a logical grouping
of individual measurable Service Level Indicators (SLIs). For example, an SLO can
define the percentage of time a service is available to the user, how well the service is
performing in terms of response time or volume, and so on. Service Level Indicators
(SLIs) are quantifiable performance and usage metrics that can be used to evaluate
the quality of a service.
To create an SLA, follow these steps:
1. Log in to Enterprise Manager as a user with
EM_ADMINISTRATOR
role.
2. From the Targets menu, select Services.
3. Click on a Generic Service target on the list. The Service Home page is displayed.
4. From the Generic Service menu, select Service Level Agreement, then select
Configuration. The Service Level Agreement Configuration page appears.
5. On this page, you will see a list of all the SLAs defined for the selected service.
Select an SLA from the list to view the details in the Service Level Agreement
Details table. You can create an SLA or make a copy of an existing SLA (Create
Like).
6. In the Service Level Agreement region, click Create. The Configure Service Level
Agreement page appears.
Figure 29-2 Create Service Level Agreement: Configure Service Level
Agreement
Enter the following details:
•Name and description of the SLA.
•Name of the customer for whom the SLA is being created.
•The Lifecycle Status of the SLA. When an SLA is being created, it will be in
the Definition Stage. For more details on the Lifecycle Status, see Lifecycle of
an SLA.
•Specify the SLA Period. This is the contractual time period for which the SLA
is determined and/or evaluated for compliance. (ie. quarterly, monthly, weekly
SLA). Click the Select icon and select Monthly, Weekly, or Daily. Enter the
Chapter 29
Setting Up and Using Service Level Agreements
29-27

Frequency which the SLA is to be evaluated and the date from which the SLA
is to be evaluated. The SLA goals are reset when the SLA is evaluated.
For example, if you specify the SLA Evaluation Period as Monthly, Frequency
as 12 and the date as 09/01/12, the SLA will be evaluated on that date
followed 11 consecutive evaluations in the months of October, November, and
so on.
•Specify the SLA Agreement Period. This is the From and To Date for which
the recurring SLA periods are in effect. If you do not specify the To Date here,
the SLA will have an Indefinite expiry date.
•An SLO may sometimes not be evaluated due to planned downtime or
blackouts that have been scheduled for a service. In the Service Level
Agreement Evaluation Options region, select the Include blackout times
(planned downtimes) in Service Level Objective evaluation checkbox and
specify whether the blackout times are to be included in the SLO evaluation.
You can choose to:
–Include time as met
–Include time as not met
–Exclude the blackout time during the overall computation of the SLO.
For example, if the blackout or planned downtime for the week is 1 day, then
the weekly availability is (7-1) / (7-1) days which is still 100% availability.
By default, the Include blackout times (planned downtimes) in Service
Level Objective evaluation option is not selected.
7. Click Next. In the Service Level Objectives page, define one or more SLOs that
are to be part of the SLA. You can select the Evaluation Condition for the SLA
which can be:
•All Service Level Objectives must be met.
•At least one Service Level Objective must be met.
An SLA must have at least one SLO. More than one SLO can be active at any
given time. You can either specify if all SLOs or at least one SLO should be met.
8. Click Create to define a new SLO. See Creating a Service Level Objective for
details.
9. You can add more SLOs or edit the SLO you have defined. Click Next. In the
Enable Service Level Agreement page, you can specify when the SLA is to be
enabled. You can select:
•Do Not Enable: If the SLA is not enabled, it will be in the Definition state and
can be modified if required.
•Enable Now: If the SLA is enabled, it cannot be modified as it will be in an
Active state.
•Enable Later: The SLA can be enabled later on a specified date.
10. Click Next , review details of the SLA, and click Submit. The SLA will be enabled
on the specified date and you will return to the Service Level Agreement
Configuration page.
Chapter 29
Setting Up and Using Service Level Agreements
29-28
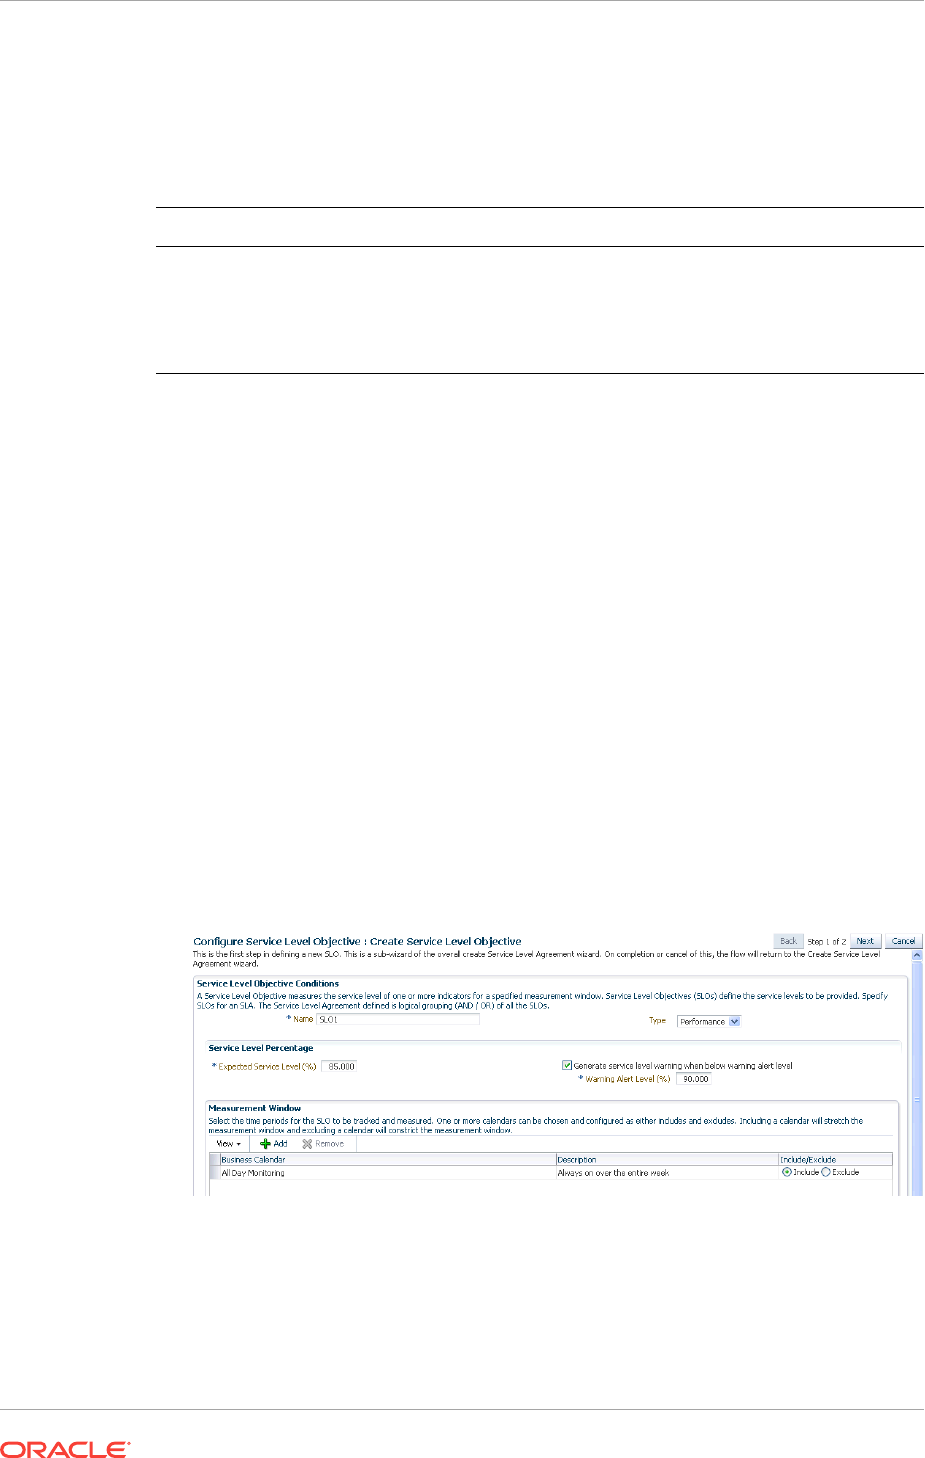
29.6.1 Actionable Item Rules for SLAs
The table below shows a list of actions that can be performed on an SLA based on its
status.
Status of SLA Create Like Edit Enable Disable Delete
Definition Yes Yes Yes No Yes
Scheduled Yes Yes No Yes No
Active Yes No No Yes No
Retired Yes No No No Yes
•An SLA in a Scheduled or Active state cannot be directly deleted. You have to
disable the SLA before you can delete it.
•When you edit an SLA in a Scheduled state, the status of the SLA changes to
Definition.
29.6.2 Creating a Service Level Objective
A Service Level Objective measures the service level of one or more indicators for a
specified measurement window. Service Level Objectives (SLOs) define the service
levels to be provided. You can specify if the SLA is considered to be satisfied if:
•All Service Level Objectives are met.
•At least one Service Level Objective is met.
To create an SLO, follow these steps:
1. Click Create in the Configure Service Level Objective page. The Create Service
Level Objective page appears.
Figure 29-3 Create Service Level Objective
2. Enter the following details:
•Name of the SLO being defined.
•Type of SLO: The SLO can be based on Availability or Performance metrics.
•Expected Service Level%: This indicates the percentage of time the SLO
conditions are met to ensure that the SLA is satisfied.
Chapter 29
Setting Up and Using Service Level Agreements
29-29

•Warning Alert Level%: If the SLO conditions do not meet the specified
threshold, a critical alert is generated.
For example, if the Expected Service Level% is 90% and the Actual Service
Level% is in the range of 90 to 99%, a Warning Alert is generated. If the Actual
Service Level% is lesser than 90%, a Critical Alert is generated. This indicates
that the SLA has been breached. If the Actual Service Level% is greater than
99%, it indicates that the SLA conditions have been satisfactorily met.
•Measurement Window: The time periods during which the SLO is in effect. A
measurement window can have more than one time period assigned. For
example, a measurement window can be configured as weekday peak hours
which are Monday to Friday, from 9AM to 6PM and the weekend peak hours
as 10AM to 2PM.
While creating an SLO, you can choose more than one Business Calendar for
an SLO. For example, suppose you want to evaluate each SLO from 8AM to
5PM except at lunch time (12PM to 1PM). You can create two measurement
windows and exclude the lunch time from being measured.
Another example of merging two measurement windows is when you want to
combine weekly evaluation with calendar evaluation. If you want to evaluate
an SLO every Monday and on the 15th of every month, you can create two
monitoring windows and include these conditions in both the windows.
By default, there are 3 predefined business calendars. You can also create
your own calendar. See Defining Custom SLA Business Calendars for details.
3. Click Next. In the Create Service Level Indicators page, you can add one or more
SLIs or conditions that allow the SLO to be measured.
Figure 29-4 Create Service Level Indicators
For example, if you are adding a performance SLI, you can specify that the Page
Load Time should be less than or equal to 3 seconds. If this condition is not met,
the SLI is considered to be violated. Specify the Evaluation Condition for the SLI:
•All Service Level Indicators must be met.
•At least one Service Level Indicator must be met.
4. Click Add to add one or more metrics and specify the value and the evaluation
condition. Click Submit to return to the Configure Service Level Objective page.
29.6.3 Lifecycle of an SLA
The following diagram shows the lifecycle of an SLA.
Chapter 29
Setting Up and Using Service Level Agreements
29-30
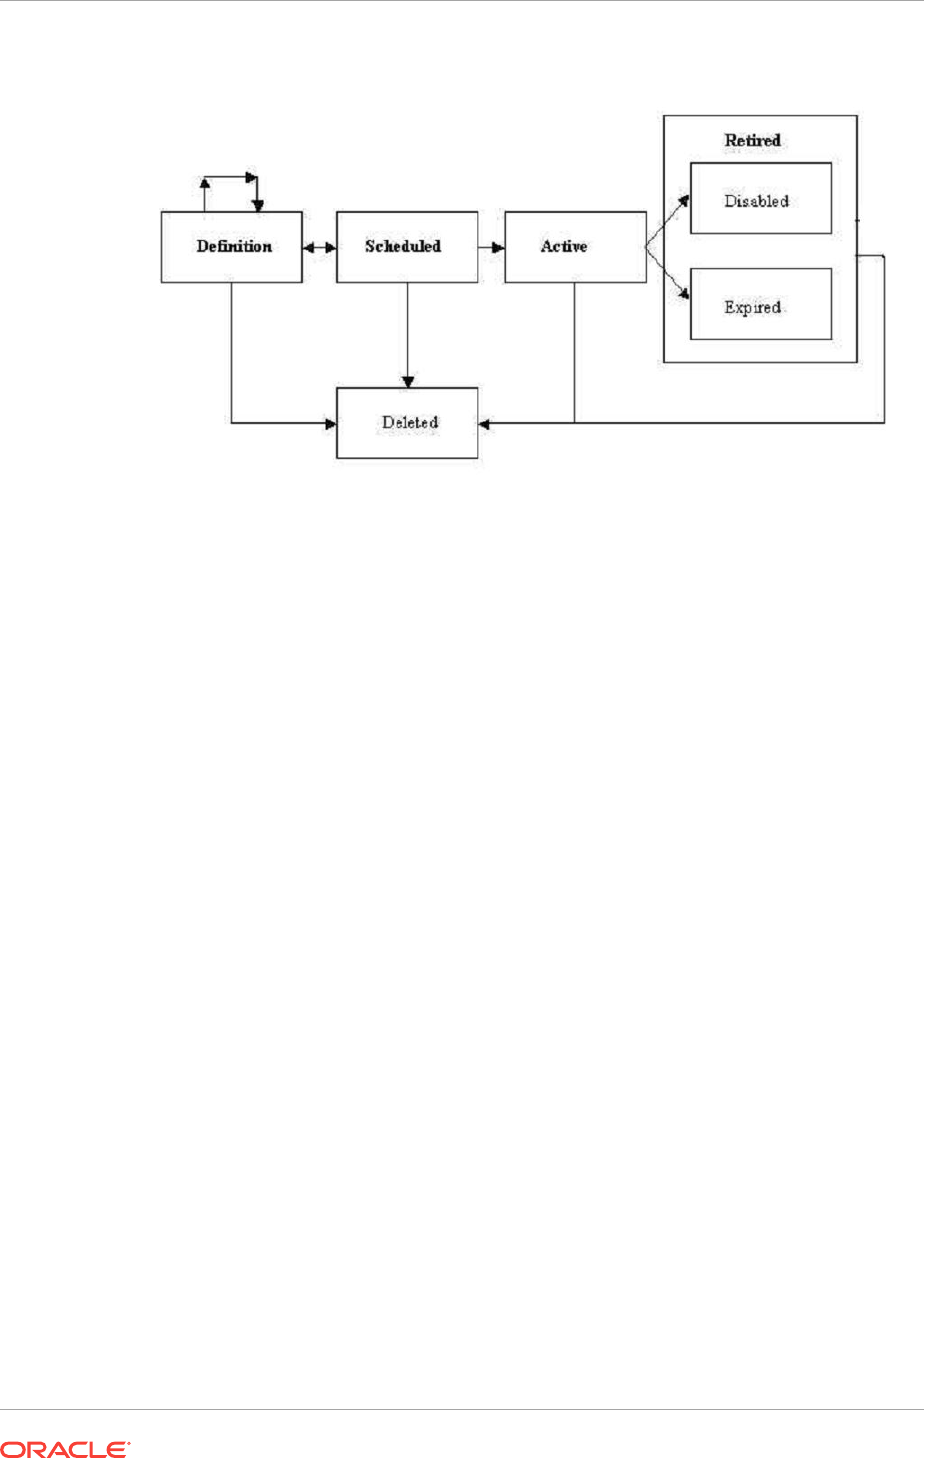
Figure 29-5 SLA Lifecycle
The SLA lifecycle consists of the following phases:
•Definition: This is the stage where the SLA is created and the SLOs are defined.
You can configure or edit the SLA definition till the SLA is activated.
•Scheduled: This stage represents the period before the SLA is scheduled to go
into effect at a future date.
•Active: This is the stage where the start date of a scheduled SLA is reached, or
when the SLA is manually enabled.
•Retired: This is the stage when the SLA reaches the Expiry Date or the SLA is
manually disabled.
•Disabled: An SLA can be manually disabled before it reaches the Expiry Date.
Once an SLA is disabled, it cannot be reactivated. You must use the Create Like
option to create a similar SLA and enable it.
•Expired: This is the stage where the SLA has reached the Expiry Date and is no
longer active.
•Deleted: An SLA can be deleted if it is the Definition or Retired stage. An SLA that
is an Active or Scheduled stage cannot be deleted.
29.6.4 Viewing the Status of SLAs for a Service
You can view the status of all SLAs for a service. To view the current status of the
SLAs for a service, follow these steps:
1. From the Targets menu, select Services.
2. Click on a Generic Service target on the list. The Service Home page is displayed.
3. From the Generic Service menu, select Service Level Agreement, then select
Current Status. The Service Level Agreement Current Status page appears.
4. This page shows a list of all the active SLAs that have been defined for this
service. For each SLA, the SLA Status, SLA Evaluation Period, and the Service
Level Objectives are displayed.
Chapter 29
Setting Up and Using Service Level Agreements
29-31

5. Select an SLA to view detailed information in the SLA. The following details are
displayed:
•Tracking Status: This is the instant status of the SLI. For an Availability SLO, it
is the status of the target. For a Performance SLO, it is the value of the
Performance or Usage metric at a specific point in time.
•Service Level (%) : The percentage of time (from the beginning of the current
evaluation period till the current date) the SLO conditions are met or the
Tracking Status is true. If the Actual Service Level % is lesser than the
Expected Service Level %, or the SLO conditions are met, the Service Level
% graph is green.
•Type: This is the type of SLOs that have been defined for the SLA. This can
be based on Availability or Performance metrics. An Availability SLO is based
on the Response Metric [ Service Target Availability]. It is specified in terms of
the amount or percentage of time when the availability objective should be
met. A Performance SLO gauges how well a service is performing. It includes
measurements of speed and/or volume such as throughput or workload (ie.
response times, transactions/hour). A Performance SLO can either be
specified in terms of a set of SLIs, SLO conditions, and the amount or
percentage of time when the objective should be met.
•SLO Violation: The violation allowances for each SLA evaluation period.
–Total: The duration of the Evaluation Period * ( Expected Service Level).
–Actual: The time when the SLO is not met during the Evaluation Period.
–Remaining: The time when the SLO could not be met without breaching
the SLA. If the SLO is always met during the Evaluation Period, it
indicates that there are no used allowances and the value in the Actual
field will be 0.
29.6.5 Defining Custom SLA Business Calendars
Business Calendars are measurement windows that define a specific window of time
in which the Service Level Objectives (SLO) are being measured. Out-of-the-box
predefined business calendars are available. Apart from these, you can create custom
business calendars. To create a custom business calendar, from the Targets menu,
select Services. From the Services Features menu, select Business Calendars.
A list of business calendars that have been defined is displayed here. You can:
•Create: Click Create to set up a business calendar. The Add / Edit Business
Calendar page is appears.
•Create Like: Select a calendar and click Create Like to make a copy of this
calendar.
•Edit: Select a calendar, click Edit and make the necessary changes in the Add /
Edit Business Calendar page.
•Delete: Select a calendar and click Delete to delete it. You cannot edit or delete a
business calendar that is associated with one or more SLAs.
•View Associated Service Level Agreements: A business calendar can be used
by one or more SLAs. Select a business calendar and click View Associated
Service Level Agreements to view the SLAs that are associated with this
calendar.
Chapter 29
Setting Up and Using Service Level Agreements
29-32

29.7 Using the Services Dashboard
The services dashboard provides a brief summary of all service related information in
a single place. It provides a consolidated view of critical aspects of a service such as
availability, performance, SLAs associated with the service, status of key system
components, and so on.
29.7.1 Viewing the All Dashboards Page
To view the All Dashboards page, follow these steps:
1. From the Targets menu, select Services.
2. From the Services Features menu, select Dashboards.
3. The All Dashboards page appears where you can see a list of all dashboards that
have been created.
4. From the All Dashboards page, you can do the following:
•Create Dashboard: Enter a unique name in the Dashboard Name field and a
description, and click Create Dashboard. The newly added dashboard
appears in the table. To create a dashboard, you must have an
EM_ADMINISTRATOR
role with Create Services Dashboard privilege.
•Customize Dashboard: Select a dashboard from the list and click Customize
and make the changes in the Edit Services Dashboard page. The dashboard
can be customized only by the user who has created it.
•Delete: Select a dashboard from the list and click Delete. The selected
dashboard is deleted. The dashboard can be deleted only by the user who has
created it.
5. Click on a Dashboard Name link to drill down to the Dashboard Details page.
29.7.2 Viewing the Dashboard Details Page
This page displays the following details:
•Service Name: Click on the link to drill down to the Service Details page.
•Incidents: Any incidents that have occurred.
•Performance / Usage Metric: The name of the performance and usage metrics
available for the service and the latest value of each metric is displayed. The
Trend charts show the metric trend over the last 24 hours. Click on the Trend chart
to see a detailed view over the trend.
•SLA: Shows the number of enabled SLAs that are in Active, Critical or Warning
state.
•Key Components: Shows the key targets that are up or available for this service.
•System Incidents: Any incidents that have occurred for the underlying systems of
the service are displayed.
Chapter 29
Using the Services Dashboard
29-33
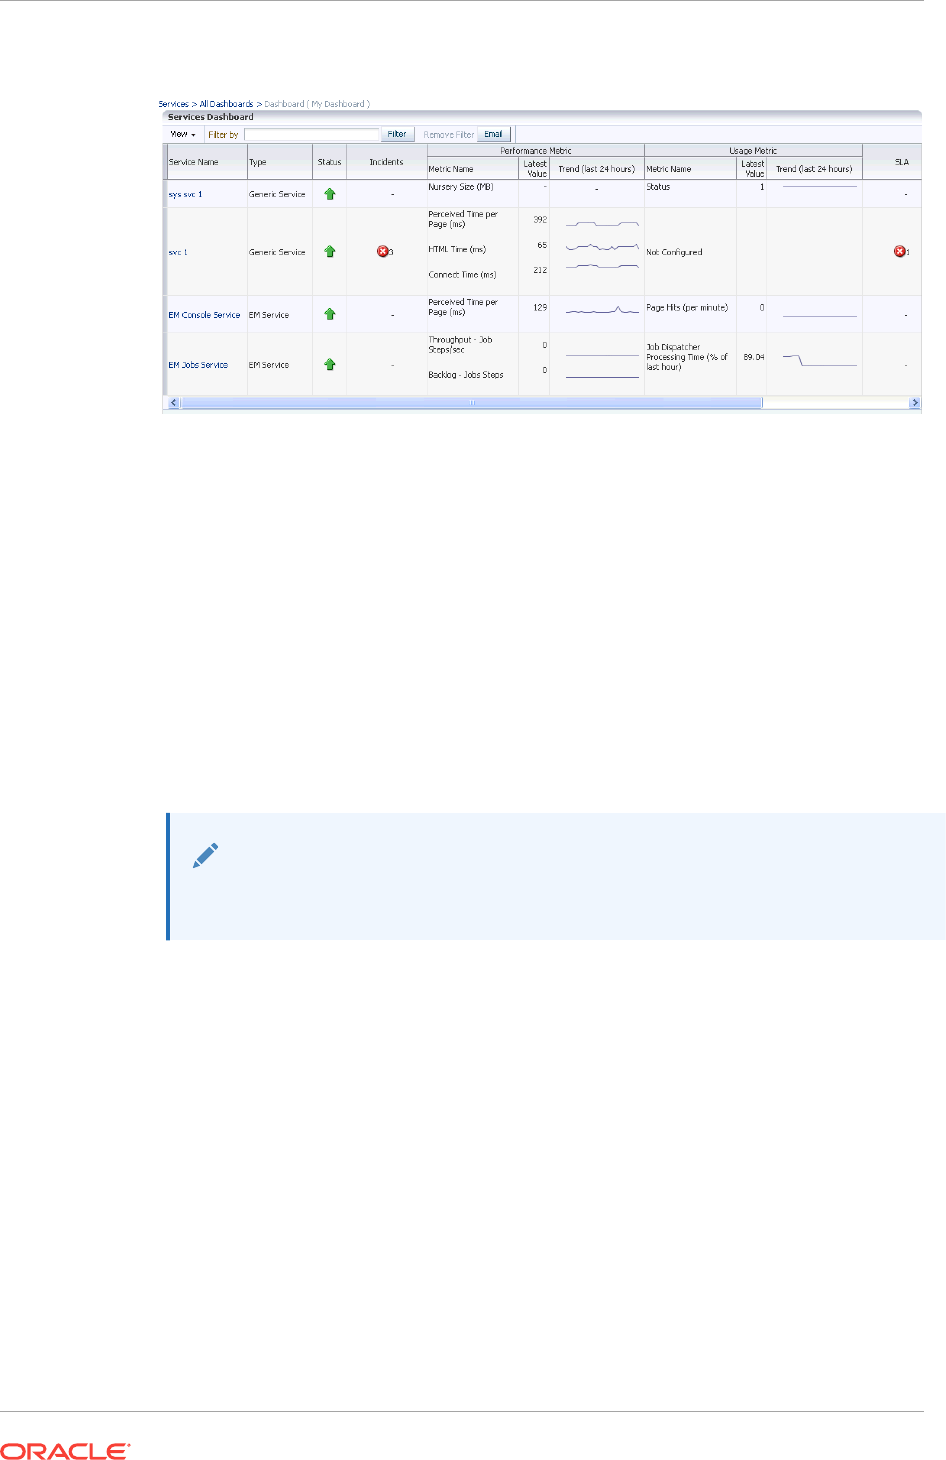
Figure 29-6 Services Dashboard
You can filter the list of services that are listed in the dashboard. Specify a value in the
Filter By field and click Filter. The filter will be applied on each row in all the services
and the resulting list is displayed.
You can email a dashboard to one or more email addresses. Click Email and enter the
email address and the subject of the dashboard. Click Send. This feature works only
the htttp mode.
29.7.3 Customizing and Personalizing the Dashboard
You can customize a dashboard and make the changes available to all users. To
customize a dashboard, select a row on the All Dashboards page and click
Customize.
Note:
The following privileges are required to cr
To add one or more services to the dashboard, click the Wrench icon. The Component
Properties: Services Dashboard window appears. Select the type of service that you
want to add to the dashboard and click Search. A list of services is displayed in the
Available Targets table. Select one or more services that you want to add, move them
to the Selected Targets table and click Apply. To add metrics to the respective
services click on the Metrics tab and select the respective services to add metrics and
click OK. The selected services and metrics now appear in the Services Dashboard
table.
To delete a service target from the dashboard, select the row and click the Wrench
icon. The Component Properties: Services Dashboard window appears. Deselect the
services and metrics that are to be removed from the dashboard, click Apply and then
click OK. To reset the changes you have made to the dashboard, click Reset Page.
Any changes that have been made to the dashboard will be removed permanently.
Click Close to exit the Edit mode.
Chapter 29
Using the Services Dashboard
29-34

You can make specific changes to a dashboard to suit your requirements. Click the
Personalize icon and add or delete one ore more services from the dashboard. The
changes that you make will be visible only to you and the other users cannot see the
changes.
29.7.4 Viewing the Dashboard Service Details Page
This page shows detailed information for the selected service.
Figure 29-7 Dashboard Details Page
It contains the following tabs:
•Overview: This tab provides a brief overview of the selected service. Click on the
Service link to drill down to the Service Home page. It contains the following
regions.
–General: This region shows the name of the service, status, date from which
the service is available, availability percentage, type of service (test or system
based), down time, and error time. Click on the service name to drill down to
the Service Home page.
–Component Availability: This region shows the status of the components in
the service. It shows the status of the component and the date from which the
service has been Up. Select the Show Only Key Tests check box to view only
the key service tests
•SLA: Shows a list of SLAs that have been enabled for this service. The name,
status and the date from which the SLA is applicable is displayed. The SLA history
over the last 7 days is also displayed.
•Metrics: This tab shows the performance and metrics charts that have been
defined for this service. It also shows the incidents that have occured for the
service and the underlying systems on which the service is based.
Chapter 29
Using the Services Dashboard
29-35
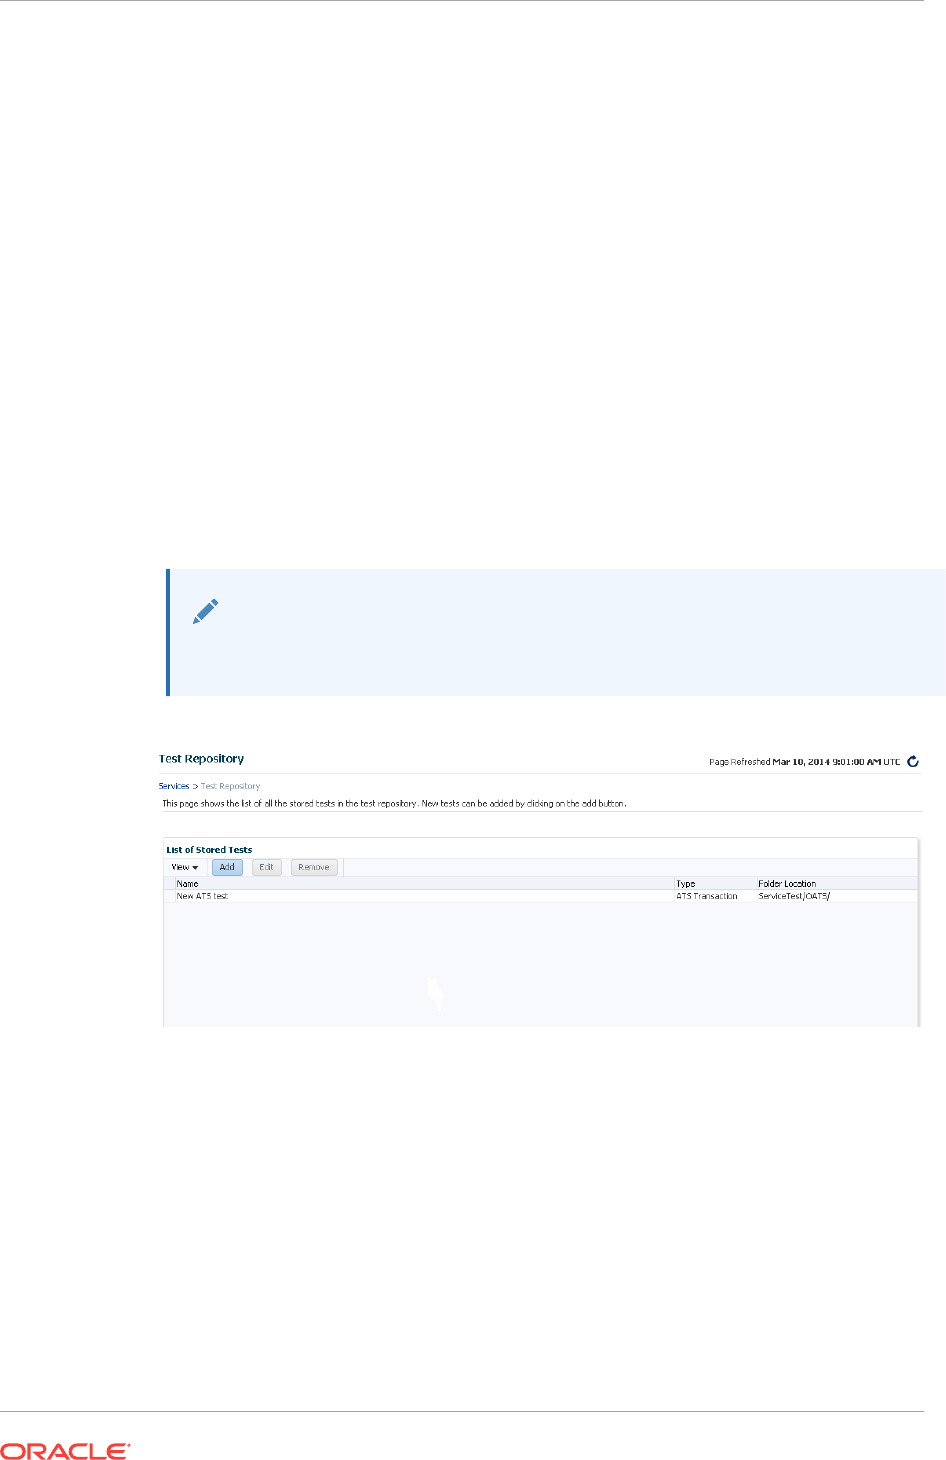
29.8 Using the Test Repository
A test repository is a centralized location where you can maintain all the test scripts.
To use the Test Repository, you should have pre-configured the OMS Software Library
location. For more information, see Configuring Software Library Storage Location.
The advantages of using a Test Repository include:
•Previously, a test could be created only in the context of a service. However, now,
you have the flexibility of creating any number of test scripts outside the context of
a service, and storing them in this centralized location called Test Repository.
Uploading Test Scripts and Creating Services are now independent events. Once
the test scripts are available in the repository, you can use them while creating
your service.
•Previously, only the owner of the test script had the copy of the script. Now, with
introduction of Test Repository, the scripts are maintained in a centralized location
which allows all the users to access the scripts. At the time of creating a service,
you can just import your scripts from the repository with the click of a button,
thereby making the whole experience very user-friendly and quick.
Note:
Currently, ATS test scripts can be stored in the central repository.
29.8.1 Viewing the Test Repository
To view the test scripts uploaded to the test repository, follow these steps:
1. From the Targets menu, select Services.
2. From the Services Features menu, select Test Repository.
3. The Test Repository page appears where you can see a list of all the tests that
have been created.
4. From the Test Repository page, you can do the following:
•Create Tests: You can create the following types of tests.
Chapter 29
Using the Test Repository
29-36

–ATS Tests: Click Create. In the Test Information section, select ATS
Transaction in the Type drop down list and enter a unique test name and
description. In the ATS Information section, click Browse to upload a test
script from your local machine. Once you select a relevant file, the file
name along with the step and module details are displayed. Click Save to
save the script.
•Editing Tests: Select the test, and click Edit. You can edit the following types
of tests:
–The ATS script cannot be modified within the Enterprise Manager
Console. But you can download a previously uploaded script and import
the zip file to ATS OpenScript. For more information on how to download
and edit an ATS script, see Editing an ATS Script.
•Removing Tests: Select the test, and click Delete to delete the test script.
•Viewing Tests: Click the test name to view the details of the test in the Test
Details table.
29.8.2 Editing an ATS Script
To download the script bundle and edit them, follow these steps:
•Click Download and save the zip file at the prompt.
•Launch OpenScript and from select File menu select Import Script to import the zip
file to ATS OpenScript.
•After you have edited the script in ATS OpenScript, select File, then select Export
Script to export the new script and save the zip file.
•Log into to Cloud Control, and navigate to the ATS Service Test page. Click
Upload to upload the updated script file to Enterprise Manager.
29.9 Configuring Service Levels
A service level rule is defined as an assessment criteria used to determine service
quality. It allows you to specify availability and performance criteria that your service
must meet during business hours as defined in your Service Level Agreement. For
example, e-mail service must be 99.99% available between 8am and 8pm, Monday
through Friday.
A service level rule specifies the percentage of time a service meets the performance
and availability criteria as defined in the Service Level Rule. By default, a service is
expected to meet the specified criteria 85% of the time during defined business hours.
You may raise or lower this percentage level according to service expectations. A
service level rule is based on the following:
•Business Hours: Time range during which the service level should be calculated
as specified in your Service Level Agreement.
•Availability: Allows you to specify when the service should be considered
available. This will only affect the service level calculations and not the actual
availability state displayed in the console. You can choose a service to be
considered up when it is one or more of the following states:
–Up: By default the service is considered to be Up or available.
Chapter 29
Configuring Service Levels
29-37

–Under Blackout: This option allows you to specify service blackout time
(planned activity that renders the service as technically unavailable) as
available service time.
–Unknown: This option allows you to specify time that a service is unmonitored
because the Management Agent is unavailable be counted as available
service time.
•Performance Criteria: You can optionally designate poor performance of a
service as a Service Level violation. For example, if your Website is up, but it
takes 10 seconds to load a single page, your service may be considered
unavailable.
•Business Criteria: Business criteria are useful in determining in the health of the
business processes for a particular service. You can optionally define business
metrics that can affect the Service Level. A Service Level violation occurs when a
critical alert is generated for a specified business metric.
Note:
The Business Criteria column is displayed only if one or more key business
indicators are associated with the service. Refer to the Oracle Enterprise
Manager Integration Guide.
•Actual Service Level: This is calculated as percentage of time during business
hours that your service meets the specified availability, performance, and business
criteria.
•Expected Service Level: Denotes a minimum acceptable service level that your
service must meet over any relevant evaluation period.
You can define only one service level rule for each service. The service level rule will
be used to evaluate the Actual Service Level over a time period and compare it
against the Expected Service Level.
29.9.1 Defining Service Level Rules
A Service Level Rule is defined as assessment criteria to measure Service quality. A
Service Level Rule is based on the following:
•Time range for which the rule is applicable.
•Metrics that define the rule.
•The user expectation on these metrics values
The Expected Service Level is the expected quality for the service and is defined
based on the time range and metrics of the Service Level Rule. For example, the
Expected Service Level can be that the service is available 99% of the time during
business hours.
When you create a service, the default service rule is applied to the service. However,
you must edit the service level rule for each service to accurately define the
assessment criteria that is appropriate for your service. To define a service level rule:
1. Click the Targets tab and Services subtab. The Services main page is displayed.
2. Click the service name link to go to the Service Home page.
Chapter 29
Configuring Service Levels
29-38

3. In the Related Links section, click Edit Service Level Rule.
4. On the Edit Service Level Rule page, specify the expected service level and the
actual service level and click OK. The expected service level specifies the
percentage of time a service meets the performance, usage, availability, and
business criteria defined in the Service Level Rule. The actual service level
defines the baseline criteria used to define service quality and includes business
hours, availability, performance criteria, usage criteria, and business criteria.
Note:
Any Super Administrator, owner of the service, or Enterprise Manager
administrator with OPERATOR_TARGET target privileges can define or
update the Service Level Rule.
29.9.2 Viewing Service Level Details
You can view service level information directly from the either of the following:
•Enterprise Manager Cloud Control Console -From any Service Home page, you
can click on the Actual Service Level to drill down to the Service Level Details
page. This page displays what Actual Service Level is achieved by the service
over the last 24 hours/ 7 days / 31 days, compared to the Expected Service Level.
In addition, details on service violation and time of each violation are presented in
both graphical and textual formats.
•Information Publisher - Information Publisher provides an out-of-box report
definition called the Services Dashboard that provides a comprehensive view of
any service. From the Report Definition page, click on the Services Monitoring
Dashboard report definition to generate a comprehensive view of an existing
service. By default, the availability, performance, status, usage, business, and
Service Level of the service are displayed. The Information Publisher also
provides service-specific report elements that allow you to create your own custom
report definitions. The following report elements are available:
–Service Level Details: Displays Actual Service Level achieved over a time-
period and violations that affected it.
–Service Level Summary: Displays service level violations that occurred over
selected time-period for a set of services.
–Services Monitoring Dashboard: Displays status, performance, usage,
business, and service level information for a set of services.
–Services Status Summary: Information on one or more services' current
status, performance, usage, business, and component statuses.
Refer to the Online Help for more details on the report elements.
29.10 Configuring a Service Using the Command Line
Interface
Using the Command Line Interface, you can define service targets, templates and set
up incidents. EMCLI is intended for use by enterprise or system administrators writing
Chapter 29
Configuring a Service Using the Command Line Interface
29-39

scripts (shell/batch file, perl, tcl, php, etc.) that provide workflow in the customer's
business process. EMCLI can also be used by administrators interactively, and directly
from an operating system console. Refer to Enterprise Manager Command Line
Interface Guide for details.
Samples EMCLI templates to create a Web transaction and an ATS service test are
shown below.
Example 29-1 Web Transaction Service Test Template
<?xml version = '1.0' encoding = 'UTF-8'?> <transaction-template
template_type="generic_service" xmlns="template">
<variables>
<variable name="HOST1" value="linuxserver26.myco.com"/>
<variable name="PORT1" value="5416"/>
<variable name="PROTOCOL1" value="https"/>
</variables>
<transactions>
<mgmt_bcn_transaction>
<mgmt_bcn_txn_with_props>
<mgmt_bcn_txn description="Test for checking the availability of EM
Console/Website" is_representative="true"
name="EM Console Service Test" monitoring="true"
txn_type="HTTP"/>
<properties>
<property name="readTimeout" num_value="120000.0" prop_type="2"
encrypt="false"/>
<property name="Collection Interval" num_value="5.0" prop_type="2"
encrypt="false"/>
<property name="certValidationMode" string_value="1" prop_type="1"
encrypt="false"/>
<property name="maxDownloadSize" num_value="1.0E8" prop_type="2"
encrypt="false"/>
<property name="sensitiveValuesProtection" string_value="0"
prop_type="1" encrypt="false"/>
<property name="failureStringModes" string_value="regularText"
prop_type="1" encrypt="false"/>
<property name="UserAgent" string_value="Mozilla/4.0 (compatible;MSIE
6.0; Windows NT 5.1) OracleEMAgentURLTiming/3.0" prop_type="1" encrypt="false"/>
<property name="successStringModes" string_value="regularText"
prop_type="1" encrypt="false"/>
<property name="variablesModes" string_value="urlEncode"
prop_type="1" encrypt="false"/>
<property name="content" string_value="0"
prop_type="1"encrypt="false"/>
<property name="AcceptLanguage" string_value="en" prop_type="1"
encrypt="false"/>
<property name="connectionTimeout" num_value="120000.0" prop_type="2"
encrypt="false"/>
<property name="useCache" string_value="yes"
prop_type="1"encrypt="false"/>
<property name="stringValidationMode" string_value="1" prop_type="1"
encrypt="false"/>
<property name="granularity" string_value="transaction" prop_type="1"
encrypt="false"/>
<property name="numThreads" num_value="4.0" prop_type="2"
encrypt="false"/>
<property name="retries" num_value="1.0" prop_type="2"
encrypt="false"/>
<property name="timeout" num_value="300000.0" prop_type="2"
encrypt="false"/>
Chapter 29
Configuring a Service Using the Command Line Interface
29-40

<property name="retryInterval" num_value="5000.0" prop_type="2"
encrypt="false"/>
</properties>
<per_bcn_properties/>
</mgmt_bcn_txn_with_props>
<steps_defn_with_props>
<mgmt_bcn_step_with_props>
<mgmt_bcn_step step_number="1" name="1.Access Logout page"
step_type="HTTP"/>
<properties>
<property name="req_mode" num_value="1.0" prop_type="2"
encrypt="false"/>
<property name="http_method" string_value="G" prop_type="1"
encrypt="false"/>
<property name="url" string_value="{PROTOCOL1}://{HOST1}:
{PORT1}/em/console/logon/logoff?event=load" prop_type="1" encrypt="false"/>
</properties>
</mgmt_bcn_step_with_props>
</steps_defn_with_props>
<stepgroups_defn/>
<txn_thresholds>
<mgmt_bcn_threshold warning_threshold="6000.0" warning_operator="0"
critical_threshold="12000.0" critical_operator="0" num_occurrences="1">
<mgmt_bcn_threshold_key metric_name="http_response"
metric_column="avg_response_time"/>
</mgmt_bcn_threshold>
<mgmt_bcn_threshold warning_threshold="0.0" warning_operator="1"
critical_threshold="0.0" critical_operator="1" num_occurrences="1">
<mgmt_bcn_threshold_key metric_name="http_response"
metric_column="status"/>
</mgmt_bcn_threshold>
</txn_thresholds>
<step_thresholds/>
<stepgroup_thresholds/>
</mgmt_bcn_transaction>
</transactions>
</transaction-template>
Example 29-2 ATS Service Test Template
<?xml version = '1.0' encoding = 'UTF-8'?>
<transaction-template template_type="generic_service" xmlns="template">
<variables/>
<transactions>
<mgmt_bcn_transaction>
<mgmt_bcn_txn_with_props>
<mgmt_bcn_txn is_representative="true" name="ATS Page"
monitoring="true" txn_type="OATS"/>
<properties>
<property name="Collection Interval" num_value="5.0" prop_type="2"
encrypt="false"/>
<property name="scriptDescription" string_value="[1] SignIn
[2]
Welcome
[3] Single Sign-Off
[4] Sign In" prop_type="1"encrypt="false"/>
<property name="fileUploadTime" string_value="2012-08-0908:47:22.0"
prop_type="1" encrypt="false"/>
<property name="OpenScriptJwgName" string_value="ATKHomepage.zip"
prop_type="1" encrypt="false"/>
<property name="usageOptions" string_value="userDefined"
prop_type="1" encrypt="false"/>
<property name="fileSize" string_value="41368" prop_type="1"
encrypt="false"/>
Chapter 29
Configuring a Service Using the Command Line Interface
29-41

<property name="beaconDistributionOverride"
string_value="AtsCredentials=1" prop_type="1" encrypt="false"/>
<property name="FilePropertyValue" prop_type="7" encrypt="false"/>
<property name="databankFilesJar" prop_type="7" encrypt="false"/>
<property name="databankFiles"
string_value="AtsCredentials,AtsCredentials.csv,3;" prop_type="1" encrypt="false"/>
<property name="granularity" string_value="transaction" prop_type="1"
encrypt="false"/>
<property name="databankValues"
string_value="people.firstname=yang.,people.lastName=wang,middle.middlename_col=x."
prop_type="1" encrypt="false"/>
<property name="modules"
string_value="oracle.oats.scripting.modules.utilities;version=2.4.0
oracle.oats.s
cripting.modules.http;version=2.4.0
"
prop_type="1" encrypt="false"/>
<property name="databankAliasMapping"
string_value="AtsCredentials=AtsCredentials.csv" prop_type="1" encrypt="false"/>
<property name="defaultCLIOptions" string_value="-dboptions*:
1:FIRST_RECORD_ONLY -jwg ATKHomepage.jwg -noReport true" prop_type="1"
encrypt="false"/>
</properties>
<per_bcn_properties/>
</mgmt_bcn_txn_with_props>
<steps_defn_with_props>
<mgmt_bcn_step_with_props>
<mgmt_bcn_step step_number="1" name="[1] Sign In" step_type="OATS"/>
<properties>
<property name="url" string_value="http:://www.test.com/test1"
prop_type="1" encrypt="false"/>
</properties>
</mgmt_bcn_step_with_props>
<mgmt_bcn_step_with_props>
<mgmt_bcn_step step_number="2" name="[2] Welcome" step_type="OATS"/>
<properties>
<property name="url" string_value="http:://www.test.com/test2"
prop_type="1" encrypt="false"/>
</properties>
</mgmt_bcn_step_with_props>
<mgmt_bcn_step_with_props>
<mgmt_bcn_step step_number="3" name="[3] Single Sign-Off"
step_type="OATS"/>
<properties>
<property name="url" string_value="http:://www.test.com/test3"
prop_type="1" encrypt="false"/>
</properties>
</mgmt_bcn_step_with_props>
<mgmt_bcn_step_with_props>
<mgmt_bcn_step step_number="4" name="[4] Sign In" step_type="OATS"/>
<properties>
<property name="url" string_value="http:://www.test.com/test4"
prop_type="1" encrypt="false"/>
</properties>
</mgmt_bcn_step_with_props>
</steps_defn_with_props>
<stepgroups_defn/>
<txn_thresholds>
<mgmt_bcn_threshold warning_threshold="0.0" warning_operator="1"
critical_threshold="0.0" critical_operator="1" num_occurrences="1">
<mgmt_bcn_threshold_key metric_name="openscript_response"
metric_column="status"/>
</mgmt_bcn_threshold>
Chapter 29
Configuring a Service Using the Command Line Interface
29-42

</txn_thresholds>
<step_thresholds/>
<stepgroup_thresholds/>
</mgmt_bcn_transaction>
</transactions>
</transaction-template>
29.11 Troubleshooting Service Tests
This section lists some of the common errors you may encounter while using the
Forms and the Web Transaction test type. The following topics are covered here:
•Verifying and Troubleshooting Forms Transactions
•Verifying and Troubleshooting Web Transactions
29.11.1 Verifying and Troubleshooting Forms Transactions
The section covers the following:
•Troubleshooting Forms Transaction Playback
•Troubleshooting Forms Transaction Recording
29.11.1.1 Troubleshooting Forms Transaction Playback
This section lists some of the common errors you may encounter while playing back a
Forms transaction and provides suggestions to resolve these errors.
1. Error Message: Connection to Forms Server is lost. Possible version mismatch
between
agentjars
and
formsjars
.
Possible Cause: The transaction was recorded using an out-of-the-box Forms
version.
Solution: Verify the version of the Forms Application that you are running by
checking the version number in the About Oracle Forms Online Help. If this
version is not supported, follow the steps listed under Error Message 2.
2. Error Message: Version Not Supported <
forms_version
>
Possible Cause: The machine on which the beacon has been installed does not
contain the necessary forms jar files.
Solution: To resolve this error, follow these steps:
a. Login to the system on which the Forms server has been installed. Locate the
frmall.jar
(if you are using Forms 10.1 or later) or
f90all.jar
(if are using
Forms 9.0.4 or later) under the
$FORMS_HOME/forms/java
directory.
b. Login to the system on which the beacon has been deployed and copy the jar
file to the
$ORACLE_HOME/jlib/forms/<version>/
directory. The version you
specify here should be the same as the version string in the error message.
Make sure that the directory is empty before you copy over the jar file.
If you are using Oracle Applications R12 and you encounter this error, follow these
steps to resolve the error:
a. Login to the system in which the Oracle Application server has been deployed.
Locate the following files:
Chapter 29
Troubleshooting Service Tests
29-43

$JAVA_TOP/oracle/apps/fnd/jar/fndforms.jar
$JAVA_TOP/oracle/apps/fnd/jar/fndewt.jar
b. Login to the system on which the beacon has been deployed and copy these
files to the
$ORACLE_HOME/jlib/forms/apps/
directory. Make sure that the
directory is empty before you copy over the jar files.
Note:
You cannot monitor two deployments of Oracle Applications from the same
beacon if different versions of Oracle Applications have been used.
3. Error Message: Forms URL is not pointing to the forms servlet.
Possible Cause: When the Forms transaction was recorded, the location of the
forms servlet could not be determined.
Solution: Make sure that the Forms URL Parameter is pointing to the forms
servlet. It should be
http://<hostname>:<port>/forms/frmservlet
for Forms10g or
http://<hostname>:<port>/forms/f90servlet
for Forms 9i. This parameter is
automatically set by the Forms Transaction Recorder. But if it has not been set,
you can locate the URL by following these steps:
•Launch the Forms application.
•View the source HTML file in the Forms launcher window.
•Locate the
xsurl
variable. The URL is stored in this variable.
4. Error Message: Could not connect to <
machine name
>.
Possible Cause: The machine on which the beacon has been installed cannot
access the Forms Application.
Solution: Make sure the machine on which the beacon has been installed can
access the Forms Application and firewalls have been properly configured.
Support for playing back Forms transactions through proxy server is not available
in this release.
5. Error Message: Invalid module path in the initial message.
Possible Cause: The transaction may have been incorrectly recorded or may be
corrupt.
Solution: Try to record the transaction again.
6. Error Message: Cannot connect to login server.
Possible Cause: This error may occur due the following reasons:
•The Login URL that you have specified may be incorrect.
•An invalid HTTPS certificate may have been provided for the login server.
Solution:
•Verify that the Login URL is correct.
•If you are using HTTPS to connect to login server, make sure the certificate on
the server is written for the login server machine itself. Make sure the SSL
Certificate is imported into Agent and the CN of the certificate matches the
host name of the login Server URL.
Chapter 29
Troubleshooting Service Tests
29-44

29.11.1.2 Troubleshooting Forms Transaction Recording
This section lists some troubleshooting steps that you can use when the Forms
transaction cannot be recorded successfully.
1. Make sure that all your Internet Explorer instances are closed and no java runtime
programs are open.
2. Start recording again with the java console open. You can view any exceptions or
error messages displayed on the console.
3. You should now see the text "
Forms Transaction Recorder Version: <version
number>"
on the console. If this text is displayed, proceed to step 5. If you do not
see the text, check if the
formsRecorder
.
jar
has been copied to the Forms archive
directory. You can perform this check using either of the following methods:
a. Navigate to the Forms archive directory and check if the
formsRecorder.jar
file
is present in the directory.
b. Navigate to the Enable Forms Transaction Monitoring page, select the
corresponding Forms server target and click Configure. Enter the host
credentials to see if the Forms Transaction Recorder has already been
configured on this Forms server. If the
formsRecorder.jar
is not present in the
Forms archive directory, you need to configure your Forms server for
transaction monitoring. After ensuring that the
formsRecorder.jar
is present in
the archive directory of the Forms server, go back to Step 1 and try recording
again.
4. If you see an exception related to the java .policy file displayed on the java
console, check the file to ensure that it has the required content and is in the right
location. If any errors are found, you must fix these errors and try recording again.
5. If the recording still fails, check if the Enterprise Manager Certificate has been
imported to the secure site.f the certificate has not been imported, you must import
it and try recording again.
29.11.2 Verifying and Troubleshooting Web Transactions
Note:
In Enterprise Manager 13.1, the Web Transaction recording and playback
(including Browser Simulation) feature is not available. You cannot record new
transactions or play back existing Web transactions.
This section lists some of the common errors you may encounter while recording and
playing back Web Transactions.
1. Scenario: Verify Service Test displays:
Connection establishment timed out --
http://..../
Possible Cause: The beacon can only access that URL via a proxy server and it
has not been configured.
Solution: From the All Targets page, select the beacon, click Configure and set
the beacon proxy setting.
Chapter 29
Troubleshooting Service Tests
29-45
2. Scenario: Verify Service Test displays:
Authorization Required -- https://...../
Possible Cause: The Basic Authentication information is not recorded
automatically.
Solution: To resolve this error, follow these steps:
a. From the Service Tests and Beacons page, select the service test, click Edit.
b. Make sure you enter all the Basic Authentication information: Username,
Password, and Realm.
Note:
Realm usually appears above the Username label in the Browser's
authorization dialog box.
3. Scenario: Verify Service Test displays
sun.security.validator.ValidatorException
:
No trusted certificate found --
https://....../.
Possible Cause: The beacon does not know about this SSL Certificate.
Possible Solution: From the Service Tests and Beacons page, select the service
test, and click Edit. Under Advanced Properties, and set Authenticate SSL
Certificates to No.
4. Scenario: Verify Service Test displays:
Timeout of 300000 exceeded for
https://....../ Response time = 3000000
Possible Cause: The test may be too complex to complete within the allotted
time. Or, this may be an actual performance issue with the server.
Possible Solution: From the Service Tests and Beacons page, select the service
test, and click Edit. If this is not a server performance issue, under Advanced
Properties, increase the Timeout Value.
5. Scenario: The Verify Service Test option reports that the service as down, but the
Web application is up and you can successfully play back the Web transaction.
Possible Cause: The Web application is only compatible with Internet Explorer or
Mozilla-based browsers.
Possible Solution: From the Service Tests and Beacons page, select the service
test, and click Edit. Under Advanced Properties, set the User Agent Header as
Mozilla/4.0 (compatible; MSIE 6.0; Windows NT 5.1) OracleEMAgentURLTiming/3.0.
Note:
For Enterprise Manager 10.2.0.4 and beyond, this User Agent Header is set
automatically during Web transaction recording.
6. Scenario: Test Performance Page does not show any step metrics.
Possible Cause: By default, only transaction-level metrics are collected.
Possible Solution: From the Service Tests and Beacons page, select the service
test, click Edit, and set Data Granularity to Step.
Chapter 29
Troubleshooting Service Tests
29-46

30
Introducing Enterprise Manager Support for
SNMP
This chapter provides a brief overview of Enterprise Manager support for SNMP. It
includes the following sections:
•Benefits of SNMP Support
•About the SNMP Management Station
•How Enterprise Manager Supports SNMP
•Sending SNMP Trap Notifications
•Monitoring External Devices Using SNMP
•About the Management Information Base (MIB)
•About Metric Extensions
The Simple Network Management Protocol (SNMP) is a protocol used for managing or
monitoring devices, where many of these devices are network-type devices such as
routers, switches, and so on. SNMP enables a single application to first retrieve
information, then push new information between a wide range of systems independent
of the underlying hardware.
Designed primarily for database, network, and system administrators, SNMP support
integrates Enterprise Manager into a number of existing, widely-used management
systems. Also, Enterprise Manager can extend its monitoring scope to devices that
can be monitored using SNMP.
30.1 Benefits of SNMP Support
The primary benefits of SNMP support include the following:
•The monitoring of key Oracle products is quickly integrated into any management
framework based upon SNMP.
•These Oracle products are located, identified, and monitored in real time across
enterprise networks of any size.
•Administrators see standard Oracle icons that represent Oracle products in a
network map. You can dynamically customize this map.
•Administrators see the current status of Oracle products, as shown by several
status variables that are defined for each product in a management information
base (MIB), or they can select which elements to view by their status.
•Administrators can anticipate exceptional conditions by defining thresholds and
alerts, to respond to special situations as soon as they occur or to enable
automatic responses.
•Administrators can store and analyze historical data that has been obtained
through SNMP.
30-1

•Providers of management applications can easily build customized solutions for
Oracle customers because SNMP is an open standard.
Strictly speaking, SNMP support is intended more for monitoring Oracle products than
for managing them. SNMP support is invaluable for tracking the status of an entire
network of Oracle applications — first, to verify normal operations, and second, to spot
and react to potential problems as soon as they are detected. However, for purposes
of investigating and solving some problems, other Oracle tools such as Oracle SQL
*Plus Worksheet may be more appropriate. This is because SNMP support is
designed to query status, but not to change system parameters, whereas other tools
are designed to set or tune system parameters.
Note:
Oracle SNMP is not supported on HP OpenVMS platform.
30.2 About the SNMP Management Station
The SNMP management station refers to a node from which managed elements are
monitored using the SNMP protocol. Typically, it is a standalone workstation that is on
the same network as the managed elements. While this book will consistently use the
term SNMP management station, other terms used for it include management console,
management system, or managing node.
Because most frameworks use SNMP as a basis for communication, Oracle products
that support SNMP can be integrated into virtually every management framework.
Third-party products such as CA Unicenter, HP OpenView, Tivoli NetView, Aprisma
Spectrum, Sun Solstice, and Castle Rock SNMPc Network Manager provide SNMP
Management Station functionality.
30.3 How Enterprise Manager Supports SNMP
Enterprise Manager supports SNMP by integrating with third-party management
systems, sharing event information through SNMP traps and extending the monitoring
scope of Enterprise Manager by monitoring new devices and targets using SNMP.
There are number of ways that Enterprise Manager uses SNMP as illustrated in
Figure 30-1:
1. Sharing event information with third-party management systems by generating
SNMP trap notifications from Enterprise Manager to an SNMP management
station. For example, you can use SNMP to notify a third-party application that a
selected metric has exceeded its threshold.
This method supports SNMP version 1 (SNMPv1) and SNMP version 3
(SNMPv3).
For more information, see Sending SNMP Trap Notifications and Using
Notifications .
2. Extending the monitoring scope of Enterprise Manager to new entities by receiving
SMNP traps or fetching SNMP data from or to the managed entity. By developing
a metadata plug-in to receive SNMP traps, you can enable Enterprise Manager to
monitor a product capable of throwing SNMP traps.
Chapter 30
About the SNMP Management Station
30-2

This method supports SNMP version 1 (SNMPv1), SNMP version 2 (SNMPv2c),
and SNMP version 3 (SNMPv3).
For more information, see Monitoring External Devices Using SNMP and the
Oracle Enterprise Manager Cloud Control Extensibility Programmer's Reference. .
3. Creating new metrics to query SNMP agents by using SNMP adapters to allow
Management Agents to query native SNMP agents on host targets for
Management Information Base (MIB) variable information to be used as metric
data.
This method supports SNMP version 1 (SNMPv1), SNMP version 2 (SNMPv2c),
and SNMP version 3 (SNMPv3).
For more information, see About Metric Extensions and Using Metric Extensions .
Chapter 30
How Enterprise Manager Supports SNMP
30-3
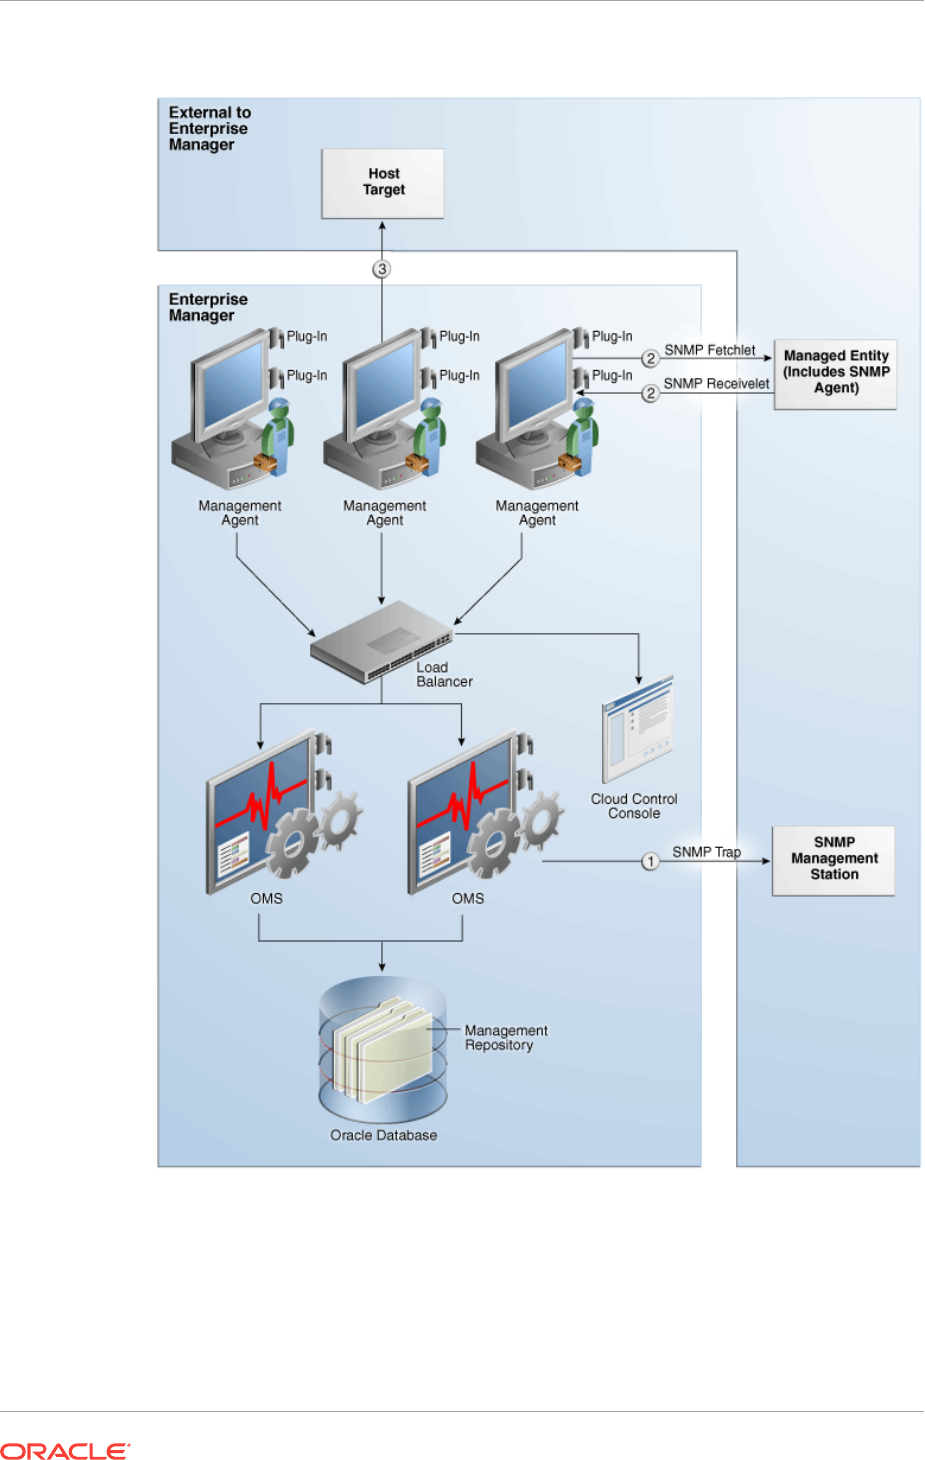
Figure 30-1 How Enterprise Manager Supports SNMP
30.4 Sending SNMP Trap Notifications
Using the Enterprise Manager notification system, you can share Enterprise Manager
event information with other SNMP-enabled third-party applications through SNMP
traps. Enterprise Manager supports the SNMPv1 protocol for sending traps. For
Chapter 30
Sending SNMP Trap Notifications
30-4

example, you might want to send event information as traps to a third-party
applications from Enterprise Manager when one of the following events takes place:
•a certain metric has exceeded a threshold (metric alert event)
•a target is down (target availability event)
•a job fails (job status change event)
Note:
For a full list and description of Enterprise Manager event types, see Event
Management.
Using SNMP traps with the notification system is a matter of:
1. Defining a notification method that uses an SNMP trap. For more information, see
Sending SNMP Traps to Third Party Systems.
2. Assigning the notification method to a rule. You can edit an existing rule or create
a new incident rule. For more information, see Setting Up Rule Sets.
30.4.1 About the Management Information Base (MIB)
While SNMP allows Enterprise Manager to send information to third-party SNMP-
enabled applications, there might be situations where you want SNMP-enabled
applications to obtain information from Enterprise Manager. This is accomplished with
the help of MIB variables, and by signing up for SNMP traps. Details of the trap
contents can be obtained from the MIB variables.
For more information about the MIB, see Management Information Base (MIB) and
Interpreting Variables of the Enterprise Manager MIB.
Note:
A valid Diagnostic Pack license is required to use the Enterprise Manager MIB
variables.
30.5 Monitoring External Devices Using SNMP
It is often critical for an administrator to receive alerts from applications that are not
managed by Enterprise Manager. Many of these applications can be configured to
trigger SNMP traps when an alert condition takes place. You can receive these traps
within Enterprise Manager and start monitoring those applications from Enterprise
Manager. Having the capability to receive and analyze SNMP traps raised by such
applications allows you extend Enterprise Manager's monitoring and alerting
capabilities to these applications and reduce monitoring complexity in your IT
environments.
You can configure Enterprise Manager to receive the SNMP traps raised by an
application (not managed by Enterprise Manager) and display the traps as alerts in
Enterprise Manager.
Chapter 30
Monitoring External Devices Using SNMP
30-5

To receive these traps, you must develop a metadata plug-in to represent the
managed entity. Then use an SNMP receivelet or SNMP fetchlet to receive or get
monitoring data about that entity.
For more information about developing metadata plug-ins, see the Oracle Enterprise
Manager Cloud Control Extensibility Programmer's Reference.
30.5.1 About SNMP Receivelets
While monitoring third-party entities in your managed environment, if the status of a
third-party network element turns unavailable or if its metric severity conditions (metric
thresholds) are met or exceeded, the SNMP Agent of that third-party network element
sends a notification to the Management Agent. These notifications are in the form of
SNMP traps that get triggered asynchronously upon reaching the performance
thresholds, and without any requests from the Management Agent.
Since these traps are based on SNMP, the Management Agent uses SNMP
Receivelets to receive and translate these SNMP traps into a form compatible with
Oracle Management Service.
For more information about the SNMP receivelet, see the Oracle Enterprise Manager
Cloud Control Extensibility Programmer's Reference.
30.5.2 About SNMP Fetchlets
Fetchlets are parameterized data access mechanisms available to map relevant data
from a managed element into Enterprise Manager's metric format. In the standards
area, Enterprise Manager currently uses SNMP Fetchlets to fetch information from
SNMP-enabled entities within your managed environment.
The SNMP fetchlet queries the SNMP Agent for data about the managed entity as
defined in the target type's Management Information Base (MIB). For more information
about the MIB, see About the Management Information Base (MIB) and Management
Information Base (MIB).
For more information about the SNMP fetchlet, see the Oracle Enterprise Manager
Cloud Control Extensibility Programmer's Reference.
30.6 About Metric Extensions
Metric extensions provide you with the ability to extend Oracle's monitoring capabilities
to monitor conditions specific to your IT environment. For example, you can create a
new metric for a host target type. Use an SNMP Adapter to allow Enterprise Manager
Management Agents to query native SNMP agents on target hosts for Management
Information Base (MIB) variable information to be used as the metric data.
For more information about Metric Extensions and the SNMP Adapter, see Using
Metric Extensions .
Chapter 30
About Metric Extensions
30-6

Part V
Systems Infrastructure
This section contains the following chapters:
•Working with Systems Infrastructure Targets
•Managing Networks
•Managing Storage
•Monitoring Servers
•Managing the PDU
•Managing the Rack
•Managing Oracle SuperCluster
•Monitoring Oracle Operating Systems
•Monitoring Oracle Solaris Zones
•Monitoring Oracle VM Server for SPARC
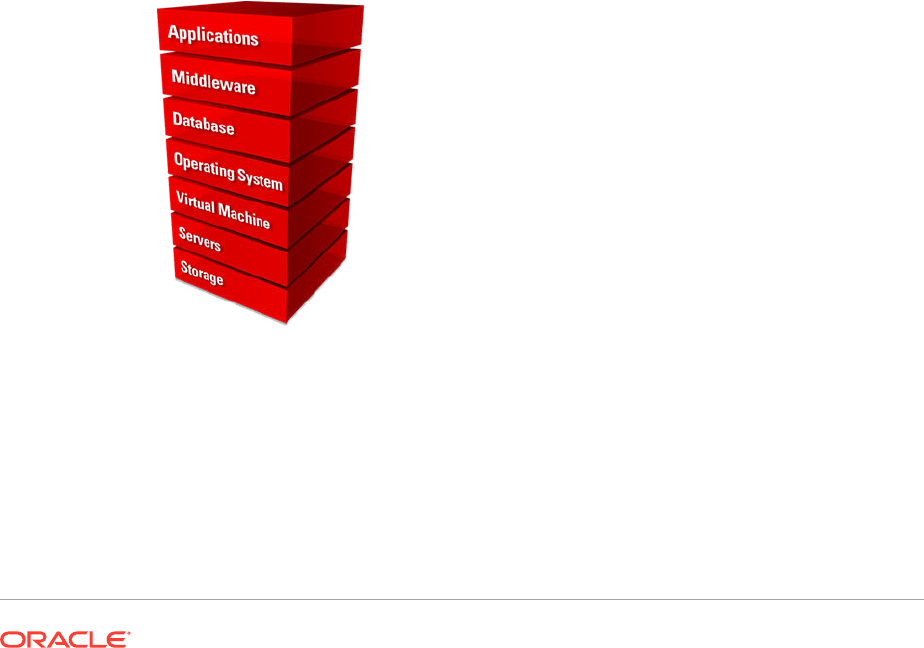
31
Working with Systems Infrastructure
Targets
This chapter describes the Oracle Enterprise Manager Systems Infrastructure plug-in.
This chapter covers the following:
•Overview of Enterprise Manager Systems Infrastructure
•Overview of the Systems Infrastructure User Interface
•Creating Roles for Systems Infrastructure Administration
•Related Resources for Systems Infrastructure Targets
31.1 Overview of Enterprise Manager Systems
Infrastructure
A host is a computer where managed databases and other services reside. A host is
one of many components or targets that Oracle Enterprise Manager Cloud Control
monitors. Oracle Enterprise Manager Cloud Control is an enterprise-level data center
management solution for the Oracle product stack, from applications to storage disks,
as shown in Figure 31-1.
Figure 31-1 Oracle Product Stack
The Enterprise Manager Systems Infrastructure (EMSI) plug-in is a fully integrated
software plug-in that provides monitoring and an enterprise-wide view the bottom half
of the stack, including Oracle Solaris and Linux operating systems, virtualized
operating systems (zones) and virtual machines (logical domains), servers, storage
appliances, storage for a host, and network resources.
The Oracle Enterprise Manager Cloud Control console interface provides detailed
information about managed components and shows the relationship between the
31-1

components. You can drill down to view greater details about specific components or
metrics.
For server targets, you can view server details, including power usage, network
information, service processor configuration, and fan and temperature information.
Other hardware targets include chassis, racks, power distribution units, and network
equipment. You can view the storage resources and their components for a host or a
storage appliance, including storage pools, storage hardware, filesystems, logical
volumes, and Logical Units (LUNs).
For Oracle Solaris and Linux operating system targets, you can view resource and
process information, top consumers, performance, and open incidents details. In
addition, you can view details about Oracle Solaris alternate boot environments and
zones.
When you use Oracle VM Server for SPARC to virtualize hardware or Oracle Solaris
to virtualize operating systems, the details appear on virtualization platform pages.
Virtualization platform pages provide high-level details such as overall guest, CPU and
memory, incident, and configuration information. You can drill down to individual virtual
server pages to view metrics specific to a selected logical domain or zone.
The Enterprise Manager Systems Infrastructure also provides a view of Oracle
SuperCluster engineered systems. Oracle SuperCluster integrates SPARC compute
nodes, an Oracle ZFS Storage Appliance, InfiniBand switches, PDUs, and Exadata
Storage Servers into a multi-rack system. You can view all of the components of an
Oracle SuperCluster including Compute Nodes, Exadata Storage Servers, InfiniBand
Switches, Power Distribution Units, and ZFS Storage Servers. You can expand the
Compute Nodes to view the logical domains and zones.
31.1.1 About Monitoring for the Systems Infrastructure Targets
A series of monitoring rules and parameters monitor your managed targets. Alerts and
incidents are raised for resources that are not performing as expected.
Each target has a dashboard that displays details based on the target type. All
dashboards show the number of warning, critical, and fatal open incidents with links
that enable you to drill down to the Incident Manager for the specific incident.
A Management Agent deployed on the host gathers information and keeps track of
activity, status, performance and the health of the targets. You can view metrics for the
following discovered Oracle target types:
•Servers
•Storage servers
•Networks
•Racks and power distribution units (PDUs)
•Oracle Solaris and Linux operating systems
•Oracle Solaris Zones
•Oracle VM Server for SPARC and logical domains
•Oracle SuperCluster engineered systems
Chapter 31
Overview of Enterprise Manager Systems Infrastructure
31-2

31.1.2 About Dynamic Views for the Systems Infrastructure Targets
Depending on the type of target, a target home page might include graphs, charts and
tables to provide greater detail at a glance. The home pages of more complex targets
include dynamic photorealistic views and relationship charts. In some cases, you can
interact with the images to better understand how hardware is deployed and how
resources are utilized.
The following charts and views enable you to assess a target quickly and determine
the relationships at a glance:
•Relationship Chart: Displays how resources are allocated among guests. For
example, the Systems Infrastructure Virtualization Platform page of an Oracle VM
Server for SPARC includes a Core Distribution tab that displays the vCPU and
core allocation. The chart contains concentric circles with segments that display
which CPUs and cores are allocated to which guests, and which CPUs and cores
are not allocated. You can click a guest in the outer ring to view detailed
information about that guest's resource consumption.
•Photorealistic View: Displays the components and ports of a hardware target, and
if there are open incidents. For example, the Oracle SuperCluster engineered
system monitoring pages provide a photorealistic view, which enables you to see
how the system is laid out in the rack. All active targets in the system appear in the
image. You can view greater detail by hovering your mouse over a target in the
image. When a component of the engineered system has an open incident, the
component appears in the image with a red border.
•Schematic View: Displays a symbolic view that displays the labels of an
engineered system's components. At a glance, you can see the LED status (up,
down, or blackout) and temperature of the server, ZFS Storage Appliance Server,
InfiniBand Switch, and PDU in the engineered system.
31.2 Overview of the Systems Infrastructure User Interface
Information gathered by the Systems Infrastructure plug-in appears in an updated user
interface. Each target home page is slightly different, depending on the type of target
and whether the target utilizes Oracle VM Server for SPARC or Oracle Solaris Zones
virtualization technology.
Open incidents, resource utilization and metrics for a target appear in a dashboard,
helping you to maintain high availability and optimized performance. Tabs in the user
interface contain more detailed metric information. Information appears in graphs,
tables, charts, and schematic, and photorealistic views to help you to quickly
understand the status and relationships between components.
31.2.1 About the Target Home Page
The home page enables you to quickly view the status, identify potential resource
issues, and view the service request and configuration history of a specific target.
From this page, you can drill down to specifics for an open incident, view detailed
metrics, and guest details.
You can access the home pages from the All Targets menu. Each home page includes
a dashboard across the top. Greater details and historic graphs are available in the
tabs on the right side of the page.
Chapter 31
Overview of the Systems Infrastructure User Interface
31-3
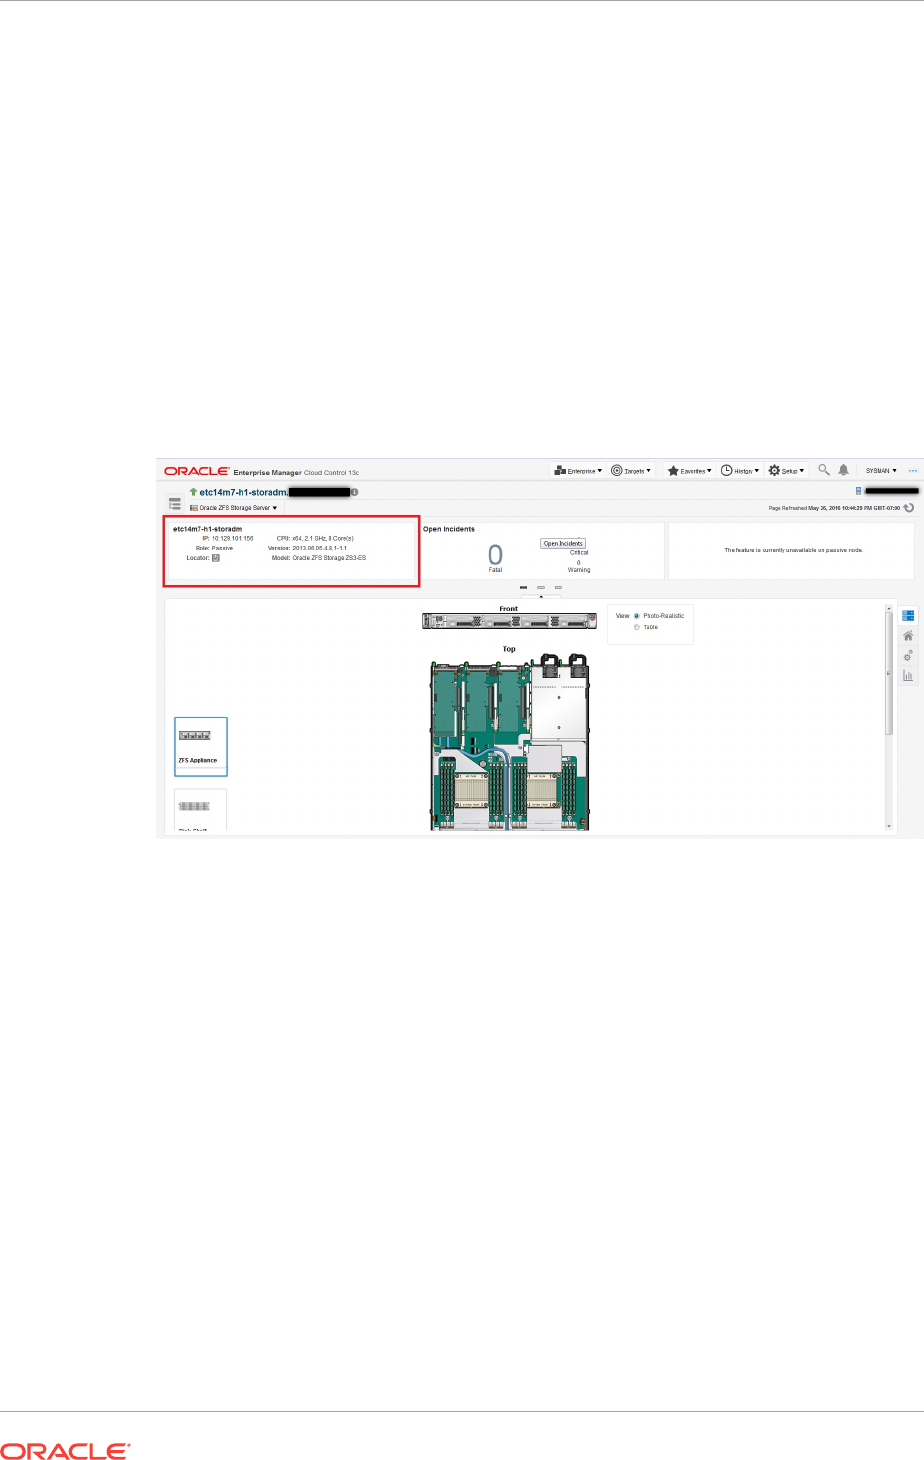
The dashboard is designed to display an overview of important information and
information that you might want to monitor closely. The information appears in a series
of sections, called dashlets. At least four dashlets appear in the dashboard. The target
type determines the number of dashlets and the content. Click the small button below
the row of dashlets to toggle to the next series of dashlets. Below the navigation
buttons is a single button that gives you the option to minimize the dashboard.
About the Target Home Page is an example of the first three dashlets on an Oracle
ZFS Storage Server target home page. This example shows target type and date the
page was last refreshed. The first dashlet contains target details, the second dashlet
shows the number of open incidents and the severity level. The third dashlet shows
the amount of space used and available for this target. One or more buttons appears
beneath the Open Incidents dashlet, as indicated by the red box. Click a button to
navigate to the next series of dashlets.
Figure 31-2 Dashboard
While the content will differ, each home page provides a consolidated view of the
status, resource utilization, and metrics for the target. The following are some of the
details that appear in dashlets:
•Target details, such as the name and status of the selected target, appears in the
first dashlet.
•Incident information appears in the second dashlet. The number of Critical,
Warning and Informational incidents that are currently open appear in this dashlet.
Each number is a link to greater detail.
•Resource usage, top statistics, and metrics information specific to the target type
appears in one or more dashlets.
•The number of service requests for the selected target that were filed with Oracle
in the past 30 days and the past 5 days appears in a dashlet.
•Last configuration change and last reported incident time appear in the last
dashlet.
In some cases, you can click content in a dashlet to drill down to get more information.
For example, the Open Incidents dashlet links to more detailed information. When you
click a number next to the type of incident, the dashboard flips and shows a table of
Chapter 31
Overview of the Systems Infrastructure User Interface
31-4

incidents with the target name, a synopsis, and additional information depending on
the type of incident. You can drill down further to navigate to the Incident Manager for
the highest level of detail.
See About the Virtualization Home Page and About the Oracle Engineered Systems
Home Page for some differences in the home pages for these types of targets.
31.2.2 About the Virtualization Home Page
When you are using the Oracle VM Server for SPARC or Oracle Solaris Zone
virtualization technology, the target home pages are different.
The following are the target home pages for virtualization:
•Virtualization Platform page
•Virtual Server page
The Virtualization Platform page is the home page for the Control Domain or for the
Global Zone. The Virtualization Platform page has a Target Navigation icon in the
upper left corner that contains links to the Virtual Server home page for each
associated logical domain or zone.
For zones and logical domains, the number of incidents that appear on the
Virtualization Platform page includes incidents for all associated zones and domains.
For example, the control domain and all associated logical domains.
31.2.3 About the Oracle Engineered Systems Home Page
For Oracle SuperCluster engineered systems, you can monitor the components of the
engineered system from the target's home page. The monitoring pages provide a
photorealistic view and a schematic view of the engineered system. The photorealistic
view is helpful in seeing how the system is physically laid out in the rack. You can
hover over the image to view details about the components. The schematic view
displays the component labels and LED status.
31.3 Creating Roles for Systems Infrastructure
Administration
The Systems Infrastructure plug-in does not define its own roles for access controls.
To manage the plug-in, you must create roles and administrators, and then assign
roles to administrators. The roles restrict a user's privileges.
Note:
For security reasons, Oracle recommends that the SYSMAN account be used
only as a template to create other accounts, and not used directly.
To create roles to provide management rights to users:
1. Log in to the Enterprise Manager Cloud Control as the super administrator user.
2. Click Setup, then Security.
Chapter 31
Creating Roles for Systems Infrastructure Administration
31-5

3. Select Roles.
On the Security page, a list of predefined roles is provided. These roles can serve
as basis to define custom roles to suite specific site level requirements.
Note:
The predefined roles provided cannot be edited or deleted.
4. Select a role that closely matches the role you wish to create. Click Create Like.
5. On the Properties page, enter a name for the new role. You can optionally add a
description. Click Next.
6. On the Roles page, select the roles from the list of Available Roles. Click Move to
add the role to Selected Roles. Click Next.
7. On the Target Privileges page, select the privilege you want to grant to the new
role. Click Next.
8. On the Resource Privileges page, you can edit specific privileges to be explicitly
granted. Click the Manage Privilege Grant edit icon to make the changes. Click
Next.
9. On the Administrators page, select the administrators from the list of Available
Administrators that you want to grant the new role to. Click Move to add the
administrator to Selected Administrators. Click Next.
10. On the Review page, a complete summary of the new role you have created is
displayed. Click Back to go to previous screens to make changes. Click Finish to
complete the role creation.
When the newly created administrator logs in, unlike SYSMAN, the administrator is
restricted by the privileges set.
31.4 Related Resources for Systems Infrastructure Targets
See the following for more information:
•Discovering and Adding Host and Non-Host Targets
•Discovering, Promoting, and Adding System Infrastructure Targets
•Using Incident Management
Chapter 31
Related Resources for Systems Infrastructure Targets
31-6
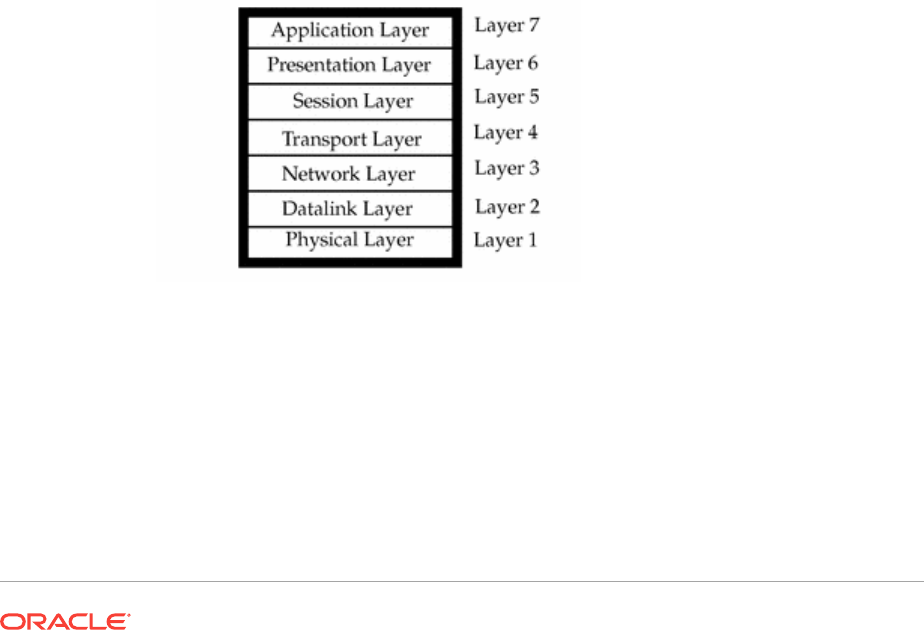
32
Managing Networks
The following information is included:
•Get Started with Managing Networks
•Location of Network Information in the User Interface
•Actions for Network Management
•View Topology
•Fabric
•Datalinks
•Networks
•Related Resources for Network Management
32.1 Get Started with Managing Networks
Enterprise Manager discovers and manages targets that populate Layers 1, 2, and 3
of the Open Systems Interconnection (OSI) model, shown in Figure 32-1. In the OSI
model, a layer supports the layer above it and is provisioned by the layer below it. Any
faults in a layer affect the layer above it.
Figure 32-1 OSI Model
•Layer 1: Fabric targets are in the physical layer of the OSI model, such as network
switches.
•Layer 2: Datalink targets are in the link layer of the model. For Ethernet fabrics,
datalinks are VLAN IDs. For InfiniBand fabrics, datalinks are partition keys. This
layer also includes combinations of links, such as link aggregations.
•Layer 3: Network targets are in the network layer of the model, which are network
interfaces plumbed as IP addresses and IPMP groups.
32-1

Network management includes all the activities for making network resources
available to targets:
•Discover fabrics and their datalinks and networks.
•Collect metrics for layer-related configuration and performance.
•Detect faults at each level.
•View the topology, a graphic view of the relationships in the fabrics and networks.
32.2 Location of Network Information in the User Interface
Table 32-1 shows where to find information.
Table 32-1 Location of Network Information in the BUI
Resource Location
To see fabrics View All Targets and select Ethernet/InfiniBand Fabric.
To see networks View All Targets and select Systems Infrastructure
Network. Select a network.
To see datalinks View All Targets, then select either Systems Infrastructure
Network or Host. Select a network, click Network
Connectivity tab, then click Data links option.
To see network switches View All Targets and select System Infrastructure Oracle
InfiniBand Switch or System Infrastructure Cisco
Switch.
To see the virtualization host that is using a network Display a network and view Connected Nodes section or
click Network Members tab.
To see incidents for a network View Networks Incident dashlet.
To see status of the network switch View All Targets and select Systems Infrastructure Switch
then view the Temperature, the Fan performance, and
Throughput dashlets.
To view the performance of a network switch View All Targets and select Systems Infrastructure Switch
then select a network switch. Click the Performance tab.
You can refresh the display at any time.
To view the metrics that are being monitored for a
network switch
View All Targets and select Systems Infrastructure
Switch. Right-click on Systems Infrastructure Switch and
select Monitoring, then All Metrics.
To see ports of the network switch View All Targets and select Systems Infrastructure
Switch. Select a network switch. A grid shows the used and
available ports.
To discover a fabric Use one of the Add Target procedures.
To delete a fabric, datalink, or network Use the Remove Target action.
32.3 Actions for Network Management
You can perform the following actions, depending on the requirements.
•Discover switches, and network-connected targets. When you discover a network-
connected target such as a fabric, its datalinks and networks also become
discovered assets.
Chapter 32
Location of Network Information in the User Interface
32-2
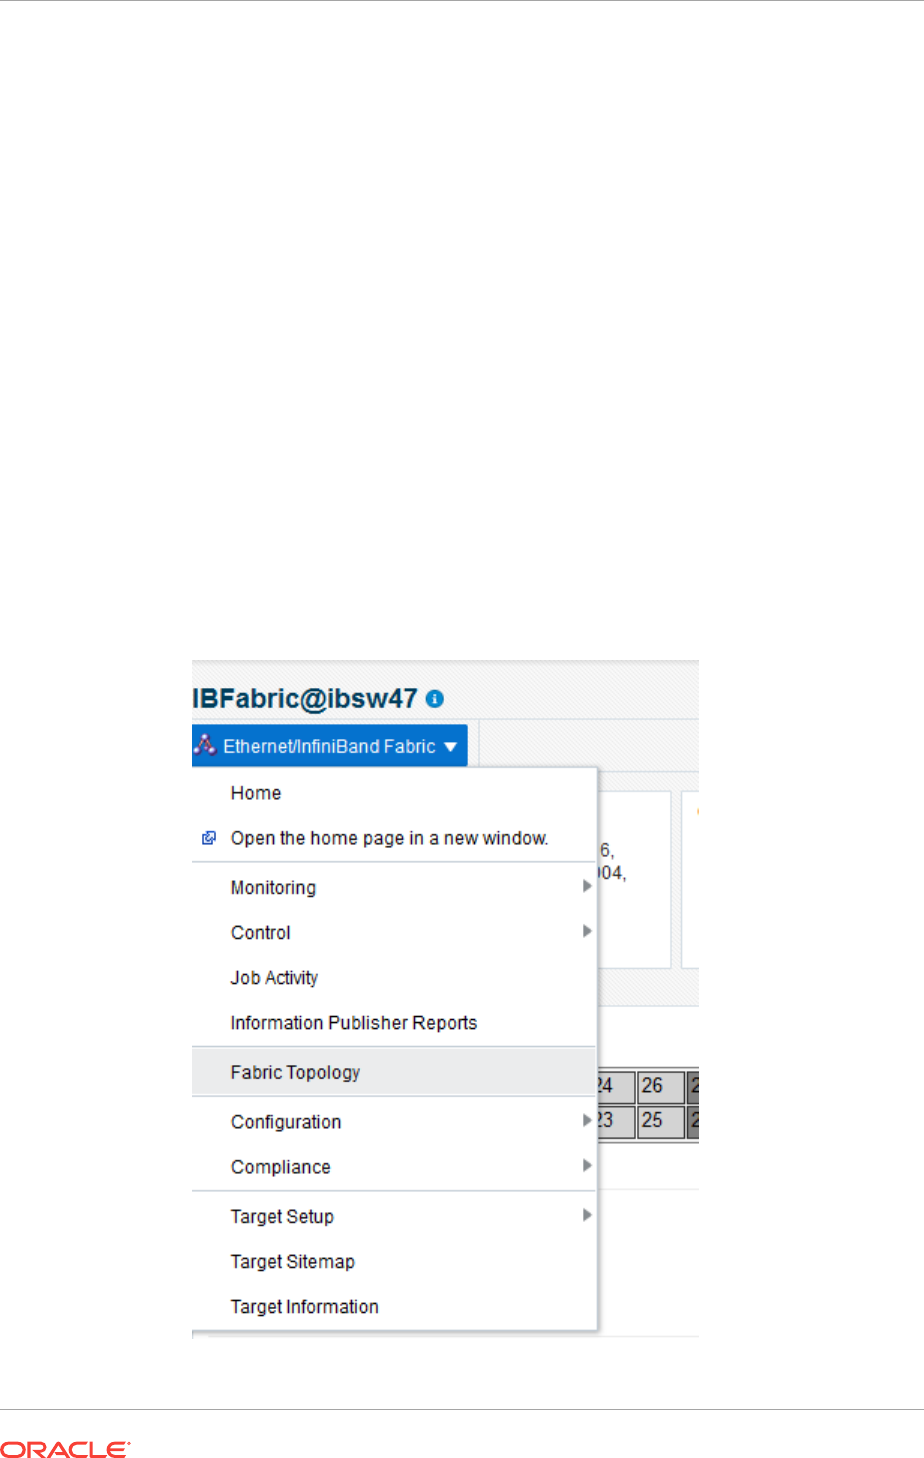
•View the configuration of fabrics, datalinks, and networks.
•Diagnose problems using incidents and performance metrics.
•Modify how the targets are monitored and how performance is measured.
32.4 View Topology
The topology shows the relationships among assets. The network topology consists of
ports, datalinks, and network interfaces.
1. Select Targets and then All Targets.
2. For a fabric, select Ethernet/InfiniBand Fabric.
For a network switch, select Systems Infrastructure Switch.
For a network, select Systems Infrastructure Network.
3. Select one of the targets.
4. On the target's landing page, click the down arrow next the type of target to
display a menu.
5. For a fabric, select Fabric Topology as shown in Figure 32-2.
Figure 32-2 Menu Selections for Topology
Chapter 32
View Topology
32-3
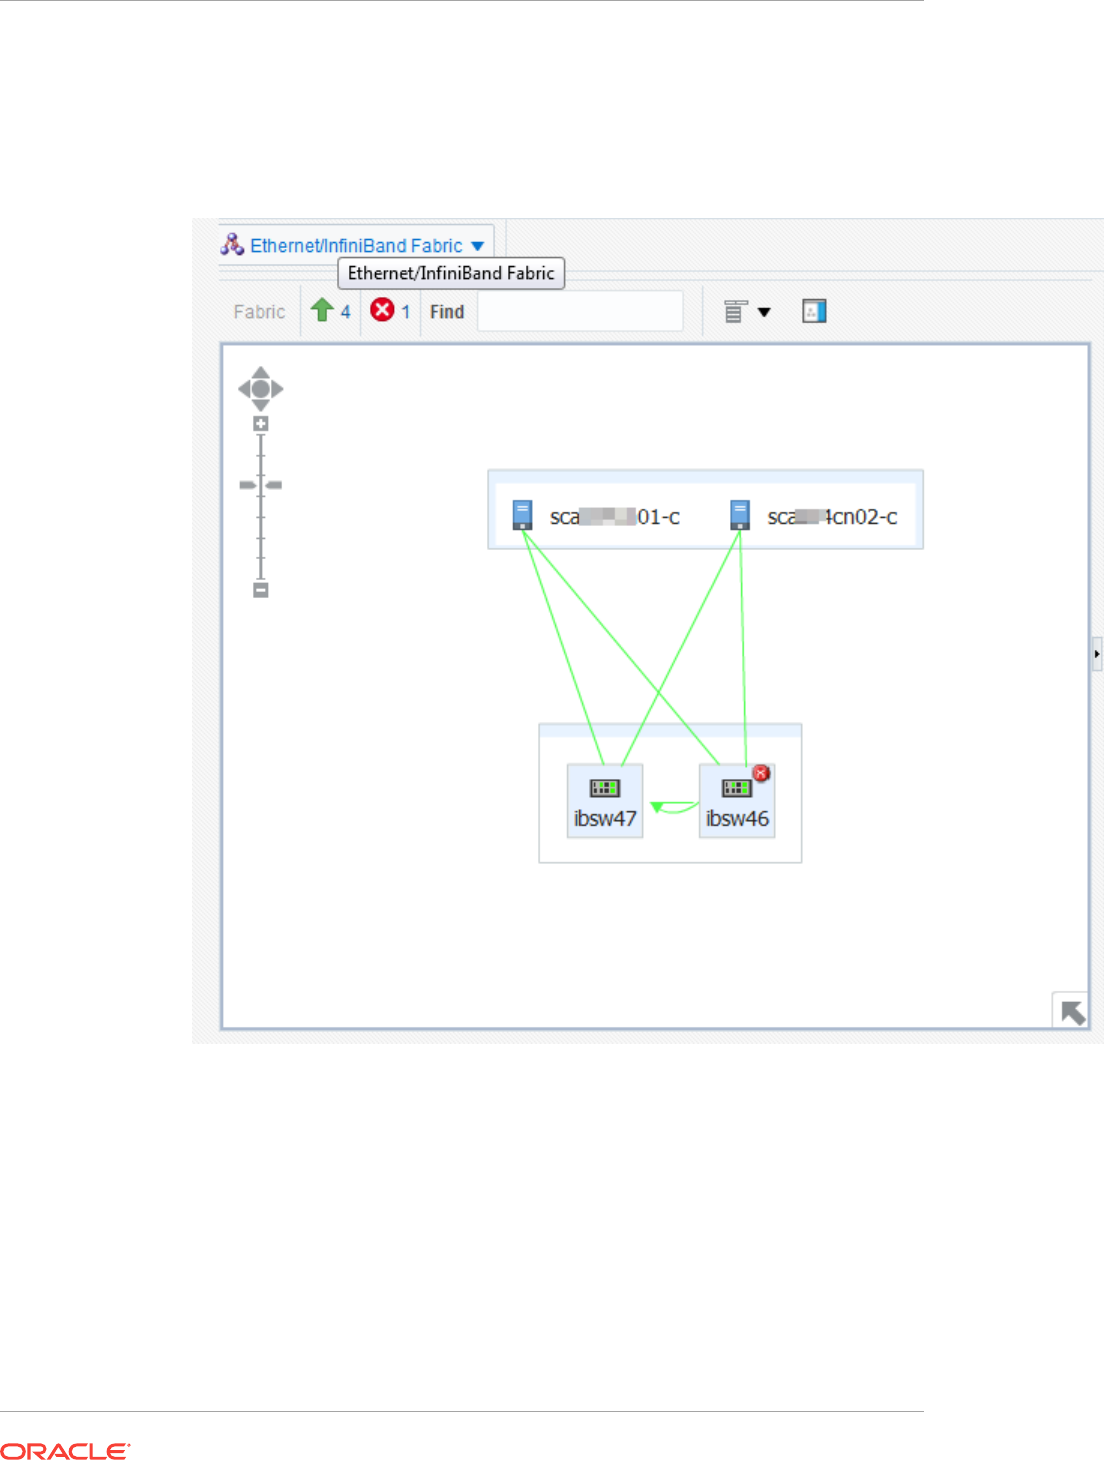
6. The Topology page shows the relationships of this target. You can adjust the
display of the topology to learn more about the target. Figure 32-3 shows the
assets that use the selected fabric because the Filter options include them.
Figure 32-3 Fabric Topology
7. Hover on an object in the topology to display the asset's information. Figure 32-4
shows the result of hovering over a switch of a fabric.
Chapter 32
View Topology
32-4
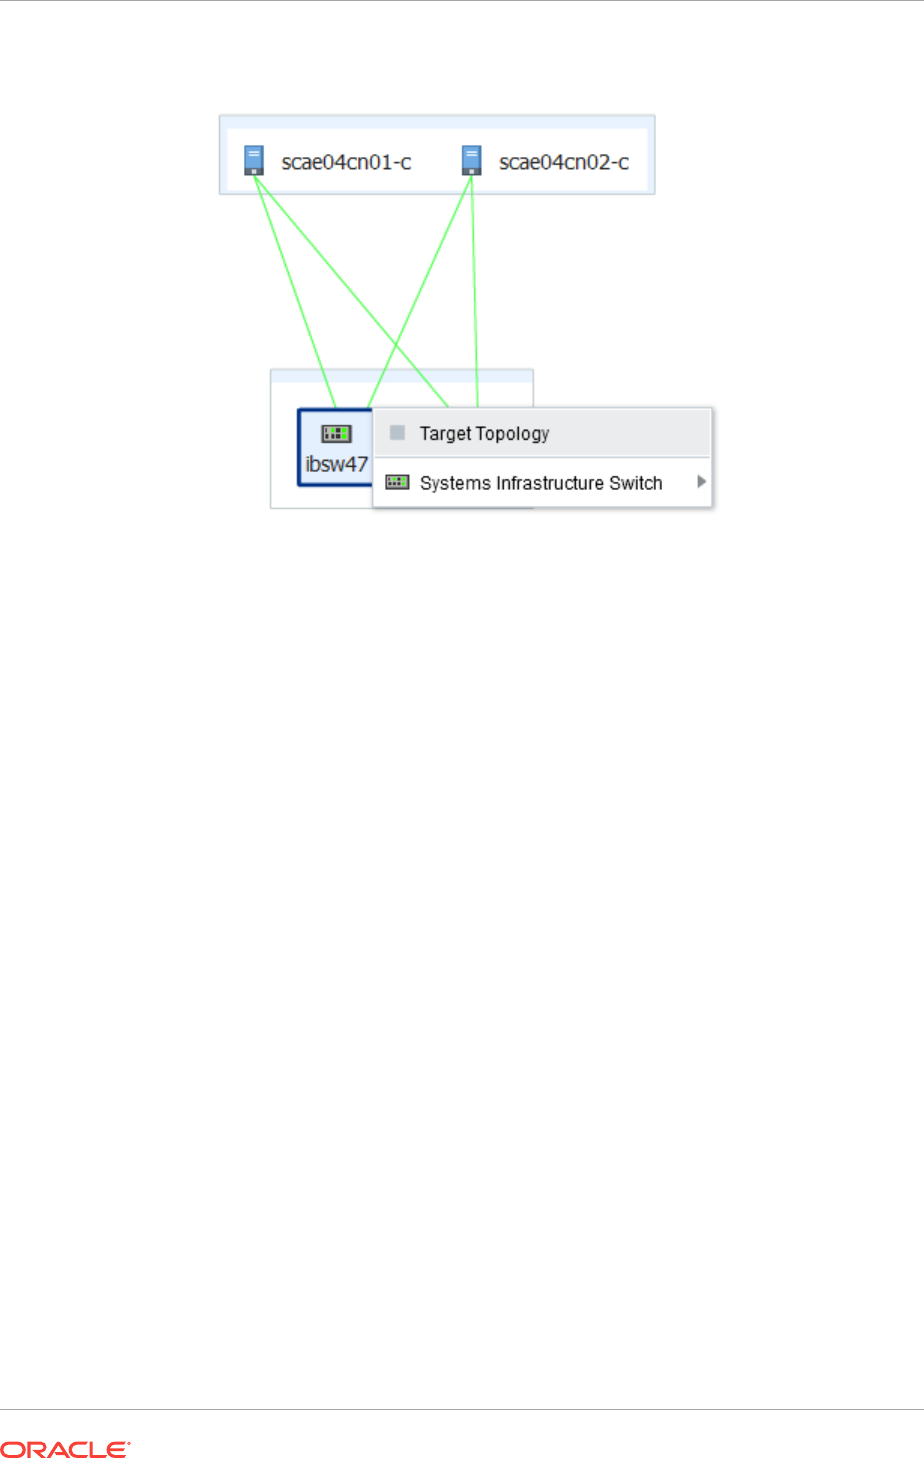
Figure 32-4 Target Topology
8. To view a different target, click All Targets again and then click the Remove icon
next to the target type to remove the filter.
32.5 Fabric
•About Fabrics
•View Information About Fabrics
•About Fabric Information
•About Performance of Fabrics
•Delete a Fabric
32.5.1 About Fabrics
A fabric represents the physical network targets including the connection between
targets, that is, a port. For a switch, all ports support the fabric. For a network-enabled
device such as a server or a storage appliance, its port is its connection to the fabric.
As the physical layer of the OSI model, any fault in the fabric affects the datalinks and
networks that rely on the fabric.
A fabric's name is based on the name of the target. For example, when you discover
an InfiniBand switch named
abcp01sw-ib02
, the fabric is named
IBFabric@abcp01sw-
ib02.us.example.com
. When the switch is a component of a system, the fabric is named
for the first target in the system to be discovered. A fabric with the name
ETHFabric@abcp01cn02.us.example.com
indicates that this Ethernet fabric followed the
discovery of a compute node.
Enterprise Manager can discover and manage Ethernet fabrics and InfiniBand fabrics.
For information about discovering fabrics, see Discovering, Promoting, and Adding
System Infrastructure Targets. After discovery, you can view the attributes that these
fabrics have in common and also their unique attributes.
Chapter 32
Fabric
32-5

32.5.2 View Information About Fabrics
To see information about a fabric:
1. Select Targets and then All Targets.
2. Select Ethernet/InfiniBand Fabric.
3. Select one of the fabrics. The landing page for the fabric shows the incidents for
this fabric and the nodes that use this fabric.
Chapter 32
Fabric
32-6
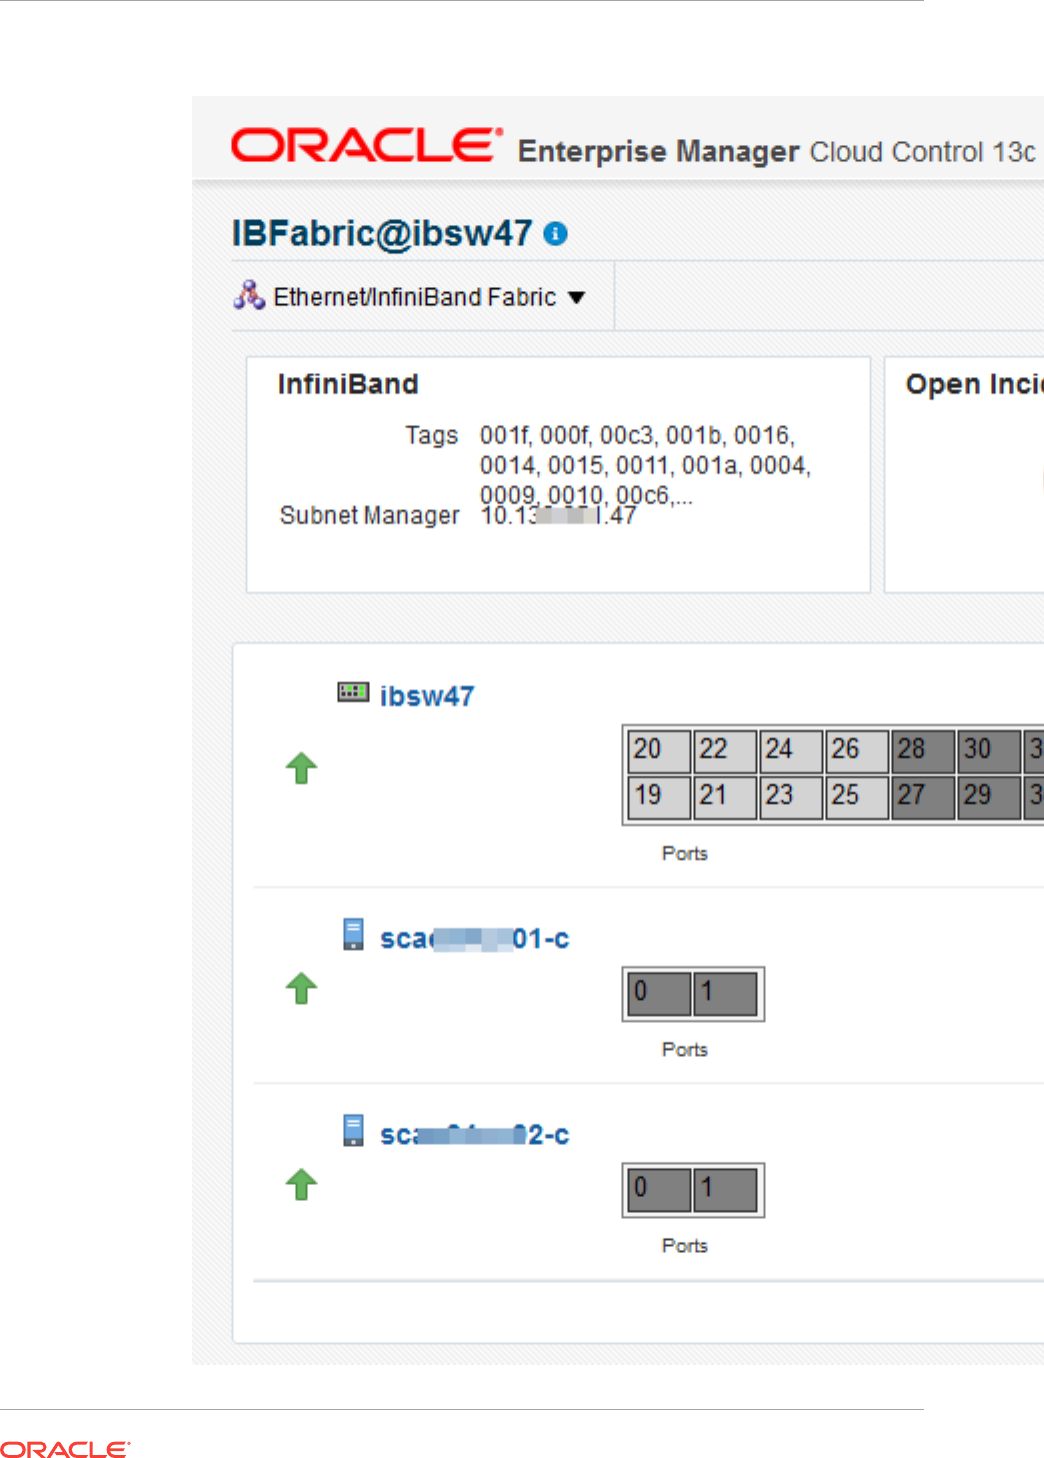
Figure 32-5 Fabric Landing Page
Chapter 32
Fabric
32-7

4. Click the Fabric Details icon or the Fabrics Performance icon to view more
information about this fabric.
Figure 32-6 Fabric Performance Icon
32.5.3 About Fabric Information
The Fabric dashboard's dashlets include the following information:
•VLAN IDs or partition keys for this fabric:
–For an Ethernet fabric with tagged VLANs, this section lists each VLAN ID. If
there are no tagged VLANs, this section displays
Untagged
.
–For an InfiniBand fabric, this section lists each partition key.
•Open Incidents
•Ports Occupation
•Last Configuration time
The Connected Nodes section lists every node, or network switch, in the fabric. You
can also display specific information by hovering on the node, as show in Figure 32-7.
Chapter 32
Fabric
32-8
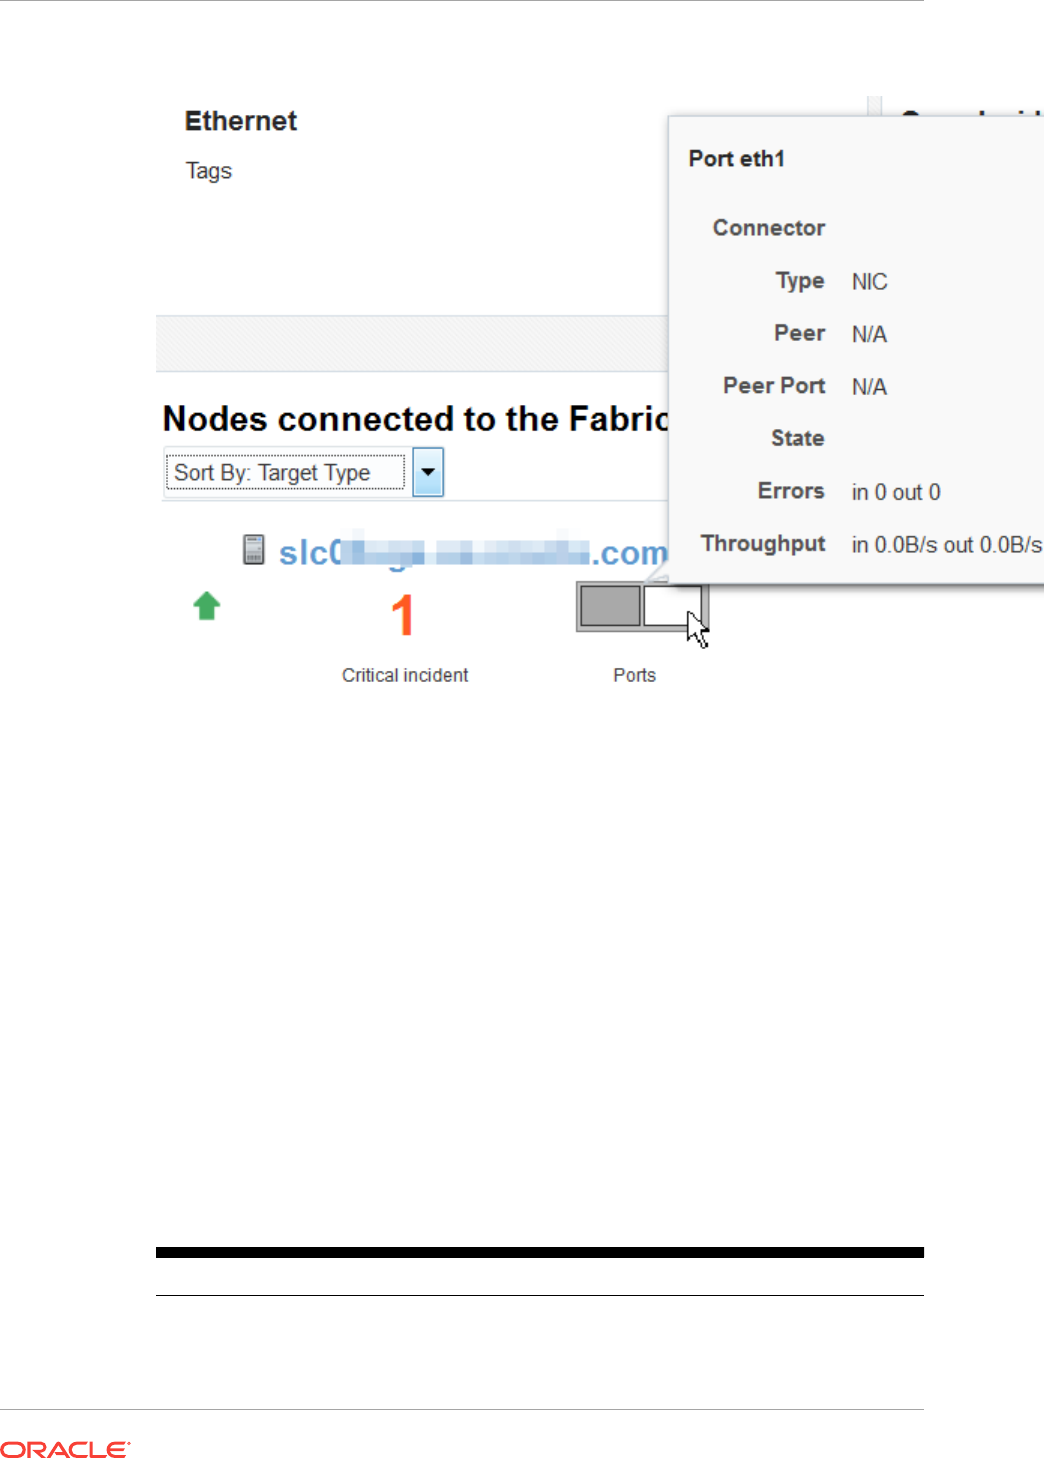
Figure 32-7 Fabric's Nodes
32.5.4 About Performance of Fabrics
Metrics are collected and displayed in real-time when possible. For the ILOM service
processors of networks switches, the collection of metrics is not in real time. In these
cases, the Last Collected metrics are displayed with a timestamp.
You can view incidents for a fabric or a network switch in the fabric and view a record
of performance.
One factor that effects both performance and metric collection is the version of SNMP
that you specify when you discover a network switch using the Add Using Guided
Process wizard. Although all three versions of SNMP are supported, Version 3 is
recommended because it is the most secure and the most efficient. Version 2c, which
uses public community strings instead of credentials to get access to the network
switch, is the default version and provides efficient performance. Version 1 of SNMP,
which is not recommended, is not secure and collects metrics using multiple inquiries.
If you require Version 1, you must increase SNMP's timeout value to at least 180
seconds. Table 32-2 summarizes the options for SNMP specification.
Table 32-2 Supported Versions of SNMP
Version of SNMP Level of Security Level of Performance Recommendation
Version 3 High: requires
username and
password
High: Metrics are
collected in bulk by one
inquiry.
Recommended
Chapter 32
Fabric
32-9

Table 32-2 (Cont.) Supported Versions of SNMP
Version of SNMP Level of Security Level of Performance Recommendation
Version 2 Not secure: Public
community string
Acceptable if Version
2c is used, which can
collect metrics in bulk.
Other sub-versions
require extended
expiration intervals.
Performance can be
acceptable, but
security is poor.
Version 1 Not secure: Public
community string
Requires expiration
interval of at least 180
seconds.
Not recommended
32.5.5 Delete a Fabric
A fabric is deleted automatically when all targets connected to the fabric are removed.
To remove a fabric, use the Remove Target action to remove each target. After the
last target is removed, the fabric is deleted.
32.6 Datalinks
•About Datalinks
•View Information About Datalinks
32.6.1 About Datalinks
When you discover a network switch or network-enabled device, its datalinks are
discovered including:
•Target Components
•LAG Configuration
•LAG Membership
•Bonding Configuration
•IPMP Configuration
•IPMP Membership
The datalink layer manages networks that share resources by means VLANs (tagged
and untagged VLAN IDs), InfiniBand partitions (default and assigned partition keys),
and Fibre Channel zones. Datalinks can also depend on other datalinks to increase
throughput or reliability.
32.6.2 View Information About Datalinks
To see information about datalinks:
1. Select Targets and then All Targets.
2. Select Host.
3. Select a host.
Chapter 32
Datalinks
32-10
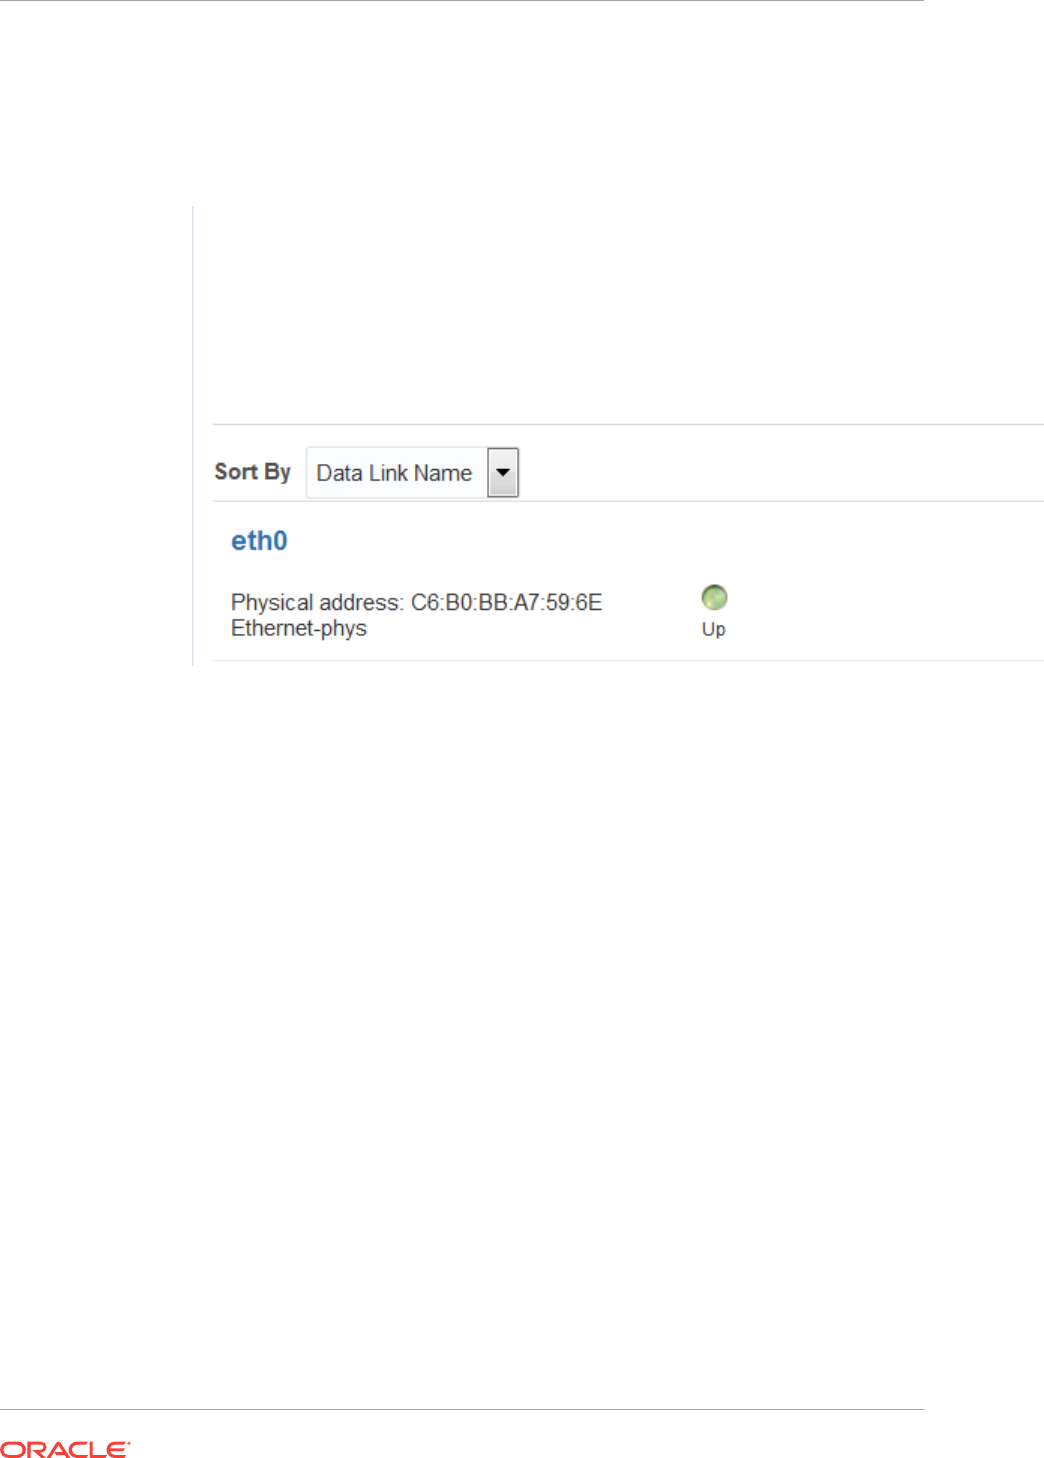
4. In the summary, click the Network Connectivity tab.
5. Click the Data links option.
Figure 32-8 Data links
6. Click the More... option to see the path and the transmission rate.
32.7 Networks
•About Networks
•View Information About Networks
•Delete Networks
32.7.1 About Networks
When you discover a network switch or network-enabled device, its networks are
discovered. You can view the following information about a selected network:
•Metric and Collection Settings
•Metric Collection Errors
•Status History
•Incident Manager
•Alert History
•Blackouts and Brownouts
•Create Blackout...
•End Blackout...
•All Metrics
Chapter 32
Networks
32-11

•Create Brownout...
•End Brownout...
•Job Activity
•Information Publisher Reports
•Last Collected
•Comparison & Drift Management
•Compare...
•Search...
•History
•Save...
•Saved
•Topology
•Compliance Results
•Standard Associations
•Real-time Observations
•Monitoring Configuration
•Administrator Access
•Remove Target...
•Add to Group...
•Properties
•Target Sitemap
•Target Information
When you discover an operating system, you can view the following information about
an OS target's network connectivity:
•Network interfaces: MAC address, IP address, netmask and broadcast address
•IPV4 and Ipv6
•Routing tables
•Open network ports
32.7.2 View Information About Networks
To see information about a network switch:
1. Select Targets and then All Targets.
2. Select Ethernet/InfiniBand Fabric.
3. Select one of the fabrics.
4. Select one of the network switches.
5. Use the tabs, such as the Performance tab, to view information about this target.
To see home page of Systems Infrastructure Switch :
Chapter 32
Networks
32-12
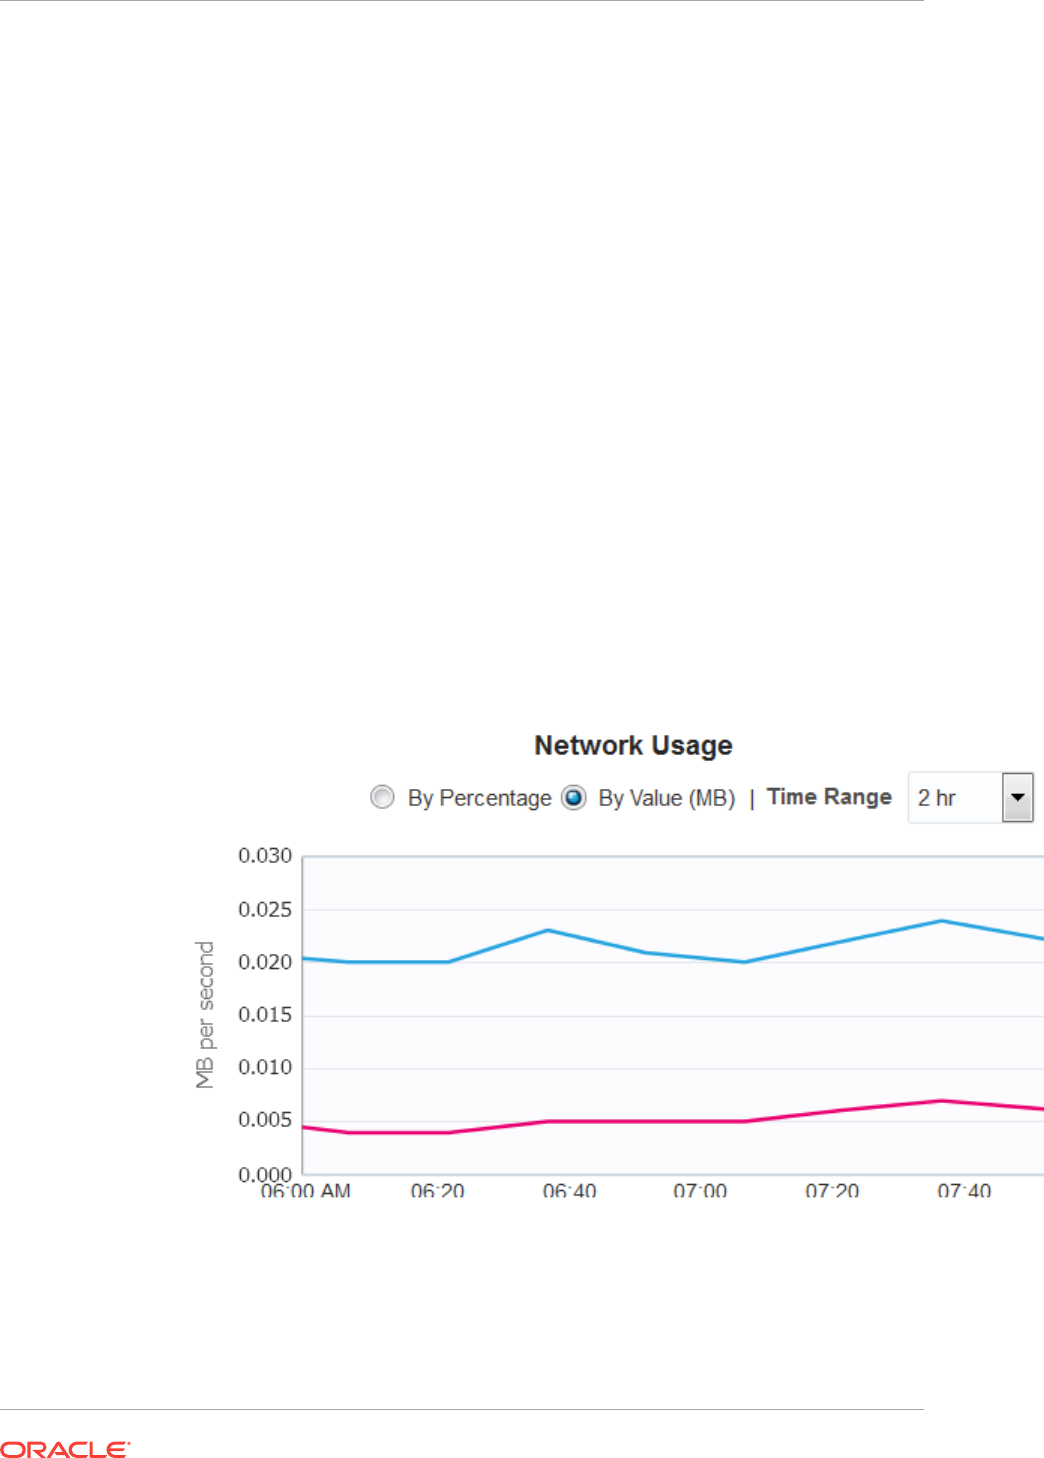
1. Select Targets and then All Targets.
2. Select Systems Infrastructure Network.
3. Select a subnet.
32.7.3 Delete Networks
A network is deleted automatically when all targets connected to the network are
removed. To remove a network, use the Remove Target action to remove each
target. After the last target is removed, the network is deleted.
32.7.4 View Network Details of a Host Target
You can select the host and then its operating system or you can select the operating
system and then choose the server from the list, as described in this procedure.
1. Select Targets and then All Targets.
2. Scroll down to the Operating System section and select the type of operating
system. All servers with that operating system are listed.
3. Select a host target.
4. In the OS dashboard, scroll down to the Network Usage chart for an overview of
network activity. You can change the values of this graph and its time interval.
Figure 32-9 Graph of Network Usage
5. Click the Network Connectivity tab to view details. You can then click the
Interfaces or the Data links options.
32.8 Related Resources for Network Management
See the following for more information:
Chapter 32
Related Resources for Network Management
32-13


33
Managing Storage
The following information is included in this chapter:
•Get Started with Managing Storage
•Location of Storage Information in the User Interface
•Actions for Storage Management
•About Storage Appliance Dashboard
•About Photorealistic Image
•About Summary
•About Projects
•About Charts
•About Host Storage Information
•About Storage Configuration Topology
•About Storage Metrics
•About Storage Cluster Membership
•About Storage Resource Deletion
•Using Oracle ZFS Storage Appliance in Engineered Systems
•Related Resources for Storage
33.1 Get Started with Managing Storage
Oracle Enterprise Manager discovers and manages storage resources and their
components, including storage pools, storage hardware, filesystems, and logical
volumes.
A storage server exposes its resources as Logical Units (LUNs) or Shares. A storage
client has access to these LUNs and shares, and represents them as its own
filesystems or devices and also exposes these filesystems to its own clients, such as
applications, databases, or virtual machines.
The System Infrastructure plug-in manages the storage resources for a Storage
Appliance and for a Host.
Storage management includes all the activities for making storage resources available
to operating systems and virtual assets. The following are some of the activities:
•Discover storage targets and derive their relationship.
•Collect configuration and performance metrics for all storage target components.
•Detect incidents.
•Monitor the storage target components such as, LUNs, filesystems, projects, and
pools.
33-1
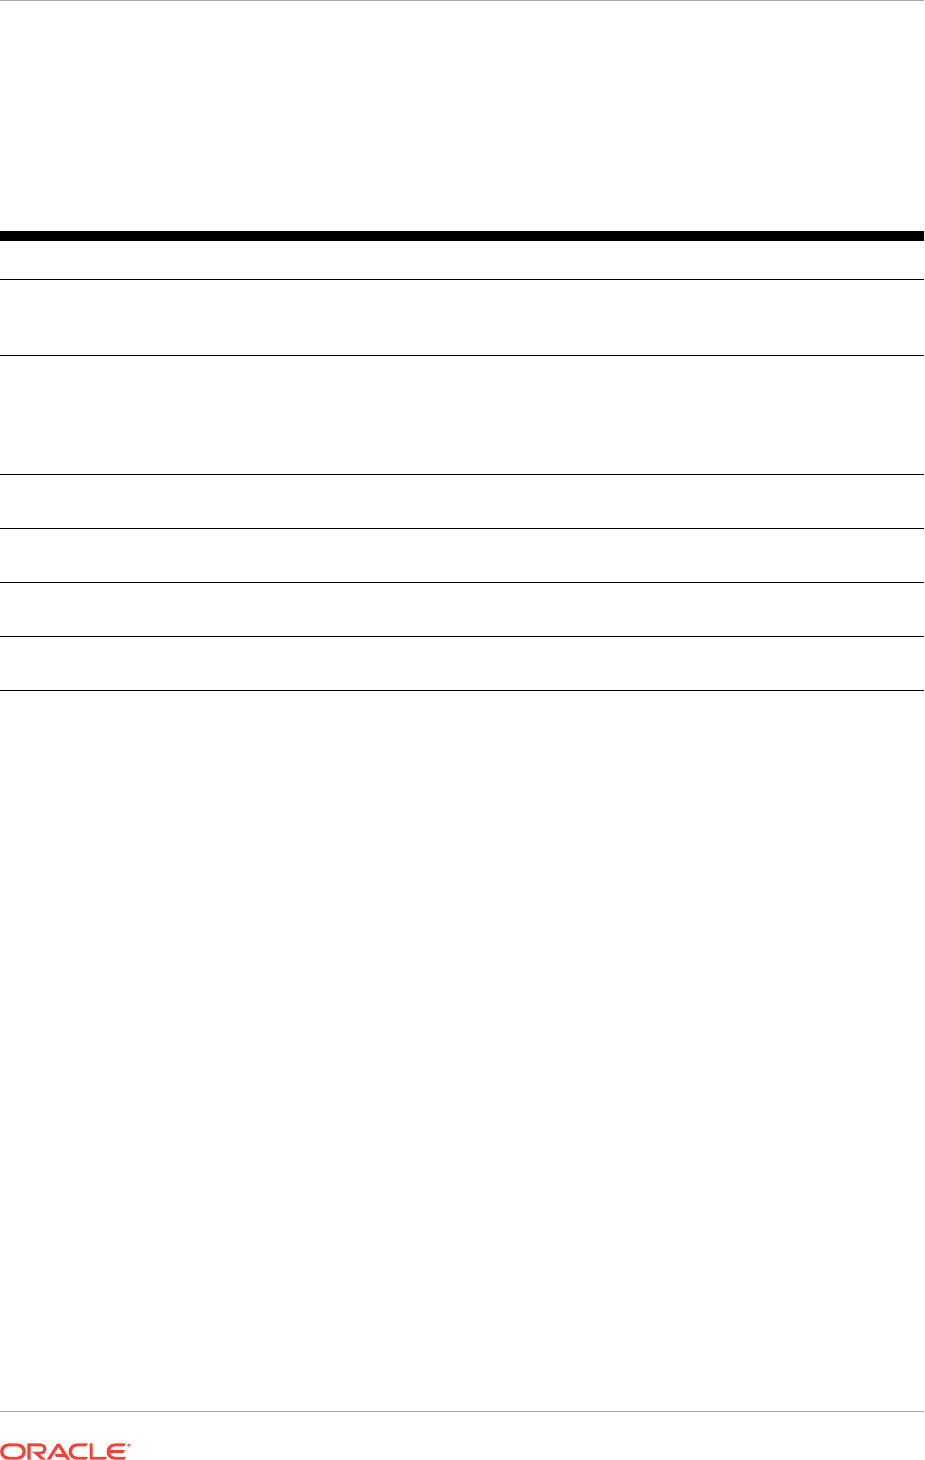
33.2 Location of Storage Information in the User Interface
Table 33-1 shows where to find information.
Table 33-1 Location of Storage Information in the User Interface
Object Location
To view Oracle ZFS Storage Appliance target Select Oracle ZFS Storage Server in the All Targets
selector. Click the Oracle ZFS Storage Server to display the
Summary page.
To view host's storage information Select Hosts in the All Targets selector. Click the specific
host to display the Summary page. Click the Storage icon to
the right. To view more details, click Disks, Filesystems,
SAN Configuration, Linux LVM Volume Group(s), or ZFS
Storage Pool(s) icons which appear to the left.
To view storage topology Right-click on a storage appliance in the All Targets selector.
Select Configuration and then click Topology.
To view storage performance metrics Right-click on a storage appliance in the All Targets selector.
Select Monitoring and then click All Metrics.
To view storage configuration metrics Right-click on a storage appliance in the All Targets selector.
Select Configuration and then click Last Collected.
To view storage cluster membership Select a storage appliance cluster in the All Targets selector.
Click on Target Navigation icon.
33.3 Actions for Storage Management
You can perform the following actions, depending on the requirements:
•Discover storage targets.
•View the configuration of storage targets.
•Diagnose incidents and performance metrics.
•Modify how the targets are monitored and how performance is measured.
•Blackout a storage appliance target which in turn, performs blackout on all of its
associated automatically promoted target members.
33.4 About Storage Appliance Dashboard
The storage appliance dashboard contains basic information about the storage
appliance's status, including incidents, space usage, disk I/O activity graphical
representations, number of LUNs, number of shares, and last configuration details in
the form of eight dashlets. See Viewing the Storage Appliance Dashboard for the
steps to view the dashboard of a selected storage appliance.
The dashlets are displayed as shown in Figure 33-1. Click the icon beneath the
dashboard to switch to another set of dashlets.
Chapter 33
Location of Storage Information in the User Interface
33-2
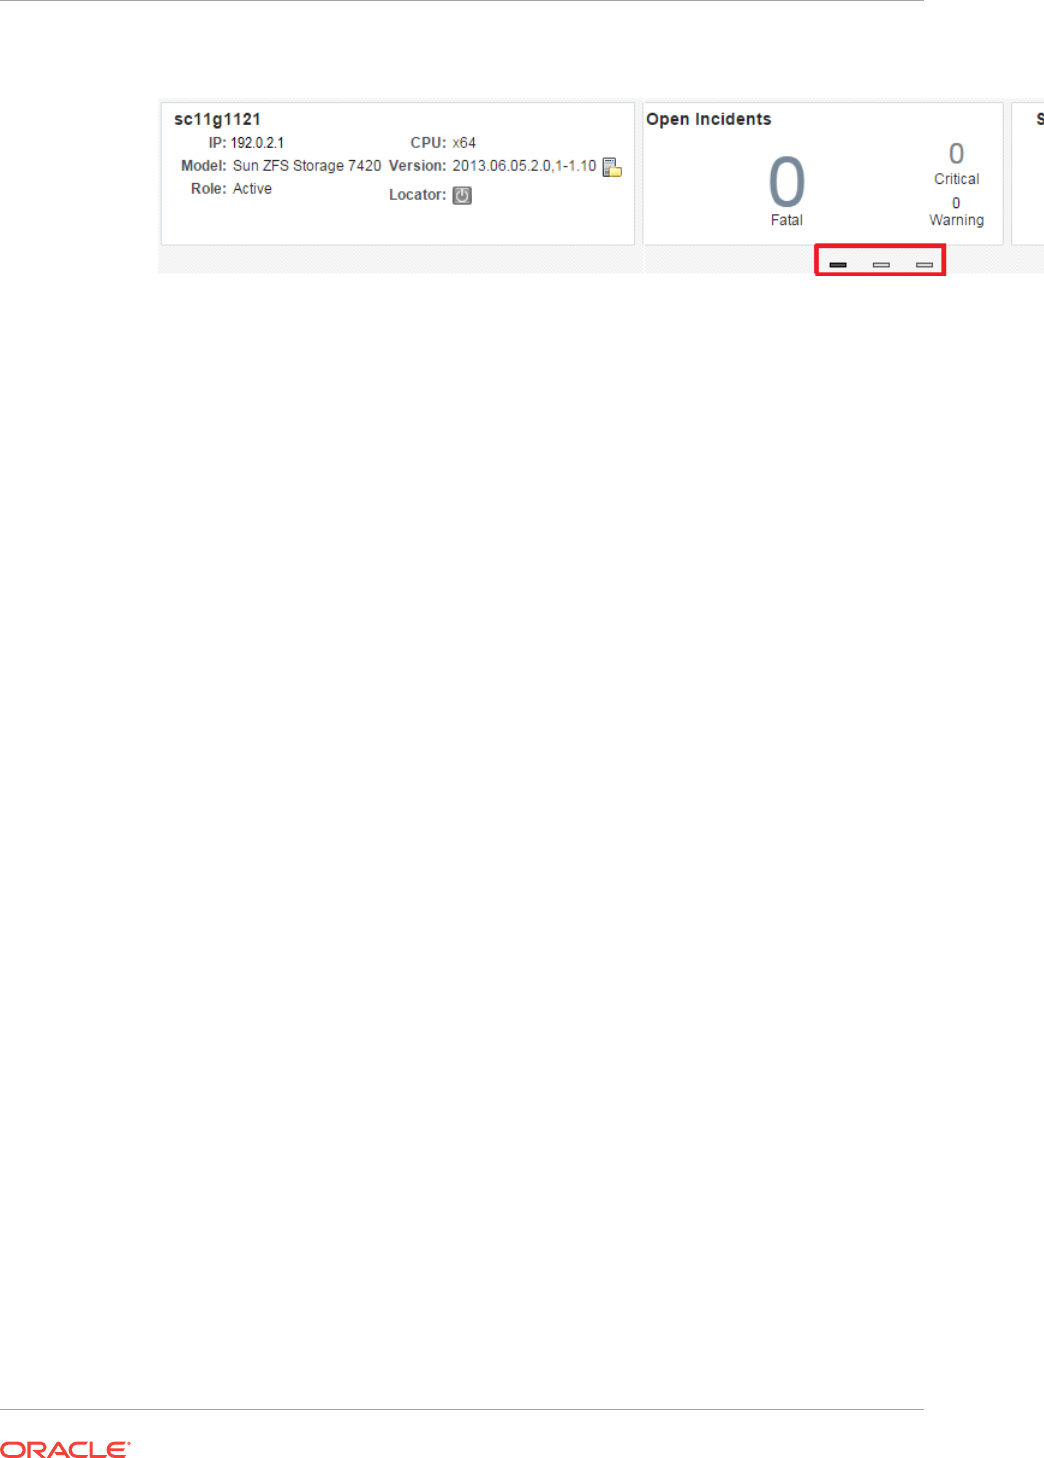
Figure 33-1 Dashlets View
You can view the following dashlets in the storage appliance dashboard:
•Basic Hardware Information: Displays the model name of the appliance or storage
server, IP Address, CPU, Version, Role, and Locator details. It also provides
information if a new appliance version is available for download.
•Open Incidents: Displays the number of open incidents in the fatal, critical, and
warning categories. Click the number displayed as the open incident in this dashlet
to view detailed information about the incidents in that category.
•Storage Utilization: Displays the percentage of used space and available space of
the appliance or storage server. It displays the storage utilization at the appliance
level.
•Disk I/O Bytes/Sec (Last 24 Hour): Displays the graphical representation of overall
disk I/O activity in bytes per second on the storage appliance.
•Distribution of Logical Units Utilization: Displays the total number of LUNs used in
the form of graphical representation. It also provides distribution of LUNs based on
storage utilization percentage.
•Distribution of Share Utilization: Displays the total number of shares used in the
form of graphical representation. It also provides distribution of shares based on
storage utilization percentage.
•Disk I/O Ops/Sec (Last 24 Hour): Displays the graphical representation of the
overall disk I/O operations per second on the storage appliance.
•Last Configuration details: Displays the date and time information of the last
configuration change and last reported incident.
33.4.1 Viewing the Storage Appliance Dashboard
To view a storage appliance's dashboard, perform the following steps:
1. From the Targets menu, select All Targets.
2. In the left navigation pane, expand Servers, Storage and Network target type.
You can view a list of appliance targets under Servers, Storage and Network.
3. Click a specific appliance target under Servers, Storage and Network.
The target name, target type, and the target status of the selected target is
displayed in the right pane.
4. Click on a specific target name from the list in the right pane to view the storage
appliance's dashboard.
Chapter 33
About Storage Appliance Dashboard
33-3
33.4.2 Viewing Storage Appliance Cluster Dashboard
To view a storage appliance cluster's dashboard, perform the following steps:
1. From the Targets menu, select All Targets.
2. In the left navigation pane, expand Groups, Systems and Services target type.
You can view a list of cluster targets under Groups, Systems and Services.
3. Click a specific cluster target under Groups, Systems and Services.
The target name, target type, and the target status of the selected cluster target is
displayed in the right pane.
4. Click on a specific cluster target name from the list in the right pane to view the
storage appliance cluster's dashboard.
33.5 About Photorealistic Image
The Hardware tab in the main window of the storage appliance user interface displays
a photorealistic view of the selected appliance, including the front, top, and rear as
shown in Figure 33-2. See Viewing the Photorealistic Image for the steps to view the
photorealistic image of a selected storage appliance.
You can hover over any component displayed in the photorealistic image to view
additional information about that component.
Figure 33-2 Hardware Tab View
You can view the following hardware information of an appliance, if it is available and
relevant to the component:
•Component Name
•Model Name
•Architecture
•Manufacturer
•Serial Number
•Critical incidents information
Chapter 33
About Photorealistic Image
33-4
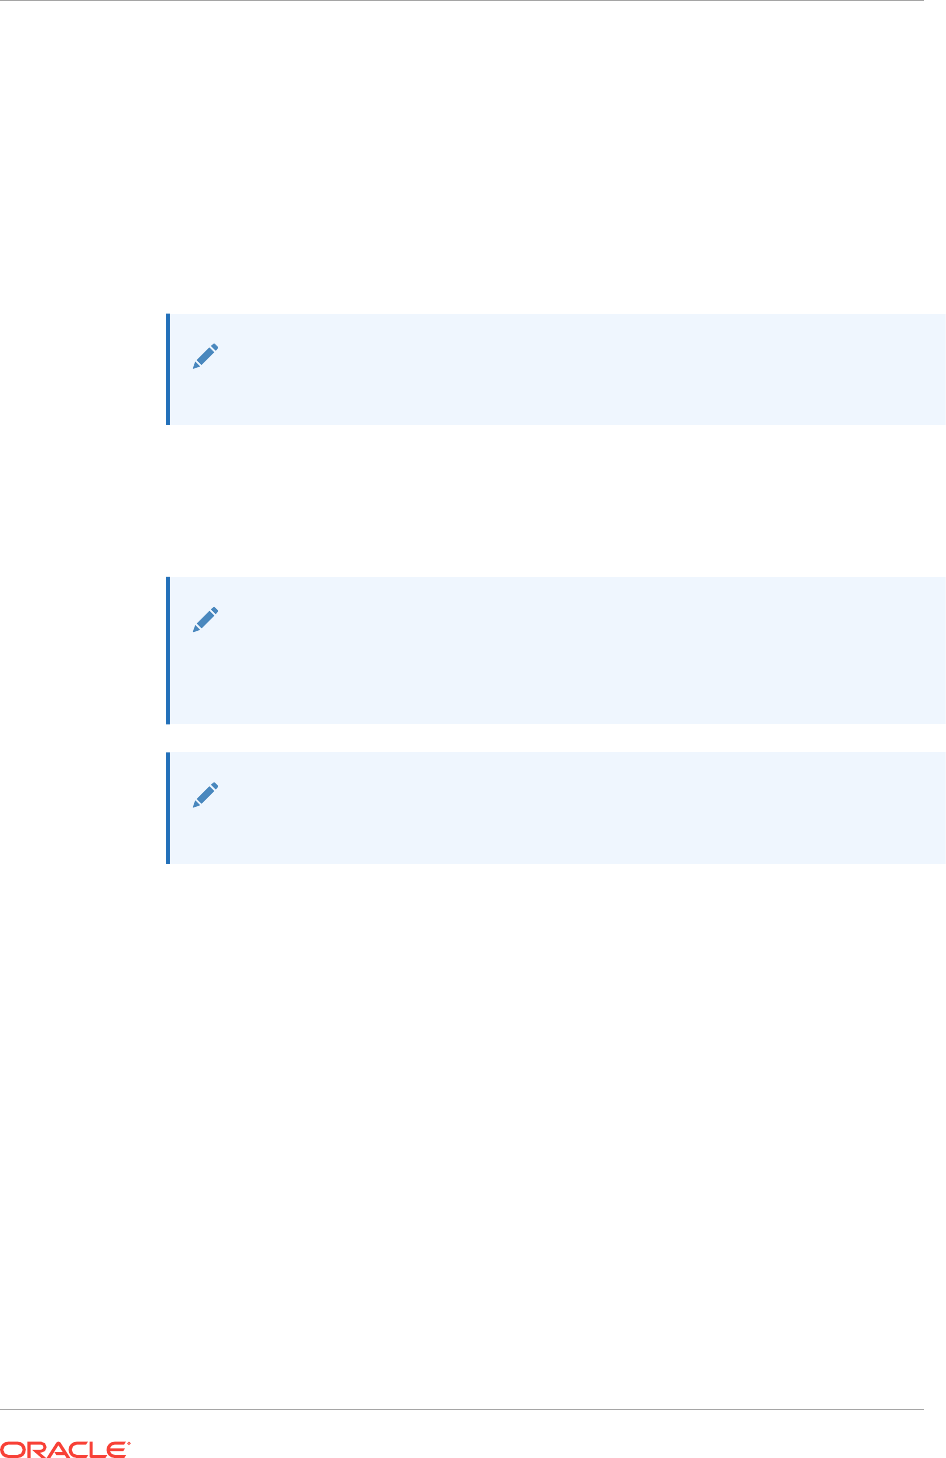
•Part Number
•Size of memory components
•Total Cores of the CPU
•Enabled Cores of the CPU
33.5.1 Viewing the Photorealistic Image
To view the Hardware tab details of an appliance, perform the following steps:
Note:
Photorealistic view of a ZFS appliance is not supported in ZS5.2.
1. From the Targets menu, select All Targets.
2. In the left navigation pane, expand Servers, Storage and Network target type.
You can view a list of appliance targets under Servers, Storage and Network.
Note:
To view the cluster targets, expand Groups, Systems and Services in the left
navigation pane. Select a specific cluster target in the right pane.
Note:
Photorealistic view of the ZFS appliance not supported in ZS5.2.
3. Click a specific appliance target under Servers, Storage and Network.
The target name, target type, and the target status of the selected target is
displayed in the right pane.
4. Click on a specific target name from the list in the right pane.
5. Click the Hardware tab which appears to the right of the storage appliance user
interface to view the photorealistic image of the target selected.
33.6 About Summary
The Summary tab in the main window of the storage appliance user interface displays
detailed information about the hardware components and the active Storage Services.
See Viewing the Summary for the steps to view the summary of a selected storage
appliance.
When you select an appliance or a storage server to view detailed information, the
user interface opens with the Summary tab view, as shown is Figure 33-3.
Chapter 33
About Summary
33-5
Figure 33-3 Summary Tab View
You can view the following storage summary information of an appliance in the
Summary tab:
•Appliance Name with an IP address and a locator light indicating the status of the
storage resource.
•A pie chart showing the information about storage pool distribution. You can click
the center node of the pie chart to view detailed summary of storage appliance.
The following details of the storage appliance are displayed:
–Used/Total Space
–Number of disks attached to the storage appliance
–Number of pools in the storage appliance
–Number of LUNs in the storage appliance
–Number of shares in the storage appliance
–Storage Services which are active for the storage appliance
–Storage Usage graph indicating the storage utilization for last 5 hours, last 24
hours, and last 7 days.
–Disks I/O ops per second graph for last 5 hours, last 24 hours, and last 7 days.
–Disks I/O bytes per second graph for last 5 hours, last 24 hours, and last 7
days.
•You can click the pool node of the appliance pie chart to view detailed summary of
the storage pool. The following details of the storage pool are displayed:
–Used/Total Space information of the pool
–Number of projects in the pool
Chapter 33
About Summary
33-6
–Number of LUNs in the pool
–Number of shares in the pool
–Status of the pool
–ZFS Storage Pool Storage Usage graph indicating the size usage of the
physical and logical group storage pools
–ZFS Storage Pool Utilization graph for last 5 Hours, last 24 Hours, and last 7
days
33.6.1 Viewing the Summary
To view the Summary tab details of an appliance or a cluster, perform the following
steps:
1. From the Targets menu, select All Targets.
2. In the left navigation pane, expand Servers, Storage and Network target type.
You can view a list of appliance targets under Servers, Storage and Network.
Note:
To view the cluster targets, expand Groups, Systems and Services in the left
navigation pane. Select a specific cluster target in the right pane.
3. Click a specific appliance target under Servers, Storage and Network.
The target name, target type, and the target status of the selected target is
displayed in the right pane.
4. Click on a specific target name from the list in the right pane.
5. Click the Summary tab to view the summary details of the selected target.
33.7 About Projects
The Projects tab in the main window of the storage appliance user interface displays
detailed information about the storage space used by the filesystems and LUNs as
shown in Figure 33-4. It also indicates the Storage Services which are active for the
particular filesystem or LUN, such as NFS, SMB, HTTP, FTP, TFTP, and SFTP. See
Viewing the Projects for the steps to view the projects of a selected storage appliance.
Chapter 33
About Projects
33-7
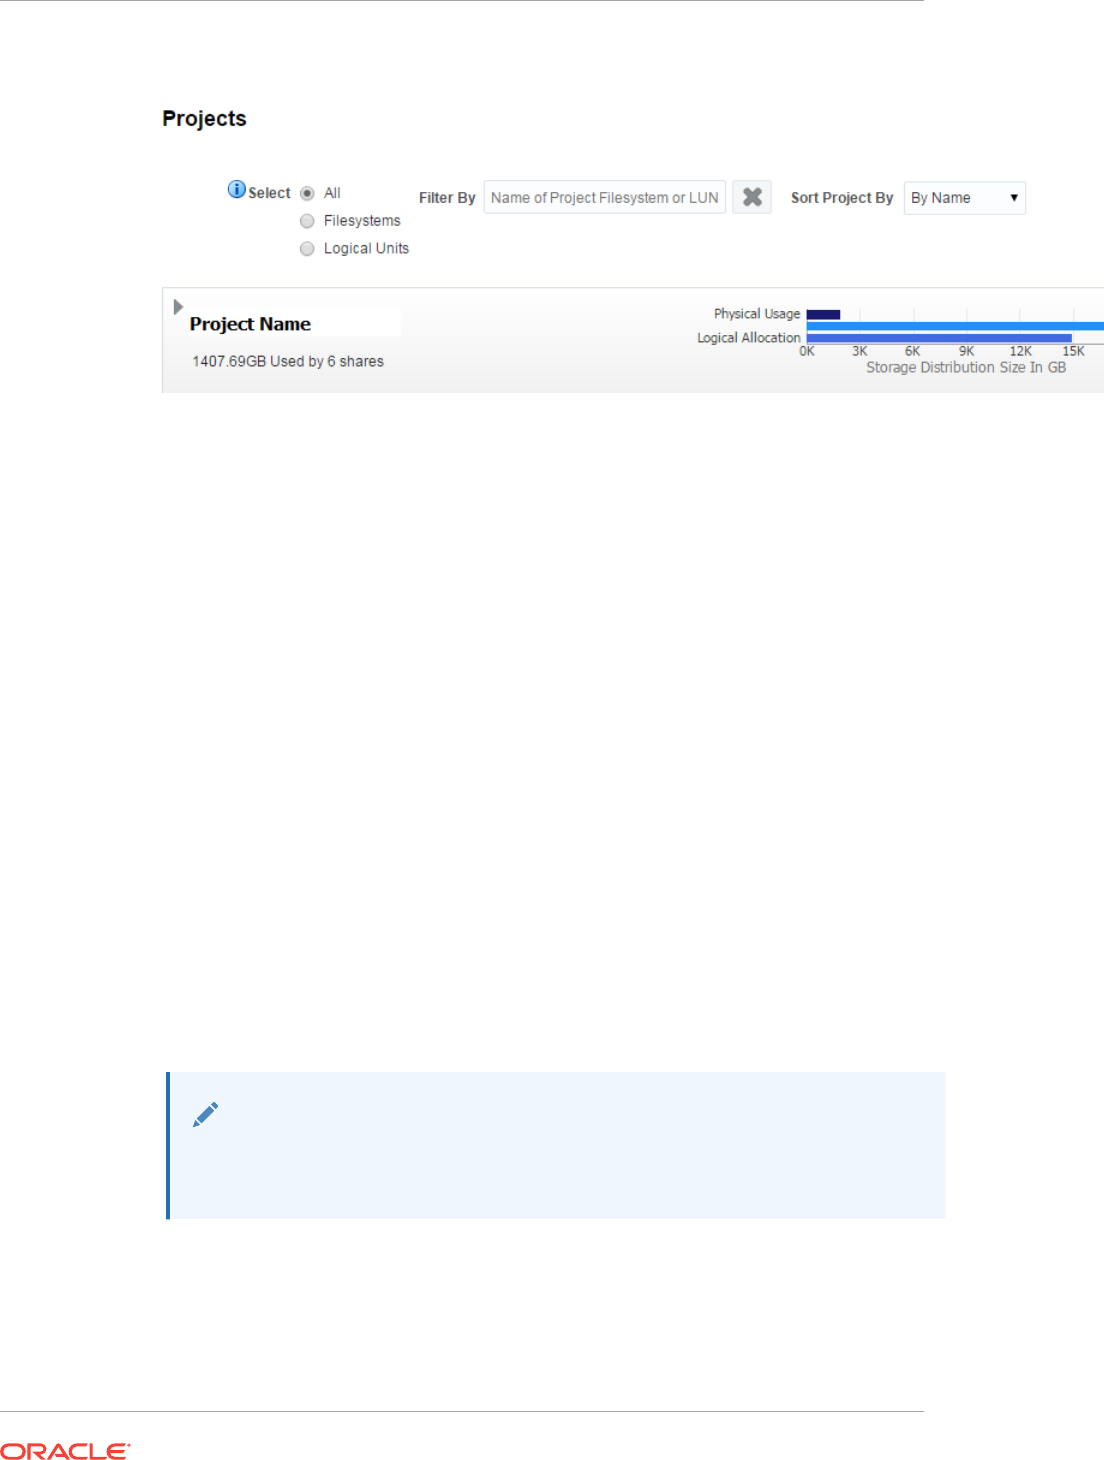
Figure 33-4 Projects Tab View
You can view the following storage project information of an appliance in the Projects
tab:
•List of filesystems and LUNs of a specific storage appliance and the storage space
used by them.
•Storage Space graph which indicates Logical Allocation, Physical Size, and
Physical Usage in GB.
–Logical Allocation bar in the graph indicates the size allocated for storage.
–Physical Size bar above the Logical Allocation bar in the graph indicates the
actual storage size.
–Physical Usage bar indicates the space that is used by storage.
•Storage Utilization in percentage.
•Storage Services that are active are indicated in Green.
33.7.1 Viewing the Projects
To view the Projects tab details of an appliance, perform the following steps:
1. From the Targets menu, select All Targets.
2. In the left navigation pane, expand Servers, Storage and Network target type.
You can view a list of appliance targets under Servers, Storage and Network.
Note:
To view the cluster targets, expand Groups, Systems and Services in the left
navigation pane. Select a specific cluster target in the right pane.
3. Click a specific appliance target under Servers, Storage and Network.
The target name, target type, and the target status of the selected target is
displayed in the right pane.
4. Click on a specific target name from the list in the right pane.
Chapter 33
About Projects
33-8

5. Click the Projects tab to view the storage details of the selected target.
33.8 About Charts
The Charts tab of a storage appliance user interface displays the Resources, Devices,
SAN Usage, NAS Usage, and ZFS Storage Pool(s) tabs. You can select one of these
tabs to view the respective graphical representation of a specific appliance.
The Charts tab appears to right of the storage appliance user interface. Click the
Charts tab to view the different graphical representation tabs of the storage appliance
to the left as shown in Figure 33-5.
Figure 33-5 Charts Tab View
You can view the following items that displays respective graphical representation of
an appliance in the Charts tab:
•Resources: The Resources tab displays the graphical representation of CPU
Utilization (%) and Memory Usage Details with respect to time.
•Devices: The Devices tab displays the graphical representation of total disk I/O
operations across all disks per second and total disk I/O bytes across all disks in
bytes per second with respect to time
•SAN Usage: The SAN Usage tab displays the graphical representation of total
operations per second and total bytes per second with respect to time.
•NAS Usage: The NAS Usage tab displays two graphical representations of total
operations per second with respect to time for NAS Utilization and SMB Utilization.
•ZFS Storage Pools: The ZFS Storage Pool(s) tab displays the graphical
representation of used space and allocated space with respect to time.
33.8.1 Viewing Resources Chart
To view the Resources chart details of an appliance, perform the following steps:
1. From the Targets menu, select All Targets.
2. In the left navigation pane, expand Servers, Storage and Network target type.
You can view a list of appliance targets under Servers, Storage and Network.
Chapter 33
About Charts
33-9

Note:
To view the cluster targets, expand Groups, Systems and Services in the left
navigation pane. Select a specific cluster target in the right pane.
3. Click a specific appliance target under Servers, Storage and Network.
The target name, target type, and the target status of the selected target is
displayed in the right pane.
4. Click on a specific target name from the list in the right pane.
5. Click the Charts tab for the different options available for viewing graphical
representation of the selected target.
6. Click the Resources tab to view the respective graphical representation of a
selected target.
7. (Optional): You can select a specific duration for which you need to view the
graph. In the Duration menu, you can select to view the graphical representation
for last 1 hour, last 24 hours, or last 5 days. By default, it displays the graph for
last 24 hours duration.
8. (Optional): You can click Table View to the lower right corner of the individual
graph to view the details in the form of a table.
33.8.2 Viewing Devices Chart
To view the Devices chart details of an appliance, perform the following steps:
1. From the Targets menu, select All Targets.
2. In the left navigation pane, expand Servers, Storage and Network target type.
You can view a list of appliance targets under Servers, Storage and Network.
Note:
To view the cluster targets, expand Groups, Systems and Services in the left
navigation pane. Select a specific cluster target in the right pane.
3. Click a specific appliance target under Servers, Storage and Network.
The target name, target type, and the target status of the selected target is
displayed in the right pane.
4. Click on a specific target name from the list in the right pane.
5. Click the Charts tab for the different options available for viewing graphical
representation of the selected target.
6. Click the Devices tab to view the respective graphical representation of a selected
target.
7. (Optional): You can select a specific duration for which you need to view the
graph. In the Duration menu, you can select to view the graphical representation
for last 1 hour, last 24 hours, or last 5 days. By default, it displays the graph for
last 24 hour duration.
Chapter 33
About Charts
33-10

8. (Optional): You can click Table View to the lower right corner of the individual
graph to view the details in the form of a table.
33.8.3 Viewing SAN Usage Chart
To view the SAN Usage chart details of an appliance, perform the following steps:
1. From the Targets menu, select All Targets.
2. In the left navigation pane, expand Servers, Storage and Network target type.
You can view a list of appliance targets under Servers, Storage and Network.
Note:
To view the cluster targets, expand Groups, Systems and Services in the left
navigation pane. Select a specific cluster target in the right pane.
3. Click a specific appliance target under Servers, Storage and Network.
The target name, target type, and the target status of the selected target is
displayed in the right pane.
4. Click on a specific target name from the list in the right pane.
5. Click the Charts tab for the different options available for viewing graphical
representation of the selected target.
6. Click the SAN Usage tab to view the respective graphical representation of a
selected target.
7. (Optional): You can select a specific duration for which you need to view the
graph. In the Duration menu, you can select to view the graphical representation
for last 1 hour, last 24 hours, or last 5 days. By default, it displays the graph for
last 24 hours duration.
8. (Optional): You can click Table View to the lower right corner of the individual
graph to view the details in the form of a table.
33.8.4 Viewing NAS Usage Chart
To view the NAS Usage chart details of an appliance, perform the following steps:
1. From the Targets menu, select All Targets.
2. In the left navigation pane, expand Servers, Storage and Network target type.
You can view a list of appliance targets under Servers, Storage and Network.
Note:
To view the cluster targets, expand Groups, Systems and Services in the left
navigation pane. Select a specific cluster target in the right pane.
3. Click a specific appliance target under Servers, Storage and Network.
Chapter 33
About Charts
33-11

The target name, target type, and the target status of the selected target is
displayed in the right pane.
4. Click on a specific target name from the list in the right pane.
5. Click the Charts tab for the different options available for viewing graphical
representation of the selected target.
6. Click the NAS Usage tab to view the NAS Utilization and SMB Utilization graphical
representation of a selected target.
7. (Optional): You can select a specific duration for which you need to view the
graph. In the Duration menu, you can select to view the graphical representation
for last 1 hour, last 24 hours, or last 5 days. By default, it displays the graph for
last 24 hours duration.
8. (Optional): You can click Table View to the lower right corner of the individual
graph to view the details in the form of a table.
33.8.5 Viewing ZFS Storage Pools Chart
To view the ZFS Storage Pool(s) chart details of an appliance, perform the following
steps:
1. From the Targets menu, select All Targets.
2. In the left navigation pane, expand Servers, Storage and Network target type.
You can view a list of appliance targets under Servers, Storage and Network.
Note:
To view the cluster targets, expand Groups, Systems and Services in the left
navigation pane. Select a specific cluster target in the right pane.
3. Click a specific appliance target under Servers, Storage and Network.
The target name, target type, and the target status of the selected target is
displayed in the right pane.
4. Click on a specific target name from the list in the right pane.
5. Click the Charts tab for the different options available for viewing graphical
representation of the selected target.
6. Click the ZFS Storage Pool(s) tab to view the respective graphical representation
of a selected target.
7. In the ZFS Storage Pool(s) drop-down, select the specific storage pool for which
you want to view the graphical representation of a selected target.
8. (Optional): You can select a specific duration for which you need to view the
graph. In the Duration menu, you can select to view the graphical representation
for last 1 hour, last 24 hours, or last 5 days. By default, it displays the graph for
last 24 hours duration.
9. (Optional): You can click Table View to the lower right corner of the individual
graph to view the details in the form of a table.
Chapter 33
About Charts
33-12
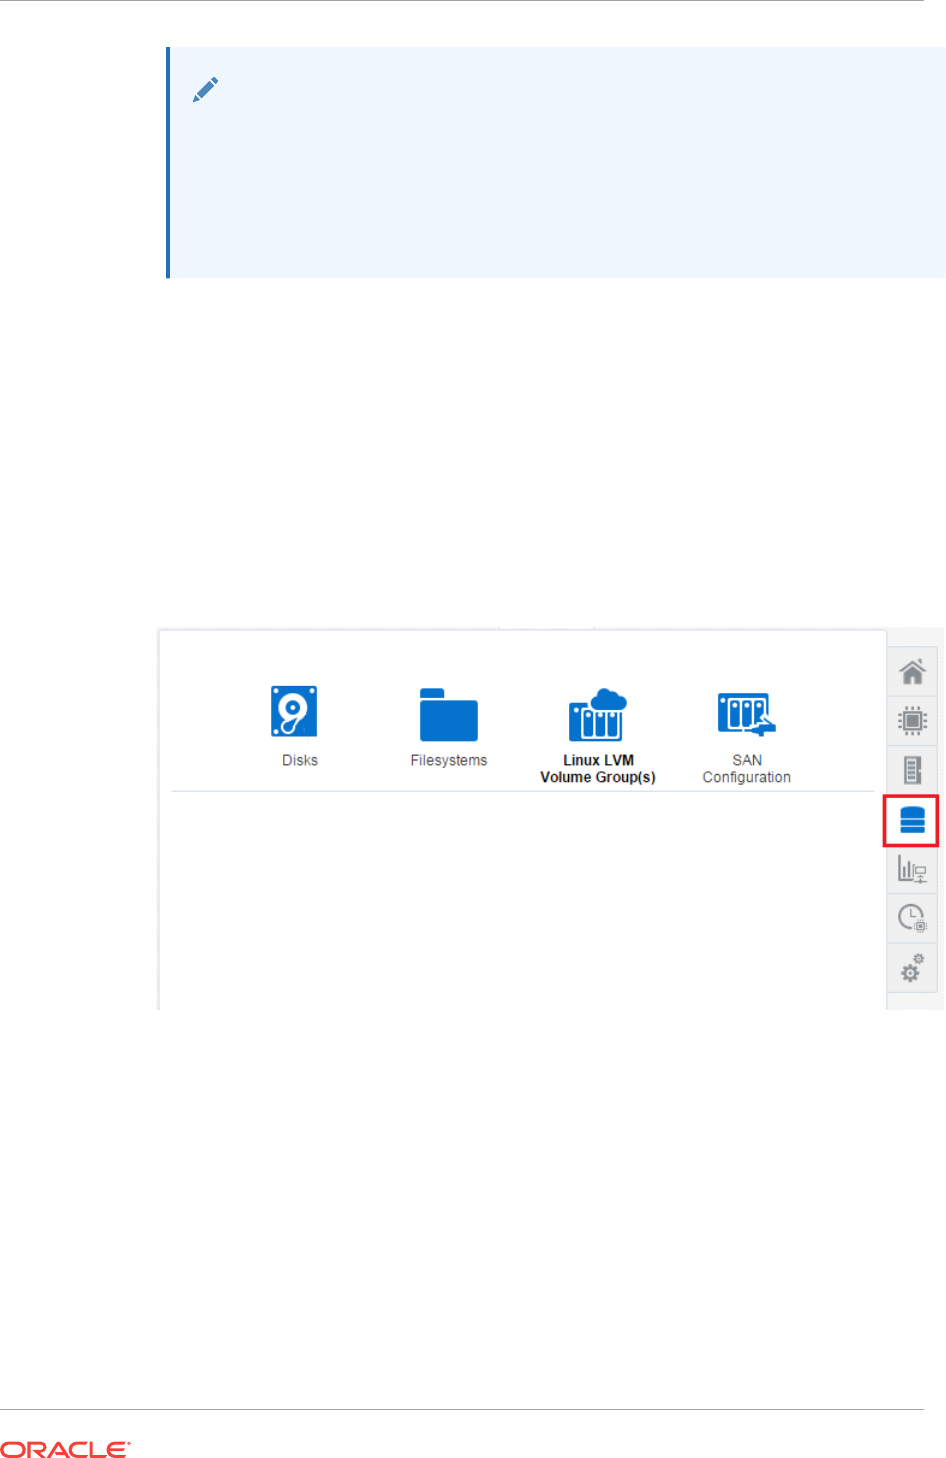
Note:
The unit mentioned in y-axis should be read as follows:
• M stands for Million
•B stands for Billion
•T stands for Trillion
33.9 About Host Storage Information
You can view the storage information of a discovered host target. The Storage tab in
the main window of the host's user interface displays the Disks, Filesystems, Linux
Volume Group(s), ZFS Storage Pool(s), and SAN Configuration tabs. You can select
one of these tabs to view more detailed information.
The Storage tab appears to right of the host's user interface. Select the Storage tab to
view the different host storage tabs to the left as shown in Figure 33-6.
Figure 33-6 Host Storage Tab View
You can view the following host's storage information in the Storage tab:
•Disks: Displays the Logical disks information and Physical disks information.
•Filesystems: Displays the Filesystem name, their mounted location, size,
incidents, and Storage Utilization.
•Linux LVM Volume Group(s): Displays different volumes names. You can click any
of the volume boxes to view the Total Space in GB, number of Incidents, number
of Volumes, Storage Utilization in percentage, and the status of the volume. This
tab appears for a Linux host only.
•ZFS Storage Pool(s): Displays different storage pool volumes. You can click any of
the volume boxes to view the Total Space in GB, number of Incidents, number of
Chapter 33
About Host Storage Information
33-13

Volumes, Storage Utilization in percentage, and the status of the volume. This tab
appears for a Oracle Solaris host only.
•SAN Configuration: Displays the Network hardware name, number of targets
connected, number of Devices connected, Session Response Time, Maximum
Connection Retry Time, FC Port ID, FC Port State, and so on.
33.9.1 Disks of a Host
The Storage tab in the main window of the host lists the Disks tab. You can view the
disks information of the Linux or Oracle Solaris host.
You can view the following host's disks information in the Disks tab:
•Type of disk, such as local or remote disk
•Name of each disk
•Size of each disk
•Device location of each disk
•Number of incidents for the respective disk if incident count is greater than 0
•Read Operations per second for last 24 hours
•Max Read Operations per second
•Write Operations per second for last 24 hours
•Max Write Operations per second
•Storage Utilization
•SnapshotCount and SnapshotUtilization for Oracle Solaris host if the snapshot
count is greater than 0
•Vendor name
33.9.1.1 Viewing Disks of a Host
To view the host's disks information, perform the following steps:
1. From the Targets menu, select All Targets.
2. In the left navigation pane, expand the Servers, Storage, and Network target
type.
You can view the host target listed.
3. Click Host.
The target name, target type, and the target status of the selected target is
displayed in the right pane.
4. Click on the specific host target from the list in the right pane.
5. Click the Storage tab which appears to the right side of the user interface.
6. Click the Disks tab.
7. (Optional): You can select to view all the disks, only the local disks, or only the
remote disks. Also, you can filter the list of disks by entering the Volume Name in
the Filtered By field.
Chapter 33
About Host Storage Information
33-14

By default, the number of disk volumes displayed are restricted to 25 by utilization and
by the volumes that have alerts. You can change this default value. After selecting
Host in the left navigation pane, right click on the specific host listed in the right pane.
Select Monitoring and click on Metric and Collection Settings. In the Metric and
Collection Settings window, locate the Volume Statistics metric and click Edit in the
Space Utilization (%) of a Volume row. Under Metric Collection Properties, the
Property Names and Property Values are displayed. The value of NumberOfVolumes
property is displayed as 25. You can edit this Property Value to the desired value.
33.9.2 Filesystems of a Host
The Storage tab in the main window of the host lists the Filesystems tab. You can view
the filesystems information of the Linux or Oracle Solaris host.
You can view the following host's filesystem information in the Filesystems tab:
•Type of filesystem, such as local or remote filesystem
•Name of each filesystem
•Size of each filesystem
•Mounted location of each filesystem
•Number of incidents for respective filesystem
•Read Operations per second for last 24 hours
•Max Read Operations per second
•Write Operations per second for last 24 hours
•Max Write Operations per second
•Storage Utilization in percentage
•Compression Ratio if enabled for Oracle Solaris host
33.9.2.1 Viewing Filesystems of a Host
To view the host's filesystems information, perform the following steps:
1. From the Targets menu, select All Targets.
2. In the left navigation pane, expand the Servers, Storage, and Network target
type.
You can view the host target listed.
3. Click Host.
The target name, target type, and the target status of the selected target is
displayed in the right pane.
4. Click on the specific host target from the list in the right pane.
5. Click the Storage tab which appears to the right side of the user interface.
6. Click the Filesystems tab.
7. (Optional): You can select to view all the filesystems, only the local filesystems, or
only the remote filesystems. Also, you can filter the list of disks by entering the
Filesystem Name in the Filtered By field.
Chapter 33
About Host Storage Information
33-15

By default, the number of filesystems displayed are restricted to 25 by utilization. You
can change this default value. After selecting Host in the left navigation pane, right
click on the specific host listed in the right pane. Select Monitoring and click on
Metric and Collection Settings. In the Metric and Collection Settings window, locate
the Filesystem Statistics metric and click Edit in the Space Utilization (%) of a
filesystem row. Under Metric Collection Properties, the Property Names and Property
Values are displayed. The value of NumberOfFilesystems property is displayed as 25.
You can edit this Property Value to the desired value. You can also set the filesystems
property to specify the filesystems that must be collected irrespective of utilization.
33.9.3 SAN Configuration of a Host
The Storage tab in the main window of the host lists the SAN Configuration tab. You
can view the SAN Configuration information of the Linux or Oracle Solaris host.
You can view the following host's SAN Configuration information in the SAN
Configuration tab:
•SAN initiator type, such as, iSCSI or FC
•IQN name for an iSCSI SAN initiator type
•Total number of targets connected
•Total number of devices attached
33.9.3.1 Viewing SAN Configuration of a Host
To view the host's SAN Configuration information, perform the following steps:
1. From the Targets menu, select All Targets.
2. In the left navigation pane, expand the Servers, Storage, and Network target
type.
You can view the host target listed.
3. Click Host.
The target name, target type, and the target status of the selected target is
displayed in the right pane.
4. Click on the specific host target from the list in the right pane.
5. Click the Storage tab which appears to the right side of the user interface.
6. Click the SAN Configuration tab.
33.9.4 Linux Volume Groups of a Host
The Storage tab in the main window of the host lists the Linux LVM Volume Group(s)
tab. You can view the Linux volume group information of the Linux host.
Note:
The Linux LVM Volume Group(s) tab is only available for a Linux environment.
Chapter 33
About Host Storage Information
33-16

You can view the following information of the selected volume in the Linux LVM
Volume Group(s) tab:
•Total Space in GB
•Target Status of LVM to indicate if up or down
•Incidents
•Volumes
•Storage Utilization in percentage
•Linux LVM Volume Group Usage graph
•Linux LVM Volume Group Hierarchy
33.9.4.1 Viewing Linux Volume Groups of a Host
To view the host's linux volume group information, perform the following steps:
1. From the Targets menu, select All Targets.
2. In the left navigation pane, expand the Servers, Storage, and Network target
type.
You can view the host target listed.
3. Click Host.
The target name, target type, and the target status of the selected target is
displayed in the right pane.
4. Click on the specific host target from the list in the right pane.
5. Click the Storage tab which appears to the right side of the user interface.
6. Click the Linux LVM Volume Group(s) tab. The different volumes are listed in the
form of blocks to the left.
7. Click on a specific volume to view detailed information.
33.9.5 ZFS Storage Pools of a Host
The Storage tab in the main window of the host lists the ZFS Storage Pool(s) tab. You
can view the detailed information of different zpools.
Note:
The ZFS Storage Pool(s) tab is only available for an Oracle Solaris
environment.
You can view the following information of the selected zpool in the ZFS Storage
Pool(s) tab:
•Total Space in GB
•Target Status of the pool to indicate if up or down
•Incidents
Chapter 33
About Host Storage Information
33-17

•Filesystems
•Volumes
•Dedup Ratio
•Storage Utilization in percentage
•Zpool status indicating if it is online, offline, or faulted
•ZFS Storage Pool Usage graph
•ZFS Storage Pool Hierarchy
33.9.5.1 Viewing ZFS Storage Pools of a Host
To view the host's ZFS storage pool information, perform the following steps:
1. From the Targets menu, select All Targets.
2. In the left navigation pane, expand the Servers, Storage, and Network target
type.
You can view the host target listed.
3. Click Host.
The target name, target type, and the target status of the selected target is
displayed in the right pane.
4. Click on the specific host target from the list in the right pane.
5. Click the Storage tab which appears to the right side of the user interface.
6. Click the ZFS Storage Pool(s) tab. The different zpools used are listed in the form
of blocks to the left.
7. Click on a specific zpool to view detailed information.
33.10 About Storage Configuration Topology
Enterprise Manager allows you to view the relationship between storage servers and
storage clients. The Topology option displays the relationships between each exposed
element such as LUNs or shares of the storage server and it's presence on a given
host as devices and filesystems. It also shows the relationship between various
applications such as database, or virtualization entities like VMs, and so on.
You can view the storage configuration topology of the storage appliance or the host.
You can also view the storage configuration topology of a specific storage server
element or a specific host element. Select the respective element and choose to view
the topology details. See Viewing Storage Configuration Topology for the steps to view
the topology of a selected storage appliance or a host.
33.10.1 Viewing Storage Configuration Topology
To view topology information of a selected target, perform the following steps:
1. From the Targets menu, select All Targets.
2. In the left navigation pane, expand Servers, Storage and Network target type.
You can view a list of appliance targets under Servers, Storage and Network.
Chapter 33
About Storage Configuration Topology
33-18

Note:
To view the cluster targets, expand Groups, Systems and Services in the left
navigation pane. Select a specific cluster target in the right pane.
3. Click a specific appliance target under Servers, Storage and Network.
The target name, target type, and the target status of the selected target is
displayed in the right pane.
4. You can view the storage configuration topology information by following one of
these methods:
•Right-click on a target name in the right pane to view the related options.
•Click a specific target in the right pane, and then click the target drop-down
list, which appears to the top-left of the user interface.
5. Select Configuration and click Topology.
33.11 About Storage Metrics
This section describes the steps to view the Storage Configuration metrics and
Storage Performance metrics. It also describes the steps to change the Storage
Performance metrics. Following are the items listed in this section:
•Viewing Storage Performance Metrics
•Viewing Storage Configuration Metrics
•Changing Metric Collection
33.11.1 Viewing Storage Performance Metrics
To view the storage performance metrics, perform the following steps:
1. From the Targets menu, select All Targets.
2. In the left navigation pane, expand Servers, Storage and Network target type.
You can view a list of appliance targets under Servers, Storage and Network.
Note:
To view the cluster targets, expand Groups, Systems and Services in the left
navigation pane. Select a specific cluster target in the right pane.
3. Click a specific appliance target under Servers, Storage and Network.
The target name, target type, and the target status of the selected target is
displayed in the right pane.
4. You can view the performance metrics of the selected target by following one of
these methods:
•Right-click on a target name in the right pane to view the related options.
Chapter 33
About Storage Metrics
33-19

•Click a specific target in the right pane, and then click the target drop-down list
which appears to the top-left of the user interface.
5. Select Monitoring and click All Metrics.
You can view the list of metric collection overview, different metric events such as
open alerts and top five altering metrics in the last 7 days, and deployed metric
extension information.
33.11.2 Viewing Storage Configuration Metrics
To view a storage configuration metrics, perform the following steps:
1. From the Targets menu, select All Targets.
2. In the left navigation pane, expand Servers, Storage and Network target type.
You can view a list of appliance targets under Servers, Storage and Network.
Note:
To view the cluster targets, expand Groups, Systems and Services in the left
navigation pane. Select a specific cluster target in the center pane.
3. Click a specific appliance target under Servers, Storage and Network.
The target name, target type, and the target status of the selected target is
displayed in the right pane.
4. You can proceed to view the storage configuration metrics by following one of
these methods:
•Right-click on a target name in the right pane to view the related options.
•Click a specific target name in the right pane, and then click the target drop-
down list which appears to the top-left of the user interface.
5. Select Configuration and click Last Collected.
6. Select a configuration metric from the left navigation pane to view the configuration
properties of the selected metric.
33.11.3 Changing Metric Collection
Oracle Enterprise Manager monitors storage resources and collects information about
them to track performance. You can change what metrics are collected and, in some
cases, change how the metrics are collected, for example, the frequency.
To change the performance metrics of a selected target, perform the following steps:
1. From the Targets menu, select All Targets.
2. In the left navigation pane, expand Servers, Storage and Network target type.
You can view a list of appliance targets under Servers, Storage and Network.
Chapter 33
About Storage Metrics
33-20

Note:
To view the cluster targets, expand Groups, Systems and Services in the left
navigation pane. Select a specific cluster target in the right pane.
3. Click a specific appliance target under Servers, Storage and Network.
The target name, target type, and the target status of the selected target is
displayed in the right pane.
4. You can proceed to view the performance metrics by following one of these
methods:
•Right-click on any of the target name in the right pane to view the related
options.
•Click a specific target name in the right pane, and then click the target drop-
down list which appears to the top-left of the user interface.
5. Select Monitoring and click All Metrics.
You can view details of the different metrics.
6. In the left navigation pane, select a specific metric. If this metric can be changed, a
Modify button appears in the right pane for Collection Schedule.
7. Click Modify.
8. In the Modify Collection Schedule window, change the value to adjust the
collection of the metric, usually the frequency and how the metric is used. Make a
note of the metrics that are dependent on this change, so that you can change
their collection, if necessary.
9. Click OK to save the changes.
33.12 About Storage Cluster Membership
You can have a cluster configuration setup with two Oracle ZFS Storage Appliances.
When such configuration is in use, you can view the cluster membership information of
the two appliances.
33.12.1 Viewing Storage Cluster Membership
To view cluster membership information of the appliances which are in a cluster
configuration setup, perform the following steps:
1. From the Targets menu, select All Targets.
2. In the left navigation pane, expand Groups, Systems and Services target type.
You can view a list of cluster targets under Groups, Systems and Services.
3. Click a specific cluster target under Groups, Systems and Services.
The target name, target type, and the target status of the selected target is
displayed in the right pane.
4. Click on a specific cluster target name from the list in the right pane.
5. Click the Target Navigation tab which appears to the left of the cluster drop-down
list, as shown in Figure 33-7.
Chapter 33
About Storage Cluster Membership
33-21
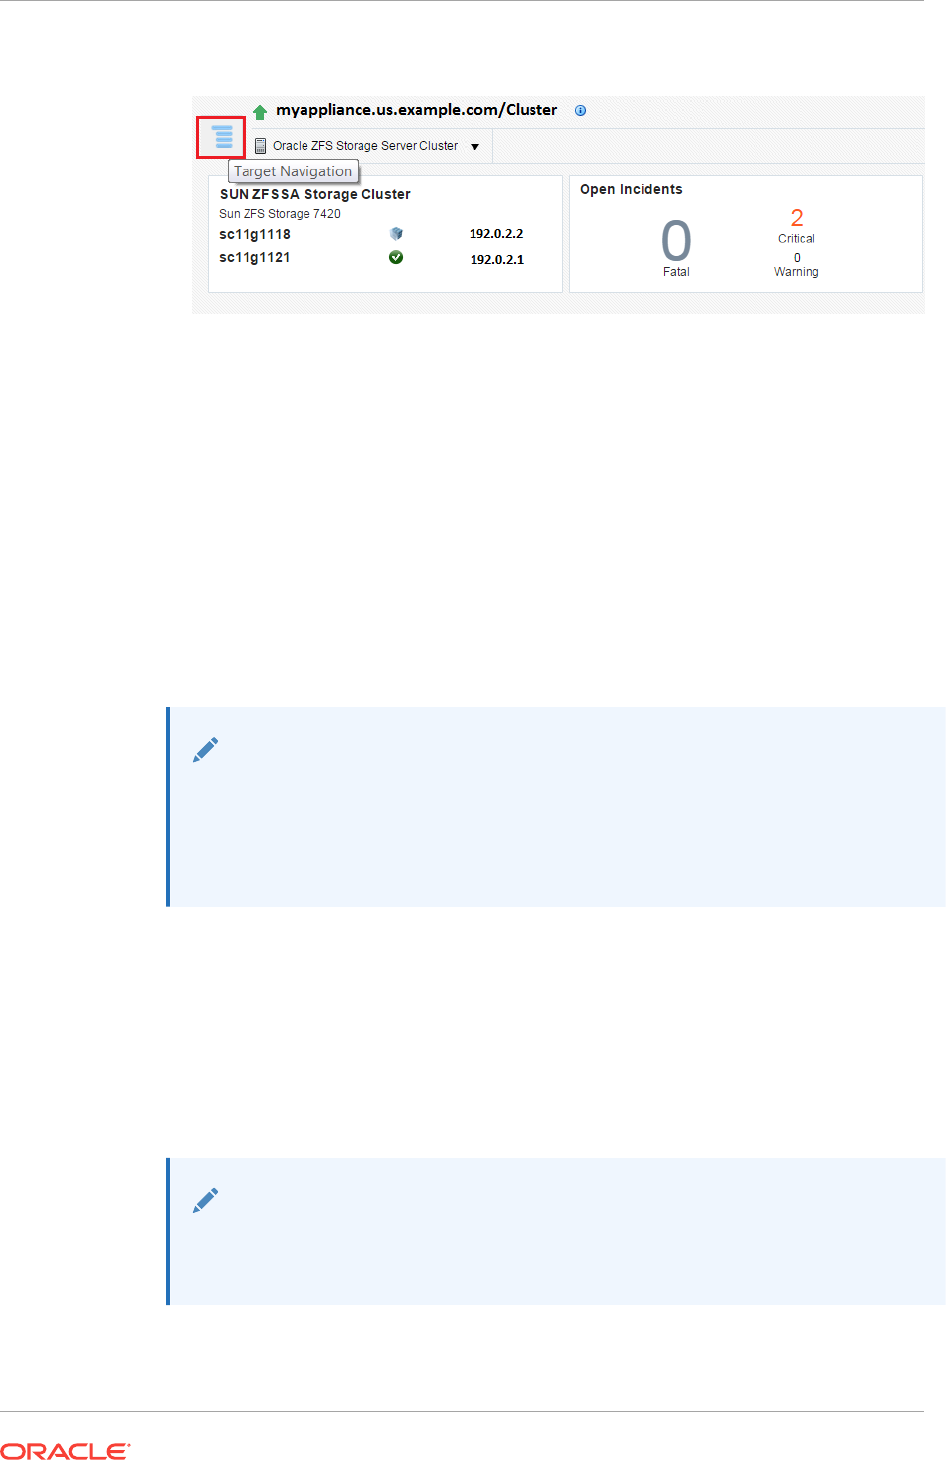
Figure 33-7 Target Navigation Tab View
6. Select a specific cluster to view the storage summary details of the cluster. You
can view the cluster information in the dashboard, images of the storage appliance
which have a cluster configuration setup, different networks and pools information.
33.13 About Storage Resource Deletion
When an appliance or a host is discovered as a target, it automatically promotes some
of the target members. See Target Members of an Oracle ZFS Storage Appliance to
view the list of automatically promoted target members. You can choose to either
remove the target or remove its members. If you choose to remove a target, such as
an appliance or a host, all the associated members are also removed. See Removing
a Storage Resource for the steps to remove a storage resource.
You must start the deletion process from the target level to delete all the members.
Note:
If the target members have a proper association with an appliance or a host,
the deletion of these members is successful. For example, a diskshelf target
member is associated to a ZFS Storage Server. If the association of these
target members are not correct, diskshelf target members are not deleted.
33.13.1 Removing a Storage Resource
To remove a storage resource, perform the following steps:
1. From the Targets menu, select All Targets.
2. In the left navigation pane, expand Servers, Storage and Network target type.
You can view a list of appliance targets under Servers, Storage and Network.
Note:
To view the cluster targets, expand Groups, Systems and Services in the left
navigation pane. Select a specific cluster target in the right pane.
3. Click a specific appliance target under Servers, Storage and Network.
Chapter 33
About Storage Resource Deletion
33-22

The target name, target type, and the target status of the selected target is
displayed in the right pane.
4. You can proceed to delete a storage resource by following one of these methods:
•Right-click on the target name which you want to remove in the right pane.
•Click a specific target name in the right pane, and then click the target drop-
down list which appears to the top-left of the user interface.
5. Select Target Setup and click Remove Target.
6. In the confirmation dialog box, click Yes to remove the specific target.
33.13.2 Removing an Oracle ZFS Storage Appliance Cluster
You can delete an Oracle ZFS Storage Appliance which is part of a cluster. See
Removing a Storage Resource for steps to delete an Oracle ZFS Storage Appliance.
When two Oracle ZFS Storage Servers have a cluster configuration setup, the deletion
of cluster target initiates deletion of both the storage servers in the cluster and the
associated target members, such as, diskshelves. The members of an Oracle ZFS
Storage Appliance include the following:
•ZFS Storage Server
•Diskshelf
•ZFS Storage Appliance Cluster
When you initiate deletion of one of the storage server that is a part of the cluster
configuration setup, the associated cluster target is deleted. The other storage server
is not deleted. The diskshelves are not deleted if there is a second storage server.
When you initiate deletion of a storage server that is not a part of the cluster
configuration setup, the associated diskshelves are deleted.
33.14 Using Oracle ZFS Storage Appliance in Engineered
Systems
This section describes the prerequisite for an Oracle ZFS Storage Appliance on
engineered systems. A non-root user should have required privileges to view the
analytic datasets. If the specific privileges are not assigned, then the analytic metrics
displays an error.
If you need data to be collected for the following metrics, the corresponding datasets
must be enabled in Oracle ZFS Storage Appliance.
Metric name DatasetName
Replication statistics by Direction
repl.bytes[direction],repl.ops[direction
]
Replication Ops by Latency
repl.ops[latency]
IOopsByLatency
io.ops[latency]
L2ARC statistics
arc.l2_accesses[hit/
miss],arc.l2_bytes,arc.l2_size
NAS IO statistics
nfs2.bytes
,
nfs3.bytes
,
nfs4.bytes
Chapter 33
Using Oracle ZFS Storage Appliance in Engineered Systems
33-23

You can add an extra privilege to a non-root user to access datasets.
To add a privilege in the appliance's user interface, perform the following steps:
1. Login to Oracle ZFS Storage Appliance user interface.
2. Click Configuration.
3. Click USERS.
4. Select non-root user and click edit icon.
5. Click Exceptions.
6. In the Scope drop-down, select Analytics.
7. Select the read: Read a statistic with this drilldown present check box.
8. Click ADD.
You can also add an exception to a non-root user using Command Line Interface for
reading analytics dataset. For example:
zfssa:> configuration users
zfssa:configuration users> select oemuser
zfssa:configuration users oemuser> exceptions
zfssa:configuration users oemuser exceptions> create
zfssa:configuration users oemuser auth (uncommitted)> set scope=stat
scope = stat
zfssa:configuration users oemuser auth (uncommitted)> set allow_read=true
allow_read = true (uncommitted)
zfssa:configuration users oemuser auth (uncommitted)> commit
zfssa:configuration users oemuser exceptions>
33.15 Related Resources for Storage
For instructions in performing actions or to learn more about the role of this feature, go
to one of the following resources.
•To view the Sun ZFS Storage 7000 System Administration Guide, log in to the
Unified Storage System software interface and click Help in the top right corner of
any screen. You can also access this guide at the host name or IP address of the
storage system:
–
https://hostname:215/wiki
–
https://ipaddress:215/wiki
•See the Oracle ZFS Storage Appliance Software product information page at
http://www.oracle.com/us/products/servers-storage/storage/unified-storage/sun-
storage-7000-uss-103104.html
for links to more information.
•See Discovering and Promoting Oracle ZFS Storage for more information on
Storage Discovery.
•See the Discovering, Promoting, and Adding System Infrastructure Targets
chapter for more information on discovering and promoting system infrastructure
targets.
Chapter 33
Related Resources for Storage
33-24

34
Monitoring Servers
The following features and topics are covered in this chapter:
•Get Started With Server Management
•Location of Server Information in the UI
•Actions for Server Management
•About the Hardware Dashboard
•Viewing the Hardware Dashboard
•About the Photorealistic Image of the Hardware
•Viewing the Photorealistic Image of the Hardware
•About the Logical View
•Viewing the Logical View
•About Energy Consumption
•Viewing the Energy Consumption
•About Network Connectivity
•Viewing the Network Connectivity
•About the Service Processor Configuration
•Viewing the Service Processor Configuration
•Related Resources for Server Management
34.1 Get Started With Server Management
You can discover hardware assets in Oracle Enterprise Manager by using the existing
discovery method, then deploying the Enterprise Manager agent onto the system.
Once they are discovered, you can view monitoring information about the hardware,
including incidents, power usage, network information, service processor
configuration, and fan and temperature information. The relationship between
managed hardware and the operating systems, virtualization platforms, and other
software installed on it is also represented in the user interface.
34.2 Location of Server Information in the UI
You can select any target that is a child of a server (virtual platform, guest, or host)
and the server will appear in the Navigation pane of the target.
From the All Targets page, you can also click Systems Infrastructure Server to see
the list of servers. You can click any server in this list to open the server's home page.
34-1

34.3 Actions for Server Management
You can perform the following actions:
•Discover a server
•View the server's hardware components
•View the server's configuration
•View the server's utilization of resources
34.4 About the Hardware Dashboard
The dashboard is located near the top of the main window. It contains basic
information about the server's status, including incidents, power usage, temperature
information, core information, and recent events.
The information in the dashboard is automatically displayed. Three dashlets are
visible. Click the icon beneath the dashboard to switch to another set of dashlets.
The following dashlets are displayed:
•About Basic Hardware Information
•About Open Incidents
•About Fan and Temperature Information
•About Power Usage
•About Core Information
•About the Last Configuration Change and Incident
34.4.1 About Basic Hardware Information
The first dashlet contains basic information about the hardware. The heading includes
the full hardware name and power status.
The following fields are displayed:
•IP Address
•Model
•Serial Number
•Health
•CPU
•Memory
•Firmware
•Locator
34.4.2 About Open Incidents
The second dashlet contains information about open incidents for the hardware.
Chapter 34
Actions for Server Management
34-2

The following fields are displayed:
•Fatal
•Critical
•Warning
Click on a category to view a detailed view of incidents within this category, including
their target, summary, date of last update, whether they have been acknowledged, and
status. Click the X icon in the upper right to close this detailed view.
34.4.3 About Fan and Temperature Information
The fourth dashlet displays fan and temperature information.
The following fields are displayed:
•Fan Usage: This displays the fan usage as a percentage of its maximum.
•Temperature: This displays the temperature of the hardware in degrees Celsius.
34.4.4 About Power Usage
The third dashlet displays power usage information. A chart displays the power usage
as a percentage of the maximum.
The following fields are displayed:
•Available Power
•Peak Permitted
•Used Power
•Power Policy (SPARC servers only)
34.4.5 About Core Information
The fifth dashlet displays a pie chart showing the number of active and inactive cores.
34.4.6 About the Last Configuration Change and Incident
The sixth dashlet displays the date and time of the last configuration change and the
last reported incident.
34.5 Viewing the Hardware Dashboard
1. Select All Targets from the Targets list.
2. Under the Servers, Storage, and Network heading, select Systems Infrastructure
Server.
A list of the target servers is displayed.
3. Click the target name to open the Summary page for the server. The dashlets
appear on the top of the page and provide the summary information.
Chapter 34
Viewing the Hardware Dashboard
34-3

34.6 About Server Metrics
You can view a complete list of the metrics for a selected server.
34.7 Viewing Server Metrics
1. Select All Targets from the Targets list.
2. Under the Servers, Storage, and Network heading, select Systems Infrastructure
Server.
A list of the target servers is displayed.
3. Click the target name to open the Summary page for the server.
4. Click Systems Infrastructure Server in the upper left corner of the page. Click
Monitoring, then click All Metrics.
5. Click a metric to view details, collection schedule, upload interval and other details.
34.8 About the Photorealistic Image of the Hardware
The Hardware View tab in the main window displays a photorealistic view of
compatible hardware, including the front, top, and rear, and a table view of the
hardware's components.
Select Photorealistic View to display the photorealistic view of the hardware.
Components with incidents are outlined in red.
You can click any component displayed in the photorealistic view to view additional
information about that component. The following information is displayed if it is
available and relevant to the component:
•Component Name
•Manufacturer
•Serial Number
•Part Number
•Total Cores: The number of cores for a CPU
•Enabled Cores: The number of enabled cores for a CPU
•Size: The size of memory components in GB
Select Table to display a table of the hardware components. The following information
is displayed for each component:
•Slot Number
•Component Name
•Component Type
34.9 Viewing the Photorealistic Image of the Hardware
1. Select All Targets from the Targets list.
Chapter 34
About Server Metrics
34-4

2. Under the Servers, Storage, and Network heading, select Systems Infrastructure
Server.
A list of the target servers is displayed.
3. Click the target name to open the Summary page for the server.
4. Click the Hardware View tab.
34.10 About the Logical View
The Logical View tab in the main window displays detailed information about the
hardware components and capabilities. You can select one of the tabs to view detailed
information about it.
34.10.1 About CPU Information
The CPU tab shows CPU and CPU usage information.
The top section shows summary information. A pie chart displays the number of
installed and available CPUs.
The following fields are displayed:
•Architecture
•Clock Speed
•Model
•CPU Power Consumption (Watts)
•Overall Status
The bottom section displays a table showing the available processors, including name,
active cores, serial numbers, part number, overall cache in KB, component location,
and operational status.
34.10.2 About Memory Information
The Memory tab shows overall memory and DIMM-specific information.
The top section shows summary information. A pie chart displays the number of
installed and available DIMMs.
The following fields are displayed:
•Memory (GB)
•Memory Power Consumption (Watts)
•Overall Status
The bottom section displays a table showing the memory modules, including the
memory component name, size in GB, manufacturer, part number, serial number,
location, and operational status.
34.10.3 About Power Information
The Power tab shows power and power supply information.
Chapter 34
About the Logical View
34-5

The top section shows summary information. A pie chart displays the number of
installed and available power supplies. The overall status of the power supply is
displayed.
The bottom section displays a table showing the available power supplies, including
name, manufacturer, part number, serial number, output power in watts, location, and
operational status.
34.10.4 About Fan Information
The Fan tab shows cooling and fan information.
The top section shows summary information. A pie chart displays the number of total
and available power supply unit fans. The overall status of the cooling is displayed.
The bottom section displays a table showing the available fans, including name, RPM
as a percentage of maximum, location, and operational status.
34.10.5 About Storage Information
The Storage tab shows information about the available storage.
The top section shows summary information. The following fields are displayed:
•Total Installed Storage (GB)
•Installed Disk
The bottom section displays a table showing the available storage disks, including the
name, size in gigabytes, manufacturer, serial number, part number, and operational
status. This information is displayed only if the ILOM is discovered.
34.10.6 About Disk Controller Information
The Disk Controller tab displays a table of the available disk controllers, including
name, model, manufacturer, serial number, and operational status.
This information is displayed only if the ILOM is discovered.
34.10.7 About Disk Expander Information
The Disk Expander tab displays a table of the available disk expanders, including
name, manufacturer, version, model, firmware version, and chassis ID.
This information is displayed only if the ILOM is discovered.
34.10.8 About Network Ports Information
The Network Ports tab displays information about network interface controllers and
network adapters.
The top section shows NIC and status information. The following fields are displayed:
•Installed Ethernet NICs
•Overall Status
Chapter 34
About the Logical View
34-6

The bottom section shows a table of network ports, including name, MAC address,
description, and operational status.
34.10.9 About PCI Devices Information
The PCI Devices tab displays a table of the PCI devices, including name, description,
device class, PCI device ID, PCI vendor ID, PCI end point, PCI sub device ID, and PCI
sub device vendor ID.
This information is displayed only if an Agent is deployed on an operating system on
the server.
34.10.10 About PDOMs Information
The PDOMs tab displays a table of the physical domains for M-series hardware,
including name, configuration status, assigned DCUs, and operational status.
34.10.11 About DCUs Information
The DCUs tab displays a table of the DCUs for M-series hardware, including name,
number of CPUs, memory in GB, number of fans, PDOM ID, power status, and
operational status.
34.11 Viewing the Logical View
1. Select All Targets from the Targets list.
2. Under the Servers, Storage, and Network heading, select Systems Infrastructure
Server.
A list of the target servers is displayed.
3. Click the target name to open the Summary page for the server.
4. Click the Logical View tab.
34.12 About Energy Consumption
The Energy tab in the main window displays information about the hardware's energy
consumption.
The summary section displays three graphs showing basic temperature, fan speed,
and power information. You can use the Time Range dropdown to select a different
time interval to display.
The first graph shows the inlet and exhaust temperatures in degrees Celsius.
The second graph shows the fan speed as a percentage of the maximum.
The third graph shows the power consumption and utilization in watts.
You can click the Table View link to view a table of the data points used to create the
graph.
Chapter 34
Viewing the Logical View
34-7

34.13 Viewing the Energy Consumption
1. Select All Targets from the Targets list.
2. Under the Servers, Storage, and Network heading, select Systems Infrastructure
Server.
A list of the target servers is displayed.
3. Click the target name to open the Summary page for the server.
4. Click the Energy tab.
34.14 About Network Connectivity
The Network Connectivity tab in the main window displays information about the
hardware's network interfaces, data links, and ports. You can select one of these three
options to view detailed information about it.
34.14.1 About Network Interfaces
The Network Interfaces page shows a table of the hardware's network interfaces,
including IP address, netmask, and an icon indicating the current state.
You can sort the list by interface name or interface state.
Click the more link for additional information.
34.14.2 About Network Data Links
The Network Data Links page shows a table of the hardware's data links, including
name, physical address, media, and VLAN ID.
You can sort the list by data link name or data link state.
Click the more link for additional information, including device and device path.
34.14.3 About Network Ports
The Network Ports page shows a table of the hardware's ports and their types.
You can sort the list by state, connector, or number and name.
Click the more link for additional information, including errors and throughput.
34.15 Viewing the Network Connectivity
1. Select All Targets from the Targets list.
2. Under the Servers, Storage, and Network heading, select Systems Infrastructure
Server.
A list of the target servers is displayed.
3. Click the target name to open the Summary page for the server.
Chapter 34
Viewing the Energy Consumption
34-8

4. Click the Network Connectivity tab.
34.16 About the Service Processor Configuration
The Service Processor Configuration tab in the main window displays information
about the firmware, host policy configuration, power on self test configuration, SP alert
configuration, and DNS and NTP settings. You can select one of these tabs to view
detailed information about it.
34.16.1 About Firmware Information
The Firmware Information tab shows a table with the component identifier for all
installed firmware, the type, the version, and the release date.
34.16.2 About the Host Policy Configuration
The Host Policy Configuration tab shows a table with a list of the host policy names
and their current values.
34.16.3 About the Power On Self Test Configuration
The Power On Self Test Configuration tab shows a table with a list of the power on self
test setting names and their current values.
34.16.4 About the SP Alert Configuration
The SP Alert Configuration tab shows a table with the service processor alert names.
For each alert, the table provides the alert type, alert level, destination address,
destination port, SNMP version, and community.
34.16.5 About the DNS & NTP Information
The DNS & NTP tab shows information about the DNS and NTP settings. The
following fields are displayed:
•Auto DNS/DHCP: Indicates whether DNS or DHCP is being used.
•DNS Servers: Lists the DNS servers in use.
•Search Path: Lists the search path for the DNS servers.
•Time: Lists the current time and time zone for the hardware.
•Use NTP Server: Indicates whether an NTP server is being used.
•NTP Server 1: The IP address of the first NTP server.
•NTP Server 2: The IP address of the second NTP server.
34.17 Viewing the Service Processor Configuration
1. Select All Targets from the Targets list.
2. Under the Servers, Storage, and Network heading, select Systems Infrastructure
Server.
Chapter 34
About the Service Processor Configuration
34-9

A list of the target servers is displayed.
3. Click the target name to open the Summary page for the server.
4. Click the Service Processor Configuration tab.
34.18 Managing Metrics and Incident Notifications
You can perform the following tasks to manage monitoring and incident notification:
•Viewing Metric Collection Errors
•Editing Metric and Collection Settings
•Editing a Monitoring Configuration
•Suspending Monitoring Notifications
•Suspending Monitoring for Maintenance
•Ending a Monitoring Brownout or Blackout
34.18.1 Viewing Metric Collection Errors
Metric collection errors are usually caused by installation or configuration issues. You
can view errors for a server.
1. Click Systems Infrastructure Server from the All Targets page.
2. Click the target name to open the home page.
3. Click Systems Infrastructure Server in the upper left corner of the page. Click
Monitoring, then click Metric Collection Errors.
34.18.2 Editing Metric and Collection Settings
The Metrics tab contains displays all of the monitored attributes. The default view is
metrics with thresholds. For these types of monitored attributes, you can modify the
comparison operator, the threshold limits, the corrective action, and the collection
schedule.
1. Click Systems Infrastructure Server from the All Targets page.
2. Click the target name to open the home page.
3. Click Systems Infrastructure Server in the upper left corner of the page. Click
Monitoring, then click Metric and Collection Settings.
4. Modify threshold limits or collection schedule. When a threshold field is empty, the
alert is disabled for that metric.
5. Click the Edit icon for advanced settings.
Click the Other Collected Items tab to view non-threshold monitored attributes.
You can modify the collection period for these attributes, or disable monitoring.
6. Click OK to save your changes.
34.18.3 Editing a Monitoring Configuration
1. Click Systems Infrastructure Server from the All Targets page.
Chapter 34
Managing Metrics and Incident Notifications
34-10

2. Click the target name to open the home page.
3. Click Systems Infrastructure Server in the upper left corner of the page. Click
Target Setup.
4. Click Monitoring Configuration.
34.18.4 Suspending Monitoring Notifications
Brownouts enable you to temporarily suppress notifications on a target. The Agent
continues to monitor the target under brownout. You can view the actual target status
along with an indication that the target is currently under brownout.
You can create a brownout for a server.
1. Click Systems Infrastructure Server from the All Targets page.
2. Click the target name to open the home page.
3. Click Systems Infrastructure Server in the upper left corner of the page. Click
Control.
4. Click Create Brownout.
5. Enter a name for the brownout event.
6. Select a reason from the menu and add comments, as needed.
7. Click the options to define how jobs will run and the maintenance window.
8. Click Submit.
34.18.5 Suspending Monitoring for Maintenance
Blackouts enable you to suspend monitoring on one or more targets in order to
perform maintenance operations. To place a target under blackout, you must have at
least the Blackout Target privilege on the target. If you select a host, then by default all
the targets on that host are included in the blackout. Similarly, if you select a target
that has members, then by default all the members are included in the blackout.
1. Click Systems Infrastructure Server from the All Targets page.
2. Click the target name to open the home page.
3. Click Systems Infrastructure Server in the upper left corner of the page. Click
Control.
4. Click Create Blackout.
5. Select a reason from the menu.
6. Add comments, as needed.
7. Click Submit.
34.18.6 Ending a Monitoring Brownout or Blackout
You can end a blackout or brownout for a server.
1. Click Systems Infrastructure Server from the All Targets page.
2. Click the target name to open the home page.
Chapter 34
Managing Metrics and Incident Notifications
34-11

3. Click Systems Infrastructure Server in the upper left corner of the page. Click
Control.
4. Click End Blackout or End Brownout.
34.19 Administering Servers
You can perform the following tasks to manage and administer servers:
•Viewing Compliance
•Identifying Changes in a Server Configuration
•Editing Server Administrator Access
•Adding a Server to a Group
•Editing Server Properties
34.19.1 Viewing Compliance
The Compliance pages enable you to view the compliance framework, standards, and
the server's compliance.
1. Click Systems Infrastructure Server from the All Targets page.
2. Click the target name to open the home page.
3. Click Systems Infrastructure Server in the upper left corner of the page. Click
Compliance.
4. Click the option to view Results, Standard Associations, or Real-time
Observations.
34.19.2 Identifying Changes in a Server Configuration
When an administrator changes a system's configuration, it can be helpful to know the
when the configuration was last changed. This information appears in the configuration
dashlet on the Summary page.
To view more detailed information for a server:
1. Click Systems Infrastructure Server from the All Targets page.
2. Click the target name to open the home page.
3. Click Systems Infrastructure Server in the upper left corner of the page. Click
Configuration.
4. Click the option to view Last Collected, Comparison and Drift Management,
Compare, Search, History, Save, Saved, or Topology.
34.19.3 Editing Server Administrator Access
1. Click Systems Infrastructure Server from the All Targets page.
2. Click the target name to open the home page.
3. Click Systems Infrastructure Server in the upper left corner of the page. Click
Target Setup.
Chapter 34
Administering Servers
34-12

4. Click Administrator Access.
34.19.4 Adding a Server to a Group
1. Click Systems Infrastructure Server from the All Targets page.
2. Click the target name to open the home page.
3. Click Systems Infrastructure Server in the upper left corner of the page. Click
Target Setup.
4. Click Add to Group.
34.19.5 Editing Server Properties
1. Click Systems Infrastructure Server from the All Targets page.
2. Click the target name to open the home page.
3. Click Systems Infrastructure Server in the upper left corner of the page. Click
Target Setup.
4. Click Properties.
34.20 Related Resources for Server Management
See the following chapters for more information:
•Discovering and Adding Host and Non-Host Targets
•Discovering, Promoting, and Adding System Infrastructure Targets
•Using Incident Management
Chapter 34
Related Resources for Server Management
34-13

35
Managing the PDU
The following information is included in this chapter:
•Getting Started with PDU Management
•Location of PDU Information in the User Interface
•Actions for PDU
•PDU Version Identification
•Viewing the PDU Information
•Changing PDU Monitoring Credentials
•PDU Test Connection and Metric Collection Error Troubleshooting
•PDU Error States
•PDU Alerts and Configuration
•Related Resources for PDU Management
35.1 Getting Started with PDU Management
Enterprise Manager Cloud Control 13.2 enables management and monitoring of
Oracle hardware targets, including servers, switches, ZFS Storage appliance, Exadata
storage cells, PDUs, racks, and Engineered Systems. PDU target provides monitoring
information about the PDU powering the hardware in the rack. Discovering and
managing your targets is a prerequisite for almost every action in the software. The
discovery is made quick and easy with the Guided Discovery Wizard that guides you
through the whole process. The discovery process requires only necessary information
as input and helps you solve possible issues in order to successfully complete the
discovery.
35.2 Location of PDU Information in the User Interface
Table 35-1 shows where to find information.
Table 35-1 Location of PDU Information in the BUI
Object Location
Power Distribution Unit In the Enterprise Manager user interface, under Targets, click
All Targets. In the Refine Search section, under Target type,
click Servers, Storage, and Network. Click Systems
Infrastructure PDU, then select a PDU from the displayed
list.
35-1

35.3 Actions for PDU
You can perform the following actions, depending on the requirements.
•Discover a PDU
•View the PDU
35.4 PDU Version Identification
PDU hardware is shipped in two versions, namely PDU v1 (Original PDU) and PDU v2
(Enhanced PDU).
For more information on enhanced PDU, see Monitoring Enhanced PDUs
For more information on original PDU, see Monitoring Original PDUs
You can distinguish the PDU version by accessing the PDU Management Interface.
This interface is accessible using the web browser on IP address or DNS name that
you have assigned to the PDU. Knowledge of PDU version is required to solve some
PDU monitoring or discovery issues.
Note:
PDU may be on an isolated management network not reachable by your web
browser. In that case, make sure you reach the PDU management interface
from within the management network.
1. Open the web browser.
2. Enter the address of the PDU Management Interface in the web browser.
For example, http://<IP or DNS name of your PDU> for PDU v1 or https://<IP or
DNS name of your PDU> for the PDU v2.
Note:
Whether to use http:// or https:// for the PDU v2 depends on how your PDU is
configured. Try to use both if you are not sure. If neither of http:// or https://
work, the PDU is probably offline or the PDU address is incorrect. If the PDU
Management Interface is turned off, you can turn it on using the PDU SNMP
interface.
3. In the PDU Management Interface, you can distinguish the PDU version by
checking the PDU Power Consumption section. The PDU Consumption details are
displayed only for PDU v2. Figure 35-1 is an example for PDU v1 management
interface and Figure 35-2 is an example for PDU v2 management interface.
Chapter 35
Actions for PDU
35-2
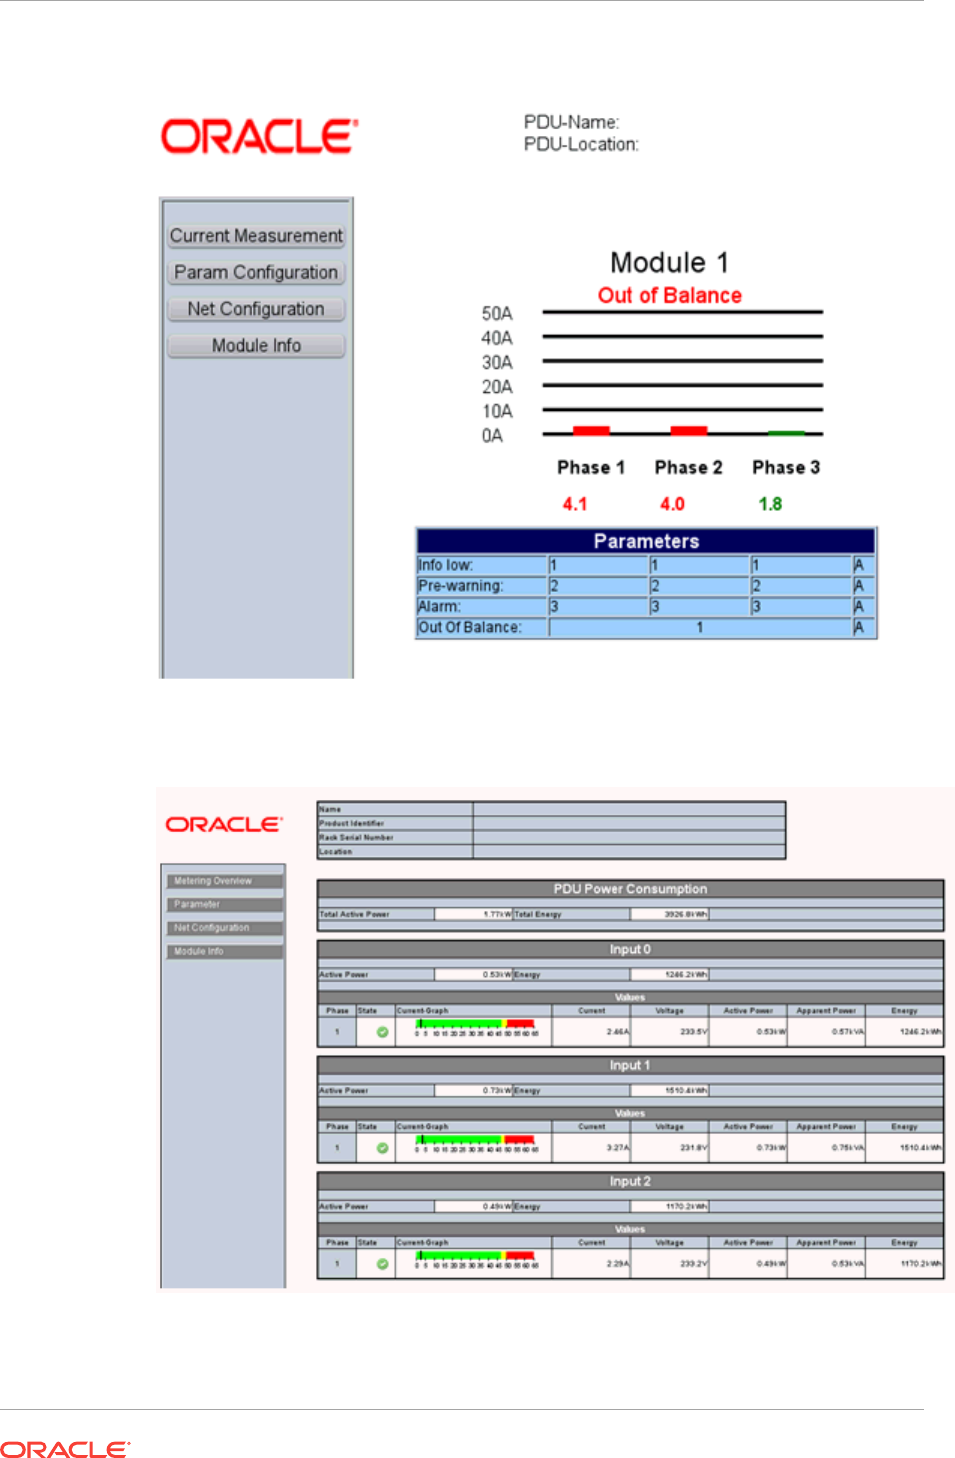
Figure 35-1 PDU v1 Management Interface
Figure 35-2 PDU v2 Management Interface
Chapter 35
PDU Version Identification
35-3

35.5 Viewing the PDU Information
The PDU information screen is divided into two parts. The top region consists of
dashlets that provide you a general overview of the system. The main region displays
more detailed information of the PDU.
The first dashlet in the first series displays the summary of the PDU. It displays PDU
model, part number, serial number, IP address, firmware version, count of modules
and status of SNMP communication with PDU. If EM Agent can communicate with
PDU using SNMP, there is a green tick, if it cannot, there is a red cross.
The second dashlet in the first series displays all the open incidents relayed on the
PDU. Click on one of the displayed numbers to view the list of incidents of a given
severity.
The third dashlet in the first series displays the power usage of the PDU. It displays a
summary of the power (current) in amperes per phase of all the modules of the PDU.
The first dashlet in the second series displays the last configuration changes made on
the PDU. It also displays the time when the last incident was raised.
35.5.1 Physical View of the PDU
Click the first tab in the main section of the PDU landing page for a physical view of
the PDU. Physical view of the PDU displays the front and side view of the PDU. The
PDU consists of one or more modules. You can click on any of the modules or the
PDU itself to view more detailed information.
You can switch between photorealistic and tabular representation of the view.
•Photorealistic view provides a realistic picture of the PDU, providing detailed
graphics of all the components.
•Table view is a tabular representation of the physical view, providing a list of
displayed components with the most important information.
Figure 35-3 is a representation of the physical view of the PDU.
Chapter 35
Viewing the PDU Information
35-4
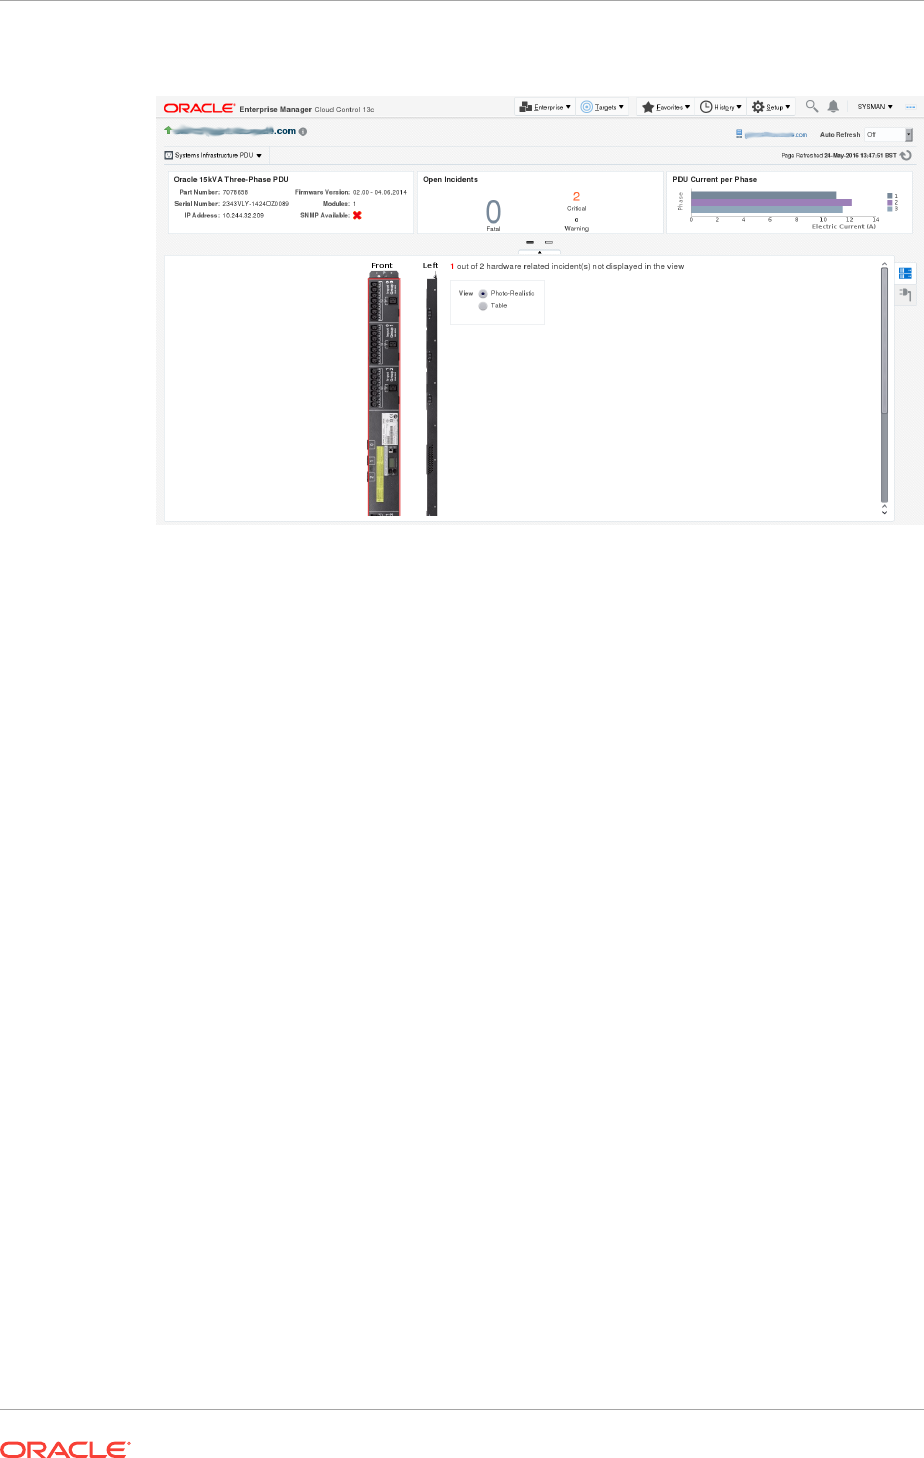
Figure 35-3 PDU Physical View
35.5.2 PDU Load View
Click the second tab of the main section of the PDU landing page to see the PDU
Load view. The PDU load view displays historical data of the phase load (current, in
Ampere) per module.
35.6 Changing PDU Monitoring Credentials
In case the HTTP and SNMP PDU credentials are changed on the PDU, you can
change the credentials in the Enterprise Manager using the PDU's Management
Interface.
35.6.1 Change the HTTP Credentials
Perform the following steps to change the http credentials:
1. Under Setup, click Security, then click Monitoring Credentials.
2. In the Target Type column, select Systems Infrastructure PDU, then click Manage
Monitoring Credentials.
Chapter 35
Changing PDU Monitoring Credentials
35-5
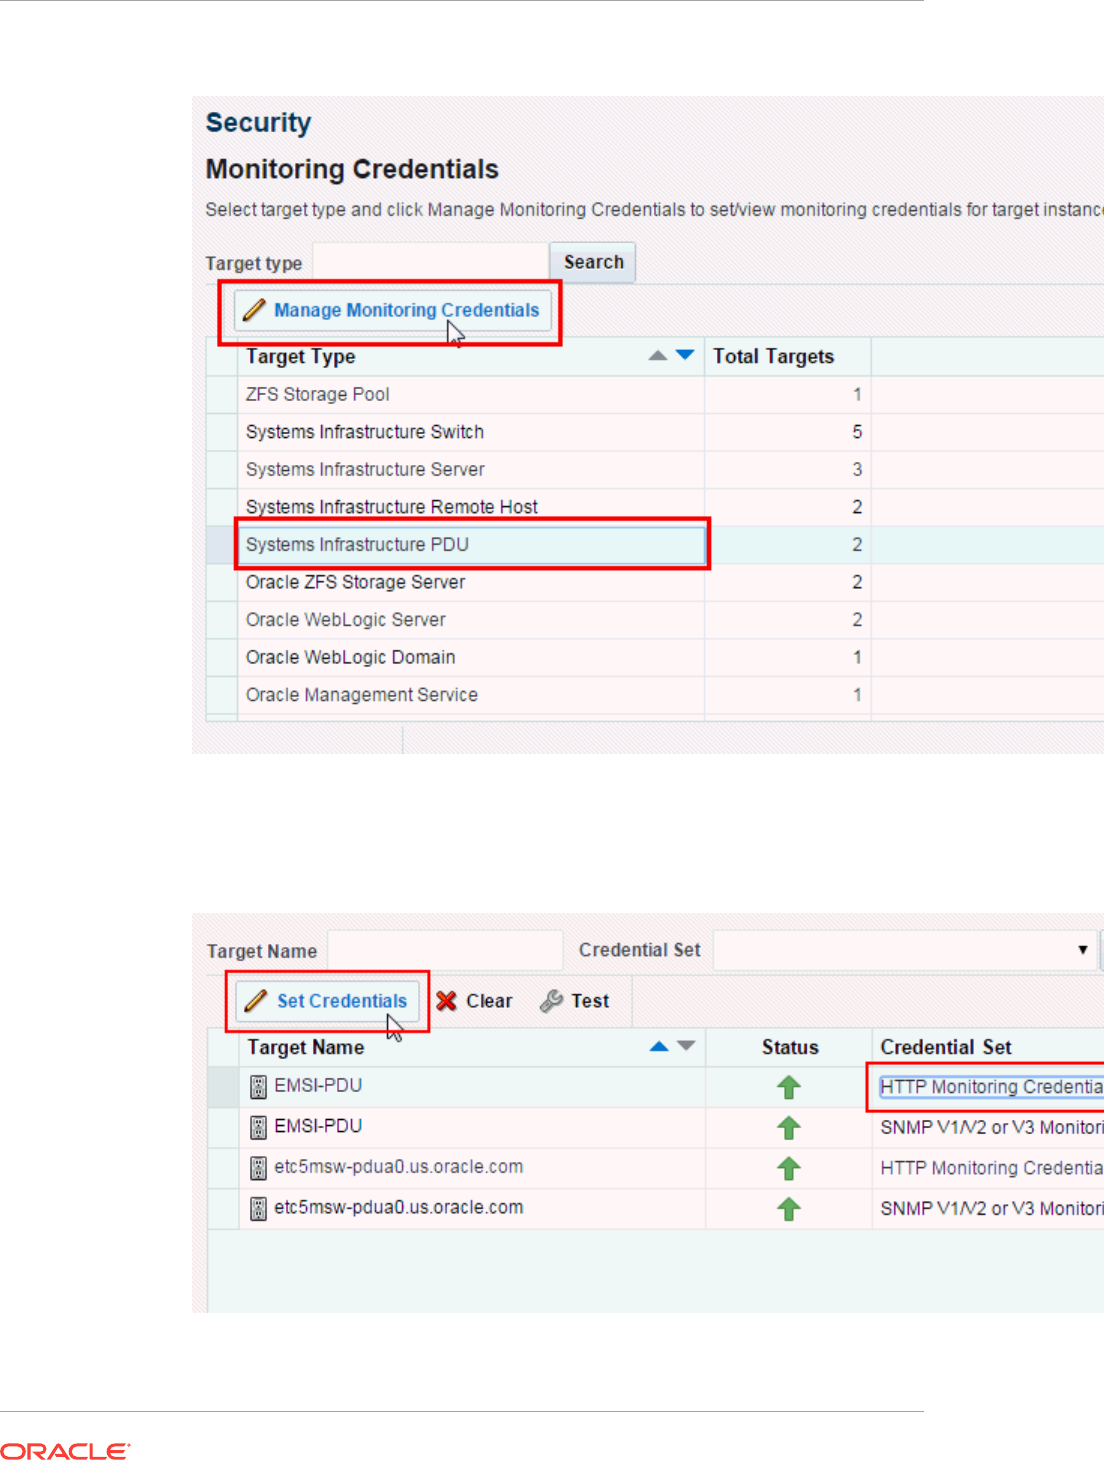
Figure 35-4 Select Target Type
3. In the Systems Infrastructure PDU Monitoring Credentials screen, select the HTTP
Monitoring Credentials (in the Credential Set column), then click Set Credentials.
Figure 35-5 Set HTTP Credentials
4. In the Enter Monitoring Credentials screen, enter new credentials for the PDU
HTTP, then click Test and Save.
Chapter 35
Changing PDU Monitoring Credentials
35-6
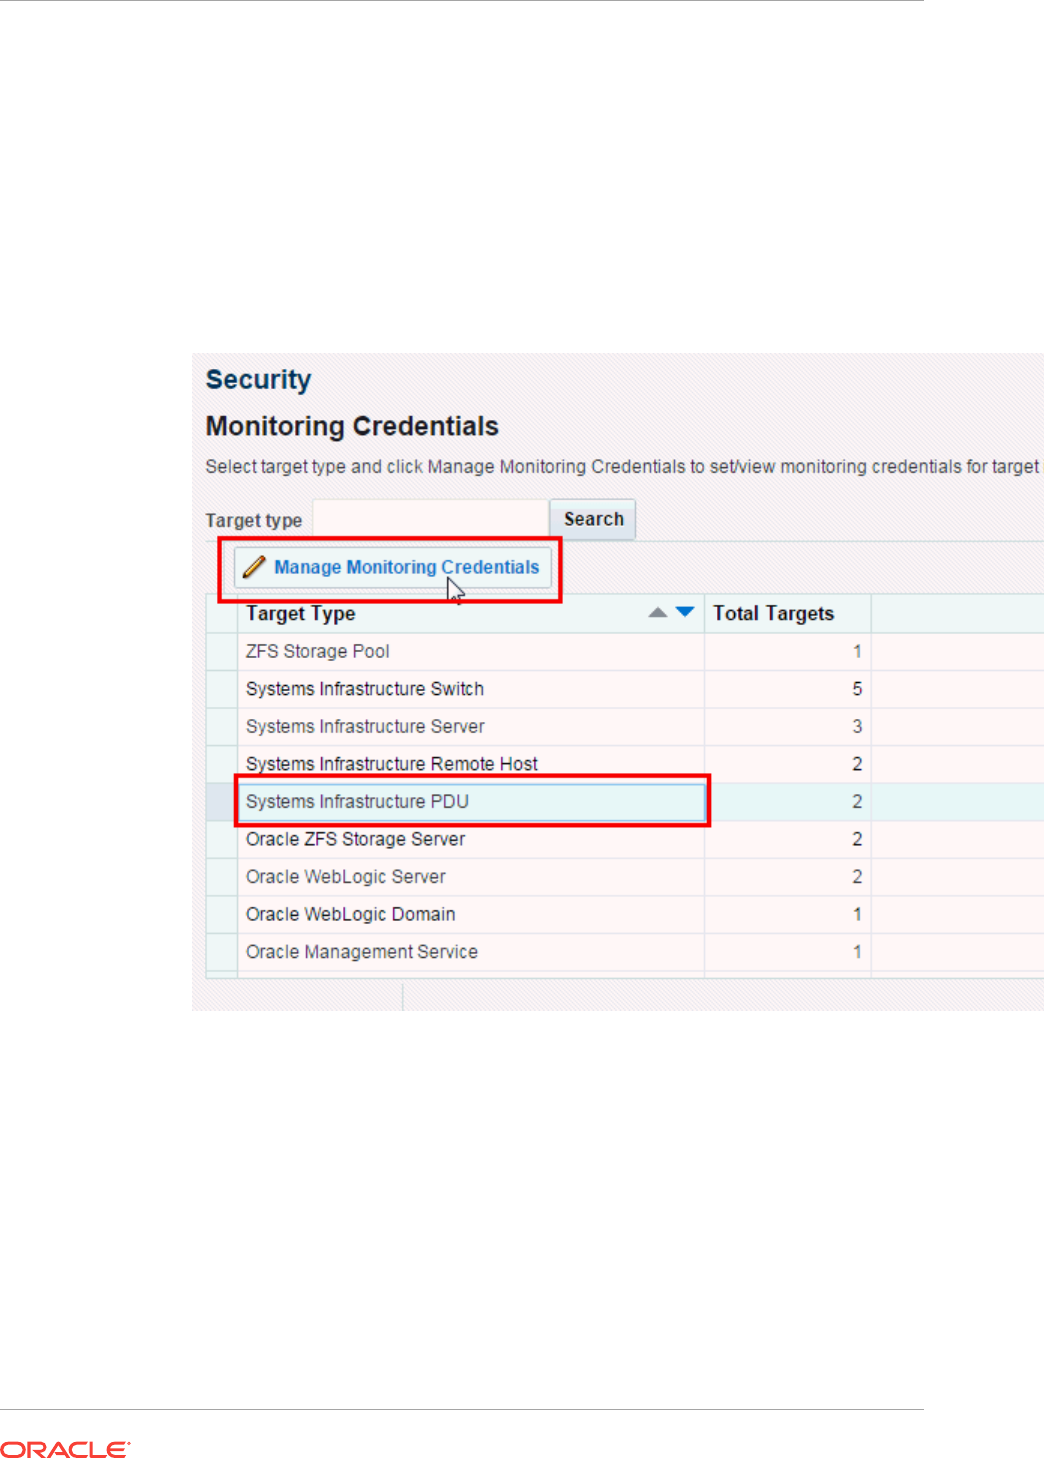
35.6.2 Changing the SNMP Credentials
Perform the following steps to change the SNMP credentials:
1. Under Setup, click Security, then click Monitoring Credentials.
2. In the Target Type column, select Systems Infrastructure PDU, then click Manage
Monitoring Credentials.
Figure 35-6 Select Target Type
3. In the Systems Infrastructure PDU Monitoring Credentials screen, select the
SNMP Monitoring Credentials (in the Credential Set column), then click Set
Credentials.
Chapter 35
Changing PDU Monitoring Credentials
35-7
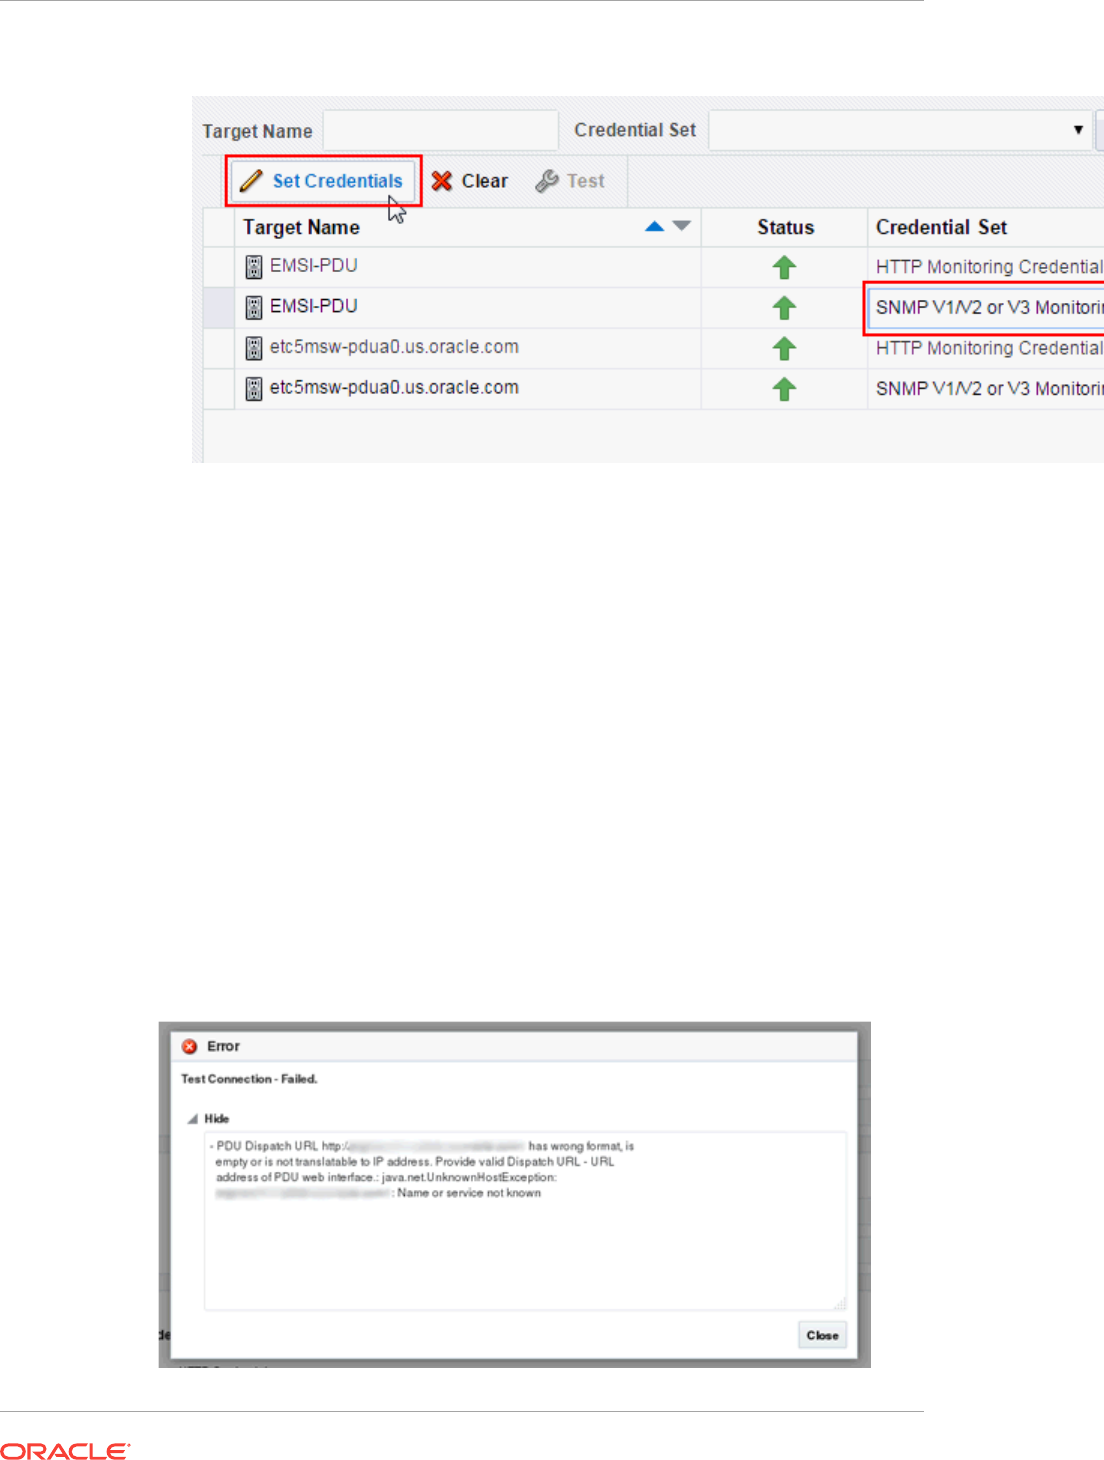
Figure 35-7 Set SNMP Credentials
4. In the Enter Monitoring Credentials screen, enter new credentials for the PDU
SNMP, then click Save.
35.7 PDU Test Connection and Metric Collection Error
Troubleshooting
Collection of some PDU metric or test connection might fail. In that case, PDU test
connection fails with an error message. This section explains how to troubleshoot such
conditions.
35.7.1 Test Connection Error Identification
If a test connection fails, a message with a problem description is displayed. See the
PDU Error States and Resolution table for possible PDU error states and their
resolution and try to fix the problem source as described in the table and repeat the
test connection.
Figure 35-8 Test Connection Error
Chapter 35
PDU Test Connection and Metric Collection Error Troubleshooting
35-8

35.7.2 Metric Collection Error Identification
If collection of some metric fails, a metric collection error event is raised for the PDU.
Note:
Incidents are not generated from metric collection errors by default. You can
turn on incidents generation under Setup > Incidents > Incident Rules.
Search for the rule Group metric collection error events for a target and
enable it.
Perform the following steps to identify and view and view all metric collection errors of
PDU:
1. Go to Target Menu at the left top corner of the PDU landing page, click Systems
Infrastructure PDU.
2. Click Monitoring, then click All Metrics.
3. In the Overview section, click on the number in Metric Collection Errors.
4. Select and click a metric collection error to view more details. A detailed error
description is displayed.
See the PDU Error States and Resolution table for possible PDU error states and
their resolution, try to fix the problem source as described in the Table 35-2. Repeat
evaluation for every failed metric.
35.7.3 Metric Recollection
If you have evaluated all failed metrics, repeat the metric collection.
1. Go to Target Menu at the left top corner of the PDU landing page, click
Configuration, then click Last Collected.
2. In the Latest Configuration screen, click the Refresh button.
Chapter 35
PDU Test Connection and Metric Collection Error Troubleshooting
35-9
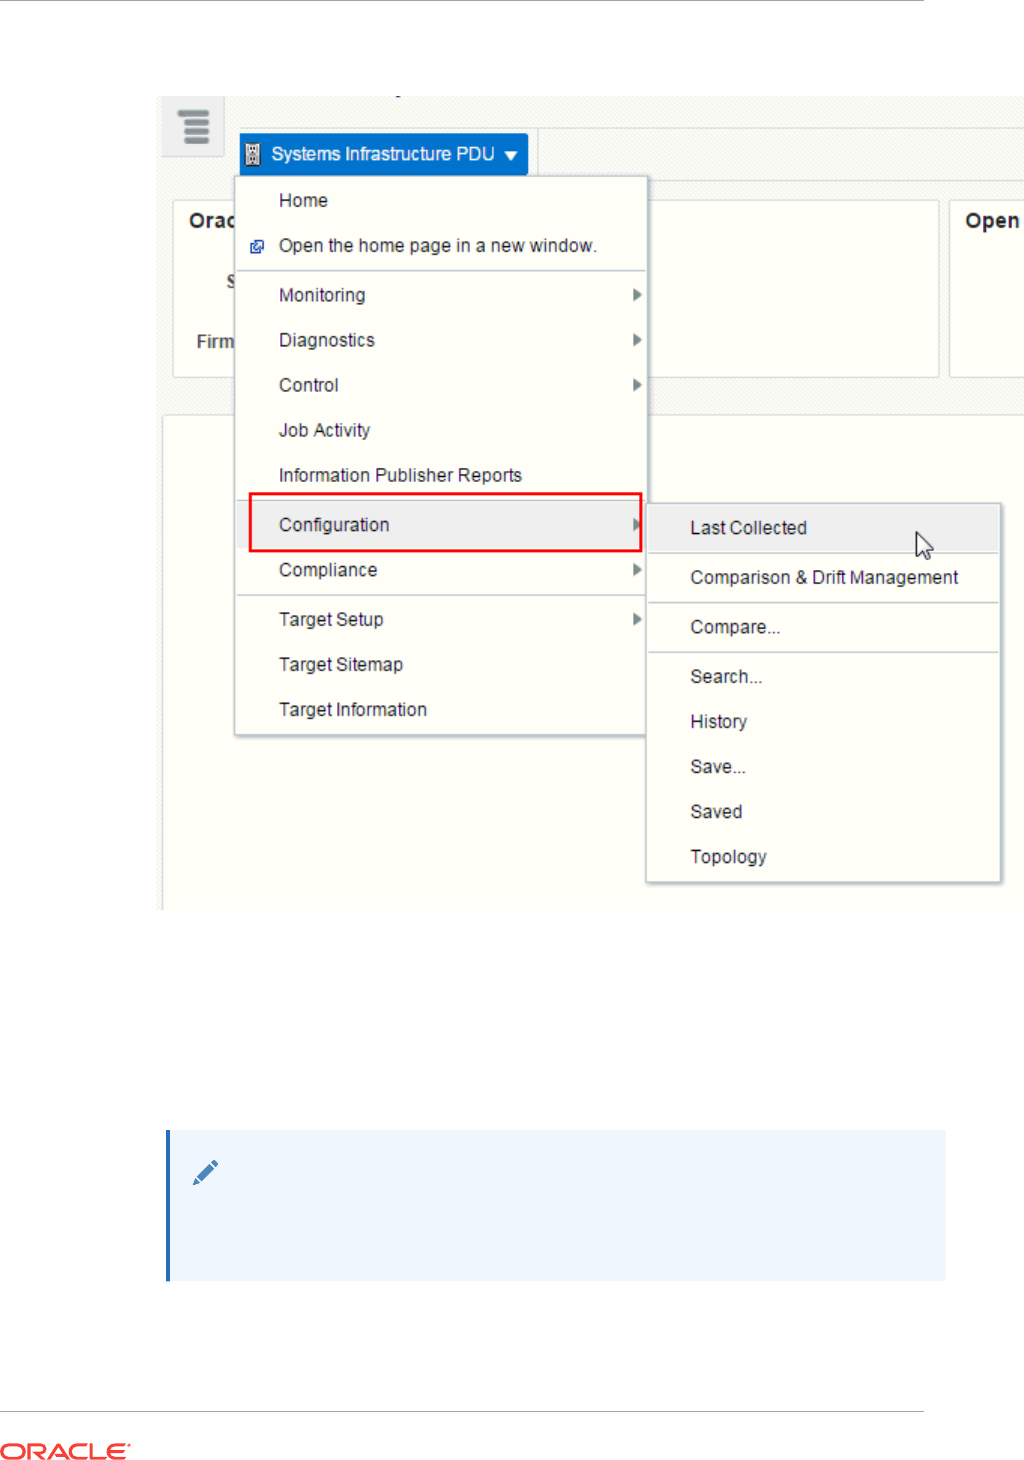
Figure 35-9 PDU Target Menu
When metrics are collected again and all reasons of collection errors are resolved, the
incident disappears from Incidents Manager, dashlet, and Photorealistic view.
If the failed metric is displayed with the word Status, it is a performance metric which
cannot be refreshed. You have to wait for the next scheduled metric recollection. In a
default configuration, PDU performance metrics are recollected every 15 minutes.
Note:
Metric recollection interval can be changed by user in Enterprise Manager in
Target Menu, submenu Metrics, item Metric and Collection Settings.
Chapter 35
PDU Test Connection and Metric Collection Error Troubleshooting
35-10

35.8 PDU Error States
Most of the error states that can happen during test connection or metric collection are
caused by PDU or network misconfiguration or unresponsive PDU. These errors can
be fixed by user.
If you have completed problem resolution, repeat metric collection as described in
Metric Recollection or test connection as described in Discovering and Promoting
PDUs.
List of errors in the PDU Error States and Resolution table is not a complete list. New
messages may be added or changed in the next releases.
Table 35-2 PDU Error States and Resolutions
Error Message Resolution
PDU Dispatch URL http://
pdu.example.com has incorrect
format, is empty or is not translatable
to IP address. Provide valid Dispatch
URL - URL address of PDU web
interface.: detailed exception
Check that you provided valid PDU DNS name in PDU
discovery.
If you are sure you provided valid DNS name, make
sure you have got DNS correctly configured on hosts
with monitoring and backup agents.
Cannot communicate with #PDU:
127.0.0.1. PDU is unreachable. PDU
Web interface cannot be reached
using HTTP or HTTPS. Check if PDU
is online (Open address http://
127.0.0.1 in web browser, try both
http:// and https://) and try to repeat
action (metric collection, connection
test).: detailed exception
Check that PDU is up and running as described in PDU
Version Identification.
Check your network configuration if PDU is reachable
from monitoring agent and backup agent if set.
Cannot communicate with #PDU:
pdu.example.com using SNMP. PDU
SNMP interface is down or
unreachable or SNMP community
string is incorrectly configured. Check
if PDU is online (Open address
https://pdu.example.com in web
browser), check if community string is
set correctly in Enterprise Manager
and in PDU (Open address https://
pdu.example.com in web browser, go
to Net Configuration section, login,
see NMS IPs-Communities table and
Trap Hosts Setup IPs-Communities
table), check if SNMP is enabled
(Open address https://
pdu.example.com in web browser, go
to Net Configuration section, login,
see if SNMP is enabled) and try to
repeat action (metric collection,
connection test).
Check that PDU is up as described in PDU Version
Identification.
If yes, check if NMS and Trap Hosts Setup tables are
correct and SNMP Community string was not changed
or SNMPv3 Access table and Trap Hosts Setup table
are correct and SNMPv3 credentials were not changed
as described in Verify PDU v1 NMS Table and Trap
Hosts Setup Table and Verify PDU v2 NMS Table,
SNMPv3 Access Table, and Trap Hosts Setup Table
Then recollect SNMP Configuration metric as described
in Metric Recollection.
If SNMP Community or SNMPv3 credentials were
changed in the PDU Management Interface, change it
in the Enterprise Manager as well. SNMP credentials
changes are described in Metric Collection Error
Identification.
Chapter 35
PDU Error States
35-11

Table 35-2 (Cont.) PDU Error States and Resolutions
Error Message Resolution
Cannot communicate with #PDU:
pdu.example.com using SNMP v3
Check that PDU is up as described in PDU Version
Identification.
If yes, check if SNMPv3 Access table and Trap Hosts
Setup tables are correct and SNMPv3 credentials were
not changed as described in Verify PDU v2 NMS Table,
SNMPv3 Access Table, and Trap Hosts Setup Table
Then recollect SNMP Configuration metric as described
in Metric Recollection.
If SNMPv3 credentials were changed in the PDU
Management Interface, change it in the Enterprise
Manager as well. SNMP credentials change is
described in Changing the SNMP Credentials
Cannot identify PDU model of #PDU:
pdu.example.com. PDU model is not
supported or it not possible to identify
PDU model because the PDU is not
reachable. Check that PDU is online
(Open address https://
pdu.example.com in web browser, try
both http:// and https://) and try to
repeat action (metric collection,
connection test) or try a different
PDU.
Check that PDU is up and running as described in PDU
Version Identification.
Check your network configuration if PDU is reachable.
Make sure that IP address od DNS name entered
during discovery point to PDU not some different
hardware and to supported PDU model as described in
PDU Version Identification.
Cannot login to #PDU:
pdu.example.com. Wrong
credentials. Please provide correct
PDU user name and password in
Enterprise Manager and try to repeat
action (metric collection, connection
test)
Check that you provided correct HTTP credentials
during PDU discovery.
If incident with this message was raised, PDU HTTP
credentials were probably changed in the PDU
Management Interface. You have to change them in the
Enterprise Manager as well. HTTP credentials change
is described in Change the HTTP Credentials.
Cannot login to #PDU:
pdu.example.com. Another user is
already logged in. Cannot proceed till
another user is logged out. Ask
another user to logout or wait until
user is logged out automatically
(approximately 30 minutes) and try to
repeat action (metric collection,
connection test).
Another user is logged in to the PDU Management
Interface.
If the user who is logged in is you, go to the PDU
Management Interface (see Discovering and Promoting
PDUs) and click Logout button.
If the user logged in is someone else, you have to wait
for automatic logout for approximately 30 minutes.
Unable to find PDU SNMP
Community string for #PDU:
pdu.example.com. Provide correct
community string in Enterprise
Manager and try to repeat action
(metric collection, connection test).
Provide correct SNMP Community string in PDU
discovery and repeat discovery.
If incident with this message was raised, you have to
change SNMP monitoring credentials in the Enterprise
Manager. SNMP credentials change is described in
Changing the SNMP Credentials.
Chapter 35
PDU Error States
35-12

Table 35-2 (Cont.) PDU Error States and Resolutions
Error Message Resolution
SNMP version 3 is not supported for
#PDU: pdu.example.com original
(v1). Provide SNMP version 1
credentials in Enterprise Manager
and try to repeat action (metric
collection, connection test).
SNMP V3 credentials are not supported for Original
PDU (PDU v1), you have to provide SNMP V1
credentials
Provide correct SNMP Community string in PDU
discovery and repeat discovery.
If incident with this message was raised, you have to
change SNMP monitoring credentials in the Enterprise
Manager. SNMP credentials change is described in
Changing the SNMP Credentials.
Cannot write monitoring EM Agent
host IP address to the NMS IPs-
Communities table of #PDU:
pdu.example.com using PDU web
interface. There is already entry with
desired agent IP address 192.0.2.100
but with different community string.
Remove this entry from table
manually using the PDU web
interface or change it to have correct
community string (Open address
https://pdu.example.com in web
browser, go to Net Configuration
section, login, see NMS IPs-
Communities table) or provide correct
community string in Enterprise
Manager and repeat action (SNMP
config metric collection, connection
test).
Make sure you entered correct SNMP community string
during PDU discovery.
Check if NMS table is correct and SNMP Community
string was not changed as described in Verify PDU v1
NMS Table and Trap Hosts Setup Table and Verify
PDU v2 NMS Table, SNMPv3 Access Table, and Trap
Hosts Setup Table.
If incident with this message was raised, you have to
change SNMP monitoring credentials in the Enterprise
Manager. SNMP credentials change is described in
Changing the SNMP Credentials.
Cannot write monitoring EM Agent
host IP address to the Trap Hosts
Setup IPs-Communities table of
#PDU: pdu.example.com using PDU
web interface. There is already entry
with desired agent IP address
192.0.2.100 but with different
community string. Remove this entry
from table manually using the PDU
web interface or change it to have
correct community string (Open
address https://pdu.example.com in
web browser, go to Net Configuration
section, login, see Trap Hosts Setup
IPs-Communities table) or provide
correct community string in
Enterprise Manager and repeat
action (SNMP config metric
collection, connection test).
Make sure you entered correct SNMP community string
during PDU discovery.
Check if Trap Hosts Setup table is correct and SNMP
Community string was not changed as described in
Verify PDU v1 NMS Table and Trap Hosts Setup Table
and Verify PDU v2 NMS Table, SNMPv3 Access Table,
and Trap Hosts Setup Table.
If incident with this message was raised, you have to
change SNMP monitoring credentials in the Enterprise
Manager. SNMP credentials change is described in
Changing the SNMP Credentials.
Chapter 35
PDU Error States
35-13

Table 35-2 (Cont.) PDU Error States and Resolutions
Error Message Resolution
Cannot write monitoring EM Agent
host IP address to the NMS IPs-
Communities table of #PDU:
pdu.example.com using PDU web
interface. Table is full. Remove some
entries from table manually using the
PDU web interface (Open address
https://pdu.example.com in web
browser, go to Net Configuration
section, login, see NMS IPs-
Communities table) and repeat action
(SNMP config metric collection,
connection test).
Check that there is an empty slot in the NMS table as
described in chapters Verify PDU v1 NMS Table and
Trap Hosts Setup Table and Verify PDU v2 NMS Table,
SNMPv3 Access Table, and Trap Hosts Setup Table.
Cannot write monitoring EM Agent
host IP address to the Trap Hosts
Setup IPs-Communities table of
#PDU: pdu.example.com using PDU
web interface. Table is full. Remove
some entries from table manually
using the PDU web interface (Open
address https://pdu.example.com in
web browser, go to Net Configuration
section, login, see Trap Hosts Setup
IPs-Communities table) and repeat
action (SNMP config metric
collection, connection test).
Check that there is an empty slot in the Trap Hosts
Setup table as described in Verify PDU v1 NMS Table
and Trap Hosts Setup Table and Verify PDU v2 NMS
Table, SNMPv3 Access Table, and Trap Hosts Setup
Table.
Cannot write SNMP v3 monitoring
credentials to the SNMP v3 Access
table of #PDU: pdu.example.com
using PDU web interface. There is
already entry with desired user name
user but with different password or
security level. Remove this entry from
table manually using the PDU web
interface or change it to have correct
password and security level (Open
address https://pdu.example.com in
web browser, go to Net Configuration
section, login, see SNMP v3 Access
table) or provide correct SNMP v3
credentials in Enterprise Manager
and repeat action (SNMP config
metric collection, connection test). Do
not provide privacy password.
Privacy is not suported for
communication between PDU and
EM agent.
Make sure you entered correct SNMPv3 credentials
during PDU discovery.
Check if SNMPv3 Access table and Trap Hosts Setup
tables are correct and SNMPv3 credentials were not
changed as described in Verify PDU v2 NMS Table,
SNMPv3 Access Table, and Trap Hosts Setup Table
If incident with this message was raised, you have to
change SNMP monitoring credentials in the Enterprise
Manager. SNMP credentials change is described in
Changing the SNMP Credentials.
Chapter 35
PDU Error States
35-14

Table 35-2 (Cont.) PDU Error States and Resolutions
Error Message Resolution
Cannot write SNMP v3 monitoring
credentials to the SNMP v3 Access
table of #PDU: pdu.example.com
using PDU web interface. Table is
full. Remove some entries from table
manually using the PDU web
interface (Open address https://
pdu.example.com in web browser, go
to Net Configuration section, login,
see SNMP v3 Access) and repeat
action (SNMP config metric
collection, connection test).
Check if there is an empty row in SNMPv3 Access table
as described in Verify PDU v2 NMS Table, SNMPv3
Access Table, and Trap Hosts Setup Table.
Cannot write monitoring EM Agent
host IP address to the Trap Hosts
Setup IPs-Communities table of
#PDU: pdu.example.com using PDU
web interface. There is already entry
with desired agent IP address
127.0.0.1 but with different SNMP v3
user. Remove this entry from table
manually using the PDU web
interface or change it to have correct
SNMP v3 user (Open address {2} in
web browser, go to Net Configuration
section, login, see Trap Hosts Setup
IPs-Communities table) or provide
correct SNMP v3 credentials in
Enterprise Manager and repeat
action (SNMP config metric
collection, connection test). Do not
provide privacy password. Privacy is
not suported for communication
between PDU and EM agent.
Make sure you entered correct SNMPv3 credentials
during PDU discovery.
Check if SNMPv3 Access table and Trap Hosts Setup
table are correct and SNMPv3 credentials were not
changed as described in Verify PDU v2 NMS Table,
SNMPv3 Access Table, and Trap Hosts Setup Table.
If incident with this message was raised, you have to
change SNMP monitoring credentials in the Enterprise
Manager. SNMP credentials change is described in
Changing the SNMP Credentials.
Too short SNMP Authentication
password for #PDU:
pdu.example.com. Password must be
at least 8 characters long. Provide
correct SNMP credentials in
Enterprise Manager and try to repeat
action (metric collection, connection
test).
If incident with this message was raised, you have to
change SNMP monitoring credentials in the Enterprise
Manager. SNMP credentials change is described in
Changing the SNMP Credentials. Provide SNMPv3
password at least 8 characters long.
SNMP Credentials for #PDU:
pdu.example.com were not provided.
Provide correct SNMP credentials in
Enterprise Manager and try to repeat
action (metric collection, connection
test).
If incident with this message was raised, you have to
change SNMP monitoring credentials in the Enterprise
Manager. SNMP credentials change is described in
Changing the SNMP Credentials.
You have to provide SNMPv3
authentication password for #PDU:
pdu.example.com. Provide SNMP
version 3 credentials in Enterprise
Manager and try to repeat action
(metric collection, connection test).
If incident with this message was raised, you have to
change SNMP monitoring credentials in the Enterprise
Manager. SNMP credentials change is described in
Changing the SNMP Credentials.
Chapter 35
PDU Error States
35-15

Table 35-2 (Cont.) PDU Error States and Resolutions
Error Message Resolution
Do not provide privacy password in
SNMP v3 credentials for #PDU:
pdu.example.com. Privacy is not
suported for communication between
PDU and EM agent. Remove privacy
password from SNMP version 3
credentials in Enterprise Manager
and try to repeat action (metric
collection, connection test).
If incident with this message was raised, you have to
change SNMP monitoring credentials in the Enterprise
Manager. SNMP credentials change is described in
Changing the SNMP Credentials. Remove privacy
password from SNMP version 3 credentials.
#PDU: pdu.example.com reports it
has zero modules or phases. PDU
web interface does not work
correctly. Please restart PDU web
interface. Refer to Sun Rack II Power
Distribution Units User''s Guide for
how to (depending on PDU version,
PDU can be restarted using
dedicated hardware button or from
PDU web interface https://
pdu.example.com). Try to repeat
action (metric collection, connection
test) after restart.
Follow error message text.
You have specified wrong SNMP MIB
version to be used to monitor #PDU:
pdu.example.com. Please enter
'Enhanced' or 'Original'. You entered
something.
Follow error message text.
Exception during lookup for IP
address of network interface on EM
Agent host through which is #PDU:
pdu.example.com with address
#PDU: pdu.example.com reachable.
PDU is not reachable from Agent
host.
Exception during lookup for IP
addresses of network interfaces on
EM Agent host through which #PDU:
pdu.example.com could be
reachable.
#PDU: pdu.example.com with
address 203.0.113.200 is not
reachable through any network
interface on EM Agent host. Select
another agent or try to resolve issues
causing that PDU is not reachable.
Check that PDU is up and running as described in PDU
Version Identification.
Check your network configuration if PDU is reachable.
#PDU: pdu.example.com: Problem
description. You probably tried to
access unsupported PDU hardware
not a supported PDU.
Check that PDU is up and running as described in PDU
Version Identification.
Check your network configuration if PDU is reachable.
Make sure that IP address od DNS name entered
during discovery point to PDU not some different
hardware and to supported PDU model as described in
PDU Version Identification.
Chapter 35
PDU Error States
35-16

Table 35-2 (Cont.) PDU Error States and Resolutions
Error Message Resolution
Unsupported model of #PDU:
pdu.example.com. Only PDU with
maximum count of 4 modules is
supported. Detected count of
modules: 5
Check that PDU is up and running as described in PDU
Version Identification.
Check your network configuration if PDU is reachable.
Make sure that IP address od DNS name entered
during discovery point to PDU not some different
hardware and to supported PDU model as described in
PDU Version Identification.
PDU does not respond. It is
overloaded or offline. Cannot get/find
something. Check if PDU is online
(Open address https://
pdu.example.com in web browser)
and try to repeat action (metric
collection, connection test).
Check that PDU is up and running as described in
chapter PDU Version Identification.
Check your network configuration if PDU is reachable.
Make sure that IP address od DNS name entered
during discovery point to PDU not some different
hardware and to supported PDU model as described in
PDU Version Identification.
35.9 PDU Alerts and Configuration
PDU and Enterprise Manager can be configured to report two kinds of incidents to the
user:
•If current level of a phase of some module in amperes crossed some set warning
or alarm threshold.
•If difference between current level in ampere of phases of PDU module is bigger
than the set threshold.
You can set warning and alarm thresholds in both PDU and Enterprise Manager.
These settings are independent on each other. Incidents are generated independently
from warning and alarm thresholds set in PDU and in Enterprise Manager.
35.9.1 Configuring Alerts in a PDU
Perform the following steps to configure alarm and warning thresholds in a legacy
PDU Management Interface:
1. Open the PDU Management Interface in the web browser (See PDU Version
Identification).
2. In the PDU User Interface, click Param Configuration.
3. Login with your user name and password.
4. Set alarm and warning current thresholds in amperes, then click Submit.
Note:
Info low is not used for PDU monitoring in Enterprise Manager.
5. Repeat the above steps for all modules.
Chapter 35
PDU Alerts and Configuration
35-17
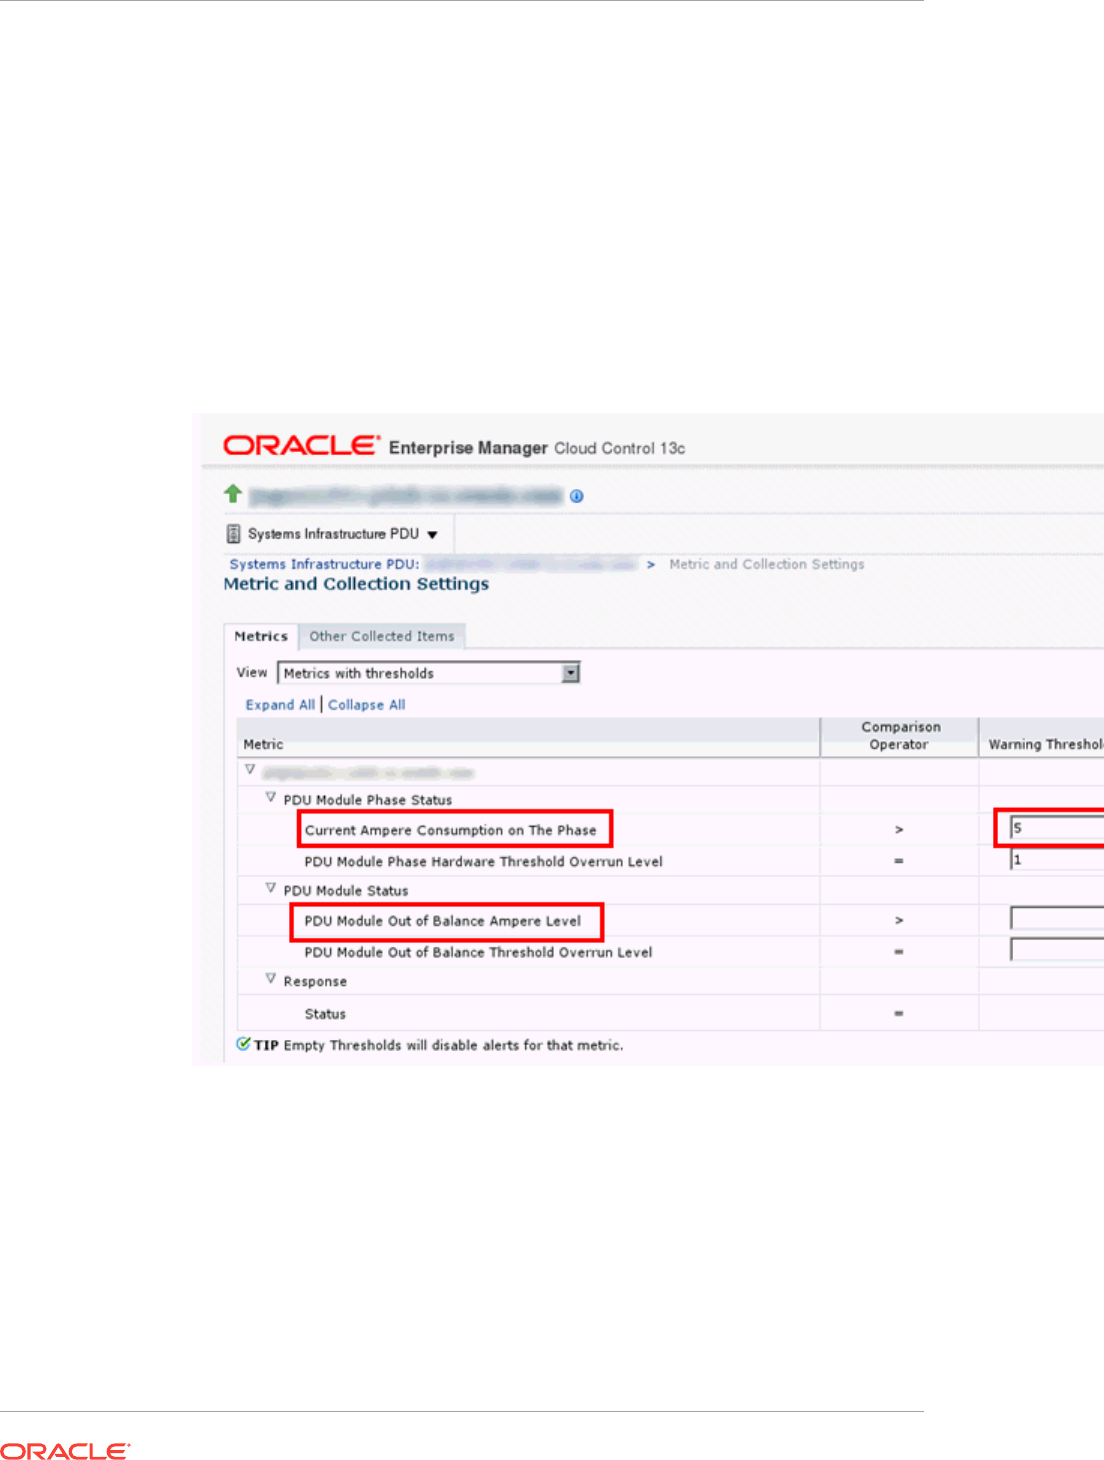
35.9.2 Configuring Alerts in Enterprise Manager
Perform the following steps to configure alarm and warning thresholds in Enterprise
Manager.
1. Open PDU landing page as described in Physical View of the PDU.
2. Click the Target Menu Systems Infrastructure PDU.
3. Under Systems Infrastructure PDU, select Monitoring, then click Metric and
Collection Settings.
Figure 35-10 Metric and Collection Settings
4. In the table, click the Edit icon against Current Ampere Consumption on the Phase
and edit the values of Warning Threshold and Critical Threshold.
5. Click the Edit icon against PDU Module out of Balance Ampere Level and edit the
value of Critical Threshold.
Chapter 35
PDU Alerts and Configuration
35-18

Note:
Do not change Warning Threshold and Critical Threshold for PDU Module
Phase Hardware Threshold Overrun Level and PDU Module out of Balance
Threshold Overrun Level. It those values are changed, incidents will not to be
generated based on alarm and warning levels set directly in the PDU or they
will be generated incorrectly.
If values were already changed, set PDU Module Phase Hardware Threshold
Overrun Level Warning Threshold to 1, Critical Threshold to 2, and PDU
Module out of Balance Threshold Overrun Level Critical Threshold to 1.
6. Click OK.
35.9.3 Viewing Alert Incidents
To view incidents generated from alarm and warning threshold and identify the
incident, click Open Incidents dashlet to view a summary of all the incidents on the
PDU. Click a specific incident to view incident details.
•For example, any incident generated from alarm and warning thresholds set
directly in PDU contains the following text:
PDU Module 0, Phase 1 crossed the Module Phase Ampere Level alarm or
warning threshold set in PDU Web interface on Parameter page. Module Phase
Ampere Level was 2.4 A.
•For example, any incident generated from alarm and warning thresholds set in the
Enterprise Manager contains the following text:
PDU Module 1, Phase 1 crossed the Module Phase Ampere Level alarm 2 A or
warning 1 A threshold set by user in monitoring template. Module Phase Ampere
Level was 3.2 A.
Incidents are automatically cleared when current level goes under the set alarm and
warning levels.
35.9.4 SNMP Traps Forwarding
PDU is by default configured by Enterprise Manager to generate and send traps to IP
address where Enterprise Manager monitoring agent and backup reside.
Enterprise Manager can receive these traps and generate Alert Incidents immediately
after alert condition is met in PDU.
PDU can send traps only to default SNMP traps port UDP 162 as is defined in SNMP
standard. Enterprise Manager agent however listens for SNMP traps on a different
port.
Because of this port mismatch, SNMP traps generated by PDU are not delivered to
Enterprise Manager by default.
Alert Incidents are still generated from alert and warning thresholds set in PDU but
they are not generated immediately. They are generated when PDU performance
metrics are recollected. By default performance metrics are recollected every 15
minutes.
Chapter 35
PDU Alerts and Configuration
35-19

Note:
Metric recollection interval can be changed by user in Enterprise Manager in
Target Menu, submenu Metrics, item Metric and Collection Settings.
To deliver PDU SNMP traps from PDU to Enterprise Manager, you have to set port
forwarding on hosts where monitoring and backup agents are deployed. Forward UDP
port 162 to UDP port where Enterprise Manager agent is listening for SNMP traps.
How to set port forwarding depends on operation system you use on host where agent
is deployed. Consult your operating system documentation on how to set UDP port
forwarding.
Note:
Do not use Linux tool snmptrapd to forward traps. The traps from snmptrapd
do not contain IP of the originating PDU, but of the snmptrapd forwarder.
Enterprise Manager uses PDU IP address to couple received SNMP trap with
monitored PDU. If received SNMP trap has wrong originator IP address, it is
thrown away by Enterprise Manager and not considered any more.
To find the port where PDU monitoring and backup agent listen for SNMP traps you
can:
•Get the port from EMD_URL property in the AGENT_INST/sysman/config/
emd.properties file on hosts where primary and monitoring agents are deployed.
(This is the port at which agent will listen over UDP for traps).
•Open All Targets page in the Enterprise Manager UI and find monitoring and
backup agent in the targets list. Number in the agent name after colon (:) is the
UDP port which the agent will listen for SNMP traps.
35.10 Related Resources for PDU Management
See the following for more information:
•Discovering and Adding Host and Non-Host Targets
•Discovering, Promoting, and Adding System Infrastructure Targets
•Using Incident Management
•Enterprise Monitoring
Chapter 35
Related Resources for PDU Management
35-20

36
Managing the Rack
The following information is included in this chapter:
•Getting Started with Rack Management
•Location of Rack Information in the User Interface
•Actions for Rack
•Target Navigation for Rack Management
•Creating a Rack
•Viewing the Rack Information
•Placing Targets in the Rack
•Related Resources for Rack Management
36.1 Getting Started with Rack Management
Target management is the process through which Enterprise Manager begins to
manage and monitor your targets including server hardware, chassis, racks, power
distribution unit, network equipment, operating systems, virtualization software, and
clustering software. Discovering and managing your targets is a prerequisite for almost
every action in the software. The discovery feature makes adding targets quick and
easy. You can discover power distribution units and racks using the guided process.
36.2 Location of Rack Information in the User Interface
Table 36-1 shows where to find information.
Table 36-1 Location of Rack Information in the BUI
Object Location
Rack In the Enterprise Manager user interface, under Targets, click
All Targets. In the Refine Search section, under Target type,
click Servers, Storage, and Network. Click Systems
Infrastructure Rack, then select a rack from the displayed
list.
Physical View of Rack In the Enterprise Manager user interface, under Targets, click
All Targets. In the Refine Search section, under Target type,
click Servers, Storage, and Network. Click Systems
Infrastructure Rack, then select a rack from the displayed
list. Click the Dashboard tab. Select Photorealistic View radio
button on the right side viewing option.
36-1
36.3 Actions for Rack
You can perform the following actions, depending on the requirements.
•Create a rack
•View the rack
•Place a target to the rack
•Edit a target in the rack
•Remove a target from the rack
•Delete a rack
36.4 Target Navigation for Rack Management
The target navigation tree displays the rack and all targets in the rack in a tree
structure. Click on any of the targets to navigate to the landing page of the selected
target.
Note:
The target navigation tree is active only if the rack is populated with targets.
Chapter 36
Actions for Rack
36-2
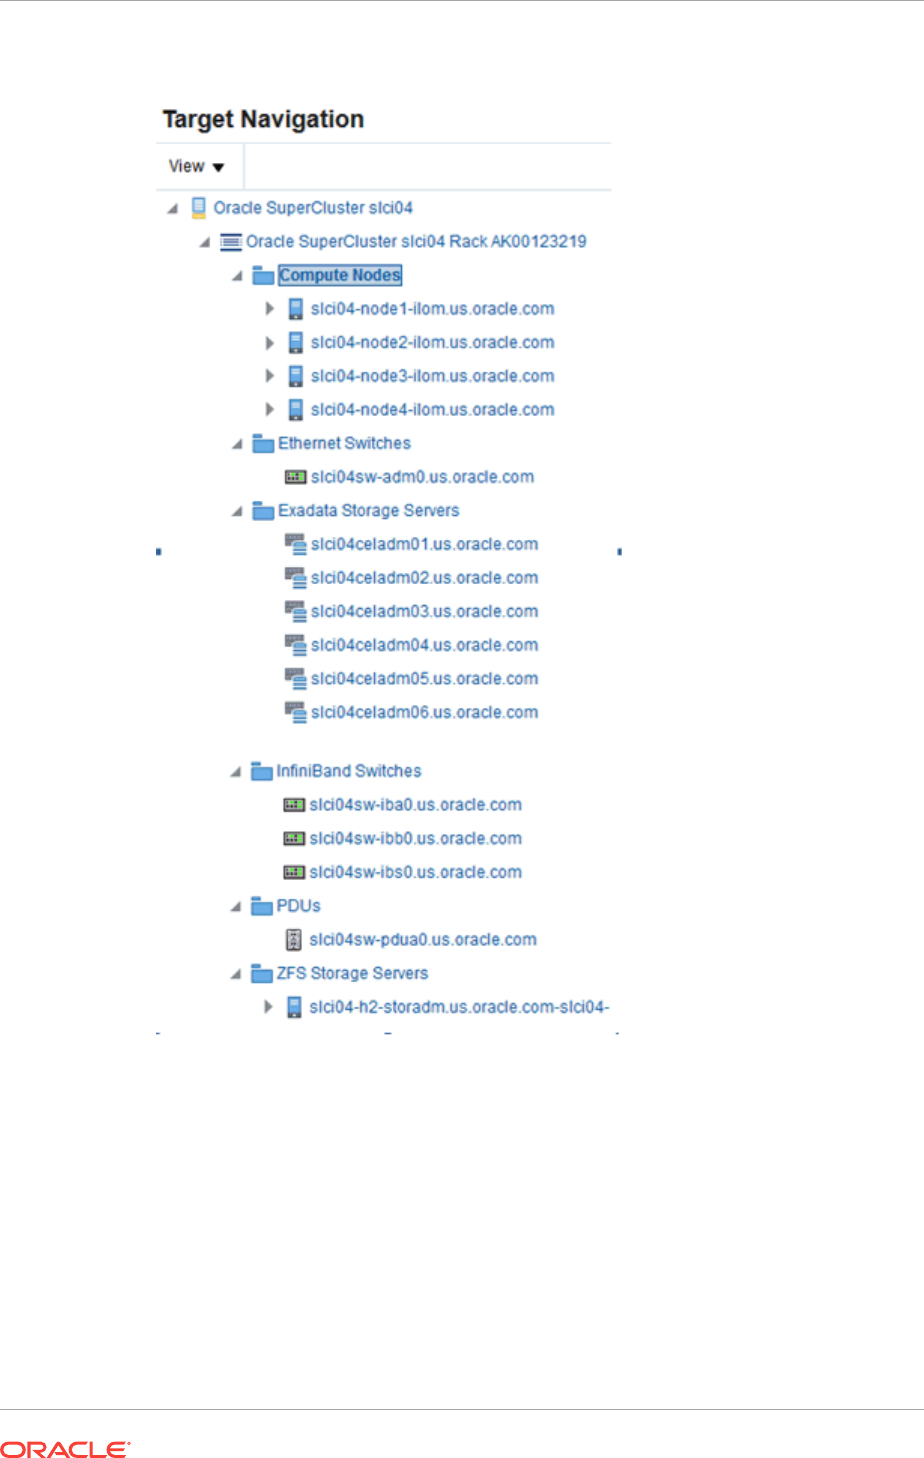
Figure 36-1 Target Navigation for Rack Management
36.5 Creating a Rack
A rack target serves as a container for other hardware targets that are managed by
Enterprise Controller. To create a rack, perform the following steps:
1. Log in to Enterprise Manager.
2. Under Setup, click Add Target, then click Add Targets Manually.
3. In the Overview section, click Add Targets using Guided Process.
Chapter 36
Creating a Rack
36-3

4. In the Add Using Guided Process screen, scroll down to Systems Infrastructure
Rack, then click Add.
5. In the Systems Infrastructure Rack Discovery screen, enter the required
information.
a. In the Target Name field, enter a name for the rack.
b. In the Type field, select the type of rack and additional information if required.
c. (Optional) You can also set additional information, such as Location, in the
Global Properties section.
6. Click Add in the top right corner of the screen. Once the job is successfully run, an
empty rack is created. You can now navigate to the rack landing screen and add
hardware targets to the rack. The following figure is an image of an empty rack.
Figure 36-2 Empty Rack
36.5.1 Creating a Rack Using Command Line Interface
You can create a rack using the command line interface.
Perform the following steps to create a rack using CLI:
1. Open the command line interface on the host where OMS is running.
2. Log in to emcli using the following command: emcli login –username=<your user
name>
3. Type the password when prompted.
4. Execute
emcli sync
.
5. Add a new rack using the following command:
Chapter 36
Creating a Rack
36-4

emcli add_target \
-name="Name of your Rack" \
-type=oracle_si_rack \
-subseparator=properties='=' \
-separator=properties=';' \
-
properties='EngineeredSystemId=SomeID;RackType=SomeType;RackSubtype=SomeSubtyp
e;TotalSlots=42'
6. Set the following in the
emcli add_target
command:
•Replace Name of your Rack with name of your Rack
•Set values for properties
36.5.1.1 Properties of Rack
Rack has four properties, namely, EngineeredSystemId, RackType, RackSubtype, and
TotalSlots. See Table 36-2 for description of the properties.
Table 36-2 Properties Description
Property Description Allowed Values Mandato
ry
Note
EngineeredSystemI
d
Unique identifier
of an Engineered
System
Arbitrary string No Does not have to
be provided if
Rack is
standalone not
belonging to
some Engineered
System
Chapter 36
Creating a Rack
36-5

Table 36-2 (Cont.) Properties Description
Property Description Allowed Values Mandato
ry
Note
RackType Rack Type
(Generic 42U
Cabinet or well-
known type e.g.
Oracle Exalogic,
SPARC
SuperCluster)
•GENERIC:
Generic 42U rack
cabinet
•EXALOGIC:
Exalogic Sun Rack
II 42U rack cabinet
•EXADATA:
Exadata Sun Rack
II 42U rack cabinet
•SUPERCLUSTER:
SuperCluster Sun
Rack II 42U rack
cabinet
•BIGDATA: Oracle
Big Data Appliance
Sun Rack II 42U
rack cabinet
•OPCA: Oracle
Private Cloud
Appliance Sun
Rack II 42U rack
cabinet
•ZDLRA: Oracle
Zero Data Loss
Recovery
Appliance Sun
Rack II 42U rack
cabinet
•EXADATA_STOR
AGE_EXPANSION
: Oracle Exadata
Storage Expansion
Sun Rack II 42U
rack cabinet
Yes Provide
GENERIC if Rack
is standalone not
belonging to
some Engineered
System
RackSubtype Optional
specification of
the RackType
size according to
Rack Type. For
example, Full,
Quarter etc. This
property is
applicable only
for Engineered
Systems racks.
•UNDEFINED
•FULL
•HALF
•QUARTER
•EIGHTH
No NA
TotalSlots Total count of
slots in the rack.
42 Yes Rack with 42
slots only is
supported.
Following is a sample command to create a generic rack:
emcli add_target \
Chapter 36
Creating a Rack
36-6

-name="Name of your Rack" \
-type=oracle_si_rack \
-subseparator=properties='=' \
-separator=properties=';' \
-properties=RackType=GENERIC;TotalSlots=42'
36.6 Viewing the Rack Information
The rack information screen is divided into two parts. The top region consists of
dashlets that provide you a general overview of the system. The main region displays
more detailed information of the rack.
The dashlets are grouped by three into one or more series that can be switched using
navigation buttons.
The first dashlet in the first series displays the summary of the rack, including the
serial number of the rack, total number, and number of occupied slots. It also displays
the location of the rack if the information is available.
The second dashlet in the first series displays number of open incidents relayed on the
rack and all the targets in the rack. Click on one of the displayed numbers to view the
list of the incidents of a given severity.
The third dashlet in the first series displays the current (in Ampere) usage per phase of
the rack.
The first dashlet in the second series displays the number of targets that are online,
offline, and aggregated number of targets in any other status.
The second dashlet in the second series displays the occupancy of the rack. It
displays the slot occupancy and PDU occupancy of the rack in a graphical
representation.
The third dashlet in the second series displays the last configuration changes made to
the rack.
Note:
Click the Second dashlet series icon (displayed below the dashlets) to view
more dashlets. Click the First dashlet series icon to view the first set of
dashlets.
36.6.1 Physical View of the Rack
Click the first tab in the main section of the rack landing page for a physical view of the
rack. Photorealistic view of the rack displays the rack and it's content providing an
overview of how the targets are placed into the rack. You can click on any of the
targets in the rack to view more detailed information about the selected targets. Click
on the rack to view the information about the rack itself. You can switch between
several representations of the physical view.
Chapter 36
Viewing the Rack Information
36-7
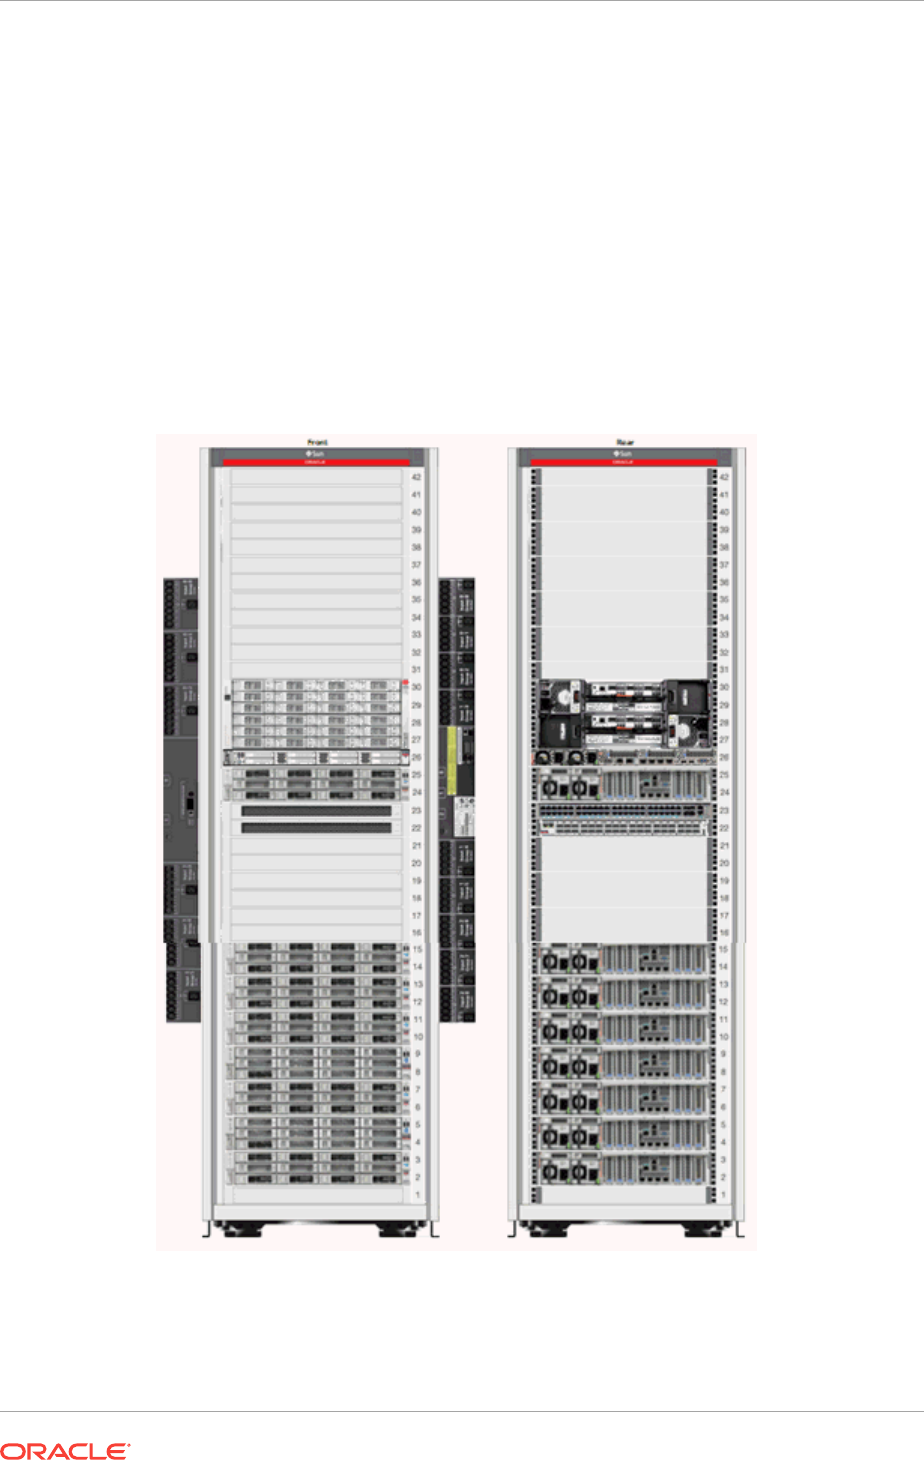
•Photorealistic view provides a realistic picture of the system with detailed graphics
of all the components.
•Schematic view is data oriented and displays the most important information such
as locator light, status, temperature, and host name. Each component in the view
has its color based on the type for easy identification of the component. Click
Show Temperature option on the right side to view the temperature of targets that
provide that information. To place targets into the empty slots, check the Empty
Slot option below the Temperature toggle. If unchecked, the empty slots are not
active.
•Table view is a tabular representation of the physical view, providing a list of
displayed components with the most important information.
Figure 36-3 Photorealistic View of the Rack
Chapter 36
Viewing the Rack Information
36-8

36.6.2 Firmware View
Click the second tab in the main section of the rack landing page to display the
Firmware view. Firmware View displays a tabular view of all the firmware of targets
placed in the rack. It displays the Target Name, Target Type, Firmware Type, and
Firmware Version in a tabular format. The search option is available on the top of the
table header for all columns such as Target Name, Target Type, Firmware Type, and
Firmware Version. In the Target Type search field, select the type of target from the
drop-down list.You can enter a firmware type in the firmware search field to view
targets with the selected firmware type only.
36.6.3 Load View
Load View displays detailed information of the load of the PDUs in the rack. It displays
a graphical view of the PDU phase load per module where the time history of the PDU
phase load is displayed.
36.6.4 Temperature View
Temperature View displays the temperature of all the targets in the rack. Historical
data such as average and maximum temperatures for last seven days is also
displayed.
36.7 Placing Targets in the Rack
After the rack is created, you can place (add) hardware targets in the rack. A
photorealistic image of the empty rack is displayed with front and rear views. There are
two types of slots in the rack, rack slot and PDU slot. In the rack slot, you can place
switches, servers, ZFS appliances, storage cells, and other targets that can be placed
into a rack. In the PDU slots, you can place the PDU.
You can invoke the action menu by right clicking on the empty or occupied rack or the
PDU slot.
36.7.1 Place a Target in the Rack
To place a target in the rack, perform the following steps:
1. Right click on an empty slot in the rack and click Place Target. The Place Target
into Rack wizard opens.
2. In the Selected Target field, click the search icon to find the target that you want to
add.
a. In the Target Type field, select the check box against the type of target that
you want to add. The discovered targets are listed.
b. Select a target from the list, then click Select.
3. In the Position field, the value is automatically filled from the slot position you
clicked. If you want to place the target in a different slot, enter the position of the
empty slot where you want the target to be placed.
4. In the Height field, specify the height of the target. The suggested height displayed
is based on the type of the target that you selected.
Chapter 36
Placing Targets in the Rack
36-9

5. In the Facing field, specify the orientation of that target such as Full, Front, or
Rear. (Some targets might occupy only half of the slot, for example, switches).
6. In the Horizontal position field, specify whether Full, Left, or Right. This is based
on the occupancy of that target. Some targets might occupy the full slot, some
might occupy either the left or right side of the slot.
7. Click OK. The target is placed into the rack.
36.7.2 Edit Target Placement in the Rack
You can edit the target position in the rack and place it to a different slot if needed.
To edit a target position, perform the following steps:
1. Right click on the target, then select Edit Target.
2. Edit the corresponding values and click OK.
36.7.3 Remove a Target from the Rack
You can delete targets placed in the rack.
Perform the following steps to remove a target from the rack.
1. Navigate to Physical View of the Rack.
2. Right click on the target that you want to delete, then click Remove Target.
3. Click OK to confirm. The target is removed from the rack.
Note:
Though the target is removed from the rack, Enterprise Manager continues to
monitor the target.
36.7.4 Delete a Rack
The rack can be removed in Enterprise Manager without targets placed in it. If the rack
target is deleted and the rack contains targets placed in it, you will be asked if you
want to remove the targets from Enterprise Manager.
Perform the following steps to delete a rack:
1. In the rack landing page, click the Target menu drop-down list.
Chapter 36
Placing Targets in the Rack
36-10

Figure 36-4 Delete Rack
2. Click Target Setup, then click Remove Target.
3. If you want remove targets placed in rack along with the removed rack, select
“Remove all targets associated to target Rack”. List of targets placed in rack will
be shown.
4. Some targets cannot be removed. Such targets have a red cross in the column
Removal Details including a reason as to why target cannot be removed.
Unremovable targets will not be removed when rack target is removed.
5. Some targets provide a custom removal flow (like SNMP monitoring
unsubscription). Such targets have a yellow exclamation mark in the column
Removal Details. If you want to remove a target with a custom removal flow, go to
the target’s landing page and remove the target from there. If you don't remove
targets with a custom removal flow, they will be removed along with rack without
custom removal options available in their removal flows.
6. Click Yes to confirm. The rack is deleted with or without the assigned targets
depending on your selection.
36.8 Related Resources for Rack Management
See the following for more information:
Chapter 36
Related Resources for Rack Management
36-11


37
Managing Oracle MiniCluster
The following information is included in this chapter:
•Getting Started with Oracle MiniCluster
•Actions for Oracle MiniCluster
•Target Navigation for Oracle MiniCluster
•Viewing the Oracle MiniCluster System
•Related Resources for Oracle MiniCluster
37.1 Getting Started with Oracle MiniCluster
Oracle MiniCluster is an Oracle Engineered System that integrates two SPARC S-7
servers and Oracle Storage Drive Enclosure DE3-24C.
Oracle MiniCluster is supported in the following configurations:
•Oracle MiniCluster S7-2
To be able to start target monitoring, it is necessary to discover it. The discovery is
made quick and easy with the Guided Discovery Wizard that guides you through the
whole process, requests only for necessary information, and helps you solve possible
issues in order to successfully complete the discovery.
37.2 Actions for Oracle MiniCluster
You can perform the following actions, depending on the requirements.
•Discover Oracle MiniCluster
•View the Oracle MiniCluster system
•Monitor the Oracle MiniCluster system
37.3 Target Navigation for Oracle MiniCluster
The target navigation tree helps you to navigate between targets in the Oracle
MiniCluster system. The Disk shelves are not listed in the navigation tree, information
about Disk Shelf devices is available in the Storage tab of the MiniCluster target
landing page.
37-1
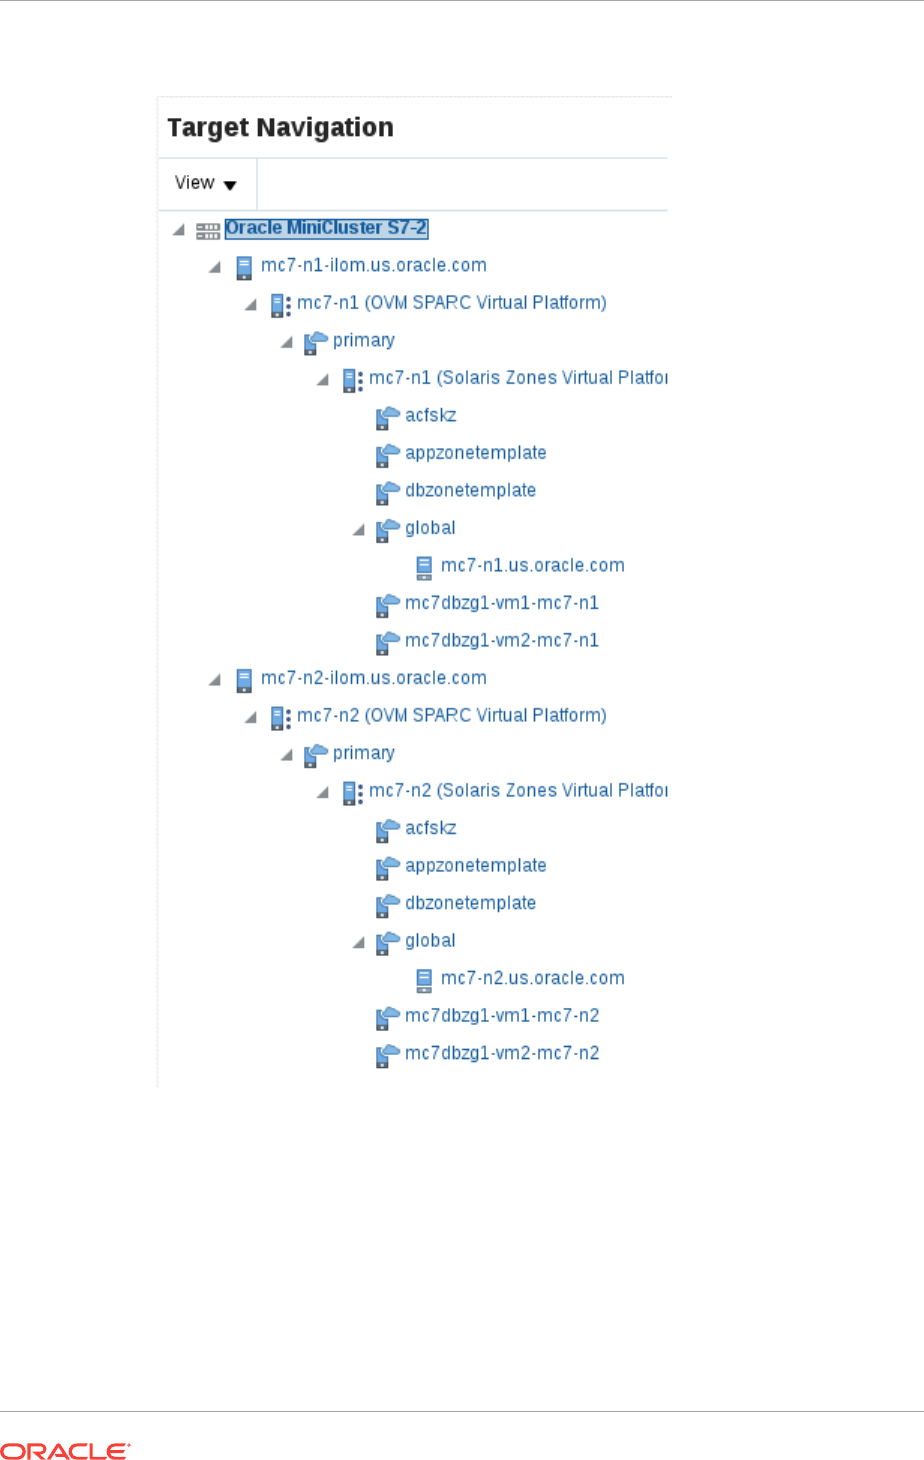
Figure 37-1 Target Navigation of Oracle MiniCluster
After the Enterprise Manager Agents are deployed to the Oracle MiniCluster Oracle
Solaris global zones, you can view the Virtualization stack for each compute node.
See Monitoring Oracle Solaris Zones and Monitoring Oracle VM Server for SPARC for
details about the Virtualization stack.
37.4 Viewing the Oracle MiniCluster System
The Oracle MiniCluster landing page provides information about the system and
aggregated information about the targets it contains. The page is divided into two
Chapter 37
Viewing the Oracle MiniCluster System
37-2

parts. The top region consists of dashlets which provides you the general overview of
the system.
The first dashlet is the Summary dashlet. It displays the summary of the system, that
is, total number of most important target types (servers, disk shelves).
The second dashlet displays the number of open incidents grouped by severity. Oracle
MiniCluster collects incidents from all associated targets. You can get more details
about incidents by clicking on the numbers in the dashlet. The details are displayed in
a table with information such as Target, Summary, Last Updated, Acknowledged, and
Status. You can click on a target to view more information of the particular target or
click on the summary to view the details of the incident.
The third dashlet displays the time of the last configuration change and last reported
incident.
The main page consists of two tabs
The first tab displays the physical view of Oracle MiniCluster servers and disk shelves.
Switch between servers and disk shelves using the carousel on the left side of the
screen. Click on any target to view important information and to open the target's
landing page.
The second tab displays information about disk shelves attached to the servers. Select
one or more disk shelves to see details about configuration and status of the disks
mounted in the disk shelf.
37.4.1 Physical View of Oracle MiniCluster
Physical view of the Oracle MiniCluster system provides an overview of the Oracle
MiniCluster system components. You can switch between the MiniCluster system
servers and disk shelves using the carousel on the left side. You can click any target
or component to get more information about it. If there are any incidents on a target,
that particular target is highlighted by a red border to indicate it needs attention. Click
on the target to view incidents grouped by severity. You can then click the severity to
open the incident manager where you can further interact with the incident.
You can switch between several representations of the physical view.
•Photorealistic view provides a realistic picture of the system, providing detailed
graphics of all the components.
•Schematic view is data oriented and displays the most important information such
as locator light, status, temperature, host name. Each component in the view has
its color based on the type for easy identification of the component.
•Table view is a tabular representation of the physical view, providing a list of
displayed components with the most important information.
Chapter 37
Viewing the Oracle MiniCluster System
37-3
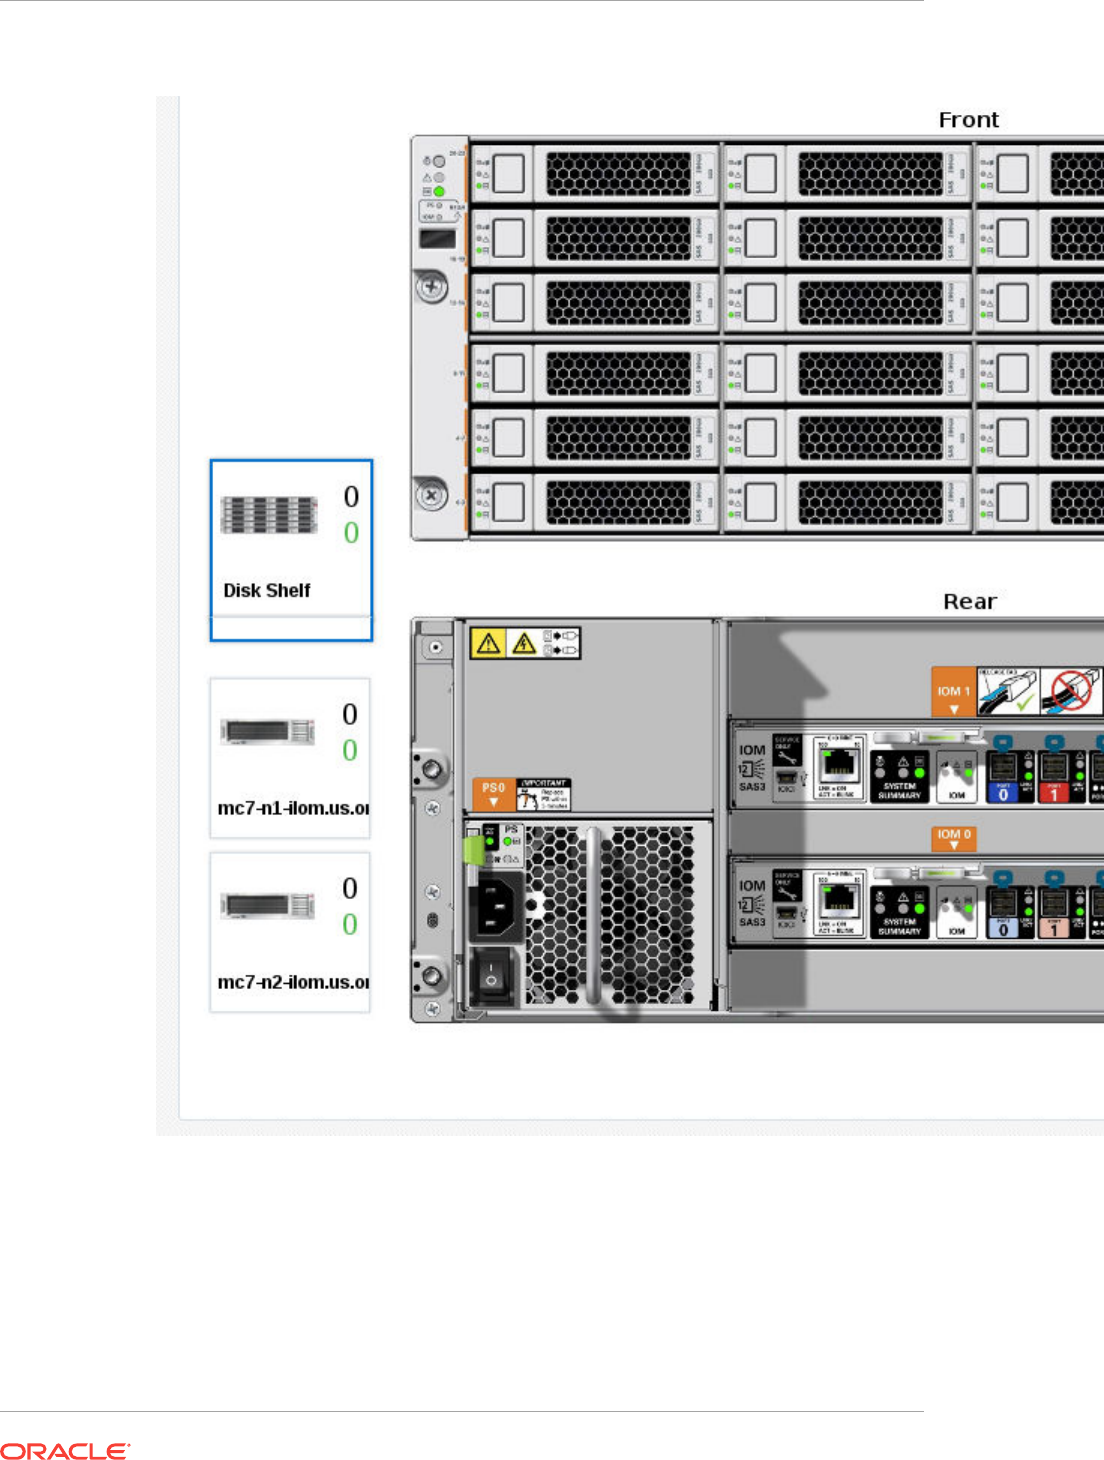
Figure 37-2 Oracle MiniCluster Rack View
37.4.2 Storage View of Oracle MiniCluster
Storage view of the Oracle MiniCluster system displays overview of the disk shelves
connected to the system including configuration and monitoring status information.
Chapter 37
Viewing the Oracle MiniCluster System
37-4
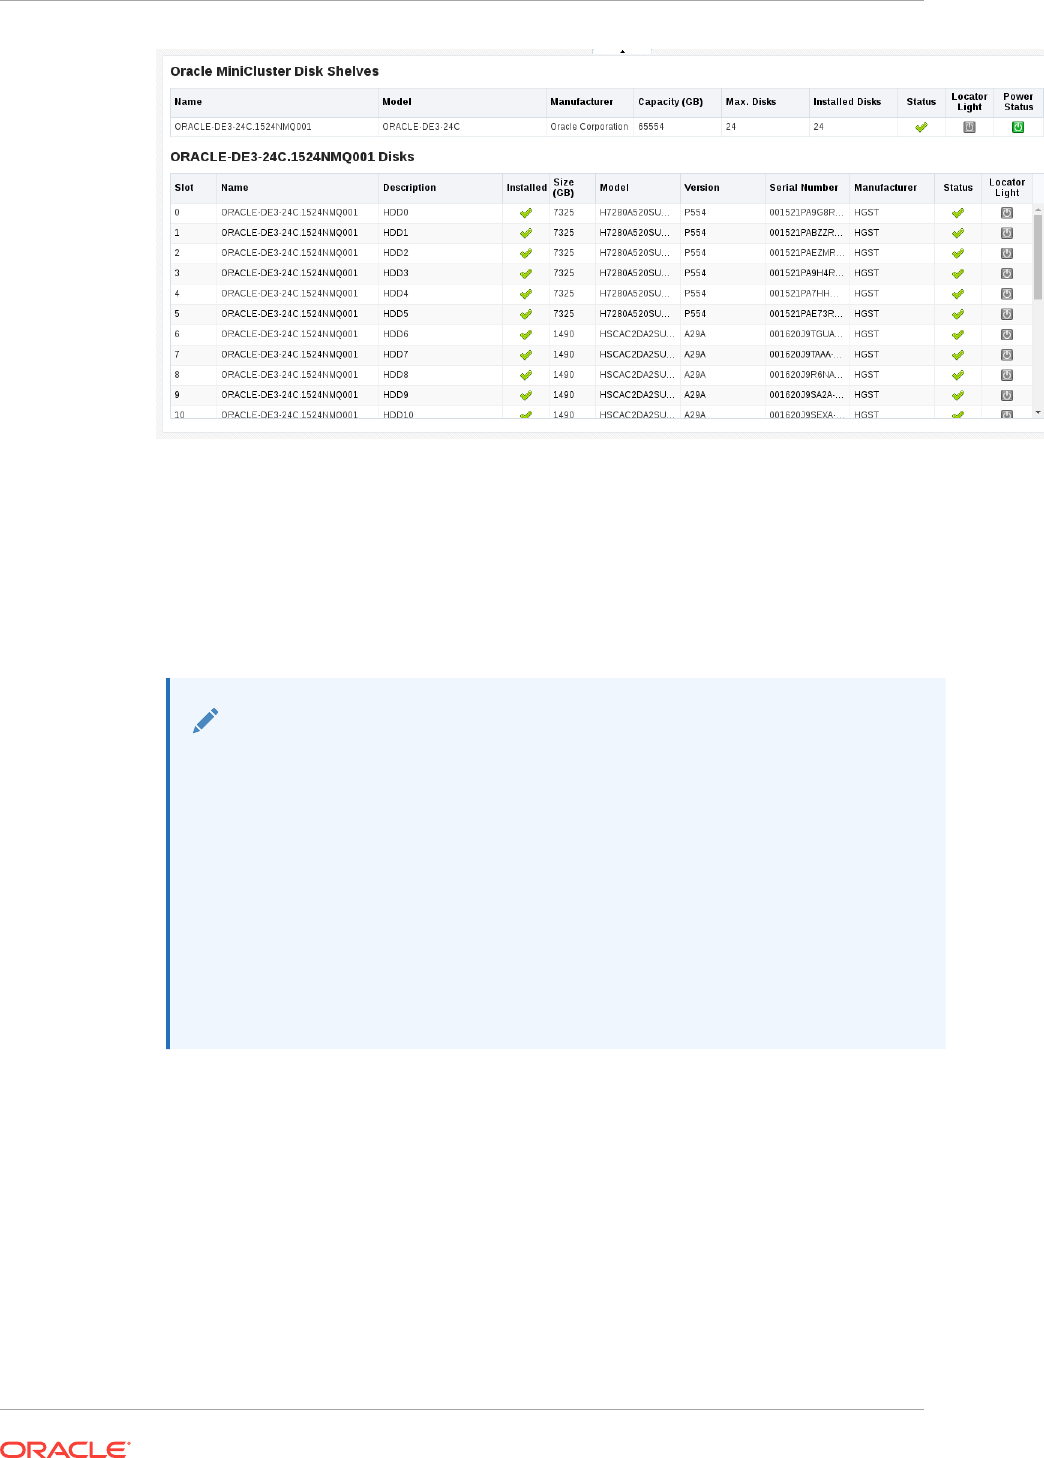
37.4.3 Virtualization Management on the Oracle MiniCluster System
For Oracle MiniCluster virtualization management, the Enterprise Manager Agent has
to be deployed to each of the virtualization platforms that is planned to be managed.
You can install EM Agents into Oracle Solaris Global and Non-Global Zones using Add
Host Targets wizard.
Note:
To enable monitoring of Oracle VM for SPARC the non-privileged user used to
install and run the Enterprise Manager agent must be granted
the solaris.ldoms.read and solaris.ldoms.ldmpower authorizations
and be assigned the LDoms Power Mgmt Observability rights profile.
For example:
/usr/sbin/usermod -A
solaris.ldoms.read,solaris.ldoms.ldmpower oracle
/usr/sbin/usermod -P 'LDoms Power Mgmt Observability'
oracle
37.5 Related Resources for Oracle MiniCluster
See the following for more information:
•Discovering and Adding Host and Non-Host Targets
•Discovering, Promoting, and Adding System Infrastructure Targets
•Using Incident Management
•Enterprise Monitoring
Chapter 37
Related Resources for Oracle MiniCluster
37-5

38
Managing Oracle SuperCluster
The following information is included in this chapter:
•Getting Started with Oracle SuperCluster
•Actions for Oracle SuperCluster
•Target Navigation for Oracle SuperCluster
•Viewing the Oracle SuperCluster System
•Related Resources for Oracle SuperCluster
38.1 Getting Started with Oracle SuperCluster
Oracle SuperCluster is an Oracle Engineered System that integrates SPARC compute
nodes, an Oracle ZFS Storage Appliance, InfiniBand and Cisco switches, PDUs, and
Exadata Storage Servers into a single or multi-rack system.
Oracle SuperCluster is supported in the following configurations:
•SPARC SuperCluster T4-4
•Oracle SuperCluster T5-8
•Oracle SuperCluster M6-32
•Oracle SuperCluster M7-8
To be able to start target monitoring, it is necessary to discover it. The discovery is
made quick and easy with the Guided Discovery Wizard that guides you through the
whole process, requests only for necessary information, and helps you solve possible
issues in order to successfully complete the discovery.
38.2 Actions for Oracle SuperCluster
You can perform the following actions, depending on the requirements.
•Discover Oracle SuperCluster
•View the Oracle SuperCluster system
•Monitor the Oracle SuperCluster system
38.3 Target Navigation for Oracle SuperCluster
The target navigation tree helps you to navigate between targets in the Oracle
SuperCluster system. The first level under the Oracle SuperCluster consists of Racks
and M-series servers. Subsequent levels consist of other hardware targets in the
system which are logically grouped by their type. Figure 38-1 displays the hardware
structure of the Oracle SuperCluster system. All targets are logically grouped by their
type, except for the ZFS Appliance. Disk shelves are not listed in the navigation tree,
see Managing Storage for more information.
38-1
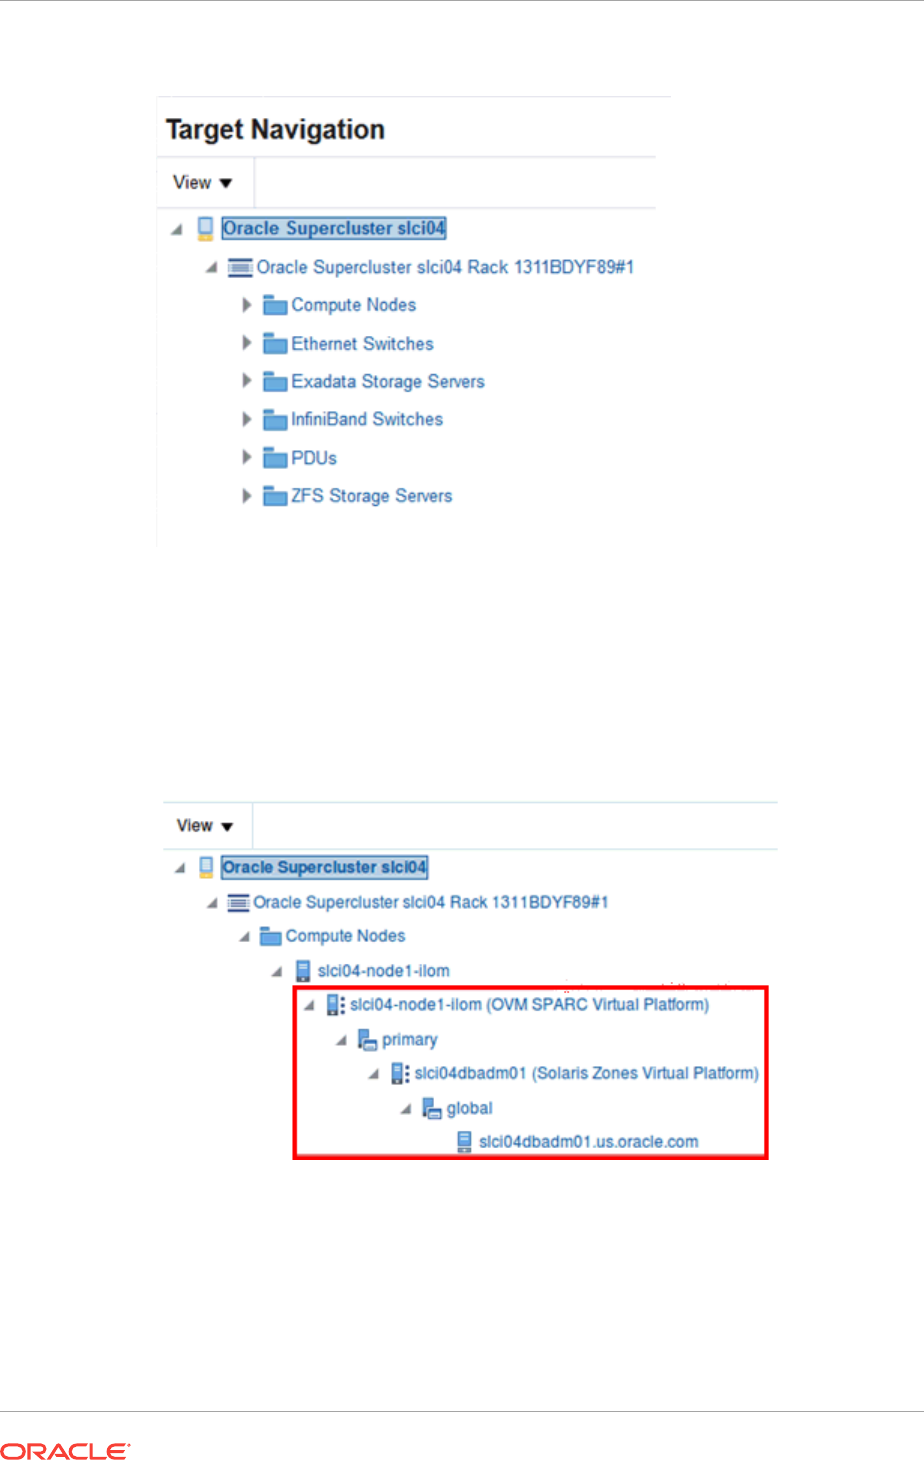
Figure 38-1 Target Navigation of Oracle SuperCluster
After the Enterprise Manager Agents are deployed to the Oracle SuperCluster VM
Servers for SPARC and Solaris zones, you can view the Virtualization stack for each
compute node as seen in Figure 38-2. See Monitoring Oracle Solaris Zones and
Monitoring Oracle VM Server for SPARC for details about the Virtualization stack.
Figure 38-2 Oracle SuperCluster Target Navigation with Virtualization Stack
38.4 Viewing the Oracle SuperCluster System
The Oracle SuperCluster landing page provides information about the system and
aggregated information about the targets it contains. The page is divided into two
parts. The top region consists of dashlets which provide you the general overview of
the system.
Chapter 38
Viewing the Oracle SuperCluster System
38-2

The first dashlet is the Summary dashlet. It displays the summary of the system, that
is, total number of most important target types (racks, switches, servers, Exadata
cells), amount of available memory, and number CPU cores.
The second dashlet displays the number of open incidents grouped by severity. Oracle
SuperCluster collects incidents from all associated targets. You can get more details
about incidents by clicking on the numbers in the dashlet. The details are displayed in
a table with information such as Target, Summary, Last Updated, Acknowledged, and
Status. You can click on a target to view more information of the particular target or
click on the summary to view the details of the incident.
The third dashlet displays the time of the last configuration change and last reported
incident.
The main page consists of one tab that displays the physical view of Oracle
SuperCluster. Click on any target to view important information and to open the
target's landing page. You can also switch to a different rack or M-series server by
selecting it in the left menu (available only if there is more than one rack or M-series
server in the system.)
38.4.1 Physical View of Oracle SuperCluster
Physical view of the Oracle SuperCluster system provides an overview of how the
Oracle SuperCluster system is physically structured in the rack.If there is more than
one rack or M-series server in the system, you can select a target from the selector
available on the left side to view its detailed physical layout. (The selector is hidden if
only one rack or server is present). You can click any target or component to get more
information about it.If there are any incidents on a target, that particular target is
highlighted by a red border to indicate it needs attention. Click on the target to view
incidents grouped by severity. You can then click the severity to open the incident
manager where you can further interact with the incident.
You can switch between several representations of the physical view.
•Photorealistic view provides a realistic picture of the system, providing detailed
graphics of all the components.
•Schematic view is data oriented and displays the most important information such
as locator light, status, temperature, host name. Each component in the view has
its color based on the type for easy identification of the component.
•Table view is a tabular representation of the physical view, providing a list of
displayed components with the most important information.
Figure 38-3 displays the front and rear views of the Oracle SuperCluster system.
Chapter 38
Viewing the Oracle SuperCluster System
38-3
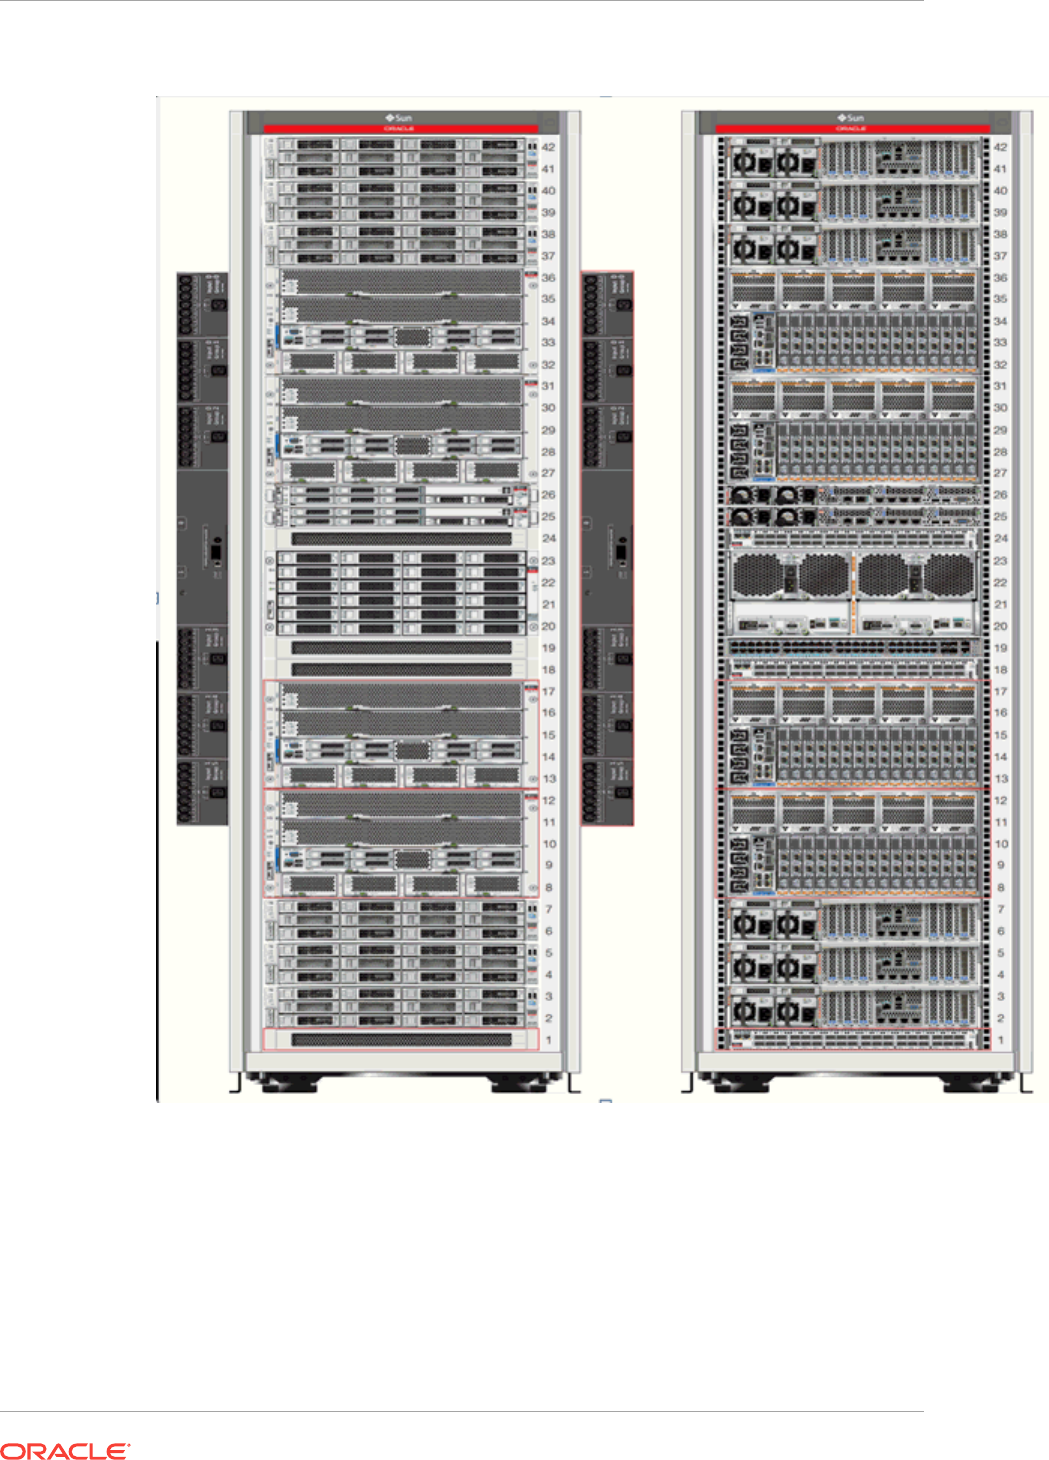
Figure 38-3 Oracle SuperCluster Rack View
38.4.2 Virtualization Management on the Oracle SuperCluster System
For Oracle Supercluster virtualization management, the Enterprise Manager Agent has
to be deployed to each of the virtualization platforms that is planned to be managed.
To monitor Oracle VM Server for SPARC, deploy the EM Agent for Host targets to the
Control Domain Operating System. This agent monitors all the Oracle VM Server for
SPARC resources as well as the Solaris zones configured on the Control Domain.
After the Enterprise manager Agent is deployed on the guest domain operating
Chapter 38
Viewing the Oracle SuperCluster System
38-4

system, Solaris zones configured in guest domains are monitored. You can install EM
Agents into Control Domain and Oracle Solaris Zones using Add Host Targets wizard.
38.5 Task Title
The Oracle SuperCluster can be removed in Enterprise Manager without SuperCluster
members. So If the rack Oracle SuperCluster is deleted, the targets which are part of
the Oracle SuperCluster System are not deleted from the Enterprise Manager and can
be still accessed in the All Targets view. Or Oracle SuperCluster can be removed
including targets which are part of the Oracle SuperCluster System. In this case
targets placed in racks which are part of the Oracle SuperCluster System will be
removed too.
Perform the following steps to delete Oracle Supercluster:
1. In the rack landing page, select the Target menu drop-down list.
2. Select Target Setup, then click Remove Target.
3. If you want remove targets which are part of the Oracle SuperCluster System,
select “Remove all targets associated to target Oracle Supercluster”. A list of
targets which are part of the Oracle SuperCluster system will be shown.
4. Some targets cannot be removed. Such targets have a red cross in the column
Removal Details including a reason of why target cannot be removed.
Unremovable targets will not be removed when Oracle SuperCluster target is
removed.
5. Some targets provide a custom removal flow (like SNMP monitoring
unsubscription). Such targets have a yellow exclamation mark in the column
Removal Details. If you want to remove target with a custom removal flow, go to
the target’s landing page and remove the target from there. If you don't remove
targets with custom removal flow, they will be removed along with Oracle
SuperCluster without custom removal options available in their removal flows.
6. Click Yes to confirm. Oracle SuperCluster is deleted.
38.6 Related Resources for Oracle SuperCluster
See the following for more information:
•Discovering and Adding Host and Non-Host Targets
•Discovering, Promoting, and Adding System Infrastructure Targets
•Using Incident Management
•Enterprise Monitoring
Chapter 38
Task Title
38-5

39
Monitoring Oracle Operating Systems
This chapter contains information about monitoring Oracle Solaris and Linux operating
systems, or hosts.
The following topics are covered:
•Get Started with Monitoring Oracle Operating Systems
•Location of Oracle Operating System Information in the UI
•Features of Operating Systems
•About the Dashboard for all Hosts
•How to Get Information About a Specific Host
•About Open Incidents
•Overview of Performance and Resource Metrics
•About Host Memory
•Viewing Host Storage
•Viewing Network Connectivity
•About Boot Environments
•Viewing Running Host Processes
•Viewing Managed Host Services
•Working with Host Metrics
•Managing Metrics and Incident Notifications for Hosts
•About Host Compliance
•Related Resources for Operating Systems
39.1 Get Started with Monitoring Oracle Operating Systems
The operating system is part of the core platform and its metrics are leveraged across
other targets in Enterprise Manager. This chapter only covers Oracle Solaris and Linux
monitoring.
To view all the hosts monitored by Oracle Enterprise Manager, select Hosts in the
Targets menu of the Enterprise Manager Cloud Control. The Hosts section of the user
interface displays Oracle Solaris and Linux operating system configuration, resource
and process metrics.
Performance and configuration metrics provide you with a unified view of an operating
system's CPU, memory, and process resource usage, enabling you to manage and
optimize resources.
Monitoring is activated when you discover and manage the operating system. A series
of escalating status levels notifies you when something is not operating as expected.
39-1

The lowest level incident status is warning, then critical, and the highest level is a fatal
incident.
The information on an operating system is designed to help you maximize
performance and utilization. The Host Summary provides a high-level overview of the
host. You can drill down to view CPU and resource usage and deeper to view the
processes that are running on the host, and real time display of current top processes
on a host.
The following features are available for operating systems:
•OS details: Displays operating system resource and processes information, Oracle
Solaris Zones and boot environments.
•Incidents: Notification of incidents with links to view details. A series of monitoring
rules and parameters monitor your managed assets. Events and incidents are
raised for resources that are not performing as expected.
•Performance: Analytics: Provides a detailed view into operating system
performance and resource usage.
•Configuration: Indicates configuration changes to the operating system.
39.2 Location of Oracle Operating System Information in the
UI
Oracle Solaris and Linux operating system information is located in the following
locations in the user interface.
Table 39-1 Location of Operating System Information in the UI
Object Location
All Oracle Solaris and Linux
operating systems
Select Hosts in the Targets selector.
If the operating system parameter does not appear in the table,
click View, click Columns, then select the Operating System
parameter. To view the version, select Target Version.
A specific Oracle Solaris or
Linux operating system
Select Hosts in the Targets selector. Click the host to display the
Home page.
System resources for a
specific Oracle Solaris or
Linux operating system
Select Hosts in the Targets selector. Click the host to display the
Summary page. To view more details, click one of the following
tabs on the right side of the Host page: CPU, Host Memory,
Storage, Network Connectivity, Host Processes, or Host
Services.
Monitoring metrics and
details, Program Resource
Utilization, Metric and
Collection Settings, Metric
Collection Errors, Status
History, Incident Manager,
Alert History, and Blackouts
and Brownouts.
Select Hosts in the Targets selector. Click the host to display the
Home page. Click the Host drop down menu, then click
Monitoring.
Chapter 39
Location of Oracle Operating System Information in the UI
39-2
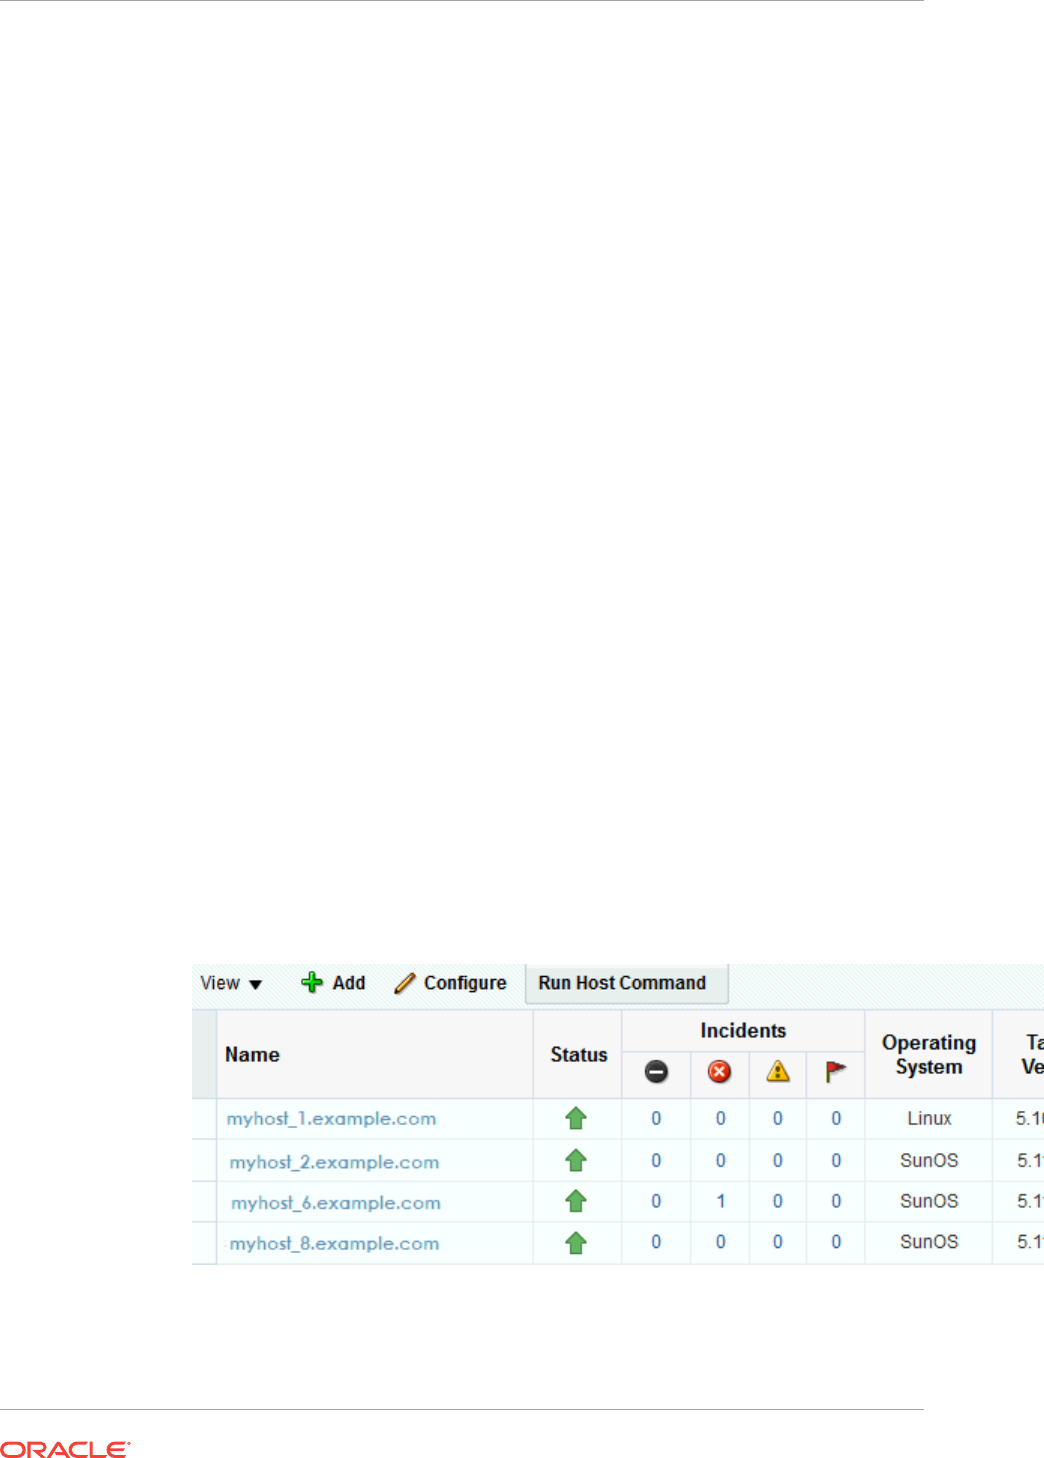
39.3 Features of Operating Systems
You can perform the following actions:
•View the configuration and status of hosts
•View host details
•View the platform, physical or virtual, on which the operating system is deployed
•View CPU and memory resource utilization and the top process utilization
•Diagnose problems using incidents and performance metrics
39.4 About the Dashboard for all Hosts
The Hosts dashboard is a sortable table that contains details about the managed
hosts, including incidents, the type of operating system, the operating system version,
CPU and memory utilization. More than 40 host parameters are available. A few
parameters are selected by default, others are hidden. You can change the
parameters that appear in the dashboard and the order in which they appear.
39.4.1 Viewing the Dashboard of all Hosts
1. From the Targets menu, select Hosts.
The Hosts page displays all managed hosts, including operating system details.
You can sort most of the columns in either ascending or descending order.
2. Click View, then Columns to view or edit the parameters to display in the
dashboard.
3. To add or remove parameters, select or deselect the parameter in the View menu.
For example, you might want to display the Incidents, Operating System, and
Target Version.
Figure 39-1 Hosts Dashboard
Chapter 39
Features of Operating Systems
39-3
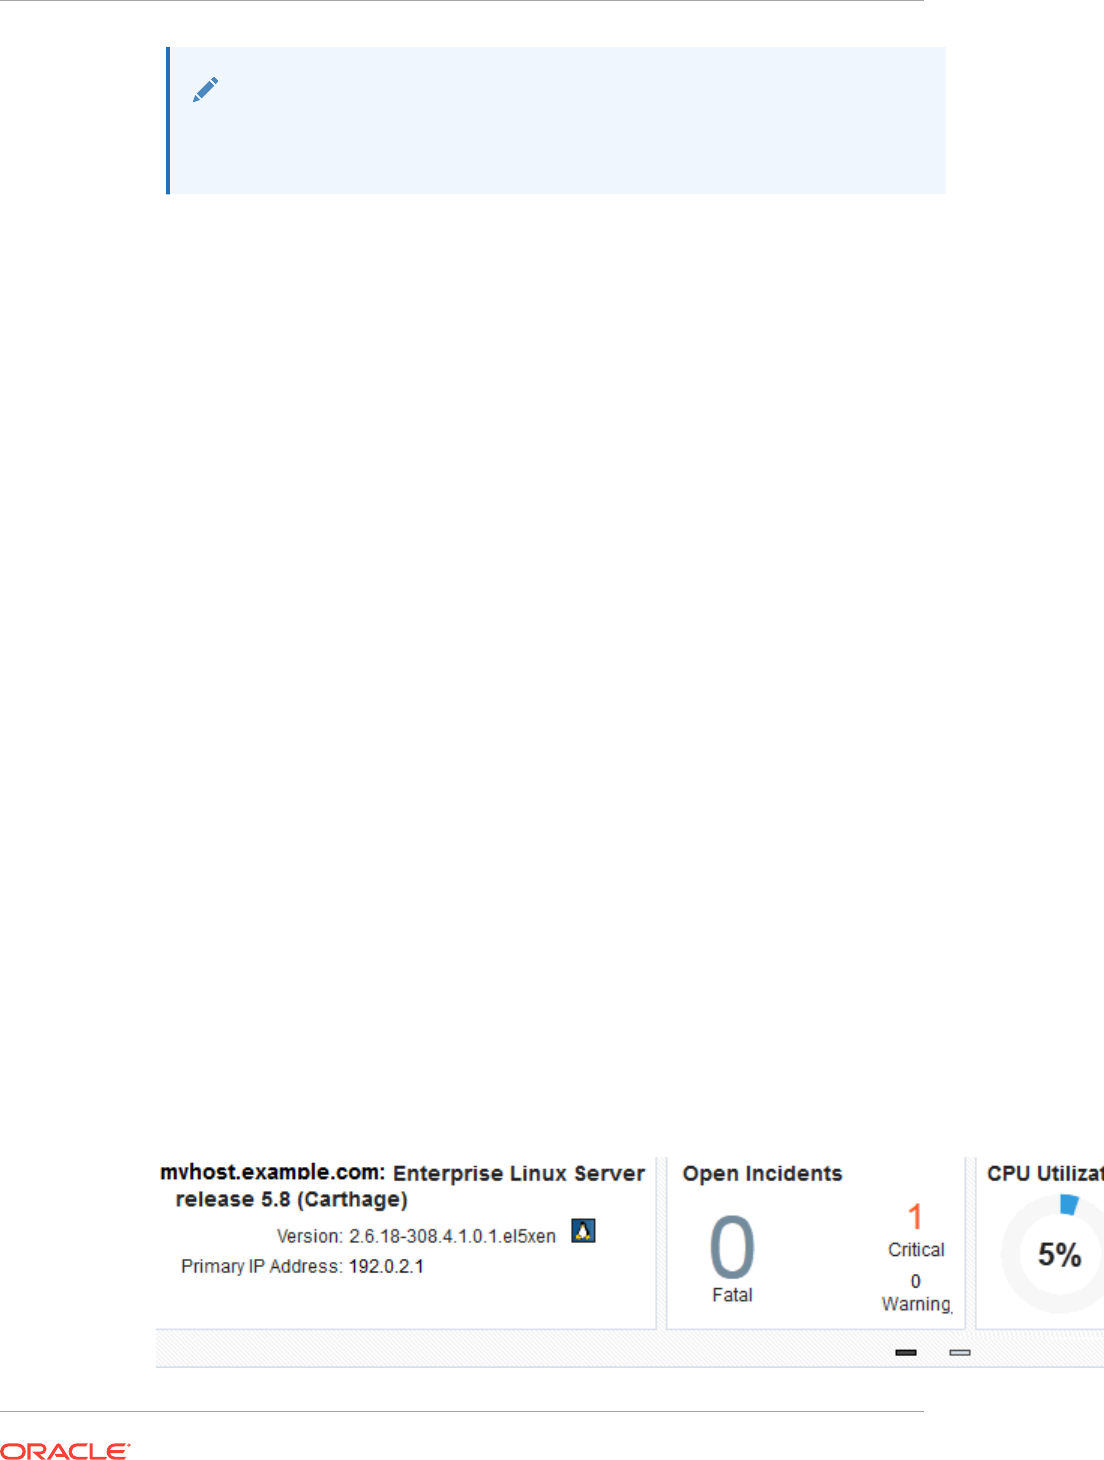
Note:
The Oracle Solaris operating system might appear as SunOS in the user
interface and the 11.0.0.0 release might appear as Target Version 5.11.0.0.0.
4. (Optional) You can reorder the columns that appear on the dashboard. Click View,
then Reorder Columns. Select a column and use the arrow button to move the
selected item to a different position. Click OK to save the change.
39.5 How to Get Information About a Specific Host
The Home page displays details and metrics for the selected operating system:
•Dashlets: A series of dashlets at the top of the page contains summary information
and might be associated with a more detailed information that is in a tab.
•Tabs: A series of tabs on the right side of the page link to more detailed
information.
•Host menu: Links to detailed information about the host, including performance
and configuration metrics, metric collection settings, status history, incidents, alert
history, and blackout and brownouts.
39.5.1 Viewing the Host Target Home Page
You can view a summary of managed operating system targets.
1. From the Targets menu, select Hosts.
The Hosts page appears with a list of all managed hosts. You can sort the list.
2. Click the host name from the list of managed hosts to display the Home page for
that host.
The Home page contains a series of dashlets that provide useful information about
the host and a summary of the host details and utilization.
39.5.2 About Dashlets for Hosts
The top of the host page contains a series of dashlets that provide a quick view of top
statistics. Click the small button below the row of dashlets to toggle to the next series
of dashlets.
Figure 39-2 Dashlets
Chapter 39
How to Get Information About a Specific Host
39-4

The following dashlets are available:
•Host details: Provides a short summary, including the host name, type of operating
system, version and release, primary IP address, and the length of up time for the
operating system.
•Open Incidents: Shows the number of Fatal, Critical, and Warning incidents.
Mouse over the number to see a small snapshot of the incident. Click a number or
a summary link to navigate to the Incident Manager console for incident details.
•CPU Utilization and Memory Utilization: Shows a graphical and number
percentage for CPU and Memory utilization.
•OS Services State: A pie chart shows the percentage of services that are running,
stopped, no state, and other states.
•Configuration changes: Shows the data and time of the last configuration change
and last reported incident.
39.5.3 About Tabs for Hosts
The following tabs appear on the host home page and are represented with icons on
its right side, click a tab to display more information:
•Summary: Displays host details, swap, CPU, CPU threads, memory utilization,
filesystem distributions, network usage.
•CPU: Displays performance and resource metrics. The following performance and
process utilization graphs are available: CPU Utilization, System Loads, CPU
Threads Utilization (including Processor Group Threads Utilization for Oracle
Solaris, and CPU Frequency State for Oracle Solaris on SPARC.)
•Host Memory: View of an operating system's memory utilization, IPCS and swap
details.
•Storage: Links to detailed storage information, including the disks, filesystem,
volume group and SAN configuration.
•Network Connectivity: Shows the network interface and subnet.
•Boot Environments: Displays the available alternate boot environments and boot
environment snapshots for Oracle Solaris operating systems.
•Host Processes: View of an operating system's top CPU, memory utilization, and
process resource usage.
•Host Services: View the services that are managed by the operating system and
the state of the services.
39.6 About the Host Menu
The Host menu contains links to detailed information about the host, including
monitoring and configuration information.
The following information is available in the Host Monitoring menu:
•CPU Details
•Memory Details
•Disk Details
Chapter 39
About the Host Menu
39-5

•Program Resource Utilization
•All Metrics
•Metric and Collection Settings
•Metric Collection Errors
•Status History
•Incident Manager
•Alert History
•Blackouts
39.6.1 Viewing the Host Monitoring Menu
1. Click Hosts from the Targets page.
2. Click the target name to open the home page.
3. Click Host in the upper left corner of the page, then click Monitoring.
4. Click an option to view greater detail. For example, click All Metrics to view all
metrics collected.
39.7 About Open Incidents
You can view all open incidents on the Hosts dashboard, or you can view open
incidents for a specific host on the open incidents dashlet of the Host home page.
The Hosts Dashboard lists all managed hosts and displays open incidents. You can
sort the columns, or click a number in a column to navigate directly to the Incident
Manager page for details. Alternatively, you can click the host name to view more
about the host and the incident from the host's home page. The Open Incident dashlet
on the Host home page displays the number of Fatal, Critical, and Warning incidents.
39.7.1 Viewing Open Incidents
To view an open incident from the host's Home page:
1. From the Targets menu, select Hosts.
The Hosts page appears with a list of all managed hosts. You can sort the list.
2. Click the host name from the list of managed hosts to display the Home page for
that host.
3. Click the number to view a summary of the open incidents.
4. Click the summary text to navigate to the Incident Manager.
Figure 39-3 Open Incidents Dashlet for a Host
Chapter 39
About Open Incidents
39-6

The Incident Manager provides incident details and the events that led to the incident.
Events, Notifications, My Oracle Support Knowledge tabs are located on the individual
bookmarks of an Incident Manager page (horizontally from left to right). If you are
online, a link will take you to My Oracle Support.
You can acknowledge the incident, add comments, or manage the incident from the
Incident Manager page.
39.7.2 Identifying Changes in an OS Configuration
When an administrator changes a host configuration, it can be helpful to know when
the configuration was last changed. This information appears in the configuration
dashlet on the Home page. Detailed configuration information is available, including
the ability to compare.
1. Click Hosts from the Targets page.
2. Click the target name to open the home page.
3. Click Host in the upper left corner of the page. Click Configuration.
4. Click the option to view Last Collected, Comparison & Drift Management,
Compare, Search, History, Save, Saved, or Topology.
39.8 Overview of Performance and Resource Metrics
Performance and resource metrics provide details on the kernel configuration and
performance, helping you to identify issues. The CPU Load chart and Free Memory
chart enable you to easily view the status. High level CPU and Memory usage are
available in the Summary tab with more details in the CPU and Host Memory tabs.
CPU data for the following metrics is collected every 15 minutes and appears in the
CPU tab:
•About CPU Utilization
•About CPU Threads Utilization
•About Processor Group Utilization for Oracle Solaris 11
The following options are available for you to view kernel information:
•Shared memory
•CPU I/O wait and buffer cache read/write details
•Physical I/O read/write, disk and disk block read/writes
•Run queue length and paging activity
•Tunable kernel parameters
Resource metrics provides details on the operating system, the available resources,
and the load on the operating system or zone.
The following details are available:
•Memory, total and available
•Swap, total configured and available
•CPU details, including the vendor name, number, frequency, revision and mask
Chapter 39
Overview of Performance and Resource Metrics
39-7

•Number of cores and threads per CPU
•Bar chart showing the utilization percentage per CPU thread
•The amount of time spent by all CPUs in different frequencies for Oracle Solaris
•CPU and memory usage over time
39.8.1 About CPU Utilization
The CPU Utilization metric displays the percentage utilization of a CPU over time for
Oracle Solaris and Linux targets. An abnormally high value indicates that the system is
under heavy load. If the value is consistently high, consider reducing the load on the
system.
CPU data is collected every 15 minutes. The default display is a graphical
representation of the Run Queue Length with a red line for the 1 minute average, a
green line for the 5 minute average, and a yellow line for the 15 minute average. To
display the information in table format, click Table View.
39.8.2 Viewing CPU Metrics
To view the kernel and performance metrics for an operating system:
1. From the Targets menu, select Hosts.
The Hosts page appears with a list of all managed hosts. You can sort the list.
2. Click the host name from the list of managed hosts.
3. Click the CPU tab to view the metrics and charts.
The information appears in a graphical format. Click Table View to change the
format. You can adjust the time frame to display historical data for the last two (2)
hours, four (4) hours, 10 hours, one day, or one week. By default, CPU and
System Load appear. Deselect to remove the information from the graphs.
39.8.3 About CPU Threads Utilization
The CPU Threads Utilization metric collects CPU thread diagnostics for Oracle Solaris
and Linux targets, useful for analysis of multi-threaded CPUs. You can view the
efficiency and the metrics for each CPU thread.
To help you to gauge the efficiency, the following charts are available:
•Bar chart showing the number of CPU threads at each frequency
•Historical charts showing the percentage of time spent at different frequencies
39.8.4 About Processor Group Utilization for Oracle Solaris 11
In addition to the CPU Utilization, you can view the following processor group
utilization details for Oracle Solaris 11 operating systems:
•List of processor groups and the number of threads per group
•Bar chart of CPU utilization per processor group
•Type of group, such as integer pipeline
Chapter 39
Overview of Performance and Resource Metrics
39-8

39.9 About Host Memory
The Host Memory page provides you with a unified view of an operating system's
memory utilization.
The page displays the following information:
•Memory Utilization: Displays overall memory utilization. The default view is a
graphical representation of the percentage of memory used over time. You can
change the view to represent the MB of memory used over time. If you prefer, you
can view the overall memory utilization in a table instead of a chart.
•Virtual Memory: Displays overall virtual memory utilization. The default view is a
graphical representation of the percentage of swap space used over time. The
default view is a graphical representation of the MB of memory used over time.
You can change the view to represent the percentage of swap space used over
time. If you prefer, you can view the overall virtual memory utilization in a table
instead of a chart.
•Page Activity: Displays a paging statistics activity in a color-coded graph format.
The chart shows the following page activity: Address Translation Page Faults
appear as a blue line, Pages Paged-in appear as a green line, Pages Paged-out
appear as an orange line, Active Pages appear as a blue line, and the Pages
Scanned by Page Stealing Daemons appear as a violet line. All activity is on a per
second basis for a single day. If you prefer, you can view the data in a table
instead of a chart.
•Memory Details: A pie chart shows the memory details. The chart displays the
Free Memory, Used Memory, and Other Shared Memory as a percentage of the
entire memory.
•Swap File: Displays the swap file and amount of space used. A graphical
representation shows at a glance the amount of used and free swap space.
•ZFS ARC cache usage: Displays ZFS ARC (Adaptive Replacement Cache) usage
for Oracle Solaris operating systems.
39.9.1 Viewing Host Memory Utilization
To view host memory charts:
1. From the Targets menu, select Hosts.
The Hosts page appears with a list of all managed hosts. You can sort the list.
2. Click the host name from the list of managed hosts.
3. Click the Host Memory tab to view the metrics and charts.
In some cases, you can click Table View next to the chart to view the information
in a table format.
4. To change the y-axis of the Memory Utilization and Virtual Memory Utilization
charts to display as a percentage instead of in MB, select By Percentage. Select
the time frame from the Time Range menu to change the default from two hours.
Chapter 39
About Host Memory
39-9

39.9.2 Viewing Memory and Swap File Details
To view details about memory and swap file:
1. From the Targets menu, select Hosts.
The Hosts page appears with a list of all managed hosts. You can sort the list.
2. Click the host name from the list of managed hosts.
3. Click the Host Memory tab, then click IPCS & Swap Details in the center pane.
39.9.3 Viewing Memory Details for a Host
1. Click Hosts from the Targets menu.
2. Click the target name to the home page.
3. Click Host in the upper left corner of the page. Click Monitoring, then click
Memory Details.
39.10 Viewing Host Storage
Host Storage contains links to detailed storage information, including the disks,
filesystems, volume group and SAN configuration. You can view all storage, or filter by
volume name, or select to view only local or remote storage.
1. From the Targets menu, select Hosts.
The Hosts page appears with a list of all managed hosts. You can sort the list.
2. Click the host name from the list of managed hosts.
3. Click the Host Storage tab.
4. Select Local or Remote to view a subset of storage. Enter a name in the Volume
Name field to filter your results.
5. Click the icon for the storage details you want to view. For example, for Linux the
options are Disks, Filesystems, Linux LVM Volume Group(s), and SAN
Configuration.
39.11 Viewing Network Connectivity
Network Connectivity shows the network interface and subnet to associate with the
host.
You can view different layers of the network:
•Network interface: View the network state, subnet and flag details for each
network interface
•Data link: View the data link state, and physical address, and the type of media,
such as ethernet, for each data link.
1. From the All Targets or Hostsmenu, select Hosts.
The Hosts page appears with a list of all managed hosts. You can sort the list.
2. Click the host name from the list of managed hosts.
Chapter 39
Viewing Host Storage
39-10

3. Click the Network Connectivity tab.
4. Click the icon to display the Interfaces or Data links layer.
39.12 About Boot Environments
Oracle Solaris 11 Boot Environments use the
beadm
utility and ZFS file systems to
create and manage boot environments. The Oracle Solaris 11 software automatically
creates boot environments.
A boot environment is an instance of a bootable Oracle Solaris image plus additional
software packages that are installed onto the image, and the set of all file systems and
devices (disk slices and mount points) that are required to operate an Oracle Solaris
OS instance. A system can have only one active boot environment, which is the
booted environment. An alternate boot environment is an inactive environment that is
not currently booted. A system can have many inactive boot environments.
A dual boot environment is often used to manage updates because it can significantly
reduce the service outage time that is usually associated with patching. Maintaining
multiple boot environments also enables quick and easy rollback to a version before
the patches were applied, if needed.
The Boot Environment tab of the Oracle Solaris operating system page displays
Oracle Solaris boot environment and file system details, including all available boot
environments, the size, and the synchronization date. For a selected boot
environment, you can view snapshot details, file system details, and any associated
zone boot environments. This tab is only available for Oracle Solaris operating
systems
The Boot Environment tab of the Oracle Solaris operating system page displays
Oracle Solaris boot environment and file system details, including all available boot
environments, the size, and the date the environment was created or synchronized.
The Boot Environment tab is only available for Oracle Solaris operating systems
39.12.1 Viewing Oracle Solaris Boot Environments
1. From the Targets menu, select Hosts.
2. Select an Oracle Solaris operating system from the list of managed hosts.
3. Click the Boot Environments tab to view the boot environment snapshot and file
system details. The file system details are at the bottom of the page, after the boot
environments.
4. Expand the operating system to display snapshots of the boot environments.
39.13 Viewing Running Host Processes
The Host Processes page provides you with a unified view of an operating system's
top processes, including the CPU and memory utilization of each process.
1. From the Targets menu, select Hosts.
The Hosts page appears with a list of all managed hosts. You can sort the list.
2. Click the host name from the list of managed hosts.
3. Click the Host Processes tab to view the processes.
Chapter 39
About Boot Environments
39-11

39.14 Viewing Managed Host Services
With Host Services, you can see which services are managed by the operating system
and the state of the services. This is useful when you want to quickly identify which
services are in need of attention and the state of services that are important to you.
Host Services monitors and displays the services running on a host. You can view the
current state of a service. However, you cannot create, delete, or modify the properties
of a service. Fault Management Resource Identifier (FMRI) identifies each service on
the system.
The following are the service states:
•Running: The service is running.
•Stopped. The service is either disabled or offline and the service is not running.
The Host Services page displays the service state, the number of spawned process
identifiers, and the spawned process identifiers (PIDs).
1. Click Hosts from the Targets menu.
2. Click the host name from the list of managed hosts to display the Summary page
for that host.
3. Click the Second dashlet series button below the dashlets to view a chart
summarizing the current status of services.
4. Click the Host Services tab on the right side of the user interface to view details of
the services.
5. The default view is to display stopped services. Click the radio button to change
the view. For Oracle Solaris, the options are: Offline, Online, or All. For Linux, the
options are: Stopped, Running, or All.
6. Click a number to view the spawned process identifiers (PIDs.)
39.15 Working with Host Metrics
More detailed host metrics are available from the Hosts menu, including the following:
•Viewing CPU, Memory, and Disk Details for a Host
•Viewing a Host's Program Resource Utilization
39.15.1 Viewing CPU, Memory, and Disk Details for a Host
1. Click Hosts from the Targets menu.
2. Click the target name to the home page.
3. Click Host in the upper left corner of the page. Click Monitoring, then click CPU
Details, Memory Details, or Disk Details.
39.15.2 Viewing a Host's Program Resource Utilization
1. Click Hosts from the Targets menu.
2. Click the target name to open the home page.
Chapter 39
Viewing Managed Host Services
39-12

3. Click Host in the upper left corner of the page. Click Monitoring, then click
Program Resource Utilization.
39.15.3 Viewing All Metrics
1. Click Hosts from the Targets menu.
2. Click the target name to open the home page.
3. Click Host in the upper left corner of the page. Click Monitoring, then click All
Metrics.
4. (Optional) To view by category instead of by metric, click View, then click By
Metric Category.
5. Click a metric to view details, collection schedule, upload interval and other details.
39.16 Managing Metrics and Incident Notifications for Hosts
You can perform the following tasks to manage monitoring and incident notification:
•Viewing Host Metric Collection Error
•Editing Metric and Collection Settings for Hosts
39.16.1 Viewing Host Metric Collection Error
Metric collection errors are usually caused by installation or configuration issues.
1. Click Hosts from the Targets menu.
2. Click the target name to open the home page.
3. Click Host in the upper left corner of the page. Click Monitoring, then click Metric
Collection Errors.
39.16.2 Editing Metric and Collection Settings for Hosts
The Metrics tab contains displays all of the monitored attributes. The default view is
metrics with thresholds. For these types of monitored attributes, you can modify the
comparison operator, the threshold limits, the corrective action, and the collection
schedule.
1. Click Hosts from the Targets menu.
2. Click the target name to open the home page.
3. Click Host in the upper left corner of the page. Click Monitoring, then click Metric
and Collection Settings.
4. Modify threshold limits or collection schedule. When a threshold field is empty, the
alert is disabled for that metric.
5. Click the Edit icon for advanced settings.
Click the Other Collected Items tab to view non-threshold monitored attributes.
You can modify the collection period for these attributes, or disable monitoring.
Chapter 39
Managing Metrics and Incident Notifications for Hosts
39-13

39.17 About Host Compliance
Host compliance provides you information on the compliance frameworks, standards,
and the targets that are associated with the compliance standard selected in the
Compliance Standard Library.
Cloud Control displays the evaluation results and level of compliance of a target
against a compliance framework. The Compliance Frameworks evaluation results
provide an overview of the state of the framework, the level of compliance (Critical,
Warning, or Compliant.) and the criticality of any violations (Critical, Warning, or Minor
Warning.) You can view the average score, as a percentage, and the Author.
When Compliance Framework errors are detected, the following information is
available:
•Root Compliance Standard
•Root Compliance Standard State
•Parent Compliance Standard
•Rule
•Root Target Information
•Target Information
•Error Date
•Error Message
39.17.1 Viewing Compliance Frameworks
The Compliance Framework tab displays the evaluation results and errors, if any.
1. Click Hosts from the Targets menu.
2. Click the target name to open the home page.
3. Click Host in the upper left corner of the page. Click Compliance, then click
Results.
4. Click Compliance Frameworks to display the Evaluation Results tab.
5. Click the Errors tab to see if there are any Compliance Framework errors.
39.17.2 Viewing Compliance Standards
You can search for a specific compliance standard for a host and view the evaluation
results and errors.
1. Click Hosts from the Targets menu.
2. Click the target name to open the home page.
3. Click Host in the upper left corner of the page. Click Compliance, then click
Results.
4. Click Compliance Standards to display the Evaluation Results tab.
5. Click the Errors tab to see if there are any Compliance Framework errors.
Chapter 39
About Host Compliance
39-14

39.17.3 Viewing Target Compliance
The Target Compliance table lists the targets that are associated with the compliance
standard selected in the Compliance Standard Library.
1. Click Hosts from the Targets menu.
2. Click the target name to open the home page.
3. Click Host in the upper left corner of the page. Click Compliance, then click
Results.
4. Click Target Compliance to display the targets that are in compliance with the
standards.
39.18 Related Resources for Operating Systems
See the following for more information:
•Discovering and Adding Host and Non-Host Targets for the concepts around
discovering and adding targets.
•Discovering, Promoting, and Adding System Infrastructure Targets for how to
discover operating systems and other system infrastructure targets.
•Managing Storage for more details about viewing a host's storage filesystems and
viewing storage information.
•View Network Details of a Host Target for more information about the types of
information that are available.
•Using Incident Management for details on managing incidents.
Go to
http://docs.oracle.com/en/operating-systems/
for the following:
•Oracle Solaris documentation
•Oracle Linux documentation
Chapter 39
Related Resources for Operating Systems
39-15

40
Monitoring Oracle Solaris Zones
This chapter contains information about monitoring Oracle Solaris Zones.
The following topics are covered:
•Get Started with Monitoring Oracle Solaris Zones
•Location of Oracle Solaris Zone Information in the UI
•Actions for Zones
•Target Navigation for Zones
•How to Get Information About a Zone
•Working with Zone Platform Metrics
•Working with Zone-Specific Metrics
•Working with Incidents for Zones
•Managing Metrics and Incident Notifications for Zones
•Administering Zones
•Additional Resources for Oracle Solaris Zones
40.1 Get Started with Monitoring Oracle Solaris Zones
Oracle Solaris Zones, also known as Oracle Solaris Containers, are used to virtualize
operating systems and provide an isolated and secure environment for running
software applications. A zone is a virtualized operating system environment created
within a single instance of the Oracle Solaris operating system.
Think of a zone as a box with flexible, software-defined walls. One or more
applications can run in this box without interacting with the rest of the system. Because
zones isolate software applications or services, applications that are running in the
same instance of the Oracle Solaris OS are managed independently of each other. For
example, you can run different versions of the same application in separate zones.
Zones require a machine that is running at least an Oracle Solaris 10 operating
system. Solaris 11 global zone and Solaris 10 update 11 global zones are supported.
The global zone is the default operating system and has control over all of the
processes and has system-wide administrative control. The global zone oversees the
CPU, memory, and network resource allocation of all of the non-global zones. A global
zone always exists, even when no other zones are configured.
Non-global zones, or simply zones, are configured inside the global zone. Zones are
isolated from the physical hardware by the virtual platform layer. A zone cannot detect
the existence of other zones.
Kernel zones are zones that implement virtualization from within the global zone's
operating system kernel. Each kernel zone has a separate kernel from the global
zone, its own file systems and user space. Configuration of each zone (including the
global zone) puts limits on the CPU, memory and I/O resources available to the zone.
40-1

Kernel zones are supported beginning with Solaris 11.2. A kernel zone enables you to
deploy a non-global zone with its own operating system kernel instance. The non-
global zone has a different kernel version to the global zone. You can create one level
of non-kernel zones inside kernel zones.
The following types of non-global zones are available with Oracle Solaris:
•Native zone: A separate Solaris 10 or Solaris 11 instance with the same version of
Solaris as the global zone. You cannot create nested zones.
•Solaris 10 branded zone: An independent Solaris 10 instance running inside a
Solaris 11 global zone, providing a migration path for existing Solaris 10
deployments. Nested non-global zones are not supported.
•Kernel Zone: Runs a separate kernel version inside the non-global zone. A kernel
zone is fully independent operating system instance, which enables you to create
nested (non-kernel) zones within the kernel zone. Kernel zones are available
beginning with the Oracle Solaris 11.2 release.
Zones are represented by an icon in the user interface. Different types of zones, such
as global zone, kernel zone, and non-global zones, have different icons.
You can monitor the following Solaris 10 and Solaris 11 global zones and their non-
global zones through the Enterprise Manager user interface.
•Solaris 10 global zones running native Solaris 10 non-global zones
•Solaris 11 global zones running branded Solaris 10 non-global zones
•Solaris 11 global zones running native Solaris 11 non-global zones
•Solaris 11 global zones running Solaris 11 kernel zones
Enterprise Manager supports the following types of virtualization:
•Oracle Solaris Zones: operating system virtualization
•Oracle VM Server for SPARC: hardware virtualization on a SPARC platform
You can view zones within any type of logical domain on a SPARC platform.
The hypervisor is responsible for managing one or more non-global zones. A non-
global zone is represented as its operating system instance deployed on a virtual
server which is given a subset of the CPU, memory and I/O resources which are
available from the physical server, and/or some virtual resources (such as virtual disks
or networks) which are backed by configured resources from the global zone. The
global zone always exists and is the controlling zone for the non-global zones.
40.2 Location of Oracle Solaris Zone Information in the UI
You can select any target that is a child or a parent of the zone (virtual platform, host,
or server) and the zone will appear in the Navigation pane of the target.
The Virtualization Platform is the container on which zones are running. A global zone
and all associated zones appear in a Zone Virtualization Platform page. A global zone
is represented by a virtual server as well. Each non-global zone (virtual server) and
kernel zone has its own Virtual Server page that displays details specific to that zone.
The following options are available on the All Targets page:
•Click Virtualization Platform to see the list of virtual platforms. You can click any
virtual platform in this list to open the virtual platform's home page.
Chapter 40
Location of Oracle Solaris Zone Information in the UI
40-2

•Click Virtual Server to see the list of virtual servers.You can click any virtual
server in this list to open the virtual server's home page.
Table 40-1 Location of Zone Information in the UI
Object Location
Virtualization Platform A Virtual Platform target home page is accessible from the All
Targets page, or from any of its parent or child targets through
the Target Navigation pane.
Click the All Targets selector at the top of the page. In the
Refine Search section, select Virtualization Platform.
The target can be a host, a server, or a zone target running on
this Virtual Platform.
A Target Navigation pane is located in the top left corner of a
parent or child home page. Click the Target Navigation pane to
expand it and see the Virtual Platform in the Navigation pane.
Zone-specific (virtual server)
page
A zone virtual server target home page is accessible from the
Solaris Zone Virtualization Platform page or the All Targets
page.
Click the All Targets selector at the top of the page. In the
Refine Search section, select Virtual Server.
If you are on the Solaris Zone Virtualization Platform page, click
a zone to navigate to the virtual server page for that zone.
40.3 Actions for Zones
The virtualization platform is automatically promoted when you discover Solaris 11 or
Solaris 10 update 11 host operating systems.
You can perform the following actions:
•View the configuration and status of zones
•View CPU and memory resource utilization and the distribution of the CPU and
memory consumers
•Diagnose problems using incidents and performance metrics
•Disable and enable monitoring notifications and monitoring
40.4 Target Navigation for Zones
The target navigation tree helps you to navigate between targets that are in a Solaris
Zones Virtual Platform. When all resources are discovered and monitored through
agent deployment on the global zone, you can navigate from the server down to the
zones.
The top level, or node, of the target navigation tree is the physical server and the
second node is the Oracle Solaris Zones Virtual Platform that is hosting the global
zone. The global zone and all other types of zones appear under the Oracle Solaris
Zones Virtual Platform. Expand the nodes to drill down the target hierarchy or click a
specific target to open that target's landing page.
Figure 40-1 is an example of a target navigation tree that shows a global zone and two
kernel zones. The first node is the physical server (smx42-1). The second node is the
Chapter 40
Actions for Zones
40-3

Solaris Zones Virtual Platform that is hosting the global zone and 2 kernel zones
(kernelzone1 and kernelzone2.) The global zone is running the operating system
(smx42-1-n17 host.) When the agent was deployed on kernelzone1, it triggered the
discovery and promotion of the Solaris Zones Virtual Platform (smvt-175-10.) The
Solaris Zones Virtual Platform in kernelzone1 is running a global zone and operating
system (smvt-175-10 host) and 2 local zones (zone 1 and zone 2).
Figure 40-1 Target Navigation for Zones
40.5 How to Get Information About a Zone
You can view information about the zone from a platform perspective, or for a specific
zone. Zones appear in a Solaris Zone Virtualization Platform page and each global
zone, kernel zone, and non-global zone has its own virtual server page.
The Solaris Zone Virtualization Platform page provides general information about the
zone, such as open incidents, CPU usage, memory resources, number of running and
configured zones, and a list of all zones for the global zone and their states.
The Virtualization Platform is the container on which zones run. Go to the Virtualization
Platform page to see the list of zones (virtual servers) running on a virtual platform.
Click a zone to see the zone's home page.
The Summary displays details and metrics for the selected zone:
Chapter 40
How to Get Information About a Zone
40-4

•Dashlets: A series of dashlets at the top of the page contains summary information
and might be associated with a more detailed information that is in a tab.
•Tabs: A series of tabs on the right side of the page link to more detailed
information, including CPU and memory performance.
The top of the page contains a series of dashlets that provide a quick view of top
statistics. Click the small button below the row of dashlets to toggle to the next series
of dashlets. Click the icon below the toggle icons to minimize the dashlets.
The Virtualization Platform dashlets provide the following types of information:
•Platform status
•Time that the zone platform has been up and running
•Open incidents
•Guest configurations
•Distribution of the CPU and memory consumers per zone
•Date and time of last configuration changes and incidents
See Working with Zone Platform Metrics for more details.
The Virtual Server dashlets provide the following types of information about a specific
zone:
•Zone status
•CPU and memory utilization
•Guest configurations
•Date and time of last configuration changes and incidents
See Working with Zone-Specific Metrics for more details.
40.6 Working with Zone Platform Metrics
Virtualization Server platform metrics enable you to monitor the performance and
resource usage of the virtualization server in your data center. You can use this
information to balance resources or plan ahead to add resources to improve future
performance.
The distribution of CPU and memory consumers is useful in managing the most
heavily loaded zones, enabling you to be proactive in identifying potential issues. The
last dashlet on the Summary page shows the date and time stamp for the last
configuration change and the last incident.
The following zone metrics are available in the dashlets across the top of the page:
•Platform Status
–Oracle Solaris version.
–Current state: View the current health status and the time that the zone has
been up and running.
–Guest count. The guest count shows the total number of zones. If zones are
still in the process of being discovered and promoted, the guest count will
indicate the total number of guests and the number of guests that are still in
the queue for auto promotion.
Chapter 40
Working with Zone Platform Metrics
40-5

–Open Incidents: View the number of Fatal, Critical, and Warning incidents.
Click a number to view a synopsis. Click the synopsis to navigate to the
Incident Manager console for incident details.
–CPU Usage and Memory Usage: This section displays circular gauges
showing the current platform CPU and memory as a percentage of the
maximum values.
–Up and Running Guests: This section displays the number of running zones
out of the number of configured zones.
–Virtual CPUs and Memory: This section displays pie charts showing the
current number of allocated and available virtual CPUs and amount of
allocated and available memory
–Distribution of the CPU consumers per zone: View the total CPU consumption
and the number of zones, or guests, that are consuming CPUs in the following
ranges: 0-20, 20-40, 40-60, 60-80, and 80-100 percent.
–Distribution of the Memory consumers per zone: View the total memory
consumption and the number of zones, or guests, that are consuming memory
in the following ranges: 0-20, 20-40, 40-60, 60-80, and 80-100 percent.
•Last changes
–Configuration change: View the date and time stamp for the last change in
configuration.
–Incident: View the date and time stamp for the last incident.
The main body is made of 2 sections. The top one provides graphs showing the vCPU
distribution per resource pool and zones, as well as the memory distribution per zones.
The second section is the list of the guests. The Virtual Platform's Guests contains a
list of the zones and zone details including the resources (vCPU, core, socket, share,
memory) configured for the zone and those actually allocated to running zones. You
can display the page as a list or a table. The default view is the List view, sorted by
Incident count. The List view has sorting and filtering options that enable you to sort by
incident and by allocated resources. Alternatively, you can view the Virtual Platform's
Guests page as a sortable table. You can sort by the zone type, zone state, and by
zone resource pool. You can also sort by the Fatal, Critical, or Warning incident
columns.
40.6.1 Viewing Zone Platform Metrics
Some metrics appear in the dashlets, for details on specific zone metrics, view the
Summary page.
1. From the Targets list, select All Targets.
2. From Servers, Storage, and Network, select Virtualization Platform.
3. Click the target name to open the Summary page for the Solaris Virtualization
platform.
4. The dashlets display the metric information. The Summary page shows details for
each zone. Details include the zone name, type of zone (global, non-global,
kernel), the status, the number of vCPUs, memory, and the incidents.
5. The main body of the page contains details about the virtualization platform's
guests, or zones.
Chapter 40
Working with Zone Platform Metrics
40-6

40.7 Working with Zone-Specific Metrics
Virtual Server metrics enable you to monitor the performance and resource usage of a
specific zone.
The Virtualization Platform shows the distribution of the CPU and memory consumers
per zone. The Virtual Server shows the load imposed by a single zone (global, non-
global, or kernel.) The last dashlet on the Virtual Server Summary page shows the
date and time stamp for the last configuration change and the last incident.
The following metrics are available in the dashlets across the top of the page:
•Virtual Server Status
–Current state: View the current health status and the type of zone (global, non-
global, or kernel.)
–Open Incidents: View the number of Fatal, Critical, and Warning incidents.
Click a number to view a synopsis. Click the synopsis to navigate to the
Incident Manager console for incident details.
•CPU and Memory Utilization
–CPU Usage: View the percentage CPU used by the virtual server.
–Memory Usage: View the percentage of memory used by the virtual server.
•Virtual Server Configuration
–Guest OS Information: View the host name, IP address, and time that the
guest (zone) has been up and running. To receive guest OS information, you
must have an agent deployed on the zone's operating system.
–Guest Configuration: View the guest UUID, host ID, and whether automatic
boot is enabled.
•Last Changes
–Configuration change: View the date and time stamp for the last change in
configuration.
–Incident: View the date and time stamp for the last incident.
The main body provides details about the CPU Resources (Shares, vCPUs, cores,
sockets) configured and also being currently allocated to the zone and memory
configured for the zone and currently allocated to the zone. The page also contains
two graphs that show the CPU usage profile and the Memory usage profile. Each
graph shows the CPU or memory usage during the past hour, day or week. More
detailed CPU and Memory graphs appear in the Virtual Server Usages tab.
40.7.1 Viewing a Summary of Zone Metrics
Zone-specific metrics and resource usage charts appear on the zone's virtual platform
Summary page.
1. Select All Targets from the Targets list.
2. Under the Servers, Storage, and Network heading, click Systems Infrastructure
Virtualization Platform. The Virtualization Platform provides the ability to drill
down to see the virtual server that has the open incident.
Chapter 40
Working with Zone-Specific Metrics
40-7

3. Click the target name to open the Summary page for the Solaris Virtualization
Platform.
40.7.2 Viewing Zone CPU and Memory Metrics
Zone-specific CPU and memory usage metrics and resource usage charts appear on
the zone's virtual server page. More detailed metrics are available in the All Metrics
page.
1. Click Systems Infrastructure Virtual Server from the All Targets page.
2. Click the target name to open the Summary page for the virtual server. The CPU
and Memory metrics appear on the zone's home page and in the home page
dashboard. The usage profiles appear for the last hour, day, or week.
3. Click the Virtual server usages icon on the right side of the page to view CPU
and Memory Resource Usages Charts. Move the slider icon on the chart page to
change the number of days to display in the chart. You can view up to seven days.
40.8 Viewing All Metrics
Platform and virtual server metrics are available in the All Metrics page.
1. Click Systems Infrastructure Virtual Server from the All Targets page.
2. Click the target name to open the Solaris Virtualization Platform or Virtual
Server page, depending on your target.
3. Click Solaris Virtualization Platform or Virtual Server in the upper left corner of
the page. Click Monitoring, then click All Metrics.Click a metric to view details,
collection schedule, upload interval and other details.
Note:
Although it appears in the list of configuration metrics, the Component Faults
metric is not supported for a Virtual Server.
The
CoreUsage
metric is only reported for guest domains that have full cores
allocated.
40.9 Working with Incidents for Zones
The following information will help when working with incident information for zones:
•About Incidents for Zones
•Viewing Open Incidents for Zones
40.9.1 About Incidents for Zones
The Virtualization Platform page shows all incidents that are open on the virtualization
platform, enabling you to quickly see if there are any issues on the platform.
For zones, the number of incidents that appear on the Virtualization Platform page
includes incidents for the global zone and any zones associated with the global zone.
Chapter 40
Viewing All Metrics
40-8

Click the number in the Open Incidents dashlet to display the list of incidents and the
target on which the incident occurred.
In the list of incidents, you can click the target (global zone or zone) link to go to the
corresponding target home page or you can click the incident to be redirected to the
corresponding target Incident Manager page.
Note:
The number of open incidents on the Virtualization Platform page indicates all
open incidents for the platform - for the global zone and all zones. By default,
the Incident Manager page for the global zone shows the open incidents for
the global zone, not the associated zones. You can change the display in the
Incident Manager to show incidents for the global zone and zones. In Incident
Manager, select Search, then select Target and all members for the Include
Members search criteria.
40.9.2 Viewing Open Incidents for Zones
The Virtualization Platform and Virtual Server pages have an Open Incident dashlet,
which displays the number of Fatal, Critical, and Warning incidents. The Virtualization
Platform page shows open incidents for the global zone and all associated zones
(non-global and kernel.) The Virtual Server page only shows incidents for the selected
zone.
1. Select All Targets from the Targets list.
2. Under the Servers, Storage, and Network heading, click Systems Infrastructure
Virtual Server or Systems Infrastructure Virtualization Platform. The
Virtualization Platform does provide the ability to drill down to see the virtual server
that has the open incident.
3. Click the target name to open the Summary page for the Solaris Virtualization
Platform.
4. The Open Incidents dashlet displays a number to indicate how many open
incidents are associated with the global zone and non-global zones.
When a zone has an open incident, a number appears by the zone name in the
Virtual Platform's Guests section of the Summary pane.
5. Click the target name in the Open Incident dashlet to go to the Virtual Server page
for the zone.
6. Click the summary text to navigate to the Incident Manager page.
The Incident Manager provides incident details and the events that led to the
incident. You can drill down to get details on the events and notifications.You can
acknowledge the incident, add comments, or manage the incident from the
Incident Manager page.
Chapter 40
Working with Incidents for Zones
40-9

Note:
The Virtualization Platform page shows all incidents for the global zone and its
zones. By default, the Incident Manager page only displays incidents for the
global zone. You can change the setting in Incident Manager to display the
target and all members.
40.10 Managing Metrics and Incident Notifications for Zones
You can perform the following tasks to manage monitoring and incident notification:
•Viewing Zone Metric Collection Errors
•Editing a Zone's Monitoring Configuration
•Suspending Monitoring Notifications for Zones
•Suspending Zone Monitoring for Maintenance
•Ending a Monitoring Brownout or Blackout for Zones
40.10.1 Viewing Zone Metric Collection Errors
Metric collection errors are usually caused by installation or configuration issues. You
can view errors for a virtual server or for the virtualization platform.
1. Click Systems Infrastructure Virtual Server or Systems Infrastructure
Virtualization Platform from the All Targets page.
2. Click the target name to open the home page.
3. Click Virtual Server or Virtualization Platform in the upper left corner of the
page. Click Monitoring, then click Metric Collection Errors.
40.10.2 Editing Metric and Collection Settings for Zones
The Metrics tab contains displays all of the monitored attributes. The default view is
metrics with thresholds. For these types of monitored attributes, you can modify the
comparison operator, the threshold limits, the corrective action, and the collection
schedule.
To edit the metrics and settings for a zone, navigate to the Virtual Server. To edit the
settings for a virtualization platform, navigate to the Virtualization Platform. The
parameters are different for each.
1. Click Systems Infrastructure Virtual Server or Systems Infrastructure
Virtualization Platform from the All Targets page.
2. Click the target name to open the home page.
3. Click Virtual Server in the upper left corner of the page. Click Monitoring, then
click Metric and Collection Settings.
4. Modify threshold limits or collection schedule. When a threshold field is empty, the
alert is disabled for that metric.
5. Click the Edit icon for advanced settings.
Chapter 40
Managing Metrics and Incident Notifications for Zones
40-10

Click the Other Collected Items tab to view non-threshold monitored attributes.
You can modify the collection period for these attributes, or disable monitoring.
40.10.3 Editing a Zone's Monitoring Configuration
1. Click Systems Infrastructure Virtual Server or Systems Infrastructure
Virtualization Platform from the All Targets page.
2. Click the target name to open the home page.
3. Click Virtual Server or Virtualization Platform in the upper left corner of the
page. Click Target Setup.
4. Click Monitoring Configuration.
40.10.4 Suspending Monitoring Notifications for Zones
Brownouts enable you to temporarily suppress notifications on a target. The Agent
continues to monitor the target under brownout. You can view the actual target status
along with an indication that the target is currently under brownout.
You can create a brownout for a virtual server or for the virtualization platform.
1. Click Systems Infrastructure Virtual Server or Systems Infrastructure
Virtualization Platform from the All Targets page.
2. Click the target name to open the home page.
3. Click Virtual Server or Virtualization Platform in the upper left corner of the
page. Click Control.
4. Click Create Brownout.
5. Enter a name for the brownout event.
6. Select a reason from the menu and add comments, as needed.
7. Click the options to define how jobs will run and the maintenance window.
8. Click Submit.
40.10.5 Suspending Zone Monitoring for Maintenance
Blackouts enable you to suspend monitoring on one or more targets in order to
perform maintenance operations. To place a target under blackout, you must have at
least the Blackout Target privilege on the target. If you select a host, then by default all
the targets on that host are included in the blackout. Similarly, if you select a target
that has members, then by default all the members are included in the blackout.
You can create a blackout for a virtual server or for the virtualization platform.
1. Click Systems Infrastructure Virtual Server or Systems Infrastructure
Virtualization Platform from the All Targets page.
2. Click the target name to open the home page.
3. Click Virtual Server or Virtualization Platform in the upper left corner of the
page. Click Control.
4. Click Create Blackout.
5. Select a reason from the menu.
Chapter 40
Managing Metrics and Incident Notifications for Zones
40-11

6. Add comments, as needed.
7. Click Submit.
40.10.6 Ending a Monitoring Brownout or Blackout for Zones
You can end a blackout or brownout for a virtual server or for the virtualization
platform.
1. Click Systems Infrastructure Virtual Server or Systems Infrastructure
Virtualization Platform from the All Targets page.
2. Click the target name to open the home page.
3. Click Virtual Server or Virtualization Platform in the upper left corner of the
page. Click Control.
4. Click End Blackout or End Brownout.
40.11 Administering Zones
You can perform the following tasks to manage and administer zones:
•Viewing Zone Compliance
•Identifying Changes in a Zone Configuration
•Editing Zone Administrator Access
•Adding a Zone to a Group
•Editing Zone Properties
40.11.1 Viewing Zone Compliance
The Compliance pages enable you to view the compliance framework, standards, and
the zone's compliance.
You can view compliance for a virtual server or for the virtualization platform.
1. Click Systems Infrastructure Virtual Server or Systems Infrastructure
Virtualization Platform from the All Targets page.
2. Click the target name to open the home page.
3. Click Virtual Server or Virtualization Platform in the upper left corner of the
page. Click Compliance.
4. Click the option to view Results, Standard Associations, or Real-time
Observations.
40.11.2 Identifying Changes in a Zone Configuration
When an administrator changes a zone configuration, it can be helpful to know the
when the configuration was last changed. This information appears in the configuration
dashlet on the Summary page. The zone configuration information does not require an
agent to be installed on the zone.
To view more detailed information for a virtual server or virtualization platform:
Chapter 40
Administering Zones
40-12

1. Click Systems Infrastructure Virtual Server or Systems Infrastructure
Virtualization Platform from the All Targets page.
2. Click the target name to open the home page.
3. Click Virtual Server or Virtualization Platform in the upper left corner of the
page. Click Configuration.
4. Click the option to view Last Collected, Comparison and Drift Management,
Compare, Search, History, Save, Saved, or Topology.
40.11.3 Editing Zone Administrator Access
1. Click Systems Infrastructure Virtual Server or Systems Infrastructure
Virtualization Platform from the All Targets page.
2. Click the target name to open the home page.
3. Click Virtual Server or Virtualization Platform in the upper left corner of the
page. Click Target Setup.
4. Click Administrator Access.
40.11.4 Adding a Zone to a Group
1. Click Systems Infrastructure Virtual Server or Systems Infrastructure
Virtualization Platform from the All Targets page.
2. Click the target name to open the home page.
3. Click Virtual Server or Virtualization Platform in the upper left corner of the
page. Click Target Setup.
4. Click Add to Group.
40.11.5 Editing Zone Properties
1. Click Systems Infrastructure Virtual Server or Systems Infrastructure
Virtualization Platform from the All Targets page.
2. Click the target name to open the home page.
3. Click Virtual Server or Virtualization Platform in the upper left corner of the
page. Click Target Setup.
4. Click Properties.
40.12 Additional Resources for Oracle Solaris Zones
See the following for more information:
•Discovering and Adding Host and Non-Host Targets
•Discovering, Promoting, and Adding System Infrastructure Targets
•Using Incident Management
•Using Blackouts and Notification Blackouts
For in-depth information about Oracle Solaris and Oracle Solaris Zones, go to
http://
docs.oracle.com/en/operating-systems/
.
Chapter 40
Additional Resources for Oracle Solaris Zones
40-13

41
Monitoring Oracle VM Server for SPARC
The following features and topics are covered in this chapter:
•Getting Started With Oracle VM Server for SPARC Virtualization
•Location of Oracle VM Server for SPARC Information in the UI
•Actions for Oracle VM Server for SPARC
•Target Navigation for Oracle VM Server for SPARC
•Supported Versions
•Viewing all Oracle VM Server for SPARC Virtualization Platforms
•About Virtualization Platform Information
•Zones within a Logical Domain
•About Logical Domain Information
•Related Resources for Oracle VM Server for SPARC
41.1 Getting Started With Oracle VM Server for SPARC
Virtualization
Oracle VM Server for SPARC technology enables server virtualization on SPARC
platforms. You can create and manage multiple virtual machine instances
simultaneously on a single SPARC machine. Each virtual machine, or guest, can run a
separate Oracle Solaris 10 or Oracle Solaris 11 operating system.
Oracle VM Server for SPARC technology is virtualization of SPARC servers. This
technology is part of a suite of methodologies for consolidation and resource
management for SPARC Chip Multi Threading (CMT) systems. Using this technology,
you can allocate the various resources of the system such as memory, CPU threads,
and devices, into logical groupings and create multiple discrete systems. These
discrete systems have their own operating system, resources, and identity within a
single system. By careful architecture, an Oracle VM Server for SPARC environment
can help you achieve greater resource usage, better scaling, and increased security
and isolation.
41.1.1 Terminology
In Oracle Enterprise Manager, a virtualization platform is a virtualization technology,
such as an Oracle VM Server for SPARC control domain, that can host guests. A
virtual server is a guest, such as a logical domain.
41.1.2 Logical Domains
When Oracle VM Server for SPARC software is installed, a domain called the control
domain is created. From this control domain, you create virtual machines called logical
41-1

domains that each run an independent OS. A logical domain is a virtual machine with
resources, such as CPU threads, memory, I/O devices, and its own operating system.
The control domain manages the logical domains. Each logical domain can be
created, destroyed, reconfigured, and rebooted independently of other logical
domains.
41.2 Location of Oracle VM Server for SPARC Information
in the UI
You can select any target that is a child or a parent of the logical domain (virtual
platform, host, or server) and the logical domain will appear in the Navigation pane of
the target.
The Virtualization Platform is the container on which logical domain virtual servers or
zones are running.
The following options are available on the All Targets page:
•Click Systems Infrastructure Virtualization Platform to see the list of virtual
platforms. You can click any virtual platform in this list to open the virtual platform's
home page.
•Click Systems Infrastructure Virtual Server to see the list of virtual servers.You
can click any virtual server in this list to open the virtual server's home page.
Table 41-1 Location of Oracle VM Server for SPARC Information in the UI
Object Location
Virtualization Platform A Virtual Platform target home page is accessible from the All
Targets page, or from any of its parent or child targets through
the Target Navigation pane.
Click the All Targets selector at the top of the page. In the
Refine Search section, select Systems Infrastructure
Virtualization Platform.
Alternatively, select any target that is a parent or a child of the
Virtual Platform in the All Targets selector. The target can be a
host, a server, or a logical domain target running on this Virtual
Platform.
A Target Navigation pane is located in the top left corner of a
parent or child home page. Click the Target Navigation pane to
expand it and see the Virtual Platform in the Navigation pane.
Virtual Server A logical domain virtual server target home page is accessible
from the zone Virtualization Platform page or the Virtual Server
page.
Click the All Targets selector at the top of the page. In the Refine
Search section, select Systems Infrastructure Virtual Server.
If you are on the Virtualization Platform page, click a zone to
navigate to the virtual server page for that zone.
41.3 Actions for Oracle VM Server for SPARC
You can discover and promote Oracle VM Servers for SPARC by deploying an Em
Agent on the Control Domain operating system. You can then monitor the Oracle VM
Chapter 41
Location of Oracle VM Server for SPARC Information in the UI
41-2

Server for SPARC and its guests. If the Control Domain or its guests have Oracle
Solaris Zones installed, they are displayed in the target navigation tree, and you can
monitor them if an EM Agent is installed in the guest domain.
You can perform the following actions:
•View the configuration and status of domains.
•View resource utilization and the top consumers of resources.
•Diagnose problems using incidents and performance metrics.
41.4 Target Navigation for Oracle VM Server for SPARC
The target navigation tree helps you to navigate between targets that are in an Oracle
VM Server for SPARC Virtual Platform (OVM SPARC Virtual Platform.) When all
resources are discovered and monitored through agent deployment on the primary
domain, you can navigate from the server down.
The top level, or node, is the physical server and the second node is the OVM SPARC
Virtual Platform that is hosting the primary domain and all other logical domains.
Expand the nodes to drill down the target hierarchy or click a specific target to open
that target's landing page.
Figure 41-1 is an example of a target navigation tree for an OVM SPARC Virtual
Platform. The first node is the physical server (slci04-node4-ilom), which is running the
Oracle VM Server for SPARC hypervisor (slci04dbadm07 (OVM SPARC Virtual
Platform)). The hypervisor appears on the second node. The third node displays four
logical domain guests: primary, ssccn4-app1, ssccn4-app2, and ssccn4-app3. The
primary domain is also a Solaris Zones Virtual Platform (slci04dbadm07 (Solaris
Zones Virtual Platform)) and that has one global zone that is running the operating
system (slci04dbadm07 host.) The fourth logical domain (ssccn4-app3) is expanded.
When an agent was deployed on the logical domain, the domain was promoted as a
zone virtual platform that is running the global zone and host slci04dbadm08.
Chapter 41
Target Navigation for Oracle VM Server for SPARC
41-3
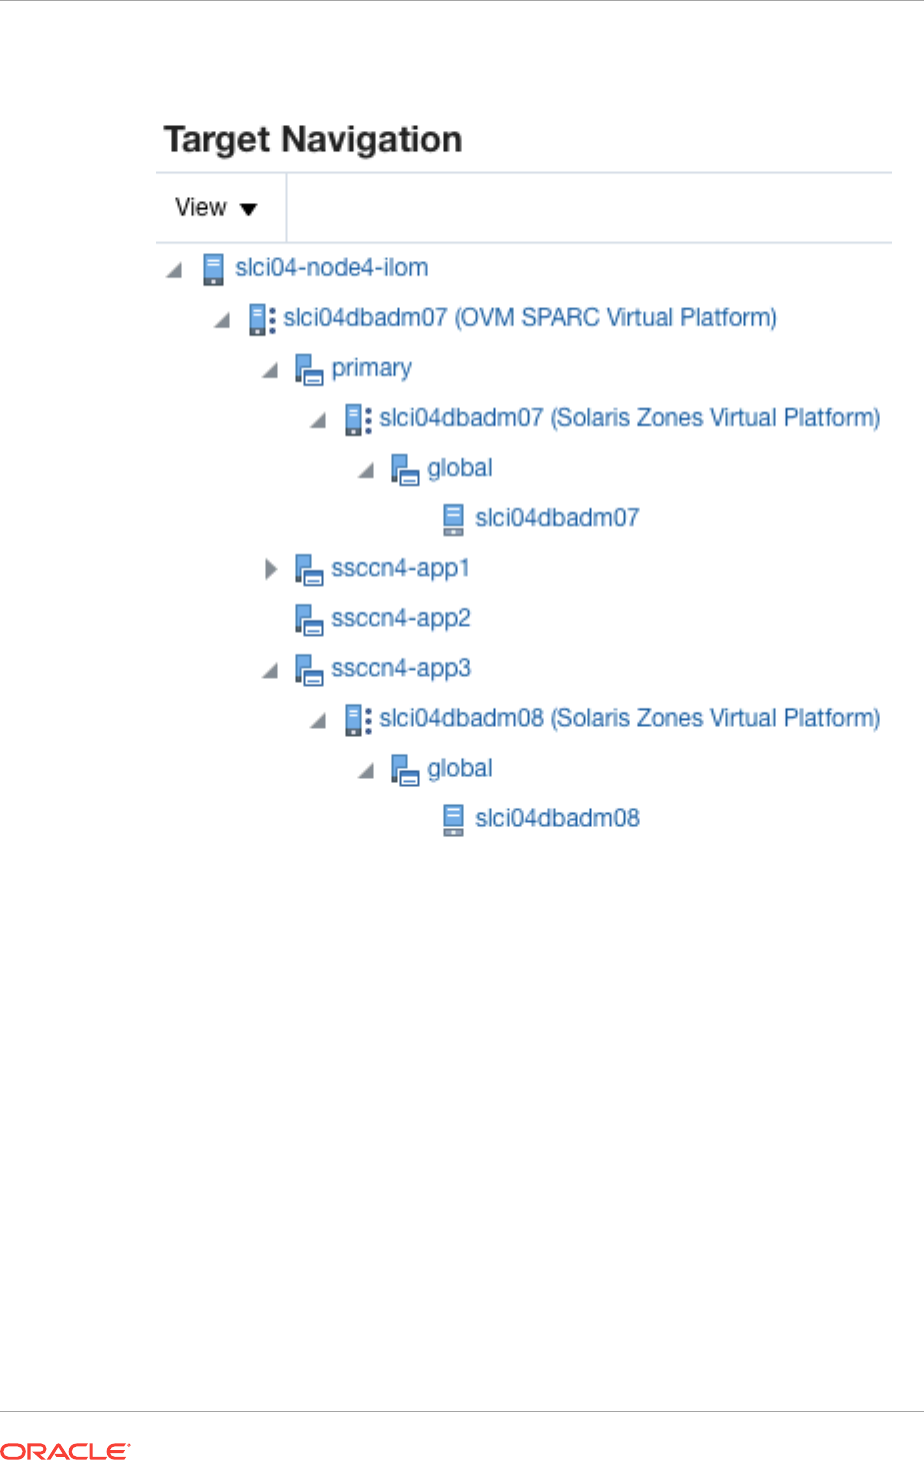
Figure 41-1 Target Navigation for Oracle VM Server for SPARC
41.5 Supported Versions
Oracle VM Server for SPARC Control Domain:
•Oracle Solaris 11.1 and later
•Oracle VM Server for SPARC 3.1 and later
Oracle VM Server for SPARC Guest Domain Operating System:
•Oracle Solaris 10 1/13
•Oracle Solaris 11.1 and later
41.6 Viewing all Oracle VM Server for SPARC Virtualization
Platforms
You can view all virtualization platforms, including all Oracle VM Server for SPARC
virtualization platforms, from the targets list.
Chapter 41
Supported Versions
41-4

1. Select All Targets from the Targets list.
2. Under the Servers, Storage, and Network heading, select Systems Infrastructure
Virtualization Platform.
A list of the target virtualization platforms is displayed.
41.7 About Virtualization Platform Information
You can select a virtualization platform to view information about the virtualization
platform and its guests.
The top section of the UI displays basic information about the selected virtualization
platform. You can click the scroll icons to move left or right.
•Platform: This section displays the platform type, its version, and its uptime.
•Open Incidents: This section displays the number of fatal, critical, and warning
incidents on the system. You can click on a category to bring up a detailed list of
incidents within that category.
Note:
The number of open incidents on the Virtualization Platform page indicates all
open incidents for the platform - for the control domain and all logical domains.
By default, the Incident Manager page for the control domain shows the open
incidents for the control domain, not the associated logical domains. You can
change the display in the Incident Manager to show incidents for the control
domain and logical domains. In Incident Manager, select Search, then select
Target and all members for the Include Members search criteria.
•CPU and Memory: This section displays circular gauges showing the current CPU
and memory as a percentage of the maximum values. For more details, click the
third tab. Beginning with Oracle VM Server for SPARC version 3.2, the Resource
Group feature is available for eligible platforms with the proper service processor
firmware. The Resource Group feature provides physical CPU information for
logical domain guests without requiring a discovered ILOM.
Note:
On older hardware and Oracle VM Server for SPARC versions earlier than
3.2, this information is displayed only if the ILOM of the hardware has been
discovered.
•Up and Running Guests: This section displays the number of running guests out of
the number of configured guests.
•Virtual CPUs, Memory, and Cores: This section displays pie charts showing the
current number of allocated and available virtual CPUs, amount of allocated and
available memory, and number of allocated and available cores.
•Total CPU Consumption and its Distribution per Guest: This section shows the
total CPU consumption and a graph of the guest count for each cpu range.
Chapter 41
About Virtualization Platform Information
41-5

•Total Memory Consumption and its Distribution per Guest: This section shows the
total memory consumption for the virtualization platform and a graph of the guest
count for each memory range.
•Total Power Consumption and its Distribution per Guest: This section shows the
total power consumption and a graph of the guest count for each power range.
•Last Configuration Change and Incident: This section shows the date of the last
configuration change on the system, and the date of the last reported incident.
41.7.1 Viewing the Virtualization Platform Basic Information
1. Select All Targets from the Targets list.
2. Under the Servers, Storage, and Network heading, select Systems Infrastructure
Virtualization Platform.
A list of the target virtualization platforms is displayed.
3. Click the target name to open the Summary page for the virtualization platform.
The dashlets appear on the top of the page and provide the summary information.
41.7.2 About the Virtualization Platform's Guest Summary
The Guest Summary section displays details about the guests that are managed by
the virtualization platform. Select the Summary tab to view this information.
The top section displays bar graphs showing the virtual CPUs and memory configured
for each guest, as a portion of the total available.
The bottom section displays a table, or list, of the guests. You can select list or table
for the guest display. In list mode, use the sort options in the upper left to sort the
guests by type, incidents, memory, or vCPUs.
By default, the domains are displayed in descending order based on the number of
incidents.
For each guest, the following information is displayed:
•Target Status Icon: This icon indicates whether the guest is monitored.
•Type Icons: These icons identify the type of guest. Separate icons identify control
domains, guest domains, root domains, IO domains, and service domains.
•Name: The guest's name.
•CPU Information: Displays the number of CPU cores and vCPUs allocated to the
guest
•Memory: Displays the memory available to the guest.
•Operational Status Icon: This icon indicates whether the guest is unbound, started,
or stopped.
•Incidents: The numbers of open fatal, critical, and warning incidents for the guest.
•Cores: Displays the number of cores allocated to the guest.
•CPU Usage Graph: Displays the current CPU usage and the CPU usage over the
past five hours. This information is displayed only if the guest is started, and is
only displayed in list mode.
You can use the search field at the top of the guest table to search for specific guests.
Chapter 41
About Virtualization Platform Information
41-6

41.7.3 Viewing the Virtualization Platform Guest Summary
1. Select All Targets from the Targets list.
2. Under the Servers, Storage, and Network heading, select Systems Infrastructure
Virtualization Platform.
A list of the target virtualization platforms is displayed.
3. Click the target name to open the Summary page for the virtualization platform.
4. Click the Summary tab.
41.7.4 About the Virtualization Platform's Services
You can view details about the I/O and network services available on the virtualization
platform, and view the topology of a virtualization platform, showing what services are
provided and consumed. Select the Services tab to view this information.
The top section displays a table of I/O and network services. For each resource, the
following information is displayed:
•Name
•Type
•Operational Status icon
•Number of guests using the resource
You can use the search field at the top of the table to search for specific services.
For each resource, you can click More to display additional information.
The bottom section displays a topology diagram, which shows each guest and the
network resources provided or consumed by each guest. You can select the only
guests option to display only the guests.
In the guests and services display, you can hover over a guest to highlight the network
services it is using, or hover over a network resource to highlight the guests using it.
In the only guests display, you can hover over a guest to show the network resources
it shares with other guests.
Click the Control Panel button to access zoom controls. You can use these controls to
zoom in, zoom out, or zoom to fit the current window.
41.7.5 Viewing the Virtualization Platform Services
1. Select All Targets from the Targets list.
2. Under the Servers, Storage, and Network heading, select Systems Infrastructure
Virtualization Platform.
A list of the target virtualization platforms is displayed.
3. Click the target name to open the Summary page for the virtualization platform.
4. Click the Services tab.
Chapter 41
About Virtualization Platform Information
41-7

41.7.6 About the Virtualization Platform's vCPU and Core Allocation
You can view details about vCPU and core allocation. Select the Core Distribution tab
to view this information.
This section displays a pie chart, showing which CPUs and cores are allocated to
which guests, and which are unallocated. You can click on a guest in the outer layer to
view detailed information about that guest's resource consumption. The following fields
are displayed:
•Name: The guest's user-friendly name.
•Type Icons: These icons identify the type of guest. Separate icons identify control
domains, guest domains, root domains, IO domains, and service domains.
•Operational Status Icon
•Number of vCPUs: The number of virtual CPUs assigned to the guest.
•CPU Usage: Displays the guest's CPU usage over the last hour, day, or week.
41.7.7 Viewing the Virtualization Platform vCPU and Core Allocation
1. Select All Targets from the Targets list.
2. Under the Servers, Storage, and Network heading, select Systems Infrastructure
Virtualization Platform.
A list of the target virtualization platforms is displayed.
3. Click the target name to open the Summary page for the virtualization platform.
4. Click the Core Distribution tab.
41.7.8 About Virtualization Platform Metrics
You can view a complete list of the metrics for a selected virtualization platform.
41.7.9 Viewing Platform Metrics
1. Select All Targets from the Targets list.
2. Under the Servers, Storage, and Network heading, select Systems Infrastructure
Virtualization Platform.
A list of the target virtualization platforms is displayed.
3. Click the target name to open the Summary page for the virtualization platform.
4. Click Virtualization Platform in the upper left corner of the page. Click
Monitoring, then click All Metrics.
5. Click a metric to view details, collection schedule, upload interval and other details.
41.8 Zones within a Logical Domain
You can discover and monitor zones installed on the operating system of a logical
domain, including the control domain, if you have installed an EM Agent on the logical
domain operating system.
Chapter 41
Zones within a Logical Domain
41-8

41.8.1 Viewing Zones in a Logical Domain
The zones view for zones installed on a logical domain is shown beneath the logical
domain in the target navigation pane. You can select the zones view or select an
individual zone to view more information.
41.9 About Logical Domain Information
Oracle Enterprise Manager collects detailed information about monitored logical
domains, including CPU and memory usage, logical domain status, and incidents. You
can view these metrics by selecting a logical domain.
The top section of the UI displays basic information about the selected logical domain.
You can click the scroll icons to move left or right.
The following sections are displayed:
•Logical Domain: This section displays the logical domain name, its types, and its
uptime.
•Open Incidents: This section displays the number of fatal, critical, and warning
incidents on the system. You can click on a category to bring up a detailed list of
incidents within that category.
•CPU and Power: This section displays a circular gauge showing the current CPU
usage as a percentage of the maximum value and the current power usage in
Watts.
•Guest OS Information: This section displays information about the guest's
operating system, if it has been discovered. This information includes the
hostname, IP address, and uptime.
•Guest Configuration: This section shows guest configuration information, including
the guest UUID, an icon indicating whether the guest is set to boot automatically,
and the console port.
•Last Configuration Change and Incident: This section shows the date of the last
configuration change on the system, and the date of the last reported incident.
41.9.1 Viewing the Logical Domain's Basic Information
1. Select All Targets from the Targets list.
2. Under the Servers, Storage, and Network heading, select Systems Infrastructure
Virtual Server.
A list of the target virtual servers is displayed.
3. Click the target name to open the Summary page for the virtual server.
41.9.2 About the Virtual Server Summary Information
The virtual server summary tab displays basic information about the virtual server,
including status, virtual CPU, and memory usage.
The following fields are displayed:
•Number of vCPUS or Cores
Chapter 41
About Logical Domain Information
41-9

•Amount of Memory
•Automatic Boot Configuration
•UUID
•Graphs of the historical CPU usage percentage over the past hour, day, and week
•Graphs of the historical Power usage in Watts over the past hour, day, and week
41.9.3 Viewing the Virtual Server Summary Information
1. Select All Targets from the Targets list.
2. Under the Servers, Storage, and Network heading, select Systems Infrastructure
Virtual Server.
A list of the target virtual servers is displayed.
3. Click the target name to open the Summary page for the virtual server.
4. Click the Summary tab.
41.9.4 About the Virtual Server Power and CPU Usage Charts
The Virtual Server Usages tab displays charts of the guest's CPU and power usage.
Select one of the following icons to display the relevant chart:
•CPU (%): Displays a chart of the virtual server's CPU usage, as a percentage of
the total.
•Power (Watts): Displays a chart of the power in Watts consumed by the CPU and
by the memory.
For each chart, you can select a number of days to display using the slider in the
upper right.
41.9.5 Viewing the Virtual Server Power and CPU Usage Charts
1. Select All Targets from the Targets list.
2. Under the Servers, Storage, and Network heading, select Systems Infrastructure
Virtual Server.
A list of the target virtual servers is displayed.
3. Click the target name to open the Summary page for the virtual server.
4. Click the Virtual Server Usages tab.
41.10 Managing Metrics and Incident Notifications
You can perform the following tasks to manage monitoring and incident notification:
•Viewing Metric Collection Errors
•Editing Metric and Collection Settings
•Editing a Monitoring Configuration
•Suspending Monitoring Notifications
•Suspending Monitoring for Maintenance
Chapter 41
Managing Metrics and Incident Notifications
41-10

•Ending a Monitoring Brownout or Blackout
41.10.1 Viewing Metric Collection Errors
Metric collection errors are usually caused by installation or configuration issues. You
can view errors for a virtual server or for the virtualization platform.
1. Click Systems Infrastructure Virtual Server or Systems Infrastructure
Virtualization Platform from the All Targets page.
2. Click the target name to open the home page.
3. Click Virtual Server or Virtualization Platform in the upper left corner of the
page. Click Monitoring, then click Metric Collection Errors.
41.10.2 Editing Metric and Collection Settings
The Metrics tab contains displays all of the monitored attributes. The default view is
metrics with thresholds. For these types of monitored attributes, you can modify the
comparison operator, the threshold limits, the corrective action, and the collection
schedule.
To edit the metrics and settings for a virtual server, navigate to the Virtual Server. To
edit the settings for a virtualization platform, navigate to the Virtualization Platform.
The parameters are different for each.
1. Click Systems Infrastructure Virtual Server or Systems Infrastructure
Virtualization Platform from the All Targets page.
2. Click the target name to open the home page.
3. Click Virtual Server or Virtualization Platform in the upper left corner of the
page. Click Monitoring, then click Metric and Collection Settings.
4. Modify threshold limits or collection schedule. When a threshold field is empty, the
alert is disabled for that metric.
5. Click the Edit icon for advanced settings.
Click the Other Collected Items tab to view non-threshold monitored attributes.
You can modify the collection period for these attributes, or disable monitoring.
6. Click OK to save your changes.
41.10.3 Editing a Monitoring Configuration
1. Click Systems Infrastructure Virtual Server or Systems Infrastructure
Virtualization Platform from the All Targets page.
2. Click the target name to open the home page.
3. Click Virtual Server or Virtualization Platform in the upper left corner of the
page. Click Target Setup.
4. Click Monitoring Configuration.
Chapter 41
Managing Metrics and Incident Notifications
41-11

41.10.4 Suspending Monitoring Notifications
Brownouts enable you to temporarily suppress notifications on a target. The Agent
continues to monitor the target under brownout. You can view the actual target status
along with an indication that the target is currently under brownout.
You can create a brownout for a virtual server or for the virtualization platform.
1. Click Systems Infrastructure Virtual Server or Systems Infrastructure
Virtualization Platform from the All Targets page.
2. Click the target name to open the home page.
3. Click Virtual Server or Virtualization Platform in the upper left corner of the
page. Click Control.
4. Click Create Brownout.
5. Enter a name for the brownout event.
6. Select a reason from the menu and add comments, as needed.
7. Click the options to define how jobs will run and the maintenance window.
8. Click Submit.
41.10.5 Suspending Monitoring for Maintenance
Blackouts enable you to suspend monitoring on one or more targets in order to
perform maintenance operations. To place a target under blackout, you must have at
least the Blackout Target privilege on the target. If you select a host, then by default all
the targets on that host are included in the blackout. Similarly, if you select a target
that has members, then by default all the members are included in the blackout.
You can create a blackout for a virtual server or for the virtualization platform.
1. Click Systems Infrastructure Virtual Server or Systems Infrastructure
Virtualization Platform from the All Targets page.
2. Click the target name to open the home page.
3. Click Virtual Server or Virtualization Platform in the upper left corner of the
page. Click Control.
4. Click Create Blackout.
5. Select a reason from the menu.
6. Add comments, as needed.
7. Click Submit.
41.10.6 Ending a Monitoring Brownout or Blackout
You can end a blackout or brownout for a virtual server or for the virtualization
platform.
1. Click Systems Infrastructure Virtual Server or Systems Infrastructure
Virtualization Platform from the All Targets page.
2. Click the target name to open the home page.
Chapter 41
Managing Metrics and Incident Notifications
41-12

3. Click Virtual Server or Virtualization Platform in the upper left corner of the
page. Click Control.
4. Click End Blackout or End Brownout.
41.11 Administering Oracle VM Server for SPARC
You can perform the following tasks to manage and administer Oracle VM Server for
SPARC:
•Viewing Compliance
•Identifying Changes in a Virtual Server Configuration
•Editing Virtual Server Administrator Access
•Adding a Virtual Server to a Group
•Editing Virtual Server Properties
41.11.1 Viewing Compliance
The Compliance pages enable you to view the compliance framework, standards, and
the virtual server or virtual platform's compliance.
You can view compliance for a virtual server or for the virtualization platform.
1. Click Systems Infrastructure Virtual Server or Systems Infrastructure
Virtualization Platform from the All Targets page.
2. Click the target name to open the home page.
3. Click Virtual Server or Virtualization Platform in the upper left corner of the
page. Click Compliance.
4. Click the option to view Results, Standard Associations, or Real-time
Observations.
41.11.2 Identifying Changes in a Virtual Server Configuration
When an administrator changes a virtual server or virtualization platform configuration,
it can be helpful to know the when the configuration was last changed. This
information appears in the configuration dashlet on the Summary page.
To view more detailed information for a virtual server or virtualization platform:
1. Click Systems Infrastructure Virtual Server or Systems Infrastructure
Virtualization Platform from the All Targets page.
2. Click the target name to open the home page.
3. Click Virtual Server or Virtualization Platform in the upper left corner of the
page. Click Configuration.
4. Click the option to view Last Collected, Comparison and Drift Management,
Compare, Search, History, Save, Saved, or Topology.
Chapter 41
Administering Oracle VM Server for SPARC
41-13

41.11.3 Editing Virtual Server Administrator Access
1. Click Systems Infrastructure Virtual Server or Systems Infrastructure
Virtualization Platform from the All Targets page.
2. Click the target name to open the home page.
3. Click Virtual Server or Virtualization Platform in the upper left corner of the
page. Click Target Setup.
4. Click Administrator Access.
41.11.4 Adding a Virtual Server to a Group
1. Click Systems Infrastructure Virtual Server or Systems Infrastructure
Virtualization Platform from the All Targets page.
2. Click the target name to open the home page.
3. Click Virtual Server or Virtualization Platform in the upper left corner of the
page. Click Target Setup.
4. Click Add to Group.
41.11.5 Editing Virtual Server Properties
1. Click Systems Infrastructure Virtual Server or Systems Infrastructure
Virtualization Platform from the All Targets page.
2. Click the target name to open the home page.
3. Click Virtual Server or Virtualization Platform in the upper left corner of the
page. Click Target Setup.
4. Click Properties.
41.12 Related Resources for Oracle VM Server for SPARC
See the Oracle Enterprise Manager Cloud Control Administrator's Guide for
information about the following:
•Discovering and Adding Host and Non-Host Targets
•Discovering, Promoting, and Adding System Infrastructure Targets
•Using Incident Management
Chapter 41
Related Resources for Oracle VM Server for SPARC
41-14

42
Provisioning Zones with Oracle Database
on Database Domains
This section describes how to create Solaris Zones in Database Domains and deploy
Oracle RAC (Real Application Clusters) databases in these Solaris zones.
Topics:
•Prerequisites
•Create a DB Zones Cluster
•Scale Up Cluster
•Scale Down Cluster
•Delete Cluster
42.1 Prerequisites
Deploy an EM agent on SuperCluster Control Domains and Database Domains
An EM agent must be deployed on the SuperCluster Control Domains, as a user who
is granted Role-Based Access Control privileges to monitor Oracle VM Server for
SPARC. See Discovering and Promoting Oracle VM Server for SPARC .
An EM agent must also be deployed on Database Domains on which Solaris Zones
will be created.
Discover the SuperCluster
See Discovering and Promoting Oracle SuperCluster.
Discover the Exadata Database Machine
See Discover the Exadata Database Machine.
Import Grid Infrastructure and Database Software gold images in Software
Library
There are two options to import Grid Infrastructure and Database gold images in the
Enterprise Manager Software Library. Either you can clone an existing deployment, or
you can import Provisioning Archive (PAR) files stored on a host.
•Option 1:
Once you have discovered a Host on which Oracle Clusterware and a Database is
deployed, you can create an Oracle Clusterware Clone and Oracle Database
Software Clone component in the Software Library. See Creating an Oracle
Database Clone from a Reference Home and Creating an Oracle Clusterware
Clone from a Reference Home.
42-1

Once done for both Component sub-type "Oracle Clusterware Clone" or "Oracle
Database Software Clone", you can create a Database Zones Cluster.
You can then also export these clones as Provisioning Archives (PAR files) to any
host, so that you can later import these PAR files on any other Enteprise Manager
Software Library to have "Oracle Clusterware Clone" and "Oracle Database
Software Clone" imported in this library, this is the option 2 described below.
To create such PAR file, from the Software Library Home Page, select Actions,
then click Export.
•Option 2:
If you have already Provisioning Archive (PAR) files stored on a host (files created
as described above in option 1), then from any Enterprise Manager you can
deploy an agent on this host and import the par files on this host to the Software
Library.
It can be done from the Software Library Home Page through selecting Actions,
then clicking Import.
Once you have imported a Provisioning Archive for Oracle Clusterware and
imported another PAR file for the Database, you are ready to create a Database
Zones Cluster.
42.2 Create a DB Zones Cluster
1. Create a Cluster Definition.
a. Select a Database Machine target and once on the Database Machine Home
Page, select Database Machine, then Provisioning, and finally click Create
cluster.
b. Enter a cluster name, the list of available Domains provided are Domains on
which an Enterprise Manager agent was deployed.
c. Select one or several Database Domains on which a Solaris zone will be
created.
d. Select at least 3 Exadata Storage Servers:
Chapter 42
Create a DB Zones Cluster
42-2
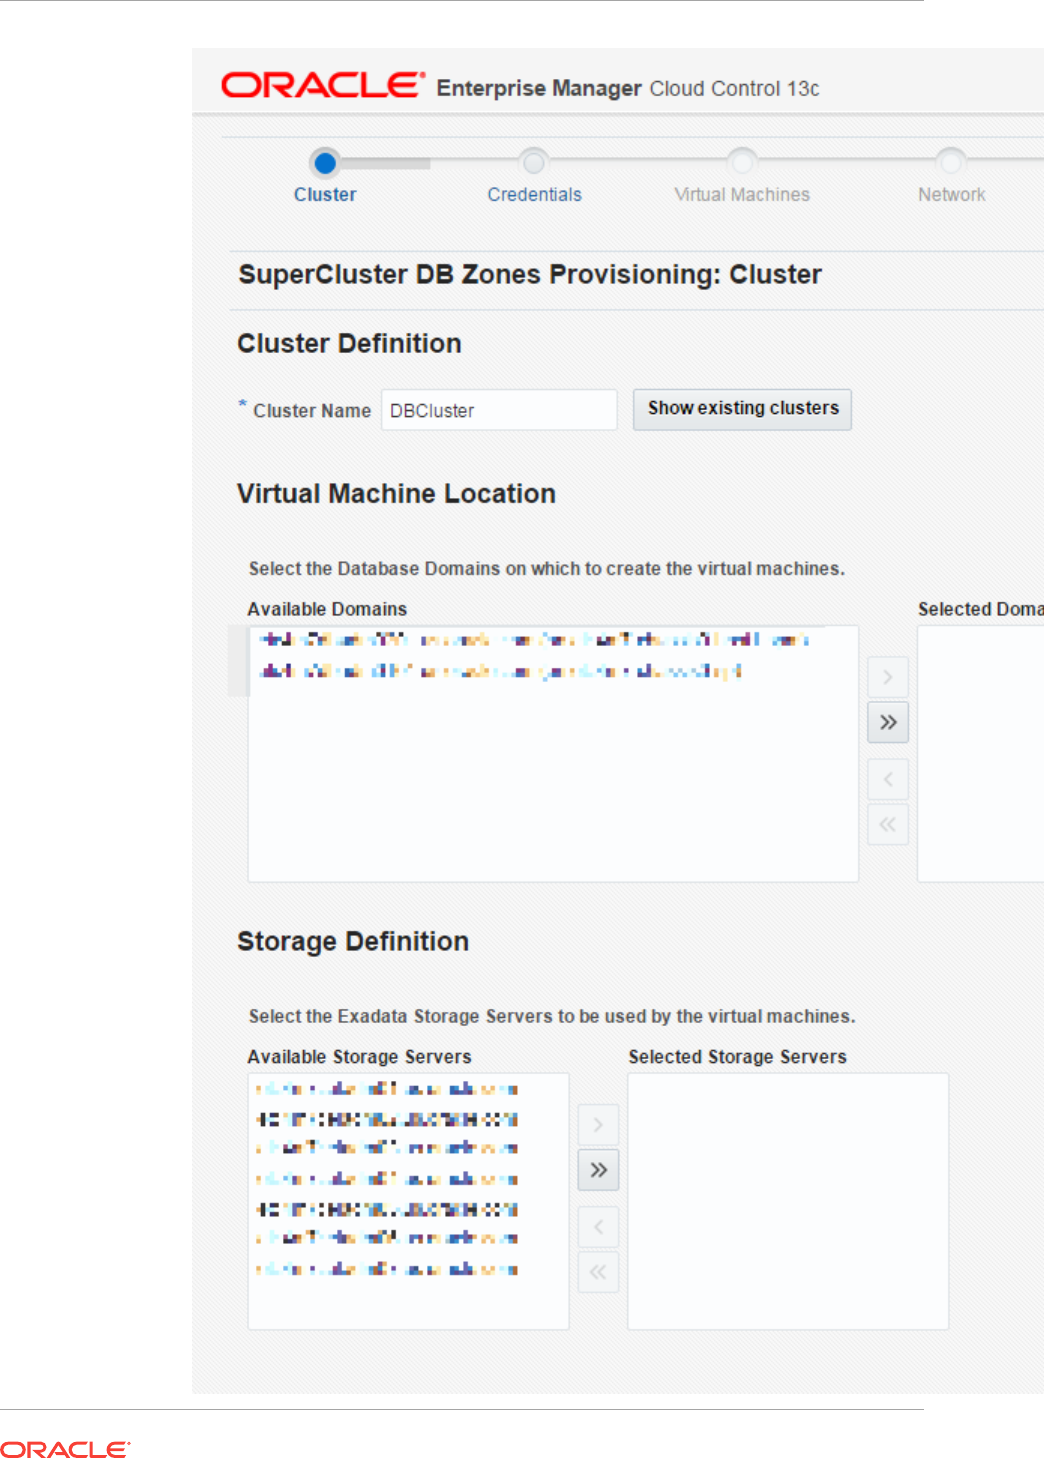
Chapter 42
Create a DB Zones Cluster
42-3

2. Create Credentials by providing root credentials of Database Domains and
administrator credentials of Exadata Storage Servers that were selected:
Chapter 42
Create a DB Zones Cluster
42-4
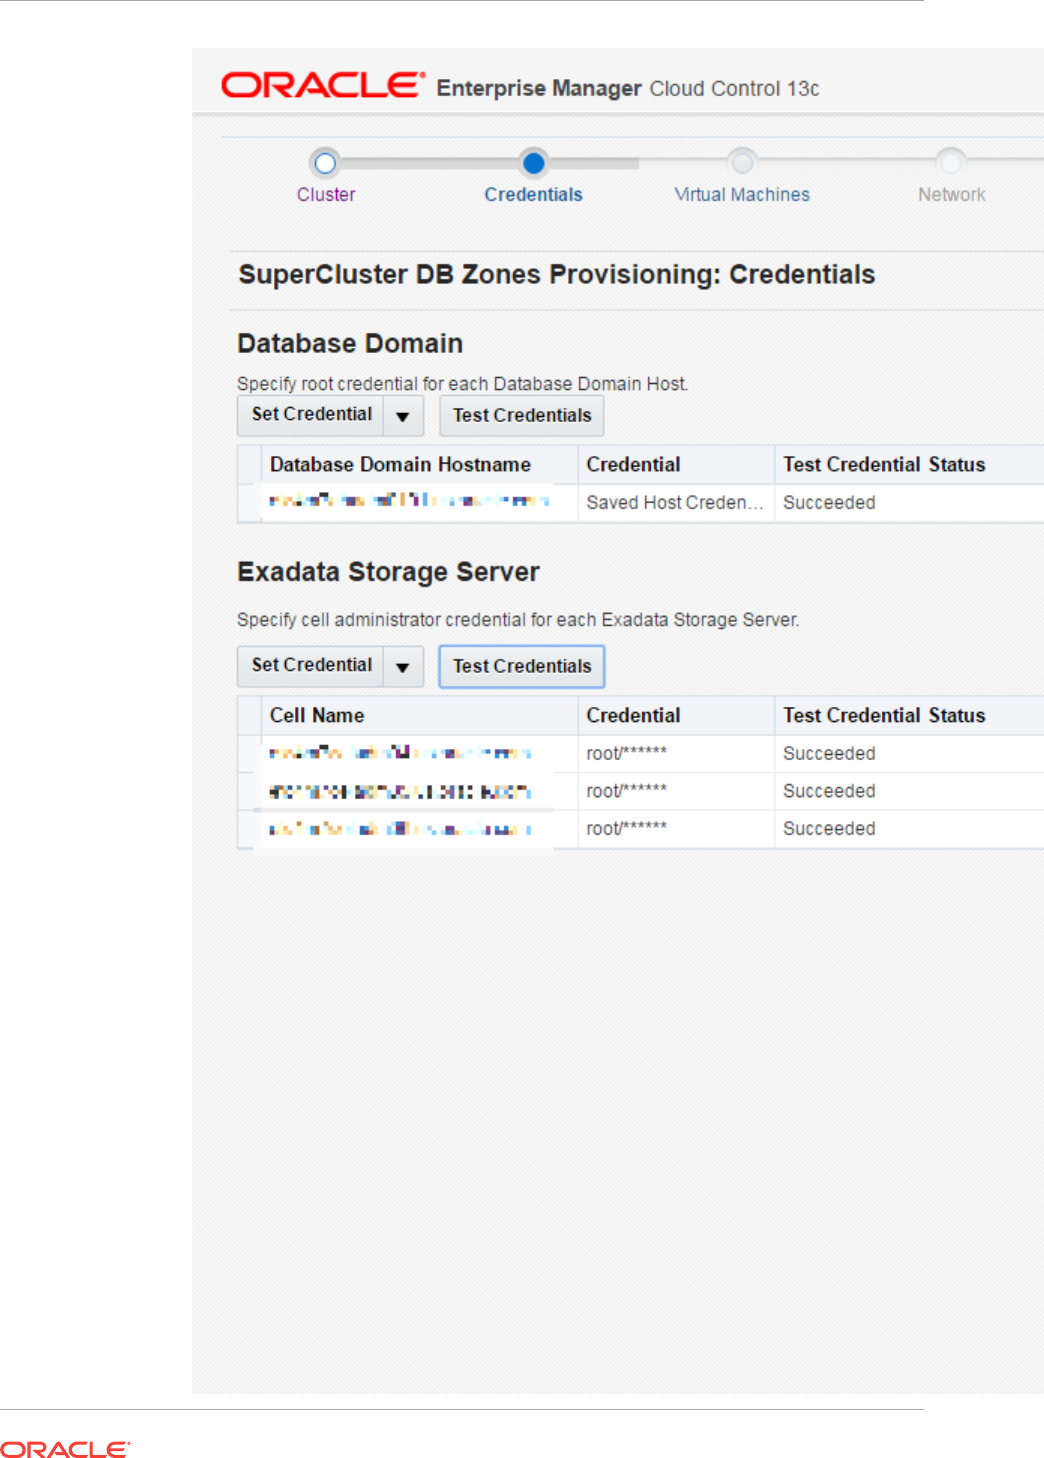
Chapter 42
Create a DB Zones Cluster
42-5

3. Create a Virtual Machine Definition.
One Solaris Zone will be created on each selected Database Domain.
By default the Small Virtual Machine size is selected. This will allocate 1 CPU core
to each Solaris Zone to create, and a quota of 50GB will be set on the ZFS
filesystem mounted on /u01 on the Solaris Zone and used to store the Grid
Infrastructure and Database. You can select another Virtual Machine size
(Medium or Large) or click on Customize... to adjust the number of CPU cores
and storage size. You can click on Show Details... to see the number of available
CPU cores on each of the Database Domains selected. A certain number of cores
should be set aside for the global zone (the Operating System instance on the
Database Domain) depending on the size of the Domain: 2 cores could be set
aside for the global zone on a small Domain of less than 32 cores, and 4 cores
could be set aside for the global zone on Domains with more cores. The remaining
cores can be allocated to new Solaris zones that will be created on this Domain.
a. Provide the root password for the root account that will be created on each
Solaris Zone.
b. DNS IP addresses are pre-populated. Enter the IP address of a NTP (Network
Time Protocol) Server.
c. Grid Infrastructure and Database Software versions are populated from the
Gold Images in Software Library (see the Prerequisite section above).
d. Provide the password for new accounts that will be created on each Solaris
zone.
Chapter 42
Create a DB Zones Cluster
42-6
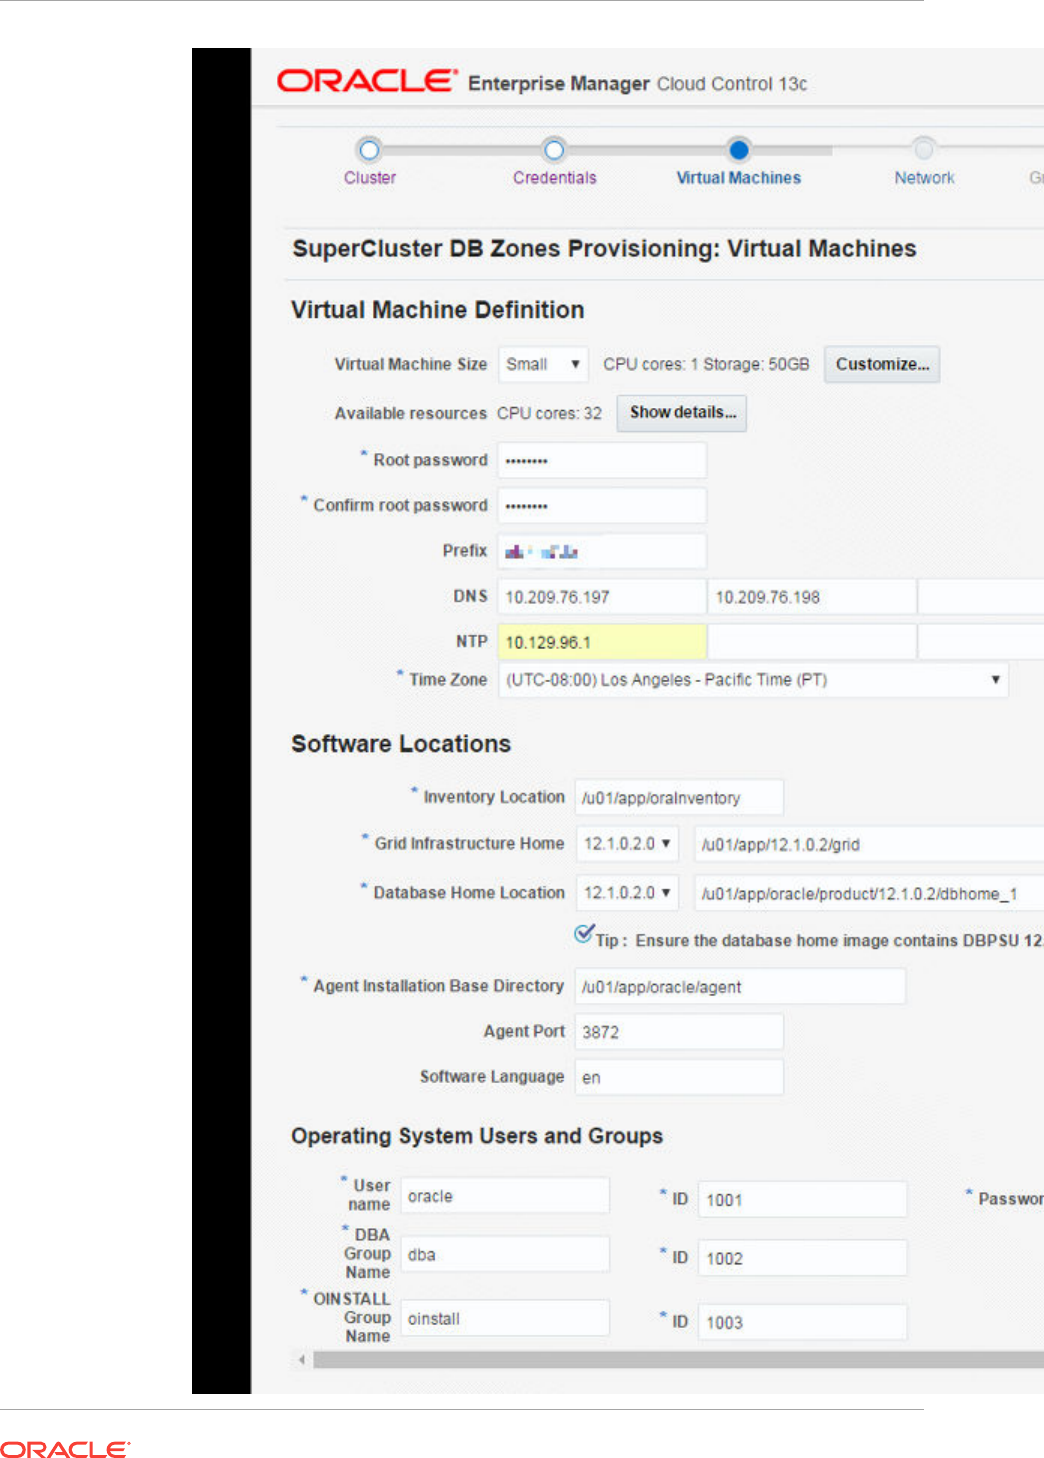
Chapter 42
Create a DB Zones Cluster
42-7

4. Configure the Network.
Network Domains and Subnet masks are pre-populated.
Provide IP addresses for Admin Network Gateway IP and and Client Network
Gateway IP.
Provide IP addresses and hostnames for each network (admin network, client
network, Virtual IP on client network, private network) for the Solaris Zone on each
Database Domain selected:
Chapter 42
Create a DB Zones Cluster
42-8

Chapter 42
Create a DB Zones Cluster
42-9

5. Create a Grid Infrastructure and Initial Database.
Provide the SCAN hostname (Single Client Access Name that provides a single
hostname for clients to access Oracle Databases running in the cluster), ASM
password, Disk group names (must be unique, a check will be performed to verify
no such disk group already exists), global database name and SID, and
Administrative users passwords.
Chapter 42
Create a DB Zones Cluster
42-10
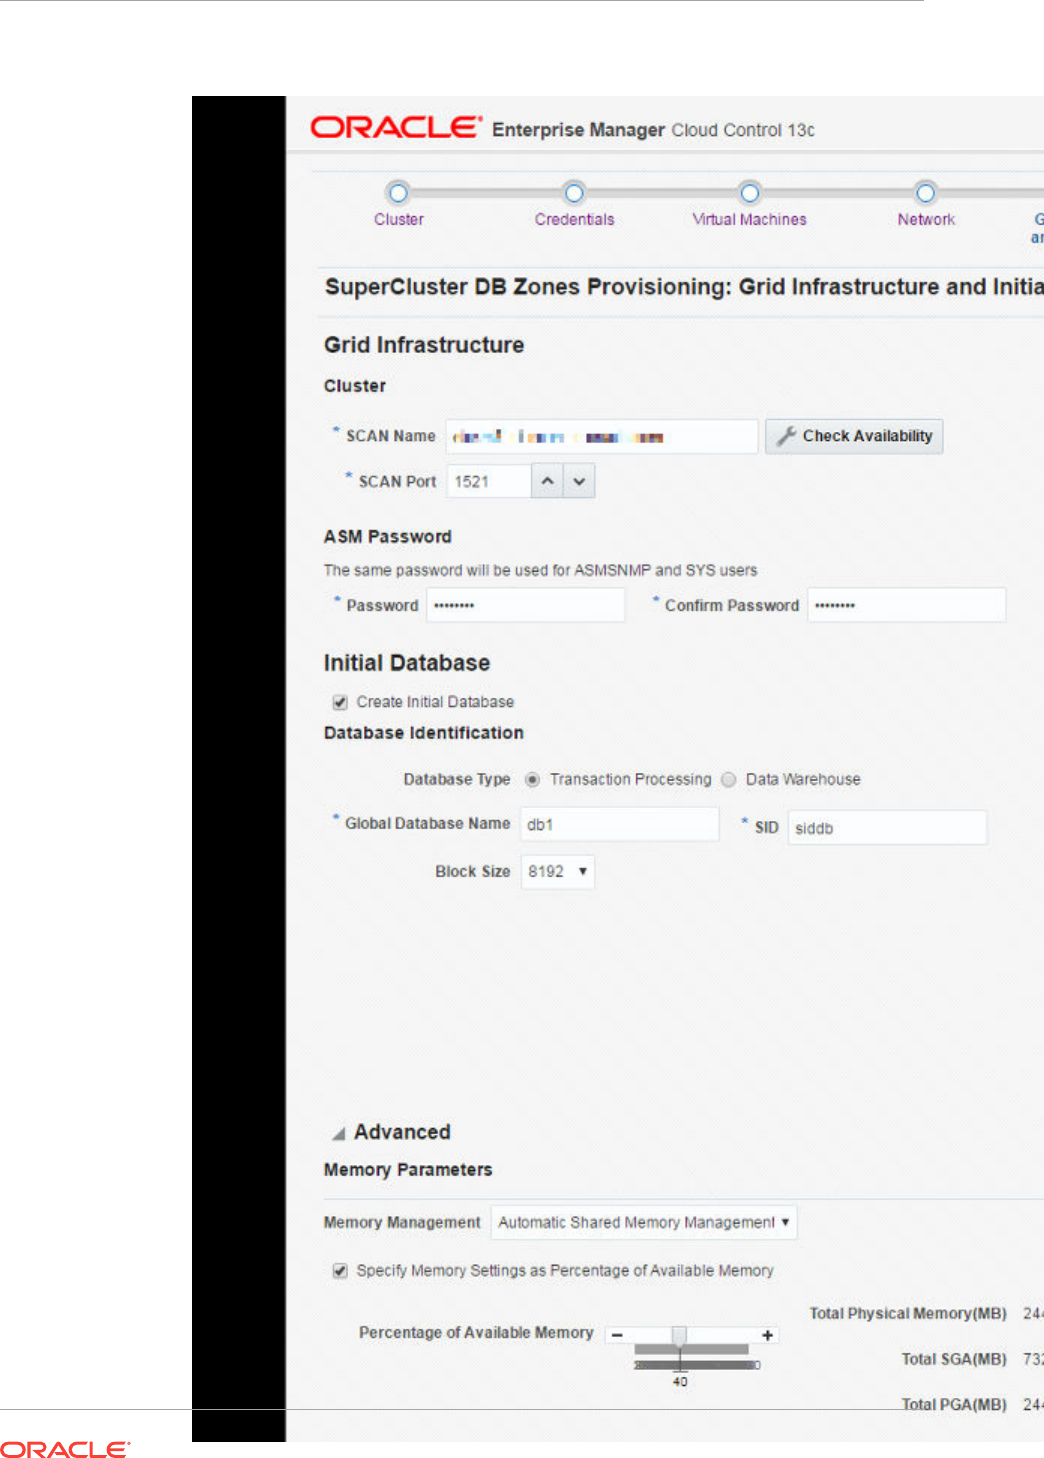
Click the check box to create the initial database and provide additional
information for Database Identification and Administrator Credentials:
Chapter 42
Create a DB Zones Cluster
42-11
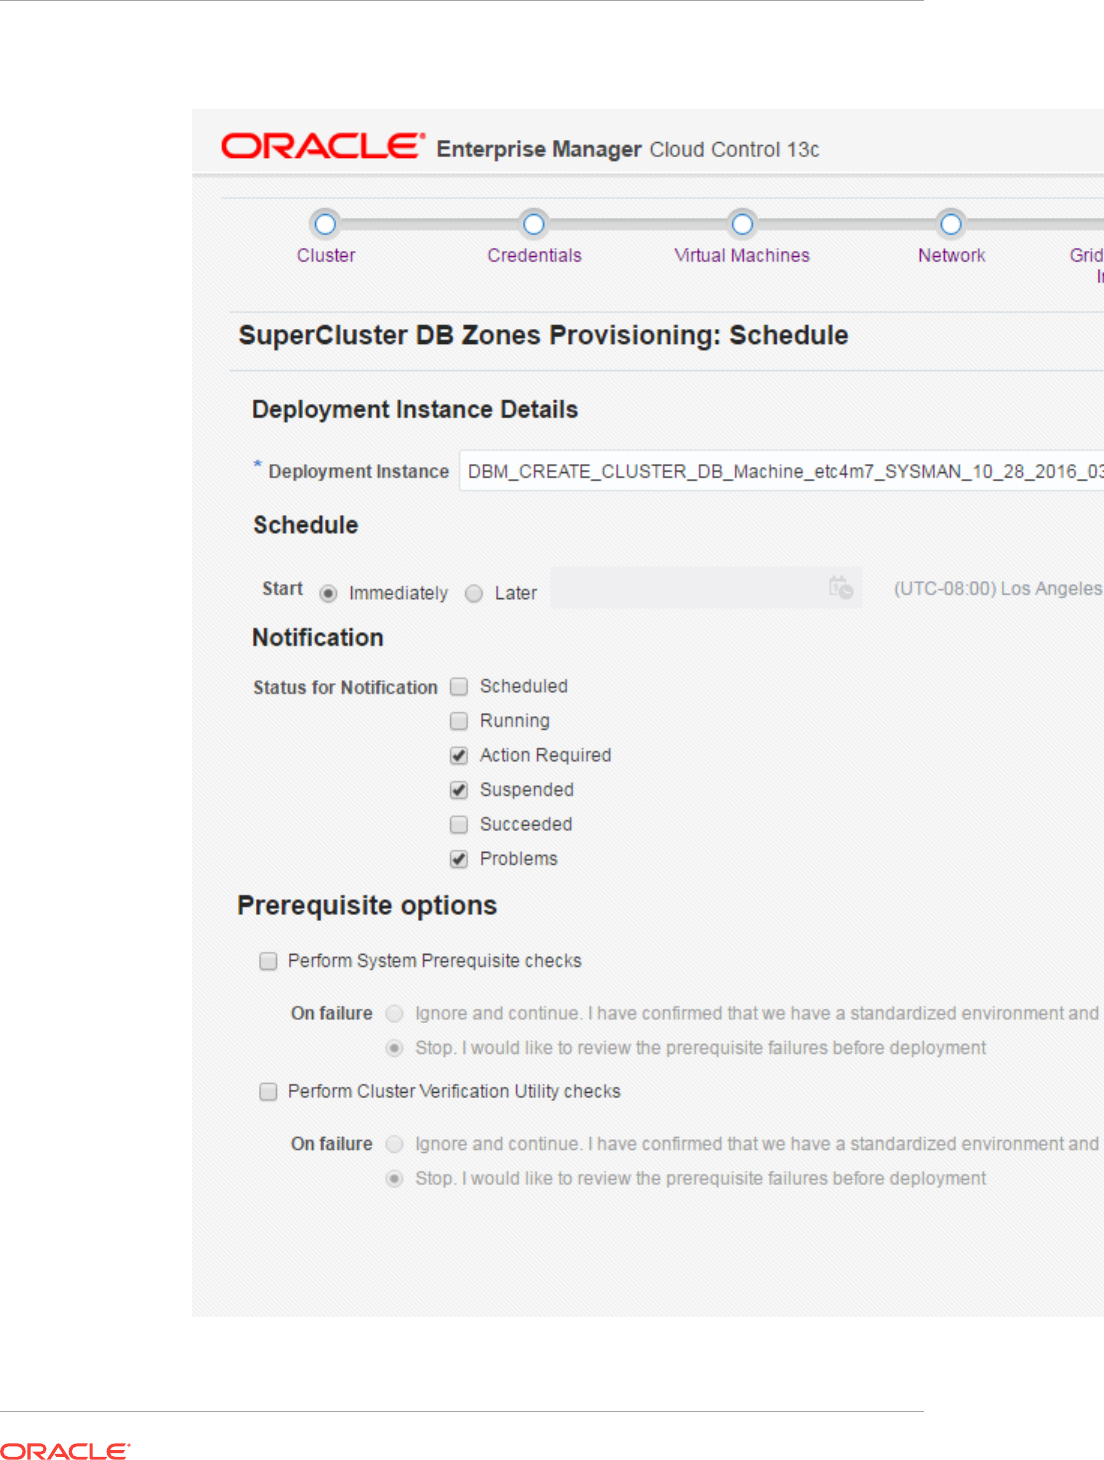
6. Schedule a Deployment
Schedule the deployment, by default this is started immediately.
Chapter 42
Create a DB Zones Cluster
42-12

7. Review and submit. Once submitted, the deployment procedure activity can be
followed from the menu selecting Enterprise, then selecting Provisioning and
Patching, finally clicking Procedure Activity.
42.3 Scale Up Cluster
1. Select a cluster and Database Domains
Select a Database Machine target and once on the Database Machine Home
Page, select Database Machine, then select Provisioning , then click Scale Up
Cluster.
Select the Cluster to extend, then select Database Domains on which to create a
new DB zone.
Chapter 42
Scale Up Cluster
42-13
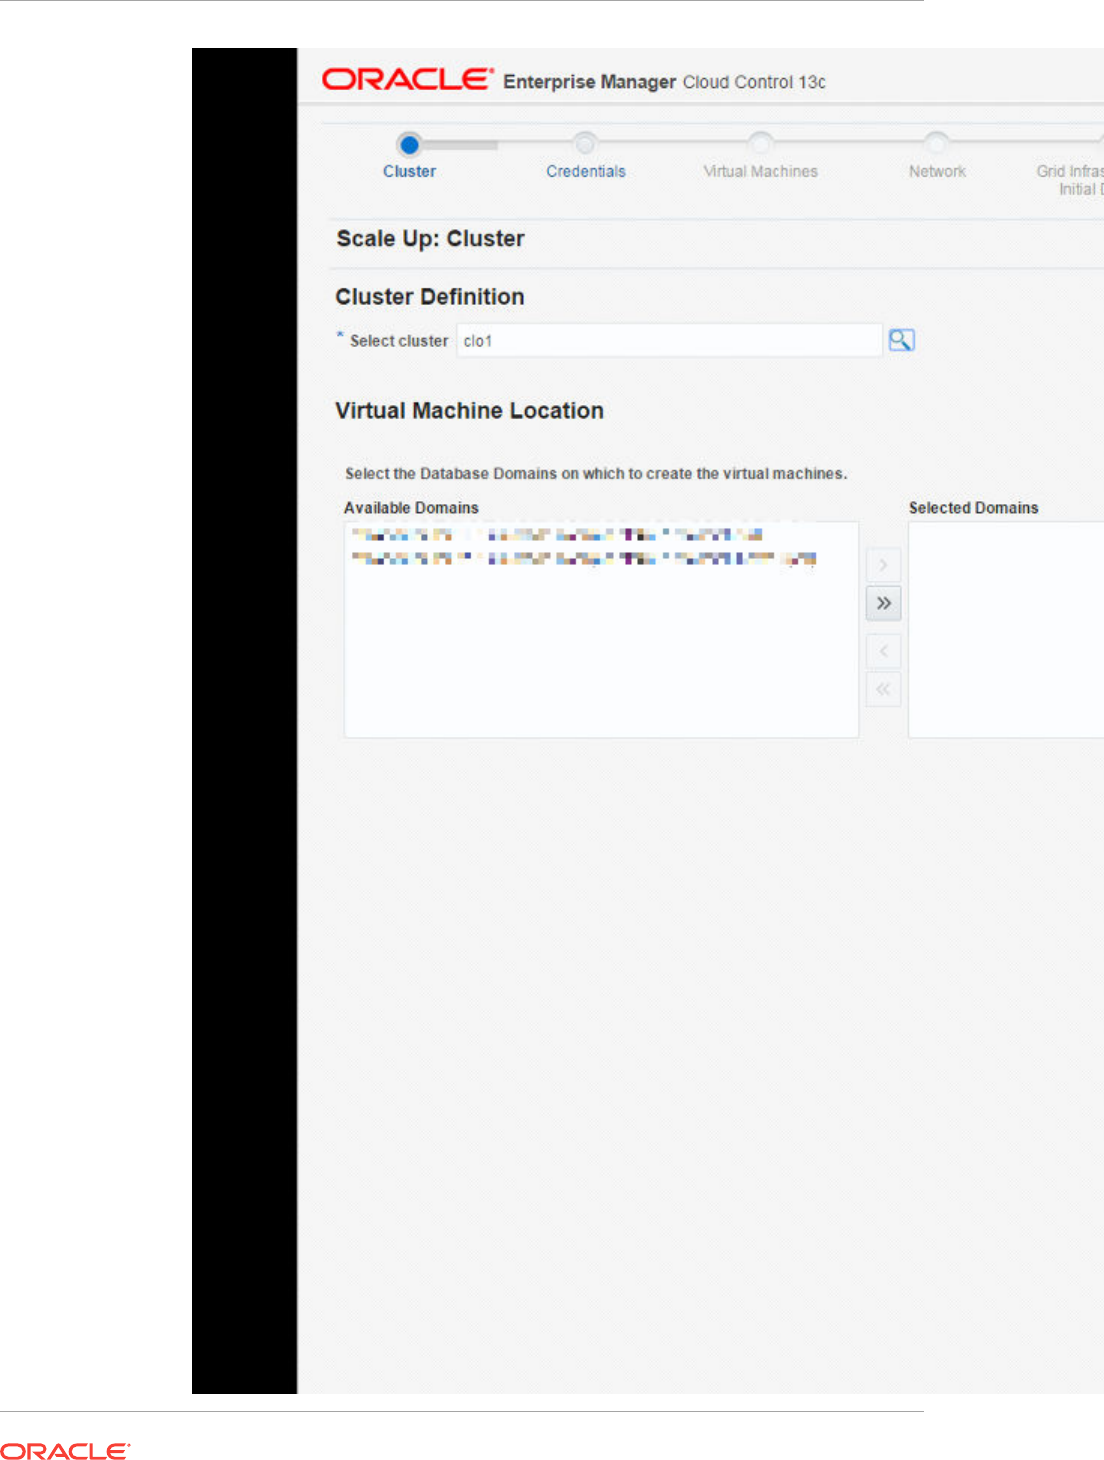
Chapter 42
Scale Up Cluster
42-14

2. Provide the required credentials.
Provide root credentials for Database Domains.
Provide Solaris zone Host credentials for the Oracle Home (oracle user).
Provide Solaris zone host root credentials.
Provide Cluster ASM credentials (user sys, role sysdba).
Provide Cluster Database Credential (user sys, role sysdba).
Chapter 42
Scale Up Cluster
42-15
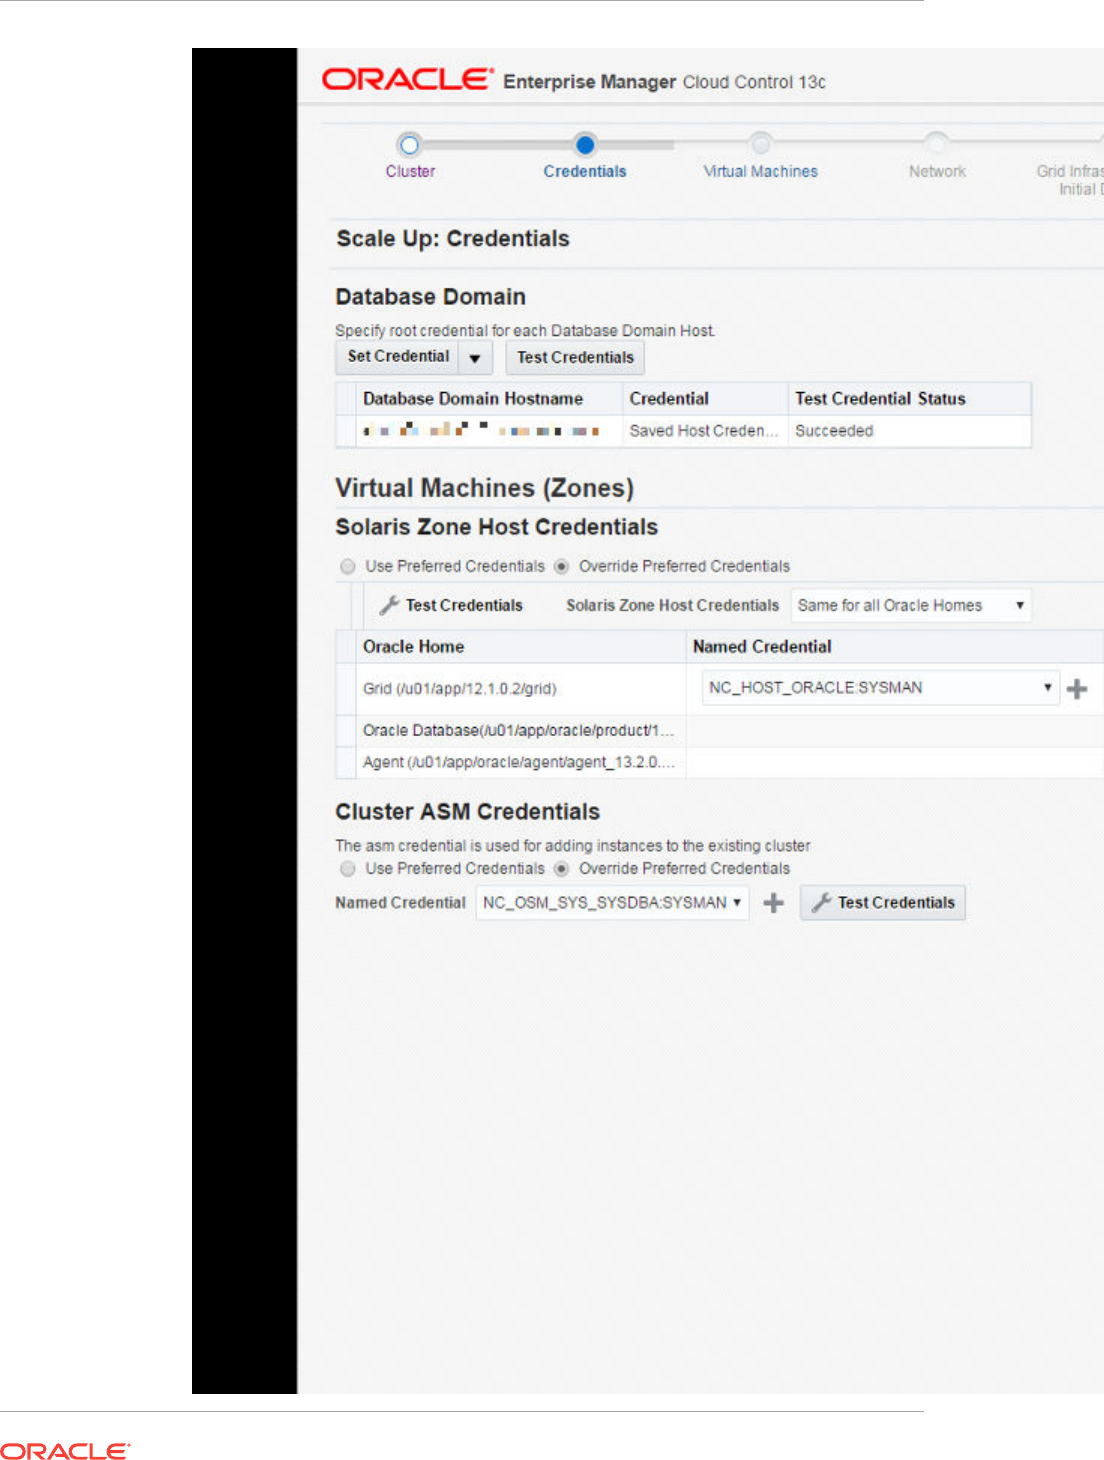
Chapter 42
Scale Up Cluster
42-16

3. Verify the info of the Virtual Machines Definition
Chapter 42
Scale Up Cluster
42-17
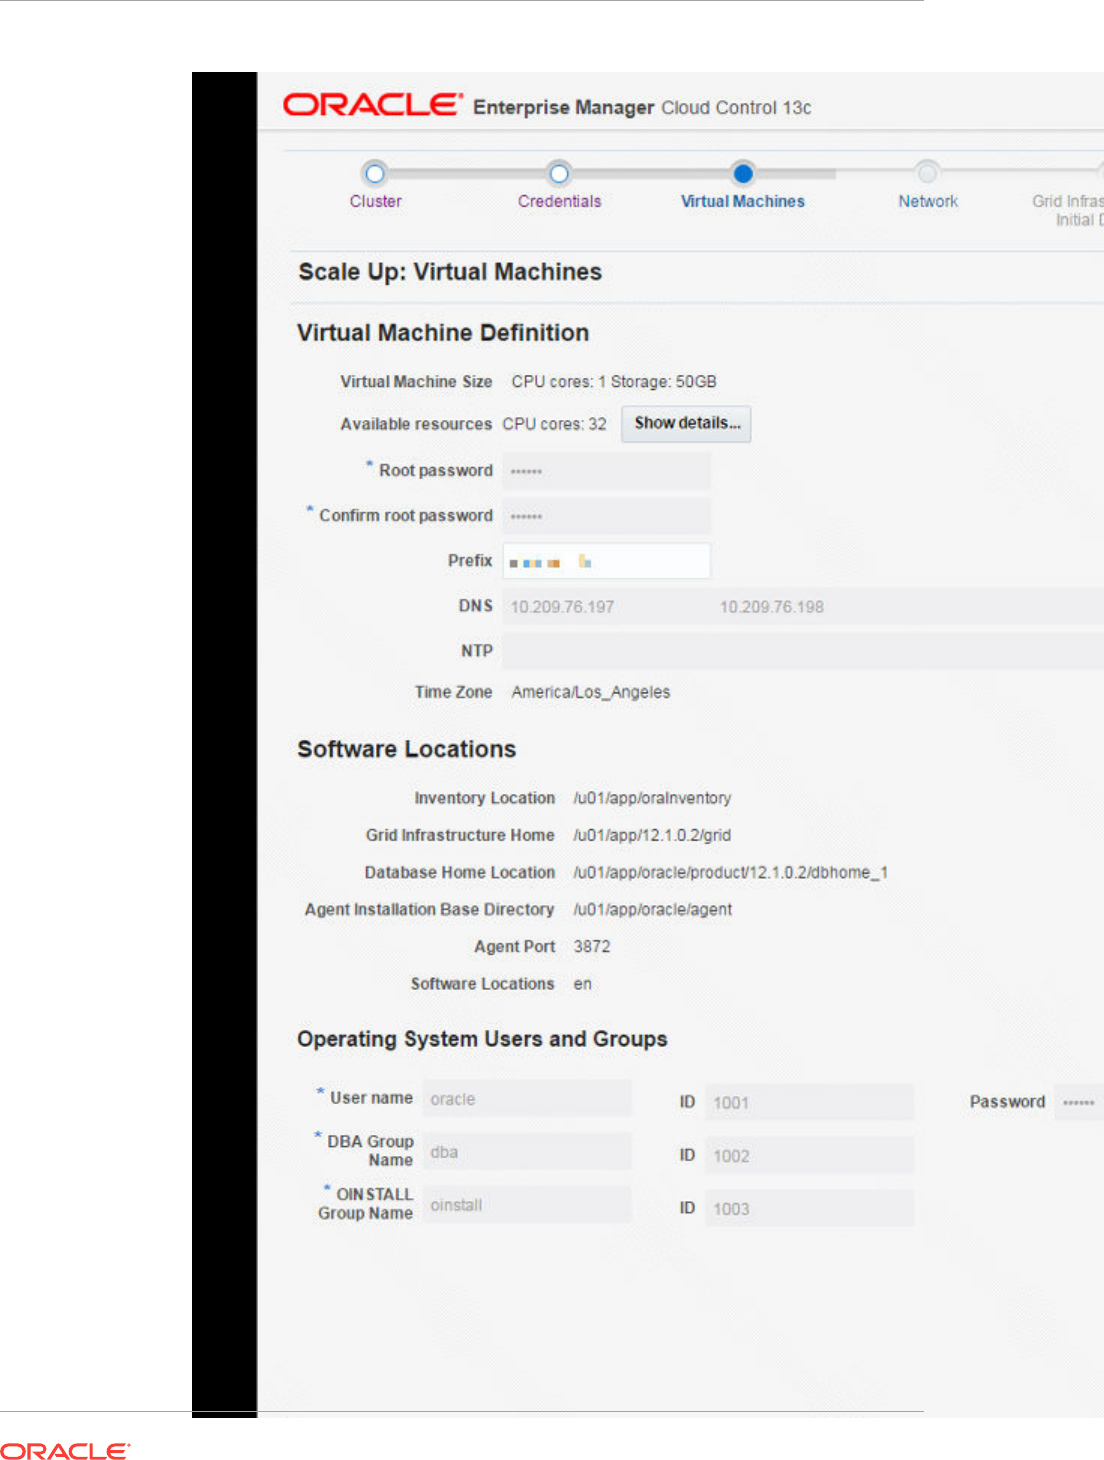
No input to provide here, values are taken from DB zones already in the cluster.
Chapter 42
Scale Up Cluster
42-18

4. Define the Network
Network Domains and Subnet masks are pre-populated.
Provide Gateway IP addresses for Admin and Client Networks.
Provide IP addresses and hostnames for each network (admin network, client
network, Virtual IP on client network, private network).
Chapter 42
Scale Up Cluster
42-19
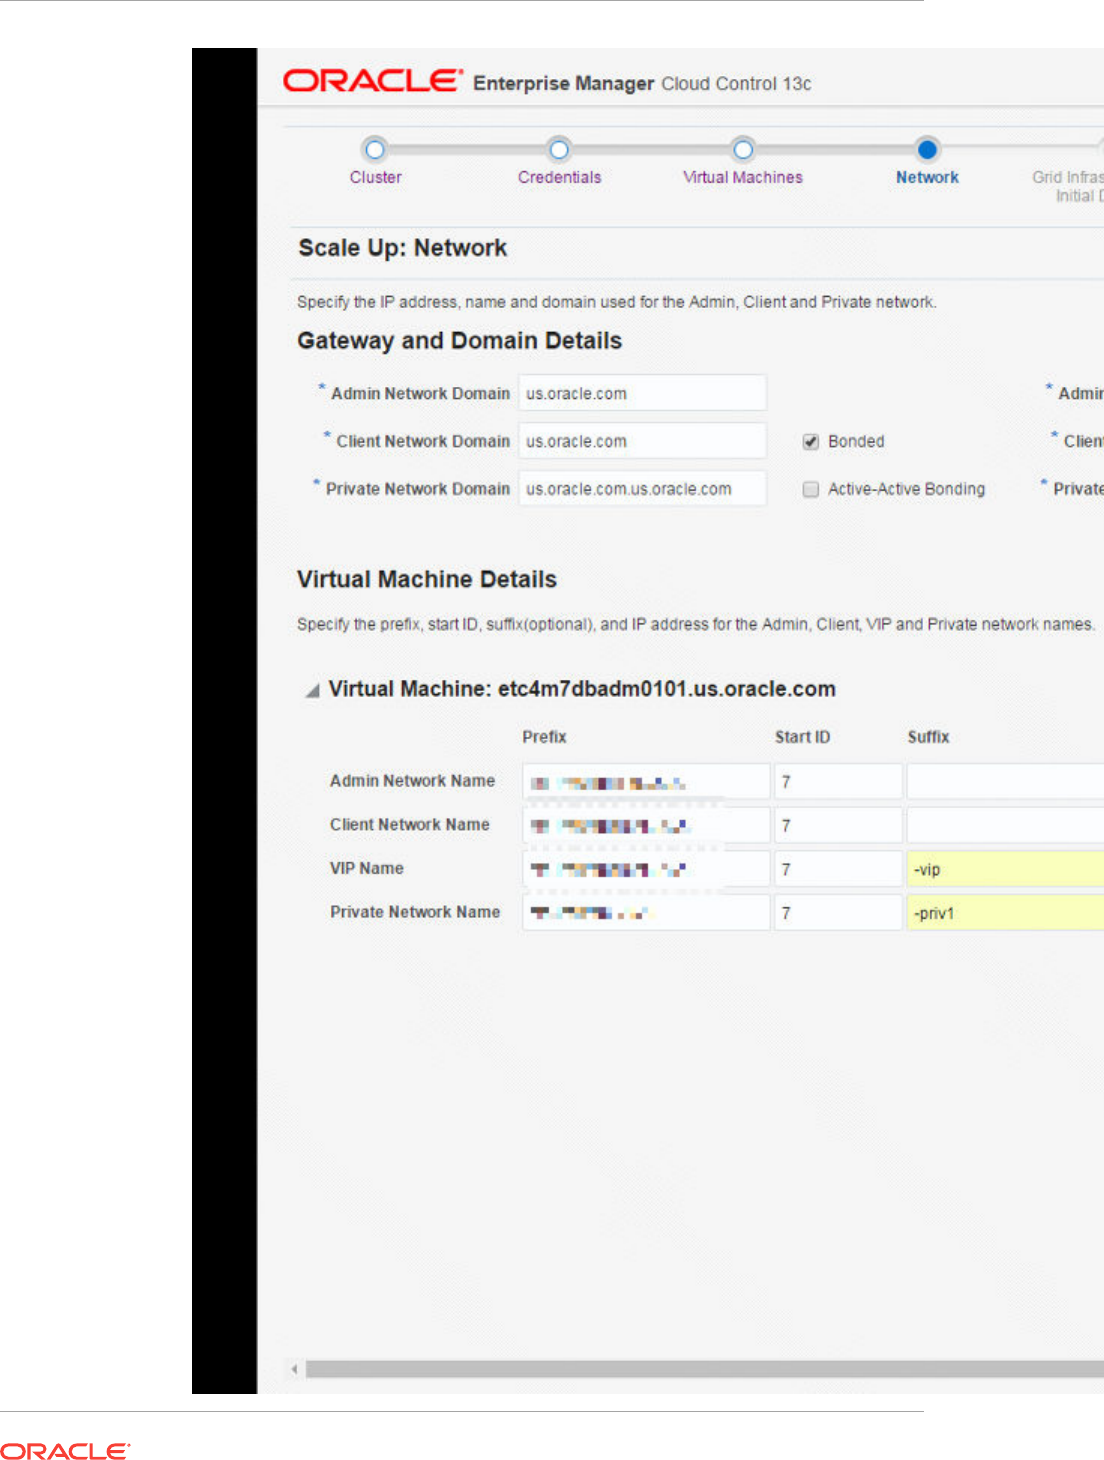
Chapter 42
Scale Up Cluster
42-20

5. Deployment schedule
Chapter 42
Scale Up Cluster
42-21
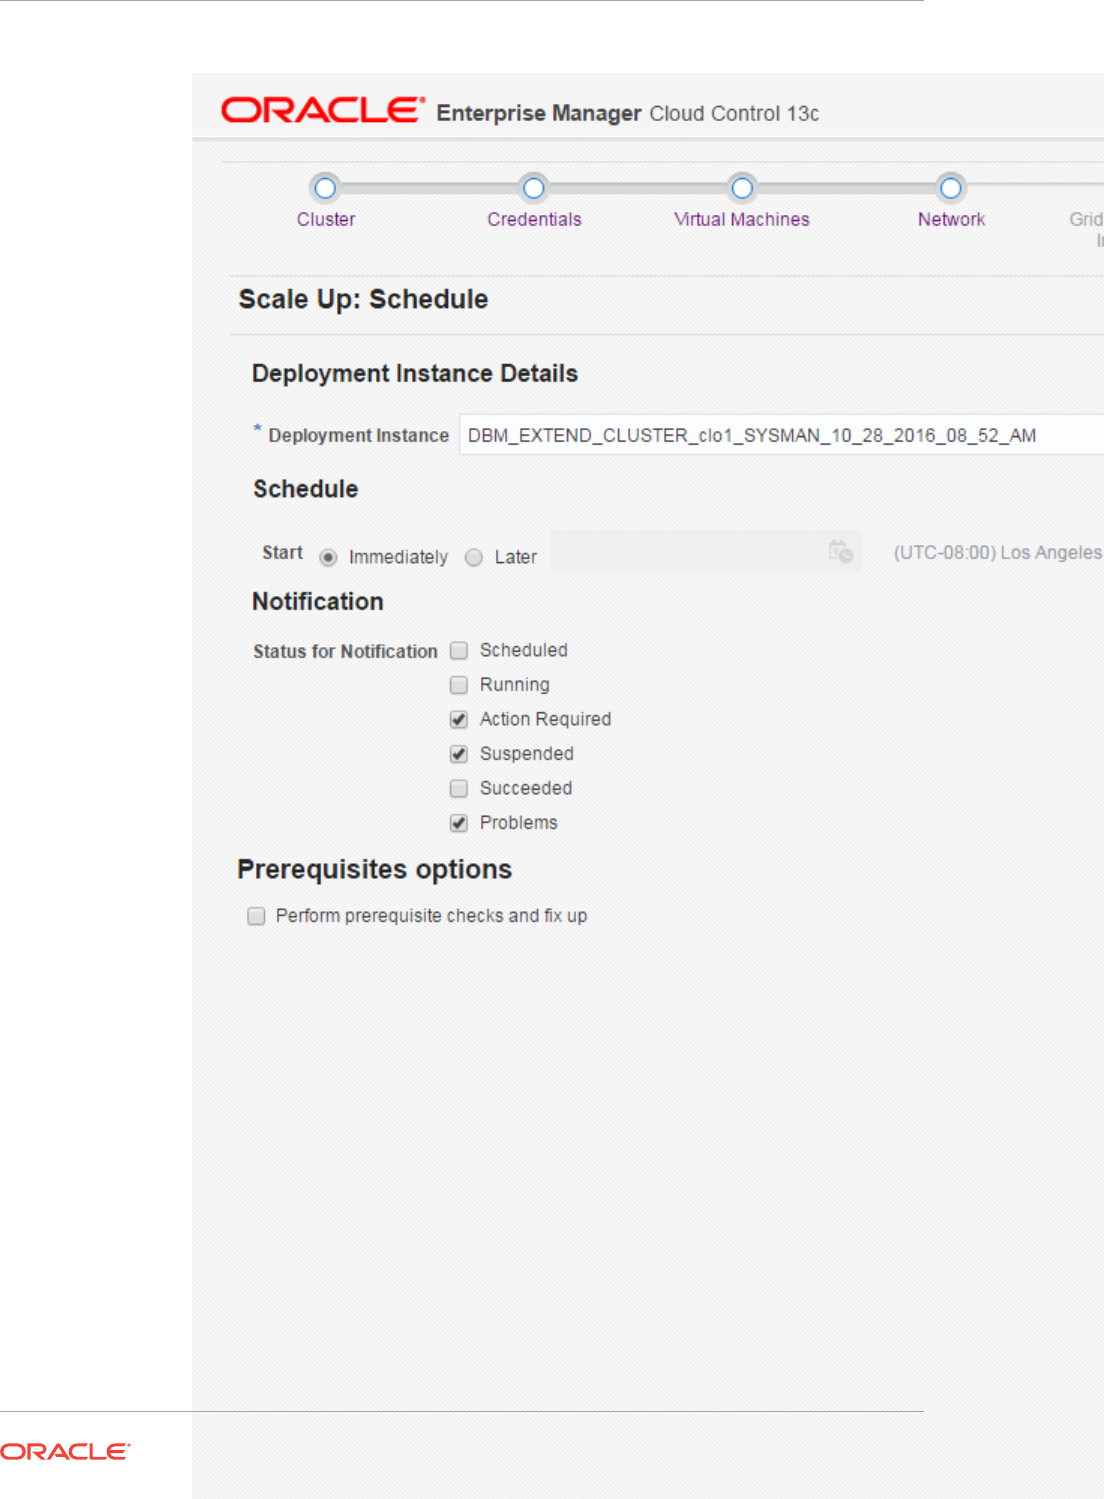
Schedule the Deployment, by default started immediately:
Chapter 42
Scale Up Cluster
42-22

42.4 Scale Down Cluster
1. Select the cluster and Solaris zone to delete
From DB machine Home Page, select Database Machine, then selecting
Provisioning, then click Scale down cluster.
Select the Cluster to scale down. Once selected the list of DB zones in the Cluster
appear.
Select the Solaris Zones to delete
Provide Solaris zone Host credentials for the Oracle Home (oracle user)
Provide Solaris zone Host root credentials
Provide Exadata Storage Server Credentials
Provide Database Domains host root credentials
Chapter 42
Scale Down Cluster
42-23
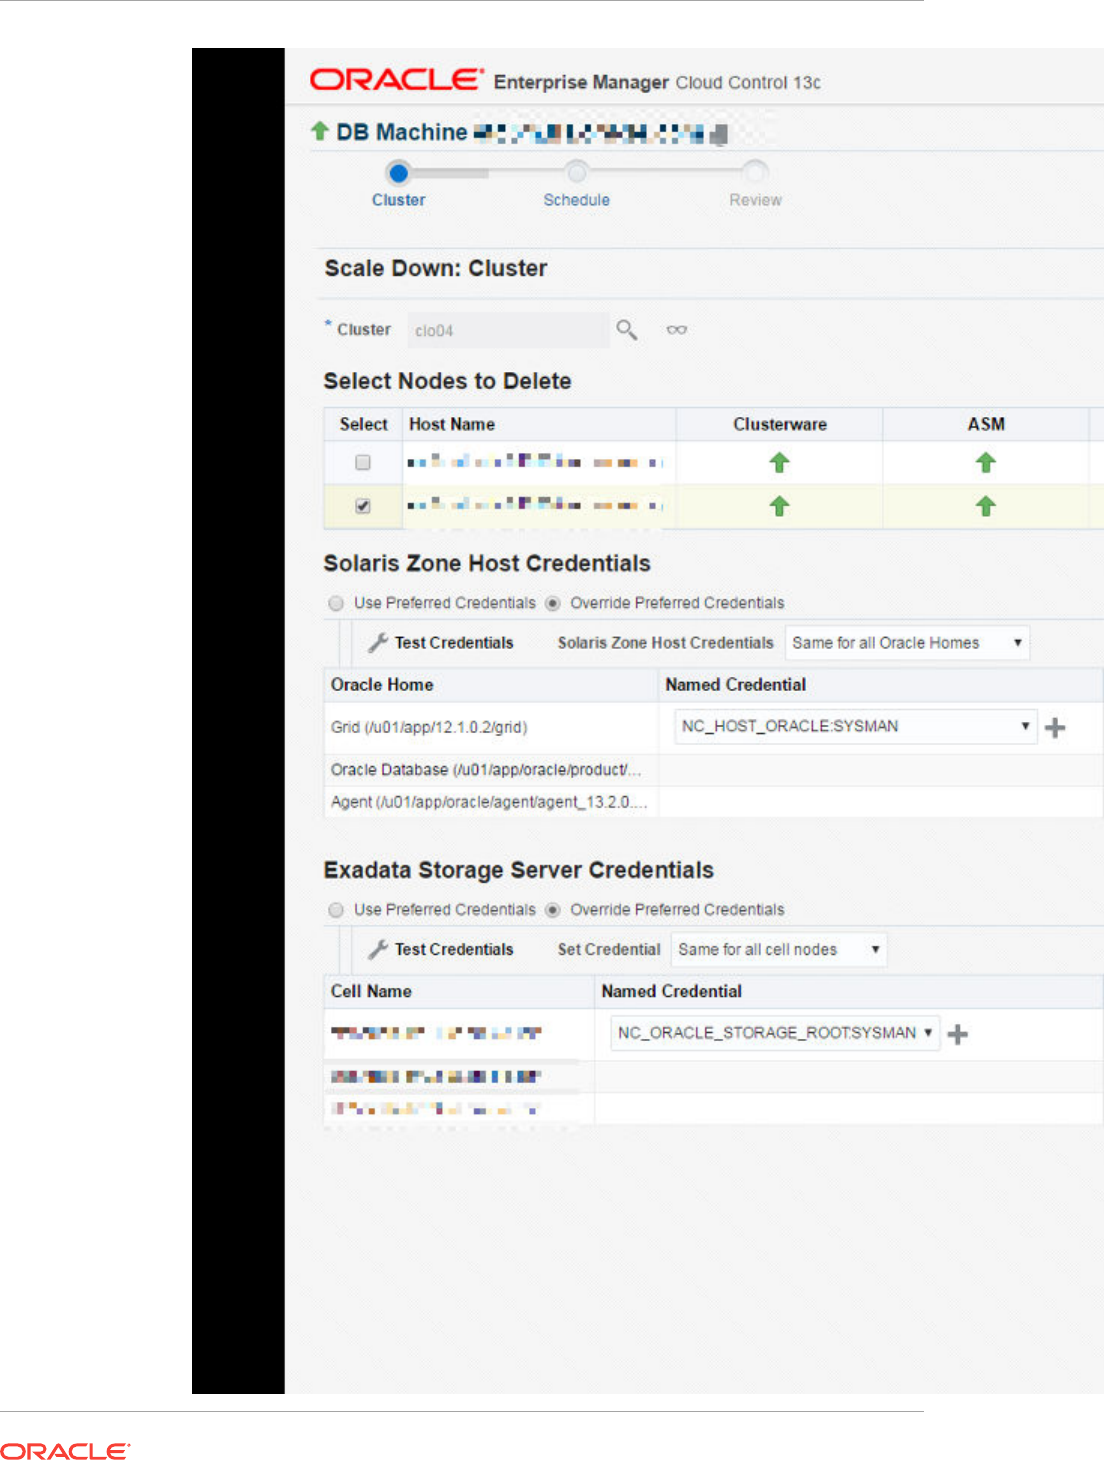
Chapter 42
Scale Down Cluster
42-24

2. Define a Deployment schedule
Chapter 42
Scale Down Cluster
42-25

Schedule the Deployment, by default started immediately:
Chapter 42
Scale Down Cluster
42-26

3. Review and submit
42.5 Delete Cluster
1. Select the cluster to delete
From DB machine Home Page, select Database Machine, then select
Provisioning, then click Delete cluster.
Select the Cluster to delete. Once selected the list of DB zones in the Cluster
appear.
Provide Solaris zones Host credentials for the Oracle Home (oracle user).
Provide Solaris zones Host root credentials.
Provide Exadata Storage Server Credentials.
Provide Database Domains host root credentials.
Chapter 42
Delete Cluster
42-27
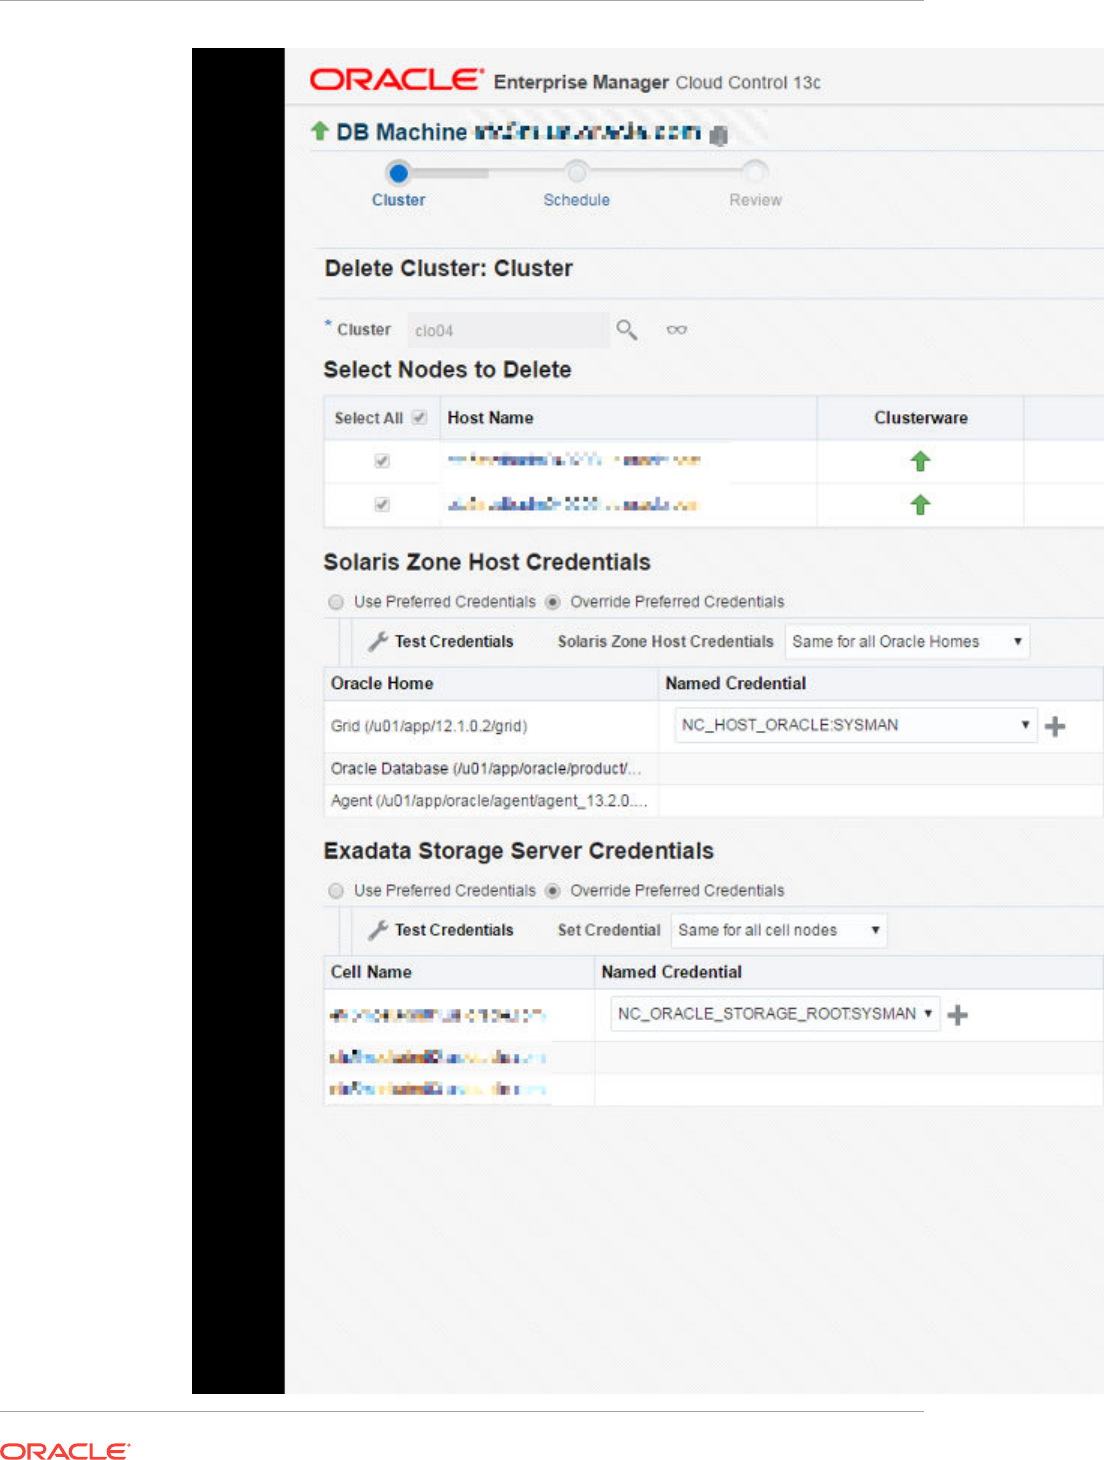
Chapter 42
Delete Cluster
42-28

2. Define a Deployment schedule
Chapter 42
Delete Cluster
42-29
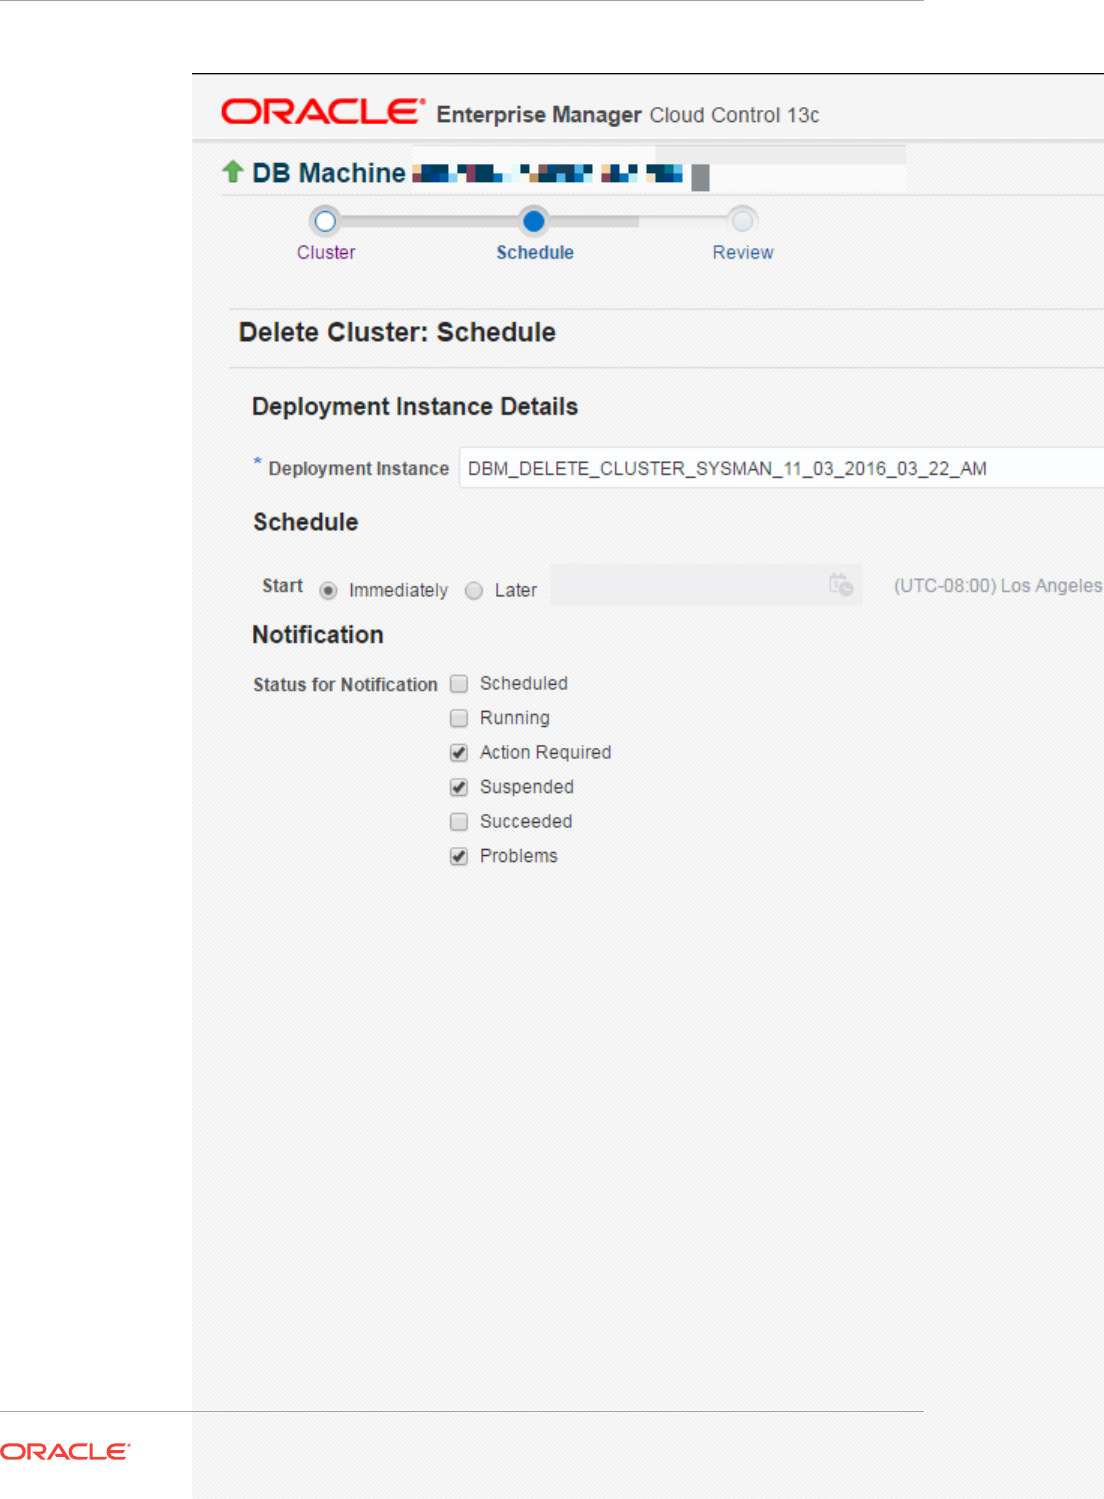
Schedule the Deployment, by default it starts immediately:
Chapter 42
Delete Cluster
42-30

3. Review and submit
Chapter 42
Delete Cluster
42-31


43
Using Information Publisher
Information Publisher, Enterprise Manager's reporting framework, makes information
about your managed environment available to audiences across your enterprise.
Strategically, reports are used to present a view of enterprise monitoring information
for business intelligence purposes, but can also serve an administrative role by
showing activity, resource utilization, and configuration of managed targets. IT
managers can use reports to show availability of sets of managed systems. Executives
can view reports on availability of applications (such as corporate email) over a period
of time.
Note:
The Information Publisher (IP) reporting framework is still supported for
Enterprise Manager 13c, however, new report development using this
framework has been deprecated for Enterprise Manager 13c.
The reporting framework allows you to create and publish customized reports: Intuitive
HTML-based reports can be published via the Web, stored, or e-mailed to selected
recipients. Information Publisher comes with a comprehensive library of predefined
reports that allow you to generate reports out-of-box without additional setup and
configuration.
This chapter covers the following topics:
•About Information Publisher
•Out-of-Box Report Definitions
•Custom Reports
•Scheduling Reports
•Sharing Reports
43.1 About Information Publisher
Information Publisher provides powerful reporting and publishing capability.
Information Publisher reports present an intuitive interface to critical decision-making
information stored in the Management Repository while ensuring the security of this
information by taking advantage of Enterprise Manager's security and access control.
Information Publisher's intuitive user-interface allows you to create and publish reports
with little effort. The key benefits of using Information Publisher are:
•Provides a framework for creating content-rich, well-formatted HTML reports
based on Management Repository data.
•Out-of-box reports let you start generating reports immediately without any system
configuration or setup.
43-1

•Ability to schedule automatic generation of reports and store scheduled copies
and/or e-mail them to intended audiences.
•Ability for Enterprise Manager administrators to share reports with the entire
business community: executives, customers, and other Enterprise Manager
administrators.
Information Publisher provides you with a feature-rich framework that is your central
information source for your enterprise.
43.2 Out-of-Box Report Definitions
The focal point of Information Publisher is the report definition. A report definition tells
the reporting framework how to generate a specific report by defining report properties
such as report content, user access, and scheduling of report generation.
Information Publisher comes with a comprehensive library of predefined report
definitions, allowing you to generate fully formatted HTML reports presenting critical
operations and business information without any additional configuration or setup. .
Generating this HTML report involved three simple steps:
Step 1: Click Availability History (Group) in the report definition list.
Step 2: Select the group for which you want to run the report.
Step 3: Click Continue to generate the fully-formed report.
Supplied report definitions are organized by functional category with each category
covering key areas.
To access the Information Publisher home page, from the Enterprise menu, choose
Reports and then Information Publisher.
43.3 Custom Reports
Although the predefined report definitions that come with Information Publisher cover
the most common reporting needs, you may want to create specialized reports. If a
predefined report comes close to meeting your information requirements, but not quite,
you can use Information Publisher's Create Like function to create a new report
definition based on one of the existing reports definitions.
43.3.1 Creating Custom Reports
To create custom reports:
1. Choose whether to modify an existing report definition or start from scratch. If an
existing report definition closely matches your needs, it is easy to customize it by
using the Create Like function.
2. Specify name, category, and sub-category. Cloud Control provides default
categories and sub-categories that are used for out-of-box reports. However, you
can categorize custom reports in any way you like.
3. Specify any time-period and/or target parameters. The report viewer will be
prompted for these parameters while viewing the report.
Chapter 43
Out-of-Box Report Definitions
43-2

4. Add reporting elements. Reporting elements are pre-defined content building
blocks, that allow you to add a variety of information to your report. Some
examples of reporting elements are charts, tables, and images.
5. Customize the report layout. Once you have assembled the reporting elements,
you can customize the layout of the report.
43.3.2 Report Parameters
By declaring report parameters, you allow the user to control what data is shown in the
report. There are two types of parameters: target and time-period.
Example: If you are defining a report that will be used to diagnose a problem (such as
a memory consumption report), the viewer will be able to see information for their
target of interest.
By specifying the time-period parameter, the viewer will be able to analyze historical
data for their period of interest.
Analyzing Historical Data
Information Publisher allows you to view reports for a variety of time-periods:
•Last 24 Hours/ 7 Days/ 31 Days
•Previous X Days/ Weeks/ Months/ Years (calendar units)
•This Week/ This Month/ This Year (this week so far)
•Any custom date range.
43.3.3 Report Elements
Report elements are the building blocks of a report definition. In general, report
elements take parameters to generate viewable information. For example, the Chart
from SQL element takes a SQL query to extract data from the Management
Repository and a parameter specifying whether to display the data in the form of a pie,
bar, or line chart. Report elements let you "assemble" a custom report definition using
the Information Publisher user interface.
Information Publisher provides a variety of reporting elements. Generic reporting
elements allow you to display any desired information, in the form of charts, tables or
images. For example, you can include your corporate Logo, with a link to your
corporate Web site. Monitoring elements show monitoring information, such as
availability and alerts for managed targets. Service Level Reporting elements show
availability, performance, usage and achieved service levels, allowing you to track
compliance with Service Level Agreements, as well as share information about
achieved service levels with your customers and business executives.
43.4 Scheduling Reports
Enterprise manager allows you to view reports interactively and/or schedule
generation of reports on a flexible schedule. For example, you might want to generate
an "Inventory Snapshot" report of all of the servers in your environment every day at
midnight.
Chapter 43
Scheduling Reports
43-3

43.4.1 Flexible Schedules
Cloud Control provides the following scheduling options:
•One-time report generation either immediately or at any point in the future
•Periodic report generation
–Frequency: Any number of Minutes/ Hours/ Days/ Weeks/ Months/ Years
–You can generate copies indefinitely or until a specific date in the future.
43.4.2 Storing and Purging Report Copies
Enterprise Manager allows you to store any number of scheduled copies for future
reference. You can delete each stored copy manually or you can set up automated
purging based on either the number of stored copies or based on retention time. For
example, you can have Enterprise Manager purge all reports that are more than 90
days old.
43.4.3 E-mailing Reports
You can choose for scheduled reports to be e-mailed to any number of recipients. You
can specify reply-to address and subject of the e-mail.
43.5 Sharing Reports
Information Publisher facilitates easy report sharing with the entire user community.
Enterprise Manager administrators can share reports with other administrators and
roles. However, there may be cases when you need to share reports with non-
Enterprise Manager administrators, such as customers and/or business executives. To
facilitate information sharing with these users, Enterprise Manager renders a separate
reporting Web site that does not require user authentication.
Note:
To ensure that no sensitive information is compromised, only Enterprise
Manager administrators with a special system privilege are allowed to publish
reports to the Enterprise Manager reports Web site.
Information Publisher honors Enterprise Manager roles and privileges, ensuring that
only Enterprise Manager administrators can create reports on the information they are
allowed to see.When sharing reports, administrators have an option of allowing report
viewers to see the report with the owner's privileges. For example, as a system
administrator you might want to share a host's performance information with a DBA
using your server, but you do not want to grant the DBA any privileges on your host
target. In this case, you could create a host performance report, and allow the DBA to
view it with your privileges. This way, they only see the information you want them to
see, without having access to the host homepage.
Chapter 43
Sharing Reports
43-4

44
Creating Usage Tracking Reports
Usage Tracking Reports provides an overview of the Database features that are
identified as being used by your organization.
Note:
Usage Tracking Reports are intended for informational purposes only and do
not represent your license entitlements or requirements. To understand your
license requirements, contact the License Management Services
representative at:
http://www.oracle.com/us/corporate/license-management-services/index.html
This chapter covers the following topics:
•Usage Tracking Reports
•Collecting Data for Database Usage Tracking
•Generating Database Usage Tracking Report
•Database Usage Tracking Summary Report
•Generating the Fusion Middleware Usage Tracking Summary Report
44.1 Usage Tracking Reports
Usage Tracking Reports are Oracle-supplied reports that are available with Oracle
Business Intelligence Publisher (BI Publisher), the primary reporting system that
provides a single, Web-based platform for authoring, managing, and delivering
interactive reports and all types of highly formatted documents. The procedures
detailed in this chapter assume that you have already integrated BI Publisher into
Enterprise Manager.
There are two Usage Tracking Reports:
•Database Usage Tracking Summary Report is a high level summary of the
Database Version, Edition, licensable Options and Enterprise Management Pack
usage.
This report can be run and viewed online. The output report can be exported to
PDF, RTF, Excel formats.
•Database Usage Tracking Report provides the above usage data in an exportable
(csv) format. The exported data can be sent to Oracle License Management
Services for further analysis to determine licensing requirements. Please contact
the License Management Services representative at http://www.oracle.com/us/
corporate/license-management-services/index.html to initiate an engagement.
44-1

This report cannot be run online and can only be scheduled. A single file for each
database instance will be generated each time the report is scheduled to run. The
format of the output files is comma separated values (CSV).
Creating Usage Tracking Reports consists of the following high-level tasks:
1. Setting up Database Usage Tracking credentials. (Required for both Database
Usage Tracking Summary Report and Database Usage Tracking Report.)
2. Enabling the metric collection (via monitoring templates. (Required for both
Database Usage Tracking Summary Report and Database Usage Tracking
Report.)
3. Configuring the FTP Server (where reports are to be generated) in BI Publisher.
(Not required for the Database Usage Tracking Summary Report.)
4. Generating the Usage Tracking Reports.
44.2 Collecting Data for Database Usage Tracking
Prior to producing the Database Usage Tracking Report, corresponding Metric
Collections must be configured and enabled. This includes the following steps:
1. Setting Database Usage Tracking Credentials
2. Enabling or disabling (when the collection is finished) the Metric Collection.
Depending on the preferences and available licensing, this can be done:
•Using Monitoring Templates, from the OEM console, for the database targets
which are licensed with Diagnostics Pack.
•Using EM Command Line Interface (EM CLI), for any database target,
regardless of the licensing.
There are two types of metric collections:
•Weekly metrics - to be collected once in 7 days: lms_wk_ci and lms_wk_ci_cdb
•Hourly metrics - to be collected every hour: lms_hr_ci and lms_hr_ci_cdb
This collection must me enabled only when session information is needed, and
should be carefully monitored because of the amount of data that can be
generated.
For each of these two types, there are two different metric collections:
•For standard traditional database targets: lms_wk_ci and lms_hr_ci
•For Container Database (CDB) targets: lms_wk_ci_cdb and lms_hr_ci_cdb, which
collect data from CDB$ROOT container and also from all the Pluggable
Databases (PDBs)
44.2.1 Setting Database Usage Tracking Credentials
1. Log in to Enterprise Manager. From the Setup menu, select Security and then
Monitoring Credentials.
2. Choose the desired database target from the list and click Manage Monitoring
Credentials. The target Credential page displays.
3. Choose the target name from the list and click Set Credentials. The Enter
Monitoring Credentials dialog displays.
Chapter 44
Collecting Data for Database Usage Tracking
44-2
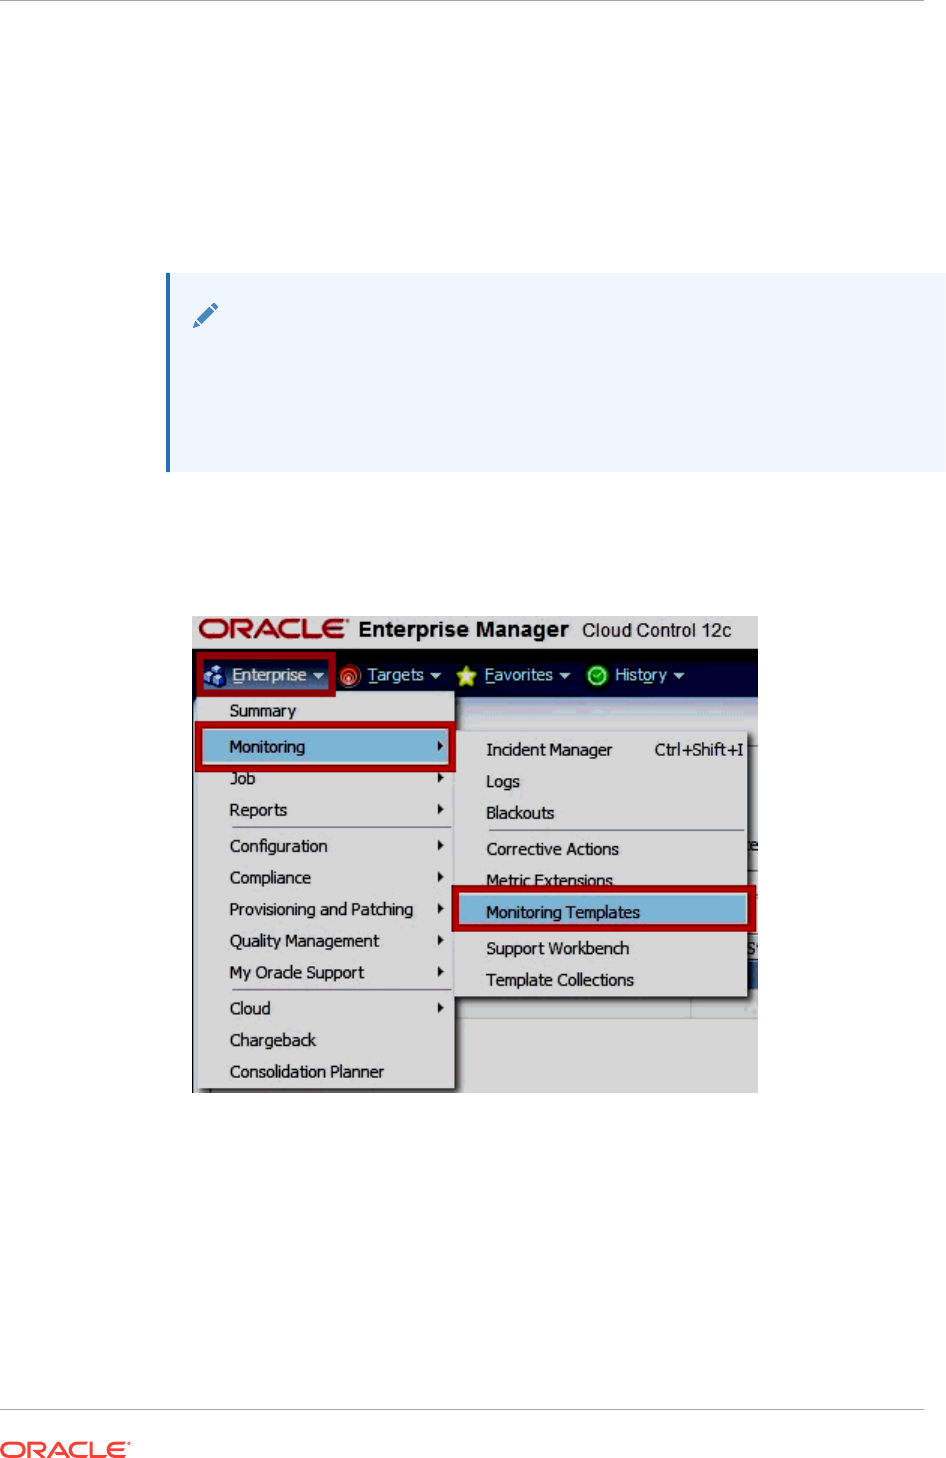
4. Enter the requisite monitoring credentials and click Save.
44.2.2 Enabling/Disabling the Metric Collection using Monitoring
Templates
This method uses Monitoring Templates, a Diagnostics Pack feature, therefore can be
used only on the database targets licensed with Diagnostics Pack.
Note:
The use of monitoring templates for database targets is licensed under the
Oracle Diagnostics Pack. You can also use the Enterprise Manager command
line interface (EM CLI) to enable/disable metric collections which do not
require an extra license.
Enabling the weekly metric collection:
1. From the Enterprise menu, select Monitoring, and then Monitoring Templates.
2. Choose Database Instance as target type, check Display Oracle Certified
Templates and then click Go.
Chapter 44
Collecting Data for Database Usage Tracking
44-3
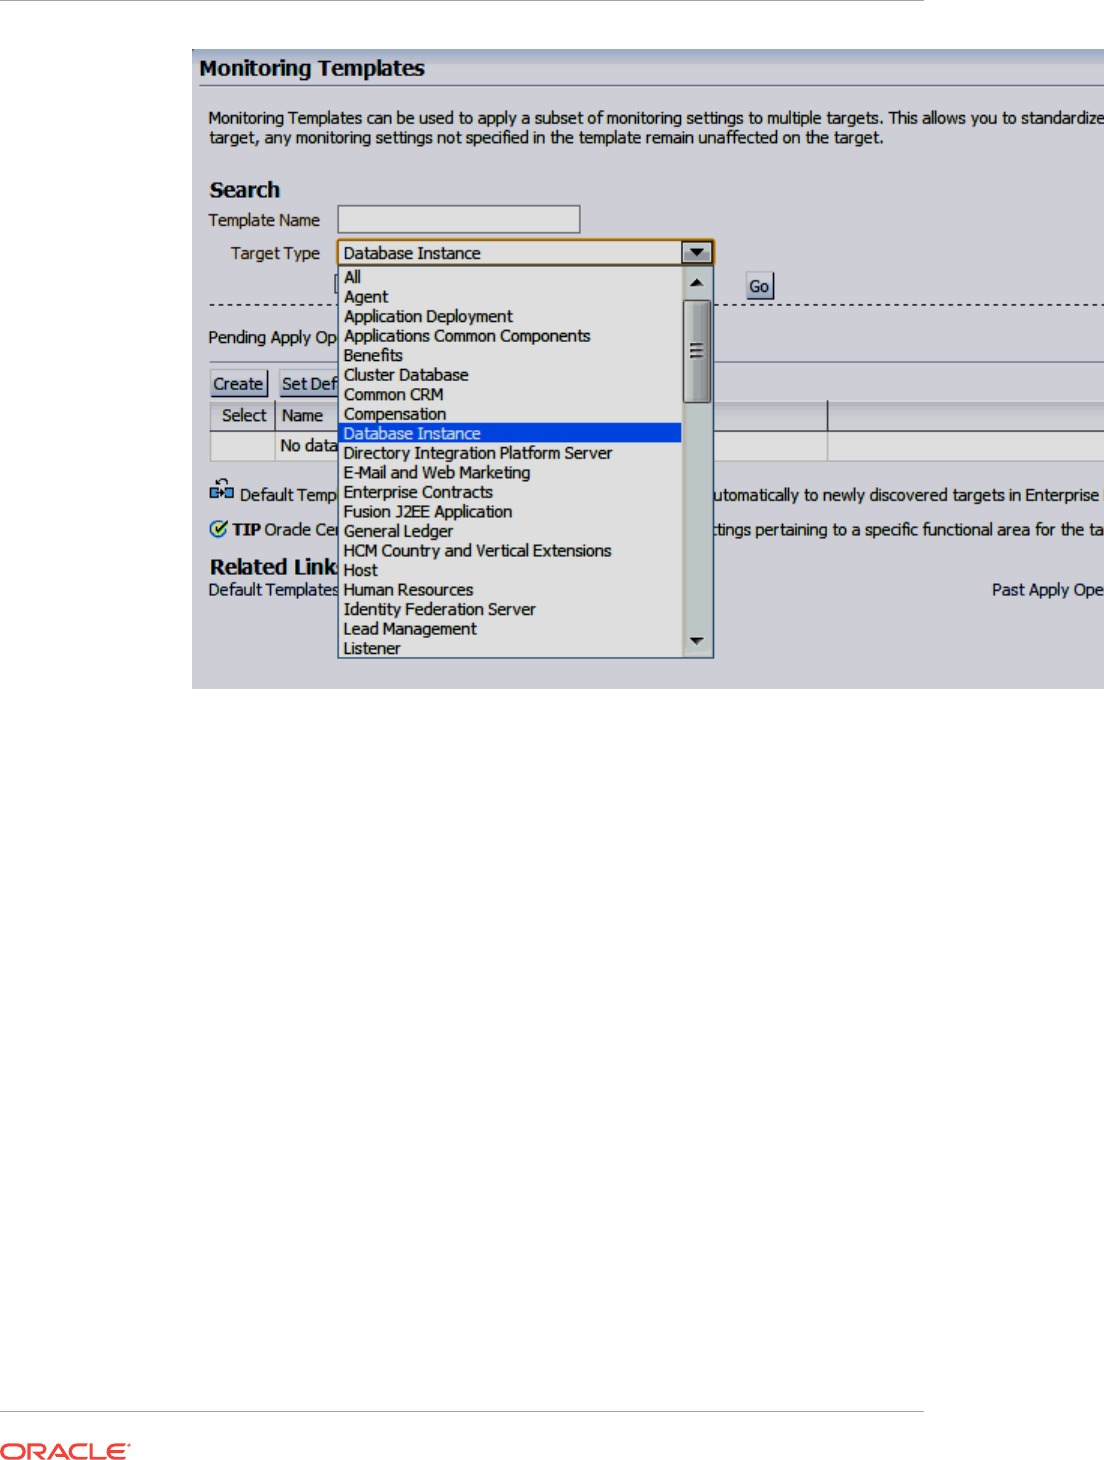
3. Chose Oracle Certified - Enable Database Usage Tracking Weekly Metrics,
then click Apply.
Chapter 44
Collecting Data for Database Usage Tracking
44-4
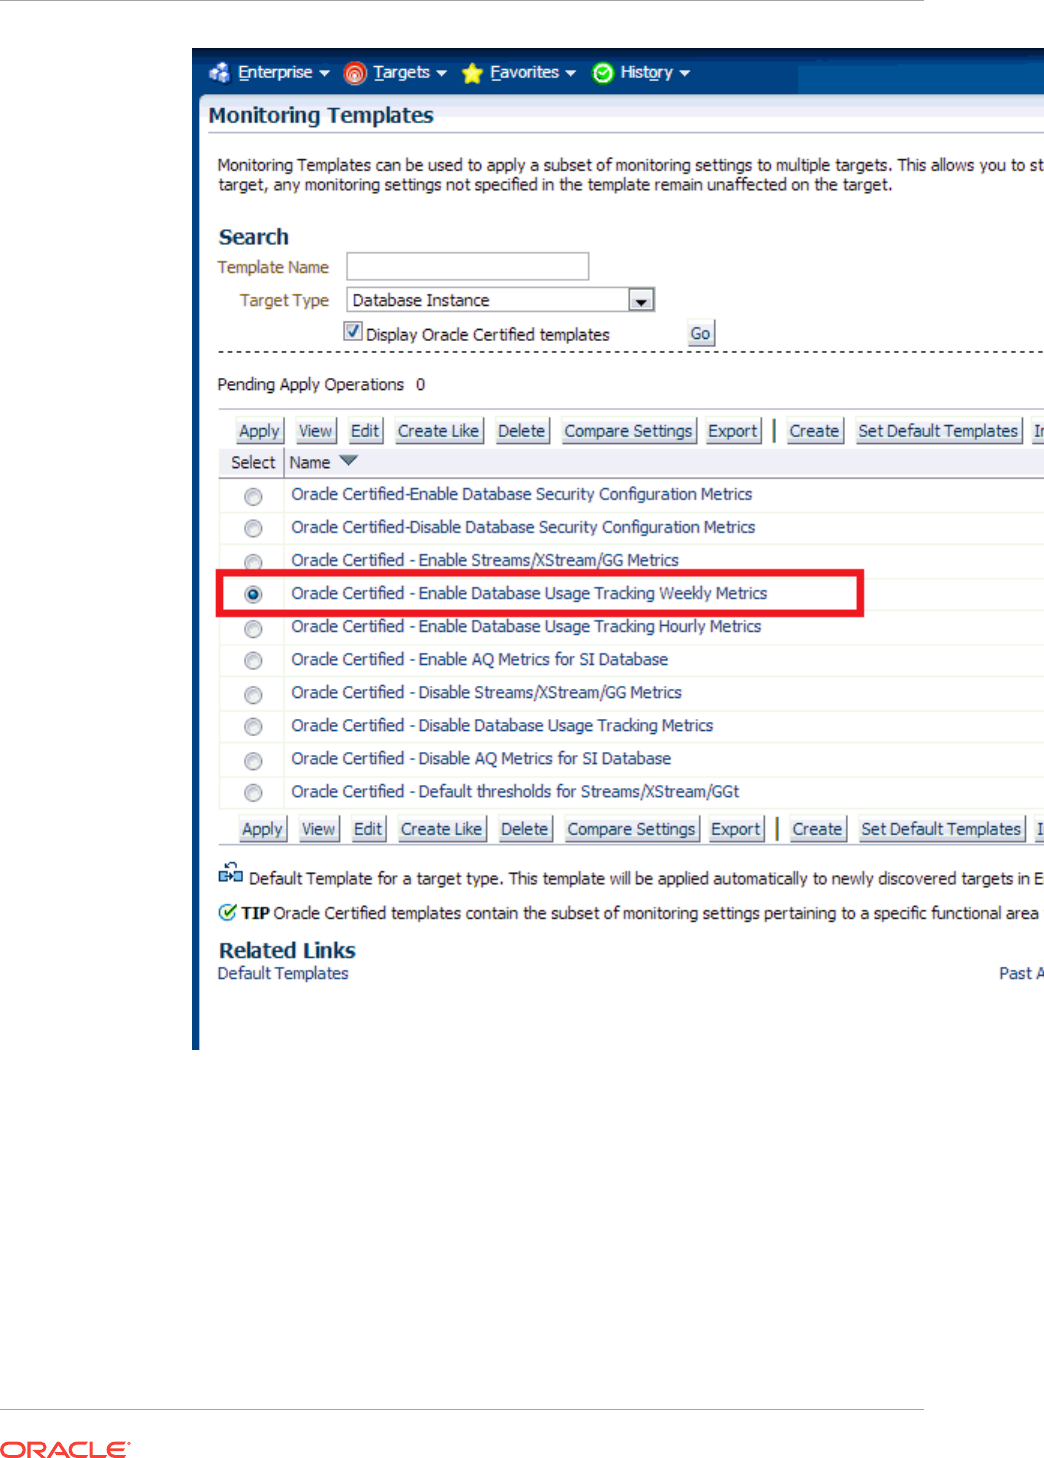
4. From the new page, click Add. Choose the desired targets using check boxes and
then click Select.
Chapter 44
Collecting Data for Database Usage Tracking
44-5
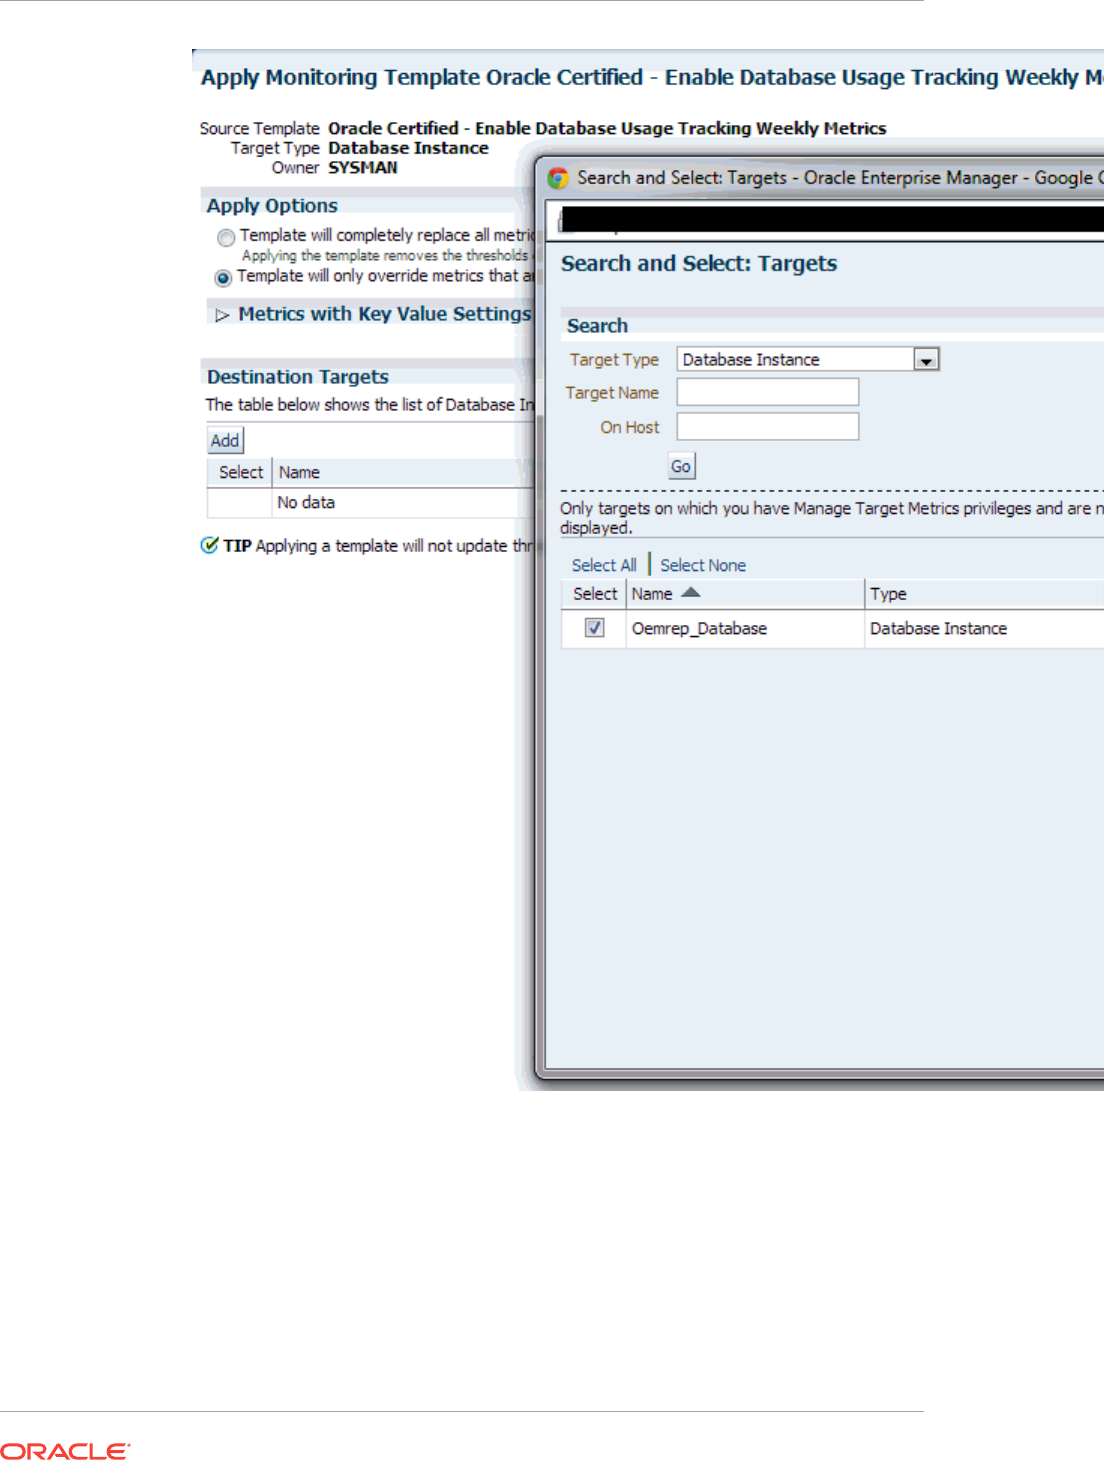
5. Click OK to finalize the changes.
Chapter 44
Collecting Data for Database Usage Tracking
44-6
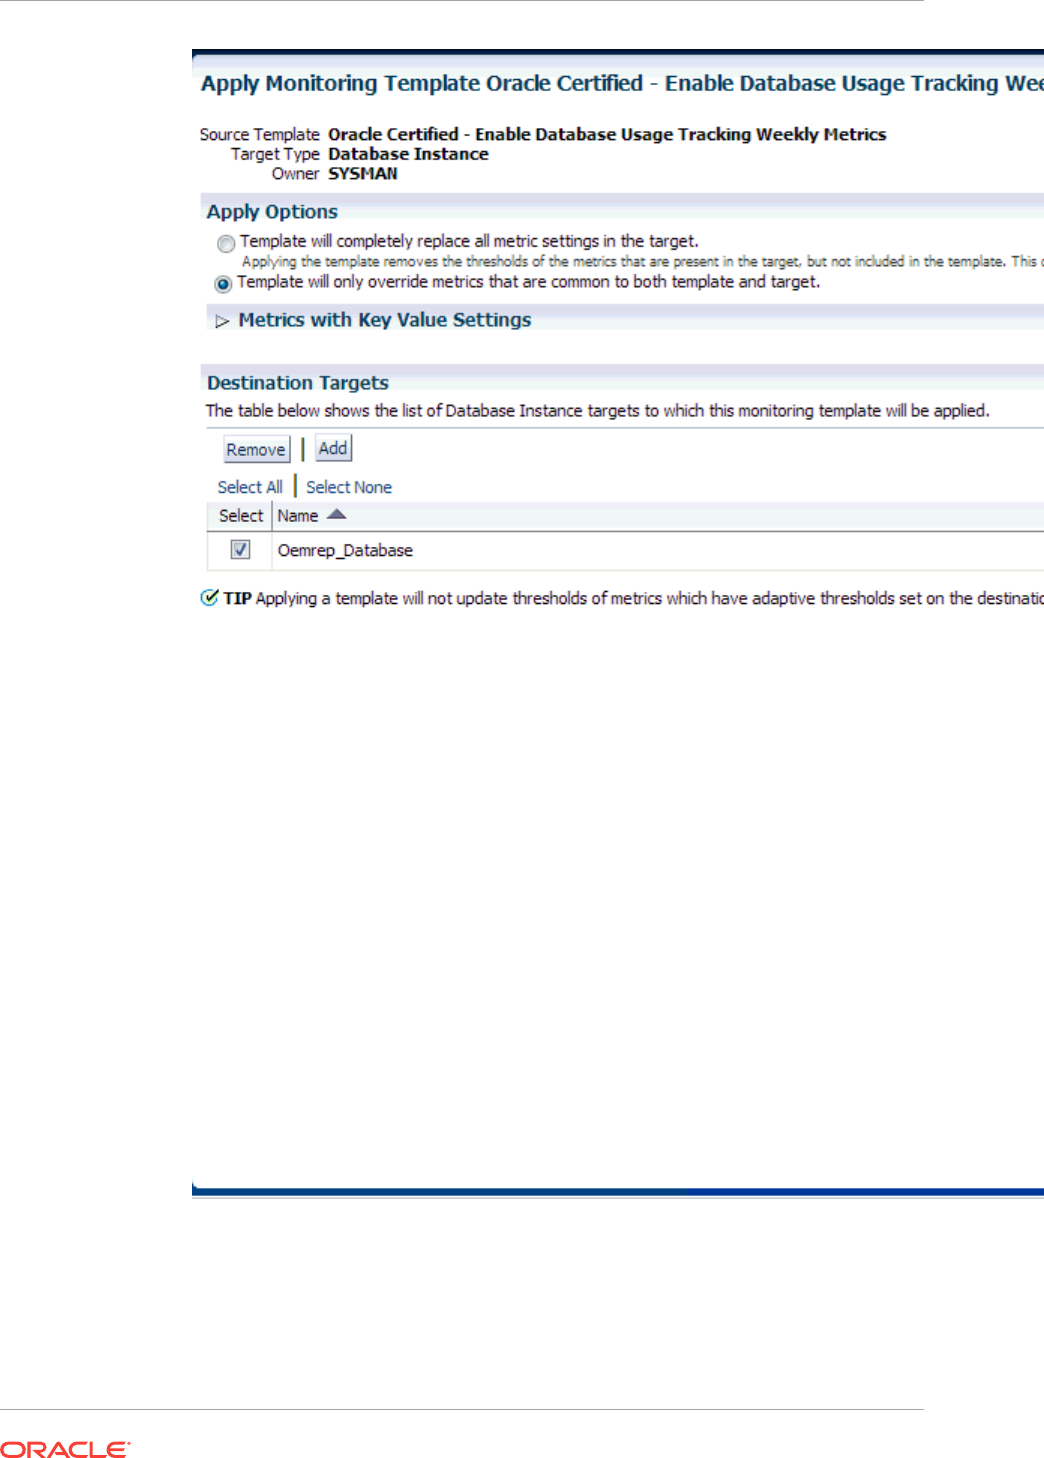
6. Verify the confirmation message and Pending Apply Operations column that
shows the number of targets that have not yet been updated. Make sure there are
no ("0") pending apply operations.
Chapter 44
Collecting Data for Database Usage Tracking
44-7
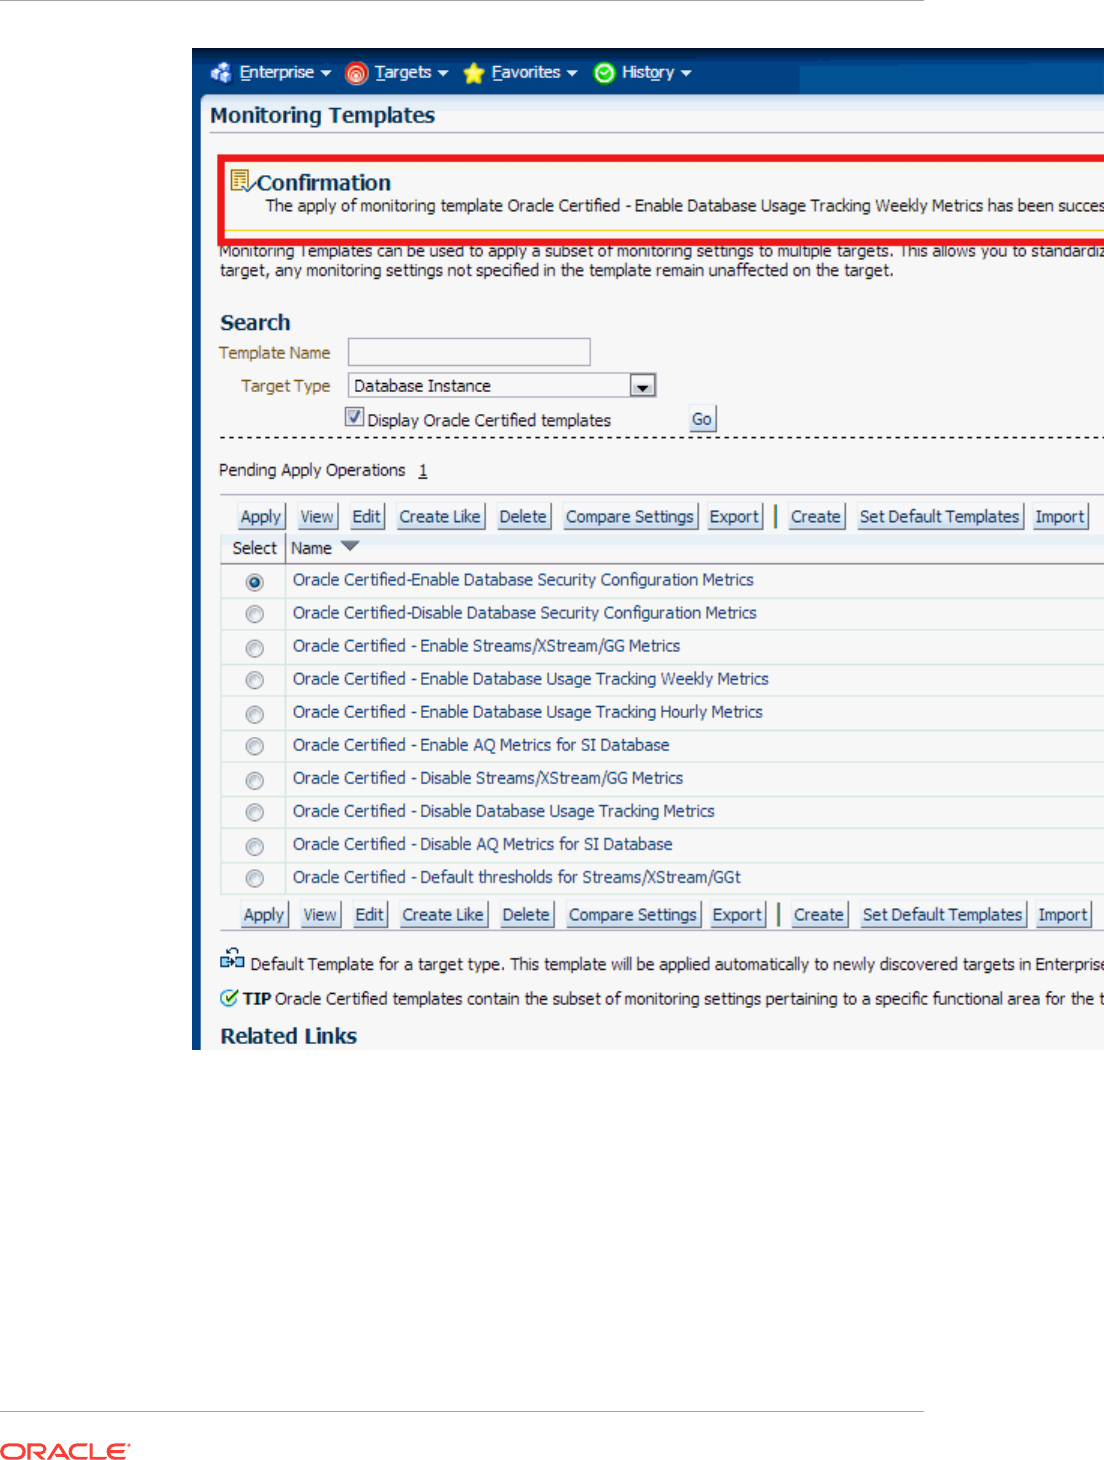
Enabling the hourly metric collection:
1. From the Enterprise menu, select Monitoring, and then Monitoring Templates.
Chapter 44
Collecting Data for Database Usage Tracking
44-8
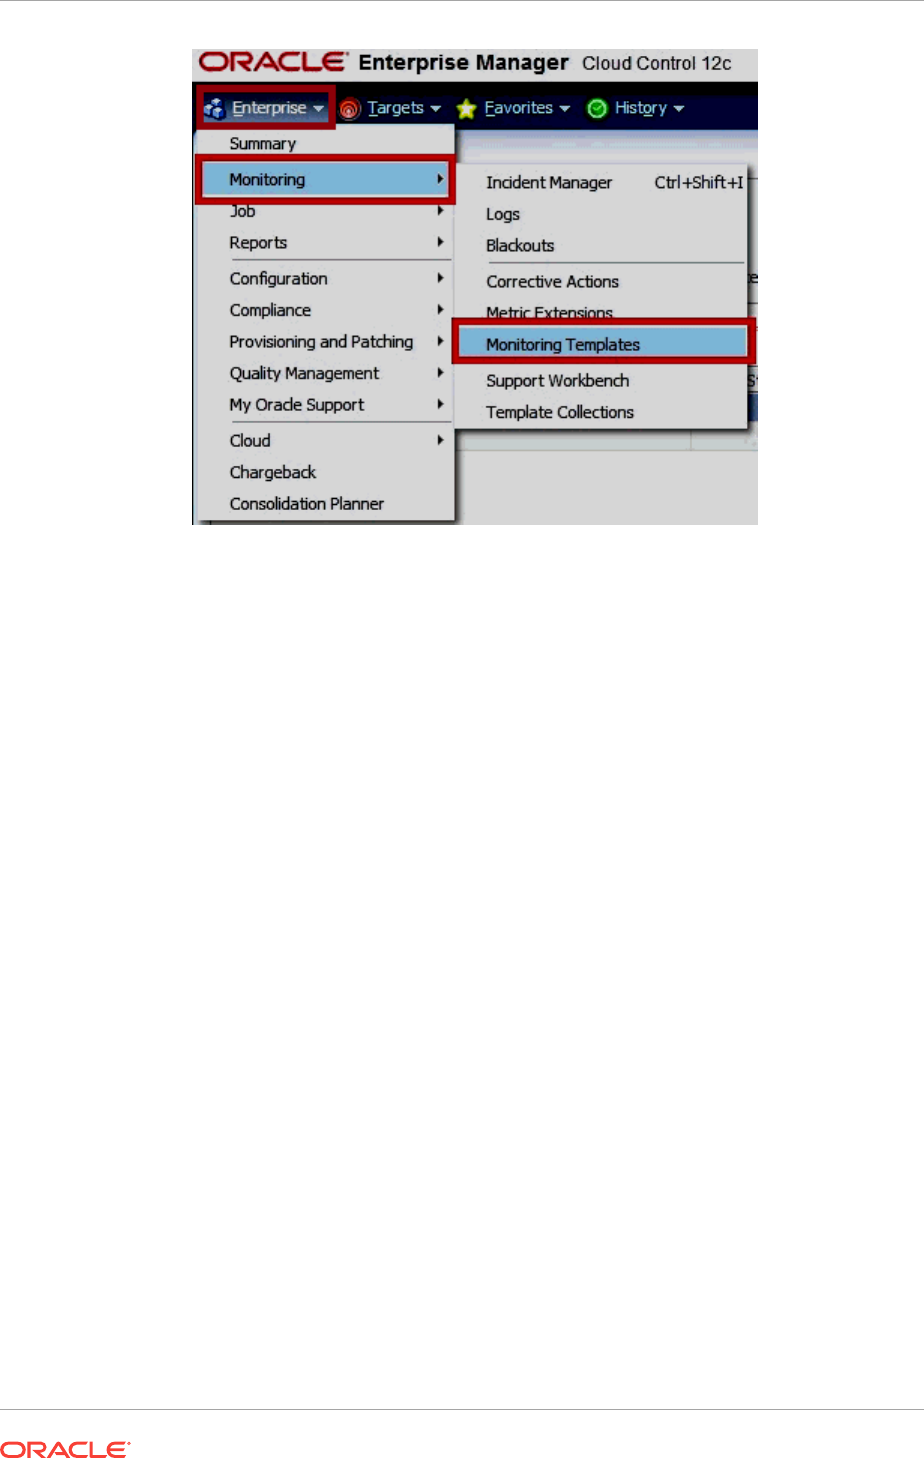
2. Choose Database Instance as the target type, check Display Oracle Certified
Templates and click Go.
Chapter 44
Collecting Data for Database Usage Tracking
44-9

3. Choose Oracle Certified - Enable Database Usage Tracking Hourly Metrics,
then click Apply.
Chapter 44
Collecting Data for Database Usage Tracking
44-10

4. Click Add and then choose the desired targets.
Chapter 44
Collecting Data for Database Usage Tracking
44-11
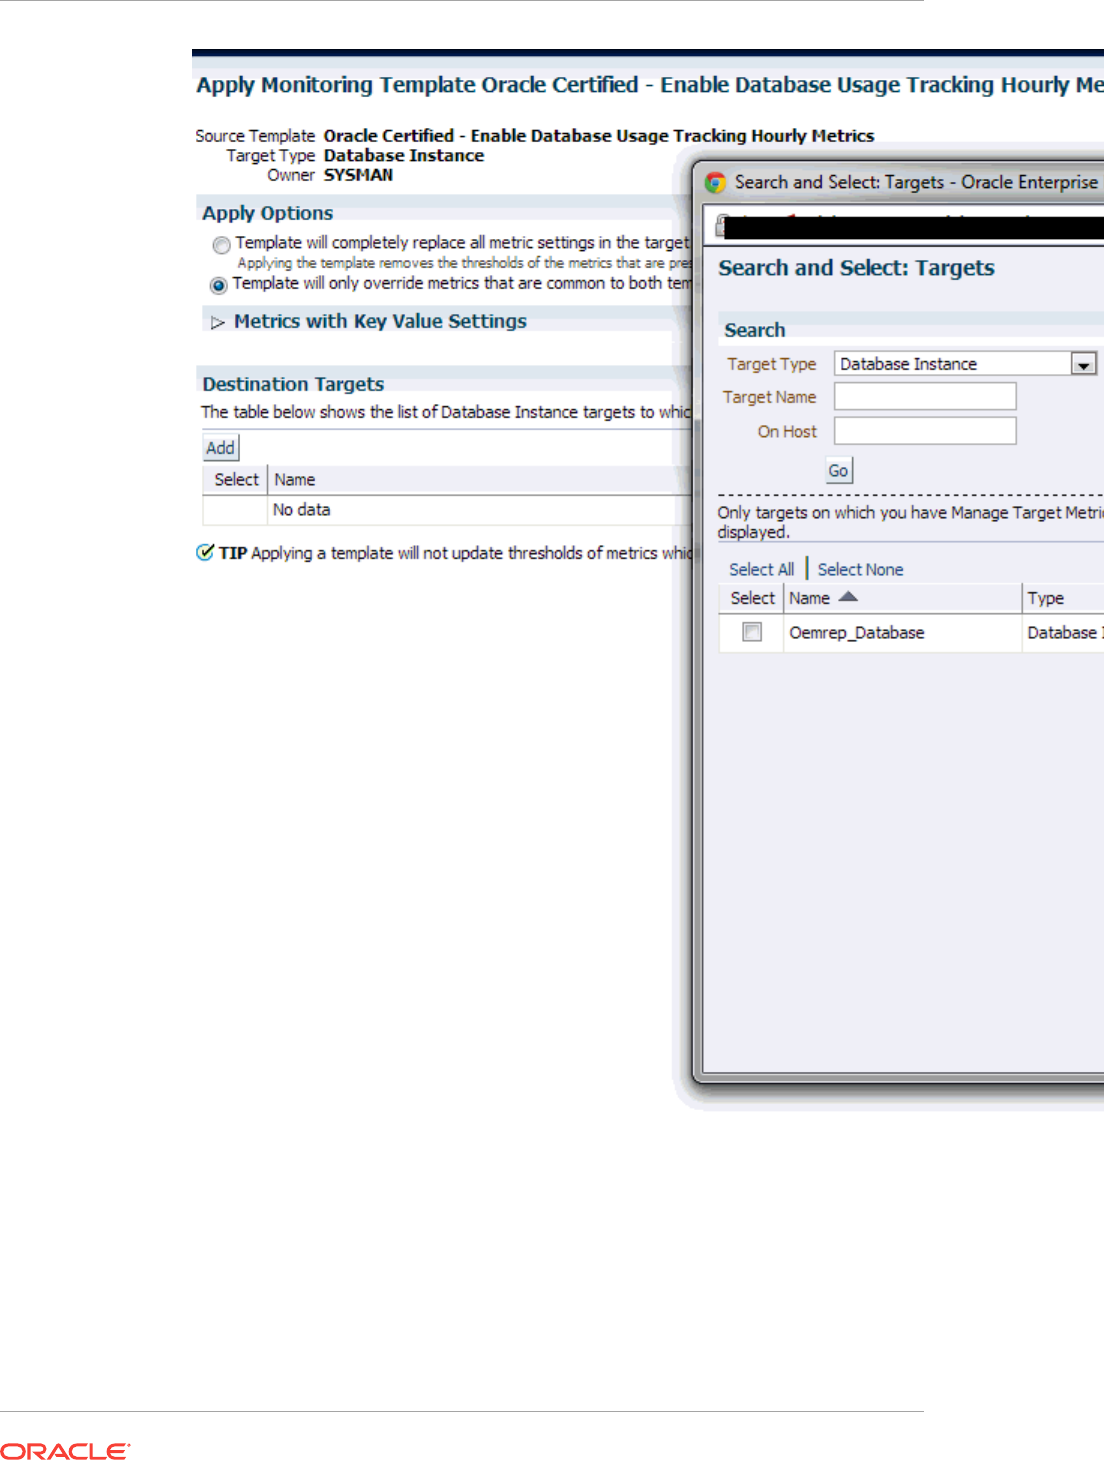
5. Click OK to finalize the changes.
Chapter 44
Collecting Data for Database Usage Tracking
44-12

6. A confirmation message displays at the top of the page.
Chapter 44
Collecting Data for Database Usage Tracking
44-13
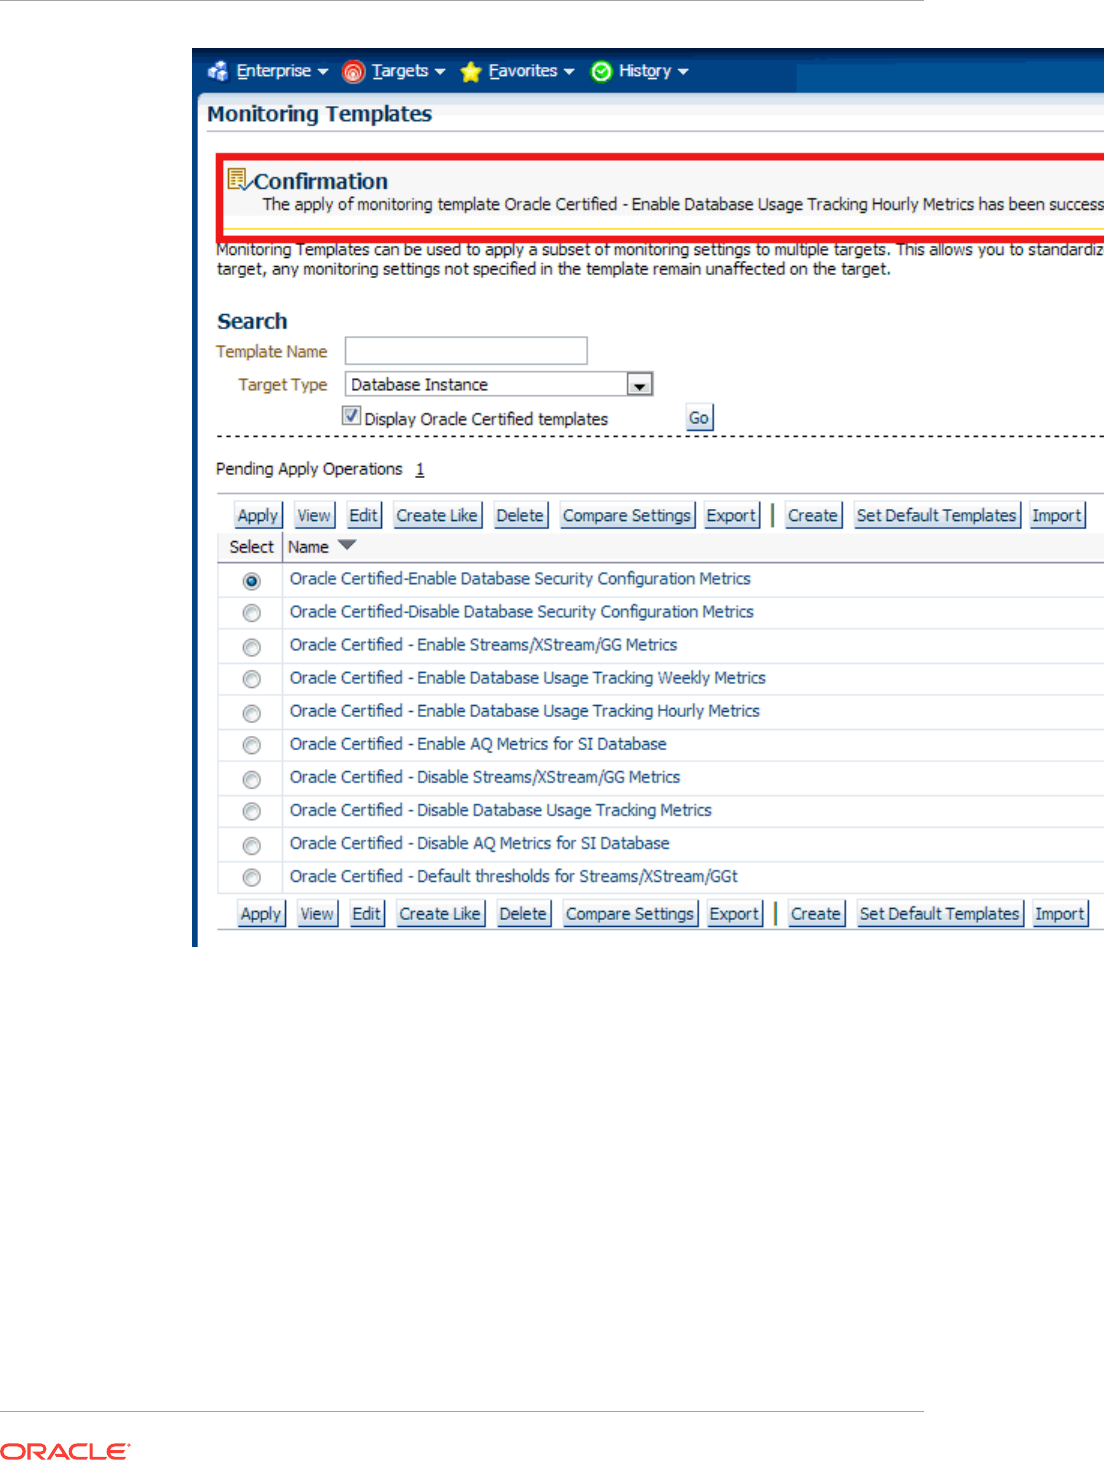
Disabling Usage Tracking Metric Collection:
1. Follow the steps 1 and 2 as show in the previous section.
2. In Step 3, choose Oracle Certified - Disable Database Usage Tracking Metrics,
which disables both hourly and weekly collections.
3. Follow steps 4 to 6 from the previous section.
44.2.3 Enabling/Disabling the Metric Collection using the Command
Line Interface
In the previous section, "Enabling/Disabling the Metric Collection using Monitoring
Templates," you performed these actions using the Enterprise Manager Cloud Control
console for database targets licensed with Diagnostics Pack. However, you can also
use the Enterprise Manager command line interface (EM CLI) to enable/disable metric
Chapter 44
Collecting Data for Database Usage Tracking
44-14

collection from the operating system command line, in which case no extra licensing is
required.
The following topics are covered in this section:
•Setting up EM CLI login
•Enabling/disabling the metric collection
•Using EM CLI to list all the database targets
•Using SQL to verify collection status
44.2.3.1 Setting up EM CLI login
Before running the EM CLI commands to enable/disable metric collection, the EM CLI
login must be configured.This is typically done by specifying the URL, username, and
password as shown in the following example:
emcli setup -url="https://jupiter.solarsystem.com:7799/em" -username=sysman -
password=manager -trustall
44.2.3.2 Enabling/disabling the metric collection
Metric collection is enabled/disabled using the EM CLI
modify_collection_schedule
verb. This verb is fully documented in the Oracle Enterprise Manager Command Line
Interface Guide.
The following syntax must be use for Database Usage Tracking purposes:
emcli modify_collection_schedule
-targetType="oracle_database"
-targetNames="tname1;tname2;tname3;..."
-collectionName="lms_wk_ci_cdb|lms_hr_ci_cdb|lms_wk_ci|lms_hr_ci"
-freqType="HOUR|DAY|WEEKLY"
-freqValue="1|7| MON|TUE|WED|THU|FRI|SAT|SUN"
-collectionStatus="ENABLED|DISABLED"
-preview="N"
Parameters
•targetNames
The target name should be the same as exists in the repository. All of the targets
should be the same target type you specified in the targetType parameter. Use a
semicolon ( ; ) to separate the names. Changes to the collection schedule will be
executed for only valid target name and target type combinations. For
example:
tname1;tname2;tname3
•collectionName
Name of one of the four metric collections predefined for Database Usage
Tracking. "wk" indicates weekly collection while "hr" indicates the hourly collection.
"_cdb" suffix indicates that the collection is to be applied only to CDB database
targets.
–lms_hr_ci_cdb and lms_wk_ci_cdb - must be applied to all CDB database
targets (with PDBs)
–lms_hr_ci and lms_wk_ci - must be applied to all the rest of database targets
•freqType and freqValue
Chapter 44
Collecting Data for Database Usage Tracking
44-15

Indicate the frequency. These two parameters are not needed or ignored (if
provided) in the case of collectionStatus="DISABLED".
These parameters can be one of the following:
–freqType=HOUR freqValue=1
–freqType= DAYS freqValue=7
–freqType=WEEKLY freqValue=MON (or any other weekday)
•collectionStatus
Enables or disables the collection. The default is Enabled. If Disabled, freqType
and freqValue are ignored.
Usage Examples
•Enabling weekly metrics on a CDB database target.
emcli modify_collection_schedule \
-targetType="oracle_database" \
-targetNames="targetdb3" \
-collectionName="lms_wk_ci_cdb" \
-freqType="DAY" \
-freqValue="7" \
-collectionStatus="ENABLED" \
-preview="N"
Note: On MS Windows, replace "\" with the Windows-specific command line
continuation character: "^".
•Enabling weekly metrics on a multiple non-CDB database targets.
emcli modify_collection_schedule \
-targetType="oracle_database" \
-targetNames="targetdb1;targetdb2" \
-collectionName="lms_wk_ci" \
-freqType="WEEKLY" \
-freqValue="SUN" \
-collectionStatus="ENABLED" \
-preview="N"
•Disabling weekly metrics on a CDB database target.
emcli modify_collection_schedule \
-targetType="oracle_database" \
-targetNames="targetdb3" \
-collectionName="lms_wk_ci_cdb" \
-collectionStatus="DISABLED" \
-preview="N"
•Disabling weekly metrics on multiple non-CDB database targets.
emcli modify_collection_schedule \
-targetType="oracle_database" \
-targetNames="targetdb1;targetdb2" \
-collectionName="lms_wk_ci" \
-collectionStatus="DISABLED" \
-preview="N"
•Enabling hourly metrics on a CDB database target.
emcli modify_collection_schedule \
-targetType="oracle_database" \
-targetNames="targetdb3" \
Chapter 44
Collecting Data for Database Usage Tracking
44-16

-collectionName="lms_hr_ci_cdb" \
-freqType="DAY" \
-freqValue="7" \
-collectionStatus="ENABLED" \
-preview="N"
•Enabling hourly metrics on a multiple non-CDB database targets.
emcli modify_collection_schedule \
-targetType="oracle_database" \
-targetNames="targetdb1;targetdb2" \
-collectionName="lms_hr_ci" \
-freqType="WEEKLY" \
-freqValue="SUN" \
-collectionStatus="ENABLED" \
-preview="N"
•Disabling hourly metrics on a CDB database target.
emcli modify_collection_schedule \
-targetType="oracle_database" \
-targetNames="targetdb3" \
-collectionName="lms_hr_ci_cdb" \
-collectionStatus="DISABLED" \
-preview="N"
•Disabling hourly metrics on multiple non-CDB database targets.
emcli modify_collection_schedule \
-targetType="oracle_database" \
-targetNames="targetdb1;targetdb2" \
-collectionName="lms_hr_ci" \
-collectionStatus="DISABLED" \
-preview="N"
44.2.3.3 Using EM CLI to list all the database targets
During the configuration process, it might be useful to list all the database targets in
order to make sure that none are missed.
To list all database targets, run the following EM CLI command:
emcli get_targets -targets="oracle_database"
44.2.3.4 Using SQL to verify collection status
The following SQL query can be run on OEM Repository to list the collection status
and schedules assigned to the database targets.
select
t.TARGET_NAME,
c.COLL_NAME,
c.IS_ENABLED,
c.SCHEDULE_EX
from SYSMAN.MGMT_TARGETS t
left join SYSMAN.MGMT_COLLECTIONS c on t.TARGET_GUID = c.OBJECT_GUID and
c.COLL_NAME like 'lms_%_ci%'
where t.target_type = 'oracle_database'
order by t.TARGET_NAME, c.COLL_NAME;
Chapter 44
Collecting Data for Database Usage Tracking
44-17
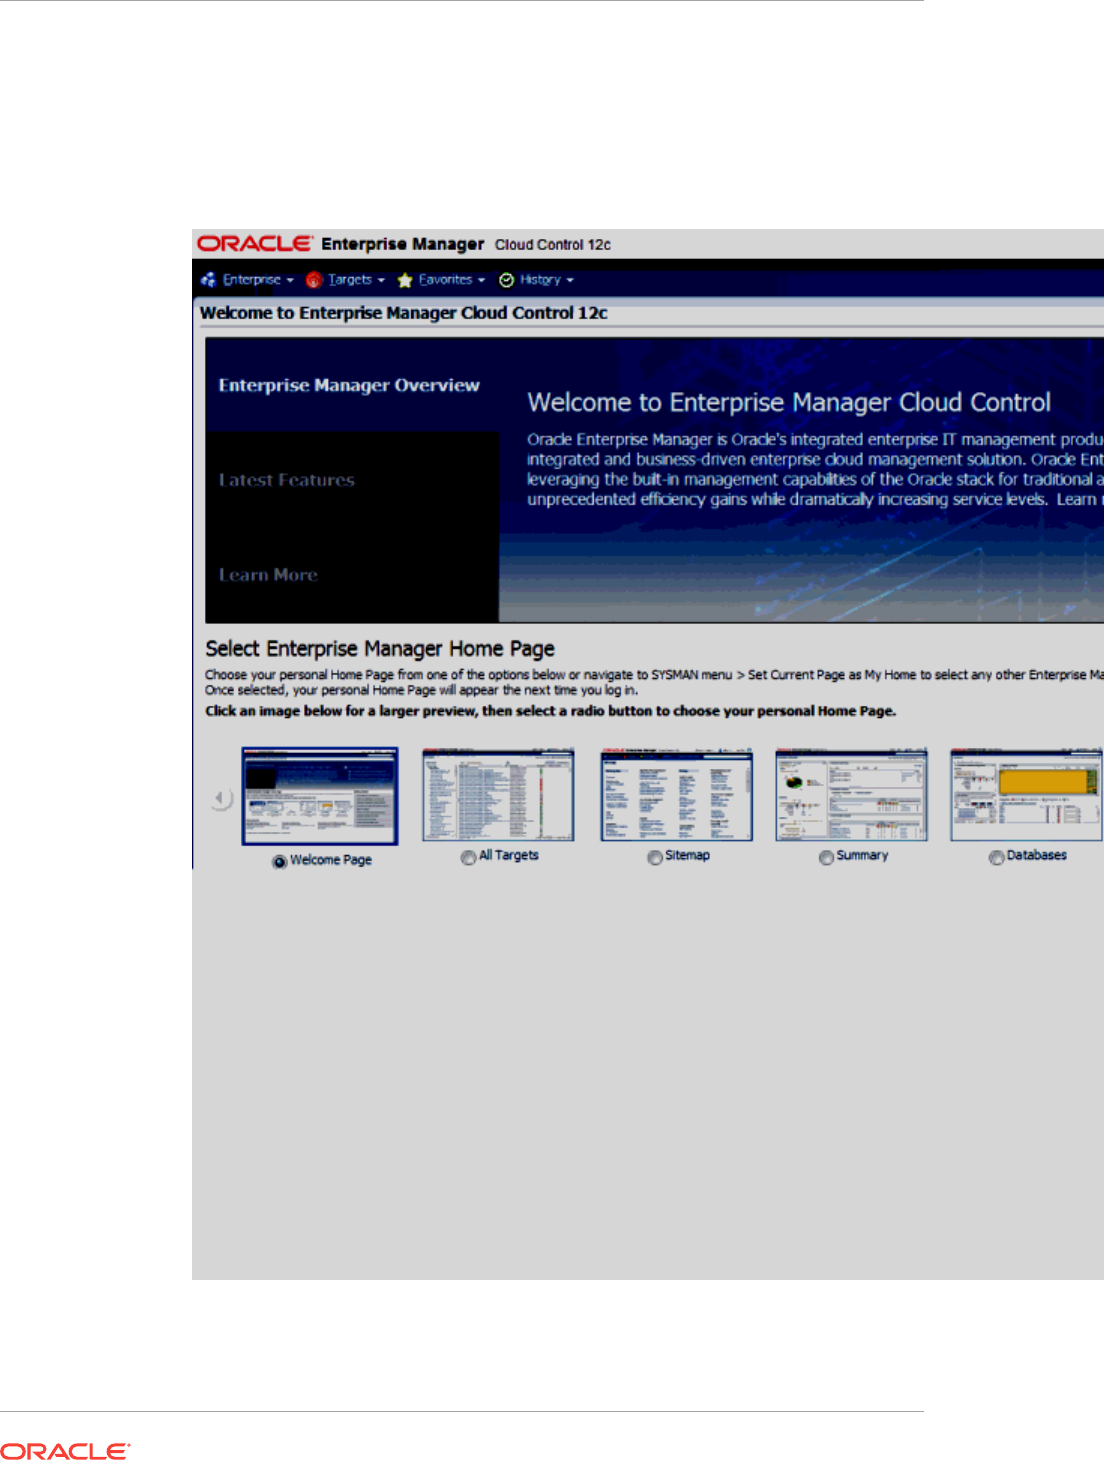
44.2.4 Creating a Database Usage Tracking Report
1. Log in to Enterprise Manager. From the Setup menu, select Security and then
Monitoring Credentials.
2. Choose the Database Instance target type and click Manage Monitoring
Credentials.
Chapter 44
Collecting Data for Database Usage Tracking
44-18
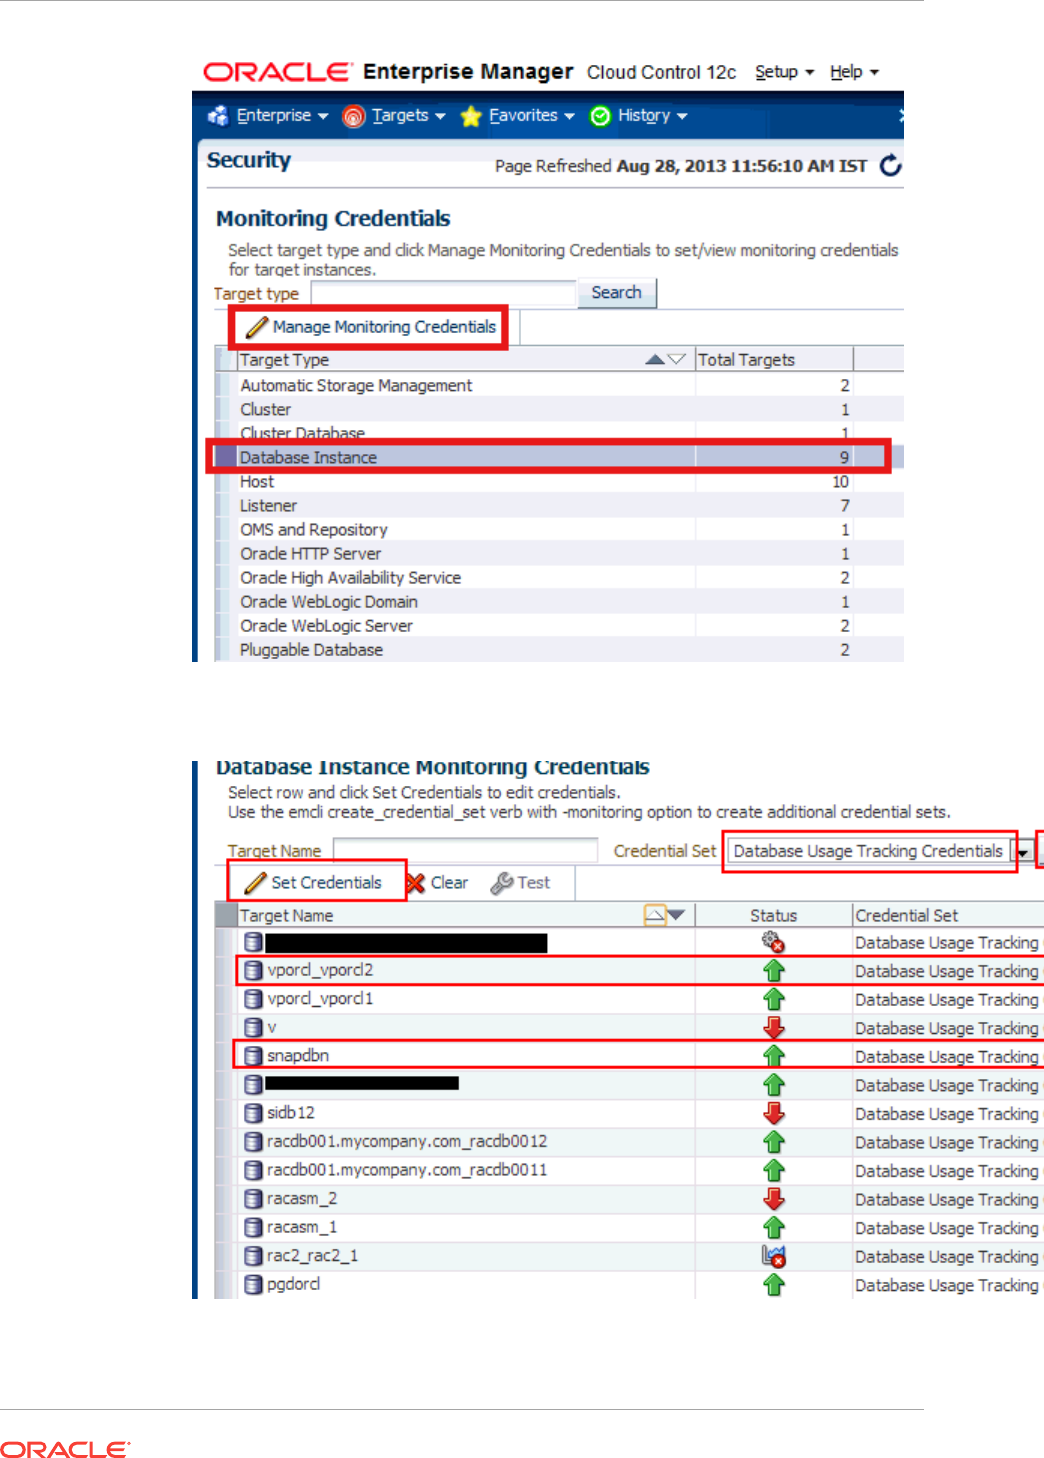
3. Select Database Usage Tracking Credentials entry in the Credential Set list and
click Search.
Click on the row for the desired target and then click Set Credentials.
Chapter 44
Collecting Data for Database Usage Tracking
44-19
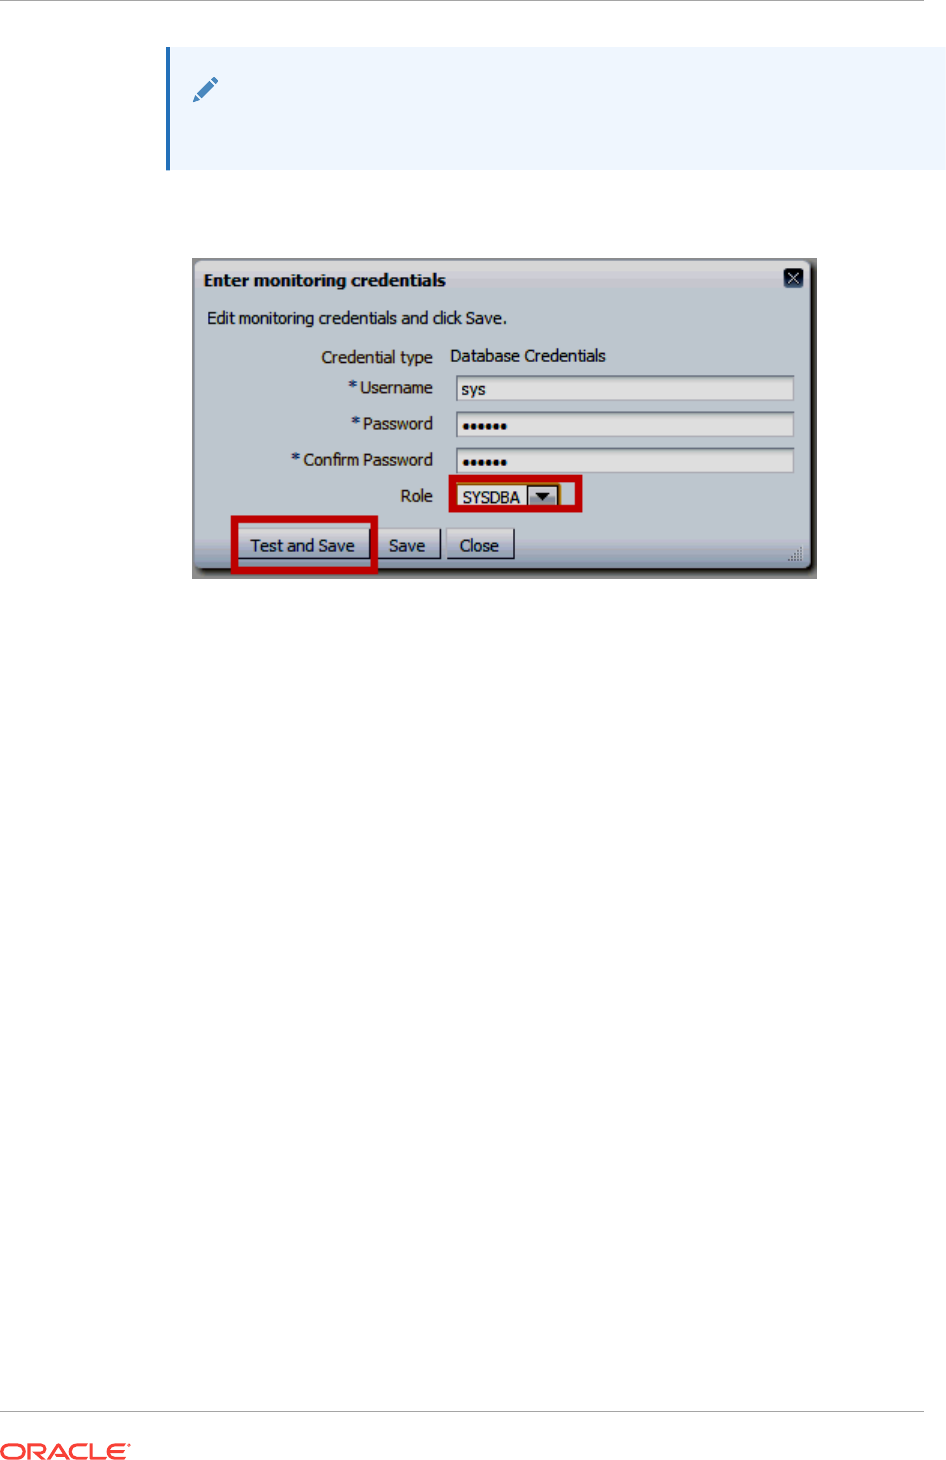
Note:
This operation needs to be performed for all the Database Instances.
4. Enter the username and password for a database user with SYSDBA privilege.
5. Alternate method: Use the Enterprise Manager command line utility (EM CLI) to
make the above settings as shown in the following examples.
Example 44-1 Multiple Targets
emcli set_monitoring_credential -target_names="testdb1;testdb2" -
target_type=oracle_database -set_name=DBCredsLMSMonitoring -cred_type=DBCreds -
attributes="DBUserName:<USERNAME>;DBPassword:<PASSWORD>;DBRole:SYSDBA"
Example 44-2 Single Target
emcli set_monitoring_credential -target_name=Oemrep_Database -
target_type=oracle_database -set_name=DBCredsLMSMonitoring-cred_type=DBCreds -
attributes="DBUserName:<USERNAME>;DBPassword:<PASSWORD>;DBRole:SYSDBA"
44.3 Generating Database Usage Tracking Report
Generating Database Usage Tracking Report consists of the following two steps:
1. Configuring Business Intelligence Publisher (BI Publisher) - setup the delivery
destination of the output files (FTP server and folder)
2. Running Usage Tracking Report - produce the CSV files after the data is collected
44.3.1 Configuring Business Intelligence Publisher (BI Publisher)
1. From the Enterprise menu, select Reports and then BI Publisher Enterprise
Reports.
Chapter 44
Generating Database Usage Tracking Report
44-20
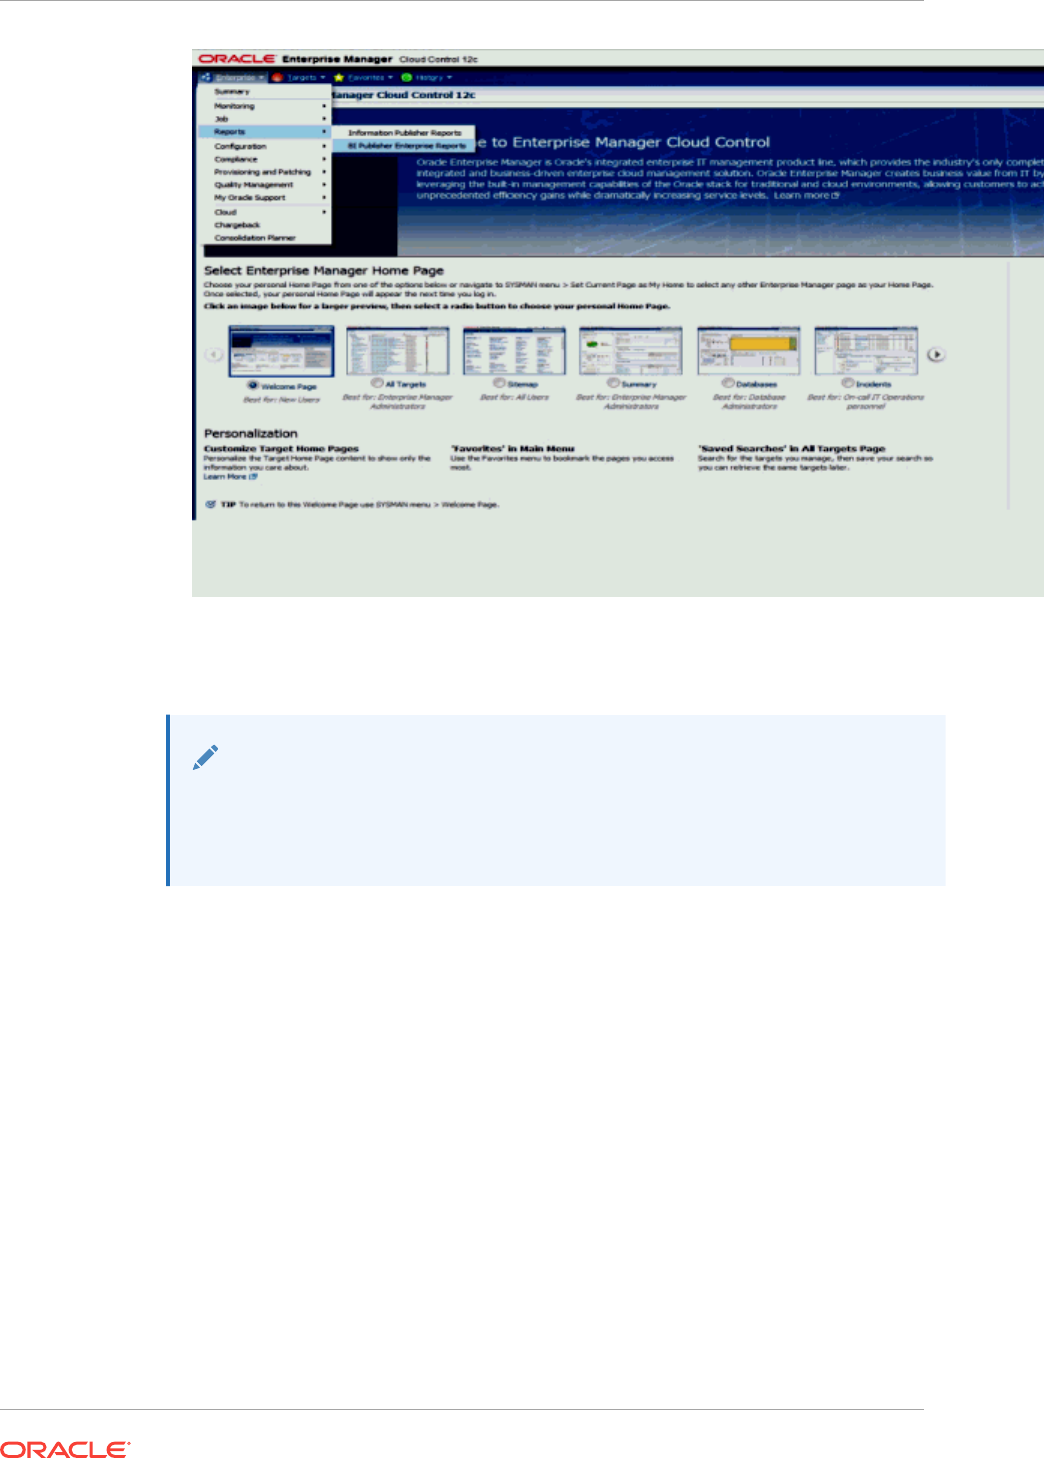
2. Click on BI Publisher Enterprise Reports Web Application to navigate to the
Oracle BI Publisher URL. Log in to BI Publisher using the same credentials used
to Log in to Enterprise Manager.
Note:
Do NOT click on the Database Usage Tracking Report shown at the bottom
of the page. The online execution of this Usage Tracking Report has been
disabled.
Chapter 44
Generating Database Usage Tracking Report
44-21
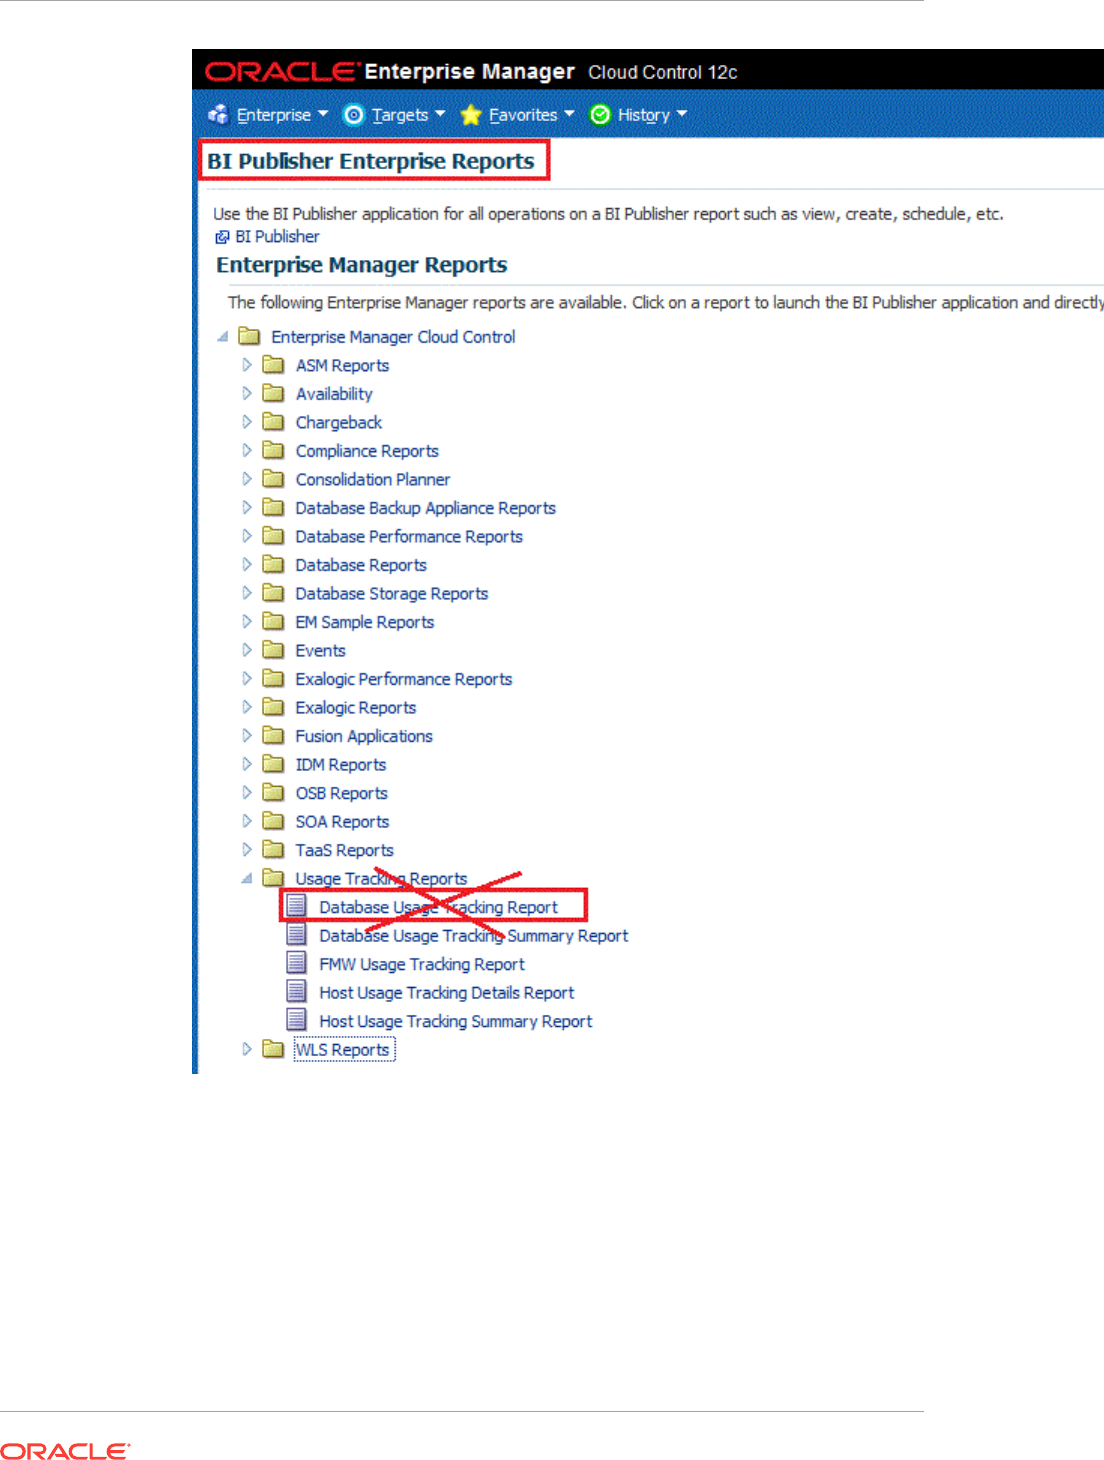
3. Set up the delivery destination.
Click on the Administration tab on the top right corner of the page. Then select
FTP under Delivery as shown below:
Chapter 44
Generating Database Usage Tracking Report
44-22
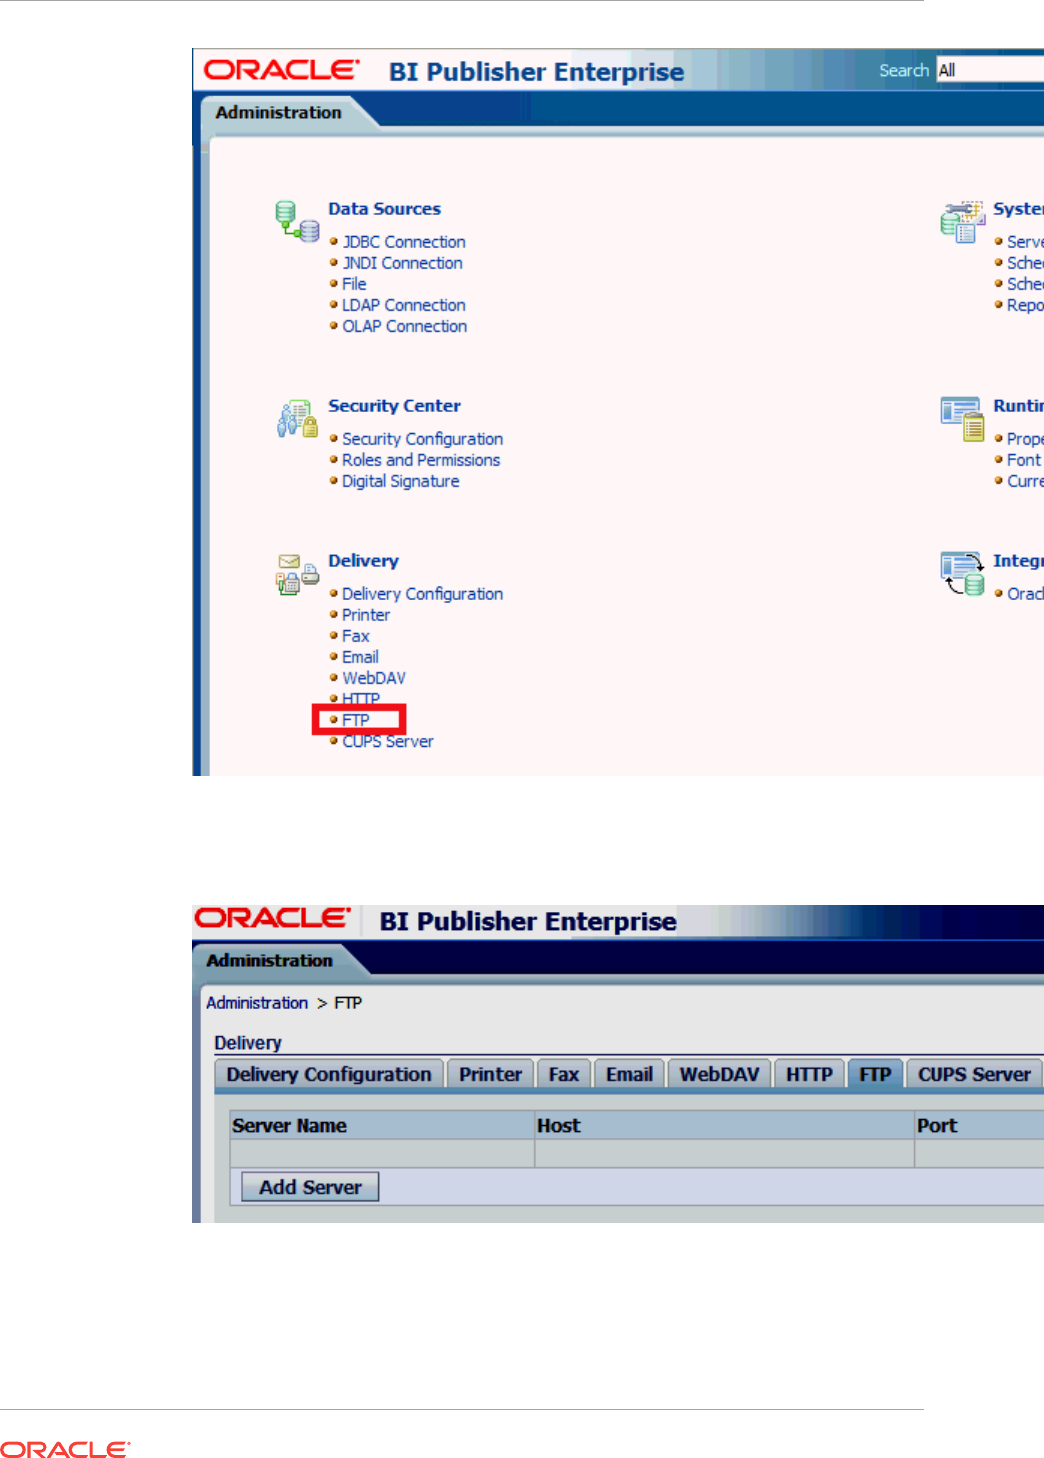
4. Add an FTP Server:
Click Add Server.
Enter the following fields for the FTP server:
Server Name - Example : myFTPserver (any name of your choice)
Host - Example : myhost.company.com
Chapter 44
Generating Database Usage Tracking Report
44-23
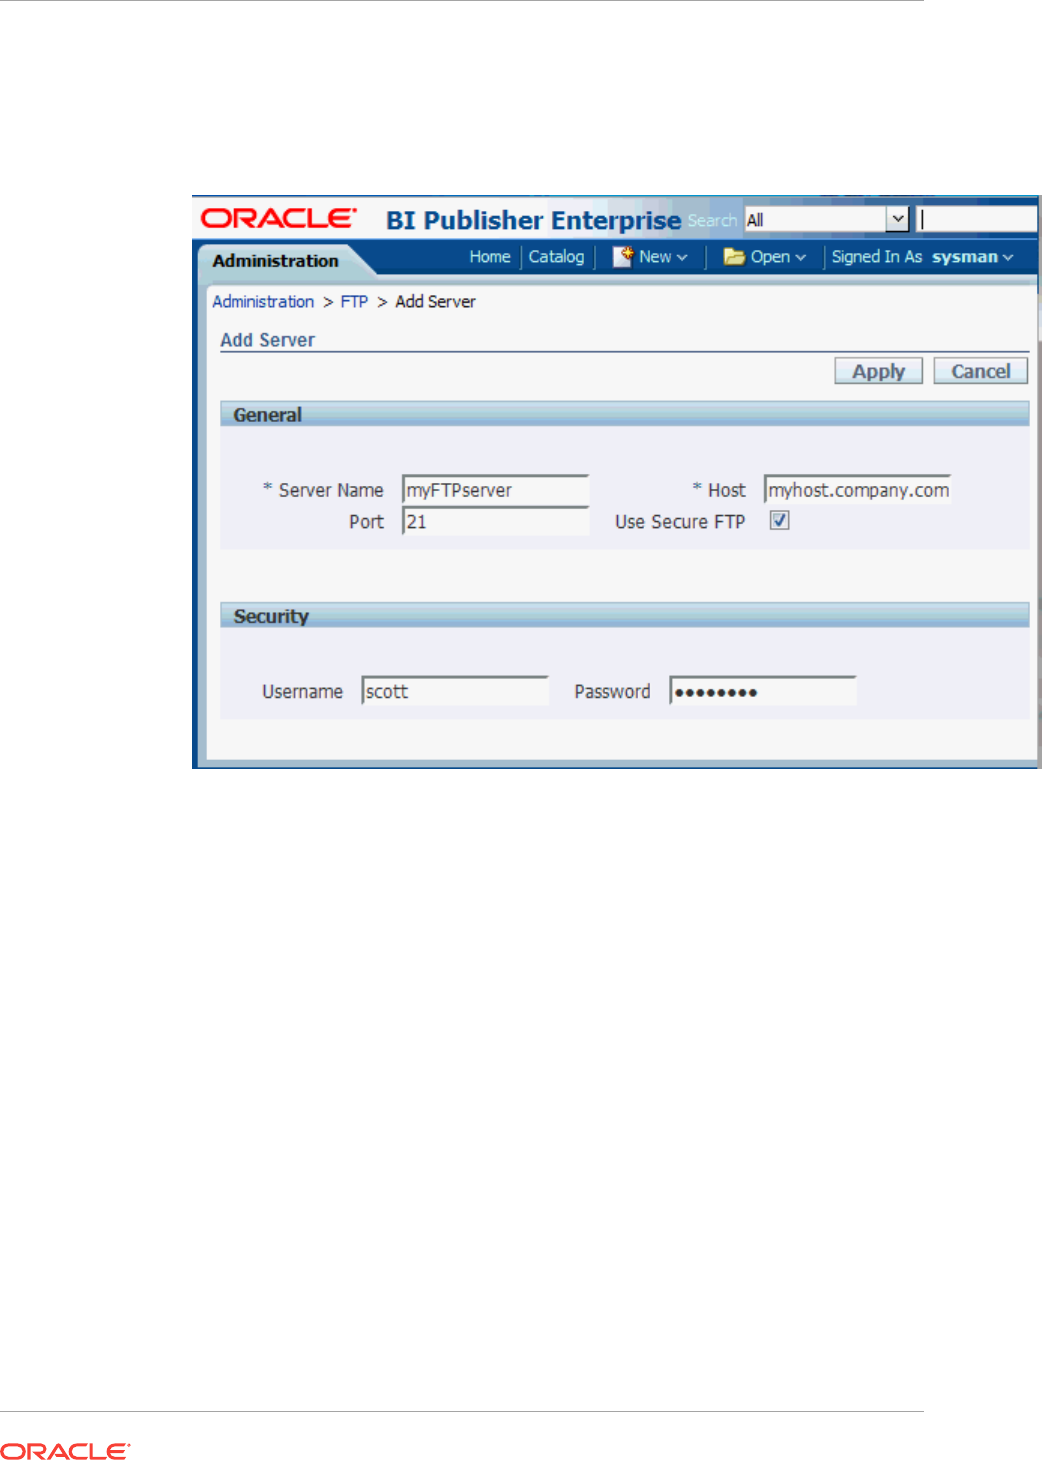
Port - Example : 22
Select "Use Secure FTP" check box to enable secure FTP (SFTP)
Enter a username and password to connect to the host
5. Configure the data model with the FTP server configured above in step 4.
Click on Catalog Folders or alternatively the Catalog menu as shown in the
following graphic.
Chapter 44
Generating Database Usage Tracking Report
44-24
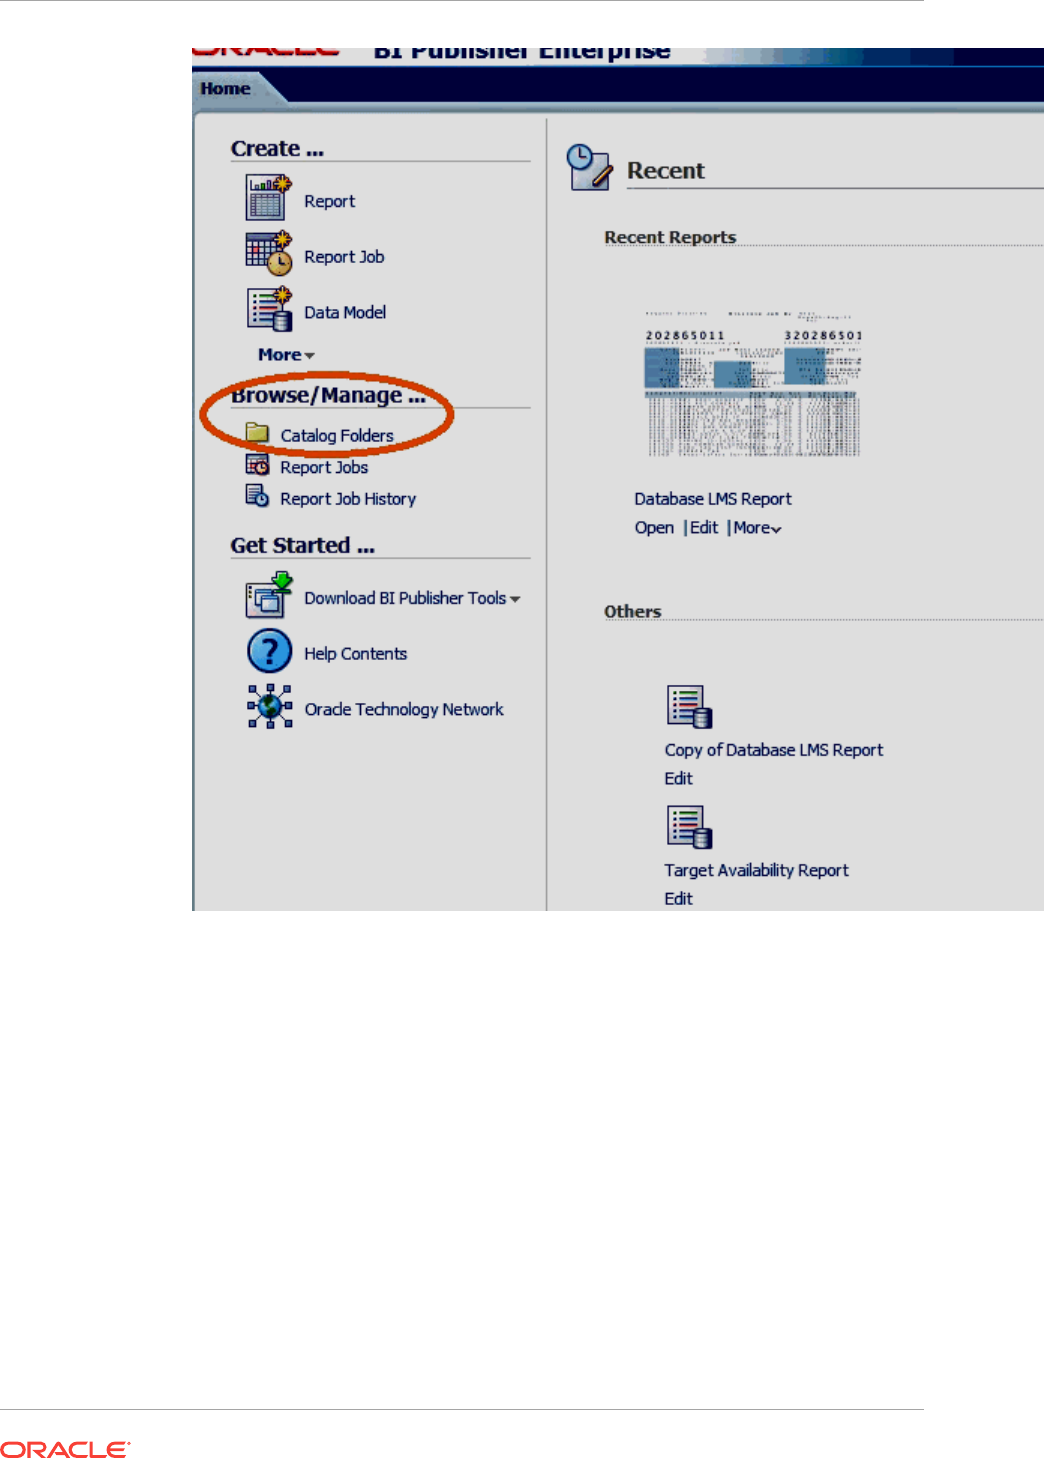
Select Shared Folders, then select Enterprise Manager Cloud Control and then
EM_Datamodels
Scroll to Database Usage Tracking Report and click Edit.
Chapter 44
Generating Database Usage Tracking Report
44-25
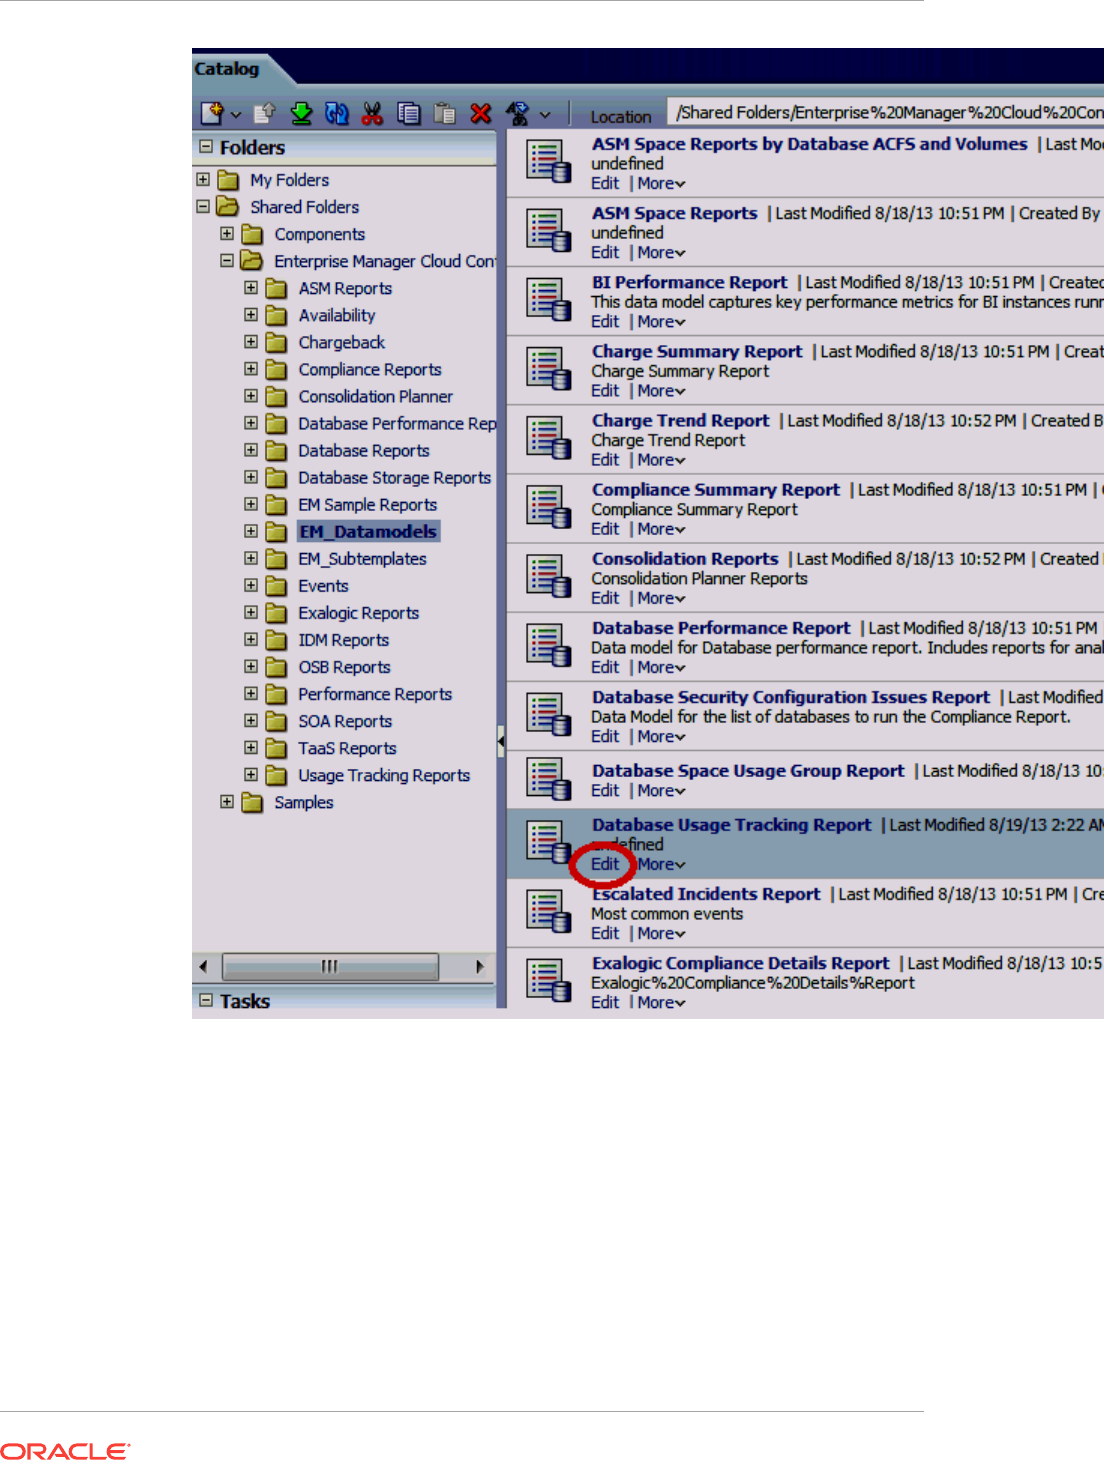
On the bottom of the left list, select Bursting, and then BurstToFTPserver.
In the SQL Query area, update the query as show below:
•"myFTPserver" (configured in step 4) as the value for the PARAMETER1
column.
•The output directory (absolute path of the directory on the disk) as the value
for the PARAMETER4 column.
Chapter 44
Generating Database Usage Tracking Report
44-26
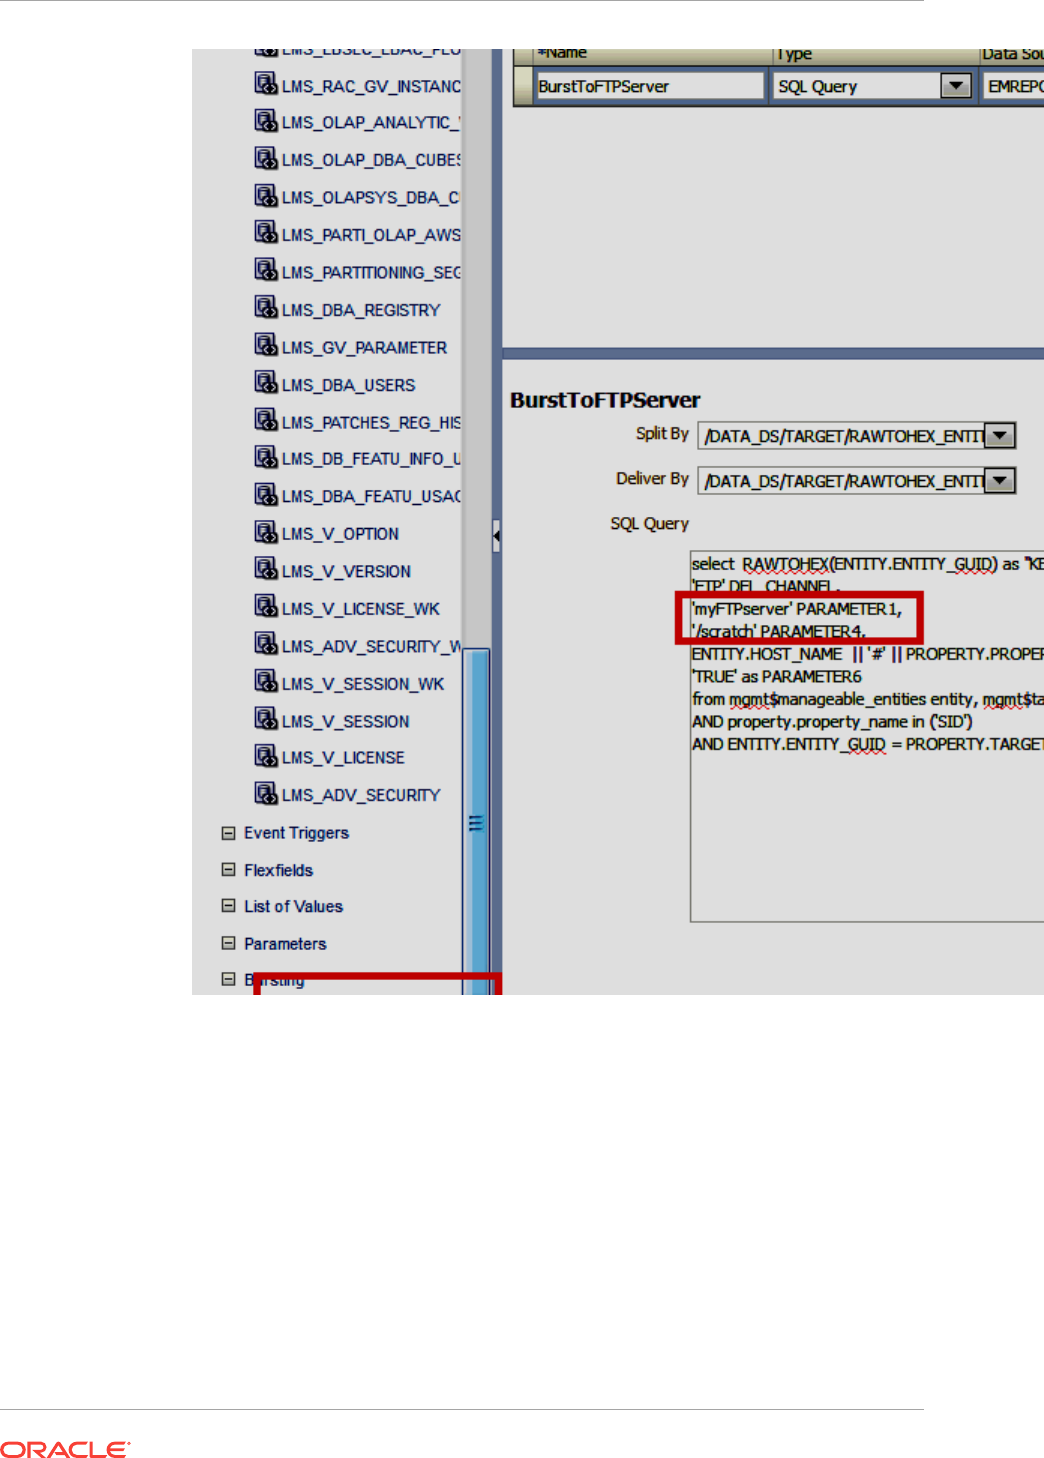
44.3.2 Running Usage Tracking Reports:
1. From the Catalog menu, select Shared Folders, then select Enterprise Manager
Cloud Control, then Usage Tracking Reports, then Database Usage Tracking
Report, and finally Schedule.
Chapter 44
Generating Database Usage Tracking Report
44-27
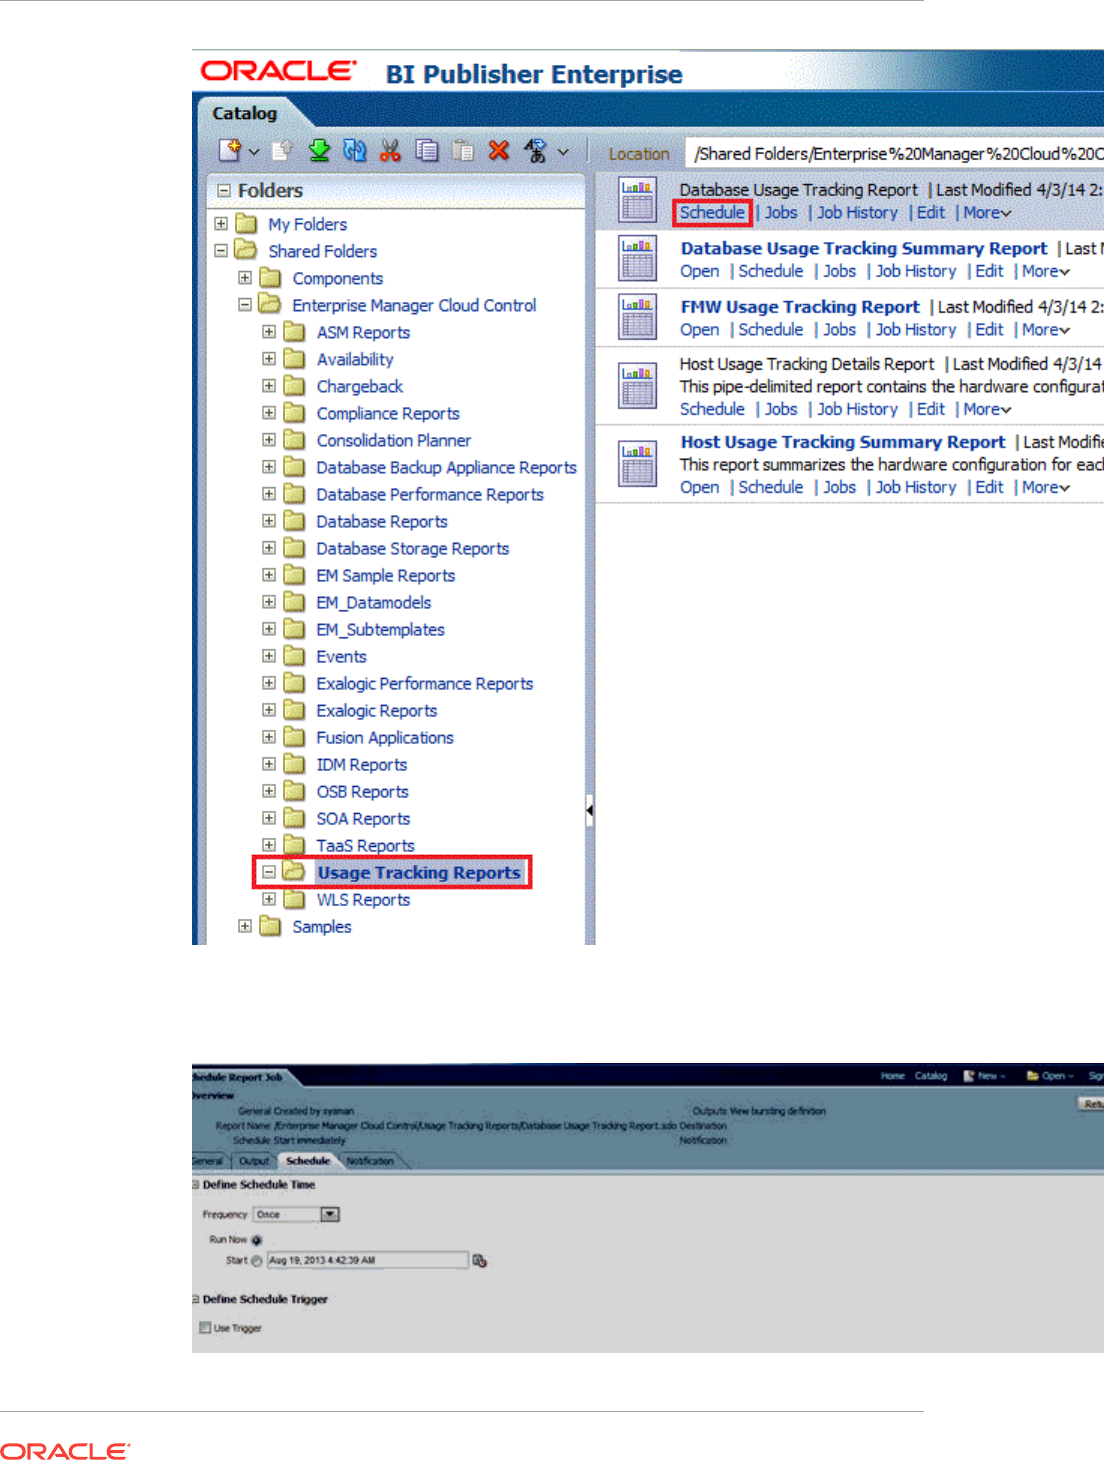
2. Make sure that, in the Schedule tab, the frequency is set to Once and Run Now is
selected. Click Submit.
Chapter 44
Generating Database Usage Tracking Report
44-28
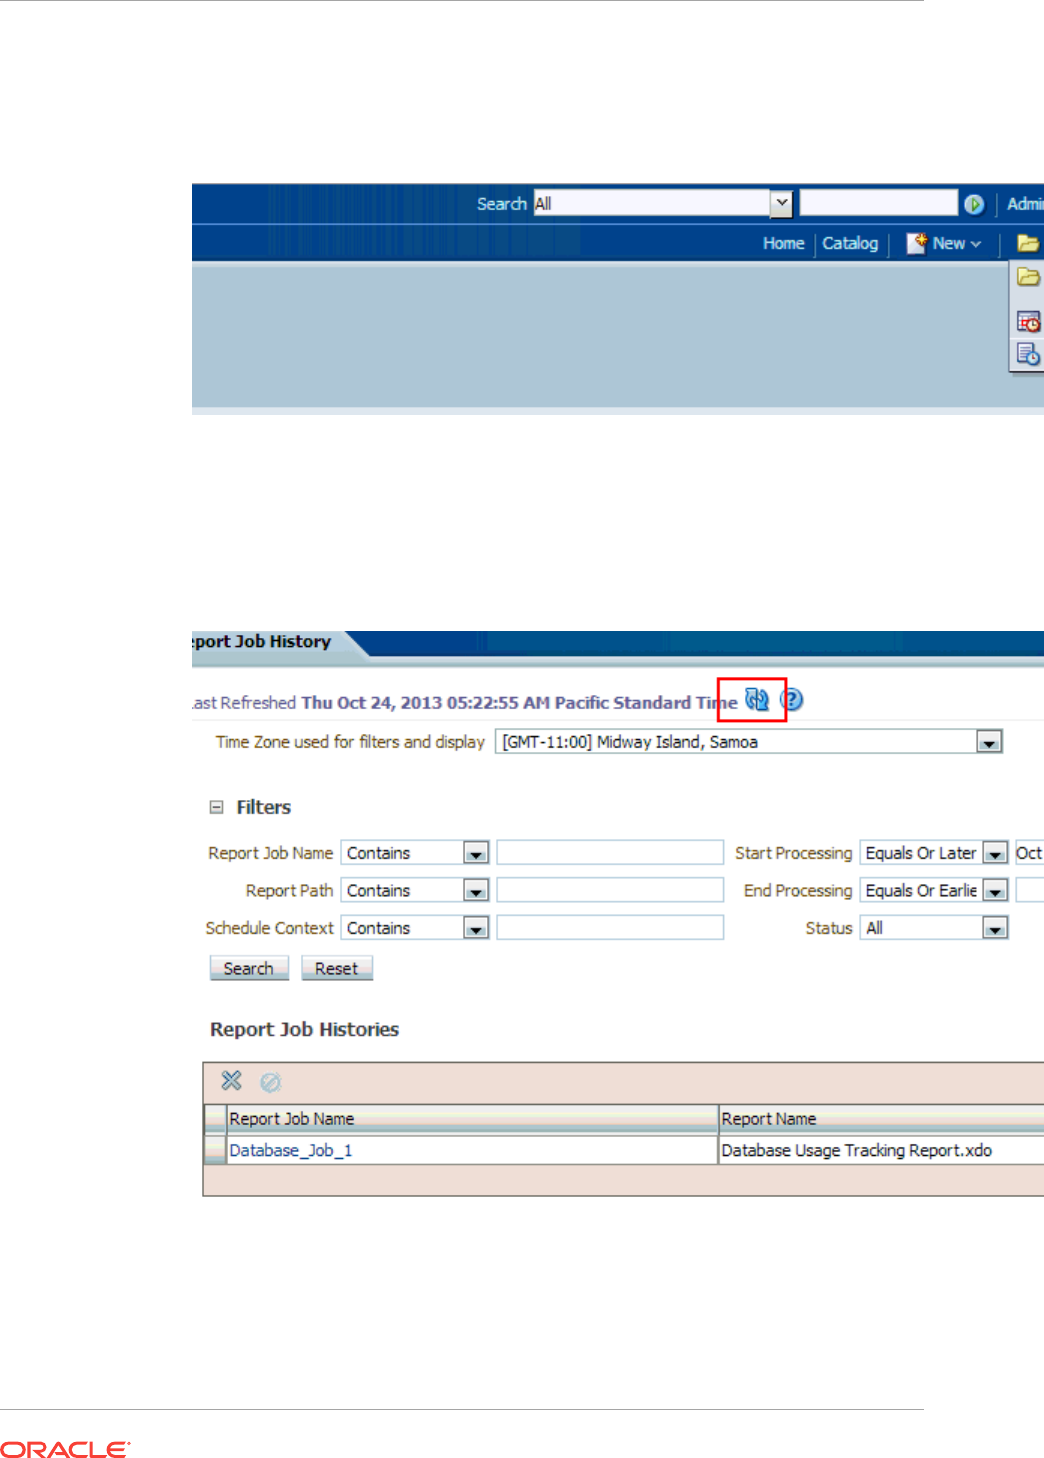
3. In the popup window, enter a job name to uniquely identify the job later.
The status of the submitted job can be monitored in "Report Job History" page as
shown below.
Errors (if any) in the metric collection are displayed at the bottom of each report
that gets generated for an instance.
Use the refresh button highlighted in the screen shot (job_running.png) to refresh
the status of the job
Wait until the status of the job changes from Running to Success.
Chapter 44
Generating Database Usage Tracking Report
44-29
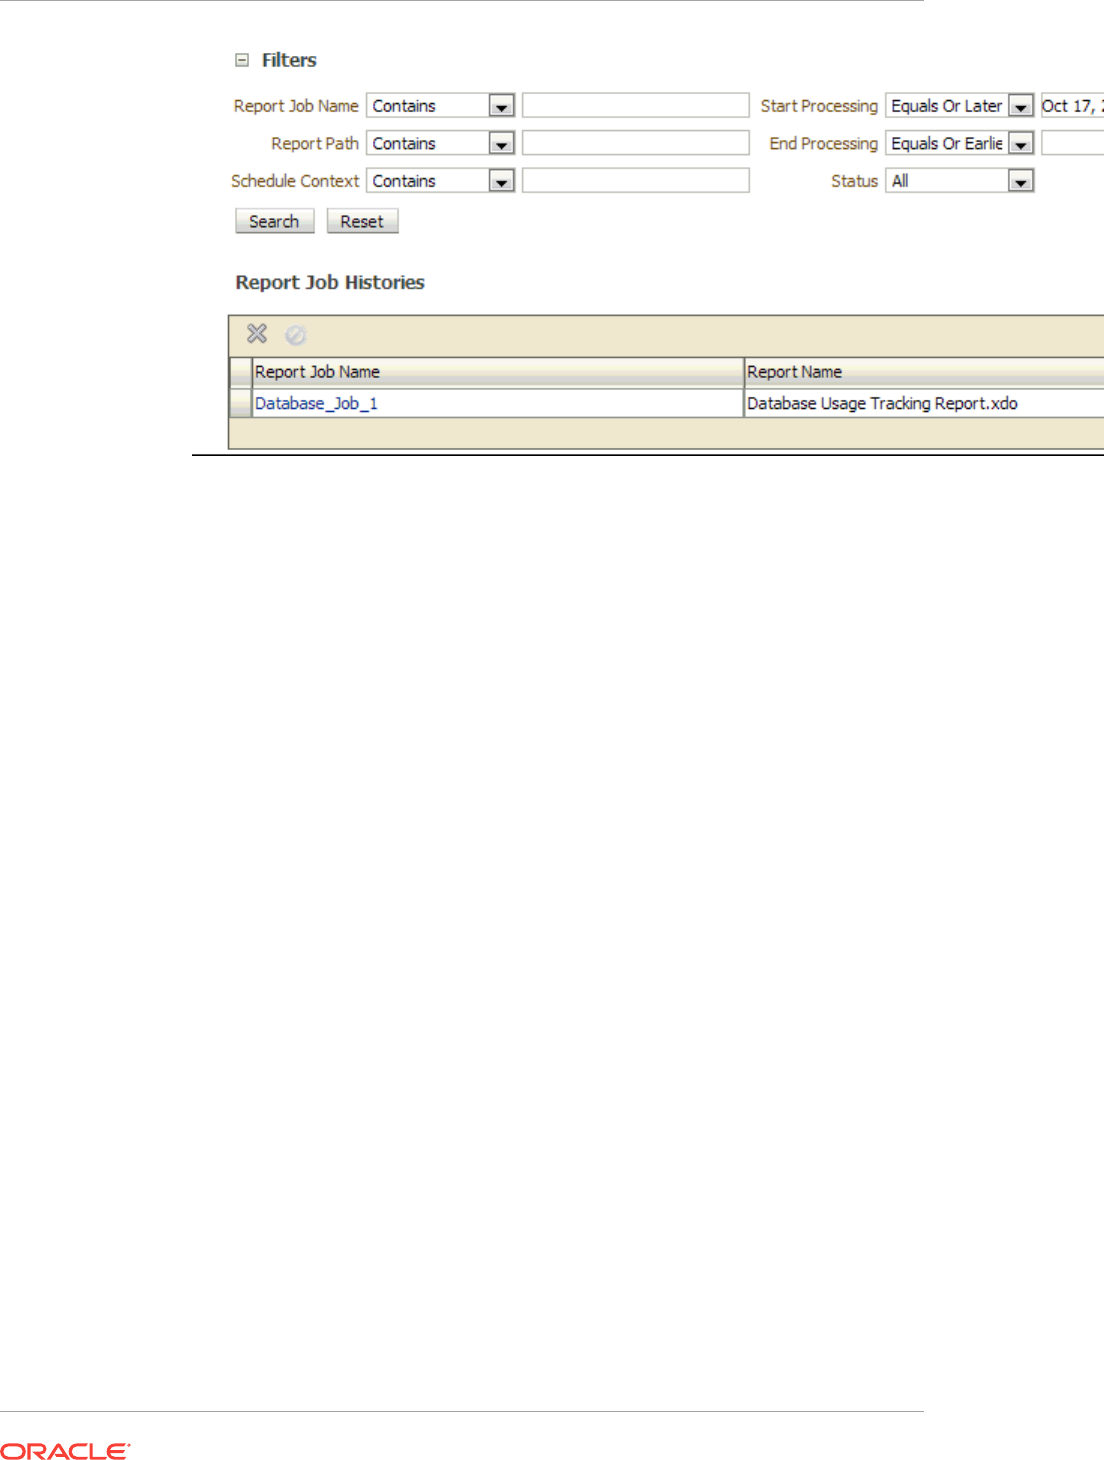
44.4 Database Usage Tracking Summary Report
Follow steps 1, 2 described in "Database Usage Tracking Report" if they have not
already been done.
1. Set up Database Usage Tracking credentials.
2. Enable the metric collection.
3. Once logged into Enterprise Manager, from the Enterprise menu, select Reports
and then BI Publisher Reports.
Chapter 44
Database Usage Tracking Summary Report
44-30
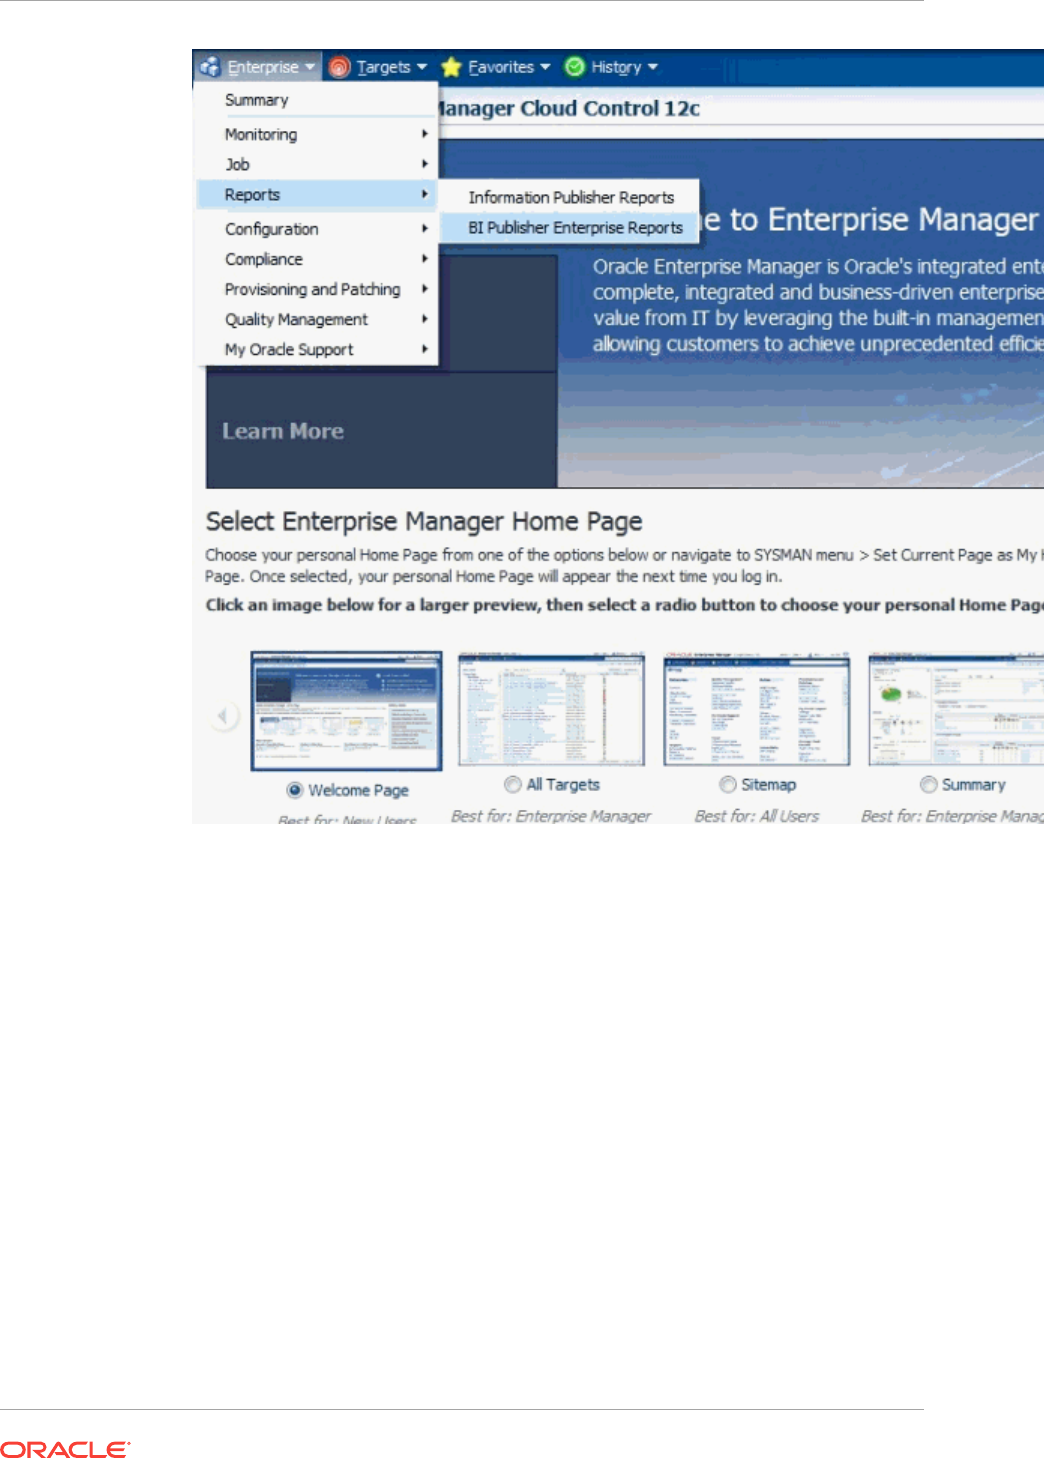
4. Click on Database Usage Tracking Summary Report in the tree. You will be
prompted to log in to BI Publisher for the first time.
Chapter 44
Database Usage Tracking Summary Report
44-31
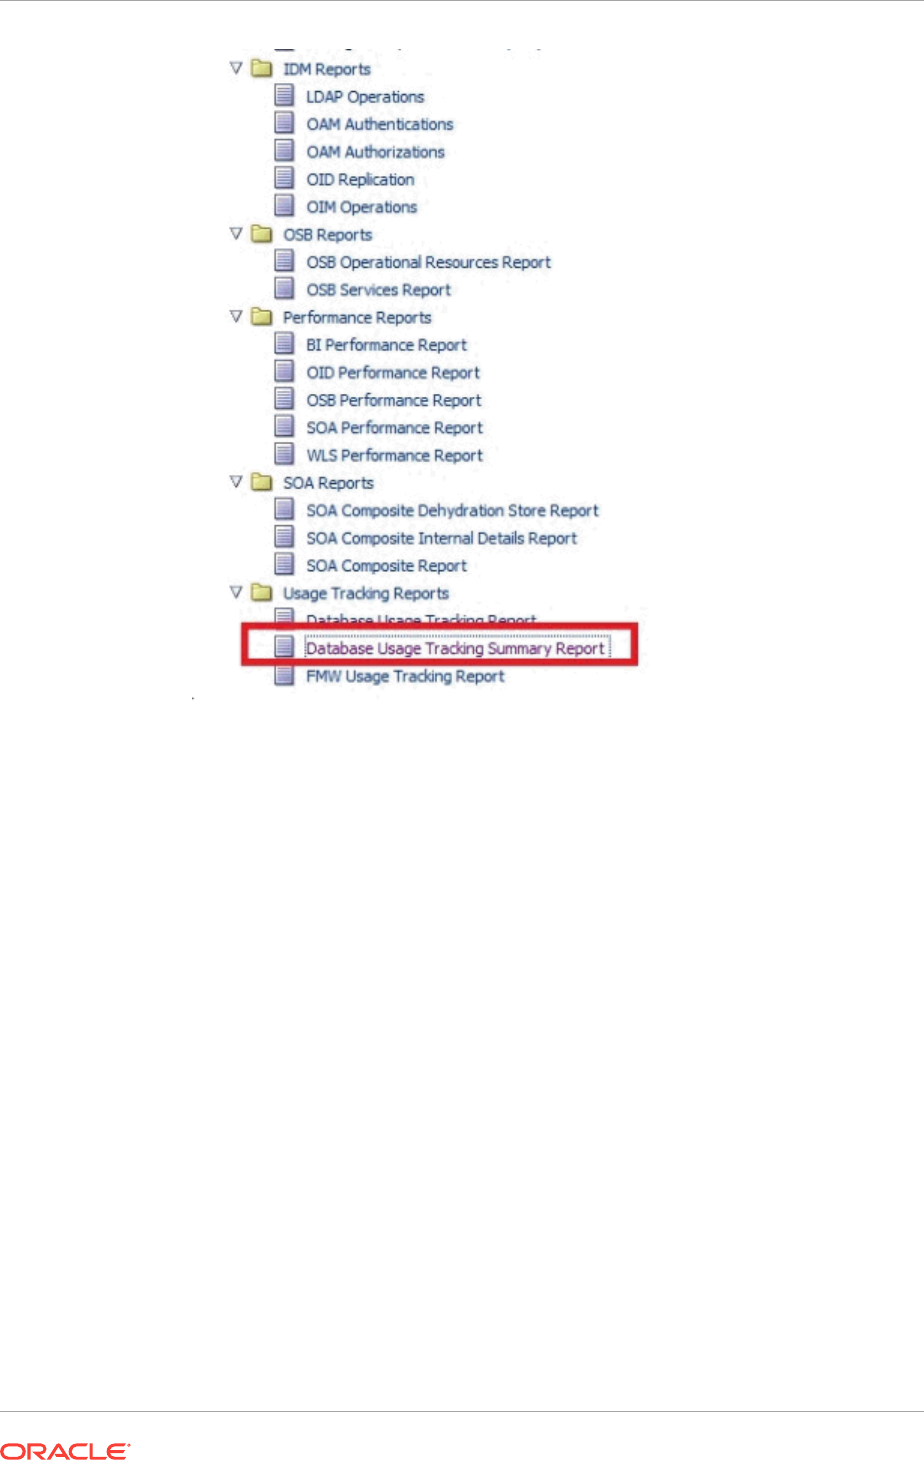
5. The report can also be viewed by logging in to BI Publisher.
Chapter 44
Database Usage Tracking Summary Report
44-32

Chapter 44
Database Usage Tracking Summary Report
44-33
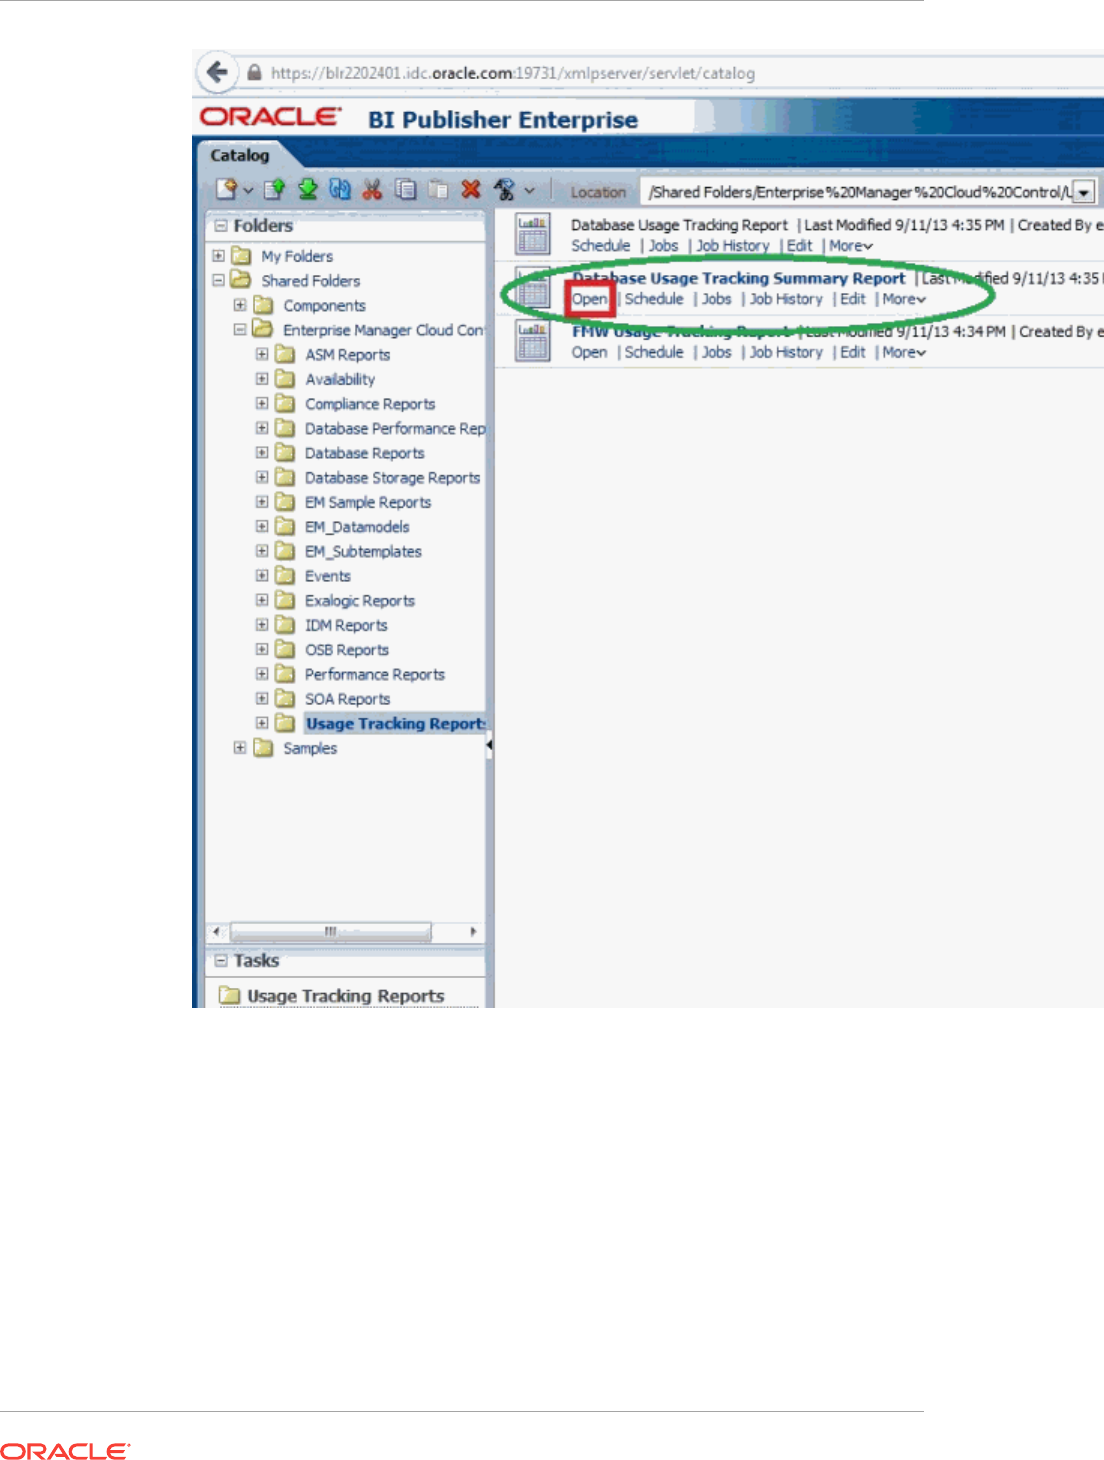
Chapter 44
Database Usage Tracking Summary Report
44-34
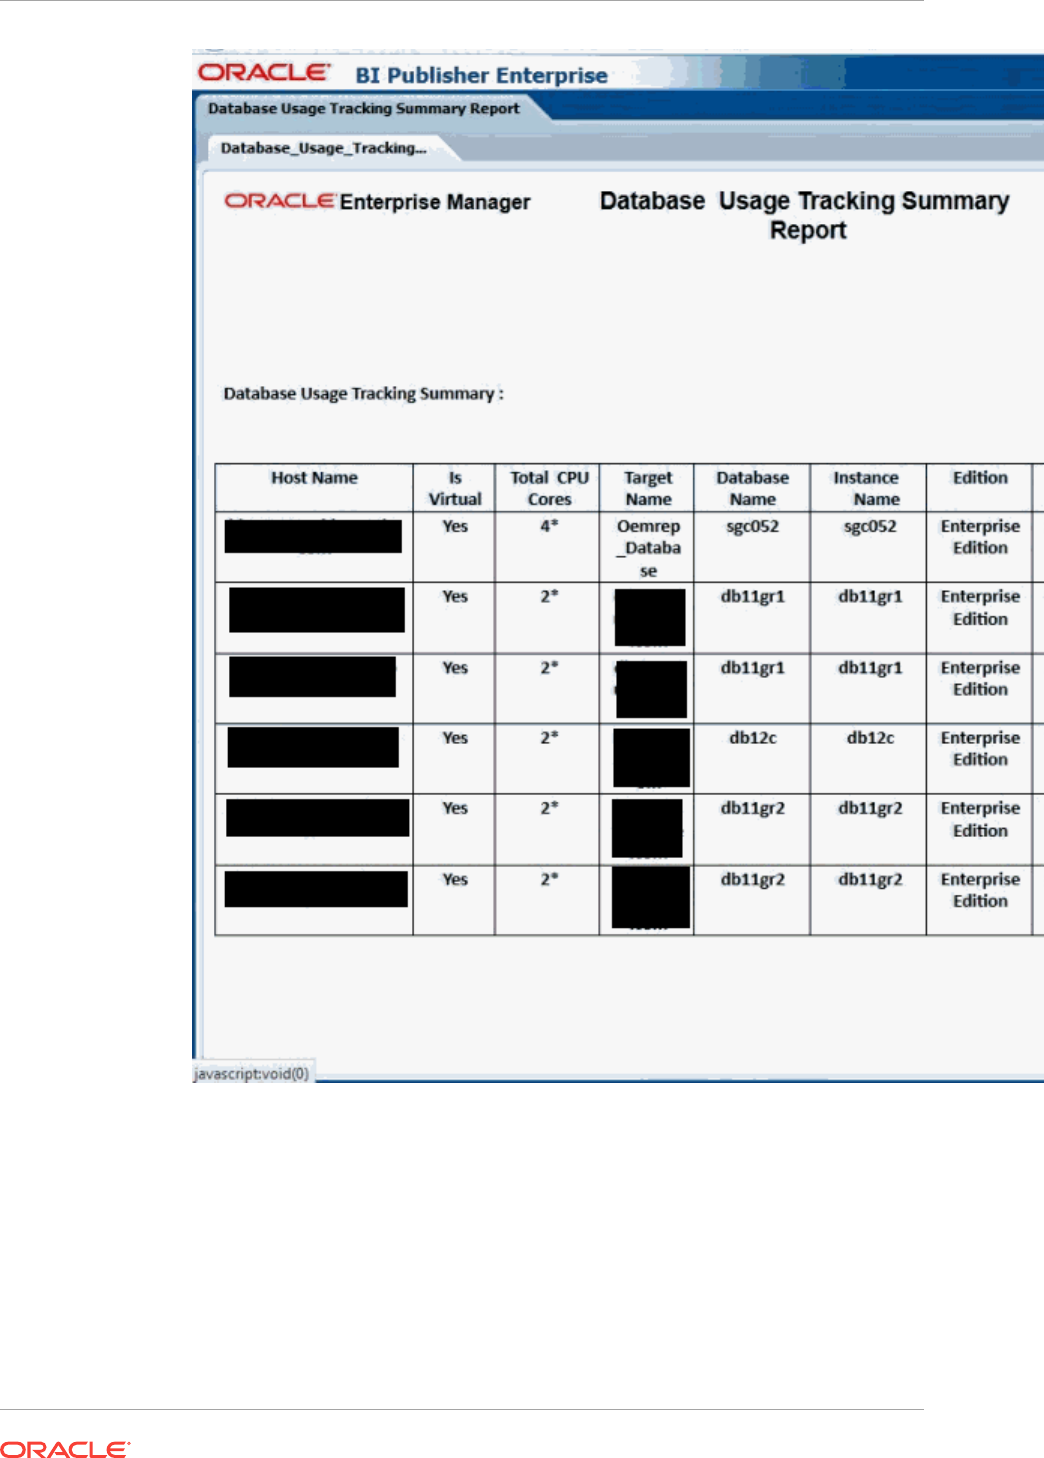
Chapter 44
Database Usage Tracking Summary Report
44-35
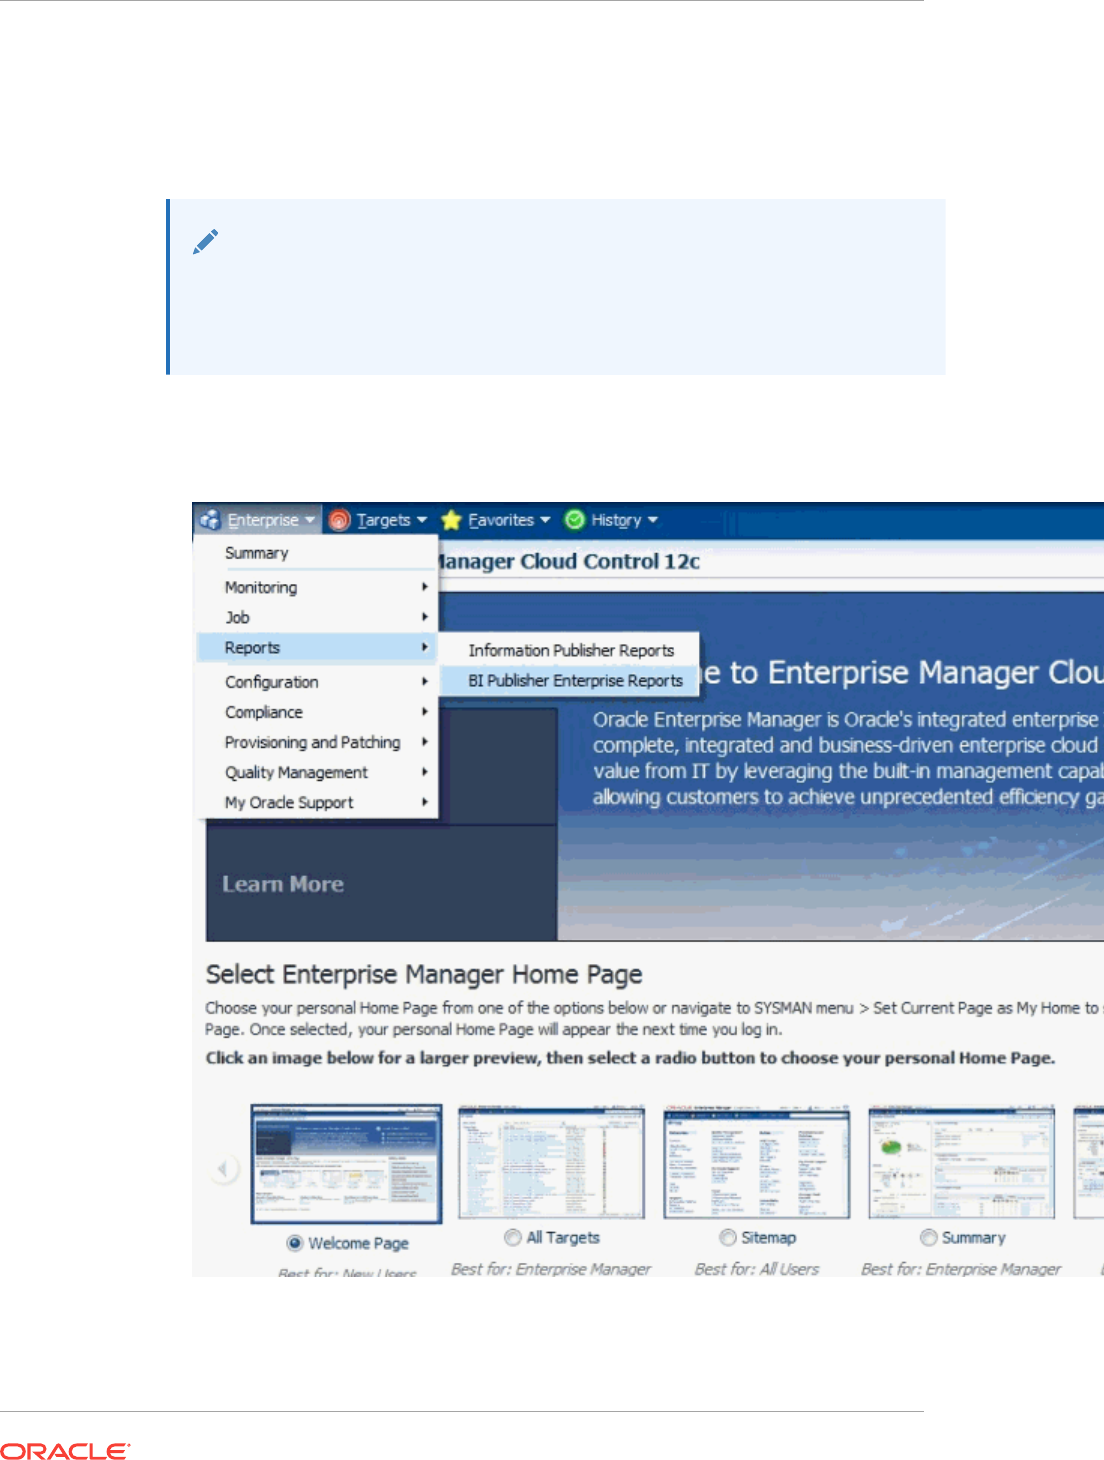
44.5 Generating the Fusion Middleware Usage Tracking
Summary Report
Note:
The Fusion Middleware Usage Tracking Summary Report contains data that is
collected when the Enterprise Manager Fusion Middleware Plug-in is installed.
There are no steps required to enable the Fusion Middleware metric collection.
1. Once logged in to Enterprise Manager, from the Enterprise menu, select
Reports, and then BI Publisher Reports.
2. Click on FMW Usage Tracking Report in the tree. You will be prompted to login
to BI Publisher for the first time.
Chapter 44
Generating the Fusion Middleware Usage Tracking Summary Report
44-36
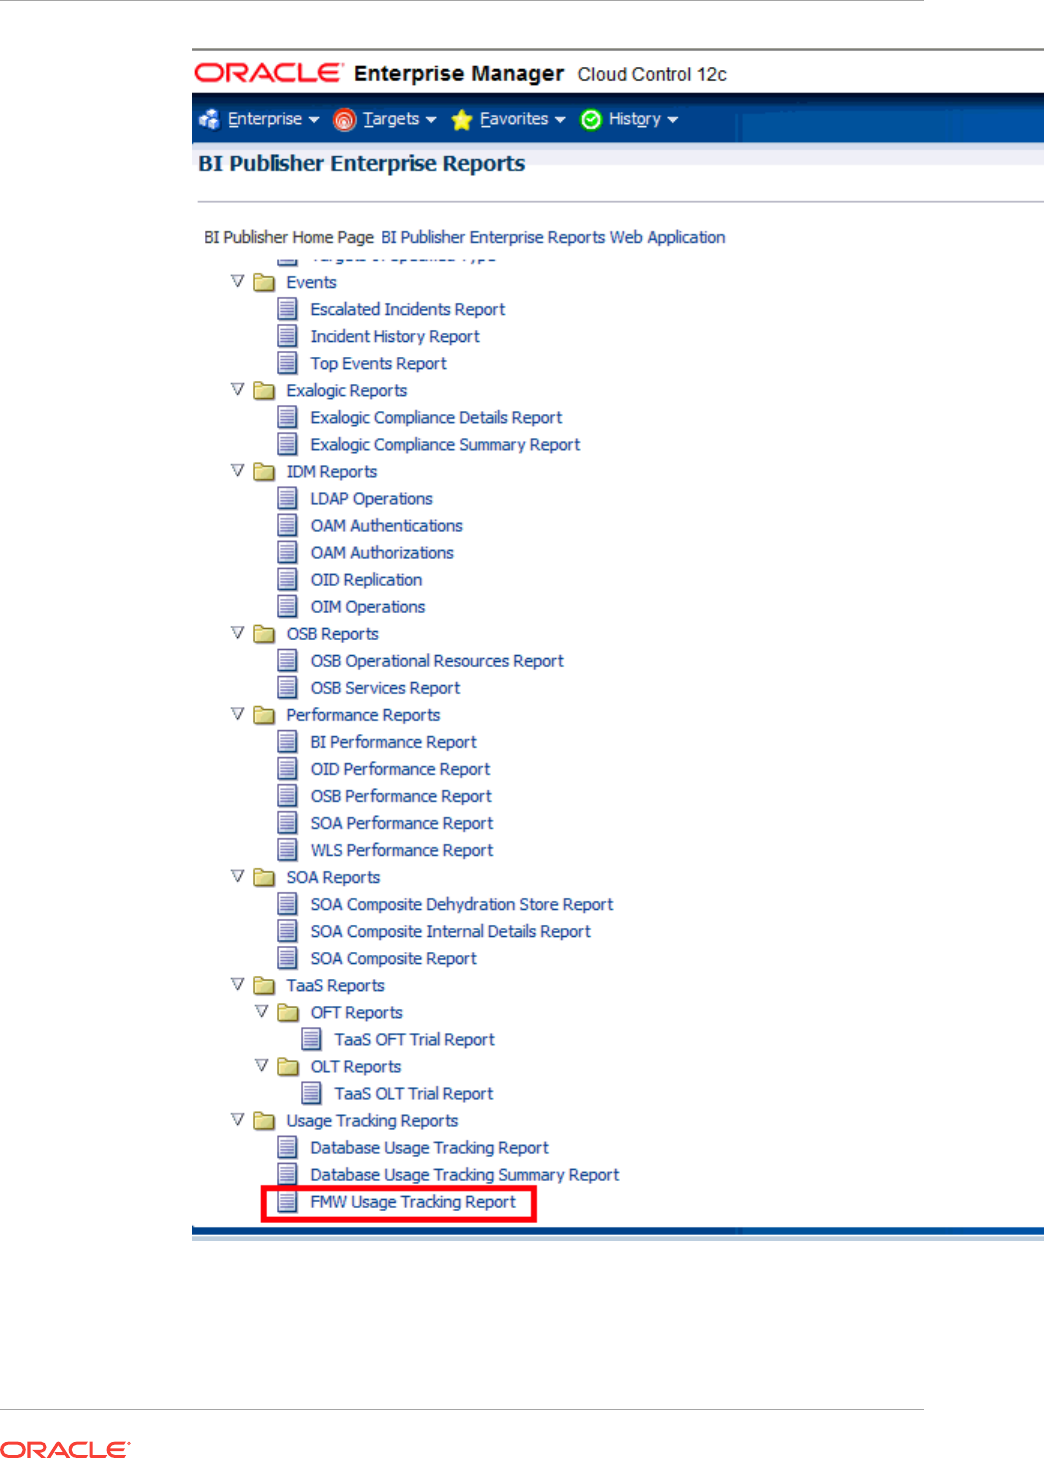
3. The report can also be viewed by logging in to BI Publisher.
Click on Catalog Folders or the Catalog Menu as shown.
Chapter 44
Generating the Fusion Middleware Usage Tracking Summary Report
44-37
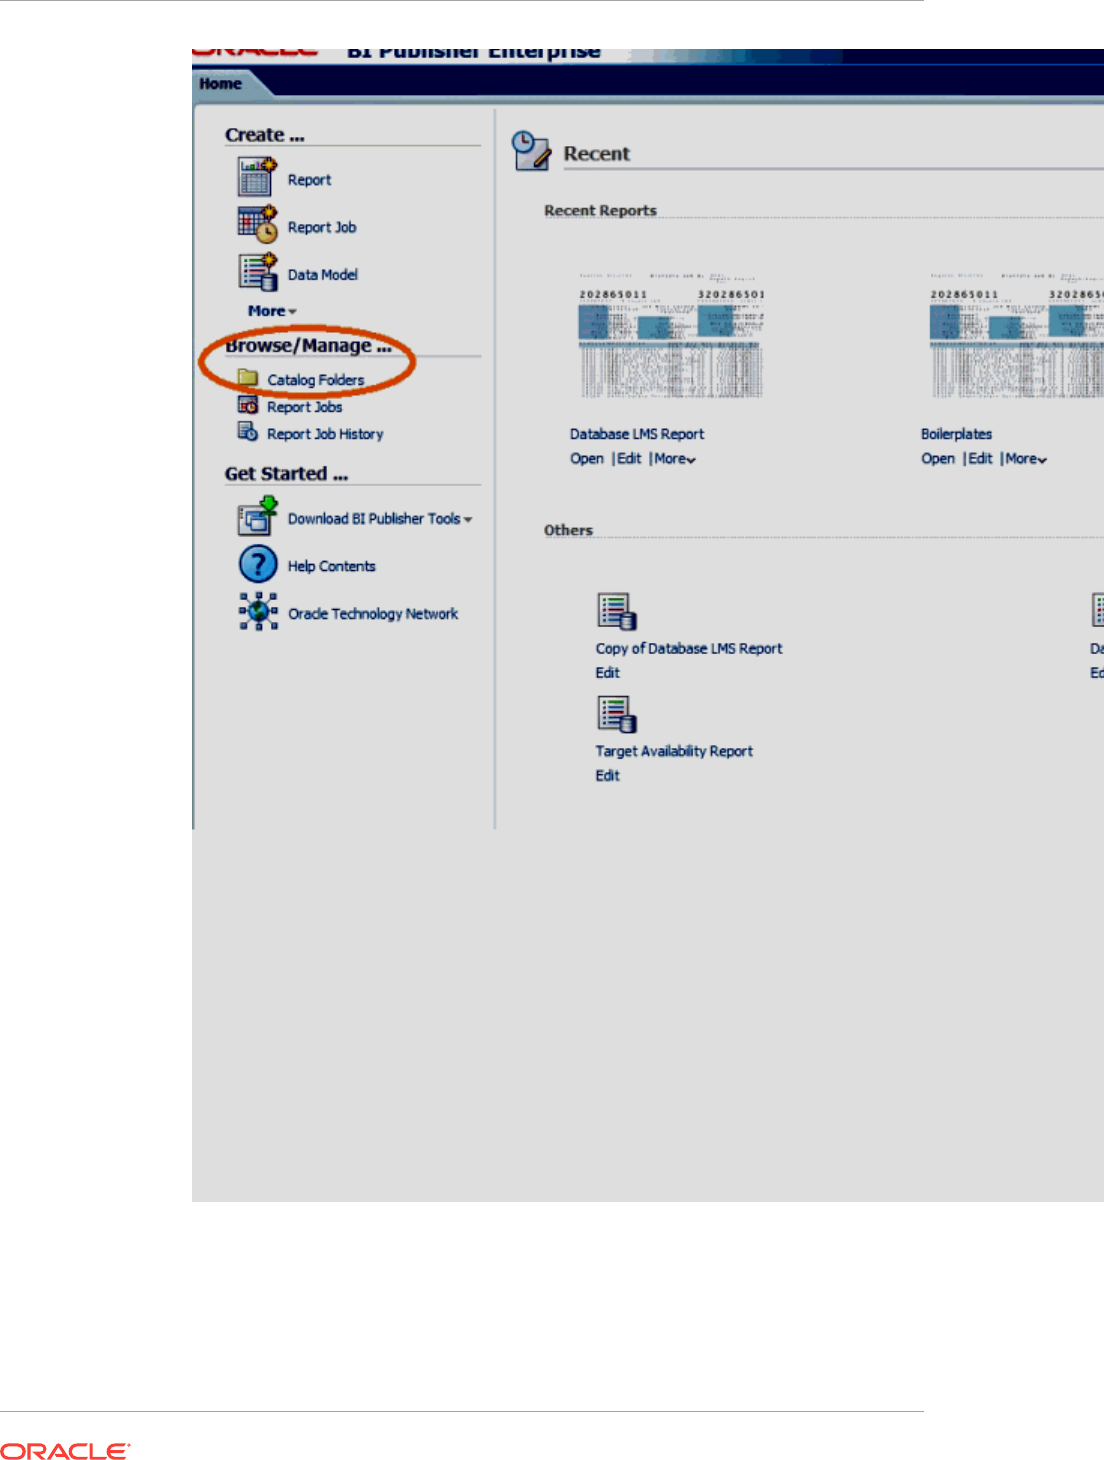
Chapter 44
Generating the Fusion Middleware Usage Tracking Summary Report
44-38
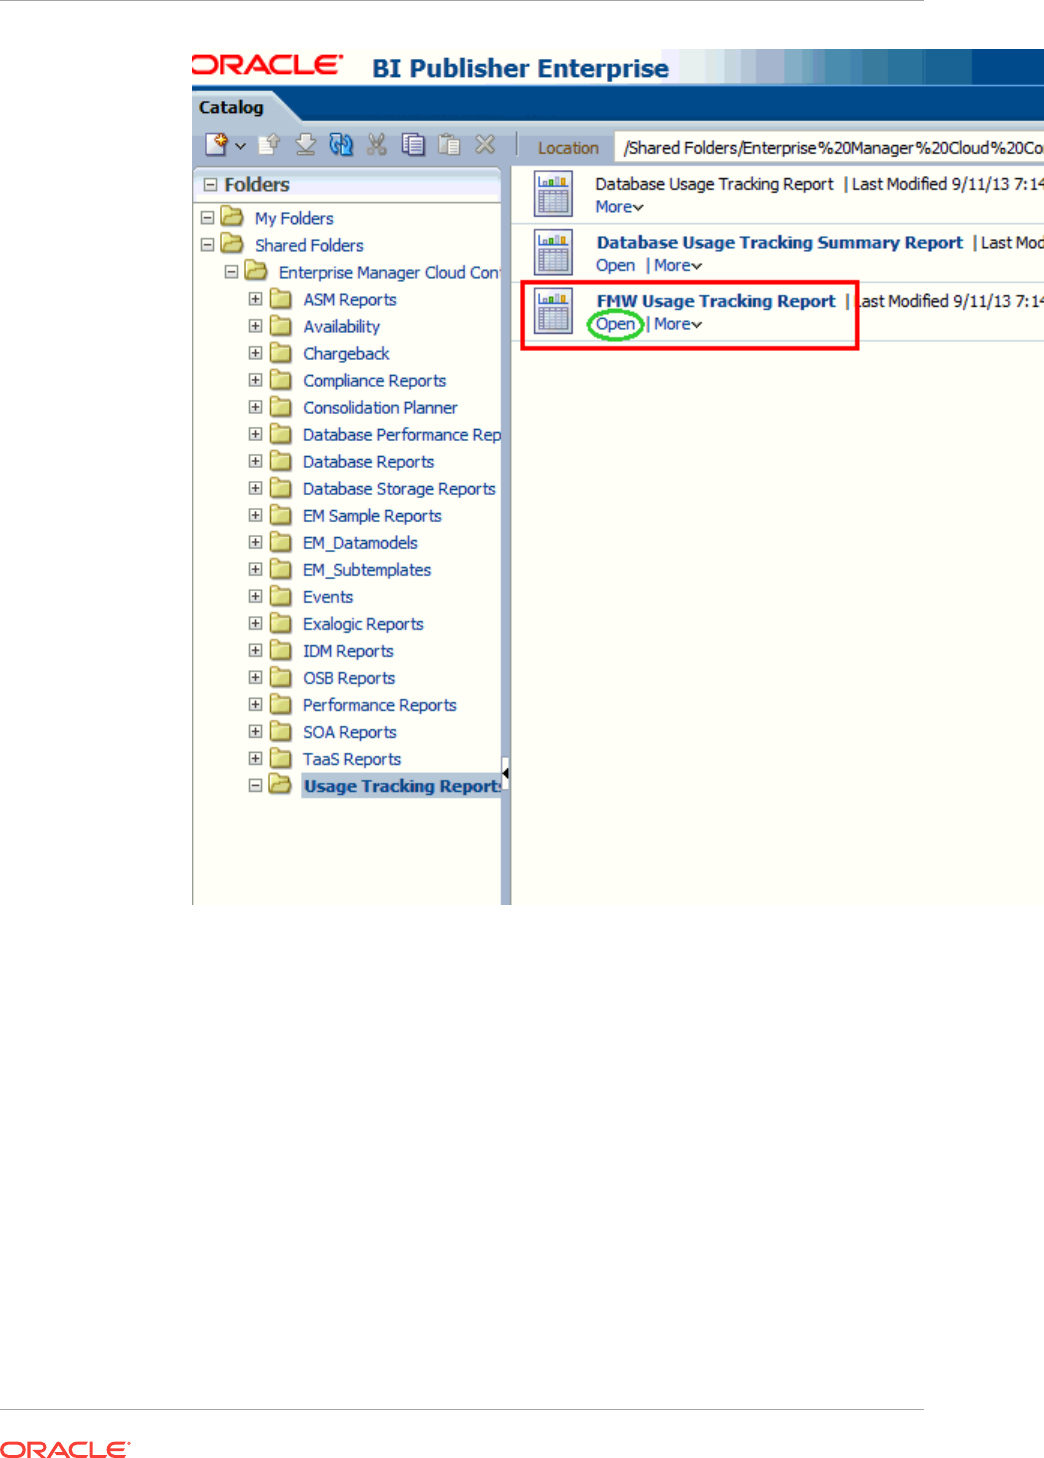
Chapter 44
Generating the Fusion Middleware Usage Tracking Summary Report
44-39
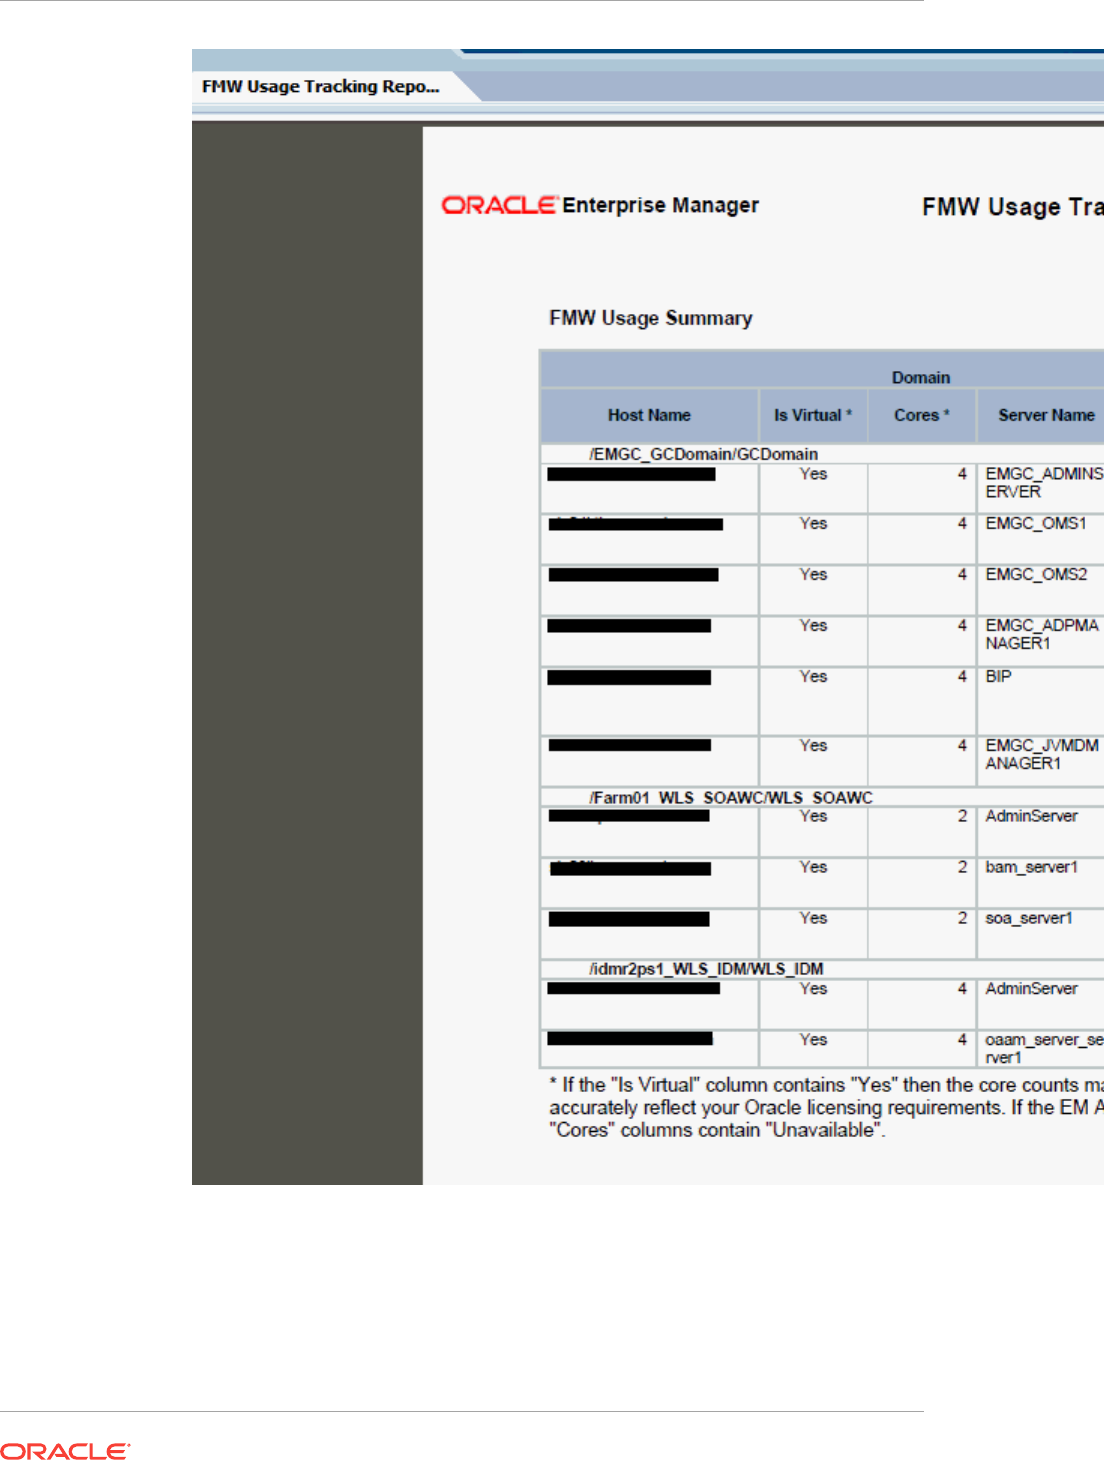
44.6 Host Usage Tracking Reports
The Host Usage Tracking Reports provides an overview of the Host processor
information. This is to be used for informational purposes only and this does not
represent your license entitlement or requirement. Please contact the License
Management Services representative at
Chapter 44
Host Usage Tracking Reports
44-40
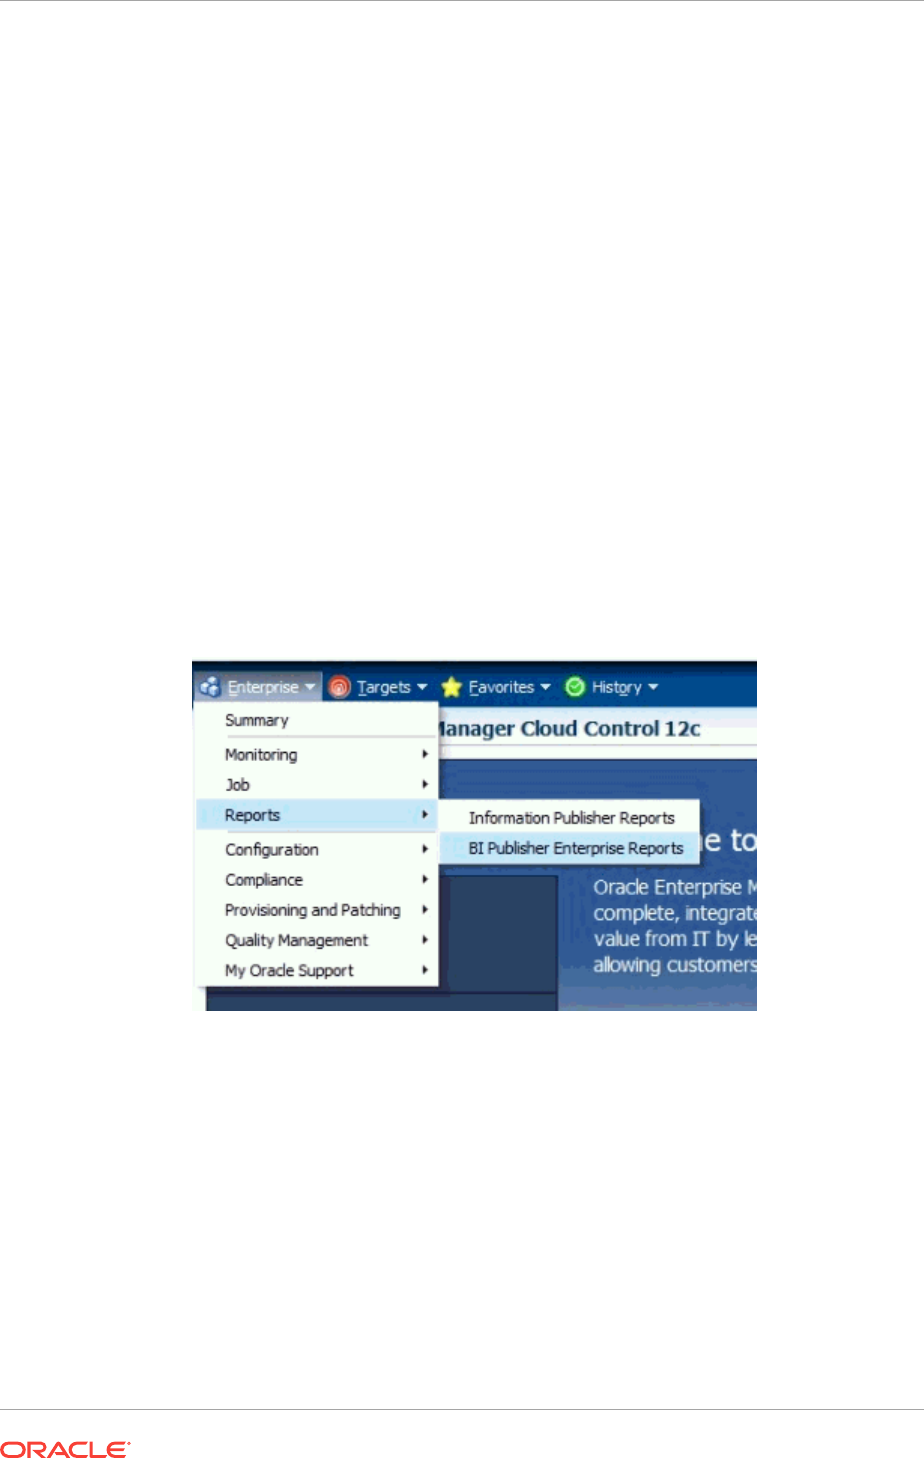
http://www.oracle.com/us/corporate/license-management-services/index.html to
understand your license requirements.
Two reports namely "Host Usage Tracking Summary Report" and "Host Usage
Tracking Details Report" have been added.
•"Host Usage Tracking Summary Report" is a high level summary of the processor
information on the Host system.
This report can be run and viewed online. The output report can be exported to
PDF, RTF, Excel formats.
•"Host Usage Tracking Details Report" provides the above usage data in an
exportable format. The exported data can be sent to Oracle License Management
Services for further analysis to determine licensing requirements. Please contact
the License Management Services representative at http://www.oracle.com/us/
corporate/license-management-services/index.html to initiate an engagement.
A single file with each managed host's processor information is created. The
format of the output files is limited to a pipe delimited file.
44.6.1 Generating the Host Usage Tracking Summary Report
1. Once logged into Enterprise Manager, from the Enterprise menu, select Reports
and then BI Publisher Reports.
2. In the tree list, click "Host Usage Tracking Summary Report" .You will be prompted
to log into BI Publisher for the first time.
Chapter 44
Host Usage Tracking Reports
44-41
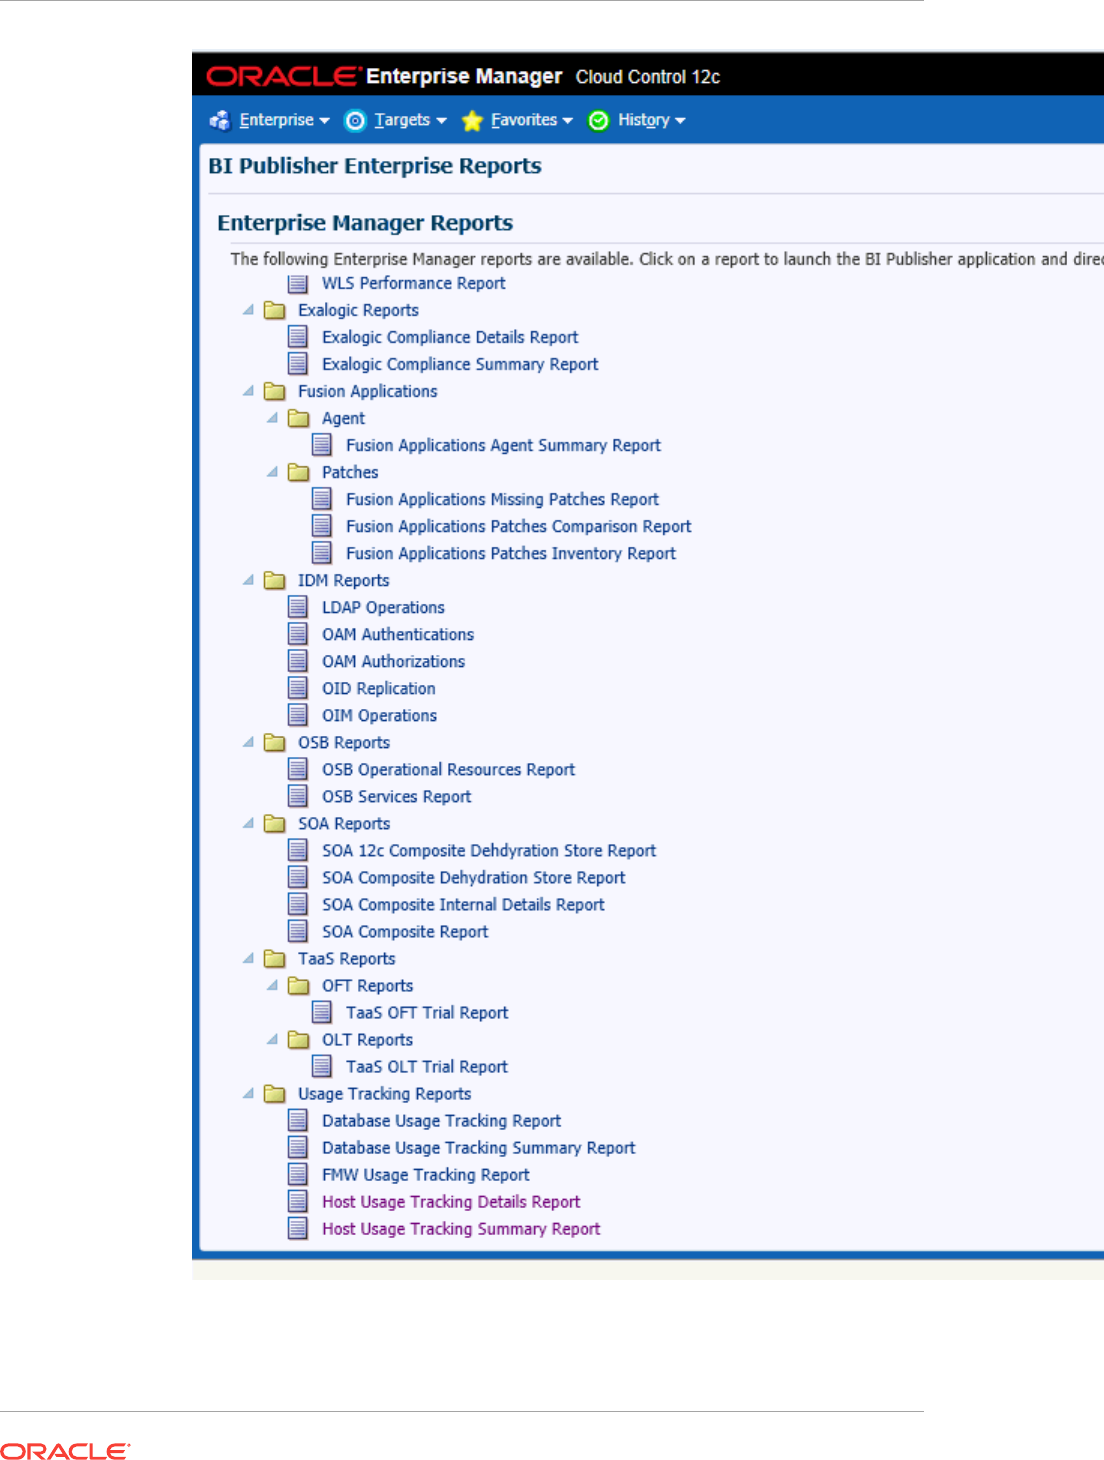
Chapter 44
Host Usage Tracking Reports
44-42
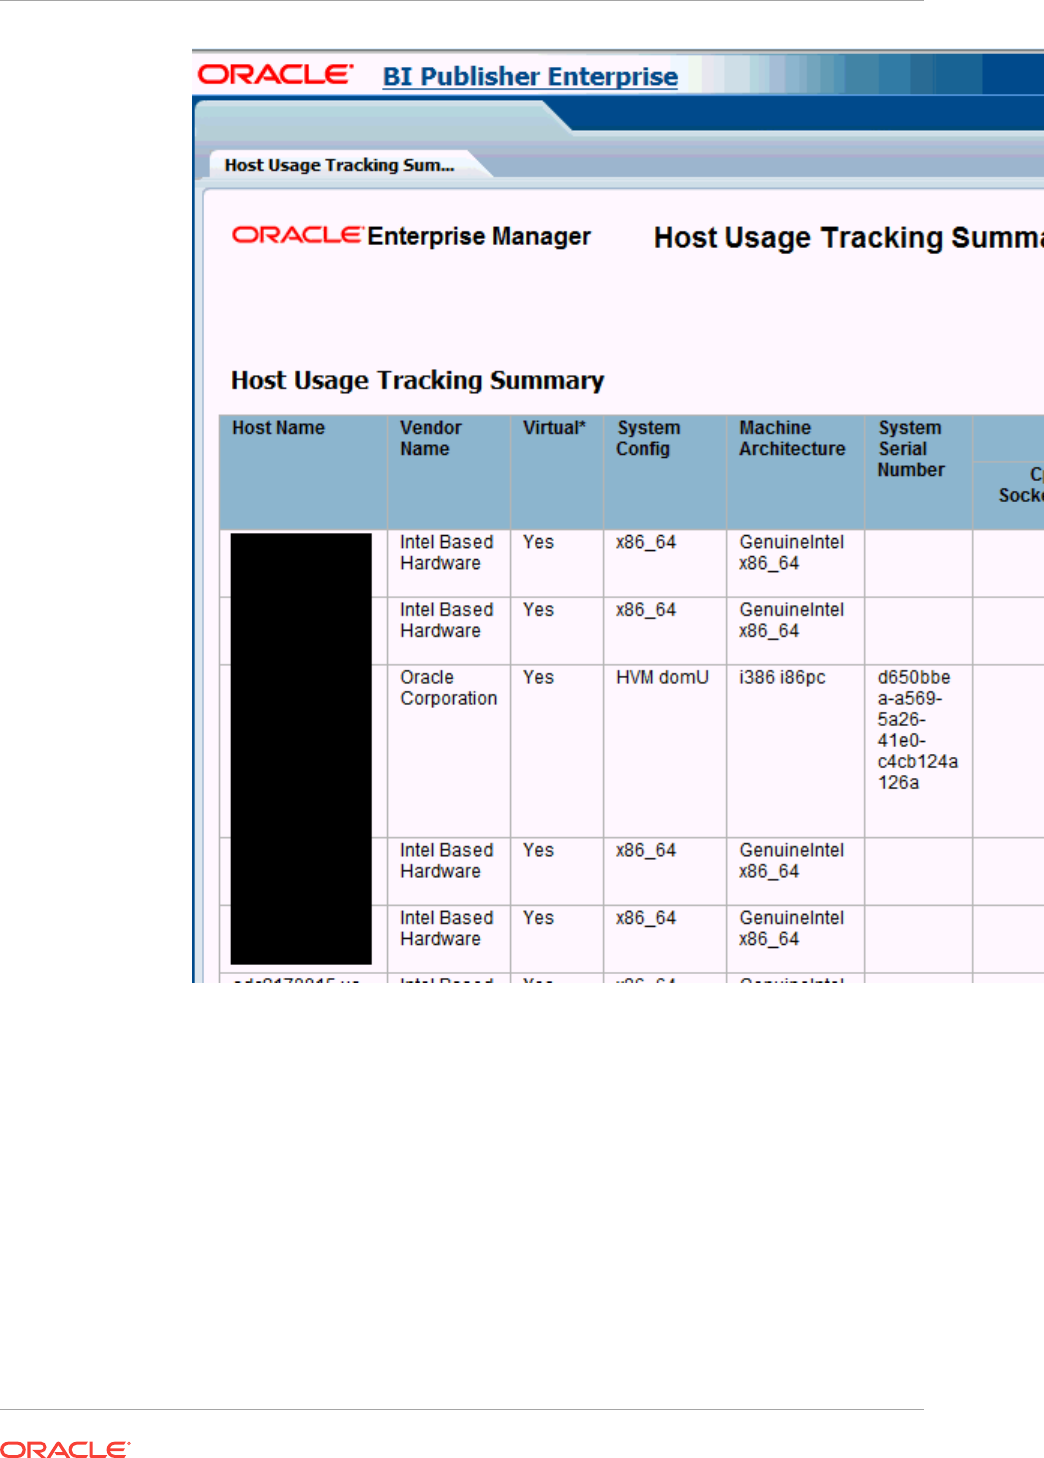
44.6.2 Generating the Host Usage Tracking Details Report
1. Once logged into Enterprise Manager, from the Enterprise menu, select Reports
and then BI Publisher Reports.
Chapter 44
Host Usage Tracking Reports
44-43
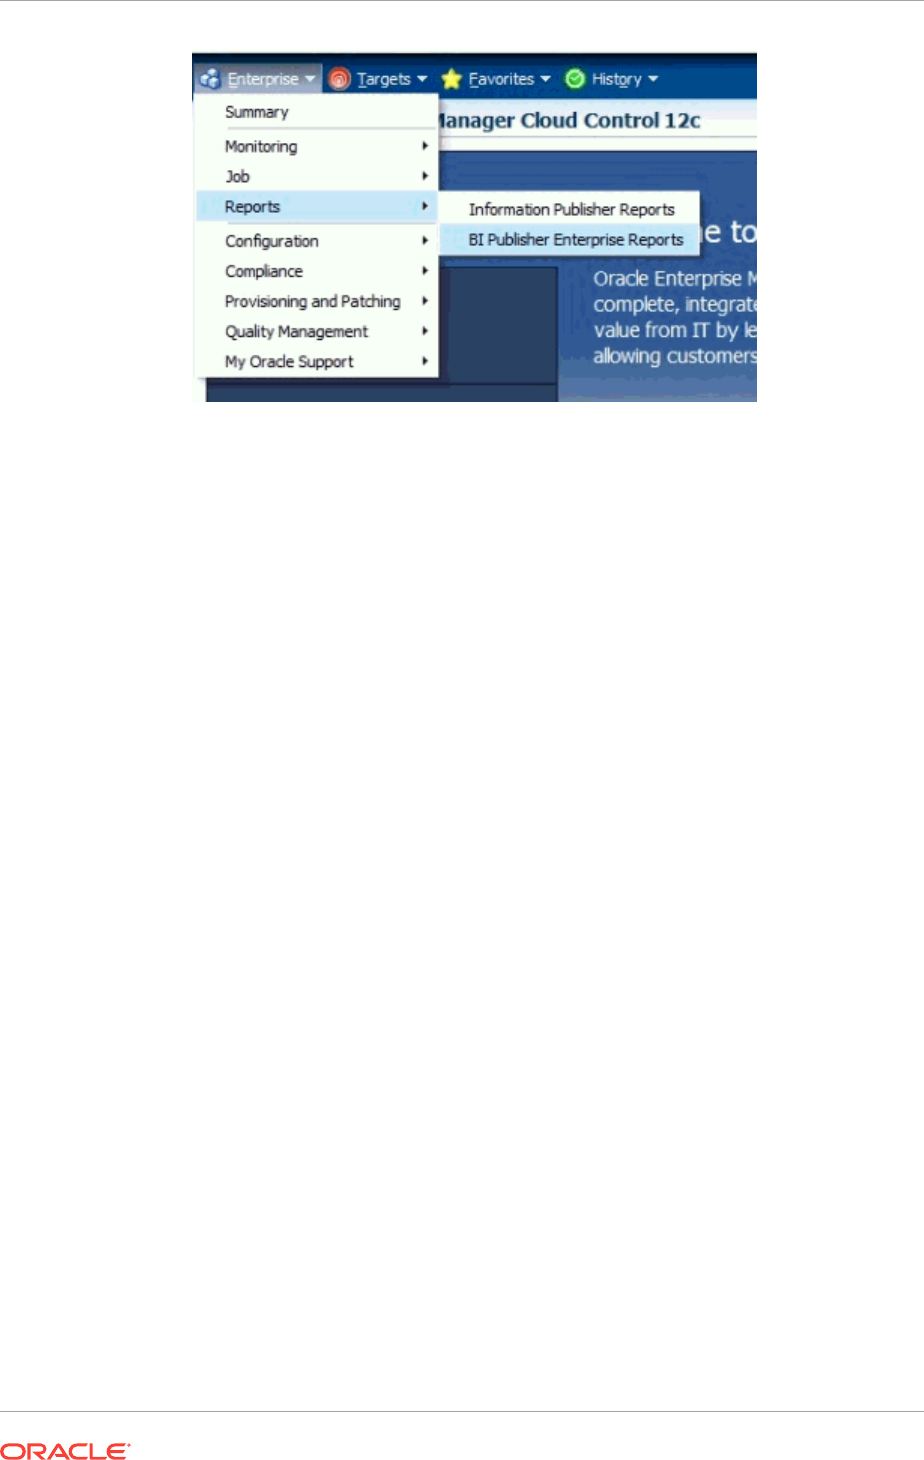
2. In the tree list click "Host Usage Tracking Details Report". You will be prompted to
login to BI Publisher for the first time.
Chapter 44
Host Usage Tracking Reports
44-44
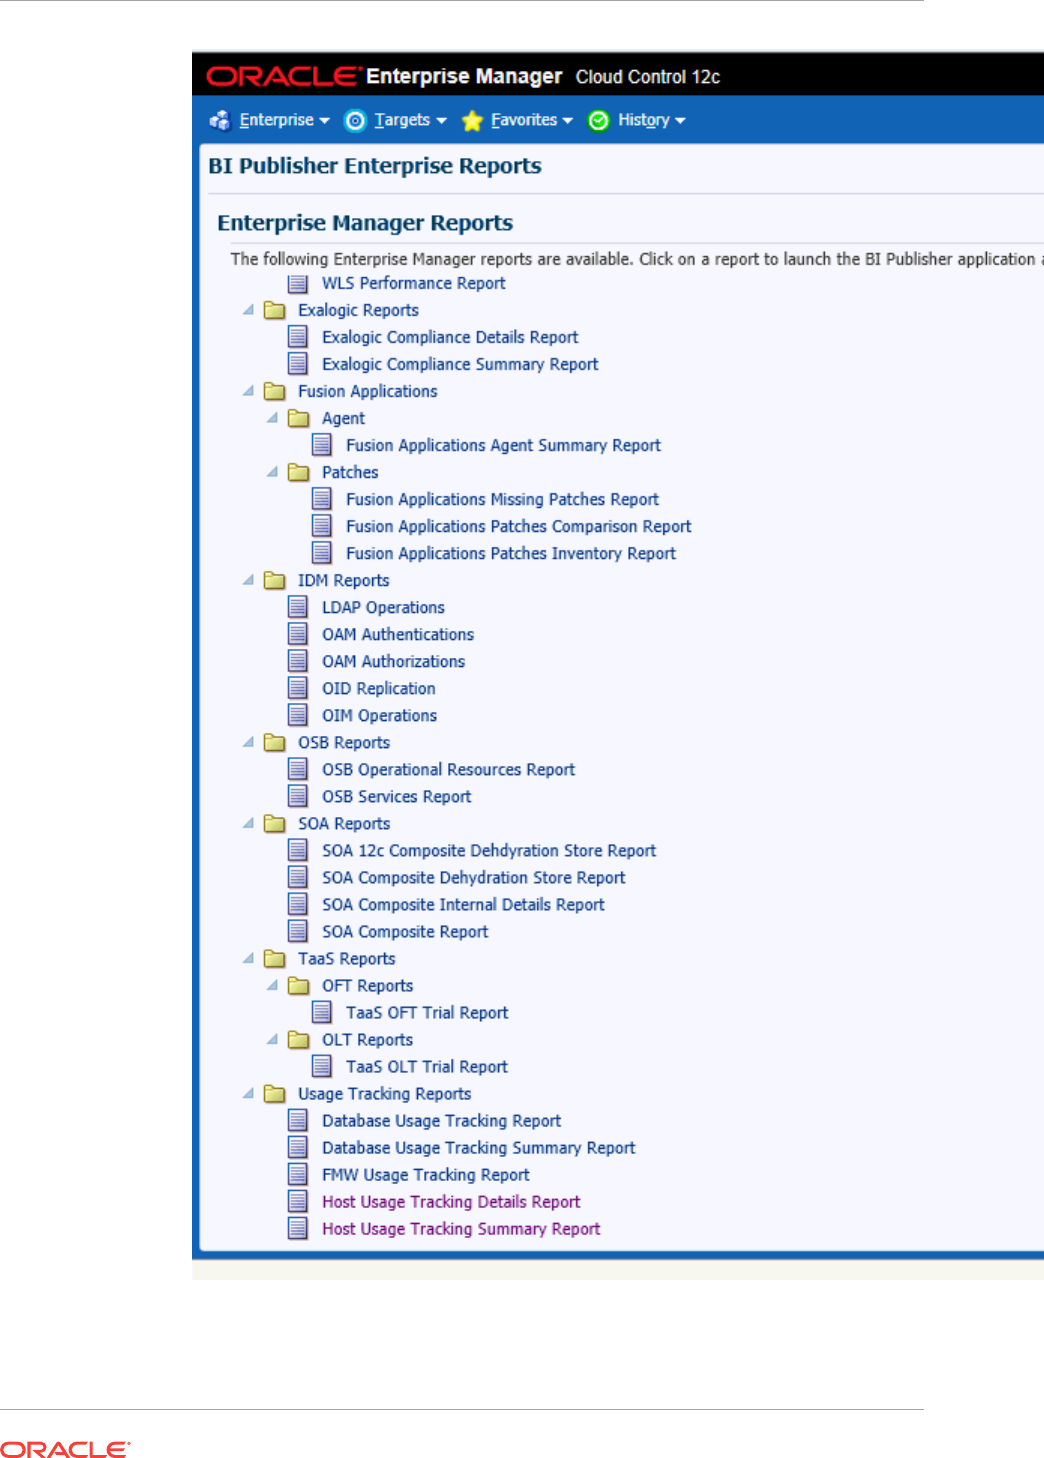
3. Click the "View" icon in the upper-right corner and click "Text".
Chapter 44
Host Usage Tracking Reports
44-45
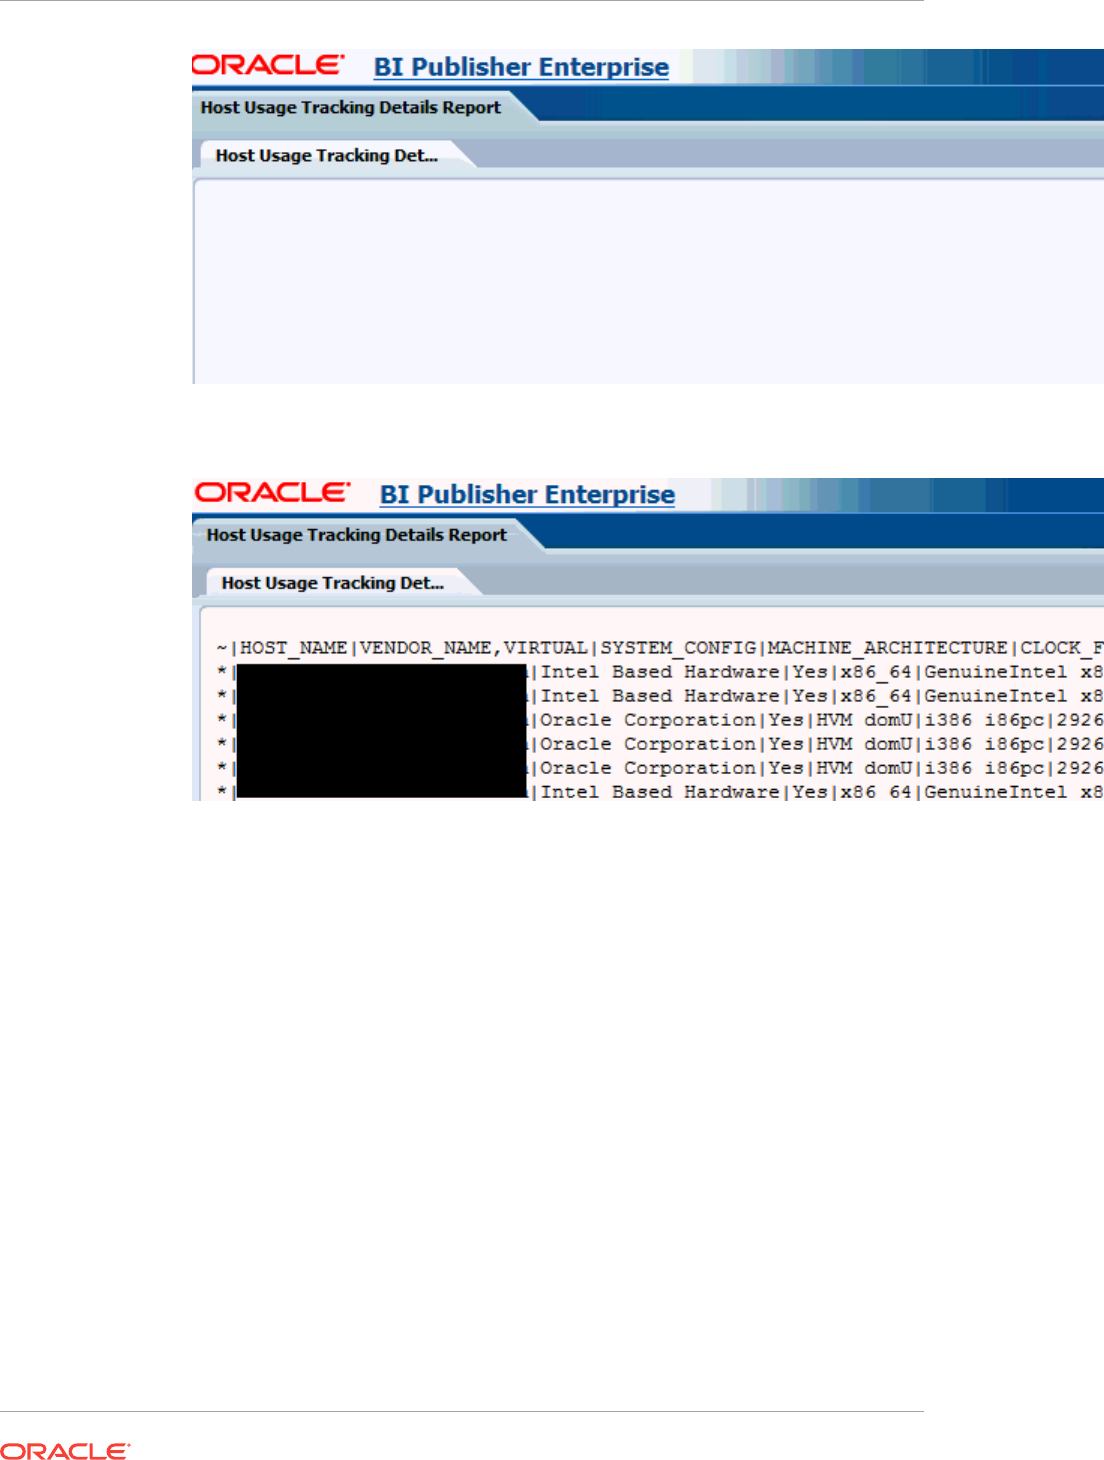
4. Click the "Actions" icon in the upper-right corner and select "Export" then "Text"
5. Select "Save"
Chapter 44
Host Usage Tracking Reports
44-46
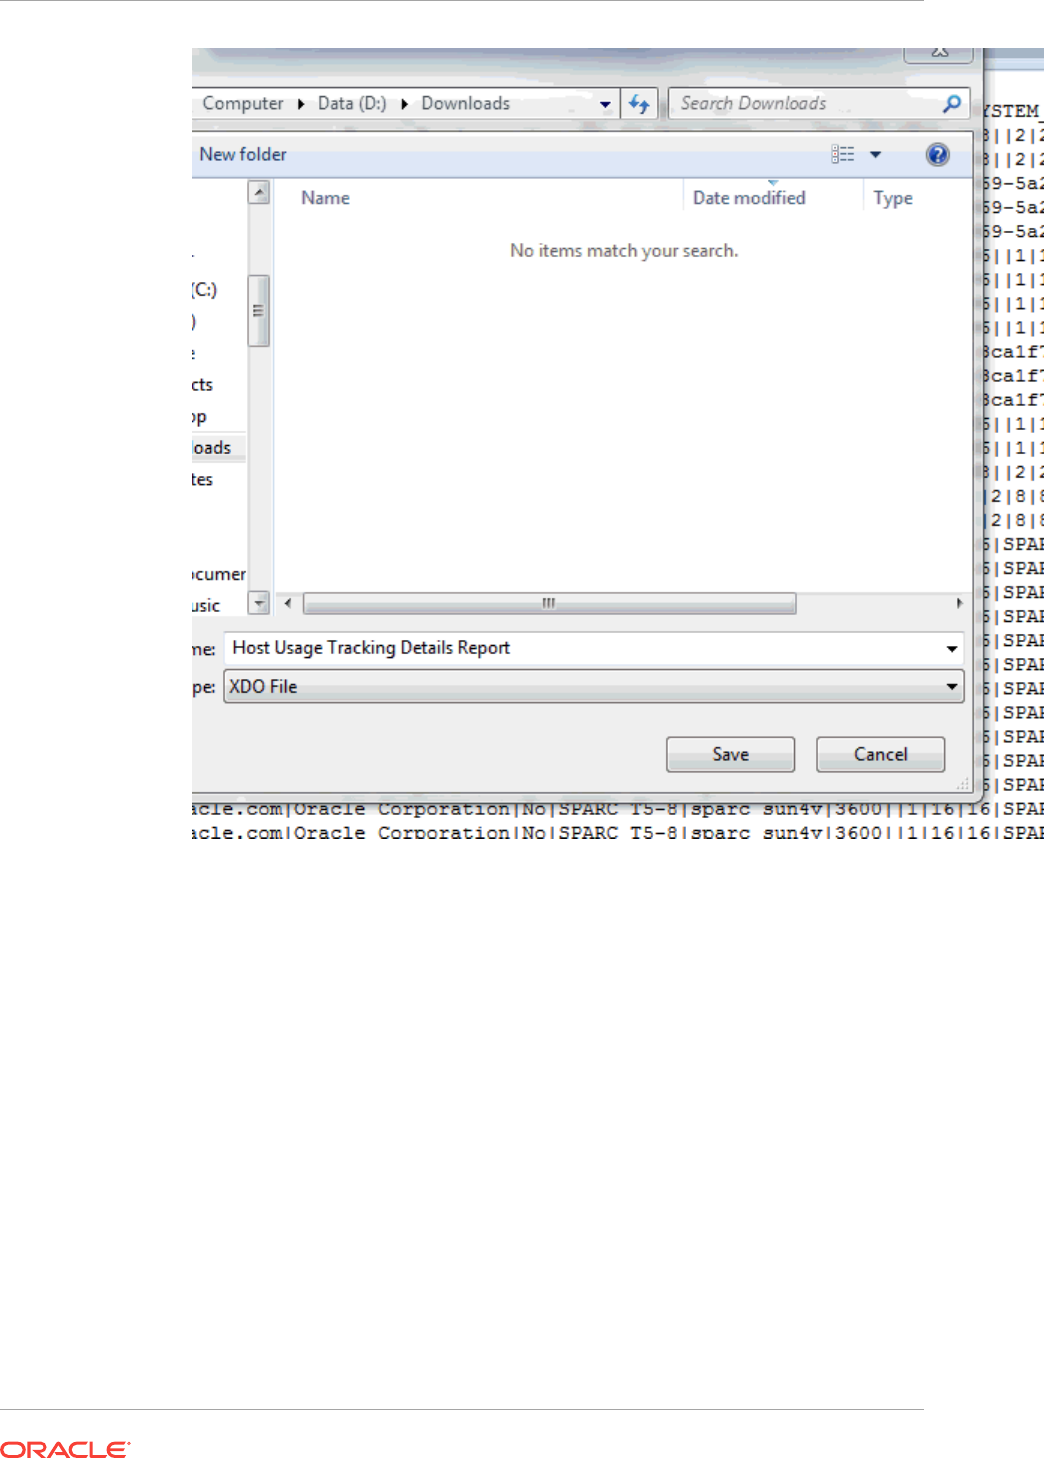
Chapter 44
Host Usage Tracking Reports
44-47


45
Remote Access To Enterprise Manager
This chapter describes how to set up and use an iDevice to remotely connect to
Enterprise Manager for the purpose of managing incidents and problems in Cloud
Control.
The chapter also explains how to connect to the Enterprise Manager desktop version
directly from the Safari browser.
The following sections describe setup and use of Cloud Control Mobile:
Reviewing System Requirements
Performing Initial Setup
Connecting the First Time
Encountering the Login Screen
Managing Settings
Using Cloud Control Mobile in Incident Manager
Working in Cloud Control Mobile
Learning Tips and Tricks
To use your iDevice to connect directly to the desktop version, see Connecting to
Enterprise Manager Desktop Version.
45.1 Reviewing System Requirements
Cloud Control Mobile can be deployed to the following Enterprise Manager Cloud
Control 12c minimum configurations:
•A new installation of the Enterprise Manager Cloud Control 12c (12.1.0.1) patched
release (released February 2012 or later)
•An existing Enterprise Manager Cloud Control 12c (12.1.0.1) installation with
Bundle Patch 1 (BP1) applied
Additional requirements are as follows:
•iDevice (iPhone, iPod touch, or iPad) running iOS 4.2.x or later
•A Wi-Fi or 3G connection to a network that has access to Enterprise Manager
(Cloud Control Mobile supports connections over VPN)
•An Apple account with which to download the app from the iTunes App Store
45.2 Performing Initial Setup
Initial setup involves the following tasks:
•Connect to a Wi-Fi or 3G network
•Install and configure VPN
•Download the Cloud Control Mobile app and sync with your iDevice
45-1

•Add a Cloud Control URL to connect to the installed Enterprise Manager
45.3 Connecting the First Time
When you first install the app, there is no default Enterprise Manager connection, so
you must supply a Cloud Control URL. There are two ways to do this:
•Use the iDevice Settings app
•Launch the Cloud Control Mobile app
In either case, first log in to VPN if required before proceeding with the instructions
below. Without the VPN connection, the login screen will not appear.
iDevice Settings
Define a default Cloud Control URL as follows:
1. Tap the Settings icon on the Home screen.
2. Tap Cloud Control in the apps list.
3. On the Cloud Control screen, enter a name to identify the site and type the Cloud
Control URL to which to connect. The URL should be of the form:
https://www.yoursite.com/em
4. Tap Settings to store the information and return to the list of apps.
Initial App Launch
Define a default Cloud Control URL as follows:
1. Tap the Cloud Control Mobile icon on the Home screen.
2. On the Add Site screen, enter a name to identify the site and type the Cloud
Control URL to which to connect. The URL should be of the form:
https://www.yoursite.com/em
Before you can type in the name field you may first have to clear the field by
tapping the X at the right.
3. Tap Done to store the information.
4. Tap Done on the Sites screen. Note that you also have the option to add
additional sites before exiting this screen.
5. Tap Settings on the Sites navigation bar to close the Sites list screen.
6. Tap Save on the Settings navigation bar to complete the action.
Proceed with the login.
45.4 Encountering the Login Screen
You encounter the login screen under the following conditions:
•After supplying a default Cloud Control URL upon initial launch
•Anytime you subsequently launch the app
•When you change the default site
Chapter 45
Connecting the First Time
45-2
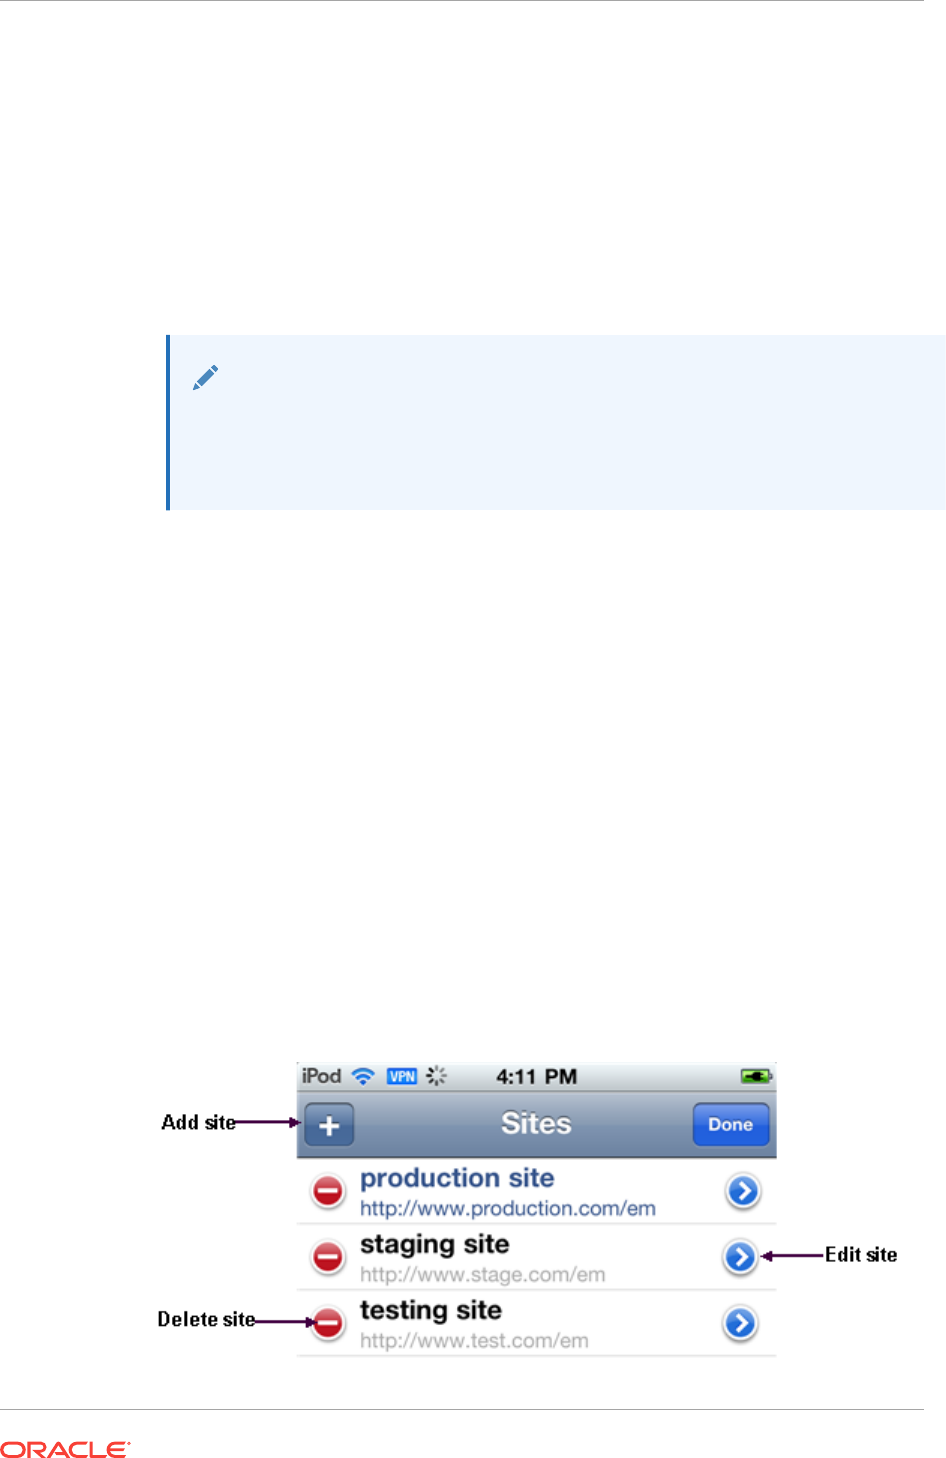
•When you log out
Tap the Settings icon to see a list of sites or to change the default login site. See
Managing Settings for more information.
Specify your credentials and tap Login; the Incident Manager opens, displaying the
my open incidents and problems view.
If your Enterprise Manager installation does not have a site certificate signed by a valid
certificate authority, an alert overlays the login screen noting an invalid certificate. You
have the option to continue with the login or change the URL to which you are trying to
connect.
Note:
If your installed Enterprise Manager uses single sign-on, the SSO process
supplants site login. Upon completion of single sign-on, the workflow proceeds
to the my open incidents and problems view.
45.5 Managing Settings
Cloud Control Mobile has its own settings interface apart from the iDevice Settings app
that you use to manage all apps.
In managing Cloud Control Mobile app settings, you perform the following actions:
•Add a site
•Edit a site
•Delete a site
•Change the default site
Each action starts with the same basic steps:
1. Tap the actions icon on the right of the navigation bar.
2. Tap Settings in the action sheet.
3. Tap the Edit Sites table row.
4. Tap Edit. The Sites management screen appears:
Chapter 45
Managing Settings
45-3

Then proceed as described below for each individual action.
Add a Site
1. Tap the + sign on the left of the Sites navigation bar.
2. Type a name and a URL for the site to be added.
3. Tap Done on the Add Site navigation bar to close the screen.
4. Tap Done on the Sites navigation bar to exit edit mode.
5. Tap Settings on the Sites navigation bar to close the Sites list screen.
6. Tap Save on the Settings navigation bar to complete the action.
Edit a Site
1. Tap the blue arrow to the right of the URL to be edited.
2. Change the values as appropriate.
3. Tap Done on the Edit Site navigation bar to close the screen.
4. Tap Done on the Sites navigation bar to exit edit mode.
5. Tap Settings on the Sites navigation bar to close the Sites list screen.
6. Tap Save on the Sites navigation bar to complete the action.
Delete a Site
1. Tap the red circle to the left of the URL to be deleted.
2. Tap Delete that appears on the right in the table row.
3. Tap Done on the Sites navigation bar to close the screen.
4. Tap Settings on the Sites navigation bar to close the Sites list screen.
5. Tap Save on the Settings navigation bar to complete the action.
Change the Default Site
1. Tap the site to be the new default. The check mark to the right in the table row
confirms your selection.
2. Tap Settings to close the Sites list screen.
3. Tap Save to complete the action.
4. After a brief moment, the Login screen appears. Specify credentials to log in to the
new site.
Note that you also can change the default site in iDevice Settings for Cloud Control.
45.6 Using Cloud Control Mobile in Incident Manager
Connecting to Cloud Control remotely, you can do the following in Incident Manager:
•View your open incidents and problems; drill down to incident and problem details,
including associated updates and events
•See the list of incidents for a given problem; link to these incidents and their details
•Acknowledge incidents and problems
Chapter 45
Using Cloud Control Mobile in Incident Manager
45-4
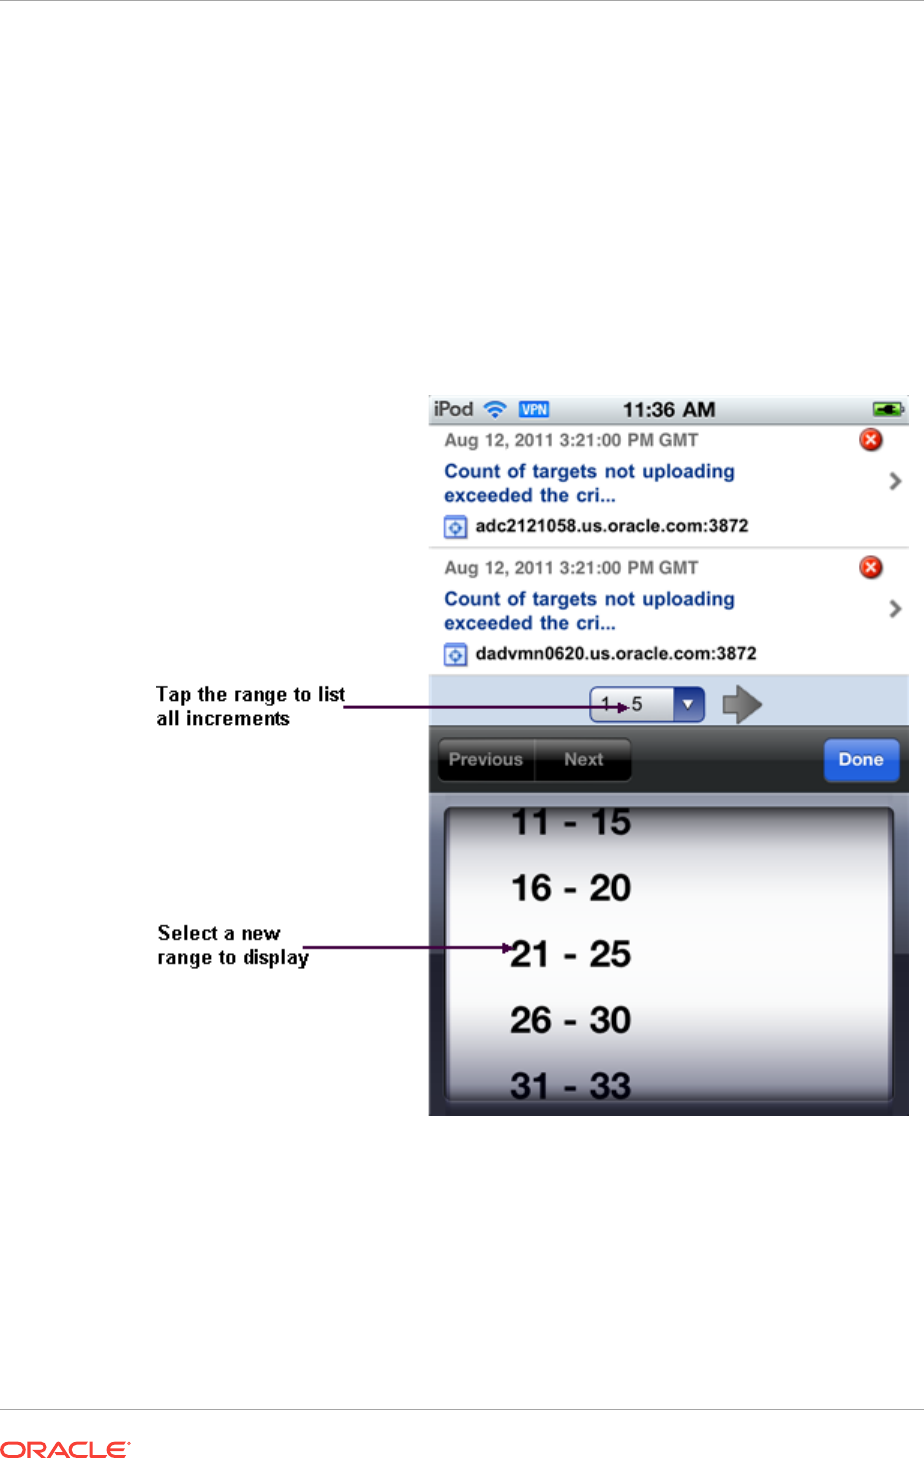
•Manage incident and problem workflow for better tracking (change status, assign
owner, escalate, and so forth)
•See who has been notified about an issue and what comments have been added
by administrators
In addition, The FAQ that follows may help in understanding differences, subtleties,
and nuances between the mobile app and its desktop counterpart.
How do I view more issues?
The app displays five rows at a time. Use the next and previous controls at the bottom
of the display to scroll the list. Or tap the number range itself (1 - 5) to pick from a list
of increments.
How do I view issue details?
Simply tap the line that identifies the incident or problem. On the Details screen, you
can continue to drill down to updates and events as well as expand the summary
description.
Are the views the same in the mobile app as in the desktop version?
Chapter 45
Using Cloud Control Mobile in Incident Manager
45-5

Yes, except for event-related views (standard or custom), which are not available in
the app. Any custom views created in the desktop version augment the list of standard
views.
Can I refresh the view?
Yes, just tap the refresh icon on the left of the navigation bar. When you do, the
timestamp reflects the date and time of the refresh.
Can I view target details?
Yes, first drill down to incident details, then tap the target name to jump to target
details. Tap Incident to return to the incident details.
Can I set search criteria or create a custom view?
No, you cannot set search criteria or create a custom view in the mobile app, but you
can create and manage views in the desktop version, which are then available in the
mobile app.
Can I invoke the incident rules feature?
No, but you can receive notifications generated by incident rules on your mobile
device, provided your Enterprise Manager account has the appropriate notification
preferences.
Can I connect to My Oracle Support?
If a problem has an assigned SR number, you can click the number to view the SR
details in the My Oracle Support (MOS) Mobile app.
Can I access guided resolution information and diagnostics?
No.
Do all iDevices work the same way with the mobile app?
Pretty much. The one difference you will note on an iPad is that if you tap a link to an
issue or a target in an external source such as Safari or an e-mail message, Safari
launches, pointing to the relevant page in the desktop version, where you are greeted
with the usual Cloud Control login screen. With the other devices, tapping a link in an
external source launches the mobile app.
45.7 Working in Cloud Control Mobile
This section covers the following operational tasks in Cloud Control Mobile:
•Viewing Incidents and Problems
•Changing Views
•Performing Actions
Chapter 45
Working in Cloud Control Mobile
45-6
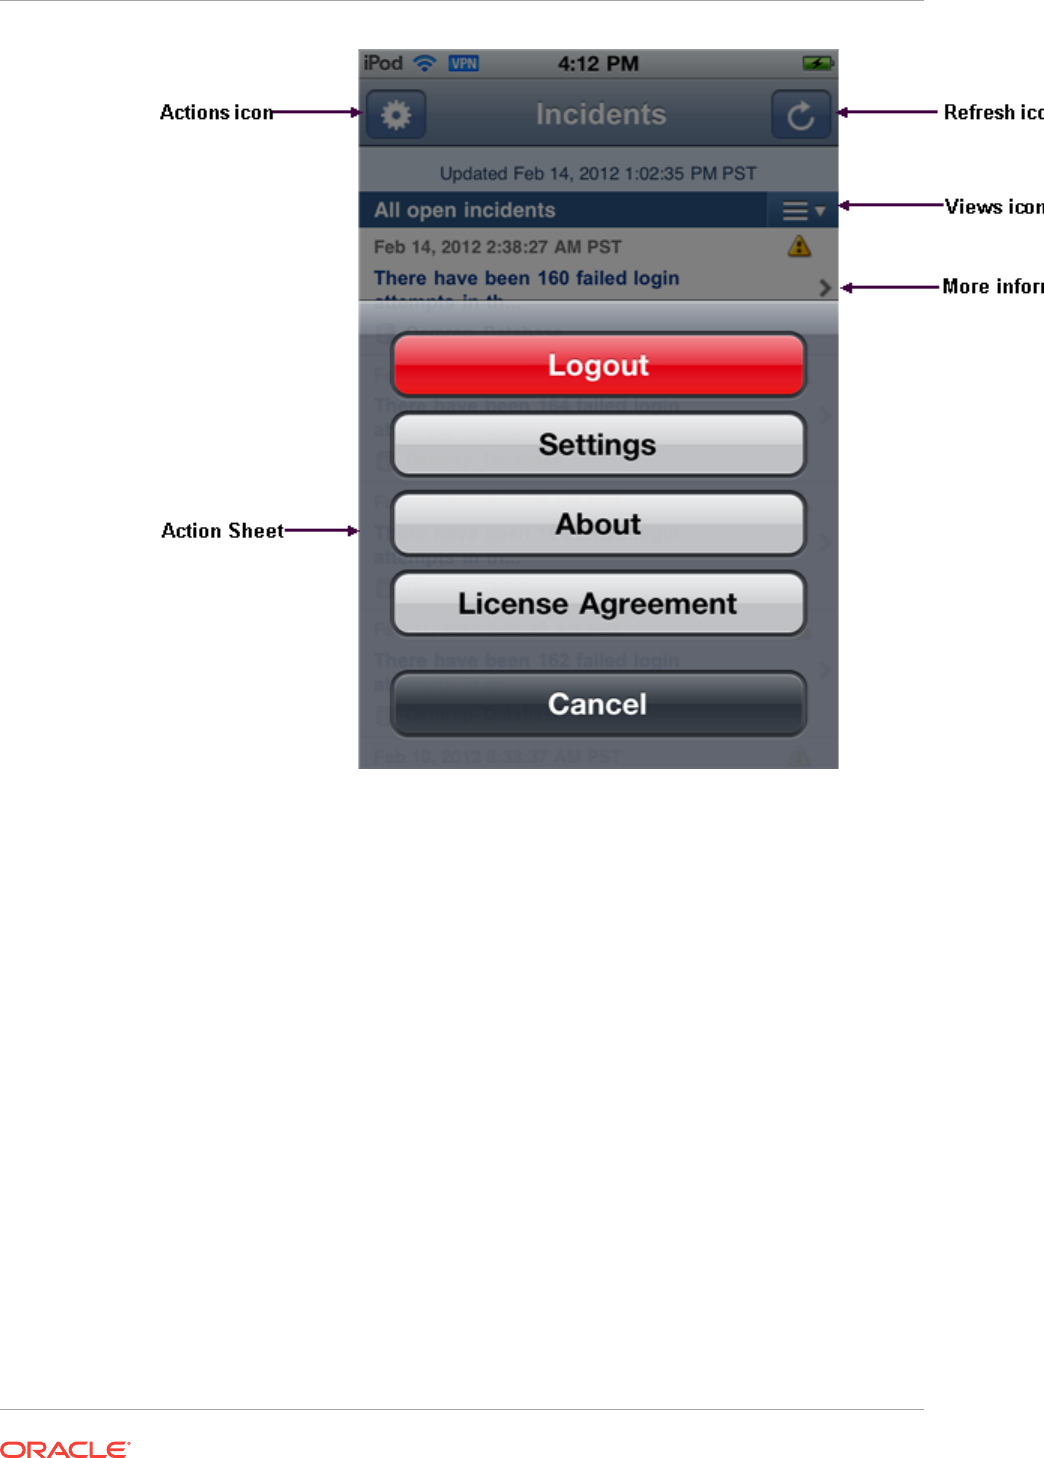
45.7.1 Viewing Incidents and Problems
Although navigation is intuitive, the following sections offer guidance on viewing
incidents and problems. As the interactions are slightly different, there is a separate
section for each type of issue.
Viewing Incidents
Use the following guidelines as you view incidents in the list:
•An arrow on the right indicates availability of additional information.
•Tap anywhere in the incident row to drill down to incident details.
•The summary appears at the top. As summaries can be lengthy, you may need to
tap the opening lines of the summary to view the complete summary. Tap Incident
to return to incident details.
•Problem ID in incident details is a link to problem details. If you follow the link, tap
Incidents there to return to the starting point; that is, the original list view where
you first opened the incident.
•In the incident details view, target name is a link to target details. Tap Incident
there to return to incident details.
•Tracking information appears below target name in the incident details view.
Chapter 45
Working in Cloud Control Mobile
45-7

•Scroll down in incident details and tap All Updates to see the equivalent of the
Updates tab in the desktop version. Tap Incident there to return to incident
details.
•Scroll further and tap Event List to see the equivalent of the Events tab in the
desktop version. Tap Incident there to return to incident details.
Viewing Problems
Use the following guidelines as you view problems in the list:
•An arrow on the right indicates availability of additional information.
•Tap anywhere in the problem row to drill down to problem details.
•The summary appears at the top. As summaries can be lengthy, you may need to
tap the opening lines of the summary to view the complete summary. Tap
Problem to return to problem details.
•If the problem has an SR number assigned, tap the number to log in to the My
Oracle Support (MOS) Mobile app using your MOS credentials. You can then view
the SR details and take appropriate action. Go to the Home screen and tap the
Cloud Control Mobile app icon to return to problem details.
•In the problem details view, target name is a link to target details. Tap Problem
there to return to problem details.
•Tracking information appears below target name in the problem details view.
•Scroll down in problem details and tap All Updates to see the equivalent of the
Updates tab in the desktop version. Tap Problem there to return to problem
details.
•Scroll further to see additional details such as first and last incident and number of
incidents in which the problem has occurred.
•Scroll further and tap Incident List to see the equivalent of the Incidents tab in
the desktop version. Tap Problem there to return to problem details.
•Each incident summary in the list is a link to the details of the incident. If you follow
the link, tap Incidents there to return to the starting point; that is, the original list
view where you first opened the issue.
45.7.2 Changing Views
When you first log in, the my open incidents and problems view appears by default.
You can change the view as follows:
1. Open the Views menu by tapping the views icon (three horizontal lines to the right
of the current views title).
2. Tap the view you want. The check mark to the right confirms your selection.
3. Tap Incidents to display the new view.
45.7.3 Performing Actions
You can perform the following actions while viewing incident or problem details:
•Acknowledge the issue
•Manage the workflow of the issue
Chapter 45
Working in Cloud Control Mobile
45-8

To acknowledge an incident or problem:
1. While viewing the details, tap Actions.
2. Tap Acknowledge in the action sheet.
A message confirms the update on the Details screen.
Note that the Acknowledge action may not appear in the action sheet for a variety of
reasons; for example, the issue has already been acknowledged or closed, or you do
not have the right permissions to acknowledge the issue.
To manage the workflow of an incident or problem for better tracking:
1. While viewing the details, tap Actions.
2. Tap Manage in the action sheet.
3. Complete the Manage dialog the same as you would in the desktop version. The
only thing missing is the ability to add styles and formatting to the comment.
4. Tap Save to complete the action.
45.8 Learning Tips and Tricks
Use a touch-and-hold gesture at any time within the app to display on the bottom of
the screen the current site to which you are logged in or about to log in. If the site
name is unavailable, the URL appears. With the site identity displayed, tap the
information icon on the right to access the Settings screen, where you can manage
your sites and change the default site. Repeat the touch-and-hold gesture to remove
the site display from the bottom of the screen.
Chapter 45
Learning Tips and Tricks
45-9
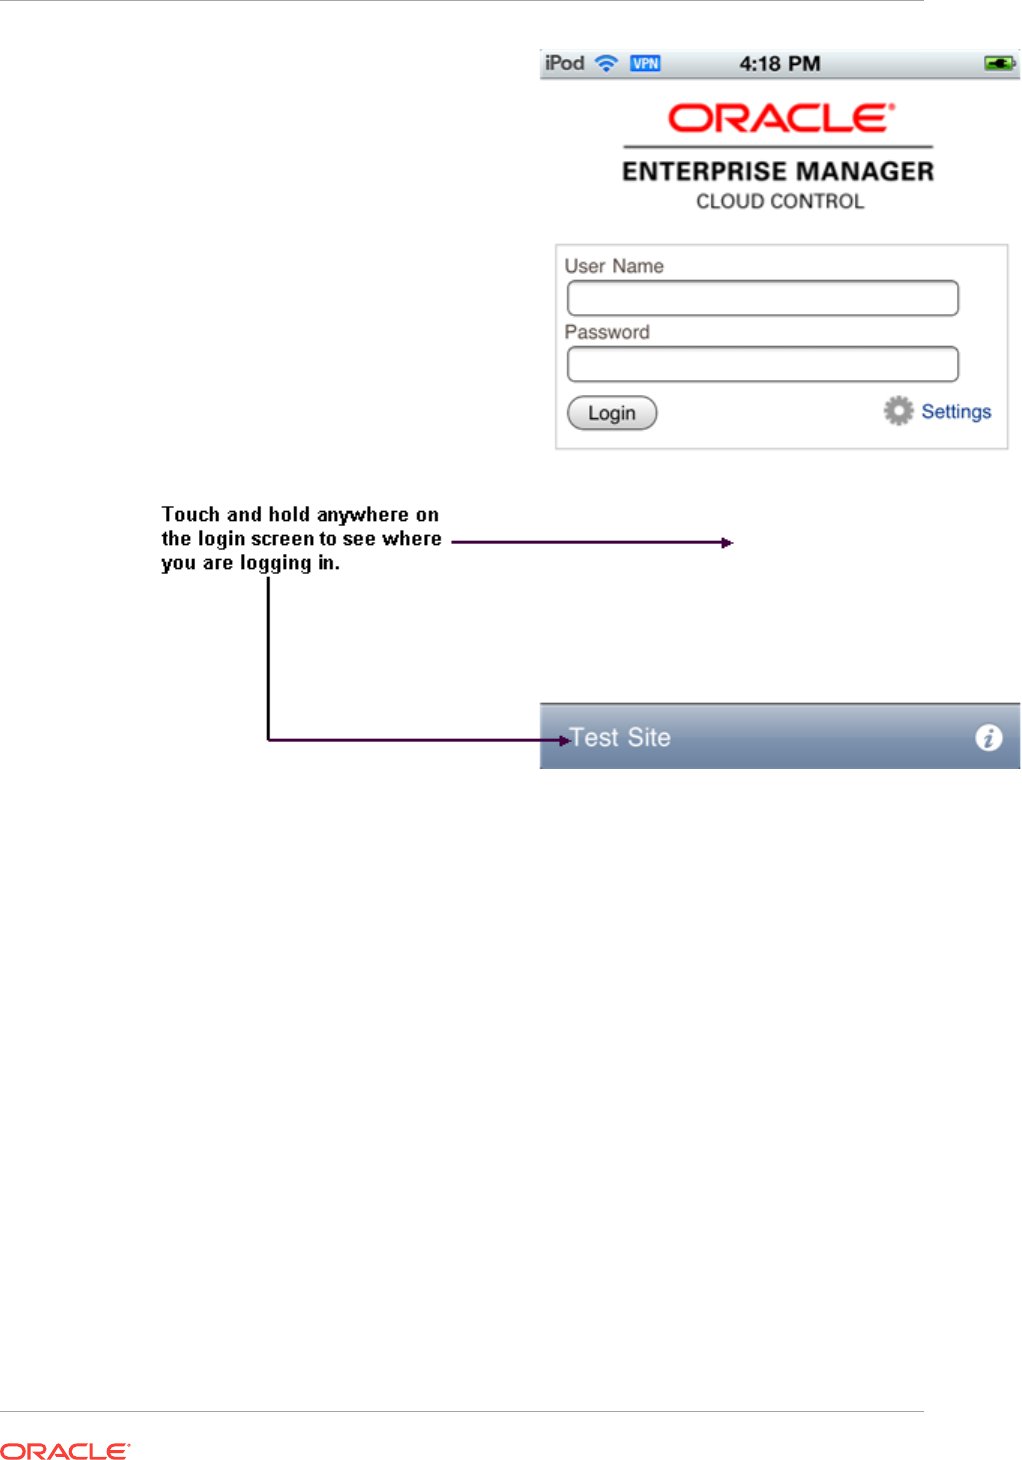
If you have logged out of the app and find that you are stuck on a page trying to return
to Cloud Control Mobile, you have a couple of options to resolve the issue:
•Open Connecting the First Time and change the Cloud Control default URL.
•Force quit the app and restart Cloud Control Mobile. For example, press and hold
the On/Off button on top of the device until the power off slider appears, and then
press the Home button until the app closes.
45.9 Connecting to Enterprise Manager Desktop Version
With Enterprise Manager Cloud Control 12c (12.1.0.2), you can log in to the desktop
version of Enterprise Manager using Safari on your iDevice, provided your iDevice is
on the same network as Enterprise Manager. If you are remote, you may need to
establish a VPN connection.
1. Connect to a WiFi or 3G network.
2. Establish a VPN connection if necessary.
3. Open Safari and specify an Enterprise Manager URL.
4. Enter login credentials to access Cloud Control.
Chapter 45
Connecting to Enterprise Manager Desktop Version
45-10

With Cloud Control open on your iDevice, you have access to the full feature set.
Consider the following as you navigate around the interface:
•Practice gestures to get a sense of how to zoom on a piece of screen real estate.
•Be patient when tapping menu selections; it does not necessarily occur
instantaneously.
•Touch and hold a selection to open a context (right-click) menu. This gesture too
requires some practice to develop the right sensitivity.
•Not all pages render precisely.
•Pages that have Flex/Flash effects will not render at all.
Note:
If you connect to the desktop version of Enterprise Manager through Safari, be
sure to set the Safari AutoFill Names and Passwords configuration setting to
OFF. Otherwise, the login credentials can be saved to the local store, where
they are susceptible to apps scanning for sensitive data.
Chapter 45
Connecting to Enterprise Manager Desktop Version
45-11

A
Interpreting Variables of the Enterprise
Manager MIB
Enterprise Manager Cloud Control can send SNMP traps to third-party, SNMP-
enabled applications. Details of the trap contents can be obtained from the
management information base (MIB) variables. This appendix provides information to
help you interpret the variables of the private Oracle Enterprise Manager MIB.
For information about the format of MIB variable descriptions, see Reading the MIB
Variable Descriptions.
This appendix contains the following sections:
•oraEMNGEvent
•oraEM4AlertTable
•oraEM4JobAlertTable
Note:
SNMP trap notification methods created from Cloud Control 12c and later
send the oraEMNGEvent trap.
SNMP trap notification methods created before Enterprise Manager Release
12c send oraEM4Alert and oraEM4JobAlert traps. After upgrading to
Enterprise Manager Release 12c or later, existing methods from earlier
releases continue to deliver the old traps for backward compatibility.
A.1 oraEMNGEvent
The following sections describe the SNMP traps sent from SNMP trap notification
methods created from Cloud Control 12c and later.
Table A-1 oraEMNGEvent Variables and Corresponding Object IDs
Variable Name Object ID
oraEMNGEventIndex 1.3.6.1.4.1.111.15.3.1.1.1.1
oraEMNGEventNotifType 1.3.6.1.4.1.111.15.3.1.1.2.1
oraEMNGEventMessage 1.3.6.1.4.1.111.15.3.1.1.3.1
oraEMNGEventMessageURL 1.3.6.1.4.1.111.15.3.1.1.4.1
oraEMNGEventSeverity 1.3.6.1.4.1.111.15.3.1.1.5.1
oraEMNGEventSeverityCode 1.3.6.1.4.1.111.15.3.1.1.6.1
oraEMNGEventRepeatCount 1.3.6.1.4.1.111.15.3.1.1.7.1
A-1

Table A-1 (Cont.) oraEMNGEvent Variables and Corresponding Object IDs
Variable Name Object ID
oraEMNGEventActionMsg 1.3.6.1.4.1.111.15.3.1.1.8.1
oraEMNGEventOccurrenceTime 1.3.6.1.4.1.111.15.3.1.1.9.1
oraEMNGEventReportedTime 1.3.6.1.4.1.111.15.3.1.1.10.1
oraEMNGEventCategories 1.3.6.1.4.1.111.15.3.1.1.11.1
oraEMNGEventCategoryCodes 1.3.6.1.4.1.111.15.3.1.1.12.1
oraEMNGEventType 1.3.6.1.4.1.111.15.3.1.1.13.1
oraEMNGEventName 1.3.6.1.4.1.111.15.3.1.1.14.1
oraEMNGAssocIncidentId 1.3.6.1.4.1.111.15.3.1.1.15.1
oraEMNGAssocIncidentOwner 1.3.6.1.4.1.111.15.3.1.1.16.1
oraEMNGAssocIncidentAcked 1.3.6.1.4.1.111.15.3.1.1.17.1
oraEMNGAssocIncidentStatus 1.3.6.1.4.1.111.15.3.1.1.18.1
oraEMNGAssocIncidentPriority 1.3.6.1.4.1.111.15.3.1.1.19.1
oraEMNGAssocIncidentEscLevel 1.3.6.1.4.1.111.15.3.1.1.20.1
oraEMNGEventTargetName 1.3.6.1.4.1.111.15.3.1.1.21.1
oraEMNGEventTargetNameURL 1.3.6.1.4.1.111.15.3.1.1.22.1
oraEMNGEventTargetType 1.3.6.1.4.1.111.15.3.1.1.23.1
oraEMNGEventHostName 1.3.6.1.4.1.111.15.3.1.1.24.1
oraEMNGEventTargetOwner 1.3.6.1.4.1.111.15.3.1.1.25.1
oraEMNGEventTgtLifeCycleStatus 1.3.6.1.4.1.111.15.3.1.1.26.1
oraEMNGEventTargetVersion 1.3.6.1.4.1.111.15.3.1.1.27.1
oraEMNGEventUserDefinedTgtProp 1.3.6.1.4.1.111.15.3.1.1.28.1
oraEMNGEventSourceObjName 1.3.6.1.4.1.111.15.3.1.1.29.1
oraEMNGEventSourceObjNameURL 1.3.6.1.4.1.111.15.3.1.1.30.1
oraEMNGEventSourceObjType 1.3.6.1.4.1.111.15.3.1.1.31.1
oraEMNGEventSourceObjSubType 1.3.6.1.4.1.111.15.3.1.1.32.1
oraEMNGEventSourceObjOwner 1.3.6.1.4.1.111.15.3.1.1.33.1
oraEMNGEventCAJobName 1.3.6.1.4.1.111.15.3.1.1.34.1
oraEMNGEventCAJobStatus 1.3.6.1.4.1.111.15.3.1.1.35.1
oraEMNGEventCAJobOwner 1.3.6.1.4.1.111.15.3.1.1.36.1
oraEMNGEventCAJobStepOutput 1.3.6.1.4.1.111.15.3.1.1.37.1
oraEMNGEventCAJobType 1.3.6.1.4.1.111.15.3.1.1.38.1
oraEMNGEventRuleSetName 1.3.6.1.4.1.111.15.3.1.1.39.1
oraEMNGEventRuleName 1.3.6.1.4.1.111.15.3.1.1.40.1
oraEMNGEventRuleOwner 1.3.6.1.4.1.111.15.3.1.1.41.1
oraEMNGEventSequenceId 1.3.6.1.4.1.111.15.3.1.1.42.1
oraEMNGEventRCADetails 1.3.6.1.4.1.111.15.3.1.1.43.1
oraEMNGEventContextAttrs 1.3.6.1.4.1.111.15.3.1.1.44.1
Appendix A
oraEMNGEvent
A-2

Table A-1 (Cont.) oraEMNGEvent Variables and Corresponding Object IDs
Variable Name Object ID
oraEMNGEventUserComments 1.3.6.1.4.1.111.15.3.1.1.45.1
oraEMNGEventUpdates 1.3.6.1.4.1.111.15.3.1.1.46.1
oraEMNGEventTotalOccurrenceCount 1.3.6.1.4.1.111.15.3.1.1.47.1
oraEMNGEventCurrOccurrenceCount 1.3.6.1.4.1.111.15.3.1.1.48.1
oraEMNGEventCurrFirstOccurDate 1.3.6.1.4.1.111.15.3.1.1.49.1
oraEMNGEventCurrLastOccurDate 1.3.6.1.4.1.111.15.3.1.1.50.1
oraEMNGEventRCAStatus 1.3.6.1.4.1.111.15.3.1.1.51.1
oraEMNGEventReportedState 1.3.6.1.4.1.111.15.3.1.1.52.1
oraEMNGEventTypeAttr1 1.3.6.1.4.1.111.15.3.1.1.61.1
oraEMNGEventTypeAttr2 1.3.6.1.4.1.111.15.3.1.1.62.1
oraEMNGEventTypeAttr3 1.3.6.1.4.1.111.15.3.1.1.63.1
oraEMNGEventTypeAttr4 1.3.6.1.4.1.111.15.3.1.1.64.1
oraEMNGEventTypeAttr5 1.3.6.1.4.1.111.15.3.1.1.65.1
oraEMNGEventTypeAttr6 1.3.6.1.4.1.111.15.3.1.1.66.1
oraEMNGEventTypeAttr7 1.3.6.1.4.1.111.15.3.1.1.67.1
oraEMNGEventTypeAttr8 1.3.6.1.4.1.111.15.3.1.1.68.1
oraEMNGEventTypeAttr9 1.3.6.1.4.1.111.15.3.1.1.69.1
oraEMNGEventTypeAttr10 1.3.6.1.4.1.111.15.3.1.1.70.1
oraEMNGEventTypeAttr11 1.3.6.1.4.1.111.15.3.1.1.71.1
oraEMNGEventTypeAttr12 1.3.6.1.4.1.111.15.3.1.1.72.1
oraEMNGEventTypeAttr13 1.3.6.1.4.1.111.15.3.1.1.73.1
oraEMNGEventTypeAttr14 1.3.6.1.4.1.111.15.3.1.1.74.1
oraEMNGEventTypeAttr15 1.3.6.1.4.1.111.15.3.1.1.75.1
oraEMNGEventTypeAttr16 1.3.6.1.4.1.111.15.3.1.1.76.1
oraEMNGEventTypeAttr17 1.3.6.1.4.1.111.15.3.1.1.77.1
oraEMNGEventTypeAttr18 1.3.6.1.4.1.111.15.3.1.1.78.1
oraEMNGEventTypeAttr19 1.3.6.1.4.1.111.15.3.1.1.79.1
oraEMNGEventTypeAttr20 1.3.6.1.4.1.111.15.3.1.1.80.1
oraEMNGEventTypeAttr21 1.3.6.1.4.1.111.15.3.1.1.81.1
oraEMNGEventTypeAttr22 1.3.6.1.4.1.111.15.3.1.1.82.1
oraEMNGEventTypeAttr23 1.3.6.1.4.1.111.15.3.1.1.83.1
oraEMNGEventTypeAttr24 1.3.6.1.4.1.111.15.3.1.1.84.1
oraEMNGEventTypeAttr25 1.3.6.1.4.1.111.15.3.1.1.85.1
A.1.1 oraEMNGEventIndex
Appendix A
oraEMNGEvent
A-3

Syntax
Integer
Access
Read-only
Status
Mandatory
Description
The index of a particular event, unique only at the moment an event is generated.
A.1.2 oraEMNGEventNotifType
Syntax
DisplayString
Access
Read-only
Status
Mandatory
Explanation
The notification type. Possible values are:
•NOTIF_NORMAL
•NOTIF_RETRY
•NOTIF_DURATION
•NOTIF_REPEAT
•NOTIF_CA
•NOTIF_RCA
A.1.3 oraEMNGEventMessage
Syntax
DisplayString
Access
Read-only
Appendix A
oraEMNGEvent
A-4

Status
Mandatory
Explanation
The message associated with this event.
A.1.4 oraEMNGEventMessageURL
Syntax
DisplayString
Access
Read-only
Status
Mandatory
Explanation
The Enterprise Manager Cloud Control console URL for the event message. It is
populated for events with severities other than INFORMATIONAL. This variable is
empty if the trap size exceeds the configured SNMP packet size.
A.1.5 oraEMNGEventSeverity
Syntax
DisplayString
Access
Read-only
Status
Mandatory
Explanation
The severity of the event, such as Fatal, Critical, Warning, Advisory, Information, or
Clear.
A.1.6 oraEMNGEventSeverityCode
Syntax
DisplayString
Appendix A
oraEMNGEvent
A-5

Access
Read-only
Status
Mandatory
Explanation
The internal code of the severity, such as Fatal, Critical, Warning, Advisory,
Informational, or Clear.
A.1.7 oraEMNGEventRepeatCount
Syntax
DisplayString
Access
Read-only
Status
Mandatory
Explanation
The repeat notification counter for the event.
A.1.8 oraEMNGEventActionMsg
Syntax
DisplayString
Access
Read-only
Status
Mandatory
Explanation
The action message for this event.
A.1.9 oraEMNGEventOccurrenceTime
Syntax
DisplayString
Appendix A
oraEMNGEvent
A-6

Access
read-only
Status
Mandatory
Explanation
The time when this event occurred (optional). This is only populated for events that
have an occurrence time.
A.1.10 oraEMNGEventReportedTime
Syntax
DisplayString
Access
Read-only
Status
Mandatory
Explanation
The time when this event was reported.
A.1.11 oraEMNGEventCategories
Syntax
DisplayString
Access
Read-only
Status
Mandatory
Explanation
The list of categories to which this event belongs. This variable is empty if the trap size
exceeds the configured SNMP packet size.
A.1.12 oraEMNGEventCategoryCodes
Appendix A
oraEMNGEvent
A-7

Syntax
DisplayString
Access
Read-only
Status
Mandatory
Explanation
The list of internal category codes to which this event belongs. This variable is empty if
the trap size exceeds the configured SNMP packet size.
A.1.13 oraEMNGEventType
Syntax
DisplayString
Access
Read-only
Status
Mandatory
Explanation
The name of the event type to which this event belongs.
Available Event Types
•metric_alert
•target_availability
•job_status_change
•metric_error
•user_reported
•cs_core
•sla_alert
•mext_update
•selfupdate
•cs_rule_violation
A.1.14 oraEMNGEventName
Appendix A
oraEMNGEvent
A-8

Syntax
DisplayString
Access
Read-only
Status
Mandatory
Explanation
The name of this event.
A.1.15 oraEMNGAssocIncidentId
Syntax
DisplayString
Access
Read-only
Status
Mandatory
Explanation
The ID of the associated incident with the event (optional).
A.1.16 oraEMNGAssocIncidentOwner
Syntax
DisplayString
Access
Read-only
Status
Mandatory
Explanation
Owner of the associated incident with the event (optional).
A.1.17 oraEMNGAssocIncidentAcked
Appendix A
oraEMNGEvent
A-9

Syntax
DisplayString
Access
Read-only
Status
Mandatory
Explanation
Acknowledged status of the associated incident with the event. 1 indicates
acknowledged. 0 indicates unacknowledged.
A.1.18 oraEMNGAssocIncidentStatus
Syntax
DisplayString
Access
Read-only
Status
Mandatory
Explanation
The status of the associated incident with the event.
A.1.19 oraEMNGAssocIncidentPriority
Syntax
DisplayString
Access
Read-only
Status
Mandatory
Explanation
The priority of the associated incident with the event.
A.1.20 oraEMNGAssocIncidentEscLevel
Appendix A
oraEMNGEvent
A-10

Syntax
DisplayString
Access
Read-only
Status
Mandatory
Explanation
The escalation level of the associated incident with the event.
A.1.21 oraEMNGEventTargetName
Syntax
DisplayString
Access
Read-only
Status
Mandatory
Explanation
The name of the target to which this event applies. Populated for events that are about
a target only.
A.1.22 oraEMNGEventTargetNameURL
Syntax
DisplayString
Access
Read-only
Status
Mandatory
Explanation
The Enterprise Manager Console URL of the target to which this event applies.
Populated for events that are about a target only. This variable is empty if the trap size
exceeds the configured SNMP packet size.
Appendix A
oraEMNGEvent
A-11

A.1.23 oraEMNGEventTargetType
Syntax
DisplayString
Access
Read-only
Status
Mandatory
Explanation
The type of the target to which this event applies. Populated for events that are about
a target only.
A.1.24 oraEMNGEventHostName
Syntax
DisplayString
Access
Read-only
Status
Mandatory
Explanation
The name of the host on which this event originated. Populated for events that are
about a target only.
A.1.25 oraEMNGEventTargetOwner
Syntax
DisplayString
Access
Read-only
Status
Mandatory
Appendix A
oraEMNGEvent
A-12

Explanation
The primary administrator of the target on which this event originated. This variable is
empty if the trap size exceeds the configured SNMP packet size.
A.1.26 oraEMNGEventTgtLifeCycleStatus
Syntax
DisplayString
Access
Read-only
Status
Mandatory
Explanation
The life cycle status of the target on which this event originated.
A.1.27 oraEMNGEventTargetVersion
Syntax
DisplayString
Access
Read-only
Status
Mandatory
Explanation
The version of the target on which this event originated.
A.1.28 oraEMNGEventUserDefinedTgtProp
Syntax
DisplayString
Access
read-only
Status
Mandatory
Appendix A
oraEMNGEvent
A-13

Explanation
The user defined target properties [name,value pair list] of the associated target with
this event. This variable is empty if the trap size exceeds the configured SNMP packet
size.
A.1.29 oraEMNGEventSourceObjName
Syntax
DisplayString
Access
Read-only
Status
Mandatory
Explanation
The name of the source object to which this event belongs to. Populated for events
that are about a non-target object only, such as Jobs.
A.1.30 oraEMNGEventSourceObjNameURL
Syntax
DisplayString
Access
Read-only
Status
Mandatory
Explanation
Enterprise Manager Console URL for the source object to which this event belongs.
This variable is empty if the trap size exceeds the configured SNMP packet size.
A.1.31 oraEMNGEventSourceObjType
Syntax
DisplayString
Access
Read-only
Appendix A
oraEMNGEvent
A-14

Status
Mandatory
Explanation
The type of the source object to which this event belongs.
A.1.32 oraEMNGEventSourceObjSubType
Syntax
DisplayString
Access
Read-only
Status
Mandatory
Explanation
The subtype of the source object to which this event belongs. (Optional). This variable
is empty if the trap size exceeds the configured SNMP packet size.
A.1.33 oraEMNGEventSourceObjOwner
Syntax
DisplayString
Access
Read-only
Status
Mandatory
Explanation
The primary administrator of the source object to which this event belongs. (Optional).
This variable is empty if the trap size exceeds the configured SNMP packet size.
A.1.34 oraEMNGEventCAJobName
Syntax
DisplayString
Appendix A
oraEMNGEvent
A-15

Access
Read-only
Status
Mandatory
Explanation
The name of the corrective action job associated with this event.
A.1.35 oraEMNGEventCAJobStatus
Syntax
DisplayString
Access
Read-only
Status
Mandatory
Explanation
The status of the corrective action job associated with this event.
A.1.36 oraEMNGEventCAJobOwner
Syntax
DisplayString
Access
Read-only
Status
Mandatory
Explanation
The owner of the corrective action job associated with this event.
A.1.37 oraEMNGEventCAJobStepOutput
Syntax
DisplayString
Appendix A
oraEMNGEvent
A-16

Access
Read-only
Status
Mandatory
Explanation
The job step output from the corrective action job associated with this event.
A.1.38 oraEMNGEventCAJobType
Syntax
DisplayString
Access
Read-only
Status
Mandatory
Explanation
The job type from the corrective action job associated with this event.
A.1.39 oraEMNGEventRuleSetName
Syntax
DisplayString
Access
Read-only
Status
Mandatory
Explanation
The name of the ruleset that caused this notification. This variable is empty if the trap
size exceeds the configured SNMP packet size.
A.1.40 oraEMNGEventRuleName
Syntax
DisplayString
Appendix A
oraEMNGEvent
A-17

Access
Read-only
Status
Mandatory
Explanation
The name of the rule within the ruleset that caused this notification.
A.1.41 oraEMNGEventRuleOwner
Syntax
DisplayString
Access
Read-only
Status
Mandatory
Explanation
The owner of the ruleset that caused this notification.
A.1.42 oraEMNGEventSequenceId
Syntax
DisplayString
Access
Read-only
Status
Mandatory
Explanation
An Enterprise Manager-generated identifier that uniquely identifies the current issue
until it is cleared.
A.1.43 oraEMNGEventRCADetails
Syntax
DisplayString
Appendix A
oraEMNGEvent
A-18

Access
Read-only
Status
Mandatory
Explanation
Root Cause Analysis information associated with this event if it exists.
A.1.44 oraEMNGEventContextAttrs
Syntax
DisplayString
Access
Read-only
Status
Mandatory
Explanation
The context attributes associated with this event. This variable is empty if the trap size
exceeds the configured SNMP packet size.
A.1.45 oraEMNGEventUserComments
Syntax
DisplayString
Access
Read-only
Status
Mandatory
Explanation
The user comments associated with this event. This variable is empty if the trap size
exceeds the configured SNMP packet size.
A.1.46 oraEMNGEventUpdates
Appendix A
oraEMNGEvent
A-19

Syntax
DisplayString
Access
Read-only
Status
Mandatory
Explanation
The updates associated with this event. This variable is empty if the trap size exceeds
the configured SNMP packet size.
A.1.47 oraEMNGEventTotalOccurrenceCount
Syntax
DisplayString
Access
Read-only
Status
Mandatory
Explanation
Total number of occurrences of the same event on a target across all open
deduplicated events. This attribute applies only to deduplicated events.
A.1.48 oraEMNGEventCurrOccurrenceCount
Syntax
DisplayString
Access
Read-only
Status
Mandatory
Explanation
Total occurrences of the event in this collection period. This attribute applies only to
deduplicated events.
Appendix A
oraEMNGEvent
A-20

A.1.49 oraEMNGEventCurrFirstOccurDate
Syntax
DisplayString
Access
Read-only
Status
Mandatory
Explanation
Timestamp when the event first occurred in this collection period. This attribute applies
only to deduplicated events.
A.1.50 oraEMNGEventCurrLastOccurDate
Syntax
DisplayString
Access
Read-only
Status
Mandatory
Explanation
Timestamp when the event last occurred in this collection period. This attribute applies
only to deduplicated events.
A.1.51 oraEMNGRCAStatus
Syntax
DisplayString
Access
Read-only
Status
Mandatory
Appendix A
oraEMNGEvent
A-21

Explanation
Summary of Root Cause Analysis, if applicable.
A.1.52 oraEMNGEventReportedState
Syntax
DisplayString
Access
Read-only
Status
Mandatory
Explanation
This is an optional value reporting the latest state of an entity and is only applicable for
events that are representing a state transition for a specified entity. For example, for
Target availability and Job state change events, this value would be the latest state of
the target or job, respectively.
A.1.53 oraEMNGEventTypeAttr(1-71)
The following tables list oraEMNGEventType MIB variables 1 through 71. Each table
categorizes the MIB variables by specific event type.
Table A-2 Metric Alert Event Type
Variable Name OID Number Event Type
Attribute
Description
oraEMNGEventTypeAttr1 1.3.6.1.4.1.111.15.3.1.1.6
1.1
Metric GUID A unique ID for the metric.
oraEMNGEventTypeAttr2 1.3.6.1.4.1.111.15.3.1.1.6
2.1
Severity GUID A unique ID for the alert record.
oraEMNGEventTypeAttr3 1.3.6.1.4.1.111.15.3.1.1.6
3.1
Cycle GUID A unique ID for the alert cycle.
oraEMNGEventTypeAttr4 1.3.6.1.4.1.111.15.3.1.1.6
4.1
Collection Name The name of the collection
collecting the metric.
oraEMNGEventTypeAttr5 1.3.6.1.4.1.111.15.3.1.1.6
5.1
Metric Group The name of the metric.
oraEMNGEventTypeAttr6 1.3.6.1.4.1.111.15.3.1.1.6
6.1
Metric The name of the metric column.
oraEMNGEventTypeAttr7 1.3.6.1.4.1.111.15.3.1.1.6
7.1
Metric Description A brief description of the metric.
oraEMNGEventTypeAttr8 1.3.6.1.4.1.111.15.3.1.1.6
8.1
Metric value The value of the metric when the
event triggered.
Appendix A
oraEMNGEvent
A-22

Table A-2 (Cont.) Metric Alert Event Type
Variable Name OID Number Event Type
Attribute
Description
oraEMNGEventTypeAttr9 1.3.6.1.4.1.111.15.3.1.1.6
9.1
Key Value The monitored object for the metric
corresponding to the Metric Alert
event.
oraEMNGEventTypeAttr10 1.3.6.1.4.1.111.15.3.1.1.7
0.1
Key Column 1 Key Column 1
oraEMNGEventTypeAttr11 1.3.6.1.4.1.111.15.3.1.1.7
1.1
Key Column 1 Value The value of Key Column 1.
oraEMNGEventTypeAttr12 1.3.6.1.4.1.111.15.3.1.1.7
2.1
Key Column 2 Key Column 2
oraEMNGEventTypeAttr13 1.3.6.1.4.1.111.15.3.1.1.7
3.1
Key Column 2 Value The value of Key Column 2.
oraEMNGEventTypeAttr14 1.3.6.1.4.1.111.15.3.1.1.7
4.1
Key Column 3 Key Column 3
oraEMNGEventTypeAttr15 1.3.6.1.4.1.111.15.3.1.1.7
5.1
Key Column 3 Value The value of Key Column 3.
oraEMNGEventTypeAttr16 1.3.6.1.4.1.111.15.3.1.1.7
6.1
Key Column 4 Key Column 4
oraEMNGEventTypeAttr17 1.3.6.1.4.1.111.15.3.1.1.7
7.1
Key Column 4 Value The value of Key Column 4.
oraEMNGEventTypeAttr18 1.3.6.1.4.1.111.15.3.1.1.7
8.1
Key Column 5 Key Column 5
oraEMNGEventTypeAttr19 1.3.6.1.4.1.111.15.3.1.1.7
9.1
Key Column 5 Value The value of Key Column 5.
oraEMNGEventTypeAttr20 1.3.6.1.4.1.111.15.3.1.1.8
0.1
Key Column 6 Key Column 6
oraEMNGEventTypeAttr21 1.3.6.1.4.1.111.15.3.1.1.8
1.1
Key Column 6 Value The value of Key Column 6.
oraEMNGEventTypeAttr22 1.3.6.1.4.1.111.15.3.1.1.8
2.1
Key Column 7 Key Column 7
oraEMNGEventTypeAttr23 1.3.6.1.4.1.111.15.3.1.1.8
3.1
Key Column 7 Value The value of Key Column 7.
oraEMNGEventTypeAttr24 1.3.6.1.4.1.111.15.3.1.1.8
4.1
Number of keys The number of key metric columns
in the metric.
Table A-3 Target Availability Event Type
Variable Name OID Number Event Type
Attribute
Description
oraEMNGEventTypeAttr1 1.3.6.1.4.1.111.15.3.1.1.61.
1
Availability status The current availability status
of the target.
oraEMNGEventTypeAttr2 1.3.6.1.4.1.111.15.3.1.1.62.
1
Severity GUID The GUID of the severity
record associated with this
availability status.
Appendix A
oraEMNGEvent
A-23

Table A-3 (Cont.) Target Availability Event Type
Variable Name OID Number Event Type
Attribute
Description
oraEMNGEventTypeAttr3 1.3.6.1.4.1.111.15.3.1.1.63.
1
Availability Sub-status The sub-status of a target for
the current status.
oraEMNGEventTypeAttr4 1.3.6.1.4.1.111.15.3.1.1.64.
1
Transition Severity The severity that resulted in
the target's status change to
the current availability status.
oraEMNGEventTypeAttr5 1.3.6.1.4.1.111.15.3.1.1.65.
1
Response metric
GUID
The Metric GUID of response
metric.
oraEMNGEventTypeAttr6 1.3.6.1.4.1.111.15.3.1.1.66.
1
Severity GUID of the
first severity in the
availability cycle
The GUID of the first severity
record in this availability
cycle.
Table A-4 Job Status Change Event Type
Variable Name OID Number Event Type
Attribute
Description
oraEMNGEventTypeAttr1 1.3.6.1.4.1.111.15.3.1.1.61.
1
Execution ID The unique ID of the job
execution.
oraEMNGEventTypeAttr2 1.3.6.1.4.1.111.15.3.1.1.62.
1
Job Status The status of the job
execution.
oraEMNGEventTypeAttr3 1.3.6.1.4.1.111.15.3.1.1.63.
1
Execution Log The job output of the last
step executed.
oraEMNGEventTypeAttr4 1.3.6.1.4.1.111.15.3.1.1.64.
1
Job Status Code The execution status code of
job execution.
oraEMNGEventTypeAttr5 1.3.6.1.4.1.111.15.3.1.1.65.
1
State Change ID The unique ID of the last
status change.
Table A-5 Compliance Standard Rule Violation Event Type
Variable Name OID Number Event Type
Attribute
Description
oraEMNGEventTypeAttr1 1.3.6.1.4.1.111.15.3.1.1.61.
1
Root Compliance
Standard
The root compliance
standard node display name.
oraEMNGEventTypeAttr2 1.3.6.1.4.1.111.15.3.1.1.62.
1
Root Compliance
Standard Version
The root compliance
standard version.
oraEMNGEventTypeAttr3 1.3.6.1.4.1.111.15.3.1.1.63.
1
Root Compliance
Standard Author
The author of the root
compliance standard.
oraEMNGEventTypeAttr4 1.3.6.1.4.1.111.15.3.1.1.64.
1
Parent Compliance
Standard
The parent compliance
standard node display name.
oraEMNGEventTypeAttr5 1.3.6.1.4.1.111.15.3.1.1.65.
1
Compliance Standard
Version
The compliance standard
version.
oraEMNGEventTypeAttr6 1.3.6.1.4.1.111.15.3.1.1.66.
1
Parent Compliance
Standard Author
The author of a parent
compliance standard.
oraEMNGEventTypeAttr7 1.3.6.1.4.1.111.15.3.1.1.67.
1
Root Target Name The root target name.
Appendix A
oraEMNGEvent
A-24

Table A-5 (Cont.) Compliance Standard Rule Violation Event Type
Variable Name OID Number Event Type
Attribute
Description
oraEMNGEventTypeAttr8 1.3.6.1.4.1.111.15.3.1.1.68.
1
Root Target Type The root target type.
oraEMNGEventTypeAttr9 1.3.6.1.4.1.111.15.3.1.1.69.
1
Rule Name The rule display name
Table A-6 Compliance Standard Score Event Type
Variable Name OID Number Event Type
Attribute
Description
oraEMNGEventTypeAttr1 1.3.6.1.4.1.111.15.3.1.1.61.
1
Root Compliance
Standard
The root compliance
standard node display name.
oraEMNGEventTypeAttr2 1.3.6.1.4.1.111.15.3.1.1.62.
1
Root Compliance
Standard Author
The author of the root
compliance standard.
oraEMNGEventTypeAttr3 1.3.6.1.4.1.111.15.3.1.1.63.
1
Root Compliance
Standard Version
The version of the root
compliance standard.
oraEMNGEventTypeAttr4 1.3.6.1.4.1.111.15.3.1.1.64.
1
Compliance Standard The compliance standard
node display name.
oraEMNGEventTypeAttr5 1.3.6.1.4.1.111.15.3.1.1.65.
1
Compliance Standard
Version
The version of a compliance
standard.
oraEMNGEventTypeAttr6 1.3.6.1.4.1.111.15.3.1.1.66.
1
Compliance Standard
Author
The author of a compliance
standard.
oraEMNGEventTypeAttr7 1.3.6.1.4.1.111.15.3.1.1.67.
1
Root Target Name The root target name.
oraEMNGEventTypeAttr8 1.3.6.1.4.1.111.15.3.1.1.68.
1
Root Target Type The root target type.
oraEMNGEventTypeAttr10 1.3.6.1.4.1.111.15.3.1.1.70.
1
Warning Threshold The warning threshold of a
compliance score.
oraEMNGEventTypeAttr9 1.3.6.1.4.1.111.15.3.1.1.69.
1
Compliance Score The compliance score.
oraEMNGEventTypeAttr11 1.3.6.1.4.1.111.15.3.1.1.71.
1
Critical Threshold The critical threshold of a
compliance score.
Table A-7 Metric Error Event Type
Variable Name OID Number Event Type
Attribute
Description
oraEMNGEventTypeAttr1 1.3.6.1.4.1.111.15.3.1.1.61.
1
Metric Group The name of the metric.
oraEMNGEventTypeAttr2 1.3.6.1.4.1.111.15.3.1.1.62.
1
Collection Name The name of the collection
collecting the metric.
Appendix A
oraEMNGEvent
A-25

Table A-8 Metric Extension Event Type
Variable Name OID Number Event Type
Attribute
Description
oraEMNGEventTypeAttr1 1.3.6.1.4.1.111.15.3.1.1.61.
1
Metric Extension
Version attribute
The version of the metric
extension.
Table A-9 Self-update Event Type
Variable Name OID Number Event Type
Attribute
Description
oraEMNGEventTypeAttr1 1.3.6.1.4.1.111.15.3.1.1.61.
1
Type Type
oraEMNGEventTypeAttr2 1.3.6.1.4.1.111.15.3.1.1.62.
1
Description Description
oraEMNGEventTypeAttr3 1.3.6.1.4.1.111.15.3.1.1.63.
1
Version Version
oraEMNGEventTypeAttr4 1.3.6.1.4.1.111.15.3.1.1.64.
1
Status Status
Table A-10 Service Level Agreement Alert Event Type
Variable Name OID Number Event Type
Attribute
Description
oraEMNGEventTypeAttr1 1.3.6.1.4.1.111.15.3.1.1.61.
1
Service Level
Agreement Name
Service Level Agreement
Name
oraEMNGEventTypeAttr2 1.3.6.1.4.1.111.15.3.1.1.62.
1
Service Level
Objective Name
Service Level Objective
Name
oraEMNGEventTypeAttr3 1.3.6.1.4.1.111.15.3.1.1.63.
1
Service Level
Objective Type
The type of the Service Level
Objective which will be either
Performance or Availability
oraEMNGEventTypeAttr4 1.3.6.1.4.1.111.15.3.1.1.64.
1
Value at Event
Triggered
The value at Event Triggered
oraEMNGEventTypeAttr5 1.3.6.1.4.1.111.15.3.1.1.65.
1
Customer Name Customer Name
Table A-11 User-reported Event Type
Variable Name OID Number Event Type
Attribute
Description
oraEMNGEventTypeAttr1 1.3.6.1.4.1.111.15.3.1.1.61.
1
Name The name describing the
nature of the issue.
oraEMNGEventTypeAttr2 1.3.6.1.4.1.111.15.3.1.1.62.
1
key The optional key describing a
sub-component within the
target that this event is
about.
Appendix A
oraEMNGEvent
A-26

A.2 oraEM4AlertTable
The oraEM4AlertTable describes the SNMP traps sent from Oracle Enterprise
Manager for both metric severity alerts and policy violations.
Table A-12 lists the variables of the oraEM4AlertTable and their corresponding Object
IDs.
Table A-12 oraEM4AlertTable Variables and Corresponding Object IDs
Variable Name Object ID
oraEM4AlertTargetName 1.3.6.1.4.1.111.15.1.1.1.2.1
oraEM4AlertTargetType 1.3.6.1.4.1.111.15.1.1.1.3.1
oraEM4AlertHostName 1.3.6.1.4.1.111.15.1.1.1.4.1
oraEM4AlertMetricName 1.3.6.1.4.1.111.15.1.1.1.5.1
oraEM4AlertKeyName 1.3.6.1.4.1.111.15.1.1.1.6.1
oraEM4AlertKeyValue 1.3.6.1.4.1.111.15.1.1.1.7.1
oraEM4AlertTimeStamp 1.3.6.1.4.1.111.15.1.1.1.8.1
oraEM4AlertSeverity 1.3.6.1.4.1.111.15.1.1.1.9.1
oraEM4AlertMessage 1.3.6.1.4.1.111.15.1.1.1.10.1
oraEM4AlertRuleName 1.3.6.1.4.1.111.15.1.1.1.11.1
oraEM4AlertRuleOwner 1.3.6.1.4.1.111.15.1.1.1.12.1
oraEM4AlertMetricValue 1.3.6.1.4.1.111.15.1.1.1.13.1
oraEM4AlertContext 1.3.6.1.4.1.111.15.1.1.1.14.1
oraEM4AlertCycleGuid 1.3.6.1.4.1.111.15.1.1.1.15.1
oraEM4AlertRepeatCount 1.3.6.1.4.1.111.15.1.1.1.16.1
oraEM4AlertUDTargetProperties 1.3.6.1.4.1.111.15.1.1.1.17.1
oraEM4AlertAck 1.3.6.1.4.1.111.15.1.1.1.18.1
oraEM4AlertAckBy 1.3.6.1.4.1.111.15.1.1.1.19.1
oraEM4AlertNotifType 1.3.6.1.4.1.111.15.1.1.1.20.1
oraEM4AlertViolationGuid 1.3.6.1.4.1.111.15.1.1.1.21.1
A description of each of these variables follows.
A.2.1 oraEM4AlertTargetName
Syntax
DisplayString
Max-Access
Read-only
Appendix A
oraEM4AlertTable
A-27

Status
Mandatory
Explanation
The name of the target to which this alert applies.
Typical Range
Not applicable
Significance
Very important
A.2.2 oraEM4AlertTargetType
Syntax
DisplayString
Max-Access
read-only
Status
Mandatory
Explanation
The type of the target to which this alert applies.
Typical Range
Not applicable
Significance
Very important
A.2.3 oraEM4AlertHostName
Syntax
DisplayString
Max-Access
Read-only
Status
Mandatory
Appendix A
oraEM4AlertTable
A-28

Explanation
The name of the host on which this alert originated.
Typical Range
Not applicable
Significance
Very important
A.2.4 oraEM4AlertMetricName
Syntax
DisplayString
Max-Access
Read-only
Status
Mandatory
Explanation
The name of the metric or policy which generated this alert.
Typical Range
Not applicable
Significance
Very important
A.2.5 oraEM4AlertKeyName
Syntax
DisplayString
Max-Access
Read-only
Status
Mandatory
Explanation
The name of the key-column, if present, for the metric which generated this alert.
Appendix A
oraEM4AlertTable
A-29

Typical Range
Not applicable
Significance
Very important
A.2.6 oraEM4AlertKeyValue
Syntax
DisplayString
Max-Access
Read-only
Status
Mandatory
Explanation
The value of the key-column, if present, for the metric which generated this alert.
Typical Range
Not applicable
Significance
Very important
A.2.7 oraEM4AlertTimeStamp
Syntax
DisplayString
Max-Access
read-only
Status
Mandatory
Explanation
The time at which this alert was generated.
Typical Range
Not applicable
Appendix A
oraEM4AlertTable
A-30

Significance
Important
A.2.8 oraEM4AlertSeverity
Syntax
DisplayString
Max-Access
Read-only
Status
Mandatory
Explanation
The severity of the alert (for example, Clear, Informational, Warning, Critical,
Unreachable Start, Blackout End, Blackout Start, Metric Error Clear, Metric Error Start,
Status Pending).
Typical Range
Critical, warning, clear
Significance
Very important
A.2.9 oraEM4AlertMessage
Syntax
DisplayString
Max-Access
Read-only
Status
Mandatory
Explanation
The message associated with the alert.
Typical Range
Not applicable
Appendix A
oraEM4AlertTable
A-31

Significance
Very important
A.2.10 oraEM4AlertRuleName
Syntax
DisplayString
Max-Access
Read-only
Status
Mandatory
Explanation
The name of the notification rule that caused this notification.
Typical Range
Not applicable
Significance
Important
A.2.11 oraEM4AlertRuleOwner
Syntax
DisplayString
Max-Access
Read-only
Status
Mandatory
Explanation
The owner of the notification rule that caused this notification.
Typical Range
Not applicable
Significance
Important
Appendix A
oraEM4AlertTable
A-32

A.2.12 oraEM4AlertMetricValue
Syntax
DisplayString
Max-Access
Read-only
Status
Mandatory
Explanation
The value of the metric which caused this alert to be generated.
Typical Range
Not applicable
Significance
Important
A.2.13 oraEM4AlertContext
Syntax
DisplayString
Max-Access
Read-only
Status
Mandatory
Explanation
A comma separated list of metric column names and values associated with the metric
that caused this alert to be generated.
Typical Range
Not applicable
Significance
Important
A.2.14 oraEM4AlertCycleGuid
Appendix A
oraEM4AlertTable
A-33

Syntax
DisplayString
Max-Access
Read-only
Status
Mandatory
Explanation
An Enterprise Manager-generated identifier that is unique for the lifecycle of an alert.
Typical Range
Not applicable
Significance
Important
A.2.15 oraEM4AlertRepeatCount
Syntax
DisplayString
Max-Access
Read-only
Status
Mandatory
Explanation
The repeat notification counter for the alert.
Typical Range
Not applicable
Significance
Important
A.2.16 oraEM4AlertUDTargetProperties
Syntax
DisplayString
Appendix A
oraEM4AlertTable
A-34

Max-Access
Read-only
Status
Mandatory
Explanation
User-defined target properties associated with the target.
Typical Range
Not applicable
Significance
Important
A.2.17 oraEM4AlertAck
Syntax
DisplayString
Max-Access
Read-only
Status
Mandatory
Explanation
Acknowledged status flag associated with the alert. 1 indicates acknowledged. 0
indicates unacknowledged.
Typical Range
Not applicable
Significance
Important
A.2.18 oraEM4AlertAckBy
Syntax
DisplayString
Max-Access
Read-only
Appendix A
oraEM4AlertTable
A-35

Status
Mandatory
Explanation
Acknowledged By value associated with the alert.
Typical Range
Not applicable
Significance
Important
A.2.19 oraEM4AlertNotifType
Syntax
DisplayString
Max-Access
Read-only
Status
Mandatory
Explanation
Notification type.
Possible values:
•1 - Normal
•4 - Repeat
•9 - Duration
Typical Range
Not applicable
Significance
Important
A.2.20 oraEM4AlertViolationGuid
Syntax
DisplayString
Appendix A
oraEM4AlertTable
A-36

Max-Access
Read-only
Status
Mandatory
Explanation
An Enterprise Manager-generated identifier that identifies a particular alert.
Typical Range
Not applicable
Significance
Important
A.3 oraEM4JobAlertTable
The oraEM4JobAlertTable describes changes in the status of either a Job or a
Corrective Action that is running as part of the Oracle Enterprise Manager Job system.
Table A-13 lists the variables of the oraEM4JobAlertTable and their corresponding
Object IDs.
Table A-13 oraEM4JobAlertTable Variables and Corresponding Object IDs
Variable Name Object ID
oraEM4JobAlertJobName 1.3.6.1.4.1.111.15.1.2.1.2.1
oraEM4JobAlertJobOwner 1.3.6.1.4.1.111.15.1.2.1.3.1
oraEM4JobAlertJobType 1.3.6.1.4.1.111.15.1.2.1.4.1
oraEM4JobAlertJobStatus 1.3.6.1.4.1.111.15.1.2.1.5.1
oraEM4JobAlertTargets 1.3.6.1.4.1.111.15.1.2.1.6.1
oraEM4JobAlertTimeStamp 1.3.6.1.4.1.111.15.1.2.1.7.1
oraEM4JobAlertRuleName 1.3.6.1.4.1.111.15.1.2.1.8.1
oraEM4JobAlertRuleOwner 1.3.6.1.4.1.111.15.1.2.1.9.1
oraEM4JobAlertMetricName 1.3.6.1.4.1.111.15.1.2.1.10.1
oraEM4JobAlertMetricValue 1.3.6.1.4.1.111.15.1.2.1.11.1
oraEM4JobAlertContext 1.3.6.1.4.1.111.15.1.2.1.12.1
oraEM4JobAlertKeyName 1.3.6.1.4.1.111.15.1.2.1.13.1
oraEM4JobAlertKeyValue 1.3.6.1.4.1.111.15.1.2.1.14.1
oraEM4JobAlertSeverity 1.3.6.1.4.1.111.15.1.2.1.15.1
oraEM4JobAlertJobId 1.3.6.1.4.1.111.15.1.2.1.16.1
oraEM4JobAlertJobExecId 1.3.6.1.4.1.111.15.1.2.1.17.1
A description of each of these variables follows.
Appendix A
oraEM4JobAlertTable
A-37

A.3.1 oraEM4JobAlertJobName
Syntax
DisplayString
Max-Access
Read-only
Status
Mandatory
Explanation
The name of the job to which this alert applies.
Typical Range
Not applicable
Significance
Very important
A.3.2 oraEM4JobAlertJobOwner
Syntax
DisplayString
Max-Access
Read-only
Status
Mandatory
Explanation
The owner of the job to which this alert applies.
Typical Range
Not applicable
Significance
Very important
A.3.3 oraEM4JobAlertJobType
Appendix A
oraEM4JobAlertTable
A-38

Syntax
DisplayString
Max-Access
Read-only
Status
Mandatory
Explanation
The type of the job to which this alert applies.
Typical Range
Not applicable
Significance
Important
A.3.4 oraEM4JobAlertJobStatus
Syntax
DisplayString
Max-Access
Read-only
Status
Mandatory
Explanation
The status of the job to which this alert applies.
Typical Range
Not applicable
Significance
Very important
A.3.5 oraEM4JobAlertTargets
Syntax
DisplayString
Appendix A
oraEM4JobAlertTable
A-39

Max-Access
Read-only
Status
Mandatory
Explanation
A comma separated list of target to which this alert applies.
Typical Range
Not applicable
Significance
Very important
A.3.6 oraEM4JobAlertTimeStamp
Syntax
DisplayString
Max-Access
Read-only
Status
Mandatory
Explanation
The time at which this job status changed causing this alert.
Typical Range
Not applicable
Significance
Important
A.3.7 oraEM4JobAlertRuleName
Syntax
DisplayString
Max-Access
Read-only
Appendix A
oraEM4JobAlertTable
A-40

Status
Mandatory
Explanation
The name of the notification rule that caused this notification.
Typical Range
Not applicable
Significance
Important
A.3.8 oraEM4JobAlertRuleOwner
Syntax
DisplayString
Max-Access
Read-only
Status
Mandatory
Explanation
The owner of the notification rule that caused this notification.
Typical Range
Not applicable
Significance
Important
A.3.9 oraEM4JobAlertMetricName
Syntax
DisplayString
Max-Access
Read-only
Status
Mandatory
Appendix A
oraEM4JobAlertTable
A-41

Explanation
The name of the metric or policy which caused the Corrective Action to run that
caused this alert.
Typical Range
Not applicable
Significance
Very important
A.3.10 oraEM4JobAlertMetricValue
Syntax
DisplayString
Max-Access
Read-only
Status
Mandatory
Explanation
The value of the metric which caused the Corrective Action to run that caused this
alert.
Typical Range
Not applicable
Significance
Important
A.3.11 oraEM4JobAlertContext
Syntax
DisplayString
Max-Access
Read-only
Status
Mandatory
Appendix A
oraEM4JobAlertTable
A-42

Explanation
A comma separated list of metric column names and values associated with the metric
which caused the Corrective Action to run that caused this alert.
Typical Range
Not applicable
Significance
Important
A.3.12 oraEM4JobAlertKeyName
Syntax
DisplayString
Max-Access
Read-only
Status
Mandatory
Explanation
The name of the key-column, if present, for the metric which caused the Corrective
Action to run that generated this alert.
Typical Range
Not applicable
Significance
Very important
A.3.13 oraEM4JobAlertKeyValue
Syntax
DisplayString
Max-Access
Read-only
Status
Mandatory
Appendix A
oraEM4JobAlertTable
A-43

Explanation
The value of the key-column, if present, for the metric which caused the Corrective
Action to run that generated this alert.
Typical Range
Not applicable
Significance
Very important
A.3.14 oraEM4JobAlertSeverity
Syntax
DisplayString
Max-Access
Read-only
Status
Mandatory
Explanation
The severity of the metric which caused the Corrective Action to run that generated
this alert (for example, Critical).
Typical Range
Critical, warning, clear
Significance
Very important
A.3.15 oraEM4JobAlertJobId
Syntax
DisplayString
Max-Access
Read-only
Status
Mandatory
Appendix A
oraEM4JobAlertTable
A-44

Explanation
The job ID of the Enterprise Manager job that triggered this notification.
Typical Range
Not applicable
Significance
Very important
A.3.16 oraEM4JobAlertJobExecId
Syntax
DisplayString
Max-Access
Read-only
Status
Mandatory
Explanation
The job execution ID of the Enterprise Manager job that triggered this notification.
Typical Range
Not applicable
Significance
Very important
Appendix A
oraEM4JobAlertTable
A-45

B
Enterprise Manager MIB Definition
The following MIB definition is the latest version at the time of publication. For the most
recent version of the Enterprise Manager 13c MIB definition, view your installation MIB
definition file at:
OMS_HOME/network/doc/omstrap.v1
B.1 MIB Definition
ORACLE-ENTERPRISE-MANAGER-4-MIB DEFINITIONS ::= BEGIN
IMPORTS
TRAP-TYPE
FROM RFC-1215
DisplayString
FROM RFC1213-MIB
OBJECT-TYPE
FROM RFC-1212
enterprises
FROM RFC1155-SMI;
oracle OBJECT IDENTIFIER ::= { enterprises 111 }
oraEM4 OBJECT IDENTIFIER ::= { oracle 15 }
oraEM4Objects OBJECT IDENTIFIER ::= { oraEM4 1 }
oraEM4AlertTable OBJECT-TYPE
SYNTAX SEQUENCE OF OraEM4AlertEntry
ACCESS not-accessible
STATUS mandatory
DESCRIPTION
"Information on alerts generated by Oracle Enterprise Manager. This table is
not queryable; it exists only to document the variables included in the oraEM4Alert
trap. Each trap contains a single instance of each variable in the table."
::= { oraEM4Objects 1 }
oraEM4AlertEntry OBJECT-TYPE
SYNTAX OraEM4AlertEntry
ACCESS not-accessible
STATUS mandatory
DESCRIPTION
"Information about a particular Oracle Enterprise Manager alert."
INDEX { oraEM4AlertIndex }
::= { oraEM4AlertTable 1 }
OraEM4AlertEntry ::=
SEQUENCE {
oraEM4AlertIndex
INTEGER,
oraEM4AlertTargetName
B-1

DisplayString,
oraEM4AlertTargetType
DisplayString,
oraEM4AlertHostName
DisplayString,
oraEM4AlertMetricName
DisplayString,
oraEM4AlertKeyName
DisplayString,
oraEM4AlertKeyValue
DisplayString,
oraEM4AlertTimeStamp
DisplayString,
oraEM4AlertSeverity
DisplayString,
oraEM4AlertMessage
DisplayString,
oraEM4AlertRuleName
DisplayString,
oraEM4AlertRuleOwner
DisplayString,
oraEM4AlertMetricValue
DisplayString,
oraEM4AlertContext
DisplayString,
oraEM4AlertCycleGuid
DisplayString,
oraEM4AlertRepeatCount
DisplayString,
oraEM4AlertUDTargetProperties
DisplayString,
oraEM4AlertAck
DisplayString,
oraEM4AlertAckBy
DisplayString,
oraEM4AlertNotifType
DisplayString,
oraEM4AlertViolationGuid
DisplayString
}
oraEM4AlertIndex OBJECT-TYPE
Appendix B
MIB Definition
B-2

SYNTAX INTEGER (0..2147483647)
ACCESS read-only
STATUS mandatory
DESCRIPTION
"Index of a particular alert, unique only at the moment an alert is generated."
::= { oraEM4AlertEntry 1 }
oraEM4AlertTargetName OBJECT-TYPE
SYNTAX DisplayString
ACCESS read-only
STATUS mandatory
DESCRIPTION
"The name of the target to which this alert applies."
::= { oraEM4AlertEntry 2 }
oraEM4AlertTargetType OBJECT-TYPE
SYNTAX DisplayString
ACCESS read-only
STATUS mandatory
DESCRIPTION
"The type of the target to which this alert applies."
::= { oraEM4AlertEntry 3 }
oraEM4AlertHostName OBJECT-TYPE
SYNTAX DisplayString
ACCESS read-only
STATUS mandatory
DESCRIPTION
"The name of the host on which this alert originated."
::= { oraEM4AlertEntry 4 }
oraEM4AlertMetricName OBJECT-TYPE
SYNTAX DisplayString
ACCESS read-only
STATUS mandatory
DESCRIPTION
"The name of the metric or policy which generated this alert."
::= { oraEM4AlertEntry 5 }
oraEM4AlertKeyName OBJECT-TYPE
SYNTAX DisplayString
ACCESS read-only
STATUS mandatory
DESCRIPTION
"The name of the key-column, if present, for the metric which generated this
alert."
::= { oraEM4AlertEntry 6 }
oraEM4AlertKeyValue OBJECT-TYPE
SYNTAX DisplayString
ACCESS read-only
STATUS mandatory
DESCRIPTION
"The value of the key-column, if present, for the metric which generated this
alert."
::= { oraEM4AlertEntry 7 }
oraEM4AlertTimeStamp OBJECT-TYPE
SYNTAX DisplayString
ACCESS read-only
STATUS mandatory
Appendix B
MIB Definition
B-3

DESCRIPTION
"The time at which this alert was generated."
::= { oraEM4AlertEntry 8 }
oraEM4AlertSeverity OBJECT-TYPE
SYNTAX DisplayString
ACCESS read-only
STATUS mandatory
DESCRIPTION
"The severity of the alert e.g. Clear, Informational, Warning, Critical,
Unreachable Clear, Unreachable Start, Blackout End, Blackout Start, Metric Error
Clear, Metric Error Start, Status Pending."
::= { oraEM4AlertEntry 9 }
oraEM4AlertMessage OBJECT-TYPE
SYNTAX DisplayString
ACCESS read-only
STATUS mandatory
DESCRIPTION
"The message associated with the alert."
::= { oraEM4AlertEntry 10 }
oraEM4AlertRuleName OBJECT-TYPE
SYNTAX DisplayString
ACCESS read-only
STATUS mandatory
DESCRIPTION
"The name of the notification rule that caused this notification."
::= { oraEM4AlertEntry 11 }
oraEM4AlertRuleOwner OBJECT-TYPE
SYNTAX DisplayString
ACCESS read-only
STATUS mandatory
DESCRIPTION
"The owner of the notification rule that caused this notification."
::= { oraEM4AlertEntry 12 }
oraEM4AlertMetricValue OBJECT-TYPE
SYNTAX DisplayString
ACCESS read-only
STATUS mandatory
DESCRIPTION
"The value of the metric which caused this alert to be generated."
::= { oraEM4AlertEntry 13 }
oraEM4AlertContext OBJECT-TYPE
SYNTAX DisplayString
ACCESS read-only
STATUS mandatory
DESCRIPTION
"A comma separated list of metric column names and values associated with the
metric that caused this alert to be generated."
::= { oraEM4AlertEntry 14 }
oraEM4AlertCycleGuid OBJECT-TYPE
SYNTAX DisplayString
ACCESS read-only
STATUS mandatory
DESCRIPTION
"An EM generated identifier that is unique for the lifecyle of an alert."
Appendix B
MIB Definition
B-4

::= { oraEM4AlertEntry 15 }
oraEM4AlertRepeatCount OBJECT-TYPE
SYNTAX DisplayString
ACCESS read-only
STATUS mandatory
DESCRIPTION
"The repeat notification counter for the alert."
::= { oraEM4AlertEntry 16 }
oraEM4AlertUDTargetProperties OBJECT-TYPE
SYNTAX DisplayString
ACCESS read-only
STATUS mandatory
DESCRIPTION
"User-defined target properties associated with the target."
::= { oraEM4AlertEntry 17 }
oraEM4AlertAck OBJECT-TYPE
SYNTAX DisplayString
ACCESS read-only
STATUS mandatory
DESCRIPTION
"Acknowledged status flag associated with the alert. 1 indicates acknowledged,
0 indicates unacknowledged."
::= { oraEM4AlertEntry 18 }
oraEM4AlertAckBy OBJECT-TYPE
SYNTAX DisplayString
ACCESS read-only
STATUS mandatory
DESCRIPTION
"Acknowledged By value associated with the alert."
::= { oraEM4AlertEntry 19 }
oraEM4AlertNotifType OBJECT-TYPE
SYNTAX DisplayString
ACCESS read-only
STATUS mandatory
DESCRIPTION
"Notification Type. 1 - Normal, 4 - Repeat, 9 - Duration"
::= { oraEM4AlertEntry 20 }
oraEM4AlertViolationGuid OBJECT-TYPE
SYNTAX DisplayString
ACCESS read-only
STATUS mandatory
DESCRIPTION
"An EM generated identifier that identifies a particular alert."
::= { oraEM4AlertEntry 21 }
oraEM4Traps OBJECT IDENTIFIER ::= { oraEM4 2 }
oraEM4Alert TRAP-TYPE
ENTERPRISE oraEM4Traps
VARIABLES { oraEM4AlertTargetName, oraEM4AlertTargetType,
oraEM4AlertHostName, oraEM4AlertMetricName,
oraEM4AlertKeyName, oraEM4AlertKeyValue, oraEM4AlertTimeStamp,
oraEM4AlertSeverity, oraEM4AlertMessage,
oraEM4AlertRuleName, oraEM4AlertRuleOwner,
oraEM4AlertMetricValue, oraEM4AlertContext, oraEM4AlertCycleGuid,
Appendix B
MIB Definition
B-5

oraEM4AlertRepeatCount,
oraEM4AlertUDTargetProperties, oraEM4AlertAck, oraEM4AlertAckBy,
oraEM4AlertNotifType, oraEM4AlertViolationGuid }
DESCRIPTION
"The variables included in the oraEM4Alert trap."
::= 1
oraEM4JobAlertTable OBJECT-TYPE
SYNTAX SEQUENCE OF OraEM4JobAlertEntry
ACCESS not-accessible
STATUS mandatory
DESCRIPTION
"Information on alerts generated by Oracle Enterprise Manager. This table is
not queryable; it exists only to document the variables included in the
oraEM4JobAlert trap. Each trap contains a single instance of each variable in the
table."
::= { oraEM4Objects 2 }
oraEM4JobAlertEntry OBJECT-TYPE
SYNTAX OraEM4JobAlertEntry
ACCESS not-accessible
STATUS mandatory
DESCRIPTION
"Information about a particular Oracle Enterprise Manager alert."
INDEX { oraEM4JobAlertIndex }
::= { oraEM4JobAlertTable 1 }
OraEM4JobAlertEntry ::=
SEQUENCE {
oraEM4JobAlertIndex
INTEGER,
oraEM4JobAlertJobName
DisplayString,
oraEM4JobAlertJobOwner
DisplayString,
oraEM4JobAlertJobType
DisplayString,
oraEM4JobAlertJobStatus
DisplayString,
oraEM4JobAlertTargets
DisplayString,
oraEM4JobAlertTimeStamp
DisplayString,
oraEM4JobAlertRuleName
DisplayString,
oraEM4JobAlertRuleOwner
DisplayString,
oraEM4JobAlertMetricName
DisplayString,
oraEM4JobAlertMetricValue
Appendix B
MIB Definition
B-6

DisplayString,
oraEM4JobAlertContext
DisplayString,
oraEM4JobAlertKeyName
DisplayString,
oraEM4JobAlertKeyValue
DisplayString,
oraEM4JobAlertSeverity
DisplayString,
oraEM4JobAlertJobId
DisplayString,
oraEM4JobAlertJobExecId
DisplayString
}
oraEM4JobAlertIndex OBJECT-TYPE
SYNTAX INTEGER (0..2147483647)
ACCESS read-only
STATUS mandatory
DESCRIPTION
"Index of a particular alert, unique only at the moment an alert is generated."
::= { oraEM4JobAlertEntry 1 }
oraEM4JobAlertJobName OBJECT-TYPE
SYNTAX DisplayString
ACCESS read-only
STATUS mandatory
DESCRIPTION
"The name of the job to which this alert applies."
::= { oraEM4JobAlertEntry 2 }
oraEM4JobAlertJobOwner OBJECT-TYPE
SYNTAX DisplayString
ACCESS read-only
STATUS mandatory
DESCRIPTION
"The owner of the job to which this alert applies."
::= { oraEM4JobAlertEntry 3 }
oraEM4JobAlertJobType OBJECT-TYPE
SYNTAX DisplayString
ACCESS read-only
STATUS mandatory
DESCRIPTION
"The type of the job to which this alert applies."
::= { oraEM4JobAlertEntry 4 }
oraEM4JobAlertJobStatus OBJECT-TYPE
SYNTAX DisplayString
ACCESS read-only
STATUS mandatory
DESCRIPTION
"The status of the job to which this alert applies."
::= { oraEM4JobAlertEntry 5 }
Appendix B
MIB Definition
B-7

oraEM4JobAlertTargets OBJECT-TYPE
SYNTAX DisplayString
ACCESS read-only
STATUS mandatory
DESCRIPTION
"A comma separated list of target to which this alert applies."
::= { oraEM4JobAlertEntry 6 }
oraEM4JobAlertTimeStamp OBJECT-TYPE
SYNTAX DisplayString
ACCESS read-only
STATUS mandatory
DESCRIPTION
"The time at which this job status changed causing this alert."
::= { oraEM4JobAlertEntry 7 }
oraEM4JobAlertRuleName OBJECT-TYPE
SYNTAX DisplayString
ACCESS read-only
STATUS mandatory
DESCRIPTION
"The name of the notification rule that caused this notification."
::= { oraEM4JobAlertEntry 8 }
oraEM4JobAlertRuleOwner OBJECT-TYPE
SYNTAX DisplayString
ACCESS read-only
STATUS mandatory
DESCRIPTION
"The owner of the notification rule that caused this notification."
::= { oraEM4JobAlertEntry 9 }
oraEM4JobAlertMetricName OBJECT-TYPE
SYNTAX DisplayString
ACCESS read-only
STATUS mandatory
DESCRIPTION
"The name of the metric or policy which caused the Corrective Action to run
that caused this alert."
::= { oraEM4JobAlertEntry 10 }
oraEM4JobAlertMetricValue OBJECT-TYPE
SYNTAX DisplayString
ACCESS read-only
STATUS mandatory
DESCRIPTION
"The value of the metric which caused the Corrective Action to run that caused
this alert."
::= { oraEM4JobAlertEntry 11 }
oraEM4JobAlertContext OBJECT-TYPE
SYNTAX DisplayString
ACCESS read-only
STATUS mandatory
DESCRIPTION
"A comma separated list of metric column names and values associated with the
metric which caused the Corrective Action to run that caused this alert."
::= { oraEM4JobAlertEntry 12 }
oraEM4JobAlertKeyName OBJECT-TYPE
Appendix B
MIB Definition
B-8

SYNTAX DisplayString
ACCESS read-only
STATUS mandatory
DESCRIPTION
"The name of the key-column, if present, for the metric which caused the
Corrective Action to run that generated this alert."
::= { oraEM4JobAlertEntry 13 }
oraEM4JobAlertKeyValue OBJECT-TYPE
SYNTAX DisplayString
ACCESS read-only
STATUS mandatory
DESCRIPTION
"The value of the key-column, if present, for the metric which caused the
Corrective Action to run that generated this alert."
::= { oraEM4JobAlertEntry 14 }
oraEM4JobAlertSeverity OBJECT-TYPE
SYNTAX DisplayString
ACCESS read-only
STATUS mandatory
DESCRIPTION
"The severity of the metric which caused the Corrective Action to run that
generated this alert e.g. Critical."
::= { oraEM4JobAlertEntry 15 }
oraEM4JobAlertJobId OBJECT-TYPE
SYNTAX DisplayString
ACCESS read-only
STATUS mandatory
DESCRIPTION
"The Job Id of the EM Job that triggered this notification."
::= { oraEM4JobAlertEntry 16 }
oraEM4JobAlertJobExecId OBJECT-TYPE
SYNTAX DisplayString
ACCESS read-only
STATUS mandatory
DESCRIPTION
"The Job Execution Id of the EM Job that triggered this notification."
::= { oraEM4JobAlertEntry 17 }
oraEM4JobAlert TRAP-TYPE
ENTERPRISE oraEM4Traps
VARIABLES { oraEM4JobAlertJobName, oraEM4JobAlertJobOwner,
oraEM4JobAlertJobType, oraEM4JobAlertJobStatus,
oraEM4JobAlertTargets, oraEM4JobAlertTimeStamp,
oraEM4JobAlertRuleName, oraEM4JobAlertRuleOwner,
oraEM4JobAlertMetricName, oraEM4JobAlertMetricValue,
oraEM4JobAlertContext, oraEM4JobAlertKeyName,
oraEM4JobAlertKeyValue, oraEM4JobAlertSeverity,
oraEM4JobAlertJobId, oraEM4JobAlertJobExecId }
DESCRIPTION
"The variables included in the oraEM4JobAlert trap."
::= 2
oraEMNGObjects OBJECT IDENTIFIER ::= { oraEM4 3 }
oraEMNGEventTable OBJECT-TYPE
SYNTAX SEQUENCE OF OraEMNGEventEntry
ACCESS not-accessible
Appendix B
MIB Definition
B-9

STATUS mandatory
DESCRIPTION
"Information on events published to Oracle Enterprise Manager. This table is
not queryable; it exists only to document the variables included in the
oraEMNGEventTrap trap. Each trap can contain a single instance of each variable in
the table."
::= { oraEMNGObjects 1 }
oraEMNGEventEntry OBJECT-TYPE
SYNTAX OraEMNGEventEntry
ACCESS not-accessible
STATUS mandatory
DESCRIPTION
"Information about a particular Oracle Enterprise Manager event."
INDEX { oraEMNGEventIndex }
::= { oraEMNGEventTable 1 }
OraEMNGEventEntry ::=
SEQUENCE {
oraEMNGEventIndex
INTEGER,
oraEMNGEventNotifType
DisplayString,
oraEMNGEventMessage
DisplayString,
oraEMNGEventMessageURL
DisplayString,
oraEMNGEventSeverity
DisplayString,
oraEMNGEventSeverityCode
DisplayString,
oraEMNGEventRepeatCount
DisplayString,
oraEMNGEventActionMsg
DisplayString,
oraEMNGEventOccurrenceTime
DisplayString,
oraEMNGEventReportedTime
DisplayString,
oraEMNGEventCategories
DisplayString,
oraEMNGEventCategoryCodes
DisplayString,
oraEMNGEventType
DisplayString,
oraEMNGEventName
DisplayString,
Appendix B
MIB Definition
B-10

oraEMNGAssocIncidentId
DisplayString,
oraEMNGAssocIncidentOwner
DisplayString,
oraEMNGAssocIncidentAcked
DisplayString,
oraEMNGAssocIncidentStatus
DisplayString,
oraEMNGAssocIncidentPriority
DisplayString,
oraEMNGAssocIncidentEscLevel
DisplayString,
oraEMNGEventTargetName
DisplayString,
oraEMNGEventTargetNameURL
DisplayString,
oraEMNGEventTargetType
DisplayString,
oraEMNGEventHostName
DisplayString,
oraEMNGEventTargetOwner
DisplayString,
oraEMNGEventTgtLifeCycleStatus
DisplayString,
oraEMNGEventTargetVersion
DisplayString,
oraEMNGEventUserDefinedTgtProp
DisplayString,
oraEMNGEventSourceObjName
DisplayString,
oraEMNGEventSourceObjNameURL
DisplayString,
oraEMNGEventSourceObjType
DisplayString,
oraEMNGEventSourceObjSubType
DisplayString,
oraEMNGEventSourceObjOwner
DisplayString,
oraEMNGEventCAJobName
DisplayString,
oraEMNGEventCAJobStatus
Appendix B
MIB Definition
B-11

DisplayString,
oraEMNGEventCAJobOwner
DisplayString,
oraEMNGEventCAJobStepOutput
DisplayString,
oraEMNGEventCAJobType
DisplayString,
oraEMNGEventRuleSetName
DisplayString,
oraEMNGEventRuleName
DisplayString,
oraEMNGEventRuleOwner
DisplayString,
oraEMNGEventSequenceId
DisplayString,
oraEMNGEventRCADetails
DisplayString,
oraEMNGEventContextAttrs
DisplayString,
oraEMNGEventUserComments
DisplayString,
oraEMNGEventUpdates
DisplayString,
oraEMNGEventTotalOccurrenceCount
DisplayString,
oraEMNGEventCurrOccurrenceCount
DisplayString,
oraEMNGEventCurrFirstOccurDate
DisplayString,
oraEMNGEventCurrLastOccurDate
DisplayString,
oraEMNGEventRCAStatus
DisplayString,
oraEMNGEventReportedState
DisplayString,
oraEMNGEventTypeAttr1
DisplayString,
oraEMNGEventTypeAttr2
DisplayString,
oraEMNGEventTypeAttr3
DisplayString,
Appendix B
MIB Definition
B-12

oraEMNGEventTypeAttr4
DisplayString,
oraEMNGEventTypeAttr5
DisplayString,
oraEMNGEventTypeAttr6
DisplayString,
oraEMNGEventTypeAttr7
DisplayString,
oraEMNGEventTypeAttr8
DisplayString,
oraEMNGEventTypeAttr9
DisplayString,
oraEMNGEventTypeAttr10
DisplayString,
oraEMNGEventTypeAttr11
DisplayString,
oraEMNGEventTypeAttr12
DisplayString,
oraEMNGEventTypeAttr13
DisplayString,
oraEMNGEventTypeAttr14
DisplayString,
oraEMNGEventTypeAttr15
DisplayString,
oraEMNGEventTypeAttr16
DisplayString,
oraEMNGEventTypeAttr17
DisplayString,
oraEMNGEventTypeAttr18
DisplayString,
oraEMNGEventTypeAttr19
DisplayString,
oraEMNGEventTypeAttr20
DisplayString,
oraEMNGEventTypeAttr21
DisplayString,
oraEMNGEventTypeAttr22
DisplayString,
oraEMNGEventTypeAttr23
DisplayString,
Appendix B
MIB Definition
B-13

oraEMNGEventTypeAttr24
DisplayString,
oraEMNGEventTypeAttr25
DisplayString
}
oraEMNGEventIndex OBJECT-TYPE
SYNTAX INTEGER (0..2147483647)
ACCESS read-only
STATUS mandatory
DESCRIPTION
"Index of a particular event, unique only at the moment an event is generated."
::= { oraEMNGEventEntry 1 }
oraEMNGEventNotifType OBJECT-TYPE
SYNTAX DisplayString
ACCESS read-only
STATUS mandatory
DESCRIPTION
"Notification Type. NOTIF_NORMAL, NOTIF_RETRY, NOTIF_DURATION, NOTIF_REPEAT,
NOTIF_CA, NOTIF_RCA"
::= { oraEMNGEventEntry 2 }
oraEMNGEventMessage OBJECT-TYPE
SYNTAX DisplayString
ACCESS read-only
STATUS mandatory
DESCRIPTION
"The message associated with this event."
::= { oraEMNGEventEntry 3 }
oraEMNGEventMessageURL OBJECT-TYPE
SYNTAX DisplayString
ACCESS read-only
STATUS mandatory
DESCRIPTION
"EM Console URL for the event message. Populated for events with severity other
than INFORMATIONAL. Empty if trap size exceeds configured snmp packet size."
::= { oraEMNGEventEntry 4 }
oraEMNGEventSeverity OBJECT-TYPE
SYNTAX DisplayString
ACCESS read-only
STATUS mandatory
DESCRIPTION
"The severity of the event e.g. Fatal, Critical, Warning, Advisory,
Information, Clear."
::= { oraEMNGEventEntry 5 }
oraEMNGEventSeverityCode OBJECT-TYPE
SYNTAX DisplayString
ACCESS read-only
STATUS mandatory
DESCRIPTION
"Internal code of the severity: FATAL, CRITICAL, WARNING, ADVISORY,
INFORMATIONAL, CLEAR."
::= { oraEMNGEventEntry 6 }
oraEMNGEventRepeatCount OBJECT-TYPE
SYNTAX DisplayString
Appendix B
MIB Definition
B-14

ACCESS read-only
STATUS mandatory
DESCRIPTION
"The repeat notification counter for the event."
::= { oraEMNGEventEntry 7 }
oraEMNGEventActionMsg OBJECT-TYPE
SYNTAX DisplayString
ACCESS read-only
STATUS mandatory
DESCRIPTION
"The action message for this event."
::= { oraEMNGEventEntry 8 }
oraEMNGEventOccurrenceTime OBJECT-TYPE
SYNTAX DisplayString
ACCESS read-only
STATUS mandatory
DESCRIPTION
"The time when this event occurred (optional), this is only populated for
events that have occurrence time."
::= { oraEMNGEventEntry 9 }
oraEMNGEventReportedTime OBJECT-TYPE
SYNTAX DisplayString
ACCESS read-only
STATUS mandatory
DESCRIPTION
"The time when this event was reported."
::= { oraEMNGEventEntry 10 }
oraEMNGEventCategories OBJECT-TYPE
SYNTAX DisplayString
ACCESS read-only
STATUS mandatory
DESCRIPTION
"The list of categories to which this event belongs to. Empty if trap size
exceeds configured snmp packet size."
::= { oraEMNGEventEntry 11 }
oraEMNGEventCategoryCodes OBJECT-TYPE
SYNTAX DisplayString
ACCESS read-only
STATUS mandatory
DESCRIPTION
"The list of internal category codes to which this event belongs to. Empty if
trap size exceeds configured snmp packet size."
::= { oraEMNGEventEntry 12 }
oraEMNGEventType OBJECT-TYPE
SYNTAX DisplayString
ACCESS read-only
STATUS mandatory
DESCRIPTION
"The name of the event type to which this event belongs to."
::= { oraEMNGEventEntry 13 }
oraEMNGEventName OBJECT-TYPE
SYNTAX DisplayString
ACCESS read-only
STATUS mandatory
Appendix B
MIB Definition
B-15

DESCRIPTION
"The name of this event."
::= { oraEMNGEventEntry 14 }
oraEMNGAssocIncidentId OBJECT-TYPE
SYNTAX DisplayString
ACCESS read-only
STATUS mandatory
DESCRIPTION
"ID of the associated incident with the event (optional)."
::= { oraEMNGEventEntry 15 }
oraEMNGAssocIncidentOwner OBJECT-TYPE
SYNTAX DisplayString
ACCESS read-only
STATUS mandatory
DESCRIPTION
"Owner of the associated incident with the event (optional)."
::= { oraEMNGEventEntry 16 }
oraEMNGAssocIncidentAcked OBJECT-TYPE
SYNTAX DisplayString
ACCESS read-only
STATUS mandatory
DESCRIPTION
"Acknowledged status of the associated incident with the event. 1 indicates
acknowledged, 0 indicates unacknowledged."
::= { oraEMNGEventEntry 17 }
oraEMNGAssocIncidentStatus OBJECT-TYPE
SYNTAX DisplayString
ACCESS read-only
STATUS mandatory
DESCRIPTION
"The status of the associated incident with the event."
::= { oraEMNGEventEntry 18 }
oraEMNGAssocIncidentPriority OBJECT-TYPE
SYNTAX DisplayString
ACCESS read-only
STATUS mandatory
DESCRIPTION
"The proirity of the associated incident with the event."
::= { oraEMNGEventEntry 19 }
oraEMNGAssocIncidentEscLevel OBJECT-TYPE
SYNTAX DisplayString
ACCESS read-only
STATUS mandatory
DESCRIPTION
"The Escalation Level of the associated incident with the event."
::= { oraEMNGEventEntry 20 }
oraEMNGEventTargetName OBJECT-TYPE
SYNTAX DisplayString
ACCESS read-only
STATUS mandatory
DESCRIPTION
"The name of the target to which this event applies. Populated for events that
are about a target only."
::= { oraEMNGEventEntry 21 }
Appendix B
MIB Definition
B-16

oraEMNGEventTargetNameURL OBJECT-TYPE
SYNTAX DisplayString
ACCESS read-only
STATUS mandatory
DESCRIPTION
"EM Console URL of the target to which this event applies. Populated for events
that are about a target only. Empty if trap size exceeds configured snmp packet
size."
::= { oraEMNGEventEntry 22 }
oraEMNGEventTargetType OBJECT-TYPE
SYNTAX DisplayString
ACCESS read-only
STATUS mandatory
DESCRIPTION
"The type of the target to which this event applies. Populated for events that
are about a target only."
::= { oraEMNGEventEntry 23 }
oraEMNGEventHostName OBJECT-TYPE
SYNTAX DisplayString
ACCESS read-only
STATUS mandatory
DESCRIPTION
"The name of the host on which this event originated. Populated for events that
are about a target only."
::= { oraEMNGEventEntry 24 }
oraEMNGEventTargetOwner OBJECT-TYPE
SYNTAX DisplayString
ACCESS read-only
STATUS mandatory
DESCRIPTION
"The primary administrator of the target on which this event originated. Empty
if trap size exceeds configured snmp packet size."
::= { oraEMNGEventEntry 25 }
oraEMNGEventTgtLifeCycleStatus OBJECT-TYPE
SYNTAX DisplayString
ACCESS read-only
STATUS mandatory
DESCRIPTION
"The life cycle status of the target on which this event originated."
::= { oraEMNGEventEntry 26 }
oraEMNGEventTargetVersion OBJECT-TYPE
SYNTAX DisplayString
ACCESS read-only
STATUS mandatory
DESCRIPTION
"The version of the target on which this event originated."
::= { oraEMNGEventEntry 27 }
oraEMNGEventUserDefinedTgtProp OBJECT-TYPE
SYNTAX DisplayString
ACCESS read-only
STATUS mandatory
DESCRIPTION
"The user defined target properties [name,value pair list] of the associated
target with this event. Empty if trap size exceeds configured snmp packet size."
Appendix B
MIB Definition
B-17

::= { oraEMNGEventEntry 28 }
oraEMNGEventSourceObjName OBJECT-TYPE
SYNTAX DisplayString
ACCESS read-only
STATUS mandatory
DESCRIPTION
"The name of the source object to which this event belongs to. Populated for
events that are about a non-target object only, such as Job."
::= { oraEMNGEventEntry 29 }
oraEMNGEventSourceObjNameURL OBJECT-TYPE
SYNTAX DisplayString
ACCESS read-only
STATUS mandatory
DESCRIPTION
"EM Console URL for the source object to which this event belongs to. Empty if
trap size exceeds configured snmp packet size."
::= { oraEMNGEventEntry 30 }
oraEMNGEventSourceObjType OBJECT-TYPE
SYNTAX DisplayString
ACCESS read-only
STATUS mandatory
DESCRIPTION
"The type of the source object to which this event belongs to."
::= { oraEMNGEventEntry 31 }
oraEMNGEventSourceObjSubType OBJECT-TYPE
SYNTAX DisplayString
ACCESS read-only
STATUS mandatory
DESCRIPTION
"The sub type of the source object to which this event belongs to (Optional
property). Empty if trap size exceeds configured snmp packet size."
::= { oraEMNGEventEntry 32 }
oraEMNGEventSourceObjOwner OBJECT-TYPE
SYNTAX DisplayString
ACCESS read-only
STATUS mandatory
DESCRIPTION
"The primary adminstrator of the source object to which this event belongs to.
(Optional property). Empty if trap size exceeds configured snmp packet size."
::= { oraEMNGEventEntry 33 }
oraEMNGEventCAJobName OBJECT-TYPE
SYNTAX DisplayString
ACCESS read-only
STATUS mandatory
DESCRIPTION
"The Name of the Corrective Action Job associated with this event."
::= { oraEMNGEventEntry 34 }
oraEMNGEventCAJobStatus OBJECT-TYPE
SYNTAX DisplayString
ACCESS read-only
STATUS mandatory
DESCRIPTION
"The Status of the Corrective Action Job associated with this event."
::= { oraEMNGEventEntry 35 }
Appendix B
MIB Definition
B-18

oraEMNGEventCAJobOwner OBJECT-TYPE
SYNTAX DisplayString
ACCESS read-only
STATUS mandatory
DESCRIPTION
"The Owner of the Corrective Action Job associated with this event."
::= { oraEMNGEventEntry 36 }
oraEMNGEventCAJobStepOutput OBJECT-TYPE
SYNTAX DisplayString
ACCESS read-only
STATUS mandatory
DESCRIPTION
"The job step output from the Corrective Action Job associated with this event."
::= { oraEMNGEventEntry 37 }
oraEMNGEventCAJobType OBJECT-TYPE
SYNTAX DisplayString
ACCESS read-only
STATUS mandatory
DESCRIPTION
"The job type from the Corrective Action Job associated with this event."
::= { oraEMNGEventEntry 38 }
oraEMNGEventRuleSetName OBJECT-TYPE
SYNTAX DisplayString
ACCESS read-only
STATUS mandatory
DESCRIPTION
"The name of the ruleset that caused this notification. Empty if trap size
exceeds configured snmp packet size."
::= { oraEMNGEventEntry 39 }
oraEMNGEventRuleName OBJECT-TYPE
SYNTAX DisplayString
ACCESS read-only
STATUS mandatory
DESCRIPTION
"The name of the rule within the ruleset that caused this notification."
::= { oraEMNGEventEntry 40 }
oraEMNGEventRuleOwner OBJECT-TYPE
SYNTAX DisplayString
ACCESS read-only
STATUS mandatory
DESCRIPTION
"The owner of the ruleset that caused this notification."
::= { oraEMNGEventEntry 41 }
oraEMNGEventSequenceId OBJECT-TYPE
SYNTAX DisplayString
ACCESS read-only
STATUS mandatory
DESCRIPTION
"An EM generated identifier that uniquely identifies current issue until it is
cleared."
::= { oraEMNGEventEntry 42 }
oraEMNGEventRCADetails OBJECT-TYPE
SYNTAX DisplayString
Appendix B
MIB Definition
B-19

ACCESS read-only
STATUS mandatory
DESCRIPTION
"Root Cause Analysis details associated with this event if it exists."
::= { oraEMNGEventEntry 43 }
oraEMNGEventContextAttrs OBJECT-TYPE
SYNTAX DisplayString
ACCESS read-only
STATUS mandatory
DESCRIPTION
"The context attributes associated with this event. Empty if trap size exceeds
configured snmp packet size."
::= { oraEMNGEventEntry 44 }
oraEMNGEventUserComments OBJECT-TYPE
SYNTAX DisplayString
ACCESS read-only
STATUS mandatory
DESCRIPTION
"The user comments associated with this event. Empty if trap size exceeds
configured snmp packet size."
::= { oraEMNGEventEntry 45 }
oraEMNGEventUpdates OBJECT-TYPE
SYNTAX DisplayString
ACCESS read-only
STATUS mandatory
DESCRIPTION
"The updates associated with this event. Empty if trap size exceeds configured
snmp packet size."
::= { oraEMNGEventEntry 46 }
oraEMNGEventTotalOccurrenceCount OBJECT-TYPE
SYNTAX DisplayString
ACCESS read-only
STATUS mandatory
DESCRIPTION
"Total number of occurrences of the same event on a target across all open
deduplicated events. This attribute applies only to deduplicated events."
::= { oraEMNGEventEntry 47 }
oraEMNGEventCurrOccurrenceCount OBJECT-TYPE
SYNTAX DisplayString
ACCESS read-only
STATUS mandatory
DESCRIPTION
"Total occurrences of the event in this collection period. This attribute
applies only to deduplicated events."
::= { oraEMNGEventEntry 48 }
oraEMNGEventCurrFirstOccurDate OBJECT-TYPE
SYNTAX DisplayString
ACCESS read-only
STATUS mandatory
DESCRIPTION
"Timestamp when the event first occurred in this collection period. This
attribute applies only to deduplicated events."
::= { oraEMNGEventEntry 49 }
oraEMNGEventCurrLastOccurDate OBJECT-TYPE
Appendix B
MIB Definition
B-20

SYNTAX DisplayString
ACCESS read-only
STATUS mandatory
DESCRIPTION
"Timestamp when the event last occurred in this collection period. This
attribute applies only to deduplicated events."
::= { oraEMNGEventEntry 50 }
oraEMNGEventRCAStatus OBJECT-TYPE
SYNTAX DisplayString
ACCESS read-only
STATUS mandatory
DESCRIPTION
"Summary of Root Cause Analysis, if applicable."
::= { oraEMNGEventEntry 51 }
oraEMNGEventReportedState OBJECT-TYPE
SYNTAX DisplayString
ACCESS read-only
STATUS mandatory
DESCRIPTION
"This is an optional value reporting the latest state of an entity and is only
applicable for events that are representing a state transition for a given entity.
For example, for Target availability and Job state change events, this value would
be the latest state of the target or job, respectively."
::= { oraEMNGEventEntry 52 }
oraEMNGEventTypeAttr1 OBJECT-TYPE
SYNTAX DisplayString
ACCESS read-only
STATUS mandatory
DESCRIPTION
"Name and value pair as name=value for event type specific attribute#1."
::= { oraEMNGEventEntry 61 }
oraEMNGEventTypeAttr2 OBJECT-TYPE
SYNTAX DisplayString
ACCESS read-only
STATUS mandatory
DESCRIPTION
"Name and value pair as name=value for event type specific attribute#2."
::= { oraEMNGEventEntry 62 }
oraEMNGEventTypeAttr3 OBJECT-TYPE
SYNTAX DisplayString
ACCESS read-only
STATUS mandatory
DESCRIPTION
"Name and value pair as name=value for event type specific attribute#3."
::= { oraEMNGEventEntry 63 }
oraEMNGEventTypeAttr4 OBJECT-TYPE
SYNTAX DisplayString
ACCESS read-only
STATUS mandatory
DESCRIPTION
"Name and value pair as name=value for event type specific attribute#4."
::= { oraEMNGEventEntry 64 }
oraEMNGEventTypeAttr5 OBJECT-TYPE
SYNTAX DisplayString
Appendix B
MIB Definition
B-21

ACCESS read-only
STATUS mandatory
DESCRIPTION
"Name and value pair as name=value for event type specific attribute#5."
::= { oraEMNGEventEntry 65 }
oraEMNGEventTypeAttr6 OBJECT-TYPE
SYNTAX DisplayString
ACCESS read-only
STATUS mandatory
DESCRIPTION
"Name and value pair as name=value for event type specific attribute#6."
::= { oraEMNGEventEntry 66 }
oraEMNGEventTypeAttr7 OBJECT-TYPE
SYNTAX DisplayString
ACCESS read-only
STATUS mandatory
DESCRIPTION
"Name and value pair as name=value for event type specific attribute#7."
::= { oraEMNGEventEntry 67 }
oraEMNGEventTypeAttr8 OBJECT-TYPE
SYNTAX DisplayString
ACCESS read-only
STATUS mandatory
DESCRIPTION
"Name and value pair as name=value for event type specific attribute#8."
::= { oraEMNGEventEntry 68 }
oraEMNGEventTypeAttr9 OBJECT-TYPE
SYNTAX DisplayString
ACCESS read-only
STATUS mandatory
DESCRIPTION
"Name and value pair as name=value for event type specific attribute#9."
::= { oraEMNGEventEntry 69 }
oraEMNGEventTypeAttr10 OBJECT-TYPE
SYNTAX DisplayString
ACCESS read-only
STATUS mandatory
DESCRIPTION
"Name and value pair as name=value for event type specific attribute#10."
::= { oraEMNGEventEntry 70 }
oraEMNGEventTypeAttr11 OBJECT-TYPE
SYNTAX DisplayString
ACCESS read-only
STATUS mandatory
DESCRIPTION
"Name and value pair as name=value for event type specific attribute#11."
::= { oraEMNGEventEntry 71 }
oraEMNGEventTypeAttr12 OBJECT-TYPE
SYNTAX DisplayString
ACCESS read-only
STATUS mandatory
DESCRIPTION
"Name and value pair as name=value for event type specific attribute#12."
::= { oraEMNGEventEntry 72 }
Appendix B
MIB Definition
B-22

oraEMNGEventTypeAttr13 OBJECT-TYPE
SYNTAX DisplayString
ACCESS read-only
STATUS mandatory
DESCRIPTION
"Name and value pair as name=value for event type specific attribute#13."
::= { oraEMNGEventEntry 73 }
oraEMNGEventTypeAttr14 OBJECT-TYPE
SYNTAX DisplayString
ACCESS read-only
STATUS mandatory
DESCRIPTION
"Name and value pair as name=value for event type specific attribute#14."
::= { oraEMNGEventEntry 74 }
oraEMNGEventTypeAttr15 OBJECT-TYPE
SYNTAX DisplayString
ACCESS read-only
STATUS mandatory
DESCRIPTION
"Name and value pair as name=value for event type specific attribute#15."
::= { oraEMNGEventEntry 75 }
oraEMNGEventTypeAttr16 OBJECT-TYPE
SYNTAX DisplayString
ACCESS read-only
STATUS mandatory
DESCRIPTION
"Name and value pair as name=value for event type specific attribute#16."
::= { oraEMNGEventEntry 76 }
oraEMNGEventTypeAttr17 OBJECT-TYPE
SYNTAX DisplayString
ACCESS read-only
STATUS mandatory
DESCRIPTION
"Name and value pair as name=value for event type specific attribute#17."
::= { oraEMNGEventEntry 77 }
oraEMNGEventTypeAttr18 OBJECT-TYPE
SYNTAX DisplayString
ACCESS read-only
STATUS mandatory
DESCRIPTION
"Name and value pair as name=value for event type specific attribute#18."
::= { oraEMNGEventEntry 78 }
oraEMNGEventTypeAttr19 OBJECT-TYPE
SYNTAX DisplayString
ACCESS read-only
STATUS mandatory
DESCRIPTION
"Name and value pair as name=value for event type specific attribute#19."
::= { oraEMNGEventEntry 79 }
oraEMNGEventTypeAttr20 OBJECT-TYPE
SYNTAX DisplayString
ACCESS read-only
STATUS mandatory
Appendix B
MIB Definition
B-23

DESCRIPTION
"Name and value pair as name=value for event type specific attribute#20."
::= { oraEMNGEventEntry 80 }
oraEMNGEventTypeAttr21 OBJECT-TYPE
SYNTAX DisplayString
ACCESS read-only
STATUS mandatory
DESCRIPTION
"Name and value pair as name=value for event type specific attribute#21."
::= { oraEMNGEventEntry 81 }
oraEMNGEventTypeAttr22 OBJECT-TYPE
SYNTAX DisplayString
ACCESS read-only
STATUS mandatory
DESCRIPTION
"Name and value pair as name=value for event type specific attribute#22."
::= { oraEMNGEventEntry 82 }
oraEMNGEventTypeAttr23 OBJECT-TYPE
SYNTAX DisplayString
ACCESS read-only
STATUS mandatory
DESCRIPTION
"Name and value pair as name=value for event type specific attribute#23."
::= { oraEMNGEventEntry 83 }
oraEMNGEventTypeAttr24 OBJECT-TYPE
SYNTAX DisplayString
ACCESS read-only
STATUS mandatory
DESCRIPTION
"Name and value pair as name=value for event type specific attribute#24."
::= { oraEMNGEventEntry 84 }
oraEMNGEventTypeAttr25 OBJECT-TYPE
SYNTAX DisplayString
ACCESS read-only
STATUS mandatory
DESCRIPTION
"Name and value pair as name=value for event type specific attribute#25."
::= { oraEMNGEventEntry 85 }
oraEMNGEvent TRAP-TYPE
ENTERPRISE oraEM4Traps
VARIABLES {
oraEMNGEventNotifType,
oraEMNGEventMessage, oraEMNGEventMessageURL,
oraEMNGEventSeverity, oraEMNGEventSeverityCode,
oraEMNGEventRepeatCount, oraEMNGEventActionMsg,
oraEMNGEventOccurrenceTime, oraEMNGEventReportedTime,
oraEMNGEventCategories, oraEMNGEventCategoryCodes,
oraEMNGEventType, oraEMNGEventName,
oraEMNGAssocIncidentId, oraEMNGAssocIncidentOwner,
oraEMNGAssocIncidentAcked, oraEMNGAssocIncidentStatus,
oraEMNGAssocIncidentPriority, oraEMNGAssocIncidentEscLevel,
oraEMNGEventTargetName, oraEMNGEventTargetNameURL,
oraEMNGEventTargetType, oraEMNGEventHostName,
oraEMNGEventTargetOwner, oraEMNGEventTgtLifeCycleStatus,
oraEMNGEventTargetVersion, oraEMNGEventUserDefinedTgtProp,
Appendix B
MIB Definition
B-24

oraEMNGEventSourceObjName, oraEMNGEventSourceObjNameURL,
oraEMNGEventSourceObjType, oraEMNGEventSourceObjSubType,
oraEMNGEventSourceObjOwner, oraEMNGEventCAJobName,
oraEMNGEventCAJobStatus, oraEMNGEventCAJobOwner,
oraEMNGEventCAJobStepOutput, oraEMNGEventCAJobType,
oraEMNGEventRuleSetName, oraEMNGEventRuleName,
oraEMNGEventRuleOwner, oraEMNGEventSequenceId,
oraEMNGEventRCADetails, oraEMNGEventContextAttrs,
oraEMNGEventUserComments, oraEMNGEventUpdates,
oraEMNGEventTotalOccurrenceCount, oraEMNGEventCurrOccurrenceCount,
oraEMNGEventCurrFirstOccurDate, oraEMNGEventCurrLastOccurDate,
oraEMNGEventRCAStatus,
oraEMNGEventTypeAttr1, oraEMNGEventTypeAttr2,
oraEMNGEventTypeAttr3, oraEMNGEventTypeAttr4,
oraEMNGEventTypeAttr5, oraEMNGEventTypeAttr6,
oraEMNGEventTypeAttr7, oraEMNGEventTypeAttr8,
oraEMNGEventTypeAttr9, oraEMNGEventTypeAttr10,
oraEMNGEventTypeAttr11, oraEMNGEventTypeAttr12,
oraEMNGEventTypeAttr13, oraEMNGEventTypeAttr14,
oraEMNGEventTypeAttr15, oraEMNGEventTypeAttr16,
oraEMNGEventTypeAttr17, oraEMNGEventTypeAttr18,
oraEMNGEventTypeAttr19, oraEMNGEventTypeAttr20,
oraEMNGEventTypeAttr21, oraEMNGEventTypeAttr22,
oraEMNGEventTypeAttr23, oraEMNGEventTypeAttr24,
oraEMNGEventTypeAttr25,
oraEMNGEventReportedState
}
DESCRIPTION
"The variables included in the oraEMNGAlert trap."
::= 3
END
Appendix B
MIB Definition
B-25

C
SNMP Trap Mappings
The following tables list SNMP trap mappings between Enterprise Manager 12c and
later and previous releases.
C.1 Pre-12c Enterprise Manager Metric Alerts
Before Enterprise Manager 12c, metric alerts were sent using the oraEM4Alert trap
type. From Enterprise Manager 12c onwards, the event type corresponding to these
alerts is metric alert. The value for oraEMNGEventType in an Enterprise Manager 12c
or 13c SNMP trap would be set to 'Metric Alert'.
Table C-1 Metric Alert Mappings
Pre-12C OID Number Pre-12C OID Name 12C and later OID
Number
12C and later OID Name
1.3.6.1.4.1.111.15.1.1.1.2
.1
oraEM4AlertTargetName 1.3.6.1.4.1.111.15.3.1.1.21
.1
oraEMNGEventTargetName
1.3.6.1.4.1.111.15.1.1.1.3
.1
oraEM4AlertTargetType 1.3.6.1.4.1.111.15.3.1.1.23
.1
oraEMNGEventTargetType
1.3.6.1.4.1.111.15.1.1.1.4
.1
oraEM4AlertHostName 1.3.6.1.4.1.111.15.3.1.1.24
.1
oraEMNGEventHostName
1.3.6.1.4.1.111.15.1.1.1.5
.1
oraEM4AlertMetricName 1.3.6.1.4.1.111.15.3.1.1.65
.1
oraEMNGEventTypeAttr5
1.3.6.1.4.1.111.15.1.1.1.6
.1
oraEM4AlertKeyName 1.3.6.1.4.1.111.15.3.1.1.66
.1
oraEMNGEventTypeAttr6
1.3.6.1.4.1.111.15.1.1.1.7
.1
oraEM4AlertKeyValue * See the note below for
details
* See the note below for
details
1.3.6.1.4.1.111.15.1.1.1.8
.1
oraEM4AlertTimeStamp 1.3.6.1.4.1.111.15.3.1.1.10
.1
oraEMNGEventReportedTime
1.3.6.1.4.1.111.15.1.1.1.9
.1
oraEM4AlertSeverity 1.3.6.1.4.1.111.15.3.1.1.5.
1
oraEMNGEventSeverity
1.3.6.1.4.1.111.15.1.1.1.1
0.1
oraEM4AlertMessage 1.3.6.1.4.1.111.15.3.1.1.3.
1
oraEMNGEventMessage
1.3.6.1.4.1.111.15.1.1.1.1
1.1
oraEM4AlertRuleName 1.3.6.1.4.1.111.15.3.1.1.39
.1
oraEMNGEventRuleSetName
1.3.6.1.4.1.111.15.1.1.1.1
2.1
oraEM4AlertRuleOwner 1.3.6.1.4.1.111.15.3.1.1.41
.1
oraEMNGEventRuleOwner
1.3.6.1.4.1.111.15.1.1.1.1
3.1
oraEM4AlertMetricValue 1.3.6.1.4.1.111.15.3.1.1.68
.1
oraEMNGEventTypeAttr8
1.3.6.1.4.1.111.15.1.1.1.1
4.1
oraEM4AlertContext 1.3.6.1.4.1.111.15.3.1.1.44
.1
oraEMNGEventContextAttrs
1.3.6.1.4.1.111.15.1.1.1.1
5.1
oraEM4AlertCycleGuid 1.3.6.1.4.1.111.15.3.1.1.70
.1
oraEMNGEventTypeAttr3
C-1

Table C-1 (Cont.) Metric Alert Mappings
Pre-12C OID Number Pre-12C OID Name 12C and later OID
Number
12C and later OID Name
1.3.6.1.4.1.111.15.1.1.1.1
6.1
oraEM4AlertRepeatCount 1.3.6.1.4.1.111.15.3.1.1.7.
1
oraEMNGEventRepeatCount
1.3.6.1.4.1.111.15.1.1.1.1
7.1
oraEM4AlertUDTargetPro
perties
1.3.6.1.4.1.111.15.3.1.1.28
.1
oraEMNGEventUserDefinedT
gtProp
1.3.6.1.4.1.111.15.1.1.1.1
8.1
oraEM4AlertAck 1.3.6.1.4.1.111.15.3.1.1.17
.1
oraEMNGAssocIncidentAcked
1.3.6.1.4.1.111.15.1.1.1.1
9.1
oraEM4AlertAckBy 1.3.6.1.4.1.111.15.3.1.1.16
.1
oraEMNGAssocIncidentOwner
1.3.6.1.4.1.111.15.1.1.1.2
0.1
oraEM4AlertNotifType 1.3.6.1.4.1.111.15.3.1.1.2.
1
oraEMNGEventNotifType
1.3.6.1.4.1.111.15.1.1.1.2
1.1
oraEM4AlertViolationGuid 1.3.6.1.4.1.111.15.3.1.1.42
.1
oraEMNGEventSequenceId
C.2 Pre-12C Target Availability Alerts
Before Enterprise Manager 12c, target availability alerts were sent using oraEM4Alert
SNMP trap type. From Enterprise Manager 12c onwards, the event type
corresponding to these alerts is target_availability. Value for oraEMNGEventType in
an Enterprise Manager 12c or 13c trap would be set to 'Target Availability'.
Table C-2 Target Availability Alert Mappings
Pre-12C OID Number Pre-12C OID Name 12C and later OID
Number
12C and later OID Name
1.3.6.1.4.1.111.15.1.1.1.2.
1
oraEM4AlertTargetName 1.3.6.1.4.1.111.15.3.1.1.21
.1
oraEMNGEventTargetName
1.3.6.1.4.1.111.15.1.1.1.3.
1
oraEM4AlertTargetType 1.3.6.1.4.1.111.15.3.1.1.23
.1
oraEMNGEventTargetType
1.3.6.1.4.1.111.15.1.1.1.4.
1
oraEM4AlertHostName 1.3.6.1.4.1.111.15.3.1.1.24
.1
oraEMNGEventHostName
1.3.6.1.4.1.111.15.1.1.1.5.
1
oraEM4AlertMetricName N/A N/A
1.3.6.1.4.1.111.15.1.1.1.6.
1
oraEM4AlertKeyName // deprecated in 12C, was
always null in 11GC
// deprecated in 12C, was
always null in 11GC
1.3.6.1.4.1.111.15.1.1.1.7.
1
oraEM4AlertKeyValue N/A N/A
1.3.6.1.4.1.111.15.1.1.1.8.
1
oraEM4AlertTimeStamp 1.3.6.1.4.1.111.15.3.1.1.10
.1
oraEMNGEventReportedTime
1.3.6.1.4.1.111.15.1.1.1.9.
1
oraEM4AlertSeverity 1.3.6.1.4.1.111.15.3.1.1.61
.1
oraEMNGEventTypeAttr1 //
target_status
1.3.6.1.4.1.111.15.1.1.1.1
0.1
oraEM4AlertMessage 1.3.6.1.4.1.111.15.3.1.1.3.
1
oraEMNGEventMessage
Appendix C
Pre-12C Target Availability Alerts
C-2

Table C-2 (Cont.) Target Availability Alert Mappings
Pre-12C OID Number Pre-12C OID Name 12C and later OID
Number
12C and later OID Name
1.3.6.1.4.1.111.15.1.1.1.1
1.1
oraEM4AlertRuleName 1.3.6.1.4.1.111.15.3.1.1.39
.1
oraEMNGEventRuleSetName
1.3.6.1.4.1.111.15.1.1.1.1
2.1
oraEM4AlertRuleOwner 1.3.6.1.4.1.111.15.3.1.1.41
.1
oraEMNGEventRuleOwner
1.3.6.1.4.1.111.15.1.1.1.1
3.1
oraEM4AlertMetricValue N/A N/A
1.3.6.1.4.1.111.15.1.1.1.1
4.1
oraEM4AlertContext 1.3.6.1.4.1.111.15.3.1.1.44
.1
oraEMNGEventContextAttrs
1.3.6.1.4.1.111.15.1.1.1.1
5.1
oraEM4AlertCycleGuid 1.3.6.1.4.1.111.15.3.1.1.66
.1
oraEMNGEventTypeAttr6
1.3.6.1.4.1.111.15.1.1.1.1
6.1
oraEM4AlertRepeatCount 1.3.6.1.4.1.111.15.3.1.1.7.
1
oraEMNGEventRepeatCount
1.3.6.1.4.1.111.15.1.1.1.1
7.1
oraEM4AlertUDTargetPro
perties
1.3.6.1.4.1.111.15.3.1.1.28
.1
oraEMNGEventUserDefinedT
gtProp
1.3.6.1.4.1.111.15.1.1.1.1
8.1
oraEM4AlertAck 1.3.6.1.4.1.111.15.3.1.1.17
.1
oraEMNGAssocIncidentAcked
1.3.6.1.4.1.111.15.1.1.1.1
9.1
oraEM4AlertAckBy 1.3.6.1.4.1.111.15.3.1.1.16
.1
oraEMNGAssocIncidentOwner
1.3.6.1.4.1.111.15.1.1.1.2
0.1
oraEM4AlertNotifType 1.3.6.1.4.1.111.15.3.1.1.2.
1
oraEMNGEventNotifType
1.3.6.1.4.1.111.15.1.1.1.2
1.1
oraEM4AlertViolationGuid 1.3.6.1.4.1.111.15.3.1.1.42
.1
oraEMNGEventSequenceId
C.3 Pre-12C Corrective Action Results for Metric Alerts
Before Enterprise Manager 12c, corrective action results for metric alerts were sent
using the oraEM4JobAlert trap type. From Enterprise Manager 12c onwards, the event
type corresponding to these alerts is metric alert. The value for oraEMNGEventType in
an Enterprise Manager 12c or 13c trap would be set to 'Metric Alert'.
Table C-3 Corrective Action Results for Metric Alert Mappings
Pre-12c OID Number Pre-12c OID Name 12c and later OID
Number
12c and later OID Name
1.3.6.1.4.1.111.15.1.2.1.2.
1
oraEM4JobAlertJobName 1.3.6.1.4.1.111.15.3.1.1.34
.1
oraEMNGEventCAJobName
1.3.6.1.4.1.111.15.1.2.1.3.
1
oraEM4JobAlertJobOwner 1.3.6.1.4.1.111.15.3.1.1.36
.1
oraEMNGEventCAJobOwner
1.3.6.1.4.1.111.15.1.2.1.4.
1
oraEM4JobAlertJobType 1.3.6.1.4.1.111.15.3.1.1.38
.1
oraEMNGEventCAJobType
1.3.6.1.4.1.111.15.1.2.1.5.
1
oraEM4JobAlertJobStatus 1.3.6.1.4.1.111.15.3.1.1.35
.1
oraEMNGEventCAJobStatus
Appendix C
Pre-12C Corrective Action Results for Metric Alerts
C-3

Table C-3 (Cont.) Corrective Action Results for Metric Alert Mappings
Pre-12c OID Number Pre-12c OID Name 12c and later OID
Number
12c and later OID Name
1.3.6.1.4.1.111.15.1.2.1.6.
1
oraEM4JobAlertTargets 1.3.6.1.4.1.111.15.3.1.1.23
.1
oraEMNGEventTargetType
NA NA 1.3.6.1.4.1.111.15.3.1.1.21
.1
oraEMNGEventTargetName
1.3.6.1.4.1.111.15.1.2.1.7.
1
oraEM4JobAlertTimeStam
p
1.3.6.1.4.1.111.15.3.1.1.10
.1
oraEMNGEventReportedTim
e
1.3.6.1.4.1.111.15.1.2.1.8.
1
oraEM4JobAlertRuleNam
e
1.3.6.1.4.1.111.15.3.1.1.39
.1
oraEMNGEventRuleSetName
1.3.6.1.4.1.111.15.1.2.1.9.
1
oraEM4JobAlertRuleOwn
er
1.3.6.1.4.1.111.15.3.1.1.41
.1
oraEMNGEventRuleOwner
1.3.6.1.4.1.111.15.1.2.1.1
0.1
oraEM4JobAlertMetricNa
me
1.3.6.1.4.1.111.15.3.1.1.65
.1
oraEMNGEventTypeAttr5
1.3.6.1.4.1.111.15.1.2.1.1
1.1
oraEM4JobAlertMetricVal
ue
1.3.6.1.4.1.111.15.3.1.1.68
.1
oraEMNGEventTypeAttr8
1.3.6.1.4.1.111.15.1.2.1.1
2.1
oraEM4JobAlertContext 1.3.6.1.4.1.111.15.3.1.1.44
.1
oraEMNGEventContextAttrs
1.3.6.1.4.1.111.15.1.2.1.1
3.1
oraEM4JobAlertKeyName 1.3.6.1.4.1.111.15.3.1.1.66
.1
oraEMNGEventTypeAttr6
1.3.6.1.4.1.111.15.1.2.1.1
4.1
oraEM4JobAlertKeyValue 1.3.6.1.4.1.111.15.3.1.1.69
.1
oraEMNGEventTypeAttr9
1.3.6.1.4.1.111.15.1.2.1.1
5.1
oraEM4JobAlertSeverity 1.3.6.1.4.1.111.15.3.1.1.5.
1
oraEMNGEventSeverity
1.3.6.1.4.1.111.15.1.2.1.1
6.1
oraEM4JobAlertJobId NA NA
1.3.6.1.4.1.111.15.1.2.1.1
7.1
oraEM4JobAlertJobExecI
d
NA NA
C.4 Corrective Action Results for Target Availability
Before Enterprise Manager 12c, corrective action results for target availability alerts
were sent using the oraEM4JobAlert trap type. From Enterprise Manager 12c
onwards, the event type corresponding to these alerts is target_availability alert. The
value for oraEMNGEventType in an Enterprise Manager 12c or 13c trap would be set
to 'Metric Alert'.
Table C-4 Target Availability Mappings
Pre-12c OID Number Pre-12c OID Name 12c and later OID
Number
12c and later OID Name
1.3.6.1.4.1.111.15.1.2.1.2.
1
oraEM4JobAlertJobName 1.3.6.1.4.1.111.15.3.1.1.34
.1
oraEMNGEventCAJobName
1.3.6.1.4.1.111.15.1.2.1.3.
1
oraEM4JobAlertJobOwne
r
1.3.6.1.4.1.111.15.3.1.1.36
.1
oraEMNGEventCAJobOwner
Appendix C
Corrective Action Results for Target Availability
C-4

Table C-4 (Cont.) Target Availability Mappings
Pre-12c OID Number Pre-12c OID Name 12c and later OID
Number
12c and later OID Name
1.3.6.1.4.1.111.15.1.2.1.4.
1
oraEM4JobAlertJobType 1.3.6.1.4.1.111.15.3.1.1.38
.1
oraEMNGEventCAJobType
1.3.6.1.4.1.111.15.1.2.1.5.
1
oraEM4JobAlertJobStatus 1.3.6.1.4.1.111.15.3.1.1.35
.1
oraEMNGEventCAJobStatus
1.3.6.1.4.1.111.15.1.2.1.6.
1
oraEM4JobAlertTargets 1.3.6.1.4.1.111.15.3.1.1.23
.1
oraEMNGEventTargetType
and
N/A N/A 1.3.6.1.4.1.111.15.3.1.1.21
.1
oraEMNGEventTargetName
1.3.6.1.4.1.111.15.1.2.1.7.
1
oraEM4JobAlertTimeSta
mp
1.3.6.1.4.1.111.15.3.1.1.10
.1
oraEMNGEventReportedTime
1.3.6.1.4.1.111.15.1.2.1.8.
1
oraEM4JobAlertRuleNam
e
1.3.6.1.4.1.111.15.3.1.1.39
.1
oraEMNGEventRuleSetName
1.3.6.1.4.1.111.15.1.2.1.9.
1
oraEM4JobAlertRuleOwn
er
1.3.6.1.4.1.111.15.3.1.1.41
.1
oraEMNGEventRuleOwner
1.3.6.1.4.1.111.15.1.2.1.1
0.1
oraEM4JobAlertMetricNa
me
N/A N/A
1.3.6.1.4.1.111.15.1.2.1.1
1.1
oraEM4JobAlertMetricVal
ue
N/A N/A
1.3.6.1.4.1.111.15.1.2.1.1
2.1
oraEM4JobAlertContext 1.3.6.1.4.1.111.15.3.1.1.44
.1
oraEMNGEventContextAttrs
1.3.6.1.4.1.111.15.1.2.1.1
3.1
oraEM4JobAlertKeyName N/A N/A
1.3.6.1.4.1.111.15.1.2.1.1
4.1
oraEM4JobAlertKeyValue N/A N/A
1.3.6.1.4.1.111.15.1.2.1.1
5.1
oraEM4JobAlertSeverity 1.3.6.1.4.1.111.15.3.1.1.61
.1
oraEMNGEventTypeAttr5 //
target_status
1.3.6.1.4.1.111.15.1.2.1.1
6.1
oraEM4JobAlertJobId N/A N/A
1.3.6.1.4.1.111.15.1.2.1.1
7.1
oraEM4JobAlertJobExecI
d
N/A N/A
C.5 Job Status Change
Before Enterprise Manager 12c , job status change was sent using oraEM4JobAlert
trap type. From Enterprise Manager 12c onwards, the event type corresponding to
these alerts is the job_status_change alert. The value for the oraEMNGEventType in
an Enterprise Manager 12c or 13c trap would be set to 'Job Status Change'.
Appendix C
Job Status Change
C-5
Table C-5 Job Status Change Mappings
Pre-12c OID Number Pre-12c OID Name 12c and later OID
Number
12c and later OID Name
1.3.6.1.4.1.111.15.1.2.1.2.
1
oraEM4JobAlertJobName 1.3.6.1.4.1.111.15.3.1.1.2
9.1
oraEMNGEventSourceObjNa
me
1.3.6.1.4.1.111.15.1.2.1.3.
1
oraEM4JobAlertJobOwner 1.3.6.1.4.1.111.15.3.1.1.3
3.1
oraEMNGEventSourceObjOw
ner
1.3.6.1.4.1.111.15.1.2.1.4.
1
oraEM4JobAlertJobType 1.3.6.1.4.1.111.15.3.1.1.3
2.1
oraEMNGEventSourceObjSub
Type
1.3.6.1.4.1.111.15.1.2.1.5.
1
oraEM4JobAlertJobStatus 1.3.6.1.4.1.111.15.3.1.1.6
2.1
oraEMNGEventTypeAttr2
1.3.6.1.4.1.111.15.1.2.1.6.
1
oraEM4JobAlertTargets 1.3.6.1.4.1.111.15.3.1.1.2
3.1
oraEMNGEventTargetType
and
NA NA 1.3.6.1.4.1.111.15.3.1.1.2
1.1
oraEMNGEventTargetName
1.3.6.1.4.1.111.15.1.2.1.7.
1
oraEM4JobAlertTimeStam
p
1.3.6.1.4.1.111.15.3.1.1.1
0.1
oraEMNGEventReportedTime
1.3.6.1.4.1.111.15.1.2.1.8.
1
oraEM4JobAlertRuleNam
e
1.3.6.1.4.1.111.15.3.1.1.3
9.1
oraEMNGEventRuleSetName
1.3.6.1.4.1.111.15.1.2.1.9.
1
oraEM4JobAlertRuleOwn
er
1.3.6.1.4.1.111.15.3.1.1.4
1.1
oraEMNGEventRuleOwner
1.3.6.1.4.1.111.15.1.2.1.1
0.1
oraEM4JobAlertMetricNa
me
NA NA
1.3.6.1.4.1.111.15.1.2.1.1
1.1
oraEM4JobAlertMetricVal
ue
NA NA
1.3.6.1.4.1.111.15.1.2.1.1
2.1
oraEM4JobAlertContext 1.3.6.1.4.1.111.15.3.1.1.4
4.1
oraEMNGEventContextAttrs
1.3.6.1.4.1.111.15.1.2.1.1
3.1
oraEM4JobAlertKeyName NA NA
1.3.6.1.4.1.111.15.1.2.1.1
4.1
oraEM4JobAlertKeyValue NA NA
1.3.6.1.4.1.111.15.1.2.1.1
5.1
oraEM4JobAlertSeverity NA NA
1.3.6.1.4.1.111.15.1.2.1.1
6.1
oraEM4JobAlertJobId NA NA
1.3.6.1.4.1.111.15.1.2.1.1
7.1
oraEM4JobAlertJobExecI
d
1.3.6.1.4.1.111.15.3.1.1.6
1.1
oraEMNGEventTypeAttr1
* Note: When mapping 1.3.6.1.4.1.111.15.1.1.1.7.1 oraEM4AlertKeyValue to a12c or
13c metric_alert event to 1.3.6.1.4.1.111.15.1.1.1.7.1 oraEM4AlertKeyValue, you must
look at 1.3.6.1.4.1.111.15.3.1.1.84.1 oraEMNGEventTypeAttr24.
if oraEMNGEventTypeAttr24 is null
then
oraEM4AlertKeyValue is null
if oraEMNGEventTypeAttr24 value = "Number of keys=1"
oraEM4AlertKeyValue --> oraEMNGEventTypeAttr8
Appendix C
Job Status Change
C-6

if oraEMNGEventTypeAttr24 value = "Number of keys=x" where x is greater than
1
=> check the values for the following pairs of attributes.
<oraEMNGEventTypeAttr10, oraEMNGEventTypeAttr11>
<oraEMNGEventTypeAttr12, oraEMNGEventTypeAttr13>
<oraEMNGEventTypeAttr14, oraEMNGEventTypeAttr15>
<oraEMNGEventTypeAttr16, oraEMNGEventTypeAttr17>
<oraEMNGEventTypeAttr18, oraEMNGEventTypeAttr19>
<oraEMNGEventTypeAttr20, oraEMNGEventTypeAttr21>
<oraEMNGEventTypeAttr22, oraEMNGEventTypeAttr23>
...
...
As many pairs as the number of parts present in the key would be populated, the rest
of it will be set to null.
For each non-null pair of attributes, the first attribute provides the name for that part of
the key and second attribute provides the value for that part of the key.
Note:
OID 1.3.6.1.4.1.111.15.3.1.1.13.1 specifies the event type. Examples:
For a metric_alert event type
oraEMNGEventType=Metric Alert
For a target_availability event type,
oraEMNGEventType=Target Availability
For a job_status_change event type
oraEMNGEventType=Job Status Change
Appendix C
Job Status Change
C-7
D
Overview of Target Availability States
The following sections summarize available states and how to set real-time target
status updates.
D.1 Target Availability State Changes
Enterprise Manager displays a comprehensive array of target availability statuses in
the form of informational icons. Various Cloud Control console pages display these
icons to indicate the current status of targets in the repository.
The following table contains all available target availability status icons and their
meaning.
Icon Availability
State
Description
N/A N/A Target availability state does not apply.
Down Target is down.
The target may be unreachable due to the fact that the Agent is
down. If the Agent was brought down as part of planned
maintenance, consider creating a blackout on the Agent.
Up Target is up.
Availability
Evaluation Error
An error occurred while attempting to determine target availability
status. A target availability evaluation error can be caused by metric
collection errors, the Agent being unreachable, or network
problems.
Agent Down The Agent monitoring the target is down.
If an Agent was brought down in error it should be restarted. If
Agent was brought down as part of planned maintenance, consider
creating a blackout on the Agent.
Agent Down,
Target Up
The Agent monitoring the target is down, however, the target is
currently up but not monitored.
To troubleshoot, go to the Agent homepage and run the Symptom
Analysis tool located next to the Status field.
D-1

Icon Availability
State
Description
Agent
Unreachable
The Agent is not reachable. Specifically, the Oracle Management
Service (OMS) cannot communicate with the Agent.
An Agent is generally unreachable when it is down, when it is
blocked by the OMS, or when the Management Agent host is down.
A Management Agent may also be unreachable due to network
problems or certain other issues.
Agent
Unreachable
(Under
Migration)
The Agent is unreachable because it is in the process of being
migration.
Agent
Unreachable
(Cannot Write to
File System)
The Agent cannot write to the file system.
Check the Agent file system for accessibility. To troubleshoot
problems, navigate to the Agent home page from the Enterprise
Manager console and run the Symptom Analysis tool (located next
to the Status field).
Agent
Unreachable
(Collections
Disabled)
Agent metric collection has been disabled.
Check that the Agent can upload to the OMS. To troubleshoot
problems, navigate to the Agent home page from the Enterprise
Manager console and run the Symptom Analysis tool (located next
to the Status field).
Agent
Unreachable
(Disk Full)
The Agent file system is full.
Check the Agent file system for available space. To troubleshoot
problems, navigate to the Agent home page from the Enterprise
Manager console and run the Symptom Analysis tool (located next
to the Status field).
Agent
Unreachable
(Post Blackout)
The Agent is unreachable because the first alert condition has not
yet occurred since the blackout period ended.
Agent Blocked
(Blocked
Manually)
The Agent has been blocked manually.
Unblock the Agent.
Agent Blocked
(Plug-in
Mismatch)
The Agent has been blocked due to a plug-in mismatch.
If the Agent has been restored from a backup, perform an Agent
Resync.
Agent Blocked
(Bounce
Counter
Mismatch)
The Agent has been blocked due to Bounce Counter mismatch.
If the Agent has been restored from a backup, perform an Agent
Resync.
Appendix D
Target Availability State Changes
D-2

Icon Availability
State
Description
Agent
Unreachable
(Agent
Misconfigured)
The Agent is configured for communication with a different OMS.
Check the Agent configuration to ensure the Agent is
communicating with the correct OMS.
Agent
Unreachable
(Communication
Broken)
The Agent is unreachable due to a communication break between
the Agent and the OMS.
Blackout The target is currently blacked out.
Status Pending The target status is currently unknown.
Status Pending
(Target Addition
in Progress)
The target status is currently unknown. Target addition is in
progress.
Status Pending
(Post Blackout)
The target status is currently unknown. Blackout has recently ended
on this target and Availability Status is pending.
Status Pending
(Post Metric
Error)
A metric error has recently ended on the target and Availability
Status is pending. To troubleshoot, refer to My Oracle Support
article Enterprise Manager 12c: How to run the "Targets Status
Diagnostics Report" to Troubleshoot Target Status Availability
Issues (up, down, metric collection error, pending, unreachable) for
all Targets (Doc ID 1546575.1).
D.2 Target Status Change Updates
Enterprise Manager can automatically update target information for specific target
context UI pages without having to refresh the browser page or wait for the status
change to be detected by the Response metric, where the collection interval delay
may take anywhere from a few tenths of a second to a few minutes.
A target context page displays information about a particular target. It has a context
header at the top showing information such as target name, target type, target status,
or target menu.
Appendix D
Target Status Change Updates
D-3

Status change updates are available for the following target types:
•Agent
•Host
•Database Instance (Single Instance Database Only)
•Application Deployment
•WebLogic Server
As mentioned earlier, this feature allows target context pages to be updated
automatically when that target's status changes (from up to down, for example). By
default, automatic status change update is off. You can toggle this feature on and off
using the oracle.sysman.core.uifwk.realTimeUIEnabled OMS property.
To enable status change updates, run the following emctl command:
emctl set property -name oracle.sysman.core.uifwk.realTimeUIEnabled -value true
Appendix D
Target Status Change Updates
D-4

E
Timeout Values for Enterprise Manager
Components
Table E-1 describes the timeout values for Enterprise Manager components.
Table E-1 Time Out Values for Enterprise Manager Components
Compone
nt
Description Timeout
Value (in
minutes)
Command
Apache
timeout
Number of seconds that an Apache
session is kept active.
If Apache timeout is set beyond the
operating system TCP timeout, it will
cause unpredictable results. The
operating system timeout is set to 2
hours by default.
5 mins by
default
Run the following command:
$ omsvfy show tcp
Parameters
Incoming
Value
--------------------
tcp_keepalive_time
7200
tcp_keepalive_intvl
75
tcp_fin_timeout
60
--------------------
E-1

Table E-1 (Cont.) Time Out Values for Enterprise Manager Components
Compone
nt
Description Timeout
Value (in
minutes)
Command
OMS
timeout or
Login
timeout
This is the
oracle.sysman.eml.maxInactiveTi
me
parameter that can be set per
OMS. To prevent unauthorized
access to the Cloud Control,
Enterprise Manager will
automatically log you out of Cloud
Control when there is no activity for
a predefined period of time. For
example, if you leave your browser
open and leave your office. This
default behavior prevents
unauthorized users from using your
Enterprise Manager administrator
account.
If you make changes to the login
timeout value, be sure to consider
the security implications of leaving
your session open for other than the
default timeout period.
Note: The default timeout value
does not apply when you restart the
Web server or the OMS. In both of
those cases, you will be asked to log
in to the Cloud Control Console,
regardless of the default timeout
value.
45 min by
default
Run the following command:
emctl set property -name
oracle.sysman.eml.maxInact
iveTime -value
time_in_minutes -module
emoms
Then, restart OMS for the
value to take effect.
ADF
timeout
This is controlled by the variable
oracle.adf.view.rich.poll.timeo
ut
. The variable applies to pages
that have auto poll. ADF pages may
be enabled with automatic poll. After
a page does not receive any
keyboard or mouse event for
duration of
oracle.adf.view.rich.poll.timeo
ut
variable, then the poll stops.
From that point on, the page
participates in the standard server-
side session timeout.
10 min None
Appendix E
E-2

Index
A
Accessing Plug-In Manager, 23-9
accessing Software Library Administration page,
22-8
accessing Software Library console, 22-2
Adapters, 8-21
Adaptive Metric Thresholds, testing, 9-9
Adaptive Threshold, 9-1
Adaptive Threshold Metrics, deregistering, 9-10
Adaptive Threshold Metrics, Registering, 9-2
Adaptive Thresholds, accuracy, 9-7
Adaptive Thresholds, concepts, 9-1
Adaptive Thresholds, configuring, 9-6
adaptive thresholds, monitoring templates, 9-10
Add HTTP Location, 22-16
Add NFS Location, 22-16
Add OMS Agent file system, 22-15
Add OMS Agent file system location, 22-17
Add OMS Shared file system, 22-13
adding targets, 23-8
ADF timeout setting, E-2
administration group
creating, 6-10
definition, 6-1
hierarchy, 6-12
Administration Groups, 1-7
Administrators, 30-1
Advanced Threshold Management, 9-1
Agents, updating, 21-8
aggregration and purging policies
See data retention policies, 20-2
alert message, customizing, 1-8
alerts
automated responses, 1-5
corrective actions, 1-5
notification methods, 1-10
notifications for, 1-10
Always-On Monitoring, 12-1, 12-7
commands, 12-24
Configuration Assistant, 12-13
configure downtime contacts, 12-17
configure with Enterprise Manager, 12-21
Configuring, 12-12
configuring email servers, 12-17
Always-On Monitoring (continued)
Data Maintenance, 12-27
Database Character Set Definition, 12-5
Database Sizing, 12-2
diagnostics, 12-30
downtime contacts, 12-17
EM CLI, 12-19
job, 12-17
email configuration, 12-17
Enabling/Disabling Notifications, 12-23
Getting Status ((amp)) Logs, 12-23
HA((amp))DR, 12-31
installing, 12-7
prerequisites, 12-1
synchronizing, 12-20
updating, 12-26
Always-On Monitoring Properties, 12-28
analyzing
job activity, 10-19
apache timeout setting, E-1
archive logging
for Management Repository database, 20-1
auditing
enabling, 20-2
Auto Apply Templates, 7-2
automated
responses to alerts, 1-5
automated patching
Offline mode, 25-1
Online mode, 25-1
automated patching advantages, 25-2
automatic domain member discovery, 15-11
automatic logout, E-2
automatic target discovery, 15-1
changes in domain, 15-11
Availability History Report, picture of, 43-2
B
baseline normalized views, 1-4
Baseline periods, 9-1
baseline periods, moving window, 9-1
Beacons
introduction, 1-2
beadm, 39-11
Index-1

benefits of Information Publisher, 43-1
blackouts
command-line interface and, 1-6
controlling with emctl, 4-5
examples, 4-6
functionality of, 1-6
retroactive, 1-6
Blackouts, 4-3
Blackouts Best Effort, 4-7
boot environments, 39-11
C
catalog archives, 23-17
Checkpoint Firewall, Oracle ecosystem and, 1-2
Cloud Control
starting, 27-3
starting all components of, 27-3
Cloud Control Mobile, 2-20
acknowledge issue, 45-9
change views, 45-8
force quit, 45-10
iDevice, 45-1
Incident Manager, 45-4
incidents and problems, 45-7
iTunes App Store, 45-1
logging in, 45-2
manage issue workflow, 45-9
manage settings, 45-3
My Oracle Support, 45-6
requirements, 45-1
setup, 45-1
SR number, 45-6
touch-and-hold, 45-9
Command Line Interface (EMCLI)
blackouts and, 1-6
configuring
blackouts, functionality of, 1-6
monitoring templates, 1-7
configuring Services
availability
beacons, 29-3
key beacons, 29-4
Command Line Interface, 29-39
creating, 29-2
metrics
usage, 29-25
monitoring settings, 29-11
beacon overrides, 29-11
Collection Settings tab, 29-11
Data Granularity property, 29-12
frequency, 29-11
performance metrics, 29-22
aggregation function, 29-23
recording transactions, 29-26
configuring Services (continued)
Root Cause Analysis, 29-9
Topology page, 29-9
Service Level Rules, 29-37
actual service level, 29-38
availability, 29-37
business hours, 29-37
expected service level, 29-38
Information Publisher, 29-39
performance criteria, 29-37
Services Dashboard, 29-39
service test-based availability
key service tests, 29-8
service tests and beacons
configuring dedicated beacons, 29-15
configuring Web proxy, 29-15
selecting test type, 29-12
configuring Software Librar
installation procedure
OMS Agent storage, 22-14
OMS shared file system, 22-13
referenced storage location, 22-16
configuring Software Library, 22-1
administrators privileges, 22-3
installation procedure, 22-12
maintenance procedure, 22-39
deleting Software Library storage
location., 22-40
periodic maintenance tasks, 22-39
re-importing Oracle owned entity files,
22-40
overview, 22-1
prerequisites, 22-12
roles and Software Library privileges, 22-3
storage, 22-8
user roles and privileges, 22-3
connect descriptor, 20-11
using to identify the Management Repository
database, 20-10, 20-11
Connectors, 1-14
corrective actions
alerts and, 1-5
privileges required for, 1-5
CPU
details, 39-12
thread utilization, 39-8
utilization and metrics, 39-8
creating
administration groups, 6-10
custom reports, 43-2
report definitions, 43-2
Critical URL Monitoring, as substitute for
Management Agent, 1-2
cross platform transportable database, 20-15
custom reports, 43-2
Index
Index-2

customizing
notifications, 1-11
customizing Cloud Control pages, 26-1
D
dashboard
groups, 5-11
data
aggregating, 20-3
purging, 20-3
data purge policy, 20-4
data retention policies
for Application Performance Management
data, 20-2
Management data, 20-5
Management Repository, 20-2
modifying default, 20-5
database
insufficient memory, 20-9
database scheduler
troubleshooting, 20-7
Database Usage Tracking Report, 44-1
Database Usage Tracking Report, creating,
44-18
Database Usage Tracking Summary Report,
44-1
databases
moving tablespaces, 20-15
Datalinks, 32-1, 32-10
view, 32-2, 32-10
dbms_scheduler, 20-8
allowed sessions, 20-8
disabling, 20-8
DBMS_SCHEDULER
troubleshooting, 20-7
DBSNMP database user, 27-7
setting the password for, 27-7
default aggregation, 20-2
Default Templates, 7-2
deploying plug-ins, 23-19, 23-22
deployment, 23-4
deployment plug-ins, 23-21
deployment status, 23-23
discovering targets, 23-6
disk
details, 39-12
disk mirroring and stripping
Management Repository guideline, 20-1
disk space management
controlling the size and number of log and
trace files, 28-19
controlling the size of log and trace files,
28-20
downloading logs, 28-8
downloading plug-ins, 23-15, 23-16
drop command, 20-9, 20-10
dropping the Management Repository, 20-9
E
E-mail Customization, 3-9
e-mail notifications, upper limits, 3-4
e-mails, formats of, 1-11
EMCLI, setting up, 21-5
emctl
controlling blackouts, 4-5
emctl commands
Management Agent, 27-13
EMCTL Commands for OMS, 27-8
emctl reload, 27-15
emctl status blackout, 4-6
emctl upload, 27-14
emctl.log, 28-18
emctl.log file, 27-33
emoms_pbs.trc, 28-18
emoms.log, 28-19
emomslogging.properties
MaxBackupIndex, 28-20
MaxFileSize, 28-20
EMS
controlling, 12-23
downtime contacts, 12-17
EMSCA, 12-13
EMSCA, parameters, 12-13
EMSI
discovery, 16-5
Enterprise Manager
blackouts, functionality of, 1-6
monitoring templates, 1-7
Enterprise Manager, maintaining, 19-1
event attributes, 2-2
Event connectors, 1-14
Event Management, 2-2
events
historical data, 20-4
Events, 1-5
Extended Network, as substitute for Management
Agent, 1-2
extensibility paradigm, 23-2
F
Fabrics, 32-1, 32-5, 32-8
discovery, 16-26, 16-29
incidents, 32-9
performance metrics, 32-9
view, 32-2, 32-6
Fetchlets, 30-6
force quit
Index
3

force quit (continued)
Cloud Control Mobile, 45-10
G
gcagent_errors.log, 28-11
generating HTML reports, 43-2
Grid Control
stopping, 27-3
stopping all components of, 27-3
Group Hierarchy, 6-3
Group Members page, picture of, 5-11
groups
central monitoring location, 5-9
dashboard, 5-11
description and purpose, 5-1
management features, 5-5
member targets, 5-11
H
Health Overview, 19-2
helpdesk connectors, 1-14
home page
setting, 26-3
host
compliance, 39-14
compliance framework, 39-14
compliance standards, 39-14
memory, 39-9
metric settings, 39-13
metrics, 39-13
monitoring, 39-1
storage, 39-10
target compliance, 39-15
host metrics, 39-12
host services
states, 39-12
hourly metric collection, enabling, 44-8
Hybrid Cloud, 17-1
I
IBM WebSphere
Oracle ecosystem and, 1-2
iDevice
supported by Cloud Control Mobile, 45-1
Incident Attributes, 2-7
incident creation, 2-11
Incident Management, 2-5
Incident Manager, 1-12
Cloud Control Mobile, 45-4
Incident Priority, 2-7
Incidents
Incidents (continued)
fabrics, 32-9
switches, 32-2
incidents and problems
Cloud Control Mobile, 45-7
incidents, working with, 2-40
Information Publisher
Create Like function, 43-2
generating HTML reports, 43-2
overview of, 43-1
predefined reports, 5-13
report
definitions, 43-2
elements, 43-3
reporting framework, 43-1
sharing reports, 43-4
viewing reports, 43-4
informational updates, 21-7
iTunes App Store
Cloud Control Mobile, 45-1
J
Job Activity page, 10-1
job slave processes, 20-8
job_queue_processes, 20-8
jobs
analyzing job activity, 10-19
definition of, 10-1
Job Activity page, 10-1
job executions, 10-4
job runs, 10-4
modifying retention period, 20-6
multitask, 10-18
notification rules for e-mail, 10-12
operations on runs and executions, 10-4
privileges for sharing job responsibilities,
10-6
purpose of, 10-1
L
load balancer switches
BIG-IP, Oracle ecosystem and, 1-2
local store, 21-3
log files
controlling the size and number of, 28-19
locating and configuring, 28-1
locating Management Agent, 28-12
locating Management Service, 28-18
Management Agent, 28-11
Oracle Management Service, 28-17
searching, 28-6
log4j.appender.emlogAppender.
MaxBackupIndex, 28-20
Index
Index-4

log4j.appender.emlogAppender. MaxFileSize,
28-20
log4j.appender.emtrcAppender.
MaxBackupIndex, 28-20
log4j.appender.emtrcAppender. MaxFileSize,
28-20
logging in to Cloud Control Mobile, 45-2
logical domains
discovery, 16-7
login timeout setting, E-2
LVM (Logical Volume Manager), 20-1
M
Management Agent, 28-11
Critical URL Monitoring as substitute, 1-2
Extended Network as substitute, 1-2
purpose of, 1-1
Management Agent logs
setting log levels, 28-13–28-15
setting trace levels, 28-17
Management Information Base (MIB), 3-45
definition, 3-45
MIB variable descriptions, 3-46
Management Repository, 20-2
creating, 20-10
deployment guidelines, 20-1
dropping, 20-9
introduction of, 1-2
migration, 20-14
migration prerequisites, 20-14
recreating, 20-9
removing, 20-9
server connection hung error, 20-12
troubleshooting, 20-12
Management Service
starting and stopping on Windows systems,
27-5
managing
groups, 5-5
managing Cloud Control Mobile sites, 45-3
managing logs, 28-1
manual domain member discovery, 15-12
MAX_UTILIZATION, 20-9
MaxBackupIndex
property in emomslogging.properties, 28-20
MaxFileSize
property in emomslogging.properties, 28-20
memory
details, 39-12
metric
thresholds, 1-3
metric alert message, customizing, 1-8
Metric Baselines, 1-3
Metric Columns, Delta, 8-8
Metric Columns, Rate, 8-8
Metric Extension, 1-5
Metric Extension Lifecycle, 8-3
Metric Extension, creating, 8-8
Metric Extension, deleting, 8-16
Metric Extension, editing, 8-14
Metric Extension, exporting, 8-15
Metric Extension, importing, 8-15
metric extensions, 30-6
Metric extensions, 8-1
Metric Extensions, administrator privileges, 8-5
Metric Extensions, deploying, 8-16
Metric Extensions, updating older versions, 8-17
metrics
threshold values, 1-3
thresholds, 1-3
MGMT_METRICS_1DAY table, 20-5
MGMT_METRICS_1HOUR table, 20-5
MGMT_METRICS_RAW table, 20-5
MIB
See Management Information Base (MIB)
Migrating, 22-40
migration
post migration verification, 20-21
repository, 20-14
repository methodologies, 20-15
using physical standby, 20-19
modes of patching, 25-1
monitoring
alerts as they occur, 5-11
basics of, 1-1
templates
function of, 1-7
monitoring credentials
defined, 27-7
setting, 27-7
Monitoring Overview, 1-1
Monitoring Template, creating, 7-3
Monitoring Template, definition of, 7-2
Monitoring Template, editing, 7-4
Monitoring Template, retention period, 7-11
Monitoring Templates, 7-1
Monitoring Templates, applying to targets, 7-5
Monitoring Templates, compare with targets, 7-8
Monitoring Templates, exporting/importing, 7-10
Moving window baseline periods, 9-1
multitask jobs, 10-18
My Oracle Support, OMS Patches, 24-11
My Oracle Support, OPatchauto, 24-11
N
NetApp Filers
Oracle ecosystem and, 1-2
network
Index
5

network (continued)
connectivity, 39-10
Networks, 32-1
incidents, 32-2
metrics, 32-2, 32-11
operating system, 32-12
operating systems, 32-13
performance, 32-2
topology, 32-3
view, 32-2, 32-12
new product announcements, 21-7
Non-global zones, 40-1
Notification, 30-4
notification methods
based on a PL/SQL Procedure, 3-22
based on an SNMP trap, 3-36
based on operating system commands, 3-13
definition, 3-13
notification rules
definition, 3-6
out-of-box, 3-7
out-of-the-box notification rules, 3-4
subscribing to, 3-6
notification schedules, 3-4
notification system
e-mail errors, 3-81
errors, 3-79
trace messages, 3-79
notifications
alerts, 1-10
customizing, 1-11
defining multiple mail servers, 3-3
for jobs, 10-12
long e-mail notifications, 3-4
mail server settings, 3-2
management information base (MIB), 3-45
methods, 1-10
notification method, 1-10
notification schedules, 3-4
sample Operating System command script,
3-16
setting up, 3-2
short email notifications, 3-4
O
Offline mode, 25-1
OMS
emctl commands, 27-8
OMS Configurations, OPatchauto, 24-1
OMS Configurations,OPatchauto, 24-1
OMS timeout setting, E-2
Online mode, 25-1
opatchauto lspatches, 24-19
OPatchauto Parameters, 24-4
OPatchauto Property File, 24-4
opatchauto version, 24-13
OPatchauto, prerequisites, 24-6
operating system
boot environments, 39-11
configuration changes, 39-7
CPU metrics, 39-7
dashboard, 39-3
details and metrics, 39-4
host services, 39-12
incidents, 39-6
metric collection errors, 39-13
metrics, 39-13
monitoring, 39-1
top processes, 39-11
Operating System command
sample notification method for, 3-13
sample script, 3-16
Operating System scripts, 3-13
operating systems
discovery, 16-6
Operating systems
networks, 32-12, 32-13
Oracle
ecosystem, 1-2
Oracle Data Guard, 20-1
Oracle Enterprise Manager
log files, 28-1
Oracle Enterprise Manager Cloud Control, 27-3
Oracle HTTP Server logs, 28-21
Oracle Management Agent
about log and trace files, 28-11
location of log and trace files, 28-12
log and trace files, 28-11
Oracle Management Repository
data retention policies, 20-2
dropping, 20-9
identifying with a connect descriptor, 20-10,
20-11
recreating, 20-9, 20-10
starting the Management Repository
database, 27-3
troubleshooting, 20-12
Oracle Management Service
about the log and trace files, 28-18
configuring timeout settings, E-2
location the log and trace files, 28-18
log and trace files, 28-17
modifying monitoring credentials, 27-7
Oracle Management Service logs, 28-18, 28-19
Oracle Management Service trace files, 28-20
Oracle MiniCluster
discovery, 16-1
Oracle Process Management and Notification
(OPMN)
Index
Index-6

Oracle Process Management and Notification (OPMN) (continued)
using to start and stop the Management
Service, 27-5
Oracle Solaris
boot environments, 39-11
zones, 40-1
Oracle SuperCluster
discovery, 16-12
Oracle VM Server for SPARC
discovery, 16-7
Oracle WebLogic Server logs, 28-21
Oracle ZFS Storage
discovery, 16-22
oraEM4JobAlertTable, A-37
oraEMNGEvent, A-1
orAgentTraps, A-27
OS scripts
See Operating System scripts
OSI layers, 32-1
OUI Inventory Configurations, 24-3
Out-of-Box Monitoring, 1-1
out-of-box reports, 43-2
P
Patch Format, 24-3
patch management solution
rolling back patches, 25-8
Patches and Updates, 25-2
Agent patching
Add All To Plan, 25-5
Create Plan, 25-5
Null Platform, 25-6
View Plan, 25-5
Patches page, 25-7
Review and Deploy page, 25-9
patching Enterprise Manager
Management Agent patching errors, 25-10
Management Agents
accessing Patches and Updates, 25-2
applying Agent patches, 25-5
automated patching, 25-1
manual patching, 25-13
overview, 25-1
searching Patches, 25-3
verifying the applied agent patches, 25-10
viewing Patch recommendations, 25-3
patching Enterprise Manager core components,
25-1
patching Management Agents, 25-1
patching OMS, 25-1
patching Repository, 25-1
PDU
discovery, 16-18
Performance
Performance (continued)
network metrics, 32-2
switches, 32-2
performance metrics
Beacon Aggregation Function
maximum vallue, 29-23
minimum value, 29-24
sum of values, 29-24
System Aggregation Function
maximum value, 29-23
Performance metrics
fabrics, 32-9
SNMP.SNMPTimeout, 32-9
Performance Metrics
Beacon Aggregation Function
Average, 29-23, 29-24
Minimum, 29-23
Sum, 29-23
personlizing Cloud Control pages, 26-1
PL/SQL procedures, 3-13
while creating notification methods, 3-22
planning outage periods, blackouts, 1-6
plug-in archives, 23-17
plug-in homes, 23-30
plug-in id, 23-13
plug-in manager, 23-1, 23-9, 23-25
plug-ins, 23-2, 23-3, 23-11, 23-13, 23-16, 23-31
Ports
switches, 32-2
privileges
for corrective actions, 1-5
for sharing job responsibilities, 10-6
Problem Management, 2-11
ProcessManager
service used to control the Management
Service on Windows systems, 27-5
program resource utilization, 39-12
purge job
verified, 20-7
purge policy
default, 20-6
modifying, 20-6
purging policies, 20-2, 20-3
See data retention policies, 20-2
R
RAID-capable disk
Management Repository guideline, 20-1
Receivelets, 30-6
Reevaluating metric collections, 27-5
refresh WebLogic Domain targets, 15-12
Repeat Notifications, 3-12
RepManager, 20-13
Repmanager script, 20-9
Index
7

RepManager script, 20-9
reports
creating custom reports, 43-2
custom, 43-2
definitions, Information Publisher, 43-2
e-mailing, 43-4
generating HTML report, 43-2
Information Publisher, 43-1
out-of-box, Information Publisher, 43-2
predefined, 5-13
predefined report definitions, 43-2
report elements, 43-3
scheduling, 43-3
sharing, 43-4
storing and purging, 43-4
viewing, 43-4
requirements
Cloud Control Mobile, 45-1
resource utilization, 39-12
retention period, 20-7
retention times, 20-5
default, 20-5
retroactive blackouts, 1-6
Root Cause Analysis
mode
automatic, 29-9
manual, 29-9
Rule Actions, 2-18
Rule Criteria, 2-16
Rule Set Types, 2-14
Rule Set, developing, 2-23
rule sets, 2-12
rule sets, out-of-box, 2-13
Rule Sets, setting up, 2-32
Rules, 1-10
S
scheduled maintenance with blackouts, 1-6
scheduling
reports, 43-3
reports, flexibility, 43-4
searching logs, 28-6
Security
SNMP, 16-32, 32-9
Self Update feature
setting up, 21-1
using, 21-1
server
discovery, 16-8
Server Connection Hung
error while creating the repository, 20-12
Service Tests and Beacons
Tests
DNS, 29-12
Service Tests and Beacons (continued)
Tests (continued)
FTP, 29-12
SOAP, 29-12
Web Transaction, 29-12
Services control panel
using to start the Management Service, 27-5
setting
metric threshold values, 1-3
setting your home page, 26-3
sharing reports, 43-4
SNMP, 16-32, 30-1, 32-9
SNMP Trap, 30-4
SNMP traps, 3-13, 3-36
about, A-1
sample, 3-41
SNMP Traps, 30-5
SNMP.SNMPTimeout, 16-32
Software Library, 21-3
designers, 22-4
Operators, 22-4
Super Administrators, 22-4
users, 22-5
Software Library Administration, 22-8, 22-9
referenced file locations, 22-11
Agent storage, 22-11
http storage, 22-11
NFS storage, 22-11
upload file locations, 22-9
Software Library console, 22-1
Software Library referenced locations, 22-8
Software Library storage, 22-1
Software library upload locations, 22-8
Standby OMS System, patching, 24-13
status codes, corrective actions, 3-49
Switches
ports, 32-2
view, 32-2
system errors, notification, 3-79
system patch, 24-3
T
tables
modifying retention period, 20-5
tablespaces
transporting across platforms, 20-15
target
definition of, 1-1
target discovery
automatic, 15-1
using EMCLI, 15-11
WebLogic 10.x, 15-5
WebLogic 9.x, 15-5
target monitoring credentials
Index
Index-8

target monitoring credentials (continued)
defined, 27-7
setting, 27-7
target properties, 1-8
Template Collections, 1-7, 6-10
with administration groups, 6-20
template collections, privileges, 6-18
Threshold Change Frequency, adaptive
thresholds, 9-3
thresholds
definition of, 1-3
for metrics, 1-3
Time-based Static Thresholds, 9-11
Time-based Static Thresholds, deregistering,
9-13
Time-based Static Thresholds, registering, 9-11
Time-based Thresholds, 9-1
touch-and-hold
Cloud Control Mobile, 45-9
trace files
controlling the contents of Management
Service, 28-20
controlling the size and number of, 28-19
locating Management Agent, 28-12
locating Management Service, 28-18
Management Agent, 28-11
Oracle Management Service, 28-17
troubleshooting
general techniques while creating the
Management Repository, 20-12
Management Service, 27-31
notifications, 3-79
while creating the Management Repository,
20-12
Troubleshooting
Management Service startup errors, 27-31
troubleshooting Management Agent, 27-32
Troubleshooting Management Agent startup
errors, 27-32
Troubleshooting Service Tests, 29-43
Forms Transactions, 29-43
U
undeploying plug-ins, 23-24
Universal Installer, 20-12
updates
applying in offline mode, 21-6
applying in online mode, 21-5
updating Cloud Control, 21-1
upgrading plug-ins, 23-22, 23-23
Upgrading Plug-ins, 23-22
Upgrading Plug-Ins, 23-22
Usage metrics
Aggregation Function
average value, 29-25
maximum value, 29-25
minimum value, 29-25
sum of values, 29-25
Usage Tracking Reports, 44-1
V
Valid Metric Threshold, determining, 9-14
verification
post migration, 20-21
viewing
reports, 43-4
viewing logs, 28-3
VPN
Cloud Control Mobile requirement, 45-1
W
Web Application
Source
Step, 29-23
Step Group, 29-23
Transaction, 29-23
WebLogic Domain Refresh job, 15-11
weekly metric collection, enabling, 44-3
Z
zone
CPU and memory metrics, 40-8
zones
add to a group, 40-13
administrator access, 40-13
all metrics, 40-8
compliance, 40-12
configuration, 40-12
discovery, 16-6
edit properties, 40-13
incidents, 40-8
metric and collection settings, 40-10
metric collection errors, 40-10
metrics, 40-7
monitoring, 40-1
monitoring configuration, 40-11
platform metrics, 40-5
platform pages, 40-4
suspend monitoring, 40-11
suspending monitoring notification, 40-11
target navigation, 40-3
Index
9
