Dual Eligible Beneficiaries And Potentially Avoidable Hospitalizations 9815 PAHInsight Brief
User Manual: 9815
Open the PDF directly: View PDF ![]() .
.
Page Count: 7
Policy Insight Brief
September 2011
Dual Eligible Beneficiaries and
Potentially Avoidable Hospitalizations
Misha Segal
SUMMARY: About 25% of the hospitalizations for dual eligible beneficiaries in 2005 were
potentially avoidable. Medicare and Medicaid spending for those potentially avoidable
hospitalizations (PAHs) was almost $6 billion, or about 20% of tot al spending on inpatient care
for the dual eligibles. We estimate that those costs increased to $7–$8 billion in 2011.
The frequency of PAHs varied significantly by setting; they were much more likely to happen to
dual eligibles in skilled nursing facilities. At the state level, the frequency of PAHs among dual
eligibles varied by a factor of four from the lowest st ate (Alaska) to the highest (Louisiana).
Nationally, five conditions were responsible for more than 80% of P AHs. Congestive heart
failure was the most common reason overall, while pneumonia was the leading reason in SNFs.
The Centers for Medicare and Medicaid Services (CMS) is committed to achieving significant
reductions in PAHs as part of its efforts to improve the quality of health care services while
reducing per-capita health care costs. This report demonstrates that reducing the number of
PAHs among dual eligible beneficiaries would likely lead to both a meaningful decrease in
health care spending and improvement in the quality of care for a vulnerable and frail population.
“
We estimate
that $7 billion
to $8 billion of
Medicare
spending on
hospital
services were
from PAHs in
2011.
“
Dual eligible beneficiaries are those
that qualify for both Medicare and
Medicaid benefits and represent
approximately 20% of Medicare fee-for-
service beneficiaries. Dually eligible
beneficiaries tend to be seniors and
non-elderly people with disabilities, and are
generally poorer and have worse health
status than other Medicare beneficiaries.
Dual eligible beneficiaries also tend to use
more health care services, and account for
a disproportionate share of Medicare
spending.1, 2 A major driver for higher
spending among dual eligible beneficiaries
is their higher use of services, p articularly
inpatient hospitalizations. For example,
dual eligible beneficiaries are 1.6 times
more likely to be hospitalized than non dual
eligible beneficiaries and the average
Medicare spending for hospitalizations
among dual eligibles is higher than other
Medicare beneficiaries.1, 3 Hospitalizations
often can be avoided with access to good
primary and outpatient care, and quality
care within a facility.
Hospitalizations that could have been
avoided, either because the condition
could have been prevented or treated
outside a hospital setting, are termed
"potentially avoidable hospitalizations" or
PAHs and reducing PAHs presents an
opportunity to improve both the quality of
care and reduce overall Medicare
expenditures. This Policy Insight Brief
focuses on the prevalence and cost of
PAHs across health care settings,
variations in PAH rates by state, and
health conditions associated with PAHs.
Center for Strategic Planning
2
“
In 2005, there
were almost
2.7 million
hospitalizations
among dual
eligible
beneficiaries,
of which 26%
may have been
avoidable.
“
Inpatient Hospitalizations and
PAH for Dual Eligible Population
In 2005, among 5.6 million dual eligible
beneficiaries, 27% had at least one
hospitalization; with an average
hospitalization cost of $10,226 of which
96% (or $9,815) was borne by the
Medicare program, the primary payer for
inpatient hospital services.
Among the almost 2.7 million hospitaliza-
tions for dual eligible beneficiaries, almost
700,000 (or 26%) may have been
avoidable. The overall costs for these PAHs
were $5.6 billion, with the Medicare pro -
gram bearing 96% of these costs.
To put the expenditure figure of $5.6 billion
for PAHs into perspective, it is helpful to
view in terms of overall Medicare spending
on hospital services. In 2005, Medicare
spent $180 billion on hospital services and
hospitalizations that were potentially avoid-
able constituted 3% of all Medicare hospit al
expenditures. Based upon estimated
Medicare costs for hospital service for 2011
of about $250 billion; we estimate that $7
billion to $8 billion of these cost s may be
for PAHs.4
Table 1: Inpatient Hospitalizations for
Dual Eligible Population
Population 5,569,903
Percentage with a least one
hospitalization 27%
Total hospitalizations 2,691,276
• Total costs (in billions) $27.5
• Hospitalization rate (per 1,000
person years) 574
• Average length of stay (days) 7.1
• Average Medicare cost $9,815
• Average Medicaid cost $411
Source: CMS analysis of 2005 Medicare and Medicaid linked file
Table 2: Summary Statistics on Dual
Eligible Population and PAHs
Population 5,569,903
Percentage of hospitalizations that
were potentially avoidable 26%
Percentage of Dual Eligibles with
at least one PAH 9%
Percentage of all Medicare hospital
costs from Dual Eligible PAHs 3%
Potentially avoidable hospitalizations 699,818
• Total costs (in billions) $5.6
• Rate (per 1,000 person-years) 151
• Average length of stay (days) 6.1
• Average Medicare cost for PAHs $7,665
• Average Medicaid cost for PAHs $333
2011 projected costs attributable
to Dual Eligible PAHs $7-8 Billion
Source: CMS analysis of 2005 Medicare and Medicaid linked file
Potentially Avoidable
Hospitalizations across Health
Care Settings
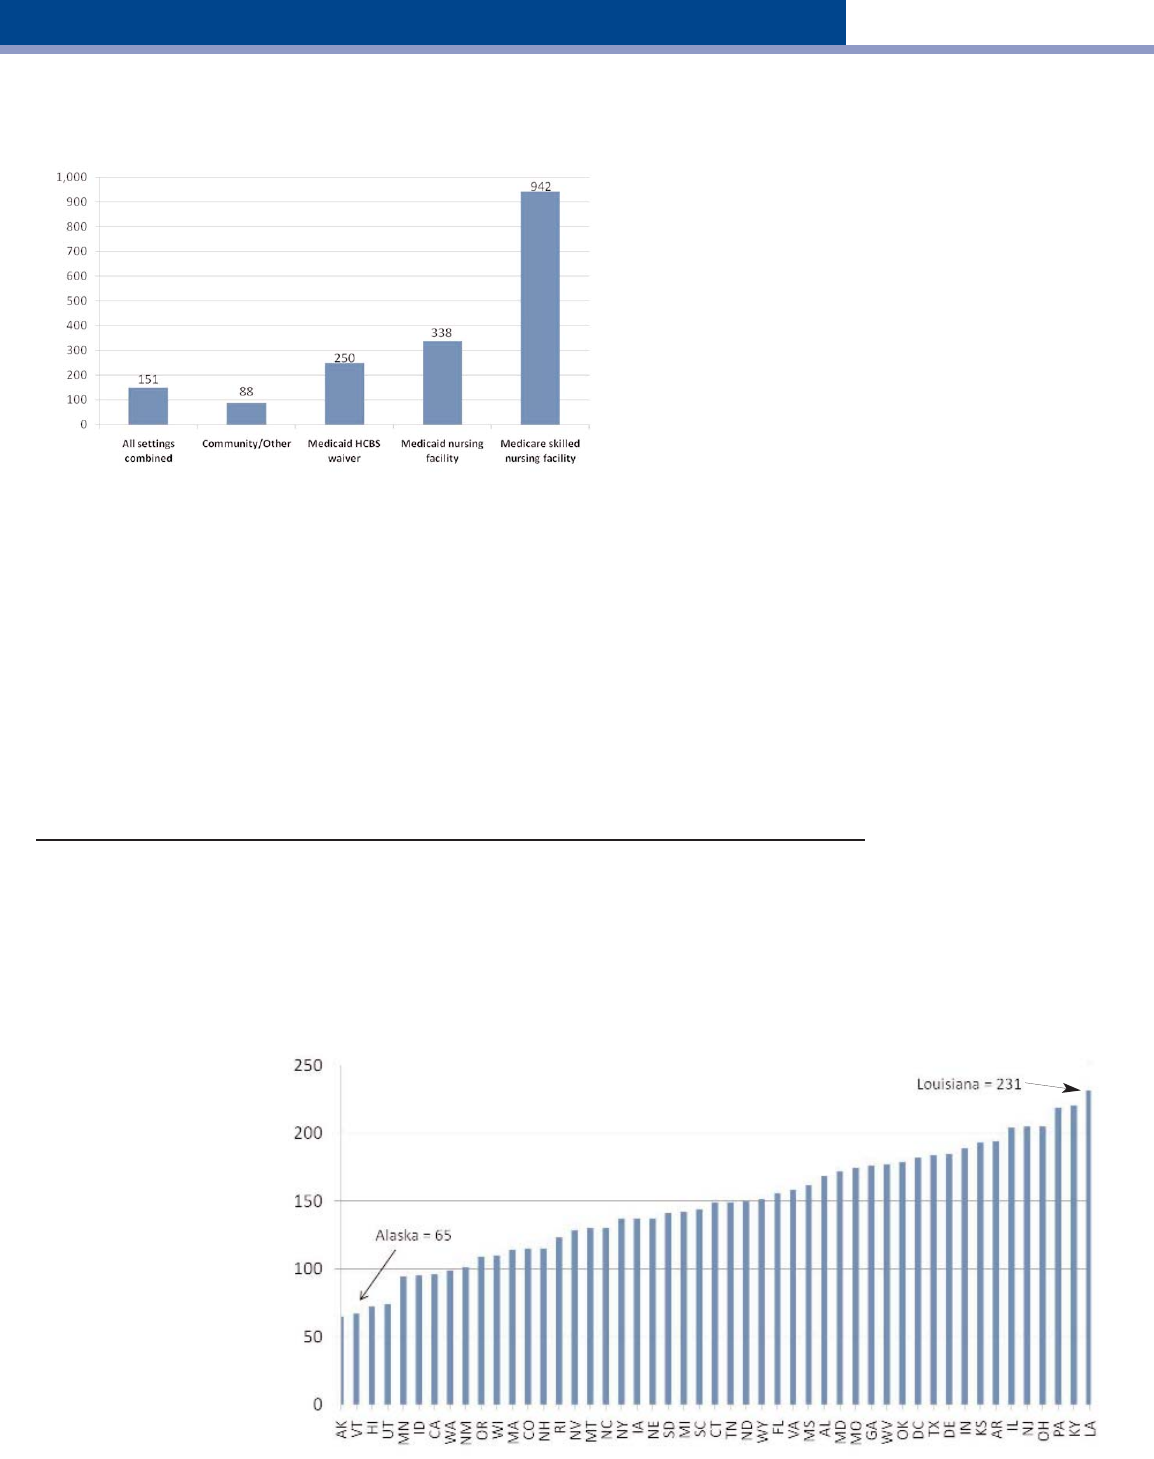
Overall, the PAH rate among dual eligible
beneficiaries was 151 per 1,000 person
years, but there was considerable variation
across health care settings. The rate was
highest in skilled nursing facilities (942 per
1,000 person years) followed by nursing
facilities. PAH rates were lowest for dual
eligible beneficiaries living in the
community, but varied by whether the
beneficiary received a waiver for home
and community based services (HCBS).
Those with the HCBS waiver had a PAH
rate of 250 per 1,000 person years
compared to 88 per 1,000 person years for
those without the waiver.
While differences in PAH rates across
settings are important for identifying
strategies to reduce potentially avoidable
hospitalizations, a few notes on the
interpretation of these differences is war-
ranted. First, beneficiaries spend far fewer
days in skilled nursing facilities (SNF) than
any other setting due to Medicare
coverage limitations and the key role
SNFs play in stabilizing and rehabilitating
complex patients. Further, these rates do
not adjust for the generally higher acuity
levels of SNF beneficiaries or the fact that
most SNF care immediately follows a
hospital stay – so many of the SNF PAHs
may also be readmissions.
Center for Strategic Planning
Figure 1: Differences across Settings
(Expressed per 1,000 person-years to adjust for differences in length of stay)
Source: CMS analysis of 2005 Medicare and Medicaid linked file
In addition to knowing the PAH rate across health care settings, it also is import ant to know
which settings have the highest percentage of beneficiaries with at least one PAH event.
Overall, the percentage of dual eligible beneficiaries who experienced at least one potentially
avoidable hospitalization was 9.1%. The percentage was highest for those in nursing home
settings at 16.4%, followed by beneficiaries with the HCBS waiver at 12.5%, skilled nursing
facility at 9.4%, and those in the community but not in HCBS at 5.2%.
Differences across settings in PAH rates and percentages reflect the fact that while the SNF
setting has the highest PAH rate, beneficiaries often do not spend much time in this setting.
In contrast, those in nursing facilities have more opportunities (more days in the setting) for
a PAH; as a result, nursing facilities have a higher percent age of beneficiaries with at least
one of these events.
Potentially Avoidable Hospitalizations across States
There is almost a fourfold difference in PAH rates across states, from the lowest in Alaska
(65 per 1,000 person years) to the highest in Louisiana (231 per 1,000 person years). While
the data show significant
variation across states, this Figure 2: Variation across States
study does not control for (Expressed per 1,000 person-years to adjust for differences in length of stay)
differences in patient health
across states. The underly-
ing data for all 50 states
can be seen in Table 3.
The states with the highest
and lowest overall PAH
rates showed little variation
across all health care
settings. Table 3 also
identifies the top five and
lowest five performing
states for each health care
setting.
U.S. Average = 151
Source: CMS analysis of 2005 Medicare and Medicaid linked file
3
“
PAH rates
vary across
health care
settings. PAH
rates are
highest for
dual eligible
beneficiaries
in skilled
nursing
facilities and
lowest for
those in
community
settings.
“

Table 3: Potentially Avoidable Hospitalizations by Source and State—Dually Eligible Beneficiaries from Aged or
Disabled, by Hospitalization Rate, 2005
Hospitalization rate (per 1,000 person-years)^^ -- Lowest 5 States ‡ , Highest 5 States †
State All Duals NF SNF HCBS Other/Community
U.S. 151 338 942 250 88
Louisiana 231† 551† 1,253† 301 115†
Kentucky 220† 463† 1,126 377† 116†
Pennsylvania 219† 318 1,025 317† 90
New Jersey 205† 446† 1,464† 2,423† 104
Ohio 205† 309 1,011 315 102
Illinois 204 395 1,196 248 94
Arkansas 194 447† 1,075 281 90
Kansas 193 344 928 212 78
Indiana 189 306 828 270 120†
Delaware 185 350 1,298† 211 83
Texas 184 414 997 266 89
District of Columbia 182 443 1,215† 379† 117†
Oklahoma 179 444 1,202† 272 86
West Virginia 177 393 895 348† 112†
Georgia 176 378 970 265 97
Missouri 174 365 1,048 245 99
Maryland 172 352 1,154 271 97
Alabama 168 337 869 226 103
Mississippi 162 487† 1,102 271 105
Virginia 158 308 754 307 90
Florida 156 345 973 252 97
Wyoming 151 247 634 231 63
North Dakota 150 242 615 197 80
Connecticut 149 202 704 204 67
Tennessee 149 409 1,018 253 110
South Carolina 144 325 908 279 97
Michigan 142 280 984 236 99
South Dakota 141 255 687 121‡ 67
Iowa 137 268 684 201 56
Nebraska 137 287 646 177 71
New York 137 293 814 * 92
Montana 130 206 556‡ 126‡ 90
North Carolina 130 312 758 279 95
Nevada 128 264 793 241 77
Rhode Island 123 320 1,063 264 61
Colorado 115 215 668 172 50‡
New Hampshire 115 162‡ 624 228 58
Massachusetts 114 290 782 271 72
Wisconsin 110 197 725 * 74
Oregon 109 180 826 137‡ 49‡
New Mexico 101 236 883 177 64
Washington 99 228 756 * 73
California 96 336 1,008 209 68
Idaho 95 185 530‡ 139‡ 42‡
Minnesota 94‡ 262 815 142 58
Utah 74‡ 156‡ 574 145 52
Hawaii 72‡ 133‡ 478‡ 166 58
Vermont 67‡ 147‡ 553‡ 133‡ 45‡
Alaska 65‡ 143‡ 195‡ 173 46‡
* Data unreliable; Note, Arizona and Maine also not included
^^ per 1,000 person year metric can be explained as follows. The national rate for NF is 338. On average, if three persons were to stay in a nursing facility for
365 days in the year, roughly one would have a PAH.
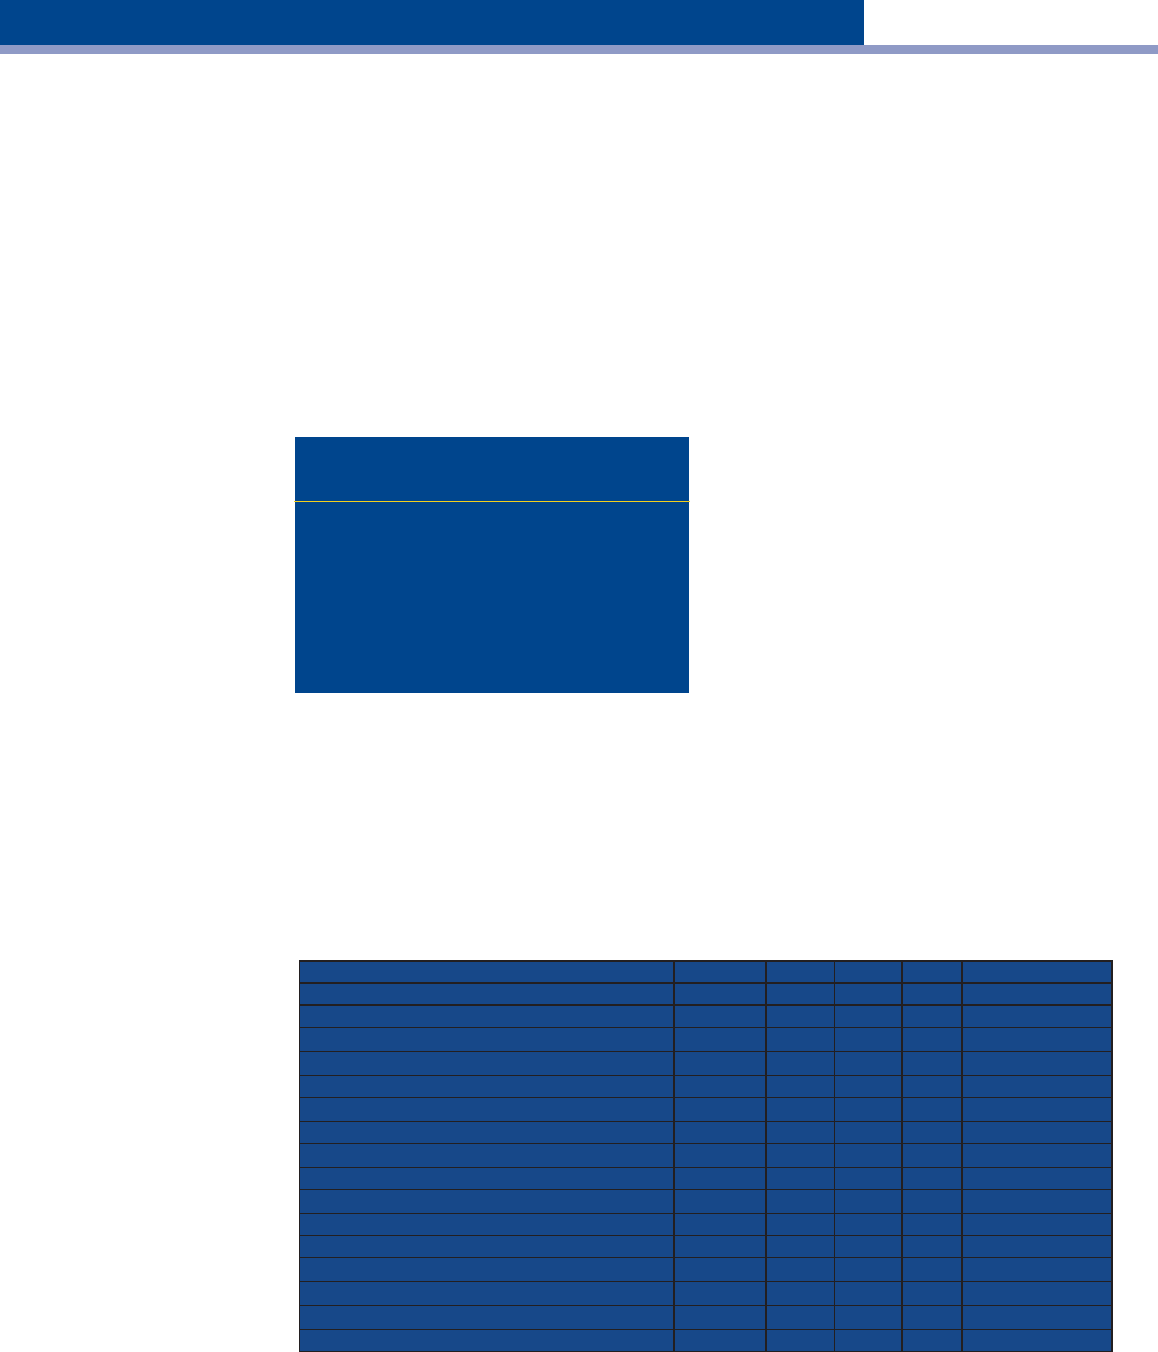
Leading PAH Conditions
Congestive heart failure, chronic obstructive
pulmonary disease/asthma, pneumonia,
dehydration, and urinary tract infections
were responsible for over 80% of potentially
avoidable hospitalizations. For all dually
eligible beneficiaries, the two leading
conditions were congestive heart failure
(22.9%) and chronic obstructive pulmonary
disease/asthma (17.0%).
Table 4: PAHs Primarily Attributable
to Select Conditions
Potentially
Condition avoidable Percentage
hospitalizations distribution
All 699,818 100.0%
Congestive heart failure 160,397 22.9%
COPD, Asthma 118,936 17.0%
Dehydration 103,024 14.7%
Pneumonia 101,357 14.5%
Urinary tract infection 87,296 12.5%
Sum of subgroup 571,010 81.6%
Center for Strategic Planning
5
Source: CMS analysis of 2005 Medicare and Medicaid linked file
There were differences by setting in the
conditions that were responsible for
potentially avoidable hospitalizations. In
general, the leading causes were similar for
beneficiaries in nursing facilities and SNFs,
while those in HCBS and otherwise in the
community had fairly similar breakdowns
by condition.
For those in nursing facilities and in SNFs,
pneumonia was the leading cause for a
PAH, accounting for nearly one-third of all
cases. The percentages were also similar
for urinary tract infections and dehydration.
However, some differences were seen
between the two settings. Congestive
heart failure accounted for 11.6% of
potentially avoidable hospitalizations from
nursing facility stays, but 16.8% from
skilled nursing facility stays. On the other
hand, falls/trauma accounted for 9.4% of
potentially avoidable hospitalizations from
Medicaid nursing facility stays, but 5.2%
from Medicare skilled nursing facility stays.
This underscores that the populations are
somewhat distinct.
For those in HCBS and otherwise in the
community, three conditions accounted for
nearly 75% of all PAHs-congestive heart
failure, COPD/asthma, and dehydration.
The biggest difference was observed with
urinary tract infection, where those in
HCBS had a significantly higher percent-
age than those otherwise in the community.
“
Five
conditions are
responsible
for over 80%
of the
potentially
avoidable
hospitalizations.
Congestive
heart failure
was the
leading
condition
associated
with a PAH.
“
Table 5: Percentage of Potentially Avoidable Hospitalizations by Condition and Setting
All Duals NF SNF HCBS Other/Community
Altered mental status, acute confusion, delirium 0.3 0.6 0.6 * *
Anemia 1.0 2.2 2.3 * *
COPD, asthma
17.0† 6.0 5.5 23.6† 26.6†
Congestive heart failure
22.9† 11.6† 16.8† 33.0† 30.8†
Constipation, impaction 1.4 1.1 0.8 2.0 1.6
Dehydration
14.7† 10.3† 12.9† 18.4† 17.7†
Diarrhea, gastroenteritis, C. Difficile 0.9 1.6 3.0 * *
Falls/trauma 3.8
9.4† 5.2 * *
Hypertension 1.0 0.2 0.2 1.0 1.8
Pneumonia
14.5† 32.8† 30.5† * *
Poor glycemic control 2.4 0.7 0.7 2.0 4.1
Psychosis, agitation, organic brain syndrome 0.6 1.4 1.1 * *
Seizures 4.2 2.6 2.1
3.6† 6.1†
Skin ulcers, cellulitis 2.3 4.9
5.9† * *
Urinary tract infection
12.5† 14.2† 11.7† 15.7† 10.6†
Weigh loss and malnutrition 0.6 0.4 0.8 0.7 0.7
* These conditions were not included for beneficiaries in HCBS or otherwise in the community.
† The top five conditions by setting.
“
For those in a
nursing facility
or SNF,
pneumonia
was the
leading
condition
associated with
a PAH.
“

Center for Strategic Planning
6
Policy Considerations and
CMS Initiatives
The misalignment between the Medicare and
Medicaid programs has been cited as one of the
leading causes for the high PAH rate among
dual eligible beneficiaries.5 Medicare is the
payer for inpatient hospital costs, so Medicaid
programs have few financial incentives to limit
hospitalizations. The perverse incentive is
particularly true for Medicaid nursing facility
residents, where complex patients can be sent
to a hospital for treatment at virtually no
additional costs to the Medicaid program.
In response, CMS has announced initiatives to
help combat the problem. The Medicare-
Medicaid Coordination Office in collaboration
with the Center for Medicare and Medicaid
Innovation will establish a new initiative to help
States improve the quality of care for people in
nursing facilities by reducing preventable inpa-
tient hospitalizations. This initiative supports the
Administration's Partnership for Patients goal of
reducing hospital readmission rates by 20% by
the end of 2013.6
CMS will competitively select and partner with
independent organizations that will provide
enhanced clinical services to people in
approximately 150 nursing homes. The
intervention will be targeted to nursing facilities
with high hospitalization rates and a high
concentration of residents who are eligible for
both the Medicare and Medicaid programs.
Conclusion
Dual eligible individuals make up less than 20%
of either Medicare or Medicaid beneficiaries, but
they account for about one quarter of Medicare
expenditures, with hospitalizations being a major
driver of increased costs3. This report shows
that 26% of all hospitalizations for this popula-
tion may have been avoidable and that roughly
one in ten dual eligible beneficiaries had at least
one PAH over the course of a year. The overall
costs for PAHs for dual eligible beneficiaries are
striking, accounting for 3% of all Medicare
spending on inpatient care in 2005. If this
percentage has remained constant since then,
the total costs in 2011 would be roughly $7-8
billion. Reducing the number of PAHs for dual
eligible beneficiaries would improve care and
likely lead to a meaningful decrease in Medicare
spending.
Data Source and
Methodological Notes
This research builds upon prior work conducted
by the Policy and Data Analysis Group on the
dual eligible population and examines the
prevalence and cost of PAHs across health
care settings, geographic areas, and type of
condition. The data source for this analysis is
the beneficiary level linked Medicare and
Medicaid administrative claims for 2005. The
study population includes fee-for-service (FFS)
beneficiaries, who were eligible for both
Medicare and full Medicaid benefits for at least
one month during the calendar year 2005,
representing nearly 85% of all dual eligible
beneficiaries (5.6 million of the total 6.6 million).
Dual eligible beneficiaries were excluded from
this analysis if they were enrolled in managed
care programs, lived in states that did not report
Medicaid data, or were assigned more than one
Medicaid identification number within the same
state.
Following the methods used in the report "Cost
Drivers for Dually Eligible Beneficiaries:
Potentially Avoidable Hospitalizations from
Nursing Facility, Skilled Nursing Facility, and
Home and Community-Based Services Waiver
Programs"3, PAH rates are expressed per 1,000
person years to take into account variation in
the length of stay across settings and to
standardize events by time. A higher rate in a
setting indicates that, on average, a person on
any given day in that setting would be more
likely to have a PAH than those in a lower rate
setting. For example, for nursing home benefici -
aries, the potentially avoidable hospitalization
rate is 338 per 1,000 person years. At a nursing
home, if three beds are full for the entire year ,
on average, the odds are that one person from
those three beds will have a potentially avoid -
able hospitalization. Also, in comparing condi-
tions across settings, we used a shorter list of
conditions for dual eligible beneficiaries receiv-
ing the HCBS waiver or otherwise in the com -
munity. The subset of conditions identified
reflects the lower levels of support available to
HCBS waiver enrollees compared to dual eligi-
ble beneficiaries in nursing facilities or skilled
nursing facilities. The major omission was
pneumonia, which accounts for nearly one-third
of PAHs for those in nursing facilities and
skilled nursing facilities. Other omissions
include altered mental state, anemia, diarrhea,
falls and trauma, psychosis, and skin ulcers.
Table 5 flags these conditions with an asterisk.

Center for Strategic Planning 7
Acknowledgements
The author is appreciative for the dat a analytics and programming performed by the Research Triangle Institute. The
author would also like to thank his colleagues in the Policy and Dat a Analysis Group, and in particular Niall Brennan and
Eric Rollins, for their insights and support.
Reviewer comments are gratefully acknowledged from the Center for S trategic Planning, Information Dissemination and
Analysis Group, particularly Christine S. Cox, Kimberly Lochner and Cynthia Riegler .
Author Information
Misha Segal, MBA is with the Center for Strategic Planning, Policy and Data Analysis Group at the Centers for Medicare
and Medicaid Services.
Suggested Citation
Segal M. Dual Eligible Beneficiaries and Potentially Avoidable Hospitalizations. Washington, DC: Centers for Medicare
and Medicaid Services, 2011.
References
1. MedPAC. A Data Book: Health Care Spending and the Medicare Program (June 2011). Washington, DC: Medicare
Payment Advisory Commission, 2011.
2. Coughlin T, Waidmann T, and O'Malley Watts M. Where Does the Burden Lie?
Medicaid and Medicare Spending for Dual Eligible Beneficiaries. The Kaiser Commission on Medicaid and the
Uninsured, the Henry J. Kaiser Family Foundation, 2009. http://www.kff.org/medicaid/7895.cfm Accessed September 1,
2011.
3. Walsh EG, Freiman M, Haber S, Bragg A, Ouslander J, and Wiener JM. Cost Drivers for Dually Eligible Beneficiaries:
Potentially Avoidable Hospitalizations from Nursing Facility, Skilled Nursing Facility, and Home and Community-Based
Services Waiver Programs. RTI International, CMS Contract No. HHSM-500-2005-00029I, 2010.
http://www.cms.gov/Reports/Downloads/costdriverstask2.pdf Accessed September 1, 2011.
4. Centers for Medicare and Medicaid Services. National Health Expenditure Dat a.
www.cms.gov/NationalHealthExpendData/25_NHE_Fact_Sheet.asp Accessed September 1, 2011.
5. Verdier, J. Coordinating and Improving Care for Dual Eligibles in Nursing Facilities: Current Obst acles and Pathways
to Improvement. Mathematica Policy Research, Inc, March 2010. http://www.mathematica-
mpr.com/publications/pdfs/health/nursing_facility_dualeligibles.pdf Accessed September 1, 2011.
6. Centers for Medicare and Medicaid Services, Medicare-Medicaid Coordination Of fice. Reducing Preventable
Hospitalizations Among Nursing Facility Residents. http://www.cms.gov/medicare-medicaid-
ordination/09_ReducingPreventableHospitalizationsAmongNursingFacilityResidents.asp#TopOfPage Accessed
September 1, 2011.
