PDFgetX3 And PDFgetN3 Ation PDFget XN3 Manual
User Manual:
Open the PDF directly: View PDF ![]() .
.
Page Count: 47

PDFgetX3 and PDFgetN3
Documentation
Release 2.0.0
Pavol Juhás, Timur Davis, Christopher J. Wright,
Christopher L. Farrow and Simon J. Billinge
November 02, 2018

CONTENTS
1 Introduction 1
1.1 License notice .............................................. 1
1.2 Authors .................................................. 1
1.3 References ................................................ 1
2 Installation 3
2.1 Software requirements .......................................... 3
2.2 Installation ................................................ 3
2.3 IPython magic command ......................................... 4
3 Quick-start guide 5
3.1 pdfgetx3 command ............................................ 5
3.2 pdfgetn3 command ............................................ 6
4 Tutorial 7
4.1 Nickel X-ray PDF ............................................ 7
4.2 Platinum X-ray series .......................................... 12
4.3 Interactive tuning of parameters ..................................... 14
4.4 Neutron PDF ............................................... 18
4.5 Fit twothetazero ............................................. 19
5 Files used in PDF extraction 21
5.1 Configuration file ............................................. 21
5.2 Input files ................................................. 21
5.3 Output files ................................................ 22
6 Interactive mode 23
7 Options and parameters 27
7.1 Program operation ............................................ 27
7.2 Configuration file options ........................................ 28
7.3 Input and output options ......................................... 28
7.4 PDF parameters ............................................. 30
7.5 Other parameters ............................................. 31
8 The plotdata program 33
8.1 Selecting files ............................................... 33
8.2 Selecting x and y data .......................................... 34
8.3 Examples ................................................. 34
9 Release notes 37
i


CHAPTER
ONE
INTRODUCTION
diffpy.pdfgetx is a simple yet powerful software for converting X-ray or neutron powder diffraction data to atomic
Pair Distribution Functions (PDFs). The software includes command line programs PDFgetX3 and PDFgetN3 for
processing X-ray and constant-wavelength neutron diffraction data respectively. PDFgetX3 and PDFgetN3 can be
used in a batch mode to convert a series of data files without user intervention. The programs can be also run in an
interactive mode that allows to control process parameters and plot the PDFs and any intermediate results. Users can
interactively tune the PDF processing parameters, visualize their effect on the results and adjust them to their optimum
values. The programs are bundled with Python library diffpy.pdfgetx for PDF processing functions, which can be used
in custom Python scripts.
1.1 License notice
Use of this software is subject to and permitted only under a separate, written Use License granted by Columbia
University. If you or your employer is not a party to such an agreement, then your use of this software is prohibited.
If you don’t know whether or not your anticipated use is under a license, you must contact Prof. Simon Billinge at
sb2896@columbia.edu. Use of this software without a license is prohibited.
Copyright 2009-2018, Trustees of Columbia University in the City of New York.
For more information please email Prof. Simon Billinge at sb2896@columbia.edu
1.2 Authors
This code was written by members of the Billinge Group at Columbia University and Brookhaven National Laboratory
including Pavol Juhás, Timur Davis, Christopher Wright, Christopher Farrow, Simon Billinge.
1.3 References
If you use this program for a scientific research that leads to publication, we ask that you acknowledge use of the
program by citing the following paper in your publication:
P. Juhás and T. Davis, C. L. Farrow, S. J. L. Billinge PDFgetX3: A rapid and highly automatable program
for processing powder diffraction data into total scattering pair distribution functions,J. Appl. Crystallogr.
46, 560-566 (2013)
For research publications that use this software to process neutron diffraction data we ask you to also cite:
P. Juhás, J. N. Louwen, L. van Eijck, E. T. C. Vogt, S. J. L. Billinge PDFgetN3: atomic pair distribution
functions from neutron powder diffraction data using ad hoc corrections,J. Appl. Crystallogr. 51 (2018)
1

PDFgetX3 and PDFgetN3 Documentation, Release 2.0.0
2 Chapter 1. Introduction

CHAPTER
TWO
INSTALLATION
2.1 Software requirements
This software is written in Python programming language, therefore you must have Python 3.7, 3.6, 3.5, 3.4 or 2.7
installed. In addition, the following third-party Python libraries are also required:
• setuptools - tools for installing Python packages
• six - Python 2 and 3 compatibility library
• NumPy - library for scientific computing with Python
• matplotlib - Python plotting library
• IPython - enhanced interactive Python shell
Standard Python releases can be obtained from https://www.python.org/downloads. The third-party libraries can be
found at the Python Package Index or using any Internet search engine.
Another more convenient option is to obtain one of the science-oriented Python distributions such as Anaconda Python,
Enthought Canopy or PythonXY, These distributions already include all the necessary libraries, so the required Python
software can be all installed in one step.
On Linux operating systems the third-party libraries are usually included in a system software repository. For example
on an Ubuntu Linux computer the software dependencies can be all installed with a single shell command
sudo apt-get install \
python3-six python3-setuptools python3-numpy python3-matplotlib ipython3
This may be, of course, as well accomplished using the GUI driven Synaptic package manager. Other Linux distribu-
tions may use different software management tools, but the names of the necessary packages should be very similar to
those above.
On Windows operating system, it may be necessary to add the C:\Python37 directory and the scripts directory
C:\Python37\Scripts to the system PATH. Some Python distributions already do so as a part of their installation
process. The easiest way to check is to start the Command Prompt, type there python and see if this starts the
Python interpreter.
2.2 Installation
The diffpy.pdfgetx software is distributed as a Python egg package, which can be obtained from the Columbia Tech-
nology Ventures. Once all the required software is in place, start the command prompt on Windows or a Unix terminal
on Linux or Mac, navigate to the directory that contains the egg file and execute the following command:
3

PDFgetX3 and PDFgetN3 Documentation, Release 2.0.0
python -m easy_install ./diffpy.pdfgetx-VERSION.egg
Here VERSION needs to be replaced to match the actual filename. It is critical to use one of the supported Python
versions otherwise the program would not work. On Linux and Mac operating systems the installation may need to run
with root user privileges, for example, by prepending sudo to the command line above. If root access is not available,
use the easy_install options --user,--prefix or --install-dir to install the software to a user-writable
directory.
This software provides two programs for PDF conversion, pdfgetx3 and pdfgetn3. To check if they are correctly
installed run
pdfgetx3 --version
pdfgetn3 --version
This should display the software version, which should equal the VERSION string in the egg package name. The
installation also includes a plotdata command for an easy plotting of text data files. To verify if plotdata works,
run the plotdata --version command. Finally, a comprehensive test of the installed software can be executed
using
python -m diffpy.pdfgetx.tests.run
2.3 IPython magic command
These instructions are intended for IPython users who would like to integrate PDFgetX3 and PDFgetN3 into their
IPython environment. If you don’t plan to customize IPython in such way you can safely skip this paragraph.
When pdfgetx3 or pdfgetn3 are run in interactive mode, they start IPython interactive shell and define an extra
%pdfgetx3 and %pdfgetn3 magic commands within the IPython session. The IPython magic commands are
not valid Python code, but work in a similar fashion as standard shell commands. The %pdfgetx3 and %pdfgetn3
magics can be thus used with the same options and arguments as if run from the shell. This is useful for processing
more files, while preserving all plots or variables that were already created in an IPython session.
The %pdfgetx3 and %pdfgetn3 magic commands can be defined permanently so they are available in all IPython
sessions. To set this up
1. find the profile_default/ipython_config.py file and open it in a text editor. If that file does not
exists, create it first by executing
ipython profile create
2. navigate to the paragraph that contains the c.InteractiveShellApp.extensions and add there the
following line:
c.InteractiveShellApp.extensions =['diffpy.pdfgetx.ipy_magics']
There must be no leading indent, i.e., the text must start at the very first column.
4 Chapter 2. Installation

CHAPTER
THREE
QUICK-START GUIDE
This guide assumes that the software has been correctly installed and its command line programs PDFgetX3 and
PDFgetN3 can be executed by typing pdfgetx3 or pdfgetn3 in a shell window. Please, refer to the installation
section if this is not working yet.
3.1 pdfgetx3 command
The pdfgetx3 program is a command-line application, therefore all the input files and run-parameters are supplied
either as command-line arguments or through a configuration file. In general, the pdfgetx3 is executed from a command
shell as
pdfgetx3 [options] input1 input2 ... inputN
The inputN stands for an input powder diffraction data. The inputN file is a simple two-column text file, where
the first column corresponds to either the 2Θdiffraction angle, or a momentum transfer, Q, in inverse nanometer or
inverse ångström units. The second column contains the corresponding X-ray intensities. The input file may start with
a header containing comments or metadata related to the measurement. PDFgetX3 will ignore any text leading to a
long two-column section. The example input files in this manual were created with the FIT2D program using its “chi”
output format, thus we will also refer to them as “chi-files”. A typical content of a “chi” file looks as folows:
Pt_bulk-00055.tif: 2-theta Scan
2-Theta Angle (Degrees)
1465
2.0003892E-02 0.0000000E+00
6.0011677E-02 0.0000000E+00
1.0001946E-01 0.0000000E+00
1.4002724E-01 0.0000000E+00
1.8003502E-01 0.0000000E+00
...
The command-line options are arguments that start with a dash “-” and are used to specify run-parameters or modify
the program behavior. The options can be specified in a short form that consists of a dash and a single character, or in
a long, more descriptive format starting with a doubled dash --. Options may require values. For short options, the
value may be joined to the option string, for example -w0.142774, while for the long options it has to be separated
with an equal sign, e.g., --wavelength=0.142774. Although all the PDF calculation parameters can be passed
as command line options, it is often more convenient to set them in a configuration file. When run parameter is present
both in a configuration file and as command-line option, the command-line value takes precedence. The command-line
options are all described in the Options and parameters section of this manual. A brief summary of options can be
also displayed by executing
5

PDFgetX3 and PDFgetN3 Documentation, Release 2.0.0
pdfgetx3 --help
The best way of getting familiar with PDFgetX3 is to process the example diffraction data described in the Tutorial.
In general, the first step is to create a commented configuration file pdfgetx3.cfg using:
pdfgetx3 --createconfig=pdfgetx3.cfg
The configuration file can have any name, but it is preferable to use either pdfgetx3.cfg or .pdfgetx3.cfg,
for these files are automatically loaded by PDFgetX3. All other configuration files must be passed explicitly to the
program using the -c, --config option.
Open the pdfgetx3.cfg file in a text editor. The lines that start with a hash mark #are comments and are not used.
The lines starting with a right brace [denote sections in the configuration file. The active lines are all formatted as
“NAME=VALUE”. Although PDFgetX3 has many options, in general only a few of them are critical for the PDF
calculation:
•dataformat – specifies the input data format
•wavelength – radiation wavelength in Å required for the “twotheta” format.
•composition – chemical composition of the sample
•qmaxinst – upper Qboundary for a meaningful measurement intensities.
•qmax –Q-cutoff for the Fourier transformation that yields the PDF.
Save the updated configuration file and run pdfgetx3 on the input data FILENAME.chi as
pdfgetx3 --verbose=info -t gr FILENAME.chi
Here the --verbose=info option makes pdfgetx3 print more information about its operation. This helps to verify
if the configuration file is indeed loaded and if the parameter values are assigned as intended. The PDFgetX3 will
not write any output files unless told so. The -t gr option tells the program to save the final G(r) curve as a
FILENAME.gr file in the working directory.
The saved .gr file contains a header with all the calculation parameters and the input file name. The .gr file can be
therefore also used as a configuration file in order to redo the same calculation
pdfgetx3 -c FILENAME.gr --plot=fq,gr
Note this command does not include any .chi file and this will as a result process the previously used input
FILENAME.chi. The --plot=fq,gr option tells PDFgetX3 to display 2 plots for the reduced structure func-
tion F(Q) and the final PDF G(r). The --plot option also implies an interactive mode therefore the program does
not exit, but starts an interactive IPython session. To exit the interactive mode, type exit() and press Enter.
3.2 pdfgetn3 command
The pdfgetx3 and pdfgetn3 programs operate in a very similar fashion apart from being set to assume X-ray and neutron
data respectively. The type of the scattering data can be also specified using the --mode option. Running pdfgetn3
is nearly identical to executing pdfgetx3 --mode=neutron. The only difference between these commands is
that pdfgetx3 checks for configuration files pdfgetx3.cfg and .pdfgetx3.cfg, whereas pdfgetn3 looks for
pdfgetn3.cfg and .pdfgetn3.cfg.
Please refer to the tutorial section for a step-by step processing of the example data files and for demonstration of
capabilities in PDFgetX3 and PDFgetN3.
6 Chapter 3. Quick-start guide

CHAPTER
FOUR
TUTORIAL
In this tutorial we will convert several X-ray powder diffraction patterns to corresponding PDFs. Open a terminal on
a Unix-based system or a Command Prompt on Windows and navigate to the examples folder included with the
PDFgetX3 distribution. The examples folder can be found in the parent “doc” directory relative to this document or
another option is to just search your file system for one of the input files mentioned below. The example files are also
available at https://www.diffpy.org/doc/pdfgetx/2.0.0/pdfgetxn3-examples.zip.
4.1 Nickel X-ray PDF
4.1.1 predefined configuration file
Change to the Ni directory. The file named ni300mesh_300k_nor_1-5.chi contains powder X-ray data mea-
sured from nickel at the Advanced Photon Source beamline 6ID-D. The file contains two columns for the 2Θscattering
angles and X-ray intensities. The second file kapton_bgrd_300k_nor_2-3.chi contains the background mea-
surement, i.e., the intensities from an empty capillary. Finally, the pdfgetx3.cfg contains a complete configuration
parameters for converting the powder pattern to a PDF. Since all processing parameters are already defined in the con-
figuration file, the first PDF calculation is very simple and involves running the pdfgetx3 program with the powder
data file as an argument:
$ pdfgetx3 ni300mesh_300k_nor_1-5.chi
For the first run there should be no output on the screen, however a new file, ni300mesh_300k_nor_1-5.gr
should appear in the work directory. We can use the plotdata program, included with this software, to plot the output
data:
$ plotdata ni300mesh_300k_nor_1-5.gr
This will open a graph window and start an IPython interactive session. To exit and close the figure, type exit() on
the IPython prompt. Let’s run the program again, but now with a --verbose=info option, to show more details
about the program actions.
$ pdfgetx3 --verbose=info ni300mesh_300k_nor_1-5.chi
INFO:applying pdfgetx3 defaults
INFO:set config.mode = xray
INFO:searching for default config file /home/user/.pdfgetx3.cfg
INFO:searching for default config file .pdfgetx3.cfg
INFO:searching for default config file pdfgetx3.cfg
INFO:loaded default config file pdfgetx3.cfg
INFO:reset config.twothetazero = 0.0
INFO:parsing config file section [DEFAULT]
(continues on next page)
7

PDFgetX3 and PDFgetN3 Documentation, Release 2.0.0
(continued from previous page)
INFO:set config.dataformat = twotheta
INFO:set config.backgroundfile = kapton_bgrd_300k_nor_2-3.chi
INFO:set config.outputtypes = gr
INFO:set config.wavelength = 0.142774
INFO:set config.composition = Ni
INFO:set config.qmaxinst = 26.5
INFO:set config.qmax = 26.0
INFO:set config.rmin = 0.0
INFO:set config.rmax = 30.0
INFO:set config.rstep = 0.01
INFO:finished parsing config file
INFO:processing command line options
INFO:set config.verbose = info
INFO:finished with command line options
INFO:using 1 input files from the command line.
INFO:configuring PDFGetter mode 'xray'
INFO:calling config_xray
INFO:started PDF processing.
INFO:processing 'ni300mesh_300k_nor_1-5.chi'
INFO:resolved output file '' as 'ni300mesh_300k_nor_1-5.gr'
WARNING:ni300mesh_300k_nor_1-5.gr already exists.
WARNING:Use "--force=yes" or "--force=once" to overwrite.
INFO:elapsed time: 0.095
Here we can see what configuration files are searched, which of them get loaded and what are the effective values of
the processing parameters. Unless the --verbose option is in effect, the program will show only messages that have
either WARNING or ERROR importance. The warning line above indicates no output has been written, because that
file already exists. This safety check can be overruled with the --force=yes option, upon which pdfgetx3 would
overwrite any existing files.
PDFgetX3 output files start with a header that lists all the processing parameters and can be used as a valid configu-
ration file with the -c option. Another option, --plot=[iq,sq,fq,gr] turns on plotting of the final PDF or of
some other result. A side effect of the --plot option is that pdfgetx3 starts in an interactive mode, so the user can
manipulate or save the plots. To put it all together, we are now going to redo the original PDF and plot its reduced
total scattering function F(Q) and the PDF curve G(r). This time the chi file is not necessary, because the input file is
already listed in the gr file that is now used as a custom configuration:
$ pdfgetx3 -c ni300mesh_300k_nor_1-5.gr --plot=fq,gr
WARNING:ni300mesh_300k_nor_1-5.gr already exists.
WARNING:Use "--force=yes" or "--force=once" to overwrite.
Variables related to PDF processing:
pdfgetter -- PDFGetter used for calculation.
config -- configuration data used by PDFGetter.
See config.inputfiles for a list of inputs.
iraw -- matrix of input raw intensities with 2 rows per file.
iq sq fq gr -- intermediate results per each input file stored
as matrix rows.
Functions:
tuneconfig -- dynamically tune configuration variables.
processfiles -- process specified data files.
clearsession -- clear all elements from the inputfiles, iraw,
(continues on next page)
8 Chapter 4. Tutorial
PDFgetX3 and PDFgetN3 Documentation, Release 2.0.0
(continued from previous page)
iq, sq, fq and gr variables.
plotdata -- plot all or selected columns from a text data file.
loaddata -- load all or selected columns from a text data file.
findfiles -- search for files matching the specified patterns.
Use "%pdfgetx3" for a fresh run without exiting IPython.
In [1]:
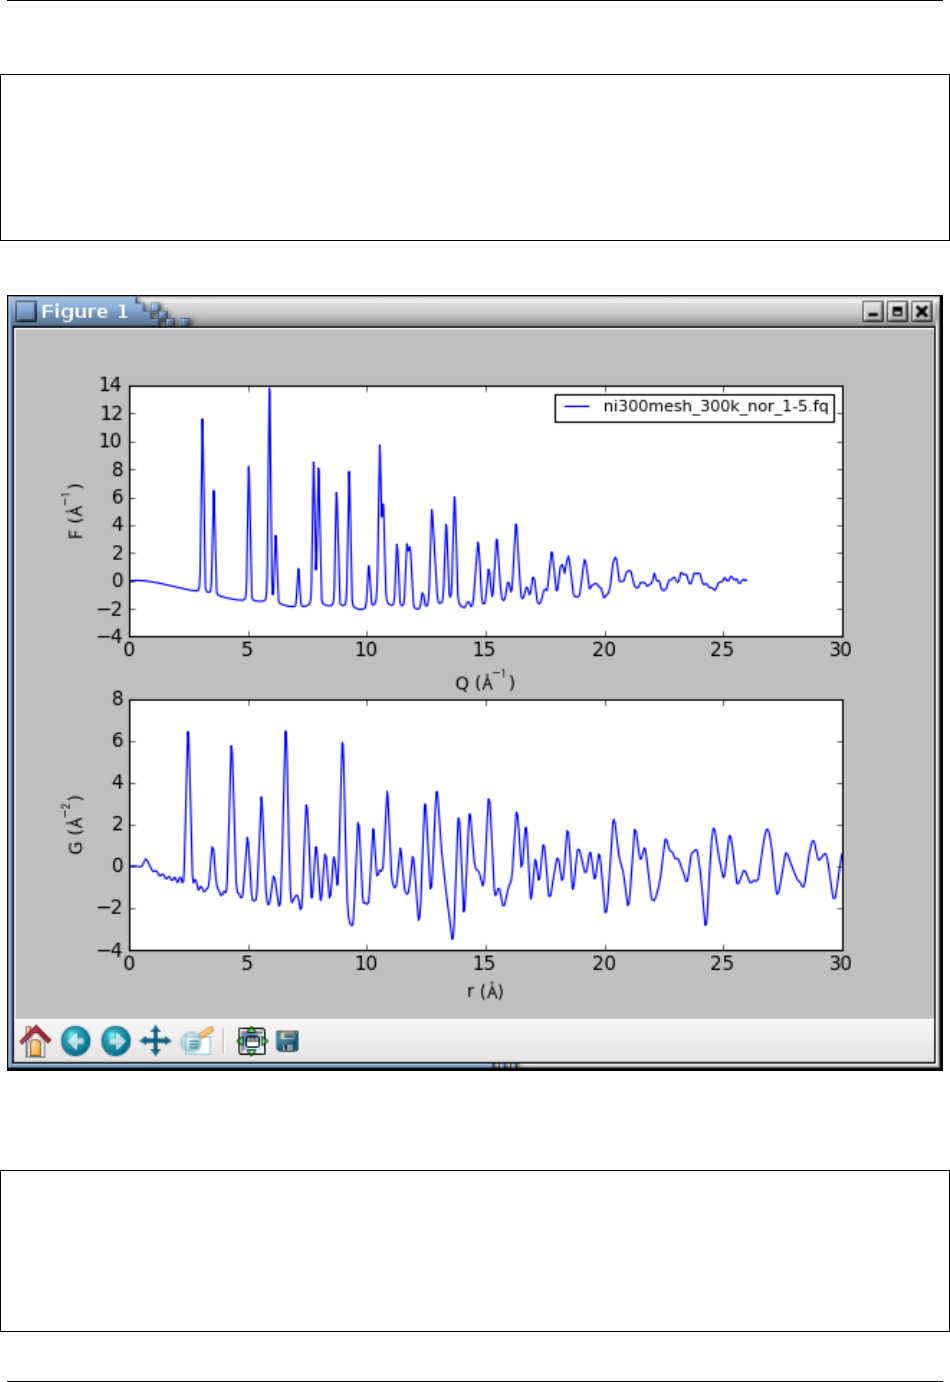
This will open a plot figure similar to
Because of the interactive mode implied by plotting, the program enters an IPython session. The IPython environment
is preloaded with several extra functions and variables related to the PDF processing. For example, the config
variable stores all the configuration parameters, and its content can be displayed with the print() function as
In [1]: print(config)
configfile =ni300mesh_300k_nor_1-5.gr
configsection =DEFAULT
dataformat =twotheta
...
qmax =26.0
(continues on next page)
4.1. Nickel X-ray PDF 9

PDFgetX3 and PDFgetN3 Documentation, Release 2.0.0
(continued from previous page)
...
The processfiles() function allows to redo the whole calculation and plotting process for additional input
files or for new parameter values. To plot the F(Q) and G(r) curves calculated at Qmax = 22 Å-1, we can call
processfiles() and pass it a keyword argument for the new qmax as follows:
In [2]: processfiles(qmax=22)
# the qmax parameter was updated to a new value, thus
In [3]: config.qmax
Out[3]: 22
There should be now two lines in each plot axis corresponding to the results at Qmax equal 26 and 22 Å-1. To exit the
program, type exit().
4.1.2 processing from scratch
We have already encountered the command-line option -c for specifying a custom configuration file. A special
argument “NONE”, will make pdfgetx3 ignore any configuration files and start up in a default state. We can use this
feature to process the nickel PDF as if we did not have any configuration file:
$ pdfgetx3 -c NONE ni300mesh_300k_nor_1-5.chi
WARNING:Nothing to do, use "-t" or "--plot" options.
ERROR:Configuration error: wavelength not specified.
ERROR:See "--help" for more hints.
There is an error, for the wavelength is necessary to convert the scattering angle 2Θto momentum transfer Q. The
X-ray wavelength was 0.142774 Å, which can be passed with the -w, --wavelength option:
$ pdfgetx3 -c NONE ni300mesh_300k_nor_1-5.chi -w 0.142774
...
ERROR:Configuration error: Chemical composition not known.
ERROR:See "--help" for more hints.
There is still an error. The PDF calculation needs an average X-ray scattering factor of the material, which is obtained
from sample chemical composition. The composition can be specified with the --composition option. The
example below uses a “\” character to indicate the command continues on the next line. Such syntax works in Unix
terminals, but on Windows the command has to be typed all on a single line:
$ pdfgetx3 -c NONE ni300mesh_300k_nor_1-5.chi -w 0.142774 \
--composition=Ni
WARNING:Nothing to do, use "-t" or "--plot" options.
...
There was no error message this time, but the program complains about a lack of action. The pdfgetx3 program does
not write any results unless instructed by the -t, --outputtypes option. The outputtypes option recognizes
the following result types: “iq”, “sq”, “fq”, “gr”. One or more of these type strings, separated by a comma, can be
included with the -t option, which will produce the corresponding output files. An empty string, such as -t "", or
-t NONE may be used to clear any outputtypes defined in the configuration file, and avoid the unseemly file-exists
warnings.
10 Chapter 4. Tutorial
PDFgetX3 and PDFgetN3 Documentation, Release 2.0.0
At this point, we will not write any output files, but will use the --plot option to display the calculated curves. The
--plot accepts the same arguments as outputtypes, so to display the F(Q) and G(r) curves we shall run
$ pdfgetx3 -c NONE ni300mesh_300k_nor_1-5.chi -w 0.142774 \
--composition=Ni --plot=fq,gr
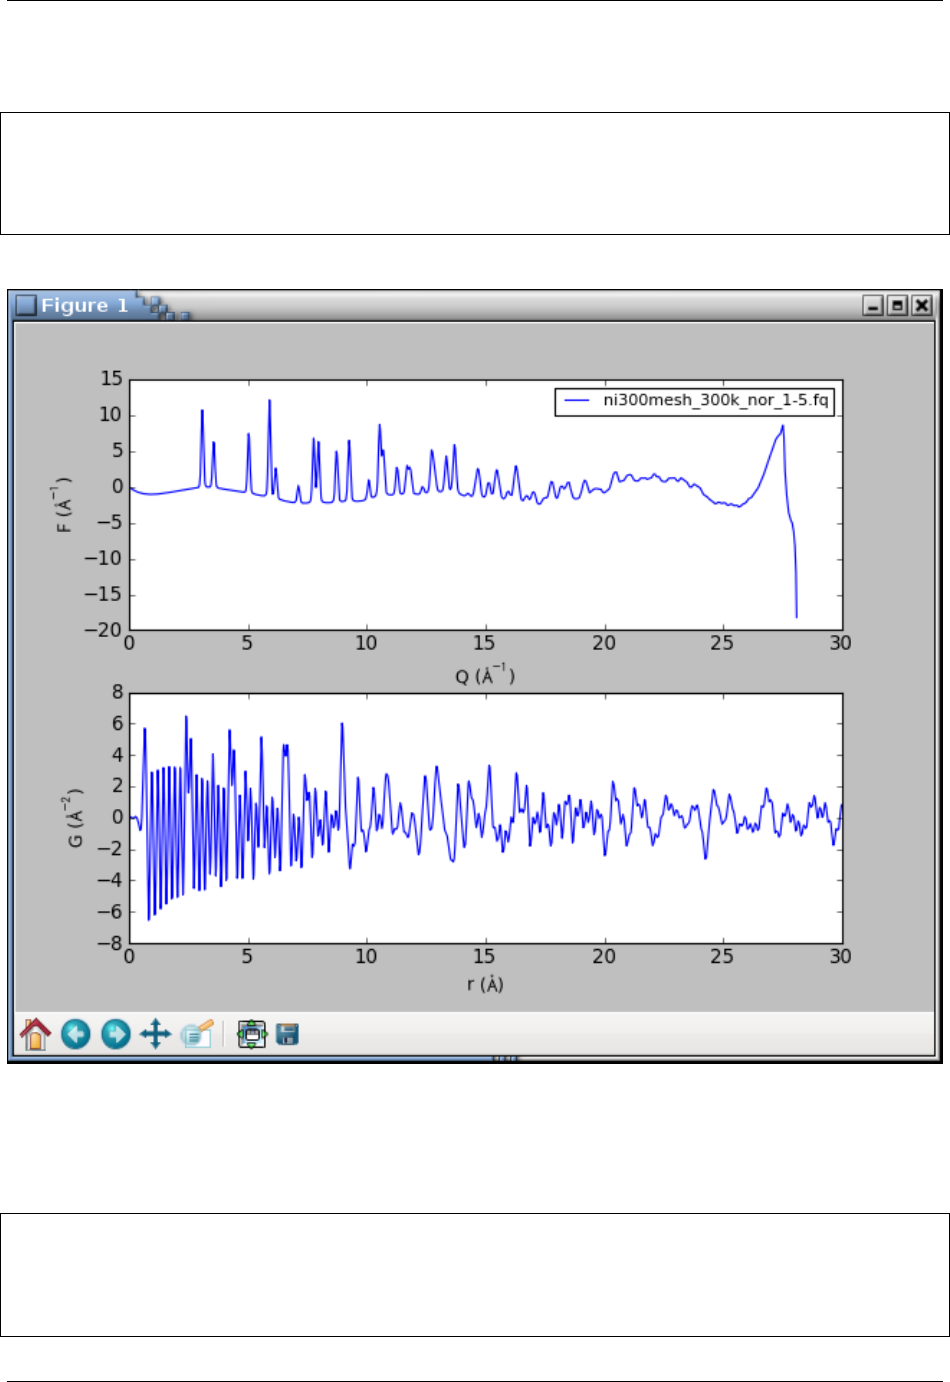
WARNING:qmaxinst reset to last nonzero point qmaxinst=28.0865680161
WARNING:qmax reset to the data boundary qmaxinst=28.0865680161
which should open the following plot window:
The graphs look terrible. The PDF is very noisy and the F(Q) curve shows a sudden break at about 27 Å-1. What
happened? The powder intensities are inaccurate at a very top of the detector angular range. The interactive session
is setup with iraw,iq,sq,fq,gr variables for the original raw data and intermediate results. We are going to
plot the “iq” variable that has the input intensities resampled on the Qgrid. The matplotlib function clf() clears the
figure, the iq variable is a two-row matrix with Qand Irows, and the axis() function lets us zoom to a given range:
In [1]: clf()
In [2]: plot(iq[0], iq[1])
Out[2]: [<matplotlib.lines.Line2D at 0x3e20f50>]
In [3]: axis([20,29,0,3000])
Out[3]: [20,29,0,3000]
4.1. Nickel X-ray PDF 11

PDFgetX3 and PDFgetN3 Documentation, Release 2.0.0
The graph shows a sudden drop in the raw intensities at 27 Å-1. The qmaxinst variable defines a Qcutoff for a
meaningful instrument intensities and, to be on a safe side, we are going to set it to 26.5 Å-1
In [4]: processfiles(qmaxinst=26.5)
WARNING:qmax reset to the data boundary qmaxinst=26.5
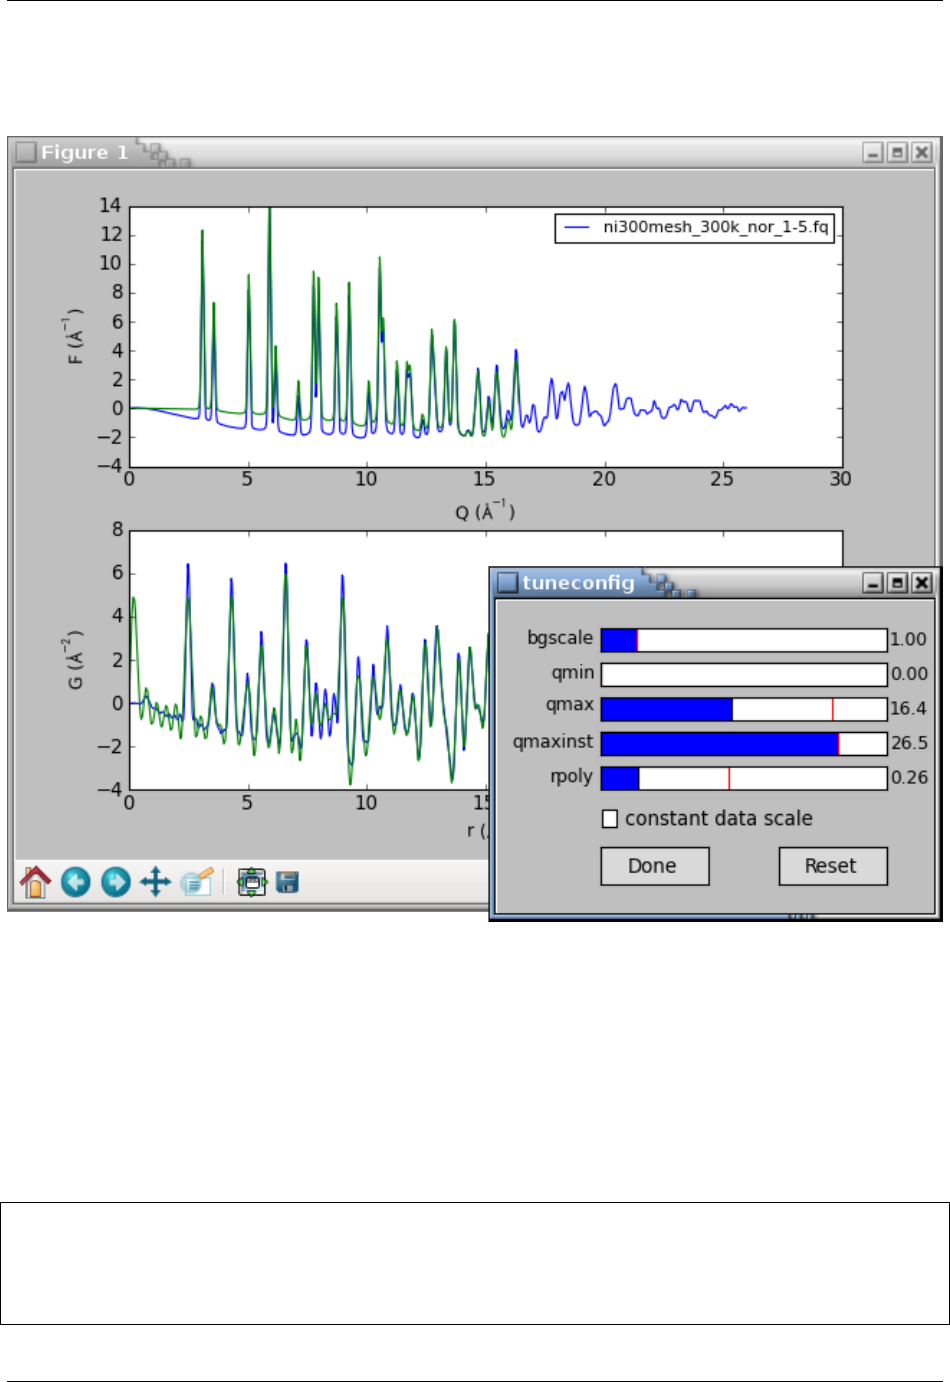
The updated curves looks reasonable without any oscillations and breakpoints. The tuneconfig() func-
tion provides a GUI-driven way for visualizing the processing parameters and their effect on the results. Type
tuneconfig() to execute the function, which should open a new window with several sliders. Try to move different
sliders and see how do the F(Q) and G(r) curves change. The rpoly parameter controls the degree of data-correction
polynomial and is an approximate low-rbound of reliable Gvalues. Once the parameters are tuned, they may be set
to exact values. We will also turn on the writing of the G(r) curve and save it to an output file nicmd.gr:
In [14]: config.qmax =26
In [15]: config.outputtypes ='gr'
In [16]: config.output ='nicmd'
In [17]: processfiles()
4.2 Platinum X-ray series
PDFgetX3 has been designed to handle large series of data files. With the fast area-detectors it is easy to measure
hundreds of X-ray patterns in a time or temperature series. Normally, these input files need to be entered as command
line arguments to the pdfgetx3 program. This is usually no problem with Unix-like shells, which expand filename
patterns to a list of matching files. However, such file generation is in general not available on Windows. The input file
names tend to include scan numbers which are useful for selecting desired data, yet even with Unix shells it is difficult
to match a range of scan numbers (z-shell being a notable exception).
4.2.1 matching input files
The pdfgetx3 program includes a built-in function for finding a set of input files. The command line arguments are
normally taken as input file names. However, if the -f, --find option is present, the arguments are understood as
patterns and the program looks for files that match ALL of them. Another option -l, --list makes pdfgetx3 print
out the matching files without any other action, which can be used to verify if the patterns match intended files.
We will try out this file search on platinum example files. Open a terminal and navigate to the Pt directory. There
should be a series subdirectory with 6 chi files indexed from 903 to 908. At first, let’s stay in the Pt directory and
run the following command
$ pdfgetx3 --list --find
Pt_bulk-00055-pdfgetx2.gr
Pt_bulk-00055-pdfgetx3.gr
Pt_bulk-00055.chi
empty_capillary-00032.chi
pdfgetx3.cfg
plotpdfcomparison.py
Without any patterns the file search matches all files in the current directory. Now let’s try to add name patterns. There
are few special patterns, for example ^matches at the beginning of the filename, $at the end and <N-M> matches a
range of integer values from Nto M. The patterns containing ^$<> need to be quoted as these characters have special
meaning in the shell. Here are some examples how it works.
Filenames containing “y”:
12 Chapter 4. Tutorial

PDFgetX3 and PDFgetN3 Documentation, Release 2.0.0
$ pdfgetx3 --list --find y
empty_capillary-00032.chi
plotpdfcomparison.py
Filenames that containing both “y” and “chi”, here we use the options --list and --find in an abbreviated form
-l and -f:
$ pdfgetx3 -lf y chi
empty_capillary-00032.chi
Filenames that start with “e”:
$ pdfgetx3 --list --find "^e"
empty_capillary-00032.chi
Filenames that contain character “2”:
$ pdfgetx3 --list --find 2
Pt_bulk-00055-pdfgetx2.gr
empty_capillary-00032.chi
Filenames that contain numeric value “2”:
$ pdfgetx3 -lf "<2>"
Pt_bulk-00055-pdfgetx2.gr
The special argument +starts a new group of patterns to generate extra files when they cannot be all covered by a
single set of patterns. For example, to match files that contain contain both “bulk” and “chi” substrings and then also
those that have “empty” and “chi” in their names, use:
$ pdfgetx3 -lf bulk chi + empty chi
Pt_bulk-00055.chi
empty_capillary-00032.chi
When pattern groups overlap the resulting matches are made unique and each file is listed only once
$ pdfgetx3 -lf bulk chi + chi
Pt_bulk-00055.chi
empty_capillary-00032.chi
4.2.2 data search path
Each group of PDFgetX3 patterns can have one entry containing forward slash “/” to specify a non-current path that is
searched for input files. The path specification affects the current and the following pattern groups unless they provide
their own path. The chi files numbered “903” to “905” and “908” from the series subdirectory can be therefore
matched using
$ pdfgetx3 -lf series/ "<903-905>" + 908
series/Pt_bulk_ramp03-00903.chi
series/Pt_bulk_ramp03-00904.chi
series/Pt_bulk_ramp03-00905.chi
series/Pt_bulk_ramp03-00908.chi
The current directory can be selected using ./
4.2. Platinum X-ray series 13

PDFgetX3 and PDFgetN3 Documentation, Release 2.0.0
$ pdfgetx3 -lf series/ 903 + ./ bulk chi
series/Pt_bulk_ramp03-00903.chi
Pt_bulk-00055.chi
When additional pattern groups contain only the path argument, they reuse the existing set of patterns. The “.chi”-
ending files in the current and series directories can be thus found using
$ pdfgetx3 -lf ".chi$" + series/
Pt_bulk-00055.chi
empty_capillary-00032.chi
series/Pt_bulk_ramp03-00903.chi
series/Pt_bulk_ramp03-00904.chi
series/Pt_bulk_ramp03-00905.chi
series/Pt_bulk_ramp03-00906.chi
series/Pt_bulk_ramp03-00907.chi
series/Pt_bulk_ramp03-00908.chi
4.2.3 output file names
By default the output files are saved in the current directory. The output path, can be changed with the -o,
--output option. The -o recognizes several tokens that are replaced with parts of the input file name, for ex-
ample, “@b” expands to an extension-stripped base name. In similar faction, “@o” is replaced with the output type
extension. Thus to generate PDFs for all files in the series directory and save them in the series-gr subfolder
do
$ pdfgetx3 --find series/ "<900-910>.chi" --output=series-gr/@b.@o
The extension “.@o” is automatic when not included anywhere in the output file name. Thus to process the Pt series
at Qmax = 18 Å-1 while saving the results in the same folder, but with a “_qmax18” suffix in their filenames do
$ pdfgetx3 --find series/ "<900-910>.chi" --qmax=18 -o series-gr/@b_qmax18
For input file Pt_bulk_ramp03-00903.chi the -o option above expands to output path series-gr/
Pt_bulk_ramp03-00903_qmax18.gr. The series-gr directory should now contain 12 “gr” files, 6 of them
processed at Qmax = 27 Å-1 as given by configuration file and 6 others processed at Qmax = 18 Å-1.
See also:
-o, --output for a list of output tokens
4.3 Interactive tuning of parameters
One of the most powerful features of PDFgetX3 is the ability to tune PDF processing parameters in an interactive
mode and immediately visualize their effect on the results. To demonstrate this feature, navigate to the Ni directory
in the shell and process the nickel PDF while plotting the F(Q) and G(r) curves. Because of plotting the program will
open an interactive IPython session. The tuning mode can be then entered by calling the tuneconfig() function
from the IPython environment
$ pdfgetx3 --plot=fq,gr ni300mesh_300k_nor_1-5.chi
...
In [1]: tuneconfig()
14 Chapter 4. Tutorial
PDFgetX3 and PDFgetN3 Documentation, Release 2.0.0
The tuneconfig() function will by default add a second set of live lines for the plotted curves and open a GUI
dialog with sliders for the tunable process parameters. Changing any slider would immediately recalculate the PDF
and update live lines in the plot.
The constant data scale check-box rescales the result curves to a constant maximum value. This is useful for assessing
if a parameter change produces different curve shape or if it just rescales the results. The tunable parameters are
described in the PDF parameters section. Only the active parameters are displayed in the tuneconfig GUI, thus there
would be no slider for the bgscale parameter if PDF has been processed without any background data.
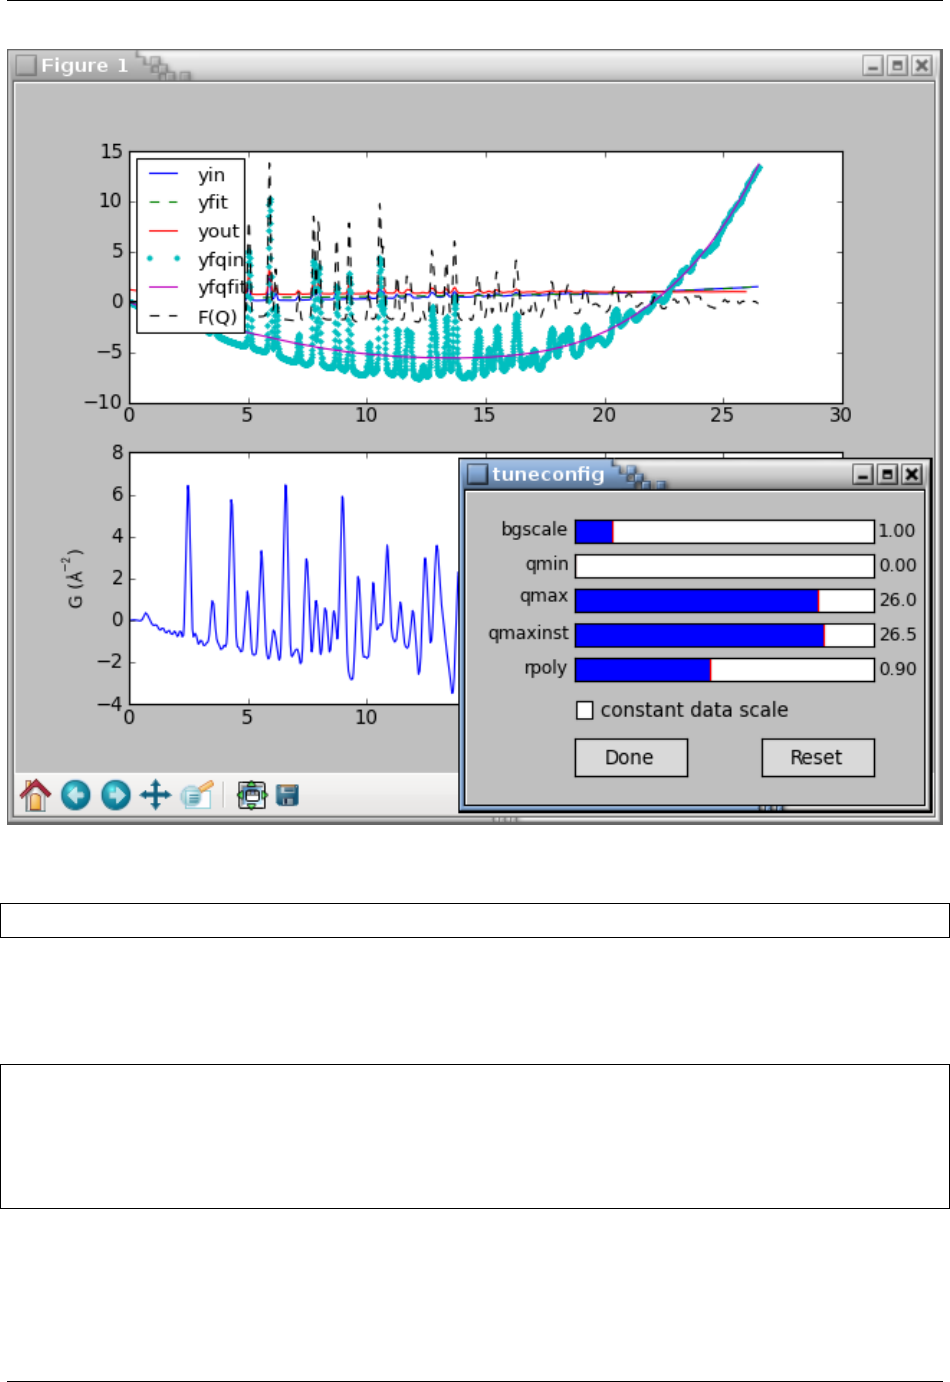
By default the tuneconfig() function displays the same curves as specified by the --plot option, however it
can be configured to show arbitrary intermediate results or even visualize selected steps in the PDF processing. We
shall demonstrate this by showing a live-plot of the polynomial correction together with the final PDF. At first, we
shall use the describe() method of the pdfgetter() object to print out the chain of transformations involved in
the PDF processing and obtain a reference to the transformation object t4 that applies the polynomial correction. The
transformation object can be then included in a list of plot identifiers that are passed to the tuneconfig() function
$ pdfgetx3 -i ni300mesh_300k_nor_1-5.chi
...
Use "%pdfgetx3" for a fresh run without exiting IPython.
In [1]: fig, ax = subplots(2)
(continues on next page)
4.3. Interactive tuning of parameters 15

PDFgetX3 and PDFgetN3 Documentation, Release 2.0.0
(continued from previous page)
In [2]: pdfgetter.describe()
0 TransformTwoThetaToQA
convert x data from twotheta to Q in 1/A
1 TransformQGridRegular
Remove the data outside the (qmin, qmaxinst) range
2 TransformBackground
subtract background intensity
3 TransformXrayASFnormChris
scale and normalize intensities by x-ray scattering factors
4 TransformSQnormRPoly
Normalize S(Q) by fitting a polynomial
5 TransformSQToFQ
Convert S(Q) to F(Q).
6 TransformFQgrid
Resample F(Q) to a regular grid suitable for FFT
7 TransformFQToGr
Convert F(Q) to G(r).
In [3]: t4 = pdfgetter.getTransformation(4)
In [4]: tuneconfig([t4, 'gr'], axeslist=ax)
In [5]: ax[0].legend(loc=2)
The subplots() function above is to create a new figure with 2 axes on top of each other. Overall, the code above
should display the following plot and a GUI window:
16 Chapter 4. Tutorial
PDFgetX3 and PDFgetN3 Documentation, Release 2.0.0
The tuning can be finished by clicking the Done button or closing the tuneconfig GUI window. The parameter values
can be thereafter adjusted to a rounded values by setting an attribute of the config object, for example:
In [5]: config.bgscale =1.5
Finally, to save the new results, we shall first confirm outputtypes have been correctly set and then use the
processfiles() function to redo the calculations, plots and data output for the updated configuration. Note
that the processfiles() function accepts keyword arguments for configuration parameters. This is used at line
In [8] to turn on the force flag and is in effect a shortcut for an extra config.force = True statement.
In [6]: config.outputtypes
Out[6]: ['gr']
In [7]: processfiles()
WARNING:ni300mesh_300k_nor_1-5.gr already exists.
WARNING:Use "--force=yes" or "--force=once" to overwrite.
In [8]: processfiles(force=True)
ni300mesh_300k_nor_1-5.gr was successfully saved at an updated configuration for there were no warnings
after the last call.
4.3. Interactive tuning of parameters 17

PDFgetX3 and PDFgetN3 Documentation, Release 2.0.0
4.4 Neutron PDF
This example illustrates PDF extraction from neutron powder data using pdfgetn3. Navigate to the n-Sapphire
directory in the shell. The sapphire755.dat file contains powder diffraction data from sapphire (𝛼-Al2O3) mea-
sured at the constant-wavelength PEARL instrument at the Delft University of Technology. The pdfgetn3.cfg
configuration file specifies processing parameters such as wavelength,twothetazero,composition, and
mode.
To extract the sapphire neutron PDF run
$ pdfgetn3 --verbose=info sapphire755.dat
INFO:applying pdfgetn3 defaults
INFO:set config.mode = neutron
INFO:searching for default config file /home/user/.pdfgetn3.cfg
INFO:searching for default config file .pdfgetn3.cfg
INFO:searching for default config file pdfgetn3.cfg
INFO:loaded default config file pdfgetn3.cfg
INFO:reset config.twothetazero = 0.0
INFO:parsing config file section [DEFAULT]
INFO:set config.dataformat = twotheta
INFO:set config.backgroundfile =
INFO:set config.outputtypes = fq, gr
INFO:set config.mode = neutron
INFO:set config.wavelength = 1.0989
INFO:set config.twothetazero = -0.38
INFO:set config.composition = Al2O3
INFO:set config.qmaxinst = 11.2
INFO:set config.qmax = 11.2
INFO:set config.rmin = 0.0
INFO:set config.rmax = 20.0
INFO:set config.rstep = 0.01
INFO:finished parsing config file
INFO:processing command line options
INFO:set config.verbose = info
INFO:finished with command line options
INFO:using 1 input files from the command line.
INFO:configuring PDFGetter mode 'neutron'
INFO:calling config_neutron
INFO:started PDF processing.
INFO:processing 'sapphire755.dat'
INFO:resolved output file '' as 'sapphire755.fq'
INFO:written outpufile sapphire755.fq
INFO:resolved output file '' as 'sapphire755.gr'
INFO:written outpufile sapphire755.gr
INFO:elapsed time: 0.097
This will produce two files sapphire755.fq,sapphire755.gr for the F(Q) and G(r) functions. To compare
them with expected results use
$ plotdata sapphire755-expected.fq sapphire755.fq
$ plotdata sapphire755-expected.gr sapphire755.gr
18 Chapter 4. Tutorial
PDFgetX3 and PDFgetN3 Documentation, Release 2.0.0
4.5 Fit twothetazero
For a good quality PDF it is essential to use powder patterns with accurate values of Q. Some instruments may
produce spectra with a slightly offset scattering angle 2Θwhich causes inaccurate Qand a noticeably worse PDF. In
this example we fit a constant-wavelength neutron PDF from nickel together with the twothetazero correction
parameter for diffractometer offset. The procedure can be used to calibrate the zero correction from a standard sample
and then use it for subsequent PDF extractions. The protocol can be also applied to fit zero correction in a full-fledged
PDF refinement in case the zero offset may change for different samples.
This tutorial requires either Linux or Mac OS X platforms, because the PDF fitting is conducted with DiffPy-CMI,
which is not yet available for Windows. If DiffPy-CMI is not yet installed, we recommend to use Anaconda Python
and set up a dedicated Anaconda environment nbcmi for this tutorial. This can be accomplished using the following
steps:
$ conda create -n nbcmi -c diffpy python=2 diffpy-cmi
$ conda activate nbcmi
$ python -m easy_install path/to/diffpy.pdfgetx-VERSION.egg
When these prerequisites are in place, change to the n-twothetazero-fit directory and open the self documented
Jupyter notebook as follows
$ jupyter notebook fit-twothetazero.ipynb
The notebook sets up and executes several PDF refinements and compares the results from fits on uncorrected data
and with a fitted twothetazero. After running all cells the notebook should produce similar graphs as in the figure
below.
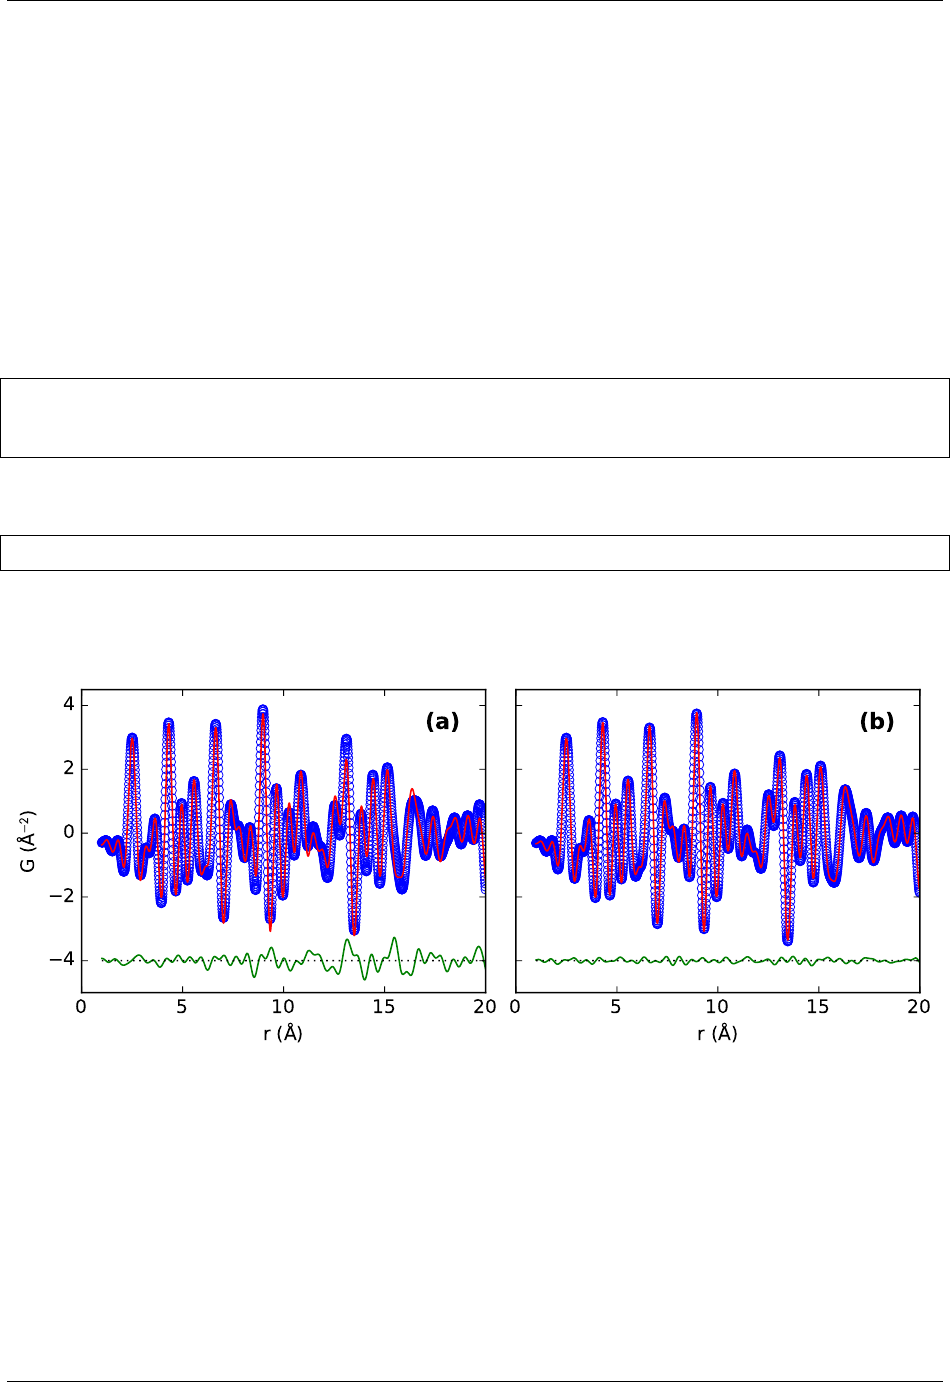
Fig. 1: Refinement of nickel neutron PDF for (a) uncorrected data and (b) with a refined zero correction. The extracted
PDFs are plotted as blue circles, simulated PDFs as red lines and the difference is plotted offset in green below.
The final refined zero offset in the notebook should be approximately -0.36°. The correction produces experimental
PDF with a remarkably better fit residual Rwwhich is lowered from (a) 0.18 to (b) 0.05.
4.5. Fit twothetazero 19

PDFgetX3 and PDFgetN3 Documentation, Release 2.0.0
20 Chapter 4. Tutorial

CHAPTER
FIVE
FILES USED IN PDF EXTRACTION
5.1 Configuration file
Configuration files may define the PDF processing parameters. By default, the pdfgetx3 program attempts to read
.pdfgetx3.cfg file from the user HOME directory, then .pdfgetx3.cfg and pdfgetx3.cfg files from the
current working directory. If configuration file has a different name, it needs to be specified with the -c, --config
option. The pdfgetn3 program works in the same way, except it checks for configuration files ~/.pdfgetn3.
cfg,.pdfgetn3.cfg and pdfgetn3.cfg.
The easiest way of creating a configuration file is to generate a template content using the --createconfig option
as
pdfgetx3 --createconfig=test.cfg
and then change the generated test.cfg file in your favorite text editor. The configuration file follows a simple “var-
name=value” syntax, any lines starting with “#” are ignored as comments.
The configuration file has several sections marked as [SECTIONNAME]. The [DEFAULT] section is mandatory and
it contains the default global settings. Any other sections are optional and they are applied only when selected with
the -s, --section option on the command line. Thus
pdfgetx3 --config=test.cfg --section=nacl
would read the parameters from the [nacl] section after reading the defaults. Having several sections in the con-
figuration file is useful when there are multiple measurements that share most of the parameters, but differ in a few
of them, for example in chemical composition. The configuration file can then contain sections per each sample that
define only the composition, while all other parameters are specified just once in the global DEFAULT section.
5.2 Input files
PDFgetX3 and PDFgetN3 accept input powder diffraction data in the form of two-column text file, where the first
column x is either the scattering angle 2Θin degrees, momentum transfer Qin inverse nanometers or Qin inverse
ångströms. The second column y contains the corresponding scattered intensities normalized per unit solid angle. The
actual type of the x-values is identified by the dataformat parameter. The input files may contain header with
comments or metadata, and the actual data are read from the first long section of numerical values.
The input files are usually passed as command-line arguments to pdfgetx3 or pdfgetn3 programs and must be
paths accessible from the current working directory.
Input files can be also defined by setting the inputfile value in the configuration file. The -d, --datapath op-
tion can be then used to provide additional data directories to search for these inputs and for the backgroundfile.
This is to support configuration files located in a different directory than the data.
21

PDFgetX3 and PDFgetN3 Documentation, Release 2.0.0
When the --find option is active, the pdfgetx3 arguments are understood as filename patterns and the input files are
found in the current or specified directory.
5.3 Output files
PDFgetX3 and PDFgetN3 can produce up to four different output data files:
• .iq – I(Q), the background-corrected intensities sampled on a regular Q-space grid in inverse ångströms,
• .sq – S(Q), the total scattering structure function, with intensities normalized by average scattering factors and
corrected by a polynomial fit,
• .fq – F(Q), the reduced structure function equal to Q(S(Q) - 1),
• .gr – G(r), the resultant PDF, where the first column is the separation rin ångströms and the second is the
function Gin Å-2.
You can specify what output files should be produced by setting the outputtypes parameter in the configuration
file or by passing the -t, --outputtypes on the command line.
The header of all output files contains the parameter values that were used in the calculation and thus it is by itself
a valid configuration file. When passed as an argument to the --config option, the PDFgetX3 will reproduce the
previous calculation.
22 Chapter 5. Files used in PDF extraction

CHAPTER
SIX
INTERACTIVE MODE
The interactive mode is activated by using either the -i, --interact option or a non-empty --plot option.
In the interactive mode the program starts an IPython interactive shell and pre-loads several functions and variables
related to the PDF calculation. It also defines IPython commands %pdfgetx3 and %pdfgetn3, which can be used
with the same syntax as the pdfgetx3 and pdfgetn3 in system shell. The interactive session is also initialized with
all functions from the matplotlib.pyplot module for convenient plotting. The functions and variables related
to PDF processing are:
pdfgetter(x=None,y=None,filename=”,**kwargs)
Instance of the PDFGetter class which serves as a low-level function that calculates the PDF. This is a callable
object, which takes as an argument a pair of input arrays for (Q, intensity) or (2Θ, intensity) depending on
dataformat. It can be also called with a keyword argument filename=FILE, which would read the input
arrays from the specified file. When called with no arguments, it calculates PDF from the last input data.
Parameters
•x(numpy.ndarray, optional) – The Qor 2Θvalues in powder diffraction pattern.
•y(numpy.ndarray, optional) – The scattered intensities in powder diffraction pattern
•filename (str, optional) – The text data file for loading the x,yvalues when they are not
specified.
•kwargs (misc, optional) – Extra keyword arguments that are applied to the config object,
for example qmax=20.
Returns A pair of output arrays (r, G).
config
Instance of the PDFConfig class that stores the parameters and input files for the program. Use
print(config) to display the current configuration values. This is the same object as pdfgetter.
config. Configuration may be changed by setting a respective attribute of the config object, for example:
In [1]: config.qmax =21
The config values may be also changed by calling the pdfgetter() or processfiles() function with
a corresponding keyword argument, for example processfiles(qmax=20, force="once").
iraw
iq
sq
fq
gr
These variables are assigned the input raw intensities and the intermediate results, stored as matrix rows. The
matrix rows correspond to twotheta1, intensity1, twotheta2, intensity2, etc. Because matrices are iterated row
first, the raw intensities from all input files can be plotted with the matplotlib plot function as plot(*iraw).
23

PDFgetX3 and PDFgetN3 Documentation, Release 2.0.0
These variables should be considered read-only and are reset with subsequent PDF calculations.
tuneconfig(plotids=None,pdfgetter=None,axeslist=None)
Show a GUI dialog for interactive tuning of configuration variables.
Parameters
•plotids – The string or iterable that specify what interactive plots should be tuned. By
default the same as config.plot. It can be also an integer index or name of a transfor-
mation in pdfgetter() or a reference to a Transformation object.
•pdfgetter – The optional PDFGetter object to be tuned. This is by default the inter-
active pdfgetter() object.
•axeslist – An optional list of matplotlib Axes for showing interactive plots. When None,
use subplot(N, 1, i) to create any necessary axes.
Note: Changes from tuneconfig() apply only to the configuration and results in memory. Use the
processfiles() function to save them to disk.
See also:
Interactive tuning of parameters tutorial
processfiles(filename=None,**kwargs)
Process all input files again with the current configuration values. This is a higher-level function than
pdfgetter(), as it also saves output files and produces plots as specified by the config object.
Parameters
•filename – One or more input files to be converted to PDFs and saved or plotted according
to the config settings. Use the previous list of input files when not specified.
•kwargs – An optional keyword arguments to set for the config object, for example
(force="once", qmax=18).
This function updates the config.inputfiles list and the iraw,iq,sq,fq and gr interactive variables.
clearsession()
Clear all elements from the config.inputfiles and also the iraw,iq,sq,fq and gr variables.
Returns No return value.
loaddata(filename,minrows=10,usecols=None,**kwargs)
Find and load data from a text file.
The data reading starts at the first matrix block of at least minrows rows and constant number of columns. This
seems to work for most of the datafiles including those generated by PDFGetX2.
Parameters
•filename (str) – Name of the file to load the text data from.
•minrows (int, optional) – Minimum number of rows in the first data block, by default 10.
All rows must have the same number of floating point values.
•usecols (int, str, slice, iterable, optional) – Indices or names of the columns to be loaded
from the data block, the default is all columns. Data blocks that do not contain sufficient
number of columns are skipped. When usecols contain string items, they are translated to
column indices by looking up a header line preceding the data block. String items formatted
as i:j:k are converted to slice objects. When usecols type is string it is split to a list of
names at comma and whitespace characters.
24 Chapter 6. Interactive mode

PDFgetX3 and PDFgetN3 Documentation, Release 2.0.0
•unpack (bool, optional) – Return data as a sequence of columns that allows tuple unpacking
such as x, y = loaddata(FILENAME, unpack=True). Note that transposing the
loaded array as loaddata(FILENAME).T has the same effect. The default is False.
•kwargs (misc, optional) – Extra keyword arguments that are passed to numpy.loadtxt.
Returns data (numpy.ndarray) – The data block loaded from the text file.
See also:
numpy.loadtxt()
This function can be imported from the diffpy.pdfgetx module.
plotdata(filenames,style=None,x=None,y=None,log=None,ax=None,**kwargs)
Plot one or more text data files.
The files are searched for data blocks which have enough columns to satisfy both xand yselectors of the plotted
data. This may result in an empty plot when file has none wide-enough data block (e.g., when y=100).
Parameters
•filenames (str or an iterable of string file names) – One or more text data files to be plotted.
•style (str) – Optional style argument for the matplotlib plot() function.
•x(int, str, or iterable, optional) – The column to be used for the x data. This can be a zero-
based index of the desired column or a column name from data header. A special symbol
“.” can be used for a sequential data index. When not specified, use the first column.
•y(int, str, iterable, or slice, optional) – One or more columns to be used for the y data.
This can be a single zero-based index of the desired column or an iterable of several indices.
The yvalue can be also a string which is split at commas and converted to integers, column
names or slice objects, e.g. “0,sine,4:7”. The slice instances are applied to the entire data
block from each loaded file. Use the second column when not specified.
•log ({‘x’, ‘y’}, optional) – Set logarithmic scaling for the specified axis and linear scaling
for all others. For example, log="y" applies linear scaling to the x-axis and logarithmic
to the y-axis. Keep the current axis scaling when not specified.
•ax (matplotlib.axes.Axes, optional) – The axes to plot to. The plotting will be performed
using the ax.plot method. The default is pyplot.gca().
•kwargs (misc, optional) – Keyword arguments for the matplotlib plot() function.
Returns lines (list) – The matplotlib Line2D objects added to the current axis.
See also:
diffpy.pdfgetx.loaddata()
This function can be imported from the diffpy.pdfgetx.plotdata module.
findfiles(patterns=(),path=’.’,dotfiles=False)
Find files that match all specified patterns.
Pattern syntax:
•^start - match “start” only at the beginning of the string.
•end$ - match “end” only at the end of string.
•<7> - match number 7 preceded by any number of leading zeros.
•<1-34> - match an integer range from 1 to 34 inclusive.
•<7-> - match an integer greater or equal 7.
25

PDFgetX3 and PDFgetN3 Documentation, Release 2.0.0
•<-> - match any integer.
•+- start a new group of patterns to match more files.
•dir/ - set search path effective from the current pattern group.
All integer ranges <N-M> above allow one or more leading zeros. The range syntax does not support matching
of negative numbers.
Parameters
•patterns (iterable of strings or str, optional) – String patterns that must all match in returned
filenames. Can be also a single string with patterns separated by whitespace characters.
When empty match all files in the current directory or in the path. A single +starts a new
pattern group for additional matches. Each pattern group may have one entry containing /,
for example, dir/ or ./, which sets the search directory for this and subsequent pattern
groups. When pattern group contains only the path entry it reuses file patterns from the
previous group.
•path (str, optional) – Directory to be searched for the files. The default is “.” to search the
current directory.
•dotfiles (bool, optional) – When True search also the hidden “.” starting files. These files
are by default ignored, but can be explicitly selected by adding the ^. pattern.
Returns filenames (list) – The list of matching filenames. Return all files when patterns are not
specified.
This function can be imported from the diffpy.pdfgetx module.
26 Chapter 6. Interactive mode

CHAPTER
SEVEN
OPTIONS AND PARAMETERS
PDFgetX3 and PDFgetN3 are very flexible in allowing users to customize the actions of the program. They have a
number of parameters that can be specified either in configuration file or as command line options. Here is a complete
description of the parameters and options used by either program.
Note: The command line options start with a leading “-” and can be only used as command line arguments when
starting the pdfgetx3 program. Within configuration file the parameter names are plain words without any leading
dashes. Finally, parameters can be also set in the interactive mode as attributes of the config object, but the assign-
ments must be valid Python statements. Here are examples of setting composition of a processed specimen using each
of these forms:
1. assigned in configuration file:
...
composition =CaTiO3
...
2. set as a command-line option when starting pdfgetx3 or pdfgetn3:
pdfgetx3 --composition=CaTiO3
3. set in the IPython interactive mode:
pdfgetx3 -i
...
In [1]: config.composition ="CaTiO3"
7.1 Program operation
-h,--help
Display a brief usage information with a list of command line options and exit.
-V,--version
Display the program version and exit.
--manual
Open this manual in a Web browser and exit.
-f,--find
Select input files that match all patterns. The command line arguments are by default taken as input files.
However, with the --find option they are processed as file patterns and the matching files are then used
27

PDFgetX3 and PDFgetN3 Documentation, Release 2.0.0
as inputs. The input files are by default searched in the current directory unless there is a path entry (e.g.,
data/) that selects a different search path. The search patterns are interpreted as fixed strings, all of
which must be present in the file name. A single argument +starts a new group of patterns to match more
files that are not covered by one set of patterns. Additional pattern groups reuse the current search path
unless they provide their own path value. Pattern groups containing only a path entry reuse file patterns
from the last group. When pattern groups overlap the repeated matches are ignored to make the resulting
list of files unique. Files starting with .are ignored unless there is ^. pattern that explicitly matches
them. The search syntax provides the following special patterns:
^ match at the beginning of the string, i.e., ^start matches only filenames that start with
“start”.
$ match at the end of string, for example, .chi$ selects file names ending with “.chi”. A
$on its own matches every string and can be used to select all files.
<N> match number Npreceded by any number of leading zeros, e.g., <7> would match in
“f7.chi”, “f007.chi”, but not in “f77.chi”.
<N-M> match an integer range from Nto Minclusive. The matched number may have one or
more leading zeros.
<7-> match number 7 or larger.
<-7> match number 7 or smaller.
<-> match any integer number.
+ start a new pattern group, for example, .chi$ + .dat$
/ set search path. An argument containing the /symbol is taken as the search path, for
example, data/ or ./. Each pattern group may provide its own search path effective
for that and any subsequent pattern group.
The ^$<> characters are often special to Unix or Windows command shells, therefore they need to be
enclosed in double quotes (") when used on command line.
See also:
tutorial on matching input files
-l,--list
List all input files and exit. This is useful with the --find option to verify if input files are matched as intended.
7.2 Configuration file options
-c CONFIG, --config=CONFIG
Read custom configuration file after loading the default ones. Do not load any configuration file when “NONE”.
-s NAME, --section=NAME
Load the custom configuration file section [SectionName] after loading the [DEFAULT] section. This is
useful for creating several configuration variants in a single configuration file.
--createconfig=FILE
Write template configuration to a new FILE and exit. Write to the standard output when FILE is “-“.
See also the configuration file section for further details.
7.3 Input and output options
inputfile
This parameter allows to specify one or more input files in the configuration file, one file per line. The
28 Chapter 7. Options and parameters

PDFgetX3 and PDFgetN3 Documentation, Release 2.0.0
inputfile is only used if no input files were provided on the pdfgetx3 or pdfgetn3 command line.
dataformat
--format=FORMAT
Format of input files. Available formats are: twotheta,QA,Qnm corresponding to a two-column text data
where the first column is either the scattering angle 2Θin degrees, Qin inverse ångströms or Qin inverse
nanometers.
backgroundfile
-b FILE, --background=FILE
Optional datafile with background intensities from an empty sample holder. It must be in the same dataformat
as other input files.
datapath
-d DATAPATH, --datapath=DATAPATH
One or more extra directories to be searched for input or background data files. The -d option can be specified
several times to add more directories, these are prepended in front of any default value. Within configuration
file the datapath directories have to be listed each on a separate line.
A special value “NONE” (or “none”) clears any previously defined paths and only the further paths, if any,
would be searched for inputs.
output
-o OUTPUT, --output=OUTPUT
Output file name, write to the standard output when “-“. The -t, --outputtypes option controls what
results are being saved. Normally the OUTPUT is used as a custom basename for the output files. The OUTPUT
may contain @f, @h, @r, @e, @t, @b, @o tokens, which are expanded as follows:
token example definition
@h dir1/dir2 the input file directory or “.”
@r dir1/dir2/filename the input path with extension removed
@e dat the input file extension without “.”
@t filename.dat the tail component of the input file
@b filename the tail component with extension removed
@o gr the output extension iq, sq, fq or gr
An empty value works the same as “@b.@o” and saves the data in the current directory with a proper extension
for the saved results. When “@o” is not present in the OUTPUT, it is appended as a default filename extension.
outputtypes
-t TYPES, --outputtypes=TYPES
Result types to be saved, one or more comma separated values. Supported values are “iq”, “sq”, “fq”, “gr”,
corresponding to the I(Q), S(Q), F(Q) and G(r) curves; these are also used as output file extensions.
Result files are not written when empty, “none” or “NONE”.
force
--force=FORCE
Overwrite existing output files. By default the output files are not written if they already exist. Possible values in
a configuration file are “true”, “yes”, “on”, “1” or “false”, “no”, “off”, “0” or “once”. The special value “once”
permits one overwrite and then resets config.force to False. Note that in interactive mode the values
assigned to config.force are converted to Python bool unless equal to “once”.
7.3. Input and output options 29

PDFgetX3 and PDFgetN3 Documentation, Release 2.0.0
7.4 PDF parameters
mode
--mode=STRING
The PDF conversion mode, i.e., the name of the pdfgetter() setup. The available modes correspond to the
radiation type used in powder diffraction experiment and can be “xray” or “neutron”.
wavelength
-w FLOAT, --wavelength=FLOAT
X-ray wavelength in ångströms. This value is required for the “twotheta” dataformat in order to convert the
scattering angles 2Θto a momentum transfer Q. For other data formats the wavelength is not necessary and may
be left undefined.
twothetazero
--twothetazero=FLOAT
Position of the zero scattering angle in diffractometer degrees. This parameter corrects for a constant offset
in the measured 2Θvalues. When loading configuration file it is assumed 0 unless specified otherwise. This
parameter is only effective for the “twotheta” dataformat.
composition
--composition=STRING
Chemical composition of the sample. Supported formats are “PbTi0.5Zr0.5O3”, “Pb 1 Ti 1/2 Zr 1/2 O 3” or
“CH3 (CH2)3 OH”. Space characters are ignored, unit counts can be omitted, but it is important to use a proper
upper and lower case in atom symbols. Elements can appear several times in the formula, e.g., “CH3 CH3”, and
the formula may contain parentheses or fractional stoichiometries.
bgscale
--bgscale=FLOAT
Scaling of the background intensities loaded from the backgroundfile, by default 1.
rpoly
--rpoly=FLOAT
r-limit for the maximum frequency in the F(Q) correction polynomial. The PDF is unreliable at shorter r,
however a very small rpoly would disable polynomial correction and give noisy PDF. Larger values produce
closer fits with a higher degree polynomial, but when too large, they might smooth-out a useful signal in the
data. The default is 0.9.
qmaxinst
--qmaxinst
The Qcutoff for the meaningful input intensities in inverse ångströms. Some data files may contain trailing
zeros or unreliable intensities at the upper bound of the detector range. The qmaxinst defines a threshold for
unreliable data. The parameter is also used as an upper boundary for the polynomial fit correction of the S(Q)
data.
qmin
--qmin
The lower Q-limit for the Fourier transformation of the F(Q) curve in inverse ångströms.
qmax
--qmax
The upper Q-limit for the Fourier transformation of the F(Q) curve in inverse ångströms. This is essentially a
limit, where sample signal decays to the level of data noise.
30 Chapter 7. Options and parameters

PDFgetX3 and PDFgetN3 Documentation, Release 2.0.0
rmin
--rmin=FLOAT
Lower bound of the r-grid for the calculated PDF in ångströms.
rmax
--rmax=FLOAT
Upper bound of the r-grid for the calculated PDF in ångströms.
rstep
--rstep=FLOAT
Spacing of the r-grid for the calculated PDF in ångströms.
7.5 Other parameters
plot
-p TYPES, --plot=TYPES
Plot the specified results. A comma separated list with one or more items from “iq”, “sq”, “fq”, “gr”. No plot is
produced when empty, “none” or “NONE”. Setting this option turns on the interactive mode.
interact
-i,--interact
Start an IPython interactive session after processing all files. Useful for tuning the configuration parameters
or interactive plotting. This is always on when plot option has been set. See also Interactive mode for further
details.
verbose
--verbose=VALUE
Level of detail for the program to report about its actions. Possible values are “error”, “warning”, “info”,
“debug”, “all” or an integer number from 0 to 5. Messages are completely suppressed when 0, all messages are
printed when verbose is 5 (“all”) or higher. This option is useful for diagnostics of any unexpected behavior in
the program.
7.5. Other parameters 31

PDFgetX3 and PDFgetN3 Documentation, Release 2.0.0
32 Chapter 7. Options and parameters

CHAPTER
EIGHT
THE PLOTDATA PROGRAM
The PDFgetX3 software includes a simple stand-alone utility plotdata for plotting text data files. In most cases
this program can be invoked from a command-shell as
plotdata file1.dat file2.dat
which plots the numerical data from the text files file1.dat,file2.dat together in a single graph. By default
the first column is used as an xvariable and the second column is used for the yvalues. After displaying the plot
the program starts an IPython interactive session allowing the user to modify or save plots. The IPython session is
initialized with the filenames variable containing a list of plotted files. It also pre-loads the plotdata() and
findfiles() functions just as in PDFgetX3 interactive session. The plotdata() function works in a similar way
as the plotdata program, just its arguments need to be passed as Python function arguments instead of command-
line options. Thus an equivalent call of the plotdata() function would be:
In [1]: plotdata(['file1.dat','file2.dat'])
8.1 Selecting files
The plotdata program includes a file searching feature that is useful for selecting a set of files in large directories.
It is also convenient for Windows operating systems, where the command prompt cannot do filename expansion for
patterns such as *.dat. The file search feature is controlled by the following options:
-f,--find
Use command line arguments as filename patterns and plot all matching files. This option works in the same way
as for pdfgetx3, for full details see the pdfgetx3 --find documentation. Note that within command line
the special patterns ^$<> need to be quoted in double quotes (") so they are not processed by command shell.
-l,--list
List the input files and exit. This is useful in conjunction with the -f, --find option to check if data files
are selected as intended.
Assuming the current directory contains 20 files named file1.dat,file2.dat,...,file20.dat, the plotting
of files 9 to 13 could be done (with a check listing) as follows
$ plotdata -fl "<9-13>.dat"
file9.dat
file10.dat
file11.dat
file12.dat
file13.dat
$ plotdata -f "<9-13>.dat"
33

PDFgetX3 and PDFgetN3 Documentation, Release 2.0.0
Within an interactive IPython session the equivalent plot could be produced by combining the plotdata() and
findfiles() functions as
In [1]: plotdata(findfiles("<9-13>.dat"))
8.2 Selecting x and y data
The plotdata program provides several ways of selecting columns for xor ydata and for specifying plot markers
or line formats. The columns can be specified using their integer index, but one needs to keep in mind the index of
the first column is “0” as per Python indexing conventions. Here is a list of options supported by the plotdata program
(and function):
-x X
index or name of the x-column to plot. See the -y option for the supported syntax, but note that Xmay select
only one column. When set to “.” use the data-row index for x.
-y Y
index or name of the y-column or columns to plot. The Ycolumn specification can be a comma separated list of
indices, column names or Python-like ranges, for example “1,2”, “G”, “1:4” (START:STOP, same as “1,2,3”),
“1:4:2” (START:STOP:STEP, same as “1,3”), or “-2:” (same as “-2,-1”, i.e, the last 2 columns). Because column
indexing starts at “0” the second column must be specified as “1”.
The column names work if the data section in the file is preceded by a headline of unique column names, for
example:
x square cube
1 1 1
2 4 8
3 9 27
4 16 64
For such data file the plotdata program will recognize column names “x”, “square” and “cube” and an implicit
“.” for row index.
-s STYLE, --style=STYLE
optional plot format specification. See the matplotlib.pyplot.plot() function for a list of available
formats.
-L LOG, --log=LOG
axes to be plotted with logarithmic scaling, for example, “x”, “y” or “xy”. Axes not listed in LOG will use linear
scaling.
-h,--help
display a brief usage info and exit.
-V,--version
show program version and exit.
--manual
Open this manual page in a Web browser and exit.
8.3 Examples
The examples directory plotdata contains a sincos.dat file that has 3-columns of values labeled as “x”, “sin”
and “cos”. Here are several examples of the plotdata capabilities when used from command line - the user is
34 Chapter 8. The plotdata program

PDFgetX3 and PDFgetN3 Documentation, Release 2.0.0
encouraged to try them out:
plotdata sincos.dat
plotdata -y1,2sincos.dat
plotdata -x. -y0:3sincos.dat
plotdata -y cos sincos.dat
plotdata -x sin -y cos -sr-- sincos.dat
An equivalent usage from a general IPython session would be:
ipython --matplotlib=auto
In [1]: from diffpy.pdfgetx.plotdata import plotdata
In [2]: plotdata('sincos.dat')
In [3]: plotdata('sincos.dat', y=[1,2])
In [4]: plotdata('sincos.dat', x='.', y=':3')
In [5]: plotdata('sincos.dat', y='cos')
In [6]: plotdata('sincos.dat', x='sin', y='cos', style='r--')
8.3. Examples 35

PDFgetX3 and PDFgetN3 Documentation, Release 2.0.0
36 Chapter 8. The plotdata program

CHAPTER
NINE
RELEASE NOTES
9.1 Version 2.0.0 – 2018-11-02
9.1.1 Added
• New mode neutron for processing constant-wavelength neutron scattering data.
• Correction for an offset of diffractometer zero angle.
• Configuration parameter twothetazero and command-line option --twothetazero for position of the
actual zero angle in diffractometer degrees.
• New program pdfgetn3 and IPython magic %pdfgetn3.
• Separate configuration file pdfgetn3.cfg for the pdfgetn3 program.
• New sub-package diffpy.pdfgetx.apps for entry points to all programs.
• Table of electron scattering factors from E. J. Kirkland, Advanced Computing in Electron Microscopy.
• The +operator for additive pattern groups when matching input files with pdfgetx3 --find.
• An optional slash-containing entry, e.g., dir/, to set the search path for pdfgetx3 --find. Each pattern
group may have one path entry which affects the current and subsequent pattern groups. Pattern groups that
have only the path entry reuse the previous file patterns, for example, dir1/ .dat$ + dir2/ + dir3/.
• The dotfiles flag argument to functs.findfiles to also find dot-starting files without an explicit pat-
tern.
• Support for Python 3.7.
• Tutorial examples for constant-wavelength neutron diffraction data.
9.1.2 Changed
• Initialization arguments of PDFConfig to set initial configuration values.
•path argument of functs.findfiles to give one search path instead of a list of paths.
•pdfgetx3 --find to search only the current directory and stop searching in --datapath.
• Improved PDF accuracy by removing repeated Q-grid interpolation.
• Handling of dot files by pdfgetx3 --find and the functs.findfiles function. The dotfiles are by
default ignored unless explicitly selected by a "^." pattern.
• Return type of functs.findfiles from IPython SList to a simple list.
37

PDFgetX3 and PDFgetN3 Documentation, Release 2.0.0
• Rename camel case interactive functions to lowercase, i.e., to loaddata,processfiles,
clearsession.
• Use config.datapath lookup in processfiles(filename).
9.1.3 Deprecated
• Function cromermann.felectronatq for electron scattering factors calculation using Mott-Bethe approx-
imate formula.
• IPython extension module diffpy.pdfgetx.ipy_pdfgetx3. Use diffpy.pdfgetx.ipy_magics
instead.
• Camel case functions loadData,processFiles,clearSession.
9.1.4 Removed
• Support for Python 2.6.
• Processing of environment variable PDFGETX3PATH.
• Support for IPython 0.x.
• Obsolete variable __gitsha__ from the version module.
• Processing of command line options in PDFConfig class.
• Implicit loading of configuration files in PDFConfig instantiation.
9.1.5 Fixed
• Import of all objects from matplotlib.pyplot into an interactive session started by plotdata.
• Inaccurate G interpolation when rstep is comparable to pi / qmax.
• Lone anchor patterns ^,$to match everything.
9.2 Version 1.2 – 2018-01-12
9.2.1 Added
• Support for Python 3.4, 3.5, 3.6 in addition to Python 2.6 and 2.7.
• Support for IPython 5.0 with preserved compatibility with IPython 0.10 and later.
• Support for matplotlib 2.0.
• New option --log=LOG for the plotdata program to set logarithmic scale for either of xor yaxis. The
plotdata() function learnt a new log argument with the same purpose.
• New argument ax for the plotdata() function that select a specific matplotlib axis for plotting.
• Support for Unicode filenames and values in the config interactive variable.
• Processing of parentheses and fractional stoichiometries in chemical formulas as in Pb (Ti Zr)1/2 O3.
• Explanatory error message when PDFgetX3 was installed for unsupported Python.
38 Chapter 9. Release notes

PDFgetX3 and PDFgetN3 Documentation, Release 2.0.0
9.2.2 Changed
• The egg package file was enhanced to support all Python versions. The software is now distributed in a single
egg rather than multiple eggs per each Python version.
• PDFgetX3 option --force to take a boolean argument (yes,no,true, etc.) or once. The configuration
parameter force can be likewise set to a bool or to a string "once". This enables a safer one-time overwrite
of existing output files.
• Plot labels to use a proper Unicode “Å” (Ångström) symbols. The “Å” symbol is also used within units in output
files.
• The usecols argument of the loadData() function to also accept scalars, open-end slice objects and
string-denoted slices such as "1:3" or "1:".
• The plotdata program and plotdata() function to accept open-end slices for the y-columns selection.
• The IPython magic function %pdfgetx3 to set the _exit_code variable as do generic shell commands run
from IPython.
• Inline documentation to use NumPy-style Napoleon format, which is human readable and can be included in the
manual.
• Release scripts to build software package bundles and documentation in binary-reproducible way.
9.2.3 Deprecated
• Compatibility with Python 2.6.
• Support for IPython 0.x.
• Variable __gitsha__ in the version module which was renamed to __git_commit__.
9.2.4 Removed
• The hold argument of the plotdata() function, because it was deprecated in matplotlib.
• Support for multiple x-columns in plotdata program and plotdata() function.
• Import of all objects from numpy module into the interactive session. NumPy is available under the np name
instead.
9.2.5 Fixed
• Avoid duplicate “.gr.gr” extension when pdfgetx3 is run with option --output=f.gr.
• Crash on loading custom configuration section from a local file, when that section is missing in global configu-
ration.
• Missing checkbox in the tuneconfig() dialog caused by matplotlib bug.
9.2. Version 1.2 – 2018-01-12 39

PDFgetX3 and PDFgetN3 Documentation, Release 2.0.0
40 Chapter 9. Release notes

INDEX
Symbols
–bgscale=FLOAT
pdfgetx3 command line option, 30
–composition=STRING
pdfgetx3 command line option, 30
–createconfig=FILE
pdfgetx3 command line option, 28
–force=FORCE
pdfgetx3 command line option, 29
–format=FORMAT
pdfgetx3 command line option, 29
–manual
pdfgetx3 command line option, 27
plotdata command line option, 34
–mode=STRING
pdfgetx3 command line option, 30
–qmax
pdfgetx3 command line option, 30
–qmaxinst
pdfgetx3 command line option, 30
–qmin
pdfgetx3 command line option, 30
–rmax=FLOAT
pdfgetx3 command line option, 31
–rmin=FLOAT
pdfgetx3 command line option, 31
–rpoly=FLOAT
pdfgetx3 command line option, 30
–rstep=FLOAT
pdfgetx3 command line option, 31
–twothetazero=FLOAT
pdfgetx3 command line option, 30
–verbose=VALUE
pdfgetx3 command line option, 31
-L LOG, –log=LOG
plotdata command line option, 34
-V, –version
pdfgetx3 command line option, 27
plotdata command line option, 34
-b FILE, –background=FILE
pdfgetx3 command line option, 29
-c CONFIG, –config=CONFIG
pdfgetx3 command line option, 28
-d DATAPATH, –datapath=DATAPATH
pdfgetx3 command line option, 29
-f, –find
pdfgetx3 command line option, 27
plotdata command line option, 33
-h, –help
pdfgetx3 command line option, 27
plotdata command line option, 34
-i, –interact
pdfgetx3 command line option, 31
-l, –list
pdfgetx3 command line option, 28
plotdata command line option, 33
-o OUTPUT, –output=OUTPUT
pdfgetx3 command line option, 29
-p TYPES, –plot=TYPES
pdfgetx3 command line option, 31
-s NAME, –section=NAME
pdfgetx3 command line option, 28
-s STYLE, –style=STYLE
plotdata command line option, 34
-t TYPES, –outputtypes=TYPES
pdfgetx3 command line option, 29
-w FLOAT, –wavelength=FLOAT
pdfgetx3 command line option, 30
-x X
plotdata command line option, 34
-y Y
plotdata command line option, 34
%pdfgetn3 IPython magic, 4
%pdfgetx3 IPython magic, 4
A
authors, 1
B
backgroundfile (configuration value), 29
bgscale (configuration value), 30
C
citations, 1
41

PDFgetX3 and PDFgetN3 Documentation, Release 2.0.0
clearsession() (in module _interactive_), 24
composition (configuration value), 30
config (interactive variable), 23
D
dataformat (configuration value), 29
datapath (configuration value), 29
E
example files, 7
examples, 7
F
findfiles() (in module diffpy.pdfgetx), 25
force (configuration value), 29
fq (interactive variable), 23
G
gr (interactive variable), 23
I
inputfile (configuration value), 28
interact (configuration value), 31
iq (interactive variable), 23
iraw (interactive variable), 23
L
license, 1
loaddata() (in module diffpy.pdfgetx), 24
M
mode (configuration value), 30
O
output (configuration value), 29
outputtypes (configuration value), 29
P
pdfgetn3 (program), 6
pdfgetter() (in module _interactive_), 23
pdfgetx3 (program), 5
pdfgetx3 command line option
–bgscale=FLOAT, 30
–composition=STRING, 30
–createconfig=FILE, 28
–force=FORCE, 29
–format=FORMAT, 29
–manual, 27
–mode=STRING, 30
–qmax, 30
–qmaxinst, 30
–qmin, 30
–rmax=FLOAT, 31
–rmin=FLOAT, 31
–rpoly=FLOAT, 30
–rstep=FLOAT, 31
–twothetazero=FLOAT, 30
–verbose=VALUE, 31
-V, –version, 27
-b FILE, –background=FILE, 29
-c CONFIG, –config=CONFIG, 28
-d DATAPATH, –datapath=DATAPATH, 29
-f, –find, 27
-h, –help, 27
-i, –interact, 31
-l, –list, 28
-o OUTPUT, –output=OUTPUT, 29
-p TYPES, –plot=TYPES, 31
-s NAME, –section=NAME, 28
-t TYPES, –outputtypes=TYPES, 29
-w FLOAT, –wavelength=FLOAT, 30
plot (configuration value), 31
plotdata (program), 31
plotdata command line option
–manual, 34
-L LOG, –log=LOG, 34
-V, –version, 34
-f, –find, 33
-h, –help, 34
-l, –list, 33
-s STYLE, –style=STYLE, 34
-x X, 34
-y Y, 34
plotdata() (in module diffpy.pdfgetx.plotdata), 25
processfiles() (in module _interactive_), 24
Q
qmax (configuration value), 30
qmaxinst (configuration value), 30
qmin (configuration value), 30
R
references, 1
release notes, 35
rmax (configuration value), 31
rmin (configuration value), 30
rpoly (configuration value), 30
rstep (configuration value), 31
S
sq (interactive variable), 23
T
tuneconfig (example), 14
tuneconfig() (in module _interactive_), 24
twothetazero (configuration value), 30
42 Index

