PVD 3 User Manual
User Manual:
Open the PDF directly: View PDF ![]() .
.
Page Count: 12
PVD 3 USER AND PROGRAMMER MANUAL

PVD 3 USER AND PROGRAMMER MANUAL
CONTENTS
Introduction ........................................................................................................................................................................................ 3
Features .............................................................................................................................................................................................. 3
Programmer Interface ........................................................................................................................................................................ 4
Developer interface overview ......................................................................................................................................................... 4
Connecting to PVD .......................................................................................................................................................................... 4
Direct clip capture ........................................................................................................................................................................... 4
Enabling additional data transmission ............................................................................................................................................ 5
User Interface ..................................................................................................................................................................................... 6
Menu & toolbar .............................................................................................................................................................................. 6
Scene tree & properties inspector .................................................................................................................................................. 8
Debug render tab ............................................................................................................................................................................ 9
Profile events tab ............................................................................................................................................................................ 9
Memory events tab ......................................................................................................................................................................... 9
Error stream tab ............................................................................................................................................................................ 10
Clip operations .............................................................................................................................................................................. 10
Thread profiler .............................................................................................................................................................................. 10
Graph window ............................................................................................................................................................................... 10
Settings ......................................................................................................................................................................................... 11
Supported platforms ......................................................................................................................................................................... 12
Contacts ............................................................................................................................................................................................ 12
PhysX SDK support web page ....................................................................................................................................................... 12
PVD web page ............................................................................................................................................................................... 12
Report issues to ............................................................................................................................................................................ 12
Changelog ......................................................................................................................................................................................... 12
3
INTRODUCTION
The PhysX Visual Debugger (PVD) is an object-based database application for analyzing captured data from a remote PhysX
simulation session. It can display a set of objects and properties and track the changes to those items over time, "playing" the
object graph forward and rewinding it so that developers can analyze the state of the engine and their application frame by frame.
The data can be captured and analyzed either in real-time or using a clip that was recorded beforehand. In real-time mode certain
functionality is not available because it requires caching of data that is not yet received. At the end of the real-time session, it is
possible to save all captured data to a clip.
PVD contains basic database querying capabilities accessed through the main menu, and thus users can graph states of objects
over time and in relation to each other. In addition it contains a 3D view of the scene from the PhysX SDK's perspective, allowing
quick scene overview and understanding of the engine's current state of the PhysX scene, actors, shapes, queries and all properties
of these.
FEATURES
Scene tree
o Scene
o Actors
o Aggregates
o Shapes
o Geometries
o Queries
o Joints
o Clothing (PhysX and APEX)
o Materials
Real-time capture
Debug render
Profile events
Memory events
Error events
Plotting graphs
RepX export
Clip operations

4
PROGRAMMER INTERFACE
DEVELOPER INTERFACE OVERVIEW
The connection between PVD and PhysX is instantiated with code in the application layer. PVD integration code within PhysX is
enabled in debug, checked and profiling configurations of the PhysX SDK. In order to reduce memory footprint and code size, it
is not enabled in release configuration. PVD listens on a TCP socket and awaits a connection request from the application. The
default network port is 5435. Sending PVD data through the network stack allows easy connection on any platforms supporting
networking.
CONNECTING TO PVD
The examples below demonstrate how to establish a connection with debug rendering, profile events and memory events all
enabled. It is important to note that using all of these modes together might slow down the application, particularly if the PhysX
scene is rapidly changing. It is good practice to limit the data transfer by enabling only the desired subset of modes. This will
reduce pressure on memory and lower the chance of a synchronization spike.
For applications using the PhysX 3.4 SDK:
physx::PxPvdTransport* mTransport = physx::PxDefaultPvdSocketTransportCreate(“localhost”, 5435, 10000);
if(mTransport == NULL)
return;
physx::PxPvdInstrumentationFlags mPvdFlags = physx::PxPvdInstrumentationFlag::eALL;
physx::PxPvd* mPvd = physx::PxCreatePvd( *mFoundation );
mPvd->connect(*mTransport,mPvdFlags);
For applications using the PhysX 3.0-3.3 SDK:
PxVisualDebuggerConnectionManager* pvd = mPhysics->getPvdConnectionManager();
if(!pvd)
return;
PxVisualDebuggerConnectionFlags theConnectionFlags( PxVisualDebuggerConnectionFlag::eDEBUG |
PxVisualDebuggerConnectionFlag::ePROFILE | PxVisualDebuggerConnectionFlag::eMEMORY );
PxVisualDebuggerExt::createConnection(pvd, “localhost”, 5435, 10000, theConnectionFlags);
DIRECT CLIP CAPTURE
In some situations it can be beneficial for an application to save PVD data directly to a file that can be loaded later by PVD for
inspection and analysis. This is particularly true if network bandwidth is a bottleneck for the application.
For applications using the PhysX 3.4 SDK:
physx::PxPvdTransport* mTransport = physx::PxDefaultPvdFileTransportCreate( "c:\\mywork\\sample.pxd2" );
if(mTransport == NULL)
return;
mPvdFlags = physx::PxPvdInstrumentationFlag::eALL;
mPvd = physx::PxCreatePvd( *mFoundation );
mPvd->connect(*mTransport,mPvdFlags);

5
For applications using the PhysX 3.0-3.3 SDK:
PxVisualDebuggerConnectionManager* pvd = mPhysics->getPvdConnectionManager();
if(!pvd)
return;
PxVisualDebuggerConnectionFlags theConnectionFlags( PxVisualDebuggerConnectionFlag::eDEBUG |
PxVisualDebuggerConnectionFlag::ePROFILE | PxVisualDebuggerConnectionFlag::eMEMORY );
PxVisualDebuggerExt::createConnection(mPhysics->getPvdConnectionManager(), "c:\\temp.pxd2",
theConnectionFlags);
ENABLING ADDITIONAL DATA TRANSMISSION
In order to save bandwidth the default behavior is that constraints, contacts and scene queries are not transmitted. It is,
however, possible to enable the transmission of these data types.
For applications using the PhysX 3.4 SDK:
PxPvdSceneClient* pvdClient = mScene->getScenePvdClient();
if(pvdClient)
{
pvdClient->setScenePvdFlag(PxPvdSceneFlag::eTRANSMIT_CONSTRAINTS, true);
pvdClient->setScenePvdFlag(PxPvdSceneFlag::eTRANSMIT_CONTACTS, true);
pvdClient->setScenePvdFlag(PxPvdSceneFlag::eTRANSMIT_SCENEQUERIES, true);
}
For application using the PhysX 3.0-3.3 SDKs:
mPhysics->getVisualDebugger()->setVisualizeConstraints(true);
mPhysics->getVisualDebugger()->setVisualDebuggerFlag(PxVisualDebuggerFlag::eTRANSMIT_CONTACTS, true);
mPhysics->getVisualDebugger()->setVisualDebuggerFlag(PxVisualDebuggerFlag::eTRANSMIT_SCENEQUERIES,
true);
6
USER INTERFACE
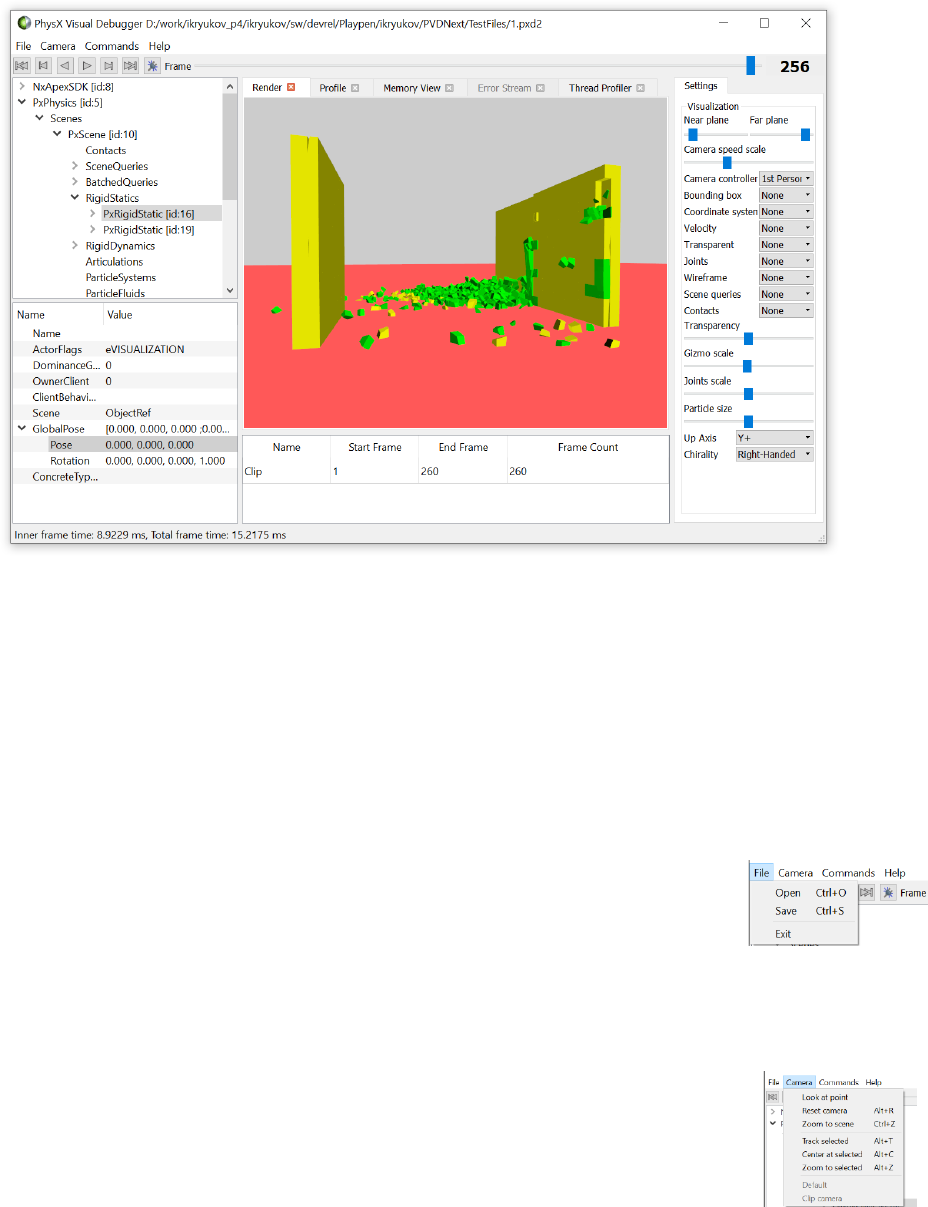
The PVD application uses a single window to display everything. Conceptually it consists of four parts – scene tree/inspector
(left), tabbed event viewer (center), settings (right) and clip transport (top). The event viewer displays debug render information,
profile events, memory event and error messages coming from the PhysX/APEX SDKs. Each PVD instance works with exactly one
clip/real-time capture at a time. It is not possible to run a real-time capture and review another clip at the same time using the
same PVD instance. It is possible, however, to run multiple instances of PVD and use them independently. It is also possible to
capture two or more scenes simultaneously provided that each PVD instance uses a different listening port. The listening ports
need to be reflected in the application code that connects to PVD.
MENU & TOOLBAR
The File menu contains commands to open/save clips and to exit application.
Open - open a pxd or pxd2 file, replacing the current scene with the new file.
Save - save the current scene. The old file will be overwritten.
The Camera menu contains commands to change the camera settings: It consists of two parts – persistent commands (before
splitter) and scene cameras (after splitter).
Look at point – calls the dialog asking user to provide three world coordinates (x, y, z) to point
the camera to.
Reset camera – resets the camera to point to the center of the scene’s bounding box.
Zoom to scene – resets the camera to point to the center of the scene’s bounding box, while
also moving it in such a way that would allow observing the whole scene at once.
Track selected – automates the camera to follow the currently selected actor. This mode will maintain the relative
offset and the selected object. This mode is handy in situations where there are a lot of actors and it is hard to track a
particular actor visually.
7
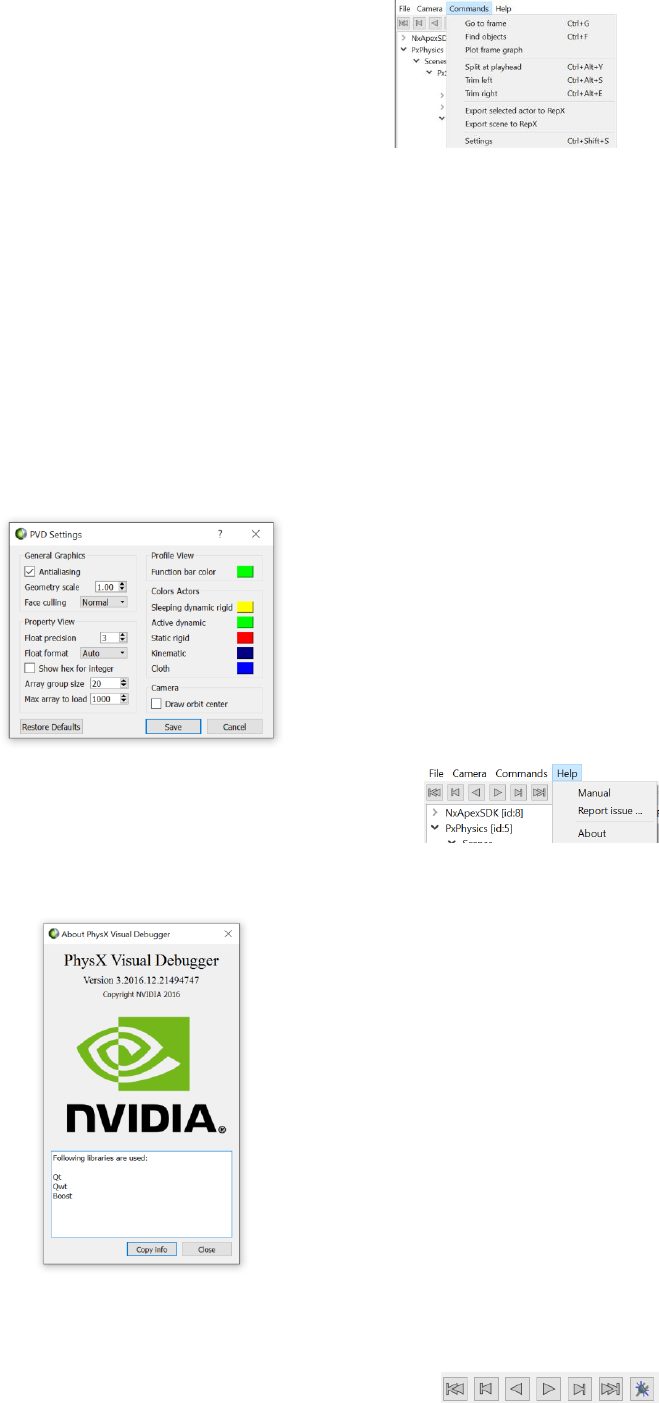
The Commands menu contains commands to help analyze the clip: clip operations, clip navigation, graph plotting, and RepX
export.
Go to frame - Sets the current frame to the specified frame number.
Find object by id – points the camera to the actor specified by id.
Plot frame graph – plots a graph depicting frame time along with main PhysX
engine phase times (collision, solver).
Split at playhead – splits the current clip in two.
Trim left – remove part of clip to the left of play head.
Trim right – remove part of clip to the right of play head.
Export selected actor to RepX – exports selected to RepX file
Export current frame to RepX – exports entire frame at play head to RepX file
Settings – PVD UI settings
The Settings dialog allows changing user interface settings.
The Help menu allows the reporting of an issue, reading this manual or calling “About” window.
Report issue… - Opens up system default e-mail application with “To” field filled up.
About – Shows “About” dialog showing the version of the running PVD instance.
The toolbar contains buttons which allow navigation of the clip by either stepping one
frame back or forward, playing it continuously back and forward or jumping to the clip
start/end. The right-most button enables/disables PVD listening on the socket for the
incoming connection from the application. Sometimes it might be useful to disable it to
RepX is a format that allows storing a
scene tree along with all of its actors,
shapes and properties. The PVD is used
“play” captured clips, while RepX is used
to simulate starting from state saved in
the file. It comes in handy when one
needs to reproduce an issue happening
in PhysX.
8
review the recorded clip simultaneously with the running game/application that tries to connect to PVD.
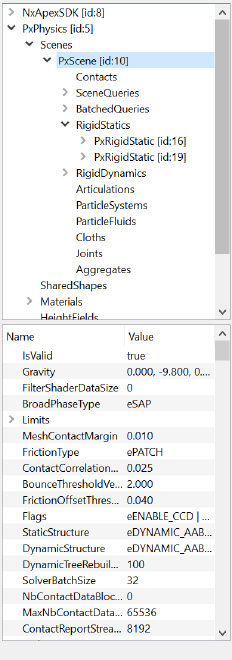
SCENE TREE & PROPERTIES INSPECTOR
The collections of objects in PhysX and/or APEX are represented in the form of a tree. The
top part is the tree itself. The bottom part depicts properties of a selected item in the
tree. Properties are unique for each type of entity (scene, actor, shape, query, etc.) and
are also specific to the PhysX/APEX SDK version. The property inspector allows the
viewing of scalar, vector, matrix, quaternion, enumeration types and arrays of these
types. There is an additional special type of property – “ObjectRef”. Double-clicking such a
property will retarget the currently selected item to the item that the ObjectRef is
pointing to. Properties of type "array" have a “+” symbol to the left, which allows
expansion of the array. The Property inspector implements the context menu containing
commands to copy or plot the value.
9
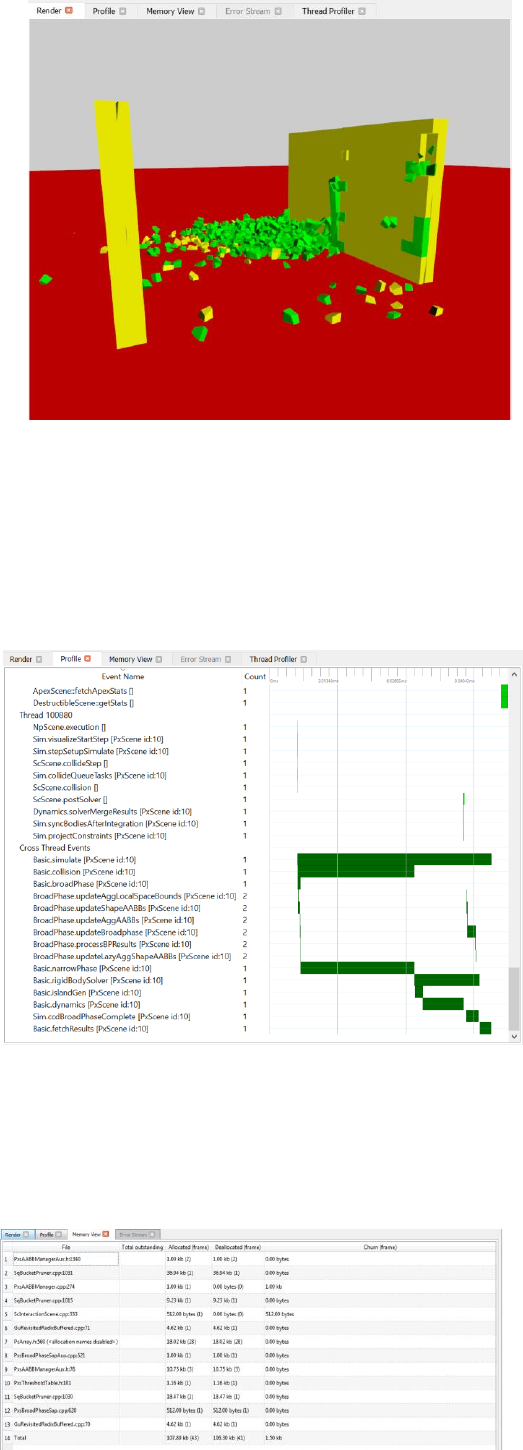
DEBUG RENDER TAB
The debug render tab displays the world as seen by PhysX. By default
there is a free mode camera available. However, if the application
provided the PVD SDK with a camera (possibly through other APIs, such
as APEX), this camera can also be used. Static rigid actors are marked
red; sleeping dynamic rigid bodies are marked orange, active dynamic
rigid bodies are marked with varying shades of green and kinematic
actors are marked blue. Raycasts are rendered as green lines with a blue
vector at the hit point. Overlap scene queries are rendered as green
lines. Bounding boxes are rendered white. The center of mass vector is
drawn red/green/blue. Velocity vectors are rendered as white arrows.
Joints are rendered green. Particle systems are rendered as cyan. Fluid
particles are rendered blue.
Mouse double left button – select actor
Mouse left button down + mouse move – camera rotation
WASD – move camera forward, strafe left, back, strafe right
Shift + WASD – move camera twice as fast
PROFILE EVENTS TAB
The Profile View displays profile information when clips (newer than
3.0) have such information. The widget provides time (horizontal
axis) versus multiple events durations (vertical axis). Since
PhysX/APEX can use multiple threads for computation, events
coming from those threads are organized in a one-level tree
structure, allowing the analysis of each thread individually. Events
are rendered as green rectangular bars. The events are originally
sorted by event-first occurrence. There is a context menu available
for each bar, containing a command to plot the duration of the bar
across all frames in the clip.
Mouse scroll – scroll the whole windows vertically.
Ctrl + mouse scroll – zoom in/out the time axis.
Shift + mouse scroll – pan left/right the time axis.
Shift + left mouse button – while holding the left mouse button down it’s possible to select a region horizontally with the tool
constantly updating duration selected with markers.
MEMORY EVENTS TAB
PhysX/APEX SDKs have an allocation callback, so all allocations and
deallocations made by either of these SDKs are logged through the
PVD SDK and displayed in the PVD. This widget displays information
for each frame individually, so only allocations/deallocations made
during the current frame are visible. The “File” column displays the
origin of each allocation/deallocation, containing file and line
number information. The “Churn” column displays how much
memory is allocated but not freed this frame. The
“Allocated”/”Deallocated” columns display the amount of memory in
10
human-readable format as well as the count of such events during the current frame.
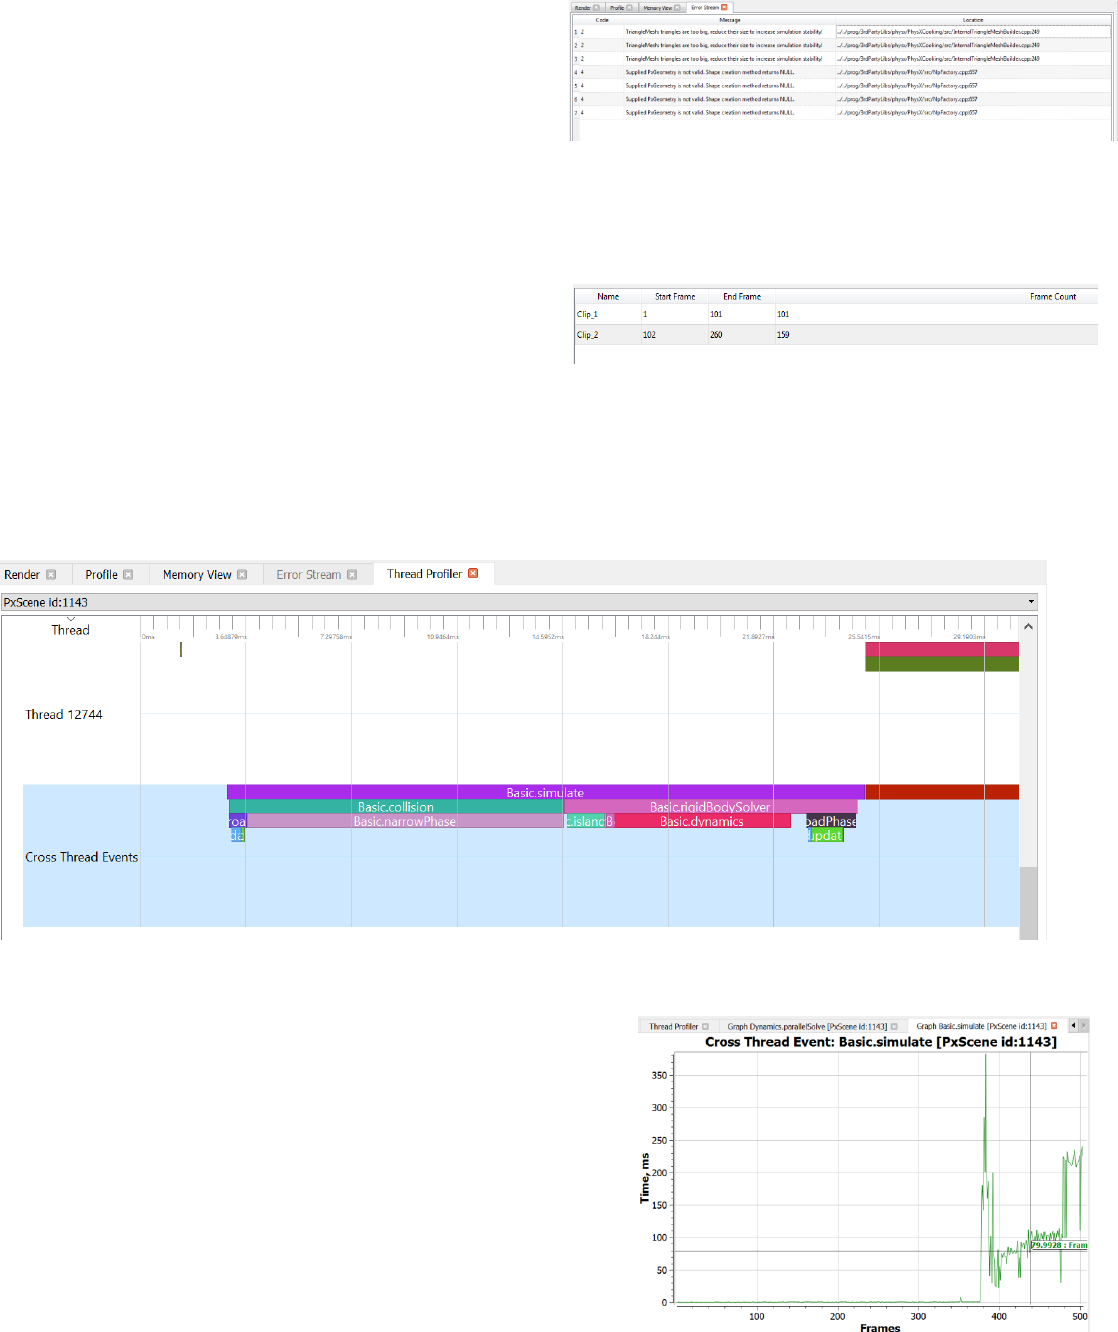
ERROR STREAM TAB
PhysX/APEX SDKs have an error callback, and these warning/error
messages are captured by the PVD SDK and thus could be displayed
in the PVD. The “Code” column displays an error code according to
the PhysX SDK specification. The location column displays the origin
of the message, depicting source file name as well as line number.
CLIP OPERATIONS
The clip operations widget displays the clips available in the current
session. With the “Split at playhead”, “Trim left”, “Trim right”
commands from the Commands menu it is possible to cut out
arbitrarily sized pieces of a clip. Furthermore, the “Save as” and
“Delete” commands allow the remaining clips to be saved individually to a file or to be deleted. This functionality can be used to
isolate a particular point in time and has the effect of reducing clip size (more easily shared).
THREAD PROFILER
The Thread profiler displays the same profile information as Profile view, but group events per thread.
GRAPH WINDOW
A fresh graph tab appears each time user each time an event/property is
graphed. The horizontal axis corresponds to the frame number, while the
vertical axis corresponds to either event duration or property value.
Through the context menu the graph can be exported to CSV format for
further analysis.
Right mouse button – context menu
Right mouse button – holding RMB allows selecting a zoom window
Mouse move – allows placing a marker on the graph denoting a Y-value of a
point of interest.
Double click – jump to selected frame – X-value.
Mouse scroll – zoom in/out
11
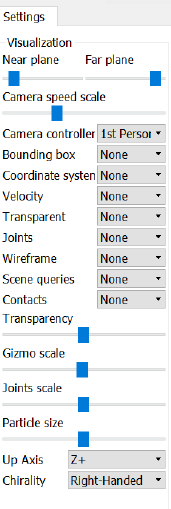
SETTINGS
The Settings pane controls render debug settings, such as camera speed, near/far planes, and various
PhysX debug rendering options.
Near plane – the near plane slider scales to the range 0 – 0.1 cubically (that is, it is not linear, but tends
to change the value slower at the beginning).
Far plane – the far plane slider scales to the range 0 – 100000.0 cubically (that is, it is not linear, but
tends to change the value slower at the beginning)
Camera speed scale – the camera speed slider scales to range 0-1000000.0 units per frame
Camera controller – choose between First and Third person camera mode
Bounding box – enable/disable bounding box visualization for all, selected or unselected actors.
Coordinate system - enable/disable rendering of local frame (vector triple, red, green, blue arrows) at
the center of mass of all, selected or unselected actors.
Velocity – enable/disable rendering of velocity vector (white arrow) for all, selected or unselected actors.
Transparent – enable transparency for all, selected or unselected actors.
Joints – enable/disable joints debug rendering.
Wireframe – enable/disable rendering of all actors using wireframe instead of solid shading.
Scene queries – enable/disable scene queries visualization.
Contacts – enable/disable contacts visualization (need to be enabled separately in the application code).
Transparency – select transparency amount
Gizmo scale – scales arrows (local frame vectors, velocity vectors, etc)
Joints scale – scales joints visualization
Particle size – size particle visualization
Up Axis – allows selecting arbitrary gravity vector (or auto-detect)
Chirality – allows selecting coordinate system chirality

12
SUPPORTED PLATFORMS
PVD is available on Windows 7, Windows 8.1, Windows 10, Mac OSX Yosemite (10.10) and higher.
To find out which platforms are supported by the PVD SDK please review the PhysX platform support documentation for the
version you’re using.
CONTACTS
PHYSX SDK SUPPORT WEB PAGE
http://supportcenteronline.com/ics/support/mylogin.asp?splash=1&deptID=1949
PVD WEB PAGE
https://developer.nvidia.com/physx-visual-debugger
REPORT ISSUES TO
mailto:pvdsupport@nvidia.com
CHANGELOG
3.2016.03.20504657: initial release of PVD 3
3.2016.03.20550388: Added particles
3.2016.03.20560874: Added crash reporter
3.2016.03.20579157: Support 4k x 4k HeightField
3.2016.03.20586211: Fixed initial camera position
3.2016.12: Thread profiler, orbit camera
