PE_Seq_GA2 Paired End Sequencing User Guide GAII 1004571 Rev A
Paired-End_Sequencin.. Paired-End_Sequencing_UserGuide_GAII_1004571_Rev_A
User Manual: Paired-End Sequencing UserGuide GAII 1004571 Rev A
Open the PDF directly: View PDF ![]() .
.
Page Count: 262 [warning: Documents this large are best viewed by clicking the View PDF Link!]
- Notice
- Revision History
- Table of Contents
- List of Figures
- List of Tables
- Overview
- Introduction
- Audience and Purpose
- Related Documentation
- Technical Assistance
- Illumina Genome Analysis System
- Paired-End Sequencing
- User Supplied Consumables and Equipment
- Preparing Samples for Paired-End Sequencing
- Introduction
- Sample Preparation Kit Contents
- Fragment Genomic DNA
- Perform End Repair
- Add ‘A’ Bases to the 3' End of the DNA Fragments
- Ligate Adaptors to DNA Fragments
- Purify Ligation Products
- Enrich the Adaptor-Modified DNA Fragments by PCR
- Validate the Library
- Using the Cluster Station
- Introduction
- Cluster Generation Steps
- Cluster Station Workflow
- Components
- Cluster Station Recipes
- Cluster Generation Kit Contents
- Preparing Sample DNA for Cluster Generation
- Preparing Reagents for Cluster Generation
- Loading Reagents for Cluster Generation
- Starting the Cluster Station
- Cluster Generation
- Preparing Reagents for Read 1 Preparation on the Cluster Station
- Loading Reagents for Read 1 Preparation on the Cluster Station
- Linearization, Blocking, and Primer Hybridization on the Cluster Station
- Troubleshooting
- Using the Genome Analyzer
- Introduction
- Workflow
- Components
- Starting the Genome Analyzer
- Software User Interface
- Basic Procedures
- SBS Sequencing Kit v2 Contents
- Prepare Reagents for Read 1 on the Genome Analyzer
- Installing the Bottle Adaptors
- Performing a Pre-Run Wash
- Loading and Priming Reagents
- Cleaning and Installing the Prism
- Cleaning and Installing the Flow Cell
- Checking for Leaks and Proper Reagent Delivery
- Applying Oil
- Performing First-Base Incorporation
- Loading the Flow Cell with Scan Mix
- Adjusting Focus
- Checking Quality Metrics
- Completing Read 1
- Preparing Reagents for Read 2 Preparation on the Paired- End Module
- Reagent Positions on the Paired-End Module
- Preparing for Read 2 on the Paired-End Module
- Preparing Reagents for Read 2 on the Genome Analyzer
- Sequencing Read 2
- Performing Post-Run Procedures
- Run Browser Reports
- Introduction
- Flow Cell Window
- Report Window
- Metric Deviation Report Window
- Integrated Primary Analysis and Reporting
- Introduction
- Starting up IPAR
- Using the Analysis Viewer
- Quality Metrics in IPAR
- Storage of IPAR Data
- Network Copy Options
- Pipeline Analysis of IPAR Data
- Run Folders
- Introduction
- Run Folder Path
- Contents of Run Folders
- Sample Sheets
- Introduction
- Configuring Sample Sheet Behavior
- Sample Sheet Example
- Recipes
- Introduction
- Stopping and Restarting a Recipe
- Protocol Section
- Chemistry Definition Section
- General Commands
- Cluster Station Commands
- Genome Analyzer Commands
- Service Recipes
- User-Defined Recipes
- Configuring Tile Selection
- Sample Genome Analyzer Recipe with Annotations
- Frequently Asked Questions
- General
- Sample Prep
- Cluster Station
- Genome Analyzer
- Technology Overview and Molecular Biology


Paired-End Sequencing User Guide iii
Notice
This publication and its contents are proprietary to Illumina, Inc., and are intended
solely for the contractual use of its customers and for no other purpose than to
operate the system described herein. This publication and its contents shall not be
used or distributed for any other purpose and/or otherwise communicated, disclosed,
or reproduced in any way whatsoever without the prior written consent of Illumina,
Inc.
For the proper operation of this system and/or all parts thereof, the instructions in this
guide must be strictly and explicitly followed by experienced personnel. All of the
contents of this guide must be fully read and understood prior to operating the
system or any of the parts thereof.
FAILURE TO COMPLETELY READ AND FULLY UNDERSTAND AND FOLLOW ALL OF
THE CONTENTS OF THIS GUIDE PRIOR TO OPERATING THIS SYSTEM, OR PARTS
THEREOF, MAY RESULT IN DAMAGE TO THE EQUIPMENT, OR PARTS THEREOF,
AND INJURY TO ANY PERSONS OPERATING THE SAME.
Illumina, Inc. does not assume any liability arising out of the application or use of any
products, component parts, or software described herein. Illumina, Inc. further does
not convey any license under its patent, trademark, copyright, or common-law rights
nor the similar rights of others. Illumina, Inc. further reserves the right to make any
changes in any processes, products, or parts thereof, described herein without notice.
While every effort has been made to make this guide as complete and accurate as
possible as of the publication date, no warranty or fitness is implied, nor does Illumina
accept any liability for damages resulting from the information contained in this
guide.
© 2008 Illumina, Inc. All rights reserved. Illumina, Solexa, Making Sense Out of Life,
Oligator, Sentrix, GoldenGate, DASL, BeadArray, Array of Arrays, Infinium,
BeadXpress, VeraCode, IntelliHyb, iSelect, CSPro, iScan, and GenomeStudio are
registered trademarks or trademarks of Illumina. All other brands and names
contained herein are the property of their respective owners.


Paired-End Sequencing User Guide v
Revision History
Part Number and Revision Letter Date
1004571 Rev. A July 2008


Paired-End Sequencing User Guide vii
Table of Contents
Notice. . . . . . . . . . . . . . . . . . . . . . . . . . . . . . . . . . . . . . . . . . . . . . . . . . . . . . . iii
Revision History . . . . . . . . . . . . . . . . . . . . . . . . . . . . . . . . . . . . . . . . . . . . . . . v
Table of Contents . . . . . . . . . . . . . . . . . . . . . . . . . . . . . . . . . . . . . . . . . . . . vii
List of Figures. . . . . . . . . . . . . . . . . . . . . . . . . . . . . . . . . . . . . . . . . . . . . . . . xiii
List of Tables . . . . . . . . . . . . . . . . . . . . . . . . . . . . . . . . . . . . . . . . . . . . . . . .xvii
Chapter 1 Overview . . . . . . . . . . . . . . . . . . . . . . . . . . . . . . . . . . 1
Introduction . . . . . . . . . . . . . . . . . . . . . . . . . . . . . . . . . . . . . . . . . . . . . . . . . . 2
Audience and Purpose. . . . . . . . . . . . . . . . . . . . . . . . . . . . . . . . . . . . . . . . . . 2
Related Documentation . . . . . . . . . . . . . . . . . . . . . . . . . . . . . . . . . . . . . . . . . 3
Technical Assistance . . . . . . . . . . . . . . . . . . . . . . . . . . . . . . . . . . . . . . . . . . . 4
Illumina Genome Analysis System . . . . . . . . . . . . . . . . . . . . . . . . . . . . . . . . . 5
Sample Prep . . . . . . . . . . . . . . . . . . . . . . . . . . . . . . . . . . . . . . . . . . . . . . 5
Cluster Station . . . . . . . . . . . . . . . . . . . . . . . . . . . . . . . . . . . . . . . . . . . . . 5
Genome Analyzer . . . . . . . . . . . . . . . . . . . . . . . . . . . . . . . . . . . . . . . . . . 5
Paired-End Module . . . . . . . . . . . . . . . . . . . . . . . . . . . . . . . . . . . . . . . . . 5
Flow Cell . . . . . . . . . . . . . . . . . . . . . . . . . . . . . . . . . . . . . . . . . . . . . . . . . 5
Paired-End Sequencing . . . . . . . . . . . . . . . . . . . . . . . . . . . . . . . . . . . . . . . . . 7
Key Differences . . . . . . . . . . . . . . . . . . . . . . . . . . . . . . . . . . . . . . . . . . . . 7
Protocol Workflow . . . . . . . . . . . . . . . . . . . . . . . . . . . . . . . . . . . . . . . . . . 8
User Supplied Consumables and Equipment . . . . . . . . . . . . . . . . . . . . . . . 11
Consumables . . . . . . . . . . . . . . . . . . . . . . . . . . . . . . . . . . . . . . . . . . . . . 11
Equipment . . . . . . . . . . . . . . . . . . . . . . . . . . . . . . . . . . . . . . . . . . . . . . . 12
Chapter 2 Preparing Samples for
Paired-End Sequencing . . . . . . . . . . . . . . . . . . . . . . 13
Introduction . . . . . . . . . . . . . . . . . . . . . . . . . . . . . . . . . . . . . . . . . . . . . . . . . 14
Sample Prep Workflow . . . . . . . . . . . . . . . . . . . . . . . . . . . . . . . . . . . . . 15
Sample Preparation Kit Contents. . . . . . . . . . . . . . . . . . . . . . . . . . . . . . . . . 16
Paired-End Sample Prep Kit, Box 1 . . . . . . . . . . . . . . . . . . . . . . . . . . . . 16
Paired-End Sample Prep Kit, Box 2 . . . . . . . . . . . . . . . . . . . . . . . . . . . . 17
Fragment Genomic DNA . . . . . . . . . . . . . . . . . . . . . . . . . . . . . . . . . . . . . . . 18
Consumables . . . . . . . . . . . . . . . . . . . . . . . . . . . . . . . . . . . . . . . . . . . . . 18
Procedure . . . . . . . . . . . . . . . . . . . . . . . . . . . . . . . . . . . . . . . . . . . . . . . 19
Perform End Repair . . . . . . . . . . . . . . . . . . . . . . . . . . . . . . . . . . . . . . . . . . . 22

viii Table of Contents
Part # 1004571 Rev. A
Consumables . . . . . . . . . . . . . . . . . . . . . . . . . . . . . . . . . . . . . . . . . . . . . 22
Procedure . . . . . . . . . . . . . . . . . . . . . . . . . . . . . . . . . . . . . . . . . . . . . . . 22
Add ‘A’ Bases to the 3' End of the DNA Fragments . . . . . . . . . . . . . . . . . . 23
Consumables . . . . . . . . . . . . . . . . . . . . . . . . . . . . . . . . . . . . . . . . . . . . . 23
Procedure . . . . . . . . . . . . . . . . . . . . . . . . . . . . . . . . . . . . . . . . . . . . . . . 23
Ligate Adaptors to DNA Fragments . . . . . . . . . . . . . . . . . . . . . . . . . . . . . . 24
Consumables . . . . . . . . . . . . . . . . . . . . . . . . . . . . . . . . . . . . . . . . . . . . . 24
Procedure . . . . . . . . . . . . . . . . . . . . . . . . . . . . . . . . . . . . . . . . . . . . . . . 24
Purify Ligation Products . . . . . . . . . . . . . . . . . . . . . . . . . . . . . . . . . . . . . . . . 25
Consumables . . . . . . . . . . . . . . . . . . . . . . . . . . . . . . . . . . . . . . . . . . . . . 25
Procedure . . . . . . . . . . . . . . . . . . . . . . . . . . . . . . . . . . . . . . . . . . . . . . . 25
Enrich the Adaptor-Modified DNA Fragments by PCR . . . . . . . . . . . . . . . . 27
Consumables . . . . . . . . . . . . . . . . . . . . . . . . . . . . . . . . . . . . . . . . . . . . . 27
Procedure . . . . . . . . . . . . . . . . . . . . . . . . . . . . . . . . . . . . . . . . . . . . . . . 27
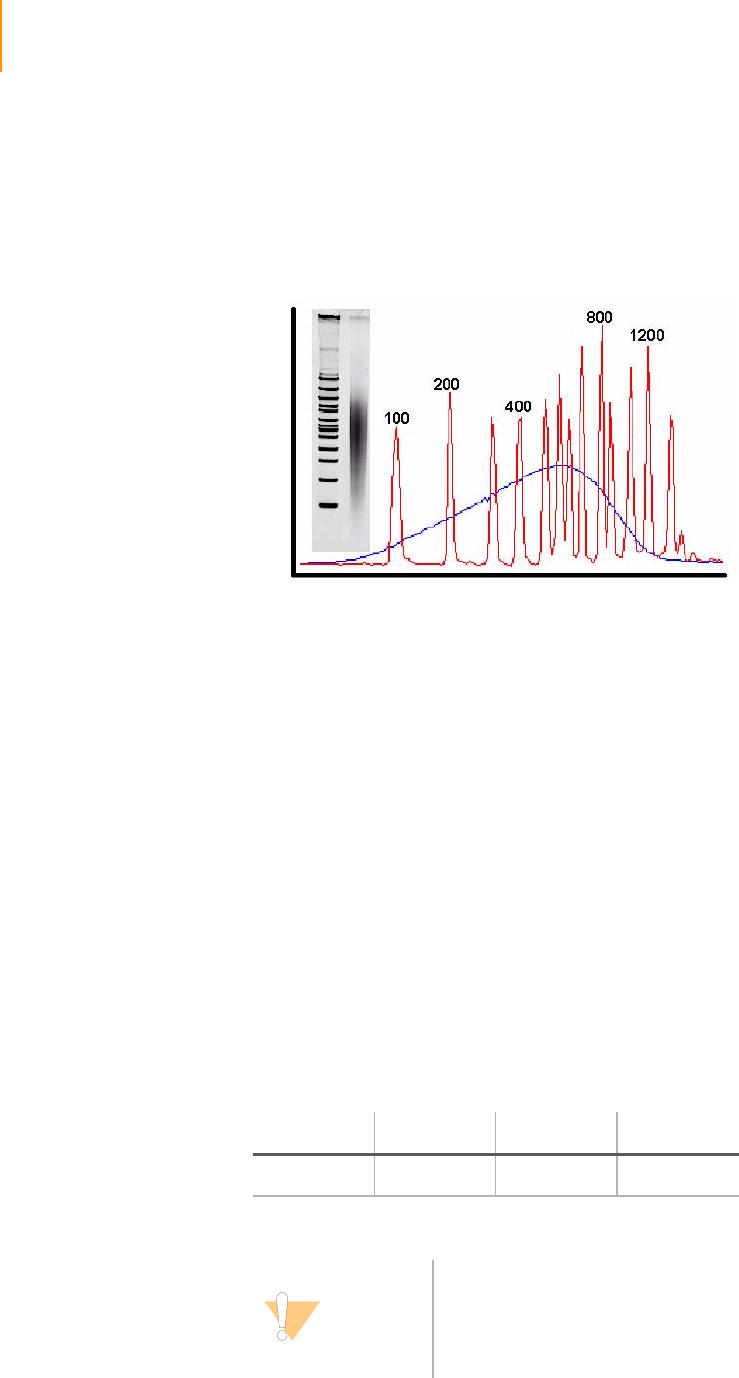
Validate the Library . . . . . . . . . . . . . . . . . . . . . . . . . . . . . . . . . . . . . . . . . . . 28
Chapter 3 Using the Cluster Station . . . . . . . . . . . . . . . . . . . . . 31
Introduction . . . . . . . . . . . . . . . . . . . . . . . . . . . . . . . . . . . . . . . . . . . . . . . . . 33
Cluster Generation Steps. . . . . . . . . . . . . . . . . . . . . . . . . . . . . . . . . . . . . . . 34
Cluster Station Workflow . . . . . . . . . . . . . . . . . . . . . . . . . . . . . . . . . . . . . . . 34
Protocol Times. . . . . . . . . . . . . . . . . . . . . . . . . . . . . . . . . . . . . . . . . . . . 35
Components . . . . . . . . . . . . . . . . . . . . . . . . . . . . . . . . . . . . . . . . . . . . . . . . 37
Power Connections . . . . . . . . . . . . . . . . . . . . . . . . . . . . . . . . . . . . . . . . 37
Instrument Areas . . . . . . . . . . . . . . . . . . . . . . . . . . . . . . . . . . . . . . . . . . 37
Reagent Area. . . . . . . . . . . . . . . . . . . . . . . . . . . . . . . . . . . . . . . . . . . . . 38
Manifolds . . . . . . . . . . . . . . . . . . . . . . . . . . . . . . . . . . . . . . . . . . . . . . . . 40
Cluster Station Recipes . . . . . . . . . . . . . . . . . . . . . . . . . . . . . . . . . . . . . . . . 45
Cluster Generation Kit Contents . . . . . . . . . . . . . . . . . . . . . . . . . . . . . . . . . 46
Paired-End Cluster Generation Kit, Box 1 (Read 1) . . . . . . . . . . . . . . . . 46
Paired-End Cluster Generation Kit, Box 2 (Read 2) . . . . . . . . . . . . . . . . 47
Paired-End Cluster Generation Kit, Box 3 (Read 1) . . . . . . . . . . . . . . . . 48
Paired-End Cluster Generation Kit, Box 4 (Read 2) . . . . . . . . . . . . . . . . 48
Other Cluster Station Consumables . . . . . . . . . . . . . . . . . . . . . . . . . . . 49
Preparing Sample DNA for Cluster Generation . . . . . . . . . . . . . . . . . . . . . . 50
Consumables . . . . . . . . . . . . . . . . . . . . . . . . . . . . . . . . . . . . . . . . . . . . . 50
Template Mix. . . . . . . . . . . . . . . . . . . . . . . . . . . . . . . . . . . . . . . . . . . . . 50
Preparing Reagents for Cluster Generation . . . . . . . . . . . . . . . . . . . . . . . . . 53
Consumables . . . . . . . . . . . . . . . . . . . . . . . . . . . . . . . . . . . . . . . . . . . . . 53
Procedure . . . . . . . . . . . . . . . . . . . . . . . . . . . . . . . . . . . . . . . . . . . . . . . 54
Loading Reagents for Cluster Generation . . . . . . . . . . . . . . . . . . . . . . . . . . 56
Starting the Cluster Station . . . . . . . . . . . . . . . . . . . . . . . . . . . . . . . . . . . . . 58
Cluster Generation. . . . . . . . . . . . . . . . . . . . . . . . . . . . . . . . . . . . . . . . . . . . 59
Running a Recipe. . . . . . . . . . . . . . . . . . . . . . . . . . . . . . . . . . . . . . . . . . 59
Positioning the Flow Cell. . . . . . . . . . . . . . . . . . . . . . . . . . . . . . . . . . . . 61
Attaching the Hybridization Manifold . . . . . . . . . . . . . . . . . . . . . . . . . . 61
Check Even Flow . . . . . . . . . . . . . . . . . . . . . . . . . . . . . . . . . . . . . . . . . . 62
Attaching the Amplification Manifold . . . . . . . . . . . . . . . . . . . . . . . . . . 62
Safe Stopping Points During Cluster Generation . . . . . . . . . . . . . . . . . 62
Unloading the Flow Cell . . . . . . . . . . . . . . . . . . . . . . . . . . . . . . . . . . . . 63
Weekly Maintenance Wash . . . . . . . . . . . . . . . . . . . . . . . . . . . . . . . . . . 64
Preparing Reagents for Read 1 Preparation on the Cluster Station. . . . . . . 65

Table of Contents ix
Paired-End Sequencing User Guide
Consumables . . . . . . . . . . . . . . . . . . . . . . . . . . . . . . . . . . . . . . . . . . . . . 65
Procedure . . . . . . . . . . . . . . . . . . . . . . . . . . . . . . . . . . . . . . . . . . . . . . . 65
Loading Reagents for Read 1 Preparation on the Cluster Station . . . . . . . . 68
Linearization, Blocking, and Primer Hybridization on the Cluster Station . . 70
Troubleshooting. . . . . . . . . . . . . . . . . . . . . . . . . . . . . . . . . . . . . . . . . . . . . . 72
Setting the Thermal Station Temperature . . . . . . . . . . . . . . . . . . . . . . . 72
Pumping Reagents . . . . . . . . . . . . . . . . . . . . . . . . . . . . . . . . . . . . . . . . 72
Priming Reagents to Waste . . . . . . . . . . . . . . . . . . . . . . . . . . . . . . . . . . 74
Unclogging the Flow Cell . . . . . . . . . . . . . . . . . . . . . . . . . . . . . . . . . . . 74
Temperature Profile. . . . . . . . . . . . . . . . . . . . . . . . . . . . . . . . . . . . . . . . 75
Software Errors . . . . . . . . . . . . . . . . . . . . . . . . . . . . . . . . . . . . . . . . . . . 75
Chapter 4 Using the Genome Analyzer . . . . . . . . . . . . . . . . . . 79
Introduction . . . . . . . . . . . . . . . . . . . . . . . . . . . . . . . . . . . . . . . . . . . . . . . . . 81
Workflow . . . . . . . . . . . . . . . . . . . . . . . . . . . . . . . . . . . . . . . . . . . . . . . . . . . 82
Procedures. . . . . . . . . . . . . . . . . . . . . . . . . . . . . . . . . . . . . . . . . . . . . . . 83
Components . . . . . . . . . . . . . . . . . . . . . . . . . . . . . . . . . . . . . . . . . . . . . . . . 84
Reagent Compartment . . . . . . . . . . . . . . . . . . . . . . . . . . . . . . . . . . . . . 85
Imaging Compartment . . . . . . . . . . . . . . . . . . . . . . . . . . . . . . . . . . . . . 86
Starting the Genome Analyzer. . . . . . . . . . . . . . . . . . . . . . . . . . . . . . . . . . . 88
Starting IPAR . . . . . . . . . . . . . . . . . . . . . . . . . . . . . . . . . . . . . . . . . . . . . 89
Network Copy . . . . . . . . . . . . . . . . . . . . . . . . . . . . . . . . . . . . . . . . . . . . 90
Software User Interface . . . . . . . . . . . . . . . . . . . . . . . . . . . . . . . . . . . . . . . . 91
Run and Manual Control/Setup Windows . . . . . . . . . . . . . . . . . . . . . . . 91
Recipe and Image Cycle Tabs . . . . . . . . . . . . . . . . . . . . . . . . . . . . . . . . 91
Temperature and Analysis Viewer Tabs. . . . . . . . . . . . . . . . . . . . . . . . . 92
Image Controls . . . . . . . . . . . . . . . . . . . . . . . . . . . . . . . . . . . . . . . . . . . 93
Pump Control . . . . . . . . . . . . . . . . . . . . . . . . . . . . . . . . . . . . . . . . . . . . 94
Basic Procedures . . . . . . . . . . . . . . . . . . . . . . . . . . . . . . . . . . . . . . . . . . . . . 95
Washing the Lines . . . . . . . . . . . . . . . . . . . . . . . . . . . . . . . . . . . . . . . . . 95
Consumables . . . . . . . . . . . . . . . . . . . . . . . . . . . . . . . . . . . . . . . . . . . . . 95
Maintenance Wash . . . . . . . . . . . . . . . . . . . . . . . . . . . . . . . . . . . . . . . . 95
Storage Wash . . . . . . . . . . . . . . . . . . . . . . . . . . . . . . . . . . . . . . . . . . . . 96
Resuming Use after Storage . . . . . . . . . . . . . . . . . . . . . . . . . . . . . . . . . 97
Unloading a Flow Cell . . . . . . . . . . . . . . . . . . . . . . . . . . . . . . . . . . . . . . 97
SBS Sequencing Kit v2 Contents . . . . . . . . . . . . . . . . . . . . . . . . . . . . . . . . . 99
What’s New . . . . . . . . . . . . . . . . . . . . . . . . . . . . . . . . . . . . . . . . . . . . . . 99
SBS Sequencing Kit, Box 1 . . . . . . . . . . . . . . . . . . . . . . . . . . . . . . . . . 100
SBS Sequencing Kit, Box 2 . . . . . . . . . . . . . . . . . . . . . . . . . . . . . . . . . 100
Prepare Reagents for Read 1 on the Genome Analyzer . . . . . . . . . . . . . . 101
Unpack and Thaw Reagents . . . . . . . . . . . . . . . . . . . . . . . . . . . . . . . . 101
Procedure . . . . . . . . . . . . . . . . . . . . . . . . . . . . . . . . . . . . . . . . . . . . . . 101
Installing the Bottle Adaptors . . . . . . . . . . . . . . . . . . . . . . . . . . . . . . . . . . 104
Performing a Pre-Run Wash . . . . . . . . . . . . . . . . . . . . . . . . . . . . . . . . . . . . 105
Consumables . . . . . . . . . . . . . . . . . . . . . . . . . . . . . . . . . . . . . . . . . . . . 105
Procedure . . . . . . . . . . . . . . . . . . . . . . . . . . . . . . . . . . . . . . . . . . . . . . 105
Loading and Priming Reagents . . . . . . . . . . . . . . . . . . . . . . . . . . . . . . . . . 107
Loading Reagents . . . . . . . . . . . . . . . . . . . . . . . . . . . . . . . . . . . . . . . . 107
Priming Reagents. . . . . . . . . . . . . . . . . . . . . . . . . . . . . . . . . . . . . . . . . 108
Cleaning and Installing the Prism. . . . . . . . . . . . . . . . . . . . . . . . . . . . . . . . 110
Handling the Prism . . . . . . . . . . . . . . . . . . . . . . . . . . . . . . . . . . . . . . . 110

xTable of Contents
Part # 1004571 Rev. A
Removing the Flow Cell and Prism . . . . . . . . . . . . . . . . . . . . . . . . . . . 110
Cleaning the Prism. . . . . . . . . . . . . . . . . . . . . . . . . . . . . . . . . . . . . . . . 111
Installing the Prism. . . . . . . . . . . . . . . . . . . . . . . . . . . . . . . . . . . . . . . . 112
Cleaning and Installing the Flow Cell . . . . . . . . . . . . . . . . . . . . . . . . . . . . 113
Cleaning the Flow Cell . . . . . . . . . . . . . . . . . . . . . . . . . . . . . . . . . . . . 113
Entering the Flow Cell ID. . . . . . . . . . . . . . . . . . . . . . . . . . . . . . . . . . . 114
Loading the Flow Cell . . . . . . . . . . . . . . . . . . . . . . . . . . . . . . . . . . . . . 114
Checking for Leaks and Proper Reagent Delivery . . . . . . . . . . . . . . . . . . . 117
Applying Oil . . . . . . . . . . . . . . . . . . . . . . . . . . . . . . . . . . . . . . . . . . . . . . . . 119
Performing First-Base Incorporation . . . . . . . . . . . . . . . . . . . . . . . . . . . . . 121
Loading the Flow Cell with Scan Mix . . . . . . . . . . . . . . . . . . . . . . . . . . . . . 123
Adjusting Focus . . . . . . . . . . . . . . . . . . . . . . . . . . . . . . . . . . . . . . . . . . . . . 124
Default XYZ Coordinates . . . . . . . . . . . . . . . . . . . . . . . . . . . . . . . . . . . 124
Manual Controls . . . . . . . . . . . . . . . . . . . . . . . . . . . . . . . . . . . . . . . . . 124
Adjusting the X Axis . . . . . . . . . . . . . . . . . . . . . . . . . . . . . . . . . . . . . . 126
Adjusting the Y Axis. . . . . . . . . . . . . . . . . . . . . . . . . . . . . . . . . . . . . . . 131
Setting XY Drift . . . . . . . . . . . . . . . . . . . . . . . . . . . . . . . . . . . . . . . . . . 131
Confirming the Footprint . . . . . . . . . . . . . . . . . . . . . . . . . . . . . . . . . . 133
Adjusting the Z Axis. . . . . . . . . . . . . . . . . . . . . . . . . . . . . . . . . . . . . . . 133
Checking Quality Metrics. . . . . . . . . . . . . . . . . . . . . . . . . . . . . . . . . . . . . . 136
Performing Autofocus Calibration . . . . . . . . . . . . . . . . . . . . . . . . . . . . 136
Viewing Data in Run Browser. . . . . . . . . . . . . . . . . . . . . . . . . . . . . . . . 137
Checking Quality Metrics in IPAR . . . . . . . . . . . . . . . . . . . . . . . . . . . . 138
Completing Read 1 . . . . . . . . . . . . . . . . . . . . . . . . . . . . . . . . . . . . . . . . . . 139
Data Transfer for Paired-End Runs . . . . . . . . . . . . . . . . . . . . . . . . . . . 140
Preparing Reagents for Read 2 Preparation on the Paired-End Module . . 141
Consumables . . . . . . . . . . . . . . . . . . . . . . . . . . . . . . . . . . . . . . . . . . . . 141
Procedure . . . . . . . . . . . . . . . . . . . . . . . . . . . . . . . . . . . . . . . . . . . . . . 142
Reagent Positions on the Paired-End Module . . . . . . . . . . . . . . . . . . . . . . 146
Loading Reagents . . . . . . . . . . . . . . . . . . . . . . . . . . . . . . . . . . . . . . . . 147
Using the Paired-End Module . . . . . . . . . . . . . . . . . . . . . . . . . . . . . . . 147
Preparing for Read 2 on the Paired-End Module. . . . . . . . . . . . . . . . . . . . 148
Prime the Paired-End Module . . . . . . . . . . . . . . . . . . . . . . . . . . . . . . . 148
Prepare for Read 2. . . . . . . . . . . . . . . . . . . . . . . . . . . . . . . . . . . . . . . . 148
Preparing Reagents for Read 2 on the Genome Analyzer . . . . . . . . . . . . . 149
Unpack and Thaw Reagents . . . . . . . . . . . . . . . . . . . . . . . . . . . . . . . . 149
Procedure . . . . . . . . . . . . . . . . . . . . . . . . . . . . . . . . . . . . . . . . . . . . . . 149
Sequencing Read 2 . . . . . . . . . . . . . . . . . . . . . . . . . . . . . . . . . . . . . . . . . . 152
Performing Post-Run Procedures . . . . . . . . . . . . . . . . . . . . . . . . . . . . . . . . 155
Weigh Reagents . . . . . . . . . . . . . . . . . . . . . . . . . . . . . . . . . . . . . . . . . 155
Post-Run Wash. . . . . . . . . . . . . . . . . . . . . . . . . . . . . . . . . . . . . . . . . . . 155
Chapter 5 Run Browser Reports . . . . . . . . . . . . . . . . . . . . . . . 157
Introduction . . . . . . . . . . . . . . . . . . . . . . . . . . . . . . . . . . . . . . . . . . . . . . . . 158
User Interface. . . . . . . . . . . . . . . . . . . . . . . . . . . . . . . . . . . . . . . . . . . . 158
Flow Cell Window . . . . . . . . . . . . . . . . . . . . . . . . . . . . . . . . . . . . . . . . . . . 159
Launching Run Browser . . . . . . . . . . . . . . . . . . . . . . . . . . . . . . . . . . . . 159
Using the Flow Cell Window . . . . . . . . . . . . . . . . . . . . . . . . . . . . . . . . 161
Checking First Cycle Results in the Flow Cell Window . . . . . . . . . . . . 165
Report Window . . . . . . . . . . . . . . . . . . . . . . . . . . . . . . . . . . . . . . . . . . . . . 168
Report Types . . . . . . . . . . . . . . . . . . . . . . . . . . . . . . . . . . . . . . . . . . . . 168

Table of Contents xi
Paired-End Sequencing User Guide
Running a Report. . . . . . . . . . . . . . . . . . . . . . . . . . . . . . . . . . . . . . . . . 169
Cluster Metrics: Measuring Cluster Quality . . . . . . . . . . . . . . . . . . . . . 172
Focus Metrics: Measuring Image Quality . . . . . . . . . . . . . . . . . . . . . . 172
Laser Spot Metrics: Measuring Autofocus Performance . . . . . . . . . . . 174
Phasing Metrics: Measuring Cycle Independence. . . . . . . . . . . . . . . . 174
Other Metrics. . . . . . . . . . . . . . . . . . . . . . . . . . . . . . . . . . . . . . . . . . . . 175
Metric Deviation Report Window. . . . . . . . . . . . . . . . . . . . . . . . . . . . . . . . 176
Running a Metric Deviation Report . . . . . . . . . . . . . . . . . . . . . . . . . . . 176
Cycle-to-Cycle Metrics: Measuring Quality Deviations . . . . . . . . . . . . 177
Chapter 6 Integrated Primary Analysis and Reporting . . . . . . 179
Introduction . . . . . . . . . . . . . . . . . . . . . . . . . . . . . . . . . . . . . . . . . . . . . . . . 180
Audience and Purpose . . . . . . . . . . . . . . . . . . . . . . . . . . . . . . . . . . . . 180
User Interface. . . . . . . . . . . . . . . . . . . . . . . . . . . . . . . . . . . . . . . . . . . . 180
Starting up IPAR. . . . . . . . . . . . . . . . . . . . . . . . . . . . . . . . . . . . . . . . . . . . . 181
Using the Analysis Viewer . . . . . . . . . . . . . . . . . . . . . . . . . . . . . . . . . . . . . 182
Introduction . . . . . . . . . . . . . . . . . . . . . . . . . . . . . . . . . . . . . . . . . . . . . 182
Overview Display. . . . . . . . . . . . . . . . . . . . . . . . . . . . . . . . . . . . . . . . . 182
Individual Parameter Plots . . . . . . . . . . . . . . . . . . . . . . . . . . . . . . . . . . 187
Quality Metrics in IPAR. . . . . . . . . . . . . . . . . . . . . . . . . . . . . . . . . . . . . . . . 188
Quality Metrics Explanation. . . . . . . . . . . . . . . . . . . . . . . . . . . . . . . . . 188
Thresholds Scaled Overview Display. . . . . . . . . . . . . . . . . . . . . . . . . . 188
Storage of IPAR Data . . . . . . . . . . . . . . . . . . . . . . . . . . . . . . . . . . . . . . . . . 189
Network Copy Options . . . . . . . . . . . . . . . . . . . . . . . . . . . . . . . . . . . . . . . 190
IPAR Saving and Transferring Images . . . . . . . . . . . . . . . . . . . . . . . . . 190
Images Not Transferred. . . . . . . . . . . . . . . . . . . . . . . . . . . . . . . . . . . . 191
Instrument Computer Saving Images . . . . . . . . . . . . . . . . . . . . . . . . . 192
Network Copy Configuration Summary. . . . . . . . . . . . . . . . . . . . . . . . 193
Pipeline Analysis of IPAR Data . . . . . . . . . . . . . . . . . . . . . . . . . . . . . . . . . . 194
Appendix A Run Folders. . . . . . . . . . . . . . . . . . . . . . . . . . . . . . . 195
Introduction . . . . . . . . . . . . . . . . . . . . . . . . . . . . . . . . . . . . . . . . . . . . . . . . 196
Run Folder Path . . . . . . . . . . . . . . . . . . . . . . . . . . . . . . . . . . . . . . . . . . . . . 196
Contents of Run Folders . . . . . . . . . . . . . . . . . . . . . . . . . . . . . . . . . . . . . . 196
Appendix B Sample Sheets . . . . . . . . . . . . . . . . . . . . . . . . . . . . 199
Introduction . . . . . . . . . . . . . . . . . . . . . . . . . . . . . . . . . . . . . . . . . . . . . . . . 200
Configuring Sample Sheet Behavior . . . . . . . . . . . . . . . . . . . . . . . . . . . . . 202
Sample Sheet Example . . . . . . . . . . . . . . . . . . . . . . . . . . . . . . . . . . . . . . . 202
Appendix C Recipes . . . . . . . . . . . . . . . . . . . . . . . . . . . . . . . . . . 205
Introduction . . . . . . . . . . . . . . . . . . . . . . . . . . . . . . . . . . . . . . . . . . . . . . . . 206
Stopping and Restarting a Recipe . . . . . . . . . . . . . . . . . . . . . . . . . . . . . . . 207
Protocol Section. . . . . . . . . . . . . . . . . . . . . . . . . . . . . . . . . . . . . . . . . . . . . 207
Chemistry Definition Section . . . . . . . . . . . . . . . . . . . . . . . . . . . . . . . . . . . 209
General Commands . . . . . . . . . . . . . . . . . . . . . . . . . . . . . . . . . . . . . . . . . . 209

xii Table of Contents
Part # 1004571 Rev. A
Cluster Station Commands . . . . . . . . . . . . . . . . . . . . . . . . . . . . . . . . . . . . 210
Genome Analyzer Commands . . . . . . . . . . . . . . . . . . . . . . . . . . . . . . . . . . 211
ReadPrep Cycles . . . . . . . . . . . . . . . . . . . . . . . . . . . . . . . . . . . . . . . . . 212
Service Recipes . . . . . . . . . . . . . . . . . . . . . . . . . . . . . . . . . . . . . . . . . . . . . 212
User-Defined Recipes. . . . . . . . . . . . . . . . . . . . . . . . . . . . . . . . . . . . . . . . . 212
Configuring Tile Selection . . . . . . . . . . . . . . . . . . . . . . . . . . . . . . . . . . . . . 213
Reducing the Number of Rows . . . . . . . . . . . . . . . . . . . . . . . . . . . . . . 213
Reducing the Number of Lanes. . . . . . . . . . . . . . . . . . . . . . . . . . . . . . 213
Sample Genome Analyzer Recipe with Annotations . . . . . . . . . . . . . . . . . 214
Tile Selection . . . . . . . . . . . . . . . . . . . . . . . . . . . . . . . . . . . . . . . . . . . . 214
Comment. . . . . . . . . . . . . . . . . . . . . . . . . . . . . . . . . . . . . . . . . . . . . . . 214
Incorporation . . . . . . . . . . . . . . . . . . . . . . . . . . . . . . . . . . . . . . . . . . . . 214
Chemistry Definitions . . . . . . . . . . . . . . . . . . . . . . . . . . . . . . . . . . . . . 215
First Base Protocol. . . . . . . . . . . . . . . . . . . . . . . . . . . . . . . . . . . . . . . . 215
Protocol . . . . . . . . . . . . . . . . . . . . . . . . . . . . . . . . . . . . . . . . . . . . . . . . 217
Appendix D Frequently Asked Questions . . . . . . . . . . . . . . . . . 219
General. . . . . . . . . . . . . . . . . . . . . . . . . . . . . . . . . . . . . . . . . . . . . . . . . . . . 220
Sample Prep. . . . . . . . . . . . . . . . . . . . . . . . . . . . . . . . . . . . . . . . . . . . . . . . 221
Cluster Station . . . . . . . . . . . . . . . . . . . . . . . . . . . . . . . . . . . . . . . . . . . . . . 222
Clusters . . . . . . . . . . . . . . . . . . . . . . . . . . . . . . . . . . . . . . . . . . . . . . . . 222
Amplification . . . . . . . . . . . . . . . . . . . . . . . . . . . . . . . . . . . . . . . . . . . . 223
Fluidics. . . . . . . . . . . . . . . . . . . . . . . . . . . . . . . . . . . . . . . . . . . . . . . . . 223
Genome Analyzer. . . . . . . . . . . . . . . . . . . . . . . . . . . . . . . . . . . . . . . . . . . . 224
Controls . . . . . . . . . . . . . . . . . . . . . . . . . . . . . . . . . . . . . . . . . . . . . . . . 224
Software. . . . . . . . . . . . . . . . . . . . . . . . . . . . . . . . . . . . . . . . . . . . . . . . 225
Focus . . . . . . . . . . . . . . . . . . . . . . . . . . . . . . . . . . . . . . . . . . . . . . . . . . 226
Flow Cells . . . . . . . . . . . . . . . . . . . . . . . . . . . . . . . . . . . . . . . . . . . . . . 226
Fluidics. . . . . . . . . . . . . . . . . . . . . . . . . . . . . . . . . . . . . . . . . . . . . . . . . 227
Instrument . . . . . . . . . . . . . . . . . . . . . . . . . . . . . . . . . . . . . . . . . . . . . . 228
Quality Metrics. . . . . . . . . . . . . . . . . . . . . . . . . . . . . . . . . . . . . . . . . . . 228
IPAR . . . . . . . . . . . . . . . . . . . . . . . . . . . . . . . . . . . . . . . . . . . . . . . . . . . 228
Technology Overview and Molecular Biology . . . . . . . . . . . . . . . . . . . . . . 233
Additional Applications . . . . . . . . . . . . . . . . . . . . . . . . . . . . . . . . . . . . 235
Instrumentation . . . . . . . . . . . . . . . . . . . . . . . . . . . . . . . . . . . . . . . . . . 235
Analysis Software and Computing Requirements . . . . . . . . . . . . . . . . 235

Paired-End Sequencing User Guide xiii
List of Figures
Figure 1 1.4 mm Flow Cell and 1.0 mm Flow Cell. . . . . . . . . . . . . . . . . . . . . . . . . . . . 6
Figure 2 Paired-End Protocol Workflow. . . . . . . . . . . . . . . . . . . . . . . . . . . . . . . . . . . . 8
Figure 3 Fragments after Sample Preparation . . . . . . . . . . . . . . . . . . . . . . . . . . . . . . 14
Figure 4 Sample Preparation Workflow . . . . . . . . . . . . . . . . . . . . . . . . . . . . . . . . . . . 15
Figure 5 Paired-End Sample Prep Kit, Box 1 . . . . . . . . . . . . . . . . . . . . . . . . . . . . . . . 16
Figure 6 Paired-End Sample Prep Kit, Box 2 . . . . . . . . . . . . . . . . . . . . . . . . . . . . . . . 17
Figure 7 Fragment Genomic DNA. . . . . . . . . . . . . . . . . . . . . . . . . . . . . . . . . . . . . . . 18
Figure 8 Remove the Nebulizer Lid . . . . . . . . . . . . . . . . . . . . . . . . . . . . . . . . . . . . . . 19
Figure 9 Assemble the Nebulizer. . . . . . . . . . . . . . . . . . . . . . . . . . . . . . . . . . . . . . . . 19
Figure 10 Replace the Nebulizer Lid . . . . . . . . . . . . . . . . . . . . . . . . . . . . . . . . . . . . . . 20
Figure 11 Connect Compressed Air . . . . . . . . . . . . . . . . . . . . . . . . . . . . . . . . . . . . . . 20
Figure 12 Library Validation Gel . . . . . . . . . . . . . . . . . . . . . . . . . . . . . . . . . . . . . . . . . 28
Figure 13 Cluster Station . . . . . . . . . . . . . . . . . . . . . . . . . . . . . . . . . . . . . . . . . . . . . . . 33
Figure 14 Scheduling the Assay. . . . . . . . . . . . . . . . . . . . . . . . . . . . . . . . . . . . . . . . . . 36
Figure 15 Cluster Station Power Connections . . . . . . . . . . . . . . . . . . . . . . . . . . . . . . . 37
Figure 16 Cluster Station Areas . . . . . . . . . . . . . . . . . . . . . . . . . . . . . . . . . . . . . . . . . . 37
Figure 17 Positions on the Cluster Station . . . . . . . . . . . . . . . . . . . . . . . . . . . . . . . . . . 38
Figure 18 Liquid Waste Container on the Cluster Station . . . . . . . . . . . . . . . . . . . . . . 39
Figure 19 Flow Cell Area Components . . . . . . . . . . . . . . . . . . . . . . . . . . . . . . . . . . . . 40
Figure 20 Flow Cell with Strip Tube and Hybridization Manifold . . . . . . . . . . . . . . . . 41
Figure 21 Flow Cell with Amplification Manifold . . . . . . . . . . . . . . . . . . . . . . . . . . . . . 42
Figure 22 Quick-Connect Clamps . . . . . . . . . . . . . . . . . . . . . . . . . . . . . . . . . . . . . . . . 43
Figure 23 Washing Bridge . . . . . . . . . . . . . . . . . . . . . . . . . . . . . . . . . . . . . . . . . . . . . . 44
Figure 24 Paired-End Cluster Generation Kit, Box 1 . . . . . . . . . . . . . . . . . . . . . . . . . . 46
Figure 25 Paired-End Cluster Generation Kit, Box 2 . . . . . . . . . . . . . . . . . . . . . . . . . . 47
Figure 26 Paired-End Cluster Generation Kit, Box 3 . . . . . . . . . . . . . . . . . . . . . . . . . . 48
Figure 27 Paired-End Cluster Generation Kit, Box 4 . . . . . . . . . . . . . . . . . . . . . . . . . . 48
Figure 28 Cluster Station Reagent Positions . . . . . . . . . . . . . . . . . . . . . . . . . . . . . . . . 56
Figure 29 Cluster Station Software Main Window . . . . . . . . . . . . . . . . . . . . . . . . . . . . 58
Figure 30 Amplification, Linearization, Blocking Recipe . . . . . . . . . . . . . . . . . . . . . . . 59
Figure 31 Sample Sheet Data . . . . . . . . . . . . . . . . . . . . . . . . . . . . . . . . . . . . . . . . . . . 60
Figure 32 Run Folder . . . . . . . . . . . . . . . . . . . . . . . . . . . . . . . . . . . . . . . . . . . . . . . . . . 60
Figure 33 Positioning the Flow Cell . . . . . . . . . . . . . . . . . . . . . . . . . . . . . . . . . . . . . . . 61
Figure 34 Flow Cell and Hybridization Manifold Installed . . . . . . . . . . . . . . . . . . . . . . 62
Figure 35 Setting Pump Controls to Unload Flow Cell . . . . . . . . . . . . . . . . . . . . . . . . 63
Figure 36 Reagent Positions on the Cluster Station (Read 1). . . . . . . . . . . . . . . . . . . . 68
Figure 37 Thermal Station Temperature . . . . . . . . . . . . . . . . . . . . . . . . . . . . . . . . . . . 72
Figure 38 Syringe Pump. . . . . . . . . . . . . . . . . . . . . . . . . . . . . . . . . . . . . . . . . . . . . . . . 72
Figure 39 Cluster Station Reagent Positions . . . . . . . . . . . . . . . . . . . . . . . . . . . . . . . . 73
Figure 40 Select Reagents . . . . . . . . . . . . . . . . . . . . . . . . . . . . . . . . . . . . . . . . . . . . . . 74
Figure 41 Lines Primed . . . . . . . . . . . . . . . . . . . . . . . . . . . . . . . . . . . . . . . . . . . . . . . . 74
Figure 42 Temperature Profile . . . . . . . . . . . . . . . . . . . . . . . . . . . . . . . . . . . . . . . . . . . 75

xiv List of Figures
Part # 1004571 Rev. A
Figure 43 Selector Valve Error Message . . . . . . . . . . . . . . . . . . . . . . . . . . . . . . . . . . . 75
Figure 44 Pumpinit Command. . . . . . . . . . . . . . . . . . . . . . . . . . . . . . . . . . . . . . . . . . . 75
Figure 45 Flowcell Tmpr Error Message . . . . . . . . . . . . . . . . . . . . . . . . . . . . . . . . . . . 76
Figure 46 COM Port Settings in Device Manager . . . . . . . . . . . . . . . . . . . . . . . . . . . . 76
Figure 47 Genome Analyzer. . . . . . . . . . . . . . . . . . . . . . . . . . . . . . . . . . . . . . . . . . . . . 81
Figure 48 Paired-End Workflow on the Genome Analyzer . . . . . . . . . . . . . . . . . . . . . 82
Figure 49 Genome Analyzer Main Compartments. . . . . . . . . . . . . . . . . . . . . . . . . . . . 84
Figure 50 Genome Analyzer Reagent Compartment. . . . . . . . . . . . . . . . . . . . . . . . . . 85
Figure 51 Reagent Positions. . . . . . . . . . . . . . . . . . . . . . . . . . . . . . . . . . . . . . . . . . . . . 85
Figure 52 Genome Analyzer Imaging Compartment . . . . . . . . . . . . . . . . . . . . . . . . . . 86
Figure 53 Front and Rear Plumbing Manifolds . . . . . . . . . . . . . . . . . . . . . . . . . . . . . . 87
Figure 54 Genome Analyzer Software Screen . . . . . . . . . . . . . . . . . . . . . . . . . . . . . . . 89
Figure 55 Run and Manual Control/Setup Windows . . . . . . . . . . . . . . . . . . . . . . . . . . 91
Figure 56 Recipe Tab . . . . . . . . . . . . . . . . . . . . . . . . . . . . . . . . . . . . . . . . . . . . . . . . . . 91
Figure 57 Image Cycle Tab . . . . . . . . . . . . . . . . . . . . . . . . . . . . . . . . . . . . . . . . . . . . . 92
Figure 58 Temperature and Analysis Viewer Tabs. . . . . . . . . . . . . . . . . . . . . . . . . . . . 92
Figure 59 Pump Control Area . . . . . . . . . . . . . . . . . . . . . . . . . . . . . . . . . . . . . . . . . . . 94
Figure 60 Lifting Front and Rear Manifolds . . . . . . . . . . . . . . . . . . . . . . . . . . . . . . . . . 98
Figure 61 Genome Analyzer Bottle Adaptor . . . . . . . . . . . . . . . . . . . . . . . . . . . . . . . 104
Figure 62 Proper Fit of Bottle Adaptor . . . . . . . . . . . . . . . . . . . . . . . . . . . . . . . . . . . 104
Figure 63 Genome Analyzer Reagent Positions. . . . . . . . . . . . . . . . . . . . . . . . . . . . . 107
Figure 64 Prism . . . . . . . . . . . . . . . . . . . . . . . . . . . . . . . . . . . . . . . . . . . . . . . . . . . . . 110
Figure 65 Lifting Front and Rear Manifolds . . . . . . . . . . . . . . . . . . . . . . . . . . . . . . . . 111
Figure 66 Loading the Prism . . . . . . . . . . . . . . . . . . . . . . . . . . . . . . . . . . . . . . . . . . . 112
Figure 67 Flow Cell . . . . . . . . . . . . . . . . . . . . . . . . . . . . . . . . . . . . . . . . . . . . . . . . . . 113
Figure 68 Loading the Flow Cell . . . . . . . . . . . . . . . . . . . . . . . . . . . . . . . . . . . . . . . . 115
Figure 69 Positioning the Flow Cell . . . . . . . . . . . . . . . . . . . . . . . . . . . . . . . . . . . . . . 115
Figure 70 Lowering the Manifold. . . . . . . . . . . . . . . . . . . . . . . . . . . . . . . . . . . . . . . . 116
Figure 71 Flow Cell and Prism Loaded . . . . . . . . . . . . . . . . . . . . . . . . . . . . . . . . . . . 116
Figure 72 Checking for Bubbles . . . . . . . . . . . . . . . . . . . . . . . . . . . . . . . . . . . . . . . . 117
Figure 73 Testing for Leaks . . . . . . . . . . . . . . . . . . . . . . . . . . . . . . . . . . . . . . . . . . . . 118
Figure 74 Applying Oil . . . . . . . . . . . . . . . . . . . . . . . . . . . . . . . . . . . . . . . . . . . . . . . . 120
Figure 75 Manual Control/Setup Window . . . . . . . . . . . . . . . . . . . . . . . . . . . . . . . . . 124
Figure 76 Left Edge of Lane 1 . . . . . . . . . . . . . . . . . . . . . . . . . . . . . . . . . . . . . . . . . . 126
Figure 77 Lens Too High . . . . . . . . . . . . . . . . . . . . . . . . . . . . . . . . . . . . . . . . . . . . . . 127
Figure 78 Lens Too Low. . . . . . . . . . . . . . . . . . . . . . . . . . . . . . . . . . . . . . . . . . . . . . . 127
Figure 79 Lens Properly Positioned . . . . . . . . . . . . . . . . . . . . . . . . . . . . . . . . . . . . . . 128
Figure 80 Crosshair at Center of Image. . . . . . . . . . . . . . . . . . . . . . . . . . . . . . . . . . . 129
Figure 81 Left Edge of Lane 1 on the Screen . . . . . . . . . . . . . . . . . . . . . . . . . . . . . . 129
Figure 82 Blurred Edge of Lane 1 . . . . . . . . . . . . . . . . . . . . . . . . . . . . . . . . . . . . . . . 130
Figure 83 Focusing Z-Axis . . . . . . . . . . . . . . . . . . . . . . . . . . . . . . . . . . . . . . . . . . . . . 133
Figure 84 Autofocusing . . . . . . . . . . . . . . . . . . . . . . . . . . . . . . . . . . . . . . . . . . . . . . . 136
Figure 85 Reagent Positions on the Paired-End Module (Read 2). . . . . . . . . . . . . . . 146
Figure 86 Open Log File at the Normal Recipe folder location. . . . . . . . . . . . . . . . . 159
Figure 87 Flow Cell Window . . . . . . . . . . . . . . . . . . . . . . . . . . . . . . . . . . . . . . . . . . . 160
Figure 88 ImageViewer . . . . . . . . . . . . . . . . . . . . . . . . . . . . . . . . . . . . . . . . . . . . . . . 162
Figure 89 Histogram of Selected Quality Metrics. . . . . . . . . . . . . . . . . . . . . . . . . . . . 163
Figure 90 Select Tiles and Chart . . . . . . . . . . . . . . . . . . . . . . . . . . . . . . . . . . . . . . . . 163
Figure 91 Chart FocusPosition . . . . . . . . . . . . . . . . . . . . . . . . . . . . . . . . . . . . . . . . . . 164
Figure 92 Chart Tile vs. Cycle . . . . . . . . . . . . . . . . . . . . . . . . . . . . . . . . . . . . . . . . . . 164
Figure 93 Focus Stage Level . . . . . . . . . . . . . . . . . . . . . . . . . . . . . . . . . . . . . . . . . . . 165
Figure 94 Cluster Intensity Levels . . . . . . . . . . . . . . . . . . . . . . . . . . . . . . . . . . . . . . . 166

List of Figures xv
Paired-End Sequencing User Guide
Figure 95 Run Browser Focus Metric . . . . . . . . . . . . . . . . . . . . . . . . . . . . . . . . . . . . . 167
Figure 96 Empty Report Window. . . . . . . . . . . . . . . . . . . . . . . . . . . . . . . . . . . . . . . . 169
Figure 97 Sample First-Cycle Report . . . . . . . . . . . . . . . . . . . . . . . . . . . . . . . . . . . . . 170
Figure 98 Sample Metric Report . . . . . . . . . . . . . . . . . . . . . . . . . . . . . . . . . . . . . . . . 171
Figure 99 Phasing Report. . . . . . . . . . . . . . . . . . . . . . . . . . . . . . . . . . . . . . . . . . . . . . 175
Figure 100 Quality Metric Deviation Report . . . . . . . . . . . . . . . . . . . . . . . . . . . . . . . . 176
Figure 101 Integrated IPAR Analysis Viewer . . . . . . . . . . . . . . . . . . . . . . . . . . . . . . . . 182
Figure 102 Analysis Viewer Screen. . . . . . . . . . . . . . . . . . . . . . . . . . . . . . . . . . . . . . . . 182
Figure 103 Zoomed in view Analysis Viewer . . . . . . . . . . . . . . . . . . . . . . . . . . . . . . . . 183
Figure 104 Analysis Viewer context menu . . . . . . . . . . . . . . . . . . . . . . . . . . . . . . . . . . 184
Figure 105 Select plots in Analysis Viewer. . . . . . . . . . . . . . . . . . . . . . . . . . . . . . . . . . 184
Figure 106 Cycle Selection in the Analysis Viewer. . . . . . . . . . . . . . . . . . . . . . . . . . . . 185
Figure 107 Plot value line. . . . . . . . . . . . . . . . . . . . . . . . . . . . . . . . . . . . . . . . . . . . . . . 185
Figure 108 Context Menu Options for the Vertical Y-value Line . . . . . . . . . . . . . . . . . 185
Figure 109 Setting White Background. . . . . . . . . . . . . . . . . . . . . . . . . . . . . . . . . . . . . 186
Figure 110 Setting the Thickness of the Threshold Gridlines . . . . . . . . . . . . . . . . . . . 186
Figure 111 Setting the Two-row Legend . . . . . . . . . . . . . . . . . . . . . . . . . . . . . . . . . . . 186
Figure 112 Analysis Viewer Legend . . . . . . . . . . . . . . . . . . . . . . . . . . . . . . . . . . . . . . . 187
Figure 113 Individual Parameter Plot. . . . . . . . . . . . . . . . . . . . . . . . . . . . . . . . . . . . . . 187
Figure 114 Sample Sheet Editor . . . . . . . . . . . . . . . . . . . . . . . . . . . . . . . . . . . . . . . . . 201
Figure 115 Protocol Section of Sequencing Recipe File . . . . . . . . . . . . . . . . . . . . . . . 208
Figure 116 Chemistry Definition Section of Sequencing Recipe File. . . . . . . . . . . . . . 209

xvi List of Figures
Part # 1004571 Rev. A

Paired-End Sequencing User Guide xvii
List of Tables
Table 1 Documentation . . . . . . . . . . . . . . . . . . . . . . . . . . . . . . . . . . . . . . . . . . . . . . . 3
Table 2 Illumina Technical Support Contacts . . . . . . . . . . . . . . . . . . . . . . . . . . . . . . . 4
Table 3 Paired-End Cluster Generation Kits with 1.4 mm Flow Cell. . . . . . . . . . . . . . 6
Table 4 PVC Tubing Dimensions . . . . . . . . . . . . . . . . . . . . . . . . . . . . . . . . . . . . . . . 18
Table 5 Cluster Generation Process . . . . . . . . . . . . . . . . . . . . . . . . . . . . . . . . . . . . . 34
Table 6 Cluster Station Protocol Times. . . . . . . . . . . . . . . . . . . . . . . . . . . . . . . . . . . 35
Table 7 Tasks in Each Cluster Station Recipe . . . . . . . . . . . . . . . . . . . . . . . . . . . . . . 45
Table 8 Adjustments to the Protocol for High Final DNA Concentrations . . . . . . . . 51
Table 9 Reagent Positions. . . . . . . . . . . . . . . . . . . . . . . . . . . . . . . . . . . . . . . . . . . . . 57
Table 10 Reagent Positions on the Cluster Station and Read 1 Preparation Volumes 69
Table 11 Genome Analyzer Reagent Names . . . . . . . . . . . . . . . . . . . . . . . . . . . . . . . 86
Table 12 Genome Analyzer Image Controls. . . . . . . . . . . . . . . . . . . . . . . . . . . . . . . . 93
Table 13 Pump Controls . . . . . . . . . . . . . . . . . . . . . . . . . . . . . . . . . . . . . . . . . . . . . . . 94
Table 14 Genome Analyzer Reagents. . . . . . . . . . . . . . . . . . . . . . . . . . . . . . . . . . . . . 99
Table 15 Genome Analyzer Reagent Positions. . . . . . . . . . . . . . . . . . . . . . . . . . . . . 108
Table 16 Manual Controls. . . . . . . . . . . . . . . . . . . . . . . . . . . . . . . . . . . . . . . . . . . . . 125
Table 17 Reagent Positions on the Paired-End Module and Read 2 Volumes . . . . . 147
Table 18 Cluster Intensity Values . . . . . . . . . . . . . . . . . . . . . . . . . . . . . . . . . . . . . . . 166
Table 19 Run Browser Report Viewer Buttons . . . . . . . . . . . . . . . . . . . . . . . . . . . . . 171
Table 20 Measuring Cluster Quality . . . . . . . . . . . . . . . . . . . . . . . . . . . . . . . . . . . . . 172
Table 21 Measuring Image Quality. . . . . . . . . . . . . . . . . . . . . . . . . . . . . . . . . . . . . . 172
Table 22 Focus Status Warning Messages . . . . . . . . . . . . . . . . . . . . . . . . . . . . . . . . 173
Table 23 Measuring Autofocus Performance . . . . . . . . . . . . . . . . . . . . . . . . . . . . . . 174
Table 24 Quality Metrics in Analysis Viewer . . . . . . . . . . . . . . . . . . . . . . . . . . . . . . . 188
Table 25 Thresholds for the Y-axis Color Bar in the Overview Display. . . . . . . . . . . 188
Table 26 Elements to Be Changed in the Configuration Files . . . . . . . . . . . . . . . . . 193
Table 27 Configuration File Locations . . . . . . . . . . . . . . . . . . . . . . . . . . . . . . . . . . . 193
Table 28 Run Folder Contents . . . . . . . . . . . . . . . . . . . . . . . . . . . . . . . . . . . . . . . . . 196
Table 29 General Recipe Commands . . . . . . . . . . . . . . . . . . . . . . . . . . . . . . . . . . . . 209
Table 30 Cluster Station Recipe Commands . . . . . . . . . . . . . . . . . . . . . . . . . . . . . . 210
Table 31 Genome Analyzer Recipe Commands . . . . . . . . . . . . . . . . . . . . . . . . . . . . 211

xviii List of Tables
Part # 1004571 Rev. A

Paired-End Sequencing User Guide 1
Chapter 1
Overview
Topics
2Introduction
2 Audience and Purpose
3 Related Documentation
4 Technical Assistance
5 Illumina Genome Analysis System
5Sample Prep
5 Cluster Station
5 Genome Analyzer
5 Paired-End Module
5 Flow Cell
7 Paired-End Sequencing
7 Key Differences
8 Protocol Workflow
11 User Supplied Consumables and Equipment
11 Consumables
12 Equipment

2CHAPTER 1
Overview
Part # 1004571 Rev. A
Introduction
The Illumina Genome Analysis System is a groundbreaking new platform for
sequence analysis and functional genomics. Dramatically improving speed
and reducing costs, it is suitable for a range of applications including whole
genome and candidate region sequencing, expression profiling, DNA-
protein interaction, and small RNA identification and quantitation.
Leveraging proprietary reversible terminators and Clonal Single Molecule
Array technology, the Illumina Genome Analysis System can generate several
billion bases of data per run, and in the process transform the way many
experiments are devised and carried out.
The Illumina Genome Analysis System is ideal for genome-scale as well as
targeted sequencing projects. This platform has the potential to allow
researchers to sequence a human genome for under $100,000 and in a
matter of weeks, a feat that marks a dramatic improvement over the
capabilities offered by existing technologies.
Sequencing-By-Synthesis (SBS), using proprietary reversible terminators,
enables the Illumina Genome Analysis System to achieve a high degree of
sequencing accuracy even through homopolymeric regions. This allows
researchers to sequence complex genomes rapidly, economically, and
accurately. The versatile format of the flow cell also enables researchers to
tailor the system to meet the specific needs of their application.
Audience and Purpose
This guide is for laboratory personnel and other individuals responsible for:
`Operating the Illumina Cluster Station, Paired-End Module, and Genome
Analyzer
II
`Maintaining instrument components and consumables
`Assessing data quality with Run Browser
This guide also provides background information about core concepts such
as recipes, sample sheets, and run folders. The chapter on frequently asked
questions provides additional support.
NOTE
For more information about the Illumina Genome Analysis
System, refer to www.morethansequencing.com.

Related Documentation 3
Paired-End Sequencing User Guide
Related Documentation
The following is a list of available documentation. Please check iCom
(www.illumina.com/icom) or consult with Illumina Technical Support to find
out about recent updates and releases of new documents such as additional
sample prep protocols.
Ta ble 1 Documentation
Guide Description
Sequencing Site Preparation Guide Information about how to prepare your lab for the Cluster Station,
Genome Analyzer, IPAR, and Paired-End Module. This guide includes
environmental requirements, lists of user-supplied consumables, and
safety hazards.
Genomic DNA Sample Prep Guide Information about how to prepare genomic DNA samples for
sequencing.
Digital Gene Expression-Tag Profiling
with NlaII Sample Prep Guide Information about how to prepare gene expression-tag samples for
sequencing using NlaIII digestion.
Digital Gene Expression-Tag Profiling
with DpnII Sample Prep Guide Information about how to prepare gene expression-tag samples for
sequencing using DpnII digestion.
Small RNA Analysis Sample Prep Guide Information about how to prepare small RNA samples for analysis.
ChIP-Seq Sample Prep Information about how to prepare genomic DNA samples for ChIP
sequencing.
Single-Read Sequencing User Guide
(For the Cluster Station and Genome
Analyzer
II
)
Information about cluster generation on the Cluster Station and
sequencing on the Genome Analyzer
II
.
Single-Read Sequencing Lab Tracking
Worksheet Printable forms where lab technicians can record lot numbers, operator
names, and other information for each run.
Paired-End Sequencing User Guide
(For the Cluster Station and Genome
Analyzer
II
)
Information about paired-end reagent prep, cluster generation on the
Cluster Station, and sequencing on the Genome Analyzer
II
.
Paired-End Sequencing Lab Tracking
Worksheet Printable forms where lab technicians can record lot numbers, operator
names, and other information for each run.
Focus Procedure Experienced User Card
(EUC) Quick reference information on focusing the Genome Analyzer.
Genome Analyzer Pipeline Software User
Guide Information about how to use the Pipeline software for offline data
analysis, including commands to configure the output files to meet your
specific needs.

4CHAPTER 1
Overview
Part # 1004571 Rev. A
Technical Assistance
For technical assistance, contact Illumina Technical Support.
Ta ble 2 Illumina Technical Support Contacts
Contact Number
Toll-free Customer Hotline (North America) 1-800-809-ILMN (1-800-809-4566)
International Customer Hotline 1-858-202-ILMN (1-858-202-4566)
Illumina Website www.illumina.com
Email techsupport@illumina.com

Illumina Genome Analysis System 5
Paired-End Sequencing User Guide
Illumina Genome Analysis System
The Genome Analysis System process is straightforward yet flexible,
consisting of four steps:
1. Sample preparation. (See Preparing Samples for Paired-End Sequencing
on page 13.)
2. Cluster generation on the Cluster Station. (See Using the Cluster Station
on page 31.)
3. Sequencing-by-Synthesis (SBS) on the Genome Analyzer. (See Using the
Genome Analyzer on page 79.)
4. Data analysis using the Genome Analyzer Pipeline software. (See the
Genome Analyzer Pipeline Software User Guide for information about
data analysis.)
Sample Prep Sequencing-by-Synthesis (SBS) can be used for multiple applications,
including DNA sequencing, chromatin immunoprecipitation, whole
transcriptome analysis, small RNA analysis, and digital gene expression-tag
profiling. While the process of generating clusters and analyzing them is
standardized across all applications, the process of preparing samples is
unique to each application. For instructions on preparing samples for your
current application, see the appropriate sample prep booklet.
Cluster Station The Cluster Station is a hardware device that hybridizes samples onto a flow
cell and amplifies them for later sequencing on the Genome Analyzer. During
cluster creation, a single DNA fragment (the template) is attached to the
surface of an oligonucleotide coated flow cell and amplified to form a
surface-bound colony (the cluster). The result is a heterogeneous population
of clusters, with each cluster consisting of many identical copies of the
original template molecule.
Genome
Analyzer
Using a massively parallel sequencing approach, the Illumina Genome
Analyzer can simultaneously sequence millions of clusters to generate several
billion bases of data from a single run. The system leverages Illumina
sequencing technology and novel reversible terminator chemistry, optimized
to achieve unprecedented levels of accuracy, cost effectiveness, and
throughput.
Paired-End
Module
The Paired-End Module is an auxiliary instrument used to supply Read 2
reagents to the Genome Analyzer via an external VICI valve.
Flow Cell The flow cell is a multi-lane glass-based substrate (for some flow cell types
also silicon) in which clusters are generated and the sequencing reaction is
performed. Each of the lanes is individually addressable, so researchers can
interrogate multiple distinct samples per flow cell.
6CHAPTER 1
Overview
Part # 1004571 Rev. A
Within each lane of the flow cell, millions of primers act as capture probes for
the fragmented DNA or cDNA. Each lane of the flow cell is capable of
yielding millions of distinct clusters and generating several hundred Mbs of
sequence data. The versatile format of the flow cell allows researchers to
tailor the use of the device to the specific needs of their applications and use
the platform for a variety of analyses.
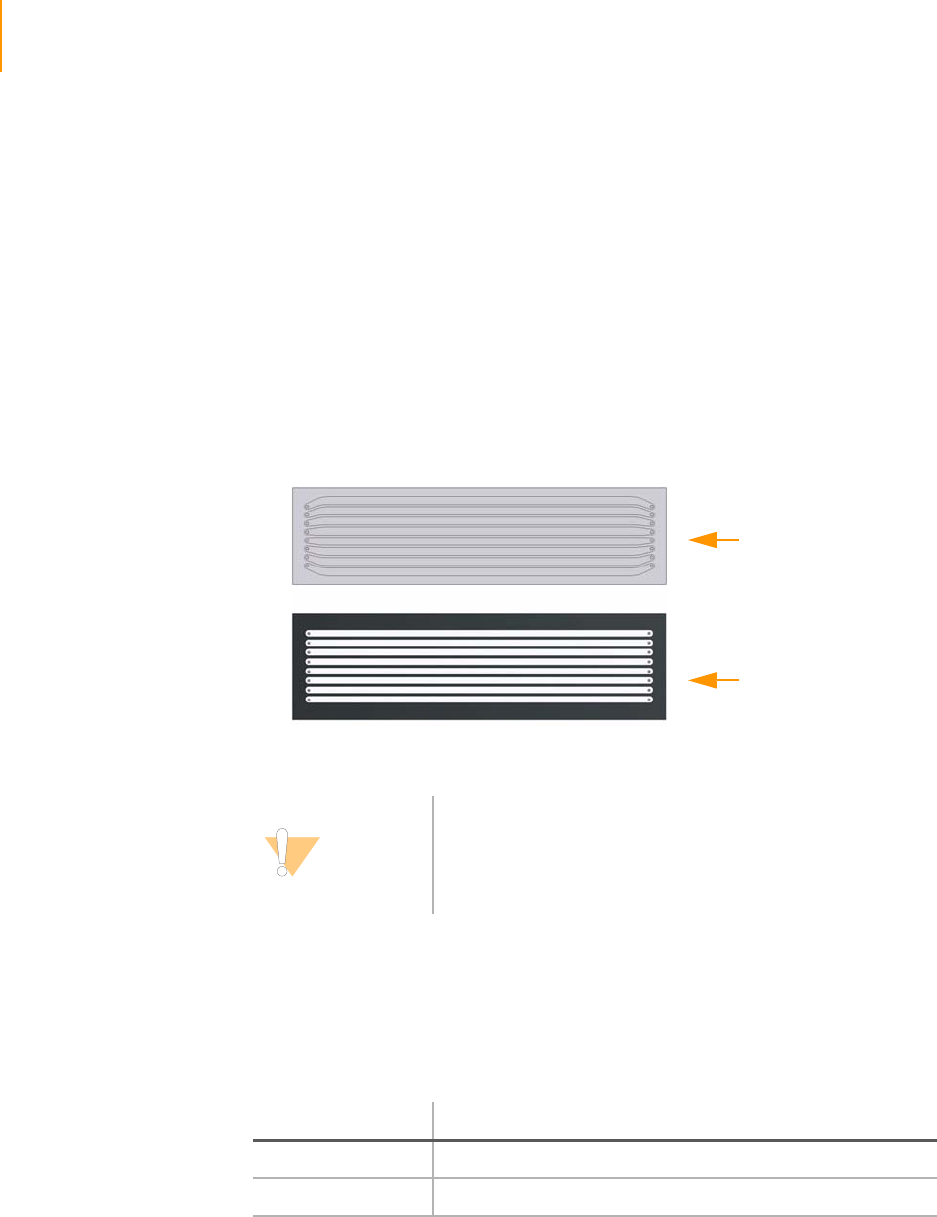
There are two different types of flow cells (Figure 1):
`The entirely clear 1.4 mm flow cell with 1.4 mm wide lanes, some of
which are curved at the ends. This flow cell is designed for use with the
Genome Analyzer II, and is not compatible with older versions of the
Genome Analyzer that have not been upgraded.
`The mostly black 1.0 mm flow cell with 1.0 mm wide lanes, all of which
are straight. This flow cell is for use with older versions of the Genome
Analyzer that have not been upgraded.
[
Figure 1 1.4 mm Flow Cell and 1.0 mm Flow Cell.
The following is a list of Cluster Generation Kits containing the 1.4 mm flow
cell. Please check iCom (www.illumina.com/icom) or consult with Illumina
Technical Support to find out about recent updates and releases of new
1.4 mm flow cell Cluster Generation Kits.
CAUTION
The Genome Analyzer II is set up to run 1.4 mm flow cells.
Although it is possible to run 1.0 mm flow cells, a
configuration change to the instrument that can only be
performed by a Field Service Engineer is required. For
contact information, see Technical Assistance on page 4.
Ta ble 3 Paired-End Cluster Generation Kits with 1.4 mm Flow Cell
Catalog Number Product Description
PE-203-1001 1 Paired-End Cluster Generation Kit - GA II
PE-203-1002 5 Paired-End Cluster Generation Kits - GA II
1.4 mm flow cell
1.0 mm flow cell

Paired-End Sequencing 7
Paired-End Sequencing User Guide
Paired-End Sequencing
This guide includes a set of protocols for the paired-end application and
instructions for operating the Paired-End Module. The paired-end protocols
include sample preparation, cluster amplification, Read 1 preparation,
Read 2 preparation, and two rounds of SBS sequencing. Described are the
steps required to enable paired-end sequencing of clusters using the Illumina
paired-end method.
Check to ensure that you have the following kits and components for paired-
end reads.
`Paired-End Flow Cell
`Paired-End Sample Preparation Kit
`Paired-End Cluster Generation Kit
`Paired-End Module and Software Package
`Two 36-Cycle SBS Sequencing Kits
Key Differences
The majority of the steps in this set of protocols are identical to those used in
the conventional cluster sequencing, but with some key differences, enabling
you to sequence both DNA strands within each cluster.
`New software—The Paired-End Module requires software version
SCS 2.0 or later.
`New functionalized flow cell—In order to perform paired-end
sequencing, a modified, paired-end enabled flow cell is required. Using a
standard flow cell will result in an inability to perform both reads of the
paired-end experiment.
`Modified sample preparation—Template preparation includes a new
adaptor oligo mix (PE adaptor oligo mix).
`Two new linearization methods—Clusters are prepared for sequencing
twice, once before each of the two SBS reads. The two linearization
methods are different to allow selective linearization of the desired
strand.
`Different sequencing primers—There are two hybridization events that
use a different sequencing primer for each read.
`Combined blocking steps—Clusters prepared using the Illumina paired-
end method require an additional blocking step to improve sequencing
performance. To simplify the protocol, the two blocking steps have been
combined into one.
`Modified Sample Preparation Kit—Sample preparation for paired-end
libraries adds a second, unique site complementary to the new
sequencing primer. The modified kit is supplied in two boxes. See
Sample Preparation Kit Contents on page 16.
`Paired-End Cluster Generation Kit—This kit contains the reagents
required to generate clusters on a paired-end flow cell and to prepare
the clusters for Read 1 and Read 2. Reagents that are required but are
not included in the kit are listed in the related section of the protocol.
The kit is supplied in four boxes. See Cluster Generation Kit Contents on
page 46.
8CHAPTER 2
Overview
Part # 1004571 Rev. A
`Paired-End Module—This module is an external valve attachment to the
Genome Analyzer. It supplies additional reagents to the flow cell during
Read 2 preparation.
`Two 36-cycle SBS Sequencing Kits—Each paired-end run requires two
rounds of standard SBS sequencing: Read 1 and Read 2. Each read uses
one standard SBS sequencing kit, supplied in two boxes and one bag.
Prepare Reagents for Read 1 on the Genome Analyzer on page 101.
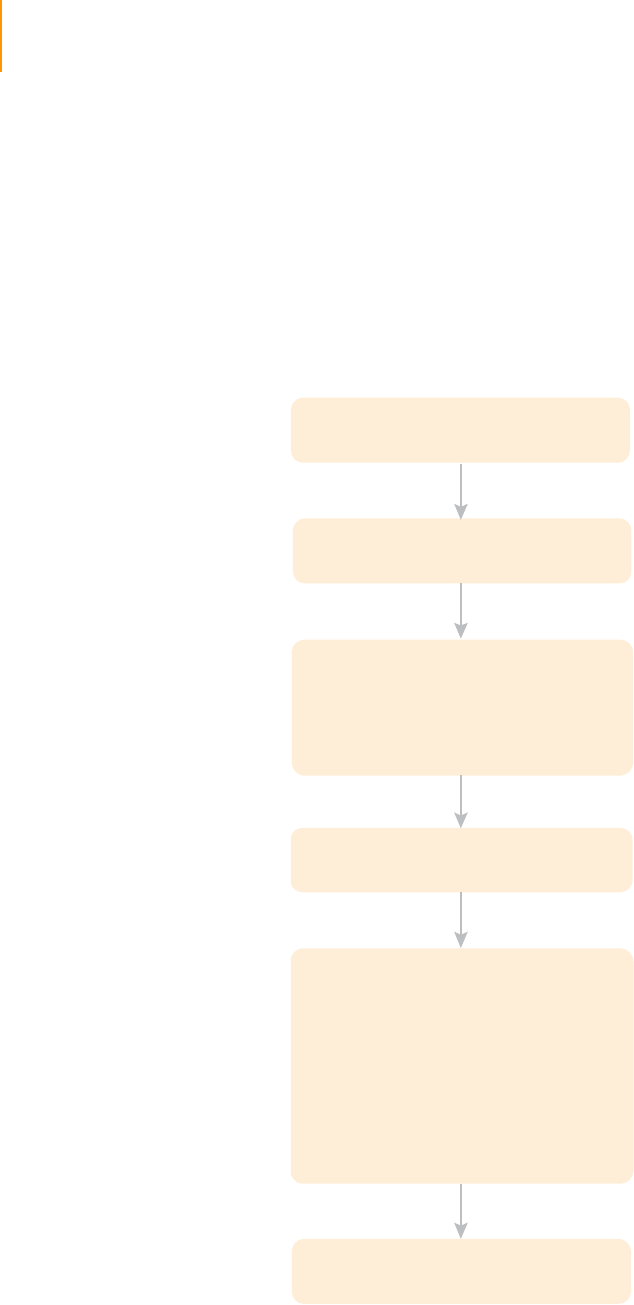
Protocol Workflow
The paired-end process sequences the same population of clusters on the
same flow cell twice, as described in the following workflow:
Figure 2 Paired-End Protocol Workflow
Paired-End Sample Prep
Paired-End Cluster Amplification
Performed on the Cluster Station
Read 1 Preparation
Performed on the Cluster Station
SBS Read 1
Performed on the Genome Analyzer
Read 2 Preparation
Performed on the Genome Analyzer
(with the Paired-End Module Attached)
SBS Read 2
Performed on the Genome Analyzer
1. Linearization 1
2. Blocking
3. Primer Hybridization
1. Primer Dehybridization
2. Deprotection
3. Resynthesis
4. Linearization 2
5. Blocking
6. Primer Hybridization

Paired-End Sequencing 9
Paired-End Sequencing User Guide
1. Sample Preparation—This step is identical to conventional sample
preparation and cluster creation, but with a modified template. Two
unique priming sites are introduced into the template during sample
preparation to allow the hybridization of two sequencing primers, one in
each of the two paired-end SBS reads.
2. Cluster Amplification—The prepared sample is introduced into the flow
cell mounted on the Cluster Station, and then amplified.
With the Illumina control PhiX library (46% GC content, average insert
length 200 bp), cluster amplification should be carried out using
35 cycles of amplification. With other libraries, the density of clusters and
number of amplification cycles to use should be chosen based on:
•The GC content of the DNA sample from which the library is
prepared
•The average insert length
As a general rule, GC-rich genomes require a higher number of
amplification cycles to achieve adequate cluster intensity. Since there is a
direct correlation between insert size and cluster size, libraries with
longer insert sizes require a reduced density of clusters to avoid
excessive overlapping of clusters.
3. Preparation for Read 1—The amplified sample, still mounted on the
Cluster Station, is prepared for Read 1. Preparation for Read 1 is
performed on the Cluster Station.
•Linearization 1—Selectively linearizes one of the two strands.
•Blocking—Prevents non-specific sites from being sequenced.
•Denaturation and hybridization—Standard denaturation and
hybridization of the first sequencing primer (Read 1 PE Sequencing
Primer).
4. Read 1 Sequencing—The flow cell is mounted on the Genome Analyzer
and subjected to 36 cycles of Sequencing-By-Synthesis, using slightly
modified sequencing protocols and standard SBS reagents.
5. Preparation for Read 2—The flow cell is prepared for Read 2 while still
mounted on the Genome Analyzer with the Paired-End Module
attached, allowing for the in situ treatment of the flow cell.
•Primer Dehybridization—Removes the extended sequencing
primer used in Read 1.
•Deprotection—Prepares the flow cell for the next step.
•Resynthesis—Regenerates the previously linearized strand.
•Linearization 2—Linearizes the strand that was sequenced in Read 1
to allow hybridization of the second sequencing primer to the newly
synthesized DNA strand.
•Blocking—Prevents non-specific sites from being sequenced.
•Denaturation and hybridization—Denatures the linearized strand
and hybridizes the second sequencing primer (Read 2 PE
Sequencing Primer).
6. Paired-End Module Wash—This washing step is part of the Paired-End
Module maintenance.

10 CHAPTER 2
Overview
Part # 1004571 Rev. A
7. Read 2 Sequencing—The flow cell is subjected to an additional
36 cycles of SBS, using slightly modified sequencing protocols and
standard SBS reagents.
8. Post Paired-End Run Wash—This washing step is part of the Paired-End
Module and Genome Analyzer maintenance.

User Supplied Consumables and Equipment 11
Paired-End Sequencing User Guide
User Supplied Consumables and Equipment
Consumables
Check to ensure that you have all of the following user-supplied
consumables.
Sample Prep
`Purified DNA (1–5 μg, 5 μg recommended)
DNA should be as intact as possible, with an OD260/280 ratio of 1.8–2.0
`Compressed air of at least 32 psi
`Clamp (1 per nebulizer)
`PVC tubing
•Fisher Scientific, catalog # 14-176-102
•Nalgene Labware, catalog # 8007-0060
`Certified low range ultra agarose (BIO-RAD, part # 161-3106)
`50X TAE buffer
`Ethidium bromide
`Loading buffer
`Low molecular weight DNA ladder (NEB, part # N3233L)
`Distilled water
`QIAquick PCR Purification Kit (QIAGEN, part # 28104)
`MinElute PCR purification kit (QIAGEN, part # 28004)
`Disposable scalpels
Cluster Generation
`5 M Betaine Solution
`0.2 μm cellulose acetate syringe filter
`30 ml syringe
`EB (10 mM Tris-Cl pH 8.5)
Sequencing
`Immersion oil, refractive index 1.473 (Cargille, catalog # 19570)
`Ethanol absolute
`De-ionized water (18 MOhm grade)
`250 ml MilliQ water (for washing the Paired-End Module)
NOTE
Betaine may be prepared in advance and stored at 4°C.

12 CHAPTER 2
Overview
Part # 1004571 Rev. A
Equipment
Check to ensure that you have all of the following user-supplied equipment
before proceeding to sample preparation.
`Benchtop microcentrifuge
`Benchtop centrifuge with swing-out rotor
`Dark Reader transilluminator (Clare Chemical Research, part # D195M) or
a UV transilluminator
`Electrophoresis unit
`Gel trays and tank
`Thermal cycler
`50 ml polypropylene conical tubes
`15 ml polypropylene conical Falcon tubes
`1.5 ml polypropylene tubes
`1.5 ml screw-cap tubes
`2.0 ml polypropylene tubes
`2.0 ml screw-cap tubes
`125 ml Nalgene bottles (4)
(ThermoFisher Scientific, catalog # 2019-0125)

Paired-End Sequencing User Guide 13
Chapter 2
Preparing Samples for
Paired-End Sequencing
Topics
14 Introduction
16 Sample Preparation Kit Contents
18 Fragment Genomic DNA
22 Perform End Repair
23 Add ‘A’ Bases to the 3' End of the DNA Fragments
24 Ligate Adaptors to DNA Fragments
25 Purify Ligation Products
27 Enrich the Adaptor-Modified DNA Fragments by PCR
28 Validate the Library
14 CHAPTER 2
Preparing Samples for Paired-End Sequencing
Part # 1004571 Rev. A
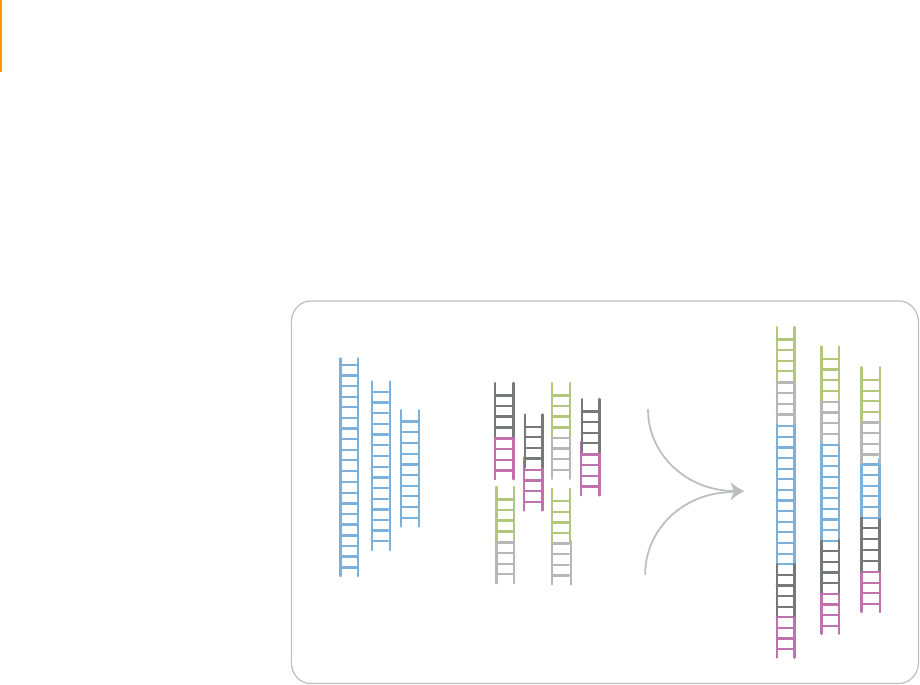
Introduction
This protocol explains how to prepare libraries of genomic DNA for paired-
end analysis on the Illumina Cluster Station and Genome Analyzer. You will
add adaptor sequences onto the ends of DNA fragments to generate the
following template format:
Figure 3 Fragments after Sample Preparation
The adaptors contain sequences that correspond to the two surface-bound
amplification primers on the flow cells used in the Cluster Station.
DNA
Fragment Adaptors
Introduction 15
Paired-End Sequencing User Guide
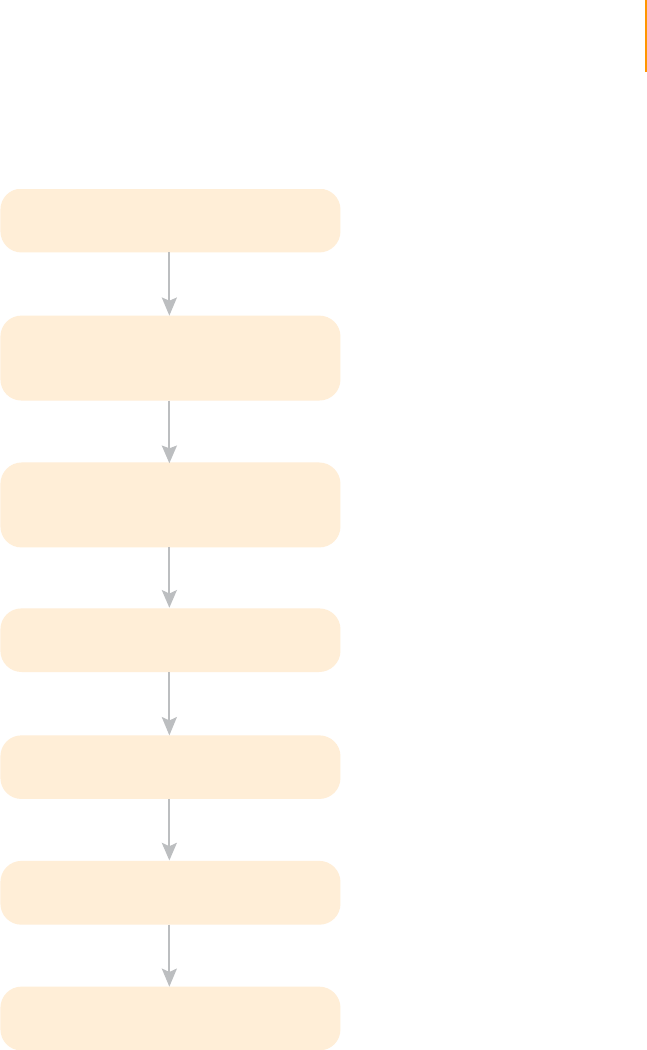
Sample Prep
Workflow
The following figure illustrates the steps required to prepare samples for
paired-end sequencing.
Figure 4 Sample Preparation Workflow
Purified genomic DNA
Fragment genomic DNA
Add an ‘A’ to the 3’ ends
Repair ends
Ligate paired-end adaptors
Removal of unligated adaptors
PCR
Fragments of less than
800 bp
Blunt-ended fragments with
5'-phosphorylated ends
3'-dA overhang
Adaptor-modified ends
Purified ligation product
Genomic DNA library
16 CHAPTER 2
Preparing Samples for Paired-End Sequencing
Part # 1004571 Rev. A
Sample Preparation Kit Contents
Check to ensure that you have all of the reagents identified in this section
before proceeding to sample preparation.
Paired-End Sample
Prep Kit, Box 1
Store at -15° to 25ºC
This box is shipped at -80°C. As soon as you receive it, store the components
at -20°C (-15°C to -25°C).
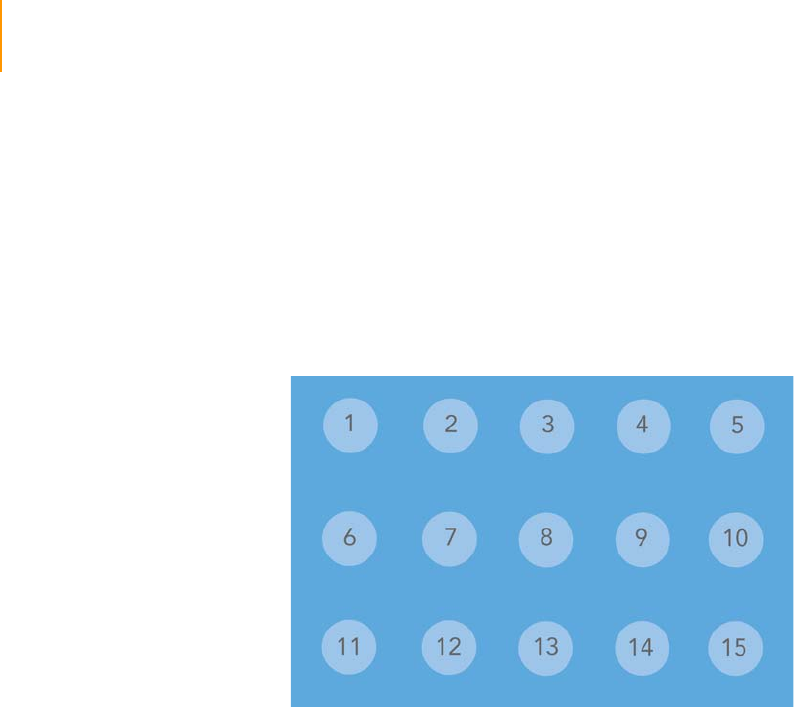
Figure 5 Paired-End Sample Prep Kit, Box 1
1. T4 DNA Ligase Buffer with 10 mM ATP, part # 1000534
2. Klenow Enzyme, part # 1000515
3. Klenow Buffer, part # 1000535
4. DNA Ligase Buffer 2X, part # 1000523
5. Phusion DNA Polymerase (Finnzymes Oy), part # 1000524
6. 10 mM dNTP Mix, part # 1001932
7. T4 PNK, part # 1000519
8. 1 mM dATP, part # 1000520
9. PE Adaptor Oligo Mix, part # 1001782
10. PCR Primer PE 1.0, part # 1001783
11. T4 DNA Polymerase, part # 1000514
12. Empty
13. Klenow Fragment (3' to 5' exo minus), part # 1000536
14. DNA Ligase, part # 1000522
15. PCR Primer PE 2.0, part # 1001784

Sample Preparation Kit Contents 17
Paired-End Sequencing User Guide
Paired-End Sample
Prep Kit, Box 2
Store at Room Temperature
Figure 6 Paired-End Sample Prep Kit, Box 2
1. Nebulization Buffer, part # 1000466
2. TE Buffer, part # 1000465
3. Ultra Pure Water, part # 1000467
4. Nebulizer Kit (10 each), part # 1000541
18 CHAPTER 2
Preparing Samples for Paired-End Sequencing
Part # 1004571 Rev. A
Fragment Genomic DNA
This protocol fragments genomic DNA using a nebulization technique, which
fragments DNA to less than 800 bp in minutes using a disposable device.
Nebulization generates double-stranded DNA fragments containing of 3' or
5' overhangs.
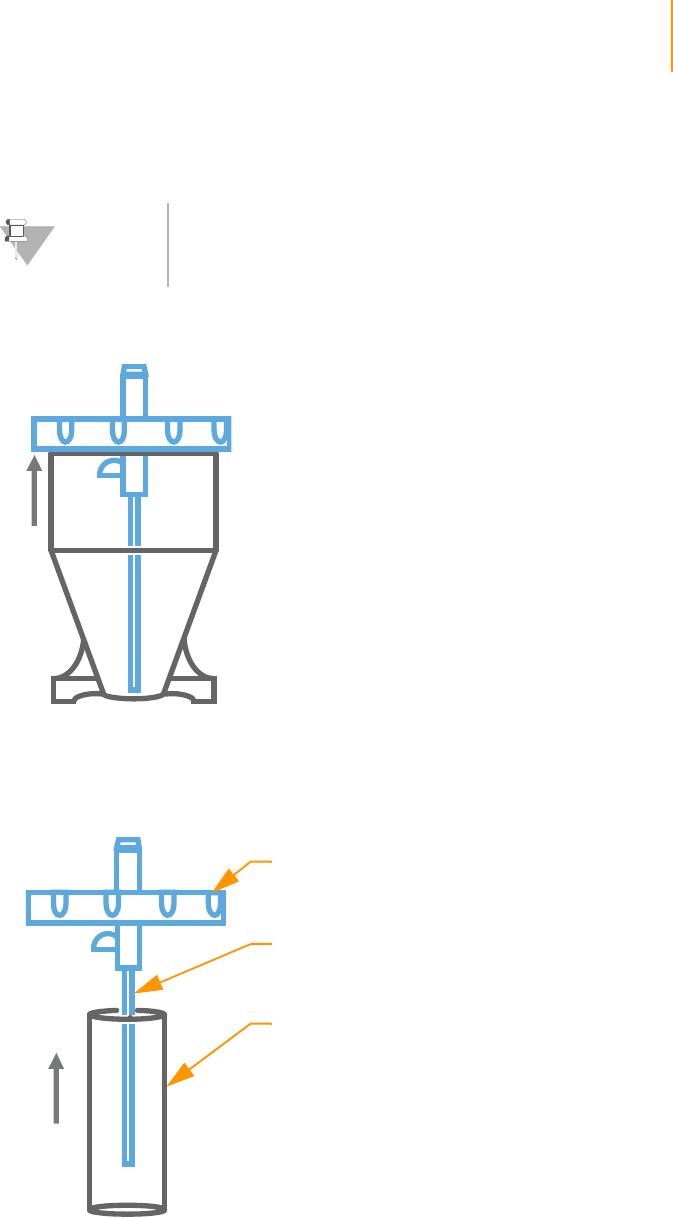
Figure 7 Fragment Genomic DNA
Consumables
Illumina-Supplied
`Nebulizers (box of 10 nebulizers and vinyl accessory tubes)
`Nebulization buffer (7 ml)
`TE Buffer
User-Supplied
`QIAquick PCR Purification Kit
`Purified DNA (1–5 μg, 5 μg recommended)
DNA should be as intact as possible, with an OD260/280 ratio of 1.8–2.0
`Compressed air of at least 32 psi
`Clamp (1 per nebulizer)
`PVC tubing
•Fisher Scientific, catalog # 14-176-102
•Nalgene Labware, catalog # 8007-0060
Ta ble 4 PVC Tubing Dimensions
ID OD Wall Length
1/4 in. 3/8 in. 1/16 in. 1 meter
CAUTION
If you intend to nebulize DNA that could possibly contain
any pathogenic sequences such as pathogenic viral DNA,
perform the nebulization process under containment
conditions (e.g., a biosafety cabinet) to prevent exposure to
aerosols.
Fragment Genomic DNA 19
Paired-End Sequencing User Guide
Procedure
The DNA sample to be processed should be highly pure, having an OD260/
280 ratio of between 1.8 and 2.0, and should be as intact as possible.
1. Remove a nebulizer from the plastic packaging and unscrew the blue lid.
Figure 8 Remove the Nebulizer Lid
2. Using gloves, remove a piece of vinyl tubing from the packaging and slip
it over the central atomizer tube. Push it all the way to the inner surface
of the blue lid.
Figure 9 Assemble the Nebulizer
3. Add 1–5 μg of purified DNA in a total volume of 50 μl of TE buffer to the
nebulizer.
4. Add 700 μl nebulization buffer to the DNA and mix well.
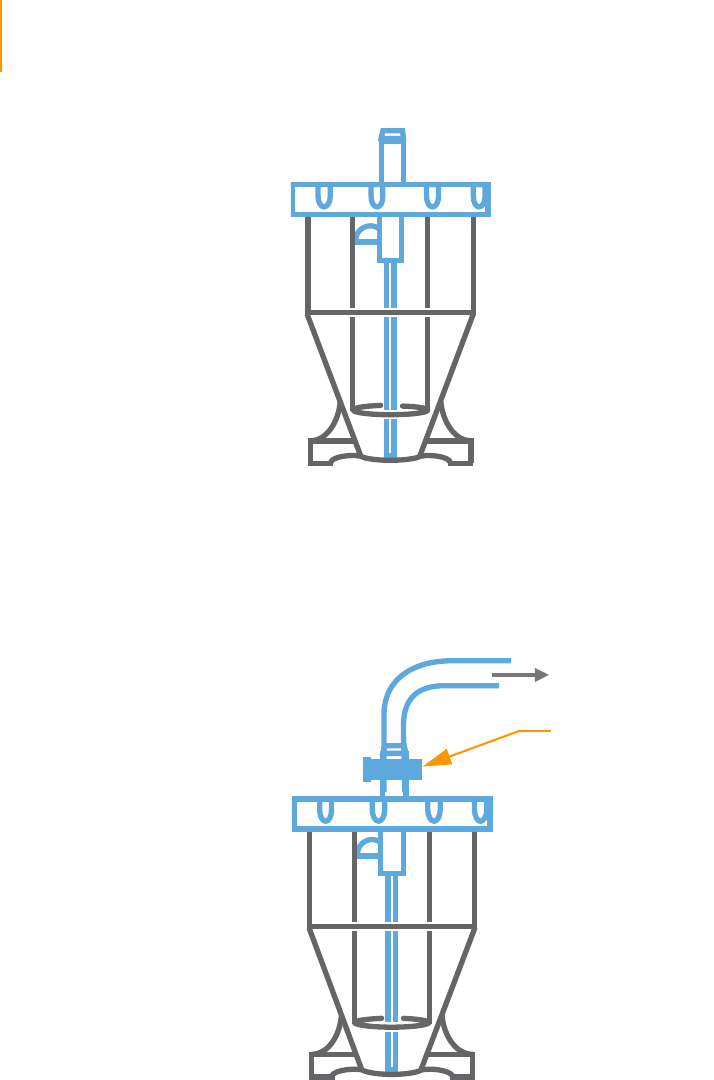
5. Screw the lid back on (finger-tight).
NOTE
If you are not familiar with this shearing method, Illumina
recommends that you test this procedure on test samples
before proceeding with your sample DNA.
Atomizer
Vinyl Tubing
Blue Lid
20 CHAPTER 2
Preparing Samples for Paired-End Sequencing
Part # 1004571 Rev. A
Figure 10 Replace the Nebulizer Lid
6. Chill the nebulizer containing the DNA solution on ice.
7. Connect the compressed air source to the inlet port on the top of the
nebulizer with the PVC tubing, ensuring a tight fit. Secure with the small
clamp.
Figure 11 Connect Compressed Air
8. Bury the nebulizer in an ice bucket and place it in a fume hood.
9. Use the regulator on the compressed air source to ensure the air is
delivered at 32–35 psi.
10. Nebulize for 6 minutes. You may notice vapor rising from the nebulizer;
this is normal.
11. Centrifuge the nebulizer at 450 xg for 2 minutes to collect the droplets
from the side of the nebulizer. If necessary, use an old nebulizer as a
counter-balance.
Clamp
Connect to
compressed air
source

Fragment Genomic DNA 21
Paired-End Sequencing User Guide
12. If a centrifuge is not available, then use 2 ml of the binding buffer (PB or
PBI buffer) from the QIAquick PCR Purification Kit to rinse the sides of the
nebulizer and collect the DNA solution at the base of the nebulizer.
13. Measure the recovered volume. Typically, you should recover 400–600 μl.
14. Follow the instructions in the QIAquick PCR Purification Kit to purify the
sample solution and concentrate it on one QIAquick column, eluting in
30 μl of EB.

22 CHAPTER 2
Preparing Samples for Paired-End Sequencing
Part # 1004571 Rev. A
Perform End Repair
This protocol converts the overhangs resulting from fragmentation into blunt
ends, using T4 DNA polymerase and Klenow enzyme. The 3' to 5'
exonuclease activity of these enzymes removes 3' overhangs and the
polymerase activity fills in the 5' overhangs.
Consumables
Illumina-Supplied
`T4 DNA ligase buffer with 10mM ATP
`10 mM dNTP mix
`T4 DNA polymerase
`Klenow enzyme
`T4 PNK
`Water
User-Supplied
`QIAquick PCR Purification Kit (QIAGEN, part # 28104)
Procedure
1. Prepare the following reaction mix:
•DNA sample (30 μl)
•Water (45 μl)
•T4 DNA ligase buffer with 10mM ATP (10 μl)
•10 mM dNTP mix (4 μl)
•T4 DNA polymerase (5 μl)
•Klenow enzyme (1 μl)
•T4 PNK (5 μl)
The total volume should be 100 μl.
2. Incubate in a thermal cycler for 30 minutes at 20ºC.
3. Follow the instructions in the QIAquick PCR Purification Kit to purify on
one QIAquick column, eluting in 32 μl of EB.

Add ‘A’ Bases to the 3' End of the DNA Fragments 23
Paired-End Sequencing User Guide
Add ‘A’ Bases to the 3' End of the DNA Fragments
This protocol adds an ‘A’ base to the 3' end of the blunt phosphorylated
DNA fragments, using the polymerase activity of Klenow fragment (3' to 5'
exo minus). This prepares the DNA fragments to be ligated to the adaptors,
which have a single ‘T’ base overhang at their 3' end.
Consumables
Illumina-Supplied
`Klenow buffer
`1 mM dATP
`Klenow exo (3' to 5' exo minus)
User-Supplied
`MinElute PCR Purification Kit (QIAGEN, part # 28004)
Procedure
1. Prepare the following reaction mix:
•DNA sample (32 μl)
•Klenow buffer (5 μl)
•1 mM dATP (10 μl)
•Klenow exo (3’ to 5’ exo minus) (3 μl)
The total volume should be 50 μl.
2. Incubate in a thermal cycler for 30 minutes at 37°C.
3. Follow the instructions in the MinElute PCR Purification Kit to purify on
one QIAquick MinElute column, eluting in 10 μl of EB.
NOTE
This protocol requires a QIAquick MinElute column rather
than a normal QIAquick column.

24 CHAPTER 2
Preparing Samples for Paired-End Sequencing
Part # 1004571 Rev. A
Ligate Adaptors to DNA Fragments
This protocol ligates adaptors to the ends of the DNA fragments, preparing
them to be hybridized to a flow cell.
Consumables
Illumina-Supplied
`DNA ligase buffer, 2X
`PE adaptor oligo mix
`DNA ligase
User-Supplied
`QIAquick PCR Purification Kit (QIAGEN, part # 28104)
Procedure
This procedure uses a 10:1 molar ratio of adaptor to genomic DNA insert,
based on a starting quantity of 5 μg of DNA before fragmentation. If you
started with less than 5 μg, reduce the volume of adaptor reagent
accordingly to maintain the 10:1 ratio of DNA.
1. Prepare the following reaction mix:
•DNA sample (10 μl)
•DNA ligase buffer, 2X (25 μl)
•PE adaptor oligo mix (10 μl)
•DNA ligase (5 μl)
The total volume should be 50 μl.
2. Incubate in a thermal cycler for 15 minutes at 20°C.
3. Follow the instructions in the QIAquick PCR Purification Kit to purify on
one QIAquick column, eluting in 30 μl of EB.

Purify Ligation Products 25
Paired-End Sequencing User Guide
Purify Ligation Products
This protocol purifies the products of the ligation reaction on a gel to remove
all unligated adaptors, remove any adaptors that may have ligated to one
another, and select a size-range of templates to go on the cluster generation
platform.
Consumables
User-Supplied
`Certified low range ultra agarose (BIO-RAD, part # 161-3106)
`50x TAE buffer
`Distilled water
`Ethidium bromide
`Loading buffer (50 mM Tris pH 8.0, 40 mM EDTA, 40% (w/v) sucrose)
`Low molecular weight DNA ladder (NEB, part # N3233L)
`QIAquick PCR Purification Kit (QIAGEN, part # 28104)
Procedure
1. Prepare a 150 ml, 2% agarose gel with distilled water and TAE. Final
concentration of TAE should be 1X at 150 ml.
2. Add ethidium bromide (EtBr) after the TAE-agarose has cooled. Final
concentration of EtBr should be 400 ng/ml (i.e., add 60 μg EtBr to
150 ml of 1X TAE).
3. Cast the gel in a tray that is approximately 14 cm in length. No ethidium
bromide is required in the running buffer.
4. Add 3 μl of loading buffer to 8 μl of the ladder.
5. Add 10 μl of loading buffer to 30 μl of the DNA from the purified ligation
reaction.
6. Load all of the ladder solution onto one lane of the gel.
CAUTION
Illumina does not recommend purifying multiple samples on
a single gel due to the risk of cross-contamination between
libraries.
NOTE
It is important to perform this procedure exactly as
described, to ensure reproducibility.
NOTE
It is important to excise as narrow a band as possible from
the gel during gel purification. Paired-end libraries should
consist of templates of the same size or nearly the same
size, and as narrow a size range as possible.
Illumina recommends that a Dark Reader is used to visualize
DNA on agarose gels.

26 CHAPTER 2
Preparing Samples for Paired-End Sequencing
Part # 1004571 Rev. A
7. Load the entire sample onto another lane of the gel, leaving a gap of at
least one empty lane between ladder and sample.
8. Run gel at 120 V for 120 minutes.
9. View the gel on a Dark Reader transilluminator or a UV transilluminator.
10. Place a clean scalpel vertically above the sample in the gel at the desired
size of the template.
11. Excise a 2 mm slice of the sample lane at approximately 300 bp using the
markers as a guide.
12. Follow the instructions in the QIAquick Gel Extraction Kit to purify on one
QIAquick column, eluting in 30 μl of EB.
13. Discard the scalpel.

Enrich the Adaptor-Modified DNA Fragments by PCR 27
Paired-End Sequencing User Guide
Enrich the Adaptor-Modified DNA Fragments by PCR
This protocol uses PCR to selectively enrich those DNA fragments that have
adaptor molecules on both ends, and to amplify the amount of DNA in the
library. The PCR is performed with two primers that anneal to the ends of the
adaptors. The number of PCR cycles is minimized to avoid skewing the
representation of the library.
Consumables
Illumina-Supplied
`Phusion DNA polymerase
`PCR primer PE 1.0
`PCR primer PE 2.0
`Ultra pure water
User-Supplied
`QIAquick PCR Purification Kit (QIAGEN, part # 28104)
Procedure
This protocol assumes 5 μg of DNA input into library prep. If you use 0.5 μg,
adjust the protocol as described in the following table.
1. Prepare the following PCR reaction mix:
•DNA (1 μl)
•Phusion DNA polymerase (25 μl)
•PCR primer PE 1.0 (1 μl)
•PCR primer PE 2.0 (1 μl)
•Ultra pure water (22 μl)
The total volume should be 50 μl.
2. Amplify using the following PCR protocol:
a. 30 seconds at 98°C
b. 10 or 12 cycles of:
10 seconds at 98°C
30 seconds at 65°C
30 seconds at 72°C
c. 5 minutes at 72°C
d. Hold at 4°C
3. Follow the instructions in the QIAquick PCR Purification Kit to purify on
one QIAquick column, eluting in 50 μl of EB.
Input of DNA to
Library Prep
Volume of Purified
Library into PCR Volume of Water Number of PCR
Cycles
5 μg 1 μl 22 μl 10
0.5 μg 10 μl 13 μl 12

28 CHAPTER 2
Preparing Samples for Paired-End Sequencing
Part # 1004571 Rev. A
Validate the Library
Illumina recommends performing the following quality control steps on your
DNA library.
1. Determine the concentration of the library by measuring the absorbance
at 260 nm. The yield from the protocol should be between 500 and
1000 ng of DNA.
2. Measure the 260/280 ratio. It should be approximately 1.8.
3. Load 10% of the volume of the library on a gel and check that the size
range is as expected: a narrow smear similar in size to the DNA excised
from the gel after the ligation.
If the DNA is not a narrow smear but instead comprises a long smear of
several hundred base pairs, then another gel purification step is
recommended. Repeat the procedure as described in Purify Ligation
Products on page 25.
4. To determine the molar concentration of the library, examine the gel
image and estimate the median size of the library smear.
a. Multiply this size by 650 (the molecular mass of a base pair) to get
the molecular weight of fragment in the library.
b. Use this number to calculate the molar concentration of the library.
5. Clone 4% of the volume of the library into a sequencing vector.
a. Sequence individual clones by conventional Sanger sequencing.
b. Verify that the insert sequences are from the genomic source DNA.
Figure 12 Library Validation Gel
NOTE
The 5' ends of the library molecules are not phosphorylated
and therefore require a phosphorylated vector for cloning.

Validate the Library 29
Paired-End Sequencing User Guide
This example shows a library run on a 4–20% TBE polyacrylamide gel,
stained with Vistra Green (GE Healthcare # RPN5786) and visualized on a
fluorescence scanner. The left lane shows a marker ladder. The center
lane and right lane show paired-end libraries with insert sizes of
approximately 250 bp to 550 bp, respectively. The two bands around
50 bp in size are primers from the enrichment PCR step and have no
effect on the subsequent formation of clusters.

30 CHAPTER 2
Preparing Samples for Paired-End Sequencing
Part # 1004571 Rev. A

Paired-End Sequencing User Guide 31
Chapter 3
Using the Cluster Station
Topics
33 Introduction
34 Cluster Generation Steps
34 Cluster Station Workflow
35 Protocol Times
37 Components
37 Power Connections
37 Instrument Areas
38 Reagent Area
40 Manifolds
45 Cluster Station Recipes
46 Cluster Generation Kit Contents
53 Preparing Reagents for Cluster Generation
50 Preparing Sample DNA for Cluster Generation
56 Loading Reagents for Cluster Generation
58 Starting the Cluster Station
59 Cluster Generation
59 Running a Recipe
61 Positioning the Flow Cell
61 Attaching the Hybridization Manifold
62 Check Even Flow
62 Attaching the Amplification Manifold
62 Safe Stopping Points During Cluster Generation
63 Unloading the Flow Cell
64 Weekly Maintenance Wash
65 Preparing Reagents for Read 1 Preparation on the Cluster Station

32 CHAPTER 3
Using the Cluster Station
Part # 1004571 Rev. A
68 Loading Reagents for Read 1 Preparation on the Cluster Station
70 Linearization, Blocking, and Primer Hybridization on the Cluster Station
72 Troubleshooting
72 Setting the Thermal Station Temperature
72 Pumping Reagents
74 Priming Reagents to Waste
74 Unclogging the Flow Cell
75 Temperature Profile
75 Software Errors
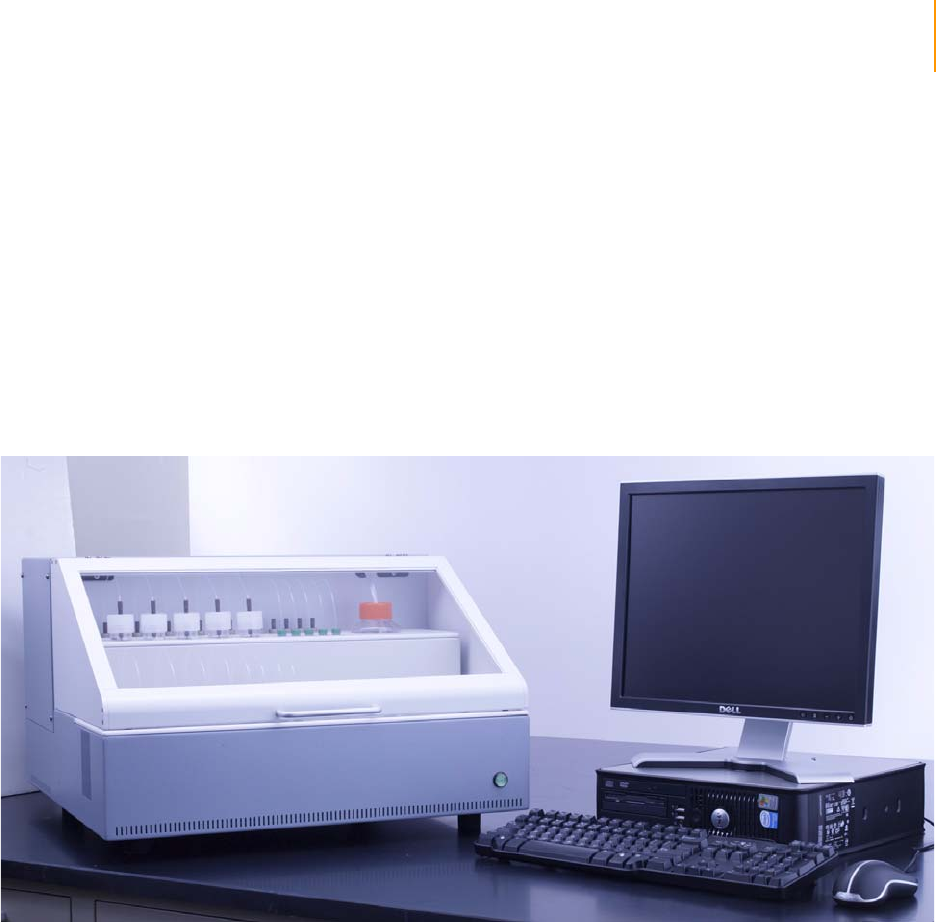
Introduction 33
Paired-End Sequencing User Guide
Introduction
The Cluster Station is a fluidics device that hybridizes samples onto a flow
cell and amplifies them for later sequencing on the Genome Analyzer. It uses
solid support amplification to create an ultra-high density sequencing flow
cell with millions of clusters, each containing ~1,000 copies of template, in
approximately 6 hours.
The Cluster Station works in conjunction with a dedicated computer and the
Illumina Cluster Station software. The open-source software allows you to run
individual subroutines or modify protocols to meet your research needs.
The Cluster Station automatically dispenses reagents and controls reaction
times, flow rates, and temperatures.
Figure 13 Cluster Station

34 CHAPTER 3
Using the Cluster Station
Part # 1004571 Rev. A
Cluster Generation Steps
Cluster generation consists of the following steps:
1. Hybridize template DNA—Hybridize template molecules onto the
oligonucleotide-coated surface of the flow cell.
2. Amplify template DNA—Isothermally amplify the molecules to
generate clonal DNA clusters.
3. Linearize—Linearize the dsDNA clusters. This is the first step of
converting dsDNA to ssDNA that is suitable for sequencing.
4. Block—Block the free 3’ OH ends of the linearized dsDNA clusters. This
prevents nonspecific sites from being sequenced.
5. Denature and hybridize sequencing primers—Denature the dsDNA
and hybridize a sequencing primer, or multiple sequencing primers, onto
the linearized and blocked clusters. After this step, the flow cell is ready
for sequencing.
Cluster Station Workflow
Ta ble 5 Cluster Generation Process
Step Instructions
1. Ensure that you have all of the
required user-supplied equipment and
consumables.
Refer to the booklet Cluster Station
Sequencing Site Preparation Guide
2. Restart the Cluster Station and
attached workstation. Starting the Cluster Station on page 58
3. Prepare fresh reagents. Preparing Reagents for Cluster
Generation on page 53
4. Open and run a recipe. Running a Recipe on page 59
5. Load the reagents in their appropriate
positions on the Cluster Station. Loading Reagents for Cluster Generation
on page 56
6. Load the flow cell onto the Cluster
Station. Positioning the Flow Cell on page 61
7. After hybridizing the sequencing
primer(s), sequence the flow cell within
4 hours.
Chapter 4, Using the Genome Analyzer

Cluster Station Workflow 35
Paired-End Sequencing User Guide
Protocol Times This table shows approximately how long the Cluster Station takes to
perform each step of the clustering protocol. Aside from the One Step
recipe, Cluster Station recipes perform a subset of the overall procedure.
Ta ble 6 Cluster Station Protocol Times
Step Duration Solution
Change Reagent (Position) Time for
Reagent
Wash 6 - 15 min
(walk-away)
Template Hybridization and
Initial Extension 38 min
(some
hands-on)
1 Hybridization Buffer (A) 2 min
2 Template Mix (B) 25 min
3Wash Buffer (C) 5 min
4 Amplification Pre-Mix* (D) 3 min 20 s
5 Initial Extension Mix with Taq Polymerase*
(E) 3 min
Isothermal Amplification 2 hr 10 min
(35 cycles)
(walk-away)
6 Formamide (9) 56 s
7 Amplification Pre-Mix* (11) 56 s
8 Amplification Mix with Bst Polymerase* (1) 72 s
Storage Buffer (12)
Safe Stopping Point (you can store flow cells indefinitely at 4°C)
Linearization 58 min
(walk-away) 9 1X Linearization Buffer* (16) 7 min
10 Linearization 1 Mix (14) 37 min
11 Wash Buffer (10) 7 min
12 Storage Buffer (12) 7 min
Blocking 46 min
(walk-away) 13 1X Blocking Buffer * (16) 7 min
14 Blocking Mix * (8) 55 min
15 Wash Buffer (10) 7 min
16 Storage Buffer (12) 7 min
Denaturation and Hybridization
of Sequencing Primer(s) 35 min
(walk-away) 14 NaOH (17) 5 min
15 TE (18) 5 min
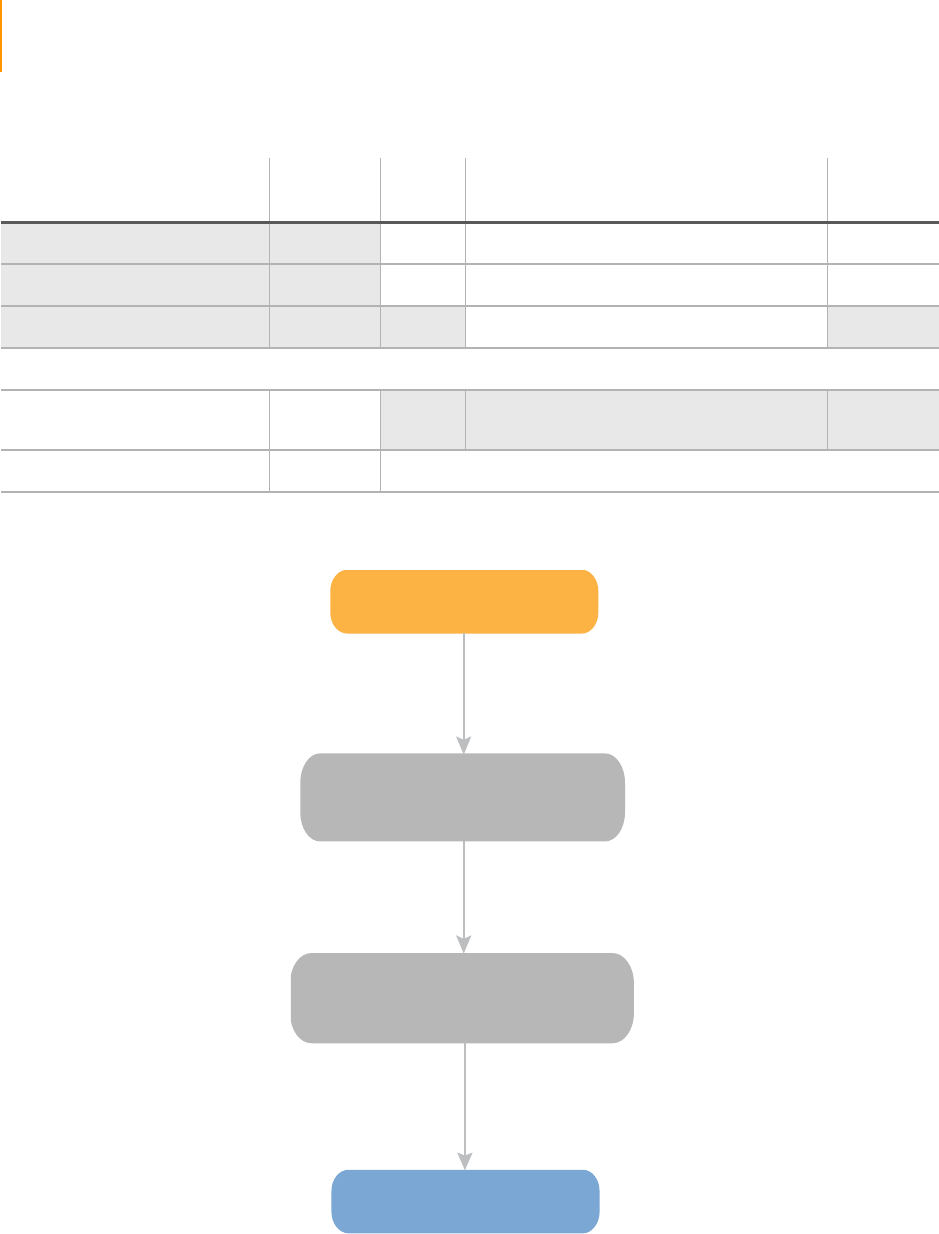
36 CHAPTER 3
Using the Cluster Station
Part # 1004571 Rev. A
This flow chart shows how you can schedule the assay according to flow cell
storage requirements.
Figure 14 Scheduling the Assay
16 Sequencing Primer Mix* (7) 20 min
17 Wash Buffer (10) 5 min
Storage Buffer (12)
Ready for sequencing. Do not store flow cell.
Wash 6 - 15 min
(walk-away)
Total Time ≈ 6h 00min * These solutions are made fresh using kit reagents
Ta ble 6 Cluster Station Protocol Times (Continued)
Step Duration Solution
Change Reagent (Position) Time for
Reagent
Lin/Block/Prime
PE_2P_R1prep_Linearization_Blocking_PrimerHyb
(3 h 00 m)
Reagent Prep
(1 h 30 m)
Genome Analyzer
Amp
Amplification_only_35cycles
(3 h 00 m)
Continue, leave overnight, or
store at 4°C indefinitely
Do not store the flow cell
after the Blocking step
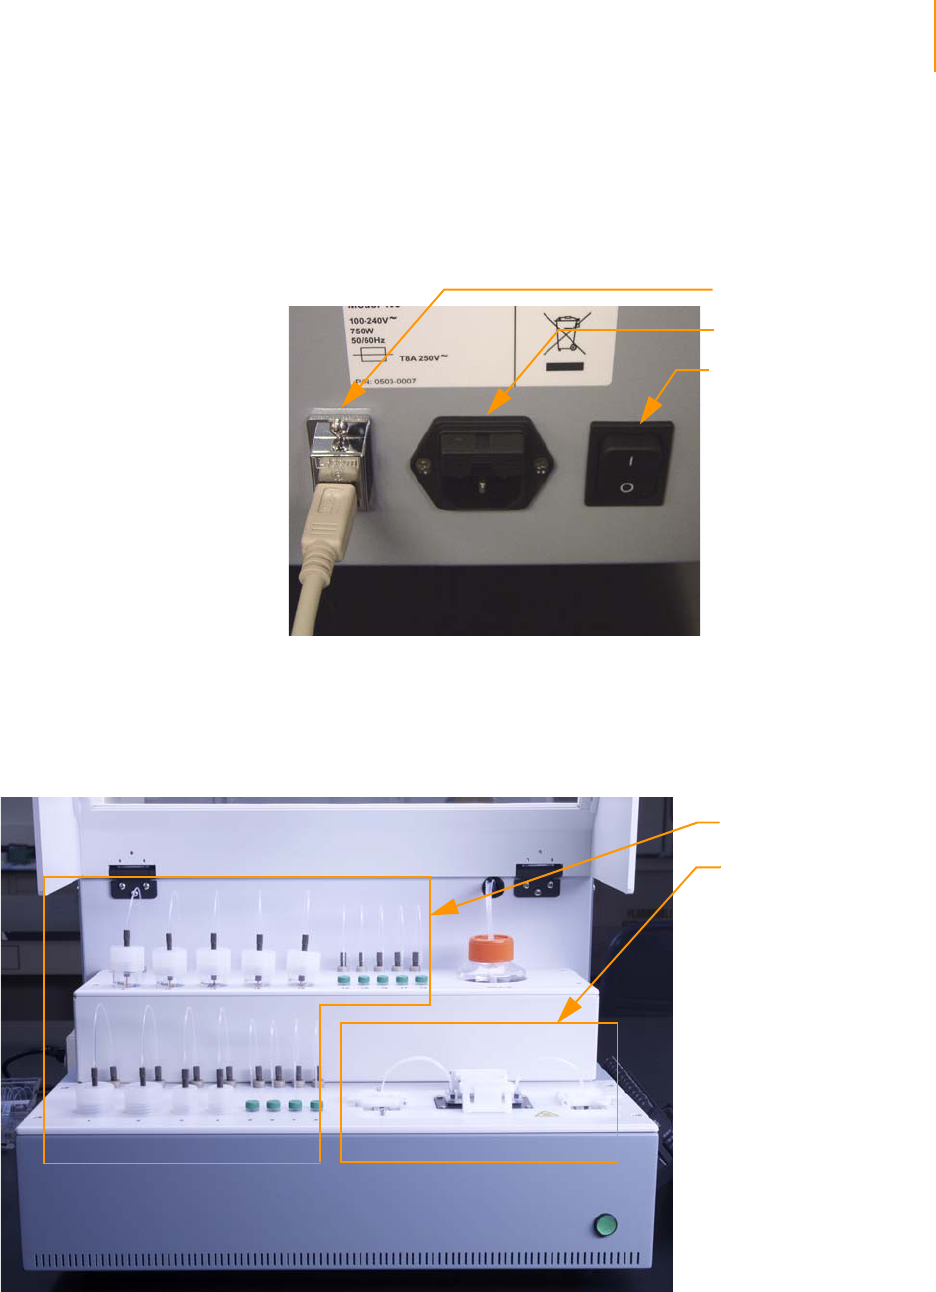
Components 37
Paired-End Sequencing User Guide
Components
Power
Connections
Place the instrument at least six inches away from the wall so that you can
easily reach the power switch, universal power input, and USB connection on
the back of the Cluster Station.
Figure 15 Cluster Station Power Connections
Instrument
Areas
All operator activity on the instrument occurs in two main compartments:
`Reagent Area
`Flow Cell Area
Figure 16 Cluster Station Areas
USB Port
Universal Power Input
Power Switch
Reagent Area
Flow Cell
Area
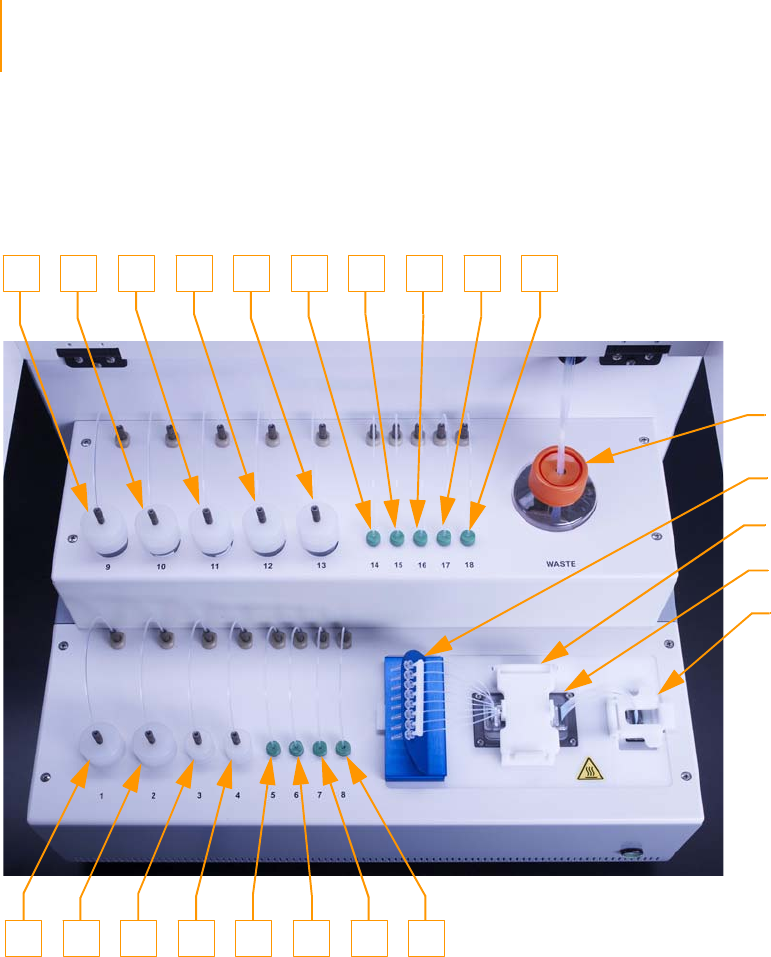
38 CHAPTER 3
Using the Cluster Station
Part # 1004571 Rev. A
Reagent Area The reagent area holds reagent tubes in various sizes, a removable strip tube
holder, and a waste container. Each reagent position has a unique number
associated with it, and each strip tube has a unique letter. When you prepare
reagents, you will be asked to place the containers in the appropriate
location.
Figure 17 Positions on the Cluster Station
Waste
Container
Strip Tube
Safety Clamp
Manifold
Quick-Connect
Clamp
910 1811 12 13 14 15 16 17
1 8765432

Components 39
Paired-End Sequencing User Guide
Waste Container
The 250 ml waste container collects the reagents after they have gone
through the flow cell or manifolds. It is located in the upper right corner of
the Cluster Station. Empty the waste container after every run. Always check
the waste level in the waste container before starting a run to ensure that it is
empty.
Figure 18 Liquid Waste Container on the Cluster Station
Fluid Handling Lines
There is about 400 μl of space in the lines between the reagent bottles and
the 26-way valve inside the Cluster Station, the area that needs to be primed.
The volume from the 26-way valve to the flow cell is approximately 45–50 μl,
while the inlet tubes on a hybridization manifold are around 35 μl per lane.
Syringes and pumps pull fluid through the system. The suction is not strong
enough to dissipate all of the air bubbles, so it is important to keep water in
the lines at all times.
Disposable hybridization or amplification manifolds are connected to either
side of the flow cell, so that they can deliver reagents from the strip tubes or
reagent bottles, respectively, into the flow cell. The removable strip tube
holder holds eight 0.2 ml strip tubes for samples and reagents.
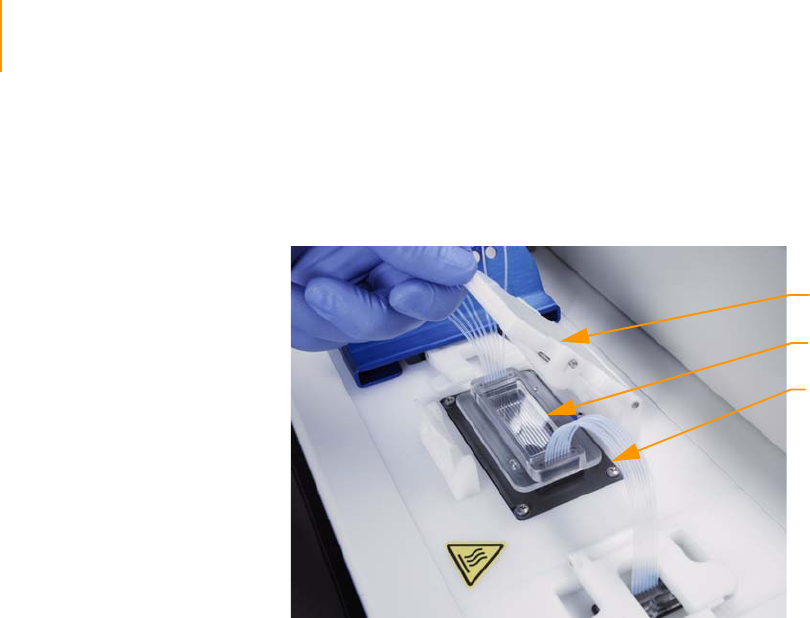
40 CHAPTER 3
Using the Cluster Station
Part # 1004571 Rev. A
Flow Cell Area Components
The flow cell is placed on the flow cell stage at the front right corner of the
Cluster Station. A white safety clamp holds the flow cell and manifold in
place.
Figure 19 Flow Cell Area Components
Manifolds Hybridization Manifold
The hybridization manifold is a disposable item used for sample loading and
hybridization, and for hybridizing multiple sequencing primers. It enables the
Cluster Station to transfer reagents from the individual wells of the eight
0.2 ml strip tubes into the flow cell. Up to eight different samples can be
loaded and hybridized in parallel. To prevent cross-contamination, use each
manifold only once.
Insert the removable strip tube holder whenever you use the hybridization
manifold. Insert the fanned-out tubes on one end of the hybridization
manifold into the strip tubes, and connect the grouped tubes on the other
side to the output port, which flows into the waste container.
Safety Clamp
Flow Cell
Manifold
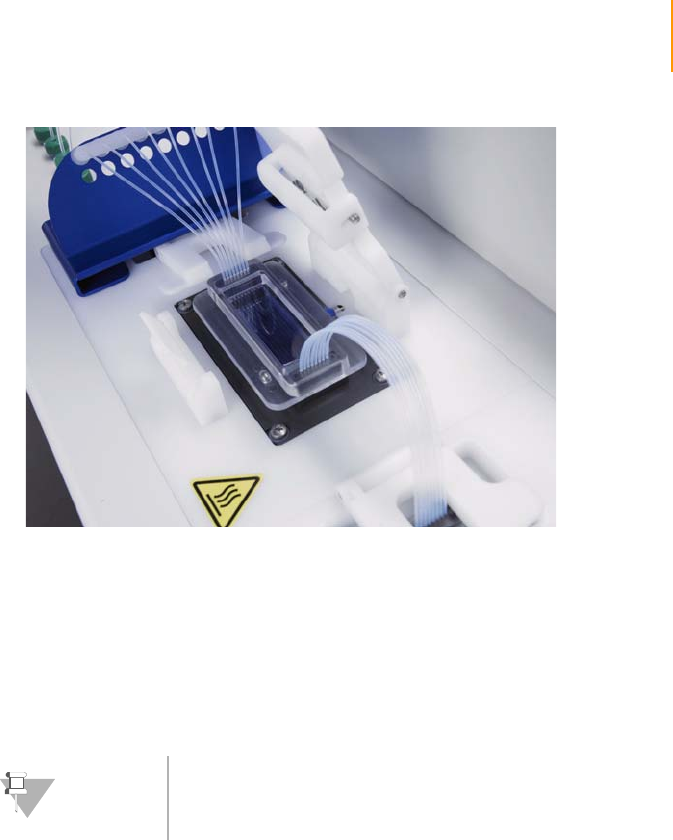
Components 41
Paired-End Sequencing User Guide
Figure 20 Flow Cell with Strip Tube and Hybridization Manifold
Amplification Manifold
The amplification manifold is a disposable item used for all steps after
template hybridization: Amplification, Linearization, Blocking, Denaturation,
and Hybridization of a single sequencing primer. It enables the Cluster
Station to transfer reagents from the Cluster Station into the flow cell in the
proper order.
Attach the amplification manifold whenever prompted by the Cluster Station
software. Connect the tubes on one end to the input port, which draws
reagents from the reagent positions on the Cluster Station. Connect the
tubes on the other side to the output port, which flows into the waste
container. Make sure the tubes are securely connected.
NOTE
To prevent cross contamination, use each manifold only
once.
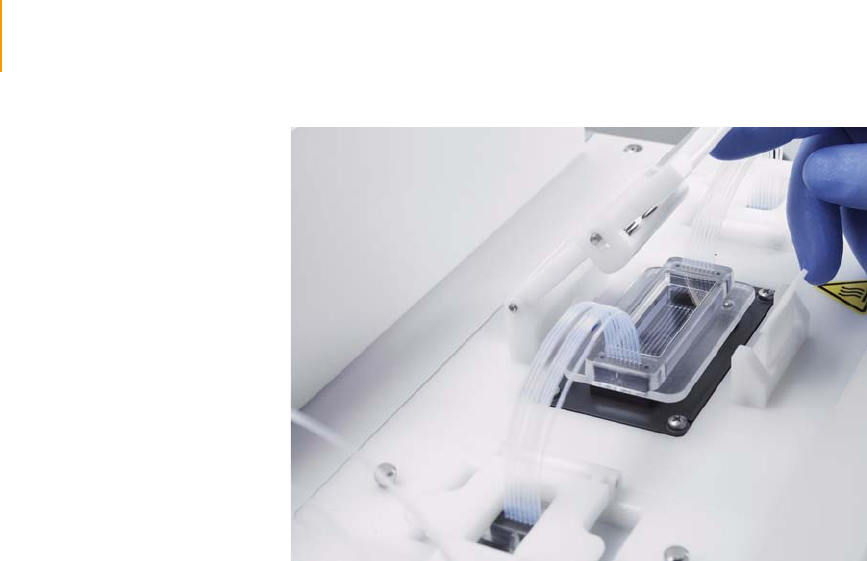
42 CHAPTER 3
Using the Cluster Station
Part # 1004571 Rev. A
Figure 21 Flow Cell with Amplification Manifold
Input Manifold
The input manifold is the port that reagents pass through to get to the flow
cell. It is located to the left of the flow cell stage as you face the Cluster
Station. One set of tubes from the amplification manifold plugs into this port
and is held in place by the quick connect clamp.
Output Manifold
The output manifold is the port that receives the liquid flowing out of the
flow cell and transfers it to the waste container. The amplification manifold,
hybridization manifold, and washing bridge all connect to the output
manifold.
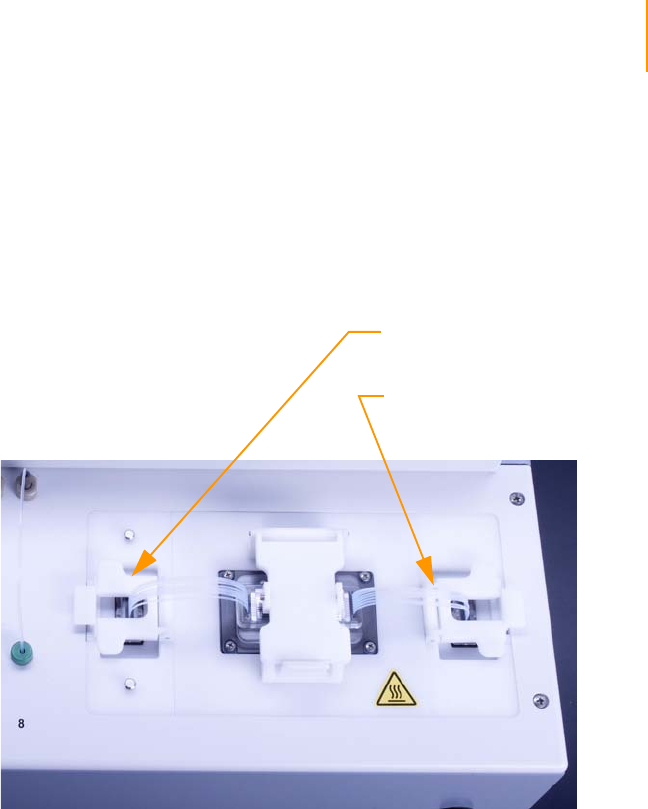
Components 43
Paired-End Sequencing User Guide
Quick-Connect Clamps
The quick-connect clamps by the input and output ports enable you to snap
the tubes on the amplification and hybridization manifolds into place.
The amplification, hybridization and washing bridge manifolds have rubber
gaskets at both ends. The gasket creates a constant tight seal to prevent
leakage. If you notice a loose gasket, tighten the seal by pushing the gasket
back into the quick connect.
Figure 22 Quick-Connect Clamps
Quick-Connect Clamp
for Output Manifold
Quick-Connect Clamp
for Input Manifold
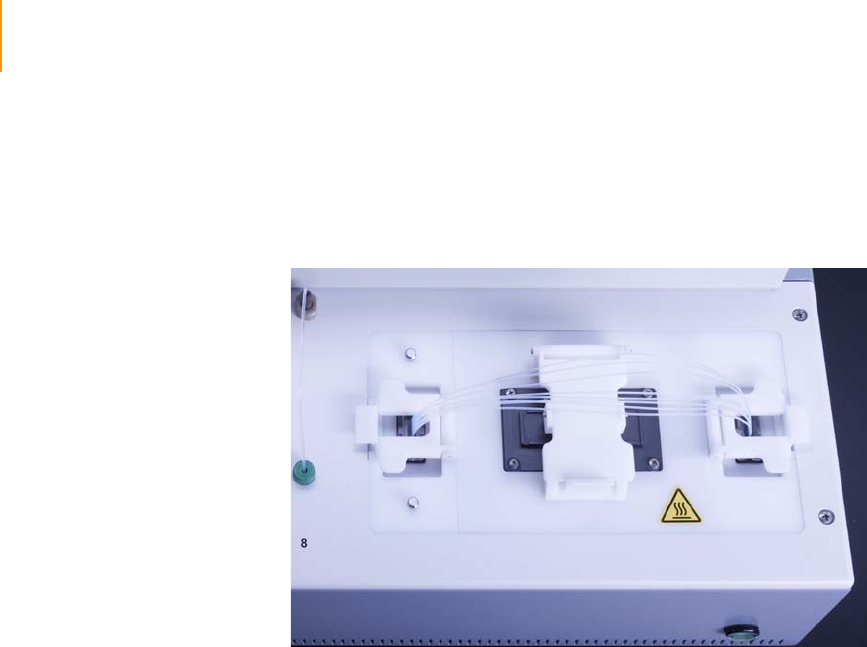
44 CHAPTER 3
Using the Cluster Station
Part # 1004571 Rev. A
Washing Bridge
The washing bridge is a reusable manifold used during instrument washes. It
connects the input manifold directly to the output manifold, bypassing the
flow cell. This allows you to flush all the reagent lines with water at the
conclusion of a cluster generation protocol.
Figure 23 Washing Bridge

Cluster Station Recipes 45
Paired-End Sequencing User Guide
Cluster Station Recipes
The Cluster Station workstation is preloaded with paired-end protocol
recipes. For approximate duration of each step in the protocol, see Protocol
Times on page 35.
The default location is <install directory>\DataCollection_v<#>\bin\Recipes.
The <#> in the filename refers to the current version of the recipe. To learn
more about recipes, see Appendix C, Recipes.
A typical workflow uses the following two recipes:
1. Amplification_only_35cycles_v<#>
2. PE_2P_R1prep_Linearization_CombinedBlocking_PrimerHyb_v<#>
At the beginning of each recipe, you must load the instrument with fresh
reagents and set up the automatic run. At the end of each run, the Cluster
Station performs a washing step.
The following table lists the tasks associated with each Cluster Station recipe.
Ta ble 7 Tasks in Each Cluster Station Recipe
Recipe Wash
Hybridize
and Amplify
Temp lat e
DNA
Linearize Block
Denature DNA
and Hybridize
Sequencing
Primer(s)
Wash
Amplification_only_35cycles_v<#> X X X
PE_2P_R1prep_Linearization_
CombinedBlocking_Primerhyb_v<#> XXXXX
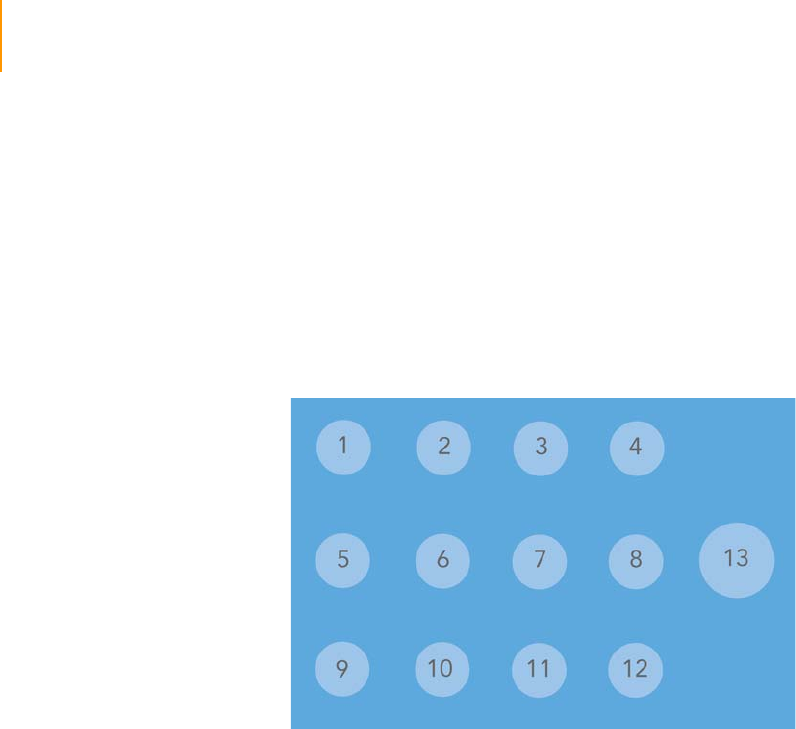
46 CHAPTER 3
Using the Cluster Station
Part # 1004571 Rev. A
Cluster Generation Kit Contents
Check to ensure that you have all of the reagents identified in this section
before proceeding to cluster generation.
Paired-End
Cluster
Generation Kit,
Box 1 (Read 1)
Store at -15° to -25ºC
This box is shipped at -80°C. As soon as you receive it, store the components
at -20°C (-15° to -25°C). Briefly vortex and centrifuge each reagent after
thawing.
Figure 24 Paired-End Cluster Generation Kit, Box 1
1. 10 mM dNTPs, part # 1000151
2. Bst DNA Polymerase, part # 1000150
3. Taq DNA Polymerase, part # 1000157
4. 10X Blocking Buffer, part # 1001790
5. 2.5 mM ddNTP Mix, part # 1003184
6. Blocking Enzyme A, part # 1001788
7. Rd 1 PE Seq Primer, part # 1004454
8. Blocking Enzyme B, part # 1001791
9. Linearization 1 Enzyme, part # 1001796
10. 10X Linearization 1 Buffer, part # 1001797
11. Empty
12. Empty
13. Cluster Buffer, part # 1000149
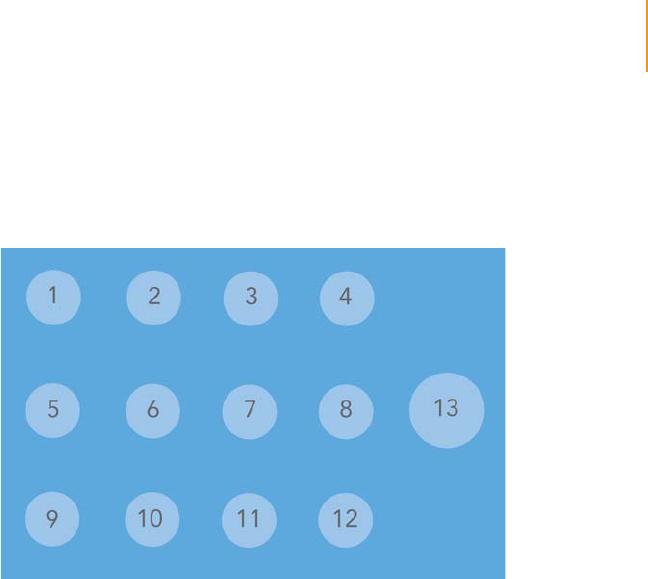
Cluster Generation Kit Contents 47
Paired-End Sequencing User Guide
Paired-End
Cluster
Generation Kit,
Box 2 (Read 2)
Store at -15° to -25ºC
This box is shipped at -80°C. As soon as you receive it, store the components
at -20°C (-15° to -25°C). Briefly vortex and centrifuge each reagent after
thawing.
Figure 25 Paired-End Cluster Generation Kit, Box 2
1. 10 mM dNTPs, part # 1000151
2. Bst DNA Polymerase, part # 1000150
3. BSA, part # 1003183
4. 10X Blocking Buffer, part # 1001790
5. 2.5 mM ddNTP Mix, part # 1003184
6. Blocking Enzyme A, part # 1001788
7. Rd 2 PE Seq Primer, part # 1004055
8. Blocking Enzyme B, part # 1001791
9. Linearization 2 Enzyme, part # 1003182
10. 10X Linearization 2 Buffer, part # 1003181
11. 5X Deprotection Buffer, part # 1003179
12. Deprotection Enzyme, part # 1003180
13. Cluster Buffer, part # 1000149
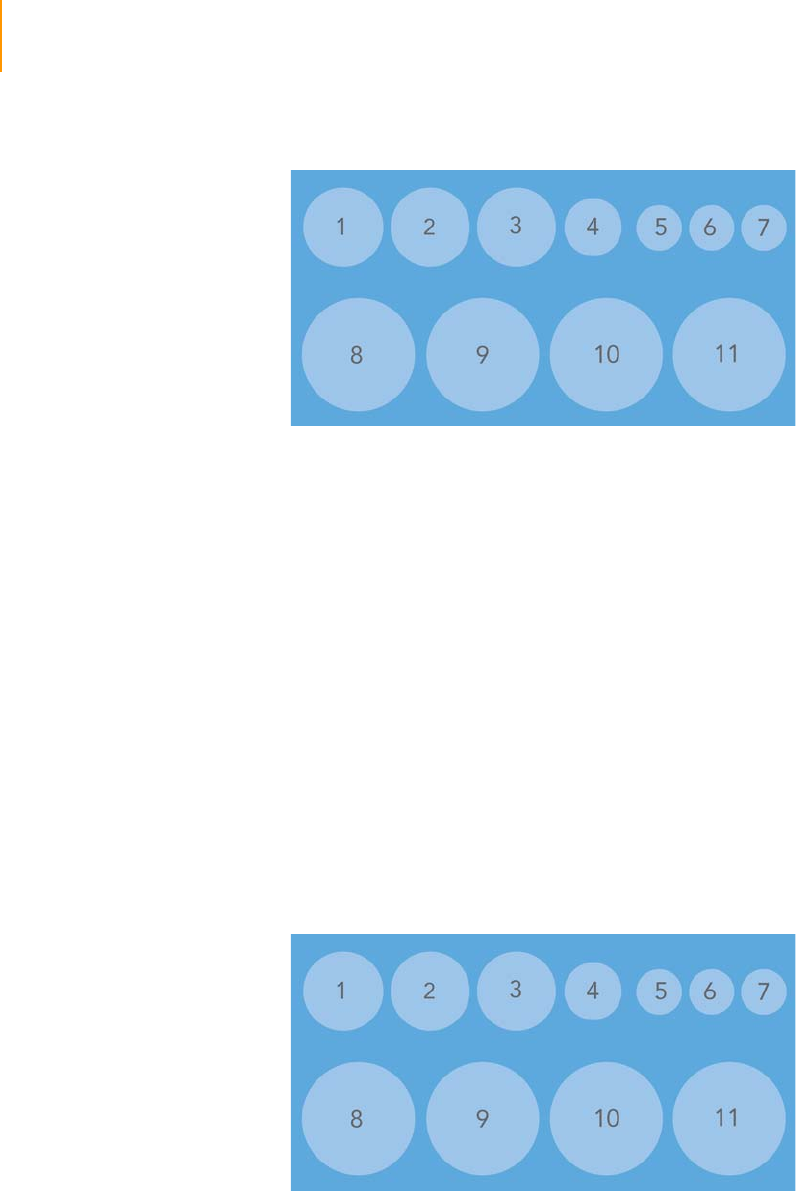
48 CHAPTER 3
Using the Cluster Station
Part # 1004571 Rev. A
Paired-End
Cluster
Generation Kit,
Box 3 (Read 1)
Store at Room Temperature
Figure 26 Paired-End Cluster Generation Kit, Box 3
1. Empty
2. Hybridization Buffer, part # 1000166
3. Empty
4. Empty
5. 2 N NaOH, part # 1000171
6. 0.1 N NaOH, part # 1000169
7. TE Buffer, part # 1000172
8. Formamide, part # 1000173
9. Wash Buffer, part # 0801-1002
10. Ultra Pure Water, part # 1000168
11. Storage Buffer, part # 1000174
Paired-End
Cluster
Generation Kit,
Box 4 (Read 2)
Store at Room Temperature
Figure 27 Paired-End Cluster Generation Kit, Box 4
1. 0.1 N NaOH, part # 1003185
2. Hybridization Buffer, part # 1000166
3. TE Buffer, part # 1003186
4. Empty

Cluster Generation Kit Contents 49
Paired-End Sequencing User Guide
5. Empty
6. Empty
7. Empty
8. Formamide, part # 1000173
9. Wash Buffer, part # 0801-1002
10. Ultra Pure Water, part # 1000168
11. Empty
Other Cluster
Station
Consumables
When you order a Cluster Generation Kit, you will also receive the following
consumables. The quantity varies depending on the kit size.
Illumina Part # Description Consumption
Rate
1004225 Paired-End Flow Cell, 1.4 mm (Genome Analyzer
II
)1 per run
0801-1320 Hybridization Manifold 1 per run
0801-1321 Amplification Manifold 2 per run

50 CHAPTER 3
Using the Cluster Station
Part # 1004571 Rev. A
Preparing Sample DNA for Cluster Generation
There are two steps involved in preparing the template mix:
1. Denature with NaOH.
2. Dilute Denatured DNA into Hybridization Buffer.
Consumables Illumina-Supplied
`2 N NaOH
User-Supplied
`EB (10 mM Tris-Cl pH 8.5)
Template Mix Prepped DNA Storage
Illumina recommends storing prepped DNA (template DNA) at a
concentration of 10 nM. Adjust the concentration for your prepped DNA
samples to 10 nM using EB buffer. For long-term storage of DNA samples at
a concentration of 10 nM, add Tween 20 to the sample to a final
concentration of 0.1% Tween. This helps to prevent adsorption of the
template to plastic tubes upon repeated freeze-thaw cycles, which would
decrease the cluster numbers from a sample over time.
DNA Concentration
The flow cell has eight parallel channels for processing up to eight different
DNA samples. The first time you process a sample, it is useful to try a
concentration range to optimize the number of clusters formed. If the DNA
concentration is too low, the clusters are too few and the sequencing
throughput is low. If the DNA concentration is too high, the clusters are too
dense and can overlap, complicating the sequencing data analysis.
Generally, the concentration of DNA used for the hybridization step on the
Cluster Station should be 1–4 pM, leading to a cluster density of
approximately 40–130 K/tile.
Denature with NaOH
Denature the template DNA with 2 N NaOH to a final DNA concentration of
0.5 nM and final NaOH concentration of 0.1 N. This is suitable for performing
the hybridization step on the Cluster Station at a DNA concentration up to
4 pM.
1. If the starting DNA concentration is 10 nM, use these volumes:
•EB (18 μl)
•10 nM Template DNA (1 μl)
•2 N NaOH (1 μl)
The total volume should be 20 μl.
NOTE
If concentrations of DNA higher than 4 pM are
required in the hybridization step, refer to Denaturing
High Concentrations of DNA on page 51.

Preparing Sample DNA for Cluster Generation 51
Paired-End Sequencing User Guide
2. Vortex the template solution.
3. Pulse centrifuge the solution.
4. Incubate for 5 minutes at room temperature to denature the template
into single strands.
Denaturing High Concentrations of DNA
Sporadically, higher concentrations of DNA are required in the hybridization
step. In those cases, adjust the protocol Denature with NaOH on page 50 as
indicated below.
Dilute Denatured DNA with Hybridization Buffer
Dilute the denatured DNA with pre-chilled Hybridization Buffer to a total
volume of 1000 μl and dispense in strip tube as described below. Illumina
recommends that you perform a titration of your DNA template to determine
a good density of clusters. A typical titration series would be to use a new
template at 1 pM, 2 pM, and 4 pM.
Using the Genome Analyzer PhiX control, concentrations of 0.5 pM, 1 pM,
and 2 pM generate cluster densities of 40K, 85K, and 130K, respectively.
Ta ble 8 Adjustments to the Protocol for High Final DNA Concentrations
Desired Final DNA
Concentration in 1 ml
Template DNA
(10 nM) EB NaOH Concentration of
Denatured Template DNA
Up to 4 pM 1 μl 18 μl 1 μl 0.5 nM
4–8 pM 2 μl 17 μl 1 μl 1.0 nM
8–12 pM 3 μl 16 μl 1 μl 1.5 nM
12–16 pM 4 μl 15 μl 1 μl 2.0 nM
16–20 pM 5 μl 14 μl 1 μl 2.5 nM
20–24 pM 6 μl 13 μl 1 μl 3.0 nM
24–28 pM 7 μl 12 μl 1 μl 3.5 nM
28–32 pM 8 μl 11 μl 1 μl 4.0 nM
32–36 pM 9 μl 10 μl 1 μl 4.5 nM
36–40 pM 10 μl 9 μl 1 μl 5.0 nM

52 CHAPTER 3
Using the Cluster Station
Part # 1004571 Rev. A
1. To reach the desired final concentration for the hybridization step, dilute
denatured DNA as follows:
2. Vortex the template solution.
3. Pulse centrifuge the solution.
4. Add 120 μl of the Illumina control sample into tube 5 of a 0.2 ml eight-
strip tube. This will place the control sample in lane 5 on the flow cell.
Illumina recommends placing the control lane in this position.
5. Add 120 μl of diluted, denatured sample DNA template into the
remaining tubes of a 0.2 ml eight-strip tube. Take careful note of which
template goes into each tube.
6. Label the strip tube “B.”
7. Set aside on ice until ready to load onto the Cluster Station.
Required Final
Concentration 0.5 pM 1 pM 2 pM 4 pM
0.5 nM
Denatured
DNA
1 μl 2 μl 4 μl 8 μl
Pre-chilled
Hybridization
Buffer
999 μl 998 μl 996 μl 992 μl
CAUTION
Excess NaOH in diluted samples inhibits the formation of
clusters, an effect which occurs if you add more than 8 μl of
the NaOH denaturation to 1 ml of hybridization buffer.

Preparing Reagents for Cluster Generation 53
Paired-End Sequencing User Guide
Preparing Reagents for Cluster Generation
This protocol describes how to prepare reagents for the amplification
process of cluster generation. All operations are performed on the Illumina
Cluster Station.
The reagents for cluster generation are supplied in boxes 1 and 3 of the
Paired-End Cluster Generation Kit. All of the reagents necessary for cluster
generation on a paired-end flow cell are contained in the kit with the
exception of 5 M Betaine and EB.
The reagents and materials provided are sufficient for processing one flow
cell. All materials are single-use.
Follow these instructions to prepare reagents before loading them into the
Cluster Station. Note that some reagents are used at more than one point
during a protocol.
Consumables Illumina-Supplied
The following reagents and consumables are supplied with the Paired-End
Read 1 Cluster Generation Kit (Boxes 1 and 3):
`Cluster Buffer
`Formamide
`Taq DNA Polymerase
`Bst DNA Polymerase
`10 mM dNTPs
`Hybridization Buffer
`Wash Buffer
`2 N NaOH
`Ultra pure water
`Storage Buffer
The following consumables are also supplied:
`Hybridization manifold (1)
`Amplification manifolds (2)
`Paired-end flow cell
User-Supplied
`5 M Betaine solution
`EB (10 mM Tris-Cl pH 8.5)
CAUTION
Avoid trapping air at the bottom of the tubes. If bubbles are
present, air will be pumped instead of the reagent.

54 CHAPTER 3
Using the Cluster Station
Part # 1004571 Rev. A
Procedure Betaine, 5M
The addition of betaine is reported to reduce the formation of secondary
structure in GC-rich regions by eliminating the base pair composition
dependence of DNA melting.
Prepare the betaine as follows:
1. Place 400 ml water into a large beaker.
2. While mixing with a magnetic stirrer, add 585.75 g betaine in ~50 g
batches.
3. Stir until the betaine has completely dissolved.
4. Incubate at 37ºC for 60 minutes.
5. Adjust the volume to 1 liter with water in a volumetric flask.
6. Filter the solution with a 0.2 μm cellulose acetate filter.
7. Store at -20°C.
Hybridization Buffer
1. Aliquot 140 μl of Hybridization Buffer into each tube of an eight-strip tube.
2. Label the strip tube “A.”
Wash Buffer
1. Aliquot 100 μl of Wash Buffer into each tube of an eight-strip tube.
2. Label the strip tube “C.”
Amplification Premix
1. To make Amplification Premix, mix the following in a 50 ml conical tube:
•Water (15 ml)
•Cluster buffer (3 ml)
•Betaine, 5M (12 ml)
The total volume should be 30 ml.
2. Filter the Amplification Premix with a Minisart single-use 0.2 μm cellulose
acetate syringe filter into a 50 ml conical tube. Label the tube
“Amplification Premix.”
3. Transfer 12 ml of the Amplification Premix into a 50 ml conical tube.
4. Label the conical tube “Reagent #11.”
5. Add 100 μl of the Amplification Premix into each tube of a 0.2 ml eight-
strip tube.
NOTE
Betaine may be prepared in advance and stored at 4°C.

Preparing Reagents for Cluster Generation 55
Paired-End Sequencing User Guide
6. Label the strip tube “D.”
Initial Extension Mix using Taq Polymerase
1. To make Initial Extension Mix using Taq Polymerase, mix the following on
ice in a 1.5 ml tube:
•Amplification Premix (975 μl)
•10 mM dNTPs (20 μl)
•Taq DNA Polymerase (5 μl)
The total volume should be 1000 μl.
2. Aliquot 120 μl of Initial Extension Mix into each tube of a 0.2 ml eight-
strip tube.
3. Label strip tube “E.”
4. Set aside on ice until ready to load onto the Cluster Station.
Amplification Mix Using Bst DNA Polymerase
1. Prepare the Bst DNA Polymerase Amplification Mix by mixing the
following in a 50 ml conical tube:
•Amplification Premix (12 ml)
•10 mM dNTPs (240 μl)
•Bst DNA Polymerase (120 μl)
The total volume should be 12.36 ml.
2. Label the conical tube “Reagent #1.”
3. Set aside on ice until ready to load onto the Cluster Station.
Formamide
1. Transfer 15 ml of Formamide into a 50 ml tube.
2. Label the tube “Reagent #9.”
Wash Buffer
1. Transfer 10 ml of Wash Buffer into a 50 ml tube.
2. Label the tube “Reagent #10.”
Storage Buffer
1. Transfer 5 ml of Storage Buffer (5 x SSC) into a 50 ml tube.
2. Label the tube “Reagent #12.”
NOTE
Save the remaining Amplification Premix to prepare the
initial extension mix and the amplification mix using Bst
DNA Polymerase.

56 CHAPTER 3
Using the Cluster Station
Part # 1004571 Rev. A
Loading Reagents for Cluster Generation
To prevent cross-contamination, follow these best practices:
`Always remove and replace reagents one tube (or bottle) at a time.
`Wear gloves at all times. Do not touch reagents with bare hands.
`Connect the 50 ml, 15 ml, and 1.5 ml tubes by holding the caps
stationary while you twist the tubes into place. This prevents crimping
and twisting of the lines.
The reagent compartment holds three sizes of tubes:
`50 ml conical bottom tubes
`15 ml conical bottom tubes
`1.5 ml tubes
The following figure illustrates accurate reagent tube and bottle placement
along with the number associated with each position. The strip tubes that fit
in the removable strip tube holder are lettered from A to J.
Figure 28 Cluster Station Reagent Positions
NOTE
Not all 15 ml tubes fit the Cluster Station. Illumina
recommends BD Falcon, Catalog # 352096 or 352097.
910 1811 12 13 14 15 16 17
1 8765432 Removable strip tube holder

Loading Reagents for Cluster Generation 57
Paired-End Sequencing User Guide
Ta ble 9 Reagent Positions
Position Reagent Tube Size
1 Amplification Mix with Bst DNA Polymerase 50 ml
2Spare 50 ml
3Spare 15 ml
4Spare 15 ml
5Spare 1.5 ml
61X Blocking Buffer 2.0 ml
7 Sequencing Primer Mix 2.0 ml
8Blocking Mix 2.0 ml
9 Formamide 50 ml
10 Wash Buffer 50 ml
11 Amplification Pre-Mix 50 ml
12 Storage Buffer 50 ml
13 Spare 50 ml
14 Linearization 1 Mix 2.0 ml
15 Spare 1.5 ml
16 1X Linearization Buffer 1.5 ml
17 0.1 N NaOH 1.5 ml
18 TE 1.5 ml
A Hybridization Buffer 0.2 ml eight-strip tube
BTemplate Mix 0.2 ml eight-strip tube
C Wash Buffer 0.2 ml eight-strip tube
DAmplification Pre-Mix 0.2 ml eight-strip tube
E Initial Extension Mix with Taq Polymerase 0.2 ml eight-strip tube
FSpare 0.2 ml eight-strip tube
GSpare 0.2 ml eight-strip tube
HSpare 0.2 ml eight-strip tube
ISpare 0.2 ml eight-strip tube
JSpare 0.2 ml eight-strip tube
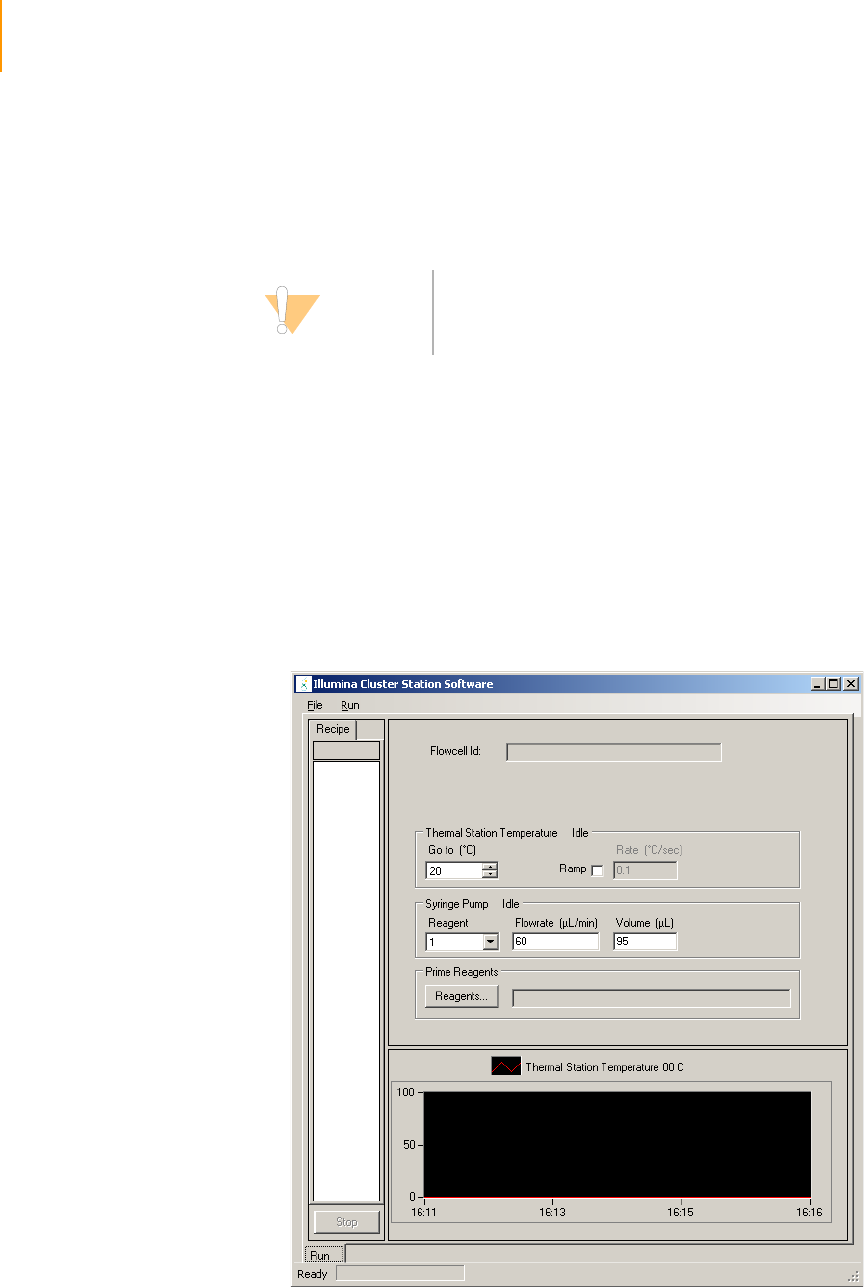
58 CHAPTER 3
Using the Cluster Station
Part # 1004571 Rev. A
Starting the Cluster Station
Illumina recommends that you reboot the Cluster Station computer once or
twice per week.
1. Turn the main power switch on the Cluster Station to the ON position.
2. Wait for 20 seconds.
3. Start the computer and log on using the default values:
Username: sbsuser
Password: sbs123
If the default logon does not work, check with your IT personnel to find
out the correct user name and password for your site.
4. Double-click the Illumina Cluster Station software icon on the computer
desktop to launch the software.
Figure 29 Cluster Station Software Main Window
CAUTION
It is important to turn on the Cluster Station before starting
the software. Otherwise, the software will not control the
Cluster Station.
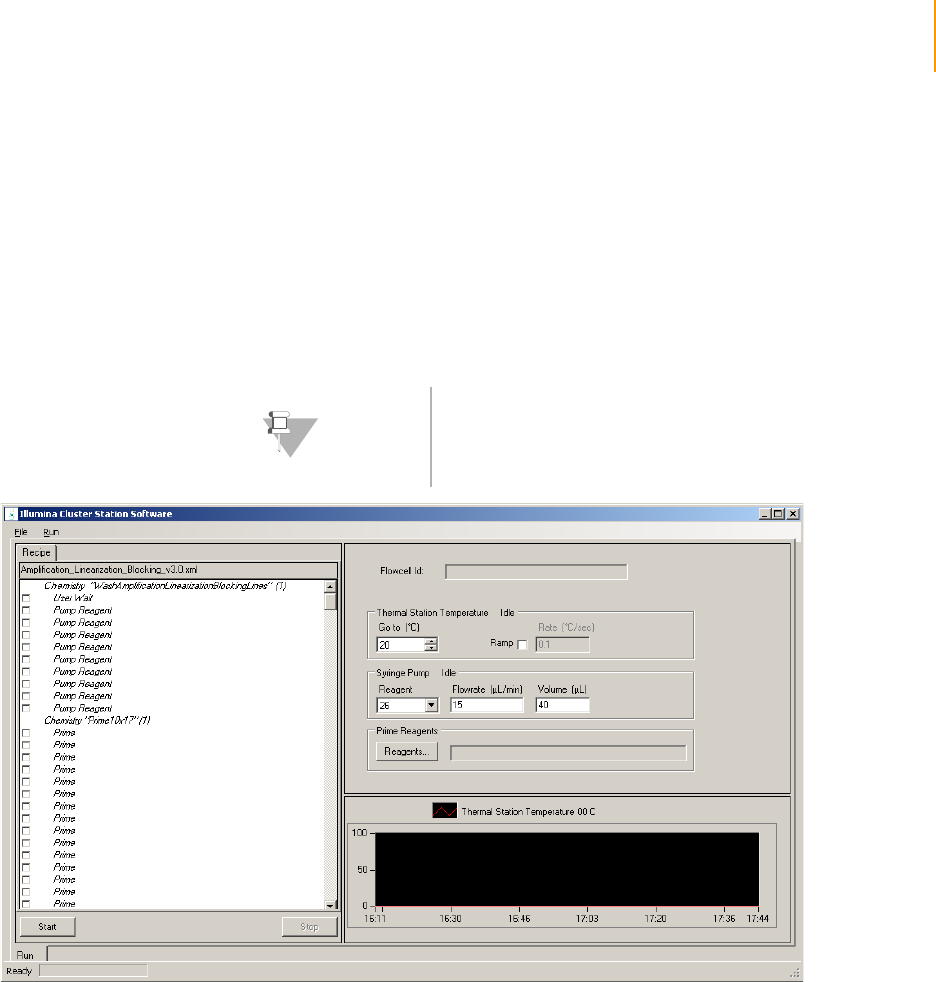
Cluster Generation 59
Paired-End Sequencing User Guide
Cluster Generation
Running a
Recipe
For information about recipes, and instructions on how to stop and resume
them, see Appendix C, Recipes.
1. In the Cluster Station software, select File | Open Recipe.
2. Open the desired recipe. For a list of recipes, see Table 7 on page 45.
The protocol steps appear in the left sidebar. After the Cluster Station
performs each step, a check mark appears beside it.
Figure 30 Amplification, Linearization, Blocking Recipe
3. Click Start.
4. If prompted, enter sample sheet data or navigate to an existing sample
sheet, and then click OK.
The prompt for a sample sheet is enabled in the configuration file RCM-
Config.xml. Refer to Configuring Sample Sheet Behavior on page 202 for
more information.
NOTE
It is advisable to complete the full recipe without
interruption. However, safe stopping points between
recipes are clearly indicated. For more information, see Safe
Stopping Points During Cluster Generation on page 62.
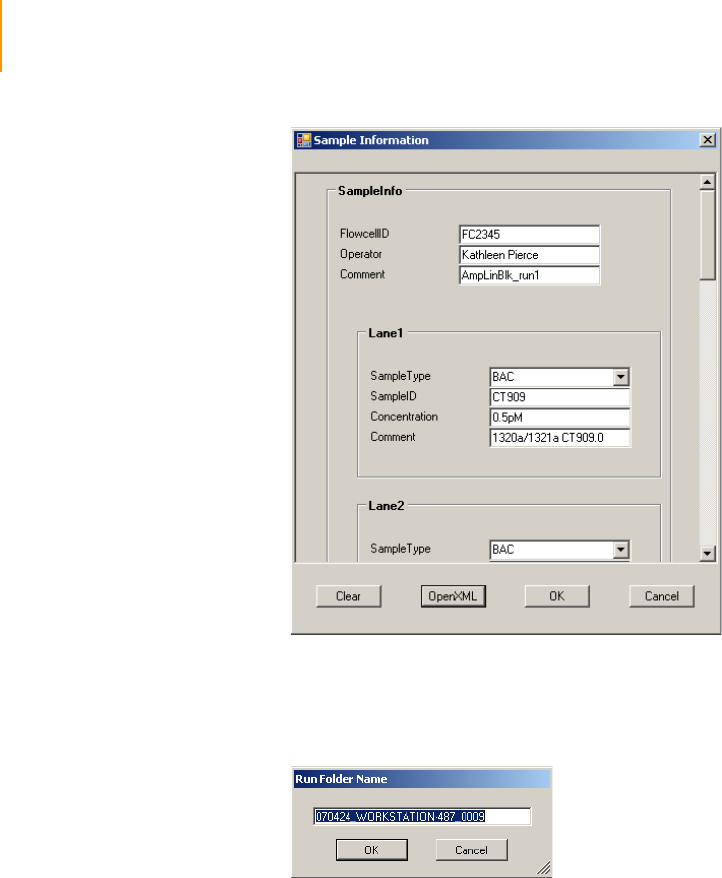
60 CHAPTER 3
Using the Cluster Station
Part # 1004571 Rev. A
Figure 31 Sample Sheet Data
5. The system automatically generates a name for the run folder that will
contain the data. Click OK to accept it, or enter a different name and
click OK.
Figure 32 Run Folder
6. Follow the onscreen instructions to load reagents. Follow the guidelines
in Loading Reagents for Cluster Generation on page 56 to position the
reagents.
7. Follow the onscreen instructions to attach the hybridization manifold. For
manifold descriptions, see Manifolds on page 40. Follow the instructions
in Attaching the Hybridization Manifold on page 61.
8. When reagents are pumped through the eight lines of the hybridization
manifold or through the eight lanes of the flow cell, check that the
solution is pumped uniformly in all eight lines. Follow the guidelines in
Check Even Flow on page 62.
9. If the solution does not flow evenly in some or all the lines, click Stop to
pause the protocol. Check the manifold connections and ensure that the
flow cell is level. Click Resume to restart the protocol. If the flow
continues to be uneven, try replacing the manifold.
10. When prompted, follow the onscreen instructions to remove the
hybridization manifold and connect the amplification manifold. Follow
the instructions in Attaching the Amplification Manifold on page 62.

Cluster Generation 61
Paired-End Sequencing User Guide
11. When the recipe finishes, select File | Close Recipe.
12. Do one of the following:
•Proceed directly to the next recipe, if there is one.
•After hybridizing the sequencing primer(s), sequence the flow cell
within 4 hours.
•Follow the directions in Safe Stopping Points During Cluster
Generation on page 62 if you want to stop.
Positioning the
Flow Cell
Always use clean gloves or plastic forceps when handling the flow cell. Do
not touch the flow cell with bare hands or marker pens. Doing so can leave
marks that could interfere with the detection of clusters.
1. Remove a flow cell from the case.
2. Rinse the flow cell with water; wipe and dry the outside using lens
cleaning tissue. Be careful not to drain the lanes when wiping the ports
(holes). This step ensures that the flow cell does not stick to the platform.
3. Make sure that the stage is clean and free from dust and salt.
4. Place the flow cell on the thermal block of the Cluster Station with the
ports facing up. The bar code should be on the bottom edge, and the
alphanumeric serial number on the upper edge, left side (Figure 33).
Figure 33 Positioning the Flow Cell
Attaching the
Hybridization
Manifold
Always shield the manifold gaskets from contamination. To avoid
contaminating the gaskets, do not place the manifold face down on any
surface.
1. Take a new hybridization manifold from a sealed bag. Make sure there is
no dust on the underside of the gaskets (remove with a wet kimwipe or
lens paper).
2. Place the center of the manifold over the flow cell. The fanned-out tubes
should point to the left, toward the removable strip tube holder.
3. Press to ensure that the manifold goes all the way down and is securely in
place. Snap the white clamp down over the manifold and flow cell to
hold them in place.
4. Place the fanned-out tubes into the tube strip to the left of the flow cell.
You may use a piece of tape to make sure the fanned-out tubes will stay
in the bottom of the tube strip.
5. Plug the clustered tubes into the output manifold to the right of the
flow cell.
Serial Number: top left
Bar Code: bottom edge
Lane 1
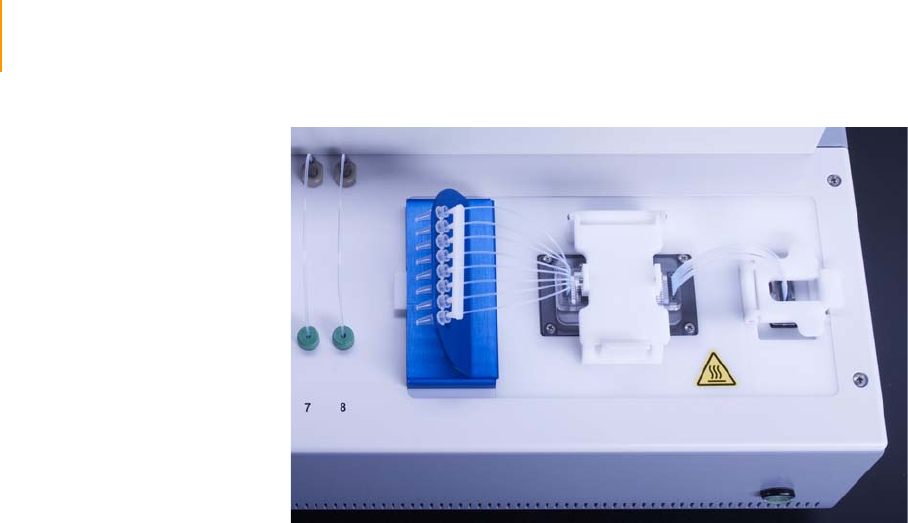
62 CHAPTER 3
Using the Cluster Station
Part # 1004571 Rev. A
Figure 34 Flow Cell and Hybridization Manifold Installed
Check Even Flow After you have installed the flow cell and hybridization manifold, you should
check whether the flow through the flow cell is even. When the first solution
is pumped through the flow cell (next section, Running a Recipe, step 8),
make sure it runs in all eight input tubes without obstruction. The tubes
should all empty at the same rate.
Attaching the
Amplification
Manifold
Always shield the manifold gaskets from contamination. To avoid
contaminating the gaskets, do not place the manifold face down on any
surface.
1. Remove the hybridization manifold.
2. Take a new amplification manifold from a sealed bag.
3. Place the center of the manifold over the flow cell.
4. Press to ensure that the manifold goes all the way down and is securely in
place. Snap the white clamp down over the manifold and flow cell to
hold them in place.
5. On the amplification manifold, both ends have clustered tubes. Secure
both ends (input and output) with quick-connect clamps.
6. Check that each line is priming by observing the initial air gap flowing
through the lines.
Safe Stopping
Points During
Cluster
Generation
The Cluster Station recipes give you flexibility in planning your workflow. For
more information, see Protocol Times on page 35.
You can store the flow cell at 4°C indefinitely after the following recipe:
`Amplification_only_v<#>
For paired-reads, you can not store the linearized and blocked flow cell for a
prolonged period of time due to the nature of the enzymes used in the
blocking step.
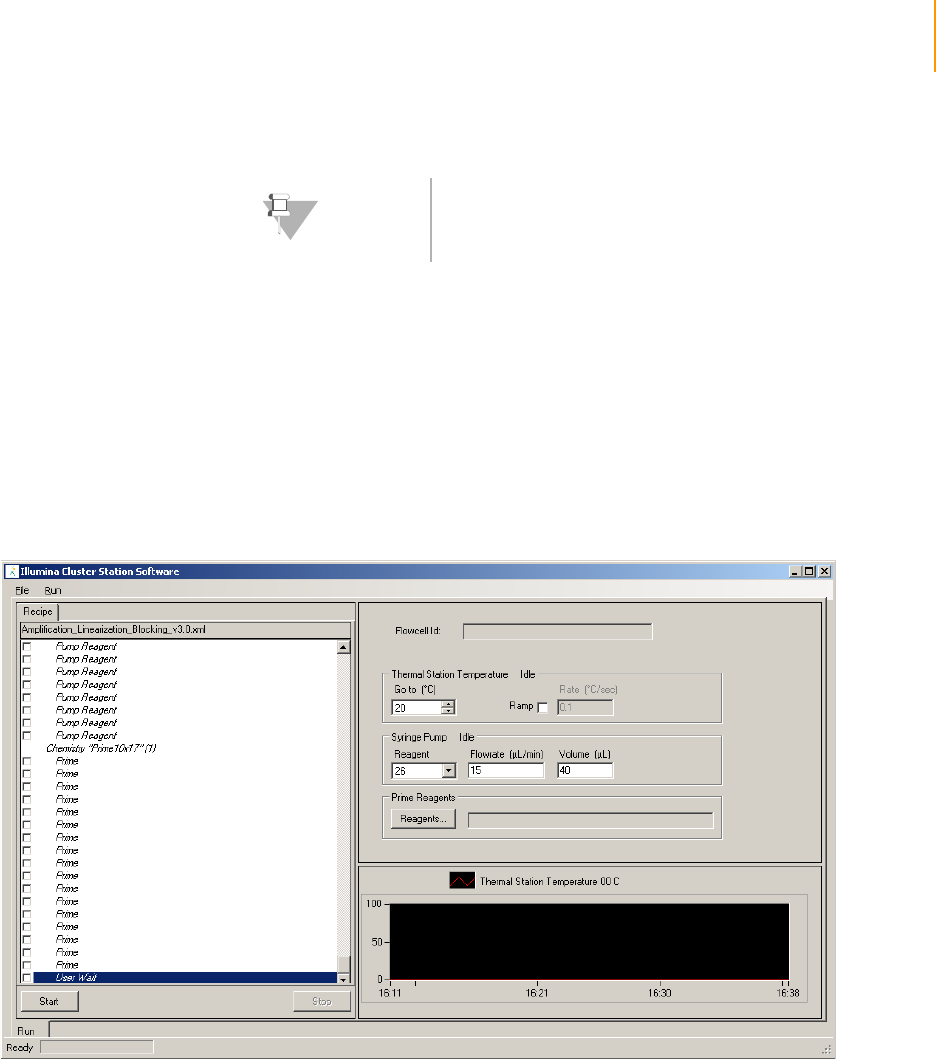
Cluster Generation 63
Paired-End Sequencing User Guide
Follow the instructions in Unloading the Flow Cell on page 63. Place the flow
cell in a 50 ml conical tube filled with Storage Buffer and store it at 4°C.
Unloading the
Flow Cell
1. Enter the following values in the Syringe Pump area to pump air into the
inlet tubes of the manifold:
Reagent: 26 (spare position with nothing in the reagent tube)
Flowrate: 15 μl/minute
Volume: One of the following:
•After amplification, linearization, blocking, or primer hybridization,
with the amplification manifold connected: 40 μl
•After multi-primer hybridization, with the hybridization manifold
connected: 25 μl
Figure 35 Setting Pump Controls to Unload Flow Cell
2. With your cursor in the Volume field, press Enter.
This helps prevent fluid from the inlet tubes from spilling onto the flow
cell when the manifold pressure is released.
3. Release the quick-connect clamp from the input manifold.
4. Lift the central white clamp off the manifold, but leave the output
manifold clamp in place.
5. Remove the flow cell from the Cluster Station.
6. Release the quick-connect clamp from the output manifold and remove
the manifold from the Cluster Station.
NOTE
After primer hybridization, the flow cell should be used for
sequencing within 4 hours

64 CHAPTER 3
Using the Cluster Station
Part # 1004571 Rev. A
7. Using a lens cleaning tissue, gently wipe the flow cell stage and the
metal posts on the input and output ports with water. Dry them
thoroughly.
Weekly
Maintenance Wash
This protocol takes approximately 21 minutes to run. Perform a maintenance
wash once a week to help prevent blockages and microbial growth in the
fluidics system.
1. If an amplification or hybridization manifold is connected to the input and
output manifolds, disconnect it.
2. From the Cluster Station software, select File | Open Recipe. Select the
recipe called DECON_Wash_All_lines_v<#>.
3. Click Start.
4. Following the onscreen instructions, connect the washing bridge to the
input and output manifolds.
5. Place the following tubes containing 5% DECON in the positions
indicated:
6. Click OK. You can reuse the 5% DECON if desired.
7. Following the onscreen instructions, replace the 5% DECON tubes with
fresh tubes containing clean water in the positions indicated:
8. Click OK.
9. Following the onscreen instructions, replace the water in each tube with
the clean water in the positions indicated:
10. Click OK.
Position on the Cluster Station Tube Size 5% DECON
Positions 1, 2, 9, 10, 11, 12, and 13 50 ml 25 ml
Positions 3 and 4 15 ml 5 ml
Positions 5, 6, 7, 8, 14, 15, 16, 17, and 18 1.5 ml 1 ml
Position on the Cluster Station Tube Size Clean Water
Positions 1, 2, 9, 10, 11, 12, and 13 50 ml 40 ml
Positions 3 and 4 15 ml 10 ml
Positions 5, 6, 7, 8, 14, 15, 16, 17, and 18 1.5 ml 1.5 ml
Position on the Cluster Station Tube Size Clean Water
Positions 1, 2, 9, 10, 11, 12, and 13 50 ml 40 ml
Positions 3 and 4 15 ml 10 ml
Positions 5, 6, 7, 8, 14, 15, 16, 17, and 18 1.5 ml 1.5 ml

Preparing Reagents for Read 1 Preparation on the Cluster Station 65
Paired-End Sequencing User Guide
Preparing Reagents for Read 1 Preparation on the Cluster
Station
This protocol describes how to prepare reagents for the linearization,
blocking, and primer hybridization process of cluster generation. All
operations are performed on the Illumina Cluster Station.
Any residual Read 1 kit reagents should be disposed of after preparation of
Read 1. The freezing and thawing of some components could potentially
cause certain steps to fail. A separate kit for the preparation of Read 2 is
supplied and contains all necessary components for the process.
Consumables
Illumina-Supplied
The following reagents and consumables are supplied with the Paired-End
Read 1 Cluster Generation Kit (Boxes 1 and 3):
`10X Linearization 1 Buffer
`Linearization 1 Enzyme
`Ultra Pure Water
`10X Blocking Buffer
`Blocking Enzyme A
`Blocking Enzyme B
`2.5 mM ddNTP Mix
`Hybridization Buffer
`0.1 N NaOH
`TE Buffer
`Wash Buffer
`Storage Buffer
`Rd 1 PE Seq Primer
The following consumables are also supplied:
`Amplification manifold (1)
Procedure
Reagent #16: 1X Linearization Buffer
1. Thaw the 10X Linearization 1 Buffer at room temperature.
2. Vortex briefly.
3. Collect the reagent to the bottom of the tube by centrifuging for
10 seconds at 10,000 xg.
4. In a 15 ml conical tube, dilute the 10X Linearization 1 Buffer to a
1X concentration with Ultra Pure Water as follows:
•Ultra Pure Water (2700 μl)
•10X Linearization 1 Buffer (300 μl)
The total volume should be 3000 μl.
5. Label the tube “1X Linearization Buffer.”

66 CHAPTER 3
Using the Cluster Station
Part # 1004571 Rev. A
6. Mix by pipetting up and down using a 5 ml pipette.
7. Transfer 1.3 ml of diluted Linearization Buffer into a 1.5 ml screw-cap
tube.
8. Label the tube “Reagent #16” and set aside until ready to load it onto
the Cluster Station.
Save the remaining 1X Linearization Buffer for the preparation of the
Linearization Mix.
Reagent #14: Linearization 1 Mix
1. Flick the Linearization 1 Enzyme tube gently.
2. Collect the reagent to the bottom of the tube by centrifuging for
10 seconds at 10,000 xg.
3. Prepare the following reagents in a 1.5 ml screw-cap tube and mix on ice
at all times:
•1X Linearization Buffer (1287 μl)
•Linearization 1 Enzyme (13 μl)
The total volume should be 1300 μl.
4. Mix by slowly pipetting up and down using a 1 ml tip.
5. Label the tube “Reagent #14” and set aside on ice until you are ready to
load it onto the Cluster Station.
Reagent #6: 1X Blocking Buffer
1. Thaw the 10X Blocking Buffer at room temperature.
2. Vortex briefly.
3. Collect the reagent to the bottom of the tube by centrifuging for
10 seconds at 10,000 xg.
4. In a 15 ml conical tube, dilute the 10X Blocking Buffer to a
1X concentration with Ultra Pure Water in the following volumes:
•Ultra Pure Water (4500 μl)
•10X Blocking Buffer (500 μl)
The total volume should be 5000 μl.
5. Label the tube “1X Blocking Buffer.”
6. Mix by pipetting up and down using a 5 ml pipette.
7. Transfer 2 ml of the 1X Blocking Buffer into a 2 ml screw-cap tube.
8. Label the tube “Reagent #6” and set aside until you are ready to load it
onto the Cluster Station.
Save the remaining 1X Blocking Buffer to prepare the Blocking Mix.
Reagent #8: Blocking Mix
1. Thaw the 2.5 mM ddNTP at room temperature.
2. Vortex briefly.
3. Collect the reagent to the bottom of the tube by centrifuging for
10 seconds at 10,000 xg.

Preparing Reagents for Read 1 Preparation on the Cluster Station 67
Paired-End Sequencing User Guide
4. Set aside on ice until you are ready to prepare the Blocking Mix.
5. Flick the Blocking Enzyme A and Blocking Enzyme B tubes gently.
6. Centrifuge the Blocking Enzyme A and Blocking Enzyme B tubes for
10 seconds at 10,000 xg.
7. Place the Blocking Enzyme A and Blocking Enzyme B tubes back on ice.
8. Prepare the following reagents in a 2 ml screw-cap tube and mix on ice at
all times:
•1X Blocking Buffer (1529 μl)
•2.5 mM ddNTP (67 μl)
•Blocking Enzyme A (20 μl)
•Blocking Enzyme B (84 μl)
The total volume should be 1700 μl.
9. Mix by slowly pipetting up and down using a 1 ml tip.
10. Label the tube “Reagent #8” and set aside on ice until you are ready to
load it onto the Cluster Station.
Reagent #7: Sequencing Primer Mix
1. Mix the following reagents in a 2 ml screw-cap tube:
•Hybridization Buffer (1313.4 μl)
•Rd 1 PE Seq Primer (6.6 μl)
The total volume should be 1320 μl.
2. Mix by pipetting up and down using a 1 ml tip.
3. Label the tube “Reagent #7” and set aside on ice until you are ready to
load it onto the Cluster Station.
Reagent #17: 0.1 N NaOH
1. The tube of 0.1 N NaOH supplied in the kit is ready to use as reagent
#17.
2. Label the tube “Reagent #17.”
Reagent #18: TE
1. The tube of TE supplied in the kit is ready to use as reagent #18.
2. Label the tube “Reagent #18.”
Reagent #10: Wash Buffer
1. Transfer 15 ml of Wash Buffer into a 50 ml tube.
2. Label the tube “Reagent #10.”
Reagent #12: Storage Buffer
1. Transfer 10 ml of Storage Buffer (5 x SSC) into a 50 ml tube.
2. Label the tube “Reagent #12.”
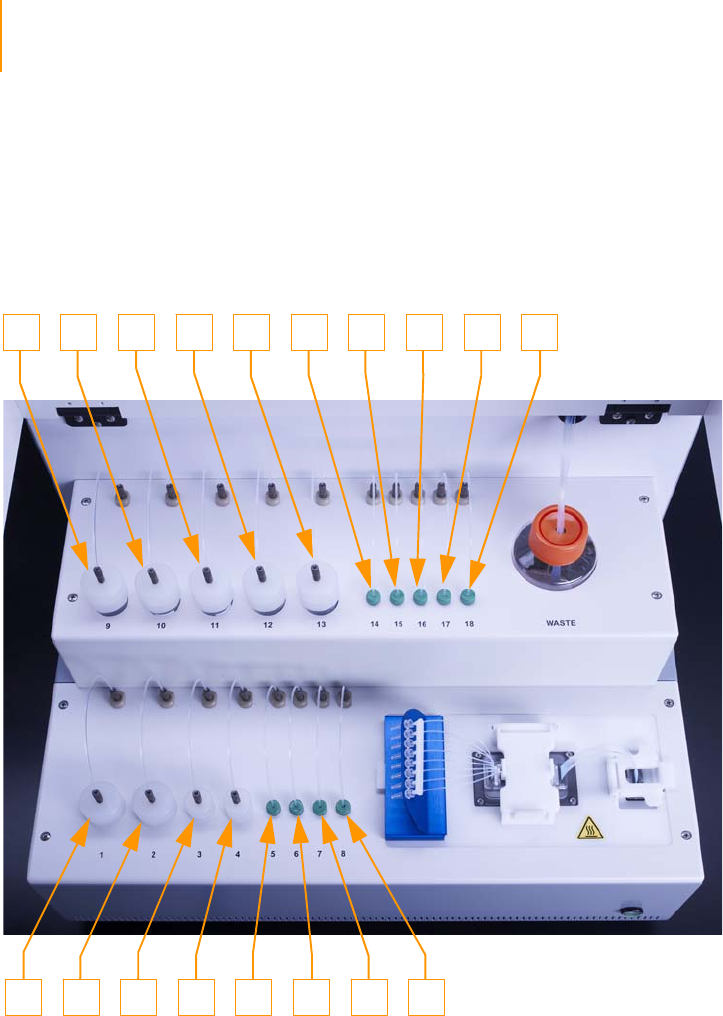
68 CHAPTER 3
Using the Cluster Station
Part # 1004571 Rev. A
Loading Reagents for Read 1 Preparation on the Cluster
Station
The following figure illustrates the reagent positions for Read 1 on the
Cluster Station. Some of the reagent positions differ from the positions you
would use for a standard run.
Figure 36 Reagent Positions on the Cluster Station (Read 1)
The following table lists the position each reagent occupies on the Cluster
Station, the initial volume of each reagent, and the expected volume after
Read 1.
910 1811 12 13 14 15 16 17
1 8765432

Loading Reagents for Read 1 Preparation on the Cluster Station 69
Paired-End Sequencing User Guide
Ta ble 1 0 Reagent Positions on the Cluster Station and Read 1 Preparation Volumes
Position Reagent Initial Volume Expected Volume After Read 1 Prep
1–5, 9, 11, 13, 15 Empty
6 1X Blocking Buffer 2000 μl 1046 μl
7 Sequencing Primer Mix 1320 μl 326 μl
8 Blocking Mix 1700 μl 146 μl
10 Wash Buffer 15,000 μl 12,414 μl
12 Storage Buffer 10,000 μl 7414 μl
14 Linearization 1 Mix 1300 μl 234 μl
16 1X Linearization Buffer 1300 μl 234 μl
17 0.1 N NaOH 1500 μl 434 μl
18 TE 1500 μl 434 μl

70 CHAPTER 3
Using the Cluster Station
Part # 1004571 Rev. A
Linearization, Blocking, and Primer Hybridization on the
Cluster Station
The software guides you through the steps for using and loading the
reagents on the Cluster Station.
1. Open the following recipe:
PE_2P_R1prep_Linearization_CombinedBlocking_PrimerHyb_v<#>.xml.
2. Click OK to proceed.
3. Follow the instructions on the screen:
“Wash lines for Read 1 linearization, blocking, and primer hybridization.
Please attach washing bridge and load water in positions 6, 7, 8, 10, 12,
14, 16, 17, and 18.”
If not already in place, attach the washing bridge and load water in the
positions requested.
4. Click OK to proceed.
The Cluster Station washes all the lines to be used for cluster
linearization, blocking, and primer hybridization.
The following message should appear: “Washing of lines finished.”
5. Click OK to proceed.
6. Follow the instructions on the screen:
“Start of Read 1 linearization, blocking, and primer hybridization
protocol. Please remove water from reagent positions 6, 7, 8, 10, 12, 14,
16, 17, and 18 for priming of air gap.”
7. Click OK to proceed.
The following message should appear:
“Air gap primed. Load reagents in positions 6, 7, 8, 10, 12, 14, 16, 17,
and 18.”
8. Click OK to proceed.
9. Follow the instructions on the screen:
“Please load flow cell and attach amplification manifold.”
Load the flow cell onto the thermal station and attach the amplification
manifold.
10. Click OK to proceed.
11. As the process starts, check for correct fluid flow through all eight lines of
the amplification manifold.
CAUTION
Do not linearize and block a paired-end flow cell until the
day of use.
Since the Blocking 2 enzyme exhibits some limited 3'–5'
exonuclease activity, storing the flow cell after blocking
could result in deblocking of the flow cell.
If you immediately hybridize the flow cell, the treatment of
NaOH during hybridization of the sequencing primer
denatures the enzyme.

Linearization, Blocking, and Primer Hybridization on the Cluster Station 71
Paired-End Sequencing User Guide
If the solution is not flowing in one or more lanes, readjust the
amplification manifold and repeat the test for regular flow in all lanes.
When the flow is regular in all lanes, proceed with the protocol.
The process can then be left to run unattended.
At the end of the process, the following message should appear:
“Flow cell is ready for sequencing on the Genome Analyzer.”
12. Disconnect the manifold at the inlet, select position 26, and pump 25 μl
of air to partially empty the inlet tubes.
13. Remove the flow cell from the Cluster Station.
The flow cell is ready to be sequenced on the Genome Analyzer.
14. Wash the lines used for linearization, blocking, and primer hybridization.
a. Fill reagent positions 6, 7, 8, 10, 12, 14, 16, 17, and 18 with water.
b. Connect the washing manifold.
CAUTION
Do not store the flow cell at this point for long periods of
time. It is not advisable for the flow cell to remain on the
Cluster Station for more than four hours. Sequencing must
be performed on the flow cell within four hours.
NOTE
A weekly DECON wash is required, using the recipe
DECON_Wash_All_Linesv3.0.xml.
The DECON solution consists of 5% DECON in water. All
lanes are washed once with DECON solution, followed by
two washes with water.
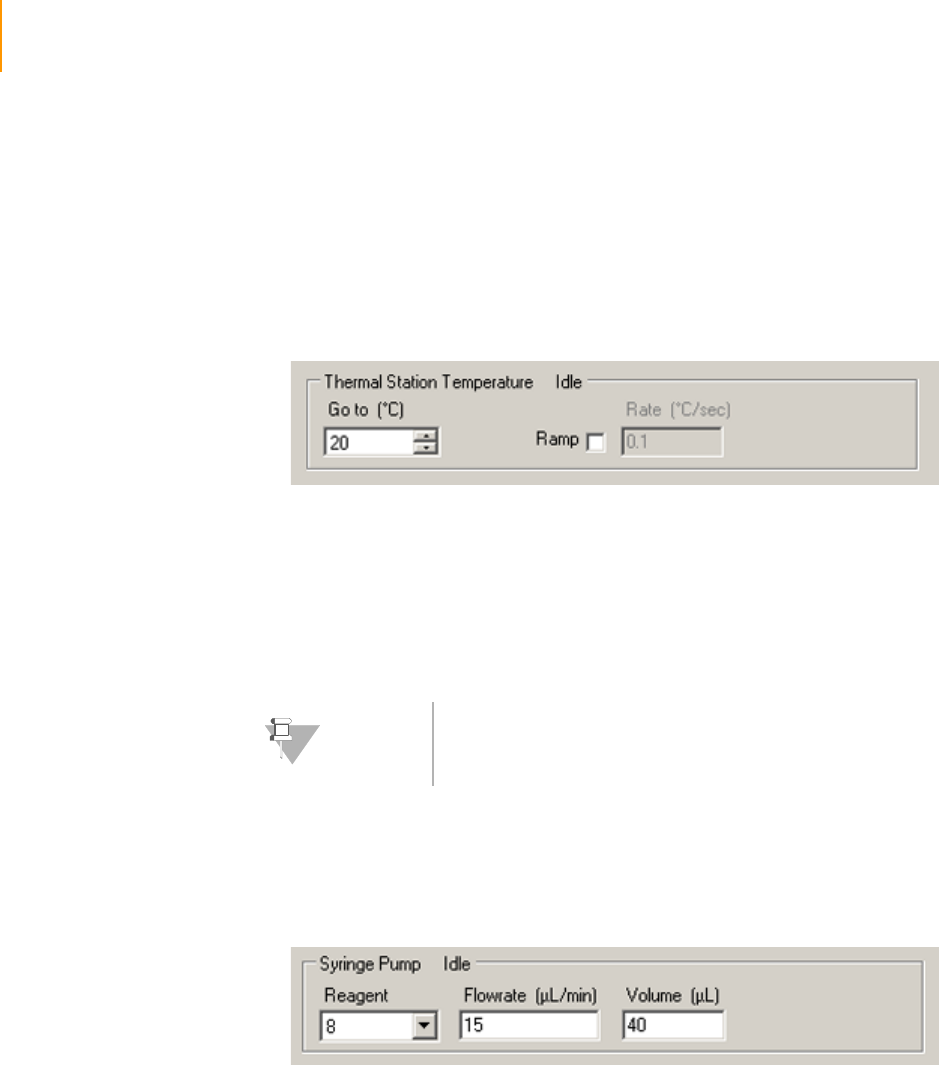
72 CHAPTER 3
Using the Cluster Station
Part # 1004571 Rev. A
Troubleshooting
The controls in the Manual Controls/Setup window in the Cluster Station
software are primarily used by Field Service for configuration or
troubleshooting.
Setting the
Thermal Station
Temperature
The Thermal Station Temperature panel allows you to manually control the
temperature of the thermal station.
Figure 37 Thermal Station Temperature
1. Enter the desired temperature (°C) in the Go To field.
2. If you want to ramp the temperature at a certain rate, select the Ramp
checkbox.
3. In the Rate field, enter the rate at which the temperature should increase
(positive number) or decrease (negative number).
4. Press Enter.
Pumping
Reagents
The Syringe Pump manual control pumps reagents through the flow cell or
washing bridge.
Figure 38 Syringe Pump
1. In the Syringe Pump field, select the reagent position.
Reagents 1–18 correspond to the reagent positions illustrated in Figure
39.
NOTE
The recommended rate for temperature change is 1 degree
per second.
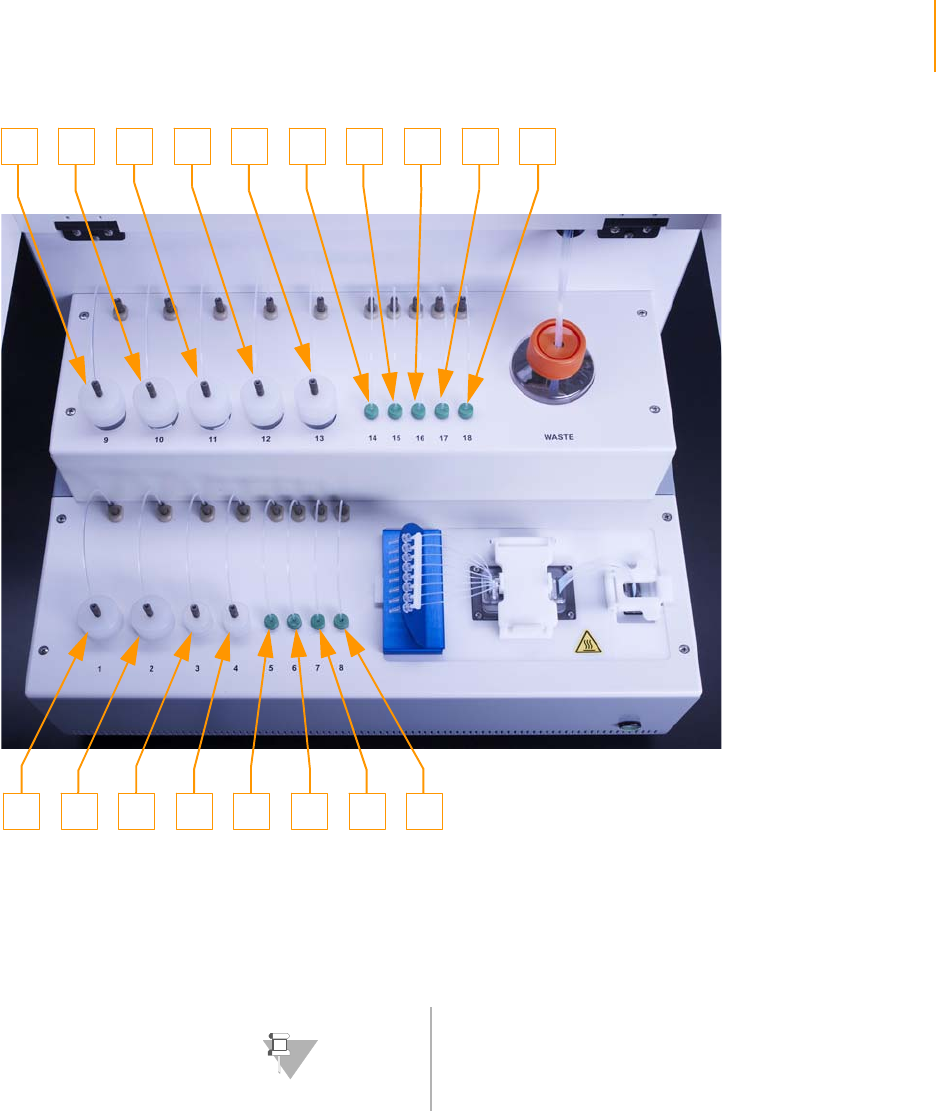
Troubleshooting 73
Paired-End Sequencing User Guide
Figure 39 Cluster Station Reagent Positions
Positions 19–26 are not connected to any reagent lines and can be used
to pump air into the system.
2. In the Flowrate field, type in the rate at which the reagents should be
pumped.
3. In the Volume field, type in the volume (μl) to be pumped.
4. With the cursor in the Volume field, press Enter.
910 1811 12 13 14 15 16 17
1 8765432
NOTE
The recommended flow rate for pumping through the
washing bridge is 240 μl/min.
The recommended rates for pumping through flow cells are
15–60 μl/min.
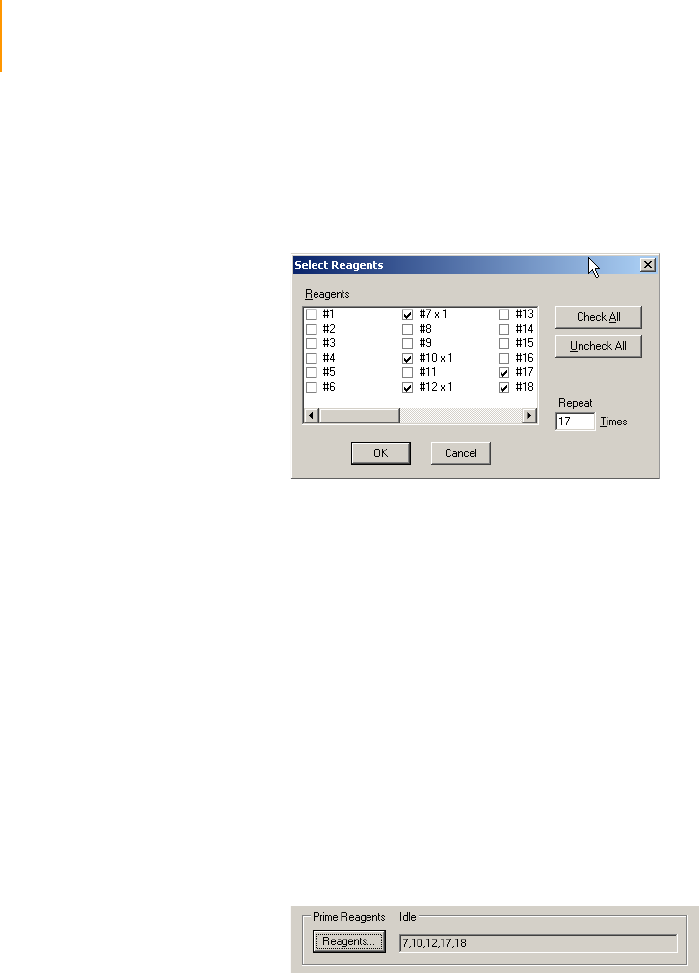
74 CHAPTER 3
Using the Cluster Station
Part # 1004571 Rev. A
Priming
Reagents to
Waste
The Prime Reagents manual control allows you to prime reagents directly to
waste, bypassing the flow cell.
1. In the Prime Reagents panel, click Reagents.
The Select Reagents dialog box appears.
Figure 40 Select Reagents
2. In the Repeat field, enter the number of times to prime the lines. Each
firing of the priming pump pumps 20 μl of fluid.
For reagent positions 5–8, 13 primes are needed to fill the reagent lines
up to the 26-way valve inside the Cluster Station.
For all other reagent positions, 17 primes are needed to fill the reagent
lines.
3. Select the checkbox beside each reagent position that you want to
prime. Click Check All if you want to prime all reagent positions.
4. If you click Check All, clear the checkboxes beside positions 19–26.
These ports are currently not connected to any reagent lines.
5. Click OK.
6. Press Enter.
The Prime Reagents panel lists all the positions it is priming.
Figure 41 Lines Primed
Unclogging the
Flow Cell
If the flow cell is blocked while priming with reagents, perform the following
steps:
1. Remove the flow cell.
2. Put the flow cell back into the buffer.
3. Flick out any liquid from the manifold.
4. Reassemble as described in Positioning the Flow Cell on page 61.
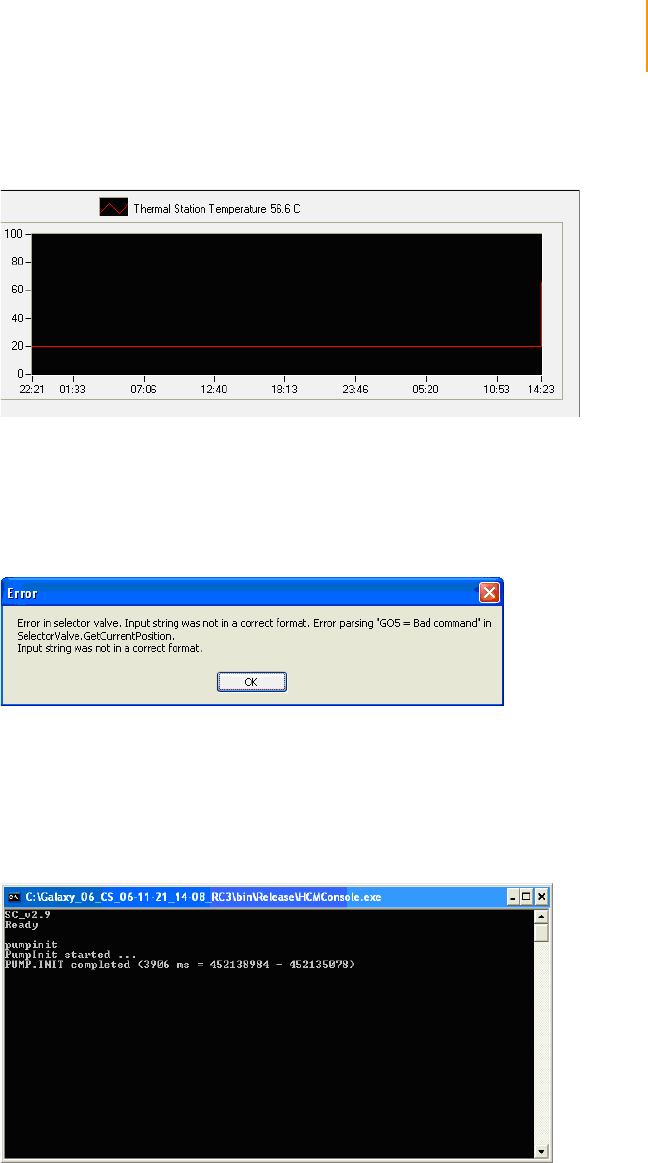
Troubleshooting 75
Paired-End Sequencing User Guide
Temperature
Profile
The Temperature Profile window shows the temperature from the start of the
run to the time the protocol stops.
Figure 42 Temperature Profile
Software Errors Selector Valve Error
If the Cluster Station power is turned off while a protocol is running, then you
might see the following error message when you restart the instrument:
Figure 43 Selector Valve Error Message
To fix the problem:
1. Open the <install directory>\bin\release folder and double-click
HCMConsole.exe.
2. Type pumpinit at the command prompt.
Figure 44 Pumpinit Command
3. Wait for the initialization to finish, and then close the command window.
4. Start the Cluster Station software.
5. Open a recipe and click Start.
6. If the message appears again, turn the Cluster Station and PC off and
then on again. Repeat the pumpinit command.
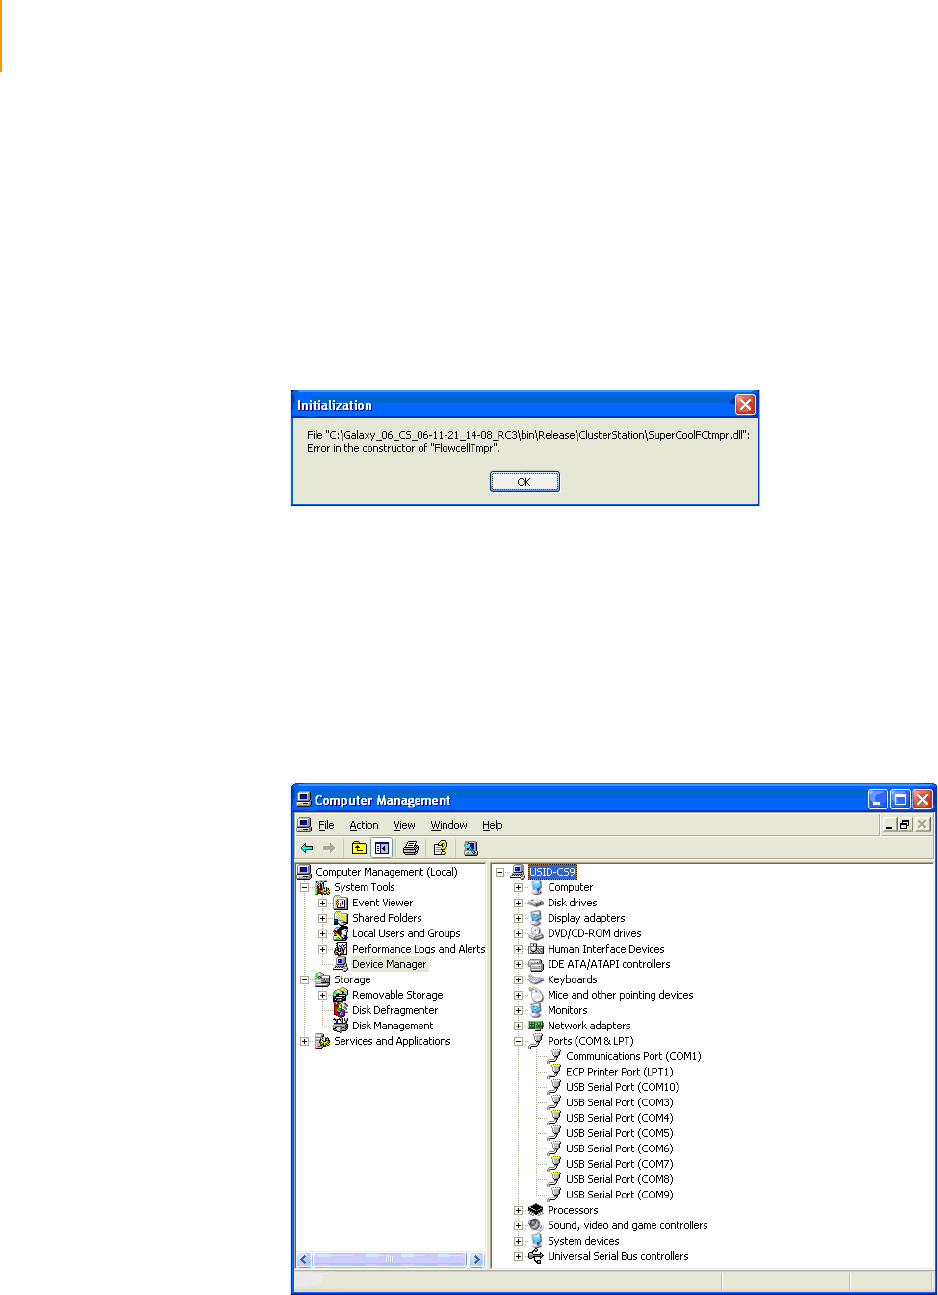
76 CHAPTER 3
Using the Cluster Station
Part # 1004571 Rev. A
7. If the message appears yet again, contact Illumina Technical Support.
FlowcellTmpr Error
You might see the FlowcellTmpr Error message if any of the following occur:
`You open RCM.exe when the Cluster Station is turned off or before
establishing communication with Perle/Edgeport USB/COM box
`You open RCM.exe while the HCMConsole.exe is running
`You accidentally launch two instances of RCM.exe. It is possible for the
software to take up to 2 minutes to launch.
Figure 45 Flowcell Tmpr Error Message
To fix the problem:
1. Turn the Cluster Station on and launch RCM.exe again.
2. If the error persists, take the following actions:
a. Right click My Computer and select Manage.
b. Expand the System Tools list and click Device Manager.
c. Expand the Ports (COM & LPT) entry and check to see if COM ports
have been assigned to the Perle/Edgeport box. If no COM ports are
assigned, then only COM1 will appear.
Figure 46 COM Port Settings in Device Manager
d. Check the USB cable connections.

Troubleshooting 77
Paired-End Sequencing User Guide
e. Turn the Cluster Station and PC off and then on again, and recheck
the COM ports.
f. Launch RCM.exe again.
3. If the message appears again, contact Illumina Technical Support.

78 CHAPTER 3
Using the Cluster Station
Part # 1004571 Rev. A

Paired-End Sequencing User Guide 79
Chapter 4
Using the Genome Analyzer
Topics
81 Introduction
82 Workflow
84 Components
85 Reagent Compartment
86 Imaging Compartment
88 Starting the Genome Analyzer
91 Software User Interface
91 Run and Manual Control/Setup Windows
91 Recipe and Image Cycle Tabs
92 Temperature and Analysis Viewer Tabs
93 Image Controls
94 Pump Control
95 Basic Procedures
95 Washing the Lines
97 Resuming Use after Storage
97 Unloading a Flow Cell
99 SBS Sequencing Kit v2 Contents
101 Prepare Reagents for Read 1 on the Genome Analyzer
104 Installing the Bottle Adaptors
105 Performing a Pre-Run Wash
107 Loading and Priming Reagents
107 Loading Reagents
108 Priming Reagents
110 Cleaning and Installing the Prism
110 Handling the Prism

80 CHAPTER 4
Using the Genome Analyzer
Part # 1004571 Rev. A
110 Removing the Flow Cell and Prism
111 Cleaning the Prism
112 Installing the Prism
113 Cleaning and Installing the Flow Cell
113 Cleaning the Flow Cell
114 Entering the Flow Cell ID
114 Loading the Flow Cell
117 Checking for Leaks and Proper Reagent Delivery
119 Applying Oil
121 Performing First-Base Incorporation
123 Loading the Flow Cell with Scan Mix
124 Adjusting Focus
124 Default XYZ Coordinates
124 Manual Controls
126 Adjusting the X Axis
131 Adjusting the Y Axis
131 Setting XY Drift
133 Confirming the Footprint
133 Adjusting the Z Axis
136 Checking Quality Metrics
136 Performing Autofocus Calibration
137 Viewing Data in Run Browser
138 Checking Quality Metrics in IPAR
139 Completing Read 1
140 Data Transfer for Paired-End Runs
141 Preparing Reagents for Read 2 Preparation on the Paired-End Module
146 Reagent Positions on the Paired-End Module
148 Preparing for Read 2 on the Paired-End Module
149 Preparing Reagents for Read 2 on the Genome Analyzer
152 Sequencing Read 2
155 Performing Post-Run Procedures
155 Post-Run Wash
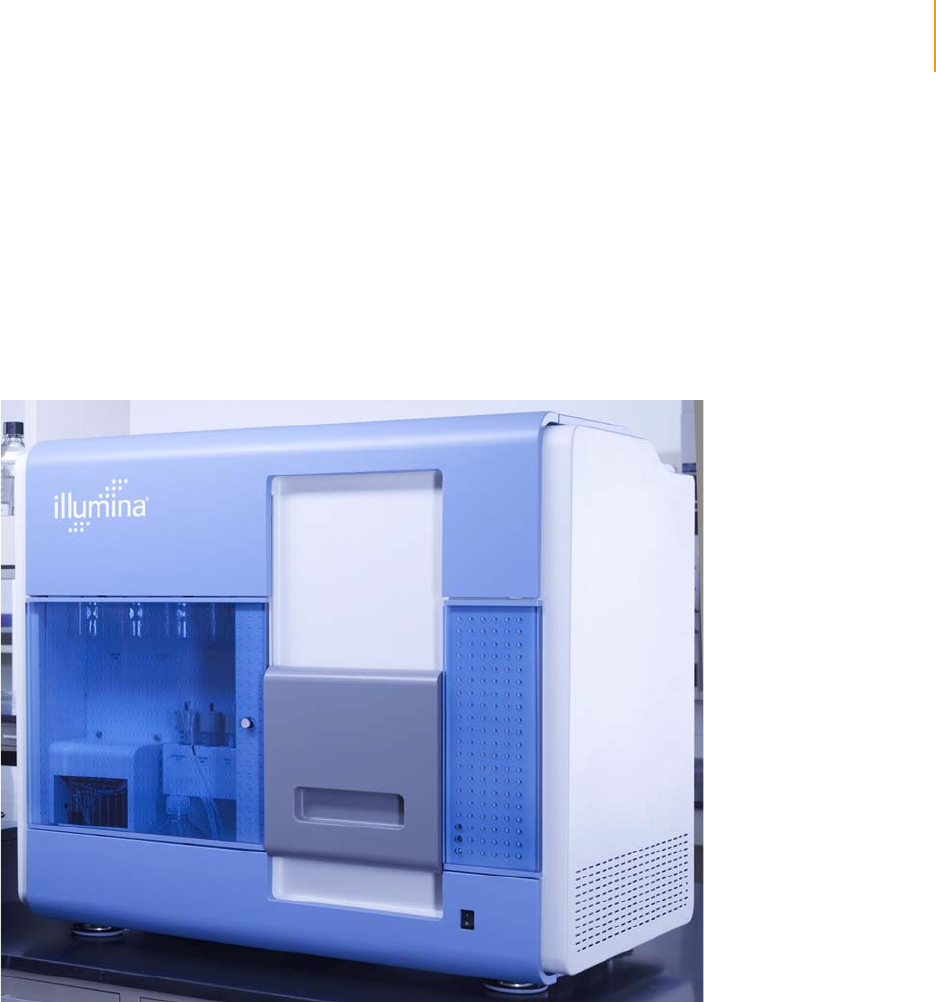
Introduction 81
Paired-End Sequencing User Guide
Introduction
The Genome Analyzer sequences clustered template DNA using a robust
four-color DNA Sequencing-By-Synthesis (SBS) technology that employs
reversible terminators with removable fluorescence. This approach provides
a high degree of sequencing accuracy even through homopolymeric regions.
High sensitivity fluorescence detection is achieved using laser excitation and
total internal reflection optics. Short sequence reads are aligned against a
reference genome and genetic differences are called using a specially
developed data pipeline.
Figure 47 Genome Analyzer
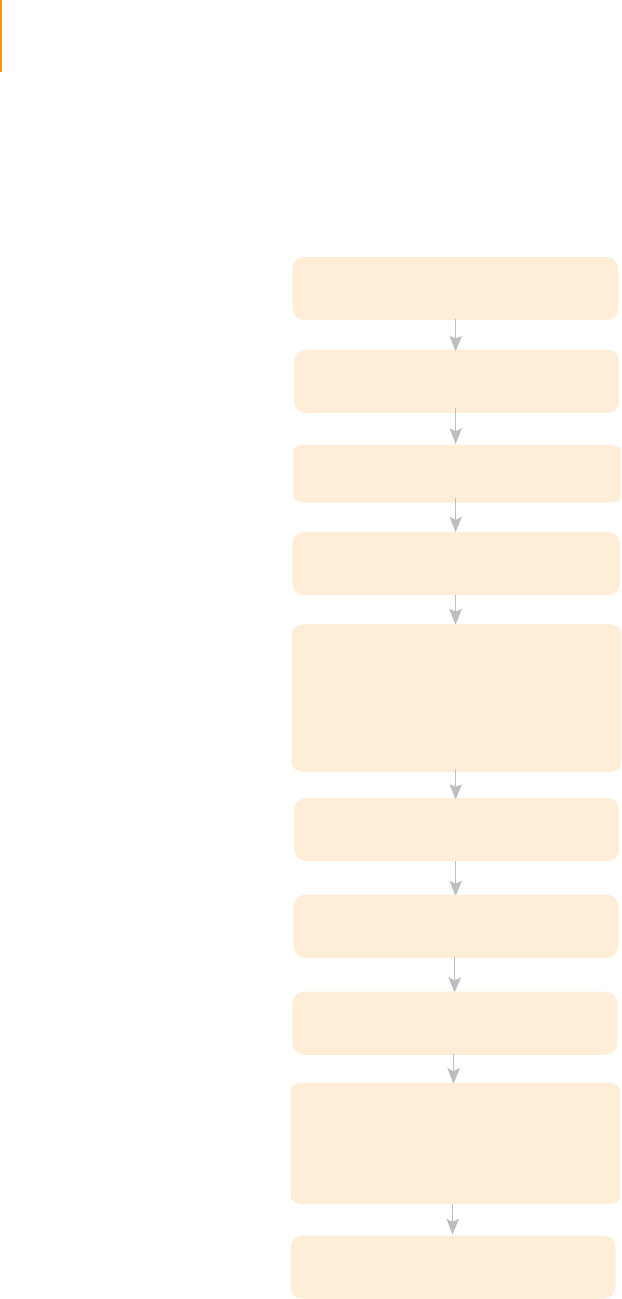
82 CHAPTER 4
Using the Genome Analyzer
Part # 1004571 Rev. A
Workflow
The following figure illustrates the workflow on the Genome Analyzer, and
the reagents and components used in each step.
Figure 48 Paired-End Workflow on the Genome Analyzer
PW1
125 ml Bottles (4)
50 ml Tubes (3)
IMX
CMX
SMX
PR1
PR2
PR3
IMX
FFN
SDP
CMX
SMX
IMX
CMX
SMX
PR1
PR2
PR3
Flow Cell
Prism
IMX
CMX
SMX
PR1
PR2
PR3
Oil
PW1
125 ml Bottles (4)
50 ml Tubes (3)
Pre-Run Instrument Wash
Prepare and Load Reagents
for Read 1
Prime Reagents
Clean and Install Prism and Flow Cell
First Base Incorporation
Apply Oil
Adjust Focus
Check Quality Metrics
Completing the Run
Post-Run Instrument Wash
Sequencing Read 1
Sequencing Read 2
Prepare and Load Reagents
on the Paired-End Module
Data Transfer
Read 2 Preparation
Prepare and Load Reagents
for Read 2
First Base Incorporation
Adjust Focus
Check Quality Metrics
Completing the Run
IMX
FFN
SDP
CMX
SMX
IMX
CMX
SMX
PR1
PR2
PR3
Read 2 Preparation Reagents
provided in the Paired-End
Cluster Generation Kit
(Boxes 2 and 4)

Workflow 83
Paired-End Sequencing User Guide
Procedures To perform a paired-end sequencing run, follow all of these procedures in the
order shown.
1. Starting the Genome Analyzer on page 88
2. Performing a Pre-Run Wash on page 105
3. Prepare Reagents for Read 1 on the Genome Analyzer on page 101
4. SBS Sequencing Kit v2 Contents on page 99
5. Loading and Priming Reagents on page 107
6. Cleaning and Installing the Prism on page 110
7. Cleaning and Installing the Flow Cell on page 113
8. Checking for Leaks and Proper Reagent Delivery on page 117
9. Applying Oil on page 119
10. Performing First-Base Incorporation on page 121
11. Loading the Flow Cell with Scan Mix on page 123
12. Adjusting Focus on page 124
13. Checking Quality Metrics on page 136
14. Completing Read 1 on page 139
15. Data Transfer for Paired-End Runs on page 140
16. Preparing Reagents for Read 2 Preparation on the Paired-End Module on
page 141
17. Preparing for Read 2 on the Paired-End Module on page 148
18. Preparing Reagents for Read 2 on the Genome Analyzer on page 149
19. Sequencing Read 2 on page 152
20. Performing Post-Run Procedures on page 155
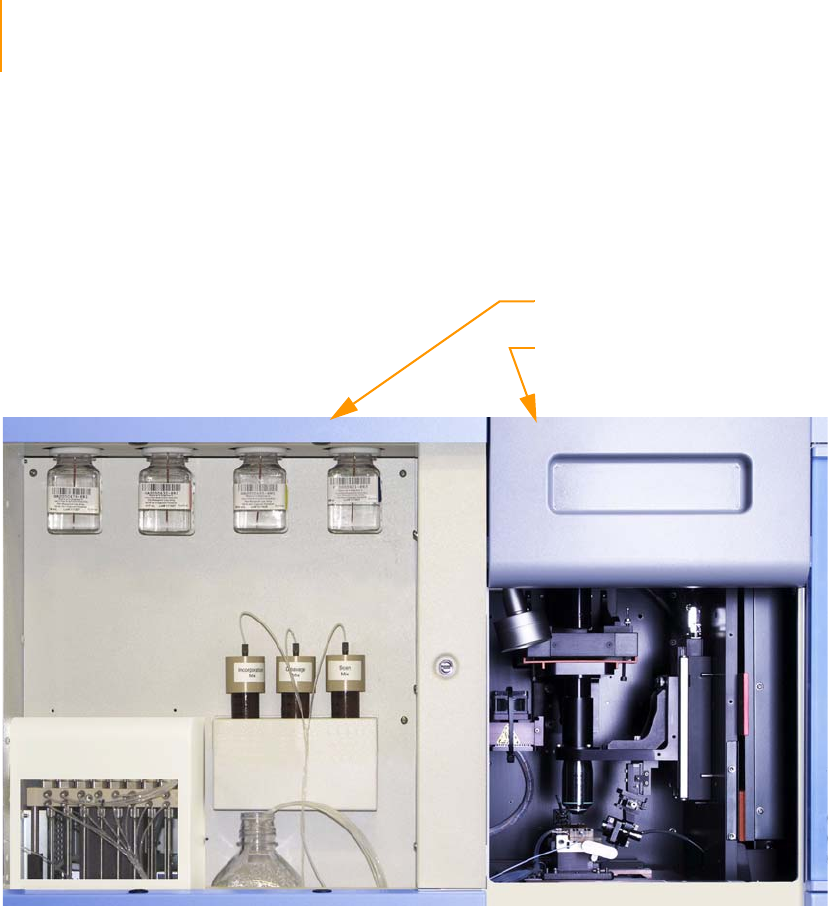
84 CHAPTER 4
Using the Genome Analyzer
Part # 1004571 Rev. A
Components
All operator activity on the instrument occurs in two main compartments:
`Reagent Compartment
`Imaging Compartment
Figure 49 Genome Analyzer Main Compartments
Reagent Compartment
Imaging Compartment

Components 85
Paired-End Sequencing User Guide
Reagent
Compartment
The left-side reagent compartment holds active reagents, buffers, wash
solutions, and the liquid waste container. The waste bottle receives liquid
waste from the fluidics pump.
Figure 50 Genome Analyzer Reagent Compartment
Each reagent is numbered according to the position it connects to on the
fluidic valve. The 125 ml reagent bottles are connected to threaded bottle
receptacles on the instrument. The 50 ml tube caps are threaded onto
reagent mix tubes before placing the capped tube into the instrument cooler.
Figure 51 Reagent Positions
Waste Bottle
Fluidics Pump
PR3
PW1
PR1
PR2
IMX
CMX
SMX
4 5 2 7 1 6 3
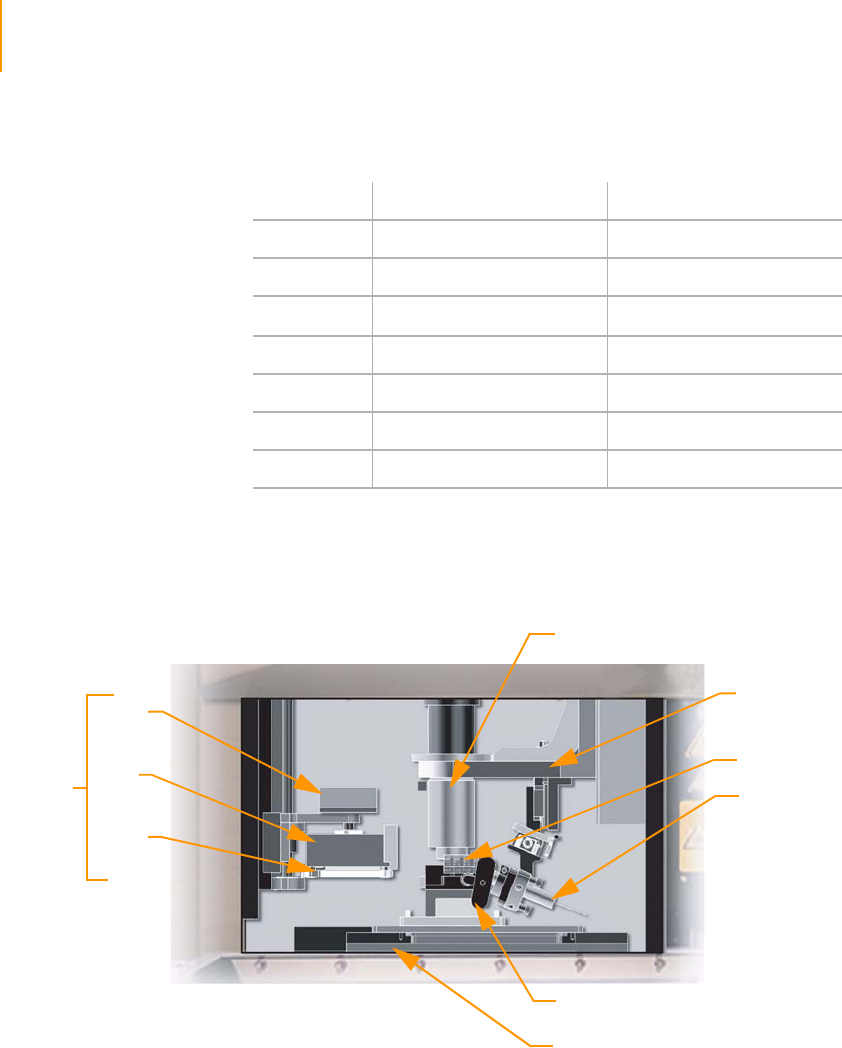
86 CHAPTER 4
Using the Genome Analyzer
Part # 1004571 Rev. A
Imaging
Compartment
The right-side compartment houses the Imaging Station, Thermal Station,
Flow Cell Stage, Fiber Optics Mount, and Manifold.
Figure 52 Genome Analyzer Imaging Compartment
The flow cell stage moves along the X (left-right) and Y (front-back) axes.
The Thermal Station and the Imaging Station (Z-Stage) move along the Z
axis.
Ta ble 1 1 Genome Analyzer Reagent Names
Solution # Reagent Name Reagent
1 IMX Incorporation Mix
2 PW1 Deionized Water
3SMX Scan Mix
4 PR1 High Salt Buffer
5 PR2 Incorporation Buffer
6 CMX Cleavage Mix
7PR3 Cleavage Buffer
Objective
Imaging Station
(Z-Stage)
Manifold
Fiber Optics
Mount
Peltier
Heater
Heat
Sink
Peltier
Fan
Thermal
Station
Manifold Lever
Flow Cell Stage
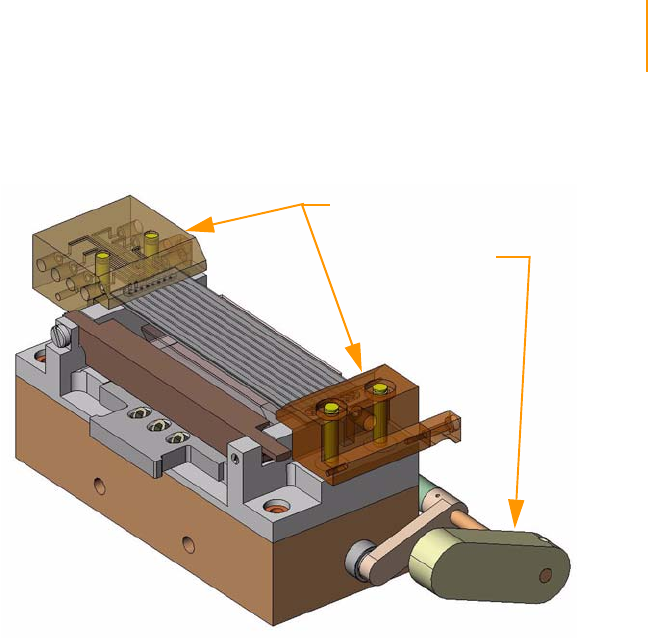
Components 87
Paired-End Sequencing User Guide
The flow cell is clamped under front and rear plumbing manifolds onto a
stage that moves between Thermal and Imaging stations.
Figure 53 Front and Rear Plumbing Manifolds
Manifolds
Manifold Handle

88 CHAPTER 4
Using the Genome Analyzer
Part # 1004571 Rev. A
Starting the Genome Analyzer
It is best to leave the Genome Analyzer on at all times. Turn it off only if it will
remain idle for more than three days. However, you should restart the SCS
software before each run to ensure that the software is properly initialized.
1. Turn the main switch to the ON position.
After a short delay the instrument emits a regular buzzing sound from the
top-right-rear region of the chassis. The sound is a normal by-product of
a stable instrument initialization.
2. Restart the computer and log on to the operating system using the
default values:
Username: sbsuser
Password: sbs123
If the default values do not work, consult your IT personnel to find out
the correct user name and password for your site.
3. Delete the data from all previous runs to ensure adequate disk space
(approximately 1 TB per run). If deleting the large files is excessively time
consuming, perform a quick reformat of the data drive, as follows:
a. Right-click My Computer and select Manage.
b. In the tree on the left side of the screen, select Storage | Disk
Management.
c. Right-click D Partition and select Format.
d. Select the Perform a Quick Format checkbox. Leave all other
parameters at the default values.
e. Click OK.
4. Create a new Run folder on the D partition to hold the run data (if not
automatically created). For more information, see Appendix A, Run
Folders.
5. Double-click the Illumina Genome Analyzer Data Collection Software
icon on the desktop.
6. The home window for the Genome Analyzer software appears.
CAUTION
The Genome Analyzer II is set up to run 1.4 mm flow cells.
Although it is possible to run 1.0 mm flow cells this requires
a configuration change to the instrument that can only be
done by a Technical Support representative (for contact
information, see Technical Assistance on page 4).
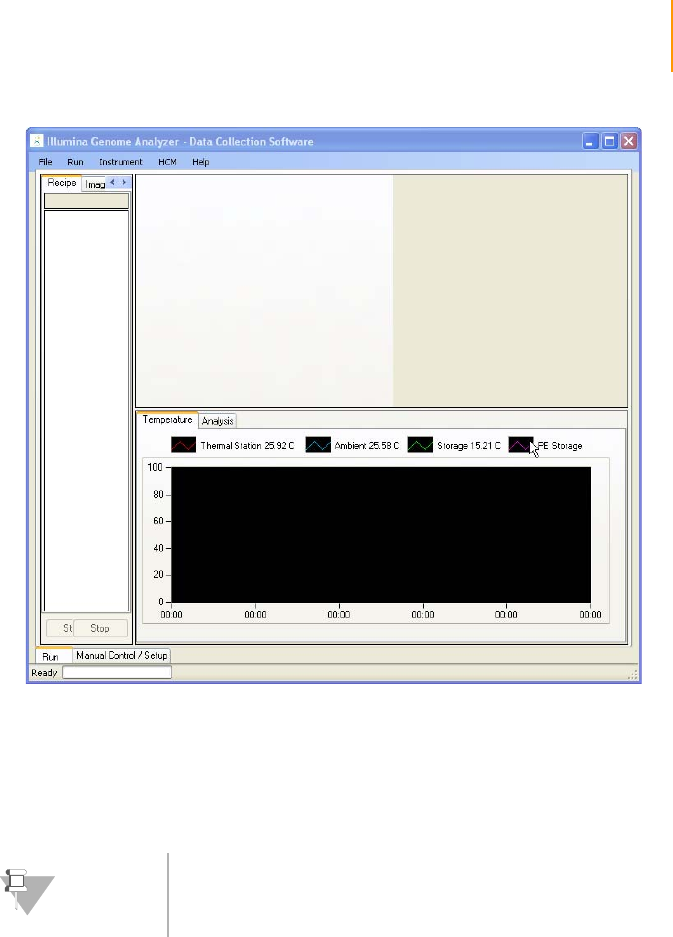
Starting the Genome Analyzer 89
Paired-End Sequencing User Guide
Figure 54 Genome Analyzer Software Screen
7. Click the Manual Control/Setup tab. Perform any operation (e.g., click
Take a Picture) to trigger the Genome Analyzer initialization. A green bar
at the bottom-left of the screen shows the progress of the initialization
routine.
Starting IPAR 1. Make sure the IPAR uninterruptible power supply (UPS) switch is in the
ON position.
2. Turn the IPAR server power switch to the ON position.
Before proceeding to the next step, wait until the IPAR server has fully
started. This could take up to three minutes.
3. Log on to the IPAR server:
a. Open the remote desktop application on the instrument computer
by selecting START | All Programs | Accessories | Remote Desktop
Connection from the task bar.
b. Connect to 192.168.137.20.
c. Log on using the default values:
Username: sbsuser
Password: sbs123
NOTE
The software ignores inputs until the routine is
complete.

90 CHAPTER 4
Using the Genome Analyzer
Part # 1004571 Rev. A
Network Copy Images, log files, and other run files are copied automatically from the local
drive to a network location while the run is proceeding. This saves a
considerable amount of time transferring data upon completion of a run. For
an explanation of this feature, or to change the network copy configuration,
see Network Copy Options on page 190.
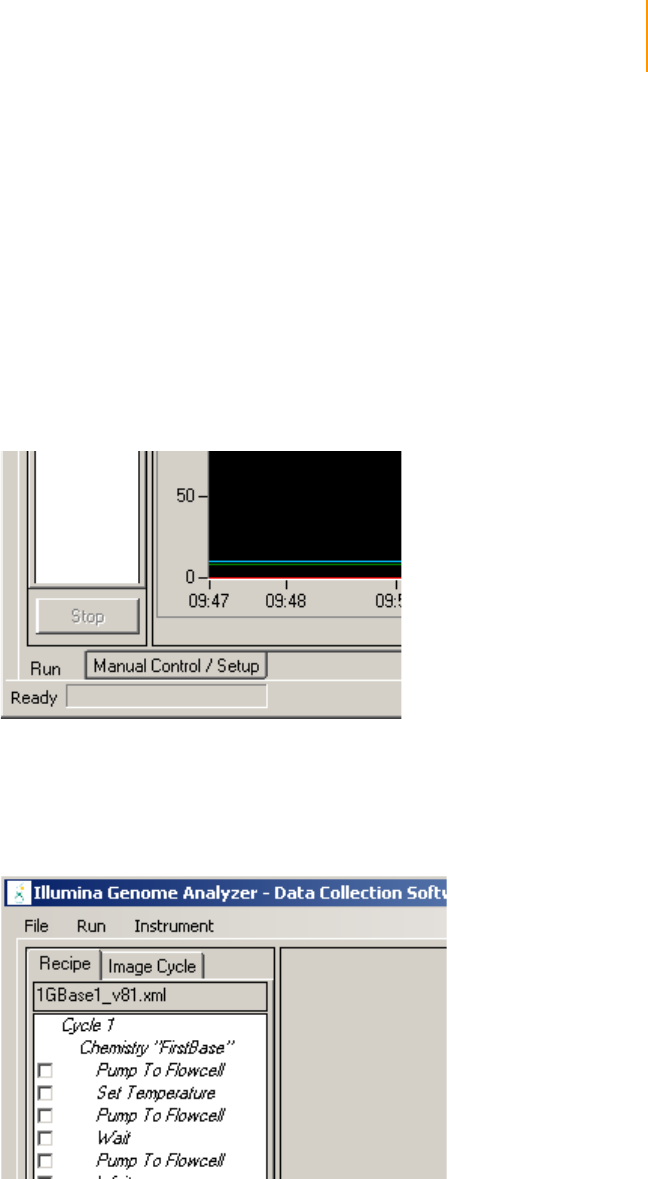
Software User Interface 91
Paired-End Sequencing User Guide
Software User Interface
This section describes the main windows, views, and controls of the Genome
Analyzer software interface.
Run and Manual
Control/Setup
Windows
The Genome Analyzer software has two main windows, the Run window and
the Manual Control/Setup window. Menu commands that are available in one
window may not be available in the other.
The software opens to the Run window.
The tabs for toggling between the Run window and the Manual Control
window are in the bottom-left corner of the screen.
Figure 55 Run and Manual Control/Setup Windows
Recipe and
Image Cycle
Tabs
Two tab views are available in the left column of the Run window. By default,
the Recipe tab is in view.
The Recipe tab lets you control and monitor recipes.
Figure 56 Recipe Tab
The Image Cycle tab lets you view the progress of the scanning run. The
column on the left side shows the entire flow cell, using color codes for each
tile:
`Blue tiles have been imaged.
`White tiles are queued for imaging.
`Gray tiles are not defined in the current run.
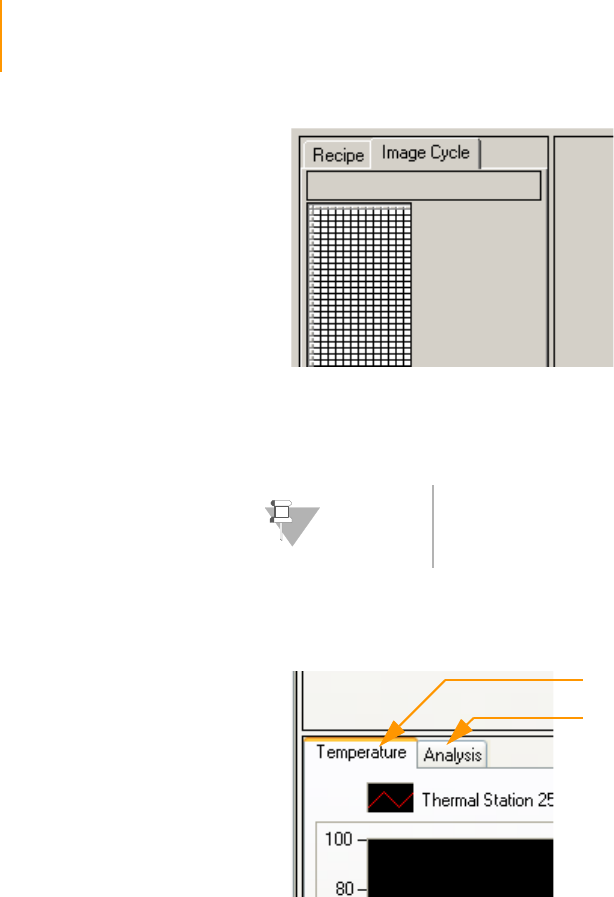
92 CHAPTER 4
Using the Genome Analyzer
Part # 1004571 Rev. A
Figure 57 Image Cycle Tab
The right side of the window shows the photographs being taken of the
current tile.
Temperature and
Analysis Viewer
Tabs
Two tab views are available at the bottom of the Run window (Figure 58). By
default, the Temperature tab is in view.
Figure 58 Temperature and Analysis Viewer Tabs
The Temperature tab lets you monitor various run temperatures.
The Analysis Viewer tab brings up the Analysis Viewer, a part of Integrated
Primary Analysis and Reporting (IPAR). The Analysis Viewer displays key
quality metrics in real time, so you can quickly decide whether or not to
complete the run. To learn about IPAR and the Analysis Viewer, see Chapter
6, Integrated Primary Analysis and Reporting.
NOTE
The Genome Analyzer GUI has to be maximized to display
all the tiles correctly.
Analysis Viewer Tab
Temperature Tab

Software User Interface 93
Paired-End Sequencing User Guide
Image Controls The Genome Analyzer software provides various tools for adjusting the
image and discovering information.
The image display uses 8 bits of data to display color, while the TIFF files that
are saved contain 16-bit color images. The Show False Color and Auto Scale
options provide methods for simulating the larger dynamic range on the
computer monitor.
Table 1 2 Genome Analyzer Image Controls
Adjustment Action
Zoom in Click and drag a rectangle over the area you want to see.
Move the zoomed image Right-click and select Center Here. The display adjusts so that the area you
clicked on is at the center.
Zoom out Right-click over the image and select Zoom Out to zoom out one level.
Right-click over the image and select Zoom Out All to zoom out all the way.
Modify the color display Right-click over the image and select Show | Color or Show | False Color.
Show Color displays the laser light colors used to acquire the image: blue for
the focus tracking images, and red (A/C) or green (G/T) for the intensity values.
Show False Color lets you customize the color contrast so that it is easier to see
peak intensities. Select from:
•None
•Blue-Green
•Green-Blue
•Blue-Red
•Red-Blue
•Red-Green
•Green-Red
When you select a two-color option, the Genome Analyzer Software uses the
upper 8 bits of the Tiff 16-color range for one color (e.g., blue), and the lower 8
bits for the other color (e.g., green).
View or hide the center mark Right-click over the image and select Show | Center Mark to toggle the display
of the center mark, which indicates the current X and Y values of the stage.
See intensity values Roll the mouse over a point of raised intensity to display the pixel position and
intensity value.
Scale the intensity values Right-click over the image and select Auto Scale | On or Auto Scale | Off.
When auto scaling is on, the minimum intensity value is mapped to 0 and the
maximum intensity value is mapped to 255.
When auto scaling is off, the system maps the 12-bit range to an intensity range
that you define in RCMConfig.xml. All data intensity values at or below the
minimum are mapped to 0 and all values at or above the maximum are mapped
to 255. Generally, this mapping is a linear function.
See focus quality and uniformity Hover the mouse to any area over the tile image in order to display the focal
quality and uniformity.
Show region of interest Right-click over the image and select Show | ROI to show the region of interest
(ROI), which is the area that is saved during the sequencing runs. The ROI is
indicated by the dotted lines on the display, and this feature allows you to check
for good agreement of the ROI edge and lane edge.
Save the image Right-click on the image and select Save As to save the image as a TIFF file.
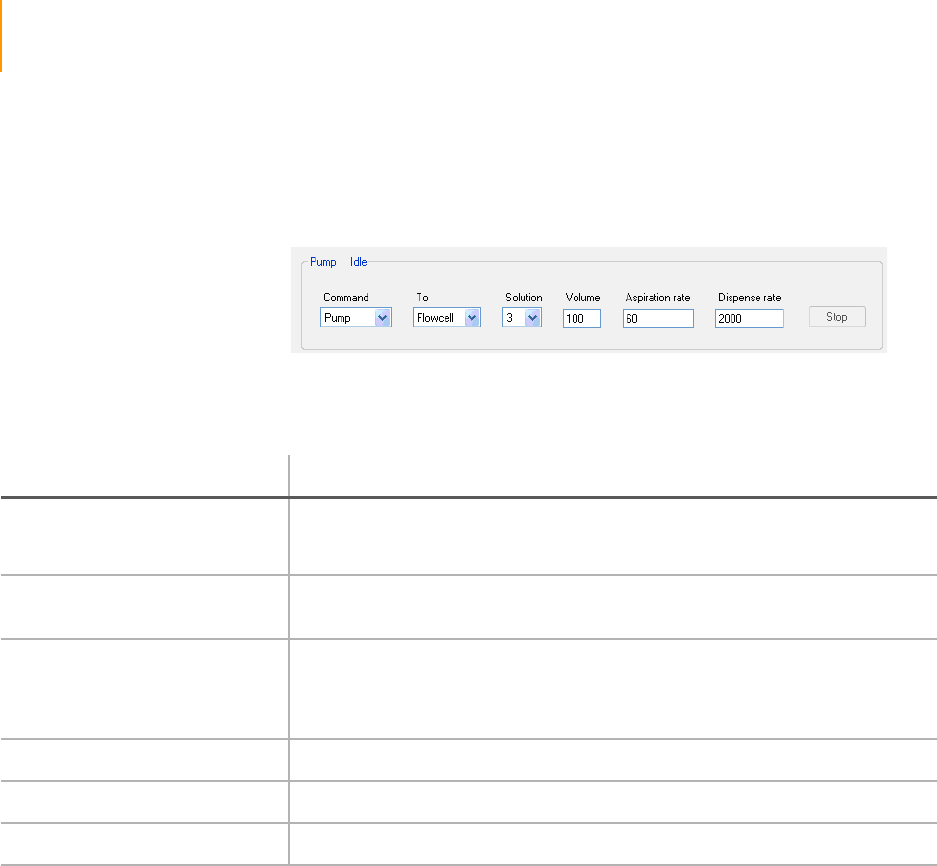
94 CHAPTER 4
Using the Genome Analyzer
Part # 1004571 Rev. A
Pump Control Some setup and maintenance protocols require you to set the pump control
parameters.
Figure 59 Pump Control Area
The Pump Control contains an additional tab for the manual operation of the
Paired-End Module.
Ta ble 1 3 Pump Controls
Control Description
Command Pump—Transfers liquid from the port indicated in the Solution field to the
location indicated in the To field. This command is used in many procedures,
such as washes.
To Flow Cell—Directs the liquid through the flow cell.
The Waste option is not used.
Solution The port from which the instrument will draw liquid.
Note: Solution 28 is currently air, rather than a liquid. You will select this position
when you remove flow cells from the system, so that fluid does not siphon down
the lines.
Volume The volume to be transferred in a single pump event, in microliters.
Aspiration rate The rate at which liquid is removed from the source, in microliters/minute.
Dispense rate The rate at which liquid is placed into the target location, in microliters/minute.

Basic Procedures 95
Paired-End Sequencing User Guide
Basic Procedures
Washing the
Lines
It is important to regularly wash the lines of the Genome Analyzer. There are
several types of washes:
`Performing a Pre-Run Wash on page 105
`Monthly Maintenance and Storage Wash on page 95
`Post-Run Wash on page 155
Monthly Maintenance and Storage Wash
The Maintenance Wash has two parts: the 1 ml water wash and the 4 ml
NaOH wash. Perform the Maintenance Wash once monthly for maintenance,
and any time you plan to leave the Genome Analyzer sitting idle for more
than three days. The monthly wash uses the same instrument cycle as the
pre-run wash, but uses a stronger base (1 N NaOH) and filtered cleaning
liquids.
Perform the storage wash if you plan to store the Genome Analyzer for more
than three days.
Consumables Illumina-Supplied
`PW1 (Wash Solution)
User-Supplied
`Lens cleaning tissue
`Nylon filter (0.2 μm pore size)
`MilliQ water for washing the Paired-End Module
`1 N NaOH (0.5 L, filtered with a 0.2 μm nylon filter)
`125 ml Nalgene bottles (4) for PW1 wash solution
(ThermoFisher Scientific, catalog # 2019-0125)
`50 ml conical tubes (3) for PW1 wash solution
Maintenance
Wash
The Maintenance Wash should be performed once a month to wash the
Genome Analyzer and Paired-End Module. The wash cycle runs for
approximately 1 hour and 24 minutes.
1. Load a used flow cell as follows:
a. Click the Manual Control/Setup tab.
b. Click Load Flow Cell.
c. Clean a used flow cell with deionized water, and then dry it with a
lens-cleaning tissue.
d. Loading the Flow Cell on page 113Load the clean, dry flow cell as
stated in the Loading the Flow Cell on page 114.
NOTE
When the manifolds are raised for the first time, place the
fluidics on standby by performing steps 5 and 6 of
Unloading a Flow Cell on page 97.

96 CHAPTER 4
Using the Genome Analyzer
Part # 1004571 Rev. A
2. Select File | Open Recipe.
3. Open the GA2-PEM_MaintenanceWash_v<#>.xml recipe.
The following prompt appears: “Please Load Wash Solutions onto the
Genome Analyzer and Water onto the Paired-End Module. Press OK to
Start Prewash.”
4. Load the Genome Analyzer with PW1 wash solution as follows:
10 ml for positions 1, 6, and 3
40 ml for port positions 4, 5, 2, and 7
5. Load the Paired-End Module with 15 ml tubes containing 10 ml of MilliQ
water on positions 9–21.
6. Click OK to start the prewash.
When the prewash is complete, the following prompt appears: “Prewash
Completed. Please Load 1N NaOH onto the Genome Analyzer and the
Paired-End Module. Press OK to Start 1N NaOH Wash.”
7. Load the Genome Analyzer with filtered 1 N NaOH as follows:
25 ml for positions 1, 6, and 3
50 ml for port positions 4, 5, 2, and 7
8. Load the Paired-End Module with 15 ml tubes containing 10 ml of
filtered 1 N NaOH on positions 9–21.
9. Click OK to start the NaOH wash.
After the NaOH wash is complete, the following prompt appears:
“NaOH Wash Completed. Please Load Wash Solutions onto the Genome
Analyzer and Water onto the Paired-End Module. Press OK to Start Post-
wash.”
10. Load the Genome Analyzer with PW1 wash solution as follows:
15 ml for positions 1, 6, and 3
50 ml for port positions 4, 5, 2, and 7
11. Load the Paired-End Module with 15 ml tubes containing 15 ml of MilliQ
water on positions 9–21.
12. Click OK to start the post-wash.
When the post-wash is complete, the following prompt appears:
“Monthly Maintenance and Storage Wash Completed.”
Storage Wash If you plan to leave the Genome Analyzer idle for more than three days,
perform this wash after the maintenance wash.
1. Load wash solutions into port positions 1, 6, 3, 4, 5, and 7 on the
Genome Analyzer.
Position 2 remains loaded with water.
CAUTION
Rotate the tubes while holding the caps stationary, to
prevent crimps and twisting in the liquid delivery lines.

Basic Procedures 97
Paired-End Sequencing User Guide
2. Place at least 5 ml of MilliQ water in each Falcon tube in positions 9–21
on the Paired-End Module.
3. Remove any tubing connected to port position 8 and close the port with
the appropriate stopper.
4. Click the Run tab.
5. Select File | Open Recipe.
6. Open the GA2-PEM_PostWash_v<#>.xml wash recipe file.
7. Click Start.
8. When the run finishes, click the Manual Control tab.
9. In the Pump area, set the parameters as follows:
Solution: 28
Volume: 0
10. With the cursor in the Volume field, press Enter.
11. Leave the flow cell in the instrument to prevent siphoning.
12. Close the Genome Analyzer software and shut down the computer.
13. Turn the Genome Analyzer power switch to the OFF position.
Resuming Use
after Storage
Perform the following steps to resume instrument use after short-term or
long-term storage:
1. Turn on the Genome Analyzer.
2. Start the computer and log on to the operating system.
3. Open the Genome Analyzer software.
4. Load wash solutions into port positions 1, 3, 4, 5, 6, and 7 on the
Genome Analyzer.
5. Load 0.5 L filtered, deionized water into Position 2.
6. Place at least 5 ml of MilliQ water in each Falcon tube in positions 9–21
on the Paired-End Module.
7. Click the Run tab.
8. Select File | Open Recipe.
9. Open the GA2-PEM_PreWash_v<#>.xml wash recipe.
10. Click Start.
Unloading a
Flow Cell
Perform the following steps to unload a flow cell from the stage:
1. Click the Manual Control/Setup tab.
2. Click Load Flowcell to slide the stage forward.
3. Select Instrument | Unlock Door to release the door to the imaging
compartment.
4. Click the Manual Control/Setup tab.
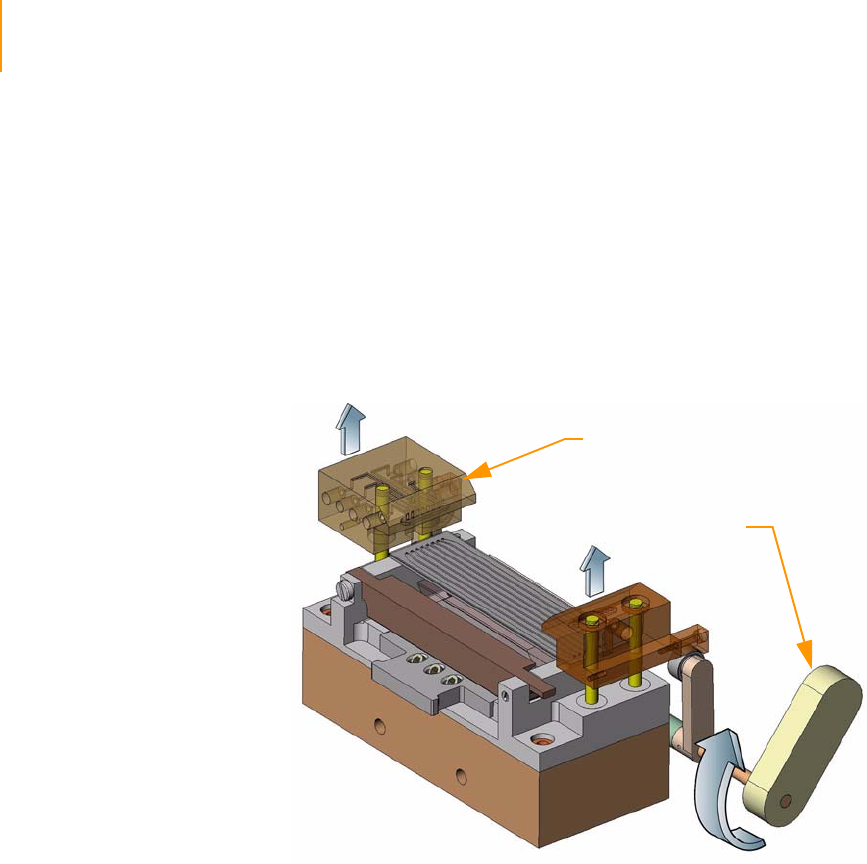
98 CHAPTER 4
Using the Genome Analyzer
Part # 1004571 Rev. A
5. In the Pump area, make sure the following values are set:
Command: Pump
To: Flowcell
Solution: 28 (to prevent siphoning reagents)
Volume: 0
Aspiration Rate: 250
Dispense Rate: 2500
6. With the cursor in the Dispense Rate box, press Enter.
7. Turn the manifold handle clockwise to lift the manifolds.
Figure 60 Lifting Front and Rear Manifolds
8. Slide the flow cell to the left to clear the manifolds, and then lift it out of
the instrument.
Manifold Handle
Manifolds Up

SBS Sequencing Kit v2 Contents 99
Paired-End Sequencing User Guide
SBS Sequencing Kit v2 Contents
This section describes the features and contents of 36-Cycle SBS Sequencing
Kit v2. For information regarding the 26-Cycle Sequencing Kit, see Preparing
Reagents for the Genome Analyzer.
What’s New `The hands-on time required to prepare reagents for the Genome
Analyzer is reduced from about 90 minutes to 10 minutes.
`The only reagent that needs to be prepared prior to loading onto the
Genome Analyzer is the IMX, which is made by combining all the
contents of the FFN and SDP tubes into the IMX container.
`No filtering of the reagents is required.
`The reagents are provided in containers that load directly onto the
instrument. The bottles are shatter-resistant and provide excellent gas
barrier properties for storage and shipping of buffers.
`Four bottle adaptors are required for position 4, 5, 2, and 7 to hold the
new shatter-resistant reagent bottles.
`The kit is condensed into a single package containing two boxes that are
shipped on dry ice. Once the package arrives, one box is stored at 4°C
and the other box at -20°C.
`Reagent labels are color coded to help reduce the possibility of reagent
mix-up while loading the reagents. Both the reagent boxes and reagent
containers include a barcode ID enabling reagent tracking.
`The IMX, SMX, and CMX are provided in a dark amber tube to better
protect and preserve the reagents.
`The reagent names have changed. The following table lists the Genome
Analyzer reagents and the reagent names in the SBS Sequencing Kit v2.
Each reagent name contains a prefix of GA# and a suffix based on the
number of cycles you are running.
Check to ensure that you have all of the reagents identified in this section
before proceeding to Read 1 on the Genome Analyzer.
Ta ble 1 4 Genome Analyzer Reagents
Position # Reagent Name Reagent
1 IMX Incorporation Mix (IMX, FFN, and SDP)
2 PW1 Deionized Water
3SMX Scan Mix
4 PR1 High Salt Buffer
5 PR2 Incorporation Buffer
6 CMX Cleavage Mix
7PR3 Cleavage Buffer

100 CHAPTER 4
Part # 1004571 Rev. A
Reagents and other consumables are shipped separately from the
instrument. They are boxed according to storage temperature requirements.
All reagents included in the SBS Sequencing Kit v2 are labeled with the prefix
GA#.
SBS Sequencing
Kit, Box 1
Store at 2° to 8°C
This box is shipped on dry ice. When you receive your kit, store the
components at 2° to 8°C. If you plan to use the components the next day,
thaw them at room temperature overnight.
`PW1
`PR1
`PR2
`PR3
SBS Sequencing
Kit, Box 2
Store at -15° to -25ºC
This box is shipped on dry ice. When you receive your kit, store the
components at -15° to -25°C.
`IMX36
`FFN36
`SDP36
`SMX36
`CMX36
CAUTION
It is very important to promptly store the
reagents at the temperature specified on the
box to ensure that they perform correctly.

Prepare Reagents for Read 1 on the Genome Analyzer 101
Paired-End Sequencing User Guide
Prepare Reagents for Read 1 on the Genome Analyzer
Follow these instructions to prepare reagents before loading them onto the
Genome Analyzer. Required materials are provided in the 36-Cycle
Sequencing Kit v2.
Unpack and Thaw
Reagents
1. Remove the following reactive part components from -20°C storage and
thaw them at room temperature or in a beaker containing deionized
water. Do not microwave.
•IMX36
•FFN36
•SMX36
If you use the beaker method, make sure the water line does not reach
the cap of the tube to prevent contamination.
Leave the SDP36 in -20°C storage until you are ready to use it to make
the Incorporation Mix.
2. Remove the CMX36 from -20°C storage and thaw it at room temperature
or in a separate beaker containing deionized water. Do not microwave. If
you use the beaker method, make sure the water line does not reach the
cap of the tube to prevent contamination.
3. Record the lot numbers of each reagent on the lab tracking worksheet.
4. Immediately after the reagents have thawed, place them on ice. Be sure
to keep the CMX36 in a separate ice bucket during reagent preparation.
5. If the components from Box 1 are still frozen, thaw them in a container of
deionized water.
Procedure
IMX36
Required Materials:
`FFN36
`IMX36
`SDP36
CAUTION
When you prepare and load reagents onto the Genome
Analyzer, you must use them in a sequencing run the same
day.
Exception: The High Salt Buffer does not need to be made
fresh for each sequencing run.
CAUTION
It is important to keep the CMX away from the other
components to avoid cross-contamination.
CAUTION
After handling the CMX container, be sure to discard your
gloves and replace them with a new pair each time.

102 CHAPTER 4
Using the Genome Analyzer
Part # 1004571 Rev. A
1. Transfer 1.75 ml of the FFN36 into the IMX36.
2. Remove the SDP36 tube from -20°C storage and briefly pulse centrifuge.
3. Transfer 220 μl of SDP36 to the IMX36 reagent (containing FFN36).
4. Cap the IMX36 (containing FFN36 and SDP36) tube tightly and invert five
times to mix.
5. Centrifuge at 1,000 xg for 1 minute at 22°C.
6. Place the IMX36 on ice until you are ready to load it onto the Genome
Analyzer.
7. Record the weight of the reagent in the lab tracking worksheet.
PR1
1. Invert the bottle of PR1 several times before loading it onto the Genome
Analyzer.
2. Record the lot number of the reagent on the lab tracking worksheet.
3. Record the weight of the reagent in the lab tracking worksheet.
PR2
1. Invert the bottle of PR2 several times to mix before loading it onto the
Genome Analyzer.
2. Record the lot number of the reagent on the lab tracking worksheet.
3. Record the weight of the reagent in the lab tracking worksheet.
PR3
1. Invert the bottle of PR3 several times before loading it onto the Genome
Analyzer.
2. Record the lot number of the reagent on the lab tracking worksheet.
3. Record the weight of the reagent in the lab tracking worksheet.
SMX36
1. Invert the SMX36 tube several times to mix well, and then centrifuge at
1,000 xg for 1 minute at 22°C before loading it onto the Genome
Analyzer.
2. Record the weight of the reagent in the lab tracking worksheet.
3. Place the SMX36 on ice until ready to load onto the Genome Analyzer.
CMX36
1. Invert the CMX36 tube several times to mix well, and then centrifuge at
1,000 xg for 1 minute at 22°C before loading it onto the Genome
Analyzer.
2. Record the weight of the reagent in the lab tracking worksheet.

Prepare Reagents for Read 1 on the Genome Analyzer 103
Paired-End Sequencing User Guide
3. Place the CMX36 in a separate ice bucket until you are ready to load it
onto the Genome Analyzer.
4. Discard your gloves and replace them with a new pair.
PW1
1. To prepare for the Genome Analyzer pre-run wash, aliquot 40 ml of PW1
into four 125 ml Nalgene bottles.
2. Aliquot 10 ml of PW1 into three 50 ml conical tubes.
See Performing a Pre-Run Wash on page 105 for pre-run wash instructions.
CAUTION
When you load the reagents onto the Genome Analyzer,
load the CMX last to avoid cross-contamination.
NOTE
Be sure to perform a pre-run wash before loading reagents
onto the Genome Analyzer.
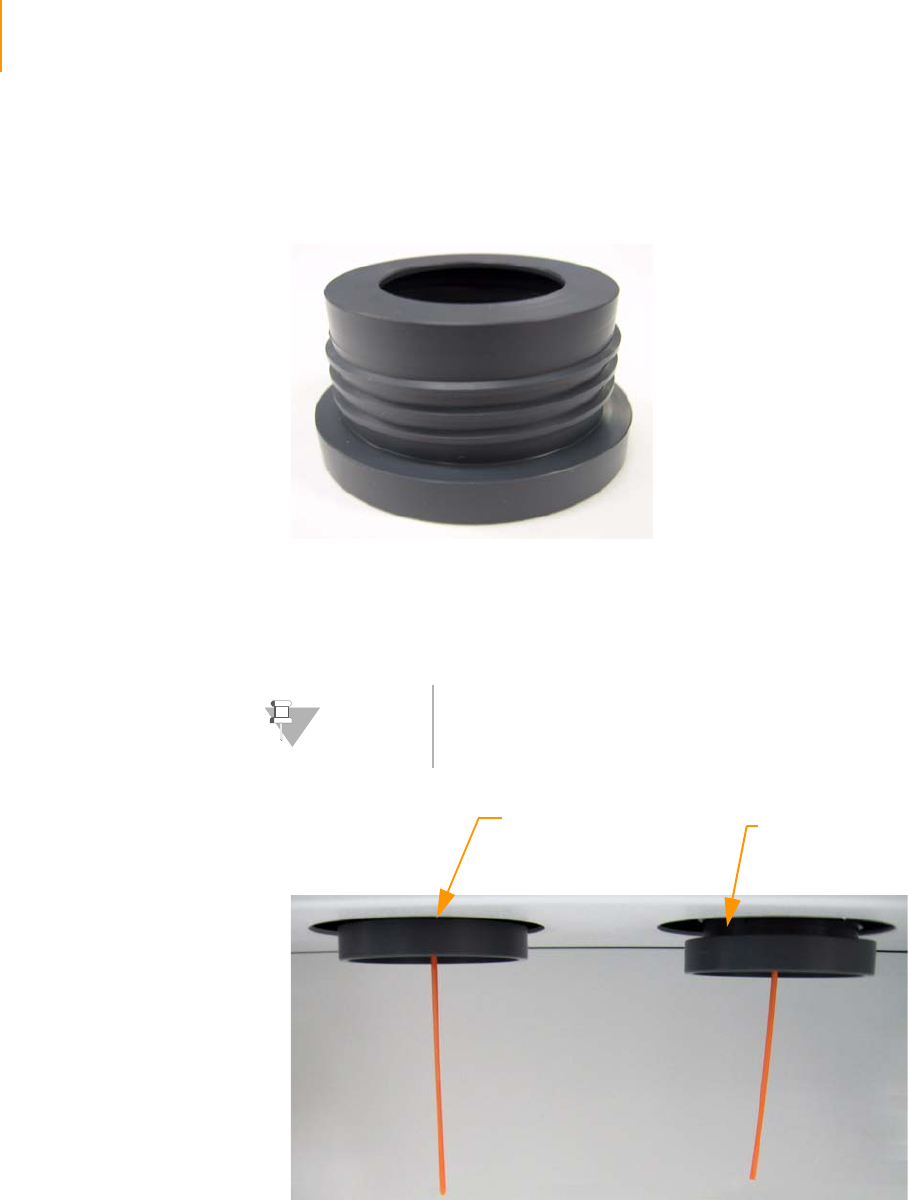
104 CHAPTER 4
Using the Genome Analyzer
Part # 1004571 Rev. A
Installing the Bottle Adaptors
1. Unpack four Genome Analyzer bottle adaptors.
Figure 61 Genome Analyzer Bottle Adaptor
2. Install the bottle adaptors at positions 4, 5, 2, and 7 on the Genome
Analyzer by threading the adaptor completely into the instrument. Hand-
tighten each adaptor until the rim of the adaptor is barely visible.
Figure 62 Proper Fit of Bottle Adaptor
NOTE
Do not overtighten the adaptors.
Improper Fit
Proper Fit

Performing a Pre-Run Wash 105
Paired-End Sequencing User Guide
Performing a Pre-Run Wash
You must perform a pre-run wash if the instrument has been idle for one day
or more, and before changing and priming reagents. The wash flushes 1 ml
of instrument wash reagent (PW1) through each reagent port and out to a
waste container. Run time is approximately 15 minutes.
After the wash, check the total volume in the waste container closely to
confirm the stability of the reagent delivery system. The primary indicators of
a stable fluid delivery system are (1) air-free volumes in syringe barrel and
flow cell and (2) expected delivery volumes from the wash cycle. Both are
necessary for optimal sequencing performance.
Consumables User-Supplied
`Lens cleaning tissue
`Nylon filter (0.2 μm pore size)
`MilliQ water for washing the Paired-End Module
`125 ml Nalgene bottles (4)
(ThermoFisher Scientific, catalog # 2019-0125)
`50 ml conical tubes (3)
Illumina-Supplied
`PW1
Procedure 1. Load the instrument with a used flow cell. See Loading the Flow Cell on
page 114.
2. Dispense 40 ml of PW1 into four 125 ml Nalgene bottles.
3. Dispense 10 ml of PW1 into three 50 ml conical tubes.
4. Load the instrument with solutions as follows:
•10 ml PW1 into port positions 1, 6, and 3
•40 ml PW1 into port positions 4, 5, 2, and 7
5. Place at least 5 ml of MilliQ water in each Falcon tube in positions 9–21
on the Paired-End Module.
6. Loosen and remove the waste tubing.
7. Bundle all waste tubes with parafilm, making sure to keep all of the ends
even.
8. Place the bundled tube ends into a 50 ml tube.
9. Click the Run tab.
CAUTION
Rotate the tubes while holding the caps stationary, to
prevent crimps and twisting in the liquid delivery lines.

106 CHAPTER 4
Using the Genome Analyzer
Part # 1004571 Rev. A
10. Select File | Open Recipe.
11. Open the GA2-PEM_PreWash_v<#>.xml recipe.
This recipe washes the Genome Analyzer and the Paired-End Module.
12. Click Start.
The wash cycle runs for approximately 40 minutes. Reagents are deliv-
ered 1 ml at a time. You should collect a total volume of 21 ml.
13. Record the delivery volume in the lab tracking worksheet. If the
measured volume is less than 90% of the expected value, do the
following:
a. Check for leaks.
b. Repeat the wash cycle.
c. Collect and measure each 1 ml delivery.
NOTE
During the sequencing run, keep one 125 ml Nalgene
bottle containing PW1 at position 2 on the Genome
Analyzer.
Save the 125 ml bottles and the 50 ml conical tubes
containing the PW1 solution for use with the post-run wash.
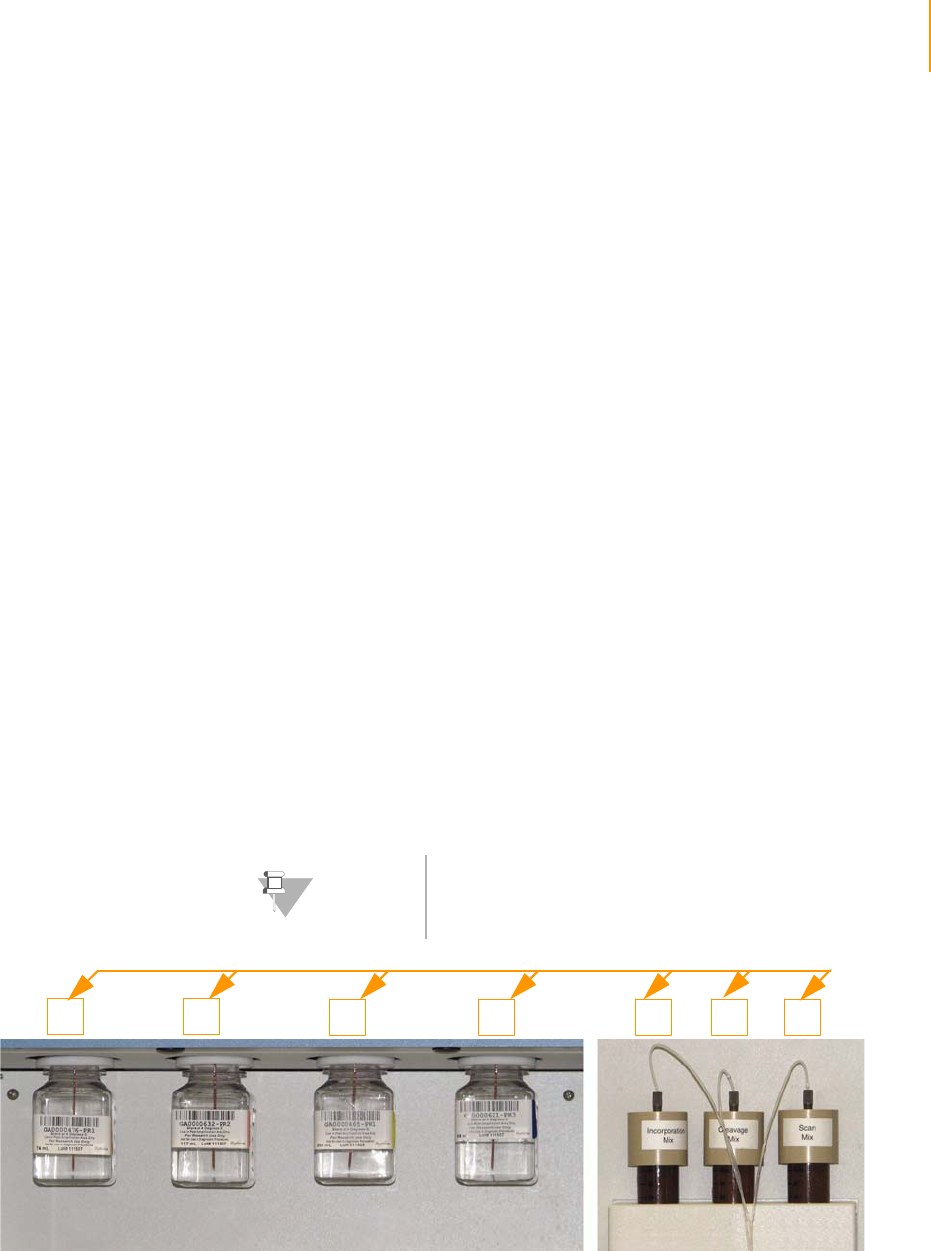
Loading and Priming Reagents 107
Paired-End Sequencing User Guide
Loading and Priming Reagents
Always perform a pre-run wash before loading reagents onto the Genome
Analyzer. See Performing a Pre-Run Wash on page 105.
Loading
Reagents
Reagents loaded onto the Genome Analyzer must be used in a sequencing
run the same day.
Safe Handling Conventions
1. To prevent cross-contamination of reagents, especially the IMX and
CMX, establish safe handling conventions such as:
•Always remove and replace one bottle or tube at a time.
•Always install the CMX last to avoid cross-contamination.
•Keep the SMX, IMX, and CMX on ice until you load them onto the
Genome Analyzer.
2. Invert all reagents several times to mix them before loading them onto
the Genome Analyzer.
3. Centrifuge the SMX, CMX, and IMX at 4°C at 1000 xg for 1 minute
before loading them onto the Genome Analyzer.
Reagent Positions
Load the prepared reagents in the appropriate positions on the Genome
Analyzer, as shown in the following figure and corresponding table. When
you attach the 50 ml tubes, hold the caps stationary and rotate the tubes to
prevent crimps in the liquid delivery lines.
Figure 63 Genome Analyzer Reagent Positions
NOTE
Save the 125 ml bottles and the 50 ml conical tubes
containing the PW1 solution for use with the post-run wash.
4 5 2 7 1 6 3
Valve
Positions

108 CHAPTER 4
Using the Genome Analyzer
Part # 1004571 Rev. A
Priming
Reagents
Before each run, you must prime all of the plumbing lines with the reagents.
You will collect a set of liquid deliveries through all valve ports out to a waste
volume, and then check total volume to confirm the stability of the reagent
delivery system.
1. Loosen and remove the waste tubing from the waste bottle.
2. Bundle all waste tubes so that the ends are even with each other, and
wrap them with parafilm.
3. Place the bundled tube ends into a 15 ml or a 50 ml conical tube.
4. Click the Run tab in the Data Collection software window.
5. Select File | Open Recipe.
6. Open the GA2_Prime_v<#>.xml recipe.
7. Click Start.
8. Collect all of the waste from the priming recipe and ensure that the
volume is 6.4 ml.
9. Record the delivery volume in the lab tracking worksheet. If the
measured volume differs from the expected value by more than 10%,
repeat the priming procedure.
Ta ble 1 5 Genome Analyzer Reagent Positions
Solution # Size Contents
1 50 ml Amber Tube IMX36
2 125 ml Bottle PW1
3 50 ml Amber Tube SMX36
4 125 ml Bottle PR1
5 125 ml Bottle PR2
6 50 ml Amber Tube CMX36
7 125 ml Bottle PR3
NOTE
Automatically tracking reagents by reading in the barcodes
for the reagents is not available for paired-end sequencing.
NOTE
Priming volumes are a key indicator of a stable fluid delivery
system. The measured volumes must be within 10% of
normal for optimal sequencing performance.

Loading and Priming Reagents 109
Paired-End Sequencing User Guide
If the delivered volume still differs from the expected volume by more
than 10%, take the following steps:
a. Click the Manual Control/Setup tab. In the Pump area, set the
following values:
Command: Pump
To: Flowcell
Solution: 28
Volume: 0
Aspiration Rate: 250
Dispense Rate: 2500
b. Click Load Flow Cell to bring the stage to the front of the instrument
and raise the lens.
c. In the Instrument pull down menu, select Unlock Door. Raise the
door.
d. Lift the manifolds and reposition the flow cell.
e. Repeat the priming procedure.
10. Proceed to Cleaning and Installing the Prism on page 110.
CAUTION
The manifolds should only be lifted for a small period of
time, else the manifolds will back flush onto the flow cell.
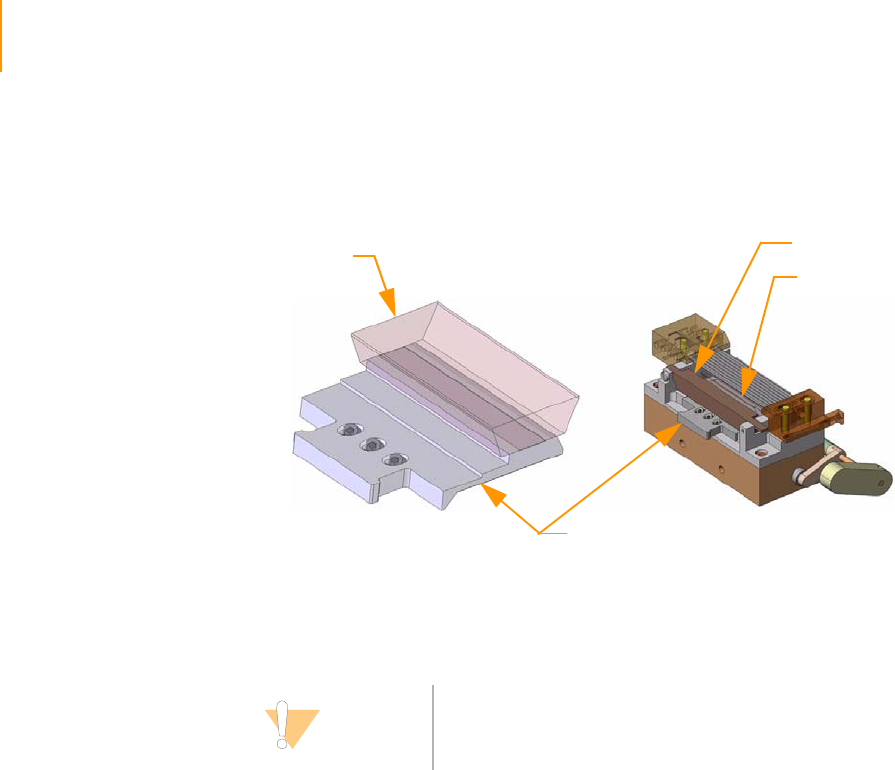
110 CHAPTER 4
Using the Genome Analyzer
Part # 1004571 Rev. A
Cleaning and Installing the Prism
The prism sits under the flow cell and serves a critical optical function.
Figure 64 Prism
Handling the
Prism
Always wear powder-free latex gloves when handling the prism. Hold the
prism by the metal prism base only.
Removing the
Flow Cell and
Prism
1. Click Load Flow Cell to bring the stage to the front of the instrument and
raise the lens. When the Flow Cell ID dialog box displays, click Cancel.
2. In the Instrument pull down menu, select Unlock Door. Raise the door.
3. Click the Manual Control/Setup tab.
4. In the Pump area, make sure the following values are set:
Command: Pump
To: Flowcell
Solution: 28 (to prevent siphoning reagents)
Volume: 0
Aspiration Rate: 250
Dispense Rate: 2500
5. With the cursor in the Dispense Rate box, press Enter.
6. Turn the manifold handle clockwise to lift the manifolds.
Prism
Beam Dump
Prism
Prism Base
CAUTION
Exercise extreme care when handling the prism to prevent
chipping, as this might degrade optical function. The critical
surface is the right side, which is the surface of laser entry.

Cleaning and Installing the Prism 111
Paired-End Sequencing User Guide
Figure 65 Lifting Front and Rear Manifolds
7. Slide the flow cell to the left to clear the manifolds, and then lift it out of
the instrument.
8. Remove the prism.
Cleaning the
Prism
Consumables
User-Supplied
`Lint-free lens cleaning tissue
`100% ethanol or Spectrophotometer-grade methanol
1. Put on new gloves.
2. Wipe down any oil that has spilled onto the flow cell holder or
accumulated onto the beam dump.
3. Place the prism on a fresh ethanol wipe on the benchtop.
4. Remove the oil by gently washing the prism with a stream of ethanol or
methanol.
5. Wipe the metal prism base with a lens cleaning tissue.
6. Fold a lens cleaning tissue to approximately the size of the prism. Wet
the edge of the tissue with ethanol or methanol and wipe off the surface
with a single sweeping motion. Repeat, refolding the tissue with each
wipe, until the prism is completely clean.
Manifold Handle
Manifolds Up
CAUTION
Be sure to remove any lint that is present on the prism or the
flow cell.
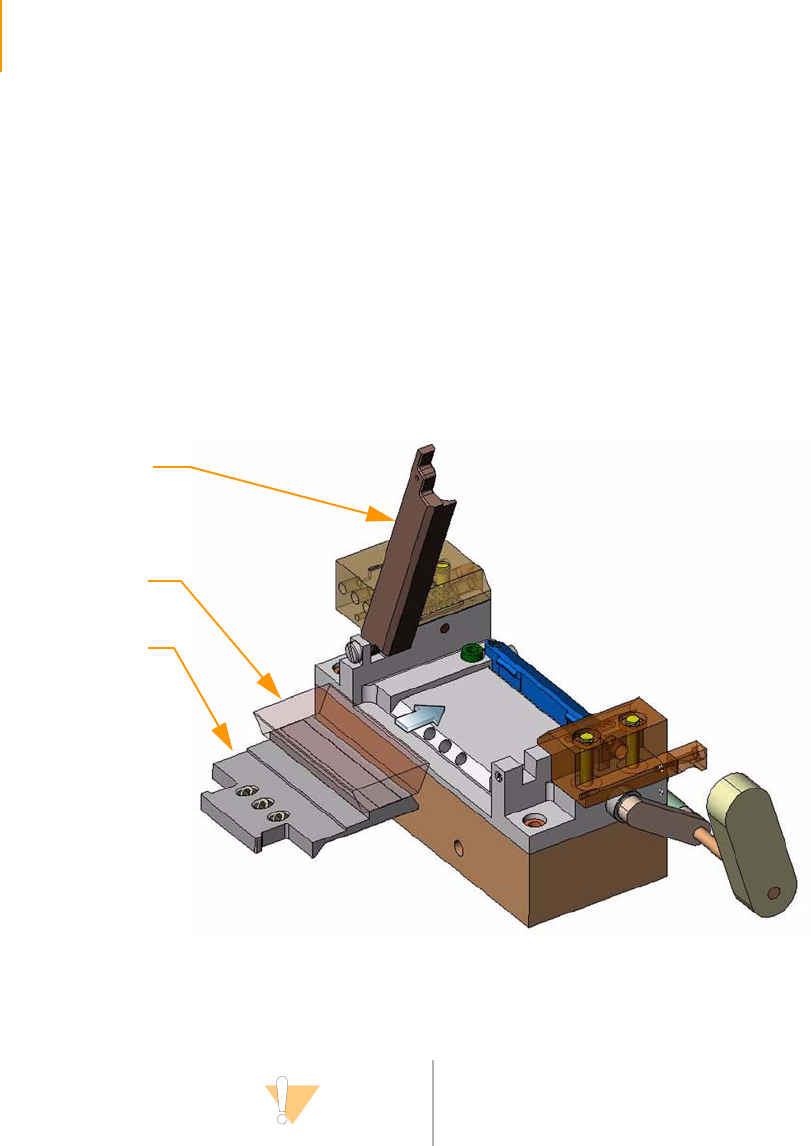
112 CHAPTER 4
Using the Genome Analyzer
Part # 1004571 Rev. A
7. To tell if the prism is clean, observe it under direct light from a variety of
angles. Pay particular attention to the surface that will face the laser entry
(right-hand side when sitting in the holder) and the large top surface.
8. Protect the prism from dust until you place it onto the Genome Analyzer.
Installing the
Prism
Install the prism before installing the flow cell.
1. Fold a lens cleaning tissue and wet it with ethanol or methanol.
2. Wipe the recessed surface of the prism holder to remove oil that may
have been spilled during the previous run.
3. Lift the beam dump and slide in the prism assembly (Figure 66).
Figure 66 Loading the Prism
4. With prism in place, lower the beam dump.
The prism assembly and beam dump lock in position.
5. Proceed to Cleaning and Installing the Flow Cell on page 113.
Beam Dump
Prism
Prism Assembly
CAUTION
Be very careful not to touch the laser mount when you install
the prism. If it is knocked out of a position, it may require an
engineer visit to fix.

Cleaning and Installing the Flow Cell 113
Paired-End Sequencing User Guide
Cleaning and Installing the Flow Cell
The flow cell is located above the prism and rests on the manifold mounting
rails.
Figure 67 Flow Cell
Cleaning the
Flow Cell
1. Put on new gloves.
2. If the flow cell appears very dirty after you remove it from the Cluster
Station, wash it under deionized water before proceeding.
3. Place the flow cell on a lens cleaning tissue on the benchtop. Make sure
that the inlet and outlet ports face up, to prevent liquid from flowing out
of the lanes.
4. Fold a lens cleaning tissue to approximately the size of the flow cell. Wet
the edge of the tissue with methanol or 100% ethanol.
5. Hold the edges of the flow cell with two gloved fingers.
Flow Cell
Inlet Manifold Ports
Outlet Manifold Ports
Bar Code on
This Edge
Lane 1
CAUTION
Work away from the inlets and outlets to avoid
contaminating the inside of the lanes that contain the
samples.
CAUTION
If you clean the flow cell while it is lying on the bench top,
you could easily apply too much pressure, and may break
the flow cell. We recommend cleaning the flow cell while
holding the edges between your fingers.

114 CHAPTER 4
Using the Genome Analyzer
Part # 1004571 Rev. A
6. Fold a fresh tissue, wet it, and wipe off each side with a single sweeping
motion. Repeat, refolding the tissue with each wipe, until the flow cell is
completely clean.
7. Use a new ethanol wipe to clean the bottom of the Peltier heater to make
sure that no oil remains from a previous run.
8. Protect the flow cell from dust until you place it onto the Genome
Analyzer.
Entering the
Flow Cell ID
The Genome Analyzer can capture and save the bar code with the flow cell
ID. A flow cell ID can also be typed by hand as an alternative to using the
barcode reader.
1. Click Load Flowcell on the manual control screen, the stage moves to
the load position, and the dialog box is displayed for the flow cell ID.
2. If you select Cancel, the dialog is closed, and no data changes are made
(any previously entered flow cell ID remains current).
3. If you select OK, the ID field is checked to ensure that it isn't blank. If it is
blank, a warning is displayed, and the operator must enter something or
else cancel the dialog.
4. The operator can enter any characters from the keyboard. The barcode IDs
are validated using the validation expression in the RCMConfig.xml file
(FlowCellID= "[F][C][0-9][0-9][0-9][0-9]").
5. Proceed to Loading the Flow Cell on page 114.
Loading the
Flow Cell
The prism must be installed before you load the flow cell.
1. Place the flow cell on top of the front and rear mounting rails, with the
inlet and outlet ports facing up. Press it gently against the right stops
(Figure 68).
NOTE
Place the flow cell on a clean white background when
reading the barcode.
NOTE
You can change the validation expression as required. In
order to disable the barcode validation enter ““ or empty
string in the <FlowCellID> field.
NOTE
In some cases, for example after running a new recipe on a
previously abandoned run, tracking of the flow cell ID may
impede using the same flow cell. In such a case, you can set
the <IgnoreFlowCellIDCheck> field in the RCMConfig.xml
file to “true” to ignore the flow cell ID tracking.
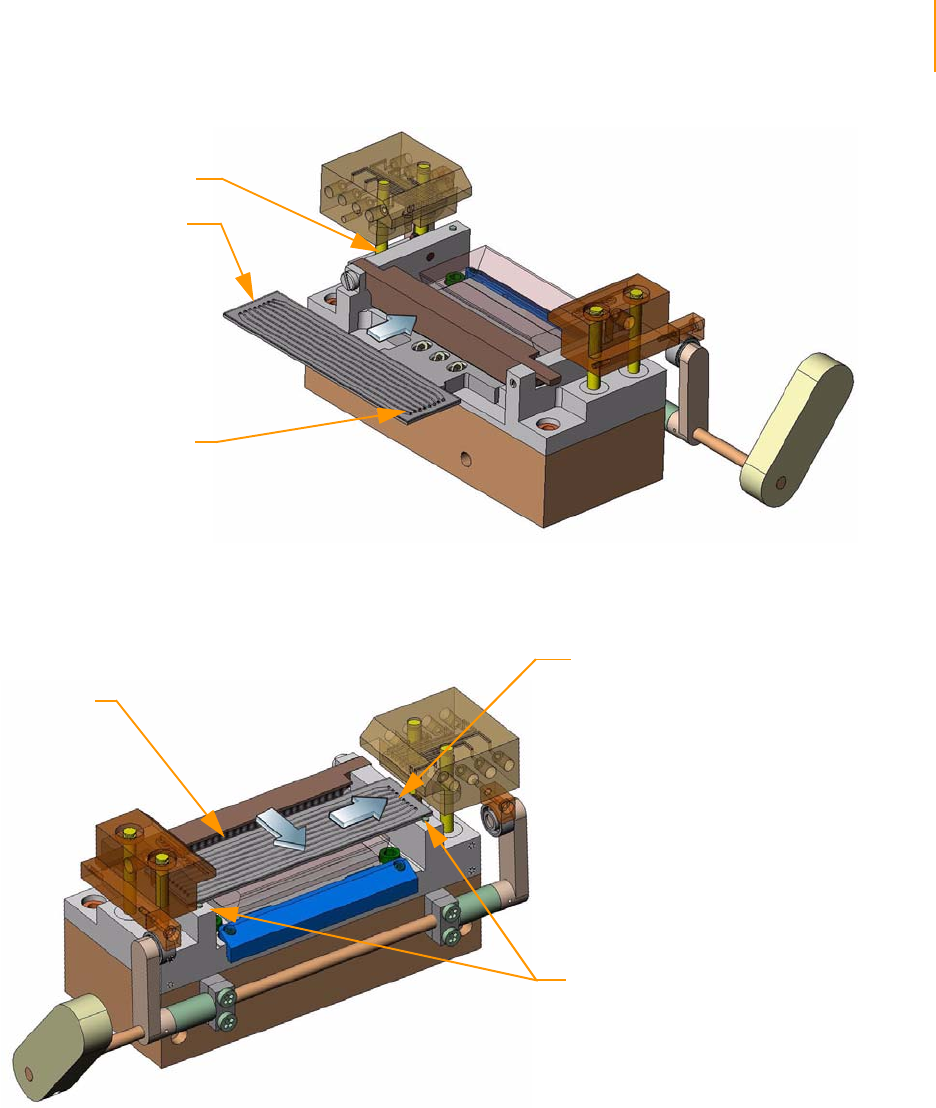
Cleaning and Installing the Flow Cell 115
Paired-End Sequencing User Guide
Figure 68 Loading the Flow Cell
2. Slide the flow cell to the back until you encounter the rear stop (Figure
69).
Figure 69 Positioning the Flow Cell
3. Using a lens cleaning tissue, gently apply pressure on the underside of
the front manifold to absorb excess liquid.
4. Test proper placement by applying gentle pressure to the rear, then to
the right to ensure the flow cell is pressed against both stops.
5. While holding the flow cell against the stops with one hand, carefully
rotate the manifold handle counterclockwise with the other hand to
lower the manifolds into place (Figure 70).
Rear Mounting Rail
Flow Cell
Inlet Manifold Ports
(Front)
Stops
Flow Cell
Outlet Manifold Ports
(Rear)
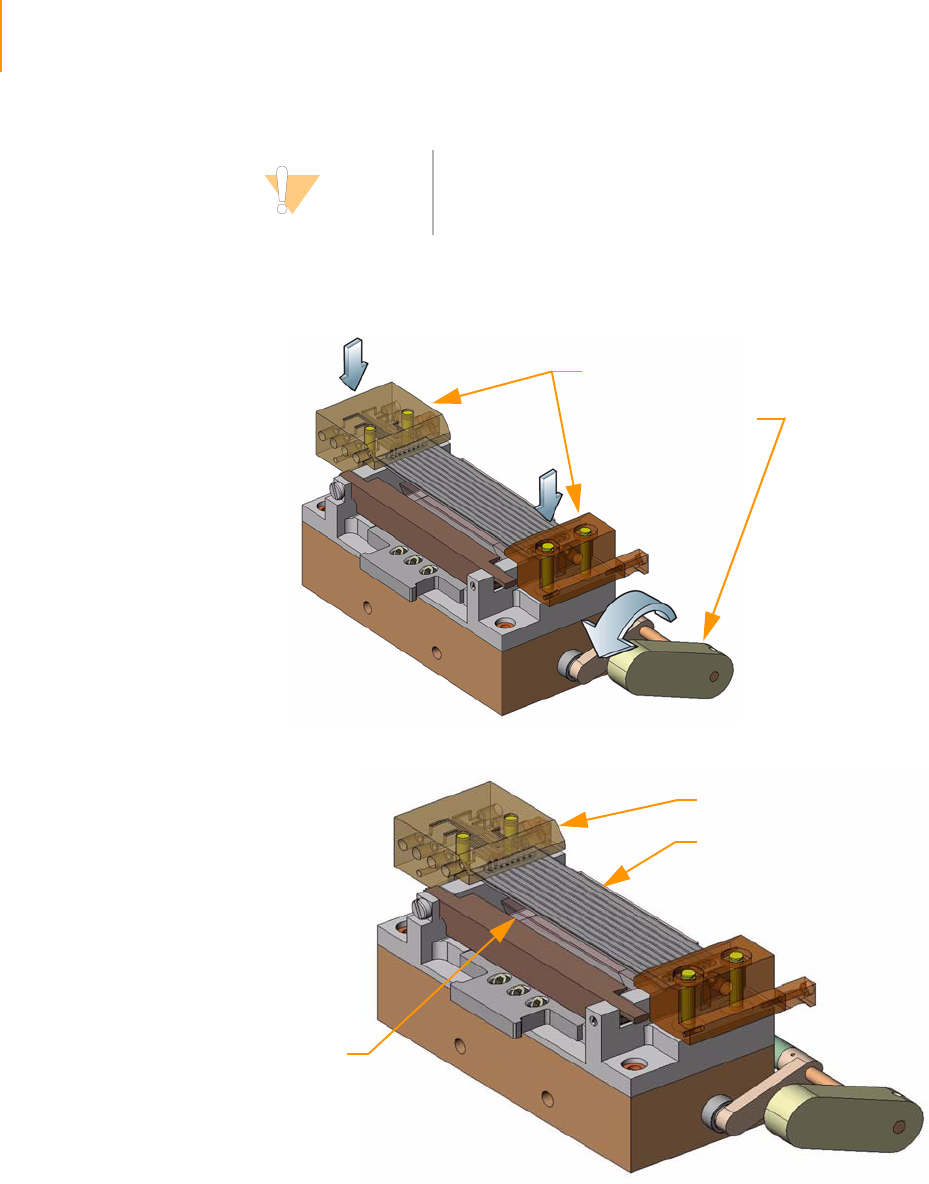
116 CHAPTER 4
Using the Genome Analyzer
Part # 1004571 Rev. A
6. Press downward on both manifolds to ensure they have seated properly
(Figure 71).
Figure 70 Lowering the Manifold
Figure 71 Flow Cell and Prism Loaded
CAUTION
The manifolds are spring-loaded, and the cam that holds
them up is steeply shaped. Be careful to control the spring
action so that the flow cell is not damaged.
Manifolds Down
Manifold Handle
Manifold
Prism
Flow Cell

Checking for Leaks and Proper Reagent Delivery 117
Paired-End Sequencing User Guide
Checking for Leaks and Proper Reagent Delivery
Reagent delivery volumes during the leak test are a key indicator of a stable
fluid delivery system. The measured volumes must be within 10% of normal
for optimal sequencing performance.
This procedure pumps Incorporation Buffer through the flow cell to check for
leaks. Excessive air bubbles through the lanes indicate leaks at the manifold.
1. Wipe the interface of the manifold and the flow cell with a lens tissue.
2. Bundle all of the lines together with parafilm, making sure to keep the
ends even.
3. Place the bundle into a 1.5 ml tube.
4. Pump 100 μl of Incorporation Buffer (solution 5) through the flow cell.
a. Click the Manual Control/Setup tab.
b. In the Pump area, set the values as follows:
Command: Pump to Flow Cell
To: Flowcell
Solution: 5
Volume: 100
Aspiration Rate: 250
Dispense Rate: 2500
c. With the cursor in the Dispense Rate box, press Enter.
5. Confirm that liquid is flowing properly through the flow cell by looking
closely for any air bubbles being chased toward the rear manifold of each
lane.
Figure 72 Checking for Bubbles
6. When the liquid has successfully displaced the air in all eight lanes, move
on to check for liquid leaks. If bubbles persist, it might indicate that the
flow cell is not properly seated on the flow cell stage.
Bubbles
Flow Cell Port
Flow Direction
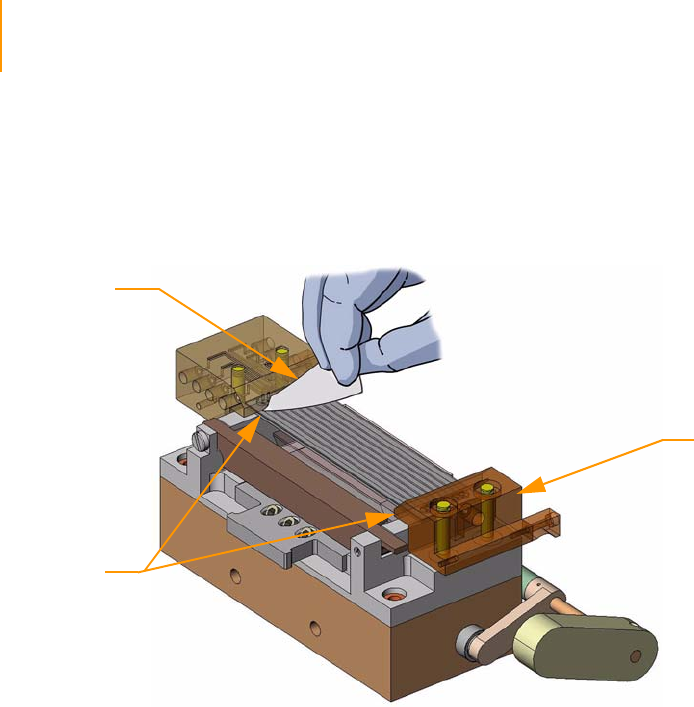
118 CHAPTER 4
Using the Genome Analyzer
Part # 1004571 Rev. A
If air continues to enter the flow cell during the leak test, the most likely
cause is a leak where the flow cell connects to the front manifold. Check
the integrity of that connection and try the leak test again.
7. Check for leaks where the flow cell touches the manifold using a lens-
cleaning tissue.
Figure 73 Test ing for Leaks
If a leak is present, perform the following steps:
a. Click the Manual Control/Setup tab. In the Pump area, set the values
as follows:
Command: Pump to Flow Cell
To: Flowcell
Solution: 28 (to prevent siphoning reagents)
Volume: 0
Aspiration Rate: 250
Dispense Rate: 2500
b. Click Load Flow Cell to bring the stage to the front of the instrument
and raise the lens.
c. Lift the manifolds, clean the interface between manifold and flow cell
with a moist lens tissue.
d. Dry and re-seat the flow cell.
e. In the Pump area, set the values as follows:
Command: Pump to Flow Cell
To: Flowcell
Solution: 5
Volume: 100
Aspiration Rate: 250
Dispense Rate: 2500
f. Pump another 100 μl of the Incorporation Buffer (solution 5) through
the system.
8. Measure the flow for each of the lanes three times. Record the measured
volumes in the lab tracking worksheet.
If the third measurement differs from the expected volume by more than
10%, have the instrument checked by an Illumina Field Service Engineer.
Swab
Test for
Leaks Here
Manifolds Down

Applying Oil 119
Paired-End Sequencing User Guide
Once the system is leak free, the system is ready to run.
9. Proceed to Applying Oil.
Applying Oil
Immersion oil between prism and flow cell is a critical optical element. The
layer of oil must be uniform and continuous to create total internal reflection.
Too much oil may result in images that are out of focus.
The amount of oil required varies from instrument to instrument. Based on
mechanical tolerances, the amount of oil required will be between 70 and
125 μl. It should be fairly repeatable for each instrument and fixed prism pair,
provided that the fixed prism and flow cell have been loaded properly.
1. Aspirate 135 μl of oil into the pipette, ensuring that there are no air
bubbles in the oil in the pipette tip. Wipe the outside of the tip with a
lens cleaning tissue.
2. Place the pipette tip on the prism at the gap between the top surface of
the prism and the front-left side of the flow cell, about 1 cm from the inlet
manifold. Use two hands, with one hand on the tip to support and guide
the tip.
3. Dispense the oil slowly from the left side; dispensing too fast will result in
oil on the top of the flow cell. Let all of the dispensed oil wick between
the flow cell and the prism as far as it will go before dispensing more.
NOTE
You may not need to dispense all of the immersion oil.
NOTE
Working from the left side of the flow cell helps to prevent
oil from accumulating along the right surface of the prism
where the laser light enters.
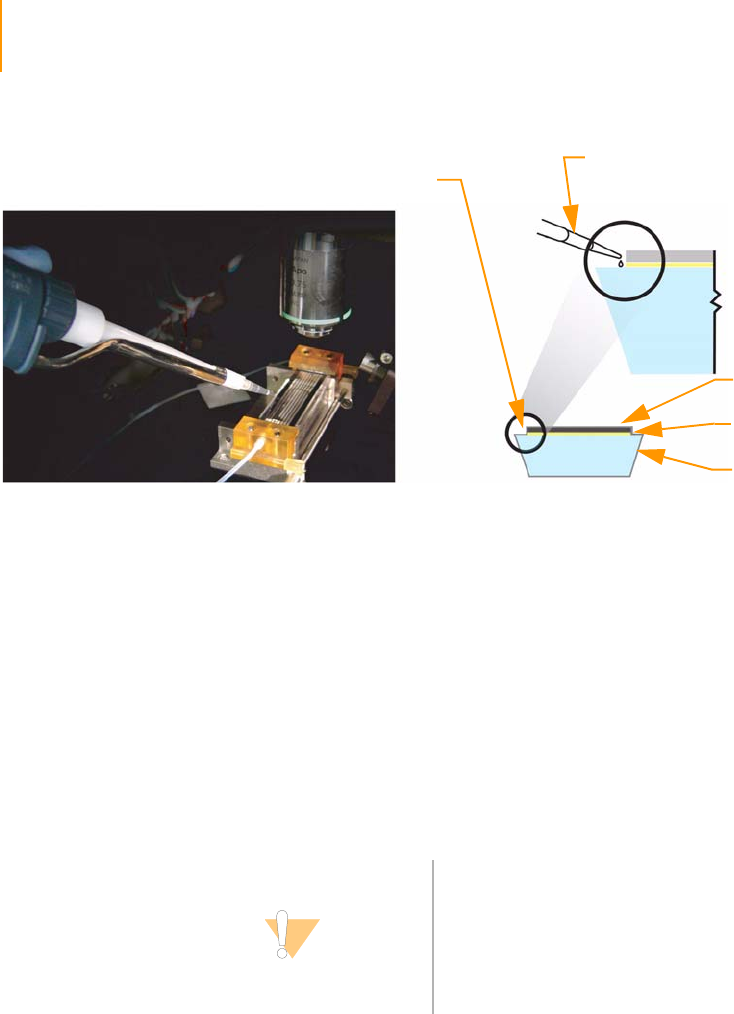
120 CHAPTER 4
Using the Genome Analyzer
Part # 1004571 Rev. A
Figure 74 Applying Oil
4. Before the oil reaches the right side of the flow cell, slide the pipette tip
in small steps towards the rear, steadily dispensing more oil along the
way. Let all of the dispensed oil wick between the flow cell and the prism
as far as it will go before dispensing more. The pipette tip must not move
faster than the leading edge of the oil wicking under the flow cell.
Observe the movement of the oil. Ensure there are no bubbles forming
between the flow cell and the prism.
5. Stop moving the pipette when the tip is about 1 cm from the rear
manifold.
You have dispensed enough oil when it has wicked to the right edge of
the flow cell.
6. Ensure that the gap underneath the flow cell has a uniform layer of oil,
that no bubbles exist between the flow cell and the prism, that there is
no oil on the top of the flow cell, and that the right surface of the prism is
clean.
If anything is unsatisfactory, remove the flow cell and prism, clean them
both thoroughly with alcohol wipes, reload, and repeat the application.
7. Use an ethanol wipe to clean the bottom surface of the Peltier heater.
This ensures that no splashed immersion oil will be stamped on the flow
cell by the Peltier.
8. Close the instrument door.
9. Proceed to Performing First-Base Incorporation on page 121.
Oil Applicator
Prism
Oil
Flow Cell
Apply oil
at this point
with applicator
End View
CAUTION
Underloading the oil will cause a loss of illumination (most
likely in lane 8, column 2, and nearest the inlet and outlet).
Overloading could cause oil to wick over the imaging
surface during the course of the run or spill over the right
surface of the prism, both of which will cause problems
when focusing images. Wicking may happen immediately,
or later during a run when the oil heats up.

Performing First-Base Incorporation 121
Paired-End Sequencing User Guide
Performing First-Base Incorporation
In this step, you will incorporate the first nucleotide and then pause the
system to set the focal plane.
From this point on in the paired-end sequencing protocol, you can use either
the two-folder paired-read method or the single-folder paired-read method.
Each uses a different set of recipes. Both methods are described in each
section.
1. Put the waste tubing of each lane into a 50 ml conical tube to determine
the amount of fluid pumped through each lane during the sequencing
run. Put the tubing through a small hole in the cap to minimize
evaporation.
2. [Optional] Depending on the method you are using, modify one of the
recipes listed below to change the number of tiles that will be imaged.
For more information, see Configuring Tile Selection on page 213.
3. Open the Illumina Genome Analyzer Data Collection software and select
File | Open Recipe.
4. Depending on the method you are using, open one of the following
recipes:
5. Click OK.
The software automatically makes a copy of the recipe file and stores it in
the current run folder. If you need to stop work at any point, you can
reopen the recipe from that location and continue from where you left
off. First Base recipes like wash and prime recipes are a special service
recipe type. The log can be found in a date stamped run folder in the
service directory of the data collection software folder. This directory
should be cleared every 2–3 months.
NOTE
The single-folder paired-read method uses a single recipe
that performs a full 2 x 36 paired-end sequencing run and
places the data in a single run folder.
Ensure that you are either running IPAR, RoboMove, or have
sufficient hard drive space to accommodate two 36-cycle
runs.
To use the single-folder paired-read recipe, you must be
running SCS 2.01 or later.
Single-Folder Paired-Read Method Two-Folder Paired-Read Method
GA2-PEM_2x36_PE_v<#>.xml GA2_FirstBase_<v#>.xml
Single-Folder Paired-Read Method Two-Folder Paired-Read Method
GA2-PEM_2x36_PE_v<#>.xml GA2_FirstBase_<v#>.xml

122 CHAPTER 4
Using the Genome Analyzer
Part # 1004571 Rev. A
6. If prompted, browse to the sample sheet for this flow cell, and then click
OK. (This feature may not be activated on all systems.)
7. Click No to dismiss the Autofocus Calibration dialog box. You cannot
perform autofocus calibration until the first fluorescently tagged base has
been incorporated.
The run proceeds through the first phase of the recipe, which incorpo-
rates the first nucleotide.
First-base incorporation chemistry takes approximately 20 minutes. At
the end, a message indicates that the first-base incorporation chemistry
is complete.
The next step is to apply Scan Mix, and then determine the focal plane of
the flow cell. This enables the software to automatically adjust focus dur-
ing the run.
8. Click Cancel as directed to pause the protocol. This allows you to control
the software manually.
9. Proceed to Loading the Flow Cell with Scan Mix on page 123.

Loading the Flow Cell with Scan Mix 123
Paired-End Sequencing User Guide
Loading the Flow Cell with Scan Mix
1. Click the Manual Control/Setup tab.
2. In the Pump area, set the values as follows to pump Scan Mix:
Command: Pump
To: Flowcell
Solution: 3
Volume: 100
Aspiration Rate: 250
Dispense Rate: 2500
3. With the cursor in the Dispense Rate field, press Enter.
4. Proceed to Adjusting Focus on page 124.
CAUTION
It is critical to introduce Scan Mix to the flow cell before
adjusting the focal plane.
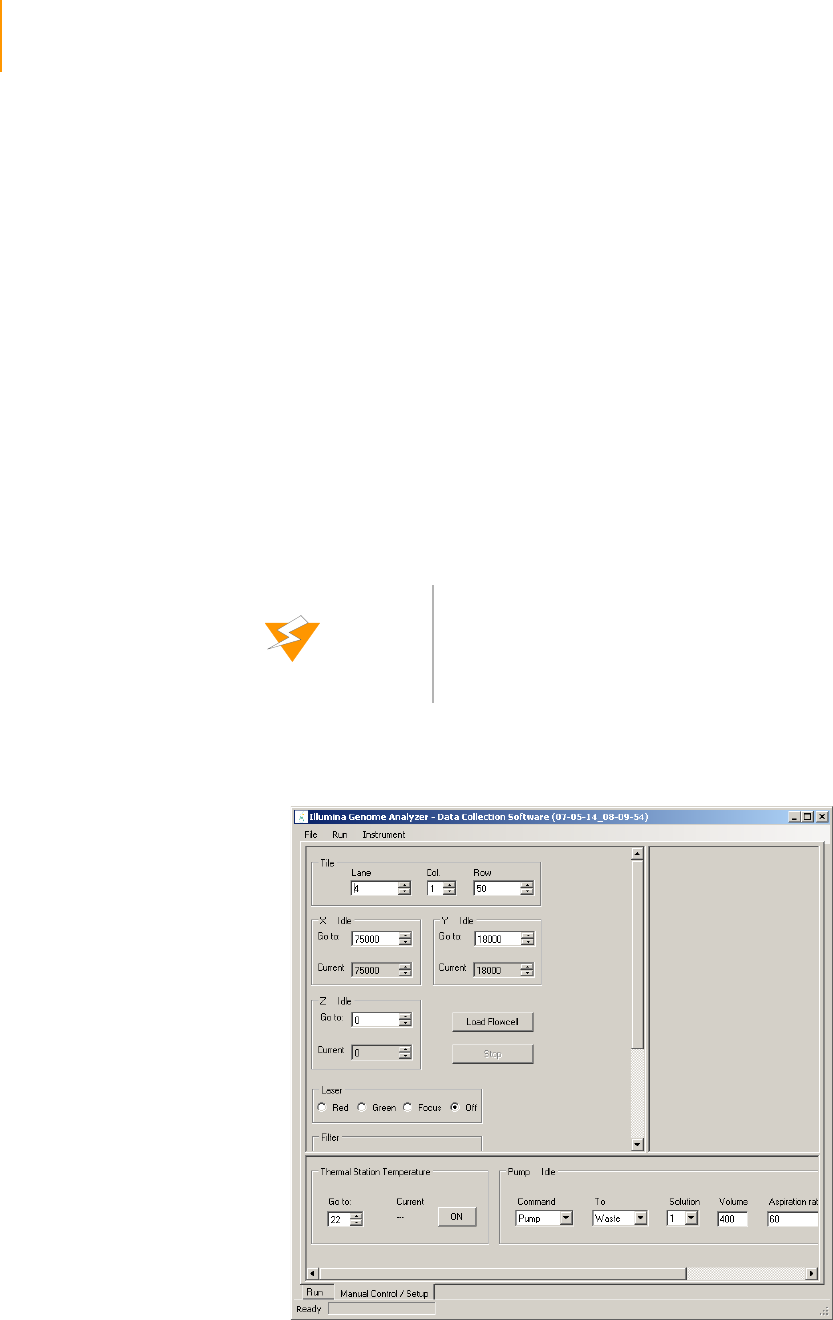
124 CHAPTER 4
Using the Genome Analyzer
Part # 1004571 Rev. A
Adjusting Focus
The Genome Analyzer uses a third laser to maintain focus for each tile over
the course of the run. In this section you will align the flow cell to the camera
and calibrate the system for best focus.
Default XYZ
Coordinates
When you initialize the Genome Analyzer, the lens orients itself using limit
switches inside the instrument. The default XYZ coordinates are identified in
the HCMConfig.xml file. These coordinates are specific to each machine and
are configured during installation. Generally, the coordinates are set so that
X=0 should put the left edge of lane 1 in the center of the screen. Y=0 puts
the objective at the forward most point of the flowcell. Z=0 should put the
clusters in focus.
The instructions in this section explain how to manually focus the instrument
so that the clusters are as sharp as possible. When you refocus and save the
new origin points, the coordinates in the HCMConfig.xml file are updated
and become the new defaults for that instrument.
Manual Controls In the Manual Focus step, you take photographs from different positions and
adjust focus along the Z axis as necessary.
Figure 75 Manual Control/Setup Window
WARNING
WARNING
Never transfer an HCMConfig.xml file to any other Genome
Analyzer. The coordinates will not be correct for that
instrument, and the lens, flow cell, or other equipment may
be damaged or broken when the lens returns to the home
position.

Adjusting Focus 125
Paired-End Sequencing User Guide
The following table describes the areas of the Manual Control/Setup window
that you use for manual focus.
Ta ble 1 6 Manual Controls
Area of the Screen Description
Tile Enter lane, column, and row coordinates to move the objective lens to a certain tile.
The XY center point for flow cells is typically Lane 4, Column 1, Row 25. This is in the
middle of the flow cell.
X/Y (μm) Shows the current position of the flow cell underneath the objective lens. Because of
minute variations between flow cells, you need to fine-tune the X value so that the
edge of lane 1 is at the center of the image after you load a new flow cell.
You can adjust the position by entering new values into the Go To fields and pressing
Enter. The laser remains stationary, and the flow cell moves underneath it.
All directions below are given as if you were standing in front of the instrument
compartment.
Increase X to move the laser toward the right of the flow cell (the stage moves toward
the left).
Increase Y to move the laser toward the back of the flow cell, near the output ports
(the stage moves toward the front). Note: You do not need to reset Y=0 unless there is
a significant hardware change, in which case an engineer will reset it.
After you set the X value correctly, re-zero the X coordinate using the Instrument | Set
Coordinate System menu.
Z (nm) Shows the current position of the objective lens relative to the flow cell. When you
insert a new flow cell, you need to refocus the lens by changing the Z position so that
the cluster images are sharp.
You can adjust the position by entering new values into the Go To boxes and pressing
Enter. The flow cell remains stationary, and the lens moves up and down. Increase Z
to move the lens away from the flow cell vertically. Decrease Z to move the lens closer
to the flow cell.
Ideally, the value of Z at the focal position should be zero (0). The farthest you can
safely move below the focal point is 40,000 nm (Z = -40000). The position of the flow
cell surface varies from one flow cell to another. Sometimes you have to move down
20,000 nm to find the focal plane of a new flow cell.
When you find the focus, re-zero the Z axis and perform Autofocus Calibration before
completing the run.
Note: The focal position on the Z axis must be higher than Z= -20,000 (as noted
above, it should ideally be zero), or the objective will not have enough room to move
down without hitting the flow cell while tracking focus position during the run.
Laser Controls which laser is used during the exposure.
Red laser—For use with A and C filters.
Green laser—For use with G and T filters.
Focus—Used by Illumina Technical Support and during autofocus calibration to
illuminate the focus spot.
Off (default)—Turns off the laser for the photo, using only ambient reflected light for
the photo. Support scientists sometimes use this to check the optical path.
Filter Moves the filter wheel to view only the light from a particular base (A, C, G, T). If you
select a filter base, the Laser must be set to the corresponding color (e.g., red for A).
If you selected the Focus laser, set Filter to None.
Camera Exposure—Lets you set the exposure time in milliseconds.
Take Picture—Click to take a picture using the current configuration.
Start Video—Click to display a series of images in a sequential loop (like a movie),
using the current configuration. Click the button again to stop the video.
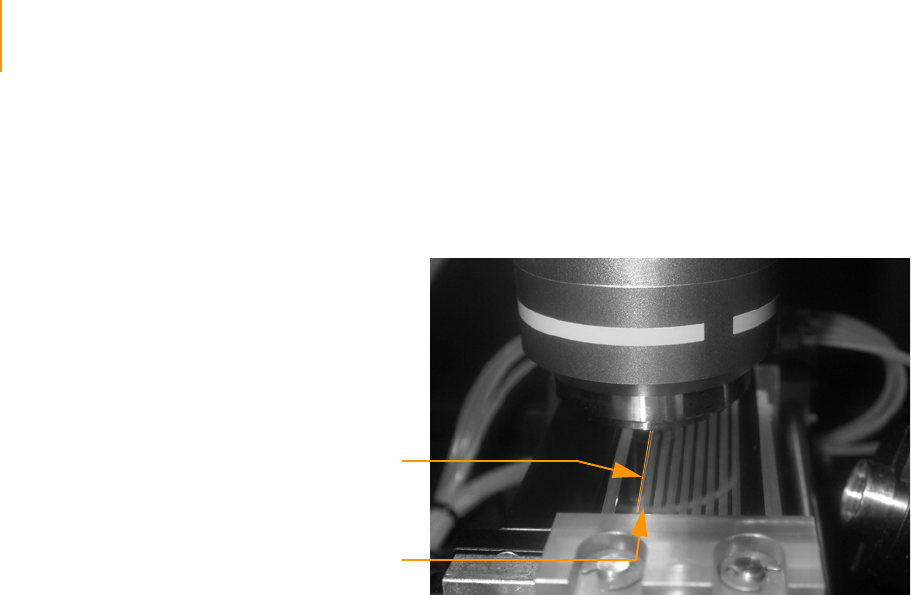
126 CHAPTER 4
Using the Genome Analyzer
Part # 1004571 Rev. A
Adjusting the
X Axis
First, you need to set the position of the flow cell along the X axis. The zero
point should be at the left edge of Lane 1, near the bottom of the flow cell
(Figure 76). This is done in five steps: Moving the Stage, Setting Initial Focus,
Finding the Left Edge, Confirming the Left Edge, and Setting Current X as
Origin.
Figure 76 Left Edge of Lane 1
Moving the Stage
The sequence of stage adjustments described below is recommended to
safely move the stage to the proper starting position, without running the risk
of hardware collision.
1. Click the Manual Control/Setup tab.
2. Set the Go To values in the X and Y areas as follows:
X (μm): 5000
Y (μm): 15,000
and press Enter.
This moves the stage to a position near the middle of the flow cell.
3. Set Z (nm): 0 (zero)
and press Enter.
This moves the objective stage close to the plane of focus prior to find-
ing the edge of the flow cell. This assumes that you reset the Z position
to zero when you focused it during the last run. For more information,
see Adjusting the Z Axis on page 133.
4. Set the Go To values in the X and Y areas as follows:
X (μm): 0 (zero)
Y (μm): 0 (zero)
This moves the objective stage to a position near the bottom left of the
flow cell. The left edge of Lane 1 is underneath the objective.
Lane 1
Left Edge
of Lane 1

Adjusting Focus 127
Paired-End Sequencing User Guide
Setting Initial Focus
You need to set the initial focus in channel T, so you can see the left edge of
Lane 1 as a sharp line. In a later stage, you will fine-tune the focus for all
channels (Adjusting the Z Axis).
The Genome Analyzer images a 760 x 720 μm tile. In order to improve the
ability to achieve focus and see images such as the ones below, use the zoom
tool to view a square of approximately 1/10 of the whole tile image.
1. Set the following values:
Laser: Green
Filter: T
Exposure (msec): 100
2. Right-click over the image and select Auto Scale | On.
3. Click Take Picture.
4. Use the descriptions here to decide in what direction to move the Z-axis.
Figure 77 Lens Too High
A distinct halo effect, especially around the smaller (less intense) clusters,
is characteristic of images acquired with the lens just above optimal focus
position. Lower the Z value.
Figure 78 Lens Too Low
NOTE
If the clusters in the image are too dim, increase the
exposure time to 200 msec. If the clusters are saturated
(mouse over cluster and see if intensity reads 4095), reduce
the exposure time.

128 CHAPTER 4
Using the Genome Analyzer
Part # 1004571 Rev. A
A uniform loss of sharpness and intensity is characteristic of images
acquired with the lens just below the optimal focus position. Increase the
Z value.
Figure 79 Lens Properly Positioned
Generally, start with a move no larger than 1000 nanometers.
Initial moves should use the full tile image until the clusters become distinct
points on the image. Subsequent moves can be smaller as you approach the
optimal focus position. Zoom in on the image for final adjustment.
5. Each time you move the Z position, take a new photo and check it. Once
the clusters come into focal range, the Z movements should be in the
range of 100–500 nm steps for each change.
6. Evaluate the image to determine whether first-base incorporation was
successful. You should see many clusters.
7. Do one of the following:
•If first-base incorporation failed, discontinue the run and perform the
post-run instrument wash (Post-Run Wash on page 155).
•If first-base incorporation was successful, continue with Finding the
Left Edge.
NOTE
If you see you are very far away from focus, you may use
2500 nm moves; make sure not to step over the focus.
NOTE
The left part of the image may be dark without any clusters
showing. This is to be expected, as this part lies outside of
lane 1 where no clusters have formed.
NOTE
Problems with focusing may be caused by too much oil.
Check whether the flow cell surface is dirty with oil; if so, you
need to remove and clean the prism and flow cell. Follow
the procedures described in Cleaning and Installing the
Prism on page 110; skip Performing First-Base Incorporation
on page 121 after reseating the prism and flow cell.
Remember to add fresh Scan Mix prior to taking pictures.

Adjusting Focus 129
Paired-End Sequencing User Guide
Finding the Left Edge
Now you are ready to set the position of the flow cell along the X axis.
1. Click Take Picture. To see the left edge, zoom out to the whole tile
image.
The edge of Lane 1 appears on the screen. The screen is 2048 x 2048
pixels in size, with each pixel representing approximately 371 nm. The
crosshair indicates the center of the image at (1024, 1024) pixels.
Figure 80 Crosshair at Center of Image
The left edge of Lane 1 should be close to the center of the image. To
identify the distance between the edge and the crosshair, use your
mouse to position the arrow over the edge of Lane 1. The pop-up win-
dow reveals the position of the arrow in pixels.
Figure 81 Left Edge of Lane 1 on the Screen
Edge of Lane
Edge of Lane
Crosshair
Edge of Lane
Edge of Lane
Crosshair

130 CHAPTER 4
Using the Genome Analyzer
Part # 1004571 Rev. A
2. If the edge is more than 3–5 pixels from the vertical crosshair, move the
stage in the X axis to bring the edge closer to the crosshair. Increase the
X value to move the edge of Lane 1 to the left; decrease it to move the
edge to the right.
Confirming the Left Edge
Next, you need to confirm that you have found the left edge of Lane 1.
1. Set the following values:
Laser: Green
Filter: None
Exposure (msec): 3
2. Click Take Picture.
The edge of Lane 1 should appear on the screen as a blurred, wide line
(Figure 82). The vertical crosshair should still be within 3-5 pixels of the
blurred edge.
Figure 82 Blurred Edge of Lane 1
NOTE
You cannot change the X origin by more than 1000 μm at a
time.
NOTE
If you do not see a blurred edge, or if the blurred edge is
not in close proximity to the crosshair, you may be imaging
the laser footprint edge. This indicates a misalignment in
the instrument, and needs to be corrected by Illumina Field
Service (for contact information, see Technical Assistance on
page 4).
Blurred Edge of
Lane
Crosshair

Adjusting Focus 131
Paired-End Sequencing User Guide
Setting Current X as Origin
Now you are ready to set the origin.
1. Select Instrument | Set Coordinate System | Set Current X as Origin.
2. Click OK to confirm that you want to reset the coordinates and XY drift.
This automatically adjusts the values in the HCMConfig.xml file. You will
adjust the XY drift (or rotation of the part about the Z axis) in Setting XY
Drift on page 131.
Adjusting the
Y Axis
Do not adjust the Y axis.
Only an Illumina Field Service Engineer should ever adjust the Y axis. This is
not necessary unless you replace a manifold, the XY stage, or the Z stage and
optical column.
Setting XY Drift If the flow cell is rotated about the Z axis, the lanes will not be aligned with X
at both ends of the lanes, and imaging may drift too far outside the lanes. To
prevent this, you need to set a drift correction factor to adjust the X
coordinate for each tile location.
Move the stage up in the Y axis to (0,35000) to find the left edge of lane 1 at
the outlet end of the lane, and set the drift as described below. The edge at
Y=35,000 is located the same way as the edge at Y=0 was found.
1. Set the Go To values in the X and Y areas as follows:
X (μm): 5000
Y (μm): 15,000
and press Enter.
This moves the stage to a position near the middle of the flow cell.
2. Set Z (nm): 0 (zero)
and press Enter.
This moves the objective stage close to the plane of focus prior to find-
ing the edge of the flow cell. This assumes that you reset the Z position
to zero when you focused it during the last run. For more information,
see Adjusting the Z Axis on page 133.
3. Set the Go To values in the X and Y areas as follows:
X (μm): 0 (zero)
Y (μm): 35,000
and press Enter.
This moves the stage to a position near the upper left of the flow cell.
The left edge of Lane 1 is underneath the objective.
NOTE
Do not skip the steps of aligning with a focused T image
first, because unless the Z is focused first, alignment is
meaningless.

132 CHAPTER 4
Using the Genome Analyzer
Part # 1004571 Rev. A
4. Set the following values:
Laser: Green
Filter: T
Exposure (msec): 100 (increase to 200 msec if the image is too dim)
5. Right-click over the image and select Auto Scale | On.
6. Click Take Picture.
The edge of Lane 1 appears on the screen. The screen is 2048 x 2048
pixels in size, with each pixel representing approximately 371 nm. The
crosshair indicates the center of the image at (1024, 1024) pixels. You
may need to adjust focus for the new tile location (see Setting Initial
Focus on page 127), since focus between tiles at opposite ends of the
flow cells may differ.
The left edge of Lane 1 should appear close to the center of the image.
To identify the distance between the edge and the crosshair, use your
mouse to position the arrow over the edge of Lane 1. The pop-up win-
dow will reveal the position of the arrow in pixels.
7. If the edge is more than 3–5 pixels from the vertical crosshair, move the
stage in the X axis to bring the edge closer to the crosshair. (Increase the
X value to move the edge of Lane 1 to the left; decrease it to move the
edge to the right.)
8. Select Instrument | Set Coordinate System | Set Current X as top-left
edge to determine XY drift.
9. The current Y is validated and the XY drift is computed. If the current Y
and the computed XY drift are within range, the operator is prompted
with a message box informing that “The drift was set to 0.nnnnn.” If one
of the values is out of range, perform the following:
•If the Y coordinate is not large enough an error message is displayed
to the operator, informing “Current Y=nnnnn is not far enough (min
= mmmmm) from the coordinate system origin.” Go back to step 1
and make sure you enter 35000 (thirty-five thousand) as Y value.
•If the drift is too large, the following error message is displayed:
“Flowcell XY Drift, resulting from TopLeftX = 333 and TopLeftY =
33333, exceeds allowed limit = 0.zzzz.” The flow cell has not been
registered correctly; check whether it is seated correctly against the
pins. If necessary, clean and reload the prism and flow cell as
described in Cleaning the Prism on page 111 and subsequent
sections.
CAUTION
The sequence of stage adjustments described above is
recommended to avoid any chance of hardware collision.
NOTE
For visual cues, see Figure 80 and Figure 81 in Adjusting
the X Axis on page 126.
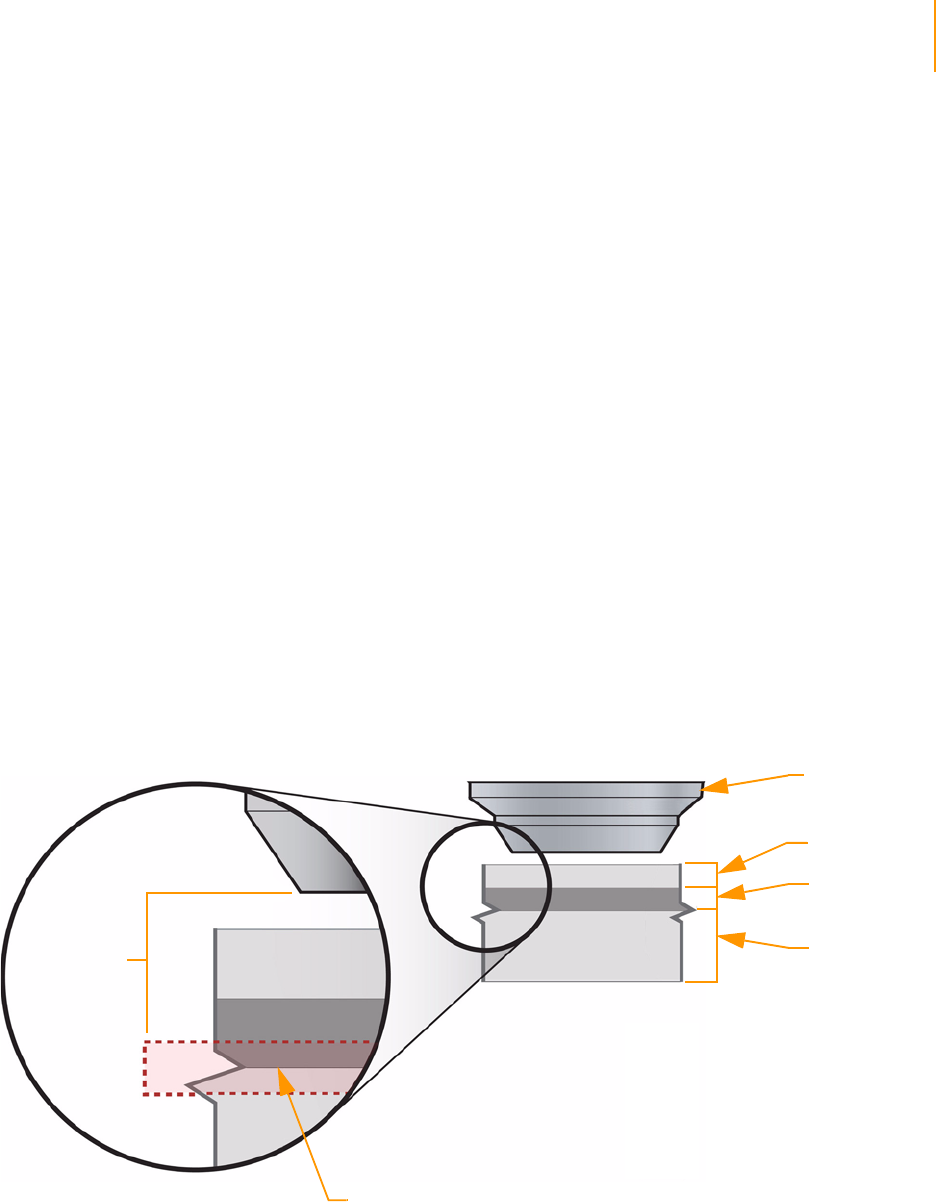
Adjusting Focus 133
Paired-End Sequencing User Guide
Confirming the
Footprint
In this section you will confirm that the footprint is properly aligned.
1. Set the following values:
Laser: Green
Filter: T
Exposure (msec): 100 (increase to 200 msec if the image is too dim,
decrease if the image is saturated)
2. Right-click over the image and select Auto Scale | On.
3. Go to lane 4, column 1, row 25. Take an image with the T filter. Adjust
focus if necessary.
The left side of the image should have a black band with no clusters; this
is the edge of the wall of the lane and will be cropped by the ROI. There
should not be a black band on the top, bottom, or right of the column 1
image; if there is, the footprint is not aligned properly.
4. Next, move to column 2 (same lane and row) and take an image.
Now, the black band without clusters should be on the right; no bands
should be on the top, bottom, or left; if there are, the footprint is out of
alignment.
If the footprint is misaligned, contact Illumina Field Service (for contact
information, see Technical Assistance on page 5).
Adjusting the
Z Axis
In this section, you take photos over Lane 4 to determine the optimal
position of focus for the flow cell using the Focus Quality (FQ) metric. You
should adjust the X axis and the XY drift before performing this procedure.
Figure 83 Focusing Z-Axis
Objective at
Height Z=0
300 μm
Wet Layer
100 μm
Glass Layer
700 μm
Flow Cell Cross-section
Cluster Surface
Focal Distance

134 CHAPTER 4
Using the Genome Analyzer
Part # 1004571 Rev. A
1. In the Tile area, set the coordinates to Lane 4, Column 1, Row 25. This is
the approximate center of the flow cell.
2. Find the best focus for channel A by recording the FQ values for a range
of Z positions:
a. Set the following values:
Laser: Red
Filter: A
Exposure (msec): 100 (increase to 200 msec if the image is too dim,
decrease if the image is saturated)
b. Right-click over the image and select Auto Scale | On
c. Click Take Picture.
d. Mouse over the image to see the FQ value, and record the FQ value
and Z position in the lab tracking worksheet.
e. Move the Z-position in increments of 200 nm, decreasing to 100 nm
as the focus improves (higher FQ value). Repeat steps c–d each time
you move the Z position.
f. When you are able to identify the peak FQ value, move the Z-stage
to the associated Z-position. Select Instrument | Set Coordinate
System | Set Current Z as Origin.
3. Find the optimal focus for channels A, C, G, and T by recording the FQ
values for a range of Z positions, and determining the Z position with the
highest combined FQ value.
a. Record the FQ values for channel A, C, G, and T by repeating steps
2c–d
—Channel A: Laser Red, Filter A.
—Channel C: Laser Red, Filter C.
—Channel G: Laser Green, Filter G.
—Channel T: Laser Green, Filter T.
CAUTION
Minimize the number and duration of exposures during
manual focus on a given tile. Photo bleaching will start to
diminish the intensity of the cluster signals after a few
seconds of total exposure.
NOTE
Typically, the center tile is used for setting the focus but you
may prefer to move closer to the start of imaging at Lane 1,
Column 1, Row 5.
Ensure that the calibration curve is of good quality and the
flow cell drift is less than 5,000 nm. This is calculated for you
by the First Cycle report from Run Browser. See First-Cycle
Report on page 168.
NOTE
Focus Quality has a dependence on cluster size and has a
“focused” optimum value from 74–85.

Adjusting Focus 135
Paired-End Sequencing User Guide
b. Move the Z stage 500 nm up and down in 100 nm steps. Take
pictures at every step, and record the FQ values and associated
Z positions for all channels.
c. Add up all four FQ values for every Z position in the last column of
the lab tracking worksheet.
d. Determine the Z position with the highest sum of FQ values. This is
the optimal Z-position.
e. Move the Z-stage to the optimal Z-position, and select Instrument |
Set Coordinate System | Set Current Z as Origin.
4. Proceed to Checking Quality Metrics on page 136.
NOTE
At the correct depth of focus, the FQ values will remain
stable with little change over a range of 500 nm. You should
calibrate auto focus and set Z=0 in the center of this 500 nm
range.
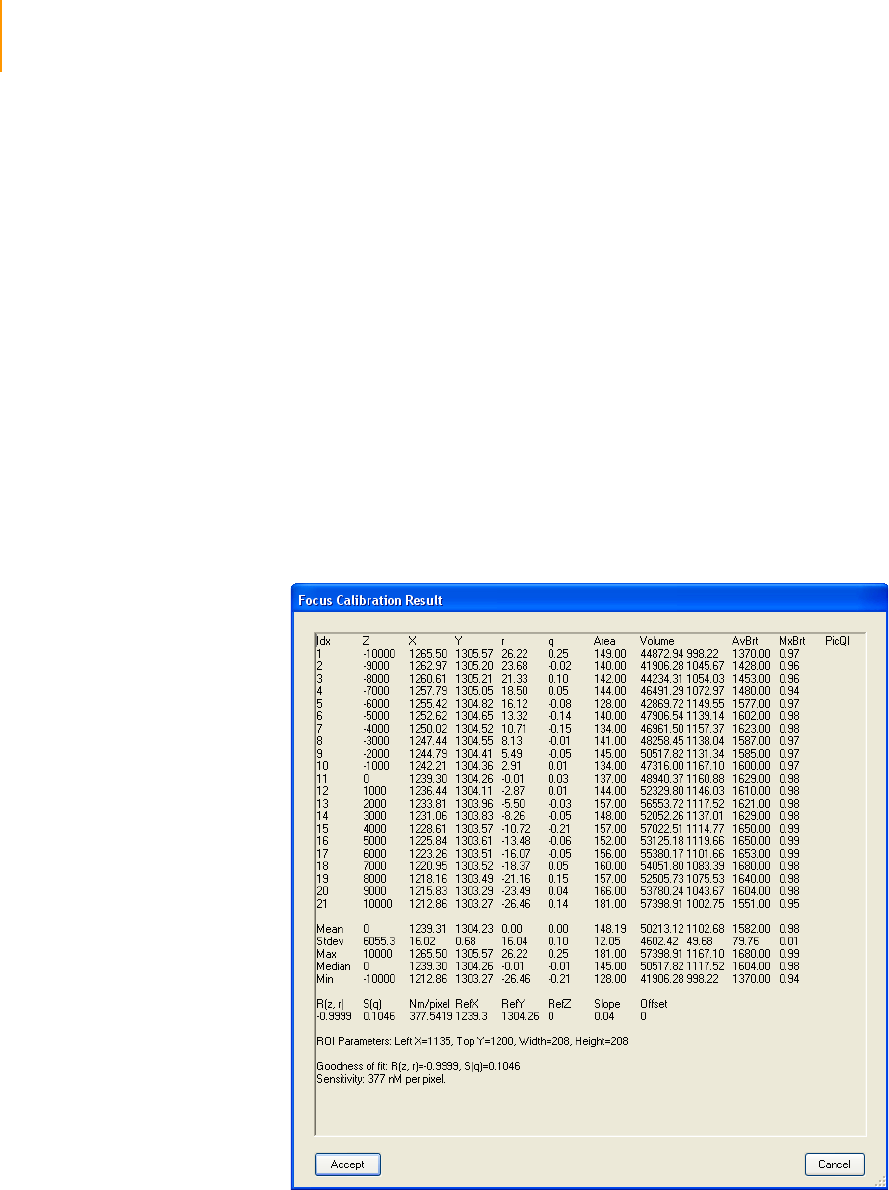
136 CHAPTER 4
Using the Genome Analyzer
Part # 1004571 Rev. A
Checking Quality Metrics
Performing
Autofocus
Calibration
In autofocus calibration, the system takes a series of photos and performs an
analysis that will enable it to focus correctly on each tile during the run. After
starting the calibration, all you need to do is watch for warnings in the Result
window.
1. Click the Run tab.
2. Highlight the UserWait step right before the “Incorporation” line in
Cycle 1, if it is not already selected.
3. Click Resume.
4. Click Yes at the prompt.
The software automatically performs an autofocus calibration based on
the Z value that you determined during manual focus.
5. After calibration, the following window appears, showing the calibration
values.
Figure 84 Autofocusing
6. Check the following specifications:
Goodness of fit: ≥0.9900
Absolute value of the sensitivity: 350–400.
A warning appears at the bottom of the window if either parameter is out
of range. You might see any of the following warnings:

Checking Quality Metrics 137
Paired-End Sequencing User Guide
•Warning: CurveFit received _____ images, expecting 21
•Warning: Sigma( q ) = _____ exceeds allowed threshold 0.5
•Warning: Correlation coefficient R( z, r ) = _____ is less than allowed
threshold 0.95
•Warning: Focus Calibration sensitivity is too low. Nm/pixel _____
exceeds allowed threshold 500.00
•Warning: Mean spot picture quality = _____ is less than allowed
threshold 0.90. Increase exposure.
7. Do one of the following:
•If both values are within the specified range, click Accept, and then
click OK at the prompt.
•If either or both of the values does not meet the specification, move
to another tile, refocus per Adjusting the Z Axis on page 133, and try
again.
•If the calibration fails again, remove the flow cell and prism. Clean
and reload the flow cell and prism, and check for leaks. Do not
repeat the first-base chemistry step. Instead, proceed directly to
Loading the Flow Cell with Scan Mix on page 123 and continue from
there.
•If the calibration fails again, consult Illumina Technical Support.
For additional information about autofocus calibration that will help you
determine whether to continue, run a Laser Spot Metric Report in Run
Browser. For instructions, see Running a Report on page 169; for an
explanation of the laser spot metrics, see Laser Spot Metrics: Measuring
Autofocus Performance on page 174.
8. Proceed to Checking Quality Metrics in IPAR on page 138.
Viewing Data in
Run Browser
Run Browser is a report tool that automatically generates and opens the first
cycle report after first-base incorporation. You should always load the run log
file(s) to assess the quality of the data and decide whether to continue the
run.
If you want to view the data in the Run Browser user interface, start Run
Browser manually as described in Checking First Cycle Results in the Flow
Cell Window on page 165. To view and analyze the data, and learn about
Run Browser, follow the instructions in Chapter 5, Run Browser Reports.
After analyzing first-base incorporation data, proceed to Completing Read 1
on page 139.
NOTE
Surface contamination is the most common cause for poor
autofocus calibration. For example, a little oil may have
gotten on the surface when you applied oil to the flow cell/
prism interface.

138 CHAPTER 4
Using the Genome Analyzer
Part # 1004571 Rev. A
Checking
Quality Metrics
in IPAR
Integrated Primary Analysis and Reporting (IPAR) is a tool that displays key
quality metrics in real time, so you can quickly decide whether or not to
complete the run. To view and analyze the data, and learn about IPAR, see
Chapter 6, Integrated Primary Analysis and Reporting.

Completing Read 1 139
Paired-End Sequencing User Guide
Completing Read 1
If you are satisfied with the results of the first-base incorporation, follow these
instructions to complete Read 1. A full sequencing run may take 48–72 hours.
Paired-end sequencing recipes are essentially identical to standard SBS
recipes with the important exception that they end with a deblock cycle and
the flow cell is then equilibrated in high salt buffer. This ensures any
fluorescent background is removed prior to sequencing Read 2. Failure to
use a paired-end recipe will result in a very high fluorescent background for
Read 2 and may also compromise the intensity of the second read, both of
which have a significant impact on data quality.
1. Depending on the method you are using, either resume the single-folder
recipe or open the two-folder recipe:
This step leaves the flow cell ready for Read 2 preparation by:
•Ending with a deblock cycle
•Flushing the flow cell with high salt buffer
2. Click Start.
3. When prompted, click OK to accept the name of the run folder. For more
information about run folders, see Appendix A, Run Folders.
4. When the Autofocus Calibration dialog box appears, click No (you have
already calibrated), and the Genome Analyzer resumes sequencing.
5. Observe the images in the second cycle to determine if they stay in
focus. If the focus is poor, stop the run and refocus before all of the
images are collected.
If you are using the single-folder recipe, the following prompt appears
when the run is complete: “Read 1 SBS Complete. Load Read 2 Prep
Reagents onto the Paired End Module. Click OK to Start Read 2 Prep.”
NOTE
During a run, the operator can pause or stop the run by
clicking Stop. The instrument is put into the “safe state.”
After pausing a run, the operator can resume it by clicking
Resume. The protocol is resumed from the selected recipe
item on the Recipe tab. If a run is stopped during imaging,
75 μl of Scan Mix must be pumped prior to resuming the
run.
Single-Folder Paired-Read Method Two-Folder Paired-Read Method
GA2-PEM_2x36_PE_v<#>.xml GA2_36Cycle_PE_v<#>.xml
NOTE
If the Genome Analyzer has been idle for several minutes,
stay with the imaging of the first 10 tiles to confirm focus is
good. If focus is off, redo manual focus on lane 4 as
described in Adjusting the Z Axis on page 133, and click Yes
when the Autofocus Calibration dialog box appears.

140 CHAPTER 4
Using the Genome Analyzer
Part # 1004571 Rev. A
Data Transfer for
Paired-End Runs
If you are using the two-folder paired-read method, your data must be
transferred to your network storage for data analysis after Read 1 is complete
and before starting the recipe for Read 2.
1. Check that all of the data from the Run Folder have been copied to your
network storage location, including:
a. Images
b. Focus images (if stored)
c. Log files
d. Configuration files
e. Calibration files
2. Confirm that all of the data has been transferred and checked.
3. Delete the Run Folder from the instrument data drive.
NOTE
The flow cell can safely be left on the Genome Analyzer in
High Salt Buffer for a period of three days after completion
of Read 1 and before beginning Read 2 preparation.
NOTE
Using the RoboCopy script to automatically copy files is
recommended over manually copying files.
CAUTION
Do not attempt to start the Read 2 recipe until the deletion
is complete. The disk space checking algorithm used by the
instrument software may produce an error.

Preparing Reagents for Read 2 Preparation on the Paired-End Module 141
Paired-End Sequencing User Guide
Preparing Reagents for Read 2 Preparation on the Paired-
End Module
This protocol describes how to prepare reagents for Read 2 preparation on
the Paired-End Module. The Paired-End Module is used to supply the Read 2
reagents to the Genome Analyzer via an external VICI valve.
All operations are performed on the Genome Analyzer.
`Primer Dehybridization
`Deprotection
`Resynthesis
`Linearization
`Blocking
`Primer Hybridization
Consumables
Illumina-Supplied
The following reagents and consumables are supplied with the Paired-End
Read 2 Cluster Generation Kit (boxes 2 and 4):
`0.1 N NaOH
`TE Buffer
`5X Deprotection Buffer
`Deprotection Enzyme
`Cluster Buffer
`10 mM dNTPs
`Bst DNA Polymerase
`Formamide
`10X Linearization 2 Buffer
`Linearization 2 Enzyme
`BSA
`Ultra Pure Water
`Blocking Enzyme A
`10X Blocking Buffer
`2.5 mM ddNTP
`Blocking Enzyme B
`Wash Buffer
`Hybridization Buffer
`Rd 2 PE Seq Primer
User-Supplied
`5 M Betaine solution
`250 ml MilliQ water (for washing the Paired-End Module)

142 CHAPTER 4
Using the Genome Analyzer
Part # 1004571 Rev. A
Procedure Reagent #21: Wash Buffer
1. Transfer 10 ml of wash buffer into a 15 ml Falcon tube.
2. Label the tube “Reagent #21.”
Reagent #19: 0.1 N NaOH
1. Transfer 4 ml of 0.1 N NaOH into a 15 ml Falcon tube.
2. Label the tube “Reagent #19.”
Reagent #20: TE Buffer
1. Transfer the TE solution into a 15 ml Falcon tube.
2. Label the tube “Reagent #20.”
Reagent #9: Deprotection Premix
1. Prepare the following solution in a 15 ml Falcon tube:
•Ultra Pure Water (1600 μl)
•5X Deprotection Buffer (400 μl)
The total volume should be 2000 μl.
2. Mix by pipetting up and down using a 1 ml tip.
3. Label the tube “Reagent #9.”
4. Place the tube on ice until you are ready to load it onto the Paired-End
Module.
Reagent #10: Deprotection Mix
1. Prepare the following solution in a 15 ml Falcon tube:
•Ultra Pure Water (1560 μl)
•5X Deprotection Buffer (400 μl)
2. Mix thoroughly by pipetting up and down using a 1 ml tip.
3. Add Deprotection Enzyme (40 μl).
The total volume should be 2000 μl.
4. Mix by pipetting up and down using a 1 ml tip.
5. Label the tube “Reagent #10” and place on ice until you are ready to
load it onto the Paired-End Module.
NOTE
All solutions for the Paired-End Module must be placed
in 15 ml Polypropylene Falcon tubes.

Preparing Reagents for Read 2 Preparation on the Paired-End Module 143
Paired-End Sequencing User Guide
Reagent #15: Formamide
1. Transfer 8 ml of Formamide into a 15 ml Falcon tube.
2. Label the tube “Reagent #15.”
Reagent #14: Cluster Premix
1. Ensure that the Cluster Buffer is completely thawed before use. Vortex
briefly if necessary.
2. Prepare the Cluster Premix in a 50 ml tube as follows:
•Ultra Pure Water (15 ml)
•Cluster Buffer (3 ml)
•5M Betaine (12 ml)
The total volume should be 30 ml.
3. Mix by gently inverting the tube five times.
4. Filter the Cluster Premix using a 0.2 μm cellulose acetate syringe filter
and a 30 ml syringe.
5. Transfer 10 ml of the filtered Cluster Premix into a 15 ml Falcon tube.
6. Label the tube “Reagent #14.”
Reagent #13: Bst Mix
1. Prepare the following solution in a 15 ml Falcon tube:
•Filtered Cluster Premix (10 ml)
•10 mM dNTP Mix (200 μl)
•Bst DNA Polymerase (100 μl)
The total volume should be 10.3 ml.
2. Mix by slowly pipetting up and down using a 10 ml pipette.
3. Label the tube “Reagent #13.”
4. Place the tube on ice until you are ready to load it onto the Paired-End
Module.
Reagent #17: Linearization 2 Buffer
1. Dilute the 10X Linearization 2 Buffer to a 1X concentration with Ultra Pure
Water as follows:
•Ultra Pure Water (1800 μl)
•10X Linearization 2 Buffer (200 μ)
The total volume should be 2000 μl.
2. Mix by pipetting up and down using a 1 ml tip.
NOTE
Save the remaining Cluster Premix to prepare the Bst Mix.

144 CHAPTER 4
Using the Genome Analyzer
Part # 1004571 Rev. A
3. Label the tube “Reagent #17.”
Reagent #11: Linearization 2 Mix
1. Mix the following on ice at all times into a 15 ml Falcon tube:
•Ultra Pure Water (1680 μl)
•10X Linearization 2 Buffer (200 μl)
•BSA (20 μl)
2. Mix thoroughly by pipetting up and down using a 1 ml tip. Do not vortex.
3. Add Linearization 2 Enzyme (100 μl).
The total volume should be 2000 μl.
4. Mix thoroughly, but gently, by pipetting up and down using a 1 ml tip.
5. Label the tube “Reagent #11.”
6. Keep on ice until you are ready to load it onto the Paired-End Module.
Reagent #18: 1X Blocking Buffer
1. Dilute the 10X Blocking Buffer to a 1X concentration in a 15 ml Falcon
tube as follows:
•Ultra Pure Water (4500 μl)
•10X Blocking Buffer (500 μl)
The total volume should be 5000 μl.
2. Mix by pipetting up and down using a 5 ml pipette.
3. Label the tube “Reagent #18.”
Reagent #12: Blocking Mix
1. Prepare the following reagents in a 15 ml Falcon tube and mix on ice at
all times:
•1X Blocking Buffer (1820 μl)
(Obtained from Reagent #18 tube)
•2.5 mM ddNTP (80 μl)
•Blocking Enzyme A (24 μl)
•Blocking Enzyme B (100 μl)
The total volume should be 2024 μl.
2. Mix by pipetting up and down using a 1 ml tip.
3. Label the tube “Reagent #12.”
4. Keep on ice until you are ready to load it onto the Paired-End Module.
NOTE
1820 μl of 1X Blocking Buffer will be used to prepare
Reagent #12 Blocking Mix.

Preparing Reagents for Read 2 Preparation on the Paired-End Module 145
Paired-End Sequencing User Guide
Reagent #16: Read 2 Sequencing Primer Mix
1. Prepare the following solution in a 15 ml Falcon tube:
•Hybridization Buffer (1492.5 μl)
•Rd 2 PE Seq Primer (7.5 μl)
The total volume should be 1500 μl
2. Mix by pipetting up and down using a 1 ml tip.
3. Label the tube “Reagent #16.”
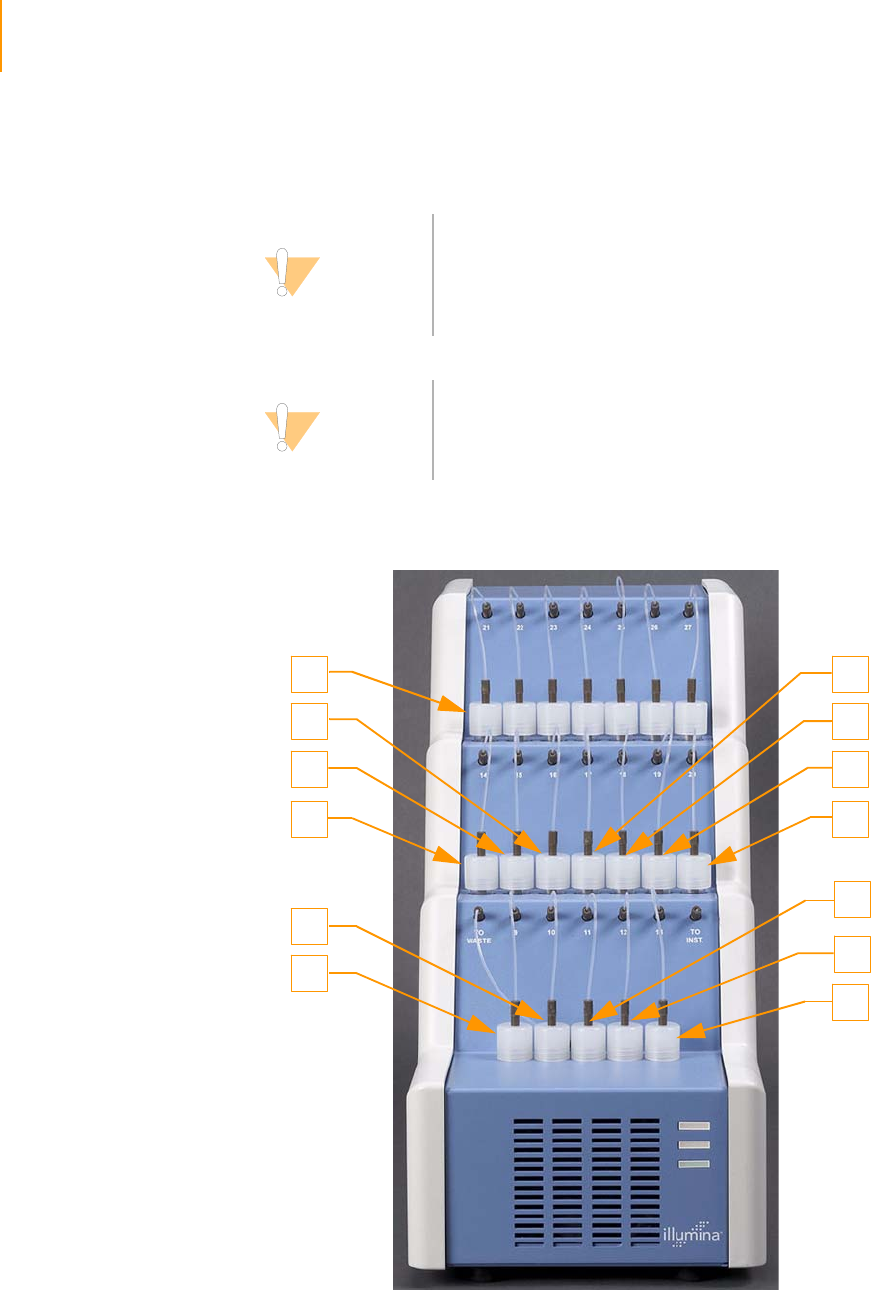
146 CHAPTER 4
Using the Genome Analyzer
Part # 1004571 Rev. A
Reagent Positions on the Paired-End Module
The following figure illustrates the reagent positions on the Paired-End
Module and the number associated with each position.
Figure 85 Reagent Positions on the Paired-End Module (Read 2)
CAUTION
When you prepare and load these reagents onto the Paired-
End Module and the Genome Analyzer, you must use them
the same day.
Exception: The High Salt Buffer does not need to be made
fresh for each sequencing run.
CAUTION
Ensure that all of the necessary software and configuration
settings changes have been made by the FSE or FAS during
the installation of the module prior to starting the first
paired-end sequencing run.
21
16
15
14
9
10
20
13
17
18
19
12
11

Reagent Positions on the Paired-End Module 147
Paired-End Sequencing User Guide
Loading Reagents
The following table identifies the position of each reagent used in the Paired-
End Module. Regardless of which recipe you use, the reagents always occupy
the same positions.
Whenever you add a reagent to one of the Paired-End Module tubes, label it
with the appropriate number as indicated.
Using the Paired-
End Module
1. Leave the flow cell mounted on the Genome Analyzer.
2. The Paired-End Module should be fitted and installed to port position 8
of the Genome Analyzer internal VICI valve prior to starting Read 1 of the
paired-end experiment.
CAUTION
It is essential to label all tubes correctly. Incorrect labeling
can cause errors in the chemistry and damage to samples.
Ta ble 1 7 Reagent Positions on the Paired-End Module and Read 2 Volumes
Position Reagent Initial Volume Expected Volume
After Priming
Expected Volume After
Read 2
9 Deprotection Premix 2000 μl 1400 μl 800 μl
10 Deprotection Mix 2000 μl 1400 μl 800 μl
11 Linearization 2 Mix 2000 μl 1400 μl 800 μl
12 Blocking Mix 2024 μl 1424 μl 304 μl
13 Bst Mix 10300 μl 9700 μl 5380 μl
14 Cluster Premix 10000 μl 9250 μl 4690 μl
15 Formamide 8000 μl 7250 μl 3890 μl
16 Read 2 Sequencing
Primer Mix 1500 μl 750 μl 150 μl
17 Linearization 2 Buffer 2000 μl 1250 μl 650 μl
18 1X Blocking Buffer 3180 μl 2430 μl 1830 μl
19 0.1 N NaOH 4000 μl 3250 μl 2050 μl
20 TE 3000 μl 2250 μl 1050 μl
21 Wash Buffer 10000 μl 9050 μl 3490 μl

148 CHAPTER 4
Using the Genome Analyzer
Part # 1004571 Rev. A
Preparing for Read 2 on the Paired-End Module
The software guides you through the steps for the automated preparation for
Read 2 on the Genome Analyzer with a Paired-End Module.
The Paired-End Module supplies all solutions to the flow cell. Temperature-
sensitive reagents are located in cooled reservoirs on the Paired-End
Module. After you finish preparing for Read 2, immediately begin Read 2
sequencing.
Prime the Paired-
End Module
The priming steps are performed automatically using the internal priming
pump on the Paired-End Module. The recipe primes each port position in
turn and dispenses the waste to the waste bottle, bypassing the flow cell.
Single-Folder Paired-Read Method
1. Connect tubes 9–21 to the corresponding port position on the Paired-
End Module.
2. Place the waste tube into the waste container.
3. Proceed to Prepare for Read 2. The single-folder recipe primes the
Paired-End Module as part of the Read 2 preparation step in the
protocol.
Two-Folder Paired-Read Method
1. Connect tubes 9–21 to the corresponding port position on the Paired-
End Module.
2. Place the waste tube into the waste container.
3. Open the PEM_R2Prime_<v#>.xml recipe.
4. Click Start.
The following prompt appears when priming is complete: “Priming
complete. Press Enter or click OK to proceed to Read 2 preparation.”
Prepare for Read 2
Preparation of Read 2 using the automated method takes approximately
4 hours and 20 minutes from the priming of the Paired-End Module. The
process is fully automated and can be left to run unattended.
Single-Folder Paired-Read Method
1. Click OK to resume recipe GA2-PEM_2x36_PE_v<#>.xml.
The recipe primes the lines and completes Read 2 preparation.
The following prompt appears when Read 2 preparation is complete:
“Read 2 Prep is complete. Load Read 2 SBS reagents onto the Genome
Analyzer.”
Two-Folder Paired-Read Method
1. Open the PEM_R2Prep_<v#>.xml recipe.
2. Click Start.
The following prompt appears when Read 2 preparation is complete:
“Flow cell rehybridized and ready for Read 2. Click OK to proceed.”

Preparing Reagents for Read 2 on the Genome Analyzer 149
Paired-End Sequencing User Guide
Preparing Reagents for Read 2 on the Genome Analyzer
Follow these instructions to prepare reagents before loading them onto the
Genome Analyzer. Required materials are provided in the 36-Cycle
Sequencing Kit v2.
Unpack and Thaw
Reagents
1. Remove the following reactive part components from -20°C storage and
thaw them at room temperature or in a beaker containing deionized
water. Do not microwave.
•IMX36
•FFN36
•SMX36
If you use the beaker method, make sure the water line does not reach
the cap of the tube to prevent contamination.
Leave the SDP36 in -20°C storage until you are ready to use it to make
the Incorporation Mix.
2. Remove the CMX36 from -20°C storage and thaw it at room temperature
or in a separate beaker containing deionized water. Do not microwave. If
you use the beaker method, make sure the water line does not reach the
cap of the tube to prevent contamination.
3. Record the lot numbers of each reagent on the lab tracking worksheet.
4. Immediately after the reagents have thawed, place them on ice. Be sure
to keep the CMX36 in a separate ice bucket during reagent preparation.
5. If the components from Box 1 are still frozen, thaw them in a container of
deionized water.
Procedure
IMX36
Required Materials:
`FFN36
`IMX36
`SDP36
CAUTION
When you prepare and load reagents onto the Genome
Analyzer, you must use them in a sequencing run the same
day.
CAUTION
It is important to keep the CMX away from the other
components to avoid cross-contamination.
CAUTION
After handling the CMX container, be sure to discard your
gloves and replace them with a new pair each time.

150 CHAPTER 4
Using the Genome Analyzer
Part # 1004571 Rev. A
1. Transfer 1.75 ml of the FFN36 into the IMX36.
2. Remove the SDP36 tube from -20°C storage and briefly pulse centrifuge.
3. Transfer 220 μl of SDP36 to the IMX36 reagent (containing FFN36).
4. Cap the IMX36 (containing FFN36 and SDP36) tube tightly and invert five
times to mix.
5. Centrifuge at 1,000 xg for 1 minute at 22°C.
6. Place the IMX36 on ice until you are ready to load it onto the Genome
Analyzer.
7. Record the weight of the reagent in the lab tracking worksheet.
PR1
1. Invert the bottle of PR1 several times before loading it onto the Genome
Analyzer.
2. Record the lot number of the reagent on the lab tracking worksheet.
3. Record the weight of the reagent in the lab tracking worksheet.
PR2
1. Invert the bottle of PR2 several times to mix before loading it onto the
Genome Analyzer.
2. Record the lot number of the reagent on the lab tracking worksheet.
3. Record the weight of the reagent in the lab tracking worksheet.
PR3
1. Invert the bottle of PR3 several times before loading it onto the Genome
Analyzer.
2. Record the lot number of the reagent on the lab tracking worksheet.
3. Record the weight of the reagent in the lab tracking worksheet.
SMX36
1. Invert the SMX36 tube several times to mix well, and then centrifuge at
1,000 xg for 1 minute at 22°C before loading it onto the Genome
Analyzer.
2. Record the weight of the reagent in the lab tracking worksheet.
3. Place the SMX36 on ice until ready to load onto the Genome Analyzer.
CMX36
1. Invert the CMX36 tube several times to mix well, and then centrifuge at
1,000 xg for 1 minute at 22°C before loading it onto the Genome
Analyzer.
2. Record the weight of the reagent in the lab tracking worksheet.

Preparing Reagents for Read 2 on the Genome Analyzer 151
Paired-End Sequencing User Guide
3. Place the CMX36 in a separate ice bucket until you are ready to load it
onto the Genome Analyzer.
4. Discard your gloves and replace them with a new pair.
PW1
1. To prepare for the Genome Analyzer pre-run wash, aliquot 40 ml of PW1
into four 125 ml Nalgene bottles.
2. Aliquot 10 ml of PW1 into three 50 ml conical tubes.
See Performing a Pre-Run Wash on page 105 for pre-run wash instructions.
CAUTION
When you load the reagents onto the Genome Analyzer,
load the CMX last to avoid cross-contamination.
NOTE
Be sure to perform a pre-run wash before loading reagents
onto the Genome Analyzer.

152 CHAPTER 4
Using the Genome Analyzer
Part # 1004571 Rev. A
Sequencing Read 2
Single-Folder Paired-Read Method
1. Exchange the reagents used for Read 1 with fresh reservoirs from the
reagents supplied in the SBS Sequencing Kit.
2. Replace all the reagent tubes on the Paired-End Module with Falcon
tubes with at least 10 ml of MilliQ water.
3. Click OK to resume the GA2-PEM_2x36Cycle_PE_v<#>.xml recipe and
start first-base incorporation for Read 2.
When the first-base incorporation is complete, the following dialog box
appears: “Read 2 first base incorporation chemistry is complete. Press
OK to continue. To perform manual focus and first base evaluation, press
Cancel.”
“To use the existing calibrated focus, click OK to start imaging (the flow
cell will automatically be flushed with Scan Mix). If you wish to refocus
manually, click Cancel.”
4. Click OK to accept the current calibrated focus and resume sequencing
Read 2. The flow cell will automatically be flushed with Scan Mix
(solution 3).
If you wish to refocus manually, perform the following:
a. Click Cancel.
CAUTION
Do not turn off or re-initialize the Genome Analyzer as the X
and Y stage coordinates will be lost, resulting in the inability
to co-localize the two reads.
Do not make any changes to the map or configuration files
between reads. This may result in the inability to co-localize
the two reads.
NOTE
The flow cell does not require remounting or cleaning and
the leak test is not necessary.
CAUTION
Waste produced during Read 2 preparation on the Paired-
End Module must be kept separate from waste produced
during Read 2 sequencing on the Genome Analyzer. Waste
from the Paired-End Module must be disposed of properly
and in accordance with facility standards.
CAUTION
Do not reprime reagents through the flow cell.

Sequencing Read 2 153
Paired-End Sequencing User Guide
b. To load the flow cell with Scan Mix, click the Manual Control/Setup
tab.
c. In the Pump area, set the values as follows to pump Scan Mix:
Command: Pump
To: Flowcell
Solution: 3
Volume: 100
Aspiration Rate: 250
Dispense Rate: 2500
d. With the cursor in the Dispense Rate box, press Enter.
e. Perform manual focus and recalibrate the autofocus laser. See
Adjusting Focus on page 124 for instructions.
f. Click OK to resume sequencing Read 2.
When imaging is complete, the following prompt appears: “Please
evaluate the first base report data for Read 2. Click OK to proceed to first
cycle imaging, or Cancel to stop.”
5. Click OK to complete the sequencing of Read 2.
Two-Folder Paired-Read Method
1. Exchange the reagents used for Read 1 with fresh reservoirs from the
reagents supplied in the SBS Sequencing Kit.
2. Open the GA2_FirstBase_v<#>.xml recipe.
3. Click OK to run the recipe.
The software automatically makes a copy of the recipe file and stores it in
the current run folder. If you need to stop work at any point, you can
reopen the recipe from that location and continue from where you left
off.
When the first-base incorporation is complete, the following dialog box
appears: “First base incorporation chemistry is complete. Press OK to
continue. To perform manual focus and first base evaluation, press
Cancel.”
4. Click Cancel to dismiss the Autofocus Calibration dialog box.
The next step is to apply Scan Mix, and then determine the focal plane of
the flow cell. This enables the software to automatically adjust the focus
during the run.
CAUTION
Do not reprime reagents through the flow cell.
NOTE
In the two-folder workflow, the focus calibration from the
first read can be used for the second read. You must
introduce Scan Mix, but not re-calibrate focus. This is
possible only if the Genome Analyzer or the software has
not been restarted in between the two reads.

154 CHAPTER 4
Using the Genome Analyzer
Part # 1004571 Rev. A
5. Load the flow cell with Scan Mix.
a. Click the Manual Control/Setup tab.
b. In the Pump area, set the values as follows to pump Scan Mix:
Command: Pump
To: Flowcell
Solution: 3
Volume: 100
Aspiration Rate: 250
Dispense Rate: 2500
c. With the cursor in the Dispense Rate box, press Enter.
6. Perform manual focus and recalibrate the autofocus laser. See Adjusting
Focus on page 124 for instructions. Reset only the Z axis as needed. Do
not adjust the X axis or XY tilt.
7. Click OK to resume Read 2 sequencing.
8. Open the GA2_36Cycle_PE_v<#>.xml.
9. Click OK to complete the sequencing of Read 2.
CAUTION
It is critical to introduce Scan Mix to the flow cell before
adjusting the focal plane.

Performing Post-Run Procedures 155
Paired-End Sequencing User Guide
Performing Post-Run Procedures
When the run is complete, notify the appropriate personnel that data are
available for analysis.
Weigh Reagents Weighing reagents when a run is complete measures reagent consumption
and fluidics performance.
1. Weigh all of the reagent bottles and record the results in the lab tracking
worksheet.
2. Weigh all of the fluids that have been pumped through the eight lanes
and record the results in the lab tracking worksheet.
Post-Run Wash
After completing Read 2, you must perform a thorough instrument wash. The
wash flushes 4 ml of wash solution through each reagent port on the
Genome Analyzer and 1 ml through each reagent port on the Paired-End
Module. Run time is approximately 45 minutes. Perform post-run washes
immediately after a run so that they do not interfere with the next run setup.
1. Load the instrument with the bottles and tubes containing PW1 that were
used for the pre-run wash as follows:
50 ml conical tubes with 10 ml of PW1 for port positions 1, 6, and 3
125 ml bottles with 40 ml of PW1 for port positions 4, 5, and 7
(Position 2 already has a bottle containing PW1 attached).
2. Place at least 5 ml of MilliQ water in each Falcon tube in positions 9–21
on the Paired-End Module.
3. Bundle all waste tubes with parafilm, making sure to keep the ends even.
4. Place the bundled tube ends into a pre-weighed 50 ml conical tube.
5. Click the Run tab.
6. Select File | Open Recipe.
7. Open the GA2-PEM_PostWash_v<#>.xml recipe.
This recipe washes the Genome Analyzer and the Paired-End Module.
8. Click Start and enter a file name.
The wash cycle runs for approximately 60 minutes.
CAUTION
At the end of the second read, both the Paired-End Module
and Genome Analyzer must be washed.
CAUTION
Rotate the tubes while holding the caps stationary to
prevent crimps and twisting in the liquid delivery lines.

156 CHAPTER 4
Using the Genome Analyzer
Part # 1004571 Rev. A
CAUTION
Using wash reagents other than the PW1solution in the
Sequencing Kit, or failing to perform the wash cycle at the
recommended intervals, may void the warranty.

Paired-End Sequencing User Guide 157
Chapter 5
Run Browser Reports
Topics
158 Introduction
158 User Interface
159 Flow Cell Window
159 Launching Run Browser
161 Using the Flow Cell Window
165 Checking First Cycle Results in the Flow Cell Window
168 Report Window
168 Report Types
169 Running a Report
172 Cluster Metrics: Measuring Cluster Quality
172 Focus Metrics: Measuring Image Quality
174 Laser Spot Metrics: Measuring Autofocus Performance
175 Other Metrics
176 Metric Deviation Report Window
177 Cycle-to-Cycle Metrics: Measuring Quality Deviations

158 CHAPTER 5
Run Browser Reports
Part # 1004571 Rev. A
Introduction
Run Browser is a utility that lets you assess the quality of run data on a
workstation with access to the run folder on the server, without the need to
perform a complete Pipeline analysis. You can view the data quickly in a
summary window, or generate reports that you can print, save, or export.
Run Browser’s primary function is to provide a graphical view of run metrics,
so that you can decide whether or not to complete the run. By default, Run
Browser automatically launches the First Cycle Report after the completion of
first-base incorporation and the Quality Metric Deviation Report at the
conclusion of a normal recipe.
Run Browser uses the following file:
`s_#_##_bro.xml
`RunLog_MM-DD-YY_HH-MM-SS.xml
User Interface The Run Browser has five main windows:
`The Flow Cell window provides a graphical interface for quickly
gathering data and seeing it in color with interactive tooltips.
`The Report window enables you to create textual reports on the same
data.
`The Metric Deviation Report window summarizes significant cycle-to-
cycle deviations of key QC values, so that problematic cycles in the run
can be identified.
`The ImageViewer displays the image for a selected tile, if available.
`Chart Windows, which allow you to monitor run quality selected tiles.

Flow Cell Window 159
Paired-End Sequencing User Guide
Flow Cell Window
Launching Run
Browser
Automatically
During installation, Run Browser is configured to automatically generate and
open the first cycle report after first-base incorporation, and the Quality
Metric Deviation Report at the end of a normal recipe. If you want to view the
data in the Run Browser user interface, start Run Browser manually as
described below.
Manually
If you wish to launch Run Browser manually at any point:
`Navigate to c:\Illumina\SCS<version>\RunBrowser\bin\Release and
double click RunBrowser.exe.
Illumina recommends that the Run Browser not be run on the instrument PC
while data collection is in progress, and that it doesn’t share the run folder on
the instrument PC. Instead, Run Browser should be run on any other available
workstation with access to the run folder on the server.
Open Log Files
1. Select File | Open.
2. Navigate from the workstation running Run Browser to the following
location on the server with the run folder:
•If you ran a First Base recipe:
Illumina\SCS<version>\bin\Service\<DateTimeStamp>\
•If you ran a Normal Recipe:
Runs\<run folder>\
3. Open the log files from the recent run (Ctrl- or Shift-select to select more
than one file).
Figure 86 Open Log File at the Normal Recipe folder location
It may take a few moments for the tiles to load. A progress bar in the
lower-left hand corner indicates log file loading progress and the number
of files loaded. If IPAR-produced *.bro files exist in <$Run-
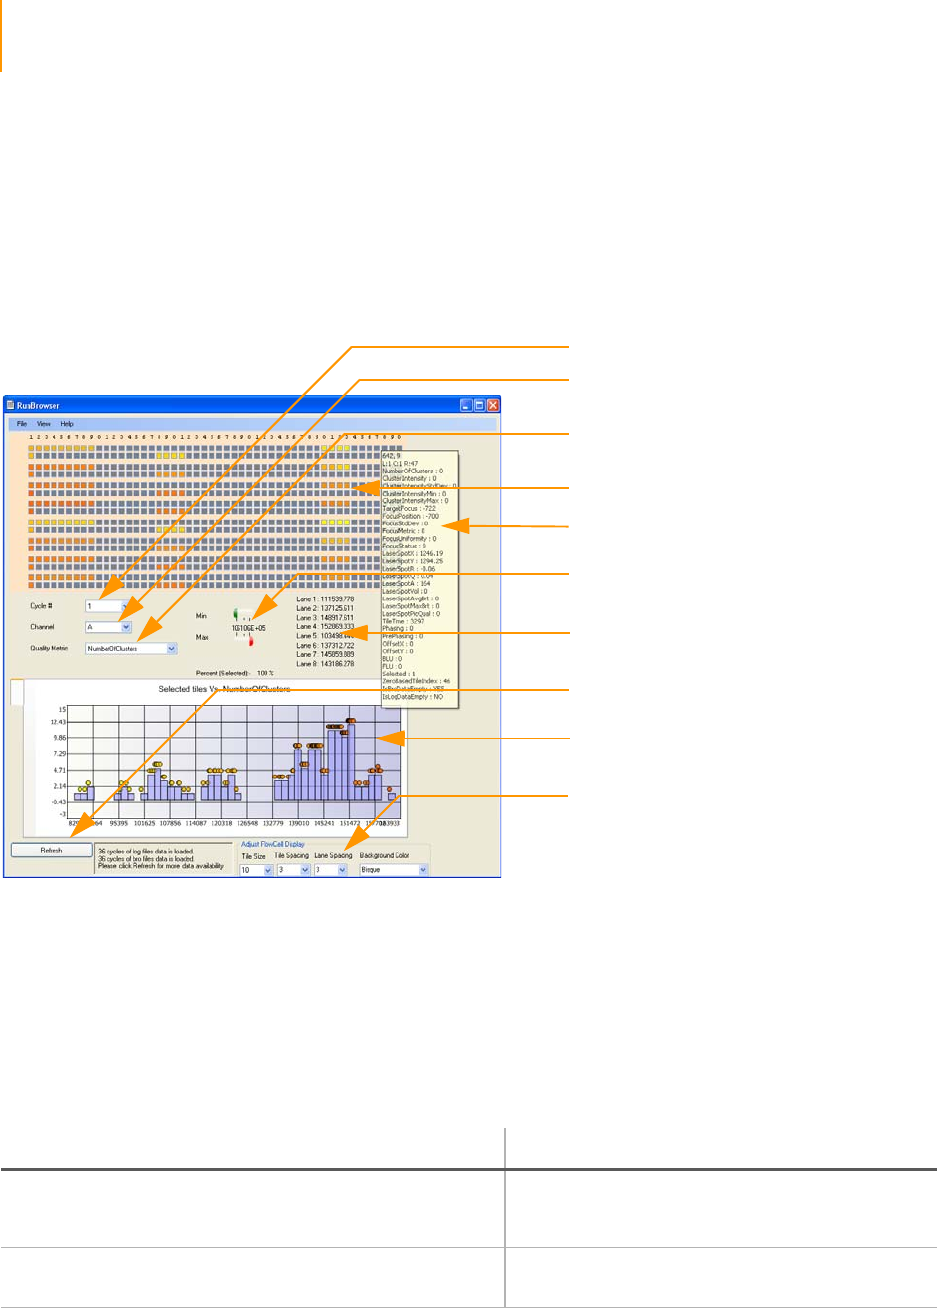
160 CHAPTER 5
Run Browser Reports
Part # 1004571 Rev. A
Folder>\data\runbrowser\, those will be loaded automatically for the
cycles whose log files have been opened.
4. The data from the run appear in the Flow Cell window, along with a map
of the flow cell. Select all tiles on the map of the flow cell by using the
right button of your mouse.
You can check data in this window by selecting different quality metrics
and mousing over the flow cell to see values for each tile (see Using the
Flow Cell Window on page 161).
Figure 87 Flow Cell Window
Changing Automatic Launch Settings
If you wish to change the automatic launch settings, do the following:
1. Navigate to C:\Illumina\SCS<version>
2. Open RunConfig.xml in a text editor.
3. Edit the following parameters:
If you do not want Run Browser to display, export a report, or show the report
automatically, do the following:
Cycle # (1-n)
Image Channel
(A, C, T, G)
Quality Metric Listbox
(select metric to view)
Map of Flow Cell
Tool Tip with Metric
Information per Tile
Lane Mean Values for
Selected Quality Metric
Min/Max Slide Controls
for Flow Cell Map Colors
Histogram of Quality Metric
for Selected Tiles
Drop down menus to adjust
tile size, tile spacing, lane
spacing, background color
Refresh for most recent
data written by SCS
Setting Description
<RunBrowserExe>C:\Illumina\SCS<version>\RunBr
owser\bin\Release\RunBrowser.exe</
RunBrowserExe>
Sets the path to the Run Browser executable.
<EnableRunBrowserAutoLaunch>true</
EnableRunBrowserAutoLaunch> Determines whether Run Browser launches
automatically.

Flow Cell Window 161
Paired-End Sequencing User Guide
1. Navigate to <install directory>\Illumina\RunBrowser_v[#]\bin\Release
2. Open RunConfig.xml in a text editor.
3. Edit the following parameters:
Using the Flow
Cell Window
Refreshing Run Browser Data
Run Browser has a Refresh feature in the bottom-left corner of the Flow Cell
Window (Figure 87). Run Browser is able to load a log file that is currently
being written by the SCS software; clicking Refresh loads the most recent
data. In addition, if any new log files are added, one click on Refresh loads
those new files into Run Browser.
Browse Loaded Metric Data
Using the drop down menus named Cycle #, Channel, and Quality Metric
(see Figure 87), you are able to navigate to the data of a certain cycle, certain
channel and certain quality metric. Hovering the mouse over a tile on the
flow cell map will show the data for a particular tile on the tool tip.
Change Flow Cell Display
You can adjust minimum and maximum values of quality metrics below which
and beyond which color of tiles should be green and red respectively (Figure
87, Min/Max Slide Controls for Flow Cell Map). The color of those tiles that
have metric values in between minimum and maximum are calculated and
updated accordingly.
Dropdown lists at the bottom of the Run Browser window let you change tile
size, tile spacing, lane spacing, and background color of the flow cell map.
ImageViewer
Once data are loaded into Run Browser, you can view images by double-
clicking a tile on the flow cell map (Figure 88). ImageViewer displays the
image if it exists for that tile for the selected cycle.
The image captured by the camera has a dynamic range of 12 bits per pixel
(range of 0–4095), while the monitor displays a range of 8 bits (range of 0–
255). The ImageViewer will autoscale the image that is chosen, setting the
Maximum intensity value as 255 and the Minimum value as 0. You can
customize the sensitivity of the image in the following ways:
`The sliders allow you to contrast portions of the image:
•By reducing the Max slider, you can differentiate darker portions of
the image (at the expense of saturating the higher intensity pixels).
•By increasing the Min slider, you can differentiate brighter portions of
the image (at the expense of losing the lower intensity pixels).
Setting Description
<ShowRunBrowser>false</ShowRunBrowser> Does not open the Run Browser user interface automatically.
<ExportReport>false</ExportReport> Does not export the Run Browser report automatically.
<ShowReport>false</ShowReport> Does not open the Run Browser report automatically.
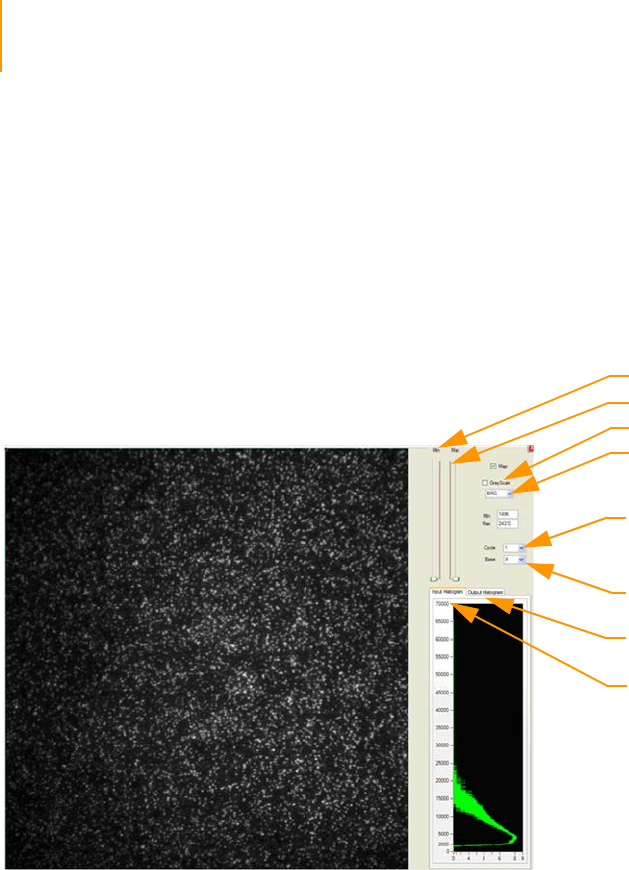
162 CHAPTER 5
Run Browser Reports
Part # 1004571 Rev. A
`Deselecting the GrayScale checkbox gives two more options:
•The BGR color setting improves viewing of lower intensity contrasts.
•The RGB color setting improves viewing of higher intensity contrasts.
In addition, ImageViewer displays two histograms that help you judge the
images. The input histogram displays the raw intensity value of the pixels on
the Y axis and the number of pixels in base 2 logarithmic scale on the X axis.
The output histogram displays the 8-bit adjusted values. Note that the
number of pixels will increase or decrease based upon the adjustment of the
Min/Max sliders.
Figure 88 ImageViewer
Histogram of Selected Quality Metrics
You can display selected quality metrics for selected tiles in the histogram at
the bottom of the Flow Cell window. Select the desired cycle, channel and
quality metric, then click and drag the mouse to select a section of the flow
cell in the flow cell map. Release the mouse button to plot a histogram of the
selected quality metric for the selected tiles. Tiles appear as circles on the
chart and have tool-tip information available.
Select
Channel
Min Slider
Select Cycle
Output
Histogram
Input
Histogram
Max Slider
BRG/RGB
GrayScale
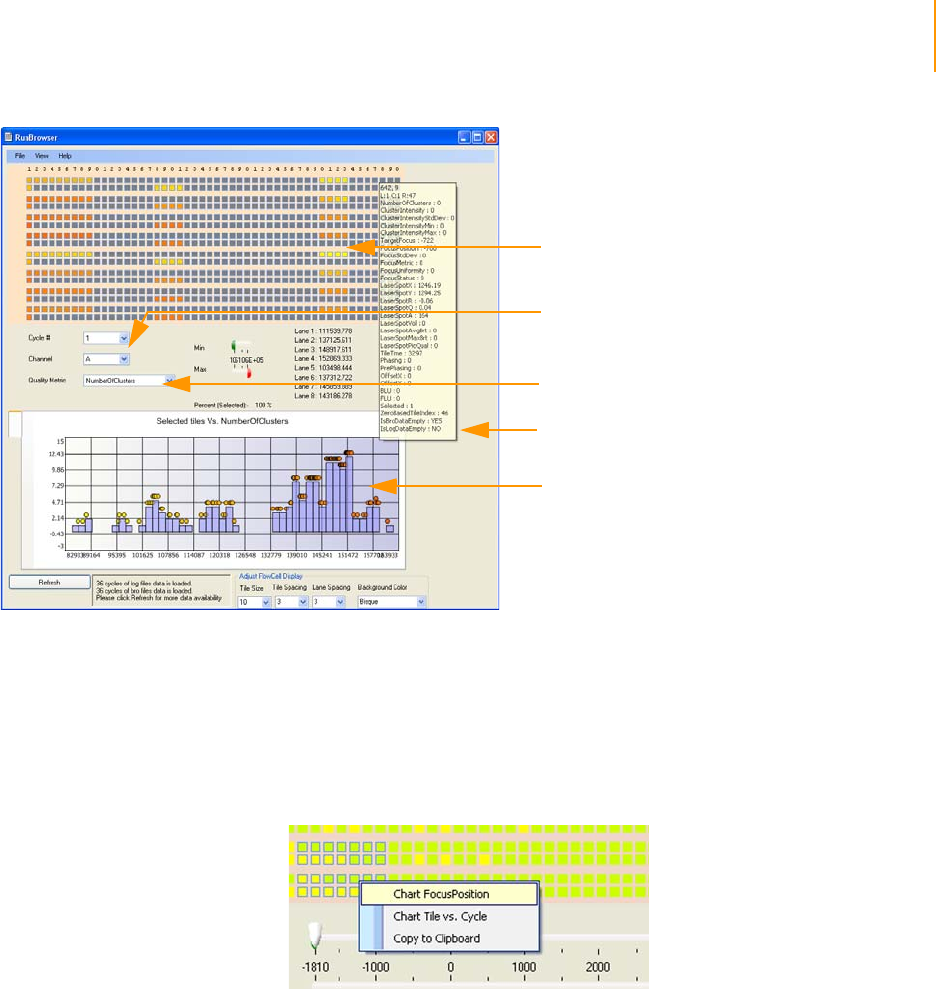
Flow Cell Window 163
Paired-End Sequencing User Guide
Figure 89 Histogram of Selected Quality Metrics.
Charts for Selected Tiles
You can generate two additional charts for selected tiles to monitor run
quality. Click and drag the mouse to select a section of the flow cell in the
flow cell map. Right click to view the context menu on the flow cell map,
which lets you plot two types of graphs or copy the flow cell map graphic
into the clipboard.
Figure 90 Select Tiles and Chart
Chart FocusPosition plots the focus position against selected tiles, for
different cycles (Figure 91).
Select cycle and
channel
Select quality metric
Resulting histogram of
quality metric for
selected tiles
Select tiles
Tooltip information
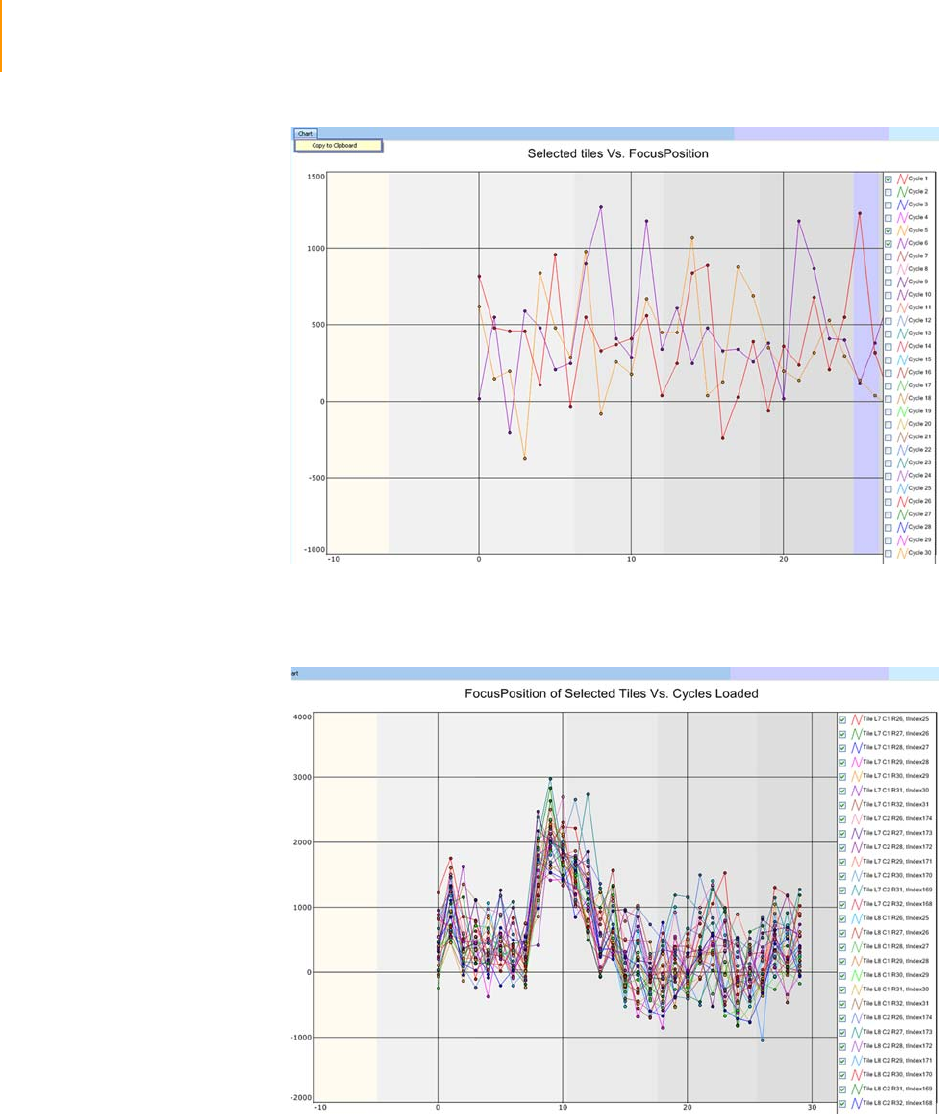
164 CHAPTER 5
Run Browser Reports
Part # 1004571 Rev. A
Figure 91 Chart FocusPosition
Chart Tile vs. Cycle plots the focus position against selected cycles, for
different tiles (Figure 92).
Figure 92 Chart Tile vs. Cycle
The charts have a Copy to Clipboard feature. This feature can be useful for
copying graphics into a presentation.
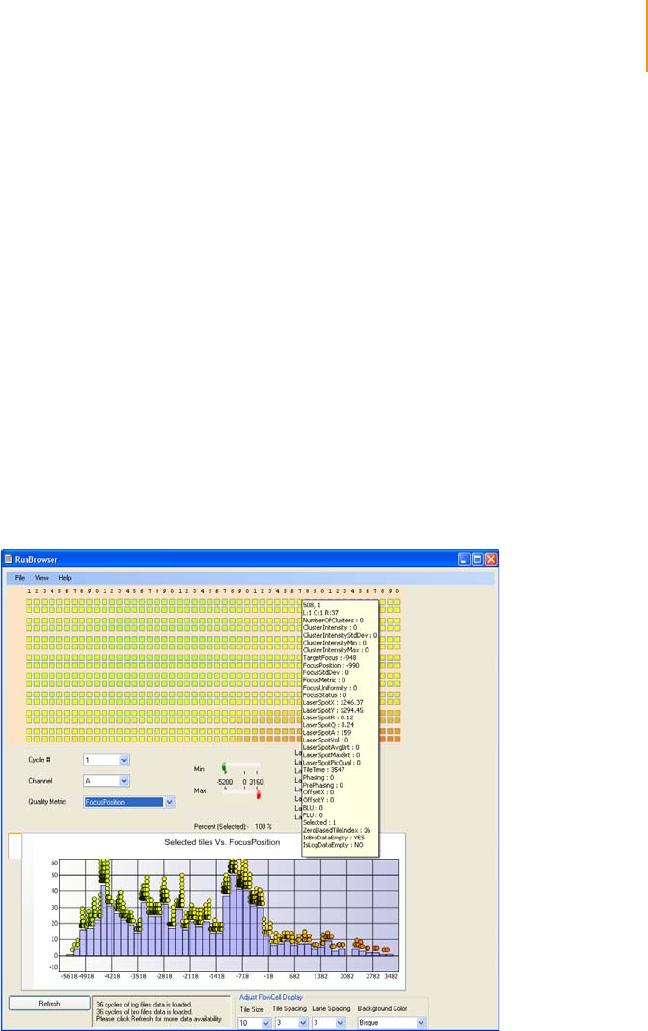
Flow Cell Window 165
Paired-End Sequencing User Guide
Checking First
Cycle Results in
the Flow Cell
Window
This section explains how to check some useful first-base incorporation
metrics in the Flow Cell window. You should also generate a First-Cycle
report (Running a Report on page 169) to see a complete summary of the
data.
1. Follow the instructions in Launching Run Browser on page 159 to open
the data from a first-base incorporation.
2. To check the tilt of the flow cell:
a. Select Focus Position from the Quality Metric list box.
The map of the flow cell changes to show focal positions at the front,
middle, and rear of the flow cell.
b. Ensure that Cycle # is set to 1.
This value is the same for all channels, so you do not need to change
the channel selection.
c. Subtract the minimum focus stage level from the maximum. The
difference should be less than 15,000 nm.
To view the focal position of a given tile, hover the mouse over the
tile in the flow cell map.
Figure 93 Focus Stage Level
3. To check the cluster intensity values:
a. Select Cluster Intensity from the Quality Metric list box.
b. Ensure that Cycle # is set to 1.
c. Select each channel in turn from the Channel list box.
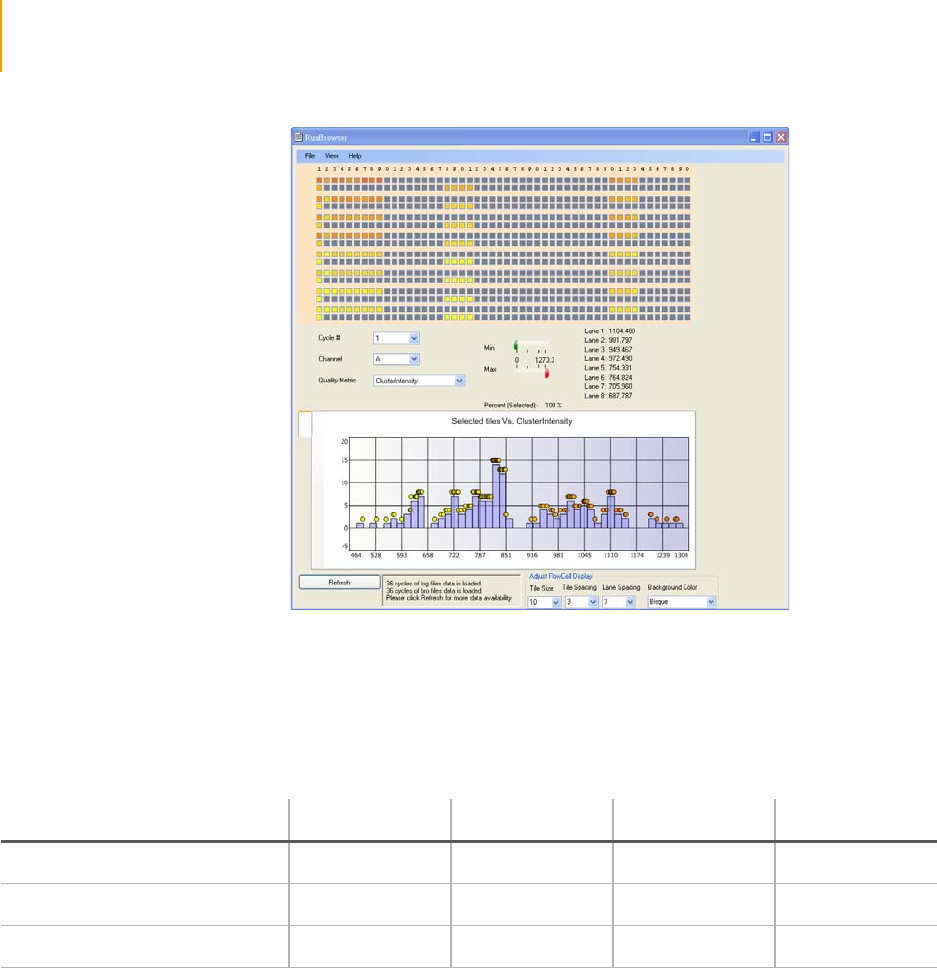
166 CHAPTER 5
Run Browser Reports
Part # 1004571 Rev. A
Figure 94 Cluster Intensity Levels
The average intensity of the selected tiles for each lane appears in a
list to the right of the Min/Max bars.
d. Evaluate the intensity values for each channel according to the values
in this table:
4. To check the focal quality:
a. Select Focus Metric from the Quality Metric list box.
b. Ensure that Cycle # is set to 1.
c. Select each channel in turn from the Channel list box.
Ta ble 1 8 Cluster Intensity Values
ACGT
High Confidence > 650 > 650 > 1000 > 1200
Reasonable Confidence > 350 > 350 > 650 > 700
Low Confidence < 250 < 250 < 350 < 400
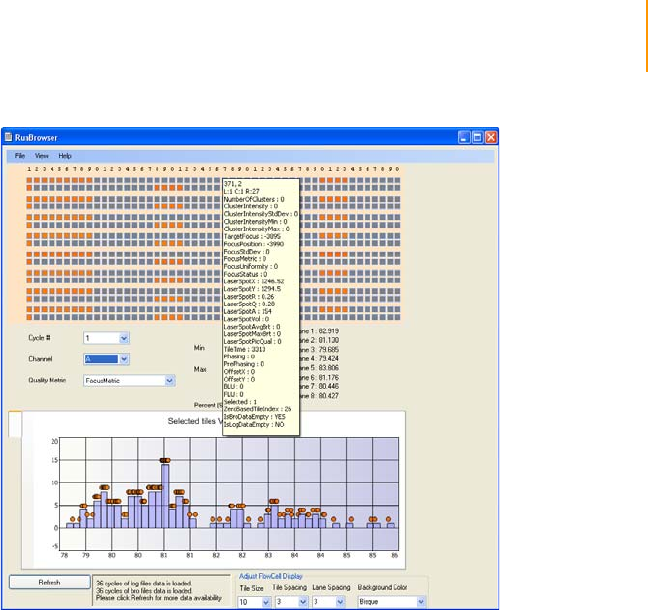
Flow Cell Window 167
Paired-End Sequencing User Guide
Figure 95 Run Browser Focus Metric
The average focal quality of the selected tiles for each lane appears
in a list to the right of the Min/Max bars.
d. Ensure that the focus metric for each lane is greater than 70.
If the focus metric for a lane is lower than 70, the flow cell surface
may be dirty, or oil may not cover the entire flow cell-prism interface.
Inspect the flow cell. You may need to clean and reload the prism
and flow cell as described in Cleaning and Installing the Prism on
page 110 and subsequent sections.

168 CHAPTER 5
Run Browser Reports
Part # 1004571 Rev. A
Report Window
Report Types Run Browser provides two types of reports generated from the Report
Window: a First-Cycle report and a set of metric reports.
First-Cycle Report
The First-Cycle report contains summary data about first-base incorporation.
Illumina recommends generating a First-Cycle report after performing first-
base incorporation and using it to make an informed decision about whether
to continue the run.
The report lists metrics for the cluster number counts, intensity values, focus
metric, focus position, and flow cell tilt.
Metric Reports
Run Browser metric reports describe the results of statistical operations
performed on the tiles in a lane during a cycle. The possible statistical
operations are:
`Minimums
`Maximums
`Medians
`Means
`Standard Deviations (SDs)
For recommendations on how to use these reports to assess run data, see
Cycle-to-Cycle Metrics: Measuring Quality Deviations on page 177.
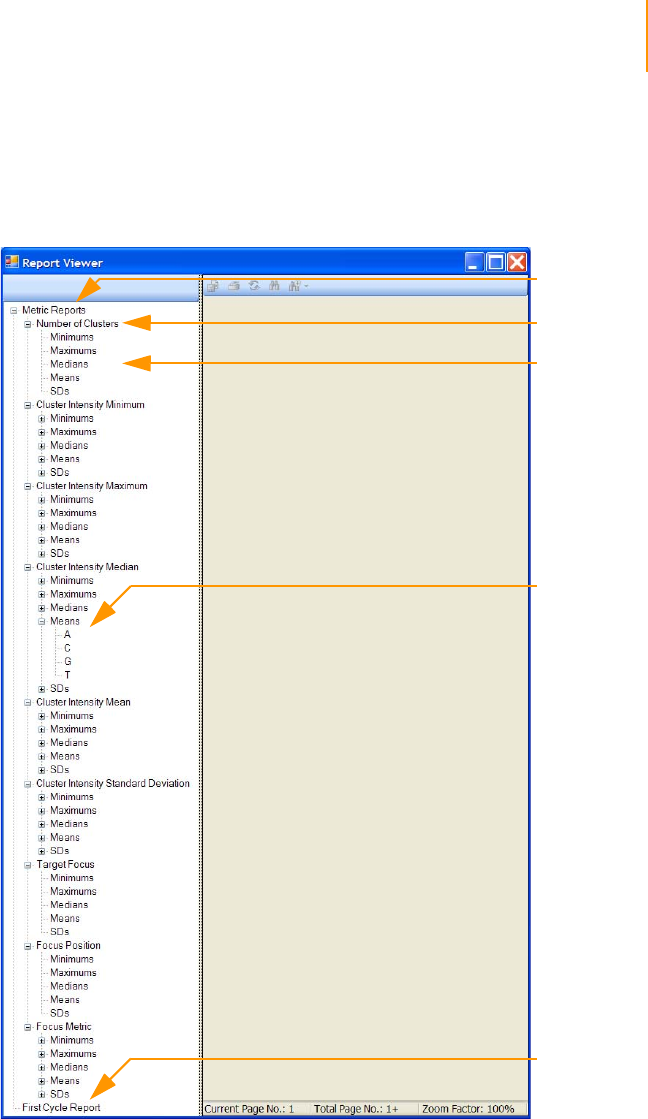
Report Window 169
Paired-End Sequencing User Guide
Running a
Report
After opening the log file as described in Launching Run Browser on
page 159, generate text reports that you can then print, save, or export as
follows:
1. Select View | Report. The Report window opens.
Figure 96 Empty Report Window
2. To generate a First-Cycle report, click First-Cycle Report in the left
sidebar.
Metric
Reports
First Cycle
Report
Statistical
Operation
Sub-
Operations
Image
Channels

170 CHAPTER 5
Run Browser Reports
Part # 1004571 Rev. A
Figure 97 Sample First-Cycle Report
3. To generate a Metrics report:
a. Click Metric Reports in the left sidebar.
a. Expand one of the metrics, such as Cluster Intensity Median.
b. Select the statistical operation with which to summarize the tiles in
each lane of a cycle (Min, Max, Median, Mean, or SD).
c. [Optional] If available, select one of the four image channels (A,C, G,
T). This only applies to metrics that have different values for each
channel.
When you select a report, the report data appear in the right pane of the
Report window.
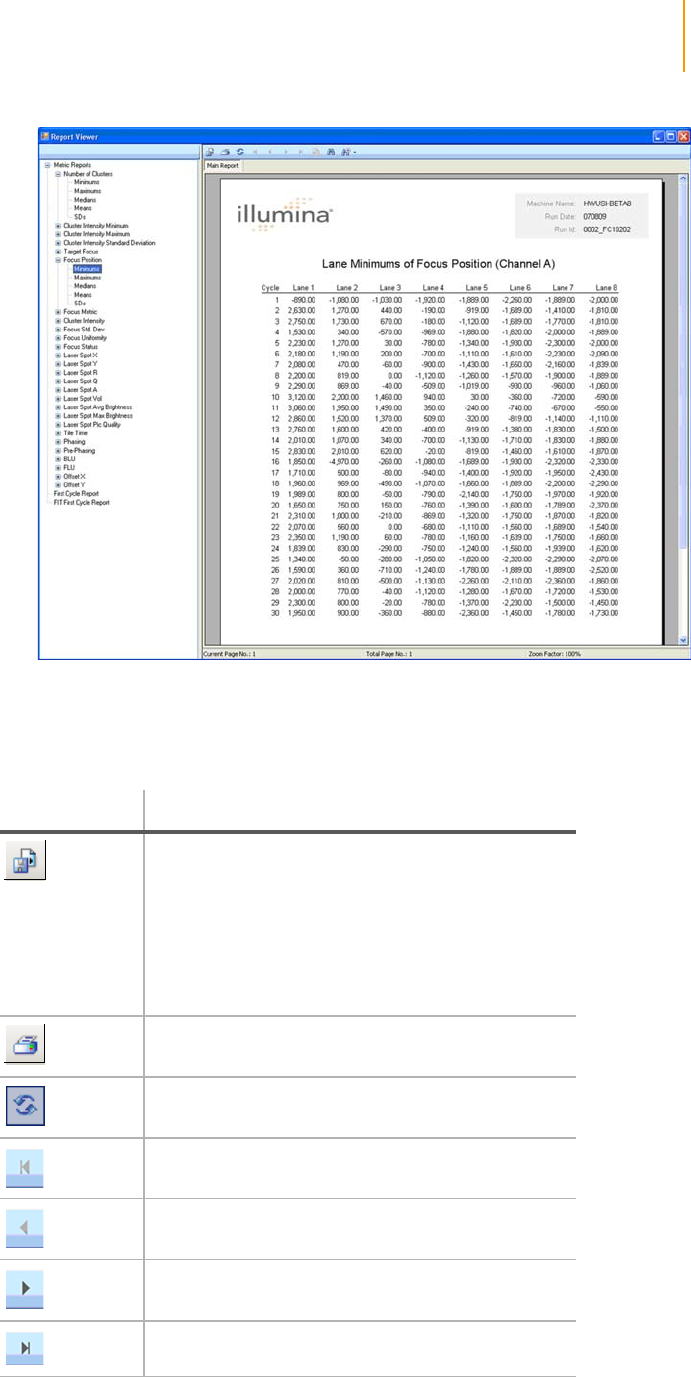
Report Window 171
Paired-End Sequencing User Guide
Figure 98 Sample Metric Report
4. Click a toolbar button to perform the associated action:
Ta ble 1 9 Run Browser Report Viewer Buttons
Button Function
Export in one of the following formats:
•Crystal Reports (*.rpt)
•Portable Document Format (*.pdf)
•Microsoft Excel (*.xls)
•Microsoft Excel Data Only (*.xls)
•Microsoft Word (*.doc)
•Rich Text Format (*.rtf)
Print report
Refresh window
Display the 1st page of the report
Shows the previous page of the report
Shows the next page of the report
Shows the last page of the report
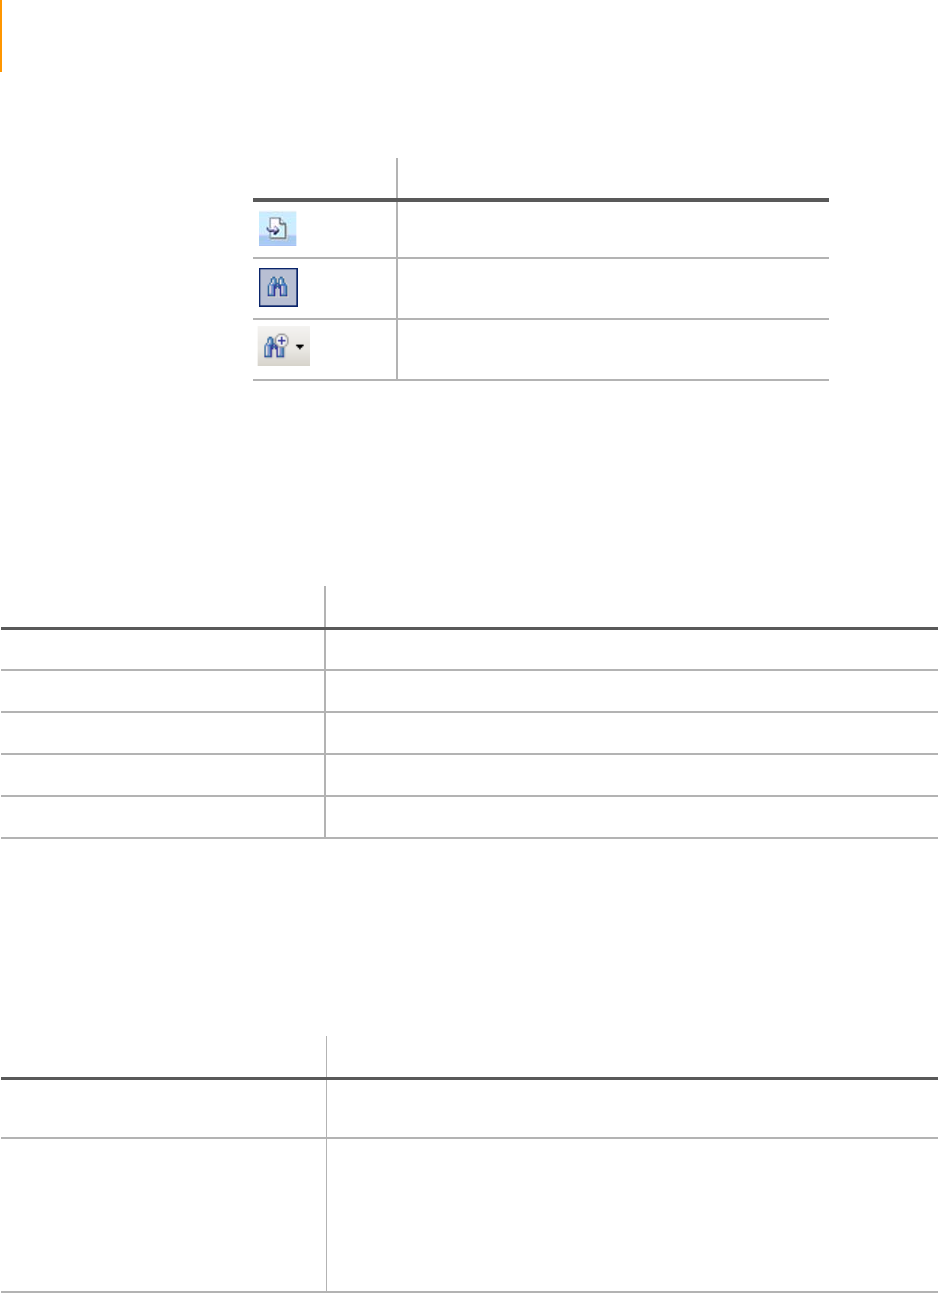
172 CHAPTER 5
Run Browser Reports
Part # 1004571 Rev. A
Cluster Metrics:
Measuring
Cluster Quality
The following reports help you evaluate cluster quality before continuing a
run. Each one performs a statistical operation on an individual image channel
(A, T, C, G) during a given cycle. See Table 18 on page 166 for confidence
levels for intensities.
Focus Metrics:
Measuring
Image Quality
The following reports help you evaluate the image quality of the run. The
data come from the *bro.xml file, where IPAR records information on the Z-
stage position and image quality of each tile.
Go to page (specify page in pop-up window)
Find text
Zoom view (options provided in cascading menu)
Ta ble 1 9 Run Browser Report Viewer Buttons (Continued)
Button Function
Ta ble 2 0 Measuring Cluster Quality
Statistical Operation Description
Cluster Intensity Median The median intensity of the selected channel, per tile.
Cluster Intensity Mean The mean intensity of the selected channel, per tile.
Cluster Intensity Minimum The minimum cluster intensity of the selected channel, per tile.
Cluster Intensity Maximum The maximum cluster intensity of the selected channel, per tile.
Cluster Intensity Standard Deviation The standard deviation of the selected channel, per tile.
Ta ble 2 1 Measuring Image Quality
Statistical Operation Description
Target Focus The Z-stage position of the target focus, as calculated by the auto-focus
algorithm. The position is the same for all channels.
Focus Position The actual Z-stage position that the hardware reports to the control
software after moving. Compare this metric with the Target Focus values to
evaluate the autofocus control loop. The position is the same for all
channels.
The focus position should stay relatively constant between cycles. If there
are significant jumps, it may indicate that the lens is going in and out of
focus.

Report Window 173
Paired-End Sequencing User Guide
Warning Messages
Focus Standard Deviation The standard deviation of the Z-stage position of a tile over all the cycles in
the run log(s) currently loaded in Run Browser. This is the only focus metric
that is calculated per tile over all cycles. If you see a large variation in the Z-
stage positions (StdDev > 6,000 nm), it indicates poor focus control or the
introduction of a significant number of bubbles into the system.
Focus Metric A number that represents the sharpness or focus quality of the image. It is
calculated separately for each channel. A high-quality image will have a
focus metric above 70.
Focus UniformityaAn assessment of the focus quality across the tile image, calculated
separately for each channel. The software divides the tile into a 3x3 grid,
calculates the focus metric for each square, and divides the minimum value
by the maximum value. Tiles with even focus have focus uniformity
numbers of about 90–95.
Focus Status A number corresponding to a warning message (see Table 22), if there is
one, for each tile. You should take these numbers into account when
deciding whether or not to complete the run.
a. The T5 metric is an old focus uniformity metric that is no longer in use.
Ta ble 2 1 Measuring Image Quality (Continued)
Statistical Operation Description
Ta ble 2 2 Focus Status Warning Messages
Number Warning Message Move Z Axis?
0 No warning message. Yes
1 Poor laser spot quality or parameter. Spot has
high q residual. Yes
2 Poor laser spot quality or parameter. Spot has
outlier spot chars (The volume of the spot
exceeds threshold).
No
3 Poor laser spot quality or parameter. Spot has
high q residual and outlier spot chars. No
4 Poor laser spot quality or parameter. Spot has
low picture quality. No
5 Poor laser spot quality or parameter. Spot has
high q residual and low picture quality. No
6 Poor laser spot quality or parameter. Spot has
outlier spot chars and low picture quality. No
7 Poor laser spot quality or parameter. Spot has
high q residual, outlier spot chars, and low
picture quality.
No

174 CHAPTER 5
Run Browser Reports
Part # 1004571 Rev. A
Laser Spot
Metrics:
Measuring
Autofocus
Performance
These reports help you evaluate the success of the autofocus subsystem over
the course of the imaging cycle. They can indicate when there is air in the
system. Histograms of these metrics will highlight problematic tiles. You
should use these metric to look for outlying values from a mean.
Phasing Metrics:
Measuring Cycle
Independence
The Genome Analyzer Pipeline uses phasing and prephasing to remove
signal components from the next (prephasing) and previous (phasing) cycles.
The window used in the Pipeline is cycles 3-12, from which the median per
lane is calculated. IPAR mimics the Pipeline calculations for phasing and
prephasing ONLY for cycle 12. This cycle can be viewed to determine the
amount of interference from adjacent cycles.
To view these report, expand Metric Reports > Phasing > Median or Metric
Reports > Pre-Phasing > Median in the Report Viewer.
Ta ble 2 3 Measuring Autofocus Performance
Statistical Operation Description
Laser Spot X The X pixel position of the center of light of the autofocus (AF) laser
spot on the tile image for the selected cycle.
Laser Spot Y The Y pixel position of the center of light of the AF laser spot on the
tile image for the selected cycle.
Laser Spot r The r value calculated from the image of the selected cycle. Large
changes in r can indicate air in the system.
Laser Spot q The q value calculated from the image of the selected cycle. Large
noise in q can represent poor setup of the autofocus system.
Laser Spot W This metric is not currently in use.
Laser Spot H This metric is not currently in use.
Laser Spot A The area, in pixels, of the detected laser spot above the detection
threshold.
Laser Spot P This metric is not currently in use.
Laser Spot D This metric is not currently in use.
Laser Spot Vol The average brightness (above the detection threshold) multiplied by
the area of the primary laser spot. A large increase in volume indicates
air in the system.
Laser Spot Average Brightness (Avg Brt) The sum of the gray values of the pixels in the laser spot, divided by
the area.
Laser Spot Maximum Brightness (Max Brt) The maximum gray value of the pixels in the laser spot, divided by the
area.
Laser Spot Pic Quality The average of the normalized autocorrelation of the image with itself,
with shifts of unit pixel to the left and down. If the image is noisy, the
measure will be low because the noise does not correlate with itself.
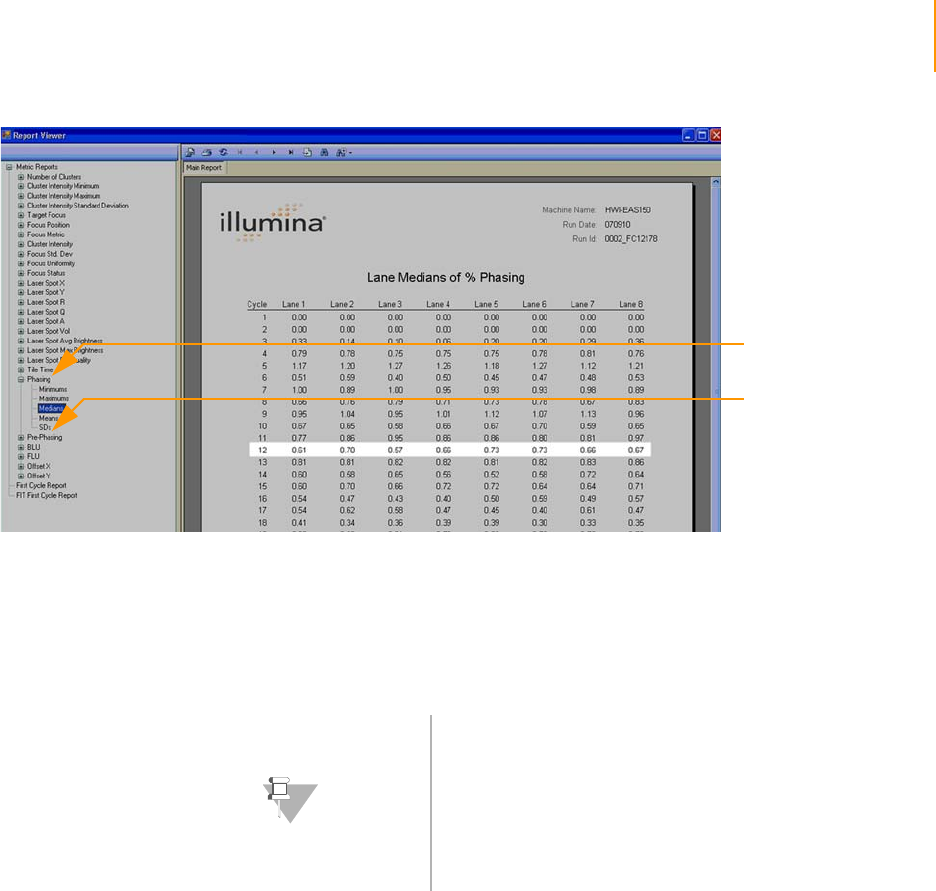
Report Window 175
Paired-End Sequencing User Guide
Figure 99 Phasing Report
Phasing/prephasing calculation requires intensity data from previous cycles.
IPAR performs phasing/prephasing calculations after the last tile from the
cycle is processed. The normal range of 0.1% to 1.0% is the signal
contribution percentage from the next or previous cycle to the current cycle.
High values (1.0%–2.0%) may indicate reagent or fluidics problems.
Other Metrics Number of Clusters
The Number of Clusters metric shows the total number of identified clusters
in each tile. It is the only cluster metric that is not specific to an image
channel. If the offset file is correctly calibrated, then the values will be within
5% of the numbers reported by offline analysis.
Tile Time: Measuring Software Overhead
The Tile Time metric shows the time spent imaging each tile, excluding the
exposure time noted in the recipe.
Phasing
Prephasing
NOTE
While RunBrowser displays phasing and prephasing
numbers starting from cycle 3, only phasing values from
cycle 12 should be expected to match the offline analysis
values. All phasing/prephasing values from other cycles are
for research purposes only.
In addition, in order for phasing and prephasing values to
match offline analysis values, the default offsets and matrix
file selections must be comparable.
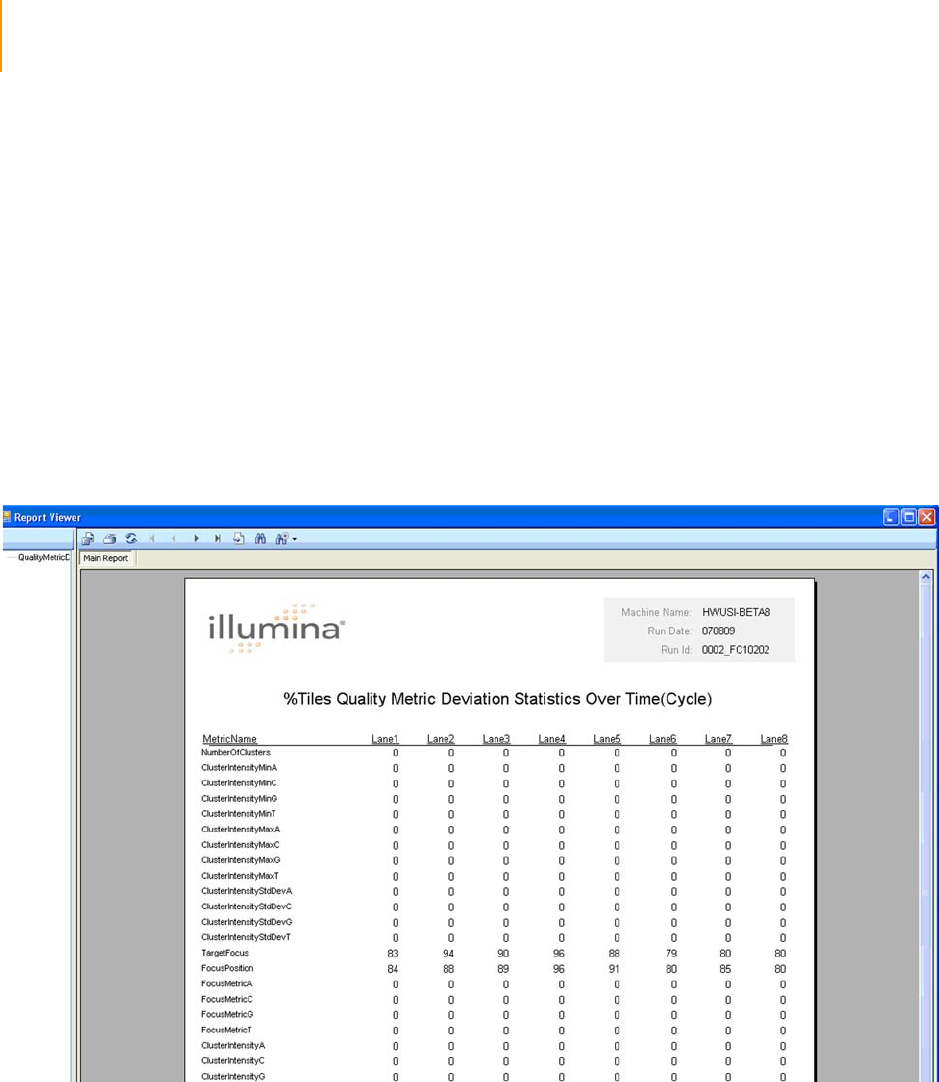
176 CHAPTER 5
Run Browser Reports
Part # 1004571 Rev. A
Metric Deviation Report Window
The Quality Metric Deviation (QMD) report summarizes significant cycle-to-
cycle deviations of key QC values, so that problematic cycles in the run can
be identified.
Running a Metric
Deviation Report
After opening the log file (see Launching Run Browser on page 159), select
View | Metric Deviation Report on the Run Browser main window to launch
the QMD report, which may take several minutes.This report runs on the data
of all cycles currently loaded into Run Browser and finds the percentage of
tiles per lane that crosses a threshold of (approximately) 25% from adjacent
(previous and next) cycles, and summarizes the result into a report.
For an explanation of the Run Browser Report Viewer Buttons, see Table 19
on page 171.
Figure 100 Quality Metric Deviation Report

Metric Deviation Report Window 177
Paired-End Sequencing User Guide
Cycle-to-Cycle
Metrics:
Measuring
Quality
Deviations
For QMD calculations, a three cycle window is analyzed to determine if there
is a significant change in a quality score that is not part of a directional trend.
`Directional deviations are not counted. That is, tiles with progressively
increasing trends or progressively decreasing trends across the moving
window of 3 cycles will not be counted as deviations.
`Only ripples in trends are counted. For example if a tile's metric value
increases by 25% from one cycle to the next cycle, and then decreases by
more than 25% in the following cycle, that tile will be counted as a
deviant for that metric. Similarly if a tile's metric value decreases by 25%
from one cycle to the next cycle, and then increases by more than 25% in
the following cycle, that tile will be counted as a deviant.
`Calculations are only performed for data loaded into Run Browser. If you
only load one Run Log file, this report will only produce data for that one
log file and any associated *.bro files.
`If a metric is missing for a particular cycle it is not counted.
`The percentage of tiles with a deviation is across all cycles loaded in Run
Browser. If a tile shows deviation at multiple cycles, it is only counted
once for the percentage calculations.
`The following formula is used to flag deviants (where V = quality Value, n
= cycle number):
To flag V shaped ripples in trends: 2( Vn ) / ( Vn-1 + Vn+1 ) < 0.75
To flag ^ shaped ripples in trends: 2 ( Vn ) / ( Vn-1 + Vn+1 ) > 1.25

178 CHAPTER 5
Run Browser Reports
Part # 1004571 Rev. A

Paired-End Sequencing User Guide 179
Chapter 6
Integrated Primary Analysis
and Reporting
Topics
180 Introduction
180 User Interface
182 Using the Analysis Viewer
182 Introduction
182 Overview Display
187 Individual Parameter Plots
188 Quality Metrics in IPAR
188 Quality Metrics Explanation
188 Thresholds Scaled Overview Display
189 Storage of IPAR Data
190 Network Copy Options
190 IPAR Saving and Transferring Images
191 Images Not Transferred
192 Instrument Computer Saving Images
193 Network Copy Configuration Summary
194 Pipeline Analysis of IPAR Data

180 CHAPTER 6
Integrated Primary Analysis and Reporting
Part # 1004571 Rev. A
Introduction
The Integrated Primary Analysis and Reporting system (IPAR) v1.0 brings up
multiple valuable features to the GA software. These include online image
analysis resulting in up to 50% reduction of the total analysis time for the
data, minimizing the need to transfer large image files across the network,
and provide real time feedback for the progress of the experiment. You can
view the data for all tiles quickly in an overview window, and navigate into the
data for specific lanes, tiles, or metrics.
The primary function for IPAR is to do image analysis. In addition, IPAR
visualizes results using calculated intensities and quality parameters from
image analysis. This enables you to quickly decide whether or not your run is
progressing as expected. IPAR is configured to run automatically on a
dedicated server, although the IPAR user interface, the Analysis Viewer, is
integrated with the Genome Analyzer instrument control software.
Audience and
Purpose
This guide is for laboratory personnel and other individuals responsible for
operating IPAR with Sequencing Control Studio (SCS) v2.01 or later.
In addition to the instructions on using IPAR, this user guide contains a
section on frequently asked questions that provides additional support.
User Interface The Analysis Viewer has two main types of plots:
`The overview display provides a graphical interface integrated in the
Genome Analyzer control software to quickly gather quality data and
view it in color with interactive tooltips. Multiple quality metrics can be
displayed in one plot. This allows you to easily find the areas that may
need your attention.
`Individual parameter plots allow you to monitor the raw values of
individual selected metrics. Only one type of quality metric can be
monitored per plot. This lets you look in depth at the raw values for
specific metrics, so you can compare them with established standards or
previous runs.

Starting up IPAR 181
Paired-End Sequencing User Guide
Starting up IPAR
You need to be logged on to the IPAR computer before starting the IPAR
analysis.
1. Make sure the UPS is powered up, then power on IPAR.
Before proceeding to the next step, wait until the IPAR server has started
up (usually 3 minutes).
2. Log on to the IPAR server:
a. Open the remote desktop application on the instrument computer
by selecting START | All Programs | Accessories | Remote Desktop
Connection from the task bar.
b. Connect to 192.168.137.20.
c. Log on using the default values:
Username: sbsuser
Password: sbs123
3. IPAR will start automatically as long as you have an active logon session
on the IPAR computer. Each time a recipe is started or resumed the
Genome Analyzer will automatically initiate a new IPAR session.
NOTE
Depending on your system configuration, you may
also log on to the IPAR computer using the shared
keyboard and monitor at the instrument computer, or
the keyboard and monitor at the IPAR computer.
NOTE
•There is no requirement to turn on the Genome
Analyzer, instrument computer and IPAR computer in
any given order.
•You do not need to reboot the IPAR computer between
runs, unless you experience any connection problems
when starting a run.
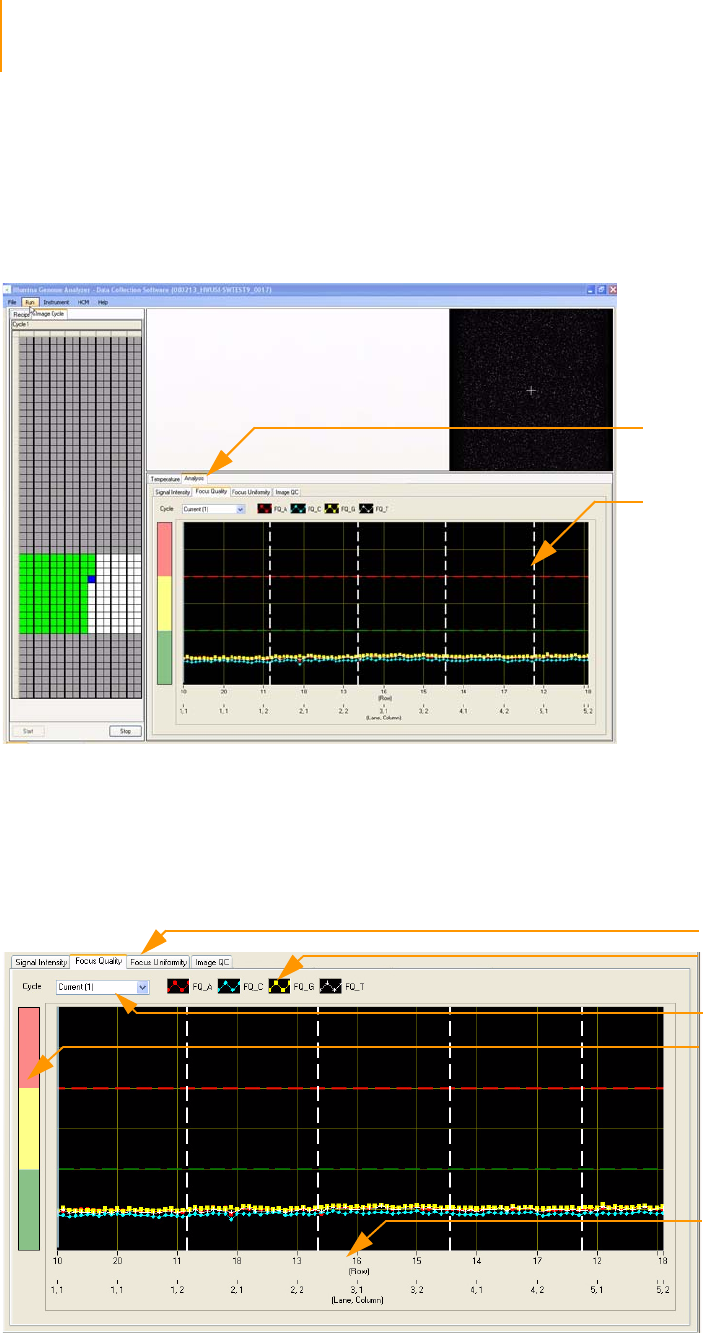
182 CHAPTER 6
Integrated Primary Analysis and Reporting
Part # 1004571 Rev. A
Using the Analysis Viewer
Introduction The multi-tabbed visualization control Analysis Viewer displays data plots
using a tile-based X axis, and a scaled or real Y value. Select the Analysis
Viewer tab to bring up the Analysis Viewer panel (Figure 101).
Figure 101 Integrated IPAR Analysis Viewer
Overview
Display
The overview display allows you to monitor different quality metrics in the
same plot (Figure 102). Different sets of quality metrics will be plotted by
selecting a different quality metric tab. The meaning of these quality metrics
is explained in Quality Metrics in IPAR on page 188.
Figure 102 Analysis Viewer Screen
Analysis Viewer Panel
Analysis Viewer Tab
Plot Legend
Cycle dropdown menu
Y-axis color bar
Lane, column and
row information
Quality metrics tabs

Using the Analysis Viewer 183
Paired-End Sequencing User Guide
Scaled Versus Raw Values
The overview display shows the quality metrics data in two ways:
`Scaled display, in which a color bar is displayed on the left to indicate
“good” values in the green region, “marginal” values in the yellow
region and “failed” values in the red region. The thresholds of these
regions are set in IPAR for some quality metrics (see Thresholds Scaled
Overview Display on page 188). Yellow and red values can be higher or
lower than green values, depending on the settings for the
particular metric.
`Raw value display, in which the raw values of quality metrics are plotted,
without color bar.
Zooming In and Zooming Out
Analysis Viewer has the following zoom options:
`Zoom in by holding the Shift key down, left-clicking and dragging the
mouse to select an area and then releasing the mouse key. See Figure
103 for a zoomed in view of an area from roughly the middle of the red
region through the middle of the green region and from lane 2, column
1, row 20 through lane 4, column 2, lane 20.
Figure 103 Zoomed in view Analysis Viewer
Scroll bars appear that allow maneuvering through the complete graph.
A user can zoom in again by using the same procedure.
`To zoom out, right-click on the graph to bring up the context menu
(Figure 104) and select Zoom out. If you have zoomed in two or more
times, Zoom Out All will be enabled, which will return the graph to the
original un-zoomed state.
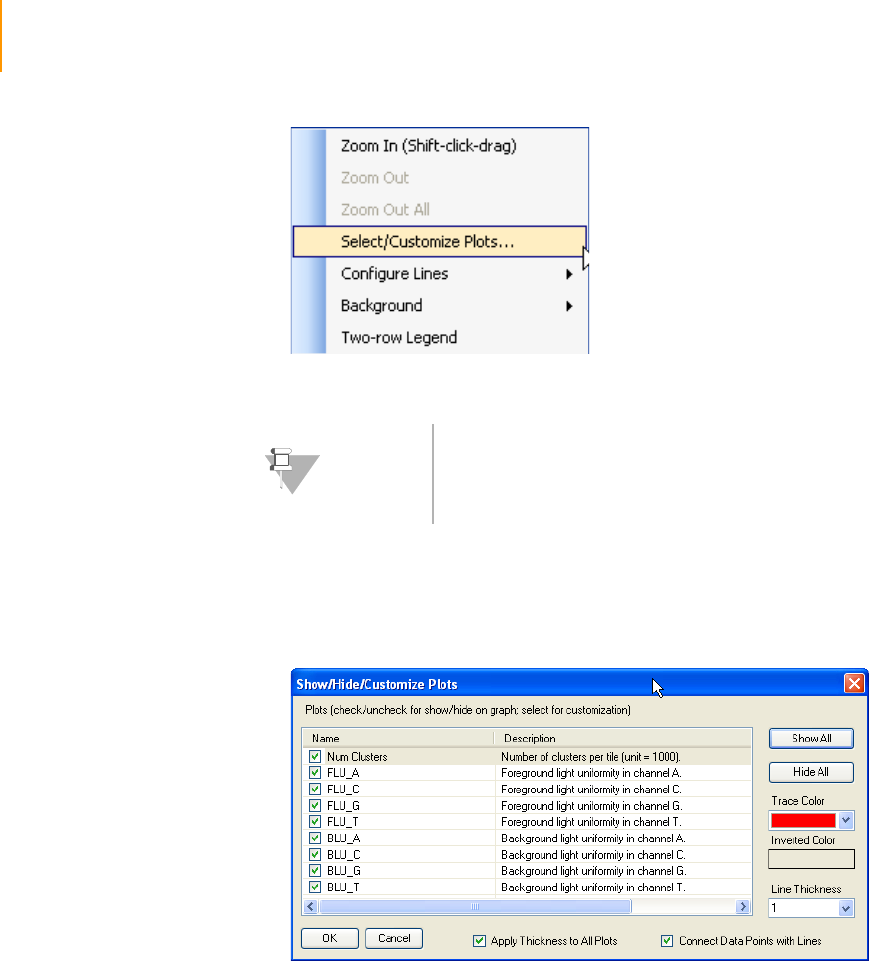
184 CHAPTER 6
Integrated Primary Analysis and Reporting
Part # 1004571 Rev. A
Figure 104 Analysis Viewer context menu
Customizing Plots
Click on Select/Customize Plots in the context menu (Figure 104) to bring
up the Show/Hide/Customize Plots dialog box (Figure 105).
Figure 105 Select plots in Analysis Viewer
`To hide a plot on the graph, deselect the check box. The graph will
automatically rescale if necessary. To show a plot, select the check box.
Again, automatic rescaling will occur.
`To show all the plots on the graph click the Show All button.
`To hide all the plots click the Hide All button.
`To change the color of a plot line and points, select the plot and select a
color from the Trace Color dropdown menu.
`To change the thickness of all the lines, select the Apply Thickness to All
Plots checkbox and select a thickness from the Line Thickness
dropdown menu.
`To change the thickness of an individual plot line, deselect the Apply
Thickness to All Plots checkbox, select the plot, and select a thickness
from the Line Thickness dropdown menu.
NOTE
The Zoom In menu item in the context menu provides
instruction on how to select an area and zoom using the
short cut keys. Unlike all other menu items in this context
menu, this menu item is there solely to provide instruction.
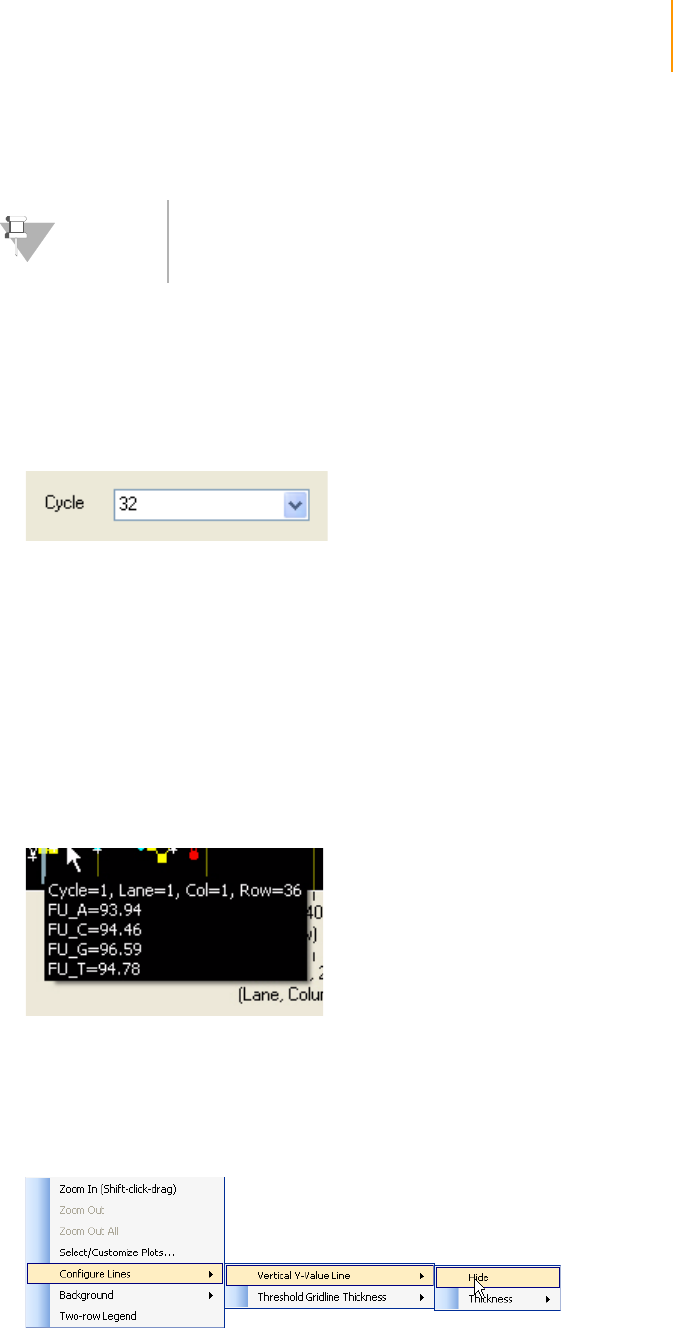
Using the Analysis Viewer 185
Paired-End Sequencing User Guide
`To just show the points in the plots rather than have connecting lines,
deselect the Connect Data Points with Lines check box.
Cycle Selection
By default IPAR displays QC data from the latest imaging cycle. To view tile
data for previous cycles, select a cycle from the Cycle dropdown box (Figure
106). This can be done in real time as data is sent to the control. You can
return to the current cycle by selecting Current (<n>).
Figure 106 Cycle Selection in the Analysis Viewer
Viewing Raw Values in the Overview Display
You can view raw values in the overview display using the vertical Y-value line.
`Click anywhere in the graph to bring a light blue vertical line to that click-
location.
`If the mouse button is held down at particular tile of interest, the values
for all parameters shown on the overview tab of interest will be displayed
in a transparent label next to the vertical Y-value line as show below
(Figure 107). Logical coordinates of the tile of interest on the flow cell are
also displayed.
Figure 107 Plot value line
`The vertical Y-value line can be dragged to display values for different
tiles.
`The vertical Y-value line can be hidden, shown, or customized using the
context menu (Figure 108).
Figure 108 Context Menu Options for the Vertical Y-value Line
NOTE
Single-clicking a legend item in the overview display will
highlight the line (thickens the plot line).
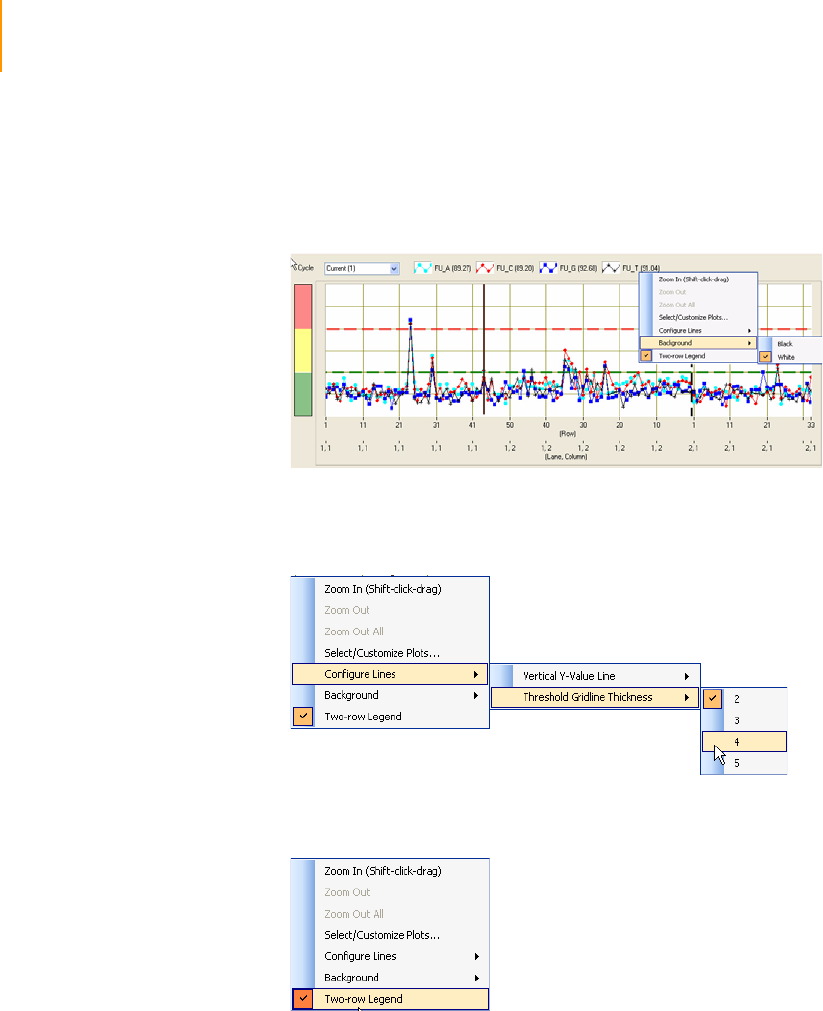
186 CHAPTER 6
Integrated Primary Analysis and Reporting
Part # 1004571 Rev. A
Additional Context Menu Options
The context menu has a few more options to customize your overview
display:
`You can set the background to white as shown in Figure 109.
Figure 109 Setting White Background
`You can set the thickness of the threshold gridlines as shown in Figure
110.
Figure 110 Setting the Thickness of the Threshold Gridlines
`You can set a two-row legend as shown in Figure 111.
Figure 111 Setting the Two-row Legend
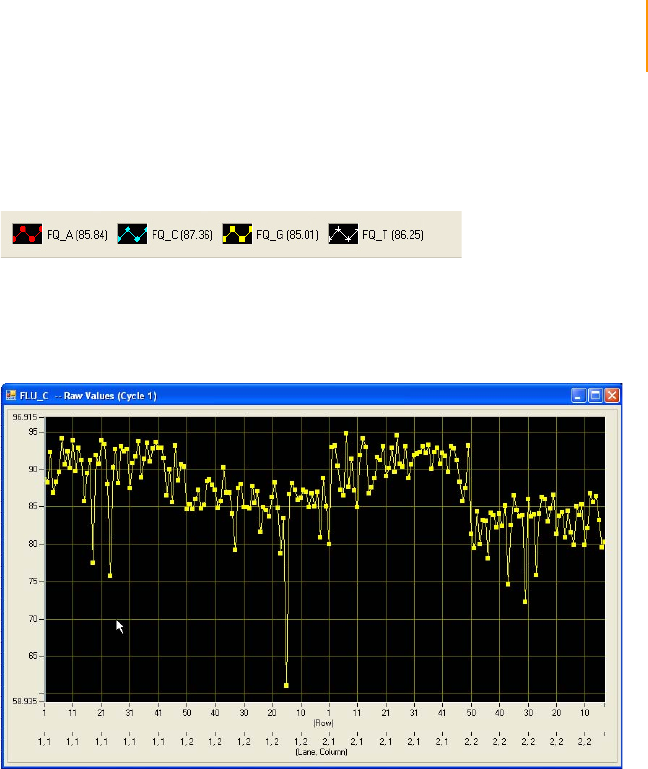
Using the Analysis Viewer 187
Paired-End Sequencing User Guide
Individual
Parameter Plots
The legend of the overview display is at the top above the graph (Figure
112), and enables selecting individual parameter plots. To do this for a
specific quality metric, double-click the legend item.
Figure 112 Analysis Viewer Legend
This will bring up a “raw” view of the un-scaled values (Figure 113). If done in
real time as data are being added to the control, this view will update as data
from the next analyzed tile becomes available.
Figure 113 Individual Parameter Plot

188 CHAPTER 6
Integrated Primary Analysis and Reporting
Part # 1004571 Rev. A
Quality Metrics in IPAR
Using IPAR, you can monitor several quality metrics during a run on the
Genome Analyzer. These quality metrics are organized in tabs in the overview
display of the Analysis Viewer. The meaning of the quality metrics is
explained below.
Quality Metrics
Explanation
The following quality metrics help you evaluate cluster quality during a run.
Many perform a statistical operation on an individual image channel (A, T, C,
G) during a given cycle.
Thresholds
Scaled Overview
Display
The thresholds of the Y-axis color bar in the scaled overview display are
stored in the xml file QCmetrics.xml, located in the folder
C:\Illumina\SCS2.x\DataCollection\bin\config.
The default values are shown below:
Ta ble 2 4 Quality Metrics in Analysis Viewer
Tab Legend Item Description
Signal Intensity Q87_N The value of the 87.5 percentile signal intensity (all
clusters) of the selected channel, per tile.
Focus Quality FQ_N Image focus quality of the selected channel, per tile. It
represents the sharpness or focus quality of the image.
A high-quality image will have a focus metric of 80 - 85;
focus quality below 75 becomes a concern.
FU_N Image focus uniformity of the selected channel, per tile.
The software divides the tile into a 3x3 grid, calculates
the focus metric for each square, and divides the
minimum value by the maximum value. Tiles with
homogeneous focus have focus uniformity numbers of
about 90–95.
Image QC Num Clusters Number of clusters per tile (unit = 1000). This
parameter is not channel specific.
FLU_N Foreground light uniformity of the selected channel,
per tile.
BLU_N Background light uniformity of the selected channel,
per tile.
Ta ble 2 5 Thresholds for the Y-axis Color Bar in the Overview Display
Legend Item Description Green Yellow Red
FQ_N Image focus quality 100-70 70-60 60-50
FU_N Image focus uniformity 100-90 90-70 70-50

Storage of IPAR Data 189
Paired-End Sequencing User Guide
Storage of IPAR Data
IPAR analysis generates output results which are saved on the instrument
computer or the IPAR server. On both computers the results are saved in the
RunFolder\Data directory created for the run in progress.
IPAR produces the following analysis results:
Computer Subfolder Key Files/Folders Description
Instrument
computer D:\Runs\RunFolder\Data Run Browser folder Contains *.bro files used with the Run
Browser application. Each file contains run
quality metrics in one file per lane, per cycle.
IPAR server E:\Analyzed\RunFolder\Data IPAR folder Contains IPAR image analysis results.
This folder is saved on the IPAR server under
<Run Folder>\Data. This Run Folder is
created on the IPAR server when a run is
started, and is given the same name as the
Run Folder on the instrument computer.
IPAR server E:\Analyzed\RunFolder\Data .params file Contains run and analysis-specific
information.

190 CHAPTER 6
Integrated Primary Analysis and Reporting
Part # 1004571 Rev. A
Network Copy Options
Images and IPAR analysis data from each experiment can be moved to a
dedicated network location. The software provides user-configurable flexible
data management options. In all of the options described below IPAR
analysis data will be saved locally and transferred to a specified network
location.
There are three supported scenarios for IPAR data and results management:
`IPAR saves images on the IPAR server and transfers the images to
specified network location
`Images are saved only to the IPAR server (they are not moved to a
network location)
`Instrument computer saves images
Once the data management script has completed all data copy and image
copy at the end of the run, it generates a special tag file in the network run
folder, GA_Netcopy_Complete.txt. This file can be used as a flag to start the
offline analysis.
The sections below explain the three options, including the required settings
for flags in configuration files.
IPAR Saving and
Transferring
Images
IPAR saves images on the IPAR server and transfers the images to
specified network location.
IPAR analysis data and images from the experiment get transferred to a
specified network location (default option).
IPAR saves images locally and on the specified network location as they are
generated. In case images were not saved on the network during the current
cycle, the instrument computer will copy them during the next imaging cycle.
Images and results need to be saved to the same network destination.
In this scenario, the IPAR server has the primary responsibility for saving
images to the network run folder and the instrument run computer functions
as a fail-safe in case the IPAR server does not copy all images.
Configuration for IPAR Saving and Transferring Images
To configure the system for this scenario, open the configuration files in
Notepad, set the indicated elements, and save under the same name in the
same location. The required values are marked in bold.
`For GalaxyRunConfig.xml in the folder C:\Illumina\SCSx.x on the
instrument computer, set the following elements:
<EnableNetworkCopy>true</EnableNetworkCopy>
<CopyImageFiles>true</CopyImageFiles>
NOTE
This is the preferred option for SCS2.01/IPAR1.01.

Network Copy Options 191
Paired-End Sequencing User Guide
<NetworkCopyRootFolder>
ENTER_PATH_TO_SERVER_ROOT_FOLDER</
NetworkCopyRootFolder>
<DeleteFilesAfterNetCopy>true</
DeleteFilesAfterNetCopy>
<CopyGoldcrestRunBrowserData>true</
CopyGoldcrestRunBrowserData>
`For ImagePath.xml in the folder C:\Illumina\SCSx.x on the instrument
computer, set the SaveClusterImages element:
- <ImagePath SaveFocusImages="false"
SaveFinalFocusImage="false"
SaveClusterImages="true">
`For RunConfig.xml in the folder C:\Illumina\SCSx.x on the instrument
computer, set the OnlineAnalysis On element:
<OnlineAnalysis On="true" StopRunOnError="false" />
`For Analysis.xml in the folder C:\Illumina\SCSx.x on the instrument
computer, set the following elements:
<Results Compress="true" AutoArchive="true"
ArchiveRoot="ENTER_PATH_TO_SERVER_ROOT_FO
LDER" />
`For StarGazerShell.xml in the folder C:\Illumina\IPARx.x on the IPAR
computer, set the Images element:
<Save ClusterDetails="true"
ImageAnalysisResults="true"
Images="true" />
Images Not
Transferred
Images are saved only to the IPAR server (they are not moved to a
network location)
Only IPAR analysis data gets transferred to a specified network location,
images will not be transferred in this scenario.
Configuration for Images Not Transferrred
To configure the system for this scenario, open the configuration files in
Notepad, set the indicated elements, and save under the same name in the
same location. The required values are marked in bold.
`For GalaxyRunConfig.xml in the folder C:\Illumina\SCSx.x on the
instrument computer, set the following elements:
<EnableNetworkCopy>true</EnableNetworkCopy>
<CopyImageFiles>false</CopyImageFiles>
<NetworkCopyRootFolder>
ENTER_PATH_TO_SERVER_ROOT_FOLDER</
NetworkCopyRootFolder>
<DeleteFilesAfterNetCopy>false</
DeleteFilesAfterNetCopy>
<CopyGoldcrestRunBrowserData>true</
CopyGoldcrestRunBrowserData>
`For ImagePath.xml in the folder C:\Illumina\SCSx.x on the instrument
computer, set the SaveClusterImages element:
- <ImagePath SaveFocusImages="false"
SaveFinalFocusImage="false"
SaveClusterImages="false">

192 CHAPTER 6
Integrated Primary Analysis and Reporting
Part # 1004571 Rev. A
`For RunConfig.xml in the folder C:\Illumina\SCSx.x on the instrument
computer, set the OnlineAnalysis On element:
<OnlineAnalysis On="true" StopRunOnError="false" />
`For Analysis.xml in the folder C:\Illumina\SCSx.x on the instrument
computer, set the following elements:
<Results Compress="true" AutoArchive="false"
ArchiveRoot="ENTER_PATH_TO_SERVER_ROOT_FO
LDER" />
`For StarGazerShell.xml in the folder C:\Illumina\IPARx.x on the IPAR
computer, set the Images element:
<Save ClusterDetails="true"
ImageAnalysisResults="true"
Images="false" />
Instrument
Computer
Saving Images
The instrument computer saves images
IPAR does not save images, only analysis data.
Configuration for Instrument Computer Saving Images
To configure the system for this scenario, open the configuration files in
Notepad, set the indicated elements, and save under the same name in the
same location. The required values are marked in bold.
`For GalaxyRunConfig.xml in the folder C:\Illumina\SCSx.x on the
instrument computer, set the following elements:
<EnableNetworkCopy>true</EnableNetworkCopy>
<CopyImageFiles>true</CopyImageFiles>
<NetworkCopyRootFolder>
ENTER_PATH_TO_SERVER_ROOT_FOLDER</
NetworkCopyRootFolder>
<DeleteFilesAfterNetCopy>true</
DeleteFilesAfterNetCopy>
<CopyGoldcrestRunBrowserData>true</
CopyGoldcrestRunBrowserData>
`For ImagePath.xml in the folder C:\Illumina\SCSx.x on the instrument
computer, set the SaveClusterImages element:
- <ImagePath SaveFocusImages="false"
SaveFinalFocusImage="false"
SaveClusterImages="true">
`For RunConfig.xml in the folder C:\Illumina\SCSx.x on the instrument
computer, set the OnlineAnalysis On element:
<OnlineAnalysis On="true" StopRunOnError="false" />
`For Analysis.xml in the folder C:\Illumina\SCSx.x on the instrument
computer, set the following elements:
<Results Compress="true" AutoArchive="false"
ArchiveRoot="ENTER_PATH_TO_SERVER_ROOT_FO
LDER" />
`For StarGazerShell.xml in the folder C:\Illumina\IPARx.x on the IPAR
computer, set the Images element:
<Save ClusterDetails="true"
ImageAnalysisResults="true"
Images="false" />

Network Copy Options 193
Paired-End Sequencing User Guide
Network Copy
Configuration
Summary
The configurations to set up the supported scenarios for network copy are
summarized for the expert user in Table 26 on page 193 and Table 27 on
page 193.
Ta ble 2 6 Elements to Be Changed in the Configuration Files
Configuration File Flag
IPAR Saving and
Transferring
Images
Images Not
Transferred
Instrument
Computer Saving
Images
GalaxyRunConfig.xml EnableNetworkCopy True True True
GalaxyRunConfig.xml CopyImageFiles True False True
GalaxyRunConfig.xml NetworkCopyRootFolder Valid path Valid path Valid path
GalaxyRunConfig.xml DeleteFilesAfterNetCopy True False True
GalaxyRunConfig.xml CopyGoldcrestRunbroData True True True
ImagePath.xml ImagePath
SaveClusterImages True False True
RunConfig.xml OnlineAnalysis On True True True
Analysis.xml Results AutoArchive True False False
Analysis.xml Results ArchiveRoot Same valid path as
NetworkCopyRoot
Folder
Same valid path as
NetworkCopyRoot
Folder
Same valid path as
NetworkCopyRoot
Folder
StarGazerShell.xml Save Images True False False
Ta ble 2 7 Configuration File Locations
Configuration File Computer Location
GalaxyRunConfig.xml Instrument computer C:\Illumina\SCSx.x
ImagePath.xml Instrument computer C:\Illumina\SCSx.x
RunConfig.xml Instrument computer C:\Illumina\SCSx.x
StarGazerShell.xml IPAR server C:\Illumina\IPARx.x
Analysis.xml Instrument computer C:\Illumina\SCSx.x

194 CHAPTER 6
Integrated Primary Analysis and Reporting
Part # 1004571 Rev. A
Pipeline Analysis of IPAR Data
Image analysis data generated with IPAR can be processed further with the
Genome Analyzer Pipeline Software (Pipeline) version 1.0 or later. The
Pipeline will perform base calling and alignment after calculating the cross-
talk matrix, phasing and pre-phasing values for the experiment.
To perform Pipeline analysis of IPAR data, ensure the following steps have
been taken:
`You have installed Pipeline v1.0 on the off-line server—earlier versions of
the pipeline are not compatible with IPAR output.
`The experiment run folder containing the IPAR image analysis results
folder has been copied to the off-line server.
`The params file for the experiment has been copied to \RunFolder\Data
on the off-line server.
See the Genome Analyzer Pipeline Software User Guide for instructions on
how to further analyze IPAR image analysis data with Pipeline.
NOTE
If you are using all mechanisms for data transfer
provided by Illumina, the second and third conditions
will be always met.


196 APPENDIX A
Run Folders
Part # 1004571 Rev. A
Introduction
Each run generates a run folder that contains data files and log files specific
for that run. All run folders are stored in a single folder (see Run Folder Path
on page 196).
When you start a run, the system prompts you to enter the folder name for it.
By default, the folder is named in this format:
YYMMDD_<Workstation Name>_<Run Number>
Example: 070320_WORKSTATION-487_0002
The run number increments by one each time you perform a run on a given
workstation. Typically, users add the flow cell ID to the run folder name. The
name cannot have any spaces.
Run Folder Path
All run folders are stored in a single folder. The name and location of this
folder are set in <install location>\bin\Config\RCMConfig, in this line:
<Run Path="D:\Runs" />
To change the run folder path, either change this line or select Run | Select
Run Folder Root in the software. Enter the full path and folder name.
Contents of Run Folders
Ta ble 2 8 Run Folder Contents
Subfolder Key Files/Folders Description
[Root level] Configuration files All active configuration files for this run are
copied to the root of the run folder path.
run.completed file Appears in the folder when a run is
successfully completed. You can tell whether
a run is still in progress by checking for this
file.
Sample Sheet If you create a sample sheet, it is copied to
this location, and the name is added to the
params file in this folder.
Recipe_*.xml When you start a run, a copy of the recipe is
moved to the run folder. The name will be
prefixed by “Recipe_”. If you stop the run,
open this recipe to start up again where you
left off.
*.params file
<run_name>.params
Identifies the name of the instrument.

Contents of Run Folders 197
Paired-End Sequencing User Guide
Log file
RunLog_<date>_<time>.xml
Whenever you stop a run, a log file detailing
the duration of every command appears in
the root of the run folder path. If you stop
and resume the run multiple times, there will
be a separate log file for each session.
Other log files for the run can be found in
<install location>\bin\Config\LogFiles.
PairedEndInfo.xml At the beginning of a paired-end run, this file
is created. It contains the FirstRead\Length
attribute indicating the “turnaround point”
of the paired-end run and the length of the
first read.
Images Contains one folder for each lane.
Each lane folder contain one subfolder for
each cycle.
Each cycle folder contains TIFF files for each
lane, named in the format of
<sample>_<lane>_<pos>_<base>.tif
Focus folders (optional) Contains the TIFF focus images.
Data Run Browser folder Contains *.bro files used with the Run
Browser application. Each file contains run
quality metrics in one file per lane, per cycle.
IPAR folder Contains IPAR image analysis results.
This folder is saved on the IPAR server under
<Run Folder>\Data. This Run Folder is
created on the IPAR server when a run is
started, and is given the same name as the
Run Folder on the instrument computer.
.params file Contains run and analysis-specific
information.
AnalysisLogs Contains QC files (one per cycle). Values in
these files are displayed in the Analysis
Viewer for each cycle.
Each XML file is named as follows:
<QC_tab_name>CycleNumber.xml. For
example, FocusQuality15.xml contains focus
quality information for all tiles of cycle 15.
Config Contains configuration parameters for the
run that are stored in XML files.
IPAR_Config Contains configuration parameters for the
current run on the IPAR server that are stored
in XML files.
ReadPrep1 Contains Images and Data subfolders specific
to the preparation of Read 1 Contains quality results from Read 1
<ReadPrep> cycle processed by IPAR.
ReadPrep2 Contains Images and Data subfolders specific
to the preparation of Read 2 Contains quality results from Read 2
<ReadPrep> cycle processed by IPAR.
Calibration_<D
ateTime> Calibration results and image files
Ta ble 2 8 Run Folder Contents (Continued)
Subfolder Key Files/Folders Description

198 APPENDIX A
Run Folders
Part # 1004571 Rev. A


200 APPENDIX B
Sample Sheets
Part # 1004571 Rev. A
Introduction
The sample sheet contains information about the samples in each lane of the
flow cell. This information can be used by the Cluster Station, Genome
Analyzer, and data analysis tools. The content and format of the sample
sheet are defined in a customizable schema file.
There are two ways to create a sample sheet:
`Enter the data in the Sample Sheet Editor when you begin a run in the
Cluster Station.
`Enter the data in the standalone Sample Sheet Editor.
Sample sheets are stored in a network location that is accessible to both the
Cluster Station and the Genome Analyzer. After you create a sample sheet
for a flow cell during cluster generation, you can access it later when you
begin sequencing.
To Enter Sample Sheet Data in the Cluster Station
1. When you click Start to begin a run, the Cluster Station opens the
Sample Information dialog box.
2. Fill in all of the fields in the Editor.
3. Click OK.
4. When prompted, confirm or change the folder storing the data for this
run, and then click OK.
If there is no sample sheet folder in the location defined in RCMCon-
fig.xml, the software creates one. The sample sheet is automatically
saved as <flow cell ID>.xml.
5. If the RCMConfig file requires it, then when you start a run on the
Genome Analyzer, it will look for the sample sheet that matches the flow
cell ID you entered. It validates the sheet against the schema, and saves
a copy of the sample sheet in the local run folder.
The data analysis tools use the copy of the sample sheet stored in the
Genome Analyzer run folder.
NOTE
The sample sheet editor is only available once a network is
set up.
NOTE
The fields you see may be different from those that appear
here, may require data to be in a certain format, or be
optional. All of this is defined in the sample sheet schema
file.
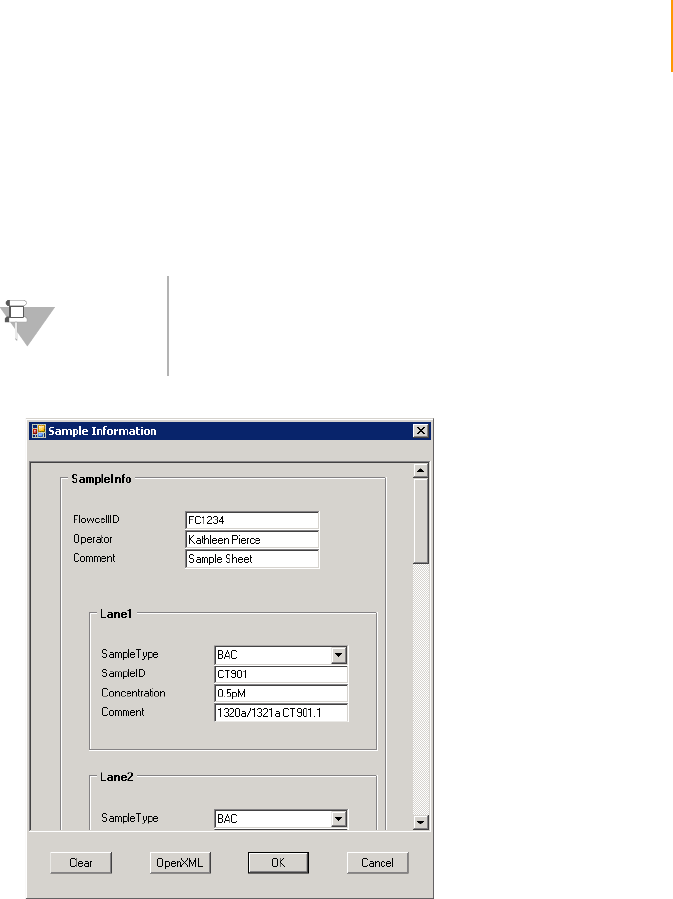
Introduction 201
Paired-End Sequencing User Guide
To Enter Sample Sheet Data in the Standalone Editor
1. Run the SampleSheetEditor.exe application in the <install
location>bin\Release folder.
2. Fill in the data and click OK.
Figure 114 Sample Sheet Editor
3. Name the sample sheet file after the flow cell ID, with an *.xml extension:
for example, FC3456.xml.
4. Save the sample sheet in the network location indicated in the
RCMConfig.xml file. When prompted for a sample sheet in the Cluster
Station or Genome Analyzer, navigate to the file.
NOTE
The fields you see may be different from those that appear
here, may require data to be in a certain format, or be
optional. All of this is defined in the sample sheet schema
file.

202 APPENDIX B
Sample Sheets
Part # 1004571 Rev. A
Configuring Sample Sheet Behavior
The RCMConfig.xml file contains a line that defines the behavior of the
sample sheet:
<SampleSheet SchemaFile="..\Config\SampleSheet.xsd"
SampleSheetPath="..\SampleSheets" Required="false"
Show ="false" />
`SchemaFile—The location of the sample sheet schema file (*.xsd). This
must be a networked location that is accessible to both the Cluster
Station and Genome Analyzer workstations. The Genome Analyzer
validates sample sheets against the schema file.
`SampleSheetPath—The location of individual sample sheets. This must
be a networked location that is accessible to both the Cluster Station and
Genome Analyzer workstations.
`Required—Whether or not the Genome Analyzer requires a sample
sheet. If Required=“true” in the RCMConfig.xml, the following things
happen:
a. The software searches for the sample sheet in the sample sheet
folder on the network with the provided flow cell ID and copies it to
the run folder.
b. If the sample sheet is not found then a browse dialog pops up for the
user to browse the appropriate sample sheet.
Sample Sheet Example
This section shows the contents of an imaginary sample sheet file.
<?xml version="1.0" encoding="utf-8" ?>
<SampleInfo>
<FlowcellID>FC5312</FlowcellID>
<Operator>Lou</Operator>
<Comment>BAC/MONO</Comment>
<Lane1>
<SampleType>BACControl</SampleType>
<SampleID>CT391</SampleID>
<Concentration>0.5pm</Concentration>
</Lane1>
<Lane2>
<SampleType>BACControl</SampleType>
<SampleID>CT391</SampleID>
<Concentration>0.5pm</Concentration>
</Lane2>

Sample Sheet Example 203
Paired-End Sequencing User Guide
<Lane3>
<SampleType>BACControl</SampleType>
<SampleID>CT391</SampleID>
<Concentration>0.5pm</Concentration>
</Lane3>
<Lane4>
<SampleType>BACControl</SampleType>
<SampleID>CT391</SampleID>
<Concentration>0.5pm</Concentration>
</Lane4>
<Lane5>
<SampleType>Monotemplate</SampleType>
<SampleID>HCT031</SampleID>
<Concentration>0.3pm</Concentration>
</Lane5>
<Lane6>
<SampleType>BACControl</SampleType>
<SampleID>CT391</SampleID>
<Concentration>0.5pm</Concentration>
</Lane6>
<Lane7>
<SampleType>BACControl</SampleType>
<SampleID>CT391</SampleID>
<Concentration>0.5pm</Concentration>
</Lane7>
<Lane8>
<SampleType>BACControl</SampleType>
<SampleID>CT391</SampleID>
<Concentration>0.5pm</Concentration>
</Lane8>
</SampleInfo>

204 APPENDIX B
Sample Sheets
Part # 1004571 Rev. A

Paired-End Sequencing User Guide 205
Appendix C
Recipes
Topics
206 Introduction
207 Stopping and Restarting a Recipe
207 Protocol Section
209 Chemistry Definition Section
209 General Commands
210 Cluster Station Commands
211 Genome Analyzer Commands
212 ReadPrep Cycles
212 Service Recipes
212 User-Defined Recipes
213 Configuring Tile Selection
213 Reducing the Number of Rows
213 Reducing the Number of Lanes
214 Sample Genome Analyzer Recipe with Annotations
214 Comment
214 Incorporation
215 Chemistry Definitions
215 First Base Protocol
217 Protocol

206 APPENDIX C
Recipes
Part # 1004571 Rev. A
Introduction
Recipes are .xml files containing a series of commands. To perform runs on
the Cluster Station or the Genome Analyzer, you open and execute the
appropriate recipe.
Each recipe file has two main sections: ChemistryDefinitions and Protocol.
`ChemistryDefinitions—Contains multiple named blocks which contain a
sequence of chemistry commands. For example, some Cluster Station
chemistry definitions are TemplateDNAHybridization, and Blocking-
CyclicPumping. Some Genome Analyzer chemistry definitions are Prime,
FirstBase, and CompleteCycle.
`Protocol—Invokes chemistry definitions in a particular sequence to
perform the run. Genome Analyzer sequencing protocols perform image
data acquisition steps (incorporation) in addition to the chemistry. All
protocols may contain UserWait messages, which pause the run and
trigger dialog boxes with instructions for the user.
Genome Analyzer recipes also contain the following section:
`Tile Selection—Determines which rows and lanes are imaged during the
incorporation cycles. You can shorten the run by limiting the number of
tiles imaged, although this generates concomitantly less data.
`Incorporation—This portion of the sequencing protocol calls out for the
imaging of the current cycle, then calls out the chemistry for the removal
and washing of the fluorescent bases and the subsequent addition of the
next base in the sequence.

Stopping and Restarting a Recipe 207
Paired-End Sequencing User Guide
Stopping and Restarting a Recipe
Click Stop if you wish to stop the currently executing command. Some
commands stop immediately, while others need to finish before stopping.
Completed steps have a check mark beside them. When a run is stopped,
the system is placed into a partial safe state. The partial safe state function
executes a pump initialization.
At the beginning of a run, the active recipe file is automatically copied to the
run folder. If the run stops before completion, there are two ways to restart
the run from the point where it left off.
1. If you have closed the application, loaded another recipe, or otherwise
navigated away from the run, select File | Open Recipe. Navigate to the
run folder and open the recipe from there.
2. Do one of the following to select the restart point:
•Highlight the first protocol step that does not have a check mark.
•Highlight any italicized command, whether it is before or after the
point where you left off.
The Resume button becomes active when you select a valid restart point.
If you stopped during an Incorporation imaging step, then the imaging
cycle restarts from the first tile.
If an error occurs, then the run stops automatically and the instrument is
placed in a safe state.
Protocol Section
Here is a snippet of a Genome Analyzer recipe file, showing part of the
Protocol section. Cluster Station recipes, and other Genome Analyzer
recipes, use different commands but have the same general format.
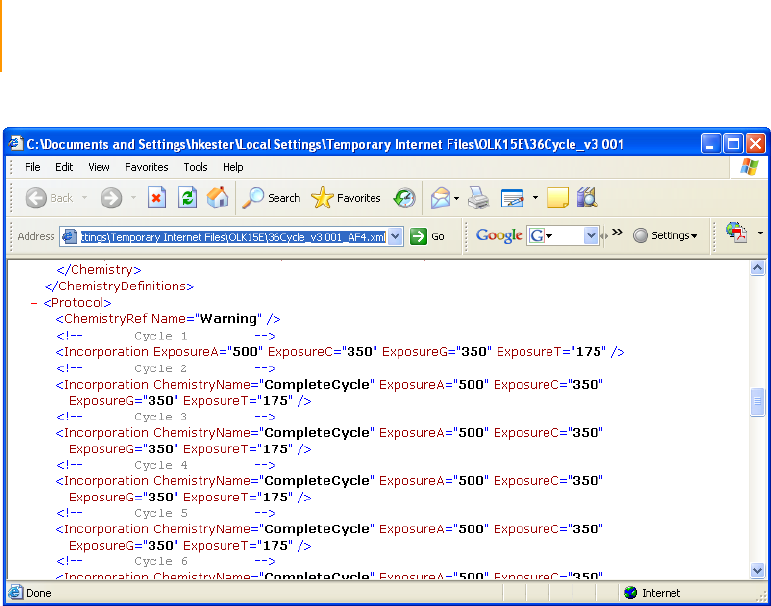
208 APPENDIX C
Recipes
Part # 1004571 Rev. A
Figure 115 Protocol Section of Sequencing Recipe File
In Genome Analyzer recipes, you can specify identical chemistry steps in two
ways:
`In separate lines of the protocol:
<ChemistryRef Name=”FirstBase” />
<Incorporation ExposureA=”400” ... / >
`Inside the line that invokes the incorporation imaging cycle:
<Incorporation ChemistryName=”FirstBase” Expo-
sureA=”400” ... />
In the second example, the incorporation step includes both the
incorporation chemistry and the imaging cycle.
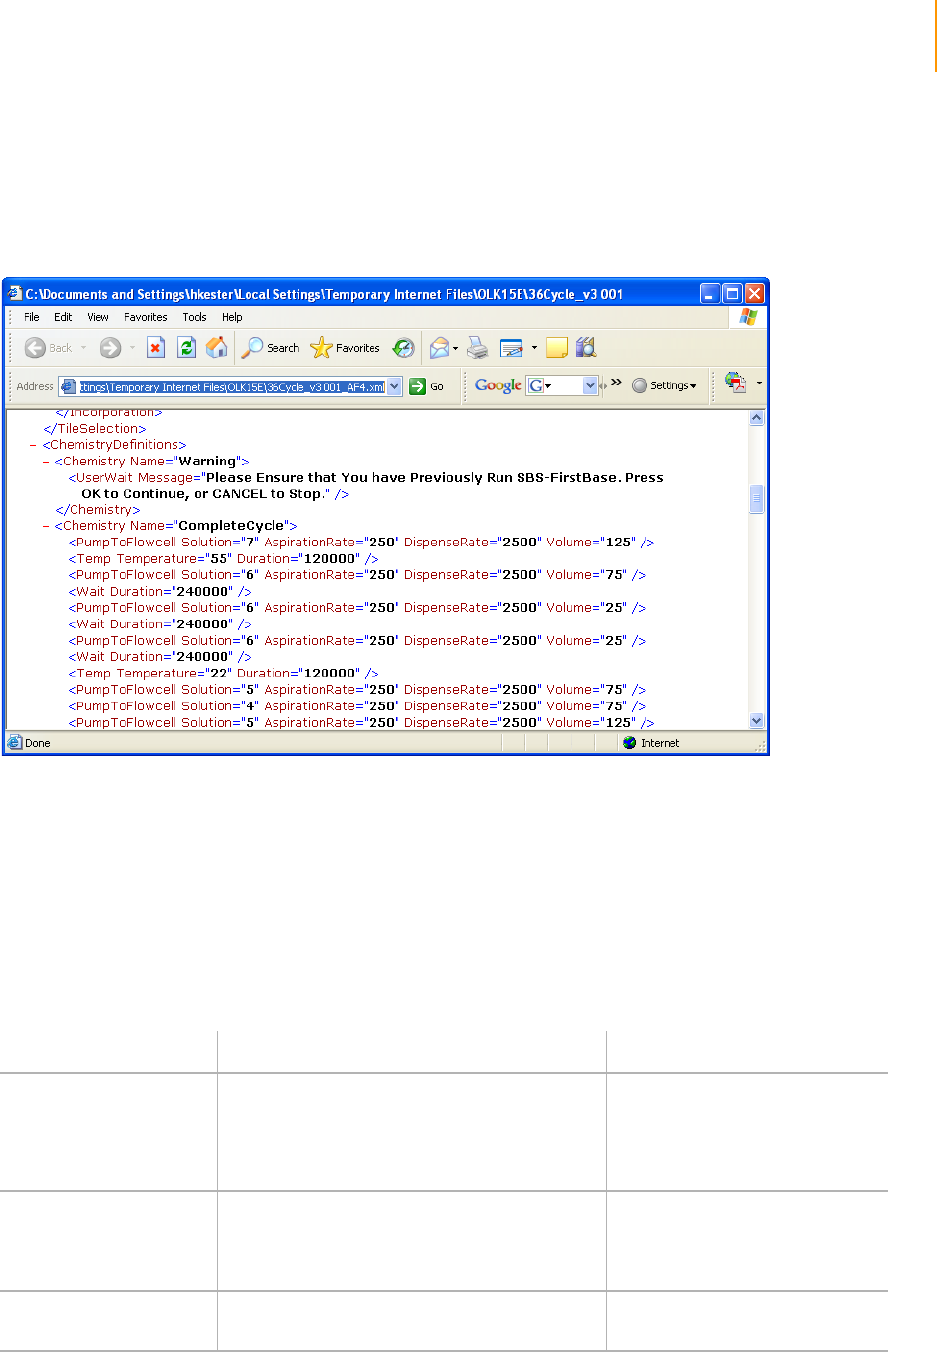
Chemistry Definition Section 209
Paired-End Sequencing User Guide
Chemistry Definition Section
Here is a snippet of a Genome Analyzer recipe file, showing a chemistry
definition. Cluster Station recipes, and other Genome Analyzer recipes, use
different chemistry definitions but have the same general format.
Figure 116 Chemistry Definition Section of Sequencing Recipe File
General Commands
These commands may appear in any recipe for the Cluster Station or
Genome Analyzer.
Ta ble 2 9 General Recipe Commands
Command Mandatory Attributes Action
TempSet Temperature—Flow cell temperature in
degrees Celsius.
Duration—Length of time that the
temperature will be maintained, in
milliseconds.
Sets the flow cell temperature.
TempRamp Temperature—Target flow cell temperature in
degrees Celsius.
Rate—The rate of change, in degrees per
second.
Ramps the temperature of the
flow cell.
Wait Duration—The wait time, in milliseconds. Sets the time for the chemistry
step to complete.

210 APPENDIX C
Recipes
Part # 1004571 Rev. A
Cluster Station Commands
These commands appear only in Cluster Station recipes.
UserWait [Optional] Message—An explanatory or
instructional message that appears in a dialog
box when the run pauses.
Normally, this is used when the
run requires user input to
continue. Click OK to continue
the run or Cancel to stop the run.
Ta ble 2 9 General Recipe Commands
Command Mandatory Attributes Action
Ta ble 3 0 Cluster Station Recipe Commands
Command Mandatory Attributes Action
Pump Reagent—The number of the solution to be
pumped.
AspirationRate—Pump rate in μl/minute.
Volume—Pump volume in μl.
Pumps reagent to the flow cell.
The dispense rate is fixed at
3000 μl/minute.
Prime Reagent—The number of the reagent to be
primed. Primes the lines. Each prime
command pumps 20 μl of
reagent.
TempSet Temperature—Flow cell temperature in
degrees Celsius.
Duration—Length of time that the
temperature will be maintained, in
milliseconds.
Sets the flow cell temperature.
TempRamp Temperature—Target flow cell temperature in
degrees Celsius.
Rate—The rate of change, in degrees per
second.
Ramps the temperature of the
flow cell.

Genome Analyzer Commands 211
Paired-End Sequencing User Guide
Genome Analyzer Commands
These commands appear only in Genome Analyzer recipes.
Ta ble 3 1 Genome Analyzer Recipe Commands
Command Mandatory Attributes Action
PumpToFlowcell Solution—The number of the solution to be
pumped.
AspirationRate—Pump rate in μl/minute.
Default is 60; maximum value is 120.
DispenseRate—Pump rate in μl/minute.
Default is 2000.
Volume—Pump volume in μl.
Pumps reagent from the named
solution bottle/tube through the
flow cell.
Incorporation [Optional] ChemistryName—Invokes a
particular chemistry as part of the
incorporation cycle, such as FirstBase.
ExposureA, ExposureG, ExposureC, and
ExposureT—The image exposure time for
each image channel during the incorporation
cycle, in milliseconds.
Sets the exposure time for each
image channel during
incorporation. May also invoke
incorporation chemistry.
RowRange Min—The first row in the range {1–50}
Max—The last row in the range {1–50}
Identifies a range of adjacent
rows for incorporation.
LaneRange Min—The first lane in the range {1–4}
Max—The last lane in the range {1–4}
Identifies a range of adjacent
lanes for incorporation.
LaneRange only applies to the
first four lanes.
Lane Index—The number of the lane for
incorporation Identifies one or more lanes for
incorporation. Write separate
<Lane Index= ...> commands for
each lane.
You can include <Row> or
<RowRange> commands inside
the <Lane> command to limit the
number of rows within each lane.
Row Index—The number of the row for
incorporation Identifies one or more rows for
incorporation. Write separate
<Row Index= ...> commands for
each lane.
ReadPrep ChemistryName—Invokes a particular
chemistry as part of the incorporation cycle,
such as FirstBase.
ExposureA, ExposureG, ExposureC, and
ExposureT—The image exposure time for
each image channel during the incorporation
cycle, in milliseconds.
Applies chemistry and performs
test scan with separate online
analysis before each paired-end
read. The second occurrence of
this element marks the “turn
around” point of the paired-end
run and determines the length of
the first read.

212 APPENDIX C
Recipes
Part # 1004571 Rev. A
ReadPrep Cycles In addition to Incorporation and Cleavage, the ReadPrep element is a third
cycle type in the protocol section of the SCS recipes. The ReadPrep cycle
performs scans and collects data before each paired-end read. The second
occurrence of this element marks the “turnaround point” of the paired-end
run and determines the length of the first read. ReadPrep does not affect
cycle numbers assigned by the software to any Incorporation or Cleavage
elements.
Each ReadPrep cycle is processed by the IPAR server as the first cycle of a
new run. Corresponding results on the IPAR server are written to separate
sub-folders of the Run Folder, “Read 1” and “Read 2.” After the second
ReadPrep element, the main run resumes as if no ReadPrep cycles existed in
the recipe.
Service Recipes
Service recipes are protocols for maintaining the flow cell and instrument. To
make a recipe a service recipe, add the Type attribute to the RecipeFile
element as follows:
<RecipeFile Type="Service">
To specify a normal recipe, add the following:
<RecipeFile Type="Normal">
A service recipe causes the software to skip the sample sheet dialog box and
to suppress the run folder dialog box. All information relating to the run, such
as the recipe and config files, is saved in the following folder:
..\Service, where the parent folder is
<install directory>\DataCollection_v<#>\bin
The folder containing the information from this run is named for the date and
time that the recipe was executed.
User-Defined Recipes
You can create and edit recipes in a text editor such as Notepad. User-
defined recipes are validated upon loading.
Cluster Station recipes must meet two requirements to be considered valid.
First, a recipe must have fewer than 20 temperature set points. Second, a
recipe cannot contain any sequential repeating pattern of two or more
temperature set points.
NOTE
The first-base incorporation recipe is a service recipe.

Configuring Tile Selection 213
Paired-End Sequencing User Guide
Configuring Tile Selection
You can edit Genome Analyzer sequencing recipes to select only certain tiles
for imaging.
By default, all lanes and rows will be imaged, which maximizes the amount of
data captured for each experiment. However, in some cases you might want
to shorten the run by reducing the area to be imaged. To narrow the number
of lanes or rows for an experiment, use the Row, Lane, RowRange, and
LaneRange tags.
Reducing the
Number of Rows
This selection chooses rows 6–10, 21–25, 36–40 for Incorporation. All lanes
within those rows are selected by default, unless the LaneRange command is
used to reduce the number.
<TileSelection>
<Incorporation>
<RowRange Min="6" Max="10" />
<RowRange Min="21" Max="25" />
<RowRange Min="36" Max="40" />
</Incorporation>
</TileSelection>
Reducing the
Number of
Lanes
This selection chooses only the middle four lanes for incorporation imaging.
<TileSelection>
<Incorporation>
<Lane Index="3"/>
<Lane Index="4"/>
<Lane Index="5"/>
<Lane Index="6"/>
</Incorporation>
</TileSelection>
CAUTION
Exercise extreme care when editing a recipe. Always
make a backup copy of the recipe before altering it.

214 APPENDIX C
Recipes
Part # 1004571 Rev. A
Sample Genome Analyzer Recipe with Annotations
This section examines the structure of a recipe, using a Genome Analyzer
sequencing recipe as an example. Cluster Station recipes and other Genome
Analyzer recipes have different content, but similar sections, commands, and
attributes.
Tile Selection <TileSelection>
The Tile Selection portion of the recipe indicates the specific tiles to be
imaged. Only a subset of the tiles are imaged during first-base incorporation,
while all tiles are imaged during the complete sequencing run.
Comment <!--
<Incorporation /> This results in number of lanes
equal 0 => do all of them
<Lane /> Not legal, don't know which lane is
being referenced
<Rows /> or leaving out the 'Rows' element has
the same effect; the number of rows is 0 =>
do all of them.
-->
<!-- xxxxxx -->This notation allows for a comment to be inserted. This
character string tells the software not to interpret the comments as a
command.
Comments provide instructional notation about the recipe.
Incorporation <Incorporation>
The Incorporation section of the recipe refers to images taken after
nucleotide incorporation occurs.
<Lane Index="1">
By specifying the Lane Index you can modify the number of tiles to be
imaged per lane.
<RowRange Min="23" Max="27" />
<RowRange Min="33" Max="37" />
<RowRange Min="43" Max="47" />
Tiles 23–27, 33–37, 43–47 from Lane 1 will be imaged.
RowRange Min="23" Max="27" indicates five rows will be imaged. This
command is inclusive; that is, 23, 24, 25, 26, and 27 will be imaged.
</Lane>
<Lane Index="2">
<RowRange Min="23" Max="27" />
<RowRange Min="33" Max="37" />

Sample Genome Analyzer Recipe with Annotations 215
Paired-End Sequencing User Guide
<RowRange Min="43" Max="47" />
Tiles 23–27, 33–37, 43–47 from Lane 2 will be imaged.
</Lane>
<Lane Index="4">
<RowRange Min="33" Max="37" />
In Lane 4, however, only 5 rows will be imaged.
</Lane>
</Incorporation>
End of Incorporation section.
An easy way to image the same tiles per lane is as follows:
<Incorporation>
<Row Range Min="1" Max "35">
</Incorporation>
Chemistry
Definitions
<ChemistryDefinitions>
In <ChemistryDefinitions>, a series of operations can be grouped together
and defined as a “chemistry.” A chemistry consists of one or more commands
and can include temperature changes, reagent deliveries, wait steps, and
user messages.
Volumes are in milliliters.
Waits are in milliseconds.
These chemistries are later called during the Protocol portion of the recipe.
<Chemistry Name="Prime">
</Chemistry>
<Chemistry Name="End">
Define protocol: End last stem.
<PumpToFlowcell Solution="2"
AspirationRate="60" DispenseRate="2000"
Volume="4000" />
Pump 4 ml of solution 2 (H20).
</Chemistry>
First Base
Protocol
<Chemistry Name="FirstBase">
Define First Base protocol.
<PumpToFlowcell Solution="5"
AspirationRate="60" DispenseRate="2000"
Volume="1000" />
Pump 1 ml of Incorporation Buffer.
<Temp Temperature="55" Duration="120000" />
Set temperature to 55°C and wait 2 minutes.

216 APPENDIX C
Recipes
Part # 1004571 Rev. A
<PumpToFlowcell Solution="1"
AspirationRate="60" DispenseRate="2000"
Volume="600" />
Pump 600 μl of incorporation mix.
<Wait Duration="240000" />
Wait 4 minutes.
<PumpToFlowcell Solution="1"
AspirationRate="60" DispenseRate="2000"
Volume="200" />
Pump 200 μl of incorporation mix.
<Wait Duration="240000" />
Wait 4 minutes.
<PumpToFlowcell Solution="1"
AspirationRate="60" DispenseRate="2000"
Volume="200" />
Pump 200 μl of incorporation mix.
<Wait Duration="240000" />
Wait 4 minutes.
<Temp Temperature="22" Duration="120000" />
Set temperature to 22°C, wait 2 minutes.
<PumpToFlowcell Solution="5"
AspirationRate="60" DispenseRate="2000"
Volume="600" />
Pump 600 μl of Incorporation Buffer.
<PumpToFlowcell Solution="4"
AspirationRate="60" DispenseRate="2000"
Volume="600" />
Pump 600 μl of High Salt Buffer.
<PumpToFlowcell Solution="3"
AspirationRate="60" DispenseRate="2000"
Volume="800" />
Pump 800 μl of Scan Mix.
<TempOff />
Temperature off.
<UserWait Message="First Base Incorporation
Chemistry Complete
To perform manual focus and 1st base
evaluation now, press cancel" />
User wait step.
</Chemistry>
End First Base definition.

Sample Genome Analyzer Recipe with Annotations 217
Paired-End Sequencing User Guide
Protocol <Protocol>
In the Protocol section of the recipe, all of the recipe components defined to
this point are combined to define instrument cycles of chemistries such as
priming, washing, and incorporation. The exact combination is determined
by the instrument and the recipe.
This sample protocol from the Genome Analyzer consists of 36 cycles of
incorporation followed by imaging. The Incorporation command takes two
inputs, an optional chemistry and exposure times for each filter/base.
<ChemistryRef Name="Warning" />
Displays a warning that you first have to run the SBS-FirstBase protocol.
<!-- Cycle 1 -->
This is a comment indicating the following commands begin Cycle 1.
<Incorporation ExposureA="500" ExposureC="350"
ExposureG="350" ExposureT="175" />
Image incorporation tiles, exposure times: 500 ms, 350 ms, 350 ms, and
175 ms per picture for channels A, C, G, and T, respectively.
<!-- Cycle 2 -->
This is a comment indicating the following commands begin Cycle 2.
<Incorporation ChemistryName="CompleteCycle"
ExposureA="500" ExposureC="350"
ExposureG="350" ExposureT="175" />
Call up CompleteCycle protocol, image incorporation tiles.
<!-- Cycle 3 -->
Repeat.
<Incorporation ChemistryName="CompleteCycle"
ExposureA="500" ExposureC="350"
ExposureG="350" ExposureT="175" />
<!-- Cycle 4 -->
<Incorporation ChemistryName="CompleteCycle"
ExposureA="500" ExposureC="350"
ExposureG="350" ExposureT="175" />
.
.
.
<!-- Cycle 35 -->
<Incorporation ChemistryName="CompleteCycle"
ExposureA="500" ExposureC="350"
ExposureG="350" ExposureT="175" />
<!-- Cycle 36-->
<Incorporation ChemistryName="CompleteCycle"
ExposureA="500" ExposureC="350"
ExposureG="350" ExposureT="175" />
<ChemistryRef Name="End" />

218 APPENDIX C
Recipes
Part # 1004571 Rev. A
Call up End chemistry, after the last incorporation cycle, which delivers water
from position 2.
</Protocol>
End Protocol.

Paired-End Sequencing User Guide 219
Appendix D
Frequently Asked Questions
Topics
220 General
221 Sample Prep
222 Cluster Station
222 Clusters
223 Amplification
223 Fluidics
224 Genome Analyzer
224 Controls
225 Software
226 Focus
226 Flow Cells
227 Fluidics
228 Instrument
228 Quality Metrics
228 IPAR
233 Technology Overview and Molecular Biology
235 Additional Applications
235 Instrumentation
235 Analysis Software and Computing Requirements

220 APPENDIX D
Frequently Asked Questions
Part # 1004571 Rev. A
General
Do we need to optimize the Cluster Station and Genome Analyzer to
ensure correct, consistent results?
No. The machines are standardized and will remain stable if left in
the original configuration.
What are your recommendations for optimizing machine use?
As a best practice, you should have a number of flow cells in the 4°C
refrigerator that are ready for primer hybridization and sequencing.
This helps ensure that you can run the Genome Analyzer nearly con-
tinuously, maximizing its use. Backup flow cells also provide insur-
ance against the failure of any one flow cell. If a flow cell fails first-
base incorporation, you can simply run a backup flow cell and not
waste the Genome Analyzer reagents or the machine time. To sup-
port this flexibility, the Cluster Station must be available for primer
hybridization when needed.
How long can flow cells be stored?
After amplification, you can store flow cells indefinitely at 4°C. It then
takes approximately three hours to linearize, block, and hybridize the
primers before sequencing.
A paired-end flow cell can not be stored after the blocking step.
After primer hybridization, the sequencing should proceed as soon
as possible. Illumina recommends you begin sequencing within
four hours.
What is a recipe?
A recipe is a protocol for either the Cluster Station or the Genome
Analyzer. Most of the standard recipes come preloaded on the
instrument. For more information, see Appendix C, Recipes.
Can I edit recipes to change the chemistry, the number of cycles,
etc?
You can edit recipes, but Illumina does not recommend that you do
so, and cannot provide support for non-standard recipes. If you want
to create a customized recipe, contact Illumina Technical Support or
your Field Application Scientist.

Sample Prep 221
Paired-End Sequencing User Guide
Sample Prep
How many samples may be run at one time?
Flow cells are single-use, and all eight lanes must be used at the
same time. They may be used for the same sample (common for
sequencing applications), or for eight different samples (more com-
mon for RNA applications). There is a single flow cell per Cluster Sta-
tion Kit. There are no cross-contamination issues when using the
Cluster Station or Genome Analyzer. However we recommend run-
ning one sample per prep gel during sample prep to avoid contami-
nation. One lane should be used for the control. See Controls on
page 224.
How long does it take to prepare samples?
It takes about one day to prepare genomic DNA for sequencing,
three days to prepare RNA for gene expression analysis, and
four days to prepare small RNA.
How many different libraries can we run on one flow cell?
You can run up to eight, not including indexing.
How much genomic DNA is needed for the paired-end sample prep
kit?
Illumina recommends 1–5 μg of genomic DNA.
How is the DNA fragmented?
Illumina recommends using a nebulizer. Customers have also had
success with sonication.
What are the differences between nebulization and sonication?
Nebulization leads to a tighter size distribution of DNA fragments
than sonication but also leads to greater loss of sample.
How long does a prepared sample remain stable?
A prepared sample will remain stable indefinitely when stored at
-20°C.
What is the optimal fragment size for the genomic DNA sample prep
protocol?
The template size is determined by the length of the insert of inter-
est. The size range is 200 ±8 bp.
Is there a QC process for sample prep?
You can run a gel or sequence the product, if desired, to test the
sample prep. There is currently no QC process for testing the prod-
uct from the Cluster Station.

222 APPENDIX D
Frequently Asked Questions
Part # 1004571 Rev. A
Cluster Station
How can I prevent cross-contamination?
Be especially careful when pipetting multiple samples into a strip
tube, and change tips between each dispense. Once the samples are
in the Cluster Station, the chance of cross-contamination is negligi-
ble.
Do you offer a single-cell protocol if people want to do a smaller
experiment?
No, not at this time.
What is the variation for reagent delivery by the Cluster Station?
The Cluster Station has little variation. The most common causes of
variation are due to poor attachment of the amplification or hybrid-
ization manifolds and air trapped in reagent lines or valves.
Can the heating element on the Cluster Station perform PCR?
No. This ability has been disabled.
The user guide says not to use the manual controls on the Cluster
Station software. If we're not supposed to use them, why are they
there?
The Cluster Station manual controls are mainly used for trouble-
shooting purposes. If you contact Illumina Technical Support, the
support scientist may ask you to adjust some settings manually.
Clusters How long does it take to generate clusters on a flow cell?
It takes about 6 hours on a Cluster Station to prepare a flow cell for
sequencing, plus 1–2 hours for reagent preparation.
What happens if I increase the number of cycles on the Cluster
Station?
The clusters become proportionately larger.
Is there a benefit to adding cycles so that I get larger clusters?
No. Over-large clusters are more likely to touch each other. Because
the Genome Analyzer does not read clusters that touch each other,
over-large clusters can actually reduce the amount of data collected.
The Genome Analyzer Pipeline software also ignores clusters over a
certain size, so over-large clusters can be lost through filtering.
How can I optimize the clusters?
Short fragments tend to create tight, dense clusters. The optimal
fragment size is 200 ±8 bp.

Cluster Station 223
Paired-End Sequencing User Guide
When can we determine the cluster density?
Cluster density can be determined after performing the first-base
incorporation cycle on the Genome Analyzer. Generating a First-
Cycle report from Run Browser will give you an estimation of the clus-
ter brightness and number. For more information, see Chapter 5, Run
Browser Reports.
Can SybrGreen be used to determine cluster density instead of first-
base incorporation?
You can use SybrGreen to determine cluster density but it requires a
fluorescent microscope to examine the flow cell before running the
Genome Analyzer.
Amplification What is the DNA concentration going into the amplification step?
This varies and should be optimized for each application and library
template. For the control PhiX, we recommend 1 pM final concentra-
tion. This yields about 85,000 clusters per tile on a 1.4 mm flow cell.
What volume of DNA is pumped into each lane?
A total of 85 μl. The Cluster Station initially pumps in 75 μl, and then
pumps 10 μl more to push out the air bubbles.
What if I don’t have enough template DNA?
Template DNA concentration must be optimized at the sample prep-
aration step.
Does cDNA work the same way?
Yes. cDNA feeds into the genomic DNA prep kit, at which point the
two protocols are the same.
Can I walk away during the amplification temperature ramp (from
95°C to 40°C)?
The Cluster Station is not ready for walk-away automation until after
you have attached the amplification manifold and checked for good
flow through all lanes.
Fluidics When you perform a wash on the Cluster Station, how do you know
which solution is flushed through the flow cell at any given time?
Hover your mouse over the highlighted recipe step in the software. A
popup shows the instruction that the Cluster Station is currently exe-
cuting.
Is it normal to see bubbles coming out of the flow cell on the Cluster
Station?
It is normal during amplification. The heating and cooling naturally
cause small bubbles to form and flow out through the hybridization
manifold. There is no adverse effect on the assay.
You should not see large numbers of bubbles during any other pro-
cess on the Cluster Station.

224 APPENDIX D
Frequently Asked Questions
Part # 1004571 Rev. A
Genome Analyzer
How long does a sequencing run take?
On the Genome Analyzer, this depends on the number of cycles,
which in turn depends on the application. GEX uses 18 cycles, small
RNA uses 18–26 cycles, and sequencing uses up to 36 cycles. Each
cycle takes 1.5 hours, assuming that you image all 100 tiles per lane.
Sample preparation and clustering take additional time before the
run. After the run, the data analysis time depends on the available
computing resources.
How can I prevent cross-contamination between buffers?
Be careful when preparing reagents for the Genome Analyzer. Use
filter tips to prevent contamination between buffers.
Controls Illumina recommends running a control PhiX sample in one lane of
each flow cell. Why do we need to give up a lane for an Illumina
sample?
The data from the control sample are used to generate the matrix
file. The analysis tool uses the control to calculate phasing/pre-phas-
ing from this sample, and the relative proportion of the different
bases. Without a control lane, the software would assume that the
base composition of the sample is strictly balanced. While this is true
of a total human genome, it might not be true of non-human
genomes or a focused region of the human genome. Therefore, the
control is necessary for all expression studies, small RNA studies, and
reduced complexity studies.
Can we use the control for troubleshooting?
Yes, you can use the control library for troubleshooting purposes.
How do we tell the software what lane has the Illumina control?
This is determined during the setup of the Genome Analyzer Pipe-
line, a data analysis tool that runs on a separate server.
Once you know you have a good matrix, why do you need to keep
using an Illumina control each time?
The normal variation between runs means that one matrix cannot
apply universally.
How do I order the Illumina PhiX sample?
Currently, the PhiX sample for paired reads is only available in the
paired-end installation and training kit.
What is a matrix file?
The matrix file accounts for cross talk between dyes. It is used for
base calling.

Genome Analyzer 225
Paired-End Sequencing User Guide
What is deconvolution?
The ability to distinguish between two or more clusters that are in
close proximity to each other.
What is the offsets file?
The offsets file is automatically generated during each run to account
for the misalignment of images between the four dyes. The location
of any given cluster shifts slightly depending on which filter you are
using. Without a proper offset file, the cluster might be counted up
to four times.
If adjustment to the Genome Analyzer optical system is made, it is
necessary to recalculate the default offset file for the following run.
Software During a cycle, the software suddenly turned off and restarted. What
happened? Are my data safe? Do I need to restart the run?
Your data are safe and you do not need to restart the run. The shutoff
and restart are in response to memory management issues in Win-
dows, and occur at the beginning of a cycle. The software will auto-
matically restart in about 30 seconds and pick up the recipe at the
point it left off. This is perfectly safe and prevents you from receiving
an “out of memory” error during the run.
What is the best way to transfer image files from the Genome
Analyzer computer to a network location?
Robocopy is a script that copies files from the local drive to a net-
work location while the run is proceeding. This saves a considerable
amount of time transferring data after completion of a run. Robo-
move copies files one at a time like Robocopy, performs a compare
to ensure the integrity of the files, and then deletes them from the
local drive.
Can I manually copy files to another location while the Genome
Analyzer is running?
No. Robocopy is optimized to copy files during the chemistry cycles
so that it does not interfere with image acquisition. If you try to copy,
move, or delete files during a run, it can interfere with writing to the
disk during image acquisition and cause an error.
How do I turn Robocopy or Robomove on or off?
This is done by modifying statements in a configuration file. To
change the setting, contact your Illumina Field Application Scientist
or Field Service Engineer.
What happens if a Genome Analyzer run is interrupted before it
completes? Can I restart?
It is possible to restart a run from where it was interrupted. The easi-
est way to do this is to load the recipe file from the last round of
imaging and restart the run from where it left off. For more informa-
tion, see Stopping and Restarting a Recipe on page 207.

226 APPENDIX D
Frequently Asked Questions
Part # 1004571 Rev. A
If the runs stops during imaging, pump some fresh solution # 3 (Scan
Mix) through the flow cell, reload the recipe from the run folder, and
resume from the interrupted round of images.
If the run stops during a chemistry step, reload the recipe from the
run folder and resume from the first pump solution line.
What recipes do I use for the Genome Analyzer?
For the first round of chemistry, use FirstBase_v<#>.xml. For the
remaining rounds use 36Cycle_PE_GA2_v.1.xml.
How do I change the number of sequencing cycles?
To change the number of sequencing cycles, edit the GenomeAna-
lyzersequencing.xml file. For instructions, see Appendix C, Recipes.
The run finishes with a cycle chemistry.
Focus Why do you have to manually focus if each image is autofocused?
Manual focusing sets the appropriate range and calibration curve for
the autofocus algorithm. For more information, see Adjusting Focus
on page 124.
Should I “home” the Genome Analyzer stage before each run?
No, it is not necessary. The stage is homed automatically during ini-
tialization. For more information, see Adjusting Focus on page 124.
Flow Cells What is a tile?
A tile is an imaginary square within a lane, measuring 760 μm x
720 μm on each side (1.4 mm flow cell). Each of the eight lanes in a
flow cell is subdivided into two columns of 50 tiles. Every image is of
one tile, so a tile is essentially the same thing as an image. Each tile is
imaged five times per cycle, once for each base plus a focus image.
I have used an earlier Genome Analyzer system before, but the tile
size for the Genome Analyzer II has changed. What does this mean
for the cluster density?
The surface area for each tile of the Genome Analyzer II is 4.7 times
bigger than that for the earlier system. As a consequence, the lower
and upper limits for cluster density (total clusters) have changed:
Genome Analyzer II
with 1.4 mm flow cell
Preceding Genome Analyzer
system with 1.0 mm flow cell
Tile size 0.57 mm2/tile 0.12 mm2/tile
Lower limit cluster density 104,000 clusters/tile 22,000 clusters/tile
Upper limit cluster density 132,000 clusters/tile 28,000 clusters/tile

Genome Analyzer 227
Paired-End Sequencing User Guide
What is the difference between a lane and a channel?
A lane and a channel are the same thing. Channel can also refer to an
image channel on the Genome Analyzer (A, C, G, or T).
Do I have to image every tile in a lane?
You do not have to image every tile, but typically you will want to do
so to maximize the data generated from each lane. Imaging fewer
tiles saves time in image capturing but not in chemistry.
How do I image fewer than the maximum number of tiles?
Note: Illumina does not recommend that you change the number of
tiles being imaged during sequencing runs. The primary purpose of
this flexibility is to assist support scientists during validation.
To change the number of columns imaged, open the tilelayout.xml
file and change the column value to 1 or 2. Any other options will
generate an error.
To change the number of tiles imaged, see Configuring Tile Selec-
tion on page 213.
After the first-base incorporation, how do I tell if the flow cell is good
and I should continue with the sequencing protocol?
See Completing Read 1 on page 139 and Chapter 5, Run Browser
Reports.
Fluidics Do I need to have a flow cell in place when I am running the fluidics?
In the Genome Analyzer, you absolutely need to have a flow cell in
place. Failure to load a flow cell will introduce air into the system
which will then need to be cleared before starting a run.
Fluidics can be tested in the Cluster Station using a washing bridge
or a flow cell.
How do I manually test for leaks?
See Checking for Leaks and Proper Reagent Delivery on page 117.
What is the maximum flow rate for the syringes on the Genome
Analyzer and the Cluster Station?
Cluster Station, Paired-End Module, and Genome Analyzer recipes
are optimized in a range from 15 μl/min to 250 μl/ min depending on
the hardware and the chemistry step. The maximum limits are 250 μl
per minute. Do not use more on the Genome Analyzer or it will cavi-
tate and introduce a lot of bubbles into the system.
Some lanes in the flow cell are running backwards and there are lots
of bubbles. What is going on?
This is probably due to a blockage in the front or rear manifold or in
the input line leading to the front manifold. First, try re-seating the
flow cell. If this doesn’t work, try washing the lines with an aspiration
rate of 120 μl per minute rather than the usual 60 to force the bub-
bles out.

228 APPENDIX D
Frequently Asked Questions
Part # 1004571 Rev. A
What is the maximum volume for the syringes in the Genome
Analyzer?
The maximum volume is 250 μl. Volumes above 250 μl automatically
pull more than 2 syringe strokes.
Why are there eight syringes if they are controlled together?
Using a separate syringe for each lane on the flow cell makes it easier
to evenly control the fluidics, resulting in flow uniformity.
There are bubbles in my syringes. Is this a problem?
Isolated small bubbles are not a problem but large bubbles can
affect the flow rate across the flow cell. Strings of small bubbles can
also be problematic.
I have huge bubbles in my syringes and they will not come out with
repeated washings. How do I get them out?
Introduction of 0.05% Tween-20 in deionized water can help clear
bubbles from the syringes.
Instrument How do I initialize the Genome Analyzer?
Close and reopen the software. When you start a task, the instrument
will initialize automatically.
Can I change the length of the tubing in the Genome Analyzer to
decrease the dead volume and save costs on reagents?
Illumina does not recommend that you do so, and cannot provide
support for systems that have been modified in this way.
What is the life expectancy of a manifold? Can I order it and change
it out myself?
The life expectancy is not known at this time. Changing the manifold
is performed by an Illumina Field Service Engineer or Field Applica-
tion Scientist.
Quality Metrics Most of the values in the QMD report are zero, does this mean my
sequencing run was unsuccessful?
Zeros are expected for the most of the fields in the report.
IPAR What are the supported network configurations for IPAR?
The supported network configurations are described in the Sequenc-
ing Site Preparation Guide for Cluster Station, Genome Analyzer,
IPAR, and Paired-End Module.
How do I make sure IPAR is enabled?
In the DataCollection\Bin\Config folder, open the file RunConfig.xml
and verify that the OnlineAnalysis element is set on="true". If this is
not the case edit the element to be set on "true".

Genome Analyzer 229
Paired-End Sequencing User Guide
How do I start IPAR analysis?
IPAR will start automatically as long as you have an active log in ses-
sion on the IPAR computer. There is a "Startup" process running on
IPAR that listens for a connect request from the GA computer. Each
time a recipe is started or resumed the GA will automatically initiate
a new IPAR session.
What is the startup initialization sequence for turning on the
instrument, the GA computer and the IPAR computer?
In general, there is no requirement to turn on the instrument, GA
computer and IPAR computer in any given order. They all need to fin-
ish booting up before starting a run, and there must be active log in
sessions on the GA and IPAR computers.
Do I need to reboot the IPAR computer between runs?
No, this is not required. If you experience any connection problems
when starting a run, it is best to log out of the GA and IPAR comput-
ers, and log back in. This will free all the resources and allow the net-
work port connections to be re-established normally. If this doesn't
solve the connection issues, then you can reboot both computers
and try again. There are icons on the desktop of the IPAR computer
for shutting down and for restarting the IPAR computer.
Do I need to reboot the GA computer between runs?
Not under normal circumstances. However you should close and
restart SCS 2 on the instrument computer and restart it before start-
ing a run, just to make sure there will be sufficient resources to com-
plete the run.
Do I need to clean up data from previous runs manually on the IPAR
computer?
Yes, just as you need to do so periodically on the GA instrument
computer. Run data accumulates on the IPAR storage array and
needs to be moved or deleted periodically. The array holds approxi-
mately 3.2 Terabytes of data, which can hold roughly 10 runs of data
analysis results if images are not being saved, and 3 runs if images
are being saved. We recommend cleaning out the E:\Analyzed folder
(which is the main folder on the storage array) every few runs to make
sure there is sufficient space for the next runs.
How can I tell if IPAR is working?
There are three ways to tell. The easiest is to watch the tile layout
graph during the imaging cycle. When all four images have been
acquired for a tile, that tile turns blue on the graph. When IPAR has
processed the tile, it will turn green, yellow or red according to its
QC score. If the tiles stay blue, then IPAR is not actively analyzing the
run. The second indication is that the analysis window has a graph of
the various QC metrics. If data points are being added to the graph,
then IPAR is active. Finally you can open a remote desktop window
to the IPAR computer and see that it has a command window open
where the processed tiles are listed.

230 APPENDIX D
Frequently Asked Questions
Part # 1004571 Rev. A
What should I do if IPAR doesn’t start up automatically?
If the network is not configured properly, the cable is disconnected,
the IPAR server is off, or Startup.exe is not running on the IPAR com-
puter, you will get error messages when SCS 2 starts up. Correct the
identified problem.
If SCS 2 does not display an error, then starting IPAR is disabled in
RunConfig.xml. Verify that IPAR is configured to start: in the RunCon-
fig.xml file on the instrument PC, verify that Analysis enabled="true".
Is it necessary to connect to the IPAR server with Remote Desktop?
It is required to be logged in to the IPAR server for the IPAR analysis
to be able to start up. You can either use the KVM switch provided in
the IPAR chassis to share Keyboard/Video/Mouse with the GA com-
puter, or you can attach your own Keyboard/Video/Mouse to the
IPAR chassis. Lastly, you can use Remote Desktop to login remotely
from the instrument PC to IPAR. Remote Desktop is the easiest way,
since it doesn't require the IPAR chassis to be next to the instrument.
It is also possible to put a monitor, keyboard and mouse directly on
the IPAR server, wherever it is located.
If IPAR analysis encounters an internal error, will it cause me to lose
the run?
Not if the following settings are used: StopRunOnError="false" in
RunConfig.xml, found in the DataCollection\Bin\Config folder. Edit
RunConfig.xml and find the OnlineAnalysis element. Set StopRunOn-
Error="false" so that IPAR errors won't cause the run to stop. Make
sure network copy is enabled on the GA computer. That way the
images will be copied to the offline analysis server and you won't
lose any run data.
Can you explain the red/green/yellow of the tiles?
When IPAR analyzes the images for a tile for the current cycle it sends
back the values for each quality parameter to the instrument com-
puter. The GA software compares them to the established QC
thresholds. If all of the values are within normal expected ranges, the
tile will be colored green, meaning "good." If any of the values are in
the marginal range, then the tile is colored yellow, meaning "mar-
ginal." If any of the values are outside the valid range, then the tile is
colored red, meaning "bad." Not all parameters are scaled to have
good/marginal/bad ranges. Some parameters are simply data that
gets graphed without a QC score. Note that the QC thresholds are
contained in a configuration file, but the values have been pre-con-
figured by Illumina to cover standard protocols.
What happens if I stop the recipe and then resume it?
The IPAR session is refreshed, and the run will continue with IPAR
analysis enabled automatically.
What happens if the SCS 2 has an error and stops? Will I be able to
restart the software and get the run going again with IPAR enabled?
In this case, close SCS 2 and log out of the GA computer or reboot
the GA computer. When you restart SCS 2, you will need to reestab-
lish the focal plane, as usual. Then you will open the recipe from the

Genome Analyzer 231
Paired-End Sequencing User Guide
run folder and find the recipe step where the run left off. Click that
step in the protocol panel and then click Resume. The IPAR session
will refresh and the run will continue with IPAR enabled. However you
cannot run any other recipes (e.g. a wash or test recipe) before you
complete the current one because you will invalidate the IPAR ses-
sion and the resume will fail.
What happens if the IPAR software has an error or exception and
stops analyzing? Can I restart IPAR and have it catch up?
The default setting is to allow data collection to continue normally
even if the IPAR software has an error and stops. You won't get any
new tile information displayed in the analysis graphs, but the run will
not be affected. The IPAR software cannot be restarted to have it
catch up to the data collection. However, if you stop the run in the
imaging cycle where IPAR had the error, you can resume that imag-
ing cycle and the IPAR session will be refreshed and will begin pro-
cessing the images. But you cannot stop it at a later cycle and
resume, because IPAR will fail due to the missing cycle data.
Do I have to worry about computing the default offsets on the IPAR?
IPAR is calculating the offsets throughout the experiment in progress.
It compares the offsets values for initial cycles with the values gener-
ated from the previous experiment. If the difference is above pre-
defined threshold, IPAR will reanalyze all data collected so far with
the new offsets and will use current offsets for the rest of the cycles.
The default offsets are located in the bin\config\Analysis.xml file on
the client PC. IPAR will update them automatically when they
change. There is also an offsets log created in the run folder, which
lists the observed offsets for each cycle.
Do I still get a report for the initial first base recipe?
Yes, when the first base recipe is complete the Runbrowser will auto-
matically generate and display the first base summary report.
Can I still use Runbrowser with IPAR?
Yes, the IPAR analysis software will create the *.bro files. They are
compatible with the Runbrowser and you can view all the same infor-
mation as before.
Can I run the Pipeline on the IPAR system?
No, the Pipeline only runs on specially configured Linux systems.
Can I get the IPAR software and run it on my own computer?
The IPAR software has been highly tuned to run on specific hardware
that is optimized to receive images from the instrument computer
and perform analysis in real-time. Illumina does not validate or sup-
port the use of the IPAR software on any system other than the IPAR
hardware.

232 APPENDIX D
Frequently Asked Questions
Part # 1004571 Rev. A
Will the image analysis results from IPAR be different from the results
of the offline analysis Pipeline?
No, at least not significantly. IPAR and Pipeline v1.0 use the same
image analysis algorithms with math libraries for the corresponding
operating system they are designed for (IPAR - for Windows, Pipeline
v1.0 - for Linux). Since the math libraries are slightly different on the
two platforms, there are minute, statistically insignificant differences
in result calculations. Both platforms use the same algorithms, but
they are compiled with different compilers and libraries.
What data is created during an IPAR analysis?
IPAR analysis creates data both on the GA computer and the IPAR
computer.
On the GA computer, the tile parameters that were plotted during
the run are accessible in the run folder, in the following location: Run-
Folder\AnalysisLogs subfolder. They are saved in XML format. In
addition the Runbrowser files and the standard GA run logs are cre-
ated for use with the Runbrowser application. The images are saved
on both the GA computer and locally until they are moved off to the
network server.
On the IPAR computer, the IPAR run folders are located under the
E:\Analyzed\RunFolder\Data root folder. The image processing
results are created in the IPAR run folder that has the same name as
the one being created for this run on the GA computer. Note that the
image analysis files created by IPAR are compatible with the Pipeline
v1.0 input requirements for base calling.
Can I still save my raw images if I am using IPAR?
Yes. The supported mechanism is to use the SCS event scripts to
move the images to the network server for offline analysis with the
Pipeline. The GA computer will have enough space on the D: drive
(the RAID array) to hold all images and logs for one full 36 cycle run.
Longer runs will require using the network copy feature to delete the
images after they have been successfully copied to the network.
I got an error message when I started a run indicating something like
"only one usage of the port is allowed" What do I do?
Log out of both computers and log back in. This will ensure that Win-
dows relinquishes the port resources so they are available for the
new run.
Does the IPAR chassis have to be adjacent to the GA instrument?
Co-location of IPAR and GA is strongly recommended but is not an
absolute requirement. If they are co-located then it is possible to use
the KVM switch in the chassis to share the keyboard, video monitor
and mouse between the GA and the IPAR computers. In addition the
GA, the instrument computer and the paired end module can be
plugged into the IPAR UPS (there are three available plugs). Finally, it
avoids long runs of Ethernet cables.

Technology Overview and Molecular Biology 233
Paired-End Sequencing User Guide
How does IPAR connect to the GA computer?
The GA computer requires an additional Network Interface Card
(NIC) to connect to the IPAR computer. This is provided by Illumina.
We typically provide a dual channel NIC, for future expandability, but
only use the first port (the one on the left when looking at the com-
puter from the rear). The IPAR computer comes with two network
connections, accessible from the back of the chassis. The upper one
connects to the GA computer, and the lower one connects to the
Local Area Network (LAN).
Do I need a crossover Ethernet cable to connect the GA to the IPAR?
We require a 1 gigabit per second (1gbps) link between the instru-
ment computer and the IPAR server. The standard for such connec-
tions indicates that the link level hardware be auto-sensing, so that
either a normal cable or a crossover cable can be used. The cables
must meet the full Cat 5e specification, with 4 data pairs. These
cables are provided by Illumina, but if longer ones are required, they
can be bought off the shelf as long as they meet the full Cat 5e spec-
ification.
During analysis I got the following notification: “Image analysis
offsets for this experiment were recalculated." – What does it mean?
The difference between the channel offsets in the IPAR configuration
file and the offsets for the experiment in progress exceeds pre-
defined thresholds. Therefore data acquired so far will be re-ana-
lyzed using the offsets values from the current run. All subsequent
cycles will be analyzed with the offsets for the current run as well.
Technology Overview and Molecular Biology
Instead of sequencing the entire genome, can you narrow down the
region that you wish to sequence to a candidate gene region? Do
you simply clone that region and use that as your sequencing
template instead of whole genomic DNA?
For a targeted approach, you can use PCR products that are derived
from your region of interest as your starting point. The PCR products
can be long-range PCR products or as short as 1500 bp. Illumina has
performed many experiments that target specific regions, and gener-
ally cover these by pooling multiple overlapping long-range PCR
products.
The sample preparation for sequencing does not require cloning.
The amplified target DNA goes through a process of fragmentation,
end repair, adaptor ligation, size selection, and PCR enrichment. This
process takes one day and allows you to process samples in parallel.
What sequencing redundancy is recommended?
This depends on the size of the organism you are trying to rese-
quence. For whole genome resequencing, a 25-fold over-sampling
should be adequate. For targeted resequencing involving mixes of

234 APPENDIX D
Frequently Asked Questions
Part # 1004571 Rev. A
many PCR products, 75-fold over-sampling will correct for the inabil-
ity to mix the PCR products at a 1:1 ratio.
Illumina sample prep shows no systematic bias. In sequencing the X
chromosome we achieved 16-fold average coverage, with all
sequenceable bases covered at least twice.
What is your base-pair read length?
Currently, kits support 17, 25, and 35 bp read lengths.
What is paired-end analysis?
Paired-end analysis involves sequencing both ends of a fragment of
DNA. If the fragments are of known size, this method can facilitate de
novo sequencing of repetitive elements and help to identify struc-
tural variation.
How do you ensure that different adaptors are ligated to each end of
a DNA fragment? What percentage of sequences have the same
adaptors?
We have a proprietary method that ensures ligation of two different
adaptors in the required orientation to opposing ends of a DNA frag-
ment. PCR selects for these and finalizes the construct ready for
hybridizing onto the flow cells surface. The adaptor sequences could
be determined by sequencing the ligation fragments, but sequence
information alone is not sufficient to uncover the method.
How much DNA is required to load a flow cell lane for bridge PCR?
We start the sample prep if possible with 1–5 μg of DNA, although
we have used as a little as 0.1 μg of genomic DNA and made suc-
cessful sample preparations. 1–2 μg is enough for many flow cells. To
each flow cell, for high density clusters, we use about 100 μl of a
3 pM solution of the prepared sample (i.e. 3 x 10⁻⁴ pmol) per lane.
We do not know how much of this binds to the surface, but this
amount is enough to visualize around 13 million clusters in one lane.
To what level have you pooled BACs successfully?
We have run customer samples where we have pooled BACs. The
most we have tried so far is 29 pooled BACs of 130 kb each. There
are no inherent limits in the software that would prevent this.
Do homopolymers and repetitive DNA regions impact sequencing
efficiency?
Homopolymers do not impact sequencing.
The repetitive DNA content of plants is an important element. The
number of uniquely alignable reads is a function of the repeat con-
tent, so this will have an impact on productivity. With longer reads
and paired end in the future this may be less of an issue.
What additional equipment is required to run the protocols
(sequencing, RNA, siRNA)?
Each sample preparation guide and site preparation guide contains a
list of all required equipment. We are also working on a list of com-

Technology Overview and Molecular Biology 235
Paired-End Sequencing User Guide
mon lab equipment and consumables that are assumed to be avail-
able in the lab.
Additional
Applications
Will we be able distinguish splice variants?
We are currently targeting the 3' ends so this is unlikely as the splice
variation may likely be 5' of the fragment we sequence. We are work-
ing on a whole transcriptome sequencing method to address splice
variants.
How do you analyze gene expression tag data?
Our depth of sequencing allows digital counting of transcripts in a
way similar to SAGE and MPSS. We capture a small region from
every transcript in your RNA sample and count how many times we
see the same one. This identifies the relative proportion of each tran-
script in the mixture and allows you to compare samples. The frag-
ment we sequence is obtained by capturing the 3'-most DpnII or
NlaIII site and using this as an anchor to generate a 20 or 21 bp tag.
These tags are then sequenced in millions of clusters to get the
expression levels of all genes in that sample.
Instrumentation What is the image system setup?
The Genome Analyzer uses a three-laser system. One laser is used
for autofocus and two for image acquisition, using a filter wheel to
allow two channels per laser. The green laser images G and T; the red
laser images C and A. Image capture uses a CCD camera.
Analysis
Software and
Computing
Requirements
What are the storage size requirements for the sequence data
output from a single run?
To process the data from a single run, the system requires 500 GB to
1 TB (depending on factors such as cycles, cluster density). Images
are acquired and stored on the instrument workstation and must then
be transferred to an external computer to be analyzed by the
Genome Analyzer Pipeline software, which handles image process-
ing, base calling, and sequence alignment.
The software should run on all common Unix/Linux variants. A high-
end Linux box should be adequate as the analysis computer. How-
ever, our software is compatible with Sun Grid Engine and LSF, if you
wish to install it on a cluster.
The main issue to be aware of is that the instrument generates ~1 Tb
of data during a full 2–3 day run. However ~70% of this is TIFF
images that can potentially be sent to tape after a run is finished and
you are satisfied a reanalysis is not required.
How much server space is required?
You should have at least 10 TB of data storage.
Can we see sample data to install and test the Genome Analyzer
Pipeline?
Yes, sample BAC data are obtainable under NDA.

236 APPENDIX D
Frequently Asked Questions
Part # 1004571 Rev. A
How long does it take to analyze a run?
Using a cluster of seven dual core computers, analyses run for
3–4 hours.

Paired-End Sequencing User Guide 237
Index
A
absolute value of sensitivity 136
adaptors 234
amplification manifold 41
amplification, frequently asked ques-
tions 223
amplifying template DNA 34
Analysis Viewer 182
Analysis Viewer tab 92
Analysis Viewer, IPAR 182
aspiration rate 94
autofocus calibration 136
autofocus performance 174, 175
B
base-pair read length 234
beam dump 112
blocking clusters 34
bubbles
checking flow cell 117
Cluster Station 223
C
calibration, autofocus 136
camera settings 125
candidate gene regions 233
cDNA 223
center mark 93
chemistry definitions recipe section 206
clamps 43
cleaning
flow cell 113
prism 111
Cluster Station
bubbles 223
components 37–42
fluid handling lines 39
frequently asked questions 222, 224
manifolds 40–42
overview 5
reagent positions 38
recipe commands 210
recipes 45, 59
Site Preparation Guide 3
stopping safely 62
time for each step 35
troubleshooting 72
tube sizes 56
variation 222
washes 64
waste container 39
workflow 34
clusters
blocking 34
color intensity 93
density 33, 223
frequently asked questions 222
intensity values 93, 166
linearizing 34
measuring intensity 172, 188
number of 175
photo bleaching 134
size 222
color display, modifying 93
computer
starting Cluster Station PC 58
starting Genome Analyzer PC 88
confirming footprint 133
controls 224
cross-contamination 107, 222, 224
customizing plots, Analysis Viewer 184
cycle selection, IPAR 185
cycles, increasing number 222
D
data transfer, paired-end runs 140
DECON_Wash_All_lines 64
deconvolution 225
denaturing clustered samples 34
dispense rate 94
documentation 3
E
entering, flow cell ID 114
export reports 171

238 Index
Part # 1004571 Rev. A
exposures
calibrating 127
settings 125
F
false color 93
fiber optics mount 86
filter wheel 125
first-base incorporation 121
checking results in Run Browser 165
report 168
Run Browser 158, 180
FirstBase recipe 121
First-Cycle report 168, 169
Flow Cell Area, Cluster Station 37, 40
Flow Cell window 159
flow cells
1.0 mm flow cell 6
1.4 mm flow cell 6
bubbles 223, 227
cleaning 113
cluster density 33
entering ID 114
even flow 227
frequently asked questions 226
hybridizing template DNA 34
loading into Cluster Station 61
loading into Genome Analyzer 114
loading Scan Mix 123
overview 5
removing 110
safe storage 220
stage, Genome Analyzer 86
storing 62
storing extras 72
temperature control 33
tilt 165
unloading from Cluster Station 63
unloading from Genome Analyzer
97
flow rate, syringe 227
FlowcellTmpr error 76
fluid handling
Cluster Station lines 39
frequently asked questions 223, 227
Genome Analyzer 117
fluidics pump 85
fluorescent base incorporation 206
focal plane, adjusting 124–135
focus
autofocus performance 174, 175
confirming footprint 133
confirming left edge 130
finding left edge 129
frequently asked questions 226
manual controls 125
measuring image quality 172
metrics 166
moving stage 126
quality and uniformity 93
setting initial 127
setting optimal position 133
warning messages 136, 173
X-axis 126
XY drift 131
Y-axis 131
Z-axis 133
footprint, confirming 133
fragmentation 221
G
gene expression tag data 235
Genome Analyzer
bottle adaptors 104
commands 211
components 84
default XYZ coordinates 124
image controls 93
imaging compartment 86
manifolds 87
manual controls 124
overview 5
plumbing manifolds 87
reagent positions 85, 107
software 91–94
starting 88
storage, restarting after 97
washes 95–97
workflow 82
goodness of fit 136
H
hardware
Cluster Station components 37–42
Genome Analyzer components 84
heat sink 86
help
documentation 3
technical support 4
histogram of quality metrics 159
homopolymers 234
hybridization manifold 40
hybridizing sequencing primers 34
hybridizing template DNA 34
I
Image Cycle tab 91
images
colors, modifying 93

Index 239
Paired-End Sequencing User Guide
controls, Genome Analyzer 93
data files 197
measuring quality 172
saving 93
warning messages 173
zoom 93
imaging compartment 86
immersion oil 119
Incorporation command 211
incorporation recipe section 206
individual parameter plots, IPAR 187
initial focus, setting 127
input manifold 42
installing prism 112
intensity values 93
IPAR 182
Analysis Viewer tab 92
context menu options 186
customizing plots 184
cycle selection 185
individual parameter plots 180, 187
overview display 180, 182
Pipeline analysis 189, 194
quality metrics 188
raw value display 183, 185
scaled display 183
starting 89
thresholds 188
user interface 180–187
zooming, Analysis Viewer 183
L
lab tracking worksheets 3
Lane command 211
lane mean values 159
LaneRange command 211
lanes, reducing number 213
lasers
adjusting focal plane 124–135
red, green, focus 125
spot metrics 174, 175
leaks, checking for 117, 227
left edge, confirming 130
left edge, finding 129
libraries 221
linearizing clusters 34
loading flow cells
Cluster Station 61
Genome Analyzer 114
loading reagents
Cluster Station 56
Genome Analyzer 107
loading Scan Mix 123
M
maintenance wash 64
manifolds
amplification manifold 41
Cluster Station 40–42
Genome Analyzer 87
hybridization manifold 40
input manifold 42
output manifold 42
plumbing manifolds 87
washing bridge 44
Manual Control/Setup window 91
manual controls, Genome Analyzer 124
matrix file 224
metric reports 168, 170
metrics
cluster intensity 172, 188
focus 172
laser spot 174, 175
number of clusters 175
N
nebulization 221
network location, sample sheets 200
number of clusters 175
O
objective 86
offsets file 225
oil, applying 119
output manifold 42
P
paired-end
data transfer 140
paired-end analysis 234
Paired-End Module 5
paired-end sequencing 3
params file 196
PCR 222
Peltier block 33
Peltier fan 86
Peltier heater 86
PhiX, control 224
photo bleaching 134
Pipeline analysis, IPAR data 189, 194
post-run wash 155
power connections, Cluster Station 37
pre-run wash 105
Prime command 210
priming Genome Analyzer reagents 108
print reports 171

240 Index
Part # 1004571 Rev. A
prism
assembly 112
cleaning 111
handling 110
installing 112
removing 110
protocol recipe section 206
Pump command 210
pump controls 94
PumpToFlowcell command 211
Q
quality metric listbox 159
quality metrics, IPAR 188
quick-connect clamps 43
R
raw value display, IPAR 183
RCMConfig file 200
ReadPrep command 211
ReadPrep cycles 212
reagent port. See input manifold
reagents, Cluster Station
loading 56
positions 38
preparing 53
priming to waste 74
pumping manually 72
Reagent Area 37
variation 222
waste 39
reagents, Genome Analyzer 107
loading 107
positions 107
preparing 101, 149
priming 108
Reagent Compartment 85
testing delivery 117
waste 85
reagents, Paired-End Module
positions 146, 147
preparing 141
priming 148
Recipe tab 91
recipes 206–218, 220
annotated example 214
Cluster Station 45
FirstBase 121
general commands 209
location 45
ReadPrep cycles 212
run copy 196
running on Cluster Station 59
sequencing 139
service 212
stopping and starting 207
user-defined 212
region of interest 93
removing
flow cell 110
prism 110
repetitive DNA regions 234
Report window 168
reports 175
cluster intensity 172, 188
creating 169, 176
First-Cycle 168
focus metrics 172
laser spot metrics 174, 175
metric 168
number of clusters 175
toolbar controls 171
RoboCopy 225
RoboMove 225
ROI. See region of interest
Row command 211
RowRange command 211
rows, reducing number 213
Run Browser
checking first-base incorporation
138
creating reports 169, 176
first-base incorporation results 165
flow cell window 159
launch settings 160
overview 158, 180
Report window 168
user interface 158
run data
amount per run 88
moving 225
run folders 196–197
Run window 91
run.completed file 196
S
sample sheets 200–203
editor 201
example 202
filling in 59
location 196
network location 200
samples
amplifying 34
denaturing 34
fragmentation 221
hybridizing to flow cells 34
number of 221
preparation time 221
preparing 5

Index 241
Paired-End Sequencing User Guide
storage time 221
scaled display, IPAR 183
scaling intensity values 93
scheduling
Cluster Station wash 72
Cluster Station washes 64
selector valve error 75
sensitivity, absolute value 136
Sequencing by Synthesis (SBS) 2
sequencing primers 34
sequencing recipe 139
sequencing redundancy 233
service recipes 212
software
Genome Analyzer 91–94
IPAR 180–187
overhead 175
requirements 235
Run Browser 158
sonication 221
splice variants 235
spreadsheets, exporting reports as 171
stage, moving 126
Starting IPAR 89
statistics
statistical operations 168
stopping points, Cluster Station 62
storage wash 96
storing Genome Analyzer, restarting af-
ter 97
SybrGreen 223
syringe flow rate 227
syringes, maximum volume 228
T
target focus 172
technical support 4
temperature
profile, Cluster Station 75
setting thermal station 72
Temperature tab 92
template DNA 223
TempRamp command 209, 210
TempSet command 209, 210
thermal station 72, 86
thresholds scaled overview display, IPAR
188
tile selection 206, 213, 227
tile time 175
tiles 226
time
cluster generation 222
Cluster Station protocol steps 35
tips
avoiding cross-contamination on
Genome Analyzer 107
handling prism 110
loading reagents safely 56
minimizing exposures 134
storing extra flow cells 72
tubes
attaching to Genome Analyzer 85
Cluster Station sizes 56
U
unloading flow cells
Cluster Station 63
Genome Analyzer 97
user-defined recipes 212
UserWait command 210
V
video, starting 125
W
Wait command 209
warning messages 136, 173
washes
Cluster Station 64, 72
Genome Analyzer 95–97
post-run wash 155
pre-run wash 105
storage and monthly maintenance
wash 95
washing bridge 44
waste container
Cluster Station 39
Genome Analyzer 85
waste port. See output manifold
X
X-axis, adjusting 126
XY drift, setting 131
Y
Y-axis, adjusting 131
Z
Z-axis, adjusting 133
zoom scanned image 93
zooming, Analysis Viewer 183

242 Index
Part # 1004571 Rev. A

Illumina, Inc.
9885 Towne Centre Drive
San Diego, CA 92121-1975
+1.800.809.ILMN (4566)
+1.858.202.4566 (outside North America)
techsupport@illumina.com
www.illumina.com
